united states securities and exchange commission - MITSUI ...
271
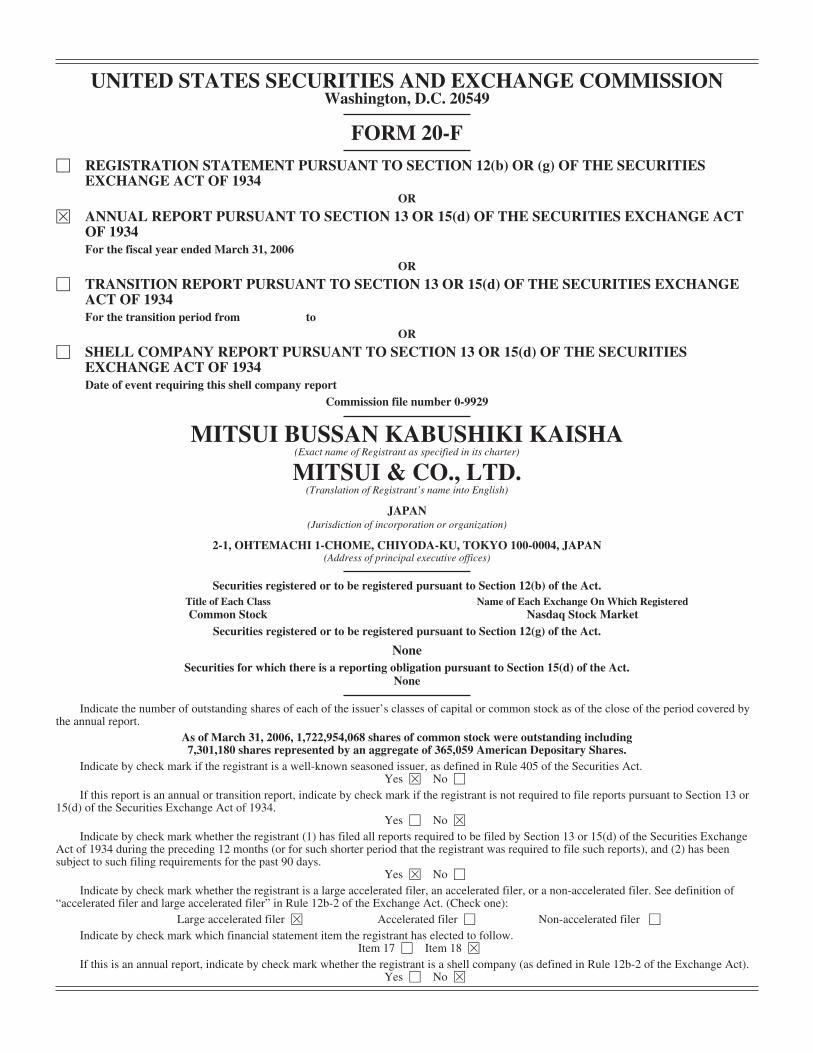
UNITED STATES SECURITIES AND EXCHANGE COMMISSION Washington, D.C. 20549 FORM 20-F ‘ REGISTRATION STATEMENT PURSUANT TO SECTION 12(b) OR (g) OF THE SECURITIES EXCHANGE ACT OF 1934 OR È ANNUAL REPORT PURSUANT TO SECTION 13 OR 15(d) OF THE SECURITIES EXCHANGE ACT OF 1934 For the fiscal year ended March 31, 2006 OR ‘ TRANSITION REPORT PURSUANT TO SECTION 13 OR 15(d) OF THE SECURITIES EXCHANGE ACT OF 1934 For the transition period from to OR ‘ SHELL COMPANY REPORT PURSUANT TO SECTION 13 OR 15(d) OF THE SECURITIES EXCHANGE ACT OF 1934 Date of event requiring this shell company report Commission file number 0-9929 MITSUI BUSSAN KABUSHIKI KAISHA (Exact name of Registrant as specified in its charter) MITSUI & CO., LTD. (Translation of Registrant’s name into English) JAPAN (Jurisdiction of incorporation or organization) 2-1, OHTEMACHI 1-CHOME, CHIYODA-KU, TOKYO 100-0004, JAPAN (Address of principal executive offices) Securities registered or to be registered pursuant to Section 12(b) of the Act. Title of Each Class Name of Each Exchange On Which Registered Common Stock Nasdaq Stock Market Securities registered or to be registered pursuant to Section 12(g) of the Act. None Securities for which there is a reporting obligation pursuant to Section 15(d) of the Act. None Indicate the number of outstanding shares of each of the issuer’s classes of capital or common stock as of the close of the period covered by the annual report. As of March 31, 2006, 1,722,954,068 shares of common stock were outstanding including 7,301,180 shares represented by an aggregate of 365,059 American Depositary Shares. Indicate by check mark if the registrant is a well-known seasoned issuer, as defined in Rule 405 of the Securities Act. Yes È No ‘ If this report is an annual or transition report, indicate by check mark if the registrant is not required to file reports pursuant to Section 13 or 15(d) of the Securities Exchange Act of 1934. Yes ‘ No È Indicate by check mark whether the registrant (1) has filed all reports required to be filed by Section 13 or 15(d) of the Securities Exchange Act of 1934 during the preceding 12 months (or for such shorter period that the registrant was required to file such reports), and (2) has been subject to such filing requirements for the past 90 days. Yes È No ‘ Indicate by check mark whether the registrant is a large accelerated filer, an accelerated filer, or a non-accelerated filer. See definition of “accelerated filer and large accelerated filer” in Rule 12b-2 of the Exchange Act. (Check one): Large accelerated filer È Accelerated filer ‘ Non-accelerated filer ‘ Indicate by check mark which financial statement item the registrant has elected to follow. Item 17 ‘ Item 18 È If this is an annual report, indicate by check mark whether the registrant is a shell company (as defined in Rule 12b-2 of the Exchange Act). Yes ‘ No È
-
Upload
khangminh22 -
Category
Documents
-
view
1 -
download
0
Transcript of united states securities and exchange commission - MITSUI ...
UNITED STATES SECURITIES AND EXCHANGE COMMISSIONWashington, D.C. 20549
FORM 20-F‘ REGISTRATION STATEMENT PURSUANT TO SECTION 12(b) OR (g) OF THE SECURITIES
EXCHANGE ACT OF 1934OR
È ANNUAL REPORT PURSUANT TO SECTION 13 OR 15(d) OF THE SECURITIES EXCHANGE ACTOF 1934For the fiscal year ended March 31, 2006
OR
‘ TRANSITION REPORT PURSUANT TO SECTION 13 OR 15(d) OF THE SECURITIES EXCHANGEACT OF 1934For the transition period from to
OR
‘ SHELL COMPANY REPORT PURSUANT TO SECTION 13 OR 15(d) OF THE SECURITIESEXCHANGE ACT OF 1934Date of event requiring this shell company report
Commission file number 0-9929
MITSUI BUSSAN KABUSHIKI KAISHA(Exact name of Registrant as specified in its charter)
MITSUI & CO., LTD.(Translation of Registrant’s name into English)
JAPAN(Jurisdiction of incorporation or organization)
2-1, OHTEMACHI 1-CHOME, CHIYODA-KU, TOKYO 100-0004, JAPAN(Address of principal executive offices)
Securities registered or to be registered pursuant to Section 12(b) of the Act.Title of Each Class Name of Each Exchange On Which RegisteredCommon Stock Nasdaq Stock Market
Securities registered or to be registered pursuant to Section 12(g) of the Act.
NoneSecurities for which there is a reporting obligation pursuant to Section 15(d) of the Act.
None
Indicate the number of outstanding shares of each of the issuer’s classes of capital or common stock as of the close of the period covered bythe annual report.
As of March 31, 2006, 1,722,954,068 shares of common stock were outstanding including7,301,180 shares represented by an aggregate of 365,059 American Depositary Shares.
Indicate by check mark if the registrant is a well-known seasoned issuer, as defined in Rule 405 of the Securities Act.Yes È No ‘
If this report is an annual or transition report, indicate by check mark if the registrant is not required to file reports pursuant to Section 13 or15(d) of the Securities Exchange Act of 1934.
Yes ‘ No È
Indicate by check mark whether the registrant (1) has filed all reports required to be filed by Section 13 or 15(d) of the Securities ExchangeAct of 1934 during the preceding 12 months (or for such shorter period that the registrant was required to file such reports), and (2) has beensubject to such filing requirements for the past 90 days.
Yes È No ‘
Indicate by check mark whether the registrant is a large accelerated filer, an accelerated filer, or a non-accelerated filer. See definition of“accelerated filer and large accelerated filer” in Rule 12b-2 of the Exchange Act. (Check one):
Large accelerated filer È Accelerated filer ‘ Non-accelerated filer ‘
Indicate by check mark which financial statement item the registrant has elected to follow.Item 17 ‘ Item 18 È
If this is an annual report, indicate by check mark whether the registrant is a shell company (as defined in Rule 12b-2 of the Exchange Act).Yes ‘ No È
Certain References and Information
As used in this report, “Mitsui” is used to refer to Mitsui & Co., Ltd. (Mitsui Bussan Kabushiki Kaisha),“we”, “us”, and “our” are used to indicate Mitsui & Co., Ltd. and subsidiaries, unless otherwise indicated.“Share” means one share of Mitsui’s common stock, “ADS” means an American Depositary Share representing20 shares, and “ADR” means an American Depositary Receipt evidencing one or more ADSs. Also, “dollar” or“$” means the lawful currency of the United States of America, and “yen” or “¥” means the lawful currency ofJapan.
All financial statements and information contained in this annual report have been prepared in accordancewith accounting principles generally accepted in the United States, or U.S. GAAP, except where otherwise noted.
A Cautionary Note on Forward-Looking Statements
This annual report includes forward-looking statements based on our current expectations, assumptions,estimates and projections about our business, our industry and capital markets around the world. Generally, theseforward-looking statements can be identified by the use of forward-looking terminology such as “may”,“expect”, “anticipate”, “estimate”, “plan” or similar words. The forward-looking statements in this annual reportare subject to various risks, uncertainties and assumptions. These statements discuss future expectations, identifystrategies, contain projections of results of operations or of our financial position, or state other forward-lookinginformation. Known and unknown risks, uncertainties and other factors could cause our actual operating resultsto differ materially from those contained or implied in any forward-looking statement. Our expectationsexpressed in these forward-looking statements may not turn out to be correct, and our actual results couldmaterially differ from and be worse than our expectations.
Important risks and factors that could cause our actual results to differ materially from our expectations arediscussed in this “Item 3.D. Risk Factors” or elsewhere in this annual report and include, without limitation:
‰ changes in economic conditions that may lead to unforeseen developments in markets for productshandled by us;
‰ fluctuations in currency exchange rates that may cause unexpected deterioration in the value oftransactions;
‰ adverse political developments in the various jurisdictions where we operate, which among things, maycreate delays or postponements of transactions and projects;
‰ changes in laws, regulations or policies in any of the countries where we conduct our operations; and
‰ significant changes in the competitive environment.
We do not assume, and specifically disclaim, any obligation to update any forward-looking statementswhich speak only as of the date made.
2

TABLE OF CONTENTS
Page
PART I . . . . . . . . . . . . . . . . . . . . . . . . . . . . . . . . . . . . . . . . . . . . . . . . . . . . . . . . . . . . . . . . . . . . . . . . . . . . . . . 5Item 1. Identity of Directors, Senior Management and Advisers . . . . . . . . . . . . . . . . . . . . . . . . . . . . . . . . 5Item 2. Offer Statistics and Expected Timetable . . . . . . . . . . . . . . . . . . . . . . . . . . . . . . . . . . . . . . . . . . . . . 5Item 3. Key Information . . . . . . . . . . . . . . . . . . . . . . . . . . . . . . . . . . . . . . . . . . . . . . . . . . . . . . . . . . . . . . . 5
A. Selected Financial Data . . . . . . . . . . . . . . . . . . . . . . . . . . . . . . . . . . . . . . . . . . . . . . . . . . . . . . . . . 5B. Capitalization and Indebtedness . . . . . . . . . . . . . . . . . . . . . . . . . . . . . . . . . . . . . . . . . . . . . . . . . . . 7C. Reasons for the Offer and Use of Proceeds . . . . . . . . . . . . . . . . . . . . . . . . . . . . . . . . . . . . . . . . . . 7D. Risk Factors . . . . . . . . . . . . . . . . . . . . . . . . . . . . . . . . . . . . . . . . . . . . . . . . . . . . . . . . . . . . . . . . . . . 7
Item 4. Information on the Company . . . . . . . . . . . . . . . . . . . . . . . . . . . . . . . . . . . . . . . . . . . . . . . . . . . . . 14A. History and Development of the Company . . . . . . . . . . . . . . . . . . . . . . . . . . . . . . . . . . . . . . . . . . 14B. Business Overview . . . . . . . . . . . . . . . . . . . . . . . . . . . . . . . . . . . . . . . . . . . . . . . . . . . . . . . . . . . . . 19C. Organizational Structure . . . . . . . . . . . . . . . . . . . . . . . . . . . . . . . . . . . . . . . . . . . . . . . . . . . . . . . . . 52D. Property, Plant and Equipment . . . . . . . . . . . . . . . . . . . . . . . . . . . . . . . . . . . . . . . . . . . . . . . . . . . . 57
Item 4A. Unresolved Staff Comments . . . . . . . . . . . . . . . . . . . . . . . . . . . . . . . . . . . . . . . . . . . . . . . . . . . . . 69Item 5. Operating and Financial Review and Prospects . . . . . . . . . . . . . . . . . . . . . . . . . . . . . . . . . . . . . . . . 70
A. Operating Results . . . . . . . . . . . . . . . . . . . . . . . . . . . . . . . . . . . . . . . . . . . . . . . . . . . . . . . . . . . . . . 70B. Liquidity and Capital Resources . . . . . . . . . . . . . . . . . . . . . . . . . . . . . . . . . . . . . . . . . . . . . . . . . . . 122C. Research & Development . . . . . . . . . . . . . . . . . . . . . . . . . . . . . . . . . . . . . . . . . . . . . . . . . . . . . . . . 135D. Trend Information . . . . . . . . . . . . . . . . . . . . . . . . . . . . . . . . . . . . . . . . . . . . . . . . . . . . . . . . . . . . . . 136E. Off-Balance Sheet Arrangements . . . . . . . . . . . . . . . . . . . . . . . . . . . . . . . . . . . . . . . . . . . . . . . . . . 136F. Tabular Disclosure of Contractual Obligations . . . . . . . . . . . . . . . . . . . . . . . . . . . . . . . . . . . . . . . . 137
Item 6. Directors, Senior Management and Employees . . . . . . . . . . . . . . . . . . . . . . . . . . . . . . . . . . . . . . . . 138A. Directors and Senior Management . . . . . . . . . . . . . . . . . . . . . . . . . . . . . . . . . . . . . . . . . . . . . . . . . 138B. Compensation . . . . . . . . . . . . . . . . . . . . . . . . . . . . . . . . . . . . . . . . . . . . . . . . . . . . . . . . . . . . . . . . . . 150C. Board Practices . . . . . . . . . . . . . . . . . . . . . . . . . . . . . . . . . . . . . . . . . . . . . . . . . . . . . . . . . . . . . . . . 150D. Employees . . . . . . . . . . . . . . . . . . . . . . . . . . . . . . . . . . . . . . . . . . . . . . . . . . . . . . . . . . . . . . . . . . . . 156E. Share Ownership . . . . . . . . . . . . . . . . . . . . . . . . . . . . . . . . . . . . . . . . . . . . . . . . . . . . . . . . . . . . . . . 158
Item 7. Major Shareholders and Related Party Transactions . . . . . . . . . . . . . . . . . . . . . . . . . . . . . . . . . . . 158A. Major Shareholders . . . . . . . . . . . . . . . . . . . . . . . . . . . . . . . . . . . . . . . . . . . . . . . . . . . . . . . . . . . . . 158B. Related Party Transactions . . . . . . . . . . . . . . . . . . . . . . . . . . . . . . . . . . . . . . . . . . . . . . . . . . . . . . . 160C. Interests of Experts and Counsel . . . . . . . . . . . . . . . . . . . . . . . . . . . . . . . . . . . . . . . . . . . . . . . . . . . 161
Item 8. Financial Information . . . . . . . . . . . . . . . . . . . . . . . . . . . . . . . . . . . . . . . . . . . . . . . . . . . . . . . . . . . 162A. Consolidated Statements and Other Financial Information . . . . . . . . . . . . . . . . . . . . . . . . . . . . . . 162B. Significant Changes . . . . . . . . . . . . . . . . . . . . . . . . . . . . . . . . . . . . . . . . . . . . . . . . . . . . . . . . . . . . . 163
Item 9. The Offer and Listing . . . . . . . . . . . . . . . . . . . . . . . . . . . . . . . . . . . . . . . . . . . . . . . . . . . . . . . . . . . . 163A. Offer and Listing Details . . . . . . . . . . . . . . . . . . . . . . . . . . . . . . . . . . . . . . . . . . . . . . . . . . . . . . . . . 163B. Plan of Distribution . . . . . . . . . . . . . . . . . . . . . . . . . . . . . . . . . . . . . . . . . . . . . . . . . . . . . . . . . . . . . 164C. Markets . . . . . . . . . . . . . . . . . . . . . . . . . . . . . . . . . . . . . . . . . . . . . . . . . . . . . . . . . . . . . . . . . . . . . . . 164D. Selling Shareholders . . . . . . . . . . . . . . . . . . . . . . . . . . . . . . . . . . . . . . . . . . . . . . . . . . . . . . . . . . . . 164E. Dilution . . . . . . . . . . . . . . . . . . . . . . . . . . . . . . . . . . . . . . . . . . . . . . . . . . . . . . . . . . . . . . . . . . . . . . . 164F. Expenses of the Issue . . . . . . . . . . . . . . . . . . . . . . . . . . . . . . . . . . . . . . . . . . . . . . . . . . . . . . . . . . . . 164
Item 10. Additional Information . . . . . . . . . . . . . . . . . . . . . . . . . . . . . . . . . . . . . . . . . . . . . . . . . . . . . . . . . . 164A. Share Capital . . . . . . . . . . . . . . . . . . . . . . . . . . . . . . . . . . . . . . . . . . . . . . . . . . . . . . . . . . . . . . . . . . 164B. Memorandum and Articles of Association . . . . . . . . . . . . . . . . . . . . . . . . . . . . . . . . . . . . . . . . . . . 164C. Material Contracts . . . . . . . . . . . . . . . . . . . . . . . . . . . . . . . . . . . . . . . . . . . . . . . . . . . . . . . . . . . . . . 173D. Exchange Controls . . . . . . . . . . . . . . . . . . . . . . . . . . . . . . . . . . . . . . . . . . . . . . . . . . . . . . . . . . . . . . 173E. Taxation . . . . . . . . . . . . . . . . . . . . . . . . . . . . . . . . . . . . . . . . . . . . . . . . . . . . . . . . . . . . . . . . . . . . . . 175F. Dividends and Paying Agents . . . . . . . . . . . . . . . . . . . . . . . . . . . . . . . . . . . . . . . . . . . . . . . . . . . . . 177G. Statement by Experts . . . . . . . . . . . . . . . . . . . . . . . . . . . . . . . . . . . . . . . . . . . . . . . . . . . . . . . . . . . . 177
3
Page
H. Documents on Display . . . . . . . . . . . . . . . . . . . . . . . . . . . . . . . . . . . . . . . . . . . . . . . . . . . . . . . . . . . 177I. Subsidiary Information . . . . . . . . . . . . . . . . . . . . . . . . . . . . . . . . . . . . . . . . . . . . . . . . . . . . . . . . . . . 178
Item 11. Quantitative and Qualitative Disclosures about Market Risk . . . . . . . . . . . . . . . . . . . . . . . . . . . . 178Item 12. Description of Securities Other than Equity Securities . . . . . . . . . . . . . . . . . . . . . . . . . . . . . . . . . 181
PART II . . . . . . . . . . . . . . . . . . . . . . . . . . . . . . . . . . . . . . . . . . . . . . . . . . . . . . . . . . . . . . . . . . . . . . . . . . . . . . 182Item 13. Defaults, Dividend Arrearages and Delinquencies . . . . . . . . . . . . . . . . . . . . . . . . . . . . . . . . . . . . 182Item 14. Material Modifications to the Rights of Security Holders and Use of Proceeds . . . . . . . . . . . . . . 182Item 15. Controls and Procedures . . . . . . . . . . . . . . . . . . . . . . . . . . . . . . . . . . . . . . . . . . . . . . . . . . . . . . . . . 182Item 16. [Reserved] . . . . . . . . . . . . . . . . . . . . . . . . . . . . . . . . . . . . . . . . . . . . . . . . . . . . . . . . . . . . . . . . . . . 182Item 16A. Audit Committee Financial Expert . . . . . . . . . . . . . . . . . . . . . . . . . . . . . . . . . . . . . . . . . . . . . . . 182Item 16B. Code of Ethics . . . . . . . . . . . . . . . . . . . . . . . . . . . . . . . . . . . . . . . . . . . . . . . . . . . . . . . . . . . . . . . 183Item 16C. Principal Accountant Fees and Services . . . . . . . . . . . . . . . . . . . . . . . . . . . . . . . . . . . . . . . . . . . 183Item 16D. Exemptions from the Listing Standards for Audit Committees . . . . . . . . . . . . . . . . . . . . . . . . . 184Item 16E. Purchases of Equity Securities by the Issuer and Affiliated Purchasers . . . . . . . . . . . . . . . . . . . 185
PART III . . . . . . . . . . . . . . . . . . . . . . . . . . . . . . . . . . . . . . . . . . . . . . . . . . . . . . . . . . . . . . . . . . . . . . . . . . . . . . 186Item 17. Financial Statements . . . . . . . . . . . . . . . . . . . . . . . . . . . . . . . . . . . . . . . . . . . . . . . . . . . . . . . . . . . 186Item 18. Financial Statements . . . . . . . . . . . . . . . . . . . . . . . . . . . . . . . . . . . . . . . . . . . . . . . . . . . . . . . . . . . 186Item 19. Exhibits . . . . . . . . . . . . . . . . . . . . . . . . . . . . . . . . . . . . . . . . . . . . . . . . . . . . . . . . . . . . . . . . . . . . . 186
4

PART I
Item 1. Identity of Directors, Senior Management and Advisers.
Not applicable.
Item 2. Offer Statistics and Expected Timetable.
Not applicable.
Item 3. Key Information.
A. Selected Financial Data.
The selected consolidated income statement data and the selected consolidated cash flow statement data forthe years ended March 31, 2006, 2005 and 2004 and the selected consolidated balance sheet data as of March 31,2006 and 2005 below are derived from our audited consolidated financial statements prepared in accordance withU.S. GAAP, which are included elsewhere in this annual report. The selected consolidated income statement dataand the selected consolidated cash flow statement data for the years ended March 31, 2003 and 2002 and theselected consolidated balance sheet data as of March 31, 2004, 2003 and 2002 are derived from our previouslypublished audited consolidated financial statements prepared in accordance with U.S. GAAP, which are notincluded in this annual report. The consolidated financial statements as of March 31, 2006 and 2005 and for theyears ended March 31, 2006, 2005 and 2004 have been audited by Deloitte Touche Tohmatsu, independentauditors, whose report is filed as part of this annual report.
The selected consolidated financial statements have been prepared in accordance with U.S. GAAP andshould be read in conjunction with, and are qualified in their entirety by reference to “Item 5. Operating andFinancial Review and Prospects,” and our consolidated financial statements and notes thereto included elsewherein this annual report.
In Billions of Yen, Except Amounts per Share and Common Stock Data
As of or for the Years Ended March 31,
2006 2005 2004 2003 2002
Consolidated Income Statement Data:Results of Operations:
Revenues(1) . . . . . . . . . . . . . . . . . . . . . . . . . . ¥ 4,115 ¥3,495 ¥2,970 ¥2,778 ¥2,475Gross Profit(1) . . . . . . . . . . . . . . . . . . . . . . . . 817 709 611 566 537Equity in Earnings of Associated
Companies(1) . . . . . . . . . . . . . . . . . . . . . . . 94 64 40 15 24Income from Continuing Operations(1) . . . . 201 114 79 39 61Net Income . . . . . . . . . . . . . . . . . . . . . . . . . . 202 121 68 31 55Income from Continuing Operations per
Share(1):Basic . . . . . . . . . . . . . . . . . . . . . . . . . . . 125.49 72.00 50.21 24.42 38.25Diluted . . . . . . . . . . . . . . . . . . . . . . . . . 118.13 67.86 47.42 23.09 35.89
Net Income per Share:Basic . . . . . . . . . . . . . . . . . . . . . . . . . . . 126.26 76.55 43.25 19.68 34.97Diluted . . . . . . . . . . . . . . . . . . . . . . . . . 118.85 72.12 40.89 18.69 32.85
Cash Dividends Declared per Share . . . . . . . . . . . 20 9 8 8 8Cash Dividends Declared per Share in
U.S. Dollars(2) . . . . . . . . . . . . . . . . . . . . . . . . . . $ 0.17 $ 0.09 $ 0.07 $ 0.07 $ 0.06
5

In Billions of Yen, Except Amounts per Share and Common Stock Data
As of or for the Years Ended March 31,
2006 2005 2004 2003 2002
Consolidated Balance Sheet Data:Financial Position at Year-End:
Total Assets . . . . . . . . . . . . . . . . . . . . . ¥ 8,574 ¥ 7,593 ¥ 6,716 ¥ 6,541 ¥ 6,668Total Shareholders’ Equity . . . . . . . . . 1,678 1,123 963 862 915Long-term Debt, less Current
Maturities . . . . . . . . . . . . . . . . . . . . . 2,911 2,905 2,541 2,500 2,619Return on Equity . . . . . . . . . . . . . . . . . 14.5% 11.6% 7.5% 3.5% 6.3%Common Stock . . . . . . . . . . . . . . . . . . . 296 192 192 192 192
Other Information at Year-End:Common Stock:Number of Shares Outstanding
(in Thousands) . . . . . . . . . . . . . . . . . 1,722,954 1,582,211 1,581,013 1,581,377 1,583,180Number of Shareholders . . . . . . . . . . . . . . . 121,503 107,034 109,722 115,267 118,700
In Billions of Yen
For the Years Ended March 31,
2006 2005 2004 2003 2002
Consolidated Cash Flow Statement Data:Cash Flows:
Net Cash Provided by OperatingActivities . . . . . . . . . . . . . . . . . . . . . ¥ 146 ¥ 200 ¥ 100 ¥ 52 ¥ 134
Net Cash Used in InvestingActivities . . . . . . . . . . . . . . . . . . . . . (347) (224) (134) (4) (83)
(1) In accordance with Statement of Financial Accounting Standards No. 144, “Accounting for the Impairmentor Disposal of Long-Lived Assets,” the prior year figures relating to discontinued operations have beenreclassified.
(2) The U.S. dollar amounts represent translations of the Japanese yen amounts at the rates in effect on therespective dividend payment dates.
Exchange Rate Information
The information set forth below with respect to exchange rates is based on the official noon buying rates forJapanese yen of the Federal Reserve Bank of New York. These rates are provided solely for the convenience ofthe reader and are not the exchange rates used by us in the preparation of our consolidated financial statementsincluded in this annual report.
The official exchange rate on September 20, 2006 was ¥117.29 = U.S.$1.00. The following table sets forththe high and low official noon buying rates for Japanese yen of the Federal Reserve Bank of New York in eachmonth of the previous six months.
Yen per U.S. Dollar
High Low
August 2006 . . . . . . . . . . . . . . . . . . . . . . . . . . . . . . . . . . . . . . . . . . . . . . . . . . . . . . . . . . . . . ¥117.35 ¥114.21July 2006 . . . . . . . . . . . . . . . . . . . . . . . . . . . . . . . . . . . . . . . . . . . . . . . . . . . . . . . . . . . . . . . . 117.44 113.97June 2006 . . . . . . . . . . . . . . . . . . . . . . . . . . . . . . . . . . . . . . . . . . . . . . . . . . . . . . . . . . . . . . . . 116.42 111.66May 2006 . . . . . . . . . . . . . . . . . . . . . . . . . . . . . . . . . . . . . . . . . . . . . . . . . . . . . . . . . . . . . . . . 113.46 110.07April 2006 . . . . . . . . . . . . . . . . . . . . . . . . . . . . . . . . . . . . . . . . . . . . . . . . . . . . . . . . . . . . . . . 118.66 113.79March 2006 . . . . . . . . . . . . . . . . . . . . . . . . . . . . . . . . . . . . . . . . . . . . . . . . . . . . . . . . . . . . . . 119.07 115.89
6
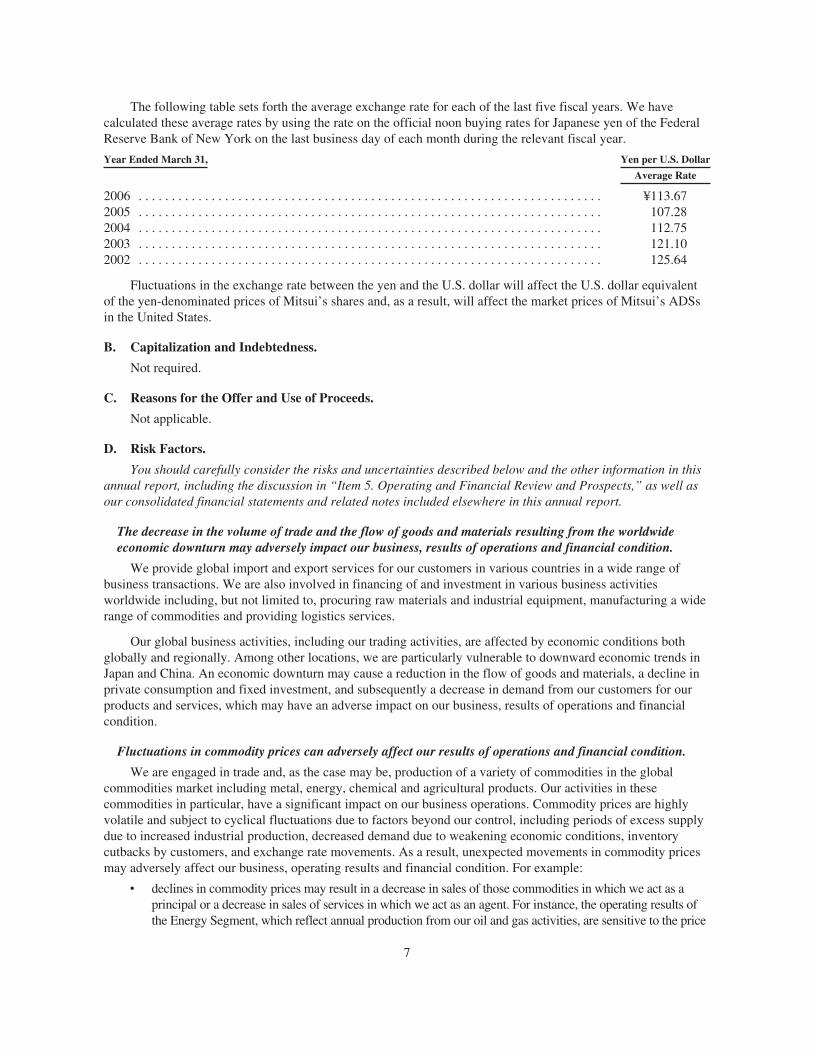
The following table sets forth the average exchange rate for each of the last five fiscal years. We havecalculated these average rates by using the rate on the official noon buying rates for Japanese yen of the FederalReserve Bank of New York on the last business day of each month during the relevant fiscal year.
Year Ended March 31, Yen per U.S. Dollar
Average Rate
2006 . . . . . . . . . . . . . . . . . . . . . . . . . . . . . . . . . . . . . . . . . . . . . . . . . . . . . . . . . . . . . . . . . . . . . . ¥113.672005 . . . . . . . . . . . . . . . . . . . . . . . . . . . . . . . . . . . . . . . . . . . . . . . . . . . . . . . . . . . . . . . . . . . . . . 107.282004 . . . . . . . . . . . . . . . . . . . . . . . . . . . . . . . . . . . . . . . . . . . . . . . . . . . . . . . . . . . . . . . . . . . . . . 112.752003 . . . . . . . . . . . . . . . . . . . . . . . . . . . . . . . . . . . . . . . . . . . . . . . . . . . . . . . . . . . . . . . . . . . . . . 121.102002 . . . . . . . . . . . . . . . . . . . . . . . . . . . . . . . . . . . . . . . . . . . . . . . . . . . . . . . . . . . . . . . . . . . . . . 125.64
Fluctuations in the exchange rate between the yen and the U.S. dollar will affect the U.S. dollar equivalentof the yen-denominated prices of Mitsui’s shares and, as a result, will affect the market prices of Mitsui’s ADSsin the United States.
B. Capitalization and Indebtedness.
Not required.
C. Reasons for the Offer and Use of Proceeds.
Not applicable.
D. Risk Factors.
You should carefully consider the risks and uncertainties described below and the other information in thisannual report, including the discussion in “Item 5. Operating and Financial Review and Prospects,” as well asour consolidated financial statements and related notes included elsewhere in this annual report.
The decrease in the volume of trade and the flow of goods and materials resulting from the worldwideeconomic downturn may adversely impact our business, results of operations and financial condition.
We provide global import and export services for our customers in various countries in a wide range ofbusiness transactions. We are also involved in financing of and investment in various business activitiesworldwide including, but not limited to, procuring raw materials and industrial equipment, manufacturing a widerange of commodities and providing logistics services.
Our global business activities, including our trading activities, are affected by economic conditions bothglobally and regionally. Among other locations, we are particularly vulnerable to downward economic trends inJapan and China. An economic downturn may cause a reduction in the flow of goods and materials, a decline inprivate consumption and fixed investment, and subsequently a decrease in demand from our customers for ourproducts and services, which may have an adverse impact on our business, results of operations and financialcondition.
Fluctuations in commodity prices can adversely affect our results of operations and financial condition.
We are engaged in trade and, as the case may be, production of a variety of commodities in the globalcommodities market including metal, energy, chemical and agricultural products. Our activities in thesecommodities in particular, have a significant impact on our business operations. Commodity prices are highlyvolatile and subject to cyclical fluctuations due to factors beyond our control, including periods of excess supplydue to increased industrial production, decreased demand due to weakening economic conditions, inventorycutbacks by customers, and exchange rate movements. As a result, unexpected movements in commodity pricesmay adversely affect our business, operating results and financial condition. For example:
‰ declines in commodity prices may result in a decrease in sales of those commodities in which we act as aprincipal or a decrease in sales of services in which we act as an agent. For instance, the operating results ofthe Energy Segment, which reflect annual production from our oil and gas activities, are sensitive to the price
7

of crude oil. A decline of U.S.$1 per barrel in the price of crude oil will adversely affect the revenues andequity in earnings of associated companies of this segment and result in a decrease in the segment’s annualnet income of approximately ¥1.6 billion for the year ending March 31, 2007;
‰ because we are engaged in spot and derivative trading of commodities, unexpected changes in price mayresult in trading losses; and
‰ as we invest a substantial amount of money in the production of commodities, a prolonged or cyclicaldecline in the price of commodities can have a long term adverse effect on our results of operations andfinancial condition and make it increasingly difficult for us to recover our capital investments or todivest our interests at prices acceptable to us, if at all.
For further information about the impact by commodity price fluctuations on our business and results ofoperations for the year ended March 31, 2006 and in the future, see “Item 5.A. Operating Results.”
Exchange rate fluctuations may adversely affect our operating results.
We are exposed to risks associated with foreign currency exchange rate fluctuations. Although our reportingcurrency is the Japanese yen, a significant portion of our business operations, consolidated revenues andoperating expenses is denominated in currencies other than the Japanese yen. As a result, appreciation ordepreciation in the value of other currencies as compared to the Japanese yen could result in materialtransactional gains or losses. As most of revenues, costs of revenues, and selling, general and administrativeexpenses incurred from regular business activities at overseas subsidiaries and associated companies are quotedin the U.S. dollar, the Australian dollar, the Euro, or other currencies, our net income may be affected by thefluctuations of these currencies and we are exposed to translation risk in our assets and liabilities denominated inforeign currencies. In addition, exchange rate fluctuations may reduce the value of investment in overseassubsidiaries and associated companies and adversely affect our accumulated other comprehensive income. As aresult, exchange rate fluctuations may negatively affect our operating results.
See “Item 3.A. Selected Financial Data—Exchange Rate Information”, “Item 5.A. Operating Results” and“Item 5. B. Liquidity and Capital Resources.”
We are subject to significant counterparty credit risk from various companies or projects with which we dobusiness or to which we lend.
We are exposed to significant counterparty credit risks. For example:
‰ We provide vendor financing services and also act as guarantors to banks that provide financing to ourcustomers. In addition, many of our customers purchase products and services from us on credit. AtMarch 31, 2006, current trade receivable (less unearned interest and allowance for doubtfulreceivables—current) was ¥2,579.3 billion, representing 30.1% of our total assets and recognized lossesfor doubtful receivables—current for the year ended March 31, 2006 and balance of the allowance fordoubtful receivables—current were ¥2.0 billion and ¥26.7 billion, respectively;
‰ We engage in significant project financing activities as a lender or guarantor whereby we assumerepayment risk; and
‰ We have counterparty payment risk from various derivative transactions we enter into as part of ourhedging activities.
Our management policy for credit exposure cannot eliminate entirely risks relating to the possibility of ourcustomers experiencing financial difficulties. Moreover, we may experience difficulty in collecting paymentfrom our counterparties if:
‰ liquidity crises arise in Japan or elsewhere in the world;
‰ real estate prices or stock prices in Japan or other markets decline sharply, thereby adversely affectingthe liquidity of our counterparties; or
‰ the number of corporate bankruptcies in Japan increases.
8
Changes in interest rates could have an adverse effect on our operating results.
We are exposed to risks associated with interest rate fluctuations, which may affect our overall operationalcosts and the value of our financial assets and liabilities, particularly, our debt obligations, which primarilyconsist of debt raised in the capital markets and bank loans. We utilize various financial and derivativeinstruments which are sensitive to interest rate changes. An increase in interest rates, especially in Japan and theUnited States, may adversely affect our results of operations.
See “Item 5.B. Liquidity and Capital Resources—Funding Sources.”
If the value of assets for which we act as lessor, such as real property and equipment, aircraft, oceantransport vessels and rolling stock decline, we may record a significant impairment loss.
Assets for which we act as lessor, such as real property, aircraft, ocean transport vessels, rolling stock andequipment, are exposed to potential significant impairment losses due to the decline in the value of these assets.As of March 31, 2006, the value of these assets in which we act as lessor, presented on our Consolidated BalanceSheets as “Property leased to others—at cost, less accumulated depreciation,” was ¥218.6 billion. The carryingamounts of these assets in which we act as lessor are affected by certain factors which are beyond our controlsuch as their global supply and demand, prevailing interest rates, prices of relevant products and services andregional and/or global cyclical trends. There can be no assurance that adjustments for impairment losses withrespect to such assets will not be made. Any adjustments may have an adverse effect on our financial conditionand results of operations.
For information on our accounting policies and estimates with respect to impairment on long-lived assets,see “Critical Accounting Policies and Estimates” of “Item 5.A. Operating Results.”
Declines in the market value of equity and/or debt securities in Japan may decrease the value of ourpension assets which in turn may increase the cost of satisfying our unfunded pension obligations.
Declines in the market value of Japanese government bonds, other debt securities and marketable equitysecurities in Japan would reduce the value of our pension plan assets. Decline in the value of our pension planassets or increase in our unfunded pension obligations could adversely affect our results of operations andfinancial condition.
See “Item 5.A. Operating Results” and Note 14, “PENSION COSTS AND SEVERANCE INDEMNITIES,”to our consolidated financial statements.
Our liquidity could be adversely affected by a downgrade in our credit ratings, significant changes in thelending or investment policies of our creditors or investors.
A downgrade in our credit ratings or a significant change in the lending or investment policies of ourcreditors or investors could result in an increase in our interest expense and could adversely impact our ability toaccess the debt markets, and could have an adverse effect on our financial position and liquidity.
For information on our funding sources and credit ratings, see “Item 5.B. Liquidity and Capital Resources.”
Due to our significant investments in marketable equity securities of Japanese issuers, a substantial declinein the Japanese stock market, as experienced in the past, could negatively affect our investment portfolio.
A significant portion of our investment portfolio consists of marketable equity securities of Japanese issuers.At March 31, 2006, our marketable equity securities were carried at a fair value of ¥574.5 billion. Among others,Mitsui’s marketable equity securities of Japanese issuers amounted to ¥509.2 billion, representing 74.8% of thefair value of our total available-for-sale securities and 5.9% of our total assets. The Japanese equity securities
9
market has experienced a decline in recent years. For the year ended March 31, 2006, 2005 and 2004, losses onavailable-for-sale securities were not significant, but for the year ended March 31, 2003 our Statements ofConsolidated Income reflected valuation losses on available-for-sale securities of ¥15.6 billion, principally on thestocks of banking institutions reflecting the overall decline in stock prices in Japan. While we periodically reviewour equity portfolio, volatility and decline in the Japanese equity securities market could negatively impact thevalue of our investment portfolio and our results of operations and financial condition.
For information on our accounting policies and estimates with respect to impairment on marketablesecurities, see “Critical Accounting Policies and Estimates” of “Item 5.A. Operating Results.”
Some of our operations are concentrated in a limited number of regions or countries, which could harm ourbusiness and results of operations if activity levels in these regions or countries decline.
We are engaged in various types of businesses worldwide which expose us to risks associated withfluctuations in commodity prices, the supply and demand of commodities, foreign exchange rates and interestrates, in addition to risks associated with regional political and economic instabilities. Furthermore, some of ourbusiness activities may be exposed to concentration risk in particular industries located in specific regions orcountries. For example:
‰ In Russia and Brazil, our interests in the exploration, development and production of mineral resourcesand energy are increasing.
‰ In Indonesia, we actively participate in infrastructure projects, including the operation of power plants,and maintain a nationwide motorcycle retail finance business.
As a result, declining levels of trading activities or asset volumes in specific sectors in certain regions orcountries could have a disproportionately negative effect on our business, financial condition and results ofoperations.
For more information, see “Energy Segment”, “Iron & Steel Raw Materials and Non-Ferrous MetalsSegment” and “Machinery & Infrastructure Projects Segment” of “Item 4.B. Business Overview.”
We may not be able to successfully restructure or eliminate unprofitable or underperforming subsidiaries orassociated companies in a timely manner and any efforts to do so may not lead to improved results ofoperations.
We are continuously restructuring our underperforming businesses. To implement this procedure, we haveintroduced a quantitative monitoring system to assess the performance of our subsidiaries and associatedcompanies. If we fail to successfully eliminate or restructure our underperforming subsidiaries and associatedcompanies in a timely manner or if these efforts fail to improve our business operations as contemplated, we maybecome less efficient compared to our competitors who are mainly other major Japanese general tradingcompanies, and our results of operations may be adversely affected.
Our alliances by forming joint ventures with, and strategic investments in, third parties may not result insuccessful operations.
We participate in various businesses directly or indirectly through joint ventures or by making strategicinvestments in other companies and business enterprises. The outcome of these joint ventures and strategicinvestments is unpredictable because:
‰ the operational success is critically dependent on factors that are beyond our control such as thefinancial condition and performance of the partner companies or the strategic investees; or
‰ with respect to certain associated companies, we may fail to exercise adequate control over themanagement, operations and assets of the companies in which we invested or may fail to make majordecisions without the consent of other shareholders or participants due to lack of common businessgoals and strategic objectives with our alliance partners.
10

Any occurrence of these events could have a material adverse effect on our business, results of operations orfinancial condition.
Our businesses in exploration, development and production of mineral resources and oil and gas may notdevelop in line with assumed costs and schedules, and are subject to the risks associated with estimatingreserves and the operating performance of third party operators.
Reflecting rising prices of mineral resources and oil and gas in recent years, exploration, development andproduction of mineral resources and oil and gas are gaining in importance to our operating results. Mining and oiland gas projects involve risks, for example:
‰ development of projects may face schedule delays or cost overruns due to difficulties in technicalconditions, procurement of materials, financial conditions and government regulations;
‰ reserves are estimated based on available geological, technical, contractual and economic information,therefore actual development and production may significantly differ from originally estimated reserves;and
‰ reserve replacement, on which future production will depend, may not be successfully implemented dueto uncertainties such as failures in exploration or negotiations for acquisitions of known reserves withtheir owners.
We participate as a non-operator in many of these projects. Under these circumstances, we carefullyconsider the business potential and profitability of projects based on the information and data provided by thirdparty operators, who substantially control operations of such projects, including decision-making in the course ofdevelopment and production. In addition to the above-mentioned risks, third party operators’ failure in managingthose projects may adversely affect our operating results and financial condition.
For more information, see “Iron & Steel Raw Materials and Non-Ferrous Metals Segment” and “EnergySegment” of “Item 4.B. Business Overview.”
Intense competition from other Japanese general trading companies could have an adverse effect on ourresults of operations.
The markets for many of the products and services we provide are highly competitive. Our primarycompetition is with other Japanese general trading companies which engage in similar business activities invarious fields. Our competitors may have:
‰ stronger business associations and relationships with our customers, suppliers and business partners inboth domestic and global markets; or
‰ stronger global network and regional expertise, diversified global customer bases, greater financialengineering skills and market insights.
Unless we can successfully continue to meet the changing needs of our customers by providing them withinnovative and integrated services in a cost effective manner, we may lose our market share or relationships withour existing customers in certain of our operating segments. Failure to successfully compete with our competitorsmay have an adverse effect on our business, financial condition and results of operations.
We may lose the opportunities for entry into new business areas because of the limitation of requiredhuman resources.
In response to the maturation of consumption in Japan and other developed countries, we have beenfocusing on entering new consumer oriented businesses. Additionally, we are undertaking a reorganization of ourtraditional businesses in industrial products and raw materials to better reflect the globalization of the economy
11

and the rapid progress of information technology. To meet these goals, we have been investing human resourcesin these new business areas, focusing on employees who are most capable of carrying out business plans andmanaging other personnel. However, in certain business areas, we may have a shortage of required humanresources which can cause a loss of opportunities to start new businesses, which in turn may adversely affect ourfuture business, operating results and financial condition.
Restrictions under environmental laws and regulations and any accidents relating to our use of hazardousmaterials could negatively affect our business, results of operations and financial condition.
We are involved in various projects and business transactions worldwide that are subject to extensiveenvironmental laws and regulations. In particular, our Iron & Steel Raw Materials and Non-Ferrous MetalsSegment and Energy Segment may be adversely affected by present or future environmental regulations orenforcement in connection with our exploration, development and production activities. For example, we aresubject to complex sets of environmental regulations in Australia, Brazil, Russia, and the Middle East. Theselaws and regulations may:
‰ require us to perform site clean-ups;
‰ require us to curtail or cease certain operations;
‰ impose fines and payments for significant environmental damage;
‰ require us to install costly pollution control equipment; and
‰ require us to modify our operations.
Newly enacted environmental laws and regulations or changes therein and protests by environmental groupsmay materially impact the progress of these projects.
We are a shareholder of Coronet Industries Inc. (“Coronet”), a former manufacturer of animal feedsupplements, with 30% share interest. Coronet has been working with the U.S. Environmental Protection Agency(“EPA”) and the State of Florida on an investigation of environmental conditions and prior operations at itsfacility in Florida. In addition, Coronet has been named as a defendant in two civil actions initiated by residentsliving near the plant. Mitsui, as well as its United States subsidiary, Mitsui & Co. (U.S.A.), Inc., have beennamed as defendants in one of these actions. These actions are both in their early stages.
We are subject to extensive laws and regulations in Japan and other countries throughout the world.Changes in these laws and regulations could adversely affect our results of operations.
Our business operations are subject to extensive laws and regulations in Japan and other countriesthroughout the world. Our operations are subject to laws and regulations governing, among other things, tariffs,business and investment approvals, import and export (including restrictions from the viewpoint of national andinternational-security), antitrust, consumer and commercial restrictions, currency exchange control, andenvironmental protection. Moreover, many of our infrastructure projects in developing countries are subject toless developed legal systems. As a result, our costs may increase due to factors such as the lack of acomprehensive set of laws and regulations, an unpredictable judicial system based on inconsistent applicationand interpretation of laws and regulations, and changing practices of regulatory and administrative bodies. Forexample, we are subject to sudden and unpredictable changes to:
‰ tariffs for products and services that we provide;
‰ technical specifications with respect to environmental regulations;
‰ income tax and duty rates; and
‰ foreign exchange controls with respect to repatriation of investments and dividends.
Furthermore, many of our oil and gas and mining operations are located in politically or economicallyunstable parts of the world, including Russia. Although we are involved in the exploration, development and
12
production activities through various contractual arrangements in these regions, there is no assurance that thecontracts will be upheld or extended when they expire. Moreover, there can be no assurance that the regulatorybodies of these areas will not unilaterally interfere and alter the contractual terms of our oil and gas operationsinvolving production rates, pricing formulas, royalties, environmental protection cost, land tenure or otherwise. Ifthese regulatory bodies unilaterally alter such contractual terms or if we are unable to comply with any new lawsand regulations, our business, operating results and financial condition could be adversely affected. Furthermore,we could incur substantial additional costs to comply with any new laws and regulations.
See “Item 4.B. Business Overview—Government Regulations.”
Employee misconduct could adversely affect our results of operations and reputation.
Due to our size, as well as the operational and geographic breadth of our activities, our day-to-dayoperations are necessarily de-centralized. As a result, we cannot fully ensure that our employees comply with allapplicable laws and regulations as well as our internal policies. For example, our employees may engage inunauthorized trading activities and exceed the allotted market risk exposure for various commodities or extend anunauthorized amount of credit to a client, which, in either case, may result in unknown losses or unmanageablerisks. Moreover, our employees could engage in various unauthorized activities prohibited under the laws ofJapan or other jurisdictions to which we are subject, including export regulations, anticorruption laws, antitrustlaws and tax regulations. There can be no assurance that the efforts we undertake to ensure employees’compliance with applicable laws and regulations as well as our internal policies will succeed in preventingmisconduct by our employees. Depending on its nature, employees’ misconduct could have negative effects onour results of operations and reputation.
See “Compensation and Other Charges Related to DPF Incident” of “Item 5.A. Operating Results.”
Because of daily price range limitations under Japanese stock exchange rules, you may not be able to sellyour shares of our common stock at a particular price on any particular trading day, or at all.
Stock prices on Japanese stock exchanges are determined on a real-time basis by the equilibrium betweenbids and offers. These exchanges are order-driven markets without specialists or market makers to guide priceformation. To prevent excessive volatility, these exchanges set daily upward and downward price rangelimitations for each stock, based on the previous day’s closing price. Although transactions may continue at theupward or downward limit price if the limit price is reached on a particular trading day, no transactions may takeplace outside these limits on these exchanges. Consequently, an investor wishing to sell at a price above or belowthe relevant daily limit on these exchanges may not be able to effect a sale at such price on a particular tradingday, or at all.
See “Item 10.B. Memorandum and Articles of Association—Daily Price Fluctuation Limits under JapaneseStock Exchange Rules.”
As holders of ADSs, you will have fewer rights than a direct shareholder and you will have to act throughthe depositary to exercise those rights.
The rights of shareholders under Japanese law to take actions, including exercising voting rights, receivingdividends and distributions, bringing derivative actions, examining our accounting books and records andexercising appraisal rights are available only to holders recorded on our register of shareholders. Because thedepositary, through its custodian agents, is the recorded holder of the shares underlying the ADSs, only thedepositary can exercise those rights in connection with the deposited shares. The depositary will make efforts tovote the shares underlying your ADSs as instructed by you and will pay to you the dividends and distributionscollected from us. However, as ADS holders, you will not be able to bring a derivative action, examine ouraccounting books and records or exercise appraisal rights except through and with the consent of the depositary.
13
Item 4. Information on the Company.
A. History and Development of the Company.
History
Mitsui Bussan Kabushiki Kaisha (“Mitsui & Co., Ltd.” in English) was incorporated on July 25, 1947, asDaiichi Bussan Kabushiki Kaisha, a corporation (Kabushiki Kaisha) under the Commercial Code of Japan withcommon stock of ¥195,000. We were originally listed on the Tokyo Stock Exchange in May 1949.
Our registered office is located at 2-1, Ohtemachi 1-chome, Chiyoda-ku, Tokyo 100-0004, Japan. Mitsui’stelephone number is +81-3-3285-1111.
Since our establishment, our business lines have involved trading in a variety of commodities, including theimport of raw materials and the export of industrial products. As we grew in tandem with the Japanese postwareconomic recovery, we expanded into overseas activities, such as the establishment of Mitsui & Co. (Australia)Ltd. in 1956. During the 1950s, Daiichi Bussan Kabushiki Kaisha was formed through the merger of varioustrading companies. On February 16, 1959, that entity took our present name, after having attained the status ofbeing one of the largest general trading companies, and a history closely connected to the development of foreigntrade in postwar Japan. An example of a business activity which introduced innovative industrial systems toJapan in our early days was the establishment of Nippon Remington Univac Kaisha Ltd. (currently Nihon UnisysLtd.), a domestic computer related joint venture with Sperry Rand Corporation of the United States, in 1958.
During the 1960s, the Japanese government promoted trade with foreign countries and deregulated Japanesecapital markets, which led to high growth of the Japanese economy. We played a pivotal role in promoting thegrowth of certain basic industries by supplying foods, industrial raw material and energy such as oil and coalfrom abroad. This included the development of mineral resources overseas, nurturing markets for Japaneseexports and introducing various new technologies. We established Mitsui & Co. (U.S.A.), Inc. in April 1966, andMitsui Knowledge Industry Co., Ltd. in October 1967. In May 1963, we issued American Depositary Shareswhich were subsequently listed on The NASDAQ National Market in February 1971.
In the 1970s, as the world economy weathered two oil crises, we began to diversify the supply source ofnatural resources including development of liquefied natural gas (“LNG”) resources. During this time, the exportof industrial plant from Japan, mainly to oil producing countries, drastically increased and we organized andsupported projects by arranging finance and on occasion establishing markets for products.
During this period, we suffered losses with respect to a joint venture project we entered into in connectionwith Iranian petrochemicals. These losses were a result of the petrochemical manufacturing complex beingdamaged by military attacks, causing the project to finally be dissolved in 1991.
Also during the 1970s, we entered into new industries. For example, in 1971 we established MitsuiLeasing & Development, our associated company in the leasing industry, and in 1972 we purchased an equityinterest in Mikuni Coca-Cola Bottling Co., Ltd. in the beverage industry.
In the 1980s, Japan’s industrial structure moved increasingly towards the production of high-value-addedproducts such as products related to information technology (“IT”) and new materials used for high techproducts. Consequently, we began extending our business field to target these new markets. Most notable werethe semiconductor materials and carbon fiber fields promoted mainly by our chemical related divisions.
In the late 1990s, the Asian economies experienced a financial crisis. Although the appreciation in realestate and stocks prior to the crisis created a temporary economic boom in Japan, their eventual collapse resultedin a wide-ranging economic slowdown. These conditions necessitated the reorganization of our profit structuresand the development of new businesses.
At the same time, however, there was also a rapid development of information infrastructure worldwide,reflecting the deregulation of the communication sector proceeding from the 1980s in Japan and other countries,
14
and the spread of new technology, such as the Internet, accelerated communication among market participants inreal time and at reduced costs. From the late 1980s, we made investments in IT and communication businesses,including in common carriers such as Tokyo Telecommunication Network Co., Inc (currently KDDICorporation), JSAT Corporation, a communications satellites company, and broadcasting companies, such asSKY Perfect Communications Inc.
Medium-Term Strategic and Financial Plan to March 2006
In May 2004, Mitsui announced the Medium-Term Strategic and Financial Plan for the two years toMarch 31, 2006. The key elements of the plan which aimed at creating a solid foundation for sustainable longer-term growth were as follows:
Continuous Review of Business Portfolio and Investment Plan
The Medium-Term Strategic and Financial Plan called for investments in the amount of ¥500 billion(including ¥100 billion in fixed assets) over the two year period to March 2006, mainly in our core areas ofstrength, namely mineral resources, including expansion of iron ore and coal mines in Australia, and energy,including the Sakhalin II LNG and oil development project in Russia and the Enfield oil project in WesternAustralia, and infrastructure project businesses, including our power producing business.
The plan also called for developing or strengthening other key areas, such as consumer products andservices businesses and automotive-related businesses. Consequently, the investing activities resulted in net cashoutflows of ¥347.3 billion and ¥224.0 billion for the years ended March 31, 2006 and 2005, respectively. Formore information, see the discussion of “Capital Expenditures” in this item; and “Cash Flows from InvestingActivities” of “Item 5.B. Liquidity and Capital Resources—Cash Flows” for the years ended March 31, 2006 and2005.
Evolution of Business Models Leveraging Business Engineering Capabilities
Anticipating structural changes in the diversified markets, we intended to take the lead in developing newbusiness opportunities. For example, we increased our involvement in media-related businesses and theoutsourcing business in diverse areas. See “Item 4.B. Business Overview—Lifestyle, Consumer Service andInformation, Electronics & Telecommunication Segment.”
We also intended to generate growth by strengthening our existing core businesses. Development andimprovement of supply chain management (“SCM”) system by making use of IT and logistics expertise to meetthe customers’ requirement have been crucial. See “Iron & Steel Products Segment” and “Chemical Segment” of“Item 4.B. Business Overview.” Another example was in our automotive-related businesses, where we expandedoperations into growth areas such as automotive related retail finance and logistics. See “Item 4.B. BusinessOverview—Machinery & Infrastructure Projects Segment—Machinery Business Unit.”
Implementation of Global Strategies Focusing on Emerging Markets
In response to the development of unified regional economies in Asia, Europe and the Americas, we have beenstrengthening operations in growing areas such as Greater China, Central and Eastern Europe, Russia and Brazil,forming strategic alliances with leading domestic and international companies, as appropriate. In parallel withincreased involvement in these regions by business units in our headquarters, Mitsui reorganized the structure ofoperating segments abroad. See “Asia Segment” and “Europe Segment” of “Item 4.B. Business Overview.”
Medium-Term Management Outlook Announced in May 2006
Following the completion of the period covered by the Medium-Term Strategic and Financial Plan toMarch, 2006, Mitsui established and announced a new Medium-term Management Outlook in May 2006, basedon a company-wide consideration of the business activities that we should develop over the next three-to-fiveyears, along with the necessary initiatives as below:
15

Development of Strategic Business Portfolio
We developed key policies based on dividing our business into the four areas outlined below. In workingtoward our vision for the next three to five years, we intend to make investments of approximately ¥800 billionover two years ending March 2008.
‰ In mineral resources and energy, we intend to complete the development of large-scale projects such asSakhalin II, and to expand existing projects such as our LNG project in Western Australia and iron oreand coal production in Australia, while investing selectively in high-quality new projects.
‰ In the area of global marketing networks, particularly in steel products, chemical products andmachinery, we provide and refine SCM and other sophisticated functions. We will focus on theautomobile, IT and energy businesses, and focus on developing areas through collaboration amongoperating segments outside Japan, particularly Asia.
‰ In the consumer service area, we plan to create closer collaboration by bringing together the Lifestyle,Consumer Services and Information, Electronics & Telecommunication business units, and to focus ondeveloping businesses that have the potential to become future earnings sources.
‰ In the infrastructure area, we plan to invest selectively in high-quality projects, mainly in powergeneration, water supply, energy and transportation.
For information, including funding and treasury policies, also see “Item 5.B. Liquidity and CapitalResources.”
Evolution of business models leveraging business engineering capabilities
We seek to leverage our strengths in marketing, finance and logistics, and actively promote joint operationsbetween business units. Furthermore, we continue to make efforts to develop new business opportunities, forexample:
‰ We plan to focus on consumer-oriented services in Japan that show great potential for growth,including: media and information, health, medical and senior care, retail support and outsourcing.
‰ We plan to pursue business development in environment-related businesses, such as emission rightstrading and recycling, along with new energy businesses, such as biomass ethanol and solar power.
Implementation of global strategies
We will focus the allocation of human resources on growth sectors in Asia, and align our strategy with ourcustomers. We will employ and foster the development of a diverse group of personnel at overseas trading andother subsidiaries and associated companies around the world.
Capital Expenditures
Our capital expenditures, including investments in debt securities, property and equipment and leased assets,amounted to ¥613 billion, ¥526 billion and ¥491 billion for the years ended March 31, 2006, 2005 and 2004,respectively. A breakdown of our capital expenditures is provided below.
Billions of Yen
Years Ended March 31,
2006 2005 2004
Investments in and advances to associated companies . . . . . . . . . . . . . . . . . . . . . . . ¥176 ¥190 ¥203Acquisitions of available-for-sale securities . . . . . . . . . . . . . . . . . . . . . . . . . . . . . . . 121 91 131Acquisitions of held-to-maturity debt securities . . . . . . . . . . . . . . . . . . . . . . . . . . . . 2 2 0Acquisitions of other investments . . . . . . . . . . . . . . . . . . . . . . . . . . . . . . . . . . . . . . . 67 68 47Additions to property leased to others and property and equipment . . . . . . . . . . . . 247 170 113Acquisitions of subsidiaries, net of cash acquired . . . . . . . . . . . . . . . . . . . . . . . . . . — 5 (3)
Total . . . . . . . . . . . . . . . . . . . . . . . . . . . . . . . . . . . . . . . . . . . . . . . . . . . . . . . . . . . . . ¥613 ¥526 ¥491
16
See “Item 5.B. Liquidity and Capital Resources—Cash Flows” for further information.
Of additions to property leased to others and property and equipment, the following were our mostsignificant expenditures with respect to property and equipment:
‰ development of the Enfield crude oil project in Western Australia in the Energy Segment for ¥22 billionand ¥64 billion for the years ended March 31, 2006 and 2005, respectively; and
‰ expansion of our iron ore and coal mines in Australia in the Iron & Steel Raw Materials andNon-Ferrous Metals Segment for ¥36 billion, ¥17 billion and ¥17 billion for the years ended March 31,2006, 2005 and 2004, respectively.
See “Energy Segment” and “Iron & Steel Raw Materials and Non-Ferrous Metals Segment” of “Item 4.B.Business Overview.”
Additions to property leased to others included rolling stock leased to railway companies mainly in theUnited States and European countries, aircraft leased to global carriers and ocean vessels chartered to globalshipping companies as follows:
‰ ¥54 billion of rolling stock and ¥8 billion of aircraft for the year ended March 31, 2006;
‰ ¥9 billion of rolling stock and ¥7 billion of ocean vessels for the year ended March 31, 2005; and
‰ ¥10 billion of aircraft and ¥7 billion of ocean vessels for the year ended March 31, 2004.
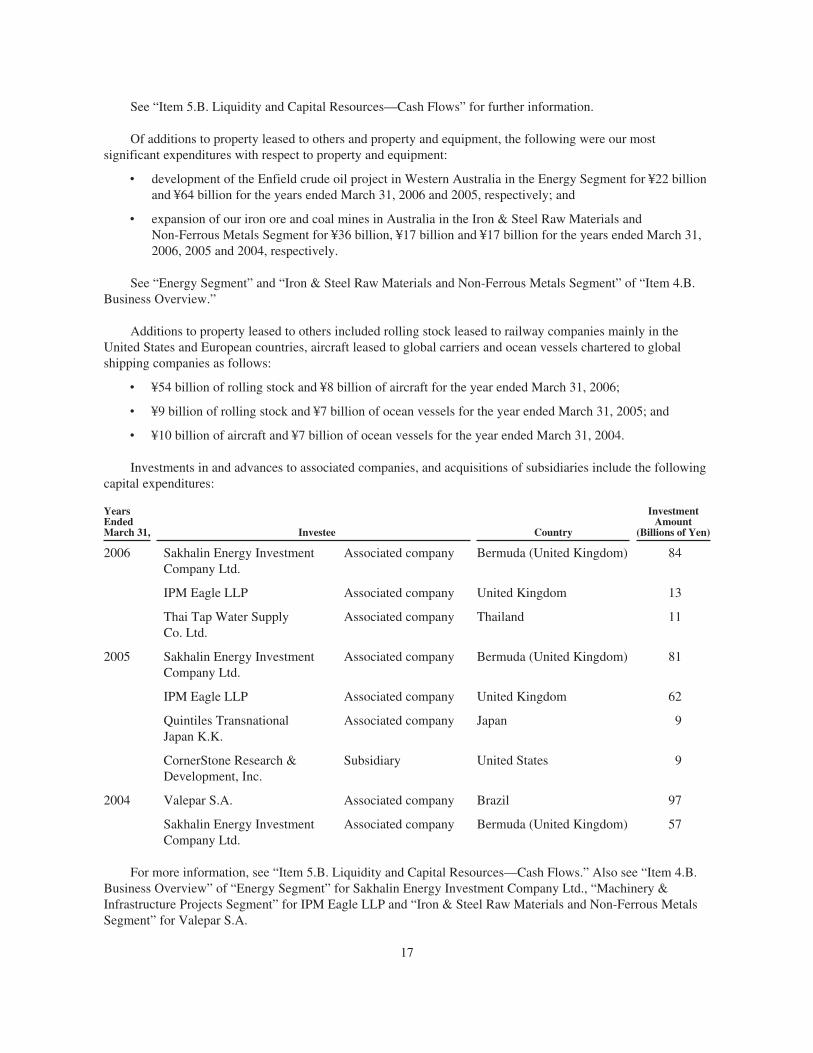
Investments in and advances to associated companies, and acquisitions of subsidiaries include the followingcapital expenditures:
YearsEndedMarch 31, Investee Country
InvestmentAmount
(Billions of Yen)
2006 Sakhalin Energy InvestmentCompany Ltd.
Associated company Bermuda (United Kingdom) 84
IPM Eagle LLP Associated company United Kingdom 13
Thai Tap Water SupplyCo. Ltd.
Associated company Thailand 11
2005 Sakhalin Energy InvestmentCompany Ltd.
Associated company Bermuda (United Kingdom) 81
IPM Eagle LLP Associated company United Kingdom 62
Quintiles TransnationalJapan K.K.
Associated company Japan 9
CornerStone Research &Development, Inc.
Subsidiary United States 9
2004 Valepar S.A. Associated company Brazil 97
Sakhalin Energy InvestmentCompany Ltd.
Associated company Bermuda (United Kingdom) 57
For more information, see “Item 5.B. Liquidity and Capital Resources—Cash Flows.” Also see “Item 4.B.Business Overview” of “Energy Segment” for Sakhalin Energy Investment Company Ltd., “Machinery &Infrastructure Projects Segment” for IPM Eagle LLP and “Iron & Steel Raw Materials and Non-Ferrous MetalsSegment” for Valepar S.A.
17
Acquisitions of available-for-sale securities included the acquisition of shares in Seven & i Holdings Co.,Ltd in the amount of ¥50 billion. See “Item 4.B. Business Overview—Foods & Retail Segment” and “Item 5.B.Liquidity and Capital Resources—Cash Flows” for further information.
Capital expenditures are usually financed by external sources, such as commercial banking institutions.
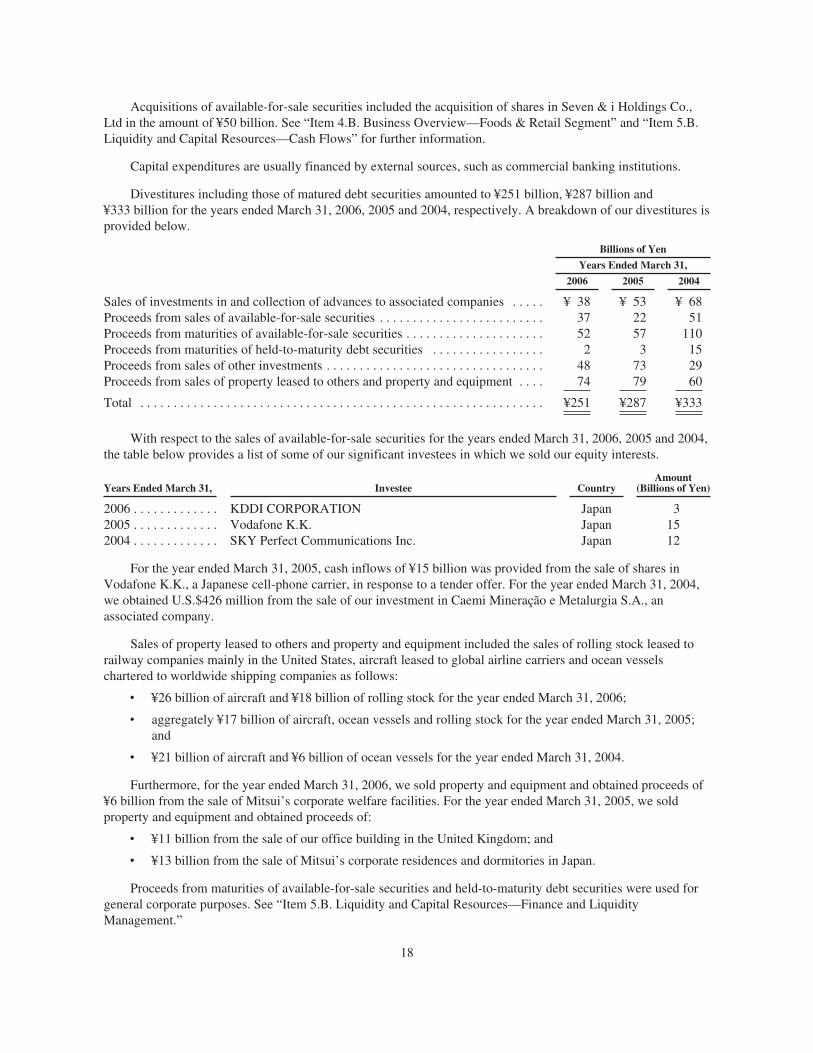
Divestitures including those of matured debt securities amounted to ¥251 billion, ¥287 billion and¥333 billion for the years ended March 31, 2006, 2005 and 2004, respectively. A breakdown of our divestitures isprovided below.
Billions of Yen
Years Ended March 31,
2006 2005 2004
Sales of investments in and collection of advances to associated companies . . . . . ¥ 38 ¥ 53 ¥ 68Proceeds from sales of available-for-sale securities . . . . . . . . . . . . . . . . . . . . . . . . . 37 22 51Proceeds from maturities of available-for-sale securities . . . . . . . . . . . . . . . . . . . . . 52 57 110Proceeds from maturities of held-to-maturity debt securities . . . . . . . . . . . . . . . . . 2 3 15Proceeds from sales of other investments . . . . . . . . . . . . . . . . . . . . . . . . . . . . . . . . . 48 73 29Proceeds from sales of property leased to others and property and equipment . . . . 74 79 60
Total . . . . . . . . . . . . . . . . . . . . . . . . . . . . . . . . . . . . . . . . . . . . . . . . . . . . . . . . . . . . . ¥251 ¥287 ¥333
With respect to the sales of available-for-sale securities for the years ended March 31, 2006, 2005 and 2004,the table below provides a list of some of our significant investees in which we sold our equity interests.
Years Ended March 31, Investee CountryAmount
(Billions of Yen)
2006 . . . . . . . . . . . . . KDDI CORPORATION Japan 32005 . . . . . . . . . . . . . Vodafone K.K. Japan 152004 . . . . . . . . . . . . . SKY Perfect Communications Inc. Japan 12
For the year ended March 31, 2005, cash inflows of ¥15 billion was provided from the sale of shares inVodafone K.K., a Japanese cell-phone carrier, in response to a tender offer. For the year ended March 31, 2004,we obtained U.S.$426 million from the sale of our investment in Caemi Mineração e Metalurgia S.A., anassociated company.
Sales of property leased to others and property and equipment included the sales of rolling stock leased torailway companies mainly in the United States, aircraft leased to global airline carriers and ocean vesselschartered to worldwide shipping companies as follows:
‰ ¥26 billion of aircraft and ¥18 billion of rolling stock for the year ended March 31, 2006;
‰ aggregately ¥17 billion of aircraft, ocean vessels and rolling stock for the year ended March 31, 2005;and
‰ ¥21 billion of aircraft and ¥6 billion of ocean vessels for the year ended March 31, 2004.
Furthermore, for the year ended March 31, 2006, we sold property and equipment and obtained proceeds of¥6 billion from the sale of Mitsui’s corporate welfare facilities. For the year ended March 31, 2005, we soldproperty and equipment and obtained proceeds of:
‰ ¥11 billion from the sale of our office building in the United Kingdom; and
‰ ¥13 billion from the sale of Mitsui’s corporate residences and dormitories in Japan.
Proceeds from maturities of available-for-sale securities and held-to-maturity debt securities were used forgeneral corporate purposes. See “Item 5.B. Liquidity and Capital Resources—Finance and LiquidityManagement.”
18

B. Business Overview.
Throughout this section “B. Business Overview,” we describe the domicile of our subsidiaries andassociated companies, in parentheses following names of those companies. For example, Mitsui Iron OreDevelopment, Pty. Ltd. (Australia) means that the company’s name is Mitsui Iron Ore Development, Pty. Ltd.and that it is domiciled in Australia.
Nature of Our Operations and Principal Activities
We are a general trading company engaged in a range of global business activities including generalworldwide trading of various commodities, arranging financing for customers and suppliers in connection withour trading activities, organizing and coordinating industrial projects, participating in financing and investingarrangements, assisting in the procurement of raw materials and equipment, providing new technologies andprocesses for manufacturing, and coordinating transportation and marketing of finished goods. Our tradingactivities include the sale, distribution, purchase, marketing and supply of a wide variety of products includingiron and steel, non-ferrous metals, machinery, electronics, chemicals, energy-related commodity and products,food products, textiles, general merchandise and real estate. We also participate in the development of naturalresources such as oil, gas, iron and steel raw materials. In addition, we engage in strategic business investmentswhereby we invest our own capital and provide management expertise in the development of joint ventures andnew enterprises in certain industries such as information technology (“IT”) and biotechnology. We also providefinancial services whereby we assist our customers in minimizing the risk exposure associated with theirbusinesses through the use of derivatives and other hedging instruments.
While we continue to diversify our activities, the provision of services remains one of our core activities.Specifically, we act as an intermediary between buyers and sellers engaged in import, export, and offshore anddomestic trading activities. For example, we develop markets overseas for exporters and locate raw materials orproduct sources that meet the needs of importers. To facilitate smooth customer transactions, we draw upon ourvarious capabilities such as market information analysis, credit supervision, financing and transportationlogistics.
In addition to our Head Office, Mitsui had 18 branches and offices located in Japan and 153 branches,offices and trading subsidiaries located in other parts of the world as of July 1, 2006. They provide marketinformation to each other and cooperate in developing various business opportunities. Each of our subsidiarieshas its own marketing strategy based on its particular business activities and customer relationships.
Seasonality of Our Business Activities
The trading of individual products such as heating oil, foods and textiles is influenced by seasonal factors.For example, heating oil is traded more frequently in winter than in summer months. In addition, revenues ofMITSUI FOODS CO, LTD., our food wholesale subsidiary, increases from October to December and decreasesfrom January to March, reflecting seasonal demand in Japan. However, the seasonality of any product eitherindividually or in the aggregate does not significantly affect our consolidated financial position and results ofoperations.
Dependence on Patents and Licenses and Industrial, Commercial or Financial Contracts
We have various patents and licenses as well as industrial, commercial and financial contracts (includingcontracts with customers or suppliers) to conduct our business. These patents, licenses or contracts eitherindividually or in the aggregate are not material to our business operations or results of operations.
Marketing Channels
Marketing channels vary by commodity, customer and region. We have established subsidiaries andassociated companies for promotion and distribution in response to specific business environments.
19
See “Products and Services and Principal Activities by Reportable Operating Segments” below. Specialsales methods, including financial arrangements, provided by our Machinery & Infrastructure Projects Segmentand development of SCM systems conducted by various operating segments are also described therein.
Competitive Position
Our main competitors are other Japanese general trading companies. Moreover, all of our potential businesspartners could also be competitors. To ensure our competitiveness, we strive to continue to successfully meet thechanging needs of our customers worldwide. Analysis of competitive position by operating segment is providedin “Products and Services and Principal Activities by Reportable Operating Segments” below and also see“Item 3.D. Risk Factors.”
Government Regulations
Our business activities are subject to various governmental regulations in the countries in which we operate.These regulations generally relate to obtaining business and investment approvals, and meeting the requirementsof export regulations, including those related to national security considerations, tariffs, antitrust, consumer andbusiness taxation, exchange controls and environmental laws and regulations. Certain of our businesstransactions such as our activities in the energy, mining, telecommunications, financing, food, consumerproducts, machinery, chemicals, etc. are regulated and subject to the relevant laws and regulations. See“Item 3.D. Risk Factors.”
Regulations with Respect to the Exploration and Production of Oil, Gas, and Mineral Resources
We are involved in various projects involving exploration for and production of crude oil, natural gas, ironraw material and non-ferrous metals in many different countries in which we participate as a minoritystakeholder and non-operator. These exploration and production activities are subject to a broad range of locallaws and regulations, which affect virtually all aspects of these activities. Contractual arrangements in connectionwith our oil, gas and mining activities, such as leases, licenses and production agreements are generally enteredinto with a government entity or a government owned company. See “Iron & Steel Raw Materials andNon-Ferrous Metals Segment” and “Energy Segment” of “Item 4.B. Business Overview.”
To date, changes in governmental laws and regulations have not had a material adverse effect on our oil, gasand mining projects. Some of our oil, gas and mineral projects are located in politically and economically stableregions, such as Australia, where the legal systems are relatively developed. However, we also hold interests inoil, gas and mineral resources in regions where legal systems are less developed. These investments may beadversely impacted by factors such as a lack of comprehensive sets of laws and regulations, an unpredictablejudicial system based on inconsistent application and interpretation of laws and regulations, and constantlychanging practices of regulatory and administrative bodies.
Governmental Regulations with Respect to Infrastructure Projects
We are engaged in various infrastructure projects worldwide. These include construction of power plants,oil and gas pipelines, telecommunications and broadcasting systems, cargo transportation systems, and publictransit systems in developing countries. In these projects, we are subject to extensive laws and regulations withrespect to technical specifications, environmental protection, pricing, labor, taxation, foreign exchange and othermatters. We commonly enter into contractual arrangements with government owned companies that are subjectto their own sets of laws and regulations. Changes in laws and regulations after the commencement of projectsmay result in lengthy delays which can negatively impact our cash flows and hinder the repatriation of capitalfrom such projects.
Governmental Regulations with Respect to Human Health and Environment
We are subject to extensive laws and regulations worldwide with respect to human health and theenvironment. Regulations governing food products for human consumption are complex, detailed and stringent.
20
For instance, in Japan, our food related operations are under the supervision of the Ministry of Agriculture,Forestry and Fisheries, and the Ministry of Health, Labor and Welfare. We are subject to the Food Safety BasicLaw, which codifies the safety standard for food products. For example, it determines the threshold amount atwhich harmful substances such as pesticide residues are considered to be unacceptable. We must expendsignificant resources to comply with these regulations not only in Japan but in all jurisdictions where we engagein food-related operations.
We are also subject to complex environmental laws and regulations worldwide. For example, in Japan,when trading, storing or transporting chemical products or disposing of wastes and by-products from ourindustrial plants, we are required to notify the local regulators and/or obtain approvals or licenses. Any violationof laws and regulations may not only result in severe fines and penalties, but the regulators may require us tocurtail or even cease operations, install expensive pollution control systems, and comply with enhancednotification obligations.
Products and Services and Principal Activities by Reportable Operating Segments
For the year ended March 31, 2006, we had twelve reportable operating segments which consisted of eightproducts and services focused reportable operating segments and four region-focused reportable operatingsegments listed as below:
Our eight products and services focused operating segments were:
‰ Iron & Steel Products
‰ Iron & Steel Raw Materials and Non-Ferrous Metals
‰ Machinery & Infrastructure Projects
‰ Chemical
‰ Energy
‰ Foods & Retail
‰ Lifestyle, Consumer Service and Information, Electronics & Telecommunication
‰ Logistics & Financial Markets
Our four region-focused operating segments were:
‰ Americas
‰ Europe
‰ Asia
‰ Other Overseas Areas
For information on the composition of our products and services focused reportable segments and region-focused reportable operating segments, also see “Item 5.A. Operating Results—Operating Results by OperatingSegment.”
21
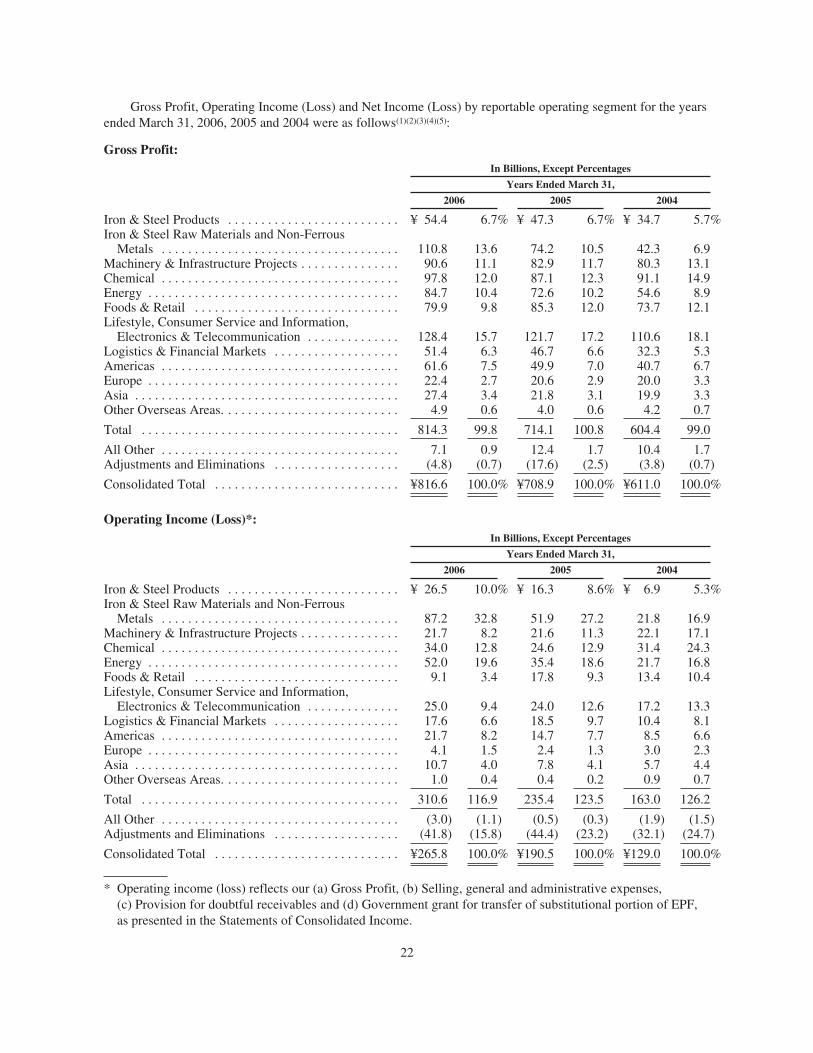
Gross Profit, Operating Income (Loss) and Net Income (Loss) by reportable operating segment for the yearsended March 31, 2006, 2005 and 2004 were as follows(1)(2)(3)(4)(5):
Gross Profit:In Billions, Except Percentages
Years Ended March 31,
2006 2005 2004
Iron & Steel Products . . . . . . . . . . . . . . . . . . . . . . . . . . ¥ 54.4 6.7% ¥ 47.3 6.7% ¥ 34.7 5.7%Iron & Steel Raw Materials and Non-Ferrous
Metals . . . . . . . . . . . . . . . . . . . . . . . . . . . . . . . . . . . . 110.8 13.6 74.2 10.5 42.3 6.9Machinery & Infrastructure Projects . . . . . . . . . . . . . . . 90.6 11.1 82.9 11.7 80.3 13.1Chemical . . . . . . . . . . . . . . . . . . . . . . . . . . . . . . . . . . . . 97.8 12.0 87.1 12.3 91.1 14.9Energy . . . . . . . . . . . . . . . . . . . . . . . . . . . . . . . . . . . . . . 84.7 10.4 72.6 10.2 54.6 8.9Foods & Retail . . . . . . . . . . . . . . . . . . . . . . . . . . . . . . . 79.9 9.8 85.3 12.0 73.7 12.1Lifestyle, Consumer Service and Information,
Electronics & Telecommunication . . . . . . . . . . . . . . 128.4 15.7 121.7 17.2 110.6 18.1Logistics & Financial Markets . . . . . . . . . . . . . . . . . . . 51.4 6.3 46.7 6.6 32.3 5.3Americas . . . . . . . . . . . . . . . . . . . . . . . . . . . . . . . . . . . . 61.6 7.5 49.9 7.0 40.7 6.7Europe . . . . . . . . . . . . . . . . . . . . . . . . . . . . . . . . . . . . . . 22.4 2.7 20.6 2.9 20.0 3.3Asia . . . . . . . . . . . . . . . . . . . . . . . . . . . . . . . . . . . . . . . . 27.4 3.4 21.8 3.1 19.9 3.3Other Overseas Areas. . . . . . . . . . . . . . . . . . . . . . . . . . . 4.9 0.6 4.0 0.6 4.2 0.7
Total . . . . . . . . . . . . . . . . . . . . . . . . . . . . . . . . . . . . . . . 814.3 99.8 714.1 100.8 604.4 99.0
All Other . . . . . . . . . . . . . . . . . . . . . . . . . . . . . . . . . . . . 7.1 0.9 12.4 1.7 10.4 1.7Adjustments and Eliminations . . . . . . . . . . . . . . . . . . . (4.8) (0.7) (17.6) (2.5) (3.8) (0.7)
Consolidated Total . . . . . . . . . . . . . . . . . . . . . . . . . . . . ¥816.6 100.0% ¥708.9 100.0% ¥611.0 100.0%
Operating Income (Loss)*:In Billions, Except Percentages
Years Ended March 31,
2006 2005 2004
Iron & Steel Products . . . . . . . . . . . . . . . . . . . . . . . . . . ¥ 26.5 10.0% ¥ 16.3 8.6% ¥ 6.9 5.3%Iron & Steel Raw Materials and Non-Ferrous
Metals . . . . . . . . . . . . . . . . . . . . . . . . . . . . . . . . . . . . 87.2 32.8 51.9 27.2 21.8 16.9Machinery & Infrastructure Projects . . . . . . . . . . . . . . . 21.7 8.2 21.6 11.3 22.1 17.1Chemical . . . . . . . . . . . . . . . . . . . . . . . . . . . . . . . . . . . . 34.0 12.8 24.6 12.9 31.4 24.3Energy . . . . . . . . . . . . . . . . . . . . . . . . . . . . . . . . . . . . . . 52.0 19.6 35.4 18.6 21.7 16.8Foods & Retail . . . . . . . . . . . . . . . . . . . . . . . . . . . . . . . 9.1 3.4 17.8 9.3 13.4 10.4Lifestyle, Consumer Service and Information,
Electronics & Telecommunication . . . . . . . . . . . . . . 25.0 9.4 24.0 12.6 17.2 13.3Logistics & Financial Markets . . . . . . . . . . . . . . . . . . . 17.6 6.6 18.5 9.7 10.4 8.1Americas . . . . . . . . . . . . . . . . . . . . . . . . . . . . . . . . . . . . 21.7 8.2 14.7 7.7 8.5 6.6Europe . . . . . . . . . . . . . . . . . . . . . . . . . . . . . . . . . . . . . . 4.1 1.5 2.4 1.3 3.0 2.3Asia . . . . . . . . . . . . . . . . . . . . . . . . . . . . . . . . . . . . . . . . 10.7 4.0 7.8 4.1 5.7 4.4Other Overseas Areas. . . . . . . . . . . . . . . . . . . . . . . . . . . 1.0 0.4 0.4 0.2 0.9 0.7
Total . . . . . . . . . . . . . . . . . . . . . . . . . . . . . . . . . . . . . . . 310.6 116.9 235.4 123.5 163.0 126.2
All Other . . . . . . . . . . . . . . . . . . . . . . . . . . . . . . . . . . . . (3.0) (1.1) (0.5) (0.3) (1.9) (1.5)Adjustments and Eliminations . . . . . . . . . . . . . . . . . . . (41.8) (15.8) (44.4) (23.2) (32.1) (24.7)
Consolidated Total . . . . . . . . . . . . . . . . . . . . . . . . . . . . ¥265.8 100.0% ¥190.5 100.0% ¥129.0 100.0%
* Operating income (loss) reflects our (a) Gross Profit, (b) Selling, general and administrative expenses,(c) Provision for doubtful receivables and (d) Government grant for transfer of substitutional portion of EPF,as presented in the Statements of Consolidated Income.
22
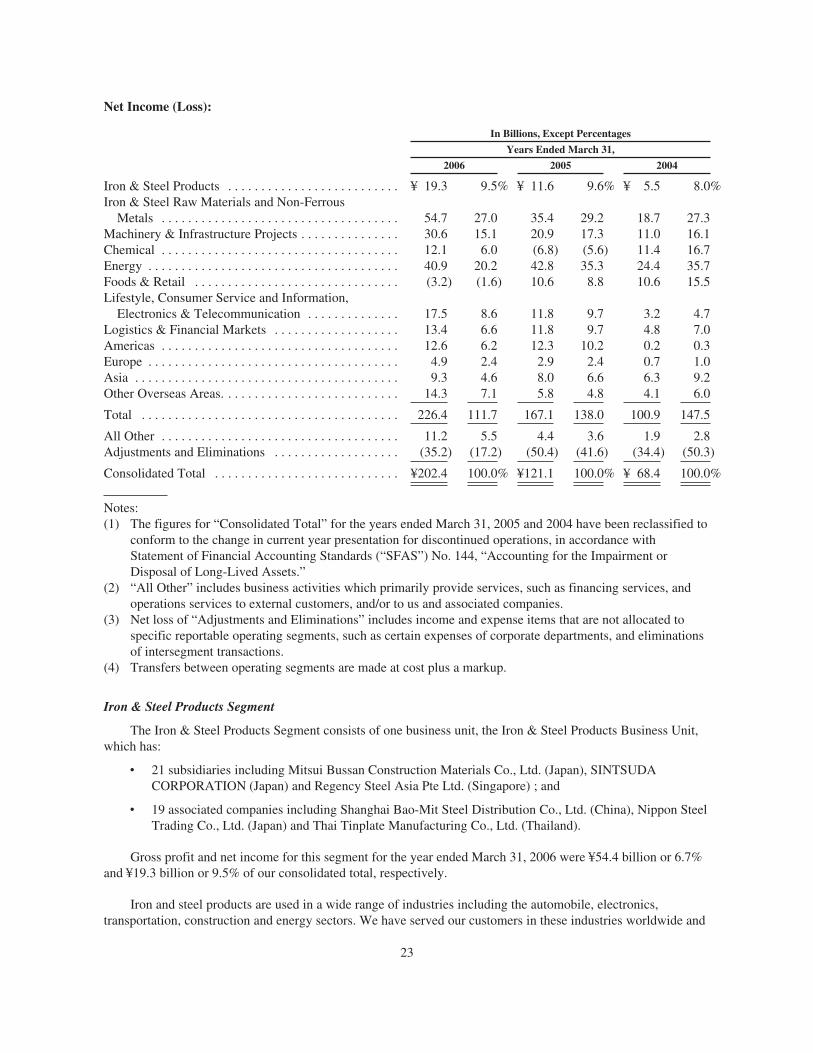
Net Income (Loss):
In Billions, Except Percentages
Years Ended March 31,
2006 2005 2004
Iron & Steel Products . . . . . . . . . . . . . . . . . . . . . . . . . . ¥ 19.3 9.5% ¥ 11.6 9.6% ¥ 5.5 8.0%Iron & Steel Raw Materials and Non-Ferrous
Metals . . . . . . . . . . . . . . . . . . . . . . . . . . . . . . . . . . . . 54.7 27.0 35.4 29.2 18.7 27.3Machinery & Infrastructure Projects . . . . . . . . . . . . . . . 30.6 15.1 20.9 17.3 11.0 16.1Chemical . . . . . . . . . . . . . . . . . . . . . . . . . . . . . . . . . . . . 12.1 6.0 (6.8) (5.6) 11.4 16.7Energy . . . . . . . . . . . . . . . . . . . . . . . . . . . . . . . . . . . . . . 40.9 20.2 42.8 35.3 24.4 35.7Foods & Retail . . . . . . . . . . . . . . . . . . . . . . . . . . . . . . . (3.2) (1.6) 10.6 8.8 10.6 15.5Lifestyle, Consumer Service and Information,
Electronics & Telecommunication . . . . . . . . . . . . . . 17.5 8.6 11.8 9.7 3.2 4.7Logistics & Financial Markets . . . . . . . . . . . . . . . . . . . 13.4 6.6 11.8 9.7 4.8 7.0Americas . . . . . . . . . . . . . . . . . . . . . . . . . . . . . . . . . . . . 12.6 6.2 12.3 10.2 0.2 0.3Europe . . . . . . . . . . . . . . . . . . . . . . . . . . . . . . . . . . . . . . 4.9 2.4 2.9 2.4 0.7 1.0Asia . . . . . . . . . . . . . . . . . . . . . . . . . . . . . . . . . . . . . . . . 9.3 4.6 8.0 6.6 6.3 9.2Other Overseas Areas. . . . . . . . . . . . . . . . . . . . . . . . . . . 14.3 7.1 5.8 4.8 4.1 6.0
Total . . . . . . . . . . . . . . . . . . . . . . . . . . . . . . . . . . . . . . . 226.4 111.7 167.1 138.0 100.9 147.5
All Other . . . . . . . . . . . . . . . . . . . . . . . . . . . . . . . . . . . . 11.2 5.5 4.4 3.6 1.9 2.8Adjustments and Eliminations . . . . . . . . . . . . . . . . . . . (35.2) (17.2) (50.4) (41.6) (34.4) (50.3)
Consolidated Total . . . . . . . . . . . . . . . . . . . . . . . . . . . . ¥202.4 100.0% ¥121.1 100.0% ¥ 68.4 100.0%
Notes:(1) The figures for “Consolidated Total” for the years ended March 31, 2005 and 2004 have been reclassified to
conform to the change in current year presentation for discontinued operations, in accordance withStatement of Financial Accounting Standards (“SFAS”) No. 144, “Accounting for the Impairment orDisposal of Long-Lived Assets.”
(2) “All Other” includes business activities which primarily provide services, such as financing services, andoperations services to external customers, and/or to us and associated companies.
(3) Net loss of “Adjustments and Eliminations” includes income and expense items that are not allocated tospecific reportable operating segments, such as certain expenses of corporate departments, and eliminationsof intersegment transactions.
(4) Transfers between operating segments are made at cost plus a markup.
Iron & Steel Products Segment
The Iron & Steel Products Segment consists of one business unit, the Iron & Steel Products Business Unit,which has:
‰ 21 subsidiaries including Mitsui Bussan Construction Materials Co., Ltd. (Japan), SINTSUDACORPORATION (Japan) and Regency Steel Asia Pte Ltd. (Singapore) ; and
‰ 19 associated companies including Shanghai Bao-Mit Steel Distribution Co., Ltd. (China), Nippon SteelTrading Co., Ltd. (Japan) and Thai Tinplate Manufacturing Co., Ltd. (Thailand).
Gross profit and net income for this segment for the year ended March 31, 2006 were ¥54.4 billion or 6.7%and ¥19.3 billion or 9.5% of our consolidated total, respectively.
Iron and steel products are used in a wide range of industries including the automobile, electronics,transportation, construction and energy sectors. We have served our customers in these industries worldwide and
23

provided support services for Japanese steel mills. The Iron & Steel Products Business Unit conductsmanufacturing, trading, marketing, processing and distribution of:
‰ steel sheet for automobile and electric appliances, steel plates for shipbuilding and heavy electricmachinery, galvanized steel products and tin material and products;
‰ steel products for oil and gas projects including oil well tube and line pipe;
‰ wire rod, specialty steel and bearing;
‰ steel bars and other steel construction materials; and
‰ semi-finished items including steel slabs to be processed into steel plates and steel billets to beprocessed into steel bars and wire rods.
To expand beyond the above-mentioned activities, this business unit has also made investments insubsidiaries and associated companies including coil centers as bases for processing and distribution, steelmakers as manufacturing bases and steel product trading companies.
In the steel products business, both manufacturers and users are large-scale and sophisticated organizations.As simple intermediation between these entities is no longer sufficient to serve their needs, the business unit hasdeveloped its services based on SCM by making use of our IT and logistics expertise. By working closely withmanufacturers and users, we optimize distribution and inventory control, thus sharing with customers the benefitof associated cost reductions. For example:
‰ We have established steel service centers, galvanized steel plants and tin-plating facilities at oursubsidiaries and/or joint ventures with Japanese and overseas business partners in order to meet therising demand from manufacturers of automobiles, electric appliances and heavy electric machinery thathave transplanted their production centers to the United States, Southeast Asia and China. For example,we participated in Shanghai Bao-Mit Steel Distribution Co., Ltd. (China), a joint venture with ShanghaiBaosteel Group Corporation, a Chinese iron and steel manufacturing company, in order to build anetwork of steel products service centers in China. Through this associated company, we have beenpromoting the integration of service centers within China in order to improve operational efficiency, andwe are actively pursuing additional investments.
‰ We frequently draw upon the unit’s logistics expertise in delivering a wide range of materials andproducts in large volume under optimized schedule along with expertise in project financing. We alsotake advantage of the business relationships and marketing channels of other business units in the fieldsof energy, industrial plants, shipping and machinery. This enabled us to be involved in various industrialprojects including the construction of oil and gas pipeline projects such as the Sakhalin project for steelstructure supply and Yemen LNG project operated by TOTAL (46km transfer line) through high gradesteel pipe delivery.
During the year ended March 31, 2004, we acquired Regency Steel Asia Pte Ltd. (Singapore), a steelproducts wholesaler. This acquisition was made with the aim to expand global wholesale operations in therapidly growing steel products markets in Asia.
As mentioned above, the businesses of the Iron & Steel Products Business Unit are highly sensitive toworldwide demand for steel products, especially in Asia, including China. At the same time, this business unitconcentrates on achieving low-cost operations in the domestic market which is already mature, through spin-offand other business reorganizations. In addition, we have been strengthening our ties with domestic steel makersand wholesalers through collaboration in sales of products, procurement of raw materials and equity investments.
Our major competitors in Japan and overseas are other Japanese trading companies. In their efforts toachieve low-cost operations through economy of scale, some of our competitors have consolidated andestablished joint ventures, such as Marubeni-Itochu Steel Inc. and Metal One Corporation. In order to remain
24
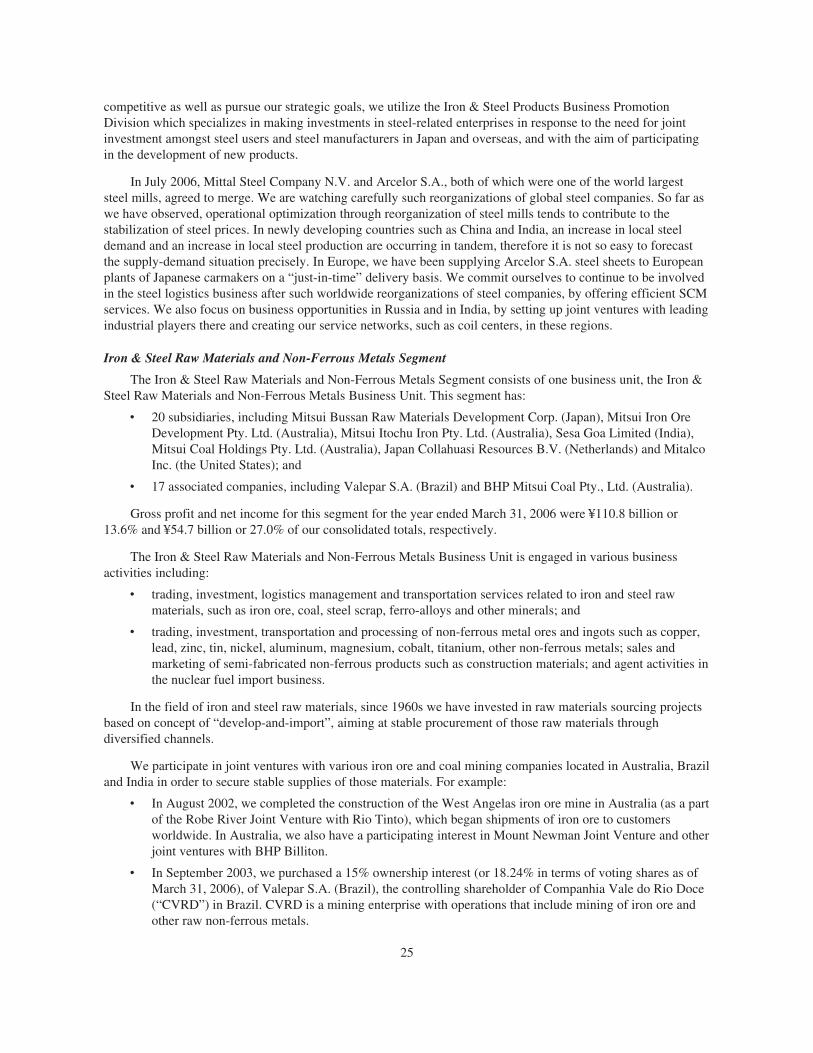
competitive as well as pursue our strategic goals, we utilize the Iron & Steel Products Business PromotionDivision which specializes in making investments in steel-related enterprises in response to the need for jointinvestment amongst steel users and steel manufacturers in Japan and overseas, and with the aim of participatingin the development of new products.
In July 2006, Mittal Steel Company N.V. and Arcelor S.A., both of which were one of the world largeststeel mills, agreed to merge. We are watching carefully such reorganizations of global steel companies. So far aswe have observed, operational optimization through reorganization of steel mills tends to contribute to thestabilization of steel prices. In newly developing countries such as China and India, an increase in local steeldemand and an increase in local steel production are occurring in tandem, therefore it is not so easy to forecastthe supply-demand situation precisely. In Europe, we have been supplying Arcelor S.A. steel sheets to Europeanplants of Japanese carmakers on a “just-in-time” delivery basis. We commit ourselves to continue to be involvedin the steel logistics business after such worldwide reorganizations of steel companies, by offering efficient SCMservices. We also focus on business opportunities in Russia and in India, by setting up joint ventures with leadingindustrial players there and creating our service networks, such as coil centers, in these regions.
Iron & Steel Raw Materials and Non-Ferrous Metals Segment
The Iron & Steel Raw Materials and Non-Ferrous Metals Segment consists of one business unit, the Iron &Steel Raw Materials and Non-Ferrous Metals Business Unit. This segment has:
‰ 20 subsidiaries, including Mitsui Bussan Raw Materials Development Corp. (Japan), Mitsui Iron OreDevelopment Pty. Ltd. (Australia), Mitsui Itochu Iron Pty. Ltd. (Australia), Sesa Goa Limited (India),Mitsui Coal Holdings Pty. Ltd. (Australia), Japan Collahuasi Resources B.V. (Netherlands) and MitalcoInc. (the United States); and
‰ 17 associated companies, including Valepar S.A. (Brazil) and BHP Mitsui Coal Pty., Ltd. (Australia).
Gross profit and net income for this segment for the year ended March 31, 2006 were ¥110.8 billion or13.6% and ¥54.7 billion or 27.0% of our consolidated totals, respectively.
The Iron & Steel Raw Materials and Non-Ferrous Metals Business Unit is engaged in various businessactivities including:
‰ trading, investment, logistics management and transportation services related to iron and steel rawmaterials, such as iron ore, coal, steel scrap, ferro-alloys and other minerals; and
‰ trading, investment, transportation and processing of non-ferrous metal ores and ingots such as copper,lead, zinc, tin, nickel, aluminum, magnesium, cobalt, titanium, other non-ferrous metals; sales andmarketing of semi-fabricated non-ferrous products such as construction materials; and agent activities inthe nuclear fuel import business.
In the field of iron and steel raw materials, since 1960s we have invested in raw materials sourcing projectsbased on concept of “develop-and-import”, aiming at stable procurement of those raw materials throughdiversified channels.
We participate in joint ventures with various iron ore and coal mining companies located in Australia, Braziland India in order to secure stable supplies of those materials. For example:
‰ In August 2002, we completed the construction of the West Angelas iron ore mine in Australia (as a partof the Robe River Joint Venture with Rio Tinto), which began shipments of iron ore to customersworldwide. In Australia, we also have a participating interest in Mount Newman Joint Venture and otherjoint ventures with BHP Billiton.
‰ In September 2003, we purchased a 15% ownership interest (or 18.24% in terms of voting shares as ofMarch 31, 2006), of Valepar S.A. (Brazil), the controlling shareholder of Companhia Vale do Rio Doce(“CVRD”) in Brazil. CVRD is a mining enterprise with operations that include mining of iron ore andother raw non-ferrous metals.
25
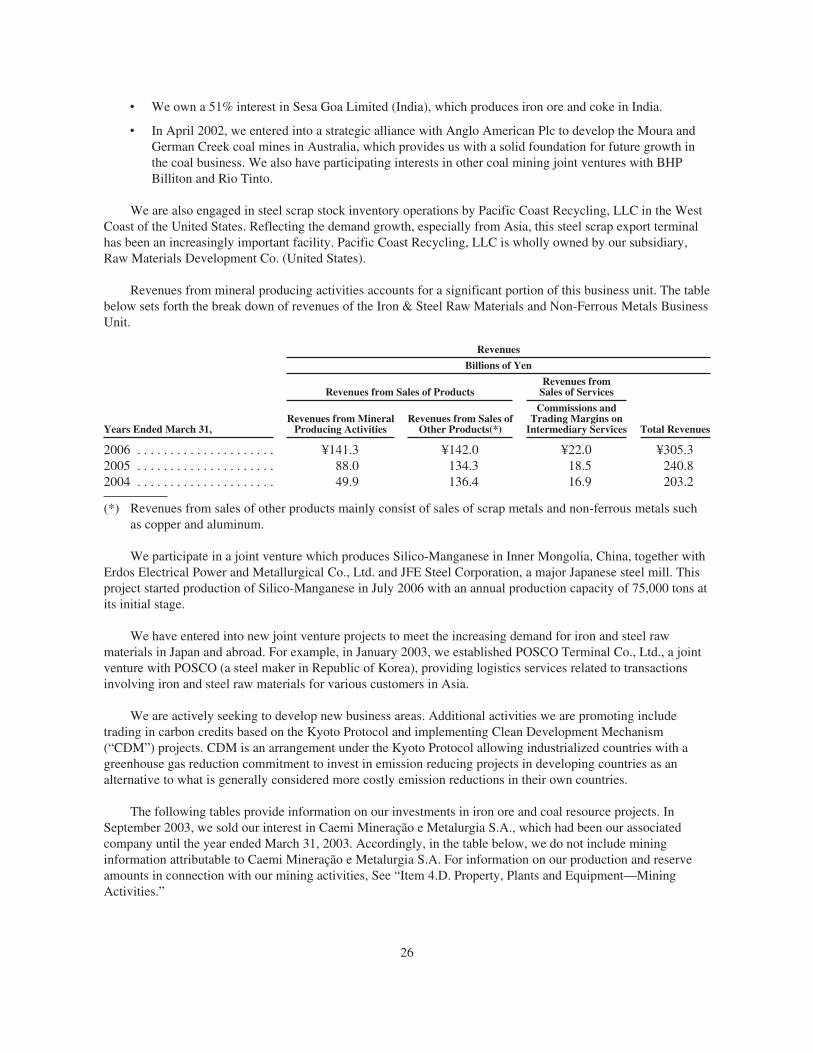
‰ We own a 51% interest in Sesa Goa Limited (India), which produces iron ore and coke in India.
‰ In April 2002, we entered into a strategic alliance with Anglo American Plc to develop the Moura andGerman Creek coal mines in Australia, which provides us with a solid foundation for future growth inthe coal business. We also have participating interests in other coal mining joint ventures with BHPBilliton and Rio Tinto.
We are also engaged in steel scrap stock inventory operations by Pacific Coast Recycling, LLC in the WestCoast of the United States. Reflecting the demand growth, especially from Asia, this steel scrap export terminalhas been an increasingly important facility. Pacific Coast Recycling, LLC is wholly owned by our subsidiary,Raw Materials Development Co. (United States).
Revenues from mineral producing activities accounts for a significant portion of this business unit. The tablebelow sets forth the break down of revenues of the Iron & Steel Raw Materials and Non-Ferrous Metals BusinessUnit.
Revenues
Billions of Yen
Revenues from Sales of ProductsRevenues from
Sales of Services
Total RevenuesYears Ended March 31,Revenues from Mineral
Producing ActivitiesRevenues from Sales of
Other Products(*)
Commissions andTrading Margins on
Intermediary Services
2006 . . . . . . . . . . . . . . . . . . . . . ¥141.3 ¥142.0 ¥22.0 ¥305.32005 . . . . . . . . . . . . . . . . . . . . . 88.0 134.3 18.5 240.82004 . . . . . . . . . . . . . . . . . . . . . 49.9 136.4 16.9 203.2
(*) Revenues from sales of other products mainly consist of sales of scrap metals and non-ferrous metals suchas copper and aluminum.
We participate in a joint venture which produces Silico-Manganese in Inner Mongolia, China, together withErdos Electrical Power and Metallurgical Co., Ltd. and JFE Steel Corporation, a major Japanese steel mill. Thisproject started production of Silico-Manganese in July 2006 with an annual production capacity of 75,000 tons atits initial stage.
We have entered into new joint venture projects to meet the increasing demand for iron and steel rawmaterials in Japan and abroad. For example, in January 2003, we established POSCO Terminal Co., Ltd., a jointventure with POSCO (a steel maker in Republic of Korea), providing logistics services related to transactionsinvolving iron and steel raw materials for various customers in Asia.
We are actively seeking to develop new business areas. Additional activities we are promoting includetrading in carbon credits based on the Kyoto Protocol and implementing Clean Development Mechanism(“CDM”) projects. CDM is an arrangement under the Kyoto Protocol allowing industrialized countries with agreenhouse gas reduction commitment to invest in emission reducing projects in developing countries as analternative to what is generally considered more costly emission reductions in their own countries.
The following tables provide information on our investments in iron ore and coal resource projects. InSeptember 2003, we sold our interest in Caemi Mineração e Metalurgia S.A., which had been our associatedcompany until the year ended March 31, 2003. Accordingly, in the table below, we do not include mininginformation attributable to Caemi Mineração e Metalurgia S.A. For information on our production and reserveamounts in connection with our mining activities, See “Item 4.D. Property, Plants and Equipment—MiningActivities.”
26
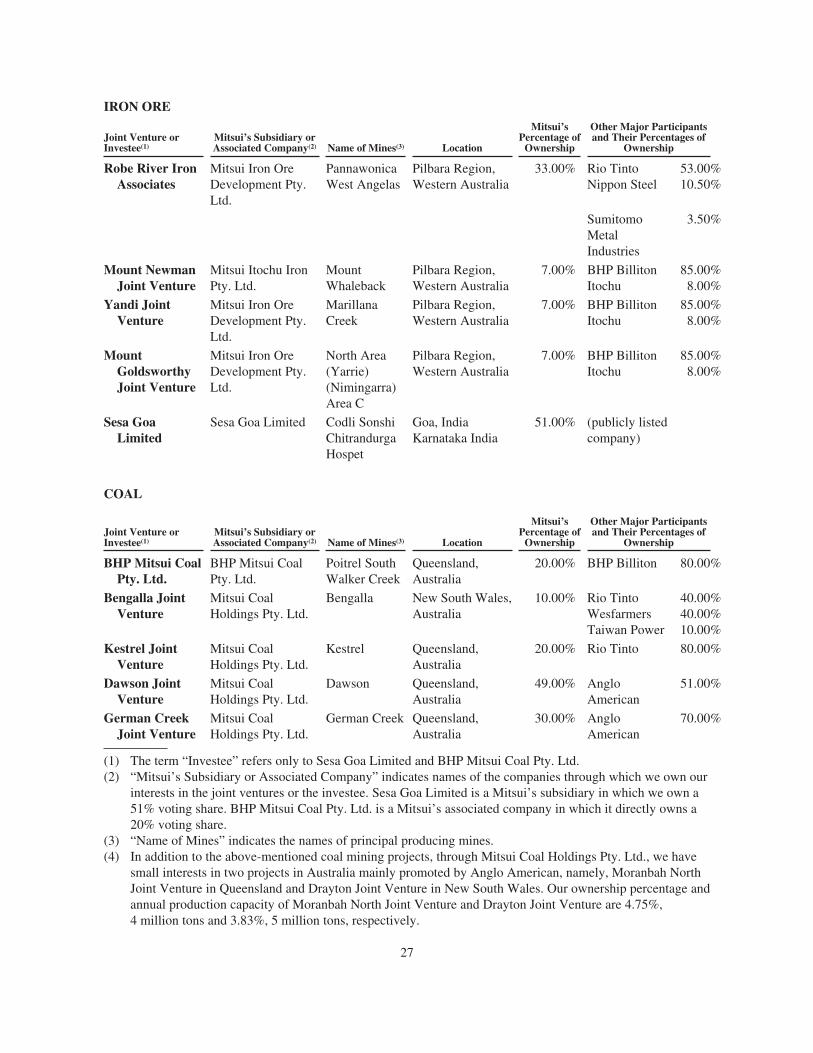
IRON ORE
Joint Venture orInvestee(1)
Mitsui’s Subsidiary orAssociated Company(2) Name of Mines(3) Location
Mitsui’sPercentage of
Ownership
Other Major Participantsand Their Percentages of
Ownership
Robe River IronAssociates
Mitsui Iron OreDevelopment Pty.Ltd.
PannawonicaWest Angelas
Pilbara Region,Western Australia
33.00% Rio TintoNippon Steel
53.00%10.50%
SumitomoMetalIndustries
3.50%
Mount NewmanJoint Venture
Mitsui Itochu IronPty. Ltd.
MountWhaleback
Pilbara Region,Western Australia
7.00% BHP BillitonItochu
85.00%8.00%
Yandi JointVenture
Mitsui Iron OreDevelopment Pty.Ltd.
MarillanaCreek
Pilbara Region,Western Australia
7.00% BHP BillitonItochu
85.00%8.00%
MountGoldsworthyJoint Venture
Mitsui Iron OreDevelopment Pty.Ltd.
North Area(Yarrie)(Nimingarra)Area C
Pilbara Region,Western Australia
7.00% BHP BillitonItochu
85.00%8.00%
Sesa GoaLimited
Sesa Goa Limited Codli SonshiChitrandurgaHospet
Goa, IndiaKarnataka India
51.00% (publicly listedcompany)
COAL
Joint Venture orInvestee(1)
Mitsui’s Subsidiary orAssociated Company(2) Name of Mines(3) Location
Mitsui’sPercentage of
Ownership
Other Major Participantsand Their Percentages of
Ownership
BHP Mitsui CoalPty. Ltd.
BHP Mitsui CoalPty. Ltd.
Poitrel SouthWalker Creek
Queensland,Australia
20.00% BHP Billiton 80.00%
Bengalla JointVenture
Mitsui CoalHoldings Pty. Ltd.
Bengalla New South Wales,Australia
10.00% Rio TintoWesfarmersTaiwan Power
40.00%40.00%10.00%
Kestrel JointVenture
Mitsui CoalHoldings Pty. Ltd.
Kestrel Queensland,Australia
20.00% Rio Tinto 80.00%
Dawson JointVenture
Mitsui CoalHoldings Pty. Ltd.
Dawson Queensland,Australia
49.00% AngloAmerican
51.00%
German CreekJoint Venture
Mitsui CoalHoldings Pty. Ltd.
German Creek Queensland,Australia
30.00% AngloAmerican
70.00%
(1) The term “Investee” refers only to Sesa Goa Limited and BHP Mitsui Coal Pty. Ltd.(2) “Mitsui’s Subsidiary or Associated Company” indicates names of the companies through which we own our
interests in the joint ventures or the investee. Sesa Goa Limited is a Mitsui’s subsidiary in which we own a51% voting share. BHP Mitsui Coal Pty. Ltd. is a Mitsui’s associated company in which it directly owns a20% voting share.
(3) “Name of Mines” indicates the names of principal producing mines.(4) In addition to the above-mentioned coal mining projects, through Mitsui Coal Holdings Pty. Ltd., we have
small interests in two projects in Australia mainly promoted by Anglo American, namely, Moranbah NorthJoint Venture in Queensland and Drayton Joint Venture in New South Wales. Our ownership percentage andannual production capacity of Moranbah North Joint Venture and Drayton Joint Venture are 4.75%,4 million tons and 3.83%, 5 million tons, respectively.
27

In non-ferrous metals field, we have been engaged in trading of copper, nickel, cobalt, aluminum ingots andother non-ferrous metal materials. We are also expanding and promoting our investments and participation invarious non-ferrous metals mining and smelting projects to secure stable sources of supply. For example:
‰ We participate in Compania Minera Dona Ines de Collahuasi SCM (Chile), a copper mine developmentproject, in which we hold a 7.43% interest. The project, which commenced commercial production in1998, has been developed jointly with Anglo American Plc and Falconbridge Ltd. and has annualproduction capacity of about 500,000 tons of copper per annum. In addition, we have a 1.25% interest inMinera Los Pelambres in Chile whose production capacity is about 360,000 tons of copper per annum.
‰ We participate in a nickel-cobalt mining and refining project at Rio Tuba area in the Republic ofPhilippines which has been developed jointly with Sumitomo Metal Mining Co., Ltd., SojitzCorporation (formerly Nissho Iwai Corporation) and a local partner. This project started commercialproduction of nickel-cobalt mixed sulfide in April 2005 using a high-pressure acid leaching process, anadvanced processing technology for nickel production, and has already reached its design capacity inMarch 2006. In addition, in April 2005, we, jointly with Sumitomo Metal Mining Co., Ltd., concludedan agreement for participation in the Goro Nickel Development Project in New Caledonia, which hadbeen promoted by Inco Limited. This project is expected to be completed by the end of 2007 and toproduce in total about 60,000 tons of nickel and about 5,000 tons of cobalt per annum.
‰ We have a 15.04% interest in Nippon Amazon Aluminum Co., Ltd.(Japan) which has invested inaluminum smelting and refining business in Brazil. On June 30, 2006, our subsidiary Mitalco Inc.(United States) reached an agreement to sell its 32 percent stakes in Intalco and Eastalco aluminumsmelters to Alcoa Inc. However, our strategy of being proactively involved in aluminum investments asone of our core business activities remains unchanged, and we will continue to pursue new investmentopportunities as well as expand current investments in aluminum.
Machinery & Infrastructure Projects Segment
The Machinery & Infrastructure Projects Segment consists of the Infrastructure Projects Business Unit andthe Machinery Business Unit.
Gross profit and net income for this segment for the year ended March 31, 2006 were ¥90.6 billion or 11.1%and ¥30.6 billion or 15.1% of our consolidated totals, respectively.
The Machinery & Infrastructure Projects Segment holds 67 subsidiaries, including:
‰ Mitsui Bussan Plant & Project Corp. (Japan) and Mitsui Rail Capital Holdings, Inc. (United States) inthe Infrastructure Projects Business Unit; and
‰ Lepta Shipping Co., Ltd. (Liberia), Toyota Chile S.A. (Chile), Mitsui Automotive Europe B.V.(Netherlands), P.T. Bussan Auto Finance (Indonesia) in the Machinery Business Unit.
Additionally it has 53 associated companies such as:
‰ IPM Eagle LLP (United Kingdom), P.T. Paiton Energy (Indonesia) and, Toyo Engineering Corporation(Japan) in the Infrastructure Projects Business Unit; and
‰ Toyota Canada Inc. (Canada), United Auto Group, Inc. (United States) and Komatsu Australia Pty. Ltd.(Australia) in the Machinery Business Unit.
Infrastructure Projects Business Unit
The business activities of the Infrastructure Projects Business Unit (formerly the Power, Transportation &Plant Projects Business Unit) together with 27 subsidiaries and 14 associated companies cover a wide range ofinvolvement in project implementation and related services, including:
‰ electric power projects such as power plants, power transmission and substation facilities;
28
‰ energy related projects such as oil and gas development projects, oil refineries, LNG manufacturingfacilities and pipelines;
‰ water supply projects such as desalination plants, wastewater processing facilities and water supply andsewerage facilities;
‰ railway transportation-related business such as rolling stock and railway facilities and systems;
‰ social infrastructure projects such as construction of airport, port facilities, road and other publicfacilities;
‰ basic industry projects such as iron, non-ferrous metals, chemical plants; and.
‰ environment-related projects such as waste disposal and recycling plants.
We are undertaking a number of projects that may stimulate economic growth in developing countries andcountries rich in natural resources. We focus on the needs of those countries and apply our project engineeringcapabilities and expert knowledge in financing, logistics, taxation and legal affairs, so as to devise optimalsolutions that address the complex and diverse issues that those nations are facing. This business unit oftenarranges financing for projects by international financial institutions and export credit agencies worldwide.Moreover, it from time to time provides loans or issues guarantees on behalf of the project owners.
The following are examples of the types of projects and the activities in which this unit renders services,mainly as an agent in securing the contract, arranging financing and executing the contract:
‰ In the Commonwealth of Independent States (“CIS”), the Middle East, Brazil and Indonesia, we havebeen engaged in the structuring and the arrangement of debt and equity project financing for variousnatural gas energy or oil product projects. Together with export credit agencies and commercial banks,we also extended loans to project participants.
‰ We have acted as the Engineering, Procurement and Construction (“EPC”) contractor for various oil andgas production projects and for the construction of infrastructure facilities including power plants andpetrochemical plants in which we procured manufacturing equipment from Japanese and overseassubcontractors.
‰ For the Taiwan High Speed Rail project, we are a commercial leader of a consortium consisting ofJapanese railway car manufacturers and general trading companies, which supplied rolling stock andtransportation facilities.
This business unit is increasing activities which facilitate the implementation of projects. These activities gobeyond the conventional EPC approach of acting as an intermediary between project owners and sub-contractors.Instead, these activities often involve arrangement of sophisticated financing schemes, risk sharing throughequity participation and operation and maintenance of plant and facilities after their construction completion.Based on this concept, the unit is promoting investments in certain related infrastructure projects including theacquisition of independent power producer (“IPP”) overseas. For example:
‰ In December 2004, we, together with International Power plc, completed the acquisition of theinternational power generation portfolio (nine power plants in total 4,514 megawatt as of March 2005)of MEC International BV, a Dutch holding company owned by Edison Mission Energy, and in July2005 also acquired the Saltend 1,200 megawatt combined cycle power plant from Calpine Corporation.We established IPM Eagle LLP (United Kingdom) jointly with International Power plc to hold andmanage these power generation businesses.
‰ We have formed a joint venture with Calpine Corporation to construct, own and operate the1,005 megawatt combined cycle power plants called Greenfield Energy Center which has secured a20 year Clean Energy Supply contract with Ontario Power Authority, Canada.
29
‰ We own a 36.3% voting interest in P.T. Paiton Energy (Indonesia), an Indonesian power producer,which owns a 1,230 megawatt coal fired power plant in East Java, Indonesia. P.T. Paiton Energy sellselectricity to P.T. Perusahaan Listrik Negara, an electric utility company owned by the Indonesiangovernment, under a power purchase agreement. P.T. Paiton Energy was originally established in 1994by Mitsui and other partners, including Edison Mission Energy.
Reflecting these developments, the combined power generation capacities for the unit’s equity share invarious power projects as of the end of June 2006 in operation and under construction were 2,643 megawatt and618 megawatt, respectively. As well as the above-mentioned projects, these power generation capacities includedthose of Umm Al Nar in the United Arab Emirates, Loy Yang A and Tarong North Power Station in Australiaand Valladolid III in Mexico.
This business unit is also engaged in the following projects:
‰ In January 2005, Mitsui acquired a 25% interest in the LNG terminal in Altamira, Mexico which hadbeen owned by Royal Dutch Shell (75%) and Total (25%). The facility is expected to start operations inlate 2006, supplying up to 5 billion cubic meters per annum of natural gas for 25 years to ComisiónFederal de Electricidad, a state power company.
‰ In March 2006, Mitsui acquired a 35% interest in Thai Tap Water Supply Company Limited, to supplytap water to the provincial authorities near Bangkok, Thailand under 30-year water supply agreement.
‰ In April 2006, Mitsui acquired 100% share of Gás Participações Ltda. (Brazil), which participates inseven local gas distribution companies with a 24.5% interest in each, with other shareholders, PetrobrasGas S.A., and the respective state governments in Brazil.
This business unit runs railway wagon and electric locomotive leasing subsidiaries, Mitsui Rail CapitalHoldings, Inc. (United States) established in 1996 and Mitsui Rail Capital Europe B.V. (Netherlands) establishedin 2004.
Environmental issues are a worldwide concern. Our initiatives in this field include creating andimplementing recycling systems for automobiles, electric appliances and plastic bottles made from polyethyleneterephthalate. Also, we are engaged in the construction of wind power facilities and other environment-relatedprojects such as greenhouse gas emission reduction.
Our major competitors include other Japanese general trading companies, international financial institutions,global engineering companies, construction companies and multi-national IPP’s.
Machinery Business Unit
The Machinery Business Unit, together with 40 subsidiaries and 39 associated companies, is engaged in thefollowing business activities:
‰ import and export, assembly and manufacturing, distribution and dealership of motor vehicles, motorcycles and their parts; retail finance and automobile auction business;
‰ sales and trading of tankers, LNG carriers, container vessels, cargo vessels; operation of own vessels;chartering vessels; and ocean vessel related finance;
‰ trading of aircraft and helicopters, leasing of aircraft, and trading of other products such as defenserelated equipment, aerospace system and aircraft engines; and
‰ trading of industrial machinery including mining and construction equipment, production equipment andmachining tool.
30
Our motor vehicles business is a major part of operations in this business unit. This business unit has a longtrack record of exporting and marketing Japanese automobiles and has developed networks of our subsidiariesand associated companies as import wholesalers, dealers and assembler for Japanese vehicles in many regions ofthe world. For example, we have been exporting Toyota, Subaru and motor vehicles of other Japanesemanufacturers to various countries worldwide including Canada (Toyota), Chile (Toyota), Peru (Toyota), Italy(Subaru), Germany (Subaru and Yamaha), Thailand (Hino) and Malaysia (Daihatsu).
In recent years, the relocation of Japan’s automobile production centers from domestic locations to othercountries has been accelerating, and we have diversified our activities with the strategic allocation of ourfinancial and human resources to prioritized areas of our motor vehicles business worldwide, such as logisticsservices for manufacturing components, retail operations, retail finance and auction businesses. For example:
‰ We have operated a subsidiary P.T. Bussan Auto Finance (Indonesia), a retail finance company forYamaha motorcycles since 1997;
‰ We have ownership in United Auto Group, Inc. (“UAG”), an automobile dealership group in the UnitedStates, with 15.4% voting share. By combining what we learned from our involvement in UAG with ourknowledge of the global market, we continue to explore other opportunities to expand into retaildealership operations in developing markets such as Russia, China and India; and
‰ We have been handling the logistics operations of automobile parts for Toyota’s manufacturingoperations in North America, Europe, India and China.
Our vessel and marine project related activities include marketing newly built commercial vessels to shipowners and operators in Japan and overseas, operating vessels, acting as broker for the sale and purchase ofsecond hand vessels and for chartering vessels, and marketing equipment for vessels to shipbuilding companies.
Along with these operations, we are engaged in energy-related marine projects, including the jointownership and operation of Floating Storage and Offloading (“FSO”) and Floating Production Storage andOffloading (“FPSO”) facilities, and LNG vessels. In addition, we arrange various types of financing for ourcustomers, such as syndicated loans involving international financial institutions, export credit agencies and otherfinancial institutions for large scale transactions. We also provide direct loans to some of our clients.
In connection with our other business activities, we own and operate commercial vessels.
In our aerospace systems related activities, we provide and arrange operating leases and finance leases tovarious airlines worldwide and are engaged in the sale and purchase of aircraft through our subsidiary TomboAviation Inc. (United States).
With respect to distribution activities in our industrial system business, we are engaged in distribution andleasing of construction machinery and mining equipment such as dump trucks and hydraulic shovels throughKomatsu Australia Pty Ltd. (Australia) and Komatsu Australia Corporate Finance Pty Ltd. (Australia), associatedcompanies acquired in 2001, crucial operations in this field. Furthermore, we are also pursuing constructionmachinery and mining equipment distribution in other regions such as North America, including through RoadMachinery, LLC (United States), and South America. Furthermore, in 2005 we acquired such operations inRussia as well. We are also engaged in trading and distribution of high-precision machine tools, manufacturingequipment and control systems supplied by Japanese manufacturers such as FANUC LTD. In 2005, weestablished Fanuc Roboshot Europe Gmbh (Germany) and several representative offices in China of oursubsidiary MMK Co. Ltd. (Japan), in order to enhance sales of injection machines and machine tools. The otherimportant business is distribution of outdoor power equipment and utility equipment in North America.
The business sectors in which the above divisions are engaged are highly competitive. Competitors include,but are not limited to, other Japanese general trading companies, international financial institutions andmanufacturers.
31
Chemical Segment
The Chemical Segment consists of the First Chemicals Business Unit (formerly the Organic ChemicalsBusiness Unit) and the Second Chemicals Business Unit (formerly the Plastics & Inorganic Chemicals BusinessUnit).
Gross profit and net income for this segment for the year ended March 31, 2006 were ¥97.8 billion or 12.0%and ¥12.1 billion or 6.0% of our consolidated totals, respectively.
The Chemical Segment has 40 subsidiaries, including:
‰ Novus International, Inc. (United States), P.T. Kaltim Pasifik Amoniak (Indonesia), Mitsui BussanSolvent & Coating Co., Ltd. (Japan), Fertilizantes Mitsui S.A. Industria e Comercio (Brazil) in the FirstChemicals Business Unit; and
‰ Mitsui Bussan Plastics Co., Ltd. (Japan), Nippon Trading Co., Ltd.(Japan), Daito Chemical Co., Ltd.(Japan), Mitsui Electronics Asia Pte. Ltd. (Singapore) in the Second Chemicals Business Unit.
It has 31 associated companies, including:
‰ Honshu Chemical Industry Co., Ltd. (Japan) and Agro Kanesho Co., Ltd. (Japan) in the First ChemicalsBusiness Unit; and
‰ Advanced Composites Inc. (United States) in the Second Chemicals Business Unit.
First Chemicals Business Unit
Together with 20 subsidiaries and 16 associated companies, the First Chemicals Business Unit is engaged intrade, sales, distribution and production of the following commodities and related activities:
‰ Gas Chemicals: Methanol, Ammonia
‰ Basic Petrochemicals: Olefins, Aromatics, Ethylene Dichloride (“EDC”), Vinyl Chloride Monomer(“VCM”), Caustic Soda
‰ Petrochemicals & Fiber Intermediates: Para-Xylene (“PX”), Purified Terephthalic Acid (“PTA”),Monoethylene Glycol (“MEG”), Acrylonitrile (“AN”), Acetyls, Styrene Monomer (“SM”).
‰ Industrial Chemicals: Phenol, Acetone, Bis Phenol A, Methyl Methacrylate (“MMA”), Nylon, AcrylatesIntermediates
‰ Specialty Chemicals: Detergent Intermediates and Oleochemicals, Polyurethanes, Colors & FunctionalChemicals, Rosin, Aroma Chemicals
‰ Life Science: pharmaceutical, medical, animal health and nutrition, food science, bio-business
‰ Agri Science: crop protection chemicals (Herbicide, Insecticide, Fungicide, intermediates for thesechemicals)
‰ Fertilizer: Urea, Ammonium Sulfate, Phosphate Rock, Diammonium Phosphate, Fused MagnesiumPhosphate, Potash
In petrochemical products areas, the unit’s main activities involve trading of the above-mentioned productsin Japan and worldwide through extensive business relationships with manufacturers and customers such asMitsui Chemicals, Inc., Toray Industries, Inc., Tosoh Corporation, Dow Chemical Company, BP p.l.c., and BayerAktiengesellschaft.
32
We have invested in manufacturing facilities and logistic facilities such as tank terminals in Houston, theUnited States, Ningbo, China, Bangkok, Thailand, Johor, Malaysia, and Merak, Indonesia. For example, wehave:
‰ a 19.25% equity share in a joint venture, International Methanol Company (Saudi Arabia), whichcommenced commercial operation with a production capacity of 1 million ton per annum of methanol atthe end of 2004;
‰ an ammonia producing subsidiary, P.T. Kaltim Pasifik Amoniak (Indonesia), which has a productioncapacity of 0.7 million ton per annum of ammonia; and
‰ a shipping subsidiary, Daiichi Tanker Co., Ltd. (Japan), which has special type chemical tanker fleets.
This business unit has been successful in earning revenues by increasing market share in certain productssuch as Olefins, Aromatics and other Plastic Monomers. Moreover, the steady growth of demand forpetrochemicals in the world, particularly in China and other Asian countries, is driving earnings for this unit.
During the past several years, most worldwide petrochemical companies have been struggling to survivethrough drastic restructurings which include the reorganization of their sales structures and mergers andacquisitions. However, despite the difficult environment for participants in the petrochemical market, we believethat we remain competitive with other Japanese general trading companies and plan to strengthen our marketposition by expanding our trade volume and market share. Our sales channels to various customers in diversegeographic areas enable us to make geographical and/or time swap arrangements. Our global logistics servicesnetwork functions as a competitive advantage over other Japanese general trading companies in gaining morebusiness transactions.
In the field of life science, this business unit handles pharmaceutical products, pharmaceutical intermediateand raw materials, food and feed additives such as amino acids and enzymes. Novus International, Inc. (UnitedStates), a feed additive manufacturing subsidiary, produces and sells amino acids. In addition, we focus onpharmaceutical manufacturing processes through Beta-Chem, Inc. (Japan), as well as on research, developmentand marketing in the field of biotechnology and agricultural chemicals.
This business unit has extended the distribution of agricultural chemical products worldwide throughsubsidiaries such as Mitsui Agri Science International sa/nv (Belgium) and Mitsui Agri Science International,Inc. (United States).
This business unit is engaged in import, export and offshore transactions involving various types offertilizers and phosphoric acid derivatives. In addition, this business unit runs a fertilizer manufacturingsubsidiary, Fertilizantes Mitsui S.A. Industria e Comercio (Brazil).
We look to expand our operations in China, which is strategically important for the future of this businessunit. For example, in the field of food additives, we started commercial production of Sorbitol in October 2005,and Crystallized Glucose in February 2006 at the joint venture in Chang Chun together with Hong Kong’s GlobalBio-chem Technology Group Co., Ltd.
Second Chemicals Business Unit
The Second Chemicals Business Unit has 20 subsidiaries and 15 associated companies and is engaged insales, trade and production of the following commodities and related activities:
‰ basic inorganic materials such as sulfur, sulfuric acid, salt, titanium ore and iodine;
‰ inorganic products such as soda ash, caustic soda, catalyst, industrial gas and titanium oxide;
‰ electronic materials such as electrolytic copper foil, optical fiber, and high-purity chemicals employedin semiconductor production;
33
‰ plastic materials and products such as polyvinyl chloride, elastomers, polyolefin, ABS resin,engineering plastics, polystyrene, plastic food containers, wrapping materials, industrial films andcarbon fiber;
‰ additives of plastic such as elasticizer, stabilizer and pigment; and
‰ SCM related businesses for production and distribution of office automation equipment, cell phone andelectric appliances.
In the inorganic raw materials field, this business unit operates logistics systems and SCM systems forvarious industries in Japan and overseas. For example, we export sulfur, a byproduct of petroleum refining, toAsian countries, by operating specialized tankers.
In order to overcome various unfavorable economic conditions such as depletion in the supply of mineralresources or an increase in acquisition cost of raw materials from our existing suppliers, we have been seekingopportunities to participate in new supply sources. We reallocated resources by restructuring logistics operations,and built up our capabilities in sulfur, soda ash, and fiberglass materials in Asia, primarily in China.
While we have been expanding the logistics network of our salt business in China which complements ourexisting sea salt joint venture business in Shark Bay, Australia, Mitsui acquired a major share in the Onslow saltfield in Australia in 2006. As a result, our annual salt production capacity increased to 3.8 million tons, whichenable us to secure a stable supply for the chlor-alkali industry in Japan and other Asian countries.
This business unit produced and sold proprietary diesel particulate filters (“DPF”s) for buses and trucks,which were later found out to be non-conforming to the regulatory standards of the Tokyo MetropolitanGovernment and seven other municipal governments. With regard to DPF data falsification discovered during theyear ended March 31, 2005 and Mitsui’s responsive measures, see “Item 5.A. Operating Results- Compensationand other charges related to DPF incident.”
In the plastics field, this business unit has traditionally handled various kinds of raw plastic materials andplastic products in domestic and overseas markets. This business unit has also handled newly developedelectronic materials and products as well as SCM services. We expanded SCM services for printers and liquidcrystal display panels as well as reinforced our resin compound operations in China, Southeast Asia, the UnitedStates and Europe.
With the focus of economic activity shifting to Asia, this business unit enhanced its business in China.
‰ In 2003, this business unit established Mitsui Plastics Trading (Shanghai) Co., Ltd., an engineeringplastics sales company.
‰ In 2004, this business unit established Mitsui International Logistics and Trade (Suzhou) Co., Ltd.,which provides logistics services as an export/import trading company in the Suzhou Industrial Zone,one of China’s national development regions. It handles specialty chemicals, gases, parts, and othermaterials used in semiconductors and liquid crystal displays.
This business unit has been making efforts in research and development activities. For example, withrespect to development and commercialization of carbon nanotube and zeolite membranes, see “Item 5.C.Research & Development.”
In the plastic materials and products market where the scope of their usage is expanding, other Japanesegeneral trading companies are our competitors. To maintain our competitiveness, specialized knowledge for eachmarket and the capability to find the best technological and logistical solutions is essential.
Energy Segment
The Energy Segment is engaged in the trading, manufacturing, development and distribution of variousenergy-related products including: crude oil and petroleum products such as gasoline, naphtha, jet fuel, kerosene,diesel oil, fuel oil, asphalt, petroleum coke, lubricants and liquefied petroleum gas (“LPG”), as well as natural gasand LNG.
34
This segment consists of one business unit, the Energy Business Unit, which has
‰ 22 subsidiaries, including Mitsui Oil Co., Ltd. (Japan), Mitsui Liquefied Gas Co., Ltd. (Japan), KokusaiOil & Chemical Co., Ltd. (Japan) and Mitsui Oil (Asia) Pte. Ltd. (Singapore), Mitsui LNG NederlandB.V. (Netherlands), Mitsui E&P Middle East B.V. (Netherlands), Mitsui E&P Australia Pty Limited(Australia), Mitsui E&P New Zealand Limited (New Zealand), Mitsui Gas Development Qatar B.V.(Netherlands), Wandoo Petroleum Pty. Ltd. (Australia), and Mittwell Energy Resources Pty., Ltd(Australia); and,
‰ 10 associated companies, including Mitsui Oil Exploration Co., Ltd. (Japan), Kyokuto PetroleumIndustries, Ltd. (Japan), Japan Australia LNG (MIMI) PTY. Ltd. (Australia) and Sakhalin EnergyInvestment Company Ltd. (Bermuda).
Gross profit and net income for this segment for the year ended March 31, 2006 were ¥84.7 billion or 10.4%and ¥40.9 billion or 20.2% of our consolidated totals, respectively.
We are one of the world’s major oil traders based on our total trading volume of crude oil and petroleumproducts (excluding derivative products) which for the year ended March 31, 2006 amounted to approximatelyone fourth of Japan’s total imports of 5 million barrels per day on a consolidated basis. These trading operationare conducted by Mitsui, Mitsui Oil (Asia) Pte. Ltd. (Singapore) and Mitsui Oil (Asia) Hong Kong Ltd. (HongKong, China). This business unit has a 35% minority share in Westport Petroleum, Inc. (United States). In March2006, we sold its entire shareholding in Arcadia Petroleum Ltd. (United Kingdom), formerly a subsidiary whichhad been actively engaged in crude oil trading, to a third party.
We are also engaged in domestic marketing and refining of oil and gas related products through KyokutoPetroleum Industries, Ltd. (Japan), a refinery jointly owned (50:50) by the ExxonMobil Corp. Group and our oilsales subsidiary, Mitsui Oil & Gas Co., Ltd. (Japan).
The Energy Business Unit is engaged in numerous LNG, natural gas and oil development projects whichrequire long lead-times for their development and implementation. We are involved in four LNG projectscurrently in operation:
‰ Abu Dhabi Gas Liquefaction Limited in Abu Dhabi, in which we hold a 15% interest in LNGproduction and exporting activities, and which has some 5 million tonnes per annum LNG productioncapacity;
‰ Northwest Shelf JV (“NWS JV”) in Australia, in which we hold an 8.33% interest in LNG productionand exporting activities, and which has some 11.7 million tonnes per annum production capacity;
‰ Qatar Liquefied Gas Company Ltd. in Qatar, in which we hold a 7.5% interest in LNG production andexporting activities, and which has some 9.6 million tonnes per annum production capacity. We alsohold a 1.5% interest in Qatar Liquefied Gas Company Ltd. 3, which is expected to start production inmid 2009 with some 7.8 million tonnes per annum production capacity; and
‰ Oman LNG L.L.C. in Oman, in which we hold a 2.77% interest in LNG production and exportingactivities, and which has some 6.6 million tonnes per annum production capacity.
We participate in oil and gas related joint venture activities, typically as a “non-operator” minority equityholder. We have yet to accumulate sufficient technical knowledge and expertise to act as an operator of oil andgas projects. Operators are generally responsible for all operational aspects, which include the exploration,development and production of oil and gas resources. Therefore, given our non-operator status, we have limitedor no control over the manner in which operations are conducted, including the timing and scheduling of thedevelopment, capital expenditures, production of the reserves, and the safety and environmental standards usedin connection with these joint ventures.
However, it is our strategy as a general trading company to seek to diversify our investments in variouscountries and in a broad range of projects rather than acting as operators on few specific projects. Also see thediscussion on our exploration, development and production of mineral resources and oil and gas in “Item 3.D.Risk Factors.”
35
In May 2006, the NWS JV delivered its first cargo to the LNG terminal in Guangdong, China. Also withrespect to NWS JV, we made a final investment decision for the fifth train in June 2005 following the successfulproduction start-up of the fourth LNG producing train in 2004. The capacity of this fifth train is planned to be4.2 million tonnes per annum and is scheduled to begin in the latter half of 2008. As of June 2006, constructionof the fifth-train project is progressing as scheduled. In Qatar, the debottlenecking work on the existing LNGfacilities was completed in May 2005 and production capacity has increased to 9.6 million tonnes per annum in2006. These new LNG producing capacities will supply both existing and new customers. An “LNG producingtrain” is a set of facilities in a liquefaction plant to produce LNG from natural gas. “Debottlenecking” refers toadditional investment and modification work on the existing LNG producing plants or trains to increase theirproduction capacity by eliminating the bottleneck in existing plants or trains that restrict production capacity.
In the Sakhalin II project, we hold a 25% interest in Sakhalin Energy Investment Company Ltd. (Bermuda).Since 1999, seasonal oil production continued from the Molikpaq facility on the Astokhskoye field, offshoreSakhalin Island. In addition, Sakhalin Energy Investment Co., Ltd. announced on May 15, 2003, that it wouldbegin the Phase II development of the Sakhalin II Project. This announcement marked the beginning of the full-scale development of the Piltun-Astokhskoye oil field aimed at year-round crude oil production, and theLunskoye gas field, including construction of a two-train LNG plant in the south of Sakhalin Island for export tothe Asia Pacific LNG markets based on long-term contracts. At its peak, the facility is expected to produce60 million barrels per annum of crude oil and 9.6 million tonnes per annum of LNG.
The total required funds for the Phase II development of the Sakhalin II Project is now estimated to beUS$20 billion, double the original budget of US$10 billion, due to increased expenses related to changes infacility design and construction delays, as well as the rising procurement costs of labor and materials. SakhalinEnergy Investment Company has been making every effort to achieve the earliest possible start of LNGshipments, which is now scheduled in summer 2008, and to contain costs. Up to August 2006, we have seen thefollowing developments:
‰ The actual progress rate of the total project was about 76% as of end of June 2006.
‰ Sakhalin Energy Investment Company also continued to progress the sale of the remaining unsoldvolumes of LNG. In June 2006, Tokyo Gas Co, Ltd. committed to purchasing additional volumes,taking overall sales of Sakhalin II LNG to 90% of designed production capacity.
On September 18, the Ministry of Natural Resources of the Russian Federation announced that it had madethe decision to revoke its order issued in 2003 pertaining to the environmental approval of the Phase IIDevelopment of the Sakhalin II Project. While we can not definitely predict future development of this situation,Sakhalin Energy Investment Company Ltd. will continue to work with the relevant authorities to resolve theissue.
This business unit holds interests in other LNG projects which are under construction. We hold 8.5%interest in Equatorial Guinea LNG in Equatorial Guinea, which is expected to start production in the middle of2007 with a production capacity of 3.4 million tonnes per annum. Through our subsidiary, Overseas PetroleumCorporation (Japan), we own a 1% interest in the Tangguh LNG project in Indonesia, which is expected to startproduction in 2008 with production capacity being 7.6 million tonnes per annum.
Identifying, exploring and developing oil and gas reserve prospects are key factors to success in this area.Our principal strategic region for this business are Australia, South East Asia and the Middle East.
During the year ended March 31, 2006, continuous near field exploration activities, together with water-floodoperations, resulted in higher than budgeted oil production at the Block 9 oil fields in Oman by Mitsui E&P MiddleEast B.V. (Netherlands), and commercial production started at the Casino gas & condensate field offshore SouthAustralia during February 2006 operated by Mittwell Energy Resources Pty. Ltd. (Australia), and a final investmentdecision to develop the Tui area oil fields offshore North Island of New Zealand by Mitsui E&P New ZealandLimited (New Zealand) was made by the joint ventures. Mitsui E&P New Zealand Limited subsequently increasedits participating interest in the joint venture from 12.5% to 35%.
36
In March 2004, Mitsui E&P Australia Pty Limited (Australia) acquired a 40% interest in each of WA-28-L andexploration block WA-271-P located in the North West Shelf area in Australia, which together contained threeundeveloped oil fields, Enfield, Vincent, and Laverda. The development of Enfield Oil Field has progressedaccording to schedule and budget and commercial production started in July 2006 with designed capacity of100,000 barrel per day. The final investment decision for Vincent Oil Field located in the same block as Enfield wasmade in March 2006 with total development cost of approximately U.S. $720 million, which is expected to startproduction in 2008.
In April 2006, MitEnergy Upstream LLC (United States) was established by Mitsui, Mitsui & Co. (U.S.A.)Inc. and Mitsui Oil Exploration Co., Ltd., to acquire from Pogo Producing Company (“Pogo”) 50% share of anundivided interest in Pogo’s oil and gas leasehold assets offshore in the Gulf of Mexico. The purchase priceamounted to ¥53.2 billion. More than half of total 85 blocks are currently producing oil and gas, with anapproximate daily production capacity of up to 12,000 barrels of oil equivalent, thus we expect a relatively shortpayback period.
In May 2006, commercial production started at the Cliff Head oil field offshore Western Australia, andcommissioning work started at the BassGas project (Yolla gas & Condensate field, offshore Victoria) both byWandoo Petroleum Pty. (Australia).
Together with our associated company Mitsui Oil Exploration Co., Ltd. (Japan), we continue putting a highpriority on expanding our oil and gas equity reserves. In March 2006, Mitsui agreed with Mitsui Engineering &Shipping Co., Ltd. to purchase 6% of the total issued shares of Mitsui Oil Exploration Co., Ltd. of which Mitsuiheld a 44.35% share prior to concluding the agreement. Mitsui initially purchased a 3% share at that time, andwill purchase the remaining 3% share by March 2007, making Mitsui’s share in Mitsui Oil Exploration Co., Ltd.50.35% of the total issued shares.
Mitsui Oil Exploration Co., Ltd. has been actively engaged in oil and natural gas exploration, developmentand production projects in Thailand and neighboring Southeast Asian countries as well as in the Middle East. Forexample, in June 2005, Mitsui Oil Exploration Co., Ltd. acquired Pogo’s Thailand assets, a 46.34% interest in theB8/32 Concession and the adjacent Block 9A Concession located in the Gulf of Thailand, jointly with a partnerin Thailand. The purchase price was U.S.$820 million, of which Mitsui Oil Exploration Co., Ltd. contributedapproximately 40%.
As a result, our oil and gas reserves increased to 688 million barrels of oil equivalent (“BOE”) at the end ofMarch 2006, after offsetting the decrease through production of 32 million BOE during the year ended March 31,2005. As of March 31, 2006, the proportion of proved developed reserves to proved developed and undevelopedreserves is approximately 28%, a relatively low level. See “Item 4.D. Property, Plants and Equipment—Oil andGas Producing Activities” and “Supplemental Information on Oil and Gas Producing Activities” to theconsolidated financial statements included elsewhere in this annual report on Form 20-F.
We are also exploring various emerging business opportunities in the energy industry. Mitsui expectsbio-ethanol to be a crucial renewable fuel in the future, and we expect world demand to rise. In April 2006,Mitsui reached an agreement with Petróleo Brasileiro SA (“Petrobras”) to jointly carry out a feasibility study forpromoting the production of bio-ethanol and related products in Brazil and for the marketing of such products inthe international market. In the same context, we are involved in the electricity retail business in Japan throughour wholly owned subsidiary, GTF Green Power Co., Ltd. (Japan), which has succeeded the business from ourassociated company, GTF Institute Co., Ltd. (Japan). We are exploring new business opportunities, includingbiomass energy, and intend to attempt power generation using renewable biomass fuel under GTF Green Power.Furthermore, we are promoting an oil sand production venture through a 4% share in Canada Oil Sands Co., Ltd.
The international markets for crude oil and petroleum products are highly competitive and volatile, as thesecommodities are traded on exchanges such as NYMEX in New York, IPE in London, and TOCOM in Tokyo. In
37
the worldwide trading business, we compete with international oil companies, national oil companies in oilproducing countries and oil trading companies, including Japanese trading companies. In maintaining ourcompetitive edge under these circumstances, it is critical for us to maintain good relationships with suppliers andcustomers as well as to mitigate price risks by utilizing hedging tools such as the futures markets. We are alsoactive in seeking to secure long-term offtake contracts of petroleum and gas products such as fuel oil andcondensate to be sold to Japanese utility and refining companies. Long-term offtake contracts are sales andpurchase contracts for various commodities, such as crude oil and petroleum products, entered into by suppliersand buyers, or “offtakers”, of such commodities for one or more years. Concurrent with the offtake contracts, thesellers of such commodities usually enter into financing arrangements whereby the sales proceeds from suchcommodities are used to finance a related project. For example, on March 25, 2003, the Energy Business Unitentered into an offtake contract with PERUSAHAAN PERTAMBANGAN MINYAK DAN GAS BUMINEGRA(“PERTAMINA”), the national oil and gas company of Indonesia, and committed itself to “lift and pay” forpetroleum products for a period of time. Concurrently, our Infrastructure Projects Business Unit was engaged inthe structuring and the arrangement of debt financing with various lenders to provide a U.S.$200 million loan toPERTAMINA which would be utilized to build a facility at its existing Balongan Refinery to produce about50,000 barrels per day of unleaded gasoline. PERTAMINA will supply us with the petroleum products from itsexisting refineries and the proceeds from the sales of these products will be used as the source of debt service forthe U.S.$200 million loan.
In the domestic refining and marketing business for oil and gas related products, we have faced severecompetition from domestic oil refining and distributing companies due to the structural surplus situation forrefining capacity in Japan. Kyokuto Petroleum Industries, Ltd. (Japan), Mitsui Oil Co., Ltd. (Japan) and MitsuiLiquefied Gas Co., Ltd. (Japan), our core associated company and subsidiaries for domestic oil and gas refiningand marketing business activities are in relatively sound financial situations owing to the extensive restructuringof inefficient assets and work force, and are pursuing efficient and competitive operations.
Japanese Government environmental regulations stipulate that sulfur content must be reduced to 10 parts permillion (“ppm”) beginning in 2007 for diesel oil and in 2008 for gasoline. Major Japanese oil refineries anddistributors voluntarily started to supply 10 ppm standard products beginning in January 2005, before therestriction came into effect. To maintain a competitive position in the market, Kyokuto Petroleum Industries, Ltd.elected to invest in new equipment to strengthen its sulfur removal capabilities. Transformation of its diesel oilequipment was completed in April 2005 and gasoline equipment is scheduled to be completed in March 2007.
With respect to oil and gas exploration and production (“E&P”) business, in our view, the key to success isto constantly increase, or at a minimum maintain, certain volumes of oil and gas reserve prospects as is thecommon practice for international oil and gas companies. However, despite our management’s intensive focus onexpanding our E&P business activities, our oil and gas reserves are still far less than that of the national oilcompanies of oil producing countries and major oil and gas companies. Other Japanese companies thatparticipate in E&P activities do not commonly disclose their proved oil and gas reserves. Based on the limitedproved oil and gas reserves information of other Japanese E&P companies that are publicly available, we believethat we generally have higher amounts of proved oil and gas reserves as compared to most Japanese E&Pcompanies. Accordingly, we believe that we are competitive with other Japanese E&P companies.
With respect to our LNG related operations, we have entered into various long term sales contracts, basedon “take or pay” conditions, with customers such as Japanese utility companies. We believe the worldwide LNGbusiness has been undergoing gradual structural changes since the late 1990’s as follows:
‰ Exploration and development of natural gas and production of LNG require significant capital andfinancial commitments. Moreover, this involves a broad range of logistical and technological expertise,including linking suppliers to distributors and consumers while developing plants in order to efficientlyextract and liquefy the natural gas for transportation and then re-gasifying the LNG. Up until themid-1990’s, purchase commitments by buyers with full “take or pay” obligations for a period of20 years or more had been an essential element for equity holders, distributors and sellers of LNG
38

projects to make the capital and financial commitment to build LNG production facilities. These equityinvestors had resisted making a capital and financial commitment without being able to fully securestable long-term purchase commitments. In recent years, however, equity holders of several LNGprojects have been making investments without fully securing long-term purchase commitments frombuyers.
‰ Due to technological innovations in the last decade, LNG producers have successfully reduced capitalcosts with respect to the construction of LNG production plants and LNG vessels. Technologicalinnovation has also enabled the producers to increase the design capacities of LNG production plantsand LNG vessels allowing them to benefit from economies of scale. These technological developmentsallow LNG to be more competitive with other types of energy sources.
‰ In response to the needs of LNG buyers, the LNG spot market has been expanding, whereby thepercentage of spot trades in worldwide LNG contracts rose to 10.6% in 2005 from 1.3% in 1992.
‰ In addition to the traditional core LNG markets in Japan, the Republic of Korea and Taiwan, the marketis rapidly expanding in Europe and the United States. At the same time, new markets have beenemerging in countries such as China and India due to an increasing demand for electricity. Consideringthe sizable economies of these countries and the increasing popularity of LNG as a “clean energy”source, the LNG market has been developing rapidly worldwide.
The recent structural changes in the LNG industry, including those mentioned above, continue to have amixed effect on our business operations. For example, due to the reduction in capital costs from technologicalinnovations, the emergence of the spot LNG market and other factors, not only has the LNG industry becomemore competitive among existing energy-related companies, but it has also seen an increase of new entrants.
Foods & Retail Segment
The Foods & Retail Segment consists of one business unit, the Foods & Retail Business Unit, which has 29subsidiaries including MITSUI FOODS CO., LTD. (Japan), Wilsey Foods Inc. (United States), Mitsui NorinCo., Ltd. (Japan), DAI-ICHI BROILER CO., LTD. (Japan), Hokushuren Company Limited (Japan) and RetailSystem Service Co., Ltd. (Japan); and 14 associated companies including Mikuni Coca-Cola Bottling Co., Ltd.(Japan), Mitsui Sugar Co., Ltd. (Japan) and KADOYA SESAME MILLS INCORPORATED (Japan).
Gross profit for this segment for the year ended March 31, 2006 was ¥79.9 billion or 9.8% of ourconsolidated totals. This segment recorded a net loss of ¥3.2 billion or minus 1.6% of our consolidated total.
The Foods & Retail Business Unit engages in:
‰ Import and domestic/offshore trade of wheat, barley, soybeans, corn, fats and oils, raw sugar, and rice;
‰ Import and domestic/offshore trade of processed foods such as canned products, frozen foods andcondiments, liquor, beverages such as coffee, tea and juice, dairy products, and foodstuffs such asmarine products, animal products and vegetables;
‰ Import and domestic trade of packaging, wrapping materials, and miscellaneous daily goods;
‰ Manufacturer of beverages, beverage ingredients, boilers, and sugar-based products;
‰ Domestic distribution and sales through the nationwide wholesaler subsidiary MITSUI FOODS CO.,LTD. (Japan); and
‰ Support services, such as supply chain management including logistics management, and productplanning and development for retailers.
The Foods & Retail Business Unit is involved in a wide range of fields in a value chain of foods, from theglobal procurement of food material and production of food products to the traffic and wholesale of foods,packaging materials, and sundry goods.
39
To secure a source of foodstuffs and a stable supply we purchase grain, oilseeds, and raw sugar from theUnited States, Canada, Brazil, and Australia and sell them in Japan and other Asian countries. We sell coffee toJapan and the United States from production areas primarily in Brazil. We purchase raw materials for beverages,such as tea leaves and juice, marine products, animal products, and dairy products from major supply sourcesaround the world and deliver them primarily to Japan. We are also engaged in domestic broiler chicken raising,processing, and sales through a subsidiary DAI-ICHI BROILER CO., LTD. (Japan).
We have positioned the United States as our main base of operations and the core of our global food supplystrategy. In collaboration with Mitsui & Co. (U.S.A.), Inc., this business unit has developed and maintained thefollowing buinesses:
‰ In the cereals and grains area, we have formed a joint venture, United Harvest, LLC, with CHS Inc., anagricultural cooperative in the United States. Our exports of wheat from the United States are among thebest, amounting to approximately four million tons per annum.
‰ Ventura Foods, LLC, another joint venture formed with CHS Inc., is one of the largest suppliers ofcooking oils for the institutional market in the United States. We invest in this company throughWILSEY FOODS, INC.
In food-manufacturing operations, during the year ended March 31, 2004, we increased our equity stake inMitsui Norin Co., Ltd. (Japan), which is one of the major manufacturers of tea leaves in Japan, and made it oursubsidiary with the intention of positioning it as a core company in our beverage business, realizing synergieswith our existing network for procurement of raw materials and domestic distribution.
Competition varies depending on products in the upstream areas of grain, feed, sugar and food materials, butis generally based on price or quality of products. Many Japanese general trading companies, internationalproducers, and traders are competitors to varying degrees with respect to most of the food products we handle.
MITSUI FOODS CO., LTD. (Japan) plays a vital role in this unit’s wholesale operations. It is expanding itsbusiness activities to include general merchandise stores, supermarkets, convenience stores, and catering andrestaurant chains throughout Japan, focusing on processed food and liquor transactions. The Foods & RetailBusiness Unit is developing and strengthening its nationwide distribution chain focused on MITSUI FOODSCO., LTD., including investments and business tie-ups from the parent company with regional wholesalers.
In the foodstuffs distribution field, the needs for reduced distribution costs, secure temperature-controlledsupply, and faster delivery are becoming more sophisticated and diverse. To meet these changes, the Foods &Retail Business Unit is engaging in wholesale transactions with and providing support services to retailers. Theseinclude:
‰ inventory management and procurement of foodstuffs, processed foods, and packaging based on salesinformation obtained from retailers; and
‰ proposals for developing new products and services, and support in the form of traceability for securingfood safety.
In April 2006, MITSUI FOODS CO., LTD. and Mitsui agreed with KOKUBU & CO., LTD., a majorJapanese food wholesaler, to form a business alliance, which includes support by KOKUBU & CO., LTD. forimprovement of management and operations of MITSUI FOODS CO., LTD. and cooperation in productcategories to be reinforced by both companies.
Mitsui maintains a comprehensive alliance with Seven & i Holdings Co., Ltd., Japan’s nationwidediversified retailer. Seven & i Holdings Co., Ltd. operates shopping malls, general merchandise stores,supermarkets, convenience stores such as 7-Eleven, restaurant chains such as Denny’s, and financial servicecompanies such as the IYBank, and opened SEVEN-ELEVEN (BEIJING) in April 2004.
40
Mitsui offers the following supply services to Seven & i Holdings Co., Ltd. through our domesticsubsidiaries, such as MITSUI FOODS CO., LTD., Retail System Service Co., Ltd. and VENDORSERVICE CO., LTD.
‰ supply sundry goods and consumables, such as processed food, liquor, fast food, toys, and games, tomore than ten thousand 7-Eleven stores in Japan;
‰ supply food materials, containers, and packaging materials to vendors who supply boxed lunches,pre-cooked meals, and processed food to 7-Eleven stores in Japan;
‰ supply various temperature-controlled products to 7-Eleven stores in Japan; and
‰ supply cold products through the affiliate company Beijing Sanxin Refrigeration Logistics Co., Ltd. to7-Eleven stores in Beijing.
To strengthen our business ties, the Foods & Retail Business Unit purchased ¥10 billion ofIto-Yokado Co., Ltd. shares and ¥40 billion of Seven-Eleven Japan Co., Ltd. shares. The Ito-Yokado Groupestablished a new holding company, Seven & i Holdings Co., Ltd., on September 1, 2005, and the shares that weacquired are equal to roughly 1.2% of Seven & i Holdings Co., Ltd. outstanding shares.
Our competitors in the wholesale and retail businesses are mainly general trading companies in Japan. In thetraffic area, our competitors are also traffic companies that operate third-party logistics. In domestic wholesaling,there is fierce competition among suppliers, and we are making efforts to increase revenues and reduce logisticscosts by achieving better economies of scale through mergers and acquisitions from time to time.
Lifestyle, Consumer Service and Information, Electronics & Telecommunication Segment
This segment is comprised of the Lifestyle Business Unit; the Consumer Service Business Unit; and theInformation, Electronics and Telecommunication Business Unit.
Gross profit and net income for this segment for the year ended March 31, 2006 were ¥128.4 billion or15.7% and ¥17.5 billion or 8.6% of our consolidated total, respectively.
This segment owns 44 subsidiaries including:
‰ Mitsui Bussan Inter-fashion Ltd. (Japan) in the Lifestyle Business Unit;
‰ Bussan Real Estate Development Co., Ltd. (Japan), MBK Real Estate Ltd. (United States), MitsuiBussan House-Techno, Inc. (Japan) and CABLENET SAITAMA CO., LTD. (Japan) in the ConsumerService Business Unit; and
‰ Telepark Corp. (Japan), NextCom K.K. (Japan), TOYO Officemation, Inc. (Japan) and MitsuiElectronics Inc. (Japan) in the Information, Electronics and Telecommunication Business Unit.
And it has 42 associated companies including:
‰ ALCANTARA S.p.A. (Italy), Nippon Brunswick Co., Ltd. (Japan) in the Lifestyle Business Unit;
‰ QVC JAPAN INC. (Japan), AIM Services Co., Ltd. (Japan) and Sumisho & Mitsuibussan KenzaiCo., Ltd. (Japan) in the Consumer Service Business Unit; and
‰ Nihon Unisys, Ltd. (Japan), Moshi Moshi Hotline, Inc. (Japan) in the Information, Electronics andTelecommunication Business Unit.
Lifestyle Business Unit
Effective April 1, 2004, the former Textile & Fashion Unit and the former General Merchandise Unit wereintegrated into a single business unit named the Lifestyle Business Unit.
Together with 11 subsidiaries and 18 associated companies, the Lifestyle Business Unit is engaged indomestic, import, export and offshore trading and manufacturing of the following materials and products, as wellas related services and investments:
‰ apparel products, including development and manufacturing of those products; and brand merchandize-related businesses including equity participation in joint ventures with brand owners and brand licensing;
41

‰ textile raw materials and fabrics; and technical collaboration in these products field;
‰ non-apparel products such as interior and living items and consumer goods; and
‰ industrial materials such as pulp and paper.
In the fashion field, we actively provide innovative services to accommodate new developments in thefashion and apparel markets. Our main business activities are divided into two categories:
‰ original equipment manufacturing (“OEM”) business for domestic apparel manufacturers; and
‰ business transactions involving branded luxury and accessible luxury products from Europe and theUnited States for the Japanese market as well as brand licensing businesses in Japan.
In the field of apparel and OEM, we play active roles at various stages in the value chain, including design,planning and procurement of materials as well as sewing and processing. To meet our goals of minimizing costsand enhancing quality, we work with apparel makers and related companies to select the optimal materials andprocessing centers from the wide variety of choices available in Japan, Europe, the Americas, Asia and otherareas.
We regard China as an important manufacturing base and also a significant consumer market as well. Tofurther strengthen our OEM business capabilities and our provision of support services, we utilize oursubsidiaries and associated companies such as Mitsui Bussan Inter-Fashion Ltd. (Japan) and Alta ModaInternational Ltd. (Hong Kong), both of which offer well-organized manufacturing process management led byexperts hired specially for that role.
With respect to brand businesses in Japan, we are engaged in both license and import business transactionsinvolving internationally well-known branded merchandise from Europe and the United States such as Burberry,Paul Stuart, Trussardi, Valentino, Max Mara, Etro and Juicy Couture. In the case of license agreements we enterinto with the respective European and American licensors, we sublicense certain rights including, but not limitedto, marketing and manufacturing rights to apparel makers and wholesalers, while we retain the exclusivedistributorship rights. We, if necessary, establish joint venture subsidiaries with such European and Americanbrand owners to control license arrangements or to distribute imported products in order to establish wellcontrolled nationwide sales network composed of wholesalers, department stores, specialty-stores or our ownretail outlets.
In brand businesses, our competitors are other general trading companies and apparel specialty tradersincluding Itochu Corporation and Mitsubishi Corporation. The keys to maintain our competitiveness are to raisethe value of the brand which we promote in the market and to increase the number of valuable brands we dealwith.
In consumer goods fields, this business unit is engaged in the trading, production, processing anddistribution of various goods such as general household and consumer goods, light industrial machinery andsupplies, medical equipment and office automation systems as set forth below:
‰ We supply a wide range of top-quality consumer goods imported from around the world, which includehigh-quality Sonicare ultrasonic toothbrushes, Brunswick bowling equipment and systems, MAGLITEhandy flashlights, and top-of-the-line Lladro porcelain;
‰ We trade woodchip and pulp, furthermore, we develop several afforestation projects in Australia, someof which are jointly promoted with several Japanese partners including paper manufacturingcompanies; and
42

‰ As for paper and ceramic products, we closely partner with Japanese manufacturers and participate injoint venture operations in China to sell products there and export them from China, as well as handlingproducts in and from Japan.
In the business area of consumer goods such as sporting and leisure goods, continuous changes in lifestylesrequire new business models which reflect such changes. Accordingly, we seek to locate new materials and newsuppliers, arrange effective distribution methods and develop attractive brand names. Such efforts are realizedthrough a combination of our human and organizational network and industrial expertise.
Consumer Service Business Unit
Major business areas of this business unit, including 18 subsidiaries and 16 associated companies, consist ofthe following:
‰ real estate development including construction, sale and leasing of houses, condominiums, commercialfacilities, senior housing and office buildings and related construction material businesses;
‰ media-related service business including broadcasting, content service, television shopping channels,software service, amusement business and Internet-based marketing service;
‰ outsourcing services including catering, uniform rental, building maintenance, and temporary personnelservice, child care service;
‰ medical service and health care related businesses such as nursing care-related services, clinic facilitiesand medical related information service.
Real estate development businesses include the following activities:
‰ Mitsui engages in development of condominium and commercial property in the Tokyo metropolitanarea. Mitsui Bussan House-Techno, Inc. (Japan) has been engaged in construction and marketing ofhigh-end home units under the Mitsui House brand, however, due to shrinking market in Japan, itdecided to withdraw from the business in July 2006.
‰ MBK Real Estate Ltd. (United States) handles the development and sale of unit houses and seniorhousing properties in the California market, as well as commercial properties on the West Coast of theUnited States.
‰ Our associated company Sumisho & Mitsuibussan Kenzai Co., Ltd. (Japan) supplies constructionmaterials in the domestic market.
‰ In March 2005 we jointly established Mall & SC Development, Inc. (Japan) with Ito-Yokado Co., Ltd.to pursue the development and management of shopping malls and shopping centers.
In the media-related service business, as a consumer service and content provider, we provide televisionshopping services operated by an associated company, QVC Japan, Inc. (Japan), which was established jointlywith QVC Inc. of the United States; and an entertainment and educational channel for children and parentsoperated by Kids Station Inc. (Japan), our subsidiary, both of which are delivered over cable or digital satellitebroadcast networks.
In the outsourcing businesses, AIM Services Co., Ltd. (Japan), an associated company jointly establishedwith ARAMARK Corporation in the United States, has provided a variety of service in Japan since 1976. Majorparts of its businesses are food service and support services for companies and schools as well as those forhospitals and social welfare facilities. In December 2005, it acquired a 100% share of MEFOS Ltd, a provider ofhospital food services, which strengthened its business base in the market where competition is increasinglyfierce. Moreover, it is engaged in refreshment and support services for offices, and provides services of design,cleaning and facilities management, linen supply, uniform rental and contract staffing to dining facilities.
We are in the process of cultivating new opportunities in medical services through our subsidiary,Medivance Co. (Japan), Ltd. In August 2005, we also founded an associated company venture with
43

Recruit Co., Ltd., which provides a healthcare information service on the Internet. This segment also made 5%equity participation in and formed an alliance with Duskin Co., Ltd., which is engaged in cleaning services, foodservices and nursing care services nationwide.
Information, Electronics and Telecommunication Business Unit
The Information, Electronics and Telecommunication Business Unit is involved in information technologyservices and solutions. These are delivered through the unit’s 15 subsidiaries and 8 associated companiesestablished in the following five major fields:
‰ network and systems integration (“NI/ SI”) businesses;
‰ mobile communication businesses including sales agency of mobile handset and telecommunicationslines; and development and sales of mobile content;
‰ business process outsourcing services including enterprise information management and call-centerservices;
‰ semiconductors related businesses including sales agency for semiconductor chips, semiconductormanufacturing equipments and semiconductor inspection equipments; and
‰ display related businesses including export and trading of flat-panel displays and parts.
In the field of NI/SI businesses, NextCom K.K. (Japan), a subsidiary and Nihon Unisys, Ltd. (Japan), anassociated company both listed on the Tokyo Stock Exchange, provide integrated solutions to a wide range ofcustomers.
‰ NextCom K.K. provides services, such as consultation, designing, building and operation of networksystems including self-developed systems, to a wide range of business enterprises includingtelecommunications carriers, government offices, local municipalities and public bodies engaged inhealthcare and education. NextCom K.K. is also engaged in planning and development of networksystems which are equipped with voice recognition technology and typically used by call centers. It isalso involved in high-secruity systems, for example automatic billing systems used by pay-TVbroadcasters. In December 2004, following the merger of NextCom K.K., a former associated company,BSI Co., Ltd., a software development and marketing subsidiary, and ADAM NET Ltd., a datatelecommunications equipment marketing subsidiary, NextCom K.K. remained as the survivingcompany among them and became a subsidiary.
‰ Nihon Unisys, Ltd. is engaged in designing and building of computer systems, business processoutsourcing services, support services and other peripheral services as well as sales of computersystems, including both hardware and software. These services are provided to business enterprises inthe financial, manufacturing and distribution and public sectors. Mitsui owns a 32.4% voting interest inNihon Unisys, Ltd. as of March 2006. Unisys Corporation in the United States, which formerly held thesame equity stake as Mitsui, sold its entire shareholding in Nihon Unisys, Ltd. in March 2006, andMitsui has since been its single largest shareholder.
We are promoting various mobile communication businesses through alliances with domestic cell phoneservice providers and manufacturers. Telepark Corp. (Japan) is a core subsidiary in this field. Telepark Corp. isone of the major agencies in Japan for cell phone subscription as well as a retailer and distributor of cell phonehandsets. It sold 3.2 million cell phones for the year ended March 31, 2006. It has also acted as agent forsubscription of fixed telecommunications lines, including broadband connections. Telepark Corp. is listed on theTokyo Stock Exchange. Telepark Corp. was established in 2001 following the merger of three Mitsui subsidiariesthat were established in 1990s and engaged in sales agency of telecommunications lines and related businesses.
The market for business process outsourcing services has been expanding in Japan. We have positioned thismarket as a crucial business field and have promoted businesses through a subsidiary, TOYO Officemation, Inc.(Japan), and an associated company, Moshi Moshi Hotline, Inc. (Japan). TOYO Officemation, Inc. (Japan),
44
which has been engaged in distribution of information processing devices such as optical character readers(“OCR”) and information input devices, has recently focused on enterprise information management such ascustomer information input, management and operation. Moshi Moshi Hotline, Inc. (Japan) is one of the Japan’smajor providers of call centers and related outsourcing services. It had been our subsidiary when we establishedit along with contributions from other eleven investors. Moshi Moshi Hotline, Inc. later went public on theover-the-counter market and is now listed on the Tokyo Stock Exchange. Our voting interest is 34.3%.
In the field of electronics products, Mitsui Electronics Inc. (Japan) acts as a sales agent for semiconductorrelated devices, semiconductor manufacturing equipment and semiconductor inspection equipment. In recentyears, particularly, Mitsui Electronics Inc. (Japan) has focused on providing semiconductor related products andservices to Japanese customers who are shifting their production bases to China. We have also been engaged inexport and trading of flat-panel displays and parts. We set up a joint venture company in Shanghai to market thestrategic products of SVA (GROUP) CO., LTD., a Chinese electronics manufacturer, in China and worldwide.
This business unit is dependent on the operating results of our subsidiaries and associated companies, mostof which are located in Japan, where technological development is rapid and competition is fierce. Our importantfunction involves business incubation of IT related products and services, which is ordinarily promoted alongwith market development and expansion as is the case with Telepark Corp. and Moshi Moshi Hotline, Inc.
This business unit acknowledges that businesses represented by the concepts of “convergence oftelecommunication and broadcasting” and “outsourcing services” are gaining importance on the back ofadvancing communications technology and increasing demand for more sophisticated content. From thisviewpoint, the business strategies of this business unit include such ones close to those extended by theConsumer Service Business Unit.
Logistics & Financial Markets Segment
The Logistics & Financial Markets Segment is engaged in transportation and logistics services, insuranceand financial business in Japan and abroad.
Gross profit and net income for this segment for the year ended March 31, 2006 were ¥51.4 billion or 6.3%and ¥13.4 billion or 6.6% of our consolidated totals, respectively.
This segment is composed of the Financial Markets Business Unit and the Transportation Logistics BusinessUnit, and has 36 subsidiaries including:
‰ in the Financial Markets Business Unit, Mitsui & Co. Energy Risk Management Ltd. (United Kingdom),Mitsui & Co. Precious Metals, Inc. (United States), Mitsui Bussan Futures Ltd. (Japan); and
‰ in the Transportation Logistics Business Unit, Nitto Logistics Co., Ltd. (Japan), Mitsuibussan Insuranceand Consulting Co., Ltd. (Japan), Tri-Net (Japan) Inc. (Japan).
This segment has 5 associated companies including Mitsui Leasing & Development, Ltd. (Japan) andQuintiles Transnational Japan K.K. (Japan) in the Financial Markets Business Unit.
Financial Markets Business Unit
This business unit has 24 subsidiaries and 2 associated companies and is engaged in the following businessactivities:
‰ dealing in derivative financial instruments such as foreign exchange and financial futures, and trading ofand investment in debt and equity securities;
‰ trading in precious metals, non-ferrous metals listed on the London Metal Exchange and derivativecommodity instruments for energy, agricultural foods and other commodities;
‰ financial equity investments including principal investment and venture capital operation;
‰ real estate investment trust (“REIT”) related businesses;
45

‰ development, origination and sales of financial products, investment in and portfolio management offinancial products; and
‰ leasing businesses
Mitsui and its subsidiaries such as Mitsui & Co. Precious Metals, Inc. (United States) are engaged in tradingand brokerage in precious metals, non-ferrous metals listed on the London Metal Exchange and derivativecommodity instruments for energy, agricultural foods and other commodities. We are also engaged in sales andmarketing of various derivative and financial instruments of our own development to investors and marketparticipants. Mitsui & Co., Energy Risk Management Ltd. (United Kingdom), which we established in March2002, enjoyed growth in derivative trading operations, mainly of crude oil and natural gas related commodities.Japan Alternative Investment Co., Ltd. (Japan) began operations in April 2002, acting as placement agent foralternative investment products, such as hedge funds, private equity funds and commodity funds. Mitsui BussanFutures Ltd. (Japan) is a domestic subsidiary engaged in the future commodities brokering including preciousmetals and other commodities such as foods and oil products.
In June 2004, Mitsui and Quintiles Transnational Corp. agreed on Mitsui taking a 20% shareholding inQuintiles Transnational Japan K.K. (Japan), in a transaction designed to accelerate the growth of QuintilesTransnational Japan K.K. Quintiles Transnational Corp. is a major worldwide company, providing outsourcingservices in the pharmaceutical industry. This transaction fit well with our goal of investing in first-classinternational companies in the healthcare and outsourcing service industries and, in particular, enhancing thosecompanies’ Japanese operations. This business unit is also engaged in venture capital business throughsubsidiaries such as MVC Corporation (Japan).
In July 2004, this business unit formed Mitsui & Co., Logistics Partners Ltd. (Japan), as an assetmanagement company for REITs that specialize in the management of investments in warehouses anddistribution centers. In May 2005, we completed the listing of Japan’s first logistics facilities related REIT, JapanLogistics Fund Inc. on the Tokyo Stock Exchange.
This business unit has 40.63% participating interest in Mitsui Leasing & Development, Ltd. (Japan), aleasing company with its strengths in leasing of information-processing equipments and large scale equipment, aswell as industrial machinery, aircrafts and ocean vessels.
Transportation Logistics Business Unit
The Transportation Logistics Business Unit provides sophisticated, high value added logistics services tocustomers leveraging its longstanding experience in offering such services groupwide. This business unit alsoseeks the development of new business domains through integrating logistics, financial and informationtechnology.
Together with 12 subsidiaries and 3 associated companies, this business unit is engaged in the followingbusiness activities:
‰ international and domestic transport services including transportation of plants and other special cargos,tramper shipping, and airfreight;
‰ warehousing and port services; operation, construction and management of warehouses and harborfacilities;
‰ insurance agency and insurance consultation;
‰ solutions services for logistics, including SCM; and
‰ establishment and operation of REITs which invest in logistics facilities.
In the international and domestic transport services field, we have established 5 core subsidiaries includingTri-Net (Japan) Inc., which cover our operations in Japan, the Americas, Europe, South East Asia, and China,respectively. Each of those subsidiaries collaborates with the Head Office and overseas trading subsidiaries
46
worldwide, and provides international transportation services mainly using marine containers. They also provideinternational combined transportation services by integrating land, sea and air transportation . In the tramperbusiness, they provide transportation services for power and chemical plant projects and bulky cargoes such ascoal, grain and fertilizers.
We have been making investments to expand our logistics businesses in the BRICs countries, the MiddleEast and other emerging markets. For example, in January 2006 we acquired a 25% equity stake in BALtransHoldings, Ltd. (Hong Kong, China) which is listed in Hong Kong Stock Exchange and maintains 14 distributionbases in Main Land China.
In the field of warehousing, distribution and port service related business within Japan, this business unit hasMitsui Bussan Logistics Co., Ltd. as a holding company for three domestic subsidiaries, KYOGI WAREHOUSECO., LTD. (Japan), Nitto Logistics Co., Ltd. (Japan) and TOSHIN SOKO KAISHA, LTD. (Japan). For example,Nitto Logistics Co., Ltd. conducts joint operations with a domestic specialty store retailer of private label apparelfor outsourced production and inventory management. It provides information processing functions so that itscustomers optimize their logistics transactions.
This business has a subsidiary, Mitsuibussan Insurance and Consulting Co., Ltd. (Japan), as an insuranceagency. In addition, the business unit has acquired insurance companies for captive insurance and operatessubsidiaries which are engaged in this business field, including Insurance Company of Trinet (USA), Inc. Thisbusiness unit also maintains consulting services on a variety of insurance issues, by taking advantage of theexperience and know-how in risk management of this business unit.
In collaboration with the Financial Markets Business Unit, this business unit promotes logistics-related realestate property REITs. This unit intends to increase the assets for such REIT programs, seeking opportunities forthe development of facilities, brokerage in properties and tenants.
Americas Segment
The Americas Segment trades in various commodities and conducts related business led by overseas tradingsubsidiaries in North, Central and South America. Mitsui & Co. (U.S.A.), Inc., or Mitsui U.S.A., manages thebusiness of the segment as the center of the regional strategy. Effective April 2006, following the introduction ofour regional business unit system, the Americas Business Unit was formed which consists of those tradingsubsidiaries operating in this region. The Chief Operating Officer of this business unit has been delegated anauthority of operations within the region.
Gross profit and net income for this segment for the year ended March 31, 2006 were ¥61.6 billion or 7.5%and ¥12.6 billion or 6.2% of our consolidated totals, respectively.
This segment consists of 9 trading subsidiaries including Mitsui U.S.A., Mitsui & Co. (Canada) Ltd., MitsuiBrasileira Importacao e Exportacao S.A., Mitsui Chile Ltda., and 30 other subsidiaries owned mainly by MitsuiU.S.A., including Mitsui Steel Holdings, Inc., Portac Inc., Channel Terminal Corp., Westport Petroleum Inc.,Mitsui Tubular Products, LLC. and Mitsui Comtek Corp. and 2 associated companies.
Mitsui U.S.A. is our largest overseas subsidiary, and carries out many diversified business activities togetherwith our subsidiaries and associated companies, in collaboration with the operating segments of the Head Officein Japan. Mitsui U.S.A. has been leading our entry in the U.S. market, and we believe that Mitsui U.S.A. is oneof the major exporters of American products.
Mitsui U.S.A. has its corporate head office in New York City. Other offices are located in Cleveland,Detroit, Houston, Los Angeles, Nashville, Portland, San Francisco, Seattle and Washington, D.C. Businessactivities of Mitsui U.S.A.’s major operating divisions are as follows:
‰ The Iron & Steel Products Division maintains alliances with steel mills, steel processors, and customers in theU.S. and other countries. Working closely with solution providers, it specializes in SCM of steel products,
47
manages inventory and process arrangements. This division has been focusing on business activities throughsubsidiaries such as Mitsui Steel, Inc. for steel product sales and demand chain management (“DCM”)services, Mitsui Steel Holdings, Inc which holds Mi-Tech Steel Inc., a steel service center, PK U.S.A., Inc.,an automotive steel stamping, Hannibal Industries, Inc., a steel tube and pallet rack manufacturing operator,Champions Pipe & Supply, a pipe distributor, and MTP LLC, a pipe sales entity.
‰ The Iron & Raw Materials and Non-Ferrous Metals Division specializes in iron and steel raw materials,coal, primary aluminum, aluminum alloy, copper cathode, and non-ferrous metals. The division issupported by relationships with subsidiaries jointly held with the Head Office, for example, RawMaterials Development Co., Ltd., in which the division has an equity share of 20%.
‰ The Power, Transportation & Plant Projects Division deals in power, energy, transportation, andindustrial and infrastructure projects in the Americas through close coordination with the Head Office.In addition, subsidiaries such as Hydro Capital Corp. for waste water treatment projects in Mexico andMIT Wind Power, Inc. for wind power generation in Texas are engaged in this business field.
‰ The Machinery Division deals in motor vehicles, ship and marine projects, aircraft and construction andindustrial machinery. The Division works closely with United Auto Group, Hino Motors, Chevron,Modec International, Embraer, JetBlue and Komatsu. Particularly, its activities are focused oninvestment in distribution & retails of automobile and construction machinery, outdoor powerequipment, newbuilding ship tonnage provider to oil major and shipping companies, and aircraft leasingfor growing regional airlines.
‰ The Organic Chemicals Division and the Plastics & Inorganic Chemicals Division are engaged in thedomestic and international trade of various organic and inorganic chemicals and chemical intermediates,plastic resins, compounds and final products, pharmaceutical intermediates, food additives, fertilizer andcrop protection chemicals, and petrochemicals. For example, this division has a subsidiary, ChannelTerminal Corp., which is engaged in the chemical tank leasing business. Recent development of thisdivision toward a new business is an acquisition of CornerStone Research & Development Inc., whichfocuses on processing and packaging of healthcare foods and suppliments.
‰ The Energy Division specializes in the global trading of petroleum products, including crude oil, heavyoil and petroleum coke, as well as the importation of LNG. This division has a subsidiary, WestportPetroleum, Inc., in which Mitsui U.S.A. has 65.0% equity share. The remaining share is owned by theHead office. Westport Petroleum, Inc. is engaged in sales, trading and commercial and operationalservices to the energy industry with respect to pipeline and cargo trading of petroleum productsthroughout the United States and major international energy markets. These transactions by WestportPetroleum, Inc. account for a significant portion of our revenues from sales of products groupwide.
‰ The Foods and Retail division deals in grain, coffee, foods materials and other foods products. Thisdivision has a subsidiary, United Grain Corp, which forms United Harvest, LLC, a joint venture withCHS Inc. for export facility operations for wheat and barley, and also has 20% minority interest inWILSEY FOODS INC. See also “Foods &Retail Business Unit” for business collaboration withCHS Inc. Additionally, Mitsui Foods Inc. is specialized in the import food distribution business.
‰ The Life commerce division focuses on consumer-oriented business development. This division has asubsidiary, Portac, Inc., a lumber mill, which produces dimension lumber and specialty items for U.Sconsumption and export. In other areas, the division has an equity share in MBK Real Estate Ltd., a realestate subsidiary jointly held with the Head Office and engaged in development and homebuilding services.
Europe Segment
The Europe Segment trades in various commodities and conducts related businesses led by overseas tradingsubsidiaries in Europe and Africa. Mitsui & Co. Europe PLC (“Mitsui Europe”) is authorized to manage thebusiness of this segment as the center of its regional strategy. In addition, this segment carries out diversifiedbusiness activities in collaboration with the operating segments of the Head Office. Effective April 2006,following the introduction of our regional business unit system, the Europe Business Unit was formed which
48
consists of those trading subsidiaries in this region. The Chief Operating Officer of this business unit has beendelegated an authority for operations within the region.
Gross profit and net income for this segment for the year ended March 31, 2006 were ¥22.4 billion or 2.7%and ¥4.9 billion or 2.4% of our consolidated totals, respectively.
As of March 31, 2006, this segment consisted of 10 trading subsidiaries, including Mitsui Europe,Mitsui & Co. UK PLC, Mitsui & Co. Deutschland GmbH, 6 subsidiaries and 6 associated companies.
Mitsui Europe, our wholly-owned subsidiary with its head office in London, manages the overall businessactivities in Western Europe, Africa, Central, Eastern Europe and Turkey through its 9 operating subsidiaries,10 branch offices and liaison offices. Mitsui Europe collaborates with our subsidiaries and associated companiesof other operating segments.
In April 2005, this segment reorganized its internal structure. Before the change, each of those operatingsubsidiaries independently reported to the Managing Director of Mitsui Europe, with the result that their businessplans and operations tended to be limited to specific countries. In order to accelerate business development basedon a product strategy that encompasses the whole of Europe, this segment introduced a Business Division Systemwithin Europe, in which Divisional Operating Officers oversee operations by products and services in the regionand directly report to Managing Director of Mitsui Europe.
Recently, the major parts of business in this segment have been sales and trading in steel products,chemicals and machinery. For example, this segment provided assistance services for SCM of steel productsprocured by Norsk Hydro ASA. In the chemical business, this segment has been engaged in sales and trade invarious chemical products and materials supported by our global network and relationship with large scalemanufactures including Bayer Aktiengesellschaft. In machinery business, for Mitsui’s worldwide power plantand industrial plant and transportation projects, this segment has provided assistance service in collaboration withEuropean manufacturers such as Siemens Aktiengesellschaft.
Over the years, in Central and Eastern Europe, we have established trading subsidiaries and representativeoffices to expand business opportunities in the region, and have continuously participated in joint ventures,mainly with Japanese manufactures. In connection with the enlargement of European Union, Japaneseautomobile, electric and chemical manufactures are rushing to set up operations in the region. We arecollaborating with them by taking advantage of our existing business bases.
During the year ended March 31, 2006, we entered a joint operation with Arcelor S.A., a European steelmaker, which was merged to Arcelor and Mittal Steel Company N.V, to supply steel sheet to Japaneseautomobile and automobile parts manufacturers.
Asia Segment
In order to develop new business opportunities emerging with the development of network economies basedaround China, the ASEAN countries and India, we introduced an Asian Regional Managing Directorship system.Broad authority and responsibility to manage our businesses throughout non-Japan Asia is delegated to theRegional Managing Director, Asia starting in the year ended March 31, 2006. Effective April 2006, following theintroduction of our regional business unit system, the Asia Business Unit was formed and consists of the tradingsubsidiaries, branches and liaison offices in this region. The Chief Operating Officer of this business unit hasbeen delegated an authority for operation within this region.
Gross profit and net income for this segment for the year ended March 31, 2006 were ¥27.4 billion or 3.4%and ¥9.3 billion or 4.6% of our consolidated totals, respectively.
China
China has been a focus of recent global attention, with 9.9% and 10.1% growth in gross domestic product in2005 and 2004, respectively, as a result of its accession to the WTO and a growing reputation as an efficient and
49
cost effective manufacturer of goods. We have been increasing our operations in, and shifting managementresources to, Greater China, which includes mainland China, Hong Kong and Taiwan, in order to expand andstrengthen our business operations involving products such as automobiles, consumer products, IT, electronics,energy and metals, while reinforcing our transportation and logistics services.
Our presence in China is comprised of ten local subsidiaries, including Mitsui & Co., (China) Ltd., aninvesting company in Beijing and six subsidiaries in China’s bonded areas including Mitsui & Co. (Shanghai)Ltd. as well as Mitsui & Co. (Hong Kong) Ltd. In addition, we have established representative offices in 13 citiesin China as of March 2006.
In September 2005, Mitsui received approval from the Chinese Ministry of Commerce to establish threewholly owned trading companies, permitting us to conduct import and export and wholesale trade domesticallywithin China, which would enable us to trade in a broader range of products, including valueadded services infinance and logistics. Thus, Mitsui & Co. (China) Trading Ltd. and Mitsui & Co. (Guangdong) Ltd. wereestablished in 2005 and started operations.
Mitsui & Co., (China) Ltd. has made investments jointly with the business units of the Head Office incritical joint ventures in China. Among others, we place a high priority on establishment of logistic networkwithin China. For example:
‰ In March 2003, we entered into a comprehensive strategic alliance with China Postal Logistics Co., Ltd.Through this alliance, we are in a position to utilize the facilities and distribution networks of China’spostal service, the China State Post Bureau.
‰ Mitsui International Logistics and Trade (Suzhou) Co., Ltd., in which Mitsui & Co., (China) Ltd. hasminority share, has the right to conduct import and export under our own name outside a bonded area.
ASEAN Region
In the ASEAN region, overseas offices including the Singapore, Kuala Lumpur and Manila branches,trading subsidiaries including Mitsui & Co., (Thailand) Ltd., Mitsiam International Ltd. (Thailand), PT MitsuiIndonesia (Indonesia) and associated companies jointly collaborate with the Head Office and engage in variousbusiness activities involving, among other things, chemical and metal products and industrial type projects. Suchindustrial projects are referred to in the discussion of business activities of the Infrastructure Projects BusinessUnit above. With the Head Office, these branches and trading subsidiaries jointly establish various subsidiariesand participate in joint ventures formed with the third parties.
Southwest Asia
Our operations in India were traditionally handled by branch offices in New Delhi, Calcutta, Madras andBombay and were concentrated primarily in exporting commodities, such as iron ore, finished iron and steelproducts, textiles, and marine products, to Japan and other areas of the world. However, with the increasingderegulation of the Indian economy, in March 2003 we established Mitsui & Co., India Pvt. Ltd. ThroughMitsui & Co., India Pvt. Ltd, we expect not only to engage in import and export-related transactions but also topursue investment opportunities in domestic distribution channels.
Other Overseas Areas Segment
This segment includes all of our region-based subsidiaries, liaison offices and affiliated companiesexcluding those in our Americas, Europe and Asia Segments. The subsidiaries, liaison offices and associatedcompanies in this segment are located primarily in Oceania, the Middle East, and CIS. The Overseas AreasSegment is engaged in business activities that are essentially similar to that of Mitsui. We conduct businessactivities in all industry sectors based on our specialized knowledge particular to that region.
Gross profit and net income for this segment for the year ended March 31, 2006 were ¥4.9 billion or 0.6%and ¥14.3 billion or 7.1% of consolidated totals, respectively.
50
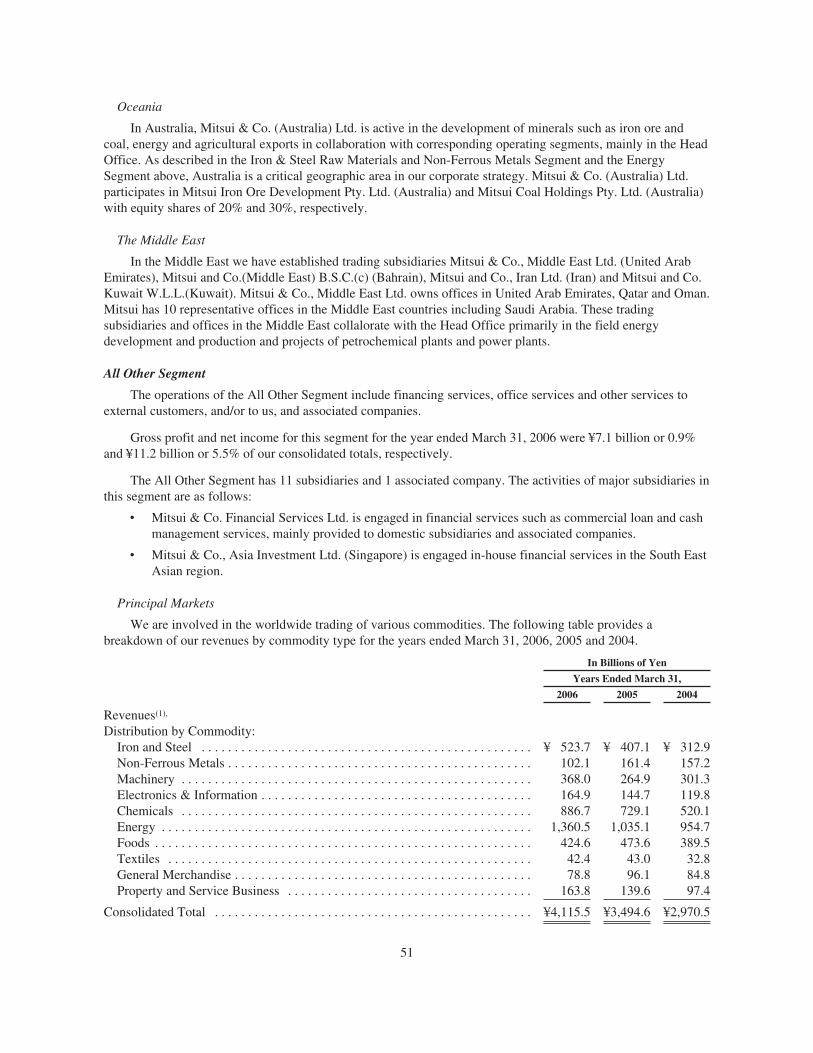
Oceania
In Australia, Mitsui & Co. (Australia) Ltd. is active in the development of minerals such as iron ore andcoal, energy and agricultural exports in collaboration with corresponding operating segments, mainly in the HeadOffice. As described in the Iron & Steel Raw Materials and Non-Ferrous Metals Segment and the EnergySegment above, Australia is a critical geographic area in our corporate strategy. Mitsui & Co. (Australia) Ltd.participates in Mitsui Iron Ore Development Pty. Ltd. (Australia) and Mitsui Coal Holdings Pty. Ltd. (Australia)with equity shares of 20% and 30%, respectively.
The Middle East
In the Middle East we have established trading subsidiaries Mitsui & Co., Middle East Ltd. (United ArabEmirates), Mitsui and Co.(Middle East) B.S.C.(c) (Bahrain), Mitsui and Co., Iran Ltd. (Iran) and Mitsui and Co.Kuwait W.L.L.(Kuwait). Mitsui & Co., Middle East Ltd. owns offices in United Arab Emirates, Qatar and Oman.Mitsui has 10 representative offices in the Middle East countries including Saudi Arabia. These tradingsubsidiaries and offices in the Middle East collalorate with the Head Office primarily in the field energydevelopment and production and projects of petrochemical plants and power plants.
All Other Segment
The operations of the All Other Segment include financing services, office services and other services toexternal customers, and/or to us, and associated companies.
Gross profit and net income for this segment for the year ended March 31, 2006 were ¥7.1 billion or 0.9%and ¥11.2 billion or 5.5% of our consolidated totals, respectively.
The All Other Segment has 11 subsidiaries and 1 associated company. The activities of major subsidiaries inthis segment are as follows:
‰ Mitsui & Co. Financial Services Ltd. is engaged in financial services such as commercial loan and cashmanagement services, mainly provided to domestic subsidiaries and associated companies.
‰ Mitsui & Co., Asia Investment Ltd. (Singapore) is engaged in-house financial services in the South EastAsian region.
Principal Markets
We are involved in the worldwide trading of various commodities. The following table provides abreakdown of our revenues by commodity type for the years ended March 31, 2006, 2005 and 2004.
In Billions of Yen
Years Ended March 31,
2006 2005 2004
Revenues(1),
Distribution by Commodity:Iron and Steel . . . . . . . . . . . . . . . . . . . . . . . . . . . . . . . . . . . . . . . . . . . . . . . . . . ¥ 523.7 ¥ 407.1 ¥ 312.9Non-Ferrous Metals . . . . . . . . . . . . . . . . . . . . . . . . . . . . . . . . . . . . . . . . . . . . . . 102.1 161.4 157.2Machinery . . . . . . . . . . . . . . . . . . . . . . . . . . . . . . . . . . . . . . . . . . . . . . . . . . . . . 368.0 264.9 301.3Electronics & Information . . . . . . . . . . . . . . . . . . . . . . . . . . . . . . . . . . . . . . . . . 164.9 144.7 119.8Chemicals . . . . . . . . . . . . . . . . . . . . . . . . . . . . . . . . . . . . . . . . . . . . . . . . . . . . . 886.7 729.1 520.1Energy . . . . . . . . . . . . . . . . . . . . . . . . . . . . . . . . . . . . . . . . . . . . . . . . . . . . . . . . 1,360.5 1,035.1 954.7Foods . . . . . . . . . . . . . . . . . . . . . . . . . . . . . . . . . . . . . . . . . . . . . . . . . . . . . . . . . 424.6 473.6 389.5Textiles . . . . . . . . . . . . . . . . . . . . . . . . . . . . . . . . . . . . . . . . . . . . . . . . . . . . . . . 42.4 43.0 32.8General Merchandise . . . . . . . . . . . . . . . . . . . . . . . . . . . . . . . . . . . . . . . . . . . . . 78.8 96.1 84.8Property and Service Business . . . . . . . . . . . . . . . . . . . . . . . . . . . . . . . . . . . . . 163.8 139.6 97.4
Consolidated Total . . . . . . . . . . . . . . . . . . . . . . . . . . . . . . . . . . . . . . . . . . . . . . . . ¥4,115.5 ¥3,494.6 ¥2,970.5
51
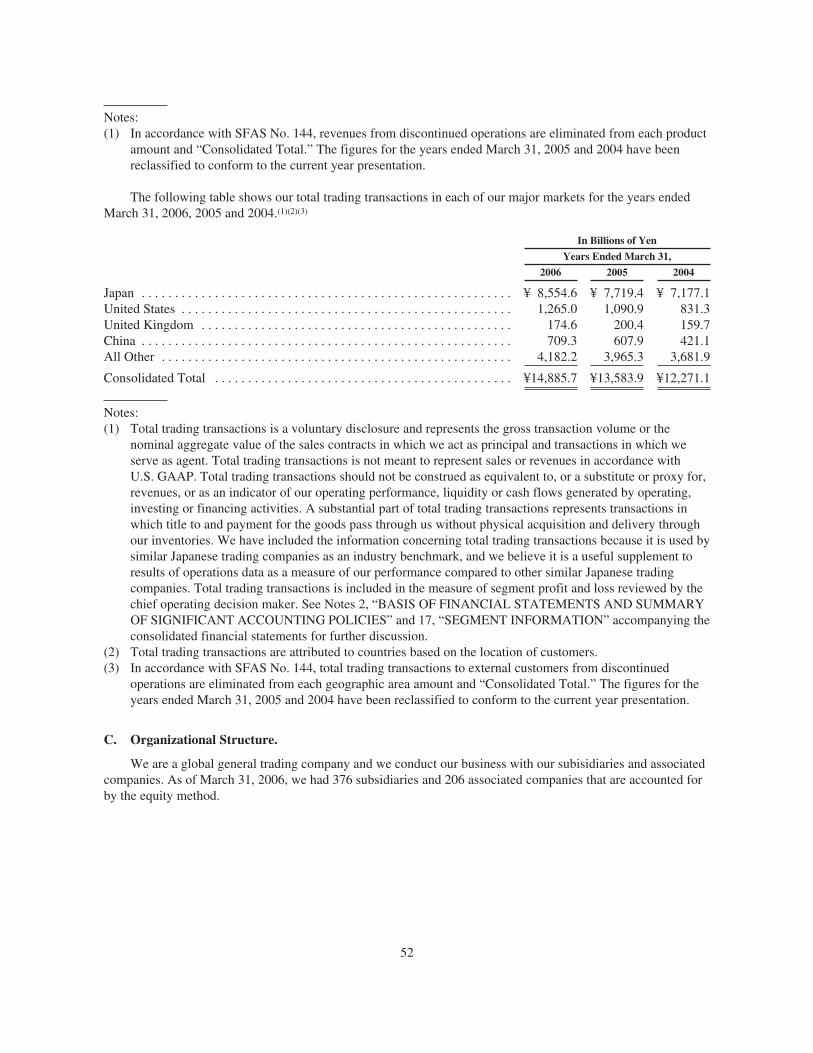
Notes:(1) In accordance with SFAS No. 144, revenues from discontinued operations are eliminated from each product
amount and “Consolidated Total.” The figures for the years ended March 31, 2005 and 2004 have beenreclassified to conform to the current year presentation.
The following table shows our total trading transactions in each of our major markets for the years endedMarch 31, 2006, 2005 and 2004.(1)(2)(3)
In Billions of Yen
Years Ended March 31,
2006 2005 2004
Japan . . . . . . . . . . . . . . . . . . . . . . . . . . . . . . . . . . . . . . . . . . . . . . . . . . . . . . . . ¥ 8,554.6 ¥ 7,719.4 ¥ 7,177.1United States . . . . . . . . . . . . . . . . . . . . . . . . . . . . . . . . . . . . . . . . . . . . . . . . . . 1,265.0 1,090.9 831.3United Kingdom . . . . . . . . . . . . . . . . . . . . . . . . . . . . . . . . . . . . . . . . . . . . . . . 174.6 200.4 159.7China . . . . . . . . . . . . . . . . . . . . . . . . . . . . . . . . . . . . . . . . . . . . . . . . . . . . . . . . 709.3 607.9 421.1All Other . . . . . . . . . . . . . . . . . . . . . . . . . . . . . . . . . . . . . . . . . . . . . . . . . . . . . 4,182.2 3,965.3 3,681.9
Consolidated Total . . . . . . . . . . . . . . . . . . . . . . . . . . . . . . . . . . . . . . . . . . . . . ¥14,885.7 ¥13,583.9 ¥12,271.1
Notes:(1) Total trading transactions is a voluntary disclosure and represents the gross transaction volume or the
nominal aggregate value of the sales contracts in which we act as principal and transactions in which weserve as agent. Total trading transactions is not meant to represent sales or revenues in accordance withU.S. GAAP. Total trading transactions should not be construed as equivalent to, or a substitute or proxy for,revenues, or as an indicator of our operating performance, liquidity or cash flows generated by operating,investing or financing activities. A substantial part of total trading transactions represents transactions inwhich title to and payment for the goods pass through us without physical acquisition and delivery throughour inventories. We have included the information concerning total trading transactions because it is used bysimilar Japanese trading companies as an industry benchmark, and we believe it is a useful supplement toresults of operations data as a measure of our performance compared to other similar Japanese tradingcompanies. Total trading transactions is included in the measure of segment profit and loss reviewed by thechief operating decision maker. See Notes 2, “BASIS OF FINANCIAL STATEMENTS AND SUMMARYOF SIGNIFICANT ACCOUNTING POLICIES” and 17, “SEGMENT INFORMATION” accompanying theconsolidated financial statements for further discussion.
(2) Total trading transactions are attributed to countries based on the location of customers.(3) In accordance with SFAS No. 144, total trading transactions to external customers from discontinued
operations are eliminated from each geographic area amount and “Consolidated Total.” The figures for theyears ended March 31, 2005 and 2004 have been reclassified to conform to the current year presentation.
C. Organizational Structure.
We are a global general trading company and we conduct our business with our subisidiaries and associatedcompanies. As of March 31, 2006, we had 376 subsidiaries and 206 associated companies that are accounted forby the equity method.
52
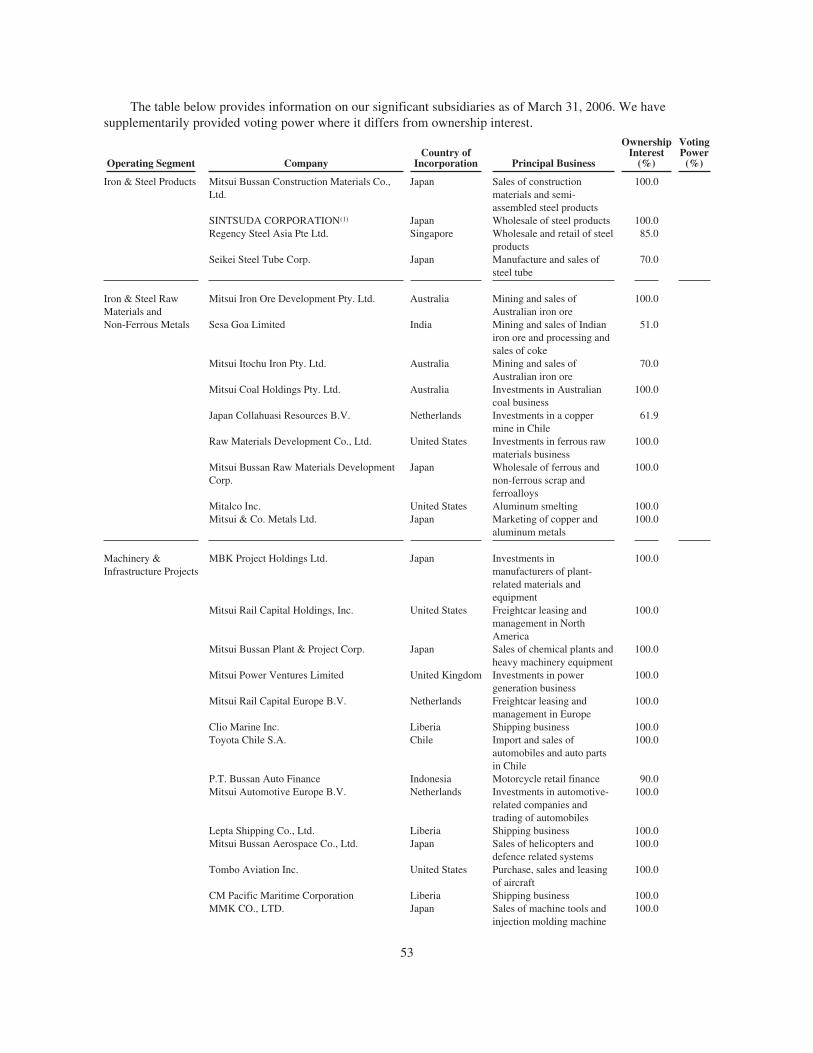
The table below provides information on our significant subsidiaries as of March 31, 2006. We havesupplementarily provided voting power where it differs from ownership interest.
Operating Segment CompanyCountry of
Incorporation Principal Business
OwnershipInterest
(%)
VotingPower
(%)
Iron & Steel Products Mitsui Bussan Construction Materials Co.,Ltd.
Japan Sales of constructionmaterials and semi-assembled steel products
100.0
SINTSUDA CORPORATION(1) Japan Wholesale of steel products 100.0Regency Steel Asia Pte Ltd. Singapore Wholesale and retail of steel
products85.0
Seikei Steel Tube Corp. Japan Manufacture and sales ofsteel tube
70.0
Iron & Steel RawMaterials andNon-Ferrous Metals
Mitsui Iron Ore Development Pty. Ltd. Australia Mining and sales ofAustralian iron ore
100.0
Sesa Goa Limited India Mining and sales of Indianiron ore and processing andsales of coke
51.0
Mitsui Itochu Iron Pty. Ltd. Australia Mining and sales ofAustralian iron ore
70.0
Mitsui Coal Holdings Pty. Ltd. Australia Investments in Australiancoal business
100.0
Japan Collahuasi Resources B.V. Netherlands Investments in a coppermine in Chile
61.9
Raw Materials Development Co., Ltd. United States Investments in ferrous rawmaterials business
100.0
Mitsui Bussan Raw Materials DevelopmentCorp.
Japan Wholesale of ferrous andnon-ferrous scrap andferroalloys
100.0
Mitalco Inc. United States Aluminum smelting 100.0Mitsui & Co. Metals Ltd. Japan Marketing of copper and
aluminum metals100.0
Machinery &Infrastructure Projects
MBK Project Holdings Ltd. Japan Investments inmanufacturers of plant-related materials andequipment
100.0
Mitsui Rail Capital Holdings, Inc. United States Freightcar leasing andmanagement in NorthAmerica
100.0
Mitsui Bussan Plant & Project Corp. Japan Sales of chemical plants andheavy machinery equipment
100.0
Mitsui Power Ventures Limited United Kingdom Investments in powergeneration business
100.0
Mitsui Rail Capital Europe B.V. Netherlands Freightcar leasing andmanagement in Europe
100.0
Clio Marine Inc. Liberia Shipping business 100.0Toyota Chile S.A. Chile Import and sales of
automobiles and auto partsin Chile
100.0
P.T. Bussan Auto Finance Indonesia Motorcycle retail finance 90.0Mitsui Automotive Europe B.V. Netherlands Investments in automotive-
related companies andtrading of automobiles
100.0
Lepta Shipping Co., Ltd. Liberia Shipping business 100.0Mitsui Bussan Aerospace Co., Ltd. Japan Sales of helicopters and
defence related systems100.0
Tombo Aviation Inc. United States Purchase, sales and leasingof aircraft
100.0
CM Pacific Maritime Corporation Liberia Shipping business 100.0MMK CO., LTD. Japan Sales of machine tools and
injection molding machine100.0
53

Operating Segment CompanyCountry of
Incorporation Principal Business
OwnershipInterest
(%)
VotingPower
(%)
Tombo Capital Corporation Japan Purchase, sales and leasingof aircraft
100.0
Chemical P.T. Kaltim Pasifik Amoniak Indonesia Production and sales ofanhydrous ammonia
55.0
Novus International, Inc. United States Manufacturing and sales offeed additives
65.0
Fertilizantes Mitsui S.A. Industria e Comercio Brazil Production and sales offertilizers
100.0
Nikken Fine Chemicals Co., Ltd. Japan Production and sales ofsorbitol and related organicchemical products
100.0
MITSUI BUSSAN SOLVENT & COATINGCO., LTD.
Japan Sales and trading of solventsand coating materials
100.0
Japan-Arabia Methanol Company Ltd. Japan Investments in methanolproducing business in SaudiArabia and sales of products
55.0
Mitsui Bussan Agro Business Co., Ltd. Japan Development and sales offertilizers and agriculturalproducts
100.0
Daito Chemical Co., Ltd. Japan Production and sales ofindustrial chemicals
70.0
Mitsui Bussan Plastics Co., Ltd. Japan Wholesale of plastic rawmaterials and products
100.0
Nippon Trading Co., Ltd. Japan Sales of plastics andchemicals
53.9 54.4
Mitsui Electronics Asia Pte. Ltd. Singapore Service in the process ofgrinding of liquid crystaldisplay parts
100.0
Bussan Nanotech Research Institute Inc. Japan Research and developmentof nano-products
100.0
Energy Mitsui E&P Australia Pty Limited Australia Exploration, developmentand production of oil andnatural gas
100.0
Mittwell Energy Resources Pty., Ltd. Australia Sales of crude oil andcondensate, development ofCasino gas field in Australia
100.0
Mitsui E&P Middle East B.V. Netherlands Exploration, developmentand production of oil andnatural gas in Oman
79.1 60.0
Wandoo Petroleum Pty Ltd Australia Exploration, developmentand production of oil andnatural gas
70.9 100.0
Mitsui Gas Development Qatar B.V. Netherlands Development andproduction of natural gasand condensate
100.0
Mitsui LNG Nederland B.V. Netherlands Investments in Qatar LNGproject
100.0
Mitsui & Co. (E&P) B.V. Netherlands Exploration, production andinvestments in oil andnatural gas
100.0
Endeavour Resources Limited United Kingdom Investments in JapanAustralia LNG (MIMI) Pty.Ltd.
100.0
Mitsui Sakhalin Holdings B.V. Netherlands Investments in SakhalinEnergy InvestmentCompany Ltd.
100.0
Mitsui E&P New Zealand Limited New Zealand Exploration, production andinvestments in oil andnatural gas
100.0
54

Operating Segment CompanyCountry of
Incorporation Principal Business
OwnershipInterest
(%)
VotingPower
(%)
Mitsui Oil (Asia) Pte. Ltd. Singapore Physical and future tradingof crude oil and petroleumproducts
100.0
Mitsui Oil Co., Ltd. Japan Sales of petroleum productsin Japan
89.9
Mitsui Liquefied Gas Co., Ltd. Japan Sales of liquefied petroleumgas in Japan
89.9
Kokusai Oil & Chemical Co., Ltd. Japan Sales of petroleum productsin Japan
100.0
Foods & Retail Mitsui Norin Co., Ltd. Japan Manufacture and sales offood products
51.9 87.6
MITSUI FOODS CO., LTD. Japan Wholesale of foods andbeverages
99.9
WILSEY FOODS, INC. United States Investments in processed oilfood company
90.0
DAI-ICHI BROILER CO., LTD. Japan Production, processing andsales of broilers
72.3
VENDOR SERVICE CO., LTD. Japan Procurement and demandchain planning andmanagement of foodmaterials
100.0
Hokushuren Company Limited Japan Wholesale of liquor andfoods
70.5 72.9
Retail System Service Co., Ltd. Japan Sales of sundries andfoodstuff to retailers
100.0
Lifestyle, ConsumerService andInformation,Electronics &Telecommunication
Mitsui Bussan Inter-Fashion Ltd. Japan Planning and managementof production anddistribution of apparel
100.0
Bussan Real Estate Development Co., Ltd. Japan Real estate sales, leasingand management
100.0
MBK Real Estate Ltd. United States Real estate-related business 100.0Mitsui Bussan House-Techno, Inc. Japan Housing business 100.0CABLENET SAITAMA CO., LTD. Japan Cable TV business in urban
area50.8
Kids Station Inc. Japan Broadcasting of TVprograms for children
67.0
Telepark Corp. Japan Sales of mobile phones andrelated telecommunicationservices
61.9
Nextcom K.K. Japan Network integration focusedon multi-vendor and in-house developed solutions
49.0
Mitsui Knowledge Industry Co., Ltd. Japan Planning, development,maintenance and operationof computer systems
67.4
TOYO Officemation, Inc. Japan Design, operation andmaintenance of informationsystems
100.0
Mitsui Electronics Inc.(2) Japan Investments insemiconductor device salescompanies
100.0
Logistics &Financial Markets
Mitsui & Co. Energy Risk Management Ltd. United Kingdom Trading of energyderivatives
100.0
Mitsui & Co. Precious Metals, Inc. United States Trading of precious metals 100.0Mitsui Bussan Futures Ltd. Japan Future commission
merchant100.0
Mitsui Bussan Precious Metals (Hong Kong)Limited
Hong Kong,China
Trading of precious metals 100.0
55
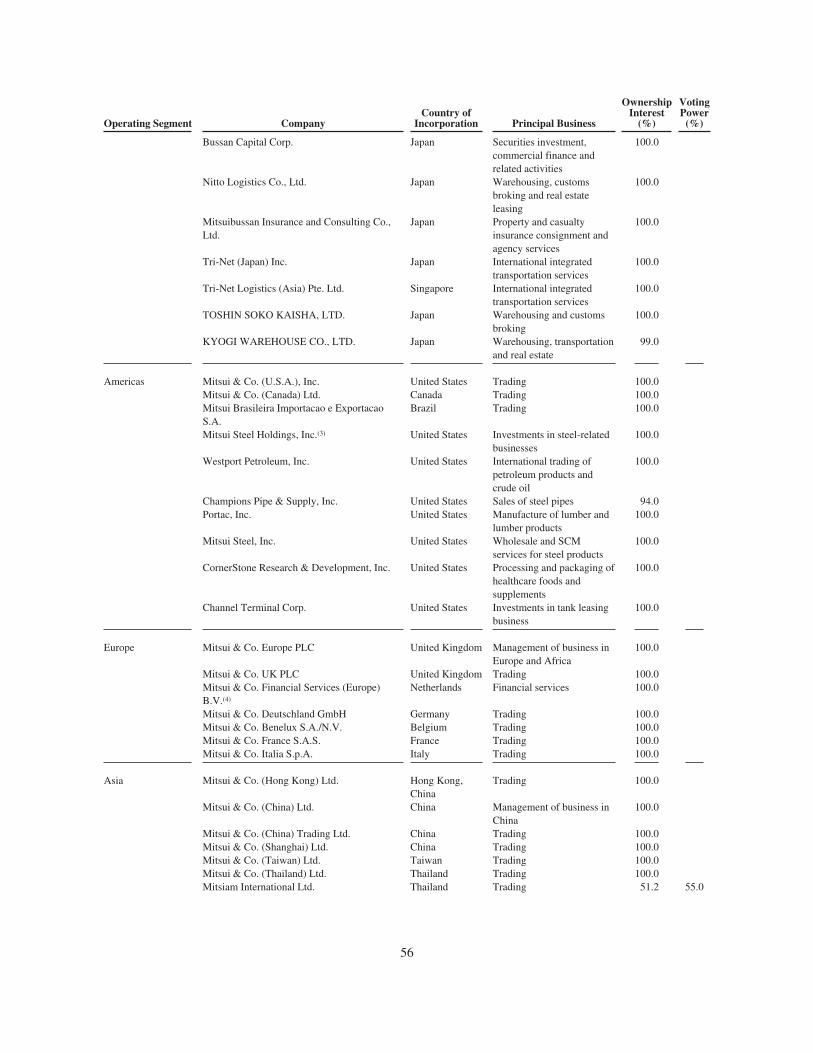
Operating Segment CompanyCountry of
Incorporation Principal Business
OwnershipInterest
(%)
VotingPower
(%)
Bussan Capital Corp. Japan Securities investment,commercial finance andrelated activities
100.0
Nitto Logistics Co., Ltd. Japan Warehousing, customsbroking and real estateleasing
100.0
Mitsuibussan Insurance and Consulting Co.,Ltd.
Japan Property and casualtyinsurance consignment andagency services
100.0
Tri-Net (Japan) Inc. Japan International integratedtransportation services
100.0
Tri-Net Logistics (Asia) Pte. Ltd. Singapore International integratedtransportation services
100.0
TOSHIN SOKO KAISHA, LTD. Japan Warehousing and customsbroking
100.0
KYOGI WAREHOUSE CO., LTD. Japan Warehousing, transportationand real estate
99.0
Americas Mitsui & Co. (U.S.A.), Inc. United States Trading 100.0Mitsui & Co. (Canada) Ltd. Canada Trading 100.0Mitsui Brasileira Importacao e ExportacaoS.A.
Brazil Trading 100.0
Mitsui Steel Holdings, Inc.(3) United States Investments in steel-relatedbusinesses
100.0
Westport Petroleum, Inc. United States International trading ofpetroleum products andcrude oil
100.0
Champions Pipe & Supply, Inc. United States Sales of steel pipes 94.0Portac, Inc. United States Manufacture of lumber and
lumber products100.0
Mitsui Steel, Inc. United States Wholesale and SCMservices for steel products
100.0
CornerStone Research & Development, Inc. United States Processing and packaging ofhealthcare foods andsupplements
100.0
Channel Terminal Corp. United States Investments in tank leasingbusiness
100.0
Europe Mitsui & Co. Europe PLC United Kingdom Management of business inEurope and Africa
100.0
Mitsui & Co. UK PLC United Kingdom Trading 100.0Mitsui & Co. Financial Services (Europe)B.V.(4)
Netherlands Financial services 100.0
Mitsui & Co. Deutschland GmbH Germany Trading 100.0Mitsui & Co. Benelux S.A./N.V. Belgium Trading 100.0Mitsui & Co. France S.A.S. France Trading 100.0Mitsui & Co. Italia S.p.A. Italy Trading 100.0
Asia Mitsui & Co. (Hong Kong) Ltd. Hong Kong,China
Trading 100.0
Mitsui & Co. (China) Ltd. China Management of business inChina
100.0
Mitsui & Co. (China) Trading Ltd. China Trading 100.0Mitsui & Co. (Shanghai) Ltd. China Trading 100.0Mitsui & Co. (Taiwan) Ltd. Taiwan Trading 100.0Mitsui & Co. (Thailand) Ltd. Thailand Trading 100.0Mitsiam International Ltd. Thailand Trading 51.2 55.0
56
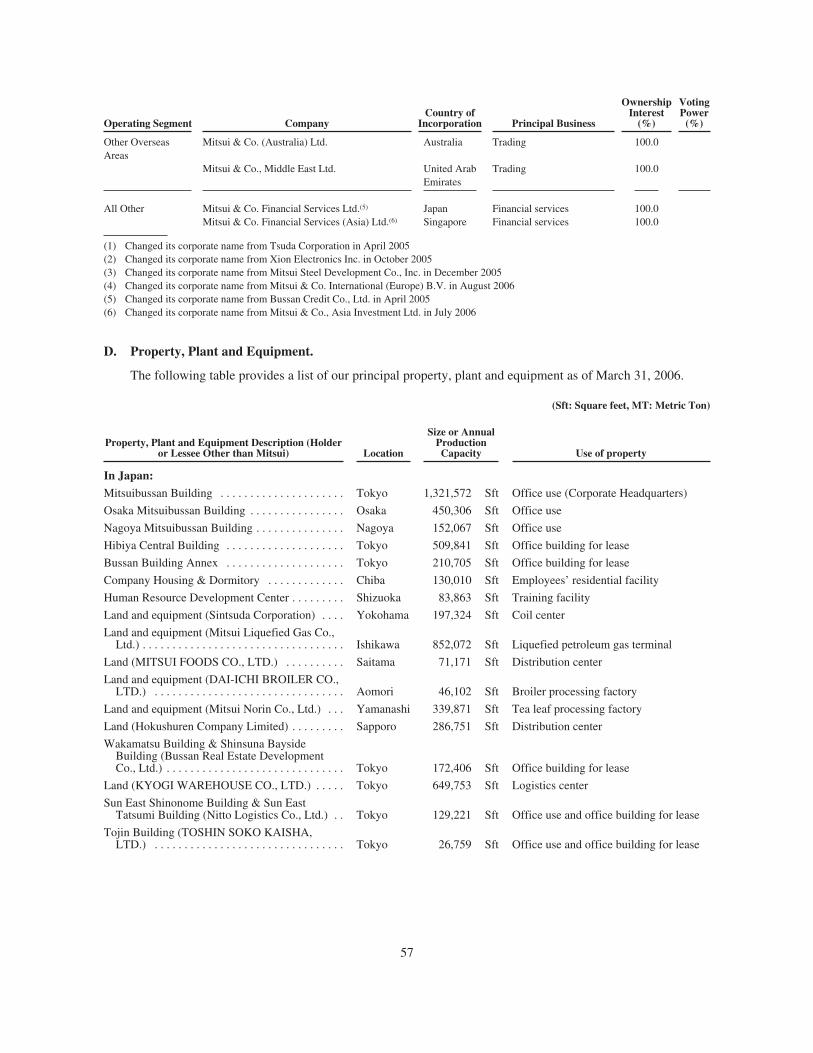
Operating Segment CompanyCountry of
Incorporation Principal Business
OwnershipInterest
(%)
VotingPower
(%)
Other OverseasAreas
Mitsui & Co. (Australia) Ltd. Australia Trading 100.0
Mitsui & Co., Middle East Ltd. United ArabEmirates
Trading 100.0
All Other Mitsui & Co. Financial Services Ltd.(5) Japan Financial services 100.0Mitsui & Co. Financial Services (Asia) Ltd.(6) Singapore Financial services 100.0
(1) Changed its corporate name from Tsuda Corporation in April 2005(2) Changed its corporate name from Xion Electronics Inc. in October 2005(3) Changed its corporate name from Mitsui Steel Development Co., Inc. in December 2005(4) Changed its corporate name from Mitsui & Co. International (Europe) B.V. in August 2006(5) Changed its corporate name from Bussan Credit Co., Ltd. in April 2005(6) Changed its corporate name from Mitsui & Co., Asia Investment Ltd. in July 2006
D. Property, Plant and Equipment.
The following table provides a list of our principal property, plant and equipment as of March 31, 2006.
(Sft: Square feet, MT: Metric Ton)
Property, Plant and Equipment Description (Holderor Lessee Other than Mitsui) Location
Size or AnnualProductionCapacity Use of property
In Japan:
Mitsuibussan Building . . . . . . . . . . . . . . . . . . . . . Tokyo 1,321,572 Sft Office use (Corporate Headquarters)
Osaka Mitsuibussan Building . . . . . . . . . . . . . . . . Osaka 450,306 Sft Office use
Nagoya Mitsuibussan Building . . . . . . . . . . . . . . . Nagoya 152,067 Sft Office use
Hibiya Central Building . . . . . . . . . . . . . . . . . . . . Tokyo 509,841 Sft Office building for lease
Bussan Building Annex . . . . . . . . . . . . . . . . . . . . Tokyo 210,705 Sft Office building for lease
Company Housing & Dormitory . . . . . . . . . . . . . Chiba 130,010 Sft Employees’ residential facility
Human Resource Development Center . . . . . . . . . Shizuoka 83,863 Sft Training facility
Land and equipment (Sintsuda Corporation) . . . . Yokohama 197,324 Sft Coil center
Land and equipment (Mitsui Liquefied Gas Co.,Ltd.) . . . . . . . . . . . . . . . . . . . . . . . . . . . . . . . . . . Ishikawa 852,072 Sft Liquefied petroleum gas terminal
Land (MITSUI FOODS CO., LTD.) . . . . . . . . . . Saitama 71,171 Sft Distribution center
Land and equipment (DAI-ICHI BROILER CO.,LTD.) . . . . . . . . . . . . . . . . . . . . . . . . . . . . . . . . Aomori 46,102 Sft Broiler processing factory
Land and equipment (Mitsui Norin Co., Ltd.) . . . Yamanashi 339,871 Sft Tea leaf processing factory
Land (Hokushuren Company Limited) . . . . . . . . . Sapporo 286,751 Sft Distribution center
Wakamatsu Building & Shinsuna BaysideBuilding (Bussan Real Estate DevelopmentCo., Ltd.) . . . . . . . . . . . . . . . . . . . . . . . . . . . . . . Tokyo 172,406 Sft Office building for lease
Land (KYOGI WAREHOUSE CO., LTD.) . . . . . Tokyo 649,753 Sft Logistics center
Sun East Shinonome Building & Sun EastTatsumi Building (Nitto Logistics Co., Ltd.) . . Tokyo 129,221 Sft Office use and office building for lease
Tojin Building (TOSHIN SOKO KAISHA,LTD.) . . . . . . . . . . . . . . . . . . . . . . . . . . . . . . . . Tokyo 26,759 Sft Office use and office building for lease
57
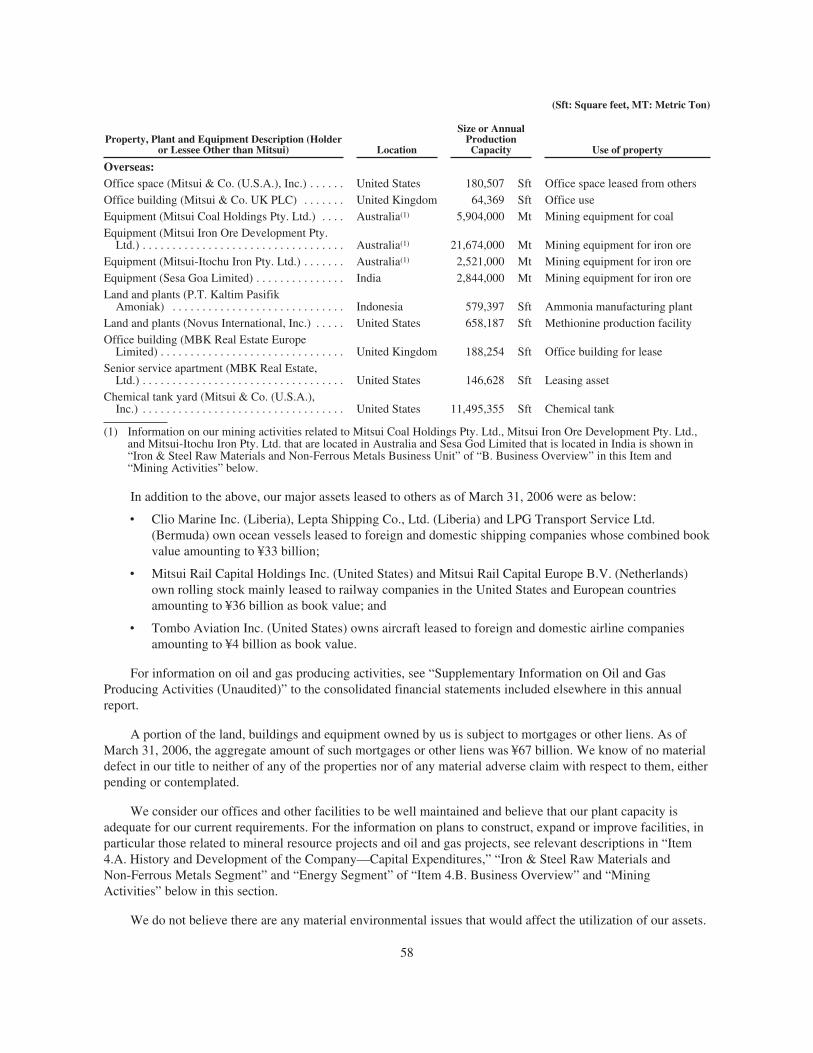
(Sft: Square feet, MT: Metric Ton)
Property, Plant and Equipment Description (Holderor Lessee Other than Mitsui) Location
Size or AnnualProductionCapacity Use of property
Overseas:Office space (Mitsui & Co. (U.S.A.), Inc.) . . . . . . United States 180,507 Sft Office space leased from othersOffice building (Mitsui & Co. UK PLC) . . . . . . . United Kingdom 64,369 Sft Office useEquipment (Mitsui Coal Holdings Pty. Ltd.) . . . . Australia(1) 5,904,000 Mt Mining equipment for coalEquipment (Mitsui Iron Ore Development Pty.
Ltd.) . . . . . . . . . . . . . . . . . . . . . . . . . . . . . . . . . . Australia(1) 21,674,000 Mt Mining equipment for iron oreEquipment (Mitsui-Itochu Iron Pty. Ltd.) . . . . . . . Australia(1) 2,521,000 Mt Mining equipment for iron oreEquipment (Sesa Goa Limited) . . . . . . . . . . . . . . . India 2,844,000 Mt Mining equipment for iron oreLand and plants (P.T. Kaltim Pasifik
Amoniak) . . . . . . . . . . . . . . . . . . . . . . . . . . . . . Indonesia 579,397 Sft Ammonia manufacturing plantLand and plants (Novus International, Inc.) . . . . . United States 658,187 Sft Methionine production facilityOffice building (MBK Real Estate Europe
Limited) . . . . . . . . . . . . . . . . . . . . . . . . . . . . . . . United Kingdom 188,254 Sft Office building for leaseSenior service apartment (MBK Real Estate,
Ltd.) . . . . . . . . . . . . . . . . . . . . . . . . . . . . . . . . . . United States 146,628 Sft Leasing assetChemical tank yard (Mitsui & Co. (U.S.A.),
Inc.) . . . . . . . . . . . . . . . . . . . . . . . . . . . . . . . . . . United States 11,495,355 Sft Chemical tank
(1) Information on our mining activities related to Mitsui Coal Holdings Pty. Ltd., Mitsui Iron Ore Development Pty. Ltd.,and Mitsui-Itochu Iron Pty. Ltd. that are located in Australia and Sesa God Limited that is located in India is shown in“Iron & Steel Raw Materials and Non-Ferrous Metals Business Unit” of “B. Business Overview” in this Item and“Mining Activities” below.
In addition to the above, our major assets leased to others as of March 31, 2006 were as below:
‰ Clio Marine Inc. (Liberia), Lepta Shipping Co., Ltd. (Liberia) and LPG Transport Service Ltd.(Bermuda) own ocean vessels leased to foreign and domestic shipping companies whose combined bookvalue amounting to ¥33 billion;
‰ Mitsui Rail Capital Holdings Inc. (United States) and Mitsui Rail Capital Europe B.V. (Netherlands)own rolling stock mainly leased to railway companies in the United States and European countriesamounting to ¥36 billion as book value; and
‰ Tombo Aviation Inc. (United States) owns aircraft leased to foreign and domestic airline companiesamounting to ¥4 billion as book value.
For information on oil and gas producing activities, see “Supplementary Information on Oil and GasProducing Activities (Unaudited)” to the consolidated financial statements included elsewhere in this annualreport.
A portion of the land, buildings and equipment owned by us is subject to mortgages or other liens. As ofMarch 31, 2006, the aggregate amount of such mortgages or other liens was ¥67 billion. We know of no materialdefect in our title to neither of any of the properties nor of any material adverse claim with respect to them, eitherpending or contemplated.
We consider our offices and other facilities to be well maintained and believe that our plant capacity isadequate for our current requirements. For the information on plans to construct, expand or improve facilities, inparticular those related to mineral resource projects and oil and gas projects, see relevant descriptions in “Item4.A. History and Development of the Company—Capital Expenditures,” “Iron & Steel Raw Materials andNon-Ferrous Metals Segment” and “Energy Segment” of “Item 4.B. Business Overview” and “MiningActivities” below in this section.
We do not believe there are any material environmental issues that would affect the utilization of our assets.
58
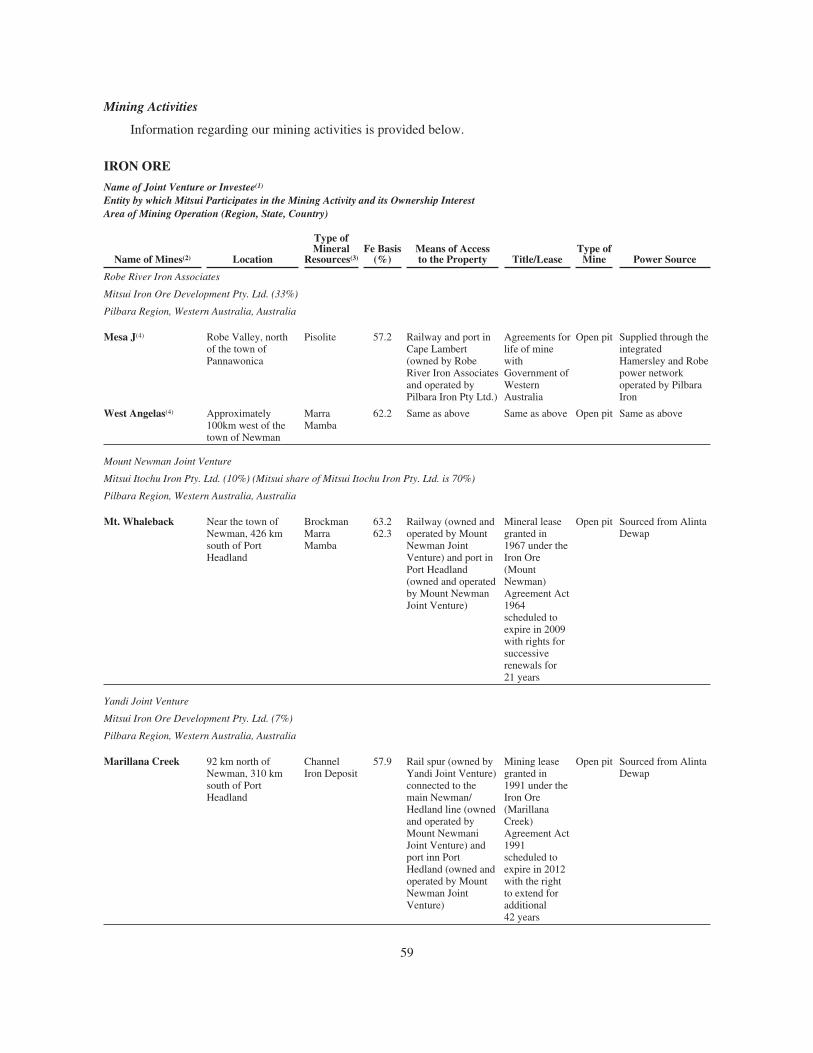
Mining Activities
Information regarding our mining activities is provided below.
IRON ORE
Name of Joint Venture or Investee(1)
Entity by which Mitsui Participates in the Mining Activity and its Ownership InterestArea of Mining Operation (Region, State, Country)
Name of Mines(2) Location
Type ofMineral
Resources(3)Fe Basis
(%)Means of Accessto the Property Title/Lease
Type ofMine Power Source
Robe River Iron Associates
Mitsui Iron Ore Development Pty. Ltd. (33%)
Pilbara Region, Western Australia, Australia
Mesa J(4) Robe Valley, northof the town ofPannawonica
Pisolite 57.2 Railway and port inCape Lambert(owned by RobeRiver Iron Associatesand operated byPilbara Iron Pty Ltd.)
Agreements forlife of minewithGovernment ofWesternAustralia
Open pit Supplied through theintegratedHamersley and Robepower networkoperated by PilbaraIron
West Angelas(4) Approximately100km west of thetown of Newman
MarraMamba
62.2 Same as above Same as above Open pit Same as above
Mount Newman Joint Venture
Mitsui Itochu Iron Pty. Ltd. (10%) (Mitsui share of Mitsui Itochu Iron Pty. Ltd. is 70%)
Pilbara Region, Western Australia, Australia
Mt. Whaleback Near the town ofNewman, 426 kmsouth of PortHeadland
BrockmanMarraMamba
63.262.3
Railway (owned andoperated by MountNewman JointVenture) and port inPort Headland(owned and operatedby Mount NewmanJoint Venture)
Mineral leasegranted in1967 under theIron Ore(MountNewman)Agreement Act1964scheduled toexpire in 2009with rights forsuccessiverenewals for21 years
Open pit Sourced from AlintaDewap
Yandi Joint Venture
Mitsui Iron Ore Development Pty. Ltd. (7%)
Pilbara Region, Western Australia, Australia
Marillana Creek 92 km north ofNewman, 310 kmsouth of PortHeadland
ChannelIron Deposit
57.9 Rail spur (owned byYandi Joint Venture)connected to themain Newman/Hedland line (ownedand operated byMount NewmaniJoint Venture) andport inn PortHedland (owned andoperated by MountNewman JointVenture)
Mining leasegranted in1991 under theIron Ore(MarillanaCreek)Agreement Act1991scheduled toexpire in 2012with the rightto extend foradditional42 years
Open pit Sourced from AlintaDewap
59

Name of Mines(2) Location
Type ofMineral
Resources(3)Fe Basis
(%)Means of Accessto the Property Title/Lease
Type ofMine Power Source
Mount Goldsworthy Joint Venture
Mitsui Iron Ore Development Pty. Ltd. (7%)
Pilbara Region, Western Australia, Australia
North Area(Yarrie)(Nimingarra)
210 km east of PortHeadland
Nimingarra 60.3 Railway (owned andoperated by MountGoldsworthy JointVenture) and port inPort Headland(owned and operatedby MountGoldsworthy JointVenture)
Multiple mineralleases under the IronOre (MountGoldsworthy)Agreement Act 1964and the Iron Ore(Goldsworthy—Nimingarra)Agreement Act1972. The last oneexpires in 2014, withrights of renewalover these leases forsuccessive 21-yearperiods.
Open pit Sourced fromAlinta Dewap
Area C 120 km northwest ofNewman, 37 kmsouthwest of Yandi
MarraMamba
62.0 Rail spur (owned byGoldsworthy JointVenture) connectingto the Yandi spurline (owned byYandi Joint Venture)and then onto themain Newman/Hedland line (ownedand operated byMount NewmanJoint Venture) andport in Port Hedland(owned and operatedby GoldsworthyJoint Venture)
Same as above(The mining leaseexpires in 2007 andhas a right ofrenewal for furtherperiod of 21 years.)
Open pit Sourced fromAlinta Dewap
Sesa Goa Limited
Sesa Goa Limited (51%)
Goa and Karnataka, India
Codli Goa, India Fines/Lumps 58.0to
62.0
Barge and port inMormugao
Combination of ownlease and sub lease
Open pit Supplied by state
Sonshi Goa, India Fines/Lumps 58.0to
62.0
Barge and port inMormugao
Combination of ownlease and sub lease
Open pit Supplied by state
Chitradurga Karnataka, India Fines/Lumps 63.5to
64.0
Railway, truck andshipping facility atMormugao andChennai
Combination of ownlease and sub lease
Open pit Supplied by state
Hospet Karnataka, India Fines/Lumps 63.5to
64.0
Railway, truck andshipping facility atMormugao andChennai
Combination of ownlease and sub lease
Open pit Supplied by state
(1) The term “Investee” refers only to Sesa Goa Limited.(2) “Name of Mines” indicates the names of principal producing mines.(3) “Pisolite”, “Marra Mamba”, “Brockman”, “Channel Iron Deposit” and “Nimingarra” refer to the types of iron ore that are found in the
Pilbara region of Western Australia.(4) The percentage figures of “Fe Basis” of Mesa J and West Angelas represent the figures corresponding to mines, excluding the figures
corresponding to stockpile components.
60
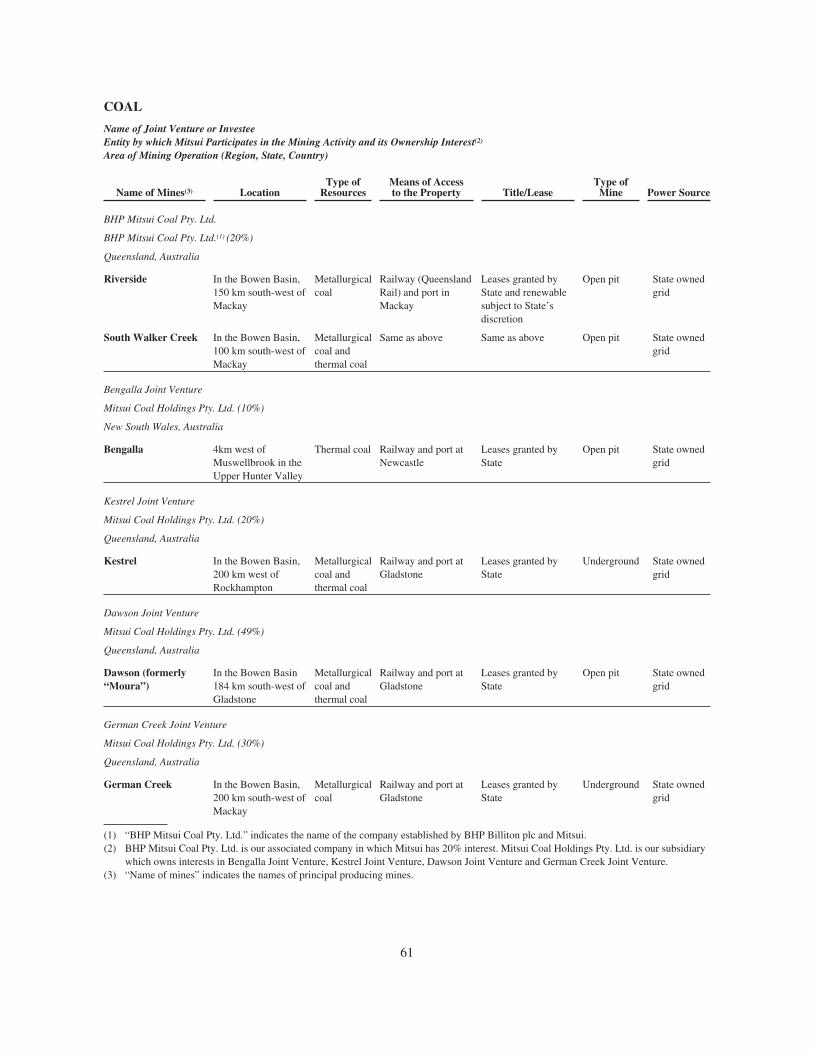
COAL
Name of Joint Venture or InvesteeEntity by which Mitsui Participates in the Mining Activity and its Ownership Interest(2)
Area of Mining Operation (Region, State, Country)
Name of Mines(3) LocationType of
ResourcesMeans of Accessto the Property Title/Lease
Type ofMine Power Source
BHP Mitsui Coal Pty. Ltd.
BHP Mitsui Coal Pty. Ltd.(1) (20%)
Queensland, Australia
Riverside In the Bowen Basin,150 km south-west ofMackay
Metallurgicalcoal
Railway (QueenslandRail) and port inMackay
Leases granted byState and renewablesubject to State’sdiscretion
Open pit State ownedgrid
South Walker Creek In the Bowen Basin,100 km south-west ofMackay
Metallurgicalcoal andthermal coal
Same as above Same as above Open pit State ownedgrid
Bengalla Joint Venture
Mitsui Coal Holdings Pty. Ltd. (10%)
New South Wales, Australia
Bengalla 4km west ofMuswellbrook in theUpper Hunter Valley
Thermal coal Railway and port atNewcastle
Leases granted byState
Open pit State ownedgrid
Kestrel Joint Venture
Mitsui Coal Holdings Pty. Ltd. (20%)
Queensland, Australia
Kestrel In the Bowen Basin,200 km west ofRockhampton
Metallurgicalcoal andthermal coal
Railway and port atGladstone
Leases granted byState
Underground State ownedgrid
Dawson Joint Venture
Mitsui Coal Holdings Pty. Ltd. (49%)
Queensland, Australia
Dawson (formerly“Moura”)
In the Bowen Basin184 km south-west ofGladstone
Metallurgicalcoal andthermal coal
Railway and port atGladstone
Leases granted byState
Open pit State ownedgrid
German Creek Joint Venture
Mitsui Coal Holdings Pty. Ltd. (30%)
Queensland, Australia
German Creek In the Bowen Basin,200 km south-west ofMackay
Metallurgicalcoal
Railway and port atGladstone
Leases granted byState
Underground State ownedgrid
(1) “BHP Mitsui Coal Pty. Ltd.” indicates the name of the company established by BHP Billiton plc and Mitsui.(2) BHP Mitsui Coal Pty. Ltd. is our associated company in which Mitsui has 20% interest. Mitsui Coal Holdings Pty. Ltd. is our subsidiary
which owns interests in Bengalla Joint Venture, Kestrel Joint Venture, Dawson Joint Venture and German Creek Joint Venture.(3) “Name of mines” indicates the names of principal producing mines.
61
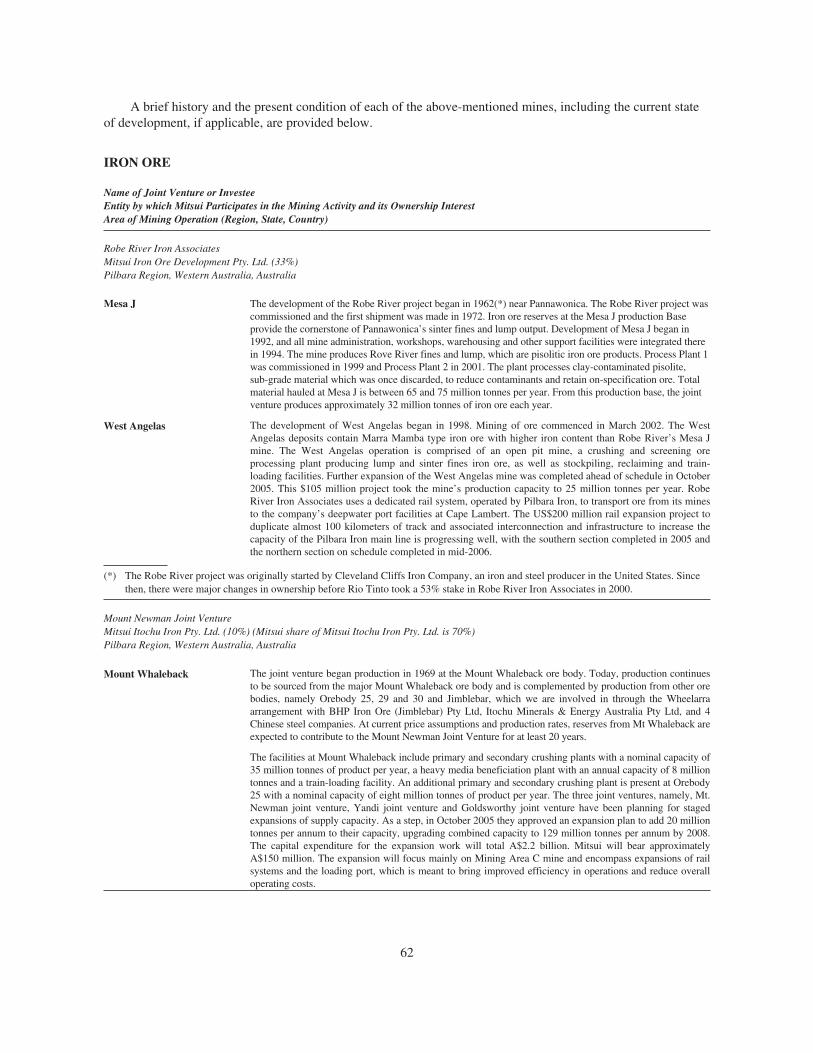
A brief history and the present condition of each of the above-mentioned mines, including the current stateof development, if applicable, are provided below.
IRON ORE
Name of Joint Venture or InvesteeEntity by which Mitsui Participates in the Mining Activity and its Ownership InterestArea of Mining Operation (Region, State, Country)
Robe River Iron AssociatesMitsui Iron Ore Development Pty. Ltd. (33%)Pilbara Region, Western Australia, Australia
Mesa J The development of the Robe River project began in 1962(*) near Pannawonica. The Robe River project wascommissioned and the first shipment was made in 1972. Iron ore reserves at the Mesa J production Baseprovide the cornerstone of Pannawonica’s sinter fines and lump output. Development of Mesa J began in1992, and all mine administration, workshops, warehousing and other support facilities were integrated therein 1994. The mine produces Rove River fines and lump, which are pisolitic iron ore products. Process Plant 1was commissioned in 1999 and Process Plant 2 in 2001. The plant processes clay-contaminated pisolite,sub-grade material which was once discarded, to reduce contaminants and retain on-specification ore. Totalmaterial hauled at Mesa J is between 65 and 75 million tonnes per year. From this production base, the jointventure produces approximately 32 million tonnes of iron ore each year.
West Angelas The development of West Angelas began in 1998. Mining of ore commenced in March 2002. The WestAngelas deposits contain Marra Mamba type iron ore with higher iron content than Robe River’s Mesa Jmine. The West Angelas operation is comprised of an open pit mine, a crushing and screening oreprocessing plant producing lump and sinter fines iron ore, as well as stockpiling, reclaiming and train-loading facilities. Further expansion of the West Angelas mine was completed ahead of schedule in October2005. This $105 million project took the mine’s production capacity to 25 million tonnes per year. RobeRiver Iron Associates uses a dedicated rail system, operated by Pilbara Iron, to transport ore from its minesto the company’s deepwater port facilities at Cape Lambert. The US$200 million rail expansion project toduplicate almost 100 kilometers of track and associated interconnection and infrastructure to increase thecapacity of the Pilbara Iron main line is progressing well, with the southern section completed in 2005 andthe northern section on schedule completed in mid-2006.
(*) The Robe River project was originally started by Cleveland Cliffs Iron Company, an iron and steel producer in the United States. Sincethen, there were major changes in ownership before Rio Tinto took a 53% stake in Robe River Iron Associates in 2000.
Mount Newman Joint VentureMitsui Itochu Iron Pty. Ltd. (10%) (Mitsui share of Mitsui Itochu Iron Pty. Ltd. is 70%)Pilbara Region, Western Australia, Australia
Mount Whaleback The joint venture began production in 1969 at the Mount Whaleback ore body. Today, production continuesto be sourced from the major Mount Whaleback ore body and is complemented by production from other orebodies, namely Orebody 25, 29 and 30 and Jimblebar, which we are involved in through the Wheelarraarrangement with BHP Iron Ore (Jimblebar) Pty Ltd, Itochu Minerals & Energy Australia Pty Ltd, and 4Chinese steel companies. At current price assumptions and production rates, reserves from Mt Whaleback areexpected to contribute to the Mount Newman Joint Venture for at least 20 years.
The facilities at Mount Whaleback include primary and secondary crushing plants with a nominal capacity of35 million tonnes of product per year, a heavy media beneficiation plant with an annual capacity of 8 milliontonnes and a train-loading facility. An additional primary and secondary crushing plant is present at Orebody25 with a nominal capacity of eight million tonnes of product per year. The three joint ventures, namely, Mt.Newman joint venture, Yandi joint venture and Goldsworthy joint venture have been planning for stagedexpansions of supply capacity. As a step, in October 2005 they approved an expansion plan to add 20 milliontonnes per annum to their capacity, upgrading combined capacity to 129 million tonnes per annum by 2008.The capital expenditure for the expansion work will total A$2.2 billion. Mitsui will bear approximatelyA$150 million. The expansion will focus mainly on Mining Area C mine and encompass expansions of railsystems and the loading port, which is meant to bring improved efficiency in operations and reduce overalloperating costs.
62

Yandi Joint VentureMitsui Iron Ore Development Pty. Ltd. (7%)Pilbara Region, Western Australia, Australia
Marillana Creek Development of the ore body began in 1991 with a capacity of 10 million tonnes per annum and theproject’s first shipment of iron ore was in March 1992. Capacity was progressively expanded between 1994and 2003 and the current capacity is 42 million tonnes per annum. Two processing plants (OHP1 andOHP2) and a primary crusher and overland conveyor (Iowa) are used to crush and screen the Yandi ore anddeliver it to one of two train loading facilities. At the current production rate, it is expected that the reserveswill be sufficient for at least 20 years.
Mount Goldsworthy Joint VentureMitsui Iron Ore Development Pty. Ltd. (7%)Pilbara Region, Western Australia, Australia
North Area(Yarrie)(Nimingarra)
Mount Goldsworthy was commissioned in 1966 in the North Area. The original Goldsworthy mine wasclosed in 1982 and mining operations ceased at Shay Bay in 1993. Since then, mining has continued fromthe adjacent Nimingarra mine and Yarrie mine, 30 kilometers to the south-east. Two primary crushers exist,one at Yarrie and the other at Nimingarra. The ore is crushed and then railed to Finucane Island.
Area C In October 2003, the joint venture opened the new Area C mine located 120 kilometers north-west ofNewman, which produces a Marra Mamba ore deposit, which is sold under the trademark MAC.
Initial mining has commenced at the C Deposit under the POSMAC arrangement, to which BHP BillitonMinerals Pty Ltd, POS-Ore Pty Ltd, Itochu Minerals & Energy Australia Pty Ltd and we are parties. Underthis arrangement, POSCO has committed to purchase 3 million tonnes per annum.
All production from the Mount Goldsworthy North (Yarrie and Nimingarra deposits) is transported on aseparate railway to Port Hedland. Ore from Area C is transported via a 39 kilometer new section of railwayto the Yandi mine which then connects to the main Newman to Port Hedland railway. From there, theventure ships the ore through the Nelson Point and Finucane Island facilities. Ore is produced fromGoldsworthy North area at a nominal capacity of 8 million tonnes of product per year as of the end ofMarch 2006.
The ore currently being produced at Area C is from C Deposit, which is an open-pit mine. The oreprocessing plant at Area C has a nominal capacity of 23 million tonnes of product per year. E Deposit willalso contribute to Area C products commencing in 2005-2006 and other Area C deposits (F, A and DDeposits) commencing in 2008-2009. At current price assumptions and production rates, reserves fromArea C will continue to support Area C products for at least 20 years.
Sesa Goa LimitedSesa Goa Limited (51%)Goa and Karnataka, India
Codli Sonshi Sesa Goa Limited commenced operations in 1954 in North Goa, India. Sesa Goa’s main mining operationsare at the Codli and Sonshi mines. Goan ore tends to be relatively high in alumina content, and most Goanore is beneficiated to raise the iron content. We acquired a 51% interest in Sesa Goa in 1996.
Chitradurga Hospet The main operation in Karnataka is at Chitradurga mine. A second mine is located at Hospet. These minesare equidistant from the part of Mormugao and Chennai and ore can be shipped from either port.
COALName of Joint Venture or InvesteeEntity by which Mitsui Participates in the Mining Activity and its Ownership InterestArea of Mining Operation (Region, State, Country)
BHP Mitsui Coal Pty. Ltd.BHP Mitsui Coal Pty. Ltd. (20%)Queensland, Australia
Riverside Reserves from Riverside were depleted in March 2005.
South Walker Creek South Walker Creek became operational in 1998. It produces pulverized coal injection fuel and minorquantities of by- product energy coal. South Walker Creek has a production capacity of four million tonnes peryear. Exploration has increased the reserve base in the past year. BHP Mitsui Coal holds undeveloped leases inthe Bowen Basin (specifically, the areas of Wards Well, Lancewood, Kemmis-Walker, Bee Creek and NeboWest) and is developing Poitrel.
63
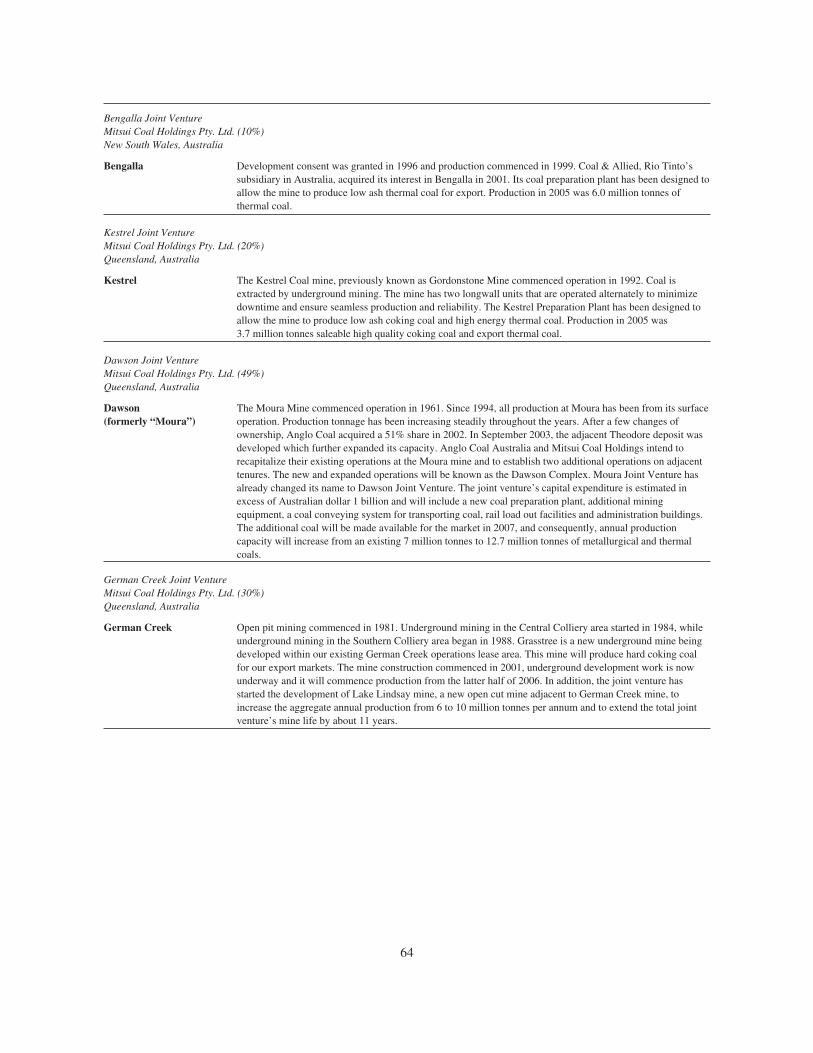
Bengalla Joint VentureMitsui Coal Holdings Pty. Ltd. (10%)New South Wales, Australia
Bengalla Development consent was granted in 1996 and production commenced in 1999. Coal & Allied, Rio Tinto’ssubsidiary in Australia, acquired its interest in Bengalla in 2001. Its coal preparation plant has been designed toallow the mine to produce low ash thermal coal for export. Production in 2005 was 6.0 million tonnes ofthermal coal.
Kestrel Joint VentureMitsui Coal Holdings Pty. Ltd. (20%)Queensland, Australia
Kestrel The Kestrel Coal mine, previously known as Gordonstone Mine commenced operation in 1992. Coal isextracted by underground mining. The mine has two longwall units that are operated alternately to minimizedowntime and ensure seamless production and reliability. The Kestrel Preparation Plant has been designed toallow the mine to produce low ash coking coal and high energy thermal coal. Production in 2005 was3.7 million tonnes saleable high quality coking coal and export thermal coal.
Dawson Joint VentureMitsui Coal Holdings Pty. Ltd. (49%)Queensland, Australia
Dawson(formerly “Moura”)
The Moura Mine commenced operation in 1961. Since 1994, all production at Moura has been from its surfaceoperation. Production tonnage has been increasing steadily throughout the years. After a few changes ofownership, Anglo Coal acquired a 51% share in 2002. In September 2003, the adjacent Theodore deposit wasdeveloped which further expanded its capacity. Anglo Coal Australia and Mitsui Coal Holdings intend torecapitalize their existing operations at the Moura mine and to establish two additional operations on adjacenttenures. The new and expanded operations will be known as the Dawson Complex. Moura Joint Venture hasalready changed its name to Dawson Joint Venture. The joint venture’s capital expenditure is estimated inexcess of Australian dollar 1 billion and will include a new coal preparation plant, additional miningequipment, a coal conveying system for transporting coal, rail load out facilities and administration buildings.The additional coal will be made available for the market in 2007, and consequently, annual productioncapacity will increase from an existing 7 million tonnes to 12.7 million tonnes of metallurgical and thermalcoals.
German Creek Joint VentureMitsui Coal Holdings Pty. Ltd. (30%)Queensland, Australia
German Creek Open pit mining commenced in 1981. Underground mining in the Central Colliery area started in 1984, whileunderground mining in the Southern Colliery area began in 1988. Grasstree is a new underground mine beingdeveloped within our existing German Creek operations lease area. This mine will produce hard coking coalfor our export markets. The mine construction commenced in 2001, underground development work is nowunderway and it will commence production from the latter half of 2006. In addition, the joint venture hasstarted the development of Lake Lindsay mine, a new open cut mine adjacent to German Creek mine, toincrease the aggregate annual production from 6 to 10 million tonnes per annum and to extend the total jointventure’s mine life by about 11 years.
64
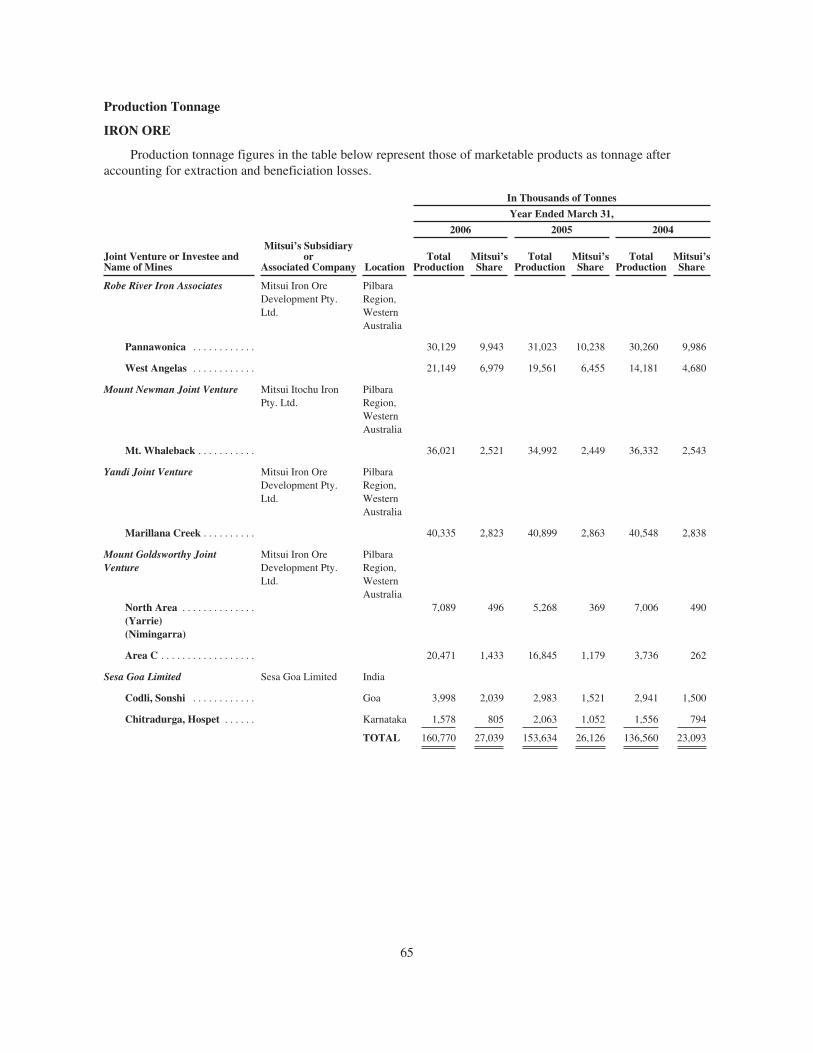
Production Tonnage
IRON ORE
Production tonnage figures in the table below represent those of marketable products as tonnage afteraccounting for extraction and beneficiation losses.
In Thousands of Tonnes
Year Ended March 31,
2006 2005 2004
Joint Venture or Investee andName of Mines
Mitsui’s Subsidiaryor
Associated Company LocationTotal
ProductionMitsui’sShare
TotalProduction
Mitsui’sShare
TotalProduction
Mitsui’sShare
Robe River Iron Associates Mitsui Iron OreDevelopment Pty.Ltd.
PilbaraRegion,WesternAustralia
Pannawonica . . . . . . . . . . . . 30,129 9,943 31,023 10,238 30,260 9,986
West Angelas . . . . . . . . . . . . 21,149 6,979 19,561 6,455 14,181 4,680
Mount Newman Joint Venture Mitsui Itochu IronPty. Ltd.
PilbaraRegion,WesternAustralia
Mt. Whaleback . . . . . . . . . . . 36,021 2,521 34,992 2,449 36,332 2,543
Yandi Joint Venture Mitsui Iron OreDevelopment Pty.Ltd.
PilbaraRegion,WesternAustralia
Marillana Creek . . . . . . . . . . 40,335 2,823 40,899 2,863 40,548 2,838
Mount Goldsworthy JointVenture
Mitsui Iron OreDevelopment Pty.Ltd.
PilbaraRegion,WesternAustralia
North Area . . . . . . . . . . . . . .(Yarrie)(Nimingarra)
7,089 496 5,268 369 7,006 490
Area C . . . . . . . . . . . . . . . . . . 20,471 1,433 16,845 1,179 3,736 262
Sesa Goa Limited Sesa Goa Limited India
Codli, Sonshi . . . . . . . . . . . . Goa 3,998 2,039 2,983 1,521 2,941 1,500
Chitradurga, Hospet . . . . . . Karnataka 1,578 805 2,063 1,052 1,556 794
TOTAL 160,770 27,039 153,634 26,126 136,560 23,093
65

COAL
Production tonnage figures in the table below represent those of marketable products as tonnage afteraccounting for extraction and beneficiation losses.
In Thousands of Tonnes
Year Ended March 31,
2006 2005 2004
Joint Venture or Investee andName of Mines
Mitsui’s Subsidiaryor
Associated Company LocationTotal
ProductionMitsui’sShare
TotalProduction
Mitsui’sShare
TotalProduction
Mitsui’sShare
BHP Mitsui Coal Pty. Ltd. BHP Mitsui Coal Pty.Ltd.
Queensland,Australia
Riverside . . . . . . . . . . . . . . . . . . 2,384 477 3,323 665 2,641 528
South Walker Creek . . . . . . . . 3,273 655 3,658 732 3,927 785
Bengalla Joint Venture . . . . . . . . . . . Mitsui Coal HoldingsPty. Ltd.
New SouthWales,Australia
5965 596 5,312 531 6,203 620
Kestrel Joint Venture . . . . . . . . . . . . Mitsui Coal HoldingsPty. Ltd.
Queensland,Australia
3,720 744 3,282 656 3,322 664
Dawson Joint Venture . . . . . . . . . . . .(formerly “Moura Joint Venture”)
Mitsui Coal HoldingsPty. Ltd.
Queensland,Australia
6,200 3,038 7,023 3,441 5,964 2,922
German Creek Joint Venture . . . . . . Mitsui Coal HoldingsPty. Ltd.
Queensland,Australia
5,086 1,526 5,782 1,735 5,422 1,627
TOTAL 26,628 7,036 28,380 7,760 27,479 7,146
Reserve Tonnage
IRON ORE
Reserves of iron ore classified according to operator are presented in the tables below. As used below,“marketable reserve” refers to tonnage after accounting for extraction and beneficiation losses, and “recoverablereserve” refers to tonnage after accounting for extraction losses.
Operator: Rio Tinto Ltd.(1)(2)
Reserves as disclosed by Rio Tinto Ltd. consist of proved and probable marketable reserves.
In Millions of Tonnes
Year Ended December 31,
2005 2004 2003
Joint Venture or Investee andName of Mines
Mitsui’s Subsidiaryor
Associated Company Location
TotalMarketable
ReserveMitsui’sShare
TotalMarketable
ReserveMitsui’sShare
TotalMarketable
ReserveMitsui’sShare
Robe River Iron Associates Mitsui Iron OreDevelopmentPty. Ltd.
PilbaraRegion,WesternAustralia
Pannawonica(3)(4) . . . . . . . . . 303 100 172 57 200 66West Angelas(3) . . . . . . . . . . 394 130 418 138 440 145
(1) Iron ore reserves are shown as recoverable reserves of marketable product after accounting for all mining and processing losses. Millrecoveries are not available.
(2) Reserves of Robe River Iron Associates indicate reserves as of the end of December 2005, 2004 and 2003.(3) Stockpile components of reserves are included.(4) Pannawonica reserves have increased following revision and updating of geological models and mine designs, leading to the inclusion of
reserves for the Mesa A deposit.
66

Operator: BHP Billiton Ltd.(1)(2)(3)(4)
Reserve amounts of Mt. Newman, Yandi and Mt. Goldsworthy consist of proved and probable recoverablereserves.
In Millions of Tonnes
Year Ended June 30,
2005 2004 2003
Joint Venture or Investee andName of Mines
Mitsui’s Subsidiaryor
Associated Company Location
Totalrecoverable
ReserveMitsui’sShare
Totalrecoverable
ReserveMitsui’sShare
Totalrecoverable
ReserveMitsui’sShare
Mount Newman Joint Venture Mitsui Itochu IronPty. Ltd.
PilbaraRegion,WesternAustralia
Mt. Whaleback . . . . . . . . . . 836 59 955 67 1,026 72
Yandi Joint Venture Mitsui Iron OreDevelopmentPty. Ltd.
PilbaraRegion,WesternAustralia
Marillana Creek . . . . . . . . . 860 60 901 63 641 45
Mount GoldsworthyJoint Venture
Mitsui Iron OreDevelopmentPty. Ltd.
PilbaraRegion,WesternAustralia
North Area . . . . . . . . . . . . .(Yarrie)(Nimingarra)
14 1 13 1 21 2
Area C . . . . . . . . . . . . . . . . . 474 33 499 35 204 14
(1) Mining dilution and mining recovery (in general around 95%) has been taken into account in the estimation of reserves.(2) No third party audits have been conducted specifically for the purposes of this disclosure.(3) Metallurgical recoveries for the operations are 100% except for Mt Newman Joint Venture of which metallurgical recovery is 92 to
100%.(4) Reserves provided in the table above indicate reserves as of the end of June 2005, 2004 and 2003.
Operator: Sesa Goa Ltd.(1)(2)
Reserve amounts of Sesa Goa consist of proved and probable recoverable reserves.
In Millions of Tonnes
Year Ended March 31,
2006 2005 2004
Joint Venture or Investee andName of Mines
Mitsui’s Subsidiaryor
Associated Company Location
Totalrecoverable
ReserveMitsui’sShare
Totalrecoverable
ReserveMitsui’sShare
Totalrecoverable
ReserveMitsui’sShare
Sesa Goa Limited Sesa Goa Limited India
Codli, Sonshi . . . . . . . . . . . Goa 57 29 55 28 53 27
Chitradurga, Hospet . . . . . Karnataka 28 14 30 15 20 10
(1) Iron ore reserves are shown as recoverable reserves before accounting for all mining and processing losses. For the year ended March 31,2006, average rates of mill recovery for marketable products for Codli and Sonshi, and for Chitradurga and Hospet were both 70%.
(2) Reserves of Sesa Goa Ltd. indicate reserves as of the end of March 2006, 2005 and 2004.
67

COAL
In the table below, coal reserves are shown as marketable reserves, which are tonnage after accounting forextraction and processing and preparation losses.
In Millions of Tonnes
Mitsui’sSubsidiary
orAssociatedCompany
Year Ended March 31,
2006 2005 2004
Joint Venture or Investee andName of Mines Operator Location
TotalReserve
Mitsui’sShare
TotalReserve
Mitsui’sShare
TotalReserve
Mitsui’sShare
BHP Mitsui Coal Pty. Ltd.(1) BHP Billiton Ltd. BHP MitsuiCoal Pty. Ltd.
Queensland,Australia
Riverside(2) . . . . . . . . . . . — — 3 1 5 1
South Walker Creek . . . 45 9 92 18 96 19
Bengalla Joint Venture(3) . . . . Rio Tinto Ltd. Mitsui CoalHoldings Pty.Ltd.
New SouthWales,Australia
155 16 161 16 166 17
Kestrel Joint Venture(3) . . . . . Rio Tinto Ltd. Mitsui CoalHoldings Pty.Ltd.
Queensland,Australia
116 23 120 24 123 25
Dawson Joint Venture(3) . . . . .(formerly Moura JointVenture)
Anglo American Mitsui CoalHoldings Pty.Ltd.
Queensland,Australia
298 146 208 102 132 65
German Creek JointVenture(3) . . . . . . . . . . . . . . . . .(including LakeLindsay Mine)
Anglo American Mitsui CoalHoldings Pty.Ltd.
Queensland,Australia
177 53 78 23 90 27
TOTAL 791 247 662 184 612 154
(1) Reserves of BHP Mitsui Coal Pty. Ltd. indicates reserves as of the end of June 2005, 2004 and 2003, respectively. 2006 reserves meansreserves as of the end of June 2005.
(2) Reserves from Riverside were depleted in March 2005.(3) Reserves of Bengalla Joint Venture, Kestrel Joint Venture, Dawson Joint Venture and German Creek Joint Venture indicate reserves as
of the end of December 2005, 2004 and 2003, respectively. 2006 reserves mean reserves as of the end of December 2005.
We hold a 15% profit share in Valepar S.A., which held a 34% profit share of the common stock andpreferred stock of Companhia Vale do Rio Doce (“CVRD”) as of December 31, 2005. Accordingly, 5.1% (34% x15%) of CVRD’s production and reserve amounts are indirectly attributable to us. The following table providesiron ore production and reserve amounts for CVRD, and Mitsui’s share of the production and reserve amounts ofCVRD.
Production Tonnage (for the year ended December 31)
Millions of Tonnes
2005 2004 2003
Total Production Mitsui’s Share Total Production Mitsui’s Share Total Production Mitsui’s Share
233.9 11.9 211.3 10.8 188.3 9.6
Proven and Probable Reserves (as of December 31)
Millions of Tonnes
2005 2004 2003
Total Reserve Mitsui’s Share Total Reserve Mitsui’s Share Total Reserve Mitsui’s Share
7,981.8 407.7 6,869.1 350.3 4,926.20 251.6
68

Oil and Gas Producing Activities
The following table shows crude oil, condensate, natural gas liquids and natural gas production from ourreserves for the three fiscal years indicated:
Production Information
Millions of Barrels Billions of Cubic Feet
Crude Oil, Condensate andNatural Gas Liquids(1) Natural Gas(1)
Year Ended March 31, Middle East Oceania Others Worldwide Middle East Oceania Others Worldwide
2006 . . . . . . . . . . . . . . . . . . 3 6 5 14 6 59 39 1042005 . . . . . . . . . . . . . . . . . . 3 6 5 14 9 49 34 922004 . . . . . . . . . . . . . . . . . . 2 8 5 15 — 45 29 74
The following tables show proved reserves and proved developed reserves of crude oil, condensate, naturalgas liquids and natural gas as of the ending date of three fiscal years indicated:
Proved Reserve Information:
Proved Reserves
Millions of Barrels Billions of Cubic Feet
Crude Oil, Condensate andNatural Gas Liquids(1) Natural Gas(1)
Year Ended March 31, Middle East Oceania Others Worldwide Middle East Oceania Others Worldwide
At March 31, 2006 . . . . . . . 23 94 104 221 40 881 1,789 2,710At March 31, 2005 . . . . . . . 24 78 92 194 75 840 1,393 2,308At March 31, 2004 . . . . . . . 23 49 127 199 84 873 965 1,922
Proved Developed Reserves(2)
Millions of Barrels Billions of Cubic Feet
Crude Oil, Condensate andNatural Gas Liquids(1) Natural Gas(1)
Year Ended March 31, Middle East Oceania Others Worldwide Middle East Oceania Others Worldwide
At March 31, 2006 . . . . . . . 18 20 25 63 39 319 67 425At March 31, 2005 . . . . . . . 24 20 18 62 75 356 82 513At March 31, 2004 . . . . . . . 23 21 19 63 84 330 69 483
(1) 1 barrel of crude oil = 5,800 cubic feet of natural gas(2) The proportion of Proved Developed Reserves to Proved Developed and Undeveloped Reserves is
approximately 28% as of March 31, 2006 and relatively low. The expected costs to develop theseundeveloped reserves are estimated to be ¥515 billion in total as of March 31, 2006. Undeveloped reservesare largely attributable to an associated company in Russia and an associated company in Australia.Production of crude oil in 2007 and LNG in 2008 are expected, for the associated company in Russia.Production of crude oil and LNG has already commenced at the existing facilities at the Australiancompany. The drilling of additional development wells will be performed over the project life according tothe project drilling program.
Information on our oil and gas producing activities is shown in the “Supplemental Information on Oil andGas Producing Activities (Unaudited)” to the consolidated financial statements included elsewhere in this annualreport. And also see “Operating and Financial Review and Prospects—Operating Results by OperatingSegment—Energy Segment.”
Item 4A. Unresolved Staff Comments
We are a large accelerated filer as defined in Rule 12b-2 under the Securities Exchange Act of 1934. Thereare no written comments which have been provided by the staff of the Securities and Exchange Commission
69
regarding our periodic reports under that Act not less than 180 days before the end of the fiscal year endedMarch 31, 2006 and which remain unresolved as of the date of the filing of this Form 20-F with the Commissionand which we believe are material.
Item 5. Operating and Financial Review and Prospects
A. Operating Results
You should read the following discussion and analysis of our financial condition and results of operationstogether with “Selected Financial Data” and our consolidated financial statements, that appear elsewhere in thisannual report. This discussion and analysis contains forward-looking statements that involve risks, uncertaintiesand assumptions. Our actual results may differ materially from those anticipated in these forward-lookingstatements.
As used in this Operating and Financial Review and Prospects, “Mitsui” is used to refer to Mitsui & Co.,Ltd. (Mitsui Bussan Kabushiki Kaisha), and “we,” “us,” and “our” are used to indicate Mitsui & Co., Ltd. andsubsidiaries, unless otherwise indicated.
In the Consolidated Financial Statements and accompanying Notes to Consolidated Financial Statements,the “Company” is used to refer to Mitsui & Co., Ltd., and the “companies” is used to refer to Mitsui & Co., Ltd.and subsidiaries, unless otherwise indicated.
All references to “Note” throughout the Operating and Financial Review and Prospects relate to the Notes toConsolidated Financial Statements contained elsewhere in this Annual Report.
Throughout the Operating and Financial Review and Prospects, we describe the domicile of our subsidiariesand associated companies in parentheses following names of those companies. For example, Mitsui Iron OreDevelopment, Pty. Ltd. (Australia) means that the company’s name is Mitsui Iron Ore Development, Pty. Ltd.and that it is domiciled in Australia.
Operations of a subsidiary that either have been disposed of or are classified as held for sale have beenaccounted for as discontinued operations under accounting principles generally accepted in the United States ofAmerica (“U.S. GAAP”). This means that income statement and cash flow information are reclassified for allyears to separate the discontinued operations from our continuing operations. This presentation is required byU.S. GAAP and facilitates historical and future trend analysis of our continuing operations.
Key Performance Measures under Management’s Discussion
Although our operating results and financial condition are influenced by various factors, managementbelieves that as of the end of the fiscal year under review the following indicators can be usefully employed todiscuss trends in our performance and financial condition.
Gross profit, operating income* and equity in earnings of associated companies
We undertake worldwide business activities, involving diversified risk-return profiles, ranging fromintermediary services as agent to development and production of mineral resources and energy. In this context,changes in the amounts of gross profit, operating income and equity in earnings of associated companies byoperating segment reflect the overall progress of our business, and greatly affect the amount of net income in theStatements of Consolidated Income. For further information, refer to the table of “Operating SegmentInformation” and subsequent discussions in “Operating Results by Operating Segment” in this Operating andFinancial Review and Prospects.
* Operating Income
Operating income is included in the measure of segment performance reviewed by the chief operatingdecision maker. Operating income is comprised of our (a) gross profit, (b) selling, general andadministrative expenses, (c) provision for doubtful receivables and (d) government grant for transfer ofsubstitutional portion of the Employee Pension Fund (“EPF”), as presented in the Statements ofConsolidated Income.
70
Trends in the price of and supply-demand for mineral resources and energy
Our operating results are influenced by conditions of various commodity markets. In recent years, ouroperating results have been influenced by supply-demand balance and price fluctuations for mineral resourcesand energy that have been driven by expanding demand from emerging countries, particularly China, and theimportance of our mineral resources and energy operations in our overall operating results has increased. Forfurther information regarding trends and prospects in this field, refer to the sections relating to the Iron & SteelRaw Materials and Non-Ferrous Metals Segment and the Energy Segment in “Operating Results by OperatingSegment.”
Investment plans and financial leverage
According to our Medium-term Management Outlook announced in May 2006, we intend to invest a total of¥800 billion during the two fiscal years ending March 2007 and 2008, in order to build strategic businessportfolios in the four business areas of Mineral Resources and Energy Area; Global Marketing Networks Area,including steel products and chemicals; Infrastructure Area, including power generation; and Consumer ServicesArea, including outsourcing services and content businesses. Mitsui is monitoring and managing our financialleverage with a view of securing an efficient return on equity as well as maintaining and improving credit ratingsand financial soundness in order to secure the capital resources required for these investments and to refinanceour interest bearing debt. For further discussion on these investments and related financial policies, refer to “B.Liquidity and Capital Resources” in this Operating and Financial Review and Prospects.
Results of Operations
Summary of Operations for the Year Ended March 31, 2006
Operating Environment
Principal developments in the economic environment that influenced our results of operations during theyear ended March 31, 2006 included the following:
‰ The global economy continued its steady expansion driven by the growth in the United States, as well asemerging countries, particularly China. The expansion again brought higher consumption, housinginvestment and capital investment. Emerging countries especially continued strong economic growth ledby increasing personal consumption from a growing middle-income class and by robust infrastructuredemand.
‰ These factors contributed to a substantial increase in global trade and spurred the rising trend incommodity prices such as crude oil, iron ore, coal and non-ferrous metals.
‰ The Japanese economy entered a period of self-sustaining growth. Capital investment increasedreflecting expansion of corporate earnings while improved employment and wages supported afavorable trend in personal consumption. In addition, export volume increased supported by anexpansion of the global economy and the weak yen.
‰ In the United States, the Federal Reserve Board (“FRB”) continued its policy of raising interest rates,which resulted in a gradual rise in interest rates worldwide. In March 2006, the Bank of Japanterminated its quantitative easing policy, which it had followed for the prior five years.
Summary of Operating Results, Financial Condition and Cash Flows
‰ Operating results
— For the year ended March 31, 2006, we recorded net income of ¥202.4 billion, an increase of ¥81.3billion, or 67.1%, from ¥121.1 billion for the year ended March 31, 2005.
— Most operating segments except for the Foods & Retail Segment recorded improved operatingresults, which benefited from a favorable economic environment.
71

— Gross profit and equity in earnings of associated companies increased by ¥107.7 billion, or 15.2%;and ¥29.9 billion, or 46.5%, respectively, reflecting favorable commodity prices including mineralresources and energy. On the other hand, Mitalco Inc. (United States) and MITSUI FOODS CO.,LTD. (Japan) recorded significant one-time impairment losses on long-lived assets. In addition,interest expenses increased principally from the investment in the Sakhalin II project.
‰ Financial condition
Total assets as of March 31, 2006 reached ¥8.6 trillion mainly due to investments in the energy andmineral resources businesses, the infrastructure businesses and the foods and retail businesses; increasesin trade receivables and inventories; and the increases in unrealized holding gains on available-for-salesecurities. As a result of a public offering and increased retained earnings, our shareholders’ equity as ofMarch 31, 2006 reached ¥1.7 trillion.
‰ Cash flows
Net cash provided by operating activities for the year ended March 31, 2006 was ¥146.4 billion. Netcash used in investing activities was ¥347.3 billion, resulting primarily from investments in energy andmineral resources businesses as well as infrastructure businesses.
Impact of Foreign Currency Exchange Fluctuation on Operating Results
Due to the increase in gross profit and equity in earnings of associated companies discussed above, netincome for the year ended March 31, 2006 from overseas subsidiaries and associated companies reached ¥174.8billion, significantly higher than ¥117.9 billion recorded for the year ended March 31, 2005. The impact of anyappreciation of the yen against the currencies used by these companies as functional currency in their reporting—principally U.S. dollars, Australian dollars and Euros—is becoming even more significant.
During the year ended March 31, 2006, the U.S. dollar continued to appreciate against the yen and the Euro,reflecting the increasing disparity in interest rates over Japan and Europe. The average U.S. dollar—yenexchange rate during the year ended March 31, 2006 was ¥113.93 = U.S.$1, representing yen depreciation of¥6.33, or 5.9%, compared to the average rate during the year ended March 31, 2005 of ¥107.60 = U.S.$1.
The impact of foreign currency exchange fluctuations on net income for the year ending March 2007 willlargely depend on the net income denominated in local currencies of overseas subsidiaries and associatedcompanies. Based on net income in the business plans of these companies covering the year ending March 2007,yen appreciation by ¥1 against 1 U.S. dollar would have the net effect of reducing net income by approximately¥1.6 billion.
Discussion and Analysis of Operating Results for the Year Ended March 31, 2006 as Compared to the YearEnded March 31, 2005
Revenues
In accordance with U.S. GAAP, revenues are reported based on the gross amount billed to a customer or onthe net amount retained (that is, the amount billed to a customer less the amount paid to a supplier). Revenues arereported based on gross amounts for transactions where we have the related risks and rewards of ownership suchas transactions where we are a primary obligor in the arrangement and/or assume general inventory risk withoutany significant mitigation of our risk level. Revenues are reported based on net amounts where we assume a lowdegree of related risks and rewards, effectively acting as an agent for the applicable products or services. Atypical example of reporting revenues based on net amounts is a transaction where we receive a commission orfee at a fixed rate based on transaction volume or amount.
We classified our revenues into sales of products, sales of services and other sales with the correspondingcosts of revenues.
72

The table below provides these three categories of revenues by products in “PRODUCT INFORMATION”*in Note 17, “SEGMENT INFORMATION.”
Billions of Yen
Years Ended March 31,
2006 2005 Change
Sales ofProducts
Sales ofServices
OtherSales Total
Sales ofProducts
Sales ofServices
OtherSales Total
Sales ofProducts
Sales ofServices
OtherSales Total
Iron and Steel . . . . . . . . ¥ 454.7 ¥ 68.8 ¥ 0.2 ¥ 523.7 ¥ 351.2 ¥ 55.7 ¥ 0.2 ¥ 407.1 ¥103.5 ¥13.1 ¥ 0.0 ¥116.6Non-Ferrous Metals . . . 77.7 9.2 15.2 102.1 137.0 8.4 16.0 161.4 (59.3) 0.8 (0.8) (59.3)Machinery . . . . . . . . . . . 219.1 97.6 51.3 368.0 163.4 63.3 38.2 264.9 55.7 34.3 13.1 103.1Electronics &
Information . . . . . . . . 77.5 87.4 0.0 164.9 74.9 69.8 0.0 144.7 2.6 17.6 0.0 20.2Chemicals . . . . . . . . . . . 785.9 93.3 7.5 886.7 642.7 79.8 6.6 729.1 143.2 13.5 0.9 157.6Energy . . . . . . . . . . . . . . 1,331.8 7.7 21.0 1,360.5 1,009.3 14.0 11.8 1,035.1 322.5 (6.3) 9.2 325.4Foods . . . . . . . . . . . . . . 377.8 47.2 (0.4) 424.6 423.7 50.1 (0.2) 473.6 (45.9) (2.9) (0.2) (49.0)Textiles . . . . . . . . . . . . . 24.5 16.8 1.1 42.4 22.1 19.8 1.1 43.0 2.4 (3.0) 0.0 (0.6)General
Merchandise . . . . . . . 69.8 9.0 0.0 78.8 86.0 10.2 (0.1) 96.1 (16.2) (1.2) 0.1 (17.3)Property and Service
Business . . . . . . . . . . 60.8 75.3 27.7 163.8 53.8 63.0 22.8 139.6 7.0 12.3 4.9 24.2
Consolidated Total . . . . ¥3,479.6 ¥512.3 ¥123.6 ¥4,115.5 ¥2,964.1 ¥434.1 ¥96.4 ¥3,494.6 ¥515.5 ¥78.2 ¥27.2 ¥620.9
Sales of Products
Sales of products include the sale of various products as a principal in the transactions, the manufacture andsale of a wide variety of products such as metals, chemicals, foods and machinery, the development, productionand sale of natural resources such as iron ore, coal, oil and gas, and the development and sale of real estate.
For the year ended March 31, 2006, revenues from the sales of products were ¥3,479.6 billion, an increaseof ¥515.5 billion, or 17.4%, from ¥2,964.1 billion for the year ended March 31, 2005. Major factors by productwere as follows:
‰ Revenues from Energy were ¥1,331.8 billion, an increase of ¥322.5 billion from the ¥1,009.3 billion forthe year ended March 31, 2005. Revenues from sales of crude oil and oil products increased at WestportPetroleum, Inc. (United States) by ¥137.9 billion, reflecting higher oil prices. Revenues from domesticsale of oil products also increased at Mitsui Oil Co., Ltd. (Japan) and Mitsui Liquefied Gas Co., Ltd.(Japan) by a combined total of ¥79.6 billion. Regarding price trends of oil and gas for the year endedMarch 31, 2006, refer to the discussion under “Energy Segment” of “Operating Results by OperatingSegment.”
‰ Revenues from Chemicals were ¥785.9 billion, an increase of ¥143.2 billion from the ¥642.7 billion forthe year ended March 31, 2005. The principal reasons include increases in Mitsui’s sales of syntheticfiber intermediates, methanol, ammonia and basic petrochemicals, due to higher prices for thesepetrochemical products reflecting higher crude oil prices.
‰ Revenues from Iron and Steel were ¥454.7 billion, an increase of ¥103.5 billion from the ¥351.2 billionfor the year ended March 31, 2005. Mitsui Iron Ore Development Pty. Ltd. (Australia) and Sesa GoaLimited (India) recorded an increase of ¥27.6 billion and ¥10.0 billion, respectively, due to the rise in
* Revenues reported in “PRODUCT INFORMATION” are classified by similarity of products as required byU.S. GAAP, and are not intended to represent classification by operating segment. As an example, revenuesof “Chemicals” in “PRODUCT INFORMATION” include not only those reported in the Chemical Segmentbut also those reported in other operating segments such as the Americas Segment for sales of chemical-related products or services. To differentiate between classification by product and classification byoperating segment, classification by product is italicized in this “Revenues” and “Gross profit classified bycategory of revenues” in the next “Gross Profit.”
73
iron ore prices. Champions Pipe & Supply, Inc. (United States) recorded an increase of ¥14.5 billion,reflecting a favorable steel tubular products market. Regarding price trends of iron ore and coal for theyear ended March 31, 2006, refer to the discussion under “Iron & Steel Raw Materials and Non-FerrousMetals Segment” of “Operating Results by Operating Segment.”
Sales of Services
Sales of services include the revenues from trading margins and commissions related to various tradingtransactions in which we act as a principal or an agent. Specifically, we charge a commission for the performanceof various services such as logistics and warehouse services, information and communication services andtechnical support. For some back-to-back sales and purchase transactions of products, we act as a principal andrecord the net amount of sale and purchase prices as revenues. We also facilitate arrangement of the contractsbetween manufacturers and customers and deliveries of the products between suppliers and customers.
For the year ended March 31, 2006, revenues from the sales of services were ¥512.3 billion, an increase of¥78.2 billion from ¥434.1 billion for the year ended March 31, 2005. Major factors by products were as follows:
‰ Revenues from Iron and Steel and Chemicals increased by ¥13.1 billion and ¥13.5 billion, respectively.Favorable market conditions and increases in transaction volume resulted in the overall increase both atMitsui and subsidiaries.
‰ Revenues from Machinery were ¥97.6 billion, an increase of ¥34.3 billion from the ¥63.3 billion for theyear ended March 31, 2005, primarily attributable to the increases at overseas automobile-relatedsubsidiaries through their logistics and distributorship services.
‰ Revenues from Electronics & Information were ¥87.4 billion, an increase of ¥17.6 billion from the¥69.8 billion for the year ended March 31, 2005, principally because revenues from sales of informationand communication services increased due to a full year contribution of NextCom K.K. (Japan) whichbecame a subsidiary from the third quarter of the year ended March 31, 2005. Telepark Corp. (Japan)also contributed reflecting the expanded cell phone sales intermediary business.
Other Sales
Other sales principally include the revenues from derivative commodity instruments and derivative financialinstruments held for trading purposes, the revenues from leasing activities of real estate, rolling stock, oceantransport vessels, aircraft and machinery equipment and the revenues from external consumer financing.
For the year ended March 31, 2006, revenues from other sales were ¥123.6 billion, an increase of ¥27.2billion from ¥96.4 billion for the year ended March 31, 2005, which was primarily attributable to the followingfactors:
‰ Leasing revenues were ¥65.3 billion, an increase of ¥9.9 billion from the ¥55.4 billion for the yearended March 31, 2005 due to the contribution of KYOGI WAREHOUSE CO., LTD (Japan), whichbecame a subsidiary from the year ended March 31, 2006, and Mitsui Rail Capital Holdings, Inc.(United States), a leasing company of rolling stock.
‰ Derivative trading revenues were ¥39.7 billion, an increase of ¥7.7 billion from the ¥32.0 billion for theyear ended March 31, 2005. The principal reasons for this increase were strong energy derivativestrading at Mitsui & Co. Energy Risk Management Ltd. (United Kingdom), Mitsui Oil (Asia) Pte. Ltd.(Singapore) and Mitsui Oil (Asia) Hong Kong Ltd. (Hong Kong, China).
‰ In addition, business expansion of the motorcycle retail finance at P.T. Bussan Auto Finance (Indonesia)contributed to an increase of revenues from other sales.
74
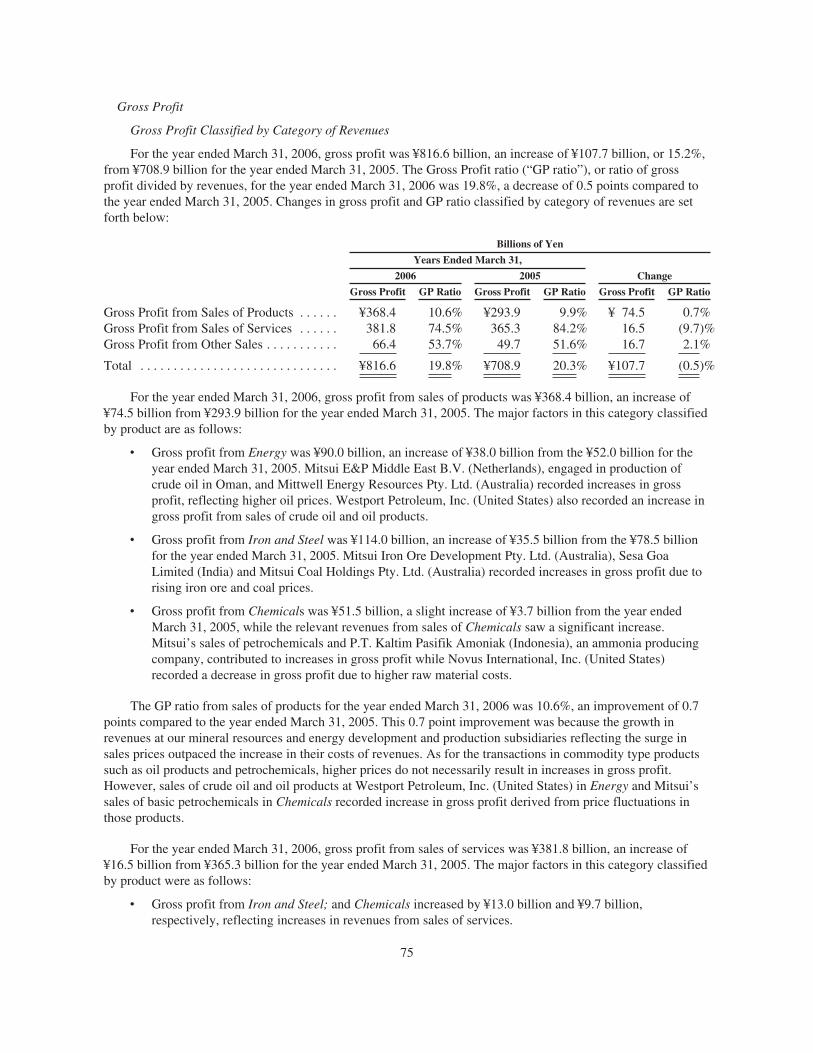
Gross Profit
Gross Profit Classified by Category of Revenues
For the year ended March 31, 2006, gross profit was ¥816.6 billion, an increase of ¥107.7 billion, or 15.2%,from ¥708.9 billion for the year ended March 31, 2005. The Gross Profit ratio (“GP ratio”), or ratio of grossprofit divided by revenues, for the year ended March 31, 2006 was 19.8%, a decrease of 0.5 points compared tothe year ended March 31, 2005. Changes in gross profit and GP ratio classified by category of revenues are setforth below:
Billions of Yen
Years Ended March 31,
2006 2005 Change
Gross Profit GP Ratio Gross Profit GP Ratio Gross Profit GP Ratio
Gross Profit from Sales of Products . . . . . . ¥368.4 10.6% ¥293.9 9.9% ¥ 74.5 0.7%Gross Profit from Sales of Services . . . . . . 381.8 74.5% 365.3 84.2% 16.5 (9.7)%Gross Profit from Other Sales . . . . . . . . . . . 66.4 53.7% 49.7 51.6% 16.7 2.1%
Total . . . . . . . . . . . . . . . . . . . . . . . . . . . . . . ¥816.6 19.8% ¥708.9 20.3% ¥107.7 (0.5)%
For the year ended March 31, 2006, gross profit from sales of products was ¥368.4 billion, an increase of¥74.5 billion from ¥293.9 billion for the year ended March 31, 2005. The major factors in this category classifiedby product are as follows:
‰ Gross profit from Energy was ¥90.0 billion, an increase of ¥38.0 billion from the ¥52.0 billion for theyear ended March 31, 2005. Mitsui E&P Middle East B.V. (Netherlands), engaged in production ofcrude oil in Oman, and Mittwell Energy Resources Pty. Ltd. (Australia) recorded increases in grossprofit, reflecting higher oil prices. Westport Petroleum, Inc. (United States) also recorded an increase ingross profit from sales of crude oil and oil products.
‰ Gross profit from Iron and Steel was ¥114.0 billion, an increase of ¥35.5 billion from the ¥78.5 billionfor the year ended March 31, 2005. Mitsui Iron Ore Development Pty. Ltd. (Australia), Sesa GoaLimited (India) and Mitsui Coal Holdings Pty. Ltd. (Australia) recorded increases in gross profit due torising iron ore and coal prices.
‰ Gross profit from Chemicals was ¥51.5 billion, a slight increase of ¥3.7 billion from the year endedMarch 31, 2005, while the relevant revenues from sales of Chemicals saw a significant increase.Mitsui’s sales of petrochemicals and P.T. Kaltim Pasifik Amoniak (Indonesia), an ammonia producingcompany, contributed to increases in gross profit while Novus International, Inc. (United States)recorded a decrease in gross profit due to higher raw material costs.
The GP ratio from sales of products for the year ended March 31, 2006 was 10.6%, an improvement of 0.7points compared to the year ended March 31, 2005. This 0.7 point improvement was because the growth inrevenues at our mineral resources and energy development and production subsidiaries reflecting the surge insales prices outpaced the increase in their costs of revenues. As for the transactions in commodity type productssuch as oil products and petrochemicals, higher prices do not necessarily result in increases in gross profit.However, sales of crude oil and oil products at Westport Petroleum, Inc. (United States) in Energy and Mitsui’ssales of basic petrochemicals in Chemicals recorded increase in gross profit derived from price fluctuations inthose products.
For the year ended March 31, 2006, gross profit from sales of services was ¥381.8 billion, an increase of¥16.5 billion from ¥365.3 billion for the year ended March 31, 2005. The major factors in this category classifiedby product were as follows:
‰ Gross profit from Iron and Steel; and Chemicals increased by ¥13.0 billion and ¥9.7 billion,respectively, reflecting increases in revenues from sales of services.
75
‰ Increases in revenues from sales of services of Machinery and Electronics & Information were largelyoffset by increases in the related costs of those revenues. Those transactions for which gross billedamounts are reported as revenue included logistics services in automobile businesses and networkconfiguration, operation and maintenance services at NextCom K.K. (Japan).
The GP ratio from sales of services for the year ended March 31, 2006 was 74.5%, a decrease of 9.7 pointscompared to the year ended March 31, 2005. This decrease was mainly due to a relative increase in transactionswhere the gross billed amounts were reported as revenues and GP ratios were less than 100% such as the above-mentioned logistics services in automobile businesses and NextCom K.K. (Japan), compared to the transactionssuch as intermediary services where the net amount of sales and purchase prices in back-to-back transactionswere reported as revenues with GP ratios of 100%.
For the year ended March 31, 2006, gross profit from other sales was ¥66.4 billion, an increase of ¥16.7billion from the ¥49.7 billion for the year ended March 31, 2005. The major reasons were the same as describedin “Revenues—Other sales” above.
The GP ratio from other sales for the year ended March 31, 2006 was 53.7%, an increase of 2.1 pointscompared to the year ended March 31, 2005.
Gross Profit Classified by Operating Segment
By operating segment, major factors for the increase in gross profit for the year ended March 31, 2006 arediscussed as below:
‰ In the Iron & Steel Raw Materials & Non-Ferrous Metals Segment, Mitsui Iron Ore Development, Pty.Ltd. (Australia) and Sesa Goa Limited (India) recorded significant increases, as iron ore prices for theyear ended March 31, 2006 rose by 71.5% on a pure ore content basis compared to the year endedMarch 31, 2005, reflecting strong demand from Asia, particularly China. Mitsui Coal Holdings Pty. Ltd.(Australia) also recorded a significant increase, as the contract prices for metallurgical coal and thermalcoal for the year ended March 31, 2006 rose. Prices for representative Australian metallurgical coal roseby approximately 120%.
‰ In the Chemical Segment, overall market prices of petrochemical products stayed high, reflecting thehigh crude oil price, and Mitsui’s petrochemicals trading continuously benefited from favorable marketconditions following the previous year. Due to higher ammonia prices, PT Kaltim Pasifik Amoniak(Indonesia) reported an increase in gross profit. In addition, we recorded increases in gross profit intrading of plastics, electronic materials and crystalline liquid for IT related industries and inorganic rawmaterials such as salt and sulfur, reflecting increasing demand of those materials mainly in Asia.
‰ In the Energy Segment, rising crude oil prices resulted in significant increases in gross profit of overseassubsidiaries engaged in the development and production of oil and gas, such as Mitsui E&P Middle EastB.V. (Netherlands) operating in Oman and Mittwell Energy Resources Pty., Ltd. (Australia). Mitsui Oil(Asia) Pte. Ltd. (Singapore) and Mitsui Oil (Asia) Hong Kong Ltd. (Hong Kong, China) recordedincreases in gross profit for oil products trading, reflecting the strong demand in Asia and higher crudeoil prices.
‰ In the Americas Segment, an oil products trading subsidiary Westport Petroleum, Inc. (United States)recorded a significant increase in gross profit, and a steel pipe sales subsidiary Champions Pipe &Supply, Inc. (United States) also recorded an increase. In addition, there was an increase by ¥1.2 billiondue to a full-year contribution from CornerStone Research & Development Inc. (United States) whichbecame a subsidiary from the third quarter of the year ended March 31, 2005.
Gross profit rose ¥14.0 billion for subsidiaries acquired or established from the second quarter of the yearended March 31, 2005 to the end of the year ended March 31, 2006, compared to the year ended March 31, 2005.
76
Those subsidiaries include Road Machinery, LLC (United States) which became a subsidiary in the fourthquarter of the year ended March 31, 2005, Hokushuren Company Limited (Japan) which became a subsidiary inthe second quarter of the year ended March 31, 2006, NextCom K.K. (Japan) which became a subsidiary in thethird quarter of the year ended March 31, 2005, and CornerStone Research & Development Inc. (United States)as mentioned above.
Selling, General and Administrative Expenses
Selling, general and administrative expenses for the year ended March 31, 2006 were ¥550.8 billion, anincrease of ¥41.2 billion, or 8.1%, from ¥509.6 billion for the year ended March 31, 2005. In the same manner aswith gross profit we saw that selling, general and administrative expenses rose ¥12.6 billion at subsidiariesacquired or established from the second quarter of the year ended March 31, 2005 to the end of the year endedMarch 31, 2006.
The main reasons for the increase of selling, general and administrative expenses are classified as below:
‰ Personnel expenses were ¥276.1 billion for the year ended March 31, 2006, an increase of ¥25.2 billionfrom ¥250.9 billion for the year ended March 31, 2005. In overseas subsidiaries, Mitsui & Co. EnergyRisk Management Ltd. (United Kingdom) and Westport Petroleum, Inc. (United States) reportedincreases of ¥3.6 billion and ¥3.0 billion, respectively, because of increases in performance linkedbonuses to traders corresponding to increases in gross profit from their trading activities. In domesticsubsidiaries, MITSUI FOODS, CO., LTD. (Japan) recorded an increase of ¥1.9 billion in connectionwith the establishment of new distribution bases. There were also increases from the above-mentionednewly acquired domestic subsidiaries such as Hokushuren Company Limited (Japan) and NextComK.K. (Japan). Mitsui reported an increase of ¥4.5 billion principally due to increases in bonuses toemployees.
‰ Communication and information expenses were ¥42.2 billion for the year ended March 31, 2006, anincrease of ¥3.9 billion from ¥38.3 billion for the year ended March 31, 2005. This increase resultedfrom the introduction of a new enterprise resource planning system in November 2004 wheremaintenance and depreciation expenses were recognized for the full year ended March 31, 2006.
Provision for Doubtful Receivables
Provision for doubtful receivables for the year ended March 31, 2006 was minimal, less than ¥0.1 billion, animprovement from ¥8.8 billion for the year ended March 31, 2005. In both years ended March 31, 2006 and2005, the provision for doubtful receivables consisted mainly of individually small provisions for a number ofcustomers. Improvement in the year ended March 31, 2006 was partly attributable to the collection of debtswhich had been written off as uncollectible in the past. The major provisions for doubtful receivables in the yearended March 31, 2005 included a provision for a machinery-related domestic customer.
Interest Income and Interest Expense
Interest income for the year ended March 31, 2006 was ¥38.3 billion, an increase of ¥2.8 billion, or 7.9%,from ¥35.5 billion for the year ended March 31, 2005. Interest expense was ¥59.9 billion, an increase of ¥16.5billion, or 38.0%, from ¥43.4 billion for the year ended March 31, 2005. As a result, interest expense, net ofinterest income was ¥21.6 billion, an increase of ¥13.7 billion, or 173.4%, from ¥7.9 billion for the year endedMarch 31, 2005. A breakdown of the principal changes for the year ended March 31, 2006 is as follows:
‰ At Mitsui Sakhalin Holdings B.V. (Netherlands), interest expenses increased by ¥6.7 billion due to anincrease in interest bearing debt which was used to fund the increasing investments in Sakhalin EnergyInvestment Company Ltd. (Bermuda) and an increase in U.S. dollar interest rates.
‰ Mitsui recorded an increase of ¥3.0 billion in interest expenses, reflecting increases in interest bearingdebt associated with increases in investments.
77
‰ Mitsui & Co. (U.S.A.), Inc. (United States) recorded an increase of ¥1.9 billion in interest expense,reflecting an increase in U.S. dollar interest rates.
Interest rate trends for the year ended March 31, 2006 for the Japanese yen and U.S. dollar, the majorcurrencies in which we have borrowings, are as follows:
‰ The average of the month-end Japanese yen three-month London Interbank Offered Rate (“LIBOR”)remained 0.07%, roughly unchanged from the 0.05% during the year ended March 31, 2005, as theBank of Japan maintained its very low interest rate policy. The average yield rate on 10-year JapaneseGovernment Bonds was 1.44% for the year ended March 31, 2006, slightly declining from 1.52% duringthe year ended March 31, 2005. Meanwhile, the yield rate on 10-year Japanese Government Bonds roseto 1.78% as of March 31, 2006 on the back of the termination of its quantitative easing policy in March2006.
‰ The average of the month-end U.S. dollar three-month LIBOR during the year ended March 31, 2006was 4.12%, up from the average of 2.13% during the year ended March 31, 2005, reflecting the FRB’spolicy of gradually raising the Federal Funds target rate to 4.75% in the period from June 2004 to March2006.
Regarding progress of our investment plans and financial policies, refer to “Liquidity and CapitalResources.”
Dividend Income
Dividend income for the year ended March 31, 2006 was ¥30.7 billion, an increase of ¥6.1 billion, or 24.8%,from ¥24.6 billion for the year ended March 31, 2005. Total dividends from LNG projects in the Middle East,namely Abu Dhabi, Qatar and Oman, were ¥13.4 billion, a slight increase of ¥0.6 billion from the ¥12.8 billionfor the year ended March 31, 2005. There was a dividend from an investment company related to gains on salesof interests in telecommunication companies in Africa and increases in dividends from various domestic listedcompanies.
Gains on Sales of Securities—Net
The net realized gain on sales of securities for the year ended March 31, 2006 was ¥37.9 billion, an increaseof ¥3.1 billion, or 8.9% from ¥34.8 billion for the year ended March 31, 2005.
The following is a breakdown of main points related to net gains on sales of securities for the year endedMarch 31, 2006.
‰ In the Lifestyle, Consumer Service and Information, Electronics & Telecommunication Segment and theAmericas Segment, we recorded a ¥5.5 billion gain on the sale of shares in Metro PCS, Inc. in theUnited States. We also reported a ¥3.3 billion gain from the exchange of shares in POWEREDCOM,Inc. for KDDI CORPORATION in Japan and a ¥2.0 billion gain on the sale of shares in P.T.Excelcomindo Pratama, Tbk in Indonesia.
‰ In the Foods & Retail Segment, we reported a ¥4.2 billion gain from the exchange of shares of Seven-Eleven Japan Co., Ltd. in Japan for newly issued shares of Seven & i Holdings Co., Ltd. in Japan, inconnection with the establishment of Seven & i Holdings Co., Ltd.
‰ We recorded a ¥2.8 billion gain on the sale of Iraqi Government Bonds which were acquired inexchange for commercial debt following the relevant international debt relief agreement.
The following is a breakdown of the main points related to net gains on sales of securities for the year endedMarch 31, 2005.
‰ In the Lifestyle, Consumer Service and Information, Electronics & Telecommunication Segment, wereported a ¥7.2 billion gain on the sale of shares in Vodafone K.K., a Japanese cell-phone carrier, in
78
response to a tender offer, and a ¥4.1 billion gain in Telepark Corp. (Japan), a subsidiary engaged insales of mobile devices and fixed telecommunication lines, following its initial public offering on theSecond Section of the Tokyo Stock Exchange. Also in December 2004, in connection with the merger ofa former associated company NextCom K.K. (Japan), a software development and marketing subsidiaryBSI Co., Ltd., and a data telecommunications equipment marketing subsidiary ADAM NET Ltd., Mitsuiwas allotted shares in NextCom K.K. (Japan) in exchange for shares in two subsidiaries and recorded a¥3.7 billion gain from the exchange of shares of those two subsidiaries.
‰ In the Chemical Segment and the Other Overseas Areas Segment, we sold shares in BangkokPolyethylene Public Company Limited (Thailand), a maker of high density polyethylene, and recorded again of ¥3.9 billion.
Gain on Issuance of Stock by a Subsidiary
As mentioned above in gains on sales of securities—net, Telepark Corp. (Japan) registered and issued 8,000shares of common stock in an initial public offering on the Second Section of the Tokyo Stock Exchange in April2004. As a result of the public offering, our ownership interest in Telepark Corp. (Japan) decreased and werecognized a gain of ¥1.7 billion on this issuance as a separate line item in the Statements of ConsolidatedIncome, under gain on issuance of stock by a subsidiary, in addition to a ¥4.1 billion gain on securities asdiscussed above. For further information, see Note 19, “ISSUANCE OF STOCK BY SUBSIDIARIES ANDASSOCIATED COMPANIES.”
Loss on Write-Down of Securities
For the year ended March 31, 2006, the loss on write-down of securities was ¥10.6 billion, a decrease of¥5.9 billion or 35.8%, from ¥16.5 billion for the year ended March 31, 2005.
For the year ended March 31, 2005, the Japanese stock markets experienced repeated minor adjustmentswithin a narrow range between a high of ¥12,163.89 and a low of ¥10,505.05 in the Nikkei Stock Average, due tosurging crude oil prices, concern over worldwide inflation, appreciation of the yen and a slowdown in the UnitedStates economy while underpinned by hopes for recoveries of domestic and overseas economies and anexpansion in corporate earnings. For the year ended March 31, 2006, the Japanese stock markets saw an upturnfollowing the recovery of the Japanese economy and expanding corporate earnings with the Nikkei StockAverage at ¥17,059.66 as of March 31, 2006, compared to ¥11,668.95 as of March 31, 2005.
Reflecting these developments in the stock market, the write-down of marketable securities for the yearended March 31, 2006 was small at ¥1.8 billion, a slight increase over ¥0.6 billion for the year ended March 31,2005.
With respect to non-marketable securities, individual write-down losses were insignificant for the yearended March 31, 2006. For the year ended March 31, 2005, considering a deterioration in financial condition dueto sluggish advertising revenues, we recorded losses on shares of satellite broadcaster BS-i, INCORPORATED(in Japan, not the same company as BSI Co., Ltd., listed under Gains on Sales of Securities—Net) and BS JapanCorporation in Japan of ¥1.9 billion and ¥1.2 billion, respectively. MBK Australia Resorts Pty. Ltd. (Australia)reported a write-down of ¥1.7 billion based on the estimated sale price for its investment in the Mirage Resortsbusiness in Australia.
Gain on Disposal or Sales of Property and Equipment—Net
Gain on disposal or sales of property and equipment—net for the year ended March 31, 2006 was ¥6.0billion, a decrease of ¥0.5 billion, or 7.7%, from a ¥6.5 billion gain for the year ended March 31, 2005. In theyear ended March 31, 2006, Mitsui recorded a ¥5.6 billion gain on the sale of Mitsui’s company-owned welfare
79

facilities and a ¥1.3 billion gain on the sale of its corporate residences and dormitories. In the year endedMarch 31, 2005, in addition to a ¥3.2 billion gain from the sale of Mitsui’s corporate residences and dormitories,there was a ¥1.8 billion gain from the sale of warehouses for lease by a logistics-related subsidiary, Tri-NetLogistics Management, Inc. (United States). Properties sold in the years ended March 31, 2006 and 2005 hadbeen acquired before the significant land price increase in Japan in the late 1980s and early 1990s.
Impairment Loss of Long-Lived Assets
The impairment loss on long-lived assets for the year ended March 31, 2006 was ¥36.1 billion, an increaseof ¥15.5 billion or 75.2%, from ¥20.6 billion for the year ended March 31, 2005. The main elements ofimpairment losses for the year ended March 31, 2006 are as follows:
‰ In the Iron & Steel Raw Materials and Non-Ferrous Metals Segment, we reported an ¥11.8 billionimpairment loss on property and equipment owned by an aluminum smelting subsidiary, Mitalco Inc.(United States), reflecting the rising trend of electricity costs.
‰ In the Foods & Retail Segment, MITSUI FOODS CO., LTD. (Japan) recorded a ¥6.0 billion impairmentloss on land and facilities which would be idle as a result of reorganization of distribution bases.
‰ Mitsui and domestic subsidiaries recorded a total of ¥2.8 billion impairment losses on land fordevelopment and land for lease.
‰ In the Americas Segment, NutriScience Technologies, Inc. (United States), a pet food flavormanufacturing company, reported a ¥1.6 billion impairment loss on plant facilities.
The main elements for the year ended March 31, 2005 were as follows:
‰ In the Iron & Steel Raw Materials and Non-Ferrous Metals Segment, we reported a ¥6.5 billionimpairment loss on plant facilities at Mitalco Inc. (United States), reflecting the rising trend ofelectricity costs.
‰ We recorded a ¥3.3 billion impairment loss on land for development purposes and a loss of ¥1.3 billionon land for lease, both held in Japan by Mitsui.
‰ In the Energy Segment, Mitsui Oil Co., Ltd. (Japan) recorded an impairment loss of ¥2.3 billion mainlyon gas stations.
For more information on impairment losses on long-lived assets, see Note 10, “IMPAIRMENT LOSS OFLONG-LIVED ASSETS,” and on our reevaluation and restructuring of subsidiaries and associated companies,see Note 25, “EXIT OR DISPOSAL ACTIVITIES.”
Compensation and Other Charges Related to DPF Incident
In November 2004, Mitsui discovered that false data had been produced and submitted to authorities fordiesel particulate filters (“DPF”s) manufactured by Mitsui’s subsidiary, PUREarth Incorporated (Japan), and soldby Mitsui. These filters were subsidized by the Tokyo Metropolitan Government and seven other prefectural andmunicipal governments, as well as the Ministry of Land, Infrastructure and Transport, the Ministry of theEnvironment, and related industry associations. Mitsui had sold approximately 21,500 units of the product.
Mitsui has carried out a three-part user response plan involving: (1) the free replacement of DPFs, (2) thereimbursement of the amount paid for purchasing Mitsui’s DPFs in exchange for their redemption and (3) asupport program for the purchase of alternative vehicles, as well as redemption of DPFs. As a result ofconsiderable efforts, we have redeemed more than 99% of the DPFs as of June 2006. In addition, Mitsui hascompleted full compensation of relevant subsidies.
For the year ended March 31, 2005, Mitsui recorded ¥36.0 billion as compensation and other charges relatedto DPF incident in the Statements of Consolidated Income, consisting of a user response charge of approximately
80
¥28.0 billion and subsidy compensation of approximately ¥8.0 billion. The user response charge was estimatedbased on expected costs in each user response plan, considering the requirement of each respective user as atMarch 31, 2005. For the year ended March 31, 2006, Mitsui recorded an additional user response charge of ¥9.0billion, re-estimating expected costs in each user response plan reflecting changes in the requirement of eachrespective user.
For more information, see Note 22, “COMPENSATION AND OTHER CHARGES RELATED TO DPFINCIDENT.”
Other Expense—Net
For the year ended March 31, 2006, other expense—net was ¥9.9 billion, an increase of ¥1.9 billion, or23.8%, from ¥8.0 billion for the year ended March 31, 2005. The main elements of other expenses—net for theyear ended March 31, 2006 were as follows:
‰ Mitalco Inc. (United States) recorded losses including a ¥2.8 billion loss on impairment of goodwillconsidering deterioration in the terms of the power purchase contract during the course of renewalnegotiations.
‰ Oil and gas development and production subsidiaries including Mitsui E&P Australia Pty. Ltd.(Australia) recorded ¥2.2 billion exploration expenses reflecting an expansion in exploration activities.
‰ NutriScience Technologies, Inc. (United States) recorded ¥1.4 billion in restructuring-related charges.
The main elements of other expense—net for the year ended March 31, 2005 were as follows:
‰ Oil and gas development and production subsidiaries, including Wandoo Petroleum Pty. Ltd. (Australia)recorded ¥2.5 billion exploration expenses.
‰ We recorded ¥2.0 billion restructuring-related charges, mainly representing costs related to thetermination of an indemnity agreement which had been made in connection with the sale of a ceramicbuilding materials and fiberboard business at Mitsui Wood Systems, Inc. (Japan) in October 2001.
For more information on other expense—net, see Note 20, “OTHER EXPENSE—NET,” and on ourrestructuring activities, see Note 25, “EXIT OR DISPOSAL ACTIVITIES.”
Income Taxes
For the year ended March 31, 2006, income taxes were ¥124.7 billion, an increase of ¥22.9 billion, or22.5%, from ¥101.8 billion for the year ended March 31, 2005, reflecting increases in income from continuingoperations before income taxes, minority interests and equity in earnings. The effective tax rate was 49.3%, adecrease of 10.9 points from 60.2% for the year ended March 31, 2005. This was mainly due to establishing avaluation allowance in a large amount for the year ended March 31, 2005 which was provided on deferred taxassets on the impairment loss of certain of Mitsui’s investments recorded in the past years, as a result of a changein a policy to sell certain investments. This factor represented a 10.6 point decline in effective tax rate in the yearended March 31, 2006.
For further information, see Note 21, “INCOME TAXES.”
Mitsui was under an audit by the Tokyo Regional Taxation Bureau with regard to transfer price taxation inconnection with the North West Shelf LNG Project in Western Australia for the period of six fiscal years fromthe year ended March 31, 2000 to the year ended March 31, 2005.
On June 30, 2006, Mitsui received a notice of tax assessment from the Tokyo Regional Taxation Bureau forthe one year ended March 31, 2000.
81
According to the notice of tax assessment, the taxable income was corrected by ¥4.9 billion and theadditional tax liabilities for the Corporation Tax, Enterprise Tax and Inhabitant Tax, including penalties andinterests, are ¥2.4 billion. See Note 30, “UNAUDITED SUBSEQUENT EVENT.” These additional taxes andcharges were reflected into the operating results for the first quarter of the year ending March 31, 2007.
Following receipt of notice of tax assessment and payment of the relevant taxes and charges, Mitsui filed anappeal with the Tokyo Regional Taxation Bureau. Mitsui is currently preparing a request for a mutual agreementprocedure pursuant to the provision in the tax treaty between Japan and Australia.
While we are entirely unconvinced by the basis of tax assessment for this matter, we can not definitelypredict the probability or amounts of any tax assessment for the remaining five fiscal years.
Minority Interests in Earnings of Subsidiaries
For the year ended March 31, 2006, minority interests in earnings of subsidiaries were ¥21.5 billion, anincrease of ¥3.9 billion, or 22.2%, from ¥17.6 billion for the year ended March 31, 2005. Major factors areprovided below.
‰ In the Iron & Steel Raw Materials and Non-Ferrous Metals Segment, Sesa Goa Limited (India) (with aminority interest of 49%) recorded a minority interest of ¥7.1 billion, an increase from ¥5.0 billion forthe year ended March 31, 2005, on the back of rises in iron ore prices.
‰ In the Chemical Segment, P.T. Kaltim Pasifik Amoniak (Indonesia) (with a minority interest of 45%)recorded a minority interest of ¥2.5 billion, an increase from ¥1.1 billion for the year ended March 31,2005, on the back of higher ammonia prices.
Equity in Earnings of Associated Companies—Net (After Income Tax Effect)
For the year ended March 31, 2006, equity in earnings of associated companies—net (after income taxeffect) was ¥94.2 billion, a significant increase of ¥29.9 billion, or 46.5%, from ¥64.3 billion for the year endedMarch 31, 2005.
Among others, the Energy Segment and the Iron & Steel Raw Materials and Non-Ferrous Metals Segmentrecorded increases over their steady earnings for the year ended March 31, 2005, driven by rising prices andincreasing transaction volume of energy and mineral resources.
‰ In the Energy Segment, earnings increased at Japan Australia LNG (MIMI) Pty, Ltd. (Australia) whichis involved in natural gas, crude oil and condensate exploration, development and marketing in WestAustralia, due to rising oil prices and increased production from the start-up of the fourth LNGproduction train in August 2004. Mitsui Oil Exploration Co., Ltd. (Japan) which is chiefly engaged inthe production of gas and crude oil in offshore Thailand, also recorded an increase to ¥5.9 billion for theyear ended March 31, 2006 from ¥2.7 billion for the year ended March 31, 2005, mainly due to the risesin oil prices. Also, Sakhalin Energy Investment Company Ltd. (Bermuda) increased earnings on risingcrude oil prices.
‰ In the Iron & Steel Raw Materials and Non-Ferrous Metals Segment, earnings of Valepar S.A. (Brazil),a holding company of the Brazilian iron ore and mineral resources company Companhia Vale do RioDoce (“CVRD”), and Robe River Mining Company Pty. Ltd. (Australia), an iron ore mining company,increased to ¥14.6 billion and ¥9.0 billion, respectively, for the year ended March 31, 2006, from ¥6.4billion and ¥4.8 billion, respectively, for the year ended March 31, 2005.
‰ In the Machinery & Infrastructure Projects Segment, a full-year contribution of IPM Eagle LLP (UnitedKingdom), which became an associated company (equity method investee) from the third quarter of theyear ended March 31, 2005, resulted in an increase in earnings.
82
Income (Loss) from Discontinued Operations—Net (After Income Tax Effect)
For the year ended March 31, 2006, income (loss) from discontinued operations—net (after income taxeffect) was income of ¥1.2 billion, a ¥6.0 billion decrease from income of ¥7.2 billion recorded for the yearended March 31, 2005.
‰ The primary component of discontinued operations for the year ended March 31, 2006 was ArcadiaPetroleum Ltd. (United Kingdom), a crude oil trading subsidiary reported in the Energy Segment andthe Europe Segment. While Arcadia Petroleum Ltd. had been trading physical crude oil as well as futureoil and oil derivatives, its expanding activity under booming oil prices exposed us to larger risks, such asmarket risk, and would require us to invest additional operating resources. As a result of an overallreview of the business model of Arcadia Petroleum Ltd. and our business portfolio, we decided to sellall the shares of Arcadia Petroleum Ltd. to a new owner. We sold all shares during the year endedMarch 31, 2006. The income from discontinued operation of Arcadia Petroleum Ltd. was minimal forthe year ended March 31, 2006 and ¥6.0 billion for the year ended March 31, 2005.
‰ The primary component of discontinued operations for the year ended March 31, 2005 is Shirasagi GolfClub Co., Ltd. (Japan), a subsidiary reported in the All Other Segment. Shirasagi Golf Club Co., Ltd.had been engaged in the operation of a membership golf club in Japan, which had reported consecutivelosses since the opening of the golf club because both the number of customers and the average sale percustomer had declined. In these business conditions, as it was very unlikely that Shirasagi Golf ClubCo., Ltd. would be able to improve its earnings and pay off its debts in the future, Mitsui disposed ofother than by sales the operation during the year ended March 31, 2005. For the year ended March 31,2005, the income from discontinued operation of Shirasagi Golf Club Co., Ltd. was ¥0.7 billion,partially reversing losses in previous years.
For additional information about our discontinued operations, see Note 4, “DISCONTINUEDOPERATIONS.”
Summary of Operations for the Year Ended March 31, 2005
Operating Environment
The global economy continued the steady improvement that began in the middle of the year endedMarch 31, 2004. Principal developments in the economic environment that influenced our results of operationsduring the year ended March 31, 2005 included the following:
‰ The global economy expanded steadily, driven by growth in the United States as well as emergingcountries in Asia, particularly China, and other regions. Contributing factors included higherconsumption and housing investment resulting from historically low interest rates as well asacceleration of demand for motor vehicles and firm infrastructure developments in emerging economies.
‰ These factors contributed to a substantial increase in global trade, supported by very strong demandfrom Asia, particularly China, and spurred the rising trend in commodity prices such as crude oil, ironore, coal and non-ferrous metals since the previous fiscal year.
‰ The Japanese economy continued to recover in the first half of the year under review, underpinned bystrong exports to high-growth areas of Asia, and higher capital expenditure as corporate earningsimproved in Japan. In the second half of the fiscal year, however, economic recovery slowed downespecially in the manufacturing sector in response to inventory adjustments in the home electronicequipment and IT-related markets as well as concerns about oil price rise.
‰ The Bank of Japan continued its quantitative easing policy, and short-term interest rates remained verylow. In the United States, meanwhile, the FRB began progressively raising interest rates beginning inJune 2004 in order to restrain inflationary expectations.
83

Summary of Operations for the Year Ended March 31, 2005
For the year ended March 31, 2005, we recorded net income of ¥121.1 billion, an increase of ¥52.7 billion,or 77.0%, from ¥68.4 billion recorded for the year ended March 31, 2004. As outlined below, gross profit andequity in earnings of associated companies made significant contributions, while the increase in net other incomeand expenses was relatively small.
‰ Gross profit increased by ¥97.9 billion, or 16.0%, to ¥708.9 billion for the year ended March 31, 2005,compared with ¥611.0 billion for the year ended March 31, 2004. Overseas subsidiaries in the Iron &Steel Raw Materials and Non-Ferrous Metals Segment generated higher gross profit due to price risesand increased shipments of iron ore and coal while gross profit grew in the Energy Segment supportedby higher crude oil prices. In addition, market transactions in areas such as commodity derivatives andoil trading performed well.
‰ Net other income and expenses increased ¥22.3 billion, or 4.3%, to ¥539.9 billion for the year endedMarch 31, 2005, compared to ¥517.6 billion for the year ended March 31, 2004.
— Compensation and other charges related to DPF incident of ¥36.0 billion was recorded for userresponse plans including free product replacement and compensation for relevant subsidy providersrelating to DPFs, which is discussed in “Discussion and Analysis of Operating Results for the YearEnded March 31, 2005—Compensation and Other Charges Related to DPF incident” below.
— Selling, general and administrative expenses increased ¥20.2 billion in the year ended March 31,2005, largely because there was no government grant for the transfer of the substitutional portion ofthe EPF, compared to ¥17.2 billion recorded in the year ended March 31, 2004.
— With regard to loss on write-down of securities and other expense—net, the figures recorded inthese categories for the year under review reflect the absence of large one-time expenses such asthose recorded in the year ended March 31, 2004 of ¥21.7 billion for the write-down of securitiesrelating to investment in the Japanese telecommunications carrier POWERDCOM, Inc. and ¥13.7billion for the settlement of an antitrust lawsuit filed against a feed ingredient manufacturingsubsidiary Bioproducts, Inc. (United States).
‰ Equity in earnings of associated companies rose by ¥24.2 billion, or 60.3%, to ¥64.3 billion for the yearended March 31, 2005, compared with ¥40.1 billion for the year ended March 31, 2004. As was the casewith gross profit, this reflected the strong performance of associated companies in the Iron & Steel RawMaterials and Non-Ferrous Metals Segment and the Energy Segment that benefited from the rise incommodity prices.
Due to the increase in gross profit and equity in earnings of associated companies outlined above, netincome for the year ended March 31, 2005 from overseas subsidiaries and associated companies reached ¥117.9billion, significantly higher than ¥53.5 billion recorded for the year ended March 31, 2004.
During the year ended March 31, 2005, the U.S. dollar continued to weaken against the yen, against abackground of worsening current account and federal deficits and higher oil prices. The average U.S. dollar-yenexchange rate during the year ended March 31, 2005 was ¥107.60 = U.S.$1, representing yen appreciation of¥5.16, or 4.6%, over the average rate during the year ended March 31, 2004 of ¥112.76 = U.S.$1.
84
Discussion and Analysis of Operating Results for the Year Ended March 31, 2005 as Compared to the YearEnded March 31, 2004
Revenues
Sales of Products
During the year ended March 31, 2005, sales of products were ¥2,964.1 billion, an increase of ¥485.6billion, or 19.6%, from ¥2,478.5 billion for the year ended March 31, 2004. The major reasons classified byproducts are as follows:
‰ Revenues from sales of Chemicals rose ¥208.1 billion principally because of increases in Mitsui’s salesof petrochemical products, reflecting higher prices for petroleum products due to higher crude oil prices,and increases in volume driven by the strong demand in China and other Asian countries.
‰ Revenues from sales of Energy increased by ¥86.3 billion. The average crude oil price (basis of JapanCrude Cocktail) during the year ended March 31, 2005 was U.S.$36 per barrel, compared to U.S.$29 forthe year ended March 31, 2004, driven by strong demand from China and uncertainty in supply from theMiddle East and other areas. In this environment, revenues from sales of crude oil and oil productsincreased at Westport Petroleum Inc. (United States) and revenues increased domestically as oil productsales companies, Mitsui Oil Co., Ltd. (Japan) and Kokusai Oil & Chemical Co., Ltd. (Japan) were ableto transfer higher crude oil cost in their wholesale and retail pricing.
‰ Revenues from sales of Iron and Steel increased ¥85.4 billion. In the year ended March 31, 2005, withlong-term contract prices for iron ore 18.6% higher than in the year ended March 31, 2004, subsidiariesin mineral resources business such as Sesa Goa Limited (India) and Mitsui Iron Ore Development Pty.Ltd. (Australia) achieved higher revenues. Also, supported by a strong market for steel products inNorth America, China and elsewhere in Asia, Champions Pipe & Supply, Inc. (United States), engagedin oil pipe sales, recorded higher revenues.
Sales of Services
Sales of services include the revenues from trading margins and commissions related to various tradingtransactions in which we act as a principal or an agent. Specifically, we charge a commission for the performanceof various services such as logistic and warehouse services, information and communication services andtechnical support. For some back-to-back sales and purchase transactions of products, we act as a principal andrecord the net amount of sales and purchase prices as revenues. We also facilitate conclusion of the contractsbetween manufacturers and customers and deliveries of the products between suppliers and customers.
For the year ended March 31, 2005, sales of services were ¥434.1 billion, an increase of ¥10.8 billion, or2.6%, from ¥423.3 billion for the year ended March 31, 2004. Principal reasons for this increase included higherrevenues from information and communications services accompanying the acquisition of former associatedcompany NextCom K.K. (Japan) during the year ended March 31, 2005, and strong performance in cell phonesales at Telepark Corp. (Japan).
Other Sales
Other sales principally include the revenues from derivative commodity instruments and derivative financialinstruments held for trading purposes, the revenues from leasing activities of real estate, aircraft, ocean transportvessels, rolling stock and equipment and the revenues from external consumer financing.
For the year ended March 31, 2005, other sales were ¥96.4 billion, an increase of ¥27.7 billion, or 40.3%,from ¥68.7 billion for the year ended March 31, 2004, which was primarily attributable to:
‰ Derivative trading revenues were ¥32.0 billion for the year ended March 31, 2005, an increase of ¥13.6billion from ¥18.4 billion for the year ended March 31, 2004. The principal reason for this increase wasstrong energy derivatives trading at Mitsui & Co. Energy Risk Management Ltd. (United Kingdom) inthe context of extremely high volatility in the crude oil market; and
85
‰ Leasing revenues were ¥55.4 billion for the year ended March 31, 2005, an increase of ¥13.2 billionfrom ¥42.2 billion for the year ended March 31, 2004.
Gross Profit
Gross Profit Classified by Category of Revenues
For the year ended March 31, 2005, gross profit was ¥708.9 billion, an increase of ¥97.9 billion, or 16.0%,from ¥611.0 billion for the year ended March 31, 2004. The GP ratio for the year ended March 31, 2005 was20.3%, a decrease of 0.3 points compared to the year ended March 31, 2004. Changes in gross profit and GP ratioclassified by category of revenues are set forth below:
Billions of Yen
Years Ended March 31,
2005 2004 Change
Gross Profit GP Ratio Gross Profit GP Ratio Gross Profit GP Ratio
Gross Profit from Sales of Products . . . . . . ¥293.9 9.9% ¥195.2 7.9% ¥ 98.7 2.0%Gross Profit from Sales of Services . . . . . . 365.3 84.2% 382.2 90.3% (16.9) (6.1)%Gross Profit from Other Sales . . . . . . . . . . . 49.7 51.6% 33.6 48.9% 16.1 2.7%
Total . . . . . . . . . . . . . . . . . . . . . . . . . . . . . . ¥708.9 20.3% ¥611.0 20.6% ¥ 97.9 (0.3)%
The GP ratio from sales of products for the year ended March 31, 2005 was 9.9%, an increase of 2.0 pointscompared to the year ended March 31, 2004. This increase was mainly due to the rate of increase in revenue atour natural resources development subsidiaries outpacing the rate of increase in costs of revenues, due to thesurge in prices for natural resources. In particular, Sesa Goa Limited (India) and Mitsui Iron Ore DevelopmentPty. Ltd. (Australia), both of which are engaged in the development and production of iron ore, saw significantincreases in gross profit driven by rising prices of iron ore, as did Mitsui Coal Holdings Pty. Ltd. (Australia)which is engaged in the development and production of metallurgical coal and thermal coal. In the product ofenergy, gross profit increased at Mitsui E&P Middle East B.V. (Netherlands) which is engaged in developmentand production of crude oil in Oman due to a major rise in crude oil prices.
The GP ratio from sales of services for the year ended March 31, 2005 was 84.2%, a decrease of 6.1 pointscompared to the year ended March 31, 2004. This decrease was mainly due to a relative increase in transactionswhere the total billed amounts were reported as revenues, compared to transactions where the net amount of salesand purchase prices were reported as revenues with GP ratios of 100%. Specifically, NextCom K.K. (Japan),formerly an associated company, became a subsidiary in the third quarter of the year ended March 31, 2005,which resulted in an increase in the transactions for which gross billed amounts are reported as revenue innetwork configuration, operation and maintenance services. Also at Mitsui, an increase in such transactions wasrecorded in the logistic services business. Moreover, at Mitsui and many of its subsidiaries, transactions reportedbased on net amounts, where we assume a low degree of related risks and rewards declined relatively.
The GP ratio in other sales for the year ended March 31, 2005 was 51.6%, an increase of 2.7 pointscompared to the year ended March 31, 2004. This increase was mainly due to a major increase in revenues fromderivative commodity instruments held for trading purpose reported in net amount, principally an increase inrevenues from energy derivative transactions at Mitsui & Co. Energy Risk Management Ltd. (United Kingdom)and commodities derivative and foreign exchange transactions at Mitsui, generally driven by the extremely highvolatility in the crude oil markets.
86
Gross Profit Classified by Operating Segment
For the year ended March 31, 2005, the growth in gross profit was attributable to the operating segments asset forth below:
‰ The Iron & Steel Raw Materials and Non-Ferrous Metals Segment recorded significant increases, as themarket for metal raw materials rose on strong demand from Asia, particularly China, along with anincrease in transaction volume. For the year ended March 31, 2005, iron ore prices under long termcontracts rose 18.6%. Sesa Goa Limited (India) and Mitsui Iron Ore Development Pty. Ltd. (Australia)recorded major increases. And Mitsui Coal Holdings Pty. Ltd. (Australia), which is involved in thedevelopment of metallurgical coal and thermal coal, also increased gross profit.
‰ In the Energy Segment, Arcadia Petroleum Ltd. (United Kingdom) generated significant profit increasesas a result of focusing on crude oil trading after reporting losses on petroleum product trading in theyear ended March 31, 2004. Mitsui E&P Middle East B.V. (Netherlands), which is engaged in crude oilproduction in Oman, and Mittwell Energy Resources Pty. Ltd. (Australia), our crude oil and condensatefocused subsidiary, saw increased gross profit reflecting rising oil prices.
• In the Logistics & Financial Markets Segment, Mitsui & Co. Energy Risk Management Ltd. (UnitedKingdom) generated increases in energy derivative trading reflecting the extremely high volatility in thecrude oil market. Mitsui’s commodities derivative and foreign exchange transactions also producedgood results.
‰ In the Iron and Steel Products Segment, Regency Steel Asia Pte Ltd. (Singapore) and Mitsui recordedincreases, as the market for steel products rose on strong demand from Asia, particularly in China. Steelproducts operations for the year ended March 31, 2005 generally maintained similar levels oftransaction volume to the year ended March 31, 2004, amid price rises and tight demand.
‰ In the Foods & Retail Segment, Mitsui’s commodity trading including grain and raw sugar contributedto the increase in gross profit. Moreover, as Mitsui Norin Co., Ltd. (Japan) became a subsidiary from thesecond quarter of the year ended March 31, 2004, gross profit for the year ended March 31, 2005—thefirst year of a full-year contribution—rose ¥5.1 billion compared to the year ended March 31, 2004. TheLifestyle, Consumer Service and Information, Electronics & Telecommunication Segment was firm onthe sale of large-scale commercial facilities and residential subdivisions by MBK Real Estate Ltd.(United States), along with NextCom K.K. (Japan) which became a subsidiary from the third quarter ofthe year ended March 31, 2005.
‰ In the Americas Segment, there were broad expansions in gross profit at steel product subsidiariesincluding Mitsui Steel Development Co., Inc. (United States) driven by active demand and firm marketprices. Portac, Inc. (United States), our lumber and lumber products subsidiary, also saw increased grossprofit on surging lumber prices.
Gross profit rose ¥19.9 billion for subsidiaries acquired or established from the second quarter of the yearended March 31, 2004 to the end of the year ended March 31, 2005 compared to the year ended March 31, 2004.Those subsidiaries include NextCom K.K. (Japan), formerly an associated company which became a subsidiaryin the third quarter of the year ended March 31, 2005, and Mitsui Norin Co. Ltd. (Japan) as mentioned above.
Selling, General and Administrative Expenses
Selling, general and administrative expenses for the year ended March 31, 2005 were ¥509.6 billion, anincrease of ¥20.2 billion, or 4.1%, from ¥489.4 billion for the year ended March 31, 2004. The main reasons forthis change are listed below:
‰ Personnel expenses were ¥250.9 billion for the year ended March 31, 2005, a decrease of ¥7.2 billionfrom ¥258.1 billion for the year ended March 31, 2004. Personnel expenses at Mitsui improvedsignificantly because of a ¥19.2 billion reduction in amortization of unrecognized net actuarial loss, and
87
operating results for the year ended March 31, 2005 were not impacted by a ¥10.5 billion settlement lossrecorded during the year ended March 31, 2004 in relation to the completion of the transfer to theJapanese government of the substitutional portion of the Mitsui’s EPF. Meanwhile, there was aconsiderable increase in personnel expenses mainly at overseas subsidiaries. Especially, personnelexpenses at Mitsui & Co. Energy Risk Management Ltd. (United Kingdom), on the back of majorincreases in gross profit from commodities trading, rose ¥4.6 billion due to large increases inperformance linked bonuses to traders.
‰ Communication and information expenses were ¥38.3 billion for the year ended March 31, 2005, anincrease of ¥5.1 billion over ¥33.2 billion for the year ended March 31, 2004. This increase resultedfrom the introduction of a new enterprise resource planning system and implementation of a totaloverhaul of office automation equipment in Mitsui.
‰ Selling, general and administrative expenses other than personnel and communication and informationexpenses were ¥174.8 billion in the year ended March 31, 2005, an increase of ¥22.0 billion from¥152.8 billion for the year ended March 31, 2004. There was an increased expense of ¥7.4 billion atdomestic subsidiaries, mainly due to the ¥3.0 billion increases at the above-mentioned Mitsui Norin Co.,Ltd. (Japan). Telepark Corp. (Japan) also recorded an increase of ¥1.9 billion reflecting the expandedcell phone business. Overseas subsidiaries recorded an increase of ¥7.9 billion, including ¥1.0 billion atP.T. Bussan Auto Finance (Indonesia), reflecting an expansion in business activities. There was also anincreased expense of ¥6.4 billion including office administration costs and various stamp duties.
In the same manner as gross profit, selling, general and administrative expenses rose ¥14.6 billion atsubsidiaries acquired or established from the second quarter of the year ended March 31, 2004 to the end of theyear ended March 31, 2005.
Provision for Doubtful Receivables
Provision for doubtful receivables for the year ended March 31, 2005 was ¥8.8 billion, a reduction of ¥1.1billion, or 11.1%, from ¥9.9 billion for the year ended March 31, 2004. In both years ended March 31, 2005 and2004, provision for doubtful receivables consisted mainly of individually small provisions for a number ofcustomers. Of those, the major provisions for doubtful receivables in the year ended March 31, 2005 included a¥0.9 billion provision for a machinery-related domestic customer, while overseas there was a ¥0.8 billionprovision for an overseas customer of Mitsui & Co. Energy Risk Management Ltd. (United Kingdom).
The major provisions for doubtful receivables for the year ended March 31, 2004 included provisionsagainst overseas customers for machinery related transactions, and provisions for domestic and overseascustomers in the steel products business.
Interest Income and Interest Expense
Interest income for the year ended March 31, 2005 was ¥35.5 billion, an increase of ¥5.5 billion, or 18.3%,from the ¥30.0 billion for the year ended March 31, 2004. Interest expenses were ¥43.4 billion, an increase of¥7.8 billion, or 21.9%, from ¥35.6 billion for the year ended March 31, 2004. As a result, interest expense, net ofinterest income was ¥7.9 billion, an increase of ¥2.3 billion, or 41.1%, from ¥5.6 billion for the year endedMarch 31, 2004. A breakdown of the principal changes for the year ended March 31, 2005 is as follows:
‰ At Mitsui Sakhalin Holdings B.V. (Netherlands), investments increased to Sakhalin Energy InvestmentCompany Ltd. (Bermuda), and interest expenses rose ¥1.8 billion on the resultant increase inborrowings; and
‰ Interest expenses at Mitsui & Co. (U.S.A), Inc. (United States) rose ¥1.7 billion reflecting a rise in U.S.dollar interest rates.
88
Interest rate trends for the year ended March 31, 2005 for the Japanese yen and U.S. dollar, the majorcurrencies in which we have borrowings, are as follows:
‰ The average of the month-end Japanese yen three-month LIBOR remained 0.05%, roughly unchangedfrom the 0.06% during the year ended March 31, 2004, as the Bank of Japan maintained its existing verylow interest rate policy. The average interest rate on 10-year Japanese Government Bonds was 1.52%,rising from the 1.16% during the year ended March 31, 2004, as yields slipped gradually in line with theemergence of perceptions of a slowing in the business cycle, after a rise to 1.9% in June 2004 on theback of an improvement in global business sentiment; and
‰ The average of the month-end U.S. dollar three-month LIBOR during the year ended March 31, 2005was 2.13%, up from the 1.16% during the year ended March 31, 2004, reflecting the gradual rise in theFederal Funds target rate to 3.0% by the FRB in the period between June 2004 and May 2005, even asthe FRB maintained its easing stance.
Dividend Income
Our dividend income for the year ended March 31, 2005 was ¥24.6 billion, an increase of ¥6.2 billion, or33.7%, from ¥18.4 billion for the year ended March 31, 2004. Dividends from LNG projects in the Middle East(Abu Dhabi, Oman and Qatar) were ¥12.8 billion, a ¥4.7 billion increase from the ¥8.1 billion for the year endedMarch 31, 2004, reflecting their strong performance due to higher oil prices.
Government Grant for Transfer of Substitutional Portion of EPF
On March 12, 2004, Mitsui completed the transfer of the substitutional portion of EPF, which is a definedbenefit pension program established under the Welfare Pension Insurance Law, to the Japanese government. As aresult, in the year ended March 31, 2004 a government grant for transfer of the substitutional portion of EPF of¥17.2 billion was recorded. The grant represents the difference between the accumulated benefit obligationssettled with regard to the substitutional portion and the related government-specified portion of the plan assetsthat were transferred. For information concerning the accounting for the transfer of the substitutional portion ofEPF, see Note 14, “PENSION COSTS AND SEVERANCE INDEMNITIES.”
Gain on Sales of Securities—Net
The net realized gain on sales of securities for the year ended March 31, 2005 was ¥34.8 billion, an increaseof ¥7.3 billion, or 26.5% from ¥27.5 billion for the year ended March 31, 2004.
The following is a breakdown of main points related to net gains on sales of securities for the year endedMarch 31, 2005.
‰ In the Lifestyle, Consumer Service and Information, Electronics & Telecommunication Segment, wereported a ¥7.2 billion gain on the sale of shares in Vodafone K.K., a Japanese cell-phone carrier, inresponse to a tender offer, and a ¥4.1 billion gain in Telepark Corp. (Japan), a subsidiary engaged insales of mobile devices and fixed telecommunication lines, following its initial public offering on theSecond Section of the Tokyo Stock Exchange. Also in December 2004, in connection with the merger ofa former associated company NextCom K.K., a software development and marketing subsidiary BSICo., Ltd., and a data telecommunications equipment marketing subsidiary ADAM NET Ltd., Mitsui wasallotted shares in NextCom K.K. (Japan) in exchange for shares in two subsidiaries and recorded a ¥3.7billion gain from the exchange of shares of those two subsidiaries.
‰ In the Chemical Segment and the Other Overseas Areas Segment, we sold shares in BangkokPolyethylene Public Company Limited (Thailand), a maker of high density polyethylene, and recorded again of ¥3.9 billion.
89

In the year ended March 31, 2004, we recorded a gain of ¥6.7 billion from the sale of shares of SKY PerfectCommunications Inc. in the Lifestyle, Consumer Service and Information, Electronics & TelecommunicationSegment, a gain of ¥4.4 billion from the sale of Caemi Mineraçã o e Metalurgia S.A. in the Iron & Steel RawMaterials and Non-Ferrous Metals Segment, and a gain of ¥1.0 billion from the sale of MODEC Inc. in theMachinery & Infrastructure Projects Segment.
Gain on Issuance of Stock by a Subsidiary
This was reported for the year ended March 31, 2005 only. For information, see “Discussion and Analysisof Operating Results for the Year Ended March 31, 2006.”
Loss on Write-Down of Securities
For the year ended March 31, 2005, the loss on write-down of securities was ¥16.5 billion, a decrease of¥14.5 billion, or 46.8%, from the ¥31.0 billion for the year ended March 31, 2004.
Stock prices in Japan started to rebound around May 2003 as the Japanese government’s decision to injectfunds into certain banks reduced concerns about the stability of the financial system. Stocks continued to recovertowards the end of March 2004 supported by improvements in corporate profits and gradual economic recovery.For the year ended March 31, 2005, within a narrow range between a high of ¥12,163.89 and a low of ¥10,505.05in the Nikkei Stock Average, the Japanese stock markets experienced repeated minor adjustments due to surgingcrude oil prices, concern over worldwide inflation, appreciation of the yen and a slowdown in the United Stateseconomy. However, the stock markets were underpinned by hopes for recoveries of domestic and overseaseconomies and an expansion in corporate profits. The Nikkei Stock Average closed at ¥11,668.95, ¥11,715.39,and ¥7,972.71 on March 31, 2005, 2004 and 2003, respectively.
Reflecting these developments in the stock market, the write-down of marketable securities for the yearended March 31, 2005 reduced slightly to ¥0.6 billion from ¥1.1 billion for the year ended March 31, 2004.
With respect to non-marketable securities, considering a deterioration in financial condition due to sluggishadvertising revenue, we recorded losses on shares of satellite broadcaster BS-i, INCORPORATED (not the samecompany as BSI Co., Ltd., listed under Gains on Sales of Securities—Net) and BS Japan Corporation of ¥1.9billion and ¥1.2 billion, respectively. MBK Australia Resorts Pty, Ltd. (Australia) reported a write-down of ¥1.7billion based on the estimated sale price for its investment in the Mirage Resorts business in Australia. Therewere also other instances of small losses. For the year ended March 31, 2004, we recorded a ¥21.7 billion loss onshares in POWEREDCOM, Inc, a Japanese telecommunications company, in consideration of the deterioration inits financial position, reflecting the operating loss caused by fierce price competition along with expansion of theInternet and the decrease in revenues from fixed-line business. Setting aside the ¥1.5 billion loss on shares inMitsui Denman (Ireland) Co., Ltd., write-downs of other non-marketable securities were not significant.
Gain on Disposal or Sales of Property and Equipment—Net
For the year ended March 31, 2005, gain on disposal or sales of property and equipment—net was ¥6.5billion, an increase of ¥2.4 billion, or 58.5%, over ¥4.1 billion in the year ended March 31, 2004.
In addition to a ¥3.2 billion gain from the sale of Mitsui’s corporate residences and dormitories, there was a¥1.8 billion gain from the sale of warehouses for lease by a logistics-related subsidiary, Tri-Net LogisticsManagement, Inc. (United States).
For the year ended March 31, 2004, we recorded a ¥5.7 billion gain from the sale of our corporateresidences and dormitories. Properties sold in the years ended March 31, 2005 and 2004 had been acquired longbefore the significant land price increase in Japan in the late 1980s and early 1990s. We also recorded smalllosses on the sale of aircraft and gas stations for the year ended March 31, 2004.
90

Impairment Loss of Long-Lived Assets
The impairment loss on long-lived assets for the year ended March 31, 2005 was ¥20.6 billion, a ¥0.4billion, or 2.0% decrease from ¥20.2 billion for the year ended March 31, 2004.
The main elements of impairment losses for the year ended March 31, 2005 were as follows:
‰ In the Iron & Steel Raw Materials and Non-Ferrous Metals Segment, we reported a ¥6.5 billionimpairment loss on plant facilities at an aluminum smelting subsidiary, Mitalco Inc. (United States),reflecting the rising trend of electricity costs.
‰ We recorded a ¥3.3 billion impairment loss on land for development purposes and a loss of ¥1.3 billionon land for lease, both held in Japan by Mitsui.
‰ In the Energy Segment, Mitsui Oil Co., Ltd. (Japan) recorded an impairment loss of ¥2.3 billion mainlyon gas stations.
The main elements of impairment losses for the year ended March 31, 2004 were as follows:
‰ Impairment losses on Mitsui’s corporate residences and dormitories of ¥8.0 billion were recorded due toa decline in land prices in Japan. The corporate residences and dormitories on which we recordedimpairment losses during the year ended March 31, 2004 had been acquired mainly in the early 1990s.
‰ In the Machinery & Infrastructure Projects Segment, there were impairment losses of ¥4.3 billion thatresulted from the exit from and disposal of certain business at NBI Corporation (formerly Toyo ValveCo., Ltd.) and Mitsui Bussan Machinery Co., Ltd.
‰ In the Energy Segment, Mitsui Oil Co., Ltd. (Japan) reported ¥1.7 billion in impairment losses inconnection with the restructuring of its gas stations.
For more information on impairment losses on long-lived assets, see Note 10, “IMPAIRMENT LOSS OFLONG-LIVED ASSETS,” and on our reevaluation and restructuring of subsidiaries and associated companies,see Note 25, “EXIT OR DISPOSAL ACTIVITIES.”
Compensation and Other Charges Related to DPF Incident
For the year ended March 31, 2005, Mitsui recorded ¥36.0 billion as compensation and other charges relatedto DPF incident in the Statements of Consolidated Income, consisting of a user response charge of ¥28.0 billionand subsidy compensation of ¥8.0 billion. The user response charge was estimated based on expected costs ineach user response plan, which reflects the requirement of each respective user. The subsidy compensation wasrecorded based on the amounts claimed by subsidy providers.
For more information, see Note 22, “COMPENSATION AND OTHER CHARGES RELATED TO DPFINCIDENT.”
Other Expense—Net
For the year ended March 31, 2005, other expense—net was ¥8.0 billion, a significant decrease of ¥20.7billion, or 72.1%, from ¥28.7 billion for the year ended March 31, 2004. The main elements of other expense—net for the year ended March 31, 2005 were as follows.
‰ Oil and gas development and production subsidiaries, including Wandoo Petroleum Pty. Ltd. (Australia)recorded ¥2.5 billion exploration expenses.
‰ We recorded ¥2.0 billion restructuring-related charges, mainly representing costs related to thetermination of an indemnity agreement which had been made in connection with the sale of a ceramicbuilding materials and fiberboard business at Mitsui Wood Systems, Inc. (Japan) in October 2001.
91

Other expense—net for the year ended March 31, 2004 mainly consisted of the following elements.
‰ We recorded litigation charges of ¥13.7 billion related to the settlement of an antitrust lawsuit filedagainst our subsidiary, Bioproducts, Inc. (United States), which manufactures and sells feed ingredient.
‰ We recorded ¥6.3 billion restructuring-related charges, of which main elements included a combined¥3.7 billion for Mitsui Bussan Machinery Co., Ltd. (Japan) and NBI Corporation (Japan) in theMachinery & Infrastructure Projects Segment.
For more information on other expense—net, see Note 20, “OTHER EXPENSE—NET,” and on ourrestructuring activities, see Note 25, “EXIT OR DISPOSAL ACTIVITIES.”
Income Taxes
For the year ended March 31, 2005, income taxes amounted to ¥101.8 billion, reflecting increases in incomefrom continuing operations before minority interests and equity in earnings, and recorded a major rise of ¥55.1billion, or 118.0%, from ¥46.7 billion for the year ended March 31, 2004. The effective tax rate was 60.2%, anincrease of 10.2 points from 50.0% for the year ended March 31, 2004.
This was mainly due to the impact of:
‰ increases in valuation allowance provided on deferred tax assets (an increase of 6.5 points over the yearended March 31, 2004), due mainly to the increase in valuation allowance on deferred tax assets on theimpairment loss of certain of Mitsui’s investments recorded in the past years as a result of a change in apolicy to sell certain investments; and
‰ increases in the effect of taxation on dividends (an increase of 6.2 points from the year ended March 31,2004). For further information, see Note 21, “INCOME TAXES.”
Minority Interests in Earnings of Subsidiaries
Minority interests in earnings of subsidiaries for the year ended March 31, 2005 were ¥17.6 billion, anincrease of ¥10.2 billion, or 137.8%, from ¥7.4 billion for the year ended March 31, 2004. Our major minorityinterests in earnings of subsidiaries for the year ended March 31, 2005 were ¥5.0 billion in Sesa Goa Limited(India) (with a minority interest of 49%) and ¥2.9 billion in Japan Collahuasi Resources B.V. (Netherlands) (witha minority interest of 38.1%) that owns an interest in a Chilean copper mine joint venture, Compania MineraDona Ines de Collahuasi SCM (Chile).
Our major minority interests in earnings of subsidiaries for the year ended March 31, 2004 were ¥1.5 billionin Sesa Goa Limited and ¥0.7 billion in Japan Collahuasi Resources B.V. Increases for the year ended March 31,2005 were primarily attributable to the strong performances of the above-mentioned two subsidiaries on the backof rises in prices of mineral resources.
Equity in Earnings of Associated Companies—Net (After Income Tax Effect)
For the year ended March 31, 2005, equity in earnings of associated companies—net (after income taxeffect) posted a gain of ¥64.3 billion, a significant increase of ¥24.2 billion, or 60.3%, from ¥40.1 billion for theyear ended March 31, 2004.
‰ Since the second quarter of the year ended March 31, 2004, equity in earnings of Valepar S.A. (Brazil),a holding company of the Brazilian iron ore and mineral resources company, Companhia Vale do RioDoce (“CVRD”), have been included. In the Iron & Steel Raw Materials and Non-Ferrous MetalsSegment, earnings of Valepar S.A. and Compania Minera Dona Ines de Collahuasi SCM (Chile)increased to ¥6.4 billion and ¥7.8 billion, respectively, for the year ended March 31, 2005, compared to¥2.5 billion and ¥1.9 billion, respectively, for the year ended March 31, 2004.
92

‰ In the Energy Segment, earnings increased significantly at Japan Australia LNG (MIMI) Pty Ltd.(Australia) which is involved in natural gas, crude oil and condensate exploration, development andmarketing in West Australia, due to rising oil prices and increased production on the back of facilityexpansion. Mitsui Oil Exploration Co., Ltd. (Japan) which is chiefly engaged in the production of gasand crude oil in offshore Thailand, also recorded an increase to ¥2.7 billion for the year endedMarch 31, 2005 from ¥1.1 billion for the year ended March 31, 2004, mainly due to rises in oil prices.Also, Sakhalin Energy Investment Company Ltd. (Bermuda) increased earnings on rising crude oilprices and an increase in production volume.
‰ In the Machinery & Infrastructure Projects Segment, P.T. Paiton Energy (Indonesia) posted earnings of¥2.9 billion for the year ended March 31, 2005, continuing the firm performance seen for the year endedMarch 31, 2004. Automobile sales associated companies overseas continued to show solid performancefor the year ended March 31, 2005. There was also a new contribution of ¥1.1 billion from United AutoGroup Inc. (United States), an automobile dealer which became an associated company during the yearended March 31, 2005.
Income (Loss) from Discontinued Operations—Net (After Income Tax Effect)
For the year ended March 31, 2005, income (loss) from discontinued operations—net (after income taxeffect) was income of ¥7.2 billion, a ¥15.9 billion improvement from the loss of ¥8.7 billion recorded for the yearended March 31, 2004. The primary components of discontinued operations for the year ended March 31, 2005are as follows:
‰ Shirasagi Golf Club Co., Ltd. (Japan), a subsidiary reported in the All Other Segment, had been engagedin the operation of a membership golf club in Japan, which had reported consecutive losses since theopening of the golf club because both the number of customers and the average sale per customer haddeclined. In these business conditions, as it was very unlikely that Shirasagi Golf Club Co., Ltd. wouldbe able to improve its earnings and pay off its debts in the future, Mitsui disposed of other than by salesthe operation during the year ended March 31, 2005. For the year ended March 31, 2005, the incomefrom discontinued operation of Shirasagi Golf Club Co., Ltd. was ¥0.7 billion, partially reversing lossesin previous years.
A breakdown of operations discontinued for the year ended March 31, 2004 was as follows:
• Takeoka Golf Club, a domestic subsidiary in the All Other Segment, which had been engaged in theoperation of a public golf club in Japan, suffered from a declining number of visitors due to keen competitionwith other golf clubs adjacent to the golf club and was disposed of by sale during the year ended March 31,2004. The business was disposed of and we recorded ¥3.5 billion in losses—net (after income tax effect). Wealso posted a loss from disposal of Global Octanes Corporation (United States) and other two subsidiaries,which had managed Global Octanes Texas Limited Partnership, and had been engaged in the manufactureand sale of Methyl Tertiary-Butyl Ether (“MTBE”), as its partners, but had dissolved the partnership anddisposed of the operations during the year ended March 31, 2004.
For additional information about our discontinued operations, see Note 4, “DISCONTINUEDOPERATIONS.”
Cumulative Effect of Change in Accounting Principle (After Income Tax Effect)
On April 1, 2003, we adopted Statement of Financial Accounting Standards (“SFAS”) No. 143, “Accountingfor Asset Retirement Obligations.” SFAS No. 143 requires entities to record the fair value of a liability for an assetretirement obligation in the period in which it is incurred. When the liability is initially recorded, the entitycapitalizes the related cost by increasing the carrying amount of the long-lived asset. We recognized the cumulativeeffect of the initial application of SFAS No. 143 as a separate line item in the Statements of Consolidated Incomeunder “Cumulative Effect of Change in Accounting Principle (After Income Tax Effect)” amounting to ¥2.3 billion
93
including our share of amounts attributable to associated companies. This represents the difference between the netamount that was recognized in the Consolidated Balance Sheets upon the retroactive application of SFAS No. 143as of April 1, 2003 and the amounts recognized in the Consolidated Balance Sheets at that date prior to theapplication of SFAS No. 143. The asset retirement obligations are principally related to the costs of dismantling andremoving mining facilities and gas production facilities owned by subsidiaries and associated companies inAustralia, which are engaged in mining operations or oil and gas producing activities.
For additional information about the cumulative effect of change in accounting principle, see Note 11,“ASSET RETIREMENT OBLIGATIONS.”
Operating Results by Operating Segment
The business units of Mitsui’s Head Office, which are organized based on “products and services,” planoverall and worldwide strategies for their products and services and conduct their worldwide operations. Thebusiness units also collaborate with overseas branches and overseas trading subsidiaries in planning andexecuting their strategies for products and regions. The overseas branches and overseas trading subsidiaries areseparate operating units, which are delegated responsibility for the business of their regions as the centers of eachparticular regional strategy and operate diversified businesses together with their subsidiaries and associatedcompanies in collaboration with the business units. Therefore, our operating segments consist of product-focusedoperating segments comprised of the business units of the Head Office and region-focused operating segmentscomprised of overseas branches and overseas trading subsidiaries.
Our operating segments have been aggregated based on the nature of the products and other criteria intoeight product-focused reportable operating segments and four region-focused reportable operating segments,totaling twelve reportable operating segments.
As we focus on mineral resources and energy projects as core areas of investment, “Iron & Steel Products”and “Iron & Steel Raw Materials and Non-Ferrous Metals” have been promoting business more independentlythan before; therefore, these operating segments, which had been aggregated in former “Metal Products &Minerals,” are now presented as separate product-focused reportable segments, starting from the year endedMarch 31, 2006. Also, identifying consumer service businesses as a growing and strengthening business area, wehave been combining business experience and expertise of Information, Electronics and TelecommunicationBusiness Unit which had been included in former “Machinery, Electronics & Information” and business unitswhich had been included in former “Consumer Products & Services,” in order to promote a broad range ofbusiness opportunities in the emerging markets such as media/information, outsourcing, retail support andmedical/health/seniors, and to develop consumer-oriented service businesses as a new source of core earnings.
Accordingly, with regard to the business units which had been included in former “Consumer Products &Services,” Lifestyle Business Unit and Consumer Service Business Unit, which aim to provide highly value-added products and services to consumers, as well as distribution and intermediary services, by convergingproducts, services and information-technology function, are aggregated with Information, Electronics andTelecommunication Business Unit and disclosed as “Lifestyle, Consumer Service and Information, Electronics &Telecommunication.”
“Foods & Retail,” which aims to meet diversifying needs of retailers with comprehensive services whileinvesting and participating in managing of retailers, is presented as a separated product-focused reportablesegment. Machinery Business Unit and Infrastructure Projects Business Unit, which had been included in former“Machinery, Electronics & Information,” are presented as “Machinery & Infrastructure Projects.”
In order to develop new business opportunities emerging with the development of network economies basedaround China, ASEAN and India, we introduced an Asian Regional Managing Directorship system. Broadauthority and responsibility to manage our businesses throughout Asia excluding Japan is delegated to theRegional Managing Director, Asia starting from the year ended March 31, 2006. Based on this change, business
94
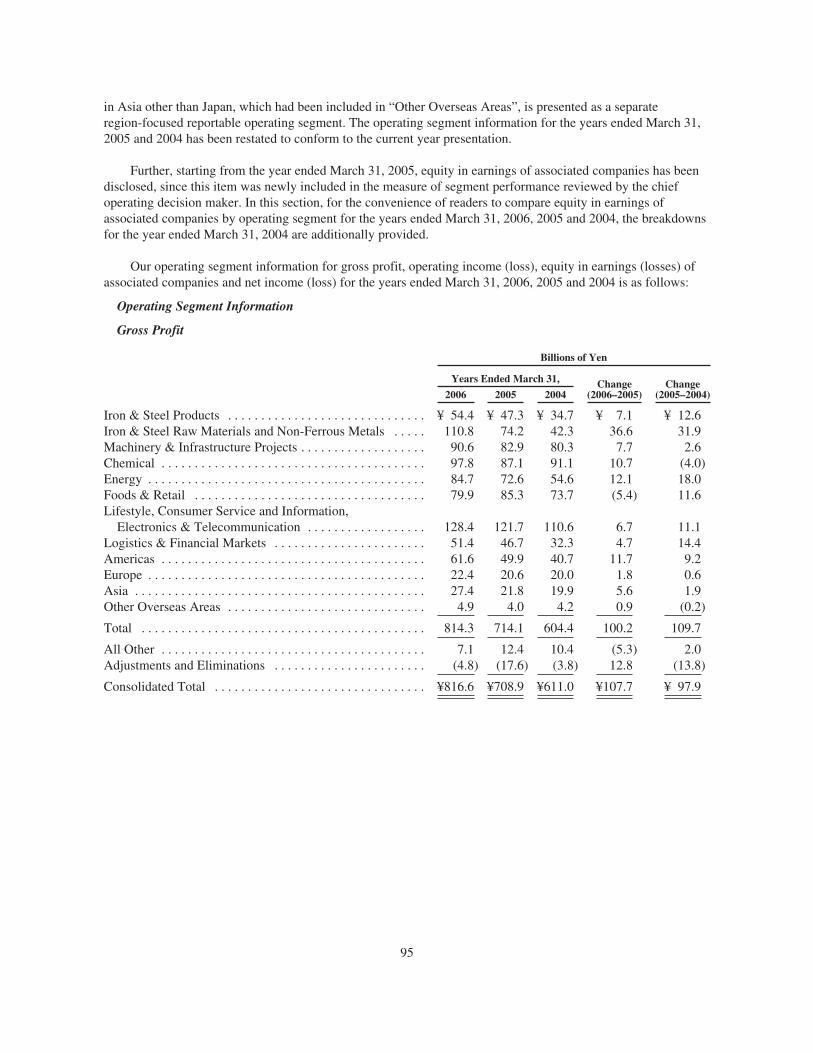
in Asia other than Japan, which had been included in “Other Overseas Areas”, is presented as a separateregion-focused reportable operating segment. The operating segment information for the years ended March 31,2005 and 2004 has been restated to conform to the current year presentation.
Further, starting from the year ended March 31, 2005, equity in earnings of associated companies has beendisclosed, since this item was newly included in the measure of segment performance reviewed by the chiefoperating decision maker. In this section, for the convenience of readers to compare equity in earnings ofassociated companies by operating segment for the years ended March 31, 2006, 2005 and 2004, the breakdownsfor the year ended March 31, 2004 are additionally provided.
Our operating segment information for gross profit, operating income (loss), equity in earnings (losses) ofassociated companies and net income (loss) for the years ended March 31, 2006, 2005 and 2004 is as follows:
Operating Segment Information
Gross Profit
Billions of Yen
Years Ended March 31, Change(2006–2005)
Change(2005–2004)2006 2005 2004
Iron & Steel Products . . . . . . . . . . . . . . . . . . . . . . . . . . . . . . ¥ 54.4 ¥ 47.3 ¥ 34.7 ¥ 7.1 ¥ 12.6Iron & Steel Raw Materials and Non-Ferrous Metals . . . . . 110.8 74.2 42.3 36.6 31.9Machinery & Infrastructure Projects . . . . . . . . . . . . . . . . . . . 90.6 82.9 80.3 7.7 2.6Chemical . . . . . . . . . . . . . . . . . . . . . . . . . . . . . . . . . . . . . . . . 97.8 87.1 91.1 10.7 (4.0)Energy . . . . . . . . . . . . . . . . . . . . . . . . . . . . . . . . . . . . . . . . . . 84.7 72.6 54.6 12.1 18.0Foods & Retail . . . . . . . . . . . . . . . . . . . . . . . . . . . . . . . . . . . 79.9 85.3 73.7 (5.4) 11.6Lifestyle, Consumer Service and Information,
Electronics & Telecommunication . . . . . . . . . . . . . . . . . . 128.4 121.7 110.6 6.7 11.1Logistics & Financial Markets . . . . . . . . . . . . . . . . . . . . . . . 51.4 46.7 32.3 4.7 14.4Americas . . . . . . . . . . . . . . . . . . . . . . . . . . . . . . . . . . . . . . . . 61.6 49.9 40.7 11.7 9.2Europe . . . . . . . . . . . . . . . . . . . . . . . . . . . . . . . . . . . . . . . . . . 22.4 20.6 20.0 1.8 0.6Asia . . . . . . . . . . . . . . . . . . . . . . . . . . . . . . . . . . . . . . . . . . . . 27.4 21.8 19.9 5.6 1.9Other Overseas Areas . . . . . . . . . . . . . . . . . . . . . . . . . . . . . . 4.9 4.0 4.2 0.9 (0.2)
Total . . . . . . . . . . . . . . . . . . . . . . . . . . . . . . . . . . . . . . . . . . . 814.3 714.1 604.4 100.2 109.7
All Other . . . . . . . . . . . . . . . . . . . . . . . . . . . . . . . . . . . . . . . . 7.1 12.4 10.4 (5.3) 2.0Adjustments and Eliminations . . . . . . . . . . . . . . . . . . . . . . . (4.8) (17.6) (3.8) 12.8 (13.8)
Consolidated Total . . . . . . . . . . . . . . . . . . . . . . . . . . . . . . . . ¥816.6 ¥708.9 ¥611.0 ¥107.7 ¥ 97.9
95

Operating Income (Loss)
Billions of Yen
Years Ended March 31, Change(2006–2005)
Change(2005–2004)2006 2005 2004
Iron & Steel Products . . . . . . . . . . . . . . . . . . . . . . . . . . . . . . ¥ 26.5 ¥ 16.3 ¥ 6.9 ¥10.2 ¥ 9.4Iron & Steel Raw Materials and Non-Ferrous Metals . . . . . 87.2 51.9 21.8 35.3 30.1Machinery & Infrastructure Projects . . . . . . . . . . . . . . . . . . . 21.7 21.6 22.1 0.1 (0.5)Chemical . . . . . . . . . . . . . . . . . . . . . . . . . . . . . . . . . . . . . . . . 34.0 24.6 31.4 9.4 (6.8)Energy . . . . . . . . . . . . . . . . . . . . . . . . . . . . . . . . . . . . . . . . . . 52.0 35.4 21.7 16.6 13.7Foods & Retail . . . . . . . . . . . . . . . . . . . . . . . . . . . . . . . . . . . 9.1 17.8 13.4 (8.7) 4.4Lifestyle, Consumer Service and Information,
Electronics & Telecommunication 25.0 24.0 17.2 1.0 6.8Logistics & Financial Markets . . . . . . . . . . . . . . . . . . . . . . . 17.6 18.5 10.4 (0.9) 8.1Americas . . . . . . . . . . . . . . . . . . . . . . . . . . . . . . . . . . . . . . . . 21.7 14.7 8.5 7.0 6.2Europe . . . . . . . . . . . . . . . . . . . . . . . . . . . . . . . . . . . . . . . . . . 4.1 2.4 3.0 1.7 (0.6)Asia . . . . . . . . . . . . . . . . . . . . . . . . . . . . . . . . . . . . . . . . . . . . 10.7 7.8 5.7 2.9 2.1Other Overseas Areas . . . . . . . . . . . . . . . . . . . . . . . . . . . . . . 1.0 0.4 0.9 0.6 (0.5)
Total . . . . . . . . . . . . . . . . . . . . . . . . . . . . . . . . . . . . . . . . . . . 310.6 235.4 163.0 75.2 72.4
All Other . . . . . . . . . . . . . . . . . . . . . . . . . . . . . . . . . . . . . . . . (3.0) (0.5) (1.9) (2.5) 1.4Adjustments and Eliminations . . . . . . . . . . . . . . . . . . . . . . . (41.8) (44.4) (32.1) 2.6 (12.3)
Consolidated Total . . . . . . . . . . . . . . . . . . . . . . . . . . . . . . . . ¥265.8 ¥190.5 ¥129.0 ¥75.3 ¥ 61.5
Equity in Earnings (Losses) of Associated Companies
Billions of Yen
Years Ended March 31, Change(2006–2005)
Change(2005–2004)2006 2005 2004
Iron & Steel Products . . . . . . . . . . . . . . . . . . . . . . . . . . . . . . ¥ 3.0 ¥ 1.7 ¥ 0.8 ¥ 1.3 ¥ 0.9Iron & Steel Raw Materials and Non-Ferrous Metals . . . . . 28.7 20.7 7.8 8.0 12.9Machinery & Infrastructure Projects . . . . . . . . . . . . . . . . . . . 14.6 10.0 5.1 4.6 4.9Chemical . . . . . . . . . . . . . . . . . . . . . . . . . . . . . . . . . . . . . . . . 3.2 2.5 (1.2) 0.7 3.7Energy . . . . . . . . . . . . . . . . . . . . . . . . . . . . . . . . . . . . . . . . . . 33.8 24.5 14.5 9.3 10.0Foods & Retail . . . . . . . . . . . . . . . . . . . . . . . . . . . . . . . . . . . 3.5 2.2 3.3 1.3 (1.1)Lifestyle, Consumer Service and Information,
Electronics & Telecommunication 3.5 (0.3) 5.5 3.8 (5.8)Logistics & Financial Markets . . . . . . . . . . . . . . . . . . . . . . . 4.0 2.5 0.2 1.5 2.3Americas . . . . . . . . . . . . . . . . . . . . . . . . . . . . . . . . . . . . . . . . 2.1 1.6 (2.5) 0.5 4.1Europe . . . . . . . . . . . . . . . . . . . . . . . . . . . . . . . . . . . . . . . . . . (0.2) 0.1 0.2 (0.3) (0.1)Asia . . . . . . . . . . . . . . . . . . . . . . . . . . . . . . . . . . . . . . . . . . . . 0.1 0.1 0.2 0.0 (0.1)Other Overseas Areas . . . . . . . . . . . . . . . . . . . . . . . . . . . . . . 0.6 0.4 0.2 0.2 0.2
Total . . . . . . . . . . . . . . . . . . . . . . . . . . . . . . . . . . . . . . . . . . . 96.9 66.0 34.1 30.9 31.9
All Other . . . . . . . . . . . . . . . . . . . . . . . . . . . . . . . . . . . . . . . . 0.3 0.4 (0.1) (0.1) 0.5Adjustments and Eliminations . . . . . . . . . . . . . . . . . . . . . . . (3.0) (2.1) 6.1 (0.9) (8.2)
Consolidated Total . . . . . . . . . . . . . . . . . . . . . . . . . . . . . . . . ¥94.2 ¥64.3 ¥40.1 ¥29.9 ¥24.2
96

Net Income (Loss)
Billions of Yen
Years Ended March 31, Change(2006–2005)
Change(2005–2004)2006 2005 2004
Iron & Steel Products . . . . . . . . . . . . . . . . . . . . . . . . . . . . . . ¥ 19.3 ¥ 11.6 ¥ 5.5 ¥ 7.7 ¥ 6.1Iron & Steel Raw Materials and Non-Ferrous Metals . . . . . 54.7 35.4 18.7 19.3 16.7Machinery & Infrastructure Projects . . . . . . . . . . . . . . . . . . . 30.6 20.9 11.0 9.7 9.9Chemical . . . . . . . . . . . . . . . . . . . . . . . . . . . . . . . . . . . . . . . . 12.1 (6.8) 11.4 18.9 (18.2)Energy . . . . . . . . . . . . . . . . . . . . . . . . . . . . . . . . . . . . . . . . . . 40.9 42.8 24.4 (1.9) 18.4Foods & Retail . . . . . . . . . . . . . . . . . . . . . . . . . . . . . . . . . . . (3.2) 10.6 10.6 (13.8) 0.0Lifestyle, Consumer Service and Information,
Electronics & Telecommunication 17.5 11.8 3.2 5.7 8.6Logistics & Financial Markets . . . . . . . . . . . . . . . . . . . . . . . 13.4 11.8 4.8 1.6 7.0Americas . . . . . . . . . . . . . . . . . . . . . . . . . . . . . . . . . . . . . . . . 12.6 12.3 0.2 0.3 12.1Europe . . . . . . . . . . . . . . . . . . . . . . . . . . . . . . . . . . . . . . . . . . 4.9 2.9 0.7 2.0 2.2Asia . . . . . . . . . . . . . . . . . . . . . . . . . . . . . . . . . . . . . . . . . . . . 9.3 8.0 6.3 1.3 1.7Other Overseas Areas . . . . . . . . . . . . . . . . . . . . . . . . . . . . . . 14.3 5.8 4.1 8.5 1.7
Total . . . . . . . . . . . . . . . . . . . . . . . . . . . . . . . . . . . . . . . . . . . 226.4 167.1 100.9 59.3 66.2
All Other . . . . . . . . . . . . . . . . . . . . . . . . . . . . . . . . . . . . . . . . 11.2 4.4 1.9 6.8 2.5Adjustments and Eliminations . . . . . . . . . . . . . . . . . . . . . . . (35.2) (50.4) (34.4) 15.2 (16.0)
Consolidated Total . . . . . . . . . . . . . . . . . . . . . . . . . . . . . . . . ¥202.4 ¥121.1 ¥ 68.4 ¥ 81.3 ¥ 52.7
Operating Income (Loss)
Operating income (loss) is included in the measure of segment performance reviewed by the chief operatingdecision maker. Operating income (loss) reflects our (a) gross profit, (b) selling, general and administrativeexpenses, (c) provision for doubtful receivables and (d) government grant for transfer of substitutionalportion of EPF, as presented in the Statements of Consolidated Income.
Iron & Steel Products Segment
Billions of Yen
Years Ended March 31, Change(2006–2005)
Change(2005–2004)2006 2005 2004
Gross Profit . . . . . . . . . . . . . . . . . . . . . . . . . . . . . . . . . . . . . . . . . ¥54.4 ¥47.3 ¥34.7 ¥ 7.1 ¥12.6Operating Income . . . . . . . . . . . . . . . . . . . . . . . . . . . . . . . . . . . . 26.5 16.3 6.9 10.2 9.4Equity in Earnings of Associated Companies . . . . . . . . . . . . . . . 3.0 1.7 0.8 1.3 0.9Net Income . . . . . . . . . . . . . . . . . . . . . . . . . . . . . . . . . . . . . . . . . 19.3 11.6 5.5 7.7 6.1
Comparison between the Years Ended March 31, 2006 and 2005
Gross profit in the Iron & Steel Products Segment for the year ended March 31, 2006 was ¥54.4 billion, anincrease of ¥7.1 billion from ¥47.3 billion for the year ended March 31, 2005. For the year ended March 31,2006, worldwide demand for steel products in general continued to stay firm. Transactions in steel tubularproducts such as oil pipes executed under tight supply-demand conditions reflecting higher oil prices; andhigh-end steel plates for shipbuilding and automobiles contributed to the increase in gross profit, especially atMitsui, although we saw weakening market conditions mainly in commodity type steel products arising fromexcessive supply from China towards the second half of the year ended March 31, 2006.
97
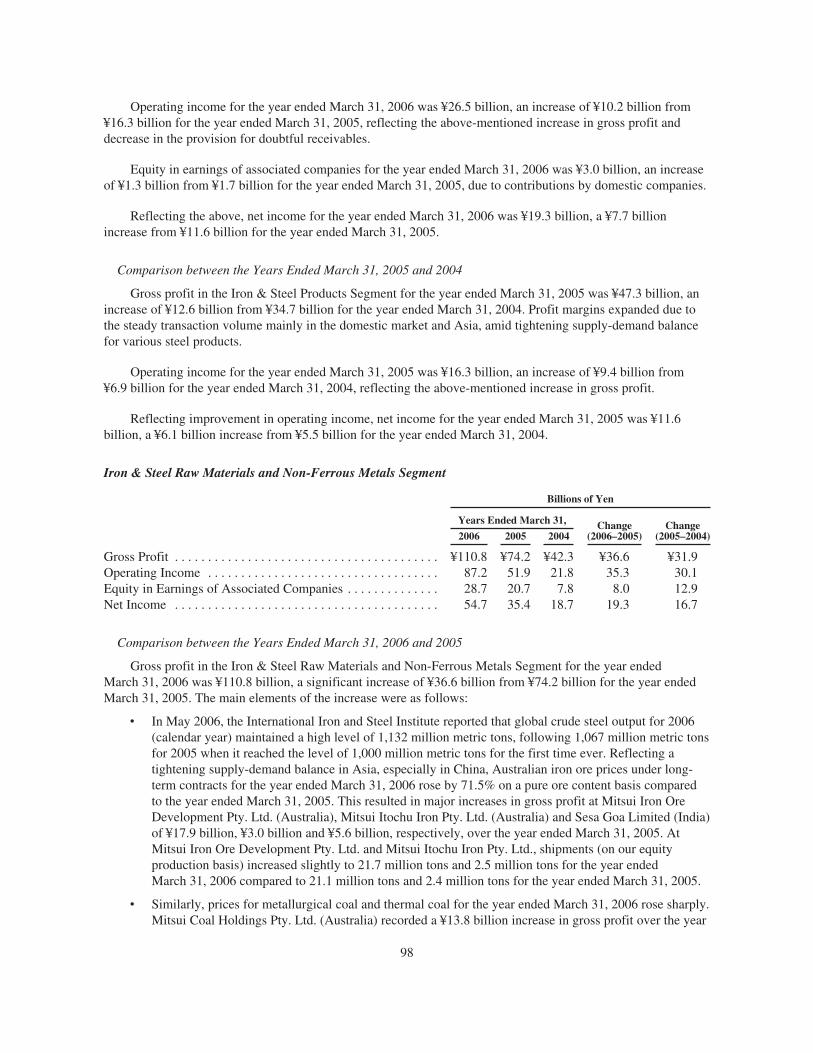
Operating income for the year ended March 31, 2006 was ¥26.5 billion, an increase of ¥10.2 billion from¥16.3 billion for the year ended March 31, 2005, reflecting the above-mentioned increase in gross profit anddecrease in the provision for doubtful receivables.
Equity in earnings of associated companies for the year ended March 31, 2006 was ¥3.0 billion, an increaseof ¥1.3 billion from ¥1.7 billion for the year ended March 31, 2005, due to contributions by domestic companies.
Reflecting the above, net income for the year ended March 31, 2006 was ¥19.3 billion, a ¥7.7 billionincrease from ¥11.6 billion for the year ended March 31, 2005.
Comparison between the Years Ended March 31, 2005 and 2004
Gross profit in the Iron & Steel Products Segment for the year ended March 31, 2005 was ¥47.3 billion, anincrease of ¥12.6 billion from ¥34.7 billion for the year ended March 31, 2004. Profit margins expanded due tothe steady transaction volume mainly in the domestic market and Asia, amid tightening supply-demand balancefor various steel products.
Operating income for the year ended March 31, 2005 was ¥16.3 billion, an increase of ¥9.4 billion from¥6.9 billion for the year ended March 31, 2004, reflecting the above-mentioned increase in gross profit.
Reflecting improvement in operating income, net income for the year ended March 31, 2005 was ¥11.6billion, a ¥6.1 billion increase from ¥5.5 billion for the year ended March 31, 2004.
Iron & Steel Raw Materials and Non-Ferrous Metals Segment
Billions of Yen
Years Ended March 31, Change(2006–2005)
Change(2005–2004)2006 2005 2004
Gross Profit . . . . . . . . . . . . . . . . . . . . . . . . . . . . . . . . . . . . . . . . ¥110.8 ¥74.2 ¥42.3 ¥36.6 ¥31.9Operating Income . . . . . . . . . . . . . . . . . . . . . . . . . . . . . . . . . . . 87.2 51.9 21.8 35.3 30.1Equity in Earnings of Associated Companies . . . . . . . . . . . . . . 28.7 20.7 7.8 8.0 12.9Net Income . . . . . . . . . . . . . . . . . . . . . . . . . . . . . . . . . . . . . . . . 54.7 35.4 18.7 19.3 16.7
Comparison between the Years Ended March 31, 2006 and 2005
Gross profit in the Iron & Steel Raw Materials and Non-Ferrous Metals Segment for the year endedMarch 31, 2006 was ¥110.8 billion, a significant increase of ¥36.6 billion from ¥74.2 billion for the year endedMarch 31, 2005. The main elements of the increase were as follows:
‰ In May 2006, the International Iron and Steel Institute reported that global crude steel output for 2006(calendar year) maintained a high level of 1,132 million metric tons, following 1,067 million metric tonsfor 2005 when it reached the level of 1,000 million metric tons for the first time ever. Reflecting atightening supply-demand balance in Asia, especially in China, Australian iron ore prices under long-term contracts for the year ended March 31, 2006 rose by 71.5% on a pure ore content basis comparedto the year ended March 31, 2005. This resulted in major increases in gross profit at Mitsui Iron OreDevelopment Pty. Ltd. (Australia), Mitsui Itochu Iron Pty. Ltd. (Australia) and Sesa Goa Limited (India)of ¥17.9 billion, ¥3.0 billion and ¥5.6 billion, respectively, over the year ended March 31, 2005. AtMitsui Iron Ore Development Pty. Ltd. and Mitsui Itochu Iron Pty. Ltd., shipments (on our equityproduction basis) increased slightly to 21.7 million tons and 2.5 million tons for the year endedMarch 31, 2006 compared to 21.1 million tons and 2.4 million tons for the year ended March 31, 2005.
‰ Similarly, prices for metallurgical coal and thermal coal for the year ended March 31, 2006 rose sharply.Mitsui Coal Holdings Pty. Ltd. (Australia) recorded a ¥13.8 billion increase in gross profit over the year
98
ended March 31, 2005, in spite of a decline in output volume and increased production cost fromsurging fuel and material costs. Prices for representative Australian metallurgical coal rose to U.S.$125per ton/FOB for the year ended March 31, 2006 compared to U.S.$57 per ton/FOB for the year endedMarch 31, 2005. Shipments by Mitsui Coal Holdings Pty. Ltd. decreased to 5.9 million tons for the yearended March 31, 2006 compared to 6.8 million tons for the year ended March 31, 2005 due to a delay instripping work caused by a labor and material shortage.
Consistent with the increase in gross profit, operating income for the year ended March 31, 2006 was ¥87.2billion, an increase of ¥35.3 billion from ¥51.9 billion for the year ended March 31, 2005.
Equity in earnings of associated companies for the year ended March 31, 2006 was ¥28.7 billion, anincrease of ¥8.0 billion from ¥20.7 billion for the year ended March 31, 2005. Major factors were as follows:
‰ Mitsui owns 18.24% of the outstanding voting shares of Valepar S.A. (Brazil), the holding company ofthe Companhia Vale do Rio Doce (“CVRD”), a Brazilian iron ore and mineral resources company.Reflecting improved operating results of CVRD, driven by rising mineral resources prices, our equity inearnings of Valepar S.A. for the year ended March 31, 2006 was ¥14.6 billion, a ¥8.2 billion increasecompared to the year ended March 31, 2005. An iron ore mining company Robe River Mining CompanyPty. Ltd. (Australia) recorded earnings of ¥9.0 billion, an improvement by ¥4.2 billion over the yearended March 31, 2005.
‰ Equity in earnings of a copper mine joint venture, Companhia Minera Dona Ines de Collahuasi SCM(Chile) was ¥3.7 billion, a ¥4.1 billion decline compared to the year ended March 31, 2005. In the yearended March 31, 2006, the investee declared dividends, so we recognized the tax effect on its retainedearnings for the additional Chilean tax charged to dividend recipients. This change outweighed thepositive effect on its operations from rising copper price. Average copper prices over the year as listedon the London Metals Exchange (“LME”) rose to U.S.$3,684 per ton/ FOB for 2005 (calendar year)from U.S.$2,868 per ton/ FOB for 2004 (calendar year).
Net income for the year ended March 31, 2006 was ¥54.7 billion, a ¥19.3 billion increase from ¥35.4 billionfor the year ended March 31, 2005. This significant increase resulted from the improvement in operating incomeand equity in earnings of associated companies.
On the other hand, considering the deterioration in the terms of the power purchase contract during thecourse of renewal negotiations, an aluminum smelting subsidiary Mitalco Inc. (United States) recorded an ¥11.8billion impairment loss on plant facilities and other expenses including impairment on goodwill of ¥2.8 billion.
Comparison between the Years Ended March 31, 2005 and 2004
Gross profit in the Iron & Steel Raw Materials and Non-Ferrous Metals Segment for the year endedMarch 31, 2005 was ¥74.2 billion, a substantial increase of ¥31.9 billion from ¥42.3 billion for the year endedMarch 31, 2004. The main factors contributing to this result were as follows:
‰ For the year ended March 31, 2005, iron ore prices under long-term contracts rose by 18.6% over theyear ended March 31, 2004, resulting in major increases in gross profit at Sesa Goa Limited (India) andMitsui Iron Ore Development Pty. Ltd. (Australia). Sesa Goa Limited in particular contributed a ¥12.2billion increase compared to the year ended March 31, 2004, supported by the expansion of sales toChina. At Mitsui Iron Ore Development Pty. Ltd., shipments (on our equity production basis) increasedto 21.1 million tons for the year ended March 31, 2005 compared to 18.3 million tons for the year endedMarch 31, 2004 on the back of expanded production at the West Angelas mine which came on line inMarch 2002.
‰ Due to the price rise for long-term contracts for thermal coal and metallurgical coal for the year endedMarch 31, 2005, Mitsui Coal Holdings Pty. Ltd. (Australia) recorded a ¥5.3 billion increase in gross
99
profit compared to the year ended March 31, 2004. Representative prices for Australian metallurgicalcoal rose to U.S.$57 per ton/FOB for the year ended March 31, 2005 compared to U.S.$47 per ton/FOBfor the year ended March 31, 2004.
Operating income for the year ended March 31, 2005 was ¥51.9 billion, a ¥30.1 billion increase from ¥21.8billion for the year ended March 31, 2004. Selling, general and administrative expenses increased, but this wassignificantly outweighed by the above-mentioned increase in gross profit.
Equity in earnings of associated companies for the year ended March 31, 2005 was ¥20.7 billion, anincrease of ¥12.9 billion from ¥7.8 billion for the year ended March 31, 2004. The main factors contributing tothis result were as follows:
‰ In the second quarter of the year ended March 31, 2004, we sold our shares in Caemi Mineraçã o eMetalurgia S.A. to CVRD at the same time as acquiring 18.24% of the outstanding voting shares inValepar S.A. (Brazil), the holding company of CVRD. Our equity in earnings of Valepar S.A. for theyear ended March 31, 2005 was ¥6.4 billion, a ¥3.9 billion increase compared to the year endedMarch 31, 2004, also reflecting the positive impact of higher mineral resource prices on its financialperformance.
‰ Our equity in earnings in the copper mine joint venture, Companhia Minera Dona Ines de CollahuasiSCM (Chile), for the year ended March 31, 2005 was ¥7.8 billion, an increase of ¥5.9 billion comparedto the year ended March 31, 2004. Average copper prices over the year as listed on the LME rose toU.S.$2,868 per ton/ FOB for 2004 (calendar year) from U.S.$1,780 per ton/ FOB for 2003 (calendaryear).
Net income for the year ended March 31, 2005 was ¥35.4 billion, a significant increase of ¥16.7 billion from¥18.7 billion for the year ended March 31, 2004, reflecting increased operating income and equity in earnings ofassociated companies, despite the following negative factors:
‰ The year ended March 31, 2005 saw reduced gains on sales of securities, reflecting the absence of the¥4.4 billion gain recorded from the sale of shares in Caemi Mineraçã o e Metalurgia S.A. for the yearended March 31, 2004.
‰ We recorded ¥6.5 billion in impairment losses on plant facilities at an aluminum smelting subsidiary,Mitalco Inc. (United States) for the year ended March 31, 2005, reflecting the rising trend of electricitycosts.
Short- and Long-Term Outlook on Prices and Supply-Demand Balance for Iron & Steel Raw Materials,and Our Equity Production
Short-Term Pricing and Supply-Demand Balance
The iron ore and coal (metallurgical coal) production joint venture businesses in Australia and other regionsin which we participate with major overseas mineral resources companies enter into supply contracts withJapanese steel makers and major clients in other countries. Based on these contracts, sales prices are reviewedand renegotiated each fiscal year. For the year ending March 31, 2007, the annual prices of iron ore and coal areas follows. (Unit prices for iron ore and coal from each mine in production also reflect the difference ofrespective grades and types.)
‰ For the year ending March 31, 2007, the annual prices of iron ore concluded by major mining housesand worldwide major users rose by 19% compared to the year ended March 31, 2006 on a pure orecontent basis. The price level reflected limited production capacities in Australia and Brazil andtightened market supply and demand balance in the face of active global demand for iron and steel rawmaterials mainly from China.
‰ Prices for representative Australian metallurgical coal declined to around U.S.$110 per ton/ FOB for theyear ending March 31, 2007, approximately 10% down from the year ended March 31, 2006.
100
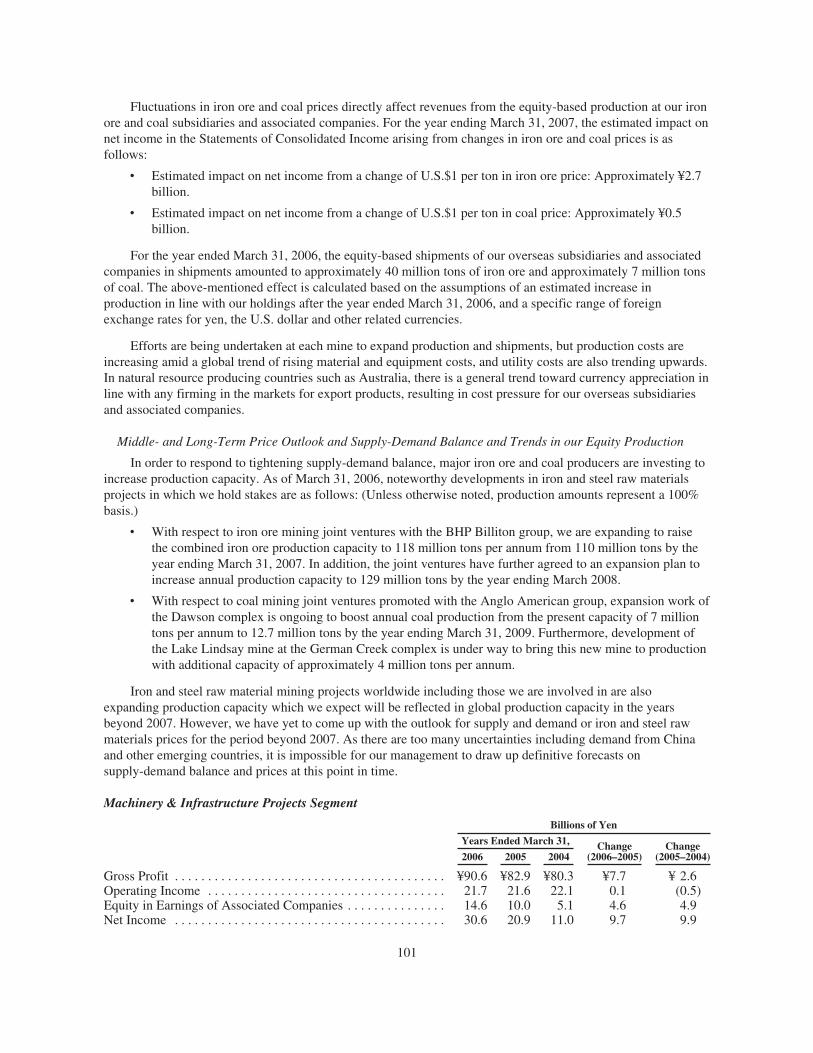
Fluctuations in iron ore and coal prices directly affect revenues from the equity-based production at our ironore and coal subsidiaries and associated companies. For the year ending March 31, 2007, the estimated impact onnet income in the Statements of Consolidated Income arising from changes in iron ore and coal prices is asfollows:
‰ Estimated impact on net income from a change of U.S.$1 per ton in iron ore price: Approximately ¥2.7billion.
‰ Estimated impact on net income from a change of U.S.$1 per ton in coal price: Approximately ¥0.5billion.
For the year ended March 31, 2006, the equity-based shipments of our overseas subsidiaries and associatedcompanies in shipments amounted to approximately 40 million tons of iron ore and approximately 7 million tonsof coal. The above-mentioned effect is calculated based on the assumptions of an estimated increase inproduction in line with our holdings after the year ended March 31, 2006, and a specific range of foreignexchange rates for yen, the U.S. dollar and other related currencies.
Efforts are being undertaken at each mine to expand production and shipments, but production costs areincreasing amid a global trend of rising material and equipment costs, and utility costs are also trending upwards.In natural resource producing countries such as Australia, there is a general trend toward currency appreciation inline with any firming in the markets for export products, resulting in cost pressure for our overseas subsidiariesand associated companies.
Middle- and Long-Term Price Outlook and Supply-Demand Balance and Trends in our Equity Production
In order to respond to tightening supply-demand balance, major iron ore and coal producers are investing toincrease production capacity. As of March 31, 2006, noteworthy developments in iron and steel raw materialsprojects in which we hold stakes are as follows: (Unless otherwise noted, production amounts represent a 100%basis.)
‰ With respect to iron ore mining joint ventures with the BHP Billiton group, we are expanding to raisethe combined iron ore production capacity to 118 million tons per annum from 110 million tons by theyear ending March 31, 2007. In addition, the joint ventures have further agreed to an expansion plan toincrease annual production capacity to 129 million tons by the year ending March 2008.
‰ With respect to coal mining joint ventures promoted with the Anglo American group, expansion work ofthe Dawson complex is ongoing to boost annual coal production from the present capacity of 7 milliontons per annum to 12.7 million tons by the year ending March 31, 2009. Furthermore, development ofthe Lake Lindsay mine at the German Creek complex is under way to bring this new mine to productionwith additional capacity of approximately 4 million tons per annum.
Iron and steel raw material mining projects worldwide including those we are involved in are alsoexpanding production capacity which we expect will be reflected in global production capacity in the yearsbeyond 2007. However, we have yet to come up with the outlook for supply and demand or iron and steel rawmaterials prices for the period beyond 2007. As there are too many uncertainties including demand from Chinaand other emerging countries, it is impossible for our management to draw up definitive forecasts onsupply-demand balance and prices at this point in time.
Machinery & Infrastructure Projects Segment
Billions of Yen
Years Ended March 31, Change(2006–2005)
Change(2005–2004)2006 2005 2004
Gross Profit . . . . . . . . . . . . . . . . . . . . . . . . . . . . . . . . . . . . . . . . . ¥90.6 ¥82.9 ¥80.3 ¥7.7 ¥ 2.6Operating Income . . . . . . . . . . . . . . . . . . . . . . . . . . . . . . . . . . . . 21.7 21.6 22.1 0.1 (0.5)Equity in Earnings of Associated Companies . . . . . . . . . . . . . . . 14.6 10.0 5.1 4.6 4.9Net Income . . . . . . . . . . . . . . . . . . . . . . . . . . . . . . . . . . . . . . . . . 30.6 20.9 11.0 9.7 9.9
101
Comparison between the Years Ended March 31, 2006 and 2005
Gross profit in the Machinery & Infrastructure Projects Segment for the year ended March 31, 2006 was¥90.6 billion, an increase of ¥7.7 billion from ¥82.9 billion for the year ended March 31, 2005. Gross profitincreased at a motorcycle retail finance subsidiary P.T. Bussan Auto Finance (Indonesia), and at overseasautomotive related operations particularly in the Americas. There were also contributions from a newly acquiredconstruction machinery sales subsidiary Road Machinery, LLC (United States).
Operating income for the year ended March 31, 2006 was ¥21.7 billion, a slight increase of ¥0.1 billionfrom ¥21.6 billion for the year ended March 31, 2005, because the increase in gross profit was largely offset byincreases in selling, general and administrative expenses at the above-mentioned subsidiaries that showed growthin gross profit.
Equity in earnings of associated companies for the year ended March 31, 2006 was ¥14.6 billion, anincrease of ¥4.6 billion from ¥10.0 billion for the year ended March 31, 2005, mainly due to the contribution ofIPM Eagle LLP (United Kingdom), which is engaged in overseas power generation businesses, and strongperformance in ship and marine project related businesses.
Net income for the year ended March 31, 2006 was ¥30.6 billion, an increase of ¥9.7 billion from ¥20.9billion for the year ended March 31, 2005, due to the above-mentioned improvements in operating income andequity in earnings of associated companies.
Comparison between the Years Ended March 31, 2005 and 2004
Gross profit in the Machinery & Infrastructure Projects Segment for the year ended March 31, 2005 was¥82.9 billion, an increase of ¥2.6 billion from ¥80.3 billion for the year ended March 31, 2004. The maincomponents of the changes in gross profit were as below:
‰ Business expansion of P.T. Bussan Auto Finance (Indonesia), a motorcycle retail finance company,resulted in growth of ¥1.7 billion. In general, overseas subsidiaries in the automotive related businessesrecorded increased gross profit.
‰ In the year ended March 31, 2004, there was a significant contribution from plant and transportationprojects such as a power station and railway project in Malaysia, and an oil refinery in Russia. In theyear ended March 31, 2005 execution of such large contracts declined and gross profit decreasedslightly.
Operating income for the year ended March 31, 2005 was ¥21.6 billion, a ¥0.5 billion decrease from the¥22.1 billion for the year ended March 31, 2004. The increase in gross profit was more than offset by increasedselling, general and administrative expenses including personnel expenses for overseas subsidiaries in theautomotive related businesses.
Equity in earnings of associated companies for the year ended March 31, 2005 was ¥10.0 billion, anincrease of ¥4.9 billion from ¥5.1 billion for the year ended March 31, 2004. P.T. Paiton Energy (Indonesia)continued to be buoyant, recording a figure of ¥2.9 billion. In addition to the favorable performance of overseasautomotive associated companies, the United Auto Group, Inc. (United States), a company which newly becamean associated company made a new contribution of ¥1.1 billion.
Net income for the year ended March 31, 2005 was ¥20.9 billion, a ¥9.9 billion increase from ¥11.0 billionfor the year ended March 31, 2004. During the year ended March 31, 2004, we reorganized the business of NBICorporation (Japan), formerly known as Toyo Valve Co., Ltd. and Mitsui Bussan Machinery Co., Ltd. (Japan),which led to impairment losses on property and equipment of ¥4.3 billion and other expense—net of ¥3.7 billion,both one-time expenses.
102
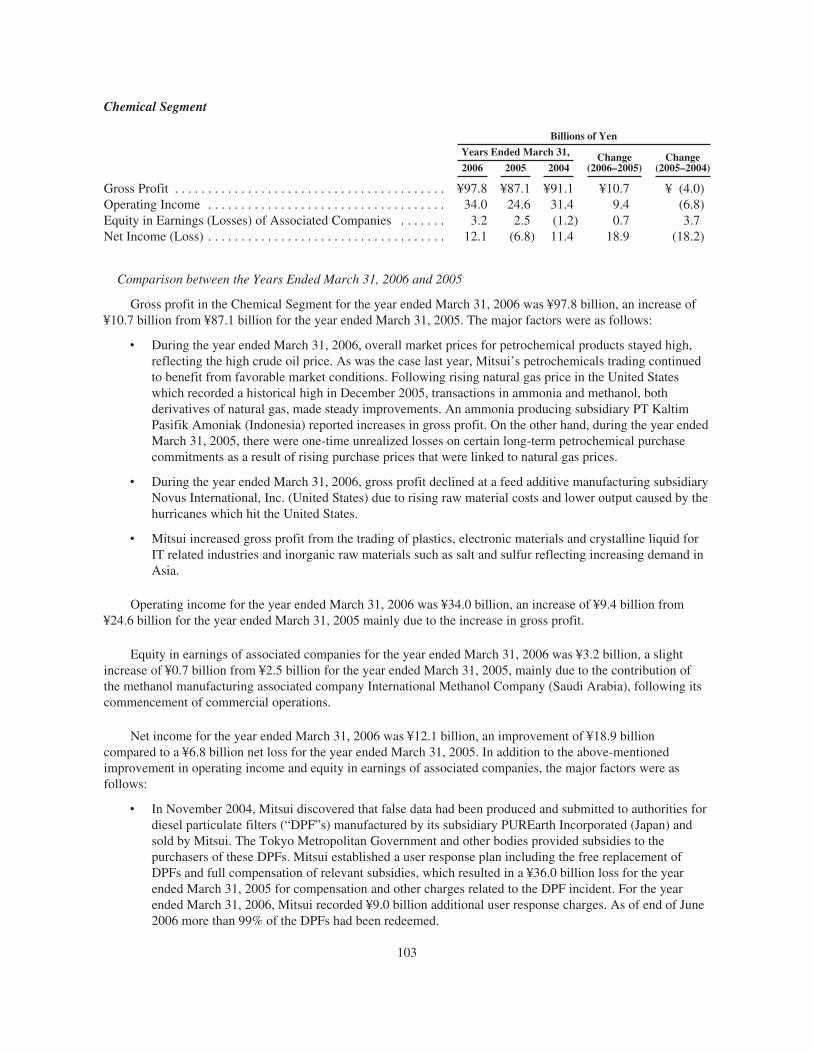
Chemical Segment
Billions of Yen
Years Ended March 31, Change(2006–2005)
Change(2005–2004)2006 2005 2004
Gross Profit . . . . . . . . . . . . . . . . . . . . . . . . . . . . . . . . . . . . . . . . . ¥97.8 ¥87.1 ¥91.1 ¥10.7 ¥ (4.0)Operating Income . . . . . . . . . . . . . . . . . . . . . . . . . . . . . . . . . . . . 34.0 24.6 31.4 9.4 (6.8)Equity in Earnings (Losses) of Associated Companies . . . . . . . 3.2 2.5 (1.2) 0.7 3.7Net Income (Loss) . . . . . . . . . . . . . . . . . . . . . . . . . . . . . . . . . . . . 12.1 (6.8) 11.4 18.9 (18.2)
Comparison between the Years Ended March 31, 2006 and 2005
Gross profit in the Chemical Segment for the year ended March 31, 2006 was ¥97.8 billion, an increase of¥10.7 billion from ¥87.1 billion for the year ended March 31, 2005. The major factors were as follows:
‰ During the year ended March 31, 2006, overall market prices for petrochemical products stayed high,reflecting the high crude oil price. As was the case last year, Mitsui’s petrochemicals trading continuedto benefit from favorable market conditions. Following rising natural gas price in the United Stateswhich recorded a historical high in December 2005, transactions in ammonia and methanol, bothderivatives of natural gas, made steady improvements. An ammonia producing subsidiary PT KaltimPasifik Amoniak (Indonesia) reported increases in gross profit. On the other hand, during the year endedMarch 31, 2005, there were one-time unrealized losses on certain long-term petrochemical purchasecommitments as a result of rising purchase prices that were linked to natural gas prices.
‰ During the year ended March 31, 2006, gross profit declined at a feed additive manufacturing subsidiaryNovus International, Inc. (United States) due to rising raw material costs and lower output caused by thehurricanes which hit the United States.
‰ Mitsui increased gross profit from the trading of plastics, electronic materials and crystalline liquid forIT related industries and inorganic raw materials such as salt and sulfur reflecting increasing demand inAsia.
Operating income for the year ended March 31, 2006 was ¥34.0 billion, an increase of ¥9.4 billion from¥24.6 billion for the year ended March 31, 2005 mainly due to the increase in gross profit.
Equity in earnings of associated companies for the year ended March 31, 2006 was ¥3.2 billion, a slightincrease of ¥0.7 billion from ¥2.5 billion for the year ended March 31, 2005, mainly due to the contribution ofthe methanol manufacturing associated company International Methanol Company (Saudi Arabia), following itscommencement of commercial operations.
Net income for the year ended March 31, 2006 was ¥12.1 billion, an improvement of ¥18.9 billioncompared to a ¥6.8 billion net loss for the year ended March 31, 2005. In addition to the above-mentionedimprovement in operating income and equity in earnings of associated companies, the major factors were asfollows:
‰ In November 2004, Mitsui discovered that false data had been produced and submitted to authorities fordiesel particulate filters (“DPF”s) manufactured by its subsidiary PUREarth Incorporated (Japan) andsold by Mitsui. The Tokyo Metropolitan Government and other bodies provided subsidies to thepurchasers of these DPFs. Mitsui established a user response plan including the free replacement ofDPFs and full compensation of relevant subsidies, which resulted in a ¥36.0 billion loss for the yearended March 31, 2005 for compensation and other charges related to the DPF incident. For the yearended March 31, 2006, Mitsui recorded ¥9.0 billion additional user response charges. As of end of June2006 more than 99% of the DPFs had been redeemed.
103
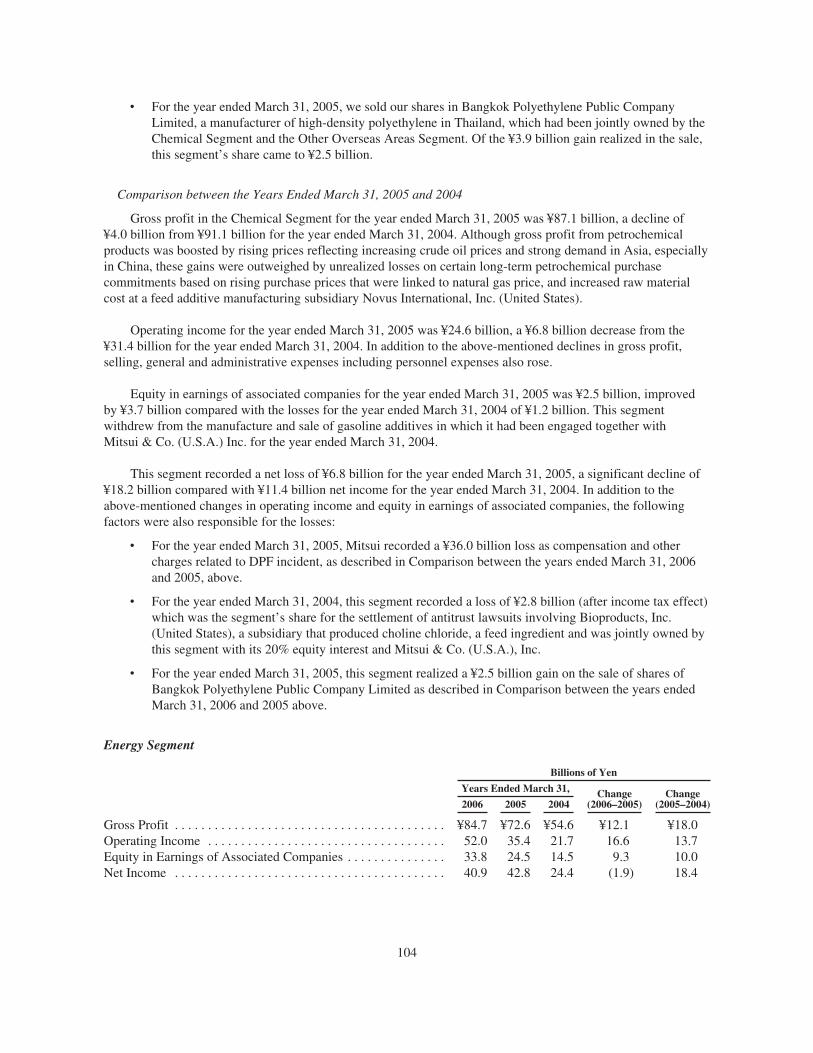
‰ For the year ended March 31, 2005, we sold our shares in Bangkok Polyethylene Public CompanyLimited, a manufacturer of high-density polyethylene in Thailand, which had been jointly owned by theChemical Segment and the Other Overseas Areas Segment. Of the ¥3.9 billion gain realized in the sale,this segment’s share came to ¥2.5 billion.
Comparison between the Years Ended March 31, 2005 and 2004
Gross profit in the Chemical Segment for the year ended March 31, 2005 was ¥87.1 billion, a decline of¥4.0 billion from ¥91.1 billion for the year ended March 31, 2004. Although gross profit from petrochemicalproducts was boosted by rising prices reflecting increasing crude oil prices and strong demand in Asia, especiallyin China, these gains were outweighed by unrealized losses on certain long-term petrochemical purchasecommitments based on rising purchase prices that were linked to natural gas price, and increased raw materialcost at a feed additive manufacturing subsidiary Novus International, Inc. (United States).
Operating income for the year ended March 31, 2005 was ¥24.6 billion, a ¥6.8 billion decrease from the¥31.4 billion for the year ended March 31, 2004. In addition to the above-mentioned declines in gross profit,selling, general and administrative expenses including personnel expenses also rose.
Equity in earnings of associated companies for the year ended March 31, 2005 was ¥2.5 billion, improvedby ¥3.7 billion compared with the losses for the year ended March 31, 2004 of ¥1.2 billion. This segmentwithdrew from the manufacture and sale of gasoline additives in which it had been engaged together withMitsui & Co. (U.S.A.) Inc. for the year ended March 31, 2004.
This segment recorded a net loss of ¥6.8 billion for the year ended March 31, 2005, a significant decline of¥18.2 billion compared with ¥11.4 billion net income for the year ended March 31, 2004. In addition to theabove-mentioned changes in operating income and equity in earnings of associated companies, the followingfactors were also responsible for the losses:
‰ For the year ended March 31, 2005, Mitsui recorded a ¥36.0 billion loss as compensation and othercharges related to DPF incident, as described in Comparison between the years ended March 31, 2006and 2005, above.
‰ For the year ended March 31, 2004, this segment recorded a loss of ¥2.8 billion (after income tax effect)which was the segment’s share for the settlement of antitrust lawsuits involving Bioproducts, Inc.(United States), a subsidiary that produced choline chloride, a feed ingredient and was jointly owned bythis segment with its 20% equity interest and Mitsui & Co. (U.S.A.), Inc.
‰ For the year ended March 31, 2005, this segment realized a ¥2.5 billion gain on the sale of shares ofBangkok Polyethylene Public Company Limited as described in Comparison between the years endedMarch 31, 2006 and 2005 above.
Energy Segment
Billions of Yen
Years Ended March 31, Change(2006–2005)
Change(2005–2004)2006 2005 2004
Gross Profit . . . . . . . . . . . . . . . . . . . . . . . . . . . . . . . . . . . . . . . . . ¥84.7 ¥72.6 ¥54.6 ¥12.1 ¥18.0Operating Income . . . . . . . . . . . . . . . . . . . . . . . . . . . . . . . . . . . . 52.0 35.4 21.7 16.6 13.7Equity in Earnings of Associated Companies . . . . . . . . . . . . . . . 33.8 24.5 14.5 9.3 10.0Net Income . . . . . . . . . . . . . . . . . . . . . . . . . . . . . . . . . . . . . . . . . 40.9 42.8 24.4 (1.9) 18.4
104
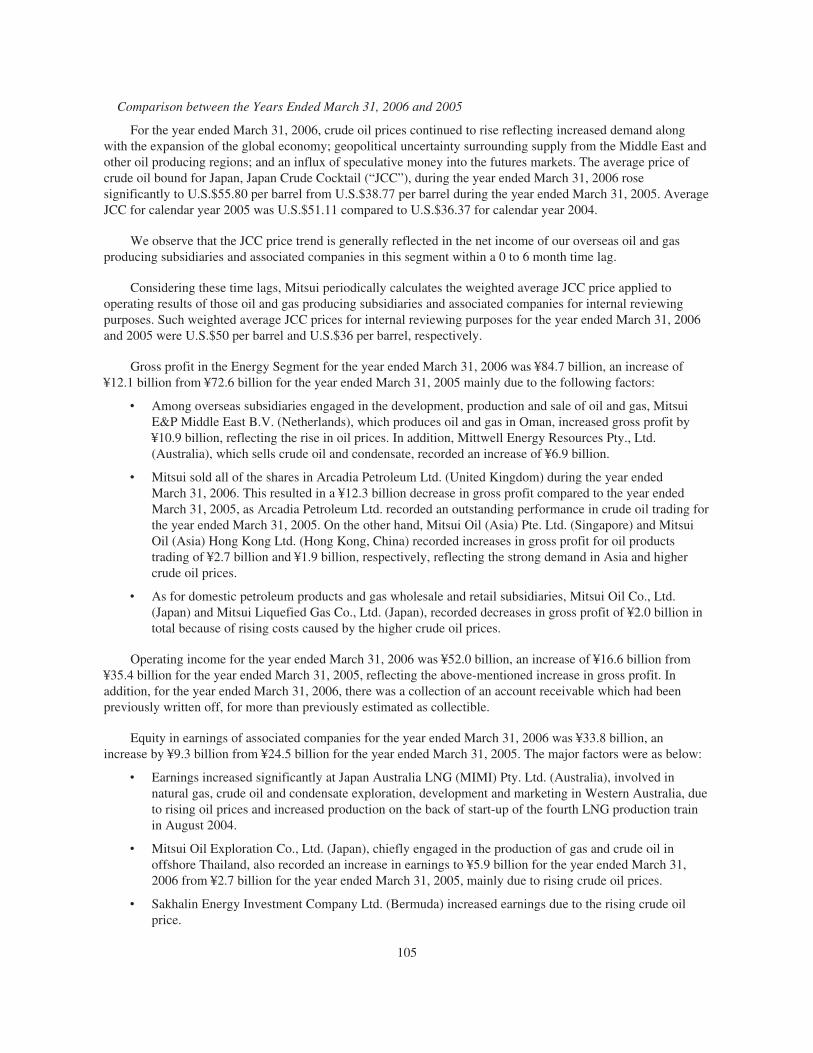
Comparison between the Years Ended March 31, 2006 and 2005
For the year ended March 31, 2006, crude oil prices continued to rise reflecting increased demand alongwith the expansion of the global economy; geopolitical uncertainty surrounding supply from the Middle East andother oil producing regions; and an influx of speculative money into the futures markets. The average price ofcrude oil bound for Japan, Japan Crude Cocktail (“JCC”), during the year ended March 31, 2006 rosesignificantly to U.S.$55.80 per barrel from U.S.$38.77 per barrel during the year ended March 31, 2005. AverageJCC for calendar year 2005 was U.S.$51.11 compared to U.S.$36.37 for calendar year 2004.
We observe that the JCC price trend is generally reflected in the net income of our overseas oil and gasproducing subsidiaries and associated companies in this segment within a 0 to 6 month time lag.
Considering these time lags, Mitsui periodically calculates the weighted average JCC price applied tooperating results of those oil and gas producing subsidiaries and associated companies for internal reviewingpurposes. Such weighted average JCC prices for internal reviewing purposes for the year ended March 31, 2006and 2005 were U.S.$50 per barrel and U.S.$36 per barrel, respectively.
Gross profit in the Energy Segment for the year ended March 31, 2006 was ¥84.7 billion, an increase of¥12.1 billion from ¥72.6 billion for the year ended March 31, 2005 mainly due to the following factors:
‰ Among overseas subsidiaries engaged in the development, production and sale of oil and gas, MitsuiE&P Middle East B.V. (Netherlands), which produces oil and gas in Oman, increased gross profit by¥10.9 billion, reflecting the rise in oil prices. In addition, Mittwell Energy Resources Pty., Ltd.(Australia), which sells crude oil and condensate, recorded an increase of ¥6.9 billion.
‰ Mitsui sold all of the shares in Arcadia Petroleum Ltd. (United Kingdom) during the year endedMarch 31, 2006. This resulted in a ¥12.3 billion decrease in gross profit compared to the year endedMarch 31, 2005, as Arcadia Petroleum Ltd. recorded an outstanding performance in crude oil trading forthe year ended March 31, 2005. On the other hand, Mitsui Oil (Asia) Pte. Ltd. (Singapore) and MitsuiOil (Asia) Hong Kong Ltd. (Hong Kong, China) recorded increases in gross profit for oil productstrading of ¥2.7 billion and ¥1.9 billion, respectively, reflecting the strong demand in Asia and highercrude oil prices.
‰ As for domestic petroleum products and gas wholesale and retail subsidiaries, Mitsui Oil Co., Ltd.(Japan) and Mitsui Liquefied Gas Co., Ltd. (Japan), recorded decreases in gross profit of ¥2.0 billion intotal because of rising costs caused by the higher crude oil prices.
Operating income for the year ended March 31, 2006 was ¥52.0 billion, an increase of ¥16.6 billion from¥35.4 billion for the year ended March 31, 2005, reflecting the above-mentioned increase in gross profit. Inaddition, for the year ended March 31, 2006, there was a collection of an account receivable which had beenpreviously written off, for more than previously estimated as collectible.
Equity in earnings of associated companies for the year ended March 31, 2006 was ¥33.8 billion, anincrease by ¥9.3 billion from ¥24.5 billion for the year ended March 31, 2005. The major factors were as below:
‰ Earnings increased significantly at Japan Australia LNG (MIMI) Pty. Ltd. (Australia), involved innatural gas, crude oil and condensate exploration, development and marketing in Western Australia, dueto rising oil prices and increased production on the back of start-up of the fourth LNG production trainin August 2004.
‰ Mitsui Oil Exploration Co., Ltd. (Japan), chiefly engaged in the production of gas and crude oil inoffshore Thailand, also recorded an increase in earnings to ¥5.9 billion for the year ended March 31,2006 from ¥2.7 billion for the year ended March 31, 2005, mainly due to rising crude oil prices.
‰ Sakhalin Energy Investment Company Ltd. (Bermuda) increased earnings due to the rising crude oilprice.
105

Net income for the year ended March 31, 2006 was ¥40.9 billion, a decrease by ¥1.9 billion from ¥42.8billion for the year ended March 31, 2005. Besides increases in operating income and equity in earnings ofassociated companies, dividend income from our three LNG projects in the Middle East remained at acontinuously high level of ¥13.4 billion, a ¥0.6 billion increase over the year ended March 31, 2005. However,these positive factors were more than offset by the following factors:
‰ This segment significantly increased repatriation of undistributed earnings from overseas subsidiariesand associated companies compared to the year ended March 31, 2005. The increased dividendsreceived from those overseas companies resulted in a large increase in income tax expenses at Mitsui.
‰ Interest expenses at Mitsui Sakhalin Holdings B.V. (Netherlands) increased by ¥6.7 billion due to therise in U.S. dollar interest rates and the increase in interest bearing debt to finance the investment in theSakhalin II project.
Comparison between the Years Ended March 31, 2005 and 2004
During the year ended March 31, 2005, the price of crude oil rose considerably, driven by increasingdemand, particularly from China, and spurred by the instability in supply from the Middle East and other regions.A flood of speculative money into the futures market drove up the price of West Texas Intermediate (“WTI”) toan all-time high up to March 2005 at U.S.$57.60 per barrel. JCC soared from U.S.$29.43 per barrel during theyear ended March 31, 2004 to U.S.$38.77 per barrel during the year ended March 31, 2005 (the average incalendar 2004 was U.S.$36.37 per barrel).
Gross profit in the Energy Segment for the year ended March 31, 2005 was ¥72.6 billion, an increase of¥18.0 billion from ¥54.6 billion for the year ended March 31, 2004. The main factors were as below:
‰ For the year ended March 31, 2004 Arcadia Petroleum Ltd. (United Kingdom) recorded a loss inpetroleum products trading, from which it withdrew. For the year ended March 31, 2005 ArcadiaPetroleum Ltd. concentrated on crude oil trading and its gross profit improved by ¥13.5 billion from theyear ended March 31, 2004.
‰ Among overseas subsidiaries engaged in the development, production and sale of oil and gas, MitsuiE&P Middle East B.V. (Netherlands), which develops and produces oil and gas in Oman, increasedgross profit by ¥3.3 billion, reflecting the rise in oil prices and an increase in sales volume. In addition,Mittwell Energy Resources Pty., Ltd. (Australia), which sells crude oil and condensate, recorded anincrease of ¥1.7 billion.
‰ Domestic petroleum product sales showed strong performance, successfully passing higher oil prices onin their wholesale and retail pricing. Combined gross profits of three of our domestic salessubsidiaries—Mitsui Oil Co., Ltd., Mitsui Liquefied Gas Co., Ltd. (which was separated out fromMitsui Oil Co., Ltd. in December 2004) and Kokusai Oil & Chemical Co., Ltd.—increased by ¥4.7billion for the year ended March 31, 2005.
Operating income for the year ended March 31, 2005 was ¥35.4 billion, a ¥13.7 billion increase from ¥21.7billion for the year ended March 31, 2004. This growth reflected the above-mentioned increase in gross profit,but was partially offset by a ¥3.8 billion increase in selling, general and administrative expenses at ArcadiaPetroleum Ltd. arising from higher trader bonuses.
Equity in earnings of associated companies for the year ended March 31, 2005 was ¥24.5 billion, anincrease of ¥10.0 billion from ¥14.5 billion for the year ended March 31, 2004.
‰ Earnings increased significantly at Japan Australia LNG (MIMI) Pty, Ltd. (Australia), involved innatural gas, crude oil and condensate exploration, development and marketing in West Australia, due torising oil prices and increased production on the back of expanded facilities.
106
‰ Mitsui Oil Exploration Co., Ltd. (Japan), chiefly engaged in the production of gas and crude oil inoffshore Thailand, also recorded an increase to ¥2.7 billion for the year ended March 31, 2005 from ¥1.1billion for the year ended March 31, 2004, mainly driven by rising crude oil prices.
‰ Also, Sakhalin Energy Investment Company Ltd. (Bermuda) increased earnings on rising crude oilprices and an increase in production volume.
Net income for the year ended March 31, 2005 was ¥42.8 billion, a significant increase of ¥18.4 billion from¥24.4 billion for the year ended March 31, 2004. This increase resulted from the above-mentioned improvementin both operating income and equity in earnings of associated companies. In addition, dividend income from ourthree LNG projects in the Middle East, namely, in Abu Dhabi, Oman and Qatar totaled ¥12.8 billion for the yearended March 31, 2005, an increase of ¥4.7 billion over ¥8.1 billion for the year ended March 31, 2004, reflectingtheir strong performance from rising oil prices.
Short- and Long-Term Outlook on Prices and Supply-Demand Balance for Energy, and Our EquityProduction
Short-Term Pricing and Supply-Demand Balance
A survey conducted by the International Energy Agency (May 2006) indicated that world crude oil demandin 2005 was 83.6 million barrels per day, with an estimated demand for 2006 of 84.8 million barrels per day. Asof June 2006, general observations on short-term supply-demand balance of crude oil by agencies andcorporations in this industry suggest that:
‰ Robust global economic growth will continue to support oil demand, however, considering strongexpectations for increasing output by non-Organization of Petroleum Exporting Countries (“OPEC”)and spare capacity amongst OPEC countries, particularly Saudi Arabia, it will be less likely that spotcrude oil supply-demand will be extremely tightened. Meantime, productions for certain grades of crudeoil are not at satisfactory levels to meet demand, so we may see tight or surplus market conditions byrespective grades.
‰ High crude oil price has also been supported by factors such as growing geopolitical uncertainties oversuch countries as Iran, Nigeria and Iraq; and tightened supply-demand balance of oil products in theUnited States associated with changes in specifications. Furthermore, the oil market can be influencedby other accidental events such as hurricane damage and troubles at refineries.
Our production of oil and gas for the year ended March 31, 2006 was about 32 million barrels (gas isconverted to barrels of oil at the ratio of 5,800 cubic feet of natural gas to 1 barrel of crude oil), as presented inTable 4. Proved Reserve Quantity Information of Supplemental Information on Oil and Gas Producing Activities(Unaudited). The Enfield crude oil project which has a design production capacity at 100,000 barrels per daystarted production in July 2006, while LNG production of the Sakhalin II project will still be in the developmentstage during the year ending March 31, 2007. Considering contributions from the Enfield crude oil project, forthe year ending March 31, 2007, a change of U.S.$1 per barrel in crude oil prices is expected to have an effect of¥1.6 billion on net income in the Statements of Consolidated Income as a result of changes in revenues of our oiland gas related subsidiaries and associated companies. Similar to the discussion regarding iron and steel rawmaterials, actual results of operations are also influenced by production costs, trends in foreign exchange ratesand other factors surrounding those subsidiaries and associated companies.
Middle- and Long-Term Price Outlook and Supply-Demand Balance and Trends in Our Equity Production
The middle- and long-term trends in supply, demand, and prices of crude oil are subject to far greater levelsof uncertainty than trends in the short-term, and it is therefore impossible for management to make a definitiveforecast. On the other hand, with respect to LNG, we are focusing on the changes in market structure that arecurrently taking place, and acting accordingly as follows:
‰ In the past, the market has grown mainly with long-term purchase contracts by power and gascompanies operating in Japan and the Far East. Expansion of incumbent projects and green field
107
projects coming on stream will increase the volume of supply to the market, while demand, which hastraditionally centered around the Far East, will be joined by growing demand from Europe and theUnited States, while huge markets in China and India will emerge. Therefore, globalization both interms of supply and demand is expected to progress. In addition, as the opportunity for supply anddemand adjustments in these markets increases, LNG is expected to become a more marketablecommodity.
‰ Long-term purchase contracts with Japanese companies in many projects are expected to come due forrenewal around 2010, and more flexible terms reflecting the above-mentioned supply-demand trendswill be requested from the buyers. In evaluating the opportunities for the expansion of incumbentprojects or participation in green field projects, we are putting an emphasis on securing stable supply aswell as diversifying our source of supply to enhance flexibility.
Assuming that we do not acquire any additional interests in oil and gas beyond those we held as ofMarch 31, 2006, our equity based production capacity from 2009 onwards (by which time production of crude oilfrom our investments at the Enfield crude oil project and LNG at the Sakhalin II project will have come onstream) will increase to an annual equity-based production capacity of over 80 million barrels, from the above-mentioned 32 million barrels for the year ended March 31, 2006.
The total required funds for the phase II development of the Sakhalin II Project is now estimated U.S.$20billion, double the original budget of U.S.$10 billion, due to increased expenses related to changes in facilitydesign and construction delays as well as the rising procurement costs of labor and materials.
Sakhalin Energy Investment Company Ltd. (Bermuda) has been making every effort to achieve the earliestpossible start of LNG shipments, which is now scheduled in summer 2008, and to contain costs. Up to August2006, we have seen the following developments:
‰ The actual progress rate of the total project was about 76% as of end of June 2006.
‰ Sakhalin Energy Investment Company Ltd. also continued to make progress in the sale of the remainingunsold volumes of LNG. In June 2006, Tokyo Gas Co., Ltd. committed to purchasing additionalvolume, taking overall sales of Sakhalin II LNG to 90% of designed production capacity.
On September 18, the Ministry of Natural Resources of the Russian Federation announced that it had madethe decision to revoke its order issued in 2003 pertaining to the environmental approval of the Phase IIDevelopment of the Sakhalin II Project. While we can not definitely predict future development of this situation,Sakhalin Energy Investment Company Ltd. will continue to work with the relevant authorities to resolve theissue.
Foods & Retail SegmentBillions of Yen
Years Ended March 31, Change(2006–2005)
Change(2005–2004)2006 2005 2004
Gross Profit . . . . . . . . . . . . . . . . . . . . . . . . . . . . . . . . . . . . . . . . . ¥79.9 ¥85.3 ¥73.7 ¥ (5.4) ¥11.6Operating Income . . . . . . . . . . . . . . . . . . . . . . . . . . . . . . . . . . . . 9.1 17.8 13.4 (8.7) 4.4Equity in Earnings of Associated Companies . . . . . . . . . . . . . . . 3.5 2.2 3.3 1.3 (1.1)Net Income (Loss) . . . . . . . . . . . . . . . . . . . . . . . . . . . . . . . . . . . . (3.2) 10.6 10.6 (13.8) 0.0
Comparison between the Years Ended March 31, 2006 and 2005
Gross profit in the Foods & Retail Segment for the year ended March 31, 2006 was ¥79.9 billion, a ¥5.4billion decrease from ¥85.3 billion for the year ended March 31, 2005. The major factors for this decline, in spiteof the contribution from a newly acquired subsidiary Hokushuren Company Limited (Japan) were as follows:
‰ For the year ended March 31, 2006, gross profit decreased at Mitsui in the beverage businesses,compared to the year ended March 31, 2005 when those businesses showed strong performance due to asummer heat wave in 2004. Transactions also decreased in marine products and cheese businesses.
‰ Gross profit of Mitsui Norin Co., Ltd. (Japan) decreased by ¥2.0 billion due to a decline in sales ofcatechin, a substance in tea.
108
‰ Gross profit of MITSUI FOODS CO., LTD. (Japan) decreased by ¥1.7 billion, principally attributable tothe termination of business relations with The Daiei, Inc, a Japanese national retailer.
Operating income for the year ended March 31, 2006 was ¥9.1 billion, a decrease of ¥8.7 billion from ¥17.8billion for the year ended March 31, 2005. In addition to the above-mentioned decrease in gross profit, this wasdue to an increase in selling, general and administrative expenses as a result of the acquisition of HokushurenCompany Limited and an increase in personnel expenses at MITSUI FOODS CO., LTD. in connection with theestablishment of new distribution bases.
Equity in earnings of associated companies for the year ended March 31, 2006 was ¥3.5 billion, a ¥1.3billion increase from ¥2.2 billion for the year ended March 31, 2005. This was primarily due to the contributionfrom Ventura Foods LLC (United States), a processed oil foods manufacturer, reflecting improvement in rawmaterial costs.
This segment recorded net loss of ¥3.2 billion for the year ended March 31, 2006, a ¥13.8 billion declinefrom ¥10.6 billion net income for the year ended March 31, 2005. This downturn was attributable to the above-mentioned decrease in operating income. In addition, this segment recorded the following:
‰ MITSUI FOODS CO., LTD recorded ¥6.0 billion impairment losses on land and distribution facilitieswhich would become idle as a result of the reorganization of distribution bases, and establishedvaluation allowances for its deferred tax assets.
‰ We recorded a ¥4.2 billion gain from the exchange of shares of Ito-Yokado Co., Ltd. and Seven-ElevenJapan Co., Ltd., for newly issued shares of Seven & i Holdings Co., Ltd., one of Japan’s diversifiedretailers.
In April 2006, MITSUI FOODS CO., LTD. and Mitsui reached an agreement with KOKUBU & CO., LTD.,a Japanese food wholesaler, in principle to form a business alliance. It includes KOKUBU’s support andguidance for the management and operations of MITSUI FOODS in order to reinforce the business functions ofMITSUI FOODS and improve efficiency in its distribution logistics.
Comparison between the Years Ended March 31, 2005 and 2004
Gross profit in the Foods & Retail Segment for the year ended March 31, 2005 was ¥85.3 billion, anincrease of ¥11.6 billion from the ¥73.7 billion for the year ended March 31, 2004. The main factors contributingto this growth were as follows:
‰ With the acquisition of Mitsui Norin Co., Ltd. (Japan) in the second quarter of the year ended March 31,2004, gross profit for the year ended March 31, 2005 increased by ¥5.1 billion from the year endedMarch 31, 2004 reflecting its full year contribution.
‰ Mitsui’s profit margin on commodity trading in corn, soybeans, raw sugar and other agriculturalcommodities increased, following rises in the prices for those commodities.
Operating income for the year ended March 31, 2005 was ¥17.8 billion, a ¥4.4 billion increase over ¥13.4billion for the year ended March 31, 2004. An increase of ¥4.0 billion in selling, general and administrativeexpenses at Mitsui Norin Co., Ltd. following its acquisition partly offset the above-mentioned increase in grossprofit.
Equity in earnings of associated companies for the year ended March 31, 2005 was ¥2.2 billion, a decreaseof ¥1.1 billion from ¥3.3 billion for the year ended March 31, 2004. Ventura Foods LLC (United States) recordeda decline of ¥1.1 billion due to falling sales prices as a result of increased competition in the first half of the yearended March 31, 2005.
Net income for the year ended March 31, 2005 was ¥10.6 billion, the same level as the year endedMarch 31, 2004, as the increase in operating income was partly offset by the decline in equity in earnings ofassociated companies.
109
Lifestyle, Consumer Service and Information, Electronics & Telecommunication Segment
Billions of Yen
Years Ended March 31, Change(2006–2005)
Change(2005–2004)2006 2005 2004
Gross Profit . . . . . . . . . . . . . . . . . . . . . . . . . . . . . . . . . . . . . . ¥128.4 ¥121.7 ¥110.6 ¥6.7 ¥11.1Operating Income . . . . . . . . . . . . . . . . . . . . . . . . . . . . . . . . . 25.0 24.0 17.2 1.0 6.8Equity in Earnings (Losses) of Associated Companies . . . . 3.5 (0.3) 5.5 3.8 (5.8)Net Income . . . . . . . . . . . . . . . . . . . . . . . . . . . . . . . . . . . . . . 17.5 11.8 3.2 5.7 8.6
Comparison between the Years Ended March 31, 2006 and 2005
Gross profit in the Lifestyle, Consumer Service and Information, Electronics & TelecommunicationSegment for the year ended March 31, 2006 was ¥128.4 billion, a ¥6.7 billion increase from ¥121.7 billion forthe year ended March 31, 2005. The major factors for this increase were as follows:
‰ In IT related business fields, gross profit rose at Telepark Corp. (Japan). There were also contributionsfrom NextCom K.K. (Japan) which became a subsidiary in the third quarter of the year ended March 31,2005.
‰ In lifestyle business fields, gross profit decreased due to withdrawal from cement businesses and overallpoor performance in textile businesses.
‰ In consumer service business fields, Mitsui Bussan House-Techno, Inc. (Japan) recorded a decline dueto decreased sales of houses built for sale.
Operating income for the year ended March 31, 2006 was ¥25.0 billion, an increase of ¥1.0 billion from¥24.0 billion for the year ended March 31, 2005. The above-mentioned improvement in gross profit was partlyoffset by increases in selling, general and administrative expenses and provision for doubtful receivables atMitsui Bussan Forestry Co., Ltd. (Japan).
Equity in earnings of associated companies for the year ended March 31, 2006 was ¥3.5 billion, a ¥3.8billion improvement from ¥0.3 billion loss for the year ended March 31, 2005. A television shopping servicecompany QVC JAPAN, INC. (Japan) and a food catering service company AIM Services Co., Ltd. (Japan)contributed to this improvement, while there were losses at telecommunication related associated companies inColombia due to provision for doubtful receivables for the year ended March 31, 2005.
Net income for the year ended March 31, 2006 was ¥17.5 billion, a ¥5.7 billion increase from ¥11.8 billionfor the year ended March 31, 2005 principally due to the improvement in the above-mentioned operating incomeand equity in earnings. Other major factors were as follows:
‰ Gains on sales of securities decreased ¥3.4 billion compared to the year ended March 31, 2005. For theyear ended March 31, 2006, there were gains on sales of shares in Metro PCS, Inc. in the United States,KDDI CORPORATION in Japan and PT Excelcomindo Pratama, Tbk in Indonesia amounting to ¥3.5billion, ¥3.3 billion and ¥2.0 billion, respectively. For the year ended March 31, 2005, there were gainson sales of shares in Vodafone K.K. and our subsidiary Telepark Corp. (Japan) amounting to ¥7.2billion and ¥4.1 billion, respectively, as well as a ¥3.7 billion gain associated with the merger ofNextCom K.K.
‰ For the year ended March 31, 2005, considering a deterioration in financial condition due to sluggishadvertising revenue at satellite broadcasters BS-i, INCORPORATED and BS Japan Corporation, thissegment recorded losses on write-downs of these shares of ¥1.9 billion and ¥1.2 billion, respectively.
‰ For the year ended March 31, 2006, Mitsui received ¥2.0 billion dividend from an investment companyrelated to gains on the sales of interests in telecommunication companies in Africa.
110
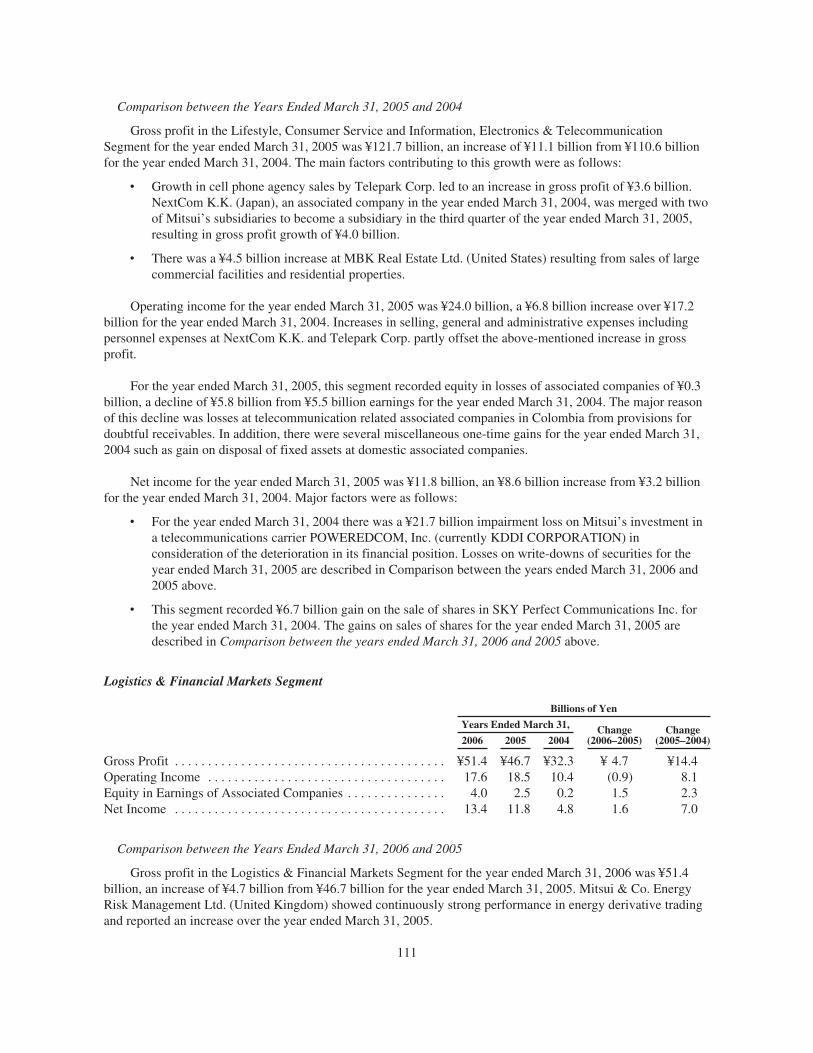
Comparison between the Years Ended March 31, 2005 and 2004
Gross profit in the Lifestyle, Consumer Service and Information, Electronics & TelecommunicationSegment for the year ended March 31, 2005 was ¥121.7 billion, an increase of ¥11.1 billion from ¥110.6 billionfor the year ended March 31, 2004. The main factors contributing to this growth were as follows:
‰ Growth in cell phone agency sales by Telepark Corp. led to an increase in gross profit of ¥3.6 billion.NextCom K.K. (Japan), an associated company in the year ended March 31, 2004, was merged with twoof Mitsui’s subsidiaries to become a subsidiary in the third quarter of the year ended March 31, 2005,resulting in gross profit growth of ¥4.0 billion.
‰ There was a ¥4.5 billion increase at MBK Real Estate Ltd. (United States) resulting from sales of largecommercial facilities and residential properties.
Operating income for the year ended March 31, 2005 was ¥24.0 billion, a ¥6.8 billion increase over ¥17.2billion for the year ended March 31, 2004. Increases in selling, general and administrative expenses includingpersonnel expenses at NextCom K.K. and Telepark Corp. partly offset the above-mentioned increase in grossprofit.
For the year ended March 31, 2005, this segment recorded equity in losses of associated companies of ¥0.3billion, a decline of ¥5.8 billion from ¥5.5 billion earnings for the year ended March 31, 2004. The major reasonof this decline was losses at telecommunication related associated companies in Colombia from provisions fordoubtful receivables. In addition, there were several miscellaneous one-time gains for the year ended March 31,2004 such as gain on disposal of fixed assets at domestic associated companies.
Net income for the year ended March 31, 2005 was ¥11.8 billion, an ¥8.6 billion increase from ¥3.2 billionfor the year ended March 31, 2004. Major factors were as follows:
‰ For the year ended March 31, 2004 there was a ¥21.7 billion impairment loss on Mitsui’s investment ina telecommunications carrier POWEREDCOM, Inc. (currently KDDI CORPORATION) inconsideration of the deterioration in its financial position. Losses on write-downs of securities for theyear ended March 31, 2005 are described in Comparison between the years ended March 31, 2006 and2005 above.
‰ This segment recorded ¥6.7 billion gain on the sale of shares in SKY Perfect Communications Inc. forthe year ended March 31, 2004. The gains on sales of shares for the year ended March 31, 2005 aredescribed in Comparison between the years ended March 31, 2006 and 2005 above.
Logistics & Financial Markets Segment
Billions of Yen
Years Ended March 31, Change(2006–2005)
Change(2005–2004)2006 2005 2004
Gross Profit . . . . . . . . . . . . . . . . . . . . . . . . . . . . . . . . . . . . . . . . . ¥51.4 ¥46.7 ¥32.3 ¥ 4.7 ¥14.4Operating Income . . . . . . . . . . . . . . . . . . . . . . . . . . . . . . . . . . . . 17.6 18.5 10.4 (0.9) 8.1Equity in Earnings of Associated Companies . . . . . . . . . . . . . . . 4.0 2.5 0.2 1.5 2.3Net Income . . . . . . . . . . . . . . . . . . . . . . . . . . . . . . . . . . . . . . . . . 13.4 11.8 4.8 1.6 7.0
Comparison between the Years Ended March 31, 2006 and 2005
Gross profit in the Logistics & Financial Markets Segment for the year ended March 31, 2006 was ¥51.4billion, an increase of ¥4.7 billion from ¥46.7 billion for the year ended March 31, 2005. Mitsui & Co. EnergyRisk Management Ltd. (United Kingdom) showed continuously strong performance in energy derivative tradingand reported an increase over the year ended March 31, 2005.
111

Operating income for the year ended March 31, 2006 was ¥17.6 billion, a decrease of ¥0.9 billion from¥18.5 billion for the year ended March 31, 2005, reflecting an increase in personnel expenses at Mitsui & Co.Energy Risk Management Ltd.
Equity in earnings of associated companies for the year ended March 31, 2006 was ¥4.0 billion, a ¥1.5billion increase from ¥2.5 billion for the year ended March 31, 2005.
Net income for the year ended March 31, 2006 was ¥13.4 billion, an increase of ¥1.6 billion from ¥11.8billion for the year ended March 31, 2005.
Comparison between the Years Ended March 31, 2005 and 2004
Gross profit in the Logistics & Financial Markets Segment for the year ended March 31, 2005 was ¥46.7billion, an increase of ¥14.4 billion from ¥32.3 billion for the year ended March 31, 2004. Mitsui & Co. EnergyRisk Management Ltd. (United Kingdom) increased gross profit by ¥11.0 billion from the year ended March 31,2004 in energy derivative trading on the back of extremely high volatility in the crude oil market. Moreover,Mitsui’s transactions in commodities derivatives in energy and non-ferrous metals and foreign exchangecontracts produced good results.
Operating income for the year ended March 31, 2005 was ¥18.5 billion, an ¥8.1 billion increase from ¥10.4billion for the year ended March 31, 2004. The increase in bonuses paid to traders at Mitsui & Co. Energy RiskManagement Ltd. caused selling, general and administrative expenses to rise by ¥4.6 billion, partly offsetting theabove-mentioned growth in gross profit.
Equity in earnings of associated companies for the year ended March 31, 2005 was ¥2.5 billion, an increaseof ¥2.3 billion from ¥0.2 billion for the year ended March 31, 2004. Mitsui Leasing & Development Ltd. (Japan)recorded an increase in its machinery and ship leasing business, reflecting the booming global shipping industry.
Net income for the year ended March 31, 2005 was ¥11.8 billion, an increase of ¥7.0 billion from ¥4.8billion for the year ended March 31, 2004, which was attributable to the increase in operating income and equityin earnings of associated companies.
Americas Segment
Billions of Yen
Years Ended March 31, Change(2006–2005)
Change(2005–2004)2006 2005 2004
Gross Profit . . . . . . . . . . . . . . . . . . . . . . . . . . . . . . . . . . . . . . . . . ¥61.6 ¥49.9 ¥40.7 ¥11.7 ¥ 9.2Operating Income . . . . . . . . . . . . . . . . . . . . . . . . . . . . . . . . . . . . 21.7 14.7 8.5 7.0 6.2Equity in Earnings (Losses) of Associated Companies . . . . . . . 2.1 1.6 (2.5) 0.5 4.1Net Income . . . . . . . . . . . . . . . . . . . . . . . . . . . . . . . . . . . . . . . . . 12.6 12.3 0.2 0.3 12.1
Comparison between the Years Ended March 31, 2006 and 2005
Gross profit in the Americas Segment for the year ended March 31, 2006 was ¥61.6 billion, an increase of¥11.7 billion from ¥49.9 billion for the year ended March 31, 2005. An oil products trading subsidiary WestportPetroleum, Inc. (United States) recorded a significant increase of ¥13.2 billion and a steel pipe sales subsidiaryChampions Pipe & Supply, Inc. (United States) recorded a ¥1.7 billion increase. In addition, there was acontribution of ¥1.2 billion from CornerStone Research & Development Inc. (United States) which was acquiredduring the year ended March 31, 2005. However, gross profit decreased by ¥1.9 billion at Portac, Inc. (UnitedStates), which produces lumber and lumber products, due to a decline in the prices of its products.
112

Operating income for the year ended March 31, 2006 was ¥21.7 billion, a ¥7.0 billion increase from ¥14.7billion for the year ended March 31, 2005, reflecting the increase in gross profit, which was partly offset byhigher trader bonuses at Westport Petroleum, Inc.
Net income for the year ended March 31, 2006 was ¥12.6 billion, a slight increase of ¥0.3 billion from ¥12.3billion for the year ended March 31, 2005. The increase in operating income was offset by the following factors:
‰ Interest expenses at Mitsui & Co. (U.S.A.), Inc. and its subsidiaries increased by ¥3.0 billion resultingfrom a rise in U.S. dollar interest rates.
‰ Mitsui & Co. (U.S.A.), Inc. has a minority interest in Mitalco Inc. and shared the net losses of thissubsidiary for the years ended March 31, 2005 and 2006 with the Iron & Steel Raw Materials andNon-Ferrous Metals Segment.
Comparison between the Years Ended March 31, 2005 and 2004
Gross profit in the Americas Segment for the year ended March 31, 2005 was ¥49.9 billion, an increase of¥9.2 billion from the ¥40.7 billion for the year ended March 31, 2004. Steel product subsidiaries enjoyedfavorable business conditions, namely, steep price rises in the steel product market reflecting the strong growthof the United States economy. Champions Pipe & Supply, Inc. (United States) recorded a ¥3.5 billion rise ingross profit. In addition, Portac, Inc. (United States), a subsidiary that manufactures lumber and lumber products,increased gross profit by ¥1.6 billion due to the surge in lumber prices.
Operating income for the year ended March 31, 2005 was ¥14.7 billion, a ¥6.2 billion increase from ¥8.5billion for the year ended March 31, 2004. Selling, general and administrative expenses rose at Mitsui SteelDevelopment Co., Inc. (United States) and other subsidiaries, partly offsetting the growth in gross profit.
Equity in earnings of associated companies for the year ended March 31, 2005 was ¥1.6 billion, animprovement of ¥4.1 billion from the loss of ¥2.5 billion for the year ended March 31, 2004. There was arecovery from the impact of losses on the operations in the manufacture and sale of gasoline additives, whichwere disposed of during the year ended March 31, 2004.
Net income for the year ended March 31, 2005 was ¥12.3 billion, an increase of ¥12.1 billion from the ¥0.2billion for the year ended March 31, 2004. This increase was due to increases in operating income and equity inearnings of associated companies. In addition, as described in the Chemical Segment section, this segment nolonger had to bear its share of a ¥13.7 billion charge recorded as other expense for the year ended March 31,2004, arising from the settlement of an antitrust lawsuit filed against Bioproducts, Inc. (United States) whichmanufactures and sells feed ingredients.
Europe Segment
Billions of Yen
Years Ended March 31, Change(2006–2005)
Change(2005–2004)2006 2005 2004
Gross Profit . . . . . . . . . . . . . . . . . . . . . . . . . . . . . . . . . . . . . . . . . ¥22.4 ¥20.6 ¥20.0 ¥ 1.8 ¥ 0.6Operating Income . . . . . . . . . . . . . . . . . . . . . . . . . . . . . . . . . . . . 4.1 2.4 3.0 1.7 (0.6)Equity in Earnings (Losses) of Associated Companies . . . . . . . (0.2) 0.1 0.2 (0.3) (0.1)Net Income . . . . . . . . . . . . . . . . . . . . . . . . . . . . . . . . . . . . . . . . . 4.9 2.9 0.7 2.0 2.2
Comparison between the Years Ended March 31, 2006 and 2005
Gross profit in the Europe Segment for the year ended March 31, 2006 was ¥22.4 billion, an increase of ¥1.8billion from ¥20.6 billion for the year ended March 31, 2005, which was mainly attributable to the growth in thesteel pipes and organic chemicals businesses.
113

Operating income for the year ended March 31, 2006 was ¥4.1 billion, a ¥1.7 billion increase from ¥2.4billion for the year ended March 31, 2005, reflecting the increase in gross profit.
Net income for the year ended March 31, 2006 was ¥4.9 billion, a ¥2.0 billion increase from ¥2.9 billion forthe year ended March 31, 2005.
This segment had a minority interest in Arcadia Petroleum Ltd. (United Kingdom), which was sold duringthe year ended March 31, 2006. The increase in operating income was partly offset by the absence of thecontribution from Arcadia Petroleum Ltd.
Comparison between the Years Ended March 31, 2005 and 2004
Gross profit in the Europe Segment for the year ended March 31, 2005 was ¥20.6 billion, a slight increase of¥0.6 billion from ¥20.0 billion for the year ended March 31, 2004. Gross profit of our trading subsidiaries inEurope generally stayed at about the same level as the year ended March 31, 2004.
Operating income for the year ended March 31, 2005 was ¥2.4 billion, a ¥0.6 billion decrease from ¥3.0billion for the year ended March 31, 2004. Increase in selling, general and administrative expenses, chieflypersonnel expenses and office expenses, outweighed the nominal growth in gross profit.
Net income for the year ended March 31, 2005 was ¥2.9 billion, an increase of ¥2.2 billion from ¥0.7 billionfor the year ended March 31, 2004. This was attributable to an improvement in net income of Arcadia PetroleumLtd.
Asia Segment
Billions of Yen
Years Ended March 31, Change(2006–2005)
Change(2005–2004)2006 2005 2004
Gross Profit . . . . . . . . . . . . . . . . . . . . . . . . . . . . . . . . . . . . . . . . . ¥27.4 ¥21.8 ¥19.9 ¥5.6 ¥ 1.9Operating Income . . . . . . . . . . . . . . . . . . . . . . . . . . . . . . . . . . . . 10.7 7.8 5.7 2.9 2.1Equity in Earnings of Associated Companies . . . . . . . . . . . . . . . 0.1 0.1 0.2 0.0 (0.1)Net Income . . . . . . . . . . . . . . . . . . . . . . . . . . . . . . . . . . . . . . . . . 9.3 8.0 6.3 1.3 1.7
Comparison between the Years Ended March 31, 2006 and 2005
Gross profit in the Asia Segment for the year ended March 31, 2006 was ¥27.4 billion, a ¥5.6 billionincrease from ¥21.8 billion for the year ended March 31, 2005. This was attributable to the good performance inthe chemical businesses at the Singapore branch; and in the steel products and chemical businesses at Mitsui &Co. (Hong Kong) Ltd. and the other trading subsidiaries in China.
Operating income for the year ended March 31, 2006 was ¥10.7 billion, a ¥2.9 billion increase from ¥7.8billion for the year ended March 31, 2005. The increase in gross profit was partly offset by increases in selling,general and administrative expenses mainly at trading subsidiaries in China and a provision for doubtfulreceivables at a trading subsidiary in Thailand.
Net income for the year ended March 31, 2006 was ¥9.3 billion, a ¥1.3 billion increase from ¥8.0 billion forthe year ended March 31, 2005.
Comparison between the Years Ended March 31, 2005 and 2004
Gross profit in the Asia Segment for the year ended March 31, 2005 was ¥21.8 billion, an increase of ¥1.9billion from ¥19.9 billion for the year ended March 31, 2004. This was due to continuing favorable conditions,chiefly in the fields of steel products and chemicals at trading subsidiaries and overseas offices in Asia.
114

Net income for the year ended March 31, 2005 was ¥8.0 billion, an increase of ¥1.7 billion from ¥6.3 billionfor the year ended March 31, 2004. This increase was due to the increase in operating income. In addition, thissegment also recorded a ¥1.4 billion gain on the sale of the segment’s shares in Bangkok Polyethylene PublicCompany Limited, a manufacturer of high-density polyethylene in Thailand for the year ended March 31, 2005.
Other Overseas Areas Segment
Billions of Yen
Years Ended March 31, Change(2006–2005)
Change(2005–2004)2006 2005 2004
Gross Profit . . . . . . . . . . . . . . . . . . . . . . . . . . . . . . . . . . . . . . . . ¥ 4.9 ¥4.0 ¥4.2 ¥0.9 ¥(0.2)Operating Income . . . . . . . . . . . . . . . . . . . . . . . . . . . . . . . . . . . 1.0 0.4 0.9 0.6 (0.5)Equity in Earnings of Associated Companies . . . . . . . . . . . . . . 0.6 0.4 0.2 0.2 0.2Net Income . . . . . . . . . . . . . . . . . . . . . . . . . . . . . . . . . . . . . . . . 14.3 5.8 4.1 8.5 1.7
Comparison between the Years Ended March 31, 2006 and 2005
Net income for the year ended March 31, 2006 was ¥14.3 billion, an ¥8.5 billion increase from ¥5.8 billionfor the year ended March 31, 2005. This was due to contributions to the segment from its interests in Mitsui IronOre Development Pty. Ltd. (Australia) and Mitsui Coal Holdings Pty. Ltd. (Australia), which showed stronggrowth in net income for the year ended March 31, 2006, as described in the Iron & Steel Raw Materials andNon-Ferrous Metals Segment.
Comparison between the Years Ended March 31, 2005 and 2004
Net income for the year ended March 31, 2005 was ¥5.8 billion, an increase of ¥1.7 billion from ¥4.1 billionfor the year ended March 31, 2004. This increase was due to improvement in the minority share owned byMitsui & Co. (Australia) Ltd. (Australia) in Mitsui Iron Ore Development Pty. Ltd. (Australia) and Mitsui CoalHoldings Pty. Ltd. (Australia) which showed strong growth in net income for the year ended March 31, 2005 asdescribed in the Iron & Steel Raw Materials and Non-Ferrous Metals Segment.
All Other
Billions of Yen
Years Ended March 31, Change(2006–2005)
Change(2005–2004)2006 2005 2004
Gross Profit . . . . . . . . . . . . . . . . . . . . . . . . . . . . . . . . . . . . . . . . . ¥ 7.1 ¥12.4 ¥10.4 ¥(5.3) ¥2.0Operating Loss . . . . . . . . . . . . . . . . . . . . . . . . . . . . . . . . . . . . . . (3.0) (0.5) (1.9) (2.5) 1.4Equity in Earnings (Losses) of Associated Companies . . . . . . . 0.3 0.4 (0.1) (0.1) 0.5Net Income . . . . . . . . . . . . . . . . . . . . . . . . . . . . . . . . . . . . . . . . . 11.2 4.4 1.9 6.8 2.5
Comparison between the Years Ended March 31, 2006 and 2005
The activities of this segment include financing services, office services and other services to externalcustomers, and/or to us, and associated companies.
Gross profit in the All Other Segment for the year ended March 31, 2006 was ¥7.1 billion, a ¥5.3 billiondecrease from ¥12.4 billion for the year ended March 31, 2005. The major reason for this decline was the sale ofa domestic public golf club business.
Operating loss for the year ended March 31, 2006 was ¥3.0 billion, a ¥2.5 billion increase from the ¥0.5billion loss for the year ended March 31, 2005. This was primarily attributable to the above-mentioned decline ingross profit, but was partly offset by a decline in selling, general and administrative expenses.
115

Net income for the year ended March 31, 2006 was ¥11.2 billion, a ¥6.8 billion increase from ¥4.4 billionfor the year ended March 31, 2005, primarily attributable to the sales of Mitsui’s corporate welfare facilities.
Comparison between the Years Ended March 31, 2005 and 2004
Net income for the year ended March 31, 2005 was ¥4.4 billion, an increase of ¥2.5 billion from the ¥1.9billion for the year ended March 31, 2004. For the year ended March 31, 2004, we recorded a ¥5.8 billionimpairment loss of long-lived assets that had occurred when Takeoka Golf Club sold its public golf clubbusiness. We recorded an impairment loss of ¥3.3 billion for the year ended March 31, 2005 on the land held byMitsui for domestic development projects due to the decline in land prices in Japan.
Inflation
Management believes that inflation did not have a significant effect on our reported results of operations.
Critical Accounting Policies and Estimates
Accounting policies and estimates are considered to be critical if they are important to our financialcondition and results of operations and involve estimates that require management’s subjective or significantjudgment about the effect of matters that are inherently uncertain. For a summary of our significant accountingpolicies including the critical accounting policies discussed below, see Note 2, “BASIS OF FINANCIALSTATEMENTS AND SUMMARY OF SIGNIFICANT ACCOUNTING POLICIES.”
The preparation of the consolidated financial statements in conformity with U.S. GAAP requiresmanagement to make estimates and assumptions that affect the carrying values of assets and liabilities and thedisclosure of contingent assets and liabilities at the date of the consolidated financial statements and the reportedamounts of revenues and expenses during the reporting period. On an ongoing basis, we evaluate the estimatesthat are based on historical experiences and on various other assumptions that are believed to be reasonable underthe circumstances. The results of these evaluations form the basis for making judgments about the carryingvalues of assets and liabilities and the reported amounts of revenues and expenses that are not readily apparentfrom other sources. Actual results may differ from those estimates under different assumptions. The followingitems require significant management judgments and estimates.
Impairment of Long-Lived Assets
The amount of impairment losses of long-lived assets, other than goodwill and non-amortizable intangibleassets, for the years ended March 31, 2006, 2005 and 2004 and the balance of the long-lived assets, net ofaccumulated depreciation and amortization, as of the end of March 31, 2006, 2005 and 2004 were as follows:
Billions of Yen
As of March 31,
2006 2005 2004
Long-lived assets . . . . . . . . . . . . . . . . . . . . . . . . . . . . . . . . . . . . . . . . . . . . . . . . . . . . . ¥1,019.9 ¥906.3 ¥882.8Impairment loss . . . . . . . . . . . . . . . . . . . . . . . . . . . . . . . . . . . . . . . . . . . . . . . . . . . . . . 36.1 20.5 19.1
Impairment losses of long-lived assets had a material impact on our net income for recent years. Theselosses were mainly due to the declining profitability resulting from deterioration in the terms of the powerpurchase contract during the course of renewal negotiations and the reorganization of business structure anddistribution bases owned by our subsidiaries. See “Impairment Loss of Long-Lived Assets” line-by-lineexplanation in “Results of Operations” for additional information.
Our long-lived assets to be held and used or to be disposed of other than by sale are reviewed forimpairment whenever events or changes in circumstances indicate that the carrying amount of an asset may not
116
be recoverable. This review is performed by comparing the carrying amount of the asset with the aggregateamount of the estimated undiscounted future cash flows (“impairment analysis”). If the carrying value of theasset is greater than the aggregate amount of undiscounted future cash flows, then the asset is consideredimpaired, and an impairment loss is recorded for the amount by which the carrying value of the asset exceeds itsfair value. The fair value of the asset is calculated as present value of the future cash flows that are expected fromthe asset.
Cash flow projections used in our impairment analysis and fair value calculations are based on the businessplan authorized by our management or, if this is not available, on the operating plan reflecting the most recentcondition of the long–lived asset. In these plans, we assume, for example, that the most recent selling prices ofthe real estate in the surrounding areas will reasonably continue in the future, and estimate the sales prices of theproducts from facilities and equipment for the certain future period based on the average price for the equivalentlength of period in the past or on the analysts’ reports.
As for the discount rate used in fair value calculations, when expected variations of cash flows are notconsidered in the cash flow estimate, a discount rate, which includes the risk factor for the cash flow deviation, isused. Assumptions that marketplace participants would use in their estimates of fair value are incorporated in thediscount rate when such information is available. When such information is not available, an expected internalrate of return used for management purposes or a weighted average cost of capital of a company that owns thelong–lived asset, whichever is higher, is also considered for the discounted cash flow calculation.
Factors to be considered when estimating future cash flows and determining discount rates vary for eachlong-lived asset because of the difference in the nature of the assets and in operating circumstances, such aslocation, owner, operator, profitability and other factors.
Management believes that the estimates of future cash flows and the determination of discount rates and fairvalue are reasonable; however, changes in estimates resulting in lower future cash flows and fair values due tounforeseen changes in business assumptions could negatively affect the valuations of those long-lived assets.
Allowance for Doubtful Receivables
Since we are a general trading company, trade receivables represent a large portion of our total assets, andtherefore, the accounting estimates used to establish an allowance for doubtful receivables are critical.
When we deem it is probable that we will be unable to collect amounts that are contractually due to us forcertain large loan receivables, the specific loan is reviewed for impairment. Factors considered in assessingcollectibility include length of period past due, financial condition of the debtor, requests for debt restructuringand filings for bankruptcy.
An impairment loss for a specific loan deemed to be impaired, as specifically determined under SFASNo. 114, “Accounting by Creditors for Impairment of a Loan—an amendment of FASB Statements No. 5 and15,” is measured based on the present value of expected cash flows discounted at the loan’s original effectiveinterest rate or the fair value of collateral if the loan is collateral dependent. The expected cash flows from assetsand liabilities of the debtor and the fair value of collateral are determined mainly based on an evaluation ofindependent real estate appraisers, publicly available indications of the real estate price, market price of financialassets and liabilities, guarantors’ financial condition and other factors. The recoverable amounts are reviewed ona quarterly basis and if necessary, an additional allowance is established. See Note 7, “ALLOWANCE FORDOUBTFUL RECEIVABLES,” for impaired loan amounts and the respective allowance amounts.
In addition to the above, an allowance for doubtful receivables is recognized for probable losses inherent inreceivables not specifically deemed to be impaired. The amount of allowance is the amount judged to beadequate based primarily on our credit loss experiences and an evaluation of potential losses on the receivables,considering various factors, including current economic condition and financial condition of the debtors. We
117
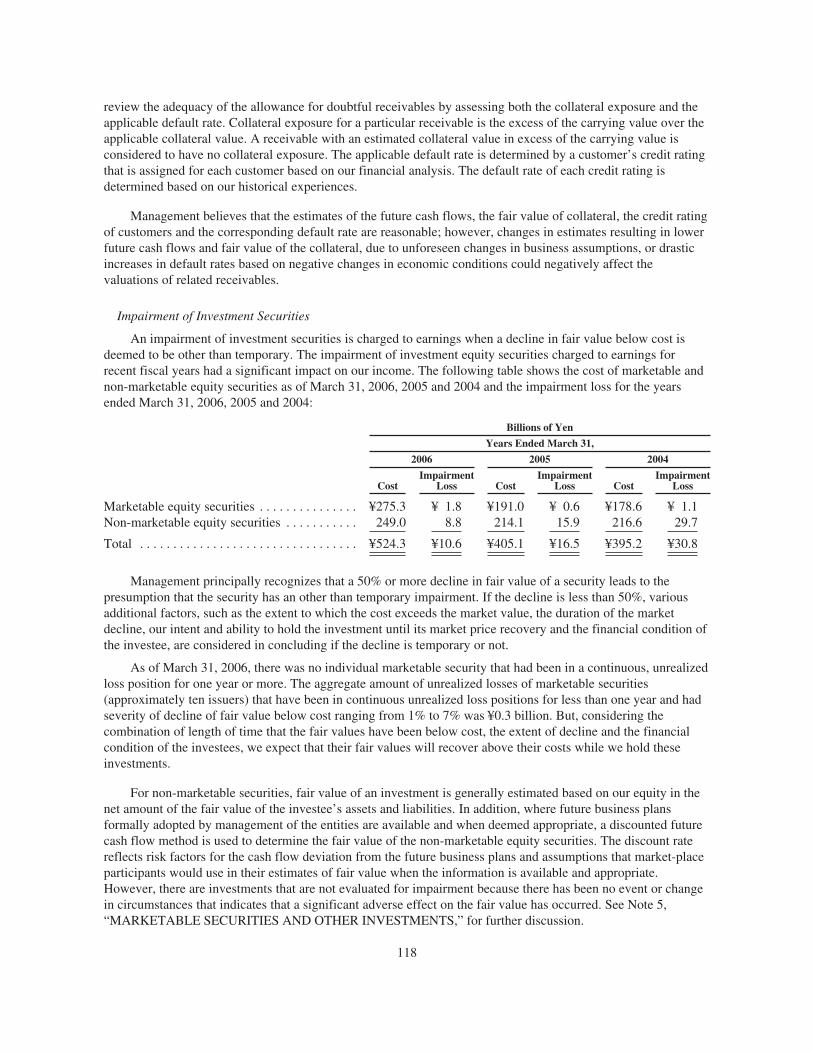
review the adequacy of the allowance for doubtful receivables by assessing both the collateral exposure and theapplicable default rate. Collateral exposure for a particular receivable is the excess of the carrying value over theapplicable collateral value. A receivable with an estimated collateral value in excess of the carrying value isconsidered to have no collateral exposure. The applicable default rate is determined by a customer’s credit ratingthat is assigned for each customer based on our financial analysis. The default rate of each credit rating isdetermined based on our historical experiences.
Management believes that the estimates of the future cash flows, the fair value of collateral, the credit ratingof customers and the corresponding default rate are reasonable; however, changes in estimates resulting in lowerfuture cash flows and fair value of the collateral, due to unforeseen changes in business assumptions, or drasticincreases in default rates based on negative changes in economic conditions could negatively affect thevaluations of related receivables.
Impairment of Investment Securities
An impairment of investment securities is charged to earnings when a decline in fair value below cost isdeemed to be other than temporary. The impairment of investment equity securities charged to earnings forrecent fiscal years had a significant impact on our income. The following table shows the cost of marketable andnon-marketable equity securities as of March 31, 2006, 2005 and 2004 and the impairment loss for the yearsended March 31, 2006, 2005 and 2004:
Billions of Yen
Years Ended March 31,
2006 2005 2004
CostImpairment
Loss CostImpairment
Loss CostImpairment
Loss
Marketable equity securities . . . . . . . . . . . . . . . ¥275.3 ¥ 1.8 ¥191.0 ¥ 0.6 ¥178.6 ¥ 1.1Non-marketable equity securities . . . . . . . . . . . 249.0 8.8 214.1 15.9 216.6 29.7
Total . . . . . . . . . . . . . . . . . . . . . . . . . . . . . . . . . ¥524.3 ¥10.6 ¥405.1 ¥16.5 ¥395.2 ¥30.8
Management principally recognizes that a 50% or more decline in fair value of a security leads to thepresumption that the security has an other than temporary impairment. If the decline is less than 50%, variousadditional factors, such as the extent to which the cost exceeds the market value, the duration of the marketdecline, our intent and ability to hold the investment until its market price recovery and the financial condition ofthe investee, are considered in concluding if the decline is temporary or not.
As of March 31, 2006, there was no individual marketable security that had been in a continuous, unrealizedloss position for one year or more. The aggregate amount of unrealized losses of marketable securities(approximately ten issuers) that have been in continuous unrealized loss positions for less than one year and hadseverity of decline of fair value below cost ranging from 1% to 7% was ¥0.3 billion. But, considering thecombination of length of time that the fair values have been below cost, the extent of decline and the financialcondition of the investees, we expect that their fair values will recover above their costs while we hold theseinvestments.
For non-marketable securities, fair value of an investment is generally estimated based on our equity in thenet amount of the fair value of the investee’s assets and liabilities. In addition, where future business plansformally adopted by management of the entities are available and when deemed appropriate, a discounted futurecash flow method is used to determine the fair value of the non-marketable equity securities. The discount ratereflects risk factors for the cash flow deviation from the future business plans and assumptions that market-placeparticipants would use in their estimates of fair value when the information is available and appropriate.However, there are investments that are not evaluated for impairment because there has been no event or changein circumstances that indicates that a significant adverse effect on the fair value has occurred. See Note 5,“MARKETABLE SECURITIES AND OTHER INVESTMENTS,” for further discussion.
118
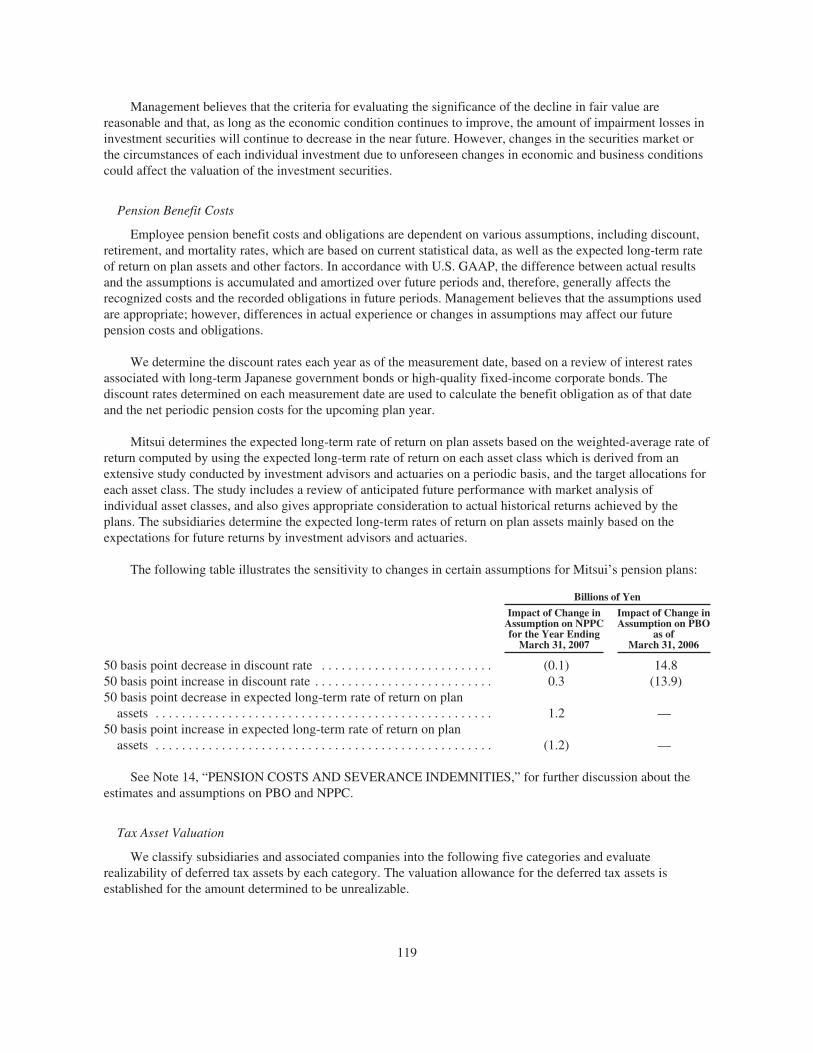
Management believes that the criteria for evaluating the significance of the decline in fair value arereasonable and that, as long as the economic condition continues to improve, the amount of impairment losses ininvestment securities will continue to decrease in the near future. However, changes in the securities market orthe circumstances of each individual investment due to unforeseen changes in economic and business conditionscould affect the valuation of the investment securities.
Pension Benefit Costs
Employee pension benefit costs and obligations are dependent on various assumptions, including discount,retirement, and mortality rates, which are based on current statistical data, as well as the expected long-term rateof return on plan assets and other factors. In accordance with U.S. GAAP, the difference between actual resultsand the assumptions is accumulated and amortized over future periods and, therefore, generally affects therecognized costs and the recorded obligations in future periods. Management believes that the assumptions usedare appropriate; however, differences in actual experience or changes in assumptions may affect our futurepension costs and obligations.
We determine the discount rates each year as of the measurement date, based on a review of interest ratesassociated with long-term Japanese government bonds or high-quality fixed-income corporate bonds. Thediscount rates determined on each measurement date are used to calculate the benefit obligation as of that dateand the net periodic pension costs for the upcoming plan year.
Mitsui determines the expected long-term rate of return on plan assets based on the weighted-average rate ofreturn computed by using the expected long-term rate of return on each asset class which is derived from anextensive study conducted by investment advisors and actuaries on a periodic basis, and the target allocations foreach asset class. The study includes a review of anticipated future performance with market analysis ofindividual asset classes, and also gives appropriate consideration to actual historical returns achieved by theplans. The subsidiaries determine the expected long-term rates of return on plan assets mainly based on theexpectations for future returns by investment advisors and actuaries.
The following table illustrates the sensitivity to changes in certain assumptions for Mitsui’s pension plans:
Billions of Yen
Impact of Change inAssumption on NPPCfor the Year Ending
March 31, 2007
Impact of Change inAssumption on PBO
as ofMarch 31, 2006
50 basis point decrease in discount rate . . . . . . . . . . . . . . . . . . . . . . . . . . (0.1) 14.850 basis point increase in discount rate . . . . . . . . . . . . . . . . . . . . . . . . . . . 0.3 (13.9)50 basis point decrease in expected long-term rate of return on plan
assets . . . . . . . . . . . . . . . . . . . . . . . . . . . . . . . . . . . . . . . . . . . . . . . . . . . 1.2 —50 basis point increase in expected long-term rate of return on plan
assets . . . . . . . . . . . . . . . . . . . . . . . . . . . . . . . . . . . . . . . . . . . . . . . . . . . (1.2) —
See Note 14, “PENSION COSTS AND SEVERANCE INDEMNITIES,” for further discussion about theestimates and assumptions on PBO and NPPC.
Tax Asset Valuation
We classify subsidiaries and associated companies into the following five categories and evaluaterealizability of deferred tax assets by each category. The valuation allowance for the deferred tax assets isestablished for the amount determined to be unrealizable.
119

First Category
Companies, which constantly generate sufficient taxable income every year to cover all the futuredeductible temporary differences as of the end of each fiscal year, and no significant change exists or is expectedin the business environment. For this category, we view all deferred tax asset amounts as realizable.
Second Category
Companies with stable operating results in past years (approximately in the last three years), but that did notgenerate sufficient taxable income in the current year to cover all the future deductible temporary differences asof the end of the fiscal year. For this category, the portion of the deferred tax assets that is recoverable based onan analysis of the scheduled taxable income in the future is determined to be realizable.
Third Category
Companies with unstable operating results in the past years, and that did not generate sufficient taxableincome in the current year to cover all the future deductible temporary differences as of the end of the fiscal year.For this category, the portion of the deferred tax assets that is recoverable based on an analysis of the scheduledtaxable income within a reasonable estimation period is determined to be realizable.
Fourth Category
Companies, which have significant amounts of tax loss carryforwards at the end of the fiscal year, haveexperienced the expiration of a significant amount of tax loss carryforwards in the past three years, or will fail toutilize a significant amount of tax loss carryforward up to the expiration date in the current period. For thiscategory, the portion of the deferred tax assets that is recoverable with a high degree of certainty based on ananalysis of the scheduled taxable income within the next fiscal year is determined to be realizable.
If the tax loss carryforward results from a non-recurring and unusual event such as the significantrestructuring of the business or a change in law or regulation, and the companies otherwise consistently generatetaxable income, the portion of the deferred tax assets that is recoverable based on an analysis of the scheduledtaxable income within a reasonable estimation period is determined to be realizable.
Fifth Category
Companies, which have recorded a significant amount of tax loss carryforwards for each of the past threeyears and are expected to record a significant tax loss in the current year as well. For this category, no deferredtax assets are determined to be realizable.
For Mitsui, the realizability of deferred tax assets is determined based on all available evidence, bothpositive and negative, including all currently available information regarding tax deductibility on future yearsand ability to generate sufficient taxable income prior to the expiration of the loss carryforwards.
Management believes it is more likely than not that all of our deferred tax assets, net of valuation allowance,will be realized. However, the amount of realizable net deferred tax assets may change in the near term ifestimates of future taxable income during the carryforward period are changed or if statutory tax rates orcarryforward periods are changed. See Note 21, “INCOME TAXES,” for further discussion about the deferredtax assets and valuation allowance.
New Accounting Standards
Inventory Costs
In November 2004, the FASB issued SFAS No. 151, “Inventory Costs—an amendment of ARB No. 43,Chapter 4.”
120
SFAS No. 151 requires that abnormal amounts of idle facility expense, freight, handling costs, and wastedmaterial (spoilage) should be recognized as current-period charges. In addition, SFAS No. 151 requires thatallocation of fixed production overheads to the costs of conversion be based on the normal capacity of theproduction facilities.
SFAS No. 151 is effective for inventory costs incurred during fiscal years beginning after June 15, 2005.The effect of adoption of this statement on our financial position and results of operations will be immaterial.
Share-Based Payment
In December 2004, the FASB issued SFAS No. 123 (revised 2004), “Share-Based Payment” (“SFASNo. 123R”). SFAS No. 123R requires the compensation cost from share-based payment transactions to berecognized in the financial statements. The amount of the compensation cost is measured based on the grant-datefair value of the equity instruments issued or the liabilities incurred. In addition, the award of liabilityinstruments will be remeasured at the end of each reporting period. The compensation cost is recognized over therequisite service period.
In April 2005, the U.S. Securities and Exchange Commission (“SEC”) adopted a new rule which amendedthe effective dates for SFAS No. 123R. Under the new rule, SFAS No. 123R is effective for fiscal yearsbeginning after June 15, 2005. The effect of adoption of this statement on our financial position and results ofoperations will be immaterial.
Accounting for Stripping Costs Incurred during Production in the Mining Industry
In March 2005, the FASB Emerging Issues Task Force reached a consensus on Issue No. 04-6 (“EITFNo. 04-6”), “Accounting for Stripping Costs Incurred during Production in the Mining Industry.”
EITF No. 04-6 requires that stripping costs incurred during the production stage of the mine be accountedfor as variable production costs that should be considered a component of mineral inventory costs and arerecognized as a component of costs of sales in the same period as the revenue from the sale of the inventory.
EITF No. 04-6 is effective for fiscal years beginning after December 15, 2005. The effect of adoption of thisconsensus on our financial position and results of operations will be immaterial.
Accounting for Purchases and Sales of Inventory with the Same Counterparty
In September 2005, the FASB Emerging Issues Task Force reached a consensus on Issue No. 04-13 (“EITFNo. 04-13”), “Accounting for Purchases and Sales of Inventory with the Same Counterparty.”
EITF No. 04-13 requires that two or more inventory purchase and sales transactions with the samecounterparty that are entered into in contemplation of one another should be combined for purposes of applyingAccounting Principles Board Opinion No. 29, “Accounting for Nonmonetary Transactions.”
EITF No. 04-13 also requires that all nonmonetary exchanges of inventory within the same line of businessother than those whereby an entity transfers finished goods inventory in exchange for the receipt of raw materialsor work-in-process inventory should be recognized at the carrying amount of the inventory transferred.
EITF No. 04-13 is effective for new arrangements entered into, and modifications or renewals of existingarrangements, beginning in the first interim or annual reporting period beginning after March 15, 2006. Theeffect of adoption of this consensus on our financial position and results of operations will be immaterial.
Accounting for Certain Hybrid Financial Instruments
In February 2006, the FASB issued SFAS No. 155, “Accounting for Certain Hybrid Financial Instruments—an amendment of FASB Statements No. 133 and 140.”
121

One of the amendments to SFAS No. 133 and SFAS No. 140 is that SFAS No. 155 permits an entity to electfair value remeasurement for any hybrid financial instrument in its entirety with changes in fair value recognizedin earnings, in which the hybrid financial instrument contains an embedded derivative that otherwise wouldrequire bifurcation.
SFAS No. 155 is effective for all financial instruments acquired, issued, or subject to a remeasurement eventoccurring after the beginning of an entity’s first fiscal year that begins after September 15, 2006. The effect ofadoption of this statement on our financial position and results of operations is not currently known and cannotbe reasonably estimated until further analysis is completed.
Accounting for Servicing of Financial Assets
In March 2006, the FASB issued SFAS No. 156, “Accounting for Servicing of Financial Assets—anamendment of FASB Statement No. 140.”
SFAS No. 156 requires all separately recognized servicing assets and servicing liabilities to be initiallymeasured at fair value, if practicable, and permits an entity to choose either the amortization method or the fairvalue measurement method for subsequent measurement of each class of separately recognized servicing assetsand servicing liabilities.
SFAS No. 156 is effective as of the beginning of the first fiscal year that begins after September 15, 2006.The effect of adoption of this statement on our financial position and results of operations is not currently knownand cannot be reasonably estimated until further analysis is completed.
B. Liquidity and Capital Resources
Use of Non-GAAP Financial Measures
Non-GAAP financial measures are defined in the SEC regulations as financial measures that either excludeor include amounts that are not excluded from or included in the most directly comparable measure calculatedand presented in accordance with GAAP.
Net Debt-to-Equity Ratio
We refer to “Net Debt-to-Equity Ratio” (“Net DER”) in this Liquidity and Capital Resources and elsewherein this annual report. Net DER is comprised of “net interest bearing debt” divided by shareholders’ equity.
“Net interest bearing debt” is defined as adjusted interest bearing debt, defined below, less cash and cashequivalents and time deposits. Our interest bearing debt primarily consists of long-term debt. As discussed in“Funding and Treasury Policies and Objectives,” to flexibly meet capital requirements and to prepare for futuredebt-service requirements in case of unforeseen deteriorations in financial markets, currently we hold a relativelyhigh level of cash and cash equivalents reflecting the current financial market conditions and future capitalrequirements. Under this policy, Net DER is a useful internal measure for our management to review the balancebetween:
‰ our capacity to meet debt repayments; and
‰ leverage to improve return on equity in our capital structure.
Management believes it is also helpful for the readers of this annual report.
To calculate our adjusted interest bearing debt, the followings balances are excluded:
‰ accounts payables, derivative liabilities and others;
‰ capital lease obligations; and
‰ SFAS No. 133 fair value adjustment.
122

Elimination of the SFAS No. 133 fair value adjustment is made because Japanese investors usually evaluateNet DER of other general trading companies in this manner.
This calculation does not recognize the fact that cash and cash equivalents and time deposits may not becompletely available for debt repayments because some amount of cash and cash equivalents and time depositsmay be required for operational needs including contractual obligations or capital expenditures.
“Net interest bearing debt” and “Net DER” are presented in the table below.
Billions of Yen
As of March 31,
2006 2005
Short-term debt . . . . . . . . . . . . . . . . . . . . . . . . . . . . . . . . . . . . . . . . . . . . . . . . . . . . . . . . . . . . ¥ 540.8 ¥ 615.4Long-term debt . . . . . . . . . . . . . . . . . . . . . . . . . . . . . . . . . . . . . . . . . . . . . . . . . . . . . . . . . . . . 3,264.1 3,196.9Less eliminating factors included in long-term debt:
Accounts payables, derivative liabilities and others . . . . . . . . . . . . . . . . . . . . . . . . . . . . (253.3) (193.0)Capital lease obligations . . . . . . . . . . . . . . . . . . . . . . . . . . . . . . . . . . . . . . . . . . . . . . . . . (24.6) (21.3)
Less SFAS No. 133 fair value adjustment . . . . . . . . . . . . . . . . . . . . . . . . . . . . . . . . . . . . . . . 37.7 (58.2)
Adjusted interest bearing debt . . . . . . . . . . . . . . . . . . . . . . . . . . . . . . . . . . . . . . . . . . . . . . . . . 3,564.7 3,539.8Less cash and cash equivalents and time deposits . . . . . . . . . . . . . . . . . . . . . . . . . . . . . . . . . (734.1) (819.9)
Net interest bearing debt . . . . . . . . . . . . . . . . . . . . . . . . . . . . . . . . . . . . . . . . . . . . . . . . . . . . . ¥2,830.6 ¥2,719.9
Shareholders’ equity . . . . . . . . . . . . . . . . . . . . . . . . . . . . . . . . . . . . . . . . . . . . . . . . . . . . . . . . ¥1,677.9 ¥1,122.8
Net DER (times) . . . . . . . . . . . . . . . . . . . . . . . . . . . . . . . . . . . . . . . . . . . . . . . . . . . . . . . . . . . 1.69 2.42
The most directly comparable GAAP measure is considered to be “Debt-to-Equity Ratio” (“DER”).However, this ratio measures gross debt relative to equity, and does not measure changes in cash position.
Adjusted DER (times) . . . . . . . . . . . . . . . . . . . . . . . . . . . . . . . . . . . . . . . . . . . . . . . . . . . . . . . 2.12 3.15(defined as adjusted interest bearing debt divided by shareholders’ equity)
Free Cash Flow
We define “free cash flow” as the sum of net cash provided by operating activities and net cash used ininvesting activities. Management believes that such indicator is useful to investors, to measure available net cashfor investment in strategic opportunities and/or debt repayment; or magnitude of reliance on borrowing toprocure funds for strategic investments.
The following table shows a reconciliation of net cash provided by operating activities to free cash flow.
Billions of Yen
Years Ended March 31,
2006 2005 2004
Net cash provided by operating activities . . . . . . . . . . . . . . . . . . . . . . . . . . . . . . . . . ¥ 146.4 ¥ 200.1 ¥ 100.1Net cash used in investing activities . . . . . . . . . . . . . . . . . . . . . . . . . . . . . . . . . . . . . (347.3) (224.0) (134.2)
Free cash flow . . . . . . . . . . . . . . . . . . . . . . . . . . . . . . . . . . . . . . . . . . . . . . . . . . . . . . ¥(200.9) ¥ (23.9) ¥ (34.1)
Finance and Liquidity Management
Funding and Treasury Policies and Objectives
Our basic funding policy is to secure stable sources of funds to maintain adequate liquidity and financing tosatisfy capital requirements for our operations and to maintain the strength of our balance sheet. In order to
123
achieve our objectives, our principal strategy is to obtain long-term funds (those with maturities of around 10years) from financial institutions, including insurance companies and banks, and through the issuance ofcorporate bonds. In addition, we utilize financing programs provided by government financing agencies forvarious projects to obtain long-term financing. Another strategy is to maintain sufficient liquidity to flexiblymeet capital requirements and to prepare for future debt-service requirements in case of unforeseen deteriorationsin financial markets. We hold cash and cash equivalents as liquidity sources, which consist mainly of highly-liquid and highly-rated short-term financial instruments and deposits. We aim to maintain the proper level ofcash and cash equivalents, reflecting the current financial market conditions and future capital requirements.
In principle, wholly owned domestic subsidiaries do not individually raise their funds in financial markets orborrow from banks, but instead use a cash management service provided by Mitsui & Co. Financial Services Ltd.(Japan), our financing subsidiary. The same policy and practices have been extended to wholly owned overseassubsidiaries through our regional financing subsidiaries, which centralizes the fund raising function and promotesefficient use of funds. Approximately 81% of total interest bearing debt as of March 31, 2006 (excluding SFASNo. 133 fair value adjustment) was raised by Mitsui and the above-mentioned financing subsidiaries as in-housebanking bases.
Funding Sources
We borrow funds based on our longstanding relations with financial institutions in Japan and overseas,borrow from government financing agencies, and also utilize project financing. In addition to these fundingsources, Mitsui maintains a ¥200 billion debt shelf-registration and a ¥2,400 billion commercial paper program inJapan. Similarly, Mitsui & Co. (U.S.A.), Inc., Mitsui & Co. International (Europe) B.V., Mitsui & Co., AsiaInvestment Ltd. and Mitsui & Co., Ltd. have arranged a joint Euro medium-term note (“MTN”) program ofU.S.$5 billion. Mitsui guarantees notes issued by these overseas subsidiaries. For raising short-term funds,Mitsui & Co. (U.S.A.), Inc. has a U.S.$1.5 billion U.S. domestic commercial paper program, and we have madearrangements for commercial paper programs in some other overseas markets.
Unused lines of credit, for short-term financing outside of Japan, aggregated ¥756.6 billion at March 31,2006. Certain overseas subsidiaries compensate banks for these facilities in the form of commitment fees, whichwere not material in each of the past three years.
Taking advantage of a favorable financial market environment, during the year ended March 31, 2006, weincreased long-term funding by borrowing from financial institutions and issuing bonds in Japan and MTNs inoverseas markets for debt retirement and for working capital requirements. There was one bond issue that raised¥15.0 billion in total (with maturity of 12.5 years) under the shelf-registration in Japan during the year endedMarch 31, 2006. As a result, long-term debt accounted for approximately 85% of total debt as of March 31, 2006,which we regard as a satisfactory level from the viewpoint of our financial policies.
In February 2006, Mitsui issued 130 million new shares of its common stock at an issuing price of¥1,467.55 per share in an international offering in reliance on Regulation S and in a Japanese offering. In March2006, Mitsui issued additional 9.75 million new shares of its common stock at the same issuing price through athird party allotment in connection with the execution of the over-allotment option in the Japanese offering.Mitsui received approximately ¥205.1 billion in aggregate cash proceeds (before deducting stock issuingexpenses).
Approximately 77% of the total of short-term and long-term debt as of March 31, 2006 was denominated inJapanese yen and the rest was primarily denominated in U.S. dollars. We employ certain derivative financialinstruments, which include interest rate swaps, currency swaps and foreign exchange forward contracts, tomanage financial exposures resulting from our financing activities. Currency swap agreements and foreignexchange forward contracts are used to manage risks associated with the fluctuations in foreign exchange rates.The principal financial derivative instruments that are employed to manage interest rate risk exposure are interestrate swap agreements. A large part of such agreements are used for fair value hedging of fixed rate interest
124
bearing debt, including fixed interest rate borrowing, bonds and notes, converting into floating interest ratesbased on the three-month or six-month LIBOR. The interest rates on approximately 79% of Mitsui’s long-termdebt, other than borrowings for certain projects, were floating after taking into account interest rate swaparrangements as of March 31, 2006.
See Note 26, “DERIVATIVE INSTRUMENTS AND HEDGING ACTIVITIES,” for further description ofour risk management policies.
Credit Ratings
To facilitate access to funds from capital markets, Mitsui and certain of our overseas trading subsidiarieshave obtained ratings for their commercial paper (short-term debt) and long-term senior unsecured debt (long-term debt) from Rating and Investment Information, Inc. (“R&I”), Moody’s Investors Service, Inc. (“Moody’s”)and Standard and Poor’s Services (“S&P”). The ratings as of June 2006 were as follows:
R&I Moody’s S&P
Short-term debt . . . . . . . . . . . . . . . . . . . . . . . . . . . . . . . . . . . . . . . . . . . . . . . . . . . . . . . . a-1+ P-1 A-1
Long-term debt . . . . . . . . . . . . . . . . . . . . . . . . . . . . . . . . . . . . . . . . . . . . . . . . . . . . . . . . AA- A2 A*
* The credit rating by S&P on long-term debt was provided without our request.
S&P in February 2006 raised our long-term credit rating to “A” from “A-” and short-term credit rating to“A-1” from “A-2.” S&P cited the following factors for the change in ratings:
‰ increase in shareholders’ equity through accumulation of retained earnings as well as public offering;
‰ improvement in profit base and asset quality through refinements in investment and withdrawaldecisions for operations; and
‰ enhancement of risk management system.
Mitsui intends to maintain and improve its current credit ratings by enhancing its earnings and riskmanagement.
Credit ratings are an assessment by the rating agencies of the credit risks associated with us and are basedon information provided by us and other sources that the rating agencies consider reliable. Lower ratingsgenerally result in higher borrowing costs and reduced access to capital markets. Credit ratings do not constitutea recommendation to buy, sell or hold securities and are subject to change or withdrawal by each of the ratingagencies at any time. As rating agencies may have different criteria in evaluating the risk associated with acompany, you should evaluate each rating independently of other ratings. Ratings may be changed withoutpre-notice at any time.
Liquidity Management
For the interest rate structure and the maturity profile of our outstanding debt, see Note 13, “SHORT-TERMAND LONG-TERM DEBT.”
Cash and cash equivalents were ¥697.1 billion, ¥791.8 billion and ¥638.3 billion as of March 31, 2006, 2005and 2004, respectively.
As of March 31, 2006, net interest bearing debt (interest bearing debt less cash and cash equivalents andtime deposits) was ¥2,830.6 billion, an increase of ¥110.7 billion from ¥2,719.9 billion as of March 31, 2005.However, the Net DER improved from 2.42 as of March 31, 2005 to 1.69 as of March 31, 2006, reflecting asignificant increase in shareholders’ equity.
The ratio of current assets to current liabilities remained comparable from 134.7% as of March 31, 2005 to135.2% as of March 31, 2006. The increases in investments and other non-current assets are financed by theincreases in long-term debt and shareholders’ equity including public offerings.
125

As of March 31, 2006, we had given guarantees for obligations of various third parties and associatedcompanies. These guarantees are not expected to require substantial use of our capital resources. We have nothad any material payment requirements resulting from these guarantees for the past three years. For details onguarantees issued by us, see Note 23, “COMMITMENTS AND CONTINGENT LIABILITIES.”
With the exception of project financing and non-recourse financing, it is our policy not to concludeagreements for important financial transactions with financial institutions that contain additional debt restrictionclauses that may cause acceleration of our obligations, including debt incurrence restrictions, negative pledges,restrictions on dividend payments and various financial ratio limits, and there are no material financial covenantsin the agreements undertaken.
Assuming that our subsidiaries have sufficient distributable net assets or retained earnings as provided underthe local laws of the relevant jurisdictions, there are no material contractual or legal restrictions on the ability ofour subsidiaries to transfer funds to us in the form of dividends, loans or advances. There are no materialeconomic restrictions on payments of dividends, loans or advances to us by our subsidiaries other than generalwithholding or other taxes calculated at the rates determined by the local tax laws of the relevant jurisdictions.
We held ¥697.1 billion of cash and cash equivalents as of March 31, 2006 in comparison to ¥222.6 billionof outstanding debt with current maturities including commercial paper, MTNs and bonds. Of the cash and cashequivalents, approximately 57% was held by Mitsui and approximately 92% was denominated in Japanese yen.We believe that we maintain sufficient liquidity to satisfy our working capital and debt-service requirements forthe foreseeable future through existing cash and cash equivalents and time deposits, the sales of certain assets inparallel with outside borrowings from financial institutions, as well as, the issuance of bonds and notes.
We plan to contribute ¥22.7 billion to our defined-benefit pension plans for the year ending March 31, 2007.This cash requirement will be managed under our funding policy mentioned above.
Investment Plans and Financial Policies of the Medium-Term Management Outlook
According to our Medium-term Management Outlook announced in May 2006, we plan to investapproximately ¥800 billion during the two years ending March 31, 2007 and 2008. The principal investments inthis plan are described below.
— Approximately ¥400 billion in Mineral Resources and Energy Area,
— Approximately ¥50-100 billion in Global Marketing Networks Area,
— Approximately ¥150-200 billion in Consumer Services Area, and
— Approximately ¥150 billion in Infrastructure Area.
Many of the projects in the investment plan involve bidding. The outcome of bidding will have an effect onour actual cash flows and financial condition for the year ending March 31, 2007.
We will procure funding for these investments by fund raising (including project finance) from the privatesector and government financing agencies and direct financing from capital markets, in addition, retainedearnings are also a crucial source of funds. We forecast our level of interest bearing debt to increase by about¥200 billion in the year ending March 31, 2007; however, this amount may vary, depending on the rate ofprogress of the investment plan.
In formulating our investment plans we are paying careful attention to our level of financial leverage—including our ratio of shareholders’ equity to total assets (“Shareholders’ Equity Ratio”) and our Net DER. As ofMarch 31, 2006, our Shareholders’ Equity Ratio and our Net DER were 19.6% and 1.69 compared to 14.8% and2.42 as of March 31, 2005, primarily due to the accumulation of retained earnings and the public offering. Webelieve that the favorable movement of these two indices clearly represents an enhancement in the stability of ourfund raising capacity. Considering the investment plan outlined above, we are forecasting a Net DER of around1.58 as of March 31, 2007.
126
Non-Exchange Traded Commodity Contracts at Fair Value
We perform trading activities in commodities that are listed on the terminal (futures) markets. Our tradingconsists of derivative instruments traded in the commodity futures markets, as well as non-exchange tradedcommodity contracts including commodity derivatives. Non-exchange traded commodity contracts are recordedat fair value based on prices actively quoted in the terminal (futures) market for commodities such as preciousmetals. Some non-exchange traded commodity contracts, such as non-exchange traded derivatives of crude oiland oil products, are recorded at fair value based on the prices provided by other external sources. Their effect onearnings and financial position is immaterial.
Transactions with Related Parties
When conducting our business operations throughout the world, we form alliances with leading partnercompanies in Japan and overseas, including manufacturers and companies in the fields of natural resources, suchas energy and ferrous materials. In addition to investing in, or providing loans to, associated companies where weare a minority shareholder, we conduct selling and purchasing transactions of various products on a recurringbasis with such associated companies.
Our principal associated companies include Valepar S.A. (18.2%), Mitsui Oil Exploration Co., Ltd.(47.3%), Japan Australia LNG (MIMI) Pty. Ltd. (50.0%), IPM Eagle LLP (30.0%), Sakhalin Energy InvestmentCompany Ltd. (25.0%), Nihon Unisys, Ltd. (32.4%), and United Auto Group, Inc. (15.4%), among others.
During the years ended March 31, 2006, 2005 and 2004, our gross revenues from transactions with theseassociated companies amounted to ¥89.1 billion, ¥121.3 billion and ¥107.8 billion, respectively, and the values ofgoods and services purchased from such companies and reported as cost of revenues were ¥238.0 billion, ¥192.4billion and ¥161.2 billion, respectively.
Prices applied in transactions with associated companies are computed in the same way that such priceswould be calculated in transactions with unrelated third parties. In addition, when associated companies arecounterparties in transactions with us and we conduct such business under long-term procurement and/or salescontracts, in general, we conclude a corresponding sales contract with the purchasers (unrelated parties) of goodsprocured by us and/or with suppliers (unrelated parties) of the goods we sell to associated companies. In addition,we were the guarantor for ¥ 55.0 billion and ¥57.6 billion in funds borrowed and other financial obligations ofassociated companies as of March 31, 2006 and 2005, respectively. Regarding any other commitments related totransactions with associated companies, we do not normally assume risk in excess of our percentage of shareownership in such associated companies.
Assets, Liabilities and Shareholders’ Equity
Total assets as of March 31, 2006 were ¥8,573.6 billion, an increase of ¥980.2 billion from ¥7,593.4 billionas of March 31, 2005.
Current assets as of March 31, 2006 were ¥4,746.8 billion, an increase of ¥326.1 billion from ¥4,420.7billion as of March 31, 2005. Along with the higher market prices of commodities and increased businesstransactions, the following items increased:
‰ Accounts receivables increased by ¥133.4 billion, mainly at Mitsui, especially in the segments of theChemical, the Machinery & Infrastructure Projects and the Iron & Steel Raw Materials and Non-FerrousMetals; and at Mitsui & Co. Precious Metals, Inc. (United States) in the Logistics & Financial MarketsSegment.
‰ Inventories increased by ¥98.9 billion, mainly at Mitsui’s Logistics & Financial Markets Segment andWestport Petroleum, Inc. (United States).
127

‰ Derivative assets increased by ¥167.1 billion because of mark-to-market gains of derivative transactionsmainly at Mitsui & Co. Precious Metals, Inc. (United States) and Mitsui & Co. Energy RiskManagement Ltd. (United Kingdom).
Total current liabilities as of March 31, 2006 were ¥3,510.9 billion, an increase of ¥229.1 billion from¥3,281.8 billion as of March 31, 2005. The main factors were as follows:
‰ Short-term debt decreased by ¥74.6 billion mainly at Mitsui. On the other hand, current maturities oflong-term debt increased by ¥61.2 billion mainly at Mitsui & Co. (U.S.A.), Inc. (United States) andMitsui & Co. Financial Services Ltd. (Japan).
‰ Accounts payables increased by ¥116.3 billion corresponding to the above-mentioned increase inaccounts receivables mainly at Mitsui & Co. Precious Metals, Inc. Similarly, derivative liabilitiesincreased by ¥59.7 billion mainly at Mitsui & Co. Precious Metals, Inc. and Mitsui & Co. Energy RiskManagement Ltd.
As a result, working capital, or current assets minus current liabilities, as of March 31, 2006 was ¥1,235.9billion, a ¥97.0 billion increase compared to ¥1,138.9 billion as of March 31, 2005.
The sum of total investments and non-current receivables, property and equipment—at cost, intangibleassets less accumulated amortization, deferred tax assets—non current and other assets totaled ¥3,826.7 billion asof March 31, 2006, a ¥654.0 billion increase compared to ¥3,172.7 billion as of March 31, 2005, mainly due tothe following factors:
‰ Within total investments and non-current receivables, investments in and advances to associatedcompanies as of March 31, 2006 was ¥1,300.6 billion, a ¥327.4 billion increase compared to ¥973.2billion as of March 31, 2005. This increase was mainly attributable to investments in mineral resourcesand energy related development projects and infrastructure projects, for example:
— Sakhalin Energy Investment Company Ltd. (Bermuda), a project implementing vehicle of theSakhalin II project, for ¥102.4 billion (including effect from foreign exchange translation of ¥18.9billion) in the Energy Segment;
— SUMIC Nickel Netherlands B.V. (Netherlands) participating in the Goro Nickel Project, for ¥7.8billion in the Iron & Steel Raw Materials and Non-Ferrous Metals Segment;
— IPM Eagle LLP (United Kingdom) in connection with acquisition of the Saltend power plantamounting to ¥13.7 billion (including effect from foreign exchange translation of ¥0.6 billion) in theMachinery & Infrastructure Projects Segment: and
— Thai Tap Water Supply Company Limited for ¥11.0 billion in the Machinery & InfrastructureProjects Segment.
In addition to the above-mentioned increase, there were increases which do not involve cash outflowsuch as:
— increases in equity in earnings (before tax effect) of ¥77.9 billion (net of dividends received fromassociated companies);
— a ¥24.5 billion increase in unrealized holding gains on available-for-sale securities including thoserelated to the shares in INPEX CORPORATION (currently INPEX Holdings Inc.) owned by ourassociated company Mitsui Oil Exploration Co., Ltd. (Japan); and
— a ¥39.1 billion improvement in foreign exchange translation cumulative adjustments including ¥25.2billion in connection with investment in Valepar S. A. (Brazil).
128
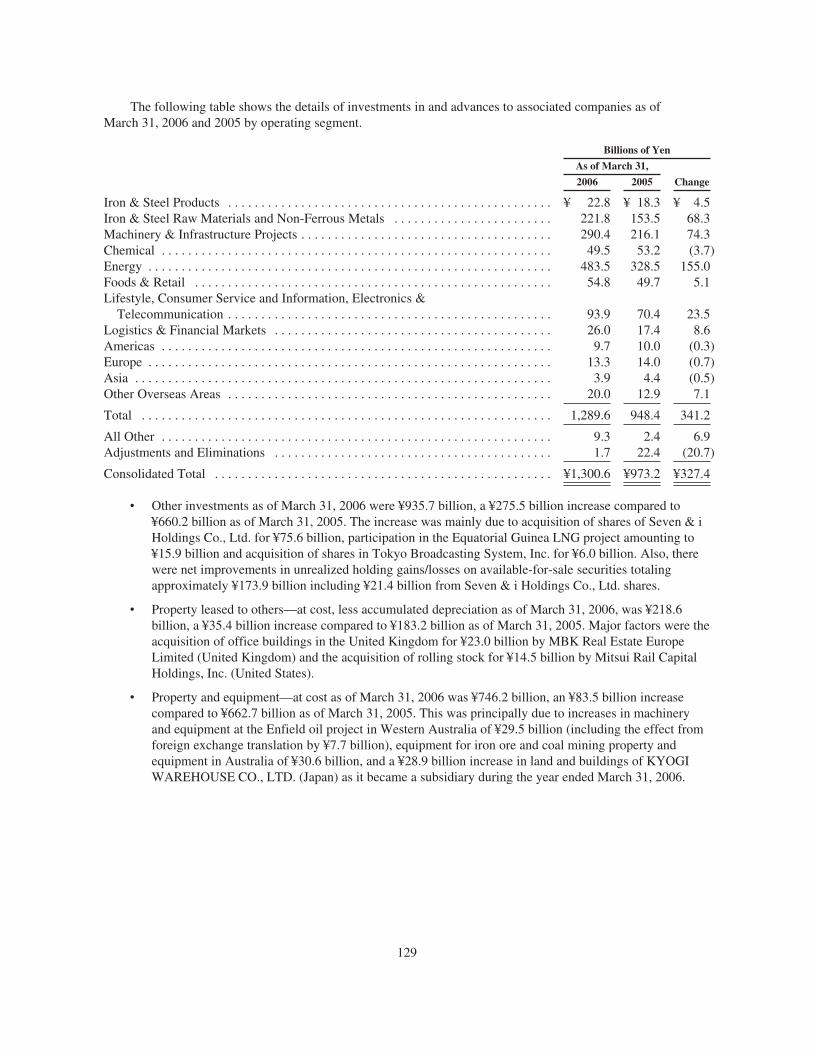
The following table shows the details of investments in and advances to associated companies as ofMarch 31, 2006 and 2005 by operating segment.
Billions of Yen
As of March 31,
Change2006 2005
Iron & Steel Products . . . . . . . . . . . . . . . . . . . . . . . . . . . . . . . . . . . . . . . . . . . . . . . . . ¥ 22.8 ¥ 18.3 ¥ 4.5Iron & Steel Raw Materials and Non-Ferrous Metals . . . . . . . . . . . . . . . . . . . . . . . . 221.8 153.5 68.3Machinery & Infrastructure Projects . . . . . . . . . . . . . . . . . . . . . . . . . . . . . . . . . . . . . . 290.4 216.1 74.3Chemical . . . . . . . . . . . . . . . . . . . . . . . . . . . . . . . . . . . . . . . . . . . . . . . . . . . . . . . . . . . 49.5 53.2 (3.7)Energy . . . . . . . . . . . . . . . . . . . . . . . . . . . . . . . . . . . . . . . . . . . . . . . . . . . . . . . . . . . . . 483.5 328.5 155.0Foods & Retail . . . . . . . . . . . . . . . . . . . . . . . . . . . . . . . . . . . . . . . . . . . . . . . . . . . . . . 54.8 49.7 5.1Lifestyle, Consumer Service and Information, Electronics &
Telecommunication . . . . . . . . . . . . . . . . . . . . . . . . . . . . . . . . . . . . . . . . . . . . . . . . . 93.9 70.4 23.5Logistics & Financial Markets . . . . . . . . . . . . . . . . . . . . . . . . . . . . . . . . . . . . . . . . . . 26.0 17.4 8.6Americas . . . . . . . . . . . . . . . . . . . . . . . . . . . . . . . . . . . . . . . . . . . . . . . . . . . . . . . . . . . 9.7 10.0 (0.3)Europe . . . . . . . . . . . . . . . . . . . . . . . . . . . . . . . . . . . . . . . . . . . . . . . . . . . . . . . . . . . . . 13.3 14.0 (0.7)Asia . . . . . . . . . . . . . . . . . . . . . . . . . . . . . . . . . . . . . . . . . . . . . . . . . . . . . . . . . . . . . . . 3.9 4.4 (0.5)Other Overseas Areas . . . . . . . . . . . . . . . . . . . . . . . . . . . . . . . . . . . . . . . . . . . . . . . . . 20.0 12.9 7.1
Total . . . . . . . . . . . . . . . . . . . . . . . . . . . . . . . . . . . . . . . . . . . . . . . . . . . . . . . . . . . . . . 1,289.6 948.4 341.2
All Other . . . . . . . . . . . . . . . . . . . . . . . . . . . . . . . . . . . . . . . . . . . . . . . . . . . . . . . . . . . 9.3 2.4 6.9Adjustments and Eliminations . . . . . . . . . . . . . . . . . . . . . . . . . . . . . . . . . . . . . . . . . . 1.7 22.4 (20.7)
Consolidated Total . . . . . . . . . . . . . . . . . . . . . . . . . . . . . . . . . . . . . . . . . . . . . . . . . . . ¥1,300.6 ¥973.2 ¥327.4
‰ Other investments as of March 31, 2006 were ¥935.7 billion, a ¥275.5 billion increase compared to¥660.2 billion as of March 31, 2005. The increase was mainly due to acquisition of shares of Seven & iHoldings Co., Ltd. for ¥75.6 billion, participation in the Equatorial Guinea LNG project amounting to¥15.9 billion and acquisition of shares in Tokyo Broadcasting System, Inc. for ¥6.0 billion. Also, therewere net improvements in unrealized holding gains/losses on available-for-sale securities totalingapproximately ¥173.9 billion including ¥21.4 billion from Seven & i Holdings Co., Ltd. shares.
‰ Property leased to others—at cost, less accumulated depreciation as of March 31, 2006, was ¥218.6billion, a ¥35.4 billion increase compared to ¥183.2 billion as of March 31, 2005. Major factors were theacquisition of office buildings in the United Kingdom for ¥23.0 billion by MBK Real Estate EuropeLimited (United Kingdom) and the acquisition of rolling stock for ¥14.5 billion by Mitsui Rail CapitalHoldings, Inc. (United States).
‰ Property and equipment—at cost as of March 31, 2006 was ¥746.2 billion, an ¥83.5 billion increasecompared to ¥662.7 billion as of March 31, 2005. This was principally due to increases in machineryand equipment at the Enfield oil project in Western Australia of ¥29.5 billion (including the effect fromforeign exchange translation by ¥7.7 billion), equipment for iron ore and coal mining property andequipment in Australia of ¥30.6 billion, and a ¥28.9 billion increase in land and buildings of KYOGIWAREHOUSE CO., LTD. (Japan) as it became a subsidiary during the year ended March 31, 2006.
129
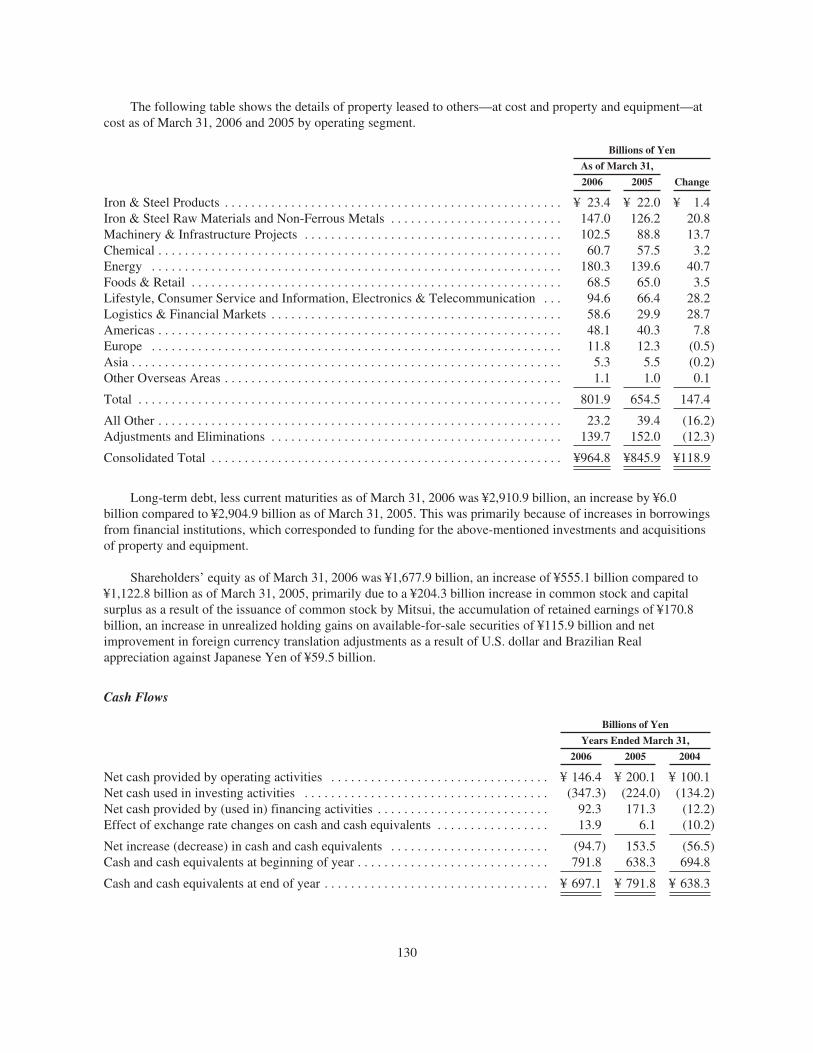
The following table shows the details of property leased to others—at cost and property and equipment—atcost as of March 31, 2006 and 2005 by operating segment.
Billions of Yen
As of March 31,
Change2006 2005
Iron & Steel Products . . . . . . . . . . . . . . . . . . . . . . . . . . . . . . . . . . . . . . . . . . . . . . . . . . . ¥ 23.4 ¥ 22.0 ¥ 1.4Iron & Steel Raw Materials and Non-Ferrous Metals . . . . . . . . . . . . . . . . . . . . . . . . . . 147.0 126.2 20.8Machinery & Infrastructure Projects . . . . . . . . . . . . . . . . . . . . . . . . . . . . . . . . . . . . . . . 102.5 88.8 13.7Chemical . . . . . . . . . . . . . . . . . . . . . . . . . . . . . . . . . . . . . . . . . . . . . . . . . . . . . . . . . . . . . 60.7 57.5 3.2Energy . . . . . . . . . . . . . . . . . . . . . . . . . . . . . . . . . . . . . . . . . . . . . . . . . . . . . . . . . . . . . . 180.3 139.6 40.7Foods & Retail . . . . . . . . . . . . . . . . . . . . . . . . . . . . . . . . . . . . . . . . . . . . . . . . . . . . . . . . 68.5 65.0 3.5Lifestyle, Consumer Service and Information, Electronics & Telecommunication . . . 94.6 66.4 28.2Logistics & Financial Markets . . . . . . . . . . . . . . . . . . . . . . . . . . . . . . . . . . . . . . . . . . . . 58.6 29.9 28.7Americas . . . . . . . . . . . . . . . . . . . . . . . . . . . . . . . . . . . . . . . . . . . . . . . . . . . . . . . . . . . . . 48.1 40.3 7.8Europe . . . . . . . . . . . . . . . . . . . . . . . . . . . . . . . . . . . . . . . . . . . . . . . . . . . . . . . . . . . . . . 11.8 12.3 (0.5)Asia . . . . . . . . . . . . . . . . . . . . . . . . . . . . . . . . . . . . . . . . . . . . . . . . . . . . . . . . . . . . . . . . . 5.3 5.5 (0.2)Other Overseas Areas . . . . . . . . . . . . . . . . . . . . . . . . . . . . . . . . . . . . . . . . . . . . . . . . . . . 1.1 1.0 0.1
Total . . . . . . . . . . . . . . . . . . . . . . . . . . . . . . . . . . . . . . . . . . . . . . . . . . . . . . . . . . . . . . . . 801.9 654.5 147.4
All Other . . . . . . . . . . . . . . . . . . . . . . . . . . . . . . . . . . . . . . . . . . . . . . . . . . . . . . . . . . . . . 23.2 39.4 (16.2)Adjustments and Eliminations . . . . . . . . . . . . . . . . . . . . . . . . . . . . . . . . . . . . . . . . . . . . 139.7 152.0 (12.3)
Consolidated Total . . . . . . . . . . . . . . . . . . . . . . . . . . . . . . . . . . . . . . . . . . . . . . . . . . . . . ¥964.8 ¥845.9 ¥118.9
Long-term debt, less current maturities as of March 31, 2006 was ¥2,910.9 billion, an increase by ¥6.0billion compared to ¥2,904.9 billion as of March 31, 2005. This was primarily because of increases in borrowingsfrom financial institutions, which corresponded to funding for the above-mentioned investments and acquisitionsof property and equipment.
Shareholders’ equity as of March 31, 2006 was ¥1,677.9 billion, an increase of ¥555.1 billion compared to¥1,122.8 billion as of March 31, 2005, primarily due to a ¥204.3 billion increase in common stock and capitalsurplus as a result of the issuance of common stock by Mitsui, the accumulation of retained earnings of ¥170.8billion, an increase in unrealized holding gains on available-for-sale securities of ¥115.9 billion and netimprovement in foreign currency translation adjustments as a result of U.S. dollar and Brazilian Realappreciation against Japanese Yen of ¥59.5 billion.
Cash Flows
Billions of Yen
Years Ended March 31,
2006 2005 2004
Net cash provided by operating activities . . . . . . . . . . . . . . . . . . . . . . . . . . . . . . . . . ¥ 146.4 ¥ 200.1 ¥ 100.1Net cash used in investing activities . . . . . . . . . . . . . . . . . . . . . . . . . . . . . . . . . . . . . (347.3) (224.0) (134.2)Net cash provided by (used in) financing activities . . . . . . . . . . . . . . . . . . . . . . . . . . 92.3 171.3 (12.2)Effect of exchange rate changes on cash and cash equivalents . . . . . . . . . . . . . . . . . 13.9 6.1 (10.2)
Net increase (decrease) in cash and cash equivalents . . . . . . . . . . . . . . . . . . . . . . . . (94.7) 153.5 (56.5)Cash and cash equivalents at beginning of year . . . . . . . . . . . . . . . . . . . . . . . . . . . . . 791.8 638.3 694.8
Cash and cash equivalents at end of year . . . . . . . . . . . . . . . . . . . . . . . . . . . . . . . . . . ¥ 697.1 ¥ 791.8 ¥ 638.3
130
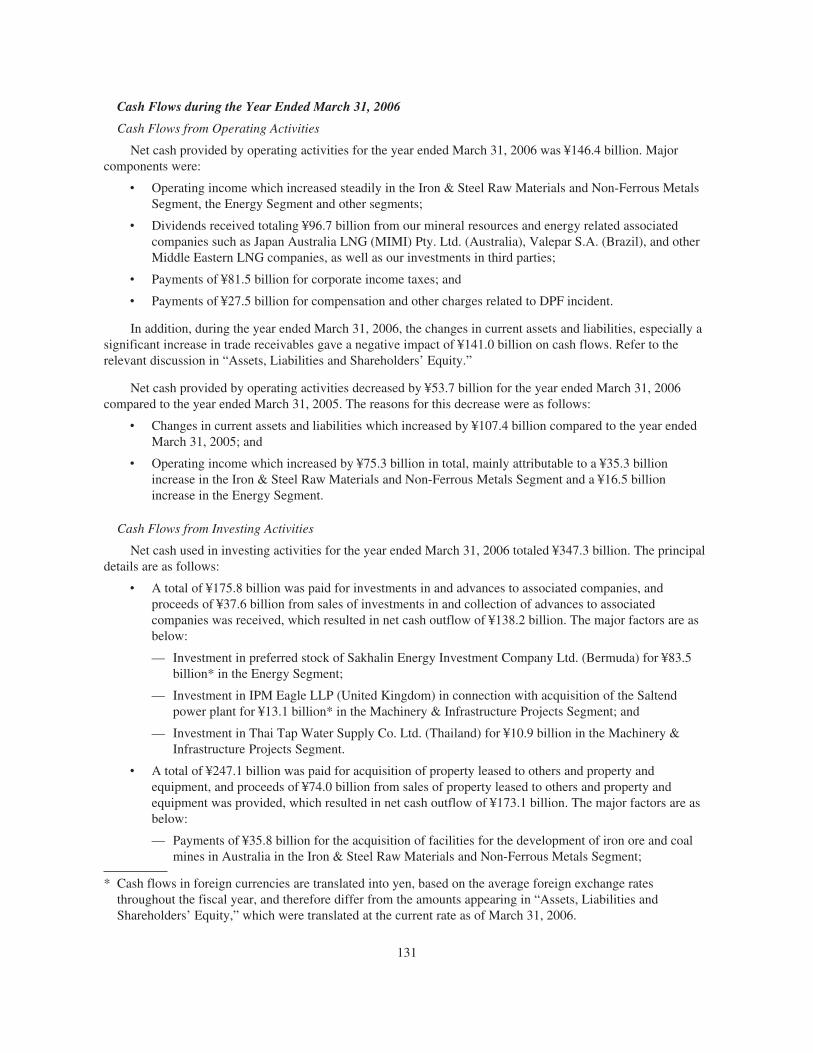
Cash Flows during the Year Ended March 31, 2006
Cash Flows from Operating Activities
Net cash provided by operating activities for the year ended March 31, 2006 was ¥146.4 billion. Majorcomponents were:
‰ Operating income which increased steadily in the Iron & Steel Raw Materials and Non-Ferrous MetalsSegment, the Energy Segment and other segments;
‰ Dividends received totaling ¥96.7 billion from our mineral resources and energy related associatedcompanies such as Japan Australia LNG (MIMI) Pty. Ltd. (Australia), Valepar S.A. (Brazil), and otherMiddle Eastern LNG companies, as well as our investments in third parties;
‰ Payments of ¥81.5 billion for corporate income taxes; and
‰ Payments of ¥27.5 billion for compensation and other charges related to DPF incident.
In addition, during the year ended March 31, 2006, the changes in current assets and liabilities, especially asignificant increase in trade receivables gave a negative impact of ¥141.0 billion on cash flows. Refer to therelevant discussion in “Assets, Liabilities and Shareholders’ Equity.”
Net cash provided by operating activities decreased by ¥53.7 billion for the year ended March 31, 2006compared to the year ended March 31, 2005. The reasons for this decrease were as follows:
‰ Changes in current assets and liabilities which increased by ¥107.4 billion compared to the year endedMarch 31, 2005; and
‰ Operating income which increased by ¥75.3 billion in total, mainly attributable to a ¥35.3 billionincrease in the Iron & Steel Raw Materials and Non-Ferrous Metals Segment and a ¥16.5 billionincrease in the Energy Segment.
Cash Flows from Investing Activities
Net cash used in investing activities for the year ended March 31, 2006 totaled ¥347.3 billion. The principaldetails are as follows:
‰ A total of ¥175.8 billion was paid for investments in and advances to associated companies, andproceeds of ¥37.6 billion from sales of investments in and collection of advances to associatedcompanies was received, which resulted in net cash outflow of ¥138.2 billion. The major factors are asbelow:
— Investment in preferred stock of Sakhalin Energy Investment Company Ltd. (Bermuda) for ¥83.5billion* in the Energy Segment;
— Investment in IPM Eagle LLP (United Kingdom) in connection with acquisition of the Saltendpower plant for ¥13.1 billion* in the Machinery & Infrastructure Projects Segment; and
— Investment in Thai Tap Water Supply Co. Ltd. (Thailand) for ¥10.9 billion in the Machinery &Infrastructure Projects Segment.
‰ A total of ¥247.1 billion was paid for acquisition of property leased to others and property andequipment, and proceeds of ¥74.0 billion from sales of property leased to others and property andequipment was provided, which resulted in net cash outflow of ¥173.1 billion. The major factors are asbelow:
— Payments of ¥35.8 billion for the acquisition of facilities for the development of iron ore and coalmines in Australia in the Iron & Steel Raw Materials and Non-Ferrous Metals Segment;
131
* Cash flows in foreign currencies are translated into yen, based on the average foreign exchange ratesthroughout the fiscal year, and therefore differ from the amounts appearing in “Assets, Liabilities andShareholders’ Equity,” which were translated at the current rate as of March 31, 2006.
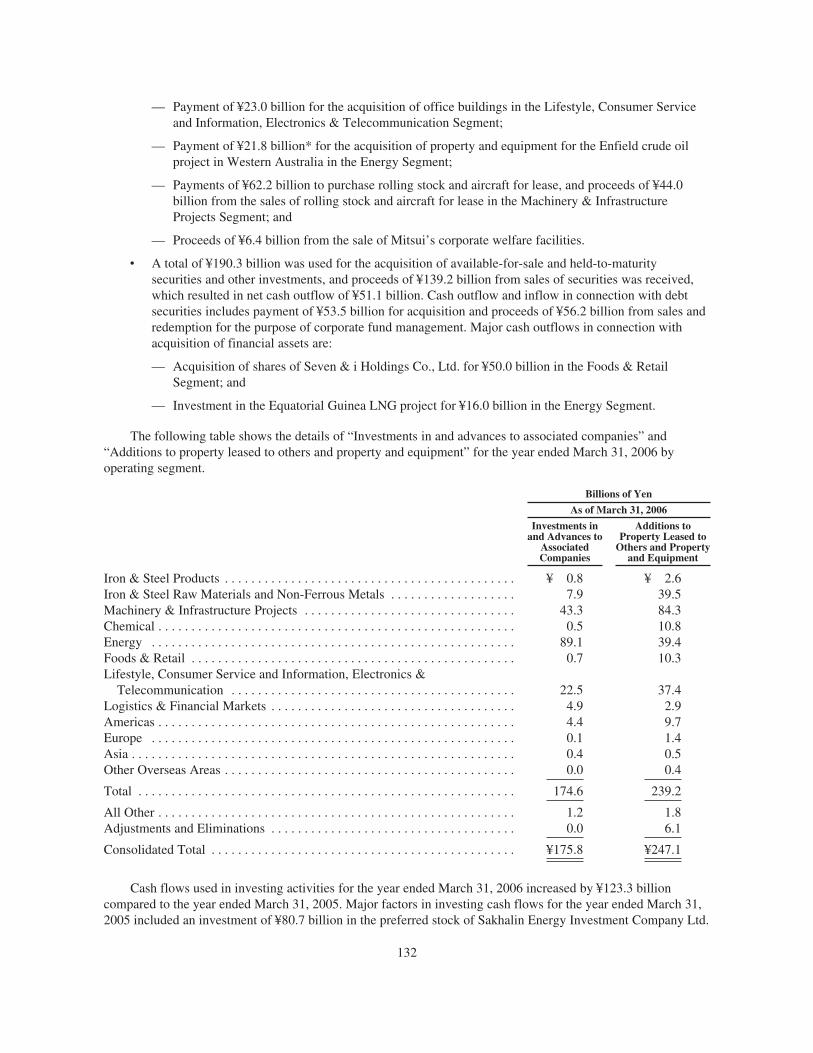
— Payment of ¥23.0 billion for the acquisition of office buildings in the Lifestyle, Consumer Serviceand Information, Electronics & Telecommunication Segment;
— Payment of ¥21.8 billion* for the acquisition of property and equipment for the Enfield crude oilproject in Western Australia in the Energy Segment;
— Payments of ¥62.2 billion to purchase rolling stock and aircraft for lease, and proceeds of ¥44.0billion from the sales of rolling stock and aircraft for lease in the Machinery & InfrastructureProjects Segment; and
— Proceeds of ¥6.4 billion from the sale of Mitsui’s corporate welfare facilities.
‰ A total of ¥190.3 billion was used for the acquisition of available-for-sale and held-to-maturitysecurities and other investments, and proceeds of ¥139.2 billion from sales of securities was received,which resulted in net cash outflow of ¥51.1 billion. Cash outflow and inflow in connection with debtsecurities includes payment of ¥53.5 billion for acquisition and proceeds of ¥56.2 billion from sales andredemption for the purpose of corporate fund management. Major cash outflows in connection withacquisition of financial assets are:
— Acquisition of shares of Seven & i Holdings Co., Ltd. for ¥50.0 billion in the Foods & RetailSegment; and
— Investment in the Equatorial Guinea LNG project for ¥16.0 billion in the Energy Segment.
The following table shows the details of “Investments in and advances to associated companies” and“Additions to property leased to others and property and equipment” for the year ended March 31, 2006 byoperating segment.
Billions of Yen
As of March 31, 2006
Investments inand Advances to
AssociatedCompanies
Additions toProperty Leased to
Others and Propertyand Equipment
Iron & Steel Products . . . . . . . . . . . . . . . . . . . . . . . . . . . . . . . . . . . . . . . . . . . . ¥ 0.8 ¥ 2.6Iron & Steel Raw Materials and Non-Ferrous Metals . . . . . . . . . . . . . . . . . . . 7.9 39.5Machinery & Infrastructure Projects . . . . . . . . . . . . . . . . . . . . . . . . . . . . . . . . 43.3 84.3Chemical . . . . . . . . . . . . . . . . . . . . . . . . . . . . . . . . . . . . . . . . . . . . . . . . . . . . . . 0.5 10.8Energy . . . . . . . . . . . . . . . . . . . . . . . . . . . . . . . . . . . . . . . . . . . . . . . . . . . . . . . 89.1 39.4Foods & Retail . . . . . . . . . . . . . . . . . . . . . . . . . . . . . . . . . . . . . . . . . . . . . . . . . 0.7 10.3Lifestyle, Consumer Service and Information, Electronics &
Telecommunication . . . . . . . . . . . . . . . . . . . . . . . . . . . . . . . . . . . . . . . . . . . 22.5 37.4Logistics & Financial Markets . . . . . . . . . . . . . . . . . . . . . . . . . . . . . . . . . . . . . 4.9 2.9Americas . . . . . . . . . . . . . . . . . . . . . . . . . . . . . . . . . . . . . . . . . . . . . . . . . . . . . . 4.4 9.7Europe . . . . . . . . . . . . . . . . . . . . . . . . . . . . . . . . . . . . . . . . . . . . . . . . . . . . . . . 0.1 1.4Asia . . . . . . . . . . . . . . . . . . . . . . . . . . . . . . . . . . . . . . . . . . . . . . . . . . . . . . . . . . 0.4 0.5Other Overseas Areas . . . . . . . . . . . . . . . . . . . . . . . . . . . . . . . . . . . . . . . . . . . . 0.0 0.4
Total . . . . . . . . . . . . . . . . . . . . . . . . . . . . . . . . . . . . . . . . . . . . . . . . . . . . . . . . . 174.6 239.2
All Other . . . . . . . . . . . . . . . . . . . . . . . . . . . . . . . . . . . . . . . . . . . . . . . . . . . . . . 1.2 1.8Adjustments and Eliminations . . . . . . . . . . . . . . . . . . . . . . . . . . . . . . . . . . . . . 0.0 6.1
Consolidated Total . . . . . . . . . . . . . . . . . . . . . . . . . . . . . . . . . . . . . . . . . . . . . . ¥175.8 ¥247.1
Cash flows used in investing activities for the year ended March 31, 2006 increased by ¥123.3 billioncompared to the year ended March 31, 2005. Major factors in investing cash flows for the year ended March 31,2005 included an investment of ¥80.7 billion in the preferred stock of Sakhalin Energy Investment Company Ltd.
132

(Bermuda), ¥64.4 billion for the acquisition of mineral rights and property and equipment in the Enfield crude oilproject in Western Australia and an investment of ¥62.2 billion in IPM Eagle LLP (United Kingdom), as well asan inflow of ¥14.5 billion from the sale of shares in Vodafone K.K.
Cash Flows from Financing Activities
Net cash provided by financing activities for the year ended March 31, 2006 was ¥92.3 billion. Majorfactors were as below:
‰ Mitsui raised ¥203.8 billion (net of stock issuance costs before taxes) from the public offering of130 million shares in February 2006 and the third party allotment of 9.75 million shares in March 2006.
‰ Net cash flow in short-term debt decreased by ¥89.4 billion due to repayments of notes on MTNprograms and commercial papers issued by Mitsui and overseas trading subsidiaries. Net of proceedsfrom and repayment of long-term debt was ¥10.4 billion. Mitsui increased long-term borrowings inresponse to the above-mentioned investing activities, while domestic and overseas financial subsidiariesrepaid long-term borrowings.
‰ Dividend paid by Mitsui totaled ¥31.6 billion.
Net cash flow provided from financing activities for the year ended March 31, 2006 decreased by ¥79.0billion compared to the year ended March 31, 2005. For the year ended March 31, 2005, there were higher levelsof long-term funds procured through borrowing from financial institutions and the issuance of bonds. Refer toFunding Sources above, for details of our fund procurement for the year ended March 31, 2006.
Cash and Cash Equivalents as of March 31, 2006
In addition to the increase of ¥13.9 billion due to changes in exchange rates, the balance of our cash andcash equivalents as of March 31, 2006 was ¥697.1 billion, a decrease by ¥94.7 billion compared to ¥791.8 as ofMarch 31, 2005.
Cash Flows under the Medium-Term Management Outlook
Reflecting our active investment program, free cash flows, which we define as the total of cash flows fromoperating activities and cash flows from investing activities, recorded a deficit of ¥200.9 billion for the yearended March 31, 2006. Management expects that our free cash flow will continue to be negative until the yearending March 31, 2008 and will turn to positive from the year ending March 31, 2009, mainly due to thefollowing reasons:
‰ Mitsui intends to execute investments of approximately ¥800 billion in total during the two years endingMarch 31, 2007 and 2008, which include approximately ¥400 billion investments in mineral resourcesand energy related development projects. Most of these development projects require lead time beforestarting to generate cash flow, though it is expected that continuously strong demand in the mineralresources and energy markets will support our operating results during those periods.
‰ It is expected that the start of commercial operation of two major energy projects, the Enfield crude oilproject (during the year ending March 31, 2007) and the Sakhalin II LNG project (during the yearending March 31, 2009), as well as the completion of expansion projects in iron ore and coal mines inAustralia, will contribute to significant improvement in free cash flow.
Cash Flows during the Year Ended March 31, 2005
Cash Flows from Operating Activities
Net cash provided by operating activities for the year ended March 31, 2005 was ¥200.1 billion, which wasprimarily attributable to:
‰ Operating income which increased steadily in the Iron & Steel Raw Materials and Non-Ferrous MetalsSegment, Energy Segment, and other segments;
133
‰ Dividends received totaling ¥53.6 billion from our mineral resources and energy related associatedcompanies such as Japan Australia LNG (MIMI) Pty. Ltd.(Australia), Valepar S.A.(Brazil), and otherMiddle Eastern LNG companies, as well as our investments in third parties;
‰ Total payments, in relation to contributions to our defined benefit pension plan and payments underunfunded severance indemnities plans amounting to ¥30.9 billion;
‰ A one-time payment of ¥8.1 billion for compensation and other charges related to DPF incident; and
‰ Payments of ¥56.9 billion for corporate income taxes.
Net cash provided by operating activities increased by ¥100 billion for the year ended March 31, 2005compared with the year ended March 31, 2004. The reasons for this increase were:
‰ Operating income which increased by ¥71.2 billion in total, by operating segment mainly attributable toa ¥39.4 billion increase in the Iron & Steel Raw Materials and Non-Ferrous Metals Segment and ¥13.8billion in the Energy Segment; and
‰ Dividends received from associated companies as well as investees other than subsidiaries andassociated companies.
Cash Flows from Investing Activities
Net cash used in investing activities for the year ended March 31, 2005 totaled ¥224.0 billion. Of thisamount, ¥133.3 billion was used in relation to investments and loans (investing activities not related to propertyleased to others and property and equipment). The details are as follows:
‰ A total of ¥190.4 billion was paid for investments in and advances to associated companies. Thisincluded an ¥80.7 billion* investment in preferred stock of Sakhalin Energy Investment Company Ltd.(Bermuda) and an investment of ¥62.2 billion* in IPM Eagle LLP (United Kingdom) that purchasedEdison Mission Energy’s overseas power plants generation business portfolio. Deduction of a ¥52.7billion proceeds from sales of investments in and collection of advances to associated companiesresulted in a net cash outflow of ¥137.7 billion.
‰ A total of ¥68.5 billion was used on the acquisition of debt securities for fund management purposes,mainly from Mitsui and its financing subsidiaries, and ¥59.8 billion was obtained as proceeds frommaturities of such debt securities. While ¥14.5 billion was provided by the sale of shares in VodafoneK.K. (Japan), ¥8.9 billion was used in the purchase of shares in CornerStone Research & DevelopmentInc. (United States).
‰ A total of ¥90.7 billion was paid for fixed assets, which includes property leased to others and propertyand equipment. The main items are listed below.
— Payments of ¥64.4 billion* for the acquisition of mineral rights and other fixed assets in the Enfieldcrude oil project in Western Australia;
— Payments of ¥17.2 billion for the acquisition of facilities for the development of iron ore and coalmines;
— Payments of ¥16.0 billion to purchase rolling stock and ocean transport vessels for lease, andproceeds of ¥17.0 billion from the sale of aircraft, rolling stock and ocean transport vessels forlease;
— Proceeds of ¥10.8 billion from the sale of our office building in the United Kingdom; and
— Proceeds of ¥12.8 billion from the sale of Mitsui’s corporate residences and dormitories.
134
* Cash flows in foreign currencies were translated into yen, based on the average foreign exchange ratesthroughout the fiscal year, and therefore differ from the amounts appearing in “Assets, Liabilities andShareholders’ Equity,” which were translated by the exchange rate as of March 31, 2005.
Cash flows used in investing activities increased by ¥89.8 billion for the year ended March 31, 2005compared with the year ended March 31, 2004. Typical cash outflows and inflows for the year ended March 31,2004 included an investment of ¥97.1 to acquire shares in Valepar S.A. (Brazil), an investment of ¥56.7 billion inthe preferred stock of Sakhalin Energy Investment Company Ltd. (Bermuda), and proceeds of ¥49.8 billion fromthe sale of shares in Caemi Mineraçã o e Metalurgia S.A. (Brazil).
Cash Flows from Financing Activities
Net cash provided by financing activities for the year ended March 31, 2005 was ¥171.3 billion, which wasprimarily attributable to:
‰ An increase in long and short-term debt of ¥183.8 billion mainly consisting of the increased long-termborrowings and issuance of long-term bonds by Mitsui, Mitsui & Co. (U.S.A.) Inc. and other tradingsubsidiaries. Of this amount, ¥141.2 billion was procured by Mitsui;
‰ In response to increasing demand for funds for our investments and acquisition of fixed assets, weincreased our level of long-term fund procurement, taking advantage of a favorable financial marketenvironment. As a result, our long-term debt increased by ¥120.7 billion, and bonds increased by ¥55.0billion; and
‰ Other cash flows from financing activities included ¥2.6 billion proceeds from the issuance of stock inTelepark Corp. (Japan), and payments of ¥14.2 billion for cash dividends.
Cash flows from financing activities for the year ended March 31, 2005 increased by ¥183.5 billion from theyear ended March 31, 2004. The main sources, as described above, were increases in levels of long-term fundprocurement through our borrowing from financial institutions and the issuance of bonds. Refer to “FundingSources” above for details of our fund procurement for the year ended March 31, 2005.
Cash and Cash Equivalents as of March 31, 2005
In addition to the increase of ¥6.1 billion due to changes in exchange rates, the balance of our cash and cashequivalents increased by ¥153.5 billion for the year ended March 31, 2005 to ¥791.8 billion as of March 31,2005.
C. Research & Development
For the year ended March 31, 2006, research and development (“R&D”) expenses for the various R&Dactivities underway totaled ¥5.1 billion, which included ¥3.4 billion in the Chemical Segment related tonanotechnology, biotechnology and life science and ¥0.9 billion in the Foods & Retail Segment.
In the nanotechnology field, a key research area in the Chemical Segment, we have been developing andpromoting the commercialization of ethanol separation technology by using zeolite membranes, which willdramatically improve the energy efficiency of biomass ethanol production. Biomass ethanol is a renewableenergy source, and as such it is being utilized all over the world as an additive for automobile gasoline and fuelfor power generation, as a means of addressing the issue of global warming. By realizing improved energyefficiency in the production of biomass ethanol through the use of zeolite membranes, it is expected to contributeto reduce CO2 emissions and improve the global environment.
Carbon nanotubes are expected to be developed for a variety of advanced applications in the future, and weare continuing to cooperate with industry and academia to conduct development research into these applications,providing the produced carbon nanotubes for many partner university laboratories and companies as we strivetogether to commercialize this technology. Along with this work, we are also carrying out research on relatedsafety issues.
135
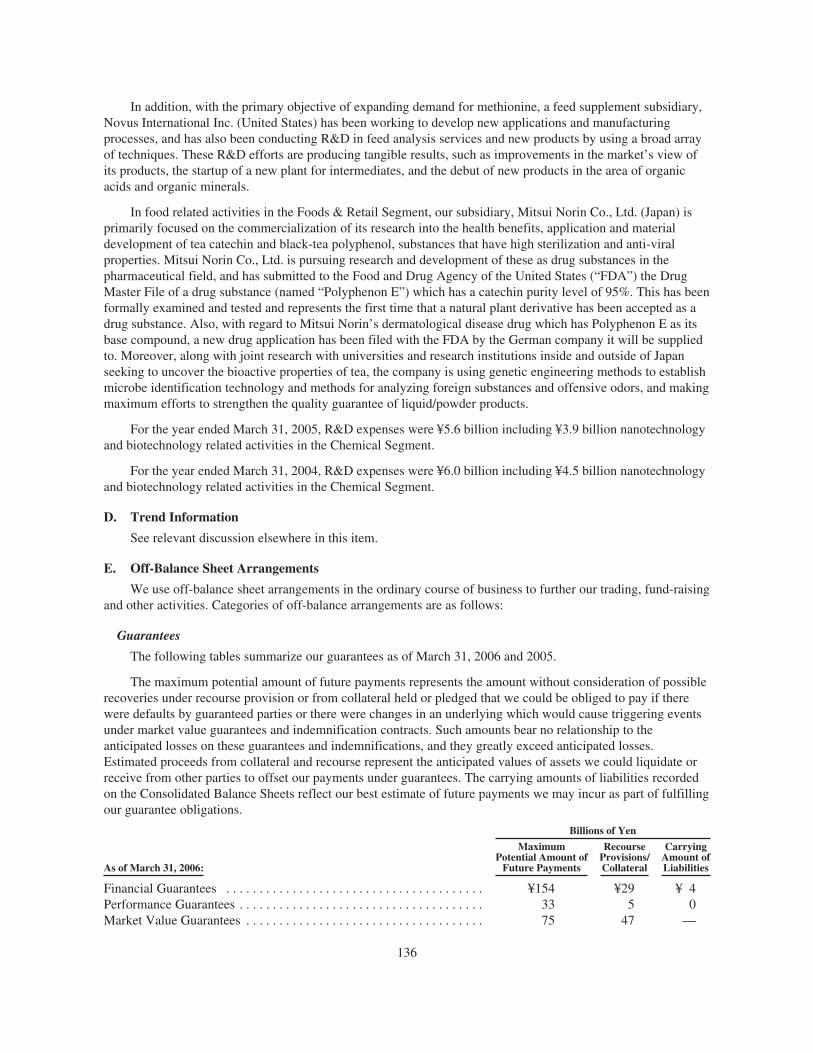
In addition, with the primary objective of expanding demand for methionine, a feed supplement subsidiary,Novus International Inc. (United States) has been working to develop new applications and manufacturingprocesses, and has also been conducting R&D in feed analysis services and new products by using a broad arrayof techniques. These R&D efforts are producing tangible results, such as improvements in the market’s view ofits products, the startup of a new plant for intermediates, and the debut of new products in the area of organicacids and organic minerals.
In food related activities in the Foods & Retail Segment, our subsidiary, Mitsui Norin Co., Ltd. (Japan) isprimarily focused on the commercialization of its research into the health benefits, application and materialdevelopment of tea catechin and black-tea polyphenol, substances that have high sterilization and anti-viralproperties. Mitsui Norin Co., Ltd. is pursuing research and development of these as drug substances in thepharmaceutical field, and has submitted to the Food and Drug Agency of the United States (“FDA”) the DrugMaster File of a drug substance (named “Polyphenon E”) which has a catechin purity level of 95%. This has beenformally examined and tested and represents the first time that a natural plant derivative has been accepted as adrug substance. Also, with regard to Mitsui Norin’s dermatological disease drug which has Polyphenon E as itsbase compound, a new drug application has been filed with the FDA by the German company it will be suppliedto. Moreover, along with joint research with universities and research institutions inside and outside of Japanseeking to uncover the bioactive properties of tea, the company is using genetic engineering methods to establishmicrobe identification technology and methods for analyzing foreign substances and offensive odors, and makingmaximum efforts to strengthen the quality guarantee of liquid/powder products.
For the year ended March 31, 2005, R&D expenses were ¥5.6 billion including ¥3.9 billion nanotechnologyand biotechnology related activities in the Chemical Segment.
For the year ended March 31, 2004, R&D expenses were ¥6.0 billion including ¥4.5 billion nanotechnologyand biotechnology related activities in the Chemical Segment.
D. Trend Information
See relevant discussion elsewhere in this item.
E. Off-Balance Sheet Arrangements
We use off-balance sheet arrangements in the ordinary course of business to further our trading, fund-raisingand other activities. Categories of off-balance arrangements are as follows:
Guarantees
The following tables summarize our guarantees as of March 31, 2006 and 2005.
The maximum potential amount of future payments represents the amount without consideration of possiblerecoveries under recourse provision or from collateral held or pledged that we could be obliged to pay if therewere defaults by guaranteed parties or there were changes in an underlying which would cause triggering eventsunder market value guarantees and indemnification contracts. Such amounts bear no relationship to theanticipated losses on these guarantees and indemnifications, and they greatly exceed anticipated losses.Estimated proceeds from collateral and recourse represent the anticipated values of assets we could liquidate orreceive from other parties to offset our payments under guarantees. The carrying amounts of liabilities recordedon the Consolidated Balance Sheets reflect our best estimate of future payments we may incur as part of fulfillingour guarantee obligations.
Billions of Yen
As of March 31, 2006:
MaximumPotential Amount of
Future Payments
RecourseProvisions/Collateral
CarryingAmount ofLiabilities
Financial Guarantees . . . . . . . . . . . . . . . . . . . . . . . . . . . . . . . . . . . . . . . ¥154 ¥29 ¥ 4Performance Guarantees . . . . . . . . . . . . . . . . . . . . . . . . . . . . . . . . . . . . . 33 5 0Market Value Guarantees . . . . . . . . . . . . . . . . . . . . . . . . . . . . . . . . . . . . 75 47 —
136
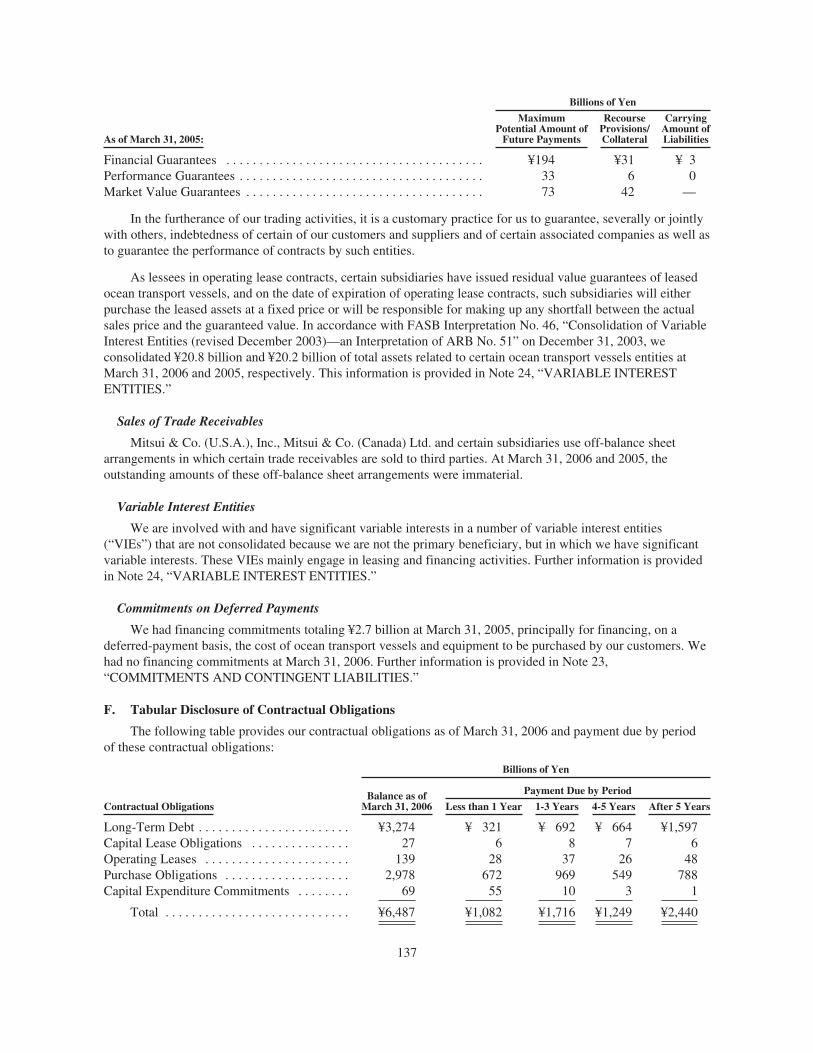
Billions of Yen
As of March 31, 2005:
MaximumPotential Amount of
Future Payments
RecourseProvisions/Collateral
CarryingAmount ofLiabilities
Financial Guarantees . . . . . . . . . . . . . . . . . . . . . . . . . . . . . . . . . . . . . . . ¥194 ¥31 ¥ 3Performance Guarantees . . . . . . . . . . . . . . . . . . . . . . . . . . . . . . . . . . . . . 33 6 0Market Value Guarantees . . . . . . . . . . . . . . . . . . . . . . . . . . . . . . . . . . . . 73 42 —
In the furtherance of our trading activities, it is a customary practice for us to guarantee, severally or jointlywith others, indebtedness of certain of our customers and suppliers and of certain associated companies as well asto guarantee the performance of contracts by such entities.
As lessees in operating lease contracts, certain subsidiaries have issued residual value guarantees of leasedocean transport vessels, and on the date of expiration of operating lease contracts, such subsidiaries will eitherpurchase the leased assets at a fixed price or will be responsible for making up any shortfall between the actualsales price and the guaranteed value. In accordance with FASB Interpretation No. 46, “Consolidation of VariableInterest Entities (revised December 2003)—an Interpretation of ARB No. 51” on December 31, 2003, weconsolidated ¥20.8 billion and ¥20.2 billion of total assets related to certain ocean transport vessels entities atMarch 31, 2006 and 2005, respectively. This information is provided in Note 24, “VARIABLE INTERESTENTITIES.”
Sales of Trade Receivables
Mitsui & Co. (U.S.A.), Inc., Mitsui & Co. (Canada) Ltd. and certain subsidiaries use off-balance sheetarrangements in which certain trade receivables are sold to third parties. At March 31, 2006 and 2005, theoutstanding amounts of these off-balance sheet arrangements were immaterial.
Variable Interest Entities
We are involved with and have significant variable interests in a number of variable interest entities(“VIEs”) that are not consolidated because we are not the primary beneficiary, but in which we have significantvariable interests. These VIEs mainly engage in leasing and financing activities. Further information is providedin Note 24, “VARIABLE INTEREST ENTITIES.”
Commitments on Deferred Payments
We had financing commitments totaling ¥2.7 billion at March 31, 2005, principally for financing, on adeferred-payment basis, the cost of ocean transport vessels and equipment to be purchased by our customers. Wehad no financing commitments at March 31, 2006. Further information is provided in Note 23,“COMMITMENTS AND CONTINGENT LIABILITIES.”
F. Tabular Disclosure of Contractual Obligations
The following table provides our contractual obligations as of March 31, 2006 and payment due by periodof these contractual obligations:
Billions of Yen
Contractual ObligationsBalance as of
March 31, 2006
Payment Due by Period
Less than 1 Year 1-3 Years 4-5 Years After 5 Years
Long-Term Debt . . . . . . . . . . . . . . . . . . . . . . . ¥3,274 ¥ 321 ¥ 692 ¥ 664 ¥1,597Capital Lease Obligations . . . . . . . . . . . . . . . 27 6 8 7 6Operating Leases . . . . . . . . . . . . . . . . . . . . . . 139 28 37 26 48Purchase Obligations . . . . . . . . . . . . . . . . . . . 2,978 672 969 549 788Capital Expenditure Commitments . . . . . . . . 69 55 10 3 1
Total . . . . . . . . . . . . . . . . . . . . . . . . . . . . ¥6,487 ¥1,082 ¥1,716 ¥1,249 ¥2,440
137

The amounts of “Long-Term Debt” include bank borrowings, bonds and long-term trade payables,excluding the effect of the SFAS No. 133 fair value adjustment. “Capital Lease Obligations “ represents theschedule of payments for future minimum lease payments. “Operating Leases” represents the schedule ofpayments for future minimum rentals. Minimum rental payments have not been reduced by minimum subleaserentals of ¥57.9 billion due in the future under noncancelable subleases. “Purchase Obligations” represents theschedule of payments for long-term purchase obligations, net of advance payments of ¥86.5 billion made tosuppliers as of March 31, 2006. The purchased items are principally oil products, chemical materials, oceantransport vessels, metals and machinery and equipment, either at fixed prices or at basic purchase pricesadjustable to the market. In general, our customers, primarily large Japanese industrial companies and shippingfirms, are also parties to the contracts or by separate agreements and are committed to purchase the items fromus. “Capital Expenditure Commitments” represents the unpaid amounts of total contracts for the acquisition ofplant and equipment at the reporting date but not recognized in the financial statements.
In addition to the above, we plan to contribute ¥22.7 billion to our defined benefit pension plans for the yearending March 31, 2007.
For additional information regarding long-term debt, capital lease obligations, operating leases and purchaseobligations, see Note 13, “SHORT-TERM AND LONG-TERM DEBT,” Note 8, “LEASES,” and Note 23,“COMMITMENTS AND CONTINGENT LIABILITIES,” respectively.
Item 6. Directors, Senior Management and Employees.
A. Directors and Senior Management.
We are managed by a Board of Directors and Executive Officers. As of June 30, 2006, we have elevenDirectors and thirty-eight Executive Officers including seven of whom are also Directors. In accordance withMitsui’s Articles of Incorporation, each Director was elected for a term of one year. Each Executive Officer hasbeen appointed by the Board of Directors.
The Board of Directors is our decision-making body. The Board of Directors determines our basicguidelines and policies by establishing our corporate strategy, reviewing our business plans, and supervising andmonitoring the activities of our Executive Officers.
The Executive Officers are responsible for the execution of our corporate activities. They must follow andenforce the general guidelines and policies established by the Board of Directors and Mitsui’s Articles ofIncorporation.
As of June 30, 2006, Mitsui’s Executive Officers consisted of one President, four Executive Vice Presidents,six Senior Executive Managing Officers, twelve Executive Managing Officers and fifteen Managing Officers.
The execution of the Directors’ functions (including their functions to supervise and monitor the activitiesof the Executive Officers) is audited by Corporate Auditors. Each Corporate Auditor is elected by shareholders ofMitsui at a general meeting of shareholders. As of June 30, 2006, we have six Corporate Auditors. In performingtheir auditing activities, they act independently of each other while they are constituted, and act through theBoard of Corporate Auditors, as the Corporate Law of Japan requires.
138
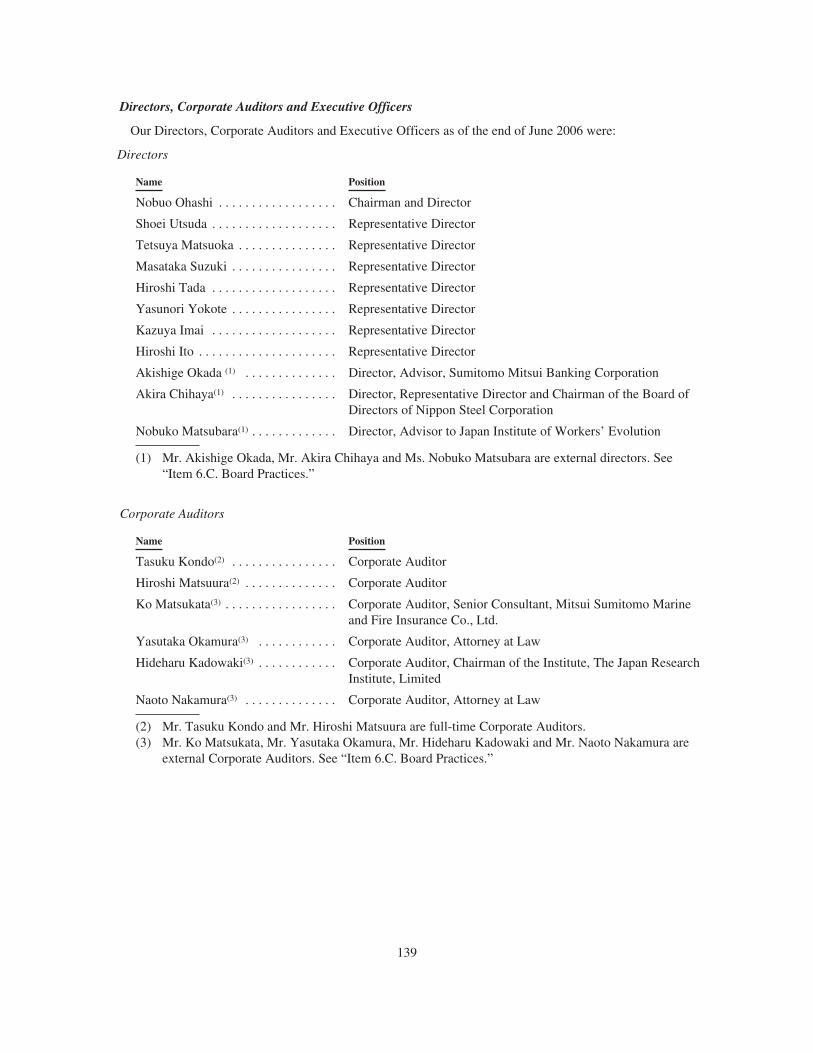
Directors, Corporate Auditors and Executive Officers
Our Directors, Corporate Auditors and Executive Officers as of the end of June 2006 were:
Directors
Name Position
Nobuo Ohashi . . . . . . . . . . . . . . . . . . Chairman and Director
Shoei Utsuda . . . . . . . . . . . . . . . . . . . Representative Director
Tetsuya Matsuoka . . . . . . . . . . . . . . . Representative Director
Masataka Suzuki . . . . . . . . . . . . . . . . Representative Director
Hiroshi Tada . . . . . . . . . . . . . . . . . . . Representative Director
Yasunori Yokote . . . . . . . . . . . . . . . . Representative Director
Kazuya Imai . . . . . . . . . . . . . . . . . . . Representative Director
Hiroshi Ito . . . . . . . . . . . . . . . . . . . . . Representative Director
Akishige Okada (1) . . . . . . . . . . . . . . Director, Advisor, Sumitomo Mitsui Banking Corporation
Akira Chihaya(1) . . . . . . . . . . . . . . . . Director, Representative Director and Chairman of the Board ofDirectors of Nippon Steel Corporation
Nobuko Matsubara(1) . . . . . . . . . . . . . Director, Advisor to Japan Institute of Workers’ Evolution
(1) Mr. Akishige Okada, Mr. Akira Chihaya and Ms. Nobuko Matsubara are external directors. See“Item 6.C. Board Practices.”
Corporate Auditors
Name Position
Tasuku Kondo(2) . . . . . . . . . . . . . . . . Corporate Auditor
Hiroshi Matsuura(2) . . . . . . . . . . . . . . Corporate Auditor
Ko Matsukata(3) . . . . . . . . . . . . . . . . . Corporate Auditor, Senior Consultant, Mitsui Sumitomo Marineand Fire Insurance Co., Ltd.
Yasutaka Okamura(3) . . . . . . . . . . . . Corporate Auditor, Attorney at Law
Hideharu Kadowaki(3) . . . . . . . . . . . . Corporate Auditor, Chairman of the Institute, The Japan ResearchInstitute, Limited
Naoto Nakamura(3) . . . . . . . . . . . . . . Corporate Auditor, Attorney at Law
(2) Mr. Tasuku Kondo and Mr. Hiroshi Matsuura are full-time Corporate Auditors.(3) Mr. Ko Matsukata, Mr. Yasutaka Okamura, Mr. Hideharu Kadowaki and Mr. Naoto Nakamura are
external Corporate Auditors. See “Item 6.C. Board Practices.”
139
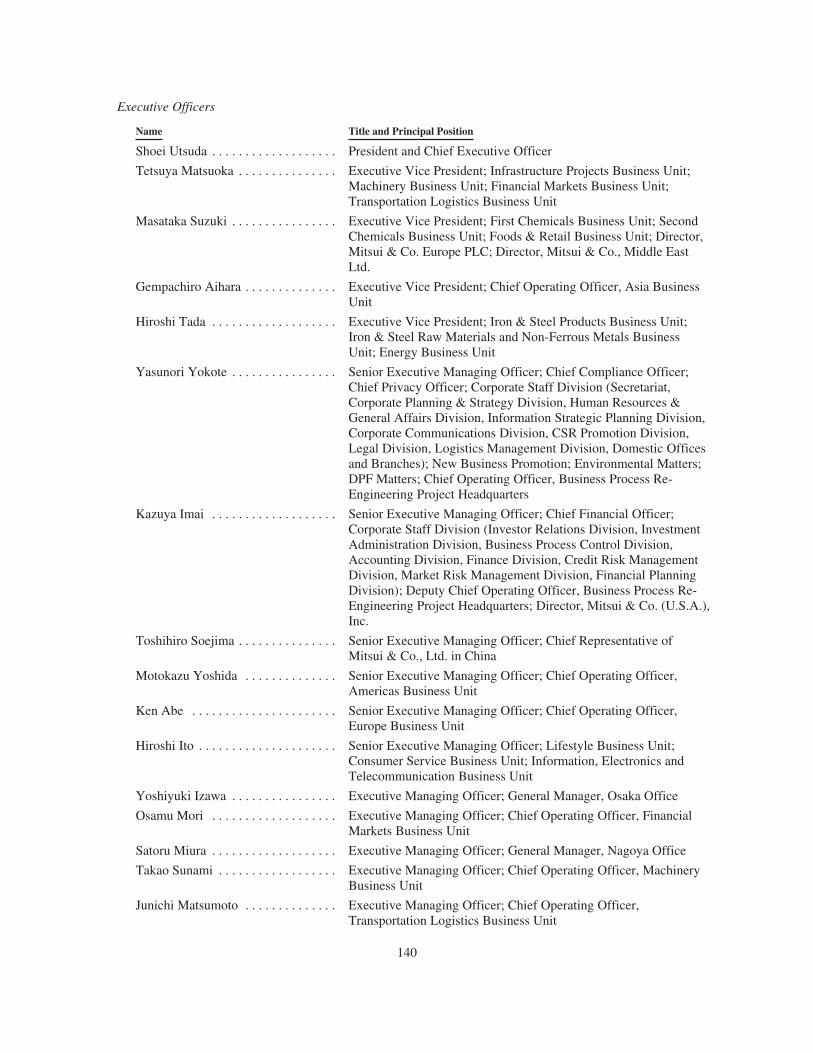
Executive Officers
Name Title and Principal Position
Shoei Utsuda . . . . . . . . . . . . . . . . . . . President and Chief Executive Officer
Tetsuya Matsuoka . . . . . . . . . . . . . . . Executive Vice President; Infrastructure Projects Business Unit;Machinery Business Unit; Financial Markets Business Unit;Transportation Logistics Business Unit
Masataka Suzuki . . . . . . . . . . . . . . . . Executive Vice President; First Chemicals Business Unit; SecondChemicals Business Unit; Foods & Retail Business Unit; Director,Mitsui & Co. Europe PLC; Director, Mitsui & Co., Middle EastLtd.
Gempachiro Aihara . . . . . . . . . . . . . . Executive Vice President; Chief Operating Officer, Asia BusinessUnit
Hiroshi Tada . . . . . . . . . . . . . . . . . . . Executive Vice President; Iron & Steel Products Business Unit;Iron & Steel Raw Materials and Non-Ferrous Metals BusinessUnit; Energy Business Unit
Yasunori Yokote . . . . . . . . . . . . . . . . Senior Executive Managing Officer; Chief Compliance Officer;Chief Privacy Officer; Corporate Staff Division (Secretariat,Corporate Planning & Strategy Division, Human Resources &General Affairs Division, Information Strategic Planning Division,Corporate Communications Division, CSR Promotion Division,Legal Division, Logistics Management Division, Domestic Officesand Branches); New Business Promotion; Environmental Matters;DPF Matters; Chief Operating Officer, Business Process Re-Engineering Project Headquarters
Kazuya Imai . . . . . . . . . . . . . . . . . . . Senior Executive Managing Officer; Chief Financial Officer;Corporate Staff Division (Investor Relations Division, InvestmentAdministration Division, Business Process Control Division,Accounting Division, Finance Division, Credit Risk ManagementDivision, Market Risk Management Division, Financial PlanningDivision); Deputy Chief Operating Officer, Business Process Re-Engineering Project Headquarters; Director, Mitsui & Co. (U.S.A.),Inc.
Toshihiro Soejima . . . . . . . . . . . . . . . Senior Executive Managing Officer; Chief Representative ofMitsui & Co., Ltd. in China
Motokazu Yoshida . . . . . . . . . . . . . . Senior Executive Managing Officer; Chief Operating Officer,Americas Business Unit
Ken Abe . . . . . . . . . . . . . . . . . . . . . . Senior Executive Managing Officer; Chief Operating Officer,Europe Business Unit
Hiroshi Ito . . . . . . . . . . . . . . . . . . . . . Senior Executive Managing Officer; Lifestyle Business Unit;Consumer Service Business Unit; Information, Electronics andTelecommunication Business Unit
Yoshiyuki Izawa . . . . . . . . . . . . . . . . Executive Managing Officer; General Manager, Osaka Office
Osamu Mori . . . . . . . . . . . . . . . . . . . Executive Managing Officer; Chief Operating Officer, FinancialMarkets Business Unit
Satoru Miura . . . . . . . . . . . . . . . . . . . Executive Managing Officer; General Manager, Nagoya Office
Takao Sunami . . . . . . . . . . . . . . . . . . Executive Managing Officer; Chief Operating Officer, MachineryBusiness Unit
Junichi Matsumoto . . . . . . . . . . . . . . Executive Managing Officer; Chief Operating Officer,Transportation Logistics Business Unit
140

Name Title and Principal Position
Shunichi Miyazaki . . . . . . . . . . . . . . Executive Managing Officer; General Manager, Internal AuditingDivision
Shinjiro Ogawa . . . . . . . . . . . . . . . . . Executive Managing Officer; Chief Operating Officer, Information,Electronics and Telecommunication Business Unit
Toshimasa Furukawa . . . . . . . . . . . . Executive Managing Officer; Chief Operating Officer,Infrastructure Projects Business Unit
Jitsuro Terashima . . . . . . . . . . . . . . . Executive Managing Officer; President, Mitsui Global StrategicStudies Institute
Motonori Murakami . . . . . . . . . . . . . Executive Managing Officer; Assistant to Senior ExecutiveManaging Officer (Corporate Staff Division), Assistant to ChiefFinancial Officer
Koji Nakamura . . . . . . . . . . . . . . . . . Executive Managing Officer; Chief Operating Officer, SecondChemicals Business Unit
Kenichi Yamamoto . . . . . . . . . . . . . . Executive Managing Officer; Chief Operating Officer, LifestyleBusiness Unit
Toshio Awata . . . . . . . . . . . . . . . . . . Managing Officer; General Manager, Information StrategicPlanning Division; Chief Information Officer
Masaaki Murakami . . . . . . . . . . . . . . Managing Officer; President, Mitsui & Co. (Canada) Ltd.
Kiyotaka Watanabe . . . . . . . . . . . . . . Managing Officer; Chief Operating Officer, Iron & Steel ProductsBusiness Unit
Masaaki Fujita . . . . . . . . . . . . . . . . . . Managing Officer; Chief Operating Officer, Foods & RetailBusiness Unit
Junichi Mizonoue . . . . . . . . . . . . . . . Managing Officer; Chief Operating Officer, First ChemicalsBusiness Unit
Takao Omae . . . . . . . . . . . . . . . . . . . Managing Officer; President, Mitsui Brasileira Importacao EExportacao S.A.
Norinao Iio . . . . . . . . . . . . . . . . . . . . Managing Officer; Chief Operating Officer, Energy Business Unit
Osamu Koyama . . . . . . . . . . . . . . . . . Managing Officer; Executive Vice President, Mitsui & Co.(U.S.A), Inc.
Terukazu Okahashi . . . . . . . . . . . . . . Managing Officer; Deputy General Manager, Osaka Office
Osamu Takahashi . . . . . . . . . . . . . . . Managing Officer; Chief Operating Officer, Consumer ServiceBusiness Unit
Hideyo Hayakawa . . . . . . . . . . . . . . . Managing Officer; General Manager, Legal Division
Hiraku Shimomaki . . . . . . . . . . . . . . Managing Officer; President, Mitsui & Co. Deutschland GmbH
Shigeru Hanagata . . . . . . . . . . . . . . . Managing Officer; Deputy Chief Operating Officer, MachineryBusiness Unit
Masami Iijima . . . . . . . . . . . . . . . . . . Managing Officer; Chief Operating Officer, Iron & Steel RawMaterials and Non-Ferrous Metals Business Unit
Seiichi Tanaka . . . . . . . . . . . . . . . . . . Managing Officer; General Manager, Human Resources & GeneralAffairs Division
141
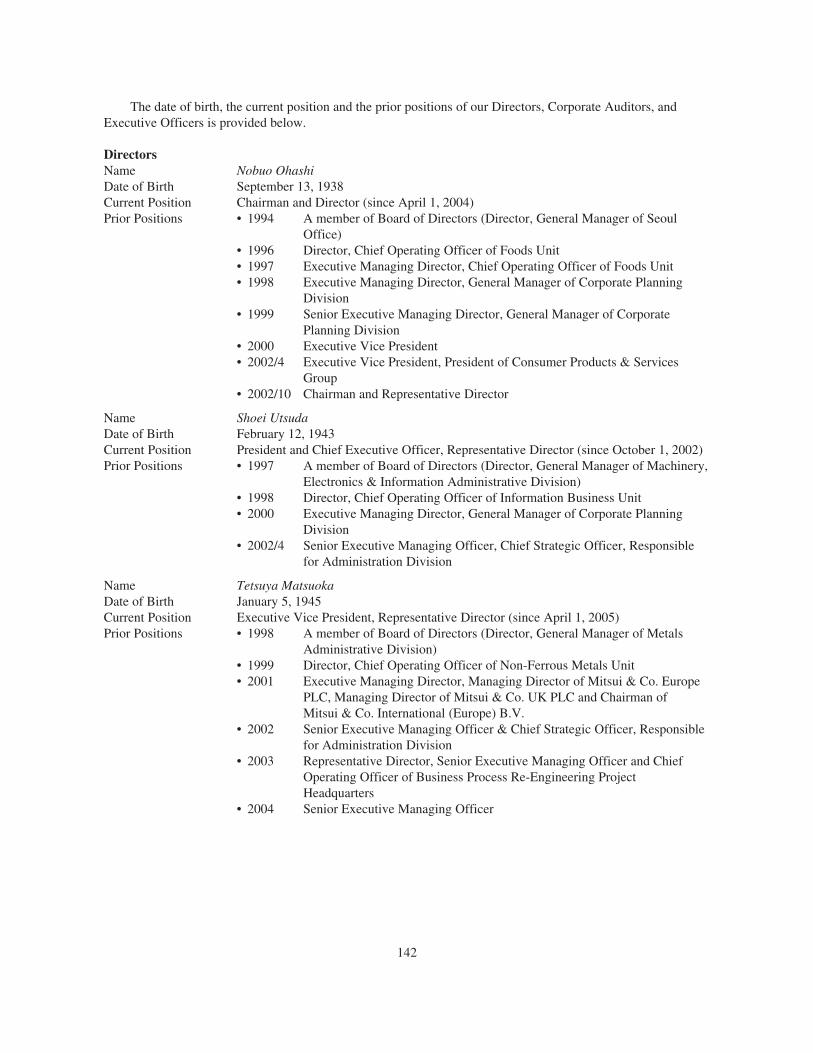
The date of birth, the current position and the prior positions of our Directors, Corporate Auditors, andExecutive Officers is provided below.
DirectorsName Nobuo OhashiDate of Birth September 13, 1938Current Position Chairman and Director (since April 1, 2004)Prior Positions • 1994 A member of Board of Directors (Director, General Manager of Seoul
Office)• 1996 Director, Chief Operating Officer of Foods Unit• 1997 Executive Managing Director, Chief Operating Officer of Foods Unit• 1998 Executive Managing Director, General Manager of Corporate Planning
Division• 1999 Senior Executive Managing Director, General Manager of Corporate
Planning Division• 2000 Executive Vice President• 2002/4 Executive Vice President, President of Consumer Products & Services
Group• 2002/10 Chairman and Representative Director
Name Shoei UtsudaDate of Birth February 12, 1943Current Position President and Chief Executive Officer, Representative Director (since October 1, 2002)Prior Positions • 1997 A member of Board of Directors (Director, General Manager of Machinery,
Electronics & Information Administrative Division)• 1998 Director, Chief Operating Officer of Information Business Unit• 2000 Executive Managing Director, General Manager of Corporate Planning
Division• 2002/4 Senior Executive Managing Officer, Chief Strategic Officer, Responsible
for Administration Division
Name Tetsuya MatsuokaDate of Birth January 5, 1945Current Position Executive Vice President, Representative Director (since April 1, 2005)Prior Positions • 1998 A member of Board of Directors (Director, General Manager of Metals
Administrative Division)• 1999 Director, Chief Operating Officer of Non-Ferrous Metals Unit• 2001 Executive Managing Director, Managing Director of Mitsui & Co. Europe
PLC, Managing Director of Mitsui & Co. UK PLC and Chairman ofMitsui & Co. International (Europe) B.V.
• 2002 Senior Executive Managing Officer & Chief Strategic Officer, Responsiblefor Administration Division
• 2003 Representative Director, Senior Executive Managing Officer and ChiefOperating Officer of Business Process Re-Engineering ProjectHeadquarters
• 2004 Senior Executive Managing Officer
142
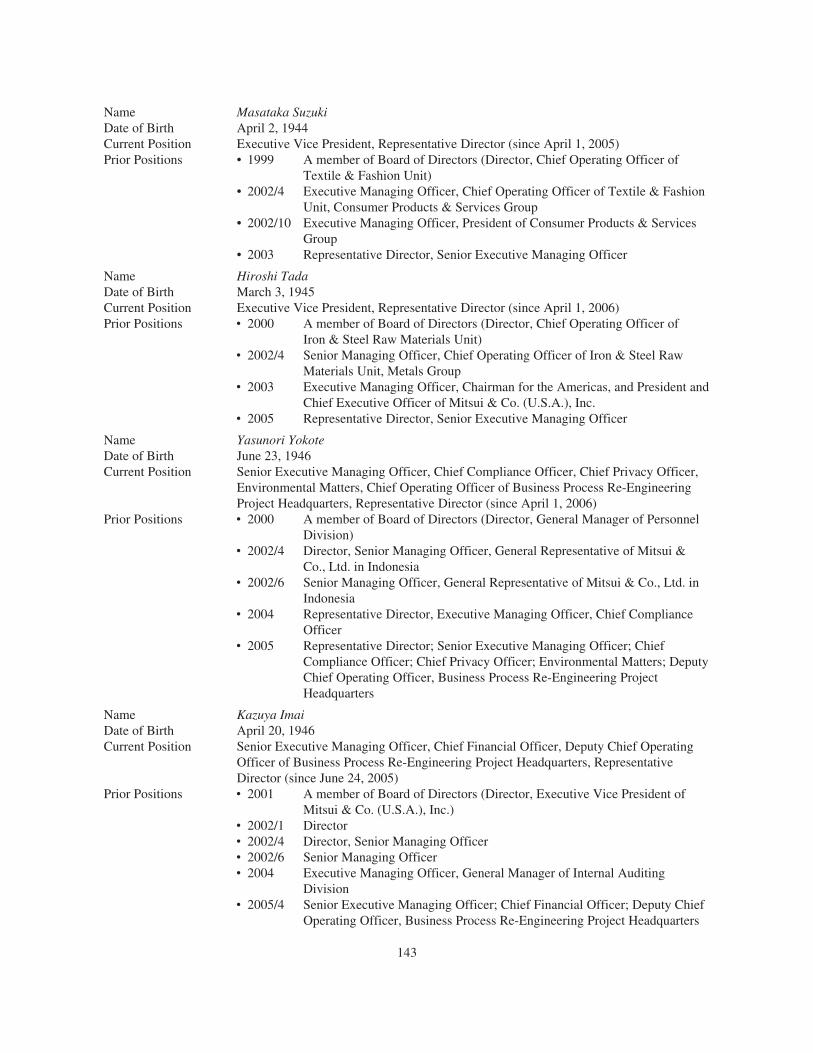
Name Masataka SuzukiDate of Birth April 2, 1944Current Position Executive Vice President, Representative Director (since April 1, 2005)Prior Positions • 1999 A member of Board of Directors (Director, Chief Operating Officer of
Textile & Fashion Unit)• 2002/4 Executive Managing Officer, Chief Operating Officer of Textile & Fashion
Unit, Consumer Products & Services Group• 2002/10 Executive Managing Officer, President of Consumer Products & Services
Group• 2003 Representative Director, Senior Executive Managing Officer
Name Hiroshi TadaDate of Birth March 3, 1945Current Position Executive Vice President, Representative Director (since April 1, 2006)Prior Positions ‰ 2000 A member of Board of Directors (Director, Chief Operating Officer of
Iron & Steel Raw Materials Unit)‰ 2002/4 Senior Managing Officer, Chief Operating Officer of Iron & Steel Raw
Materials Unit, Metals Group‰ 2003 Executive Managing Officer, Chairman for the Americas, and President and
Chief Executive Officer of Mitsui & Co. (U.S.A.), Inc.‰ 2005 Representative Director, Senior Executive Managing Officer
Name Yasunori YokoteDate of Birth June 23, 1946Current Position Senior Executive Managing Officer, Chief Compliance Officer, Chief Privacy Officer,
Environmental Matters, Chief Operating Officer of Business Process Re-EngineeringProject Headquarters, Representative Director (since April 1, 2006)
Prior Positions ‰ 2000 A member of Board of Directors (Director, General Manager of PersonnelDivision)
‰ 2002/4 Director, Senior Managing Officer, General Representative of Mitsui &Co., Ltd. in Indonesia
‰ 2002/6 Senior Managing Officer, General Representative of Mitsui & Co., Ltd. inIndonesia
‰ 2004 Representative Director, Executive Managing Officer, Chief ComplianceOfficer
‰ 2005 Representative Director; Senior Executive Managing Officer; ChiefCompliance Officer; Chief Privacy Officer; Environmental Matters; DeputyChief Operating Officer, Business Process Re-Engineering ProjectHeadquarters
Name Kazuya ImaiDate of Birth April 20, 1946Current Position Senior Executive Managing Officer, Chief Financial Officer, Deputy Chief Operating
Officer of Business Process Re-Engineering Project Headquarters, RepresentativeDirector (since June 24, 2005)
Prior Positions ‰ 2001 A member of Board of Directors (Director, Executive Vice President ofMitsui & Co. (U.S.A.), Inc.)
‰ 2002/1 Director‰ 2002/4 Director, Senior Managing Officer‰ 2002/6 Senior Managing Officer‰ 2004 Executive Managing Officer, General Manager of Internal Auditing
Division‰ 2005/4 Senior Executive Managing Officer; Chief Financial Officer; Deputy Chief
Operating Officer, Business Process Re-Engineering Project Headquarters
143

Name Hiroshi ItoDate of Birth February 8, 1947Current Position Senior Executive Managing Officer, Representative Director (since June 23, 2006)Prior Positions ‰ 2003 Managing Officer, Chief Operating Officer of Service Business Unit
‰ 2004 Managing Officer, Chief Operating Officer of Consumer Service Business Unit‰ 2005 Senior Executive Managing Officer‰ 2006/4
Name Akishige OkadaDate of Birth April 9, 1938Current Position Director (since June 27, 2003)Prior Positions ‰ 1991 Director, The Mitsui Taiyo Kobe Bank, Ltd.
‰ 1997 President, The Sakura Bank, Ltd.‰ 2001 Director, Chairman of Sumitomo Mitsui Banking Corporation‰ 2002 Director, Chairman of Sumitomo Mitsui Financial Group‰ 2005 Advisor, Sumitomo Mitsui Banking Corporation (remaining in the same
position on June 30, 2006)
Name Akira ChihayaDate of Birth March 6, 1935Current Position Director (since June 24, 2004)Prior Positions ‰ 1987 Director of Nippon Steel Corporation
‰ 1998 Representative Director and President of Nippon Steel Corporation‰ 2003 Director, Representative Director and Chairman of the Board of Directors
of Nippon Steel Corporation (remaining in the same position on June 30,2006)
Name Nobuko MatsubaraDate of Birth January 9, 1941Current Position Director (since June 23, 2006)Prior Positions ‰ 2006 Advisor to Japan Institute of Workers’ Evolution (remaining in the same
position on June 30, 2006)
Corporate AuditorsName Tasuku KondoDate of Birth August 12, 1942Current Position Corporate Auditor (since June 24, 2005)Prior Positions ‰ 1996 A member of Board of Directors (Director, General Manager of Finance
Division)‰ 1998 Executive Managing Director‰ 2002 Senior Executive Managing Officer and Chief Financial Officer,
Responsible for General Accounting Division, Finance Division andCorporate Risk Management Division
‰ 2004 Executive Vice President and Chief Financial Officer‰ 2005/4 Representative Director
Name Hiroshi MatsuuraDate of Birth May 24, 1946Current Position Corporate Auditor (since June 27, 2003)Prior Positions ‰ 1996 General Manager of Credit Division
‰ 2002 General Manager of Corporate Risk Management Division
144
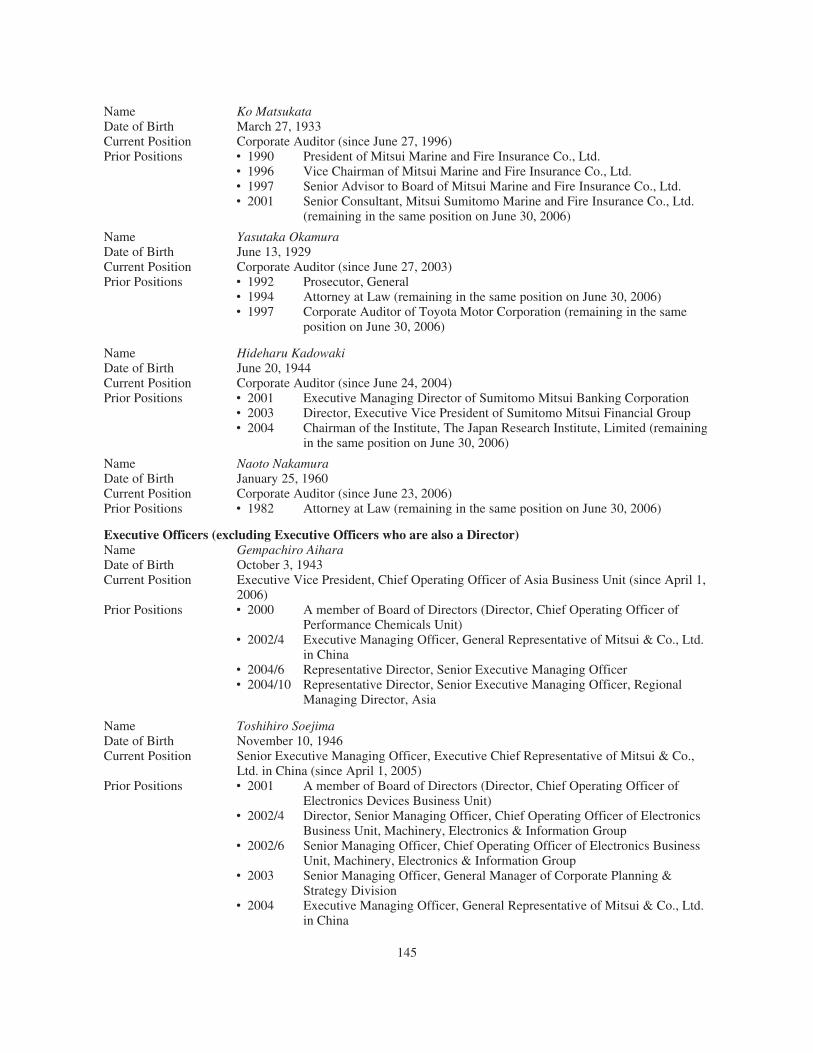
Name Ko MatsukataDate of Birth March 27, 1933Current Position Corporate Auditor (since June 27, 1996)Prior Positions ‰ 1990 President of Mitsui Marine and Fire Insurance Co., Ltd.
‰ 1996 Vice Chairman of Mitsui Marine and Fire Insurance Co., Ltd.‰ 1997 Senior Advisor to Board of Mitsui Marine and Fire Insurance Co., Ltd.‰ 2001 Senior Consultant, Mitsui Sumitomo Marine and Fire Insurance Co., Ltd.
(remaining in the same position on June 30, 2006)
Name Yasutaka OkamuraDate of Birth June 13, 1929Current Position Corporate Auditor (since June 27, 2003)Prior Positions ‰ 1992 Prosecutor, General
‰ 1994 Attorney at Law (remaining in the same position on June 30, 2006)‰ 1997 Corporate Auditor of Toyota Motor Corporation (remaining in the same
position on June 30, 2006)
Name Hideharu KadowakiDate of Birth June 20, 1944Current Position Corporate Auditor (since June 24, 2004)Prior Positions ‰ 2001 Executive Managing Director of Sumitomo Mitsui Banking Corporation
‰ 2003 Director, Executive Vice President of Sumitomo Mitsui Financial Group‰ 2004 Chairman of the Institute, The Japan Research Institute, Limited (remaining
in the same position on June 30, 2006)
Name Naoto NakamuraDate of Birth January 25, 1960Current Position Corporate Auditor (since June 23, 2006)Prior Positions ‰ 1982 Attorney at Law (remaining in the same position on June 30, 2006)
Executive Officers (excluding Executive Officers who are also a Director)Name Gempachiro AiharaDate of Birth October 3, 1943Current Position Executive Vice President, Chief Operating Officer of Asia Business Unit (since April 1,
2006)Prior Positions ‰ 2000 A member of Board of Directors (Director, Chief Operating Officer of
Performance Chemicals Unit)‰ 2002/4 Executive Managing Officer, General Representative of Mitsui & Co., Ltd.
in China‰ 2004/6 Representative Director, Senior Executive Managing Officer‰ 2004/10 Representative Director, Senior Executive Managing Officer, Regional
Managing Director, Asia
Name Toshihiro SoejimaDate of Birth November 10, 1946Current Position Senior Executive Managing Officer, Executive Chief Representative of Mitsui & Co.,
Ltd. in China (since April 1, 2005)Prior Positions ‰ 2001 A member of Board of Directors (Director, Chief Operating Officer of
Electronics Devices Business Unit)‰ 2002/4 Director, Senior Managing Officer, Chief Operating Officer of Electronics
Business Unit, Machinery, Electronics & Information Group‰ 2002/6 Senior Managing Officer, Chief Operating Officer of Electronics Business
Unit, Machinery, Electronics & Information Group‰ 2003 Senior Managing Officer, General Manager of Corporate Planning &
Strategy Division‰ 2004 Executive Managing Officer, General Representative of Mitsui & Co., Ltd.
in China
145
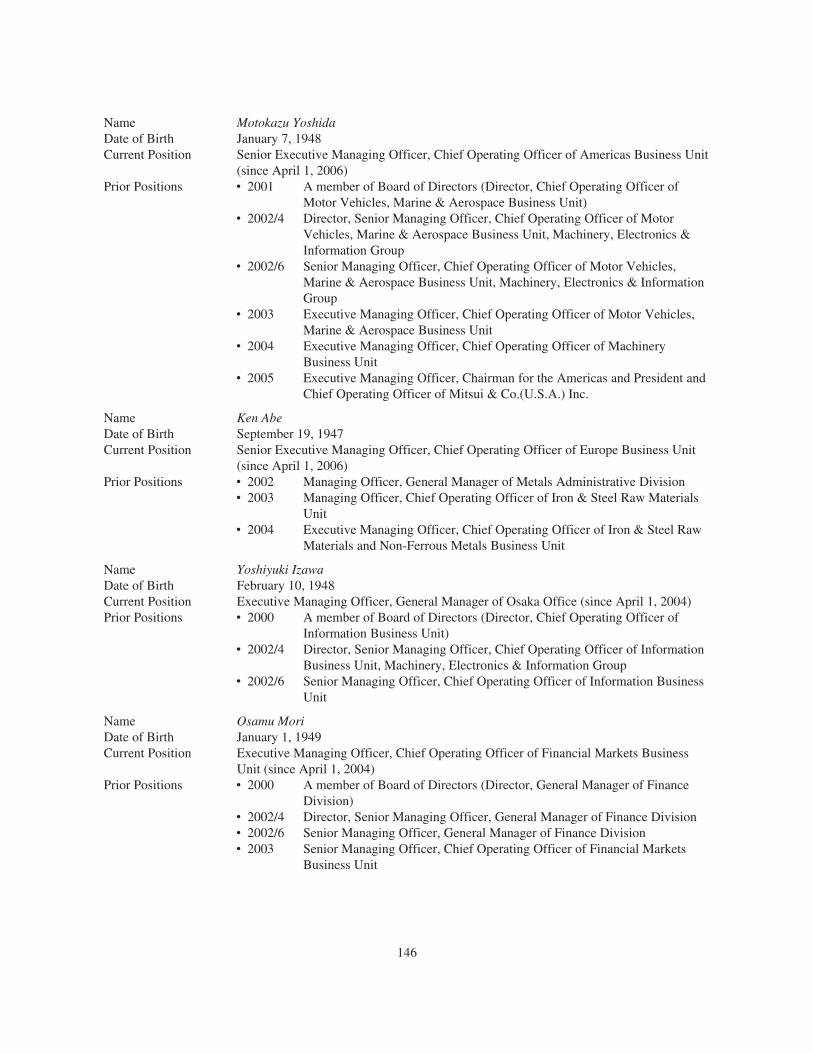
Name Motokazu YoshidaDate of Birth January 7, 1948Current Position Senior Executive Managing Officer, Chief Operating Officer of Americas Business Unit
(since April 1, 2006)Prior Positions ‰ 2001 A member of Board of Directors (Director, Chief Operating Officer of
Motor Vehicles, Marine & Aerospace Business Unit)‰ 2002/4 Director, Senior Managing Officer, Chief Operating Officer of Motor
Vehicles, Marine & Aerospace Business Unit, Machinery, Electronics &Information Group
‰ 2002/6 Senior Managing Officer, Chief Operating Officer of Motor Vehicles,Marine & Aerospace Business Unit, Machinery, Electronics & InformationGroup
‰ 2003 Executive Managing Officer, Chief Operating Officer of Motor Vehicles,Marine & Aerospace Business Unit
‰ 2004 Executive Managing Officer, Chief Operating Officer of MachineryBusiness Unit
‰ 2005 Executive Managing Officer, Chairman for the Americas and President andChief Operating Officer of Mitsui & Co.(U.S.A.) Inc.
Name Ken AbeDate of Birth September 19, 1947Current Position Senior Executive Managing Officer, Chief Operating Officer of Europe Business Unit
(since April 1, 2006)Prior Positions ‰ 2002 Managing Officer, General Manager of Metals Administrative Division
‰ 2003 Managing Officer, Chief Operating Officer of Iron & Steel Raw MaterialsUnit
‰ 2004 Executive Managing Officer, Chief Operating Officer of Iron & Steel RawMaterials and Non-Ferrous Metals Business Unit
Name Yoshiyuki IzawaDate of Birth February 10, 1948Current Position Executive Managing Officer, General Manager of Osaka Office (since April 1, 2004)Prior Positions ‰ 2000 A member of Board of Directors (Director, Chief Operating Officer of
Information Business Unit)‰ 2002/4 Director, Senior Managing Officer, Chief Operating Officer of Information
Business Unit, Machinery, Electronics & Information Group‰ 2002/6 Senior Managing Officer, Chief Operating Officer of Information Business
Unit
Name Osamu MoriDate of Birth January 1, 1949Current Position Executive Managing Officer, Chief Operating Officer of Financial Markets Business
Unit (since April 1, 2004)Prior Positions ‰ 2000 A member of Board of Directors (Director, General Manager of Finance
Division)‰ 2002/4 Director, Senior Managing Officer, General Manager of Finance Division‰ 2002/6 Senior Managing Officer, General Manager of Finance Division‰ 2003 Senior Managing Officer, Chief Operating Officer of Financial Markets
Business Unit
146

Name Satoru MiuraDate of Birth March 2, 1947Current Position Executive Managing Officer, General Manager of Nagoya Office (since April 1, 2005)Prior Positions ‰ 2001 A member of Board of Directors (Director, Chief Operating Officer of
Iron & Steel Products Unit)‰ 2002/4 Director, Senior Managing Officer, Chief Operating Officer of Iron & Steel
Products Unit, Metals Group‰ 2002/6 Senior Managing Officer, Chief Operating Officer of Iron & Steel Products
Unit‰ 2004 Executive Managing Officer, Chief Operating Officer of Iron & Steel
Products Business Unit
Name Takao SunamiDate of Birth August 22, 1947Current Position Executive Managing Officer, Chief Operating Officer of Machinery Business Unit
(since January 1, 2005)Prior Positions ‰ 2002 Managing Officer, General Manager of e-Mitsui Business Division
‰ 2003 Managing Officer, General Manager of Fukuoka Office
Name Junichi MatsumotoDate of Birth September 25, 1947Current Position Executive Managing Officer, Chief Operating Officer of Transportation Logistics
Business Unit (since April 1, 2005)Prior Positions ‰ 2002 Managing Officer, General Manager of Corporate Planning Division
‰ 2003 Managing Officer, Deputy General Vice Representative of Mitsui & Co.,Ltd. in China
‰ 2004 Managing Officer, Chief Operating Officer of Transportation LogisticsBusiness Unit
Name Shunichi MiyazakiDate of Birth February 11, 1948Current Position Executive Managing Officer, General Manager of Internal Auditing Division (since
April 1, 2005)Prior Positions ‰ 2002 Managing Officer, General Manager of Consumer Products & Services
Administrative Division
Name Shinjiro OgawaDate of Birth September 17, 1948Current Position Executive Managing Officer, Chief Operating Officer of Information, Electronics and
Telecommunication Business Unit (since April 1, 2006)Prior Positions ‰ 2002 Managing Officer, General Manager of Machinery, Electronics &
Information Administrative Division‰ 2004 Managing Officer, Chief Operating Officer of Information, Electronics and
Telecommunication Business Unit
Name Toshimasa FurukawaDate of Birth December 25, 1948Current Position Executive Managing Officer, Chief Operating Officer of Infrastructure Business Unit
(since April 1, 2006)Prior Positions ‰ 2002 Managing Officer, President of Mitsui & Co. (Taiwan) Ltd.
‰ 2004 Managing Officer, General Manager of Machinery, Electronics &Information Administrative Division
‰ 2005 Managing Officer, Chief Operating Officer of Power, Transportation &Plant Projects Business Unit
147
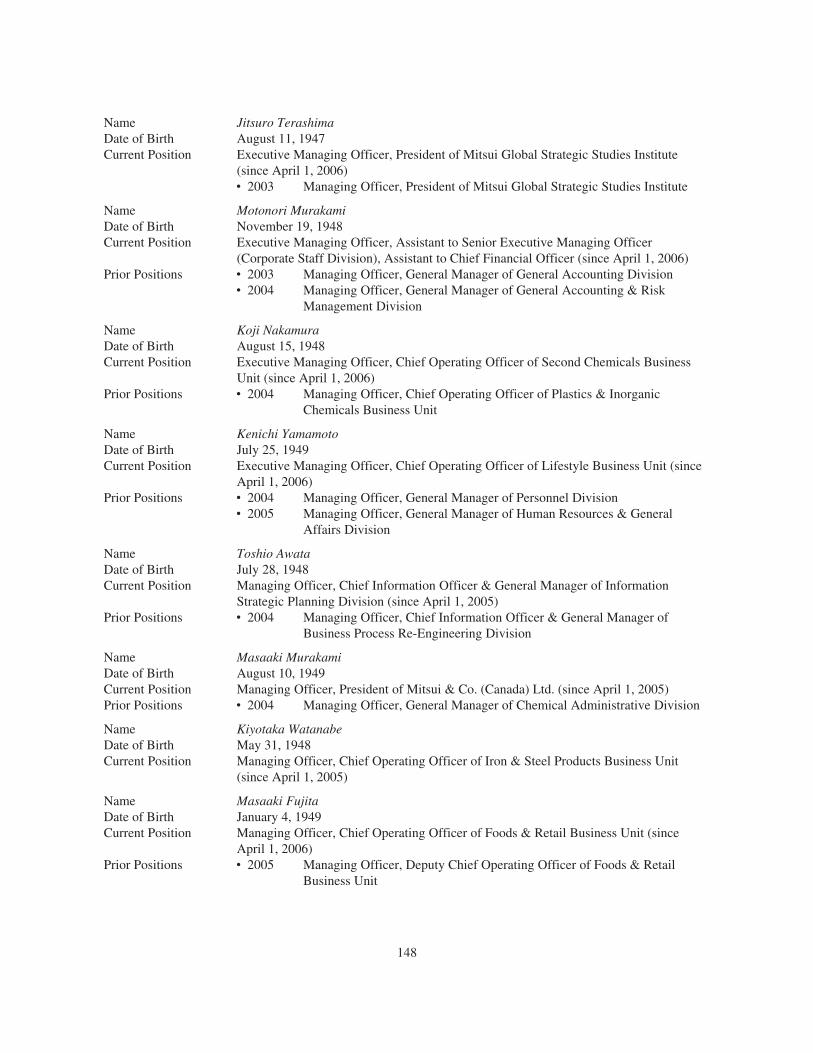
Name Jitsuro TerashimaDate of Birth August 11, 1947Current Position Executive Managing Officer, President of Mitsui Global Strategic Studies Institute
(since April 1, 2006)‰ 2003 Managing Officer, President of Mitsui Global Strategic Studies Institute
Name Motonori MurakamiDate of Birth November 19, 1948Current Position Executive Managing Officer, Assistant to Senior Executive Managing Officer
(Corporate Staff Division), Assistant to Chief Financial Officer (since April 1, 2006)Prior Positions ‰ 2003 Managing Officer, General Manager of General Accounting Division
‰ 2004 Managing Officer, General Manager of General Accounting & RiskManagement Division
Name Koji NakamuraDate of Birth August 15, 1948Current Position Executive Managing Officer, Chief Operating Officer of Second Chemicals Business
Unit (since April 1, 2006)Prior Positions ‰ 2004 Managing Officer, Chief Operating Officer of Plastics & Inorganic
Chemicals Business Unit
Name Kenichi YamamotoDate of Birth July 25, 1949Current Position Executive Managing Officer, Chief Operating Officer of Lifestyle Business Unit (since
April 1, 2006)Prior Positions ‰ 2004 Managing Officer, General Manager of Personnel Division
‰ 2005 Managing Officer, General Manager of Human Resources & GeneralAffairs Division
Name Toshio AwataDate of Birth July 28, 1948Current Position Managing Officer, Chief Information Officer & General Manager of Information
Strategic Planning Division (since April 1, 2005)Prior Positions ‰ 2004 Managing Officer, Chief Information Officer & General Manager of
Business Process Re-Engineering Division
Name Masaaki MurakamiDate of Birth August 10, 1949Current Position Managing Officer, President of Mitsui & Co. (Canada) Ltd. (since April 1, 2005)Prior Positions ‰ 2004 Managing Officer, General Manager of Chemical Administrative Division
Name Kiyotaka WatanabeDate of Birth May 31, 1948Current Position Managing Officer, Chief Operating Officer of Iron & Steel Products Business Unit
(since April 1, 2005)
Name Masaaki FujitaDate of Birth January 4, 1949Current Position Managing Officer, Chief Operating Officer of Foods & Retail Business Unit (since
April 1, 2006)Prior Positions ‰ 2005 Managing Officer, Deputy Chief Operating Officer of Foods & Retail
Business Unit
148
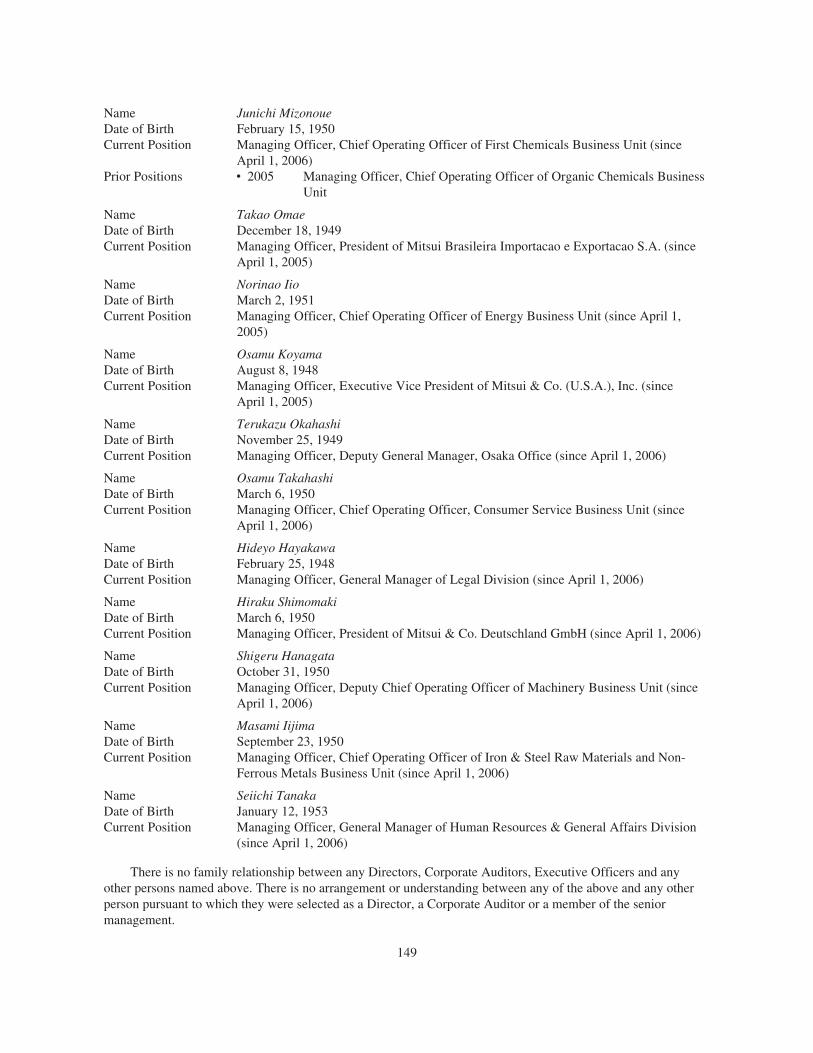
Name Junichi MizonoueDate of Birth February 15, 1950Current Position Managing Officer, Chief Operating Officer of First Chemicals Business Unit (since
April 1, 2006)Prior Positions ‰ 2005 Managing Officer, Chief Operating Officer of Organic Chemicals Business
Unit
Name Takao OmaeDate of Birth December 18, 1949Current Position Managing Officer, President of Mitsui Brasileira Importacao e Exportacao S.A. (since
April 1, 2005)
Name Norinao IioDate of Birth March 2, 1951Current Position Managing Officer, Chief Operating Officer of Energy Business Unit (since April 1,
2005)
Name Osamu KoyamaDate of Birth August 8, 1948Current Position Managing Officer, Executive Vice President of Mitsui & Co. (U.S.A.), Inc. (since
April 1, 2005)
Name Terukazu OkahashiDate of Birth November 25, 1949Current Position Managing Officer, Deputy General Manager, Osaka Office (since April 1, 2006)
Name Osamu TakahashiDate of Birth March 6, 1950Current Position Managing Officer, Chief Operating Officer, Consumer Service Business Unit (since
April 1, 2006)
Name Hideyo HayakawaDate of Birth February 25, 1948Current Position Managing Officer, General Manager of Legal Division (since April 1, 2006)
Name Hiraku ShimomakiDate of Birth March 6, 1950Current Position Managing Officer, President of Mitsui & Co. Deutschland GmbH (since April 1, 2006)
Name Shigeru HanagataDate of Birth October 31, 1950Current Position Managing Officer, Deputy Chief Operating Officer of Machinery Business Unit (since
April 1, 2006)
Name Masami IijimaDate of Birth September 23, 1950Current Position Managing Officer, Chief Operating Officer of Iron & Steel Raw Materials and Non-
Ferrous Metals Business Unit (since April 1, 2006)
Name Seiichi TanakaDate of Birth January 12, 1953Current Position Managing Officer, General Manager of Human Resources & General Affairs Division
(since April 1, 2006)
There is no family relationship between any Directors, Corporate Auditors, Executive Officers and anyother persons named above. There is no arrangement or understanding between any of the above and any otherperson pursuant to which they were selected as a Director, a Corporate Auditor or a member of the seniormanagement.
149
B. Compensation.
The aggregate amount of compensation, including benefits from Directors’, Auditors’ and ExecutiveOfficers’ Pension Plans, paid to Directors, Corporate Auditors and Executive Officers during the year endedMarch 31, 2006, was ¥3,204 million.
Our retirement allowance system for Directors, Corporate Auditors and Executive Officers was abolishedpursuant to a resolution of the Board of Directors in February 2004. Up to this resolution, in accordance withcustomary Japanese business practices, a retiring Director or Corporate Auditor was entitled to receive aretirement allowance, which was subject to approval by shareholders at a general meeting of shareholders. Theamount of the retirement allowance generally reflected the number of years of service, rank at the time ofretirement and special contributions to our performance.
Retirement allowances accrued prior to the abolition of the retirement allowance system, including benefitsfrom Directors’, Corporate Auditors’ and Executive Officers’ Pension Plans, paid to retired individual Directors,Corporate Auditors and Executive Officers during the year ended March 31, 2006 totaled ¥595 million, and theannual bonuses paid to Directors, Corporate Auditors and Executive Officers during the year ended March 31,2006 was ¥600 million, both of which were included in the ¥3,204 million aggregate compensation discussedabove.
The amount set aside by us for Directors’, Corporate Auditors’ and Executive Officers’ Pension Plans toprovide pension benefit to retired Directors, Corporate Auditors, and Executive Officers was ¥2,154 million as ofMarch 31, 2006.
Mitsui has no stock option plans for Mitsui’s Directors and Senior Management as of June 30, 2006.
C. Board Practices.
The information in “Item 6.A. Directors and Senior Management” is incorporated into this section byreference.
None of our Directors have entered into any service contracts with us providing for benefits upontermination of his or her employment.
The Corporate Law of Japan allows a company to adopt the “Committee System” as the framework forcorporate governance. We have decided, however, to maintain the corporate auditor system because we believethat our Corporate Auditors, of whom two are full-time and four are external Auditors as of June 30, 2006 andtheir functions are legally defined and reinforced, provide adequate auditing functions. Furthermore, internalDirectors are familiar with our business operations and can therefore contribute to effective management.Although we retained the corporate auditor system, we have decided to adopt certain aspects of the CommitteeSystem and have established three committees (The Governance Committee, the Nomination Committee, and theRemuneration Committee) to provide advice to the Board of Directors. In addition, other measures have beentaken, such as shortening the term of Directors and Executive Officers from two years to one year, eliminatingthe retirement allowance, and increasing the number of external Directors.
150
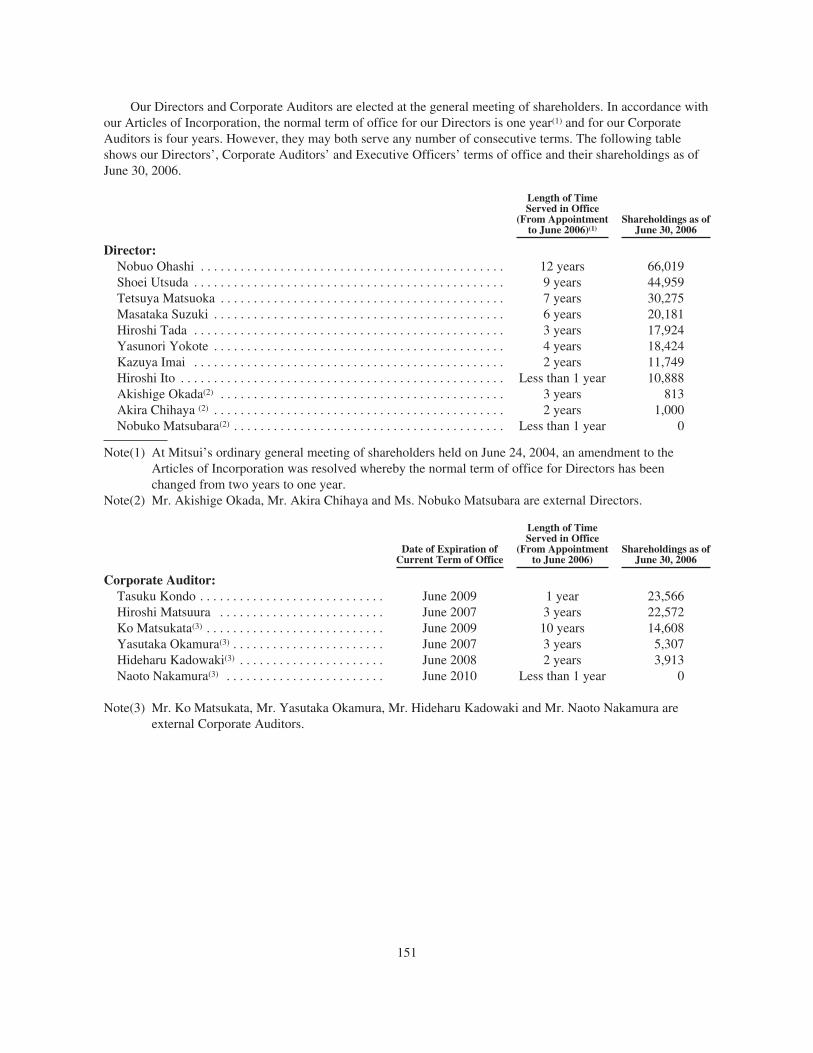
Our Directors and Corporate Auditors are elected at the general meeting of shareholders. In accordance withour Articles of Incorporation, the normal term of office for our Directors is one year(1) and for our CorporateAuditors is four years. However, they may both serve any number of consecutive terms. The following tableshows our Directors’, Corporate Auditors’ and Executive Officers’ terms of office and their shareholdings as ofJune 30, 2006.
Length of TimeServed in Office
(From Appointmentto June 2006)(1)
Shareholdings as ofJune 30, 2006
Director:Nobuo Ohashi . . . . . . . . . . . . . . . . . . . . . . . . . . . . . . . . . . . . . . . . . . . . . . 12 years 66,019Shoei Utsuda . . . . . . . . . . . . . . . . . . . . . . . . . . . . . . . . . . . . . . . . . . . . . . . 9 years 44,959Tetsuya Matsuoka . . . . . . . . . . . . . . . . . . . . . . . . . . . . . . . . . . . . . . . . . . . 7 years 30,275Masataka Suzuki . . . . . . . . . . . . . . . . . . . . . . . . . . . . . . . . . . . . . . . . . . . . 6 years 20,181Hiroshi Tada . . . . . . . . . . . . . . . . . . . . . . . . . . . . . . . . . . . . . . . . . . . . . . . 3 years 17,924Yasunori Yokote . . . . . . . . . . . . . . . . . . . . . . . . . . . . . . . . . . . . . . . . . . . . 4 years 18,424Kazuya Imai . . . . . . . . . . . . . . . . . . . . . . . . . . . . . . . . . . . . . . . . . . . . . . . 2 years 11,749Hiroshi Ito . . . . . . . . . . . . . . . . . . . . . . . . . . . . . . . . . . . . . . . . . . . . . . . . . Less than 1 year 10,888Akishige Okada(2) . . . . . . . . . . . . . . . . . . . . . . . . . . . . . . . . . . . . . . . . . . . 3 years 813Akira Chihaya (2) . . . . . . . . . . . . . . . . . . . . . . . . . . . . . . . . . . . . . . . . . . . . 2 years 1,000Nobuko Matsubara(2) . . . . . . . . . . . . . . . . . . . . . . . . . . . . . . . . . . . . . . . . . Less than 1 year 0
Note(1) At Mitsui’s ordinary general meeting of shareholders held on June 24, 2004, an amendment to theArticles of Incorporation was resolved whereby the normal term of office for Directors has beenchanged from two years to one year.
Note(2) Mr. Akishige Okada, Mr. Akira Chihaya and Ms. Nobuko Matsubara are external Directors.
Date of Expiration ofCurrent Term of Office
Length of TimeServed in Office
(From Appointmentto June 2006)
Shareholdings as ofJune 30, 2006
Corporate Auditor:Tasuku Kondo . . . . . . . . . . . . . . . . . . . . . . . . . . . . June 2009 1 year 23,566Hiroshi Matsuura . . . . . . . . . . . . . . . . . . . . . . . . . June 2007 3 years 22,572Ko Matsukata(3) . . . . . . . . . . . . . . . . . . . . . . . . . . . June 2009 10 years 14,608Yasutaka Okamura(3) . . . . . . . . . . . . . . . . . . . . . . . June 2007 3 years 5,307Hideharu Kadowaki(3) . . . . . . . . . . . . . . . . . . . . . . June 2008 2 years 3,913Naoto Nakamura(3) . . . . . . . . . . . . . . . . . . . . . . . . June 2010 Less than 1 year 0
Note(3) Mr. Ko Matsukata, Mr. Yasutaka Okamura, Mr. Hideharu Kadowaki and Mr. Naoto Nakamura areexternal Corporate Auditors.
151

Length of TimeServed in Office
(From Appointmentto June 2006)(4)
Shareholdings as ofJune 30, 2006
Executive Officer (excluding Executive Officers who are also aDirector):Gempachiro Aihara . . . . . . . . . . . . . . . . . . . . . . . . . . . . . . . . . . . . . . . . . . 6 years 15,875Toshihiro Soejima . . . . . . . . . . . . . . . . . . . . . . . . . . . . . . . . . . . . . . . . . . . 5 years 12,188Motokazu Yoshida . . . . . . . . . . . . . . . . . . . . . . . . . . . . . . . . . . . . . . . . . . 5 years 10,399Ken Abe . . . . . . . . . . . . . . . . . . . . . . . . . . . . . . . . . . . . . . . . . . . . . . . . . . 4 years 22,520Yoshiyuki Izawa . . . . . . . . . . . . . . . . . . . . . . . . . . . . . . . . . . . . . . . . . . . . 6 years 11,110Osamu Mori . . . . . . . . . . . . . . . . . . . . . . . . . . . . . . . . . . . . . . . . . . . . . . . 6 years 25,719Satoru Miura . . . . . . . . . . . . . . . . . . . . . . . . . . . . . . . . . . . . . . . . . . . . . . . 5 years 11,310Takao Sunami . . . . . . . . . . . . . . . . . . . . . . . . . . . . . . . . . . . . . . . . . . . . . . 4 years 13,211Junichi Matsumoto . . . . . . . . . . . . . . . . . . . . . . . . . . . . . . . . . . . . . . . . . . 4 years 14,000Shunichi Miyazaki . . . . . . . . . . . . . . . . . . . . . . . . . . . . . . . . . . . . . . . . . . 4 years 12,828Shinjiro Ogawa . . . . . . . . . . . . . . . . . . . . . . . . . . . . . . . . . . . . . . . . . . . . . 4 years 12,573Toshimasa Furukawa . . . . . . . . . . . . . . . . . . . . . . . . . . . . . . . . . . . . . . . . 4 years 12,085Jitsuro Terashima . . . . . . . . . . . . . . . . . . . . . . . . . . . . . . . . . . . . . . . . . . . 3 years 21,255Motonori Murakami . . . . . . . . . . . . . . . . . . . . . . . . . . . . . . . . . . . . . . . . . 3 years 19,888Koji Nakamura . . . . . . . . . . . . . . . . . . . . . . . . . . . . . . . . . . . . . . . . . . . . . 2 years 9,237Kenichi Yamamoto . . . . . . . . . . . . . . . . . . . . . . . . . . . . . . . . . . . . . . . . . . 2 years 9,625Toshio Awata . . . . . . . . . . . . . . . . . . . . . . . . . . . . . . . . . . . . . . . . . . . . . . 2 years 6,220Masaaki Murakami . . . . . . . . . . . . . . . . . . . . . . . . . . . . . . . . . . . . . . . . . . 2 years 16,310Kiyotaka Watanabe . . . . . . . . . . . . . . . . . . . . . . . . . . . . . . . . . . . . . . . . . . 1 year 2,462Masaaki Fujita . . . . . . . . . . . . . . . . . . . . . . . . . . . . . . . . . . . . . . . . . . . . . . 1 year 2,227Junichi Mizonoue . . . . . . . . . . . . . . . . . . . . . . . . . . . . . . . . . . . . . . . . . . . 1 year 2,227Takao Omae . . . . . . . . . . . . . . . . . . . . . . . . . . . . . . . . . . . . . . . . . . . . . . . 1 year 7,030Norinao Iio . . . . . . . . . . . . . . . . . . . . . . . . . . . . . . . . . . . . . . . . . . . . . . . . 1 year 2,742Osamu Koyama . . . . . . . . . . . . . . . . . . . . . . . . . . . . . . . . . . . . . . . . . . . . . 1 year 0Terukazu Okahashi . . . . . . . . . . . . . . . . . . . . . . . . . . . . . . . . . . . . . . . . . . Less than 1 year 5,309Osamu Takahashi . . . . . . . . . . . . . . . . . . . . . . . . . . . . . . . . . . . . . . . . . . . Less than 1 year 4,145Hideyo Hayakawa . . . . . . . . . . . . . . . . . . . . . . . . . . . . . . . . . . . . . . . . . . . Less than 1 year 0Hiraku Shimomaki . . . . . . . . . . . . . . . . . . . . . . . . . . . . . . . . . . . . . . . . . . Less than 1 year 3,000Shigeru Hanagata . . . . . . . . . . . . . . . . . . . . . . . . . . . . . . . . . . . . . . . . . . . Less than 1 year 7,570Masami Iijima . . . . . . . . . . . . . . . . . . . . . . . . . . . . . . . . . . . . . . . . . . . . . . Less than 1 year 8,000Seiichi Tanaka . . . . . . . . . . . . . . . . . . . . . . . . . . . . . . . . . . . . . . . . . . . . . . Less than 1 year 0
Total Shareholdings by Directors, Corporate Auditors, and ExecutiveOfficers . . . . . . . . . . . . . . . . . . . . . . . . . . . . . . . . . . . . . . . . . . . . . . . . . . . 593,263
Note(4) The rules of Executive Officers provide for the term of the Executive Officers as one year startingApril 1 and ending March 31.
Mitsui’s Articles of Incorporation provide that the Board of Directors shall elect from among its membersRepresentative Directors, one of whom shall be the President. Under the Corporate Law of Japan, each of theRepresentative Directors has statutory authority and power to represent and act on behalf of the company in allrespects.
Under the Corporate Law of Japan, at least half of the Corporate Auditors should be persons who have notat any time been a director, executive officer, manager or employee of a company or any of its subsidiaries priorto his or her election as a Corporate Auditor. Each Corporate Auditor has a statutory duty to examine financialstatements, in collaboration with independent auditors, and business reports and also to supervise the
152
administration of the company’s affairs by Directors. Corporate Auditors are required to participate in meetingsof the Board of Directors but are not entitled to vote.
The Board of Corporate Auditors is comprised of all Corporate Auditors. The Board of Corporate Auditorshas a statutory duty to prepare its audit report each year. A Corporate Auditor may note his or her opinion in theaudit report if his or her opinion is different from the opinion expressed in the independent auditors’ report. TheBoard of Corporate Auditors is empowered to establish audit principles, methods of examination by theCorporate Auditors of the company’s affairs and financial position and other matters concerning the performanceof the Corporate Auditors’ duties. The Corporate Auditors may not at the same time be directors, managers oremployees of the company or any of its subsidiaries.
Exemption from Certain Corporate Governance Requirements of NASDAQ.
Nasdaq Marketplace Rule 4350(a)(1) provides that a foreign private issuer may follow its home countrypractice in lieu of the requirements of Rule 4350, provided that such foreign private issuer discloses in its annualreports filed with the Securities and Exchange Commission each requirement of Rule 4350 that it does not followand describes the home country practice followed by the issuer in lieu of such requirements. Such requirementsof Rule 4350 and the relevant home country practices we follow are described below:
‰ Nasdaq Marketplace Rule 4350(b) requires that there be a distribution to shareholders of copies of ourannual report containing our audited financial statements a reasonable period of time prior to our annualmeeting of shareholders. In accordance with the Corporate law of Japan, we hold an annual meeting ofshareholders within three months after the end of each fiscal year. Also, in accordance with theCorporate Law of Japan, we distribute to shareholders, prior to the annual meeting of shareholders,copies of a report of business operations, together with our audited consolidated and unconsolidatedfinancial statements prepared in accordance with Japanese GAAP in Japanese. Concurrently with suchdistribution, we distribute Japanese GAAP audited consolidated and unconsolidated financial statementsin English to the depository for the ADSs, and instruct the depository to distribute the same to theregistered ADS holders in a timely manner. The English version contains a statement that, upon requestby an interested party, we will provide the party with a copy of our annual report on Form 20-F. As areporting company under the Securities Exchange Act of 1934, we are required to prepare financialstatements in accordance with U.S. GAAP for inclusion in our annual report on Form 20-F, which mustbe filed within six months after the end of each fiscal year.
‰ Nasdaq Marketplace Rule 4350(c)(1) requires that a majority of the board of directors of each issuer beindependent directors as defined in Rule 4200, and Rule 4350(c)(2) requires that independent directorsof each issuer have regularly scheduled meetings at which only independent directors are present. ForJapanese companies, including us, which employ a corporate governance system based on a board ofcorporate auditors, the Corporate Law of Japan has no independence requirement with respect todirectors. The task of overseeing management and accounting firms is assigned to the corporateauditors, who are separate from the company’s management. Japanese companies, including us, whichemploy a corporate governance system based on a board of corporate auditors, are required to have atleast 50% “external” corporate auditor who must meet additional independence requirements under theCorporate Law of Japan. An external corporate auditor is defined in the Corporate Law of Japan as acorporate auditor who has not served as a director, executive officer, manager or any other employee ofthe company or any of its subsidiaries at any time prior to the appointment. Currently, we have fourexternal Corporate Auditors. Our Board of Corporate Auditors, which, as explained below, performsfunctions similar to those of an audit committee, has regularly scheduled meetings at which onlyCorporate Auditors are present.
‰ Nasdaq Marketplace Rule 4350(d)(2) requires that each issuer have and will continue to have an auditcommittee of at least three members, each of whom (1) is independent as defined under Rule4200(a)(15), (2) meets the requirements of Rule 10A-3(b)(1) under the Securities Exchange Act of
153
1934, (3) has not participated in the preparation of the financial statements of the issuer or any currentsubsidiary thereof at any time during the past three years, and (4) is able to read and understandfundamental financial statements, including a company’s balance sheet, income statement and cash flowstatement, as required by Rule 4350(d)(2). Nasdaq Marketplace Rule 4350(d)(1) requires that eachissuer have adopted a formal written audit committee charter specifying the items enumerated in thatrule and that its audit committee have reviewed and reassessed the adequacy of the charter on an annualbasis. Under the Corporate Law of Japan, we are not required to establish or maintain such an auditcommittee. The Corporate Law of Japan has no independence requirement with respect to directors of“large” companies (defined under the Corporate Law of Japan as joint stock corporations with statedcapital of ¥500 million or more or with total liabilities equal to or exceeding ¥20 billion), includingMitsui, that employ a corporate governance system based on a board of corporate auditors. In manysuch “large” companies, functions similar to those of such an audit committee are performed by itsboard of corporate auditors. We have established such a Board of Corporate Auditors, each of whomdoes not concurrently serve as a director, manager or any other employee of the company or any of itssubsidiaries. Under the Corporate Law of Japan, corporate auditors are elected at a general meeting ofshareholders and are under a statutory duty to review the administration of the affairs of Mitsui by itsDirectors and to examine financial statements and other documents and reports of Mitsui. Japanesecompanies, including us, which employ a corporate governance system based on a board of corporateauditors, are required to have at least 50% “external” corporate auditor who must meet additionalindependence requirements under the Corporate Law of Japan. An external corporate auditor is definedin the Corporate Law of Japan as a corporate auditor who had not served as a director, executive officer,manager or any other employee of the company or any of its subsidiaries at any time prior to theappointment. Currently, we have six Corporate Auditors, four of whom are external Corporate Auditorswho meet these additional requirements. Mitsui’s Board of Corporate Auditors has adopted its ownregulations setting forth the scope of its responsibilities and the manner in which it carries out suchresponsibilities, and certain other matters.
‰ Nasdaq Marketplace Rule 4350(c)(3) requires that compensation of the chief executive officer of eachissuer be determined by, or recommended by its board of directors for determination either by (i) amajority of its independent directors or (ii) a compensation committee comprised solely of independentdirectors, and that compensation of all other executive officers be determined by, or recommended bythe board of directors for determination either by (i) a majority of the independent directors or (ii) acompensation committee comprised solely of independent directors. As explained above, we are notrequired to have independent Directors. With regard to director compensation (excluding bonuses, etc.),the Corporate Law of Japan requires the board of directors to pass a board resolution proposing directorcompensation to be submitted for approval at a general meeting of shareholders. Within the upper limitapproved at the general meeting of shareholders, the board of directors may determine the amount ofcompensation for each director. The board of directors, by resolution of the board of directors, maydelegate such decision to the chief executive officer or other persons authorized by the board ofdirectors. As for Mitsui, the upper limit of compensation for its Directors approved by the generalmeeting of shareholders is 60 million yen per month and the Board of Directors has determined todelegate to the Chief Executive Officer the decision-making authority as to the amount of compensationfor each Director within such limit. In addition to regular compensation, the aggregate amount ofbonuses and other financial benefits payable to Directors as consideration for the performance of theirduties is also subject to approval by shareholders at a general meeting of shareholders under theCorporate Law of Japan. With regard to employee (including officer) compensation, an approval at thegeneral meeting of shareholders is not required under the Corporate Law of Japan. Therefore, the boardof directors has the authority to determine matters relating to employee compensation. The board ofdirectors, by resolution of the board of directors, may delegate employee compensation matters to thechief executive officer or other persons authorized by the board of directors. As for Mitsui, its Board ofDirectors has duly resolved Regulations for Executive Officers, which provide that Executive Officerswho are also Directors of the Company shall not be paid any compensation in their capacities as
154
Executive Officers and that the compensation of the Executive Officers who are not Directors of theCompany shall be decided by the Board of Directors, or decided by the chief executive officer or otherOfficers authorized by the Board of Directors. Mitsui determines compensation of its Chief ExecutiveOfficer and other Officers in accordance with the aforementioned procedures. Corporate auditors do nothave any specific duties with respect to compensation of the chief executive officer and other executiveofficers under the Corporate Law of Japan. However, the duties of corporate auditors include a generalduty to audit the affairs of the company to ensure that the business is being operated in accordance withapplicable law and its charter. If the corporate auditors conclude, in connection with the performance ofthose duties, that the compensation of directors violated applicable law or the company’s charter, thecorporate auditors are required to report their conclusion to the general meeting of shareholders and maybring a lawsuit against the responsible directors.
‰ Nasdaq Marketplace Rule 4350(c)(4) requires that director nominees be selected or recommended forthe board of directors’ selection either by (i) a majority of the independent directors or (ii) a nominationcommittee comprised solely of independent directors. Also, Nasdaq Marketplace Rule 4350(c)(4)(B)requires that each issuer have adopted a formal written charter or board resolution, as applicable,addressing the nominations process and such related matters as may be required under the U.S. federalsecurities laws. As explained above, we are not required to have independent directors. Under theCorporate Law of Japan, a director may be nominated by (i) a resolution of the board of directors or(ii) a shareholder owning one percent or more of the outstanding shares of a company or 300 or moreshares of the company for at least 6 months. Approval by a majority of the shareholders in attendance ata general meeting of shareholders is required to elect a director. There is no specific requirement that acompany adopt a written charter or board resolution addressing the nominations process, nor is itcustomary to do so. As for Mitsui, nominations of Directors of Mitsui are approved at a meeting of thenomination committee, a non-statutory committee established as an advisory board to the Board ofDirectors, prior to being submitted to a general meeting of shareholders. Corporate auditors do not haveany specific duties with respect to nomination of directors under the Corporate Law of Japan. However,the duties of corporate auditors include a general duty to audit the affairs of the company to ensure thatthe business is being operated in accordance with applicable law and its charter. If the corporate auditorsconclude, in connection with the performance of those duties, that the nomination of directors violatedapplicable law or the company’s charter, the corporate auditors are required to report their conclusion tothe general meeting of shareholders and may bring a lawsuit against the responsible directors.
‰ Nasdaq Marketplace Rule 4350(f) requires that there be a provision in the by-laws for a quorum for anymeeting of the holders of common stock and that such quorum be not less than 331⁄3% of theoutstanding shares of the common voting stock. In accordance with the Corporate Law of Japan,however, under our Articles of Incorporation no quorum is required for the adoption of resolutions at ageneral meeting of shareholders, except for (i) the election of Directors and Corporate Auditors forwhich the quorum shall not be less than one-third of the total voting rights and (ii) resolutions for otherspecified issues required by the Corporate Law of Japan (the “special shareholders’ resolutions”), whichinclude an amendment to the Articles of Incorporation, a reduction of stated capital, the removal of aCorporate Auditor, dissolution, merger or consolidation requiring shareholders resolution, the transfer ofthe whole or an important part of the business, the taking over of the whole of the business of any othercorporation requiring shareholders’ resolutions, share exchange or share transfer requiring shareholdersresolution for the purpose of establishing 100% parent-subsidiary relationships, splitting of thecorporation into two or more corporations requiring shareholders’ resolution, any offering of new sharesat a “specially favorable” price (or any offering of the rights to subscribe for, or acquire its shares at a“specially favorable” conditions) to any persons other than shareholders, for which the quorum shall beat least one-third of the total voting rights and the approval of the holders of at least two-thirds of thevoting rights represented at the meeting is required. This approach is consistent with generally acceptedbusiness practices of publicly-held companies in Japan.
‰ Nasdaq Marketplace Rule 4350(g) provides that each issuer solicit proxies and provide proxy statementsfor all meetings of shareholders and provide copies of such proxy solicitation to Nasdaq. Currently a
155
Japanese company whose shares are listed on the securities exchanges defined in the Securities andExchange Law, including us, may, but is not required to, solicit proxies for meetings of shareholders. Ifsuch a Japanese company solicits proxies for a meeting of shareholders, it is required to provide proxystatements and documents for reference as provided for in the Securities and Exchange Law and providecopies of such proxy statements and documents for reference to the Kanto Local Finance Bureau.
‰ Nasdaq Marketplace Rule 4350(h) provides that each issuer conduct appropriate review of all relatedparty transactions for potential conflict of interest situations on an ongoing basis and that all suchtransactions be approved by the issuer’s audit committee or another independent body of the board ofdirectors. Following the requirements of the Corporate Law of Japan, we require a Director to obtain theapproval of our Board of Directors in order for such Director to enter into such transactions.
‰ Nasdaq Marketplace Rule 4350(i)(1) requires that shareholder approval be obtained for the issuance ofthe issuer’s stock in certain conditions or certain specified transactions described therein. The CorporateLaw of Japan requires us to seek shareholder approval of various matters, and in certain instances thespecial shareholders’ resolutions as described above are required for approval. In addition, while theCorporate Law of Japan permits, in certain instances, the issuance of equity securities withoutshareholder approval, the Corporate Law of Japan also contains provisions requiring the timelydissemination of information relating to such issuance, allowing for opportunities for shareholders tovoice their concern with such issuance, and mandating the election of statutory auditors whose fiduciaryduty is to, among other things, oversee on behalf of the shareholders actions by the board of directorsrelating to such issuance.
The rights of ADS holders, including their rights relating to corporate governance practices, are provided inthe deposit agreement.
Limitation of Liabilities of Directors and Corporate Auditors
The Articles of Incorporation of Mitsui provide that Mitsui may, by resolution of the Board of Directors,limit the liabilities of Directors and Corporate Auditors to the extent as permitted by the Corporate Law of Japan.The Articles of Incorporation of Mitsui also provide that Mitsui may conclude a contract with external Directorsand external Corporate Auditors to limit the liability of such Directors and Corporate Auditors to the extent aspermitted by the Corporate Law of Japan. In accordance with such provision of the Articles of Incorporation,Mitsui has concluded with external Directors (Mr. Akishige Okada, Mr. Akira Chihaya and Ms. NobukoMatsubara) and external Corporate Auditors (Mr. Ko Matsukata, Mr. Yasutaka Okamura, Mr. HideharuKadowaki and Mr. Naoto Nakamura), respectively, contracts to limit their liability to the extent permitted by theCorporate Law of Japan.
D. Employees
As of March 31, 2006 and 2005, we had 40,993 and 38,210 employees, respectively. The average number oftemporary employees during the year ended March 31, 2006 was 11,984. From the year ended March 31, 2006,we changed our reportable segments. We restated the figure of employees in the following table as of March 31,2005 to conform to the current year presentation of operating segments. For more information, see Note 17,“Segment Information,” to our consolidated financial statements.
156
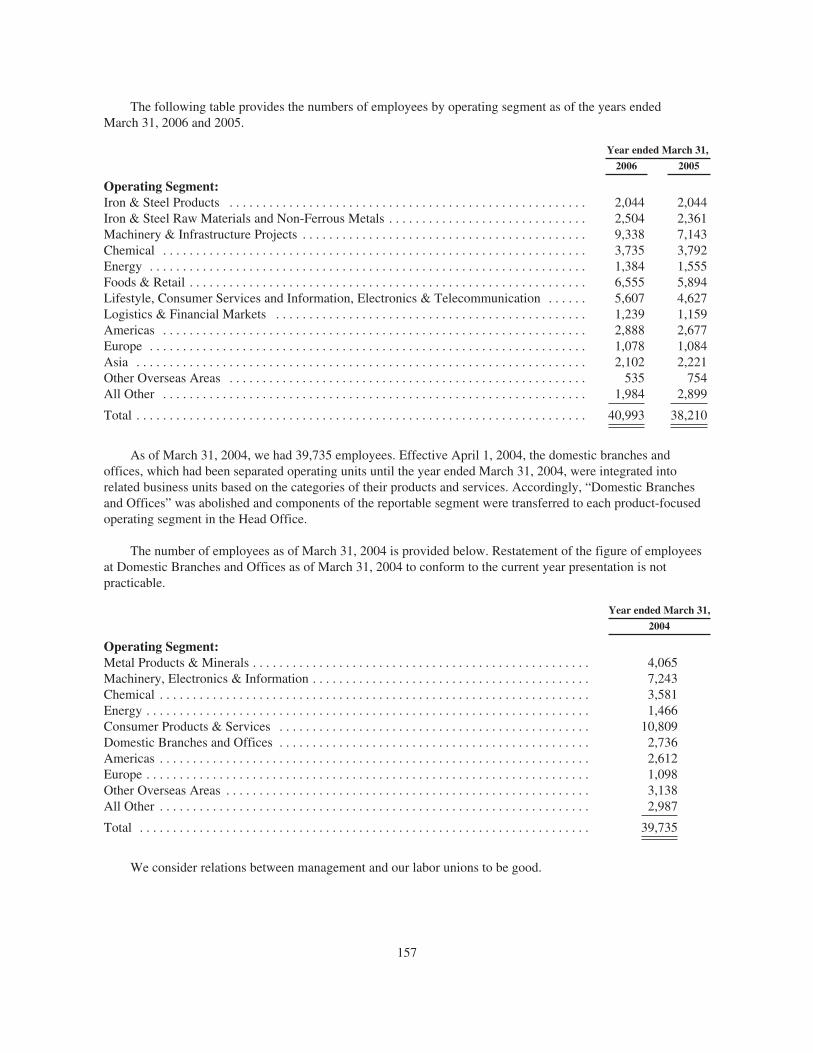
The following table provides the numbers of employees by operating segment as of the years endedMarch 31, 2006 and 2005.
Year ended March 31,
2006 2005
Operating Segment:Iron & Steel Products . . . . . . . . . . . . . . . . . . . . . . . . . . . . . . . . . . . . . . . . . . . . . . . . . . . . . . 2,044 2,044Iron & Steel Raw Materials and Non-Ferrous Metals . . . . . . . . . . . . . . . . . . . . . . . . . . . . . . 2,504 2,361Machinery & Infrastructure Projects . . . . . . . . . . . . . . . . . . . . . . . . . . . . . . . . . . . . . . . . . . . 9,338 7,143Chemical . . . . . . . . . . . . . . . . . . . . . . . . . . . . . . . . . . . . . . . . . . . . . . . . . . . . . . . . . . . . . . . . 3,735 3,792Energy . . . . . . . . . . . . . . . . . . . . . . . . . . . . . . . . . . . . . . . . . . . . . . . . . . . . . . . . . . . . . . . . . . 1,384 1,555Foods & Retail . . . . . . . . . . . . . . . . . . . . . . . . . . . . . . . . . . . . . . . . . . . . . . . . . . . . . . . . . . . . 6,555 5,894Lifestyle, Consumer Services and Information, Electronics & Telecommunication . . . . . . 5,607 4,627Logistics & Financial Markets . . . . . . . . . . . . . . . . . . . . . . . . . . . . . . . . . . . . . . . . . . . . . . . 1,239 1,159Americas . . . . . . . . . . . . . . . . . . . . . . . . . . . . . . . . . . . . . . . . . . . . . . . . . . . . . . . . . . . . . . . . 2,888 2,677Europe . . . . . . . . . . . . . . . . . . . . . . . . . . . . . . . . . . . . . . . . . . . . . . . . . . . . . . . . . . . . . . . . . . 1,078 1,084Asia . . . . . . . . . . . . . . . . . . . . . . . . . . . . . . . . . . . . . . . . . . . . . . . . . . . . . . . . . . . . . . . . . . . . 2,102 2,221Other Overseas Areas . . . . . . . . . . . . . . . . . . . . . . . . . . . . . . . . . . . . . . . . . . . . . . . . . . . . . . 535 754All Other . . . . . . . . . . . . . . . . . . . . . . . . . . . . . . . . . . . . . . . . . . . . . . . . . . . . . . . . . . . . . . . . 1,984 2,899
Total . . . . . . . . . . . . . . . . . . . . . . . . . . . . . . . . . . . . . . . . . . . . . . . . . . . . . . . . . . . . . . . . . . . . 40,993 38,210
As of March 31, 2004, we had 39,735 employees. Effective April 1, 2004, the domestic branches andoffices, which had been separated operating units until the year ended March 31, 2004, were integrated intorelated business units based on the categories of their products and services. Accordingly, “Domestic Branchesand Offices” was abolished and components of the reportable segment were transferred to each product-focusedoperating segment in the Head Office.
The number of employees as of March 31, 2004 is provided below. Restatement of the figure of employeesat Domestic Branches and Offices as of March 31, 2004 to conform to the current year presentation is notpracticable.
Year ended March 31,
2004
Operating Segment:Metal Products & Minerals . . . . . . . . . . . . . . . . . . . . . . . . . . . . . . . . . . . . . . . . . . . . . . . . . . . 4,065Machinery, Electronics & Information . . . . . . . . . . . . . . . . . . . . . . . . . . . . . . . . . . . . . . . . . . 7,243Chemical . . . . . . . . . . . . . . . . . . . . . . . . . . . . . . . . . . . . . . . . . . . . . . . . . . . . . . . . . . . . . . . . . 3,581Energy . . . . . . . . . . . . . . . . . . . . . . . . . . . . . . . . . . . . . . . . . . . . . . . . . . . . . . . . . . . . . . . . . . . 1,466Consumer Products & Services . . . . . . . . . . . . . . . . . . . . . . . . . . . . . . . . . . . . . . . . . . . . . . . 10,809Domestic Branches and Offices . . . . . . . . . . . . . . . . . . . . . . . . . . . . . . . . . . . . . . . . . . . . . . . 2,736Americas . . . . . . . . . . . . . . . . . . . . . . . . . . . . . . . . . . . . . . . . . . . . . . . . . . . . . . . . . . . . . . . . . 2,612Europe . . . . . . . . . . . . . . . . . . . . . . . . . . . . . . . . . . . . . . . . . . . . . . . . . . . . . . . . . . . . . . . . . . . 1,098Other Overseas Areas . . . . . . . . . . . . . . . . . . . . . . . . . . . . . . . . . . . . . . . . . . . . . . . . . . . . . . . 3,138All Other . . . . . . . . . . . . . . . . . . . . . . . . . . . . . . . . . . . . . . . . . . . . . . . . . . . . . . . . . . . . . . . . . 2,987
Total . . . . . . . . . . . . . . . . . . . . . . . . . . . . . . . . . . . . . . . . . . . . . . . . . . . . . . . . . . . . . . . . . . . . 39,735
We consider relations between management and our labor unions to be good.
157

E. Share Ownership.
Directors, Corporate Auditors and Executive Officers
As of June 30, 2006, the members of Mitsui’s Board of Directors, Corporate Auditors and ExecutiveOfficers held as a group, 593,263 shares of our common stock, representing 0.03% of the shares outstanding.This number of shares included 41,509 shares held by Mitsui Executives’ Shareholding Association.
None of Mitsui’s Directors, Corporate Auditors nor Executive Officers is the beneficial owner of more than1% of Mitsui’s common stock. The number of shares held by Mitsui’s Directors, Corporate Auditors andExecutive Officers, on an individual basis, is provided in “Item 6.C. Board Practices,” and is incorporated hereinby reference.
In July, 2006, a new management shareholding scheme was introduced, whereby each of Mitsui’s Directors(excluding external Directors) and Executive Officers are required to purchase Mitsui’s shares through MitsuiExecutives’ Shareholding Association. Mitsui’s Directors (excluding external Directors) and Executive Officerspurchase Mitsui’s shares in an amount equivalent to 10% of his or her salary, which amount is deducted from hisor her salary for the purchases through said Mitsui Executives’ Shareholding Association.
Employees Shareholding Association
Mitsui operates an Employees’ Shareholding Association which, as of June 30, 2006, had 3,298 employeemember participants.
Employee members declare monthly the amount to be deducted from his or her salary to be used to purchaseshares of common stock of Mitsui through the Employees’ Shareholding Association. Employee membersreceive from Mitsui a monthly subsidy equivalent to 10% of the declared amount, enabling them to purchaseshares equivalent to 110% of the declared amount. Employee members are entitled to dividends which areapplied towards the purchase of additional shares through the Employees’ Shareholding Association. Employeemembers are able to sell part of their shares that have been reserved for them under the Employees’ ShareholdingAssociation’s plan, in multiples of 1,000 shares, once every month. As of June 30, 2006, the total amount ofshares having voting rights owned by the Employees’ Shareholding Association was 11,397,589, representing0.66% of the total shares issued and outstanding.
Mitsui does not have any other arrangements for involving its employees in the capital of Mitsui, includingany arrangement that involves the issue or grant of options, shares or securities of Mitsui.
Item 7. Major Shareholders and Related Party Transactions.
A. Major Shareholders.
As of March 31, 2006, there were 1,725,018,515 shares of our common stock issued (including2,064,447 shares of treasury stock), of which 7,301,180 shares were in the form of ADSs, representing 0.42% ofour then outstanding common stock, and 212,267,210 shares, representing 12.31% of our then outstandingcommon stock, were held of record in the form of common stock by residents in the United States. The numberof registered ADS holders was 40, and the number of registered holders of shares of common stock in the UnitedStates was 180.
158

The following table shows our major shareholders as of March 31, 2006, including shareholders who ownedless than 5% of our then outstanding common stock, disclosed under the Securities and Exchange Law of Japan.
ShareholdersThousands of Shares ofCommon Stock Owned
Percentage ofCommon Stock Issued(*)
The Master Trust Bank of Japan, Ltd. (trust account) . . . . . . . . . . . 173,080 10.03%Japan Trustee Services Bank, Ltd. (trust account) . . . . . . . . . . . . . . 143,434 8.31Mitsui Life Insurance Company, Limited . . . . . . . . . . . . . . . . . . . . . 51,033 2.95Sumitomo Mitsui Banking Corporation . . . . . . . . . . . . . . . . . . . . . . 38,500 2.23The Chuo Mitsui Trust and Banking Company, Limited . . . . . . . . . 37,410 2.16The Chase Manhattan Bank NA London . . . . . . . . . . . . . . . . . . . . . 37,270 2.16Nippon Life Insurance Company . . . . . . . . . . . . . . . . . . . . . . . . . . . 35,070 2.03Mizuho Corporate Bank, Ltd. . . . . . . . . . . . . . . . . . . . . . . . . . . . . . . 32,183 1.86The Bank of Tokyo-Mitsubishi UFJ, Ltd. . . . . . . . . . . . . . . . . . . . . . 30,375 1.76State Street Bank and Trust Company 505103 . . . . . . . . . . . . . . . . . 28,620 1.65
(*) The figures are rounded down to two decimal places.
Under the Securities and Exchange Law of Japan, any person that becomes a holder (together with itsrelated persons) of more than 5% of the total issued voting shares of a company listed on any Japanese stockexchange (including ADSs representing such shares) must file a report with the Director of the relevant LocalFinance Bureau and send a copy of such report to the company. A similar report must also be filed if thepercentage holding of a holder of more than 5% of the total issued voting shares of a company increases ordecreases by 1% or more.
Based on such reports we have received, we are aware that each of the following persons, together with itsaffiliates, was the beneficial owner of our common stock in the amounts and as of the dates shown in thefollowing tables:
Schroder Investment Management (Japan) Ltd.
Ownership as ofThousands of Shares ofCommon Stock Owned
Percentage ofCommon Stock Issued(*)
March 31, 2004 . . . . . . . . . . . . . . . . . . . . . . . . . . . . . . . . . . . . . . . . . 146,045,454 9.22%September 30, 2004 . . . . . . . . . . . . . . . . . . . . . . . . . . . . . . . . . . . . . . 132,175,833 8.35March 31, 2005 . . . . . . . . . . . . . . . . . . . . . . . . . . . . . . . . . . . . . . . . . 105,825,213 6.68September 30, 2005 . . . . . . . . . . . . . . . . . . . . . . . . . . . . . . . . . . . . . . 98,021,300 6.19March 31, 2006 . . . . . . . . . . . . . . . . . . . . . . . . . . . . . . . . . . . . . . . . . 76,106,300 4.41
Mitsui Asset Trust Banking Company, Limited
Ownership as ofThousands of Shares ofCommon Stock Owned
Percentage ofCommon Stock Issued(*)
November 30, 2003 . . . . . . . . . . . . . . . . . . . . . . . . . . . . . . . . . . . . . . 87,912,465 5.55%February 22, 2005 . . . . . . . . . . . . . . . . . . . . . . . . . . . . . . . . . . . . . . . 70,694,710 4.46February 28, 2006 . . . . . . . . . . . . . . . . . . . . . . . . . . . . . . . . . . . . . . . 71,136,710 4.49
Mizuho Corporate Bank, Ltd.
Ownership as ofThousands of Shares ofCommon Stock Owned
Percentage ofCommon Stock Issued(*)
April 30, 2003 . . . . . . . . . . . . . . . . . . . . . . . . . . . . . . . . . . . . . . . . . . 76,810,314 4.84%
159
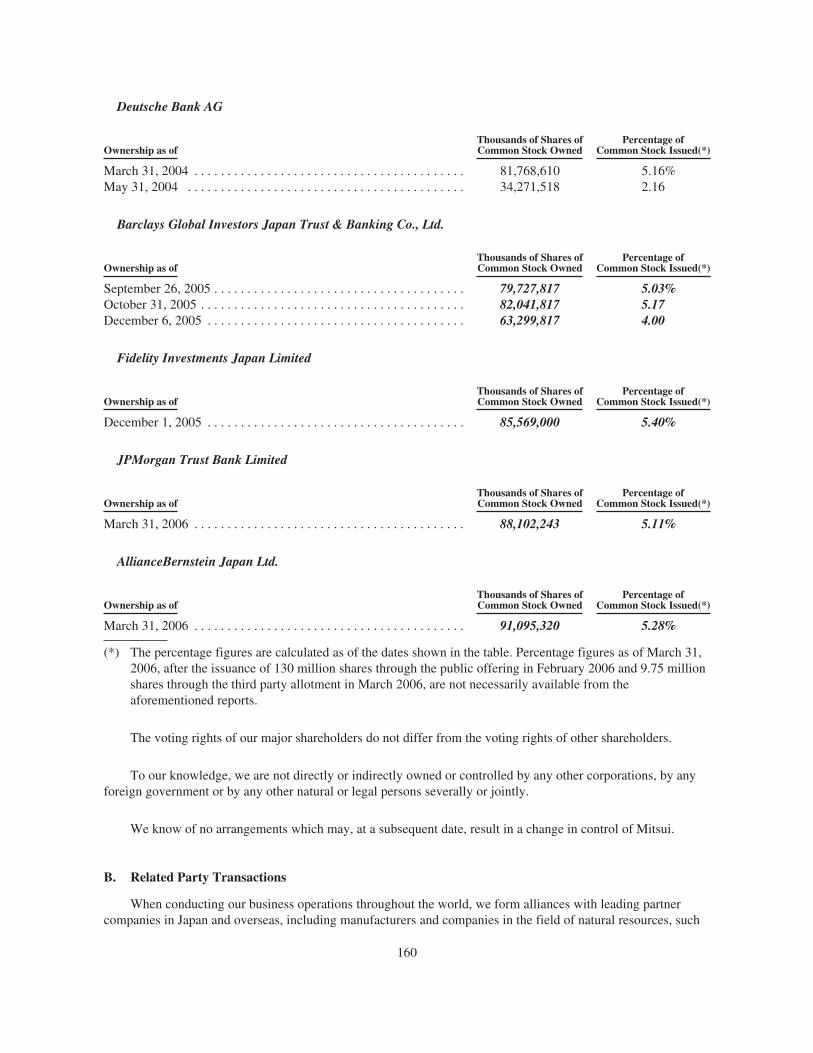
Deutsche Bank AG
Ownership as ofThousands of Shares ofCommon Stock Owned
Percentage ofCommon Stock Issued(*)
March 31, 2004 . . . . . . . . . . . . . . . . . . . . . . . . . . . . . . . . . . . . . . . . . 81,768,610 5.16%May 31, 2004 . . . . . . . . . . . . . . . . . . . . . . . . . . . . . . . . . . . . . . . . . . 34,271,518 2.16
Barclays Global Investors Japan Trust & Banking Co., Ltd.
Ownership as ofThousands of Shares ofCommon Stock Owned
Percentage ofCommon Stock Issued(*)
September 26, 2005 . . . . . . . . . . . . . . . . . . . . . . . . . . . . . . . . . . . . . . 79,727,817 5.03%October 31, 2005 . . . . . . . . . . . . . . . . . . . . . . . . . . . . . . . . . . . . . . . . 82,041,817 5.17December 6, 2005 . . . . . . . . . . . . . . . . . . . . . . . . . . . . . . . . . . . . . . . 63,299,817 4.00
Fidelity Investments Japan Limited
Ownership as ofThousands of Shares ofCommon Stock Owned
Percentage ofCommon Stock Issued(*)
December 1, 2005 . . . . . . . . . . . . . . . . . . . . . . . . . . . . . . . . . . . . . . . 85,569,000 5.40%
JPMorgan Trust Bank Limited
Ownership as ofThousands of Shares ofCommon Stock Owned
Percentage ofCommon Stock Issued(*)
March 31, 2006 . . . . . . . . . . . . . . . . . . . . . . . . . . . . . . . . . . . . . . . . . 88,102,243 5.11%
AllianceBernstein Japan Ltd.
Ownership as ofThousands of Shares ofCommon Stock Owned
Percentage ofCommon Stock Issued(*)
March 31, 2006 . . . . . . . . . . . . . . . . . . . . . . . . . . . . . . . . . . . . . . . . . 91,095,320 5.28%
(*) The percentage figures are calculated as of the dates shown in the table. Percentage figures as of March 31,2006, after the issuance of 130 million shares through the public offering in February 2006 and 9.75 millionshares through the third party allotment in March 2006, are not necessarily available from theaforementioned reports.
The voting rights of our major shareholders do not differ from the voting rights of other shareholders.
To our knowledge, we are not directly or indirectly owned or controlled by any other corporations, by anyforeign government or by any other natural or legal persons severally or jointly.
We know of no arrangements which may, at a subsequent date, result in a change in control of Mitsui.
B. Related Party Transactions
When conducting our business operations throughout the world, we form alliances with leading partnercompanies in Japan and overseas, including manufacturers and companies in the field of natural resources, such
160
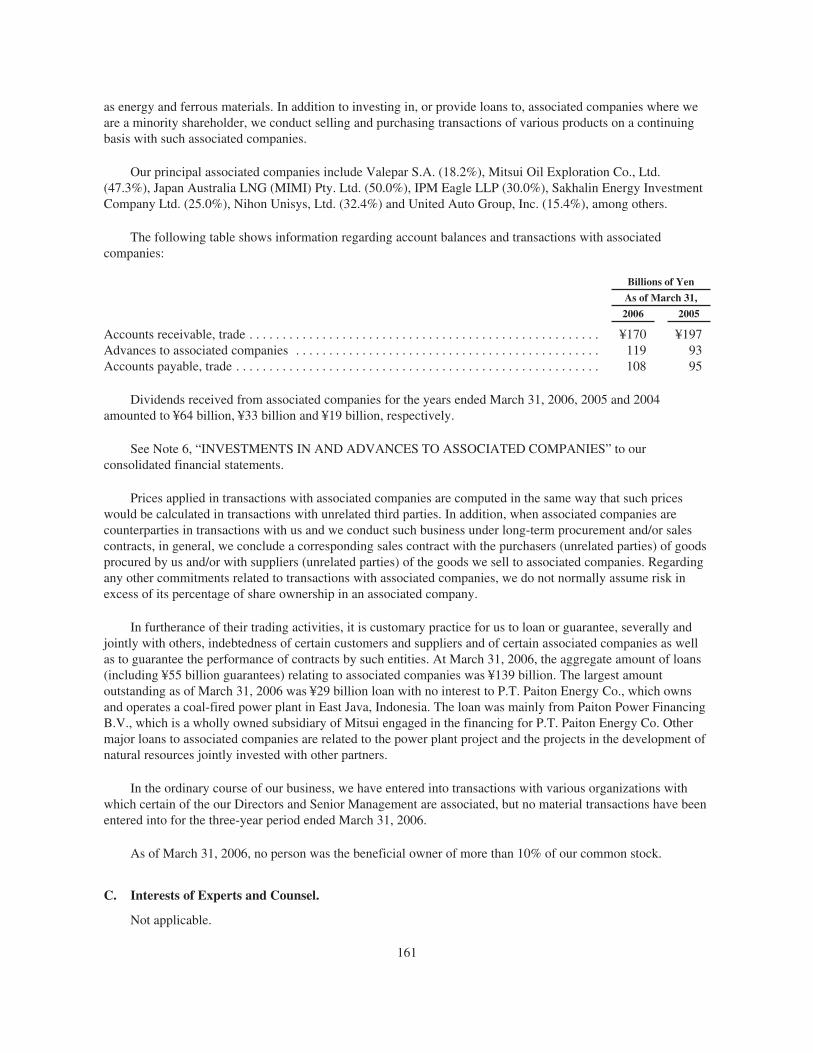
as energy and ferrous materials. In addition to investing in, or provide loans to, associated companies where weare a minority shareholder, we conduct selling and purchasing transactions of various products on a continuingbasis with such associated companies.
Our principal associated companies include Valepar S.A. (18.2%), Mitsui Oil Exploration Co., Ltd.(47.3%), Japan Australia LNG (MIMI) Pty. Ltd. (50.0%), IPM Eagle LLP (30.0%), Sakhalin Energy InvestmentCompany Ltd. (25.0%), Nihon Unisys, Ltd. (32.4%) and United Auto Group, Inc. (15.4%), among others.
The following table shows information regarding account balances and transactions with associatedcompanies:
Billions of Yen
As of March 31,
2006 2005
Accounts receivable, trade . . . . . . . . . . . . . . . . . . . . . . . . . . . . . . . . . . . . . . . . . . . . . . . . . . . . . ¥170 ¥197Advances to associated companies . . . . . . . . . . . . . . . . . . . . . . . . . . . . . . . . . . . . . . . . . . . . . . 119 93Accounts payable, trade . . . . . . . . . . . . . . . . . . . . . . . . . . . . . . . . . . . . . . . . . . . . . . . . . . . . . . . 108 95
Dividends received from associated companies for the years ended March 31, 2006, 2005 and 2004amounted to ¥64 billion, ¥33 billion and ¥19 billion, respectively.
See Note 6, “INVESTMENTS IN AND ADVANCES TO ASSOCIATED COMPANIES” to ourconsolidated financial statements.
Prices applied in transactions with associated companies are computed in the same way that such priceswould be calculated in transactions with unrelated third parties. In addition, when associated companies arecounterparties in transactions with us and we conduct such business under long-term procurement and/or salescontracts, in general, we conclude a corresponding sales contract with the purchasers (unrelated parties) of goodsprocured by us and/or with suppliers (unrelated parties) of the goods we sell to associated companies. Regardingany other commitments related to transactions with associated companies, we do not normally assume risk inexcess of its percentage of share ownership in an associated company.
In furtherance of their trading activities, it is customary practice for us to loan or guarantee, severally andjointly with others, indebtedness of certain customers and suppliers and of certain associated companies as wellas to guarantee the performance of contracts by such entities. At March 31, 2006, the aggregate amount of loans(including ¥55 billion guarantees) relating to associated companies was ¥139 billion. The largest amountoutstanding as of March 31, 2006 was ¥29 billion loan with no interest to P.T. Paiton Energy Co., which ownsand operates a coal-fired power plant in East Java, Indonesia. The loan was mainly from Paiton Power FinancingB.V., which is a wholly owned subsidiary of Mitsui engaged in the financing for P.T. Paiton Energy Co. Othermajor loans to associated companies are related to the power plant project and the projects in the development ofnatural resources jointly invested with other partners.
In the ordinary course of our business, we have entered into transactions with various organizations withwhich certain of the our Directors and Senior Management are associated, but no material transactions have beenentered into for the three-year period ended March 31, 2006.
As of March 31, 2006, no person was the beneficial owner of more than 10% of our common stock.
C. Interests of Experts and Counsel.
Not applicable.
161

Item 8. Financial Information.
A. Consolidated Statements and Other Financial Information.
Consolidated Financial Statements
The audited consolidated financial statements required by this item are included elsewhere in this annualreport.
Export Sales
The total amount of revenues from export transactions for the year ended March 31, 2006 was ¥333 billionor 8% of total revenue of ¥4,115 billion.
Legal Proceedings
Antitrust Suits against Mitsui, Mitsui U.S.A. and Bioproducts
Our wholly-owned U.S. subsidiary, Bioproducts, Inc., which was producing and selling choline chloride, aningredient of animal feed and pet foods, was named as a defendant in lawsuits in the United States, together withother third-party choline chloride manufacturers. In these cases, manufacturers of choline chloride allegedlyviolated U.S. antitrust laws.
Although Mitsui and its wholly-owned U.S. subsidiary, Mitsui & Co. (U.S.A.), Inc. (“Mitsui U.S.A.”), wereneither a manufacturer nor a seller of choline chloride in the U.S. market, Mitsui and Mitsui U.S.A. were alsonamed as defendants in a class action lawsuits based on the plaintiffs’ allegation that Mitsui and Mitsui U.S.A.were involved in the violation of antitrust laws. During the course of the legal proceedings, Mitsui and MitsuiU.S.A. have consistently denied any wrongdoing. However, in the trial before the Federal District Court of theDistrict of Columbia in June 2003, the jury rendered a verdict stating that the defendants participated in theviolation of antitrust laws. Mitsui and Mitsui U.S.A. considered undertaking the legal proceedings necessary tooverrule the verdict, but given the circumstances, it was determined that a settlement with the class actionplaintiffs would be in the best interest of Mitsui and all of its stakeholders, and entered into an agreement forsettlement with the class action plaintiffs by paying U.S.$53.0 million as a settlement amount. The settlementwas subject to court approval, which was obtained on April 27, 2005.
For other related lawsuits that are still pending, although there can be no assurance of the ultimate results,management believes that there is less than a reasonable possibility that losses in addition to amounts that havebeen reserved for possible litigation losses will occur, and that the amount of any such additional losses wouldnot have a material impact on our consolidated financial position, results of operations or cash flows.
Other Matters
Various other claims and legal actions are pending against us in respect of contractual obligations and othermatters arising out of the conduct of our business. Appropriate provision has been recorded for the estimated losson claims and legal actions including those mentioned above. In the opinion of management, any additionalliability will not materially affect our consolidated financial position, results of operations, or cash flows.
Dividend Policy
We have set the target dividend payout ratio at 20% of consolidated net income, and by growing profits atMitsui will aim to progressively and sustainably increase dividend payments. Such payments will, however, besubject to our future earnings, financial condition, approval at the shareholders’ meeting (in the case of year-enddividends) and other factors, including statutory and other restrictions with respect to the payment of dividends.
162
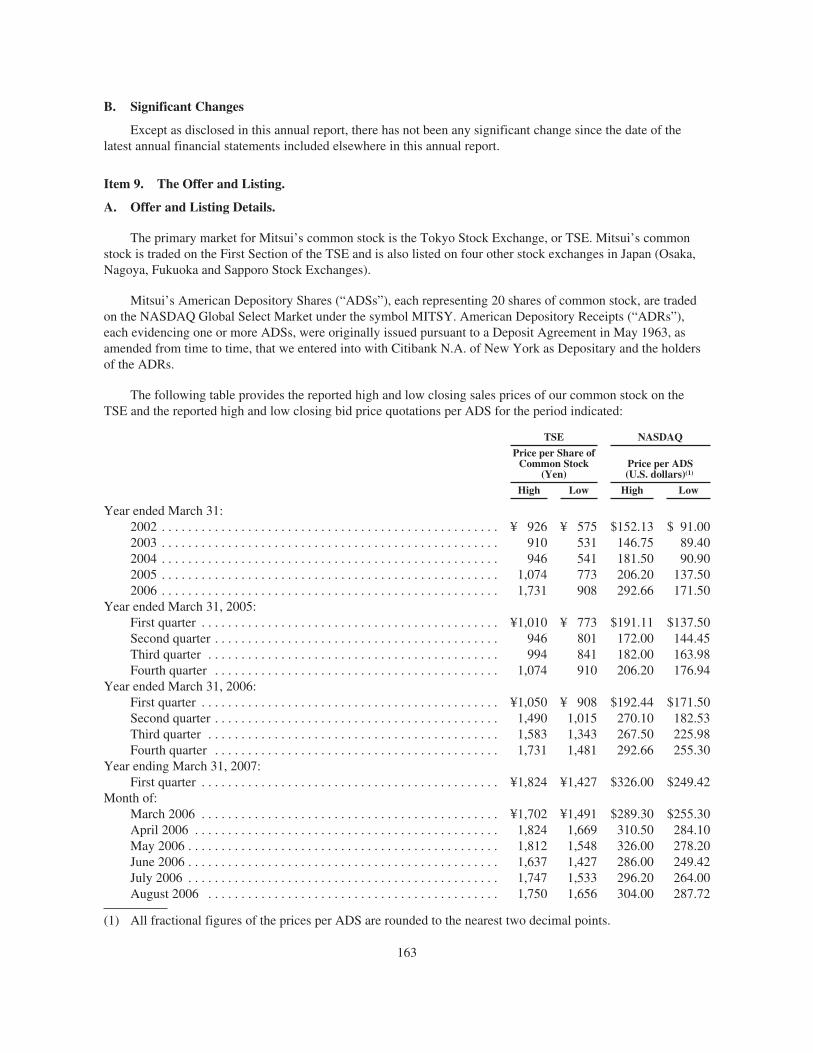
B. Significant Changes
Except as disclosed in this annual report, there has not been any significant change since the date of thelatest annual financial statements included elsewhere in this annual report.
Item 9. The Offer and Listing.
A. Offer and Listing Details.
The primary market for Mitsui’s common stock is the Tokyo Stock Exchange, or TSE. Mitsui’s commonstock is traded on the First Section of the TSE and is also listed on four other stock exchanges in Japan (Osaka,Nagoya, Fukuoka and Sapporo Stock Exchanges).
Mitsui’s American Depository Shares (“ADSs”), each representing 20 shares of common stock, are tradedon the NASDAQ Global Select Market under the symbol MITSY. American Depository Receipts (“ADRs”),each evidencing one or more ADSs, were originally issued pursuant to a Deposit Agreement in May 1963, asamended from time to time, that we entered into with Citibank N.A. of New York as Depositary and the holdersof the ADRs.
The following table provides the reported high and low closing sales prices of our common stock on theTSE and the reported high and low closing bid price quotations per ADS for the period indicated:
TSE NASDAQ
Price per Share ofCommon Stock
(Yen)Price per ADS(U.S. dollars)(1)
High Low High Low
Year ended March 31:2002 . . . . . . . . . . . . . . . . . . . . . . . . . . . . . . . . . . . . . . . . . . . . . . . . . . . ¥ 926 ¥ 575 $152.13 $ 91.002003 . . . . . . . . . . . . . . . . . . . . . . . . . . . . . . . . . . . . . . . . . . . . . . . . . . . 910 531 146.75 89.402004 . . . . . . . . . . . . . . . . . . . . . . . . . . . . . . . . . . . . . . . . . . . . . . . . . . . 946 541 181.50 90.902005 . . . . . . . . . . . . . . . . . . . . . . . . . . . . . . . . . . . . . . . . . . . . . . . . . . . 1,074 773 206.20 137.502006 . . . . . . . . . . . . . . . . . . . . . . . . . . . . . . . . . . . . . . . . . . . . . . . . . . . 1,731 908 292.66 171.50
Year ended March 31, 2005:First quarter . . . . . . . . . . . . . . . . . . . . . . . . . . . . . . . . . . . . . . . . . . . . . ¥1,010 ¥ 773 $191.11 $137.50Second quarter . . . . . . . . . . . . . . . . . . . . . . . . . . . . . . . . . . . . . . . . . . . 946 801 172.00 144.45Third quarter . . . . . . . . . . . . . . . . . . . . . . . . . . . . . . . . . . . . . . . . . . . . 994 841 182.00 163.98Fourth quarter . . . . . . . . . . . . . . . . . . . . . . . . . . . . . . . . . . . . . . . . . . . 1,074 910 206.20 176.94
Year ended March 31, 2006:First quarter . . . . . . . . . . . . . . . . . . . . . . . . . . . . . . . . . . . . . . . . . . . . . ¥1,050 ¥ 908 $192.44 $171.50Second quarter . . . . . . . . . . . . . . . . . . . . . . . . . . . . . . . . . . . . . . . . . . . 1,490 1,015 270.10 182.53Third quarter . . . . . . . . . . . . . . . . . . . . . . . . . . . . . . . . . . . . . . . . . . . . 1,583 1,343 267.50 225.98Fourth quarter . . . . . . . . . . . . . . . . . . . . . . . . . . . . . . . . . . . . . . . . . . . 1,731 1,481 292.66 255.30
Year ending March 31, 2007:First quarter . . . . . . . . . . . . . . . . . . . . . . . . . . . . . . . . . . . . . . . . . . . . . ¥1,824 ¥1,427 $326.00 $249.42
Month of:March 2006 . . . . . . . . . . . . . . . . . . . . . . . . . . . . . . . . . . . . . . . . . . . . . ¥1,702 ¥1,491 $289.30 $255.30April 2006 . . . . . . . . . . . . . . . . . . . . . . . . . . . . . . . . . . . . . . . . . . . . . . 1,824 1,669 310.50 284.10May 2006 . . . . . . . . . . . . . . . . . . . . . . . . . . . . . . . . . . . . . . . . . . . . . . . 1,812 1,548 326.00 278.20June 2006 . . . . . . . . . . . . . . . . . . . . . . . . . . . . . . . . . . . . . . . . . . . . . . . 1,637 1,427 286.00 249.42July 2006 . . . . . . . . . . . . . . . . . . . . . . . . . . . . . . . . . . . . . . . . . . . . . . . 1,747 1,533 296.20 264.00August 2006 . . . . . . . . . . . . . . . . . . . . . . . . . . . . . . . . . . . . . . . . . . . . 1,750 1,656 304.00 287.72
(1) All fractional figures of the prices per ADS are rounded to the nearest two decimal points.
163
Share prices on Japanese stock exchanges are determined on a real-time basis by the equilibrium betweenbids and offers. These exchanges set daily price limits, which limit the maximum range of fluctuation within asingle trading day. Daily price limits are set according to the previous day’s closing price or special quote.Although transactions may continue at the upward or downward limit price if the limit price is reached on aparticular trading day, no transactions may take place outside these limits. Consequently, an investor wishing tosell at a price above or below the relevant daily limit may not be able to sell his shares at such price on aparticular trading day, or at all.
On September 20, 2006, the closing sales price per share of our common stock on the TSE was ¥1,446, andthe closing sales price per ADS on the NASDAQ Global Select Market was U.S.$249.46.
B. Plan of Distribution.
Not applicable.
C. Markets.
See “Item 9.A. Offer and Listing Details.”
D. Selling Shareholders.
Not applicable.
E. Dilution.
Not applicable.
F. Expenses of the Issue.
Not applicable.
Item 10. Additional Information.
A. Share Capital.
Not applicable.
B. Memorandum and Articles of Association.
General
Set forth below is information relating to the organization and common stock of Mitsui, including briefsummaries of the relevant provisions of Mitsui’s Articles of Incorporation and Share Handling Regulationsadopted by Mitsui’s Board of Directors, as currently in effect, and of the Corporate Law of Japan and relatedlegislation.
With the revision of the Corporate Law of Japan and related legislation on May 1, 2006, the relevantprovisions of Mitsui’s Articles of Incorporation and Share Handling Regulations were, among other things,amended as follows:
(1) Article 16 of Mitsui’s Article of Incorporation provides that Mitsui may, in convening GeneralMeetings of Shareholders, post on the Internet information required to be recorded or indicated inreference documents for General Meetings of Shareholders, business reports, financial statements andconsolidated financial statements in accordance with the provisions of laws and regulations. Suchposting of information may be deemed to constitute provision of such information to shareholders;
164
(2) Article 18 of Mitsui’s Articles of Incorporation provides that a shareholder may exercise his/her votingrights by proxy who shall be one shareholder of Mitsui with voting rights;
(3) Article 24 of Mitsui’s Articles of Incorporation enables the Board of Directors to simplify theresolution process by providing that Mitsui shall deem a resolution of the Board of Directors to havebeen adopted if all the Directors agree in writing or electromagnetic record thereto and otherrequirements provided for in the Corporate Law of Japan are satisfied; and
(4) Article 32 of Mitsui’s Articles of Incorporation enables Mitsui to enter into agreements to limit theliability of its external Corporate Auditors so that Mitsui may engage suitable personnel who are ableto fulfill their expected roles as external Corporate Auditors.
Organization
Mitsui is a corporation (kabushiki kaisha ) incorporated in Japan under the Corporate Law of Japan. It isregistered in the Commercial Register (shogyo tokibo ) maintained by the Tokyo Legal Affairs Bureau andseveral other registry offices of the Ministry of Justice.
Objects and Purposes
Article 2 of Mitsui’s Articles of Incorporation provides that our objects are to engage in the followingbusiness:
1. Foreign trade, purchases and sales, wholesale, agency and brokerage business relating to the followingcommodities:
(1) Ferrous and non-ferrous metals and their raw materials, manufactured goods, and minerals.
(2) Coal, petroleum, natural gas and other fuels and their by-products.
(3) All kinds of machines, appliances (including measuring instruments and medical apparatus) andequipment including manufacturing equipment, communications equipment and antipollutionequipment, rolling stock and vehicles, ships and boats, aerospace equipment and aircraft, and partsfor the foregoing.
(4) All kinds of chemical products, salt, fertilizers, high-pressure gas, explosives, pharmaceuticals(including medicines, non-medicinal drugs, medicine for veterinary use, narcotics, poisons andstimulants), radio isotopes, cosmetics, and raw materials for the foregoing.
(5) Cereals, sugar, oils and fats, feeds and their raw materials; livestock, agricultural, dairy andmarine products, processed foods, alcoholic beverages and other foodstuffs and drinks.
(6) All kinds of textile products and their raw materials.
(7) All kinds of fur products and raw fur.
(8) Lumber, cement, other building materials and housing-related equipment.
(9) Rubber, pulp, paper and their manufactured goods; tobacco, cigars, cigarettes and sundry goods.
(10) Industrial water and drinking water.
2. Exploration, development, manufacturing, processing, scrapping and recycling business relating to theabove-mentioned items.
3. Acquisition, planning, preservation, utilization and disposition of copyright, patents and otherintellectual property rights, know-how, systems technology and other software, including acting as anintermediary in such transactions.
4. Information processing and supply, telecommunications, broadcasting, advertising, publishing, printingand translation businesses, and the production and sale of audio and visual copyright products.
165
5. Forestry, sawmilling and lumber processing businesses.
6. Chattel leasing business.
7. Secondhand goods business.
8. Transportation and transportation agency, land transportation, marine transportation business, porttransportation, freight forwarding, customs brokerage, shipping agency and warehousing businesses.
9. Intermediary business for non-life insurance and insurance under the Automobile Liability Law, lifeinsurance sales and overseas non-life reinsurance business.
10. Construction sub-contracting, building design and supervision and management of various constructionworks.
11. Acquisition, disposition, leasing, other utilization and development of real estate and acting asintermediary in such transactions.
12. Supply and development of hot springs.
13. Surveying and research relating to land, sea and sky.
14. Investing in, purchasing, selling and brokering negotiable instruments, etc.
15. Lending money, guaranteeing and assuming debts, sale and purchase of various receivables, foreignexchange transactions and conducting any other financing business.
16. Operation and management of medical facilities, day-care facilities, sports facilities, restaurants, andhotel and travel businesses.
17. Planning, administration and implementation of various events.
18. Temporary personnel placement, employment agency, and personnel education, guidance and trainingto develop appropriate job skills and qualifications.
19. Maintenance and management of real estate.
20. Investment, commodities investments sales and advisory services, securities investment advisoryservices, trustee services, sale of beneficial interests in trusts, investment trust management servicesand asset management services for investment corporations.
21. Generation, supply, and sale and purchase of electricity.
22. Administrative agency services for management, labour and accounting work.
23. Buying, selling, and derivative transactions for greenhouse gas emission rights and related intermediaryservices.
24. Agency and intermediary services for credit card applications.
25. Consultancy business relating to the foregoing items.
26. Other lines of business relating to any of the foregoing items.
Directors
There is no provision in our Articles of Incorporation as to a Director’s power to vote on a proposal,arrangement or contract in which a Director is materially interested, but, under the Corporate Law of Japan, adirector is required to refrain from voting on such matters when passing a resolution of the board of directors.
The Corporate Law of Japan provides that compensation for directors is determined at a general meeting ofshareholders of a company. Within the upper limit approved by the general meeting of shareholders, the board ofdirectors will determine the amount of compensation for each director. The board of directors may, by itsresolution, leave such decision to the discretion of the company’s chief executive officer.
166

The Corporate Law of Japan provides that the incurrence by a company of a significant loan from a thirdparty should be approved by the company’s board of directors. Our Regulations of the Board of Directors haveadopted this policy.
There is no mandatory retirement age for our Directors under the Corporate Law of Japan or our Articles ofIncorporation.
There is no requirement concerning the number of shares one individual must hold in order to qualify him orher as a Director of Mitsui under the Corporate Law of Japan or our Articles of Incorporation.
Common Stock
Authorized capital
Article 6 of the Mitsui’s Articles of Incorporation provides that the total number of shares that can be issuedby Mitsui is two billion five hundred million (2,500,000,000) shares.
Under Mitsui’s Articles of Incorporation, currently in effect, only shares of common stock are issuable and1,725,018,515 shares of common stock (including treasury stock of 2,064,447 shares) were issued, fully paid asof March 31, 2006.
Dividends
Dividends on our shares are generally distributed in proportion to the number of shares owned by eachshareholder.
In Japan, the ex-dividend date and the record date for any dividend precede the date of determination of theamount of the dividend to be paid. Generally, the ex-dividend date is three business day prior to the record date.
Under the Corporate Law of Japan, we are permitted to make distributions of surpluses to our shareholdersany number of times per fiscal year pursuant to resolutions of our general meeting of shareholders, subject tocertain limitations described below. Distributions of surpluses are required, in principle, to be authorized by aresolution of the general meeting of shareholders. In an exception to the above rule, we are permitted to makedistributions of surpluses in cash to our shareholders by board resolution once per fiscal year if our Articles ofIncorporation so provide. Currently, our Articles of Incorporation so provide.
Distributions of surpluses may be made in cash or in-kind in proportion to the number of shares held byeach shareholder. If a distribution of surpluses is to be made in-kind, we may, pursuant to a general meeting ofshareholders resolution, or as the case may be, a board resolution, grant our shareholders a right to require us tomake the distribution in cash instead of in-kind. If no such right is granted, the relevant distribution must beapproved by a special resolution of a general meeting of shareholders. Currently, we do not have any concreteplan to make a distribution of surpluses in kind.
Under the Corporate Law of Japan, when we make a distribution of surpluses, we must set aside in ouradditional paid-in capital or legal reserves an amount equal to at least one-tenth of the amount of surpluses sodistributed, unless the sum of our additional paid-in capital and legal reserves is one-quarter or more of our statedcapital. Under the Corporate Law of Japan, we may distribute any dividends up to the excess of the aggregate of(a) and (b) below, less the aggregate of (c) through (f) below, on an unconsolidated basis, as of the effective dateof such distribution, if our net assets are not less than ¥3,000,000:
(a) the amount of surpluses, as described below;
(b) in the event that extraordinary financial statements as of, or for a period from the beginning of thebusiness year to, the specified date are approved, the aggregate amount of (i) the aggregate amount of
167
(x) the net income for such period described in the profit and loss statement included in theextraordinary financial statements and (y) the amount of payment made to fulfill certain obligations asprovided for by an ordinance of the Ministry of Justice, and (ii) the amount of consideration that wereceived for the treasury stock that we disposed of during such period;
(c) the book value of our treasury stock;
(d) in the event that we disposed of treasury stock after the end of the previous business year, the amountof consideration that we received for such treasury stock;
(e) in the event of that which is described in (b) in this paragraph, the absolute difference between zero andthe amount of net loss for such period described in the profit and loss statement included in theextraordinary financial statements; and
(f) the aggregate amount of accounts as provided for by an ordinance of the Ministry of Justice.
For the purposes of this section, the amount of surpluses is the excess of the aggregate of I. through IV.below, less the aggregate of V. through VII. below, on an unconsolidated basis:
I. the total amount of (x) assets and (y) the book value of treasury stock, less the total amount of(i) liabilities, (ii) stated capital, (iii) additional paid-in capital, (iv) legal reserve and (v) certain otheramounts set forth in an ordinance of the Ministry of Justice;
II. in the event that we disposed of treasury stock after the end of the previous business year, thedifference between the book value of such treasury stock and the consideration that we received forsuch treasury stock;
III. in the event that we reduced our stated capital after the end of the previous business year, the amount ofsuch reduction less the portion thereof that has been transferred to additional paid-in capital and/or thelegal reserve (if any);
IV. in the event that additional paid-in capital and/or legal reserves were reduced after the end of theprevious business year, the amount of such reduction less the portion thereof that has been transferredto stated capital (if any);
V. in the event that we canceled treasury stock after the end of the previous business year, the book valueof such treasury stock;
VI. in the event that we distributed dividends after the end of the previous business year, the aggregate ofthe following amounts:
a. the aggregate amount of the book value of the distributed assets, excluding the book value of suchassets that would be distributed to shareholders for their exercise of the right to receive dividendsin cash instead of dividends in kind;
b. the aggregate amount of cash distributed to shareholders who exercised the right to receivedividends in cash instead of dividends in kind; and
c. the aggregate amount of cash paid to shareholders holding fewer shares that was required in orderto receive dividends in kind;
VII. the aggregate amounts of a. through c. below, less d. below:
a. in the event that the amount of surpluses was reduced and transferred to additional paid-in capital,the legal reserve and/or stated capital after the end of the previous business year, the amount soreduced;
b. in the event that we distributed dividends after the end of the previous business year, the amountset aside in our reserve;
c. in the event that we disposed of treasury stock in the process of (x) a merger in which we acquiredall rights and obligations of a company, (y) a corporate split in which we acquired all or a part of
168
the rights and obligations of a split company or (z) a share exchange in which we acquired allshares of a company after the end of the previous business year, the difference between the bookvalue of such treasury stock and the consideration that we received for such treasury stock; and
d. in the event that we made (x) a merger in which we acquired all rights and obligations of acompany, (y) a corporate split in which we acquired all or a part of the rights and obligations of asplit company or (z) a share exchange in which we acquired all shares of a company after the endof the previous business year, the aggregate amount of (i) the amount of our additional paid-incapital after such merger, corporate split or share exchange, less the amount of our additionalpaid-in capital before such merger, corporate split or share exchange, and (ii) the amount of ourlegal reserve after such merger, corporate split or share exchange, less the amount of our legalreserve after such merger, corporate split or share exchange.
Under the Corporate Law of Japan, we are permitted to prepare non-consolidated extraordinary financialstatements consisting of a balance sheet as of any date subsequent to the end of the previous business year and anincome statement for the period from the first day of the current business year to the date of such balance sheet.If we prepare such extraordinary financial statements, special provisions may apply to the calculation ofdistributable amounts.
We plan to make distributions of surpluses twice per fiscal year, if possible. The record date for annualdividends is March 31 and the record date for interim dividends is September 30.
Under the Articles of Incorporation, Mitsui is not obliged to pay any interest on interim dividends paid incash which are left unclaimed for a period of three years after the date on which they first became payable.
Shareholders’ Meetings
Mitsui normally holds its ordinary general meeting of shareholders in June of each year in Tokyo, Japan. Inaddition, Mitsui may hold an extraordinary general meeting of shareholders whenever necessary by giving atleast two weeks advance notice to shareholders.
Under the Corporate Law of Japan and related regulations, notice of a general meeting of shareholderssetting forth the date, time, place, purpose thereof etc and providing a summary of the matters to be acted upon,must be mailed to each shareholder having voting rights (or, in the case of a non-resident shareholder, to his orher resident proxy or mailing address in Japan) at least two weeks prior to the date set for the meeting. Therecord date for any ordinary general meeting of shareholders of Mitsui is March 31.
Any shareholder or group of shareholders holding at least 3% of the total outstanding voting rights, for acontinuous period of six months or longer, may require the convocation of a general meeting of shareholders fora particular purpose. Unless such a general meeting of shareholders is convened promptly or a convocation noticeof a meeting which is to be held not later than eight weeks from the day such demand is dispatched, the requiringshareholders may, upon obtaining court approval, convene such shareholders’ meeting.
Any shareholder or group of shareholders holding at least 300 voting rights, or 1% of the total outstandingvoting rights, for a continuous period of six months or longer, may propose a matter to be considered at a generalmeeting of shareholders by making such request to a director at least eight weeks prior to the date set for suchmeeting.
To attend a shareholders’ meeting in person or by proxy, shareholders must provide proof of identity uponrequest. Shareholders may be represented by proxies in writing appointed for the meeting. Proxy must be oneshareholder of Mitsui with voting rights. A Director appointed by the Board of Directors acts as the chairman at ameeting of shareholders.
169

Voting rights
A shareholder is entitled to one vote per unit subject to the limitations on voting rights set forth in thefollowing paragraph and “Unit” share system—Voting rights under the unit share system” below. Except asotherwise provided by law or by the Articles of Incorporation, a resolution can be adopted at a general meeting ofshareholders by a majority of the voting rights represented at the meeting. The Corporate Law of Japan andMitsui’s Articles of Incorporation provide, however, that the quorum for the election of Directors and CorporateAuditors shall not be less than one-third of the total voting rights. Mitsui’s shareholders are not entitled tocumulative voting in the election of Directors. A corporate shareholder, 25% or more of whose outstandingshares are directly or indirectly owned by Mitsui, may not exercise its voting rights with respect to shares ofMitsui that it owns. Shareholders may exercise their voting rights through proxies, provided that the proxies arealso Mitsui’s shareholders holding voting rights. Mitsui’s shareholders also may cast their votes in writing orelectronically.
Under the Corporate Law of Japan and our Articles of Incorporation, certain corporate actions must beapproved by “special shareholders’ resolutions” of our meeting of shareholders, for which the quorum isone-third of the total number of shares having voting rights and the approval of the holders of two-thirds of ourshares having voting rights represented at the meeting is required. Examples of corporate actions that requirespecial shareholders’ resolutions are:
‰ any amendment to our articles of incorporation (except for amendments that may be authorized solelyby the Board of Directors under the Corporate Law of Japan);
‰ a reduction of capital, except for a reduction of capital for the purpose of replenishing capitaldeficiencies;
‰ a distribution by us of surpluses in-kind, if we do not grant shareholders the right to require us to effectthe distribution in cash, instead of in-kind;
‰ a dissolution, merger or consolidation, subject to a certain exception under which a shareholders’resolution is not required;
‰ the transfer of the whole or an important part of the business, except for the transfer of an important partof the business in which the book value of transferred assets does not exceed 20% of that of thecompany’s total assets;
‰ the taking over of the whole of the business of any other corporation;
‰ a share exchange or share transfer for the purpose of establishing a 100% parent-subsidiary relationship,subject to a certain exception under which a shareholders’ resolution is not required;
‰ a corporate split, subject to a certain exception under which a shareholders’ resolution is not required;
‰ the offering of new shares at a “specially favorable” price and any offering of stock acquisition rights orbonds with stock acquisition rights at a “specially favorable” price or in a “specially favorable”condition to any persons other than shareholders; and
‰ any purchase of the company’s own shares from a certain person.
Liquidation rights
In the event of Mitsui’s liquidation, the assets remaining after payment of all debts and liquidation expensesand taxes will be distributed among shareholders in proportion to the respective number of shares of commonstock held.
Record date
March 31 is the record date for Mitsui’s year-end dividends. The shareholders and beneficial shareholderswho are registered as the holders of the number of shares constituting 1 unit or more whole units in Mitsui’s
170
register of shareholders and/or beneficial shareholders at the end of each March 31 are also entitled to exerciseshareholders’ voting rights at the ordinary general meeting of shareholders with respect to the fiscal year endingon such March 31. September 30 is the record date for interim dividends.
Mitsui’s shares generally go ex-dividend or ex-rights on Japanese stock exchanges on the third business dayprior to a record date (or if the record date is not a business day, the fourth business day prior thereto), for thepurpose of dividends or rights offerings.
Repurchase by Mitsui of its Common Stock
Under the Corporate Law of Japan and Mitsui’s Articles of Incorporation, the Board of Directors isauthorized to resolve to purchase its own shares. Except as otherwise permitted by the Corporate Law, Mitsuimay purchase its own shares by a resolution of the Board of Directors, provided, however, that Mitsui shallreport at the upcoming ordinary general meeting of shareholders the reason for its purchase, the total number ofshares and the total acquisition amount which Mitsui may purchase, and the purchase price cannot exceed theamount which can be distributed as interim dividends as above-mentioned in “Dividends,” less the sum ofdividends which have been actually paid as interim dividends.
Mitsui may also acquire its own shares in response to a shareholder’s request for purchase of his or hershares representing less than 1 unit. See “‘Unit’ share system—Repurchase by Mitsui of shares constituting lessthan a full unit” below.
Transfer of shares
Under the Corporate Law of Japan, the transfer of shares of a company which issues share certificates iseffected by delivery of share certificates but, in order to assert shareholders’ rights against a company, thetransferee must have its name and address registered on a company’s register of shareholders. For this purpose,Mitsui’s shareholders are required to file their names, addresses and seals with The Chuo Mitsui Trust andBanking Company, Limited, which is the manager of Mitsui’s register of shareholders. Foreign shareholders mayfile specimen signatures in lieu of seals. Non-resident shareholders are required to appoint a standing proxy inJapan or designate a mailing address in Japan.
The central clearing system of share certificates under the Law Concerning Central Clearing of ShareCertificates and Other Securities in Japan applies to Mitsui’s shares. Pursuant to this system, a holder of shares isable to choose, at his/her discretion, to participate in this system and all certificates of the shares elected to be putinto this system are deposited with the Japan Securities Depository Center, Inc. (“JASDEC”) (through aparticipating institution having a clearing account with JASDEC, if the holder is not such a participatinginstitution) and all such shares are registered in the name of JASDEC, on Mitsui’s register of shareholders. Eachparticipating shareholder (“beneficial shareholder”) will, in turn, be registered in the register of Mitsui’sbeneficial shareholders, and be treated in the same way as shareholders registered on Mitsui’s register ofshareholders. In connection with the transfer of shares held under this system, entry of the share transfer in theregister maintained by JASDEC for participating institutions shall have the same effect as delivery of sharecertificates.
“Unit” share system
Pursuant to the Corporate Law of Japan, Mitsui has adopted 1,000 shares (50 ADSs) as 1 unit of shares.This unit share system is called “tangen-kabu-system.”
Any amendment to the Articles of Incorporation reducing the number of shares constituting a unit oreliminating the provisions for units of shares may be made by a resolution of the Board of Directors rather thanby special shareholders’ resolutions. The number of shares constituting 1 unit cannot exceed 1,000.
171
Voting rights under the unit share system
Under the unit share system, shareholders shall have one voting right for each unit of shares that they hold.Any number of shares less than a full unit will carry no voting rights.
Share certificates for less than a unit of shares
Under its Articles of Incorporation, except as otherwise provided in the Share Handling Regulations, Mitsuiwill not issue share certificates for less than one unit of shares. Thus, unless Mitsui’s Board of Directors passes aresolution to eliminate the provisions for units of shares from the Articles of Incorporation or the shareholdersamend the Articles of Incorporation by special shareholders resolutions to eliminate the provision fornon-issuance of share certificates for less than one unit of shares, a share certificate for any number of shares lessthan a full unit will in general not be issued. As the transfer of shares normally requires the delivery of sharecertificates, any fraction of one unit for which no share certificates are issued is not transferable.
Repurchase by Mitsui of shares constituting less than a full unit
A holder of shares constituting less than one unit may require Mitsui to purchase such shares at their marketvalue.
Increase in purchase of the shares to make one unit
Under the Articles of Incorporation, any shareholder who holds shares less than one unit may request Mitsuito sell such number of shares owned by Mitsui as are necessary to make one unit by adding the number of sharesowned by such shareholder in accordance with the Share Handling Regulations and the Corporate Law of Japan.
Effect of the unit share system on holders of ADSs
A holder who owns ADSs evidencing less than 1,000 common shares will indirectly own less than onewhole unit. Although, as discussed above, under the unit share system holders of less than one unit have the rightto require Mitsui to purchase their shares or sell such number of shares owned by Mitsui as are necessary to makeone unit by adding the number of their shares, holders of ADSs that represent other than integral multiples ofwhole units are unable to withdraw the underlying shares representing less than one unit and, therefore, areunable, as a practical matter, to exercise the rights to require Mitsui to purchase nor sell such underlying shares,unless Mitsui’s Articles of Incorporation are amended to eliminate the provision not to issue share certificates forthe number of shares less than one whole unit. As a result, access to the Japanese markets by holders of ADSsthrough the withdrawal mechanism will not be available for dispositions of shares in lots less than one unit. Theunit share system does not affect the transferability of ADSs, which may be transferred in lots of any size.
Reporting of Substantial Shareholdings
The Securities and Exchange Law of Japan and its related regulations require any person who has become,beneficially and solely or jointly, a holder of more than 5% of the total issued shares of a company listed on anyJapanese stock exchange or whose shares are traded on an over-the-counter market in Japan, to file a reportconcerning such shareholdings with the director of the relevant Local Finance Bureau of the Ministry of Financewithin five business days. With certain exceptions, a similar report must also be made in respect of anysubsequent change of 1% or more in any such holding or of any change in material matters set out in anypreviously-filed reports. For this purpose, shares issuable or transferable to such person upon exercise ofexchangeable securities, conversion of convertible securities or exercise of warrants or stock acquisition rights(including those incorporated in bonds with share subscription rights) are taken into account in determining boththe number of shares held by such holder and the issuer’s total issued share capital. Copies of each report mustalso be furnished to the issuer of the shares and to all Japanese stock exchanges on which the shares are listed or,in the case of shares traded over-the-counter, to the Japan Securities Dealers Association.
172
Exercise of Voting Rights
Except for the general limitation under Japanese anti trust and anti monopoly regulations against the holdingof shares of a Japanese corporation which leads or may lead to a restraint of trade or monopoly, and except forgeneral limitations under the Corporate Law of Japan or Mitsui’s Articles of Incorporation on the rights ofshareholders applicable regardless of residence or nationality, there is no limitation under Japanese laws andregulations applicable to Mitsui or under its Articles of Incorporation on the rights of non-resident or foreignshareholders to hold or exercise voting rights on the shares of common stock of Mitsui.
Change in Control
There is no provision in Mitsui’s Articles of Incorporation that would have an effect of delaying, deferringor preventing a change in control of Mitsui and that would operate only with respect to merger, consolidation,acquisition or corporate restructuring involving Mitsui.
Daily Price Fluctuation Limits under Japanese Stock Exchange Rules
Share prices on Japanese stock exchanges are determined on a real-time basis by the equilibrium betweenbids and offers. These exchanges are order-driven markets without specialists or market makers to guide priceformation. To prevent excessive volatility, these exchanges set daily upward and downward price fluctuationlimits for each share, based on the previous day’s closing price. Although transactions may continue at theupward or downward limit price if the limit price is reached on a particular trading day, no transactions may takeplace outside these limits. Consequently, an investor wishing to sell at a price above or below the relevant dailylimit may not be able to sell his or her shares at such price on a particular trading day, or at all.
On September 20, 2006, the closing price of our shares on the Tokyo Stock Exchange was ¥1,446 per share.The following table shows the respective daily price limit for a stock on the Tokyo Stock Exchange with aclosing price per share corresponding to three ranges. Other daily price limits would apply if our per share pricemoved to other ranges.
Selected Daily Price Limits
Previous Day’s Closing Price or Special Quote Maximum Daily Price Movement
Greater or equal to . . . . . . . . . . . . . . . . ¥1,000 Less than ¥1,500 200Greater or equal to . . . . . . . . . . . . . . . . 1,500 Less than 2,000 300Greater or equal to . . . . . . . . . . . . . . . . 2,000 Less than 3,000 400
For a history of the trading price of our shares on the Tokyo Stock Exchange, see “Item 9.A. Offer andListing Details” of this annual report.
C. Material Contracts.
We have not been a party to any material contract, other than contracts entered into in the ordinary course ofbusiness, within past two years immediately preceding the date of this report.
D. Exchange Controls.
Foreign Exchange Regulations
The Foreign Exchange and Foreign Trade Law of Japan, as currently in effect, and the cabinet orders andministerial ordinances thereunder (the “Foreign Exchange Regulations”) govern certain matters relating to theacquisition and holding of the shares or the ADSs, by “Non-Residents of Japan” and by “Foreign Investors” ashereinafter defined.
173
“Non-Residents of Japan” are defined as individuals who are not resident in Japan and corporations whoseprincipal offices are located outside Japan. Branches and other offices of Japanese corporations located outsideJapan are regarded as Non-Residents of Japan, and branches and other offices located within Japan of foreigncorporations are regarded as residents of Japan. “Foreign Investors” are defined to be (i) individuals not residentin Japan, (ii) corporations which are organized under the laws of foreign countries or whose principal offices arelocated outside Japan, and (iii) other corporations of which (a) 50% or more of the shares are held directly orindirectly by (i) or (ii) above, (b) a majority of officers consists of Non-Residents of Japan or (c) a majority ofofficers having the power of representation consists of Non-Residents of Japan.
Acquisition of Shares
In general, acquisition of shares of stock of a Japanese company listed on any Japanese stock exchange ortraded in any over-the-counter market in Japan (“Listed Shares”) by a Non-Resident of Japan from a resident ofJapan is not subject to any prior filing requirements except as described below. However, the Minister of FinanceJapan (the “MOF”) and other Ministers having jurisdiction over the business of the subject company (together,the “Ministers”) may require a prior approval for any such acquisition in certain exceptional circumstances. Theresident of Japan who transferred the shares of a Japanese company to a Non-Resident of Japan must file a reportconcerning such transfer with the MOF within 20 days after the transfer unless such transfer is made through abank, securities company or financial futures trader licensed under the relevant Japanese law or consideration ofsuch transfer is ¥100 million or less.
If the number of Listed Shares to be acquired, or the number of Listed Shares that will be held as a result ofsuch acquisition, by a Foreign Investor (whether from a resident of Japan, another Foreign Investor or from orthrough security companies) is 10% or more of the total outstanding shares of the subject company, the ForeignInvestor must file a post facto report with the Ministers within 15 days of the date of acquisition. In certainexceptional cases, a prior notification is required in respect of such an acquisition.
Acquisition of Shares upon Exercise of Subscription Rights Attached to Bonds
The acquisition by a Non-Resident of Japan of shares upon exercise of his or her rights under the bonds withrights for subscription of new shares offered overseas is exempted from the notification and reportingrequirements described under this “Item 10.D. Exchange Controls—Acquisition of Shares” above.
ADRs
The deposit of the shares by a Non-Resident of Japan, the issuance of the ADRs, in exchange therefore andthe withdrawal of the underlying shares upon surrender of the ADRs are not subject to any formalities referred tounder “Acquisition of Shares” above, except where as a result of such deposit (or withdrawal) the aggregatenumber of shares held by the depositary (or its nominee) or the holder surrendering the ADRs, as the case maybe, would be certain percentage of the total outstanding shares, in which event the relevant report is required asoutlined under “Item 10. B. Memorandum and Articles of Association—Reporting of Substantial Shareholdings”and/or under this “Item 10.D. Exchange Controls—Acquisition of Shares.”
Dividends and Proceeds of Sales
Dividends paid on, and the proceeds of sales in Japan of the shares held by Non-Residents of Japan may beconvertible into any foreign currency and repatriated abroad with no limit on the amount under the ForeignExchange Regulations currently in effect. The acquisition of the shares by Non-Residents of Japan by way ofstock splits is not subject to any of the aforesaid notification and confirmation requirements.
174
E. Taxation.
Japanese Taxation
The following is a summary of the principal Japanese national tax consequences to owners of our shares orADSs who are non-resident individuals or non-Japanese corporations without a permanent establishment in Japanto which income from our shares is attributable. The tax treatment is subject to possible changes in the applicableJapanese laws or double taxation conventions occurring after that date. This summary is not exhaustive of allpossible tax considerations that may apply to a particular investor. Investors are encouraged to consult their owntax advisers as to:
‰ the overall tax consequences of the acquisition, ownership and disposition of shares or ADSs, includingspecifically the tax consequences under Japanese law;
‰ the laws of the jurisdiction of which they are resident; and
‰ any tax treaty between Japan and their country of residence.
Generally, a non-resident holder of shares or ADSs is subject to Japanese withholding tax on dividends paidby us. In the absence of any applicable tax treaty, convention or agreement reducing the maximum rate ofwithholding tax, the rate of Japanese withholding tax applicable to dividends paid by us to non-resident holders is7% for dividends to be paid on or before March 31, 2008, and 15% thereafter, except for dividends paid to anyindividual shareholder who holds 5% or more of the issued shares of Mitsui. Japan has income tax treaties,conventions or agreements whereby the maximum withholding tax rate for dividend payment is set at, in mostcases, 15% for portfolio investors, with, among other countries, Australia, Belgium, Canada, Denmark, Finland,France, Germany, Ireland, Italy, Luxembourg, The Netherlands, New Zealand, Norway, Singapore, Spain,Sweden, Switzerland and the United Kingdom. Under the new U.S.-Japan tax treaty (the “Treaty”), themaximum withholding rate on dividends for portfolio investors is 10%, if (i) they do not have a permanentestablishment in Japan, and (ii) the shares on ADSs with respect to which such dividends are paid are noteffectively connected with such permanent establishment, and (iii) they are qualified U.S. residents eligible forbenefits under the Treaty. Under the Treaty, withholding tax on dividends for pension funds which are qualifiedU.S. resident eligible for benefits under the Treaty is exempt from Japanese taxation by way of withholding orotherwise, unless such dividends are derived from the carrying on of a business, directly or indirectly, by suchpension funds. Japanese tax law provides in general that if the Japanese statutory rate is lower than the maximumrate applicable under tax treaties, conventions or agreements, the Japanese statutory rate shall be applicable.
Stock splits are not subject to Japanese income or corporate tax. A capitalization of retained earnings orlegal reserve by Japanese corporations is not subject to Japanese income or corporate tax as “constructivedividends” in case of no cash payment or assets delivery. A capitalization of capital surplus is not subject toJapanese income or corporate tax.
Non-resident holders who are entitled to a reduced rate of Japanese withholding tax on payments ofdividends on the shares by us are required to submit an Application Form for the Income Tax Conventionregarding Relief from Japanese Income Tax on Dividends in advance through us to the relevant tax authoritybefore the payment of dividends. A standing proxy for non-resident holders may provide the application. Withrespect to ADSs, this reduced rate is applicable if the depositary or its agent submits two Application Forms forIncome Tax Convention (one prior to payment of dividends, the other within eight months after our fiscal year-end). To claim this reduced rate, a non-resident holder of ADSs will be required to file proof of taxpayer status,required by the depositary. Non-resident holders who do not submit an application in advance will generally beentitled to claim a refund from the relevant Japanese tax authority of withholding taxes withheld in excess of therate of an applicable tax treaty.
Gains derived from the sale outside Japan of Mitsui’s shares or the ADSs by Non-Residents of Japan,including non-Japanese corporations, will not be subject to Japanese taxes on income. Gains derived from the
175
sale in Japan of Mitsui’s shares or the ADSs by a Non-Resident of Japan or a non-Japanese corporation nothaving a permanent establishment in Japan to which such income is attributable are, in general, not subject toJapanese income or corporate tax.
Japanese inheritance and gift taxes, at progressive rates, may be payable by an individual who acquire theshares or the ADSs as a legatee, heir or donee.
United States Taxation
General
This discussion of certain U.S. federal tax consequences only applies to U.S. holders who hold our ADSs orcommon shares as capital assets for tax purposes and are not members of a special class of holders subject tospecial rules, including: dealers in securities; traders in securities who elect to use a mark-to-market method ofaccounting for their securities holdings; tax-exempt organizations; insurance companies; persons liable foralternative minimum tax; persons who actually or constructively own 10% or more of Mitsui voting stock;persons who hold shares or ADSs as part of a hedging or straddle or conversion transaction; or U.S. holderswhose functional currency is not the U.S. dollar. A U.S. holder is a beneficial owner of shares or ADSs that is: acitizen or resident of the United States; a domestic corporation; an estate whose income is subject to U.S. federalincome tax regardless of its source; or a trust, if a U.S. court can exercise primary supervision over the trust’sadministration and one or more U.S. persons are authorized to control all substantial decisions of the trust.
This section is based on the Internal Revenue Code of 1986, as amended, its legislative history, existing andproposed regulations, published rulings and court decisions. These laws are subject to change, possibly on aretroactive basis. In addition, this section is based in part upon the assumption that each obligation in the depositagreement and any related agreement will be performed in accordance with its terms.
Moreover, the effect of any applicable U.S. state or local tax laws is not discussed in this annual report.
For U.S. federal income tax purposes, if a person holds ADRs evidencing ADSs, that person will be treatedas the owner of the underlying shares represented by those ADSs. Exchanges of common shares for ADRs, andADRs for ordinary shares, will not be subject to U.S. federal income tax.
Each holder should consult its own tax advisor regarding the United States federal, state and local and othertax consequences of owning and disposing of common shares and ADSs in its particular circumstances. Inparticular, each holder should confirm its status as a person eligible for benefits under the Treaty with its advisorand should discuss any possible consequences of failing to qualify as a person eligible for benefits under theTreaty.
Taxation of Dividends
Subject to the passive foreign investment company (“PFIC”) rules discussed below, the gross amount of anydividend paid to a U.S. holder by Mitsui out of its current or accumulated earnings and profits (as determined forU.S. federal income tax purposes) is subject to United States federal income taxation. For noncorporateU.S. holders, dividends paid in taxable years beginning before January 1, 2011 that constitute qualified dividendincome will be taxable at a maximum tax rate of 15% provided that shares or ADSs were held for more than60 days during the 121-day period beginning 60 days before the ex-dividend date and other holding periodrequirements are met. Dividends Mitsui pays with respect to its shares or ADSs generally will be qualifieddividend income. Dividends are taxable to U.S. holders when they, in the case of shares, or the depositary, in thecase of ADSs, receive them, either actually or constructively. The dividend will not be eligible for the dividends-received deduction generally allowed to U.S. corporations in respect of dividends received from otherU.S. corporations. Any distribution in excess of current and accumulated earnings and profits (as determined forU.S. federal income tax purposes) will be treated as a non-taxable return of capital to the extent of a holder’sbasis in the ADSs or common shares and thereafter as capital gain.
176
A U.S. holder must include any foreign tax withheld from the dividend payment in his or her gross amounteven though the U.S. holder did not in fact receive it. The amount of the dividend distribution that a U.S. holdermust include in his or her income will be the U.S. dollar value of the Japanese yen payments made, determined atthe spot Japanese yen/ U.S. dollar rate on the date such dividend distribution is includible in such holder’sincome, regardless of whether the payment is in fact converted into U.S. dollars. Generally, any gain or lossresulting from currency exchange fluctuations during the period from the date a holder includes the dividendpayment in income to the date such payment is converted into U.S. dollars will be treated as ordinary income orloss and will not be eligible for the special tax rate applicable to qualified dividend income. Such gain or loss willgenerally be income or loss from sources within the United States for foreign tax credit limitation purposes.
Dividends will be income from sources outside the United States, but dividends paid in taxable yearsbeginning before January 1, 2007 generally will be “passive” or “financial services” income, and dividends paid intaxable years beginning after December 31, 2006 will, depending on the U.S. holder’s circumstances, be “passive”or “general” income which, in either case, is treated separately from other types of income for purposes ofcomputing the foreign tax credit allowable to the U.S. holder. No U.S. foreign tax credit will be allowed toU.S. holders of common shares or ADSs in respect of any personal property or similar tax imposed by Japan (or anytaxing authority thereof or therein). Subject to certain limitations, the Japanese tax withheld and paid over to Japanwill be creditable or deductible against your United States federal income tax liability. Special rules apply indetermining the foreign tax credit limitation with respect to dividends that are subject to the maximum 15% tax rate.
Taxation of Capital Gains
Subject to the PFIC rules discussed below, a U.S. holder who sells or otherwise disposes of common sharesor ADSs will recognize gain or loss for U.S. federal income tax purposes in an amount equal to the differencebetween the U.S. dollar value of the amount realized and his or her tax basis (determined in U.S. dollars) in suchshares or ADSs. Capital gain of a noncorporate U.S. holder that is recognized before January 1, 2011 is generallytaxed at a maximum rate of 15% where the holder has a holding period greater than one year. The gain or losswill generally be income or loss from sources within the U.S. for foreign tax credit limitation purposes.
PFIC Rules
Mitsui does not believe that the common shares or ADSs will be treated as stock of a PFIC for United Statesfederal income tax purposes, but this conclusion is a factual determination that is made annually and thus is subjectto change. If Mitsui were treated as a PFIC, unless a U.S. holder elected to be taxed annually on a mark-to-marketbasis with respect to the common shares or ADSs, gain realized on the sale or other disposition of the shares orADSs would in general not be treated as capital gain. Instead a U.S. holder would be treated as if he or she hadrealized such gain and certain “excess distributions” ratably over the holding period for the shares or ADSs andwould be taxed at the highest tax rate in effect for each such year to which the gain was allocated, together with aninterest charge in respect of the tax attributable to each such year. With certain exceptions, the common shares orADSs will be treated as stock in a PFIC if Mitsui were a PFIC at any time during the U.S. holder’s holding period inthe common shares or ADSs. In addition, dividends received from Mitsui would not be eligible for the special taxrates applicable to qualified dividend income if Mitsui were a PFIC either in the taxable year of the distribution orthe preceding taxable year, but instead would be taxable at rates applicable to ordinary income.
F. Dividends and Paying Agents.
Not applicable.
G. Statement by Experts.
Not applicable.
H. Documents on Display.
We are subject to the informational requirements of the Securities Exchange Act of 1934 and, in accordancetherewith, we file annual reports on Form 20-F within six months of our fiscal year-end and furnish other reports
177

and information on Form 6-K with the Securities and Exchange Commission. These reports and otherinformation can be inspected at the public reference room at the Securities and Exchange Commission at100 F Street, N.E., Washington, D.C. 20549. You can also obtain copies of such material by mail from the publicreference room of the Securities and Exchange Commission at prescribed fees. You may obtain information onthe operation of the Securities and Exchange Commission public reference room by calling the Securities andExchange Commission in the United States at 1-800-SEC-0330. You can also access to the documents filed viathe Electronic Data Gathering, Analysis and Retrieval, or EDGAR, system on the website of the Securities andExchange Commission (http://www.sec.gov).
I. Subsidiary Information.
Not applicable.
Item 11. Quantitative and Qualitative Disclosures about Market Risk.
In the normal course of business, we are exposed to many risks arising from the potential change infinancial and other instruments’ values caused by fluctuations in interest rates, foreign currency exchange rates,commodity prices and equity prices. We maintain a comprehensive risk management policy to use derivativefinancial and commodity instruments, including foreign exchange forward contracts, interest rate and currencyswap agreements, commodity futures, forwards, options and swap agreements, however, these risks are not fullyinsulated. To a lesser degree, Mitsui and certain subsidiaries also enter into derivative financial and commodityinstruments for trading purposes within position limits and loss limits (trading limits) strictly set under the riskmanagement structure, which is described below.
We have established market risk management procedures at several levels throughout our organization.Chief Operating Officers of operating segments have the first line of responsibility for managing market riskwithin prescribed limits. These officers have in-depth knowledge of the primary sources of risk in theirindividual markets and the instruments available to hedge their exposures.
The General Accounting & Risk Management Division within our headquarters monitors the company-wideprocess of risk management and compliance with trading limits set for operating segments. The GeneralAccounting & Risk Management Division also provides general oversight with respect to the market riskmanagement process for operating segments.
Interest Rate Risk
Our normal business activities expose us to market risk arising from changes in interest rates. To manageour interest rate risk, we enter into interest rate swap agreements and interest rate and currency swap agreementsin order to modify and match the interest rate characteristics of our assets and liabilities.
Foreign Currency Exchange Rate Risk
Our global operations in many countries generate foreign currency exposures related to imports, exports andfinancing in currencies other than the local currency. We use derivative instruments such as foreign exchangeforward contracts, currency swap agreements, and interest rate and currency swap agreements to hedge marketrisk arising from the changes in foreign exchange rates associated with existing assets, obligations, future cashflows from receivables and payables resulting from selling and purchasing activities, long-term financingtransactions, identifiable commitments and forecasted transactions denominated in foreign currencies.
Commodity Price Risk
As major participants in global commodities markets, we trade in physical precious and base metals, energyproducts (crude oil and refined oil products) and agricultural products (wheat, coffee, sugar and others), andutilize a variety of derivatives related to these commodities, such as futures, forwards, swaps and options.Derivatives on those commodities are often used to hedge price movements in the underlying physical inventory
178
or future inventory needs and to fix the expected future cash flows from forecasted transactions. To facilitatehedging, we are often required to take positions in the commodity markets in the form of future, forward, swapand option contracts involving those commodities.
Equity Price Risk
We hold stocks issued by our business partners including, amongst others, our customers and suppliers asmarketable securities for the promotion of business and strategic objectives. We also hold other marketablesecurities for investment purposes. We are exposed to equity price risk inherent in these stocks. We do not takecontinuous hedging measures against the market exposures on those securities.
Risk Management of Derivative Financial Instruments and Other Financial Instruments
As an independent monitoring and advisory division for currency and interest rate risks to which we areexposed, the General Accounting & Risk Management Division obtains and analyzes detailed information onfinancial transactions, measures the risks and reports them directly to a member of senior management. Forfinancial instruments entered into for trading purposes, such as interest rate swap transactions, foreign exchangeforward contracts, interest rate futures and others, the General Accounting & Risk Management Divisionmeasures daily Value-at-Risk (“VaR”) and conducts back-testing, validating their risk model by comparing itsassumptions with actual results semi-annually.
In addition to a policy that the counterparties in most derivative transactions are strictly limited to highlyrated financial institutions, the General Accounting & Risk Management Division continuously evaluates thecreditworthiness and the level of transactions with individual institutions and estimates our current and potentialexposure, or the cost of replacing existing swaps and other transactions, in the event that a counterparty is unableto meet its obligations.
Risk Management of Derivative Commodity Instruments
Each of our operating segments has a general framework for measuring portfolio risk which is based onaggregate risk limits approved by our management and credit risk of counterparties. The transactions areconfirmed with counterparties and are recorded by independent risk management sections. The results of tradingare periodically reported to our Executive Officers in charge of risk management.
VaR
We use the VaR method to measure market risk. VaR is a statistical measure of the potential maximum lossin the fair value of a portfolio resulting from adverse market movements in underlying risk factors, over adefined period, within a certain confidence level. As VaR incorporates historical data regarding changes inmarket risk factors, our actual results may differ materially from the calculations below. The sum of the VaRs forthe risk categories do not represent our aggregate VaR, because market risk factors such as interest rates andcurrency exchange rates are partially correlated to offset a portion of the simple sum of the VaRs. At March 31,2006 and 2005, we estimated VaR in one day with respect to the interest rate, foreign currency exchange rate andcommodity price risks (with some exceptions to certain commodity price risks in which case VaRs in five daysare used) using a variance-covariance method and a historical simulation approach with a confidence level of97.7%.
VaRs for Non-Trading Activities
The following table sets forth the year-end, high, low and average VaR figures of interest rate risk, foreigncurrency exchange rate risk and commodity price risk for non-trading purposes, for the years ended March 31,2006 and 2005.
179
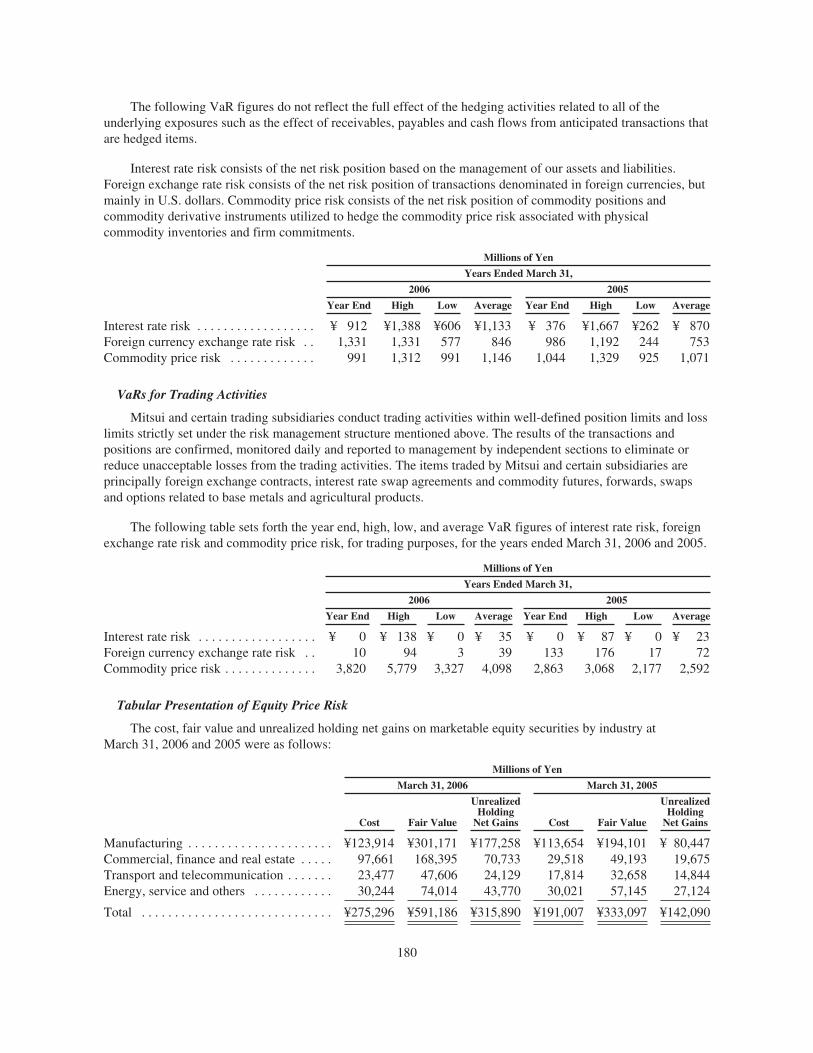
The following VaR figures do not reflect the full effect of the hedging activities related to all of theunderlying exposures such as the effect of receivables, payables and cash flows from anticipated transactions thatare hedged items.
Interest rate risk consists of the net risk position based on the management of our assets and liabilities.Foreign exchange rate risk consists of the net risk position of transactions denominated in foreign currencies, butmainly in U.S. dollars. Commodity price risk consists of the net risk position of commodity positions andcommodity derivative instruments utilized to hedge the commodity price risk associated with physicalcommodity inventories and firm commitments.
Millions of Yen
Years Ended March 31,
2006 2005
Year End High Low Average Year End High Low Average
Interest rate risk . . . . . . . . . . . . . . . . . . ¥ 912 ¥1,388 ¥606 ¥1,133 ¥ 376 ¥1,667 ¥262 ¥ 870Foreign currency exchange rate risk . . 1,331 1,331 577 846 986 1,192 244 753Commodity price risk . . . . . . . . . . . . . 991 1,312 991 1,146 1,044 1,329 925 1,071
VaRs for Trading Activities
Mitsui and certain trading subsidiaries conduct trading activities within well-defined position limits and losslimits strictly set under the risk management structure mentioned above. The results of the transactions andpositions are confirmed, monitored daily and reported to management by independent sections to eliminate orreduce unacceptable losses from the trading activities. The items traded by Mitsui and certain subsidiaries areprincipally foreign exchange contracts, interest rate swap agreements and commodity futures, forwards, swapsand options related to base metals and agricultural products.
The following table sets forth the year end, high, low, and average VaR figures of interest rate risk, foreignexchange rate risk and commodity price risk, for trading purposes, for the years ended March 31, 2006 and 2005.
Millions of Yen
Years Ended March 31,
2006 2005
Year End High Low Average Year End High Low Average
Interest rate risk . . . . . . . . . . . . . . . . . . ¥ 0 ¥ 138 ¥ 0 ¥ 35 ¥ 0 ¥ 87 ¥ 0 ¥ 23Foreign currency exchange rate risk . . 10 94 3 39 133 176 17 72Commodity price risk . . . . . . . . . . . . . . 3,820 5,779 3,327 4,098 2,863 3,068 2,177 2,592
Tabular Presentation of Equity Price Risk
The cost, fair value and unrealized holding net gains on marketable equity securities by industry atMarch 31, 2006 and 2005 were as follows:
Millions of Yen
March 31, 2006 March 31, 2005
Cost Fair Value
UnrealizedHolding
Net Gains Cost Fair Value
UnrealizedHolding
Net Gains
Manufacturing . . . . . . . . . . . . . . . . . . . . . . ¥123,914 ¥301,171 ¥177,258 ¥113,654 ¥194,101 ¥ 80,447Commercial, finance and real estate . . . . . 97,661 168,395 70,733 29,518 49,193 19,675Transport and telecommunication . . . . . . . 23,477 47,606 24,129 17,814 32,658 14,844Energy, service and others . . . . . . . . . . . . 30,244 74,014 43,770 30,021 57,145 27,124
Total . . . . . . . . . . . . . . . . . . . . . . . . . . . . . ¥275,296 ¥591,186 ¥315,890 ¥191,007 ¥333,097 ¥142,090
180

For the year ended March 31, 2006, the general increase in unrealized holding gains compared to the yearended March 31, 2005 was due to the overall improvement in Japanese stock prices. The increase in cost and fairvalue of the commercial, finance and real estate sector was mainly due to new investment in retail and financeindustries. The manufacturing sector also showed the increase in cost and fair value mainly due to newinvestments in the chemical industry.
Maturities and fair values of debt securities classified as available-for-sale and held-to-maturity atMarch 31, 2006 were as follows:
Millions of Yen
Available-for-Sale Held-to-Maturity
Amortized CostAggregateFair Value Amortized Cost
AggregateFair Value
Contractual maturities:Within 1 year . . . . . . . . . . . . . . . . . . . . . . . . . . . . . . . . . ¥29,947 ¥29,962 ¥ 1,468 ¥ 1,468After 1 year through 5 years . . . . . . . . . . . . . . . . . . . . . . 58,664 58,753 10,452 10,452After 5 years through 10 years . . . . . . . . . . . . . . . . . . . . 1,206 1,206 10 10After 10 years . . . . . . . . . . . . . . . . . . . . . . . . . . . . . . . . . 6 6 — —
Total . . . . . . . . . . . . . . . . . . . . . . . . . . . . . . . . . . . . . . ¥89,823 ¥89,927 ¥11,930 ¥11,930
The actual maturities may differ from the contractual maturities shown above because certain issuers mayhave the right to redeem debt securities before their maturity.
Item 12. Description of Securities Other than Equity Securities.
Not applicable.
181
PART II
Item 13. Defaults, Dividend Arrearages and Delinquencies.
None.
Item 14. Material Modifications to the Rights of Security Holders and Use of Proceeds.
None.
Item 15. Controls and Procedures.
Disclosure Controls and Procedures
Our management, with the participation of its principal executive and principal financial officer, hasperformed an evaluation of the effectiveness of disclosure controls and procedures (as defined by Rule 13a-15(e)under the U.S. Securities Exchange Act of 1934) as of the end of the period covered by this report. Based uponthat evaluation, our principal executive and principal financial officer concluded that the disclosure controls andprocedures were effective as of the end of the period covered by this report.
There was no change in our internal control over financial reporting that occurred during the period coveredby this report that has materially affected, or is reasonably likely to materially affect, our internal control overfinancial reporting.
Item 16. [Reserved]
Item 16A. Audit Committee Financial Expert.
Our Board of Corporate Auditors has determined that Tasuku Kondo, Hiroshi Matsuura and HideharuKadowaki qualify as an “audit committee financial expert” as defined in this Item 16A serving on our Board ofCorporate Auditors. Mr. Kadowaki meets the independence requirements imposed on corporate auditors underthe Corporate Law of Japan.
Mr. Kondo joined Mitsui in 1965. Since then he had always worked in the field of accounting or financingand was appointed as Director and General Manager of Finance Division in 1996 and as Representative Directorand Chief Financial Officer in 2001. He was elected as one of our Corporate Auditors at the ordinary generalmeeting of shareholders held in June 2005.
Mr. Matsuura joined Mitsui in 1970. Since then he had always worked in the field of management of creditrisk, country risk, investment risk and market risk and was appointed as General Manager of the Corporate RiskManagement Division before having been elected as one of our Corporate Auditors at the ordinary generalmeeting of shareholders held in June 2003. Through his career, he has acquired, among other things, experienceauditing, analyzing and evaluating financial statements of a great number of companies to be granted our creditincluding loan, guarantee and investment for various transactions.
Mr. Kadowaki was elected as one of our Corporate Auditors at the ordinary general meeting of shareholdersheld in June 2004. His main career has been in the field of financial risk management at Mitsui Bank, SakuraBank, Sumitomo Mitsui Banking Corporation, and Sumitomo Mitsui Financial Group, Inc. His final position inthe bank was an executive vice president who, while overseeing the entire operation of the bank, was responsiblefor risk management and internal auditing.
182
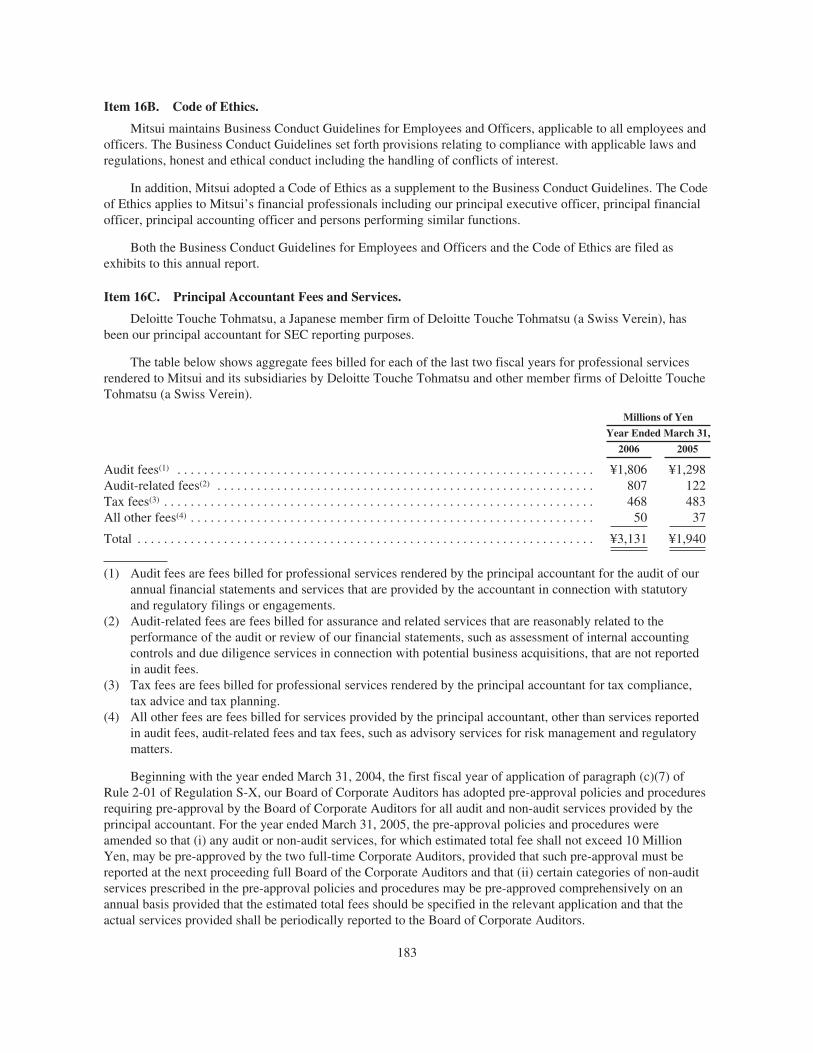
Item 16B. Code of Ethics.
Mitsui maintains Business Conduct Guidelines for Employees and Officers, applicable to all employees andofficers. The Business Conduct Guidelines set forth provisions relating to compliance with applicable laws andregulations, honest and ethical conduct including the handling of conflicts of interest.
In addition, Mitsui adopted a Code of Ethics as a supplement to the Business Conduct Guidelines. The Codeof Ethics applies to Mitsui’s financial professionals including our principal executive officer, principal financialofficer, principal accounting officer and persons performing similar functions.
Both the Business Conduct Guidelines for Employees and Officers and the Code of Ethics are filed asexhibits to this annual report.
Item 16C. Principal Accountant Fees and Services.
Deloitte Touche Tohmatsu, a Japanese member firm of Deloitte Touche Tohmatsu (a Swiss Verein), hasbeen our principal accountant for SEC reporting purposes.
The table below shows aggregate fees billed for each of the last two fiscal years for professional servicesrendered to Mitsui and its subsidiaries by Deloitte Touche Tohmatsu and other member firms of Deloitte ToucheTohmatsu (a Swiss Verein).
Millions of Yen
Year Ended March 31,
2006 2005
Audit fees(1) . . . . . . . . . . . . . . . . . . . . . . . . . . . . . . . . . . . . . . . . . . . . . . . . . . . . . . . . . . . . . . . ¥1,806 ¥1,298Audit-related fees(2) . . . . . . . . . . . . . . . . . . . . . . . . . . . . . . . . . . . . . . . . . . . . . . . . . . . . . . . . . 807 122Tax fees(3) . . . . . . . . . . . . . . . . . . . . . . . . . . . . . . . . . . . . . . . . . . . . . . . . . . . . . . . . . . . . . . . . . 468 483All other fees(4) . . . . . . . . . . . . . . . . . . . . . . . . . . . . . . . . . . . . . . . . . . . . . . . . . . . . . . . . . . . . . 50 37
Total . . . . . . . . . . . . . . . . . . . . . . . . . . . . . . . . . . . . . . . . . . . . . . . . . . . . . . . . . . . . . . . . . . . . . ¥3,131 ¥1,940
(1) Audit fees are fees billed for professional services rendered by the principal accountant for the audit of ourannual financial statements and services that are provided by the accountant in connection with statutoryand regulatory filings or engagements.
(2) Audit-related fees are fees billed for assurance and related services that are reasonably related to theperformance of the audit or review of our financial statements, such as assessment of internal accountingcontrols and due diligence services in connection with potential business acquisitions, that are not reportedin audit fees.
(3) Tax fees are fees billed for professional services rendered by the principal accountant for tax compliance,tax advice and tax planning.
(4) All other fees are fees billed for services provided by the principal accountant, other than services reportedin audit fees, audit-related fees and tax fees, such as advisory services for risk management and regulatorymatters.
Beginning with the year ended March 31, 2004, the first fiscal year of application of paragraph (c)(7) ofRule 2-01 of Regulation S-X, our Board of Corporate Auditors has adopted pre-approval policies and proceduresrequiring pre-approval by the Board of Corporate Auditors for all audit and non-audit services provided by theprincipal accountant. For the year ended March 31, 2005, the pre-approval policies and procedures wereamended so that (i) any audit or non-audit services, for which estimated total fee shall not exceed 10 MillionYen, may be pre-approved by the two full-time Corporate Auditors, provided that such pre-approval must bereported at the next proceeding full Board of the Corporate Auditors and that (ii) certain categories of non-auditservices prescribed in the pre-approval policies and procedures may be pre-approved comprehensively on anannual basis provided that the estimated total fees should be specified in the relevant application and that theactual services provided shall be periodically reported to the Board of Corporate Auditors.
183
For the year ended March 31, 2006, we have amended the pre-approval policies and procedures in order tomake clearer our principal policy that the audit services for Mitsui and its subsidiaries are to be rendered byDeloitte Touche Tohmatsu and other member firms of Deloitte Touche Tohmatsu (a Swiss Verein) while allnon-audit services are to be rendered by the accounting firms not belonging to the group of Deloitte ToucheTohmatsu with some specific exceptions. Among those exceptions are certain tax services, certain due diligenceservices for acquisition, etc. which would not be considered to impair the independence of our principalaccountant.
All of the services provided by the principal accountant for the year ended March 31, 2006 were approvedby the full-time Corporate Auditors or the Board of Corporate Auditors pursuant to the pre-approval policies andprocedures described above, and none of such services were approved pursuant to the procedures described inRule 2-01(c)(7)(i)(C) of Regulation S-X, which waives the general requirement for pre-approval in certaincircumstances.
Item 16D. Exemptions from the Listing Standards for Audit Committees.
With respect to the requirements of Rule 10A-3 under the Securities Exchange Act of 1934 relating to listedcompany audit committees, which apply to us through Rules 4350(d)(3) and 4350(d)(2)(A)(ii) of the NASDManual, we rely on an exemption provided by paragraph (c)(3) of that Rule available to foreign private issuerswith boards of corporate auditors meeting certain requirements. For a Nasdaq-listed Japanese company with aboard of corporate auditors, the requirements for relying on paragraph (c)(3) of Rule 10A-3 are as follows:
‰ The board of corporate auditors must be established, and its members must be selected, pursuant toJapanese law expressly requiring such a board for Japanese companies that elect to have a corporategovernance system with corporate auditors,
‰ Japanese law must and does require the board of corporate auditors to be separate from the board ofdirectors,
‰ None of the members of the board of corporate auditors may be elected by management, and none of thelisted company’s executive officers may be a member of the board of corporate auditors,
‰ Japanese law must and does set forth standards for the independence of the members of the board ofcorporate auditors from the listed company or its management, and
‰ The board of corporate auditors, in accordance with Japanese law or the registrant’s governingdocuments, must be responsible, to the extent permitted by Japanese law, for the appointment, retentionand oversight of the work of any registered public accounting firm engaged (including, to the extentpermitted by Japanese law, the resolution of disagreements between management and the auditorregarding financial reporting) for the purpose of preparing or issuing an audit report or performing otheraudit, review or attest services for the listed company, including its principal accountant which audits itsconsolidated financial statements included in its annual reports on Form 20-F.
To the extent permitted by Japanese law:
‰ The board of corporate auditors must establish procedures for (i) the receipt, retention and treatment ofcomplaints received by us regarding accounting, internal accounting controls, or auditing matters, and(ii) the confidential, anonymous submission by our employees of concerns regarding questionableaccounting or auditing matters,
‰ The board of corporate auditors must have the authority to engage independent counsel and otheradvisers, as it determines necessary to carry out its duties, and
184
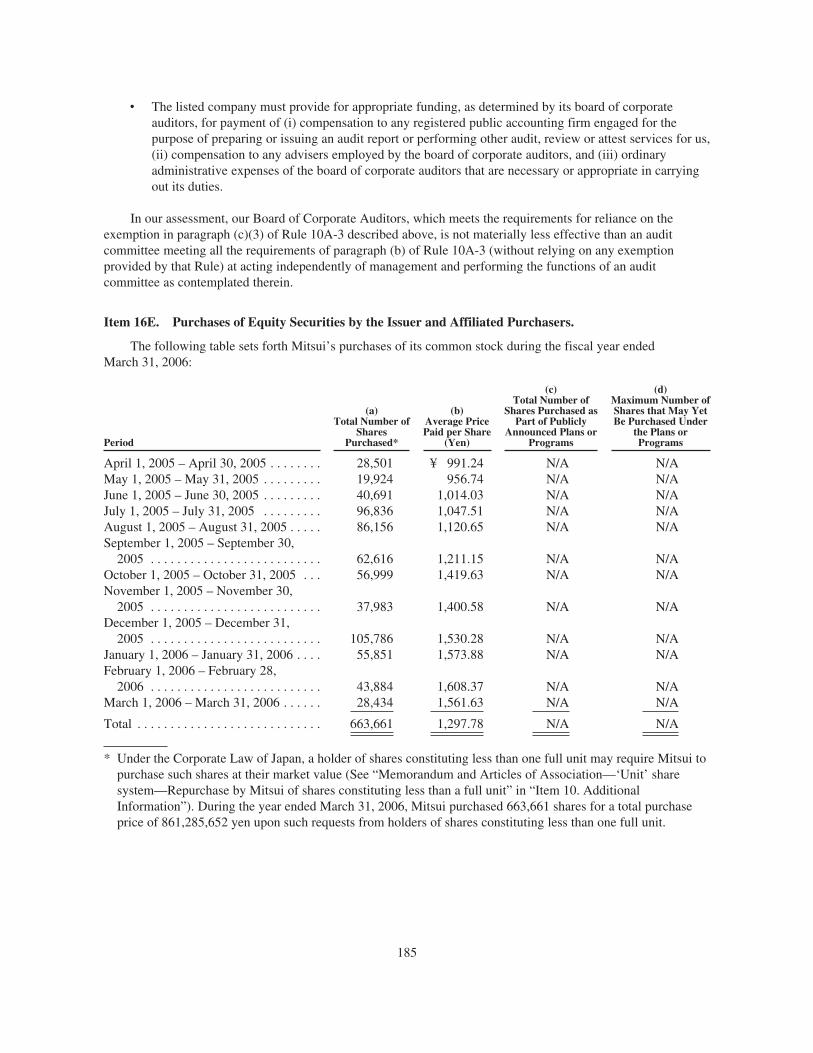
‰ The listed company must provide for appropriate funding, as determined by its board of corporateauditors, for payment of (i) compensation to any registered public accounting firm engaged for thepurpose of preparing or issuing an audit report or performing other audit, review or attest services for us,(ii) compensation to any advisers employed by the board of corporate auditors, and (iii) ordinaryadministrative expenses of the board of corporate auditors that are necessary or appropriate in carryingout its duties.
In our assessment, our Board of Corporate Auditors, which meets the requirements for reliance on theexemption in paragraph (c)(3) of Rule 10A-3 described above, is not materially less effective than an auditcommittee meeting all the requirements of paragraph (b) of Rule 10A-3 (without relying on any exemptionprovided by that Rule) at acting independently of management and performing the functions of an auditcommittee as contemplated therein.
Item 16E. Purchases of Equity Securities by the Issuer and Affiliated Purchasers.
The following table sets forth Mitsui’s purchases of its common stock during the fiscal year endedMarch 31, 2006:
Period
(a)Total Number of
SharesPurchased*
(b)Average PricePaid per Share
(Yen)
(c)Total Number of
Shares Purchased asPart of Publicly
Announced Plans orPrograms
(d)Maximum Number ofShares that May YetBe Purchased Under
the Plans orPrograms
April 1, 2005 – April 30, 2005 . . . . . . . . 28,501 ¥ 991.24 N/A N/AMay 1, 2005 – May 31, 2005 . . . . . . . . . 19,924 956.74 N/A N/AJune 1, 2005 – June 30, 2005 . . . . . . . . . 40,691 1,014.03 N/A N/AJuly 1, 2005 – July 31, 2005 . . . . . . . . . 96,836 1,047.51 N/A N/AAugust 1, 2005 – August 31, 2005 . . . . . 86,156 1,120.65 N/A N/ASeptember 1, 2005 – September 30,
2005 . . . . . . . . . . . . . . . . . . . . . . . . . . 62,616 1,211.15 N/A N/AOctober 1, 2005 – October 31, 2005 . . . 56,999 1,419.63 N/A N/ANovember 1, 2005 – November 30,
2005 . . . . . . . . . . . . . . . . . . . . . . . . . . 37,983 1,400.58 N/A N/ADecember 1, 2005 – December 31,
2005 . . . . . . . . . . . . . . . . . . . . . . . . . . 105,786 1,530.28 N/A N/AJanuary 1, 2006 – January 31, 2006 . . . . 55,851 1,573.88 N/A N/AFebruary 1, 2006 – February 28,
2006 . . . . . . . . . . . . . . . . . . . . . . . . . . 43,884 1,608.37 N/A N/AMarch 1, 2006 – March 31, 2006 . . . . . . 28,434 1,561.63 N/A N/A
Total . . . . . . . . . . . . . . . . . . . . . . . . . . . . 663,661 1,297.78 N/A N/A
* Under the Corporate Law of Japan, a holder of shares constituting less than one full unit may require Mitsui topurchase such shares at their market value (See “Memorandum and Articles of Association—‘Unit’ sharesystem—Repurchase by Mitsui of shares constituting less than a full unit” in “Item 10. AdditionalInformation”). During the year ended March 31, 2006, Mitsui purchased 663,661 shares for a total purchaseprice of 861,285,652 yen upon such requests from holders of shares constituting less than one full unit.
185
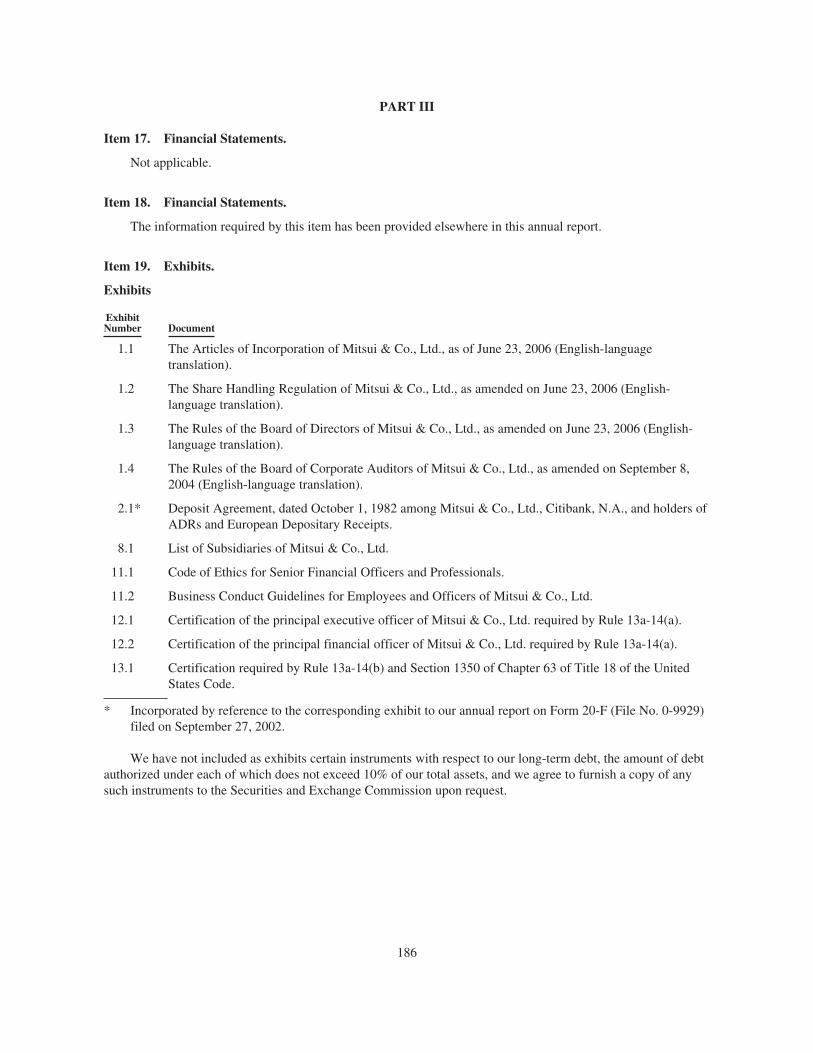
PART III
Item 17. Financial Statements.
Not applicable.
Item 18. Financial Statements.
The information required by this item has been provided elsewhere in this annual report.
Item 19. Exhibits.
Exhibits
ExhibitNumber Document
1.1 The Articles of Incorporation of Mitsui & Co., Ltd., as of June 23, 2006 (English-languagetranslation).
1.2 The Share Handling Regulation of Mitsui & Co., Ltd., as amended on June 23, 2006 (English-language translation).
1.3 The Rules of the Board of Directors of Mitsui & Co., Ltd., as amended on June 23, 2006 (English-language translation).
1.4 The Rules of the Board of Corporate Auditors of Mitsui & Co., Ltd., as amended on September 8,2004 (English-language translation).
2.1* Deposit Agreement, dated October 1, 1982 among Mitsui & Co., Ltd., Citibank, N.A., and holders ofADRs and European Depositary Receipts.
8.1 List of Subsidiaries of Mitsui & Co., Ltd.
11.1 Code of Ethics for Senior Financial Officers and Professionals.
11.2 Business Conduct Guidelines for Employees and Officers of Mitsui & Co., Ltd.
12.1 Certification of the principal executive officer of Mitsui & Co., Ltd. required by Rule 13a-14(a).
12.2 Certification of the principal financial officer of Mitsui & Co., Ltd. required by Rule 13a-14(a).
13.1 Certification required by Rule 13a-14(b) and Section 1350 of Chapter 63 of Title 18 of the UnitedStates Code.
* Incorporated by reference to the corresponding exhibit to our annual report on Form 20-F (File No. 0-9929)filed on September 27, 2002.
We have not included as exhibits certain instruments with respect to our long-term debt, the amount of debtauthorized under each of which does not exceed 10% of our total assets, and we agree to furnish a copy of anysuch instruments to the Securities and Exchange Commission upon request.
186
MITSUI & CO., LTD. (MITSUI BUSSAN KABUSHIKI KAISHA) AND SUBSIDIARIES
INDEX TO CONSOLIDATED FINANCIAL STATEMENTS AND SCHEDULES
The audited consolidated financial statements of Mitsui & Co., Ltd. (Mitsui Bussan Kabushiki Kaisha) andsubsidiaries, together with the report of Deloitte Touche Tohmatsu as of March 31, 2006 and 2005, and for theyears ended March 31, 2006, 2005 and 2004, filed as part of this annual reports are as follows:
Page
Report of Independent Registered Public Accounting Firm . . . . . . . . . . . . . . . . . . . . . . . . . . . . . . . . . . . . . . F-2Consolidated Balance Sheets, March 31, 2006 and 2005 . . . . . . . . . . . . . . . . . . . . . . . . . . . . . . . . . . . . . . . . F-3Statements of Consolidated Income for the Years Ended March 31, 2006, 2005 and 2004 . . . . . . . . . . . . . . F-5Statements of Consolidated Shareholders’ Equity for the Years Ended March 31, 2006, 2005 and 2004 . . . F-6Statements of Consolidated Cash Flows for the Years Ended March 31, 2006, 2005 and 2004 . . . . . . . . . . F-7Notes to Consolidated Financial Statements . . . . . . . . . . . . . . . . . . . . . . . . . . . . . . . . . . . . . . . . . . . . . . . . . . F-8Supplemental Information on Oil and Gas Producing Activities (Unaudited) . . . . . . . . . . . . . . . . . . . . . . . . F-79
Supplemental Information:
Schedules for the Years Ended March 31, 2006, 2005 and 2004:
(Schedules are omitted because of the absence of the conditions under which they are required or becausethe required information is included in the consolidated financial statements or notes thereto.)
Financial statements of majority-owned subsidiaries of the registrant not consolidated and of 50% or lessowned persons accounted for by the equity method have been omitted because Mitsui & Co., Ltd.’s proportionateshare of the income from continuing operations before income taxes, and total assets of each such company isless than 20% of the respective consolidated amounts, and the investment in and advances to each company isless than 20% of consolidated total assets.
F-1
Report of Independent Registered Public Accounting Firm
To the Board of Directors and Shareholders ofMitsui & Co., Ltd. (Mitsui Bussan Kabushiki Kaisha):
We have audited the accompanying consolidated balance sheets of Mitsui & Co., Ltd. (Mitsui BussanKabushiki Kaisha) and subsidiaries (the “Company”) as of March 31, 2006 and 2005, and the related statementsof consolidated income, consolidated shareholders’ equity, and consolidated cash flows for each of the threeyears in the period ended March 31, 2006 (all expressed in Japanese yen). These financial statements are theresponsibility of the Company’s management. Our responsibility is to express an opinion on these financialstatements based on our audits.
We conducted our audits in accordance with the standards of the Public Company Accounting OversightBoard (United States). Those standards require that we plan and perform the audit to obtain reasonable assuranceabout whether the financial statements are free of material misstatement. The Company is not required to have,nor were we engaged to perform, an audit of its internal control over financial reporting. Our audits includedconsideration of internal control over financial reporting as a basis for designing audit procedures that areappropriate in the circumstances, but not for the purpose of expressing an opinion on the effectiveness of theCompany’s internal control over financial reporting. Accordingly, we express no such opinion. An audit alsoincludes examining, on a test basis, evidence supporting the amounts and disclosures in the financial statements,assessing the accounting principles used and significant estimates made by management, as well as evaluatingthe overall financial statement presentation. We believe that our audits provide a reasonable basis for ouropinion.
In our opinion, such consolidated financial statements present fairly, in all material respects, the financialposition of Mitsui & Co., Ltd. and subsidiaries as of March 31, 2006 and 2005, and the results of their operationsand their cash flows for each of the three years in the period ended March 31, 2006, in conformity withaccounting principles generally accepted in the United States of America.
As discussed in Note 11 to the consolidated financial statements, effective April 1, 2003, the Companychanged its method of accounting for asset retirement obligations to conform to Statement of FinancialAccounting Standards No. 143.
Our audits also comprehended the translation of Japanese yen amounts into U.S. dollar amounts and, in ouropinion, such translation has been made in conformity with the basis stated in Note 2. Such U.S. dollar amountsare presented solely for the convenience of readers outside Japan.
/s/ DELOITTE TOUCHE TOHMATSUDeloitte Touche TohmatsuTokyo, Japan
June 15, 2006, except for Note 29, as to which the date is June 23, 2006
F-2
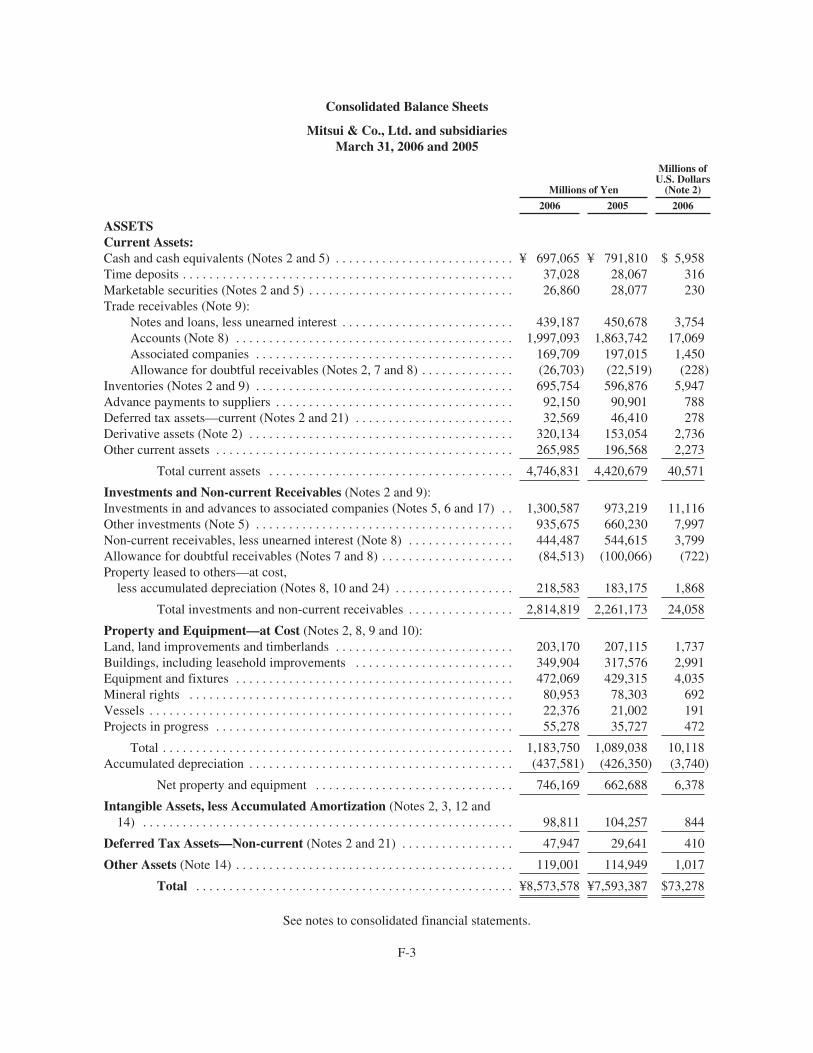
Consolidated Balance Sheets
Mitsui & Co., Ltd. and subsidiariesMarch 31, 2006 and 2005
Millions of Yen
Millions ofU.S. Dollars
(Note 2)
2006 2005 2006
ASSETSCurrent Assets:Cash and cash equivalents (Notes 2 and 5) . . . . . . . . . . . . . . . . . . . . . . . . . . . ¥ 697,065 ¥ 791,810 $ 5,958Time deposits . . . . . . . . . . . . . . . . . . . . . . . . . . . . . . . . . . . . . . . . . . . . . . . . . . 37,028 28,067 316Marketable securities (Notes 2 and 5) . . . . . . . . . . . . . . . . . . . . . . . . . . . . . . . 26,860 28,077 230Trade receivables (Note 9):
Notes and loans, less unearned interest . . . . . . . . . . . . . . . . . . . . . . . . . . 439,187 450,678 3,754Accounts (Note 8) . . . . . . . . . . . . . . . . . . . . . . . . . . . . . . . . . . . . . . . . . . 1,997,093 1,863,742 17,069Associated companies . . . . . . . . . . . . . . . . . . . . . . . . . . . . . . . . . . . . . . . 169,709 197,015 1,450Allowance for doubtful receivables (Notes 2, 7 and 8) . . . . . . . . . . . . . . (26,703) (22,519) (228)
Inventories (Notes 2 and 9) . . . . . . . . . . . . . . . . . . . . . . . . . . . . . . . . . . . . . . . 695,754 596,876 5,947Advance payments to suppliers . . . . . . . . . . . . . . . . . . . . . . . . . . . . . . . . . . . . 92,150 90,901 788Deferred tax assets—current (Notes 2 and 21) . . . . . . . . . . . . . . . . . . . . . . . . 32,569 46,410 278Derivative assets (Note 2) . . . . . . . . . . . . . . . . . . . . . . . . . . . . . . . . . . . . . . . . 320,134 153,054 2,736Other current assets . . . . . . . . . . . . . . . . . . . . . . . . . . . . . . . . . . . . . . . . . . . . . 265,985 196,568 2,273
Total current assets . . . . . . . . . . . . . . . . . . . . . . . . . . . . . . . . . . . . . 4,746,831 4,420,679 40,571
Investments and Non-current Receivables (Notes 2 and 9):Investments in and advances to associated companies (Notes 5, 6 and 17) . . 1,300,587 973,219 11,116Other investments (Note 5) . . . . . . . . . . . . . . . . . . . . . . . . . . . . . . . . . . . . . . . 935,675 660,230 7,997Non-current receivables, less unearned interest (Note 8) . . . . . . . . . . . . . . . . 444,487 544,615 3,799Allowance for doubtful receivables (Notes 7 and 8) . . . . . . . . . . . . . . . . . . . . (84,513) (100,066) (722)Property leased to others—at cost,
less accumulated depreciation (Notes 8, 10 and 24) . . . . . . . . . . . . . . . . . . 218,583 183,175 1,868
Total investments and non-current receivables . . . . . . . . . . . . . . . . 2,814,819 2,261,173 24,058
Property and Equipment—at Cost (Notes 2, 8, 9 and 10):Land, land improvements and timberlands . . . . . . . . . . . . . . . . . . . . . . . . . . . 203,170 207,115 1,737Buildings, including leasehold improvements . . . . . . . . . . . . . . . . . . . . . . . . 349,904 317,576 2,991Equipment and fixtures . . . . . . . . . . . . . . . . . . . . . . . . . . . . . . . . . . . . . . . . . . 472,069 429,315 4,035Mineral rights . . . . . . . . . . . . . . . . . . . . . . . . . . . . . . . . . . . . . . . . . . . . . . . . . 80,953 78,303 692Vessels . . . . . . . . . . . . . . . . . . . . . . . . . . . . . . . . . . . . . . . . . . . . . . . . . . . . . . . 22,376 21,002 191Projects in progress . . . . . . . . . . . . . . . . . . . . . . . . . . . . . . . . . . . . . . . . . . . . . 55,278 35,727 472
Total . . . . . . . . . . . . . . . . . . . . . . . . . . . . . . . . . . . . . . . . . . . . . . . . . . . . . 1,183,750 1,089,038 10,118Accumulated depreciation . . . . . . . . . . . . . . . . . . . . . . . . . . . . . . . . . . . . . . . . (437,581) (426,350) (3,740)
Net property and equipment . . . . . . . . . . . . . . . . . . . . . . . . . . . . . . 746,169 662,688 6,378
Intangible Assets, less Accumulated Amortization (Notes 2, 3, 12 and14) . . . . . . . . . . . . . . . . . . . . . . . . . . . . . . . . . . . . . . . . . . . . . . . . . . . . . . . . 98,811 104,257 844
Deferred Tax Assets—Non-current (Notes 2 and 21) . . . . . . . . . . . . . . . . . 47,947 29,641 410
Other Assets (Note 14) . . . . . . . . . . . . . . . . . . . . . . . . . . . . . . . . . . . . . . . . . . 119,001 114,949 1,017
Total . . . . . . . . . . . . . . . . . . . . . . . . . . . . . . . . . . . . . . . . . . . . . . . . ¥8,573,578 ¥7,593,387 $73,278
See notes to consolidated financial statements.
F-3
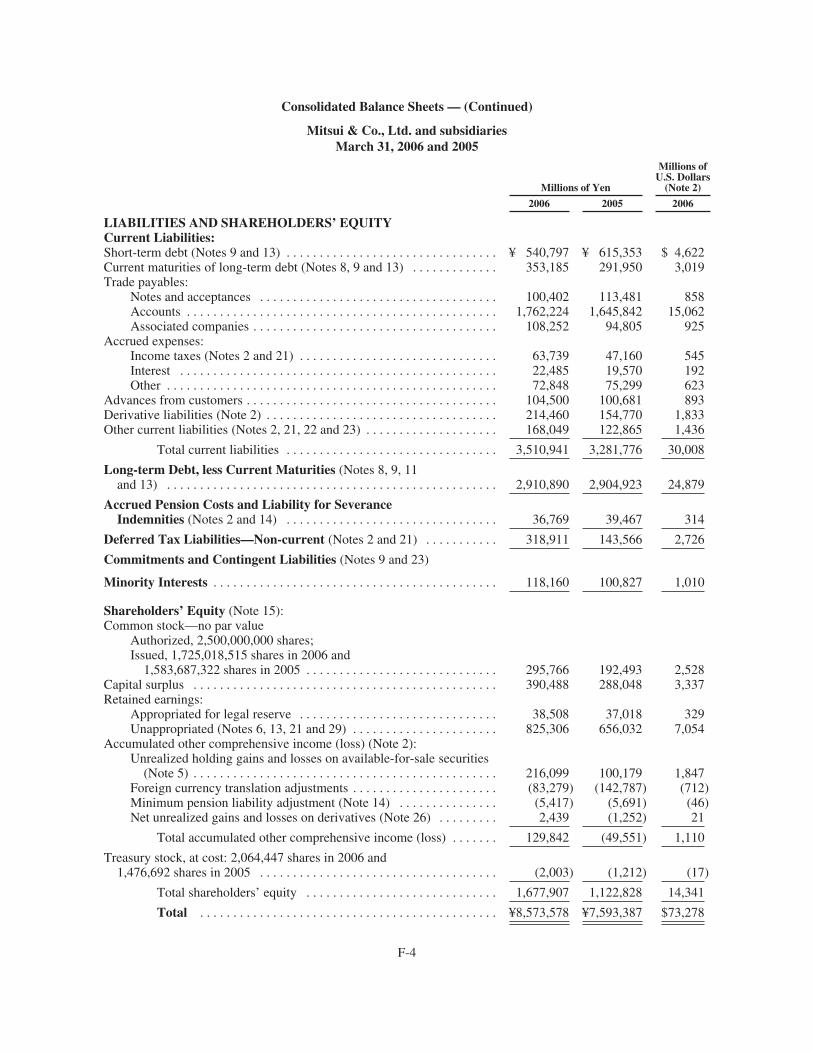
Consolidated Balance Sheets — (Continued)
Mitsui & Co., Ltd. and subsidiariesMarch 31, 2006 and 2005
Millions of Yen
Millions ofU.S. Dollars
(Note 2)
2006 2005 2006
LIABILITIES AND SHAREHOLDERS’ EQUITYCurrent Liabilities:Short-term debt (Notes 9 and 13) . . . . . . . . . . . . . . . . . . . . . . . . . . . . . . . . ¥ 540,797 ¥ 615,353 $ 4,622Current maturities of long-term debt (Notes 8, 9 and 13) . . . . . . . . . . . . . 353,185 291,950 3,019Trade payables:
Notes and acceptances . . . . . . . . . . . . . . . . . . . . . . . . . . . . . . . . . . . . 100,402 113,481 858Accounts . . . . . . . . . . . . . . . . . . . . . . . . . . . . . . . . . . . . . . . . . . . . . . . 1,762,224 1,645,842 15,062Associated companies . . . . . . . . . . . . . . . . . . . . . . . . . . . . . . . . . . . . . 108,252 94,805 925
Accrued expenses:Income taxes (Notes 2 and 21) . . . . . . . . . . . . . . . . . . . . . . . . . . . . . . 63,739 47,160 545Interest . . . . . . . . . . . . . . . . . . . . . . . . . . . . . . . . . . . . . . . . . . . . . . . . 22,485 19,570 192Other . . . . . . . . . . . . . . . . . . . . . . . . . . . . . . . . . . . . . . . . . . . . . . . . . . 72,848 75,299 623
Advances from customers . . . . . . . . . . . . . . . . . . . . . . . . . . . . . . . . . . . . . . 104,500 100,681 893Derivative liabilities (Note 2) . . . . . . . . . . . . . . . . . . . . . . . . . . . . . . . . . . . 214,460 154,770 1,833Other current liabilities (Notes 2, 21, 22 and 23) . . . . . . . . . . . . . . . . . . . . 168,049 122,865 1,436
Total current liabilities . . . . . . . . . . . . . . . . . . . . . . . . . . . . . . . . 3,510,941 3,281,776 30,008
Long-term Debt, less Current Maturities (Notes 8, 9, 11and 13) . . . . . . . . . . . . . . . . . . . . . . . . . . . . . . . . . . . . . . . . . . . . . . . . . . 2,910,890 2,904,923 24,879
Accrued Pension Costs and Liability for SeveranceIndemnities (Notes 2 and 14) . . . . . . . . . . . . . . . . . . . . . . . . . . . . . . . . 36,769 39,467 314
Deferred Tax Liabilities—Non-current (Notes 2 and 21) . . . . . . . . . . . 318,911 143,566 2,726
Commitments and Contingent Liabilities (Notes 9 and 23)
Minority Interests . . . . . . . . . . . . . . . . . . . . . . . . . . . . . . . . . . . . . . . . . . . 118,160 100,827 1,010
Shareholders’ Equity (Note 15):Common stock—no par value
Authorized, 2,500,000,000 shares;Issued, 1,725,018,515 shares in 2006 and
1,583,687,322 shares in 2005 . . . . . . . . . . . . . . . . . . . . . . . . . . . . . 295,766 192,493 2,528Capital surplus . . . . . . . . . . . . . . . . . . . . . . . . . . . . . . . . . . . . . . . . . . . . . . 390,488 288,048 3,337Retained earnings:
Appropriated for legal reserve . . . . . . . . . . . . . . . . . . . . . . . . . . . . . . 38,508 37,018 329Unappropriated (Notes 6, 13, 21 and 29) . . . . . . . . . . . . . . . . . . . . . . 825,306 656,032 7,054
Accumulated other comprehensive income (loss) (Note 2):Unrealized holding gains and losses on available-for-sale securities
(Note 5) . . . . . . . . . . . . . . . . . . . . . . . . . . . . . . . . . . . . . . . . . . . . . . 216,099 100,179 1,847Foreign currency translation adjustments . . . . . . . . . . . . . . . . . . . . . . (83,279) (142,787) (712)Minimum pension liability adjustment (Note 14) . . . . . . . . . . . . . . . (5,417) (5,691) (46)Net unrealized gains and losses on derivatives (Note 26) . . . . . . . . . 2,439 (1,252) 21
Total accumulated other comprehensive income (loss) . . . . . . . 129,842 (49,551) 1,110
Treasury stock, at cost: 2,064,447 shares in 2006 and1,476,692 shares in 2005 . . . . . . . . . . . . . . . . . . . . . . . . . . . . . . . . . . . . (2,003) (1,212) (17)
Total shareholders’ equity . . . . . . . . . . . . . . . . . . . . . . . . . . . . . 1,677,907 1,122,828 14,341
Total . . . . . . . . . . . . . . . . . . . . . . . . . . . . . . . . . . . . . . . . . . . . . ¥8,573,578 ¥7,593,387 $73,278
F-4
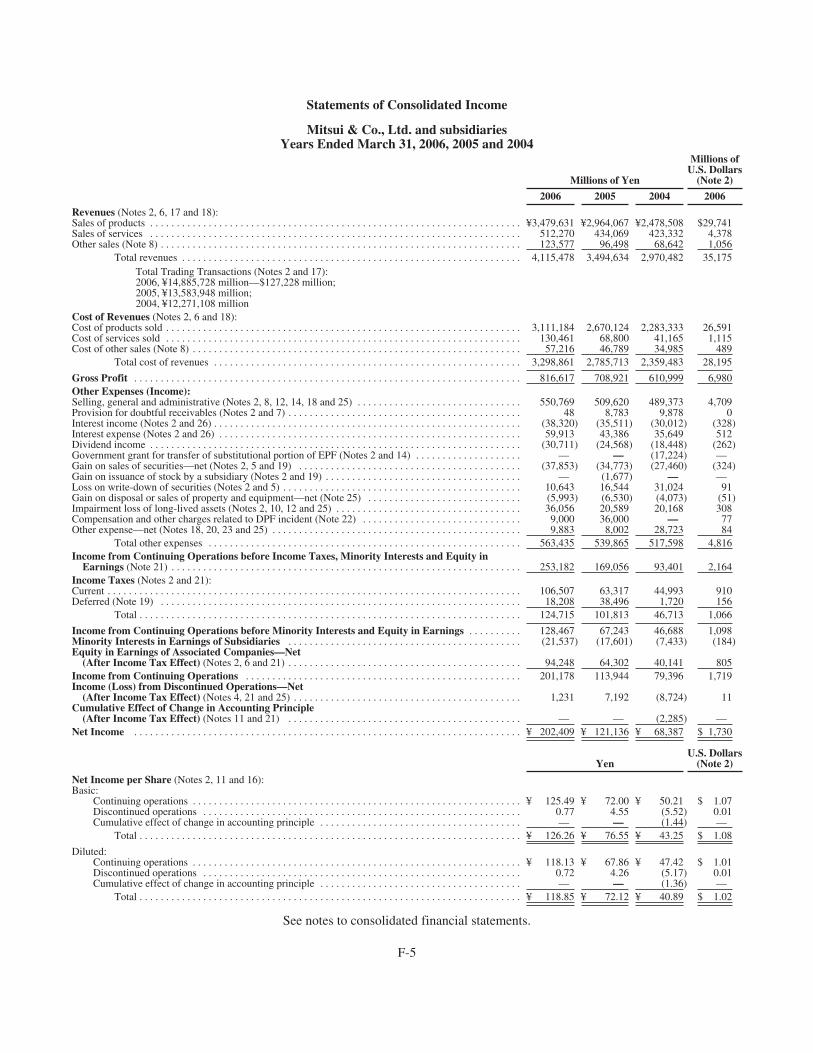
Statements of Consolidated Income
Mitsui & Co., Ltd. and subsidiariesYears Ended March 31, 2006, 2005 and 2004
Millions of Yen
Millions ofU.S. Dollars
(Note 2)
2006 2005 2004 2006
Revenues (Notes 2, 6, 17 and 18):Sales of products . . . . . . . . . . . . . . . . . . . . . . . . . . . . . . . . . . . . . . . . . . . . . . . . . . . . . . . . . . . . . . . . . . . . . . ¥3,479,631 ¥2,964,067 ¥2,478,508 $29,741Sales of services . . . . . . . . . . . . . . . . . . . . . . . . . . . . . . . . . . . . . . . . . . . . . . . . . . . . . . . . . . . . . . . . . . . . . . 512,270 434,069 423,332 4,378Other sales (Note 8) . . . . . . . . . . . . . . . . . . . . . . . . . . . . . . . . . . . . . . . . . . . . . . . . . . . . . . . . . . . . . . . . . . . . 123,577 96,498 68,642 1,056
Total revenues . . . . . . . . . . . . . . . . . . . . . . . . . . . . . . . . . . . . . . . . . . . . . . . . . . . . . . . . . . . . . . . . 4,115,478 3,494,634 2,970,482 35,175Total Trading Transactions (Notes 2 and 17):2006, ¥14,885,728 million—$127,228 million;2005, ¥13,583,948 million;2004, ¥12,271,108 million
Cost of Revenues (Notes 2, 6 and 18):Cost of products sold . . . . . . . . . . . . . . . . . . . . . . . . . . . . . . . . . . . . . . . . . . . . . . . . . . . . . . . . . . . . . . . . . . . 3,111,184 2,670,124 2,283,333 26,591Cost of services sold . . . . . . . . . . . . . . . . . . . . . . . . . . . . . . . . . . . . . . . . . . . . . . . . . . . . . . . . . . . . . . . . . . . 130,461 68,800 41,165 1,115Cost of other sales (Note 8) . . . . . . . . . . . . . . . . . . . . . . . . . . . . . . . . . . . . . . . . . . . . . . . . . . . . . . . . . . . . . . 57,216 46,789 34,985 489
Total cost of revenues . . . . . . . . . . . . . . . . . . . . . . . . . . . . . . . . . . . . . . . . . . . . . . . . . . . . . . . . . . 3,298,861 2,785,713 2,359,483 28,195
Gross Profit . . . . . . . . . . . . . . . . . . . . . . . . . . . . . . . . . . . . . . . . . . . . . . . . . . . . . . . . . . . . . . . . . . . . . . . . . 816,617 708,921 610,999 6,980Other Expenses (Income):Selling, general and administrative (Notes 2, 8, 12, 14, 18 and 25) . . . . . . . . . . . . . . . . . . . . . . . . . . . . . . . 550,769 509,620 489,373 4,709Provision for doubtful receivables (Notes 2 and 7) . . . . . . . . . . . . . . . . . . . . . . . . . . . . . . . . . . . . . . . . . . . . 48 8,783 9,878 0Interest income (Notes 2 and 26) . . . . . . . . . . . . . . . . . . . . . . . . . . . . . . . . . . . . . . . . . . . . . . . . . . . . . . . . . . (38,320) (35,511) (30,012) (328)Interest expense (Notes 2 and 26) . . . . . . . . . . . . . . . . . . . . . . . . . . . . . . . . . . . . . . . . . . . . . . . . . . . . . . . . . 59,913 43,386 35,649 512Dividend income . . . . . . . . . . . . . . . . . . . . . . . . . . . . . . . . . . . . . . . . . . . . . . . . . . . . . . . . . . . . . . . . . . . . . . (30,711) (24,568) (18,448) (262)Government grant for transfer of substitutional portion of EPF (Notes 2 and 14) . . . . . . . . . . . . . . . . . . . . — — (17,224) —Gain on sales of securities—net (Notes 2, 5 and 19) . . . . . . . . . . . . . . . . . . . . . . . . . . . . . . . . . . . . . . . . . . (37,853) (34,773) (27,460) (324)Gain on issuance of stock by a subsidiary (Notes 2 and 19) . . . . . . . . . . . . . . . . . . . . . . . . . . . . . . . . . . . . . — (1,677) — —Loss on write-down of securities (Notes 2 and 5) . . . . . . . . . . . . . . . . . . . . . . . . . . . . . . . . . . . . . . . . . . . . . 10,643 16,544 31,024 91Gain on disposal or sales of property and equipment—net (Note 25) . . . . . . . . . . . . . . . . . . . . . . . . . . . . . (5,993) (6,530) (4,073) (51)Impairment loss of long-lived assets (Notes 2, 10, 12 and 25) . . . . . . . . . . . . . . . . . . . . . . . . . . . . . . . . . . . 36,056 20,589 20,168 308Compensation and other charges related to DPF incident (Note 22) . . . . . . . . . . . . . . . . . . . . . . . . . . . . . . 9,000 36,000 — 77Other expense—net (Notes 18, 20, 23 and 25) . . . . . . . . . . . . . . . . . . . . . . . . . . . . . . . . . . . . . . . . . . . . . . . 9,883 8,002 28,723 84
Total other expenses . . . . . . . . . . . . . . . . . . . . . . . . . . . . . . . . . . . . . . . . . . . . . . . . . . . . . . . . . . . 563,435 539,865 517,598 4,816Income from Continuing Operations before Income Taxes, Minority Interests and Equity in
Earnings (Note 21) . . . . . . . . . . . . . . . . . . . . . . . . . . . . . . . . . . . . . . . . . . . . . . . . . . . . . . . . . . . . . . . . . . 253,182 169,056 93,401 2,164Income Taxes (Notes 2 and 21):Current . . . . . . . . . . . . . . . . . . . . . . . . . . . . . . . . . . . . . . . . . . . . . . . . . . . . . . . . . . . . . . . . . . . . . . . . . . . . . . 106,507 63,317 44,993 910Deferred (Note 19) . . . . . . . . . . . . . . . . . . . . . . . . . . . . . . . . . . . . . . . . . . . . . . . . . . . . . . . . . . . . . . . . . . . . 18,208 38,496 1,720 156
Total . . . . . . . . . . . . . . . . . . . . . . . . . . . . . . . . . . . . . . . . . . . . . . . . . . . . . . . . . . . . . . . . . . . . . . . . 124,715 101,813 46,713 1,066
Income from Continuing Operations before Minority Interests and Equity in Earnings . . . . . . . . . . 128,467 67,243 46,688 1,098Minority Interests in Earnings of Subsidiaries . . . . . . . . . . . . . . . . . . . . . . . . . . . . . . . . . . . . . . . . . . . . (21,537) (17,601) (7,433) (184)Equity in Earnings of Associated Companies—Net
(After Income Tax Effect) (Notes 2, 6 and 21) . . . . . . . . . . . . . . . . . . . . . . . . . . . . . . . . . . . . . . . . . . . . 94,248 64,302 40,141 805Income from Continuing Operations . . . . . . . . . . . . . . . . . . . . . . . . . . . . . . . . . . . . . . . . . . . . . . . . . . . . 201,178 113,944 79,396 1,719Income (Loss) from Discontinued Operations—Net
(After Income Tax Effect) (Notes 4, 21 and 25) . . . . . . . . . . . . . . . . . . . . . . . . . . . . . . . . . . . . . . . . . . . 1,231 7,192 (8,724) 11Cumulative Effect of Change in Accounting Principle
(After Income Tax Effect) (Notes 11 and 21) . . . . . . . . . . . . . . . . . . . . . . . . . . . . . . . . . . . . . . . . . . . . — — (2,285) —Net Income . . . . . . . . . . . . . . . . . . . . . . . . . . . . . . . . . . . . . . . . . . . . . . . . . . . . . . . . . . . . . . . . . . . . . . . . . ¥ 202,409 ¥ 121,136 ¥ 68,387 $ 1,730
YenU.S. Dollars
(Note 2)
Net Income per Share (Notes 2, 11 and 16):Basic:
Continuing operations . . . . . . . . . . . . . . . . . . . . . . . . . . . . . . . . . . . . . . . . . . . . . . . . . . . . . . . . . . . . . . ¥ 125.49 ¥ 72.00 ¥ 50.21 $ 1.07Discontinued operations . . . . . . . . . . . . . . . . . . . . . . . . . . . . . . . . . . . . . . . . . . . . . . . . . . . . . . . . . . . . 0.77 4.55 (5.52) 0.01Cumulative effect of change in accounting principle . . . . . . . . . . . . . . . . . . . . . . . . . . . . . . . . . . . . . . — — (1.44) —
Total . . . . . . . . . . . . . . . . . . . . . . . . . . . . . . . . . . . . . . . . . . . . . . . . . . . . . . . . . . . . . . . . . . . . . . . . ¥ 126.26 ¥ 76.55 ¥ 43.25 $ 1.08
Diluted:Continuing operations . . . . . . . . . . . . . . . . . . . . . . . . . . . . . . . . . . . . . . . . . . . . . . . . . . . . . . . . . . . . . . ¥ 118.13 ¥ 67.86 ¥ 47.42 $ 1.01Discontinued operations . . . . . . . . . . . . . . . . . . . . . . . . . . . . . . . . . . . . . . . . . . . . . . . . . . . . . . . . . . . . 0.72 4.26 (5.17) 0.01Cumulative effect of change in accounting principle . . . . . . . . . . . . . . . . . . . . . . . . . . . . . . . . . . . . . . — — (1.36) —
Total . . . . . . . . . . . . . . . . . . . . . . . . . . . . . . . . . . . . . . . . . . . . . . . . . . . . . . . . . . . . . . . . . . . . . . . . ¥ 118.85 ¥ 72.12 ¥ 40.89 $ 1.02
See notes to consolidated financial statements.
F-5
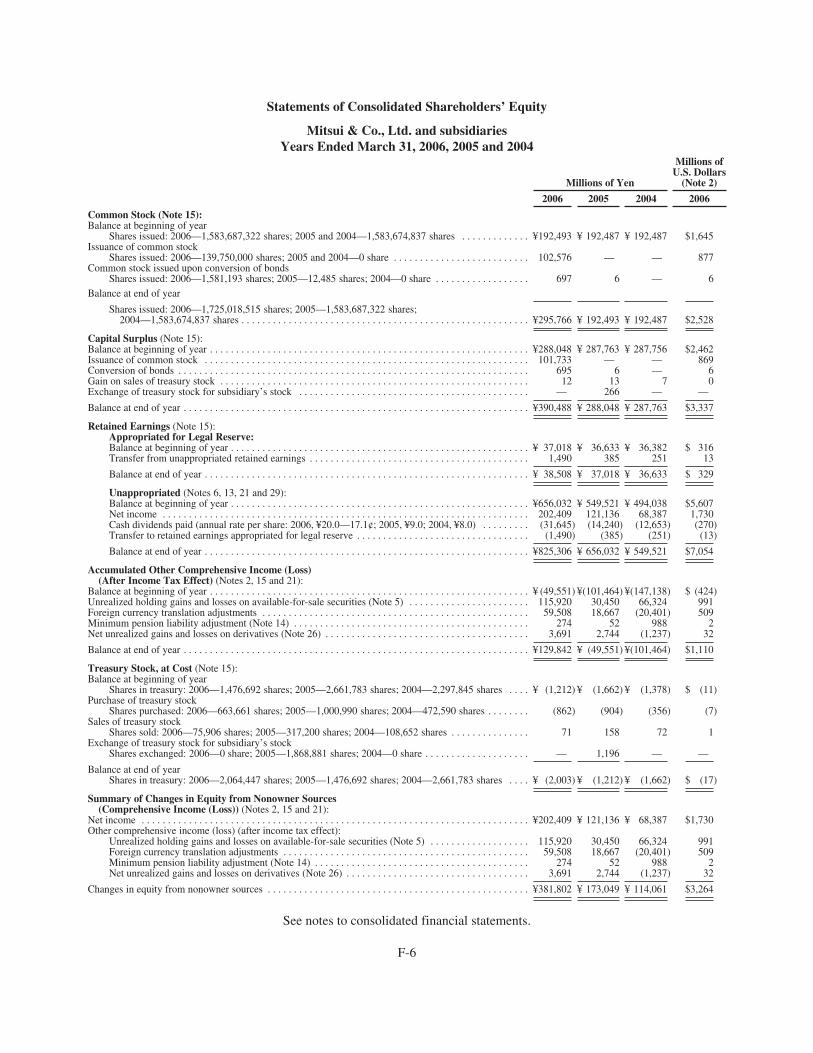
Statements of Consolidated Shareholders’ Equity
Mitsui & Co., Ltd. and subsidiariesYears Ended March 31, 2006, 2005 and 2004
Millions of Yen
Millions ofU.S. Dollars
(Note 2)
2006 2005 2004 2006
Common Stock (Note 15):Balance at beginning of year
Shares issued: 2006—1,583,687,322 shares; 2005 and 2004—1,583,674,837 shares . . . . . . . . . . . . . ¥192,493 ¥ 192,487 ¥ 192,487 $1,645Issuance of common stock
Shares issued: 2006—139,750,000 shares; 2005 and 2004—0 share . . . . . . . . . . . . . . . . . . . . . . . . . . 102,576 — — 877Common stock issued upon conversion of bonds
Shares issued: 2006—1,581,193 shares; 2005—12,485 shares; 2004—0 share . . . . . . . . . . . . . . . . . . 697 6 — 6Balance at end of year
Shares issued: 2006—1,725,018,515 shares; 2005—1,583,687,322 shares;2004—1,583,674,837 shares . . . . . . . . . . . . . . . . . . . . . . . . . . . . . . . . . . . . . . . . . . . . . . . . . . . . . . . ¥295,766 ¥ 192,493 ¥ 192,487 $2,528
Capital Surplus (Note 15):Balance at beginning of year . . . . . . . . . . . . . . . . . . . . . . . . . . . . . . . . . . . . . . . . . . . . . . . . . . . . . . . . . . . . . ¥288,048 ¥ 287,763 ¥ 287,756 $2,462Issuance of common stock . . . . . . . . . . . . . . . . . . . . . . . . . . . . . . . . . . . . . . . . . . . . . . . . . . . . . . . . . . . . . . 101,733 — — 869Conversion of bonds . . . . . . . . . . . . . . . . . . . . . . . . . . . . . . . . . . . . . . . . . . . . . . . . . . . . . . . . . . . . . . . . . . . 695 6 — 6Gain on sales of treasury stock . . . . . . . . . . . . . . . . . . . . . . . . . . . . . . . . . . . . . . . . . . . . . . . . . . . . . . . . . . . 12 13 7 0Exchange of treasury stock for subsidiary’s stock . . . . . . . . . . . . . . . . . . . . . . . . . . . . . . . . . . . . . . . . . . . . — 266 — —
Balance at end of year . . . . . . . . . . . . . . . . . . . . . . . . . . . . . . . . . . . . . . . . . . . . . . . . . . . . . . . . . . . . . . . . . . ¥390,488 ¥ 288,048 ¥ 287,763 $3,337
Retained Earnings (Note 15):Appropriated for Legal Reserve:Balance at beginning of year . . . . . . . . . . . . . . . . . . . . . . . . . . . . . . . . . . . . . . . . . . . . . . . . . . . . . . . . . ¥ 37,018 ¥ 36,633 ¥ 36,382 $ 316Transfer from unappropriated retained earnings . . . . . . . . . . . . . . . . . . . . . . . . . . . . . . . . . . . . . . . . . . 1,490 385 251 13
Balance at end of year . . . . . . . . . . . . . . . . . . . . . . . . . . . . . . . . . . . . . . . . . . . . . . . . . . . . . . . . . . . . . . ¥ 38,508 ¥ 37,018 ¥ 36,633 $ 329
Unappropriated (Notes 6, 13, 21 and 29):Balance at beginning of year . . . . . . . . . . . . . . . . . . . . . . . . . . . . . . . . . . . . . . . . . . . . . . . . . . . . . . . . . ¥656,032 ¥ 549,521 ¥ 494,038 $5,607Net income . . . . . . . . . . . . . . . . . . . . . . . . . . . . . . . . . . . . . . . . . . . . . . . . . . . . . . . . . . . . . . . . . . . . . . 202,409 121,136 68,387 1,730Cash dividends paid (annual rate per share: 2006, ¥20.0—17.1¢; 2005, ¥9.0; 2004, ¥8.0) . . . . . . . . . (31,645) (14,240) (12,653) (270)Transfer to retained earnings appropriated for legal reserve . . . . . . . . . . . . . . . . . . . . . . . . . . . . . . . . . (1,490) (385) (251) (13)
Balance at end of year . . . . . . . . . . . . . . . . . . . . . . . . . . . . . . . . . . . . . . . . . . . . . . . . . . . . . . . . . . . . . . ¥825,306 ¥ 656,032 ¥ 549,521 $7,054
Accumulated Other Comprehensive Income (Loss)(After Income Tax Effect) (Notes 2, 15 and 21):
Balance at beginning of year . . . . . . . . . . . . . . . . . . . . . . . . . . . . . . . . . . . . . . . . . . . . . . . . . . . . . . . . . . . . . ¥ (49,551) ¥(101,464) ¥(147,138) $ (424)Unrealized holding gains and losses on available-for-sale securities (Note 5) . . . . . . . . . . . . . . . . . . . . . . . 115,920 30,450 66,324 991Foreign currency translation adjustments . . . . . . . . . . . . . . . . . . . . . . . . . . . . . . . . . . . . . . . . . . . . . . . . . . . 59,508 18,667 (20,401) 509Minimum pension liability adjustment (Note 14) . . . . . . . . . . . . . . . . . . . . . . . . . . . . . . . . . . . . . . . . . . . . . 274 52 988 2Net unrealized gains and losses on derivatives (Note 26) . . . . . . . . . . . . . . . . . . . . . . . . . . . . . . . . . . . . . . . 3,691 2,744 (1,237) 32
Balance at end of year . . . . . . . . . . . . . . . . . . . . . . . . . . . . . . . . . . . . . . . . . . . . . . . . . . . . . . . . . . . . . . . . . . ¥129,842 ¥ (49,551) ¥(101,464) $1,110
Treasury Stock, at Cost (Note 15):Balance at beginning of year
Shares in treasury: 2006—1,476,692 shares; 2005—2,661,783 shares; 2004—2,297,845 shares . . . . ¥ (1,212) ¥ (1,662) ¥ (1,378) $ (11)Purchase of treasury stock
Shares purchased: 2006—663,661 shares; 2005—1,000,990 shares; 2004—472,590 shares . . . . . . . . (862) (904) (356) (7)Sales of treasury stock
Shares sold: 2006—75,906 shares; 2005—317,200 shares; 2004—108,652 shares . . . . . . . . . . . . . . . 71 158 72 1Exchange of treasury stock for subsidiary’s stock
Shares exchanged: 2006—0 share; 2005—1,868,881 shares; 2004—0 share . . . . . . . . . . . . . . . . . . . . — 1,196 — —
Balance at end of yearShares in treasury: 2006—2,064,447 shares; 2005—1,476,692 shares; 2004—2,661,783 shares . . . . ¥ (2,003) ¥ (1,212) ¥ (1,662) $ (17)
Summary of Changes in Equity from Nonowner Sources(Comprehensive Income (Loss)) (Notes 2, 15 and 21):
Net income . . . . . . . . . . . . . . . . . . . . . . . . . . . . . . . . . . . . . . . . . . . . . . . . . . . . . . . . . . . . . . . . . . . . . . . . . . ¥202,409 ¥ 121,136 ¥ 68,387 $1,730Other comprehensive income (loss) (after income tax effect):
Unrealized holding gains and losses on available-for-sale securities (Note 5) . . . . . . . . . . . . . . . . . . . 115,920 30,450 66,324 991Foreign currency translation adjustments . . . . . . . . . . . . . . . . . . . . . . . . . . . . . . . . . . . . . . . . . . . . . . . 59,508 18,667 (20,401) 509Minimum pension liability adjustment (Note 14) . . . . . . . . . . . . . . . . . . . . . . . . . . . . . . . . . . . . . . . . . 274 52 988 2Net unrealized gains and losses on derivatives (Note 26) . . . . . . . . . . . . . . . . . . . . . . . . . . . . . . . . . . . 3,691 2,744 (1,237) 32
Changes in equity from nonowner sources . . . . . . . . . . . . . . . . . . . . . . . . . . . . . . . . . . . . . . . . . . . . . . . . . . ¥381,802 ¥ 173,049 ¥ 114,061 $3,264
See notes to consolidated financial statements.
F-6
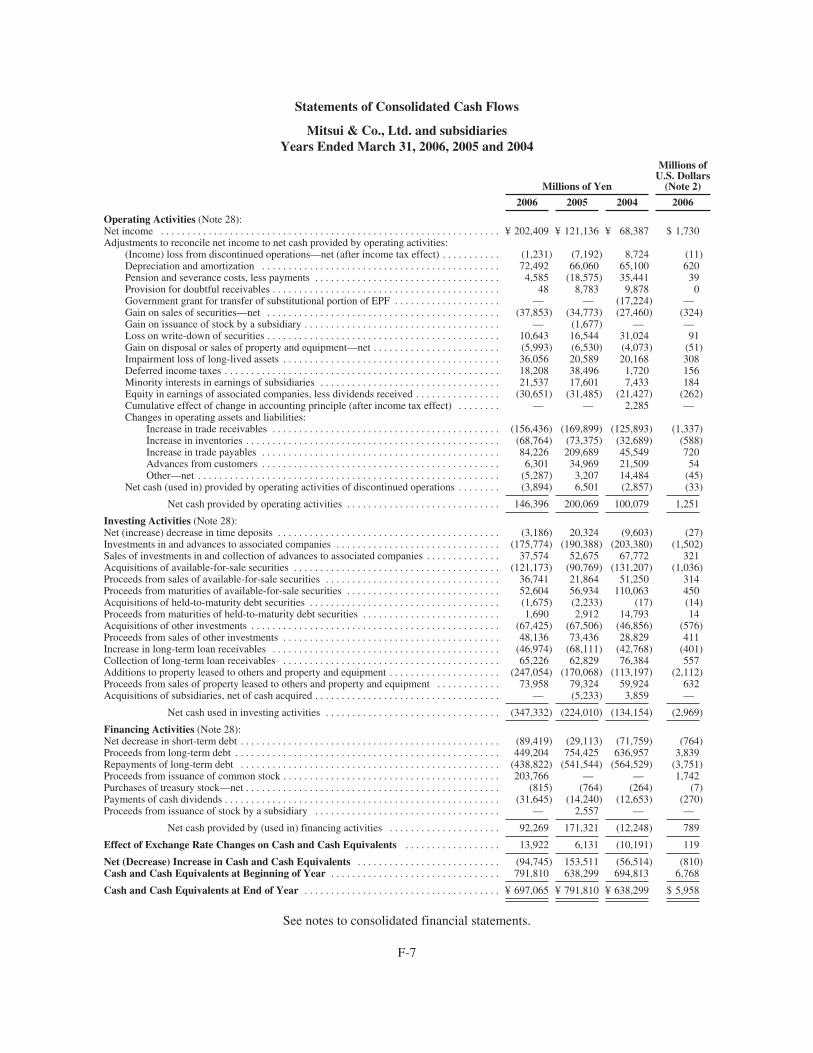
Statements of Consolidated Cash Flows
Mitsui & Co., Ltd. and subsidiariesYears Ended March 31, 2006, 2005 and 2004
Millions of Yen
Millions ofU.S. Dollars
(Note 2)
2006 2005 2004 2006
Operating Activities (Note 28):Net income . . . . . . . . . . . . . . . . . . . . . . . . . . . . . . . . . . . . . . . . . . . . . . . . . . . . . . . . . . . . . . . . ¥ 202,409 ¥ 121,136 ¥ 68,387 $ 1,730Adjustments to reconcile net income to net cash provided by operating activities:
(Income) loss from discontinued operations—net (after income tax effect) . . . . . . . . . . . (1,231) (7,192) 8,724 (11)Depreciation and amortization . . . . . . . . . . . . . . . . . . . . . . . . . . . . . . . . . . . . . . . . . . . . . 72,492 66,060 65,100 620Pension and severance costs, less payments . . . . . . . . . . . . . . . . . . . . . . . . . . . . . . . . . . . 4,585 (18,575) 35,441 39Provision for doubtful receivables . . . . . . . . . . . . . . . . . . . . . . . . . . . . . . . . . . . . . . . . . . . 48 8,783 9,878 0Government grant for transfer of substitutional portion of EPF . . . . . . . . . . . . . . . . . . . . — — (17,224) —Gain on sales of securities—net . . . . . . . . . . . . . . . . . . . . . . . . . . . . . . . . . . . . . . . . . . . . (37,853) (34,773) (27,460) (324)Gain on issuance of stock by a subsidiary . . . . . . . . . . . . . . . . . . . . . . . . . . . . . . . . . . . . . — (1,677) — —Loss on write-down of securities . . . . . . . . . . . . . . . . . . . . . . . . . . . . . . . . . . . . . . . . . . . . 10,643 16,544 31,024 91Gain on disposal or sales of property and equipment—net . . . . . . . . . . . . . . . . . . . . . . . . (5,993) (6,530) (4,073) (51)Impairment loss of long-lived assets . . . . . . . . . . . . . . . . . . . . . . . . . . . . . . . . . . . . . . . . . 36,056 20,589 20,168 308Deferred income taxes . . . . . . . . . . . . . . . . . . . . . . . . . . . . . . . . . . . . . . . . . . . . . . . . . . . . 18,208 38,496 1,720 156Minority interests in earnings of subsidiaries . . . . . . . . . . . . . . . . . . . . . . . . . . . . . . . . . . 21,537 17,601 7,433 184Equity in earnings of associated companies, less dividends received . . . . . . . . . . . . . . . . (30,651) (31,485) (21,427) (262)Cumulative effect of change in accounting principle (after income tax effect) . . . . . . . . — — 2,285 —Changes in operating assets and liabilities:
Increase in trade receivables . . . . . . . . . . . . . . . . . . . . . . . . . . . . . . . . . . . . . . . . . . . (156,436) (169,899) (125,893) (1,337)Increase in inventories . . . . . . . . . . . . . . . . . . . . . . . . . . . . . . . . . . . . . . . . . . . . . . . . (68,764) (73,375) (32,689) (588)Increase in trade payables . . . . . . . . . . . . . . . . . . . . . . . . . . . . . . . . . . . . . . . . . . . . . 84,226 209,689 45,549 720Advances from customers . . . . . . . . . . . . . . . . . . . . . . . . . . . . . . . . . . . . . . . . . . . . . 6,301 34,969 21,509 54Other—net . . . . . . . . . . . . . . . . . . . . . . . . . . . . . . . . . . . . . . . . . . . . . . . . . . . . . . . . . (5,287) 3,207 14,484 (45)
Net cash (used in) provided by operating activities of discontinued operations . . . . . . . . (3,894) 6,501 (2,857) (33)
Net cash provided by operating activities . . . . . . . . . . . . . . . . . . . . . . . . . . . . . 146,396 200,069 100,079 1,251
Investing Activities (Note 28):Net (increase) decrease in time deposits . . . . . . . . . . . . . . . . . . . . . . . . . . . . . . . . . . . . . . . . . . (3,186) 20,324 (9,603) (27)Investments in and advances to associated companies . . . . . . . . . . . . . . . . . . . . . . . . . . . . . . . (175,774) (190,388) (203,380) (1,502)Sales of investments in and collection of advances to associated companies . . . . . . . . . . . . . . 37,574 52,675 67,772 321Acquisitions of available-for-sale securities . . . . . . . . . . . . . . . . . . . . . . . . . . . . . . . . . . . . . . . (121,173) (90,769) (131,207) (1,036)Proceeds from sales of available-for-sale securities . . . . . . . . . . . . . . . . . . . . . . . . . . . . . . . . . 36,741 21,864 51,250 314Proceeds from maturities of available-for-sale securities . . . . . . . . . . . . . . . . . . . . . . . . . . . . . 52,604 56,934 110,063 450Acquisitions of held-to-maturity debt securities . . . . . . . . . . . . . . . . . . . . . . . . . . . . . . . . . . . . (1,675) (2,233) (17) (14)Proceeds from maturities of held-to-maturity debt securities . . . . . . . . . . . . . . . . . . . . . . . . . . 1,690 2,912 14,793 14Acquisitions of other investments . . . . . . . . . . . . . . . . . . . . . . . . . . . . . . . . . . . . . . . . . . . . . . . (67,425) (67,506) (46,856) (576)Proceeds from sales of other investments . . . . . . . . . . . . . . . . . . . . . . . . . . . . . . . . . . . . . . . . . 48,136 73,436 28,829 411Increase in long-term loan receivables . . . . . . . . . . . . . . . . . . . . . . . . . . . . . . . . . . . . . . . . . . . (46,974) (68,111) (42,768) (401)Collection of long-term loan receivables . . . . . . . . . . . . . . . . . . . . . . . . . . . . . . . . . . . . . . . . . 65,226 62,829 76,384 557Additions to property leased to others and property and equipment . . . . . . . . . . . . . . . . . . . . . (247,054) (170,068) (113,197) (2,112)Proceeds from sales of property leased to others and property and equipment . . . . . . . . . . . . 73,958 79,324 59,924 632Acquisitions of subsidiaries, net of cash acquired . . . . . . . . . . . . . . . . . . . . . . . . . . . . . . . . . . . — (5,233) 3,859 —
Net cash used in investing activities . . . . . . . . . . . . . . . . . . . . . . . . . . . . . . . . . (347,332) (224,010) (134,154) (2,969)
Financing Activities (Note 28):Net decrease in short-term debt . . . . . . . . . . . . . . . . . . . . . . . . . . . . . . . . . . . . . . . . . . . . . . . . . (89,419) (29,113) (71,759) (764)Proceeds from long-term debt . . . . . . . . . . . . . . . . . . . . . . . . . . . . . . . . . . . . . . . . . . . . . . . . . . 449,204 754,425 636,957 3,839Repayments of long-term debt . . . . . . . . . . . . . . . . . . . . . . . . . . . . . . . . . . . . . . . . . . . . . . . . . (438,822) (541,544) (564,529) (3,751)Proceeds from issuance of common stock . . . . . . . . . . . . . . . . . . . . . . . . . . . . . . . . . . . . . . . . . 203,766 — — 1,742Purchases of treasury stock—net . . . . . . . . . . . . . . . . . . . . . . . . . . . . . . . . . . . . . . . . . . . . . . . . (815) (764) (264) (7)Payments of cash dividends . . . . . . . . . . . . . . . . . . . . . . . . . . . . . . . . . . . . . . . . . . . . . . . . . . . . (31,645) (14,240) (12,653) (270)Proceeds from issuance of stock by a subsidiary . . . . . . . . . . . . . . . . . . . . . . . . . . . . . . . . . . . — 2,557 — —
Net cash provided by (used in) financing activities . . . . . . . . . . . . . . . . . . . . . 92,269 171,321 (12,248) 789
Effect of Exchange Rate Changes on Cash and Cash Equivalents . . . . . . . . . . . . . . . . . . 13,922 6,131 (10,191) 119
Net (Decrease) Increase in Cash and Cash Equivalents . . . . . . . . . . . . . . . . . . . . . . . . . . . (94,745) 153,511 (56,514) (810)Cash and Cash Equivalents at Beginning of Year . . . . . . . . . . . . . . . . . . . . . . . . . . . . . . . . 791,810 638,299 694,813 6,768
Cash and Cash Equivalents at End of Year . . . . . . . . . . . . . . . . . . . . . . . . . . . . . . . . . . . . . ¥ 697,065 ¥ 791,810 ¥ 638,299 $ 5,958
See notes to consolidated financial statements.
F-7

Notes to Consolidated Financial Statements
Mitsui & Co., Ltd. and subsidiaries
1. NATURE OF OPERATIONS
Mitsui & Co., Ltd. (Mitsui Bussan Kabushiki Kaisha) and subsidiaries (collectively, the “companies”), assogo shosha or general trading companies, are engaged in business activities, such as trading in variouscommodities, financing for customers and suppliers relating to such trading activities worldwide, and organizingand coordinating industrial projects through their worldwide business networks.
The companies conduct sales, export, import, offshore trades and manufacture of products in the areas of“Iron & Steel Products,” “Iron & Steel Raw Materials and Non-Ferrous Metals,” “Machinery & InfrastructureProjects,” “Chemical,” “Energy,” “Foods & Retail,” and “Lifestyle, Consumer Service and Information,Electronics & Telecommunication,” while providing general services for retailing, information andcommunications, technical support, transportation and logistics and financing.
Further, the companies are also engaged in development of natural resources such as oil and gas, and ironand steel raw materials.
In addition to the above, the companies are engaged in strategic business investments in new areas such asinformation technology, biotechnology and nanotechnology.
2. BASIS OF FINANCIAL STATEMENTS AND SUMMARY OF SIGNIFICANT ACCOUNTINGPOLICIES
I. BASIS OF FINANCIAL STATEMENTS
The accompanying consolidated financial statements are stated in Japanese yen, the currency of the countryin which Mitsui & Co., Ltd. (the “Company”) is incorporated and principally operates. The translation ofJapanese yen amounts into U.S. dollar amounts for the year ended March 31, 2006 is included solely for theconvenience of readers outside Japan and has been made at the rate of ¥117=U.S.$1, the approximate rate ofexchange at March 31, 2006. The translation should not be construed as a representation that the Japanese yenamounts could be converted into U.S. dollars at the above or any other rate.
The accompanying consolidated financial statements have been prepared on the basis of accounting principlesgenerally accepted in the United States of America (“U.S. GAAP”). Effect has been given in the consolidatedfinancial statements to adjustments which have not been entered in the companies’ general books of accountmaintained principally in accordance with accounting practices prevailing in the countries of incorporation. Majoradjustments include those relating to accounting for derivative instruments and hedging activities, recognition ofexpected losses on purchase and sale commitments, accounting for certain investments including non-monetaryexchange of investments, accounting for warrants, accounting for pension costs and severance indemnities,recognition of installment sales on the accrual basis of accounting, accounting for business combinations,accounting for goodwill and other intangible assets, accounting for asset retirement obligations, accounting forconsolidation of variable interest entities, accounting for leasing and accounting for stock issuance costs.
Total trading transactions, as presented in the accompanying Statements of Consolidated Income, are avoluntary disclosure as permitted by Financial Accounting Standards Board (“FASB”) Emerging Issues TaskForce Issue (“EITF”) No. 99-19, “Reporting Revenue Gross as a Principal versus Net as an Agent,” and representthe gross transaction volume or the aggregate nominal value of the sales contracts in which the companies act asprincipal and transactions in which the companies serve as agent. Total trading transactions should not beconstrued as equivalent to, or a substitute or a proxy for, revenues, or as an indicator of the companies’ operatingperformance, liquidity or cash flows generated by operating, investing or financing activities. The companieshave included the gross transaction volume information because similar Japanese trading companies havegenerally used it as an industry benchmark. As such, management believes that total trading transactions are auseful supplement to the results of operations information for users of the consolidated financial statements.
F-8

Notes to Consolidated Financial Statements — (Continued)
Mitsui & Co., Ltd. and subsidiaries
II. SUMMARY OF SIGNIFICANT ACCOUNTING POLICIES
Consolidation
The consolidated financial statements include the accounts of the Company, its majority-owned domesticand foreign subsidiaries, the variable interest entities (“VIEs”) where the Company or one of its subsidiaries is aprimary beneficiary, and its proportionate shares of the assets, liabilities, revenues and expenses of certain of itsoil and gas producing, and mining unincorporated joint ventures in which the companies own an undividedinterest in the assets, and pursuant to the joint venture agreements, are severally liable for their share of eachliability. The VIEs are defined by FASB Interpretation (“FIN”) No. 46, “Consolidation of Variable InterestEntities (revised December 2003)—an Interpretation of ARB No. 51” (“FIN No. 46R”). The unincorporated jointventures proportionately consolidated by the companies include but are not limited to WA-28-L J/V (40%),Block 9 J/V (35%), WA-14-L J/V (40%), Robe River Iron Associates J/V (33%), Capricorn Coal DevelopmentJ/V (30%) and Dawson J/V (49%).
The difference between the cost of investments in VIEs which are not a business and the equity in the fairvalue of the net assets at the dates of acquisition is accounted for as an extraordinary gain or loss while the excessof the cost of investments in other subsidiaries over the equity in the fair value of the net assets at the dates ofacquisition is accounted for as goodwill.
Certain subsidiaries with a fiscal year-end on or after December 31, but prior to the parent company’s fiscalyear-end of March 31, are included on the basis of the subsidiaries’ respective fiscal year-ends.
Foreign currency translation
Foreign currency financial statements have been translated in accordance with Statement of FinancialAccounting Standards (“SFAS”) No. 52, “Foreign Currency Translation.” Pursuant to this statement, the assetsand liabilities of foreign subsidiaries and associated companies are translated into Japanese yen at the respectiveyear-end exchange rates. All income and expense accounts are translated at average rates of exchange. Theresulting translation adjustments are included in accumulated other comprehensive income.
Monetary assets and liabilities denominated in foreign currencies are translated into Japanese yen atyear-end exchange rates with the resulting gains and losses recognized in earnings.
Cash equivalents
Cash equivalents are defined as short-term (original maturities of three months or less), highly liquidinvestments which are readily convertible into cash and have no significant risk of change in value includingcertificates of deposit, time deposits, financing bills and commercial papers with original maturities of threemonths or less.
Allowance for doubtful receivables
In accordance with SFAS No. 114, “Accounting by Creditors for Impairment of a Loan—an amendment ofFASB Statements No. 5 and 15,” an impairment loss for a specific loan deemed to be impaired is measured basedon the present value of expected cash flows discounted at the loan’s original effective interest rate or the fairvalue of the collateral if the loan is collateral dependent.
An allowance for doubtful receivables is recognized for all receivables not subject to the accountingrequirement of SFAS No. 114 based primarily upon the companies’ credit loss experiences and an evaluation ofpotential losses in the receivables.
F-9
Notes to Consolidated Financial Statements — (Continued)
Mitsui & Co., Ltd. and subsidiaries
Inventories
Inventories, consisting mainly of commodities and materials for resale, are stated at the lower of cost,principally on the specific-identification basis, or market.
Derivative instruments and hedging activities
In accordance with SFAS No. 133, “Accounting for Derivative Instruments and Hedging Activities,” asamended by SFAS No. 138, “Accounting for Certain Derivative Instruments and Certain Hedging Activities—anamendment of FASB Statement No. 133,” and SFAS No. 149, “Amendment of Statement 133 on DerivativeInstruments and Hedging Activities,” all derivative instruments are recognized and measured at fair value aseither assets or liabilities in the Consolidated Balance Sheets. The accounting for changes in the fair valuedepends on the intended use of the derivative instruments and their resulting hedge designation.
The companies enter into derivative commodity instruments, such as future, forward, option and swapcontracts, as a means of hedging the exposure to changes in the fair value of inventories and unrecognized firmcommitments and the exposure to variability in the expected future cash flows from forecasted transactions,principally for non-ferrous metals, crude oil and agricultural products.
Changes in the fair value of derivative commodity instruments, designated and effective as fair valuehedges, are recognized in sales of products or cost of products sold as offsets to changes in the fair value of thehedged items. Changes in the fair value of derivative commodity instruments, designated and effective as cashflow hedges, are initially recorded as other comprehensive income and reclassified into earnings as sales ofproducts or cost of products sold when the hedged transactions affect earnings. Changes in the fair value of theineffective portion are recognized in sales of products or cost of products sold immediately.
Changes in the fair value of derivative commodity instruments, for which hedge requirements are not metunder SFAS No. 133, are currently recognized in sales of products or cost of products sold without any offsettingchanges in the fair value of the hedged items.
The Company and certain subsidiaries also enter into agreements for derivative commodity instruments as apart of their trading activities. These derivative instruments are marked to market and gains or losses resultingfrom these contracts are reported in other sales.
Changes in the fair value of all open positions of precious metals traded in terminal (future) markets arerecognized in other sales in order to reflect the fair value of commodity trading transactions consisting ofinventories, unrecognized firm commitments and derivative commodity instruments as a whole.
The companies enter into derivative financial instruments such as interest rate swap agreements, foreignexchange forward contracts, currency swap agreements, and interest rate and currency swap agreements as ameans of hedging their interest rate and foreign exchange exposure.
Changes in the fair value of interest rate swap agreements, designated and effective as fair value hedges forchanges in the fair value of fixed-rate financial assets or liabilities attributable to changes in the designatedbenchmark interest rate, are recognized in interest income and expense as offsets to changes in the fair value ofhedged items. Changes in the fair value of interest rate swap agreements, designated and effective as cash flowhedges for changes in the cash flows of floating-rate financial assets or liabilities attributable to changes in thedesignated benchmark interest rate, are initially recorded in other comprehensive income and reclassified intoearnings as interest income and expense when the hedged transactions affect earnings. Changes in the fair valueof the ineffective portion are recognized in interest income and expense immediately.
F-10
Notes to Consolidated Financial Statements — (Continued)
Mitsui & Co., Ltd. and subsidiaries
Changes in the fair value of foreign exchange forward contracts and currency swap agreements, designatedand effective as cash flow hedges for changes in the cash flows of foreign-currency-denominated assets orliabilities, unrecognized firm commitments and forecasted transactions attributable to changes in the relatedforeign currency exchange rate, are initially recorded in other comprehensive income and reclassified intoearnings as foreign exchange gains or losses when the hedged transactions affect earnings. Changes in the fairvalue of the ineffective portion are recognized in foreign exchange gains or losses immediately.
Changes in the fair value of interest rate and currency swap agreements, designated and effective as fairvalue hedges or cash flow hedges for changes in the fair values or cash flows of foreign-currency-denominatedassets or liabilities attributable to changes in the designated benchmark interest rate or the related foreigncurrency exchange rate are recorded as either earnings or other comprehensive income depending on thetreatment of foreign currency hedges as fair value hedges or cash flow hedges.
Changes in the fair value of derivative financial instruments, for which hedge requirements are not metunder SFAS No. 133, are currently recognized in interest income and expense for interest rate swap agreementsand in foreign exchange gains or losses for foreign exchange forward contracts, currency swap agreements andinterest rate and currency swap agreements.
The Company and certain subsidiaries also enter into agreements for certain derivative financial instrumentsas a part of their trading activities. These derivative financial instruments are marked to market and the relatedgains or losses are reported in other sales.
The companies use non-derivative financial instruments, such as foreign-currency-denominated debt, inorder to reduce the foreign currency exposure in the net investment in a foreign operation. The foreign currencytransaction gains or losses on these instruments, designated as and effective as hedging instruments, are deferredand recorded as foreign currency translation adjustments within other comprehensive income to the extent theyare effective as hedge. These amounts are only recognized in income upon the complete or partial sale of therelated investment or the complete liquidation of the investment.
For the Statements of Consolidated Cash Flows, cash flows from derivative commodity instruments andderivative financial instruments that qualify for hedge accounting are included in the same category as the itemsbeing hedged.
Debt and marketable equity securities
The companies classify debt and marketable equity securities, at acquisition, into one of three categories:held-to-maturity, available-for-sale or trading under provisions of SFAS No. 115, “Accounting for CertainInvestments in Debt and Equity Securities.”
Trading securities are carried at fair value and unrealized holding gains and losses are included in earnings.
Debt securities are classified as held-to-maturity and measured at amortized cost in the ConsolidatedBalance Sheets only if the companies have the positive intent and ability to hold those securities to maturity.Premiums and discounts amortized in the period are included in interest income.
Debt and marketable equity securities other than those classified as trading or held-to-maturity securities areclassified as available-for-sale securities and carried at fair value with related unrealized holding gains and lossesreported in accumulated other comprehensive income in shareholders’ equity on a net-of-tax basis.
For other than a temporary decline in the value of debt and marketable equity securities below their cost oramortized cost, the investment is reduced to its fair value, which becomes the new cost basis of the investment.
F-11
Notes to Consolidated Financial Statements — (Continued)
Mitsui & Co., Ltd. and subsidiaries
The amount of the reduction is reported as a loss for the year in which such determination is made. Variousfactors, such as the extent which the cost exceeds the market value, the duration of the market decline, thefinancial condition and near-term prospects of the issuer, and the intent and ability to retain the investment for aperiod of time sufficient to allow for any anticipated recovery in market value, are reviewed to judge whether thedecline is other than temporary.
The cost of debt and marketable securities sold is determined based on the moving-average cost method.
Non-marketable equity securities
Non-marketable equity securities are carried at cost. When other than a temporary decline in the value ofsuch securities below their cost occurs, the investment is reduced to its fair value and an impairment loss isrecognized. Various factors, such as the financial condition and near-term prospects of the issuer, are reviewed tojudge whether it is other than temporary.
The cost of non-marketable equity securities sold is determined based on the moving-average cost method.
Investments in associated companies
Investments in associated companies (investees owned 20% to 50%, corporate joint ventures and otherinvestees over which the companies have the ability to exercise significant influence) and noncontrollinginvestments in general partnerships, limited partnerships and limited liability companies are accounted for underthe equity method, after appropriate adjustments for intercompany profits and dividends. The differencesbetween the cost of such investments and the companies’ equity in the underlying fair value of the net assets ofassociated companies at the dates of acquisition are recognized as equity method goodwill.
For other than a temporary decline in the value of investments in associated companies below the carryingamount, the investment is reduced to its fair value and an impairment loss is recognized.
Leasing
The companies are engaged in lease financing consisting of direct financing leases and leveraged leases, andin operating leases of properties. For direct financing leases, unearned income is amortized to income over thelease term at a constant periodic rate of return on the net investment. Income on leveraged leases is recognizedover the life of the lease at a constant rate of return on the positive net investment. Initial direct costs are deferredand amortized using the interest method over the lease period. Operating lease income is recognized as othersales over the term of underlying leases on a straight-line basis.
The companies are also lessees of various assets. Rental expenses on operating leases are recognized overthe respective lease terms using the straight-line method.
Property and equipment
Property and equipment are stated at cost.
Depreciation of property and equipment (including property leased to others) is computed principally underthe declining-balance method for assets located in Japan and under the straight-line method for assets locatedoutside Japan, using rates based upon the estimated useful lives of the related property and equipment. Theestimated useful lives for buildings, equipment and fixtures, and vessels are primarily 8 to 65 years, 2 to 30
F-12
Notes to Consolidated Financial Statements — (Continued)
Mitsui & Co., Ltd. and subsidiaries
years, and 8 to 20 years, respectively. Mineral rights are amortized over their respective estimated useful lives,which are 14 to 20 years, using the straight-line method or the unit-of-production method.
Leasehold improvements are amortized over the lesser of the useful life of the improvement or the term ofthe underlying lease.
Significant renewals and additions are capitalized at cost. Maintenance and repairs, and minor renewals andbetterments are charged to expense as incurred.
Impairment of long-lived assets
In accordance with SFAS No. 144, “Accounting for the Impairment or Disposal of Long-Lived Assets,”long-lived assets to be held and used or to be disposed of other than by sale are reviewed, by using undiscountedfuture cash flows, for impairment whenever events or changes in circumstances indicate that the carrying amountof the assets may not be recoverable. If the sum of the expected future cash flows is less than the carrying amountof the asset, an impairment loss is recognized. Such impairment loss is measured as the amount by which thecarrying amount of the asset exceeds its fair value. Long-lived assets to be disposed of by sale are reported at thelower of carrying amount or fair value less cost to sell.
Business combinations
In accordance with SFAS No. 141, “Business Combinations,” the purchase method of accounting is used forall business combinations. The companies separately recognize and report acquired intangible assets as goodwillor other intangible assets. Any excess of fair value of acquired net assets over cost arising from a businesscombination is immediately recognized as an extraordinary gain.
Goodwill and other intangible assets
In accordance with SFAS No. 142, “Goodwill and Other Intangible Assets,” goodwill is not amortized buttested for impairment annually or more frequently if impairment indicators arise. Identifiable intangible assetswith a finite useful life are amortized over their respective estimated useful lives and reviewed for impairment inaccordance with SFAS No. 144. Any identifiable intangible asset determined to have an indefinite useful life isnot amortized, but instead tested for impairment in accordance with SFAS No. 142 until its useful life isdetermined to be no longer indefinite.
Equity method goodwill is reviewed for impairment as a part of other than a temporary decline in the valueof investments in associated companies below the carrying amount in accordance with Accounting PrinciplesBoard (“APB”) Opinion No. 18, “The Equity Method of Accounting for Investments in Common Stock.”
Intangible assets subject to amortization consist primarily of software, unpatented technologies, trademarks,patents and customer relationships which are amortized over their respective estimated useful lives using thestraight-line method. The estimated useful lives for software, unpatented technologies, trademarks, patents andcustomer relationships are 3 to 5 years, 10 years, 5 to 10 years, 5 years and 10 to 30 years, respectively.Intangible assets not subject to amortization mainly consist of land rights and trademarks.
Oil and gas producing activities
Oil and gas exploration and development costs are accounted for using the successful efforts method ofaccounting. The costs of acquiring properties, costs of drilling and equipping exploratory wells, and costs ofdevelopment wells and related plant and equipment are capitalized, and amortized using the unit-of-productionmethod. Exploratory well costs are expensed, if economically recoverable reserves are not found. Otherexploration costs, such as geological and geophysical costs, are expensed as incurred.
F-13

Notes to Consolidated Financial Statements — (Continued)
Mitsui & Co., Ltd. and subsidiaries
In accordance with SFAS No. 144, proved properties are reviewed for impairment whenever events orchanges in circumstances indicate that the carrying value may not be recoverable. If the proved properties aredetermined to be impaired, an impairment loss is recognized based on the fair value. Unproven properties areassessed annually for impairment in accordance with the guidance in SFAS No. 19, “Financial Accounting andReporting by Oil and Gas Producing Companies,” with any impairment charged to expense. The companies’policy is to consider the unproved properties not impaired if the estimated reserves of those properties can beestablished to be economically viable. Economically viable means that they may be developed in such a way thatit is probable that over their project lives they will generate, at a minimum, zero net cash flow on anundiscounted pre-tax basis, based on current prices. For the purpose of this test, the current price is the price atthe end of the period for which the review is conducted for the reserves concerned.
Mining operations
Mining exploration costs are expensed as incurred until the mining project has been established ascommercially viable by a final feasibility study. Once established as commercially viable, costs are capitalized asdevelopment costs and are amortized using the unit-of-production method or straight-line method based on theproven and probable reserves.
In open pit mining operations, it is necessary to remove overburden and other waste materials to accessmineral deposits. The costs of removing waste materials are referred to as “stripping costs.” During thedevelopment of a mine, before production commences, such costs are generally capitalized as part of thedevelopment costs. Removal of waste materials continues during the production stage of the mine. Such post-production stripping costs are variable production costs to be considered a component of mineral inventory costsand are recognized as a component of costs of products sold in the same period as the related revenues from thesales of the minerals. Depending on the configuration of the mineral deposits, the post-production stripping costscould lead to a lower of cost or market inventory adjustment.
Asset retirement obligations
In accordance with SFAS No. 143, “Accounting for Asset Retirement Obligations,” the companies recordthe fair value of a liability for an asset retirement obligation in the period in which it is incurred. When theliability is initially recorded, the companies capitalize the related cost by increasing the carrying amount of thelong-lived asset. Over time, the liability is accreted to its present value each period, and the capitalized cost isdepreciated over the useful life of the related asset.
Pension and severance indemnities plans
The companies have pension plans and/or severance indemnities plans covering substantially all employeesother than directors. The costs of the pension plans and severance indemnities plans are accrued based onamounts determined using actuarial methods, in accordance with SFAS No. 87, “Employers’ Accounting forPensions.”
Guarantees
In accordance with FIN No. 45, “Guarantor’s Accounting and Disclosure Requirements for Guarantees,Including Indirect Guarantees of Indebtedness of Others—an Interpretation of FASB Statements No. 5, 57 and107 and rescission of FASB Interpretation No. 34,” the companies recognize, at the inception of a guarantee, aliability for the fair value of the obligation undertaken for the guarantee.
F-14
Notes to Consolidated Financial Statements — (Continued)
Mitsui & Co., Ltd. and subsidiaries
Revenue recognition
The companies recognize revenues when they are realized or realizable and earned. Revenues are realized orrealizable and earned when the companies have persuasive evidence of an arrangement, the goods have beendelivered or the services have been rendered to the customer, the sales price is fixed or determinable andcollectibility is reasonably assured. In addition to this general policy, the following are specific revenuerecognition policies:
Sales of products
Sales of products include the sales of various products as a principal in the transactions, the manufacture andsale of a wide variety of products such as metals, chemicals, foods and general consumer merchandise, thedevelopment of natural resources such as coal, iron ore, oil and gas, and the development and sale of real estate.The companies recognize those revenues at the time the delivery conditions agreed with customers are met.These conditions are usually considered to have been met when the goods are received by the customer, the titleto the warehouse receipts is transferred, or the implementation testing is duly completed.
For long-term construction contracts such as railroad projects, depending on the nature of the contract,revenues are accounted for by the percentage-of-completion method if estimates of costs to complete and extentof progress toward completion of long-term contracts are reasonably dependable, otherwise the companies usethe completed contract method.
The Company and certain subsidiaries enter into buy/sell arrangements, mainly relating to transactions ofcrude oil and petroleum products. Under buy/sell arrangements, which are entered into primarily to optimizesupply or demand requirements, the Company and certain subsidiaries agree to buy (sell) a specific quality andquantity of commodities to be delivered at a specific location and/or time while agreeing to sell (buy) the samequality and quantity of the commodities at a different location and/or time to the same counterparty. The buy/sellarrangements are reported on a net basis in the Statements of Consolidated Income.
Sales of services
Sales of services include the revenues from trading margins and commissions related to various tradingtransactions in which the companies act as a principal or an agent. Specifically, the companies charge acommission for the performance of various services such as logistic and warehouse services, information andcommunication services, and technical support. For some back-to-back sales and purchase transactions ofproducts, the companies act as a principal and record the net amount of sales and purchase prices as revenues.The companies also facilitate conclusion of the contracts between manufacturers and customers and deliveries forthe products between suppliers and customers. Revenues from service related businesses are recorded asrevenues when the contracted services are rendered to third-party customers pursuant to the agreements.
Other sales
Other sales principally include the revenues from leasing activities of real estate, rolling stock, oceantransport vessels, aircraft, equipment and others, the revenues from derivative commodity instruments andderivative financial instruments held for trading purposes, and the revenues from external consumer financing.See accounting policies for leasing and derivative instruments and hedging activities for the revenue recognitionpolicies regarding leasing and derivative transactions, respectively.
Research and development expenses
Research and development costs are charged to expenses when incurred.
F-15
Notes to Consolidated Financial Statements — (Continued)
Mitsui & Co., Ltd. and subsidiaries
Advertising expenses
Advertising costs are charged to expenses when incurred.
Issuance of stock by subsidiaries and associated companies
A subsidiary or an associated company may issue its shares to third parties at amounts per share in excess ofor less than the Company’s average per share carrying value. With respect to such transactions, the resultinggains or losses arising from the change in equity interest are recorded in income for the year in which such sharesare issued.
Income taxes
Income tax expense is based on reported earnings before income taxes. Deferred income taxes reflect theimpact of temporary differences between assets and liabilities recognized for financial reporting purposes andsuch amounts recognized for tax purposes and tax loss carryforwards. These deferred taxes are measured usingthe currently enacted tax rates in effect for the year in which the temporary differences or tax loss carryforwardsare expected to reverse. Valuation allowances are established when it is more likely than not that some or all ofthe deferred tax assets will not be realized.
Net income per share
Basic net income per share is computed by dividing net income by the weighted-average number ofcommon shares outstanding for the period. Diluted net income per share reflects the potential dilution as a resultof issuance of shares upon conversion of the companies’ convertible bonds.
III. RECLASSIFICATION
Certain reclassifications and format changes have been made to prior year amounts to conform to the currentyear presentation.
IV. NEW ACCOUNTING STANDARDS
The meaning of other-than-temporary impairment and its application to certain investments
During the year ended March 31, 2006, the companies adopted FASB Staff Position (“FSP”) Nos. FAS115-1 and FAS 124-1 “The Meaning of Other-Than-Temporary Impairment and Its Application to CertainInvestments.”
FSP Nos. FAS 115-1 and FAS 124-1 provides guidance on determining when an investment is consideredimpaired, whether that impairment is other than temporary, and the measurement of an impairment loss. FSPNos. FAS 115-1 and FAS 124-1 also includes accounting considerations subsequent to the recognition of another-than-temporary impairment and requires certain quantitative and qualitative disclosures about unrealizedlosses on debt and equity securities.
The effect of adoption of this guidance on the companies’ financial position and results of operations wasimmaterial.
Inventory costs
In November 2004, the FASB issued SFAS No. 151, “Inventory Costs—an amendment of ARB No. 43,Chapter 4.”
F-16
Notes to Consolidated Financial Statements — (Continued)
Mitsui & Co., Ltd. and subsidiaries
SFAS No. 151 requires that abnormal amounts of idle facility expense, freight, handling costs, and wastedmaterial (spoilage) should be recognized as current-period charges. In addition, SFAS No. 151 requires thatallocation of fixed production overheads to the costs of conversion be based on the normal capacity of theproduction facilities.
SFAS No. 151 is effective for inventory costs incurred during fiscal years beginning after June 15, 2005.The effect of adoption of this statement on the companies’ financial position and results of operations will beimmaterial.
Exchanges of nonmonetary assets
During the year ended March 31, 2006, the companies adopted SFAS No. 153, “Exchanges of NonmonetaryAssets—an amendment of APB Opinion No. 29.”
SFAS No. 153 eliminates the exception to fair value measurement for nonmonetary exchanges of similarproductive assets and replaces it with a general exception to fair value measurement for exchanges ofnonmonetary assets that do not have commercial substance. A nonmonetary exchange has commercial substanceif the future cash flows of the entity are expected to change significantly as a result of the exchange.
The effect of adoption of this statement on the companies’ financial position and results of operations wasimmaterial.
Share-based payment
In December 2004, the FASB issued SFAS No. 123 (revised 2004), “Share-Based Payment” (“SFASNo. 123R”). SFAS No. 123R requires the compensation cost from share-based payment transactions to berecognized in the financial statements. The amount of the compensation cost is measured based on the grant-datefair value of the equity instruments issued or the liabilities incurred. In addition, the award of liabilityinstruments will be remeasured at the end of each reporting period. The compensation cost is recognized over therequisite service period.
In April 2005, the U.S. Securities and Exchange Commission adopted a new rule which amends theeffective dates for SFAS No. 123R. Under the new rule, SFAS No. 123R is effective for fiscal years beginningafter June 15, 2005. The effect of adoption of this statement on the companies’ financial position and results ofoperations will be immaterial.
Accounting for stripping costs incurred during production in the mining industry
In March 2005, the FASB Emerging Issues Task Force reached a consensus on Issue No. 04-6 (“EITFNo. 04-6”), “Accounting for Stripping Costs Incurred during Production in the Mining Industry.”
EITF No. 04-6 requires that stripping costs incurred during the production stage of the mine be accountedfor as variable production costs that should be considered a component of mineral inventory costs and recognizedas a component of costs of sales in the same period as the revenue from the sale of the inventory.
EITF No. 04-6 is effective for fiscal years beginning after December 15, 2005. The effect of adoption of thisconsensus on the companies’ financial position and results of operations will be immaterial.
Conditional asset retirement obligations
During the year ended March 31, 2006, the companies adopted FIN No. 47, “Accounting for ConditionalAsset Retirement Obligations—an interpretation of FASB Statement No. 143.”
F-17
Notes to Consolidated Financial Statements — (Continued)
Mitsui & Co., Ltd. and subsidiaries
FIN No. 47 clarifies that an entity is required to recognize a liability for the fair value of a legal obligation toperform asset retirement activities that are conditional on a future event if the amount can be reasonablyestimated. FIN No. 47 also clarifies when an entity would have sufficient information to reasonably estimate thefair value of an asset retirement obligation.
The effect of adoption of this interpretation on the companies’ financial position and results of operationswas immaterial.
Accounting for purchases and sales of inventory with the same counterparty
In September 2005, the FASB Emerging Issues Task Force reached a consensus on Issue No. 04-13 (“EITFNo. 04-13”), “Accounting for Purchases and Sales of Inventory with the Same Counterparty.”
EITF No. 04-13 requires that two or more inventory purchase and sales transactions with the samecounterparty that are entered into in contemplation of one another should be combined for purposes of applyingAPB Opinion No. 29, “Accounting for Nonmonetary Transactions.” EITF No. 04-13 also requires that allnonmonetary exchanges of inventory within the same line of business other than those whereby an entitytransfers finished goods inventory in exchange for the receipt of raw materials or work-in-process inventoryshould be recognized at the carrying amount of the inventory transferred.
EITF No. 04-13 is effective for new arrangements entered into, and modifications or renewals of existingarrangements, beginning in the first interim or annual reporting period beginning after March 15, 2006. Theeffect of adoption of this consensus on the companies’ financial position and results of operations will beimmaterial.
Accounting for certain hybrid financial instruments
In February 2006, the FASB issued SFAS No. 155, “Accounting for Certain Hybrid Financial Instruments—an amendment of FASB Statements No. 133 and 140.”
One of the amendments to SFAS No. 133 and SFAS No. 140 is that SFAS No. 155 permits an entity to electfair value remeasurement for any hybrid financial instrument in its entirety with changes in fair value recognizedin earnings, in which the hybrid financial instrument contains an embedded derivative that otherwise wouldrequire bifurcation.
SFAS No. 155 is effective for all financial instruments acquired, issued, or subject to a remeasurement eventoccurring after the beginning of an entity’s first fiscal year that begins after September 15, 2006. The effect ofadoption of this statement on the companies’ financial position and results of operations is not currently knownand cannot be reasonably estimated until further analysis is completed.
Accounting for servicing of financial assets
In March 2006, the FASB issued SFAS No. 156, “Accounting for Servicing of Financial Assets—anamendment of FASB Statement No. 140.”
SFAS No. 156 requires all separately recognized servicing assets and servicing liabilities to be initiallymeasured at fair value, if practicable, and permits an entity to choose either the amortization method or the fairvalue measurement method for subsequent measurement of each class of separately recognized servicing assetsand servicing liabilities.
F-18
Notes to Consolidated Financial Statements — (Continued)
Mitsui & Co., Ltd. and subsidiaries
SFAS No. 156 is effective as of the beginning of its first fiscal year that begins after September 15, 2006.The effect of adoption of this statement on the companies’ financial position and results of operations is notcurrently known and cannot be reasonably estimated until further analysis is completed.
V. USE OF ESTIMATES IN THE PREPARATION OF THE CONSOLIDATED FINANCIALSTATEMENTS
The preparation of consolidated financial statements in conformity with U.S. GAAP requires managementto make estimates and assumptions that affect the reported amounts of assets and liabilities and disclosure ofcontingent assets and liabilities at the date of the consolidated financial statements and the reported amounts ofrevenues and expenses during the reporting period. Actual results could differ from those estimates.
3. BUSINESS COMBINATIONS
For the year ended March 31, 2006
The business combinations, which were completed during the year ended March 31, 2006, were immaterial.
For the year ended March 31, 2005
The following are the primary business combinations, which were completed during the year endedMarch 31, 2005.
Cornerstone Nutritional Labs, LLC
On December 21, 2004, CornerStone Research & Development, Inc., a wholly owned subsidiary ofMitsui & Co. (U.S.A.), Inc. (“Mitsui USA,” a wholly owned subsidiary of the Company), agreed withCornerstone Nutritional Labs, LLC (“Cornerstone”) to take over its nutraceutical business by acquiringsubstantially all of the assets used in the business for U.S. $84.5 million. Cornerstone covers every aspect ofnutraceutical production including raw material sourcing, blending, encapsulation and packaging in addition tonew product development and sells its products to wholesalers mainly throughout the United States and Canada.
Demand for nutraceuticals in the U.S. market, which is one of the largest supplements markets in the world,has been continuously growing. By acquiring Cornerstone’s business through Mitsui USA, which had sold rawmaterials for supplements to Cornerstone, the companies have established a vertically integrated businessstructure from raw material sourcing to manufacturing end products and believe the acquisition will contribute tothe companies’ business performance. This acquisition is consistent with the companies’ core strategy, whichplaces strategic investments in the medical and healthcare field.
The consolidated financial statements for the year ended March 31, 2005 include the operating results ofCornerstone from the date of acquisition.
The purchase price was determined based on the expected future cash flows Cornerstone will generate. Theexcess of the purchase price over the fair value of net assets acquired was recorded as goodwill. The significantfactors that contributed to the determination of the purchase price that resulted in the recognition of goodwillinclude the following: (1) the growth potential of Cornerstone’s supplements business due to an increaseddemand by major supplement makers to contract manufacturers including Cornerstone to provide every aspect ofnutraceutical production and (2) the synergies that might be achieved from combining the operations with theCompany and Mitsui USA’s supplements businesses.
F-19

Notes to Consolidated Financial Statements — (Continued)
Mitsui & Co., Ltd. and subsidiaries
In connection with this acquisition, ¥4,395 million and ¥3,490 million were assigned to intangible assetssubject to amortization and goodwill, respectively. The intangible assets subject to amortization consist primarilyof customer relationships of ¥4,093 million with an amortization period of ten years. The goodwill is deductiblefor tax purposes and has been assigned to the Americas Segment.
The following table summarizes the estimated fair values of the assets acquired and liabilities assumed atthe date of acquisition:
Millions of Yen
Current assets . . . . . . . . . . . . . . . . . . . . . . . . . . . . . . . . . . . . . . . . . . . . . . . . . . . . . . . . . . . . . . . . . . . ¥ 2,174Property and equipment . . . . . . . . . . . . . . . . . . . . . . . . . . . . . . . . . . . . . . . . . . . . . . . . . . . . . . . . . . . 209Intangible assets . . . . . . . . . . . . . . . . . . . . . . . . . . . . . . . . . . . . . . . . . . . . . . . . . . . . . . . . . . . . . . . . . 7,885
Total assets acquired . . . . . . . . . . . . . . . . . . . . . . . . . . . . . . . . . . . . . . . . . . . . . . . . . . . . . . . . . 10,268
Current liabilities . . . . . . . . . . . . . . . . . . . . . . . . . . . . . . . . . . . . . . . . . . . . . . . . . . . . . . . . . . . . . . . . (1,414)
Total liabilities assumed . . . . . . . . . . . . . . . . . . . . . . . . . . . . . . . . . . . . . . . . . . . . . . . . . . . . . . . (1,414)
Net assets acquired . . . . . . . . . . . . . . . . . . . . . . . . . . . . . . . . . . . . . . . . . . . . . . . . . . . . . . . . . . . ¥ 8,854
Pro forma results of operations for the above business combination have not been presented because theeffects were not material to the consolidated financial statements.
NextCom K.K.
BSI Co., Ltd. (“BSI,” a wholly owned subsidiary of the Company), ADAM NET Ltd. (“ADAM NET,” a92.3% owned subsidiary of the Company) and NextCom K.K. (“NextCom,” a 31.2% owned associated companyof the Company accounted for under the equity method) entered into a merger agreement on September 10, 2004and merged on December 11, 2004. NextCom remains as the surviving company among them. In conjunctionwith the merger, NextCom issued its own stocks to each shareholder of BSI and ADAM NET. As a result, theCompany’s ownership of voting shares of NextCom rose by 16.5% to 47.7%. Upon the merger, by appointing amajority of the board members, the companies took control of the decision making by NextCom’s board ofdirectors, and consequently, NextCom became a subsidiary of the Company. This exchange transaction wasaccounted for as partial sales of shares of BSI and ADAM NET previously owned by the Company and partialacquisitions of shares of NextCom. As a result of the partial sales transaction, the companies recognized a gain of¥3,715 million in gain on sales of securities—net during the year ended March 31, 2005.
NextCom is engaged in the development and distribution of networking equipment, the consultation ofnetwork building, and system integration as its main businesses, and also provides other services relating to theabove main businesses in Japan. The companies have designated network integration and system integrationbusinesses, which are expected to be high growth businesses along with growth in the broadband networkmarket, as strategic initiatives, and aim to build a framework which creates synergies of comprehensive servicesincluding both upstream and downstream services in the information technology industry for the purpose ofmaximizing the companies’ profit. This acquisition is consistent with the companies’ core strategy as mentionedabove.
The consolidated financial statements for the year ended March 31, 2005 include the operating results ofNextCom as a subsidiary from the date of acquisition, i.e., the date of the merger.
Since NextCom is listed on the Tokyo Stock Exchange, the purchase price of the partial acquisitions wasdetermined based on the market price of the shares of NextCom over a reasonable period of time before and after
F-20

Notes to Consolidated Financial Statements — (Continued)
Mitsui & Co., Ltd. and subsidiaries
the terms of the acquisition were agreed to and announced. The excess of the purchase price of ¥4,441 million,over the fair value of net assets acquired was recorded as goodwill. The significant factors that contributed to thedetermination of the purchase price that resulted in the recognition of goodwill include the following: (1) thegrowth potential of NextCom by taking advantage of scale, strengthening technological capabilities, and abroadening customer base, which are brought about by the merger of the three companies and (2) the synergiesthat might be achieved from combining the operations with the companies’ businesses. These factors are basedon the expectations of continuous growth of network integration and system integration businesses.
In connection with this acquisition, ¥128 million, ¥7 million and ¥3,063 million were assigned to intangibleassets subject to amortization, intangible assets not subject to amortization and goodwill, respectively. Thegoodwill is not deductible for tax purposes and has been assigned to the Lifestyle, Consumer Service andInformation, Electronics & Telecommunication Segment.
The following table summarizes the estimated fair values of the assets acquired and liabilities assumed atthe date of acquisition:
Millions of Yen
Current assets . . . . . . . . . . . . . . . . . . . . . . . . . . . . . . . . . . . . . . . . . . . . . . . . . . . . . . . . . . . . . . . . . . . ¥ 16,995Property and equipment . . . . . . . . . . . . . . . . . . . . . . . . . . . . . . . . . . . . . . . . . . . . . . . . . . . . . . . . . . . 908Intangible assets . . . . . . . . . . . . . . . . . . . . . . . . . . . . . . . . . . . . . . . . . . . . . . . . . . . . . . . . . . . . . . . . . 3,198Investments and other assets . . . . . . . . . . . . . . . . . . . . . . . . . . . . . . . . . . . . . . . . . . . . . . . . . . . . . . . 1,488
Total assets acquired . . . . . . . . . . . . . . . . . . . . . . . . . . . . . . . . . . . . . . . . . . . . . . . . . . . . . . . . . 22,589
Current liabilities . . . . . . . . . . . . . . . . . . . . . . . . . . . . . . . . . . . . . . . . . . . . . . . . . . . . . . . . . . . . . . . . (6,270)Long-term liabilities . . . . . . . . . . . . . . . . . . . . . . . . . . . . . . . . . . . . . . . . . . . . . . . . . . . . . . . . . . . . . . (1,356)Minority interest . . . . . . . . . . . . . . . . . . . . . . . . . . . . . . . . . . . . . . . . . . . . . . . . . . . . . . . . . . . . . . . . . (5,981)
Total liabilities assumed . . . . . . . . . . . . . . . . . . . . . . . . . . . . . . . . . . . . . . . . . . . . . . . . . . . . . . . (13,607)
Net assets acquired . . . . . . . . . . . . . . . . . . . . . . . . . . . . . . . . . . . . . . . . . . . . . . . . . . . . . . . . . . . ¥ 8,982
Pro forma results of operations for the above business combination have not been presented because theeffects were not material to the consolidated financial statements.
For the year ended March 31, 2004
The following is a primary business combination, which was completed during the year ended March 31,2004.
On May 30, 2003, the Company entered into an agreement with Mitsui Norin Co., Ltd. (“Mitsui Norin”) toacquire the newly issued shares of Mitsui Norin for ¥6,400 million and completed the acquisition on August 19,2003, resulting in the 85% ownership of voting shares of Mitsui Norin. Mitsui Norin mainly manufactures andsells processed products of tea and beverage material for tea.
Prior to the acquisition, Mitsui Norin had suffered from a large amount of impaired real estate investments madeduring the Japanese bubble economy period. In connection with a revival plan, Mitsui Norin exited the propertydevelopment business and focused its management resources on the profitable food business. Having considered theplan, the Company decided to acquire the newly issued shares to further strengthen Mitsui Norin’s competitiveness inthe food businesses, which consist mainly of manufacturing and sales of tea for home and business use and leaves fortea beverages. The Company has a strategic business plan to assist and expand the operations of Mitsui Norin as a coreconsolidated subsidiary in the tea material businesses conducted by the companies.
F-21

Notes to Consolidated Financial Statements — (Continued)
Mitsui & Co., Ltd. and subsidiaries
The consolidated financial statements for the year ended March 31, 2004 include the operating results ofMitsui Norin from the date of acquisition.
The purchase price was determined based on the expected future cash flows Mitsui Norin will generate. Theexcess of the purchase price over the fair value of net assets acquired was recorded as goodwill. The significantfactors that contributed to the determination of the purchase price that resulted in the recognition of goodwillinclude the following: (1) Mitsui Norin’s long-term relationships with customers in the food market, (2) growthpotential of Mitsui Norin’s tea materials business and (3) the synergies that might be achieved from combiningthe operations with the Company’s food businesses.
In connection with this acquisition, ¥16,607 million, ¥2,387 million and ¥16,547 million were assigned tointangible assets subject to amortization, intangible assets not subject to amortization and goodwill, respectively.The intangible assets subject to amortization consist primarily of unpatented technologies of ¥15,658 millionwith an amortization period of ten years. The intangible assets not subject to amortization consist primarily of atrademark of ¥2,375 million. The goodwill is deductible for tax purposes and has been assigned to the Foods &Retail Segment.
The following table summarizes the estimated fair values of the assets acquired and liabilities assumed atthe date of acquisition:
Millions of Yen
Current assets . . . . . . . . . . . . . . . . . . . . . . . . . . . . . . . . . . . . . . . . . . . . . . . . . . . . . . . . . . . . . . . . . . . ¥ 30,736Property and equipment . . . . . . . . . . . . . . . . . . . . . . . . . . . . . . . . . . . . . . . . . . . . . . . . . . . . . . . . . . . 8,162Intangible assets . . . . . . . . . . . . . . . . . . . . . . . . . . . . . . . . . . . . . . . . . . . . . . . . . . . . . . . . . . . . . . . . . 35,541Investments and other assets . . . . . . . . . . . . . . . . . . . . . . . . . . . . . . . . . . . . . . . . . . . . . . . . . . . . . . . 3,263
Total assets acquired . . . . . . . . . . . . . . . . . . . . . . . . . . . . . . . . . . . . . . . . . . . . . . . . . . . . . . . . . 77,702
Current liabilities . . . . . . . . . . . . . . . . . . . . . . . . . . . . . . . . . . . . . . . . . . . . . . . . . . . . . . . . . . . . . . . . (54,414)Long-term liabilities . . . . . . . . . . . . . . . . . . . . . . . . . . . . . . . . . . . . . . . . . . . . . . . . . . . . . . . . . . . . . . (11,151)Minority interest . . . . . . . . . . . . . . . . . . . . . . . . . . . . . . . . . . . . . . . . . . . . . . . . . . . . . . . . . . . . . . . . . (5,737)
Total liabilities assumed . . . . . . . . . . . . . . . . . . . . . . . . . . . . . . . . . . . . . . . . . . . . . . . . . . . . . . . (71,302)
Net assets acquired . . . . . . . . . . . . . . . . . . . . . . . . . . . . . . . . . . . . . . . . . . . . . . . . . . . . . . . . . . . ¥ 6,400
Pro forma results of operations for the above business combination have not been presented because theeffects were not material to the consolidated financial statements.
4. DISCONTINUED OPERATIONS
In accordance with SFAS No. 144, the companies present the results of discontinued operations (includingoperations of a subsidiary that either has been disposed of or is classified as held for sale) as a separate line itemin the Statements of Consolidated Income under income (loss) from discontinued operations—net (after incometax effect). The figures of the Statements of Consolidated Income and the Statements of Consolidated CashFlows for the prior years related to the discontinued operations have been reclassified to conform to the currentyear presentation.
The carrying amounts of assets and liabilities of a disposal group classified as held for sale were immaterialfor the years ended March 31, 2006 and 2005.
F-22
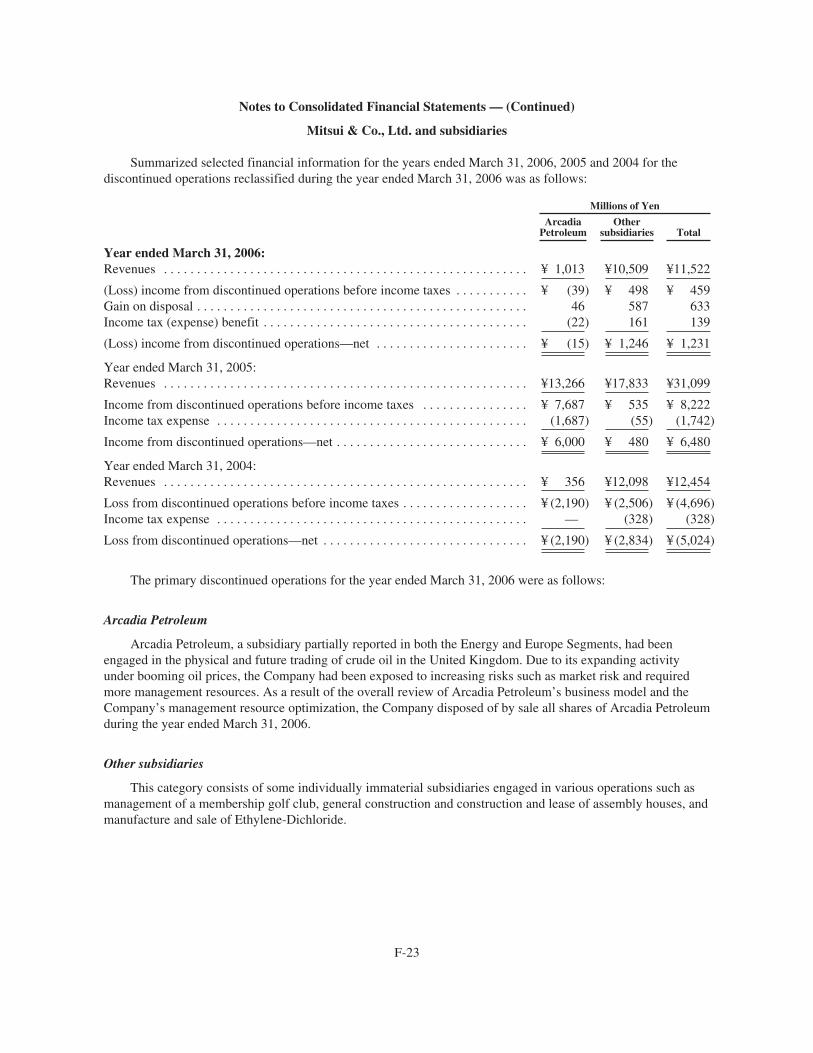
Notes to Consolidated Financial Statements — (Continued)
Mitsui & Co., Ltd. and subsidiaries
Summarized selected financial information for the years ended March 31, 2006, 2005 and 2004 for thediscontinued operations reclassified during the year ended March 31, 2006 was as follows:
Millions of Yen
ArcadiaPetroleum
Othersubsidiaries Total
Year ended March 31, 2006:Revenues . . . . . . . . . . . . . . . . . . . . . . . . . . . . . . . . . . . . . . . . . . . . . . . . . . . . . . . ¥ 1,013 ¥10,509 ¥11,522
(Loss) income from discontinued operations before income taxes . . . . . . . . . . . ¥ (39) ¥ 498 ¥ 459Gain on disposal . . . . . . . . . . . . . . . . . . . . . . . . . . . . . . . . . . . . . . . . . . . . . . . . . . 46 587 633Income tax (expense) benefit . . . . . . . . . . . . . . . . . . . . . . . . . . . . . . . . . . . . . . . . (22) 161 139
(Loss) income from discontinued operations—net . . . . . . . . . . . . . . . . . . . . . . . ¥ (15) ¥ 1,246 ¥ 1,231
Year ended March 31, 2005:Revenues . . . . . . . . . . . . . . . . . . . . . . . . . . . . . . . . . . . . . . . . . . . . . . . . . . . . . . . ¥13,266 ¥17,833 ¥31,099
Income from discontinued operations before income taxes . . . . . . . . . . . . . . . . ¥ 7,687 ¥ 535 ¥ 8,222Income tax expense . . . . . . . . . . . . . . . . . . . . . . . . . . . . . . . . . . . . . . . . . . . . . . . (1,687) (55) (1,742)
Income from discontinued operations—net . . . . . . . . . . . . . . . . . . . . . . . . . . . . . ¥ 6,000 ¥ 480 ¥ 6,480
Year ended March 31, 2004:Revenues . . . . . . . . . . . . . . . . . . . . . . . . . . . . . . . . . . . . . . . . . . . . . . . . . . . . . . . ¥ 356 ¥12,098 ¥12,454
Loss from discontinued operations before income taxes . . . . . . . . . . . . . . . . . . . ¥ (2,190) ¥ (2,506) ¥ (4,696)Income tax expense . . . . . . . . . . . . . . . . . . . . . . . . . . . . . . . . . . . . . . . . . . . . . . . — (328) (328)
Loss from discontinued operations—net . . . . . . . . . . . . . . . . . . . . . . . . . . . . . . . ¥ (2,190) ¥ (2,834) ¥ (5,024)
The primary discontinued operations for the year ended March 31, 2006 were as follows:
Arcadia Petroleum
Arcadia Petroleum, a subsidiary partially reported in both the Energy and Europe Segments, had beenengaged in the physical and future trading of crude oil in the United Kingdom. Due to its expanding activityunder booming oil prices, the Company had been exposed to increasing risks such as market risk and requiredmore management resources. As a result of the overall review of Arcadia Petroleum’s business model and theCompany’s management resource optimization, the Company disposed of by sale all shares of Arcadia Petroleumduring the year ended March 31, 2006.
Other subsidiaries
This category consists of some individually immaterial subsidiaries engaged in various operations such asmanagement of a membership golf club, general construction and construction and lease of assembly houses, andmanufacture and sale of Ethylene-Dichloride.
F-23
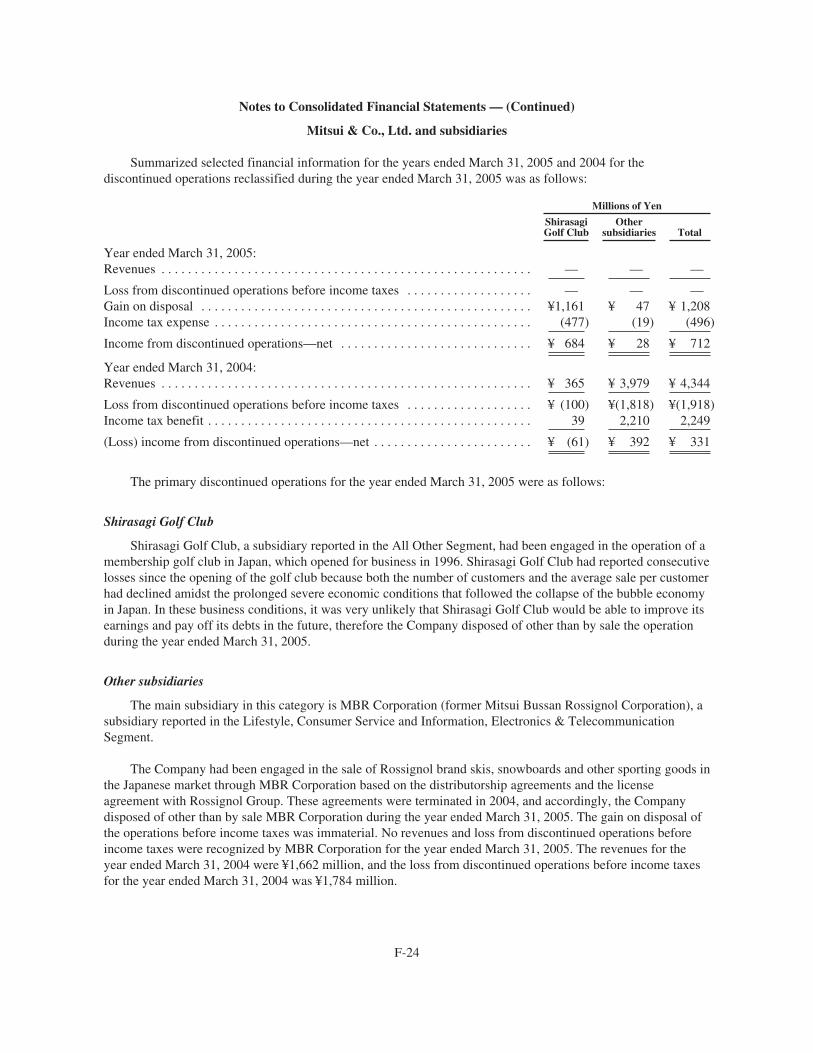
Notes to Consolidated Financial Statements — (Continued)
Mitsui & Co., Ltd. and subsidiaries
Summarized selected financial information for the years ended March 31, 2005 and 2004 for thediscontinued operations reclassified during the year ended March 31, 2005 was as follows:
Millions of Yen
ShirasagiGolf Club
Othersubsidiaries Total
Year ended March 31, 2005:Revenues . . . . . . . . . . . . . . . . . . . . . . . . . . . . . . . . . . . . . . . . . . . . . . . . . . . . . . . . — — —
Loss from discontinued operations before income taxes . . . . . . . . . . . . . . . . . . . — — —Gain on disposal . . . . . . . . . . . . . . . . . . . . . . . . . . . . . . . . . . . . . . . . . . . . . . . . . . ¥1,161 ¥ 47 ¥ 1,208Income tax expense . . . . . . . . . . . . . . . . . . . . . . . . . . . . . . . . . . . . . . . . . . . . . . . . (477) (19) (496)
Income from discontinued operations—net . . . . . . . . . . . . . . . . . . . . . . . . . . . . . ¥ 684 ¥ 28 ¥ 712
Year ended March 31, 2004:Revenues . . . . . . . . . . . . . . . . . . . . . . . . . . . . . . . . . . . . . . . . . . . . . . . . . . . . . . . . ¥ 365 ¥ 3,979 ¥ 4,344
Loss from discontinued operations before income taxes . . . . . . . . . . . . . . . . . . . ¥ (100) ¥(1,818) ¥(1,918)Income tax benefit . . . . . . . . . . . . . . . . . . . . . . . . . . . . . . . . . . . . . . . . . . . . . . . . . 39 2,210 2,249
(Loss) income from discontinued operations—net . . . . . . . . . . . . . . . . . . . . . . . . ¥ (61) ¥ 392 ¥ 331
The primary discontinued operations for the year ended March 31, 2005 were as follows:
Shirasagi Golf Club
Shirasagi Golf Club, a subsidiary reported in the All Other Segment, had been engaged in the operation of amembership golf club in Japan, which opened for business in 1996. Shirasagi Golf Club had reported consecutivelosses since the opening of the golf club because both the number of customers and the average sale per customerhad declined amidst the prolonged severe economic conditions that followed the collapse of the bubble economyin Japan. In these business conditions, it was very unlikely that Shirasagi Golf Club would be able to improve itsearnings and pay off its debts in the future, therefore the Company disposed of other than by sale the operationduring the year ended March 31, 2005.
Other subsidiaries
The main subsidiary in this category is MBR Corporation (former Mitsui Bussan Rossignol Corporation), asubsidiary reported in the Lifestyle, Consumer Service and Information, Electronics & TelecommunicationSegment.
The Company had been engaged in the sale of Rossignol brand skis, snowboards and other sporting goods inthe Japanese market through MBR Corporation based on the distributorship agreements and the licenseagreement with Rossignol Group. These agreements were terminated in 2004, and accordingly, the Companydisposed of other than by sale MBR Corporation during the year ended March 31, 2005. The gain on disposal ofthe operations before income taxes was immaterial. No revenues and loss from discontinued operations beforeincome taxes were recognized by MBR Corporation for the year ended March 31, 2005. The revenues for theyear ended March 31, 2004 were ¥1,662 million, and the loss from discontinued operations before income taxesfor the year ended March 31, 2004 was ¥1,784 million.
F-24
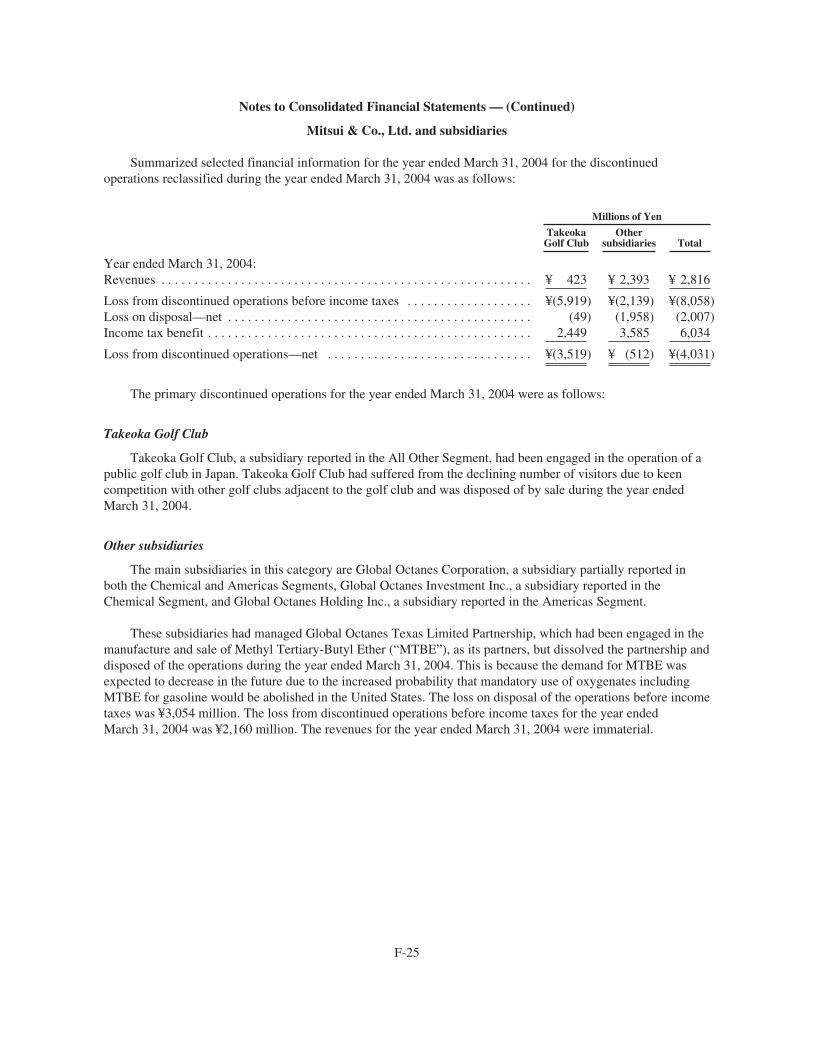
Notes to Consolidated Financial Statements — (Continued)
Mitsui & Co., Ltd. and subsidiaries
Summarized selected financial information for the year ended March 31, 2004 for the discontinuedoperations reclassified during the year ended March 31, 2004 was as follows:
Millions of Yen
TakeokaGolf Club
Othersubsidiaries Total
Year ended March 31, 2004:Revenues . . . . . . . . . . . . . . . . . . . . . . . . . . . . . . . . . . . . . . . . . . . . . . . . . . . . . . . . ¥ 423 ¥ 2,393 ¥ 2,816
Loss from discontinued operations before income taxes . . . . . . . . . . . . . . . . . . . ¥(5,919) ¥(2,139) ¥(8,058)Loss on disposal—net . . . . . . . . . . . . . . . . . . . . . . . . . . . . . . . . . . . . . . . . . . . . . . (49) (1,958) (2,007)Income tax benefit . . . . . . . . . . . . . . . . . . . . . . . . . . . . . . . . . . . . . . . . . . . . . . . . . 2,449 3,585 6,034
Loss from discontinued operations—net . . . . . . . . . . . . . . . . . . . . . . . . . . . . . . . ¥(3,519) ¥ (512) ¥(4,031)
The primary discontinued operations for the year ended March 31, 2004 were as follows:
Takeoka Golf Club
Takeoka Golf Club, a subsidiary reported in the All Other Segment, had been engaged in the operation of apublic golf club in Japan. Takeoka Golf Club had suffered from the declining number of visitors due to keencompetition with other golf clubs adjacent to the golf club and was disposed of by sale during the year endedMarch 31, 2004.
Other subsidiaries
The main subsidiaries in this category are Global Octanes Corporation, a subsidiary partially reported inboth the Chemical and Americas Segments, Global Octanes Investment Inc., a subsidiary reported in theChemical Segment, and Global Octanes Holding Inc., a subsidiary reported in the Americas Segment.
These subsidiaries had managed Global Octanes Texas Limited Partnership, which had been engaged in themanufacture and sale of Methyl Tertiary-Butyl Ether (“MTBE”), as its partners, but dissolved the partnership anddisposed of the operations during the year ended March 31, 2004. This is because the demand for MTBE wasexpected to decrease in the future due to the increased probability that mandatory use of oxygenates includingMTBE for gasoline would be abolished in the United States. The loss on disposal of the operations before incometaxes was ¥3,054 million. The loss from discontinued operations before income taxes for the year endedMarch 31, 2004 was ¥2,160 million. The revenues for the year ended March 31, 2004 were immaterial.
F-25
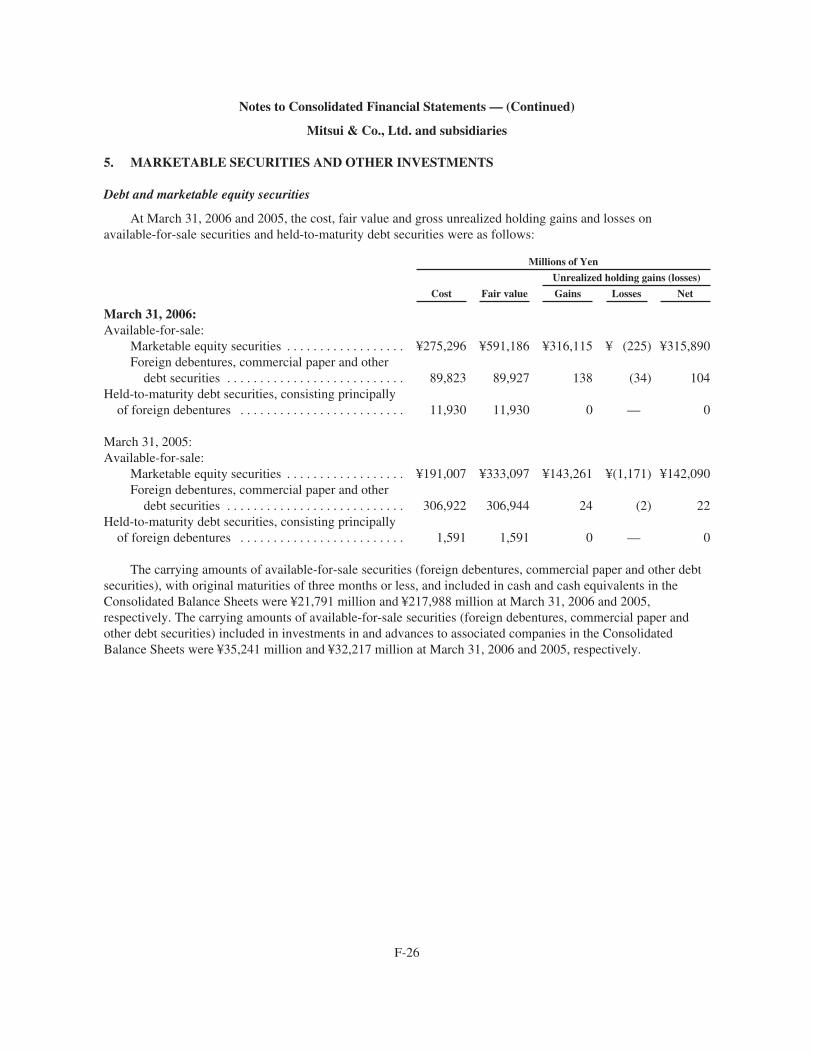
Notes to Consolidated Financial Statements — (Continued)
Mitsui & Co., Ltd. and subsidiaries
5. MARKETABLE SECURITIES AND OTHER INVESTMENTS
Debt and marketable equity securities
At March 31, 2006 and 2005, the cost, fair value and gross unrealized holding gains and losses onavailable-for-sale securities and held-to-maturity debt securities were as follows:
Millions of Yen
Cost Fair value
Unrealized holding gains (losses)
Gains Losses Net
March 31, 2006:Available-for-sale:
Marketable equity securities . . . . . . . . . . . . . . . . . . ¥275,296 ¥591,186 ¥316,115 ¥ (225) ¥315,890Foreign debentures, commercial paper and other
debt securities . . . . . . . . . . . . . . . . . . . . . . . . . . . 89,823 89,927 138 (34) 104Held-to-maturity debt securities, consisting principally
of foreign debentures . . . . . . . . . . . . . . . . . . . . . . . . . 11,930 11,930 0 — 0
March 31, 2005:Available-for-sale:
Marketable equity securities . . . . . . . . . . . . . . . . . . ¥191,007 ¥333,097 ¥143,261 ¥(1,171) ¥142,090Foreign debentures, commercial paper and other
debt securities . . . . . . . . . . . . . . . . . . . . . . . . . . . 306,922 306,944 24 (2) 22Held-to-maturity debt securities, consisting principally
of foreign debentures . . . . . . . . . . . . . . . . . . . . . . . . . 1,591 1,591 0 — 0
The carrying amounts of available-for-sale securities (foreign debentures, commercial paper and other debtsecurities), with original maturities of three months or less, and included in cash and cash equivalents in theConsolidated Balance Sheets were ¥21,791 million and ¥217,988 million at March 31, 2006 and 2005,respectively. The carrying amounts of available-for-sale securities (foreign debentures, commercial paper andother debt securities) included in investments in and advances to associated companies in the ConsolidatedBalance Sheets were ¥35,241 million and ¥32,217 million at March 31, 2006 and 2005, respectively.
F-26

Notes to Consolidated Financial Statements — (Continued)
Mitsui & Co., Ltd. and subsidiaries
At March 31, 2006 and 2005, the fair value and gross unrealized holding losses on available-for-salesecurities and held-to-maturity debt securities, aggregated by investment category and length of time thatindividual securities have been in continuous unrealized loss positions, were as follows:
Millions of Yen
Less than 12 months 12 months or more
Fair valueUnrealized
holding losses Fair valueUnrealized
holding losses
March 31, 2006:Available-for-sale:
Marketable equity securities . . . . . . . . . . . . . . . . . . . . . . . ¥ 2,370 ¥ (225) — —Foreign debentures, commercial paper and other debt
securities . . . . . . . . . . . . . . . . . . . . . . . . . . . . . . . . . . . . 4,706 (34) — —Held-to-maturity debt securities, consisting principally of
foreign debentures . . . . . . . . . . . . . . . . . . . . . . . . . . . . . . . . . — — — —
Total . . . . . . . . . . . . . . . . . . . . . . . . . . . . . . . . . . . . . . ¥ 7,076 ¥ (259) — —
March 31, 2005:Available-for-sale:
Marketable equity securities . . . . . . . . . . . . . . . . . . . . . . . ¥16,402 ¥(1,171) — —Foreign debentures, commercial paper and other debt
securities . . . . . . . . . . . . . . . . . . . . . . . . . . . . . . . . . . . . 4 (2) — —Held-to-maturity debt securities, consisting principally of
foreign debentures . . . . . . . . . . . . . . . . . . . . . . . . . . . . . . . . . — — — —
Total . . . . . . . . . . . . . . . . . . . . . . . . . . . . . . . . . . . . . . ¥16,406 ¥(1,173) — —
The companies’ investments in available-for-sale securities in an unrealized holding loss position consistedprimarily of marketable equity securities (approximately 10 issuers) of customers in various industries. Theunrealized losses on these securities were due principally to a temporary decline in the stock market. The severityof decline in fair value less than cost was 1% to 7% and the duration of the impairment was less than ninemonths. The companies evaluated the near-term prospects of the issuer in relation to the severity and duration ofimpairment. Based on that evaluation and the companies’ ability and intent to hold these investments for areasonable period of time sufficient for a forecasted recovery of fair value, the companies did not consider theseinvestments to be other-than-temporarily impaired at March 31, 2006.
For the years ended March 31, 2006, 2005 and 2004, losses of ¥1,775 million, ¥586 million and ¥1,262million, respectively, were recognized on write-downs of available-for-sale securities to reflect the decline inmarket value considered to be other than temporary.
The portion of net trading gains and losses for the year that relates to trading securities still held atMarch 31, 2006, 2005 and 2004 were as follows:
Millions of Yen
2006 2005 2004
Net trading gains (losses) . . . . . . . . . . . . . . . . . . . . . . . . . . . . . . . . . . . . . . . . . . . . . . . . . . . . . . ¥0 ¥(7) ¥(32)
F-27
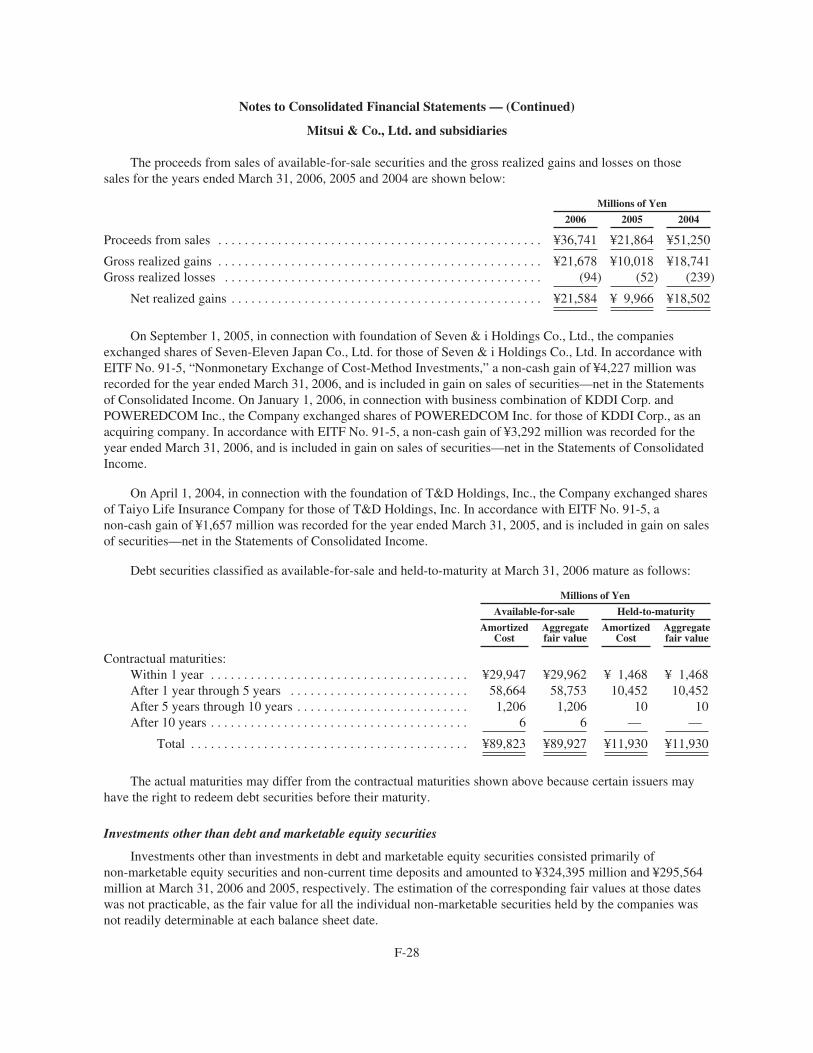
Notes to Consolidated Financial Statements — (Continued)
Mitsui & Co., Ltd. and subsidiaries
The proceeds from sales of available-for-sale securities and the gross realized gains and losses on thosesales for the years ended March 31, 2006, 2005 and 2004 are shown below:
Millions of Yen
2006 2005 2004
Proceeds from sales . . . . . . . . . . . . . . . . . . . . . . . . . . . . . . . . . . . . . . . . . . . . . . . . . ¥36,741 ¥21,864 ¥51,250
Gross realized gains . . . . . . . . . . . . . . . . . . . . . . . . . . . . . . . . . . . . . . . . . . . . . . . . . ¥21,678 ¥10,018 ¥18,741Gross realized losses . . . . . . . . . . . . . . . . . . . . . . . . . . . . . . . . . . . . . . . . . . . . . . . . (94) (52) (239)
Net realized gains . . . . . . . . . . . . . . . . . . . . . . . . . . . . . . . . . . . . . . . . . . . . . . . ¥21,584 ¥ 9,966 ¥18,502
On September 1, 2005, in connection with foundation of Seven & i Holdings Co., Ltd., the companiesexchanged shares of Seven-Eleven Japan Co., Ltd. for those of Seven & i Holdings Co., Ltd. In accordance withEITF No. 91-5, “Nonmonetary Exchange of Cost-Method Investments,” a non-cash gain of ¥4,227 million wasrecorded for the year ended March 31, 2006, and is included in gain on sales of securities—net in the Statementsof Consolidated Income. On January 1, 2006, in connection with business combination of KDDI Corp. andPOWEREDCOM Inc., the Company exchanged shares of POWEREDCOM Inc. for those of KDDI Corp., as anacquiring company. In accordance with EITF No. 91-5, a non-cash gain of ¥3,292 million was recorded for theyear ended March 31, 2006, and is included in gain on sales of securities—net in the Statements of ConsolidatedIncome.
On April 1, 2004, in connection with the foundation of T&D Holdings, Inc., the Company exchanged sharesof Taiyo Life Insurance Company for those of T&D Holdings, Inc. In accordance with EITF No. 91-5, anon-cash gain of ¥1,657 million was recorded for the year ended March 31, 2005, and is included in gain on salesof securities—net in the Statements of Consolidated Income.
Debt securities classified as available-for-sale and held-to-maturity at March 31, 2006 mature as follows:
Millions of Yen
Available-for-sale Held-to-maturity
AmortizedCost
Aggregatefair value
AmortizedCost
Aggregatefair value
Contractual maturities:Within 1 year . . . . . . . . . . . . . . . . . . . . . . . . . . . . . . . . . . . . . . . ¥29,947 ¥29,962 ¥ 1,468 ¥ 1,468After 1 year through 5 years . . . . . . . . . . . . . . . . . . . . . . . . . . . 58,664 58,753 10,452 10,452After 5 years through 10 years . . . . . . . . . . . . . . . . . . . . . . . . . . 1,206 1,206 10 10After 10 years . . . . . . . . . . . . . . . . . . . . . . . . . . . . . . . . . . . . . . . 6 6 — —
Total . . . . . . . . . . . . . . . . . . . . . . . . . . . . . . . . . . . . . . . . . . ¥89,823 ¥89,927 ¥11,930 ¥11,930
The actual maturities may differ from the contractual maturities shown above because certain issuers mayhave the right to redeem debt securities before their maturity.
Investments other than debt and marketable equity securities
Investments other than investments in debt and marketable equity securities consisted primarily ofnon-marketable equity securities and non-current time deposits and amounted to ¥324,395 million and ¥295,564million at March 31, 2006 and 2005, respectively. The estimation of the corresponding fair values at those dateswas not practicable, as the fair value for all the individual non-marketable securities held by the companies wasnot readily determinable at each balance sheet date.
F-28

Notes to Consolidated Financial Statements — (Continued)
Mitsui & Co., Ltd. and subsidiaries
Investments in non-marketable equity securities are carried at cost; however, if the fair value of aninvestment has declined and is judged to be other than temporary, the investment is written down to its estimatedfair value. Losses on write-downs of these investment securities recognized to reflect the declines in fair valueconsidered to be other than temporary were ¥8,868 million, ¥15,958 million and ¥29,804 million for the yearsended March 31, 2006, 2005 and 2004, respectively.
The aggregate carrying amount of the companies’ non-marketable equity securities accounted for under thecost method totaled ¥248,970 million and ¥214,126 million at March 31, 2006 and 2005, respectively.Investments with an aggregate carrying amount of ¥226,177 million at March 31, 2006 and ¥171,485 million atMarch 31, 2005, were not evaluated for impairment because the companies did not identify any events orchanges in circumstances that may have had a significant adverse effect on the fair value of those investmentsand the companies determined that it is not practicable to estimate the fair value of those investments inaccordance with SFAS No. 107, “Disclosures about Fair Value of Financial Instruments.”
6. INVESTMENTS IN AND ADVANCES TO ASSOCIATED COMPANIES
Investments in associated companies (investees owned 20% to 50%, corporate joint ventures and otherinvestees over which the companies have the ability to exercise significant influence) are accounted for under theequity method. In addition, noncontrolling investments in general partnerships, limited partnerships and limitedliability companies are also accounted for under the equity method. Such investments include, but are not limitedto, the companies’ investments in Valepar S.A. (18.24%), Mitsui Oil Exploration Co., Ltd. (47.35%), JapanAustralia LNG (MIMI) Pty. Ltd. (50.00%), IPM Eagle LLP (30.00%), Sakhalin Energy Investment CompanyLtd. (25.00%), Nihon Unisys, Ltd. (32.42%) and United Auto Group, Inc. (15.36%).
The investment in Valepar S.A. is accounted for under the equity method because of the Company’s abilityto exercise significant influence over operating and financial policies primarily through board representation andpower of veto over significant operating and financial decisions through the board of directors. As the soleoperating company among the shareholders, which consist primarily of pension funds and financial institutions,the Company utilizes its experience and expertise in operating businesses and substantively participates in thedecision-making processes.
The companies are the second largest shareholder group of United Auto Group, Inc. (“UAG”) and enteredinto a shareholders agreement with its largest shareholder group owning approximately 41% of its voting shares.Based on a reciprocal voting provision set forth in the agreement for shareholder election of the directors ofUAG, the companies and its largest shareholder group constitute a “group” within the meaning of Section 13(d)of the Securities Exchange Act of 1934 and jointly participate in the management of UAG. The investment inUAG is accounted for under the equity method because of the companies’ ability to exercise significant influenceover operating and financial policies primarily through board representation by a director and executive vicepresident dispatched from the companies. UAG is utilizing the companies’ global network to develop its businessactivities outside the United States and, as part of the process, the companies substantively participate in thedecision-making processes.
Associated companies are engaged primarily in the development of natural resources and the manufactureand distribution of various products. The major geographic areas of such entities are Japan, the Americas,Europe, Asia and Oceania.
F-29
Notes to Consolidated Financial Statements — (Continued)
Mitsui & Co., Ltd. and subsidiaries
Investments in and advances to associated companies at March 31, 2006 and 2005 consisted of thefollowing:
Millions of Yen
2006 2005
Investments in capital stock . . . . . . . . . . . . . . . . . . . . . . . . . . . . . . . . . . . . . . . . . . . . . . . . ¥1,181,219 ¥880,609Advances . . . . . . . . . . . . . . . . . . . . . . . . . . . . . . . . . . . . . . . . . . . . . . . . . . . . . . . . . . . . . . 119,368 92,610
Total . . . . . . . . . . . . . . . . . . . . . . . . . . . . . . . . . . . . . . . . . . . . . . . . . . . . . . . . . . . . . . ¥1,300,587 ¥973,219
The carrying value of the investments in associated companies exceeded the companies’ equity in theunderlying net assets of such associated companies by ¥113,431 million and ¥100,540 million at March 31, 2006and 2005, respectively. The excess is attributed first to certain fair value adjustments on a net-of-tax basis at thetime of the initial and subsequent investments in those companies with the remaining portion considered asequity method goodwill. The fair value adjustments are generally attributed to property and equipment whichconsist primarily of mineral rights amortized over their respective estimated useful lives, principally 8 to 42years, using either the straight-line or the unit-of-production method.
Investments in common stock of publicly traded associated companies include marketable equity securitiescarried at ¥142,180 million and ¥117,109 million at March 31, 2006 and 2005, respectively. Correspondingaggregate quoted market values were ¥315,365 million and ¥169,620 million, respectively.
Summarized financial information for associated companies at March 31, 2006 and 2005 and for the yearsended March 31, 2006, 2005 and 2004 was as follows:
Millions of Yen
2006 2005
Current assets . . . . . . . . . . . . . . . . . . . . . . . . . . . . . . . . . . . . . . . . . . . . . . . . . . . . . . . . ¥ 4,203,539 ¥3,702,750Property and equipment—net of accumulated depreciation . . . . . . . . . . . . . . . . . . . . . 5,764,884 4,195,274Other assets . . . . . . . . . . . . . . . . . . . . . . . . . . . . . . . . . . . . . . . . . . . . . . . . . . . . . . . . . . 1,904,449 1,473,911
Total assets . . . . . . . . . . . . . . . . . . . . . . . . . . . . . . . . . . . . . . . . . . . . . . . . . . . . . . ¥11,872,872 ¥9,371,935
Current liabilities . . . . . . . . . . . . . . . . . . . . . . . . . . . . . . . . . . . . . . . . . . . . . . . . . . . . . . ¥ 3,326,220 ¥2,974,848Long-term liabilities . . . . . . . . . . . . . . . . . . . . . . . . . . . . . . . . . . . . . . . . . . . . . . . . . . . 3,378,679 2,835,459Minority interests . . . . . . . . . . . . . . . . . . . . . . . . . . . . . . . . . . . . . . . . . . . . . . . . . . . . . 1,150,406 599,892Shareholders’ equity . . . . . . . . . . . . . . . . . . . . . . . . . . . . . . . . . . . . . . . . . . . . . . . . . . . 4,017,567 2,961,736
Total liabilities and shareholders’ equity . . . . . . . . . . . . . . . . . . . . . . . . . . . . . . . ¥11,872,872 ¥9,371,935
The companies’ equity in the net assets of associated companies . . . . . . . . . . . . . . . . ¥ 1,067,788 ¥ 780,069
Millions of Yen
2006 2005 2004
Revenues . . . . . . . . . . . . . . . . . . . . . . . . . . . . . . . . . . . . . . . . . . . . . . . . . . ¥7,240,519 ¥6,295,587 ¥4,212,195Gross profit . . . . . . . . . . . . . . . . . . . . . . . . . . . . . . . . . . . . . . . . . . . . . . . . 2,037,245 1,582,586 986,659Income before cumulative effect of change in accounting principle . . . . 585,579 357,019 195,059Net income . . . . . . . . . . . . . . . . . . . . . . . . . . . . . . . . . . . . . . . . . . . . . . . . 585,579 357,019 190,857
F-30
Notes to Consolidated Financial Statements — (Continued)
Mitsui & Co., Ltd. and subsidiaries
The companies’ revenues and purchases from associated companies included in cost of revenues during theyears ended March 31, 2006, 2005 and 2004 were as follows:
Millions of Yen
2006 2005 2004
Revenues . . . . . . . . . . . . . . . . . . . . . . . . . . . . . . . . . . . . . . . . . . . . . . . . . . . . . . ¥ 89,134 ¥121,283 ¥107,816Purchases . . . . . . . . . . . . . . . . . . . . . . . . . . . . . . . . . . . . . . . . . . . . . . . . . . . . . . 238,015 192,405 161,221
Dividends received from associated companies for the years ended March 31, 2006, 2005 and 2004amounted to ¥63,597 million, ¥32,817 million and ¥18,714 million, respectively.
Consolidated unappropriated retained earnings at March 31, 2006 and 2005 included the companies’ equityin net undistributed earnings of associated companies in the amount of ¥205,811 million and ¥142,823 million,respectively.
7. ALLOWANCE FOR DOUBTFUL RECEIVABLES
An analysis of the change in the allowance for doubtful receivables is as follows:
Millions of Yen
Current Non-current Total
Year ended March 31, 2006:Balance at beginning of year . . . . . . . . . . . . . . . . . . . . . . . . . . . . . . . . . . . . . . . ¥22,519 ¥100,066 ¥122,585Credits charged off . . . . . . . . . . . . . . . . . . . . . . . . . . . . . . . . . . . . . . . . . . . . . . . (369) (25,045) (25,414)Provision for doubtful receivables . . . . . . . . . . . . . . . . . . . . . . . . . . . . . . . . . . . 2,036 (1,988) 48Others . . . . . . . . . . . . . . . . . . . . . . . . . . . . . . . . . . . . . . . . . . . . . . . . . . . . . . . . . 2,517 11,480 13,997
Balance at end of year . . . . . . . . . . . . . . . . . . . . . . . . . . . . . . . . . . . . . . . . . . . . ¥26,703 ¥ 84,513 ¥111,216
Year ended March 31, 2005:Balance at beginning of year . . . . . . . . . . . . . . . . . . . . . . . . . . . . . . . . . . . . . . . ¥22,498 ¥110,098 ¥132,596Credits charged off . . . . . . . . . . . . . . . . . . . . . . . . . . . . . . . . . . . . . . . . . . . . . . . (3,604) (19,241) (22,845)Provision for doubtful receivables . . . . . . . . . . . . . . . . . . . . . . . . . . . . . . . . . . . 6,306 2,477 8,783Others . . . . . . . . . . . . . . . . . . . . . . . . . . . . . . . . . . . . . . . . . . . . . . . . . . . . . . . . . (2,681) 6,732 4,051
Balance at end of year . . . . . . . . . . . . . . . . . . . . . . . . . . . . . . . . . . . . . . . . . . . . ¥22,519 ¥100,066 ¥122,585
Year ended March 31, 2004:Balance at beginning of year . . . . . . . . . . . . . . . . . . . . . . . . . . . . . . . . . . . . . . . ¥21,236 ¥139,793 ¥161,029Credits charged off . . . . . . . . . . . . . . . . . . . . . . . . . . . . . . . . . . . . . . . . . . . . . . . (3,230) (33,584) (36,814)Provision for doubtful receivables . . . . . . . . . . . . . . . . . . . . . . . . . . . . . . . . . . . 6,502 3,376 9,878Others . . . . . . . . . . . . . . . . . . . . . . . . . . . . . . . . . . . . . . . . . . . . . . . . . . . . . . . . . (2,010) 513 (1,497)
Balance at end of year . . . . . . . . . . . . . . . . . . . . . . . . . . . . . . . . . . . . . . . . . . . . ¥22,498 ¥110,098 ¥132,596
Note: “Others” principally includes the effect of consolidation of certain subsidiaries, reclassification todiscontinued operations and the effect of changes in foreign currency exchange rates.
F-31
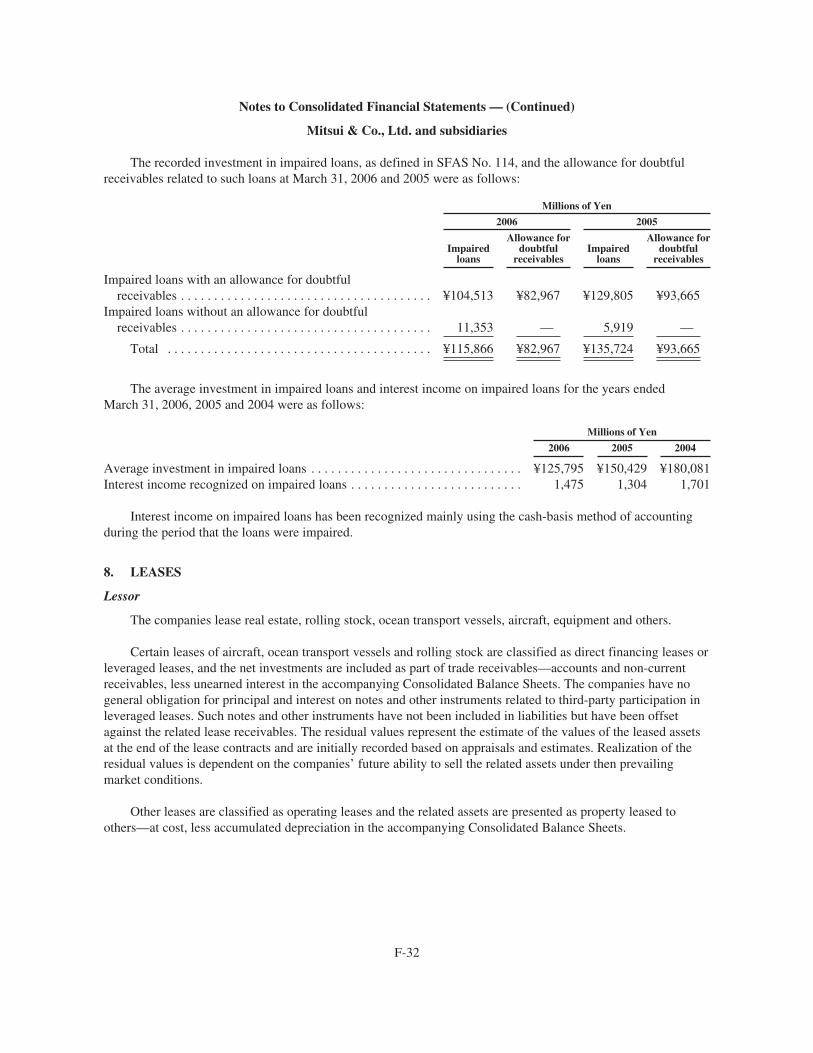
Notes to Consolidated Financial Statements — (Continued)
Mitsui & Co., Ltd. and subsidiaries
The recorded investment in impaired loans, as defined in SFAS No. 114, and the allowance for doubtfulreceivables related to such loans at March 31, 2006 and 2005 were as follows:
Millions of Yen
2006 2005
Impairedloans
Allowance fordoubtful
receivablesImpaired
loans
Allowance fordoubtful
receivables
Impaired loans with an allowance for doubtfulreceivables . . . . . . . . . . . . . . . . . . . . . . . . . . . . . . . . . . . . . . ¥104,513 ¥82,967 ¥129,805 ¥93,665
Impaired loans without an allowance for doubtfulreceivables . . . . . . . . . . . . . . . . . . . . . . . . . . . . . . . . . . . . . . 11,353 — 5,919 —
Total . . . . . . . . . . . . . . . . . . . . . . . . . . . . . . . . . . . . . . . . ¥115,866 ¥82,967 ¥135,724 ¥93,665
The average investment in impaired loans and interest income on impaired loans for the years endedMarch 31, 2006, 2005 and 2004 were as follows:
Millions of Yen
2006 2005 2004
Average investment in impaired loans . . . . . . . . . . . . . . . . . . . . . . . . . . . . . . . . ¥125,795 ¥150,429 ¥180,081Interest income recognized on impaired loans . . . . . . . . . . . . . . . . . . . . . . . . . . 1,475 1,304 1,701
Interest income on impaired loans has been recognized mainly using the cash-basis method of accountingduring the period that the loans were impaired.
8. LEASES
Lessor
The companies lease real estate, rolling stock, ocean transport vessels, aircraft, equipment and others.
Certain leases of aircraft, ocean transport vessels and rolling stock are classified as direct financing leases orleveraged leases, and the net investments are included as part of trade receivables—accounts and non-currentreceivables, less unearned interest in the accompanying Consolidated Balance Sheets. The companies have nogeneral obligation for principal and interest on notes and other instruments related to third-party participation inleveraged leases. Such notes and other instruments have not been included in liabilities but have been offsetagainst the related lease receivables. The residual values represent the estimate of the values of the leased assetsat the end of the lease contracts and are initially recorded based on appraisals and estimates. Realization of theresidual values is dependent on the companies’ future ability to sell the related assets under then prevailingmarket conditions.
Other leases are classified as operating leases and the related assets are presented as property leased toothers—at cost, less accumulated depreciation in the accompanying Consolidated Balance Sheets.
F-32
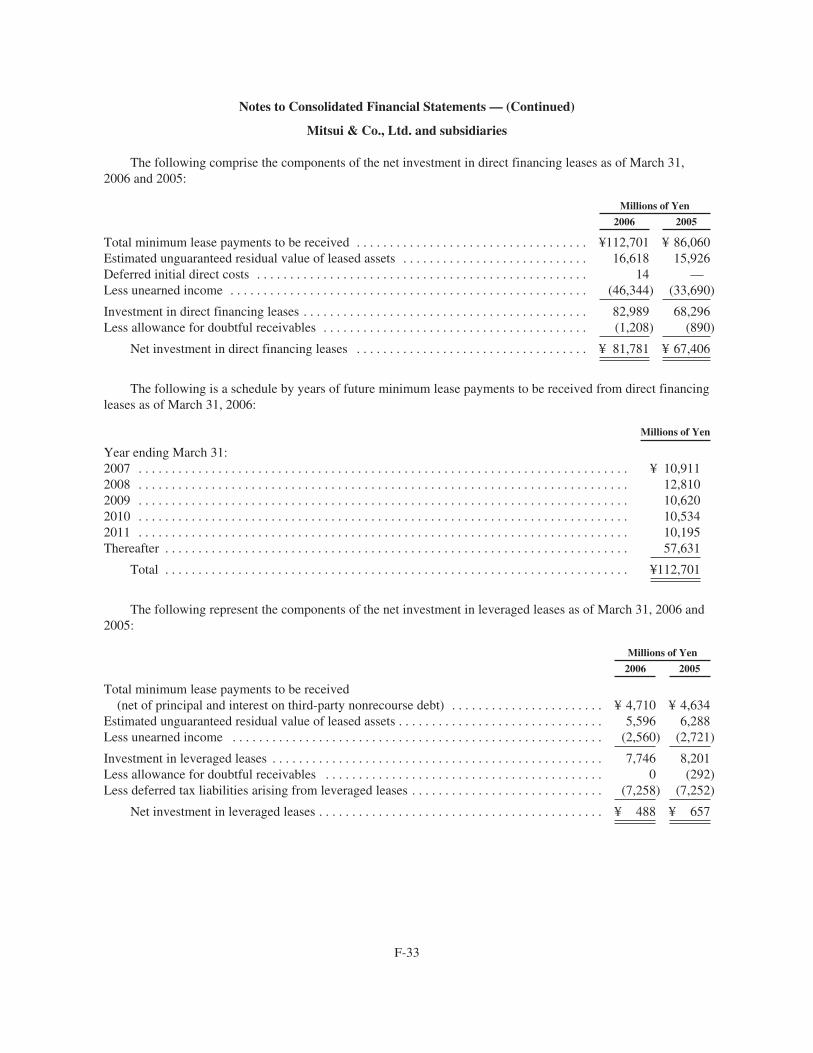
Notes to Consolidated Financial Statements — (Continued)
Mitsui & Co., Ltd. and subsidiaries
The following comprise the components of the net investment in direct financing leases as of March 31,2006 and 2005:
Millions of Yen
2006 2005
Total minimum lease payments to be received . . . . . . . . . . . . . . . . . . . . . . . . . . . . . . . . . . . ¥112,701 ¥ 86,060Estimated unguaranteed residual value of leased assets . . . . . . . . . . . . . . . . . . . . . . . . . . . . 16,618 15,926Deferred initial direct costs . . . . . . . . . . . . . . . . . . . . . . . . . . . . . . . . . . . . . . . . . . . . . . . . . . 14 —Less unearned income . . . . . . . . . . . . . . . . . . . . . . . . . . . . . . . . . . . . . . . . . . . . . . . . . . . . . . (46,344) (33,690)
Investment in direct financing leases . . . . . . . . . . . . . . . . . . . . . . . . . . . . . . . . . . . . . . . . . . . 82,989 68,296Less allowance for doubtful receivables . . . . . . . . . . . . . . . . . . . . . . . . . . . . . . . . . . . . . . . . (1,208) (890)
Net investment in direct financing leases . . . . . . . . . . . . . . . . . . . . . . . . . . . . . . . . . . . ¥ 81,781 ¥ 67,406
The following is a schedule by years of future minimum lease payments to be received from direct financingleases as of March 31, 2006:
Millions of Yen
Year ending March 31:2007 . . . . . . . . . . . . . . . . . . . . . . . . . . . . . . . . . . . . . . . . . . . . . . . . . . . . . . . . . . . . . . . . . . . . . . . . . . ¥ 10,9112008 . . . . . . . . . . . . . . . . . . . . . . . . . . . . . . . . . . . . . . . . . . . . . . . . . . . . . . . . . . . . . . . . . . . . . . . . . . 12,8102009 . . . . . . . . . . . . . . . . . . . . . . . . . . . . . . . . . . . . . . . . . . . . . . . . . . . . . . . . . . . . . . . . . . . . . . . . . . 10,6202010 . . . . . . . . . . . . . . . . . . . . . . . . . . . . . . . . . . . . . . . . . . . . . . . . . . . . . . . . . . . . . . . . . . . . . . . . . . 10,5342011 . . . . . . . . . . . . . . . . . . . . . . . . . . . . . . . . . . . . . . . . . . . . . . . . . . . . . . . . . . . . . . . . . . . . . . . . . . 10,195Thereafter . . . . . . . . . . . . . . . . . . . . . . . . . . . . . . . . . . . . . . . . . . . . . . . . . . . . . . . . . . . . . . . . . . . . . . 57,631
Total . . . . . . . . . . . . . . . . . . . . . . . . . . . . . . . . . . . . . . . . . . . . . . . . . . . . . . . . . . . . . . . . . . . . . . ¥112,701
The following represent the components of the net investment in leveraged leases as of March 31, 2006 and2005:
Millions of Yen
2006 2005
Total minimum lease payments to be received(net of principal and interest on third-party nonrecourse debt) . . . . . . . . . . . . . . . . . . . . . . . ¥ 4,710 ¥ 4,634
Estimated unguaranteed residual value of leased assets . . . . . . . . . . . . . . . . . . . . . . . . . . . . . . . 5,596 6,288Less unearned income . . . . . . . . . . . . . . . . . . . . . . . . . . . . . . . . . . . . . . . . . . . . . . . . . . . . . . . . (2,560) (2,721)
Investment in leveraged leases . . . . . . . . . . . . . . . . . . . . . . . . . . . . . . . . . . . . . . . . . . . . . . . . . . 7,746 8,201Less allowance for doubtful receivables . . . . . . . . . . . . . . . . . . . . . . . . . . . . . . . . . . . . . . . . . . 0 (292)Less deferred tax liabilities arising from leveraged leases . . . . . . . . . . . . . . . . . . . . . . . . . . . . . (7,258) (7,252)
Net investment in leveraged leases . . . . . . . . . . . . . . . . . . . . . . . . . . . . . . . . . . . . . . . . . . . ¥ 488 ¥ 657
F-33

Notes to Consolidated Financial Statements — (Continued)
Mitsui & Co., Ltd. and subsidiaries
The following provides an analysis of the companies’ investment in property on operating leases andproperty held for lease by classes as of March 31, 2006 and 2005:
Millions of Yen
2006 2005
CostAccumulateddepreciation Net Cost
Accumulateddepreciation Net
Real estate . . . . . . . . . . . . . . . . . . . . . . ¥187,037 ¥(59,913) ¥127,124 ¥164,468 ¥(59,863) ¥104,605Rolling stock . . . . . . . . . . . . . . . . . . . . 45,790 (2,458) 43,332 21,238 (1,470) 19,768Ocean transport vessels . . . . . . . . . . . . 34,820 (6,590) 28,230 29,685 (5,575) 24,110Aircraft . . . . . . . . . . . . . . . . . . . . . . . . 5,745 (97) 5,648 31,737 (5,391) 26,346Equipment and others . . . . . . . . . . . . . 30,775 (16,526) 14,249 19,895 (11,549) 8,346
Total . . . . . . . . . . . . . . . . . . . . . . ¥304,167 ¥(85,584) ¥218,583 ¥267,023 ¥(83,848) ¥183,175
The following is a schedule by years of minimum future rentals on noncancelable operating leases as ofMarch 31, 2006:
Millions of Yen
Year ending March 31:2007 . . . . . . . . . . . . . . . . . . . . . . . . . . . . . . . . . . . . . . . . . . . . . . . . . . . . . . . . . . . . . . . . . . . . . . . . . . ¥11,4752008 . . . . . . . . . . . . . . . . . . . . . . . . . . . . . . . . . . . . . . . . . . . . . . . . . . . . . . . . . . . . . . . . . . . . . . . . . . 9,4902009 . . . . . . . . . . . . . . . . . . . . . . . . . . . . . . . . . . . . . . . . . . . . . . . . . . . . . . . . . . . . . . . . . . . . . . . . . . 7,4942010 . . . . . . . . . . . . . . . . . . . . . . . . . . . . . . . . . . . . . . . . . . . . . . . . . . . . . . . . . . . . . . . . . . . . . . . . . . 6,1092011 . . . . . . . . . . . . . . . . . . . . . . . . . . . . . . . . . . . . . . . . . . . . . . . . . . . . . . . . . . . . . . . . . . . . . . . . . . 5,106Thereafter . . . . . . . . . . . . . . . . . . . . . . . . . . . . . . . . . . . . . . . . . . . . . . . . . . . . . . . . . . . . . . . . . . . . . . 22,175
Total . . . . . . . . . . . . . . . . . . . . . . . . . . . . . . . . . . . . . . . . . . . . . . . . . . . . . . . . . . . . . . . . . . . . . . ¥61,849
Lessee
The companies lease equipment, real estate and others under capital leases. At March 31, 2006,approximately 60% of the capital leases are with the Company’s associated company, Mitsui Leasing &Development, Ltd.
The following provides an analysis of the companies’ leased assets recorded under capital leases by classesas of March 31, 2006 and 2005:
Millions of Yen
2006 2005
CostAccumulateddepreciation Net Cost
Accumulateddepreciation Net
Equipment . . . . . . . . . . . . . . . . . . . . . . . . . . ¥25,927 ¥(14,005) ¥11,922 ¥28,024 ¥(13,651) ¥14,373Real estate . . . . . . . . . . . . . . . . . . . . . . . . . . 7,747 (641) 7,106 3,015 (329) 2,686Others . . . . . . . . . . . . . . . . . . . . . . . . . . . . . 3,725 (1,877) 1,848 3,831 (1,629) 2,202
Total . . . . . . . . . . . . . . . . . . . . . . . . . . ¥37,399 ¥(16,523) ¥20,876 ¥34,870 ¥(15,609) ¥19,261
F-34
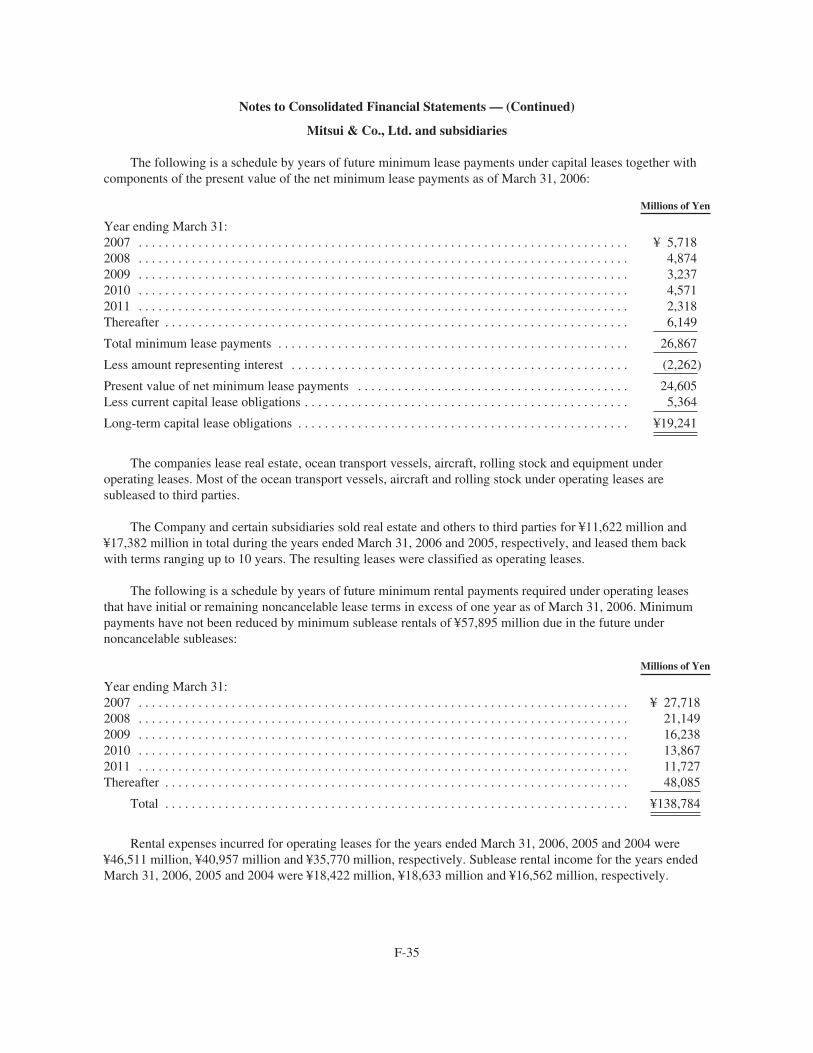
Notes to Consolidated Financial Statements — (Continued)
Mitsui & Co., Ltd. and subsidiaries
The following is a schedule by years of future minimum lease payments under capital leases together withcomponents of the present value of the net minimum lease payments as of March 31, 2006:
Millions of Yen
Year ending March 31:2007 . . . . . . . . . . . . . . . . . . . . . . . . . . . . . . . . . . . . . . . . . . . . . . . . . . . . . . . . . . . . . . . . . . . . . . . . . . ¥ 5,7182008 . . . . . . . . . . . . . . . . . . . . . . . . . . . . . . . . . . . . . . . . . . . . . . . . . . . . . . . . . . . . . . . . . . . . . . . . . . 4,8742009 . . . . . . . . . . . . . . . . . . . . . . . . . . . . . . . . . . . . . . . . . . . . . . . . . . . . . . . . . . . . . . . . . . . . . . . . . . 3,2372010 . . . . . . . . . . . . . . . . . . . . . . . . . . . . . . . . . . . . . . . . . . . . . . . . . . . . . . . . . . . . . . . . . . . . . . . . . . 4,5712011 . . . . . . . . . . . . . . . . . . . . . . . . . . . . . . . . . . . . . . . . . . . . . . . . . . . . . . . . . . . . . . . . . . . . . . . . . . 2,318Thereafter . . . . . . . . . . . . . . . . . . . . . . . . . . . . . . . . . . . . . . . . . . . . . . . . . . . . . . . . . . . . . . . . . . . . . . 6,149
Total minimum lease payments . . . . . . . . . . . . . . . . . . . . . . . . . . . . . . . . . . . . . . . . . . . . . . . . . . . . . 26,867
Less amount representing interest . . . . . . . . . . . . . . . . . . . . . . . . . . . . . . . . . . . . . . . . . . . . . . . . . . . (2,262)
Present value of net minimum lease payments . . . . . . . . . . . . . . . . . . . . . . . . . . . . . . . . . . . . . . . . . 24,605Less current capital lease obligations . . . . . . . . . . . . . . . . . . . . . . . . . . . . . . . . . . . . . . . . . . . . . . . . . 5,364
Long-term capital lease obligations . . . . . . . . . . . . . . . . . . . . . . . . . . . . . . . . . . . . . . . . . . . . . . . . . . ¥19,241
The companies lease real estate, ocean transport vessels, aircraft, rolling stock and equipment underoperating leases. Most of the ocean transport vessels, aircraft and rolling stock under operating leases aresubleased to third parties.
The Company and certain subsidiaries sold real estate and others to third parties for ¥11,622 million and¥17,382 million in total during the years ended March 31, 2006 and 2005, respectively, and leased them backwith terms ranging up to 10 years. The resulting leases were classified as operating leases.
The following is a schedule by years of future minimum rental payments required under operating leasesthat have initial or remaining noncancelable lease terms in excess of one year as of March 31, 2006. Minimumpayments have not been reduced by minimum sublease rentals of ¥57,895 million due in the future undernoncancelable subleases:
Millions of Yen
Year ending March 31:2007 . . . . . . . . . . . . . . . . . . . . . . . . . . . . . . . . . . . . . . . . . . . . . . . . . . . . . . . . . . . . . . . . . . . . . . . . . . ¥ 27,7182008 . . . . . . . . . . . . . . . . . . . . . . . . . . . . . . . . . . . . . . . . . . . . . . . . . . . . . . . . . . . . . . . . . . . . . . . . . . 21,1492009 . . . . . . . . . . . . . . . . . . . . . . . . . . . . . . . . . . . . . . . . . . . . . . . . . . . . . . . . . . . . . . . . . . . . . . . . . . 16,2382010 . . . . . . . . . . . . . . . . . . . . . . . . . . . . . . . . . . . . . . . . . . . . . . . . . . . . . . . . . . . . . . . . . . . . . . . . . . 13,8672011 . . . . . . . . . . . . . . . . . . . . . . . . . . . . . . . . . . . . . . . . . . . . . . . . . . . . . . . . . . . . . . . . . . . . . . . . . . 11,727Thereafter . . . . . . . . . . . . . . . . . . . . . . . . . . . . . . . . . . . . . . . . . . . . . . . . . . . . . . . . . . . . . . . . . . . . . . 48,085
Total . . . . . . . . . . . . . . . . . . . . . . . . . . . . . . . . . . . . . . . . . . . . . . . . . . . . . . . . . . . . . . . . . . . . . . ¥138,784
Rental expenses incurred for operating leases for the years ended March 31, 2006, 2005 and 2004 were¥46,511 million, ¥40,957 million and ¥35,770 million, respectively. Sublease rental income for the years endedMarch 31, 2006, 2005 and 2004 were ¥18,422 million, ¥18,633 million and ¥16,562 million, respectively.
F-35
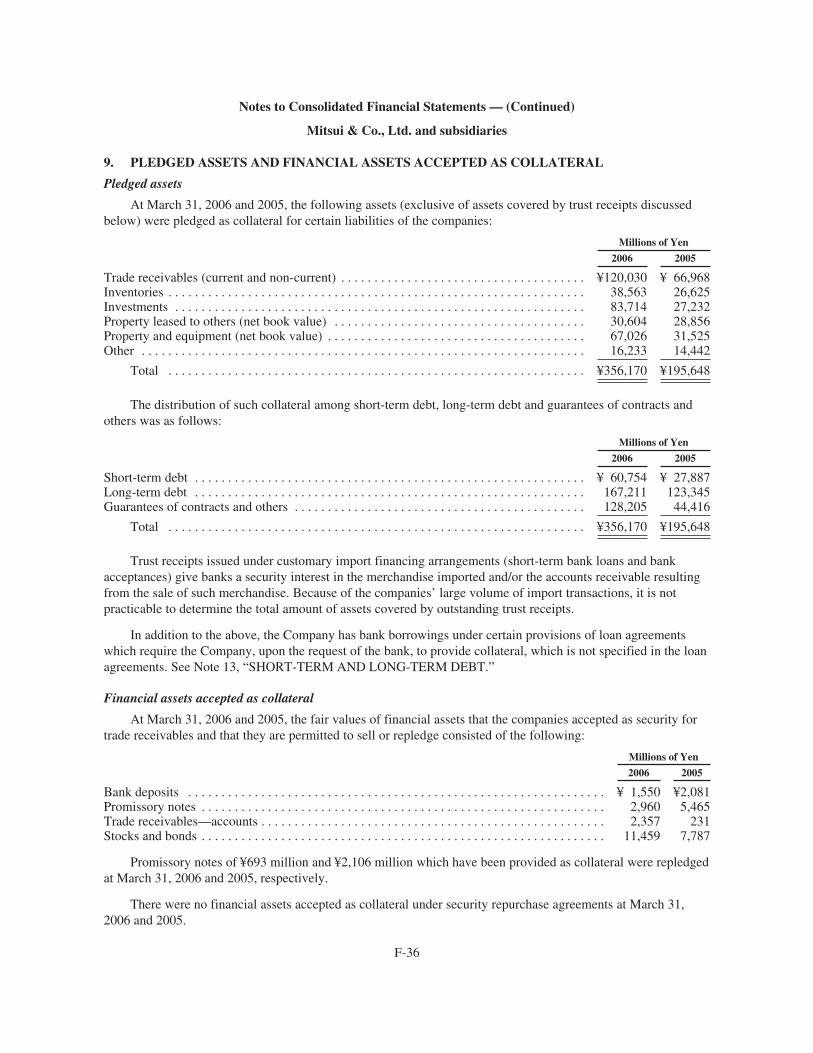
Notes to Consolidated Financial Statements — (Continued)
Mitsui & Co., Ltd. and subsidiaries
9. PLEDGED ASSETS AND FINANCIAL ASSETS ACCEPTED AS COLLATERAL
Pledged assets
At March 31, 2006 and 2005, the following assets (exclusive of assets covered by trust receipts discussedbelow) were pledged as collateral for certain liabilities of the companies:
Millions of Yen
2006 2005
Trade receivables (current and non-current) . . . . . . . . . . . . . . . . . . . . . . . . . . . . . . . . . . . . . ¥120,030 ¥ 66,968Inventories . . . . . . . . . . . . . . . . . . . . . . . . . . . . . . . . . . . . . . . . . . . . . . . . . . . . . . . . . . . . . . . 38,563 26,625Investments . . . . . . . . . . . . . . . . . . . . . . . . . . . . . . . . . . . . . . . . . . . . . . . . . . . . . . . . . . . . . . 83,714 27,232Property leased to others (net book value) . . . . . . . . . . . . . . . . . . . . . . . . . . . . . . . . . . . . . . 30,604 28,856Property and equipment (net book value) . . . . . . . . . . . . . . . . . . . . . . . . . . . . . . . . . . . . . . . 67,026 31,525Other . . . . . . . . . . . . . . . . . . . . . . . . . . . . . . . . . . . . . . . . . . . . . . . . . . . . . . . . . . . . . . . . . . . 16,233 14,442
Total . . . . . . . . . . . . . . . . . . . . . . . . . . . . . . . . . . . . . . . . . . . . . . . . . . . . . . . . . . . . . . . ¥356,170 ¥195,648
The distribution of such collateral among short-term debt, long-term debt and guarantees of contracts andothers was as follows:
Millions of Yen
2006 2005
Short-term debt . . . . . . . . . . . . . . . . . . . . . . . . . . . . . . . . . . . . . . . . . . . . . . . . . . . . . . . . . . . ¥ 60,754 ¥ 27,887Long-term debt . . . . . . . . . . . . . . . . . . . . . . . . . . . . . . . . . . . . . . . . . . . . . . . . . . . . . . . . . . . 167,211 123,345Guarantees of contracts and others . . . . . . . . . . . . . . . . . . . . . . . . . . . . . . . . . . . . . . . . . . . . 128,205 44,416
Total . . . . . . . . . . . . . . . . . . . . . . . . . . . . . . . . . . . . . . . . . . . . . . . . . . . . . . . . . . . . . . . ¥356,170 ¥195,648
Trust receipts issued under customary import financing arrangements (short-term bank loans and bankacceptances) give banks a security interest in the merchandise imported and/or the accounts receivable resultingfrom the sale of such merchandise. Because of the companies’ large volume of import transactions, it is notpracticable to determine the total amount of assets covered by outstanding trust receipts.
In addition to the above, the Company has bank borrowings under certain provisions of loan agreementswhich require the Company, upon the request of the bank, to provide collateral, which is not specified in the loanagreements. See Note 13, “SHORT-TERM AND LONG-TERM DEBT.”
Financial assets accepted as collateral
At March 31, 2006 and 2005, the fair values of financial assets that the companies accepted as security fortrade receivables and that they are permitted to sell or repledge consisted of the following:
Millions of Yen
2006 2005
Bank deposits . . . . . . . . . . . . . . . . . . . . . . . . . . . . . . . . . . . . . . . . . . . . . . . . . . . . . . . . . . . . . . . ¥ 1,550 ¥2,081Promissory notes . . . . . . . . . . . . . . . . . . . . . . . . . . . . . . . . . . . . . . . . . . . . . . . . . . . . . . . . . . . . . 2,960 5,465Trade receivables—accounts . . . . . . . . . . . . . . . . . . . . . . . . . . . . . . . . . . . . . . . . . . . . . . . . . . . . 2,357 231Stocks and bonds . . . . . . . . . . . . . . . . . . . . . . . . . . . . . . . . . . . . . . . . . . . . . . . . . . . . . . . . . . . . . 11,459 7,787
Promissory notes of ¥693 million and ¥2,106 million which have been provided as collateral were repledgedat March 31, 2006 and 2005, respectively.
There were no financial assets accepted as collateral under security repurchase agreements at March 31,2006 and 2005.
F-36
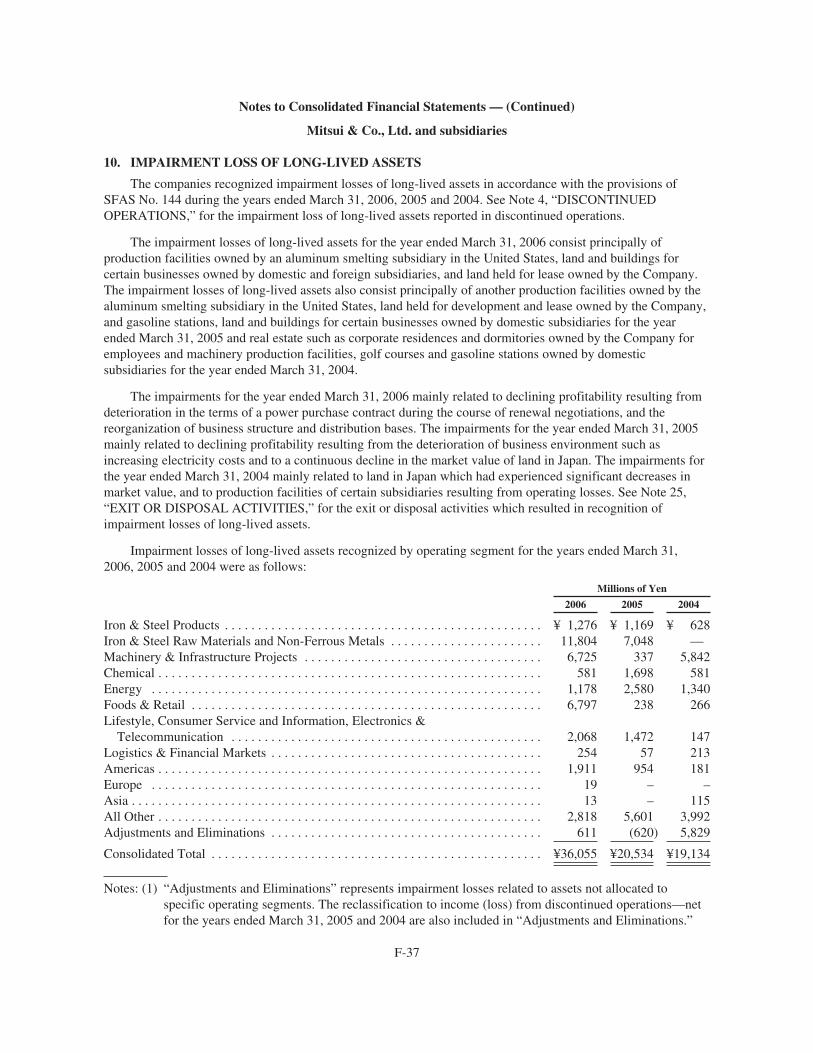
Notes to Consolidated Financial Statements — (Continued)
Mitsui & Co., Ltd. and subsidiaries
10. IMPAIRMENT LOSS OF LONG-LIVED ASSETS
The companies recognized impairment losses of long-lived assets in accordance with the provisions ofSFAS No. 144 during the years ended March 31, 2006, 2005 and 2004. See Note 4, “DISCONTINUEDOPERATIONS,” for the impairment loss of long-lived assets reported in discontinued operations.
The impairment losses of long-lived assets for the year ended March 31, 2006 consist principally ofproduction facilities owned by an aluminum smelting subsidiary in the United States, land and buildings forcertain businesses owned by domestic and foreign subsidiaries, and land held for lease owned by the Company.The impairment losses of long-lived assets also consist principally of another production facilities owned by thealuminum smelting subsidiary in the United States, land held for development and lease owned by the Company,and gasoline stations, land and buildings for certain businesses owned by domestic subsidiaries for the yearended March 31, 2005 and real estate such as corporate residences and dormitories owned by the Company foremployees and machinery production facilities, golf courses and gasoline stations owned by domesticsubsidiaries for the year ended March 31, 2004.
The impairments for the year ended March 31, 2006 mainly related to declining profitability resulting fromdeterioration in the terms of a power purchase contract during the course of renewal negotiations, and thereorganization of business structure and distribution bases. The impairments for the year ended March 31, 2005mainly related to declining profitability resulting from the deterioration of business environment such asincreasing electricity costs and to a continuous decline in the market value of land in Japan. The impairments forthe year ended March 31, 2004 mainly related to land in Japan which had experienced significant decreases inmarket value, and to production facilities of certain subsidiaries resulting from operating losses. See Note 25,“EXIT OR DISPOSAL ACTIVITIES,” for the exit or disposal activities which resulted in recognition ofimpairment losses of long-lived assets.
Impairment losses of long-lived assets recognized by operating segment for the years ended March 31,2006, 2005 and 2004 were as follows:
Millions of Yen
2006 2005 2004
Iron & Steel Products . . . . . . . . . . . . . . . . . . . . . . . . . . . . . . . . . . . . . . . . . . . . . . . . ¥ 1,276 ¥ 1,169 ¥ 628Iron & Steel Raw Materials and Non-Ferrous Metals . . . . . . . . . . . . . . . . . . . . . . . 11,804 7,048 —Machinery & Infrastructure Projects . . . . . . . . . . . . . . . . . . . . . . . . . . . . . . . . . . . . 6,725 337 5,842Chemical . . . . . . . . . . . . . . . . . . . . . . . . . . . . . . . . . . . . . . . . . . . . . . . . . . . . . . . . . . 581 1,698 581Energy . . . . . . . . . . . . . . . . . . . . . . . . . . . . . . . . . . . . . . . . . . . . . . . . . . . . . . . . . . . 1,178 2,580 1,340Foods & Retail . . . . . . . . . . . . . . . . . . . . . . . . . . . . . . . . . . . . . . . . . . . . . . . . . . . . . 6,797 238 266Lifestyle, Consumer Service and Information, Electronics &
Telecommunication . . . . . . . . . . . . . . . . . . . . . . . . . . . . . . . . . . . . . . . . . . . . . . . 2,068 1,472 147Logistics & Financial Markets . . . . . . . . . . . . . . . . . . . . . . . . . . . . . . . . . . . . . . . . . 254 57 213Americas . . . . . . . . . . . . . . . . . . . . . . . . . . . . . . . . . . . . . . . . . . . . . . . . . . . . . . . . . . 1,911 954 181Europe . . . . . . . . . . . . . . . . . . . . . . . . . . . . . . . . . . . . . . . . . . . . . . . . . . . . . . . . . . . 19 – –Asia . . . . . . . . . . . . . . . . . . . . . . . . . . . . . . . . . . . . . . . . . . . . . . . . . . . . . . . . . . . . . . 13 – 115All Other . . . . . . . . . . . . . . . . . . . . . . . . . . . . . . . . . . . . . . . . . . . . . . . . . . . . . . . . . . 2,818 5,601 3,992Adjustments and Eliminations . . . . . . . . . . . . . . . . . . . . . . . . . . . . . . . . . . . . . . . . . 611 (620) 5,829
Consolidated Total . . . . . . . . . . . . . . . . . . . . . . . . . . . . . . . . . . . . . . . . . . . . . . . . . . ¥36,055 ¥20,534 ¥19,134
Notes: (1) “Adjustments and Eliminations” represents impairment losses related to assets not allocated tospecific operating segments. The reclassification to income (loss) from discontinued operations—netfor the years ended March 31, 2005 and 2004 are also included in “Adjustments and Eliminations.”
F-37
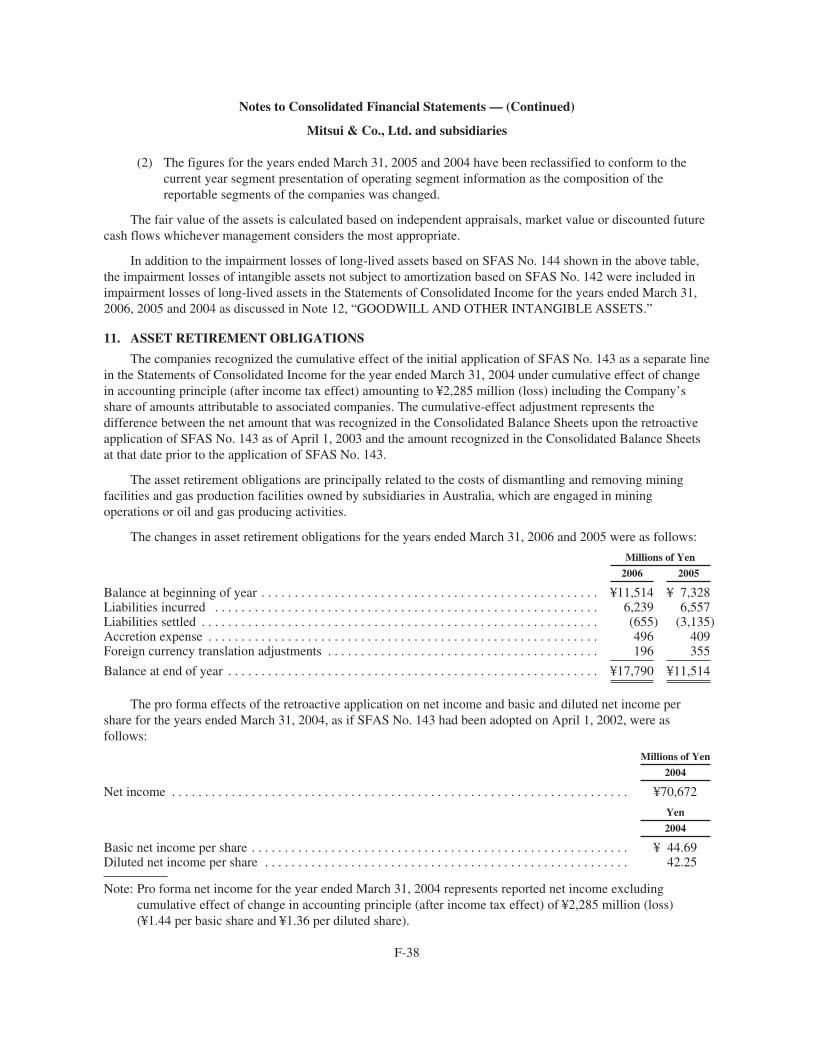
Notes to Consolidated Financial Statements — (Continued)
Mitsui & Co., Ltd. and subsidiaries
(2) The figures for the years ended March 31, 2005 and 2004 have been reclassified to conform to thecurrent year segment presentation of operating segment information as the composition of thereportable segments of the companies was changed.
The fair value of the assets is calculated based on independent appraisals, market value or discounted futurecash flows whichever management considers the most appropriate.
In addition to the impairment losses of long-lived assets based on SFAS No. 144 shown in the above table,the impairment losses of intangible assets not subject to amortization based on SFAS No. 142 were included inimpairment losses of long-lived assets in the Statements of Consolidated Income for the years ended March 31,2006, 2005 and 2004 as discussed in Note 12, “GOODWILL AND OTHER INTANGIBLE ASSETS.”
11. ASSET RETIREMENT OBLIGATIONS
The companies recognized the cumulative effect of the initial application of SFAS No. 143 as a separate linein the Statements of Consolidated Income for the year ended March 31, 2004 under cumulative effect of changein accounting principle (after income tax effect) amounting to ¥2,285 million (loss) including the Company’sshare of amounts attributable to associated companies. The cumulative-effect adjustment represents thedifference between the net amount that was recognized in the Consolidated Balance Sheets upon the retroactiveapplication of SFAS No. 143 as of April 1, 2003 and the amount recognized in the Consolidated Balance Sheetsat that date prior to the application of SFAS No. 143.
The asset retirement obligations are principally related to the costs of dismantling and removing miningfacilities and gas production facilities owned by subsidiaries in Australia, which are engaged in miningoperations or oil and gas producing activities.
The changes in asset retirement obligations for the years ended March 31, 2006 and 2005 were as follows:
Millions of Yen
2006 2005
Balance at beginning of year . . . . . . . . . . . . . . . . . . . . . . . . . . . . . . . . . . . . . . . . . . . . . . . . . . . ¥11,514 ¥ 7,328Liabilities incurred . . . . . . . . . . . . . . . . . . . . . . . . . . . . . . . . . . . . . . . . . . . . . . . . . . . . . . . . . . 6,239 6,557Liabilities settled . . . . . . . . . . . . . . . . . . . . . . . . . . . . . . . . . . . . . . . . . . . . . . . . . . . . . . . . . . . . (655) (3,135)Accretion expense . . . . . . . . . . . . . . . . . . . . . . . . . . . . . . . . . . . . . . . . . . . . . . . . . . . . . . . . . . . 496 409Foreign currency translation adjustments . . . . . . . . . . . . . . . . . . . . . . . . . . . . . . . . . . . . . . . . . 196 355
Balance at end of year . . . . . . . . . . . . . . . . . . . . . . . . . . . . . . . . . . . . . . . . . . . . . . . . . . . . . . . . ¥17,790 ¥11,514
The pro forma effects of the retroactive application on net income and basic and diluted net income pershare for the years ended March 31, 2004, as if SFAS No. 143 had been adopted on April 1, 2002, were asfollows:
Millions of Yen
2004
Net income . . . . . . . . . . . . . . . . . . . . . . . . . . . . . . . . . . . . . . . . . . . . . . . . . . . . . . . . . . . . . . . . . . . . . ¥70,672
Yen
2004
Basic net income per share . . . . . . . . . . . . . . . . . . . . . . . . . . . . . . . . . . . . . . . . . . . . . . . . . . . . . . . . . ¥ 44.69Diluted net income per share . . . . . . . . . . . . . . . . . . . . . . . . . . . . . . . . . . . . . . . . . . . . . . . . . . . . . . . 42.25
Note: Pro forma net income for the year ended March 31, 2004 represents reported net income excludingcumulative effect of change in accounting principle (after income tax effect) of ¥2,285 million (loss)(¥1.44 per basic share and ¥1.36 per diluted share).
F-38
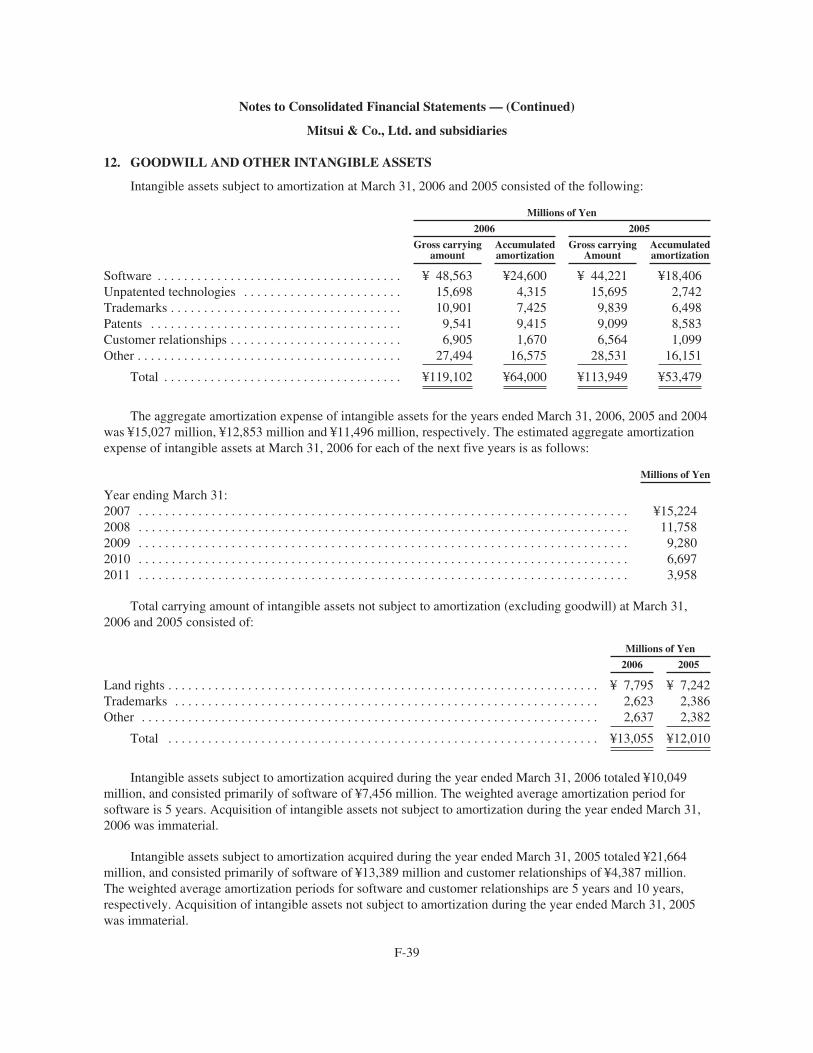
Notes to Consolidated Financial Statements — (Continued)
Mitsui & Co., Ltd. and subsidiaries
12. GOODWILL AND OTHER INTANGIBLE ASSETS
Intangible assets subject to amortization at March 31, 2006 and 2005 consisted of the following:
Millions of Yen
2006 2005
Gross carryingamount
Accumulatedamortization
Gross carryingAmount
Accumulatedamortization
Software . . . . . . . . . . . . . . . . . . . . . . . . . . . . . . . . . . . . . ¥ 48,563 ¥24,600 ¥ 44,221 ¥18,406Unpatented technologies . . . . . . . . . . . . . . . . . . . . . . . . 15,698 4,315 15,695 2,742Trademarks . . . . . . . . . . . . . . . . . . . . . . . . . . . . . . . . . . . 10,901 7,425 9,839 6,498Patents . . . . . . . . . . . . . . . . . . . . . . . . . . . . . . . . . . . . . . 9,541 9,415 9,099 8,583Customer relationships . . . . . . . . . . . . . . . . . . . . . . . . . . 6,905 1,670 6,564 1,099Other . . . . . . . . . . . . . . . . . . . . . . . . . . . . . . . . . . . . . . . . 27,494 16,575 28,531 16,151
Total . . . . . . . . . . . . . . . . . . . . . . . . . . . . . . . . . . . . ¥119,102 ¥64,000 ¥113,949 ¥53,479
The aggregate amortization expense of intangible assets for the years ended March 31, 2006, 2005 and 2004was ¥15,027 million, ¥12,853 million and ¥11,496 million, respectively. The estimated aggregate amortizationexpense of intangible assets at March 31, 2006 for each of the next five years is as follows:
Millions of Yen
Year ending March 31:2007 . . . . . . . . . . . . . . . . . . . . . . . . . . . . . . . . . . . . . . . . . . . . . . . . . . . . . . . . . . . . . . . . . . . . . . . . . . ¥15,2242008 . . . . . . . . . . . . . . . . . . . . . . . . . . . . . . . . . . . . . . . . . . . . . . . . . . . . . . . . . . . . . . . . . . . . . . . . . . 11,7582009 . . . . . . . . . . . . . . . . . . . . . . . . . . . . . . . . . . . . . . . . . . . . . . . . . . . . . . . . . . . . . . . . . . . . . . . . . . 9,2802010 . . . . . . . . . . . . . . . . . . . . . . . . . . . . . . . . . . . . . . . . . . . . . . . . . . . . . . . . . . . . . . . . . . . . . . . . . . 6,6972011 . . . . . . . . . . . . . . . . . . . . . . . . . . . . . . . . . . . . . . . . . . . . . . . . . . . . . . . . . . . . . . . . . . . . . . . . . . 3,958
Total carrying amount of intangible assets not subject to amortization (excluding goodwill) at March 31,2006 and 2005 consisted of:
Millions of Yen
2006 2005
Land rights . . . . . . . . . . . . . . . . . . . . . . . . . . . . . . . . . . . . . . . . . . . . . . . . . . . . . . . . . . . . . . . . . ¥ 7,795 ¥ 7,242Trademarks . . . . . . . . . . . . . . . . . . . . . . . . . . . . . . . . . . . . . . . . . . . . . . . . . . . . . . . . . . . . . . . . 2,623 2,386Other . . . . . . . . . . . . . . . . . . . . . . . . . . . . . . . . . . . . . . . . . . . . . . . . . . . . . . . . . . . . . . . . . . . . . 2,637 2,382
Total . . . . . . . . . . . . . . . . . . . . . . . . . . . . . . . . . . . . . . . . . . . . . . . . . . . . . . . . . . . . . . . . . ¥13,055 ¥12,010
Intangible assets subject to amortization acquired during the year ended March 31, 2006 totaled ¥10,049million, and consisted primarily of software of ¥7,456 million. The weighted average amortization period forsoftware is 5 years. Acquisition of intangible assets not subject to amortization during the year ended March 31,2006 was immaterial.
Intangible assets subject to amortization acquired during the year ended March 31, 2005 totaled ¥21,664million, and consisted primarily of software of ¥13,389 million and customer relationships of ¥4,387 million.The weighted average amortization periods for software and customer relationships are 5 years and 10 years,respectively. Acquisition of intangible assets not subject to amortization during the year ended March 31, 2005was immaterial.
F-39
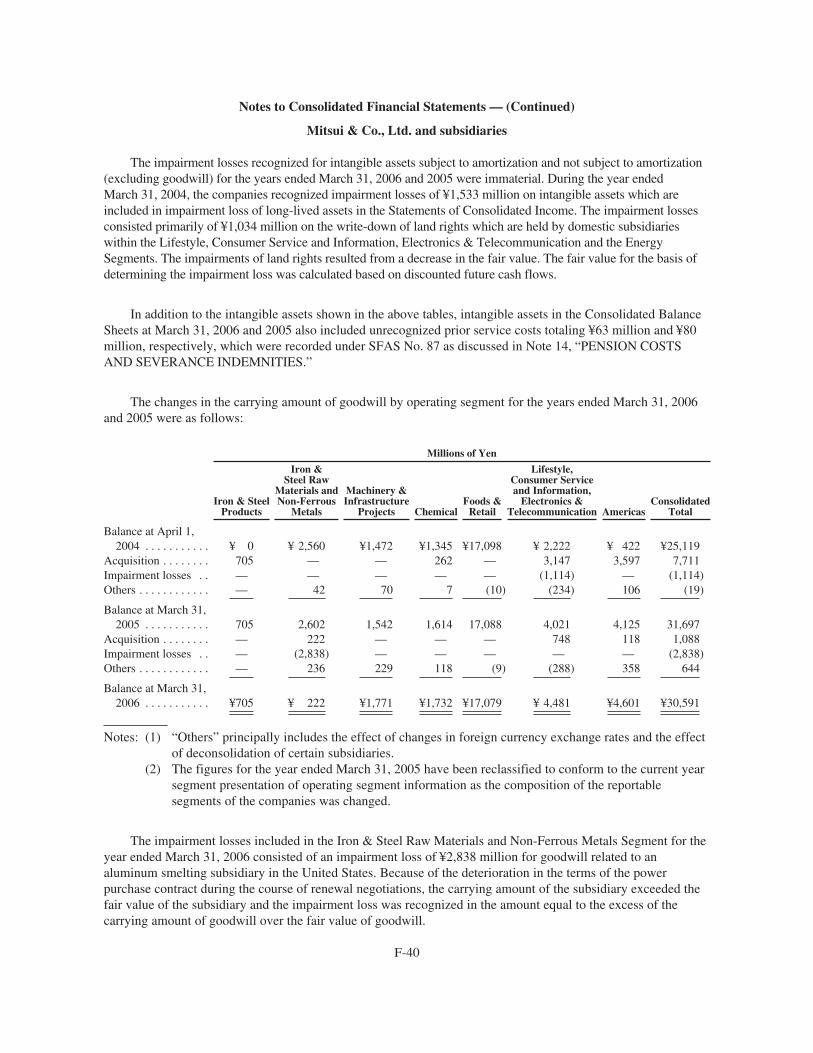
Notes to Consolidated Financial Statements — (Continued)
Mitsui & Co., Ltd. and subsidiaries
The impairment losses recognized for intangible assets subject to amortization and not subject to amortization(excluding goodwill) for the years ended March 31, 2006 and 2005 were immaterial. During the year endedMarch 31, 2004, the companies recognized impairment losses of ¥1,533 million on intangible assets which areincluded in impairment loss of long-lived assets in the Statements of Consolidated Income. The impairment lossesconsisted primarily of ¥1,034 million on the write-down of land rights which are held by domestic subsidiarieswithin the Lifestyle, Consumer Service and Information, Electronics & Telecommunication and the EnergySegments. The impairments of land rights resulted from a decrease in the fair value. The fair value for the basis ofdetermining the impairment loss was calculated based on discounted future cash flows.
In addition to the intangible assets shown in the above tables, intangible assets in the Consolidated BalanceSheets at March 31, 2006 and 2005 also included unrecognized prior service costs totaling ¥63 million and ¥80million, respectively, which were recorded under SFAS No. 87 as discussed in Note 14, “PENSION COSTSAND SEVERANCE INDEMNITIES.”
The changes in the carrying amount of goodwill by operating segment for the years ended March 31, 2006and 2005 were as follows:
Millions of Yen
Iron & SteelProducts
Iron &Steel Raw
Materials andNon-Ferrous
Metals
Machinery &Infrastructure
Projects ChemicalFoods &
Retail
Lifestyle,Consumer Serviceand Information,
Electronics &Telecommunication Americas
ConsolidatedTotal
Balance at April 1,2004 . . . . . . . . . . . ¥ 0 ¥ 2,560 ¥1,472 ¥1,345 ¥17,098 ¥ 2,222 ¥ 422 ¥25,119
Acquisition . . . . . . . . 705 — — 262 — 3,147 3,597 7,711Impairment losses . . — — — — — (1,114) — (1,114)Others . . . . . . . . . . . . — 42 70 7 (10) (234) 106 (19)
Balance at March 31,2005 . . . . . . . . . . . 705 2,602 1,542 1,614 17,088 4,021 4,125 31,697
Acquisition . . . . . . . . — 222 — — — 748 118 1,088Impairment losses . . — (2,838) — — — — — (2,838)Others . . . . . . . . . . . . — 236 229 118 (9) (288) 358 644
Balance at March 31,2006 . . . . . . . . . . . ¥705 ¥ 222 ¥1,771 ¥1,732 ¥17,079 ¥ 4,481 ¥4,601 ¥30,591
Notes: (1) “Others” principally includes the effect of changes in foreign currency exchange rates and the effectof deconsolidation of certain subsidiaries.
(2) The figures for the year ended March 31, 2005 have been reclassified to conform to the current yearsegment presentation of operating segment information as the composition of the reportablesegments of the companies was changed.
The impairment losses included in the Iron & Steel Raw Materials and Non-Ferrous Metals Segment for theyear ended March 31, 2006 consisted of an impairment loss of ¥2,838 million for goodwill related to analuminum smelting subsidiary in the United States. Because of the deterioration in the terms of the powerpurchase contract during the course of renewal negotiations, the carrying amount of the subsidiary exceeded thefair value of the subsidiary and the impairment loss was recognized in the amount equal to the excess of thecarrying amount of goodwill over the fair value of goodwill.
F-40
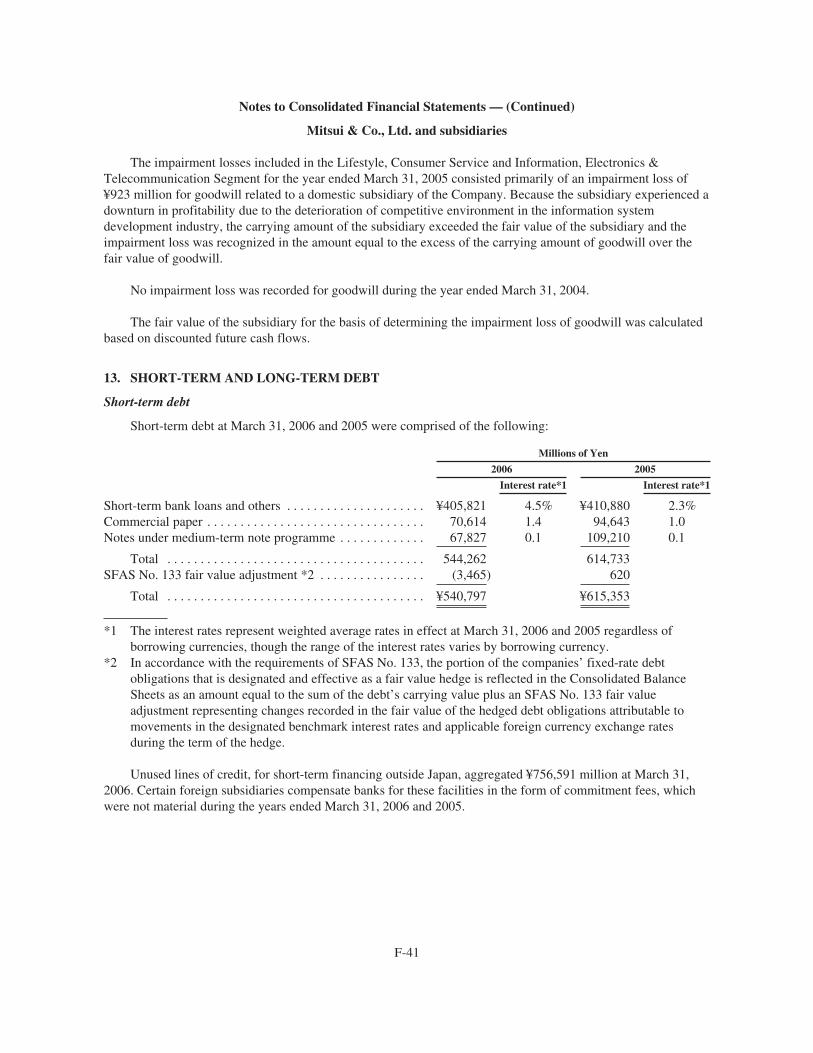
Notes to Consolidated Financial Statements — (Continued)
Mitsui & Co., Ltd. and subsidiaries
The impairment losses included in the Lifestyle, Consumer Service and Information, Electronics &Telecommunication Segment for the year ended March 31, 2005 consisted primarily of an impairment loss of¥923 million for goodwill related to a domestic subsidiary of the Company. Because the subsidiary experienced adownturn in profitability due to the deterioration of competitive environment in the information systemdevelopment industry, the carrying amount of the subsidiary exceeded the fair value of the subsidiary and theimpairment loss was recognized in the amount equal to the excess of the carrying amount of goodwill over thefair value of goodwill.
No impairment loss was recorded for goodwill during the year ended March 31, 2004.
The fair value of the subsidiary for the basis of determining the impairment loss of goodwill was calculatedbased on discounted future cash flows.
13. SHORT-TERM AND LONG-TERM DEBT
Short-term debt
Short-term debt at March 31, 2006 and 2005 were comprised of the following:
Millions of Yen
2006 2005
Interest rate*1 Interest rate*1
Short-term bank loans and others . . . . . . . . . . . . . . . . . . . . . ¥405,821 4.5% ¥410,880 2.3%Commercial paper . . . . . . . . . . . . . . . . . . . . . . . . . . . . . . . . . 70,614 1.4 94,643 1.0Notes under medium-term note programme . . . . . . . . . . . . . 67,827 0.1 109,210 0.1
Total . . . . . . . . . . . . . . . . . . . . . . . . . . . . . . . . . . . . . . . 544,262 614,733SFAS No. 133 fair value adjustment *2 . . . . . . . . . . . . . . . . (3,465) 620
Total . . . . . . . . . . . . . . . . . . . . . . . . . . . . . . . . . . . . . . . ¥540,797 ¥615,353
*1 The interest rates represent weighted average rates in effect at March 31, 2006 and 2005 regardless ofborrowing currencies, though the range of the interest rates varies by borrowing currency.
*2 In accordance with the requirements of SFAS No. 133, the portion of the companies’ fixed-rate debtobligations that is designated and effective as a fair value hedge is reflected in the Consolidated BalanceSheets as an amount equal to the sum of the debt’s carrying value plus an SFAS No. 133 fair valueadjustment representing changes recorded in the fair value of the hedged debt obligations attributable tomovements in the designated benchmark interest rates and applicable foreign currency exchange ratesduring the term of the hedge.
Unused lines of credit, for short-term financing outside Japan, aggregated ¥756,591 million at March 31,2006. Certain foreign subsidiaries compensate banks for these facilities in the form of commitment fees, whichwere not material during the years ended March 31, 2006 and 2005.
F-41
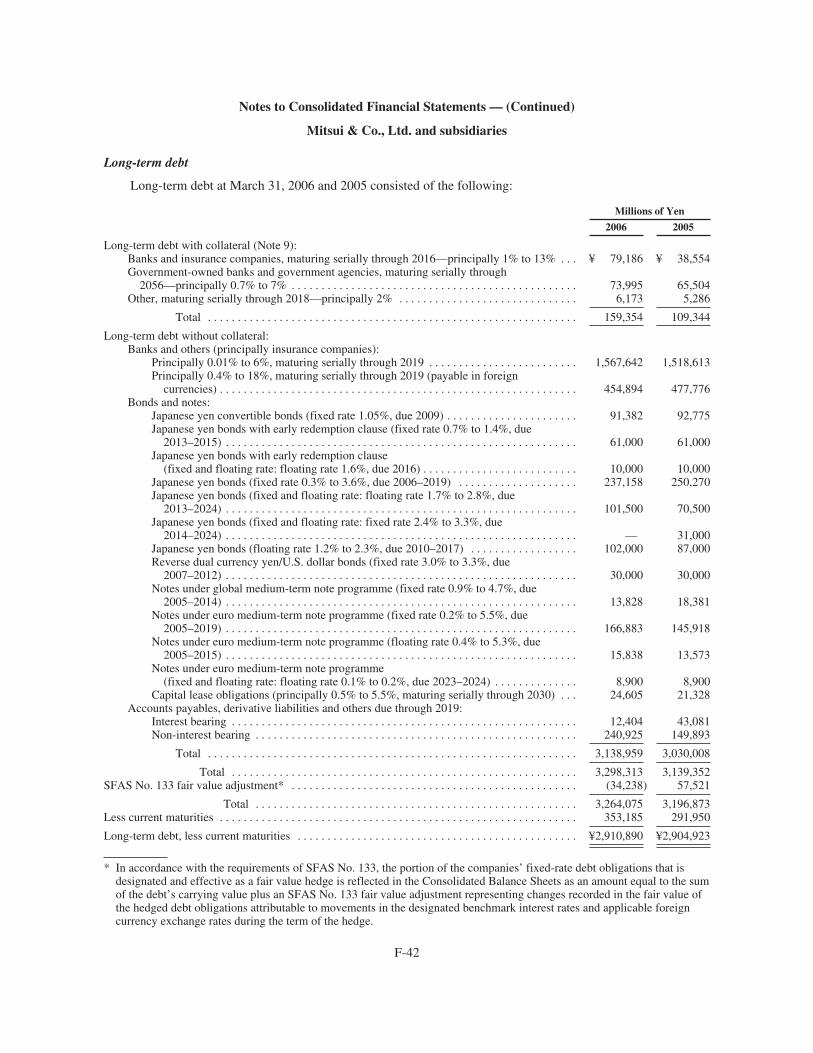
Notes to Consolidated Financial Statements — (Continued)
Mitsui & Co., Ltd. and subsidiaries
Long-term debt
Long-term debt at March 31, 2006 and 2005 consisted of the following:
Millions of Yen
2006 2005
Long-term debt with collateral (Note 9):Banks and insurance companies, maturing serially through 2016—principally 1% to 13% . . . ¥ 79,186 ¥ 38,554Government-owned banks and government agencies, maturing serially through
2056—principally 0.7% to 7% . . . . . . . . . . . . . . . . . . . . . . . . . . . . . . . . . . . . . . . . . . . . . . . . 73,995 65,504Other, maturing serially through 2018—principally 2% . . . . . . . . . . . . . . . . . . . . . . . . . . . . . . 6,173 5,286
Total . . . . . . . . . . . . . . . . . . . . . . . . . . . . . . . . . . . . . . . . . . . . . . . . . . . . . . . . . . . . . . 159,354 109,344
Long-term debt without collateral:Banks and others (principally insurance companies):
Principally 0.01% to 6%, maturing serially through 2019 . . . . . . . . . . . . . . . . . . . . . . . . . 1,567,642 1,518,613Principally 0.4% to 18%, maturing serially through 2019 (payable in foreign
currencies) . . . . . . . . . . . . . . . . . . . . . . . . . . . . . . . . . . . . . . . . . . . . . . . . . . . . . . . . . . . . 454,894 477,776Bonds and notes:
Japanese yen convertible bonds (fixed rate 1.05%, due 2009) . . . . . . . . . . . . . . . . . . . . . . 91,382 92,775Japanese yen bonds with early redemption clause (fixed rate 0.7% to 1.4%, due
2013–2015) . . . . . . . . . . . . . . . . . . . . . . . . . . . . . . . . . . . . . . . . . . . . . . . . . . . . . . . . . . . 61,000 61,000Japanese yen bonds with early redemption clause
(fixed and floating rate: floating rate 1.6%, due 2016) . . . . . . . . . . . . . . . . . . . . . . . . . . 10,000 10,000Japanese yen bonds (fixed rate 0.3% to 3.6%, due 2006–2019) . . . . . . . . . . . . . . . . . . . . 237,158 250,270Japanese yen bonds (fixed and floating rate: floating rate 1.7% to 2.8%, due
2013–2024) . . . . . . . . . . . . . . . . . . . . . . . . . . . . . . . . . . . . . . . . . . . . . . . . . . . . . . . . . . . 101,500 70,500Japanese yen bonds (fixed and floating rate: fixed rate 2.4% to 3.3%, due
2014–2024) . . . . . . . . . . . . . . . . . . . . . . . . . . . . . . . . . . . . . . . . . . . . . . . . . . . . . . . . . . . — 31,000Japanese yen bonds (floating rate 1.2% to 2.3%, due 2010–2017) . . . . . . . . . . . . . . . . . . 102,000 87,000Reverse dual currency yen/U.S. dollar bonds (fixed rate 3.0% to 3.3%, due
2007–2012) . . . . . . . . . . . . . . . . . . . . . . . . . . . . . . . . . . . . . . . . . . . . . . . . . . . . . . . . . . . 30,000 30,000Notes under global medium-term note programme (fixed rate 0.9% to 4.7%, due
2005–2014) . . . . . . . . . . . . . . . . . . . . . . . . . . . . . . . . . . . . . . . . . . . . . . . . . . . . . . . . . . . 13,828 18,381Notes under euro medium-term note programme (fixed rate 0.2% to 5.5%, due
2005–2019) . . . . . . . . . . . . . . . . . . . . . . . . . . . . . . . . . . . . . . . . . . . . . . . . . . . . . . . . . . . 166,883 145,918Notes under euro medium-term note programme (floating rate 0.4% to 5.3%, due
2005–2015) . . . . . . . . . . . . . . . . . . . . . . . . . . . . . . . . . . . . . . . . . . . . . . . . . . . . . . . . . . . 15,838 13,573Notes under euro medium-term note programme
(fixed and floating rate: floating rate 0.1% to 0.2%, due 2023–2024) . . . . . . . . . . . . . . 8,900 8,900Capital lease obligations (principally 0.5% to 5.5%, maturing serially through 2030) . . . 24,605 21,328
Accounts payables, derivative liabilities and others due through 2019:Interest bearing . . . . . . . . . . . . . . . . . . . . . . . . . . . . . . . . . . . . . . . . . . . . . . . . . . . . . . . . . . 12,404 43,081Non-interest bearing . . . . . . . . . . . . . . . . . . . . . . . . . . . . . . . . . . . . . . . . . . . . . . . . . . . . . . 240,925 149,893
Total . . . . . . . . . . . . . . . . . . . . . . . . . . . . . . . . . . . . . . . . . . . . . . . . . . . . . . . . . . . . . . 3,138,959 3,030,008
Total . . . . . . . . . . . . . . . . . . . . . . . . . . . . . . . . . . . . . . . . . . . . . . . . . . . . . . . . . . 3,298,313 3,139,352SFAS No. 133 fair value adjustment* . . . . . . . . . . . . . . . . . . . . . . . . . . . . . . . . . . . . . . . . . . . . . . . . (34,238) 57,521
Total . . . . . . . . . . . . . . . . . . . . . . . . . . . . . . . . . . . . . . . . . . . . . . . . . . . . . . 3,264,075 3,196,873Less current maturities . . . . . . . . . . . . . . . . . . . . . . . . . . . . . . . . . . . . . . . . . . . . . . . . . . . . . . . . . . . . 353,185 291,950
Long-term debt, less current maturities . . . . . . . . . . . . . . . . . . . . . . . . . . . . . . . . . . . . . . . . . . . . . . . ¥2,910,890 ¥2,904,923
* In accordance with the requirements of SFAS No. 133, the portion of the companies’ fixed-rate debt obligations that isdesignated and effective as a fair value hedge is reflected in the Consolidated Balance Sheets as an amount equal to the sumof the debt’s carrying value plus an SFAS No. 133 fair value adjustment representing changes recorded in the fair value ofthe hedged debt obligations attributable to movements in the designated benchmark interest rates and applicable foreigncurrency exchange rates during the term of the hedge.
F-42
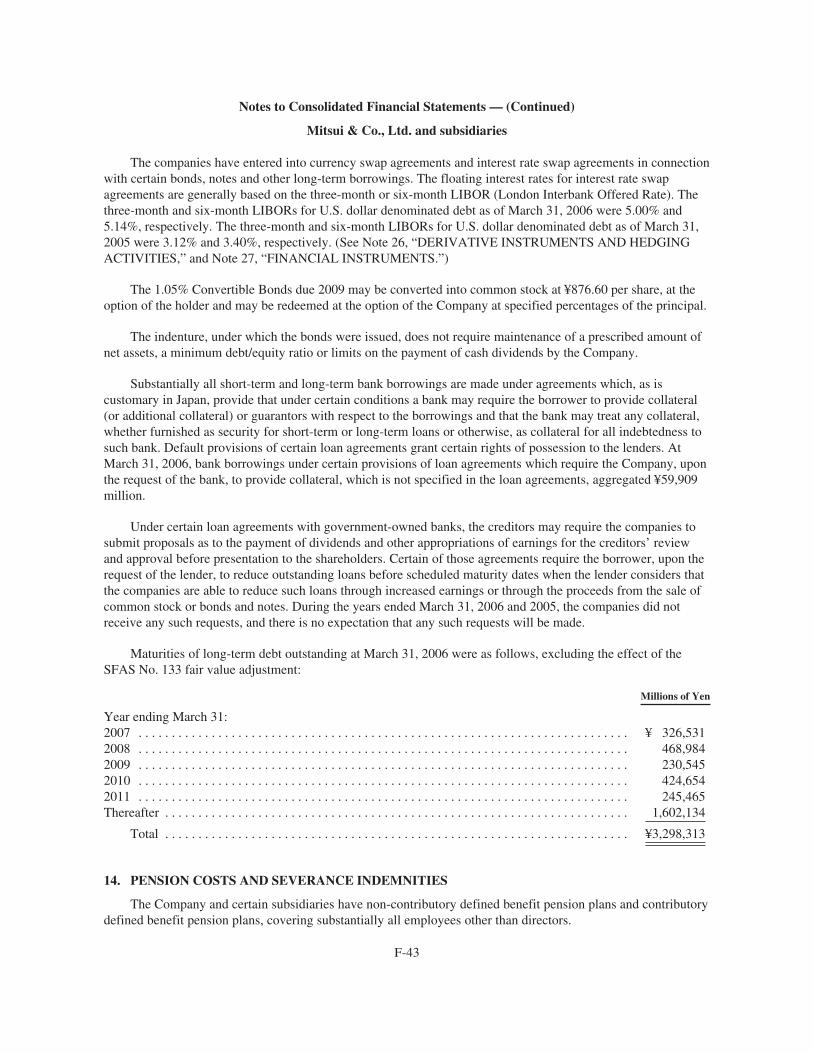
Notes to Consolidated Financial Statements — (Continued)
Mitsui & Co., Ltd. and subsidiaries
The companies have entered into currency swap agreements and interest rate swap agreements in connectionwith certain bonds, notes and other long-term borrowings. The floating interest rates for interest rate swapagreements are generally based on the three-month or six-month LIBOR (London Interbank Offered Rate). Thethree-month and six-month LIBORs for U.S. dollar denominated debt as of March 31, 2006 were 5.00% and5.14%, respectively. The three-month and six-month LIBORs for U.S. dollar denominated debt as of March 31,2005 were 3.12% and 3.40%, respectively. (See Note 26, “DERIVATIVE INSTRUMENTS AND HEDGINGACTIVITIES,” and Note 27, “FINANCIAL INSTRUMENTS.”)
The 1.05% Convertible Bonds due 2009 may be converted into common stock at ¥876.60 per share, at theoption of the holder and may be redeemed at the option of the Company at specified percentages of the principal.
The indenture, under which the bonds were issued, does not require maintenance of a prescribed amount ofnet assets, a minimum debt/equity ratio or limits on the payment of cash dividends by the Company.
Substantially all short-term and long-term bank borrowings are made under agreements which, as iscustomary in Japan, provide that under certain conditions a bank may require the borrower to provide collateral(or additional collateral) or guarantors with respect to the borrowings and that the bank may treat any collateral,whether furnished as security for short-term or long-term loans or otherwise, as collateral for all indebtedness tosuch bank. Default provisions of certain loan agreements grant certain rights of possession to the lenders. AtMarch 31, 2006, bank borrowings under certain provisions of loan agreements which require the Company, uponthe request of the bank, to provide collateral, which is not specified in the loan agreements, aggregated ¥59,909million.
Under certain loan agreements with government-owned banks, the creditors may require the companies tosubmit proposals as to the payment of dividends and other appropriations of earnings for the creditors’ reviewand approval before presentation to the shareholders. Certain of those agreements require the borrower, upon therequest of the lender, to reduce outstanding loans before scheduled maturity dates when the lender considers thatthe companies are able to reduce such loans through increased earnings or through the proceeds from the sale ofcommon stock or bonds and notes. During the years ended March 31, 2006 and 2005, the companies did notreceive any such requests, and there is no expectation that any such requests will be made.
Maturities of long-term debt outstanding at March 31, 2006 were as follows, excluding the effect of theSFAS No. 133 fair value adjustment:
Millions of Yen
Year ending March 31:2007 . . . . . . . . . . . . . . . . . . . . . . . . . . . . . . . . . . . . . . . . . . . . . . . . . . . . . . . . . . . . . . . . . . . . . . . . . . ¥ 326,5312008 . . . . . . . . . . . . . . . . . . . . . . . . . . . . . . . . . . . . . . . . . . . . . . . . . . . . . . . . . . . . . . . . . . . . . . . . . . 468,9842009 . . . . . . . . . . . . . . . . . . . . . . . . . . . . . . . . . . . . . . . . . . . . . . . . . . . . . . . . . . . . . . . . . . . . . . . . . . 230,5452010 . . . . . . . . . . . . . . . . . . . . . . . . . . . . . . . . . . . . . . . . . . . . . . . . . . . . . . . . . . . . . . . . . . . . . . . . . . 424,6542011 . . . . . . . . . . . . . . . . . . . . . . . . . . . . . . . . . . . . . . . . . . . . . . . . . . . . . . . . . . . . . . . . . . . . . . . . . . 245,465Thereafter . . . . . . . . . . . . . . . . . . . . . . . . . . . . . . . . . . . . . . . . . . . . . . . . . . . . . . . . . . . . . . . . . . . . . . 1,602,134
Total . . . . . . . . . . . . . . . . . . . . . . . . . . . . . . . . . . . . . . . . . . . . . . . . . . . . . . . . . . . . . . . . . . . . . . ¥3,298,313
14. PENSION COSTS AND SEVERANCE INDEMNITIES
The Company and certain subsidiaries have non-contributory defined benefit pension plans and contributorydefined benefit pension plans, covering substantially all employees other than directors.
F-43
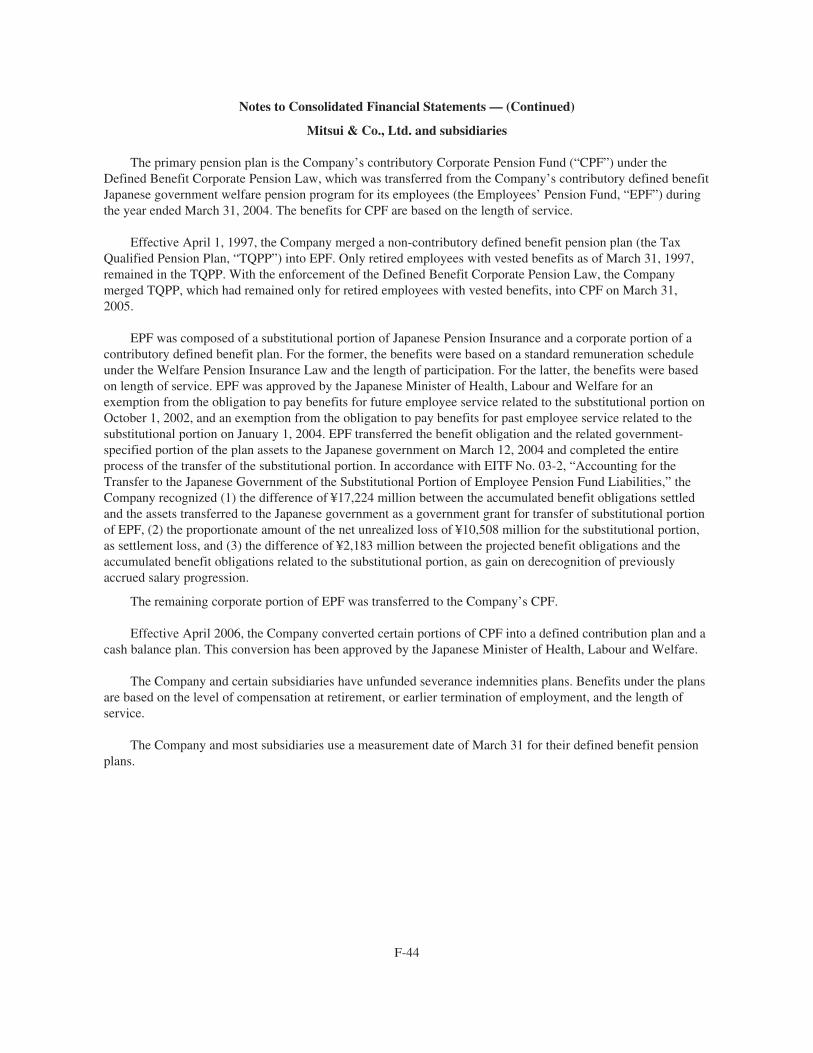
Notes to Consolidated Financial Statements — (Continued)
Mitsui & Co., Ltd. and subsidiaries
The primary pension plan is the Company’s contributory Corporate Pension Fund (“CPF”) under theDefined Benefit Corporate Pension Law, which was transferred from the Company’s contributory defined benefitJapanese government welfare pension program for its employees (the Employees’ Pension Fund, “EPF”) duringthe year ended March 31, 2004. The benefits for CPF are based on the length of service.
Effective April 1, 1997, the Company merged a non-contributory defined benefit pension plan (the TaxQualified Pension Plan, “TQPP”) into EPF. Only retired employees with vested benefits as of March 31, 1997,remained in the TQPP. With the enforcement of the Defined Benefit Corporate Pension Law, the Companymerged TQPP, which had remained only for retired employees with vested benefits, into CPF on March 31,2005.
EPF was composed of a substitutional portion of Japanese Pension Insurance and a corporate portion of acontributory defined benefit plan. For the former, the benefits were based on a standard remuneration scheduleunder the Welfare Pension Insurance Law and the length of participation. For the latter, the benefits were basedon length of service. EPF was approved by the Japanese Minister of Health, Labour and Welfare for anexemption from the obligation to pay benefits for future employee service related to the substitutional portion onOctober 1, 2002, and an exemption from the obligation to pay benefits for past employee service related to thesubstitutional portion on January 1, 2004. EPF transferred the benefit obligation and the related government-specified portion of the plan assets to the Japanese government on March 12, 2004 and completed the entireprocess of the transfer of the substitutional portion. In accordance with EITF No. 03-2, “Accounting for theTransfer to the Japanese Government of the Substitutional Portion of Employee Pension Fund Liabilities,” theCompany recognized (1) the difference of ¥17,224 million between the accumulated benefit obligations settledand the assets transferred to the Japanese government as a government grant for transfer of substitutional portionof EPF, (2) the proportionate amount of the net unrealized loss of ¥10,508 million for the substitutional portion,as settlement loss, and (3) the difference of ¥2,183 million between the projected benefit obligations and theaccumulated benefit obligations related to the substitutional portion, as gain on derecognition of previouslyaccrued salary progression.
The remaining corporate portion of EPF was transferred to the Company’s CPF.
Effective April 2006, the Company converted certain portions of CPF into a defined contribution plan and acash balance plan. This conversion has been approved by the Japanese Minister of Health, Labour and Welfare.
The Company and certain subsidiaries have unfunded severance indemnities plans. Benefits under the plansare based on the level of compensation at retirement, or earlier termination of employment, and the length ofservice.
The Company and most subsidiaries use a measurement date of March 31 for their defined benefit pensionplans.
F-44

Notes to Consolidated Financial Statements — (Continued)
Mitsui & Co., Ltd. and subsidiaries
Obligations and funded status
The following table sets forth the reconciliation of benefit obligations, plan assets and funded status of theplans:
Millions of Yen
2006 2005
Change in benefit obligation:Benefit obligation at beginning of year . . . . . . . . . . . . . . . . . . . . . . . . . . . . . . . . . . . . . ¥261,197 ¥255,806Service cost . . . . . . . . . . . . . . . . . . . . . . . . . . . . . . . . . . . . . . . . . . . . . . . . . . . . . . . . . . 10,833 10,798Interest cost . . . . . . . . . . . . . . . . . . . . . . . . . . . . . . . . . . . . . . . . . . . . . . . . . . . . . . . . . . 5,935 5,616Plan participants’ contributions . . . . . . . . . . . . . . . . . . . . . . . . . . . . . . . . . . . . . . . . . . . 359 365Plan amendments . . . . . . . . . . . . . . . . . . . . . . . . . . . . . . . . . . . . . . . . . . . . . . . . . . . . . . — (342)Actuarial loss . . . . . . . . . . . . . . . . . . . . . . . . . . . . . . . . . . . . . . . . . . . . . . . . . . . . . . . . . 10,139 1,552Benefits paid from plan assets . . . . . . . . . . . . . . . . . . . . . . . . . . . . . . . . . . . . . . . . . . . . (11,442) (10,799)Direct benefit payments . . . . . . . . . . . . . . . . . . . . . . . . . . . . . . . . . . . . . . . . . . . . . . . . (2,874) (3,120)Settlements . . . . . . . . . . . . . . . . . . . . . . . . . . . . . . . . . . . . . . . . . . . . . . . . . . . . . . . . . . (7,227) —Acquisitions and divestitures . . . . . . . . . . . . . . . . . . . . . . . . . . . . . . . . . . . . . . . . . . . . 3,986 774Foreign currency translation adjustments . . . . . . . . . . . . . . . . . . . . . . . . . . . . . . . . . . . 1,060 547
Benefit obligation at end of year . . . . . . . . . . . . . . . . . . . . . . . . . . . . . . . . . . . . . . 271,966 261,197
Change in plan assets:Fair value of plan assets at beginning of year . . . . . . . . . . . . . . . . . . . . . . . . . . . . . . . . 291,645 262,786Actual return on plan assets . . . . . . . . . . . . . . . . . . . . . . . . . . . . . . . . . . . . . . . . . . . . . 63,819 11,218Employer contribution . . . . . . . . . . . . . . . . . . . . . . . . . . . . . . . . . . . . . . . . . . . . . . . . . . 3,590 27,734Plan participants’ contributions . . . . . . . . . . . . . . . . . . . . . . . . . . . . . . . . . . . . . . . . . . . 359 365Benefits paid from plan assets . . . . . . . . . . . . . . . . . . . . . . . . . . . . . . . . . . . . . . . . . . . . (11,442) (10,799)Settlements . . . . . . . . . . . . . . . . . . . . . . . . . . . . . . . . . . . . . . . . . . . . . . . . . . . . . . . . . . (4,559) —Acquisitions and divestitures . . . . . . . . . . . . . . . . . . . . . . . . . . . . . . . . . . . . . . . . . . . . 2,390 95Foreign currency translation adjustments . . . . . . . . . . . . . . . . . . . . . . . . . . . . . . . . . . . 704 246
Fair value of plan assets at end of year . . . . . . . . . . . . . . . . . . . . . . . . . . . . . . . . . 346,506 291,645
Funded status at end of year . . . . . . . . . . . . . . . . . . . . . . . . . . . . . . . . . . . . . . . . . . . . . . . . . 74,540 30,448Unrecognized prior service cost . . . . . . . . . . . . . . . . . . . . . . . . . . . . . . . . . . . . . . . . . . . . . . (5,816) (6,413)Unrecognized net actuarial loss . . . . . . . . . . . . . . . . . . . . . . . . . . . . . . . . . . . . . . . . . . . . . . 6,146 53,855
Net amount recognized . . . . . . . . . . . . . . . . . . . . . . . . . . . . . . . . . . . . . . . . . . . . . ¥ 74,870 ¥ 77,890
Amounts recognized in the Consolidated Balance Sheets consist of:Intangible assets . . . . . . . . . . . . . . . . . . . . . . . . . . . . . . . . . . . . . . . . . . . . . . . . . . . . . . ¥ 63 ¥ 80Other assets (prepaid pension costs) . . . . . . . . . . . . . . . . . . . . . . . . . . . . . . . . . . . . . . . 102,439 107,958Accrued pension costs and liability for severance indemnities . . . . . . . . . . . . . . . . . . (36,769) (39,467)Accumulated other comprehensive loss (before income tax effect) . . . . . . . . . . . . . . . 9,137 9,319
Net amount recognized . . . . . . . . . . . . . . . . . . . . . . . . . . . . . . . . . . . . . . . . . . . . . ¥ 74,870 ¥ 77,890
The prior service cost is amortized over the average remaining service period of employees expected toreceive related benefits.
The amortization periods of the unrecognized net actuarial loss are seven years for CPF and the averageremaining service period for other defined benefit pension plans.
The accumulated benefit obligation for the companies’ defined benefit pension plans as of March 31, 2006and 2005 was ¥269,978 million and ¥256,692 million, respectively.
F-45
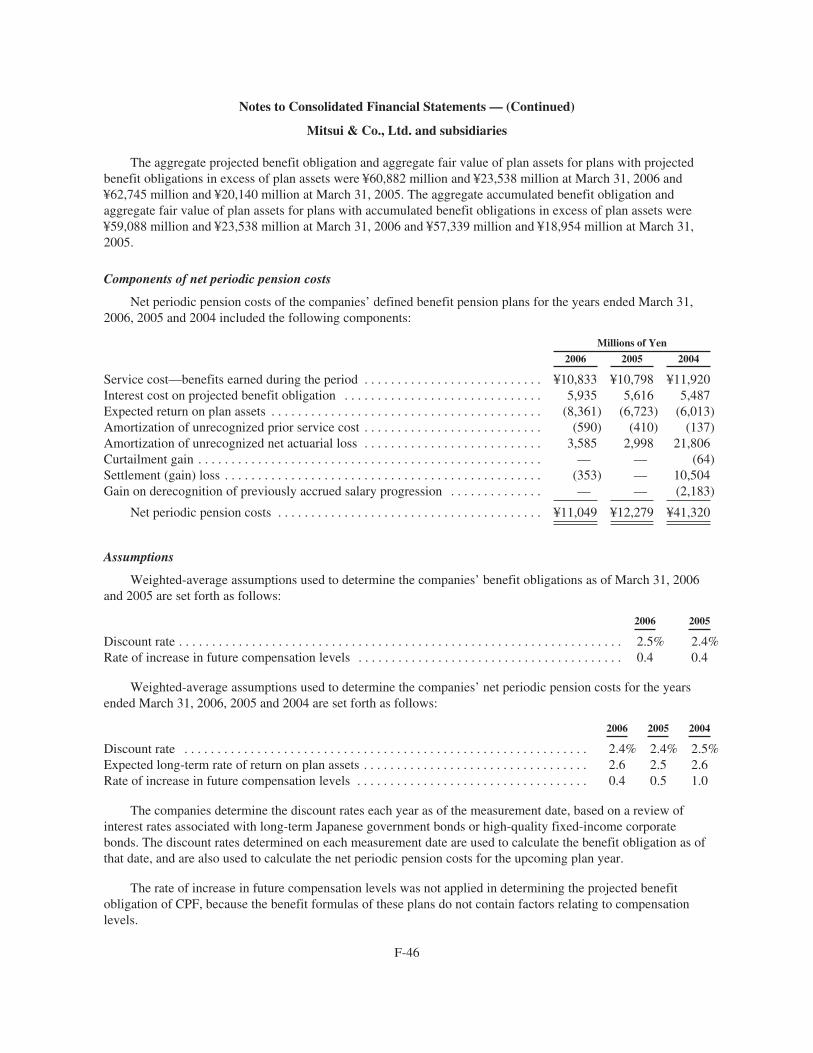
Notes to Consolidated Financial Statements — (Continued)
Mitsui & Co., Ltd. and subsidiaries
The aggregate projected benefit obligation and aggregate fair value of plan assets for plans with projectedbenefit obligations in excess of plan assets were ¥60,882 million and ¥23,538 million at March 31, 2006 and¥62,745 million and ¥20,140 million at March 31, 2005. The aggregate accumulated benefit obligation andaggregate fair value of plan assets for plans with accumulated benefit obligations in excess of plan assets were¥59,088 million and ¥23,538 million at March 31, 2006 and ¥57,339 million and ¥18,954 million at March 31,2005.
Components of net periodic pension costs
Net periodic pension costs of the companies’ defined benefit pension plans for the years ended March 31,2006, 2005 and 2004 included the following components:
Millions of Yen
2006 2005 2004
Service cost—benefits earned during the period . . . . . . . . . . . . . . . . . . . . . . . . . . . ¥10,833 ¥10,798 ¥11,920Interest cost on projected benefit obligation . . . . . . . . . . . . . . . . . . . . . . . . . . . . . . 5,935 5,616 5,487Expected return on plan assets . . . . . . . . . . . . . . . . . . . . . . . . . . . . . . . . . . . . . . . . . (8,361) (6,723) (6,013)Amortization of unrecognized prior service cost . . . . . . . . . . . . . . . . . . . . . . . . . . . (590) (410) (137)Amortization of unrecognized net actuarial loss . . . . . . . . . . . . . . . . . . . . . . . . . . . 3,585 2,998 21,806Curtailment gain . . . . . . . . . . . . . . . . . . . . . . . . . . . . . . . . . . . . . . . . . . . . . . . . . . . . — — (64)Settlement (gain) loss . . . . . . . . . . . . . . . . . . . . . . . . . . . . . . . . . . . . . . . . . . . . . . . . (353) — 10,504Gain on derecognition of previously accrued salary progression . . . . . . . . . . . . . . — — (2,183)
Net periodic pension costs . . . . . . . . . . . . . . . . . . . . . . . . . . . . . . . . . . . . . . . . ¥11,049 ¥12,279 ¥41,320
Assumptions
Weighted-average assumptions used to determine the companies’ benefit obligations as of March 31, 2006and 2005 are set forth as follows:
2006 2005
Discount rate . . . . . . . . . . . . . . . . . . . . . . . . . . . . . . . . . . . . . . . . . . . . . . . . . . . . . . . . . . . . . . . . . . . 2.5% 2.4%Rate of increase in future compensation levels . . . . . . . . . . . . . . . . . . . . . . . . . . . . . . . . . . . . . . . . 0.4 0.4
Weighted-average assumptions used to determine the companies’ net periodic pension costs for the yearsended March 31, 2006, 2005 and 2004 are set forth as follows:
2006 2005 2004
Discount rate . . . . . . . . . . . . . . . . . . . . . . . . . . . . . . . . . . . . . . . . . . . . . . . . . . . . . . . . . . . . . 2.4% 2.4% 2.5%Expected long-term rate of return on plan assets . . . . . . . . . . . . . . . . . . . . . . . . . . . . . . . . . . 2.6 2.5 2.6Rate of increase in future compensation levels . . . . . . . . . . . . . . . . . . . . . . . . . . . . . . . . . . . 0.4 0.5 1.0
The companies determine the discount rates each year as of the measurement date, based on a review ofinterest rates associated with long-term Japanese government bonds or high-quality fixed-income corporatebonds. The discount rates determined on each measurement date are used to calculate the benefit obligation as ofthat date, and are also used to calculate the net periodic pension costs for the upcoming plan year.
The rate of increase in future compensation levels was not applied in determining the projected benefitobligation of CPF, because the benefit formulas of these plans do not contain factors relating to compensationlevels.
F-46
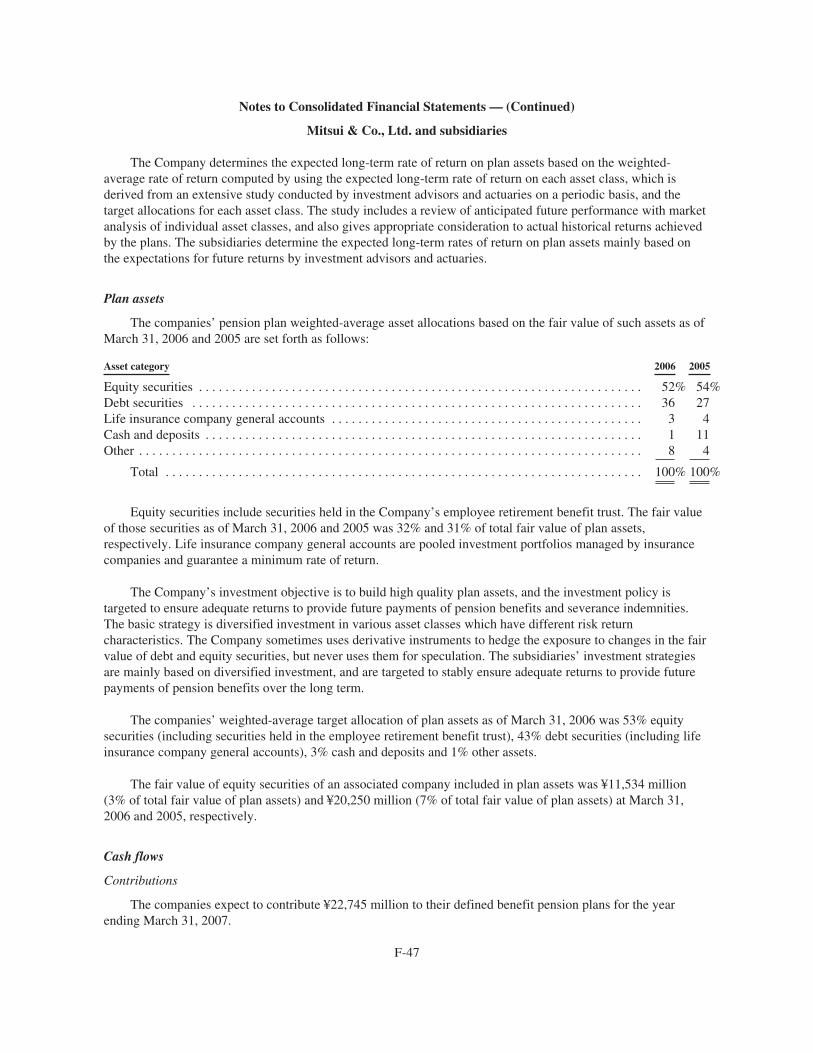
Notes to Consolidated Financial Statements — (Continued)
Mitsui & Co., Ltd. and subsidiaries
The Company determines the expected long-term rate of return on plan assets based on the weighted-average rate of return computed by using the expected long-term rate of return on each asset class, which isderived from an extensive study conducted by investment advisors and actuaries on a periodic basis, and thetarget allocations for each asset class. The study includes a review of anticipated future performance with marketanalysis of individual asset classes, and also gives appropriate consideration to actual historical returns achievedby the plans. The subsidiaries determine the expected long-term rates of return on plan assets mainly based onthe expectations for future returns by investment advisors and actuaries.
Plan assets
The companies’ pension plan weighted-average asset allocations based on the fair value of such assets as ofMarch 31, 2006 and 2005 are set forth as follows:
Asset category 2006 2005
Equity securities . . . . . . . . . . . . . . . . . . . . . . . . . . . . . . . . . . . . . . . . . . . . . . . . . . . . . . . . . . . . . . . . . . . 52% 54%Debt securities . . . . . . . . . . . . . . . . . . . . . . . . . . . . . . . . . . . . . . . . . . . . . . . . . . . . . . . . . . . . . . . . . . . . 36 27Life insurance company general accounts . . . . . . . . . . . . . . . . . . . . . . . . . . . . . . . . . . . . . . . . . . . . . . . 3 4Cash and deposits . . . . . . . . . . . . . . . . . . . . . . . . . . . . . . . . . . . . . . . . . . . . . . . . . . . . . . . . . . . . . . . . . . 1 11Other . . . . . . . . . . . . . . . . . . . . . . . . . . . . . . . . . . . . . . . . . . . . . . . . . . . . . . . . . . . . . . . . . . . . . . . . . . . . 8 4
Total . . . . . . . . . . . . . . . . . . . . . . . . . . . . . . . . . . . . . . . . . . . . . . . . . . . . . . . . . . . . . . . . . . . . . . . . 100% 100%
Equity securities include securities held in the Company’s employee retirement benefit trust. The fair valueof those securities as of March 31, 2006 and 2005 was 32% and 31% of total fair value of plan assets,respectively. Life insurance company general accounts are pooled investment portfolios managed by insurancecompanies and guarantee a minimum rate of return.
The Company’s investment objective is to build high quality plan assets, and the investment policy istargeted to ensure adequate returns to provide future payments of pension benefits and severance indemnities.The basic strategy is diversified investment in various asset classes which have different risk returncharacteristics. The Company sometimes uses derivative instruments to hedge the exposure to changes in the fairvalue of debt and equity securities, but never uses them for speculation. The subsidiaries’ investment strategiesare mainly based on diversified investment, and are targeted to stably ensure adequate returns to provide futurepayments of pension benefits over the long term.
The companies’ weighted-average target allocation of plan assets as of March 31, 2006 was 53% equitysecurities (including securities held in the employee retirement benefit trust), 43% debt securities (including lifeinsurance company general accounts), 3% cash and deposits and 1% other assets.
The fair value of equity securities of an associated company included in plan assets was ¥11,534 million(3% of total fair value of plan assets) and ¥20,250 million (7% of total fair value of plan assets) at March 31,2006 and 2005, respectively.
Cash flows
Contributions
The companies expect to contribute ¥22,745 million to their defined benefit pension plans for the yearending March 31, 2007.
F-47

Notes to Consolidated Financial Statements — (Continued)
Mitsui & Co., Ltd. and subsidiaries
Estimated Future Benefit Payments
The following benefit payments, which reflect expected future service, as appropriate, are expected to bepaid:
Millions of Yen
Year ending March 31:2007 . . . . . . . . . . . . . . . . . . . . . . . . . . . . . . . . . . . . . . . . . . . . . . . . . . . . . . . . . . . . . . . . . . . . . . . . . . ¥13,7912008 . . . . . . . . . . . . . . . . . . . . . . . . . . . . . . . . . . . . . . . . . . . . . . . . . . . . . . . . . . . . . . . . . . . . . . . . . . 13,9282009 . . . . . . . . . . . . . . . . . . . . . . . . . . . . . . . . . . . . . . . . . . . . . . . . . . . . . . . . . . . . . . . . . . . . . . . . . . 14,5612010 . . . . . . . . . . . . . . . . . . . . . . . . . . . . . . . . . . . . . . . . . . . . . . . . . . . . . . . . . . . . . . . . . . . . . . . . . . 14,8602011 . . . . . . . . . . . . . . . . . . . . . . . . . . . . . . . . . . . . . . . . . . . . . . . . . . . . . . . . . . . . . . . . . . . . . . . . . . 15,1262012–2016 . . . . . . . . . . . . . . . . . . . . . . . . . . . . . . . . . . . . . . . . . . . . . . . . . . . . . . . . . . . . . . . . . . . . . 78,360
In addition to the above defined benefit pension plans, the Company provides the “Early Retirement SupportPlan” to eligible employees, which guarantees, prior to normal retirement age, certain supplemental paymentsbased on preretirement compensation levels. During the years ended March 31, 2006, 2005 and 2004, theCompany recorded ¥5,313 million, ¥3,107 million and ¥3,201 million of periodic payments in excess of previousprojections and projected benefits based on factors including the history of benefit payments as selling, generaland administrative expenses, respectively.
15. SHAREHOLDERS’ EQUITY
Effective May 1, 2006, the Corporate Law of Japan (the “Corporate Law”) reformed and replaced theCommercial Code of Japan (the “Code”), while Japanese companies were subject to the Code until April 30,2006.
Common stock and capital surplus
Under the Code, certain issuances of common stock, including conversions of bonds and notes and exercisesof warrants issued, are required to be credited to the common stock account for at least 50% of the proceeds.
At March 31, 2006, 104,245,950 shares of common stock were reserved for the conversion of outstandingbonds.
The Code permits, upon approval by the Board of Directors, transfers of amounts from capital surplus to thecommon stock account. The amounts available for transfer are based on capital surplus as defined by accountingpractices prevailing in Japan. Additional amounts recorded as capital surplus to conform with U.S. GAAP shallnot be transferred to the common stock account under the Code. The net amount of such capital surplus was¥68,267 million at March 31, 2006 and primarily relate to accounting for warrants, business combinations andstock issuance costs. When debt securities were previously issued with detachable stock purchase warrants, theportion of the proceeds which was allocable to the warrants was credited to capital surplus under U.S. GAAP. Inaddition, the step acquisition of the shares held by minority shareholders of a subsidiary by selling unissuedshares of the Company was accounted for by the purchase method under U.S. GAAP rather than by the poolingof interests method which was prevailing in Japan when such business combinations occurred.
Pursuant to the resolution of the Board of Directors, the Company made free distributions of common stockin prior years. Such free distributions did not result in the transfer of retained earnings to common stock orcapital surplus. Corporations in the United States issuing shares in similar transactions would be required to
F-48
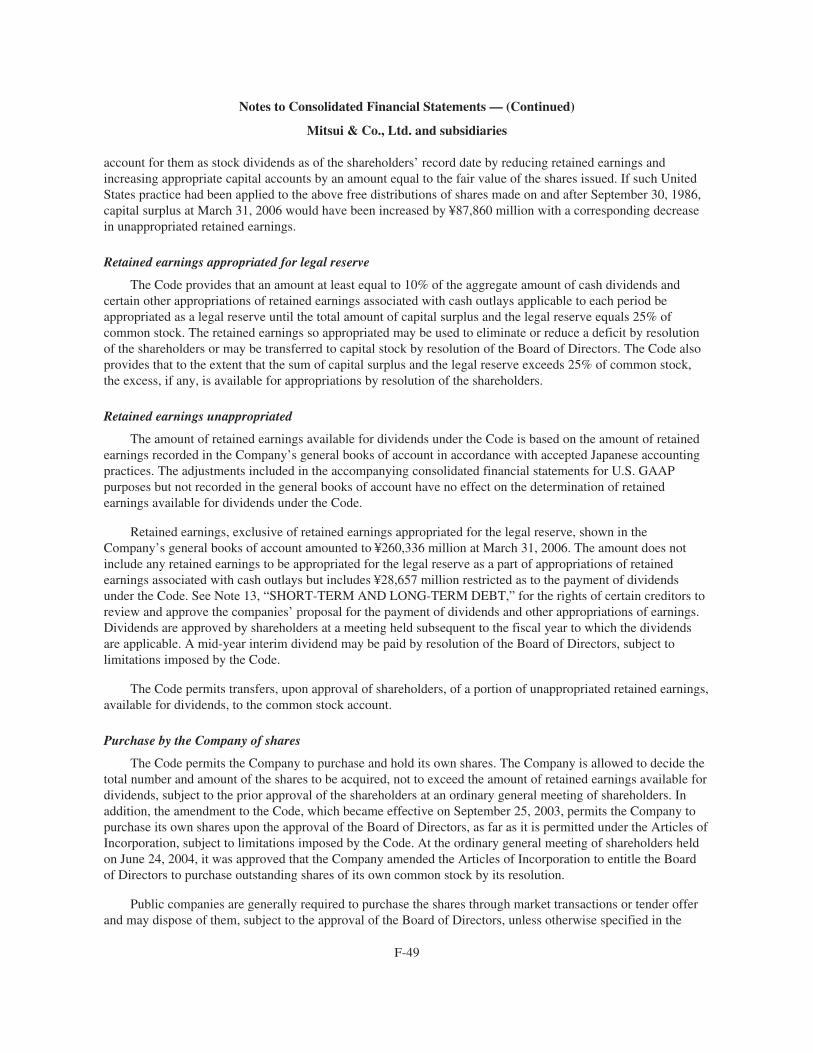
Notes to Consolidated Financial Statements — (Continued)
Mitsui & Co., Ltd. and subsidiaries
account for them as stock dividends as of the shareholders’ record date by reducing retained earnings andincreasing appropriate capital accounts by an amount equal to the fair value of the shares issued. If such UnitedStates practice had been applied to the above free distributions of shares made on and after September 30, 1986,capital surplus at March 31, 2006 would have been increased by ¥87,860 million with a corresponding decreasein unappropriated retained earnings.
Retained earnings appropriated for legal reserve
The Code provides that an amount at least equal to 10% of the aggregate amount of cash dividends andcertain other appropriations of retained earnings associated with cash outlays applicable to each period beappropriated as a legal reserve until the total amount of capital surplus and the legal reserve equals 25% ofcommon stock. The retained earnings so appropriated may be used to eliminate or reduce a deficit by resolutionof the shareholders or may be transferred to capital stock by resolution of the Board of Directors. The Code alsoprovides that to the extent that the sum of capital surplus and the legal reserve exceeds 25% of common stock,the excess, if any, is available for appropriations by resolution of the shareholders.
Retained earnings unappropriated
The amount of retained earnings available for dividends under the Code is based on the amount of retainedearnings recorded in the Company’s general books of account in accordance with accepted Japanese accountingpractices. The adjustments included in the accompanying consolidated financial statements for U.S. GAAPpurposes but not recorded in the general books of account have no effect on the determination of retainedearnings available for dividends under the Code.
Retained earnings, exclusive of retained earnings appropriated for the legal reserve, shown in theCompany’s general books of account amounted to ¥260,336 million at March 31, 2006. The amount does notinclude any retained earnings to be appropriated for the legal reserve as a part of appropriations of retainedearnings associated with cash outlays but includes ¥28,657 million restricted as to the payment of dividendsunder the Code. See Note 13, “SHORT-TERM AND LONG-TERM DEBT,” for the rights of certain creditors toreview and approve the companies’ proposal for the payment of dividends and other appropriations of earnings.Dividends are approved by shareholders at a meeting held subsequent to the fiscal year to which the dividendsare applicable. A mid-year interim dividend may be paid by resolution of the Board of Directors, subject tolimitations imposed by the Code.
The Code permits transfers, upon approval of shareholders, of a portion of unappropriated retained earnings,available for dividends, to the common stock account.
Purchase by the Company of shares
The Code permits the Company to purchase and hold its own shares. The Company is allowed to decide thetotal number and amount of the shares to be acquired, not to exceed the amount of retained earnings available fordividends, subject to the prior approval of the shareholders at an ordinary general meeting of shareholders. Inaddition, the amendment to the Code, which became effective on September 25, 2003, permits the Company topurchase its own shares upon the approval of the Board of Directors, as far as it is permitted under the Articles ofIncorporation, subject to limitations imposed by the Code. At the ordinary general meeting of shareholders heldon June 24, 2004, it was approved that the Company amended the Articles of Incorporation to entitle the Boardof Directors to purchase outstanding shares of its own common stock by its resolution.
Public companies are generally required to purchase the shares through market transactions or tender offerand may dispose of them, subject to the approval of the Board of Directors, unless otherwise specified in the
F-49
Notes to Consolidated Financial Statements — (Continued)
Mitsui & Co., Ltd. and subsidiaries
Code, or as far as the Articles of Incorporation do not require a resolution of the shareholders at the shareholders’meeting. As an example of the disposal of its own shares, the Company sells the shares or chooses to transfer theshares instead of issuing new shares in case of merger, stock transfer or exchange, or spin-off. In addition, theCode enables the Company to retire its own shares by resolution of the Board of Directors.
The Corporate Law
Effective May 1, 2006, the Corporate Law requires that an amount equal to 10% of dividends must beappropriated as capital surplus or a legal reserve depending on the equity account charged upon the payment ofsuch dividends until the total aggregate amount of capital surplus and the legal reserve equals 25% of thecommon stock. Under the Code, the aggregate amount of capital surplus and the legal reserve that exceeds 25%of the common stock may be made available for dividends by resolution of the shareholders. Under the CorporateLaw, the total amount of capital surplus and the legal reserve may be reversed without limitation of suchthreshold. The Corporate Law also provides that common stock, capital surplus, legal reserve and unappropriatedretained earnings can be transferred among the accounts under certain conditions upon resolution of theshareholders, while it is no longer allowed to transfer a portion of retained earnings to the common stockaccount.
In addition, the Corporate Law permits to pay dividends at any time during the fiscal year in addition to theyear-end dividend upon resolution at the shareholders’ meeting. Furthermore, the Board of Directors may declaredividends if a company has prescribed so in its articles of incorporation and met certain criteria under theCorporate Law.
F-50
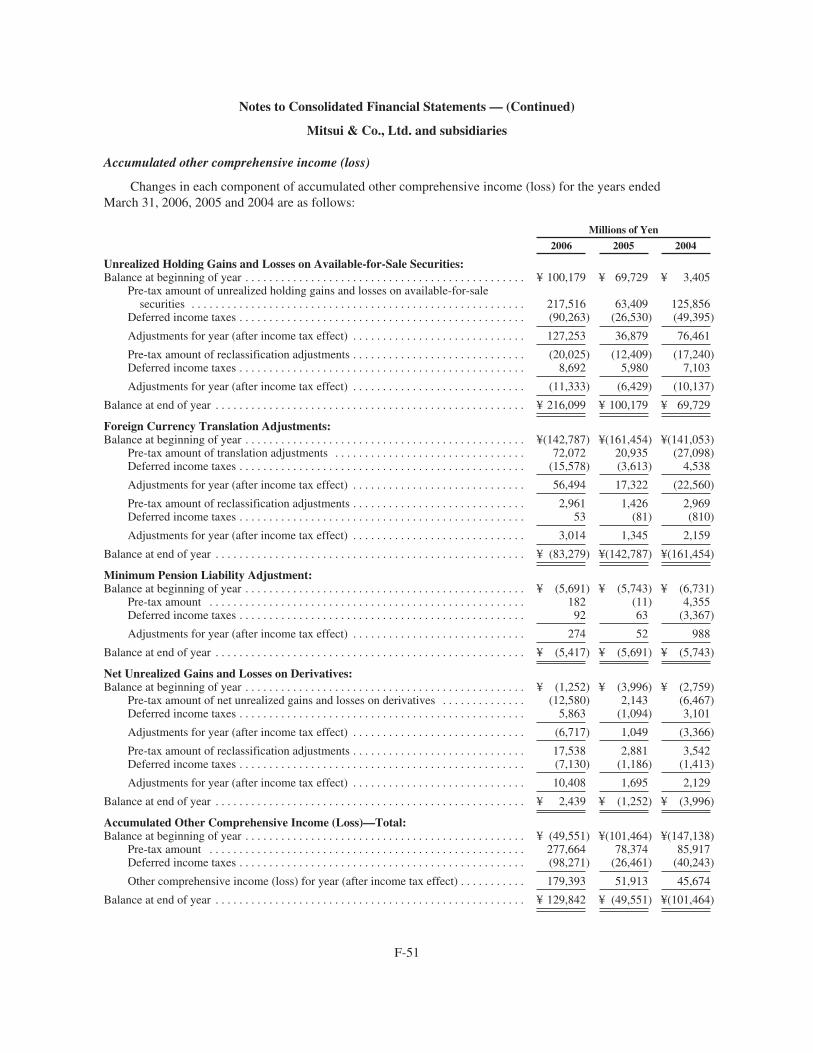
Notes to Consolidated Financial Statements — (Continued)
Mitsui & Co., Ltd. and subsidiaries
Accumulated other comprehensive income (loss)
Changes in each component of accumulated other comprehensive income (loss) for the years endedMarch 31, 2006, 2005 and 2004 are as follows:
Millions of Yen
2006 2005 2004
Unrealized Holding Gains and Losses on Available-for-Sale Securities:Balance at beginning of year . . . . . . . . . . . . . . . . . . . . . . . . . . . . . . . . . . . . . . . . . . . . . . . ¥ 100,179 ¥ 69,729 ¥ 3,405
Pre-tax amount of unrealized holding gains and losses on available-for-salesecurities . . . . . . . . . . . . . . . . . . . . . . . . . . . . . . . . . . . . . . . . . . . . . . . . . . . . . . . . 217,516 63,409 125,856
Deferred income taxes . . . . . . . . . . . . . . . . . . . . . . . . . . . . . . . . . . . . . . . . . . . . . . . . (90,263) (26,530) (49,395)
Adjustments for year (after income tax effect) . . . . . . . . . . . . . . . . . . . . . . . . . . . . . 127,253 36,879 76,461
Pre-tax amount of reclassification adjustments . . . . . . . . . . . . . . . . . . . . . . . . . . . . . (20,025) (12,409) (17,240)Deferred income taxes . . . . . . . . . . . . . . . . . . . . . . . . . . . . . . . . . . . . . . . . . . . . . . . . 8,692 5,980 7,103
Adjustments for year (after income tax effect) . . . . . . . . . . . . . . . . . . . . . . . . . . . . . (11,333) (6,429) (10,137)
Balance at end of year . . . . . . . . . . . . . . . . . . . . . . . . . . . . . . . . . . . . . . . . . . . . . . . . . . . . ¥ 216,099 ¥ 100,179 ¥ 69,729
Foreign Currency Translation Adjustments:Balance at beginning of year . . . . . . . . . . . . . . . . . . . . . . . . . . . . . . . . . . . . . . . . . . . . . . . ¥(142,787) ¥(161,454) ¥(141,053)
Pre-tax amount of translation adjustments . . . . . . . . . . . . . . . . . . . . . . . . . . . . . . . . 72,072 20,935 (27,098)Deferred income taxes . . . . . . . . . . . . . . . . . . . . . . . . . . . . . . . . . . . . . . . . . . . . . . . . (15,578) (3,613) 4,538
Adjustments for year (after income tax effect) . . . . . . . . . . . . . . . . . . . . . . . . . . . . . 56,494 17,322 (22,560)
Pre-tax amount of reclassification adjustments . . . . . . . . . . . . . . . . . . . . . . . . . . . . . 2,961 1,426 2,969Deferred income taxes . . . . . . . . . . . . . . . . . . . . . . . . . . . . . . . . . . . . . . . . . . . . . . . . 53 (81) (810)
Adjustments for year (after income tax effect) . . . . . . . . . . . . . . . . . . . . . . . . . . . . . 3,014 1,345 2,159
Balance at end of year . . . . . . . . . . . . . . . . . . . . . . . . . . . . . . . . . . . . . . . . . . . . . . . . . . . . ¥ (83,279) ¥(142,787) ¥(161,454)
Minimum Pension Liability Adjustment:Balance at beginning of year . . . . . . . . . . . . . . . . . . . . . . . . . . . . . . . . . . . . . . . . . . . . . . . ¥ (5,691) ¥ (5,743) ¥ (6,731)
Pre-tax amount . . . . . . . . . . . . . . . . . . . . . . . . . . . . . . . . . . . . . . . . . . . . . . . . . . . . . 182 (11) 4,355Deferred income taxes . . . . . . . . . . . . . . . . . . . . . . . . . . . . . . . . . . . . . . . . . . . . . . . . 92 63 (3,367)
Adjustments for year (after income tax effect) . . . . . . . . . . . . . . . . . . . . . . . . . . . . . 274 52 988
Balance at end of year . . . . . . . . . . . . . . . . . . . . . . . . . . . . . . . . . . . . . . . . . . . . . . . . . . . . ¥ (5,417) ¥ (5,691) ¥ (5,743)
Net Unrealized Gains and Losses on Derivatives:Balance at beginning of year . . . . . . . . . . . . . . . . . . . . . . . . . . . . . . . . . . . . . . . . . . . . . . . ¥ (1,252) ¥ (3,996) ¥ (2,759)
Pre-tax amount of net unrealized gains and losses on derivatives . . . . . . . . . . . . . . (12,580) 2,143 (6,467)Deferred income taxes . . . . . . . . . . . . . . . . . . . . . . . . . . . . . . . . . . . . . . . . . . . . . . . . 5,863 (1,094) 3,101
Adjustments for year (after income tax effect) . . . . . . . . . . . . . . . . . . . . . . . . . . . . . (6,717) 1,049 (3,366)
Pre-tax amount of reclassification adjustments . . . . . . . . . . . . . . . . . . . . . . . . . . . . . 17,538 2,881 3,542Deferred income taxes . . . . . . . . . . . . . . . . . . . . . . . . . . . . . . . . . . . . . . . . . . . . . . . . (7,130) (1,186) (1,413)
Adjustments for year (after income tax effect) . . . . . . . . . . . . . . . . . . . . . . . . . . . . . 10,408 1,695 2,129
Balance at end of year . . . . . . . . . . . . . . . . . . . . . . . . . . . . . . . . . . . . . . . . . . . . . . . . . . . . ¥ 2,439 ¥ (1,252) ¥ (3,996)
Accumulated Other Comprehensive Income (Loss)—Total:Balance at beginning of year . . . . . . . . . . . . . . . . . . . . . . . . . . . . . . . . . . . . . . . . . . . . . . . ¥ (49,551) ¥(101,464) ¥(147,138)
Pre-tax amount . . . . . . . . . . . . . . . . . . . . . . . . . . . . . . . . . . . . . . . . . . . . . . . . . . . . . 277,664 78,374 85,917Deferred income taxes . . . . . . . . . . . . . . . . . . . . . . . . . . . . . . . . . . . . . . . . . . . . . . . . (98,271) (26,461) (40,243)
Other comprehensive income (loss) for year (after income tax effect) . . . . . . . . . . . 179,393 51,913 45,674
Balance at end of year . . . . . . . . . . . . . . . . . . . . . . . . . . . . . . . . . . . . . . . . . . . . . . . . . . . . ¥ 129,842 ¥ (49,551) ¥(101,464)
F-51
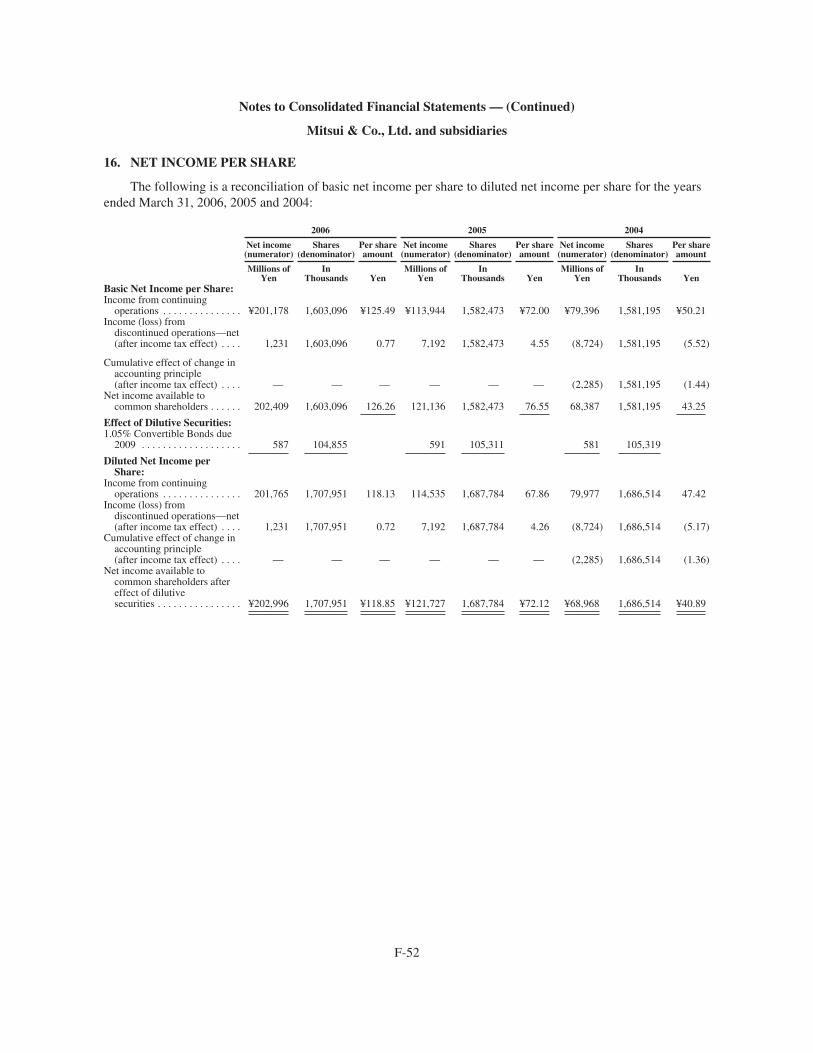
Notes to Consolidated Financial Statements — (Continued)
Mitsui & Co., Ltd. and subsidiaries
16. NET INCOME PER SHARE
The following is a reconciliation of basic net income per share to diluted net income per share for the yearsended March 31, 2006, 2005 and 2004:
2006 2005 2004
Net income(numerator)
Shares(denominator)
Per shareamount
Net income(numerator)
Shares(denominator)
Per shareamount
Net income(numerator)
Shares(denominator)
Per shareamount
Millions ofYen
InThousands Yen
Millions ofYen
InThousands Yen
Millions ofYen
InThousands Yen
Basic Net Income per Share:Income from continuing
operations . . . . . . . . . . . . . . . ¥201,178 1,603,096 ¥125.49 ¥113,944 1,582,473 ¥72.00 ¥79,396 1,581,195 ¥50.21Income (loss) from
discontinued operations—net(after income tax effect) . . . . 1,231 1,603,096 0.77 7,192 1,582,473 4.55 (8,724) 1,581,195 (5.52)
Cumulative effect of change inaccounting principle(after income tax effect) . . . . — — — — — — (2,285) 1,581,195 (1.44)
Net income available tocommon shareholders . . . . . . 202,409 1,603,096 126.26 121,136 1,582,473 76.55 68,387 1,581,195 43.25
Effect of Dilutive Securities:1.05% Convertible Bonds due
2009 . . . . . . . . . . . . . . . . . . . 587 104,855 591 105,311 581 105,319
Diluted Net Income perShare:
Income from continuingoperations . . . . . . . . . . . . . . . 201,765 1,707,951 118.13 114,535 1,687,784 67.86 79,977 1,686,514 47.42
Income (loss) fromdiscontinued operations—net(after income tax effect) . . . . 1,231 1,707,951 0.72 7,192 1,687,784 4.26 (8,724) 1,686,514 (5.17)
Cumulative effect of change inaccounting principle(after income tax effect) . . . . — — — — — — (2,285) 1,686,514 (1.36)
Net income available tocommon shareholders aftereffect of dilutivesecurities . . . . . . . . . . . . . . . . ¥202,996 1,707,951 ¥118.85 ¥121,727 1,687,784 ¥72.12 ¥68,968 1,686,514 ¥40.89
F-52
Notes to Consolidated Financial Statements — (Continued)
Mitsui & Co., Ltd. and subsidiaries
17. SEGMENT INFORMATION
SFAS No. 131, “Disclosures about Segments of an Enterprise and Related Information,” requires disclosureof financial and descriptive information about operating segments, which are components of an enterprise whoseoperating results are regularly reviewed by the enterprise’s chief operating decision maker in deciding aboutresources to be allocated to the segment and assessing its performance.
The business units of the companies’ Head Office, which are organized based on “products and services,”plan overall and worldwide strategies for their products and services and conduct their worldwide operations.The business units also collaborate with overseas branches and overseas trading subsidiaries in planning andexecuting their strategies for products and regions. The overseas branches and overseas trading subsidiaries areseparate operating units, which are delegated the business of their regions as the centers of each particularregional strategy and operate diversified business together with their subsidiaries and associated companies incollaboration with the business units.
Therefore, the companies’ operating segments consist of product-focused operating segments comprised ofthe business units of the Head Office and region-focused operating segments comprised of overseas branches andoverseas trading subsidiaries. The companies’ operating segments have been aggregated based on the nature ofthe products and other criteria into eight product-focused reportable operating segments and four region-focusedreportable operating segments, totaling twelve reportable operating segments.
As the companies focus on investments in mineral resources and energy projects as core investment area,“Iron & Steel Products” and “Iron & Steel Raw Materials and Non-Ferrous Metals” have been promoting moreindependent businesses than before, therefore these operating segments, which were formerly aggregated in“Metal Products & Minerals” are presented as a separate product-focused reportable segments, starting from theyear ended March 31, 2006.
Also, positioning consumer service businesses as a growing and strengthening business area, the companiesintegrated function and expertise of Information, Electronics and Telecommunication Business Unit which wasformerly included in “Machinery, Electronics & Information” and operating business units which were formerlyincluded in “Consumer Products & Services” in order to promote a broad range of business opportunities in theemerging markets such as media, information, outsourcing, retail support, medical, health and seniors, and todevelop consumer-oriented service businesses as a new source of core earnings. Based on these corporatestrategies, with regard to the operating segments which were formerly included in “Consumer Products &Services”, Lifestyle Business Unit and Consumer Service Business Unit, which aim to provide highly value-added products and services to consumers, as well as ordinary distribution and intermediary services, byconverging products, services and information-technology function, are aggregated with Information, Electronicsand Telecommunication Business Unit and disclosed as “Lifestyle, Consumer Service and Information,Electronics & Telecommunication.” And “Foods & Retail,” which aims to meet diversifying needs of retailerswith comprehensive services while investing to and participating in management of retailers, is presented as aseparated product-focused reportable segment. Machinery Business Unit and Power, Transportation & PlantProjects Business Unit, which were formerly included in “Machinery, Electronics & Information,” are presentedas “Machinery & Infrastructure Projects.”
In order to develop new business opportunities emerging with the development of network economies basedaround China, ASEAN and India, we introduced an Asian Regional Managing Directorship system. Broadauthority and responsibility to manage our businesses throughout Asia excluding Japan is delegated to the AsianRegional Managing Director, starting from the year ended March 31, 2006. Based on this change, figures inrelation to Asia other than Japan, which were formerly included in Other Overseas Areas, are disclosed as aseparate region-focused reportable operating segment.
F-53
Notes to Consolidated Financial Statements — (Continued)
Mitsui & Co., Ltd. and subsidiaries
The operating segment information for the years ended March 31, 2005 and 2004 has been restated toconform to the current year presentation.
Further, starting from the year ended March 31, 2006, items related to the consolidated balance sheets andthe consolidated cash flows; investments in and advances to associated companies, depreciation andamortization, and additions to property leased to others and property and equipment are disclosed in theoperating segment information, since these items are newly included in the measure of segment performancereviewed by the chief operating decision maker. Also since intersegment total trading transactions is no longerused as a measure of segments’ performance reviewed by the chief operating decision maker, starting from theyear ended March 31, 2006, it is excluded from segments’ total trading transactions and only those to externalcustomers are presented. And, starting from the year ended March 31, 2005, equity in earnings of associatedcompanies has been disclosed, since this item was newly included in the measure of segments’ performancereviewed by the chief operating decision maker.
A description of reportable operating segments of the Company follows.
Iron & Steel Products manufactures, sells and trades iron and steel products in Japan and abroad.
Iron & Steel Raw Materials and Non-Ferrous Metals develops raw material resources of iron andnon-ferrous metals in foreign countries, and manufactures, sells and trades raw materials and metal products inJapan and abroad.
Machinery & Infrastructure Projects is engaged in the manufacture, sale and trade of machinery products,leasing, financing and promotion of certain projects such as plant constructions and infrastructure buildings inJapan and abroad.
Chemical manufactures, sells and trades chemical products in Japan and abroad.
Energy develops energy resources overseas and manufactures, sells and trades oil, gas and related productsin Japan and abroad.
Foods & Retail manufactures, sells and trades foods and provides support service to large retailers in Japanand abroad.
Lifestyle, Consumer Service and Information, Electronics & Telecommunication manufactures, sells andtrades textiles and IT products for consumers, and is engaged in consumer-related business such as media &information, outsourcing business and real estate business in Japan and abroad.
Logistics & Financial Markets engages in logistics services, insurance and financial businesses in Japan andabroad.
Americas, Europe, Asia and Other Overseas Areas trade in various commodities and conduct relatedbusiness led by overseas trading subsidiaries or offices located in each region.
F-54
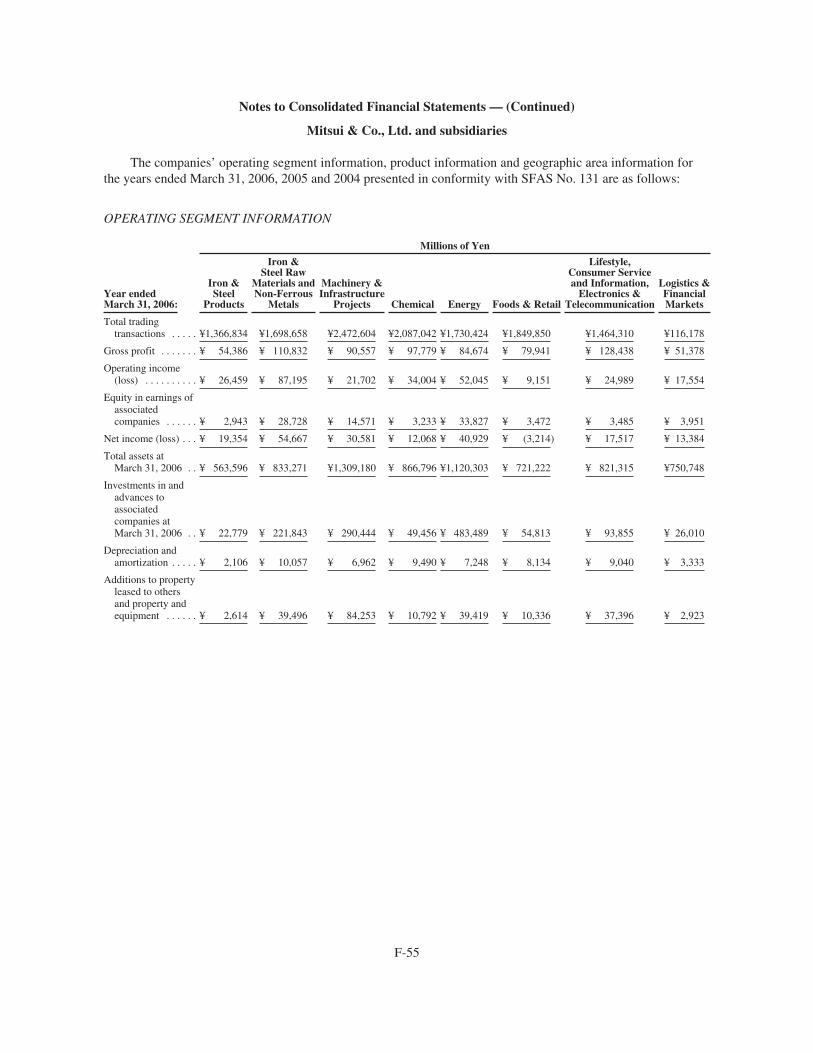
Notes to Consolidated Financial Statements — (Continued)
Mitsui & Co., Ltd. and subsidiaries
The companies’ operating segment information, product information and geographic area information forthe years ended March 31, 2006, 2005 and 2004 presented in conformity with SFAS No. 131 are as follows:
OPERATING SEGMENT INFORMATION
Millions of Yen
Year endedMarch 31, 2006:
Iron &Steel
Products
Iron &Steel Raw
Materials andNon-Ferrous
Metals
Machinery &Infrastructure
Projects Chemical Energy Foods & Retail
Lifestyle,Consumer Serviceand Information,
Electronics &Telecommunication
Logistics &FinancialMarkets
Total tradingtransactions . . . . . ¥1,366,834 ¥1,698,658 ¥2,472,604 ¥2,087,042 ¥1,730,424 ¥1,849,850 ¥1,464,310 ¥116,178
Gross profit . . . . . . . ¥ 54,386 ¥ 110,832 ¥ 90,557 ¥ 97,779 ¥ 84,674 ¥ 79,941 ¥ 128,438 ¥ 51,378
Operating income(loss) . . . . . . . . . . ¥ 26,459 ¥ 87,195 ¥ 21,702 ¥ 34,004 ¥ 52,045 ¥ 9,151 ¥ 24,989 ¥ 17,554
Equity in earnings ofassociatedcompanies . . . . . . ¥ 2,943 ¥ 28,728 ¥ 14,571 ¥ 3,233 ¥ 33,827 ¥ 3,472 ¥ 3,485 ¥ 3,951
Net income (loss) . . . ¥ 19,354 ¥ 54,667 ¥ 30,581 ¥ 12,068 ¥ 40,929 ¥ (3,214) ¥ 17,517 ¥ 13,384
Total assets atMarch 31, 2006 . . ¥ 563,596 ¥ 833,271 ¥1,309,180 ¥ 866,796 ¥1,120,303 ¥ 721,222 ¥ 821,315 ¥750,748
Investments in andadvances toassociatedcompanies atMarch 31, 2006 . . ¥ 22,779 ¥ 221,843 ¥ 290,444 ¥ 49,456 ¥ 483,489 ¥ 54,813 ¥ 93,855 ¥ 26,010
Depreciation andamortization . . . . . ¥ 2,106 ¥ 10,057 ¥ 6,962 ¥ 9,490 ¥ 7,248 ¥ 8,134 ¥ 9,040 ¥ 3,333
Additions to propertyleased to othersand property andequipment . . . . . . ¥ 2,614 ¥ 39,496 ¥ 84,253 ¥ 10,792 ¥ 39,419 ¥ 10,336 ¥ 37,396 ¥ 2,923
F-55

Notes to Consolidated Financial Statements — (Continued)
Mitsui & Co., Ltd. and subsidiaries
Millions of Yen
Year endedMarch 31, 2006: Americas Europe Asia
OtherOverseas
Areas Total All Other
Adjustmentsand
EliminationsConsolidated
Total
Total tradingtransactions: . . . . . . ¥1,108,931 ¥ 427,960 ¥ 496,551 ¥ 65,896 ¥14,885,238 ¥ 7,869 ¥ (7,379) ¥14,885,728
Gross profit . . . . . . . . . ¥ 61,588 ¥ 22,456 ¥ 27,370 ¥ 4,926 ¥ 814,325 ¥ 7,122 ¥ (4,830) ¥ 816,617
Operating income(loss) . . . . . . . . . . . . ¥ 21,723 ¥ 4,119 ¥ 10,667 ¥ 993 ¥ 310,601 ¥ (3,041) ¥ (41,760) ¥ 265,800
Equity in earnings ofassociatedcompanies . . . . . . . . ¥ 2,126 ¥ (174) ¥ 121 ¥ 633 ¥ 96,916 ¥ 301 ¥ (2,969) ¥ 94,248
Net income (loss) . . . . ¥ 12,652 ¥ 4,898 ¥ 9,266 ¥ 14,341 ¥ 226,443 ¥ 11,172 ¥ (35,206) ¥ 202,409
Total assets atMarch 31, 2006 . . . . ¥ 455,615 ¥ 259,541 ¥ 181,696 ¥ 62,267 ¥ 7,945,550 ¥2,539,817 ¥(1,911,789) ¥ 8,573,578
Investments in andadvances toassociatedcompanies atMarch 31, 2006 . . . . ¥ 9,714 ¥ 13,278 ¥ 3,897 ¥ 19,988 ¥ 1,289,566 ¥ 9,331 ¥ 1,690 ¥ 1,300,587
Depreciation andamortization . . . . . . ¥ 4,734 ¥ 898 ¥ 520 ¥ 162 ¥ 62,684 ¥ 1,085 ¥ 8,723 ¥ 72,492
Additions to propertyleased to others andproperty andequipment . . . . . . . . ¥ 9,747 ¥ 1,380 ¥ 526 ¥ 425 ¥ 239,307 ¥ 1,789 ¥ 5,958 ¥ 247,054
Millions of Yen
Year endedMarch 31, 2005(As restated):
Iron &Steel
Products
Iron &Steel Raw
Materials andNon-Ferrous
Metals
Machinery &Infrastructure
Projects Chemical EnergyFoods &
Retail
Lifestyle,Consumer Serviceand Information,
Electronics &Telecommunication
Logistics &FinancialMarkets
Total tradingtransactions:External
customers . . . . . . ¥1,227,833 ¥1,412,428 ¥2,206,031 ¥1,901,950 ¥ 1,402,521 ¥1,777,144 ¥ 1,370,456 ¥ 94,354Intersegment . . . . . . 116,043 123,314 96,320 408,446 82,231 56,923 45,942 11,172
Total . . . . . . . . . . ¥1,343,876 ¥1,535,742 ¥2,302,351 ¥2,310,396 ¥ 1,484,752 ¥1,834,067 ¥ 1,416,398 ¥ 105,526
Gross profit . . . . . . . . . ¥ 47,290 ¥ 74,159 ¥ 82,911 ¥ 87,112 ¥ 72,604 ¥ 85,275 ¥ 121,751 ¥ 46,662
Operating income(loss) . . . . . . . . . . . . ¥ 16,262 ¥ 51,876 ¥ 21,564 ¥ 24,559 ¥ 35,453 ¥ 17,847 ¥ 23,989 ¥ 18,480
Equity in earnings ofassociatedcompanies . . . . . . . . ¥ 1,730 ¥ 20,714 ¥ 10,035 ¥ 2,450 ¥ 24,480 ¥ 2,167 ¥ (286) ¥ 2,439
Net income (loss) . . . . ¥ 11,575 ¥ 35,416 ¥ 20,920 ¥ (6,852)¥ 42,759 ¥ 10,594 ¥ 11,805 ¥ 11,835
Total assets atMarch 31, 2005 . . . . ¥ 527,591 ¥ 699,903 ¥1,068,116 ¥ 779,930 ¥ 894,175 ¥ 605,136 ¥ 742,571 ¥ 405,355
F-56
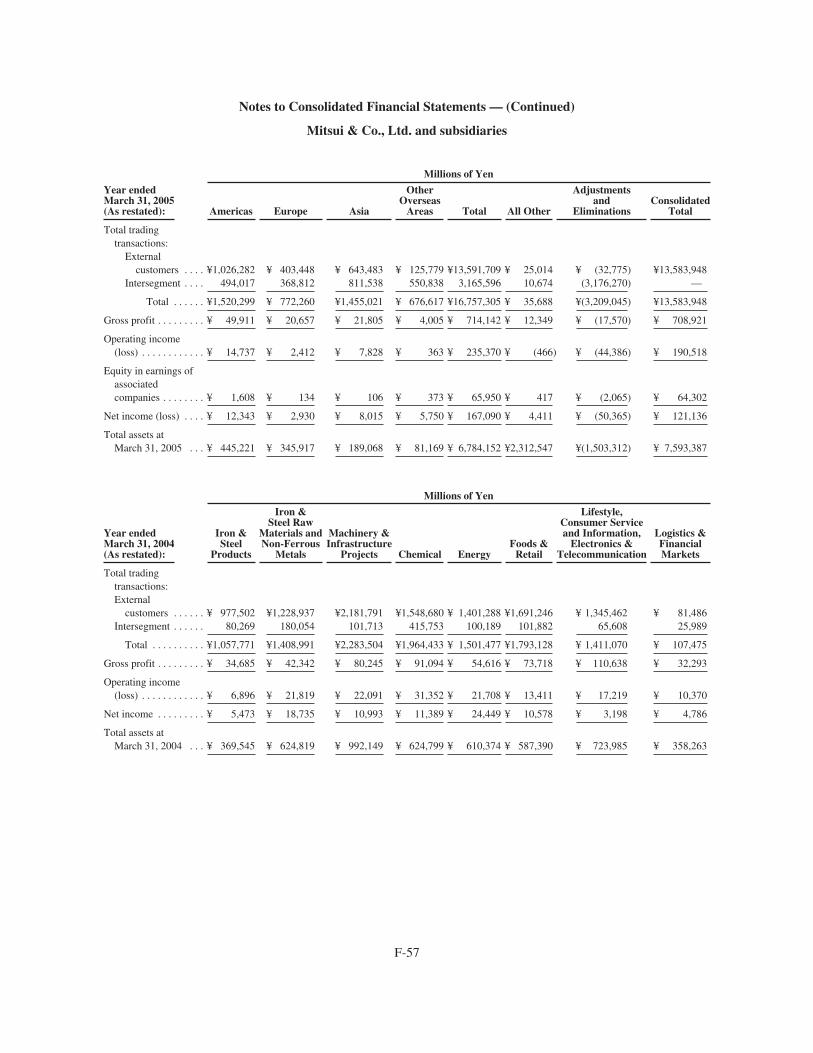
Notes to Consolidated Financial Statements — (Continued)
Mitsui & Co., Ltd. and subsidiaries
Millions of Yen
Year endedMarch 31, 2005(As restated): Americas Europe Asia
OtherOverseas
Areas Total All Other
Adjustmentsand
EliminationsConsolidated
Total
Total tradingtransactions:
Externalcustomers . . . . ¥1,026,282 ¥ 403,448 ¥ 643,483 ¥ 125,779 ¥13,591,709 ¥ 25,014 ¥ (32,775) ¥13,583,948
Intersegment . . . . 494,017 368,812 811,538 550,838 3,165,596 10,674 (3,176,270) —
Total . . . . . . ¥1,520,299 ¥ 772,260 ¥1,455,021 ¥ 676,617 ¥16,757,305 ¥ 35,688 ¥(3,209,045) ¥13,583,948
Gross profit . . . . . . . . . ¥ 49,911 ¥ 20,657 ¥ 21,805 ¥ 4,005 ¥ 714,142 ¥ 12,349 ¥ (17,570) ¥ 708,921
Operating income(loss) . . . . . . . . . . . . ¥ 14,737 ¥ 2,412 ¥ 7,828 ¥ 363 ¥ 235,370 ¥ (466) ¥ (44,386) ¥ 190,518
Equity in earnings ofassociatedcompanies . . . . . . . . ¥ 1,608 ¥ 134 ¥ 106 ¥ 373 ¥ 65,950 ¥ 417 ¥ (2,065) ¥ 64,302
Net income (loss) . . . . ¥ 12,343 ¥ 2,930 ¥ 8,015 ¥ 5,750 ¥ 167,090 ¥ 4,411 ¥ (50,365) ¥ 121,136
Total assets atMarch 31, 2005 . . . ¥ 445,221 ¥ 345,917 ¥ 189,068 ¥ 81,169 ¥ 6,784,152 ¥2,312,547 ¥(1,503,312) ¥ 7,593,387
Millions of Yen
Year endedMarch 31, 2004(As restated):
Iron &Steel
Products
Iron &Steel Raw
Materials andNon-Ferrous
Metals
Machinery &Infrastructure
Projects Chemical EnergyFoods &
Retail
Lifestyle,Consumer Serviceand Information,
Electronics &Telecommunication
Logistics &FinancialMarkets
Total tradingtransactions:External
customers . . . . . . ¥ 977,502 ¥1,228,937 ¥2,181,791 ¥1,548,680 ¥ 1,401,288 ¥1,691,246 ¥ 1,345,462 ¥ 81,486Intersegment . . . . . . 80,269 180,054 101,713 415,753 100,189 101,882 65,608 25,989
Total . . . . . . . . . . ¥1,057,771 ¥1,408,991 ¥2,283,504 ¥1,964,433 ¥ 1,501,477 ¥1,793,128 ¥ 1,411,070 ¥ 107,475
Gross profit . . . . . . . . . ¥ 34,685 ¥ 42,342 ¥ 80,245 ¥ 91,094 ¥ 54,616 ¥ 73,718 ¥ 110,638 ¥ 32,293
Operating income(loss) . . . . . . . . . . . . ¥ 6,896 ¥ 21,819 ¥ 22,091 ¥ 31,352 ¥ 21,708 ¥ 13,411 ¥ 17,219 ¥ 10,370
Net income . . . . . . . . . ¥ 5,473 ¥ 18,735 ¥ 10,993 ¥ 11,389 ¥ 24,449 ¥ 10,578 ¥ 3,198 ¥ 4,786
Total assets atMarch 31, 2004 . . . ¥ 369,545 ¥ 624,819 ¥ 992,149 ¥ 624,799 ¥ 610,374 ¥ 587,390 ¥ 723,985 ¥ 358,263
F-57
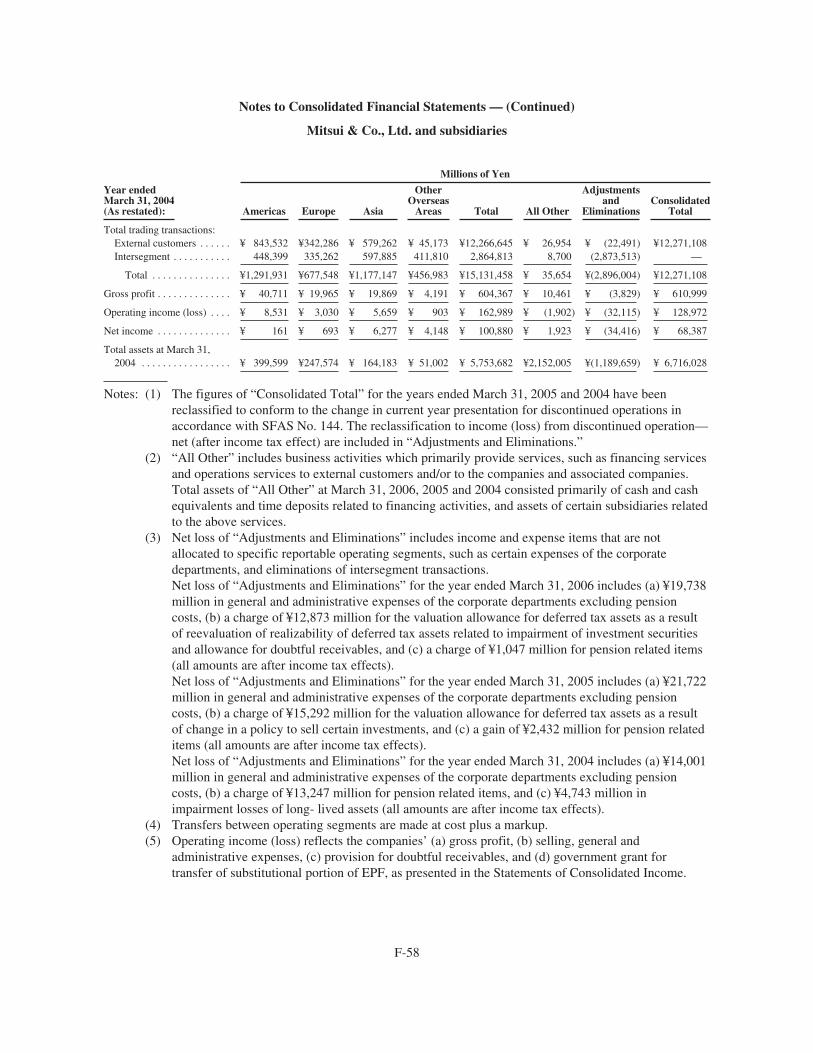
Notes to Consolidated Financial Statements — (Continued)
Mitsui & Co., Ltd. and subsidiaries
Millions of Yen
Year endedMarch 31, 2004(As restated): Americas Europe Asia
OtherOverseas
Areas Total All Other
Adjustmentsand
EliminationsConsolidated
Total
Total trading transactions:External customers . . . . . . ¥ 843,532 ¥342,286 ¥ 579,262 ¥ 45,173 ¥12,266,645 ¥ 26,954 ¥ (22,491) ¥12,271,108Intersegment . . . . . . . . . . . 448,399 335,262 597,885 411,810 2,864,813 8,700 (2,873,513) —
Total . . . . . . . . . . . . . . . ¥1,291,931 ¥677,548 ¥1,177,147 ¥456,983 ¥15,131,458 ¥ 35,654 ¥(2,896,004) ¥12,271,108
Gross profit . . . . . . . . . . . . . . ¥ 40,711 ¥ 19,965 ¥ 19,869 ¥ 4,191 ¥ 604,367 ¥ 10,461 ¥ (3,829) ¥ 610,999
Operating income (loss) . . . . ¥ 8,531 ¥ 3,030 ¥ 5,659 ¥ 903 ¥ 162,989 ¥ (1,902) ¥ (32,115) ¥ 128,972
Net income . . . . . . . . . . . . . . ¥ 161 ¥ 693 ¥ 6,277 ¥ 4,148 ¥ 100,880 ¥ 1,923 ¥ (34,416) ¥ 68,387
Total assets at March 31,2004 . . . . . . . . . . . . . . . . . ¥ 399,599 ¥247,574 ¥ 164,183 ¥ 51,002 ¥ 5,753,682 ¥2,152,005 ¥(1,189,659) ¥ 6,716,028
Notes: (1) The figures of “Consolidated Total” for the years ended March 31, 2005 and 2004 have beenreclassified to conform to the change in current year presentation for discontinued operations inaccordance with SFAS No. 144. The reclassification to income (loss) from discontinued operation—net (after income tax effect) are included in “Adjustments and Eliminations.”
(2) “All Other” includes business activities which primarily provide services, such as financing servicesand operations services to external customers and/or to the companies and associated companies.Total assets of “All Other” at March 31, 2006, 2005 and 2004 consisted primarily of cash and cashequivalents and time deposits related to financing activities, and assets of certain subsidiaries relatedto the above services.
(3) Net loss of “Adjustments and Eliminations” includes income and expense items that are notallocated to specific reportable operating segments, such as certain expenses of the corporatedepartments, and eliminations of intersegment transactions.Net loss of “Adjustments and Eliminations” for the year ended March 31, 2006 includes (a) ¥19,738million in general and administrative expenses of the corporate departments excluding pensioncosts, (b) a charge of ¥12,873 million for the valuation allowance for deferred tax assets as a resultof reevaluation of realizability of deferred tax assets related to impairment of investment securitiesand allowance for doubtful receivables, and (c) a charge of ¥1,047 million for pension related items(all amounts are after income tax effects).Net loss of “Adjustments and Eliminations” for the year ended March 31, 2005 includes (a) ¥21,722million in general and administrative expenses of the corporate departments excluding pensioncosts, (b) a charge of ¥15,292 million for the valuation allowance for deferred tax assets as a resultof change in a policy to sell certain investments, and (c) a gain of ¥2,432 million for pension relateditems (all amounts are after income tax effects).Net loss of “Adjustments and Eliminations” for the year ended March 31, 2004 includes (a) ¥14,001million in general and administrative expenses of the corporate departments excluding pensioncosts, (b) a charge of ¥13,247 million for pension related items, and (c) ¥4,743 million inimpairment losses of long- lived assets (all amounts are after income tax effects).
(4) Transfers between operating segments are made at cost plus a markup.(5) Operating income (loss) reflects the companies’ (a) gross profit, (b) selling, general and
administrative expenses, (c) provision for doubtful receivables, and (d) government grant fortransfer of substitutional portion of EPF, as presented in the Statements of Consolidated Income.
F-58
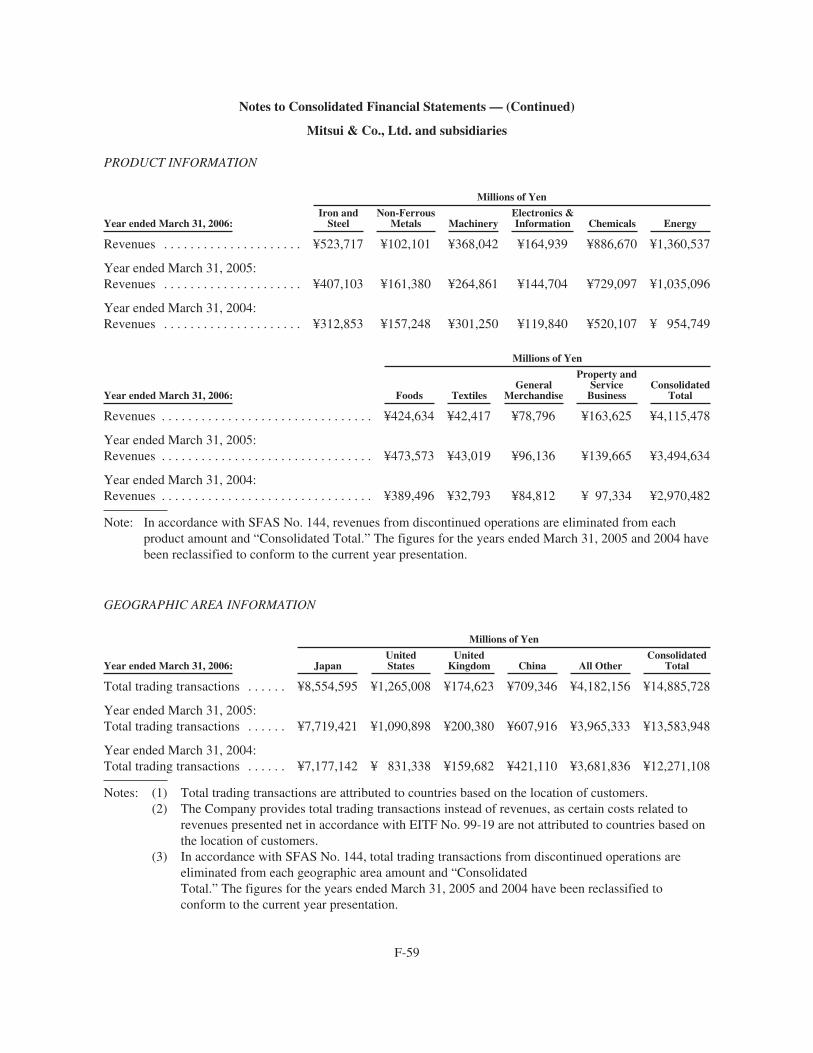
Notes to Consolidated Financial Statements — (Continued)
Mitsui & Co., Ltd. and subsidiaries
PRODUCT INFORMATION
Millions of Yen
Year ended March 31, 2006:Iron and
SteelNon-Ferrous
Metals MachineryElectronics &Information Chemicals Energy
Revenues . . . . . . . . . . . . . . . . . . . . . ¥523,717 ¥102,101 ¥368,042 ¥164,939 ¥886,670 ¥1,360,537
Year ended March 31, 2005:Revenues . . . . . . . . . . . . . . . . . . . . . ¥407,103 ¥161,380 ¥264,861 ¥144,704 ¥729,097 ¥1,035,096
Year ended March 31, 2004:Revenues . . . . . . . . . . . . . . . . . . . . . ¥312,853 ¥157,248 ¥301,250 ¥119,840 ¥520,107 ¥ 954,749
Millions of Yen
Year ended March 31, 2006: Foods TextilesGeneral
Merchandise
Property andService
BusinessConsolidated
Total
Revenues . . . . . . . . . . . . . . . . . . . . . . . . . . . . . . . . ¥424,634 ¥42,417 ¥78,796 ¥163,625 ¥4,115,478
Year ended March 31, 2005:Revenues . . . . . . . . . . . . . . . . . . . . . . . . . . . . . . . . ¥473,573 ¥43,019 ¥96,136 ¥139,665 ¥3,494,634
Year ended March 31, 2004:Revenues . . . . . . . . . . . . . . . . . . . . . . . . . . . . . . . . ¥389,496 ¥32,793 ¥84,812 ¥ 97,334 ¥2,970,482
Note: In accordance with SFAS No. 144, revenues from discontinued operations are eliminated from eachproduct amount and “Consolidated Total.” The figures for the years ended March 31, 2005 and 2004 havebeen reclassified to conform to the current year presentation.
GEOGRAPHIC AREA INFORMATION
Millions of Yen
Year ended March 31, 2006: JapanUnitedStates
UnitedKingdom China All Other
ConsolidatedTotal
Total trading transactions . . . . . . ¥8,554,595 ¥1,265,008 ¥174,623 ¥709,346 ¥4,182,156 ¥14,885,728
Year ended March 31, 2005:Total trading transactions . . . . . . ¥7,719,421 ¥1,090,898 ¥200,380 ¥607,916 ¥3,965,333 ¥13,583,948
Year ended March 31, 2004:Total trading transactions . . . . . . ¥7,177,142 ¥ 831,338 ¥159,682 ¥421,110 ¥3,681,836 ¥12,271,108
Notes: (1) Total trading transactions are attributed to countries based on the location of customers.(2) The Company provides total trading transactions instead of revenues, as certain costs related to
revenues presented net in accordance with EITF No. 99-19 are not attributed to countries based onthe location of customers.
(3) In accordance with SFAS No. 144, total trading transactions from discontinued operations areeliminated from each geographic area amount and “ConsolidatedTotal.” The figures for the years ended March 31, 2005 and 2004 have been reclassified toconform to the current year presentation.
F-59
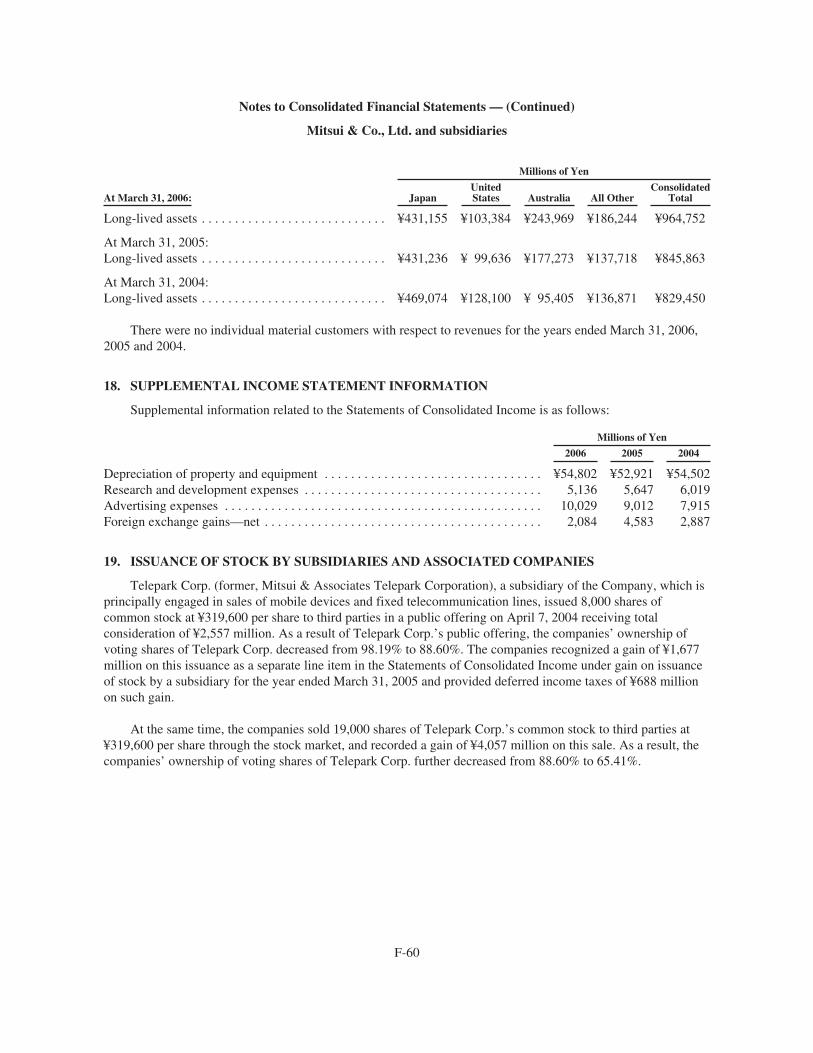
Notes to Consolidated Financial Statements — (Continued)
Mitsui & Co., Ltd. and subsidiaries
Millions of Yen
At March 31, 2006: JapanUnitedStates Australia All Other
ConsolidatedTotal
Long-lived assets . . . . . . . . . . . . . . . . . . . . . . . . . . . . ¥431,155 ¥103,384 ¥243,969 ¥186,244 ¥964,752
At March 31, 2005:Long-lived assets . . . . . . . . . . . . . . . . . . . . . . . . . . . . ¥431,236 ¥ 99,636 ¥177,273 ¥137,718 ¥845,863
At March 31, 2004:Long-lived assets . . . . . . . . . . . . . . . . . . . . . . . . . . . . ¥469,074 ¥128,100 ¥ 95,405 ¥136,871 ¥829,450
There were no individual material customers with respect to revenues for the years ended March 31, 2006,2005 and 2004.
18. SUPPLEMENTAL INCOME STATEMENT INFORMATION
Supplemental information related to the Statements of Consolidated Income is as follows:
Millions of Yen
2006 2005 2004
Depreciation of property and equipment . . . . . . . . . . . . . . . . . . . . . . . . . . . . . . . . . ¥54,802 ¥52,921 ¥54,502Research and development expenses . . . . . . . . . . . . . . . . . . . . . . . . . . . . . . . . . . . . 5,136 5,647 6,019Advertising expenses . . . . . . . . . . . . . . . . . . . . . . . . . . . . . . . . . . . . . . . . . . . . . . . . 10,029 9,012 7,915Foreign exchange gains—net . . . . . . . . . . . . . . . . . . . . . . . . . . . . . . . . . . . . . . . . . . 2,084 4,583 2,887
19. ISSUANCE OF STOCK BY SUBSIDIARIES AND ASSOCIATED COMPANIES
Telepark Corp. (former, Mitsui & Associates Telepark Corporation), a subsidiary of the Company, which isprincipally engaged in sales of mobile devices and fixed telecommunication lines, issued 8,000 shares ofcommon stock at ¥319,600 per share to third parties in a public offering on April 7, 2004 receiving totalconsideration of ¥2,557 million. As a result of Telepark Corp.’s public offering, the companies’ ownership ofvoting shares of Telepark Corp. decreased from 98.19% to 88.60%. The companies recognized a gain of ¥1,677million on this issuance as a separate line item in the Statements of Consolidated Income under gain on issuanceof stock by a subsidiary for the year ended March 31, 2005 and provided deferred income taxes of ¥688 millionon such gain.
At the same time, the companies sold 19,000 shares of Telepark Corp.’s common stock to third parties at¥319,600 per share through the stock market, and recorded a gain of ¥4,057 million on this sale. As a result, thecompanies’ ownership of voting shares of Telepark Corp. further decreased from 88.60% to 65.41%.
F-60

Notes to Consolidated Financial Statements — (Continued)
Mitsui & Co., Ltd. and subsidiaries
20. OTHER EXPENSE–NET
Other expense—net for the years ended March 31, 2006, 2005 and 2004 consists of the following:
Millions of Yen
2006 2005 2004
Impairment loss of goodwill . . . . . . . . . . . . . . . . . . . . . . . . . . . . . . . . . . . . . . . . . . . . ¥2,838 ¥1,114 —Exploration expenses . . . . . . . . . . . . . . . . . . . . . . . . . . . . . . . . . . . . . . . . . . . . . . . . . . 2,170 2,458 ¥ 1,367Foreign exchange losses (gains)—net . . . . . . . . . . . . . . . . . . . . . . . . . . . . . . . . . . . . . 1,817 5 (10)Restructuring-related charges . . . . . . . . . . . . . . . . . . . . . . . . . . . . . . . . . . . . . . . . . . . . 1,404 1,950 6,284Litigation charges . . . . . . . . . . . . . . . . . . . . . . . . . . . . . . . . . . . . . . . . . . . . . . . . . . . . . 69 430 16,173Other . . . . . . . . . . . . . . . . . . . . . . . . . . . . . . . . . . . . . . . . . . . . . . . . . . . . . . . . . . . . . . . 1,585 2,045 4,909
Total . . . . . . . . . . . . . . . . . . . . . . . . . . . . . . . . . . . . . . . . . . . . . . . . . . . . . . . . . . . ¥9,883 ¥8,002 ¥28,723
Note: In accordance with SFAS No. 144, the expense and/or income from discontinued operations, if any, iseliminated from each line item presented in the above table. The figures for the years ended March 31, 2005and 2004 have been reclassified to conform to the current year presentation.
21. INCOME TAXES
Income taxes in Japan applicable to the companies, imposed by the national, prefectural and municipalgovernments, in the aggregate resulted in normal effective statutory tax rates of approximately 41% for the yearsended March 31, 2006 and 2005 and 42% for the year ended March 31, 2004, respectively. Foreign subsidiariesare subject to income taxes of the countries in which they operate.
On March 31, 2003, the local tax laws in Japan were amended, and an enterprise tax on the basis of the sizeof business was introduced for the year ended March 31, 2005. As a result, the statutory tax rate becameapproximately 41% effective April 1, 2004.
A reconciliation between the normal statutory tax rate in Japan applied to income from continuingoperations and the effective income tax rate on income from continuing operations for the years ended March 31,2006, 2005 and 2004 is summarized as follows:
%
2006 2005 2004
Normal statutory tax rate in Japan applied to income from continuing operations beforeincome taxes, minority interests and equity in earnings . . . . . . . . . . . . . . . . . . . . . . . . . 41.0% 41.0% 42.0%
Increases (decreases) in tax rate resulting from:Expenses not deductible for tax purposes and income not taxable—net . . . . . . . . . . . 1.2 2.5 4.1Application of lower tax rates to certain taxable income . . . . . . . . . . . . . . . . . . . . . . . (3.9) (5.6) (5.4)Effect of taxation on dividends . . . . . . . . . . . . . . . . . . . . . . . . . . . . . . . . . . . . . . . . . . 11.5 8.7 2.5Changes in valuation allowance—net . . . . . . . . . . . . . . . . . . . . . . . . . . . . . . . . . . . . . 1.1 11.7 5.2Other—net . . . . . . . . . . . . . . . . . . . . . . . . . . . . . . . . . . . . . . . . . . . . . . . . . . . . . . . . . . (1.6) 1.9 1.6
Effective income tax rate on income from continuing operations . . . . . . . . . . . . 49.3% 60.2% 50.0%
F-61
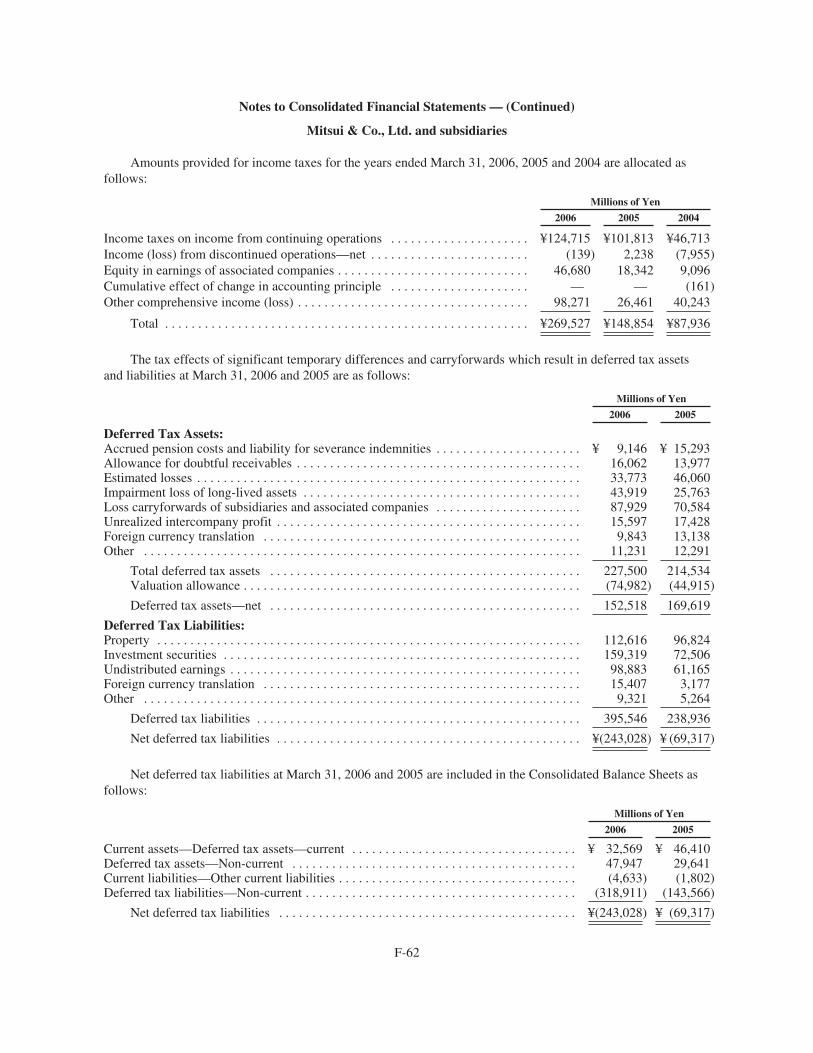
Notes to Consolidated Financial Statements — (Continued)
Mitsui & Co., Ltd. and subsidiaries
Amounts provided for income taxes for the years ended March 31, 2006, 2005 and 2004 are allocated asfollows:
Millions of Yen
2006 2005 2004
Income taxes on income from continuing operations . . . . . . . . . . . . . . . . . . . . . ¥124,715 ¥101,813 ¥46,713Income (loss) from discontinued operations—net . . . . . . . . . . . . . . . . . . . . . . . . (139) 2,238 (7,955)Equity in earnings of associated companies . . . . . . . . . . . . . . . . . . . . . . . . . . . . . 46,680 18,342 9,096Cumulative effect of change in accounting principle . . . . . . . . . . . . . . . . . . . . . — — (161)Other comprehensive income (loss) . . . . . . . . . . . . . . . . . . . . . . . . . . . . . . . . . . . 98,271 26,461 40,243
Total . . . . . . . . . . . . . . . . . . . . . . . . . . . . . . . . . . . . . . . . . . . . . . . . . . . . . . . ¥269,527 ¥148,854 ¥87,936
The tax effects of significant temporary differences and carryforwards which result in deferred tax assetsand liabilities at March 31, 2006 and 2005 are as follows:
Millions of Yen
2006 2005
Deferred Tax Assets:Accrued pension costs and liability for severance indemnities . . . . . . . . . . . . . . . . . . . . . . ¥ 9,146 ¥ 15,293Allowance for doubtful receivables . . . . . . . . . . . . . . . . . . . . . . . . . . . . . . . . . . . . . . . . . . . 16,062 13,977Estimated losses . . . . . . . . . . . . . . . . . . . . . . . . . . . . . . . . . . . . . . . . . . . . . . . . . . . . . . . . . . 33,773 46,060Impairment loss of long-lived assets . . . . . . . . . . . . . . . . . . . . . . . . . . . . . . . . . . . . . . . . . . 43,919 25,763Loss carryforwards of subsidiaries and associated companies . . . . . . . . . . . . . . . . . . . . . . 87,929 70,584Unrealized intercompany profit . . . . . . . . . . . . . . . . . . . . . . . . . . . . . . . . . . . . . . . . . . . . . . 15,597 17,428Foreign currency translation . . . . . . . . . . . . . . . . . . . . . . . . . . . . . . . . . . . . . . . . . . . . . . . . 9,843 13,138Other . . . . . . . . . . . . . . . . . . . . . . . . . . . . . . . . . . . . . . . . . . . . . . . . . . . . . . . . . . . . . . . . . . 11,231 12,291
Total deferred tax assets . . . . . . . . . . . . . . . . . . . . . . . . . . . . . . . . . . . . . . . . . . . . . . . 227,500 214,534Valuation allowance . . . . . . . . . . . . . . . . . . . . . . . . . . . . . . . . . . . . . . . . . . . . . . . . . . . (74,982) (44,915)
Deferred tax assets—net . . . . . . . . . . . . . . . . . . . . . . . . . . . . . . . . . . . . . . . . . . . . . . . 152,518 169,619
Deferred Tax Liabilities:Property . . . . . . . . . . . . . . . . . . . . . . . . . . . . . . . . . . . . . . . . . . . . . . . . . . . . . . . . . . . . . . . . 112,616 96,824Investment securities . . . . . . . . . . . . . . . . . . . . . . . . . . . . . . . . . . . . . . . . . . . . . . . . . . . . . . 159,319 72,506Undistributed earnings . . . . . . . . . . . . . . . . . . . . . . . . . . . . . . . . . . . . . . . . . . . . . . . . . . . . . 98,883 61,165Foreign currency translation . . . . . . . . . . . . . . . . . . . . . . . . . . . . . . . . . . . . . . . . . . . . . . . . 15,407 3,177Other . . . . . . . . . . . . . . . . . . . . . . . . . . . . . . . . . . . . . . . . . . . . . . . . . . . . . . . . . . . . . . . . . . 9,321 5,264
Deferred tax liabilities . . . . . . . . . . . . . . . . . . . . . . . . . . . . . . . . . . . . . . . . . . . . . . . . . 395,546 238,936
Net deferred tax liabilities . . . . . . . . . . . . . . . . . . . . . . . . . . . . . . . . . . . . . . . . . . . . . . ¥(243,028) ¥ (69,317)
Net deferred tax liabilities at March 31, 2006 and 2005 are included in the Consolidated Balance Sheets asfollows:
Millions of Yen
2006 2005
Current assets—Deferred tax assets—current . . . . . . . . . . . . . . . . . . . . . . . . . . . . . . . . . . ¥ 32,569 ¥ 46,410Deferred tax assets—Non-current . . . . . . . . . . . . . . . . . . . . . . . . . . . . . . . . . . . . . . . . . . . 47,947 29,641Current liabilities—Other current liabilities . . . . . . . . . . . . . . . . . . . . . . . . . . . . . . . . . . . . (4,633) (1,802)Deferred tax liabilities—Non-current . . . . . . . . . . . . . . . . . . . . . . . . . . . . . . . . . . . . . . . . . (318,911) (143,566)
Net deferred tax liabilities . . . . . . . . . . . . . . . . . . . . . . . . . . . . . . . . . . . . . . . . . . . . . ¥(243,028) ¥ (69,317)
F-62
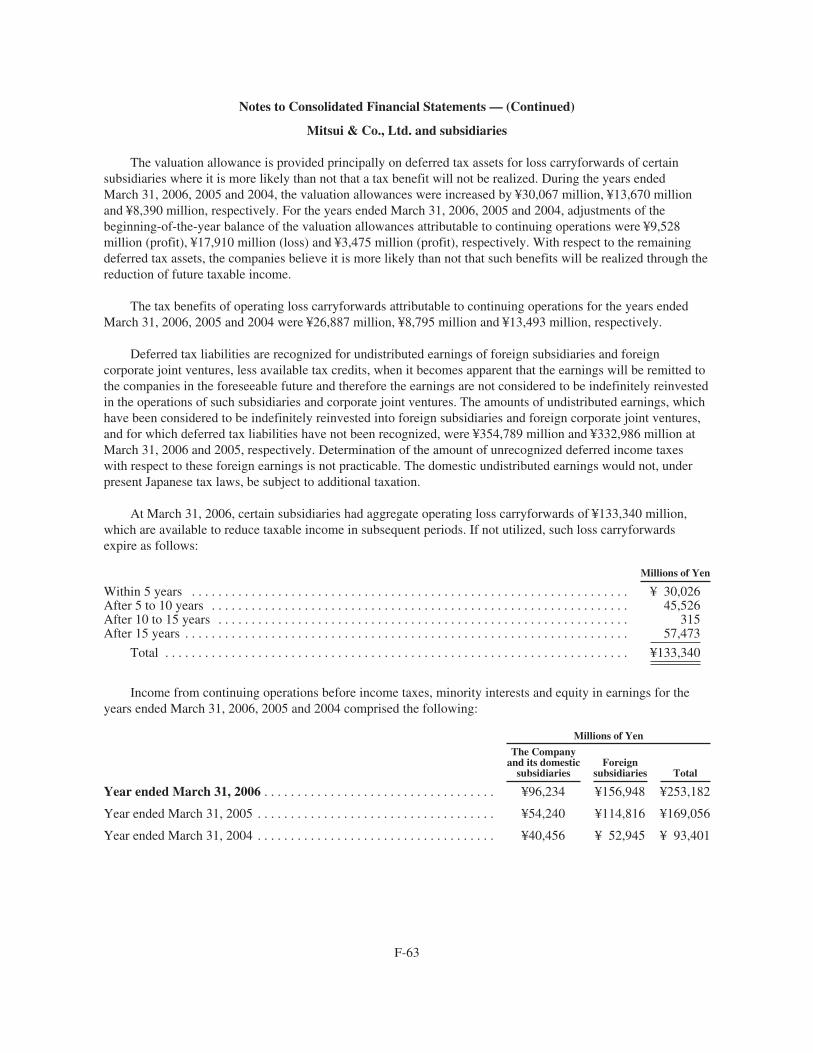
Notes to Consolidated Financial Statements — (Continued)
Mitsui & Co., Ltd. and subsidiaries
The valuation allowance is provided principally on deferred tax assets for loss carryforwards of certainsubsidiaries where it is more likely than not that a tax benefit will not be realized. During the years endedMarch 31, 2006, 2005 and 2004, the valuation allowances were increased by ¥30,067 million, ¥13,670 millionand ¥8,390 million, respectively. For the years ended March 31, 2006, 2005 and 2004, adjustments of thebeginning-of-the-year balance of the valuation allowances attributable to continuing operations were ¥9,528million (profit), ¥17,910 million (loss) and ¥3,475 million (profit), respectively. With respect to the remainingdeferred tax assets, the companies believe it is more likely than not that such benefits will be realized through thereduction of future taxable income.
The tax benefits of operating loss carryforwards attributable to continuing operations for the years endedMarch 31, 2006, 2005 and 2004 were ¥26,887 million, ¥8,795 million and ¥13,493 million, respectively.
Deferred tax liabilities are recognized for undistributed earnings of foreign subsidiaries and foreigncorporate joint ventures, less available tax credits, when it becomes apparent that the earnings will be remitted tothe companies in the foreseeable future and therefore the earnings are not considered to be indefinitely reinvestedin the operations of such subsidiaries and corporate joint ventures. The amounts of undistributed earnings, whichhave been considered to be indefinitely reinvested into foreign subsidiaries and foreign corporate joint ventures,and for which deferred tax liabilities have not been recognized, were ¥354,789 million and ¥332,986 million atMarch 31, 2006 and 2005, respectively. Determination of the amount of unrecognized deferred income taxeswith respect to these foreign earnings is not practicable. The domestic undistributed earnings would not, underpresent Japanese tax laws, be subject to additional taxation.
At March 31, 2006, certain subsidiaries had aggregate operating loss carryforwards of ¥133,340 million,which are available to reduce taxable income in subsequent periods. If not utilized, such loss carryforwardsexpire as follows:
Millions of Yen
Within 5 years . . . . . . . . . . . . . . . . . . . . . . . . . . . . . . . . . . . . . . . . . . . . . . . . . . . . . . . . . . . . . . . . . . ¥ 30,026After 5 to 10 years . . . . . . . . . . . . . . . . . . . . . . . . . . . . . . . . . . . . . . . . . . . . . . . . . . . . . . . . . . . . . . . 45,526After 10 to 15 years . . . . . . . . . . . . . . . . . . . . . . . . . . . . . . . . . . . . . . . . . . . . . . . . . . . . . . . . . . . . . . 315After 15 years . . . . . . . . . . . . . . . . . . . . . . . . . . . . . . . . . . . . . . . . . . . . . . . . . . . . . . . . . . . . . . . . . . . 57,473
Total . . . . . . . . . . . . . . . . . . . . . . . . . . . . . . . . . . . . . . . . . . . . . . . . . . . . . . . . . . . . . . . . . . . . . . ¥133,340
Income from continuing operations before income taxes, minority interests and equity in earnings for theyears ended March 31, 2006, 2005 and 2004 comprised the following:
Millions of Yen
The Companyand its domestic
subsidiariesForeign
subsidiaries Total
Year ended March 31, 2006 . . . . . . . . . . . . . . . . . . . . . . . . . . . . . . . . . . . ¥96,234 ¥156,948 ¥253,182
Year ended March 31, 2005 . . . . . . . . . . . . . . . . . . . . . . . . . . . . . . . . . . . . ¥54,240 ¥114,816 ¥169,056
Year ended March 31, 2004 . . . . . . . . . . . . . . . . . . . . . . . . . . . . . . . . . . . . ¥40,456 ¥ 52,945 ¥ 93,401
F-63

Notes to Consolidated Financial Statements — (Continued)
Mitsui & Co., Ltd. and subsidiaries
Income taxes on income from continuing operations for the years ended March 31, 2006, 2005 and 2004comprised the following:
Millions of Yen
The Companyand its domestic
subsidiariesForeign
subsidiaries Total
Year ended March 31, 2006:Current . . . . . . . . . . . . . . . . . . . . . . . . . . . . . . . . . . . . . . . . . . . . . . . . ¥36,321 ¥ 70,186 ¥106,507Deferred . . . . . . . . . . . . . . . . . . . . . . . . . . . . . . . . . . . . . . . . . . . . . . . 44,037 (25,829) 18,208
Total . . . . . . . . . . . . . . . . . . . . . . . . . . . . . . . . . . . . . . . . . . . . . . ¥80,358 ¥ 44,357 ¥124,715
Year ended March 31, 2005:Current . . . . . . . . . . . . . . . . . . . . . . . . . . . . . . . . . . . . . . . . . . . . . . . . ¥32,843 ¥ 30,474 ¥ 63,317Deferred . . . . . . . . . . . . . . . . . . . . . . . . . . . . . . . . . . . . . . . . . . . . . . . 29,738 8,758 38,496
Total . . . . . . . . . . . . . . . . . . . . . . . . . . . . . . . . . . . . . . . . . . . . . . ¥62,581 ¥ 39,232 ¥101,813
Year ended March 31, 2004:Current . . . . . . . . . . . . . . . . . . . . . . . . . . . . . . . . . . . . . . . . . . . . . . . . ¥27,158 ¥ 17,835 ¥ 44,993Deferred . . . . . . . . . . . . . . . . . . . . . . . . . . . . . . . . . . . . . . . . . . . . . . . 2,624 (904) 1,720
Total . . . . . . . . . . . . . . . . . . . . . . . . . . . . . . . . . . . . . . . . . . . . . . ¥29,782 ¥ 16,931 ¥ 46,713
22. COMPENSATION AND OTHER CHARGES RELATED TO DPF INCIDENT
The Company discovered during the year ended March 31, 2005 that false data of a performance test wereproduced and submitted to authorities for diesel particulate filters (“DPF”s) manufactured by PUREarthIncorporated, a wholly owned subsidiary of the Company, and sold by the Company. The DPFs were subsidizedby the Tokyo Metropolitan Government and seven other prefectural and municipal governments, as well as theMinistry of Land, Infrastructure and Transport, the Ministry of the Environment, and related industryassociations. The Company sold approximately 21,500 units of the product.
The Company has carried out a three-part user response plan as a top priority, that involves: (1) the freereplacement of DPFs, (2) the reimbursement of the amount paid for purchasing the Company’s DPFs upon theirredemption following the scrapping or resale of vehicles, and (3) support program for the purchase of alternativevehicles. In addition, the Company completed the full compensation of relevant subsidies during the year endedMarch 31, 2006.
The Company recorded ¥36,000 million as compensation and other charges related to DPF incident in theStatements of Consolidated Income for the year ended March 31, 2005, consisting of a user response charge ofapproximately ¥28,000 million and subsidy compensation of approximately ¥8,000 million. Subsequently, theCompany reviewed the expected costs of each user response plan based on the changes of requests from users ofthe Company’s DPFs, and recorded an additional user response charge of ¥9,000 million for the year endedMarch 31, 2006.
The outstanding balance of ¥9,391 million at March 31, 2006, which was net of compensation and othercharges related to DPF incident of ¥45,000 million and the Company’s payments of ¥35,609 million for subsidycompensation and other related expenses until March 31, 2006, was recorded in other current liabilities in theConsolidated Balance Sheets.
F-64
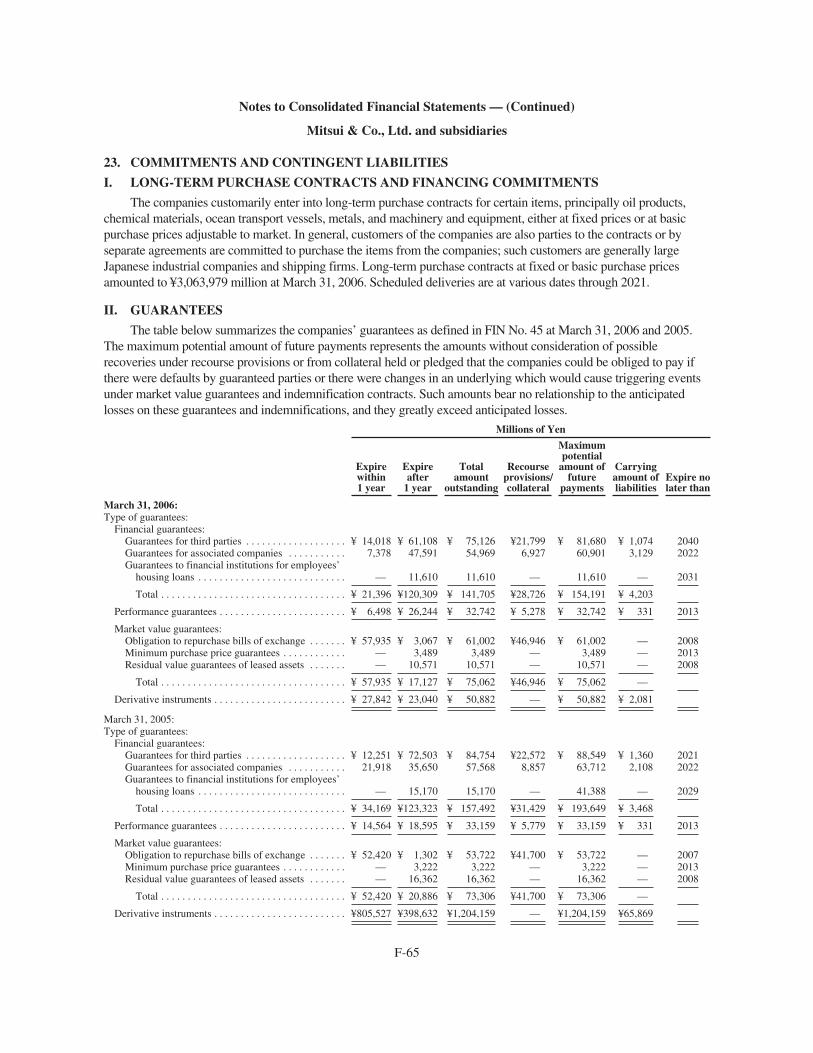
Notes to Consolidated Financial Statements — (Continued)
Mitsui & Co., Ltd. and subsidiaries
23. COMMITMENTS AND CONTINGENT LIABILITIES
I. LONG-TERM PURCHASE CONTRACTS AND FINANCING COMMITMENTS
The companies customarily enter into long-term purchase contracts for certain items, principally oil products,chemical materials, ocean transport vessels, metals, and machinery and equipment, either at fixed prices or at basicpurchase prices adjustable to market. In general, customers of the companies are also parties to the contracts or byseparate agreements are committed to purchase the items from the companies; such customers are generally largeJapanese industrial companies and shipping firms. Long-term purchase contracts at fixed or basic purchase pricesamounted to ¥3,063,979 million at March 31, 2006. Scheduled deliveries are at various dates through 2021.
II. GUARANTEES
The table below summarizes the companies’ guarantees as defined in FIN No. 45 at March 31, 2006 and 2005.The maximum potential amount of future payments represents the amounts without consideration of possiblerecoveries under recourse provisions or from collateral held or pledged that the companies could be obliged to pay ifthere were defaults by guaranteed parties or there were changes in an underlying which would cause triggering eventsunder market value guarantees and indemnification contracts. Such amounts bear no relationship to the anticipatedlosses on these guarantees and indemnifications, and they greatly exceed anticipated losses.
Millions of Yen
Expirewithin1 year
Expireafter
1 year
Totalamount
outstanding
Recourseprovisions/collateral
Maximumpotential
amount offuture
payments
Carryingamount ofliabilities
Expire nolater than
March 31, 2006:Type of guarantees:
Financial guarantees:Guarantees for third parties . . . . . . . . . . . . . . . . . . . ¥ 14,018 ¥ 61,108 ¥ 75,126 ¥21,799 ¥ 81,680 ¥ 1,074 2040Guarantees for associated companies . . . . . . . . . . . 7,378 47,591 54,969 6,927 60,901 3,129 2022Guarantees to financial institutions for employees’
housing loans . . . . . . . . . . . . . . . . . . . . . . . . . . . . — 11,610 11,610 — 11,610 — 2031
Total . . . . . . . . . . . . . . . . . . . . . . . . . . . . . . . . . . . ¥ 21,396 ¥120,309 ¥ 141,705 ¥28,726 ¥ 154,191 ¥ 4,203
Performance guarantees . . . . . . . . . . . . . . . . . . . . . . . . ¥ 6,498 ¥ 26,244 ¥ 32,742 ¥ 5,278 ¥ 32,742 ¥ 331 2013
Market value guarantees:Obligation to repurchase bills of exchange . . . . . . . ¥ 57,935 ¥ 3,067 ¥ 61,002 ¥46,946 ¥ 61,002 — 2008Minimum purchase price guarantees . . . . . . . . . . . . — 3,489 3,489 — 3,489 — 2013Residual value guarantees of leased assets . . . . . . . — 10,571 10,571 — 10,571 — 2008
Total . . . . . . . . . . . . . . . . . . . . . . . . . . . . . . . . . . . ¥ 57,935 ¥ 17,127 ¥ 75,062 ¥46,946 ¥ 75,062 —
Derivative instruments . . . . . . . . . . . . . . . . . . . . . . . . . ¥ 27,842 ¥ 23,040 ¥ 50,882 — ¥ 50,882 ¥ 2,081
March 31, 2005:Type of guarantees:
Financial guarantees:Guarantees for third parties . . . . . . . . . . . . . . . . . . . ¥ 12,251 ¥ 72,503 ¥ 84,754 ¥22,572 ¥ 88,549 ¥ 1,360 2021Guarantees for associated companies . . . . . . . . . . . 21,918 35,650 57,568 8,857 63,712 2,108 2022Guarantees to financial institutions for employees’
housing loans . . . . . . . . . . . . . . . . . . . . . . . . . . . . — 15,170 15,170 — 41,388 — 2029
Total . . . . . . . . . . . . . . . . . . . . . . . . . . . . . . . . . . . ¥ 34,169 ¥123,323 ¥ 157,492 ¥31,429 ¥ 193,649 ¥ 3,468
Performance guarantees . . . . . . . . . . . . . . . . . . . . . . . . ¥ 14,564 ¥ 18,595 ¥ 33,159 ¥ 5,779 ¥ 33,159 ¥ 331 2013
Market value guarantees:Obligation to repurchase bills of exchange . . . . . . . ¥ 52,420 ¥ 1,302 ¥ 53,722 ¥41,700 ¥ 53,722 — 2007Minimum purchase price guarantees . . . . . . . . . . . . — 3,222 3,222 — 3,222 — 2013Residual value guarantees of leased assets . . . . . . . — 16,362 16,362 — 16,362 — 2008
Total . . . . . . . . . . . . . . . . . . . . . . . . . . . . . . . . . . . ¥ 52,420 ¥ 20,886 ¥ 73,306 ¥41,700 ¥ 73,306 —
Derivative instruments . . . . . . . . . . . . . . . . . . . . . . . . . ¥805,527 ¥398,632 ¥1,204,159 — ¥1,204,159 ¥65,869
F-65

Notes to Consolidated Financial Statements — (Continued)
Mitsui & Co., Ltd. and subsidiaries
(1) Financial guarantees
The companies provide various types of guarantees to the benefit of third parties and related partiesprincipally to enhance their credit standings, and would be required to execute payments if a guaranteed partyfailed to fulfill its obligation with respect to a borrowing or trade payable.
Categories of financial guarantees are as follows:
Guarantees for third parties
The companies guarantee, severally or jointly with others, indebtedness of certain customers and suppliersin the furtherance of their trading activities.
Guarantees for associated companies
The companies, severally or jointly with others, issue guarantees for associated companies for the purposeof furtherance of their trading activities and credit enhancement of associated companies.
Guarantees to financial institutions for employees’ housing loans
As a part of the benefits program for its employees, the Company issues guarantees to financial institutionsfor employees’ housing loans. The maximum duration of the guarantees is 25 years. The Company obtains amortgage on the employees’ assets, if necessary.
At March 31, 2006 and 2005, the following table sets forth the major parties who have received thecompanies’ financial guarantees. The amounts shown below were calculated by offsetting the recourse provisionsand collateral against outstanding balance of the guarantee provided to each guaranteed party.
Millions of Yen
March 31, 2006:Guaranteed party:
Nippon Asahan Aluminium . . . . . . . . . . . . . . . . . . . . . . . . . . . . . . . . . . . . . . . . . . . . . . . . . . . . ¥ 9,559Usinas Siderurgicas de Minas Gerais . . . . . . . . . . . . . . . . . . . . . . . . . . . . . . . . . . . . . . . . . . . . . 6,813Petro21 Intertrade Company . . . . . . . . . . . . . . . . . . . . . . . . . . . . . . . . . . . . . . . . . . . . . . . . . . . 6,489Pagardewa Project Finance . . . . . . . . . . . . . . . . . . . . . . . . . . . . . . . . . . . . . . . . . . . . . . . . . . . . 6,346KDDI (former POWEREDCOM) . . . . . . . . . . . . . . . . . . . . . . . . . . . . . . . . . . . . . . . . . . . . . . . 4,712SUMIC Nickel Netherlands . . . . . . . . . . . . . . . . . . . . . . . . . . . . . . . . . . . . . . . . . . . . . . . . . . . . 4,405Project Finance BLRE . . . . . . . . . . . . . . . . . . . . . . . . . . . . . . . . . . . . . . . . . . . . . . . . . . . . . . . . 4,003ITM INVESTMENT COMPANY . . . . . . . . . . . . . . . . . . . . . . . . . . . . . . . . . . . . . . . . . . . . . . . 3,105Siam Cement . . . . . . . . . . . . . . . . . . . . . . . . . . . . . . . . . . . . . . . . . . . . . . . . . . . . . . . . . . . . . . . 2,920Leeward Navigation . . . . . . . . . . . . . . . . . . . . . . . . . . . . . . . . . . . . . . . . . . . . . . . . . . . . . . . . . . 2,256Others . . . . . . . . . . . . . . . . . . . . . . . . . . . . . . . . . . . . . . . . . . . . . . . . . . . . . . . . . . . . . . . . . . . . . 62,371
Total . . . . . . . . . . . . . . . . . . . . . . . . . . . . . . . . . . . . . . . . . . . . . . . . . . . . . . . . . . . . . . . . . . ¥112,979
F-66
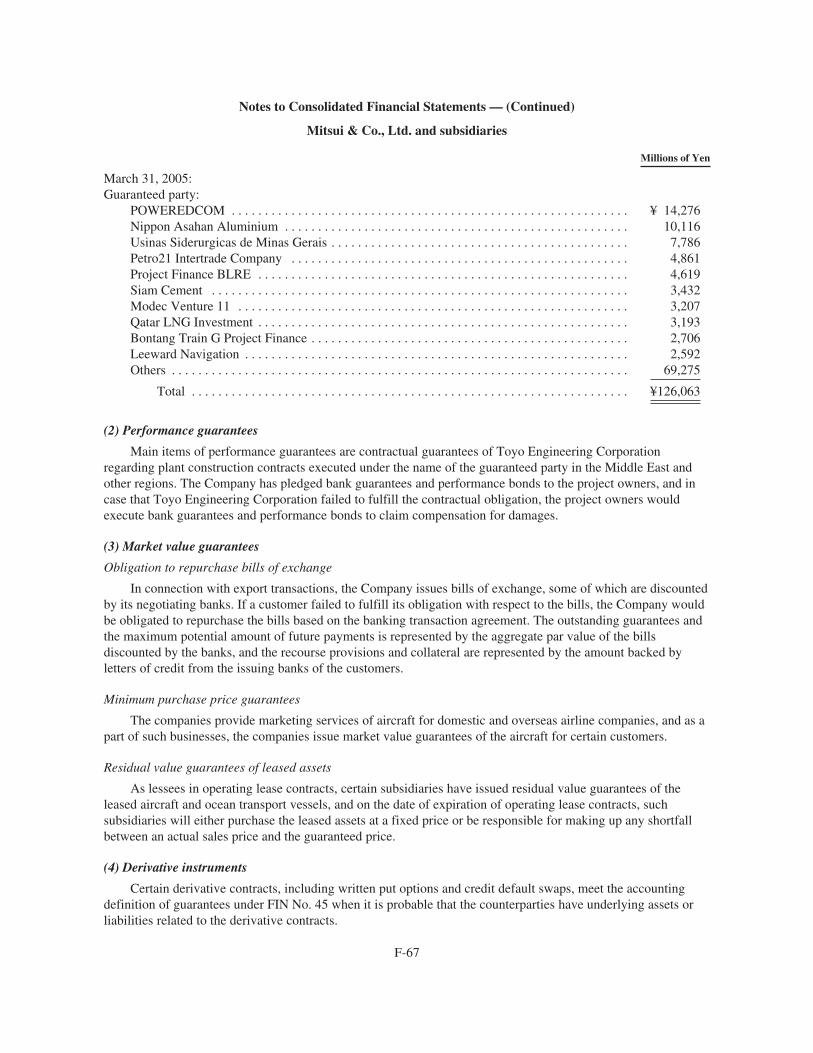
Notes to Consolidated Financial Statements — (Continued)
Mitsui & Co., Ltd. and subsidiaries
Millions of Yen
March 31, 2005:Guaranteed party:
POWEREDCOM . . . . . . . . . . . . . . . . . . . . . . . . . . . . . . . . . . . . . . . . . . . . . . . . . . . . . . . . . . . . ¥ 14,276Nippon Asahan Aluminium . . . . . . . . . . . . . . . . . . . . . . . . . . . . . . . . . . . . . . . . . . . . . . . . . . . . 10,116Usinas Siderurgicas de Minas Gerais . . . . . . . . . . . . . . . . . . . . . . . . . . . . . . . . . . . . . . . . . . . . . 7,786Petro21 Intertrade Company . . . . . . . . . . . . . . . . . . . . . . . . . . . . . . . . . . . . . . . . . . . . . . . . . . . 4,861Project Finance BLRE . . . . . . . . . . . . . . . . . . . . . . . . . . . . . . . . . . . . . . . . . . . . . . . . . . . . . . . . 4,619Siam Cement . . . . . . . . . . . . . . . . . . . . . . . . . . . . . . . . . . . . . . . . . . . . . . . . . . . . . . . . . . . . . . . 3,432Modec Venture 11 . . . . . . . . . . . . . . . . . . . . . . . . . . . . . . . . . . . . . . . . . . . . . . . . . . . . . . . . . . . 3,207Qatar LNG Investment . . . . . . . . . . . . . . . . . . . . . . . . . . . . . . . . . . . . . . . . . . . . . . . . . . . . . . . . 3,193Bontang Train G Project Finance . . . . . . . . . . . . . . . . . . . . . . . . . . . . . . . . . . . . . . . . . . . . . . . . 2,706Leeward Navigation . . . . . . . . . . . . . . . . . . . . . . . . . . . . . . . . . . . . . . . . . . . . . . . . . . . . . . . . . . 2,592Others . . . . . . . . . . . . . . . . . . . . . . . . . . . . . . . . . . . . . . . . . . . . . . . . . . . . . . . . . . . . . . . . . . . . . 69,275
Total . . . . . . . . . . . . . . . . . . . . . . . . . . . . . . . . . . . . . . . . . . . . . . . . . . . . . . . . . . . . . . . . . . ¥126,063
(2) Performance guarantees
Main items of performance guarantees are contractual guarantees of Toyo Engineering Corporationregarding plant construction contracts executed under the name of the guaranteed party in the Middle East andother regions. The Company has pledged bank guarantees and performance bonds to the project owners, and incase that Toyo Engineering Corporation failed to fulfill the contractual obligation, the project owners wouldexecute bank guarantees and performance bonds to claim compensation for damages.
(3) Market value guarantees
Obligation to repurchase bills of exchange
In connection with export transactions, the Company issues bills of exchange, some of which are discountedby its negotiating banks. If a customer failed to fulfill its obligation with respect to the bills, the Company wouldbe obligated to repurchase the bills based on the banking transaction agreement. The outstanding guarantees andthe maximum potential amount of future payments is represented by the aggregate par value of the billsdiscounted by the banks, and the recourse provisions and collateral are represented by the amount backed byletters of credit from the issuing banks of the customers.
Minimum purchase price guarantees
The companies provide marketing services of aircraft for domestic and overseas airline companies, and as apart of such businesses, the companies issue market value guarantees of the aircraft for certain customers.
Residual value guarantees of leased assets
As lessees in operating lease contracts, certain subsidiaries have issued residual value guarantees of theleased aircraft and ocean transport vessels, and on the date of expiration of operating lease contracts, suchsubsidiaries will either purchase the leased assets at a fixed price or be responsible for making up any shortfallbetween an actual sales price and the guaranteed price.
(4) Derivative instruments
Certain derivative contracts, including written put options and credit default swaps, meet the accountingdefinition of guarantees under FIN No. 45 when it is probable that the counterparties have underlying assets orliabilities related to the derivative contracts.
F-67
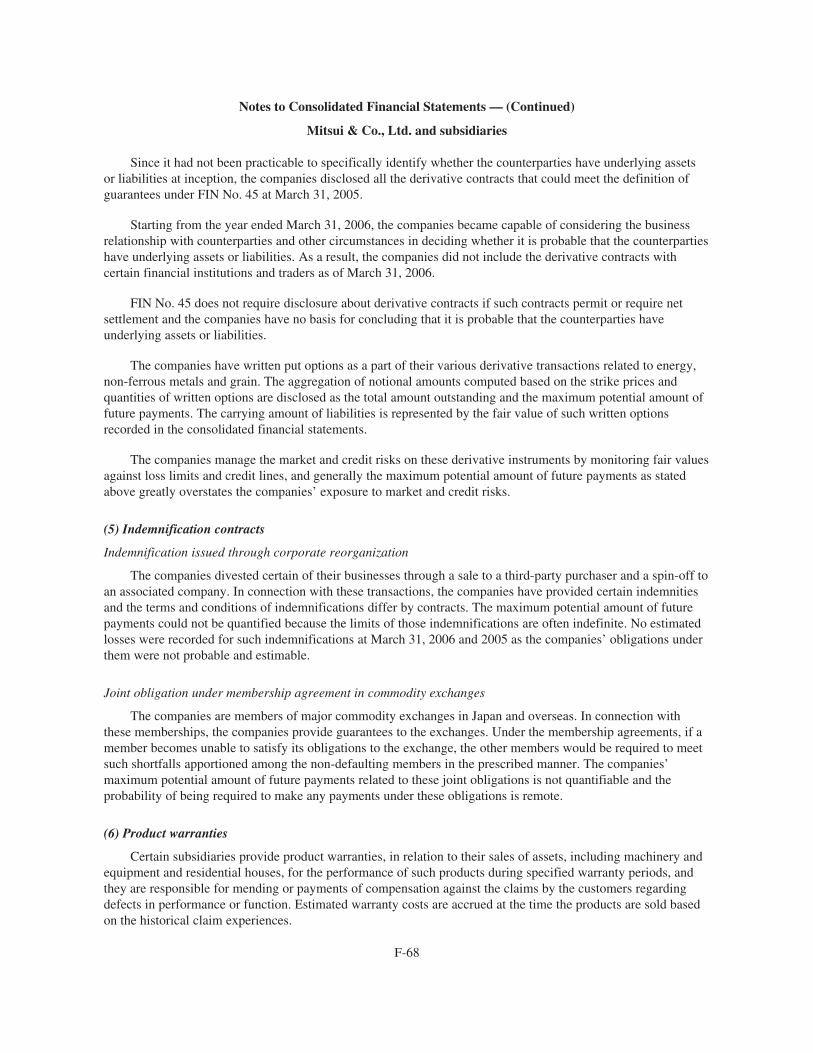
Notes to Consolidated Financial Statements — (Continued)
Mitsui & Co., Ltd. and subsidiaries
Since it had not been practicable to specifically identify whether the counterparties have underlying assetsor liabilities at inception, the companies disclosed all the derivative contracts that could meet the definition ofguarantees under FIN No. 45 at March 31, 2005.
Starting from the year ended March 31, 2006, the companies became capable of considering the businessrelationship with counterparties and other circumstances in deciding whether it is probable that the counterpartieshave underlying assets or liabilities. As a result, the companies did not include the derivative contracts withcertain financial institutions and traders as of March 31, 2006.
FIN No. 45 does not require disclosure about derivative contracts if such contracts permit or require netsettlement and the companies have no basis for concluding that it is probable that the counterparties haveunderlying assets or liabilities.
The companies have written put options as a part of their various derivative transactions related to energy,non-ferrous metals and grain. The aggregation of notional amounts computed based on the strike prices andquantities of written options are disclosed as the total amount outstanding and the maximum potential amount offuture payments. The carrying amount of liabilities is represented by the fair value of such written optionsrecorded in the consolidated financial statements.
The companies manage the market and credit risks on these derivative instruments by monitoring fair valuesagainst loss limits and credit lines, and generally the maximum potential amount of future payments as statedabove greatly overstates the companies’ exposure to market and credit risks.
(5) Indemnification contracts
Indemnification issued through corporate reorganization
The companies divested certain of their businesses through a sale to a third-party purchaser and a spin-off toan associated company. In connection with these transactions, the companies have provided certain indemnitiesand the terms and conditions of indemnifications differ by contracts. The maximum potential amount of futurepayments could not be quantified because the limits of those indemnifications are often indefinite. No estimatedlosses were recorded for such indemnifications at March 31, 2006 and 2005 as the companies’ obligations underthem were not probable and estimable.
Joint obligation under membership agreement in commodity exchanges
The companies are members of major commodity exchanges in Japan and overseas. In connection withthese memberships, the companies provide guarantees to the exchanges. Under the membership agreements, if amember becomes unable to satisfy its obligations to the exchange, the other members would be required to meetsuch shortfalls apportioned among the non-defaulting members in the prescribed manner. The companies’maximum potential amount of future payments related to these joint obligations is not quantifiable and theprobability of being required to make any payments under these obligations is remote.
(6) Product warranties
Certain subsidiaries provide product warranties, in relation to their sales of assets, including machinery andequipment and residential houses, for the performance of such products during specified warranty periods, andthey are responsible for mending or payments of compensation against the claims by the customers regardingdefects in performance or function. Estimated warranty costs are accrued at the time the products are sold basedon the historical claim experiences.
F-68
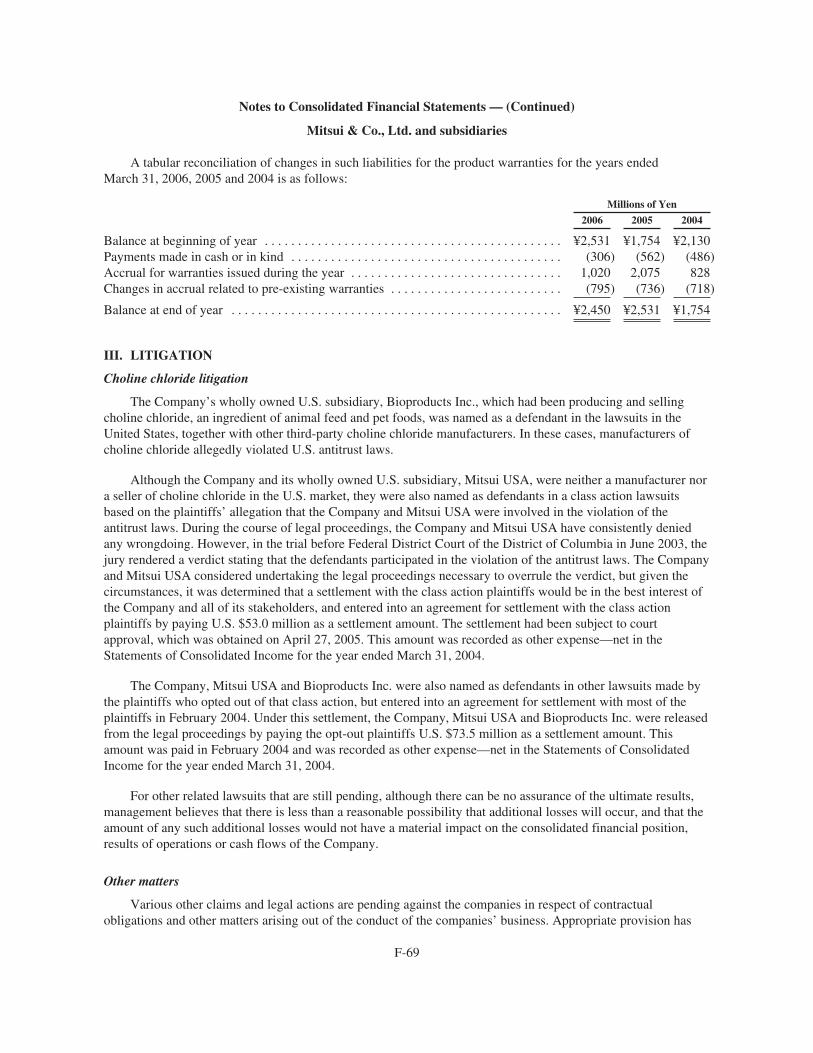
Notes to Consolidated Financial Statements — (Continued)
Mitsui & Co., Ltd. and subsidiaries
A tabular reconciliation of changes in such liabilities for the product warranties for the years endedMarch 31, 2006, 2005 and 2004 is as follows:
Millions of Yen
2006 2005 2004
Balance at beginning of year . . . . . . . . . . . . . . . . . . . . . . . . . . . . . . . . . . . . . . . . . . . . . ¥2,531 ¥1,754 ¥2,130Payments made in cash or in kind . . . . . . . . . . . . . . . . . . . . . . . . . . . . . . . . . . . . . . . . . (306) (562) (486)Accrual for warranties issued during the year . . . . . . . . . . . . . . . . . . . . . . . . . . . . . . . . 1,020 2,075 828Changes in accrual related to pre-existing warranties . . . . . . . . . . . . . . . . . . . . . . . . . . (795) (736) (718)
Balance at end of year . . . . . . . . . . . . . . . . . . . . . . . . . . . . . . . . . . . . . . . . . . . . . . . . . . ¥2,450 ¥2,531 ¥1,754
III. LITIGATION
Choline chloride litigation
The Company’s wholly owned U.S. subsidiary, Bioproducts Inc., which had been producing and sellingcholine chloride, an ingredient of animal feed and pet foods, was named as a defendant in the lawsuits in theUnited States, together with other third-party choline chloride manufacturers. In these cases, manufacturers ofcholine chloride allegedly violated U.S. antitrust laws.
Although the Company and its wholly owned U.S. subsidiary, Mitsui USA, were neither a manufacturer nora seller of choline chloride in the U.S. market, they were also named as defendants in a class action lawsuitsbased on the plaintiffs’ allegation that the Company and Mitsui USA were involved in the violation of theantitrust laws. During the course of legal proceedings, the Company and Mitsui USA have consistently deniedany wrongdoing. However, in the trial before Federal District Court of the District of Columbia in June 2003, thejury rendered a verdict stating that the defendants participated in the violation of the antitrust laws. The Companyand Mitsui USA considered undertaking the legal proceedings necessary to overrule the verdict, but given thecircumstances, it was determined that a settlement with the class action plaintiffs would be in the best interest ofthe Company and all of its stakeholders, and entered into an agreement for settlement with the class actionplaintiffs by paying U.S. $53.0 million as a settlement amount. The settlement had been subject to courtapproval, which was obtained on April 27, 2005. This amount was recorded as other expense—net in theStatements of Consolidated Income for the year ended March 31, 2004.
The Company, Mitsui USA and Bioproducts Inc. were also named as defendants in other lawsuits made bythe plaintiffs who opted out of that class action, but entered into an agreement for settlement with most of theplaintiffs in February 2004. Under this settlement, the Company, Mitsui USA and Bioproducts Inc. were releasedfrom the legal proceedings by paying the opt-out plaintiffs U.S. $73.5 million as a settlement amount. Thisamount was paid in February 2004 and was recorded as other expense—net in the Statements of ConsolidatedIncome for the year ended March 31, 2004.
For other related lawsuits that are still pending, although there can be no assurance of the ultimate results,management believes that there is less than a reasonable possibility that additional losses will occur, and that theamount of any such additional losses would not have a material impact on the consolidated financial position,results of operations or cash flows of the Company.
Other matters
Various other claims and legal actions are pending against the companies in respect of contractualobligations and other matters arising out of the conduct of the companies’ business. Appropriate provision has
F-69
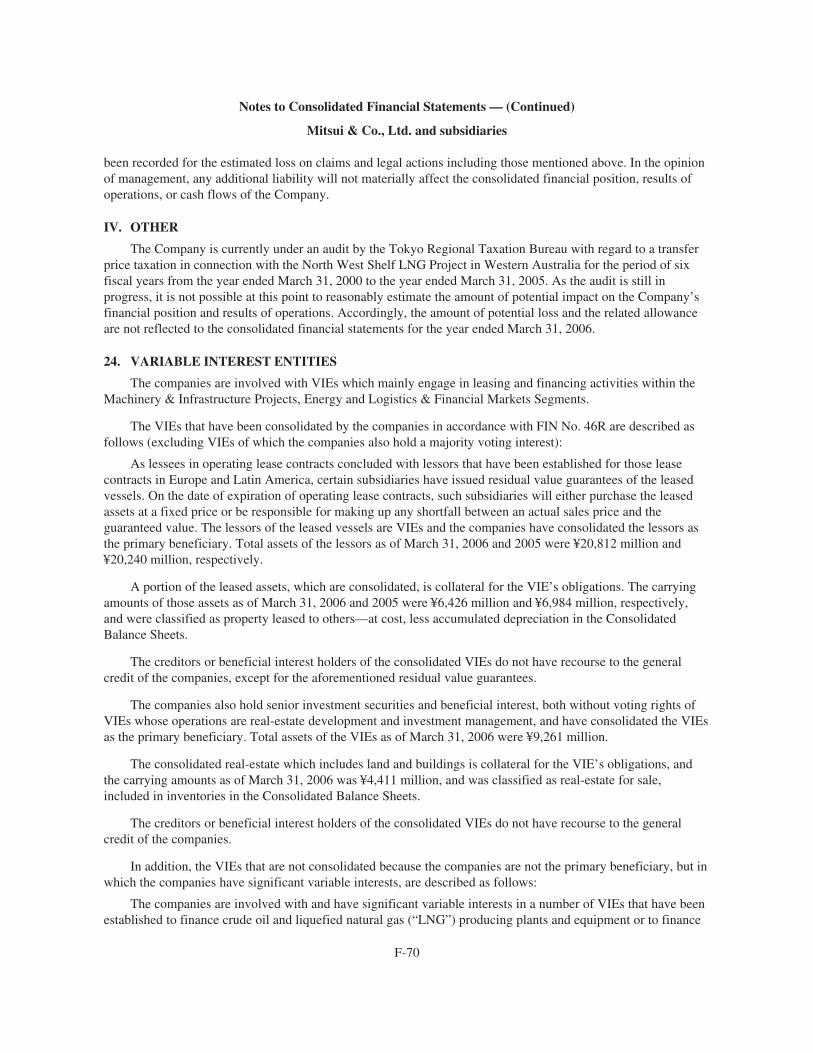
Notes to Consolidated Financial Statements — (Continued)
Mitsui & Co., Ltd. and subsidiaries
been recorded for the estimated loss on claims and legal actions including those mentioned above. In the opinionof management, any additional liability will not materially affect the consolidated financial position, results ofoperations, or cash flows of the Company.
IV. OTHER
The Company is currently under an audit by the Tokyo Regional Taxation Bureau with regard to a transferprice taxation in connection with the North West Shelf LNG Project in Western Australia for the period of sixfiscal years from the year ended March 31, 2000 to the year ended March 31, 2005. As the audit is still inprogress, it is not possible at this point to reasonably estimate the amount of potential impact on the Company’sfinancial position and results of operations. Accordingly, the amount of potential loss and the related allowanceare not reflected to the consolidated financial statements for the year ended March 31, 2006.
24. VARIABLE INTEREST ENTITIES
The companies are involved with VIEs which mainly engage in leasing and financing activities within theMachinery & Infrastructure Projects, Energy and Logistics & Financial Markets Segments.
The VIEs that have been consolidated by the companies in accordance with FIN No. 46R are described asfollows (excluding VIEs of which the companies also hold a majority voting interest):
As lessees in operating lease contracts concluded with lessors that have been established for those leasecontracts in Europe and Latin America, certain subsidiaries have issued residual value guarantees of the leasedvessels. On the date of expiration of operating lease contracts, such subsidiaries will either purchase the leasedassets at a fixed price or be responsible for making up any shortfall between an actual sales price and theguaranteed value. The lessors of the leased vessels are VIEs and the companies have consolidated the lessors asthe primary beneficiary. Total assets of the lessors as of March 31, 2006 and 2005 were ¥20,812 million and¥20,240 million, respectively.
A portion of the leased assets, which are consolidated, is collateral for the VIE’s obligations. The carryingamounts of those assets as of March 31, 2006 and 2005 were ¥6,426 million and ¥6,984 million, respectively,and were classified as property leased to others—at cost, less accumulated depreciation in the ConsolidatedBalance Sheets.
The creditors or beneficial interest holders of the consolidated VIEs do not have recourse to the generalcredit of the companies, except for the aforementioned residual value guarantees.
The companies also hold senior investment securities and beneficial interest, both without voting rights ofVIEs whose operations are real-estate development and investment management, and have consolidated the VIEsas the primary beneficiary. Total assets of the VIEs as of March 31, 2006 were ¥9,261 million.
The consolidated real-estate which includes land and buildings is collateral for the VIE’s obligations, andthe carrying amounts as of March 31, 2006 was ¥4,411 million, and was classified as real-estate for sale,included in inventories in the Consolidated Balance Sheets.
The creditors or beneficial interest holders of the consolidated VIEs do not have recourse to the generalcredit of the companies.
In addition, the VIEs that are not consolidated because the companies are not the primary beneficiary, but inwhich the companies have significant variable interests, are described as follows:
The companies are involved with and have significant variable interests in a number of VIEs that have beenestablished to finance crude oil and liquefied natural gas (“LNG”) producing plants and equipment or to finance
F-70

Notes to Consolidated Financial Statements — (Continued)
Mitsui & Co., Ltd. and subsidiaries
subordinated debts by providing guarantees or subordinated loans to the VIEs. Those VIEs provide financing forcustomers located principally in Latin America, Middle East and Southeast Asia in the form of leases and loans.Total assets of the VIEs as of March 31, 2006 and 2005 were ¥1,089,410 million and ¥1,117,752 million,respectively, and the maximum exposure to loss as a result of the companies’ involvement with the VIEs as ofMarch 31, 2006 and 2005 were ¥80,857 million and ¥83,464 million, respectively.
The amount of maximum exposure to loss represents a loss that the companies could incur from thevariability in value of the leased assets, from financial difficulties of the customers or from other causes withoutconsideration of possible recoveries through insurance and the like. In addition, the amount bears no relation tothe loss anticipated to be incurred from the companies’ involvement with the VIEs and is considered to exceedgreatly the anticipated loss.
25. EXIT OR DISPOSAL ACTIVITIES
The Company focuses on the maximization of its consolidated corporate value. To achieve this objective,the Company is trying to strengthen its consolidated capabilities through optimal group management. TheCompany actively restructures its businesses to make them more efficient by regularly reassessing the businessenvironment and operational objectives of each of its businesses.
In addition to these restructurings, the companies have disposed of certain long-lived assets based onreviews of whether the companies should keep holding those assets from the standpoint of profitability. For theyear ended March 31, 2006, the companies recorded total exit or disposal costs of ¥30,600 million, which aredefined by SFAS No. 146, “Accounting for Costs Associated with Exit or Disposal Activities.” The costsconsisted of losses on disposal and impairment of long-lived assets of ¥28,337 million, one-time terminationbenefits of ¥1,678 million, and other associated costs of ¥585 million. These exit or disposal costs were recordedin the Iron & Steel Raw Materials and Non-Ferrous Metals Segment of ¥11,804 million, the Machinery &Infrastructure Projects Segment of ¥7,901 million, the Foods & Retail Segment of ¥4,955 million, the AmericasSegment of ¥2,960 million, the All Other Segment of ¥1,784 million and the Lifestyle, Consumer Service andInformation, Electronics & Telecommunication Segment of ¥1,196 million for the year ended March 31, 2006.For the year ended March 31, 2005, the companies recorded total exit or disposal costs defined by SFAS No. 146of ¥4,161 million, which consisted of a contract termination cost of ¥1,950 million, losses on disposal andimpairment of long-lived assets of ¥1,680 million, and other associated costs of ¥531 million. These exit ordisposal costs were recorded principally in the Lifestyle, Consumer Service and Information, Electronics &Telecommunication Segment of ¥1,950 million, the Energy Segment of ¥609 million, the Europe Segment of¥531 million and the Americas Segment of ¥462 million for the year ended March 31, 2005. For the year endedMarch 31, 2004, the companies recorded total exit or disposal costs defined by SFAS No. 146 of ¥18,432million, which consisted of losses on disposal and impairment of long-lived assets of ¥10,458 million, contracttermination costs of ¥4,537 million, and other associated costs of ¥3,437 million. These exit or disposal costswere recorded principally in the Machinery & Infrastructure Projects Segment of ¥9,461 million, the EnergySegment of ¥3,742 million, the Chemical and Americas Segments of ¥3,054 million for the year ended March 31,2004.
Exit or disposal activities for the years ended March 31, 2006, 2005 and 2004 commenced and weresubstantially completed within the same fiscal years. The ending balances of liabilities for the exit or disposalcosts were immaterial at March 31, 2006, 2005 and 2004.
The primary exit or disposal activities for the year ended March 31, 2006 were as follows:
Mitalco Inc., a subsidiary reported in the Iron & Steel Raw Materials and Non-Ferrous Metals Segment, isengaged in aluminum smelting in the United States. Because of the deterioration in the terms of the power
F-71
Notes to Consolidated Financial Statements — (Continued)
Mitsui & Co., Ltd. and subsidiaries
purchase contract during the course of renewal negotiations, which would have significant adverse effect on itssmelting cost, the companies recorded ¥11,804 million in impairment loss of long-lived assets in the Statementsof Consolidated Income for the year ended March 31, 2006.
Mitsui Foods Co., Ltd., a subsidiary reported in the Foods & Retail Segment, is mainly engaged in thewholesale of food products in Japan. Due to the termination of the transactions with The Daiei Inc., itrestructured the domestic distribution facilities and recorded ¥4,096 million in impairment loss of long-livedassets and other associated costs of ¥859 million in selling, general and administrative in the Statements ofConsolidated Income for the year ended March 31, 2006.
NutriScience Technologies Inc., a subsidiary reported in the Americas Segment, has been mainly engaged inthe pet food and feed ingredients businesses in the United States and the United Kingdom. Due to the increasedcompetition in the industry, the companies decided to exit from this business field and recorded ¥1,556 million inimpairment loss of long-lived assets and other associated costs of ¥1,404 million in other expense—net in theStatements of Consolidated Income for the year ended March 31, 2006.
The primary exit or disposal activity for the year ended March 31, 2005 was as follows:
The Company had compensated losses on defects arising from the ceramic building materials and fiberboardbusiness in the Lifestyle, Consumer Service and Information, Electronics & Telecommunication Segment, whichwere sold in October 2001, pursuant to the indemnification agreement between the Company and the buyer of thebusiness as of 2001. During the year ended March 31, 2005, the Company terminated the agreement as a result ofthe negotiation with the buyer. In connection with this termination of the agreement, the Company recorded anassociated cost of ¥1,950 million in other expense—net in the Statements of Consolidated Income for the yearended March 31, 2005 and reversed the remaining liability previously recorded under the indemnification.
The primary exit or disposal activities for the year ended March 31, 2004 were as follows:
NBI Co., Ltd. (former Toyo Valve Co., Ltd.), a subsidiary reported in the Machinery & InfrastructureProjects Segment, has been engaged in the manufacture and sale of valves and system equipment. On March 31,2004, it sold its valve business to KITZ Material Corporation, a subsidiary of KITZ Corporation which engagesin the manufacture and sale of valves for construction facilities and industrial plants. The decision to sell thevalve business was made as a result of the continuing oversupply of valves within the valve industry in Japan dueto deterioration in capital investment. As a result of this disposal activity, the companies recorded ¥157 million inloss on disposal or sales of property and equipment—net, ¥4,127 million in impairment loss of long-lived assets,and other associated costs of ¥1,747 million in other expense—net in the Statements of Consolidated Income forthe year ended March 31, 2004.
Mitsui Bussan Machinery Co., Ltd., a subsidiary reported in the Machinery & Infrastructure ProjectsSegment, has been engaged in the sale and leasing of machine tools and construction and industrial machinery.Because of its unprofitable performance in the shrinking Japanese construction and industrial machinery markets,the Company has decided to exit from the construction and industrial machinery businesses, as they have beenevaluated as businesses with historically low profitability and future growth potential compared to the machinetools business. As a result of this exit decision, the companies recorded ¥150 million in impairment loss of long-lived assets, lease termination and asset disposal costs of ¥1,957 million in other expense—net, and otherassociated costs of ¥216 million in selling, general and administrative in the Statements of Consolidated Incomefor the year ended March 31, 2004.
Mitsui Oil & Gas Co., Ltd. and Kokusai Oil & Chemical Co., Ltd., subsidiaries reported in the EnergySegment, are engaged in the import and domestic sale of petroleum products. In order to maintain their
F-72

Notes to Consolidated Financial Statements — (Continued)
Mitsui & Co., Ltd. and subsidiaries
competitiveness in gasoline station operations, they have relocated stations, introduced self-service stations, andestablished multifunctional value-added stations, such as stations with convenience stores. These subsidiarieshave also disposed of and/or combined previously existing stations and streamlined their distribution processes.In connection with such restructuring and streamlining efforts, the subsidiaries disposed of certain unprofitablegasoline stations, which resulted in recording ¥1,742 million in loss on disposal or sales of property andequipment—net and other associated costs of ¥2,000 million in other expense—net in the Statements ofConsolidated Income for the year ended March 31, 2004.
Global Octanes Corporation, a subsidiary partially reported in both the Chemical and Americas Segments,Global Octanes Investment Inc., a subsidiary reported in the Chemical Segment, and Global Octanes HoldingInc., a subsidiary reported in the Americas Segment, had managed Global Octanes Texas Limited Partnership,which had been engaged in manufacture and sale of MTBE, as its partners. These subsidiaries, however,disposed of the operations, since the future demand for MTBE in the United States was expected to decline. As aresult of these disposal activities, the companies recorded impairment loss of long-lived assets and other assets of¥3,054 million (before income tax) in loss from discontinued operations—net (after income tax effect) in theStatements of Consolidated Income for the year ended March 31, 2004. Refer to Note 4, “DISCONTINUEDOPERATIONS,” for further discussion on discontinued operations.
26. DERIVATIVE INSTRUMENTS AND HEDGING ACTIVITIES
The companies are exposed to market risks related to foreign currency exchange rates, interest rates andcommodity prices in the ordinary course of business.
In order to offset or reduce these risks, the companies use derivative instruments, such as foreign exchangeforward contracts, currency swap agreements, interest rate swap agreements, commodity future, forward, optionand swap contracts, to hedge the exposure to changes in the fair value or expected future cash flows ofrecognized assets and liabilities, unrecognized firm commitments and forecasted transactions. The companiesalso use non-derivative financial instruments, such as foreign-currency-denominated debt, to hedge the foreigncurrency exposure in the net investment in a foreign operation.
Foreign currency exchange rate risk hedging activities
The companies use derivative instruments, such as foreign exchange forward contracts, currency swapagreements and interest rate and currency swap agreements, to fix the expected future cash flows from foreign-currency-denominated receivables and payables resulting from selling and purchasing activities in currenciesother than the local currency and long-term financing transactions as part of the companies’ global operations inmany countries. The companies also use non-derivative financial instruments, such as foreign-currency-denominated debt, in order to hedge the foreign currency exposure in the net investment in a foreign operation.
Interest rate risk hedging activities
The companies use interest rate swap agreements and interest rate and currency swap agreements todiversify the sources of fund raising, reduce fund-raising costs, fix the expected future cash flows from long-termfinancial assets and liabilities with floating interest rates and reduce the exposure to changes in the fair value oflong-term financial assets and liabilities with fixed interest rates.
F-73

Notes to Consolidated Financial Statements — (Continued)
Mitsui & Co., Ltd. and subsidiaries
Commodity price risk hedging activities
The companies use derivative instruments, such as commodity future, forward, option and swap contracts,to reduce the exposure to changes in the fair value of inventories and unrecognized firm commitments and to fixthe expected future cash flows from forecasted transactions in marketable commodities, such as non-ferrousmetals, crude oil and agricultural products.
Risk management policy
The companies have strictly segregated the trading sections from the sections that record the results andpositions of derivative instruments and are responsible for cash settlement and account confirmation withcounterparties. Risk management sections classify the derivative transactions into trading transactions andhedging transactions. The distinction between trading and hedging transactions is strictly managed by affirmingthe correspondence with the hedged items for transactions for hedging purposes. Furthermore, these riskmanagement sections comprehensively monitor, evaluate and analyze the positions of derivative instruments andreport the results periodically to the Company’s executive officers in charge of risk management. Based on thesereports, the executive officers assess derivative instruments and the market risks surrounding these instruments,and establish the companies’ policy regarding derivative instruments.
Fair value hedges
Changes in the fair value of derivative instruments designated as hedging the exposure to changes in the fairvalue of recognized assets or liabilities or unrecognized firm commitments are recorded in earnings together withchanges in the fair value of the corresponding hedged items.
The net gain or loss recognized in earnings representing the amount of the hedges’ ineffectiveness and thecomponent of the derivative instruments’ gain or loss excluded from the assessment of hedge effectiveness wereimmaterial for the years ended March 31, 2006, 2005 and 2004.
The amount of net gain or loss recognized in earnings when a hedged firm commitment no longer qualifiesas a fair value hedge was immaterial for the years ended March 31, 2006, 2005 and 2004.
Cash flow hedges
Changes in the fair value of foreign exchange forward contracts, currency swap agreements and interest rateand currency swap agreements designated as hedging instruments to hedge the exposure to variability in expectedfuture cash flows of recognized assets or liabilities, unrecognized firm commitments and forecasted transactionsdenominated in foreign currencies are initially recorded as other comprehensive income. The amounts inaccumulated other comprehensive income are reclassified into earnings when earnings are affected by the hedgeditems.
Changes in the fair value of interest rate swap agreements designated as hedging instruments to reduce theexposure to variability in expected future cash flows of floating-rate financial assets and liabilities are initiallyrecorded as other comprehensive income. The amounts in accumulated other comprehensive income arereclassified into earnings as interest income and expense when earnings are affected by the hedged items.
Changes in the fair value of commodity forward and swap contracts designated as hedging instruments tohedge the exposure to variability in expected future cash flows of the marketable commodities are initiallyrecorded as other comprehensive income. The amounts in accumulated other comprehensive income arereclassified into earnings as sales of products or cost of products sold when earnings are affected by the hedgedtransactions.
F-74
Notes to Consolidated Financial Statements — (Continued)
Mitsui & Co., Ltd. and subsidiaries
The ineffective portion of the hedging instruments’ gain or loss and the component of the derivativeinstruments’ gain or loss excluded from the assessment of hedge effectiveness are reported in earningsimmediately. If the hedged forecasted transaction will not occur by the end of the originally specified timeperiod, gain or loss on the hedging instrument reported in accumulated other comprehensive income isreclassified into earnings. These amounts were immaterial for the years ended March 31, 2006, 2005 and 2004.
The estimated net amount of the existing gains or losses in accumulated other comprehensive income atMarch 31, 2006 that is expected to be reclassified into earnings within the next 12 months is a net loss of ¥93million.
The maximum length of time over which the companies are hedging their exposure to the variability inexpected future cash flows for forecasted transactions (excluding those forecasted transactions related to thepayment of variable interest on existing financial instruments) is 21 months. Commodity swap contracts are usedas hedging instruments for the forecasted transactions.
Hedges of the net investment in a foreign operation
The foreign currency transaction gain or loss on the non-derivative financial instrument that is designatedas, and is effective as, hedging instruments to hedge the foreign currency exposure of a net investment in aforeign operation is recorded as foreign currency translation adjustments within other comprehensive income tothe extent it is effective as a hedge. The net amount of gains or losses included in the foreign currency translationadjustments was immaterial for the years ended March 31, 2006, 2005 and 2004.
Derivative instruments for trading purposes and risk management policy
The Company and certain subsidiaries use derivative instruments such as foreign exchange forwardcontracts, interest rate swap agreements and commodity future, forward, swap and option contracts for tradingpurposes. The Company’s executive officers in charge of risk management have set strict position and loss limitsfor these instruments. Independent back offices and middle offices strictly separated from trading sections (frontoffices) monitor, evaluate and analyze the position of trading transactions and market risks. Those results areperiodically reported to the executive officers. Among others, VaR (Value at Risk: Statistical measure of thepotential maximum loss in the fair value of a portfolio resulting from adverse market movements in theunderlying risk factors such as foreign currency exchange rates, interest rates and commodity prices, over adefined period, within a certain confidence level) is used to measure the market risks of derivative instrumentsfor trading purposes.
27. FINANCIAL INSTRUMENTS
FAIR VALUE OF FINANCIAL INSTRUMENTS
In accordance with the requirements of SFAS No. 107, the companies have provided the following fairvalue estimates and information about valuation methodologies.
Quoted market prices, where available, are used to estimate fair values of financial instruments. However,quoted market prices are not available for a substantial portion of the financial instruments. Accordingly, fairvalues for such financial instruments are estimated using discounted cash flow analysis or other valuationtechniques.
Current financial assets other than marketable securities and current financial liabilities
The carrying amount is believed to approximate the fair value of the majority of these instruments becauseof their short maturities.
F-75

Notes to Consolidated Financial Statements — (Continued)
Mitsui & Co., Ltd. and subsidiaries
Marketable securities and other investments
See Note 5, “MARKETABLE SECURITIES AND OTHER INVESTMENTS.”
Non-current receivables and advances to associated companies
The fair values of non-current receivables, including fixed rate, long-term loans receivable, are estimated bydiscounted cash flow analysis, using interest rates currently being offered for loans or accounts receivable withsimilar terms to borrowers or customers of similar credit quality and remaining maturities. It is believed that thecarrying amounts of loans with floating rates approximate the fair value.
Long-term debt
The fair values for long-term debt, except for debt with floating rates whose carrying amounts approximatefair value, are estimated by discounted cash flow analysis, using rates currently available for similar types ofborrowings with similar terms and remaining maturities.
Financial guarantees and financing commitments
The fair values of financial guarantees are estimated based on the present values of expected future cashflows, considering the remaining terms of the arrangements and the counterparties’ credit standings.
The companies have not estimated the fair values of financing commitments because management does notbelieve it is practicable to estimate the fair values due to uncertainty involved in attempting to assess thelikelihood and timing of commitments being drawn upon, coupled with the lack of an established market.However, management believes the likelihood is remote that material payments will be required under thesefinancing commitments.
Currency and interest rate swap agreements
The fair values of currency and interest rate swap agreements are estimated by discounted cash flowanalysis, using rates currently available for similar types of swap agreements at the reporting date. Currencyswap agreements include certain derivatives with both foreign exchange and interest rate exposures. Fair valuesof those agreements consist of foreign exchange and interest rate factors.
Foreign exchange forward contracts
The fair values of foreign exchange forward contracts are estimated based on market prices for contractswith similar terms.
F-76
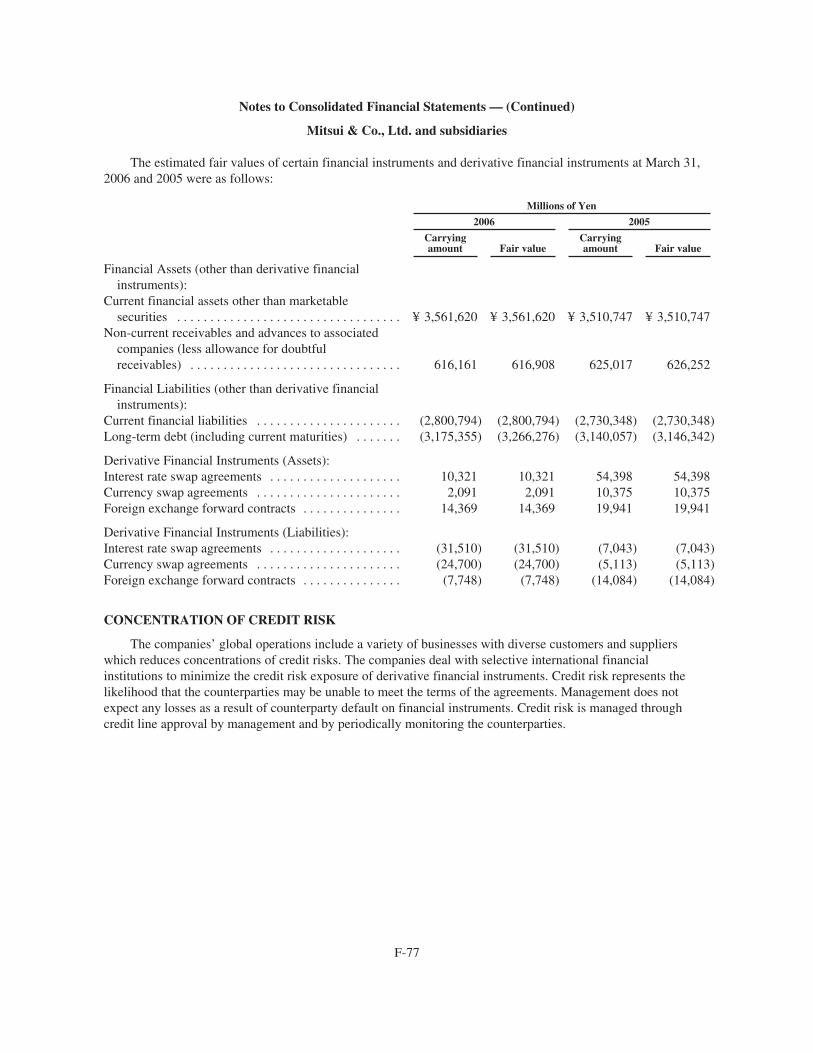
Notes to Consolidated Financial Statements — (Continued)
Mitsui & Co., Ltd. and subsidiaries
The estimated fair values of certain financial instruments and derivative financial instruments at March 31,2006 and 2005 were as follows:
Millions of Yen
2006 2005
Carryingamount Fair value
Carryingamount Fair value
Financial Assets (other than derivative financialinstruments):
Current financial assets other than marketablesecurities . . . . . . . . . . . . . . . . . . . . . . . . . . . . . . . . . . ¥ 3,561,620 ¥ 3,561,620 ¥ 3,510,747 ¥ 3,510,747
Non-current receivables and advances to associatedcompanies (less allowance for doubtfulreceivables) . . . . . . . . . . . . . . . . . . . . . . . . . . . . . . . . 616,161 616,908 625,017 626,252
Financial Liabilities (other than derivative financialinstruments):
Current financial liabilities . . . . . . . . . . . . . . . . . . . . . . (2,800,794) (2,800,794) (2,730,348) (2,730,348)Long-term debt (including current maturities) . . . . . . . (3,175,355) (3,266,276) (3,140,057) (3,146,342)
Derivative Financial Instruments (Assets):Interest rate swap agreements . . . . . . . . . . . . . . . . . . . . 10,321 10,321 54,398 54,398Currency swap agreements . . . . . . . . . . . . . . . . . . . . . . 2,091 2,091 10,375 10,375Foreign exchange forward contracts . . . . . . . . . . . . . . . 14,369 14,369 19,941 19,941
Derivative Financial Instruments (Liabilities):Interest rate swap agreements . . . . . . . . . . . . . . . . . . . . (31,510) (31,510) (7,043) (7,043)Currency swap agreements . . . . . . . . . . . . . . . . . . . . . . (24,700) (24,700) (5,113) (5,113)Foreign exchange forward contracts . . . . . . . . . . . . . . . (7,748) (7,748) (14,084) (14,084)
CONCENTRATION OF CREDIT RISK
The companies’ global operations include a variety of businesses with diverse customers and supplierswhich reduces concentrations of credit risks. The companies deal with selective international financialinstitutions to minimize the credit risk exposure of derivative financial instruments. Credit risk represents thelikelihood that the counterparties may be unable to meet the terms of the agreements. Management does notexpect any losses as a result of counterparty default on financial instruments. Credit risk is managed throughcredit line approval by management and by periodically monitoring the counterparties.
F-77
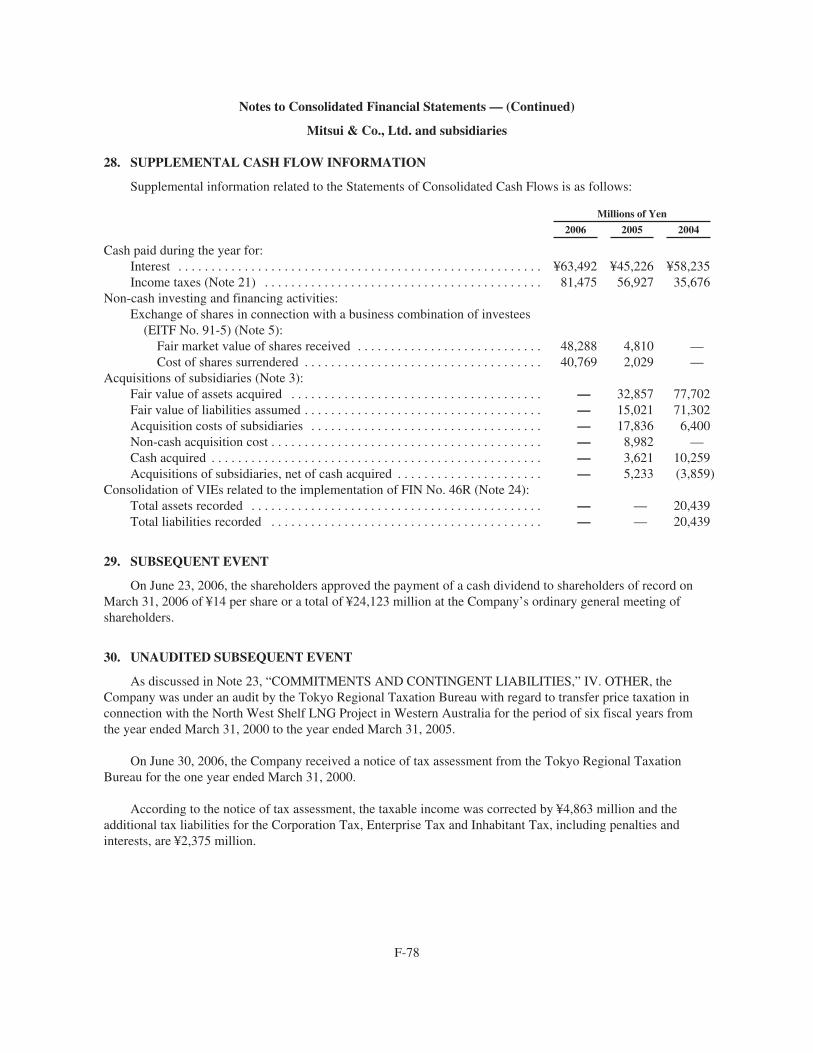
Notes to Consolidated Financial Statements — (Continued)
Mitsui & Co., Ltd. and subsidiaries
28. SUPPLEMENTAL CASH FLOW INFORMATION
Supplemental information related to the Statements of Consolidated Cash Flows is as follows:
Millions of Yen
2006 2005 2004
Cash paid during the year for:Interest . . . . . . . . . . . . . . . . . . . . . . . . . . . . . . . . . . . . . . . . . . . . . . . . . . . . . . . ¥63,492 ¥45,226 ¥58,235Income taxes (Note 21) . . . . . . . . . . . . . . . . . . . . . . . . . . . . . . . . . . . . . . . . . . 81,475 56,927 35,676
Non-cash investing and financing activities:Exchange of shares in connection with a business combination of investees
(EITF No. 91-5) (Note 5):Fair market value of shares received . . . . . . . . . . . . . . . . . . . . . . . . . . . . 48,288 4,810 —Cost of shares surrendered . . . . . . . . . . . . . . . . . . . . . . . . . . . . . . . . . . . . 40,769 2,029 —
Acquisitions of subsidiaries (Note 3):Fair value of assets acquired . . . . . . . . . . . . . . . . . . . . . . . . . . . . . . . . . . . . . . — 32,857 77,702Fair value of liabilities assumed . . . . . . . . . . . . . . . . . . . . . . . . . . . . . . . . . . . . — 15,021 71,302Acquisition costs of subsidiaries . . . . . . . . . . . . . . . . . . . . . . . . . . . . . . . . . . . — 17,836 6,400Non-cash acquisition cost . . . . . . . . . . . . . . . . . . . . . . . . . . . . . . . . . . . . . . . . . — 8,982 —Cash acquired . . . . . . . . . . . . . . . . . . . . . . . . . . . . . . . . . . . . . . . . . . . . . . . . . . — 3,621 10,259Acquisitions of subsidiaries, net of cash acquired . . . . . . . . . . . . . . . . . . . . . . — 5,233 (3,859)
Consolidation of VIEs related to the implementation of FIN No. 46R (Note 24):Total assets recorded . . . . . . . . . . . . . . . . . . . . . . . . . . . . . . . . . . . . . . . . . . . . — — 20,439Total liabilities recorded . . . . . . . . . . . . . . . . . . . . . . . . . . . . . . . . . . . . . . . . . — — 20,439
29. SUBSEQUENT EVENT
On June 23, 2006, the shareholders approved the payment of a cash dividend to shareholders of record onMarch 31, 2006 of ¥14 per share or a total of ¥24,123 million at the Company’s ordinary general meeting ofshareholders.
30. UNAUDITED SUBSEQUENT EVENT
As discussed in Note 23, “COMMITMENTS AND CONTINGENT LIABILITIES,” IV. OTHER, theCompany was under an audit by the Tokyo Regional Taxation Bureau with regard to transfer price taxation inconnection with the North West Shelf LNG Project in Western Australia for the period of six fiscal years fromthe year ended March 31, 2000 to the year ended March 31, 2005.
On June 30, 2006, the Company received a notice of tax assessment from the Tokyo Regional TaxationBureau for the one year ended March 31, 2000.
According to the notice of tax assessment, the taxable income was corrected by ¥4,863 million and theadditional tax liabilities for the Corporation Tax, Enterprise Tax and Inhabitant Tax, including penalties andinterests, are ¥2,375 million.
F-78
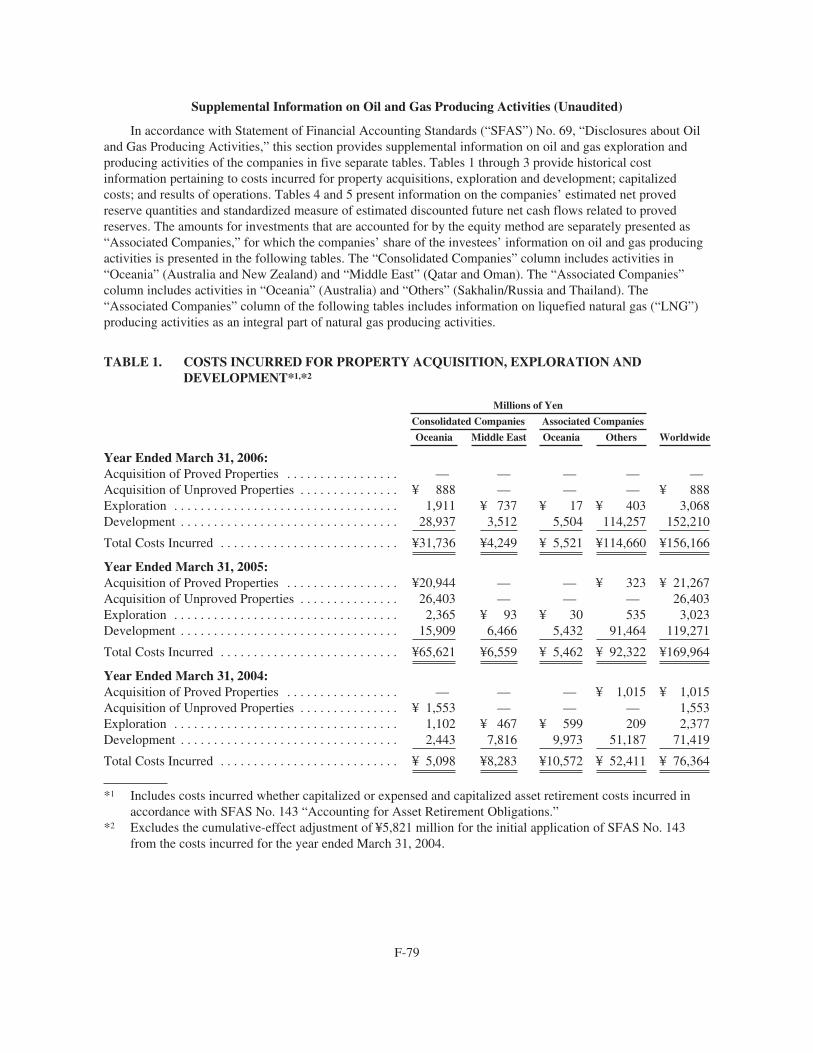
Supplemental Information on Oil and Gas Producing Activities (Unaudited)
In accordance with Statement of Financial Accounting Standards (“SFAS”) No. 69, “Disclosures about Oiland Gas Producing Activities,” this section provides supplemental information on oil and gas exploration andproducing activities of the companies in five separate tables. Tables 1 through 3 provide historical costinformation pertaining to costs incurred for property acquisitions, exploration and development; capitalizedcosts; and results of operations. Tables 4 and 5 present information on the companies’ estimated net provedreserve quantities and standardized measure of estimated discounted future net cash flows related to provedreserves. The amounts for investments that are accounted for by the equity method are separately presented as“Associated Companies,” for which the companies’ share of the investees’ information on oil and gas producingactivities is presented in the following tables. The “Consolidated Companies” column includes activities in“Oceania” (Australia and New Zealand) and “Middle East” (Qatar and Oman). The “Associated Companies”column includes activities in “Oceania” (Australia) and “Others” (Sakhalin/Russia and Thailand). The“Associated Companies” column of the following tables includes information on liquefied natural gas (“LNG”)producing activities as an integral part of natural gas producing activities.
TABLE 1. COSTS INCURRED FOR PROPERTY ACQUISITION, EXPLORATION ANDDEVELOPMENT*1,*2
Millions of Yen
Consolidated Companies Associated Companies
Oceania Middle East Oceania Others Worldwide
Year Ended March 31, 2006:Acquisition of Proved Properties . . . . . . . . . . . . . . . . . — — — — —Acquisition of Unproved Properties . . . . . . . . . . . . . . . ¥ 888 — — — ¥ 888Exploration . . . . . . . . . . . . . . . . . . . . . . . . . . . . . . . . . . 1,911 ¥ 737 ¥ 17 ¥ 403 3,068Development . . . . . . . . . . . . . . . . . . . . . . . . . . . . . . . . . 28,937 3,512 5,504 114,257 152,210
Total Costs Incurred . . . . . . . . . . . . . . . . . . . . . . . . . . . ¥31,736 ¥4,249 ¥ 5,521 ¥114,660 ¥156,166
Year Ended March 31, 2005:Acquisition of Proved Properties . . . . . . . . . . . . . . . . . ¥20,944 — — ¥ 323 ¥ 21,267Acquisition of Unproved Properties . . . . . . . . . . . . . . . 26,403 — — — 26,403Exploration . . . . . . . . . . . . . . . . . . . . . . . . . . . . . . . . . . 2,365 ¥ 93 ¥ 30 535 3,023Development . . . . . . . . . . . . . . . . . . . . . . . . . . . . . . . . . 15,909 6,466 5,432 91,464 119,271
Total Costs Incurred . . . . . . . . . . . . . . . . . . . . . . . . . . . ¥65,621 ¥6,559 ¥ 5,462 ¥ 92,322 ¥169,964
Year Ended March 31, 2004:Acquisition of Proved Properties . . . . . . . . . . . . . . . . . — — — ¥ 1,015 ¥ 1,015Acquisition of Unproved Properties . . . . . . . . . . . . . . . ¥ 1,553 — — — 1,553Exploration . . . . . . . . . . . . . . . . . . . . . . . . . . . . . . . . . . 1,102 ¥ 467 ¥ 599 209 2,377Development . . . . . . . . . . . . . . . . . . . . . . . . . . . . . . . . . 2,443 7,816 9,973 51,187 71,419
Total Costs Incurred . . . . . . . . . . . . . . . . . . . . . . . . . . . ¥ 5,098 ¥8,283 ¥10,572 ¥ 52,411 ¥ 76,364
*1 Includes costs incurred whether capitalized or expensed and capitalized asset retirement costs incurred inaccordance with SFAS No. 143 “Accounting for Asset Retirement Obligations.”
*2 Excludes the cumulative-effect adjustment of ¥5,821 million for the initial application of SFAS No. 143from the costs incurred for the year ended March 31, 2004.
F-79

TABLE 2. CAPITALIZED COSTS RELATED TO OIL AND GAS PRODUCING ACTIVITIES
Millions of Yen
Consolidated Companies Associated Companies
Oceania Middle East Oceania Others Worldwide
Year Ended March 31, 2006:Proved Properties* . . . . . . . . . . . . . . . . . . . . . . . . . . . ¥ 96,328 ¥38,420 ¥124,683 ¥417,849 ¥677,280Unproved Properties . . . . . . . . . . . . . . . . . . . . . . . . . . 30,252 — — 2,430 32,682
Gross Capitalized Properties . . . . . . . . . . . . . . . . . . . 126,580 38,420 124,683 420,279 709,962Accumulated Depreciation, Depletion, Amortization
and Valuation Allowances . . . . . . . . . . . . . . . . . . . 14,900 13,433 73,594 97,485 199,412
Net Capitalized Costs . . . . . . . . . . . . . . . . . . . . . . . . . ¥111,680 ¥24,987 ¥ 51,089 ¥322,794 ¥510,550
Year Ended March 31, 2005:Proved Properties* . . . . . . . . . . . . . . . . . . . . . . . . . . . ¥ 60,775 ¥26,191 ¥126,618 ¥277,034 ¥490,618Unproved Properties . . . . . . . . . . . . . . . . . . . . . . . . . . 26,346 — — 4,818 31,164
Gross Capitalized Properties . . . . . . . . . . . . . . . . . . . 87,121 26,191 126,618 281,852 521,782Accumulated Depreciation, Depletion, Amortization
and Valuation Allowances . . . . . . . . . . . . . . . . . . . 14,261 5,710 69,435 85,830 175,236
Net Capitalized Costs . . . . . . . . . . . . . . . . . . . . . . . . . ¥ 72,860 ¥20,481 ¥ 57,183 ¥196,022 ¥346,546
Year Ended March 31, 2004:Proved Properties* . . . . . . . . . . . . . . . . . . . . . . . . . . . ¥ 21,989 ¥23,674 ¥118,332 ¥185,443 ¥349,438Unproved Properties . . . . . . . . . . . . . . . . . . . . . . . . . . 1,977 — — 4,928 6,905
Gross Capitalized Properties . . . . . . . . . . . . . . . . . . . 23,966 23,674 118,332 190,371 356,343Accumulated Depreciation, Depletion, Amortization
and Valuation Allowances . . . . . . . . . . . . . . . . . . . 14,191 3,193 63,119 77,686 158,189
Net Capitalized Costs . . . . . . . . . . . . . . . . . . . . . . . . . ¥ 9,775 ¥20,481 ¥ 55,213 ¥112,685 ¥198,154
* Includes capitalized asset retirement costs in accordance with SFAS No. 143.
F-80
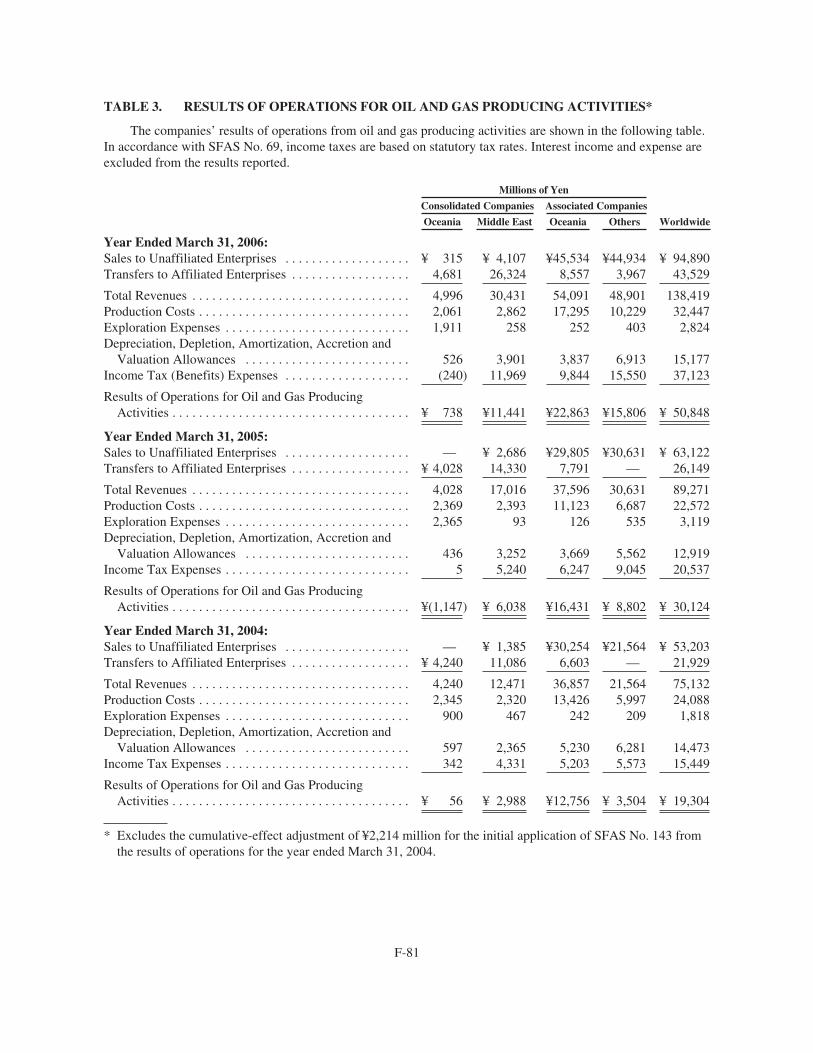
TABLE 3. RESULTS OF OPERATIONS FOR OIL AND GAS PRODUCING ACTIVITIES*
The companies’ results of operations from oil and gas producing activities are shown in the following table.In accordance with SFAS No. 69, income taxes are based on statutory tax rates. Interest income and expense areexcluded from the results reported.
Millions of Yen
Worldwide
Consolidated Companies Associated Companies
Oceania Middle East Oceania Others
Year Ended March 31, 2006:Sales to Unaffiliated Enterprises . . . . . . . . . . . . . . . . . . . ¥ 315 ¥ 4,107 ¥45,534 ¥44,934 ¥ 94,890Transfers to Affiliated Enterprises . . . . . . . . . . . . . . . . . . 4,681 26,324 8,557 3,967 43,529
Total Revenues . . . . . . . . . . . . . . . . . . . . . . . . . . . . . . . . . 4,996 30,431 54,091 48,901 138,419Production Costs . . . . . . . . . . . . . . . . . . . . . . . . . . . . . . . . 2,061 2,862 17,295 10,229 32,447Exploration Expenses . . . . . . . . . . . . . . . . . . . . . . . . . . . . 1,911 258 252 403 2,824Depreciation, Depletion, Amortization, Accretion and
Valuation Allowances . . . . . . . . . . . . . . . . . . . . . . . . . 526 3,901 3,837 6,913 15,177Income Tax (Benefits) Expenses . . . . . . . . . . . . . . . . . . . (240) 11,969 9,844 15,550 37,123
Results of Operations for Oil and Gas ProducingActivities . . . . . . . . . . . . . . . . . . . . . . . . . . . . . . . . . . . . ¥ 738 ¥11,441 ¥22,863 ¥15,806 ¥ 50,848
Year Ended March 31, 2005:Sales to Unaffiliated Enterprises . . . . . . . . . . . . . . . . . . . — ¥ 2,686 ¥29,805 ¥30,631 ¥ 63,122Transfers to Affiliated Enterprises . . . . . . . . . . . . . . . . . . ¥ 4,028 14,330 7,791 — 26,149
Total Revenues . . . . . . . . . . . . . . . . . . . . . . . . . . . . . . . . . 4,028 17,016 37,596 30,631 89,271Production Costs . . . . . . . . . . . . . . . . . . . . . . . . . . . . . . . . 2,369 2,393 11,123 6,687 22,572Exploration Expenses . . . . . . . . . . . . . . . . . . . . . . . . . . . . 2,365 93 126 535 3,119Depreciation, Depletion, Amortization, Accretion and
Valuation Allowances . . . . . . . . . . . . . . . . . . . . . . . . . 436 3,252 3,669 5,562 12,919Income Tax Expenses . . . . . . . . . . . . . . . . . . . . . . . . . . . . 5 5,240 6,247 9,045 20,537
Results of Operations for Oil and Gas ProducingActivities . . . . . . . . . . . . . . . . . . . . . . . . . . . . . . . . . . . . ¥(1,147) ¥ 6,038 ¥16,431 ¥ 8,802 ¥ 30,124
Year Ended March 31, 2004:Sales to Unaffiliated Enterprises . . . . . . . . . . . . . . . . . . . — ¥ 1,385 ¥30,254 ¥21,564 ¥ 53,203Transfers to Affiliated Enterprises . . . . . . . . . . . . . . . . . . ¥ 4,240 11,086 6,603 — 21,929
Total Revenues . . . . . . . . . . . . . . . . . . . . . . . . . . . . . . . . . 4,240 12,471 36,857 21,564 75,132Production Costs . . . . . . . . . . . . . . . . . . . . . . . . . . . . . . . . 2,345 2,320 13,426 5,997 24,088Exploration Expenses . . . . . . . . . . . . . . . . . . . . . . . . . . . . 900 467 242 209 1,818Depreciation, Depletion, Amortization, Accretion and
Valuation Allowances . . . . . . . . . . . . . . . . . . . . . . . . . 597 2,365 5,230 6,281 14,473Income Tax Expenses . . . . . . . . . . . . . . . . . . . . . . . . . . . . 342 4,331 5,203 5,573 15,449
Results of Operations for Oil and Gas ProducingActivities . . . . . . . . . . . . . . . . . . . . . . . . . . . . . . . . . . . . ¥ 56 ¥ 2,988 ¥12,756 ¥ 3,504 ¥ 19,304
* Excludes the cumulative-effect adjustment of ¥2,214 million for the initial application of SFAS No. 143 fromthe results of operations for the year ended March 31, 2004.
F-81

TABLE 4. PROVED RESERVE QUANTITY INFORMATION
The following table describes proved oil and gas reserves and changes thereto for the years ended March 31,2006, 2005 and 2004. The definitions used herein are in accordance with SFAS No. 25, “Suspension of CertainAccounting Requirements for Oil and Gas Producing Companies.”
Proved Developed and Undeveloped Reserves:
Crude Oil, Condensate and Natural GasLiquids*1 Natural Gas*1, *3
Millions of Barrels Billions of Cubic Feet
ConsolidatedCompanies
AssociatedCompanies
Worldwide
ConsolidatedCompanies
AssociatedCompanies
WorldwideOceaniaMiddle
East Oceania Others OceaniaMiddle
East Oceania Others
Reserves at April 1, 2003 . . . . . . . . . 12 28 40 71 151 27 — 1,173 221 1,421Changes Attributable to:
Revision of Previous Estimates(includes improved recovery) . . — (3) 5 7 9 — — (282) 2 (280)
Extensions and Discoveries . . . . . . — — — 52 52 — 84 — 729 813Purchases . . . . . . . . . . . . . . . . . . . . — — — 2 2 — — — 42 42Sales . . . . . . . . . . . . . . . . . . . . . . . . — — — — — — — — — —Production . . . . . . . . . . . . . . . . . . . (2) (2) (6) (5) (15) — — (45) (29) (74)
Reserves at March 31, 2004 . . . . . . . 10 23 39 127 199 27 84 846 965 1,922Changes Attributable to:
Revision of Previous Estimates(includes improved recovery) . . — 3 (6) (32) (35) — — (26) 4 (22)
Extensions and Discoveries . . . . . . 2 1 — — 3 42 — — 437 479Purchases . . . . . . . . . . . . . . . . . . . . 39 — — 2 41 — — — 21 21Sales . . . . . . . . . . . . . . . . . . . . . . . . — — — — — — — — — —Production . . . . . . . . . . . . . . . . . . . (1) (3) (5) (5) (14) — (9) (49) (34) (92)
Reserves at March 31, 2005 . . . . . . . 50 24 28 92 194 69 75 771 1,393 2,308Changes Attributable to:
Revision of Previous Estimates(includes improved recovery) . . 3 1 16 16 36 13 (31) 87 (11) 58
Extensions and Discoveries . . . . . . 3 1 — — 4 — 2 — 432 434Purchases . . . . . . . . . . . . . . . . . . . . — — — 1 1 — — — 14 14Sales . . . . . . . . . . . . . . . . . . . . . . . . — — — — — — — — — —Production . . . . . . . . . . . . . . . . . . . (1) (3) (5) (5) (14) (2) (6) (57) (39) (104)
Reserves at March 31, 2006 . . . . . . . 55 23 39 104 221 80 40 801 1,789 2,710
Proved Developed Reserves*2:Reserves at April 1, 2003 . . . . . . . . . . 9 28 17 18 72 — — 364 58 422Reserves at March 31, 2004 . . . . . . . . 7 23 14 19 63 — 84 330 69 483Reserves at March 31, 2005 . . . . . . . . 6 24 14 18 62 — 75 356 82 513
Reserves at March 31, 2006 . . . . . . . 7 18 13 25 63 56 39 263 67 425
*1 1 barrel of crude oil = 5,800 cubic feet of natural gas*2 The proportion of Proved Developed Reserves to Proved Developed and Undeveloped Reserves is about 28 percent as of March 31,
2006 and relatively low. The expected costs to develop these undeveloped reserves are estimated to be ¥514,822 million in total as ofMarch 31, 2006, which is included in “Future Development Cost” in Table 5. The major undeveloped reserves are attributable to anassociated company in Russia and an associated company in Australia. It is expected to commence the full-year production of crude oilin 2007 and LNG in 2008, for the associated company in Russia. In relation to the associated company in Australia, the production ofcrude oil and LNG has already commenced at the existing facilities. The drilling of additional development wells will be performed overthe project life according to the drilling program of the project.
*3 The proved gas reserves are restricted to those volumes that are related to firm sales commitments.
F-82

TABLE 5. STANDARDIZED MEASURE OF DISCOUNTED FUTURE NET CASH FLOWSRELATED TO PROVED OIL AND GAS RESERVES
The standardized measure of discounted future cash flows, related to the preceding proved oil and gasreserves, is calculated in accordance with SFAS No. 69. Estimated future cash inflows from production arecomputed by applying year-end prices to year-end quantities of estimated net proved reserves. Futuredevelopment and production costs are those estimated future expenditures necessary to develop and produceyear-end estimated proved reserves based on year-end cost indices, assuming continuation of year-end economicconditions. Estimated future income taxes are calculated by applying appropriate year-end statutory tax rates.Discounted future net cash flows are calculated using a discount factor of 10 percent. The information provideddoes not represent management’s estimate of the companies’ expected future cash flows or value of proved oiland gas reserves. Estimates of proved reserve quantities shall change over time as new information becomesavailable. Moreover, probable and possible reserves, which may become proved in the future, are excluded fromthe calculations. The arbitrary valuation prescribed under SFAS No. 69 requires assumptions as to the timing offuture development and production costs. The calculations are made as of each fiscal year-end and should not berelied upon as an indication of the companies’ future cash flows or value of their oil and gas reserves.
1) Standardized Measure of Discounted Future Net Cash Flows
Millions of Yen
Worldwide
Consolidated Companies Associated Companies
Oceania Middle East Oceania Others
At March 31, 2006:Future Cash Inflows from Production . . . . . . . . . . . . . . . . ¥ 342,585 ¥ 228,044 ¥ 672,116 ¥1,644,418 ¥2,887,163Future Production Costs . . . . . . . . . . . . . . . . . . . . . . . . . . . (124,615) (26,924) (205,686) (369,594) (726,819)Future Development Costs . . . . . . . . . . . . . . . . . . . . . . . . . (27,206) (7,291) (114,152) (437,194) (585,843)Future Income Taxes . . . . . . . . . . . . . . . . . . . . . . . . . . . . . (25,763) (104,206) (115,459) (202,793) (448,221)
Undiscounted Future Net Cash Flows . . . . . . . . . . . . . . . . 165,001 89,623 236,819 634,837 1,126,28010% Annual Discount for Timing of Estimated Cash
Flows . . . . . . . . . . . . . . . . . . . . . . . . . . . . . . . . . . . . . . . (46,925) (32,936) (135,169) (463,532) (678,562)
Standardized Measure of Discounted Future Net CashFlows . . . . . . . . . . . . . . . . . . . . . . . . . . . . . . . . . . . . . . . ¥ 118,076 ¥ 56,687 ¥ 101,650 ¥ 171,305 ¥ 447,718
At March 31, 2005:Future Cash Inflows from Production . . . . . . . . . . . . . . . . ¥ 206,903 ¥ 180,308 ¥ 392,005 ¥1,021,275 ¥1,800,491Future Production Costs . . . . . . . . . . . . . . . . . . . . . . . . . . . (39,241) (20,760) (161,141) (240,064) (461,206)Future Development Costs . . . . . . . . . . . . . . . . . . . . . . . . . (42,915) (9,467) (98,020) (267,650) (418,052)Future Income Taxes . . . . . . . . . . . . . . . . . . . . . . . . . . . . . (37,675) (80,860) (62,292) (141,239) (322,066)
Undiscounted Future Net Cash Flows . . . . . . . . . . . . . . . . 87,072 69,221 70,552 372,322 599,16710% Annual Discount for Timing of Estimated Cash
Flows . . . . . . . . . . . . . . . . . . . . . . . . . . . . . . . . . . . . . . . (35,103) (27,902) (28,197) (275,684) (366,886)
Standardized Measure of Discounted Future Net CashFlows . . . . . . . . . . . . . . . . . . . . . . . . . . . . . . . . . . . . . . . ¥ 51,969 ¥ 41,319 ¥ 42,355 ¥ 96,638 ¥ 232,281
At March 31, 2004:Future Cash Inflows from Production . . . . . . . . . . . . . . . . ¥ 36,333 ¥ 138,382 ¥ 382,405 ¥ 656,697 ¥1,213,817Future Production Costs . . . . . . . . . . . . . . . . . . . . . . . . . . . (20,177) (20,641) (226,059) (145,972) (412,849)Future Development Costs . . . . . . . . . . . . . . . . . . . . . . . . . (5,140) (9,067) (4,850) (228,608) (247,665)Future Income Taxes . . . . . . . . . . . . . . . . . . . . . . . . . . . . . (2,085) (58,820) (51,950) (98,338) (211,193)
Undiscounted Future Net Cash Flows . . . . . . . . . . . . . . . . 8,931 49,854 99,546 183,779 342,11010% Annual Discount for Timing of Estimated Cash
Flows . . . . . . . . . . . . . . . . . . . . . . . . . . . . . . . . . . . . . . . (1,539) (21,446) (39,289) (211,595) (273,869)
Standardized Measure of Discounted Future Net CashFlows . . . . . . . . . . . . . . . . . . . . . . . . . . . . . . . . . . . . . . . ¥ 7,392 ¥ 28,408 ¥ 60,257 ¥ (27,816) ¥ 68,241
F-83

2) Details of Changes for the Year
Millions of Yen
Consolidated Companies Associated Companies Worldwide
2006 2005 2004 2006 2005 2004 2006 2005 2004
Present Value at April 1 . . . . . . . . . . . . ¥ 93,288 ¥ 35,800 ¥ 34,017 ¥138,993 ¥ 32,441 ¥ 182,466 ¥ 232,281 ¥ 68,241 ¥ 216,483
Sales/Transfers of Oil and GasProduced, Net of ProductionCosts . . . . . . . . . . . . . . . . . . . . . . . . . (30,504) (16,282) (12,046) (75,468) (50,417) (38,998) (105,972) (66,699) (51,044)
Development Costs Incurred . . . . . . . . 31,993 22,375 10,259 119,761 96,896 61,160 151,754 119,271 71,419Purchases of Reserves in Place . . . . . . — 23,150 — 1,633 1,578 1,894 1,633 24,728 1,894Extensions and Discoveries . . . . . . . . . 5,734 11,117 16,746 87,361 124,122 119,609 93,095 135,239 136,355Net Changes in Prices,
Development and ProductionCost . . . . . . . . . . . . . . . . . . . . . . . . 51,594 23,033 (2,475) (57,345) (37,454) (253,034) (5,751) (14,421) (255,509)
Revisions of PreviousQuantity Estimates*1 . . . . . . . . . . . . (11,786) — (2,837) 49,653 (33,933) (37,158) 37,867 (33,933) (39,995)
Accretion of Discount . . . . . . . . . . . . . 9,329 3,580 3,402 13,899 3,244 18,247 23,228 6,824 21,649Net Changes in Income Taxes . . . . . . . 4,698 (11,387) (137) (23,129) 1,839 29,126 (18,431) (9,548) 28,989Others*2 . . . . . . . . . . . . . . . . . . . . . . . . 20,417 1,902 (11,129) 17,597 677 (50,871) 38,014 2,579 (62,000)
Net Changes for the Year . . . . . . . . . . . 81,475 57,488 1,783 133,962 106,552 (150,025) 215,437 164,040 (148,242)
Present Value at March 31 . . . . . . . . . . ¥174,763 ¥ 93,288 ¥ 35,800 ¥272,955 ¥138,993 ¥ 32,441 ¥ 447,718 ¥232,281 ¥ 68,241
*1 Includes amounts resulting from changes in the timing of production.*2 Main portion of “Others” is foreign currency translation adjustments.
F-84
SIGNATURE
Pursuant to the requirements of Section 12 of the Securities Exchange Act of 1934, the registrant herebycertifies that it meets all of the requirements for filing on Form 20-F and that it has duly caused and authorizedthe undersigned to sign this annual report on its behalf.
MITSUI & CO., LTD.(Registrant)
Date: September 27, 2006 by /s/ KAZUYA IMAI
Kazuya ImaiSenior Executive Managing Officer and
Chief Financial Officer