UNDERSTANDING THE UNIQUE ASSEMBLY HISTORY OF CENTRAL GROUP GALAXIES
18
DRAFT VERSION OCTOBER 29, 2014 Preprint typeset using L A T E X style emulateapj v. 12/14/05 UNDERSTANDING THE UNIQUE ASSEMBLY HISTORY OF CENTRAL GROUP GALAXIES BENEDETTA VULCANI 1 ,KEVIN BUNDY 1 ,CLAIRE LACKNER 1 ,ALEXIE LEAUTHAUD 1 ,TOMMASO TREU 2,3 ,SIMONA MEI 4,5 ,LODOVICO COCCATO 6 ,J EAN PAUL KNEIB 7 ,MATTHEW AUGER 8 , AND CARLO NIPOTI 9 1 Kavli Institute for the Physics and Mathematics of the Universe (Kavli IPMU, WPI), Todai Institutes for Advanced Study, the University of Tokyo, Kashiwa, 277-8582, Japan 2 Department of Physics, University of California, Santa Barbara, CA 93106, USA 3 Division of Astronomy and Astrophysics, University of California, Los Angeles, CA 90095-1547, USA 4 GEPI, Observatoire de Paris, Section de Meudon, 5 Place J. Janssen, 92190 Meudon Cedex, France 5 Université Paris Denis Diderot, 75205 Paris Cedex 13, France 6 European Southern Observatory, Karl-Schwarzschild-Straße 2, D-85748 Garching bei Muenchen, Germany 7 Laboratoire d’Astrophysique, Ecole Polytechnique Fédérale de Lausanne, Observatoire de Sauverny, CH-1290 Versoix, Switzerland 8 Institute of Astronomy, Madingley Road, Cambridge CB3 0HA, UK and 9 Department of Physics and Astronomy, Bologna University, viale Berti-Pichat 6/2, I-40127 Bologna, Italy Draft version October 29, 2014 ABSTRACT Central Galaxies (CGs) in massive halos live in unique environments with formation histories closely linked to that of the host halo. In local clusters they have larger sizes (R e ) and lower velocity dispersions (σ) at fixed stellar mass M * , and much larger R e at a fixed σ than field and satellite galaxies (non-CGs). Using spectroscopic observations of group galaxies selected from the COSMOS survey, we compare the dynamical scaling relations of early-type CGs and non-CGs at z ∼0.6, to distinguish possible mechanisms that produce the required evolution. CGs are systematically offset towards larger R e at fixed σ compared to non-CGs with similar M * . The CG R e - M * relation also shows differences, primarily driven by a sub-population (∼15%) of galaxies with large R e , while the M * - σ relations are indistinguishable. These results are accentuated when double Sérsic profiles, which better fit light in the outer regions of galaxies, are adopted. They suggest that even group-scale CGs can develop extended components by these redshifts that can increase total R e and M * estimates by factors of ∼2. To probe the evolutionary link between our sample and cluster CGs , we also analyze two cluster samples at z ∼ 0.6 and z ∼ 0. We find similar results for the more massive halos at comparable z, but much more distinct CG scaling relations at low-z. Thus, the rapid, late-time accretion of outer components, perhaps via the stripping and accretion of satellites, would appear to be a key feature that distinguishes the evolutionary history of CGs. Subject headings: galaxies: clusters: general – galaxies: distances and redshifts – galaxies: evolution – galax- ies: groups: general – galaxies: dynamics 1. INTRODUCTION Galaxy scaling relations among properties such as mass, size, velocity dispersion, luminosity, and color, provide valu- able insight into galaxy structure and evolution. Early- type (ellipticals and S0s) galaxies, in particular, form a rel- atively homogeneous population that is described by well- defined scaling relations. The stellar velocity dispersion, σ, (Minkowski 1962; Faber & Jackson 1976) and projected half- light radius, R e , (Kormendy 1977) correlate with galaxy lumi- nosity and stellar mass. These trends reflect underlying virial relations and are often expressed in terms of the Fundamental Plane (FP) (Faber et al. 1987; Dressler et al. 1987; Djorgov- ski & Davis 1987). Reconciling the tightness of the FP with the growth by merger postulated by hierarchical models (e.g. Forbes, Pon- man & Brown 1998) has motivated much effort on under- standing how scaling relations are affected by mergers, which predominantly move early-type galaxies along scaling rela- tions (e.g. Nipoti, Londrillo & Ciotti 2003; Fakhouri, Ma & Boylan-Kolchin 2010). This expectation is in agreement with the modest evolution of the FP since z ∼ 1, and defined in terms of stellar mass (M * ), i.e., removing the effects of the evolution of the stellar population (e.g., Treu et al. 2005; Auger et al. 2010). Electronic address: [email protected] Recent work, however, has emphasized the significant evo- lution observed in projections of the FP that relate size and mass. Especially remarkable are the compact and massive red “nuggets” seen predominantly at z ∼ 2 that are the expected progenitors of at least some present-day ellipticals (Trujillo et al. 2006; van Dokkum et al. 2008; Bezanson et al. 2009). A number of physical explanations for their significant size growth have been proposed (see, Hopkins et al. 2010). The most popular involve mergers (e.g., Naab, Johansson & Os- triker 2009; Nipoti et al. 2012), especially minor mergers (Hopkins et al. 2010; Trujillo, Ferreras & de La Rosa 2011), although observations indicate that even the minor merger rate may be insufficient (Newman et al. 2012; Cimatti, Nipoti & Cassata 2012; Sonnenfeld, Nipoti & Treu 2014). One way to gain insight into this problem is to study an ex- treme population, namely the central galaxies (CGs) in mas- sive dark matter halos. Often referred to as Brightest Cluster Galaxies (BCGs) (e.g., Beers & Geller 1983; Jones & For- man 1984), CGs provide a valuable laboratory because their unique location ties their assembly history to that of the parent halo (e.g., Coziol et al. 2009), making them subject to a pos- sible increase in mergers and accretion from tidal stripping events, as well as different gas cooling and heating mecha- nisms. Likely as a result, BCGs are offset from early-type scaling relations at the present day, with larger sizes and lower velocity dispersions at fixed luminosity (Thuan & Roman- arXiv:1410.7402v1 [astro-ph.GA] 27 Oct 2014
Transcript of UNDERSTANDING THE UNIQUE ASSEMBLY HISTORY OF CENTRAL GROUP GALAXIES
DRAFT VERSION OCTOBER 29, 2014Preprint typeset using LATEX style emulateapj v. 12/14/05
UNDERSTANDING THE UNIQUE ASSEMBLY HISTORY OF CENTRAL GROUP GALAXIES
BENEDETTA VULCANI1 , KEVIN BUNDY1 , CLAIRE LACKNER1 , ALEXIE LEAUTHAUD1 , TOMMASO TREU2,3 , SIMONA MEI4,5 , LODOVICOCOCCATO6 , JEAN PAUL KNEIB7 , MATTHEW AUGER8 , AND CARLO NIPOTI9
1Kavli Institute for the Physics and Mathematics of the Universe (Kavli IPMU, WPI), Todai Institutes for Advanced Study, the University of Tokyo, Kashiwa,277-8582, Japan
2Department of Physics, University of California, Santa Barbara, CA 93106, USA3Division of Astronomy and Astrophysics, University of California, Los Angeles, CA 90095-1547, USA
4GEPI, Observatoire de Paris, Section de Meudon, 5 Place J. Janssen, 92190 Meudon Cedex, France5Université Paris Denis Diderot, 75205 Paris Cedex 13, France
6European Southern Observatory, Karl-Schwarzschild-Straße 2, D-85748 Garching bei Muenchen, Germany7Laboratoire d’Astrophysique, Ecole Polytechnique Fédérale de Lausanne, Observatoire de Sauverny, CH-1290 Versoix, Switzerland
8Institute of Astronomy, Madingley Road, Cambridge CB3 0HA, UK and9Department of Physics and Astronomy, Bologna University, viale Berti-Pichat 6/2, I-40127 Bologna, Italy
Draft version October 29, 2014
ABSTRACTCentral Galaxies (CGs) in massive halos live in unique environments with formation histories closely linked
to that of the host halo. In local clusters they have larger sizes (Re) and lower velocity dispersions (σ) atfixed stellar mass M∗, and much larger Re at a fixed σ than field and satellite galaxies (non−CGs). Usingspectroscopic observations of group galaxies selected from the COSMOS survey, we compare the dynamicalscaling relations of early-type CGs and non−CGs at z ∼0.6, to distinguish possible mechanisms that producethe required evolution. CGs are systematically offset towards larger Re at fixed σ compared to non-CGs withsimilar M∗. The CG Re−M∗ relation also shows differences, primarily driven by a sub-population (∼15%) ofgalaxies with large Re, while the M∗−σ relations are indistinguishable. These results are accentuated whendouble Sérsic profiles, which better fit light in the outer regions of galaxies, are adopted. They suggest thateven group-scale CGs can develop extended components by these redshifts that can increase total Re and M∗estimates by factors of∼2. To probe the evolutionary link between our sample and cluster CGs , we also analyzetwo cluster samples at z ∼ 0.6 and z ∼ 0. We find similar results for the more massive halos at comparable z,but much more distinct CG scaling relations at low-z. Thus, the rapid, late-time accretion of outer components,perhaps via the stripping and accretion of satellites, would appear to be a key feature that distinguishes theevolutionary history of CGs.Subject headings: galaxies: clusters: general – galaxies: distances and redshifts – galaxies: evolution – galax-
ies: groups: general – galaxies: dynamics
1. INTRODUCTION
Galaxy scaling relations among properties such as mass,size, velocity dispersion, luminosity, and color, provide valu-able insight into galaxy structure and evolution. Early-type (ellipticals and S0s) galaxies, in particular, form a rel-atively homogeneous population that is described by well-defined scaling relations. The stellar velocity dispersion, σ,(Minkowski 1962; Faber & Jackson 1976) and projected half-light radius, Re, (Kormendy 1977) correlate with galaxy lumi-nosity and stellar mass. These trends reflect underlying virialrelations and are often expressed in terms of the FundamentalPlane (FP) (Faber et al. 1987; Dressler et al. 1987; Djorgov-ski & Davis 1987).
Reconciling the tightness of the FP with the growth bymerger postulated by hierarchical models (e.g. Forbes, Pon-man & Brown 1998) has motivated much effort on under-standing how scaling relations are affected by mergers, whichpredominantly move early-type galaxies along scaling rela-tions (e.g. Nipoti, Londrillo & Ciotti 2003; Fakhouri, Ma& Boylan-Kolchin 2010). This expectation is in agreementwith the modest evolution of the FP since z ∼ 1, and definedin terms of stellar mass (M∗), i.e., removing the effects ofthe evolution of the stellar population (e.g., Treu et al. 2005;Auger et al. 2010).
Electronic address: [email protected]
Recent work, however, has emphasized the significant evo-lution observed in projections of the FP that relate size andmass. Especially remarkable are the compact and massive red“nuggets” seen predominantly at z ∼ 2 that are the expectedprogenitors of at least some present-day ellipticals (Trujillo etal. 2006; van Dokkum et al. 2008; Bezanson et al. 2009).A number of physical explanations for their significant sizegrowth have been proposed (see, Hopkins et al. 2010). Themost popular involve mergers (e.g., Naab, Johansson & Os-triker 2009; Nipoti et al. 2012), especially minor mergers(Hopkins et al. 2010; Trujillo, Ferreras & de La Rosa 2011),although observations indicate that even the minor merger ratemay be insufficient (Newman et al. 2012; Cimatti, Nipoti &Cassata 2012; Sonnenfeld, Nipoti & Treu 2014).
One way to gain insight into this problem is to study an ex-treme population, namely the central galaxies (CGs) in mas-sive dark matter halos. Often referred to as Brightest ClusterGalaxies (BCGs) (e.g., Beers & Geller 1983; Jones & For-man 1984), CGs provide a valuable laboratory because theirunique location ties their assembly history to that of the parenthalo (e.g., Coziol et al. 2009), making them subject to a pos-sible increase in mergers and accretion from tidal strippingevents, as well as different gas cooling and heating mecha-nisms. Likely as a result, BCGs are offset from early-typescaling relations at the present day, with larger sizes and lowervelocity dispersions at fixed luminosity (Thuan & Roman-
arX
iv:1
410.
7402
v1 [
astr
o-ph
.GA
] 2
7 O
ct 2
014

2 Vulcani et al.
ishin 1981; Hoessel, Oegerle & Schneider 1987; Schombert1987; Oegerle & Hoessel 1991; Lauer et al. 2007; Liu et al.2008; Bernardi 2009). Understanding the origin of these off-sets, especially the increase in sizes, can provide insight intothe processes that drive the more subtle evolution of normalearly-type galaxies.
As with the red nuggets mystery, theoretical explanationsfor the offset scaling relations of BCGs tend to rely on merg-ers and can be classified in two different categories: 1)merger-driven changes that fundamentally alter the resultingstructure of the remnant, and 2) minor-merging induced ac-cretion of low-density stellar material that builds envelopes atlarge radii. Arguing in favor of the first explanation, Boylan-Kolchin, Ma & Quataert (2006) performed a series of majormerger simulations and studied the spatial and velocity struc-ture of the remnants. Regardless of orbital energy or angu-lar momentum, the remnants remained confined to the FP, al-though their location on projected relations depended on theorbits assumed. Boylan-Kolchin, Ma & Quataert (2006) usedthese simulations to argue that infall along dark matter fila-ments leads to an increase in radial mergers among CGs thatcan produce the offsets observed. When evaluated in a cos-mological context, De Lucia & Blaizot (2007) showed thatlate-time dissipationless merging produces simulated BCGsthat show little scatter in luminosity over a wide range of red-shifts, as observed (e.g. Sandage 1972; Postman & Lauer1995; Aragon-Salamanca et al. 1993; Stanford, Eisenhardt& Dickinson 1998).
In the second category are mechanisms such tidal strip-ping of cluster galaxies (Gallagher & Ostriker 1972; Rich-stone 1975, 1976; Merritt 1985), and an uncertain relation-ship with the formation of an intracluster light (ICL) compo-nent (e.g. Gonzalez, Zabludoff & Zaritsky 2005; Zibetti et al.2005; Lauer et al. 2007) which may be the result of tidal strip-ping at very large radii (e.g., Weil, Bland-Hawthorn & Malin1997; Puchwein et al. 2010; Rudick, Mihos & McBride 2011;Martel, Barai & Brito 2012; Cui et al. 2014 and referencestherein). This inside-out growth, with the accumulation ofstars in the distant outskirts of CGs, has also been reproducedin hydrodynamical zoom-in simulations (Naab, Johansson &Ostriker 2009; Feldmann et al. 2010).
Finally, mechanisms like galactic “cannibalism” (the merg-ing or capture of cluster satellites due to dynamical friction;Ostriker & Tremaine 1975; White 1976; Ostriker & Hausman1977; Nipoti et al. 2004) might contribute to both the cate-gories. Indeed, the dynamical friction is expected to act moreefficiently on more massive systems, while its time scale islong for low mass satellites.
Moreover, existing spectroscopic studies found that formany CGs the properties of the stellar populations in theoutskirts (age, metallicity, and α-enhancement) are differentfrom those in central regions (Coccato, Gerhard & Arnaboldi2010; Greene et al. 2013; Pastorello et al. 2014), consistentwith the accretion scenario.
In principle, these models could be tested by fitting sec-ondary, extended components to observed light profiles. In-deed, many studies have highlighted the multi-componentnature of early-type profiles (e.g., Caon, Capaccioli &D’Onofrio 1993; Lauer et al. 1995; Kormendy 1999; Gra-ham et al. 2003; Ferrarese et al. 1994, 2006; Kormendy etal. 2009; Dullo & Graham 2012; Bernardi et al. 2014). Un-fortunately, as we emphasize in this work, multi-componentfits are often highly degenerate, even when high-resolutionand exquisite depths are achieved for local samples (see, e.g.,
Huang et al. 2013). It is therefore important to bring to bearadditional information encoded in the scaling relations whenevaluating these proposed scenarios.
The goal of this paper is to enable such an evaluationby extending CGs scaling relations to both higher redshiftsand lower halo mass than has been previously studied. Weaim to understand which mechanisms are most important andwhether there is a critical halo mass or redshift at which CGsdifferentiate from the rest of the early-type population. A keyadvantage of working at the lower mass scale of galaxy groupsis that the CGs are more modest in terms of mass and luminos-ity. It is therefore easier to find non−CGs counterparts withsimilar mass and morphology, both in the field and in groups,and test whether the unique properties of CGs are driven bydeep-seated structural changes or the accretion of outer com-ponents.
By studying a sample in the COSMOS field, we can makeuse of previous efforts to determine robust group and mem-bership catalogs (Leauthaud et al. 2010; George et al. 2011),carefully identify CGs (George et al. 2012), and take advan-tage of high-resolution imaging from the Hubble Space Tele-scope (HST) (Koekemoer et al. 2007) and multi-wavelengthobservations used to derive precise photometric redshifts (Il-bert et al. 2010). To this legacy data set, we describe our addi-tion of targeted deep spectroscopy from the Very Large Tele-scope (VLT) to derive accurate stellar velocity dispersions forboth CGs and non−CGs, and present a detailed analysis ofprofile fitting to the HST imaging.
Throughout this paper, we assume H0 = 72kms−1 Mpc−1,Ωm = 0.258, and ΩΛ = 0.742 (Hinshaw et al. 2009). TheChabrier (2003) initial mass function (IMF) in the mass range0.1–100 M is adopted.
2. THE SAMPLE
2.1. COSMOS groupsWe use an X-ray-selected sample of galaxy groups from
the COSMOS field (Scoville et al. 2007). As presented byGeorge et al. (2011, 2012), the sample of galaxy groupshas been selected from an X-ray mosaic combining imagesfrom the XMM-Newton (Hasinger et al. 2007) and Chandra(Elvis et al. 2009) observatories following the procedure ofFinoguenov et al. (2009, 2010). Once extended X-ray sourceshave been detected, a red sequence finder has been employedon galaxies with a projected distance less than 0.5 Mpc fromthe centers to identify an optical counterpart and determinethe redshift of the group, which has been then refined withspectroscopic redshifts when available.1
Member galaxies have been selected according to theirphotometric redshifts and proximity to X-ray centroids. ABayesian membership probability has been assigned to eachgalaxy by comparing the photometric redshift probabilitydistribution function to the expected redshift distribution ofgroup and field galaxies near each group. From the list ofmembers, the galaxy with the highest stellar mass within anNFW scale radius of the X-ray centroid is selected as thegroup center. A final membership probability has been as-signed by repeating the selection process within a new cylin-der recentered on this galaxy.
1 This sample is more complete than comparable group catalogs selectedvia red-sequence and 3D redshift overdensity methods (Wilman et al. 2005;Gerke et al. 2007) because X-ray selection better traces halo mass (Nagai,Vikhlinin & Kravtsov 2007) and avoids incompleteness and sparse samplinguncertainties common in spec-z samples.

Central Group galaxies assembly history 3
The COSMOS CGs we study in this work were originallyidentified in George et al. (2011) who referred to them asthe “Most Massive Central Galaxies”. They are defined as themember galaxy with the highest stellar mass within a radiusgiven by the sum of the group’s scale radius and the positionaluncertainty of the associated X-ray peak. This definition wasstudied in detail and determined to be the optimum choice byGeorge et al. (2012) who measured the weak gravitationallensing signal around each of the multiple candidate centers(based on luminosity, stellar mass, and proximity to the X-raycenter) to find the one which maximized the lensing signal.The quality of the selection algorithm was further tested withmock catalogs and spectroscopic redshifts, adding robustnessto the sample adopted in this paper.
George et al. (2012) consider only groups with a confi-dent spectroscopic association, far from field edges, not po-tentially merging groups and groups with more than fourmembers identified, for a total of 129 groups. However, toincrease the statistics in the scaling relations, we considerall 169 groups with an identified CG,2 ranging from redshift0< z< 1 and from halo masses ∼ 1013 <M200c/M < 1014,as estimated with weak lensing (Leauthaud et al. 2010).M200c = 200ρc(4π/3)R3 is the mass enclosed within R200c,which is the radius within which the mean mass density equals200 times the critical density of the universe at the halo red-shift, ρc(z).
2.2. Extant Data ProductsWe exploit additional COSMOS data, briefly summarized
here. The HST/ACS FW814 imaging is described in Scovilleet al. (2007) and Koekemoer et al. (2007), and is used forthe profile fitting in this work.
Stellar masses have been determined by fitting stellar pop-ulation synthesis models to the spectral energy distributionsof galaxies, varying the age, amount of dust extinction, andmetallicity in the models. We use the stellar masses fromBundy et al. (2006, 2010), which are based on fits to Bruzual& Charlot (2003) models and a Chabrier (2003) IMF, in themass range 0.1–100 M.
To separate passive from star forming galaxies, we use acolor-color diagrams that include rest-frame UV, optical, andnear-IR colors, as presented in Bundy et al. (2010). Passivegalaxies must satisfy the following cuts:
NUV −R> 4.2(1 + z)−0.43−0.2(MK + 20)
andNUV −R>C1(z) +C2(z)(R− J)
where MK is the rest-frame absolute Ks-band magnitude andthe constants, C1 and C2, have been chosen by inspection inredshift bins. For our sample, for z = [0.30, 0.50, 0.70, 0.85]C1(z) = [4.4, 4.2, 4.0, 3.9] and C2(z) = [2.41, 2.41, 2.5, 2.6].
2.3. FORS2 observations and reductionsDespite the array of data sets available in COSMOS, fol-
lowup spectroscopy was required to determine accurate ve-locity dispersions for group CGs as well as an appropriatecontrol sample of non−CGs. To accomplish this, a four-nightprogram3 (PI: S. Mei) using the FOcal Reducer and low dis-persion Spectrograph (FORS2, Appenzeller et al. 1998) on
2 Including the groups excluded by George et al. (2012) does not biasresults.
3 The ESO program ID was 084.B-0523(A).
the VLT was executed from 14–17 Februrary 2010. The holo-graphic 600 RI+19 grism (with filter GG435) was used with0.′′6 width slits to acheive a wavelength range of 5900–8000Å with an instrumental dispersion of σsp ≈ 75 km s−1. A to-tal of 27 slit plates, each with a field of view of 6.′8 by 5.′7and positioned to span roughly 3 COSMOS groups, were ob-served in 1 hr blocks (45 min on-sky integration time). A totalof 353 targets (85 CGs and 268 non−CGs) were observed.
Slits were allocated with the highest priority to candidateCGs using a preliminary CG catalog provided by M. George(private communication). The second most likely CG candi-dates were also targeted. The control sample of non−CGswas required to have M∗ > 109.5M and divided into groupmembers and field galaxies. Group non−CGs had to satisfythe membership criteria presented in George et al. (2011).Field non−CGs were chosen from galaxies not associatedwith any group and additionally were prioritized to match asclosely as possible the M∗ distribution of CGs. No morphol-ogy cuts were implemented in the selection because the fullrange of the morphological distribution of CGs is relativelybroad (although some cuts were later applied in our analysis(see §2.5). To obtain a velocity dispersion, targets were re-quired to have a F814W I-band MAG_AUTO AB magnitudebrighter than 20.5 and a redshift (either spectroscopic or pho-tometric) in the range 0.2 < z < 0.9. When room on the slitmasks was available, additional sources related to other sci-ence goals were also targeted.
For the present work, reductions were performed usingscripts from the Carnegie Python Distribution4 (CarPy) orig-inally packaged to reduce spectroscopic observations fromLDSS2.5 The scripts work primarily on the 2D spectralimages, applying bias subtraction, slit tracing, flat fielding,and wavelength rectification based on supplied arc and flatframes. Traces from multiple exposures are combined andextracted into 1D spectra. A range of tests and optimizationsof the scripts was explored often with fine-tuning required forthe wavelength rectification and sky subtraction of individualslits.
2.4. Derived quantities2.4.1. Stellar velocity dispersion fitting
Following Suyu et al. (2010) and Harris et al. (2012), weuse a Python-based implementation of the velocity dispersioncode from van der Marel (1994), expanded to use a linearcombination of template spectra (written by M. W. Auger).The code simultaneously fits a linear combination of broad-ened stellar templates and a polynomial continuum to the datausing a Markov Chain Monte Carlo (MCMC) routine to findthe probability distribution function of the velocity dispersion(σ) and velocity (v). We use a set of templates from the INDO-US stellar library containing spectra for a set of seven K and Ggiants with a variety of temperatures and spectra for an F2 andan A0 giant. Before fitting, template spectra are convolved tothe instrumental resolution determined from the science spec-trum. Our reported measurement of σ and v are the median ofthe MCMC distribution, and measurement errors are the semi-difference of the values at the 16 and 84 percentile values.6Systematic errors due to template variations are accounted for
4 http://code.obs.carnegiescience.edu/carnegie-python-distribution
5 see http://astro.dur.ac.uk/ãms/dan6 We do not fit higher order moments (h3 and h4). However, they would
have little effect on the high σ values of our galaxies.

4 Vulcani et al.
FIG. 1.— Example of a CG spectrum (black line) with a model generatedfrom all nine INDO-US templates and a fifth-order continuum over plotted(red line). The gray shaded areas are the regions not included in the fit, andthe lower panel shows the fit residuals. The S/N obtained from the FeMGfeature is 31.
in our fitting routine since the template weights are fitted si-multaneously with the velocity dispersion and marginalizedover.
For all the measurements, we use the entire wavelengthrange to perform the fit,7 defining regions to mask to ensurethat we fit only the stellar contributions to each spectrum andusing a 5th-order polynomial to fit the continuum. We thenexclude from the fit the following emission lines: OII λ3715-3740, Hδ λ4060- 4110, Hγ λ4330-4345, Hβ λ4850- 4870,OIIIa λ4950- 4965, OIIIb λ5000- 5015, Hα λ 6550, 6573. Inaddition, we mask the main telluric bands and the sky lines.Every spectrum has been inspected by eye by one of us (B.V.)to mask possible additional bad regions of the spectra thatcould alter the fit.
Each of these parameters (wavelength range, mask, poly-nomial order) has been determined by visual inspection ofeach spectrum with a S/N ≥7 pixel −1, while galaxies withS/N<7 pixel −1 have been disregarded from the analysis. Fig-ure 1 shows an example of a typical spectrum, with a modelover plotted and the regions masked. Following Jorgensen,Franx & Kjaergaard (1995) and taking into account that ourslits have a rectangular shape of 0.6′′×Re, we correct veloc-ity dispersions to standard central velocity dispersions within
1/8 Re, applying the formula: σ = σap×[
1.025(0.6×Re)1/2
Re/8
]0.04.
Such correction produces an increase in the reported centralvelocity dispersions of 5–10%.
2.4.2. Profile fits and size estimates
Because our ultimate goal is distinguishing processes thataffect the fundamental internal structure of galaxies (e.g.,radial major mergers) from those that affect only the out-skirts and leave the core unchanged (e.g., growth of outer en-velopes), fitting model profiles to HST images of our sampleand interpreting the resulting half-light radii estimates is crit-ically important. As discussed in §1, there are several lines ofevidence that massive early-type galaxies are made up of mul-tiple components possibly formed at different epochs (e.g.,Gonzalez, Zabludoff & Zaritsky 2005; Hopkins et al. 2009b;
7 We tested that measurements obtained using only specific regions of thespectra gives results that are fairly in agreement with those obtained adoptingthe entire spectrum.
Hopkins et al. 2009c; Dhar & Williams 2010; Dullo & Gra-ham 2013; Huang et al. 2013; Bernardi et al. 2014). Ideally,the profile fits to different components would correspond tomeaningful information about truly distinct physical compo-nents, their shapes, sizes, and associated masses. Unfortu-nately, as we show below, even with the HST data availablefor our sample, the best-fit parameters for multi-componentfits can be highly degenerate, rendering physical insight frommulti-component fits very uncertain.
The first is the widely-used de Vaucouleurs profile. Notonly does it facilitate comparisons between our work and oth-ers, it also maintains a fixed shape, making comparisons be-tween galaxies easier to interpret. The de Vaucouleurs pro-file is primarily sensitive to light in the central regions andless sensitive to “extra” material in the outskirts. This, inturn, makes the de Vaucouleurs half-light radii systematicallysmall. The second model is a double Sérsic. Its several ex-tra degrees of freedom ensure that the more complex profilesresulting from significant amounts of light in the galaxy’s out-skirts can be adequately accounted for, while still accuratelymodeling the galaxy’s central regions. While the half-light ra-dius of either one of the two Sérsic components may not bephysically meaningful, the total half-light radius is likely to bemore sensitive to outer envelopes than the more restricted deVaucouleurs profile, whose shape cannot adjust to accommo-date light at distant radii (e.g., Gonzalez, Zabludoff & Zarit-sky 2005; Bernardi et al. 2013).
We can demonstrate the need for caution when interpret-ing the half-light radii of the individual Sérsic components byfitting a different two-component model to the same galax-ies and comparing the component half-light radii. We findthat fitting a more restrictive double de Vaucouleurs profile tothe galaxies is often equivalent to fitting a double Sérsic pro-file. For two thirds of both CGs and non−CGs, a double deVaucouleurs and double Sérsic profile are indistinguishablebased on the reduced χ2 values, accounting for the extra de-grees of freedom in the double Sérsic profile. This should becontrasted to the difference in χ2 values between single- anddouble-component models, which justifies using a double-component model for 90% of the galaxies in the sample. Thetwo-component Sérsic and de Vaucouleurs models yield dra-matically different half-light radii for the separate componentsof the galaxies, with scatter on the order of 100% in the half-light radius of the outer component, while the total half-lightradii vary by ∼20%. Thus, the total half-light radii are muchmore robust.
The lack of a difference between the goodness-of-fit of dou-ble de Vaucouleurs and double Sérsic profiles also demon-strates that using more complicated models is not necessaryfor most of the galaxies in this sample, as extra parametersare not justified. For the minority of galaxies with additionalfeatures in the radial profile, more complicated models may bemerited (Huang et al. 2013). In this work, we use the doubleSérsic fits as visual inspection has shown fewer catastrophicfailures for the more flexible profile.
The uncertainty in interpreting the half-light radii of the in-dividual Sérsic components can also by illustrated by lookingat specific galaxies in the sample. For CGs with significantouter envelopes, the two Sérsic components often align wellwith the inner galaxy and outer envelope. For smaller sys-tems, the two Sérsic components are often attributed to a diskand a bulge, or a bright central region and the bulk of thegalaxy. Figure 2 shows two galaxies for which the single deVaucouleurs does not provide an adequate fit, but the added
Central Group galaxies assembly history 5
FIG. 2.— Example of a CG whose outer Sérsic component is representa-tive of an outer envelope (top), and of a non−CG whose two Sérsic compo-nents are attributed to a bulge and disk (bottom). Both images are are arcsinhstretched.
Sérsic profile fits different physical structures in the galaxy.The top panels show a CG in which the larger Sérsic com-ponent refers to the outer envelope, while the single de Vau-couleurs profile fails to capture the outer envelope. The lowerpanels in Figure 2 show a non−CG. In this case, the largerSérsic profile models the disk of the galaxy, not an outer en-velope. Whether or not the outer Sérsic component refers toan outer envelope depends on the galaxy morphology, par-ticularly the brightest features in the galaxy. This ambiguityfurther justifies using the total half-light radius instead of theradii for the individual components.
With these choices defined, we fit both de Vaucouleurs anddouble Sérsic models to the HST/ACS FW814 images of bothCGs and non−CGs in our sample. These images have beendrizzled such that they have a pixel scale of 0.03”/pix (Koeke-moer et al. 2007). For each galaxy, we create a postage stampimage with a size 4× aiso, where aiso is the major axis diam-eter of the SEXTRACTOR isophotal area. We also mask anyother sources from by SEXTRACTOR in the postage stamp im-age. For 16 of the images, we manually mask nearby sourceswhich would otherwise disrupt the model fitting.
Each model component is described by seven parameters:flux normalization, half-light radius, Sérsic index (fixed ton = 4 for de Vaucouleurs profiles), axis ratio, centroid posi-tion, and position angle. In the two-component Sérsic model,the centroid positions of both components are held to the samevalue, but all other parameters are free and independent. Themodels are fit using a version of the galaxy fitter used byLackner & Gunn (2012), modified to accommodate HST im-ages. Briefly, we obtain the best-fitting model parameters byperforming a χ2 minimization over the difference between thePSF-convolved model and the galaxy image, weighted by themeasured inverse variance of the image. Although the modelsused here are symmetric under rotations, we do not bin pixelsin radius, but perform a full two-dimensional fit. The initialconditions for the model fits are taken from single-componentSérsic fits, which are not used in the subsequent analysis. Theinitial conditions for the half-light radius and axis ratio for
the single-component fits are derived from the SEXTRACTORisophotal area.
The total half-light radius of the double Sérsic fits is com-puted numerically by determining the size of the ellipse thatcontains half the flux. For both the de Vaucouleurs and dou-ble Sérsic profiles, we report half-light radii along the major-axis. The axis ratio and the position angle of the ellipseare taken from the single-component Sérsic fit. While theleast-squared fitting does report errors on the half-light radii,these are likely under-estimated. Instead, we compute thescatter in the size measured using different profiles (Sérsic,de Vaucouleurs, double Sérsic, double de Vaucouleurs, deVaucouleurs +Sérsic, exponential+Sérsic, de Vaucouleurs +exponential). The typical scatter in these half-light radii is∼ 20%, and we use this as the uncertainty for all half-lightradii, from now on called simply sizes for brevity.
2.4.3. Stellar mass corrections
While ideally independent, to derive the properties com-pared in the usual galaxy scaling relations requires similarassumptions. In this section we make an attempt to reducethe systematics due to the different assumptions made to es-timate sizes and masses. Indeed, sizes have been determinedthrough a profile fit to the galaxy’s surface brightness, whilemasses were estimated under a different set of assumptions forthe shape of the same surface brightness profile. In particular,stellar masses have been scaled to a Kron “total magnitude”(MAG_AUTO) as measured in the K-band, not to a luminositydetermined from a multi-component profile fit (Bundy et al.2010).
To obtain mass estimates that are more closely associatedwith the profiles we use to derive size estimates, we applythe following correction. We first assume that the K-bandMAG_AUTO is obtained with the same SExtractor photometricestimator as the F814W MAG_AUTO magnitudes (Leauthaudet al. 2010), and ignore potential color gradients. We thencompute the difference in magnitude, δm, between the F814WMAG_AUTO and the magnitude associated with either the deVaucouleurs or double Sérsic fit described above. Assumingthe same M/L for all early-types, the resulting difference inlog mass, δ logM∗, is given by δ logM∗ =−δm/2.5 in units ofdex. We apply the appropriate correction to M∗ for either thede Vaucouleurs or double Sérsic fits as required. In parallelwith the discussion on size estimates above, the resulting M∗values referenced to the de Vaucouleurs profile are dominatedby a galaxy’s central region and are less sensitive to mass inthe outskirts. The M∗ values referenced to the double Sér-sic profile, instead, are a more accurate representation of thetotal mass profile, including material potentially in an outerenvelope.
Figure 3 shows the comparison between the stellar massescorrected using the two different profiles. At low masses, es-timates are in agreement, while for logM?/M>11 doubleSérsic masses are systematically larger than de Vaucouleursmasses, indicating that the former profile is likely includingan outer envelope for massive galaxies.
2.5. The final sample propertiesTable 1 describes our final sample, reporting the number of
galaxies removed for various reasons at each stage of analysis.We note that, with respect to the original sample, we haveapplied an additional cut in Sérsic index (n > 2.5), to removethose galaxies that are characterized by a non negligible disk,hence for which a de Vaucouleurs profile is not accurate.

6 Vulcani et al.
FIG. 3.— Comparison of the stellar mass estimates associated with the twoprofiles we adopt to derive size estimates. Black line represents the identity.
TABLE 1THE SPECTROSCOPIC SAMPLE AT VARIOUS STAGES OF OUR DATA
ANALYSIS
Step CGs non−CGsObserved with original target definition 85 268Catastrophically bad spectroscopy -12 -28Untrustworthy velocity dispersion (S/N<7) -25 -115Spectroscopically confused pairs -4 -0Catastrophic failure in profile fitting and size determination -2 -1Sérsic index n < 2.5 -3 -17Fnal Sample 41 107
FIG. 4.— Redshift distribution for all galaxies (CGs: green line, non−CGs:black line) with a robust velocity dispersion measurement (see §2.4.1 for de-tails).
On the whole, our final sample consists of 107 non−CGsand 41 CGs for which a robust σ is available. In addition,when possible, we enlarge our CG sample by adding 128 CGswithout σ (all−CGs), having checked that the mass distribu-tion is comparable for the two samples.
Figure 4 shows the redshift distribution of the spectroscopicsample, for all−CGs and non−CGs separately. The spannedredshift range goes from z∼0.1 to 0.8, even though in bothsamples most of the galaxies are located between z =0.2-0.6.A Kolmogorov-Smirnov (K-S) test, which quantifies the prob-ability that two data sets are drawn from the same parent dis-tribution, can not exclude the hypothesis that distributions aresimilar.
3. ADDITIONAL SAMPLES FROM THE LITERATURE
To put our COSMOS results in the context of previous workon clusters at both high and low redshift, we make specificuse of additional samples from the literature. Taken together,we warn that these samples are inhomogeneous in both dataand methods and use different definitions of CGs. We donot attempt quantitative intra-sample comparisons, but rela-tive comparisons within each sample between CGs and non-CGs are robust. In all cases where relevant, we have con-verted derived quantities to our adopted cosmology and stellarmasses to a Chabrier (2003) IMF.
3.1. Cluster at intermediate z: EDisCSTo compare our CG sample in COSMOS groups to CGs
in more massive clusters and groups at similar redshifts, weuse the ESO Distant Cluster Survey (EDisCS - White et al.2005), a catalog of 25 clusters and groups. EDisCS pro-
vides information of galaxies both in clusters (both centraland satellites) and in the field. Clusters and groups haveredshifts between 0.4 and 0.9 and structure velocity disper-sions between 166 and 1080 kms−1 (Halliday et al. 2004;Clowe et al. 2006; Milvang-Jensen et al. 2008), yielding es-timated halo masses between 1012 and 1.5× 10¹⁵M, with amean value of ∼4×10¹⁴M. Photo-z membership was estab-lished using a modified version of the technique developedin Brunner & Lubin (2000) (De Lucia et al. 2004, 2007;Pelló et al. 2009). Such an approach rejects spectroscopicnon-members while retaining at least 90% of the confirmedcluster members. A posteriori, it was verified that abovelogM?/M=∼10.2,∼20% of the galaxies classified as photo-z cluster members were actually interlopers, and, conversely,only∼6% of those galaxies classified as spectroscopic clustermembers were rejected by the photo-z technique (Vulcani etal. 2011). The identification of the CG was based on avail-able spectroscopy, the brightness, color, and spatial distribu-tions of galaxies, their photometric redshifts and weak lensingmaps (White et al. 2005; Whiley et al. 2008).
We specifically use the EDisCS data set presented by Sagliaet al. (2010). Velocity dispersions were measured for allgalaxy spectra using the IDL routine pPXF (Cappellari &Emsellem 2004) and corrected using the recipe by Jorgensen,Franx & Kjaergaard (1995). The half-light radii were derivedby fitting either HST ACS images (Desai et al. 2007) or I-band VLT images (White et al. 2005) using the GIM2D soft-ware (Simard et al. 2002). Given the fact that most of theEDisCS HST observations on which the profile fitting wasperformed employed a strategy similar to that in COSMOS(same camera and similar exposure time), we expect that thesurface brightness depth of these images is similar to COS-MOS. Two-component, two-dimensional fits were performed,adopting a de Vaucouleurs bulge plus an exponential disk con-volved with the PSF of the images (for details, see Simard etal. 2009). Unlike Saglia et al. (2010), we do not use circular-ized half-luminosity radii, reporting instead major-axis scalelengths as we adopt for the COSMOS sample. Rest-frameabsolute photometry were derived from SED fitting (Rudnicket al. 2009) and used to derive stellar masses, which werecomputed adopting the calibrations of Bell & de Jong (2001).and B-V colors, and renormalized using the corrections foran elliptical galaxy given in de Jong & Bell (2007). For theEDisCS clusters we do not have detailed information on theprofile fitting, so we cannot reference M∗ values to specificprofile choices, as we did for our COSMOS data, therefore

Central Group galaxies assembly history 7
we use the original stellar masses as provided by Saglia et al.(2010).
3.2. Cluster at low z: WINGSFor a low-z comparison that allows for an evaluation of
potential redshift evolution, we take advantage of the WIde-field Nearby Galaxy-cluster Survey (WINGS- Fasano et al.2006), which gives us information on 77 galaxy clusters at0.04< z< 0.07 that span a halo mass range of∼ 1.5×10¹⁴−2.1×10¹⁵M. Integrated and aperture photometry have beenobtained for galaxies using SEXTRACTOR (Bertin & Arnouts1996). For CGs, great attention has been paid to avoid mu-tual photometric contamination between big galaxies with ex-tended stellar haloes and smaller, halo-embedded companions(Varela et al. 2009). Briefly, the largest galaxies in eachcluster were carefully modeled with IRAF-ELLIPSE and re-moved from the original images in order to allow a reliablemasking of the small companions when performing the sur-face photometry of the big galaxies themselves. The surfacebrightness limit was computed setting the detection thresh-old to 4.5σbg/arcsec2, with σbg the standard deviation of thebackground signal. This limit translates to a detection limitof µT hreshold(V ) ∼ 25.7mag/arcsec2. The WINGS surfacephotometry has been obtained using GASPHOT (Pignatelli,Fasano & Cassata 2006; D’Onofrio et al. 2014)) and non-circularized, major-axis sizes have been estimated using a sin-gle Sérsic law.
Galaxy stellar mass estimates were derived using the Bell& de Jong (2001) relation which correlates the stellar mass-to-light ratio with the optical colors of the integrated stellarpopulation (Vulcani et al. 2011). Using the magnitudes com-puted by the GASPHOT routine, we apply corrections to thestellar masses given in Vulcani et al. (2011) similar to thosefor the COSMOS galaxies, to reference the M∗ estimates toadopted single-Sérsic surface brightness profiles. The singleSérsic profile is intermediate between the de Vaucouleurs anddouble Sérsic profiles in its sensitivity to light at large radii.
Here we use the CG sample presented in Fasano et al.(2010), which consists of 75 galaxies. However, only 55of these have a reliable estimates of the velocity dispersionsfrom the published data of the NFPS and SDSS-DR6 surveys(Bernardi et al. 2003; Smith et al. 2004).
4. RESULTS
In this section, we present a comparison of the dynamicaland structural properties of CGs and non−CGs drawn fromthe z∼ 0.6 COSMOS group sample. Our goal is to use differ-ences between these populations and their scaling relations toplace constraints on the physical mechanisms that drive off-sets in the properties of CGs at low-z and can account for theevolutionary paths of early-type galaxies more generally.
As discussed in §1, we seek observational signatures thatcan distinguish between structural evolution occurring in thecores of galaxies from growth occurring primarily at largeradii. Unfortunately, our observations do not offer a robustway to cleanly separate the inner and outer components ofgalaxies in our sample. Instead, we make use of differentcombinations of observables which we argue are sensitive toproperties of either the inner or outer regions. As an example,we investigate size and M∗ estimates using fits to two types ofmodel surface brightness profiles: the single de Vaucouleursand the double Sérsic. The former adequately models the in-ner, "primary" region of early-type galaxies, while the latteris also sensitive to light in the outer regions.
We start by characterizing CGs and non−CGs in terms oftheir global distributions in stellar mass, velocity dispersionand size distributions. Figure 5 shows that (all−)CGs arelarger in all quantities than non−CGs and the double Sérsicsizes are larger on average than the de Vaucouleurs sizes. Thespanned σ range is comparable in the two samples. Both con-sidering the whole sample and the sample fro which a robust σis available, the K-S test excludes the hypothesis that the twodistributions are similar for each quantity at > 99.9% level.
The observed overlap between the COSMOS-group CG andnon−CG stellar mass distributions indicates that, as opposedto massive clusters where the CGs are by far the most mas-sive objects and it is very difficult to find equally massivenon−CGs for comparison, we can begin to disentangle theinfluence of the mass from the influence of the environment(central/satellite). Nonetheless, CGs and non−CGs still showdifferent M∗ distributions that are not perfectly matched (CGsare on average larger). To make further progress and deter-mine whether CGs are simply the tail of the general popula-tion, in the next section, we investigate the scaling relationsof these two populations.
4.1. Scaling relations4.1.1. Size-Stellar mass relation
We start by investigating the relation between Re and M∗,as shown in Fig. 6. Here we plot all the group CGs, regard-less of whether they have a measured velocity dispersion. Weemphasize that our goal here is a relative comparison betweenCGs and non−CGs and so we do not adopt any completenesscorrections, since completeness effects impact both popula-tions the same way.
The top plot uses values for Re and M∗ that are derived fromthe de Vaucouleurs profile fits. These single-component pro-files are known to fit a majority of early-types over a rangeof mass and redshift well (e.g., van der Wel et al. 2008). Asa result, and given our expectation that the majority of early-types are fit even better with multiple components, the de Vau-couleurs profile-based Re and M∗ estimates can be associatedwith an inner, “primary” component, which is mostly unaf-fected by the addition of an outer envelope. The size-massrelation using these estimates suggests a slightly larger andsomewhat asymmetric scatter for all−CGs, with a possibletendency for modest outliers with larger Re,deV at fixed M∗,deV ,especially towards higher masses.
The bottom-left plot in Figure 6 explores the relation de-rived for the double Sérsic fits. The assumption of this profileleads to greater sensitivity to any outer components. Whenwe construct the relation with Re,dSer and M∗,dSer, a more sub-stantial fraction of all−CGs than non−CGs appear to de-viate from the relation defined by the non−CGs and, in-deed, followed by the majority of all−CGs. Note that thestrongest outliers have M∗,dSer estimates 2–3 times larger thanthe masses estimated from the de Vaucouleurs profile, indicat-ing the significant amount of additional stellar material cap-tured by the 2-component fit.
Finally, the bottom-right panel compares Re,dSer to M∗,deV .In a very rough way, this relation attempts to highlight the ef-fect on total size of a potential outer component (as revealedby the double Sérsic fit) as a function of the mass of the pri-mary “inner” component (M∗,deV ). We now see the largestdeviation in the sizes of all−CGs at fixed stellar mass. Aplausible interpretation of these results is that a fraction ofCOSMOS group CGs—with a range in primary component

8 Vulcani et al.
FIG. 5.— de Vaucouleurs stellar mass, velocity dispersion and effective radius distributions for CGs (green lines) and non−CGs (black lines). In the mass andsize distribution panels we show the CG distribution both for the entire sample (dashed line) and for the subsample with a measured velocity dispersion (solidline).
TABLE 2SCALING RELATIONS
Y X sample free parameters fixed slopeSlope a Intercept b Scatter Slope a Intercept b
σ M?,deVCGs 0.28±0.07 -0.7±0.8 0.06±0.02 0.26 -0.51±0.01
non−CGs 0.26±0.04 -0.5±0.5 0.07±0.02 0.26 -0.51±0.09
Re,deV M?,deVall−CGs 0.6±0.1 -6±1 0.04±0.01 0.55 -5.46±0.03non−CGs 0.55±0.07 -5.5±0.8 0.023±0.005 0.55 -5.49±0.02
Re,dSer M?, dSer all−CGs 0.7±0.1 -7±1 0.1±0.1 0.51 -4.85±0.03non−CGs 0.51±0.09 -5±1 0.07±0.03 0.51 -4.94±0.02
Re,dSer M?,deVall−CGs 0.6±0.1 -6±1 0.16±0.02 0.65 -6.45±0.03non−CGs 0.65±0.07 -6.5 ±0.8 0.025±0.005 0.65 -6.51±0.02
Re,deV σCGs 0.2±0.4 0±1 0.05±0.01 0.05 0.70±0.03
non−CGs 0.1±0.2 0.5±0.5 0.04±0.01 0.05 0.50±0.02
Re,dSer σCGs 0.6±0.4 -1±1 0.06±0.02 0.43 -0.11±0.04
non−CGs 0.4±0.3 -0.4±0.6 0.06±0.01 0.43 -0.34±0.02
NOTE. — Fits are of the form logY = a logX +b with M? in units of M, σ in units of kms−1, Re in units of kpc.
stellar masses—have acquired outer components, which leadsto larger measured sizes, particularly for the more sensitivemulti-component models, and significantly larger total stellarmasses. The majority of all−CGs, however, remain on themass-size relation defined by non−CGs.
Recently, a bending in the size-luminosity relation has alsobeen pointed out by Bernardi et al. (2014). This work hasshown that galaxies with M∗ > 2×10¹¹M have larger sizesthan expected from a simple linear relation between size andtotal luminosity.
We fit lines to these correlations using the technique pro-posed by Kelly (2007), which employs a Bayesian frameworkto avoid biases introduced by inappropriate choices for theprior distributions of the independent variables. We also ac-count for the errors in both the dependent and independentvariables and allow for the intrinsic scatter. In addition, wehave tested for differences in the relations of the two pop-ulations by fixing the slope for all−CGs to be the same asnon−CGs and fitting the zero-points.
Table 2 reports our obtained fit parameters. When all theparameters are free, given the small dynamical range probed,fits are not well constrained, and all relations are in statis-tical agreement. Even after fixing the slope, when the deVaucouleurs profile is adopted to estimate sizes and masses(top and bottom-left panel), all−CGs and non−CGs are bestfit with relations that are in statistical agreement. In con-trast, when double Sérsic sizes are considered, all−CGs andnon−CGs are no longer statistically compatible. As men-tioned above, some of the difference in size between groupall−CGs and non−CGs might stem from the somewhat dif-
ferent M? ranges spanned by the two samples. To test this, weconsider only the range of overlap (logM?/M∼ 10.6-11.6)and perform 10,000 random draws of both populations. Withthis reduced dynamic range, we find that the parameters of theRe−M? relation are in agreement within 3σ−errors betweenthe two samples in 48.5± 0.5% of the extractions when thede Vaucouleurs profile is adopted, and in 29.1± 0.4% of theextractions when the double Sérsic profile is adopted. Despitethe fact that the majority of all−CGs follow the non−CG re-lation, this test reinforces the presence of fundamental differ-ences in the Re−M? between the two populations, even over afixed range in M∗. The statistical significance of these differ-ences is perhaps underestimated by inadequacies of the simplelinear fit we have adopted. It is not able to capture the behav-ior that can be seen visually in Figure 6, namely a deviationfrom a linear form driven by a modest fraction of all−CGs.
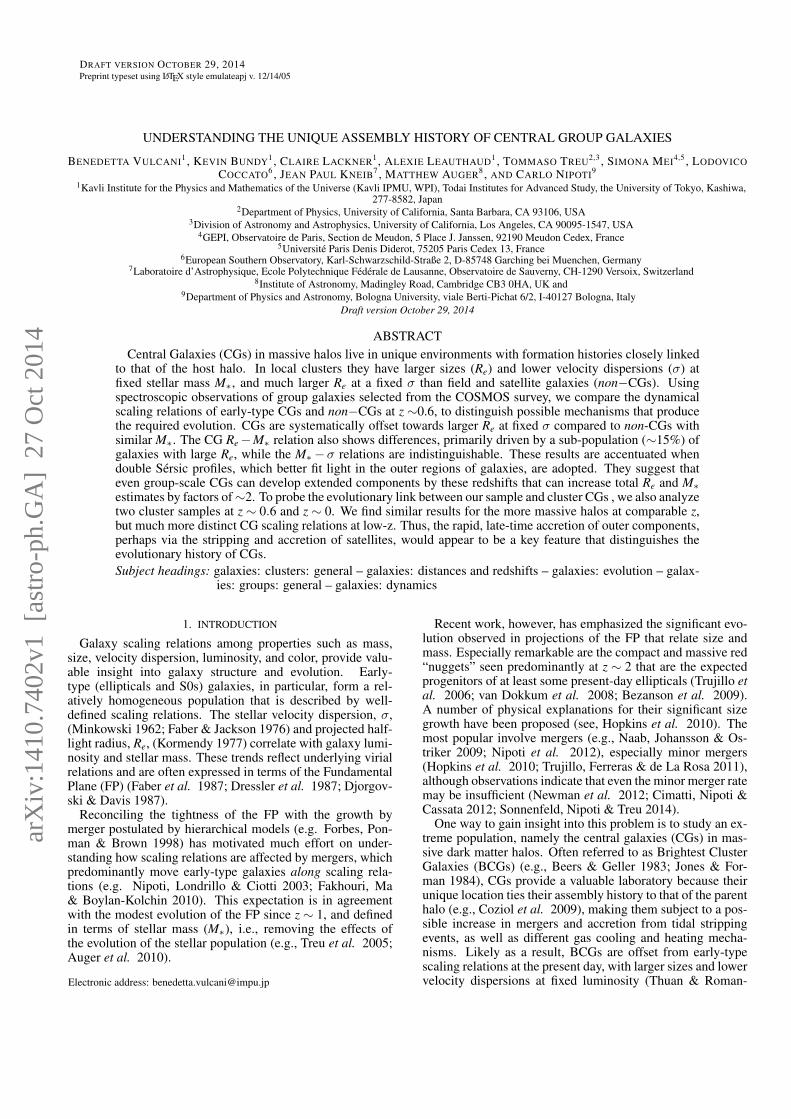
We wish to isolate this fraction of CGs with potentiallylarge outer components. We use the Re,dSer–M∗,deV relationin the bottom-right panel of Figure 6 to identify those galax-ies located at > 1σ from the average relation determined bycombining all−CGs and non−CGs together. A total of 23all−CGs are flagged as outliers, representing the 13% of thepopulation. In §6 we will examine whether this population ispeculiar in other ways. We note that there are two non−CGsthat are offset at high mass as well. We visually inspected thenon−CGs and found that they are really characterized by anouter envelope, probably the result of a recent merger. In onecase it is due to the presence of a close companion. Therefore,outer components might associated with non−CGs as well, orthere might be a mis-identification of some non−CGs which

Central Group galaxies assembly history 9
FIG. 6.— Re −M? relation for CGs (green circles) and non−CGs (black triangles) for the entire COSMOS sample. Solid lines are the linear fit to the relations,the green dashed line is the fit to the CGs when their slope is fixed to be the same as non−CGs. In the upper panel sizes have been measured adopting a deVaucouleurs profile, in the bottom panels with a double Sérsic profile (left: mass correction using the double Sérsic profile, right: mass correction using the deVaucouleurs profile). The typical errors are shown in the bottom left corner of each panel. In the inset, the 1-σ contour errors to the fits are given. In the upperpanel, the orange lines represent the linear (solid) and quadratic (dotted) fit as given in Hyde & Bernardi (2009) for a low-z sample of early type galaxies, the redlines represent the fits as given in Bernardi (2009) for CGs in the local universe, for two different CG samples, all fitted with a de Vaucouleurs profiles. In thebottom right panel, regions at > 1σ from the CG +non−CG relation have been marked in cyan (see text for details).
are actually CGs.In the case of the de Vaucouleurs quantities, we compare
our results to those presented in Hyde & Bernardi (2009) andBernardi (2009). The former considered early-type galax-ies in the local universe in all environments, while the lat-ter explored a sample of cluster CGs in the local universe.They both used the same size profile and IMF as we do.Hyde & Bernardi (2009) give both a linear fit and a quadraticone, Bernardi (2009) analyzed two slightly different clusterCG samples and probed a smaller mass range than we do(logM?/M∼11-12). Here we report all of their results. Wenote that these relations have been computed using circular-ized sizes, so they are not directly comparable to ours. In
any case they provide us with a baseline comparison to re-sults from the local Universe. We see that the Re,deV –M∗,deVrelation in COSMOS is compatible with the Hyde & Bernardi(2009) fits for early-type galaxies. In contrast, the fit deter-mined by Bernardi (2009) for local cluster CGs is steeper thanwhat we find here. This suggests evolution in the scaling re-lation (see also Trujillo et al. 2004; McIntosh et al. 2005),which we explore in more detail below.
4.1.2. Velocity dispersion- Stellar mass relation
Next, we examine the relation between stellar mass and ve-locity dispersion, shown in Figure 7. Of the three scalingrelation variables (Re, M∗, and σ), the velocity dispersion is

10 Vulcani et al.
FIG. 7.— σ−M? relation for CGs (green circles) and non−CGs (blacktriangles) for the spectroscopic COSMOS sample. Lines and symbols are asin the upper panel of Fig. 6.
likely the least sensitive to material in potential outer compo-nents because it is a luminosity-weighted quantity and there-fore dominated by the galaxy’s center. Furthermore, we haveapplied (minor) corrections to derive estimates for σ withinRe8 , making it further representative of just the center. Given
the results of the previous section, which demonstrated thesimilarity between CGs and non−CGs in observables moresensitive to the inner regions, we would therefore expect theσ–M∗ relation for CGs and non−CGs to be nearly identical.
Restricting our analysis to those galaxies with a measuredvelocity dispersion, Figure 7 shows the reult agrees with ourexpectations. The σ–M∗ relation is virtually independent ofthe profile adopted8 and so we show only the de Vaucouleurscase. COSMOS CGs and non−CGs are characterized by verysimilar relations, with CGs simply occupying the statisticalextreme of the general population.
Not surprisingly, the parameters of a linear fit to the σ−M? relation are in agreement within the errors for the twopopulations, both when slopes are free and when they arefixed. Parameters are also compatible with the relation ob-tained by Hyde & Bernardi (2009). Deviations might beobserved at low masses, but the number of galaxies withlogM?/M<10.8 is small in our sample. In contrast, the re-sults for cluster CGs presented in Bernardi (2009) are signifi-cantly different, indicating a potential flattening of the σ−M∗relation for CGs with time that we explore further below.
4.1.3. Size - Velocity dispersion relation
Finally, we turn to a comparison of sizes and velocity dis-persions, a scaling relation that relates an observable that canbe sensitive to an outer component (Re) to one that is expectedto be almost entirely defined by the inner regions (σ). Twoversions of this relation are shown in Figure 8. The left paneluses Re,deV and the right panel, Re,dSer. In both cases, we seemore scatter than in the previous relations, but also a much
8 The correction of the velocity dispersion to the standard central velocitydispersion depends only weakly on the effective radius (see §2.4.1)
larger separation between group CGs and non−CGs. At anygiven velocity dispersion, CGs are systematically larger thannon−CGs by a factor of∼1.5. When the double Sérsic profileis adopted, differences between CGs and non−CGs are evenmore striking with some CG outliers significantly above thenon−CG population. This result can be interpreted as a moreextreme version of the bottom-right panel of the size-massrelation (Figure 6) which compared Re,dSer to M∗,deV . Herewe expect σ to be even less affected than M∗,deV by light atlarge radii. Galaxies with significant outer components shouldtherefore be even more distinct in the Re,dSer–σ relation.
We note that when the de Vaucouleurs profile is consid-ered (left panel of Figure 8), the non−CG sample shows ahint of two separate trends, only one of which appears consis-tent with Hyde & Bernardi (2009). As shown in Fig. 9, thisdifference may be related to the star formation rate and mor-phology of our early-type sample. We see that galaxies withsomewhat lower Sérsic index (2.5 < n < 3.5), and ongoingstar formation have larger sizes than their counterparts withhigher n, and less star formation, at any given σ. This maybe because disks are typically more extended (larger) than el-lipticals (e.g., Shen et al. 2003) and therefore when a diskis present, even along with a substantial bulge, the total esti-mated size could increase. These two trends are barely visiblein the CG sample, likely because the CG sample is smaller andcontains fewer disk galaxies. When the sizes are derived fromthe double Sérsic fits, the two distinct trends in the non−CGsample disappears. This may be because the double Sérsicprofile better accounts for the central bulge and disk in themore disk dominated galaxies at low σ values, reducing theirtotal sizes as compared to the single de Vaucouleurs profile.
5. COMPARISONS TO HIGH- AND LOW-REDSHIFT CLUSTERS
In the previous section, we showed evidence that scalingrelations for CGs in COSMOS groups at z ∼ 0.6 differ com-pared to the results of Lauer et al. (2007) (who investigateda sample of 219 early-type galaxies which include the BCGsample described in Laine et al. 2003), and Bernardi (2009)for clusters in the local universe. Setting aside systematic dif-ferences between the samples and measurement techniques,two physical factors may be at play: the much larger halomasses of clusters and potential redshift evolution.
We now examine these possibilities by studying the scalingrelations obtained from two other samples: EDisCS, a sampleof clusters that matches the COSMOS sample in redshift butincludes much larger halos, and WINGS, a sample of clus-ters at z ≈ 0. The latter offers advantages over results fromSDSS because it is more similar in both selection and mea-surements to our COSMOS sample which allows us to applysimilar tests.
In what follows, we again stress that we can perform onlyrelative comparisons, within each sample, between CGs andnon−CGs. Systematics in sizes and masses, which are com-puted in different ways for different samples, as well as dif-ferent definition of CGs, prevent more quantiative and abso-lute comparisons. In addition, as discussed below, the ob-servations underpinning these samples have different surfacebrightness detection limits that, in principle, might affect theresults.
5.1. Halo mass dependenceWe first inspect the scaling relations obtained using the
z ∼ 0.6 EDisCS sample. It is important to remember thatthe COSMOS groups are representative of structures as mas-

Central Group galaxies assembly history 11
FIG. 8.— Re −σ relation for CGs (green circles) and non−CGs (black triangles) for the spectroscopic COSMOS sample. Lines and symbols are as Fig. 6.
TABLE 3SCALING RELATIONS IN CLUSTERS
EDisCS
Y X sample free parameters fixed slopeSlope a Intercept b Scatter Slope a Intercept b
σ M?CGs 0.3±0.2 -1±3 0.005±0.003 0.18 0.34±0.02
non-CGs 0.18±0.03 0.3±0.3 0.010±0.001 0.18 0.332±0.007
Re,deV+disk M?CGs 0.7±0.4 -7±5 0.02±0.01 0.70 -6.88±0.03
non-CGs 0.70±0.08 -7.0±0.9 0.12±0.01 0.70 -7.06±0.02
Re,deV+disk σCGs 1.0±0.5 -1±1 0.02±0.01 0.6 -0.23±0.03
non-CGs 0.6±0.2 -0.8±0.6 0.15±0.01 0.6 -0.74±0.02
WINGS
Y X sample free parameters fixed slopeSlope a Intercept b Scatter Slope a Intercept b
σ M?,SerCGs 0.5±0.3 -3±3 0.003±0.002 0.38 -1.97±0.02
non-CGs 0.38±0.01 -1.8±0.1 0.0062±0.0004 0.38 -1.784±0.002
Re,ser M?,SerCGs – – – 0.68 -6.41±0.05
non-CGs 0.68±0.02 -6.7±0.3 0.030±0.002 0.68 -6.701±0.005
Re,ser σCGs 1.0±0.4 -1±1 0.06±0.01 0.59 0.04±0.03
non-CGs 0.59±0.04 -0.9±0.1 0.060±0.002 0.59 -0.823±0.006
NOTE. — Fits are of the form logY = a logX +b with M? in units of M, σ in units of kms−1, Re in units of kpc.
sive as Mhalo ∼ 1014 M, while EDisCS clusters extend up toMhalo ∼ 1015.2 M (see also §6).
Recall that for the EDisCS clusters we do not have detailedinformation on the profile fitting, so we cannot reference M∗values to specific profile choices. We consider all galaxies inthe sample, but when fitting EDisCS scaling relations, we takeinto account only galaxies above the mass completeness limitof logM?/M∼ 10.5 (Vulcani et al. 2011).
The left panel of Figure 10 presents the size-mass relationsfor both non−CGs and the CGs in these z ∼ 0.6 clusters.Combining non-CG satellites and field galaxies together,9 fewdifferences are detected compared to cluster CGs. As in theCOSMOS sample, CGs have larger sizes for a given stellar
9 We have not detected any environmental dependence in the relations (inagreement with Maltby et al. 2010; Rettura et al. 2010 at similar and higherredshift. See also Kelkar et al. submitted), so, to improve the statistics, weconsider cluster satellites and field galaxies together.
mass (of a factor 1.2), but differences are marginally statisti-cally significant (Tab. 3). We warn the reader that differencesin size might be triggered by the fact that in the EDisCS sam-ple CGs and non−CGs have different mass distributions. NoCG population with extremely large sizes is apparent, but wecaution that the EDisCS CG sample is small.
Moving to the σ−M∗ relation, the central panel in Fig. 10shows that cluster CGs and non−CGs have similar velocitydispersions. As we saw in COSMOS, we find no difference inthe σ−M∗ relations for CGs in more massive halos. Linearfits are in agreement within the errors, both when all parame-ters are free and when a fixed slope is adopted (Tab. 3).
However, again mirroring results from the COSMOSgroups, we find that cluster CGs do stand out from non-CGsin the Re−σ relation (right panel in Fig. 10): CGs are sys-tematically offset high, by a factor of 3, and the parameters ofthe fits are significantly different.

12 Vulcani et al.
FIG. 9.— Re −σ relation for non−CGs, when sizes are measured adoptinga de Vaucouleurs profile. Star forming and quenched (upper panel), high andlow n (bottom panel) galaxies are shown separately. The typical errors areshown in the bottom left corner of each panel.
Despite the generally larger scatter in the EDisCS scalingrelations (perhaps an indication that the EDisCS sample is lesshomogenous or subject to larger measurement uncertainties),the larger halo masses do not seem to result in a CG popu-lation that is more distinct from non−CGs compared to whatwe find at group-mass scales. If anything, there may be lessevidence in this small sample for the type of outliers in size atfixed mass or σ that seem characteristic of the COSMOS CGsample.
This is consistent with previous studies of the mass-size re-lation in the same COSMOS groups (Huertas-Company et al.2013), and as compared to high redshift clusters in (Delaye
et al. 2014). These works also do not show a significant de-pendence of the mass-size relation on halo mass.
5.2. Redshift dependenceHaving found little evidence for stronger offsets in CG
properties as a function of halo mass, we now turn to the scal-ing relations for the z=0 cluster sample from WINGS (Figure11) to evaluate the potential impact of redshift evolution.
Recall that we apply corrections to the stellar masses givenin Vulcani et al. (2011) similar to those for the COSMOSgalaxies, to reference the M∗ estimates to adopted single-Sérsic surface brightness profiles. We consider only galaxiesabove the mass completeness limit of logM?/M∼9.8.
Unlike the higher redshift EDisCS clusters, Fig. 11 showshow CGs in z = 0 clusters strongly deviate from non-CGs in
all scaling relations. At fixed velocity dispersion, for exam-ple, CGs have larger masses (by a factor of ∼ 3) and largersizes10 (by a factor of 7) compared to non−CGs (left and cen-tral panels of Fig. 11 respectively). The consequence is a CGRe−σ relation that is completely offset with respect to the onefor the non-CGs (right panel of Fig. 11). The relations of thetwo populations are statistically different at high significance.We note that we could not find a meaningful fit for CGs in theRe−M? relation without fixing the slope. The parameters ofthe fits are given in Table 3.
Also different from the COSMOS or EDisCS samples athigher redshift, the M∗ distribution of WINGS CGs is remark-ably distinct: a gap between CGs and non−CGs is apparent(above all in the Re −M? relation), suggesting that galax-ies slightly less massive than the CGs have merged or beenstripped.
These results recall those presented in Valentinuzzi et al.(2010), who found that the mean size and mass of CGs
have respectively increased by factors of ∼4 and ∼2 betweenz∼0.6 (EDisCS) and z∼0.04 (WINGS).
These findings reinforce the results of Lauer et al. (2007)and Bernardi (2009). Taken at face value, because the WINGSCGs are substantially offset in all of the scaling relations, andbecause more information about the multi-component natureof the light profiles is not available, it is difficult to interpretFigure 11 in the context of structural changes affecting the“primary” inner regions of the CGs versus the potential addi-tion of outer regions. However, as we discuss further in §6,the earlier snapshot provided by the COSMOS (and EDisCS)sample, strongly suggests the growth of outer components.These components would increase the total M∗ and Re butleave σ relatively unchanged, thus explaining the scaling re-lations observed at z≈ 0. An important consideration that weexamine below, however, is whether the appearance of theseouter components at low redshift may be an observational ef-fect owing to the deeper intrinsic luminosity densities that canbe probed in nearby studies.
5.3. Surface brightness considerations for intra-samplecomparisons
In the previous sections we found that in clusters and groupsat intermediate redshift, at a fixed stellar mass, CGs often havelarger sizes than non-CGs, but very similar velocity disper-sions. As a result, CGs and non−CGs are particularly well-separated in the size-velocity dispersion plane. In contrast,in local clusters, all CG scaling relations are offset comparedto non-CGs. Could the more extreme behavior at low-z becaused by the fact that the low-density outskirts are easier todetect in nearby systems?
First, we stress that in the different samples, sizes have beenmeasured adopting different profiles, hence quantitative intra-sample comparisons will likely be affected by systematic dif-ferences. In our COSMOS sample, size estimates obtainedassuming different profiles typically vary by 20%. Therefore,we can only qualitatively contrast the observed trends.
Next we make an appraisal of the imaging data used inthe low-z WINGS sample compared to the higher redshiftEDisCS and COSMOS samples. At z ≈ 0, shallower ob-servations should more easily detect material with the samephysical projected luminosity density. For the different sam-
10 We note that if we had not applied a mass correction relevant for the Sér-sic profiles adopted, discrepancies between the two samples would be evenlarger.

Central Group galaxies assembly history 13
FIG. 10.— Scaling relations for CGs (green circles) and non-CGs (black triangles) galaxies in clusters at z ∼ 0.6, drawn from the EDisCS clusters. Solid linesare the linear fit to the relations, the green dotted line is the fit to the CGs when their slope is fixed to be the same as non-CGs. The typical errors are shown in thebottom left corner of each panel. In the insets, the 1-σ contour errors to the fits are given. Left panel: Re −M? relation. Central panel: σ−M? relation. Rightpanel: Re −σ relation.
FIG. 11.— Scaling relations for CGs (green circles) and non-CGs (black triangles) galaxies in clusters at z ∼ 0, drawn from the WINGS clusters. Solid linesare the linear fit to the relations, the green dotted line is the fit to the CGs when their slope is fixed to be the same as non-CGs. The typical errors are shown in thebottom left corner of each panel. In the insets, the 1-σ contour errors to the fits are given. Left panel: Re −M? relation. Central panel: σ−M? relation. Rightpanel: Re −σ relation.
ples, we convert the reported surface brightness limits frommag/arcsec2 to L/kpc2. In WINGS the surface bright-ness limit was computed setting the detection threshold to4.5σbg/arcsec2 (see §3). This limit translates to a detectionlimit of µT hreshold(V ) ∼ 25.7mag/arcsec2 and corresponds to∼ 2.22× 10⁶L/kpc2 at z = 0.05. In COSMOS the sur-face brightness limit is computed adopting a similar detectionthreshold as in WINGS. This limit translates to a detectionlimit of µT hreshold(I) ∼ 26.4mag/arcsec2 and corresponds to∼ 2.11× 10⁶L/kpc2 and ∼ 5.82× 10⁶L/kpc2 at z = 0.4and z = 0.8 respectively. Given the similarity of EDisCS andCOSMOS HST observations, we can adopt the same thresh-olds for those two samples. This means that at least up toz ∼ 0.6 we would expect to detect potential outer envelopesdown to the same physical projected density in all three datasets.
We note that Martizzi, Teyssier & Moore (2014) showedthat a limit in surface brightness of µ(V ) ∼ 25mag/arcsec2
(slightly shallower than that of the WINGS sample), is suffi-cient for detection of only 10-60% of the toal CG mass, whilea 2 magnitude deeper limit would allow for detection of 40-80% of the total CG+envelope mass. Therefore, in all thedatasets, we may be missing most of the mass related to the
envelopes. This entails that our measured sizes are actuallylower limits of the actual sizes of the objects. In addition, thisis probably affecting more the lower-mass galaxies, thereforemost likely the non−CGs.
Next, we consider a relative comparison. Assuming that thescale of the outskirts is similar in galaxies of all luminosities,we wish to test whether, for any galaxy, we are able to de-tect the same dynamic range in surface luminosity density forall data sets. Using the mean sizes and luminosities for eachsample, we find that the ratio of the peak average CG sur-face brightness compared to the limiting surface brightness issimilar in the EDisCS and WINGS samples, while it is morethan an order of magnitude smaller in COSMOS, owing tothe fact that CGs in the COSMOS groups are roughly an or-der of magnitude less luminous. This means that low surfacebrightness components contributing the same relative fractionof luminosity to the primary component are intrinsically moredifficult to detect in the COSMOS group sample. Our utiliza-tion of single and 2-component profiles in §4 helps overcomethis limitation.
6. DISCUSSION
The main aim of this paper has been to carefully study thedynamical and structural properties of a sample of CG galax-

14 Vulcani et al.
ies in groups at intermediate redshift. By comparing CG prop-erties to those of non−CGs and tracking potential evolution,we seek to test theoretical explanations for the greater off-sets for cluster CGs at z ≈ 0 than at z ∼ 0.6. We have fo-cused on distinguishing between two types of mechanisms,both enhanced by the unique location of CGs: 1) Violent pro-cesses (e.g., radial mergers) that drive deep structural changes(Boylan-Kolchin, Ma & Quataert 2006) and 2) Smooth stellaraccretion at large radii, as motivated by deep observations ofthe multi-component nature of early-type galaxies (e.g., Dullo& Graham 2012 and references therein). Both types of pro-cesses may be operating at lower levels in early-type galax-ies generally, and offer different explanations for the moregeneric size growth observed since z∼ 2 (e.g., Trujillo et al.2006; van Dokkum et al. 2008).
Detecting and quantifying the size and mass of potentialouter envelopes is a very delicate task. Indeed, observationshave to be deep enough to detect an excess of light in the pro-file at large distances from the center and often these regionsare contaminated by the presence of other galaxies or con-fused with the sky. In addition, the choice of the profile to fitgalaxies strongly influences the possibility of detecting suchenvelopes. Even when a double profile is adopted, it is not al-ways easy to understand whether the outer component is rep-resentative of the external regions or of material not boundedto the galaxy.
We have argued that the velocity dispersion is linked al-most exclusively to the inner component of galaxies and notaffected by their outskirts. Its value might be set early on,when the galaxy first assembled, and not influenced by eventsoccurring in the outer parts. Size estimates track the innercomponent as well, but are also sensitive to an outer compo-nent. While σ does not depend on the choice of the profile,size does. As for masses, that scaled to the double Sérsic pro-file is an attempt to get information on the entire galaxy, whilethat scaled to the de Vaucouleurs profile is a rough attempt toincrease sensitivity to the inner component, alone.
In our analysis, we detected differences between CGs andnon−CGs in groups at intermediate redshift, in the scaling re-lations involving size, stellar mass, and velocity dispersion.Group CGs at z ∼ 0.6 are systematically more massive withsystematically higher velocity dispersions than their non−CGcounterparts. However, the σ−M? relations are very similar.In contrast, scaling relations that involve the size of the galax-ies are quite different for the two populations. Even thoughresults depend on the profile adopted, for M ≥ 1011M thereare clear signs for a sub-population of CGs whose propertiesdeviate from the normal trends. Discrepancies are strongestwhen the size estimates we believe are most sensitive to outercomponents (double Sérsic) are plotted as a function of σ, theobservable most sensitive to the inner regions.
Investigating galaxies in clusters at similar redshift, we ob-tain qualitatively similar results.11 We find that the discrep-ancy in Re between CGs and non−CGs is∼1.5 times larger inclusters than in groups, despite the current lack of evidence fora significant population of cluster CG outliers at intermediateredshift, a possible selection effect. The relative similarity be-tween our group-scale results and those for clusters at similarredshifts, suggests that halo mass plays only a marginal role ininfluencing scaling relations, a topic we return to below. Con-firmation would require a profile analysis on a larger sample
11 Once a common slope has been adopted, the σ−M? relations obtainedfor EDisCS and COSMOS are in agreement within the uncertainties.
of intermediate-z cluster CGs with similar sensitivity to outercomponents as in our COSMOS analysis.
In local clusters, discrepancies are more pronounced: allscaling relations are different for CGs and non-CGs, suggest-ing that from z∼ 0.6 to z∼ 0 processes that impact either oneor all galaxy properties are occurring in a way that affectssize, mass and velocity dispersion differently. In addition,there might be a dependence of mass and size growth on halomass: Vulcani et al. (2014) found that the relation betweenthe stellar mass of the CG and the velocity dispersion of itshost cluster (which is proportional to the halo mass) is steeperin WINGS than in EDisCS. Similarly, we find hints that thesize-halo mass relation is steeper in WINGS than in EDisCS.These findings suggest a faster evolution in both stellar massand size for central galaxies located in more massive haloes.
Taken together, these results favor a scenario in which theprimary component of the central galaxies (i.e. velocity dis-persions) evolves little, but outer envelopes are accreted overtime, and relatively rapidly from z ∼ 0.6 to z ∼ 0 (see alsoValentinuzzi et al. 2010). From the similarity of the σ−M?
relation for CGs and non−CGs at intermediate redshift, itseems that the early phase of formation of the two popula-tions was analogous, and that CGs differentiate only at laterepochs. The new material accreted at large radius puffs upthe galaxy without increasing its velocity dispersion and withonly a modest increase in M∗. However, as witnessed by thesnapshot provided by the COSMOS sample, not all CGs buildthese envelopes at the same rate. We also note that non−CGsin all samples show little evolution in dynamical scaling re-lations (see also Saglia et al. 2010), although there is in-triguing evidence for a growing mass “gap” between satellitenon−CGs and the CG.
Before discussing the possible mechanisms responsible forthe observed growth, we focus on the properties of the groupCGs with larger sizes as a proxy for the presence of such en-velopes and to see whether these CGs are unique in terms oftheir halo and satellite populations.
6.1. Indicators of candidate envelopesWe select as outliers those galaxies that deviate by more
than 1 standard deviation from the general Re,dSer−M?,deV re-lation when a double Sérsic size and de Vaucouleurs stellarmass are adopted (see Fig. 6). With the hosts of candidate en-velopes defined, we look for correlations with halo and satel-lite properties.
Figure 12 shows the double Sérsic Re−M200c (upper panel)and the de Vaucouleurs M∗−M200c (lower panel) relations forall CGs in the COSMOS group sample. CGs with larger sizes,and hence most likely to have envelopes, are preferentiallyfound in the most massive haloes (logM200c > 13.4). How-ever, not all massive haloes host CGs characterized by a largeRe. In the bottom panel, we see that CGs with large envelopesare distributed across all M∗ as a function of M200c. As be-fore, CG with a possible presence of an outer component donot stand out.
There is a hint, however, that envelopes may be preferen-tially found around CGs with less ongoing star formation.Exploiting the quenching parameter described in Bundy etal. (2010) and in §2.2, we find that 80±10% of CGs withcandidate envelopes are quenched, while only 67±6% arequenched among CGs that lie on the standard Re–M∗ rela-tion. Probably due to our small sample statistics, percentagesare not statistically different, but there might be a hint that thepresence of an envelope induces quenching.
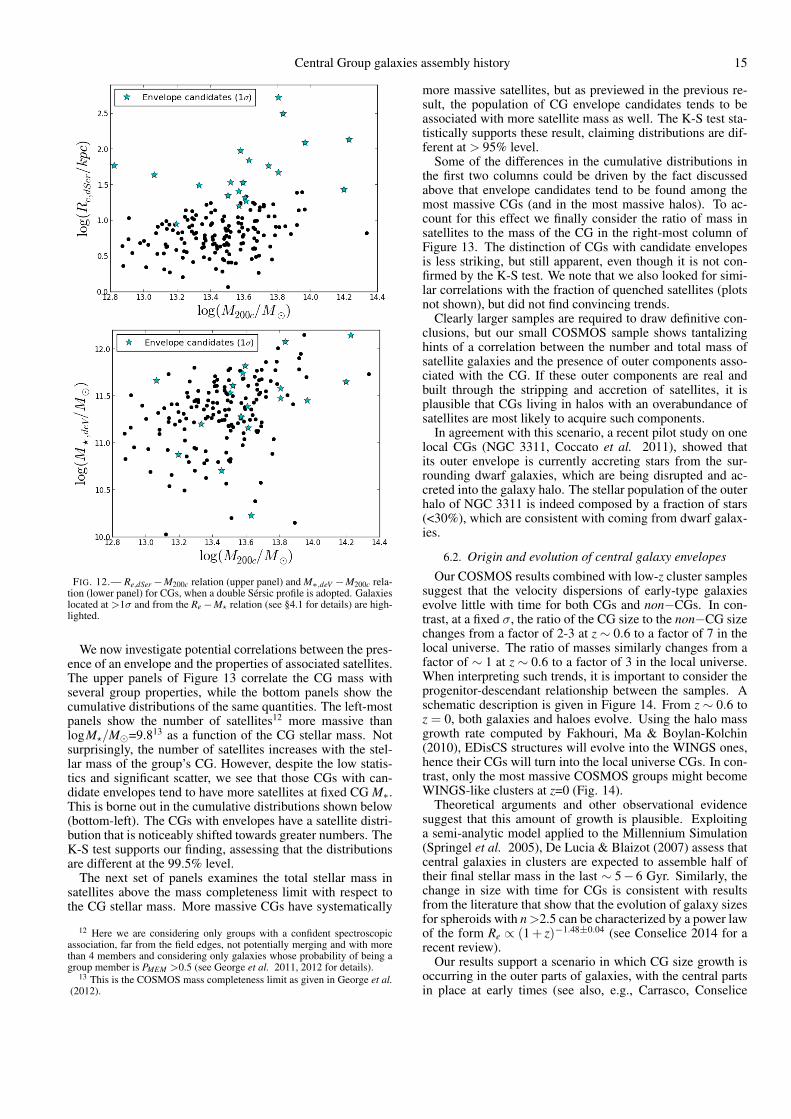
Central Group galaxies assembly history 15
FIG. 12.— Re,dSer −M200c relation (upper panel) and M∗,deV −M200c rela-tion (lower panel) for CGs, when a double Sérsic profile is adopted. Galaxieslocated at >1σ and from the Re −M? relation (see §4.1 for details) are high-lighted.
We now investigate potential correlations between the pres-ence of an envelope and the properties of associated satellites.The upper panels of Figure 13 correlate the CG mass withseveral group properties, while the bottom panels show thecumulative distributions of the same quantities. The left-mostpanels show the number of satellites12 more massive thanlogM?/M=9.813 as a function of the CG stellar mass. Notsurprisingly, the number of satellites increases with the stel-lar mass of the group’s CG. However, despite the low statis-tics and significant scatter, we see that those CGs with can-didate envelopes tend to have more satellites at fixed CG M∗.This is borne out in the cumulative distributions shown below(bottom-left). The CGs with envelopes have a satellite distri-bution that is noticeably shifted towards greater numbers. TheK-S test supports our finding, assessing that the distributionsare different at the 99.5% level.
The next set of panels examines the total stellar mass insatellites above the mass completeness limit with respect tothe CG stellar mass. More massive CGs have systematically
12 Here we are considering only groups with a confident spectroscopicassociation, far from the field edges, not potentially merging and with morethan 4 members and considering only galaxies whose probability of being agroup member is PMEM >0.5 (see George et al. 2011, 2012 for details).
13 This is the COSMOS mass completeness limit as given in George et al.(2012).
more massive satellites, but as previewed in the previous re-sult, the population of CG envelope candidates tends to beassociated with more satellite mass as well. The K-S test sta-tistically supports these result, claiming distributions are dif-ferent at > 95% level.
Some of the differences in the cumulative distributions inthe first two columns could be driven by the fact discussedabove that envelope candidates tend to be found among themost massive CGs (and in the most massive halos). To ac-count for this effect we finally consider the ratio of mass insatellites to the mass of the CG in the right-most column ofFigure 13. The distinction of CGs with candidate envelopesis less striking, but still apparent, even though it is not con-firmed by the K-S test. We note that we also looked for simi-lar correlations with the fraction of quenched satellites (plotsnot shown), but did not find convincing trends.
Clearly larger samples are required to draw definitive con-clusions, but our small COSMOS sample shows tantalizinghints of a correlation between the number and total mass ofsatellite galaxies and the presence of outer components asso-ciated with the CG. If these outer components are real andbuilt through the stripping and accretion of satellites, it isplausible that CGs living in halos with an overabundance ofsatellites are most likely to acquire such components.
In agreement with this scenario, a recent pilot study on onelocal CGs (NGC 3311, Coccato et al. 2011), showed thatits outer envelope is currently accreting stars from the sur-rounding dwarf galaxies, which are being disrupted and ac-creted into the galaxy halo. The stellar population of the outerhalo of NGC 3311 is indeed composed by a fraction of stars(<30%), which are consistent with coming from dwarf galax-ies.
6.2. Origin and evolution of central galaxy envelopesOur COSMOS results combined with low-z cluster samples
suggest that the velocity dispersions of early-type galaxiesevolve little with time for both CGs and non−CGs. In con-trast, at a fixed σ, the ratio of the CG size to the non−CG sizechanges from a factor of 2-3 at z ∼ 0.6 to a factor of 7 in thelocal universe. The ratio of masses similarly changes from afactor of ∼ 1 at z ∼ 0.6 to a factor of 3 in the local universe.When interpreting such trends, it is important to consider theprogenitor-descendant relationship between the samples. Aschematic description is given in Figure 14. From z ∼ 0.6 toz = 0, both galaxies and haloes evolve. Using the halo massgrowth rate computed by Fakhouri, Ma & Boylan-Kolchin(2010), EDisCS structures will evolve into the WINGS ones,hence their CGs will turn into the local universe CGs. In con-trast, only the most massive COSMOS groups might becomeWINGS-like clusters at z=0 (Fig. 14).
Theoretical arguments and other observational evidencesuggest that this amount of growth is plausible. Exploitinga semi-analytic model applied to the Millennium Simulation(Springel et al. 2005), De Lucia & Blaizot (2007) assess thatcentral galaxies in clusters are expected to assemble half oftheir final stellar mass in the last ∼ 5− 6 Gyr. Similarly, thechange in size with time for CGs is consistent with resultsfrom the literature that show that the evolution of galaxy sizesfor spheroids with n>2.5 can be characterized by a power lawof the form Re ∝ (1 + z)−1.48±0.04 (see Conselice 2014 for arecent review).
Our results support a scenario in which CG size growth isoccurring in the outer parts of galaxies, with the central partsin place at early times (see also, e.g., Carrasco, Conselice

16 Vulcani et al.
FIG. 13.— Group satellite properties as a function of the CG mass. Upper panels: number of satellites (left), total mass in satellites (central) and total massin satellites divided by the mass of the CG. In the central panel, dotted line indicates the 1:1 relation. Bottom panels: Cumulative distributions of the samequantities. Galaxies located at >1σ from the Re −M? relation (see §4.1 for details) are highlighted.
& Trujillo 2010; van Dokkum et al. 2010). This indicatesthat the build up of massive galaxies is an inside-out process(e.g., Hopkins et al. 2009). While this scenario may applyto both central and satellites galaxies, our results suggest itis enhanced in CGs in all environments. The massive CG atthe center of the halo’s potential well, may not only have ahigher probability to be a site for interactions, but surely ex-erts greater tidal forces, which can distort nearby companionsand bring galaxies down to the bottom of the potential well.
Mergers are a primary channel for high-mass galaxygrowth, and minor mergers in particular have been invokedto explain size evolution (e.g. Naab, Johansson & Ostriker2009; Shankar, Weinberg & Miralda-Escudé 2013; Shankaret al. 2014. They can also induce low levels of star forma-tion in early-types at z∼0.8, as well as add significant amountof stellar mass to these galaxies (Kaviraj et al. 2011, 2009)(but see Sonnenfeld, Nipoti & Treu 2014 who suggest thatthe outer regions of massive early types grow by accretion ofstars and dark matter, while small amounts of dissipation andnuclear star formation conspire to keep the mass density pro-file constant and approximately isothermal). However, thereis currently some controversy over whether the observed mi-nor merger rate at z < 1 is high enough to provide the re-quired increase in sizes, with the most massive galaxies withM? > 1011M appearing to have enough minor mergers (e.g.,Kaviraj et al. 2009) to produce this size evolution (Bluck etal. 2012; Poggianti et al. 2013), while this may not be thecase for lower mass systems (e.g., Newman et al. 2012).
Some further insight may be gained by comparing our re-sults to evolutionary predictions from the model describedin Nipoti et al. (2012). They estimated the merger-drivenredshift evolution of the scaling relations considered here for
FIG. 14.— Mass halo evolution of COSMOS groups and EDisCS clusterform z ∼ 0.6 to z ∼0, compared to the WINGS mass range.
typical massive early-type galaxies. They neglected dissipa-tive processes, and thus maximized the evolution in surfacedensity, under the assumption that the accreted satellites arespheroids.
We stress that this comparison is a simplification in manyaspects: indeed, the prescription gives an average growth,without taking into account stochastic events that can makeeach galaxy grow differently. Moreover, it adopts one-to-onemapping between halo and stellar mass with no scatter.
With these caveats in mind, we use the expected mass evo-lution of halos from z ∼ 0.6, to z ∼ 0 to infer the evolutionof the stellar mass for each CG in the COSMOS and EDisCS

Central Group galaxies assembly history 17
samples in the same redshift interval, using the Mhalo−M∗relation at z ∼ 0.3 and z ∼ 0.5 found by Leauthaud et al.(2012). We then obtain the expected evolution in size and ve-locity dispersion given the evolution in stellar mass. Compar-ing the scaling relations obtained by evolving CG propertiesto the scaling relations obtained for the WINGS cluster CGswe find that, in all the cases, the predicted evolution reducesthe discrepancies between the high and low-z samples: therelative increase is greater for the sizes than for masses, andvelocity dispersions show only a small decrease. Very broadlyspeaking, the formalism of Nipoti et al. (2012) yields pre-dictions that are consistent with the evolution inferred here.A more quantitative comparison with an improved version ofthis model will be the subject of future work. It will also bevaluable to compare results from hydrodynamic simulations(e.g., Feldmann et al. 2010; Naab et al. 2013).
7. CONCLUSIONS
Utilizing followup VLT spectroscopy of COSMOS X-raygroups (George et al. 2011, 2012), we have studied the dy-namical scaling relations of central and satellite galaxy pop-ulations in the previously unexplored regime of intermediateredshift (z ∼ 0.6) and group-scale dark matter halos (Mhalo ∼1013M). This regime is important for disentangling the roleof mass and evolution among proposed mechanisms that at-tempt to explain offsets in the properties of z ≈ 0 “BCGs” ascompared to cluster and field early-type galaxies.
Our analysis and our main results can be summarized asfollows:
• Mindful of strong evidence for the multi-component na-ture of early-type surface-brightness profiles, we con-struct Re and M∗ estimators that differ in their sensitiv-ity to light at large radii (adopting a de Vaucouleurs anddouble Sérsic profiles).
• We use these Re and M∗ estimators in combination withσ to examine scaling relations that reveal evidence forouter envelope components preferentially found amongroughly 1
7 of the CGs (central galaxies) in our COS-MOS sample.
• We find that the CGs with candidate envelopes tend tohave larger M∗ and live in more massive halos. We alsofind tantalizing evidence that the presence of an enve-lope is correlated with an overabundance of satellites atfixed CG M∗ and is more likely around quenched CGs,although larger samples are needed to confirm theseconclusions.
• We perform a relative comparison of the scaling rela-tions of CGs and non−CGs in clusters at similar red-shifts (from EDisCS) and at z ≈ 0 (from WINGS).The smaller sample of EDisCS CGs shows a somewhatlarger average offset in Re compared to non−CGs, butno evidence for the more extreme CG outliers foundin COSMOS, perhaps because the applied size estima-tor is not as sensitive to outer components. Thus, the
dependence of CG properties on Mhalo at fixed redshiftappears to be mild. The CGs in WINGS clusters, on theother hand, are more drastically offset in all scaling re-lations, in agreement with other samples and work fromSDSS.
Taken together, these results favor a scenario in whichthe CGs in groups and clusters rapidly accrete outer compo-nents, a process that is already underway by z∼ 0.6 (see alsoValentinuzzi et al. 2010). Assuming this process eventuallyeffects all massive CGs, the increases in mass and size causedby this accreted material appear to be sufficient to explain theoffsets in CG scaling relations by z≈ 0. Meanwhile, the cen-tral velocity dispersion of CGs appears to evolve mildly if atall. In line with many other arguments (e.g., Hopkins et al.2010; Greene et al. 2013; Pérez et al. 2013), this inside-outgrowth, in which a primary inner component forms early, withfurther material deposited in the outskirts at late times, maynot require violent episodes of radial major mergers (Boylan-Kolchin, Ma & Quataert 2006) that alter the CGs’ core struc-ture.
It remains to be seen whether the rate of merging, tidaldisruption, and accretion is sufficient to explain the inferredgrowth of envelopes (e.g., Newman et al. 2012), although ourinitial comparison to the prescription of Nipoti et al. (2012) ispromising. It will also be important to quantify the evolution-ary trends inferred here with large, uniform samples that spanlarger ranges in both Mhalo and redshift. Finally, a key limita-tion is the inability to obtain robust multi-component fits thatcorrespond to true physical components. An accurate estima-tor of the mass in the proposed envelope component wouldbe very valuable, although this challenge is surely coupled toour understanding of the ICL. Recently, Montes & Trujillo(2014) showed that the origin of the ICL is similar to thatof the outskirts of galaxies. The two components can onlybe distinguish dynamically (e.g. Longobardi et al. 2013).In the future, spectroscopic measures may provide a meansforward if outer components can be distinguished chemically(e.g., Greene et al. 2013). Large IFU surveys like the upcom-ing MaNGA (Mapping Nearby Galaxies at Apache Point Ob-servatory, Bundy et al. 2014) might then enable more robustdecompositions that could be used to improve profile-fittingtechniques.
We acknowledge the referee for her/his useful comments.We thank A. Moretti and the WINGS team for providingus their data. This work was supported by the World Pre-mier International Research Center Initiative (WPI), MEXT,Japan. BV was also supported by the Kakenhi Grant-in-Aidfor Young Scientists (B)(26870140) from the Japan Societyfor the Promotion of Science (JSPS). TT gratefully acknowl-edges support from the Packard Fellowship in the form of aPackard Fellowship.
REFERENCES
Appenzeller, I. et al. 1998, The Messenger, 94, 1.Aragon-Salamanca, A. et al. 1993, MNRAS, 262, 764.Auger, M. W. et al. 2010, ApJ, 724, 511.Beers, T. C. and Geller, M. J. 1983, ApJ, 274, 491.Bell, E. F. and de Jong, R. S. 2001, ApJ, 550, 212.
Bernardi, M. 2009, MNRAS, 395, 1491.Bernardi, M. et al. 2013, MNRAS, 436, 697.Bernardi, M. et al. 2014, MNRAS, 443, 874.Bernardi, M. et al. 2003, AJ, 125, 1866.Bertin, E. and Arnouts, S. 1996, A&AS, 117, 393.
18 Vulcani et al.
Bezanson, R. et al. 2009, ApJ, 697, 1290.Bluck, A. F. L. et al. 2012, ApJ, 747, 34.Boylan-Kolchin, M., Ma, C.-P., and Quataert, E. 2006, MNRAS, 369, 1081.Brunner, R. J. and Lubin, L. M. 2000, AJ, 120, 2851.Bruzual, G. and Charlot, S. 2003, MNRAS, 344, 1000.Bundy, K. et al. 2006, ApJ, 651, 120.Bundy, K. et al. 2010, ApJ, 719, 1969.Caon, N., Capaccioli, M., and D’Onofrio, M. 1993, MNRAS, 265, 1013.Cappellari, M. and Emsellem, E. 2004, PASP, 116, 138.Carrasco, E. R., Conselice, C. J., and Trujillo, I. 2010, MNRAS, 405, 2253.Chabrier, G. 2003, PASP, 115, 763.Cimatti, A., Nipoti, C., and Cassata, P. 2012, MNRAS, 422, L62.Clowe, D. et al. 2006, A&A, 451, 395.Coccato, L., Gerhard, O., and Arnaboldi, M. 2010, MNRAS, 407, L26.Coccato, L. et al. 2011, A&A, 533, A138.Conselice, C. J. 2014, ArXiv e-prints.Coziol, R. et al. 2009, AJ, 137, 4795.Cui, W. et al. 2014, MNRAS, 437, 816.de Jong, R. S. and Bell, E. F. 2007. Comparing Dynamical and Stellar
Population Mass-To-Light Ratio Estimates, 107.De Lucia, G. and Blaizot, J. 2007, MNRAS, 375, 2.De Lucia, G. et al. 2004, ApJ, 610, L77.De Lucia, G. et al. 2007, MNRAS, 374, 809.Delaye, L. et al. 2014, MNRAS, 441, 203.Desai, V. et al. 2007, ApJ, 660, 1151.Dhar, B. K. and Williams, L. L. R. 2010, MNRAS, 405, 340.Djorgovski, S. and Davis, M. 1987, ApJ, 313, 59.D’Onofrio, M. et al. 2014, ArXiv e-prints.Dressler, A. et al. 1987, ApJ, 313, L37.Dullo, B. T. and Graham, A. W. 2012, ApJ, 755, 163.Dullo, B. T. and Graham, A. W. 2013, ArXiv e-prints.Elvis, M. et al. 2009, ApJS, 184, 158.Faber, S. M. et al. 1987, in Nearly Normal Galaxies. From the Planck Time
to the Present, ed. S. M. Faber, 175.Faber, S. M. and Jackson, R. E. 1976, ApJ, 204, 668.Fakhouri, O., Ma, C.-P., and Boylan-Kolchin, M. 2010a, MNRAS, 406, 2267.Fakhouri, O., Ma, C.-P., and Boylan-Kolchin, M. 2010b, MNRAS, 406, 2267.Fasano, G. et al. 2010, MNRAS, 404, 1490.Fasano, G. et al. 2006, A&A, 445, 805.Feldmann, R. et al. 2010, ApJ, 709, 218.Ferrarese, L. et al. 2006, ApJS, 164, 334.Ferrarese, L. et al. 1994, AJ, 108, 1598.Finoguenov, A. et al. 2009, ApJ, 704, 564.Finoguenov, A. et al. 2010, MNRAS, 403, 2063.Forbes, D. A., Ponman, T. J., and Brown, R. J. N. 1998, ApJ, 508, L43.Gallagher, III, J. S. and Ostriker, J. P. 1972, AJ, 77, 288.George, M. R. et al. 2012, ApJ, 757, 2.George, M. R. et al. 2011, ApJ, 742, 125.Gerke, B. F. et al. 2007, MNRAS, 376, 1425.Gonzalez, A. H., Zabludoff, A. I., and Zaritsky, D. 2005, ApJ, 618, 195.Graham, A. W. et al. 2003, AJ, 125, 2951.Greene, J. E. et al. 2013, ApJ, 776, 64.Halliday, C. et al. 2004, A&A, 427, 397.Harris, C. E. et al. 2012, ApJS, 201, 29.Hasinger, G. et al. 2007, ApJS, 172, 29.Hinshaw, G. et al. 2009, ApJS, 180, 225.Hoessel, J. G., Oegerle, W. R., and Schneider, D. P. 1987, AJ, 94, 1111.Hopkins, P. F. et al. 2010a, ApJ, 715, 202.Hopkins, P. F. et al. 2009, MNRAS, 398, 898.Hopkins, P. F. et al. 2010b, ApJ, 724, 915.Huang, S. et al. 2013, ApJ, 766, 47.Huertas-Company, M. et al. 2013, MNRAS, 428, 1715.Hyde, J. B. and Bernardi, M. 2009, MNRAS, 394, 1978.Ilbert, O. et al. 2010, ApJ, 709, 644.Jones, C. and Forman, W. 1984, ApJ, 276, 38.Jorgensen, I., Franx, M., and Kjaergaard, P. 1995, MNRAS, 276, 1341.Kaviraj, S. et al. 2009, MNRAS, 394, 1713.Kaviraj, S. et al. 2011, MNRAS, 411, 2148.Kelly, B. C. 2007, ApJ, 665, 1489.Koekemoer, A. M. et al. 2007, ApJS, 172, 196.Kormendy, J. 1977, ApJ, 218, 333.Kormendy, J. 1999, in Galaxy Dynamics - A Rutgers Symposium, ed. D. R.
Merritt, M. Valluri, and J. A. Sellwood, volume 182 of AstronomicalSociety of the Pacific Conference Series, 124.
Kormendy, J. et al. 2009, ApJS, 182, 216.
Lackner, C. N. and Gunn, J. E. 2012, MNRAS, 421, 2277.Laine, S. et al. 2003, AJ, 125, 478.Lauer, T. R. et al. 1995, AJ, 110, 2622.Lauer, T. R. et al. 2007, ApJ, 662, 808.Leauthaud, A. et al. 2010, ApJ, 709, 97.Leauthaud, A. et al. 2012, ApJ, 744, 159.Liu, F. S. et al. 2008, MNRAS, 385, 23.Longobardi, A. et al. 2013, A&A, 558, A42.Maltby, D. T. et al. 2010, MNRAS, 402, 282.Martel, H., Barai, P., and Brito, W. 2012, ApJ, 757, 48.Martizzi, D., Teyssier, R., and Moore, B. 2014, ArXiv e-prints.McIntosh, D. H. et al. 2005, ApJ, 632, 191.Merritt, D. 1985, ApJ, 289, 18.Milvang-Jensen, B. et al. 2008, A&A, 482, 419.Minkowski, R. 1962, in Problems of Extra-Galactic Research, ed. G. C.
McVittie, volume 15 of IAU Symposium, 112.Montes, M. and Trujillo, I. 2014, ApJ, 794, 137.Naab, T., Johansson, P. H., and Ostriker, J. P. 2009, ApJ, 699, L178.Naab, T. et al. 2013, ArXiv e-prints.Nagai, D., Vikhlinin, A., and Kravtsov, A. V. 2007, ApJ, 655, 98.Newman, A. B. et al. 2012, ApJ, 746, 162.Nipoti, C., Londrillo, P., and Ciotti, L. 2003, MNRAS, 342, 501.Nipoti, C. et al. 2004, MNRAS, 355, 1119.Nipoti, C. et al. 2012, MNRAS, 422, 1714.Oegerle, W. R. and Hoessel, J. G. 1991, ApJ, 375, 15.Ostriker, J. P. and Hausman, M. A. 1977, ApJ, 217, L125.Ostriker, J. P. and Tremaine, S. D. 1975, ApJ, 202, L113.Pastorello, N. et al. 2014, MNRAS, 442, 1003.Pelló, R. et al. 2009, A&A, 508, 1173.Pérez, E. et al. 2013, ApJ, 764, L1.Pignatelli, E., Fasano, G., and Cassata, P. 2006, A&A, 446, 373.Poggianti, B. M. et al. 2013, ApJ, 762, 77.Postman, M. and Lauer, T. R. 1995, ApJ, 440, 28.Puchwein, E. et al. 2010, MNRAS, 406, 936.Rettura, A. et al. 2010, ApJ, 709, 512.Richstone, D. O. 1975, ApJ, 200, 535.Richstone, D. O. 1976, ApJ, 204, 642.Rudick, C. S., Mihos, J. C., and McBride, C. K. 2011, ApJ, 732, 48.Rudnick, G. et al. 2009, ApJ, 700, 1559.Saglia, R. P. et al. 2010, A&A, 524, A6.Sandage, A. 1972, ApJ, 178, 1.Schombert, J. M. 1987, ApJS, 64, 643.Scoville, N. et al. 2007, ApJS, 172, 1.Shankar, F. et al. 2014, MNRAS, 439, 3189.Shankar, F., Weinberg, D. H., and Miralda-Escudé, J. 2013, MNRAS, 428,
421.Shen, S. et al. 2003, MNRAS, 343, 978.Simard, L. et al. 2009, A&A, 508, 1141.Simard, L. et al. 2002, ApJS, 142, 1.Smith, R. J. et al. 2004, AJ, 128, 1558.Sonnenfeld, A., Nipoti, C., and Treu, T. 2014, ApJ, 786, 89.Springel, V. et al. 2005, Nature, 435, 629.Stanford, S. A., Eisenhardt, P. R., and Dickinson, M. 1998, ApJ, 492, 461.Suyu, S. H. et al. 2010, ApJ, 711, 201.Thuan, T. X. and Romanishin, W. 1981, ApJ, 248, 439.Treu, T. et al. 2005, ApJ, 633, 174.Trujillo, I., Ferreras, I., and de La Rosa, I. G. 2011, MNRAS, 415, 3903.Trujillo, I. et al. 2006, MNRAS, 373, L36.Trujillo, I. et al. 2004, ApJ, 604, 521.Valentinuzzi, T. et al. 2010, ApJ, 721, L19.van der Marel, R. P. 1994, MNRAS, 270, 271.van der Wel, A. et al. 2008, ApJ, 688, 48.van Dokkum, P. G. et al. 2010, ApJ, 709, 1018.van Dokkum, P. G. et al. 2008, ApJ, 677, L5.Varela, J. et al. 2009, A&A, 497, 667.Vulcani, B. et al. 2014, ApJ, 788, 57.Vulcani, B. et al. 2011, MNRAS, 412, 246.Weil, M. L., Bland-Hawthorn, J., and Malin, D. F. 1997, ApJ, 490, 664.Whiley, I. M. et al. 2008, MNRAS, 387, 1253.White, S. D. M. 1976, MNRAS, 177, 717.White, S. D. M. et al. 2005, A&A, 444, 365.Wilman, D. J. et al. 2005, MNRAS, 358, 71.Zibetti, S. et al. 2005, MNRAS, 358, 949.