UNDERSTANDING ENTREPRENEURIAL MINDSET: A STUDY OF ENTREPRENEURIAL SELF-EFFICACY, LOCUS OF CONTROL...
12
VOL. 1, NO 1, JULY 2010, 51-62 UNDERSTANDING ENTREPRENEURIAL MINDSET: A STUDY OF ENTREPRENEURIAL SELF-EFFICACY, LOCUS OF CONTROL AND INTENT TO START A BUSINESS Andrew Borchers* and Sung-Hee Park** Kettering University Abstract—With growing interest in entrepreneurship in higher education, faculty are facing increased calls to instill an “entrepreneurial mindset” in students. The authors base this study on a rich literature history on self-efficacy and expectancy theory. Starting with work by Chen, Greene, and Crick (1998) and Rotter (1966), the study measures entrepreneurial self-efficacy (ESE) with 22 items, locus of control (LOC) with 23 items and intention to start a business (ITSB) with five items among a sample of engineering and business students (n=191). We also collected paired data from students before and after taking a course in innovation and new ventures. Along with basic analyses using correlation and paired sample t-tests, we performed confirmatory factor analysis and a Multi-Group SEM to test the effects of LOC on the link between ESE and ITSB. We support Chen et al.’s (1998) work in showing that ESE and ITSB are in fact related, and we demonstrate a moderating role for LOC in the relationship between ESE and ITSB. The authors discuss conclusions and further areas for study. 1. Introduction Many observers have recognized entrepreneurship as a rising star in higher education over the past ten years. Interest has expanded from business schools to many academic domains including engineering. Student interest in the field has fueled demands for practical education in business formation, which, in turn, has led to a rising concern with the relevance of traditional business education (Jones & English, 2004, pp. 416-423; Bennis & O’Toole, 2005, 96-104). The success of entrepreneurs, like Jeff Bezos and Bill Gates, is one reference point that sparks student interest in entrepreneurship. Also widely reported are the entrepreneurial developments in both e- commerce and in the biomedical fields. Writers like C.K. Prahalad (2004) have also advanced entrepreneurship as a vehicle for social change in the developing world. Entrepreneurial education is not solely the domain of business schools. Increasingly, there is interest in innovation and new ventures within technical disciplines, such as engineering and science. A study among Canadian universities shows support (although not always through formal courses) among deans in science, medicine and engineering (Menzies, 2004). Organizations like the National Collegiate Inventors and Innovators Alliance (NCIIA) have sparked interest in entrepreneurship among science and engineering students through a variety of programs. Notably, a significant numbers of non-business school researchers and practitioners *Interim Dept Head Business Department; **Asst. Prof Business Dept Kettering University; 1700 W. Third Ave; Flint, MI 48504; www.kettering.edu
Transcript of UNDERSTANDING ENTREPRENEURIAL MINDSET: A STUDY OF ENTREPRENEURIAL SELF-EFFICACY, LOCUS OF CONTROL...
VOL. 1, NO 1, JULY 2010, 51-62
UNDERSTANDING ENTREPRENEURIAL MINDSET:
A STUDY OF ENTREPRENEURIAL SELF-EFFICACY,
LOCUS OF CONTROL AND INTENT TO START A BUSINESS
Andrew Borchers* and Sung-Hee Park**
Kettering University
Abstract—With growing interest in entrepreneurship in higher education, faculty
are facing increased calls to instill an “entrepreneurial mindset” in students. The
authors base this study on a rich literature history on self-efficacy and expectancy
theory. Starting with work by Chen, Greene, and Crick (1998) and Rotter (1966), the
study measures entrepreneurial self-efficacy (ESE) with 22 items, locus of control
(LOC) with 23 items and intention to start a business (ITSB) with five items among a
sample of engineering and business students (n=191). We also collected paired data
from students before and after taking a course in innovation and new ventures. Along
with basic analyses using correlation and paired sample t-tests, we performed
confirmatory factor analysis and a Multi-Group SEM to test the effects of LOC on the
link between ESE and ITSB. We support Chen et al.’s (1998) work in showing that ESE
and ITSB are in fact related, and we demonstrate a moderating role for LOC in the
relationship between ESE and ITSB. The authors discuss conclusions and further areas
for study.
1. Introduction Many observers have recognized entrepreneurship as a rising star in higher education over the
past ten years. Interest has expanded from business schools to many academic domains including
engineering. Student interest in the field has fueled demands for practical education in business
formation, which, in turn, has led to a rising concern with the relevance of traditional business
education (Jones & English, 2004, pp. 416-423; Bennis & O’Toole, 2005, 96-104). The success
of entrepreneurs, like Jeff Bezos and Bill Gates, is one reference point that sparks student interest
in entrepreneurship. Also widely reported are the entrepreneurial developments in both e-
commerce and in the biomedical fields. Writers like C.K. Prahalad (2004) have also advanced
entrepreneurship as a vehicle for social change in the developing world.
Entrepreneurial education is not solely the domain of business schools. Increasingly, there is
interest in innovation and new ventures within technical disciplines, such as engineering and
science. A study among Canadian universities shows support (although not always through
formal courses) among deans in science, medicine and engineering (Menzies, 2004). Organizations like the National Collegiate Inventors and Innovators Alliance (NCIIA) have
sparked interest in entrepreneurship among science and engineering students through a variety of
programs. Notably, a significant numbers of non-business school researchers and practitioners
*Interim Dept Head Business Department; **Asst. Prof Business Dept
Kettering University; 1700 W. Third Ave; Flint, MI 48504; www.kettering.edu

A. Borchers and S.-H. Park
52
attended the recent NCIIA conferences in Portland (2006), Tampa (2007), Dallas (2008),
Alexandria, VA (2009) and San Francisco (2010). The conference schedules for these events
show significant interest in topics ranging from engineering and scientific innovation to projects
in the developing world and environmental sustainability.
Along with the rise of interest in entrepreneurial education have come calls both in the popular
and academic press to instill an ―entrepreneurial mindset‖ in students. Many authors, including
Timmons (1989), Timmons and Spinelli (2007), and McGrath (2000), speak to unique personal
attributes that differentiate entrepreneurs from other leaders. McGrath (2000) identifies the
difference between conventional management and entrepreneurial leadership in five key
elements: 1. Continuous search for opportunity – Entrepreneurial leaders create a climate to support
this search.
2. Framing – Entrepreneurial leaders define success on different terms and articulate
strategic direction in different ways from conventional managers.
3. Stocking an opportunity register – Entrepreneurial leaders continuously seek out and
identify opportunities.
4. Focus – Entrepreneurial leaders focus their thinking by making small investments that
allow them to make better decisions on which opportunities to pursue later on.
5. Promoting adaptive execution – Entrepreneurial leaders use discovery driven planning,
where leaders learn as they go and adapt their execution to market realities.
In his work with Spinelli, Timmons (2007) identifies a set of core attributes that he believes are
central to entrepreneurial behavior. These include:
Commitment and determination
Leadership
Opportunity obsession
Tolerance of risk
Ambiguity and uncertainty
Creativity
Self-reliance and adaptability
Motivation to excel
Courage
This call for ―entrepreneurial mindset‖ creates an interesting challenge for researchers in
identifying exactly what one means by the term. In this study, we address this challenge by
building on two lines of research that focus on ―self-efficacy,‖ the belief one has in his or her own
ability to complete a task and ―locus of control,‖ which refers to how individuals attribute the
results of their lives to internal or external forces. In our work, we examine the relationship
between these two constructs and the dependent variable ―intent to start a business.‖
We explore these constructs in the context of Kettering University, a small, private engineering
focused university in Flint, MI. The institution employs a co-operative model of engineering
education, where students complete alternate terms of work and study. Currently, the university
works with over 500 co-operative employers. Over the years, student co-op experiences have
become much more diverse and now range from work with large corporate to small
entrepreneurial firms. This transition, along with a general trend in engineering education to focus
on innovation, is a strong motivator for the institution to incorporate entrepreneurial education in
its programs.

Understanding entrepreneurial mindset
53
2. Literature
We based this study on two literature sources. First, the work of Chao Chen, Patricia Green, and
Ann Crick (1998) establishes the idea of entrepreneurial self-efficacy (ESE) as an antecedent to
intent to start a new business (ITSB). In their study, Chen et al. seek to identify characteristics
that are entrepreneurial in nature. They propose a measure of entrepreneurial self-efficacy (ESE)
that contains 22 items in five factors: marketing, innovation, management, risk taking and
financial controls. Chen et al. define ESE as ―the strength of an individual’s belief that he or she
is capable of successfully performing the roles and tasks of an entrepreneur‖ (pp. 295-316). They
also note that prior research consistently shows that self-efficacy is a strong predictor of future
performance.
The research of Chen et al. is deeply rooted in literature regarding the concepts of self-efficacy
and expectancy theory. Additionally, their data collection, the concept of ―entrepreneurial
mindset,‖ comes into plain view. The researchers developed the ESE construct using two study
groups. One group (n=140) was a set of mid-career MBA students in two entrepreneurship
classes. Here they established that self-efficacy predicts a student’s intention to start a business.
Chen et al. studied a second group of entrepreneurs (n=281) to confirm that the factors they
identified in the first group did, in fact, support a differentiation between managers and
entrepreneurs.
It is interesting that Chen et al. conclude that ESE is a moderately stable belief that requires
systematic effort to change. Entrepreneurial education, according to Chen et al., all too often
focuses on technical skills and not on developing attitudes and perceptions. Pretorius, Nieman,
and Vuuren write in a similar vein, noting two models of entrepreneurial education used in South
Africa. In the entrepreneurial performance education model, the focus is on motivation and
entrepreneurial and business skills. Pretorius et al. state that this model postulates a direct linear
relationship between entrepreneurial performances as functions of motivation and skills. The
second model, called the entrepreneurial education model, is a more holistic approach that
includes five factors:
1. entrepreneurial success themes
2. business knowledge and skills
3. business plan utilization, learning approaches
4. the facilitator
5. the program’s context
Both of these models clearly go beyond mere technical skills as a base for entrepreneurial
success.
The second major literature source is the work of J. B. Rotter (1966) on locus of control. Locus of
control refers to how individuals attribute the results of their lives to internal or external forces.
Some individuals show a high internal locus of control: they believe that events largely result
from their own behavior. Other individuals have a high external locus of control in believing that
forces outside of their control, including fate or chance, determine events. A number of
researchers working on entrepreneurship (including Diaz-Bretones & Rodriguez, 2003; Timmons
& Spinelli, 2007) have referenced this classic work. Further, this literature draws a close
connection between self-efficacy (ESE) and locus of control. Timmons (1989; 2007) states:
Successful entrepreneurs believe in themselves. They do not believe fate, luck, or
other powerful, external forces or persons the success or failure of their venture

A. Borchers and S.-H. Park
54
will be governed by. They believe that their accomplishments and setbacks lie
within their own control and influence, that they personally can affect the
outcome. This attitude is also consistent with the self-confident desire to take
personal responsibility—so long as this does not lead to overconfidence,
arrogance, or lack of humility.
These authors have found self-efficacy to be a key psychological attribute in understanding an
individual’s decision to be an entrepreneur.
3. Research Questions As Kettering University begins to offer academic and co-curricular activities in entrepreneurship,
we set out to explore entrepreneurial education in an engineering school context. In particular, we
posit the following questions:
a) Among Kettering University students, will Chen et al.’s (1998) ESE construct correlate
with intentions to start a new enterprise (ITSB)?
b) What role does locus of control play in student’s ESE and intent to start a new enterprise?
c) Can data reduction identify underlying concepts among Chen et al.’s (1998) 22
measures? Are these underlying constructs consistent with Chen et al.’s (1998) original
work?
d) Will students report higher levels of ESE and ITSB after completing a course in
innovation?
4. Methodology
We sought to understand entrepreneurial thinking among students at Kettering University. The
authors surveyed a sample of students (n=191) in nine classes during 2006-2009. Seven of the
classes (n=166) were sections of an upper level elective course in innovation and new venturing.
One class was a freshmen introduction to business class (n=12) populated by business and
engineering students. The final class was a senior design capstone class (n=13) populated with
mechanical engineering students.
In a first round of data collection (n=44) students in four of these classes were asked to complete
a 33 question survey. Participation was voluntary, and we explained the importance of the study
as part of the university’s plans to add coursework in entrepreneurship. Questions included the 22
items identified by Chen et al. (1998) in their ESE construct, five items to measure ―intention to
start a business‖ (ITSB) and six items for demographics. We conducted additional rounds of data
collection in 2007, 2008 and 2009. With these rounds, the sample size grew to 191. During these
rounds, we asked students to answer all the items in the first round in addition to a standard
measure of locus of control using 23 items. Further, these students completed a post survey
measuring the ESE and ITSB concepts after completion of the new venture course.
5. Findings As a first step, we checked the reliability of the measures included in the study. The ITSB
(intention to start a business) measure showed a Cronbach alpha of .91. The ESE (entrepreneurial
self-efficacy) measure showed a Cronbach alpha of .92. The five component measures
(marketing, innovation, management, risk taking and finance) showed Cronbach alpha scores of
.77 to .87. Hence, it appears that in the current data collection efforts the constructs advanced by
Chen et al. were reliable.
Understanding entrepreneurial mindset
55
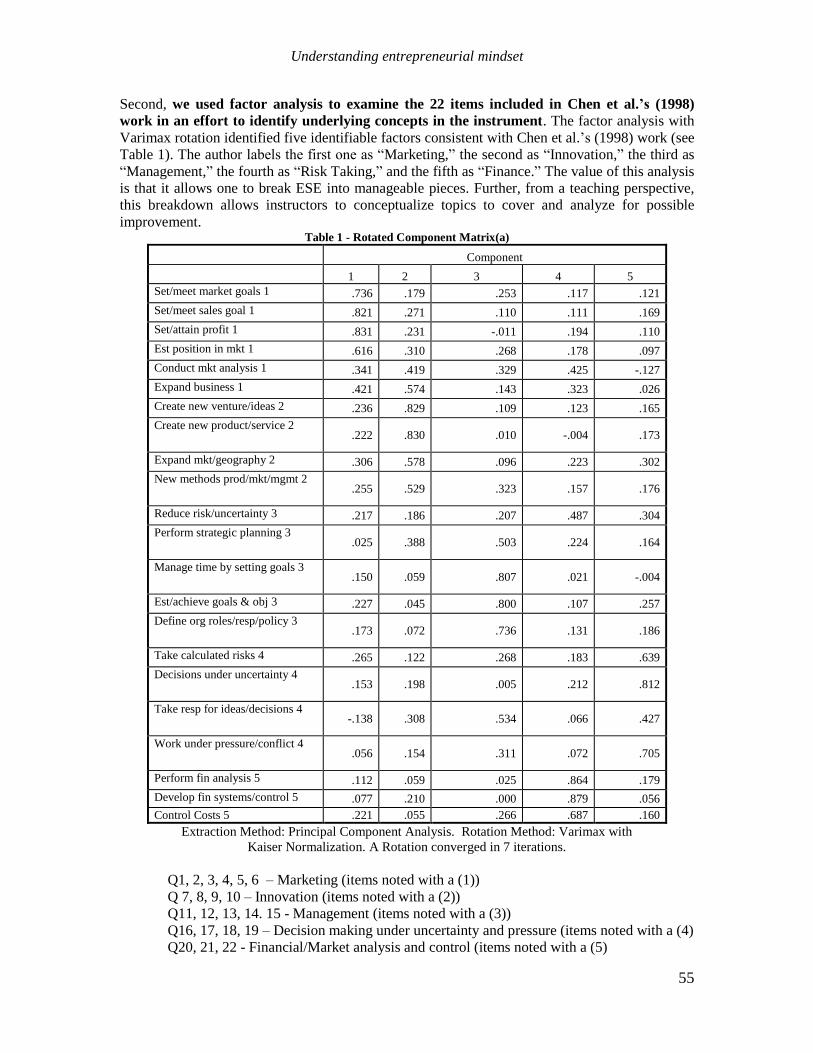
Second, we used factor analysis to examine the 22 items included in Chen et al.’s (1998)
work in an effort to identify underlying concepts in the instrument. The factor analysis with
Varimax rotation identified five identifiable factors consistent with Chen et al.’s (1998) work (see
Table 1). The author labels the first one as ―Marketing,‖ the second as ―Innovation,‖ the third as
―Management,‖ the fourth as ―Risk Taking,‖ and the fifth as ―Finance.‖ The value of this analysis
is that it allows one to break ESE into manageable pieces. Further, from a teaching perspective,
this breakdown allows instructors to conceptualize topics to cover and analyze for possible
improvement. Table 1 - Rotated Component Matrix(a)
Component
1 2 3 4 5
Set/meet market goals 1 .736 .179 .253 .117 .121
Set/meet sales goal 1 .821 .271 .110 .111 .169
Set/attain profit 1 .831 .231 -.011 .194 .110
Est position in mkt 1 .616 .310 .268 .178 .097
Conduct mkt analysis 1 .341 .419 .329 .425 -.127
Expand business 1 .421 .574 .143 .323 .026
Create new venture/ideas 2 .236 .829 .109 .123 .165
Create new product/service 2 .222 .830 .010 -.004 .173
Expand mkt/geography 2 .306 .578 .096 .223 .302
New methods prod/mkt/mgmt 2 .255 .529 .323 .157 .176
Reduce risk/uncertainty 3 .217 .186 .207 .487 .304
Perform strategic planning 3 .025 .388 .503 .224 .164
Manage time by setting goals 3 .150 .059 .807 .021 -.004
Est/achieve goals & obj 3 .227 .045 .800 .107 .257
Define org roles/resp/policy 3 .173 .072 .736 .131 .186
Take calculated risks 4 .265 .122 .268 .183 .639
Decisions under uncertainty 4 .153 .198 .005 .212 .812
Take resp for ideas/decisions 4 -.138 .308 .534 .066 .427
Work under pressure/conflict 4 .056 .154 .311 .072 .705
Perform fin analysis 5 .112 .059 .025 .864 .179
Develop fin systems/control 5 .077 .210 .000 .879 .056
Control Costs 5 .221 .055 .266 .687 .160
Extraction Method: Principal Component Analysis. Rotation Method: Varimax with
Kaiser Normalization. A Rotation converged in 7 iterations.
Q1, 2, 3, 4, 5, 6 – Marketing (items noted with a (1))
Q 7, 8, 9, 10 – Innovation (items noted with a (2))
Q11, 12, 13, 14. 15 - Management (items noted with a (3))
Q16, 17, 18, 19 – Decision making under uncertainty and pressure (items noted with a (4)
Q20, 21, 22 - Financial/Market analysis and control (items noted with a (5)

A. Borchers and S.-H. Park
56
Third, we ran correlations on multiple variables from the student survey including ITSB,
ESE, locus of control, demographic elements, along with the five factors identified by factor
analysis (see Table 2). Notably, the constructs of ESE and ITSB were correlated with an R value
of .310 and a significance of .000, which was consistent with Chen et al. (1998). We found locus
of control correlates with both ITSB and ESE in the expected direction (negative). Note: we
scaled our measure of locus of control so that high external locus of control scales close to one;
and high internal locus of control scales close to zero. This indicates that individuals with high
internal locus of control (and hence a low locus score in our measurement) have higher ESE and
ITSB than individuals with high external locus of control. In addition, we found that none of the
demographic variables –including class, GPA, gender or family/friends in entrepreneurship—
significantly correlated with ITSB. Consistent with the findings of Chen et al. (1998), these
variables correlate, at best, weakly with the ITSB construct. Table 2 - Correlations
EFFICACY INTENT LOCUS PEFFICA PINTENT
EFFICACY Pearson
Correlation 1 .310(**) -.230(**) .316(**) .137
Sig. (2-tailed) . .000 .005 .001 .168
N 188 188 144 103 103
INTENT Pearson
Correlation .310(**) 1 -.170(*) .199(*) .759(**)
Sig. (2-tailed) .000 . .042 .044 .000
N 188 188 144 103 103
LOCUS Pearson
Correlation -.230(**) -.170(*) 1 -.108 -.114
Sig. (2-tailed) .005 .042 . .276 .250
N 144 144 144 103 103
PEFFICA Pearson
Correlation .316(**) .199(*) -.108 1 .310(**)
Sig. (2-tailed) .001 .044 .276 . .001
N 103 103 103 106 106
PINTENT Pearson
Correlation .137 .759(**) -.114 .310(**) 1
Sig. (2-tailed) .168 .000 .250 .001 .
N 103 103 103 106 106
**Correlation is significant at the 0.01 level (2-tailed). *Correlation is significant at the 0.05 level (2-tailed).
Fourth, we conducted paired t-tests for the 2007, 2008 and 2009 observations in order to see
if ESE (and its components) or ITSB changed between the pre and post measures (see
statistics in Appendix I). While our work lacks experimental controls, such as randomization and
placebo groups, our test on ESE was significant and showed the hoped for sign (positive) while
the test on ITSB is not significant. With respect to ESE and its components, our results suggest
that students exposed to entrepreneurship in our course came away with a stronger
entrepreneurial self-efficacy. The change in ITSB was not significant, but has interesting
implications for entrepreneurship education that we discuss later. Table 3 - Paired Samples Test
Paired Differences t df Sig. (2-tailed)
Mean
Std.
Deviation
Std. Error
Mean
95% Confidence Interval
of the Difference
Lower Upper
Pair 1
INTENT - PINTENT .009 .5901 .0581 -.107 .124 .150 102 .881
Pair 2
PEFFICA - EFFICACY .6516 .7014 .0691 .5145 .7887 9.428 102 .000
Understanding entrepreneurial mindset
57
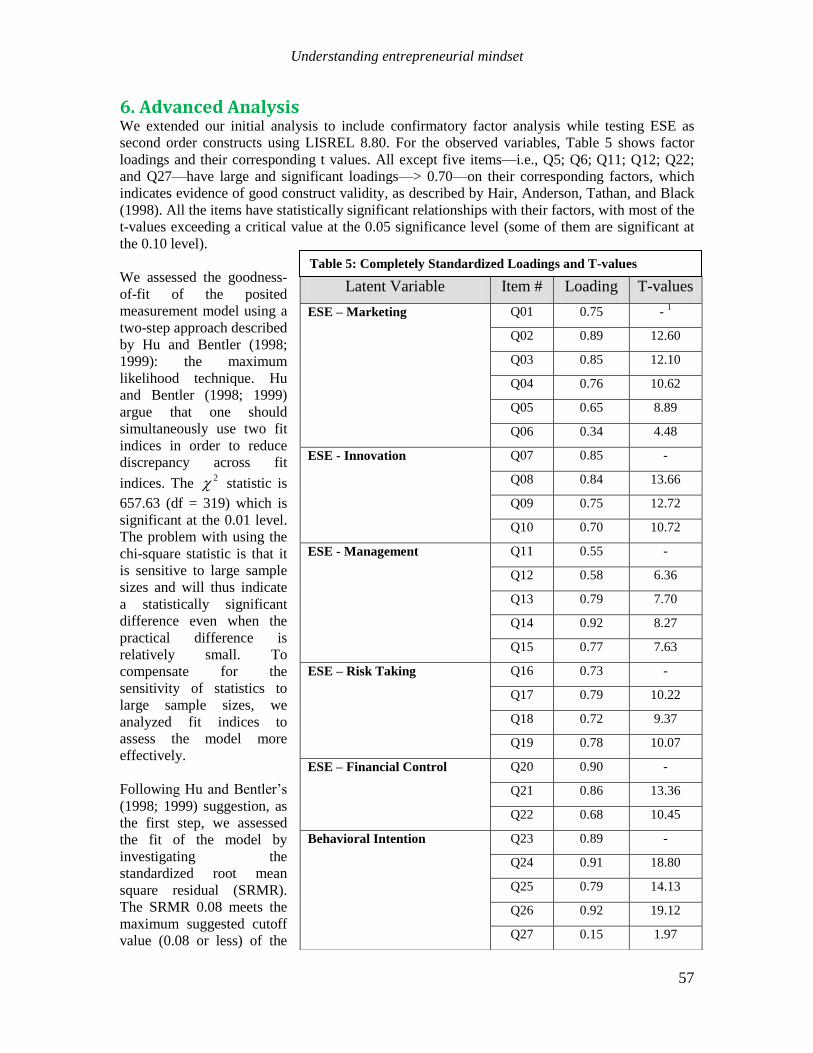
6. Advanced Analysis We extended our initial analysis to include confirmatory factor analysis while testing ESE as
second order constructs using LISREL 8.80. For the observed variables, Table 5 shows factor
loadings and their corresponding t values. All except five items—i.e., Q5; Q6; Q11; Q12; Q22;
and Q27—have large and significant loadings—> 0.70—on their corresponding factors, which
indicates evidence of good construct validity, as described by Hair, Anderson, Tathan, and Black
(1998). All the items have statistically significant relationships with their factors, with most of the
t-values exceeding a critical value at the 0.05 significance level (some of them are significant at
the 0.10 level).
We assessed the goodness-
of-fit of the posited
measurement model using a
two-step approach described
by Hu and Bentler (1998;
1999): the maximum
likelihood technique. Hu
and Bentler (1998; 1999)
argue that one should
simultaneously use two fit
indices in order to reduce
discrepancy across fit
indices. The 2 statistic is
657.63 (df = 319) which is
significant at the 0.01 level.
The problem with using the
chi-square statistic is that it
is sensitive to large sample
sizes and will thus indicate
a statistically significant
difference even when the
practical difference is
relatively small. To
compensate for the
sensitivity of statistics to
large sample sizes, we
analyzed fit indices to
assess the model more
effectively.
Following Hu and Bentler’s
(1998; 1999) suggestion, as
the first step, we assessed
the fit of the model by
investigating the
standardized root mean
square residual (SRMR).
The SRMR 0.08 meets the
maximum suggested cutoff
value (0.08 or less) of the
Latent Variable Item # Loading T-values
ESE – Marketing Q01 0.75 - 1
Q02 0.89 12.60
Q03 0.85 12.10
Q04 0.76 10.62
Q05 0.65 8.89
Q06 0.34 4.48
ESE - Innovation Q07 0.85 -
Q08 0.84 13.66
Q09 0.75 12.72
Q10 0.70 10.72
ESE - Management Q11 0.55 -
Q12 0.58 6.36
Q13 0.79 7.70
Q14 0.92 8.27
Q15 0.77 7.63
ESE – Risk Taking Q16 0.73 -
Q17 0.79 10.22
Q18 0.72 9.37
Q19 0.78 10.07
ESE – Financial Control
Q20 0.90 -
Q21 0.86 13.36
Q22 0.68 10.45
Behavioral Intention Q23 0.89 -
Q24 0.91 18.80
Q25 0.79 14.13
Q26 0.92 19.12
Q27 0.15 1.97
Table 5: Completely Standardized Loadings and T-values
A. Borchers and S.-H. Park
58
model. Next, we compared the fit of the model to the independence model with the comparative
fit index (CFI). The CFI 0.97 suggests that the model fit data comparatively better than the
independence model in a ―good‖ level value (0.90 or greater). Additionally, the Tucker-Lewis
Index (NNFI) 0.97 suggests a good fit of the model as well. We also calculated the root mean
square error of approximation (RMSEA). The RMSEA 0.074 suggests that the model fits the data
well (the suggested cutoff value for a good fit is usually 0.10 or less). Overall, the results suggest
that the model is accurately measuring the constructs in the theorized manner while the data
supports the theory.
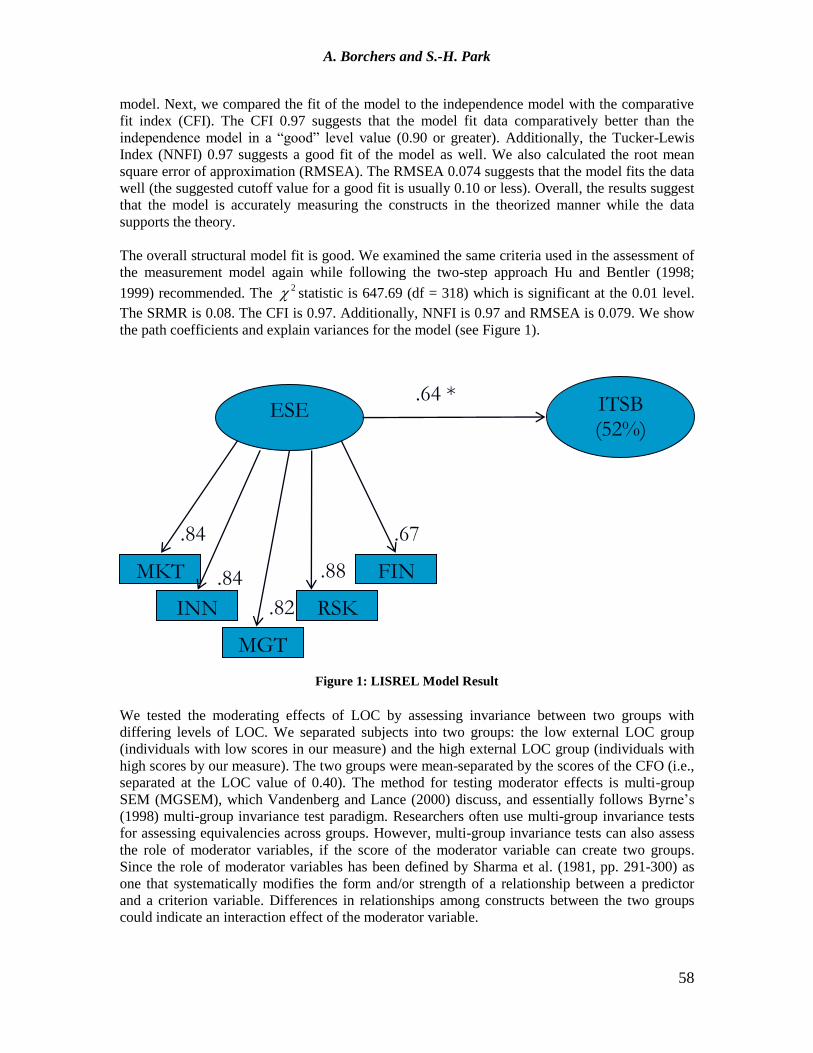
The overall structural model fit is good. We examined the same criteria used in the assessment of
the measurement model again while following the two-step approach Hu and Bentler (1998;
1999) recommended. The 2 statistic is 647.69 (df = 318) which is significant at the 0.01 level.
The SRMR is 0.08. The CFI is 0.97. Additionally, NNFI is 0.97 and RMSEA is 0.079. We show
the path coefficients and explain variances for the model (see Figure 1).
Figure 1: LISREL Model Result
We tested the moderating effects of LOC by assessing invariance between two groups with
differing levels of LOC. We separated subjects into two groups: the low external LOC group
(individuals with low scores in our measure) and the high external LOC group (individuals with
high scores by our measure). The two groups were mean-separated by the scores of the CFO (i.e.,
separated at the LOC value of 0.40). The method for testing moderator effects is multi-group
SEM (MGSEM), which Vandenberg and Lance (2000) discuss, and essentially follows Byrne’s
(1998) multi-group invariance test paradigm. Researchers often use multi-group invariance tests
for assessing equivalencies across groups. However, multi-group invariance tests can also assess
the role of moderator variables, if the score of the moderator variable can create two groups.
Since the role of moderator variables has been defined by Sharma et al. (1981, pp. 291-300) as
one that systematically modifies the form and/or strength of a relationship between a predictor
and a criterion variable. Differences in relationships among constructs between the two groups
could indicate an interaction effect of the moderator variable.
ESE
MKT
INN RSK
FIN
ITSB (52%)
.84
.84
.82
.88
.67
.64 *
MGT
Understanding entrepreneurial mindset
59
A multi-group invariance test begins by fitting a model to the data for each of the two groups
considered separately with none of the parameters constrained to be equal across groups.
Statisticians often call this the baseline model. Next, researchers increase constraints on the
baseline model by specifying the parameters of interest to be constrained across groups. Then,
one compares the chi-square difference test between the baseline model and the more restrictive
models in order to determine whether the model and the individual parameter estimates are
invariant across the samples. A significant difference in chi-square represents a deterioration of
the model, and researchers should reject the null hypothesis that parameters are equal (as
suggested by Koufterosa & Marcoulides, 2006).
Per Koufterosa and Marcoulides (2006), actual tests of the moderating role of LOC involved
comparison of the measurement invariance model against the structural coefficient invariance
model, where measurement invariance (i.e., parallel invariance) means setting all factor loadings
and error variances equal across groups; and structural coefficients invariance means setting all
structural coefficients equal across groups (pp. 286–307). Establishing measurement model
invariance prior to examining invariance of structural model invariance is essential because any
potential differences in these measurement model parameters may contribute to structural model
non-equivalency. We also should note that we are looking at the differences in 2 as well as
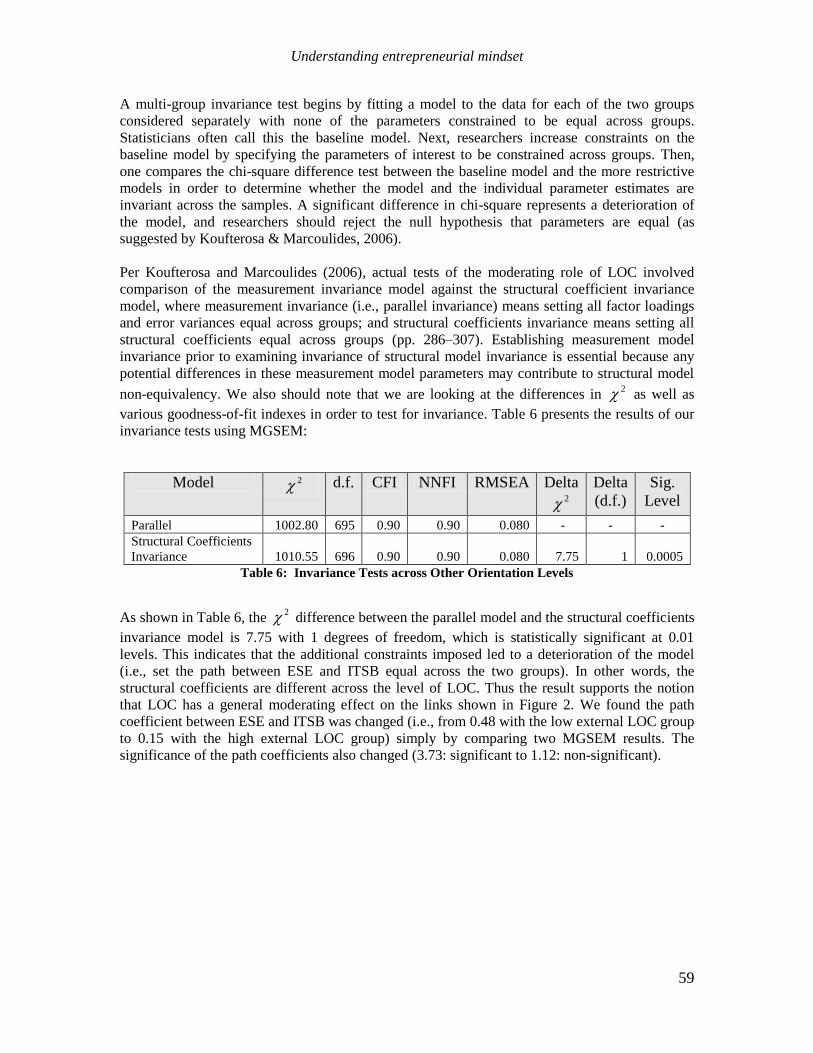
various goodness-of-fit indexes in order to test for invariance. Table 6 presents the results of our
invariance tests using MGSEM:
Table 6: Invariance Tests across Other Orientation Levels
As shown in Table 6, the 2 difference between the parallel model and the structural coefficients
invariance model is 7.75 with 1 degrees of freedom, which is statistically significant at 0.01
levels. This indicates that the additional constraints imposed led to a deterioration of the model
(i.e., set the path between ESE and ITSB equal across the two groups). In other words, the
structural coefficients are different across the level of LOC. Thus the result supports the notion
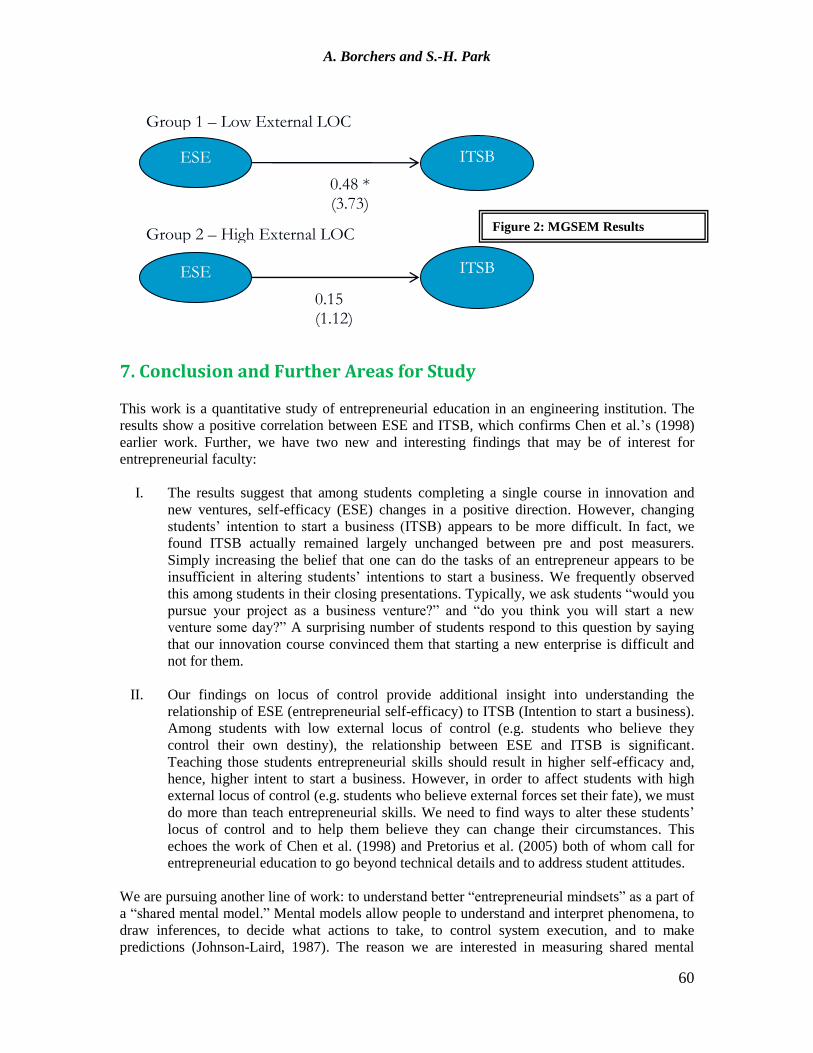
that LOC has a general moderating effect on the links shown in Figure 2. We found the path
coefficient between ESE and ITSB was changed (i.e., from 0.48 with the low external LOC group
to 0.15 with the high external LOC group) simply by comparing two MGSEM results. The
significance of the path coefficients also changed (3.73: significant to 1.12: non-significant).
Model 2 d.f. CFI NNFI RMSEA Delta 2
Delta
(d.f.)
Sig.
Level
Parallel 1002.80 695 0.90 0.90 0.080 - - -
Structural Coefficients
Invariance 1010.55 696 0.90 0.90 0.080 7.75 1 0.0005
A. Borchers and S.-H. Park
60
©
7. Conclusion and Further Areas for Study This work is a quantitative study of entrepreneurial education in an engineering institution. The
results show a positive correlation between ESE and ITSB, which confirms Chen et al.’s (1998)
earlier work. Further, we have two new and interesting findings that may be of interest for
entrepreneurial faculty:
I. The results suggest that among students completing a single course in innovation and
new ventures, self-efficacy (ESE) changes in a positive direction. However, changing
students’ intention to start a business (ITSB) appears to be more difficult. In fact, we
found ITSB actually remained largely unchanged between pre and post measurers.
Simply increasing the belief that one can do the tasks of an entrepreneur appears to be
insufficient in altering students’ intentions to start a business. We frequently observed
this among students in their closing presentations. Typically, we ask students ―would you
pursue your project as a business venture?‖ and ―do you think you will start a new
venture some day?‖ A surprising number of students respond to this question by saying
that our innovation course convinced them that starting a new enterprise is difficult and
not for them.
II. Our findings on locus of control provide additional insight into understanding the
relationship of ESE (entrepreneurial self-efficacy) to ITSB (Intention to start a business).
Among students with low external locus of control (e.g. students who believe they
control their own destiny), the relationship between ESE and ITSB is significant.
Teaching those students entrepreneurial skills should result in higher self-efficacy and,
hence, higher intent to start a business. However, in order to affect students with high
external locus of control (e.g. students who believe external forces set their fate), we must
do more than teach entrepreneurial skills. We need to find ways to alter these students’
locus of control and to help them believe they can change their circumstances. This
echoes the work of Chen et al. (1998) and Pretorius et al. (2005) both of whom call for
entrepreneurial education to go beyond technical details and to address student attitudes.
We are pursuing another line of work: to understand better ―entrepreneurial mindsets‖ as a part of
a ―shared mental model.‖ Mental models allow people to understand and interpret phenomena, to
draw inferences, to decide what actions to take, to control system execution, and to make
predictions (Johnson-Laird, 1987). The reason we are interested in measuring shared mental
ESE ITSB
0.15 (1.12)
ESE ITSB
0.48 * (3.73)
Group 1 – Low External LOC
Group 2 – High External LOC
Figure 2: MGSEM Results

Understanding entrepreneurial mindset
61
model is that it can be a good indicator of our programs’ performance. The ultimate outcome
sought from our entrepreneurial program is to create an entrepreneurial mindset among our
students that contributes either to innovation or to new venture creation later in their careers.
Through measuring shared mental model between successful entrepreneurs and our students, we
believe we can assess whether or not our program creates an entrepreneurial mindset among the
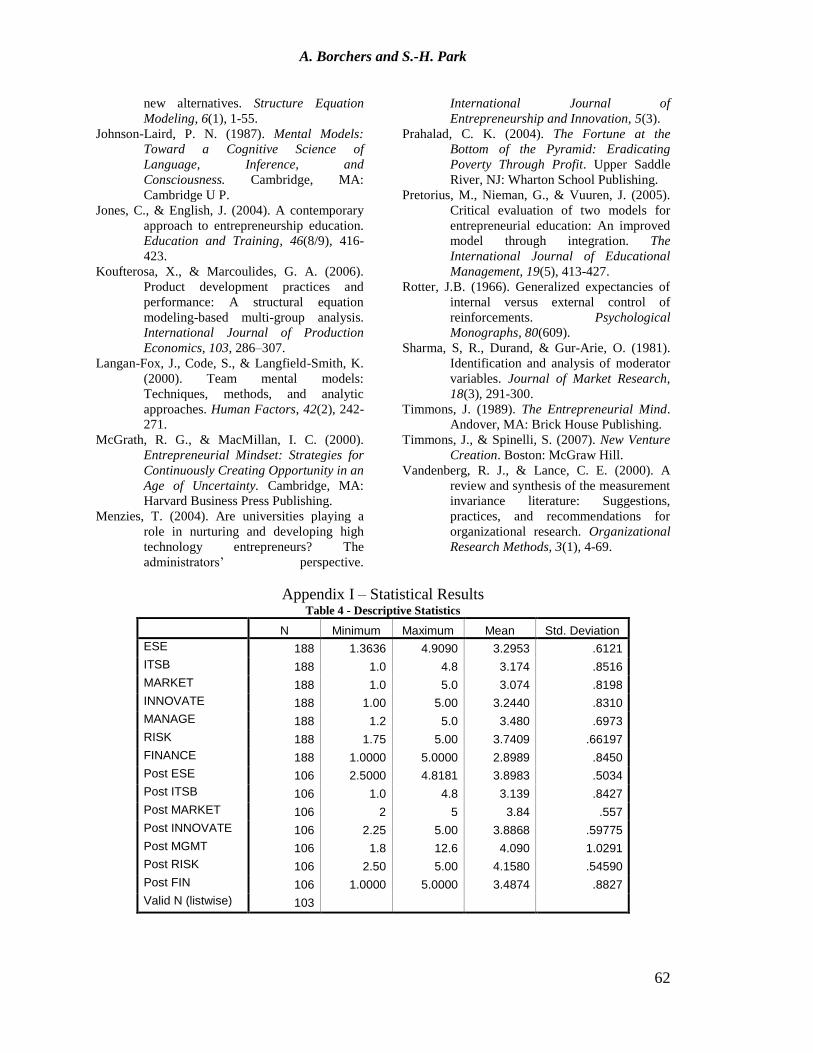
students now rather than being forced to wait years to see what students actually do. Figure 3
(below) represents the expected shared mental model between successful entrepreneurs and the
students in our program. As an indicator of our program’s success, we expect to see the mental
models of students progressing through the program become increasing similar to the mental
models of experienced entrepreneurs.
Figure 3: Shared Mental Model in Entrepreneurship Across the Curriculum
According to Langan-Fox, Code, and Langfield-Smith (2000), there are three available methods
for developing shared mental models (pp. 242-271):
1. pair wise ratings,
2. repertory grid technique, and
3. casual mapping.
Each method involves work with a small group of experts (experienced entrepreneurs in our case)
prior to measuring students. We are currently working on this approach as a next step in our
research.
Acknowledgements Authors’ Note: The authors wish to acknowledge generous support for this research from the
Kern Family Foundation
Notes Bennis, W. G., & O’Toole, J. (2005). How
Business Schools Lost Their Way.
Harvard Business Review, 83(5), 96-
104.
Byrne, B.M. (1998). Structural Equation
Modeling: Basic Concepts, Application,
and Programming. Mahwah, NJ:
Lawrence Earlbaum Associated, Inc.
Chen, C., Greene, P. G., & Crick, A. (1998). Does
entrepreneurial self-efficacy distinguish
entrepreneurs from managers? Journal of
Business Venturing, 13, 295-316.
Diaz-Bretones, F, & Rodriguez, A. (2003). Locus
of control, Nach and values of
community entrepreneurs. Social
Behavior and Personality, 31(8), 739-
748.
Hair, J.F., Anderson, R.E., Tathan, R.I., & W.C.
Black. (1998). Multivariate Data
Analysis with Reading. Englewood
Cliffs, NJ: Prentice Hall.
Hu, L., & Bentler, P. M. (1998). Fit indices in
covariance structure modeling:
Sensitivity to underparameterized model
misspecification. Psychological
Methods, 3. 424-453.
Hu, L. & Bentler, P. M. (1999). Cutoff criteria for
fit indexes in covariance structure
analysis: Conventional criteria versus
Entrepreneurs’
Mindset
Students’
Mindset
Interactions
(Entrepreneurial
Education
Programs)
Shared
Mental Model
at pre- EAC Shared
Mental Model
post EAC
A. Borchers and S.-H. Park
62
new alternatives. Structure Equation
Modeling, 6(1), 1-55.
Johnson-Laird, P. N. (1987). Mental Models:
Toward a Cognitive Science of
Language, Inference, and
Consciousness. Cambridge, MA:
Cambridge U P.
Jones, C., & English, J. (2004). A contemporary
approach to entrepreneurship education.
Education and Training, 46(8/9), 416-
423.
Koufterosa, X., & Marcoulides, G. A. (2006).
Product development practices and
performance: A structural equation
modeling-based multi-group analysis.
International Journal of Production
Economics, 103, 286–307.
Langan-Fox, J., Code, S., & Langfield-Smith, K.
(2000). Team mental models:
Techniques, methods, and analytic
approaches. Human Factors, 42(2), 242-
271.
McGrath, R. G., & MacMillan, I. C. (2000).
Entrepreneurial Mindset: Strategies for
Continuously Creating Opportunity in an
Age of Uncertainty. Cambridge, MA:
Harvard Business Press Publishing.
Menzies, T. (2004). Are universities playing a
role in nurturing and developing high
technology entrepreneurs? The
administrators’ perspective.
International Journal of
Entrepreneurship and Innovation, 5(3).
Prahalad, C. K. (2004). The Fortune at the
Bottom of the Pyramid: Eradicating
Poverty Through Profit. Upper Saddle
River, NJ: Wharton School Publishing.
Pretorius, M., Nieman, G., & Vuuren, J. (2005).
Critical evaluation of two models for
entrepreneurial education: An improved
model through integration. The
International Journal of Educational
Management, 19(5), 413-427.
Rotter, J.B. (1966). Generalized expectancies of
internal versus external control of
reinforcements. Psychological
Monographs, 80(609).
Sharma, S, R., Durand, & Gur-Arie, O. (1981).
Identification and analysis of moderator
variables. Journal of Market Research,
18(3), 291-300.
Timmons, J. (1989). The Entrepreneurial Mind.
Andover, MA: Brick House Publishing.
Timmons, J., & Spinelli, S. (2007). New Venture
Creation. Boston: McGraw Hill.
Vandenberg, R. J., & Lance, C. E. (2000). A
review and synthesis of the measurement
invariance literature: Suggestions,
practices, and recommendations for
organizational research. Organizational
Research Methods, 3(1), 4-69.
Appendix I – Statistical Results Table 4 - Descriptive Statistics
N Minimum Maximum Mean Std. Deviation
ESE 188 1.3636 4.9090 3.2953 .6121
ITSB 188 1.0 4.8 3.174 .8516
MARKET 188 1.0 5.0 3.074 .8198
INNOVATE 188 1.00 5.00 3.2440 .8310
MANAGE 188 1.2 5.0 3.480 .6973
RISK 188 1.75 5.00 3.7409 .66197
FINANCE 188 1.0000 5.0000 2.8989 .8450
Post ESE 106 2.5000 4.8181 3.8983 .5034
Post ITSB 106 1.0 4.8 3.139 .8427
Post MARKET 106 2 5 3.84 .557
Post INNOVATE 106 2.25 5.00 3.8868 .59775
Post MGMT 106 1.8 12.6 4.090 1.0291
Post RISK 106 2.50 5.00 4.1580 .54590
Post FIN 106 1.0000 5.0000 3.4874 .8827
Valid N (listwise) 103