Developing Literacy in English-language Learners: Key Issues and Promising Practices
Upload
khangminh22Category
view
1download
0
UNDERREPRESENTATION OF ENGLISH LANGUAGE LEARNERS 1
Underrepresentation of English-Language Learners in Gifted Education
and the Influence of Gifted Education Policy
Todd Kettler1 and Yasmin C. Laird1
1Department of Educational Psychology, Baylor University
Pre-Print Version 1
June 18, 2020
Author Note
Todd Kettler https://orcid.org/0000-0003-3816-242X
Yasmin C. Laird https://orcid.org/0000-0003-2918-0693
We have no known conflict of interest to disclose.
Correspondence concerning this manuscript should be addressed to Todd Kettler, Baylor
University, Department of Educational Psychology, One Bear Place #97301, Waco, TX 76798,
email: [email protected].

UNDERREPRESENTATION OF ENGLISH LANGUAGE LEARNERS 2
Abstract
English Language Learners (ELL) are the fastest growing population in United States public
education and are likely underrepresented in gifted education. This study analyzed a nationally
representative sample of the largest school districts (n=311) in the United States accounting for
approximately 35% of the total public school enrollment of K12 education. Five pre-registered
hypotheses were tested to explore the nature of ELL underrepresentation in gifted education.
Eighty-six percent of the schools had ELL relative difference in composition index (RDCI)
scores in the large underrepresentation category (< -60), and the pattern of underrepresentation
was consistent in all four census regions of the U.S. Underrepresentation in schools with state
policy mandates to identify gifted students was no different that ELL underrepresentation in non-
mandated policy states. Variables of gifted program inclusiveness (r = .07) and prevalence of
ELL student populations (r = .05) were not associated with variation in ELL underrepresentation.
Key Words: gifted, English language learner (ELL), policy, underrepresentation

UNDERREPRESENTATION OF ENGLISH LANGUAGE LEARNERS 3
Underrepresentation of English-Language Learners in Gifted Education
and the Influence of Gifted Education Policy
English language learners (ELL) are the fastest-growing population of learners in the
United States (U.S. Department of Education National Center for Education Statistics Common
Core of Data, (DOE) 2017). However, despite the growing numbers of ELLs, they remain
marginalized and underrepresented in a variety of educational settings and programs in
comparison to traditional majority populations of learners (Callahan, 2005; Mun et al., 2016). As
a result, these linguistically diverse students may face struggles for access and opportunity, as
well as barriers to achievement in schools (Poza, 2016). This marginalization has been shown to
be consistently associated with negative consequences on the academic success of ELLs, as it
has resulted in disparities in Advanced Placement course participation, ACT and SAT scores, as
well as college readiness and degree attainment (Kettler & Hurst, 2017; Poza, 2016). Even
though the United States Department of Education (n.d.) asserts that children should have an
equitable education regardless of cultural group or economic strata, the consistent
marginalization of ELLs in general education and advanced academics illuminates a problem and
a challenge which deserves thorough exploration.
Marginalized Populations in Gifted Education
A persistent concern of gifted education in the United States is the marginalization of
culturally and linguistically diverse students. With the steady increase in the number of students
who are ELLs, there is a need to examine which factors influence the prevalence of ELLs who
are identified for gifted and talented programs and services. According to the DOE (2017), in the
fall of 2017 there were more than 5,000,000 ELLs in public schools, which equated to roughly
10.1% of the entire public school student population. In the fall of 2000, only 8.1% of students in

UNDERREPRESENTATION OF ENGLISH LANGUAGE LEARNERS 4
the U.S. public school student population, or 3.8 million students, were ELLs (DOE, 2017).
While the number of ELLs in the United States has been steadily increasing, some data indicate
that they remain less likely than their native English-speaking peers to be recommended for
placement in gifted education programs (Bernal, 2002; Lohman, Korb, & Lakin, 2008; Peters,
Gentry, Whiting, & McBee, 2019). Even though it is expected that ELLs would be equally
represented in gifted programming, these students are often underserved in gifted programs and
overrepresented in special education programs (Donovan & Cross, 2002; Patton, 1998; Vasquez,
2007). More than 20 years ago when ELLs constituted a smaller proportion of the student
population, Plummer (1995) estimated that they were underrepresented in gifted programs by
30% to 70% and over-represented in special education programs by 40% to 50%. While these
estimates are dated, they suggest a need to systematically estimate the current metrics of
disproportional representation for the ELL population in gifted education.
In 2012, only 1.8% of students who participated in gifted education programs in the
United States were ELL, indicting underrepresentation (DOE, 2017). According to more recent
U.S. data from 49 states and the District of Columbia, ELLs were similarly under-enrolled in
gifted and talented (GT) programming, especially in states that have a large share of all of the
ELLs in schools nationwide such as California, Nevada, and New Mexico (DOE, 2017).
Underrepresentation may be attributed to implicit bias (Nel, 1992; Nesper, 1987) against
non-English speakers in gifted education even though theoretically, there is no theory to support
exceptional ability disproportionally distributed based on native language. Another potential
explanation for ELL underrepresentation is curtailed and inhibited oral participation in class
(Morita, 2004). In other words, even in cases where bilingual children have greater cognitive
flexibility and problem-solving skills than monolingual children, ELLs often do not get a chance

UNDERREPRESENTATION OF ENGLISH LANGUAGE LEARNERS 5
to show what they can do due to their lack of English language skills (Harris et al., 2013; Lakin
& Lohman, 2011; Lohman et al., 2008). According to the National Association for Gifted
Children (NAGC), there is a need to better identify and serve culturally and linguistically diverse
gifted students (NAGC, 2011). The NAGC (2011) also advocates for increased diversity in the
United States for gifted education programs to reflect the changing demographics of the national
population. This includes the equitable identification and support of gifted students, especially
for those students who represent cultural and linguistic diversity.
Long-standing inequity in educational experience for ELLs previously led some program
administrators to search for the best procedure of identifying and supporting gifted students so
that those who do not speak English natively are not marginalized in their gifted and talented
programs (Ford & Harris, 1999; Frasier, Garcia & Passow, 1995); however, little has changed for
the proportional representation of ELL students in gifted education. More recent research has led
to advances in gifted identification options (Harradine, Coleman, & Winn, 2014; McBee,
Shaunessy, & Matthews, 2012), but the prevalence of ELLs in gifted services remains relatively
low. Enrollment trends suggest that diverse students will continue to enter schools in the United
States, therefore it is increasingly recommended for schools to have approaches, guidelines, and
programs in place to best identify and educate gifted and talented students, regardless of cultural
or linguistic differences.
Although educational practitioners have access to various research-based gifted
identification measures for students, discrimination theory (Farkas, 2003; Mickelson, 2003)
suggests that one reason why ELLs are not identified at the same rate as non-ELLs is
inappropriate identification procedures (California Association for the Gifted, n.d.). Gifted
identification procedures have the potential of marginalizing students who are from different

UNDERREPRESENTATION OF ENGLISH LANGUAGE LEARNERS 6
cultures, linguistic backgrounds, or low socioeconomic status (Coronado & Lewis, 2017).
Furthermore, tests, educators, administrators, and parents can show bias during the identification
process which can put ELLs at risk (Coronado & Lewis, 2017). Moreover, teachers and
administrators may have lower expectations for diverse students, all of which stem from negative
stereotypes, assumptions, and other beliefs about these students (Ford & Grantham, 2003). Thus,
teachers may overlook the academic potential of ELLs due to false beliefs that English language
abilities are a characteristic of giftedness, or cultural biases on what giftedness should look like
in children without considering their cultural background (Coronado & Lewis, 2017). The
current collective pictures of giftedness in the United States have been shown to favor certain
student types, ethnicities, socioeconomic groups, and even genders. Furthermore, research has
indicated that culturally and linguistically diverse students, in particular, have merely been
recognized for their weaknesses and language barriers, rather than on their cognitive strengths
(Barkan & Bernal, 1991).
Language barriers can also affect the parents of ELL students, as these parents may not
understand or even refuse gifted services for their students based on miscommunication or lack
of sufficient information in the target language (Castellano & Diaz, 2002). If the parent of the
ELL is uninformed or misunderstands the importance of gifted and talented programs, they may
not see any benefit to the program which could lead to a barrier between parents and schools
(Gallagher & Coleman, 1994). Based on this miscommunication, gifted identification could be
undermined if the gifted qualities of students are overshadowed by their deficits, such as
language limitations (Ford & Grantham, 2003). Conventional markers for giftedness can be
especially inequitable for ELLs, as their language and culture may mask their exceptional
promise (Castellano, 1998). ELL students often have limited support systems, opportunities, and

UNDERREPRESENTATION OF ENGLISH LANGUAGE LEARNERS 7
financial access in comparison to non-ELL students; therefore, ELLs may not be able to qualify
according to traditional GT assessments or thrive in GT programs even if they do qualify
(Coronado & Lewis, 2017).
The Coronado and Lewis (2017) study examined the disproportionality of ELL
representation in gifted and talented programs in Texas. The study, although it only focused on
one state, illuminated the condition of ELLs in gifted education which could be similar to other
states in the United States as well. ELL students were under-represented in gifted education
programs in Texas despite (a) relatively strong gifted education policy mandating identification
and services, (b) the use of assessments in the student’s native language or the use of non-verbal
assessments, (c) and considerable local flexibility to establish qualification procedures (NAGC &
The Council of State Directors of Programs for the Gifted, 2015). Though Texas as a whole met
the target percentage of 5-7% total GT identification, ELL students were under-represented in all
20 of the educational regions in Texas with levels of disproportionality ranging from moderate to
severe (Coronado & Lewis, 2017). Moderate to severe underrepresentation of ELL students in
gifted education in Texas could signal an alarming trend nationally considering the Texas
policies for gifted and talented identification are generally favorable for linguistically diverse
students.
Relative Differences in Composition
One way to study underrepresentation or over-representation is to measure the group’s
relative difference in composition in the general population compared to a target population (e.g
those with discipline referrals, those in special education, those in gifted education). The Relative
Difference in Composition Index (RDCI) has been applied in equity research in gifted education,
special education, and school discipline research to describe disproportionate participation

UNDERREPRESENTATION OF ENGLISH LANGUAGE LEARNERS 8
among race/ethnic groups in schools or school systems (Bollmer et al., 2014; Gibb & Skiba,
2008; Gregory & Weinstein, 2008). The RDCI is a ratio that measures the relative difference
between the proportion of students with a particular characteristic and a specific condition or
placement in the school context. The RDCI equation used in this study was advocated by the
U.S. Department of Education, Institute of Educational Sciences (Nishioka et al., 2017). This
index is derived by taking the proportion of a target group in the GT program (x) and subtracting
the proportion of that same target group in the total population (y). Then that difference is
divided by the proportion of the target group in the population (y). Finally, that value is
multiplied by 100 (Nishioka et al, 2017, p. 13).
𝑅𝐷𝐶𝐼 =𝑥 − 𝑦
𝑦∗ 100
For example, a district where 15% of the total population is ELL, and 3% of the GT population is
ELL, RDCI would be calculated as follows:
𝑅𝐷𝐶𝐼 =3 − 15
15∗ 100 = −80
RDCI values are relatively easy to interpret. A value of zero is perfect representation, or
zero difference in composition. Negative RDCI values represent underrepresentation, and
positive values represent over-representation. The absolute value of the RDCI indicates the
magnitude of the underrepresentation or overrepresentation. In the above example, an RDCI of -
80 indicates underrepresentation. An RDCI of -20 would also have represented
underrepresentation though less severe than -80. An RDCI of 5 would indicate a slight
overrepresentation as all RDCI values above zero indicate overrepresentation.
Previous research in gifted education using an RDCI measurement (Ford & King, 2014;
Stephens, 2020; Wright, Ford, & Young, 2017) applied a formula different from the one
published by the U.S. Department of Education in 2017. While the purpose of the research in

UNDERREPRESENTATION OF ENGLISH LANGUAGE LEARNERS 9
those studies was also underrepresentation of groups in gifted education, the calculations of
RDCI were different. Thus, while the concept of using RDCI is not new to gifted education
research, there may be some variation in how RDCI has been calculated across studies.
Gifted Education Policy
Gifted education policy research over the previous three decades has been minimal
(Plucker, 2018). There are generally three levels of policy pertaining to gifted education: (a)
national policy, (b) state policy, and (c) local school district policy (Gallagher, 2013). Our
primary interest in this study is gifted education policy at the state-level. A few studies have
examined state-level policy as it relates to funding gifted programs and services (e.g. Baker
2001; Baker & Friedman-Nimz, 2003; Baker & McIntire, 2003; Kettler, Russell, & Puryear,
2015). Those studies examined local funding and staffing discrepancies that occured even with
relatively strong gifted education state mandates. Fewer studies have investigated the impact of
state level policies on identification and services, but Purcell, (1995) found that programs tend to
expand in states with mandates. Similarly, gifted education programs in states without mandates
may decline with shrinking budgets (Purcell, 1992; 1993).
More recently, McBee et al. (2012) studied the effects of district-level policies on the
underrepresentation of typically marginalized groups. The study examined school districts in
Florida, a state that allows schools to establish district-level policies under a Plan B law. Plan B
is an alternative, equity-focused identification policy. These Plan B local district policies
established alternative procedures with the intent of increased identification of marginalized
student groups. Average treatment effects for the local Plan B policies were estimated with a
propensity score matching design. They found that estimated treatment effects were significant
for both Black students and economically disadvantaged students (the only two marginalized

UNDERREPRESENTATION OF ENGLISH LANGUAGE LEARNERS 10
groups studied). The odds ratio (1.95) indicated that economically disadvantaged students were
almost twice as likely to be identified for the gifted education program in Plan B policy schools.
The odds ratio (1.69) for Black students indicated a two-thirds increase in the likelihood of
identification for gifted education in the Plan B policy schools. Local policy emphasizing equity
improved representation of those target groups in schools using the Plan B model.
The NAGC published the State of the States report (2015) which provided descriptive
data on state policies related to gifted education, and their website (www.nagc.org) provides
brief information about each state’s policies. Based on the NAGC report, 12 states and the
District of Columbia do not have policies mandating identification of gifted and talented
students. Even in the absence of state policy mandates for identification, some school districts
choose to identify gifted students and provide gifted and talented programs and services (Purcell,
1992). Though equity and access have been widely studied in gifted education (e.g. Lamb,
Boedeker, & Kettler, 2019; Peters & Engerrand, 2016; Peters et al., 2019), there is little clarity of
whether gifted education state policy leads to more equitable access. One way to examine the
impact of policy related to ELL students in gifted education is to compare the
underrepresentation of ELL students in schools located in states with gifted education policy to
schools operating gifted education in states without gifted education policy.
Purpose of this Study
This study calculated the relative difference in composition index (RDCI) of English
Language Learners (ELL) participating in gifted education in a nationwide, representative
sample of the largest school districts in the United States using data from the National Center for
Educational Statistics and the Office of Civil Rights Education Data. Using RDCI as a valid
metric to estimate proportional representation of populations in gifted education, we tested the

UNDERREPRESENTATION OF ENGLISH LANGUAGE LEARNERS 11
hypotheses that ELL students are under-represented in gifted education in the United States.
Additionally, the study investigated additional hypotheses related to the underrepresentation of
ELL students including (a) potential regional difference, (b) influence of state gifted education
policy and ELL participation in gifted education, (c) the inclusive or exclusive nature of the
gifted education program, and (d) the impact of the overall prevalence of ELL students in a
district and their representation in the gifted education program.
Five specific hypotheses were pre-registered though Open Science Framework prior to
data collection and analyses.
H1: English Language Learners are under-represented in gifted education programs in the
United States compared to their prevalence in the overall student population.
H2: There are differences in ELL underrepresentation across the four census established
regions of the United States (West, Midwest, Northeast, and South).
H3: Schools in states with gifted education policy requirements for gifted education will have
a more proportional representation of ELL students in gifted education programs.
H4: Schools with greater participation in gifted education (more inclusive), will have a more
proportional representation of ELL students in gifted education programs.
H5: Schools with proportionally larger ELL student populations will have a more
proportional representation of ELL students in gifted education programs.
Method
This was an observational, descriptive study utilizing secondary data. Units of analyses
were school districts (n = 310), and the data collected from those school districts were harvested
from public records available through the National Center for Educational Statistics and the
Office of Civil Rights Education Data (OCR Data). Using the software G*Power 3.1.9.7, we

UNDERREPRESENTATION OF ENGLISH LANGUAGE LEARNERS 12
conducted a power analysis to determine an appropriate sample size based on analytic
parameters of (a) alpha level at .05 and power at .95 and (b) estimated medium effect sizes d =
0.5, f = .25, and r = .3. The analyses indicated a minimum sample size of 280 would be
sufficient, and the actual sample of 310 exceeded that minimum.
Sample
The data collection process sought a nationally representative sample. Inclusion criteria
were (a) must have a gifted and talented education program as reported by OCR Data, and (b)
include at least 2,500 students (Gibb & Skiba, 2008). Using enrollment size (total students), the
300 largest school districts in the United States were included in the sample. Since the study was
focused on underrepresentation in gifted education, having a gifted and talented education
program was necessary for inclusion. Therefore, school districts which according to the OCR
data did not report any gifted and talented students were eliminated. After the 300 largest
districts with gifted and talented programs were identified, we wanted to make sure every state
was represented in the sample. Thirty-nine of the 50 states were represented by at least one
school district in the initial sample of 300. For the states not included initially (n = 11), we
identified and included the largest school district with a gifted education program in each of
those states. The distribution of included school districts by state and region (defined by the U.S.
Census) is displayed in Table 1. The only state not represented was Vermont. Gifted education is
not mandated in Vermont education policy, and there was no school district with more than
2,500 students that had a gifted education program. The District of Columbia was not included
because the district does not identify gifted and talented students. The sample of 310 school
districts was 1.7% of the total number of school districts in the United States, but they represent

UNDERREPRESENTATION OF ENGLISH LANGUAGE LEARNERS 13
an enrollment of 17,627,513 students which was 35% of the estimated 50,300,000 public school
students in the United States (DOE, 2017).
Variables
Each school district in the sample was assigned a grouping variable based on its location
using the four census regions of the United States Census (West, Midwest, Northeast, and
South). Each school district was also assigned to one of two groups based on the state’s policy
for identifying gifted and talented students (GT identification-mandated or GT identification-not
mandated). A variable of interest for the analysis was the degree to which each district’s gifted
and talented program was exclusive or inclusive in the identification of gifted students. This was
represented by each district’s percent of the total population that was identified as gifted and
talented. Smaller percentages of identified gifted students indicated exclusive approaches to
identification, and larger percentages of identified gifted students indicated more inclusive
approaches to identification. Another variable used in the study was the general prevalence of
ELL students in the total district population. The prevalence of ELL students was represented by
the percent of the total district population that was classified as ELL. Higher percentages of ELL
students indicated a greater prevalence of ELLs in the district as a whole.
For each school district included in the study, we calculated the Relative Difference in
Composition Index (RDCI) as a metric to represent the difference between ELL student
proportional representation in the total population of the district compared to ELL student
proportional representation in the gifted education program of the district.
With the RDCI metric, a value of zero indicates exact representation in gifted education.
Results

UNDERREPRESENTATION OF ENGLISH LANGUAGE LEARNERS 14
The school districts in this sample were representative of large public school districts in
the United States. Enrollment ranged from 3,240 students to 984,500 students with a median
district size of 37,248.5 students. The race/ethnicity composition of students in the sample was
somewhat representative of the total public school population in the U.S (see Figure 1). The
overall population in the U.S public schools includes slightly more White students and slightly
fewer Black and Hispanic students. Descriptive data for the analyzed variables in the study are
presented in Table 2. The proportion of students in the sample who participated in the free and
reduced lunch program ranged from zero to 100% with a mean of 52.9% (SD=21.2).
Underrepresentation of ELL Students in Gifted Education
Hypothesis-1 predicted that ELL students would be under-represented in gifted and
talented education programs. To test this hypothesis, we calculated the Relative Difference in
Composition Index (RDCI) for each school district in the study. The RDCI values ranged from
the low end of RDCI = -100 to RDCI = 204.76 on the high end. To achieve an RDCI of -100, the
school district reported zero ELL students in the gifted and talented program, and 27 (8.71%)
school districts had an RDCI of -100. The mean RDCI value for the entire sample was -77.28
(SD=32.21).
To interpret this distribution of RDCI scores, we created a categorical designation based
on the 80% rule or 20% allowance concept that originated in measures of disparate impact in
employment law (Barrett, 1998) and has occasionally been applied in studies of gifted education
equity analyses (e.g., Lamb et al., 2019; Wright et al., 2017). The categories and distribution data
are presented in Table 3. Using a one-sample chi-square test we analyzed the observed
distribution of schools (n=310) into the five categories. To test the null hypothesis that ELL
students are equitably represented in gifted education. We chose a conservative predicted

UNDERREPRESENTATION OF ENGLISH LANGUAGE LEARNERS 15
distribution expecting schools to be evenly distributed across all five categories (20% in each
category). This estimate is conservative in that were it true, still only 40% of the schools would
have equitable representation of ELL students in gifted education. The X2 = 834.99 df=4, p <
.001 indicated a poor fit against the expected even distribution. ELL students in this sample of
schools were under-represented with 298 of the 310 schools (96.1%) falling in either small,
medium, or large underrepresentation categories, and 265 of the schools (85.5%) were in the
large underrepresentation category. Thus, we rejected the null hypothesis that ELL students are
equitably identified for gifted education programs.
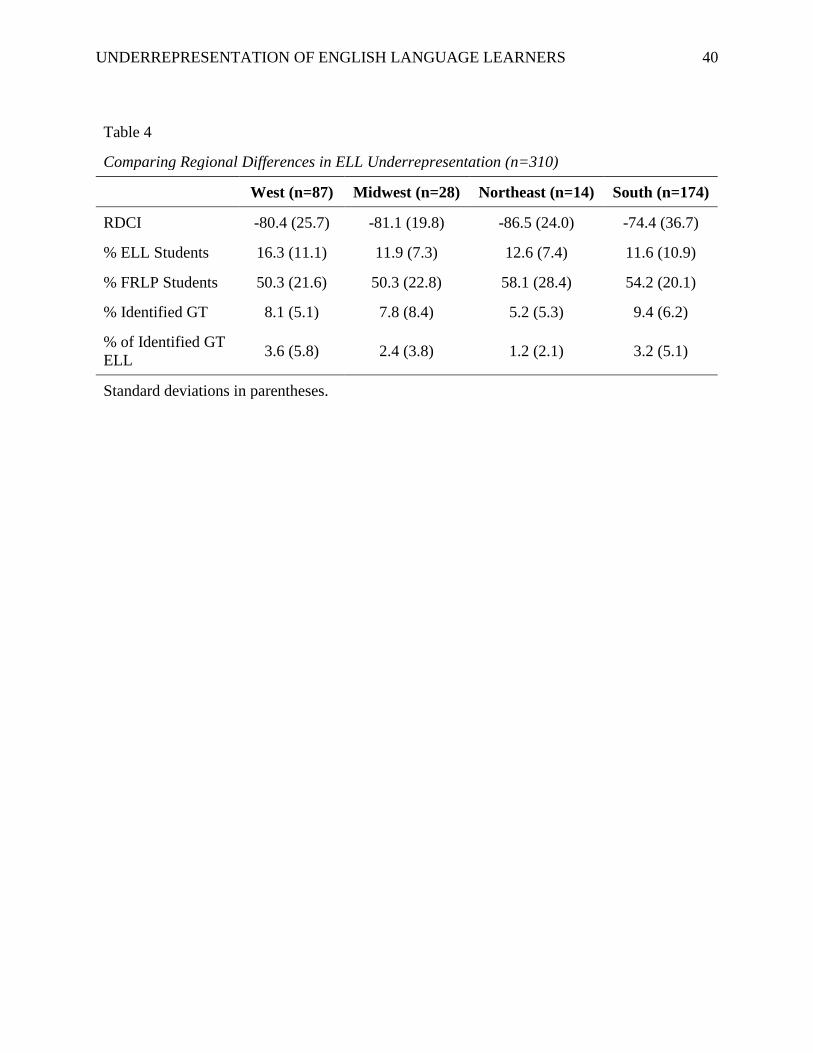
Regional Differences in ELL Underrepresentation
The second hypothesis extended the analyses of ELL underrepresentation to consider
whether the underrepresentation is consistent across the U.S. We hypothesized that there would
be regional differences in ELL underrepresentation in the U.S. as policies and practices in gifted
education may follow regional patterns in the absence of stabilizing federal policy. To test the
null hypothesis that there are no regional differences, each school in the sample was assigned to
one of four regional groups based on the U.S. Census-designated regions (see Table 1). With
different group sizes, we used Levene’s test to verify the assumption of equal variance, F(3, 306)
= 1.24, p = .295. The one-way analysis of variance indicated there were no regional differences
across the four regions of the U.S., F(3, 306) = 1.31, p = .27. Thus, we did not reject the null
hypotheses that there are no regional differences in underrepresentation across the U.S. ELL
students appear to be similarly underrepresented in gifted education programs in the West,
Midwest, Northeast, and Southern regions of the U.S.
Gifted Education Policy

UNDERREPRESENTATION OF ENGLISH LANGUAGE LEARNERS 16
The third hypothesis tested the potential effect of state policy mandating identification of
gifted students on the underrepresentation of ELL students in gifted education. Even in states
where policy does not require schools to identify gifted and talented students, some or even
many schools do voluntarily identify gifted and talented students in the absence of policy
requirements. Schools in the sample were assigned to two groups. The policy group of schools
(n=245) were in states requiring the identification of gifted students, the no-policy group of
schools (n=65) were in states that do not require identification of gifted students. Based on the
McBee et al. (2012) study where district-level identification policy increased representative
identification, our hypothesis predicted that schools in states with gifted education policy
requirements for identifying gifted students would have a more proportional representation of
ELL students in gifted education programs. Levene’s Test was used to verify the equality of
variance assumption, F=.001, p = .974, and an independent samples t-test was used to compare
the mean RDCI scores of the policy group of schools against the no-policy group of schools with
equality of variance verified. The policy schools had a mean RDCI score of -76.82 (SD=32.94)
and the no-policy schools had a mean RDCI score of -79.03 (SD=29.49). The observed mean
difference was 2.21 with a 95% confidence interval of the mean difference from -6.64 to 11.07,
t(308) = .49, p = .623. Thus, we did not reject the null hypothesis that there was no difference
between the policy group and the no-policy group. ELL students in schools in states with policy
requiring identification were similarly under-represented as they are in schools without state
policy mandating gifted student identification. In the two-group comparison, gifted education
state-level policy for identifying gifted students appeared to have no impact on equitable
identification of ELL students.

UNDERREPRESENTATION OF ENGLISH LANGUAGE LEARNERS 17
To explore a little deeper, we looked specifically at the three states that had the greatest
number of schools in the sample: Texas, California, and Florida. Texas and California also had
among the highest proportion of LEP students per school averaging more than 21% LEP students
in each school. When we compared Texas (GT policy) to California (no GT policy) we found a
mean difference in RDCI of 14.95 [95% CI: 7.42, 22.48], t(98) = 3.94, p < .01, d = .80. Just
looking at those two states Texas schools on average have a better RDCI than California schools.
In that direct comparison, we might conclude that state-level GT policy has a positive impact on
the representation of ELL students in gifted education. However, we also made a direct
comparison between Texas and Florida, two states with GT policy mandates to identify. This
comparison revealed a mean difference in RDCI of 28.40 [95% CI: 22.72, 33.56]. t(82) = 7.45, p
< .01, d = 1.98. Thus, there was a pronounced difference in RDCI among two states with GT
policy mandates to identify, suggesting that state-level policy alone does not account for the
difference in ELL representation in gifted education.
Inclusive Versus Exclusive Gifted Education Programs
We tested the theory that inclusive approaches to gifted education would result in more
equitable representation of ELL students in gifted education. Inclusive approaches are complex
and may manifest in many ways, but in this study, we used the variable of the overall percent of
the school population identified as gifted as an indicator of how inclusively the school
approached gifted identification. Schools identifying a higher percentage of the overall
population demonstrate more inclusive attitudes and procedures in the identification process. The
hypothesis stated that schools with greater participation in gifted education (more inclusive), will
have a more proportional representation of ELL students in gifted education programs. We tested
the null hypothesis that no relationship exists between the proportion of the total school

UNDERREPRESENTATION OF ENGLISH LANGUAGE LEARNERS 18
population identified as gifted and two variables (a) RDCI and (b) proportion of the gifted
population that was ELL.
The Pearson correlation matrix (see Table 5) indicated no relation existed between the
inclusive nature of gifted identification and the RDCI of each school (r = .065, p = .253, n =
310). Thus, we did not reject the null hypothesis. RDCI does not seem to be affected by inclusive
versus exclusive approaches to gifted identification in a school. In an exploratory test, we also
considered the relationship between the inclusive nature of gifted identification in a school (total
% identified GT) and the proportion of the gifted population that was classified as ELL. There
was a positive relationship between these variables (r = .148, p = .009, n = 310). Thus, a small
effect was found where schools that identify a greater proportion of the total population as gifted
(inclusive), also tend to have a greater proportion of ELL students in their gifted program. Why
was there a small positive effect for the inclusiveness of GT identification on the proportion of
the GT program that was ELL but no effect of inclusiveness on the RDCI? The fifth hypothesis
considering the prevalence of ELL learners cleared that up somewhat.
Prevalence of English Language Learners
For our fifth hypothesis, we examined a demographic, contextual theory that schools with
proportionally larger ELL student populations would have a more equitable representation of
ELL students in gifted education programs. Similar to the previous hypothesis, this one
examined a relationship between continuous variables: the proportion of the population that was
ELL and RDCI. We analyzed Pearson correlation coefficients (see Table 5) to test the null
hypothesis that no relationship exists between the prevalence of the ELL population in the school
and the school’s RDCI. The data from our sample would not support rejecting the null (r = .053,
p = .349, n = 310). Though the proportion of ELL students in the schools in the sample ranged

UNDERREPRESENTATION OF ENGLISH LANGUAGE LEARNERS 19
from 0.1% to 59.1%, there was no relationship between that variance and the RDCI metric of
underrepresentation of ELL students in gifted education. We also considered an exploratory test
of the relationship between the prevalence of the ELL population in a school and the prevalence
of ELL students in the gifted program (r = .499, p < .001, n = 310). Thus, the data in this sample
indicate that schools with proportionally larger ELL populations also have proportionally more
students identified for GT programs. However, the difference between the prevalence of ELL
students in the school population and the GT population remained large, and there was little or
no impact on the RDCI.
The final exploratory analysis considered how variables predict a school district’s RDCI
relative to ELL student representation in gifted education. We used a multiple regression model
to regress RDCI on four predictor variables (a) percent of the school population that is ELL, (b)
percent of the school population that is economically disadvantaged, (c) the inclusive nature of
the gifted program (percent of population identified GT), and (d) the proportion of the GT
population that is ELL. The four predictor variables accounted for 40% of the variance in RDCI
for this sample of schools, F(4, 303) = 50.18, p < .001. The estimated influence of each variable
in the model is presented in Table 6. The two variables that most predict RDCI were (a) the
proportion of the gifted population that is ELL and (b) the prevalence of ELL students in the
total population. It seems somewhat obvious that the proportion of the gifted population that is
ELL predicts RDCI—that variable is in the RDCI equation. However, the prevalence of ELL
students appears to be a suppressor in this model. A suppressor variable is recognized as one
having a large standardized beta but no correlation to the outcome variable (Courville &
Thompson, 2001; Ziglari, 2017). Prevalence of ELL students in the total population improved
the prediction of the criteria in the model not because it was related to RDCI (It is not related to

UNDERREPRESENTATION OF ENGLISH LANGUAGE LEARNERS 20
RDCI.) but because it is related to the proportion of the GT population that is ELL. The
regression model further supports the lack of a relationship between the inclusiveness of GT
identification (defined by higher percent identified) and the school’s RDCI score. It is potentially
noteworthy that the overall socio-economic profile of the school showed no relationship (r = .07,
β = .063, and rs2 = .012) to the RDCI score. ELL students are similarly underrepresented in
schools with little economic disadvantage and schools with significant economic disadvantage.
Discussion
While underrepresentation of racial and ethnic groups in gifted education has been a
well-documented phenomenon in gifted education (Peters, et al., 2019), linguistically diverse
students may experience even more pronounced underrepresentation in gifted education.
Advocacy for the inclusion of bilingual and ELL students in gifted education has persisted for
three decades (Barkan & Bernal, 1991). Bermúdez and Rakow (1993) reported that even in
districts with large Hispanic populations, very few schools were identifying gifted ELL students.
Similarly, Irby and Lara-Alecio (1996) found ELL students under-represented and articulated a
list of attributes of gifted ELL students to support pro-active efforts to identify these students.
More recently, Esquierdo and Arreguín-Anderson (2012) reported enrollment trends and argued
that bilingual students remain largely invisible in gifted education programs.
This study confirmed what Gubbins et al. (2018) found; ELL students are generally
underrepresented in gifted education programs. Using a representative nation-wide sample, we
applied the U.S. Department of Education’s formula to calculate RDCI and developed a five-
category designation to interpret those RDCI values. These categories used in conjunction with
RDCI can be used to determine not only underrepresentation but also the magnitude of that
underrepresentation for any population of interest. ELL students were consistently

UNDERREPRESENTATION OF ENGLISH LANGUAGE LEARNERS 21
underrepresented in gifted education in U.S. schools, and the underrepresentation was consistent
across all four census-designated regions of the U.S. This data-based finding is consistent with
three decades of expressed concern for the underrepresentation of ELL or bilingual students in
gifted education.
The effects of gifted education policy are infrequently studied, and analyses of the effects
of identification policies are infrequent even in the small group of policy studies (McBee et al.,
2012; Plucker, 2018). Identification policies vary from state to state (National Association for
Gifted Children & The Council of State Directors of Programs for the Gifted, 2015) with some
states describing very specific identification procedures (e.g. Ohio) and other states providing
open-ended guidelines allowing local schools to determine the particular measures and
recommendation protocols (e.g. Texas). This study conceptually replicated the results of the
Peters, et al. (2019) study that found little relationship between state policy mandates to identify
and equitable identification. While the Peters et al. study computed a representation index and
we computed the RDCI, both studies of national samples found similar levels of inequity in the
identification of ELL students in states with and without mandates. It might seem easy to
conclude that gifted education policy does not affect identification outcomes, but we caution
against that conclusion. The impact of policy for gifted identification is likely more nuanced than
the design of this study could detect. For instance, even in those states that do not have policy
mandates for gifted student identification, schools may be following very similar procedures for
the identification of gifted students. For instance, even in states without policy mandates, there
may be a state coordinator for gifted education services (e.g. Missouri) and state professional
organizations that support gifted education even in the absence of policy (e.g. California).

UNDERREPRESENTATION OF ENGLISH LANGUAGE LEARNERS 22
The results of this study are meaningful because the data indicate that the
underrepresentation of ELL students in gifted education is impervious to state-level gifted
identification policy mandates. Existing state policies might be beneficial, but the data would
indicate that they are not sufficient for equitable practices identifying ELL or bilingual students
for gifted education. Possible solutions might include a stronger equity-focused policy where
policy does exist. The McBee et al. (2012) study of the influence of local district policy stands
out as an example of how equitable identification might be improved with local policies that
directly influence identification practices. It is important to note that even in the McBee et al.
(2012) study, Black students and economically disadvantaged students were still proportionally
underrepresented, but the underrepresentation was less pronounced in the Plan B schools.
Perhaps the McBee et al. (2012) study points to possible solutions that may require intentional
modification of state identification policy in order to produce more equitable identification.
How inclusive a gifted education program is might be estimated by the proportion of the
total school population served by the program. In this sample of schools, the range of the
proportional size of the gifted program spanned from a minimum of less than 1% to 48%
identified gifted. The median proportion was 7.6 % identified gifted. Twenty percent of the
schools had less than 4% identified, and twenty percent had more than 12% identified. The data
provide little context for the reported value other than the inference that identifying a larger
proportion of students is inherently more inclusive than identifying a smaller proportion. Thus,
we acknowledge the limitations associated with designations of inclusiveness to the
identification procedures of schools based on this variable. Peters and Engerrand (2016)
suggested the manner in which students are identified or not identified may be more related to
underrepresentation than the specific assessments used. Similarly, two-step processes of

UNDERREPRESENTATION OF ENGLISH LANGUAGE LEARNERS 23
identification tend to lead to greater underrepresentation than universal screening processes
which consider every student for gifted education (McBee, Peters, & Miller, 2016). We found
that there was no relationship between the proportional size (inclusiveness) of the gifted program
and the underrepresentation of ELL students. We did find a small, positive relationship between
the inclusiveness of the gifted program and the proportion of the gifted program that was ELL,
but that relationship did not systematically improve the RDCI of the schools with greater
proportions of ELL students in the gifted program generally because they also had greater
proportions of ELL students in the total school population. Future studies might consider more
conceptually rich definitions of inclusive identification procedures that more carefully consider
the manner in which students are identified.
The data in our sample indicated no relationship between greater prevalence of ELL
students and better representation of ELL students in the gifted education program. ELL students
are the fastest-growing student group in U.S. schools, yet identifying them for gifted education
programs remains a challenge (Mun et al., 2016). The size of the ELL populations in our sample
varied from less than 1% to almost 60% of the student population in a school district. While we
hypothesized that greater prevalence of ELL students in a school district would be related to
more inclusive approaches to ELL students in gifted education, the data did not support that
relationship. Rigid gifted identification practices may remain dominant even when the school
context includes widespread cultural and linguistic diversity (Borland, 2009; Callahan, 2005).
Cultural differences have been found to impact the expression of giftedness (Esquivel &
Houtz, 1999). According to Harris et al. (2013), ELL students’ giftedness may be manifested in
different ways than non-ELL students; therefore, identification procedures may need to broaden
conceptions of giftedness. Typical school-based perceptions of giftedness do not seek

UNDERREPRESENTATION OF ENGLISH LANGUAGE LEARNERS 24
nontraditional approaches to identification that consider culture, linguistics, and ethnicity, as
important conduits of talent in ELL students (Frasier & Passow, 1994; Johnsen, 1999;
Montgomery, 2001). Before the underrepresentation of ELL gifted learners can be changed,
gatekeepers of gifted education need to more fully recognize the characteristics of these unique
learners as well as how their differences are reflected in inequities in GT procedures for
identification, assessment, and delivery of services.
Summary and Future Directions
This study examined five pre-preregistered hypotheses related to the underrepresentation
of ELL students in gifted education programs. The evidence strongly indicated
underrepresentation of ELL students in gifted education, and the process suggested an easy to
use heuristic for local schools to measure and interpret equitable and inequitable representation
in gifted education. While policy research regarding equitable identification remains sparse, this
study adds some evidence regarding the general ineffectiveness of policy to promote equity in
identification without specific equity-focused processes and/or accountability provisions. Gifted
education programs continue to harbor narrow conceptions of talent and potential. A more
inclusive approach to talent recognition and development might consider developing linguistic
fluency in more than one language as a strength or an indicator of talent (see Kettler, Shui, &
Johnsen, 2006). Expanding conceptions of giftedness toward talent development opens the
conversation to ask which talents specifically, and multilingualism is a viable answer that could
potentially expand bilingual or multi-lingual approaches to gifted education.
The body of research validating the underrepresentation of ELL students in gifted
education is well-established. However, good questions remain. While some research and
advocacy efforts include both linguistic diversity with ethnic and racial diversity, it is not clear

UNDERREPRESENTATION OF ENGLISH LANGUAGE LEARNERS 25
whether changes of policy and practice impact linguistically diverse students similarly to
English-L1 students from underrepresented race/ethnicity groups. Along those lines, additional
policy research is warranted on ways that identification policies influence equity-focused
practices in school districts. However, policy is not the only viable solution. We need to initiate
design-based studies with school systems willing to consider alternative approaches to
identification that are equity-focused. The path to inequity is nuanced and likely too are the
solutions.
Limitations
One of the limitations of ELL research is the temporary and fluid nature of the ELL
designation. For instance, some studies (Hakuta, Butler, & Witt, 2000) indicate that it takes
approximately five years of English learning interventions for students to master English as a
primary language of schooling/learning. For high ability students, the timeline may be shorter. In
some cases, students are removed from ELL programs after demonstrating English mastery; thus,
they are no longer classified as ELL. When we conduct database research (as in this study), the
data category of percent of students ELL may only reflect the students still in ELL programs, not
the students who have placed out of those programs.
Additionally, grouping schools into groups based on policy mandates may sound clear
and efficient, but policy in reality may be more complex than that. For instance, Missouri policy
says schools may identify gifted students; thus, we classify Missouri as a non-mandate state.
However, if a school district in Missouri chooses to identify, they are required to follow the state
policies for identification. Thus, the schools identifying gifted students in Missouri in effect are
not operating much differently than schools in policy-mandate states beyond the initial decision

UNDERREPRESENTATION OF ENGLISH LANGUAGE LEARNERS 26
to identify gifted and talented students in the absence of a mandate. Future studies may need to
consider policy nuances that are more discreet than mandate or no-mandate.

UNDERREPRESENTATION OF ENGLISH LANGUAGE LEARNERS 27
References
Baker, B. D. (2001). Measuring the outcomes of state policies for gifted education: An equity
analysis of Texas school district. Gifted Child Quarterly, 45(1), 4-15.
https://doi.org/10.1177/001698620104500102
Baker, B. D., & Friedman-Nimz, R. (2003). Gifted children, vertical equity, and state school
finance policies and practices. Journal of Educational Finance, 28, 523-555.
https://doi.org/10.3102/01623737026001039
Baker, B. D., & McIntire, J. (2003). Evaluating state funding for gifted education programs.
Roeper Review, 25, 173-179. https://doi.org/10.1080/02783190309554225
Barkan, J. H., & Bernal, E. M. (1991). Gifted education for bilingual and limited English
proficient students. Gifted Child Quarterly, 35, 144-147.
https://doi.org/10.1177/001698629103500306
Barrett, R. S. (1998). Challenging the myths of fair employment practices. Quorum.
Bermúdez, A., & Rakow, S. (1993). Analyzing teachers’ perception of identification procedures
for gifted and talented Hispanic limited English proficient students at-risk. The Journal of
Educational Issues of Language Minority Students, 7, 21-31.
https://eric.ed.gov/?id=EJ415108
Bernal, E. M. (2002). Three ways to achieve a more equitable representation of culturally and
linguistically different students in GT programs. Roeper Review, 24, 82-88.
https://doi.org/10.1080/02783190209554134
Bollmer, J. M., Bethel, J. W., Munk, T. E., & Bitterman, A. R. (2014). Methods for assessing
racial/ethnic disproportionality in special education: A technical assistance guide, rev.
ed. Westat.

UNDERREPRESENTATION OF ENGLISH LANGUAGE LEARNERS 28
Borland, J. H. (2009). Myth 2: The gifted constitute 3% to 5% of the population. Moreover,
giftedness equals high IQ, which is a stable measure of aptitude. Gifted Child Quarterly,
53, 236-238. https://doi.org/10.1177/0016986209346825
Callahan, C. M. (2005). Identifying gifted students from underrepresented populations. Theory
Into Practice, 44, 98-104. https://doi.org/10.1207/s15430421tip4402_4
California Association for the Gifted. (n.d.). Underrepresentation: A position paper.
http://c.ymcdn.com/sites/www.cagifted.org/resource/resmgr/docs/position17under.pdf
Castellano, J. (1998). Identifying and assessing gifted and talented bilingual Hispanic students.
Eric Clearinghouse on Rural Education and small schools.
Castellano, J. A., & Diaz, E. I. (Eds.). (2002). Reaching new horizons: Gifted and talented
education for culturally and linguistically diverse students. Allyn & Bacon.
Coronado, J., & Lewis, K. (2017). The disproportional representation of English language
learners in gifted and talented programs in Texas. Gifted Child Today, 40, 238–244.
https://doi.org/10.1177/1076217517722181
Courville, T., & Thompson, B. (2001). Use of structure coefficients in published multiple
regression articles: Beta is not enough. Educational and Psychological Measurement,
61(2), 229-248. https://doi.org/10.1177/0013164401612006
Department of Education (DOE), National Center for Education Statistics, Common Core of
Data. (2017). Local education agency universe survey. Digest of Education Statistics.
Donovan, M., & Cross, C. (Eds.). (2002). Minority students in special and gifted education.
National Academy Press.

UNDERREPRESENTATION OF ENGLISH LANGUAGE LEARNERS 29
Esquierdo, J. J., & Arreguín-Anderson, M. (2012). The “invisible” gifted and talented bilingual
students: A current report on enrollment in GT programs. Journal for the Education of
the Gifted, 35, 35-47. https://doi.org/10.1177/0162353211432041
Esquivel, G. B., & Houtz, J. C. (1999). Creativity and giftedness in culturally diverse students.
Hampton Press.
Farkas, G. (2003). Racial disparities and discrimination in education: What do we know, how do
we know it, and what do we need to know? Teachers College Record, 105, 1119-1146.
https://brainmass.com/file/1474172/Racial+Disparities+and+Discrimination+in+Educatio
n+What+Do+We+know%2C+How+Do+We+Know+It%2C+and+What+Do+We+Need+
to+Know-.pdf
Ford, D. Y., & Grantham, T. C. (2003). Providing access for culturally diverse gifted students:
From deficit to dynamic thinking. Theory Into Practice, 42, 217-225.
https://doi.org/10.1207/s15430421tip4203_8
Ford, D. Y., & Harris, J. J., III. (1999). Multicultural gifted education. Teachers College Press.
Ford, D. Y., & King, R. A. (2014). No blacks allowed: Segregated gifted education in the context
of Brown v. Board of Education. The Journal of Negro Education, 83, 300–310.
https://doi.org/10.7709/jnegroeducation.83.3.0300
Frasier, M. M., & Passow, A. H. (1994). Towards a new paradigm for identifying talent potential
(Research Monograph No. 94112). University of Connecticut, National Research
Center on the Gifted and Talented.
Frasier, M. M., García, J. H., & Passow, A. H. (1995). A review of assessment issues in gifted

UNDERREPRESENTATION OF ENGLISH LANGUAGE LEARNERS 30
education and their implications for identifying gifted minority students. The National
Research Center on the Gifted and Talented.
http://www.gifted.uconn.edu/nrcgt/reports/rm95204/rm95204.pdf
Gallagher, J. J. (2013). Political issues in gifted education. In C. M. Callahan & H. L. Hertberg-
Davis (Eds.), Fundamentals of gifted education: Considering multiple perspectives (pp.
458-469). Routledge.
Gallagher, J. J., & Coleman, M. R. (1994). A Javits project: Gifted education policy studies
program final. Gifted Education Policy Studies Program, University of North Carolina.
Gibb, A. C., & Skiba, R. J. (2008). Using data to address equity issues in special education.
Education Policy Brief, 6(3), 1–8. Center for Evaluation & Education Policy.
http://eric.ed.gov/?id=ED500606
Gregory, A., & Weinstein, R. S. (2008). The discipline gap and African Americans: Deviance or
cooperation in the high school classroom. Journal of School Psychology, 46(4), 455–475.
https://doi.org/10.1016/j.jsp.2007.09.001
Gubbins, E. J., Siegle, D., Hamilton, R., Peters, P., Carpenter, A. Y., O’Rourke, P., . . . Estepar-
Garcia, W. (2018). Exploratory study on the identification of English learners for gifted
and talented programs. Storrs: University of Connecticut, National Center for Research
on Gifted Education.
https://ncrge.uconn.edu/wpcontent/uploads/sites/982/2018/06/NCRGE-EL-Report-1.pdf
Harris, B., Plucker, J. A., Rapp, K. E., & Martínez, R. S. (2009). Identifying gifted and talented
English language learners: A case study. Journal for the Education of the Gifted, 32,
368-393. https://doi.org/10.4219/jeg-2009-858

UNDERREPRESENTATION OF ENGLISH LANGUAGE LEARNERS 31
Hakuta, K., Butler, Y. G., & Witt, D. (2000). How long does it take English learners to attain
proficiency? University of California Linguistic Minority Research Institute.
Irby, B. J., & Lara-Alecio, R. (1996). Attributes of Hispanic gifted bilingual students as
perceived by bilingual educators in Texas. SABE Journal, 11, 120-142.
https://www.researchgate.net/profile/Rafael_Lara-
Alecio/publication/267552699_Attributes_of_Hispanic_Gifted_Bilingual_Students_as_P
erceived_by_Bilingual_Educators_in_Texas/links/57f3aa7b08ae8da3ce536934.pdf
Johnsen, S. (1999). What the research says about Latino gifted and talented students.
Tempo, 19(2), 26–31.
Kettler, T., & Hurst, L. T. (2017). Advanced academic participation: A longitudinal analysis of
ethnicity gaps in suburban schools. Journal for the Education of the Gifted, 40, 3-19.
https://doi.org/10.1177/0162353216686217
Kettler, T., Russell, J., & Puryear, J. S. (2015). Inequitable access to gifted education: Variance
in funding and staffing based on locale and contextual school variables. Journal for the
Education of the Gifted, 38, 99-117. https://doi.org/10.1177/0162353215578277
Kettler, T., Shui, A., & Johnsen, S. J. (2006). AP as an intervention for middle school Hispanic
students. Gifted Child Today, 29(1), 39-46. https://doi.org/10.4219/gct-2006
Lakin, J. M., & Lohman, D. F. (2011). The predictive accuracy of verbal, quantitative, and
nonverbal reasoning tests: Consequences for talent identification and program diversity.
Journal for the Education of the Gifted, 34(4), 595–623.
https://doi.org/10.1177/016235321103400404

UNDERREPRESENTATION OF ENGLISH LANGUAGE LEARNERS 32
Lamb, K. N., Boedeker, P., & Kettler, T. (2019). Inequities of enrollment in gifted education: A
statewide application of the 20% equity allowance formula. Gifted Child Quarterly, 63,
205-224. https://doi.org/10.1177/0016986219830768
Lohman, D. F., Korb, K. A., & Lakin, J. M. (2008). Identifying academically gifted
English-language learners using nonverbal tests. Gifted Child Quarterly, 52(4),
275–296. https://doi.org/10.1177/0016986208321808
McBee, M. T., Peters, S. J., & Miller, E. M. (2016). The impact of the nomination stage on gifted
program identification: A comprehensive psychometric analysis. Gifted Child Quarterly,
60, 258-278. https://doi.org/10.1177/0016986216656256
McBee, M. T., Shaunessy, E., & Matthews, M. S. (2012). Policy matters: An analysis of district-
level efforts to increase identification of underrepresented learners. Journal of Advanced
Academics, 23, 326-344. https://doi.org/10.1177/1932202X12463511
Mickelson, R. (2003). When are racial disparities in education the result of racial discrimination?
A social science perspective. Teachers College Record, 105, 1052-1086.
https://doi.org/10.1111/1467-9620.00277
Montgomery, D. (Ed.). (2001). Able underachievers. Whurr.
Morita, N. (2004). Negotiating participation and identity in second language academic
communities. TOSEL Quarterly, 38, 573-603. https://doi.org.10.2307/3588281
Mun, R. U., Langley, S. D., Ware, S., Gubbins, E. J., Siegle, D., Callahan, C. M., McCoach, D.
B., Hamilton, R. (2016). Effective practices for identifying and serving English language
learners in gifted education: A systematic review of the literature. University of
Connecticut, National Center for Research on Gifted Education.

UNDERREPRESENTATION OF ENGLISH LANGUAGE LEARNERS 33
https://ncrge.uconn.edu/wp-content/uploads/sites/982/2016/01/NCRGE_EL_Lit-
Review.pdf
National Association for Gifted Children. (2011). Position statement: Identifying and serving
culturally and linguistically diverse gifted students.
https://www.nagc.org/sites/default/files/Position%20Statement/Identifying%20and%20Se
rving%20Culturally%20and%20Linguistically.pdf
National Association for Gifted Children & The Council of State Directors of Programs for the
Gifted. (2015). 2014-2015 State of the states in gifted education: Policy and practice
data. http://www.nagc.org/sites/default/files/key%20reports/2014-
2015%20State%20of%20the%20States%20%28final%29.pdf
Nishioka, V. (with Shigeoka, S., & Lolich, E.). (2017). School discipline data indicators: A
guide for districts and schools (REL 2017–240). U.S. Department of Education, Institute
of Education Sciences, National Center for Education Evaluation and Regional
Assistance, Regional Educational Laboratory Northwest. Retrieved from
http://ies.ed.gov/ncee/edlabs
Nel, J. (1992). The empowerment of minority students: Implications of Cummins’ model for
teacher education. Action in Teacher Education, 14(3), 38-45.
https://doi.org/10.1080/01626620.1992.10463130
Nesper, J. (1987). The role of beliefs in the practice of teaching. Journal of Curriculum Studies,
19, 317-328. https://doi.org/10.1080/0022027870190403
Patton, J. (1998). The disproportionate representation of African Americans in special education:
Looking behind the curtain for understanding and solutions. Journal of Special
Education, 32, 25–31. https://doi.org/10.1177/002246699803200104

UNDERREPRESENTATION OF ENGLISH LANGUAGE LEARNERS 34
Peters, S. J., & Engerrand, K. G. (2016). Equity and excellence: Proactive efforts in the
identification of underrepresented students for gifted and talented services. Gifted Child
Quarterly, 60, 159-171. https://doi.org/10.1177/0016986216643165
Peters, S. J., Gentry, M., Whiting, G. W., & McBee, M. T. (2019). Who gets served in gifted
education? Demographic representation and a call for action. Gifted Child Quarterly, 63,
273-287. https://doi.org/10.1177/0016986219833738
Plucker, J. A. (2018). Policy in gifted education. In J. L. Roberts, T. R. Inman, & J. H. Robins
(Eds.), Introduction to gifted education (pp. 435-449). Prufrock Press.
Plummer, D. (1995). Serving the needs of gifted children from a multicultural perspective. In J.
L. Genshaft, M. Birely, & C. L. Hollinger (Eds.), Serving gifted and talented students: A
resource for school personnel (pp. 285–300). Pro-Ed.
Poza, L. (2016). Barreras: Language ideologies, academic language, and the marginalization of
latin@ english language learners. Whittier Law Review, 37(3), 401-422.
https://heinonline.org/HOL/Page?handle=hein.journals/whitlr37&div=22&g_sent=1&cas
a_token=nBeiNmAD8FQAAAAA:ZgSQBW0fTmr1I_T3VGak8pFp5cuQIZsQ8mV3-
W5U0ena8Q10fTDIUM5AHwbMG33VK-3TEfAV&collection=journals
Purcell, J. H. (1992). State of the states: Programs for the gifted in a state without a mandate: An
“endangered species?” Roeper Review, 15, 93-95. doi.org/10.1080/02783199209553473
Purcell, J. H. (1993). The effects of the elimination of gifted and talented programs on
participating students and their parents. Gifted Child Quarterly, 37, 177-187.
https://doi.org/10.1177/001698629303700407
Purcell, J. H. (1995). Gifted education at a crossroads: The program status study. Gifted Child
Quarterly, 39(2), 57-65. https://doi.org/10.1177/001698629503900202

UNDERREPRESENTATION OF ENGLISH LANGUAGE LEARNERS 35
Stephens, K. R. (2020). Gifted education policy and advocacy: Perspectives for school
psychologists. Psychology in the Schools, Advanced Online Publication.
https://doi.org/10.1002/pits.22355
Texas Education Agency. (2016). Enrollment in Texas public schools 2014-2015.
https://tea.texas.gov/acctres/enroll_2014-15.pdf
United States Department of Education. (n.d.). Laws & guidance.
http://www2.ed.gov/policy/landing.jhtml?src=ftU.S
Vasquez, O. (2007). Latinos in the global context: Beneficiaries or irrelevants? Journal of
Latinos and Education, 6, 119–137. https://doi.org/10.31523/glmj.043002.002
Wright, B. L., Ford, D. Y., & Young, J. L. (2017). Ignorance or indifference? Seeking excellence
and equity for under‐ represented students of color in gifted education. Global Education
Review, 4(1), 45–60.
https://eric.ed.gov/contentdelivery/servlet/ERICServlet?accno=EJ1137997
Ziglari, L. (2017). Interpreting multiple regression results: β weights and structure coefficients.
General Linear Model Journal, 43(2), 13-22.
http://www.glmj.org/archives/articles/Ziglari_v43n2.pdf

UNDERREPRESENTATION OF ENGLISH LANGUAGE LEARNERS 36
Table 1
School Districts (n = 310) in the Sample by State, Region, and GT Policy Mandate
State Region of the
U.S.
Districts in
Sample
GT
Identification
Mandated
AK Alaska West 1 Yes
AL Alabama South 6 Yes
AR Arkansas South 1 Yes
AZ Arizona West 9 Yes
CA California West 44 No
CO Colorado West 11 Yes
CT Connecticut Northeast 1 No
DC Washington DC South 0 No
DE Delaware South 1 Yes
FL Florida South 28 Yes
GA Georgia South 18 Yes
HI Hawaii West 1 Yes
IA Iowa Midwest 1 Yes
ID Idaho West 2 Yes
IL Illinois Midwest 5 Yes
IN Indiana Midwest 2 Yes
KS Kansas Midwest 3 Yes
KY Kentucky South 2 Yes
LA Louisiana South 7 Yes
MA Massachusetts Northeast 2 No
MD Maryland South 9 Yes
ME Maine Northeast 1 Yes
MI Michigan Midwest 1 No
MN Minnesota Midwest 4 Yes
MO Missouri Midwest 1 No
MS Mississippi South 2 Yes
MT Montana West 1 Yes
NC North Carolina South 14 Yes
ND North Dakota Midwest 1 No
NE Nebraska Midwest 3 Yes
NH New Hampshire Northeast 1 No
NJ New Jersey Northeast 4 Yes
NM New Mexico West 2 Yes

UNDERREPRESENTATION OF ENGLISH LANGUAGE LEARNERS 37
NV Nevada West 2 Yes
NY New York Northeast 4 No
OH Ohio Midwest 3 Yes
OK Oklahoma South 4 Yes
OR Oregon West 2 Yes
PA Pennsylvania Northeast 1 Yes
RI Rhode Island Northeast 1 Yes
SC South Carolina South 9 Yes
SD South Dakota Midwest 1 No
TN Tennessee South 7 Yes
TX Texas South 56 Yes
UT Utah West 7 No
VA Virginia South 13 Yes
VT Vermont Northeast 0 No
WA Washington West 7 Yes
WI Wisconsin Midwest 2 Yes
WV West Virginia South 1 Yes
WY Wyoming West 1 No

UNDERREPRESENTATION OF ENGLISH LANGUAGE LEARNERS 38
Table 2
Describe Data for Variables Analyzed in the School Districts (n = 310)
Variable Minimum Maximum Mean SD
RDCI* -100.00 204.76 -77.28 32.21
Percent of Student Population ELL .10 59.10 12.99 10.70
Percent of Student Population
Identified GT <.01 48.00 8.69 6.17
Proportion of GT Population ELL 0 36.90 3.13 5.12
*Relative Difference in Composition Index

UNDERREPRESENTATION OF ENGLISH LANGUAGE LEARNERS 39
Table 3
Frequency of Schools in Each RDCI Category
RDCI > 20 20 to -20 -20.1 to -40 -40.1 to -60 < -60
Category Over
Representation Representative
Small Under
Representation
Medium Under
Representation
Large Under
Representation
Schools in
Present
Study
n = 310
n = 5
1.6%
n = 7
2.3%
n = 10
3.2%
n = 23
7.4%
n = 265
85.5%
UNDERREPRESENTATION OF ENGLISH LANGUAGE LEARNERS 40
Table 4
Comparing Regional Differences in ELL Underrepresentation (n=310)
West (n=87) Midwest (n=28) Northeast (n=14) South (n=174)
RDCI -80.4 (25.7) -81.1 (19.8) -86.5 (24.0) -74.4 (36.7)
% ELL Students 16.3 (11.1) 11.9 (7.3) 12.6 (7.4) 11.6 (10.9)
% FRLP Students 50.3 (21.6) 50.3 (22.8) 58.1 (28.4) 54.2 (20.1)
% Identified GT 8.1 (5.1) 7.8 (8.4) 5.2 (5.3) 9.4 (6.2)
% of Identified GT
ELL 3.6 (5.8) 2.4 (3.8) 1.2 (2.1) 3.2 (5.1)
Standard deviations in parentheses.

UNDERREPRESENTATION OF ENGLISH LANGUAGE LEARNERS 41
Table 5
Correlation Matrix of Observed Variables Related to Underrepresentation (n=310)
(1) (2) (3) (4)
(1) RDCI -
(2) % ELL .053 -
(3) % FRLP .070 .446** -
(4) % of Total GT .065 .045 -.101 -
(5) Percent of GT ELL .499** .673** .291** 148**
** p < 0.01 (2-tailed)

UNDERREPRESENTATION OF ENGLISH LANGUAGE LEARNERS 42
Table 6
Estimating Strength of Variables to Predict RDCI Relative to ELL Students (n=310)
t p β
Squared
Structure
Coefficient rs2
Zero-Order
Correlation
Prevalence of ELL Students
in a School Population 8.51 <.001 -.551 .008 .056
Prevalence of Economic
Disadvantage in a School 1.26 .208 .063 .012 .070
Percent of the Population
Identified as GT 0.64 .521 -.029 .010 .064
Percent of the Identified GT
Population that is ELL 13.98 <.001 .857 .623 .498
Multiple regression model accounted for 40% of variance. R = .631, R2 = .398

UNDERREPRESENTATION OF ENGLISH LANGUAGE LEARNERS 43
Figure 1. Representative Ethnicity of the Sample. In this graph, the sample bar represents the
mean ethnicity of all the school districts in the sample and the NCES totals bar represents the
proportional representation of students in all the U.S. public schools.
1
6
20
31
0.5
38
41
5
15
27
0.5
48
4
0
10
20
30
40
50
60
AmericanIndian
Asian Black Hispanic PacificIslander
White Two or More
Race/Ethnicity of Sample Schools Compared to All U.S. Public Schools (NCES Totals)
Sample NCES Totals
Copyright © 2022 FDOKUMEN