A Language-Independent Approach to Automatic Text Difficulty Assessment for Second-Language Learners
95
ACL 2013 Predicting and Improving Text Readability for Target Reader Populations Proceedings of the Workshop August 8, 2013 Sofia, Bulgaria
-
Upload
independent -
Category
Documents
-
view
1 -
download
0
Transcript of A Language-Independent Approach to Automatic Text Difficulty Assessment for Second-Language Learners

ACL 2013
Predicting and Improving Text Readability for Target ReaderPopulations
Proceedings of the Workshop
August 8, 2013Sofia, Bulgaria
Production and Manufacturing byOmnipress, Inc.2600 Anderson StreetMadison, WI 53704 USA
c©2013 The Association for Computational Linguistics
Order copies of this and other ACL proceedings from:
Association for Computational Linguistics (ACL)209 N. Eighth StreetStroudsburg, PA 18360USATel: +1-570-476-8006Fax: [email protected]
ISBN 978-1-937284-64-0
ii

Introduction
Welcome to the second International Workshop on Predicting and Improving Text Readability for TargetReader Populations (PITR).
The last few years have seen a resurgence of work on text simplification and readability. Examplesinclude learning lexical and syntactic simplification operations from Simple English Wikipedia revisionhistories, exploring more complex lexico-syntactic simplification operations requiring morphologicalchanges as well as constituent reordering, simplifying mathematical form, applications for target userssuch as deaf students, second language learners and low literacy adults, and fresh attempts at predictingreadability.
The PITR 2013 workshop has been organised to provide a cross-disciplinary forum for discussing keyissues related to predicting and improving text readability for target users. It will be held on August 8,2013 in conjunction with the 51st Conference of the Association for Computational Linguistics in Sofia,Bulgaria, and is sponsored by the ACL Special Interest Group on Speech and Language Processing forAssistive Technologies (SIG-SLPAT).
These proceedings include nine papers that cover various perspectives on the topic. Papers this yearfall into 3 broad categories: (i) Readability Enhancement, where the aim is to improve text quality insome way (e.g., inserting punctuation) or tailor text for specific users (e.g., hearing-impaired readers);(ii) Predicting the reading level of text, where approaches vary from psycho-linguistic measurements(e.g. reading time) to standard readability measures applied to particular genres (e.g., web texts); and(iii) Text Simplification, where papers address learning from corpora as well as evaluation metrics forsimplification systems.
We hope this volume is a valuable addition to the literature, and look forward to an exciting Workshop.
Sandra WilliamsAdvaith SiddharthanAni Nenkova
iii


Organizers:
Sandra Williams, The Open University, UK.Advaith Siddharthan, University of Aberdeen, UK.Ani Nenkova, University of Pennsylvania, USA.
Program Committee:
Julian Brooke, University of Toronto, Canada.Kevyn Collins-Thompson, Microsoft Research (Redmond), USA.Siobhan Devlin, University of Sunderland, UK.Micha Elsner, University of Edinburgh, UK.Thomas François, University of Louvain, Belgium.Caroline Gasperin, TouchType Ltd., UK.Albert Gatt, University of Malta, Malta.Pablo Gervás, Universidad Complutense de Madrid, Spain.Iryna Gurevych, Technische Universitat Darmstadt, Germany.Raquel Hervás, Universidad Complutense de Madrid, Spain.Véronique Hoste, University College Ghent, Belgium.Matt Huenerfauth, The City University of New York (CUNY), USA.Iustina Ilisei, University of Wolverhampton, UK.Annie Louis, University of Pennsylvania, USA.Hitoshi Nishikawa, NTT, Japan.Ehud Reiter, University of Aberdeen, UK.Horacio Saggion, Universitat Pompeu Fabra, Spain.Irina Temnikova, University of Wolverhampton, UK.Ielka van der Sluis, University of Groningen, The Netherlands.Kristian Woodsend, University of Edinburgh, UK.
v

Invited Speaker:
Annie Louis, University of Edinburgh, UK.
Identifying outstanding writing: Corpus and experiments based on the science journalism genre
I will discuss the hitherto unexplored area of text quality prediction: identifying outstanding piecesof writing. A system to do this task will benefit article recommendation and information retrieval.To do the task, we need to not only be able to measure spelling, grammar and organization qualitybut also quantify creative and engaging writing and topic. In addition, new resources are needed asexisting corpora are focused on non-native student writing, output of text generation systems andartificial manipulation to create texts with low quality writing.
I will propose the science journalism genre as an apt one for such text quality experiments. Sciencejournalism pieces entertain a reader as much as they teach and inform. I will introduce a corpusof science journalism articles which we have collected for use in text quality studies. The corpuscontains science journalism pieces from the New York Times split into two categories—written byaward-winning journalists and others. This corpus offers many desirable properties which wereunavailable in previous resources. It represents realistic differences in writing quality, samples arebased on professional writers rather than language learners, contains thousands of articles, andis publicly available. I will also describe automatic measures based on visual elements, surprisaland structure of these articles which are indicative of outstanding articles in the corpus and alsoturn out complementary to traditional metrics to quantify readability and organization quality ofwriting.
Bio: Annie Louis is a Newton International Fellow at the University of Edinburgh. She completedher PhD at University of Pennsylvania with a thesis on text quality prediction. She has also workedon automatic summarization and discourse parsing. She is currently working on discourse anddocument-level issues in machine translation. Annie has received a EMNLP best paper award anda SIGDIAL best student paper award.
vi

Table of Contents
Sentence Simplification as Tree TransductionDan Feblowitz and David Kauchak . . . . . . . . . . . . . . . . . . . . . . . . . . . . . . . . . . . . . . . . . . . . . . . . . . . . . . . . 1
Building a German/Simple German Parallel Corpus for Automatic Text SimplificationDavid Klaper, Sarah Ebling and Martin Volk . . . . . . . . . . . . . . . . . . . . . . . . . . . . . . . . . . . . . . . . . . . . . . 11
The C-Score – Proposing a Reading Comprehension Metrics as a Common Evaluation Measure for TextSimplification
Irina Temnikova and Galina Maneva . . . . . . . . . . . . . . . . . . . . . . . . . . . . . . . . . . . . . . . . . . . . . . . . . . . . . . 20
A Language-Independent Approach to Automatic Text Difficulty Assessment for Second-Language Learn-ers
Wade Shen, Jennifer Williams, Tamas Marius and Elizabeth Salesky . . . . . . . . . . . . . . . . . . . . . . . . . 30
Text Modification for Bulgarian Sign Language Users, Slavina Lozanova, Ivelina Stoyanova, , Svetlozara Leseva, , Svetla Koeva and Boian Savtchev .39
Modeling Comma Placement in Chinese Text for Better Readability using Linguistic Features and GazeInformation
Tadayoshi Hara, Chen Chen, Yoshinobu Kano and Akiko Aizawa . . . . . . . . . . . . . . . . . . . . . . . . . . . . 49
On The Applicability of Readability Models to Web TextsSowmya Vajjala and Detmar Meurers . . . . . . . . . . . . . . . . . . . . . . . . . . . . . . . . . . . . . . . . . . . . . . . . . . . . . 59
A Pilot Study of Readability Prediction with Reading TimeHitoshi NISHIKAWA, Toshiro MAKINO and Yoshihiro MATSUO . . . . . . . . . . . . . . . . . . . . . . . . . . 69
The CW Corpus: A New Resource for Evaluating the Identification of Complex WordsMatthew Shardlow . . . . . . . . . . . . . . . . . . . . . . . . . . . . . . . . . . . . . . . . . . . . . . . . . . . . . . . . . . . . . . . . . . . . . . 76
vii


Workshop Program(August 8, 2013)
09:20 – 10.30 Session 1: Plenary
09:20 Welcome and Introduction
09:30 Invited Talk: Identifying outstanding writing: Corpus and experimentsbased on the science journalism genreAnnie Louis, University of Edinburgh
10:30 – 11.00 Coffee break
11:00 – 12.30 Session 2: Posters
11:00 Poster Teasers
11:20 Poster Session
Sentence Simplification as Tree TransductionDan Feblowitz and David Kauchak
Building a German/Simple German Parallel Corpus for Automatic Text Simpli-ficationDavid Klaper, Sarah Ebling and Martin Volk
The C-Score – Proposing a Reading Comprehension Metrics as a Common Eval-uation Measure for Text SimplificationIrina Temnikova and Galina Maneva
A Language-Independent Approach to Automatic Text Difficulty Assessment forSecond-Language LearnersWade Shen, Jennifer Williams, Tamas Marius and Elizabeth Salesky
Guest paper: A System for the Simplification of Numerical Expressions at Differ-ent Levels of UnderstandabilitySusana Bautista, Raquel Hervás, Pablo Gervás, Richard Powerand SandraWilliams (2013). Proc. Workshop on NLP for Improving Textual Accessibil-ity (NLP4ITA), Atlanta, USA, pp.10–19.
12:30 – 14:00 Lunch break
ix

14:00 – 15:30 Session 3: Presentations
14:00 Text Modification for Bulgarian Sign Language UsersSlavina Lozanova, Ivelina Stoyanova, , Svetlozara Leseva, , Svetla Koeva andBoian Savtchev
14:20 Modeling Comma Placement in Chinese Text for Better Readability usingLinguistic Features and Gaze InformationTadayoshi Hara, Chen Chen, Yoshinobu Kano and Akiko Aizawa
14:40 On The Applicability of Readability Models to Web TextsSowmya Vajjala and Detmar Meurers
15:00 Report from NLP4ITA 2013Horacio Saggion
15:20 – 16:00 Tea break
16:00 – 1700 Session 4: Presentations and Close
16:00 The CW Corpus: A New Resource for Evaluating the Identification ofComplex WordsMatthew Shardlow
16:20 A Pilot Study of Readability Prediction with Reading TimeHitoshi NISHIKAWA, Toshiro MAKINO and Yoshihiro MATSUO
16:50 Final Discussion and Close
x
Proceedings of the 2nd Workshop on Predicting and Improving Text Readability for Target Reader Populations, pages 1–10,Sofia, Bulgaria, August 4-9 2013. c©2013 Association for Computational Linguistics
Sentence Simplification as Tree Transduction
Dan FeblowitzComputer Science Department
Pomona CollegeClaremont, CA
David KauchakComputer Science Department
Middlebury CollegeMiddlebury, VT
Abstract
In this paper, we introduce a syntax-basedsentence simplifier that models simplifi-cation using a probabilistic synchronoustree substitution grammar (STSG). To im-prove the STSG model specificity we uti-lize a multi-level backoff model with addi-tional syntactic annotations that allow forbetter discrimination over previous STSGformulations. We compare our approachto T3 (Cohn and Lapata, 2009), a re-cent STSG implementation, as well astwo state-of-the-art phrase-based sentencesimplifiers on a corpus of aligned sen-tences from English and Simple EnglishWikipedia. Our new approach performssignificantly better than T3, similarly tohuman simplifications for both simplicityand fluency, and better than the phrase-based simplifiers for most of the evalua-tion metrics.
1 Introduction
Text simplification is aimed at reducing the read-ing and grammatical complexity of text while re-taining the meaning. Text simplification has ap-plications for children, language learners, peoplewith disabilities (Carroll et al., 1998; Feng, 2008)and in technical domains such as medicine (El-hadad, 2006), and can be beneficial as a prepro-cessing step for other NLP applications (Vickreyand Koller, 2008; Miwa et al., 2010). In this paperwe introduce a new probabilistic model for sen-tence simplification using synchronous tree sub-stitution grammars (STSG).
Synchronous grammars can be viewed as simul-taneously generating a pair of recursively relatedstrings or trees (Chiang, 2006). STSG grammarrules contain pairs of tree fragments called ele-mentary trees (Eisner, 2003; Cohn and Lapata,
2009; Yamangil and Shieber, 2010). The leavesof an elementary tree can be either terminal, lex-ical nodes or aligned nonterminals (also referredto as variables or frontier nodes). Because ele-mentary trees may have any number of internalnodes structured in any way STSGs allow for morecomplicated derivations not expressible with othersynchronous grammars.
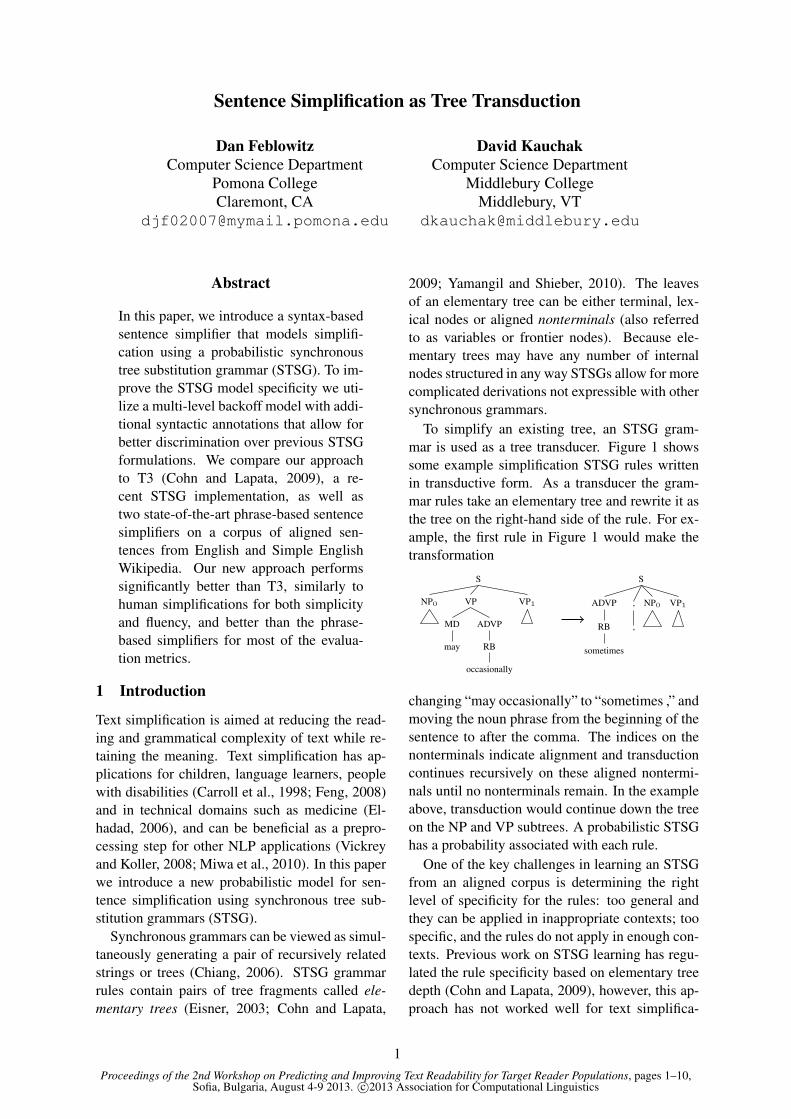
To simplify an existing tree, an STSG gram-mar is used as a tree transducer. Figure 1 showssome example simplification STSG rules writtenin transductive form. As a transducer the gram-mar rules take an elementary tree and rewrite it asthe tree on the right-hand side of the rule. For ex-ample, the first rule in Figure 1 would make thetransformation
S
VP1VP
ADVP
RB
occasionally
MD
may
NP0
S
VP1NP0,
,
ADVP
RB
sometimes
changing “may occasionally” to “sometimes ,” andmoving the noun phrase from the beginning of thesentence to after the comma. The indices on thenonterminals indicate alignment and transductioncontinues recursively on these aligned nontermi-nals until no nonterminals remain. In the exampleabove, transduction would continue down the treeon the NP and VP subtrees. A probabilistic STSGhas a probability associated with each rule.
One of the key challenges in learning an STSGfrom an aligned corpus is determining the rightlevel of specificity for the rules: too general andthey can be applied in inappropriate contexts; toospecific, and the rules do not apply in enough con-texts. Previous work on STSG learning has regu-lated the rule specificity based on elementary treedepth (Cohn and Lapata, 2009), however, this ap-proach has not worked well for text simplifica-
1

S(NP0 VP(MD(may) ADVP(RB(occasionally))) VP1) → S(ADVP(RB(sometimes)) ,(,) NP0 VP1)NP(NNS0) → NP(NNS0)
NP(JJ0 NNS1) → NP(JJ0 NNS1)VP(VB0 PP(IN(in) NP1)) → VP(VB0 NP1)
VB(assemble), → VB(join)JJ(small) → JJ(small)
NNS(packs) → NNS(packs)NNS(jackals) → NNS(jackals)
Figure 1: Example STSG rules representing the maximally general set for the aligned trees in Figure 2.The rules are written in transductive form. Aligned nonterminals are indicated by indices.
tion (Coster and Kauchak, 2011a). In this pa-per, we take a different approach and augment thegrammar with additional information to increasethe specificity of the rules (Galley and McKeown,2007). We combine varying levels of grammaraugmentation into a single probabilistic backoffmodel (Yamangil and Nelken, 2008). This ap-proach creates a model that uses specific ruleswhen the context has been previously seen in thetraining data and more general rules when the con-text has not been seen.
2 Related Work
Our formulation is most closely related to the T3model (Cohn and Lapata, 2009), which is alsobased on the STSG formalism. T3 was devel-oped for the related problem of text compression,though it supports the full range of transforma-tion operations required for simplification. We usea modified version of their constituent alignmentand rule extraction algorithms to extract the ba-sic STSG rules with three key changes. First, T3modulates the rule specificity based on elemen-tary tree depth, while we use additional grammarannotations combined via a backoff model allow-ing for a broader range of context discrimination.Second, we learn a probabilistic model while T3learns the rule scores discriminatively. T3’s dis-criminative training is computationally prohibitivefor even modest sized training sets and a proba-bilistic model can be combined with other proba-bilities in a meaningful way. Third, our implemen-tation outputs an n-best list which we then rerankbased on a trained log-linear model to select thefinal candidate.
Zhu et al. (2010) suggest a probabilistic, syntax-based approach to text simplification. Unlike theSTSG formalism, which handles all of the trans-formation operations required for sentence simpli-fication in a unified framework, their model usesa combination of hand-crafted components, each
designed to handle a different transformation op-eration. Because of this model rigidity, their sys-tem performed poorly on evaluation metrics thattake into account the content and relative to othersimplification systems (Wubben et al., 2012).
Woodsend and Lapata (2011) introduce a quasi-synchronous grammar formulation and pose thesimplification problem as an integer linear pro-gram. Their model has similar representational ca-pacity to an STSG, though the learned models tendto be much more constrained, consisting of <1000rules. With this limited rule set, it is impossibleto model all of the possible lexical substitutionsor to handle simplifications that are strongly con-text dependent. This quasi-synchronous grammarapproach performed better than Zhu et al. (2010)in a recent comparison, but still performed worsethan recent phrase-based approaches (Wubben etal., 2012).
A number of other approaches exist that useSimple English Wikipedia to learn a simplifica-tion model. Yatskar et al. (2010) and Biran etal. (2011) learn lexical simplifications, but do nottackle the more general simplification problem.Coster and Kauchak (2011a) and Wubben et al.(2012) use a modified phrase-based model basedon a machine translation framework. We compareagainst both of these systems. Qualitatively, wefind that phrasal models do not have the represen-tative power of syntax-based approaches and tendto only make small changes when simplifying.
Finally, there are a few early rule-based sim-plification systems (Chandrasekar and Srinivas,1997; Carroll et al., 1998) that provide motivationfor recent syntactic approaches. Feng (2008) pro-vides a good overview of these.
3 Probabilistic Tree-to-TreeTransduction
We model text simplification as tree-to-tree trans-duction with a probabilistic STSG acquired from
2

S1
VP
VP4
PP6
NP6
NNS8
packs
JJ7
small
IN
in
VB5
assemble
ADVP
RB
occasionally
MD
may
NP2
NNS3
jackals
S1
VP4
NP6
NNS8
packs
JJ7
small
VB5
join
NP2
NNS3
jackals
,
,
ADVP
RB
sometimes
Figure 2: An example pair of constituent aligned trees generated by the constituent alignment algorithm.Aligned constituents are indicated with a shared index number (e.g. NP2 is aligned to NP2).
a parsed, sentence-aligned corpus between normaland simplified sentences. To learn the grammar,we first align tree constituents based on an in-duced word alignment then extract grammar rulesthat are consistent with the constituent alignment.To improve the specificity of the grammar weaugment the original rules with additional lexi-cal and positional information. To simplify a sen-tence based on the learned grammar, we generatea finite-state transducer (May and Knight, 2006)and use the transducer to generate an n-best listof simplifications. We then rerank the n-best listof simplifications using a trained log-linear modeland output the highest scoring simplification. Thesubsections below look at each of these steps inmore detail. Throughout the rest of this paper, wewill refer to the unsimplified text/trees as normaland the simplified variants as simple.
3.1 Rule Extraction
Given a corpus of pairs of trees representing nor-mal and simplified sentences, the first step is toextract a set of basic STSG production rules fromeach tree pair. We used a modified version of thealgorithm presented by Cohn and Lapata (2009).Due to space constraints, we only present herea brief summary of the algorithm along with ourmodifications to the original algorithm. See Cohnand Lapata (2009) for more details.
Word-level alignments are learned usingGiza++ (Och and Ney, 2000) then tree nodes (i.e.constituents) are aligned if: there exists at leastone pair of nodes below them that is aligned andall nodes below them are either aligned to a nodeunder the other constituent or unaligned. Giventhe constituent alignment, we then extract theSTSG production rules. Because STSG rules can
have arbitrary depth, there are often many possiblesets of rules that could be extracted from a pairof trees.1 Following Cohn and Lapata (2009)we extract the maximally general rule set froman aligned pair of input trees that is consistentwith the alignment: the set of rules capable ofsynchronously deriving the original aligned treepair consisting of rules with the smallest depth.Figure 2 shows an example tree pair that hasbeen constituent aligned and Figure 1 shows theextracted STSG rules.
We modify the constituent alignment algorithmfrom Cohn and Lapata (2009) by adding the re-quirement that if node b with parent a are bothaligned to node z and its parent y, we only alignthe pairs (a, y) and (b, z), i.e. align the childrenand align the parents. This eliminates a commonoccurrence where too many associations are madebetween a pair of preterminal nodes and their chil-dren. For example, for the sentences shown in Fig-ure 2 the word alignment contains “assemble”aligned to “join”. Under the original definitionfour aligned pairs would be generated:
VB
assemble
VB
join
but only two under our revised definition:
VB
assemble
VB
join
This revised algorithm reduces the size of thealignment, decreasing the number of cases whichmust be checked during grammar extraction whilepreserving the intuitive correspondence.
1There is always at least one set of rules that can generatea tree pair consisting of the entire trees.
3

3.2 Grammar GenerationDuring the production rule extraction process, weselect the production rules that are most general.More general rules allow the resulting transducerto handle more potential inputs, but can also re-sult in unwanted transformations. When generat-ing the grammar, this problem can be mitigated byalso adding more specific rules.
Previous approaches have modulated rule speci-ficity by incorporating rules of varying depth inaddition to the maximally general rule set (Cohnand Lapata, 2009), though this approach can beproblematic. Consider the aligned subtrees rootedat nodes (VP4, VP4) in Figure 2. An STSG learn-ing algorithm that controls rule specificity basedon depth must choose between generating the rule:
VP(VB0 PP(IN(in) NP1))→ VP(VB0 NP1)
which drops the preposition, or a deeper rule thatincludes the lexical leaves such as:
VP(VB(assemble) PP(IN(in) NP1))→ VP(VB(join) NP1)
orVP(VB(assemble) PP(IN(in) NP(JJ0 NNS1)))→
VP(VB(join) NP(JJ0 NNS1))
If either of the latter rule forms is chosen, theapplicability is strongly restricted because of thespecificity and lexical requirement. If the formerrule is chosen and we apply this rule we couldmake the following inappropriate transformation:
VP
PP
NP
NN
cafeteria
DT
the
IN
in
VB
eat
VP
NP
NN
cafeteria
DT
the
VB
eat
simplifying “eat in the cafeteria” to “eat the cafe-teria”.
We adopt a different approach to increase therule specificity. We augment the production rulesand resulting grammar with several parse tree an-notations shown previously to improve SCFG-based sentence compression (Galley and McKe-own, 2007) as well as parsing (Collins, 1999): par-ent annotation, head-lexicalization, and annotationwith the part of speech of the head word.
Following Yamangil and Nelken (2008), welearn four different models and combine them intoa single backoff model. Each model level in-creases specificity by adding additional rule anno-tations. Model 1 contains only the original pro-duction rules. Model 2 adds parent annotation,
Model 3 adds the head child part of speech andModel 4 adds head child lexicalization. The headchild was determined using the set of rules fromCollins (1999). Figure 3 shows the four differentmodel representations for the VP rule above.
3.3 Probability EstimationWe train each of the four models individually us-ing maximum likelihood estimation over the train-ing corpus, specifically:
p(s|n) =count(s ∧ n)
count(n)
where s and n are tree fragments with that level’sannotation representing the right and left sides ofthe rule respectively.
During simplification, we start with the mostspecific rules, i.e. Model 4. If a tree fragmentwas not observed in the training data at that modellevel, we repeatedly try a model level simpler untila model is found with the tree fragment (Yamangiland Nelken, 2008). We then use the probabilitydistribution given by that model. A tree fragmentonly matches at a particular level if all of the anno-tation attributes match for all constituents. If noneof the models contain a given tree fragment we in-troduce a rule that copies the tree fragment withprobability one.
Two types of out-of-vocabulary problems canoccur and the strategy of adding copy rules pro-vides robustness against both. In the first, an inputcontains a tree fragment whose structure has neverbeen seen in training. In this case, copy rules allowthe structure to be reproduced, leaving the systemto make more informed changes lower down in thetree. In the second, the input contains an unknownword. This only affects transduction at the leavesof the tree since at the lower backoff levels nodesare not annotated with words. Adding copy rulesallows the program to retain, replace, or delete un-seen words based only on the probabilities of ruleshigher up for which it does have estimates. In bothcases, the added copy rules make sure that any in-put tree will have an output.
3.4 Decoding and RerankingGiven a parsed sentence to simplify and the prob-abilistic STSG grammar, the last step is to find themost likely transduction (i.e. simplification) of theinput tree based on the grammar. To accomplishthis, we convert the STSG grammar into an equiv-alent finite tree-to-tree transducer: each STSG
4

Model 1: VP (VB0 PP (IN(in) NP1))→ VP (VB0 NP1)Model 2: VPˆVP (VBˆVP0 PPˆVP (INˆPP (in) NPˆPP1))→ VPˆS (VBˆVP0 NPˆVP1)Model 3: VP[VB]ˆVP (VBˆVP0 PP[NNS]ˆVP (INˆPP (in) NP[NNS]ˆPP1))→
VP[VB]ˆS (VBˆVP0 NP[NNS]ˆVP1)Model 4: VP[VB-assemble]ˆVP (VB[assemble]ˆVP0 PP[NNS-packs]ˆVP (IN[in]ˆPP (in) NP[NNS-packs]ˆPP1))→
VP[VB-join]ˆS (VB[join]ˆVP0 NP[NNS-packs]ˆVP1)
Figure 3: The four levels of rule augmentation for an example rule ranging from Model 1 with noadditional annotations to Model 4 with all annotations. The head child and head child part of speech areshown in square brackets and the parent constituent is annotated with ˆ.
grammar rule represents a state transition and isweighted with the grammar rule’s probability. Wethen use the Tiburon tree automata package (Mayand Knight, 2006) to apply the transducer to theparsed sentence. This yields a weighted regulartree grammar that generates every output tree thatcan result from rewriting the input tree using thetransducer. The probability of each output tree inthis grammar is equal to the product of the proba-bilities of all rewrite rules used to produce it.
Using this output regular tree grammar andTiburon, we generate the 10,000 most probableoutput trees for the input parsed sentence. Wethen rerank this candidate list based on a log-linearcombination of features:
- The simplification probability based on theSTSG backoff model.
- The probability of the output tree’s yield, asgiven by an n-gram language model trained onthe simple side of the training corpus using theIRSTLM Toolkit (Federico et al., 2008).
- The probability of the sequence of the part ofspeech tags in the output tree, as given by an n-gram model trained on the part of speech tags ofthe simple side of the training corpus.
- A two-sided length penalty decreasing the scoreof output sentences whose length, normalized bythe length of the input, deviates from the trainingcorpus mean, found empirically to be 0.85.
The first feature represents the simplification like-lihood based on the STSG grammar describedabove. The next two features ensure that outputsare well-formed according to the language usedin Simple English Wikipedia. Finally, the lengthpenalty is used to prevent both over-deletion andover-insertion of out-of-source phrases. In addi-tion, the length feature mean could be reduced orincreased to encourage shorter or longer simplifi-cations if desired.
The weights of the log-linear model are opti-mized using random-restart hill-climbing search(Russell and Norvig, 2003) to maximize BLEU(Papineni et al., 2002) on a development set.2
4 Experiment Setup
To train and evaluate the systems we used the dataset from Coster and Kauchak (2011b) consistingof 137K aligned sentence pairs between SimpleEnglish Wikipedia and English Wikipedia. Thesentences were parsed using the Berkeley Parser(Petrov and Klein, 2007) and the word alignmentsdetermined using Giza++ (Och and Ney, 2000).We used 123K sentence pairs for training, 12K fordevelopment and 1,358 for testing.
We compared our system (SimpleTT – simpletree transducer) to three other simplification ap-proaches:
T3: Another STSG-based approach (Cohn and La-pata, 2009). Our approach shares similar con-stituent alignment and rule extraction algorithms,but our approach differs in that it is generativeinstead of discriminative, and T3 increases rulespecificity by increasing rule depth, while we em-ploy a backoff model based on grammar augmen-tation. In addition, we employ n-best rerankingbased on a log-linear model that incorporates anumber of additional features.
The code for T3 was obtained from the au-thors.3 Due to performance limitations, T3 wasonly trained on 30K sentence pairs. T3 was run onthe full training data for two weeks, but it neverterminated and required over 100GB of memory.The slow algorithmic step is the discriminativetraining, which cannot be easily parallelized. T3was tested for increasing amounts of data up to
2BLEU was chosen since it has been used successfully inthe related field of machine translation, though this approachis agnostic to evaluation measure.
3http://staffwww.dcs.shef.ac.uk/people/T.Cohn/t3/
5
30K training pairs and the results on the automaticevaluation measures did not improve.
Moses-Diff: A phrase-based approach based onthe Moses machine translation system (Koehn etal., 2007) that selects the simplification from the10-best output list that is most different from theinput sentence (Wubben et al., 2012). Moses-Diffhas been shown to perform better than a numberof recent syntactic systems including Zhu et al.(2010) and Woodsend and Lapata (2011).
Moses-Del: A phrase-based approach also basedon Moses which incorporates phrasal deletion(Coster and Kauchak, 2011b). The code was ob-tained from the authors.
For an additional data point to understand thebenefit of the grammar augmentation, we alsoevaluated a deletion-only system previously usedfor text compression and a variant of that sys-tem that included the grammar augmentation de-scribed above. K&M is a synchronous contextfree grammar-based approach (Knight and Marcu,2002) and augm-K&M adds the grammar aug-mentation along with the four backoff levels.
There are currently no standard evaluation met-rics for text simplification. Following previouswork (Zhu et al., 2010; Coster and Kauchak,2011b; Woodsend and Lapata, 2011; Wubbenet al., 2012) we evaluated the systems usingautomatic metrics to analyze different systemcharacteristics and human evaluations to judge thesystem quality.
Automatic Evaluation- BLEU (Papineni et al., 2002): BLEU measures
the similarity between the system output and ahuman reference and has been used successfullyin machine translation. Higher BLEU scores arebetter, indicating an output that is more similarto the human reference simplification.
- Oracle BLEU: For each test sentence we gener-ate the 1000-best output list and greedily selectthe entry with the highest sentence-level BLEUscore. We then calculate the BLEU score overthe entire test set for all such greedily selectedsentences. The oracle score provides an analy-sis of the generation capacity of the model andgives an estimate of the upper bound on theBLEU score attainable through reranking.
- Length ratio: The ratio of the length of the orig-inal, unsimplified sentence and the system sim-plified sentence.
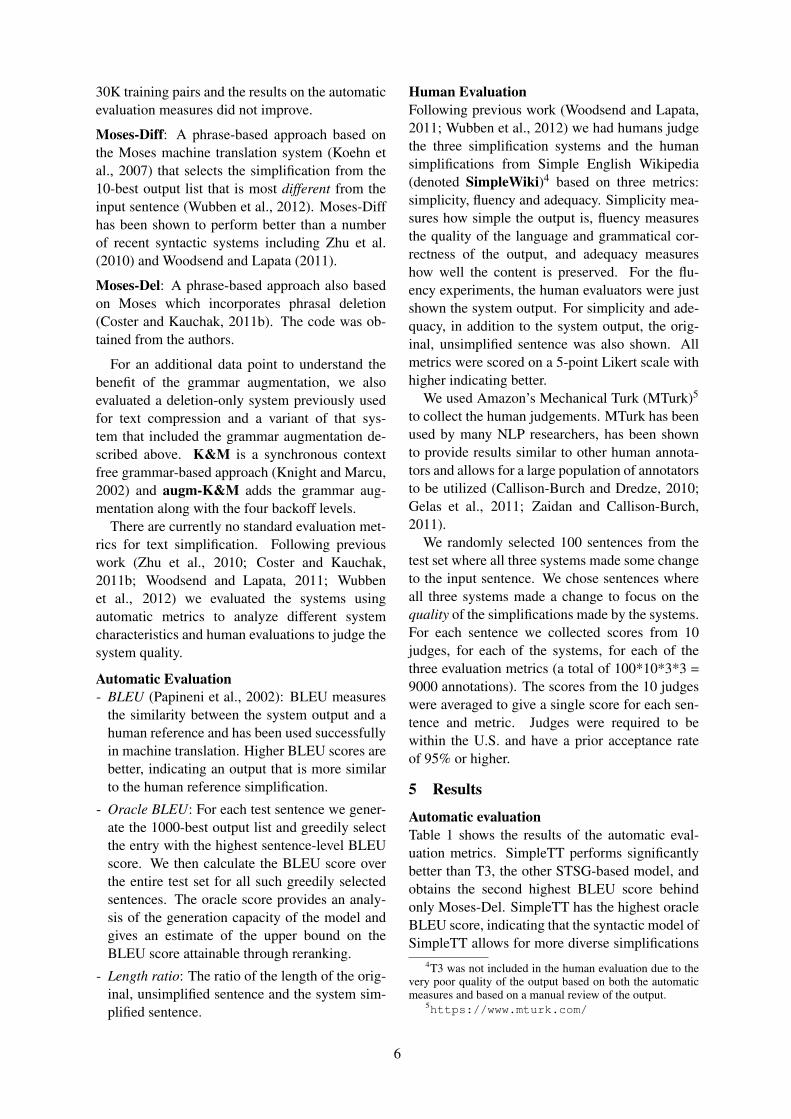
Human EvaluationFollowing previous work (Woodsend and Lapata,2011; Wubben et al., 2012) we had humans judgethe three simplification systems and the humansimplifications from Simple English Wikipedia(denoted SimpleWiki)4 based on three metrics:simplicity, fluency and adequacy. Simplicity mea-sures how simple the output is, fluency measuresthe quality of the language and grammatical cor-rectness of the output, and adequacy measureshow well the content is preserved. For the flu-ency experiments, the human evaluators were justshown the system output. For simplicity and ade-quacy, in addition to the system output, the orig-inal, unsimplified sentence was also shown. Allmetrics were scored on a 5-point Likert scale withhigher indicating better.
We used Amazon’s Mechanical Turk (MTurk)5
to collect the human judgements. MTurk has beenused by many NLP researchers, has been shownto provide results similar to other human annota-tors and allows for a large population of annotatorsto be utilized (Callison-Burch and Dredze, 2010;Gelas et al., 2011; Zaidan and Callison-Burch,2011).
We randomly selected 100 sentences from thetest set where all three systems made some changeto the input sentence. We chose sentences whereall three systems made a change to focus on thequality of the simplifications made by the systems.For each sentence we collected scores from 10judges, for each of the systems, for each of thethree evaluation metrics (a total of 100*10*3*3 =9000 annotations). The scores from the 10 judgeswere averaged to give a single score for each sen-tence and metric. Judges were required to bewithin the U.S. and have a prior acceptance rateof 95% or higher.
5 Results
Automatic evaluationTable 1 shows the results of the automatic eval-uation metrics. SimpleTT performs significantlybetter than T3, the other STSG-based model, andobtains the second highest BLEU score behindonly Moses-Del. SimpleTT has the highest oracleBLEU score, indicating that the syntactic model ofSimpleTT allows for more diverse simplifications
4T3 was not included in the human evaluation due to thevery poor quality of the output based on both the automaticmeasures and based on a manual review of the output.
5https://www.mturk.com/
6

System BLEU Oracle LengthRatio
SimpleTT 0.564 0.663 0.849Moses-Diff 0.543 –∗ 0.960Moses-Del 0.605 0.642 0.991
T3 0.244 –∗∗ 0.581K&M 0.406 0.602 0.676
augm-K&M 0.498 0.609 0.826corpus mean – – 0.85
Table 1: Automatic evaluation scores for all sys-tems tested and the mean values from the trainingcorpus. ∗Moses-Diff uses the n-best list to choosecandidates and therefore is not amenable to oraclescoring. ∗∗T3 only outputs the single best simpli-fication.
than the phrase-based models and may be moreamenable to future reranking techniques. Sim-pleTT also closely matches the in-corpus meanof the length ratio seen by human simplifications,though this can be partially explained by the lengthpenalty in the log-linear model.
Moses-Del obtains the highest BLEU score, butaccomplishes this with only small changes to theinput sentence: the length of the simplified sen-tences are only slightly different from the original(a length ratio of 0.99). Moses-Diff has the low-est BLEU score of the three simplification systemsand while it makes larger changes than Moses-Del it still makes much smaller changes than Sim-pleTT and the human simplifications.
T3 had significant problems with over-deletingcontent as indicated by the low length ratio whichresulted in a very low BLEU score. This issuehas been previously noted by others when usingT3 for text compression (Nomoto, 2009; Marsi etal., 2010).
The two deletion-only systems performedworse than the three simplification systems. Com-paring the two systems shows the benefit of thegrammar augmentation: augm-K&M has a signif-icantly higher BLEU score than K&M and alsoavoided the over-deletion that occurred in the orig-inal K&M system. The additional specificity ofthe rules allowed the model to make better deci-sions for which content to delete.
Human evaluationTable 2 shows the human judgement scores forthe simplification approaches for the three differ-ent metrics averaged over the 100 sentences andTable 3 shows the pairwise statistical significancecalculations between each system based on a two-
simplicity fluency adequacySimpleWiki 3.45 3.93 3.42SimpleTT 3.55 3.80 3.09Moses-Diff 3.07 3.64 3.91Moses-Del 3.19 3.74 3.86
Table 2: Human evaluation scores on a 5-pointLikert scale averaged over 100 sentences.
tailed paired t-test. Overall, SimpleTT performedwell with simplicity and fluency scores that werecomparable to the human simplifications. Sim-pleTT was too aggressive at removing content, re-sulting in lower adequacy scores. This phenom-ena was also seen in the human simplifications andmay be able to be corrected in future variations byadjusting the sentence length target.
The human evaluations highlight the trade-offbetween the simplicity of the output and theamount of content preserved. For simplicity, Sim-pleTT and the human simplifications performedsignificantly better than both the phrase-based sys-tems. However, simplicity does come with a cost;both SimpleTT and the human simplifications re-duced the length of the sentences by 15% on aver-age. This content reduction resulted in lower ad-equacy than the phrase-based systems. A similartrade-off has been previously shown for text com-pression, balancing content versus the amount ofcompression (Napoles et al., 2011).
For fluency, SimpleTT again scored similarly tothe human simplifications. SimpleTT performedsignificantly better than Moses-Diff and slightlybetter than Moses-Del, though the difference wasnot statistically significant.
As an aside, Moses-Del performs slightly bet-ter than Moses-Diff overall. They perform simi-larly on adequacy and Moses-Del performs betteron simplicity and Moses-Diff performs worse rel-ative to the other systems on fluency.
Qualitative observationsSimpleTT tended to simplify by deleting prepo-sitional, adjective, and adverbial phrases, and bytruncating conjunctive phrases to one of their con-juncts. This often resulted in outputs that weresyntactically well-formed with only minor infor-mation loss, for example, it converts
“The Haiti national football team is the na-tional team of Haiti and is controlled by theFederation Hatıenne de Football.”
to
7

SimplicitySimpleWiki Moses-Diff Moses-Del
SimpleTT ⇐⇐⇐ ⇐⇐⇐SimpleWiki ⇐⇐⇐ ⇐⇐⇐Moses-Diff ⇑
FluencySimpleWiki Moses-Diff Moses-Del
SimpleTT ⇐SimpleWiki ⇐⇐⇐ ⇐Moses-Diff
AdequacySimpleWiki Moses-Diff Moses-Del
SimpleTT ⇑⇑ ⇑⇑⇑ ⇑⇑⇑SimpleWiki ⇑⇑⇑ ⇑⇑⇑Moses-Diff
Table 3: Pairwise statistical significance test re-sults between systems for the human evaluationsbased on a paired t-test. The number of arrows de-notes significance with one, two and three arrowsindicating p < 0.05, p < 0.01 and p < 0.001respectively. The direction of the arrow points to-wards the system that performed better.
“The Haiti national football team is the na-tional football team of Haiti.”
which only differs from the human reference byone word.
SimpleTT also produces a number of interestinglexical and phrasal substitutions, including:
football striker → football playerfootball defender → football playerin order to → toknown as → calledmember → part
T3, on the other hand, tended to over-delete con-tent, for example simplifying:
“In earlier times, they frequently lived on theoutskirts of communities, generally in squalor.”
to just
“A lived”.
As we saw in the automatic evaluation results,the phrase-based systems tended to make fewerchanges to the input and those changes it did maketended to be more minor. Moses-Diff was moreaggressive about making changes, though it wasmore prone to errors since the simplifications cho-sen were more distant from the input sentence thanother options in the n-best list.
6 Conclusions and Future work
In this paper, we have introduced a new prob-abilistic STSG approach for sentence simplifica-tion, SimpleTT. We improve upon previous STSGapproaches by: 1) making the model probabilisticinstead of discriminative, allowing for an efficient,unified framework that can be easily interpretedand combined with other information sources, 2)increasing the model specificity using four levelsof grammar annotations combined into a singlemodel, and 3) incorporating n-best list rerankingcombining the model score, language model prob-abilities and additional features to choose the fi-nal output. SimpleTT performs significantly betterthan previous STSG formulations for text simpli-fication. In addition, our approach was rated byhuman judges similarly to human simplificationsin both simplicity and fluency and it scored bet-ter than two state-of-the-art phrase-based sentencesimplification systems along many automatic andhuman evaluation metrics.
There are a number of possible directions forextending the capabilities of SimpleTT and relatedsystems. First, while some sentence splitting canoccur in SimpleTT due to sentence split and mergeexamples in the training data, SimpleTT does notexplicitly model this. Sentence splitting could beincorporated as another probabilistic componentin the model (Zhu et al., 2010). Second, in thiswork, like many previous researchers, we assumeSimple English Wikipedia as our target simplic-ity level. However, the difficulty of Simple En-glish Wikipedia varies across articles and there aremany domains where the desired simplicity variesdepending on the target consumer. In the future,we plan to explore how varying algorithm param-eters (for example the length target) affects thesimplicity level of the output. Third, one of thebenefits of SimpleTT and other probabilistic sys-tems is they can generate an n-best list of can-didate simplifications. Better reranking of outputsentences could close this gap across all these sys-tems, without requiring deep changes to the under-lying model.
ReferencesOr Biran, Samuel Brody, and Noemie Elhadad. 2011.
Putting it simply: A context-aware approach to lexi-cal simplification. In Proceedings of ACL.
Chris Callison-Burch and Mark Dredze. 2010. Creat-
8

ing speech and language data with Amazon’s Me-chanical Turk. In Proceedings of NAACL-HLTWorkshop on Creating Speech and Language Datawith Amazon’s Mechanical Turk.
John Carroll, Gido Minnen, Yvonne Canning, SiobhanDevlin, and John Tait. 1998. Practical simplifica-tion of English newspaper text to assist aphasic read-ers. In Proceedings of AAAI Workshop on Integrat-ing AI and Assistive Technology.
Raman Chandrasekar and Bangalore Srinivas. 1997.Automatic induction of rules for text simplification.In Knowledge Based Systems.
David Chiang. 2006. An introduction to synchronousgrammars. Part of a tutorial given at ACL.
Trevor Cohn and Mirella Lapata. 2009. Sentence com-pression as tree transduction. Journal of ArtificialIntelligence Review.
Michael Collins. 1999. Head-Driven Statistical Mod-els for Natural Language Parsing. Ph.D. thesis,University of Pennsylvania.
William Coster and David Kauchak. 2011a. Learningto simplify sentences using Wikipedia. In Proceed-ings of the Workshop on Monolingual Text-To-TextGeneration.
William Coster and David Kauchak. 2011b. SimpleEnglish Wikipedia: A new text simplification task.In Proceedings of ACL.
Jason Eisner. 2003. Learning non-isomorphic treemappings for machine translation. In Proceedingsof ACL.
Noemie Elhadad. 2006. Comprehending technicaltexts: predicting and defining unfamiliar terms. InProceedings of AMIA.
Marcello Federico, Nicola Bertoldi, and Mauro Cet-tolo. 2008. IRSTLM: An open source toolkit forhandling large scale language models. In Proceed-ings of Interspeech, Brisbane, Australia.
Lijun Feng. 2008. Text simplification: A survey.CUNY Technical Report.
Michel Galley and Kathleen McKeown. 2007. Lex-icalized Markov grammars for sentence compres-sion. In Proceedings of HLT-NAACL.
Hadrien Gelas, Solomon Teferra Abate, Laurent Be-sacier, and Francois Pellegrino. 2011. Evaluation ofcrowdsourcing transcriptions for African languages.In Interspeech.
Kevin Knight and Daniel Marcu. 2002. Summariza-tion beyond sentence extraction: a probabilistic ap-proach to sentence compression. Artificial Intelli-gence.
Philipp Koehn, Hieu Hoang, Alexandra Birch, ChrisCallison-Burch, Marcello Federico, Nicola Bertoldi,Brooke Cowan, Wade Shen, Christine Moran,Richard Zens, Chris Dyer, Ondrej Bojar, AlexandraConstantin, and Evan Herbst. 2007. Moses: Opensource toolkit for statistical machine translation. InProceedings of ACL.
Erwin Marsi, Emiel Krahmer, Iris Hendrickx, and Wal-ter Daelemans. 2010. On the limits of sentencecompression by deletion. In Empirical Methods inNLG.
Jonathan May and Kevin Knight. 2006. Tiburon: Aweighted tree automata toolkit. In Proceedings ofCIAA.
Makoto Miwa, Rune Saetre, Yusuke Miyao, andJun’ichi Tsujii. 2010. Entity-focused sentence sim-plification for relation extraction. In Proceedings ofCOLING.
Courtney Napoles, Benjamin Van Durme, and ChrisCallison-Burch. 2011. Evaluating sentence com-pression: pitfalls and suggested remedies. In Pro-ceedings of the Workshop on Monolingual Text-To-Text Generation.
Tadashi Nomoto. 2009. A comparison of model freeversus model intensive approaches to sentence com-pression. In Proceedings of EMNLP.
Franz Och and Hermann Ney. 2000. Improved statisti-cal alignment models. In Proceedings of ACL.
Kishore Papineni, Kishore Papineni, Salim Roukos,Salim Roukos, Todd Ward, Todd Ward, Wei jingZhu, and Wei jing Zhu. 2002. BLEU: A methodfor automatic evaluation of machine translation. InProceedings of ACL.
Slav Petrov and Dan Klein. 2007. Improved inferencefor unlexicalized parsing. In Proceedings of HTL-NAACL.
Stuart Russell and Peter Norvig. 2003. Artificial intel-ligence: A modern approach.
David Vickrey and Daphne Koller. 2008. Sentencesimplification for semantic role labeling. In Pro-ceedings of ACL.
Kristian Woodsend and Mirella Lapata. 2011. Learn-ing to simplify sentences with quasi-synchronousgrammar and integer programming. In Proceedingsof EMNLP.
Sander Wubben, Antal van den Bosch, and EmielKrahmer. 2012. Sentence simplification by mono-lingual machine translation. In Proceedings of ACL.
Elif Yamangil and Rani Nelken. 2008. Miningwikipedia revision histories for improving sentencecompression. In Proceedings of HLT-NAACL.
9

Elif Yamangil and Stuart Shieber. 2010. Bayesian syn-chronous tree-substitution grammar induction andits application to sentence compression. In Proceed-ings of ACL.
Mark Yatskar, Bo Pang, Cristian Danescu-Niculescu-Mizil, and Lillian Lee. 2010. For the sake of sim-plicity: Unsupervised extraction of lexical simpli-fications from Wikipedia. In Proceedings of HLT-NAACL.
Omar F. Zaidan and Chris Callison-Burch. 2011.Crowdsourcing translation: Professional qualityfrom non-professionals. In Proceedings of ACL.
Zhemin Zhu, Delphine Bernhard, and Iryna Gurevych.2010. A monolingual tree-based translation modelfor sentence simplification. In Proceedings of ICCL.
10
Proceedings of the 2nd Workshop on Predicting and Improving Text Readability for Target Reader Populations, pages 11–19,Sofia, Bulgaria, August 4-9 2013. c©2013 Association for Computational Linguistics
Building a German/Simple German Parallel Corpusfor Automatic Text Simplification
David Klaper Sarah Ebling Martin VolkInstitute of Computational Linguistics, University of Zurich
Binzmühlestrasse 14, 8050 Zurich, [email protected], {ebling|volk}@cl.uzh.ch
Abstract
In this paper we report our experimentsin creating a parallel corpus using Ger-man/Simple German documents from theweb. We require parallel data to build astatistical machine translation (SMT) sys-tem that translates from German into Sim-ple German. Parallel data for SMT sys-tems needs to be aligned at the sentencelevel. We applied an existing monolingualsentence alignment algorithm. We showthe limits of the algorithm with respect tothe language and domain of our data andsuggest ways of circumventing them.
1 Introduction
Simple language (or, “plain language”, “easy-to-read language”) is language with low lexical andsyntactic complexity. It provides access to infor-mation to people with cognitive disabilities (e.g.,aphasia, dyslexia), foreign language learners, Deafpeople,1 and children. Text in simple languageis obtained through simplification. Simplificationis a text-to-text generation task involving multipleoperations, such as deletion, rephrasing, reorder-ing, sentence splitting, and even insertion (Costerand Kauchak, 2011a). By contrast, paraphrasingand compression, two other text-to-text generationtasks, involve merely rephrasing and reordering(paraphrasing) and deletion (compression). Textsimplification also shares common ground withgrammar and style checking as well as with con-trolled natural language generation.
Text simplification approaches exist for vari-ous languages, including English, French, Span-ish, and Swedish. As Matausch and Nietzio (2012)write, “plain language is still underrepresented in
1It is an often neglected fact that Deaf people tend to ex-hibit low literacy skills (Gutjahr, 2006).
the German speaking area and needs further devel-opment”. Our goal is to build a statistical machinetranslation (SMT) system that translates from Ger-man into Simple German.
SMT systems require two corpora aligned at thesentence level as their training, development, andtest data. The two corpora together can form abilingual or a monolingual corpus. A bilingualcorpus involves two different languages, while amonolingual corpus consists of data in a singlelanguage. Since text simplification is a text-to-text generation task operating within the same lan-guage, it produces monolingual corpora.
Monolingual corpora, like bilingual corpora,can be either parallel or comparable. A parallelcorpus is a set of two corpora in which “a no-ticeable number of sentences can be recognized asmutual translations” (Tomás et al., 2008). Paral-lel corpora are often compiled from the publica-tions of multinational institutions, such as the UNor the EU, or of governments of multilingual coun-tries, such as Canada (Koehn, 2005). In contrast, acomparable corpus consists of two corpora createdindependently of each other from distinct sources.Examples of comparable documents are news ar-ticles written on the same topic by different newsagencies.
In this paper we report our experiments in cre-ating a monolingual parallel corpus using Ger-man/Simple German documents from the web. Werequire parallel data to build an SMT system thattranslates from German into Simple German. Par-allel data for SMT systems needs to be aligned atthe sentence level. We applied an existing mono-lingual sentence alignment algorithm. We showthe limits of the algorithm with respect to the lan-guage and domain of our data and suggest ways ofcircumventing them.
The remainder of this paper is organized as fol-lows: In Section 2 we discuss the methodologiespursued and the data used in previous work deal-
11

ing with automatic text simplification. In Section 3we describe our own approach to building a Ger-man/Simple German parallel corpus. In particu-lar, we introduce the data obtained from the web(Section 3.1), describe the sentence alignment al-gorithm we used (Section 3.2), present the resultsof the sentence alignment task (Section 3.3), anddiscuss them (Section 3.4). In Section 4 we givean overview of the issues we tackled and offer anoutlook on future work.
2 Approaches to Text Simplification
The task of simplifying text automatically can beperformed by means of rule-based, corpus-based,or hybrid approaches. In a rule-based approach,the operations carried out typically include replac-ing words by simpler synonyms or rephrasing rel-ative clauses, embedded sentences, passive con-structions, etc. Moreover, definitions of difficultterms or concepts are often added, e.g., the termweb crawler is defined as “a computer programthat searches the Web automatically”. Gasperin etal. (2010) pursued a rule-based approach to textsimplification for Brazilian Portuguese within thePorSimples project,2 as did Brouwers et al. (2012)for French.
As part of the corpus-based approach, machinetranslation (MT) has been employed. Yatskar et al.(2010) pointed out that simplification is “a form ofMT in which the two ‘languages’ in question arehighly related”.
As far as we can see, Zhu et al. (2010) were thefirst to use English/Simple English Wikipedia datafor automatic simplification via machine transla-tion.3 They assembled a monolingual compara-ble corpus4 of 108,016 sentence pairs based onthe interlanguage links in Wikipedia and the sen-tence alignment algorithm of Nelken and Shieber(2006) (cf. Section 3.2). Their system applies a“tree-based simplification model” including ma-chine translation techniques. The system learnsprobabilities for simplification operations (substi-tution, reordering, splitting, deletion) offline from
2http://www2.nilc.icmc.usp.br/wiki/index.php/English
3English Wikipedia: http://en.wikipedia.org/; Simple English Wikipedia: http://simple.wikipedia.org/.
4We consider this corpus to be comparable rather thanparallel because not every Simple English Wikipedia articleis necessarily a translation of an English Wikipedia article.Rather, Simple English articles can be added independentlyof any English counterpart.
the comparable Wikipedia data. At runtime, an in-put sentence is parsed and zero or more simplifica-tion operations are carried out based on the modelprobabilities.
Specia (2010) used the SMT system Moses(Koehn et al., 2007) to translate from BrazilianPortuguese into a simpler version of this language.Her work is part of the PorSimples project men-tioned above. As training data she used 4483 sen-tences extracted from news texts that had beenmanually translated into Simple Brazilian Por-tuguese.5 The results, evaluated automaticallywith BLEU (Papineni et al., 2002) and NIST(Doddington, 2002) as well as manually, show thatthe system performed lexical simplification andsentence splitting well, while it exhibited prob-lems in reordering phrases and producing subject–verb–object (SVO) order. To further improve hersystem Specia (2010) suggested including syntac-tic information through hierarchical SMT (Chi-ang, 2005) and part-of-speech tags through fac-tored SMT (Hoang, 2007).
Coster and Kauchak (2011a; 2011b) trans-lated from English into Simple English using En-glish/Simple English Wikipedia data. Like Spe-cia (2010), they applied Moses as their MT sys-tem but in addition to the default configuration al-lowed for phrases to be empty. This was moti-vated by their observation that 47% of all SimpleEnglish Wikipedia sentences were missing at leastone phrase compared to their English Wikipediacounterparts. Coster and Kauchak (2011a; 2011b)used four baselines to evaluate their system: in-put=output,6 two text compression systems, andvanilla Moses. Their system, Moses-Del, achievedhigher automatic MT evaluation scores (BLEU)than all of the baselines. In particular, it outper-formed vanilla Moses (lacking the phrase deletionoption).
Wubben et al. (2012) also worked with En-glish/Simple English Wikipedia data and Moses.They added a post-hoc reranking step: Follow-ing their conviction that the output of a simplifi-cation system has to be a modified version of theinput,7 they rearranged the 10-best sentences out-put by Moses such that those differing from the
5Hence, the corpus as a whole is a monolingual parallelcorpus.
6The underlying assumption here was that not every sen-tence needs simplification.
7Note that this runs contrary to the assumption Coster andKauchak (2011a; 2011b) made.
12

input sentences were given preference over thosethat were identical. Difference was calculated onthe basis of the Levenshtein score (edit distance).Wubben et al. (2012) found their system to workbetter than that of Zhu et al. (2010) when evalu-ated with BLEU, but not when evaluated with theFlesch-Kincaid grade level, a common readabilitymetric.
Bott and Saggion (2011) presented a monolin-gual sentence alignment algorithm, which uses aHidden Markov Model for alignment. In contrastto other monolingual alignment algorithms, Bottand Saggion (2011) introduced a monotonicity re-striction, i.e., they assumed the order of sentencesto be the same for the original and simplified texts.
Apart from purely rule-based and purelycorpus-based approaches to text simplification,hybrid approaches exist. For example, Bott et al.(2012) in their Simplext project for Spanish8 let astatistical classifier decide for each sentence of atext whether it should be simplified (corpus-basedapproach). The actual simplification was then per-formed by means of a rule-based approach.
As has been shown, many MT approaches totext simplification have used English/Simple En-glish Wikipedia as their data. The only excep-tion we know of is Specia (2010), who togetherwith her colleagues in the PorSimples project builther own parallel corpus. This is presumably be-cause there exists no Simple Brazilian PortugueseWikipedia. The same is true for German: To date,no Simple German Wikipedia has been created.Therefore, we looked for data available elsewherefor our machine translation system designated totranslate from German to Simple German. We dis-covered that German/Simple German parallel datais slowly becoming available on the web. In whatfollows, we describe the data we harvested and re-port our experience in creating a monolingual par-allel corpus from this data.
3 Building a German/Simple GermanParallel Corpus from the Web
3.1 DataAs mentioned in Section 1, statistical machinetranslation (SMT) systems require parallel data.A common approach to obtain such material isto look for it on the web.9 The use of already
8http://www.simplext.es/9Resnik (1999) was the first to discuss the possibility of
collecting parallel corpora from the web.
available data offers cost and time advantages.Many websites, including that of the German gov-ernment,10 contain documents in Simple German.However, these documents are often not linked to asingle corresponding German document; instead,they are high-level summaries of multiple Germandocuments.
A handful of websites exist that offer articlesin two versions: a German version, often calledAlltagssprache (AS, “everyday language”), anda Simple German version, referred to as LeichteSprache (LS, “simple language”). Table 1 lists thewebsites we used to compile our corpus. The num-bers indicate how many parallel articles were ex-tracted. The websites are mainly of organizationsthat support people with disabilities. We crawledthe articles with customized Python scripts that lo-cated AS articles and followed the links to their LScorrespondents. A sample sentence pair from ourdata is shown in Example 1.
(1) German:Wir freuen uns über Ihr Interesse an unsererArbeit mit und für Menschen mitBehinderung.(“We appreciate your interest in our workwith and for people with disabilities.”)
Simple German:Schön, dass Sie sich für unsere Arbeitinteressieren.Wir arbeiten mit und für Menschen mitBehinderung.(“Great that you are interested in our work.We work with and for people withdisabilities.”)
The extracted data needed to be cleaned fromHTML tags. For our purpose, we considered textand paragraph structure markers as important in-formation; therefore, we retained them. We subse-quently tokenized the articles. The resulting cor-pus consisted of 7755 sentences, which amountedto 82,842 tokens. However, caution is advisedwhen looking at these numbers: Firstly, the tok-enization module overgenerated tokens. Secondly,some of the LS articles were identical, either be-cause they summarized multiple AS articles or be-cause they were generic placeholders. Hence, the
10http://www.bundesregierung.de/Webs/Breg/DE/LeichteSprache/leichteSprache_node.html (last accessed 15th April 2013)
13

Short name URL No. of parallel art.
ET www.einfach-teilhaben.de 51GWW www.gww-netz.de 65HHO www.os-hho.de 34LMT www.lebenshilfe-main-taunus.de 47OWB www.owb.de 59
Table 1: Websites and number of articles extracted
actual numbers were closer to 7000 sentences and70,000 tokens.
SMT systems usually require large amount oftraining data. Therefore, this small experimen-tal corpus is certainly not suitable for large-scaleSMT experiments. However, it can serve as proofof concept for German sentence simplification.Over time more resources will become available.
SMT systems rely on data aligned at the sen-tence level. Since the data we extracted from theweb was aligned at the article level only, we hadto perform sentence alignment. For this we splitour corpus into a training set (70% of the texts),development set (10%), and test set (20%). Wemanually annotated sentence alignments for all ofthe data. Example 2 shows an aligned AS/LS sen-tence pair.
(2) German:In den Osnabrücker Werkstätten (OW) undOSNA-Techniken sind rund 2.000 Menschenmit einer Behinderung beschäftigt.(“In the Osnabrück factories andOSNA-Techniken, about 2.000 people withdisability are employed.”)
Simple German:In den Osnabrücker Werkstätten und denOsna-Techniken arbeiten zweitausendMenschen mit Behinderung.(“Two thousand people with disability workin the Osnabrück factories andOsna-Techniken.”)
To measure the amount of parallel sentencesin our data, we calculated the alignment di-versity measure (ADM) of Nelken and Shieber(2006). ADM measures how many sentences arealigned. It is calculated as 2∗matches(T1,T2)
|T1|+|T2| , wherematches is the number of alignments between thetwo texts T1 and T2. ADM is 1.0 in a perfectlyparallel corpus, where every sentence from one
text is aligned to exactly one sentence in anothertext.
ADM for our corpus was 0.786, which meansthat approximately 78% of the sentences werealigned. This is a rather high number compared tothe values reported by Nelken and Shieber (2006):Their texts (consisting of encyclopedia articles andgospels) resulted in an ADM of around 0.3. A pos-sible explanation for the large difference in ADMis the fact that most simplified texts in our corpusare solely based on the original texts, whereas thesimple versions of the encyclopedia articles mighthave been created by drawing on external informa-tion in addition.
3.2 Sentence Alignment AlgorithmSentence alignment algorithms differ according towhether they have been developed for bilingual ormonolingual corpora. For bilingual parallel cor-pora many—typically length-based—algorithmsexist. However, our data was monolingual. Whilethe length of a regular/simple language sentencepair might be different, an overlap in vocabularycan be expected. Hence, monolingual sentencealignment algorithms typically exploit lexical sim-ilarity.
We applied the monolingual sentence alignmentalgorithm of Barzilay and Elhadad (2003). The al-gorithm has two main features: Firstly, it uses ahierarchical approach by assigning paragraphs toclusters and learning mapping rules. Secondly,it aligns sentences despite low lexical similarityif the context suggests an alignment. This isachieved through local sequence alignment, a dy-namic programming algorithm.
The overall algorithm has two phases, a train-ing and a testing phase. The training phase in turnconsists of two steps: Firstly, all paragraphs of thetexts of one side of the parallel corpus (henceforthreferred to as “AS texts”) are clustered indepen-dently of all paragraphs of the texts of the other
14

side of the parallel corpus (henceforth termed “LStexts”), and vice versa. Secondly, mappings be-tween the two sets of clusters are calculated, giventhe reference alignments.
As a preprocessing step to the clustering pro-cess, we removed stopwords, lowercased allwords, and replaced dates, numbers, and namesby generic tags. Barzilay and Elhadad (2003) ad-ditionally considered every word starting with acapital letter inside a sentence to be a proper name.In German, all nouns (i.e., regular nouns as well asproper names) are capitalized; thus, this approachdoes not work. We used a list of 61,228 first namesto remove at least part of the proper names.
We performed clustering with scipy (Jones etal., 2001). We adapted the hierarchical complete-link clustering method of Barzilay and Elhadad(2003): While the authors claimed to have set aspecific number of clusters, we believe this is notgenerally possible in hierarchical agglomerativeclustering. Therefore, we used the largest num-ber of clusters in which all paragraph pairs had acosine similarity strictly greater than zero.
Following the formation of the clusters, lex-ical similarity between all paragraphs of corre-sponding AS and LS texts was computed to es-tablish probable mappings between the two setsof clusters. Barzilay and Elhadad (2003) usedthe boosting tool Boostexter (Schapire and Singer,2000). All possible cross-combinations of para-graphs from the parallel training data served astraining instances. An instance consisted of thecosine similarity of the two paragraphs and a stringcombining the two cluster IDs. The classifica-tion result was extracted from the manual align-ments. In order for an AS and an LS paragraphto be aligned, at least one sentence from the LSparagraph had to be aligned to one sentence in theAS paragraph. Like Barzilay and Elhadad (2003),we performed 200 iterations in Boostexter. Afterlearning the mapping rules, the training phase wascomplete.
The testing phase consisted of two additionalsteps. Firstly, each paragraph of each text in thetest set was assigned to the cluster it was clos-est to. This was done by calculating the cosinesimilarity of the word frequencies in the clusters.Then, every AS paragraph was combined with allLS paragraphs of the parallel text, and Boostexterwas used in classification mode to predict whetherthe two paragraphs were to be mapped.
Secondly, within each pair of paragraphsmapped by Boostexter, sentences with very highlexical similarity were aligned. In our case, thethreshold for an alignment was a similarity of 0.5.For the remaining sentences, proximity to otheraligned or similar sentences was used as an indi-cator. This was implemented by local sequencealignment. We set the mismatch penalty to 0.02,as a higher mismatch penalty would have reducedrecall. We set the skip penalty to 0.001 conform-ing to the value of Barzilay and Elhadad (2003).The resulting alignments were written to files. Ex-ample 3 shows a successful sentence alignment.
(3) German:Die GWW ist in den Landkreisen Böblingenund Calw aktiv und bietet an den folgendenStandorten Wohnmöglichkeiten fürMenschen mit Behinderung an – ganz inIhrer Nähe!(“The GWW is active in the counties ofBöblingen and Calw and offers housingoptions for people with disabilities at thefollowing locations – very close to you!”)
Simple German:Die GWW gibt es in den Landkreisen Calwund Böblingen.Wir haben an den folgenden OrtenWohn-Möglichkeiten für Sie.(“The GWW exists in the counties of Calwand Böblingen. We have housing options foryou in the following locations.”)
The algorithm described has been modified invarious ways. Nelken and Shieber (2006) usedTF/IDF instead of raw term frequency, logistic re-gression on the cosine similarity instead of cluster-ing, and an extended version of the local alignmentrecurrence. Both Nelken and Shieber (2006) andQuirk et al. (2004) found that the first sentenceof each document is likely to be aligned. We ob-served the same for our corpus. Therefore, in ouralgorithm we adopted the strategy of uncondition-ally aligning the first sentence of each document.
3.3 ResultsTable 2 shows the results of evaluating the algo-rithm described in the previous section with re-spect to precision, recall, and F1 measure. We in-troduced two baselines:
15

Method Precision Recall F1
Adapted algorithm of Barzilay and Elhadad (2003) 27.7% 5.0% 8.5%Baseline I: First sentence 88.1% 4.8% 9.3%Baseline II: Word in common 2.2% 8.2% 3.5%
Table 2: Alignment results on test set
1. Aligning only the first sentence of each text(“First sentence”)
2. Aligning every sentence with a cosine simi-larity greater than zero (“Word in common”)
As can be seen from Table 2, by applying thesentence alignment algorithm of Barzilay and El-hadad (2003) we were able to extract only 5%of all reference alignments, while precision wasbelow 30%. The rule of aligning the first sen-tences performed well with a precision of 88%.Aligning all sentences with a word in commonclearly showed the worst performance; this is be-cause many sentences have a word in common.Nonetheless, recall was only slightly higher thanwith the other methods.
In conclusion, none of the three approaches(adapted algorithm of Barzilay and Elhadad(2003), two baselines “First sentence” and “Wordin common”) performed well on our test set. Weanalyzed the characteristics of our data that ham-pered high-quality automatic alignment.
3.4 DiscussionCompared with the results of Barzilay and El-hadad (2003), who achieved 77% precision at55.8% recall for their data, our alignment scoreswere considerably lower (27.7% precision, 5% re-call). We found two reasons for this: languagechallenges and domain challenges. In what fol-lows, we discuss each reason in more detail.
While Barzilay and Elhadad (2003) aligned En-glish/Simple English texts, we dealt with Ger-man/Simple German data. As mentioned in Sec-tion 3.2, in German nouns (regular nouns as wellas proper names) are capitalized. This makesnamed entity recognition, a preprocessing step toclustering, more difficult. Moreover, German isan example of a morphologically rich language:Its noun phrases are marked with case, leadingto different inflectional forms for articles, pro-nouns, adjectives, and nouns. English morphol-ogy is poorer; hence, there is a greater likelihood
of lexical overlap. Similarly, compounds are pro-ductive in German; an example from our corpusis Seniorenwohnanlagen (“housing complexes forthe elderly”). In contrast, English compounds aremultiword units, where each word can be accessedseparately by a clustering algorithm. Therefore,cosine similarity is more effective for English thanit is for German. One way to alleviate this problemwould be to use extensive morphological decom-position and lemmatization.
In terms of domain, Barzilay and Elhadad(2003) used city descriptions from an encyclope-dia for their experiments. For these descriptionsclustering worked well because all articles had thesame structure (paragraphs about culture, sports,etc.). The domain of our corpus was broader:It included information about housing, work, andevents for people with disabilities as well as infor-mation about the organizations behind the respec-tive websites.
Apart from language and domain challenges weobserved heavy transformations from AS to LS inour data (Figure 1 shows a sample article in ASand LS). As a result, LS paragraphs were typi-cally very short and the clustering process returnedmany singleton clusters. Example 4 shows anAS/LS sentence pair that could not be aligned be-cause of this.
(4) German:Der Beauftragte informiert über dieGesetzeslage, regt Rechtsänderungen an,gibt Praxistipps und zeigt Möglichkeiten derEingliederung behinderter Menschen inGesellschaft und Beruf auf.(“The delegate informs about the legalsituation, encourages revisions of laws, givespractical advice and points out possibilitiesof including people with disabilities insociety and at work.”)
Simple German:Er gibt ihnen Tipps und Infos.
16

Figure 1: Comparison of AS and LS article from http://www.einfach-teilhaben.de
(“He provides them with advice andinformation.”)
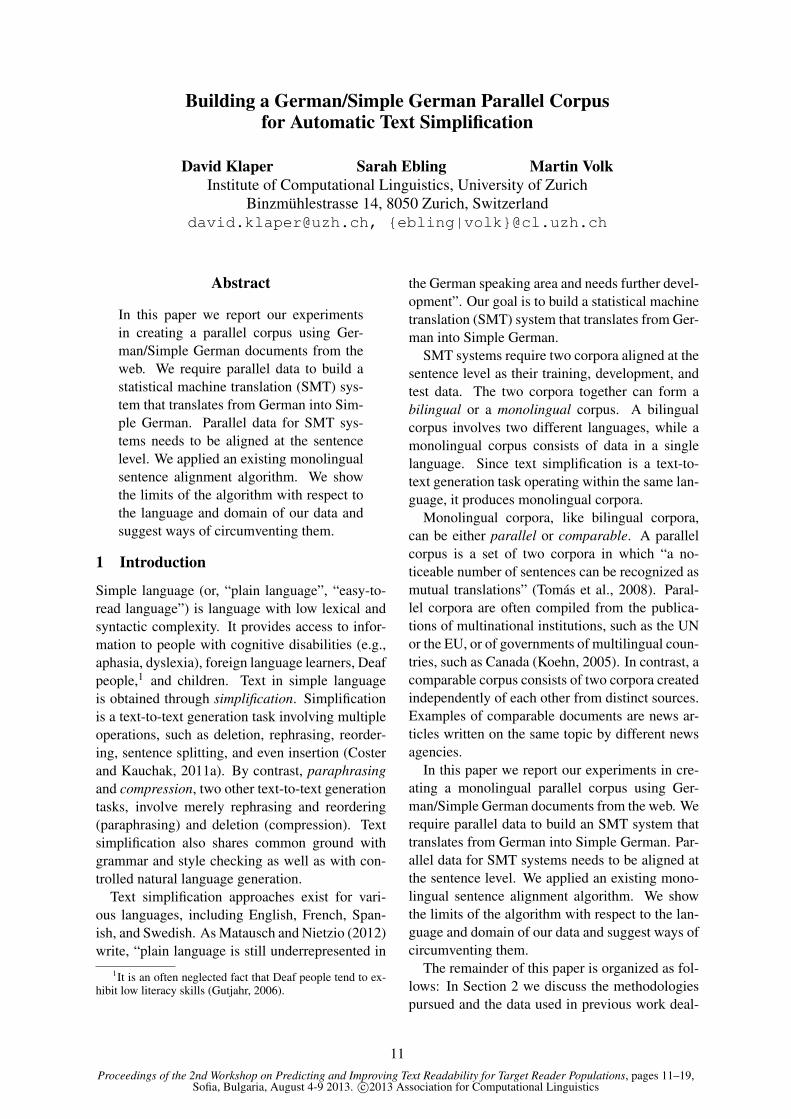
Figure 2 shows the dendrogram of the cluster-ing of the AS texts. A dendrogram shows the re-sults of a hierarchical agglomerative clustering. Atthe bottom of the dendrogram every paragraph ismarked by an individual line. At the points wheretwo vertical paths join, the corresponding clustersare merged to a new larger cluster. The Y-axis isthe dissimilarity value of the two clusters. In ourexperiment the resulting clusters are the clustersat dissimilarity 1 − 1−10. Geometrically this is ahorizontal cut just below dissimilarity 1.0. As canbe seen from Figure 2, many of the paragraphsin the left half of the picture are never mergedto a slightly larger cluster but are directly con-nected to the universal cluster that merges every-thing. This is because they contain only stopwordsor only words that do not appear in all paragraphsof another cluster. Such an unbalanced clustering,where many paragraphs are clustered to one clus-ter and many other paragraphs remain singletonclusters, reduces the precision of the hierarchicalapproach.
4 Conclusion and Outlook
In this paper we have reported our experiments increating a monolingual parallel corpus using Ger-man/Simple German documents from the web. Wehave shown that little work has been done on au-tomatic simplification of German so far. We havedescribed our plan to build a statistical machinetranslation (SMT) system that translates form Ger-man into Simple German. SMT systems requireparallel corpora. The process of creating a parallelcorpus for use in machine translation involves sen-tence alignment. Sentence alignment algorithmsfor bilingual corpora differ from those for mono-lingual corpora. Since all of our data was fromthe same language, we applied the monolingualsentence alignment approach of Barzilay and El-hadad (2003). We have shown the limits of the al-gorithm with respect to the language and domainof our data. For example, named entity recogni-tion, a preprocessing step to clustering, is harderfor German than for English, the language Barzi-lay and Elhadad (2003) worked with. Moreover,German features richer morphology than English,which leads to less lexical overlap when workingon the word form level.
17
Figure 2: Dendrogram of AS clusters
The domain of our corpus was also broader thanthat of Barzilay and Elhadad (2003), who used citydescriptions from an encyclopedia for their exper-iments. This made it harder to identify commonarticle structures that could be exploited in clus-tering.
As a next step, we will experiment with othermonolingual sentence alignment algorithms. Inaddition, we will build a second parallel corpus forGerman/Simple German: A person familiar withthe task of text simplification will produce simpleversions of German texts. We will use the result-ing parallel corpus as data for our experiments inautomatically translating from German to SimpleGerman. The parallel corpus we compiled as partof the work described in this paper can be madeavailable to interested parties upon request.
ReferencesRegina Barzilay and Noemie Elhadad. 2003. Sentence
alignment for monolingual comparable corpora. InProceedings of EMNLP.
Stefan Bott and Horacio Saggion. 2011. An un-supervised alignment algorithm for text simplifica-tion corpus construction. In Proceedings of theWorkshop on Monolingual Text-To-Text Generation,MTTG ’11, pages 20–26, Stroudsburg, PA, USA.
Stefan Bott, Horacio Saggion, and David Figueroa.2012. A Hybrid System for Spanish Text Simpli-
fication. In Proceedings of the Third Workshop onSpeech and Language Processing for Assistive Tech-nologies, pages 75–84, Montréal, Canada, June.
Laetitia Brouwers, Delphine Bernhard, Anne-LaureLigozat, and Thomas François. 2012. Simplifica-tion syntaxique de phrases pour le français. In Actesde la conférence conjointe JEP-TALN-RECITAL2012, volume 2: TALN, pages 211–224.
David Chiang. 2005. A Hierarchical Phrase-basedModel for Statistical Machine Translation. In ACL-05: 43rd Annual Meeting of the Association forComputational Linguistics, pages 263–270, Univer-sity of Michigan, Ann Arbor, Michigan, USA.
William Coster and David Kauchak. 2011a. Learn-ing to simplify sentences using Wikipedia. In Pro-ceedings of the Workshop on Monolingual Text-To-Text Generation, MTTG ’11, pages 1–9, Strouds-burg, PA, USA.
William Coster and David Kauchak. 2011b. SimpleEnglish Wikipedia: a new text simplification task.In Proceedings of the 49th Annual Meeting of theAssociation for Computational Linguistics: HumanLanguage Technologies: short papers - Volume 2,HLT ’11, pages 665–669, Stroudsburg, PA, USA.
George Doddington. 2002. Automatic Evaluationof Machine Translation Quality Using N-gram Co-occurrence Statistics. In HLT 2002: Human Lan-guage Technology Conference, Proceedings of theSecond International Conference on Human Lan-guage Technology Research, pages 138–145, SanDiego, California.
18

Caroline Gasperin, Erick Maziero, and Sandra M.Aluisio. 2010. Challenging choices for text sim-plification. In Computational Processing of the Por-tuguese Language. Proceedings of the 9th Interna-tional Conference, PROPOR 2010, volume 6001of Lecture Notes in Artificial Intelligence (LNAI),pages 40–50, Porto Alegre, RS, Brazil. Springer.
A. Gutjahr. 2006. Lesekompetenz Gehörloser: EinForschungsüberblick. Universität Hamburg.
Hieu Hoang. 2007. Factored Translation Models.In EMNLP-CoNLL 2007: Proceedings of the 2007Joint Conference on Empirical Methods in NaturalLanguage Processing and Computational NaturalLanguage Learning, pages 868–876, Prague, CzechRepublic.
Eric Jones, Travis Oliphant, Pearu Peterson, et al.2001. SciPy: Open Source Scientific Tools forPython.
Philipp Koehn, Hieu Hoang, Alexandra Birch, ChrisCallison-Burch, Marcello Federico, Nicola Bertoldi,Brooke Cowan, Wade Shen, Christine Moran,Richard Zens, Chris Dyer, Ondrej Bojar, AlexandraConstantin, and Evan Herbst. 2007. Moses: OpenSource Toolkit for Statistical Machine Translation.In ACL 2007, Proceedings of the 45th Annual Meet-ing of the Association for Computational Linguis-tics, pages 177–180, Prague, Czech Republic.
Kerstin Matausch and Annika Nietzio. 2012. Easy-to-read and plain language: Defining criteria and re-fining rules. http://www.w3.org/WAI/RD/2012/easy-to-read/paper11/.
Rani Nelken and Stuart M. Shieber. 2006. Towards ro-bust context-sensitive sentence alignment for mono-lingual corpora. In Proceedings of 11th Conferenceof the European Chapter of the Association for Com-putational Linguistics, pages 161–168.
Kishore Papineni, Salim Roukos, Todd Ward, and Wei-Jing Zhu. 2002. BLEU: a Method for AutomaticEvaluation of Machine Translation. In 40th AnnualMeeting of the Association for Computational Lin-guistics, Proceedings of the Conference, pages 311–318, Philadelphia, PA, USA.
Chris Quirk, Chris Brocket, and William Dolan. 2004.Monolingual machine translation for paraphrasegeneration. In Proceedings Empirical Methods inNatural Language Processing.
Philip Resnik. 1999. Mining the Web for BilingualText. In 37th Annual Meeting of the Association forComputational Linguistics, Proceedings of the Con-ference, pages 527–534, University of Maryland,College Park, Maryland, USA.
Robert E. Schapire and Yoram Singer. 2000. BoosTex-ter: A boosting-based system for text categorization.Machine Learning, 39(2–3):135–168.
Lucia Specia. 2010. Translating from complex tosimplified sentences. In Computational Process-ing of the Portuguese Language. Proceedings of the9th International Conference, PROPOR 2010, vol-ume 6001 of Lecture Notes in Artificial Intelligence(LNAI), pages 30–39, Porto Alegre, RS, Brazil.Springer.
Sander Wubben, Antal van den Bosch, and EmielKrahmer. 2012. Sentence simplification by mono-lingual machine translation. In Proceedings of the50th Annual Meeting of the Association for Compu-tational Linguistics: Long Papers - Volume 1, ACL’12, pages 1015–1024, Jeju Island, Korea.
Mark Yatskar, Bo Pang, Cristian Danescu-Niculescu-Mizil, and Lillian Lee. 2010. For the sake of sim-plicity: Unsupervised extraction of lexical simplifi-cations from Wikipedia. In Proceedings of the An-nual Meeting of the North American Chapter of theAssociation for Computational Linguistics, pages365–368.
Z. Zhu, D. Bernhard, and I. Gurevych. 2010. Amonolingual tree-based translation model for sen-tence simplification. In Proceedings of the Inter-national Conference on Computational Linguistics,pages 1353–1361.
19

Proceedings of the 2nd Workshop on Predicting and Improving Text Readability for Target Reader Populations, pages 20–29,Sofia, Bulgaria, August 4-9 2013. c©2013 Association for Computational Linguistics
The C-Score – Proposing a Reading Comprehension Metrics as aCommon Evaluation Measure for Text Simplification
Irina TemnikovaLinguistic Modelling Department,
Institute of Informationand Communication Technologies,
Bulgarian Academy of [email protected]
Galina ManevaLab. of Particle and Astroparticle Physics,
Institute of Nuclear Researchand Nuclear Energy,
Bulgarian Academy of [email protected]
Abstract
This article addresses the lack of commonapproaches for text simplification evalu-ation, by presenting the first attempt fora common evaluation metrics. The arti-cle proposes reading comprehension eval-uation as a method for evaluating the re-sults of Text Simplification (TS). An ex-periment, as an example application of theevaluation method, as well as three for-mulae to quantify reading comprehension,are presented. The formulae produce anunique score, the C-score, which gives anestimation of user’s reading comprehen-sion of a certain text. The score can beused to evaluate the performance of a textsimplification engine on pairs of complexand simplified texts, or to compare theperformances of different TS methods us-ing the same texts. The approach can beparticularly useful for the modern crowd-sourcing approaches, such as those em-ploying the Amazon’s Mechanical Turk1
or CrowdFlower2. The aim of this paperis thus to propose an evaluation approachand to motivate the TS community to starta relevant discussion, in order to come upwith a common evaluation metrics for thistask.
1 Context and Motivation
Currently, the area of Text Simplification (TS)is getting more and more attention. Starting asearly as in the 1996, Chandrasekar et al. pro-posed an approach for TS as a pre-processing stepbefore feeding the text to a parser. Next, the
1http://aws.amazon.com/mturk/. Last accessed on May3rd, 2013.
2http://crowdflower.com/. Last accessed on June 14th,2013.
PSET project (Devlin, 1999; Canning, 2002), pro-posed two modules for simplifying text for apha-sic readers. The text simplification approachescontinued in 2003 with Siddharthan (2003) andInui et al. (2003), and through the 2005-2006until the recent explosion of TS approaches in2010-2012. Recently, several TS-related work-shops took place: PITR 2012 (Williams et al.,2012), SLPAT 2012 (Alexandersson et al., 2012),and NLP4ITA 20123 and 2013. As in confirma-tion with the text simplification definition as the”process for reducing text complexity at differ-ent levels” (Temnikova, 2012), the TS approachestackle a variety of text complexity aspects, rang-ing from lexical (Devlin, 1999; Inui et al., 2003;Elhadad, 2006; Gasperin et al., 2009; Yatskaret al., 2010; Coster and Kauchak, 2011; Bott etal., 2012; Specia et al., 2012; Rello et al., 2013;Drndarevic et al., 2013), syntactic (Chandrasekaret al., 1996; Canning, 2002; Siddharthan, 2003;Inui et al., 2003; Gasperin et al., 2009; Zhu etal., 2010; Woodsend and Lapata, 2011; Costerand Kauchak, 2011; Drndarevic et al., 2013), todiscourse/cohesion (Siddharthan, 2003). The va-riety of problems tackled by the TS approachesdiffer, according to their final aim: (1) being apre-processing step of an input to text process-ing applications, or (2) addressing the reading dif-ficulties of specific groups of readers. The firsttype of final application ranges between parserinput (Chandrasekar et al., 1996), small screensdisplays (Daelemans et al., 2004; Grefenstette,1998), text summarization (Vanderwende et al.,2007), text extraction (Klebanov et al., 2004), se-mantic role labeling (Vickrey and Koller, 2008)and Machine Translation (MT) (Ruffino, 1982;Streiff, 1985).The TS approaches addressing spe-cific human reading needs, instead, address read-ers with low levels of literacy (Siddharthan, 2003;
3http://www.taln.upf.edu/nlp4ita/. Last accessed on May3rd, 2013.
20

Gasperin et al., 2009; Elhadad, 2006; Williamsand Reiter, 2008), language learners (Petersen andOstendorf, 2007), and readers with specific cogni-tive and language disabilities. The TS approaches,addressing this last type of readers target thosesuffering from aphasia (Devlin, 1999; Canning,2002), deaf readers (Inui et al., 2003), dyslexics(Rello et al., 2013) and the readers with generaldisabilities (Max, 2006; Drndarevic et al., 2013).
Despite the large number of current work inTS, there has been almost no attention to defin-ing common text simplification evaluation ap-proaches, which would allow the comparison ofdifferent TS systems. Until the present moment,usually, each approach has applied his/her ownmethods and materials, often taken from otherNatural Language Processing (NLP) fields, mak-ing the comparison difficult or impossible.
The aim of this paper is thus to propose an eval-uation method and to foster the discussion of thistopic in the text simplification community, as wellas to motivate the TS community to come up withcommon evaluation metrics for this task.
Next, Section 2 will describe the existing ap-proaches to evaluating TS, as well as the fewattempts towards offering a common evaluationstrategy. After that, the next sections will presentour evaluation approach, starting with Section 3describing its context, Section 4 presenting the for-mulae, Section 5 offering the results, and finallySection 6, providing a Discussion and the Conclu-sions.
2 Evaluation Methods in TextSimplification
As mentioned in the previous section, until now,the different authors adopted different combina-tions of metrics, without reaching to a commonapproach, which would allow the comparison ofdifferent systems. As the different TS evalua-tion methods are applied on a variety of differenttext units (words, sentences, texts), this makes thecomparison between approaches even harder. Asthe aim of this article is to propose a text simpli-fication evaluation metrics which would take intoaccount text comprehensibility and reading com-prehension, in this discussion we will focus mostlyon the approaches, whose aim is to simplify textsfor target readers and their evaluation strategies.
The existing TS evaluation approaches focus ei-ther on the quality of the generated text/sentences,
or on the effectiveness of text simplification onreading comprehension. The first group of ap-proaches include human judges ratings of simpli-fication, content preservation, and grammatical-ity, standard MT evaluation scores (BLEU andNIST), a variety of other automatic metrics (per-plexity, precision/recall/F-measure, and edit dis-tance). The methods, aiming to evaluate the textsimplification impact on reading comprehension,use, instead, reading speed, reading errors, speecherrors, comprehension questions, answer correct-ness, and users’ feedback. Several approachesuse a variety of readability formulae (the Flesch,Flesch-Kincaid, Coleman-Liau, and Lorge formu-lae for English, as well as readability formulae forother languages, such as for Spanish). Due to thecriticisms of readability formulae (DuBay, 2004),which often restrict themselves to a very super-ficial text level, they can be considered to standon the borderline between the two previously de-scribed groups of TS evaluation approaches. Ascan be seen from the discussion below, differentTS systems employ a combination of the listedevaluation approaches.
As one of the first text simplification systemsfor target reader populations, PSET, seems to haveapplied different evaluation strategies for differentof its components, without running an evaluationof the system as a whole. The lexical simplifi-cation component (Devlin, 1999), which replacedtechnical terms with more frequent synonyms, wasevaluated via user feedback, comprehension ques-tions and the use of the Lorge readability formula(Lorge, 1948). The syntactic simplification systemevaluated its single components and the system asa whole from different points of view, to a dif-ferent extent, and used different evaluation strate-gies. Namely, the text comprehensibility was eval-uated via reading time and answers’ correctnessgiven by sixteen aphasic readers; the componentsreplacing passive with active voice and splittingsentences were evaluated for content preservationand grammaticality via four human judges’ rat-ings; and finally, the anaphora resolution compo-nent was evaluated using precision and recall. Sid-dharthan (2003) did not carry out evaluation withtarget readers, while three human judges rated thegrammaticality and the meaning preservation ofninety-five sentences. Gasperin et al. (2009) usedprecision, recall and f-measure. Other approaches,using human judges are those of Elhadad (2006),
21

who also used precision and recall and Yatskar etal. (2010), who employed three annotators com-paring pairs of words and indicating them same,simpler, or more complex. Williams and Reiter(2008) run two experiments, the larger one in-volving 230 subjects and measured oral readingrate, oral reading errors, response correctness tocomprehension questions and finally, speech er-rors. Drndarevic et al. (2013) used 7 readabil-ity measures for Spanish to evaluate the degreeof simplification, and twenty-five human annota-tors to evaluate on a Likert scale the grammat-icality of the output and the preservation of theoriginal meaning. The recent approaches consid-ering TS as an MT task, such as Specia (2010),Zhu et al. (2010), Coster and Kauchak (2011)and Woodsend and Lapata (2011), apply standardMT evaluation techniques, such as BLEU (Pap-ineni et al., 2002), NIST (Doddington, 2002), andTERp (Snover et al., 2009). In addition, Wood-send and Lapata (2011) apply two readability mea-sures (Flesch-Kincaid, Coleman-Liau) to evalu-ate the actual reduction in complexity and humanjudges ratings for simplification, meaning preser-vation, and grammaticality. Zhu et al. (2010) ap-ply the Flesch readability score (Flesch, 1948) andn-gram language model perplexity, and Coster andKauchak (2011) – two additional automatic tech-niques (the word-level-F1 and simple string accu-racy), taken from sentence compression evaluation(Clarke and Lapata, 2006).
As we consider that the aim of text simplifica-tion for human readers is to improve text com-prehensibility, we argue that reading comprehen-sion must be evaluated, and that evaluating justthe quality of produced sentences is not enough.Differently from the approaches that employ hu-man judges, we consider that it is better to test realhuman comprehension with target readers popula-tions, rather than to make conclusions about theextent of population’s understanding on the basisof the opinion of a small number of human judges.In addition, we consider that measuring readingspeed, rate, as well as reading and speed errors,requires much more complicated and expensivetools, than having an online system to measuretime to reply and recognize correct answers. Fi-nally, we consider that cloze tests are an evalu-ation method that cannot really reflect the com-plexity of reading comprehension (for example formeasuring manipulations of the syntactic struc-
ture of sentences), and for this reason, we selectmultiple-choice questions as the testing method,which we consider the most reflecting the speci-ficities of the complexity of a text, more accessi-ble than eye-tracking technologies, and more ob-jective than users’ feedback. The approach doesnot explicitly evaluate the fluency, grammaticalityand content preservation of the simplified text, butcan be coupled with such additional evaluation.
The closest to ours approach is that of Relloet al. (2013) who evaluated reading comprehen-sion with over ninety readers with and withoutdyslexia. Besides using eye-tracking (reading timeand fixations duration), different reading devices,and users rating the text according to how easy it isit read, to understand and to remember, they obtainalso a comprehension score based on multiple-choice questions (MCQ) with 3 answers (1 cor-rect, 1 partially correct and 1 wrong). The dif-ference with our approach is that we consider thathaving only one correct answer (as suggested byGronlund (1982)), is a more objective evaluation,rather than having one partially correct answer,which would introduce subjectivity in evaluation.
To support our motivation, some state-of-the-artapproaches state the scarcity of evaluation withtarget readers (Williams and Reiter, 2008), notethat there are no commonly accepted evaluationmeasures (Coster and Kauchak, 2011), attemptto address the need of developing reading com-prehension evaluation methods (Siddharthan andKatsos, 2012), and propose common evaluationframeworks (Specia et al., 2012; De Belder andMoens, 2012). More concretely, Siddhathan andKatsos (2012) propose the magnitude estimationof readability judgements and the delayed sen-tence recall as reading comprehension evaluationmethods. Specia et al. (2012) provide a lexicalsimplification evaluation framework in the contextof Semeval-2012. The evaluation is performed us-ing a measure of inter-annotator agreement, basedon Cohen (1960). Similarly, De Belder and Moens(2012) propose a dataset for evaluating lexicalsimplification. No common evaluation frameworkhas been yet developed for syntactic simplifica-tion.
As seen in the overview, besides the multitudeof existing approaches, and the few approaches at-tempting to propose a common evaluation frame-work, there are no widely accepted evaluationmetrics or methods, which would allow the com-
22

parison of existing approaches. The next sectionpresents our evaluation approach, which we offeras a candidate for common evaluation metrics.
3 Proposed Evaluation Metrics
3.1 The Evaluation Experiment
The metrics proposed in this article, was devel-oped in the context of a previously conductedlarge-scale text simplification evaluation experi-ment (Temnikova, 2012). The experiment aimedto determine whether a manual, rule-based textsimplification approach (namely a controlled lan-guage), can re-write existing texts into more un-derstandable versions. Impact on reading com-prehension was necessary to evaluate, as the pur-pose of text simplification was to enhance in firstplace the reading comprehension of emergency in-structions. The controlled language used for sim-plification was the Controlled Language for Cri-sis Management (CLCM, more details in (Tem-nikova, 2012)), which was developed on the ba-sis of existing psychological and psycholinguis-tic literature discussing human comprehension un-der stress, which ensures its psychological valid-ity. The text units evaluated in this experimentswere whole texts, and more concretely pairs oforiginal texts and their simplified versions. We ar-gue that using whole texts for measuring readingcomprehension is better than single sentences, asthe texts provide more context for understanding.The experiment took place in the format of an on-line experiment, conducted via a specially devel-oped web interface, and required users to read sev-eral texts and answer Multiple-Choice Questions(MCQ), testing the readers’ understanding of eachof the texts. Due to the purpose of the text simpli-fication (emergency situations simulation), userswere required to read the texts in a limited time,as to imitate a stressful situation with no time tothink and re-read the text. This aspect will not betaken into account in the evaluation, as the pur-pose is to propose a general formula, applicableto a variety of different text simplification experi-ments. After reading the text in a limited time, thetext was hidden from the readers, and they werepresented with a screen, asking if they were readyto proceed with the questions. Next, each questionwas displayed one by one, along with its answers,with the readers not having the option to go backto the text. In order to ensure the constant atten-tion of the readers and to reduce readers’ tiredness
fact or, the texts were kept short (about 150-170words each), and the number of texts to be readby the reader was kept to four. In addition, to en-sure comparability, all the texts were selected in away to be more or less of the same length. The ex-periment employed a collection of a total of eighttexts, four of which original, non simplified (’com-plex’) versions, and the other four – their manu-ally simplified versions. Each user had to read twocomplex and two simplified texts, none of whichwas a variant of the other. The interface automati-cally randomized the order of displaying the texts,to ensure that different users would get differentcombinations of texts in one of the following twodifferent sequences:
• Complex-Simplified-Complex-Simplified
• Simplified-Complex-Simplified-Complex
This was done in order to minimize the im-pact of the order of displaying the texts on thetext comprehension results. After reading eachtext, the readers were prompted to answer betweenfour and five questions about each text. The MCQmethod was selected as it is considered being themost objective and easily measurable way of as-sessing comprehension (Gronlund, 1982). Thenumber of questions and answers was selected ina way to not tire the reader (four to five questionsper text and four to five answers for each ques-tion), and the questions and answers themselveswere designed following the the best MCQ prac-tices (Gronlund, 1982). Some of the practices fol-lowed involved ensuring that there is only one cor-rect answer per question, making all wrong an-swers (or ’distractors’) grammatically, and as textlength consistent with the correct answer, in orderto avoid giving hints to the reader, and making alldistractors plausible and equally attractive. Simi-larly to the texts, the questions and answers werealso displayed in different order to different read-ers, to avoid that the order influences the compre-hension results. The correct answer was displayedin different positions to avoid learning its positionand internally marked in a way to distinguish itduring evaluation from all the distractors in what-ever position it was displayed. The questions re-quired understanding of key aspects of the texts, toavoid relying on pure texts’ memorization (such asunder which conditions what was supposed to bedone, explanations, and the order in which actionsneeded to be taken). The information, evaluating
23
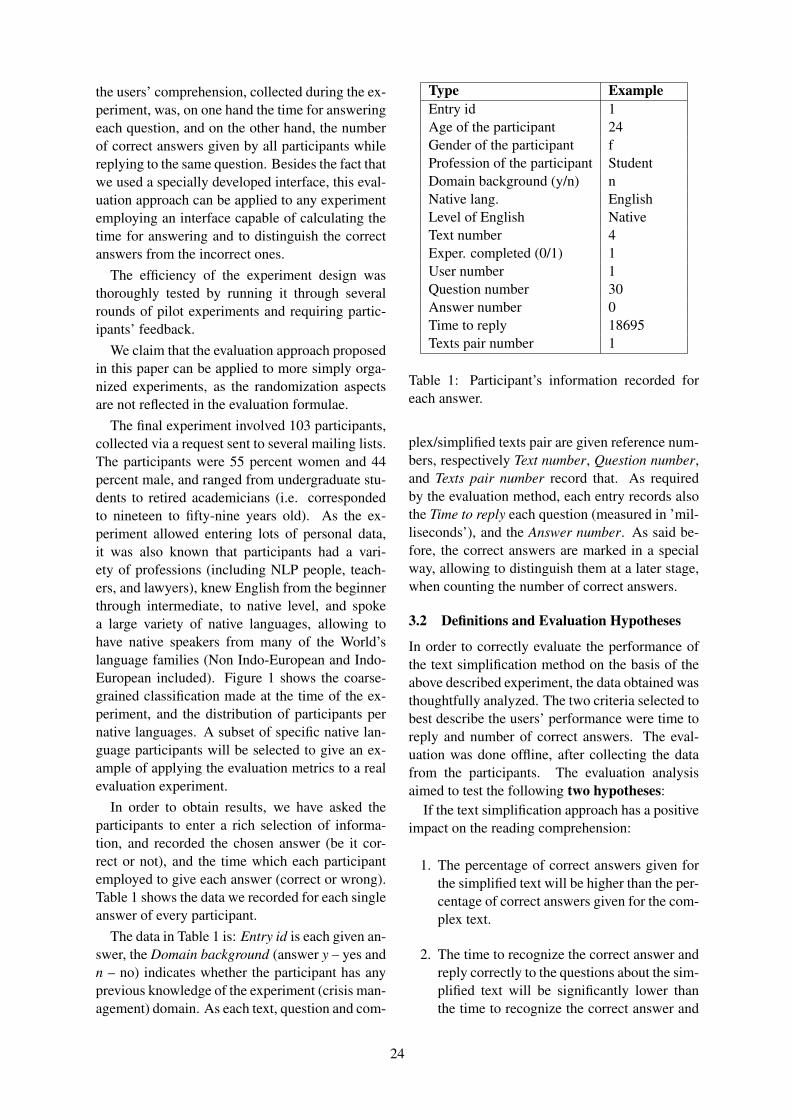
the users’ comprehension, collected during the ex-periment, was, on one hand the time for answeringeach question, and on the other hand, the numberof correct answers given by all participants whilereplying to the same question. Besides the fact thatwe used a specially developed interface, this eval-uation approach can be applied to any experimentemploying an interface capable of calculating thetime for answering and to distinguish the correctanswers from the incorrect ones.
The efficiency of the experiment design wasthoroughly tested by running it through severalrounds of pilot experiments and requiring partic-ipants’ feedback.
We claim that the evaluation approach proposedin this paper can be applied to more simply orga-nized experiments, as the randomization aspectsare not reflected in the evaluation formulae.
The final experiment involved 103 participants,collected via a request sent to several mailing lists.The participants were 55 percent women and 44percent male, and ranged from undergraduate stu-dents to retired academicians (i.e. correspondedto nineteen to fifty-nine years old). As the ex-periment allowed entering lots of personal data,it was also known that participants had a vari-ety of professions (including NLP people, teach-ers, and lawyers), knew English from the beginnerthrough intermediate, to native level, and spokea large variety of native languages, allowing tohave native speakers from many of the World’slanguage families (Non Indo-European and Indo-European included). Figure 1 shows the coarse-grained classification made at the time of the ex-periment, and the distribution of participants pernative languages. A subset of specific native lan-guage participants will be selected to give an ex-ample of applying the evaluation metrics to a realevaluation experiment.
In order to obtain results, we have asked theparticipants to enter a rich selection of informa-tion, and recorded the chosen answer (be it cor-rect or not), and the time which each participantemployed to give each answer (correct or wrong).Table 1 shows the data we recorded for each singleanswer of every participant.
The data in Table 1 is: Entry id is each given an-swer, the Domain background (answer y – yes andn – no) indicates whether the participant has anyprevious knowledge of the experiment (crisis man-agement) domain. As each text, question and com-
Type ExampleEntry id 1Age of the participant 24Gender of the participant fProfession of the participant StudentDomain background (y/n) nNative lang. EnglishLevel of English NativeText number 4Exper. completed (0/1) 1User number 1Question number 30Answer number 0Time to reply 18695Texts pair number 1
Table 1: Participant’s information recorded foreach answer.
plex/simplified texts pair are given reference num-bers, respectively Text number, Question number,and Texts pair number record that. As requiredby the evaluation method, each entry records alsothe Time to reply each question (measured in ’mil-liseconds’), and the Answer number. As said be-fore, the correct answers are marked in a specialway, allowing to distinguish them at a later stage,when counting the number of correct answers.
3.2 Definitions and Evaluation Hypotheses
In order to correctly evaluate the performance ofthe text simplification method on the basis of theabove described experiment, the data obtained wasthoughtfully analyzed. The two criteria selected tobest describe the users’ performance were time toreply and number of correct answers. The eval-uation was done offline, after collecting the datafrom the participants. The evaluation analysisaimed to test the following two hypotheses:
If the text simplification approach has a positiveimpact on the reading comprehension:
1. The percentage of correct answers given forthe simplified text will be higher than the per-centage of correct answers given for the com-plex text.
2. The time to recognize the correct answer andreply correctly to the questions about the sim-plified text will be significantly lower thanthe time to recognize the correct answer and
24

Figure 1: Coarse-grained distribution of participants per native languages.
reply correctly to the questions about thecomplex text.
The two hypotheses were tested previously byemploying only the key variables (time to replyand number of correct answers). It has beenproven that comprehension increases with the per-centage of correct answers and decreases with theincrease of the time to reply. On the basis ofthese facts, we define the C-Score (a text Compre-hension Score) – an objective evaluation metrics,which allows to give a reading comprehension es-timate to a text, or to compare two texts or two ormore text simplification approaches. The C-Scoreis calculated text per text. In order to address a va-riety of situations, we propose three versions of theC-Score, which cover, gradually, all possible vari-ables which can affect comprehension in such anexperiment. In the following sections we presenttheir formulae, the variables involved, and discusstheir results, advantages and shortcomings.
3.3 The C-Score Version One. The C-ScoreSimple.
Given a text comprehension experiment featuringn texts with m questions with r answers each, anability to measure time to reply to questions andto recognize the correct answers, we define the C-Score Simple as given below:
Csimple =Pr
tmean(1)
Where: Pr is the percentage of correct answers,from all answers given to all the questions aboutthis text, and t is the average time to reply to allquestions about this text (both with a correct anda wrong answer). The time is expressed in arbi-trary seconds-based units, depending on the ex-periment. The logic behind this formula is simple:we consider that comprehension increases with thepercentage of correctly answered questions, anddiminishes if the mean time to answer questionsincreases.
3.4 The C-Score Version Two. C-ScoreComplete.
The C-Score complete takes into consideration arich selection of variables reflecting the questionsand answers complexity. In this C-Score version,we consider that the experiment designers will se-lect short texts (e.g. 150 words) of a similar length,with the aim to reduce participants’ tiredness fac-tor, as we did in our experimental settings.
Ccomplete =Pr
Nq
Nq∑q=1
Qs(q)tmean(q)
(2)
In this formula, Pr is the percentage of correctanswers by all participants for this text, Nq is the
25

number of questions of this text (4-5 in our experi-ment), and t is the average time to reply to all ques-tions about this text (4-5 in our experiment). Weintroduce the concept Question Size, (Qs), whichis calculated for each question and takes into ac-count the number of answers of the question (Na),the question length in words (Lq), and the totallength in words of its answers (La):
Qs = Na(Lq + La) (3)
We consider that the number of questions nega-tively influences the comprehension results, as thereader gets cognitively tired to process more andmore questions about different key aspects of thetext. In addition, Gronlund (1982) suggests to re-strict the number of questions per text to four-fiveto achieve better learning. For this reason, we con-sider that comprehension decreases, if the num-ber of questions is higher. We also consider thatanswering correctly/faster to a difficult questionshows better text comprehension than giving fasta correct answer to a simply-worded question. Forthis reason we award question difficulty, and weplace it above the fraction.
3.5 The C-Score Version Three. C-ScoreTextsize.
Finally, the last version of C-Score takes into ac-count the case when the texts used for compari-son can be of a different length, and in this way,the texts’ complexity (for example, when compar-ing the results of two different TS engines, withouthaving access to the same texts). For this reason,the C-Score 3 considers the text length (called textsize, Ts) of the texts used in the experiment. Asa longer text will be more difficult to understandthan a shorter text, the text length is placed nearthe percentage of correct answers.
Ctextsize =PrTs
Nq
Nq∑q=1
Qs(q)tmean(q)
(4)
4 C-Score Results
We have implemented and applied the above de-scribed formulae to the experimental data, pre-sented in Section 3.1. As we have only one textsimplification approach, two user scenarios arepresented:
1. Original (’Complex’) vs. Simplified (’Sim-ple’) pairs of texts comparison. The subset of
participants are the speakers of Basque, Turk-ish, Hungarian, Lithuanian, Vietnamese, Chi-nese, and Indian languages. All three formu-lae have been applied.
2. Comparison of the comprehension of thesame text of readers from different sub-groups. The readers have been divided byage. This scenario can be used to inferpsycho-linguistic findings about the readingabilities of different participants.
Please note that the texts pairs are: Text 1 and2; Text 3 and 4; Text 5 and 6; and Text 7 and 8.In each couple, the first text is complex and thesecond is its simplified version. The results forthe first evaluation scenario are respectively dis-played in Table 2 for C-Score Simple, Table 3 forC-Score Complete and Table 4 for C-Score Text-size. The results of C-Score Complete have beenmultiplied per 100 for better readability. As a re-minder, we consider that higher the score is, betteris text comprehension. From this point of view,if the text simplification approach was successful,Text 2 (Simplified) should have a higher C-Scorethan its original, complex Text 1, Text 4 (Simpli-fied) should have a higher C-Score than its orig-inal Text 3, Text 6 (Simplified) – a higher scorethan the complex Text 5, and Text 8 (Simplified) –a higher score than its original Text 7.
In the second scenario, the participants datahas been divided into data relevant to participantsunder 45 years old (ninety-two participants) andinto participants over 45 years old (eleven partic-ipants). In this case only the C-Score Simple hasbeen applied. The results of this evaluation areshown in Table 5. As our aim is to compare thereading abilities of different ages of people, andnot the results of text simplification, only the com-plex texts are taken into account. The results showthat the comprehension score of participants under45 years old is higher for all texts (despite the un-even participants’ distribution), except in the caseof complex Text 5.
A similar phenomenon can be observed in Ta-bles 2, 3 and 4, where in all text pairs, except forpair 3, i.e. Texts 5 and 6 (where can be observedthe opposite), the simplified text has a higher com-prehension score than its complex original. Thehypothesis about the different behavior of Text 5and 6 is that it is text-specific. This is confirmedby Table 5, which shows that besides the big dif-
26

Text number C-Score SimpleText 1 (Complex) 21.3Text 2 (Simplified) 35.3Text 3 (Complex) 24.8Text 4 (Simplified) 34.9Text 5 (Complex) 36.8Text 6 (Simplified) 23.6Text 7 (Complex) 40.5Text 8 (Simplified) 51.5
Table 2: Experiment results for C-Score Simple.
ferences in reading comprehension between par-ticipants under 45 years old and participants over45 years old, Text 5 has more or less the samecomprehension score for both groups of readers.From this fact we can assume that this text is prob-ably fairly easy, so this type of combination of textsimplification rules does not simplify it, and in-stead, when applied makes it less comprehensibleor more awkward for the human readers.
Text number C-Score CompleteText 1 (Complex) 66.3Text 2 (Simplified) 114.3Text 3 (Complex) 65.3Text 4 (Simplified) 89.9Text 5 (Complex) 104.0Text 6 (Simplified) 66.9Text 7 (Complex) 106.7Text 8 (Simplified) 153.0
Table 3: Experiment results for C-Score Com-plete.
Text number C-Score TextsizeText 1 (Complex) 109.5Text 2 (Simplified) 192.0Text 3 (Complex) 107.7Text 4 (Simplified) 131.3Text 5 (Complex) 171.6Text 6 (Simplified) 102.4Text 7 (Complex) 176.1Text 8 (Simplified) 263.3
Table 4: Experiment results for C-ScoreTextsize.
5 Discussion and Conclusions
This article has presented an extended discussionof the methods employed for evaluation in the text
Text number Under 45 Over 45Text 1 (Complex) 39.7 22.5Text 3 (Complex) 37.2 18.4Text 5 (Complex) 38.4 38.9Text 7 (Complex) 54.3 35.9
Table 5: C-Score Simple for one text.
simplification domain. In order to address the lackof common or standard evaluation approaches,this article proposed three evaluation formulae,which measure the reading comprehension of pro-duced texts. The formulae have been developed onthe basis of an extensive reading comprehensionexperiment, aiming to evaluate the impact of a textsimplification approach (a controlled language) onemergency instructions. Two evaluation scenarioshave been presented, the first of which calculatedwith all three formulae, while the second used onlythe simplest one. In this way, the article aimsto address both the lack of common TS evalua-tion metrics as suggested in Section 2 (Coster andKauchak, 2011) and the scarcity of reading com-prehension (Siddharthan and Katsos, 2012) evalu-ation with real users (Williams and Reiter, 2008),by proposing a tailored approach for this type oftext simplification evaluation. With this article weaim at inciting the Text Simplification Commu-nity to open a discussion forum about commonmethods for evaluating text simplification, in or-der to provide objective evaluation metrics allow-ing the comparison of different approaches, and toensure that simplification really achieves its aims.We also argue that taking in consideration the end-users and text units used for evaluation is impor-tant. In our approach, we address only the eval-uation of text simplification approaches aiming toimprove reading comprehension and experimentsin which time to reply to questions and percent-age of correct answers can be measured. A plausi-ble scenario for applying our evaluation approachwould be to use the Amazon Mechanical Turkfor crowd-sourcing and then to evaluate the per-formance of a text simplification system on com-plex and simplified texts, to compare the perfor-mance of two or more approaches, or of two ver-sions of the same system on the same pairs oftexts. These formulae can be also employed inpsycholinguistically-oriented experiments, whichaim to reach cognitive findings regarding specifictarget reader groups, such as dyslexics or autis-
27
tic readers. Future work will involve the com-parison of the above proposed evaluation metricswith any of the metrics already employed in therelated work, such as the recent and classic read-ability formulae, eye-tracking, reading rate, hu-man judges ratings, and others. We consider thatcontent preservation and grammaticality are notnecessary to be evaluated for this approach, as thesimplified texts have been produced manually, bylinguists, who were native speakers of English.
Acknowledgments
The authors would like to thank Prof. Dr. PetarTemnikov for the ideas and advices about the re-search methodology, Dr. Anke Buttner for the psy-cholinguistic counseling about the experiment de-sign, including questions, answers and texts se-lection and the simplification method psycholog-ical validity, and Dr. Constantin Orasan and Dr.Le An Ha for the testing interface implementa-tion. The research of Irina Temnikova reported inthis paper was partially supported by the projectAComIn ”Advanced Computing for Innovation”,grant 316087, funded by the FP7 Capacity Pro-gramme (Research Potential of Convergence Re-gions).
Finally, the authors would also like to thank thePITR 2013 reviewers for their useful feedback.
ReferencesJan Alexandersson, Peter Ljunglf, Kathleen F. Mc-
Coy, Brian Roark, and Annalu Waller, editors.2012. Proceedings of the Third Workshop on Speechand Language Processing for Assistive Technolo-gies. Association for Computational Linguistics,Montreal, Canada, June.
Stefan Bott, Luz Rello, Biljana Drndarevic, and Hora-cio Saggion. 2012. Can spanish be simpler? lexsis:Lexical simplification for spanish. In Proceedings ofthe 24th International Conference on ComputationalLinguistics (Coling 2012), Mumbai, India (Decem-ber 2012).
Yvonne Canning. 2002. Syntactic Simplification ofText. Ph.D. thesis, University of Sunderland, UK.
Raman Chandrasekar, Christine Doran, and BangaloreSrinivas. 1996. Motivations and methods for textsimplification. In Proceedings of the 16th confer-ence on Computational linguistics-Volume 2, pages1041–1044. Association for Computational Linguis-tics.
James Clarke and Mirella Lapata. 2006. Modelsfor sentence compression: A comparison across do-
mains, training requirements and evaluation mea-sures. In Proceedings of the 21st International Con-ference on Computational Linguistics and the 44thannual meeting of the Association for Computa-tional Linguistics, pages 377–384. Association forComputational Linguistics.
Jacob Cohen et al. 1960. A coefficient of agreementfor nominal scales. Educational and psychologicalmeasurement, 20(1):37–46.
William Coster and David Kauchak. 2011. Learning tosimplify sentences using wikipedia. In Proceedingsof the Workshop on Monolingual Text-To-Text Gen-eration, pages 1–9. Association for ComputationalLinguistics.
Walter Daelemans, Anja Hothker, and Erik Tjong KimSang. 2004. Automatic sentence simplification forsubtitling in dutch and english. In Proceedings ofthe 4th International Conference on Language Re-sources and Evaluation, pages 1045–1048.
Jan De Belder and Marie-Francine Moens. 2012. Adataset for the evaluation of lexical simplification.In Computational Linguistics and Intelligent TextProcessing, pages 426–437. Springer.
Siobhan Devlin. 1999. Automatic Language Simplifi-cation for Aphasic Readers. Ph.D. thesis, Universityof Sunderland, UK.
George Doddington. 2002. Automatic evaluationof machine translation quality using n-gram co-occurrence statistics. In Proceedings of the secondinternational conference on Human Language Tech-nology Research, pages 138–145. Morgan Kauf-mann Publishers Inc.
Biljana Drndarevic, Sanja Stajner, Stefan Bott, SusanaBautista, and Horacio Saggion. 2013. Automatictext simplification in spanish: A comparative evalu-ation of complementing modules. In ComputationalLinguistics and Intelligent Text Processing, pages488–500. Springer.
William H. DuBay. 2004. The principles of readabil-ity. Impact Information, pages 1–76.
Noemie Elhadad. 2006. User-sensitive text summa-rization: Application to the medical domain. Ph.D.thesis, Columbia University.
Rudolf Flesch. 1948. A new readability yardstick. TheJournal of applied psychology, 32(3).
Caroline Gasperin, Erick Maziero, Lucia Specia, TASPardo, and Sandra M Aluisio. 2009. Natural lan-guage processing for social inclusion: a text sim-plification architecture for different literacy levels.the Proceedings of SEMISH-XXXVI Seminario Inte-grado de Software e Hardware, pages 387–401.
Gregory Grefenstette. 1998. Producing intelligenttelegraphic text reduction to provide an audio scan-ning service for the blind. In Working notes of the
28

AAAI Spring Symposium on Intelligent Text summa-rization, pages 111–118.
Norman Edward Gronlund. 1982. Constructingachievement tests. Prentice Hall.
Kentaro Inui, Atsushi Fujita, Tetsuro Takahashi, RyuIida, and Tomoya Iwakura. 2003. Text simplifica-tion for reading assistance: a project note. In Pro-ceedings of the second international workshop onParaphrasing-Volume 16, pages 9–16. Associationfor Computational Linguistics.
Beata Beigman Klebanov, Kevin Knight, and DanielMarcu. 2004. Text simplification for information-seeking applications. In On the Move to Mean-ingful Internet Systems 2004: CoopIS, DOA, andODBASE, pages 735–747. Springer.
Irving Lorge. 1948. The lorge and flesch readabil-ity formulae: A correction. School and Society,67:141–142.
Aurelien Max. 2006. Writing for language-impairedreaders. In Computational Linguistics and Intelli-gent Text Processing, pages 567–570. Springer.
Kishore Papineni, Salim Roukos, Todd Ward, and Wei-Jing Zhu. 2002. Bleu: a method for automaticevaluation of machine translation. In Proceedings ofthe 40th annual meeting on association for compu-tational linguistics, pages 311–318. Association forComputational Linguistics.
Sarah E. Petersen and Mari Ostendorf. 2007. Text sim-plification for language learners: a corpus analysis.In In Proc. of Workshop on Speech and LanguageTechnology for Education.
Luz Rello, Ricardo Baeza-Yates, Stefan Bott, and Ho-racio Saggion. 2013. Simplify or help? text sim-plification strategies for people with dyslexia. Proc.W4A, 13.
J. Richard Ruffino. 1982. Coping with machine trans-lation. Practical Experience of Machine Transla-tion.
Advaith Siddharthan and Napoleon Katsos. 2012. Of-fline sentence processing measures for testing read-ability with users. In Proceedings of the First Work-shop on Predicting and Improving Text Readabilityfor target reader populations, pages 17–24. Associ-ation for Computational Linguistics.
Advaith Siddharthan. 2003. Syntactic simplificationand text cohesion. Ph.D. thesis, University of Cam-bridge, UK.
Matthew Snover, Nitin Madnani, Bonnie J Dorr, andRichard Schwartz. 2009. Fluency, adequacy, orhter?: exploring different human judgments with atunable mt metric. In Proceedings of the FourthWorkshop on Statistical Machine Translation, pages259–268. Association for Computational Linguis-tics.
Lucia Specia, Sujay Kumar Jauhar, and Rada Mihal-cea. 2012. Semeval-2012 task 1: English lexi-cal simplification. In Proceedings of the First JointConference on Lexical and Computational Seman-tics, pages 347–355. Association for ComputationalLinguistics.
Lucia Specia. 2010. Translating from complex to sim-plified sentences. In Computational Processing ofthe Portuguese Language, pages 30–39. Springer.
A. A. Streiff. 1985. New developments in titus 4.Lawson (1985), 185:192.
Irina Temnikova. 2012. Text Complexity and Text Sim-plification in the Crisis Management domain. Ph.D.thesis, Wolverhampton, UK.
Lucy Vanderwende, Hisami Suzuki, Chris Brockett,and Ani Nenkova. 2007. Beyond sumbasic: Task-focused summarization with sentence simplificationand lexical expansion. Information Processing &Management, 43(6):1606–1618.
David Vickrey and Daphne Koller. 2008. Sentencesimplification for semantic role labeling. In Pro-ceedings of the 46th Annual Meeting of the Asso-ciation for Computational Linguistics: Human Lan-guage Technologies (ACL-2008: HLT), pages 344–352.
Sandra Williams and Ehud Reiter. 2008. Generatingbasic skills reports for low-skilled readers. NaturalLanguage Engineering, 14(4):495–525.
Sandra Williams, Advaith Siddharthan, and AniNenkova, editors. 2012. Proceedings of the FirstWorkshop on Predicting and Improving Text Read-ability for target reader populations. Associationfor Computational Linguistics, Montreal, Canada,June.
Kristian Woodsend and Mirella Lapata. 2011. Learn-ing to simplify sentences with quasi-synchronousgrammar and integer programming. In Proceedingsof the Conference on Empirical Methods in NaturalLanguage Processing, pages 409–420. Associationfor Computational Linguistics.
Mark Yatskar, Bo Pang, Cristian Danescu-Niculescu-Mizil, and Lillian Lee. 2010. For the sake of sim-plicity: Unsupervised extraction of lexical simplifi-cations from wikipedia. In Human Language Tech-nologies: The 2010 Annual Conference of the NorthAmerican Chapter of the Association for Computa-tional Linguistics, pages 365–368. Association forComputational Linguistics.
Zhemin Zhu, Delphine Bernhard, and Iryna Gurevych.2010. A monolingual tree-based translation modelfor sentence simplification. In Proceedings of the23rd international conference on computational lin-guistics, pages 1353–1361. Association for Compu-tational Linguistics.
29

Proceedings of the 2nd Workshop on Predicting and Improving Text Readability for Target Reader Populations, pages 30–38,Sofia, Bulgaria, August 4-9 2013. c©2013 Association for Computational Linguistics
A Language-Independent Approach to Automatic Text DifficultyAssessment for Second-Language Learners
Wade Shen1, Jennifer Williams1, Tamas Marius2, and Elizabeth Salesky †1
1MIT Lincoln Laboratory Human Language Technology Group,244 Wood Street Lexingon, MA 02420, USA
{swade,jennifer.williams,elizabeth.salesky}@ll.mit.edu
2DLI Foreign Language Center, Bldg. 420, Room 119 Monterey, CA 93944, [email protected]
Abstract
In this paper, we introduce a new base-line for language-independent text diffi-culty assessment applied to the Intera-gency Language Roundtable (ILR) profi-ciency scale. We demonstrate that readinglevel assessment is a discriminative prob-lem that is best-suited for regression. Ourbaseline uses z-normalized shallow lengthfeatures and TF-LOG weighted vectors onbag-of-words for Arabic, Dari, English,and Pashto. We compare Support VectorMachines and the Margin-Infused RelaxedAlgorithm measured by mean squared er-ror. We provide an analysis of which fea-tures are most predictive of a given level.
1 Introduction
The ability to obtain new materials of an appro-priate language proficiency level is an obstaclefor second-language learners and educators alike.With the growth of publicly available Internet andnews sources, learners and instructors of foreignlanguages should have ever-increasing access tolarge volumes of foreign language text. How-ever, sifting through this pool of foreign languagedata poses a significant challenge. In this paperwe demonstrate two machine learning regressionmethods which can be used to help both learn-ers and course developers by automatically rat-ing documents based on the text difficulty. Thesemethods can be used to automatically identifydocuments at specific levels in order to speedcourse or test development, providing learners
† This work was sponsored by the Department of De-fense under Air Force Contract FA8721-05-C-0002. Opin-ions, interpretations, conclusions, and recommendations arethose of the authors and are not necessarily endorsed by theUnited States Government.
with custom-tailored materials that match theirlearning needs.
ILR (Interagency Language Roundtable) levelsreflect differences in text difficulty for second-language learners at different stages of their edu-cation. A description of each level is shown in Ta-ble 1 (Interagency Language Roundtable, 2013).Some levels differ in terms of sentence structure,length of document, type of communication, etc.,while others, especially the higher levels, differ interms of the domain and style of writing. Giventhese differences, we expect that both semanticcontent and grammar-related features will be nec-essary to distinguish between documents at differ-ent levels.
Level Description0 No proficiency0+ Memorized proficiency1 Elementary proficiency1+ Elementary proficiency, plus2 Limited working proficiency2+ Limited working proficiency, plus3 General professional proficiency3+ General professional proficiency, plus4 Advanced professional proficienty4+ Advanced professional proficiency, plus5 Functionally native proficiency
Table 1: Description of ILR levels.
Automatically determining ILR levels fromdocuments is a research problem without knownsolutions. We have developed and adapted a se-ries of rating algorithms and a set of experimentsgauging the feasibility of automatic ILR level as-signment for text documents. Using data providedby the Defense Language Institute Foreign Lan-guage Center (DLIFLC), we show that while theproblem is tractable, the performance of automatic
30
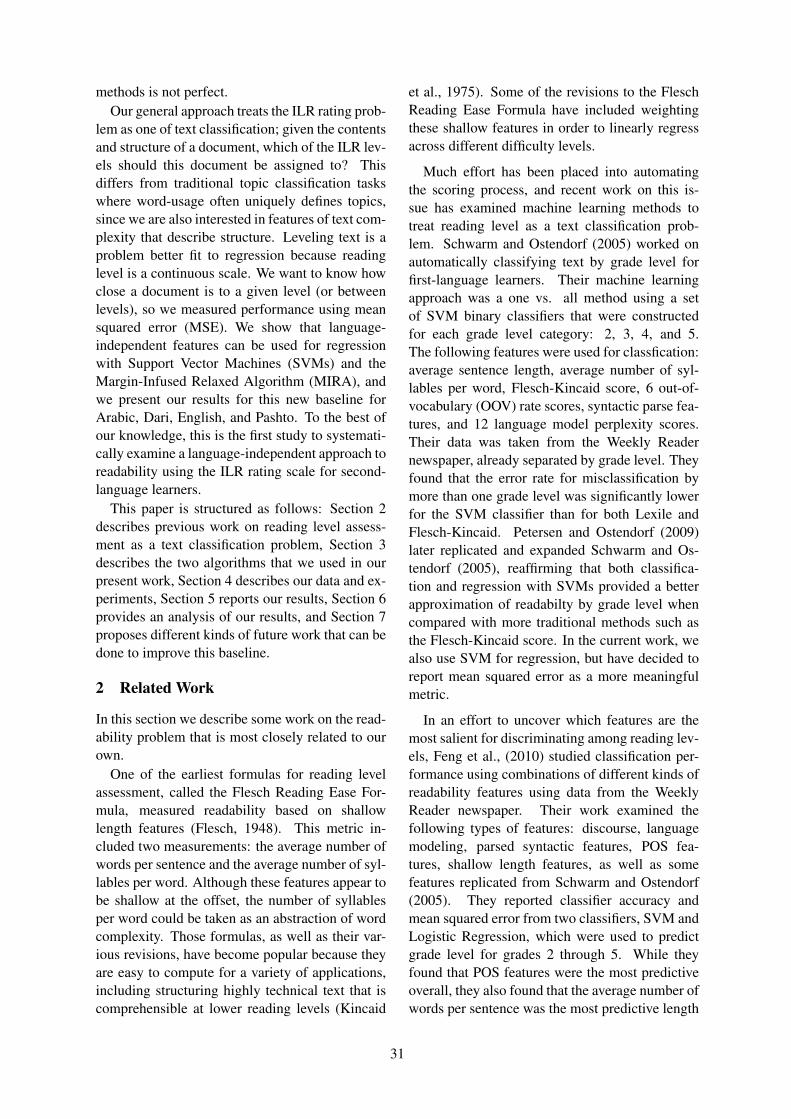
methods is not perfect.Our general approach treats the ILR rating prob-
lem as one of text classification; given the contentsand structure of a document, which of the ILR lev-els should this document be assigned to? Thisdiffers from traditional topic classification taskswhere word-usage often uniquely defines topics,since we are also interested in features of text com-plexity that describe structure. Leveling text is aproblem better fit to regression because readinglevel is a continuous scale. We want to know howclose a document is to a given level (or betweenlevels), so we measured performance using meansquared error (MSE). We show that language-independent features can be used for regressionwith Support Vector Machines (SVMs) and theMargin-Infused Relaxed Algorithm (MIRA), andwe present our results for this new baseline forArabic, Dari, English, and Pashto. To the best ofour knowledge, this is the first study to systemati-cally examine a language-independent approach toreadability using the ILR rating scale for second-language learners.
This paper is structured as follows: Section 2describes previous work on reading level assess-ment as a text classification problem, Section 3describes the two algorithms that we used in ourpresent work, Section 4 describes our data and ex-periments, Section 5 reports our results, Section 6provides an analysis of our results, and Section 7proposes different kinds of future work that can bedone to improve this baseline.
2 Related Work
In this section we describe some work on the read-ability problem that is most closely related to ourown.
One of the earliest formulas for reading levelassessment, called the Flesch Reading Ease For-mula, measured readability based on shallowlength features (Flesch, 1948). This metric in-cluded two measurements: the average number ofwords per sentence and the average number of syl-lables per word. Although these features appear tobe shallow at the offset, the number of syllablesper word could be taken as an abstraction of wordcomplexity. Those formulas, as well as their var-ious revisions, have become popular because theyare easy to compute for a variety of applications,including structuring highly technical text that iscomprehensible at lower reading levels (Kincaid
et al., 1975). Some of the revisions to the FleschReading Ease Formula have included weightingthese shallow features in order to linearly regressacross different difficulty levels.
Much effort has been placed into automatingthe scoring process, and recent work on this is-sue has examined machine learning methods totreat reading level as a text classification prob-lem. Schwarm and Ostendorf (2005) worked onautomatically classifying text by grade level forfirst-language learners. Their machine learningapproach was a one vs. all method using a setof SVM binary classifiers that were constructedfor each grade level category: 2, 3, 4, and 5.The following features were used for classfication:average sentence length, average number of syl-lables per word, Flesch-Kincaid score, 6 out-of-vocabulary (OOV) rate scores, syntactic parse fea-tures, and 12 language model perplexity scores.Their data was taken from the Weekly Readernewspaper, already separated by grade level. Theyfound that the error rate for misclassification bymore than one grade level was significantly lowerfor the SVM classifier than for both Lexile andFlesch-Kincaid. Petersen and Ostendorf (2009)later replicated and expanded Schwarm and Os-tendorf (2005), reaffirming that both classifica-tion and regression with SVMs provided a betterapproximation of readabilty by grade level whencompared with more traditional methods such asthe Flesch-Kincaid score. In the current work, wealso use SVM for regression, but have decided toreport mean squared error as a more meaningfulmetric.
In an effort to uncover which features are themost salient for discriminating among reading lev-els, Feng et al., (2010) studied classification per-formance using combinations of different kinds ofreadability features using data from the WeeklyReader newspaper. Their work examined thefollowing types of features: discourse, languagemodeling, parsed syntactic features, POS fea-tures, shallow length features, as well as somefeatures replicated from Schwarm and Ostendorf(2005). They reported classifier accuracy andmean squared error from two classifiers, SVM andLogistic Regression, which were used to predictgrade level for grades 2 through 5. While theyfound that POS features were the most predictiveoverall, they also found that the average number ofwords per sentence was the most predictive length
31

feature. This length feature alone achieved 52%accuracy with the Logistic Regression classifier.In the present work, we use the average number ofwords per sentence as a length feature and showthat this metric has some correspondence with thedifferent ILR levels.
Another way to examine readability is to treatit as a sorting problem; that is, given some collec-tion of texts, to sort them from easiest to most dif-ficult. Tanaka-Ishii et al., (2010) presented a novelmethod for determining readibility based on sort-ing texts using text from two groups: low difficultyand high difficulty. They reported their resultsin terms of the Spearman correlation coefficientto compare performance of Flesch-Kincaid, Dale-Chall, SVM regression, and their sorting method.They showed that their sorting method was supe-rior to the other methods, followed by SVM re-gression. However, they call for a more mod-ern and efficient approach to the problem, such asonline learning, that would estimate weights forregression. We answer their call with an onlinelearning approach in this work.
3 Algorithms
In this section, we describe two maximum marginapproaches that we used in our experiments. Bothare based on the principle of structural risk mini-mization. We selected the SVM algorithm becauseof its proven usefulness for automatic readabilityassessment. In addition, the Margin-Infused Re-laxed Algorithm is advantageous because it is anonline algorithm and therefore allows for incre-mental training while still taking advantange ofstructural risk minimization.
3.1 Structural Risk Minimization
For many classification and regression problems,maximum margin approaches are shown to per-form well with minimal amounts of training data.In general, these approaches involve linear dis-criminative classifiers that attempt to learn hy-perplane decision boundaries which separate oneclass from another. Since multiple hyperplanesthat separate classes can exist, these methods addan additional constraint: they attempt to learn hy-perplanes while maximizing a region around theboundary called the margin. We show an exam-ple of this kind of margin in Figure 1, where themargin represents the maximum distance betweenthe decision boundary and support vectors. The
maximum margin approach helps prevent overfit-ting issues that can occur during training, a princi-ple called structural risk minimization. Thereforewe experiment with two such margin-maximizingalgorithms, described below.
Figure 1: Graphical depiction of the maximummargin principle.
3.2 Support Vector Machines
For text classification problems, the most popularmaximum margin approach is the SVM algorithm,introduced by Vapnik (1995). This approach usesa quadratic programming method to find the sup-port vectors that define the margin. This is a batchtraining algorithm requiring all training data to bepresent in order to perform the optimization pro-cedure (Joachims, 1998a). We used LIBSVM toimplement our own SVM for regression (Changand Lin, 2001).
Discriminative methods seek to best dividetraining examples in each class from out-of-classexamples. SVM-based methods are examplesof this approach and have been successfully ap-plied to other text classification problems, includ-ing previous work on reading level assessment(Schwarm and Ostendorf, 2005; Petersen and Os-tendorf, 2009; Feng et al., 2010). This approachattempts to explicitly model the decision boundarybetween classes. Discriminative methods build amodel for each class c that is defined by the bound-ary between examples of class c and examplesfrom all other classes in the training data.
32

3.3 Margin-Infused Relaxed AlgorithmOnline approaches have the advantage of allowingincremental adaptation when new labeled exam-ples are added during training. We implementeda version of MIRA from Crammer and Singer(2003), which we used for regression. Cram-mer and Singer (2003) proved MIRA as an on-line multiclass classifier that employs the prin-ciple of structural risk minimization, and is de-scribed as ultraconservative because it only up-dates weights for misclassified examples. Forclassification, MIRA is formulated as shown inequation (1):
c⇤ = arg max
c2Cfc(d) (1)
wherefc(d) = w · d (2)
and w is the weight vector which defines themodel for class c. During training, examples arepresented to the algorithm in an online fashion (i.e.one at a time) and the weight vector is updatedaccourding to the update shown in equation (2):
wt = wt�1 + l(wt�1,dt�1)vt�1 (3)
l(wt�1,dt�1) = ||dt�1 �wt�1||� ✏ (4)
vt�1 = (sign(||dt�1 �wt�1||)� ✏)dt�1 (5)
where l(·) is the loss function, ✏ corresponds tothe margin slack, and vt�1 is the negative gradientof the loss vector for the previously seen example||dt�1 � wt�1||. This update forces the weightvector towards erroneous examples during train-ing. The magnitude of the change is proportionalto the l(·). For correct training examples, no up-date is performed as l(·) = 0. In a binary classi-fication task, MIRA attempts to minimize the lossfunction in (4), such that the magnitude of the dis-tance between a document vector and the weightvector is also minimized.
However, unlike topic classification or classi-fication of words based on their semantic classwhere the classes are generally discrete, the ILRlevels lie on a continuum (i.e. level 2 >> level1 >> level 0). Therefore we are more interestedin using MIRA for regression because we wantto compare the predicted value with the true real-valued label, rather than a class label. For regres-sion, we can redefine the MIRA loss function asfollows:
l(wt,dt) = |lt � dt · wt|� ✏ (6)
In this case, lt is the correct value (in our case,ILR level) for training document dt and dt · wt isthe predicted value given the current weight vectorwt. We expect that minimizing this loss functioncumulatively over the entire training set will yielda regression model that can predict ILR levels forunseen documents.
This revised loss function results in a modi-fied update equation for each online update ofthe MIRA weight vector (generating a new set ofweights wt from the previously seen example):
wt = wt�1 + l(wt�1,dt�1)vt�1 (7)
vt�1 = (sign(|lt�1�dt�1 ·wt�1|)�✏)dt�1 (8)
vt�1 defines the direction of loss and the mag-nitude of the update relative to the current train-ing example dt�1. Since this approach is online,MIRA does not guarantee minimal loss or maxi-mum margin constraints for all of the training data.However, in practice, these methods perform aswell as their SVM counterparts without the needfor batch training (Crammer et al., 2006).
4 Experiments
4.1 Data
All of our experiments used data from four lan-guages: Arabic (AR), Dari (DAR), English (EN),and Pashto (PS). In Table 2, we show the distri-bution of number of documents per ILR level foreach language. All of our data was obtained fromthe Directorate of Language Science and Technol-ogy (LST) and the Language Technology Evalua-tion and Application Division (LTEA) at the De-fense Language Institute Foreign Language Cen-ter (DLIFLC). The data was compiled using anonline resource (Domino). Language experts (na-tive speakers) used various texts from the Inter-net which they considered to be authentic mate-rial and they created the Global Language OnlineSupport System (GLOSS) system. The texts wereused to debug the GLOSS system and to see howwell GLOSS worked for the respective languages.Each of the texts were labeled by two independentlinguists expertly trained in ILR level scoring. Theratings from these two linguists were then adjudi-cated by a third linguist. We used the resultingadjudicated labels for our training and evaluation.
We preprocessed the data by doing the follow-ing tokenization: removed extra whitespace, nor-malized URIs, normalized currency, normalized
33

Level AR DAR EN PS1 204 197 198 1971+ 200 197 197 1992 199 201 204 2002+ 199 194 196 1983 198 195 202 1983+ 194 194 198 2004 198 195 190 195Overall 1394 1375 1390 1394
Table 2: Total collection documents per languageper ILR level.
numbers, normalized abbreviations, normalizedpunctuation, and folded to lowercase. We identi-fied words by splitting text on whitespace and weidentified sentences by splitting text on punctua-tion.
4.2 Features
It is necessary to define a set of features to helpthe regressors distinguish between the ILR levels.We conducted our experiments using two differenttypes of features: word-usage features and shallowlength features. Shallow length features are shownto be useful in reading level prediction tasks (Fenget al., 2010). Word-usage features, such as theones used here, are meant to capture some low-level topical differences between ILR levels.
Word-usage features: Word frequencies (orweighted word frequencies) are commonly usedas features for topic classification problems, asthese features are highly correlated with topics(e.g. words like player and touchdown are verycommon in documents about topics like football,whereas they are much less common in documentsabout opera). We used TF-LOG weighted wordfrequencies on bag-of-words for each document.
Length features: In addition to word-usage, weadded three z-normalized length features: (1) av-erage sentence length (in words) per document,(2) number of words per document, and (3) aver-age word length (in characters) per document. Weused these as a basic measure of language levelcomplexity. These features are easily computedby automatic means, and they capture some of thestructural differences between the ILR levels.
Figures 2, 3, 4, and 5 show the z-normalizedaverage word count per sentence for Arabic, Dari,English, and Pashto respectively. The overall dataset for each language has a normalized mean of
Figure 2: Arabic, z-normalized average wordcount per sentence for ILR levels 1, 2 and 3.
Figure 3: Dari, z-normalized average word countper sentence for ILR levels 1, 2 and 3.
Figure 4: English, z-normalized average wordcount per sentence for ILR levels 1, 2 and 3.
34
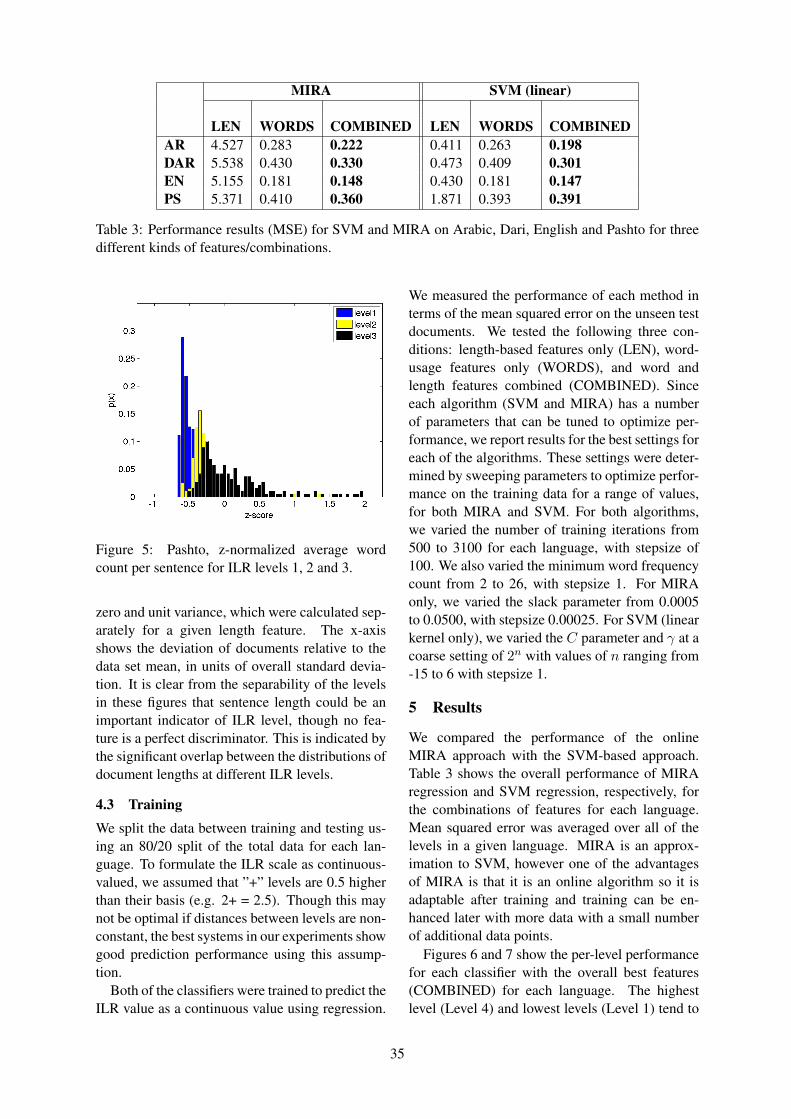
MIRA SVM (linear)
LEN WORDS COMBINED LEN WORDS COMBINEDAR 4.527 0.283 0.222 0.411 0.263 0.198DAR 5.538 0.430 0.330 0.473 0.409 0.301EN 5.155 0.181 0.148 0.430 0.181 0.147PS 5.371 0.410 0.360 1.871 0.393 0.391
Table 3: Performance results (MSE) for SVM and MIRA on Arabic, Dari, English and Pashto for threedifferent kinds of features/combinations.
Figure 5: Pashto, z-normalized average wordcount per sentence for ILR levels 1, 2 and 3.
zero and unit variance, which were calculated sep-arately for a given length feature. The x-axisshows the deviation of documents relative to thedata set mean, in units of overall standard devia-tion. It is clear from the separability of the levelsin these figures that sentence length could be animportant indicator of ILR level, though no fea-ture is a perfect discriminator. This is indicated bythe significant overlap between the distributions ofdocument lengths at different ILR levels.
4.3 TrainingWe split the data between training and testing us-ing an 80/20 split of the total data for each lan-guage. To formulate the ILR scale as continuous-valued, we assumed that ”+” levels are 0.5 higherthan their basis (e.g. 2+ = 2.5). Though this maynot be optimal if distances between levels are non-constant, the best systems in our experiments showgood prediction performance using this assump-tion.
Both of the classifiers were trained to predict theILR value as a continuous value using regression.
We measured the performance of each method interms of the mean squared error on the unseen testdocuments. We tested the following three con-ditions: length-based features only (LEN), word-usage features only (WORDS), and word andlength features combined (COMBINED). Sinceeach algorithm (SVM and MIRA) has a numberof parameters that can be tuned to optimize per-formance, we report results for the best settings foreach of the algorithms. These settings were deter-mined by sweeping parameters to optimize perfor-mance on the training data for a range of values,for both MIRA and SVM. For both algorithms,we varied the number of training iterations from500 to 3100 for each language, with stepsize of100. We also varied the minimum word frequencycount from 2 to 26, with stepsize 1. For MIRAonly, we varied the slack parameter from 0.0005to 0.0500, with stepsize 0.00025. For SVM (linearkernel only), we varied the C parameter and � at acoarse setting of 2
n with values of n ranging from-15 to 6 with stepsize 1.
5 Results
We compared the performance of the onlineMIRA approach with the SVM-based approach.Table 3 shows the overall performance of MIRAregression and SVM regression, respectively, forthe combinations of features for each language.Mean squared error was averaged over all of thelevels in a given language. MIRA is an approx-imation to SVM, however one of the advantagesof MIRA is that it is an online algorithm so it isadaptable after training and training can be en-hanced later with more data with a small numberof additional data points.
Figures 6 and 7 show the per-level performancefor each classifier with the overall best features(COMBINED) for each language. The highestlevel (Level 4) and lowest levels (Level 1) tend to
35

exhibit the worst performance across all languagesfor each regression method. Poorer performanceon the outlying levels could be due to overfittingfor both SVM and MIRA on those levels. TheILR scale includes 4 major levels at half-step in-tervals between each one. We are not sure if us-ing a different scale, such as grade levels rangingfrom 1 to 12, would also exhibit poorer perfor-mance on the outlying levels because the highestILR level corresponds to native-like fluency. ThisU-shaped performance is seen across both classi-fiers for each of the languages.
6 Analysis
Our results show that SVM slightly outperformedMIRA for all of the languages. We believe thatthe reason why MIRA performed worse than SVMis because it was overfit during training whereasSVM was not. This could be due to the parame-ters that we set during our sweep in training. Weselected C and � as parameters to SVM linear-kernel for the best performance. The � values forEnglish and Arabic were set at more than 1000times smaller than the values for Pashto and Dari(AR:�=6.1035156 ⇥ 10
�5, DAR:�=0.0078125,
EN:�=3.0517578 ⇥ 10
�5, PS:�=0.03125). This
means that the margins for Pashto and Dari wereset to be larger respective to English and Arabic.One reason why these margins were larger is be-cause the features that we used had more discrimi-native power for English and Arabic. In fact, bothMIRA and SVM performed worse on Pashto andDari.
Since the method described here makes use of
Figure 6: MIRA performance (MSE) per ILR levelfor each language.
Figure 7: SVM performance (MSE) per ILR levelfor each language.
linear classifiers that weigh word-usage and lengthfeatures, it is possible to examine the weights thata classifier learns during training to see which fea-tures the algorithm deems most useful in discrim-inating between ILR levels. One way to do thisis to use a multiclass classifier on our data for thecategorical levels (e.g. 1, 1+, 2, etc.) and exam-ine the weights that were generated for each class.MIRA is formulated to be a multiclass classifierso we examined its weights for the features. Wechose MIRA instead of SVM, even though LIB-SVM supports multiclass classification, becausewe wanted to capture differences between levelswhich we could not do with one vs. all. We exam-ined classifier weights of greatest magnitude to seewhich features were the most indicative and mostcontra-indicative for that level. We report thesetwo types of features for Level 3 and Level 4 inTables 4 and 5, respectively. Level 3 documentscan have some complex topics, such as politics
and art, however it can be noted that some of themore abstract topics like love and hate are contra-indicative of Level 3. On the other hand, we seethat abstract topics are highly indicative Level 4documents where topics such as philosophy, reli-
gion, virtue, hypothesis, and theory are discussed.We also note that moral is highly contra-indicativeof Level 3 but is highly indicative of Level 4.
7 Discussion and Future Work
We have presented an approach to score docu-ments based on their ILR level automatically us-ing language-independent features. Measures ofstructural complexity like the length-based fea-
36

MostIndicative +
Most Contra-Indicative -
obama 1.739 said -2.259to 1.681 your -1.480
republicans 1.478 is -1.334? 1.398 moral -0.893
than 1.381 this -0.835more 1.365 were -0.751cells 1.355 area -0.751
american 1.338 love -0.730americans 1.335 says -0.716
art 1.315 hate -0.702it’s 1.257 against -0.682
could 1.180 people -0.669democrats 1.143 body -0.669
as 1.139 you -0.666a 1.072 man -0.652
but 1.041 all -0.644america 0.982 over -0.591
Table 4: Dominant features for English at ILRLevel 3.
tures used in this work are important to achiev-ing good ILR prediction performance. We intendto investigate further measures that could improvethis baseline, including features from automaticparsers or unsupervised morphology to measuresyntactic complexity. Here we have shown thathigher reading levels in English correspond morewith abstract topics. In future work, we also wantto capture some of the stylistic features of text,such as the complexity of dialogue exchanges.
For both SVM and MIRA, the combination oflength and word-usage features had the best im-pact on performance across languages. We foundbetter performance on this task overall for SVMand we believe that MIRA was overfitting duringtraining. For MIRA, this is likely due to an inter-action between a small number of features and thestopping criterion (mean squared error = 0) thatwe used in training, which tends to overfit. We in-tend to investigate the stopping criterion in futurework. Still, we have shown that MIRA can be use-ful in this task because it is an online algorithm,and it allows for incremental training and activelearning.
Our current approach can be quickly adaptedfor a new subset of languages because the featuresthat we used here were language-independent. Weplan to build a flexible architecture that enableslanguage-specific feature extraction to be com-
MostIndicative +
Most Contra-Indicative -
of 3.298 +number+ -2.524this 2.215 . -2.514
moral 1.880 government -1.120philosophy 1.541 have -1.109
is 1.242 people -1.007theory 1.138 would -0.909
in 1.131 could -0.878absolute 1.034 after -0.875religion 1.011 you -0.874
hyperbole 0.938 ,” -0.870mind 0.934 were -0.827
as 0.919 was -0.811hypothesis 0.904 years -0.795
schelling 0.883 your -0.747thought 0.854 americans -0.746
virtue 0.835 at -0.745alchemy 0.828 they -0.720
Table 5: Dominant features for English at ILRLevel 4.
bined with our method so that these techniquescan be easily used for new languages. We willcontinuously improve this baseline using the ap-proaches described in this paper. We found thatthese two algorithms along with these types offeatures performed pretty well on 4 different lan-guages. It is surprising that these features wouldcorrelate across languages even though there areindividual differences between each language. Infuture work, we are interested to look deeper intothe nature of language-independence for this task.
With respect to content, we are interested to findout if more word features are needed for somelanguages but not others. There could be diver-sity of vocabulary at higher ILR levels, which wecould measure with entropy. Additionally, sincethe MIRA classifier that we are using is an on-line classifier with weight vector representationfor each feature, we could examine the weightsand measure the mutual information by ILR levelabove a certain threshold to find which features arethe most predictive of an ILR level, for each lan-guage. Lastly, we have assumed that the ILR rat-ing metric is approximately linear, and althoughwe have used linear classifiers in this task, we areinterested to learn if other transformations wouldgive us a better sense of ILR level discrimination.
37

ReferencesChih-Chung Chang and Chih-Jen Lin. 2001.
LIBSVM: a library for support vec-tor machines. Software available athttp://www.csie.ntu.edu.tw/⇠cjlin/libsvm.
Koby Crammer and Yoram Singer. 2003. Ultracon-servative Online Algorithms for Multiclass Prob-lems. Journal of Machine Learning Research,3(2003):951-991.
Koby Crammer, Ofer Dekel, Joseph Keshet, ShaiShalev-Shwartz, and Yoram Singer. 2006. OnlinePassive-Agressive Algorithms. Journal of Machine
Learning Research, 7(2006):551-585.
George R. Doddington, Mark A. Przybocki, Alvin F.Martin, and Douglas A. Reynolds. 2000. The NISTspeaker recognition evaluation - overview, method-ology, systems, results, perspective. Speech Com-
munication, 31(2-3):225-254.
Lijun Feng, Martin Jansche, Matt Huenerfauth,Noemie Elhadad. 2010. A Comparison of Fea-tures for Automatic Readability Assessment. InProceedings of the 23rd International Conference on
Computational Linguistics: Posters. Association forComputational Linguistics, 2010.
Rudolph Flesch. 1948. A new readability yardstick.Journal of Applied Psychology, 32(3):221-233.
Interagency Language Roundtable. ILR Skill Scale.http://www.govtilr.org/Skills/
ILRscale4.htm, 2013. Accessed February 27,2013.
Thorsten Joachims. 1998a. Text categorization withsupport vector machines: learning with many rel-evant features. In Proceedings of the European
Conference on Machine Learning, pages 137-142,1998a.
Peter J. Kincaid, Lieutenant Robert P. Fishburne, Jr.,Richard L. Rogers, and Brad S. Chissom. 1975.Derivation of new readability formulas for Navy en-listed personnel. Research Branch Report 8-75, U.S.Naval Air Station, Memphis, 1975.
Sarah E. Petersen and Mari Ostendorf. 2009. A ma-chine learning approach to reading level assessment.Computer Speech and Language, 23(2009):89-106.
Sarah. E. Schwarm and Mari Ostendorf. 2005. Read-ing Level Assessment Using Support Vector Ma-chines and Statistical Language Models. In Pro-
ceedings of the 43rd Annual Meeting of the Asso-
ciation for Computational Linguistics.
Kumiko Tanaka-Ishii, Satoshi Tezuka, and Hiroshi Ter-ada. 2010. Sorting texts by readability. Computa-
tional Linguistics, 36(2):203-227.
Vladimir Vapnik. 1995. The Nature of Statistical
Learning Theory. Springer, New York, 1995.
38

Proceedings of the 2nd Workshop on Predicting and Improving Text Readability for Target Reader Populations, pages 39–48,Sofia, Bulgaria, August 4-9 2013. c©2013 Association for Computational Linguistics
Text Modification for Bulgarian Sign Language UsersSlavina Lozanova∗ Ivelina Stoyanova† Svetlozara Leseva†
[email protected] [email protected] [email protected]
Svetla Koeva† Boian Savtchev‡
[email protected] [email protected]
∗ AssistNet, Sofia, Bulgaria† Department of Computational Linguistics, IBL, BAS, Sofia, Bulgaria‡ Cambridge Language Assessment Centre BG015, Sofia, Bulgaria
Abstract
The paper discusses the main issues re-garding the reading skills and compre-hension proficiency in written Bulgarianof people with communication difficulties,and deaf people, in particular. We considerseveral key components of text compre-hension which pose a challenge for deafreaders and propose a rule-based systemfor automatic modification of Bulgariantexts intended to facilitate comprehensionby deaf people, to assist education, etc. Inorder to demonstrate the benefits of such asystem and to evaluate its performance, wehave carried out a study among a group ofdeaf people who use Bulgarian Sign Lan-guage (BulSL) as their primary language(primary BulSL users), which comparesthe comprehensibility of original texts andtheir modified versions. The results showsa considerable improvement in readabilitywhen using modified texts, but at the sametime demonstrates that the level of com-prehension is still low, and that a complexset of modifications will have to be imple-mented to attain satisfactory results.
1 Introduction
The individual development of deaf people de-pends on a complex of factors, which include thecause and the degree of hearing loss, the age ofhearing loss onset, educational background, lan-guage and communication methods, cultural iden-tification, disability preconceptions. Hearing lossleads to a limited spoken language input, delaysin language acquisition and communication dif-ficulties. Deaf children and adults demonstratelower reading achievements than hearing peopleregardless of the degree of hearing loss, and theuse (or lack) of high-performing hearing amplifi-
cation devices (Paul, 1998; Conrad, 1979; Mussel-man, 2000; Traxler, 2000; Vermeulen AM, 2007),which shows that reading skills are influencedby complex social, linguistic and communication-related factors rather than by the sensory disabilityalone.
The paper explores reading comprehension ofDeaf people1 who use Bulgarian Sign Language(BulSL) as their primary language. Various re-search studies both in Bulgaria and abroad haveshown that hearing-impaired BulSL users havepoorer reading skills than their hearing peers. Var-ious methods for text modification have been ex-plored to the end of obtaining texts that corre-spond to the proficiency of the readers. Most ofthe modification methodologies have been focusedon simplifying the original texts and decreasingtheir complexity (Inui et al., 2003). Our approach,however, focuses not on simplification, but on theadaptation of the structure of the original texts tothe linguistic properties of BulSL.
The paper is organized as follows. Section 2discusses the reading skills of BulSL users, payingattention to children’s and adult education in Bul-garia focused on the acquisition of Bulgarian andthe relationship between BulSL and verbal Bulgar-ian. After outlining the main principles which un-derlie text adaptation aimed at fostering text com-prehensibility in the target population, we presenta rule-based method for automatic modification ofBulgarian written texts. The method applies a setof linguistic transformations and produces modi-fied versions of the texts, which are better suitedto the needs of BulSL users (Section 3). Section4 describes an experiment devised to explore thereading comprehension of BulSL users of originaland modified texts. Section 5 draws conclusions
1Capitalized ’Deaf’ is used to denote the community ofdeaf people who use Sign Language as their primary lan-guage. The term emphasizes the socio-cultural model ofDeafness rather than the medical view of hearing impairment.
39

and outlines some directions for future work.
2 Reading Skills of Hearing-ImpairedPeople
2.1 Education
Previous research has shown that deaf students lagbehind their hearing peers in reading comprehen-sion, because they experience difficulties with vo-cabulary (Paul, 1996), syntax (Kelly, 1996), andthe use of prior knowledge and metacognition(Trezek et al., 2010). In addition, reading com-prehension difficulties are often linked to lack ofgeneral knowledge due to inadequate educationand limited access to information (Lewis and Jack-son, 2001). Two independently performed studies(Albertini and Mayer, 2011; Parault and William,2010) have found out that deaf college students’reading skills are below those of six-graders2.
MacAnally et al. (1999) support the hypothe-sis that using less complicated and more accessi-ble reading materials, consisting of language con-structions close or similar to sign language struc-ture can facilitate reading comprehension and mo-tivate deaf people to read. In support of this claimBerent (2004) points out that deaf students wouldread more smoothly if the subject, verb, and objectare in a simple SVO (subject-verb-object) wordorder. These studies provide evidence in favourof text adaptation that reflects features of the signlanguage and the development of modified teach-ing materials.
Bulgarian education for the deaf is based en-tirely on the oral approach and no systematic efforthas been invested into exploring total communi-cation and bilingual approaches (Lozanova, 2002;Saeva, 2010). Even in the specialized schoolsfor the deaf, where sign language communicationoccurs naturally, BulSL has not been integratedinto the school curriculum. Besides, the linguis-tic analysis of BulSL has been limited to meredescriptions and presentation of signs: Bulgar-ian Sign Language dictionaries (1966, 1996); SignLanguage Dictionary in Civil Education (Stoy-anova et al., 2003); Specialized Multimedia BulSLdictionary3 (2005).
In order to improve education and the readingand communication skills of deaf people, a com-prehensive study of BulSL is necessary, that will
211-12-year-olds.3http://www.signlanguage-bg.com
provide the basis for developing advanced meth-ods for automatic text modification directed to im-proving text readability for deaf BulSL users.
2.2 Sign Language and Verbal Language
Research has shown that Deaf children of Deafparents (DCDP) with sign language as their pri-mary mode of communication outperform theirdeaf peers of hearing parents (DCHP) on differ-ent academic tests, including reading tests (May-berry, 2000). Several studies have found a positivecorrelation between the advanced American SignLanguage (ASL) skills of deaf students and theirhigher reading skills (Hoffmeister, 2000; Paddenand Ramsey, 2000). Evidence is not conclusive asto how sign languages relate to verbal languagesand what influence they have on the acquisitionof general communication skills and knowledgeabout the world.
The extensive research on sign languages in thelast fifty years worldwide has shown that they areindependent linguistic systems which differ fromverbal languages (Stokoe, 1960; Stokoe, 1972;Sutton-Spence and Woll, 2003). Being an inde-pendent language, a sign language affects the wayin which its users conceptualize the world, accord-ing to the principle of linguistic relativity, first for-mulated by Sapir and Whorf (Lee, 1996). Dueto the fact that sign languages are very differentfrom verbal ones, many Deaf people attain a cer-tain level of proficiency in a verbal language at thestate of interlanguage4 (Selinker, 1972) but thatlevel is not sufficient to ensure successful socialintegration.
2.3 Readability of Written Texts for NativeUsers of Sign Language
Readability is measured mainly on the basis of vo-cabulary and sentence complexity, including wordlength and sentence length: the higher the letter,syllable and word count of linguistic units, thegreater the demand on the reader. Some syntacticstructures also affect readability – negative and in-terrogative constructions, passive voice, complexsentences with various relations between the mainclause and the subordinates, long distance depen-dencies, etc. Besides, readability improves if theinformation in a text is well-organized and effec-
4The term ’interlanguage’ denotes the intermediate statein second language acquisition characterized by insufficientunderstanding and grammatical and lexical errors in languageproduction.
40

tively presented so that its local and global dis-course structure is obvious to the reader (Swann,1992).
Text modification is often understood as simpli-fication of text structure but this may result in aninadequately low level of complexity and loss ofrelevant information. Moreover, using a limitedvocabulary, avoiding certain syntactic structures,such as complex sentences, is detrimental to thecommunication and learning skills.
The efforts towards providing equal access toinformation for Deaf people lack clear principlesand uniformity. Firstly, there is no system of cri-teria for evaluation of text complexity in terms ofvocabulary, syntactic structure, stylistics and prag-matics. Further, no standard framework and re-quirements for text modification have been estab-lished, which limits its applications.
3 Text Modification of Bulgarian
Language modification for improved readability isnot a new task and its positive and negative aspectshave been extensively discussed (BATOD, 2006).One of the most important arguments against textmodification is that it requires a lot of resources interms of human effort and time. An appealing al-ternative is to employ NLP methods that will facil-itate the implementation of automatic modificationfor improved readability of written texts aimed atthe BulSL community.
3.1 General Principles of Text ModificationSeveral studies have observed different aspects oftext modification: splitting chosen sentences withexisting tools (Petersen and Ostendorf, 2007),’translating’ from complex to simplified sentenceswith statistical machine translation methods (Spe-cia, 2010), developing text simplification systems(Candido et al., 2009), etc. (Siddharthan, 2011)compares a rule-based and a general purpose gen-erator approaches to text adaptation. Recently theavailability of the Simple English Wikipedia hasprovided the opportunity to use purely data-drivenapproaches (Zhu et al., 2010). The main oper-ation types both in statistical and in rule-basedapproaches are: change, delete, insert, and split(Bott and Saggion, 2011).
Although text modification is a highly languagedependent task, it observes certain general princi-ples:
• Modified text should be identical or very
close in meaning to the original.
• Modified text should be grammatically cor-rect and structurally authentic by preservingas much as possible of the original textual andsyntactic structure.
• In general, modified text should be character-ized by less syntactic complexity comparedwith the original text. However, the purposeof the modification is not to simplify the textbut rather to make the information in it moreaccessible and understandable by represent-ing it in relatively short information chunkswith simple syntax without ellipses.
• It should be possible to extend the rangeof modifications and include other compo-nents which contribute to readability or intro-duce other functionalities that facilitate read-ing comprehension, such as visual represen-tations.
3.2 Stages of Text ModificationAt present we apply a limited number of modifica-tions: clause splitting, simplification of syntacticstructure of complex sentences, anaphora resolu-tion, subject recovery, clause reordering and inser-tion of additional phrases.
3.2.1 PreprocessingThe preprocessing stage includes annotation withthe minimum of grammatical information nec-essary for the application of the modificationrules. The texts are sentence-split, tokenized,POS-tagged and lemmatized using the BulgarianLanguage Processing Chain5 (Koeva and Genov,2011). Subsequently, clause splitting is appliedusing a general method based on POS tagging,lists of clause delimiters – clause linking wordsand multiword expressions and punctuation, and aset of language specific rules.
We define a clause as a sequence of words be-tween two clause delimiters where exactly one fi-nite verb occurs. A finite verb is either: (a) a sin-gle finite verb, e.g. yade (eats); (b) or a finite verbphrase formed by an auxiliary and a full verb, e.g.shteshe da yade (would eat); or (c) a finite copu-lar verb phrase with a non-verbal subject comple-ment, e.g. byaha veseli (were merry).
We identify finite verbs by means of a set ofrules applied within a window, currently set up to
5http://dcl.bas.bg/services/
41

two words to the left or to the right:Rule P1. A single finite verb is recognized by thePOS tagger. (Some smoothing rules are applied todetect the verb forms actually used in the context– e.g. forms with reflexive and negative particles).Rule P2. If auxiliaries and a lexical verb formoccur within the established window, they form asingle finite verb phrase. (This rule subsumes anumber of more specific rules that govern the for-mation of analytical forms of lexical verbs by at-taching auxiliary verbs and particles.)Rule P3. If an auxiliary (or a copular verb) but nota lexical verb form occurs within the establishedwindow, the auxiliary or copula itself is a singlefinite verb.Rule P4. If a modal and/or a phase verb and a lex-ical verb form occur within the established win-dow, they form a single finite verb phrase.Rule P5. If a modal (and/or a phase) verb butnot a lexical verb form occurs within the estab-lished window, the modal verb itself is a single fi-nite verb.
A clause is labeled by a clause opening (CO)at the beginning and a clause closing (CC) at theend. We assume that at least one clause boundary– an opening and/or a close – occurs between anypair of successive finite verbs in a sentence. EachCO is paired with a CC, even if it might not beexpressed by an overt element.
We distinguish two types of COs with respect tothe type of clause they introduce: coordinate andsubordinate. Most of the coordinating conjunc-tions in Bulgarian are ambiguous since they canlink not only clauses, but also words and phrases.On the contrary, most of the subordinating con-junctions, to the exception of several subordina-tors which are homonymous with prepositions,particles or adverbs, are unambiguous.
Clause closing delimiters are sentence end,closing comma, colon, semicolon, dash.
The following set of clause splitting rules areapplied (C1-C9):Rule C1. The beginning of a sentence is a coordi-nate CO.Rule C2. A subordinating clause linking word orphrase denotes a subordinate CO.Rule C3. If a subordinate CO is on the top of thestack, we look to the right for a punctuation clausedelimiter (e.g. comma) which functions as a CCelement.Rule C4. If a subordinate CO is on the top of the
stack, and the CC is not identified yet, we lookfor a coordinating clause linking word or phrasewhich marks a coordinate CO.Rule C5. If a coordinate CO is on the top ofthe stack, we look for another coordinating clauselinking word or phrase which marks a coordinateCO.Rule C6. If a coordinate CO is on the top ofthe stack and no coordinate CO is found, we lookfor a punctuation clause delimiter (e.g. a comma)which functions as a CC element.Rule C7. If no clause boundary has been identi-fied between two finite verbs, we insert a clauseboundary before the second finite verb.Rule C8. All COs from the stack should have acorresponding CC.Rule C9. The part of the sentence to the right ofthe last finite verb until the end of the sentenceshould contain the CCs for all COs still in thestack.
3.2.2 Empty subject recoveryThe detection, resolution, and assignment of func-tion tags to empty sentence constituents have be-come subject of interest in relation to parsing(Johnson, 2002; Ryan Gabbard and Marcus, 2004;Dienes and Dubey, 2003), in machine translation,information extraction, automatic summarization(Mitkov, 1999), etc. The inventory of empty cate-gories includes null pronouns, traces of extractedsyntactic constituents, empty relative pronouns,etc. So far, we have limited our work to subjectrecovery.
A common feature of many, if not all, sign lan-guages (BulSL among others) is that each sentencerequires an overt subject. Moreover, each subjectis indexed by the signer by pointing to the denotedperson or thing if it is present in the signing area,or by setting up a point in space as a referenceto that person or thing, if it is outside the sign-ing area, and referring to that point whenever therespective person or object is mentioned. In or-der to avoid ambiguity, different referents are as-signed different spatial points. Deaf people findit difficult to deal with complex references in writ-ten texts where additional disambiguating markersare rarely available. Being a pro(noun)-drop lan-guage, Bulgarian allows the omission of the sub-ject when it is grammatically inferable from thecontext.
So far the following rules for subject recoveryhave been defined and implemented:
42

Rule SR1. In case the verb is in the first or sec-ond person singular or plural and the clause lacks anominative personal pronoun that agrees with thefinite verb, a personal pronoun with the respectiveagreement features is inserted in the text.Rule SR2. In case the verb is in the third personsingular or plural and the clause lacks a noun ora noun phrase that a) precedes the verb; and b)agrees with the verb in person, number and gen-der, the closest noun (a head in a noun phrase) inthe preceding clause that satisfies the agreementfeatures of the verb is inserted in the text. (Theprecision of the rule for singular verbs is low.)
3.2.3 Anaphora ResolutionWith respect to text modification regardinganaphora resolution, we focus on a limited typesof pronominal anaphors – personal, relative andpossessive pronouns.
Bulgarian personal pronouns agree in genderand number with their antecedent. Possessive pro-nouns express a relation between a possessor anda possessed item, and agree both with their an-tecedent (through the root morpheme) and with thehead noun (through the number and gender fea-tures of the inflection). For instance in the sen-tence Vidyah direktora v negovata kola (I saw thedirector in his car), the possessive pronoun negovindicates that the possessor is masculine or neutersingular and the inflection -a – that the possessedis feminine gender, singular. The agreement withthe possessor is a relevant feature to text modifica-tion. Some relative pronouns koyto (which) (typeone) agree with their antecedent in gender andnumber while others (type two) – chiyto (whose)agree with the noun they modify and not with theirantecedent.
We have formulated the following rules foranaphora resolution:Rule AR1. The antecedent of a personal or a pos-sessive pronoun is the closest noun (the head in thenoun phrase) within a given window to the left ofthe pronoun which satisfies the agreement featuresof the pronoun.Rule AR2. The antecedent of a relative pronounis the nearest noun (the head in the noun phrase)in the preceding clause that satisfies the agreementfeatures of the pronoun.
The following rules for modification ofanaphora can be used:Rule R1. The third personal pronoun is replacedwith the identified antecedent.
Rule R2. The possessive pronoun is replaced witha prepositional phrase formed by the prepositionna (of ) and the identified antecedent.Rule R3. A relative pronoun of type one isreplaced with the identified antecedent.Rule R4. The relative pronoun chiyto (whose)is replaced with a prepositional phrase formedby the preposition na (of) and the identifiedantecedent.Rule R5. The relative pronoun kakavto (suchthat) is replaced by a noun phrase formed bya demonstrative pronoun and the identifiedantecedent takava chanta (that bag).
3.2.4 Simplification of Complex SentencesComplex sentences are one of the main issuesfor deaf readers because in BulSL, as well as inother sign languages, they are expressed as sep-arate signed statements and the relation betweenthem is explicit.
(Van Valin and LaPolla, 1997) observe that theelements in complex sentences (and other con-structions) are linked with a different degree ofsemantic and syntactic tightness, which is re-flected in the Interclausal Relations Hierarchy.The clauses in a sentence have different degree ofindependence, which determines whether they canbe moved within the sentence or whether they canform an individual sentence.
Temporally related events in BulSL most oftenare represented in a chronological order, and therelation between them is expressed by separatesigns or constructions (Example 1).
Example 1.Zabavlyavayte se, dokato nauchavate i novineshta.Have fun while you learn new things.
Signed sentence:Vie se zabavlyavate. Ednovremenno nauchavatenovi neshta /ednovremenno/.You have fun. Simultaneously, you learn newthings /simultaneously/.(the sign ’simultaneously’ can be repeated at theend of the sentence again)
Chambers et al. (2007) and Tatu and Srikanth(2008) identify event attributes and event-eventfeatures which are used to describe temporal re-lations between events. Attributes include tense,grammatical aspect, modality, polarity, event
43
class. Further, the event-event features include thefollowing: before, includes, begins, ends, simul-taneously, and their respective inverses (Cham-bers et al., 2007), as well as sameActor (bi-nary feature indicating that the events share thesame semantic role Agent), eventCoref (binary at-tribute capturing co-reference information), one-Sent (true when both events are within the samesentence), relToDocDate (defining the temporalrelation of each event to the document date) (Tatuand Srikanth, 2008).
(Pustejovsky et al., 2003) also introduce tempo-ral functions to capture expressions such as threeyears ago, and use temporal prepositions (for,during) and temporal connectives (before, while).Three types of links are considered: TLINK (tem-poral link between an event and a moment or pe-riod of time); SLINK (subordination link betweentwo events); and ALINK (aspectual link betweenaspectual types).
The structure of the complex sentences is sim-plified by clause reordering that explicitly reflectsthe chronological order of the described events.The preposition or postposition of clauses withtemporal links if, before, after, etc. may not matchthe actual causal order. In such cases the order ofclauses is simply reversed based on rules of thetype:
Temporal link sled kato /when, after/Construction CL1 temporal link CL2Modification(s) CL2. Sled tova /then/ CL1.
3.2.5 Post-editingPost editing aims at providing grammatically cor-rect and semantically complete modified text.Clause reordering might lead to inappropriate useof verb tenses. Coping a subject from the previoussentence might require a transformation from anindefinite to a definite noun phrase. Thus, severalchecks for grammaticality and text cohesion areperformed and relevant changes to verb forms andnoun definiteness are made. Specific expressionsare introduced to highlight temporal, causative,conditional and other relations and to serve as con-nectives.
Example 2 shows a fully modified text.
Example 2.Original:
Vaz osnova na doklada ot razsledvaneto, sled katolitseto e bilo uvedomeno za vsichki dokazatelstvai sled kato e bilo izslushano, organat e izdal
razreshenie.
Based on the report from the investigation,after the person has been notified about allevidence and after /he/ has been heard, theauthorities have issued a permit.
Modified:Litseto e bilo uvedomeno za vsichki dokazatelstva.Litseto e bilo izslushano.Sled tova vaz osnova na doklada ot razsledvaneto,organat mozhe da dade razreshenie.
The person has been notified about all evi-dence.The person has been heard.After that based on the report from the investiga-tion, the authorities may issue a permit.
3.3 Evaluation of System Performance
The evaluation of performance is based on theBulgarian part of the Bulgarian-English Clause-Aligned Corpus (Koeva et al., 2012) whichamounts to 176,397 tokens and includes severalcategories: administrative texts, fiction, news. Theoverall evaluation of the system performance is as-sessed in terms of the evaluation of all subtasks(Section 3.2) as presented in Table 1. The evalu-ation of finite verbs and anaphora recognition, aswell as subject identification is performed manu-ally on a random excerpt of the corpus. Clausesplitting is evaluated on the basis of the manualannotation of the corpus. We assess the precisionand recall in terms of full recognition and partialrecognition. In the first case the entire verb phrase,clause, anaphora, or dropped subject is recognizedcorrectly, while in the latter – only a part of therespective linguistic item is identified. We ac-count for partial recognition since it is often suf-ficient to produce correct overall results, e.g. par-tial verb phrase recognition in most cases yieldscorrect clause splitting.
4 Experiments and Evaluation ofReadability of Modified Texts
4.1 Outline of the Experiment
4.1.1 Aims and Objectives
The objective of the experiment was to conduct apilot testing of original and modified texts in order
44

Task Precision Recall F1
Finite verb phrases(full)
0.914 0.909 0.912
Finite verb phrases(partial)
0.980 0.975 0.977
Clauses borders 0.806 0.827 0.817Clauses (begin-ning)
0.908 0.931 0.919
Anaphora (full) 0.558 0.558 0.558Anaphora (partial) 0.615 0.615 0.615Subject (full) 0.590 0.441 0.504Subject (partial) 0.772 0.548 0.671
Table 1: Evaluation of different stages of textmodification
to determine and confirm the need of text modi-fication for deaf people whose primary languageis BulSL and the verbal language is acquired as asecond language.
The rationale was to identify and distinguish be-tween levels of comprehension of original and au-tomatically modified texts.
4.1.2 Respondents’ ProfileThe participants were selected regardless of theirdegree and onset of hearing loss. The experimenttargeted the following group of people:
• Socially active adults (18+);
• BulSL users;
• People with developed reading skills.
4.2 Pilot Test Design Methodology andImplementation
4.2.1 Text SelectionWe decided to use original and modified versionsof journalistic (e.g. news items) and administra-tive (e.g. legal) texts. The guiding principle wasto select texts that are similar in terms of length,complexity, and difficulty.
The selected news refer to topics of general in-terest such as politics in neighbouring countries,culture, etc. The administrative texts representreal-life scenarios, rather than abstract or rare le-gal issues. In general, selected texts do not includedomain-specific terms and professional jargon.
Regarding text modification the main objectivewas to preserve the meaning of the original text in
compliance with the principles of textual and fac-tual accuracy and integrity, and appropriate com-plexity. The result from the automatic modifica-tions has been manually checked and post-editedto ensure grammaticality.
4.2.2 MethodologyThe testing is conducted either online via tests ine-form (predominantly), or using paper-based ver-sions. Respondents are given texts of each type,i.e. two original and two modified texts. Eachtext is associated with two tasks, which have to becompleted correctly after the reading. The tasksseek to check the level of understanding of themain idea, details, purpose, implication, temporalrelations (the sequence of events), and the abilityto follow the text development.
• Task-type 1: Sequence questions. The re-spondents have to arrange text elements (sen-tences and clauses) listed in a random se-quence into a chronological order. The taskcovers temporal, causative, conditional, andother relations, and its goal is to test readingcomprehension which involves temporal andlogical relations and inferences.
• Task-type 2: Multiple response questions(MRQ) for testing general reading com-prehension. MRQ are similar to Multiplechoice questions (MCQs) in that they providea predefined set of options, but MRQ allowany number and combinations of options.
Text Type Version #sen-tences
#clauses
#tem-poralshifts
1 News Original 2 6 22 News Modified 5 6 03 Admin Original 1 4 24 Admin Modified 4 4 0
Table 2: Structure of the test
4.2.3 Structure of the TestThe test consists of four different texts, each ofthem with two subtasks – for checking the com-prehension of temporal relations and the logicalstructure of the events in the text (type 1), and gen-eral comprehension (type 2).
The number of sentences, clauses and temporalshifts for each text is presented in Table 2.
45

4.3 Analysis of Results
19 deaf adults proficient in BulSL have taken partin the pilot test study. The results are presented inTable 3 and on Figure 1.
Task Type Version correct all %1.1 News Original 5 19 26.322.1 News Modified 9 19 47.373.1 Admin Original 6 19 31.584.1 Admin Modified 10 19 52.631.2 News Original 7 19 36.842.2 News Modified 9 19 47.373.2 Admin Original 7 19 36.844.2 Admin Modified 10 19 52.63
Table 3: Results of chronological order sub-tasks (1.1-4.1) and general comprehension sub-tasks (1.2-4.2)
We recognize the fact that the small numberof respondents does not provide sufficient datato draw conclusions regarding the improvementof readability when using modified texts. How-ever, the results show a significant improvement(t = 2.0066 with p = 0.0485 < 0.05) in the over-all comprehension (chronological order and gen-eral understanding) when using the modified textsin comparison with the original texts.
Figure 1: Results in % of correct answers for orig-inal and modified texts
Still, the improvement in readability after thetext modification is very low and not sufficient toprovide reliable communication strategies and ac-cess to information. Further work will be aimed atmore precise methodology for testing the readingskills of deaf people.
5 Conclusions
As the pilot test suggests, the limited number ofmodifications is not sufficient to compensate forthe problems which deaf people experience withreading. A wider range of text modifications arenecessary in order to cover the problematic areasof verbal language competence. Other issues in-clude the use of personal and possessive pronouns,in particular clitics, which are often dropped, thecorrect use of auxiliary verbs and analytical verbforms. Additional problems such as adjective andnoun agreement, subject and verb agreement, etc.need to be addressed specifically, since these havea very different realization in sign languages (e.g.,subject and verb are related spatially).
It should be emphasized that there has not beenany systematic effort for studying BulSL so far.The detailed exploration of the linguistic proper-ties of BulSL in relation to Bulgarian can give adeeper understanding about the problems in theacquisition of Bulgarian and in particular, thereading difficulties experienced by deaf readers.
Directions for future work include:
• To explore the relationship between readingcomprehension and social, educational andother factors;
• To explore the dependence between readingskills and proficiency in BulSL;
• To analyze problems in relation to vocabularywith relation to reading;
• To build a detailed methodology for testingof reading comprehension;
• To explore further the potential of text modi-fication with respect to BulSL in relation tothe comparative analyses of the features ofBulSL and verbal Bulgarian language.
ReferencesJ. Albertini and C. Mayer. 2011. Using miscue analy-
sis to assess comprehension in deaf college readers.Journal of Deaf Studies and Deaf Education, 16:35–46.
BATOD. 2006. Training materials for language modi-fication.
Gerald Berent. 2004. Deaf students’ command of En-glish relative clauses (Paper presented at the annualconvention of Teachers of English to Speakers ofOther Languages).
46

Stefan Bott and Horacio Saggion. 2011. Spanish textsimplification: An exploratory study. In XXVII Con-greso de la Sociedad Espaola para el Procesamientodel Lenguaje Natural (SEPLN 2011), Huevla, Spain.
Arnaldo Candido, Erick Maziero, Caroline Gasperin,Thiago A. S. Pardo, Lucia Specia, and SandraAluisio. 2009. Supporting the adaptation of textsfor poor literacy readers: a text simplification ed-itor for Brazilian Portuguese. In Proceedings ofthe Fourth Workshop on Innovative Use of NLP forBuilding Educational Applications, pages 34–42.
Nathanael Chambers, Shan Wang, and Dan Juraf-sky. 2007. Classifying temporal relations betweenevents. In Proceedings of the ACL 2007 Demo andPoster Sessions, Prague, June 2007, pages 173–176.
R. Conrad. 1979. The deaf schoolchild. London:Harper and Row.
Peter Dienes and Amit Dubey. 2003. Deep syntac-tic processing by combining shallow methods. InProceedings of the 41st Annual Meeting of the Asso-ciation for Computational Linguistics, volume 1.
R. J. Hoffmeister. 2000. A piece of the puzzle: ASLand reading comprehension in deaf children. InC. Chamberlain, J. P. Morford, and R. I. Mayberry,editors, Language acquisition by eye, pages 143–163. Mahwah, NJ: Earlbaum.
Kentaro Inui, Atsushi Fujita, Tetsuro Takahashi, RyuIida, and Tomoya Iwakura. 2003. Text simplifi-cation for reading assistance: A project note. InPARAPHRASE ’03 Proceedings of the second in-ternational workshop on Paraphrasing, volume 16,pages 9–16. Association for Computational Linguis-tics Stroudsburg, PA, USA.
Mark Johnson. 2002. A simple pattern-matching al-gorithm for recovering empty nodes and their an-tecedents. In Proceedings of the 40th Annual Meet-ing of the Association for Computational Linguis-tics.
L. Kelly. 1996. The interaction of syntactic compe-tence and vocabulary during reading by deaf stu-dents. Journal of Deaf Studies and Deaf Education,1(1):75–90.
S. Koeva and A. Genov. 2011. Bulgarian languageprocessing chain. In Proceedings of Integration ofmultilingual resources and tools in Web applica-tions. Workshop in conjunction with GSCL 2011,University of Hamburg.
Svetla Koeva, Borislav Rizov, Ekaterina Tarpomanova,Tsvetana Dimitrova, Rositsa Dekova, Ivelina Stoy-anova, Svetlozara Leseva, Hristina Kukova, and An-gel Genov. 2012. Bulgarian-english sentence- andclause-aligned corpus. In Proceedings of the SecondWorkshop on Annotation of Corpora for Researchin the Humanities (ACRH-2), Lisbon, 29 November2012, pages 51–62. Lisboa: Colibri.
Penny Lee. 1996. The Logic and Development ofthe Linguistic Relativity Principle. The Whorf The-ory Complex: A Critical Reconstruction. John Ben-jamins Publishing.
Margaret Jelinek Lewis and Dorothy Jackson. 2001.Television literacy: Comprehension of program con-tent using closed-captions for the deaf. Journal ofDeaf Studies and Deaf Education, 6(1):43–53.
Slavina Lozanova. 2002. Predpostavki za razvitiena bilingvizma kato metod za obuchenie na detsa suvreden sluh. Spetsialna pedagogika.
R. I. Mayberry. 2000. Cognitive development ofdeaf children: The interface of language and percep-tion in cognitive neuroscience. In Child Neuropsy-chology, Volume 7 of handbook of neuropsychology,pages 71–107. Amesterdam: Elsvier.
P. McAnally, S. Rose, and S. Quigley. 1999. Readingpractices with deaf learners. Austin, TX: Pro-Ed.
Ruslan Mitkov. 1999. Anaphora resolution: thestate of the art; working paper, (based on the col-ing’98/acl’98 tutorial on anaphora resolution).
Carol Musselman. 2000. How do children who can’thear learn to read an alphabetic script? a review ofthe literature on reading and deafness. Journal ofDeaf Studies and Deaf Education, 5:9–31.
C. Padden and C Ramsey. 2000. American SignLanguage and reading ability in deaf children. InC. Chamberlain, J. P. Morford, and R. I. Mayberry,editors, Language acquisition by eye, pages 165–189. Mahwah, NJ: Earlbaum.
S. J. Parault and H. William. 2010. Reading motiva-tion, reading comprehension and reading amount indeaf and hearing adults. Journal of Deaf Studies andDeaf Education, 15:120–135.
Peter Paul. 1996. Reading vocabulary knowledge anddeafness. Journal of Deaf Studies and Deaf Educa-tion, 1(1):3–15.
Peter Paul. 1998. Literacy and deafness: The develop-ment of reading, writing and literate thought. Need-ham, MA: Allyn & Bacon.
Sarah Petersen and Mari Ostendorf. 2007. Naturallanguage processing tools for reading level assess-ment and text simplification for bilingual education.University of Washington Seattle, WA.
James Pustejovsky, Jose Casta no, Robert Ingria, RoserSaurı, Robert Gaizauskas, Andrea Setzer, GrahamKatz, and Dragomir Radev. 2003. TimeML: RobustSpecification of Event and Temporal Expressions inText. Technical report, AAAI.
Seth Kulick Ryan Gabbard and Mitchell Marcus. 2004.Using linguistic principles to recover empty cate-gories. In Proceedings of the 42nd Annual Meetingon Association For Computational Linguistics, page184191.
47

S. Saeva. 2010. Gluhota i Bilingvizam. Aeropres BG.
L. Selinker. 1972. Interlanguage. International Re-view of Applied Linguistics, 10:209–231.
Advaith Siddharthan. 2011. Text simplification usingtyped dependencies: A comparison of the robustnessof different generation strategies. In Proceedings ofthe 13th European Workshop on Natural LanguageGeneration (ENLG) , pages 211, September.
L. Specia. 2010. Translating from complex to simpli-fied sentences. In 9th International Conference onComputational Processing of the Portuguese Lan-guage (Propor-2010), Porto Alegre, Brazil, vol-ume 6001 of Lecture Notes in Artificial Intelligence,pages 30–39. Springer.
William Stokoe. 1960. Sign language structure: Anoutline of the visual communication systems of theamerican deaf. Studies in linguistics: Occasionalpapers, 8.
William Stokoe. 1972. Semiotics and Human SignLanguages. NICI, Printers, Ghent.
Ivelina Stoyanova, Tanya Dimitrova, and Viktorija Tra-jkovska. 2003. A handbook in civil education with asign language dictionary. In Social and EducationalTraining for Hearing Impaired youths: A Handbookin Civil Education with a Sign Language Dictionary.Petar Beron, Sofia. (in Bulgarian).
Rachel Sutton-Spence and Bencie Woll. 2003. TheLinguistics of British Sign Language: An Introduc-tion. Cambridge University Press, 3rd edition.
W. Swann. 1992. Learning for All: Classroom Diver-sity. Milton Keynes: The Open University.
Marta Tatu and Munirathnam Srikanth. 2008. Experi-ments with reasoning for temporal relations betweenevents. In COLING ’08 Proceedings of the 22nd In-ternational Conference on Computational Linguis-tics, volume 1, pages 857–864.
C. B. Traxler. 2000. The stanford achievement test, 9thedition: National norming and performance stan-dards for deaf and hard-of-hearing students. Journalof Deaf Studies and Deaf Education, 5:337348.
Beverly Trezek, Ye Wang, and Peter Paul. 2010. Read-ing and deafness: Theory, research and practice.Clifton Park, NY: Cengage Learning.
Robert Van Valin and Randy LaPolla. 1997. Syntax:Structure, Meaning, and Function. Cambridge Uni-versity Press.
Schreuder R Knoors H Snik A. Vermeulen AM, vanBon W. 2007. Reading comprehension of deaf chil-dren with cochlear implants. Journal of Deaf Stud-ies and Deaf Education, 12(3):283–302.
Zhemin Zhu, Delphine Bernhard, and Iryna Gurevych.2010. A monolingual tree-based translation modelfor sentence simplification. In Proceedings of The23rd International Conference on ComputationalLinguistics, Beijing, China, pages 1353–1361.
48

Proceedings of the 2nd Workshop on Predicting and Improving Text Readability for Target Reader Populations, pages 49–58,Sofia, Bulgaria, August 4-9 2013. c©2013 Association for Computational Linguistics
Modeling Comma Placement in Chinese Text for Better Readability usingLinguistic Features and Gaze Information
Tadayoshi Hara1 Chen Chen2∗
Yoshinobu Kano3,1 Akiko Aizawa 1
1National Institute of Informatics, Japan 2The University of Tokyo, Japan3PRESTO, Japan Science and Technology Agency{harasan, kano, aizawa }@nii.ac.jp
Abstract
Comma placements in Chinese text arerelatively arbitrary although there aresome syntactic guidelines for them. In thisresearch, we attempt to improve the read-ability of text by optimizing comma place-ments through integration of linguistic fea-tures of text and gaze features of readers.
We design a comma predictor for gen-eral Chinese text based on conditional ran-dom field models with linguistic features.After that, we build a rule-based filter forcategorizing commas in text according totheir contribution to readability based onthe analysis of gazes of people reading textwith and without commas.
The experimental results show that ourpredictor reproduces the comma distribu-tion in the Penn Chinese Treebank with78.41 in F1-score and commas chosen byour filter smoothen certain gaze behaviors.
1 Introduction
Chinese is an ideographic language, with no natu-ral apparent word boundaries, little morphology,and no case markers. Moreover, most Chinesesentences are quite long. These features make itespecially difficult for Chinese learners to identifycomposition of a word or a clause in a sentence.
Punctuation marks, especially commas, are al-lowed to be placed relatively arbitrarily to serve asimportant segmentation cues (Yue, 2006) for pro-viding syntactic and prosodic boundaries in text;commas indicate not only phrase or clause bound-aries but also sentence segmentations, and theycapture some of the major aspects of a writer’sprosodic intent (Chafe, 1988). The combinationof both aspects promotes cognition when readingtext (Ren and Yang, 2010; Walker et al., 2001).
∗The Japan Research Institute, Ltd. (from April, 2013)
Linguistic FeaturesCRF model
CRF model-based Comma Predictor
Gaze FeaturesHuman Annotation
Rule-based Comma Filter
Text with/without Commas
Parse Tree
Treebank
Comma Distribution for Readability
Comma Distribution in General Text
Input (Comma-less) Text
+
+
Figure 1: Our approach
However, although there are guidelines and re-search on the syntactic aspects of comma place-ment, prosodic aspects have not been explored,since they are more related with cognition. It isas yet unclear how comma placement should beoptimized for reading, and it has thus far been upto the writer (Huang and Chen, 2011).
In this research, we attempt to optimize commaplacements by integrating the linguistic features oftext and the gaze features of readers. Figure 1 il-lustrates our approach. First, we design a commapredictor for general Chinese text based on con-ditional random field (CRF) models with variouslinguistic features. Second, we build a rule-basedfilter for classifying commas in text into ones fa-cilitating or obstructing readability, by comparingthe gaze features of persons reading text with andwithout commas. These two steps are connectedby applying our rule-based filter to commas pre-dicted by our comma predictor. The experimentalresults for each step validate our approach.
Related work is described in Section 2. Thefunctions of Chinese commas are described inSection 3. Our CRF model-based comma predic-tor is examined in Section 4, and our rule-basedcomma filter is constructed and examined in Sec-tion 5 and 6. Section 7 contains a summary andoutlines future directions of this research.
49

[Case 1] When a pause between a subject and a predicate is needed. (∗ (,) means the original or comparative position of the comma in Chinese text.)e.g.我们看得见的星星,绝大多数是离地球非常远的恒星。(The stars we can see (,)∗ are mostly fixed stars that are far away from the earth.)[Case 2] When a pause between an inner predicate and an object of a sentence is needed.e.g.应该看到,科学需要一个人贡献出毕生的精力。(We should see that (,) science needs a person to devote all his/her life to it.)[Case 3] When a pause after an inner (adverbial, prepositional, etc.) modifier of a sentence is needed.e.g.对于这个城市,他并不陌生。(He is no stranger (,) to this city.) (The order of the modifier and the main clause is opposite in the English translation.)[Case 4] When a pause between clauses in a complex sentence is needed, besides the use of semicolon (;).e.g.据说苏州园林有一百多处,我到过的不过十多处。(It is said that there are more than 100 Suzhou traditional gardens, (,) no more than 10 of which Ihave been to.)[Case 5] When a pause between phrases of the same syntactic type is needed.e.g.学生比较喜欢年轻,有活力的教师 (The students prefer young (,) and energetic teachers.)
Table 1: Five main usages of commas in Chinese text
(a) Screenshot of a material
Display PC MonitorSubject
Eye Tracker
Host PC Monitor
(b) Scene of the experiment (c) Window around a gaze point
Figure 3: Settings for eye-tracking experiments
WS Word surfacePOS POS tagDIP Depth of a word in the parse treeSTAG Syntactic tagOIC Order of the clause in a sentence that a word belongs toWL Word lengthLOD Length of fragment with specific depth in a parsing tree
Table 2: Features used in our CRF model
2 Related Work
Previous work on Chinese punctuation predictionmostly focuses on sentence segmentation in au-tomatic speech recognition (Shriberg et al., 2000;Huang and Zweig, 2002; Peitz et al., 2011).
Jin et al. (2002) classified commas for sentencesegmentation and succeeded in improving pars-ing performance. Lu and Ng (2010) proposedan approach built on a dynamic CRF for predict-ing punctuations, sentence boundaries, and sen-tence types of speech utterances without prosodiccues. Zhang et al. (2006) suggested that a cascadeCRF-based approach can deal with ancient Chi-nese prose punctuation better than a single CRF.Guo et al. (2010) implemented a three-tier max-imum entropy model incorporating linguisticallymotivated features for generating commonly usedChinese punctuation marks in unpunctuated sen-tences output by a surface realizer.
(a)
WS|POS|STAG|DIP|OIC|WL|LOD|IOB-tag
(b)
Figure 2: Example of a parse tree (a) and its cor-responding training data (b) with the features
3 Functions of Chinese Commas
There are five main uses of commas in Chinesetext, as shown in Table 1. Cases 1 to 4 are fromZDIC.NET (2005), and Case 5 obviously exists inChinese text. The first three serve the function ofemphasis, while the latter two indicate coordinat-ing or subordinating clauses or phrases.
In Cases 1 and 2, a comma is inserted as akind of pause between a short subject and a longpredicate, or between a short remainder predicate,such as看到 (see/know),説明/表明 (indicate),発
50

Feature F1 (P/R) AWS 59.32 (72.67/50.12) 95.45
POS 32.51 (69.06/21.26) 94.08DIP 34.14 (68.65/22.72) 94.13
STAG 22.44 (64.00/13.60) 93.67OIC 9.27 (66.56/ 4.98) 93.42
WL 10.70 (75.24/ 5.76) 93.52LOD 35.32 (59.20/25.17) 93.81
WS+POS 63.75 (79.93/53.01) 96.03WS +DIP 70.06 (83.27/60.47) 96.61WS +STAG 57.42 (81.94/44.19) 95.67WS +OIC 60.35 (77.98/49.22) 95.73WS +WL 60.90 (76.39/50.63) 95.71WS +LOD 70.85 (78.87/64.31) 96.53WS+POS+DIP 73.41 (84.62/64.82) 96.93WS+POS+DIP+STAG 74.58 (83.66/67.27) 97.01WS+POS+DIP +OIC 76.87 (84.29/70.65) 97.23WS+POS+DIP +WL 70.18 (83.33/60.62) 96.63WS+POS+DIP +LOD 76.61 (82.61/71.43) 97.16WS+POS+DIP+STAG+OIC 76.62 (84.48/70.09) 97.21WS+POS+DIP+STAG +WL 74.12 (84.00/66.33) 96.98WS+POS+DIP+STAG +LOD 77.64 (85.11/71.38) 97.33WS+POS+DIP +OIC+WL 75.43 (84.76/67.95) 97.11WS+POS+DIP +OIC +LOD 78.23 (84.23/73.03) 97.36WS+POS+DIP +WL+LOD 74.01 (85.80/65.06) 97.02WS+POS+DIP+STAG+OIC+WL 77.25 (83.97/71.53) 97.26WS+POS+DIP+STAG+OIC +LOD 77.31 (86.36/69.97) 97.33WS+POS+DIP+STAG +WL+LOD 76.55 (85.24/69.46) 97.23WS+POS+DIP +OIC+WL+LOD 77.60 (84.30/71.89) 97.30WS+POS+DIP+STAG+OIC+WL+LOD 78.41 (83.97/73.54) 97.36F1: F1-Score,P: precision (%),R: recall (%),A: accuracy (%)
Table 3: Performance of the comma predictor
(A) #Characters,Article (B) #Punctuations, (C) / (A) (C) / (B) Subjects
ID (C) #Commas6 692 49 28 4.04% 57.14% L, T, C7 335 30 15 4.48% 50.00% L, T, C10 346 18 7 2.02% 38.89% L, T, C, Z12 221 18 7 3.17% 38.89% L, T, C14 572 33 14 2.45% 42.42% L, T, C18 471 36 13 2.76% 36.11% C, Z79 655 53 28 4.27% 52.83% Z82 471 30 13 2.76% 43.33% Z121 629 41 19 3.02% 46.34% Z294 608 50 24 3.95% 48.00% Z401 567 43 21 3.70% 48.84% L, T, C406 558 39 18 3.23% 46.15% Z413 552 52 22 3.99% 42.31% T, C, Z423 580 49 26 4.48% 53.06% L, C, Z438 674 46 28 4.15% 60.87% Z
Average 528.73 39.13 18.87 3.57% 48.22% -
Table 4: Materials assigned to each subject
見 (find) etc., and following long clause-style ob-jects. English commas, on the other hand, sel-dom have such usages (Zeng, 2006). In Cases 3and 4, commas instead of conjunctions sometimesconnect two clauses in a relation of either coordi-nation or subordination. English commas, on theother hand, are only required between independentclauses connected by conjunctions (Zeng, 2006).
Liu et al. (2010) proved that Chinese commascan change the syntactic structures of sentencesby playing lexical or syntactic roles. Ren andYang (2010) claimed that inserting commas asclause boundaries shortens the fixation time inpost-comma regions. Meanwhile, in computa-tional linguistics, Xue and Yang (2011) showed
Figure 4: Obtained eye-movement trace map
0
100,000
200,000
L1 L2 L3 L4 L5 L6 L7 T1
T2
T3
T4
T5
T6
T8
C1
C2
C3
C4
C5
C6
C7
C8
Z1
Z2
Z3
Z4
Z5
Z6
Z7
Z8
Z9
Z10
Trials (“Subject” + “Trial No.”)
With Comma No Comma
L1 – L7 T1 – T7 C1 – C8 Z1 – Z10
With commas Without commas
Tota
l vie
win
g tim
e (s
ec.)
0
100
200
Figure 5: Total viewing time
that Chinese sentence segmentation can be viewedas detecting loosely coordinated clauses separatedby commas.
4 CRF Model-based Comma Predictor
We first predict comma placements in existingtext. The prediction is formalized as a task to an-notate each word in a word sequence with an IOB-style tag such as I-Comma (following a comma),B-Comma (preceding a comma) or O (neither I-Comma nor B-Comma). We utilize a CRF modelfor this sequential labeling (Lafferty et al., 2001).
4.1 CRF Model for Comma Prediction
A conditional probability assigned to a label se-quenceY for a particular sequence of wordsX ina first-order linear-chain CRF is given by:
Pλ(Y |X) =exp(
∑nw
∑ki λifi(Yw−1, Yw, X, w))
Z0(X)
wherew is a word position inX, fi is a binaryfunction describing a feature forYw−1, Yw, X, andw, λi is a weight for that feature, andZ0 is a nor-malization factor over all possible label sequences.
The weightλi for eachfi is learned on trainingdata. Forfi, the linguistic features shown in Ta-ble 2 are derived from a syntactic parse of a sen-tence1. The first three were used initially; the restwere added after we got feedback from construc-tion of our rule-based filters (see Section 5). Fig-ure 2 shows an example of a parsing tree and itscorresponding training data.
1Some other features or tag formats which worked well inthe previous research, such as bi-/tri-gram, a preceding word(L-1) or its POS (POS-1), and IO-style tag (Leaman and Gon-zalez, 2008) were also examined, but they did not work thatwell, probably because of the difference in task settings.
51
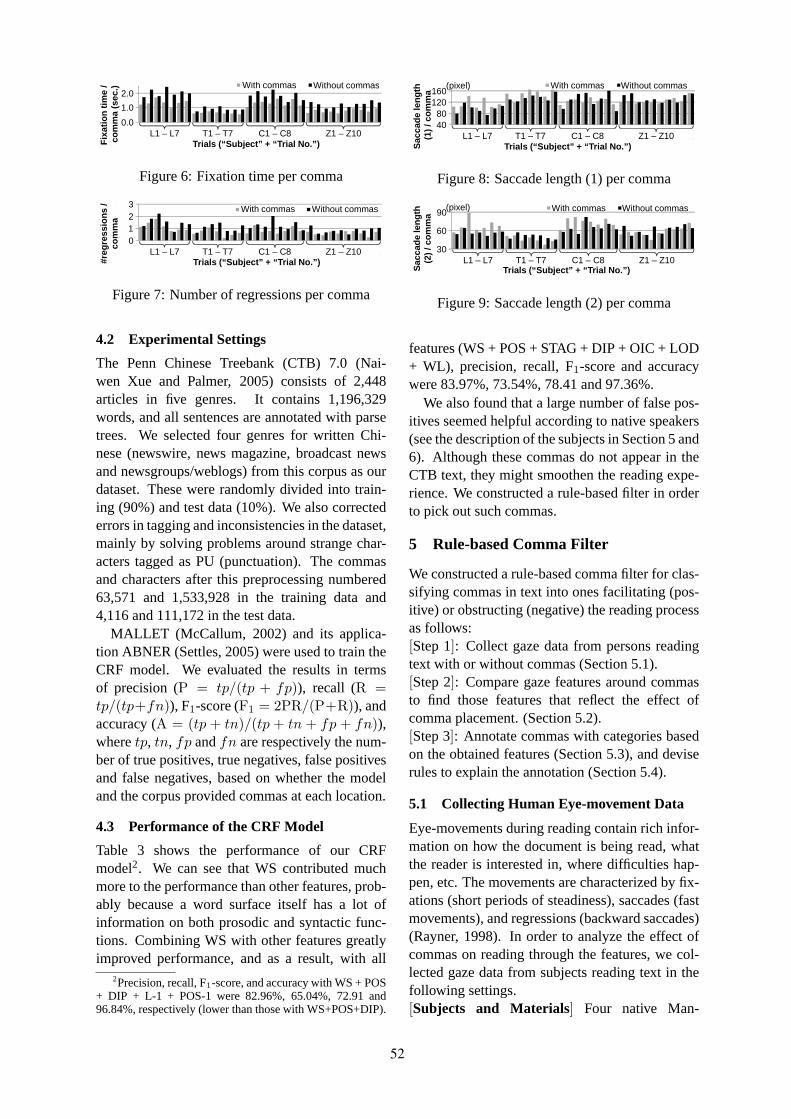
0
1,000
2,000
L1 L2 L3 L4 L5 L6 L7 T1
T2
T3
T4
T5
T6
T8
C1
C2
C3
C4
C5
C6
C7
C8
Z1
Z2
Z3
Z4
Z5
Z6
Z7
Z8
Z9
Z10
Trials (“Subject” + “Trial No.”)
With Comma No Comma
L1 – L7 T1 – T7 C1 – C8 Z1 – Z10
Fix
atio
n tim
e /
com
ma
(sec
.)0.0
1.0
2.0With commas Without commas
Figure 6: Fixation time per comma
0.01.02.03.0
L1 L2 L3 L4 L5 L6 L7 T1
T2
T3
T4
T5
T6
T8
C1
C2
C3
C4
C5
C6
C7
C8
Z1
Z2
Z3
Z4
Z5
Z6
Z7
Z8
Z9
Z10
Trials (“Subject” + “Trial No.”)
With Comma No Comma
L1 – L7 T1 – T7 C1 – C8 Z1 – Z10
#reg
ress
ions
/co
mm
a
0
With commas Without commas
123
Figure 7: Number of regressions per comma
4.2 Experimental Settings
The Penn Chinese Treebank (CTB) 7.0 (Nai-wen Xue and Palmer, 2005) consists of 2,448articles in five genres. It contains 1,196,329words, and all sentences are annotated with parsetrees. We selected four genres for written Chi-nese (newswire, news magazine, broadcast newsand newsgroups/weblogs) from this corpus as ourdataset. These were randomly divided into train-ing (90%) and test data (10%). We also correctederrors in tagging and inconsistencies in the dataset,mainly by solving problems around strange char-acters tagged as PU (punctuation). The commasand characters after this preprocessing numbered63,571 and 1,533,928 in the training data and4,116 and 111,172 in the test data.
MALLET (McCallum, 2002) and its applica-tion ABNER (Settles, 2005) were used to train theCRF model. We evaluated the results in termsof precision (P = tp/(tp + fp)), recall (R =tp/(tp+fn)), F1-score (F1 = 2PR/(P+R)), andaccuracy (A = (tp + tn)/(tp + tn + fp + fn)),wheretp, tn, fp andfn are respectively the num-ber of true positives, true negatives, false positivesand false negatives, based on whether the modeland the corpus provided commas at each location.
4.3 Performance of the CRF Model
Table 3 shows the performance of our CRFmodel2. We can see that WS contributed muchmore to the performance than other features, prob-ably because a word surface itself has a lot ofinformation on both prosodic and syntactic func-tions. Combining WS with other features greatlyimproved performance, and as a result, with all
2Precision, recall, F1-score, and accuracy with WS + POS+ DIP + L-1 + POS-1 were 82.96%, 65.04%, 72.91 and96.84%, respectively (lower than those with WS+POS+DIP).
4080
120160
L1 L2 L3 L4 L5 L6 L7 T1
T2
T3
T4
T5
T6
T8
C1
C2
C3
C4
C5
C6
C7
C8
Z1
Z2
Z3
Z4
Z5
Z6
Z7
Z8
Z9
Z10
Trials (“Subject” + “Trial No.”)
With Comma No Comma
L1 – L7 T1 – T7 C1 – C8 Z1 – Z10
Sac
cade
len
gth
(1)
/ com
ma
With commas Without commas
4080
120160
(pixel)
Figure 8: Saccade length (1) per comma
30
60
90
L1 L2 L3 L4 L5 L6 L7 T1
T2
T3
T4
T5
T6
T8
C1
C2
C3
C4
C5
C6
C7
C8
Z1
Z2
Z3
Z4
Z5
Z6
Z7
Z8
Z9
Z10
Trials (“Subject” + “Trial No.”)
With Comma No CommaWith commas Without commas
L1 – L7 T1 – T7 C1 – C8 Z1 – Z1030
Sac
cade
leng
th(2
) / c
omm
a
60
90(pixel)
Figure 9: Saccade length (2) per comma
features (WS + POS + STAG + DIP + OIC + LOD+ WL), precision, recall, F1-score and accuracywere 83.97%, 73.54%, 78.41 and 97.36%.
We also found that a large number of false pos-itives seemed helpful according to native speakers(see the description of the subjects in Section 5 and6). Although these commas do not appear in theCTB text, they might smoothen the reading expe-rience. We constructed a rule-based filter in orderto pick out such commas.
5 Rule-based Comma Filter
We constructed a rule-based comma filter for clas-sifying commas in text into ones facilitating (pos-itive) or obstructing (negative) the reading processas follows:[Step 1]: Collect gaze data from persons readingtext with or without commas (Section 5.1).[Step 2]: Compare gaze features around commasto find those features that reflect the effect ofcomma placement. (Section 5.2).[Step 3]: Annotate commas with categories basedon the obtained features (Section 5.3), and deviserules to explain the annotation (Section 5.4).
5.1 Collecting Human Eye-movement Data
Eye-movements during reading contain rich infor-mation on how the document is being read, whatthe reader is interested in, where difficulties hap-pen, etc. The movements are characterized by fix-ations (short periods of steadiness), saccades (fastmovements), and regressions (backward saccades)(Rayner, 1998). In order to analyze the effect ofcommas on reading through the features, we col-lected gaze data from subjects reading text in thefollowing settings.[Subjects and Materials] Four native Man-
52

Categories Effect on readability Outward manifestationPositive (⃝) Can improve readability. Presence would cause GF+.Semi-positive (△) Might be necessary for readability, but the importance is not as obvious as a positive comma.Absence might cause GF-.Semi-negative (2) Might be negative, but its severity is not as obvious as a negative comma. Absence might cause GF+.Negative (×) Thought to reduce a document’s readability. Presence would cause GF-.GF+/GF-: values of eye-tracking features that represent good/poor readability
Table 5: Comma categories
Subject Positive (⃝) Semi-positive (△) Semi-negative (2) Negative (×) Adjustment formulaL ∆FT′>800 500<∆FT′≤800 -100<∆FT′≤500 ∆FT′<-100 ∆FT′ = ∆FT + ∆RT× 200C ∆FT′>900 600<∆FT′≤900 -200<∆FT′≤600 ∆FT′<-200 ∆FT′ = ∆FT + ∆RT× 275T ∆FT′>600 300<∆FT′≤600 -300<∆FT′≤300 ∆FT′<-300 ∆FT′ = ∆FT + ∆RT× 250Z ∆FT′>650 350<∆FT′≤650 -250<∆FT′≤350 ∆FT′<-250 ∆FT′ = ∆FT + ∆RT× 250
∆FT = [ fixation time (without commas) [ms]]− [ fixation time (with commas) [ms]]∆RT = [ #regressions (without commas) ]− [ #regressions (with commas) ]
Table 6: Estimation formula for judging the contribution of commas to readability
ID ⃝ △ 2 ×6 13 6 4 57 8 6 1 010 5 0 1 112 1 4 2 014 4 4 5 118 5 1 4 379 11 4 9 482 5 6 2 0
ID ⃝ △ 2 ×121 11 2 6 0294 9 9 4 1401 10 7 2 2406 5 6 5 2413 8 5 6 3423 11 4 7 4438 6 16 6 0Total 112 80 64 26
Table 7: Categories of annotated commas
darin Chinese speakers (graduate students and re-searchers) read 15 newswire articles selected fromCTB 7.0 (included in the test data in Section 4.2).Table 4 and Figure 3(a) show the materials as-signed to each subject and a screenshot of one ma-terial. Each article was presented in 12-15 pointsof bold-faced Fang-Song font occupying 13×13,14×15, 15×16 or 16×16 pixels along with a linespacing of 5-10 pixels3.[Apparatus] Figure 3(b) shows a scene of theexperiment. An EyeLink 1000 eye tracker (SRResearch Ltd., Toronto, Canada) with a desktopmount monitored the movements of a right eye at1,000 Hz. The subject’s head was supported at thechin and forehead. The distance between the eyesand the monitor was around 55 cm, and each Chi-nese character subtended a visual angle 1◦. Textwas presented on a 19” monitor at a resolutionof 800×600 pixels, with the brightness adjustedto a comfortable level. The displayed article wasmasked except for the area around a gaze point(see Figure 3(c)) in order to confirm that the gazepoint was correctly detected and make the subjectconcentrate on the area (adjusted for him/her).[Procedure] Each article was presented twice(once with/once without commas) to each subject.
3These values, as well as the screen position of the article,were adjusted for each subject.
The one without commas was presented first4 (notnecessarily in a row). We did not give any compre-hension test after reading; we just asked the sub-jects to read carefully and silently at their normalor lower speed, in order to minimize the effect ofthe first reading on the second. The subjects wereinformed of the presence or absence of commasbeforehand. The apparatus was calibrated beforethe experiment and between trials. The experi-ment lasted around two hours for each subject.[Alignment of eye-tracking data to text] Figure 4shows an example of the obtained eye-movementtrace map, where circles and lines respectivelymean fixation points and saccades, and color depthshows their duration. The alignment of the data tothe text is a critical task, and although automaticapproaches have been proposed (Martınez-Gomezet al., 2012a; Martınez-Gomez et al., 2012b), theydo not seem robust enough for our purpose. Ac-cordingly, we here just compared the entire layoutof the gaze point distribution and that of the actualtext, and adjusted them to have relatively coherentpositions on the x-axis; i.e., the beginning and endof the gaze point sequence in a line were made asclose as possible to those of the line in the text.
5.2 Analysis of Eye-movement Data
The gaze data were analyzed by focusing on re-gions around each comma or where each oneshould be (three characters left and right to thecomma5).
4If we had used the reversed order, the subject would haveknowledge about original comma distribution, and this wouldcause abnormally quick reading of the text without commas.With the order we set, conflicts between false segmentations(made in first reading) and correct ones might bother the sub-ject, which is trade-off (though minor) in the second reading.
5When a comma appeared at the beginning of a line, twocharacters to the left and right of the comma and one charac-
53

1. If L Seg and RSeg are both very long, a comma must be put between them.2. If two△ appear serially, one is necessary whereas the other might be optional or judged negative, but it still depends on the lengths of the siblings.3. If two neighboring commas appear very close to each other, one of them is judged as negative whereas judgment on the other one is reserved.4. If several (more than 2)×s appear continually, one or more×s might be reserved in consideration of the global condition.5. A comma is always needed after a long sentence or clause without any syntactically significant punctuation with the function of segmentation.6. If a△ appears near a⃝, it might be judged as negative with a high probability. However, the judgment process is always from the bottom up, which
means× → 2 → △→⃝. For example, if a2 appears near a△, we judge2 first (to be positive or negative), then judge the△ in the conditionwith or without the comma of2.
Table 8: General rules for reference
Figure 5, 6 and 7 respectively show the totalviewing time, fixation time (duration for all fix-ations and saccades in a target region) per comma,and number of regressions per comma6 for eachtrial. We can see a general trend wherein the for-mer two were shorter and the latter was smaller forthe articles with commas than without. The diver-sity of the subjects was also observed in Figure 6.
Figure 8 and 9 show the saccade length percomma for different measures. The former (lat-ter) figure considers a saccade in which at leastone edge (both edges) was in the region. We can-not see any global trend, probably because of thedifference in global layout of materials brought bythe presence or absence of commas.
5.3 Categorization of Commas
Using the features shown to be effective to repre-sent the effect of comma placement, we analyzedthe statistics for each comma in order to manu-ally construct an estimation formula for judgingthe contribution of each comma to readability. Thecontribution was classified into four categories(Table 5), and the formula is described in Table 67.The adjustment formula was based on our obser-vation that the number of regressions could onlybe regarded as an aid. For example, for subjectC, if ∆FT=200ms and∆RT =−2, ∆FT′=−350,and therefore, the comma is annotated as negative.All parameters were decided empirically and man-ually checked twice (self-judgment and feedbackfrom the subjects).
On the basis of this estimation formula, all arti-cles in Table 4 were manually annotated. Table 7shows the distribution of the assigned categories8.
ter to the left and right of the final character of the last linewere analyzed.
6Calculated by counting the instances where thex-position of [a fixation / end point of a saccade] was aheadof [the former fixation / its start point]. Although the countsof these two types were almost the same, by counting both ofthem, we expected to cover any possible regression.
7One or two features are used to judge the category of acomma. We will explore more features in the future.
8In the case of severe contradictions, the annotators dis-cussed them and resolved them by voting.
5.4 Implementation of Rule-based Filter
The annotated commas were classified into Cases1 to 5 in Table 1, based on the types of left andright segment conjuncts (LSeg and RSeg, whichwere obtained from the parse trees in CTB). Foreach of the five cases, the reason for the assign-ment of a category (⃝, △, 2 or ×) to eachcomma was explained by a manually constructedrule which utilized information about LSeg andR Seg. The rules were constructed so that theywould cover as many instances as possible. Ta-ble 8 shows the general rules utilized as a refer-ence, and Table 9 shows the finally obtained rules.The rightmost column in this table shows the num-ber of commas matching each rule. These ruleswere then implemented as a filter for classifyingcommas in a given text.
For several rules (⃝10, 28, 210, 211 and212), there were only single instances. In addi-tion, although our rules were built carefully, a fewexceptions to the detailed threshold were found.Collecting and investigating more gaze data wouldhelp to make our rules more sophisticated.
6 Performance of the Rule-based Filter
We assumed that our comma predictor provides aCTB text with the same distribution as the origi-nal one in CTB (see Figure 1). Accordingly, weexamined the quality of the comma categorizationby our rule-based filter through gaze experiments.
6.1 Experimental Settings
Another five native Mandarin Chinese speakerswere invited as test subjects. The CTB articles as-signed to the subjects are listed in Table 10. Thesearticles were selected from the test data in Sec-tion 4.2 in such a way that 520<#characters<700,#commas>17, #commas/#punctuations>38%,and #commas/#characters>3.1%, since weneeded articles of appropriate length with a fairnumber of commas. After that, we manuallychose articles that seemed to attract the subjects’interest from those that satisfied the conditions.
54

Case 1: L Subject + R Predicate #commas⃝6 L IP-SBJ + RVP (length both<14 (In SegLen)) 2△7 L IP-SBJ/NP-SBJ (OrgLen>13, Ttl Len>15) 7×6 L NP-SBJ/IP-SBJ (<14) + R VP (≥25) 2
Case 2: L Predicate + R Object #commas⃝9 Long frontings (Modifier/Subject,>7) + short Lpredicate (VV/VRD/VSB· · · ,≤3) + Longer Robject (IP-OBJ,>28) 6△8 Short frontings (<5) + short Lpredicate (<3) + moderate-length Robject (IP-SBJ,<20) 426 Short frontings (<6) + short Lpredicate (≤3) + long Robject (IP-SBJ,>23) 9
Case 3: L Modifier #commas⃝3 Short frequently used Lmodifier (2-3,经⋯,据⋯, etc.) + moderate-length/long RSPO (≥w18p10) 13⃝7 Short L (PP/LCP)-TMP (5, 6) + long RNP (≥10) 4⃝10 Long L CP-CND (e.g.,若⋯, >18) + moderate-length RSeg (SPO, IP, etc.<18) 1△1 Long L modifier (PP(-XXX, P+Long NP/IP), IP-ADV,≥17) 6△4 Moderate-length/short Lmodifier (PP(-XXX, P+IP, There is IP inside,>6<15, cf.26 (NP)) 9△9 Long L (PP/LCP)-TMP (TtlLen≥10), short RSeg (NP/ADVP,<3) 4△10 Short L(LCP/PP)-LOC (<8) 222 Long L LOC (or there is LCP inside PP,>10) 523 Very short frequently used LADVP/ADV (2) 825 Short L (PP/LCP/NP)-TMP (4;5-6, when RSeg is short (<10)) 1224 Moderate-length PP(-XXX, P+NP,>8≤13) + R Seg (SPO, IP, VO, MSPO, etc.) 628 Short L IP-CND (<8) 1211 Long L PP-DIR (>20) + short RVO (≤10) 1×2 Very short L(QP/NP/LCP)-TMP (≤3) 8×5 Short frequently used Lmodifier (as in⃝3,≤3) + short/moderate-length RSeg (SPO etc.,<c20w9) 1
Case 4: L c + R c #commas⃝2 L c & R c are both long (InSegLen≥15; or one>13, the other near 20) 39⃝8 L c is the summary of Rc 2△2 Moderate-length Lc + R c (both≥10≤15; or one≥17, the other≤12) 25△3 Moderate-length clause (>10), but connected with familiar CC or ADVP 6△5 Three or more consecutive moderate-length clauses (all<15, and at least one≤10) 12×7 Very short Lc + R c (both<5), something like slogan) 1
Case 5: L p + R p #commas⃝1 Short coordinate modifiers (Both side<5) 4⃝4 Short Lp+R p (both<c15w5, and at least one<10), but pre-Lp (e.g., SBJ) is too long (>18) 2⃝5 Between two moderate-length/long phrases (both≥15; or L p≥17, R p=10-14; Or Lp=10-14, Rp>20) 39⃝11 Long pre-Lp (SBJ /ADV, etc.>16) + short Lp (≤5) + long Rp (≥18) 2(△3 Moderate-length phrase (>10), but connected with familiar CC or ADVP) (6)△6 Three or more consecutive short/moderate-length phrases (both<15, at least one<8) 521 Between short phrases (both≤c13w5), and pre-Lp (SBJ/ADV, etc.) is short/moderate-length (<11) 1327 Coordinate VPs, and LVP is a moderate-length VP (PP-MNR VP) 429 Phrasal coordination between a long (≥18) and a short (<10) phrase 3210 Moderate-length coordinate VPs (>10<15), and RVP has the structure like VP (MSP VP) 1212 Between two short/moderate-length NP phrases (both≤15, e.g., LNP-TPC+RNP-SBJ) 1×1 Moderate-length/short phrase ((i) c:one>10<18, The other>5≤10, w:one≤5, the other>5≤10; (ii) c:both≥10<15, 13
w:both>5≤7), and pre-Lp (SBJ/ADV, etc.) is short (≤5)· L x/R x: the left/right segment of a target comma which isx.(x can be “p” (phrase) / “c” (clause), syntactic tags (with function tags) such as “VP” and “IP-SBJ”, or general functions such as “Subject” and “Predicate”.)· Org Len: the number of characters in a segment (including other commas or punctuation inside).· In SegLen/Ttl Len: the number of characters between the comma and nearest punctuation (inside a long/outside a short target segment).· SPO: subject + predicate + object, belonging to the outermost sentence. The length is defined in the similar way as InSegLen.· MSPO: modifier + subject + predicate + object. The length is defined in the similar way as InSegLen.· -XX or -XXX: arbitrary type of possible functional tag (or without any functional tag) connected with the former syntactic tag.· ≤ciwj: #characters≤i and #words≤j.· In some cases (in Case 3, 4 and 5), the length is calculated after negative (or judged negative) commas are eliminated.· The rules related with TMP are applied faster than ones related with LCP (in Case 3).· △3 appears in both Case 4 (clause) and Case 5 (phrase). The number of commas is given by the sum of those in both cases.
Table 9: Entire classification of rules based on traditional comma categories
(A) #Characters,Article (B) #Punctuations, (C) / (A) (C) / (B) Subjects
ID (C) #Commas6 692 49 28 4.04% 57.14% L, S, H11 672 48 21 3.13% 43.75% L, S, F15 674 67 26 3.86% 38.81% L, S, H16 547 43 22 4.02% 51.16% L, S, F56 524 43 18 3.44% 41.86% L, H, M73 595 46 28 4.71% 60.87% S, H, F, M79 655 53 28 4.27% 52.83% H, F, M99 671 55 24 3.58% 43.64% F, M
Average 628.75 50.50 24.38 3.88% 48.27% -
Table 10: Materials assigned to each subject
Our rule-based filter was applied to the commasof each article9, and the commas were classified
9Instances of incoherence among the applied rules were
0
40,000
80,000
120,000
F79
F11
F16
F73
F99
H73
H06
H15
H79
H56 L06
L11
L15
L16
L56
M99
M79
M73
M56
S06
S11
S15
S16
S73
Trials (“Subject” + “Article ID”)
Distribution(G) Distribution(B)Positive distribution Negative distribution
04080
120
Tota
l vi
ewin
gtim
e (s
ec.)
Figure 10: Total viewing time for two distributions
into two distributions: a positive one (positive +semi-positive commas) and a negative one (nega-tive + semi-negative commas). Two types of ma-terials were thus generated by leaving the commasin one distribution and removing the others.
manually checked and corrected.
55

20
40
60
80
F79
F11
F16
F73
F99
H73
H06
H15
H79
H56 L06
L11
L15
L16
L56
M99
M79
M73
M56
S06
S11
S15
S16
S73
Trials (“Subject” + “Article ID”)
Distribution(G) Distribution(B)
EM
FF
T(
100)
Positive distribution Negative distribution
Figure 11: EMFFT for two distributions
468
10
F79
F11
F16
F73
F99
H73
H06
H15
H79
H56 L0
6L1
1L1
5L1
6L5
6M
99M
79M
73M
56S
06S
11S
15S
16S
73
Trials (“Subject” + “Article ID”)
Distribution(G) Distribution(B)
EM
FT
(80
0) Positive distribution Negative distribution
Figure 12: EMFT for two distributions
The apparatus and procedure were almost thesame as those in Section 5.1, whereas, on the ba-sis of the feedback from the previous experiments,the font size, number of characters in a line, andline spacing were fixed to single optimized values,respectively, 14-point Fang-Song font occupying15×16 pixels, 33 characters and 7 pixels.
6.2 Evaluation Metrics
We examined whether our positive/negative distri-butions really facilitated/obstructed the subjects’reading process by using the following metrics:
TT, EMFFT = FFTFT
10, EMFT = FTCN·TT
11,EMRT = RT
2·CN12, EMSLO = SLO
2·TT ,where TT, FT, RT and CN are total viewing time,fixation time, number of regressions, and num-ber of commas respectively, as described in Sec-tion 5.2. FFT and SLO are additionally introducedmetrics respectively for the “total duration for allfirst-pass fixations in a target region that excludeany regressions” and for the “length of saccadesfrom inside a target region to the outside”13. All ofthe areas around commas appearing in the originalarticle were considered target areas for the metrics.The other settings were the same as in Section 5.
6.3 Contribution of Categorized Commas
Figure 10, 11, 12, 13 and 14 respectively show TT,EMFFT , EMFT , EMRT and EMSLO for two typesof comma distributions in each trial.
10Ratio to the total fixation time in the target areas (FT).11Normalized by the total viewing time (TT).12Two types of RT count (see Section 5.2) were averaged.13Respectively to reflect “the early-stage processing of the
region” and “the information processed for a fixation and adecision of the next fixation point” (Hirotani et al., 2006).
0
5
10
F79
F11
F16
F73
F99
H73
H06
H15
H79
H56 L06
L11
L15
L16
L56
M99
M79
M73
M56
S06
S11
S15
S16
S73
Trials (“Subject” + “Article ID”)
Distribution(G) Distribution(B)
EM
RT(
10)
Positive distribution Negative distribution
Figure 13: EMRT for two distributions
0
5
10
F79
F11
F16
F73
F99
H73
H06
H15
H79
H56 L06
L11
L15
L16
L56
M99
M79
M73
M56
S06
S11
S15
S16
S73
Trials (“Subject” + “Article ID”)
Distribution(G) Distribution(B)Positive distribution Negative distribution
EM
SL
O(
100)
Figure 14: EMSLO for two distributions
For TT, we cannot see any general trend, mainlybecause this time, the reading order of the textwas random, which spread out the second readingeffect evenly between the two distributions. ForEMFFT , we cannot reach a conclusion either. Incontrast, in more than half of the trials, EMFFT
was larger for positive distributions, which wouldimply that the positive commas helped to preventthe reader’s gaze from revisiting the target regions.For most trials, except for subject S whose cal-ibration was poor and reading process was poorin M56, EMFT and EMRT decreased and EMSLO
increased for positive distributions, which impliesthat the positive commas smoothed the readingprocess around the target regions.
7 Conclusion
We proposed an approach for modeling commaplacement in Chinese text for smoothing reading.In our approach, commas are added to the text onthe basis of a CRF model-based comma predic-tor trained on the treebank, and a rule-based filterthen classifies the commas into ones facilitating orobstructing reading. The experimental results oneach part of this approach were encouraging.
In our future work, we would like see how com-mas affect reading by using much more material,and thereby refine our framework in order to bringa better reading experience to readers.
Acknowledgments
This research was partially supported by Kakenhi,MEXT Japan [23650076] and JST PRESTO.
56

References
Wallace Chafe. 1988. Punctuation and the prosody ofwritten language.Written Communication, 5:396–426.
Yuqing Guo, Haifeng Wang, and Josef van Genabith.2010. A linguistically inspired statistical modelfor Chinese punctuation generation.ACM Trans-actions on Asian Language Information Processing,9(2):6:1–6:27, June.
Masako Hirotani, Lyn Frazier, and Keith Rayner. 2006.Punctuation and intonation effects on clause andsentence wrap-up: Evidence from eye movements.Journal of Memory and Language, 54(3):425–443.
Hen-Hsen Huang and Hsin-Hsi Chen. 2011. Pause andstop labeling for Chinese sentence boundary detec-tion. In Proceedings of Recent Advances in NaturalLanguage Processing, pages 146–153.
Jing Huang and Geoffrey Zweig. 2002. Maximum en-tropy model for punctuation annotation from speech.In Proceedings of the International Conference onSpoken Language Processing, pages 917–920.
Mei xun Jin, Mi-Young Kim, Dongil Kim, and Jong-Hyeok Lee. 2002. Segmentation of Chineselong sentences using commas. InProceedings ofthe Third SIGHAN Workshop on Chinese LanguageProcessing, pages 1–8.
John D. Lafferty, Andrew McCallum, and FernandoC. N. Pereira. 2001. Conditional random fields:Probabilistic models for segmenting and labeling se-quence data. InProceedings of the Eighteenth Inter-national Conference on Machine Learning, ICML’01, pages 282–289, San Francisco, CA, USA. Mor-gan Kaufmann Publishers Inc.
Robert Leaman and Graciela Gonzalez. 2008. BAN-NER: An executable survery of advances in biomed-ical named entity recognition. InPacific Symposiumon Biocomputing (PSB’08), pages 652–663.
Baolin Liu, Zhongning Wang, and Zhixing Jin. 2010.The effects of punctuations in Chinese sentencecomprehension: An erp study.Journal of Neurolin-guistics, 23(1):66–68.
Wei Lu and Hwee Tou Ng. 2010. Better punctuationprediction with dynamic conditional random fields.In Proceedings of the 2010 Conference on EmpiricalMethods in Natural Language Processing (EMNLP’10), pages 177–186.
Pascual Martınez-Gomez, Chen Chen, Tadayoshi Hara,Yoshinobu Kano, and Akiko Aizawa. 2012a. Imageregistration for text-gaze alignment. InProceedingsof the 2012 ACM international conference on Intel-ligent User Interfaces (IUI ’12), pages 257–260.
Pascual Martınez-Gomez, Tadayoshi Hara, ChenChen, Kyohei Tomita, Yoshinobu Kano, and Akiko
Aizawa. 2012b. Synthesizing image representa-tions of linguistic and topological features for pre-dicting areas of attention. In Patricia Anthony, Mit-suru Ishizuka, and Dickson Lukose, editors,PRICAI2012: Trends in Artificial Intelligence, pages 312–323. Springer.
Andrew Kachites McCallum. 2002. MALLET: A ma-chine learning for language toolkit.
Fu-dong Chiou Naiwen Xue, Fei Xia and MartaPalmer. 2005. The Penn Chinese TreeBank: Phrasestructure annotation of a large corpus.Natural Lan-guage Engineering, 11(2):207–238.
Stephan Peitz, Markus Freitag, Arne Mauser, and Her-mann Ney. 2011. Modeling punctuation predictionas machine translation. InProceedings of Interna-tional Workshop on Spoken Language Translation,pages 238–245.
Keith Rayner. 1998. Eye movements in reading andinformation processing: 20 years of research.Psy-chological Bulletin, 124(3):372–422.
Gui-Qin Ren and Yufang Yang. 2010. Syntac-tic boundaries and comma placement during silentreading of Chinese text: evidence from eye move-ments.Journal of Research in Reading, 33(2):168–177.
Burr Settles. 2005. ABNER: an open source toolfor automatically tagging genes, proteins, and otherentity names in text.Bioinformatics, 21(14):3191–3192.
Elizabeth Shriberg, Andreas Stolcke, Dilek Hakkani-Tur, and Gokhan Tur. 2000. Prosody-based au-tomatic segmentation of speech into sentences andtopics.Speech Communication, 32(1-2):127–154.
Judy Perkins Walker, Kirk Fongemie, and TracyDaigle. 2001. Prosodic facilitation in the resolu-tion of syntactic ambiguities in subjects with leftand right hemisphere damage.Brain and Language,78(2):169–196.
Nianwen Xue and Yaqin Yang. 2011. Chinese sen-tence segmentation as comma classification. InPro-ceedings of the 49th Annual Meeting of the Asso-ciation for Computational Linguistics:shortpapers,pages 631–635.
Ming Yue. 2006. Discursive usage of six Chinesepunctuation marks. InProceedings of the COL-ING/ACL 2006 Student Research Workshop, pages43–48.
ZDIC.NET. 2005. Commonly used Chinese punctua-tion usage short list.Long Wiki, Retrieved Dec 10,2012, from http://www.zdic.net/appendix/f3.htm.(in Chinese).
X. Y. Zeng. 2006. The comparison and the useof English and Chinese comma.College English,3(2):62–65. (in Chinese).
57

Kaixu Zhang, Yunqing Xia, and Hang Yu. 2006.CRF-based approach to sentence segmentation andpunctuation for ancient Chinese prose.Jour-nal of Tsinghua Univ (Science and Technology),49(10):1733–1736. (in Chinese).
58

Proceedings of the 2nd Workshop on Predicting and Improving Text Readability for Target Reader Populations, pages 59–68,Sofia, Bulgaria, August 4-9 2013. c©2013 Association for Computational Linguistics
On The Applicability of Readability Models to Web Texts
Sowmya Vajjala Detmar MeurersSeminar fur Sprachwissenschaft
Universitat Tubingen{sowmya,dm}@sfs.uni-tuebingen.de
Abstract
An increasing range of features is beingused for automatic readability classifica-tion. The impact of the features typicallyis evaluated using reference corpora con-taining graded reading material. But howdo the readability models and the featuresthey are based on perform on real-worldweb texts? In this paper, we want to take astep towards understanding this aspect onthe basis of a broad range of lexical andsyntactic features and several web datasetswe collected.
Applying our models to web search re-sults, we find that the average reading levelof the retrieved web documents is rela-tively high. At the same time, documentsat a wide range of reading levels are iden-tified and even among the Top-10 searchresults one finds documents at the lowerlevels, supporting the potential usefulnessof readability ranking for the web. Finally,we report on generalization experimentsshowing that the features we used gener-alize well across different web sources.
1 Introduction
The web is a vast source of information on a broadrange of topics. While modern search enginesmake use of a range of features for identifying andranking search results, the question whether a webpage presents its information in a form that is ac-cessible to a given reader is only starting to receiveattention. Researching the use of readability as-sessment as a ranking parameter for web searchcan be a relevant step in that direction.
Readability assessment has a long history span-ning various fields of research from EducationalPsychology to Computer Science. At the same
time, the question which features generalize to dif-ferent types of documents and whether the read-ability models are appropriate for real-life appli-cations has only received little attention.
Against this backdrop, we want to see how wella state-of-the-art readability assessment approachusing a broad range of features performs when ap-plied to web data. Based on the approach intro-duced in Vajjala and Meurers (2012), we thus setout to explore the following two questions in thispaper:
• Which reading levels can be identified in asystematic sample of web texts?
• How well do the features used generalize todifferent web sources?
The paper is organized as follows: Section 2surveys related work. Section 3 introduces the cor-pus and the features we used. Section 4 describesour readability models. Section 5 discusses our ex-periments investigating the applicability of thesemodels to web texts. Section 6 reports on a secondset of experiments conducted to test the generaliz-ability of the features used. Section 7 concludesthe paper with a discussion of our results.
2 Related Work
2.1 Readability Assessment
The need for assessing the readability of a pieceof text has been explored in the educational re-search community for over eight decades. DuBay(2006) provides an overview of early readabilityformulae, which were based on relatively shallowfeatures and wordlists. Some of the formulae arestill being used in practice, as exemplified by theFlesch-Kincaid Grade Level (Kincaid et al., 1975)available in Microsoft Word.
More recent computational linguistic ap-proaches view readability assessment as a
59

classification problem and explore differenttypes of features. Statistical language modelinghas been a popular approach (Si and Callan,2001; Collins-Thompson and Callan, 2004),with the hypothesis that the word usage patternsacross grade levels are distinctive enough. Heil-man et. al. (2007; 2008) extended this approachby combining language models with manuallyand automatically extracted grammatical features.
The relation of text coherence and cohesionto readability is well explored in the CohMetrixproject (McNamara et al., 2002). Ma et al. (2012a;2012b) approached readability assessment as aranking problem and also compared human versusautomatic feature extraction for the task of label-ing children’s literature.
The WeeklyReader1, an American educationalnewspaper with graded readers has been a pop-ular source of data for readability classificationresearch in the recent past. Petersen and Osten-dorf (2009), Feng et al. (2009) and Feng (2010)used it to build readability models with a rangeof lexical, syntactic, language modeling and dis-course features. In Vajjala and Meurers (2012)we created a larger corpus, WeeBit, by combiningWeeklyReader with graded reading material fromthe BBCBitesize website.2 We adapted measuresof lexical richness and syntactic complexity fromSecond Language Acquisition (SLA) research asfeatures for readability classification and showedthat such measures of proficiency can successfullybe used as features for readability assessment.
2.2 Readability Assessment of Web Texts
Despite the significant body of research on read-ability assessment, applying it to retrieve relevanttexts from the web has elicited interest only in therecent past. While Bennohr (2005) and Newboldet al. (2010) created new readability formulae forthis purpose, Ott and Meurers (2010) and Tan etal. (2012) used existing readability formulae to fil-ter search engine results. The READ-X project(Miltsakaki and Troutt, 2008; Miltsakaki, 2009)combined standard readability formulae with topicclassification to retrieve relevant texts for users.
The REAP Project3 supports the lexical acqui-sition of individual learners by retrieving texts thatsuit a given learner level. Kidwell et al. (2011) also
1http://weeklyreader.com2http://www.bbc.co.uk/bitesize3http://reap.cs.cmu.edu
used a word-acquisition model for readability pre-diction. Collins-Thompson et al. (2011) and Kimet al. (2012) employed word distribution basedreadability models for personalized search and forcreating entity profiles respectively. Nakatani etal. (2010) followed a language modeling approachto rank search results to take user comprehensioninto account. Google also has an option to filtersearch results based on reading level, apparentlyusing a language modeling approach.4 Kanungoand Orr (2009) used search result snippet basedfeatures to predict the readability of short web-summaries.
All the above approaches primarily restrictthemselves to traditional formulae or statisticallanguage models encoding the distribution ofwords. The effect of lexical and syntactic featuresas used in recent research on readability thus re-mains to be studied in a web context. Furthermore,the generalizability of the features used to otherdata sets also remains to be explored. These arethe primary issues we address in this paper.
3 Corpus and Features
Let us turn to answering our first question: Whichreading levels can be identified in a systematicsample of web texts? To address this question, wefirst need to introduce the features we used, thegraded corpus we used to train the model, and thenature of the readability model.
Since the goal of this paper is not to presentnew features but to explore the application of areadability approach to the web, we here simplyadopt the feature and corpus setup introduced inVajjala and Meurers (2012). The WeeBit corpusused is a corpus of texts belonging to five readinglevels, corresponding to children of age group 7–16 years. It consists of 625 documents per readinglevel. The articles cover a range of fiction and non-fiction topics. Each article is labeled as belong-ing to one of five reading levels: Level 2, Level 3,Level 4, KS3 and GCSE.
We adapted both the lexical and syntactic fea-tures of Vajjala and Meurers (2012) to build read-ability models on the basis of the WeeBit corpusand then studied their applicability to real-worlddocuments retrieved from the web as well as theapplicability of those features across different websources.
4http://goo.gl/aVy93
60

Lexical features (LEXFEATURES) The lexicalfeatures are motivated by the lexical richness mea-sures used to estimate the quality of languagelearners’ oral narratives (Lu, 2012). We includedseveral type-token ratio variants used in SLA re-search: generic type token ratio, root TTR, cor-rected TTR, bilogarithmic TTR and Uber Index.
In addition, there are lexical variation measuresused to estimate the distribution of various partsof speech in the given text. They include thenoun variation, adjective variation, modifier vari-ation, adverb variation and verb variation, whichrepresent the proportion of words of the respec-tive part of speech categories compared to all lex-ical words in the document. Alternative measuresfor verb variation, namely, Squared Verb Variationand Corrected Verb Variation are also included.Apart from these, we also added the traditionallyused measures of average number of charactersper word, average number of syllables per word,and two readability formulae, the Flesch-Kincaidscore (Kincaid et al., 1975) and the Coleman-Liauscore (Coleman and Liau, 1975). Finally, we in-cluded the percentage of words from the Aca-demic Word List5. It is a list created by Coxhead(2000) which consists of words that are more com-monly found in academic texts.
Syntactic features (SYNFEATURES) Thesefeatures are adapted from the syntactic complexitymeasures used to analyze second language writing(Lu, 2010). They are calculated based on theparser output of the BerkeleyParser (Petrov andKlein, 2007), using the Tregex (Levy and Andrew,2006) pattern matcher. They include: meanlengths of various production units (sentence,clause and t-unit); clauses per sentence and t-unit;t-units per sentence; complex-t units per t-unitand per sentence; dependent clauses per clause,t-unit and sentence; co-ordinate phrases perclause, t-unit and sentence; complex nominals perclause and t-unit; noun phrases, verb phrases andpreposition phrases per sentence; average lengthof NP, VP and PP; verb phrases per t-unit; SBARsper sentence and average parse tree height.
We refer to the feature subset containing allthe traditionally used features (# char. per word,# syll. per word and # words per sentence) asTRADFEATURES in this paper.
5http://simple.wiktionary.org/wiki/Wiktionary:Academic_word_list
4 The Readability Model
In computational linguistics, readability assess-ment is generally approached as a classificationproblem. To our knowledge, only Heilman et al.(2008) and Ma et al. (2012a) experimented withother kinds of statistical models.
We approach readability assessment as a regres-sion problem. This produces a model which pro-vides a continuous estimate of the reading level,enabling us to see if there are documents that fallbetween two levels or above the maximal levelfound in the training data. We used the WEKAimplementation of linear regression for this pur-pose. Since linear regression assumes that the datafalls on an interval scale with evenly spaced read-ing levels, we used numeric values from 1–5 asreading levels instead of the original class namesin the WeeBit corpus. Table 1 shows the mappingfrom WeeBit classes to numeric values, along withthe age groups per class.
WeeBit class Age (years) Reading levelLevel 2 7–8 1Level 3 8–9 2Level 4 9–10 3
KS3 11–14 4GCSE 14–16 5
Table 1: WeeBit Reading Levels for Regression
We report Pearson’s correlation coefficient andRoot Mean Square Error (RMSE) as our evalua-tion metrics. Correlation coefficient measures theextent of linear relationship between two randomvariables. In readability assessment, a high corre-lation indicates that the texts at a higher difficultylevel are more likely to receive a higher level pre-diction from the model and those at lower diffi-culty level would more likely receive a lower pre-diction. RMSE can be interpreted as the aver-age deviation in grade levels between the predictedand the actual values.
We trained four regression models with the fea-ture subsets introduced in section 3: LEXFEA-TURES, SYNFEATURES, TRADFEATURES andALLFEATURES. While the criterion used in cre-ating the graded texts in WeeBit is not known, itis likely that they were created with the traditionalmeasures in mind. Indeed, the traditional featuresalso were among the most predictive features inVajjala and Meurers (2012). Hence, apart from
61

training the above mentioned four regression mod-els, we also trained a fifth model excluding the tra-ditional features and formulae. This experimentwas performed to verify if the traditional featuresare creating a skewed model that relies too heavilyon those well-known and thus easily manipulatedfeatures in making decisions on test data. We referto this fifth feature group as NOTRAD.
Table 2 shows the result of our regression ex-periments using 10-fold cross-validation on theWeeBit corpus, employing the different featuresubsets and the complete feature set.
Feature Set # Features Corr. RMSELEXFEATURES 17 0.84 0.78SYNFEATURES 25 0.88 0.64TRADFEATURES 3 0.66 1.06ALLFEATURES 42 0.92 0.54NOTRAD 37 0.89 0.63
Table 2: Linear Regression Results for WeeBit
The best correlation of 0.92 was achieved withthe complete feature set. 0.92 is considered astrong correlation and coupled with an RMSE of0.54, we can conclude that our regression modelis a good model. In comparison, in Vajjala andMeurers (2012), where we tackle readability as-sessment as a classification problem, we obtained93.3% accuracy on this dataset using all features.
Looking at the feature subsets, there also is agood correlation between the model predictionsand the actual results in the other cases, exceptfor the model considering only traditional features.While traditional features often are among themost predictive features in readability research,we also found that a model which does not includethem can perform at a comparable level (0.89).
Comparing these results with previous researchusing regression modeling for readability assess-ment is not particularly meaningful because of thedifferences in the corpus and the levels used. Forexample, while Heilman et al. (2008) used a cor-pus of 289 texts across 12 reading levels achievinga correlation of 0.77, we used the WeeBit corpuscontaining 3125 texts across 5 reading levels.6
We took the two best models of Table 2,MODALL using ALLFEATURES and MODNO-TRAD using the NOTRAD feature set, and set outto answer our first guiding question, about the
6Direct comparisons on the same data set would be mostindicative, but many datasets, such as the corpus used in Heil-man et al. (2008), are not accessible due to copyright issues.
reading levels which such models can identify in asystematic sample of web texts.
5 Applying readability models to web texts
To investigate the effect of the two readabilitymodels for real-world web texts, we studied theirperformance on two types of web data:
• web documents we crawled from specificweb sites that offer the same type of materialfor two groups of readers differing in theirreading skills
• web documents identified by a web searchengine for a sample of web queries selectedfrom a public query log
5.1 Readability of web data drawn fromcharacteristic web sites
5.1.1 Web test sets usedFollowing the approach of Collins-Thompson andCallan (2005) and Sato et al. (2008), who eval-uated readability models using independent web-based test sets, we compiled three sets of web doc-uments that given their origin can be classified intotwo classes each:
Wiki – SimpleWiki: Wikipedia7, along with itsmanually simplified version Simple Wikipedia8 isincreasingly used in two-class readability classi-fication tasks and text simplification approaches(Napoles and Dredze, 2010; Zhu et al., 2010;Coster and Kauchak, 2011). We use a collectionof 2000 randomly selected parallel articles fromeach of the two websites, which in the followingis referred to as WIKI and SIMPLEWIKI.
Time – Time for Kids: Time for Kids9 is a divi-sion of the TIME magazine10, which produces ar-ticles exclusively for children and is used widelyin classrooms. We took a sample of 2000 docu-ments each from Time and from Time for Kids forour experiments and refer them TIME and TFK.
NormalNews – ChildrensNews: We crawledwebsites that contain news articles written for chil-dren (e.g., http://www.firstnews.co.uk) andcategorized them as CHILDRENSNEWS. We alsocrawled freely accessible articles from popularnews websites such as BBC or The Guardian and
7http://en.wikipedia.org8http://simple.wikipedia.org9http://www.timeforkids.com
10http://www.time.com
62

categorized them as NORMALNEWS. We took10K documents from each of these two categoriesfor our experiments.
These three corpus pairs collected as test casesdiffer in several aspects. For example, Sim-pleWikipedia is not targeting children as such,whereas Time for Kids and ChildrensNews are.And SimpleWikipedia – Wikipedia covers paral-lel articles in two versions, whereas this is notthe case for the the two Time and the two Newscorpora. However, as far as we see these differ-ences are orthogonal to the issue we are research-ing here, namely their use as real-life test cases tostudy the effect of the classification model learnedon the WeeBit data.
We applied the two regression models whichhad performed best on the WeeBit corpus (cf. Ta-ble 2 in section 4) to these web datasets. The aver-age reading levels of the different datasets accord-ing to these two models are reported in Table 3.
Data Set MODALL MODNOTRAD
SIMPLEWIKI 3.86 2.67TFK 4.15 2.72CHILDRENSNEWS 4.19 2.39WIKI 4.21 3.33TIME 5.04 4.07NORMALNEWS 5.58 4.42
Table 3: Applying the WeeBit regression model tothe six web datasets
The table shows that both MODALL and MOD-NOTRAD place the documents from the childrenwebsites (SIMPLEWIKI, TFK and CHILDREN-SNEWS) at lower reading levels than those from
0
10
20
30
40
50
60
1 2 3 4 5 higher
% o
f doc
umen
ts b
elon
ging
to a
read
ing
leve
l
Reading level
Distribution of reading levels across web texts with traditional features
SimpleWikiTFK
ChildrensNewsWiki
TimeNormalNews
Figure 1: Reading levels assigned by MODALL
the regular websites for adults (TIME, WIKI andNORMALNEWS). However, there is an interestingdifference in the predictions made by the two mod-els. The MODALL model including the traditionalfeatures consistently assigns a higher reading levelto all the documents, and it also fails to separateCHILDRENSNEWS (4.19) from WIKI (4.20).
To be able to inspect this in detail, we plot-ted the class-wise reading level distribution of ourregression models. Figure 1 shows the distribu-tion of reading levels for these web datasets usingMODALL. As we already knew from the averages,the model assigns somewhat higher reading levelsto all documents, and the figure confirms that thetexts for children (SIMPLEWIKI, TFK and CHIL-DRENSNEWS) are only marginally distinguishedfrom the corresponding websites targeting adultreaders (TIME,WIKI and NORMALNEWS). TheNORMALNEWS dataset also seems to be placedin a much higher distribution compared to all theother test sets, with more than 50% of the docu-ments getting a prediction of “higher” (the labelused for documents placed at level 6 or higher).
Figure 2 shows the distribution of reading levelsacross the test sets according to MODNOTRAD,the model without traditional features. The modelprovides a broader coverage across all reading lev-els, with documents from children web sites andSimpleWikipedia clearly being placed at the lowerend of the spectrum and web pages targeting adultsat the higher end. NORMALNEWS documents areagain placed the highest, but less than 10% falloutside the range established by WeeBit. TIME
shows the highest diversity, with around 20% foreach reading level above the lowest one.
0
5
10
15
20
25
30
35
40
45
1 2 3 4 5 higher
% o
f doc
umen
ts b
elon
ging
to a
read
ing
leve
l
Reading level
Distribution of reading levels across web texts without traditional features
SimpleWikiTFK
ChildrensNewsWiki
TimeNormalNews
Figure 2: Reading levels using MODNOTRAD
63

The first set of experiments shows that thereadability models which were successful on theWeeBit reference corpus seem to be able to iden-tify a corresponding broad range among web doc-uments that we selected top-down by relying onprototypical websites targeting “adult” and “child”readers, which are likely to feature more difficultand easier web documents, respectively. Whilewe cannot evaluate the difference between the twomodels quantitatively, given the lack of an externalgold standard classification of the crawled data,the MODNOTRAD conceptually seems to do a bet-ter job at distinguishing the two classes of web-sites in line with the top-down expectations.
5.2 Readability of search results
Complementing the first set of experiments, estab-lishing that the readability models are capable ofplacing web documents in line with the top-downclassification of the sites they originate from, inthe second set of experiments we want to investi-gate bottom-up whether for some random topics ofinterest, the web offers texts at different readabil-ity levels. This also is of practical relevance, sinceranking web search results by readability is onlyuseful if there actually are documents at differentreading levels for a given query.
For this investigation, we took the MOD-NOTRAD model and used it to estimate thereading level of web search results. Forweb searching, we used the BING searchAPI (http://datamarket.azure.com/dataset/bing/search) and computed the reading levelsof the Top-100 search results for a sample of 50test queries, selected from a publicly accessibledatabase (Lu and Callan, 2003).
Figure 3 characterizes the data obtained throughthe web searches in terms of the percentage of doc-
Figure 3: Documents retrieved per reading level
uments belonging to a given reading level, accord-ing to the MODNOTRAD model. In the Top-100search results obtained for each of the 50 queries,the model identifies documents at all reading lev-els, with a peak at reading level 4 (correspondingto KS3 in the original WeeBit dataset).
To determine how much individual queries dif-fer in terms of the readability of the documentsthey retrieve, we also looked at the results for eachquery separately. Figure 4 shows the mean read-ing level of the Top-100 results for each of the 50search queries. From query to query, the aver-age readability of the documents retrieved seemsto differ relatively little, with most results fallinginto the higher reading levels (4 or above).
Figure 4: Average reading level of search results
Returning to the question whether there aredocuments of different reading levels for a givenquery, we need to check how much variation existsaround the observed, rather similar averages. Ta-ble 4 provides the individual reading levels of theTop-10 search results for a sample of 10 queriesfrom our experiment, along with the average read-ing level of the Top-100 results for that query. Theresults in Table 4 indicate that indeed there aredocuments at a broad range of reading levels evenamong the most relevant search results returned bythe BING web search engine.
Looking at the individual query results, wefound that although a lot of news documentstended towards a higher reading level, it is in-deed possible to find some texts at lower read-ing levels even within Top-10 results (indicated inbold). However, we found that even for queriesthat we would expect to result in hits from web-sites targeting child readers, those sites often didnot make it into the Top-10 results. The same wastrue for sites offering “simple” language, such asSimple Wikipedia, which was not among the top
64

Result Rank→ 1 2 3 4 5 6 7 8 9 10 AvgTop100
Querylocal anaesthetic 3.18 4.57 5.35 3.09 4.24 4.6 3.95 4.74 2.72 4.73 3.78copyright copy law 1.77 4.59 1.43 2.67 4.63 6.2 2.69 1.1 3.87 5.61 4.57halley comet 1.69 4.47 4.54 4.24 2.37 4.1 4.86 3.56 4.21 3.56 4.04public offer 4.4 4.35 5.06 5.03 4.36 5.16 4.13 4.67 3.81 1.1 4.39optic sensor 2.67 3.38 4.5 3.17 2.54 4.19 4.84 1.47 2.2 3.31 3.83europe union politics 3.61 4.9 6.3 4.02 2.17 4.5 1.47 1.58 4.88 6.33 4.33presidential poll 4.98 5.38 1.77 6.1 4.76 3.82 1.05 5.11 3.92 4.25 3.95shakespeare 2.39 2.9 4.2 4.74 4.76 3.89 1.47 2.13 2.6 4.06 3.58air pollution 1.17 4.93 3.7 2.3 4.36 3.73 3.71 3.49 2.22 2.67 4.21euclidean geometry 3.88 4.71 4.7 4.3 4.45 4.63 4.04 4.1 3.48 2.58 3.18
Table 4: Reading levels of individual search results
results even when it contained pages directly rel-evant to the query. To provide access to thosepages, reranking the search results based on read-ability would thus be of value.
While we do not want to jump to conclusionsbased on our sample of 50 queries, the resultsof our experiments seem to support the idea thatreadability-based re-ranking of web search resultscan help users in accessing web documents thatalso are at the right level for the given user. Re-turning to the first overall question that lead ushere, our experiments support the answer that in-deed there are documents spread across differentreading levels on the web with a tendency towardshigher reading levels.
6 Generalizability of the Feature Set
We can now turn to the second question raised inthe introduction: How well do the features gener-alize across different classes of web documents?We saw in section 5.1 that the predictions of thetwo models we used varied quite a bit, solelybased on whether the traditional readability fea-tures were included in the model or not. This con-firms the need to investigate how generally appli-cable which types of features are across datasets.
As far as we know, such an experiment vali-dating the generalizability of features was not yetperformed in this domain. As there are no pub-licly available graded web datasets to build newreadability models with the same feature set, weused the datasets we introduced in section 5.1.1 forcreating two-class readability classification mod-els. Since there are no clear age-group annota-tions with all these datasets, we decided to use abroad two-level classification instead of more fine
grained grade levels.The difference between this experiment and the
previous one lies in the primary question it at-tempts to answer. Here, the focus is on veri-fying if the features are capable of building ac-curate classification models on different trainingsets. In the previous experiment, it was on check-ing if a given classification model (which in thatexperiment was trained on the WeeBit corpus) cansuccessfully discriminate reading levels for docu-ments from various real-world texts.
We observed in Section 5.1 that with traditionalfeatures, the WeeBit based readability model as-signed higher reading levels to all the documentsfrom our web datasets. So, it would perhaps bea natural step to train these binary classificationmodels excluding the traditional features. How-ever, the traditional features may still be useful(with different weights) for constructing classifi-cation models with other training data. So, wetrained two sets of models per training set – onewith ALLFEATURES and another excluding tradi-tional features (NOTRAD).
We trained binary classification models usingthe following training sets:
• TIME – TFK texts
• WIKI – SIMPLEWIKI texts
• NORMALNEWS – KIDSNEWS texts
• TIME+WIKI – TFK+SIMPLEWIKI texts
We used the Sequential Minimal Optimization(SMO) algorithm implementation in the WEKAtool kit to train these classifiers. The choice ofthe algorithm here was motivated by the fact thattraining is quick and that SMO has successfully
65

been used in previous research on readability as-sessment (Feng, 2010; Hancke et al., 2012).
Table 5 summarizes the classification accura-cies obtained with the four models using 10-foldcross validation for the four web corpora.
Training Set Accuracy-All Accuracy-NoTradTIME – TFK 95.11% 89.52%WIKI – SIMPLEWIKI 92.32% 88.81%NORMALNEWS – KIDSNEWS 97.93% 92.54%TIME+WIKI – TFK+SIMPLEWIKI 93.38% 89.72%
Table 5: Cross-validation accuracies for binaryclassification on different web corpora
The results in the table show that the same setof features consistently result in creating accu-rate classification models for all four web corpora.Each of the two-class classification models per-formed well, despite the fact that the documentswere created by different people and most likelywith different instructions on how to write sim-ple texts or simplify already existing texts. It wasinteresting to note the role of traditional featuresin improving the accuracy of these binary classi-fication models. But, in the previous experiment,the model with traditional features consistently putall the documents into higher reading levels. It ispossible that the role of traditional features in theWeeBit corpus may be skewed as it is likely that itwas prepared with traditional readability measuresin mind. Contrasting the results of these two ex-periments raises the question of what features holdmore weight in what dataset, which is an interest-ing issue to explore in the future.
In sum, this experiment provides some clearevidence for affirmatively answering the secondquestion about the generalizability of the featureset we used. The features seem to be sufficientlygeneral for them to be useful in performing read-ability assessment of real-world documents.
7 Conclusion and Discussion
In this paper, we set out to investigate the appli-cability and generalizability of readability modelsfor real-world web texts. We started with build-ing readability models using linear regression, ona 5-level readability corpus with a range of lexi-cal and syntactic features (section 4). We appliedthe two best models thus obtained to several webdatasets we compiled from websites targeting chil-dren and others designed for adults (section 5.1)and on the Top-100 results obtained using a stan-dard web search engine (section 5.2).
We observed that the models identified textsacross a broad range of reading levels in the webcorpora. Our pilot study of the reading levels ofthe search results confirmed that readability mod-els could be useful as re-ranking or filtering pa-rameters that prioritize relevant results which areat the right level for a given user. At the sametime, we observed in both these experiments thatthe average reading level of general web articlesis relatively high according to our models. Apartfrom result ranking, this also calls for the construc-tion of efficient text simplification systems whichpick up the difficult texts and attempt to simplifythem to a given reading level.
We then proceeded to investigate how wellthe features used to build these readability mod-els generalize across different corpora. For this,we reused the corpora with articles for childrenand adult readers from prototypical websites (sec-tion 5.1.1) and built four binary classificationmodels with all of the readability features (sec-tion 6). Each of the models achieved good clas-sification accuracies, supporting that the broadfeature set used generalizes well across corpora.Whether or not to use traditional readability fea-tures is somewhat difficult to answer since thoseformulae are often taken into account when writ-ing materials, so high classification accuracy onsuch corpora may be superficial in that it is notnecessarily indicative of the spectrum of textsfound on the web (section 5.1). This also raisesthe more general question which features workbest for which kind of dataset. A systematic ex-ploration of the effect of the individual featuresalong with the impact of document topic and genreon readability would be interesting and relevant topursue in the future.
In our future work, we also intend to explorefurther features for this task and improve our un-derstanding of the correlations between the differ-ent features. Finally, we are considering reformu-lating readability assessment as ordinal regressionor preference ranking.
Acknowledgements
We would like to thank the anonymous reviewersfor their detailed, useful comments on the paper.This research was funded by the European Com-mission’s 7th Framework Program under grantagreement number 238405 (CLARA).
66
ReferencesJasmine Bennohr. 2005. A web-based personalised
textfinder for language learners. Master’s thesis,School of Informatics, University of Edinburgh.
Meri Coleman and T. L. Liau. 1975. A computer read-ability formula designed for machine scoring. Jour-nal of Applied Psychology, 60:283–284.
Kevyn Collins-Thompson and Jamie Callan. 2004.A language modeling approach to predicting read-ing difficulty. In Proceedings of HLT/NAACL 2004,Boston, USA.
Kevyn Collins-Thompson and Jamie Callan. 2005.Predicting reading difficulty with statistical lan-guage models. Journal of the American Society forInformation Science and Technology, 56(13):1448–1462.
K. Collins-Thompson, P. N. Bennett, R. W. White,S. de la Chica, and D. Sontag. 2011. Personaliz-ing web search results by reading level. In Proceed-ings of the Twentieth ACM International Conferenceon Information and Knowledge Management (CIKM2011).
William Coster and David Kauchak. 2011. Simple en-glish wikipedia: A new text simplification task. InProceedings of the 49th Annual Meeting of the Asso-ciation for Computational Linguistics: Human Lan-guage Technologies, pages 665–669, Portland, Ore-gon, USA, June. Association for Computational Lin-guistics.
Averil Coxhead. 2000. A new academic word list.Teachers of English to Speakers of Other Languages,34(2):213–238.
William H. DuBay. 2006. The Classic ReadabilityStudies. Impact Information, Costa Mesa, Califor-nia.
Lijun Feng, Nomie Elhadad, and Matt Huenerfauth.2009. Cognitively motivated features for readabilityassessment. In Proceedings of the 12th Conferenceof the European Chapter of the ACL (EACL 2009),pages 229–237, Athens, Greece, March. Associationfor Computational Linguistics.
Lijun Feng. 2010. Automatic Readability Assessment.Ph.D. thesis, City University of New York (CUNY).
Julia Hancke, Detmar Meurers, and Sowmya Vajjala.2012. Readability classification for german usinglexical, syntactic, and morphological features. InProceedings of the 24th International Conference onComputational Linguistics (COLING), pages 1063–1080, Mumbay, India.
Michael Heilman, Kevyn Collins-Thompson, JamieCallan, and Maxine Eskenazi. 2007. Combin-ing lexical and grammatical features to improvereadability measures for first and second languagetexts. In Human Language Technologies 2007:
The Conference of the North American Chapter ofthe Association for Computational Linguistics (HLT-NAACL-07), pages 460–467, Rochester, New York.
Michael Heilman, Kevyn Collins-Thompson, andMaxine Eskenazi. 2008. An analysis of statisticalmodels and features for reading difficulty prediction.In Proceedings of the 3rd Workshop on InnovativeUse of NLP for Building Educational Applicationsat ACL-08, Columbus, Ohio.
Tapas Kanungo and David Orr. 2009. Predicting thereadability of short web summaries. In Proceed-ings of the Second ACM International Conferenceon Web Search and Data Mining, WSDM ’09, pages202–211, New York, NY, USA. ACM.
P. Kidwell, G. Lebanon, and K. Collins-Thompson.2011. Statistical estimation of word acquisition withapplication to readability prediction. In Journal ofthe American Statistical Association. 106(493):21-30.
Jin Young Kim, Kevyn Collins-Thompson, Paul N.Bennett, and Susan T. Dumais. 2012. Characteriz-ing web content, user interests, and search behaviorby reading level and topic. In Proceedings of thefifth ACM international conference on Web searchand data mining, WSDM ’12, pages 213–222, NewYork, NY, USA. ACM.
J. P. Kincaid, R. P. Jr. Fishburne, R. L. Rogers, andB. S Chissom. 1975. Derivation of new readabilityformulas (Automated Readability Index, Fog Countand Flesch Reading Ease formula) for Navy enlistedpersonnel. Research Branch Report 8-75, NavalTechnical Training Command, Millington, TN.
Roger Levy and Galen Andrew. 2006. Tregex and tsur-geon: tools for querying and manipulating tree datastructures. In 5th International Conference on Lan-guage Resources and Evaluation, Genoa, Italy.
Jie Lu and Jamie Callan. 2003. Content-based retrievalin hybrid peer-to-peer networks. In Proceedings ofthe Twelfth International Conference on Informationand Knowledge Management (CIKM’03).
Xiaofei Lu. 2010. Automatic analysis of syntac-tic complexity in second language writing. Inter-national Journal of Corpus Linguistics, 15(4):474–496.
Xiaofei Lu. 2012. The relationship of lexical richnessto the quality of ESL learners’ oral narratives. TheModern Languages Journal, pages 190–208.
Yi Ma, Eric Fosler-Lussier, and Robert Lofthus. 2012a.Ranking-based readability assessment for early pri-mary children’s literature. In Proceedings of the2012 Conference of the North American Chapterof the Association for Computational Linguistics:Human Language Technologies, NAACL HLT ’12,pages 548–552, Stroudsburg, PA, USA. Associationfor Computational Linguistics.
67

Yi Ma, Ritu Singh, Eric Fosler-Lussier, and RobertLofthus. 2012b. Comparing human versus au-tomatic feature extraction for fine-grained elemen-tary readability assessment. In Proceedings of theFirst Workshop on Predicting and Improving TextReadability for target reader populations, PITR ’12,pages 58–64, Stroudsburg, PA, USA. Associationfor Computational Linguistics.
Danielle S. McNamara, Max M. Louwerse, andArthur C. Graesser. 2002. Coh-metrix: Auto-mated cohesion and coherence scores to predict textreadability and facilitate comprehension. Proposalof Project funded by the Office of Educational Re-search and Improvement, Reading Program.
Eleni Miltsakaki and Audrey Troutt. 2008. Real timeweb text classification and analysis of reading dif-ficulty. In Proceedings of the Third Workshop onInnovative Use of NLP for Building Educational Ap-plications (BEA-3) at ACL’08, pages 89–97, Colum-bus, Ohio. Association for Computational Linguis-tics.
Eleni Miltsakaki. 2009. Matching readers’ prefer-ences and reading skills with appropriate web texts.In Proceedings of the 12th Conference of the Eu-ropean Chapter of the Association for Computa-tional Linguistics: Demonstrations Session, EACL’09, pages 49–52, Stroudsburg, PA, USA. Associa-tion for Computational Linguistics.
Makoto Nakatani, Adam Jatowt, and Katsumi Tanaka.2010. Adaptive ranking of search results by consid-ering user’s comprehension. In Proceedings of the4th International Conference on Ubiquitous Infor-mation Management and Communication (ICUIMC2010), pages 182–192. ACM Press, Suwon, Korea.
Courtney Napoles and Mark Dredze. 2010. Learn-ing simple wikipedia: a cogitation in ascertainingabecedarian language. In Proceedings of the NAACLHLT 2010 Workshop on Computational Linguisticsand Writing: Writing Processes and Authoring Aids,CL&W ’10, pages 42–50, Stroudsburg, PA, USA.Association for Computational Linguistics.
Neil Newbold, Harry McLaughlin, and Lee Gillam.2010. Rank by readability: Document weighting forinformation retrieval. In Hamish Cunningham, Al-lan Hanbury, and Stefan Ruger, editors, Advances inMultidisciplinary Retrieval, volume 6107 of LectureNotes in Computer Science, pages 20–30. SpringerBerlin / Heidelberg.
Niels Ott and Detmar Meurers. 2010. Information re-trieval for education: Making search engines lan-guage aware. Themes in Science and TechnologyEducation. Special issue on computer-aided lan-guage analysis, teaching and learning: Approaches,perspectives and applications, 3(1–2):9–30.
Sarah E. Petersen and Mari Ostendorf. 2009. A ma-chine learning approach to reading level assessment.Computer Speech and Language, 23:86–106.
Slav Petrov and Dan Klein. 2007. Improved infer-ence for unlexicalized parsing. In Human LanguageTechnologies 2007: The Conference of the NorthAmerican Chapter of the Association for Computa-tional Linguistics; Proceedings of the Main Confer-ence, pages 404–411, Rochester, New York, April.
Satoshi Sato, Suguru Matsuyoshi, and Yohsuke Kon-doh. 2008. Automatic assessment of japanese textreadability based on a textbook corpus. In LREC’08.
Luo Si and Jamie Callan. 2001. A statistical model forscientific readability. In Proceedings of the 10th In-ternational Conference on Information and Knowl-edge Management (CIKM), pages 574–576. ACM.
Chenhao Tan, Evgeniy Gabrilovich, and Bo Pang.2012. To each his own: Personalized content se-lection based on text comprehensibility. In In Pro-ceedings of WSDM.
Sowmya Vajjala and Detmar Meurers. 2012. On im-proving the accuracy of readability classification us-ing insights from second language acquisition. InJoel Tetreault, Jill Burstein, and Claudial Leacock,editors, Proceedings of the 7th Workshop on Innova-tive Use of NLP for Building Educational Applica-tions (BEA7) at NAACL-HLT, pages 163–173, Mon-tral, Canada, June. Association for ComputationalLinguistics.
Zhemin Zhu, Delphine Bernhard, and Iryna Gurevych.2010. A monolingual tree-based translation modelfor sentence simplification. In Proceedings of The23rd International Conference on ComputationalLinguistics (COLING), August 2010. Beijing, China.
68

Proceedings of the 2nd Workshop on Predicting and Improving Text Readability for Target Reader Populations, pages 69–77,Sofia, Bulgaria, August 4-9 2013. c©2013 Association for Computational Linguistics
The CW Corpus: A New Resource for Evaluatingthe Identification of Complex Words
Matthew ShardlowText Mining Research Group
School of Computer Science, University of ManchesterIT301, Kilburn Building, Manchester, M13 9PL, England
Abstract
The task of identifying complex words(CWs) is important for lexical simpli-fication, however it is often carried outwith no evaluation of success. There isno basis for comparison of current tech-niques and, prior to this work, therehas been no standard corpus or eval-uation technique for the CW identi-fication task. This paper addressesthese shortcomings with a new cor-pus for evaluating a system’s perfor-mance in identifying CWs. SimpleWikipedia edit histories were mined forinstances of single word lexical simpli-fications. The corpus contains 731 sen-tences, each with one annotated CW.This paper describes the method usedto produce the CW corpus and presentsthe results of evaluation, showing itsvalidity.
1 Introduction
CW identification techniques are typically im-plemented as a preliminary step in a lexicalsimplification system. The evaluation of theidentification of CWs is an often forgottentask. Omitting this can cause a loss of accu-racy at this stage which will adversely affectthe following processes and hence the user’sunderstanding of the resulting text.
Previous approaches to the CW identifica-tion task (see Section 5) have generally omit-ted an evaluation of their method. This gapin the literature highlights the need for evalu-ation, for which gold standard data is needed.This research proposes the CW corpus, adataset of 731 examples of sentences with ex-actly one annotated CW per sentence.
A CW is defined as one which causes a sen-tence to be more difficult for a user to read.
For example, in the following sentence:
‘The cat reposed on the mat’
The presence of the word ‘reposed’ would re-duce the understandability for some readers.It would be difficult for some readers to workout the sentence’s meaning, and if the readeris unfamiliar with the word ‘reposed’, they willhave to infer its meaning from the surroundingcontext. Replacing this word with a more fa-miliar alternative, such as ‘sat’, improves theunderstandability of the sentence, whilst re-taining the majority of the original semantics.
Retention of meaning is an important fac-tor during lexical simplification. If the word‘reposed’ is changed to ‘sat’, then the specificmeaning of the sentence will be modified (gen-erally speaking, reposed may indicate a stateof relaxation, whereas sat indicates a body po-sition) although the broad meaning is still thesame (a cat is on a mat in both scenarios). Se-mantic shift should be kept to a minimum dur-ing lexical simplification. Recent work (Biranet al., 2011; Bott et al., 2012) has employeddistributional semantics to ensure simplifica-tions are of sufficient semantic similarity.
Word complexity is affected by many fac-tors such as familiarity, context, morphologyand length. Furthermore, these factors changefrom person to person and context to context.The same word, in a different sentence, may beperceived as being of a different level of diffi-culty. The same word in the same sentence,but read by a different person, may also beperceived as different in difficulty. For exam-ple, a person who speaks English as a secondlanguage will struggle with unfamiliar wordsdepending on their native tongue. Conversely,the reader who has a low reading ability willstruggle with long and obscure words. Whilstthere will be some crossover in the language
69

these two groups find difficult, this will not beexactly the same. This subjectivity makes theautomation and evaluation of CW identifica-tion difficult.
Subjectivity makes the task of natural lan-guage generation difficult and rules out auto-matically generating annotated complex sen-tences. Instead, our CW discovery process(presented in Section 2) mines simplificationsfrom Simple Wikipedia1 edit histories. Sim-ple Wikipedia is well suited to this task as itis a website where language is collaborativelyand iteratively simplified by a team of editors.These editors follow a set of strict guidelinesand accountability is enforced by the self polic-ing community. Simple Wikipedia is aimedat readers with a low English reading abilitysuch as children or people with English as asecond language. The type of simplificationsfound in Wikipedia and thus mined for use inour corpus are therefore appropriate for peo-ple with low English proficiency. By capturingthese simplifications, we produce a set of gen-uine examples of sentences which can be usedto evaluate the performance of CW identifi-cation systems. It should be noted that al-though these simplifications are best suited tolow English proficiency users, the CW identifi-cation techniques that will be evaluated usingthe corpus can be trained and applied for avariety of user groups.
The contributions of this paper are as fol-lows:
• A description of the method used to cre-ate the CW corpus. Section 2.
• An analysis of the corpus combining re-sults from 6 human annotators. Section3.
• A discussion on the practicalities sur-rounding the use of the CW corpus forthe evaluation of a CW identification sys-tem. Section 4.
Related and future work are also presented inSections 5 and 6 respectively.
2 Design
Our corpus contains examples of simplifica-tions which have been made by human editors
1http://simple.wikipedia.org/
System Score
SUBTLEX 0.3352
Wikipedia Baseline 0.3270
Kucera-Francis 0.3097
Random Baseline 0.0157
Table 1: The results of different experi-ments on the SemEval lexical simplifica-tion data (de Belder and Moens, 2012),showing the SUBTLEX data’s superiorperformance over several baselines. Eachbaseline gave a familiarity value to a setof words based on their frequency of oc-currence. These values were used to pro-duce a ranking over the data which wascompared with a gold standard rankingusing kappa agreement to give the scoresshown here. A baseline using the GoogleWeb 1T dataset was shown to give ahigher score than SUBTLEX, howeverthis dataset was not available during thecourse of this research.
during their revisions of Simple Wikipedia ar-ticles. These are in the form of sentences withone word which has been identified as requir-ing simplification.2 These examples can beused to evaluate the output of a CW identi-fication system (see Section 6). To make thediscovery and evaluation task easier, we limitthe discovered simplifications to one word persentence. So, if an edited sentence differs fromits original by more than one word, we do notinclude it in our corpus. This also promotesuniformity in the corpus, reducing the com-plexity of the evaluation task.
2.1 Preliminaries
SUBTLEX
The SUBTLEX dataset (Brysbaert and New,2009) is used as a familiarity dictionary. Itsprimary function is to associate words withtheir frequencies of occurrence, assuming thatwords which occur more frequently are sim-pler. SUBTLEX is also used as a dictionaryfor testing word existence: if a word does notoccur in the dataset, it is not considered forsimplification. This may occur in the case ofvery infrequent words or proper nouns. The
2We also record the simplification suggested by theoriginal Simple Wikipedia editor.
70

SUBTLEX data is chosen over the more con-ventional Kucera-Francis frequency (Kuceraand Francis, 1967) and over a baseline pro-duced from Wikipedia frequencies due to aprevious experiment using a lexical simplifica-tion dataset from task 1 of SemEval 2012 (deBelder and Moens, 2012). See Table 1.
Word Sense
Homonymy is the phenomenon of a wordformhaving 2 distinct meanings as in the clas-sic case: ‘Bank of England’ vs. ‘River bank ’.In each case, the word bank is referring toa different semantic entity. This presents aproblem when calculating word frequency asthe frequencies for homonyms will be com-bined. Word sense disambiguation is an un-solved problem and was not addressed whilstcreating the CW corpus. The role of wordsense in lexical simplification will be investi-gated at a later stage of this research.
Yatskar et al. (2010)
The CW corpus was built following the workof Yatskar et al. (2010) in identifying para-phrases from Simple Wikipedia edit histo-ries. Their method extracts lexical edits fromaligned sentences in adjacent revisions of aSimple Wikipedia article. These lexical editsare then processed to determine their likeli-hood of being a true simplification. Two meth-ods for determining this probability are pre-sented, the first uses conditional probabilityto determine whether a lexical edit representsa simplification and the second uses metadatafrom comments to generate a set of trustedrevisions, from which simplifications can bedetected using pointwise mutual information.Our method (further explained in Section 2.2)differs from their work in several ways. Firstly,we seek to discover only single word lexical ed-its. Secondly, we use both article metadataand a series of strict checks against a lexicon,a thesaurus and a simplification dictionary toensure that the extracted lexical edits are truesimplifications. Thirdly, we retain the originalcontext of the simplification as lexical com-plexity is thought to be influenced by context(Biran et al., 2011; Bott et al., 2012).
Automatically mining edit histories waschosen as it provides many instances quicklyand at a low cost. The other method of cre-
ating a similar corpus would have been toask several professionally trained annotatorsto produce hundreds of sets of sentences, andto mark up the CWs in these. The use ofprofessionals would be expensive and annota-tors may not agree on the way in which wordsshould be simplified, leading to further prob-lems when combining annotations.
2.2 Method
In this section, we explain the procedure tocreate the corpus. There are many process-ing stages as represented graphically in Figure1. The stages in the diagram are further de-scribed in the sections below. For simplicity,we view Simple Wikipedia as a set of pagesP, each with an associated set of revisions R.Every revision of every page is processed iter-atively until P is exhausted.
Content Articles
The Simple Wikipedia edit histories were ob-tained.3 The entire database was very large,so only main content articles were considered.All user, talk and meta articles were discarded.Non-content articles are not intended to beread by typical users and so may not reflectthe same level of simplicity as the rest of thesite.
Revisions which Simplify
When editing a Simple Wikipedia article, theauthor has the option to attach a comment totheir revision. Following the work of Yatskaret al. (2010), we only consider those revisionswhich have a comment containing some mor-phological equivalent of the lemma ‘simple’,e.g. simplify, simplifies, simplification, simpler,etc. This allows us to search for commentswhere the author states that they are simpli-fying the article.
Tf-idf Matrix
Each revision is a set of sentences. As changesfrom revision to revision are often small, therewill be many sentences which are the same inadjacent revisions. Sentences which are likelyto contain a simplification will only have oneword difference and sentences which are un-related will have many different words. Tf-idf(Salton and Yang, 1973) vectors are calculated
3Database dump dated 4th February 2012.
71

Simple Wikipedia Edit Histories
For every relevant pair of revisions ri and r
i+1
For every page
Calculate tf-idf matrix for sentences in ri and r
i+1
Threshold matrix to give likely candidates
Sentence Pairs in the form <A,B> Where A is a sentence from r
i and B is from r
i+1
For every sentence pair
Set of Pages P = p1, …, p
i
where each pi is the set of
revisions R = r1, …, r
i and
each ri
is the set of
sentences S = s1, …, s
i.
Calculate Hamming distance between A and B,check it is equal to 1
Extract the edited Words: α from A and β from B
Check α and β are real words
Check β is simpler than α
Stem α and β, checking the stems are not equal
If all conditions are met
Store pair <A,B> in CW Corpus
Process next pairFalse
True
Verify Candidates
CW corpus
Check α and β are synonymous
Extract Likely Candidates
Figure 1: A flow chart showing the process undertaken to extract lexical simplifications.Each part of this process is further explained in Section 2.2. Every pair of revisionsfrom every relevant page is processed, although the appropriate recursion is omittedfrom the flow chart for simplicity.
72

for each sentence and the matrix containingthe dot product of every pair of sentence vec-tors from the first and second revision is cal-culated. This allows us to easily see those vec-tors which are exactly the same — as thesewill have a score of one.4 It also allows us toeasily see which vectors are so different thatthey could not contain a one word edit. Weempirically set a threshold at 0.9 <= X < 1to capture those sentences which were highlyrelated, but not exactly the same.
Candidate Pairs
The above process resulted in pairs of sen-tences which were very similar according tothe tf-idf metric. These pairs were then sub-jected to a series of checks as detailed below.These were designed to ensure that as few falsepositives as possible would make it to the cor-pus. This may have meant discarding sometrue positives too, however the cautious ap-proach was adopted to ensure a higher corpusaccuracy.
Hamming Distance
We are only interested in those sentences witha difference of one word, because sentenceswith more than one word difference may con-tain several simplifications or may be a re-wording. It is more difficult to distinguishwhether these are true simplifications. Wecalculate the Hamming distance between sen-tences (using wordforms as base units) to en-sure that only one word differs. Any sentencepairs which do not have a Hamming distanceof 1 are discarded.
Reality Check
The first check is to ensure that both the wordsare a part of our lexicon, ensuring that thereis SUBTLEX frequency data for these wordsand also that they are valid words. This stagemay involve removing some valid words, whichare not found in the lexicon, however this ispreferable to allowing words that are the resultof spam or vandalism.
4As tf-idf treats a sentence as a bag of words it ispossible for two sentences to give a score of 1 if theycontain the same words, but in a different order. Thisis not a problem as if the sentence order is different,there is a minimum of 2 lexical edits — meaning westill wish to discount this pair.
Inequality Check
It is possible that although a different wordis present, it is a morphological variant ofthe original word rather than a simplification.E.g., due to a change in tense, or a correc-tion. To identify this, we stem both wordsand compare them to make sure they are notthe same. If the word stems are equal thenthey are unlikely to be a simplification, so thispair is discarded. Some valid simplificationsmay also be removed at this point, howeverthese are difficult to distinguish from the non-simplifications.
Synonymy Check
Typically, lexical simplification involves the se-lection of a word’s synonym. WordNet (Fell-baum, 1998) is used as a thesaurus to check ifthe second word is listed as a synonym of thefirst. As previously discussed (Section 2.1),we do not take word sense into account at thispoint. Some valid simplifications may not beidentified as synonyms in WordNet, howeverwe choose to take this risk — discarding allnon-synonym pairs. Improving thesaurus cov-erage for complex words is left to future work.
Stemming is favoured over lemmatisationfor two reasons. Firstly, because lemmatisa-tion requires a lot of processing power andwould have terminally slowed the process-ing of the large revision histories. Secondly,stemming is a dictionary-independent tech-nique, meaning it can handle any unknownwords. Lemmatisation requires a large dic-tionary, which may not contain the rare CWswhich are identified.
Simplicity Check
Finally, we check that the second word is sim-pler than the first using the SUBTLEX fre-quencies. All these checks result in a pair ofsentences, with one word difference. The dif-fering words are synonyms and the change hasbeen to a word which is simpler than the origi-nal. Given these conditions have been met, westore the pair in our CW Corpus as an exampleof a lexical simplification.
2.3 Examples
This process was used to mine the followingtwo examples:
73

Complex word: functions.
Simple word: uses.
A dictionary has been designed to have oneor more that can help the user in aparticular situation.
Complex word: difficult
Simple word: hard
Readability tests give a prediction as to howreaders will find a particular text.
3 Corpus Analysis
3.1 Experimental Design
To determine the validity of the CW corpus, aset of six mutually exclusive 50-instance ran-dom samples from the corpus were turned intoquestionnaires. One was given to each of 6volunteer annotators who were asked to deter-mine, for each sentence, whether it was a trueexample of a simplification or not. If so, theymarked the example as correct. This binarychoice was employed to simplify the task forthe annotators. A mixture of native and non-native English speakers was used, although nomarked difference was observed between thesegroups. All the annotators are proficient inEnglish and currently engaged in further orhigher education. In total, 300 instances oflexical simplification were evaluated, coveringover 40% of the CW corpus.
A 20 instance sample was also created asa validation set. The same 20 instanceswere randomly interspersed among each of the6 datasets and used to calculate the inter-annotator agreement. The validation dataconsisted of 10 examples from the CW cor-pus and 10 examples that were filtered outduring the earlier stages of processing. Thisprovided sufficient positive and negative datato show the annotator’s understanding of thetask. These examples were hand picked to rep-resent positive and negative data and are usedas a gold standard.
Agreement with the gold standard is cal-culated using Cohen’s kappa (Cohen, 1968).Inter-annotator agreement is calculated usingFleiss’ kappa (Fleiss, 1971), as in the evalua-tion of a similar task presented in de Belderand Moens (2012). In total, each annotatorwas presented with 70 examples and asked to
AnnotationIndex
Cohen’sKappa
SampleAccuracy
1 1 98%
2 1 96%
3 0.4 70%
4 1 100%
5 0.6 84%
6 1 96%
Table 2: The results of different annota-tions. The kappa score is given againstthe gold standard set of 20 instances. Thesample accuracy is the percentage of the50 instances seen by that annotator whichwere judged to be true examples of a lex-ical simplification. Note that kappa isstrongly correlated with accuracy (Pear-son’s correlation: r = 0.980)
label these. A small sample size was used toreduce the effects of annotator fatigue.
3.2 Results
Of the six annotations, four show the exactsame results on the validation set. These fouridentify each of the 10 examples from the CWcorpus as a valid simplification and each of the10 examples that were filtered out as an invalidsimplification. This is expected as these twosets of data were selected as examples of posi-tive and negative data respectively. The agree-ment of these four annotators further corrob-orates the validity of the gold standard. An-notator agreement is shown in Table 2.
The 2 other annotators did not stronglyagree on the validation sets. Calculating Co-hen’s kappa between each of these annotatorsand the gold standard gives scores of 0.6 and0.4 respectively, indicating a moderate to lowlevel of agreement. The value for Cohen’skappa between the two non-agreeing annota-tors is 0.2, indicating that they are in lowagreement with each other.
Analysing the errors made by these 2 anno-tators on the validation set reveals some in-consistencies. E.g., one sentence marked asincorrect changes the fragment ‘education andteaching’ to ‘learning and teaching’. However,every other annotator marked the enclosingsentence as correct. This level of inconsistencyand low agreement with the other annotators
74

shows that these annotators had difficulty withthe task. They may not have read the instruc-tions carefully or may not have understood thetask fully.
Corpus accuracy is defined as the percentageof instances that were marked as being trueinstances of simplification (not counting thosein the validation set). This is out of 50 foreach annotator and can be combined linearlyacross all six annotators.
Taking all six annotators into account, thecorpus accuracy is 90.67%. Removing theworst performing annotator (kappa = 0.4) in-creases the corpus accuracy to 94.80%. If wealso remove the next worst performing annota-tor (kappa = 0.6), leaving us with only the fourannotators who were in agreement on the val-idation set, then the accuracy increases againto 97.5%.
There is a very strong Pearson’s correlation(r = 0.980) between an annotator’s agreementwith the gold standard and the accuracy whichthey give to the corpus. Given that the loweraccuracy reported by the non-agreeing anno-tators is in direct proportion to their devia-tion from the gold standard, this implies thatthe reduction is a result of the lower qualityof those annotations. Following this, the twonon-agreeing annotators should be discountedwhen evaluating the corpus accuracy — givinga final value of 97.5%.
4 Discussion
The necessity of this corpus developed from alack of similar resources. CW identification isa hard task, made even more difficult if blindto its evaluation. With this new resource, CWidentification becomes much easier to evaluate.The specific target application for this is lex-ical simplification systems as previously men-tioned. By establishing and improving uponthe state of the art in CW identification, lexi-cal simplification systems will directly benefitby knowing which wordforms are problematicto a user.
Methodologically, the corpus is simple to useand can be applied to evaluate many currentsystems (see Section 6). Techniques using dis-tributional semantics (Bott et al., 2012) mayrequire more context than is given by just thesentence. This is a shortcoming of the corpus
in its present form, although not many tech-niques currently require this level of context.If necessary, context vectors may be extractedby processing Simple Wikipedia edit histories(as presented in Section 2.2) and extractingthe required information at the appropriatepoint.
There are 731 lexical edits in the corpus.Each one of these may be used as an exam-ple of a complex and a simple word, giving us1,462 points of data for evaluation. This islarger than a comparable data set for a simi-lar task (de Belder and Moens, 2012). Waysto further increase the number of instances arediscussed in Section 6.
It would appear from the analysis of the val-idation sets (presented above in Section 3.2)that two of the annotators struggled with thetask of annotation, attaining a low agreementagainst the gold standard. This is most likelydue to the annotators misunderstanding thetask. The annotations were done at the indi-vidual’s own workstation and the main guid-ance was in the form of instructions on thequestionnaire. These instructions should beupdated and clarified in further rounds of an-notation. It may be useful to allow annotatorsdirect contact with the person administeringthe questionnaire. This would allow clarifi-cation of the instructions where necessary, aswell as helping annotators to stay focussed onthe task.
The corpus accuracy of 97.5% implies thatthere is a small error rate in the corpus. Thisoccurs due to some non-simplifications slip-ping through the checks. The error rate meansthat if a system were to identify CWs perfectly,it would only attain 97.5% accuracy on theCW corpus. CW identification is a difficulttask and systems are unlikely to have such ahigh accuracy that this will be an issue. If sys-tems do begin to attain this level of accuracythen a more rigorous corpus will be warrantedin future.
There is significant interest in lexical sim-plification for languages which are not English(Bott et al., 2012; Aluısio and Gasperin, 2010;Dell’Orletta et al., 2011; Keskisarkka, 2012).The technique for discovering lexical simpli-fications presented here relies heavily on theexistence of Simple English Wikipedia. As no
75

other simplified language Wikipedia exists, itwould be very difficult to create a CW corpusfor any language other than English. However,the corpus can be used to evaluate CW identi-fication techniques which will be transferrableto other languages, given the existence of suf-ficient resources.
5 Related Work
As previously noted, there is a systemic lackof evaluation in the literature. Notable excep-tions come from the medical domain and in-clude the work of Zeng et al. (2005), Zeng-Treitler et al. (2008) and Elhadad (2006).Zeng et al. (2005) first look at word familiarityscoring correlated against user questionnairesand predictions made by a support vector ma-chine. They show that they are able to predictthe complexity of medical terminology with arelative degree of accuracy. This work is con-tinued in Zeng-Treitler et al. (2008), where aword’s context is used to predict its familiar-ity. This is similarly correlated against a usersurvey and used to show the importance ofcontext in predicting word familiarity. Thework of Elhadad (2006) uses frequency andpsycholinguistic features to predict term famil-iarity. They find that the size of their corpusgreatly affects their accuracy. Whilst thesetechniques focus on the medical domain, theresearch presented in this paper is concernedwith the more general task of CW identifica-tion in natural language.
There are two standard ways of identifyingCWs in lexical simplification systems. Firstly,systems attempt to simplify every word (De-vlin and Tait, 1998; Thomas and Anderson,2012; Bott et al., 2012), assuming that CWswill be modified, but for simple words, nosimpler alternative will exist. The danger isthat too many simple words may be mod-ified unnecessarily, resulting in a change ofmeaning. Secondly, systems use a thresholdover some word familiarity score (Biran et al.,2011; Elhadad, 2006; Zeng et al., 2005). Wordfrequency is typically used as the familiarityscore, although it may also be combined withword length (Biran et al., 2011). The adventof the CW corpus will allow these techniquesto be evaluated alongside each other on a com-mon data set.
The CW corpus is similar in conceptionto the aforementioned lexical simplificationdataset (de Belder and Moens, 2012) whichwas produced for the SemEval 2012 Task 1 onlexical simplification. This dataset allows syn-onym ranking systems to be evaluated on thesame platform and was highly useful duringthis research (see Table 1).
6 Future Work
The CW corpus is still relatively small at731 instances. It may be grown by carryingout the same process with revision historiesfrom the main English Wikipedia. Whilst theEnglish Wikipedia revision histories will havefewer valid simplifications per revision, theyare much more extensive and contain a lotmore data. As well as growing the CW corpusin size, it would be worthwhile to look at waysto improve its accuracy. One way would beto ask a team of annotators to evaluate everysingle instance in the corpus and to discard orkeep each according to their recommendation.
Experiments using the corpus are presentedin Shardlow (2013), further details on the useof the corpus can be found by following thisreference. Three common techniques for iden-tifying CWs are implemented and statisticallyevaluated. The CW Corpus is available fromMETA-SHARE5 under a CC-BY-SA Licence.
Acknowledgments
This research is supported by EPSRC grantEP/I028099/1. Thanks go to the annota-tors and reviewers, who graciously volunteeredtheir time.
References
Sandra Maria Aluısio and Caroline Gasperin.2010. Fostering digital inclusion and accessi-bility: the PorSimples project for simplifica-tion of Portuguese texts. In Proceedings of theNAACL HLT 2010 Young Investigators Work-shop on Computational Approaches to Lan-guages of the Americas, YIWCALA ’10, pages46–53, Stroudsburg, PA, USA. Association forComputational Linguistics.
Or Biran, Samuel Brody, and Noemie Elhadad.2011. Putting it simply: a context-aware ap-proach to lexical simplification. In Proceed-
5http://tinyurl.com/cwcorpus
76

ings of the 49th Annual Meeting of the Asso-ciation for Computational Linguistics: HumanLanguage Technologies: short papers - Volume2, HLT ’11, pages 496–501, Stroudsburg, PA,USA. Association for Computational Linguis-tics.
Stefan Bott, Luz Rello, Biljana Drndarevic, andHoracio Saggion. 2012. Can Spanish be sim-pler? LexSiS: Lexical simplification for Spanish.In Coling 2012: The 24th International Confer-ence on Computational Linguistics., pages 357–374.
Marc Brysbaert and Boris New. 2009. Movingbeyond Kucera and Francis: A critical evalua-tion of current word frequency norms and theintroduction of a new and improved word fre-quency measure for American English. BehaviorResearch Methods, 41(4):977–990.
Jacob Cohen. 1968. Weighted kappa: nominalscale agreement with provision for scaled dis-agreement or partial credit. Psychological Bul-letin, 70(4):213–220.
Jan de Belder and Marie-Francine Moens. 2012.A dataset for the evaluation of lexical simpli-fication. In Computational Linguistics and In-telligent Text Processing, volume 7182 of Lec-ture Notes in Computer Science, pages 426–437.Springer, Berlin Heidelberg.
Felice Dell’Orletta, Simonetta Montemagni, andGiulia Venturi. 2011. Read-it: assessing read-ability of Italian texts with a view to text simpli-fication. In Proceedings of the Second Workshopon Speech and Language Processing for AssistiveTechnologies, SLPAT ’11, pages 73–83, Strouds-burg, PA, USA. Association for ComputationalLinguistics.
Siobhan Devlin and John Tait. 1998. The use of apsycholinguistic database in the simplification oftext for aphasic readers, volume 77. CSLI Lec-ture Notes, Stanford, CA: Center for the Studyof Language and Information.
Noemie Elhadad. 2006. Comprehending technicaltexts: Predicting and defining unfamiliar terms.In AMIA Annual Symposium proceedings, page239. American Medical Informatics Association.
Christiane Fellbaum. 1998. WordNet: An Elec-tronic Lexical Database. MIT Press, Cambridge,MA.
Joseph L. Fleiss. 1971. Measuring nominal scaleagreement among many raters. Psychologicalbulletin, 76:378–382, November.
Robin Keskisarkka. 2012. Automatic text sim-plification via synonym replacement. Master’sthesis, Linkoping University.
Henry Kucera and W. Nelson Francis. 1967. Com-putational analysis of present-day American En-glish. Brown University Press.
Gerard Salton and Chung-Shu Yang. 1973. On thespecification of term values in automatic index-ing. Journal of Documentation, 29(4):351–372.
Matthew Shardlow. 2013. A comparison of tech-niques to automatically identify complex words.In Proceedings of the Student Research Work-shop at the 51st Annual Meeting of the Associa-tion for Computational Linguistics. Associationfor Computational Linguistics.
S. Rebecca Thomas and Sven Anderson. 2012.WordNet-based lexical simplification of a docu-ment. In Proceedings of KONVENS 2012, pages80–88. OGAI, September.
Mark Yatskar, Bo Pang, Cristian Danescu-Niculescu-Mizil, and Lillian Lee. 2010. For thesake of simplicity: unsupervised extraction oflexical simplifications from Wikipedia. In Hu-man Language Technologies: The 2010 AnnualConference of the North American Chapter ofthe Association for Computational Linguistics,HLT ’10, pages 365–368, Stroudsburg, PA, USA.Association for Computational Linguistics.
Qing Zeng, Eunjung Kim, Jon Crowell, and TonyTse. 2005. A text corpora-based estimation ofthe familiarity of health terminology. In Biolog-ical and Medical Data Analysis, volume 3745 ofLecture Notes in Computer Science, pages 184–192. Springer, Berlin Heidelberg.
Qing Zeng-Treitler, Sergey Goryachev, Tony Tse,Alla Keselman, and Aziz Boxwala. 2008. Esti-mating consumer familiarity with health termi-nology: a context-based approach. Journal ofthe American Medical Informatics Association,15:349–356.
77

Proceedings of the 2nd Workshop on Predicting and Improving Text Readability for Target Reader Populations, pages 78–84,Sofia, Bulgaria, August 4-9 2013. c©2013 Association for Computational Linguistics
A Pilot Study on Readability Prediction with Reading Time
Hitoshi Nishikawa, Toshiro Makino and Yoshihiro MatsuoNTT Media Intelligence Laboratories, NTT Corporation
1-1 Hikari-no-oka, Yokosuka-shi, Kanagawa, 239-0847 Japan{nishikawa.hitoshi
makino.toshiro, matsuo.yoshihiro
}@lab.ntt.co.jp
Abstract
In this paper we report the results of a pi-lot study of basing readability predictionon training data annotated with readingtime. Although reading time is known tobe a good metric for predicting readabil-ity, previous work has mainly focused onannotating the training data with subjec-tive readability scores usually on a 1 to5 scale. Instead of the subjective assess-ments of complexity, we use the more ob-jective measure of reading time. We createand evaluate a predictor using the binaryclassification problem; the predictor iden-tifies the better of two documents correctlywith 68.55% accuracy. We also report acomparison of predictors based on readingtime and on readability scores.
1 Introduction
Several recent studies have attempted to predictthe readability of documents (Pitler and Nenkova,2008; Burstein et al., 2010; Nenkova et al., 2010;Pitler et al., 2010; Tanaka-Ishii et al., 2010). Pre-dicting readability has a very important role in thefield of computational linguistics and natural lan-guage processing:
• Readability prediction can help users retrieveinformation from the Internet. If the read-ability of documents can be predicted, searchengines can rank the documents according toreadability, allowing users to access the infor-mation they need more easily (Tanaka-Ishii etal., 2010).
• The predicted readability of a document canbe used as an objective function in natural
language applications such as machine trans-lation, automatic summarization, and docu-ment simplification. Machine translation canuse a readability predictor as a part of the ob-jective function to make more fluent transla-tions (Nenkova et al., 2010). The readabil-ity predictor can also be used as a part of asummarizer to generate readable summaries(Pitler et al., 2010). Document simplificationcan help readers understand documents moreeasily by automatically rewriting documentsthat are not easy to read (Zhu et al., 2010;Woodsend and Lapata, 2011). This is pos-sible by paraphrasing the sentences so as tomaximize document readability.
• Readability prediction can be used for educa-tional purposes (Burstein et al., 2010). It canassess human-generated documents automat-ically.
Most studies build a predictor that outputs areadability score (generally 1-5 scale) or a clas-sifier or ranker that identifies which of two doc-uments has the better readability. Using textualcomplexity to rank documents may be adequatefor several applications in the fields of informationretrieval, machine translation, document simplifi-cation, and the assessment of human-written doc-uments. Approaches based on complexity, how-ever, do not well support document summariza-tion.
In the context of automatic summarization,users want concise summaries to understand theimportant information present in the documentsasrapidly as possible— to create summaries that canbe read as quickly as possible, we need a func-tion that can evaluate the quality of the summaryin terms of reading time.
78
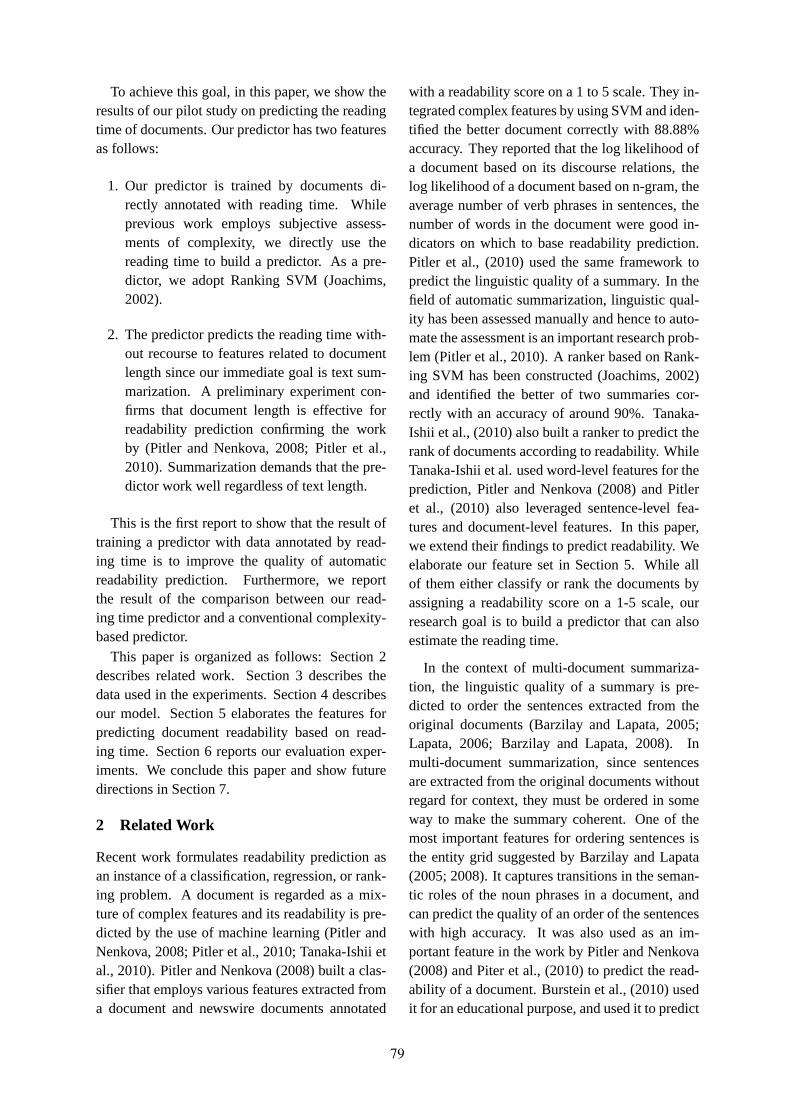
To achieve this goal, in this paper, we show theresults of our pilot study on predicting the readingtime of documents. Our predictor has two featuresas follows:
1. Our predictor is trained by documents di-rectly annotated with reading time. Whileprevious work employs subjective assess-ments of complexity, we directly use thereading time to build a predictor. As a pre-dictor, we adopt Ranking SVM (Joachims,2002).
2. The predictor predicts the reading time with-out recourse to features related to documentlength since our immediate goal is text sum-marization. A preliminary experiment con-firms that document length is effective forreadability prediction confirming the workby (Pitler and Nenkova, 2008; Pitler et al.,2010). Summarization demands that the pre-dictor work well regardless of text length.
This is the first report to show that the result oftraining a predictor with data annotated by read-ing time is to improve the quality of automaticreadability prediction. Furthermore, we reportthe result of the comparison between our read-ing time predictor and a conventional complexity-based predictor.
This paper is organized as follows: Section 2describes related work. Section 3 describes thedata used in the experiments. Section 4 describesour model. Section 5 elaborates the features forpredicting document readability based on read-ing time. Section 6 reports our evaluation exper-iments. We conclude this paper and show futuredirections in Section 7.
2 Related Work
Recent work formulates readability prediction asan instance of a classification, regression, or rank-ing problem. A document is regarded as a mix-ture of complex features and its readability is pre-dicted by the use of machine learning (Pitler andNenkova, 2008; Pitler et al., 2010; Tanaka-Ishii etal., 2010). Pitler and Nenkova (2008) built a clas-sifier that employs various features extracted froma document and newswire documents annotated
with a readability score on a 1 to 5 scale. They in-tegrated complex features by using SVM and iden-tified the better document correctly with 88.88%accuracy. They reported that the log likelihood ofa document based on its discourse relations, thelog likelihood of a document based on n-gram, theaverage number of verb phrases in sentences, thenumber of words in the document were good in-dicators on which to base readability prediction.Pitler et al., (2010) used the same framework topredict the linguistic quality of a summary. In thefield of automatic summarization, linguistic qual-ity has been assessed manually and hence to auto-mate the assessment is an important research prob-lem (Pitler et al., 2010). A ranker based on Rank-ing SVM has been constructed (Joachims, 2002)and identified the better of two summaries cor-rectly with an accuracy of around 90%. Tanaka-Ishii et al., (2010) also built a ranker to predict therank of documents according to readability. WhileTanaka-Ishii et al. used word-level features for theprediction, Pitler and Nenkova (2008) and Pitleret al., (2010) also leveraged sentence-level fea-tures and document-level features. In this paper,we extend their findings to predict readability. Weelaborate our feature set in Section 5. While allof them either classify or rank the documents byassigning a readability score on a 1-5 scale, ourresearch goal is to build a predictor that can alsoestimate the reading time.
In the context of multi-document summariza-tion, the linguistic quality of a summary is pre-dicted to order the sentences extracted from theoriginal documents (Barzilay and Lapata, 2005;Lapata, 2006; Barzilay and Lapata, 2008). Inmulti-document summarization, since sentencesare extracted from the original documents withoutregard for context, they must be ordered in someway to make the summary coherent. One of themost important features for ordering sentences isthe entity grid suggested by Barzilay and Lapata(2005; 2008). It captures transitions in the seman-tic roles of the noun phrases in a document, andcan predict the quality of an order of the sentenceswith high accuracy. It was also used as an im-portant feature in the work by Pitler and Nenkova(2008) and Piter et al., (2010) to predict the read-ability of a document. Burstein et al., (2010) usedit for an educational purpose, and used it to predict
79

the readability of essays. Lapata (Lapata, 2006)suggested the use of Kendall’s Tau as an indicatorof the quality of a set of sentences in particular or-der; she also reported that self-paced reading timeis a good indicator of quality. While Lapata fo-cuses on sentence ordering, our research goal is topredict the overall quality of a document in termsof reading time.
3 Data
To build a predictor that can estimate the read-ing time of a document, we made a collectionof documents and annotated each with its read-ing time and readability score. We randomly se-lected 400 articles from Kyoto Text Corpus 4.01.The corpus consists of newswire articles writtenin Japanese and annotated with word boundaries,part-of-speech tags and syntactic structures. Wedeveloped an experimental system that showed ar-ticles for each subject and gathered reading times.Each article was read by 4 subjects. All subjectsare native speakers of Japanese.
Basically, we designed our experiment follow-ing Pitler and Nenkova (2008). The subjects wereasked to use the system to read the articles. Theycould read each document without a time limit, theonly requirement being that they were to under-stand the content of the document. While the sub-jects were reading the article, the reading time wasrecorded by the system. We didn’t tell the subjectsthat the time was being recorded.
To prevent the subjects from only partially read-ing the document and raise the reliability of the re-sults, we made a multiple-choice question for eachdocument; the answer was to be found in the doc-ument. This was used to weed out unreliable re-sults.
After the subjects read the document, they wereasked to answer the question.
Finally, the subjects were asked questions re-lated to readability as follows:
1. How well-written is this article?
2. How easy was it to understand?
3. How interesting is this article?
Following the work by Pitler and Nenkova(2008), the subjects answered by selecting a value
1http://nlp.ist.i.kyoto-u.ac.jp/EN/
between 1 and 5, with 5 being the best and 1 be-ing the worst and we used only the answer to thefirst question (How well-written is this article?) asthe readability score. We dropped the results inwhich the subjects gave the wrong answer to themultiple-choice question. Finally, we had 683 tu-ples of documents, reading times, and readabilityscores.
4 Model
To predict the readability of a document accordingto reading time, we use Ranking SVM (Joachims,2002). A target document is converted to a featurevector as explained in Section 5, then the predictorranks two documents. The predictor assigns a realnumber to a document as its score; ranking is doneaccording to score. In this paper, a higher scoremeans better readability, i.e., shorter reading time.
5 Features
In this section we elaborate the features used topredict the reading time. While most of them wereintroduced in previous work, see Section 3, theword level features are introduced here.
5.1 Word-level Features
Character Type (CT)
Japanese sentences consist of several types ofcharacters: kanji, hiragana, katakana, and Romanletters. We use the ratio of the number of kanji tothe number of hiragana as a feature of the docu-ment.
Word Familiarity (WF)
Amano and Kondo (2007) developed a list ofwords annotated with word familiarity; it indicateshow familiar a word is to Japanese native speakers.The list is the result of a psycholinguistic experi-ment and the familiarity ranges from 1 to 7, with7 being the most familiar and 1 being the least fa-miliar. We used the average familiarity of wordsin the document as a feature.
5.2 Sentence-level Features
Language Likelihood (LL)
Language likelihood based on an n-gram languagemodel is widely used to generate natural sen-tences. Intuitively, a sentence whose languagelikelihood is high will have good readability. We
80

made a trigram language model from 17 years(1991-2007) of Mainichi Shinbun Newspapers byusing SRILM Toolkit. Since the language modelassigns high probability to shorter documents, wenormalized the probability by the number of wordsin a document.
Syntactic Complexity (TH/NB/NC/NP)
Schwarm and Ostendorf (2005) suggested thatsyntactic complexity of a sentence can be used asa feature for reading level assessment. We use thefollowing features as indicators of syntactic com-plexity:
• The height of the syntax tree (TH): we usethe height of the syntax tree as an indicator ofthe syntactic complexity of a sentence. Com-plex syntactic structures demand that readersmake an effort to interpret them. We use theaverage, maximum and minimum heights ofsyntax trees in a document as a feature.
• The number of bunsetsu (NB): in Japanesedependency parsing, syntactic relations aredefined betweenbunsetsu; they are almostthe same as Base-NP (Veenstra, 1998) withpostpositions. If a sentence has a lot of bun-setsu, it can have a complex syntactic struc-ture. We use the average, maximum and min-imum number of them as a feature.
• The number of commas (NC): a comma sug-gests a complex syntax structure such as sub-ordinate and coordinate clauses. We use theaverage, maximum and minimum number ofthem as a feature.
• The number of predicates (NP): intuitively,a sentence can be syntactically complex if ithas a lot of predicates. We use the average,maximum and minimum number of them asa feature.
5.3 Document-level Features
Discourse Relations (DR)
Pitler and Nenkova (2008) used discourse rela-tions of the Penn Discourse Treebank (Prasadet al., 2008) as a feature. Since our corpusdoesn’t have human-annotated discourse relations
between the sentences, we use the average num-ber of connectives per sentence as a feature. In-tuitively, the explicit discourse relations indicatedby the connectives will yield better readability.
Entity Grid (EG)
Along with the previous work (Pitler andNenkova, 2008; Pitler et al., 2010), we use entitygrid (Barzilay and Lapata, 2005; Barzilay and La-pata, 2008) as a feature. We make a vector whoseelement is the transition probability between syn-tactic roles (i.e. subject, object and other) of thenoun phrases in a document. Since our corpusconsists of Japanese documents, we use postpo-sitions to recognize the syntactic role of a nounphrase. Noun phrases with postpositions “Ha” and“Ga” are recognized as subjects. Noun phraseswith postpositions “Wo” and “Ni” are recognizedas objects. Other noun phrases are marked asother. We combine the entity grid vector to form afinal feature vector for predicting reading time.
Lexical Cohesion (LC)
Lexical cohesion is one of the strongest featuresfor predicting the linguistic quality of a summary(Pitler et al., 2010). Following their work, weleverage the cosine similarity of adjacent sen-tences as a feature. To calculate it, we makea word vector by extracting the content words(nouns, verbs and adjectives) from a sentence. Thefrequency of each word in the sentence is used asthe value of the sentence vector. We use the aver-age, maximum and minimum cosine similarity ofthe sentences as a feature.
6 Experiments
This section explains the setting of our experi-ment. As mentioned above, we adopted RankingSVM as a predictor. Since we had 683 tuples (doc-uments, reading time and readability scores), wemade683C2 = 232, 903 pairs of documents forRanking SVM. Each pair consists of two docu-ments where one has a shorter reading time thanthe other. The predictor learned which parameterswere better at predicting which document wouldhave the shorter reading time, i.e. higher score.We performed a 10-fold cross validation on thepairs consisting of the reading time explained inSection 3 and the features explained in Section 5.In order to analyze the contribution of each feature
81

Features AccuracyALL 68.45TH + EG + LC 68.55Character Type (CT) 52.14Word Familiarity (WF) 51.30Language Likelihood (LL) 50.40Height of Syntax Tree (TH) 61.86Number of Bunsetsu (NB) 51.54Number of Commas (NC) 47.07Number of Predicates (NP) 52.82Discourse Relations (DR) 48.04Entity Grid (EG) 67.74Lexical Cohesion (LC) 61.63Document Length 69.40Baseline 50.00
Table 1: Results of proposed reading time predic-tor.
to prediction accuracy, we adopted a linear kernel.The range of the value of each feature was normal-ized to lie between -1 and 1.
6.1 Classification based on reading time
Table 1 shows the results yielded by the read-ing time predictor. ALL indicates the accuracyachieved by the classifier with all features ex-plained in Section 5. At the bottom of Table 1,Baseline shows the accuracy of random classifica-tion. As shown in Table 1, since the height of syn-tax tree, entity grid and lexical cohesion are goodindicators for the prediction, we combined thesefeatures. TH + EG + LC indicates that this combi-nation achieves the best performance.
As to individual features, most of them couldn’tdistinguish a better document from a worse one.CT, WF and LL show similar performance toBaseline. The reason why these features failed toclearer identify the better of the pair could be be-cause the documents are newswire articles. Theratio between kanji and hiragana, CT, is similar inmost of the articles and hence it couldn’t identifythe better document. Similarly, there isn’t so muchof a difference among the documents in terms ofword familiarity, WF. The language model used,LL, was not effective against the documents testedbut it is expected that it would useful if the targetdocuments came from different fields.
Among the syntactic complexity features, TH
offers the best performance. Since its learnedfeature weight is negative, the result shows thata higher syntax tree causes longer reading time.While TH has shows good performance, NB, NCand NP fail to offer any significant advantage. Aswith the word-level features, there isn’t so muchof a difference among the documents in terms ofthe values of these features. This is likely becausemost of the newswire articles are written by ex-perts for a restricted field.
Among the document-level features, EG andLC show good performance. While Pitler andNenkova (2008) have shown that the discourse re-lation feature is strongest at predicting the linguis-tic quality of a document, DR shows poor perfor-mance. Whereas they modeled the discourse rela-tions by a multinomial distribution using human-annotated labels, DR was simply the number ofconnectives in the document. A more sophisti-cated approach will be needed to model discourse.
EG and LC show the best prediction perfor-mance of the single features, which agrees withprevious work (Pitler and Nenkova, 2008; Pitleret al., 2010). While, as shown above, most of thesentence-level features don’t have good discrimi-native performance, EG and LC work well. Sincethese features can work well in homogeneous doc-uments like newswire articles, it is reasonable toexpect that they will also work well in heteroge-neous documents from various domains.
We also show the classification result achievedwith document length. Piter and Nenkova (2008)have shown that document length is a strong indi-cator for readability prediction. We measure docu-ment length by three criteria: the number of char-acters, the number of words and the number ofsentences in the document. We used these valuesas features and built a predictor. While the docu-ment length has the strongest classification perfor-mance, the predictor with TH + EG + LC showsequivalent performance.
6.2 Classification based on readability score
We also report that the result of the classificationbased on the readability score in Table 2. Alongwith the result of the reading time, we testedALL and TH + EG + LC, and the single features.While DR shows poor classification performancein terms of reading time, it shows the best classi-
82

Features AccuracyALL 57.25TH + DR + EG + LC 56.51TH + EG + LC 56.50Character Type (CT) 51.96Word Familiarity (WF) 51.50Language Likelihood (LL) 50.68Height of Syntax Tree (TH) 55.77Number of Bunsetsu (NB) 52.99Number of Commas (NC) 51.50Number of Predicates (NP) 52.56Discourse Relations (DR) 58.14Entity Grid (EG) 56.14Lexical Cohesion (LC) 55.77Document Length 56.83Baseline 50.00
Table 2: A result of classification based on read-ability score.
Cor. coef.Reading Time 0.822Readability Score 0.445
Table 3: Correlation coefficients of the readingtime and readability score between the subjects.We calculated the coefficient for each pair of sub-jects and then averaged them.
fication performance as regards readability score.Hence we add the result of TH + DR + EG + LC.It agrees with the findings showed by Pitler andNenkova (2008) in which they have shown dis-course relation is the best feature for predicting thereadability score.
In general, the same features used for classifica-tion based on the reading time work well for pre-dicting the readability score. TH and EG, LC havegood prediction performance.
6.3 Variation in reading time vs. variation inreadability score
We show the correlation between the subjects interms of the variation in reading time and read-ability score in Table 3. As shown, the readingtime shows much higher correlation (less varia-tion) than the readability score. This agrees withthe findings shown by Lapata (2006) in whichthe reading time is a better indicator for read-
ability prediction. Since the readability scorevaries widely among the subjects, training be-comes problematic with lowers predictor perfor-mance.
The biggest difference between the predictionof the reading time and readability score is theeffect of feature DR. One hypothesis that couldexplain the difference is that the use of connec-tives works as a strong sign that the document hasa good readability score—it doesn’t necessarilyimply that the document has goodreadability—for the subjects. That is, the subjects perceivedthe documents with more connectives as readable,however, those connectives contribute to the read-ing time. Of course, our feature about discourserelations is just based on their usage frequency andhence more precise modeling could improve per-formance.
7 Conclusion and Future Work
This paper has described our pilot study of read-ability prediction based on reading time. With au-tomatic summarization in mind, we built a predic-tor that can predict the reading time, and read-ability, of a document. Our predictor identifiedthe better of two documents with 68.55% accuracywithout using features related to document length.
The following findings can be extracted fromthe results described above:
• The time taken to read documents can bepredicted through existing machine learningtechnique and the features extracted fromtraining data annotated with reading time(Pitler and Nenkova, 2008; Pitler et al.,2010).
• As Lapata (2006) has shown, reading time isa highly effective indicator of readability. Inour experiment, reading time showed goodagreement among the subjects and hencemore coherent prediction results can be ex-pected.
Future work must proceed in many directions:
1. Measuring more precise reading time is oneimportant problem. One solution is to use aneye tracker; it can measure the reading timemore accurately because it can capture when
83

the subject finishes reading a document. Inorder to prepare the data used in this paper,we set questions so as to identify and dropunreliable data. The eye tracker could allevi-ate this effort.
2. Testing the predictor in another domain isnecessary for creating practical applications.We tested the predictor only in the domainof newswire articles, as described earlier, anddifferent results might be recorded in do-mains other than newswire articles.
3. Improving the accuracy of the predictor isalso important. There could be other fea-tures associated with readability prediction.We plan to explore other features.
4. Applying the predictor to natural languagegeneration tasks is particularly important. Weplan to integrate our predictor into a summa-rizer and evaluate its performance.
References
Shigeaki Amano and Tadahisa Kondo. 2007. Reliabil-ity of familiarity rating of ordinary japanese wordsfor different years and places.Behavior ResearchMethods, 39(4):1008–1011.
Regina Barzilay and Mirella Lapata. 2005. Model-ing local coherence: an entity-based approach. InProceedings of the 43rd Annual Meeting on Asso-ciation for Computational Linguistics (ACL), pages141–148.
Regina Barzilay and Mirella Lapata. 2008. Modelinglocal coherence: An entity-based approach.Compu-tational Linguistics, 34(1):1–34.
Jill Burstein, Joel Tetreault, and Slava Andreyev. 2010.Using entity-based features to model coherence instudent essays. InProceedings of Human Lan-guage Technologies: The 2010 Annual Conferenceof the North American Chapter of the Associationfor Computational Linguistics (NAACL-HLT), pages681–684.
Thorsten Joachims. 2002. Optimizing search enginesusing clickthrough data. InProceedings of the ACMConference on Knowledge Discovery and Data Min-ing (KDD), pages 133–142.
Mirella Lapata. 2006. Automatic evaluation of infor-mation ordering: Kendall’s tau.Computational Lin-guistics, 32(4):471–484.
Ani Nenkova, Jieun Chae, Annie Louis, and EmilyPitler. 2010. Structural features for predicting thelinguistic quality of text: Applications to machinetranslation, automatic summarization and human-authored text. In Emiel Krahmer and TheunemMariet, editors,Empirical Methods in Natural Lan-guage Generation: Data-oriented Methods and Em-pirical Evaluation, pages 222–241. Springer.
Emily Pitler and Ani Nenkova. 2008. Revisitingreadability: A unified framework for predicting textquality. In Proceedings of the 2008 Conference onEmpirical Methods in Natural Language Process-ing, pages 186–195.
Emily Pitler, Annie Louis, and Ani Nenkova. 2010.Automatic evaluation of linguistic quality in multi-document summarization. InProceedings of the48th Annual Meeting of the Association for Compu-tational Linguistics, pages 544–554.
Rashmi Prasad, Nikhil Dinesh, Alan Lee, Eleni Milt-sakaki, Livio Robaldo, Aravind Joshi, and BonnieWebber. 2008. The penn discourse treebank 2.0. InProceedings of the 6th International Conference onLanguage Resources and Evaluation (LREC).
Sarah Schwarm and Mari Ostendorf. 2005. Readinglevel assessment using support vector machines andstatistical language models. InProceedings of the43rd Annual Meeting of the Association for Compu-tational Linguistics (ACL), pages 523–530.
Kumiko Tanaka-Ishii, Satoshi Tezuka, and Hiroshi Ter-ada. 2010. Sorting by readability.ComputationalLinguistics, 36(2):203–227.
Jorn Veenstra. 1998. Fast np chunking using memory-based learning techniques. InProceedings of the8th Belgian-Dutch Conference on Machine Learn-ing (Benelearn), pages 71–78.
Kristian Woodsend and Mirella Lapata. 2011. Learn-ing to simplify sentences with quasi-synchronousgrammar and integer programming. InProceed-ings of the 2011 Conference on Empirical Methodsin Natural Language Processing (EMNLP), pages409–420.
Zhemin Zhu, Delphine Bernhard, and Iryna Gurevych.2010. A monolingual tree-based translation modelfor sentence simplification. InProceedings of the23rd International Conference on ComputationalLinguistics (Coling 2010), pages 1353–1361.
84

Author Index
Aizawa, Akiko, 49
Chen, Chen, 49
Ebling, Sarah, 11
Feblowitz, Dan, 1
Hara, Tadayoshi, 49
Kano, Yoshinobu, 49Kauchak, David, 1Klaper, David, 11Koeva, Svetla, 39
Leseva, Svetlozara, 39Lozanova, Slavina, 39
MAKINO, Toshiro, 78Maneva, Galina, 20Marius, Tamas, 30MATSUO, Yoshihiro, 78Meurers, Detmar, 59
NISHIKAWA, Hitoshi, 78
Salesky, Elizabeth, 30Savtchev, Boian, 39Shardlow, Matthew, 69Shen, Wade, 30Stoyanova, Ivelina, 39
Temnikova, Irina, 20
Vajjala, Sowmya, 59Volk, Martin, 11
Williams, Jennifer, 30
85