Ultimate strength analysis of composite sections under biaxial bending and axial load

(This is a sample cover image for this issue. The actual cover is not yet available at this time.)
This article appeared in a journal published by Elsevier. The attachedcopy is furnished to the author for internal non-commercial researchand education use, including for instruction at the authors institution
and sharing with colleagues.
Other uses, including reproduction and distribution, or selling orlicensing copies, or posting to personal, institutional or third party
websites are prohibited.
In most cases authors are permitted to post their version of thearticle (e.g. in Word or Tex form) to their personal website orinstitutional repository. Authors requiring further information
regarding Elsevier’s archiving and manuscript policies areencouraged to visit:
http://www.elsevier.com/copyright

Author's personal copy
Ultimate behavior of steel beams under non-uniform bending
Mario D'Aniello a, Raffaele Landolfo a,⁎, Vincenzo Piluso b, Gianvittorio Rizzano b
a Department of Constructions and Mathematical Methods in Architecture, University of Naples “Federico II”, Italyb Department of Civil Engineering, University of Salerno, Italy
a b s t r a c ta r t i c l e i n f o
Article history:Received 29 February 2012Accepted 3 July 2012Available online xxxx
Keywords:Steel beamDuctilityMoment resisting framesOverstrengthRotation capacity
The ultimate behavior of steel beams deeply influences the overall performance of steel frames. The main re-sponse parameters are the rotation capacity and the flexural ultimate resistance. The former is the source ofthe local ductility supply needed to achieve a global dissipative behavior of structures under seismic actions,whereas the latter governs the flexural overstrength whose knowledge is needed for an appropriate applica-tion of hierarchy criteria in seismic design of structures. Therefore, a twofold classification of steel membersaccording to their ductility and overstrength is the most appropriate approach for seismic design applica-tions. Currently, modern international design codes are based on the classification of steel sections for bothplastic and seismic designs of structures, providing misleading emphasis mainly on local buckling as the pri-mary strain-weakening effect. Even though different methods are available in the technical literature forpredicting the ultimate behavior of steel members under non-uniform bending, the problem still deservesfurther investigations, because of the high number of parameters affecting the ultimate response and the va-riety of cross-sectional shapes. Therefore, a new experimental program dealing with a wide range of crosssection typologies (I and H sections, Square and Rectangular Hollow sections) under monotonic and cyclicloading has been carried out by testing specimens with different local slenderness ratios properly selectedto integrate the data already available in the technical literature. The obtained results are herein presentedand discussed.
© 2012 Elsevier Ltd. All rights reserved.
1. Introduction
The development of adequate plastic rotation capacity is a funda-mental requirement both for plastic design and for seismic design ofbuilding structures. Indeed, plastic design can be carried out providedthat members are able to develop plastic hinges rotating until the col-lapse mechanism is completely developed, without dropping their mo-ment capacity, thus assuring the required redistribution of bendingmoments. The rotation of plastic hinges required to fully develop thecollapse mechanism and/or to achieve needed displacement levels pro-vides the plastic rotation demand, which varies for different structuralconfigurations, loading arrangements, geometry, material strengthsand levels of the seismic intensity measure. It has been widely investi-gated in the literature, particularly for continuous beams and frames[1–4].
In particular, in earthquake-resistant design, rotation capacity isessential to assure that a determined portion of the input seismic en-ergy is dissipated by plastic behavior. Therefore, steel beams need todevelop a ductile behavior with high rotation capacity. To this scopeappropriate geometrical limitations to the geometry of the plate ele-ments constituting the cross-section and to the laterally unrestrainedlength need to be considered, because the flexural behavior of steel
beams can be undermined by the occurrence of plastic local bucklingof compressed elements and/or by inelastic flexural–torsional buck-ling. Therefore, in order to perform a reliable structural analysis, it isessential to quantify clearly the meaning of “sufficient rotation capac-ity” or “sufficient local ductility”.
Nowadays, Eurocode 3 [5] provides the subdivisions of cross-sections into four classes, depending on the properties of compressionelements (Fig. 1). For plastic global analysis, it is required that all mem-bers containing plastic hinges shall belong to class 1, i.e. to be made ofductile sections. According to Eurocode 8 [6], the cross section classesdefined in Eurocode 3 provide a limitation to the selected behavior fac-tor requiring class 1 for q>4, class 2 for 2bq≤4, and class 3 for q≤2 (asshown in Table 1). However, the main criticism to Eurocode classifica-tion is the small number of parameters considered to characterize thebeam performance. In fact, they relate rotation capacity to materialand cross-section factors only, neglecting very important behavioral is-sues, such as the flange–web interaction, the overall member slen-derness, the moment gradient, the lateral restraints, and the loadingconditions (monotonic or cyclic).
These considerations led several authors to develop other classifica-tion criteria. In the recent past, classification criteria accounting for bothcross-section slenderness and member slenderness were early pro-posed by [7–10] for I and H shaped members.
Furthermore, regarding seismic applications it is important to notethat it is not possible to directly extend the criteria developed for
Journal of Constructional Steel Research 78 (2012) 144–158
⁎ Corresponding author. Tel.: +39 0812538987; fax: +39 0812538989.E-mail address: [email protected] (R. Landolfo).
0143-974X/$ – see front matter © 2012 Elsevier Ltd. All rights reserved.doi:10.1016/j.jcsr.2012.07.003
Contents lists available at SciVerse ScienceDirect
Journal of Constructional Steel Research

Author's personal copy
monotonic loading to cyclic loading conditions. Therefore, under thispoint of view it is useful to underline that Eurocode 3 classification is ba-sically derived from experimental test results under monotonic loadingconditions, highlighting theweakness of Eurocode 8 classificationwhenreference is simply made to Eurocode 3. In fact, it is worth noting thatthe comparison between the width-to-thickness limits given byEurocode 3 and those given by AISC [11] reveals considerable differ-ences, particularly in case of rectangular and circular tubular members,being the limits of seismically-compact sections in AISC [11] significant-ly more severe than those corresponding to class 1 of Eurocodes. There-fore, the assessment of the adequacy of class 1 sections to satisfy thecyclic demands imposed under seismic conditions is needed.
Another design issue neglected by Eurocode 8 classification is theflexural overstrength of steel beams, which plays a key role in the appli-cationof hierarchycriteria in seismicdesign. Indeed, Eurocode8 accountsonly for the possible overstrength due to randommaterial variability byconsidering an overstrength factor equal to 1.1 γov, for all types of mem-bers, in the application of capacity design rules. Conversely, the amountof strain-hardening which can be exhibited before the complete devel-opment of local buckling is neglected, thus underestimating the actualultimate strength of members made of class 1 sections.
Starting from these considerations, it is clear that, dealing withseismic applications, a twofold classification of steel beams in ductil-ity and overstrength classes is needed. Indeed, the subdivision ofbeams into ductility classes remains of primary concern, because ro-tation capacity directly governs the global ductility of structures,but, at the same time, a subdivision of members into overstrength
classes is also desirable in order to properly apply capacity designcriteria both at local level (i.e. to design connections among dissipa-tive and not dissipative zones) and at global level (i.e. to provide ad-equate overstrength to non-dissipative members). This approach canbe achieved implementing the concept of member behavioral classes[12], which has been early adopted by the late Italian code for seismicdesign OPCM 3274 [13] (as shown in Fig. 2 and in Table 3).
Therefore, aiming at the setting up of reliable design formulas forpredicting both the rotation capacity and the flexural overstrength ofsteel beams a new experimental program has been carried out and itsoutcome is herein illustrated pointing out the influence of geometricaland mechanical parameters.
2. Rotation capacity
2.1. Generality
Themoment–curvature approach has beenwidely used in literatureto study cold-formed steel sections [14–17]. According to this approach,the cross-section local ductility is defined in terms of curvature ductilityas follows:
μχ ¼ χu
χp−1 ð1Þ
whereχp is evaluated asMp/EI andχu is the ultimate limiting curvatureat which the moment resistance drops below Mp.
Conversely, rotation capacity (R) is themeasure of the local ductilityat themember level and, therefore, it is a rotation ductility evaluated bymeans of the moment–rotation relationship [18–20] as follows:
R ¼ μθ ¼θuθp
−1 ð2Þ
being θp the rotation corresponding to flexural yielding and θu the ulti-mate beam rotation. The rotation capacity can be divided into twoparts: the stable part of rotation capacity developed up to the occur-rence of local buckling and the unstable part due to post-buckling be-havior [21].
Fig. 1. EN 1993:1-1 classification criterion.
Fig. 2. OPCM 3274 classification criterion.
Fig. 3. Generalized moment–rotation curve for a steel beam.
Table 1EC8 cross-section requirements for dissipative elements depending on ductility classand behavior factor.
Ductility class Behavior factor Cross section class(dissipative zone)
DCM 1.5bqb2 Class 1, 2 and 32bqb4 Class 1 and 2
DCH q>4 Class 1
145M. D'Aniello et al. / Journal of Constructional Steel Research 78 (2012) 144–158
Author's personal copy
Both approaches define local ductility as a non-dimensional param-eter, whosemeaning is described in Fig. 3, where the generalized force–displacement curve of amember able towithstand plastic deformationsis plotted. The moment–rotation approach is the most effective anduseful for experimental purposes and, therefore, is adopted herein.Moreover, as firstly observed in [22], this approach is the most easyand advantageous to control the output of structural analysis programs.
2.2. Predictive methods of rotation capacity
Several methods to evaluate the rotation capacity of steel membershave been proposed by different authors. These approaches can begrouped in the following categories [21]:
Theoretical methods are based on the evaluation of the rotation ca-pacity by means of the theoretical evaluation of the moment–curvature relationship and by the theoretical analysis of instabilityphenomena (particularly, the local buckling of the compressedflange). This approach has been adopted by Kemp [23]. An alterna-tive theoretical approach is constituted by the interpretation ofthe plastic collapse mechanism typology observed from experi-mental evidence. The principle of virtual works can be appliedby equating the external work to the internal work correspondingto the yield line model of the plastic collapse mechanism, so thatthe actual collapse mechanism can be derived by minimizing theinternal work with respect to one or more parameters governingthe collapse mechanism [24–29].Semi-empirical methods, differently from theoretical methods, arebased on the evaluation of local buckling phenomena by means ofempirical relationships directly derived from experimental data.In order to obtain closed form solutions, the moment–curvaturerelationship can be derived by considering an ideal section madeof two concentrated masses. This approach has been adopted byKato [30–32] by imposing to the equivalent section the same areaof the actual section, while its height is assumed by imposing theequivalence of the two sections in terms of plastic moment. Fromthe integration of the member curvature diagram, simple equationsof R are given as function of two parameters, which are ρ and s. Theformer is the ratio between the axial force (N) and the axial strength(Npl). The second is the normalized local buckling stress, given bythe ratio between the stress leading to the complete developmentof local buckling (fLB) and the yield stress (fy). Kato also proposedempirical relationships [30–32] to determine the parameter s as afunction of flange and web slenderness. However, Kato's approachis based on rigid-perfectly plastic-hardening behavior of steel, sothat the rotation due to the part of the member still in elasticrange is neglected. In addition, the stress value corresponding tothe complete development of local buckling is identified by means
of an empirical relationship obtained from stub-column test data,so that also the influence of the longitudinal stress gradient due tonon-uniform bending is neglected. These drawbacks are overcomeby the semi-empirical method proposed in [26];Empirical methods rely on statistical analyses of a large number ofdata obtained by experimental tests or numerical simulations, sever-al empirical relationships for the evaluation of the rotation capacity ofsteel members have been proposed in the technical literature. Katoand Akiyama [33,34] have proposed a simplified moment–rotationrelationship constituted by three linear branches for memberssubjected to non-uniform bending. This equation has been obtainedinterpolating the experimental results performed by [35–37].Nakamura [38] proposed a different equation for rotation capacityobtained by processing the results of 121 tests carried out onbeams having different lateral torsional-slenderness, whereasSpangemacher and Sedlacek [39] proposed a relationship based onthe results obtained from a parametrical study using FEM numericalsimulations.
More recently, Guzelbey et al. [40] have developed analternative ap-proach for the prediction of rotation capacity of wide flange beamsusing neural networks based on experimental results collected fromthe literature. Their empirical model based on neural network approachshowed an excellent agreement with experimental results leading to acorrelation coefficient equal to 0.997.
Within the framework of empirical methods, genetic programminghas been also recently proposed [41] as a very promising approach,still based on available experimental data, for developing accurate and
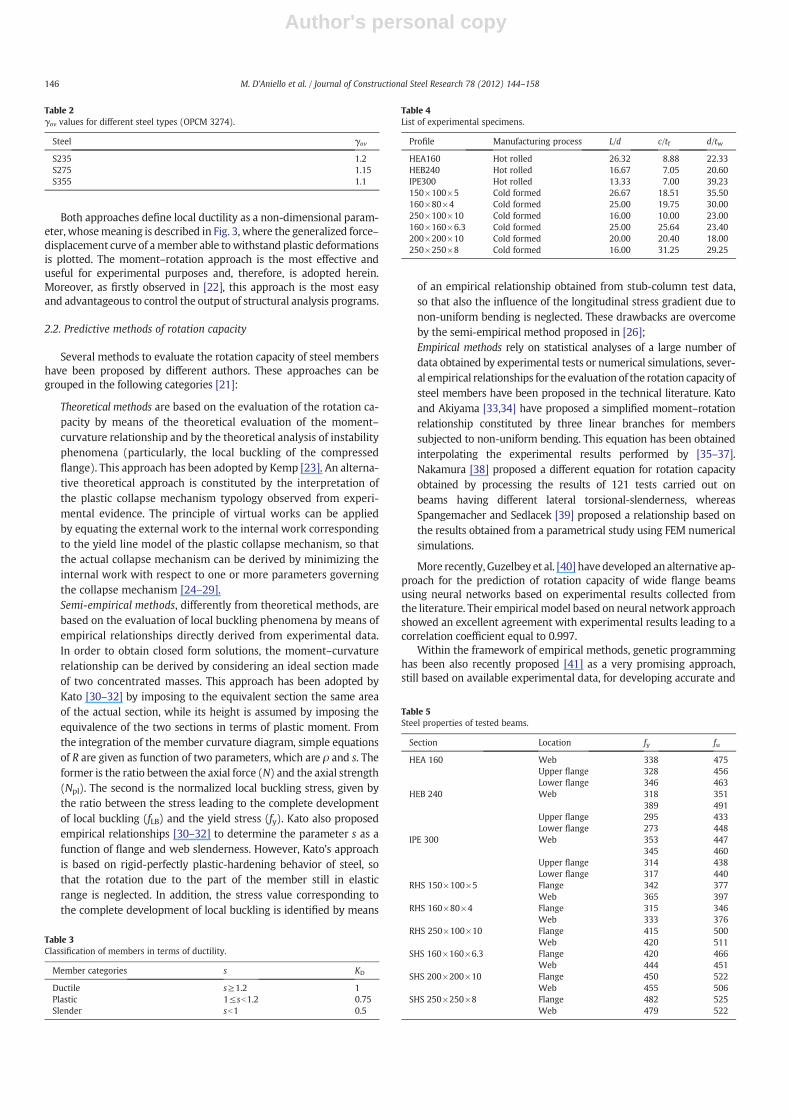
Table 2γov values for different steel types (OPCM 3274).
Steel γov
S235 1.2S275 1.15S355 1.1
Table 3Classification of members in terms of ductility.
Member categories s KD
Ductile s≥1.2 1Plastic 1≤sb1.2 0.75Slender sb1 0.5
Table 4List of experimental specimens.
Profile Manufacturing process L/d c/tf d/tw
HEA160 Hot rolled 26.32 8.88 22.33HEB240 Hot rolled 16.67 7.05 20.60IPE300 Hot rolled 13.33 7.00 39.23150×100×5 Cold formed 26.67 18.51 35.50160×80×4 Cold formed 25.00 19.75 30.00250×100×10 Cold formed 16.00 10.00 23.00160×160×6.3 Cold formed 25.00 25.64 23.40200×200×10 Cold formed 20.00 20.40 18.00250×250×8 Cold formed 16.00 31.25 29.25
Table 5Steel properties of tested beams.
Section Location fy fu
HEA 160 Web 338 475Upper flange 328 456Lower flange 346 463
HEB 240 Web 318 351389 491
Upper flange 295 433Lower flange 273 448
IPE 300 Web 353 447345 460
Upper flange 314 438Lower flange 317 440
RHS 150×100×5 Flange 342 377Web 365 397
RHS 160×80×4 Flange 315 346Web 333 376
RHS 250×100×10 Flange 415 500Web 420 511
SHS 160×160×6.3 Flange 420 466Web 444 451
SHS 200×200×10 Flange 450 522Web 455 506
SHS 250×250×8 Flange 482 525Web 479 522
146 M. D'Aniello et al. / Journal of Constructional Steel Research 78 (2012) 144–158

Author's personal copy
effective explicit formulations for predicting the rotation capacity ofsteel members.
2.3. Rotation capacity in modern codes
In modern steel design codes, plastic design is allowed provided thatmembers are able to exhibit adequate rotation capacity whose referencevalues have been established on the basis of available analytical, experi-mental and numerical studies. Indeed, after plastic design was intro-duced, Driscoll [1,2] evaluated the rotation capacity required to achieveplastic collapse in a wide range of continuous beams and portals madeof wide flange profiles. He concluded that the required R could beequal to 12 in the worst cases. Recently, this requirement has been re-laxed because of the following influences:
a) the flexibility of the connections gives rise to a redistribution ofstrains;
b) tests on complete structures showed less marked effects than intests on statically determinate elements;
c) improved resistance associated with strain hardening.
Kemp [23] has first recommended lower limits of rotation capacity(R>5 and R>3) to be used for different limit states in South AfricanCode for plastic design, whereas Yura et al. [42] already proposed R>3in the draft American LRFD Code. Nowadays, the North American stan-dard has assumed a rotation capacity of 3 to be sufficient for most civilengineering structures as indicated in Yura et al. [42] and AISC [11].This value for R is based on limiting the flange strain to four times theyield strain. Similarly, in the background document to the Europeanstandard, Bild et al. [43] and Sedlacek and Feldmann [19] investigatedand summarized the rotation requirements for three-span continuousbeams and single bay frames under point loads. They concluded that arotation capacity equal to 3 is sufficient and the corresponding limitingwidth-to-thickness limit ratios for class 1 sections were developed.These limits are also adopted in the current Italian code NTC 2008 [44].
Several studies were addressed also for cold-formed structuralhollow sections. Korol and Hudoba [14] recommended a rotation ca-pacity equal to 4 for plastic design. To satisfy this requirement somedesign rules for limiting width-to-thickness ratios were then devel-oped. This rotation capacity was further adopted by [15–17].
In Europe, Stranghoner et al. [45] performed parametric studies todetermine the rotation requirements of square, rectangular and circularhollow sections on a three-span continuous beam subjected to a pointload in the central span. The investigated factors included beam geom-etry, loading, cross-section, material and serviceability requirements.Results demonstrated that a rotation capacity of 3 is sufficient to pro-vide a full plastic behavior.
3. Flexural overstrength
3.1. Generality
The flexural overstrength (s) is the non-dimensional measure of theultimate bending capacity of steel beams, due to the amount of strain-hardening which can be exhibited before the complete developmentof local buckling. Obviously, in case ofmodelswhere the actual membersection is schematized into an equivalent ideal sectionmadeof two con-centrated masses [7,23,31], it can be intended as the ratio between thestress (fLB) corresponding to the complete development of local buck-ling and the yielding stress (fy):
s ¼ f LBf y
: ð3Þ
Conversely, in general, s may be defined in terms of bending momentsby means of the following equation:
s ¼ MLB
Mpð4Þ
whereΜLB=Μu is the peak bendingmoment experienced by the beam,corresponding to the complete development of local buckling, andΜp isthe beam plastic bending moment. This definition is described in Fig. 1.
The methods for predicting the non-dimensional ultimate bendingcapacity of steel members are essentially the same methods adoptedfor predicting the rotation capacity.
Kemp [23] proposed a theoretical solution for an ideal I beammadeof a perfectly plastic material, assuming that the critical strain occurs inthe middle of the plastic zone, whose extension was assumed equal tothe semi-wave buckling length, according to [46].
Fig. 4. Experimental layout (a), positioning of LVDTs (b,c).
147M. D'Aniello et al. / Journal of Constructional Steel Research 78 (2012) 144–158
Author's personal copy
The stress corresponding to the complete development of localbuckling is influenced also by the relative restraint between the weband the flange and also by the stress distribution across the sectiondepth. Besides, the theoretical analyses do not take into account the ef-fects due to the stress gradient related to the variation of bending mo-ment along the beam length. These effects have been early underlinedby tests performed by [47], which showed that for I and H beams thebuckling length of the flange is approximately 1.20 times larger thanthe flange width (bf). Therefore, the influence of the longitudinal stressgradient on the critical stress depends on the ratio bf/L [7], being L thedistance between the point of zero moment and the plastic hinge.
Kato [30–32] proposed empirical equations to predict the flexuraloverstrength based on the results of 68 tests carried out on “stub-column” specimens having different steel grades and local (flange andweb) slenderness parameters. The normalized overstrength s wasobtained by a multiple regression analysis as function of the flangeand web slenderness for each grade of steel.
Finally, it has to be underlined that all the proposed formulationshave to be integratedwith the control of the conditions leading to over-all flexural–torsional buckling.
3.2. Flexural overstrength in current codes
In modern seismic design codes, the value of flexural overstrengthis needed to allow for an appropriate application of hierarchy criteria.
According to AISC 341‐05 [48] the beam flexural overstrength isequal to 1.1Ry, being 1.1 a factor accounting for strain-hardening, aswell as other possible sources of overstrength, whereas Ry is ratio be-tween the expected yield stress and the specified minimum yield stress(Ry varies in the range 1.1 to 1.5, depending on steel grade), so that it ac-counts for the influence of randommaterial variability. The factor 1.1 hasbeen obtained from the wide experimental research devoted to providequalified moment-resisting connections during the SAC project [49].
The current Italian codeNTC 2008 [44] and Eurocode 8 [6] consider asimilar overstrength factor, expressed as 1.1 γov. However, according toEurocode 8 the ratio between the maximum actual yield strength fy.max
and the nominal yield strength fy has not to exceed 1.1 γov, so that itseems that the considered overstrength accounts for random materialvariability only. Moreover, Eurocode 8 does not provide a criterion foran appropriate evaluation of γov, but suggests the use of γov=1.25.This assumption leads to an overall overstrength factor equal to
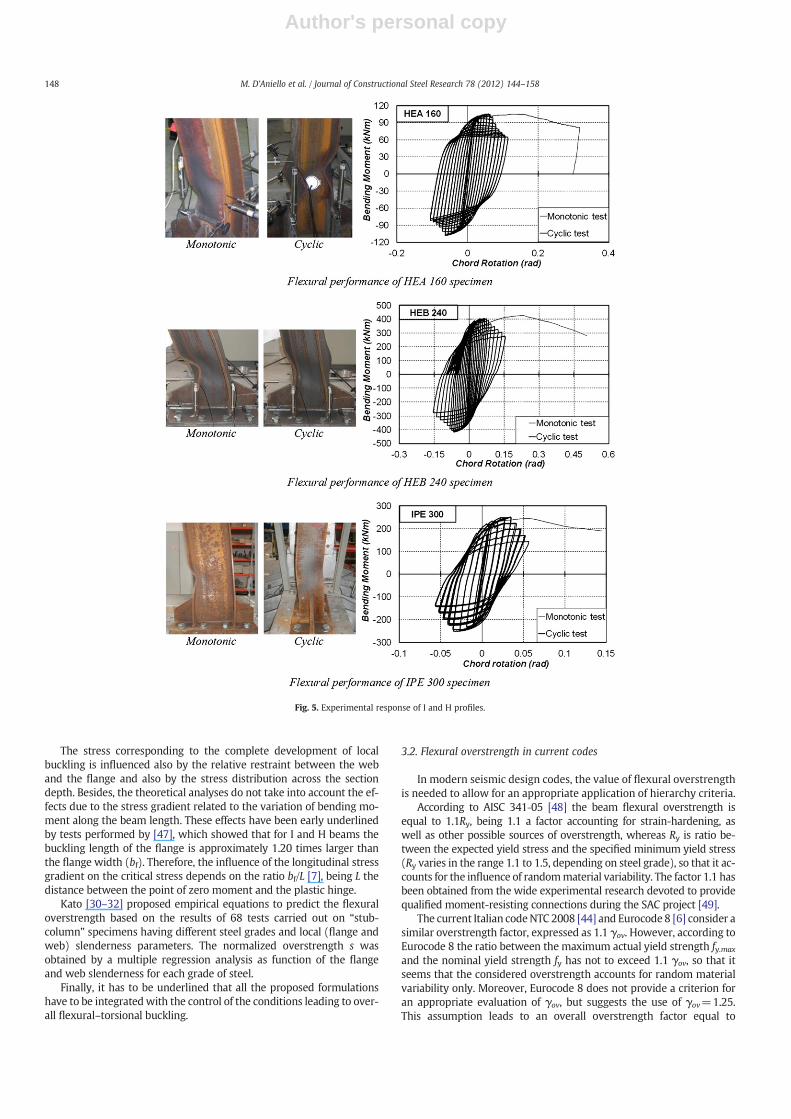
Fig. 5. Experimental response of I and H profiles.
148 M. D'Aniello et al. / Journal of Constructional Steel Research 78 (2012) 144–158
Author's personal copy
1.10×1.25=1.375, having an important role in the practical applica-tion of hierarchy criteria in capacity design.
It isworth noting that, on one hand, AISC 341‐05 clearly distinguishesthe overstrength due to random material variability, by means of theexpected yield strength, and the overstrength due to strain-hardeningand other possible sources, by means of 1.1 factor, whereas, on theother hand, this clear distinction is not made in Eurocode 8 whereoverstrength due to strain-hardening and other sources is not men-tioned. However, all the current codes do not consider that the amountof strain-hardening which can be exhibited before the complete devel-opment of local buckling is related to the width-to-thickness ratios ofthe plate elements constituting the cross section. Only the late ItaliancodeOPCM3274, nowadays no longer in use, overcame this limit by pro-viding the flexural overstrength factor (s) by means of the formulationsuggested by [8]. According to that code, s can be estimated for I and Hsections subjected to axial and/or flexural loads, considering usual steelgrades (S 235, S 275 and S 355), as follows:
s ¼ 1
0:695þ 1:632λ2f þ 0:062λ2
w−0:602 bfLv
≤ f uf y
ð5Þ
where:
λf ¼bf2:tf
ffiffiffiffiffif yE
sλw ¼ dw;e
tw
ffiffiffiffiffif yE
sð6Þ
are theflange and theweb slenderness parameters, respectively, being bfthe flange width, tf the flange thickness, dw,e the compressed part of theweb, tw the web thickness. In addition, the ratio bf/Lv, being Lv the shearlength, i.e. the distance between the plastic hinge and the point of zeromoment, accounts for the influence of the stress gradient along themember axis.
The compressed part of the web, i.e. the effective compressed web,can be computed according to [31] as:
dw;e ¼12
1þ AAw
ρ� �
dw ð7Þ
where A is the section area, Aw is theweb area, dw is the web depth and ρis the non-dimensional axial load, i.e. the ratio between the axial load andthe squash load. With reference to dissipative zones, it is well knownthat beam ends are actually able to transmit their ultimate resistance,
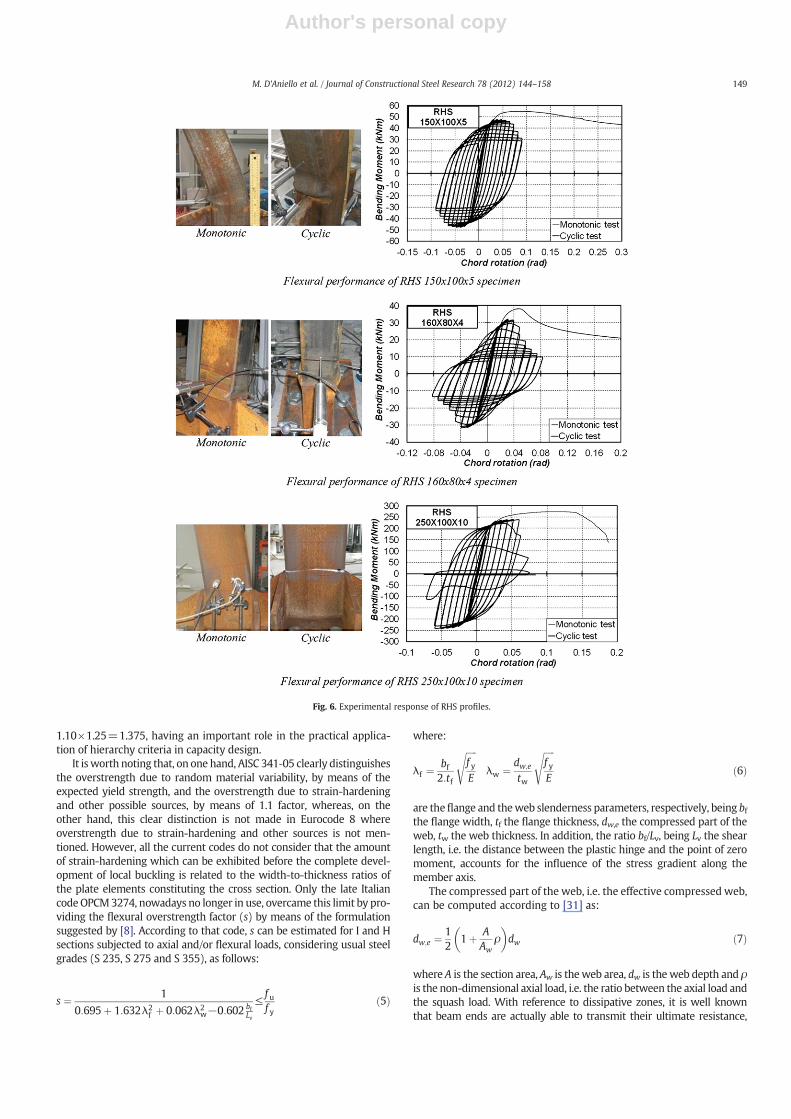
Fig. 6. Experimental response of RHS profiles.
149M. D'Aniello et al. / Journal of Constructional Steel Research 78 (2012) 144–158
Author's personal copy
provided that beam-to-column joints are designed according to the fol-lowing capacity design principle:
MjRd ≥ sγovMbRd ð8Þ
where theγov factor accounts for randommaterial variability and the s fac-tor for the strain-hardening exhibited before the complete development
of beam flange local buckling. The values of the γov factor suggested byOPCM 3274 for the different steel grades are delivered in Table 2.
4. Experimental activity
4.1. Selected specimens and test setup
Two different typologies of cross-section made of mild carbon steelwere investigated: a) hot rolled I and H sections; b) rectangular and
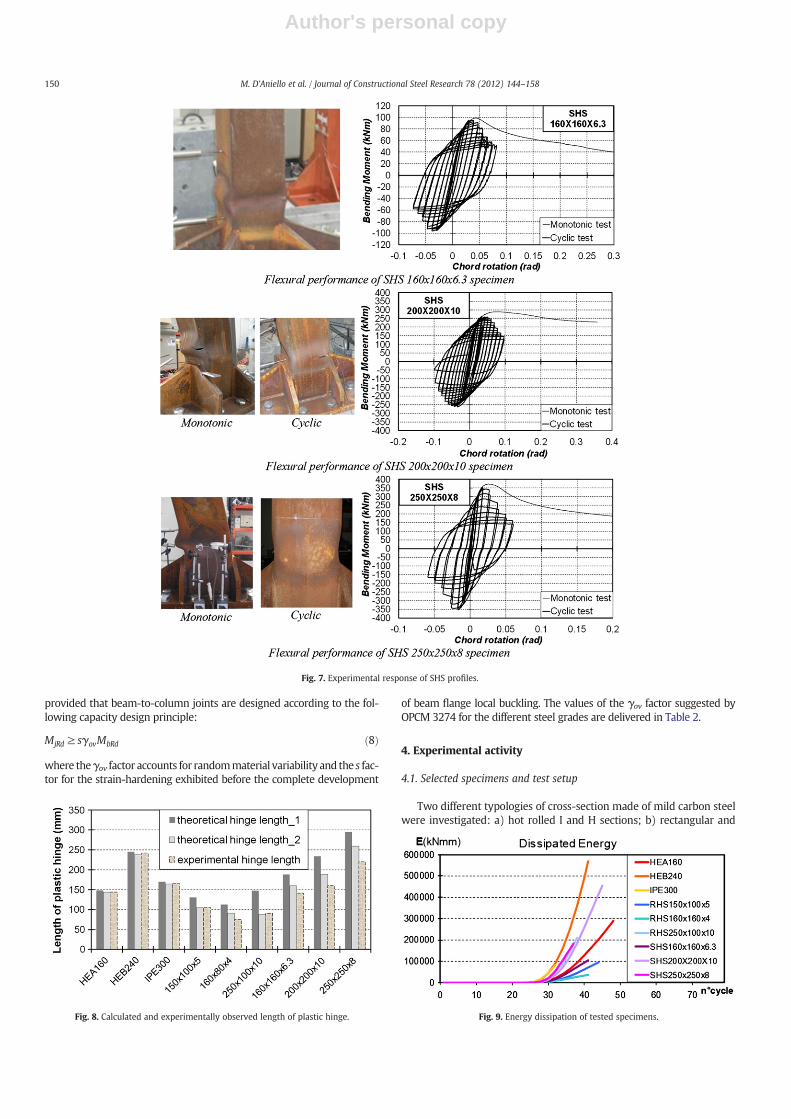
Fig. 7. Experimental response of SHS profiles.
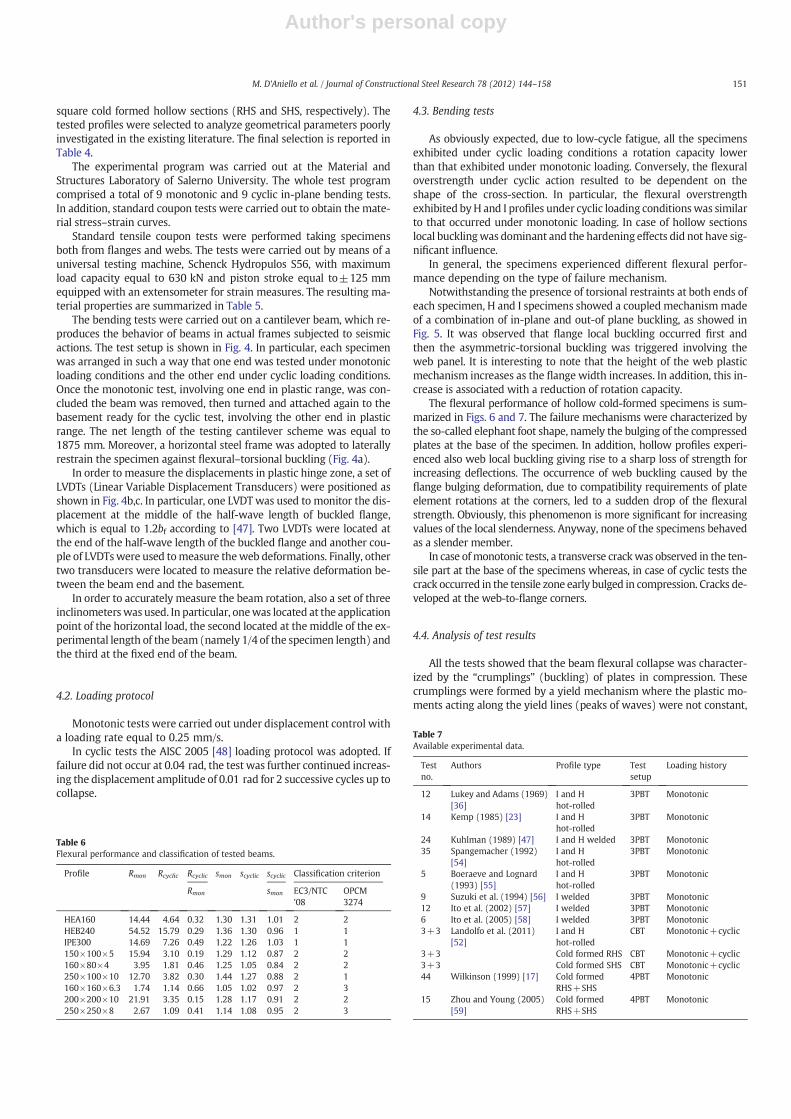
Fig. 8. Calculated and experimentally observed length of plastic hinge. Fig. 9. Energy dissipation of tested specimens.
150 M. D'Aniello et al. / Journal of Constructional Steel Research 78 (2012) 144–158
Author's personal copy
square cold formed hollow sections (RHS and SHS, respectively). Thetested profiles were selected to analyze geometrical parameters poorlyinvestigated in the existing literature. The final selection is reported inTable 4.
The experimental program was carried out at the Material andStructures Laboratory of Salerno University. The whole test programcomprised a total of 9 monotonic and 9 cyclic in-plane bending tests.In addition, standard coupon tests were carried out to obtain the mate-rial stress–strain curves.
Standard tensile coupon tests were performed taking specimensboth from flanges and webs. The tests were carried out by means of auniversal testing machine, Schenck Hydropulos S56, with maximumload capacity equal to 630 kN and piston stroke equal to±125 mmequipped with an extensometer for strain measures. The resulting ma-terial properties are summarized in Table 5.
The bending tests were carried out on a cantilever beam, which re-produces the behavior of beams in actual frames subjected to seismicactions. The test setup is shown in Fig. 4. In particular, each specimenwas arranged in such a way that one end was tested under monotonicloading conditions and the other end under cyclic loading conditions.Once the monotonic test, involving one end in plastic range, was con-cluded the beam was removed, then turned and attached again to thebasement ready for the cyclic test, involving the other end in plasticrange. The net length of the testing cantilever scheme was equal to1875 mm. Moreover, a horizontal steel frame was adopted to laterallyrestrain the specimen against flexural–torsional buckling (Fig. 4a).
In order to measure the displacements in plastic hinge zone, a set ofLVDTs (Linear Variable Displacement Transducers) were positioned asshown in Fig. 4b,c. In particular, one LVDT was used to monitor the dis-placement at the middle of the half-wave length of buckled flange,which is equal to 1.2bf according to [47]. Two LVDTs were located atthe end of the half-wave length of the buckled flange and another cou-ple of LVDTswere used tomeasure theweb deformations. Finally, othertwo transducers were located to measure the relative deformation be-tween the beam end and the basement.
In order to accurately measure the beam rotation, also a set of threeinclinometerswas used. In particular, onewas located at the applicationpoint of the horizontal load, the second located at the middle of the ex-perimental length of the beam (namely 1/4 of the specimen length) andthe third at the fixed end of the beam.
4.2. Loading protocol
Monotonic tests were carried out under displacement control witha loading rate equal to 0.25 mm/s.
In cyclic tests the AISC 2005 [48] loading protocol was adopted. Iffailure did not occur at 0.04 rad, the test was further continued increas-ing the displacement amplitude of 0.01 rad for 2 successive cycles up tocollapse.
4.3. Bending tests
As obviously expected, due to low-cycle fatigue, all the specimensexhibited under cyclic loading conditions a rotation capacity lowerthan that exhibited under monotonic loading. Conversely, the flexuraloverstrength under cyclic action resulted to be dependent on theshape of the cross-section. In particular, the flexural overstrengthexhibited byH and I profiles under cyclic loading conditionswas similarto that occurred under monotonic loading. In case of hollow sectionslocal bucklingwas dominant and the hardening effects did not have sig-nificant influence.
In general, the specimens experienced different flexural perfor-mance depending on the type of failure mechanism.
Notwithstanding the presence of torsional restraints at both ends ofeach specimen, H and I specimens showed a coupled mechanismmadeof a combination of in-plane and out-of plane buckling, as showed inFig. 5. It was observed that flange local buckling occurred first andthen the asymmetric-torsional buckling was triggered involving theweb panel. It is interesting to note that the height of the web plasticmechanism increases as the flange width increases. In addition, this in-crease is associated with a reduction of rotation capacity.
The flexural performance of hollow cold-formed specimens is sum-marized in Figs. 6 and 7. The failure mechanisms were characterized bythe so-called elephant foot shape, namely the bulging of the compressedplates at the base of the specimen. In addition, hollow profiles experi-enced also web local buckling giving rise to a sharp loss of strength forincreasing deflections. The occurrence of web buckling caused by theflange bulging deformation, due to compatibility requirements of plateelement rotations at the corners, led to a sudden drop of the flexuralstrength. Obviously, this phenomenon is more significant for increasingvalues of the local slenderness. Anyway, none of the specimens behavedas a slender member.
In case ofmonotonic tests, a transverse crackwas observed in the ten-sile part at the base of the specimens whereas, in case of cyclic tests thecrack occurred in the tensile zone early bulged in compression. Cracks de-veloped at the web-to-flange corners.
4.4. Analysis of test results
All the tests showed that the beam flexural collapse was character-ized by the “crumplings” (buckling) of plates in compression. Thesecrumplings were formed by a yield mechanism where the plastic mo-ments acting along the yield lines (peaks of waves) were not constant,
Table 6Flexural performance and classification of tested beams.
Profile Rmon Rcyclic Rcyclic smon scyclic scyclic Classification criterion
Rmon smon EC3/NTC'08
OPCM3274
HEA160 14.44 4.64 0.32 1.30 1.31 1.01 2 2HEB240 54.52 15.79 0.29 1.36 1.30 0.96 1 1IPE300 14.69 7.26 0.49 1.22 1.26 1.03 1 1150×100×5 15.94 3.10 0.19 1.29 1.12 0.87 2 2160×80×4 3.95 1.81 0.46 1.25 1.05 0.84 2 2250×100×10 12.70 3.82 0.30 1.44 1.27 0.88 2 1160×160×6.3 1.74 1.14 0.66 1.05 1.02 0.97 2 3200×200×10 21.91 3.35 0.15 1.28 1.17 0.91 2 2250×250×8 2.67 1.09 0.41 1.14 1.08 0.95 2 3
Table 7Available experimental data.
Testno.
Authors Profile type Testsetup
Loading history
12 Lukey and Adams (1969)[36]
I and Hhot-rolled
3PBT Monotonic
14 Kemp (1985) [23] I and Hhot-rolled
3PBT Monotonic
24 Kuhlman (1989) [47] I and H welded 3PBT Monotonic35 Spangemacher (1992)
[54]I and Hhot-rolled
3PBT Monotonic
5 Boeraeve and Lognard(1993) [55]
I and Hhot-rolled
3PBT Monotonic
9 Suzuki et al. (1994) [56] I welded 3PBT Monotonic12 Ito et al. (2002) [57] I welded 3PBT Monotonic6 Ito et al. (2005) [58] I welded 3PBT Monotonic3+3 Landolfo et al. (2011)
[52]I and Hhot-rolled
CBT Monotonic+cyclic
3+3 Cold formed RHS CBT Monotonic+cyclic3+3 Cold formed SHS CBT Monotonic+cyclic44 Wilkinson (1999) [17] Cold formed
RHS+SHS4PBT Monotonic
15 Zhou and Young (2005)[59]
Cold formedRHS+SHS
4PBT Monotonic
151M. D'Aniello et al. / Journal of Constructional Steel Research 78 (2012) 144–158

Author's personal copy
Table 8Experimental database for I and H profiles.
Exp. no. Test setup Profile Steel grade bf d tf tw L L* fy,flange fy web λf λw bf/L* E/Eh εh/εy(mm) (mm) (mm) (mm) (mm) (mm) (MPa) (MPa) (−) (−) (−) (−)
Lukey and Adams [36] 1 3PBT HR MCS 203.50 256.7 10.8 7.65 3480 1740 283 308 0.346 0.588 0.117 42.8 112 176.00 256.7 10.8 7.65 2946 1473 283 308 0.299 0.588 0.119 42.8 113 102.60 201.86 5.28 4.45 1554 777 371 395 0.408 0.932 0.132 48.2 9.84 73.90 201.86 5.28 4.45 1036 518 371 395 0.294 0.932 0.143 48.2 9.85 86.10 201.86 5.28 4.45 1254 627 371 395 0.343 0.932 0.137 48.2 9.86 94.00 201.86 5.28 4.45 1396 698 371 395 0.374 0.932 0.135 48.2 9.87 96.80 201.82 5.26 4.45 1448 724 371 395 0.387 0.932 0.134 48.2 9.88 101.90 251.72 5.26 4.6 1372 686 371 350 0.407 1.070 0.149 48.2 9.89 73.70 251.72 5.26 4.6 960 480 371 350 0.294 1.070 0.154 48.2 9.810 85.90 251.72 5.26 4.6 1168 584 371 350 0.343 1.070 0.147 48.2 9.811 93.50 251.72 5.26 4.6 1296 648 371 350 0.374 1.070 0.144 48.2 9.812 88.90 251.72 5.26 4.6 1280 640 371 350 0.355 1.070 0.139 48.2 9.8
Kemp [23] 1 3PBT HR MCS 150 217.8 8.09 6.65 3660 1830 340 358 0.373 0.726 0.082 48.2 9.82 145 217.4 10.57 6.82 3660 1830 285 329 0.253 0.670 0.079 42.8 113 106 273.9 7.05 5.85 3660 1830 332 388 0.299 1.058 0.058 48.2 9.84 149 217.9 8.56 6.78 1830 915 340 358 0.350 0.716 0.163 48.2 9.85 149 217.1 8.44 6.78 1830 915 294 300 0.330 0.652 0.163 42.8 116 140 209.5 10.77 6.76 1830 915 288 329 0.241 0.676 0.153 42.8 117 145 366.3 8.33 5.96 3660 1830 375 403 0.368 1.408 0.079 48.2 9.88 154 120.3 9.83 7.44 3660 1830 313 300 0.302 0.356 0.084 48.2 9.89 146 217.9 9.03 6.35 3660 1830 340 358 0.325 0.767 0.080 48.2 9.810 105 282.2 6.92 5.82 3660 1830 332 388 0.302 1.093 0.057 48.2 9.811 104 277.5 6.76 5.59 4358 2179 317 351 0.299 1.064 0.048 48.2 9.812 145.54 402.2 11.11 6.84 3660 1830 285 329 0.241 1.228 0.080 42.8 1113 W MCS 180 210 8.05 6.11 3660 1830 332 326 0.445 0.729 0.098 48.2 9.814 180 210 8 6 3632 1816 332 326 0.447 0.742 0.099 48.2 9.8
Kuhlman [47] 1 3PBT W MCS 141 294 8 5 3404 1702 236 217 0.295 0.894 0.083 37.5 12.32 150 294 8 5 3704 1852 236 217 0.314 0.894 0.081 37.5 12.33 160 294 8.5 5.5 4000 2000 449 217 0.435 0.809 0.080 37.5 10.34 160 277 8 6 2540 1270 287 260 0.370 0.765 0.126 42.8 115 160 274 8 5 2636 1318 287 252 0.370 0.894 0.121 42.8 116 160 275 8 4 2716 1358 287 252 0.370 1.122 0.118 42.8 117 160 296 8 5 1796 898 287 252 0.370 0.970 0.178 42.8 118 160 296 8 5 2196 1098 287 252 0.370 0.970 0.146 42.8 119 160 291 8 5 2598 1299 287 252 0.370 0.953 0.123 42.8 1110 170 295 8 5 2802 1401 236 217 0.356 0.897 0.121 37.5 12.311 182 294 8 5.5 3002 1501 236 217 0.381 0.812 0.121 37.5 12.312 190 294 8 5.5 3400 1700 236 217 0.398 0.812 0.112 37.5 12.313 141 260 10.2 5.5 3000 1500 333 709 0.275 1.266 0.094 48.2 9.814 150 259 10 5.5 3200 1600 333 709 0.299 1.262 0.094 48.2 9.815 160 258 10.4 5.5 3508 1754 333 709 0.306 1.253 0.091 48.2 9.816 160 169 10.2 5.5 2304 1152 333 709 0.312 0.785 0.139 48.2 9.817 160 220 10 5.5 2204 1102 333 709 0.319 1.056 0.145 48.2 9.818 161 289 10 5.5 2100 1050 333 709 0.321 1.421 0.153 48.2 9.819 160 298 10 6 2000 1000 333 341 0.319 0.934 0.160 48.2 9.820 160 299 10 6 2402 1201 333 349 0.319 0.948 0.133 48.2 9.821 160 299 10 6 2804 1402 333 349 0.319 0.948 0.114 48.2 9.822 170 299 10 6 2406 1203 333 349 0.338 0.948 0.141 48.2 9.823 183 299 10.3 6 2500 1250 333 349 0.354 0.946 0.146 48.2 9.824 190 299 10.2 6 2700 1350 333 349 0.371 0.946 0.141 48.2 9.8
Spangemacher [54] 1 3PBT HR MCS 220.5 220 15.5 9.8 1200 600 274.5 348.5 0.257 0.393 0.368 37.5 12.32 220.6 219.5 15.7 10 1200 600 274.5 348.5 0.254 0.383 0.368 37.5 12.33 219 218.7 16.3 9.6 3500 1750 278.5 286.1 0.245 0.358 0.125 42.8 114 218.4 217.4 16.1 9.4 3500 1750 278.5 286.1 0.247 0.364 0.125 42.8 115 220.5 208.3 10.5 7.5 1200 600 282.5 308 0.385 0.478 0.368 42.8 116 220 209 10.5 7.5 3000 1500 282.5 308 0.384 0.48 0.147 42.8 117 221 211 11 7.4 4000 2000 282.5 308 0.368 0.489 0.111 42.8 118 225.5 215.5 11 7.5 1200 600 420.5 437.5 0.459 0.589 0.376 48.2 9.89 225.5 210.3 11 7.5 3000 1500 420.5 437.5 0.459 0.573 0.15 48.2 9.810 222 214 10.7 7.5 4000 2000 420.5 437.5 0.464 0.586 0.111 48.2 9.811 279 278 17.6 10.5 1200 600 248.5 252.5 0.273 0.401 0.465 37.5 12.312 279.3 276.8 17.8 10.9 3000 1500 248.5 252.5 0.27 0.384 0.186 37.5 12.313 279 282 17.7 10.8 4000 2000 248.5 252.5 0.271 0.396 0.14 37.5 12.314 280 255.2 12.7 7.6 1200 600 276.5 311.5 0.4 0.582 0.467 42.8 1115 280 266 12.6 8 3000 1500 276.5 311.5 0.403 0.58 0.187 42.8 1116 280 269 12.8 7.5 4000 2000 276.5 311.5 0.397 0.625 0.14 42.8 1117 225.5 206 10.3 7.25 4000 2000 275 302 0.396 0.485 0.113 42.8 1118 225.5 208.3 11.1 7.65 4000 2000 430.5 448.5 0.46 0.562 0.113 48.2 9.819 300.5 350 15 10 3000 1500 248 323 0.344 0.627 0.2 37.5 12.320 HSS 219.2 220.4 16 9.4 1200 600 525.2 541.3 0.343 0.509 0.365 48.2 9.821 219.4 220 15.9 9.7 1200 600 525.2 541.3 0.345 0.493 0.366 48.2 9.822 218.8 219.1 16.3 9.8 3500 1750 486.2 531.7 0.323 0.479 0.125 48.2 9.823 218.6 217.3 16.2 9.4 3500 1750 486.2 531.7 0.325 0.495 0.125 48.2 9.8
152 M. D'Aniello et al. / Journal of Constructional Steel Research 78 (2012) 144–158

Author's personal copy
but ever increasing due to strain‐hardening. The yielded zones can beextended to the component plates of the specimen.
During the tests it was monitored the extension of the half-wavelength (Lm) of the buckled flange. This parameter plays a key role, be-cause it is directly related to the rotation capacity of the beam. Thehalf-wave length (Lm) can be theoretically calculated for I and H shapesby means of the following relationship [28,29,50,51]:
Lm ¼ 2βc where β ¼ 0:6⋅ tftw
� �3=4⋅ d
c
� �1=4ð9Þ
where tf is the flange thickness, tw is the web thickness, d is the beamdepth. The parameter c was derived for I beams and according to[28,29] it is given by:
c ¼ 0:5⋅bf ð10Þ
with bf the flange semi-width.
However, the tests carried out within this study showed that it ismore realistic to assume the following expressions:
c ¼ 0:5⋅ bf−twð Þ for I and H beams ð11Þ
c ¼ bf � 2 tw þ rið Þ for RHS and HSS beams ð12Þ
being ri the inside corner radius. Indeed, the graph depicted in Fig. 8shows that the plastic hinge lengths calculated model 2 (namely usingc given by Eqs. (11) and (12)) fit better the plastic hinge breadths ex-perimentally observed than those calculated with model 1 (namelyusing c given by Eq. (10)).
Regarding the amount of energy dissipation capacity exhibited bythe tested specimens a comparison is given in Fig. 9 as far as the numberof cycles increases. The greatest energy dissipation capacity is exhibitedby HEB 240.
Table 8 (continued)
Exp. no. Test setup Profile Steel grade bf d tf tw L L* fy,flange fy web λf λw bf/L* E/Eh εh/εy(mm) (mm) (mm) (mm) (mm) (mm) (MPa) (MPa) (−) (−) (−) (−)
24 281.3 283 17.4 11.5 1200 600 489 539 0.39 0.547 0.469 48.2 9.825 283.3 281.2 17.4 11.4 3000 1500 489 539 0.393 0.548 0.189 48.2 9.826 284 284.5 17.4 11.5 4000 2000 489 539 0.394 0.55 0.142 48.2 9.827 280.5 276.1 12.6 8.8 1200 600 504 535 0.545 0.72 0.468 48.2 9.828 281 275.6 12.6 9 3000 1500 504 535 0.546 0.702 0.187 48.2 9.829 281 275 12.7 9.3 4000 2000 504 535 0.542 0.677 0.141 48.2 9.830 283.4 281 17.3 11.3 3000 1500 489 539 0.395 0.552 0.189 48.2 9.831 283.2 284.7 17.4 11.5 3000 1500 489 539 0.393 0.55 0.189 48.2 9.832 283 281.5 17.3 11.35 3000 1500 489 539 0.395 0.551 0.189 48.2 9.833 300.5 350 15 10 3000 1500 486 990 0.482 1.099 0.2 48.2 9.834 300.5 350 15 10 3000 1500 817 813 0.625 0.996 0.2 48.2 9.835 300.5 350 15 10 3000 1500 967 304 0.68 0.609 0.2 48.2 9.8
Boeraeve and Lognard [55] 1 3PBT HR MCS 200.7 183.3 14.1 8.8 3000 1500 303 342 0.270 0.356 0.134 42.8 112 200.2 183.3 14.7 9.5 3000 1500 375 421 0.288 0.363 0.133 48.2 9.83 201.5 184.6 15.1 9.5 3000 1500 445 462 0.307 0.381 0.134 48.2 9.84 200.4 185.8 14.6 9.6 3000 1500 261 291 0.242 0.304 0.134 37.5 12.35 199.9 189.3 14.9 9.4 3000 1500 409 426 0.296 0.382 0.133 48.2 9.8
Suzuki et al. [56] 1 3PBT W MCS 150 150 9 6 1200 600 291 340 0.31 0.443 0.25 42.8 112 150 150 9 6 1800 900 291 340 0.31 0.443 0.167 42.8 113 HSS 150 150 9 6 1200 600 526 509 0.417 0.542 0.25 48.2 9.84 150 150 9 6 1800 900 526 509 0.417 0.542 0.167 48.2 9.85 HSS+MCS 150 150 9 6 1800 900 291 509 0.31 0.542 0.167 42.8 116 150 150 9 6 1200 600 527 340 0.417 0.443 0.25 48.2 9.87 150 150 9 6 1200 600 291 509 0.31 0.542 0.25 42.8 118 150 150 9 6 1800 900 687 340 0.477 0.443 0.167 48.2 9.89 150 150 9 6 1800 900 291 686 0.31 0.629 0.167 42.8 11
Ito et al. [57] 1 3PBT W MCS 134 400 8.8 4.4 4000 2000 285 349 0.280 1.771 0.067 42.8 112 134 400 8.8 4.5 4000 2000 285 349 0.280 1.732 0.067 42.8 113 134 398 8.9 4.4 4000 2000 285 349 0.277 1.761 0.067 42.8 114 134 398 8.8 4.4 4000 2000 285 349 0.280 1.762 0.067 42.8 115 135 398 8.7 4.4 4000 2000 285 349 0.286 1.763 0.068 42.8 116 134 400 8.9 4.4 4000 2000 285 349 0.277 1.771 0.067 42.8 117 135 441 8.9 4.4 4000 2000 285 349 0.279 1.960 0.068 42.8 118 134 438 8.9 4.4 4000 2000 285 349 0.277 1.947 0.067 42.8 119 134 441 8.8 4.4 4000 2000 285 349 0.280 1.961 0.067 42.8 1110 134 438 8.8 4.4 4000 2000 285 349 0.280 1.948 0.067 42.8 1111 135 462 8.8 4.5 4000 2000 285 349 0.283 2.013 0.068 42.8 1112 135 461 8.9 4.3 4000 2000 285 349 0.279 2.101 0.068 42.8 11
Ito et al. [58] 1 3PBT W HSS 121 305.2 11.1 6 2440 1220 559.1 599.3 0.281 1.26 0.099 48.2 9.82 117 388.2 11.1 6.1 2740 1370 592.8 613 0.28 1.621 0.085 48.2 9.83 121 446.2 11.1 6 2700 1350 559.1 599.3 0.281 1.888 0.09 48.2 9.84 HSS+MCS 121 305.4 11.2 6.2 3600 1800 559.1 324 0.279 0.896 0.067 48.2 9.85 121 399.4 11.2 6.2 3800 1900 559.1 324 0.279 1.194 0.064 48.2 9.86 121 446.2 11.1 5.9 3900 1950 559.1 324 0.281 1.411 0.062 48.2 9.8
Landolfo et al. [52] 1 CBT HR MCS 160 152 9 6 15 1875 275 275 0.322 0.404 0.077 42.8 112 240 240 17 10 21 1875 275 275 0.255 0.373 0.116 42.8 113 150 300 10.7 7.1 15 1875 275 275 0.254 0.710 0.073 42.8 11
3PBT = 3 points bending test.CBT = cantilever bending test.HR = hot-rolled.W = welded.MCS = mild carbon steel.HSS = high strength steel.
Table 8 (continued)
153M. D'Aniello et al. / Journal of Constructional Steel Research 78 (2012) 144–158

Author's personal copy
Table 9Experimental database for RHS and SHS profiles.
Exp. no. Test setup Profile Steel grade bf d t r L1 L2 L* fy λf λw bf/L* E/Eh εh/εy(mm) (mm) (mm) (mm) (mm) (mm) (mm) (MPa) (−) (−) (−) (−)
Wilkinson [17] 1 4PBT CFS MCS 50.25 151.04 4.92 9.9 1700 800 450 441 0.234 0.611 0.112 48.2 9.82 50.41 150.92 4.90 10.7 1700 800 450 441 0.236 0.606 0.112 48.2 9.83 50.27 150.43 3.92 6.8 1700 800 450 457 0.299 0.814 0.112 48.2 9.84 50.40 150.44 3.87 7.3 1700 800 450 457 0.304 0.819 0.112 48.2 9.85 50.11 150.42 3.89 7.3 1700 800 450 457 0.300 0.814 0.111 48.2 9.86 50.16 150.21 3.89 5.4 1700 800 450 423 0.289 0.804 0.111 48.2 9.87 50.22 150.47 2.97 5.9 1700 800 450 444 0.389 1.073 0.112 48.2 9.88 50.01 150.79 2.95 5.8 1700 800 450 444 0.390 1.085 0.111 48.2 9.89 50.34 150.80 2.96 5.7 1700 800 450 444 0.391 1.083 0.112 48.2 9.810 50.15 150.43 2.60 4.6 1700 800 450 446 0.444 1.252 0.111 48.2 9.811 50.41 150.39 2.57 4.6 1700 800 450 446 0.452 1.266 0.112 48.2 9.812 50.23 150.40 2.59 4.8 1700 800 450 446 0.447 1.253 0.112 48.2 9.813 50.40 150.31 2.64 5.3 1700 800 450 440 0.437 1.211 0.112 48.2 9.814 50.64 150.65 2.25 4.6 1700 800 450 444 0.517 1.445 0.113 48.2 9.815 50.57 150.51 2.28 4.2 1700 800 450 444 0.510 1.433 0.112 48.2 9.816 50.70 150.37 2.26 4.8 1700 800 450 444 0.516 1.432 0.113 48.2 9.817 50.70 100.45 2.06 3.8 1700 800 450 449 0.569 1.042 0.113 48.2 9.818 50.55 100.49 2.07 3.9 1700 800 450 449 0.565 1.035 0.112 48.2 9.819 50.24 100.46 2.04 4.7 1700 800 450 449 0.569 1.032 0.112 48.2 9.820 50.22 100.45 2.04 3.4 1700 800 450 423 0.552 1.030 0.112 48.2 9.821 50.10 75.48 1.94 4.4 1300 500 400 411 0.571 0.760 0.125 48.2 9.822 50.31 75.63 1.95 4.4 1300 500 400 411 0.571 0.758 0.126 48.2 9.823 25.28 75.31 1.98 3.7 1300 500 400 457 0.298 0.800 0.063 48.2 9.824 25.23 75.33 1.95 4.0 1300 500 400 457 0.302 0.805 0.063 48.2 9.825 25.12 75.24 1.54 3.1 1300 500 400 439 0.373 1.025 0.063 48.2 9.826 25.20 74.90 1.54 3.4 1300 500 400 439 0.374 1.011 0.063 48.2 9.827 25.08 74.98 1.56 3.9 1300 500 400 439 0.368 0.984 0.063 48.2 9.828 25.12 75.27 1.55 3.4 1300 500 400 422 0.363 0.990 0.063 48.2 9.829 25.25 75.19 1.56 3.4 1300 500 400 422 0.363 0.983 0.063 48.2 9.830 50.13 150.46 3.00 6.2 1700 800 450 370 0.351 0.966 0.111 48.2 9.831 50.19 150.50 2.96 6.5 1700 800 450 370 0.356 0.975 0.112 48.2 9.832 50.51 150.45 3.00 6.8 1700 800 450 382 0.359 0.973 0.112 48.2 9.833 50.51 150.38 3.00 6.3 1700 800 450 382 0.359 0.979 0.112 48.2 9.834 50.43 100.91 2.06 3.6 1700 800 450 400 0.534 0.993 0.112 48.2 9.835 50.52 100.83 2.05 3.8 1700 800 450 400 0.538 0.992 0.112 48.2 9.836 75.84 125.56 2.92 6.6 1700 800 450 397 0.565 0.837 0.169 48.2 9.837 75.74 125.40 2.93 6.9 1700 800 450 397 0.562 0.828 0.168 48.2 9.838 75.56 125.40 2.91 7.1 1700 800 450 397 0.564 0.831 0.168 48.2 9.839 75.10 125.40 2.53 3.9 1700 800 450 374 0.626 0.981 0.167 48.2 9.840 100.27 100.43 2.88 5.2 1700 800 450 445 0.801 0.720 0.223 48.2 9.841 100.33 100.53 2.91 5.0 1700 800 450 445 0.794 0.716 0.223 48.2 9.842 100.25 100.53 2.86 5.2 1700 800 450 445 0.807 0.725 0.223 48.2 9.843 50.21 150.32 3.90 7.9 1700 800 450 349 0.262 0.703 0.112 48.2 9.844 50.57 150.39 3.85 7.5 1700 800 450 410 0.290 0.777 0.112 48.2 9.823 50.25 151.04 4.92 9.9 1700 800 450 441 0.234 0.611 0.112 48.2 9.824 50.41 150.92 4.90 10.7 1700 800 450 441 0.236 0.606 0.112 48.2 9.825 50.27 150.43 3.92 6.8 1700 800 450 457 0.299 0.814 0.112 48.2 9.826 50.40 150.44 3.87 7.3 1700 800 450 457 0.304 0.819 0.112 48.2 9.827 50.11 150.42 3.89 7.3 1700 800 450 457 0.300 0.814 0.111 48.2 9.828 50.16 150.21 3.89 5.4 1700 800 450 423 0.289 0.804 0.111 48.2 9.829 50.22 150.47 2.97 5.9 1700 800 450 444 0.389 1.073 0.112 48.2 9.830 50.01 150.79 2.95 5.8 1700 800 450 444 0.390 1.085 0.111 48.2 9.831 50.34 150.80 2.96 5.7 1700 800 450 444 0.391 1.083 0.112 48.2 9.832 50.15 150.43 2.60 4.6 1700 800 450 446 0.444 1.252 0.111 48.2 9.833 50.41 150.39 2.57 4.6 1700 800 450 446 0.452 1.266 0.112 48.2 9.834 50.23 150.40 2.59 4.8 1700 800 450 446 0.447 1.253 0.112 48.2 9.835 50.40 150.31 2.64 5.3 1700 800 450 440 0.437 1.211 0.112 48.2 9.836 50.64 150.65 2.25 4.6 1700 800 450 444 0.517 1.445 0.113 48.2 9.837 50.57 150.51 2.28 4.2 1700 800 450 444 0.510 1.433 0.112 48.2 9.838 50.70 150.37 2.26 4.8 1700 800 450 444 0.516 1.432 0.113 48.2 9.839 50.70 100.45 2.06 3.8 1700 800 450 449 0.569 1.042 0.113 48.2 9.840 50.55 100.49 2.07 3.9 1700 800 450 449 0.565 1.035 0.112 48.2 9.841 50.24 100.46 2.04 4.7 1700 800 450 449 0.569 1.032 0.112 48.2 9.842 50.22 100.45 2.04 3.4 1700 800 450 423 0.552 1.030 0.112 48.2 9.843 50.10 75.48 1.94 4.4 1300 500 400 411 0.571 0.760 0.125 48.2 9.844 50.31 75.63 1.95 4.4 1300 500 400 411 0.571 0.758 0.126 48.2 9.8
Zhou and Young [59] 1 4PBT CFS MCS 40.1 40.1 1.96 2 1442 480.7 480.7 447 0.47 0.43 0.22 0.18 0.082 80.5 80.4 1.91 4 1442 480.7 480.7 398 0.92 0.83 0.84 0.68 0.173 79.9 79.8 4.77 7.5 1443 481 481 448 0.39 0.31 0.15 0.10 0.174 49.8 99.9 1.97 2 1440 480 480 320 0.49 0.95 0.24 0.90 0.105 49.6 99.7 3.88 4 1439 479.7 479.7 378 0.27 0.50 0.07 0.25 0.106 59.9 120.2 1.84 2.5 1442 480.7 480.7 361 0.68 1.30 0.46 1.69 0.127 59.7 120 3.89 5.5 1442 480.7 480.7 392 0.33 0.61 0.11 0.37 0.12
154 M. D'Aniello et al. / Journal of Constructional Steel Research 78 (2012) 144–158
Author's personal copy
RHS profiles exhibited a larger reduction of energy dissipation thanSHS. This effect may be due to pinching phenomena triggered by inter-action between web and compression flange local buckling.
The experimental performance of tested beams is compared to thosepredicted by the examined codes, namely according to Eurocode 3, NTC2008 and OPCM 3274. This comparison is reported in Table 6, where itcan be noted that in case of hollow sections the codes provide differentclassifications by different criteria.
In particular, for wide flange profiles all codes are conservative. Inparticular, the classification according to NTC 2008 does not provide areliable prediction of the rotation capacity of beams, underestimatingit for wide flange but being not conservative for hollow profiles. Al-though conservative in terms of rotation capacity, OPCM 3274 criterionunderestimates the overstrength, especially for hollow sections.
These results confirm the need of a classification criterion dealingwith rotation capacity and flexural overstrength accounting for thecharacteristics of the whole member by overcoming the limitationsdue to the consideration of cross-section parameters only.
5. Empirical formulations of R and s
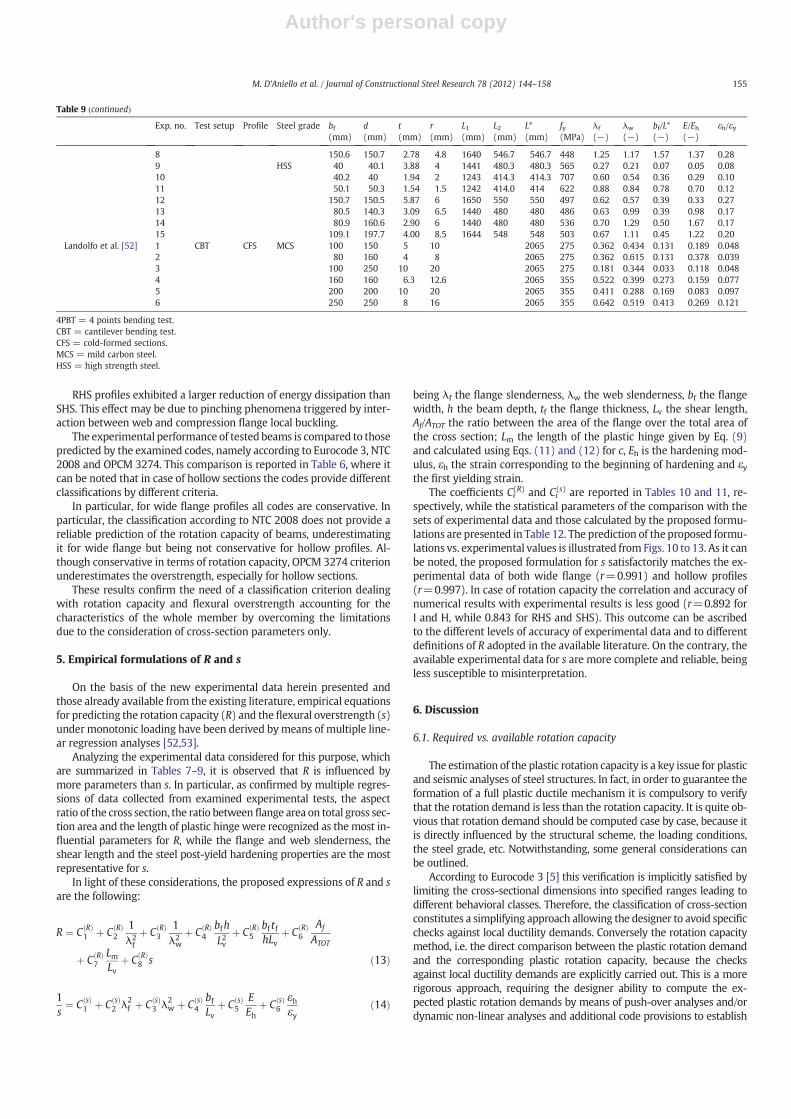
On the basis of the new experimental data herein presented andthose already available from the existing literature, empirical equationsfor predicting the rotation capacity (R) and the flexural overstrength (s)under monotonic loading have been derived bymeans of multiple line-ar regression analyses [52,53].
Analyzing the experimental data considered for this purpose, whichare summarized in Tables 7–9, it is observed that R is influenced bymore parameters than s. In particular, as confirmed by multiple regres-sions of data collected from examined experimental tests, the aspectratio of the cross section, the ratio between flange area on total gross sec-tion area and the length of plastic hinge were recognized as the most in-fluential parameters for R, while the flange and web slenderness, theshear length and the steel post-yield hardening properties are the mostrepresentative for s.
In light of these considerations, the proposed expressions of R and sare the following:
R ¼ C Rð Þ1 þ C Rð Þ
21λ2f
þ C Rð Þ3
1λ2wþ C Rð Þ
4bfhL2v
þ C Rð Þ5
bf tfhLv
þ C Rð Þ6
Af
ATOT
þ C Rð Þ7
LmLv
þ C Rð Þ8 s ð13Þ
1s¼ C sð Þ
1 þ C sð Þ2 λ2
f þ C sð Þ3 λ2
w þ C sð Þ4
bfLv
þ C sð Þ5
EEh
þ C sð Þ6
εhεy
ð14Þ
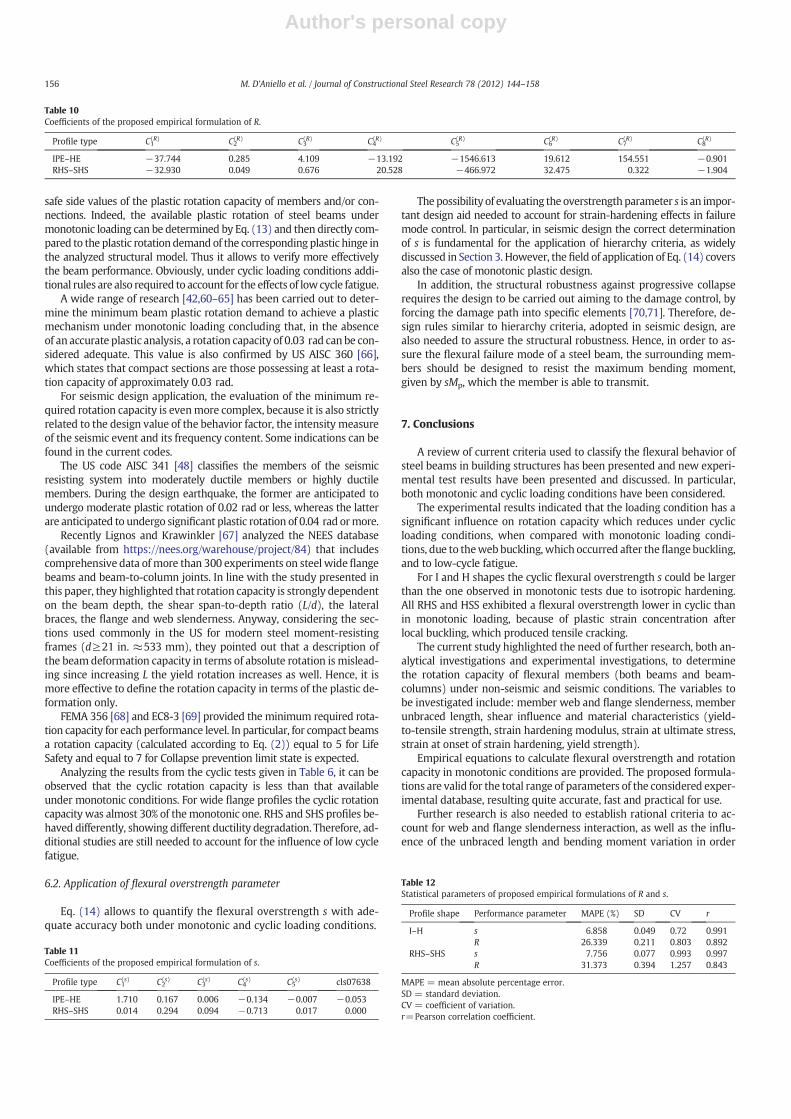
being λf the flange slenderness, λw the web slenderness, bf the flangewidth, h the beam depth, tf the flange thickness, Lv the shear length,Af/ATOT the ratio between the area of the flange over the total area ofthe cross section; Lm the length of the plastic hinge given by Eq. (9)and calculated using Eqs. (11) and (12) for c, Eh is the hardening mod-ulus, εh the strain corresponding to the beginning of hardening and εythe first yielding strain.
The coefficients Ci(R) and Ci
(s) are reported in Tables 10 and 11, re-spectively, while the statistical parameters of the comparison with thesets of experimental data and those calculated by the proposed formu-lations are presented in Table 12. The prediction of the proposed formu-lations vs. experimental values is illustrated from Figs. 10 to 13. As it canbe noted, the proposed formulation for s satisfactorily matches the ex-perimental data of both wide flange (r=0.991) and hollow profiles(r=0.997). In case of rotation capacity the correlation and accuracy ofnumerical results with experimental results is less good (r=0.892 forI and H, while 0.843 for RHS and SHS). This outcome can be ascribedto the different levels of accuracy of experimental data and to differentdefinitions of R adopted in the available literature. On the contrary, theavailable experimental data for s are more complete and reliable, beingless susceptible to misinterpretation.
6. Discussion
6.1. Required vs. available rotation capacity
The estimation of the plastic rotation capacity is a key issue for plasticand seismic analyses of steel structures. In fact, in order to guarantee theformation of a full plastic ductile mechanism it is compulsory to verifythat the rotation demand is less than the rotation capacity. It is quite ob-vious that rotation demand should be computed case by case, because itis directly influenced by the structural scheme, the loading conditions,the steel grade, etc. Notwithstanding, some general considerations canbe outlined.
According to Eurocode 3 [5] this verification is implicitly satisfied bylimiting the cross-sectional dimensions into specified ranges leading todifferent behavioral classes. Therefore, the classification of cross-sectionconstitutes a simplifying approach allowing the designer to avoid specificchecks against local ductility demands. Conversely the rotation capacitymethod, i.e. the direct comparison between the plastic rotation demandand the corresponding plastic rotation capacity, because the checksagainst local ductility demands are explicitly carried out. This is a morerigorous approach, requiring the designer ability to compute the ex-pected plastic rotation demands by means of push-over analyses and/ordynamic non-linear analyses and additional code provisions to establish
Table 9 (continued)
Exp. no. Test setup Profile Steel grade bf d t r L1 L2 L* fy λf λw bf/L* E/Eh εh/εy(mm) (mm) (mm) (mm) (mm) (mm) (mm) (MPa) (−) (−) (−) (−)
8 150.6 150.7 2.78 4.8 1640 546.7 546.7 448 1.25 1.17 1.57 1.37 0.289 HSS 40 40.1 3.88 4 1441 480.3 480.3 565 0.27 0.21 0.07 0.05 0.0810 40.2 40 1.94 2 1243 414.3 414.3 707 0.60 0.54 0.36 0.29 0.1011 50.1 50.3 1.54 1.5 1242 414.0 414 622 0.88 0.84 0.78 0.70 0.1212 150.7 150.5 5.87 6 1650 550 550 497 0.62 0.57 0.39 0.33 0.2713 80.5 140.3 3.09 6.5 1440 480 480 486 0.63 0.99 0.39 0.98 0.1714 80.9 160.6 2.90 6 1440 480 480 536 0.70 1.29 0.50 1.67 0.1715 109.1 197.7 4.00 8.5 1644 548 548 503 0.67 1.11 0.45 1.22 0.20
Landolfo et al. [52] 1 CBT CFS MCS 100 150 5 10 2065 275 0.362 0.434 0.131 0.189 0.0482 80 160 4 8 2065 275 0.362 0.615 0.131 0.378 0.0393 100 250 10 20 2065 275 0.181 0.344 0.033 0.118 0.0484 160 160 6.3 12.6 2065 355 0.522 0.399 0.273 0.159 0.0775 200 200 10 20 2065 355 0.411 0.288 0.169 0.083 0.0976 250 250 8 16 2065 355 0.642 0.519 0.413 0.269 0.121
4PBT = 4 points bending test.CBT = cantilever bending test.CFS = cold-formed sections.MCS = mild carbon steel.HSS = high strength steel.
Table 9 (continued)
155M. D'Aniello et al. / Journal of Constructional Steel Research 78 (2012) 144–158
Author's personal copy
safe side values of the plastic rotation capacity of members and/or con-nections. Indeed, the available plastic rotation of steel beams undermonotonic loading can be determined by Eq. (13) and then directly com-pared to the plastic rotation demand of the corresponding plastic hinge inthe analyzed structural model. Thus it allows to verify more effectivelythe beam performance. Obviously, under cyclic loading conditions addi-tional rules are also required to account for the effects of low cycle fatigue.
A wide range of research [42,60–65] has been carried out to deter-mine the minimum beam plastic rotation demand to achieve a plasticmechanism under monotonic loading concluding that, in the absenceof an accurate plastic analysis, a rotation capacity of 0.03 rad can be con-sidered adequate. This value is also confirmed by US AISC 360 [66],which states that compact sections are those possessing at least a rota-tion capacity of approximately 0.03 rad.
For seismic design application, the evaluation of the minimum re-quired rotation capacity is evenmore complex, because it is also strictlyrelated to the design value of the behavior factor, the intensity measureof the seismic event and its frequency content. Some indications can befound in the current codes.
The US code AISC 341 [48] classifies the members of the seismicresisting system into moderately ductile members or highly ductilemembers. During the design earthquake, the former are anticipated toundergo moderate plastic rotation of 0.02 rad or less, whereas the latterare anticipated to undergo significant plastic rotation of 0.04 rad ormore.
Recently Lignos and Krawinkler [67] analyzed the NEES database(available from https://nees.org/warehouse/project/84) that includescomprehensive data ofmore than 300 experiments on steel wideflangebeams and beam-to-column joints. In line with the study presented inthis paper, they highlighted that rotation capacity is strongly dependenton the beam depth, the shear span-to-depth ratio (L/d), the lateralbraces, the flange and web slenderness. Anyway, considering the sec-tions used commonly in the US for modern steel moment-resistingframes (d≥21 in. ≈533 mm), they pointed out that a description ofthe beamdeformation capacity in terms of absolute rotation is mislead-ing since increasing L the yield rotation increases as well. Hence, it ismore effective to define the rotation capacity in terms of the plastic de-formation only.
FEMA 356 [68] and EC8-3 [69] provided the minimum required rota-tion capacity for each performance level. In particular, for compact beamsa rotation capacity (calculated according to Eq. (2)) equal to 5 for LifeSafety and equal to 7 for Collapse prevention limit state is expected.
Analyzing the results from the cyclic tests given in Table 6, it can beobserved that the cyclic rotation capacity is less than that availableunder monotonic conditions. For wide flange profiles the cyclic rotationcapacity was almost 30% of themonotonic one. RHS and SHS profiles be-haved differently, showing different ductility degradation. Therefore, ad-ditional studies are still needed to account for the influence of low cyclefatigue.
6.2. Application of flexural overstrength parameter
Eq. (14) allows to quantify the flexural overstrength s with ade-quate accuracy both under monotonic and cyclic loading conditions.
The possibility of evaluating the overstrengthparameter s is an impor-tant design aid needed to account for strain-hardening effects in failuremode control. In particular, in seismic design the correct determinationof s is fundamental for the application of hierarchy criteria, as widelydiscussed in Section 3. However, thefield of application of Eq. (14) coversalso the case of monotonic plastic design.
In addition, the structural robustness against progressive collapserequires the design to be carried out aiming to the damage control, byforcing the damage path into specific elements [70,71]. Therefore, de-sign rules similar to hierarchy criteria, adopted in seismic design, arealso needed to assure the structural robustness. Hence, in order to as-sure the flexural failure mode of a steel beam, the surrounding mem-bers should be designed to resist the maximum bending moment,given by sMp, which the member is able to transmit.
7. Conclusions
A review of current criteria used to classify the flexural behavior ofsteel beams in building structures has been presented and new experi-mental test results have been presented and discussed. In particular,both monotonic and cyclic loading conditions have been considered.
The experimental results indicated that the loading condition has asignificant influence on rotation capacity which reduces under cyclicloading conditions, when compared with monotonic loading condi-tions, due to theweb buckling, which occurred after theflange buckling,and to low-cycle fatigue.
For I and H shapes the cyclic flexural overstrength s could be largerthan the one observed in monotonic tests due to isotropic hardening.All RHS and HSS exhibited a flexural overstrength lower in cyclic thanin monotonic loading, because of plastic strain concentration afterlocal buckling, which produced tensile cracking.
The current study highlighted the need of further research, both an-alytical investigations and experimental investigations, to determinethe rotation capacity of flexural members (both beams and beam-columns) under non-seismic and seismic conditions. The variables tobe investigated include: member web and flange slenderness, memberunbraced length, shear influence and material characteristics (yield-to-tensile strength, strain hardening modulus, strain at ultimate stress,strain at onset of strain hardening, yield strength).
Empirical equations to calculate flexural overstrength and rotationcapacity in monotonic conditions are provided. The proposed formula-tions are valid for the total range of parameters of the considered exper-imental database, resulting quite accurate, fast and practical for use.
Further research is also needed to establish rational criteria to ac-count for web and flange slenderness interaction, as well as the influ-ence of the unbraced length and bending moment variation in order
Table 11Coefficients of the proposed empirical formulation of s.
Profile type C1(s) C2
(s) C3(s) C4
(s) C5(s) cls07638
IPE–HE 1.710 0.167 0.006 −0.134 −0.007 −0.053RHS–SHS 0.014 0.294 0.094 −0.713 0.017 0.000
Table 12Statistical parameters of proposed empirical formulations of R and s.
Profile shape Performance parameter MAPE (%) SD CV r
I–H s 6.858 0.049 0.72 0.991R 26.339 0.211 0.803 0.892
RHS–SHS s 7.756 0.077 0.993 0.997R 31.373 0.394 1.257 0.843
MAPE = mean absolute percentage error.SD = standard deviation.CV = coefficient of variation.r=Pearson correlation coefficient.
Table 10Coefficients of the proposed empirical formulation of R.
Profile type C1(R) C2
(R) C3(R) C4
(R) C5(R) C6
(R) C7(R) C8
(R)
IPE–HE −37.744 0.285 4.109 −13.192 −1546.613 19.612 154.551 −0.901RHS–SHS −32.930 0.049 0.676 20.528 −466.972 32.475 0.322 −1.904
156 M. D'Aniello et al. / Journal of Constructional Steel Research 78 (2012) 144–158

Author's personal copy
to assure that beams are proportioned to provide adequate rotation ca-pacity under cyclic loading.
Acknowledgments
The financial support of the Italian Emergency Management Associ-ation (Protezione Civile Italiana): ReLUIS Project — Task 5 “Develop-ment of innovative approaches to design steel and composite steel-concrete structures” is gratefully acknowledged.
In addition, the authors would like to thank Manuela Brescia andSusanna Tortorelli, which developed their PhD thesis in this topic.
Finally, the contribution given by PhD Eng. Fabio Iannone during theexperimental activities at the Laboratory of the Dept. of Civil Engineer-ing of the University of Salerno is gratefully acknowledged.
References
[1] Driscoll GC. Rotation capacity requirements for single-span frames. Fritz Engi-neering Laboratory Report N0.268.5. Lehigh University; 1958. September, 1958.
[2] Driscoll GC. Rotation capacity of a 3-span continuous beam. Fritz Engineering Lab-oratory Report N0.268.2. Lehigh University; 1957. June.
[3] Kerfoot RP. Rotation capacity of beams. Report 297.14. Fritz Engineering Labora-tory. Lehigh University; 1965.
[4] ASCE. Plastic design in steel: a guide and commentary. Manual and report on en-gineering practice, no. 41. Welding Research Council and ASCE; 1971.
[5] CEN (European Communities for Standardization). EN 1993-1-1Eurocode 3:design of steel structures—part 1: general rules and rules for buildings; 2005.
[6] CEN (European Communities for Standardization). EN 1998‐1Eurocode 8: designof structures for earthquake resistance —part 1: general rules, seismic actions andrules for buildings; 2005.
[7] Mazzolani FM, Piluso V. Evaluation of the rotation capacity of steel beams andbeam-columns. Proceedings of 1st State of the Art Workshop COST C1, Strasbourg;1992.
[8] Mazzolani FM, Piluso V. Member behavioural classes of steel beams and beam-columns. Proc. of First State of the ArtWorkshop, COSTI, Strasbourg; 1992. p. 517-29.
[9] Gioncu V, Mazzolani FM. Alternative methods for assessing local ductility. In:Mazzolani FM, Gioncu V, editors. Behaviour of steel structures in seismic areas,STESSA'94. London: E&FN Spon; 1995. p. 182-90.
[10] Gioncu V, Mazzolani FM. Ductility of seismic resistant steel structures. London:Spon Press; 2002.
[11] AISC 360‐05. Specification for structural steel buildings. American Institute ofSteel Construction; 2005.
[12] Mazzolani FM, Piluso V. Member behavioural classes of steel beams andbeam-columns. Proc. XIV CTA conference, Viareggio (Italy), 24–27 October; 1993.
[13] OPCM 3274. First elements in the matter of general criteria for seismic classifica-tion of the national territory and of technical codes for structures in seismic zones.Official Gazette of the Italian Republic, Rome, and further modifications; 2003.
[14] Korol RM, Hudoba J. Plastic behavior of hollow structural sections. J Struct DivASCE 1972;98(5):1007-23.
[15] Hasan SW, Hancock GJ. Plastic bending tests of cold-formed rectangular hollowsections. Steel Construct J Aust Inst Steel Construct 1989;23(4):2–19.
[16] Zhao XL, Hancock GJ. Tests to determine plate slenderness limits for cold-formedrectangular hollow sections of grade C450. Steel Construct J Aust Inst SteelConstruct 1991;25(4):2–16.
[17] Wilkinson T. [1999]. The plastic behaviour of cold-formed rectangular hollow sec-tions. PhD thesis, Department of Civil Engineering at University of Sydney,Australia.
[18] Rondal J, Ph Boeraeve, Sedlacek G, Stranghöner N, Langenberg P. Rotation capacityof hollow beam sections. CIDECT; 1995.
[19] Sedlacek G, Feldmann M. [1995]. Background document 5.09 for chapter 5 ofEurocode 3 part 1.1 — the b/t ratios controlling the applicability of analysismodels in Eurocode 3 Part 1.1. Aachen.
[20] Sedlacek, G.; Dahl, W.; Stranghöner, N. & Kalinowski, B. [1998]. “Investigation ofthe rotation behaviour of hollow section beams”. EUR 17994 EN. Final report ofproject No 7210-SA/‐119.
[21] Mazzolani FM, Piluso V. Theory and design of seismic resistant steel frames.London: E & FN Spon an imprint of Chapman & Hall; 1996.
[22] Schleich, J.B.; Chantrain, P.; Chabrolin, B.; Galéa, Y.; Bureau, A.; Anza, J. & Espiga, F.[1998]. “Promotion of plastic design for steel and composite cross sections: newrequired conditions in Eurocodes 3 and 4, practical tools for designers”. Europeancommission.
Fig. 11. Experimental vs theoretical s (I and H).
Fig. 13. Experimental vs theoretical s (RHS and SHS).
Fig. 12. Experimental vs theoretical R (RHS and SHS).
Fig. 10. Experimental vs theoretical R (I and H).
157M. D'Aniello et al. / Journal of Constructional Steel Research 78 (2012) 144–158

Author's personal copy
[23] Kemp A. Interaction of plastic local and lateral buckling. J Struct Eng ASCE1985;111(10):2181-96.
[24] Climenhaga JJ, Johnson RP. Moment–rotation curves for locally buckling beams.inJ Struct Div 1972;98(ST6):1239-54.
[25] Ivanyi M. Moment rotation characteristics of locally buckling beams. PeriodicaPolytechnica, Technical University Budapest, 23(3–4); 1979. p. 217-30.
[26] Piluso V. [1992] Il comportamento inelastico dei telai sismo resistenti in acciaio(in Italian). PhD Thesis. University of Naples.
[27] Piluso V. [1997] Post-local buckling behaviour of rolled steel beams subjected tonon-uniform bending, Costruzioni Metalliche, No.3, pp. 23–34, 1997.
[28] Gioncu V, Pectu D. Available rotation capacity of wide-flange beams andbeam-columns. Part 1: theoretical approaches. J Constr Steel Res 1997;43(1–3):161-217.
[29] Gioncu V, Pectu D. Available rotation capacity of wide-flange beams andbeam-columns. Part 2: experimental and numerical tests. J Constr Steel Res1997;43(1–3):219-44.
[30] Kato B. Rotation capacity of steel members subject to local buckling. 9th WorldConference on Earthquake Engineering, 4; 1988. paper 6-2-3, Tokyo Kyoto.
[31] Kato B. Rotation capacity of H-section members as determined by local buckling.inJ Constr Steel Res 1989;13:95–109.
[32] Kato B. Deformation capacity of steel structures. inJ Constr Steel Res 1990;17:33-94.
[33] Kato B, Akiyama H. Theoretical prediction of the load–deflection relationship ofsteel members and frames. Lisbon: Proc. of IABSE symposium; 1973.
[34] Kato B., Akiyama H. [1981]. Ductility of members and frames subject to buckling,ASCE convention, May 11–15.
[35] Fukuchi Y. Flange buckling and ultimate load of beams under moment gradient.Trans AIJ 1969(166) (in Japanese).
[36] Lukey AF, Adams PF. Rotation capacity of beams under moment gradient. J StructDiv 1969;95(ST6):1173-88.
[37] Suzuki H, Kato B, Akiyama H. Flange buckling of H-section stub-columns. Proc. ofKanto Branch of A.I.J.; 1974. (in Japanese).
[38] Nakamura T. Strength and deformability of H shaped steel beams and lateral brac-ing requirements. J Constr Steel Res 1988(9):217-28.
[39] Spangemacher R, Sedlacek G. On the development of a computer simulator fortest of steel structures. Proceedings of the First World Conference on Construc-tional Steel Design, Acapulco, Mexico, 6–9 December; 1992.
[40] Guzelbey IH, Cevik A, Gogus MT. Prediction of rotation capacity of wide flangebeams using neural networks. J Constr Steel Res 2006;62:950-61.
[41] Cevik A. Genetic programming based formulation of rotation capacity of wideflange beams. J Constr Steel Res 2007;63:884-93.
[42] Yura JA, Galambos TV, Ravindra MK. The bending resistance of steel beams.J Struct Div ASCE 1978;104(ST9):1355-70 Proc. Paper no. 14015, September.
[43] Bild S, Roik K, Sedlacek G, Ch Stutzki, Spangemacher R. Background document forchapter 5 of Eurocode 3 — the b/t-ratios controlling the applicability of analysismodels in Eurocode 3. Aachen: Draft; 1989.
[44] D.M. [2008], Nuove Norme Tecniche per le Costruzioni (in Italian).[45] Stranghoner N, Sedlacek G, Ph Boeraeve. Rotation requirement and rotation ca-
pacity of rectangular, square and circular hollow section beams. Proceedings ofthe 6th international symposium on tubular structures; 1994.
[46] Lay MG, Galambos TV. Inelastic beams under uniform moment. J Struct Div ASCE1965;91:67-93.
[47] Kuhlman U. Definition of flange slenderness limits on the basis of rotation capac-ity values. inJ Constr Steel Res 1989;14:21-40.
[48] AISC 341‐05. Seismic provisions for structural steel buildings; 2005.[49] FEMA 350. Recommended seismic design criteria for new steel moment-frame
buildings; 2000.[50] Haaijer G. Plate buckling in the strain-hardening range. J Eng Mech Div ASCE
1957;83(EM2):1–47.[51] Lay MG. Flange local buckling in wide-flange shapes. J Struct Div ASCE
1965;91(ST6):95–116.[52] Landolfo R, D'Aniello M, Brescia M, Tortorelli S. Rotation capacity and classifica-
tion criteria of steel beams. The development of innovative approaches for the de-sign of steel–concrete structural systems — the line 5 of the ReLUIS-DPC2005–2008 Project. Doppiavoce, Napoli; 2011. p. 37-88.
[53] Tortorelli S, D'Aniello M, Landolfo R. Prediction of the flexural capacity of steelbeams: empirical formulation. Proc. of Eurosteel 2011. Budapest (Hungary), 30August–2 September; 2011.
[54] Spangemacher R. [1992]. Zum rotationsnachweis von stahlkonstruktionen, dienach dem traglastverfahren berechnet warden. PhD thesis (in German),University of Aachen.
[55] Boeraeve P, Lognard B. Elasto-plastic behaviour of steel frame works. J ConstrSteel Res 1993;27:3–21.
[56] Suzuki T, Ogawa T, Ikaraski K. A study on local buckling behaviour of hybridbeams. Thin-Walled Struct 1994;19:337-51.
[57] Ito M, Karatani E, Komuro Y. Moment–inelastic rotation behavior of longitudinallystiffened beams. J Bridg Eng ASCE 2002;7(4).
[58] Ito M, Nozaka K, Shirosaki T, Yamasaki K. Experimental study on moment–plasticrotation capacity of hybrid beams. J Bridg Eng ASCE 2005;10(4).
[59] Zhou F, Young B. Tests of cold-formed stainless steel tubular flexural members.Thin-Walled Struct 2005;43:1325-37.
[60] Popov EP. Seismic behaviour of structural subassemblages. ASCE 1980;106(N.ST7).[61] Kemp AR. Factors affecting the rotation capacity of plastically designed members.
Struct Eng 1986;64B(2):28-35.[62] Ziemian RD, McGuire W, Deierlein GG. Inelastic limit states design, part I: planar
frame studies. J Struct Eng ASCE 1992;118(9):2532-49.[63] Li TQ, Choo BS, Nethercot DA. Determination of rotation capacity requirements for
steel and composite beams. J Constr Steel Res 1995;32:303-32.[64] Gioncu V. Framed structures: ductility and seismic response General report.
J Constr Steel Res 1999;55(1–3):125-54.[65] Plumier A. General report on local ductility. J Constr Steel Res 2000;55:91–107.[66] AISC 360. Specification for structural steel buildings. Am Inst Steel Construct
(AISC) 2010 June 22,.[67] Lignos DG, Krawinkler H. Deterioration modeling of steel components in support
of collapse prediction of steel moment frames under earthquake loading. J StructEng ASCE 2011;137(11) November 1.
[68] FEMA 356. Prestandard and commentary for the seismic rehabilitation of build-ings. Federal Emergency Management Agency; 2000.
[69] CEN (European Communities for Standardization). EN 1998‐3Eurocode 8: designof structures for earthquake resistance —part 3: assessment and retrofitting ofbuildings; 2005.
[70] Ellingwood BR, Dusenberry DO. Building design for abnormal loads and progres-sive collapse. Comput Aided Civ Infrastruct Eng 2005;20(3):194-205.
[71] Starossek U. Progressive collapse of structures: nomenclature and procedures.IABSE. Struct Eng Int 2006;16(2).
158 M. D'Aniello et al. / Journal of Constructional Steel Research 78 (2012) 144–158
Copyright © 2022 FDOKUMEN