uest - SOAS Research Online
459
THE ROLE OF BANKS IN THE PROVISION OF EXTERNAL FINANCE TO DEVELOPING COUNTRIES WITH PARTICULAR REFERENCE TO UK BANKS BETWEEN 1970-1980 TERRY JAMES WATSHAM THE THESIS PRESENTED FOR THE EXAMINATION OF THE DEGREE OF DOCTOR OF PHILOSOPHY AT THE SCHOOL OF ORIENTAL AND AFRICAN STUDIES, UNIVERSITY OF LONDON JUNE 1984
-
Upload
khangminh22 -
Category
Documents
-
view
0 -
download
0
Transcript of uest - SOAS Research Online

THE ROLE OF BANKS IN THE PROVISION OF
EXTERNAL FINANCE TO DEVELOPING COUNTRIES
WITH PARTICULAR REFERENCE TO UK BANKS BETWEEN 1970-1980
TERRY JAMES WATSHAM
THE THESIS PRESENTED FOR THE EXAMINATION OF THE DEGREE OF DOCTOR OF PHILOSOPHY AT THE SCHOOL OF ORIENTAL AND AFRICAN STUDIES,
UNIVERSITY OF LONDON
JUNE 1984

ProQuest Number: 10731463
All rights reserved
INFORMATION TO ALL USERS The quality of this reproduction is dependent upon the quality of the copy submitted.
In the unlikely event that the author did not send a com p le te manuscript and there are missing pages, these will be noted. Also, if material had to be removed,
a note will indicate the deletion.
uestProQuest 10731463
Published by ProQuest LLC(2017). Copyright of the Dissertation is held by the Author.
All rights reserved.This work is protected against unauthorized copying under Title 17, United States C ode
Microform Edition © ProQuest LLC.
ProQuest LLC.789 East Eisenhower Parkway
P.O. Box 1346 Ann Arbor, Ml 48106- 1346

Abstract
The thesis is divided into nine chapters. The first chapter gives an overview of the external financial flows to the Less Developed Countries (LDCs) between 1970 and 1980. It explains why these countries increasingly turned to private sources of external finance and why the banks in particular were willing to provide that finance.
Noting the needs of these countries for continued access to private external finance, the thesis proceeds to investigate four areas fundamental to the continuity of that access. They are:-
1) The determinants of the financial terms of bank and bond finance.
2) The impact of further lending to LDCs upon bank balance sheets.
3) The attitudes of the lending bankers to ways of increasingprivate financial flows.
4) The reasons for the limited role played by the eurobond marketin providing such finance.
As a preliminary to investigating these points chapters two and three discuss the nature of the eurocurrency market generally, reasons for its growth and the statistical sources relating to that market. Chapter three also develops a theoretical model of the eurobank lending function.
Returning to the fundamental points noted above, chapter four investigates the determinants of the financial terms of private finance ie euro money-market interest rates, the spreads on syndicated loans to LDCs and the interest yield on LDC bond issues.
Chapter five investigates the impact of the growth in bank lending to LDCs upon UK banks' balance sheets.
Chapter six reviews the literature making suggestions for reducing the risks associated with lending to LDCs. Chapter seven reports results of a questionnaire survey of nearly two hundred London banks regarding the suggestions noted in chapter six. The presumption behind these two chapters is that reduced risk will, ceteris paribus, increase the flow of finance. The responses to the survey confirm the validity of this presumption.
The reasons for the limited role of the eurobond market in providing private external finance to LDCs is investigated in chapter eight with the aid of a second questionnaire. This survey was directed at the London managers of eurobond syndicates.
The last chapter gives a resume of the thesis and makes recommendations for easing the external debt problem of the borrowers and bankers.

3
CONTENTS Page
Preface 12
Chapter 1 : An Overview
1.1 Introduction 13
1.2 The flow of financial resources to LDCs 1970-1980 14
1.3 The need for such growth in financial flows 20
1.4 Why did the developing countries turn to the private
financial markets? 30
1.5 The impact of increased privatisation of the sources
of finance 54
1.6 Why did the commercial banks become such providers
of finance to LDCs during the 1970's? 70
1.7 Summary 79
Chapter 2 : The Eurocurrency Markets
2.1 Introduction 80
2.2 Definition of the eurocurrency market 81
2.3 Measurement of the eurocurrency market 82
2.4 Statistical sources of international bank lending 88
2.5 The use of the eurocurrency market statistics in
this thesis 89
2.6 The nature of eurobank lending 90
H
Page
Chapter 3 : The Growth of the Eurocurrency Market
3.1 The literature 99
3.2 The role of marketing in the growth of the eurocurrency
market 109
3.3 A theory of the eurobank lending function 114
3.3.1 A theory of the eurobanking firm 119
3.4 Conclusion 133
Chapter 4 : The Financial Terms of Bank Finance to LDCs
4.1 Introduction 135
4.2 Factors influencing the level of eurocurrency interest
rates generally 136
4.2.1 Inflation 138
4.2.2 Currency of denomination 140
4.2.3 The relationship between domestic and euro interest rates 141
4.2.4 The term structure of interest rates 151
4.3 Factors influencing interest costs specific to
eurocurrency loans 168
4.3.1 Specification of the yield variable 169
4.3.2 The supply price 173
4.3.3 The demand price 184
4.3.4 The simultaneous equation model 187
4.4 Factors influencing the rate of interest specifically
in the eurobond market 193
4.4.1 Introduction 193
4.4.2 Definition of yield 194
4.4.3 The risk structure of interest rates 195
4.4.4 Marketability 204

5
Page
Chapter 5 : The Impact of the Increased Private Financial Flows to Developing Countries upon the Quality of Banks'Balance Sheets
5.1 Introduction 208
5.2 Growth of worldwide international bank lending to
developing countries 211
5.3 Growth of net bank exposure to developing country
borrowers 213
5.4 Growth of UK bank lending to developing countries in
relation to the banking system's capital base 215
5.5 Growth of bank lending to developing countries compared
with the growth of banks' balance sheets 222
5.6 Servicing of the growing developing country debt 225
5.7 The net transfer of funds 237
5.8 The degree of diversification in bank loan portfolios 240
5.9 Maturity transformation 250
5.10 The maturity profile of developing country debt 253
5.11 Conclusions 256
Chapter 6 : Increasing the Access of Developing Countries to the Private Financial Markets
6.1 Introduction 258
6.2 The risks associated with international banking 260
6.3 Reducing the actual or perceived risk of lending to
developing countries 264
6.4 Reducing the interest element of the debt service burden 265
6.5 Restructuring debt 270
6.6 Improved information flows for country risk analysis 287
6.7 Co-financing with multilateral lenders eg IMF and IBRD 290
6
Chapter 6 cont
Page
6.8 Bank credit insurance and loan guarantees 295
6.9 Prudential monitoring and regulation of bank lending 301
6.10 Lender of last resort 318
6.11 Bank deposit insurance schemes 323
6.12 Portfolio diversification 326
Chapter 7 : The Survey
7.1 Introduction 329
7.2 Section I of survey 332
7.2.1 Constraints on and risks of lending to LDCs 332
7.2.2 Corporate objectives of banks lending to LDCs 335
7.3 Section II of survey 338
7.3.1 Reducing the debt service burden of interest payment 338
7.3.2 Debt restructuring 341
7.3.3 Improving the quality of information about LDCs 344
7.3.4 Co-financing with IBRD or similar international
institutions 346
7. 3.5 Credit insurance and loan guarantee schemes 348
7.3.6 Prudential controls 351
7.3.7 International lender of last resort 354
7.3.8 Miscellaneous questions 356
7.4 Conclusions from the survey 358

/
Page
Chapter 8 : The Eurobond Market and Developing Countries
8.1 Introduction 363
8.2 The nature of the eurobond market 367
8.3 The nature of a eurobond 371
8.4 The questionnaire 376
8.5 The results of the questionnaire 378
8.6 Conclusions 387
Chapter 9 : Resume and Conclusions
9.1 Resume 388
9.2 Conclusions and recommendations 392
Appendices
8
Tables Page
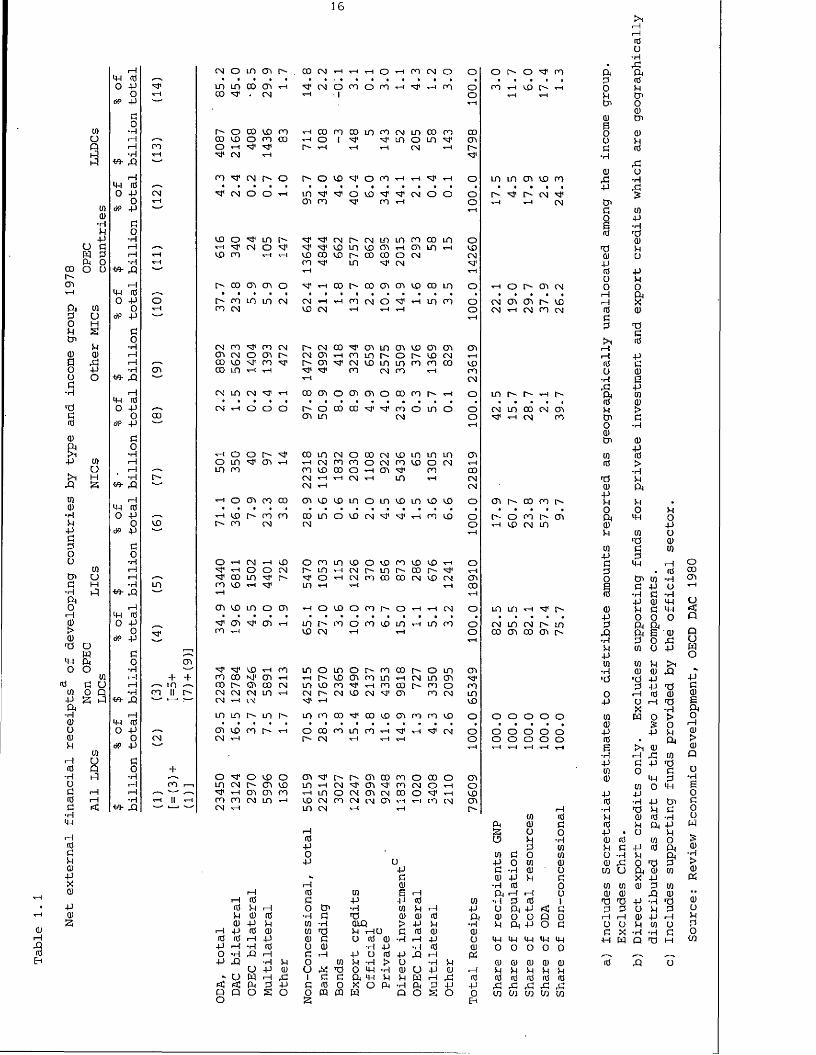
1.1 Net external financial receipts of developing countries
by type and income group 1978 16
1.2 Balance of payments disequilibrium of LDCs 21
1.3 Non oil developing countries: current account financing
1973-80 22
1.4 Growth of developing country imports 24
1.5 Growth of developing country exports 25
1.6 Savings and investment as a percentage of developing
country GNP 26
1.7 Index of oil exports to non oil LDCs 27
1.8 LDC exports (less fuel) to developed market economies 28
1.9 The IMF subsidy account 37
1.10 The allocation of SDRs to IMF members 39
1.11 Actual drawings by non oil exporting LDCs 1970-80 41
1.12 The maximum availability of IMF funds 42
1.13 Annual lending by IBRD , IDA and IFC 1970-80 47
1.14 Capital and reserves and loans outstanding of IBRD
1970-80 49
1.15 Net flows of aid to developing countries by group
of donor 52
1.16 Comparison of interest and amortisation ratios between
different income groups of borrowers and between
sources of funds 56
1.17 Currency classification of IBRD borrowing outstanding
30.6.80 64
1.18 Net transfer by banks to developing countries 1973-79 66
1.19 Net transfer by banks to borrowers classified by
income group 68
1.20 External claims and liabilities of UK banks to developing
countries classified by income group 69
9
1.21
1.22
1.2 3
1.24
2.1
2.2
2.3
2.4
3.1
4.1
4.2
4.3
4.4
5.1
5.2
5. 3
Page
External claims of US banks 1972-77 72
Best loan conditions available to selected public
sector borrowers 74
Average spreads and maturities of euroloans to
selected developing countries 75
Purchasing power of export revenue 76
Foreign currency deposits of UK residents with UK
banks 1973-79 86
Various measures of the eurocurrency market 1971-80 87
Currency classification of the London Eurocurrency
Market 87
The importance of the US $ in the global Eurocurrency
Market 1972-80 88
Maturity analysis of net position of UK banks
and certain other institutions 108
Size of the US $ domestic and eurobank deposit markets- 142
The impact of capital controls on eurocurrency interest
rates 146
The impact of selected market imperfections upon the
relationship between US domestic and eurodollar interest
rates 149
Eurodollar CD and interbank interest rates in London 205
Comparison of growth of loans, exports and GNP 212
Net bank exposure to developing country borrowers 214
Ratio of capital to non resident loans 1978, 1980
and 1982 218
10
Page
5.4 Proportion of total UK banks external claims due to
UK registered banks 218
5.5 UK registered banks exposure to 15 major LDC borrowers 219
5.6 Growth of UK bank lending to LDCs in relation to growth
of balance sheets 222
5.7 Spreads over LIBOR 1977-80 224
5.8 The changing burden of amortisation 1976 and 1980 228
5.9 The effect of inflation on a loan 230
5.10 The impact of interest rates on debt service burden
1976 and 1980 231
5.11 The changing importance of floating rate loans 232
5.12 The average grace periods on loans 1971 and 1980 235
5.13 The impact of short term debt upon total debt service 236
5.14 Net transfer from financial markets 239
5.15 The maturity distribution of net assets or net
liabilities of UK banks 250
5.16 The maturity distribution of assets of reporting banks
vis-a-vis countries outside their own area, mid 1978
to mid 1983 252
5.17 The maturity profile of external debt of the UK banks
June 1982 254
6.1 Signed co-financing agreements between the World Bank
and private banks December 1975-July 1979 293
8.1 Comparison of the value of bond issues and bank loans 364
8.2 International bond disbursements to LDCs 364
8.3 Major currencies used in bond issues 1971 and 1980 365
8.4 The dominant currencies in the eurobond and foreign
bond markets in 1980 366
8.5 Fees on euro and foreign bond issues 375

11
List of Figures Page
3.1 The impact of a shift in supply upon euromarket size 102
3.2 The impact of a shift in demand upon euromarket size 108
3.3 The impact of marketing upon euromarket size 111
3.4 The impact of marketing upon the spread between bid andoffer rates 112
3.5 The fixed and variable cost functions of a eurobank 123
3.6 The short run average total cost and marginal costfunctions of a eurobank 124
3.7 The long run cost functions of a eurobank 126
3.8 The revenue functions of a eurobank 128
3.9 The long run equilibrium of a eurobank 131
4.1 The relationship between US inflation and eurodollarinterest rates 139
4.2 Eurobond yield curves of selected LDC bonds (US $ bonds) 200
4.3 Eurobond yield curves of selected LDC bonds (EuroDeutschmark bonds) 201
5.1 Efficient portfolios: two assets 242
5.2 Efficient portfolios: many pairs of assets 242
5.3 Choice of efficient portfolio with risk free assetand borrowing 243
5.4 Choice of optimum portfolios 244
5.5 Choice of optimum portfolios with different rates ofinterest for borrowing and lending 245

Preface
This research was started in the spring of 1979. Since 1980 it has
been generously supported by Brighton Polytechnic who have met the
financial costs and sympathetically arranged my teaching so that the
research work could be carried out.
Many people have provided personal encouragement and assistance over
the last five years. At the School of Oriental and African Studies a
particular debt of gratitude is owed to Peter Ayre, my supervisor, for his
continuous encouragement and guidance towards the final objective.
At Brighton Polytechnic particular thanks are due to Dr Ken Midgley,
Head of the Department of Finance and Accountancy, for his personal
encouragement. My other colleagues in that department have also been very
helpful. Thanks are also due to Miss Liz Colley in the Brighton
Polytechnic Computer Centre for assistance with computer applications.
This research could not have been completed without the help and
cooperation from the one hundred or so bankers in London who, too numerous
to mention by name, have each individually contributed to my greater
understanding of their'operations and attitudes.
Finally, a warm thank you must go to Mrs Sharon Blows who has managed
to transform my almost illegible script into the final copy of this
thesis.

13
Chapter 1
AN OVERVIEW
1. 1 Introduction
The United Nations designated the 1970's as the second development
decade. Development did indeed take place. The poor countries of the
world experienced an annual rate of growth of GNP averaging 5.375%.
Populations also grew, making the increase in per capita GNP average 3.3%
according to World Bank figures. The same institution estimates that the
rate of gross investment averaged 26.025% per annum while the savings rate
averaged 25.375% per annum, (World Bank Annual Report 1982, pl30).
These rates of growth and investment were achieved with the
assistance of flows of external financial resources to these countries.
Financial flows can be classified into those that create debt obligations
and those that do not. The former consist of the many forms of borrowing
that take place in international financial markets, or from governments,
or from the suppliers of goods and services. The latter consist of direct
investments, and of grants and gifts, generally in the form of aid to
governments.
This study is about a section of debt creating flows - the borrowings
from financial institutions. In particular, the aim of the research is to
analyse the role of financial institutions in providing or facilitating
the financial flows to developing countries via the eurocurrency markets
between 1970 and 1980. Where possible or appropriate, the role of
financial institutions located in the United Kingdom will be highlighted.
Moreover, where events make it apposite, the time period of analysis is
extended to the time of writing (end 1983).
In the context of this research the term "UK Financial Institutions"
includes the United Kingdom offices of financial institutions registered
abroad.
14
i.2 The Flow of Financial Resources to LDCs 1970-1980
During the decade of the 1970's total annual net resource
receipts by the less developed countries (LDCs) grew from US $20.04
billions in 1970 to US $96.05 billions in 1980 according to OECD data,
(OECD 1983). During this period Official Development Assistance grew
from US $8.23 billion or 41% to US $37.33 billion or 39%
of the total. Non-concessional Flows, on the other hand, grew from US
$10.95 or 54% to US $56.41 billion or 59% of the total.
Of the Non-concessional Flows US $9.08 billion or 45% were from
private sources in 1970 whereas US $45.04 billion or 46% were from
private sources in 1980.
Of these private sources of finance, direct investment
constituted US $3.69 billions or 18% in 1970 compared with US $10.54%
billion or 11% in 1980. This decline has been compensated for by the
rise in private debt creating flows from US $5.39 billion or 27% to US
$34.5 billion or 36% over the same period.
A notable feature is that private flows were greater in the years
1978 and 1979 (ref Table 111-1 OECD 1983), when the proportions of
private flows in total flows were 55% and 52% respectively, than
they were in 1980.
It is to be expected, a priori, that the benefits derived by a
recipient country are positively related to the quantity of funds
received. Therefore the distribution of the total flow between types
of recipients, as well as the types of flows, where these have
different terms attached, is an important consideration in this
respect.
Below, the distribution of the total flow for 1978 is given. The
classification of developing countries follows that used by the OECD.
An alternative classification used by the IBRD is also used in this
study where the data require it. Appendix 1 to this study gives
details of these classifications.

It can be seen that the majority of the concessional flows go to
the poorest countries while most of the non-concessional flows go to
the richer developing countries particularly the newly industrialised
countries (NICs).
It is particularly notable that the distribution of financial
resources between LDCs bears little relation to the recipients' share
of total LDC population. For example in 1978 the NICs had 15.7% of the
total population but received 28.7% of total external financial
resources. The least developed countries (LLDCs) had 11.7% of
population but only received 6 .0% of total external financial resource
flows.
16
,0GB
u>a)
•H 54 ■P
O GM 3 Ph O CO o oCn
54o>
.Gpo
ftGo54ftajaooG
■H
t£jGG
4-J 0 )U>i H.O £
01QJft54
PGGOU
ftgft&fta>>0)
to
m0
G01pft•H0JO(U54
G■HOGGGftftdP54GJPX0)
Pcus
i— 1 CN o ft f t p- 00 CN tH 1-4 i—l o i—i ft CN o of t d ,— „ • • a t < > , . « , a a a0 P 'sf ft ft CO ft i-H ■d1 CN o ft o ft i—4 ■N1 rH ft Oo 1-4 CO "H 1 CN i— i • 1 Ocff> p "— ' i—i
p0•H P- o CO CD ft i—i 00 ft CO ft ft CN ft CO ft 00i— I a—* CO CD o ft CO i—4 o 1 'CF ft O ft "CF cni— 1 f t o i—i ■N1 ■N1 P- rH rH T—| CN rH p-*H -rH CN tH 'iFtoSift ft CN p - o P> o CD *cF o ft i—4 i—4 rF *—1 Oft d r-i 4 > • ■ • ■ ' ■ • a a a , .
0 P CN CN o o 1—I ft -cF ^F O CD 'cF 'CF CN o O Oo 1-4 ft ft NF ft i—i O<JP p •— ' rHpoft CD O ft p- CN P- CN ft ft ft 00 ft oft a— a i—t CN o 'CF 'd» CD ft CD cn i—4 cn ft rH COi— 1 i-H CD ft 1-1 i-H CD 00 CD P' 00 CO o CN CN-H i-t ft ^F ft CN ■N*-bo- Si '—' iH t—i•— 1 p- 00 ft ft O vF i—I 00 P- 00 cn cn CO CO ft Op d .— . • I * ■ i < • » ■ a a
0 P o r~ ft ft ft CN CN rH 1—4 ft CN o <cF H ft ft O0 t-l ft CN CD CN i—l t—1 i—4 odp p '— ’ rHp0-H CN ft 'cF ft CN P- CN 00 ■F cn ft cn CO cn cn cni— 1 ft CN O ft P- CN ft t—i ft ft p- o p- CD CN rHi—1 t—1 CO CD -CF ft iCF P' ft 'sF CN CD ft ft ft ft 00 CD•H ft CO ft i—t 1—i 'iF -sF ft CN ft rH ft■w- Si 1-4 CNi— i CN ft CN i—l CO ft O cn cn O CO ft p- 1 Op d • • • » t « t > . , . . ,
0 P ,— . CN tH O o O P- O CO CO 'sF d ft o in o O0 CO ft ft CN OdP P '— ' rHPo■H i-t o o p~ nF 00 ft CN o 00 CN CD ft in ft cni-H O ft »F ft T—1 T—1 CN ft ft O CN ft CD o CN rHi— 1 .— 1 ft ft ft CD 00 o i—l cn ft CO-H p- CN tH T—1 CN i—4 ft H CN-W3- Si CN 1 CNft H o ft ft CO ft CD CD ft o ft CD ft CD CD OP d a • • • ■ . . ■ •
0 p .— i—1 CO P' ft ft CO ft O CD CN d <=F i—i ft CD O0 CD P- ft CN CN OdP P 1 rHP0•H o t-H CN H CD O ft ft CD O CD ft CD CD tH ot— 3 H O o CN r- ft 1-4 CN P- ft P- 00 r-> —ErH r-1 CO ft ^F P- ^F O 1—1 CN ft 00 CO CN CO CN cn•H ft ro CD i—i ^F ft rH 1—4 rH 00bO- aQ ~ ~ H1-1 ft CD ft O ft T—| o CD o ft P- O i—4 i—i CN oP A} ■ • • • • ■ • . a
0 P _ ft sF ft t-( ft p' ft o ft CD ft 1-4 ft ft o0 ft tH CD CN vH T—3 odf> p rHpo ft•H ■—' "sf CD H ft ft O ft o r- ft CO P- o ft cnrH + + ft 00 cn rH i—i P- CD cn ft ft CN ft cn 'sFi— 1 .-• ft .— . 00 r-« ft CO CN ft CD ft rF t-H ft CO P- ft o ft•H ft It p- CN CN CN ft i—1 CN CN CO CN sF cn ft CN ftto- p 1— 1■ ■■ CN T—f IN tH CD■—i ft LO P~ ft P- ft ft CO -sF CD CD cn ft ft CD Op d • • • 1 > • , • a a a a a .
O P ft vo ft p- i—l O 00 ft f t f t rH 1-4 *=? CN O0 CN CN H P- CN i—i \-H rH OdP P '— ' r H
P0 +•H r-i O o co O ft p~ P~ cn 00 ft O 00 o cni—1 ft i— i ft CN P- f t CD ft i—t CN cn NF ft CN o 1—4 oi—I .— - i-H f t f t f t T—1 ft O CN cn CN CD O i—4 CD*rH i—i II rH ft ft CN in i—i CO CN ft CN CN cn i—i i - 4 f t CN cnto- Si v->1—1 CN i—1 ft CN 1-4 i—4 p~
GPOP
i—1 d■—i d cd S4 rH 0 tn54 QJ d •H dQJ 40 CO •H
<—i 40 d QJ CO ndd d i—i 40 0) C+J i—J •H d O QJo •H S i rH C *—i40 Si ■H U 0U 40 QJ uO W r—1 S i 1 C«=t! < Ph 3 40 c dn « O S o o pqo s
4000)m S r—l
40 f t d 01*M 01 54 1—1 40TO QJ QJ d O hQUO > 40 54 •H54 H U G d CU QJto d 0) ■H 40 U
‘H 40 ’H d QJ40 O d 40 •O rH «
cn 54 -H > O •H UTO 0 ft QJ u 40 QJ *—fa Oh 44 54 54 w r—1 rG do X O P4 •H Ph 0 40 40m w Q o £ O 0
B
O P - O ^ r o
PI h h h
in lo ft cd rnp- ■'3' p~ cn ^i-4 * - • CN
1—4O p- cn CN
CN cn cn p- COCN 1—1 CN ft CN
ft P- P- i 4 P'CN ft CD cn cn^F i—4 CN ft
ft r- oo m r[ O CD p- cnH lO tN I/)
ft ft i —i -iF
CN ft CN in00 cn 00 cn P '
O O O O OO O O O Oo o o o o
1—101 d
P h aj Gs o 0o 54 ■H
0 010) G o 0140 O 01 a)G •H QJ oQJ 40 54 G
-H d 0O h rH r—I o
•H 0 d iU O h 40 < GQJ O 0 p O54 Oh -P O G
f t f t f t ft ftO O o O 0
QJ QJ QJ QJ QJ54 54 54 54 54d d d d d
-G d : rG rC ,Gft ft ft ft ft
ftpo54ft0)aotop
■H
QJs ip
ftpQ
toQJpduoft r—I G p p
> iHrHdo■rls iftd5h
du
-Hs iftduft0 0) ftQJ54d
,Gdft
■§
01 p ■H TO q jpu
Pp0 ftx0)
t opd
Ppaiap01 QJ >
tn G0 •HQJCn QJ
4001 dd >
HTO 54QJ O h400 54 a0 O 54Oh f t 0QJ 4054 01 0
TO QJ01 G 01
40 dG f t f t0 a GO Cn 01 f ts G 40 Od •H G f t
40 QJ f tQJ 54 G f t40 O 0 O0 O h &S i & a QJ
•H G 0 S J54 01 0 404001 01 54 > .•rH QJ tu S iTO ■d 40
G 40 TO0 r—1 d QJ40 to 1—t TO
X f t01 w 0 >QJ & O40 40 54d a O ha >1 QJ
•H 1—I S i 0140 G 40 TO01 O G0) f t G
01 0 f t40 40d ■H 40 Cn
•H TO 54 G54 QJ d •Hd 54 O h 4040 a U 54QJ d 01 054 G 4J d O hO H 54 OhQJ rG 0 TO Gf t U Oh QJ 01
X 4001 01 Q> G toQJ QJ r Q QJ
TO TO 40 •H TO0 0 O 54 G
1—1 1— ! QJ 40 f tU O 54 01 OG X ■r4 f t G
4H w Q TO H___ . .__.
d S i O
ocoftu<3Q
QUWopcQ)aftoftCU>0)Q
u-Haoaoow
130)
-H>0)
b ;
qjtoppoto
17
Specific discussion of the distribution of bank debt amongst LDC
borrowers is included in pages 54 to 70 below.
Returning to the changes in the quantities of debt during the
1970's, IBRD World Debt Tables (IBRD 1983) show the stock of disbursed
debt outstanding to LDCs rising from US $91 billion in 1972 to US $404
billion in 1980. Of these amounts public and publicly guaranteed debt
rose from US $68 billion to US $331 billion and private non guaranteed
debt rose from US $21 billion to US $73 billion. However, these figures
will under estimate actual debt outstanding. The weaknesses of the
statistics covering international debt are discussed in chapter 2 page
of this thesis.
Looking in more detail at the public and publicly guaranteed debt
onlyjbecause of limitations of data on the private unguaranteed debt,
we note that disbursed debt owed to official creditors rose from US $44
billion to US $155 billion between 1972 and 1980. During the same
period debt owed to financial markets rose from US $14 billion to US
$154 billion. Thus, whereas official debt constituted 67% of total debt
in 1972, it constituted only 46% in 1980. Debt to the financial
markets, on the other hand, only accounted for 21% in 1972 but
represented 46% of total debt in 1980.
Accompanying the changing nature of the sources of debt have been
changes in the debt servicing commitments and the financial terms
attached to the debt. These are discussed in detail on page 55 of this
chapter, but at this point a few figures are in order. Between 1972 and
1980 total debt service payments rose over 700% but such payments to
the financial market creditors rose nearly 1400% compared with the
1100% rise in debt outstanding to those creditors.
The average interest rate on debt to official creditors rose from
4.3% to 5.3% during this period, maturities shortened slightly from
25.3 to 23.7 years, grace period shortened from 6.7 to 6.1 years and
the grant element fell from 41.5 to 34 per cent. However, the average

interest rate on debt owed to private creditors rose from 7.3% to
12.8%, the average maturity fell slightly from 9.2 to 8.9 years, grace
periods actually rose from 2.9 to 3.4 years and the grant element fell
from 11.1% to minus 12.5 per cent, (IBRD 1983 p3).
The substantial rise in both the amount and relative importance of
LDC debt owed to the financial markets, and to the banks in particular
begs four questions:-
1) Why was there such a need for the financial flows to
developing countries to grow as fast as they did?
2) Why have the developing countries turned so convincingly
to the private financial markets of the developed
countries for their external finance?
3) How does this shift towards private sources of finance
alter the net benefits enjoyed by the borrowers and
their ability to service existing and future debt?
4) Why have the private financial sources been so willing
to provide funds to the developing countries?
These questions are answered in the following sections of this
chapter. However, analysing the answers raises further fundamental
questions. They are:
1) What influences the financial terms attached to bank
and bond finance to LDCs?
2) How has this increase in LDC debt influenced bank
balance sheets?
3) What factors will help maintain the flow of,particularly^
bank finance to the LDCs?
4) Why has the bond market played such a small role in the
external financing of LDCs?
These questions are answered in the following way:-
Question one is answered in chapter four where the deter
minants of eurocurrency money market and bond market
interest rates and the spread on syndicated loans are
analysed.
Question two is answered in chapter five by analysing
the impact of increased bank lending to LDCs upon the
financial health of banks, particularly UK banks as
indicated by their balance sheets and profit and loss
accounts.
Question three is answered in chapter seven with the aid
of the responses of a survey of bankers in the City of
London.
Question four is also answered with the aid of a survey
of City bankers reported in chapter eight.
As a preliminary to these chapters, an analysis of the mechanics of
the eurocurrency market is the subject of chapter two and a model of the
eurobank lending function is the subject of chapter three.

20
1.3 The Need for Such Growth in Financial Flows
Balance of Payments Deficits
The immediate need for the substantial increase in international
financial flows to the developing countries during the 1970's stems
from their balance of payments disequilibria.
These disequilibria were caused by policies of economic growth,
import substitution and after 1973 the higher costs of imported fuels,
particularly oil, together with recessionary induced contraction of
export markets in the industrialised countries. Internal mismanagement
of the developing economies could also have resulted in balance of
payments difficulties, but there seems little evidence of mismanagement
for the LDCs as a group, although there are isolated examples,
(Avromovic 1982, Britti'an 1977, Hailwood 1980, Killick 1981). The policies
of growth and import substitution precluded the substantial economic
adjustment that would have been required in order to eliminate the
balance of payments deficits.
The higher cost of oil is just a specific case of a secular
deterioration in the .terms of trade experienced by non oil exporting
developing countries, as researched in such papers as Prebisch (1950),
Sproas (1980) and reviewed in Bird (1978). However, it is not intended
to investigate the impact of any secular deterioration of NOPEC terms
of non energy trade because any deterioration that may have taken place
is overwhelmed by the deterioration in terms of trade caused by higher
prices of energy imports.
The following figures show that there were substantial deficits for
LDCs as a whole until 1973. Thereafter, however, substantial deficits
were suffered by the non oil exporting developing countries (NOPEC),
while the oil exporters experienced very large surpluses.

21
Table 1.2
Balance of Payments Disequilibria of LDCs
NOPEC OIL EXPORTERSDEFICITS SURPLUSES
1970 8.6 0.3
1971 11.0 2.1
1972 8.9 1.7
1973 11.5 6.6
1974 36.9 67.8
1975 45.9 35.0
1976 32.9 40.0
1977 28.6 31.1
1978 37.5 3.3
1979 57.6 68.4
1980 82.1 112.2
Source: IMF Annual Report 1981 pl8 and 1974 p22Figures in billions US $
Given that the developing countries would have found speedy
internal adjustment to these deficits incompatible with their
aspirations of growth, it was essential for these deficits to be
financed.
The following figures show how the NOPEC deficits were financed
from 1973-1980:

Non
oil
developing
countries: current
account
financing, 19
73-1
980
22
c nc n N ? c - C O c n L O O L O m ( X . C N X f C o P i I 'M C N O
• • • • • < , ■ , * • • . .r - > C N c n o o c o t-H N T L O cs L O C O c x C N N i l O L Oc n m r —1 T~H r o ----1 X T T—1 t H CN TH
Sitd
tNCO
inoo
CDLONT
cnCOr o
v o VO v H c n L O cm r-' o
o O CM r - t-H t-H CN t —ICM *—I v o I v o CN r- Ml to Qi CM C N |
OCO
CO
CMVO
OCO
OC N
CMV O
VO CM CO CO CX Pi .-H C O P i CO O' tH X?c n CO<r4 37
.13.
0 0 NilLOCN ojtH C O CN o t-h CN 1
v o NT1 C O O t -H C N a n xt< T H r o 0 0 C o C o NH Xt<
C O X h 0 0 . - 1 L O x £ t*H V O CN C O NH l O v o c n C N oCN H . —i T—1 C N t— l H tH J
r - o r o CNr H O ' r— i LO x t*r H 1 r o
C O
c n
cn voo
ro■N1
Pu(1)pvwtdPo
inPpQ)
POPid3rHid>
p otn 1
o tdT3 > iSi
P Ptd ■d 0si a) -Hp >H
inQJ Ptd
in Q) *H NP O -H Po QJ P p 0
*«H U 3 0 PP P pO in O 0 T.id u o s tnCO QJ &
P P p tn fd o■H <d cn P rH ■—iU u p *H 0 p■H p id f t tnP in p O pCD Si p P r—1 p
fp tn 0 0) tn 0P ’H n3 > p
P O P QJ QJ 0 pP u ■H p •d -H 0P s i in ■H P tn 00 p 0 P i—1 <d P >U ft d1 o P pO Cn QJ o o 0 •HId P P 1—I B
**H St P p rH P PP u CD P o id tn UP § 'd p P 00) id P Pi *n uu p P 0)p p XI •HH -H QJ £ o to td Pp ft po
in0>uQ)in0u
poQ>indpidP•H£OuuoupQJ£
CO r-O t HI I
c n .— i v o CM r ~ - C O C-~ L O C N C O V o V O O s t H V O 0 0 i n LO* ■ • * . . ■ • • a a « . a a * . .
32 C NH
O ' 01
xF oCM
C Nt-h
t oc o
ot-H
V o r o r -T—1C Ot-H
t-HVo xjt 00 CM1
CM Xt< t H t o r - C N C N r o x ? LO C O
32 «—1 r-H I X NH xt1n-H Os Q> LO CM VO CN1
CN cn 00 LO r- CN cn VO v o TH CN vo r o r o v o rH VO
00 vo o LO 00 p H ■St cn v o r o o C o p i t H t-H u o t-h
r~- o o o LO IX. o o VO OS LO TH 00 x f
t - h c n 1 T—1 LO to TH VO Nil oi Cn o 1 T-H 1
- p0 0r—, P p
1 P0 k.
*■ *d 0p •H 0o 0 -H•H 0 PP p p -Hid 0 i—1
i—i p p ■Hd o Us p tdp 0 P Po 0 a 0o o 0 P P 0td u 0 -H p■—- p 0 p R td «. 0
0 R d 0 tn •Htn 0 tn u P 0P P Hi o •H 00 rH to -P •rH S ££ *H0 id jg £ +5 •d O Bw ■-H Ss 0 0 U 0id tn U 05 Ss u P 0 p u
P ■iH P td 0 d id o •d0 •H P R 0 R S i—i Si p> P Ss Q P 0 0 rou o O ?H 0 Sh B0 Jh td '0 p H-S 1 00 u B 0 p d 0 0 00 0 0 o d 0 v rd d > p OP t l U V d p d R d u u
P ■to R R O JLj 0 pP H 0 o tn d rQ rS 0 u 0o td B 05 d P R o 0 0
p P d 0 rR 0 U si i—1p p 0 R rH H t?S 0 id0 0 P o o Jm P d
■H p o R 5 d d o u tdP X tn 0 d rR 0 •HO 0 p s: R Si A rR P 0 si 0P Q o P Ro Eh o 0 p 0td p P O D o 0h
C NC Oftt-h inco p cn toT - t I 1.H P O P T5 Oft W QJ D
inH p<0 od - H P •—I P r H C - Hi)S P H H
•* inCD Q) O U P P P C n O *H CO Ph

The decline in the relative importance of direct investments and
the growing importance of external borrowing, and particularly the
borrowing from financial institutions has already been discussed. It
must be noted that some of this borrowing has been used to finance the
accumulation of reserves that has taken place over this period as well
as financing deficits.
Policies of Growth and Import Substitution
The influence of growth aspirations on these balance of payments
deficits is difficult to prove. However, if the developing countries
wished to increase their rate of growth, particularly through
industrialisation, one would expect to see imports of capital goods
increasing as a proportion of total imports. It may also be expected
that exports of manufactured goods would form an increasing proportion
of total exports as industrialisation proceeds. A policy of import
substitution would also cause such trends in trade.
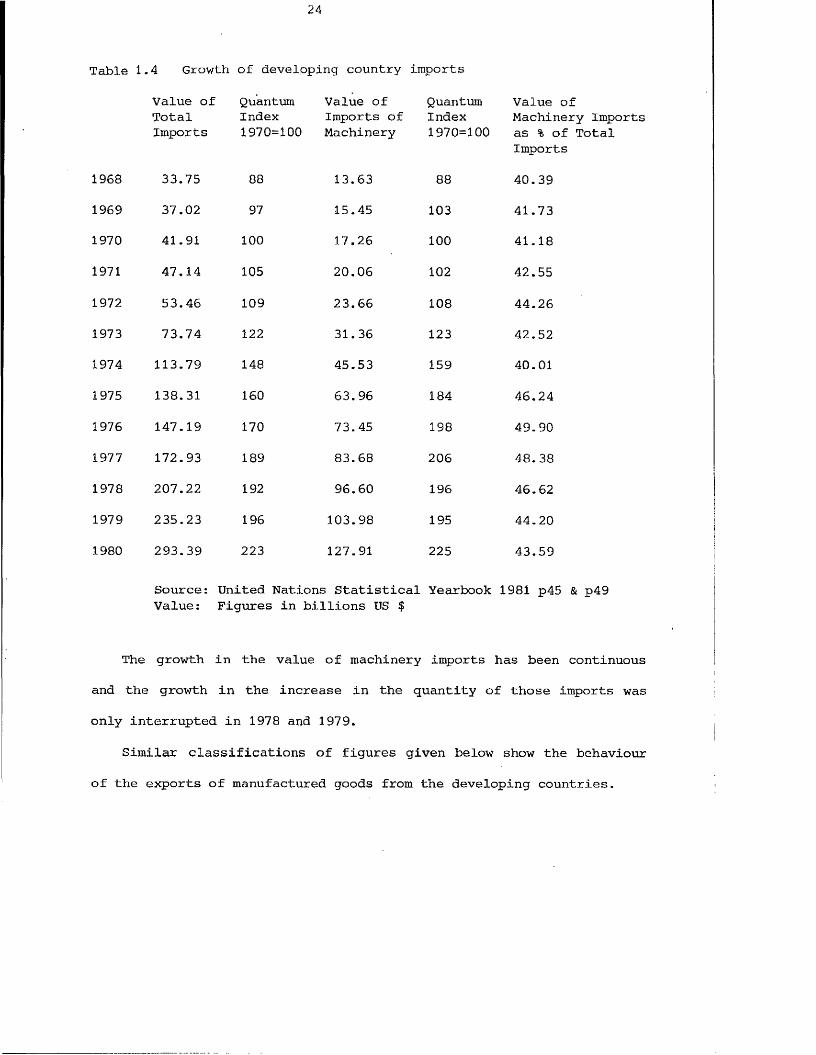
The following figures show the growth of total imports from the
developed market economies by the developing economies. The growth of
imports of machinery and the percentages of the total imports that
machinery represents are also given.
24
Table 1.4 Growth of developing country imports
Value ofTotalImports
QuantumIndex1970=100
Value of Imports of Machinery
QuantumIndex1970=100
Value ofMachinery Imports as % of Total Imports
1968 33.75 88 13.63 88 40.39
1969 37.02 97 15.45 103 41.73
1970 41.91 100 17.26 100 41.18
1971 47.14 105 20.06 102 42.55
1972 53.46 109 23.66 108 44.26
1973 73.74 122 31. 36 123 42.52
1974 113.79 148 45.53 159 40.01
1975 138.31 160 63.96 184 46.24
1976 147.19 170 73.45 198 49.90
1977 172.93 189 83.68 206 48.38
1978 207.22 192 96.60 196 46.62
1979 235.23 196 103.98 195 44.20
1980 293.39 223 127.91 225 43.59
Source: Value:
United Nations Statistical Figures in billions US $
Yearbook 1981 p45 & p49
The growth in the value of machinery imports has been continuous
and the growth in the increase in the quantity of those imports was
only interrupted in 1978 and 1979.
Similar classifications of figures given below show the behaviour
of the exports of manufactured goods from the developing countries.

Table 1.5 Growth of developing country exports
Total Exports less Fuel
ManufacturedExports
Quantum Index 1970=100
% of Total
1968 26.37 8.81 75 33.41
1969 30.13 10.80 90 35.84
1970 33.74 12.61 100 37.37
1971 34.57 13.37 102 38.68
1972 41.74 16.72 128 40.06
1973 60.72 26.20 149 43.15
1974 80.71 35.46 169 43.94
1975 76.84 34.44 164 44.82
1976 85.90 41.79 206 48.65
1977 113.05 53.53 213 47.35
1978 131.12 67.79 238 51.70
1979 165.42 88.41 266 53.45
1980 193.06 106.74 272 55.29
Source: United Nations Yearbook 1981 p44 & p48 Value : Figures in billions US $
The figures for fuel exports have been deducted from total exports
in order to abstract from the post 1973 influence of oil prices on
value of exports.
It can be seen that exports of manufactured goods have grown
considerably over this period and have assumed a more important role in
the export business of the developing countries, rising from 33.41% of
total exports in 1970 to 55.29% in 1980.
A final set of figures, extracted from various issues of the World
Bank Annual Report, show a continuous excess of gross investment over
domestic saving as proportions of developing country GNP^

Table 1.6 Savings and investment as a percentage of developing country GNP
Save Invest Save Invest% % % %
1968 15.8 18.6 1975 22.3 23.8
1969 17.3 19.9 1976 25.5 24.6
1970 17.9 19.9 1977 23.2 24.8
1971 17.9 2 0 . 1 1978 25.8 26.9
1972 18.1 20.6 1979 26.4 26.3
1973 22.2 21.7 1980 25.6 24.9
1974 23.5 22.6
Source: IBRD Annual Report, various issues
These figures show that investment has increased continuously during
the period under study and that for most years investment exceeded
domestic savings. Thus these countries, as a group, have experienced what
may be a savings constraint in the form suggested by Chenery & Bruno
(1962), McKinnon (1964), Chenery & Strout (1966); however, see Joshi
(1970). This factor alone would necessitate external flows of finance.
Clearly these three sets of figures indicate the commitment to
growth, particularly industrial growth, of the developing countries as a
group. The inferences from the United Nations figures given above are
reinforced by the IBRD figures. Furthermore, a study by Dell & Lawrence
(1980) found that increased import quantities accounted for 41% of the
cases of deterioration on the LDC trade account between 1962-1973.
Increased import prices, on the other hand, accounted for 8% of such
cases. They conclude that these figures are consistent with 11....... the
development process as well as ..... short run problems of demand
management" (pl2 ).
It is, therefore, reasonably clear that throughout this period the
growth aspirations of the developing countries as a group were at least
partially achieved particularly by export growth and import substitution

through industrialisation. Given the assumption of a positive marginal
propensity to import and that many of the capital inputs to the
industrialisation process have had to be imported, even partial
achievement of the growth objective would, ceteris paribus, cause a
deterioration in the balance of payments on current account.
Impact of Increased Oil Prices
The change in the relative price of oil since 1973 has made it
necessary, with any analysis of the developing countries, to divide the
whole group into oil exporters and non oil exporters. The oil exporters
have for the majority of years since 1973 been net exporters of
financial capital, whereas the non oil exporters have needed to import
such capital.
The following figures, again from United Nations sources, give the
index of unit value, 1970 = 100, for energy exports by developing
countries to other developing countries. As all the OPEC countries are
classified as developing, these indices reflect oil exporting
countries' exports to non oil exporting developing countries (NOLDCs).
The value of such exports is given in parenthesis for each year.
Table 1.7 Index of oil exports to NOLDCs
1968 97 (3.15) 1975 603 (26.26)
1969 98 (3.21) 1976 643 (32.13)
1970 100 (3.92) 1977 701 (36.41)
1971 . 126 (4.98) 1978 703 (33.42)
1972 135 (5.49) 1979 990 (50.72)
1973 185 (8.67) 1980 1640 (75.09)
1974 571 (26.41)
Source: United Nations Statistical Yearbook 1981 p45 Figures in parenthesis in billions US $

The increased price of oil after 1973 affected the developing
countries' balance of payment not only through their energy imports but
through all their imports because of the energy content. Nevertheless,
the greatest price rises in non energy imports were to be seen in the
manufactured imports which are energy intensive and most of. these are
imported from the developed countries.
The Impact of Oil Induced Recession in OECD Countries
The oil price rises of 1973-74 and 1979 also affected the NOLDCs
balance of payments in an indirect way by inducing a recession in the
developed economies. This reduced the demand for NOLDCs exports by the
developed countries.
The following United Nations figures show the value of total
exports excluding fuel from the developing economies to the developed
market economies.
-Table 1.8 LDC exports (less fuel) to developed market economies
1970 26.47 1975 54.86
1971 26.56 1976 70.26
1972 31.96 1977 81.45
1973 46.32 1978 93.46
1974 59.42 1979 115.04
1980 129.49
Source: United Nations Yearbook 1981 p44 Figures in billions US $ FOB
These figures reflect the drop in exports from NOLDCs which
coincides with the 1975 recession in the developed world if we accept
the crude assumption that all non fuel exports of developing countries
come from NOPEC countries.

We can now summarise this section by saying that the need for
increased financial flows to the non oil exporting developing countries
during the 1970's was caused by their balance of payments disequilibria.
These in turn were caused by:
a) Aspirations of growth and a policy of import substitution
throughout the period.
b) The increased price of oil, particularly after 1973, exacer
bated the disequilibria. Given that the costs of adjustment
would be so great, even larger flows of financial resources
were required.
c) The oil induced recession in the developed economies during
1974-75 and after 1979 also contributed to the deterioration
of the NOLDC balance of payments. Given their growth
policies, these countries had to borrow the foreign exchange
required to cover these deficits.

30
.4 Why did the Developing Countries turn to the Private Financial Markets?
The private financial markets did not suddenly find a new set of
customers in 1970. These markets had been providing some finance to the
developing countries on an increasing, though small, scale during the
1950's and 1960's. Many of the banking techniques had their genesis in
the 1960's. What was different in the '70's compared with earlier
periods was the dominance of private sector debt creating flows over
official flows and direct investment to the developing countries.
Given that the private markets and the techniques were in existence
before 1970, it is reasonable to suggest that after 1970 these markets
and techniques were a more desirable source of finance compared with
the official sources because, of the .declining desirability and avail
ability of the latter. We can therefore answer the question of why the
developing countries turned so convincingly to the private markets by
investigating the reasons for the declining desirability and relative
availability of the official financial flows.
We will begin by analysing the role of the IMF and then look at the
role of the World Bank and of Bilateral Aid.
The International Monetary Fund
The aim of this institution is to provide temporary finance to
members in order to finance their balance of payments disequilibria.
Each member of the Fund contributes its 'quota' , of which beforeJ
1976 25% was in gold or US dollars and 75% in its own currency. Since
1975 the contributions can be completely in the member's own currency.
The size of a member's quota has an influence over the amount of
finance that can be obtained from the IMF because quantitative
limitations on assistance are stated in terms of multiples of a
member's quota.Much debate about the availability of assistance from the Fund
centres upon the conditionality attached to any such assistance, (Bird

31
1979/ 1982, Pirzio-Birote 1983, Buira 1983). However, it is not
intended to discuss IMF conditionality in any detail in this thesis
because, as will be shown below, the overwhelming constraint upon the
maximum amount of assistance that the Fund could give to the LDCs has
been the resources available to the Fund.
It is shown below that even if no conditions were attached to IMF
assistance, save for the regulation regarding maximum quota multiples,
and that NOLDCs drew their maximum entitlement, this entitlement would
be an increasingly inadequate form of quantitative assistance as the
1970's progressed.
The Quantity of Funds Available from the IMF
The resources which the Fund can make available come from members'
subscriptions and from borrowed resources. Members' subscriptions are
determined in accordance with the same quotas allocated to each member
which in turn influence a member's access to Fund resources and voting
power.
The Articles of Agreement of the Fund provide for a general review
of quotas every five years. The fifth general review of quotas took
place in 1969 and a 35.5% increase in all quotas was agreed for 1970.
The total value of quotas for all members as at 30 April 1971 was SDR
28478 million which represented 8.2% of the total value of
international trade. The total value of quotas increased to SDR 39000
million by April 1980 which represented 4% of international trade. The
sixth general review of quotas in 1976 doubled the quota share of oil
exporting countries from 4.98% to 9.88%, whilst keeping the collective
share of developing countries to 20.92%. Bearing in mind that quotas
influence the total amount of finance that can be obtained from the
Fund, such action seems to be of little help to the NOLDCs, (IMF 1981
p80).

32
The Fund grants facilities under four accounts; The General
Account, The Subsidy Accpunt, The Trust Fund and The SDR Account.
Under the General Account for the period 1970-1980 the Fund made
resources available under the following facilities
- Ordinary drawings and standby arrangements
The Extended Fund Facility
The Supplementary Financing Facility
The Compensatory Financing Facility
The Buffer Stock Financing Facility
The Oil Facilities of 1974 and 1975
Ordinary drawings are available up to 125% of a member's quota.
This amount is available in five 25% tranches, the first being known as
the reserve tranche, the second as the first credit tranche and the
last three being known as the upper credit tranches.
The reserve tranche is made available unconditionally. The first
credit tranche is made available to any member regarded as making
'reasonable efforts' to solve its balance of payments problems, but in
practice is virtually automatic (ODI 1980). The upper credit tranches
are granted only after substantial justification; the higher the
tranche, the more exacting are the criteria for justification. These
funds have normally been granted under a one year (but recently three
year) standby agreement in support of a stabilisation programme agreed
with the Fund. Access to these funds is by instalments and can be
withdrawn if the performance criteria are not met.
It is the agreement of the performance criteria and the compliance
with the stabilisation programme agreed with the Fund that constitute
the conditionality associated with the ordinary drawings from the Fund.
The Extended Fund Facility The aim of this facility, established in
1974, is for the IMF to provide a facility whereby the developing
countries could obtain resources but with longer repayment periods than

applied to normal drawings from the Fund.
The repayment period was originally up to eight years but in 1979
was extended to ten years so this facility is very much one of medium
term finance. Drawings may be made over a three year period and may
reach a maximum of 140% of the member's quota with the proviso that
ordinary drawings and Extended Fund drawings must not exceed 265% of a
member's quota.
Again, there is a degree of conditionality attached to this
facility that is comparable with facilities under the upper credit
tranches. The member is expected to present an economic programme
setting the policies and objectives for the duration of the facility.
Drawings are by instalment so that the granting of instalments can
depend upon satisfactory execution of stages of the agreed programme.
The Supplementary Financing Facility became operational in
February 1979 and provides funds under standby or extended
arrangements. These funds are made available from resources that the
Fund obtains by borrowing from members specifically for supplementary
financing. They are in addition to those provided under other
facilities.
The Fund will grant the facility if:-
a) The member needs finance from the Fund that exceeds the
four credit tranches, and its problems require a
relatively long period of adjustment. The repurchase
period is 3i-7 years.
b) The member will follow policies that are compatible with
the Fund's policies on the use of resources in the upper
credit tranches or extended fund facility.
Until June 1980 a member could draw 300% of its quota under this
facility. At that date access was reduced to 200% of quota.

The Compensatory Financing Facility was established in 1963 to
provide compensatory finance to members suffering temporary shortfall
in export earnings.
The original terms of this facility were liberalised in 1965 when
limits upon drawings were increased to 50% of a member's quota subject
to the constraint that drawings should not exceed 25% of quota in any
one year. The second 25% was only to be granted if the member was
pursuing policies reasonably conducive to the development of its
exports. Repayments were expected to be made within three to five
years.
These arrangements were again liberalised in 1975 when the overall
limit was increased to 75% (liberalised to 100% in 1979) of a member's
quota with annual permitted drawings increasing to 50% - or even 75% in
the case of a disaster (limit abolished in 1979).
The benefits which developing countries can obtain from this
facility depend not only on the maximum amount available but also on
the way in which the Fund calculates the export shortfall. The Fund
considers a shortfall to exist when export earnings for a year fall
below what they would have been if price and output were both normal in
terms of a five year trend centred upon the shortfall year. However,
the Fund retains considerable discretion in evaluating shortfalls.
Therefore the bargaining strength of the member and its export
performance in the two years prior to the shortfall year influence the
benefits which the member may gain from this facility. As the trend
calculation includes the shortfall year, the trend and thus the
starting point for negotiation will be biased downwards. Until 1975 the
trend was also biased downwards because assumed export growth was
limited to 3% when in fact nominal export growth was far in excess of

that figure (Bird 1978).
Other criticisms of this facility centre upon its short term nature
with repayments due within three to five years when there is little
evidence to suggest the developing countries can cure their balance of
payments problems within that time period since they are often
structural in nature. Furthermore, the facility was originally only
available to finance shortfalls in export earnings when in fact a major
cause of a deficit on the balance of payments may be increased prices
of imports and an inelastic demand for those goods. In 1981 the
facility was extended to cover increased costs of cereal imports.
The Buffer Stock Financing Facility assists members having
difficulty financing their share of agreed international buffer stock
schemes. Credit up to 50% of quota is allowed but this facility has
been little used since its inception in 1969.
This facility is subject to the following conditions
- Finance can only be provided to individual members
participating in buffer stock schemes and not to the
international bodies controlling such schemes.
- Finance is available only to members experiencing
balance of payments difficulties due to their con
tributions to the buffer stock scheme.
- Drawings must be repaid within three to five years.
The member country must agree to cooperate with the
Fund to find solutions to its balance of payments
difficulties.
- The buffer stock scheme must be of a form approved
by the Fund.
The Oil Facilities of 1974 and 1975 were financed by means of
borrowings from members. The aim of the 1974 facility was to provide
finance based upon the difference between the cost of net petroleum and
petroleum product imports in 1974 and 1972. Shch finance could not

exceed 75% of a member's quota.
The 1975 facility was limited to 125% of a member's quota, or 85%
of the increased cost of petroleum and petroleum-based imports, whichever
was the lower. The conditionality of the 1975 facility was stricter than
for the 1974 facility in that balance of payments policies and energy
conservation and substitution policies were formally assessed.
Funds had to be repaid within three to seven years under both
facilities. A rate of interest of seven per cent for 1974 and seven and
threequarter per cent for 1975 was applied.
The figures below show the use that has been made of the Oil
Facilities:
1974 Oil Facility
All countries 2499.251
of which Developing Countries 1029.651
1975 Oil Facility
All countries 3966.237
of which Developing Countries 1334.977Figures in millions SDRs
The Subsidy Account
In an attempt to reduce the debt burden of the interest rates on
the Oil Facility, the Fund established a Subsidy Account. This was to be
used to provide financial assistance to the poorest developing countries
which had suffered most through increases in oil prices. Payments under
this account began in May 1976. The'most needy developing countries were
defined as those with a per capita income of less than US $400 per annum
and who face severe balance of payments problems on the basis of
projected import and export performance.

Table 1.9
The Subsidy Account
1976 13.82
1977 27.51
1978 24.95
1979 19.10
1980 13.79
Figures in millions SDR
It can be seen that the lion's share of the oil facilities went to
the developed countries with Italy being the largest borrower under the
1974 facility, and the United Kingdom the biggest borrower under the
1975 facility. However, all benefits under the Subsidy Account have
gone to the poorest developing countries.
The Trust Fund
The IMF announced in 1976 the establishment of a Trust Fund in
order to provide certain eligible developing countries with balance of
payments finance, which, although conditional, is granted at
concessionary rates.
Gold sales, loans and voluntary subscriptions are the sources of
funds from which the finance will be made available to those countries
eligible to receive it.
These funds are made available only to poorest developing
countries and only if the member has provided the Fund with an
acceptable economic programme in respect of another facility of the
Fund. The criteria for assessing the acceptability of such a programme
are similar to a first credit tranche proposal and therefore not very
severe. The interest rate on this facility is 0.5% per annum.
Repayments of Trust Fund loans have to be made no later than 6-10
years after the date of disbursement.

Jb
It can be seen that the advantages of the Trust Fund loans to the
poorest countries lie in the concessionary rate of interest, long
repayment period and the fact that these funds are additional to those
available from other facilities of the Fund.
Up to June 1978 disbursements under the Trust Fund totalled SDR
840.968 million. From June 1978 to end 1980 disbursements totalled SDR
1257.191 million, making total disbursements of SDR 2098.159.
In addition to the Trust Fund, some of the developing countries have
benefitted from the IMF's gold sales by a direct contribution of a
proportion of the profits. Profits from the 25 million ounces sold to the
public amounted to US $4.6 billion, of which US $1.3 billion was
distributed directly to 104 developing countries. These distributions
were made on the basis of each recipient's quota as at 31 December 1975.
Some developing country members who would have been eligible to receive
such distributions contributed their share to the Trust Fund. These
members were mainly members of OPEC.
Special Drawing Rights
Special Drawing Rights are an international form of outside money
being issued by the Fund and not being backed by debt. They were first
issued in 1970 with subsequent issues in 1971, 1972 and 1980. About 9500
million SDRs were issued to members in accordance with their quotas. The
use of SDRs by members is unconditional save for a rule that their
holdings should not drop below 30% (15% after 1.1.79) of allocation over
a period of five years.
SDRs were primarily designed to meet balance of payments needs but
other members need not accept SDRs in settlement of international
indebtedness in excess of three times their cumulative allocation.
Transfers between members take the form of book entries in the IMF's
Special Account and do not result in the reduction in the number of SDRs
in existence.

The developing countries, in common with other Fund members,
derive benefits from the allocation of SDRs in the following ways:
1) By adding to reserves they save the opportunity cost
of alternative forms of acquiring reserves.
2) They economise on foreign exchange reserves since they
can be used to pay off debts with the IMF.
3) By exchanging SDRs for foreign currency, real goods and
services may be acquired.
4) As a form of finance benefits may be derived from the
greater economic activity which a more plentiful medium
of exchange permits.
Given that SDRs are distributed in proportion to members' quotas,
it is clear that the distribution of benefits derived from each initial
allocation will have the same shortcomings as the quota system. In
particular the gift of new unconditional reserves is received in
greater proportion by the rich countries, who have the largest stocks
of reserves and therefore need free gifts least. Furthermore, by
granting largely unconditional SDRs in the same proportion to members'
access to conditional' finance, the Fund has not altered the balance of
conditionality in its facilities.
The following table shows the original total allocations of SDRs
to all IMF members and to developing country members.
Table 1.10 The allocation of SDRs to IMF members
All members Developing country members
1970 3414.0 935.8
1971 2949.2 787.4
1972 2951.5 921.4
1973-1979 Zero Zero
1980 4033.27 1551.97
SDRs billions

Bearing in mind that interest is paid by members to the Fund if they
are net users of SDR, the potential real resource gain is equal to the
allocation of SDRs minus the interest payable. Obviously the realised
resource gain depends upon the extent to which the SDRs are utilised.
Below is a summary of the actual drawings made by NOLDCs from the
various Fund facilities during the period 1970-1980. It does not take
account of any repurchases that those members have made during the period
nor the issue of SDRs.

Actual Drawings
by Non
Oil
Exporting
LDCs
1970
-198
0
4 1
oCOCTi
CF>e'en
COr*Cn
r~-r-CTi
COE'en
ine'en
r-CTi
cne'en
CME'en
E'en
or-cn
cn CO CM cn Mt1 '3*'3* CM i—1 CM CD CDcn m O cn cn LO CM CO 00m m CO cn e- m in Ocn CO cn cn cn CM e- CM Ocn T—1 inr-M rH in cn cn 00 n- 0"o r- cn 00 m M1 cn cnCO p' *—i m *—i in r-H cn t-~ cocn e- rH cn o O co CM cnCO m r~4 CM H f" in CM
rH CMCO in CO 'tCD o cn o o P' e--o 00 CO cn 00 E-.o CM r- cn r- rH CO otH St1 ■'t r— i CM CO cn
H rH
e- CO inco CM in e- CM o CMo in o ai in cn 00cn in o m in 00LO CM CM o T-1 rH
r-H rH
cn CO cn CM CMin co O 00 o O oCM r- cn r —i o in inH e- CO cn cn cn cnCM r- CO CO 00 00*—i cn cne- 00 CD r H rHo r*H in CO r- m incn LO CO ■'t cn r- 'ipm cn 00 r- r- r-cn m in sprH CM CMe- r- in e- CO COo in w CO M1 MPcn e- cn O oCM CD o cn M1 MPcn in T-l cn cn cn
H rH
e- CM m M1 sPt—1 in •rH rHco CO cn o oCO CM rH rH r—ICM r—I m P
CM f - in cn e- e-CM in *sf 'vt* co COCO cn cn CO. cn cnr- cn cn CM CMr-4 cn CM 00 00
cn 00 00 o cn cnr- 0 0 spCO m cn I in incn cn CD r H e- r'-CM
in CO r-i rHCO m in in incn cn CM in inLO e- cn cn
CM 't
a)t—i■8B
CD£ 1OPPpB(1)>PQ)HICDPi
>i-t—1•p >1
4-> +J i—i 4-1■rH -p ■p •P in
r—1 o •d iP id i—i cnai > i -p 4 ^ cd p P ■P p p 01 Pp P O O fP 4-1 g P o g p cnu o id O •P 4-> p Pm 01 p b £
> i-p &4 4-> cn rP P IP Pm p ■p p P
01 cd W P ‘P 'd tp Q >d Pm ai & g Pp Q) cn 0) *P o ai 4-1 a ai W a p Em Qid ■P c o P u p >d •p ai o >d pp O ai p Q) P Pm p i—[ i—1 p P p rP Q -p i—l
-p P & cd IH id 01 ■p Oi p 0) <U p 01 PT5 cd a P m P i—1 -p u Ph p 4-1 *d g 0 g 4->P P o ■p g •P -P X p g •H X p o p 0O B o &H m O M w Pm pq g B < B B
inmmfimcocnpa)8CDu01QP
•P4-10)3mi—Ipai■ppPgO i
•dpPi—itnPWOXPPW
£i-P'Hpo•H-PPo*PPgooO)*pP>•HPCU
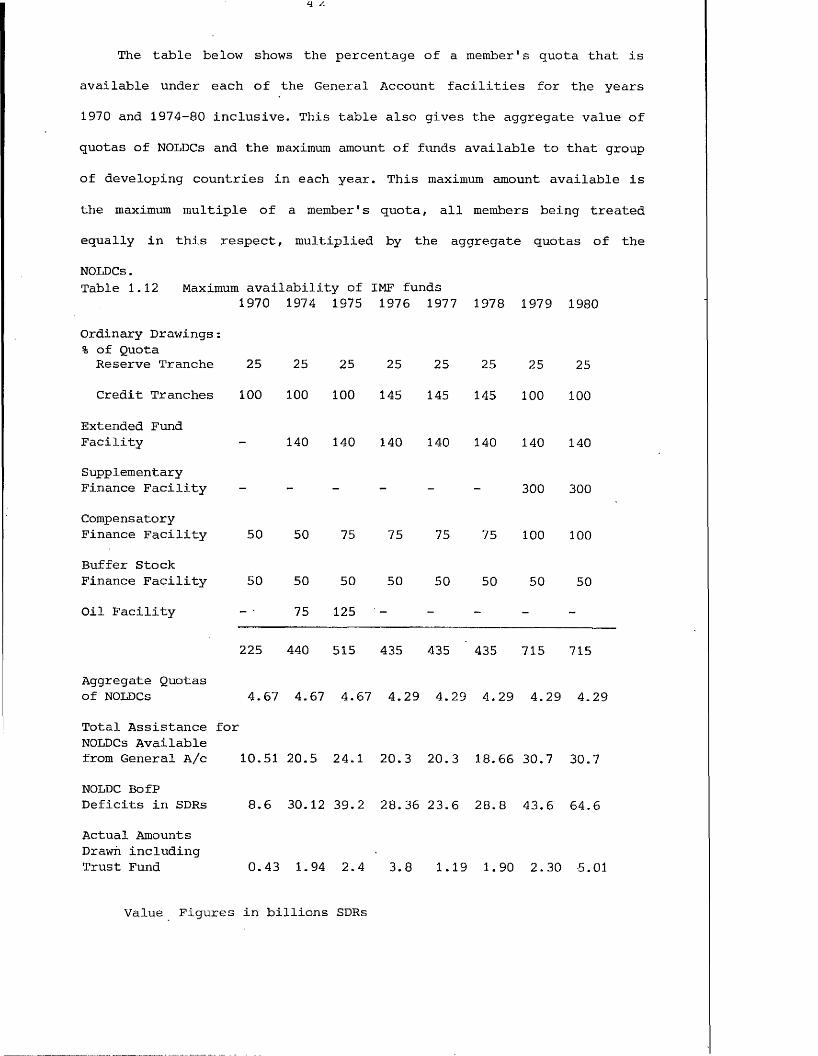
The table below shows the percentage of a member's quota that is
available under each of the General Account facilities for the years
1970 and 1974-80 inclusive. This table also gives the aggregate value of
quotas of NOLDCs and the maximum amount of funds available to that group
of developing countries in each year. This maximum amount available is
the maximum multiple of a member's quota, all members being treated
equally in this respect, multiplied by the aggregate quotas of the
NOLDCs.Table 1.12 Maximum availability of IMF funds
1970 1974 1975 1976 1977 1978 1979 1980
Ordinary Drawings:% of QuotaReserve Tranche 25 25 25 25 25 25 25 25
Credit Tranches 100 100 100 145 145 145 100 100
Extended FundFacility - 140 140 140 140 140 140 140
SupplementaryFinance Facility - - - - - - 300 300
CompensatoryFinance Facility 50 50 75 75 75 75 100 100
Buffer StockFinance Facility 50 50 50 50 50 50 50 50
Oil Facility - ■ 75 125 - - -
225 440 515 435 435 435 715 715
Aggregate Quotasof NOLDCs 4.67 4.67 4.67 4.29 4.29 4.29 4.29 4.29
Total Assistance for NOLDCs Availablefrom General A/c 10.51 20.5 24.1 20.3 20.3 18.66 30.7 30.7
NOLDC BofPDeficits in SDRs 8.6 30.12 39.2 28.36 23.6 28.8 43.6 64.6
Actual Amounts Drawn includingTrust Fund 0.43 1.94 2.4 3.8 1.19 1.90 2.30 5.01
Value Figures in billions SDRs
Clearly the maximum amount available from the General Account of
the Fund for the NOLDCs has become increasingly inadequate. This is
particularly so when it is realised that the maximum amounts quoted
above overestimate the actual amount available to that group of members
if any such members are not in deficit. This is because members not
needing the Fund's assistance cannot transfer their quotas to other
members.
Despite the fact that aggregate NOLDC deficits were greater than
aggregate NOLDC quotas and despite the fact that the financial terms of
Fund assistance were softer than those on market finance, actual
drawings were below permitted drawings throughout this period. One
reason for this is the non financial conditionality attached to most
Fund assistance. However, it is abundantly clear that whatever the
effects of conditionality may be on the demand for Fund assistance, the
availability of finance must be the biggest constraint upon that
assistance.
There is circumstantial evidence that conditionality has reduced
the demand for Fund assistance from NOLDCs. This evidence comes from the
considerably increased use of individual facilities when the
conditionality attached to those facilities Is relaxed. Examples are the
increased use of the Compensatory Finance Facility after its
liberalisation in 1975 and again in 1979. A further example is increased
use of the Extended Fund Facility in 1980 following the extension of the
repayment period from eight to ten years in 1979.
The costs and benefits of IMF conditionality must be evaluated
within the context of the quantity of funds available. Why should a
member wish to suffer the costs of conditionality when the amount of
Fund assistance is relatively small and there are other sources of
unconditional finance available?
The willingness to accept conditionality during much of the 1970's
and early 1980's must have been influenced by the availability of

relatively abundant unconditional finance. Thus, for some countries with
access to bank finance, there was no need to accept conditional Fund
assistance which, in any case, was by itself grossly inadequate
(Financial Times 18.6.82). However, at the time of writing, much of this
bank finance has become vicariously conditional in the sense that
increasing proportions of new private finance are dependent upon the
successful negotiation of, and compliance with, the terms of IMF
facilities. Thus, at the time of writing (end 1983), Fund conditionality
may be more acceptable to borrowers because the costs of not accepting
conditionality are not those of foregoing a small amount of external
finance but instead foregoing all or a major proportion of such finance.
To summarise this section, we may say that throughout the 1970's
the resources available from the IMF were inadequate to finance NOLDC
balance of payments deficits and these countries therefore turned to the
private banks for assistance. The inadequacy of IMF funds was
exacerbated by the conditionality attached to some of those funds.
The International Bank for Reconstruction and Development
Established as a sister institution of the IMF in 1944, the IBRD
has as its function the financing of economic development amongst its
poorer members. The Bank obtains the finance for its operations from the
sale of its debt obligations to private investors, governments and their
instrumentalities. The Bank's capital, which is subscribed to by its 128
member countries, its retained earnings, and the flow of repayments on
its loans, substantially contribute to the Bank's resources (Cherniavsky
1977). In fact, only 10% of authorised capital is subscribed, 90% being
held as a guarantee of the Bank's operations.
A quantitative constraint is that. the total amount of loans or
guarantees must not exceed the Bank's capital and reserves.

The Bank generally provides project finance, that is, loans made in
respect of particular projects, and can only be disbursed in relation to
the approved project. Bank finance is usually limited to the foreign
exchange content of a project and repayment must be guaranteed by the
government of the country in which the project is located.
The rate of interest to be charged quarterly on Bank loans is
calculated by adding 0.5% to the weighted average cost of the Bank's
borrowed funds (weighted by amount and maturity) over the previous twelve
months and then applied for the next quarter.
This method of calculating the interest charge meant that loans were
made at commercial rates and therefore contained little, if any, aid.
There was also criticism in that the requirement of a government
guarantee has deterred private firms from seeking finance for development
projects.
To counter these criticisms the IBRD established two subsidiary
institutions.
In 1956 the International Finance Corporation was set up in order to
provide finance for up to 50% of a private sector project. No government
guarantee is required and the IFC will not invest in projects controlled
or owned by governments. The aim is that the IFC sells off its stake when
the project is viable in order to re-use its resources elsewhere.
In 1960 it established the International Development Association.
The objective was to provide loans on softer terms than Bank loans to
finance projects in the poorer developing countries.
Finance for the IDA and IFC comes from the reserves - retained past
profits - of the IBRD as well as subscriptions by the 21 members who are
industrialised and highly developed.
In 1975 the Bank established the Intermediate Financing Facility or
The Third Window. This facility was to provide finance on terms
intermediate between the Bank and the IDA. The idea was to subsidise the
rate of interest of Bank loans by four per cent per annum, but only on

loans to the poorest members, ie those with a per capita income of less
than US $375 in 1972. This -facility effectively only lasted for one year.
The Third Window was expected to lend up to $1000 million in 1976 but
much less was lent because the Bank could not raise sufficient funds from
its members. Hurni (1980) attributes this to aid weariness amongst the
Bank's creditor members.
In order to provide for the subsidy, a Subsidy Fund was
established; its resources came from certain members of the Bank and
Switzerland on a voluntary basis (IBRD 1976).
During the 1970's there was a shift of emphasis in World Bank
lending. The traditional projects that the Bank supported were typically
infra-structure projects with long gestation periods and only indirectly
earning foreign exchange. The shift in emphasis was towards
poverty-orientated projects. As an indication of the relative importance
of this shift, whereas 22% of lending between 1969-73 went to
agriculture, 52% of lending went to agriculture during 1974-78 and in
1977 57% of agricultural lending went to 'poverty-orientated' projects.
The table below shows the total amounts lent by IBRD, IDA and IFC
from 1970 to 1980.

Table 1.13 Annual lending of IBRD, IDA and IFC 1970-1980 Of which
IBRD Third IDA IFCWindow
1970 1580 — (754) 606 (143) 112
1971 1921 - (915) 584 (235) 101
1972 1966 - (1182) 1000 (261) 116
1973 2051 - (1180) 1357 (493) 147
1974 3218 - (1533) 1095 (711) 203
1975 4320 - (1995) 1576 (1026) 212
1976 4977 478 (2470) 1655 (1252) 245
1.977 5759 - (2636) 1308 (1298) 259
1978 6098 - (2787) 2313 (1072) 338
1979 6989 - (3602) 3022 (1222) 425
1980 7644 — (4363) 3838 (1411) 681
Source: IBRD Annual Report, various issues Figures in million US $Figures in parenthesis are the actual disbursements in each year
Criticism of the World Bank Group's facilities are related to the
cost, the quantity available and the small size of any programme lending.
In relation to cost, the establishment of the IDA and the
Intermediate Financing Facility goes some way to mitigate this problem.
With regard to programme lending, the Bank's Articles of Agreement
state that "loans made or guaranteed by the Bank shall, except in special
circumstances, be for the purpose of specific projects of reconstruction
and development", (IBRD 1977). These special circumstances have changed
several times during the Bank's existence. Since 1977 they have included
the following:
1) Reconstruction and rehabilitation of the economy after
a war or severe national calamity.
2) Demand for industrial raw materials or equipment to raise
the use of existing industrial capacity.
3) A sudden fall in export earnings, where the economy
is critically dependent on a single export item.
4) A sharp deterioration in the terms of trade as a
result of a rapid rise in import prices.
Until 1970 the Bank and the IDA provided about 10% of their loans
as programme loans. From 1971 to 1974 that figure fluctuated between 4%
and 7%, increasing sharply in 1975 to 9% and declining again to 2.3% in
1977. The 1977 Annual Report of the Bank suggested that a figure of
7-10% was considered a reasonable commitment to programme lending in the
future.
Turning now to the quantity of assistance available to members,
this is not so much restricted by the members' contributions but by the
overall quantity of funds available to the Bank. The Bank's loanable
funds in any one year will depend in the main upon interest and
amortization receipts and borrowings. However, the overriding legalistic
constraint on the Bank's lending will be the regulation that total loans
must not exceed the sum of the Bank's subscribed capital and its
reserves. Nevertheless, figures below show that this regulation did not
constrain the Bank's activities during the 1970's. There have been
several replenishments of the capital stock during the Bank's existence
but because these replenishments do not earn an income for the member
governments such contributions are akin to aid. As such they are
constrained by the political will of the members, particularly the
developed country members, in granting additional aid.
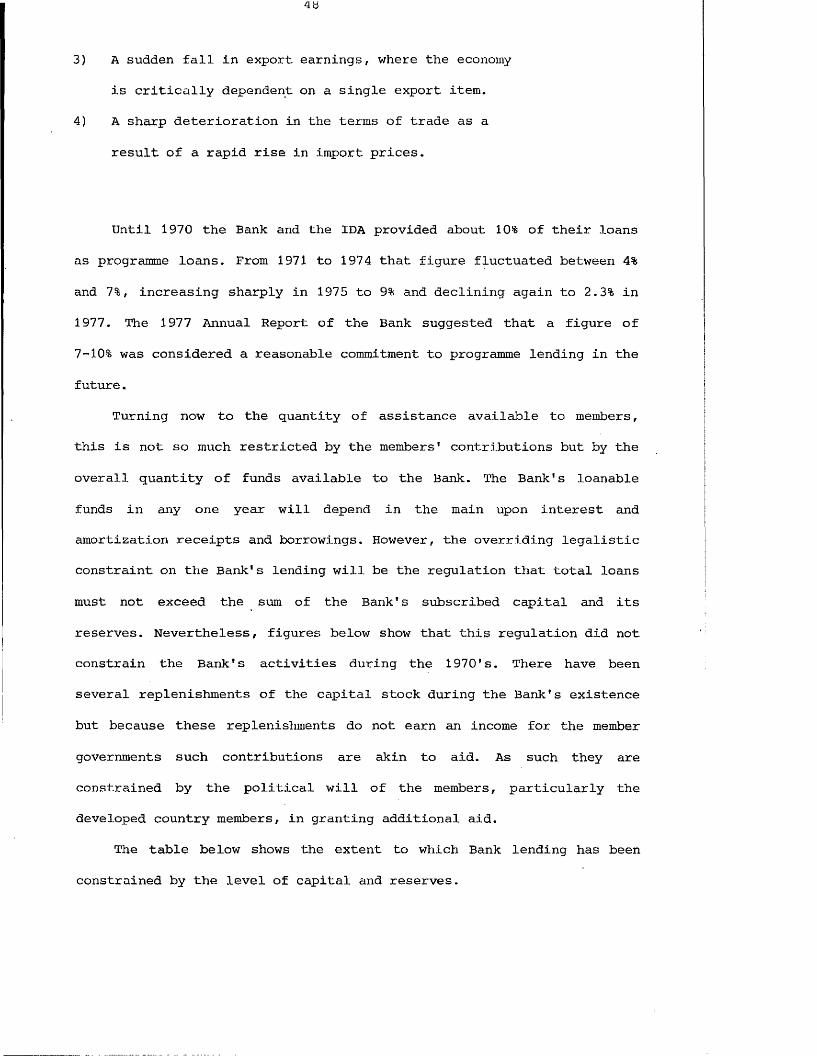
The table below shows the extent to which Bank lending has been
constrained by the level of capital and reserves.
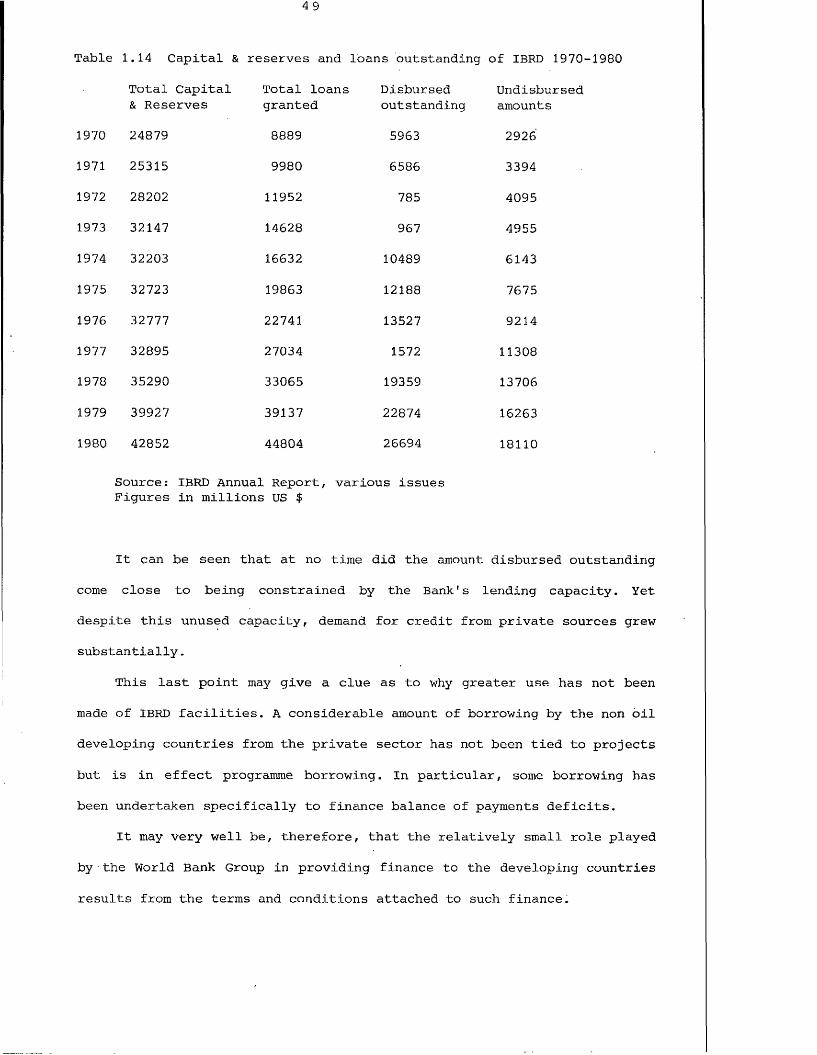
Table 1.14 Capital & reserves and loans outstanding of IBRD 1970'
Total Capital & Reserves
Total loans granted
Disbursedoutstanding
Undisbursedamounts
1970 24879 8889 5963 2926
1971 25315 9980 6586 3394
1972 28202 11952 785 4095
1973 32147 14628 967 4955
1974 32203 16632 10489 6143
1975 32723 19863 12188 7675
1976 32777 22741 13527 9214
1977 32895 27034 1572 11308
1978 35290 33065 19359 13706
1979 39927 39137 22874 16263
1980 42852 44804 26694 18110
Source: IBRD Annual Report, various issuesFigures in millions US $
It can be seen that at no time did the amount disbursed outstanding
come close to being constrained by the Bank's lending capacity. Yet
despite this unused capacity, demand for credit from private sources grew
substantially.
This last point may give a clue as to why greater use has not been
made of IBRD facilities. A considerable amount of borrowing by the non oil
developing countries from the private sector has not been tied to projects
but is in effect programme borrowing. In particular, some borrowing has
been undertaken specifically to finance balance of payments deficits.
It may very well be, therefore, that the relatively small role played
by the World Bank Group in providing finance to the developing countries
results from the terms and conditions attached to such finance.

50
The fact that the Bank has limited the amount of programme finance
it makes available means -that the supply of loans is likely to be
channelled to those countries where project investment possibilities are
greatest.
The following figures show outstanding loans as at 31 December 1980
aggregated by income groups:
Upper Middle Income 1,068,635
Intermediate Middle Income 26,548,411
Lower Middle Income 14,379,381
Low 2,771,246
Source: calculated from IBRD prospectus 27.4.81 Figures in thousands US $
It is notable that this distribution of loans is similar to that of
eurocurrency syndicated loans where commercial criteria can be expected
to apply. It may be therefore that the Bank's insistence on
creditworthiness in the projects that it finances and its lack of
interest in programme finance have combined to limit the attractiveness
of World Bank finance to developing countries. It must be remembered
that the above distribution relates to loans from IBRD; IDA loans, which
are on softer terms, all go to the poorer members of the World Bank.

Bilateral Aid Flows
The major aid donors during the 1970's have been the DAC members of
OECD and OPEC countries, with small contributions being made by the
centrally planned economies of Europe and China.
During the 1970's there were two targets for aid flows donated by
members of the United Nations. The first target was embodied in the
Development Strategy for the Second UN Development Decade (1971-1980).
This called for Net Official Development Assistance to be at least 0.7%
of GNP at market prices of the donor country. The second target was that
adopted by UNCTAD II in 1968 which calls for all financial flows, both
private and official, to represent at least 1% of GNP.
The following figures show the net flows of aid from various groups
of donors. In nominal terms these flows have increased by 350% in eleven
years; bilateral aid growth being slightly slower than multilateral aid.
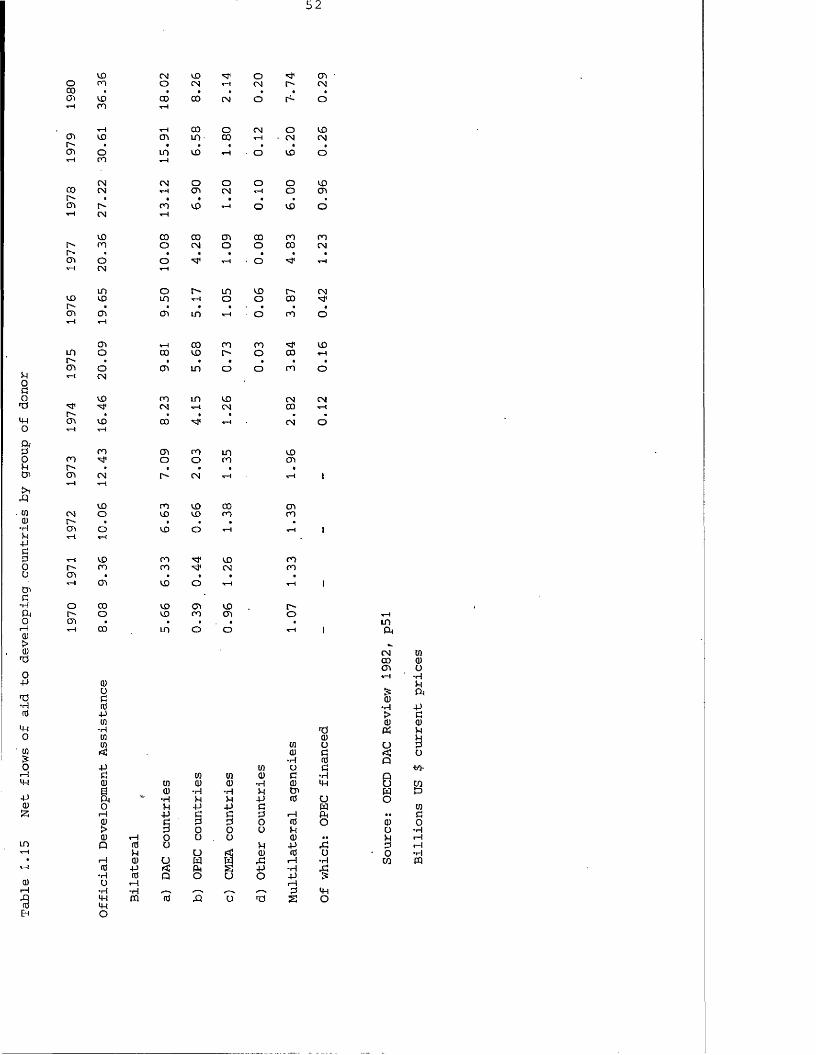
Table
1.15
Net
flows
of aid
to
deve
lopi
ng.co
untries
by group
of do
nor
52
vo CM VO O cno n o CM 1-4 CM r~- CM00 • • • • • a acn VO CO 00 CM o r1- oH ro i-iH 1--1 00 o CM o vocn VO cn m CO rH ■ CM CMa a a a * a aCn o m vo i—1 o VO oH ro i— i
CM CM o o o o vo00 CM H c n CM rH o cnr** a • a a « a acn t" ro v o rH o VO oi— i CM
vo CO 00 cn CO ro ror- ro O CM o o 00 CMa a a a a a aO'! o o rH ■ o i—l1-1 CM rH
in o r - in V O r~- CMVO vo in o o COr-' a a • a a a acn cn cn in rH o ro o
i— i
cn i-i 00 r o ro VOn o 00 vo r-- O 00 1—4
a a a a a a acn o cn i n o o ro oi-i CM
VO CO m VO CM CMCM r—t CM CO T—I
r" a a a a •cn VO 00 i—l CM OT I iH
ro cn CO in VOro o o CO cnr- a a a a acn CM r- CM i— I T-1 1T— 1 i— i
VO ro VO 00 cnCM o vo VO C O ror-~ a a a a acn o VO o 1— 1 rH 1t 1-1
H vo ro VO C Or- ro ro CM rocn a a * a ar H cn VO o i—I 1—1 1o 00 VO cn V O r-r-' o VO CO cn ocn a a a atH CO in o o i—i 1
IN Cfl0 0 CDG\ O
0) pu Pig 0Id -p-p > gin 0 0•p nd 05 pin 0 pin in o U g< ai g o
-P id a-P in o g m -g in in 0) g •p Q0) in a) CD •P fl> m o to6 a) •p ■H P Cn w DPt ■H p P -P id u o0 P •p -P g w in1— 1 -P g g g i— i 04 at g0)
§g g o id o 0 0
> o 0 u P o •pa) 1— 1 o u o a> • • p ■— iQ us u p -P b g i— i
p u »=tl Q) id o ■ o •pH 0) a w w b i— i *rl to PQ(0 -p < 04 s ■P - P b*P id D o u o -P sU rP tP-P -H ____ ,— „ g 444-1 CO cd b u 43 s O4-1O

However, the same source (page 52) shows that in real terms (1981
prices) aid increased by only 75% over that same period.
Comparing these figures with those for balance of payments deficits
on page 21 above it is clear that aid receipts by LDCs as a group
became an increasingly inadequate source of finance as the decade
progressed.
OECD figures given in Table 1.1 above show that 97.4% of ODA in
1978 went to non OPEC LDCs. Thus, even if we make the assumption that
OPEC countries therefore received very low ODA payments during the whole
of the decade, ODA receipts by non OPEC LDCs were still unable to
finance the balance of payments deficit.
Reasons for Increased Private Flows : A Summary
Having analysed the official sources of external finance, we can
now summarise the reasons for the developing countries turning to the
private financial markets as:
1) Inadequate rate of growth of funds from official
sources.
2) Conditionality applied to funds from official
sources. In particular, the terms attached to
IMF facilities and the tying of aid made private
unconditional credit preferable despite its
higher cost.
3) The relative lack of flexibility of the facilities
from official sources made the flexibility of the
eurocurrency syndicated loans market particularly
attractive. In this respect the small level of
programme lending by the IBRD is to be noted.

1.5 The Impact of Increased Privatisation of Sources of Finance
The shift in emphasis towards private sources of finance may be
expected to change the level of benefit which the developing countries
receive from their aggregate financial flows. In particular, because
private flows will be motivated by commercial criteria whereas official
flows may be expected to be, to some extent, motivated by altruism, the
shift towards private finance will mean harder financial terms. These
terms will be manifested in a combination of higher interest rates,
shorter grace periods and shorter maturities to loans.
In order to analyse the effects of the change in financial terms,
it is first necessary to ascertain how the debt disbursement was
distributed amongst recipients for each type of financial flow. With
knowledge of this distribution and of the different financial terms
attached to each, some indication of the changing financial costs to the
developing countries will be possible.
One particularly important question in this regard is the extent to
which the changing financial terms affect the developing countries'
future growth by laying prior claim to future foreign exchange
resources, these resources being used for debt servicing instead of
investment.
The Distribution of Financial Flows by Source and Recipient
In what has been said so far the developing countries have been
divided into two groups. One group is the oil exporting group which,
because of their balance of payments surpluses, particularly since 1973,
have also been net exporters of financial capital. The second group is
the non oil exporting developing countries which, as a group, are net
importers of financial capital. However, to treat this latter group as
homogeneous obscures many interesting details about the benefits they
gain from international financial flows.
In this section we follow the practice of the IBRD and divide all
developing countries into the following groups:

Upper Middle Income ie countries with a per capita GNP
of US $3000-6999 in 1978.
Intermediate Middle Income ie countries with a per
capita GNP of US $700-2999 in 1978.
Lower Middle Income ie countries with a per capita
GNP of US $300-699 in 1978.
Low Income countries ie those countries with a per
capita GNP of less than US $300 in 1978.
The following table shows the ratio of amortization payments to
outstanding disbursed debt and the ratio of interest payments to
outstanding disbursed debt. Values of both ratios are given for 1973 and
1979 so that comparison can be made. These ratios were calculated from
data extracted from the IBRD World Debt Tables.
The amortization ratio shows the proportion of total debt being
amortized each year. If the ratio rises the residual maturities and grace
periods on existing debt are shortening or those variables on new debt are
getting shorter. In the extreme, a bunching of maturities in a given time
period will lead to a dramatic rise in this ratio.
The interest ratio shows the relationship between interest payments
and debt outstanding. If this ratio rises over time, then it indicates
that interest rates on marginal loans, or in the case of floating rate
loans intramarginal loans, are rising. Thus again the higher ratio means
harder financial terms.
In effect these two ratios decompose the ratio of total debt service
payments to debt outstanding. This is considered to be worthwhile because
it enables the highlighting of the influence of changes in interest rates
- often caused by money market conditions - and changes in grace periods
and maturities which may be influenced by risk and competitive factors.
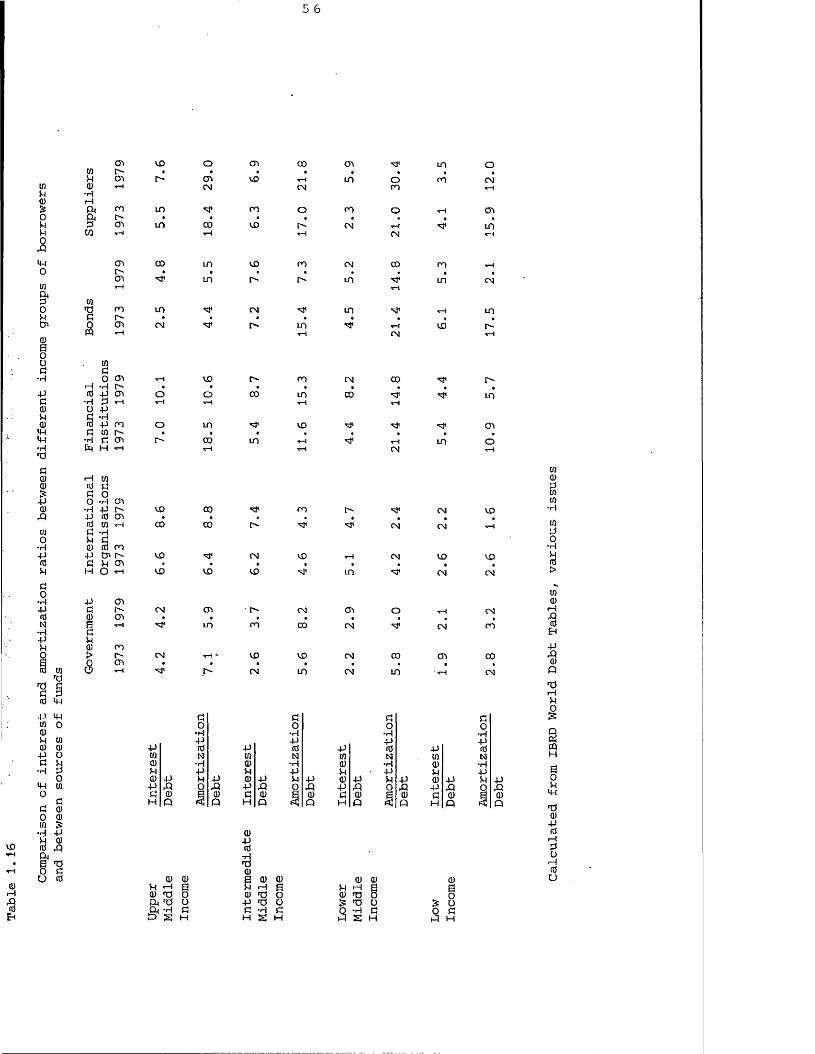
5 6
oiPai&opp
4-1001
§•0Ptn01 S0 0 d■r4Paa)p01
4-j 44•rH13
do
•rHPitiN•HPPO
014 3
4 3§d
id 4 4
P 4 401 Od)P 01d) 01P Od b■r4 3
0m 010
dd 01o di01■ P -pP 01id 4 4AE 430 du id
Ol vo O cn 00 cn 'd* in o01 n- • • • • , ,P Cn Is- cn VO rH in o m CNdi rH CN CN m -—I■Hi—1A CO in 'Sjl cn O m o H 0!& n- > • • t • ,
cn m 00 vo r-' CN t—f ■N1 inCO T—1 rH rH CN rH
CTi 00 in VO ro CN CO m -—1t-- • • » • » . , .01 n n- in in CNtH T-l0143 m m CN ■d* in "N1 x— I ind r^ • • « ■ , ,
& cn CN ■N* t*- n rH vo r-m -— ) T—1 CN rH
01d0 cn rH vo r - cn CN 00rl -h n • • , ,
rd 44 cn o o 00 m CO -d<-P 2 rH rH rH rH H0 44d -hio p m o in "d* VO ■N*d oi r - • » • ,
-p d cn r- CO m rH -d1 rHIP H rH s—! rH CN
01 ■—i 0101 id ds d op o •h cnQ) •H P VO 00 ■ r cn t'-P P cd cn • « • .
(d 01 rH 00 oo [-» si101 d •Ho p d■r4 0 in cnP P Cn r - vo -vt1 CN vo rHid d p cn • • » tP H O rH VO vo vo n 1 in
'd*
CN
CN
Q) Q)M -j Ba) 43 oA 43 oA ‘H d13 J£J I—I
ai4-1id-H43aia ai ai w i IE di 43 O P 43 O d 'P d H S H
CD d) p rH a01 43 O£ 43 OQ -H di-4 S H
LD
CNCN
VO
CN
r -
in
cn
o
vo
vo
CN
Pd
cne' CN cn • r~ CN cn O t-H CNdi en • • • • < ,
f| "d* in m 00 CN CN cnpdi>
<ne' CN r—1 *■ vo vo CN CO cn 00en • • ■ » • •
o rH 'd* r - CN in CN in ‘ t-H CN
d d d do o o 0-p -P •H -p
p p p pp id p id p id P id01 N 01 N 01 N 01 N01 ■P di *p dl -P <u ■Pp P P P p P p Pdl -P P p di P p p d> P p P dl P P PP P o p P P o p p P o P P p 0 Pd dl a di d d> a di d di R di d di diH p P H Q <53 P H P < P H p P
01d>r-4
P(dE444Pd)P
43
P
S.
gPQH
EO
4-t
43 d> -P (3 *—! 3 U i—f 4) O
1-4 H

These figures show that generally th<£* interest to debt ratio has
increased over the period reflecting the secular increase in interest
rates during the 1970's. The greatest increase in the ratio is found in
loans from the financial institutions, the smallest increases coming from
bonds. However, this latter point may reflect the relatively small use
that has been made of the international bond markets by the developing
countries.
One reason why the interest to debt ratio has risen for loans from
financial institutions is that many of these loans are tied to floating
rates of interest, therefore both marginal and intra-marginal loans
reflect the secular increase in interest rates during the 1970's.
Although the interest burden has risen during the 1970's the change
in the burden of amortization is less obvious. For loans from financial
institutions the burden appears to have fallen for all groups except the
intermediate middle income borrowers. However, although data in appendix
II show amortization rising faster than disbursements during 1978 and
1979, this is due to the considerable increase in debt refinancing that
occurred during that period. This effectively extended the maturities and
grace periods.
Clearly then, the increase in the relative share of private finance
in total finance has raised the interest servicing burden but reduced the
amortization burden. However, see chapter five, page 236 below re short
term debt.
One interesting point is that although one may expect the interest
and amortization commitments on official finance to be lower on low income
- although high risk - borrowers compared with high income borrowers, we
find that the same applies to the private sources except for bonds. We
might expect such a situation on official finance because commercial -
particularly risk - criteria may not be dominant in assessing loan
applications. However, we would not expect such a situation with private
credit because we expect risk criteria to be dominant in private
assessment of loan applications.

One explanation of this may be that lower income countries have only
recently gained access to the private sources of finance on any scale.
Where loans are made^to these poorest borrowers official -export credit
insurance with its attendant.subsidised fixed rate bank loans, will 'be
proportionately more important.' Thus the impact of rising interest
rates is reduced for these borrowers.
Turning now to data on the actual flows of funds to the developing
countries given in Appendix II, we use the concept of net transfer to
make comparisons between the sources of flows and between the
destinations of flows. The concept of net transfer is calculated as
follows, following IBRD practice:
Disbursements - Amortization = Net flow
Net flow - Interest payments = Net transfer
This concept is used here in order to facilitate the comparison of
flows from financial intermediaries with flows from other sources.
However, below, under the section discussing recycling, we analyse the
validity of this concept in relation to financial intermediaries.
These data on the net flow show the upper middle income group of
countries receiving.a rising net transfer from government sources but a
declining net transfer from all other sources. This is despite the fact
that government transfers could be made on altruistic grounds and
therefore concessionary, in which case the concessions may be more
appropriate to the poorer nations.
Intermediate middle income countries, on the other hand, have
received over the decade a declining net transfer from governments, and
a rising net transfer from all • other sources. The financial
institutions have been the most important source of these flows, being
several times greater than the government and international
organisations combined.
For the lower middle income countries, governments and
international institutions have been about equally important as sources
of financial flows. The flow from the bond markets has been erratic and
the flow from suppliers has declined since the mid 1970’s. Funds from
financial institutions have grown to be the most important form of
finance.
Features of the flows to the low income countries include the
negative net flow from the bond market and the relatively low flow from
the financial institutions. The first factor is due to the fact that
these countries have not tapped this market during the 1970's. The
reasons for the infrequent use of the bond markets by LDCs are
discussed in chapter eight of this thesis. The relatively low flow to
these countries from the financial institutions is due, firstly, to the
higher perceived risk which these countries offer to the lending
institutions. The second reason is that the higher costs of private
finance to these countries - to balance the higher risk - means that
these countries cannot afford to tap the private markets due to their
lack of concessionality.
It must also be remembered that the poorest countries do receive
large portions of their external financial flows in the form of ODA.
According to OECD figures (Review Economic Development 1980, Table
IV-IO) , the least developed countries receive 85.2% of their external
financial flows in the form of ODA and the low income countries
generally receive 71.1% of such flows as ODA. Given that the proportion
of ODA received in grant form during 1979 by these groups of.countries
is 94% and 90% respectively, the lack of access to private sources of
credit for the poorest countries is to some extent mitigated (OECD
Development Cooperation 1980, Table B2).
Note should be made of the erratic flows of supplier credit to all
the developing countries. However, bank supplied buyer credit is highly
substitutable for supplier credit. This is particularly so where such
credit is supported by official export credit insurance. Such insurance

agencies have increasingly been used by western governments as
instruments of export competition policy. This action could account for
behaviour of supplier credit in that buyer credit supplied by banks in
the supplier’s country has been substituted for supplier credit.
To summarise the effects upon the developing countries of greater
access to private sources of finance, we must note that:
- firstly, the financial borrowing costs have
risen;
secondly, the quantity of funds available has
increased dramatically;
- thirdly, that the effective maturity structure
of private debt has lengthened during the 1970's,
particularly from financial institutions;
fourthly, the distribution of access to private
funds is not uniform across all developing countries.
However, as the better-off developing countries have,
and can afford, access to private sources of finance
this means that the finance available from official
sources can be spread more thickly amongst the
poorer countries. These countries are therefore
benefitting from a greater share of concessionary
finance;
- fifthly, having said that, it must be remembered
that the credit from private sources, particularly
from financial institutions and bonds, is not evenly
distributed amongst those countries that have access
to such sources. A few developing countries take the
lion's share of both bank loans and bond issues;
- sixthly, the increased financial costs of borrowing
may not necessarily be an increased burden for the
borrower. If correct financial and social criteria
are taken into account, the higher interest rates
may not be detrimental to the borrower. However,
to the extent that the higher interest rates are
associated with higher inflation rates in the
developed world, but the loan is used to finance a
project that does not generate additional foreign
exchange earnings, then servicing that loan in
foreign currency may prove difficult. Neverthe
less, this problem is really one of debt manage
ment and should not be attributed to the increased
privatisation of debt per se.
The Recycling of Financial Flows
This topic has 'been much discussed in relation to the movement of
funds from the oil exporting countries to the non oil exporting
developing countries. However, as can be seen from the table on page .21
above, the years 1970-73 and 1978 required the recycling from the
industrialised surplus countries as well, because the OPEC surpluses
were smaller than the NOPEC deficits.
This recycling process is simply the manifestation of the role of
international financial intermediation. Financial intermediaries borrow
from sectors with surplus funds and lend to sectors with a financial
deficit. In the process a liquidity transformation often takes place.
There are three major types of financial intermediaries involved in
the recycling process, the Development Banks, the IMF and, most
importantly, the Commercial Banks.

In this section it is intended to analyse the role of each of these
intermediaries against the criteria of providing funds for the most
needy developing countries.
The development banks are included because it is contended here
that an analysis of the role of the commercial banks can only be made
with a knowledge of their contribution to the resources of the
development banks.
The Role of the Development Banks
Data for this analysis are taken from the World Bank Debt Tables.
These show disbursed debt outstanding to international organisations by
developing countries for 1979, as follows:
Upper middle income countries 1229.7
Intermediate middle income countries 18493.2
Lower middle income countries 11792.2
Low income countries 11725.2
TOTAL 43240.3Millions US $
The term 'international organisations' includes the World Bank
Group, regional development banks and other multilateral and
intergovernmental agencies. However, the influence of the other
multilateral and intergovernmental agencies was small eg World. Bank
Group alone accounted for US $32539 million (June 1979).
It can be seen that most money has been lent to the intermediate
middle income group and least to the upper middle income group of
countries, the two low income groups getting roughly equal shares..
In order to see how these flows represent genuine recycling, it is
necessary to show the sources of funds to the international
organisations.
Again, taking the World Bank as representative of all the

6 3
development banks, figures extracted from the Bank's annual reports for
1976-79 show that oil exporting countries lent the Bank US $305.5
million in 1976, US $179.5>million in 1977, US $40.1 million in 1978.
The 1979 annual report does not specify any borrowings from oil
exporters, although there are several borrowings from 'other' countries.
It can be seen that some, although modest, recycling from oil
exporters to NOPEC developing countries has been achieved by the Bank.
Nor must it be forgotten that in 1978 the oil exporters were actually in
deficit, thus all developing countries as a group were in deficit to the
developed countries. During the fiscal year 1979 the World Bank,
according to its annual report, borrowed over 5 billion US $ equivalent
of foreign currency, nearly all from the developed world. As disbursed
loans increased by over US $3i billion, the Bank actively recycled from
the industrial countries to the developed countries during that period.
The evidence of recycling OPEC surpluses is less impressive. The
following figures taken from a World Bank loan prospectus dated 24 April
1981 show Bank borrowings outstanding as at 30 June 1980.

Table 1.17 Currency classification of IBRD borrowings outstanding 30.6.80
Austrian Schillings 80.032
Belgian Francs 80.693
Canadian $ 59.865
Deutsche Mark 8,809.726
French Francs 29.354
Italian Lira 47.369
Japanese Yen 4,133.684
Kuwaiti Dinars 278.937
Netherlands Guilders 426.657
Pounds Sterling 9.898
Saudi Arabian Riyals 150.164
Swedish Kronar 30.139
Swiss Francs 5,489.652
United Arab Emirate Dirhans 72.953
US Dollars 9,819.392
Venezuelian Bolivors 109.470
29,729.319
Source: IBRD Prospectus dated 24.4.81Figures US $ millions
Of the US $29,729,319 million equivalent only US $611,524 million was
outstanding to oil exporting developing countries. These figures confirm
the small role played by the World Bank in directly recycling surpluses
from the oil exporters to the NOPEC countries. However, to the extent that
financial institutions in the developed world subscribed to IBRD bonds
with funds deposited by oil exporters, the World Bank is indirectly
involved in recycling. These figures also obscure the subscription to IBRD
bonds by financial institutions and individuals in the oil exporting
countries which are made in the major currencies.
Considering the distribution of IBRD loans given above, it is
reasonable to conclude that the recycling that does take place via these
organisations is directed to the poorer two categories of developing countries.

6 5
The Role of the IMF
This institution acts as a financial intermediary in so far as it
provides by way of loan (purchases) funds deposited by other members,
either by way of a member's quota or extra funds under special
facilities.
The Oil Facilities, the Trust Fund and the Supplementary Financing
Facility to the extent that they are financed by borrowing, are examples
of financial intermediation by the IMF. The General Agreements to Borrow
are concluded between the Fund and ten industrial members plus
Switzerland and as such do not directly represent recycling between the
OPEC and NOPEC countries.
However, the Oil Facility and the Supplementary Financing Facility
were both partly funded by OPEC members. To this extent, given that
NOPEC members benefitted under both schemes, the Fund has been directly
involved in recycling the OPEC surpluses. Two reservations must
nevertheless be made. Firstly, the major beneficiaries under the Oil
Facility have been developed country members. Secondly, although the
Fund had commitments by members to lend it SDR 7784 million to fund the
Supplementary Financing Facility, as at 30 April 1980 the Fund had only
borrowed SDR 502.4 million. Thus, this recycling role has been very
limited.
In fact in the 1980 annual report, the Fund states that it has
supplemented its resources, by borrowing, by only SDR 9.9 billion in the
six years to 1980. Given that some of these resources would have come
from developed members and lent to developed members, the actual amount
directly recycled to NOPEC members by the IMF during this period must be
relatively very small.
The Role of the Commercial Banks
In order to establish the role of these banks in the recycling
process, we can remind ourselves of the net transfer made by them to the

non oil developing countries.
Table 1. 18 Net transfer by banks to developing countries 1973-79
. Upper Middle Income
Intermediate'MiddleIncome
LowerMiddleIncome
LowIncome
1973 207.8 3602.3 545.5 203.6
1974 1119.8 3914.6 1095.1 237.4
1975 1238.9 5925.4 2049.5 163.1
1976 1233.7 9123.8 1999.8 221.6
1977 1507.3 9396.7 1618.5 270.9
1978 -148.3 15073.0 1871.0 227.4
1979 -127.4 14390.5 2787.3 158.1
Calculated Figures in
from IBRD World millions US $
Debt Tables
When analysing the distribution of financial flows between income
groups,' we noted that the concept of net transfer as calculated was not
valid where the source of finance was both debtor and creditor to the
group of borrowers. This situation occurs most obviously with the
financial intermediaries.
These financial intermediaries/ in particular the commercial banks,
are often holding deposits from, as well as making loans to, the same
developing countries. These deposits may be held by the borrowing
country for transactions purposes, or as part of their stock of foreign
exchange reserves, or the deposits could.arise from loans being drawn
down but not yet utilised.
One could go a stage further and adjust for the role of the Bank
for International Settlements. This Bank takes deposits from other
central banks and redeposits the funds in the eurocurrency market. To
the extent that these two types of deposit are used by the banks in
order to fund their loans to the developing countries, these countries
are in effect financing their own loans. It would not, therefore, be

67
correct to use the concept of the net transfer calculated as:
Disbursements - (Amortization + Interest)
when discussing the recycling of funds by these institutions.
The point is that recycling relates to the movement of funds from
one sector of the world economy to another. To the extent that
developing country deposits held with financial institutions help
finance the portfolio of loans to the developing countries, these loans
are not recycling funds from one sector to another.
In so far as the net transfer is an indicator of the new purchasing
power which is made available to the borrower, then it is quite valid to
use that indicator in relation to flows from financial institutions.
However, as a comparative measure of the relative flows to different
groups of developing countries from various sources, the relative
deposit position of those countries vis-a-vis the financial institutions
must also be taken into account. A more correct measure would offset
deposits held by the borrower with the financial institution.
To the extent that the net transfer is representative of the new
resources that have flowed to the recipient country, then the change in
deposits held by that country with financial institutions should be
deducted from the net transfer as calculated above.
In order to obtain some conceptually correct idea of the net
transfer to the developing countries by the commercial banks, the
following figures show the change in assets (loans) and liabilities
(deposits) of banks in the BIS reporting area vis-a-vis developing
countries. The balance of the flows of loans and deposits will be the
net transfer. Because these flows are calculated from the change in
stocks, of assets and liabilities between different time periods,
amortization and interest flows will be captured in the net result.
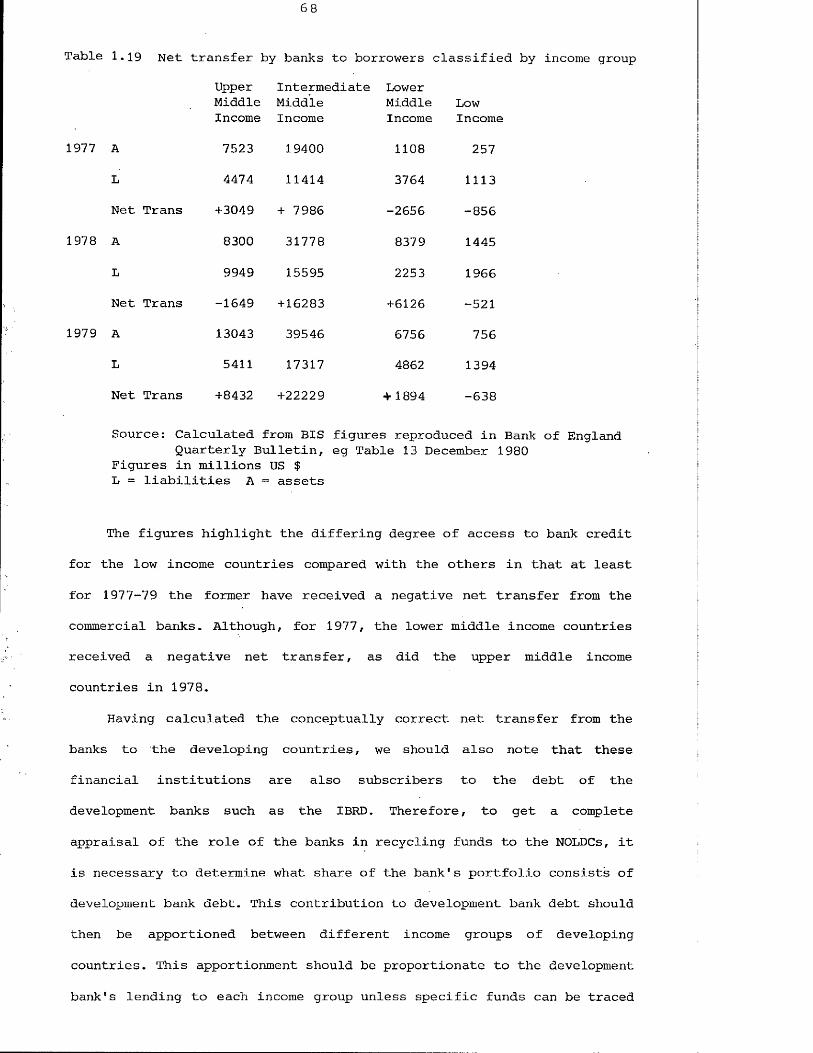
68
Table 1.19 Net transfer by banks to borrowers classified by income group
UpperMiddleIncome
IntermediateMiddleIncome
LowerMiddleIncome
LowIncome
1977 A 7523 19400 1108 257
L 4474 11414 3764 1113
Net Trans +3049 + 7986 -2656 -856
1978 A 8300 31778 8379 1445
L 9949 15595 2253 1966
Net Trans -1649 +16283 +6126 -521
1979 A 13043 39546 6756 756
L 5411 17317 4862 1394
Net Trans +8432 +22229 + 1894 -638
Source: Calculated from BIS figures reproduced in Bank of England Quarterly Bulletin, eg Table 13 December 1980
Figures in millions US $L = liabilities A = assets
The figures highlight the differing degree of access to bank credit
for the low income countries compared with the others in that at least
for 1977-79 the former have received a negative net transfer from the
commercial banks. Although, for 1977, the lower middle income countries
received a negative net transfer, as did the upper middle income
countries in 1978.
Having calculated the conceptually correct net transfer from the
banks to the developing countries, we should also note that these
financial institutions are also subscribers to the debt of the
development banks such as the IBRD. Therefore, to get a complete
appraisal of the role of the banks in recycling funds to the NOLDCs, it
is necessary to determine what share of the bank's portfolio consists of
development bank debt. This contribution to development bank debt should
then be apportioned between different income groups of developing
countries. This apportionment should be proportionate to the development
bank's lending to each income group unless specific funds can be traced
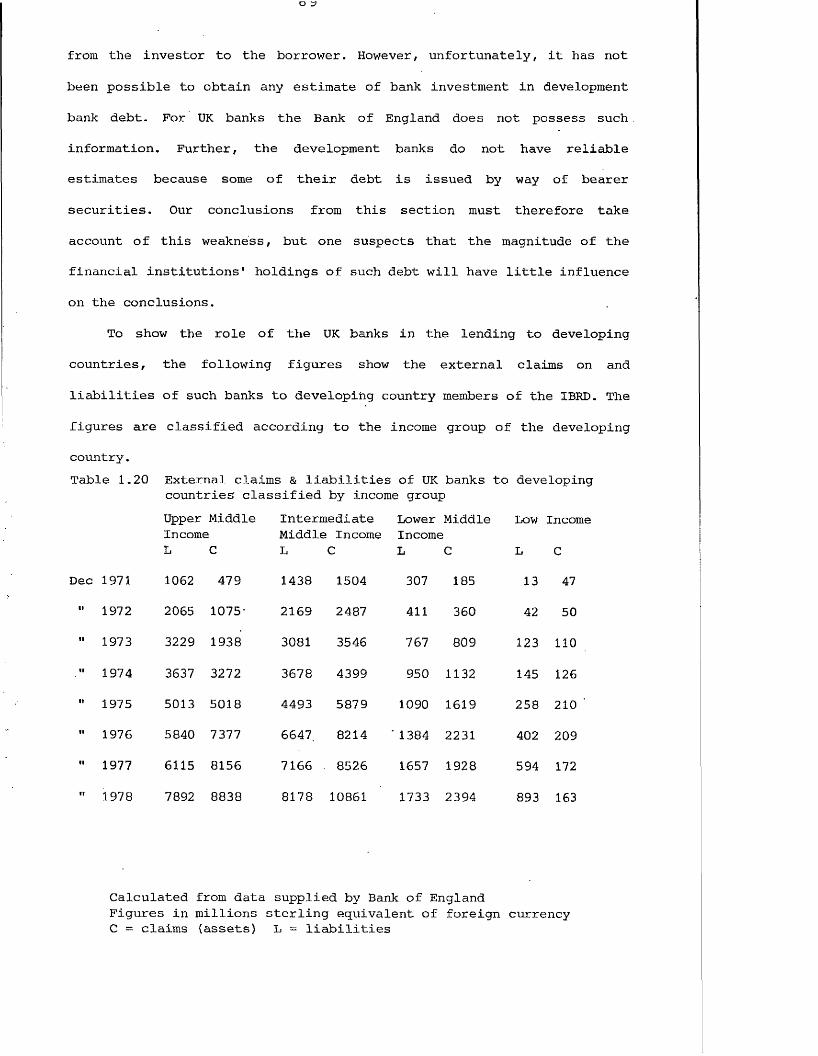
from the investor to the borrower. However, unfortunately, it has not
been possible to obtain any estimate of bank investment in development
bank debt. For UK banks the Bank of England does not possess such
information. Further, the development banks do not have reliable
estimates because some of their debt is issued by way of bearer
securities. Our conclusions from this section must therefore take
account of this weakness, but one suspects that the magnitude of the
financial institutions' holdings of such debt will have little influence
on the conclusions.
To show the role of the UK banks in the lending to developing
countries, the following figures show the external claims on and
liabilities of such banks to developing country members of the IBRD. The
figures are classified according to the income group of the developing
country.Table 1.20 External claims & liabilities of UK banks to developing
countries classified by income groupUpper Middle Intermedi ate Lower Middle Low IncoiIncome Middle Income IncomeL C L C L C L C
Dec 1971 1062 479 1438 1504 307 185 13 47
" 1972 2065 1075- 2169 2487 411 360 42 50
" 1973 3229 1938 3081 3546 767 809 123 110
" 1974 3637 3272 3678 4399 950 1132 145 126
" 1975 5013 5018 4493 5879 1090 1619 258 210
" 1976 5840 7377 6647. 8214 ' 1384 2231 402 209« 1977 6115 8156 7166 - 8526 1657 1928 594 172
" 1978 7892 8838 8178 10861 1733 2394 893 163
Calculated from data supplied by Bank of EnglandFigures in millions sterling equivalent of foreign currencyC = claims (assets) L = liabilities
70
It is notable that upper middle income countries began the decade
as net depositors to UK banks but very soon after the 1973 oil price
rise became net borrowers. The intermediate middle income countries have
always been net borrowers during this period, while the lower middle
income countries have behaved in a similar fashion to the upper middle
income group. On the other hand, the low income countries who began the
decade as modest net borrowers soon became net depositors and later in
the decade were substantial net depositors. In fact, if we combine the
figures for lower middle income and low income groups for 1978, we find
that these groups have been net depositors with the UK banks. This means
that for the year in question at least, the UK banks were only net
lenders to the richer developing countries.
However, we must not let these figures belittle the role of UK
banks in acting as financial intermediaries and facilitating the flow of
funds between developing countries. Nevertheless, such a situation leads
one to ask how these poorer developing countries are going to fare if
official financial flows continue to decline in relative terms. This is
particularly serious when it is considered that these poorer countries
need to improve their lot most, and yet may be the group least able to
generate internal finance for investment projects.
1.6 Why did the Commercial Banks become such important providers offinance to LDCs during the 1970's?
In answering this question we must note two trends of the
internationalisation of banking. The first relates to the growing
provision of international financial intermediation services and other
international banking services. This has a long history but has been
hastened by advances in international communications since the late
1950's. The second trend relates to the increased provision of

international banking services and loans to LDCs in particular.
The greater internationalisation of banking has gone hand in hand
with the increased activities of multinational corporations. There is
considerable evidence that post 1945 expansion of US Bank Offices abroad
is associated with US direct investment and trading activities (Baker
1978, Fielke 1977, Goldberg & Saunders 1980). The very large network of
UK bank overseas branches is closely associated with Britain's trading
and old colonial interests.
A recent influence of importance for the US banks was the
imposition and later relaxation of controls on financial flows abroad
imposed by the US government between 1964-74. These controls consisted
of:
- The Interest Equalisation Tax which was levied on portfolio
purchases of foreign securities by US residents from foreign
residents;
- The Voluntary Foreign Credit Restraints Programme which
limited US banks' loans to overseas borrowers; and
- The Foreign Direct Investment Programme, although voluntary
at first, became compulsory in 1968 and limited financial
outflows by US multinational corporations to overseas
subsidiaries.
During their existence, these controls forced the US banks and
their overseas (multinational) customers to transact business in the
eurocurrency market with the US banks opening branches abroad for that
purpose, particularly in London. The relaxation of these controls
enabled US banks located in the United States to adjust the distribution
of their loan portfolios between domestic and overseas assets.
This portfolio adjustment can be seen from the following figures
which show the external claims of banks in the United States.

1. 21 External claims of US banks 1972-77
ClaimsTotal
Claims on Banks
Claims on Non Banks
1972 20.8 4.4 16.4
1973 26.7 6.7 20.0
1974 46.2 14.0 32.2
1975 59.7 21.5 38.2
1976 81.0 33.1 47.6
1977 89.6 36.6 53.0
Source: Llewellyn 1979, p48
These figures show a rise of over 100% during 1974 and 1975 and
therefore give some support to the suggestion that the US banks were
involved in a stock adjustment of their portfolios during this period.
Combined with this portfolio adjustment was the impact of slack
domestic demand for loans in the USA and growing corporate liquidity in
1975 and 1976. OPEC deposits were also growing at this time, while US
domestic borrowers were using the bond market and commercial paper
markets (Llewellyn 1979, p32,.Phalen 1977).
The US controls over capital flows acted as a filip to the
eurodollar market, the major centre of which is in London. The
imposition of Regulation Q by the Federal Reserve Board is also credited
with an expansionary impact on the eurodollar market.
By 1970 the London section of the eurocurrency market had
considerable experience of handling funds received from LDC depositors.
Of particular importance, in addition to the US bank branches, were the
London offices of LDC banks and the head offices of British Overseas
Banks with branch networks in the developing countries. Thus, even
before 1973, the developing countries had experienced the benefits of
depositing funds in the eurocurrency market rather than national money
markets. With the growing OPEC surpluses after 1973, the banks found

themselves increasingly liquid as these surplus countries were attracted
by the interest rate advantage (discussed in chapter four) and their
desire for short term liquid assets.
However, the growing internationalisation of US banks and the
growing liquidity of the eurocurrency market do not, in themselves,
explain why the banks increased their lending to LDCs as compared with
other types of borrowers.
For an explanation of the willingness to lend to LDCs, the
following factors are important:
1) Desire for assets growth
2) Profitability
3) Perceived risk of lending to LDC governments
The survey discussed in chapter seven suggests that asset growth
has been an important objective of international banks during the
1970's. The model of the supply of bank loans developed in chapter three
suggests that this growth is not incompatible with growing profits. The
greater inflow of funds to the euromarkets after 1973 enabled the banks
to fund this objective at a faster rate. As the deposits were received
in foreign currencies,• it was preferable to lend in the same currency so
as to avoid exchange risk.
In addition, the increased liquidity of the eurocurrency market and
the post 1974 portfolio adjustment of the US banks roughly coincided
with a fall off in demand for bank loans by the corporate sector in the
USA and Western Europe. It was therefore necessary to expand the already
existing markets for LDC lending in order to achieve the growth and
profits objectives.
The profitability of lending to LDCs depends upon the yield on the
loan and the fees from any additional banking services that can be sold
to the borrower. Many bankers see the lending process as merely a way of
establishing new banker-customer relationships through which a whole
variety of additional loan and non loan services can be sold to the
customer.

The relative profitability of an individual loan may be
approximated by the spread or margin on that loan. However, as shown in
chapter four of this thesis, the spread or margin actually
underestimates the profitability because front end fees are charged by
the lenders.
Given this caveat, the following data from OECD Financial Market
Trends shows that at least the lending to two major LDC borrowers,
Brazil and Mexico, was more profitable than lending to an OECD country,
France.
Table 1.22
Best loan conditions available to selected public sector borrowers (maturity and spread)
Brazil Mexico FranceMAT SPD MAT SPD MAT SPD
1974 12 S/8-3/4 10 1/2 10 3/8-S/812 1/2-3/4
1975 7 1 3/4 5 1 1/2 5 1 1/4
1976 7 1 7/8 5 1 1/2 7 1-1 1/87 1 3/4
1977 5 1 7/8 5 1 1/2 5 5/88 2 1/8 10 1 1/4-1 3/4 8 7/8-1
1978 10 1 8 3/4 10 1/212 1 1/4 10 7/8-115 1 1/2
1979 12 S/8-3/4 6 1/2 15 3/8-1/212 5/8
Source: OECD Financial Market Trends, February 1980, p98
Furthermore, the following data from the IBRD shows tha
borrowers paid higher spreads and received higher maturities than France
during the third and fourth quarters of 1979.

Table 1.23 Average spreads and maturities of euroloans to selected developing countries
Average1979
Spread Average1979
Matu]
Countries III IV III IV
Algeria - 1.06 - 9.2Argentina 0.78 0.76 11.6 10.4Brazil 0.86 0.72 12.5 12.0
Chile 0.85 0.92 10.6 9.8
Colombia 0.73 1.25 10.0 10.0
Greece 0.55 0.51 10.0 10.2
Indonesia 0.68 - 10.0 -
Ivory Coast 1.63 1.50 10.0 7.6
Korea, Republic of 0.70 0.69 9.2 9.6
Malaysia 1.00 - 6.4 -
Mexico 0.73 0.69 9.3 8.8
Morocco 0.96 - 10.0 -
Nigeria 1.01 1.00 7.8 8.0
Philippines 1.01 0.92 12.9 10.9Portugal 0.79 0.88 9.5 8.8
Romania O'. 66 - 10.0 -
Spain 0.78 0.75 . 9.5 9.6
Thailand 0.64 - 8.6 -
Venezuela 0.42 0.58 1.7 7.9
Yugoslavia 0.89 0.98 10.6 8.6
Source: IBRD Annual Report 1981, pl50
During the 1970's the loan loss record of loans to LDC governments
was actually better than that on banks' OECD domestic lending. Even at
the time of writing, with the recent increase in debt reschedulings,
actual losses on LDC loans are small. Therefore, even if the larger
spreads on LDC loans reflected greater perceived risk during the 1970's,
this increased spread went straight to the profit and loss account as a
credit item.

I b
Data on profits from non loan banking services are not available.
However, responses to the survey analysed in chapter seven suggest that
one of the objectives of lending to LDCs was the development of new
banker-custoraer relationships where non loan services could be sold for a
fee.
With regard to the perceived risk of lending to LDCs, some observers
(Griffiths— Jones 1980, Mendelshon 1980) suggest that the increased
commodity prices of the late 1960's and early 1970's enhanced the
creditworthiness of the developing countries in the eyes of the
international banks. This is difficult to prove given the subjectivity of
the concept of creditworthiness, nevertheless figures below show an
increase in the purchasing power of exports of food products and raw
materials excluding fuel.
Table 1.24 Purchasing power of export revenueImport Value of Exports Purchasing Power of ExportsPrice Index Food Raw Materials (export rev-rimport price index) 0-970=100) (ex fuel) Food Raw Materials (ex fuel)
1967 97 9.60 7.16 9.90 7.38
1969 93 10.52 8.59 11.31 9.23
1970 100 11.92 8.93 11.92 8.93
1971 108 12.12 8.78 11.22 8.12
1972 117 14.24 10.46 12.17 8.94
1973 146 18.96 14.96 12.98 10.25*
Source: United Nations Statistical Yearbook 1981 p44 & 47Figures in billions US $ FOB
With such increases in the purchasing power of export earnings by
the developing countries, these countries would find it easier to service
debt and therefore would be a better credit risk for the bankers.
The 1970 Annual Report of the World Bank noted on page 44 that much
of the growth of the value of primary exports was due to higher prices.
These higher prices were reflected in a continuation of improvement in
the terms of trade for LDCs. This continuous improvement in the terms of
-Ju
l.f.
ij .t
u.h-

trade would have had a favourable impact upon bankers' assessment of
credit risk. The way was therefore open for the developing countries to
gain access to bank credit some time before the impact of the 1973 oil
price rise.
However, the increase in oil prices would, ceteris paribus,
increase the risk of lending to those countries. Two other factors which
have reduced the risk of such lending are the techniques of lending by
way of loan syndication and the roll-over nature of the loans.
The technique of loan syndication, where a syndicate of banks join
together to fund a particular loan, allows each individual bank to
achieve greater diversification of a given loan portfolio. Thus the
individual bank's loan portfolio exhibits less risk for a given level of
income.
The roll-over nature of the loan passes the interest rate risk to
the borrower, thus enabling the bank to lend for long maturities while
being able to change the interest rate charged to reflect fluctuations
in money market rates.
Both these techniques reduced the risks to individual banks of a
portfolio of loans to LDCs and made it possible for the banks to provide
loans of maturities which, it was hoped by all parties, would be long
enough to finance the post 1973 adjustment and development of the
borrowing countries. The progress of this development providing the
wherewithal to service the debt.
A further factor in perception of risk has been the establishment
of Consortium Banks in the 1960's and 70's. This spread the risk of
lending amongst the members of the consortium and because some of the
shareholders had specialist knowledge of lending to particular regions,
they were better able to assess the risk of lending (Harwick 1974). A
similar suggestion has been made by Fielke (op cit) in that US bank
branching followed US direct investment abroad. The existence of bank
branches in certain countries increased the information that the banks
received about those countries. It is therefore not surprising, given
the dominance of US banks in the "early loan syndications, that countries
with significant amounts of US direct investment received the lion's
share of international bank loans.
The reasons for the willingness of banks to lend to the LDCs can
therefore be explained by three factors:
1) The desire of the banks to expand during the 1970's, but at
times, finding loan demand in OECD markets as relatively
flat, but deposits, particularly OPEC surpluses, rising.
2) At least for most of the decade of the 1970's, an increasing
number of LDCs were considered a good credit risk.
3) Lending to LDCs was more profitable than lending to OECD
based borrowers. Even in today's financial climate, LDC
loans may still turn out to be more profitable than OECD
loans.

/ ^
1.7 Summary
This overview of the financial flows to the developing countries
notes that the private financial institutions have become the most
important source of external financial resources for these countries.
The reasons for this state of affairs are linked to the inability of
official sources of finance to be flexible enough to provide for the
needs of the developing countries, the growth aspirations of the banks
and the profitability of such business. The growing importance of
private sources of finance over the decade to 1980 has been accompanied,
as would be expected, by a hardening of the financial terms attached to
such finance.
This state of affairs leads to the asking of a further four
fundamental questions:
1) What factors influence the financial terms attached to
such finance?
2) How does the increase in LDC debt affect bank balance
sheets and profits? In particular, does it create any
risks for the international financial system and the UK
financial system in particular?
3) What factors will ensure the maintenance and indeed growth
of development finance from financial institutions?
Furthermore, what factors will increase access to these
private markets by poorer developing countries when
appropri ate ?
4) Why has the bond market played such a small role in the
external financing of LDCs?
These points are analysed in chapters four to eight of this thesis
and follow upon an analysis in chapters two and three of the mechanics
of the eurocurrency markets and eurobank lending.

Chapter 2
THE EUROCURRENCY MARKETS
2.1 Introduction
Chapter one of this thesis has shown the growing importance of bank
credit in the total external financial flows to the developing
countries. As the major part of that bank lending was carried out in the
eurocurrency markets, a detailed discussion of the functioning of the
eurocurrency market is required before analysis of the cost of funds,
the future flows of funds and the impact of these flows upon the
financial institutions can be undertaken.
The eurocurrency market is simultaneously an interbank market, a
market where governments deposit and borrow funds, and a market where
corporations and individuals lend and borrow. These markets differ from
domestic markets by their relative lack of regulation. As a result of
this lower degree of regulation there are no institutionalised
privileges and therefore differences in transactions are based only upon
economic factors such .as risk perception or size of transaction.
There are in fact several 'eurocurrency' markets in each of the
major international currencies, each market dealing in a separate form
of instrument or transaction. From the financial intermediary's view of
the market, eurocurrency deposits come from non negotiable time
deposits, certificates of deposit and interbank deposits. Eurocurrency
loans on the other hand are interbank loans or loans to non bank
customers.
2.2 Definition of the Eurocurrency Market
A eurocurrency deposit is simply a deposit with a bank in a
currency other than that of the country in which the bank is located
(Crocket 1977, pl09). Similarly, a eurocurrency loan is a loan in a
currency other than that of the country in which the bank is located.
Thus, eurocurrency bank business is the taking of deposits, and making
loans in foreign currency eg banks in the United Kingdom taking deposits
or making loans in, say, US dollars.
Clendenning (1969) defined a eurodollar transaction as any
transaction in US dollars undertaken by a commercial bank outside the
USA at eurodollar rates. This brings out a point particular to
eurocurrency business, which is that, because of factors such as greater
competition, lack of reserve requirements, fewer regulations and
economies of scale in transactions, interest rates in the eurocurrency
markets differ from those in the domestic markets of the same currency.
The reasons for these differences are fully explained in chapter four of
this thesis.
It is because of the distinct interest rate structure of the
eurocurrency markets and the unique risks attached to dealing in
eurocurrencies, discussed in chapter four, that the limited definition
of eurobanking business by Dufey and Giddy (1978 p24) is rejected by
this writer. They suggest that eurocurrency business should only include
external financial intermediation. This term meant, for them, the
matching of foreign currency deposits with foreign currency loans. Thus
any deposits not matched by loans in a similar currency are not
euroloans. However, it is contended here that it is the financial terms
that are important. If a UK bank takes dollar deposits at eurodollar
rates, those deposits are eurodollar deposits despite the fact that the
bank may sell them for sterling in the foreign exchange market and lend
the sterling, thus taking on the foreign exchange risk.
t s ^
The transactors of business in the eurocurrency market, be they
corporations, individuals, banks including central banks, or
governments, may be resident in the same country as the bank conducting
the business. Alternatively they may be resident abroad, even resident
in the country whose currency is being used.
2. 3 Measurement of the Eurocurrency Market
When measuring any market it is necessary to distinguish between
the stocks and flows of the commodity traded. In respect of the
eurocurrency market Machlup (1970 p221) has defined the market aspects as
"New offers of, and bids for, credit in eurocurrency, the new loans
contracted during the market day and the renegotiation of old loans. Non
market features are defined as loans outstanding, assets held, deposit
liabilities owed In effect the market is represented by the flows
and the stocks are, for Machlup, the non market features.
However, the statistics that are frequently used to show the size
of the eurocurrency market in fact measure only the stocks of deposits
or loans. Examples of these are:-
1) Bank for International Settlements figures for the external
positions of banks in the reporting area and certain off-shore
branches of US banks. In fact the BIS also produce figures
showing flows of loans and deposits to and from the same group
of institutions covered by the external positions figures.
2) Morgan Guarantee Trust Company of New York provide figures
in their publication ’World Financial Markets'. The same
publication provides figures for new publicised eurocurrency
loans.
3) The Bank of England figures relating to "External Liabilities
and Claims of UK Monetary Sector and Certain Other Institutions
in Foreign Currency". These cover the London section of the
eurocurrency market only.
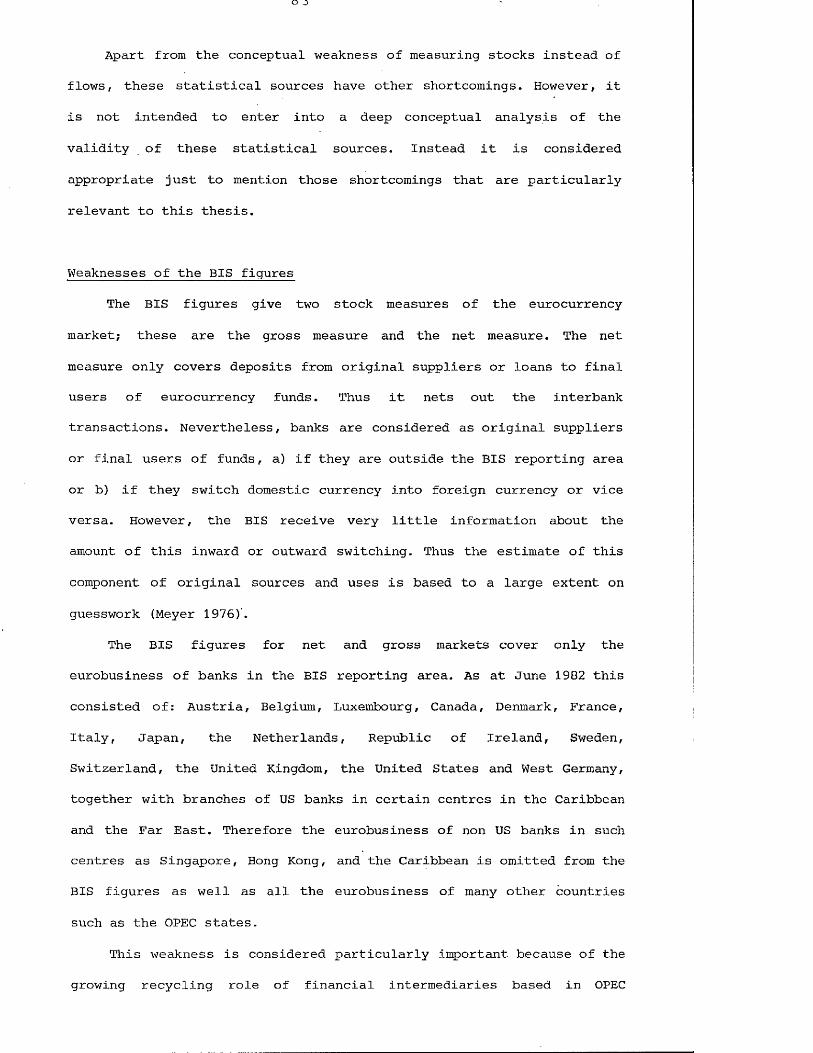
Apart from the conceptual weakness of measuring stocks instead of
flows, these statistical sources have other shortcomings. However, it
is not intended to enter into a deep conceptual analysis of the
validity of these statistical sources. Instead it is considered
appropriate just to mention those shortcomings that are particularly
relevant to this thesis.
Weaknesses of the BIS figures
The BIS figures give two stock measures of the eurocurrency
market; these are the gross measure and the net measure. The net
measure only covers deposits from original suppliers or loans to final
users of eurocurrency funds. Thus it nets out the interbank
transactions. Nevertheless, banks are considered as original suppliers
or final users of funds, a) if they are outside the BIS reporting area
or b) if they switch domestic currency into foreign currency or vice
versa. However, the BIS receive very little information about the
amount of this inward or outward switching. Thus the estimate of this
component of original sources and uses is based to a large extent on
guesswork (Meyer 1976)'.
The BIS figures for net and gross markets cover only the
eurobusiness of banks in the BIS reporting area. As at June 1982 this
consisted of: Austria, Belgium, Luxembourg, Canada, Denmark, France,
Italy, Japan, the Netherlands, Republic of Ireland, Sweden,
Switzerland, the United Kingdom, the United States and West Germany,
together with branches of US banks in certain centres in the Caribbean
and the Far East. Therefore the eurobusiness of non US banks in such
centres as Singapore, Hong Kong, and the Caribbean is omitted from the
BIS figures as well as all the eurobusiness of many other countries
such as the OPEC states.
This weakness is considered particularly important because of the
growing recycling role of financial intermediaries based in OPEC

countries. As these institutions become relatively more important in
lending to developing countries, an increasingly important section of
eurocurrency lending to the developing countries will not be captured
by the BIS figures. A study by Jay (1980) suggests that in fact banks
in 58 countries are active in eurobanking.
The reason for netting out the interbank market in the net market
concept was to avoid the problem of double counting, ie where the same
funds change hands between several banks on their journey from original
supplier to the final user. This is considered necessary so that a
measure of international capital available for financing trade and
investment etc can be arrived at.
The validity of this net concept of the market can be criticised.
Firstly, the main distinguishing feature of the eurocurrency markets is
that a separate international system of interest rates has been
developed. These rates are influenced by all eurocurrency flows,
including interbank flows, and the results of all the flows during a
given period will be the gross stock of assets and liabilities at the
end of that period. It is therefore meaningless to relate the structure
of eurocurrency interest rates to the net concept of the market.
Furthermore, we have already noted the limited geographical
coverage of the BIS figures and that banks outside the BIS reporting
area are treated as original suppliers or final users of funds. Yet it
is in the international nature of eurocurrency markets that these banks
will be carrying out interbank transactions. There is therefore some
inconsistency in the treatment of interbank transactions.
The net concept can also be criticised in that as far as an
operator in the market is concerned, he is only interested in the gross
size when he wants to evaluate his own position in the market, the
chances of obtaining funds or the risks of lending to one borrower
because of that borrower's existing exposure to the market.

The net concept also ignores the fact that banks could be end
users of eurocurrency funds just like any other borrower. These funds
may be used for real investment in the national economy of the currency
concerned.
Yet another weakness is that the gross estimate of the market size
excludes liabilities to, or claims on, residents in the countries of
the reporting banks. Although the net measure does include liabilities
and claims related to resident non banks (Dufey & Giddy 1978, p31).
The fact that eurocurrency transactions with residents are not
included in the BIS gross measure of the market will not reduce our
understanding of banks' exposure to the developing countries. However,
it does limit our understanding of the exposure of the banking system
generally to foreign currency transactions.
Weaknesses of the Morgan Guaranty figures
Morgan Guaranty publish figures for the gross and the net size of
the eurocurrency market. These figures have a slightly wider
geographical coverage in that they cover Bahrain, though not other oil
exporting states, in addition to the countries in the BIS reporting
area. Furthermore, these figures include transactions with residents of
the country in which the bank is located.
However, the most important weakness as far as this thesis is
concerned is the incomplete geographical coverage of the global
eurocurrency market.
Weaknesses of the Bank of England figures
The figures published by the Bank of England purport to relate
only to the London section of the eurocurrency market. Covering only
external claims and liabilities, they ignore transactions with UK
residents. As the following figures for deposits show, transactions
with residents were substantial even before the abolition of UK
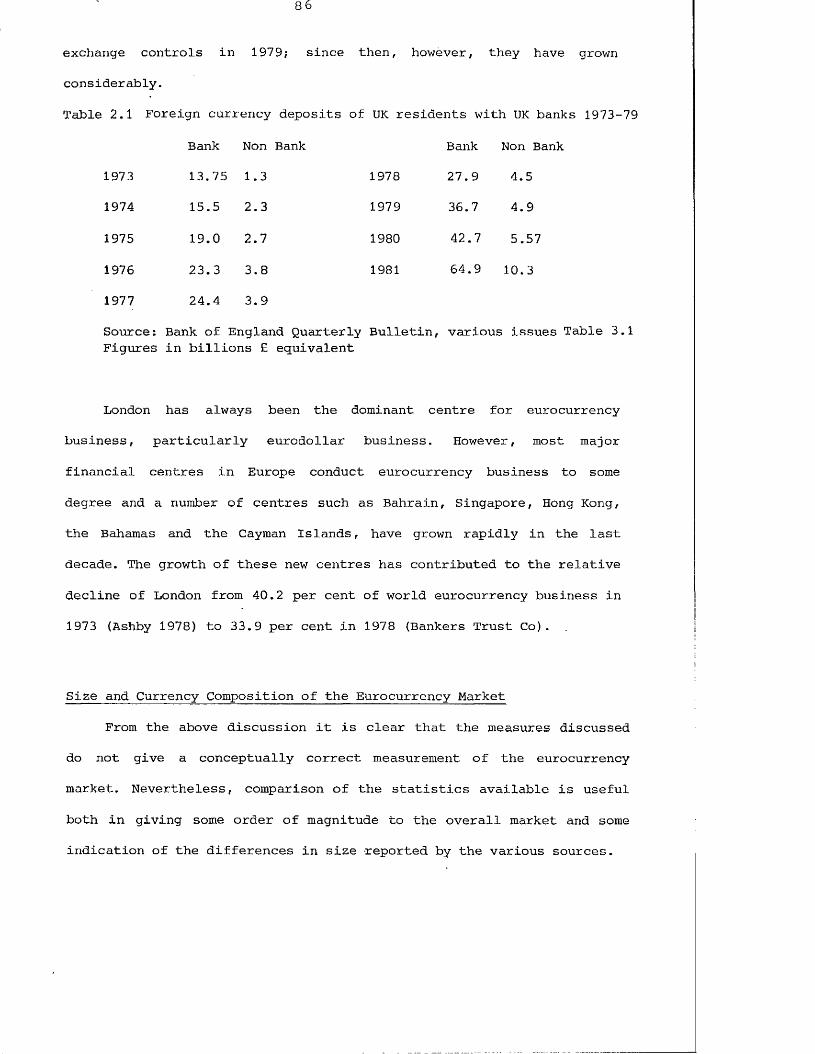
exchange controls in 1979; since then, however, they have grown
considerably.
Table 2.1 Foreign currency deposits of UK residents with UK banks 1973-79
Bank Non Bank Bank Non B.
1973 13.75 1.3 1978 27.9 4.5
1974 15.5 2.3 1979 36.7 4.9
1975 19.0 2.7 1980 42.7 5.57
1976 23.3 3.8 1981 64.9 10.3
1977 24.4 3.9
Source: Bank of England Quarterly Bulletin, various issues Table 3.1 Figures in billions £ equivalent
London has always been the dominant centre for eurocurrency
business, particularly eurodollar business. However, most major
financial centres in Europe conduct eurocurrency business to some
degree and a number of centres such as Bahrain, Singapore, Hong Kong,
the Bahamas and the Cayman Islands, have grown rapidly in the last
decade. The growth of these new centres has contributed to the relative
decline of London from 40.2 per cent of world eurocurrency business in
1973 (Ashby 1978) to 33.9 per cent in 1978 (Bankers Trust Co).
Size and Currency Composition of the Eurocurrency Market
From the above discussion it is clear that the measures discussed
do not give a conceptually correct measurement of the eurocurrency
market. Nevertheless, comparison of the statistics available is useful
both in giving some order of magnitude to the overall market and some
indication of the differences in size reported by the various sources.
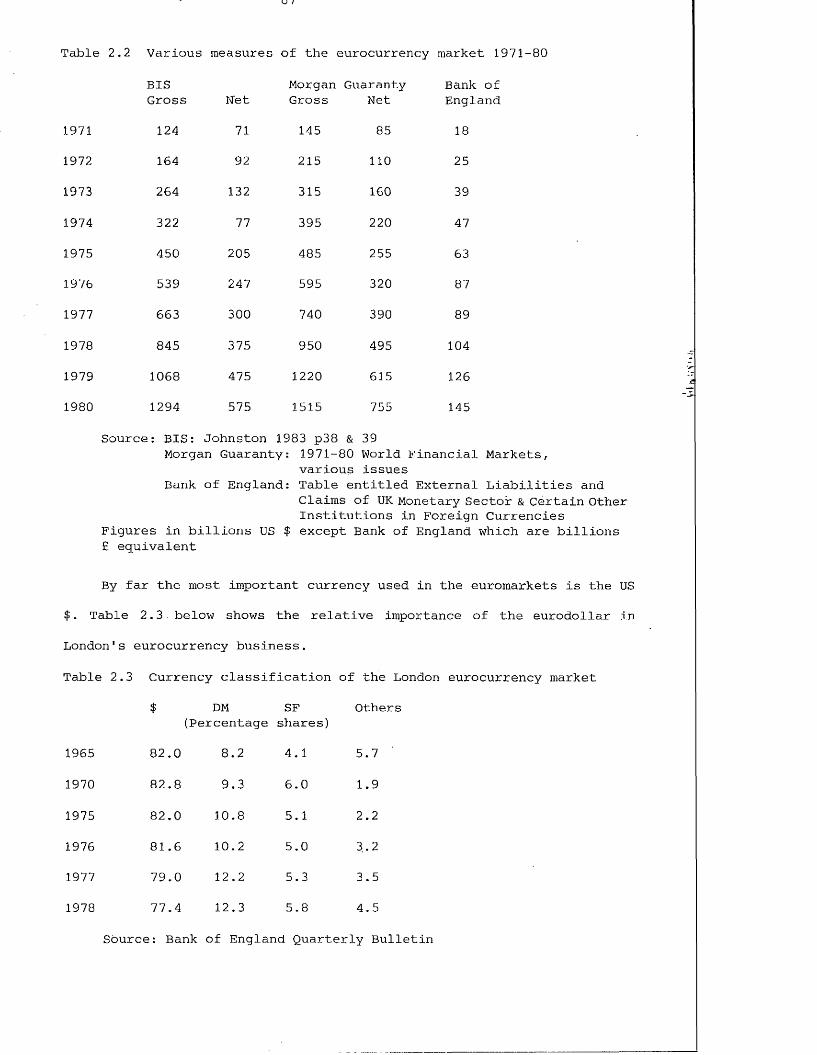
CJ /
Table 2,2 Various measures of the eurocurrency market 1(
BISGross Net
MorganGross
GuarantyNet
Bank of England
1971 124 71 145 85 18
1972 164 92 215 n o 25
1973 264 132 315 160 39
1974 322 77 395 220 47
1975 450 205 485 255 63
1976 539 247 595 320 87
1977 663 300 740 390 89
1978 845 375 950 495 104
1979 1068 475 1220 615 126
1980 1294 575 1515 755 145
Source: BIS: Johnston 1983 p38 & 39Morgan Guaranty: 1971-80 World Financial Markets,
various issuesBank of England: Table entitled External Liabilities and
Claims of UK Monetary Sector & Certain Other Institutions in Foreign Currencies
Figures in billions US $ except Bank of England which are billions £ equivalent
By far the most important currency used in the euromarkets is the US
$. Table 2.3. below shows the relative importance of the eurodollar in
London's eurocurrency business.
Table 2.3 Currency classification of the London eurocurrency market
$ DM SF Others(Percentage shares)
1965 82.0 8.2 4.1 5.7
1970 82.8 9.3 6.0 1.9
1975 82.0 10.8 5.1 2.2
1976 81.6 10.2 5.0 3.2
1977 79.0 12.2 5.3 3.5
1978 77.4 12.3 5.8 4.5
Source: Bank of England Quarterly Bulletin

8 8
For the global eurocurrency market, figures below from Morgan
Guaranty Trust show the relative importance of the US dollar to be
slightly less than that in the London section of the market.
Table 2.4 The importance of the US $ in the global eurocurrency market 1972-80
1972 78%
1973 74%
1974 76%
1975 78%
1976 80%
1977 76%
1978 74%
1979 72%
1980 74%
Source: World Financial Markets, September 1982
2.4 Statistical Sources of International Bank Lending
Apart from the sources that try to measure the size of the
eurocurrency market,' there are several sources of statistics
specifically relating to the lending to developing countries.
The IBRD produces its World Bank Debt Tables annually. These cover
international borrowing by IBRD members, thus >excluding Comecon
countries. The sources of finance by type of lender are given but the
type of debt is generally limited to public and publicly guaranteed
debt, although recently the non guaranteed private debt of 17 major
borrowers has been included. They exclude debt under one year to
maturity, some non guaranteed private debt, military debt and IMF
lending except trust fund loans (Economist 20.3.82). These figures
relate to stocks of loans although it is possible to calculate flows as
amortisation payments are shown.

8 9
The OECD Development Assistance Committee provides information on
loans made to 150 developing countries by 17 DAC members and other
lenders such as OPEC countries. The figures include official and private
long term lending but exclude OPEC private lending. Otherwise it has the
same exclusions as the World Bank Debt Tables discussed above.
The OECD DAC also produces figures for stocks of loans outstanding.
The coverage and weaknesses are the same as for the flow figures of
loans made.
The claims figures in the BIS eurocurrency market discussed above
give stocks of short term and long term bank loans. This series has the
benefit of including short term loans but otherwise suffers from the
shortcomings discussed on page 83 above.
Morgan Guaranty Trust Co produces monthly figures of publicised
eurocurrency loans with a maturity in excess of one year. Thus the
weaknesses here are that unpublicised loans are not covered, nor are
short term loans, nor domestic currency loans.
2.5 The Use of Eurocurrency Market Statistics in this Thesis
Despite the shortcomings of each statistical source discussed
above, various of those sources are used in this thesis. The criteria
for choice are based upon suitability, timeliness and availability.
To measure the London section of the eurocurrency market, figures
for external claims and liabilities of the UK monetary sector are used.
However, for measures of the global market, BIS and Morgan Guaranty
figures are used, often together to facilitate comparison.
To measure the amount of bank lending by banks to developing
countries, BIS figures are used if total exposure or maturity structure
is relevant. On the other hand, if only medium to long term loans are
relevant, then IBRD figures are used.
Given the shortcomings of these various sources of data, the
figures quoted should only be used as indications of orders of magnitude
rather than highly accurate measures of absolute amounts.

90
2.6 The Nature of Eurobank Lending
The flows of bank funds to LDCs can be classified under three broad
headings: a) Trade Finance, b) Project Finance, c) Programme Lending.
Trade Finance
This type of finance is, in the main, relatively short term in
nature and relates to flows of goods and services of a repetitive and
consumable nature. Much of such finance is actually provided by banks to
the suppliers (supplier credit) and generally the techniques of loans in
favour of buyers (buyer credits) are more akin to project finance or
programme lending. A substantial amount of trade finance provided by
banks to LDCs is insured with official export credit insurance agencies.
Programme Lending
Lending for the purpose of letting the borrower disperse the funds
virtually as he wishes is known as programme lending. The most widely
publicised uses of programme loans have been to finance a balance of
payments deficit and/or replenish stocks of foreign exchange reserves,
to repay existing loans or to assist in the finance of economic
development. It must be remembered that where economic growth is
hampered by an immediate shortage of foreign exchange, any external
credits will help alleviate the problem at least temporarily.
All programme lending is made to the government of the borrowing
country and therefore entails sovereign risk and immunity ".... foreign
governments are sovereign and therefore cannot be sued without consent.
Secondly, courts of one country ordinarily will not sit in judgement on
the acts and omissions of another country within that country's
frontiers. Thirdly, the property of a government or its instrumentality
is immune. This makes judgements against sovereign governments
unenforceable", (Angelini, Eng & Lees, op cit, p77).

Some protection has been given to the bearers of sovereign risk by
the inclusion of clauses in loan agreements waiving sovereign immunity.
These clauses have statutory support in the USA under the Foreign
Sovereign Immunities Act 1976. For the United Kingdom the State
Immunities Act 1978 gives similar protection (Burn 1979).
Sovereign risk may be less dangerous than commercial risks because
when a corporation is liquidated it ceases as a legal entity. However, a
state cannot be removed in the same manner and unless it has no further
use .for international finance, debt servicing will at worst be
postponed. This is discussed in more detail in chapter six. Indeed the
Bank for International Settlements has noted that the losses on loans to
sovereign borrowers have been less than those from lending to domestic
customers or private foreign borrowers.
Programme lending, like all external foreign currency lending,
entails country risk, that is where the nation has insufficient foreign
exchange resources to services its debts.
Project Finance
Project finance relates to finance where the only or main source of
repayment is the project being financed .... (Donaldson 1979, p53).
Obviously this sort of finance is appropriate to many public and private
investments in developing countries. For the banker the risks associated
with this type of finance can be divided into pre-completion and
post-completion risks. The former include, for example, failure of
design and technology, failure of contractors and prolonged delays
causing cost escalations. The lenders rarely take on any significant
degree of pre-completion risk. Feasibility studies, performance
guarantees from banks and proven expertise of contractors help remove
such risks. The post-completion risks include the commercial operating
risks, failure to generate sufficient cash flow to service the loan,
failure to produce sufficient quantity or sell at a sufficient price to

break even. Furthermore, there may be political and force majeure risk.
These post-completion risks can be covered by guarantees from central
governments and sometimes from export credit insurance organisations.
The signing of contracts to purchase the output of the project by users
of the output also reduces post-completion risk.
One advantage of a project loan over programme lending is that the
finance is only made available towards completion of an identifiable
project. The banker can then make an assessment of the impact of the
project upon the foreign currency earnings of the country, either by way
of export revenue or import substitution.
Project finance does not obviate country risk. If the government
controlling the project is short of foreign exchange, then the risk of
the project debt not being serviced is as great as if the loan had been
made on a programme basis. This risk prevails unless the lender can
arrange for foreign currency revenues from the project to go direct to
himself before being passed on to the borrower. This is possible for
bank lenders.
Many project loans will be made to, or guaranteed by, governments
in the country of the borrower. In such cases these loans will also be
subject to sovereign risk.
In one way project finance gives greater security to the lending
banker because of the existence of an identifiable financial flow of
project revenues even to the extent of avoiding country risk as noted
above. However, competitive pressures on project lending have served to
increase the risk to the banker by engendering non recourse project
finance. Nevertheless, in some cases detailed analysis of the risks can
reduce them to the level of those associated with balance of payments
financing but the spreads and fees will be higher (Sarmet 1981).

Syndicated Loans
Medium and long term lending to developing countries has been
dominated by the floating rate syndicated loan. However, there have also
been a number of fixed rate loans, some involving syndicates. These
loans are generally in relation to officially insured or officially
subsidised export buyer credits.
Syndicated loans are of particular interest to this thesis due to
their important role in development finance generally and the recycling
of oil exporting surpluses in particular. For the period 1973-1980
syndicated loans provided 85 per cent of the private medium and long
term funds for developing countries (Goodman 1981). Furthermore,
borrowing by non oil exporting LDCs accounted for 44 per cent of the
syndicated loans market in the first half of 1981, rising from 21 per
cent in 1972-73 (Goodman op cit).
Many loans for financing development or payments deficits are too
large for one bank to finance on its own and still have a widely
diversified portfolio. This problem has been overcome by the use of
syndicates of banks lending to one borrower on common terms. A borrower
can expect to raise larger amounts through a syndicate than through a
series of individual loans or from one bank.
Because the euromarkets are relatively new and because of the
international nature of the market, many lending banks lend to borrowers
with whom they have not previously been acquainted. Therefore
considerable expense in providing information and duplication of effort
would be entailed if the borrower negotiated with all banks separately.
Accordingly, negotiations take place between the borrower and the lead
managers. There are, therefore, considerable savings in legal fees and
other expenses by this method.
There is also the advantage that the borrower only comes to the
market once instead of continually being in the market for smaller
amounts.

The loan syndicate will consist of a manager or group of managers
known as co-managers, an agent and the banks providing the funds
(participating banks). Where co-managers are involved there will usually
be a lead manager or group of lead managers. It is usually the lead
managers or co-managers that as a group have won the mandate from the
borrower to raise the loan syndicate and negotiate the terms of the loan
agreement.
The agent carries out certain duties such as administering the draw
down of the loan, administering interest payments and repayments of
principal as well as circulating certain information to syndicate
members during the currency of the loan. He also administers any
collateral and acts for the syndicate if any legal remedies are
required. With respect to these remedies, including that of declaring a
default, the loan agreement provides that the view of the majority of
the syndicate shall prevail. The agent has less discretion in these
matters today than in past years. For these duties he receives an annual
fee.
From the point of view of the borrower, the important relationship
is between himself and the lead manager. Originally the lead manager
would have had a previously close commercial banking relationship with
the borrower. However, after periods of strong competition amongst
lending banks, the lead manager tends to be the bank or group of banks
which offers the finest terms. The lead manager has to win the mandate
from the borrower to raise the syndicate by offering the best terms and
convincing the borrower that he can deliver the 'goods'.
Even if the syndication is only on a 'best efforts' basis, the
bprrower expects a commitment from the lead manager. A bank's reputation
will not withstand many failures to fulfil the terms of the mandate. In
this respect the large commercial banks have an advantage in being
syndicate managers because of their large deposit bases. The deposit
base has to be in the currency of the loan, hence the US banks' early

leadership in eurodollar lending. The UK banks’ buying of US banks in
the late 1970's was aimed at providing a US dollar deposit base.
From the point of view of the participating bank, the important
relationship is between himself and the lead manager until the loan
agreement is signed and then, during the currency of the loan, between
the agent and himself. The participating bank may have no direct
dealings with the borrower. Again, lead managers who are large
commercial banks and are able to take a substantial portion of the loan
on their own books are favoured by participating banks.
Participants look to the lead manager to ensure that the mechanics
of the loan are correctly executed. Although no bank would admit that it
does not analyse each loan carefully, it does get some comfort from its
perception of the ability of the lead manager.
Loans can be syndicated on a broadcast basis whereby the manager
informs many banks by telex about the terms and invites offers of
participation. This is best where the borrower is well known and the
loan 'uncomplicated. Alternatively, if the loan is, say, a complicated
project loan, or market conditions are uncertain, the lead manager and
management group will fund the whole loan and not call upon outside
participants. These loans are known as club loans. In either case the
banks invited to manage or participate will be determined by
correspondent relationships, reciprocity in terms of similar or other
types of business, and the particular wishes of the borrower.
Participants will expect a front end participation fee progressively
related to the size of their participation.
There are three major types of syndication technique. The loan may
be fully underwritten. In this case the manager accepts the whole amount
of the loan but usually wants to keep only a proportion on his books and
hopes to 'sell down' the balance following the establishment of the
syndicate. Alternatively, the loan may be partially underwritten. Here
the manager undertakes to provide a substantial amount of the loan but

9 6
the borrower only receives the remaining amount if a syndicate is
successfully formed.
It may be that the managers are less certain about the terms of the
loan and only undertake their 'best efforts' to raise a syndicate. If
syndication is not successful the borrower does not get his money. When
markets are liquid underwritten loans are the norm. However, when
liquidity is tighter 'best efforts' loans become more common. The aim in
all cases is to make the terms fine enough so that the manager wins the
mandate from the borrower but generous enough to make syndication
successful without renegotiation.
The overwhelming financial and economic advantage of the syndicated
loan is that it enables the risk associated with one large loan to be
spread amongst more than one lender. Put another way, a bank with a
given size of loan portfolio can diversify that portfolio to a greater
extent with syndicated loans than one-to-one loans.
The Roll-Over (Floating Rate) Feature of Eurocurrency Loans
The syndication technique was instrumental in allowing borrowers to
obtain larger sums than previously possible. However, the developing
countries amongst other borrowers, require funds not just in large
amounts but also for relatively long periods commensurate with the
gestation period of development projects or the economic adjustment
process. The maturity required by borrowers was far greater than the
maturity acceptable to depositors. If the banks were to engage in such
substantial maturity transformation, they would expose themselves to
interest rate risk, that is that short term rates paid upon deposits
may, sometime in the future, exceed the rate on long term loans
negotiated some years previously. The banks would then make revenue
losses on their loan portfolios. Thus expectations of rising short term
rates or even uncertainty over future short term rates will limit the

amount of medium and long term fixed interest rate finance available to
any borrower.
The technique of the roll-over credit effectively passes this risk
to the borrower. Under this technique, the interest costs of a loan
consist of two elements, a reference money market rate and a spread or
margin. The reference money market rate, the frequency of the review of
that rate and the method of calculating that rate are clearly set out in
the loan agreement. The reference rate most frequently used is the three
month or six month London Interbank Offer Rate (LIBOR), although
sometimes other rates, notably the New York Prime Rate, are used (Medlar
1982).
Typically, the reference rate is an average of the LIBOR quotations
from five banks, named for this purpose in the loan agreement, at
11.00am on each review date. If that review date is every three months,
the three month LIBOR is used. If the review is every six months, then
the six month LIBOR is the appropriate rate.
The length of time between reviews determines the risk of an
unexpected change in interest rates and how that risk is apportioned
between borrower and lender. This method means that the reference rate
fluctuates with short term interest rates. Because the spread or margin
is only a fraction of the reference rate, typically between and 2%,
the borrowing costs fluctuate with short term interest rates. This means
that banks can fund long term loans with short term deposits because
fluctuations in the cost of short term finance are passed on to the
borrower. . . . "
Clearly innovations in the eurocurrency market have facilitated the
vast flow of external finance to the developing countries during the
last decade. Whether those flows can be maintained depends upon three
factors; firstly whether the existing stocks of debt and the future
flows of debt can be serviced by the developing countries; secondly

9 8
whether the lending banks perceive that the risk of lending to
developing countries has become excessive; thirdly, whether the
developing countries are being 'crowded out' of private financial
markets by other borrowers.
The roll-over credit passes the cost of uncertainty regarding future
interest rates to the borrower. Therefore, one of the major influences
on the ability of a borrower to service its eurocurrency debt must be
the interest rate costs involved. For reasons that are explained in
chapter six of this thesis, the writer considers that, by the nature of
financial intermediation via the euromarkets, it is the ability to meet
interest payments rather than the ability to repay principal that is
important in the case of sovereign borrowing. Therefore this study
investigates the determinants of interest costs on eurocurrency
syndicated loans in chapter four. However, before these interest costs
are investigated, we must analyse the reasons for the growth of the
eurocurrency market and the nature of the eurobank lending function.
This is achieved in chapter three.
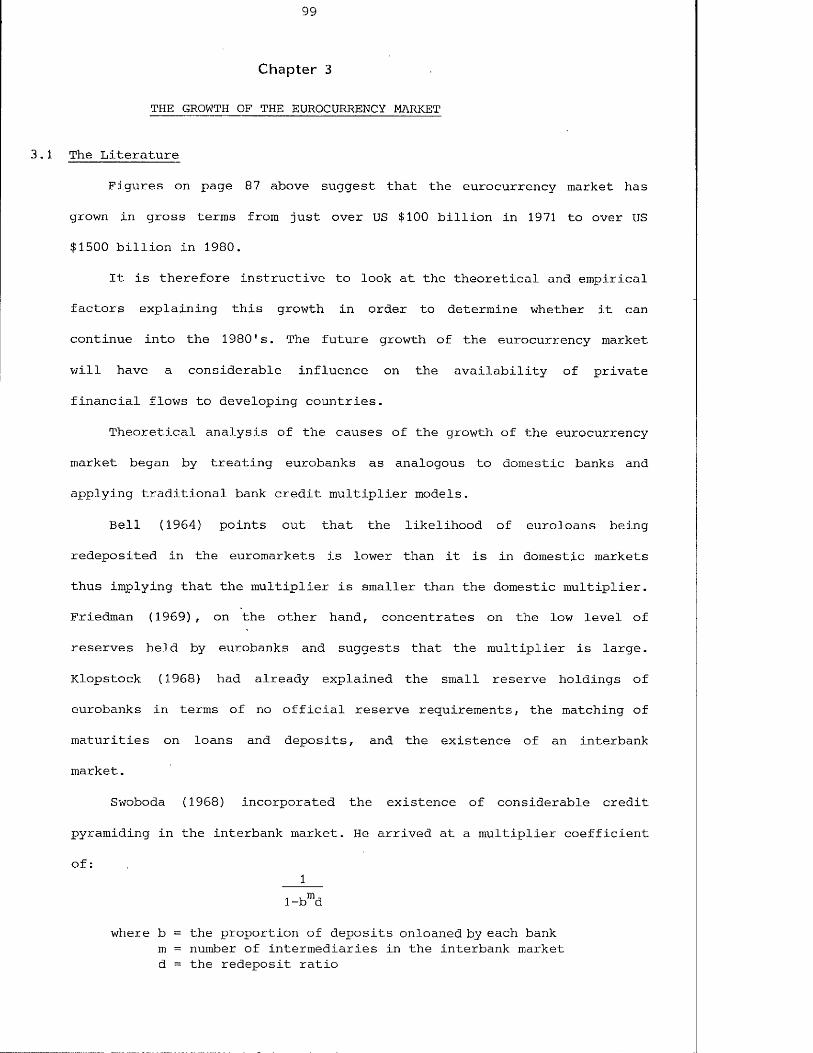
99
Chapter 3
THE GROWTH OF THE EUROCURRENCY MARKET
3.1 The Literature
Figures on page 87 above suggest that the eurocurrency market has
grown in gross terms from just over US $100 billion in 1971 to over US
$1500 billion in 1980.
It is therefore instructive to look at the theoretical and empirical
factors explaining this growth in order to determine whether it can
continue into the 1980's. The future growth of the eurocurrency market
will have a considerable influence on the availability of private
financial flows to developing countries.
Theoretical analysis of the causes of the growth of the eurocurrency
market began by treating eurobanks as analogous to domestic banks and
applying traditional bank credit multiplier models.
Bell (1964) points out that the likelihood of euroloans being
redeposited in the euromarkets is lower than it is in domestic markets
thus implying that the multiplier is smaller than the domestic multiplier.
Friedman (1969), on the other hand, concentrates on the low level of
reserves held by eurobanks and suggests that the multiplier is large.
Klopstock (1968) had already explained the small reserve holdings of
eurobanks in terms of no official reserve requirements, the matching of
maturities on loans and deposits, and the existence of an interbank
market.
Swoboda (1968) incorporated the existence of considerable credit
pyramiding in the interbank market. He arrived at a multiplier coefficient
of:1
l-brad
where b = the proportion of deposits onloaned by each bank m = number of intermediaries in the interbank market d = the redeposit ratio

This coefficient has been criticised by McKenzie (1976) on the
grounds that not every chain of interbank pyramiding will consist of m
intermediaries. In the absence of controls the reserve asset ratio may
not be the same for all banks and, furthermore, the redeposit ratio may
differ according to the portfolio preferences of each bank in the
interbank market.
Klopstock (1970) incorporates the problem of a low redeposit ratio
and therefore small multiplier where the financial institutions'
liabilities exhibit less moneyness than bank liabilities. The redeposit
ratio was considered to be small because:
1} The recipient of a dollar loan may convert it into local
currency - or
2) The recipient may buy US goods or services.
Clendenning (1971) extended a comment made by Bell (op cit) and
differentiates the role of central banks from other operators in the
system. When central banks deposit their foreign exchange reserves in
the euromarkets, the redeposit ratio will be higher and therefore the
multiplier larger than when central banks refrain from so depositing
their reserves. Ironically in 1971 G10 countries agreed to stop
depositing their reserves in the eurocurrency market, although
developing country governments continue to do so.
Clendenning had hoped to reconcile the studies producing small
multipliers with those producing large ones. However he was not
successful. Later studies by Makin give a coefficient of 18.45 (Makin
1972) and by Lee give a coefficient of 1.51 (Lee 1973). Both studies
covered a similar time period and took account of central bank activity.
This difficulty in obtaining agreement on the size of the
multiplier is hardly surprising. To begin with, multiplier models assume
an easily identified reserve base and an accurately measured quantity of
loans. Difficulties arise in measuring the reserve base of the
eurobanks, not least because lines of credit are used to support lending

operations and the magnitude of these, lines is not published. The
existence of unpublished lines of credit permits the reduction of
published reserves. It should also be remembered that eurobanks are
often only departments or branches of domestic banks with all the
financial power of the domestic institution in support.
Given the various measures of the eurocurrency market and the
international character of its business, it is doubtful whether all
transactions are captured by the statistics, in which case measures of
the multiplier will be spurious.
The traditional methodology of multiplier models took a
predetermined reserve ratio and postulated an ex ante credit multiplier
which gave an indication of the maximum amount of credit which could be
created by the banking system. However, the study by Lee, as well as
studies by FNCB (1974) and Fratiani & Savona (1971) try to identify a
reserve base and divide this into the total size of the euromarket to
arrive at a coefficient for the multiplier. This is an ex post
multiplier; it tells us nothing about whether the maximum size has been
reached nor what factors have inhibited, if any, the achievement of
maximum credit creation.
Bearing this point in mind and given the economies in eurobank
reserve holding over time which Makin notes in his 1973 paper, the
concept of the bank credit multiplier in its traditional form does not
seem to be a fruitful explanation of the growth of the eurocurrency
markets.
A more meaningful approach is to examine those factors which
influence depositors' and borrowers' preferences for eurocurrency over
domestic currency transactions in their portfolios. This portfolio
approach can then explain growth of the euromarkets in terms of
transfers of funds from domestic to eurobanks and the redeposit of
eurocurrency with eurobanks. Growth of the market is then explained in
terms of outward shifts in eurocurrency supply and demand curves as pref-

erences shift in favour of the euromarkets.
The application of portfolio theory to eurobank behaviour follows
the approach of Gurley and Shaw (1960) and Tobin (1963, 1967) to the
domestic financial institutions.
The demand for reserves by a eurobank is a continuous function of
the opportunity cost of those reserves and therefore the bank can expand
its balance sheet, assuming traditional profit maximisation, until the
marginal revenue on loans equals the marginal cost of deposits. As
lending increases, ceteris paribus, the marginal revenue will fall and
as deposits increase the marginal cost will rise. There is therefore a
finite limit to the size of the banks' balance sheet.
Hewson and Sakakibara (1974) derive supply and demand functions for
the eurocurrency markets in order to determine the constraints upon the
size of thofee markets. They suggest, following Tobin, op cit, that an
exogenous increase in eurocurrency deposits will cause a lowering of the
eurocurrency interest rates. Such a fall will cause some depositors in
the euromarkets to shift back to the domestic market because the
differential between the two is reduced. This is shown in the following
diagram.r
r t
o
Figure 3.1 Impact of a shift in supply upon euromarket size
The outward shift in deposits is represented by 'a1 but the growth
in the total euromarket is only Q2 - Ql. Thus, while the demand for
loans is a negative function of the rate of interest, the initial impact
on the size of the euromarket must be less than unity. Hewson and
Sakakibara confusingly call this impact the multiplier (Hewson and
Sakakibara op cit pl22). In fact if the redeposit ratio -is positive
subsequent endogenous shifts in the supply function, caused by redeposit
ing, will result in a long run multiplier greater than the impact multi
plier. It can be seen therefore that yet again the redeposit ratio is
important in determining the size of the eurocurrency market.
Hewson and Sakakibara also note on pl23-124 that there must be some
shift parameters, eg income, wealth or level of transactions, which
encourage investors to hold more deposits at a lower rate of interest.
If portfolio preferences were determined solely by the rate of interest,
depositors would not be in equilibrium at the new lower rate. The
exception to this would be where there was an excess demand for deposits
at the previous higher rate of interest. Given the degree of competition
in the euromarkets they consider this to be unlikely.
One shift parameter not mentioned is tastes. These could be induced
by advertising and marketing, both of which have played an increasing
role in international banking during the 1970's. Advertising and
marketing would be directed at both depositors and borrowers, resulting
in outward shifts in both the supply and demand functions. This point is
discussed in detail later in this paper.
The result of Hewson and Sakakibara1 s work is a multiplier of "not
significantly different from zero ...... and 1.61 if European central
banks had redeposited all the increases in their foreign exchange
reserves in the eurodollar m a r k e t ....... " (pi36).
More recent literature has treated the eurobanks as analogous to
non bank financial intermediaries ".... since their deposits do not
serve as a medium of exchange and their reserves (if any) are held with

US commercial banks and not with the central bank ..... " (Niehans and
Hewson 1976). This begs fundamental questions regarding the validity of
the division of financial intermediaries into banks on one hand and non
banks on the other. Witness the roles of building societies and banks in
the United Kingdom at the present!
Niehans and Hewson (1976) emphasise the role of the redeposit ratio
(for them the marginal propensity to hold eurodollars) but abstract from
this marginal propensity in order to arrive at a multiplier less than
unity.
Their work continues by discussing the relevance of looking at the
absolute size of the market. They particularly think that it is more
important to look at the liquidity creating role of the euromarkets.
They consider that, whereas domestic banks add to total liquidity by
taking short term deposits and granting longer term loans, the eurobanks
do not behave this way. They tend to match deposit maturities with loan
maturities and therefore do not engage in significant maturity
transformations. Therefore the eurobanks do not contribute significantly
to total liquidity.
This view of the lack of maturity transformation by eurobanks is
only valid if the roll-over period of the loan is considered to be the
relevant maturity of that loan. However, from the borrowers1 point of
view, if they negotiate a ten year loan rolled over, say, every six
months, then ten years is the maturity of the commitment. What is more,
the borrowers1 expenditures will be made in the expectation of ten years
of credit. Taking this view the eurobanks engage in considerable
maturity transformation and therefore add to total liquidity.
Data below compiled from the Bank of England Quarterly Bulletin for
January 1975 and June 1980 show the amount of maturity transformation
that does take place in the London eurocurrency market.

Table 3.1
Maturity analysis of net position of UK banks and certain other institutions
20.8.75 21.5.80Less than 8 days -7820 -215838 days to less than 1 month -3898 -14094
1 month to less than 3 months -7749 -20021
3 months to less than 6 months -5942 -147196 months to less than 1 year -1477 -17271 year to less than 3 years +6296 +145743 years and over +20703 +54829Figures in US $ millionsSource: Bank of England Quarterly Bulletin
A negative net position indicates that bank deposits are greater
loans at that maturity, whereas a positive net position indicates
loans are in excess of deposits. Clearly therefore the banks in
London are net holders of deposits at short maturities and net lenders
at long maturities. This runs counter to the suggestion of Niehans and
Hewson, op cit, and indicates that the London eurocurrency market does
add to their concept of world net liquidity. Given the international
nature of the eurocurrency market, there is no reason to think that
other eurocurrency centres have a maturity structure different from that
of London.
The treatment of eurobanks as analogous to non bank financial
intermediaries has resulted in at least one work suggesting that they
cannot multiple credit create (Dufey & Giddy 1978 pl26). The difference
between domestic banks and eurobanks, for Dufey and Giddy, is that
domestic banks keep their reserves in the form of the monetary base
while eurobanks keep their reserves with domestic banks. This is an
erroneous distinction for most countries because the monetary base is
not the only constituent of bank reserves eg in the UK domestic and
eurobanks hold reserves with the discount houses.

Other recent work (Llewellyn 1979, 1980) treating eurobanks as
analogous to NBFI's suggests that they can only create credit if:
1) Through greater efficiency eurobanks can offer credit at
lower rates of interest, and demand is interest elastic.
2) Domestic banks are unwilling or unable to compete in the
markets of the eurobanks.
3) Domestic banks ration credit and the resulting excess
demand is accommodated by the eurobanks.
4) Domestic banks require a wider margin between deposit
and loan rates than eurobanks either through collusion
to achieve larger profits or because of officially
imposed reserve requirements.
These points do not preclude multiple credit creation. Whether or
not eurobanks fund their increased lending from a fractional reserve
base or by attracting new reserves depends upon the redeposit ratio.
This ratio is determined by the portfolio preferences of borrowers and
lenders. Multiple credit creation is therefore determined by the same
factors that influence the portfolio preferences of eurobanks and their
customers.
Theoretically there is no reason why any financial intermediary
should not multiple credit create. To do so it has to ensure that its
liabilities are preferable to those of its competitors. Domestic banks
have an advantage in that their liabilities are the traditional store of
purchasing power and therefore exhibit greater moneyness than do those
of eurobanks. Other intermediaries, therefore, will have to incur
greater costs in order to make their liabilities more attractive. This
rising cost of attracting deposits, given loan revenue, will limit the
size of the eurobanks' balance sheet at a smaller level than if these
costs did not have to be incurred.
Again this is no different from domestic banks. Even without
reserve requirements they would not multiple credit create to infinity

since, even with a constant cost of funds function, a negatively sloped
demand for loans function would ensure that at some stage the revenue
from the marginal loan would be below the marginal cost of funds.
This may explain the low multipliers in ' the euromarkets. Their
liabilities have less moneyness than domestic deposits therefore
leakages are greater, the cost of reducing those leakages to an
acceptable level is perceived as too high in this new market.
It is clear, therefore, that the difference between bank and non
bank financial intermediaries and, in the context of this study, banks
and eurobanks is not one of kind but one of degree.
The limitations upon the eurobanks' ability to increase total
credit suggested by Llewellyn, op cit, ignore the influence and
possibility of endogenous shifts in the demand for total credit
resulting from increased income. This increase in income may be caused
by expansion of eurobank credit within the constraints that he has
suggested. If the eurobanks were to expand credit, because the domestic
banks rationed it at the current rate of interest, total income would
rise as would the total level of deposits. This rise in income would
lead to an increased demand for total credit. If domestic banks continue
to ration credit, the increased demand would have to be met in the
euromarkets. We therefore have income induced shifts in the supply of
deposits and the supply of loans. Given portfolio preferences, these
shifts result in a greater level of credit creation by the eurobanks.
This throws into doubt the validity of treating the supply and demand
functions as independent of each other. The validity of this
independence is investigated below when analysing the influence of
marketing.
An example of the way in which a redistribution and growth of
income may influence the size of the euromarkets is the depositing of
balance of payments surpluses in the eurocurrency markets. The oil
exporters have shown a marked preference for short term eurocurrency

deposits compared with domestic deposits.
A recent paper (Heller 1979) considered that the size of the
eurocurrency market is determined by the demand for eurocurrency loans.
This is easily incorporated into the portfolio theory as follows. As the
portfolio preferences of borrowers shift in favour of eurocurrency
loans, the banks will find it profitable to encourage portfolio changes
in depositors. Thus a shift in the demand for loans can cause the market
to grow within the constraints of the portfolio preferences of the
market participants. This is shown in the following diagram:
r
As the demand for loanscurve shifts from Dl toD2 the size of the marketgrows from Ql to Q2. This ignores any induced shift in the supply curve.
o
Figure 3.2 Impact of a shift in demand upon euromarket size

3.2 The Role of Marketing in the Growth of the Eurocurrency Market
It has already been noted that, given the low and maybe declining
reserve holdings of eurobanks, the redeposit ratio is an important
determinant of the size of the eurocurrency market. This ratio is
influenced by factors that cause the preferences of depositors and
borrowers to change, as well as factors which cause the global level of
deposits to change. Amongst the latter, increased income due to
increased eurocurrency lending has been suggested above.
Preferences of depositors and of borrowers are influenced by:~
1) Factors inherent in the nature of the market such as
higher deposit rates, lower loan rates and the nature
of the market instruments eg floating rate syndicated
loans.
2) A learning process over time.
3) Induced changes in tastes which result from the
marketing efforts of the banks. This role of marketing
may enhance the learning process in 2 ) above.
It is feasible that any change in the nature of the market or its
instruments could be influenced by marketing policy eg price
differentials or the development of new deposit or loan instruments.
Therefore marketing is seen as having an important influence over the
growth of the eurocurrency market.
An example of the influence of marketing and the nature of the
instrument directing borrowers’ preferences to the euromarkets has been
the heavy borrowing during the 1970's by developing countries. The
instrument, the roll-over syndicated loan, much more common in the
euromarkets than domestic markets, was ideal for the long term loans
required by developing countries. The sheer salesmanship employed by
many banks in this field has led to accusations that the banks have lent
more money to some sovereign borrowers than those borrowers really
needed.

Analysing the role of marketing on the size of the balance sheets
of financial intermediaries is very interesting since, unlike many types
of industry, the marketing effort is undertaken to attract the inputs to
the production process, ie deposits, as well as to sell the output, ie
loans.
Marketing aimed at depositors will shift the supply of deposits
function to the right. The degree of response can be considered to be a
marketing elasticity of supply of deposits. Marketing aimed at borrowers
will likewise shift the loan function to the right and a marketing
elasticity of demand for loans can be derived.
In practice, the marketing aimed at depositors will both increase
the redeposit ratio (endogenous shift) and attract new depositors
(exogenous shift) to euromarkets, though it will be impossible to
distinguish between the two.
Similarly, marketing directed towards borrowers will increase the
volume of transactions in the financial system and thus increase income.
This will result in an endogenous shift in the supply of deposits
assuming that the supply of deposits is positively related to the level
of income.
Thus the introduction of marketing throws into doubt the validity
of treating the supply and demand curves, and particularly shifts in
those curves, as independent. In particular, shifts in loan functions
will result in shifts in deposit functions.
This impact of marketing is illustrated in the following diagram.
Assume first an exogenous increase in deposits shifting the supply curve
from SI to S2. The banks then market their loan services, shifting the
demand curve to the right to Dl. This reduces the fall in the rate of
interest and thus reduces the leakage back to the domestic market
suggested by Tobin, op cit. The interest elasticity of supply of
deposits will influence the change in interest rates and the marketing
elasticity of demand for loans will determine the size of the shift in

the loan function.
If we assume, only for explanatory purposes, a previously zero
redeposit ratio, marketing aimed at depositors will increase the
redeposit ratio and shift the supply function to S3. The marketing
elasticity of supply of deposits and the interest elasticity of demand
for loans determine the interest rate and size of bank balance sheet, ie
Q3.
If the marketing were only aimed at borrowers, the demand for loans will shift to Dl. Then the marketing elasticity of demand for loans and the interest elasticity of supply of deposits will determine the size of the balance sheet.
_/— 7-
& \ <3*1
Figure 3.3 The impact of marketing upon euromarket size
It can be seen therefore that when marketing is directed at both
borrowers and lenders, the size of the banks' balance sheet is
determined by the marketing elasticity and interest elasticity of demand
for loans and by the marketing elasticity and interest elasticity of
supply of deposits.
Strictly speaking, the idea that the supply of deposits and demand
for loanable funds are equal is unrealistic. The financial markets
dominated by financial intermediaries show a spread between bid rates
and offer rates. In the eurocurrency interbank market this may be only
one eighth of one per cent. However, between original depositors and
final borrowers, it may be in excess of three per cent. This spread
represents the gross profit of the intermediating function from which
the non interest rate costs will be met.

If the bank engages in a marketing campaign, its costs will rise
and if it wishes to maintain its level of profitability, it will have
to restrain the size of its balance sheet. This is shown in the
following diagram:r ~
Cl
Figure 3.4 The impact of marketing upon the spread between bid and offer rates
Without any costs associated with financial intermediation, the bank’s
balance sheet would initially be Ql with the rate of interest 'b' .
Where costs of financial intermediation are proxied by the spread
between deposit and loans rates 'a', the balance sheet is reduced to
Q2. However, where the demand for bank services (eg deposits and loans)
is marketing elastic, the spread "a1" is increased but the resulting
outward shift in the supply and demand functions actually increases the
balance sheet to Q3. •
Obviously the smaller the gross margin required, the larger will
be the bank's balance sheet. Although marketing may increase the size
of gross margin required, there are several features of eurobanking
which work to reduce the size of that margin. These factors include
- smaller reserve asset requirements
the fact that eurobanks do not run a cash transmission
'service
- economies of scale in eurobank transactions
- lack of cartel agreements between banks
lack of regulatory expenses such as deposit insurance
premiums

It is clear from what has been said that the growth of the
eurocurrency market depends upon that market being more attractive than
the domestic currency market. The cost advantages of eurobanking over
domestic banking give the euromarkets certain advantages in terms of
being able to offer higher explicit yields on deposits and lower
explicit costs of loans. However, a number of other factors have
operated during the 1960's and 1970's to shift the preferences of
depositors and borrowers in favour of the euromarkets. The marketing of
eurobank services is considered in this chapter to be important. Various
previous studies have considered the influence of governmental
controls. No doubt these controls had a considerable influence during
their existence but the euromarkets continued to grow when the controls
were relaxed or abolished. One influence compatible with the role of
marketing as described above is that banks' corporate objectives may
include balance sheet growth as a strong element.
Indeed, it is suggested in this thesis that growth of balance
sheets has been a major objective of eurobanks during the 1970's. This
growth may be in its pure form of growth per se, subject to say, a
minimum profits constraint, or a short term manifestation of the
objective of long run profit maximisation. The next section of this
chapter, by developing a model of the eurobank lending function, shows
that because of the highly elastic demand curve for eurobank loans and
the indivisibilities of certain inputs, the eurobanking firm is
unlikely to be constrained by the maximisation of profit; the major
constraints being the minimum acceptable return on capital and/or the
maximum acceptable level of risk.

J J H
3.3 A Theory of the Eurobank Lending Function
Financial Intermediation
The welfare implications of the existence of financial markets are
well documented in textbooks covering financial economics (eg Bain
1981, Coghlan 1980, Goodhart 1975, Furness 1972). Although not
necessary for the existence of such markets, it is nevertheless true
that these markets are characterised by the existence either of
brokers, acting as agents, or of intermediaries acting as principals.
Some markets have both types of operators eg the interbank markets.
This study is concerned with the operations of financial
intermediaries and, in particular, the operations of those in the
eurocurrency market. The differences between euromarket intermediaries
and domestic bank type intermediaries are highlighted in order to
explain the objectives of eurobanks in their lending to developing
countries.
Goodhart (1975 ch6 ) suggests three functions of financial
intermediaries
1) to exploit economies of scale in financial markets,
information gathering and portfolio management.
2 ) the provision of insurance services based upon
actuarial expectation of their contingent
liabilities and economies of scale in portfolio
diversification.
3) asset transformation providing liabilities which
are preferred by lenders and issuing assets preferred
by borrowers.
On closer inspection these functions are all more profitable for
financial intermediaries than individual market participants because
the intermediary enjoys economies of scale. These economies of scale
are particularly noticeable in portfolio diversification of both assets
and liabilities and in the provision of information to lenders and
gathering of information and analysis about borrowers.
Some types of financial intermediary find their reward by simply
exploiting these economies of scale but matching the risks on their
liabilities with the risks on their assets. Examples of this are unit
trusts and insurance companies. Banks on the other hand are rewarded
for transforming the risks. For example, the archetypal bank provides
depositors with liquid low risk deposits while it provides borrowers
with longer term maturity certain loans. The bank is providing a
preferred liability to the depositor and therefore at low cost and
providing a preferred asset to the borrower and therefore at a higher
price; the differences between the prices is the banker's reward.
The banker therefore fulfills the role of asset transformation, it
provides its liability to the depositor and uses the funds to acquire
assets of different characteristics, the liability of the borrower.
This transformation takes place at three levels:
1) Transformation by maturity ie taking short-term deposits
and providing longer term loans.
2) Transformation by risk ie providing deposits with low
risk and acquiring assets of a higher risk.
3) Transformation by currency ie taking deposits in one
currency and providing loans in another. This is really
a special case of example 2 ) because the bank is simply
taking on currency exposure risk.
This transformation process is common to all banks in varying
combinations of the three types of transformation suggested above.
Therefore it is not the transformation function that isolates eurobanks
or the eurobanking departments of domestic banks from the domestic
banks themselves. Instead the writer believes that the difference
between eurobanks and other banks is not to be found in the
fundamentals of the transformation process but in the mechanics of the
techniques of transformation. Because these mechanics differ between
eurobanks and other banks, eurobanks have different cost structures and
a different industrial structure.
International and Domestic Financial Intermediaries Compared
Domestic banks provide three basic groups of services. Firstly
there is the safe custody of the medium of exchange, secondly there is
the cash transmission service provided by the debit and credit clearing
systems. Lastly there is the provision of intermediation between
financial deficit and financial surplus sectors of the economy.
Although the money transmission system and the safe custody function
are both very important for the efficient operation of the economy, the
raison d'etre of the bank is the function of financial intermediation.
Indeed the great variety of services which banks offer, including the
various types of accounts, the debit and credit clearing, the safe
custody service, as well as many ancillary advisory services, are aimed
at expanding depositors or borrowers and thus the intermediating
function.
The banks' major contribution to profits comes from the difference
between the costs of attracting deposits and the interest earned from
lending those funds. The major distinction between domestic and
international banks in this respect is in the nature of the costs
incurred in the intermediating process. Domestic banks provide the
money transmission system, a branch and/or correspondent network system
and a host of services priced at various degrees of loss to attract
funds as well as using the interbank market to attract funds.
Eurobank financial intermediaries on the other hand do not provide
a money transmission service and what services they do offer are either
earning fees that cover costs or aimed at attracting borrowers; these
services are not aimed at attracting deposits.'Deposits are attracted
by offering a competitive explicit rate of return either in the
interbank market or to various non bank sources.
Because eurobanks do not provide the small 'retail1 banking
services of domestic banks and do not maintain such large branch
networks, the short run variable costs of eurobanking do not exhibit
diminishing marginal productivity. It may be thought that if a bank has
to be more aggressive in attracting funds in order to expand, the
marginal costs of funds will rise. However, as is explained below, the
explicit interest cost of funds is not considered a cost of production
of the eurobanking firm because of the technique of pricing
eurocurrency loans. In fact, Grubel (1977) suggests that eurobanks are
acting as brokers rather than banks. However, the writer considers this
to be an erroneous interpretation as it is based upon the
interpretation of degree of eurobank maturity transformation by Hewson
(1975). However Hewson1s work, perpetuated in Niehans & Hewson (1976)
was wrong in this respect and is shown to be so bn page 105 above.
On the lending side, a marked difference between domestic and
international lending is the distance between the bank and the
borrower. Because of the competitiveness of the international loan
markets, lenders may provide funds to borrowers with whom they have had
no previous banking relationship. This is less likely to occur in
domestic banking. Accordingly, the knowledge that the international
borrower has regarding his debtor will be less and therefore the risks
higher than those attendant upon domestic lending, although the
syndication system diversifies away some of this risk. Being
international in nature, it is more likely that international lending
will result in exchange risk for the bank and the borrower.
Furthermore, to the extent that the lending is in a currency foreign to
the borrower, it will entail country risk for the lending bank.
One feature of international financial intermediation that is more
pronounced than in domestic markets, is the substantial chain of
interbank transactions. Dematte (1981) suggests that the size of the
chain is associated with the distance between original suppliers of

funds, surplus units, and final users of funds, deficit units, this
distance being greater because of the international nature of the
market. An alternative explanation is that the establishment of an
interbank market and the resulting chains stem from the competition for
deposits in currencies in which the banks do not have a natural deposit
base eg non US banks bidding for dollar deposits. Once the banks use
the interbank market for funds they provide a two way business of
bidding and offering funds even if they are net bidders. The result is
that banks engage in interbank dealings for their own sake thus
increasing the length of any 'chain1.
Because of the length of the interbank chain there are
opportunities for banks to specialise in various functions ( Dematte ,
op cit), notes three distinct functions
1) the collecting of deposits from non bank sources
2 ) the final lending to non bank borrowers
3) intermediating between banks
In practice, it is more probable that banks specialise in each of
these functions at different times. However, the location of some banks
eg OPEC, US and the branches of some British Overseas Banks, make them
well placed to attract funds, while the expertise of such banks as UK
merchant banks, consortium banks and US banks enables them to dominate
the management of loans to final users.
This specialisation within the market by constituent banks
increases the perceived distance between borrowers and lenders. This in
turn increases the competition between lenders and therefore the
variety of sources of funds to borrowers compared with that available
to the customers of domestic banks. As a result the demand curve for
eurocurrency loans from any individual bank will be more price elastic
than such a curve of a domestic bank.

119
3.3.1 A Theory of the Eurobanking Firm
One fundamental difference in the application of the theory of the
firm to international banking compared with domestic banking is that
international banking more closely resembles a one product production
system. This is because international banks use relatively more
resources lending money and relatively less resources in attracting
deposits compared with domestic banks.
The growing literature regarding the theory of the banking firm
explains a bank's behaviour from several angles.
Baltenspergen (1980) divides the literature on the banking firm
into two groups. One group he refers to as partial models, where the
total size of the bank's portfolio is given, therefore the question at
issue is the optimal allocation of this portfolio. The second group
consist of ".... Complete models of the banking firm, ie models which
attempt to explain the joint determination of not only the structure of
assets and liabilities and their interaction, but also the total scale
of the bank's operation and portfolio", (Baltenspergen, op cit, p3). It
seems that from casual observation of the aggressive marketing policies
of the eurobanks, both in relation to deposits and loans, that a theory
of the banking firm which assumes the portfolio size to be exogenously
given is inappropriate.
Of the complete models, Baltenspergen identifies three groups.
Group one models assume that banks are monopolistic price setters in
deposits and/or credit markets. These models are clearly inappropriate
for the competitive euromarkets. Group two models assume banks are risk
averse and that instead of maximising profits only, the utility
function to be maximised has profits as a positive element, and risk,
usually incorporated as variability in profits or income, as a negative
element. The group three models emphasise the importance of the real
resource or production aspects of banking. These models essentially
represent pure production cost models of banking ie they explain size
'<*■1
i;
.s»*
ii

and structure of bank liabilities and assets purely in terms of the
flows of real resource costs of generating those stocks (emphasising in
particular the cost of deposit production). This production cost
approach has been emphasised by Pesek (1970), Saving (1977), Towey
(1974) and Sealey & Lindley (1977).
Although such an approach seems a plausible starting point from
which to describe eurobanking, they have two weaknesses. Firstly, they
assume profit maximisation is the dominant element of the bank's
utility function. Secondly, stemming directly from the profit
maximising function, the deposit attracting function is assumed to
exhibit rising marginal cost while revenue shows falling marginal
revenue.
The literature cited above relates to the behaviour of "banks"
taken to mean domestic banks. These banks differ from eurobanks in the
view of the writer simply because the deposit attracting function of
domestic banks exhibits rising marginal cost whereas that of eurobanks
does not.
The suggestion that domestic banking exhibits rising marginal cost
is supported, at least for US banks, by Benston, Hanweck and Humphrey
(1982). They consider their work to be an improvement upon such work as
Bell and Murphy (1968), and Benston (1965), because these earlier
studies which generally found decreasing or constant marginal cost,
related to the provision of one type of bank service, whereas the later
work includes the total provision of all banking services by the firm.
Benston, Hanweck & Humphrey (op cit) use an output measure which
incorporates deposit taking services and loan making services. This is
only valid if the bank's objective function incorporates numbers of
deposits or value of deposits positively in the function. This may be
correct for a commercial bank that generates business from very
intimate banker-customer relationships. However, it is considered
h e r e , that such relationships are not a common feature of
eurobanking. As such, eurobanks do not get any benefit from deposits
except that they fund earning assets. Therefore, deposits are not
considered to be an output of the eurobank but simply an input to the
production process.
Frazer (1982) would suggest falling marginal costs even in
domestic banking. Osborne (1982) also suggests falling marginal costs
in attracting domestic deposits for banks situated in the USA. These
last two studies have again concentrated on one product of the banking
firm - cash transmission in the Frazer paper and deposits in the one by
Osborne.
However, in eurobanking deposits are attracted not by a variety of
labour intensive services but by the explicit interest rate paid on
deposits. If eurobanks offer additional non loan services, these are
generally fee earning services contributing to the total revenue of the
bank and not conducted basically to attract deposits. Moreover, the
eurobanks do not operate a cash transmission system.
It is important to note a distinction between the behaviour of
average and marginal costs due to changes in the number of transactions
and the changes in costs due to the size of each transaction. This
distinction is important in the analysis of financial intermediation
because in the production of, say a sparking plug, a given level of non
raw material inputs is required to transform a given quantity of raw
materials into a plug. In financial intermediation no such rigidity
exists; the same quantity of non deposit resources can be used for a
$100 loan or a $10,000 loan. As the loan size increases, so the
transaction may become more complex, say a $1 million loan requiring
more non deposit resources than the $10,000 loan but within each degree
of complexity there will be a great range of loan sizes that can
result from the same input of non deposit resources. This point is
returned to below when we discuss the short and the long run in
relation to the costs of intermediation.
One price which might rise as banks strive to increase the total
value of their lending business is the cost of deposits, particularly
from the interbank market. However, by the terms of the eurocurrency
loan agreements, the interest rate costs of funding the loans are
passed on to the borrower by charging a reference rate, eg LIBOR, plus
a spread. Therefore the funding costs do not reckon as a cost of
production to the eurobank although these costs do influence the price
which the borrower pays for the service.
This analysis therefore proceeds to investigate the non deposit
interest resource costs of financial intermediation.
Short-run Cost Functions
A bank's costs are assumed in this analysis to be dominated by
fixed costs because the major constituents are the costs of maintaining
premises, information technology systems and a highly trained
professional labour force. By the nature of the conditions of
employment and expenses of training, the professional labour force
exhibits considerable embodied capital and therefore the size of this
labour force is not varied with short term fluctuations in output ie
lending.
The variable costs consist of labour costs attributable to
clerical staff, some of which, at least in London, will be of a
temporary nature. There will also be the costs of the clerical systems
of the bank. These clerical costs are assumed to be a constant function
of the quantity of total staff employed.
An important feature of this analysis is that the fixed factors
and the variable labour factor exhibit considerable indivisibility.
Amongst the fixed factors, indivisibilities are found in the
information technology systems and in the labour force. The variable
labour factor also exhibits indivisibility because of the discrete
nature of the labour input. In this latter case the result is that

marginal cost is discontinuous and, in fact, zero for most of the
quantity of output.
At this stage, it is important to define marginal product. In this
analysis it is assumed to be only one loan ie the marginal loan and not
a number of loans, say an additional ten or twenty. The reason for
adopting such a definition here is that the output of one loan could be
a simple process ie using little labour time, or a more complex process
using more labour time. it is therefore difficult to determine how
many loans an additional unit of labour will process or how many
currency units are involved with each loan (ref pl21 above) .
Furthermore, if the management took the view that an additional
worker could process 100 loans within a given time, the marginal cost
of labour would be the wage divided by 100; if 101 loans were
processed, the marginal cost of the last loan would be zero. If, on the
other hand, the management had a rule that workers only processed 100
loans, then the marginal cost of the one hundred and first loan would
be equal to the wage of the additional worker. It is therefore
considered that it is only valid to define marginal product as a group
of units of output if • production is in discrete batches of a uniform
size and that those batches are less than the full capacity of the
worker.
The cost functions of the eurobank can thus be depicted as shown
below:C
VARIABLE COSTSFIXED COSTS
Figure 3.5 Fixed and variable cost functions of a eurobank

1 4
Figure 3.6 Short run average total cost and marginal cost functions of a eurobank
The fixed costs function is of the traditional form. The average
variable cost function exhibits indivisibilities but assumes constant
cost of variable factors. The average total cost function shows the
indivisibilities of the variable factor. The marginal cost function
shows such cost being equal to the cost of the variable factor for the
first unit produced and zero thereafter until the variable factor is
fully utilised and a new unit of that factor is employed.
Long-run Cost Functions
Traditionally the long-run in economic analysis relates to the
time period when all factors, particularly fixed factors, are variable.
Again, traditionally, fixed factors include plant and buildings. In
this analysis it is considered that buildings, information technology
systems and professional staff, although treated as fixed assets, are
not the major constraint on the size of the banking function. Here we
ignore external constraints such as prudential regulation. The major
constraint becomes the bank's standing in the market. This standing
should be considered from two angles; one is the bank's standing as a
taker of deposits. This in turn will be related to its financial
condition. The second angle is the bank's standing as a lender. This

latter point has a considerable impact upon the economies of scale in
lending which the bank can enjoy.
To explain this we must consider the economies of scale associated
with a single loan transaction. The larger the loan, the lower will be
the average total cost per currency unit loaned. However, a bank can
only make large loans or take large participations in syndicated
loans, and maintain the required degree of portfolio diversification,
if it has a large balance sheet.
Furthermore, it is known that interest rate tiering exists in the
interbank market (Ellis 1981). If large size means lower perceived
risk, large banks will incur lower funding costs than small banks.
Moreover, borrowers prefer to issue loan mandates to the larger banks
because the borrower is more confident that a larger bank can
underwrite the transaction. The members of the syndicate management
group are well placed to take large shares of each loan, enjoying
greater economies of scale in each transaction.
In addition, the larger the loan participation, the higher the
proportion of front end fees (ref ch4 pi71),thus a bank making large
loans will not only enjoy lower average costs per transaction but also
higher average revenue. This results in higher profitability, a better
capital assets ratio and a better reputation in the market.
Clearly the ability of the bank to increase its scale of operation
and the size of average transaction, assuming a constant degree of
portfolio diversification, depends upon the market's perception of the
bank. This perception in turn depends upon the bank's past
performance.
It is considered by the writer that changing this perception has a
longer time scale than changing any of the tangible fixed assets such
as buildings, information technology systems or staff.
In order to increase the standing of the bank and thereby enjoy
the economies of scale associated with large transactions, it is neces-

sary for the bank to grow and, in practice, to grow steadily and
continuously. Thus the flow of new loans from a bank and their average
size is positively related to that bank's existing stock of loans.
Therefore, although in the long run the banks may enjoy economies
of scale associated with larger information technology systems, and a
higher calibre of staff attracted to larger, and therefore assumed
more prestigious institutions, they also enjoy substantial economies
of scale due to increased transaction size. This increased transaction
size is possible as the bank's balance sheet and reputation increase;
this reputation itself being positively related to balance sheet size.
The result of this hypothesis is depicted in the following diagram
of the long run cost functions:
£
fi*>r<Tiissr c. P & IA fY f
Figure 3.7 Long run costs functions of a eurobank
The falling long run average cost results from economies of scale
due to increasing average transaction size. As total balance sheet
increases, the bank can supply more loans in larger average
transactions and thus operate at successively lower sets of short run
cost functions. Thus each successive scale of balance sheet results in
a larger scale of transaction, each having a lower average cost per
currency unit loaned. This includes lower marginal cost at the point

of hiring an additional indivisible unit of the variable factor.
Moreover, although marginal cost is often z e r o , the positive point of
marginal cost falls as average transaction size rises. Thus growth of
the bank's balance sheet by allowing the bank to operate at lower
average transactions cost allows the bank to operate at a point nearer
to where MC = MR = 0.
Furthermore, where increased transaction size results in greater
fee income or even higher spread, the bank's average and marginal
revenue will shift to the right, again enhancing balance sheet size
through retention of larger profits.
On page 109 above the importance of marketing in the growth of the
eurocurrency market was noted. If we extend the role of marketing to
the individual bank, we can see that the revenue curves are shifted to
the right thus enhancing the growth of the bank. If marketing costs
exhibit diminishing marginal productivity, they will militate against
the falling positive marginal cost point. However, for cost per
currency unit loaned to rise as a result of marketing effort,
marketing costs per currency unit must outweigh the economies of scale
in transactions costs resulting from larger average size of
transactions possible from the increased size of the total banking
operation.
Therefore, balance sheet growth and its attendant marketing and
public relations exercises are important in the bank's utility
function in that they allow for growing profits without the bank
reaching the profit maximising condition which any way may be close to
MC-MR—0. Incremental profits are important because these supplement
the bank's capital base. A growing capital base is required in order
to avoid being under-capitalised as the balance sheet grows.
This analysis of the short and long run cost functions does not by
itself explain the quantity of loans supplied. For that it is
necessary to analyse the bank's revenue functions as well.

The Revenue Functions
Because - each eurocurrency loan is individually negotiated, often
with a considerable degree of confidentiality, and because the loan
will incorporate some non price factors in its terms, each bank or
syndicate of banks can differentiate its product. As such it will face
a negatively sloped demand curve for its product. However, this
differentiation may only be slight and therefore the substitution
between different banks' products is considerable.
This ability to choose between banks according to the terms of the
loan is enhanced by the fact that the market is uncartelised.
Moreover, because eurobanks, unlike domestic banks, often do not
require an established banking relationship with the prospective
borrower before lending, it is possible to approach many banks
separately and compare the terms of loans. Therefore the price
elasticity of demand for loans from any one syndicate will be highly
elastic.
Accordingly, the revenue curves of a eurobank are characterised by
the diagram below:
P
Figure 3.8 The revenue functions of a eurobank

The Complete Model
The barriers to entry into eurobanking are very low (as distinct
from the barriers into banking generally) for institutions already engaged
in domestic banking. In effect such a change requires only the
establishment of a foreign currency bookkeeping system. Accordingly, the
ability of firms to enter and leave the industry is considerable. It is
therefore considered by the writer that the eurobanking can be
characterised by an adaptation of the monopolistically competitive model
suggested by Chamberlin (1950).
Chamberlin suggested that super profits would be competed away by
firms entering the industry, thus shifting the demand curve downwards
until the demand curve is tangential to the long run average cost curve.
In the process the demand curve may become more elastic. In Chamberlin's
model a unique profit maximising solution was possible because of the use
of linear revenue curves and 'u' shape cost curves.
In the current analysis competition in the short run will shift the
average revenue curve until it is tangential to the short run average cost
curve. In the long run competition will ensure that the average revenue
curve is tangential to. the cost curve of whichever scale of lending
function is chosen. Thus the dashed line marked AR in figure 3.9 below
represents a locus of points of long run equilibrium average revenue. The
solid line marked LATC represents a locus of points of equilibrium long
run average total cost. In both cases long run equilibrium is defined as
tangency between average revenue and average total cost for whatever scale
of lending function is chosen. The relevant marginal revenue curve will be
that associated with the average revenue curve tangential to the chosen
cost function.
Because each loan is individually negotiated, the terms can be
related to the resource costs of producing that loan. If the price charged
were above average cost, super profits would arise and be competed away
(maybe instantaneously through competitive tendering for loan mandates). If a price less than average cost is charged, a loss

will ensue which the bank can avoid by not making the loan. Therefore,
provided that the bank is aware of its cost functions when they
negotiate the terms of loans, they do not need to enter the market for
any individual loan that will result in a loss. In effect the lending
banker exhibits perfect mobility of resources in respect to any one
loan analogous to that hypothesised in the perfect competition model.
Thus, with competition for loan mandates removing super profits
and the ability to avoid losses by not entering into lending on
unfavourable terms, the banks will be able to achieve an average
revenue equal to average cost.
If one bank had resource costs significantly above its
competitors, it would be unable to lend competitively and would leave
the market altogether. The deposit funds would then flow to the more
efficient banks that can make a normal profit from loans priced at the
then existing average revenue.
With the behaviour of the marginal cost function being a positive
but declining series of points, or zero, due to the indivisibility of the variable
labour input, it is always optimal for the banker to operate at a
point where marginal cost is zero. Given the highly elastic demand
function for the individual bank as postulated above, and the ability
of marketing to shift the revenue functions to the right, the profit
maximising criterion of MC = MR will not be an effective constraint
upon bank operations even where profit growth is important in the
bank1s utility function provided that there is an additional positive
constraint. The effective constraints upon bank balance sheet growth
are the minimum acceptable return on total assets and a maximum
acceptable perception of risk. The greatest of these two becomes the
binding constraint.
The relationships between the revenue functions, marginal cost and
long run average cost on one hand and the return on total assets and
risk constraints on the other are shown below:
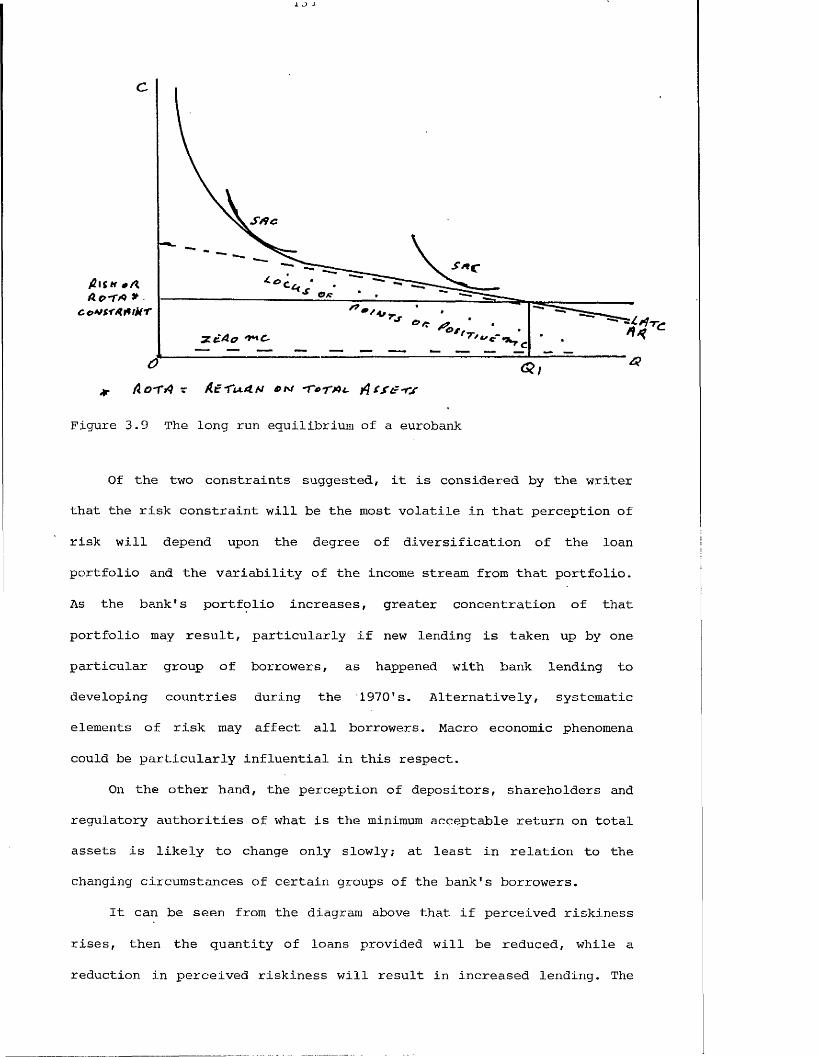
1 -I
f i t i t r Ae>'TA *
coWrAfiiM'T
A o -TA - X f r U r t A / * M -rv>7 » A . jAtXtr-rj-*
Figure 3.9 The long run equilibrium of a eurobank
Of the two constraints suggested, it is considered by the writer
that the risk constraint will be the most volatile in that perception of
risk will depend upon the degree of diversification of the loan
portfolio and the variability of the income stream from that portfolio.
As the bank's portfolio increases, greater concentration of that
portfolio may result, particularly if new lending is taken up by one
particular group of borrowers, as happened with bank lending to
developing countries during the 1970's. Alternatively, systematic
elements of risk may affect all borrowers. Macro economic phenomena
could be particularly influential in this respect.
On the other hand, the perception of depositors, shareholders and
regulatory authorities of what is the minimum acceptable return on total
assets is likely to change only slowly; at least in relation to the
changing circumstances of certain groups of the bank's borrowers.
It can be seen from the diagram above that if perceived riskiness
rises, then the quantity of loans provided will be reduced, while a
reduction in perceived riskiness will result in increased lending. The

return on total assets constraint operates in an analogous manner. This
reaction may be considered as credit rationing but it must be stressed
that this analysis relates to a single bank. For credit rationing
to be imposed by a whole market all banks will have to have similar per
ception of risk and similar degrees of risk aversity.
It may very well be that the perceived risk constraint as
hypothesised here explains the slowdown in the growth of bank lending to
developing countries observed in the last two years.
If banks do indeed behave as suggested in this chapter, it is more
appropriate to consider growth to be the major factor in the bank's
utility function.
The suggestion that the maximisation of profits may not be the only
or even dominant element of a eurobank is supported by anecdotal
evidence (Euromoney 1978, 1982) and responses to the writer's survey
discussed in chapter seven of this thesis. This evidence suggests that
market share or balance sheet size were important objectives in the late
1970's. Davis (1981) suggests that the balance sheet growth was only
just giving way to profits as an important objective at the time that he
was writing.
Further evidence that balance sheet size is an important corporate
objective comes from the continued publication of rankings of banks by
the quantity of eurocurrency loans written. These rankings are published
in Euromoney and Institutional Investor. As these publications rely upon
popular demand for their existence, the continued publication of these
rankings indicates that they provide a form of knowledge required by
readers - mostly practising bankers.
The importance of market share and balance sheet size may also be
explained by the work of Marris (1964) and Baumol (1959) suggesting that
executives' salaries are related to growth of the firm or sales revenue.
For a bank,sales growth and balance sheet growth are identical.

Furthermore, balance sheet size may be an important determinant of
depositor confidence, not least because a large portfolio allows greater
diversification of the unsystematic element of risk. Moreover, balance
sheet size may give borrowers confidence that loan requirements can be
provided by the bank. This is important where the borrower may be
wishing to expand its market share.
The bank's objectives need not be of equal dominance, indeed the
dominant objective may change during the life of the organisation, but
the market behaviour will be similar; this is suggested by Davis (1981)
and Euromoney (1982b). It is in fact quite reasonable to expect new banks
to concentrate on balance sheet growth until their presence is felt in
the market and then to give profits more priority. This is particularly
so given the advantages of depositor and borrower confidence that a
large balance sheet confers upon a bank. Responses to the survey
reported in chapter seven suggest that bank corporate objectives have
indeed changed during the 1970's and early 1980's.
Conclusion
In conclusion, it is considered that the growth of the eurocurrency
market is influenced by the portfolio preferences of depositors,
borrowers and lenders. These preferences are influenced 'by several
factors including price advantages of eurobank transactions, government
controls on domestic markets, tastes and a learning process both
enhanced by marketing efforts and the corporate objectives of the
eurobanks. These corporate objectives manifest themselves in the
portfolio preferences of the lenders.
The fixed coefficient multiplier approach is inappropriate to
explain euromarket growth because of flexibility of the reserve base and
the redeposit ratio, as well as inadequate measures of the reserve base
and total euromarket lending. The fact that the multiplier approach is
inappropriate does not of itself preclude multiple credit creation by

the eurobanks. In fact, the theoretical analysis of the influence of
marketing and relative prices upon portfolio preferences suggests that,
as the market matures, the redeposit ratio and thus multiple credit
creation could increase. The existence or otherwise of government
controls will also influence the growth of the euromarkets.
This chapter has also shown that the corporate objectives of growth
maximisation or long run profit maximisation are compatible with the
cost and revenue functions of eurobank lending. Responses to a survey
reported in more detail in chapter seven of this thesis confirm that asset
growth was an important corporate objective of eurobanks during the
1970's. The fulfilment of this objective would have a considerable
influence upon the growth rates of the euromarkets during that period.
The growth of the eurocurrency markets is of crucial importance to
the developing countries because these markets have become such an
important source of external finance. However, continued growth of the
euromarkets does not guarantee an adequate supply of eurobank credit to
developing countries. The portfolio preferences of the banks are of
utmost importance. These preferences will be influenced by the expected
rate of return and the perceived risk attached to such loans compared to
those available on alternative assets. The ability to manifest these
preferences will depend upon the constraints bearing upon the eurobanks
at any point in time.
The next chapter analyses the financial terms attached to
eurocurrency loans and eurobonds in order to ascertain the determinants
of the expected rate of return on such assets.

1J t>
Chapter 4
THE FINANCIAL TERMS OF BANK FINANCE TO LDC1S
4. 1 Introduction
This chapter analyses the determinants of the interest rate related
costs of eurocurrency bank loans to, and eurobond issues by, LDCs. These
interest rate costs are determined by factors that influence the level of
interest rates generally and by factors that influence the interest rates
on bank loans or bond issues specifically. Therefore the structure of this
chapter is in three parts.
Section 4.2 analyses those factors that influence eurocurrency
interest rates generally. In particular:
Inflation and government economic policy of the country
whose currency is being loaned;
The currency of the loan;
The term structure of interest rates;
The relationship between eurocurrency and eurobond
interest rates.
Section 4.3 analyses those factors that influence interest rate costs
specific to eurocurrency loans, in particular:
Spread and fees.
Section 4.4 analyses those factors that influence interest rate costs
specific to eurobond issues, particularly:
The risk premium;
Marketability.

Ufa
4.2 Factors Influencing the Level of Eurocurrency Interest Rates Generally
There is a very extensive literature on the determination of
interest rates generally. One view is that interest rates are determined
by the supply and demand for existing securities (Keynes 1936, Metzler
1951). Because the stock of existing securities is very large relative
to the flows of new securities to each market, the supply and demand for
new securities will not affect interest rates directly (Metzler, op
cit) .
In contrast with this view, Horwich (1964) and Moore (1968)
consider that interest rates are influenced directly by the supply and
demand for new securities. The analysis by Moore noted the importance of
the speed with which existing securities holders can make portfolio
changes once they perceive themselves to be in disequilibrium. Van
Horne (1970) makes the point that it is not the stock of existing
securities that is important but the level of transactions in those
securities (p37). This point is of direct relevance to the eurobond
market where there is an active secondary market in most issues;
investors therefore have the choice of investing in existing securities
or new securities and therefore the yields on existing securities and
new securities will converge. On the other hand, the limited secondary
market in syndicated loans would suggest that the yield on new loans
need bear little relation to that on existing loans.
It is clear, therefore, that yields on marketable securities,
whether existing or new issues, will depend upon the interaction of the
supply and demand for both types of security. The degree of interaction
will depend upon the relative size of the primary market compared with
that of the secondary market and on the elasticity of the arbitrage
schedules between the two markets. On the other hand, the inability to
arbitrage out of existing holdings on non marketable debt of syndicated
loans means that the yield on new debt will be more strongly influenced
by the supply and demand for new debt rather than the existing stock of
debt.
Given that interest rates equate the supply and demand for credit
in markets free of restriction, it follows that arbitrage and
speculation across the whole spectrum of credit instruments equilibrates
the level of interest rates between markets. If we make the assumptions
of perfect competition in all credit markets and a riskless society, the
rate of interest would be determined by the interaction of society's
positive rate of time preference and the marginal efficiency of capital.
Savers' rate of time preference would influence the supply of credit,
and borrowers' marginal efficiency of capital would influence the demand
for credit.
If we assume that economic agents are utility maximisers, then it
is possible to postulate that agents will demand assets and supply
liabilities such that the ratio of marginal utility to price on each
asset and liability is equal. It is, of course, necessary to ignore the
change in the sign between assets and liabilities.
The marginal utility of holding real assets is related to the
physical services they perform, whether it be in consumption or
production. Financial assets on the other hand do not provide any
consumption or production services. Instead they provide a positive
financial flow in the form of a rate of return. The utility of this
return can be analysed by way of the popular Tobin-Markowitz
two-parameter utility function, where utility is positively related to
the rate of return and negatively related to the risk associated with
acquiring the financial asset. (This model will be discussed in more
detail in the section covering spreads on syndicated loans.) In
particular, the greater the risk attached to such an investment, the
greater must be the rate of return required by the investor.
The utility of issuing liabilities can also be considered in terms
of a two-parameter utility function. The variance of the probability

138
distribution is related to the market prices of the financial liability.
However, for a fixed interest liability, the borrower is not concerned
with this variance as he is certain as to coupon payments and repayment
of principal. In such a case the utility function has only one
parameter, ie the yield or coupon payable.
In the case of floating rate liabilities, such as floating rate
notes and the majority of bank loans, the appropriate utility function
will have two parameters because of the risk of fluctuations in the
coupon costs.
Although an investor will be able to reduce the risk for a given
income by diversifying the portfolio of assets, the ability to diversify
liabilities is limited because of the lumpiness of the costs of issuing
liabilities and because the financial risk of the issuer stays the same.
Nevertheless, if the utility of assets is greater than that of issuing
liabilities, the economic unit can maximise its utility by increasing
its liabilities and acquiring assets.
The equating of marginal utilities between assets and liabilities
by equating the rate of time preference with the marginal efficiency of
capital will not be possible once we relax the assumption of perfect
credit markets.Of the many imperfections actually found in credit markets, those
that segment markets are particularly important to this study. Perceived
differences due to different currencies of denomination or regulatory
differences mean that the real rate of interest may differ between
markets which are thus segmented. Nevertheless, conceptually at least, a
real rate of interest can be calculated for each credit market. However,
this real rate is not observed in credit markets because in reality
these markets are not riskless.
4.2.1 Inflation
The one risk which will influence all investors in all credit
markets denominated in a particular currency is the risk of loss of

purchasing power of capital resulting from inflation. It does not matter
whether one hypothesises that expectations are developed rationally or
adaptively; provided investors perceive the risk of inflation, they will
require to be compensated for bearing that risk.
The inflation rate that is important in this study is the rate
applicable to the currency in which a eurocurrency loan or eurobond issue is denominated.
The following chart, supplied by Bankers Trust Company, London,
shows the close correlation between eurodollar interest rates and the US inflation rate.
S!r rpCSation end Eurodollar Interest Rates3 M o n th E u ro d o lla r D ep o s its
US C o n s u m e r P r ic e s (y e a r -o n -y e a r c h a n g e )25
20
15
10
1 97 3 1 9 7 4 1 9 7 5 1 9 7 6 1 9 7 7 1 9 7 8 1 9 7 9 1 9 8 0 1981
Figure 4.1 Relationship between US inflation rates and eurodollar interest rates

* 4 U
This chart also shows the influence of domestic monetary policy
upon interest rates. The use of monetary policy to directly influence
inflation or the exchange rate can cause interest rates to deviate from
their relationship with the rate of inflation.
The upwards movements of the interest rate at the end of 1978 and
again in the autumn of 1979 are good examples of the influence of
monetary policy. The first was a package to support the US dollar, and
the second followed a general tightening of monetary policy following
the appointment of Volcker as chairman of the Federal Reserve Board in
July 1979.
Clearly the information provided in this diagram would support the
suggestion that investors demand higher interest rates as inflation
rises and that in such circumstances borrowers are willing to concede
higher rates.
4.2.2 The Influence of the Currency of Denomination
It is to be expected that in any two markets whose goods are close
substitutes for each other, the absence of market imperfections will
ensure that arbitrage will keep the price of each good close to that of
the other. Such is the situation between the domestic markets and the
euromarkets for assets and liabilities denominated in the same currency.
In effect the euromarkets are extensions of the similar domestic markets,
the rates in the two markets being influenced by the activities of
arbitragers and the market imperfections that impede arbitrage.
Thus, the rate of interest on bank loans or bonds to the same
borrower in the same currency and with the same maturity etc, but
differing only by being in the domestic market or the euromarket, will
be the same unless arbitrage is inhibited by market imperfections. Thus,
eurodollar rates are likely to be the same as domestic dollar rates in
the absence of market imperfections and eurosterling rates will be close

to domestic sterling rates in similar circumstances.
Furthermore, it is to be expected that the currency structure of
euromarket interest rates will reflect differences in the cost of
obviating foreign exchange risk through the forward exchange market as
hypothesised by the Interest Parity Theorem. Therefore, to the extent
that forward exchange rates reflect expectations of exchange rate
changes, the currency structure of euromarket interest rates will
reflect those expectations.
However, in discussing the influence of currency on the level of
euromarket interest rates, we must concentrate on one currency at a time
and concern ourselves with the level of interest rates on assets and
liabilities denominated in that currency. As such, we are not concerned,
in this section, with the currency structure of interest rates and the
interest, parity theorem. VJe are, instead, concerned with domestic and
euro interest rates in the same currency and the market imperfections
between these two sectors of the market.
4.2.3 The Relationship between Euro Interest Rates and Domestic Money Market Interest Rates
There is already a considerable literature on this topic including
Aliber (1978), Clendenning (1970), Dufey and Giddy (1978), Johnston (1979) and
Lutz (1974) .
The currency backing of a eurocurrency market is held with banks in
the national money market of the currency concerned. Accordingly, if
there were no impediments to the international movement of funds and if
the assets and liabilities of the eurocurrency market were similar in
nature to those in the national money market, depositors and borrowers
would be indifferent between the two markets and interest rates would be
the same in each due to the activities of arbitragers. Differences could
be due to:-
1) Differences in the liquidity of each market as represented
by the size of each market.

2) Differences in jurisdictional risk.
3) Controls on the international flows of
financial capital.
4) Differing degrees of market imperfections
in each market.
Liquidity
Liquidity in this context is related to market size because market
size influences the marketability of the securities in question. Table
4.1 compares the gross size of the eurodollar market with the total of
bank deposit liabilities in the USA. It can be seen from the size and
rate of growth of the eurodollar market that liquidity is unlikely to be
an important influence upon differences in interest rates.
Table 4.1 Size of US $ domestic and eurobank deposit markets
Time & demands. deps Gross size of euromarket „
1974
1975
1975
1977
1978
all US banks'
747.9
786.3
838.2
939.4
956.0
Morgan Guarantee estimate
395
485
595
740
950
Sources 1. Federal Reserve Bulletin, various issues Table A16 All Commercial BanksLast Wednesday of month series
2. Morgan Guarantee Trust 'World Financial Markets'
The Impact of Jurisdictional (Political) Risk
Jurisdictional risk is the non-zero probability that restrictions or
controls in a sovereign area will frustrate the completion of a financial
transaction.
A transaction in an international money market is subject
to at least two sovereign powers. There is, therefore, additional
jurisdictional risk associated with euromarket transactions because a
second authority can frustrate the transaction. In particular, in the
eurodeposit market the risk is that exchange controls will be introduced
removing non-resident convertability in the jurisdiction where payment
is to be made. Secondly, a eurobank's assets may be seized for political
reasons and thirdly there are no lender of last resort facilities in the
euromarkets. In the euroloan market there is the risk that the currency
in which the loan is denominated may become politically unacceptable as
a means of payment.
The concern over the imposition of non-resident convertability may
be exaggerated. A country that imposed such controls would adversely
affect its international credit rating. Further, financial markets get
ample warning of such dramatic action because it is usually preceded by
controls on residents' international transactions, imports and capital
flows (Dufey & Giddy 1978, pi87).
It is unlikely that a government will be able to take over the
assets of a eurobank because a eurobank will operate in several
financial centres. The repayments of loans and payments of interest
could be redirected to a branch that is not subject to the controls.
The concern for depositors' safety may be unfounded because,
although there is no official lender of last resort to the euromarkets,
bank head offices would have to support their eurobranches if they want
to maintain confidence in their domestic banking business.
A further point which reduces the expected incidence of
jurisdictional risk from this factor is that the Bank of England has
'.... intimated on various occasions that it would, in a crisis
situation, bale out an individual bank in difficulties rather than
expose the standing and integrity of the City as a whole to doubt',
(Shaw 1978, pl24).
This writer therefore considers that additional jurisdictional risk

is an insignificant influence upon the differences between euromarket
and domestic market interest rates.

Controls on the Movement of Capital
Capital controls tend to have one of two aims, either to restrict
the flow of financial capital from national financial markets to
foreign, including euro, financial markets or to restrict the inflow of
financial capital from abroad. The USA instituted the former type of
control from 1965 to 1974. Germany and Switzerland, on the other hand,
have experimented with the second type of control.
Capital controls have the effect of segregating the national money
market from the euromarket. Therefore, the interest rates prevailing in
the two markets will be to some degree independent of each other. In
particular, the activities of arbitragers will be restricted and their
equilibrating influence on the markets will be lost.
If the controls aim at stopping funds leaving the national money
market then, ceteris paribus, interest rates in the national market will
fall and rates in the euromarket will rise. Conversely, if the controls
aim at restricting the inflow of funds to the national money market,
ceteris paribus, the rates in the euromarket will fall while rates in
the domestic market will rise.
Table 4.2 shows the differences between New York loan rates and
eurodollar loan rates for two periods, January 1972-December 1973 and
January 1977-December 1978. Capital controls were in existence limiting
flows of funds from the national to the euromarket during the first
period but not for the second period.
When considering interest rates, it is the effective rate and not
the nominal rate that is important.
The New York loan rate has been adjusted to take account of the
fact that it is custom for borrowers to have to maintain part of the
loan proceeds in a compensating current account balance which does not
earn interest. The amount of compensating balances held is assumed to be
15% of the loan proceeds (Dufey & Giddy 1978, p51).
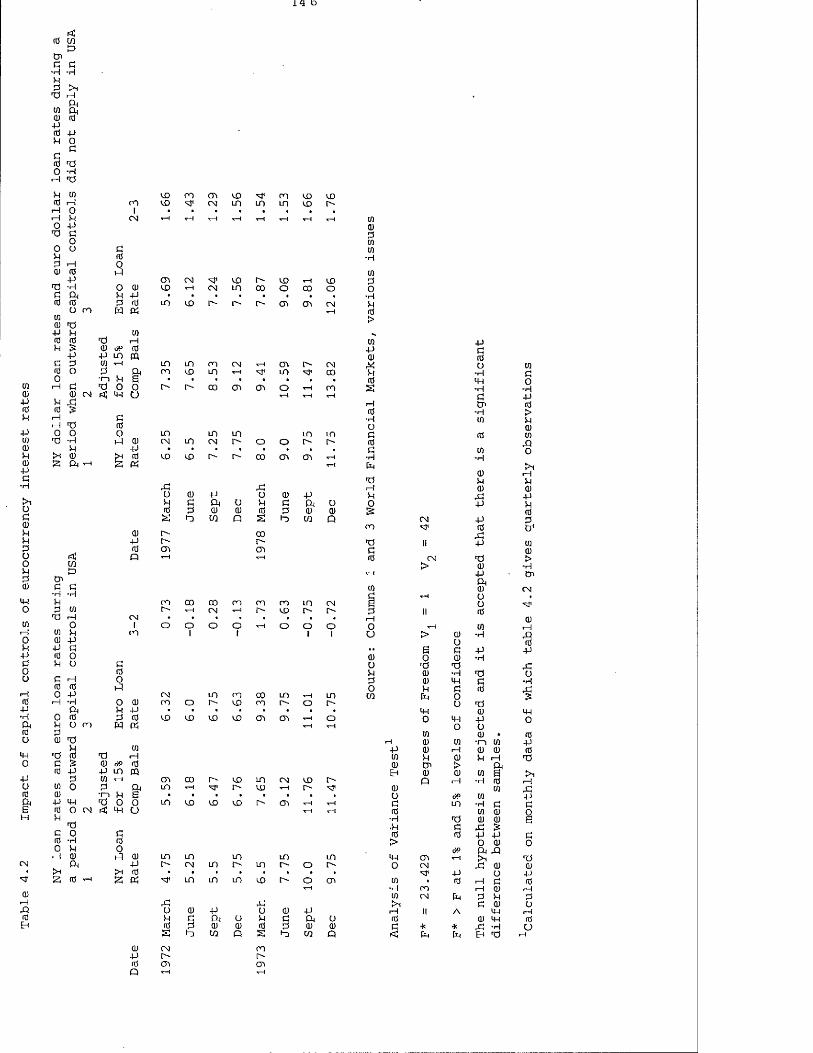
Table
4.2
Impact
of capital
controls of
eurocurrency
interest
rate
s<
rtf coto
tnb d
*h ■Hpp > i
P rHft
01 P i01 rtfprtf PP O
ddrtf p0 ■HrH P
p 01 CDrtf tH m CD
i—! O l •i—1 P CM *H0 P
P d0
0 u dp rtfp H O(1) rtf P
P cnp •H O 01 cob f t P Prtf rtf P rtf LOO co f t ftU101 PP P 01rtf rtf p i—1P £ 0) c)P rtf
P p LO mc P 01 ■«—1 inrtf O p ft mO - n P a •
1—1 b P o 0 to01 CM p o
P prtf £
H di- \ p rtfO 0 o LDP •H ft 01 CMp p •tor 0) tor rtf CDS f t t—t S ft
opS
01 toP toP cnri] Q T—HCOP>tnd d•h •Hp cOp 01 r-p i— i CM .0 1 o01 p cn01pp b
rtf 0P o drtfd h Ortf rtf ft
O P CMI—1■p o 01 coft p P •0 rtf p rtf CDpr-< O co w ftr->01 PP 01P rtf P Hd £ 01 o\° Prtf P P LO ftP 01 T1 cn01 O p ft LO01 t o p e •p ft P o o cnrtfii O CM f t ft uM Pd O drtf ■P rtfO Oi—i 01 ft 01 LO
ft p totor p •
s p .—i K ft sr
puPrtf5
CL) CMP tortf mQ H
n cn CO 'CfCM m n
r-l x-H T—( T-l
CM CO to-*—I CM in 00CD r- to to-
LO CO CM *—\CD LO .-r* • • *to 00 cn cn
LO LOLO CM r- oCD r~- to CO
P0 P od ft o pP 0 0 PP C/3 o a
COtocn1
CO CD co con—i CM T—1 to-oi
O ot rH
in cn coo to CD cn
CD co CO cn
00 t o CD LOtH to- CO« * » •CD CD CD to
LD LOCM in to- in« * » •LD in in CD
ft0 P Od ft D Pp 0 0 Pp CO Q a
c otocn.—i
14 to
m CO CDin CO tot-H tH rH 0
0dcn0-H0
CD »—i CD PO 00 o 0* • • -Pcn cn CM Pv-l P>
COPQ)cn to CMm CO
o co*-i rH rH rH
rtf-HOLO ino to to
cn rn t-HtH
*d0 Pd ft OP 0 0P C/3 P co
Pbrtf
01cn in CMCD to- to-o CO CD
I I U
0)opdoLO rH in COto o to-
rn t-H COH T-I
iHpw0EhCM CD to
x—I to 0• » • Om rH tH d*H r—I p
■H.PPt>
m LO ftto o to 0to o rn 0
rH0toi0 P rH
d ft o PP 0 0 dP CO P
pbrtfU 0
•H dp 0*H -Hd Ptn P
-H >0 P
0p 0
P0 o
-H
0 1—1P p0 0
P i pP p
pCM P p
P d 1P
II P 00
CM mJ >> 0 “rH
p tnft0 CM
rH o ■o ■sa1II p
0rH 0 t—i
> 0 -H PU PS d P P0 0 •H
T3 TS P0 ■H rd u0 P d -HP d p Pf t o &
u •dP 0 P0 p P Oo o0 0 • P0 0 *r~i 0 P0 rH 0 0 PP 0 P i—1 TOtn > Qr0 0 0 a > iP i—1 •H p P
0 Po\° 0 PLO -H d d
0 0 o*d 0 0 ad P Sp P p d
O 0 0O'P ft Pcn T-l tH 'dCM P 0 0'd’ p o p
• p 1--1 d pCO 1-1 0 HCM f t P p d
d 0 oII A p pH
0 p p■ic * p •H of t ft Eh TJ H

There is a break in the data for the years 1974 and 1975. This is
because a crisis of confidence occurred in the euromarkets following the
failure of the Cologne-based bank, I D Herstatt, on 26 June 1974. Such a
crisis would have influenced the differential between national and
euromarket rates. Accordingly, data covering this period has been
omitted from our analyis of the impact of capital controls.
The figures in table 4. 2 show that the differences between the New
York dollar and eurodollar loan rates were smaller in the former period
when capital controls were in operation than in the latter when they
were not. Indeed, during the first period eurodollar loan rates often
exceeded New York rates. The statistical significance of the differences
in interest rates is confirmed by the analysis of variance test also
reported in table 4.2. We may therefore conclude that controls on the
international movement of financial capital will influence eurocurrency
interest rates.

Market Imperfections
Money markets display market imperfections due to:-
1) Regulatory constraints such as interest ceilings, taxes
and reserve requirements.
2) Institutional factors such as credit rationing, lack of
cash transmission mechanism, economies of scale in
transactions.
3) Oligopolistic market structure due to barriers to entry.
4) Imperfect knowledge on the part of the operatives in the
market.
To the extent that eurocurrency markets have fewer market
imperfections than domestic money markets of the same currency, we would
expect to see eurodeposit rates higher and euroloan rates lower than
their domestic equivalents.
In particular, the reserve requirements imposed upon domestic
banking but non existent in eurobanking restrict the profitability of
domestic business. Accordingly, eurobanks can offer higher deposit rates
and lower loan rates while maintaining their level of profitability.
The lack of cartelisation will allow eurobanks to be more
competitive. In order that they compete with domestic banks, they must
offer higher deposit rates and lower loan rates on similar transactions.
The existence of credit rationing systems in domestic banking
rather than price adjustment, as is prevalent in euromarkets, will lead
to differences in interest rates between the markets.
There are unlikely to be differences in interest rates between
markets due to differing degrees of knowledge because the major
operatives in each market are the same viz the banks and large
corporations.
There are economies of scale in the eurobanking due to the fact
that the average size of transactions is greater in the eurocurrency
market than in the domestic banking market. The impact of economies of

Table
4.3
Impact
of selected
market
imperfections
upon
the
relationship
between
US
domestic
and
eurodollar
interest
rate
s
149
o LO r- 00 00O' LO CN ro o CN roo a—{ .—| O o O OLD • • • • a ■1 o o o o o o O1C" 1 1 1 1 1 +
CN CO CO LD LO r~ o o00 LD 00 LD LO r- S'- LOO O o O O yH o «—1O O o O o o o o1 + + 1 + 1 1 1
p ■Htno O 0)4 ft P P d ) (dr- w Q «
o LOLO o I-'LO LD LO
cn LOr- r-coLO LQ LO LD r-
oto cn cn o o LOLO LD LO LO r~00 cn *~H
*—1 oytH 10
. CNa-l
K PLD rf o3 K
P OK ro
prtSo►40)
LO ro 00 O cn CN LO f" LD T-l LD f" I''' CNO CN LD CO LO LD tH CN LO CO o 00 o 00 00 r H4 p • • • • * • . . ■ • 4
ro PW PPi
LD LD LD LO LO LD r- r- r- cn cn CNI—1 oa-t or H
cnr H
ms(U o'? P LO tn an P■n pms o<3 m
pPQ§■ou
0) P >h P S Pi
o LO CO 00 CD o CN CN CN LD p o oLO CN CO cn ro r-' CO o O co r- O' y—1LO rH LO o Y-I r- . cn CN Nt* LD to LO LD to cnLO LO LO LO LO LO LD r- r-~ CO cn yH o o CNy—1 rH T-H rH
o LO LO o LO LO LO LO LO o O oCN I> CN O' 00 ro P1 00 cn O cn cn o cn r—1LO LO LO ■N1 LO LD LD LD 00 CO o o cn CN
P cn o LD LD LD CO cn LD P 1 CO LO LD LO LD LOP ro LD cn LO LO LD P* ro LO LO IO LD r-' cn LD■H 1 * » a a a a a a a a .P CN r H a—i a-J a-H a—1 a—J a—1 a—1 a-H a-H r H rH CN CN CN
cn roLO cn LDo LOro LOLD
roLO00
00rHcn cn
LO LO LO LO LO LO LO LO LO or~- CN O' O CN LO CN P" O O p' P' Pa LOLD f-' LD LD LD LO P' P' CO Cn cn <rH Y-1 rH
oLO
>i-Qmsosnto-Hr—Ib>Pfatop0).MMPSP p■HOpmp•Hfamsftuo& p p ftS B O Ou up
cn CN CN ro COLO CD CO to CO ■w• ■ • * a a roo rH ro ro ro LOY-1 y— I r—1 tH a—I a— 1 a.
mt p P H (t< Q)LO P p P P P P P
IDP P tn po g
,puPPg0) pp ft Up CD Pt) CD Q
opPg
A AP p u P P U P pP ft U p P ft O P P ftP p P rtS P P P P P pto CD o g CD O g to CDLOr-~cn
r-r~-cn
oor~-cncncn
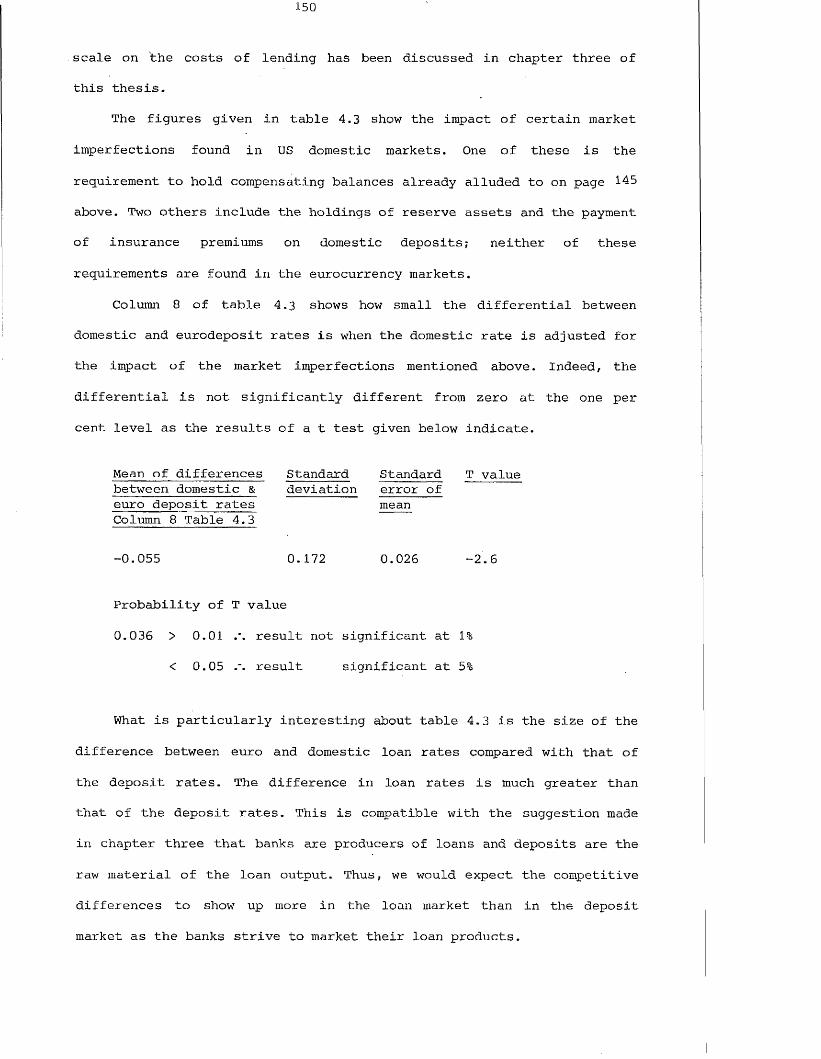
scale on the costs of lending has been discussed in chapter three of
this thesis.
The figures given in table 4.3 show the impact of certain market
imperfections found in US domestic markets. One of these is the
requirement to hold compensating balances already alluded to on page 145
above. Two others include the holdings of reserve assets and the payment
of insurance premiums on domestic deposits; neither of these
requirements are found in the eurocurrency markets.
Column 8 of table 4.3 shows how small the differential between
domestic and eurodeposit rates is when the domestic rate is adjusted for
the impact of the market imperfections mentioned above. Indeed, the
differential is not significantly different from zero at the one per
cent level as the results of a t test given below indicate.
Mean of differences Standard Standard T valuebetween domestic & deviation error ofeuro deposit rates meanColumn 8 Table 4.3
-0.055 0.172 0.026 -2.6
Probability of T value
0.036 > 0.01 result not significant at 1%
< 0.05 result significant at 5%
What is particularly interesting about table 4.3 is the size of the
difference between euro and domestic loan rates compared with that of
the deposit rates. The difference in loan rates is much greater than
that of the deposit rates. This is compatible with the suggestion made
in chapter three that banks are producers of loans and deposits are the
raw material of the loan output. Thus, we would expect the competitive
differences to show up more in the loan market than in the deposit
market as the banks strive to market their loan products.
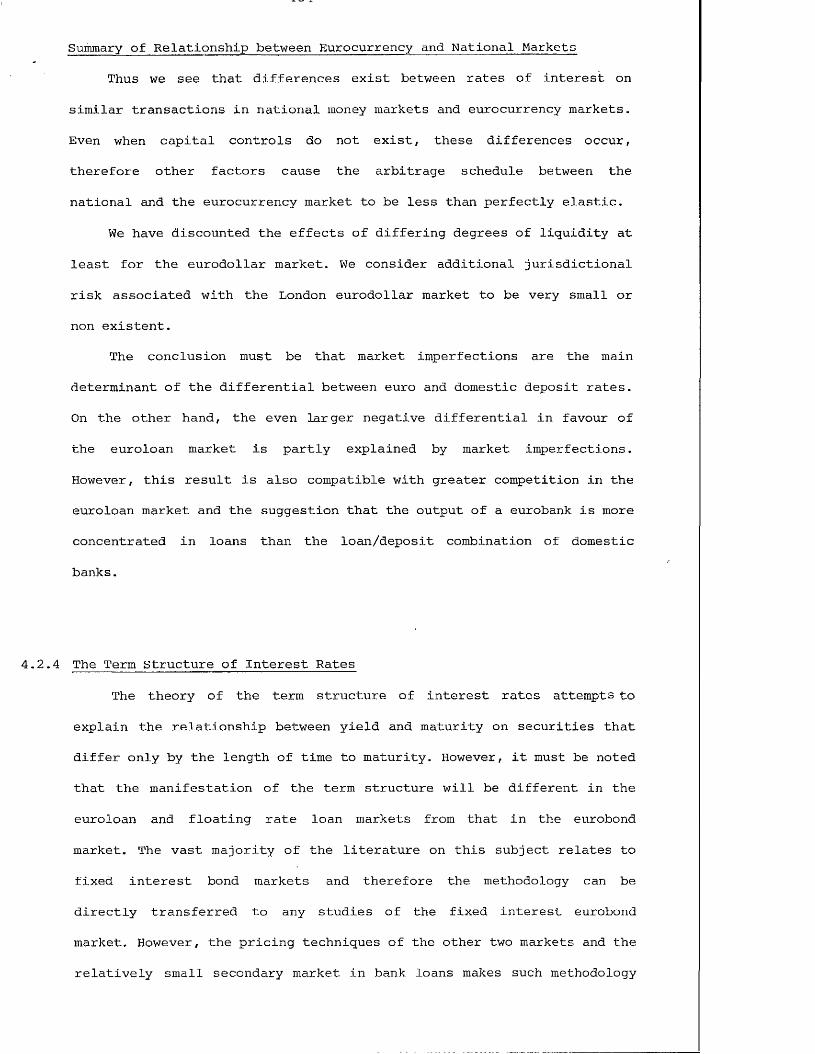
Summary of Relationship between Eurocurrency and National Markets
Thus we see that differences exist between rates of interest on
similar transactions in national money markets and eurocurrency markets.
Even when capital controls do not exist, these differences occur,
therefore other factors cause the arbitrage schedule between the
national and the eurocurrency market to be less than perfectly elastic.
We have discounted the effects of differing degrees of liquidity at
least for the eurodollar market. We consider additional jurisdictional
risk associated with the London eurodollar market to be very small or
non existent.
The conclusion must be that market imperfections are the main
determinant of the differential between euro and domestic deposit rates.
On the other hand, the even larger negative differential in favour of
the euroloan market is partly explained by market imperfections.
However, this result is also compatible with greater competition in the
euroloan market and the suggestion that the output of a eurobank is more
concentrated in loans than the loan/deposit combination of domestic
banks.
4.2.4 The Term Structure of Interest Rates
The theory of the term structure of interest rates attempts to
explain the relationship between yield and maturity on securities that
differ only by the length of time to maturity. However, it must be noted
that the manifestation of the term structure will be different in the
euroloan and floating rate loan markets from that in the eurobond
market. The vast majority of the literature on this subject relates to
fixed interest bond markets and therefore the methodology can be
directly transferred to any studies of the fixed interest eurobond
market. However, the pricing techniques of the other two markets and the
relatively small secondary market in bank loans makes such methodology

inappropriate in studies of these markets.
Pricing of eurocurrency syndicated loans and floating rate notes
consists of a reference rate eg LIBOR to which is added a spread or margin
and fees. Thus, the term structure of this interest rate related price
depends upon the term structure of the reference rate and the term
structure of the spread.
Moreover, the term structure of the interbank rate will, through
arbitrage, be strongly influenced by the term structure in the domestic
interbank market of the same currency. Comments by bankers to the writer
suggest that the term structure of the spread manifests default risk and
not expectations of interest rate changes, Hicksian liquidity premiums,
etc.
Indeed, for many loans the spread is not altered during the life of
the loan. For others there is a contractual agreement to raise the spread
during the later years of a loan's life. Even then the spread is usually
only altered once or twice. Discussions with lending bankers suggest that
this is to compensate for the bankers' greater uncertainty due to the loan
being outstanding for a longer period.
The floating rate nature of most bank loans and of floating rate
notes will preclude a term structure in these markets exhibiting Hicksian
liquidity premium ie compensation for declining secondary market prices
due to rising interest rates. Such a premium is also absent from the
interbank market where there is no secondary market in deposits because,
by definition, there can be no fall in the secondary market value. This
point is discussed in more detail on page 160 below.
Because the term structure does not apply uniquely to the
euromarkets, it is not intended to test the applicability of any term
structure hypothesis to any particular market. Instead, the competing
hypotheses will be set out and a short descriptive review of the
literature covering the empirical studies to date will be made. It should
be noted at the outset that there is still considerable conflict as to which hypothesis or combination of hypotheses have most explana

tory power. There are also considerable differences of opinion as to the
most appropriate methodology to be used and to the validity of the
empirical results obtained.
There are four main hypotheses of the term structure of interest
rates. They are;-
1) The pure expectations hypothesis
2) The expectations hypothesis augmented by a liquidity premium
3) The hedging or market segmentation hypothesis
4) The preferred habitat hypothesis
Each hypothesis will now be set out individually.
The Pure Expectations Hypothesis
This theory suggests that investors hold confident expectations of
future interest rates. Long rates are modified geometric averages of
current and expected future short rates. Thus, if investors expect short
rates to rise in the future, long rates will be above short rates. The
investor has three alternatives; one is to invest in an instrument with
a maturity equal to his anticipated holding period. Secondly, he may
invest in a shorter term security and reinvest the proceeds. Thirdly, he
may invest in a longer term security, seli at the end of the holding
period and incur a capital gain or loss.
The pure expectations hypothesis postulates that the expected
return to the investor will be the same for each alternative form of
investment. If long rates were, say, below expected future short rates,
investors would sell long securities, driving down their price and
therefore raising their yield. They would also buy short securities,
raising their price and driving down their yield. If there is a
sufficiently large body of investors acting in accordance with their
confidently held expectations, their expectations will be fulfilled.
Given the expected similarity of outcomes for investing in various

maturities, securities of differing maturities become perfect
substitutes for one another. Therefore one ten year loan is similar to
ten one year loans.
According to this hypothesis, a positively sloped yield curve
implies that investors expect short term yields to rise in the future,
while a negatively sloped yield curve implies that expected short rates
will fall. This theory was first articulated by Fisher (1896). It was
refined by Lutz (1940) and Hicks (1946).
The Liquidity Premium Hypothesis
This hypothesis differs from the pure expectations hypothesis in
that it assumes that markets are dominated by risk averse investors. The
risk to which they are assumed to be averse is loss of capital due to
fluctuating secondary market values of investments with maturities
longer than the anticipated holding period. The return on holding a one
period bond for one period is certain, but holding a longer maturity
bond for that period will be uncertain as to outcome due to uncertainty
of secondary market value at the end of the holding period. This
uncertainty stems directly from uncertainty regarding future interest
rates.
Thus, while accepting that long rates are influenced by
expectations of future short rates, investors require a premium above
the geometric mean of expected future short rates to compensate for the
risk of capital loss. Because changes in. interest rates have a greater
effect on the secondary market value of bonds the longer the maturity of
those bonds, it is to be expected that the premium will be larger the
longer the period to maturity. This theory was first put forward by
Hicks (1946).
Extending Keynes' work on regressive expectations of bond holders
in the speculative demand for money theory (Keynes 1936), it would be
expected that the risk of adverse movements in secondary market prices

would depend upon the level of interest rates. If rates were low
compared with historical experience (relative to the normal rate),
investors would expect rates to rise, thus causing falls in secondary
market prices. A larger risk premium would be required than when, say,
interest rates were higher and not expected to rise much further. If
rates were high by historical standards, they may be expected to fall,
secondary market prices will be expected to rise and there may even be a
negative risk premium.
Clearly then, at least on theoretical grounds, the liquidity
premium could be expected to vary with the level of interest rates.
The Market Segmentation Hypothesis
This hypothesis also assumes that investors are risk averse and
avoid risk by hedging, that is matching their assets with liabilities of
equal maturity. Therefore, both lenders and borrowers have definite
preferences for assets or liabilities of specific maturities. These
preferences may be induced by institutional or regulatory constraints
but the result is that each maturity can be treated as a separate
market. The yield on securities of any particular maturity is dependent
upon the separate supply and demand functions for those particular
securities. The desire to avoid risk, together with institutional or
regulatory constraints precludes borrowers and lenders shifting from one
maturity habitat to another unless, presumably, the differentials
(benefits) from so doing are extremely large. Thus, a premium has to be
paid to induce an investor to change habitat but this premium does not
have to be only at the long end.
This hypothesis assumes investors to be averse to two types of
risk. Firstly, there is the risk of fluctuating secondary market values
due to fluctuations in future interest rates, as covered by the Hicksian
liquidity premium model. However, there is also income risk. This is
where there is a risk of loss of income due to interest rates falling

during the holding period of, say, a liability which is used to fund an
asset of shorter maturity. Upon reinvestment of the asset's sales
proceeds a lower rate of interest will be earned. This may fall below
the rate payable on the liability, and thus a loss ensues. Financial
intermediaries are clearly open to this risk.
It has been suggested that the wish to avoid these risks is so
great as to preclude the influence of expectations on the term structure
(Culbertson 1957).
However, Meiselman (1961) has pointed out that, even if
institutional preferences are very strong, there are many parts of the
term structure which are overlapped by different types of institutions,
thereby providing continuity in the yield curve.
Further, provided that there are sufficient "floating investors"
which are free to move between maturities, expectations will influence
the term structure.
The Preferred Habitat Hypothesis
This hypothesis, which was originally suggested by Modigliani and
Sutch (1966), is an amalgam of the previous three theories. It accepts
the basic idea that the term structure is influenced by expectations
augmented by a risk premium of the Hicksian type However, they note that
the Hicksian liquidity premium assumes that all investors wish to
convert their portfolio into cash at the end of the short period, ie
that the investor has a short habitat (pi83).
To overcome this weakness, they draw upon the segmentation model
and suggest that different transactors will prefer different habitats.
The preference for habitats is because investors are assumed to be
averse to the risks of loss of income and loss of capital as discussed
above. That being so, Modigliani and Sutch note that the combined
influence of the compensation for the two risks could result in either
positive or negative "risk premiums" depending on the supply and demand

for securities in each habitat.
The role of arbitrage and speculation as well as transactions costs
is also recognised in this model. As differences between supply and
demand in each habitat change the relative yield in each habitat,
speculators may be encouraged to take the risk of moving out of their
preferred habitat. Also arbitragers, by borrowing in one habitat and
lending in another, will encourage equality of yields between habitats.
Lastly the transactions costs are less if investments are repaid at the
end of the desired holding period than if securities have to be sold
during or at the end of that period.
Thus, this theory postulates that the term structure of interest
rates will differ from that suggested by the pure expectations theory by
the amount of discount or premium caused by the interaction of supply
and demand in each preferred habitat. However, the size of this discount
or premium will be mitigated by speculative and arbitrage activity
between habitats and comparative transactions costs.
Empirical Investigation of the Term Structure
For a body of literature dating back to at least 1896, eg Fisher op
cit, the empirical studies of the term structure of interest rates must
be noted for the continuing if not increasing controversy regarding the
factors that determine the term structure.
Prior to the work of Meiselman (1961) there had been two approaches
to the testing of the expectations theory. One method characterised by
Woodward, cited in Hickman (1943), used questionnaires directed at
market experts to determine their expectations of future short rates and
compared these expectations with the current yield curve.
An alternative approach was to use the perfect foresight method.
Macaulay (1938) used this technique in which he substitutes the actually
prevailing rate in period t + n for the expected short rate in t
applicable n periods later. If the long rate is a geometric mean of the
current and correctly expected future short rates, then the expectations
hypothesis is substantiated.
However, Macaulay concluded that the results of his study did not
support the expectations hypothesis. Later work by Hickman (1943) and
Culbertson (1957) supported Macaulay's results.
These studies suffered one common weakness. That was that they
provided no rigorous theory of how expectations were formed. Meiselman,
op cit, rectifies this weakness by postulating that expectations are
formed by continuously changing current expectations in the light of the
forecasting error of previous expectations - an error learning model.
Meiselman interpreted his econometric results as supporting the
expectations model augmented by an error learning model. However, the
explanatory power of this model declines as maturity increases. Thus,
investors have more confident expectations of the near future than the
more distant future, and therefore near future expectations are acted
upon more definitely than more distant ones. As more distant
expectations are held with less confidence, they have a lower weighting
in the error learning process and this is consistent with the long rates
being a geometric mean of expected short rates.
Meiselman also spends considerable time testing the Hicksian
liquidity premium model and market segmentation hypothesis.
A distinction is made between the risk indifferent pure
expectations model on the basis of the constant term. A positive
constant term implies a liquidity premium. However, Meiselman found the
constant term to be equal to zero and thus he rejects the Hicksian
liquidity premium model. Wood (1963), on the other hand, shows that a
zero constant is compatible with the existence of liquidity premia
".... A constant term equal to zero, although necessary to the
expectations hypothesis under Meiselman1s assumptions, is also
consistent with the liquidity premium theory under the same
assumptions", (pi66).

Meiselman tests for the market segmentation model by investigating
the influence upon the term structure of changes in the maturity
structure of outstanding debt. He found little association between these
two variables and therefore refutes the market segmentation hypothesis.
Wood (op cit) has criticised these tests on the basis that the
supply and demand for securities of different maturities will be
dependent upon, among other things, the relationship between relative
prices and therefore yields.
Meiselman* s work has also been criticised because of the nature of
the data used. The data was in fact hand fitted yield curves derived
from Durand (1942 and 1958). Grant (1964) criticised Meiselman's
results, contending that the Durand data was constructed in such a
manner as to favour Meiselman’s results. Buse (1967) reinforces this
point by showing that similar results can be obtained by using the data
in reversed, or random, order. 1965 saw a paper by Van Horne supporting
Meiselman's results, but this in turn was criticised by Santomero (1975)
for having the same sort of data weaknesses as Meiselman's original
work.
Santomero, op cit, overcame the data weaknesses suggested above by
using the yield curve associated with eurocurrency deposits. The
advantages of this type of data are their homogeneity, their continuity,
and the absence of the need to interpolate for missing data sets.
Furthermore, this study is applying an error learning model in a
relatively new market. It was considered that his results supported
Meiselman's hypothesis.
Santomero also tested for the existence of liquidity premiums
following the methodology of Cagan (1969). According to Cagan, if the
pure expectations hypothesis holds, the return on a one period issue
should equal the return on holding a longer maturity issue and selling
at the end of one period at the market price. The difference between the
one period realised return on longer maturities and the explicit one
period return on one period securities indicates the size of the
liquidity premium associated with longer maturities.
To test for liquidity premiums in this way in the eurocurrency
deposit market for non negotiable deposits is invalid. The Hicksian
liquidity premium assumes that investors are averse to the risk of loss
of capital due to fluctuating secondary market prices due to
unanticipated fluctuations in future interest rates. In the eurocurrency
market for non negotiable deposits, such a risk does not occur because
the deposit is always repaid at par. There may in fact be an income risk
as premature withdrawal may result in forfeiture of accrued interest. It
should be noted that Santomero's results would only be valid provided
the data related exclusively to marketable negotiable certificates of
deposit which can be subject to fluctuations in secondary market prices.
Santomero considers that his results support the expectations
hypothesis, albeit with risk premiums, but that the coefficients of
determination are smaller than in previous studies. He suggests that
fluctuations in exchange rates may be one reason for this.
In fact, one should go much further. The eurocurrency deposit for
most holders is a foreign currency asset (81% according to Johnston
1982). Thus, the expected yield on a foreign currency investment must
either include the cost of avoiding exchange risk, ie forward market
hedging, or it must take into account both expectations of future
interest rates and expectations of future exchange rates. Thus, the term
structure of yields on eurocurrency deposits should take account of the
term structure of exchange rate expectations as developed by Porter
(1971), and of the term structure of the costs of forward cover, this
latter because transactions costs change with maturity in the forward
exchange market.
At the same time as the work of Santomero was published, Cargil
(1975) published the results of his study into the pure expectations
theory within the context of an efficient markets model. He concluded

that the results reject the expectations hypothesis - at least for the
British bond market. However, it should be noted that he used data
supplied by Grant (1964) and Fisher (1966) and that these two studies
disagreed between themselves in their support for Meiselman's results.
Turning now to the studies of the preferred habitat hypothesis,
Modigliani and Sutch developed their theory in order to evaluate the US
financial policy introduced in 1961 known as Operation Twist whereby the
government tried to reduce long rates by selling long maturities and
raising short rates. The high short rates were aimed at attracting short
term international capital while low long rates were aimed at
encouraging domestic investment. The results, of this study which are
relevant to the analysis of the term structure are that expectations
have an important influence but that neither the maturity structure nor
changes in that structure exert a significant lasting or transient
influence on the relation between the long and the short rates.
Modigliani and Sutch also consider that long rates involve a
blending of one, extrapolated expectations of very recent changes in
short rates, and two, regressive expectations towards a long term normal
rate. This follows a combination of the work by Duesenberry (1958) and
de Leeuw in Duesenberry et al (1965) . The Alman lag structure
constrained to sixteen quarters was also considered significant in their
results. The significance of this lag structure was criticised by
Hamburger (1971) and in fact modified by Modigliani and Sutch in their
1969 paper.
Karakitsos (1977) considers that "..... the results for both the US
and UK indicate that no one has yet succeeded in developing a reliable
statistical model relating past interest rates to expected future
rates", (pl41). He then proceeds to develop a model confirming the
interaction of regressive and extrapolatory expectations. He notes that
the peak impact of expectations in the UK market is four months and
thereafter regresses rapidly to- the long run historical expectation in
something less than three months (pi49).
His study therefore supports the preferred habitat hypothesis and
the role of expectations.
During the late 1960's a body of literature developed which ran
counter to that emphasising the role of expectations in determining the
term structure. This literature postulated that capital markets were
efficient and that interest rates follow a random walk. That is that
movements of interest rates in a current period are independent of
movements in previous periods (Granger & Rees 1968, Roll 1970, Bierwag &
Grove 1971, Pippenger 1974). If it is true that interest rates follow
this random walk, long rates will not be dependent upon a distributed
lag of expected short rate as suggested by Modigliani and Sutch, op cit,
and other literature cited above.
Phillips and Pippenger (1976) develop a simplified efficient
markets model to compare with the preferred habitat hypothesis. They
found that the long rate was equally well explained in their model by
the long rate lagged one quarter and the current change in the short
rate. This supports the notion of market efficiency and contradicts the
distributed lag model of the influence of expectations. They also
suggest that the shape of the lag structure found by Modigliani and
Sutch results from using a low degree Alman polynomial rather than the
result of extrapolative and regressive expectations (pi7).
A paper by Fildes & Fitzgerald (1980) develops a model of
expectations formation and liquidity premium with which to test the
efficiency of thet London Interbank market. The model for the liquidity
premium follows the arguments of Hamburger & Platt (1975), Nelson
(1972), and Kessel (1965). They conclude that their results give strong
support for the suggestion that rates follow a random walk in this market.
The paper by Kessel relates to liquidity premia of the Hicksian
type ie due to risk of capital loss when selling a long bond due to
fluctuations in interest rates (chapter 3). However, such a premium is

not relevant to securities where there is no fluctuation in capital
value due to fluctuation in interest rates as is the case with bank
deposits. In fact, this is similar to the criticism made of the paper by
Santomero (op cit).
It is interesting to note that a premium on long, compared with
short, yields is often found in a variety of securities, some having the
Hicksian risk and others, such as bank deposits, which cannot have such
a risk. The simultaneous existence of a premium in securities with and
without such a risk must throw into doubt the concept of the Hicksian
risk premium.
This is not to deny the existence of a premium, for it clearly
exists whenever the yield curve is positively sloped. However, the size
of any premium should not be explained only by the risk of capital loss.
Income loss is also important but only applies to maturities shorter
than the desired holding period. The lack of income risk on longer
maturities will reduce the overall risk associated with holding long
dated securities. If we treat the influence of a certain income on
longer maturities as analogous to a risk discount, it must be working to
reduce the observed risk premium. Therefore, the true 'risk' premium
considered in previous studies to be of the Hicksian form must in any
case be larger than that observed in the market.
Of course, some of the premium observed with bank deposits may
represent credit risk because the majority of these institutions are
private and therefore exhibit greater default risk than government
institutions. However, the premium observed by Fildes and Fitzgerald (op
cit) can only somewhat implausibly be explained by credit risk seeing
that they were investigating the very short end of the interbank market.
There may be an income risk from investing in long term bank
deposits which is analogous to the Hicksian risk. That is that if
interest rates rise before the repayment of the deposit, and the
depositor has to borrow, he may have to pay a rate of interest on his

borrowing that is greater than he is earning on the deposit he owns.
This risk of incurring additional interest costs given uncertainty over
future rates of interest and expenditure flows must be compensated for
with a risk premium.
A further influence over the observed premium on long rates may be
the possibility of arbitrage between bank deposits and capital market
securities. This is particularly pertinent to the eurocurrency deposit
rates where arbitrage between eurobonds and eurocurrency deposits is
frequent. Further, eurobond portfolios are often financed by
eurocurrency deposits. Thus, the costs which the market makers are
willing to incur in attracting deposits will be influenced by the return
on the eurobond portfolio. This portfolio will consist of, inter alia,
long term bonds which pay a Hicksian liquidity premium.
Transactions costs will have an influence upon the term structure
if these costs differ between maturity. These costs can be divided into
brokerage type costs including any stamp taxes on one hand and the
spread between bid and offer prices on the other. The influence of
brokerage type expenses will depend upon their relation to maturity and
the distribution of holding periods relative to the distribution of
maturities. If brokerage costs rise with maturity and holding periods
are shorter than maturities, a yield premium will be required to
compensate for the higher costs incurred.
Where the bid and offer spread widens with maturity, the costs to
investors rise and therefore a premium to cover these costs will have to
rise with maturity.
One reason for bid-offer spreads widening in the bond market as
maturity increases is the greater fluctuation in the value of the market
makers' portfolio following interest rate fluctuations. However, as is
explained in the section on marketability, maturity, at least in the
eurobond market, does not seem to influence the bid-offer spread.
Furthermore, generally eurobond transactions between market makers do

not attract brokerage costs.
It seems, therefore, that transactions costs can have little
influence over the term structure of eurobond yields and such costs are
very low in the interbank market.
In a recent article Schaefer (1981) shows that because individual
bond issues have different degrees of tax efficiency, it is not valid to
talk of a term structure common to all, say, default free bonds. The
term structure becomes specific to each of the separate tax efficient
groups.
This question of tax specificity of the term structure is important
because of the international nature of the eurobond market. With
investors in many markets but the bonds issued in an international
market, the tax laws of the investors' residences will have the dominant
influence. Given the variety of tax laws around the world, the tax
specificity of the term structure becomes a very variable concept.
Discussion of the term structure so far has ignored expectations of
future exchange rates. Porter (1971) developed a framework for analysing
the term structure of exchange rate expectations. Froewiss (1977) shows
that in a risk averse world, differences in interest rates on term
structures of securities in different currencies are a combination of
interest rate risk and exchange risk premia. Beenstock and Longbottom
(1981) develop a model that shows the influence of a world term
structure upon a domestic term structure given expectations of future
exchange rates. It seems obvious that where investors are able to choose
between investments in different currencies and maturities, the choice
will be influenced not only by the compensation available to cover
interest rate risk but also by the compensation for exchange rate risk.
Thus, if the term structure is influenced by expectations then
expectations of future interest rate and exchange rate changes will
influence the domestic and world term structures. However, if the market
segmentation hypothesis holds, then investors may have preferred
habitats not only as to maturities but also as to currencies. If this
latter case holds, the influence of the world term structure upon the
domestic term structure will be reduced (Beenstock & Longbottom, p47) .
There is plenty of evidence of periodic shifts in demand for
eurobonds denominated in certain currencies as investors develop
expectations of those currencies weakening. However, there is less
evidence of banks shifting their tastes in loans due, no doubt, to their
intermediating function and balancing their currency exposure. There is
therefore prima facie evidence that eurobond investors do have preferred
habitats with respect to the currency of their investments. However, the
currency habitat may be influenced by expectations of exchange rate
movements as suggested by Kern (1973) as well as institutional factors.
It is clear from this brief review of the literature that there is
far from unanimous opinion as to the determinants of the term structure
of interest rates. There may be some question as to the validity of
extrapolating the results of the various studies discussed to markets
other than those tested. The reason for this view is that not only may
there be preferred habitats as to maturities but also as to currencies
and types of instruments. This could be particularly important when one
takes into account the tax specific term structure suggested by
Schaefer, above, and also the influence of expected future exchange rate
changes upon the preferences of investors and borrowers.
The term structure literature can be more easily identified as
applicable to the eurobond market than the euroloan market. Its
applicability to this latter market is further reduced when it is
realised that the roll-over dates of syndicated loans are, in the
majority of cases, either three months or six months. Thus, although a
yield curve will exist in the interbank market, the borrower will, by
convention, be limited to two points along that curve and, at times
depending upon the competitive environment, may not enjoy even that
choice.

We now proceed to analyse those factors that influence the yield on
syndicated loans, specifically the spread or the margin.

4.3 Factors Influencing Interest Costs Specific to Eurocurrency Loans
As floating rate syndicated loans account for the majority of
eurocurrency loans to LDCs this section concentrates on the pricing of
those loans.
The total interest rate will consist of a reference rate, typically
LIBOR, and a spread or margin added to the reference rate. This spread
and any additional front end fees which the bank may receive constitute
the yield on the syndicated loan. It is the determination of this yield
and particularly the spread element that is the subject of this section.
OECD figures show that from 1975 to 1983 average spreads on loans to
LDCs fell to 0.87% in the second quarter of 1979 and rose to 2.02% in the
first quarter of 1983 (Financial Market Trends, various issues). Clearly
such fluctuations, which only influence new loans, can have a
considerable influence on borrowers' debt servicing costs and the yield
which the banks receive on their loan portfolios.
The yield represents the price at which the bank is willing to
supply a loan to the borrower. The planned yield will depend upon the
bank's pricing policy; the actual yield will depend upon the extent to
which competitive market forces cause the bank to deviate from its plan.
Although the yield may be analogous to the supply price of
syndicated loans, because the cost of funds to the bank is passed to the
borrower within the terms of the loan agreement, it is not analogous to
the demand price. The demand price, or cost to the borrower, consists of
the total cost of the borrowed funds. The two major components of these
costs are the yield and the money market rate, usually LIBOR, to which
the yield is added.
Immediately, we can notice a methodological problem in developing
supply and demand functions for these loans. Supply will be a function of
yield, among other things, while demand will be dependent upon total
cost. One answer to this problem may be to assume that, due to the

arbitrage activities in the wholesale money markets, all forms of credit
that are substitutes for eurocurrency loans will have similar basic
interest rates. Therefore the price influences upon demand are limited to
the mark-up above the reference rate. We also need to assume that credit
on preferential terms from such bodies as the IMF and World Bank is not a
close substitute for eurocurrency syndicated loans. Given the
conditionality associated with official preferential credit these two
assumptions are not too unrealistic and are made in the following
analysis.
This section develops a simultaneous equation model to isolate those
factors that influence yield on syndicated loans where that yield is
assumed to result from the interaction of the supply and demand for that
type of loan.
4 .3.1 Specification of the Yield Variable
Of the work carried out into the determinants of the yield or supply
of syndicated loans, generally the yield has been specified as the spread
or margin above the reference rate of interest (Feder & Just 1977, Kapur
1977, Sargen 1976). These studies mis-specify the yield variable by
ignoring the incidence of fees. It may further be argued that the yield
is mis-specified because it is not adjusted for differences in size of
loan, maturity, grace periods and the tax spare elements of some loans.
Fees are important in determining the yield which the lending banker
gets for a particular risk. With regard to eurocurrency syndicated loans,
fees are of four types: a) the commitment fee, b) the management fee, c)
the participation fee and d) the agency fee.
These fees are difficult to take account of in this study for
several reasons. Firstly, the data on fees are irregularly published and
when published the details are inconsistent between loans. The managers
of banks' syndication departments consider that the fees are to be kept

strictly confidential. One reason for this is that fees are often
manipulated in relation to the published spread in order to achieve a
confidential yield to the lender. Borrowers are often willing to pay
higher than normal confidential fees in order to achieve a lower
publicised spread (ref Financial Times 15.4.81, p25). This lower spread
will be interpreted by some as indicating that lenders perceive the
borrower as a lower credit risk than is actually the case. This would
obviously be beneficial to the borrower should further funds be required
from the market.
The second problem is that it is difficult, again due to lack of
information, to determine the actual amount paid in fees to each member
of the syndicate and therefore to what extent the yield required by each
lender is made up of spread or fees. Each type of fee exhibits different
difficulties in this respect.
The Commitment Fee: This is charged for the duration of the period
of drawdown ie from the date of the signing of the loan agreement to the
date when the borrower takes the funds. Data are not available on the ex
post duration of the drawdown period. Further, data on the maximum
permitted period of drawdown are published only occasionally. Accordingly
it is not possible here to determine the amount payable in such fees.
The Management Fee: This fee is divided amongst the managers and
sometimes co-managers pro rata to their contribution of funds. As it is
an agreed percentage of the total loan the amount of this fee is known
when details are published. However, not all members of the syndicate
will enjoy this form of fee income because they will not all be
classified as managers. Further, data are not always available for this
type of fee although provision in invariably made for it in the loan
agreement. Therefore to include the data for some loans and not for
others will introduce bias into the data.
The Participation Fee: This fee is paid to each bank participating
in the syndicate in proportion to the contribution made by each bank to

the loan. However, it is usual for the proportion paid in fee to be
higher the larger the amount lent by any individual bank. Usually several
sizes of participation are allowed for say $1-3 million, $4-5 million,
$5+ million, being associated with several fee sizes, say three-eighths
per cent, half per cent and five-eighths per cent respectively. There
fore the influence of the participation fee upon the yield depends upon
the size of the individual participations. Because data are not available
relating to the size of these participations, it is not possible to
determine how this fee influences the yield to each individual lender.
The Agency Fee: This is paid to the agent bank at regular intervals
during the life of the loan. The agent bank carries out a number of
clerical and administrative functions during the life of the loan. This
study, therefore, assumes that the agency fee only compensates the agent
bank for these extra duties and does not contribute to the yield on the
loan.
Due to the inadequate provision of data relating to fees it is felt
that it is not possible to include fees to give the correct specification
of the yield variable and unfortunately published data on spreads must be
used as a proxy for the yield.
It must be remembered that the impact of front ended fees upon
annual yield will be reduced the longer the maturity of the loan. To this
extent the ability of bankers to manipulate yields is limited. Further,
Ellis (1979) has shown that fees and spread are positively, correlated
over time. However, he did not carry out a cross section study of the
relationship between fees and spreads. Anecdotal evidence collected by
the current writer suggests that fees and spreads are negatively
correlated on some loans. Therefore the published level of spreads in any
one time period would be influenced by the number of borrowers that trade
off fees for spreads and this number may not be stable from one time
period to the next.
A further variable that influences the yield to the lender and cost

to the borrower is the grace period covering repayment of principal, or
of principal and interest. Grace periods will reduce the' effective cost
to the borrower if the funds that would have been used for paying the
principal or interest can be reinvested at a positive rate of return. It
follows that grace periods reduce the effective yield to the lender if
the foregone payments could have been reinvested at a rate of return
different to that of the original loan.
It is not possible to determine the influence that grace periods
have on effective yield or effective cost because the effect depends upon
the opportunity cost of funds during the period of grace. Suitable data
on the opportunity cost of funds is not currently available and is
unlikely to be in the future. One reason for this is that a knowledge of
such opportunity costs requires a knowledge of the subjective judgements
of yields on alternative uses of funds.
Accordingly grace periods have not been taken account of in the
specification of the yield variable.
Maturity of the loan will also influence the bankers' perceived risk
and therefore the spread should be adjusted to take account of the
different maturities. A problem arises in deciding the weighting to be
given to the maturity. Johnston (1983) found no systematic relationship
between spreads and maturities on a cross section basis. It is therefore
not possible to arrive at a trade off between those variables that has
any rigorous basis. The reason for Johnston's findings may be that the
spread is an individually negotiated element of the yield and will
therefore be influenced by the relative negotiating strengths of the
partners. As such it may be an inefficient indicator of risk,
particularly in the light of the discussion of fees above. Accordingly
this study does not weight the spread by the maturity of the loan and
therefore uses, extremely reluctantly, the published spread as a proxy
for the yield to the lending banker and the cost above LIBOR to the
borrower.

4.3.2 The Supply Price
Following the analysis of the bank lending function in chapter
three, this section postulates .that bank management have a utility
function where market share and profitability enter positively and risk
enters negatively.
Formally the utility function is given as:
u = f ( i t , R, M)
where tt = profit
R = risk
M = market share3uand 7 > 0 thus profits enter the utility function positively
< 0 risk detracts from utilityoR
8u7^ > 0 market share positively influences utility
The bank management is assumed to manipulate the following
syndicated loan variables yr,a2E(r),m, in order to maximise the above
utility function subject to the constraints tt > Trmin, R < R max
where yr = the average expected yield on the syndicated loan portfolio
0 2E(r) = the variance of the expected yield on the loan portfolio
m = share of the syndicated loans market measured either by thenumber of loan mandates won or by relative size of loan portfolio. This distinction is important because some banks aimto be lead managers of loans and then sell down their commitment under the mandate thus earning only fees; other banks aim to build up loan portfolios and earn interest as well as fees.
We have thus extended the utility function found in Tobin (1958)
where profit is represented by the mean of the expected return on assets
and risk is represented by the variance of the expected rate of return on
the assets. However, there is anecdotal evidence to suggest that profit
maximisation, an assumption made by Tobin (1958) and Markowitz (1959),
may not be an appropriate assumption for a model describing the behaviour
of a modern international bank. In particular the banks are concerned

r/4
about market share and size of loan portfolio, Davis (1976, p32) ,
Euromoney (February 1978, p21) and chapter seven page 337 of this thesis.
Because modern banking uses sophisticated marketing techniques and
allocates resources to the marketing function, market share must feature
prominently in the bank's utility function. This view is supported by the
analysis in chapter three above and by evidence that large banks are keen
to become lead managers of syndicated loans in order to enjoy the
attendant fees but then sell down as much of the loan as possible, thus
not taking upon its books any of the risk. To some extent such behaviour
is circular in that a bank can only be sure of winning mandates to manage
syndicates when it is known to be prominent in the market. Thus market
share is an important prerequisite for this type of behaviour.
There is also evidence that the banks engage in loss leader
marketing policies on loan pricing in order to get themselves established
in the international market (Economist March 31 1979).
During 1979 there was considerable anecdotal evidence in such
journals as Euromoney that the low spreads of that period were below the
marginal cost of financial intermediation. However, it is not possible to
determine whether or not the comments were aimed at trying to 'talk up1
the level of spreads at the time. Further, no mention was made of the
role of fees in the marginal revenue. We should also question the
measurement of marginal cost in eurobanking.
The analysis in chapter three shows that the marginal cost of
eurobank lending could be very low if not zero. Given the considerable
indivisibilities in the fixed capital of a modern bank, particularly
computers, modern offices and communication systems, the marginal cost of
supplying syndicated loans may be below average gost. Thus the statement
by banks that spreads are not sufficient to cover the costs of
intermediation (Maynard & Davies 1980) could mean that marginal revenue
is below marginal cost because the desire for a larger market share is
strong in the utility function. Alternatively, it could mean that the

banks consider their marginal revenue to be below average cost. This does
not mean that the banks will be making losses; because marginal revenue
could still be above the very low marginal cost suggested in chapter three,
page 124 .
The model of eurobank lending developed in chapter three suggests
that banks will lend provided they have the resources to do so or can
acquire those resources without unduly reducing profits, and also that
the risk reward ratio is acceptable. With regard to risk, the traditional
models of portfolio behaviour following Markowitz (1959) and Tobin (1958)
and discussed in detail in chapter five of this thesis, show that where
the rates of return on alternative investments are less than perfectly
correlated, the default risk can be reduced by diversifying the asset
portfolio. Further, Grubel (1968) has shown that there are welfare gains
from portfolio diversification as the total size of the portfolio gets
larger.
Accordingly, the diversification of the bank's lending portfolio
into syndicated loans may be seen as a policy aimed at reducing the risk
element in the utility function of the banking system. This view is
strengthened when it is realised that one advantage of the syndicated
loan system is that lenders need only take small participations in the
loan, thus achieving greater diversification of a given portfolio size.
Moreover, the floating rate nature of syndicated loans reduces the
funding risks that the banks would face with flat rate loans.
However, it must be remembered that only the unsystematic element of
risk can be diversified away and all loans will be subject to substantial
systematic risk (refer page 242 below).
The reward required will be related to risk in eurobank lending and
the rewards for similar degrees of risk bearing in alternative lending
markets. It is shown below, page 224 , that syndicated loans to LDCs
attract higher spreads than loans to OECD borrowers. Thus the move into
syndicated lending to LDCs during the 1970's can also be seen as

enhancing the profit element of the banks' utility functions.
From the above discussion it is possible to postulate an equation
for the supply price as follows:
Spd - f(L P R Q)
where Spd = Spread
L = Loanable funds available. This variable is proxiedby the level of deposits in the euromarkets andrepresents the resources required by the banks in their lending process.
P - The profitability of euroloans relative to alternative lending opportunities
R = Risk
Q = Quantity
In order to test this proposition it is necessary to specify the
data sets which represent the variables included in the above function.
This empirical work was concentrated on the eurodollar loans because
they are by far the most important group.
The Spread
The spread data was obtained from eurodollar syndicated loans of
five countries: Brazil, Indonesia, Republic of Korea, Mexico and the
Philippines. Between them these countries account for over 47 per cent
of the loans outstanding to financial markets in both 1974 and 1980
(calculated from IBRD 1983).
Supply of Loanable Funds
Banks take deposits from the interbank markets or from non bank
customers. In the interbank market the bank will offer and bid for
deposits in order to develop a two way business and to maintain its
image in the market. Nevertheless, there will be an emphasis on
borrowing or lending to this market as the bank adjusts its need for
liquid funds at the margin. Rates of interest paid and received on
deposits of this nature fluctuate in accordance with the marginal
adjustments of the banking system as a whole and these fluctuations are
volatile.
In contrast, the banks' behaviour in relation to non bank customers
is that they do not turn deposits away. Whether these are time deposits
or demand deposits, they are accepted by the banks, although the rate of
interest paid will be adjusted so as to equate supply with demand. As a
result, if liquidity increases in the financial system, then it must end
up with the banks or other financial intermediaries.
The only constraint upon the banks in attracting deposits is that
the funds must be employed profitably. The greater the liquidity of the
banking system, the greater will be the competition within that system to
diversify the asset portfolio. It is clear then that the willingness of
the banks to diversify into international lending will not be constant
over time. The relative demand for bank liabilities, ie supply of funds
to the banks, will influence the need for the banks to diversify. The
demand for bank loans will be important because it will influence the
amount of diversification that the banks find possible and the yield that
is attainable upon such diversification.
Competition in the diversification process will be particularly
important in that it will also influence the yields which the banks can
get on their portfolios. The greater the competition, the lower will be
the yield that the banks will have to accept for a given degree of risk.
It is therefore considered that the willingness of the banking
system to provide eurocurrency syndicated loans is positively influenced
by its liquidity. The yield which the' banks require on these loans will
be influenced by the degree of competition in this market, this
competition being positively related to liquidity. It is therefore
postulated that yields will be negatively related to the liquidity of the
banking system, in particular to the flows of funds to the eurocurrency
market.
Taking the eurodollar market as an example, three main factors are
seen to influence this flow of eurocurrency deposits. Firstly, there is
the US balance of payments disequilibrium. Secondly, there are the
balance of payments surpluses of the oil exporting countries. Thirdly,
there is the interest differential in favour of eurodollar deposits
against domestic deposits.
There has been considerable debate as to the influence of the US
balance of payments deficits upon the supply of eurodollar deposits, eg
Friedman (1969) and Klopstock (1970). Friedman suggests that a US deficit
is not a sufficient condition for growth of the eurodollar market. He
agrees that a deficit will give foreign holders a supply of dollars but
it does not ensure that they continue to hold those dollars. If the
dollar ceases to be attractive, holders can sell dollar denominated
assets and buy assets denominated in other currencies. However, we must
remember that the US dollar is the major unit of account in international
trade and will therefore be held for transactions purposes. Furthermore,
the higher interest rates available on eurodeposits make these deposits
more attractive than domestic dollar deposits to those investors who are
otherwise indifferent between the two types of investment.
Given the transactions demand for eurodeposits, it is considered
that US balance of payments deficits will influence the supply of
eurodollar deposits. The effect of the interest rate premium which
eurodeposits have over domestic deposits is discussed below.
The influence of the oil exporting countries' balance of payments
surpluses on euromarket liquidity stems directly from the US dollar being
used for transactions purposes in the international oil trade and the
willingness of the oil exporters to hold their reserves in the eurodollar
market. This propensity to hold reserves in the form of eurodollar
deposits was influenced by the transactions and investment demand for
dollars. The depth of the eurodollar market and variety of instruments
available to investors are also influential.

To the extent that oi'l exporting countries do not transform their
net oil revenues into other currencies but simply hold them as
eurodollars there will be no flow of funds out of the US banking system
but simply a change of ownership of the deposits held within the USA.
It must not be thought that the US deficit and the oil exporters'
surpluses cancel each other out. The US deficit will cause a flow of
dollars to non oil exporting countries, some of these dollars being held
in the euromarkets.
It has already been noted that there must be some incentive for the
owner of dollars to hold them in the eurodollar market rather than in the
domestic market. The most easily measured incentive is the interest
differential between domestic dollar deposits and eurodollar deposits.
The reasons for the differential have been discussed on page 141 above.
Changes in the differential between these two rates will, ceteris
paribus, cause arbitrage flows between the two markets. Therefore flows
of funds into the euromarkets will be positively related to the interest
differential.
As the spread on syndicated loans is hypothesised to be negatively
related to euromarket liquidity, it is expected that the spread will be
negatively related to each of the three influences upon liquidity
discussed above.
The Profitability of Alternative Lending Opportunities
Although increased liquidity within the banking system will cause
the banks to engage in competitive diversification of their portfolios,
it does not follow that the diversification has to be directed into
eurocurrency syndicated loans. Nevertheless there are several reasons for
expecting such diversification to be directed at the loans market.
Firstly, although the banks may experience increased liquidity
generally, the rate of change of liquidity in the separate constituent

currencies of the banks' portfolios may differ. Furthermore, as the banks
experience increased liquidity in say US dollars they will prefer to
diversify their portfolios by using the newly acquired funds to purchase
US dollar denominated assets. One reason for this is that by avoiding any
currency transformation the banks are avoiding currency risk. This is
particularly so where the maturity transformation resulting from
diversification causes the banks to seek hedging operations in thin
markets eg seeking forward cover for more than one year hence.
Secondly, banks are skilled in the basic lending operations and
therefore it is natural for them to seek to diversify their portfolios
into assets that are as similar in nature as possible to existing assets,
yet consistent with reducing unsystematic risk. This may be seen as an
attempt to reduce the marginal administrative cost of diversification by
avoiding the need to acquire completely new skills and preferring to
build upon the skills which the banks already possess. The banks, having
a better knowledge of loan markets than the markets for other services,
reduce their costs (administrative and risk) by diversifying into a
different type of loan.
Thirdly, there may be government controls limiting the type of
non-loan assets into which the banks can diversify.
Fourthly, where the banks are subject to reserve asset requirements
in their domestic banking operations, their holding of permissible
non-loan assets may have reached saturation point.
Lastly, diversification by way of loans enables the banks to
maintain their traditional marketing image in the market place. They
continue to be perceived by existing as well as potential customers as
lenders.
These five reasons for suggesting that banks will diversify into
loans rather than non-loan types of assets do not in themselves explain
why they diversify into eurocurrency syndicated loans to LDCs. Such an
explanation must indicate why the banks did not diversify into domestic

lending in the same currency as their euroleriding. One reason could be
that the profitability of eurolending is greater than domestic lending.
When one type of lending becomes relatively more profitable than
others, funds will be switched to the more profitable use. If it is
assumed that banks wish to avoid exchange risk, they will deploy dollar
funds in the domestic dollar or eurodollar markets depending upon which
is the most profitable.
Two alternative measures of profitability were tested in the supply
function. These were:
1) The difference between Prime Rate (adjusted for 15%
compensating balances) and the rate on domestic CDs
compared with the spread on euroloans to OECD based
borrowers. Data for Prime Rate and the CD rate were
extracted from World Financial Markets published by
Morgan Guarantee Trust Co of New York. The data for
spreads were extracted from Financial Market Trends
published by OECD.
This measure of profit relates to banks with a
domestic US dollar deposit base having the choice of
lending domestically or in the euromarkets.
2) The difference between Prime Rate (again adjusted
for 15% compensating balances) and LIBOR compared
with spreads to OECD borrowers. LIBOR was extracted
from World Financial Markets. This measure of profit
relates to banks using eurodollars to lend to US
domestic borrowers or to borrowers via the euromarkets.
As prime rate is the rate at which US domestic banks lend to their
best credit risks, the spread used as comparison is that of OECD based
borrowers and not LDCs.
When the profitability of domestic loans rises relative to the
spread on euroloans it is expected that bankers would lend to domestic

borrowers rather than euro borrowers. This would reduce the relative
supply of loans in the euromarket, thus pushing up the spread. It is
therefore to be expected that spreads are positively related to the
difference between the profitability of domestic loans and spreads on
euroloans.
Risk
The third element to influence the banks' diversification decisions
will be the risk involved. Banks face two types of risk in this respect.
The first type is associated with default of the investment; for
syndicated loans this manifests itself in non payment of principal and/or
interest. The second type of risk is associated with the degree of
maturity transformation or currency transformation which the banks
undertake in order to finance their syndicated lending. This risk would
manifest itself in an inability of the banks to attract new funds or to
roll over existing deposits in appropriate currencies at a cost that can
be passed on to the borrower.
The risk of default by the borrower is considered here to be the
greater risk because the risk of not being able to fund a loan on its
roll-over date is allowed for in the loan agreement. In particular the
loan agreement will state that if the lender cannot obtain the funds at
an agreeable cost the loan does not have to be renewed. Nevertheless,
having to refuse to roll over a loan because of inability to fund would
seriously reduce a bank's ability to take part in future business. There
is therefore some risk but this risk will be less important the more
liquid is the banking system. The influence of liquidity upon the
willingness to diversify has been discussed separately. It is therefore
only necessary to include borrower default risk as the third influence on
diversification. This is hypothesised to be positively related to the
spread.

The banks use many variables in combination to derive some
indication of the risk attached to a loan, therefore it is difficult to
postulate the applicability of just one variable that represents risk.
The model was run with four alternative measures of risk. These
were:
1) The ratio of interest payments to exports. This is based
upon the argument in chapter six, page 272 below that
receipts of interest have a higher ranking in the banks'
utility function than amortization payments do.
2) The ratio of interest payments to reserves. The rationale
for this ratio is similar to that in 1) above.
3) The ratio of total debt service to total export earnings.
This ratio is included because of its frequent use by
practising bankers.
4) The ratio of total debt service payments to GNP. Again
this is included for the same reason as is 3) above.
The data for these measures of risk were extracted from the IBRD
World Debt Tables 1982/83. The figures extracted were annual so quarterly
data ware derived by interpolation.
The supply price equation can now be set out formally as:
Spd = a - a USBP - a Oil rev - a (RE-RD) + a R tf + a RISK 1 2 2 3 4 5
where: Spd = Spread
USBP = The autonomous balance of payments disequilibrium of the USA
Oil rev = Oil exporting countries' revenues
(RE-RD) = Interest rate differential in favour of eurodollardeposits
Rir = Relative profitability of euro to domestic lending
RISK = One of the four measures discussed above
Detailed definitions and sources of data are given on page 191 below.

4.3.3 The Demand Price
Demand theory suggests that the price of a good is, ceteris paribus,
influenced by the quantity of that good demanded, the price of
substitutes, income, wealth, and tastes.
The demand price for syndicated loans, ignoring fees, is the spread
plus LIBOR. Thus the equation specifying price as a function of
quantity and other variables can be formally set out as:
Spd + LIBOR = f(P2 , Y, W, T, Q)
where: Spd = Spread
LIBOR = London Interbank Offer Rate
P2 = Price of substitutes
Y - Income; in this case foreign exchange incomerepresented by the autonomous balance of payments
W = Wealth; particularly foreign exchange wealth,represented by the nation’s stock of gold and foreign exchange reserves
T = Tastes
Q = Quantity demanded
However, as this section is aimed at determining the influences upon
the spread it is therefore necessary to rearrange the function so
that LIBOR appears on the right hand side of the equation, thus:
Spd = f(LIBOR, P2 , Y, W, T, Q)
LIBOR is expected, a priori, to be negatively related to spread
because, being so much larger than the spread, it will have a much
greater influence over the total cost of syndicated loans. As LIBOR rises
the spread must fall in order to maintain the total price in relation to
quantity demanded and the other variables in the demand function.
Quantity demanded will be negatively related to the spread because spread
is part of price.

Looking next at the financial flows that may be considered as
substitutes for syndicated loans( aid flows, loans from the IMF and
various development banks and eurobond finance might seem appropriate.
However, chapter one above has shown how quantitatively inadequate aid
flows from IMF and development bank funds have been during the 1970's.
Chapter eight below shows that the eurobond market has never been an
alternative source of finance for LDCs in the quantities required during
the 1970's.
Foreign exchange reserves are substitutes for borrowed funds in that
because of imperfections in financial markets, it is generally cheaper to
use ones own funds than to borrow. There are exceptions to this rule, for
example a minimum stock of reserves may be considered to be strategically
necessary. Moreover, accumulating reserves may increase the country's
credit rating in the financial markets.
Nevertheless, it is a reasonable generalisation that the larger the
stock of foreign exchange reserves, the less will be the need to borrow
in the eurocurrency markets, thus spreads are postulated to be negatively
related to the level of foreign exchange reserves.
Wealth would generally be included in a demand function as a
positive influence upon demand. However, highly liquid forms of wealth
would not be considered a positive influence on the demand for credit
where the expected rate of return on the liquid wealth is less than the
expected cost of the credit. Therefore, although foreign exchange
reserves may be considered as a proxy for the foreign currency wealth of
the borrower, it is not appropriate to include them as a wealth variable
in this model. It is also considered inappropriate to include any measure
of physical wealth in this model due to the informational problems
surrounding such a concept at the national level.
Turning now to the income factor in the demand function, we would
expect the demand for a commodity to be greater the larger is the
consumer's income. It is true that the developing countries with the

higher per capita incomes have tended to get the lion's share of
international bank lending. However, this does not indicate the role of
income in determining the cost of these loans.
Where the marginal propensity to import is positive, an increase in
income will lead to an increase in the value of imports. Moreover, the
increased import bill will manifest itself before increased exports due
to the time lag between purchasing imports such as energy and capital
goods on one hand and the sale of output on the other.
If we take the income variable in the demand function not as ex post
income but some desired (ex ante) level of income appropriate to the
government's welfare function, it is clear that an increase in this
desired level of income will manifest itself in a deterioration of the
current account of the balance of payments. The current account would
have to be financed and one method would be by borrowing in the
syndicated loan market. It is therefore felt that the current account of
the balance of payments is a determinant of demand. The spread on
syndicated loans is postulated to be positively related to the current
account deficit.
The inclusion of tastes in the neoclassical demand function is
particularly difficult to handle in the context of borrowing by
developing countries. In particular, it is difficult to develop an
explanation as to how the decision makers of developing countries develop
their tastes. It could be considered that tastes for syndicated loans are'
influenced by the marketing efforts of the lending bankers and the terms
and conditions attached to other forms of credit, as well as those
factors influencing the need for credit. That being so, the factors
underlying the marketing efforts are included in the supply function,
while the other influences are accounted for in the demand function. It
has therefore been decided not to include a variable for tastes in the
equation to be tested.

l b /
The demand price equation can now be set out formally as:
Spd = bl - b2 LIBOR - b3FXRS + b4B0PS
where: Spd Spread
LIBOR London Interbank Offer Rate on 3 month loans
FXRS The level of foreign exchange reserves held by LDCs
BOPS The balance of payments deficits of LDCs
Qd Quantity demanded
.3.4 The Simultaneous Equation Model
Specifying the model in a simultaneous equation format, the
structural equations are as follows:
SPDs = f {- USBP - OIL REV - (RE-RD) + RISK + REL 77 + Q)
SPDd = f (- LIBOR - FXRS + BOPS - Q)
SPDs = SPDd
From these, the following reduced form equations are derived:
SPDs = al - a2 USBP - a3 OIL REV - a4 (RE-RD) + a5 RISK
These equations were solved for eight separate combinations of the
two relative profit measures and four risk measures given on pages 181
and 183 above. The model itself is over-identified and therefore Two
Stage Least Squares Regression is used to solve the structural equations.
The Time Series Processor computer package was used for this purpose.
The initial runs to solve these equations using absolute values of
data gave the following results:
+ a6 REL 77 - a7 LIBOR - a8 FXRS + a9 BOPS
Q = bl - b2 USBP b3 OIL REV - b4 (RE-RD) + b.5 RISK + bS REL TT - b7 LIBOR - b.8 FXRS + b9 BOPS

The Supply Price
SPDs = C - USBP - OIL REV - (RE-RD) + RISK 2+ REL 7t2+ Q
2.85- 0.018+ 0.007 + 0.056 - 0.048 - 0.199 - 0.0001
(3.1) (-2.89) (0.9) (0.4) (-0.69) (-2.3) (-3.8)
R2 0.913
DW 2.10
The Demand Price
SPDd = C - LIBOR - FXRS + BOPS - Q
2 .11- 0.16 + 0.000002 - 0.0812 - 0.00006
(6 .6 ) (-2.7) (0.20) (-1.72) (-1.69)
R2 0.83
DW 2.1
These results were not acceptable because of certain variables being
insignificant and having the wrong sign. It was thought that these
results may have been influenced by multicolinearity between certain
variables. Inspection of the correlation matrix of all the variables
shows the following correlations between pairs of variables:
The Supply Price
Risk: 2 Risk 2
Rel tt 1 -0.78 Q 0.87
The Demand Price
FXRS BOPS
LIBOR +0.93 -0.93
BOPS Q
FXRS - 0.86 0.85

Given the degree of multicolinearity between variables it was decided
to use the first derivatives of LIBOR, Foreign Exchange Reserves, Balance
of payments, Quantity of Loans and all the profit and risk variables. The
results are given below:
The Supply Price
SPDs = C - USBP - OIL REV - (RE-RD) + RISK2 + RELirl + Q
1.82-0.026 - 0.015 - 0.66 + 0.48 - 0.25 ' - 0.00008
(.11.4) (-2.0) (-0.9) (-2.6) (+2.2) (-1.2) (-1.3)
R2 0.72 R2 0.59 DW 0.85
The Demand Price
SPDd = C - LIBOR - FXRS + BOPS - Q
1.38- 0.13 - 0.92 - 0.39 + 0.97
(12.4) (-0.8) (-0.14) (-0.30) (+0.09)
R2 -0.02 R2 -0.26 DW 0.33
The coefficients of the supply price show the importance of the US
balance of payments, interest rate differentials and risk in determining
the level of spreads. They also indicate that oil revenue, relative profit
and quantity are not significant. Indeed, both relative profit measures
discussed on page 181 proved to be negatively related to spreads. This
would suggest some segmentation between the eurodollar and domestic dollar
loan markets. In particular non US banks may not have free access to the
US domestic loan market and regional US banks may not consider euroloans
as close substitutes for loans to their domestic customers. Apart from
quantity and relative profit all coefficients in this equation have the
correct sign. As a further test on the profit variable the equations were
re-run using the level of profit on domestic loans as the profit variable
ie adjusted Prime Rate minus the CD rate or minus LIBOR. The results were
inferior to the ones given above.

The risk 2 variable (ratio of debt interest to reserves) was the only-
one of the four risk variables to be positively related to spreads both in
the tests using absolute data and in those using first derivatives. This
result corroborates suggestions made in chapter six, page 272 of the
importance bankers place on ability to service interest payments compared
with amortization payments.
With respect to the demand price, the fact that the constant is the
only significant variable is at first sight disappointing. However, the
implication that demand factors are not important in the determination of
spread is compatible with the suggested importance of bank marketing and
the low marginal cost of loans suggested in chapter three of this thesis.
The poor explanatory power of the variables included in the demand
function was similar for all eight combinations of equations incorporating
first derivatives. Moreover, in the equation using absolute values of data
only LIBOR had significant explanatory power.
The existence of first order autocorrelation in the results using
first derivatives is disappointing but is a common problem where
derivatives are used as data.
A test for first order autocorrelation as suggested by Theil and
Nagar (1961) indicates the presence of autocorrelation in both functions.
Checks of the data showed no evidence of nonlinearity and a data
transformation suggested by Beach and Mackinnon (1978) failed to remove
the autocorrelation. The problem is therefore thought to be due to the
misspecification of the spread variable as suggested on page ,169 above or
the interpolation of annual data required to obtain quarterly data for the
risk variables. Improved results will therefore have to await improved
data.
Nevertheless these results emphasise the importance of the
competitive supply of funds to the developing countries. This indicates
that at periods when euromarket liquidity increases, the spreads on
eurocurrency loans can be expected to fall.

Definitions of variables and sources of data used in model of spreads
SPREAD
USBP
OIL REV
RE-RD
RELATIVEPROFIT
RISK
The average spread weighted by quantity. Data up to end 1978
represents the spread paid by each of five countries: Brazil,
Indonesia, Korea, Mexico and the Philippines and calculated
from IBRD Borrowing in International Capital Markets. From
1979 the figures represent the spread paid by all LDCs as
shown in table 9 of various issues of the same publication.
Sections A through D of IMF Balance of Payments Yearbook,
various issues (not seasonally adjusted).
Taken from the Financial Review section of the Bank of England
Quarterly Bulletin. In particular the table 1 'Estimated/Deployment of Oil Exporters Surpluses including:
UK Sterling Deposits
Other Sterling Investments inc equities and property
Foreign Currency Deposits
US Bank Deposits
Other
Other countries
RE = Bid rate on 3 month deposits for prime bank in London. RD
= 3 month negotiable CD issued by Morgan Guarantee
Trust Company. Sources for RE and RD: Morgan Guarantee Trust
Company of New York.
The relative profit measure number 1 as specified on page 181
above.
The ratio of interest payments to reserves as mentioned on
page 183 above. The data source was the IBRD World Debt Tables
annual data interpolated between annual points to achieve
quarterly data.

LIBOR
FXRS
BOPS
London Interbank Offer Rate on US dollar loans. Source: calculated from Morgan Guarantee Trust World Financial Markets, various issues.
Foreign exchange reserves of all non oil exporting LDCs.
Source: IMF International Financial Statistics.
Imports - Exports of all non oil exporting LDCs. Source: IMF
International Financial Statistics.
Quantity of syndicated loans to all LDCs. Source: IBRD
Borrowing in International Capital Markets, various issues.

.4.4 Factors Influencing the Rate of Interest specifically in the•Eurobond Market
4 ,4.1 Introduction
There have been very few studies which aim to explain interest
rates in the eurobond market. Park (1974) and Solnik and Grail (1975)
develop models to explain "the yield" on eurobonds. Both of these works
cover US corporate eurobonds during periods of fixed exchange rates and
US capital controls. Finnerty, Schneeweis and Hedge (1980) cover the
period of floating exchange rates but still cover US corporate eurobonds
and investigate "the" eurobond yield.
The objectives of this section differ from previous work in that it
does not treat eurobonds as a homogeneous group of instruments. It is
intended to explain the reasons for the great variety of yields to be
found in the eurobond market. It is also intended to isolate, where data
will permit, the reasons for differences between yields on LDC eurobonds
and the yields on eurobonds issued by other types of borrowers.
The cost of funds from the eurobond market, as with other financial
markets, depends upon:
a) market conditions at the time of issue
b) the standing of the borrower, and
c) the terms and conditions of the instrument being issued
Subsumed within market conditions are the general level of interest
rates, the currency structure and the term structure of interest rates.
These have been discussed in section one of this chapter.
The standing of the borrower determines the risk structure of
interest rates and, because of differing investment attitudes of banks
and bond investors explained in chapter eight below, this risk structure
will be different in the eurobond market compared with the eurocurrency
loan market.
The terms and conditions of the instrument will include

marketability, callability and fiscal considerations. Marketability, or
its lack of, is important in the analysis of LDC bond yields and is
therefore discussed in this section. However, the relatively small
amount of information about call provisions, sinking funds, etc
precludes an analysis of these influences. Fiscal considerations are not
considered to be important in this section because these will be com
mon to all eurobonds and not just those issued by LDCs.
4.4.2 Definition of Yield
However, before proceeding to discuss the risk structure and terms
and conditions of eurobonds, it is necessary to briefly review the
concept of the yield as it pertains to eurobonds.
The yield to maturity
This is the rate which discounts all future receipts including
repayment of principal at maturity such that the Net Present Value of
the flow of receipts equals the current price of the bond. Yield to
maturity is the relevant measure of yield where sinking funds do not
operate.
The yield to average life
Some bonds allow for the maturity for some bondholders to be
shortened by the use of sinking funds, purchase funds or call options.
Where the terms for the retirement of bonds are known and compulsory, eg
a sinking fund, it is possible to calculate the average life of the bond
issue. The yield to average life discounts the flows due until average
life and equates the resulting Net Present Value of those flows to the
current price of the bond.
The determinants of the yield given are common to all financial
liabilities, only the relative magnitude of each influence differs
between instruments issued. While this section has as its objective the
determination of yields on eurobonds issued by developing countries,
much of what is said is common to bonds and other liabilities issued by
other types of borrowers. What does differentiate LDC bonds from those
of other issuers is the risk structure of the yields and the
marketability of the bonds. The yields are significantly higher and
marketability considerably less than found on, say, bonds issued by OECD
governments.
4.4.3 The Risk Structure of Interest Rates
It has already been noted that the yield on a financial asset
compensates for various risks suffered with such an investment. This
section is concerned only with the risk of default in payment of
principal or interest. It may be caused by the insolvency of the
borrower, including default by governmental borrowers as a result of a
shortage of foreign exchange. However, default may also be due to a
governmental borrower defaulting for ideological reasons, such as
repudiating a previous administration's debt commitments.
In the case of syndicated loans, the reward for bearing such risk
was subsumed in the fees-spread combination agreed in the loan
agreement. However, in the case of eurobond issues, this reward will be
subsumed in the overall yield, with higher risk bonds showing higher
yields, ie a risk premium.
There is very little literature related to the determination of
default risk premia in the bond markets. Examples that do exist eg
Fisher (1959), Johnson (1967) and Merton (1974) relate to corporate
bonds. The present writer knows of no literature specifically relating
to risk premia in the eurobond market, nor relating specifically to
developing countries.
Given the emphasis upon the perceived riskiness of LDC bonds which respondents to the survey of the euro-

bond market reported in chapter eight below placed upon developing
country bonds it is to be expected that the yields on such bonds
incorporate considerable risk premiums. With this assumption in mind,
this section has four objectives:
1) to determine the absolute size of the risk premium
paid by developing countries on their eurobond issues;
2 ) to establish whether or not this premium differs
between groups of developing countries;
3) to determine whether or not the premium differs with
the maturity of the bonds;
4) to establish whether or not the premium differs in
relative size between bonds denominated in different
currencies.
Merton (1974) and Bierman and Hass (1975) develop methods of
pricing corporate bonds. Neither of these approaches is considered
relevant to the pricing of sovereign borrower bonds because of the
importance of political factors in the credit rating of a sovereign
borrower. Furthermore, the concept of financial leverage (the debt to
equity ratio) used by Bierman and Hass has no relevance to sovereign
borrowing.
In this study is is intended to account for differences in the
yield only by differences in the probabilities attached to the expected
future receipts. By way of illustration, the yield to maturity on a risk
free bond can be calculated by solving for r in the following equation:-
cl cn DB — —— — . + ... + . n + ■ n(1+r) (1+r) (1+r)
where: B = pricec = interest receipts
(assumed to be received once a year at the end of each year)
D = repayment of principal

The yield to maturity on a risky bond can be calculated as follows;
R = d P 1 . . cnpn Dpn(1+r) --- (T+TT1 (1+r)
where p = the probability of actually receiving that particular payment
Clearly with p<l B will be lower for a risky bond with a given c and
r than for a riskless bond.
The probability value will be influenced by four types of risk. For
the purposes of this section, it is necessary to isolate the default
risk. To achieve this, data was filtered by the following process:
- to avoid interest rate risk yield curves with similar
maturity spans were selected;
- to avoid exchange risks all bonds were denominated in
the same currency;
- to avoid the risk of a call provision bonds with such
a provision were omitted from the data;
- the risk of unforeseen changes in tax regulations is
assumed to affect the riskless bond and the risky
bond in the same way.
Yield curves on a riskless borrower's bonds can then be compared
with the yield curves constructed from LDC bonds. The difference between
the yield curves should indicate the default risk premium paid by
developing countries.
Due to limitations of data it is only possible, at this point in
time, to determine the absolute size of the risk premium paid by some
developing countries and whether the relative size of that premium
differs between currencies. In addition, it is only possible to
determine whether or not the risk premium changes with the maturity of
the bonds for two countries, Mexico and Brazil, because only theseV
countries give sufficient data observations.
To assess the magnitude of the default risk premium, yield curves
have been constructed for IBRD bonds, representing a riskless security,
and for certain developing countries' bonds. Curves have been
constructed for bonds denominated in US dollars and for bonds
denominated in Deutschmarks. It is clear from casual observation of the
constructed yield curves that not only do the developing countries
concerned pay substantial premiums compared with the IBRD but that the
size of the premium differs between countries.
Works by Macaulay (1938), Hayes (1956) and Robinson (1960) suggest
that as there is more chance of unforeseen occurrences the longer the
term to maturity, the default risk premium should be positively related
to maturity. On the other hand, Graham, Dodd and Cottle (1962) note that
at maturity the existing debt is repaid out of the proceeds of new debt.
Therefore, the probability of repayment will be influenced by market
conditions at the time of repayment. Under such circumstances, closeness
of maturity may not mean less risk of default. There may, in fact, be a
'crisis at maturity'. As a potential crisis at maturity requires a
difficulty in refinancing debt, it can be expected to apply only to the
lesser quality risks in any particular market.
Therefore this concept may be particularly relevant to developing
country bonds because they are lesser quality risks in the eurobond
market. Noting the responses to the questionnaire on the eurobond market
about crowding out of LDC bond issues, it may be that a crisis at
maturity could occur for an LDC borrower even when general market
conditions are good.
Looking at the yield curves for US dollar eurobonds, the curve for
IBRD bonds is positively sloped along its whole length. This slope would
preclude a crisis at maturity as is to be expected of an institution
such as the World Bank. However, the yield curves for all the developing
countries show a strong negatively sloped section relating to early
maturities; the yield curves taking on a positive slope for later
maturities. This cannot be caused by currency expectations because the

IBRD yield curve is in the same currency. However, a puzzling point is
that the DM yield curves do not exhibit a negative slope for short
maturities. Further analysis is required before a crisis at maturity can
be considered to influence the risk premium of LDC eurobonds. This point
is analysed again under the section on marketability.
The crisis at maturity concept will be less important where sinking
funds and purchase funds are in operation. But it will be more important
where the bonds are only repayable at maturity. All the developing
countries and the IBRD have sinking funds or purchase funds operating
for at least some DM issues. Similarly only Algeria and Argentina (total
of 4 bond issues) did not have such funds operating on at least some US
dollar bond issues. It would therefore seem that there is no a priori
reason to think that the existence or otherwise of sinking funds or
purchase funds is influencing the slope of the yield curves.
Turning now to the positively sloped section of the yield curve,
there are examples of the risk premium rising as the term to maturity
lengthens but this is not uniform between countries. However, such a
situation is again not discernible for DM eurobonds. The reason may be
the term structure of exchange rate expectations. Investors may be
willing to take lower yields to maturity on medium term bonds because
they expect the DM to appreciate substantially during their medium term
holding period.
Comparing the yield curves in US dollars and Deutschmarks could
indicate whether or not the risk premium differs between currencies.
Indeed, looking at the yield curves constructed, it would appear that
the DM curves for Brazil and Mexico are relatively closer to the IBRD
curve than the same curves in US dollars.
Comparison of yield curves only gives an indication of the risk
premiums that LDCs have to pay. A more exact measure is the weighted
average yield on bonds outstanding. This indicator, calculated from
secondary market yields, measures the risk premium paid per unit of

ZH-
k r U.S oAZp y/tPL.O’J *.l*t=S■f : : :
2 3 m <p « : -: t:: ......
» W W i:p i.n*r~c »-- ---.— ---‘---- — * - |.......4/' — ' |-.... ►-..... *--
tr -irprr1:::: ‘:.
f7~7TT[7;7%lp7777:;--:-:-:~ — :7y^
I j r
1%
*[*:” •.:.-.? Figure "4 ’72 Eurobond ' y.I^IcT curves of"..selected"LDC" bonds.:: 1 :.\— ‘ ; i (us $ bonds) *~ :;'i _- -- •" — i; - t
-.:.:_'-LSoufce.:. Financial. Time si. Supplement .14 .12.82 EurobpT^dL |£;: ■' ;a a_ Quotations :andiiVieIds 1
7 : 7“ “ —v;;..;.‘.; ' !°x ; - ■ . '
? ' *. . •: r:: * ::r4.1-*•)..i ri:: i.lirl H:: i: 1;-::. 7:7::tI7r*.*: t : :: r!:: • • ..":.;::::„::r:: | :::
1 3 :.#r:: r 6 : 7 : X - ::*f. ::.n:/o -:*% .7:11/17 \:\y<+ : t y . / c 7: n :£!/ #?( L & S iv t i t f r t - A /tp i£ 0 £ f l*> *J £ 7 /iA/": Vzrfi/Zj * - 7r*7.
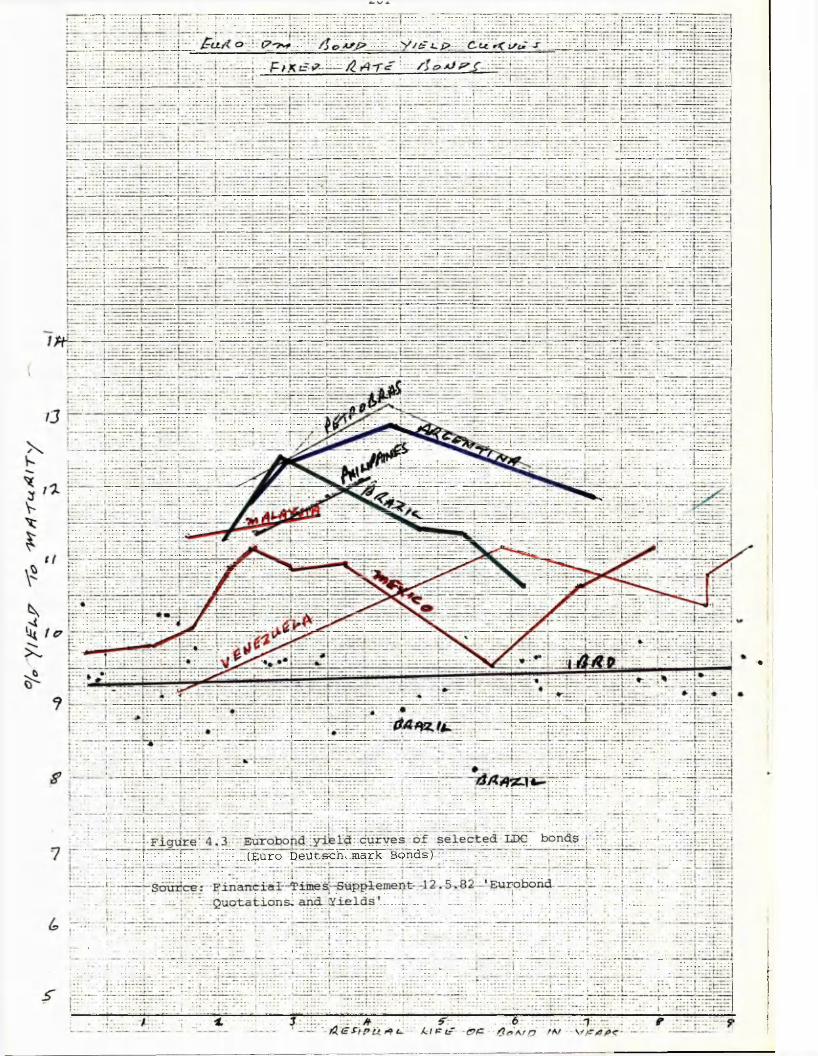
(Euro DeUt.sbhJ mark Bonds)
• ;1
i
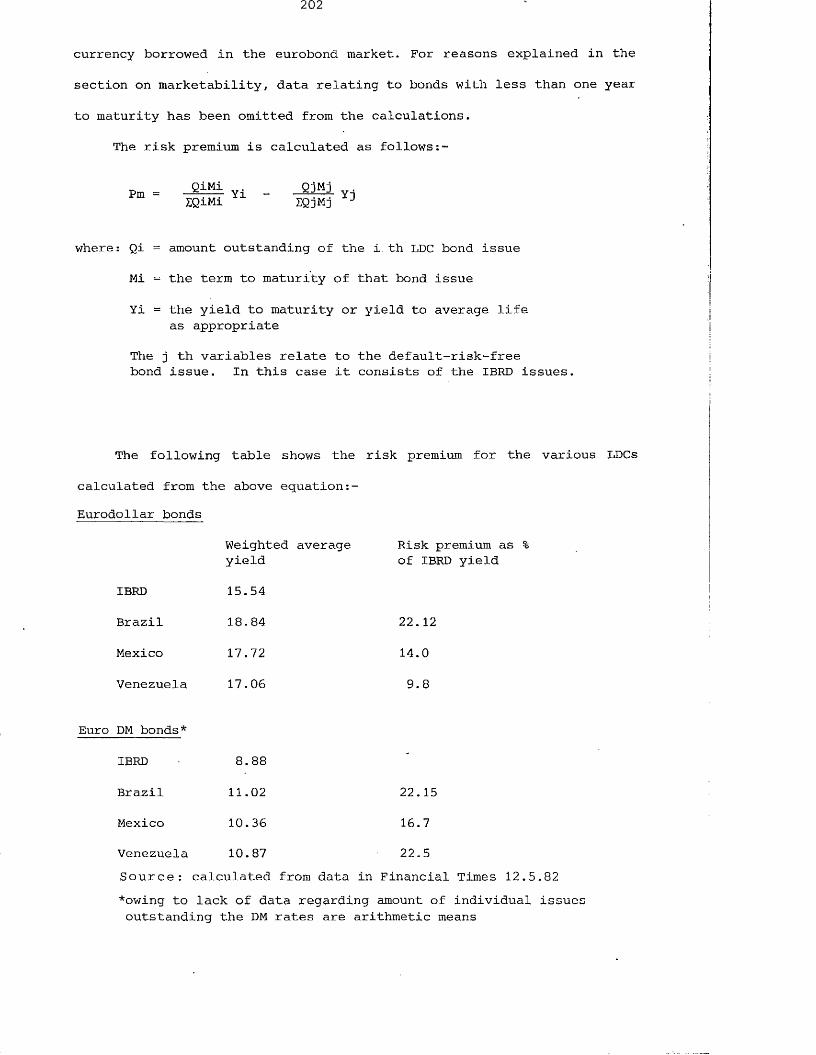
202
currency borrowed in the eurobond market. For reasons explained in the
section on marketability, data relating to bonds with less than one year
to maturity has been omitted from the calculations.
The risk premium is calculated as follows
^ QiMi . QjMjPm = Yi - * . YnEQrMr IQjMD
where: Qi = amount outstanding of the i.th LDC bond issue
Mi = the term to maturity of that bond issue
Yi = the yield to maturity or yield to average life as appropriate
The j th variables relate to the default-risk-free bond issue. In this case it consists of the IBRD issues.
The following table shows the risk premium for the various LDCs
calculated from the above equation:- Eurodollar bonds
IBRD
Brazil
Mexico
Venezuela
Weighted average yield
15.54
18.84
17.72
17.06
Risk premium as % of IBRD yield
22.12
14.0
9.8
Euro DM bonds*
IBRD
Brazil
Mexico
Venezuela
8.8811.02
10.36
10.87
22.15
16.7
22.5Source: calculated from data in Financial Times 12.5.82*owing to lack of data regarding amount of individual issues outstanding the DM rates are arithmetic means

It seems that, at least for Brazil and Mexico, the risk premium
does not differ between the two currencies studied. However, the results
should be treated with caution. Whereas the US dollar yields are
weighted averages calculated as described above, the DM yields are
simple arithmetic means because data on quantities outstanding were not
available at the time of writing.
Despite these reservations, the risk premium paid by an oil
importing country, Brazil, is clearly higher than that paid by oil
exporters, Mexico and Venezuela. The notable point is the large
difference in the risk premium for Venezuela between the currencies.
This is partly due to the different methods of calculation since
calculating the US $ premium as a simple arithmetic mean gives a risk
premium of 12.5. However, the yield curve on Venezuela's DM bonds is
more positively sloped than that of the IBRD and a larger proportion of
Venezuela's bonds have longer maturities. This is clearly shown in
f igure 4.3.
Nevertheless this section does illustrate the substantial risk
premiums which some LDCs have to pay in the eurobond market.
Furthermore, the limited number of countries from which data are
available bears witness to the limited access which LDCs have to the
eurobond market, and to the fact that only the richer LDCs have this
privilege.
In fact there is reason to believe that the risk premium paid by
developing countries is actually greater than that indicated. This is
because the IBRD is a more frequent borrower and also borrows by way of
larger issues than any developing country. Because borrowing is
relatively frequent, and because issues are large, a premium must be
paid. If the IBRD borrowed at the frequency and issue size of developing
countries, it could borrow at even finer terms.
As evidence to support this suggestion, one has only to compare

yields on IBRD bonds with those of UK corporations which individually
are a higher credit risk and are infrequent borrowers. Yet one finds
corporate bonds of similar maturity, with a large number of secondary
market makers but with smaller and fewer issues offering lower yields
than IBRD bonds. Examples are given in appendix 3 to this paper.
Clearly marketability is important and this is dealt with in the
following section.
4.4.4 Marketability
The role of a secondary market is to provide an element of
liquidity to what would otherwise be an illiquid asset. Few investors
would be willing to commit funds for between five and fifteen years if
there were no possibility of reselling to recover capital. The capital
may be required to meet unforeseen financial commitments. However,
resale may be . desired because new, more attractive, investment
opportunities may become available. Alternatively, the investors'
perception of the current investment may deteriorate due to changing
expectations of interest rates, exchange rates or default probabilities.
Clearly the marketability of the security influences its
attractiveness to investors. The higher the marketability, the greater
the attractiveness of the investment, not only for the reasons suggested
above but because, in an established secondary market, transactions
costs, implicit and explicit, will be lower.
As marketability is desired by investors who do not have perfect
foresight but are risk averse, and if we make the widely held assumption
that financial markets are dominated by risk averse investors, then
reduced marketability must be compensated for in some way. The most
obvious way is through a premium on the yield to maturity. Thus less
marketable securities will command a yield premium over more marketable
equivalent securities.

In the euromarkets, this premium is most noticeable between
non-negotiable (non-marketable) eurocurrency deposits and negotiable
certificates of deposits. There is considerable evidence that the
interest rate paid on the non-- negotiable deposits is higher than that
paid on CDs. This is shown in the following data provided by Morgan
Guarantee Trust Company in London.Table 4.4Eurodollar rates of interest in London
CD Interbank
June 1980 3 months 9.10 9.11/166 months 9.05 9.3/4
Sept 1980 3 months 13.60 14.1/86 months 13.65 14-
Dec 1980 3 months 17.80 17.15/166 months 15.85 16.1/8
Mar 1981 3 months 14.20 14.7/86 months 14.20 14.7/8
June 1981 3 months 17.20 17.7/86 months 16.55 17.3/8
Sept 1981 3 months 17.35 17.7/86 months 17.55 18.1/8
Dec 1981 3 months 13.55 13.7/86 months 14.20 14.7/8
Mar 1982 3 months 14.80 15.3/166 months 14.80 15.3/16
NB These rates are quoted in the same format as quoted in correspondence with Morgan Guarantee
The survey of the eurobond market reported in chapter eight noted
the thinness of the secondary market in developing country eurobonds,
therefore one would expect developing country eurobonds to pay a premium
over and above that paid on bonds with a deeper secondary market.
The size of the issue and the amount outstanding may influence the
secondary market yield because the amount outstanding must influence the
size of the secondary market in that particular issue and therefore its
marketability. This point has been discussed at the end of the section
dealing with risk premiums and tentative evidence is given in appendix 3
of this paper.

It will be recalled that, when analysing the default risk premium,
it was noted that the short end of the yield curves of eurodollar bonds
exhibited a negative slope as hypothesised in the literature, thus
suggesting the concept of the crisis at maturity. This feature was
particularly noticeable for bonds issued by Mexico. This point was taken
up with the London market makers of the Mexican bonds.
In the discussions the following points were made in explanation:-
1) With bonds of such short maturity there is not a two way
market (bid and offer quotes) but only bid quotes are
given. This would give an upward bias to the calculated
yields.
2) The IBRD bonds are more frequently traded. There are many
more market makers and bid and offer prices for short
maturities are more easily available.
3) Most trading is conducted in bonds up to two years from
syndication. After that time investors have finished
swapping between portfolios and the bonds are held as
investments. The price quoted is only an ’indication1
price. Actual trading would be at a different price.
It therefore seems that some of the negative slope of the short end
of the yield curves may be due to the lack of marketability and data
inadequacies. Nevertheless, this does not preclude the influence of a
crisis at maturity, but it does obscure its influence on the default
risk premium.
The marketability of the bond may also be thought to influence the
spread between bid and offer prices. The spread is a transactions cost
and it was suggested under the section on the term structure that
transactions costs may differ between maturities and thus influence the
term structure.
This point was also discussed with the market makers of Mexican
bonds. They suggested that the spread was influenced by the

marketability of the bond and not by the term to maturity. Thus a widely
syndicated issue with a long period to maturity will trade at a narrower
spread than a less popular issue with a shorter maturity.
Summary of this section
Although the interest rate costs of eurobonds are influenced by
such general factors as inflation, currency of denomination and term to
maturity, the interest rate costs to LDC bond issuers are specifically
influenced by the risk premium required by investors.
This section shows that the few LDCs that have issued eurobonds
have had to pay substantial risk premiums for such finance. The premium
attached to LDC bonds compared with IBRD bonds includes compensation for
reduced marketability of LDC bonds.
Although the data suggest, at least for US dollar eurobonds, that
investors may perceive a crisis at maturity, it is possible that such
data reflects lack of marketability of such bonds rather than any lack
of confidence.

z u o
Chapter 5
THE IMPACT OF THE INCREASED PRIVATE FINANCIAL FLOWS TO THE DEVELOPING COUNTRIES UPON THE QUALITY OF
BANKS' BALANCE SHEETS
5.1 Introduction
This chapter analyses the impact of past bank lending to developing
countries upon the banking markets in order to determine to what extent
opportunities for future lending are already constrained. The analysis
covers global eurocurrency lending to the developing countries and,
where possible, isolates the lending by UK banks to those countries in
order to highlight the situation of the UK banks.
The following have been suggested as constraints upon future bank
lending to the developing countries
1) The inability of those countries to service a larger stock
of debt because of deteriorating terms of trade, high real
rates of interest and recession in the industrialised
economies.
2) Unsustainable competitive pressure reducing bank profita
bility and therefore the ability to maintain adequate
capital.
3) Capital adequacy in the light of the inflationary
environment.
4) The portfolio preferences of the banks influenced, inter
alia, by risk and profitability and manifested through
the exposure limits that the banks set.
5) Prudential regulations which constrain maturity trans
formation, exchange transformation, exposure to individual
countries and impose capital requirements.
(Ossola 1980, Llewellyn 1982, Spaventa 1982)

Accordingly this chapter proceeds to:-
1) Investigate the growth of worldwide eurocurrency lending
to the developing countries in relation to the growth
of their GNP and growth of export revenues.
2) Analyse the growth of lending to the developing countries
by UK registered banks in relation to those banks'
capital bases.
3) Compare the growth of UK bank lending to the developing
countries with the growth of those banks' overall
balance sheets.
4) Analyse the debt servicing commitment on bank loans
to the developing countries and, in particular, the
influence of inflation on that commitment.
5) Investigate the degree of diversification in the
banks' portfolios of loans to developing countries
and the maturity structure of those portfolios.
Throughout this chapter emphasis is placed not on the absolute
magnitudes but on the trend of those magnitudes over time. This is
because the direction of change in the banking system is more important
than the condition of that system at one point in time.
This study differs from many other studies of developing country
debt (eg Dhonte 1975, Hope 1982, Maynard 1982) in that this study tries
to incorporate where appropriate data are available, the influences of
short term debt on the banks' balance sheets. It has been noted in
chapter two, page 88 that IBRD, IMF and OECD statistics omit short term
debt. Yet short term debt is important to the banks because it still
ranks as exposure to a particular borrower and still has a claim on the
borrower's means of debt repayment. Short term debt is important in the
development process in a number of ways. It is used to finance imports
of the inputs to the development process and it helps alleviate an

immediate foreign exchange or savings shortage. To the extent that short
term debt is trade-related, it is generally thought to be
self-liquidating, that means that when the goods, purchased with short
term credit, are processed and sold the means of payment is automatically
at hand. However, when considering external short term debt it is only
self-financing if the processed goods are sold as exports and earn export
revenues in currencies available for repaying the short term debt.
There is growing concern for the size of the short term debt owed by
some borrowers (Calverly 1982, FT 27.4.82, Amex Bank 1982). This concern
has become more important because many of the traditional country risk
indicators relate only to medium and long term debt. Yet short term debt
has to be serviced and competes with other debt for the nation's stock of
foreign exchange.
Figures from the Bank for International Settlements show that short
term debt owed to banks by developing countries, excluding off-shore
banking centres, rose from US $39 billion in 1976 (quoted by Calverly
1982) to US $162.5 billion in 1981 (BIS 1982). In 1981 the short term
debt accounted for 49.7% of all LDC debt owed to banks in the BIS
reporting area (BIS 1982).
Clearly when evaluating country risk the use of the indicators
relating only to medium and long term debts is inadequate. The most
appropriate indication of financial wealth is total cash flow. This has
the advantage of covering all debt payments and avoids distortions due to
borrowers shifting from well-publicised medium and long term debt into
short term debt.
This distortion is made yet worse when it is realised that much
short term debt also comes from suppliers. The banks and suppliers have
little idea of the total amount of short term credit that has been
extended and therefore there is an urgent need to improve the quality of
information in this respect.
Cash flow management becomes very important for the attainment of
economic policy objectives but it must be doubted whether many
developing governments have the appropriate information of sufficient
quality. This assumption is reinforced when the diversity and quantity
of supplier credits is recognised. To rectify this weakness at least in
terms of bank credit, some use is made in this chapter of the BIS
figures relating to external claims and liabilities of banks in the BIS
reporting area. As this data reflects the total external positions of
the banks in that area both short term and medium/long term debt are
covered. The weaknesses of the BIS coverage of the eurocurrency market
has been recognised in chapter two. However, it is considered that for
the purposes of this chapter the advantages of covering short term debt
outweigh the disadvantages of using this data.
5.2 Growth of worldwide international bank lending to developing countries
BIS figures show that loans by banks in the BIS reporting area to
developing countries grew from US $99.4 billion in 1976 to US $325.1
billion in 1980, an overall growth rate of 327%. IBRD figures show that
total medium and long term debt grew from US $77.9 billion in 1971 to US
$426 billion in 1980, while such debt from financial institutions grew
from US $11.5 billion to US $162.5 billion, an increase of 1439% over
the same period (World Debt Tables 1981) . The OECD figures give US $16.6
billion and US $180 billion as coming from capital markets during this
period, with US $9.4 billion and US $149 billion coming from banks. In
fact, these figures for banks underestimate the true position because
they exclude export credits. The magnitude reported by OECD reflects the
larger number of countries covered by that organisation compared with
the IBRD.
For the purposes of analysis, the borrowers are divided into the
same four income groups as used in chapter one, ie:

212
Upper middle income countries
Middle income countries
Low middle income countries
Low income countries
The writer has taken the BIS figures and aggregated the amounts due
to or from the 91 developing countries used in the IBRD classification of
income groups given above.Table 5.1 Comparison of growth of loans, GNP and exports
Income Group 1976 1980 Growthloans
GrowthGNP
Growlexpoj
Upper Middle Income Group 23,240 75,412 324% 185% 219%
Intermediate Middle Income Group 55,495 203,182 342% 183% 228%
Lower Middle Income Group 15,145 41,030 271% 190% 220%
Low Income Group 1,500 5,513 368% 187% 170%
Total 99,380 325,137
Figures in millions US $*This analysis begins with 1976 data because the BIS did not publish sufficiently detailed data before that date
These figures show growth rates of loans well in excess of those of
GNP and exports but this does not necessarily mean that the risk of
default is greater in 1980 than it was in 1976. It may be that the loans
were used for investment in imported capital components of investment
projects that have a long gestation period. Indeed, it would be expected
that loans would be used for such purposes if economic development were a
major policy objective of these countries. On the other hand, if these
loans have been used to finance consumption so that there is no potential
increase in output the sales of which will service the debts, then there
is prima facie cause for concern.
Even with the loans being used for investment, the external nature
of these loans requires that they must generate or save foreign exchange

in order to be serviced. If the additional foreign exchange resources are
not made available for debt servicing, default may occur.
The figures given in table 5.1 are expressed in nominal terms
despite the fact that inflation does erode the real value of debt and may
result in a net transfer of resources to the debtor as the real value of
amortisation payment at the time of payment is less than the real value
of the loan when originally drawn down. However, inflation will only
cause a net transfer of resources from the creditor to the debtor if the
interest rate charged is below the rate of inflation. If the rate of
interest is above that of inflation, the net transfer will be from the
debtor to the creditor.
A notable feature of much debt contracted on commercial terms has
been that it bears a floating rate of interest. To the extent that these
rates keep pace with or are higher than inflation, any net transfer from
creditor to debtor is cancelled out and where they result in a positive
real rate of interest, the net transfer will be from the debtor to the
creditor.
Therefore, although inflation may reduce the burden of amortising
debt, it is necessary to analyse the influence of interest rates upon the
resource transfer. This analysis is made in the section covering debt
servicing on page 225 below.
It is not possible to conclude whether the growth of bank lending
has been 'good1 or 'bad' from the banks' point of view without any
indication of • the change in quality of bank debt assets that has
resulted. This quality is dependent upon ability of the borrowers to
service those debts; this is discussed below (refer page 225).
5.3 Growth of net bank exposure to developing country borrowers
As the BIS figures are aggregated to the single country level, it
would appear that countries are depositors and borrowers at the same
instance. Indeed this is so as the governments keep some of their foreign

exchange reserves and external working balances with banks in the BIS
reporting area. Moreover, it has already been shown that the poorer
developing countries are net depositors with the banking system.
Figures in table 5.2 show the level of deposits held by the 15 major
borrowers as at 31 December 1981. The ratios of loans to deposits ranges
from highs of 552% and 1013% for Korea and Brazil respectively, down to
96% and 97% for Indonesia and Taiwan.
Table 5.2
Net bank exposure to developing country borrowers
Africa
AlgeriaNigeria
Deposits
3.71.7
Loans
8.36.0
Loans as a % of deposits
224352
Asia
IndonesiaKoreaPhilippinesTaiwanThailandMalaysia
7.53.63.6 6.81.7 3.2
7.219.910.26.65.14.4
96 552 28397
300 137
Latin America
ArgentinaBrazilChileColombiaMexicoVenezuelaEcuador
6.75.2 4.14.3
12.3 19.6
.84
24.8 52.7 10.55.4
56.9 26.24.4
3701013256125462133523
Source: Bank for International SettlementsMaturity Distribution of International Bank Lending July 1983
Amounts: Billions US $

It is tempting to net out the deposits with the loans to
arrive at a figure for net bank exposure to a particular country.
However, at this level of aggregation the writer considers that such
action is invalid. The reasons are: firstly, a borrower considering
default would either have run down its deposits in order to avoid
defaulting or removed its deposits from any banks to which it owed money.
Providing the deposits were removed before the loans are due, such action
cannot be prevented. Secondly, the banks' right of set-off is strictly
governed by law. Therefore, a. bank can only set-off deposits against
loans if the legal beneficiary of the deposits is the same legal
personality as the borrower. The figures given by the BIS do not indicate
to what degree the depositors and the borrowers are the same personality.
In many cases it is reasonable to assume that they are not. Thus, the
banks will not be able to net out deposits with loans. Indeed in many
cases the deposits will be held in different banks from those that
extended the loans.
It is likely that only in the case of a gross political act of
repudiation would the deposits be totally off-set with the loans. This
will result from a freeze on assets of the repudiating country in the
banks' host country. However, as mentioned above, the repudiating country
is unlikely to leave funds upon deposit where it is contemplating
repudiating debt.
Therefore the writer considers the concept of net exposure is
invalid as a means of representing the banks' risk of lending to
developing countries.
• 4 Growth of UK bank lending to developing countries in relation to the banking system's capital base
An inadequate capital base can constrain bank lending in the
following ways:-

1) Bank supervisors, or the banks themselves, may set
minimum capital assets ratios.
2) There may be a minimum acceptable or permissable level
of exposure to a single borrower set in terms of capital.
3) If depositors consider capital to be inadequate, the
banks will have difficulty attracting funds.
Accordingly, this section analyses the relationship between bank
capital on one hand and total lending to non residents and to the 15
major borrowers on the other. The analysis covers three dates: January
1978 ie before the second oil shock, December 1980 ie the end of the
decade and August 1982 ie the most recent figures at the time of writing.
Unfortunately, comparable data for 1973 ie just before the first oil
shock are not available.
UK banking statistics exhibit considerable shortcomings when
required for separate analysis of capital in relation to domestic and
international business. In particular Capital and Other Funds in Tables
3.1 to 3.10 of The Bank of England Quarterly Bulletin (BEQB) includes
items 'in suspense and transmission' for the individual groups of banks
covered. In order to arrive at a proxy for capital and other funds a
rather crude calculation has had to be made as described below.
The concept of capital gives rise to problems in the context of the
UK banking statistics because these cover the capital of UK branches of
foreign banks. Clearly the major capital stock of those branches is that
of the parent organisation in the headquarters country. Therefore, this
section analyses the advances to non residents in relation to the capital
stock of UK registered banks as given in Table 3 of the Bank of England
Quarterly Bulletin.
The method of calculating the figures for capital stock from the
Bank of England Quarterly Bulletin Table 3 is as follows. The summary
table 3.1 gives figures for capital and for transit and suspense items.
Tables 3.2 to 3.6 inclusive and Table 3.10 give a combined figure for

capital items, suspense items and transit items for various groups of UK
registered banks.
The proportion of suspense and transit items in total capital
suspense and transit items is calculated for all banks from Table 3.1.
Then the combined capital, suspense and transit figure for each banking
group is deflated by the proportion calculated from Table 3.1 in order to
arrive at an approximation for capital for each of the banking groups
registered in the UK. These groups cover
1) London Clearing Banks
2) Scottish Clearing Banks
3) Northern Ireland Banks
4) Accepting Houses
5) British Banks: Other
6) Consortium Banks
This methodology for isolating the influence of suspense and transit
items from the Bank of England figures is considered to be acceptable
because these items are mostly associated with the cash transmission
system. This system is dominated by the UK registered banks. The figures
are given in table 5.3 below.
Having derived figures for the UK registered banks' capital stock,
figures for those banks' share of total non resident lending must also be
calculated. This latter set of figures includes sterling and foreign
currency lending to non residents and also comes from Tables 3.2-3.6 and
3.10 of the Bank of England Quarterly Bulletin and are given in table 5.4
below.
The figures in this table show a declining ratio of capital to non
resident advances from 40% to 28% in just four and a half years. The
absolute size of the ratio is misleading because this capital is also the
capital associated with the banking business conducted with UK residents
which is not analysed here. Nevertheless, the trend should alert us to a
potential constraint on future lending to non residents.

Table 5.3 Ratio of capital to non resident loans
Capital of UK registered banks
UK registered banks' E & FC loans to non residents
Capital as % of loans to non residents
January 1 1978
9341
22648
41.2
January 2 1980
12409
32795
37.8
August 31982
17906
63924
28.0
Table 5.4 Proportion of total UK banks' non resident loans accounted for by UK registered banks
Capital
Total non resident advances
Foreign banks' non resident advances
J anuary 1 1978
9341
84946
62316
UK banks' non resident advances 22648
26.6% of non resident advances due to UK registered banks
% of London non resident advances due to foreign banks
73.4
January 2 1980
12409
123551
90756
32795
26.5
73.3
August 3 1982
17906
250021
186097
63924
25.6
74.4
Amounts: £ millions
Sources: 1 From Bank of England Quarterly Bulletin March 1979
2 " " " " 1980
3 " " " December 1982

Table 5.5
UK registered banks' exposure to 15 major LDC borrowers
Jan 1978 Jan 1980 Aug 1982
Argentina 227 632 895
Brazil 1,340 1,957 '2/702
Chile 63 210 506
Colombia 46 74 177
Mexico 1,153 1,880 3,092
Venezuela 234 934 1,082
Ecuador 51 108 184
Algeria 303 376 350
Nigeria 85 259 487
Indonesia 130 102 134
Korea S 161 458 896
Philippines 115 311 532
Taiwan
Thailand 36 92 145
Malaysia 85 114 409
TOTAL 4,029 7,507 11,591Amounts US $ millions ==================================
Loans as % of capital 43 60 65
5 largest borrowers as% of capital $3,257 5,861 8,663
% 34.8 47.2 48.4'
Largest borrower as% of capital 14.3 15.7 17.8
Source: Calculated from BEQB
Table 22 Table 12 Table 12June 1978 March 1980 Sept 1982

The banks' capital stock is used as a cushion to meet unexpected
losses from lending. It is therefore constructive to analyse the impact
of an assumed total repudiation by individual major developing country
borrowers given the trend of declining capital to loan ratios.
To make this analysis we must assume that the distribution of
advances by the UK registered banks to these major borrowers is the same
as that of all non resident advances by those banks.
We take the UK banks' exposure to the 15 major borrowers and deflate
this exposure by the proportion of non resident advances of foreign banks
in the UK to all UK banks' non resident advances given in table 5.4
above. The result will be the proportion of total exposure to these 15
major borrowers that is attributable to UK registered banks. The figures
are given in table 5.5 above. No account has been taken of any deposits
held because of the difficulties of applying the right of set-off as
explained on page 214 above. The features to note are: firstly, loans to
these borrowers as a proportion of capital have increased by over 50% in
just over four and a half years but still are less than threeguarters of
the banks' capital. Secondly, the proportion of lending to the five
biggest borrowers has increased during this period to 48% of the banks'
capital. The largest borrower accounts for 14.3% of capital in 1978 and
this rises to 17.8% in August 1982.
We cannot say, from the absolute size of the figures, that the UK
banks have excessive exposure to these major borrowers. However, the
trends of greater concentration and lower capital/asset ratios are both
moving in the direction of greater risk to the banks.
Having said that, three caveats are in order. Firstly, the figures
aggregate.across all UK registered banks when in fact it is reasonable to
expect that different banks have differing geographical concentrations of
external business. Therefore it is probable that some banks are more
exposed than others to the higher risk LDC borrowers. This may be
particularly so where the banks through their branch or subsidiary

network are deeply involved in certain Latin American or African states.
Nevertheless it is felt that the above analysis is legitimate because it
is the strength and stability of the UK banks as a whole which is
important. One bank may get into financial difficulties but past
experience has shown that a healthy financial system will come to the aid
of the weak institution.
The second caveat is that many of these loans will represent buyer
credits ie loans made by the banks to non residents specifically to
finance UK exports. Many of these credits will be covered by Export
Credit Guarantee Department Buyer Credit Guarantees. These guarantee the
banks for the full principal and interest outstanding. Furthermore, given
the nature of syndicated loans, many participations in syndicates managed
by foreign banks outside London will be buyer credits insured by the
various official export credit insurance agencies of other countries. As
these loans are insured by a government agency of an OECD country, they
do not represent exposure to a developing country borrower.
The third caveat is that advances outstanding do not represent the
whole of the risk that these banks have outstanding to non residents.
There will be considerable contingent liabilities in terms of letters of
credit and various types of guarantees. However again many of these will
be supported by ECGD guarantees.
Having noted these caveats, there are three areas pertaining to the
growing bank exposure to developing countries that are worthy of further
analysis. These are:-
1) The growth of lending to LDCs compared with the
growth of the banks' balance sheets overall
2) The maturity structure of this bank lending
3) The degree of portfolio diversification of
bank lending
The first area is analysed here and the other two are discussed in
subsequent sections of this paper.
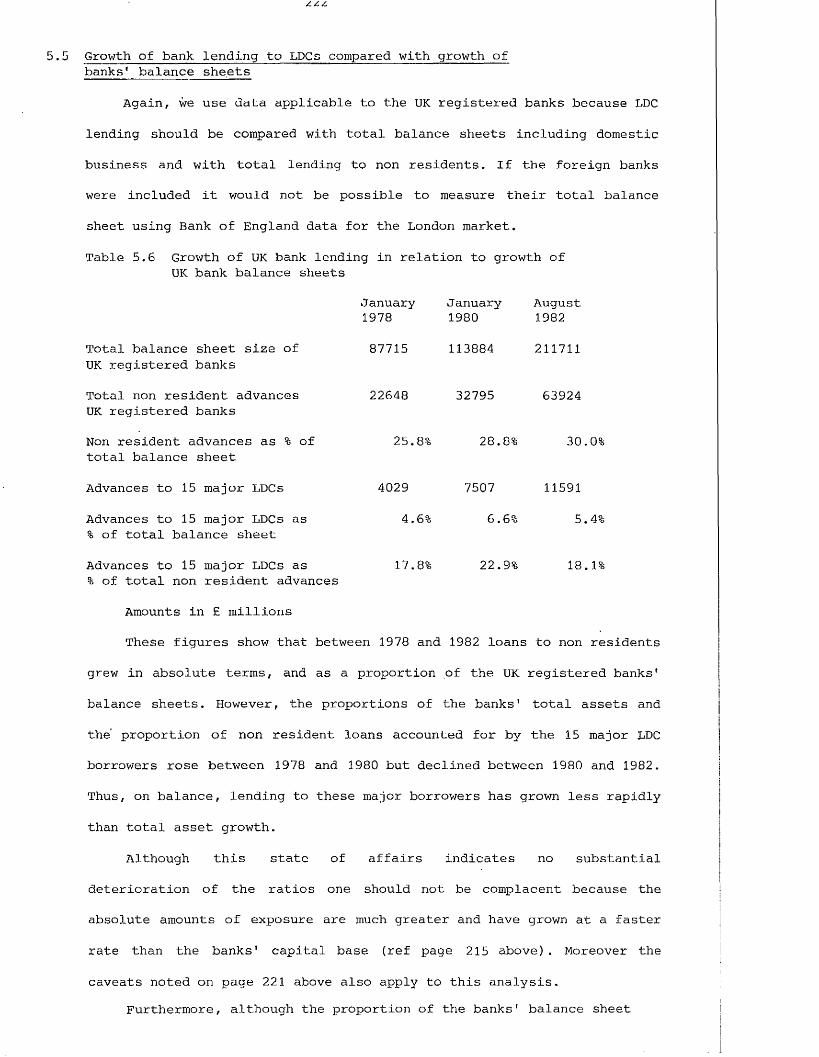
5.5 Growth of bank lending to LDCs compared with growth of banks1 balance sheets
Again, we use data applicable to the UK registered banks because LDC
lending should be compared with total balance sheets including domestic
business and with total lending to non residents. If the foreign banks
were included it would not be possible to measure their total balance
sheet using Bank of England data for the London market.
Table 5.6 Growth of UK bank lending in relation to growth of UK bank balance sheets
Total balance sheet size of UK registered banks
Total non resident advances UK registered banks
Non resident advances as % of total balance sheet
Advances to 15 major LDCs
Advances to 15 major LDCs as % of total balance sheet
Advances to 15 major LDCs as % of total non resident advances
January1978
87715
22648
25.8%
4029
4.6%
17.8%
January1980
113884
32795
28.8%
7507
6.6%
22.9%
August1982
211711
63924
30.0%
11591
5.4%
18.1%
Amounts in £ millions
These figures show that between 1978 and 1982 loans to non residents
grew in absolute terms, and as a proportion of the UK registered banks'
balance sheets. However, the proportions of the banks' total assets and
the' proportion of non resident loans accounted for by the 15 major LDC
borrowers rose between 1978 and 1980 but declined between 1980 and 1982.
Thus, on balance, lending to these major borrowers has grown less rapidly
than total asset growth.
Although this state of affairs indicates no substantial
deterioration of the ratios one should not be complacent because the
absolute amounts of exposure are much greater and have grown at a faster
rate than the banks' capital base (ref page 215 above) . Moreover the
caveats noted on page 221 above also apply to this analysis.Furthermore, although the proportion of the banks' balance sheet
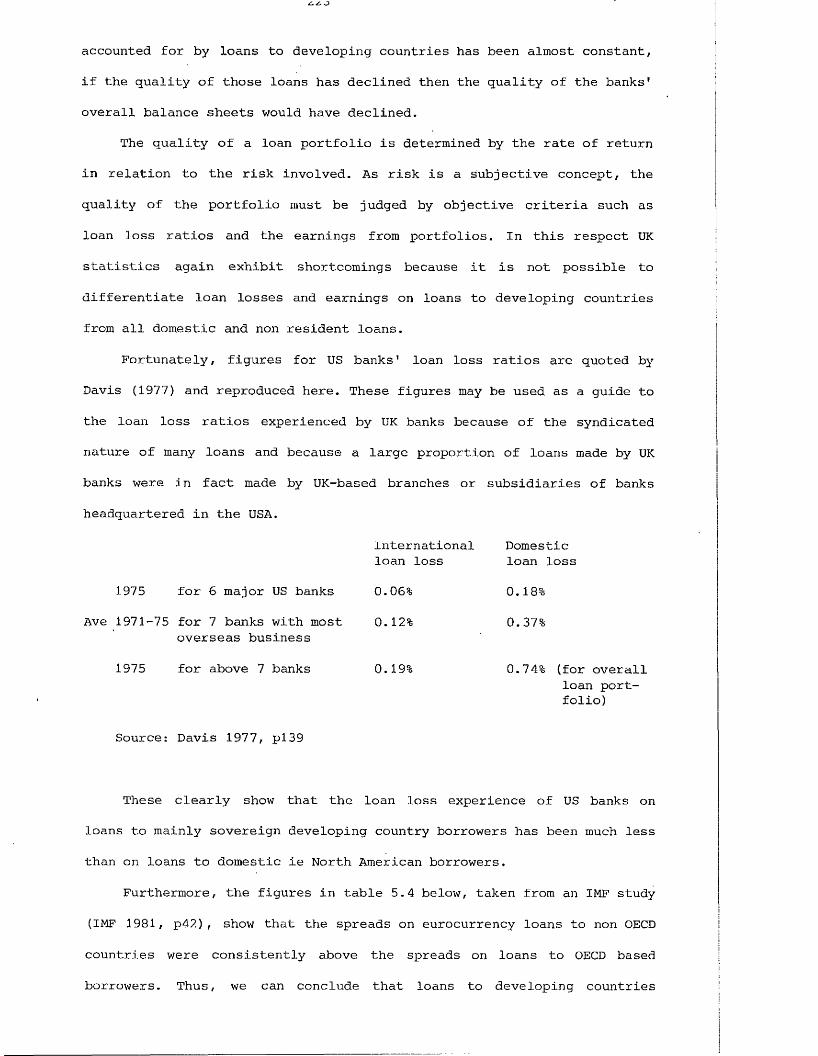
accounted for by loans to developing countries has been almost constant,
if the quality of those loans has declined then the quality of the banks'
overall balance sheets would have declined.
The quality of a loan portfolio is determined by the rate of return
in relation to the risk involved. As risk is a subjective concept, the
quality of the portfolio must be judged by objective criteria such as
loan loss ratios and the earnings from portfolios. In this respect UK
statistics again exhibit shortcomings because it is not possible to
differentiate loan losses and earnings on loans to developing countries
from all domestic and non resident loans.
Fortunately, figures for US banks' loan loss ratios are quoted by
Davis (1977) and reproduced here. These figures may be used as a guide to
the loan loss ratios experienced by UK banks because of the syndicated
nature of many loans and because a large proportion of loans made by UK
banks were in fact made by UK-based branches or subsidiaries of banks
headquartered in the USA.
1975 for 6 major US banks
Ave 1971-75 for 7 banks with most overseas business
International loan loss
0.06%
0. 12%
Domestic loan loss
0.18%
0.37%
1975 for above 7 banks 0.19% 0.74% (for overall loan portfolio)
Source: Davis 1977, pl39
These clearly show that the loan loss experience of US banks on
loans to mainly sovereign developing country borrowers has been much less
than on loans to domestic ie North American borrowers.
Furthermore, the figures in table 5.4 below, taken from an IMF study
(IMF 1981, p42) , show that the spreads on eurocurrency loans to non OECD
countries were consistently above the spreads on loans to OECD based
borrowers. Thus, we can conclude that loans to developing countries
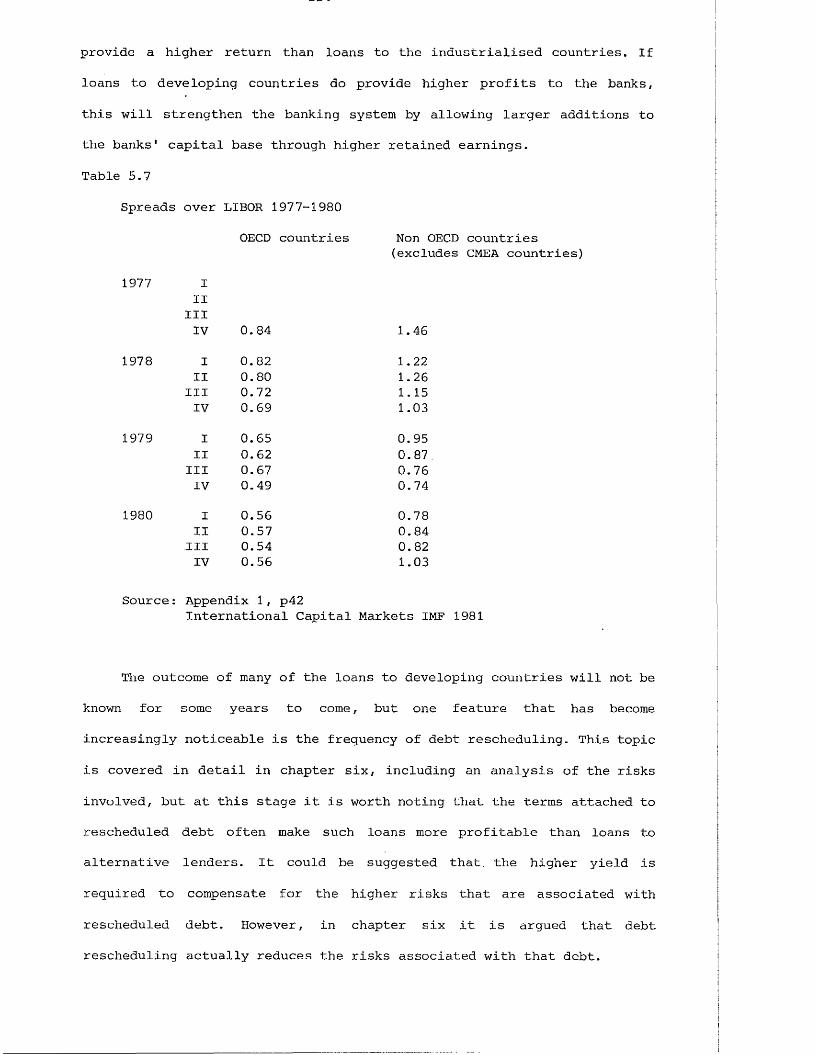
provide a higher return than loans to the industrialised countries. If
loans to developing countries do provide higher profits to the banks,
this will strengthen the banking system by allowing larger additions to
the banks' capital base through higher retained earnings.
Table 5.7
Spreads over LIBOR 1977-1980
OECD countries Non OECD countries(excludes CMEA countries)
1977
1978
1979
1980
III
IIIIV 0.84 1.46
I 0.82 1.22II 0.80 1.26
III 0.72 1.15IV 0.69 1.03
I 0.65 0.95II 0.62 0.87
III 0.67 0.76IV 0.49 0.74
I 0.56 0.78II 0.57 0.84
III 0.54 0.82IV 0.56 1.03
Source: Appendix 1, p42International Capital Markets IMF 1981
The outcome of many of the loans to developing countries will not be
known for some years to come, but one feature that has become
increasingly noticeable is the frequency of debt rescheduling. This topic
is covered in detail in chapter six, including an analysis of the risks
involved, but at this stage it is worth noting that the terms attached to
rescheduled debt often make such loans more profitable than loans to
alternative lenders. It could be suggested that, the higher yield is
required to compensate for the higher risks that are associated with
rescheduled debt. However, in chapter six it is argued that debt
rescheduling actually reduces the risks associated with that debt.

5 .6 The servicing of the growing developing country debt
It was stated on page 212 above that, although growth of debt has
been faster than that of GNP and of exports, that does not of itself
indicate that the risk of default has increased and therefore the quality
of the banks' assets reduced.
What really does influence the quality of these assets is the
ability of the debtor to service the debt. In order to be able to service
an external loan that debt must be used in a way that:-
1) generates a return greater than the debt service payments;
2 ) that return can be converted into the means of making debt
service payments. This will generally mean earning
foreign exchange or saving foreign exchange.
Point 1) is the efficiency criteria and point 2) is the
transferability criteria.
It would therefore seem that a logical start to an analysis of debt
service problems would be to carry out numerous micro economic studies of
the use of external debt. However, there are informational difficulties
in that the efficiency criteria may involve the use of shadow prices and,
given the fungibility of financial capital and of loans for programme
financing, it is difficult to identify the projects being financed
(Gutowski & Holthus 1982).
Furthermore, where this debt is incurred by governments, the return
may be in social as well as private benefits. As such those social
benefits may not directly generate the means of payment for debt
servicing purposes. Therefore the servicing needs will have to come from
the nations' savings. Thus, not only must the investment project be
efficient, but unless it makes an explicit financial return, national
savings must rise to service that debt. What is more, not only must the
savings rise, but it must be convertible into the means of debt service
payments. Therefore the use of the external financial capital must result
in new foreign exchange resources being generated or released from

alternative uses to service the foreign debt.
Clearly, unless one is analysing the fortunes of a clearly*identifiable project with independent control over its foreign exchange
revenues, the analysis of the debt service capacity of developing
countries has to be carried out at the macro economic level.
There is a considerable body of literature developing macro economic
models relating the optimum debt burden to growth rates; for example
Domar (1957), Avromovic (1964), Hayes (1964), Dhonte (1975), Soloman
(1977), IMF (1981). These models assign crucial importance to the real
rate of interest, the growth rate of world demand, the savings ratio and
the terms of trade. However, these models do not take account of the
floating rate nature of a growing number of the loans to developing
countries. Thus, the interest rates on these loans are determined by the
financial market conditions in the industrialised world. Accordingly, thei
real rate of interest on these loans influences not only the cost of
servicing the debt but also the ability to transform domestic savings
into foreign exchange via exports by influencing aggregate demand in the
industrialised world.
We thus are able to define three types of problem situations for
debtor countries relating to the use of the funds
1) The project or use of funds is not efficient ie the rate
of return does not cover the cost of the loan. The more
the country borrows the worse its predicament will get.
2) Although the project is technically efficient, the country
is unable to transform the proceeds or sufficient domestic
savings into foreign exchange.
3) The projects are technically efficient but the rate of
.return includes a 'social1 element and the government is
unable to mobilize sufficient domestic savings to service
the debt.

There is a certain irony about debt servicing. To the extent that
interest and amortization payments are in some doubt, the lending banks
will require to receive both types of payment. However, the lower the
perceived risk of default on these payments, particularly interest
payments, the less the bank will seek repayment. Indeed the banks will be
more willing to roll over such debt. This action itself reduces the risk
of default by reducing the claim on the borrowers1 cash flow to that of
interest payments only.
Clearly the amortization schedule, as well as the rate of interest,
influence the "efficiency" of the project. Therefore, efficiency should
not only be considered in terms of the "performance" of the investment
but also in terms of the appropriateness of the "financial package"
negotiated. In this respect the amortization schedule is important
because the relationship of amortization (outflow) to cash (foreign
currency) inflow will have a considerable bearing upon the
transferability problem. Where the amortization schedule (maturity
structure) of the loan is too short given the timing of the cash flow of
the borrower, the financial package is as "inefficient" as it would be if
the rate of interest charged were higher than the rate of return of the
project.
The figures given below show how total amortization and financial
market amortization have changed relative to GNP and exports between 1976
and 1980 for each of the- four income groups of developing countries. The
data relates to publicised medium and long term loans and therefore
excludes short term loans. To the extent that these figures show both
total and financial market amortization increasing relative to GNP and to
exports, then the financial packages made available to developing
countries would seem to be inefficient. The fact that the proportion of
GNP or exports absorbed by financial market amortization has grown
fastest would suggest that these financial packages could improve their
efficiency for the benefit of both parties. Maybe the growing use of
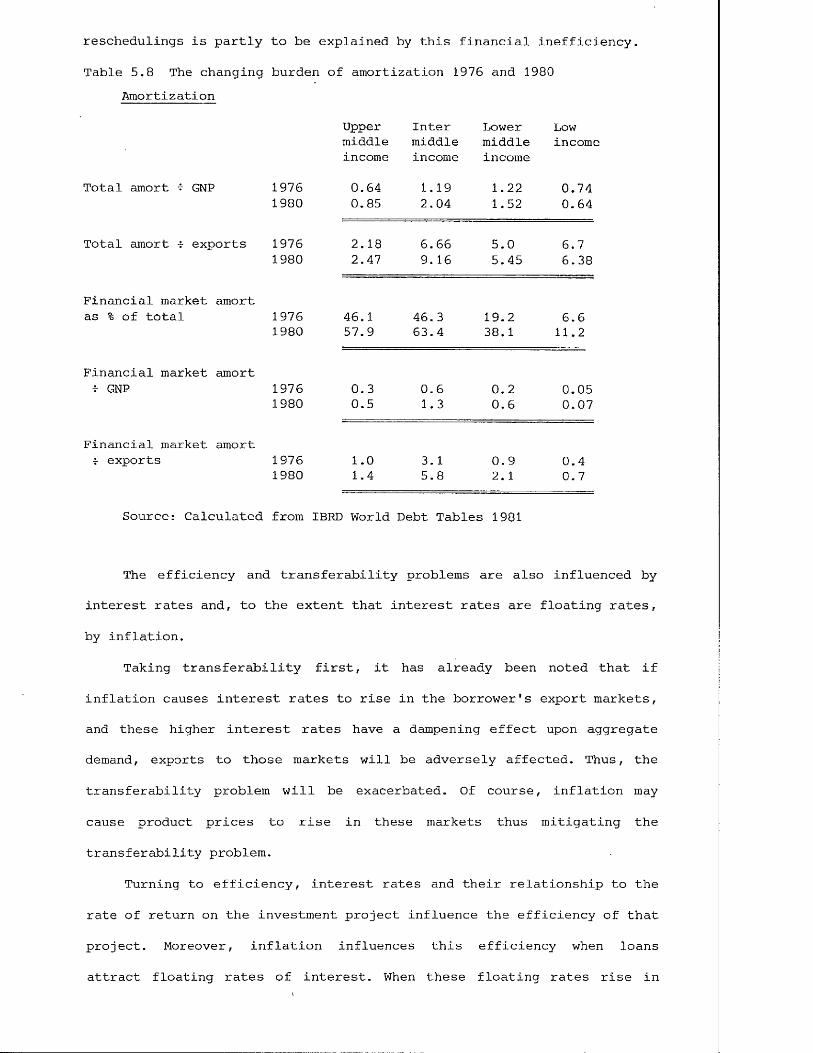
reschedulings is partly to be explained by this financial inefficiency.
Table 5.8 The changing burden of amortization 1976 and 1980 Amortization
Upper Inter Lower Lowmiddle middle middle incomeincome income income
Total amort f GNP 1976 0.64 1.19 1.22 0.741980 0.85 2.04 1.52 0.64
Total amort -j- exports 1976 2.18 6.66 5.0 6.71980 2.47 9. 16 5.45 6 . 38
Financial market amortas % of total 1976 46.1 46. 3 19.2 6.6
1980 57.9 63.4 38.1 11.2
Financial market amort■f GNP 1976 0.3 0.6 0.2 0.05
1980 0.5 1.3 0.6 0.07
Financial market amort•f exports 1976 1.0 3. 1 0.9 0.4
1980 1.4 5.8 2.1 0.7
Source: Calculated from IBRD World Debt Tables 1981
The efficiency and transferability problems are also influenced by
interest rates and, to the extent that interest rates are floating rates,
by inflation.
Taking transferability first, it has already been noted that if
inflation causes interest rates to rise in the borrower's export markets,
and these higher interest rates have a dampening effect upon aggregate
demand, exports to those markets will be adversely affected. Thus, the
transferability problem will be exacerbated. Of course, inflation may
cause product prices to rise in these markets thus mitigating the
transferability problem.
Turning to efficiency, interest rates and their relationship to the
rate of return on the investment project influence the efficiency of that
project. Moreover, inflation influences this efficiency when loans
attract floating rates of interest. When these floating rates rise in

response to inflation, the nominal interest cost rises reducing the
efficiency of the financial package. In fact what actually happens is
that the real amortization schedule is shortened relative to the actual
gestation period of the investment, thus reducing financial efficiency.
The effects of inflation upon the real amortization of a loan are clearly
shown in the following table taken from Kincaid (1981).

cnnOO-HP0)a0a•rHEh
o o 1 O O o f O CM o o O o 40 rHo o O O o O • o o CM CM -1CM CM CM CM CM CM CM CM CM 40 40
CM CO •T—I rH rH
O O 1 O O o 1 O 40 O O O O ft 'st'o O O O o O < O o £» , 40jrCM CM CM CM 40 CM CM CO 'rfCO 40 •rH rH
o O 1 O o o 1 O CO O o o O rHo O O o o o • O o 40 40 . CO40 CM CM 40 CM CM o 40 CM CM to CO
LD 0-1 »rH rH rH
O O 1 O o O 1 O CO o o o O rHO O O o O O • o o CO CO • CMCO CM CM 00 CM CM to CO CM CM rH
40 CO rHT—H CM
O O 11 O o O 1 O CO o O o O r- r—1o O O o O O i o O o O ■o CM CM o CM CM rH o CM rH CO CM r—1- r CO •r r--r-H rH rH \—1 CM
t-0
SI 03Eh
£0OrH
£O£ O •H ■p 0 I—I44£“r-l
o-pu<D4-14HP
0T)o■Hp03ft
o3ft•HO£■HPftft£■Hno£to-P
0nOO•HP(1)ft4040
no ft no no P ft0 £ o O £ £•H •H ■H •H 0 •rHP no P P no0 £ 0 0 4H flft 0 ft ft O 0P P4-1 0 P 4-1 £ 0O P O .—. O O Ptoo £ CM •H o £O ft • ft 0 o 0£ £ 00 £ 0 o■H 0 ■H LO -H P r.0£ .— .■H £ r- .d- £ 0 r—1■rH£ O £ £ £•H o £ -H II 0 ■rH 0 II £ft o 0 ft O ft P 00) r>O £ 0 R i—1 0 R 0
S i 0 r—trH •->0 S i 0 £ S i 0 0 £ i—11—1 P O i—I 0 0 i—1 £ 0P £ 11 1—1 £ i—1P £ •—- P p £ no rHnsno 0 0 0 no 0 0 no 0ft0 CO R 0 U 0 0 0 0 P 0 0 0 0;£ p 3 P P ft,£ p O ft ,£ p O P£ o £ 0 P 0 £ o £ -rH P £ a £ •H■H cn 0 — no 0 P -H 0 0 > 0 *H 0 0 > nono § 0 ft no B P 0 no 6 P o£ £ Pi 0 *H P £ £ >i 0 0 P £ £ kH 0 0 ■Hrs 0 0 £ O P o 0 0 O 0 O 0 0 0 0 0 a 0 p£ P ■H ft 'rH 0 r—1 0 P •H ft■H P p •H ft■H 00 0 -P > ft P 0 P > P £ 0 P > P ft X■H P 0 P P 0 p 0 P P S i ■H p 0 P P S i 0-p £ N 0 0 0 £ P £ N 0 0 0 £ N 0 0 0 0 no(0 0 •rH 0 0 ft O £ O ■H 0 0 nO 0 O ■H 0 0 no ft £1—1 P P 0 ■H •H P P rH P P 0 •Hm £ P 0 P P P £ P 0 P i—I P £ P 0 P r— i p£ n3 0 P S I 0 0 no 0 0 P rQ 0 0 0 O P S i 0 0 0■rH Q s £ 0 > l—1 0 O R £ 0 0 -H O £ 0 0 > oH S3 H Q < 4-1 X P H Q P P P H P Pi < -Ho £ ■H 0 Ps H > P

This table shows with a constant real rate of interest (here assumed
to be zero), inflation reduces the real amortization. However, where the
floating interest rates keep pace with inflation, the real amortization
is not reduced, it is in fact accelerated but the total real amortization
is not increased. Thus, in the examples given above, the average period
that a 5 year loan is outstanding, assuming no inflation and equal
amortization, is 3 years; with 10% inflation that period is reduced to
2.66 periods. Indeed the influence of inflation in reducing the real
maturity is greater the longer the maturity of the loan.
The following figures show the influence of rising interest rates
upon the debt service costs of the developing countries.Table 5.10 Impact of interest rates on debt service burden 1976-1980
Uppermiddleincome
Intermiddleincome
Lowermiddleincome
Lowincomt
Total interest as % of GNP 1976 0.43 0. 84 0.64 0.411980 0.7 1.84 1.22 0.41
Total interest as % of exports
19761980
1.462.03
4.78.25
2.634.35
3.694.1
Financial market interest 1976 55.9 62.1 42.2 8.0as % of total interest 1980 66.8 76.9 53. 9 18.34
Financial market interest 1976 0.24 0.52 0.27 0.03as % of GNP 1980 0.47 1.4 0.6 0.07
Financial market interest 1976 0.8 2.9 1.1 0.3as % of exports 1980 1.3 6 . 3 2.3 0.7
Source: Calculated from IBRD World Debt Tablesi 1983
These figures show that the total interest element of SI
public medium and long term debt has roughly doubled between 1976 and
1980 except for the low income group of countries where there has been no
change. Furthermore, the total interest burden has risen relative to
exports but at a slower rate than relative to GNP.

Regarding the figures for financial market interest, we note first
of all, the growing proportion of this form of interest in the total
interest burden. It is also noted that the burden of financial market
interest payments has grown faster in relation to GNP and exports than
has total interest.
Both the trends for total interest and financial market interest
payments are alarming. They indicate that not all the additional external
finance obtained between 1976 and 1980 is earning sufficient external
resources to meet the interest servicing requirements. This suggests that
debt has either been incurred to finance consumption or that the
financial package has become inefficient.
Two areas of inefficiency will be examined. Firstly, rising interest
rates on floating rate debt. Secondly, inadequate grace periods on loans
particularly in relation to interest payments.
The impact upon interest rates of inflation and the results on the
real maturity of the loan have already been noted. However, this does not
fully explain the deteriorating interest payments to exports ratio. One
further factor is the increasing importance of floating rate debt from
commercial sources. This is clearly shown in the following figures
showing this trend on a regional basis.Table 5.11 The changing importance of floating rate loans
% of floating rate loans in total loans 1971 1980
Africa South of Sahara 2.7 21.1
East Asia & Pacific 2.2 26.1
Latin America & Caribbean 7.4 58.5
North Africa & Middle East 2.2 19.2
South Asia - 0.9
More developed Mediterranean 4.2 29.0Source: IBRD World Debt Tables 1983A second factor is that the 'inflation rate1 that influences money
market rates in financial centres may not be the same rate that
influences export prices. A comparison of any country's import price

index and retail price will confirm this.
A third factor is that interest rates may be influenced by domestic
monetary policy in the industrialised countries. Thus, once again, rising
interest rates may not be compensated by rising prices of developing
country exports. The recent monetary history of the USA and UK, whereby
real rates of interest are high in historic terms, confirms this.
Clearly the increased interest rates do increase the risk of
default, not only by making a greater claim in nominal terms on the
nation's foreign exchange reserves, but also by shortening the real
maturity of the loans and affecting the financial efficiency of the
project and the financial package. This necessitates the borrowers'
refinancing or rescheduling their debts so that the real maturity of the
loan matches the gestation period of the project for which the loan is
required.
However, to the extent that interest rates rise faster than export
revenues, the debt service ratio deteriorates. As this ratio is used by
bankers in evaluating country risk, this deterioration makes it more
difficult for the sovereign borrowers to obtain the finance they require.
The influence of rising interest payments on the debt service ratio is
reinforced by the influence of those payments upon the current account of
the balance of payments. The higher interest payments cause the current
account to deteriorate when in fact, as part of those payments are
amortization, they should be recorded in the capital account. Thus, the
balance of payments/GNP ratio deteriorates which is another country risk
indicator used by the lending banks.
If the increased risk due to the shortened real maturity of the loan
is to be avoided, refinancing or rescheduling is required and yet while
the banks maintain exposure limits and capital adequacy measures in
nominal terms, these will act as constraints to further lending.
Furthermore, as inflation adjusted interest rates mean a shortening of
the real maturity, they reduce the risk to the financial intermediary.

This is because the eurobanking financial intermediary attracts its
deposits by way of floating rates of interest. Thus as deposit interest
rates compensate for inflation, the real maturity of the deposits also
falls. However, as noted above, the proportionate reduction in the real
maturity of a loan increases with maturity. Therefore, given the degree
of maturity transformation by the eurobanks, the real reduction in loan
maturity will be more than proportionate to that of deposits. Thus one
risk, that of maturity mismatch, is reduced, at least in real terms. This
in itself should be recognised by the banks when considering requests for
refinancing and rescheduling.
The problem of inadequate grace periods on loans divides itself into
two areas: one the grace period on principal, the other the grace period
on interest payments. The grace period on principal creates less of a
problem. The solvency of the borrower will be enhanced, and therefore
risk of default reduced, if commencement of amortization payments
coincides with the cash flow from the project (including increased
foreign exchange resources resulting indirectly from social projects).
Such terms are a common feature of financial packages and easily adjusted
by the lending banks to coincide with the expected cash flow from the
project.
However, a grace period regarding interest payments is much less
common. It will be argued in chapter six in this thesis (page 272) that
banks may not require that principal is repaid but that it is essential
that interest receipts remain current. Consequently, granting a grace
period on interest payments causes an immediate deterioration of the
bank's profitability. Given the high growth rate of bank lending to
developing countries during the late 1970's, if the granting of such
grace periods was to become common practice, the banks' internal finances
would be under severe pressure. As a result of the infrequent use of
grace periods on interest payments, a deterioration of the interest
payments to GNP and interest payments to exports ratios is to be expected

when there is new borrowing and projects have gestation periods that
extend beyond the current accounting period.
To give some indication of the average of grace periods on
amortization, the following figures have been extracted from the IBRD
World Debt Tables, 1981:Table 5.12 Average grace periods on loans 1971 and 1980
1971 1980
Africa South of Sahara
Private creditors 2.4 3.1Official creditors 8.2 6.6
East Asia & Pacific
Private creditors 2.6 3.1Official creditors 6.9 6.1
Latin America & Caribbean
Private creditors 2.5 3.7Official creditors 5.3 4.4
North Africa & Middle East
Private creditors 2.5 1.6Official creditors 5.6 6.3
South Asia
Private creditors 2.2 2.1Official creditors 7.3 8.1
More Developed Mediterranean
Private creditors 5.5 4.7Official creditors 7.9 6.4
These figures present a picture of inadequate grace periods
particularly from private creditors and for some regions grace periods
have been falling over time. To the best of the writer’s knowledge,
figures for periods of grace on interest payments are not available.
The amortisation schedule of the debt is also influenced by the
willingness of the borrowers and lenders to increase short term debt
relative to long term debt. The current concern about the growth of short
term debt has already been noted. The increased growth of short term debt
appears to be due to two main factors. Firstly, as interest rates

generally have reached historically high levels, borrowers have shifted
into short term debt in order to reduce interest costs. As the banks
perceive the growing debt of the developing countries as constituting a
higher level of risk, those banks have shortened the maturities available
in order to reduce the time period of their exposure to a particular
borrower. Both these actions ignore the influence of shorter maturities
upon the cash flow of the borrower. The result has been a considerable
increase in debt service payments. This greater debt service burden has
in fact increased the risks of default which the lenders sought to avoid
and has increased the burden upon cash flow which the borrowers sought to
avoid. These actions by the borrowers and the lenders increase the risks
of default because short term debt has the wrong maturity structure for
economic development and macro economic adjustment.
The following table shows the impact upon debt servicing of
including short term debt, assuming that debt due within one year will
have to be repaid in that year, by comparing the servicing commitment of
debt reported by the BIS and that reported by the IBRD. It may be argued
that short term debt will be rolled over at maturity but this is by no
means certain and, if confidence wanes, such renewal of debt will become
unlikely.
Table 5.13 Impact of short term debt upon total debt service
Debt to banks reported by BIS 1978 1981
Total debt to banks1 155.3 326.7% of total debt' due within 1 year 46.3 49.8/. Total debt due within 1 year 71.9 162.7Interest burden on debt due (assumed to be 15.5 52.27average rate for 1 year ie 10% for 1978,16% for 1981)---------------------------------------------^------ _ _
Total servicing cost of all bank debt 87.4 214.97Debt to financial markets reported by IBRD
Amortization due to financial markets2 13.85 17.57Interest due on such debt2 6.29 20.96
Total debt service medium term debt only2 20.14 38.531 BIS Maturity Distribution of International Bank Lending July 19832 IBRD World Debt Tables 1882/83

These figures show the magnitude of the shortcomings of analysing
only medium term debt. Adding short term debt and a notional figure for
interest (taken here as averaged LIBOR for the year in question) on that
debt has increased the debt service burden by over fourfold for 1978 and
by over fivefold in 1981. Even if we take the view that the debt will be
rolled over, the interest on that debt more than doubles the interest
servicing costs of total debt.
These figures will not be totally accurate because of different
country coverage and because we do not know the actual interest bill on
the short term debt. However, they do give some indication of the
importance of including short term bank debt in the servicing costs of
total bank debt.
5.7 The net transfer of funds
The concept of the net transfer is used by some analysts to measure
the net flow of resources from medium and long term international
lending. Figures produced by the IBRD of the net transfer omit short
term debt. However, changes in the short term debt from year to year
will influence this net transfer. In particular, if short term debt
decreases over time, the net transfer will be less than that suggested
by the IBRD figures and if short term debt rises, the net transfer will
be higher than the IBRD figures suggest.
Yet again total cash flow in relation to a country's debt should be
considered. When that cash flow becomes negative, the borrower is
repaying more than it is receiving in each time period. Given the
scarcity of external financial resources to some developing countries,
and that a negative cash flow in relation to external debt makes that
scarcity greater, the borrower may consider repudiating the debt.
For such a policy to be rational, the borrower must be certain that
there will be no further need for external finance and, in the case of
bank finance, no further need for the banks' services generally. Given

the-continuous need for development finance, balance of payments finance
and the need for banking services associated with international trade,
it would not be rational for borrowers to repudiate bank debt.
As the following figures show, some of the major debtor countries
have experienced negative net transfer in recent years. Indeed, it was
shown in chapter one that the poorer developing countries have a
continuous negative net transfer in relation to bond issues. Yet they do
not repudiate those issues because it would reduce their chances of
gaining private and official finance in the future.

Net
transfer
from
financial
mark
ets
CM o CO CD X— 1 CM in e' Ol
o 00 cn CM CD CD in rH en T— 100 r- o m CM rH CO CM CD t-HOi o o x-H O ’ CM ro CM 1 ox-H x^
iI tH
x— i rH Ol CO Ol Ol CO ro CO01 CD i n CO o CD Ol TF CD tF['- in 'd' H Ol 00 CO ^f ro O'Ol •o’ C O CD CO CM r- in Oi CMx-H t-H CM CM t-H
ro O ’ r- t-H 00 ro o T— 1 Oi00 O ’ CD o ’ in r- CO Ol CO rHr-' oi r- in o ’ X— 1 CD o r-Ol co co CD I CM O' X t in t-H
in CM CM CM t-H
ro x— 1 in CD n- CO CM CM CMr~ CD CO CM O r- r- CM LO T-[r~- *— t O t-H X—I Ol CM v—toi in CO rH ■o* X— 1 r- t-H 1
CM ro x-l T— t
r- CD Ol CO O' r- 00 in CO
co m Ol CM CM tF CM co O'r-> x— 1 Ol 1 rH 00 O in r- x-HOl x-H CO I CM co r- 1t—I 1 CM ro
00 CM in o Ol t—\ C31 ■O'in -■O’ o r- CM r- CM in t-H inr~ o CM 00 t-- CD ro LO )Ol CO r- 1 CM CM CDx-i 1 x— 1 CM l
01 CM Ol 00 in CO t— 1 O' Olro CD r-- CD o 'd’ O \— 1 tH r~-r - r-' in o tH ro t-H loi cn x-H rH 1 o
CM O' in CD ro CDt-H r-~ 00 CM o* OCOt-H CD
COI 1 o
t-H CDxH
CJ1 CM
ro O roCM CO 00LO CO in
O' r- inX ■ ■Ol CM CMt~- Ol CMCM CO CD1 X—1
CO CO inCD r- CMCD CD COCM1
CD
LO CO 00T}c CM oiO' CM CO'd’ CO
CD t-H oCM ■O’ COt-H x-l r-'CD CO O'
CO 00 inrM CM CDCD 00 COo COx-l
o CM t-Ho r-' OlO inCM I
OroCM
roco
inroCO
r- ro
r-'oo
oCM
oI
CDCM
inO’CM
r-'co
oo[ -•-
-vT o’CMCO
enCOx-tI
r--co CMI
CM CM CM 0+ CM e'o CD O EH O en1 O
t-H CO1 § 1 CO
nidEh
id cdG rO r—!
•H ■H Sh 0 cd cdH-> t—I HQ 0 0 P cd •iH •HG -*H 0 S <0 u N u Sh Sh0 N f—I O id •H 0 ■H 0 0Cn nJ ■H i—1 P X G Sh Cn tnSh in ■G O u 0 0 P h rH ■rHW U o H > <
-H ■iH c 0 cd0 i n o i G ■H0 o n G cd toG cd ■H cd xH > iO 0 i—1 £ -rH cd
< 0 Sh -H ■H cd i— 1G o HG id -G
H P h B Eh s
CODwgo■HrH i—i •H £U)0ShPO*rHpH
0)oShPOCO
IBRD
World
Debt
Tables
1982/83
5.8 The degree of diversification in bank loan portfolios
The degree of concentration of bank loan portfolios was discussed
on page 220 above. This section applies the mean-variance model of
portfolio selection as developed by Markowitz (1952, 1959) and extended
by Tobin (1958) and Sharpe (1964). The aim is to determine whether or
not the banks do have fully diversified loan portfolios.
The mean-variance model aims to explain the selection of efficient
portfolios. Efficiency is defined as not being able to increase the
expected rate of return without increasing the risk or not being able
to lower the risk without lowering the expected rate of return.
This model assumes that the characteristics of a portfolio can be
summarised by two measures. One, the return on the portfolio, and the
other, the risk attached to that portfolio. The rate of return is
measured by the average expected return on each of the securities in
the portfolio weighted by the proportion of each constituent security;
the mean. The risk is measured by the square root of the variance; the
standard deviation, of the probability distribution of the expected
rates of return.
The expected return on the portfolio is therefore given as:
NE (R port) = WiRii=l
where: E (R port) = expected return on portfolio
Wi = the proportion of security i inthe total portfolio
Ri = the expected return on security i
Although the expected return on a portfolio is the weighted
average of the expected return on each security, the risk of the
portfolio cannot be measured by the weighted average of the standard
deviations of each security. The reason is that, in measuring the risk
of the portfolio, we are not only concerned with the variance of the
returns but the degree in which the returns of individual securities

fluctuate together. Clearly therefore the degree of correlation between
the variance of expected returns of pairs of assets is required.
Markowitz therefore incorporated the covariance of returns between pairs
of assets in the portfolio standard deviation as follows:
n n na port = / 2 Wi2 ai2 + 2 2 E Wi Wj Covij
i=l i-1 j=l
where: a port = the standard deviation of the portfolio
Wi2 = the weights of the individual assets where theseweights are the squared proportions of individual assets in the portfolio
ai2 = the variance of asset i
Covij = the covariance between the expected returns forassets i and j
The importance of the correlation of the returns between pairs of
assets can be explained by the fact that if the expected returns always
moved together, there would be no benefit to be derived from
diversification. Where the returns are perfectly positively correlated
the standard deviation is the weighted average standard deviation of the
individual assets. However, where the expected returns are less than
perfectly correlated, the standard deviation of the portfolio will be
less than the weighted average of the standard deviations of the
individual assets. Moreover, the portfolio standard deviation declines as
the degree of correlation declines so that the portfolio standard
deviation is least when the expected returns on each pair of assets is
perfectly negatively correlated.
Thus, effective diversification does not just mean adding assets to
the'portfolio, but adding assets whose returns are least correlated with
the existing assets in the portfolio. This would be computationally
onerous and Sharpe (op cit) reduced the computational requirements by
comparing the correlation between individual assets and an index of all
similar assets.

We can therefore see that if the riskiness of a security is less
when that security is held in portfolio, that is that the riskiness of
an individual security overstates the riskiness of holding that security
in portfolio, then some of the individual security's risk can be removed
by diversification. However, some part of that individual security's
risk will remain as a factor in the overall portfolio risk. This implies
that total risk comprises two parts: 1) that which can be diversified
away (an unsystematic element), and 2) that which cannot be diversified
away (a systematic element). The unsystematic risk is uncorrelated with
the risks of the portfolio but the systematic risk is so correlated.
Thus, Total Risk = Systematic Risk + Unsystematic Risk. This
classification will be used later to classify the risks associated with
bank lending as those risks common to all loans and those risks which
are loan specific.
The choice of efficient portfolio
To illustrate the choice of an efficient portfolio assume two
securities whose returns are not perfectly correlated. If the relative
combinations of each security are changed, a variety of portfolios is
possible each with different security weightings but a constant degree
of correlation between returns. A locus of the possible trade-offs
between risk and return is depicted in figure 5.1.
£ C
Figure 5.1 Efficient portfolios: Fig 5.2 Efficient portfolios:two assets many pairs of assets

If we carry out similar calculations for a variety of combinations
of different pairs of assets, we get a series of plots as shown in figure 5.2. The
envelope curve in figure 5.2(EC) is the frontier of efficient portfolios.
The analysis above assumes that all assets are risky and that there
is no facility to borrow. However, if a risk-free asset and borrowing at
the risk - free rate are introduced, the efficient combination of
portfolios becomes the straight line marked CML in figure 5.3 below.
Figure 5.3 Choice of efficient portfolios with risk free asset and borrowing
Anywhere along the line between RFR and M investors will invest in
combinations of the risk-free assetpusually considered to be a short term
government bond^and the portfolio M. Beyond M investors borrow at the
risk-free rate and invest in the risky portfolio M.
Anywhere along the line between RFR and M investors will allocate
their wealth between the risk-free asset and the portfolio M depending
upon the amount of risk they are willing to bear. Beyond M investors will
be willing to borrow (assumed to be possible at the risk-free rate) and
invest in multiples of the portfolio M, again depending upon the amount
of risk they are willing to bear.
The actual choice of portfolio will depend not only upon what
portfolios are efficient, but also upon the utility function of the
investor. The bank investor is assumed to be risk averse and therefore
like all risk averse investors requires more return to compensate for a
greater risk (Tobin, op cit). There is therefore a utility function where
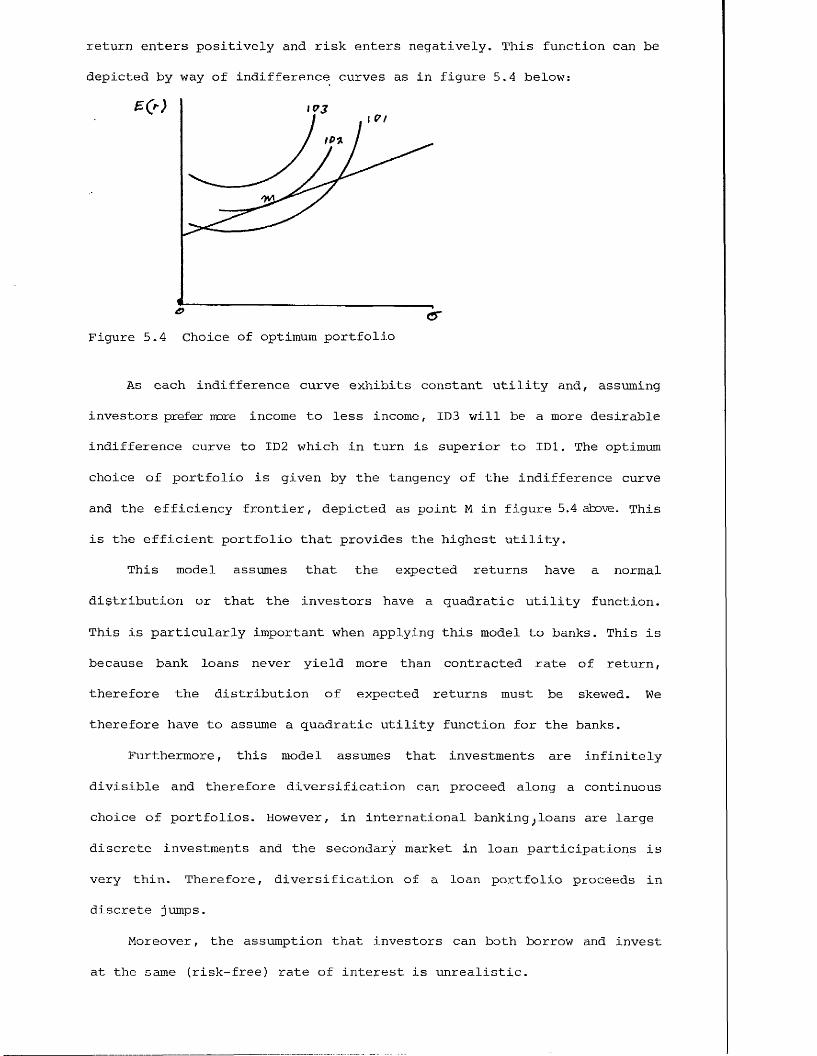
return enters positively and risk enters negatively. This function can be
depicted by way of indifference curves as in figure 5.4 below:
Figure 5.4 Choice of optimum portfolio
As each indifference curve exhibits constant utility and, assuming
investors prefer more income to less income, ID3 will be a more desirable
indifference curve to ID2 which in turn is superior to XD1. The optimum
choice of portfolio is given by the tangency of the indifference curve
and the efficiency frontier, depicted as point M in figure 5.4 above. This
is the efficient portfolio that provides the highest utility.
This model assumes that the expected returns have a normal
distribution or that the investors have a quadratic utility function.
This is particularly important when applying this model to banks. This is
because bank loans never yield more than contracted rate of return,
therefore the distribution of expected returns must be skewed. We
therefore have to assume a quadratic utility function for the banks.
Furthermore, this model assumes that investments are infinitely
divisible and therefore diversification can proceed along a continuous
choice of portfolios. However, in international banking^loans are large
discrete investments and the secondary market in loan participations is
very thin. Therefore, diversification of a loan portfolio proceeds in
discrete jumps.
Moreover, the assumption that investors can both borrow and invest
at the same (risk-free) rate of interest is unrealistic.
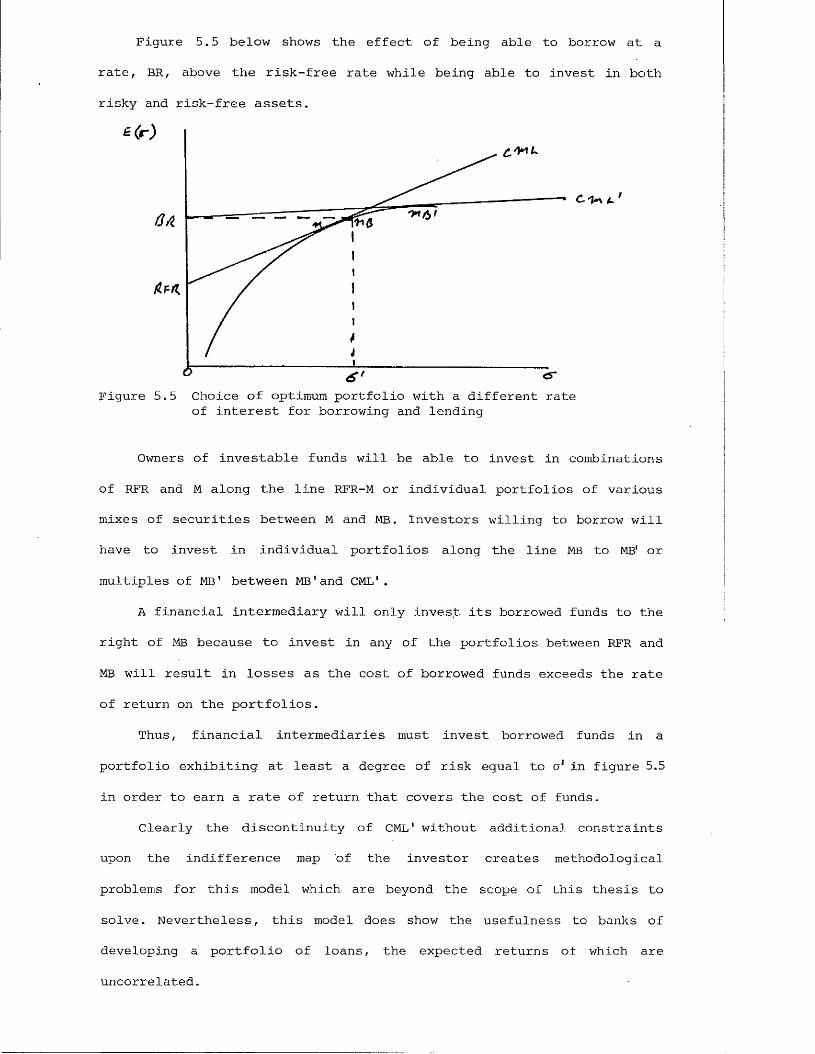
Figure 5.5 below shows the effect of being able to borrow at a
rate, BR, above the risk-free rate while being able to invest in both
risky and risk-free assets.
Figure 5.5 Choice of optimum portfolio with a different rate of interest for borrowing and lending
Owners of investable funds will be able to invest in combinations
of RFR and M along the line RFR-M or individual portfolios of various
mixes of securities between M and MB. Investors willing to borrow will
have to invest in individual portfolios along the line MB to MB' or
multiples of MB' between MB'and CML*.
A financial intermediary will only invest its borrowed funds to the
right of MB because to invest in any of the portfolios between RFR and
MB will result in losses as the cost of borrowed funds exceeds the rate
of return on the portfolios.
Thus, financial intermediaries must invest borrowed funds in a
portfolio exhibiting at least a degree of risk equal to a1 in figure 5.5
in order to earn a rate of return that covers the cost of funds.
Clearly the discontinuity of CML1 without additional constraints
upon the indifference map of the investor creates methodological
problems for this model which are beyond the scope of this thesis to
solve. Nevertheless, this model does show the usefulness to banks of
developing a portfolio of loans, the expected returns of which are
uncorrelated.
246
Therefore, a more useful aspect of this model is the division of risk
into systematic and unsystematic risk. Thus, if a banker is able to
identify the unsystematic risks in his loan portfolio, the banker will be
able to reduce the overall risk of his portfolio by taking on loans where
the unsystematic risk has a low correlation with such risks in the
existing loan portfolio.
Unfortunately, lack of data does not allow the variance of returns,
which is in any case likely to be skewed as noted above, to be measured.
It should, however, be possible to isolate causes of risk that are common
to a whole portfolio of loans and those causes which are not necessarily
common to the whole portfolio. This section therefore proceeds to
determine those causes of risk that are common to the whole portfolio. It
then analyses the extent to which causes of risk that are not common to
the whole portfolio are in fact common to many of the loans in that
portfolio. Thus, if we find that many loans share these common causes of
risk, which need not be common to the whole portfolio, we will conclude
that the banks have not sufficiently diversified their portfolios.
The data for this analysis is that relating to external claims of
banks in the BIS reporting area. The analysis makes the assumption that
each country has borrowed on one loan equal to the total outstanding to
the banks. We are therefore only determining the degree of diversification
in respect to country risk. In reality some of the loans will be to
private borrowers; we therefore implicitly assume that sub-portfolio of
loans within a particular country is adequately diversified. This
assumption must be made in this study because of data limitations.
However, it is considered by the writer to be an area where
further research would be very beneficial both to the banks and the
regulatory authorities.
Causes of risk common to all loans
The most notable cause of systematic risk on euroloans is the
system of linking interest costs to fluctuations in LIBOR or a similar
reference rate. Thus, where money market conditions in the major
financial centres cause rates of interest to rise, all eurocurrency
loans in a particular currency will respond accordingly. Given that
unanticipated increases in debt servicing costs increase the risk of
default, the linking of loans to q common fluctuating interest rate is a
source of systematic risk.
Another source of systematic risk will result from exchange rate
fluctuations. To the extent that most loans are denominated in US
dollars and the trade weighted exchange rate of the dollar rises, the
servicing costs of the loan rise, ceteris paribus. However, the
borrowing countries' dollar export earning may also rise; this is
discussed in more detail below.
A third cause of systematic risk is that in order to earn external
funds for servicing the debt, export sales are required. Therefore, to
the extent that a world recession reduces international trade globally,
there will be a systematic element of risk as all borrowers will
experience a deterioration of their export earnings.
Influences upon unsystematic risk
At the country level the most notable influences are the country
specific sources of export revenue. To determine to what extent
diversification is providing uncorrelated sources of export revenue
between countries, it is necessary to analyse the export markets of each
debtor country and the commodities that constitute its exports.
Although sources of export revenues could be country specific,

evidence from appendices IV to VI suggests that there are some common
elements. To the extent that export revenues of the borrowers a xe
dependent upon common sources, they will represent a less than fully
diversified element of unsystematic risk.
All the data for the appendices IV to VI were extracted from the
United Nations Year Book 1979-80. Appendix IV shows the proportions of
primary product exports and secondary product exports as a proportion of
the total exports of the fifteen major borrowers. If Korea is excluded
because primary products account for only 10.7% of its exports, the
average proportion is 76.1%. Thus, this group of borrowers depend
heavily on the export of primary products, the demand for which
generally has a lower price and income elasticity of demand than
manufactured goods or services. Therefore, these countries would be
particularly vulnerable to changes in the level of the economic activity
of their trading partners.
Appendix V shows the degree of concentration of the export markets
of these major borrowers. On average 62% of these borrowers' export
markets were accounted for by only five countries. Moreover, the USA was
a major market for all these borrowers, accounting for an average of 36%
of each borrower's total export market and other OECD countries provided
dominant export markets for all the borrowers except for Ecuador.
Clearly a portfolio of loans to these major borrowers would be exposed
to unsystematic risk because of the lack of diversification of the
export markets.
Appendix VIshows (by SITC code) the commodities exported by each of
the major borrowers where the amounts exported account for more than 10%
of the borrower's export or 10% of world exports. The number of types of
commodities exported by each borrower is also given. Although the group
as a whole has 20 products in this export category, there are
considerable degrees of concentration amongst Mexico, Venezuela,
Algeria, Indonesia, Ecuador, all oil exporters and Chile (copper) and
Colombia (coffee). What is more, no country had more than 20 export
product groups and the average was 11.
It has been suggested (Evans 1968) that a portfolio of 20
securities is adequately diversified when the securities are included in
the portfolio in equal proportions. With unequal proportions as found in
a bank's loan portfolio, a greater number of investments is required to
get the full benefits of diversification. This could be extended to the
diversification of the sources of export revenue. Accordingly, from the
information provided by appendix VI,the sources of export earnings are
not sufficiently diversified. Therefore the sources of the means of
repayment are not sufficiently diversified and it must be concluded that
the banks have not sufficiently diversified this aspect of their loan
risks.
However, it should be emphasised that these conclusions are
tentative because, to determine the full effect of loan diversification
on the banks' portfolio risk, a covariance matrix of all loans would
have to be drawn up. This requires a considerable computational effort
which is beyond the scope of this thesis. The establishment of such a
matrix by bank management would not only establish the level of risk of
the portfolio but also indicate the impact upon portfolio risk of
extending new loans to various borrowers. This would be very valuable
management information and should be the subject of further research.
Furthermore, these conclusions are only valid if the banks treat a
portfolio of loans to developing countries as separate from other
portfolios of assets. There are reasons for believing that loans to
developing countries do constitute a separate portfolio in that the
degree of risk due to informational inadequacies differentiates such
loans from loans to OECD based borrowers. As such it is beneficial for
the banks to achieve maximum diversification of that portfolio.
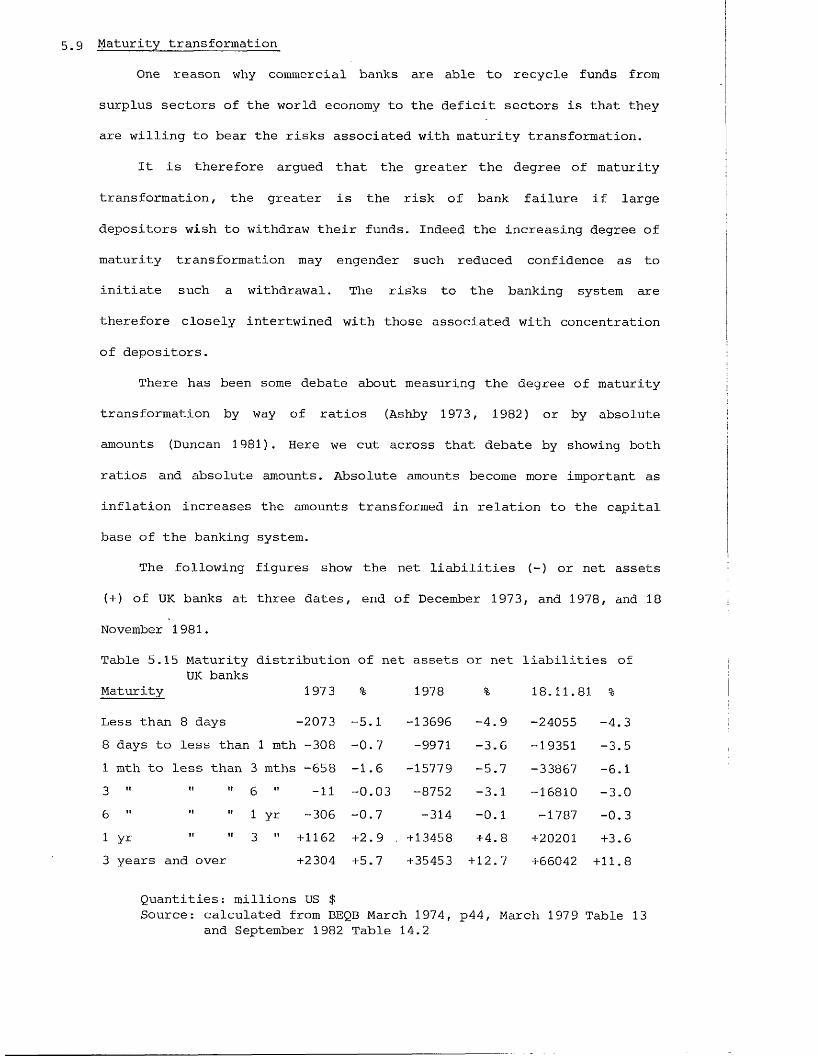
5.9 Maturity transformation
One reason why commercial banks are able to recycle funds from
surplus sectors of the world economy to the deficit sectors is that they
are willing to bear the risks associated with maturity transformation.
It is therefore argued that the greater the degree of maturity
transformation, the greater is the risk of bank failure if large
depositors wish to withdraw their funds. Indeed the increasing degree of
maturity transformation may engender such reduced confidence as to
initiate such a withdrawal. The risks to the banking system are
therefore closely intertwined with those associated with concentration
of depositors.
There has been some debate about measuring the degree of maturity
transformation by way of ratios (Ashby 1973, 1982) or by absolute
amounts (Duncan 1981). Here we cut across that debate by showing both
ratios and absolute amounts. Absolute amounts become more important as
inflation increases the amounts transformed in relation to the capital
base of the banking system.
The following figures show the net liabilities {-) or net assets
( + ) of UK banks at three dates, end of December 1973 , and 1978, and
November 1981.
Table 5.15 Maturity distribution of net assets or net liabilities ofUK banks
Maturity 197 3 % 1978 % 18.11.81 %
Less than 8 days -2073 -5.1 -13696 -4.9 -24055 4.38 days to less than 1 mth -308 -0.7 -9971 -3.6 -19351 3.51 mth to less than 3 mths -658 - 1.6 -15779 -5.7 -33867 6.1 H 1* H 6 " -11 -0.03 -8752 -3.1 -16810 3.06 " " 1 yr -306 -0.7 -314 -0.1 -1787 0.31 yr " " 3 " +1162 +2.9 . +13458 + 4.8 +20201 +3.63 years and over +2304 +5.7 +35453 + 12. 7 +66042 +11.8
Quantities: millions US $Source: calculated from BEQB March 1974, p44, March 197 9 Table 13
and September 1982 Table 14.2
Firstly, taking the absolute amount of mismatch in each maturity,
the amounts of excess liabilities over assets in the shorter maturity
bands has grown much faster than, say, the capital funds of the banks.
However, this growth has been during a time when the interbank market
has grown considerably in depth.
Looking at the percentage columns which show the percentage of each
net position to total claims, there does appear to be an increase in the
degree of maturity transformation between 1973 and 1978. The figures for
1981, however, show that the degree of transformation has been fairly
stable (it has actually declined slightly). This would support the
suggestion that the bankers went through a learning process with regard
to financial intermediation between 1973 and 1978 and subsequently have
consolidated that learning; indeed, the situation in November 1981 was
slightly improved since December 1978. Thus the degree of risk to the UK
banks at least has been stable since the time of the second oil shock.
Unfortunately data showing the degree of maturity transformation of the
whole eurocurrency market or even of banks within the BIS reporting area
is not publicly available. Therefore comparison of the London market
with the whole market cannot be made in this respect.
While the degree of maturity transformation for the market as a
whole is an indication of the transformation risk which that market
runs, the same cannot be said for the figures of individual banks. The
reason for this is the deep interbank market which now exists. This
market enables funds to pass through several banks between the initial
non-bank depositor and final non-bank user. As a result the degree of
maturity transformation for any individual bank will be less than that
of the market as a whole.
Unfortunately, data are not available that allow the changes in the
degree of maturity transformation due specifically to lending to
developing countries to be determined. However, the writer has no reason
to believe that this lending has had a significant influence on the degree of maturity transformation.

o 4< 54 4J54 •r4 0
& cd 0 f td 0 a 0 43 r-4o 0 d 54 44 •rH54 •r4 fd 0 td 44tn 54 § Q M4 *44
4-> cd fd O 0d (4 ». c
■r4 P 54 cd fd d d0 0 •H H ft Cn
0 u M 54 0 0 f t44 4-1 4-1 14 4-> 0d d *H 0 H 54 54cd 0 £ d 0 0W 4-1 <3 o3 U *44*
vD
0P000fd
pOdo co-rH (X)P cn d -rH 43 I ■h 'd54p a 0•H O fd P>1 CO P r-•rH54 I d t P >d 0 -rHS 0
h *d0 044d 0& O0 O1— I54 1— 1•r4 00 p
43 d440fd*#4 00 5444 0d 0O >1
d0 0 00 > Sft 0 44U4Jdd0 0 f t0 44 H U
0 0 d0 0 0 ft•(4 0> 0 fd 01 0 d p0 *44 d 0 01 0 0 00 0 >1ft d d ft> 0 0 0
ft > ft £* 44 0 d 440 dAS 43d ft0 54
X3 44 d0 0
tn ft 0d *d >1*r4 fd-P >1 d 054 44 0 d0 ft 0p4 54 00 d 44 i-H54 ft O
0 ft d*44 g d -h
td4-1O4-1poCL)cncd4-1d0)o540)ftd'H
CM LD -VF cov-4 CO CO CO1-4
CN O *—1LO O 00 O 0 in tHe- Cn O cn <n Id CO 0 CO cnCN CM CO CM H
ID CO T—1 r--ft CN cn CO CO CN CO CO 00 r- *D cn cn CN *D CN in VQ 0 t—t 00 vD CNCN CN co in CD ID 0 cn t—4 CN O 0 O CM CO CN CN cn r- r-- cn ft VD r- 00■vF SF SF CO CO CO CO ft rn f t ft CN ft ft H CO cn cn CO CN CO ro CO CO CO CO CO
O UD -r4 VD
ID r~- ft CO f t cn in CM ft ft CN CO 00 CO VD fi—Icn CM 0 ft CN n VD ft VQ 00ID VQ OT-1r- VD VO CM*H CO VO VD VO ft CO ft Cn ft VD ft cn VQ in in O ft VO VO
ft CO CN cn CO 0 ft 0 0 1-4 in CO 0 in 0 CO 0 CD r-- CO in ^F in CO CO r- 0CN CM CN T—1 VO 0 cn CO r- vD in r- 0 cn 00 0 0 O 0 CN H T-| cn in r- VD VDft ft ft ft LO ft 'VF ^F D CD r- r- ro CO CO CO in m m N 1 N* 'sF 'VF
CD CN CM CO 00 CN CM CO 00 CN CN cn CO CN CN co 00 CN CN co 00 CM CN CO CO CN CN COft 00 CO 00 ft CO CO 00 e' 00 00 00 r- 00 00 CO r- 00 CO CD r- 00 00 CO e' CO CO CDcn cn cn cn cn cn cn cn en cn cn cn cn cn cn cn cn cn cn cn cn cn cn cn en cn cn cnH1 *—i 1 1-4I 1—1 1-4 1-4 vH1 tH T-1 rH 1-4 rH rH t-H T—I tH —1 T-H W rH 1-4 1-4 rH•d
1fd
1fd
1*d
1fd fd fd fd
1fd fd fd fd
Ifd
1fd fd
1fd
1fd
1fd
]fd fd
1fd
[*d
1fd
1fd
1*d
1*d
1■H •r4 d -rH •H -i4 d -H •H •H d -i4 ■H ■H d •H •t4 ■i4 d *. rH d -H •H •H d ■HB a 0 a a a 0 a a a 0 a a a 0 a a a 0 a a a 0 a a a 0 a
tnd 0
0 0 •H 0■r4 0 P •rH 0> •H 54 54 01 54 O P .— . 54 ,—,0 P f t d O 0 ,1 d 0 d w H0 d 54 0 f t 0 0 H
•H 0 0 0 u 0 fd H> 0 0 •rH P □ -Hrd cn Cn 54 0 -rH 0 0 c30 ■d P d d 0 0 54 ■H Pd 0 -rH •H a . H *H C/1 d *.
0 f t 0 f t fd < . c 0 ■•H 0 fd 0 d 0 HP 1—) 'rH 1—1 r-4 d 1—H u 54 1— 1 H•rH 0 0 0 0 O ■rH fd 0 0 00 > P 0 > d P fd p p p s.0 0 d 54 0 •rH 0 ■rH p p 0 aft Q 0 0 P ---- P a 0 0 E4 H
H H T— I CN CO N 1
mcoCTin0)H0U0)QCnd■H•dd0PASdcdmi—icddo■H4-1cdd5404-1dH144Odo*H4->d43*H54P0■r|Q£*■14-1ft
54OftA!d*dm

5.io The maturity profile of developing country debt
Although the degree of maturity transformation in the eurocurrency
market stabilised between 1978 and 1981, the movement in the maturity
profile of the debt towards the short term (up to one year) continued
until mid 1982. The figures in table 5.16 summarise the trend between mid\
1978 to mid 1983 for various geographical distributions of borrowers.
The main exception to the trend is 'Other Asia1 where the trend has been
steadily declining. These figures also show the regional differences in
the proportion of short term debt. For the Middle East short term debt
has accounted for as much as 80% of total debt, while for Other Africa
the comparative figure is 30%.
These summary figures obscure substantial differences between
countries within regions. For example, within Latin America in 1982
Brazil and Mexico had 60% or more of total debt due within one year
whereas Chile had around 11% and Colombia as little as 6%. For Other
Africa in 1983 Nigeria had 39% of its debt due within one year whereas
Algeria had only 17% of such debt due. For Other Asia in 1983 Indonesia
had 35% of its debt due within one year while the Philippines had nearly
60% of such debt due.
This trend is caused both by existing debt nearing maturity and by
increasing amounts of new debt being negotiated with short maturities.
This latter trend is the most worrying in terms of development finance
because of the added servicing burden in the current financial period.
BIS (1982) report that over 66% of new money going to Latin America in
the second half of 1981 had a maturity of less than one year and that
other geographical regions were experiencing similar maturity profiles on
new debt.
Figures below give the maturity profile of external debt of the UK
banks as at June 1982. As is to be expected they also show the bunching
of maturities at the short end of the spectrum but they also highlight
how much debt was due within six months of that date.

rae
mci
uu
rru
y p
ruii
ie
01
--ex
-ee
riic
ii x
ieo
e'e
x'^
Tie
--u
j^
:iJc
iii^
^f
uo
uje
4
tf)
.1di—iO
T3(Din>1Gd ,—NG £D
cnPd0) Pid 0)G >m d oo-p
mcn cnVi io C M >i in d d 0) O! 0
CO rP +J > ,
O-P mcn cnP cn G p>i tn d d
qj . 3 <DO) H 4J > i
O-P CN
cnP in G P>i w id n! Q) ,G QJ*—i i—I +J >i
o G-p dn:cn -P p4G d■P cn cuS cn ip0)vo i—i rH
cnrG0) fi 4J
ui id g a> , GP} -P vd
-pd•PoEh
in i— r- cn T—I G vo VO cn CN r-H G invo cn r- in CD vo VO VO CD r- r- GLO rH in g VD CN CN G t- CN— - ft* <
r—I rH G m
VO CN cn r-' CN cn VO T—t in tH O r- r-VO CO G CN VO CN in r- VO G* CD 00 VOcn co r—1 cn O CN in CD cn m CN CD** — - — r. h.r-- th CN CN CN rr-t cn in CN r-rH CN CN
T—I O in O cn r- o r- CN cn in VD rHg cn cn cn in G —1 cn o rH cn m00 CN o m r—1 cn m CD VD cn cn 00— *- »* »*cn cn v—t rH r- in in rH r-
rH H
— i m CD vo o in cn co i r- cn ocn «o cn VO cn CD —1 in 00 in CN 00r- vo g T—1 cn rH CN G 1 ■G G CN vo** ** *>■ r. r. r. fet
rH rH T—1 m CN CD r—1 cn
m oo t- CN vo r- r- n 1 t- t—i CD VD Gcn oo r~~ VO vo m cn r- VD CD LO Gin cn G o vo cn —t ■G1 cn rH cn rH*> - ■» r. r.r 1 vH ---1 cn CN CO r—1 o
▼-H
co r~ vo ---1 o cn cn r—1 Oin cn g VD e' CO r- VO r-
CN rH CD cn en cn cn T—I CN i in G cnin co CN tH cn G r CO cn rH LO voVO CN G G cn cn H in CN r—1 cn o- *>■ T - - VtH rH rH m CN CO CN r—1
t-H
r- ino g cn CN g o O or- in g in G cn VO CN m r->cn cn g VD cn vo cn in CN CNO VD r- rH vo o CN CN in r- o cn cnvo co o -3* cn in in in vo rH rH in vX>g ,vo CN O G vo CO cn cn 00 cn rH
— — — H. vo G G in VO CN "G r- o o rHrH rH —J in in o
r - i
oo cn m cn in VD cn CN G1 VD cnvo vo vo in r- r- vo cn r- VO cn CO rHCN H cn o VD —! cn -G m in G o• r*. r. *. r. s.oo cn cn cn r- NT CN cn V T,.j rH cnCN rH CN G cn CN VO 00
rH r-H
•—’ rG4.)QJ QJ GOc Clc 0) OO O s CDP PG G r. o3W W d
■P fOG G i—I GP P d d0) CL) P tPO 4J 4J dm 0) cn OJQ) d G N
H <
tnG tn
•P G-P •pP f tO 0 — o3f t i—l Q) d dK 0) 4-) o oQ) > cn ■pin CL) 10 d p PP d)
■H ’Hd op G o G
• n O
n3 QJ •P
1 I p -p -po a
w ri!
ftCP0)
o :+jo
do
'HPo) a fi d ^ 0)
o>G P i
•P *P +J P d d PI U
PQJA4->o
tnG
■HMGd03QJP cn o a)
rG pcn 4->
f t G f t qj O o
i—IaJ■popi
CN00cn
G•rH•Pa>i— \HGpq> i
i— !
p0J-p
aticd ■—I tn G Hfto
G d pq
. . QJ Q) U G P
-ft Gd o > co

Again this summary obscures extremes within regions. In Asia as at
June 1982 the Philippines had 73.4% of its debt to UK banks due within
six months whereas Indonesia had only 17% of its debt so due. In Latin
America Brazil had 15% of its debt due within six months but Mexico had
33%, Argentina 34% and Venezuela had 37% of their debt so due.
It should be noted that generally there are unused credit
facilities available to borrowers. However, there is an unknown
proportion of these facilities which is informal and revocable.
Therefore some of these facilities can be withdrawn at short notice.
Because of this, unused credit facilities have not been included in this
analysis.
Whereas chapter one, page 56 shows that average maturities of
medium term bank debt increased during the 1970's, making such finance
more suitable for development purposes, the impending maturity of some
debt and the increasing use of short term debt is threatening the debt
servicing ability of the borrowers.
The question of the maturity structure of a loan portfolio is
associated with the diversifiable element of risk. To the extent that
factors which hinder the making of debt amortization payments occur at
intervals over time, a well-diversified maturity structure will reduce
portfolio risk. As such there is prima facie evidence that bank loan
portfolios to developing countries are inadequately diversified in this
respect.
Unless the banks and the borrowers take a more realistic view of
debt management by the borrowers, the successive debt crises will erode
depositor confidence to the detriment of all the parties concerned. The
problems of restructuring external debt are discussed in detail in the
following chapter.

5.11 Conclusions
From the above analysis, the writer draws the following conclgsions
about the impact of increased bank lending to developing countries upon
the banks themselves:
1) It is not possible to determine whether the growth of bank
debt has been excessive without detailed analysis of each
of the borrowers.
2) The debt service burden has increased because of higher
interest rates, increasing use of floating rate debt, and
shorter maturities on new debt. The real maturity of
floating rate debt has been shortened by inflation.
3) Lending by UK banks has grown much faster than their
capital base. If this fact reflects the position of all
banks in the eurocurrency market, this will constitute a
potential constraint on future lending. However, to the
extent that the market has experienced an almost continuous
influx of new lenders, any continuation of this trend will
partly relieve this constraint. The continuation of this
influx will depend upon profitability and financial
stability in these markets. It is therefore crucial that
the regulatory authorities place no artificial constraints
upon profitability and that the authorities strive for
financial stability in these markets if future financial
flows are to be guaranteed.
4) To the extent that growth of loans to developing countries
has been a stable proportion of total loans over the last
five years, the capital constraint is as likely to apply
to all external lending including OECD business. This
implies growing competition between OECD based borrowers
and LDC borrowers for refinancing facilities.
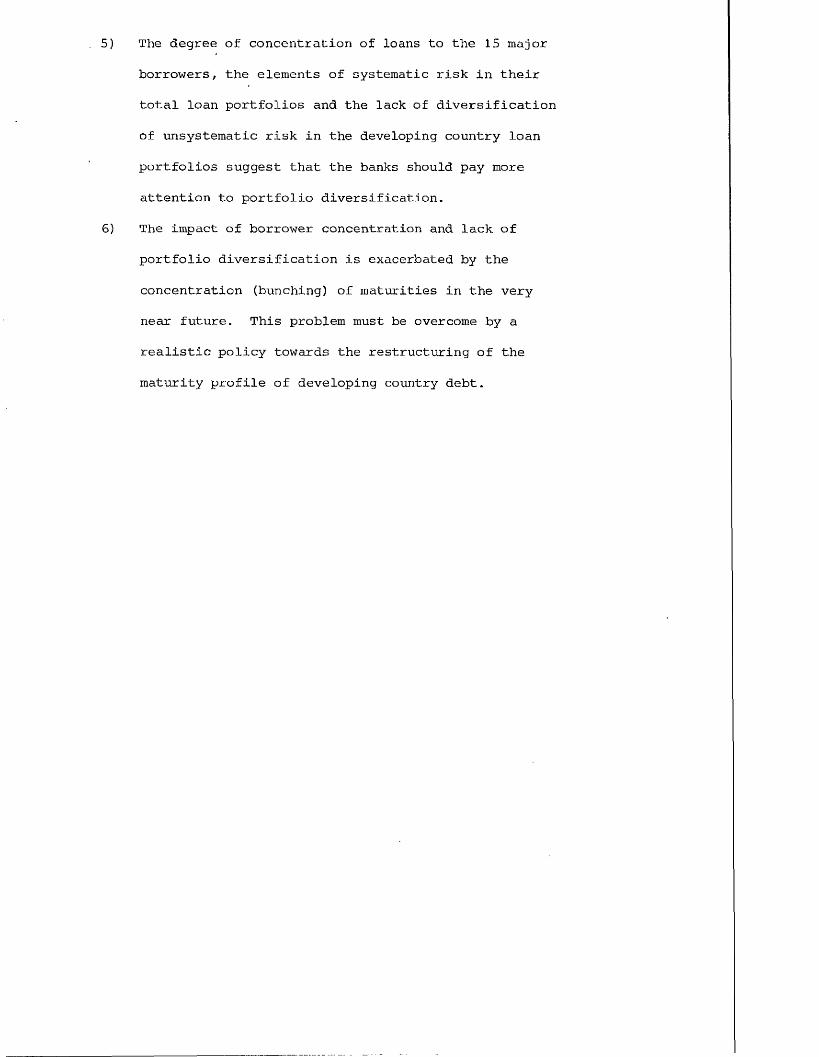
5) The degree of concentration of loans to the 15 major
borrowers, the elements of systematic risk in their
total loan portfolios and the lack of diversification
of unsystematic risk in the developing country loan
portfolios suggest that the banks should pay more
attention to portfolio diversification.
6) The impact of borrower concentration and lack of
portfolio diversification is exacerbated by the
concentration (bunching) of maturities in the very
near future. This problem must be overcome by a
realistic policy towards the restructuring of the
maturity profile of developing country debt*

Chapter 6
INCREASING THE ACCESS OF DEVELOPING COUNTRIES TO THE PRIVATE FINANCIAL MARKETS
6 .1 Introduction
Chapter five noted that total bank debt of LDCs rose faster than
their collective GNP and exports. Moreover, the debt servicing burden
rose, particularly at the end of the 1970's, because of the temporal rise
in interest rates, the movement towards floating rate loans and the
movement towards shorter maturities. For UK registered banks, at least,
there was a tendency towards greater concentration of loans and lower
capital to asset ratios.
These various factors may be seen as constraints upon further bank
lending to LDCs either because they increase the bankers' perceived risk
or because institutional constraints impinge upon the bankers' behaviour.
Factors that will potentially restrict the flow of new private
credit to the developing countries can be classified into two groups.
The first group of factors consists of those that increase the
lending bankers' perception of the risk of default. These include:
a) high real rates of interest
b) recession in the export markets for LDC products
c) increased LDC imports
d) poor economic management including debt management
e) political and social instability
The second group of factors consists of those that impede the
process of international financial intermediation. These include:
f) the impact of borrower default upon bank balance sheets
g) liquidity crises and loss of depositor confidence
h) capital adequacy
i) the impact of foreign exchange crises upon bank balance sheets
j) profitability

Clearly, many of those factors that contribute to the bankers'
perception of the risk of default are largely outside the control of the
international banking system itself. Therefore, as this thesis is
concerned with the role of financial institutions in providing external
finance, such factors will generally not be analysed in detail, although
something will be said about interest rates and debt management policy.
Those factors which potentially impede the process of financial
intermediation are to a greater extent under the control of the financial
institutions, albeit the official ones. This section of the thesis,
therefore, analyses various ways in which the bankers and the official
financial institutions may:
a) reduce the bankers' perceived risk of default by
developing country borrowers
b) mitigate the impediments to international financial
intermediation.
It should not be thought that risk of default only applies to
developing country borrowers. With the high nominal interest rates of
recent years, much corporate borrowing in the industrialised economies
has been via bank lending. Thus, a major default by an unsecured
corporate borrower would have a similar impact upon the banking system as
a similar sized default by a sovereign borrower.
Therefore, increased access of the developing countries to private
financial markets requires policies that reduce not only the actual and
perceived risks of lending to those countries in particular, but also
reduce those risks which are associated with international banking
generally.
This chapter first discusses the risks associated with international
bank lending and then analyses six suggestions for reducing the banker's
perceived risk of lending to developing countries in particular, and then
three suggestions for reducing the risks of international financial
intermediation generally. These nine suggestions are the result of an

Z b U
extensive search, by the writer, of the relevant literature.
The results of a survey conducted by the writer amongst two hundred
banks in London regarding their attitudes to these suggestions are
reported and analysed in chapter seven. This survey was conducted because
unless the lending bankers accepted,that the above nine suggestions would
reduce the risks involved, increased access to the private markets by
developing countries would not be achieved.
6 .2 The risks associated with international bank lending
There have been considerable developments in the realms of banks'
techniques of country risk analysis. The term 'country risk analysis' was
used in much of the literature to describe a technique for determining
whether a country could meet its private and public commitments on
external debt. However, much of the literature fails to differentiate the
type of risks associated with lending to different types of borrowers in
a particular country. Furthermore, it is felt that the term 'country
risk' is used in too wide a sense. The definitions given below of the
types of risk involved may not be in agreement with those used in the
literature but, being tighter definitions, classify the risks in a more
meaningful way.
Sovereign risk
This risk is incurred when lending to a sovereign borrower who does
not relinquish his right to sovereign immunity. Thus, this risk entails
the inability to enforce the terms of the loan agreement. To the extent
that the terms of the loan are unenforceable, the banks suffer sovereign
risk. This risk will hold for any loan to a sovereign borrower or one
guaranteed, or in some other way secured, by a sovereign power. In effect
sovereign risk is the risk of repudiation. I have chosen to differentiate
sovereign risk from country risk because sovereign risk relates to the
purposeful act of repudiation which only a sovereign can do with some
degree of impunity. This impunity is not however total, for one sanction
held by the international financial community is to withhold future
credit (see page 211 below). Clearly outright repudiation is only likely
if the borrowing sovereign power is planning to change its political
allegiances.
Country risk
This risk relates to a country not having sufficient foreign
exchange resources to meet its commitments on its external credits. The
cause may be political or economic and it may lead to default. However
the difference between country risk and sovereign risk is that country
risk defaults are not so clearly intentional and indeed may not be
intentional at all. Political causes may include wars or civil unrest.
The economic causes may, among others, be insufficient savings or the
inability to convert domestic savings into foreign exchange.
Country risk can affect loans both to public and to private
borrowers. Private borrowers are affected to the extent that they do not
have private control over sufficient foreign exchange resources to
service their debts and have to rely upon the adequacy of national stocks
of reserves. In such cases the private borrower competes with the public
borrower for foreign exchange reserves. If the nation is short of
reserves the private debtor cannot service his external debt despite his
domestic finances being sound.
Credit risk
This risk relates to a private borrower failing to generate
sufficient financial resources to service the loan. In the extreme, this
may lead to the bankruptcy of personal borrowers and the liquidation of
corporate borrowers. In either case the duty to repay is extinguished by
the courts in whose jurisdiction the bankruptcy or liquidation is
determined.
Thus credit risk may lead to default because the borrower cannot
obtain sufficient foreign exchange even though the nation had excess
reserves. Clearly credit risk is incurred in lending to borrowers in any
country.
The important point that differentiates credit risk of a private
borrower and country risk of a sovereign borrower is that default under
credit risk may result in extinguishing the responsibility to repay, and
therefore the bankers' asset - the debt - is also extinguished. The same
does not happen for a sovereign loan if the sovereign has insufficient
resources because the sovereign's existence and debts are not
extinguishable in the courts. Default may occur but the debt does not
cease to exist. Only if the sovereign borrower repudiates its liability
is the bankers' asset de facto extinguished.
Project risk
This risk in its pure form only relates to lending which is entirely
dependent upon the project for repayment. In pure non-recourse project
lending the lenders have no recourse to the borrowers (Shaw et al 1980) .
It was pointed out in an earlier description of project finance that
there are pre-completion and post-completion risks (ref page .91 above).
These risks apply equally to loans to the public and the private sectors.
The extent to which project risk dominates the risk attached to a loan
depends upon the terms of the loan agreement. For example, if the loan
agreement allows for repayments to be guaranteed by a corporation, then
credit risk will also be involved.
Portfolio risk
There are four elements to portfolio risk:-
a) risk due to concentration of lending or deposits
b) liquidity risk
c) currency riskd) interest rate risk (Shaw et al 1980)

Risk due to concentration of lending operates at two levels. One,
that of the individual bank which has an excessive exposure to one
country. The second, excessive exposure of the whole market to a
particular country. At both levels the greater the degree of
concentration, the greater the risk to the bank because the benefits of
diversification are reduced.
It should be noted in this respect that although banks may have an
adequate degree of diversification over, say, a number of private and
parastatal borrowers of one country, those borrowers are effectively
concentrated into one in terms of country risk.
Concentration of deposits does not hold quite the same risks to the
banks because even if one set of national depositors withdrew their funds
from the euromarkets, it is unlikely that these funds would be lost to
that market completely because of the existence of the interbank market.
Through this interbank market the banks that lost deposits would be able
to attract them back. Only if the depositor held the withdrawn proceeds
of the deposit in cash or paid it to the central bank issuing the
currency of the deposit would that deposit be lost completely to the
banking system. Nevertheless a well-diversified deposit base will add
stability to the banks' funding operation.
Liquidity risk, currency risk and interest rate risk
All three of these risks are associated with the mismatch between
assets and liabilities. Liquidity risk is associated with the degree of
maturity mismatch; currency risk is associated with the currency mismatch
between total assets and total liabilities ie foreign exchange exposure;
and interest rate risk is associated with the mismatch between the
maturity of deposits and the roll-over periods on loans.
Clearly all three types of risk can be reduced by reducing the
degree of mismatch.

Reducing the actual or perceived risk of lending to developing countries
Of the risks discussed above, four, sovereign, country, credit and
project risks result from the uncertain outcome of the borrower's
behaviour during the term of the loan. The component risks of portfolio
risk result from the uncertainty regarding the banker's behaviour during
the term of the loan. In particular, the environment within which the
process of financial intermediation takes place is uncertain and
therefore the banker's behavioural reaction to that environment is
uncertain.
Therefore, the proposals for reducing the risks to the lending
banker are divided into two groups. The first group aims to reduce the
risk to the banker by making the outcome for the bank of the borrower's
behaviour more certain. These proposals are:
1) Reducing the interest element of the debt service burden;
in particular a new facility from the IMF to help LDC
borrowers to spread the impact of upward variations in
floating rates of interest during the term of the loan.
2) A formal procedure for debt rescheduling and advisory
facilities for the banks and the LDCs in debt management
policy so that debt can be rescheduled to make the debt
profile more appropriate to the developmental and adjust
ment needs of the borrowers.
3) Improved information flow with the help of the IMF and
IBRD to assist the LDCs in debt management policy and
to the banks to enable improvements in the quality of
risk analysis.
4) Co-financing with IMF, IBRD and other official institutions.
5) Bank credit insurance and loan guarantees.
6 ) A secondary market in syndicated loans and the use of
floating spreads in the pricing of loans.

The second group of proposals is aimed at ensuring that the
environment within which the banks carry out the process of financial
intermediation is at least fully understood by the bankers. These
proposals are:
7) Improved prudential supervision and regulation by
banking authorities so as to ensure that all banks
have acceptable levels of foreign exchange exposure,
liquidity, capital, credit exposure, and high quality
management. The regulatory authorities by gaining a
global view of the markets will be able to advise
individual banks when they are not adequately
diversified or are out of line with market trends.
8) International lender of last resort.
9) Bank deposit insurance schemes.
6 .4 Reducing the interest element of the debt service burden
A recent paper (Williams 1982) suggested that for every 1% increase
in LIBOR, the cost of servicing the interest payments on LDC debt rose by
$2 billion. Although many LDCs also benefit from increased interest
income on their holdings of foreign exchange reserves, clearly increased
money market interest rates put at risk the debt servicing capacity of
the developing countries. The impact of the rise in interest rates is not
uniform amongst developing country borrowers. Those countries with the
highest proportions of their external debt in the form of floating rate
debt have been hit hardest. This is because all floating rate debt and
not just new loans attract the higher rates of interest. It has been
shown in chapter one of this thesis that only the richer developing
countries have access to bank finance. Therefore it is these countries
that have suffered most from rising interest rates; the poorer countries
being sheltered by their reliance on official subsidised credit.
It is shown later in this chapter (page 272) that the receipt of

interest payments on loans is of more crucial importance than repayment
of principal. Provided that the banks' assets earn sufficient income to
ensure adequate profits and cover the cost of attracting deposits,
repayment of loan principal is not essential for the continuous operation
of a eurobanking financial intermediary. Furthermore, the lower the
interest payments, ceteris paribus, the lower will be the risk of
default. Clearly then any measure that reduces the interest costs to LDC
borrowers must lower the risk of default, and any measures that increase
the certainty of interest receipts must increase the attractiveness of
LDC debt for the banker.
A number of suggestions have been made to reduce the interest burden
to developing country borrowers. These include subsidising interest
costs, guaranteeing interest payments and indexing interest payments.
Alternatively, the writer suggests that a facility should be made
available by the IMF specifically to finance upward fluctuations in
interest costs of loans.
Direct subsidy of the interest costs of loans by, say, OECD
governments as a form of aid may distort the use of capital causing
relatively unproductive projects to be financed. Moreover, it may permit
weak management of projects resulting in a lower rate of return, where
tighter management could have produced a higher rate of return.
One way of extending access to the poorer developing countries would
be to combine a guarantee of interest payments and a subsidy of interest
payments on bank loans to these countries. This could be achieved by
making the subsidy payments direct to the lending banks.
The criticism that relatively unproductive investments are financed
with subsidised funds can be overcome by ensuring that the subsidy does
not make the subsidised bank loans cheaper than the IMF or IDA loans.
Thus, if the bank loans are say 2% above IMF/IDA money for similar uses
respectively and subject to conditionality, the efficiency of the
investment should be maintained. The exact degree of subsidy that is

possible will depend upon the returns from the investment to be financed.
However it is not necessary that the subsidy be based upon market rates
because the average cost of funds to the banks may be a suitable rate to
be subsidised.
One problem with this system is that many bank loans are at floating
rates thus there will be an open-ended liability for the subsidising
agency.
Guarantees may make the bankers less prudent in their lending to
LDCs. Consequently, should the guarantees not be continued, the banks
would be left with a poor quality portfolio. This weakness could be
overcome by guaranteeing only a proportion of the current interest costs
in excess of those effective at the time of signing the loan agreement.
Recently the suggestion of indexing the interest costs or the
principal has been commented on (Amexbank 1981, Nowzad 1982, Financial
Times 1982). Under an indexed system borrowers would be charged a
constant real rate of interest and the principal would be increased in
line with an agreed index eg retail prices in the creditor's country.
For financial intermediaries such a system would only operate
successfully if the banks could index their liabilities. Otherwise
financial losses would ensue in each time period as the interest rates on
deposits (including compensation for inflation) would be above that of
loans. Moreover, paying a fixed real rate of interest may not benefit the
borrowers. Taking the last decade as an example, real rates of interest
have often been close to zero and even negative.
Given the need to change fiscal systems and the attitudes of
depositors, together with the benefits borrowers have enjoyed in the past
of negative real rates of interest, this writer does not consider the
indexation of bank loans to be a viable solution to the problems of
developing country borrowers in the near future.
It is suggested here, however, that the burden of rising interest
rates could be eased if the developing country borrowers had access to

short term official finance to cover increases in interest rates that
caused balance of payments difficulties. Such a facility would stabilise
the influence of interest payments upon cash flow over successive time
periods.
A scheme whereby a multilateral official agency provides such
accommodation is in line with some facilities available from the IMF but
for other causes of balance of payments problems eg deficiencies in
export earnings and increased costs of cereal imports.
The aim of such a scheme would be to enable LDCs to meet the higher
debt service costs caused by upward movements in LIBOR and using periods
when LIBOR falls to provide resources to repay the facility to the
multilateral organisation. The use of temporary facilities of this nature
seems well suited to a period of increasing volatility of short term
interest rates as was experienced during the 1970's. Given the volatile
nature of interest rates, periods when debtors borrowed from this
proposed facility would be followed by periods when rates were falling
and debtors repaid that facility.
The period for which each amount of assistance would be made
available should be related to the financial circumstances of the
borrower and expectations of the future trend in interest rates.
This facility would have to be combined with some degree of
conditionality associated with debt management policy. In particular the
attitude towards debt rescheduling, the mix of long and short term debt,
as well as future borrowing aspirations would have to be agreed before
this facility is made available. This conditionality is necessary
otherwise some borrowers may see advantages in excessive borrowing when
interest rates are low and effectively capitalising some of the increased
servicing costs. However, this capitalisation will be relatively short
term and therefore yet another crisis will ensue when the capitalisation
has to be repaid.
An additional spin-off would be improved quality of information

flowing to the banks. One condition of the facility should be that
information flowing to the IMF relating to debt and debt management
including the terms of conditionality, would be passed on to the lending
bankers. This in itself would reduce the uncertainty associated with
lending to LDCs (ref page 287 below) . The discipline upon the LDC
government having to monitor its debt more efficiently to benefit from
this facility would improve the quality of information flowing to the LDC
government itself with its attendant benefits for policy formulation.
For countries to be eligible for this facility it would be necessary
for them to show that they:
a) have balance of payments difficulties due to the
increased interest charges on external debt. This
ensures that facilities to cover interest charges
do not release resources for non essential imports.
b) that these increased interest charges are due to
increases in the levels of interest rates on that
debt and not the increased size of that debt.
c) the balance of payments problems are making it
difficult for the debtor to service its debt and
maintain previously agreed economic growth
objectives.
The amount of assistance to be given would be calculated quarterly
on a loan by loan basis. Unless current interest rates were at an
all-time peak or new loans have not been negotiated for some time, some
loans would be attracting rates of interest below those that applied at
the time of negotiation. The interest savings on these loans would be
offset against the assistance paid on account of other loans.
In order to gauge bankers' opinions about this suggestion and other
points made in this section, four questions (numbers 6-9) were included
in the survey. The results are reported fully in chapter seven, page 338
below.

6 . 5 Restructuring Debt
If a borrower has difficulty servicing its current debt, it is often
possible to reduce the debt service burden by extending the maturity
profile of the debt. For such a scheme to work it is necessary that
interest payments can be met and that by reducing the size of or delaying
the individual amortization payments, the periodic debt service payments
are reduced to a sustainable level.
The maturity profile of the debt can be extended in two ways. One is
to refinance the debt, ie repay existing loans with the proceeds of new
loans. This extends the maturity of the debt by the difference between
the period to maturity remaining on the old loan and the maturity on the
new loan. This scheme has the benefit of being able to take advantage of
any improvement in market conditions at the time of negotiating the new
loan.
However, to use refinancing it is generally necessary for the
borrower to have the market's confidence and therefore good debt
management is required to ensure that any refinancing is instituted
before a crisis is imminent. Refinancing is a very flexible system suited
to a competitive market such as the euromarkets. In particular if some of
the members of the loan syndicates do not wish to continue their
exposure, new lenders can join the syndicates for the new loan. Because
refinancing generally goes smoothly, it is little publicised, yet it is
suggested that 27% of euroloans were used to refinance debt in 1978 and
this figure will rise to 65% in 1985 (Cohen & Basagni 1980, pl06).
The second way to restructure the maturity profile of debt is by
rescheduling that debt. This is the negotiation of extensions to the
maturity of existing debts. This requires the agreement of all the
parties to the existing debt which is cumbersome given the nature of
syndicated loans, and technically is a default upon the original loan
agreement. Rescheduling is therefore a more complicated process and this
may explain why it is only carried out when a crisis has descended upon

the debtor. Like refinancing, rescheduling aims to reduce the debt
service burden by reducing the amortization payments in each future
financial period.
The current popular debate about the growing likelihood of
developing countries having to reschedule their debt is couched in terms
that imply that rescheduling is a bad thing and arises as an unhealthy
consequence of excessive international bank lending. The need to
reschedule this "unhealthily excessive" lending is assumed to have dire
consequences for the international financial system. Yet, when in
1978-79, there was a public debate about the refinancing of developing
country debt to take advantage of better financial market conditions,
there was no such concern despite' its impact on the banks' profitability
and capital adequacy.
There is no doubt that rescheduling of developing country external
debt has become more frequent in recent years; one suggestion is that the
number has risen from 3 in 1973 to an estimated 14 in 1981 (Euromoney
August 1982).
Bank liability management and debt repayment
The reduced moneyness of eurobank deposits, due to the lack of a
cash transmission mechanism, and the greater competition between
eurobanks means that eurobanks have to be very active liability managers
in order to attract deposits. The eurobanks are therefore continually
active in the markets, positively trying to attract deposits from both
bank and non-bank sources. Banks will actually take deposits in excess of
their immediate requirement and reinvest in the interbank market. They
engage in this two-way business, provided they at least break even, in
order to maintain their presence in the market and to avoid turning away
non-bank depositors. The eurobanks' liability management also extends to
maintaining a network of credit lines with other banks.

This continuous and often aggressive liability management is
necessary to ensure the continuity of funding for the banks' asset
portfolio and to ensure that funds are available for liquid reserves and
to maintain the ability to take on new lending business.
On the asset side of the eurobanks' balance sheet, loans have a less
than 100 per cent probability of being repaid. Accordingly when the bank
is considering its cash flow over time, the cash outflow in terms of
repaying deposits or meeting previously agreed loan commitments is more
certain than the cash inflow o^ repayments of principal. Thus, there is a
further incentive for continuous liability management by the eurobank in
order to avoid cash flow problems associated with late payment by
debtors.
It was shown in chapter three the importance of balance sheet growth
in the banks' utility function. Given the assumption of portfolio size
maximisation, banks will relend any repayments of principal. However,
this relending process entails costs, either high search costs when
trying to find new non-bank borrowers, or reduced earnings if principal
is temporarily placed in the interbank market. It is therefore postulated
that the banks would prefer not to be repaid, given their funding
ability, but would prefer to roll-over existing debt on current market
terms, provided that the costs of rolling-over are less than the costs of
searching out new business.
It should be pointed out that the desire to roll-over debt only
arises provided that future payments of interest are certain. The reason
for this Is that a large proportion of the interest receipts, the LIBOR
element, from a loan is committed to meeting the interest payments on the
bank's liabilities eg the bid rate for funds. Traditionally this bid rate
is high relative to the mark-up on eurocurrency loans. Thus, the
proportion of interest income that covers costs of deposits is much
greater than the element that goes towards profit. If interest income
were in arrears, the bank would have to meet its interest commitments

from its profitst reserves and capital in order to maintain depositor
confidence and its level of funding. Given the small contribution to
profits made by the gross interest revenue of any one loan and given the
continued need to fund a loan and therefore the continued funding costs,
loss of interest income on one loan will make a relatively large impact
upon current profits. Therefore it is clear that although banks may not
look for repayment of principal, the maintenance of current interest
payments is crucial.
This hypothesis explains the behaviour of many banks in helping to
reduce the current debt service commitments of borrowers. They can do
this by rolling over maturities so that interest payments are met but
total debt service payments are reduced by delaying any repayment of
principal.
There are risks associated with rolling-over debt. In particular, as
the bank extends the period of its exposure to the debtor, the greater
the likelihood is of the debtor defaulting on its commitments. At the
same time any restructuring of debt which reduces current amortization
payments reduces the risk of default by reducing the periodic demands
upon the borrower for debt service payments.
The impact of rescheduling on a bank
For debt rescheduling to cause a breakdown of international
financial intermediation, the private costs to the banks must exceed the
private benefits to those institutions. Furthermore, this excess of
private costs must be large enough to have an adverse effect upon the
viability of the banking function. This will probably occur through the
excess cost eroding the banks' profits and therefore its capital base,
causing insolvency and a loss of confidence by depositors. However, there
may be other ways in which rescheduling influences depositor confidence
and these are discussed on page 280 below.

The private costs to the banks could be in the form of losses on
rescheduled business ie costs of funding not matched by the terms of
rescheduled debt. Alternatively, there may be an opportunity cost in that
rescheduled debt may not earn as much as would be earned if the principal
were reloaned to alternative borrowers.
To what extent is rescheduling per se likely to impose an
opportunity cost upon the banks? To answer that question let us imagine a
bank that has a loan outstanding where principal is to be repaid in one
lump sum at maturity. Interest payments have been made on time but
principal cannot be repaid on due date. Current and predicted future cash
flow of the debtor allows interest payments to be continued but the
principal cannot be repaid until the seventh year hence. Also assume that
seven years is the average maturity of euroloans at the present moment.
The banks can choose between:
a) trying to recover its loan by instituting legal proceedings
against the borrower, which may result in bankruptcy or
liquidation. Whatever happens, the bank will lose a customer
and may not recover its debt in full. The opportunity cost
in this case would be the loss on recovery. This may be
substantial if the borrower is technically insolvent.
b) granting a new loan with a seven year maturity at current
market terms ie the same terms as the bank would get for
lending to a different customer. The opportunity cost
in this case would be zero.
c) rolling over ie extending the maturity on the current
loan for seven years but adjusting the interest rates
(spread and fees) to reflect current market conditions
including any change in perceived risk. Again in this
case the opportunity cost is zero. This is an example
of rescheduling.

Clearly, providing that the interest terms, maturity and grace
period of the rescheduling are in line with those of new loans,
rescheduling need not create an opportunity cost for the bank and may be
financially and politically superior to seeking legal redress.
The important points to note are that the banker perceives that the
principal will be repaid and that interest payments are made when due.
This last point, as explained on page 272 above, is crucial because
eurobanks are active liability managers paying an explicit yield on
deposits. Bank loans must earn current interest sufficient to cover the
costs of attracting deposits otherwise the bank will make losses which,
if unchecked, will lead to insolvency.
Therefore, if the borrower's financial circumstances do not permit
even payment of interest, then the loans will be making losses and should
be written off by the bank. In general, bankers do not agree to the
postponement of interest payments nor to the capitalisation of interest
arrears (Economist 20.3.82 p28). One of the problems with the 1980 Polish
debt rescheduling was that interest payments were in arrears and the
Polish negotiators wanted to capitalise those arrears. The bankers were
unanimous in refusing such a request (Economist 20.3.82 p22). However,
there have been recent exceptions for Braniff Airways and Nicaragua
(Economist 20.3.82 op cit).
If assets - loans - are not earning then the bank's action is clear:
attempt to recover principal and arrears of interest by whatever legal
means is possible. However, if the asset is potentially earning interest
but repayment of the principal is uncertain, the decision is more
complicated and depends upon the legal status of the borrower.
The private borrower
In the case of a private borrower even though the banker is
confident and decides to roll-over the existing debt, the ability to pay
interest and repay principal in the future may be terminated at a future
date by legal action for liquidation or bankruptcy initiated by an
existing or subsequent creditor. This creditor may be, for example, a
bondholder or a supplier and this creditor's right of action would stem
from the debtor's future default on his debt to that creditor. In such a
situation the bank's asset will be destroyed if the legal action is
successful and the bank will have to rely on any security held or its
share of the residual assets of the borrower, if any.
Therefore, when a defaulting private borrower can meet future
interest payments but payment of principal is uncertain, the bank has
two alternative courses of action. It may call in the loan and may at
the same time institute legal proceedings. Alternatively, it may
reschedule the loan knowing that if the borrower defaults on other
creditors' loans in the future those creditors may institute liquidation
or bankruptcy proceedings that destroy the rescheduled assets. Clearly,
the bank's decision will be influenced by the quality of any security
and its view as to the degree of improvement in the borrower's financial
health between now and the future. If the borrower's financial health is
expected only to deteriorate in the future, the bank may expect to
recover less in a future liquidation than in a current liquidation.
Strictly speaking such a decision should be taken after comparing the
net present value of the two alternative sets of ejected financial
flows. One set from the current liquidation, the other set from a
current earning asset and future liquidation.
The sovereign borrower
In the case of a sovereign borrower or a private borrower
guaranteed by a sovereign power, the situation is different. It is
worthwhile rolling over the principal even though its actual repayment
is unlikely - provided of course that the willingness and ability to
make interest payments are certain and do not impose an opportunity cost
upon the bank. This is because the sovereign borrower cannot lose its

legal personality nor can the bank's asset be destroyed through legal
proceedings instituted by third parties. The bank's asset will only
cease to exist if the sovereign borrower repudiates the loan.
Thus, given the assumed objective of the bank to maximise the size
of its earning portfolio, together with the postulated behaviour of
aggressive and continuously active liability management making repayment
of loans unnecessary for bank cash flow purposes, it is always
preferable for a bank to roll-over sovereign debt where expectations of
interest receipts are high and expectations of repudiation low.
Given the need for developing countries to have access to private
sources of development finance in the foreseeable future, the writer
considers the risk of repudiation to be very low. Furthermore, the
banking system is at the heart of trade financing. Therefore even if a
developing country no longer required medium term development finance,
it will require access to the world's banks in order to settle its
trading debts. No country, therefore, is in a position to repudiate its
debts to banks. However, for an alternative view, see Eaton and
Gersovitz (1981).
Thus, from the above analysis, it is clear that at least as far as
sovereign debt is concerned rescheduling per se is not detrimental to
the international financial system, providing the risk of repudiation is
low, interest payments are maintained and there is no opportunity cost
to the banking system.
It is necessary therefore to investigate each rescheduling
separately to determine the opportunity cost to the banking system
before we can determine whether it is a cause for concern. One
rescheduling with a positive opportunity cost may have no adverse
effects upon the banking system, but the cumulative effects of many,
each with an opportunity cost, would be a cause for concern.
One element of the opportunity cost that may change in the future
is the way in which the international banking regulatory authorities,

tax authorities and the accounting profession treat rescheduled loans in
the banks' balance sheets and profit and loss accounts. If these
authorities were to require rescheduled debts to be written down in
value in the banks1 accounts, this would almost certainly create a
positive opportunity cost of rescheduling and influence the solvency of
those banks involved and the stability of the international banking
system. Much thought should go into such matters before the authorities
take any action. In particular why should international loans be treated
differently from domestic loans and why should banks be treated
differently from other institutions such as building societies in this
respect? Clearly, the consequences of treating rescheduled debt as an
inferior form of asset requiring some writing down of its value are
widespread indeed.
In general the financial terms attached to rescheduling bank debt
do not seem to detract from the banks' profitability (Goodman 1982,
p28) . The 1977 rescheduling of Turkey's debt was at an interest rate of
one and threequarter per cent over LIBOR paid monthly. Principal was
repaid in monthly instalments over four years after a three year grace
period. Disbursements of the new money loan were tied to disbursements
under an IMF standby facility (Van de Bey 1982).
Poland's rescheduling of its 1981 debt covered 95% of principal to
be repaid over 1 \ years with four years grace. The interest rate was one
and threequarter per cent over LIBOR with a two and threequarter per
cent penalty for late payments. There was also a 1% renegotiation fee
(The Economist International Banking Survey 20.3.82, pl6 ).
Clearly where reschedulings are at preferential terms to the
borrower there are serious implications for bank profitability and
capital adequacy. An example is Nicaragua's 1980 rescheduling which
included a 7% fixed interest rate on capitalised arrears of interest and
a 12 year loan at 1% over LIBOR and a 5 year grace period (Shaw et al
1981).

One cost of recent reschedulings which would not be incurred if new
loans were made to alternative borrowers is that of protracted
negotiation. A recent case of Costa Rica's rescheduling in 1981 took one
year for negotiation to be completed. The time taken to complete the
Turkish rescheduling increased the uncertainty in financial markets such
that no new credit from banks or suppliers was made available during
negotiations. Export credit insurance agencies stopped covering trade
with Turkey. This lack of short term credit exacerbated the country's
plight.
An important factor influencing the negotiating costs is that many
countries which reschedule once do so again. One reason is that private
lenders base their negotiations on the desire to achieve a return to
normality in the shortest possible time (Davis 1980). Normality here
refers to the resumption of service payments that are overdue.
Furthermore, only the current year's debt is renegotiated instead of
looking at debt due in future years.
The Paris club and the private banks insist on rescheduling one
year's debt at a time. When negotiations on one year's debt are
completed, it is time to start on the next year's (Economist 20.3.82,
p28) . Each negotiation is taken ad hoc, the banks considering that
guidelines cannot be laid down because each country is unique. Although
the larger banks manifest themselves in each rescheduling, it may not be
until the rescheduling is under way that all bank creditors are known
(Economist op cit).
Clearly the duration and frequency of rescheduling negotiations
imposes explicit costs upon the international banking system.
Furthermore, policies of the bank regulatory authorities and accounting
profession that require rescheduled sovereign debt to be treated as an
inferior asset and written down in value, by reason only of it being
rescheduled, may cause exactly those problems which the regulatory
authorities are charged with avoiding.
There may also be implicit costs to a debt rescheduling. If
depositors perceive rescheduled sovereign debt as being an inferior
asset, depositors may have less confidence in the banking system after a
spate of reschedulings. This problem will probably manifest itself in
the interbank market. It may be that banks which find that a large
proportion of their loan portfolio consists of rescheduled debt will
find their credit rating lowered and therefore find it more difficult
and costly to attract deposits. In reality, this will probably apply to
non G10 country banks where the international lender of last resort
responsibilities of central banks are less clear (Bell 1982). However,
this is a risk for individual banks rather than the market as a whole
because if funds are to be removed altogether from the system, they must
be held in cash - an unlikely event. Nevertheless, such a lowering of
individual bank credit ratings and the attendant rise in interest rates
may impose a positive cost of rescheduling for some banks.
Because of the need for new development finance and the tendency
for maturities on banks' debt to be shorter than the gestation period of
economic adjustment, there is a growing need to reduce the costs of what
may be the increased frequency of debt rescheduling. Indeed it is
considered desirable to reduce these costs to the point where debt
rescheduling can become a legitimate instrument of debt management
policy for borrowers and accepted as such by lenders. When debt
rescheduling for sovereign borrowers becomes accepted as a legitimate
practice, the costs associated with lack of depositor confidence, the
attitudes of the accounting profession and the regulatory authorities
will be removed. This action will further enhance the usefulness of debt
rescheduling as an instrument of debt management.
There is clearly a need for all the parties to the international
banking system to understand and implement ways of reducing the costs of
debt rescheduling. Two methods are suggested and discussed below. One is
to encourage greater understanding by the managers of developing country

debt of the techniques and policies of debt management including the
benefits of efficient accounting and information systems relating to the
debt. The second is to establish an internationally recognised code of
conduct for rescheduling.
In a competitive market such as the euromarkets, there is no
cartelisation, no common view, little exchange of information and
frequently little common interest. Therefore a code of conduct is
important if protracted wrangling is to be avoided. Furthermore, the
sheer numbers of participants make ad hoc negotiation cumbersome.
According to Goodman, most reschedulings of syndicated loans have
involved more than 100 banks (Goodman 1982, p25) .
There are precedents for such a code of conduct in documents
published by the International Chamber of Commerce relating to Letters
of Credit, Commercial Bills and Guarantees. These documents constitute
part of the contract between banker and customer because agreement to
such conditions is included in the documents signed by banker and
customer. It would be equally possible to include an agreement on
rescheduling in the loan documentation.
The writer considers that a procedure for rescheduling, which would
be established under the auspices of some multinational official
institution such as the IBRD, would have the following advantages:
1) Political factors are most important in rescheduling
negotiations (Van der Bey 1982). Therefore having an
internationally agreed set of rules may ease the
politicians' difficulties.
2) Rescheduling may be given a more respectable place
in the debt management policy of the borrower and the
asset management of the creditors.\
3) ■’ Time will be saved by avoiding disagreements between
creditors as to the terms of the rescheduling by
establishing the relationship between the terms of

the rescheduling and current market terms at the
negotiations for the original loan.
4) The more enlightened attitude to rescheduling may
encourage debtors and creditors to reschedule debt
before the crisis arises, thus avoiding crisis
publicity and its attendant influence upon confidence.
5) A formal procedure may make it possible to renegotiate
not only debt currently due but debt due in the future
as well.
6) Provided the rules have the support of the developed
as well as developing governments, official debts and
non bank debts could probably be handled at the same
negotiations. Two important areas here would be
export credits, often officially guaranteed by
developed country government agencies, and bond issues.
The trouble with setting up a set of rules is that some
respectability is seen to be given to reneging on debt.
At present, three major difficulties are envisaged in establishing
such a set of rules. They are:
1) Finding an institution which can consistently be
perceived as being neutral between borrowers and
lenders.
2) Negotiating the detailed clauses that are acceptable
to official, bank, bond and other creditors given the
political interest of LDCs of obtaining the greatest
net transfer of resources.
3) The time taken for the learning process to be com
pleted by both borrowers and lenders about the benefits
of reschedulings, together with the time taken to
negotiate the code of conduct may be too long to avoid
crises which may develop in the short term. Because

these crises are therefore exacerbated, the time when
costs of rescheduling are substantially reduced and
rescheduling itself is viewed in a more enlightened
vein will be delayed even longer.
Nevertheless, these difficulties should not hinder active
discussion of ways to improve sovereign debt management policy. There is
evidence that the banks themselves consider that the current ad hoc
arrangements for rescheduling are less than satisfactory. Some
suggestions noted by Bell, op cit, include:
i) A group to advise the banks on rescheduling similar
to the groups of merchant bankers advising LDCs.
ii) Greater liaison between banks and international
institutions. The IMF could then exert pressure
to improve economic performance so as to enhance
the ability to service debt,
iii) The regulating authorities must take a more
flexible approach to capital adequacy in the
light of substantial rescheduling in the future.
These suggestions by Bell do not cope with negotiating differences
between the banks, between the banks and the debtor, nor between the
banks and other types of creditor. The recent case of Costa Rica
highlighted animosity between the banks and bondholders.
The rescheduling of official debt is usually carried out at
separate negotiations and on different terms than private debt. Maybe
all debt could be dealt with at the same negotiations. This may seem a
cumbersome operation but if procedures were standardised, this may
simplify the process dramatically. This system would also cope with the
recalcitrant bank which decides to sue and enforce a judgement rather
than help the debtor for the mutual benefit of all concerned.

One suggestion noted by Bell, op cit, was to use the IMF as a
lender. However, the IMF has never been a major supplier of funds to
LDCs (refer chapter one). The IMF's sum of quotas has shrunk in real
terms from 12% of world exports in 1960 to 4% in 1980. The ability of
the IMF to enable a member country to avoid rescheduling is severely
limited. For example, the maximum amount available to Mexico is $1.3
billion in one year compared with a 1982 deficit of $14 billion
(Euromoney 1982a)and debt currently thought to total US $80 billion.
However, there may be a role for the IMF in the rescheduling
process. It could liaise with the body enforcing the code of conduct and
all the parties, lending a small amount of money and acting as an
economic adviser to the developing countries much as it does already. If
in a rescheduling, new bank money or extensions of bank credit were only
to be made available if IMF finance bearing high degrees of
conditionality was made available concurrently, the confidence of the
bankers in rescheduling may be increased. The 1979 rescheduling for Peru
provided for such a scheme (Goodman 1982) as did the 1981 scheme for
Bolivia (Economist 20.3.82 p42).
One problem of making commercial bank rescheduling dependent on
some other financial event, say IMF parallel finance, is that if the
country does not meet the conditions of that other finance, eg the terms
of IMF conditionality, the bank rescheduling fails and the financial
condition of the borrower may be exacerbated. This appears to have
happened with Jamaica in 1980 (Economist 20.3.82).
The suggestion that the IMF should cooperate with the IBRD and the
commercial banks in rescheduling and that IMF conditionality should be
part of the rescheduling does not imply that the writer is unaware of
the political criticisms of the scheme, particularly that two western
'capitalist' institutions are combining to minimise the benefits
accruing to developing countries. To some extent this criticism can be

mitigated as the number of banks outside the OECD countries join the
syndicated loan market and agree to comply with the code of conduct on
rescheduling.
However, it is for this political reason that it is suggested here
that the IBRD should administer the rescheduling agreement. The IMF
should cooperate so that the conditionality of IMF money is compatible
with the debt management policy that is optimal for the developing
country. It is also thought that the IBRD is more acceptable to the
developing countries because it does not have a history of animosity
caused by conditionality. Moreover, the Bank would have considerable
professional respect from the private bankers because of its expertise
in development banking. However, it would be necessary for the IBRD to
soften its approach to rescheduling its own debt.
If the IMF or IBRD were to act as convenors of creditors' meetings,
the loan agreement could specify the banks in the negotiations which
will represent all the banks in the loan agreements. This may be a new
duty for the agent bank.
As the Bank and the Fund have annual meetings with members they
could make suggestions about debt management to reduce debt servicing
problems and also advise to seek a rescheduling early on, before
payments are in arrears. The use of parallel financing will enable funds
from the private sector to be combined with some IMF or IBRD resources
to refinance maturing debt and help reduce the costs to the developing
countries without reducing the profitability of the banks.
The establishment of this code of conduct may be seen as an
admission by the banks that some of the original terms of the lending
may not be complied with - in effect that their lending policy and risk
analysis are less than perfect. However, two things make modern
syndicated lending to developing countries different from other forms of
bank lending. Firstly, these loans are frequently programme loans. Their
aim is to finance the adjustment process of a whole economy. The time

span of this adjustment, difficult to forecast at any time, will be
uncertain at the time the loan agreement is signed. Given that what is
long term in bank lending is short term for macroeconomic adjustment, it
is to be expected that the maturity date of the loan will have to be
extended.
Secondly, the loans have floating interest rates and are generally
in foreign currency at least from the borrower's point of view.
Furthermore, much of what is to be purchased with the loan proceeds -
capital goods - is also priced in foreign currency. The 1970's has been
a period of fluctuating interest rates and exchange rates unprecedented
in recent history. These factors make it very difficult to forecast the
ability to service the debt and keep to those forecasts. The debt
servicing costs have generally risen over the 1970's and early 1980 as
LIBOR has risen and fluctuations in exchange rates make t-he value of
interest and principal in terms of domestic currency uncertain until
payments are due.
Therefore in many respects floating rate foreign currency loans
create greater uncertainty for both the borrower and the lender. It
seems obvious, therefore, that there should be periodic reviews of the
debtor's ability to service each debt. When the debtor's financial
circumstances change it seems reasonable to change the conditions of the
loan so as to avoid a crisis which only damages both debtor and
creditor. One problem with bank lending to developing countries is that
because of the large number of banks associated with each loan, such
periodic reviews are difficult to carry out. Therefore, consensus for
change is difficult to arrive at without some framework like that
suggested in this section. As a result reviews and changes in loan
conditions resulting from changed financial circumstances only come
about when there is a financial crisis.
In the survey of banks seven questions were asked about the
restructuring of debt, in particular about bankers' attitudes to greater

flexibility in maturity structure, the major costs of debt rescheduling,
the treatment of rescheduled debts in balance sheets and bankers’
attitudes to a code of conduct similar to that suggested in this
section. The responses are reported in chapter seven, pages 341-344.
6.6 Improved information flows for country risk analysis
Bank sources of information can be classified at three levels: 1.
Sources within the bank such as economic analysis, information from
branch offices and from visits by bank executives to the country
concerned; 2. Purchased sources of specialist information eg consultancy
studies, official statistics from the LDC or such bodies as the IMF; 3.
Day to day snippets of information from the 'News' (Hagen 1981, p22) .
Theoretically the bank will continue to collect and analyse information
until the marginal cost of collection equals the marginal benefit of
using that information.
One difference between lending to OECD based corporations and
governments on one hand and LDCs on the other is that the cost of
gaining information on LDC risks is so much greater. In many cases the
cost of gaining information of a similar quality (ie accuracy, currency
and disaggregation) is infinite because such information is not
available to the lending banker. Indeed it may not be available to the
government of the developing country.
Thus it is reasonable to assume that lending bankers often analyse
LDC credit proposals with less information than a similar proposal from
an OECD based borrower. Accordingly the banker will perceive the loan as
having greater risk because of the greater uncertainty involved.
Consequently this lack of information reduces the banker's loan
portfolio for a given level of income because of the higher risk
associated with that level of income.
It is clear therefore that any system that increases the quality

and reduces the cost of information required by bankers to make valid
credit decisions, will assist in providing the appropriate flow of funds
to the developing countries. Furthermore, to the extent that that
information is not available to the developing countries themselves,
making it available will assist those countries in their general
macroeconomic policy formulation, and in their debt management policy in
particular. In this respect the example of Zaire is quoted by Donaldson
(1979) where it took several months just to determine the extent of
Zaire's debts before credit proposals could be negotiated.
Improvement in the quality of financial management of the
developing countries was found by Lees & Eng (1979) to be significant in
increasing access of those countries to international capital markets.
While Hope (1982) notes that the developing countries can benefit from
improved information regarding their debts in the following ways:
1) Improved information ensures more appropriate borrowing
decisions.
2) Improved information enables better debt management.
There may be direct financial gains here because of
avoiding penalties for late payment of interest and
principal.
3) Improved information allows the borrowers to have
advanced warning of the needs to refinance or renegotiate
debt in order to avoid debt service difficulties.
Clearly therefore both borrowers and lenders will benefit from
improved financial information about the less developed economies.
It is often considered that the IMF, IBRD and similar institutions
have superior information to that of the private banks and that the
banks should try to share in that information. However, for this to be
done in a formal and consistent manner may risk undermining the
confidential relationship between the IMF or IBRD etc with their
members.

The IMF is currently considering how to reconcile its confidential
relationship with member countries and the need for better information
by private banks. Three suggestions are being considered:
1) To give more background information about the debt
position of developing countries.
2) To increase the Fund's influence when engaged in
parallel financing with the private banks.
3) For Fund officials to attend meetings between the
banks and the borrower even when the Fund is not
directly involved in lending (Financial Times
4. 10.82 pl5).
It may be possible to include in a loan agreement a provision that
the borrower will instruct the IMF or similar institution to transfer
information to the lending bank. However, given the competition to lend,
this may only be enforceable in a period of tight credit. Furthermore
such a move may be resisted by the international body lest it result in
reducing the quality of the information flowing to that body.
The system of co-financing, to be discussed below, does enable the
private banks to share in the knowledge and expertise of supranational
institutions because in the terms of the co-financing the borrower gives
permission for the IBRD to transfer information to the banks.
There would seem to be substantial social and private economies to
be derived from an organised central source of information. Being
staffed by experts, this organisation could investigate the LDCs*
sources of data, giving advice and assistance to the LDCs on improving
quality. This information would be such as to fulfil the requirements of
best banking practice. It may also be possible to provide 'off the
shelf' country risk analysis for the smaller banks. The output of such
an organisation would also be of benefit to the authorities charged with
regulating the world's banking systems and the eurobanking system in
particular.

The improvement of the quality of currently produced official
statistics should also be continued. Wider statistical coverage of the
euromarkets is required, while statistics on bank lending should be
expanded to include short term credits. Currently, the measurement of
short term finance (under one year) to LDCs is of very poor quality yet,
although it is onerous to record these debts because of their numbers,
they represent collectively a substantial claim upon the nation's
foreign exchange resources (ref chapter five, page 236).
It is not only information flows from developing countries of
monetary agencies that need improving. In order to evaluate the banks'
risk of lending to developing countries, each bank must be aware of its
total exposure to each borrower. Therefore the internal accounting
information systems of each bank must be able to provide all the
required information. Yet in a recent Financial Times World Survey of
Bank Annual Reports, only 24 out of the world's top 100 banks published
fully consolidated accounts (Lafferty 1982). Although the banks may have
unpublished consolidated data this cannot be taken for granted.
Moreover, it is the published accounts which other banks use when
assessing the credit standing of banks with regard to interbank lending.
Six questions regarding the quality of information were included in
the banking survey. These asked about the quality for the banks' risk
analysis and for the government's macroeconomic policy formulation.
Questions were asked about the desirability of a credit rating agency
and about the establishment of a central organisation for collection and
dissemination of information. The results are reported in chapter seven,
pages 344-346.
6 .7 Co-financing with multilateral lenders eg IMF and IBRD
Co-financing is an arrangement whereby funds from various lenders
are combined with funds from a multi lateral official agency to finance

a project. The World Bank provides the major part of its co-financing in
association with official bilateral loans and official export credit
agencies but there is growing scope for co-financing with private
lenders. An alternative approach to co-financing is for the World Bank
to sell off participations in loans it is currently negotiating (Eng et
al, op cit).
The technique of co-financing can either be in the form of joint
financing ie a common set of goods and services are purchased, or there
can be parallel financing where separate parts of the project are
financed by different sources of funds. This latter often provides more
flexible financial arrangements and is favoured by official
co-financiers.
Since 1975 it has been the policy of the IBRD to increase the
private involvement in co-financing. This financial technique could also
be used by the IMF in a formal way in order to increase the flow of
funds to LDCs. The IBRD has found that its portion of the financing acts
as a catalyst in attracting other funds and the IMF has noted the
informal arrangements whereby sometimes private bankers only lend if an
IMF facility is made available and IMF conditionality is complied with.
For the private banks co-financing adds status to the loan and
reduces the risk associated with that loan. The risk is reduced because
the banks are given vicarious access to confidential IBRD data about the
borrower and the greater political clout of this multilateral
institution. This clout is derived from the high priority that borrowers
give to servicing IBRD debt (Eng et al, op cit). This is because the
IBRD is a source of funds for countries who have not as yet progressed
to be eligible for private finance. The IBRD is therefore a first line
of finance. If the first line commitments are defaulted upon, the
borrower will be reducing considerably its chances of ever being able to
raise private finance. This political strength is also passed to the
banks via cross default clauses in the co-financing agreements. With

such a clause if a default is declared by the private lender, then the
IBRD loan would also be in default. Because developing countries are
anxious to maintain good relations with such official institutions, the
private banks' position is that much safer. The access to confidential
data comes directly from the conditions of the co-financing agreement
where the borrower agrees that the IBRD may pass on confidential
information to the private banks.
The IBRD is thought to have superior information of, and ability to
analyse, projects and thus will be expected to provide the information
and administration of the loan. This superiority stems from the greater
use made by the IBRD of specialists such as engineers, economists and
others in a painstaking analysis. Furthermore, the private bank's
analysis is made in a more competitive environment where there is
pressure to complete many analyses. Thus the banks are pleased to be
able to take advantage of the 'in depth' IBRD studies (Leeds 1980).
The commercial banks enjoy the advantages of ' reduced loan
administration, improved information, access to a broader range of loan
opportunities and reduced overall risk in portfolio. There may also be a
learning function for smaller banks as they learn about the analysis and
administration of large project loans.
Co-financing would therefore seem to be an ideal vehicle for
increasing the access of developing countries to private capital markets
where this access is constrained not by the cost of private funds but by
the lender's perception of risk. Yet to date co-financing does not seem
to have caught on. The Economist notes that up to 1981 187 banks linked
up with the World Bank and that of the 1.8 billion supplied by private
banks to June 1981, 24% came from American banks, 22% from Japanese
banks and 33% from British and European banks (Economist 20.3.82 p47).
The following data show that most of the finance for individual
projects usually comes from the World Bank and that most of the
co-financings have been for countries that already have considerable
access to the private capital markets.
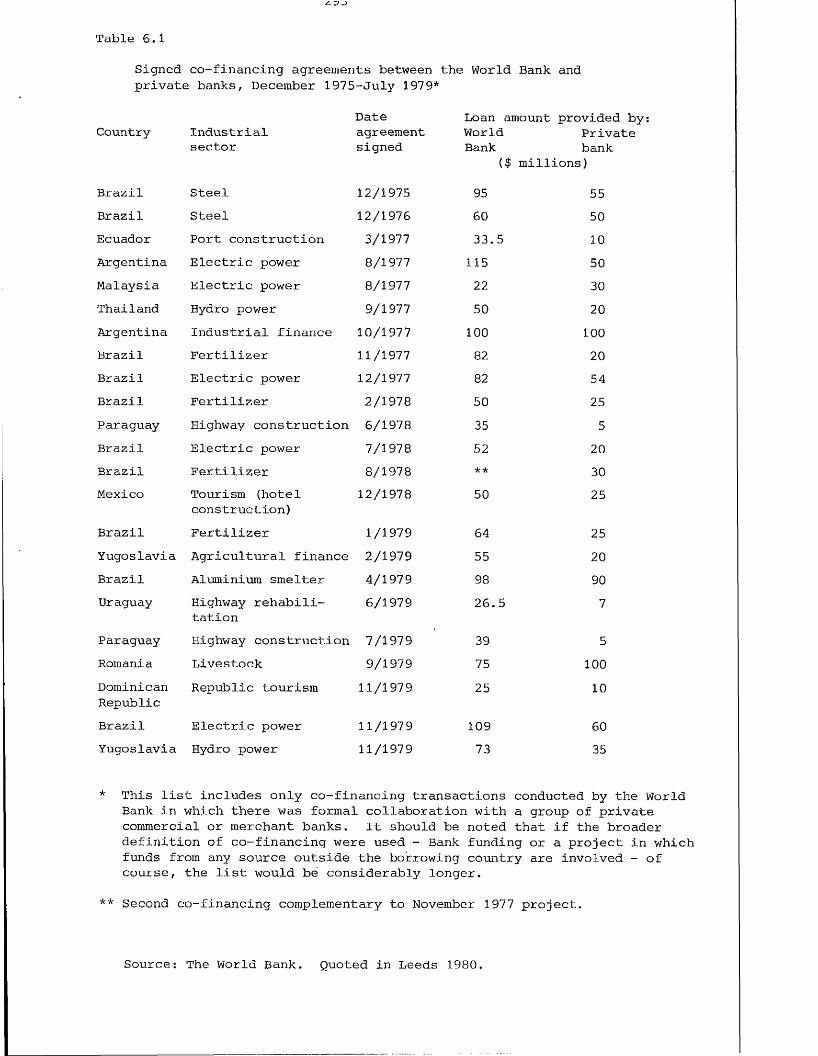
Table 6.1
Signed co-financing agreements between the World Bank and private banks, December 1975-July 1979*
Date Loan amount provided by:Country Industrial agreement World Private
sector signed Bank bank($ millions)
Brazil Steel 12/1975 95 55Brazil Steel 12/1976 60 50Ecuador Port construction 3/1977 33.5 10Argentina Electric power 8/1977 115 50Malaysia Electric power 8/1977 22 30Thailand Hydro power 9/1977 50 20Argentina Industrial finance 10/1977 100 100Brazil Fertilizer 11/1977 82 20Brazil Electric power 12/1977 82 54Brazil Fertilizer 2/1978 50 25Paraguay Highway construction 6/1978 35 5Brazil Electric power 7/1978 52 20Brazil Fertilizer 8/1978 ** 30Mexico Tourism (hotel
construction)12/1978 50 25
Brazil Fertilizer 1/1979 64 25Yugoslavia Agricultural finance 2/1979 55 20Brazil Aluminium smelter 4/1979 98 90Draguay Highway rehabili
tation6/1979 26.5 7
Paraguay Highway construction 7/1979 39 5Romania Livestock 9/1979 75 100DominicanRepublic
Republic tourism 11/1979 25 10
Brazil Electric power 11/1979 109 60Yugoslavia Hydro power 11/1979 73 35
* This list includes only co-financing transactions conducted by the World Bank in which there was formal collaboration with a group of private commercial or merchant banks. It should be noted that if the broader definition of co-financing were used - Bank funding or a project in which funds from any source outside the borrowing country are involved - of course, the list would be considerably longer.
** Second co-financing complementary to November 1977 project.
Source: The World Bank. Quoted in Leeds 1980.

One reason why co-financing may not be as popular with the private
banks is that the spreads and fees tend to be lower than on other loans.
Despite the reduced perceived risk by many bankers, they still require a
reasonable return on their total assets (Buchanan 1982). Furthermore,
some, particularly US, bankers have been concerned that bank
shareholders may not perceive co-financed loans as bearing reduced risk.
In such a situation the banks' stock market ratings will fall.
The role of co-financing in extending the number of countries
having access to private markets has been slight, yet it is precisely
here that the private banks will benefit most from the IBRD expertise
and the cross default clause. Firstly, because the private banks are not
major lenders to these countries, they would get even greater benefits
from the World Bank's relatively greater knowledge. Secondly, the cross
default clause will be an even greater sanction to countries who need
greater reliance upon IBRD funds.
Leeds (op cit) has suggested that co-financing could be extended
beyond bank syndicated loans to insurance companies, pension funds and
even bond holders. However, to the extent that regulations preclude
these institutions from lending to LDCs, co-financing seems to have
little to offer. Where risk is the main constraint, provided that
lenders perceive co-financing as reducing the risk to the private
lender, it should facilitate access to new sections of the private
capital markets. However, there seems little point in bond holders
taking on the greater risk of co-financing projects when they can invest
directly in the IBRD. A further benefit for the financial institutions
may be the gaining of other business from a wider range of developing
country borrowers.
An extension of co-financing is parallel-financing, where the
bankers make their loan drawdown conditional upon implementation of the
IMF's stabilisation programme. Unfortunately such a system seems
unlikely to operate except as a result of a crisis since the

conditionality attached to IMF loans means that members approach the IMF
only as a crisis looms.
Three questions about co-financing were included in the survey.
They related to the bankers' perception of the advantages and
disadvantages of co-financing, whether increased co-financing will
increase the flow of funds to LDCs that do not already have access to
bank finance or only increase the flow of funds to those that already
have bank finance. The results are reported on pages 346-8 of chapter
seven.
6.8 Bank credit insurance and loan guarantees
Bank credit insurance is organised on an official basis in most
industrialised countries but is generally limited to export related
credits. Much of this credit consists of medium and long term loans,
many funded through the euromarkets and many at subsidised rates of
interest. The minimum rate of interest to be charged by EEC members, and
thus the maximum subsidy from those members is determined by the
'Consensus', which meets under the auspices of the Berne Convention.
However, much of the new bank lending to LDCs has been in the form
of programme loans. As such there are no identifiable exports which can
be the basis of export credit insurance. Because of this, either a new
institution would have to be established or existing institutions would
have to change their policies. Unless the insurance institution was
supranational, the problems of non-uniformity of behaviour by national
agencies would provide similar problems to non-uniformity in supervisory
functions.
Any sort of loan insurance must impose private costs either on the
borrower or the lender. Furthermore, the premiums should be related to
risk in order to deter imprudent banking practice. Thus, the private
loan insurance organisation should increase the premiums on loans to

countries of high risk thereby encouraging those countries to put their
houses in order. But in markets as competitive as the euromarkets, it is
possible that banks will undercut competitors by not insisting on loan
insurance. This weakness can be overcome by the supervisory authorities
developing a common and advantageous attitude to insured assets compared
with uninsured ones. Secondly, the policy of advertising the proportion
of a bank's assets that are insured may influence depositors,
particularly those in the interbank market, to favour banks with a high
proportion of insured loans. Thus competition for deposits may force all
banks to insure their loans.
Furthermore, although there are many banks involved in the
euromarkets, some are relatively small participants in syndicates. The
number of large banks which are major leaders of syndicates is
relatively small and most of these are in the GlO countries. Accordingly
if the major banks are persuaded to join the loan insurance scheme, it
is unlikely that any smaller banks avoiding the insurance scheme could
establish syndicates to lend at such a magnitude as to put the
international banking system in jeopardy.
The point has been made (Dorrance 1981) that insurance is similar
to a guarantee and that when a banker receives a guarantee he looks to
the guarantor for repayment. Therefore guarantees should be avoided
because they will encourage banks not to carry out adequate risk
analysis. This in turn will increase the risks to the international
banking system.
The Dorrance thesis assumes that the costs of relying upon the
guarantee are less than relying upon repayment from the original
creditor. This, however, confuses the real nature of a guarantee. A
guarantor is only secondarily liable to the creditor. Therefore, the
creditor must first seek payment from the original debtor and the debtor
must fail to pay before the guarantor is liable under the guarantee. The
crucial question therefore is:- what costs does the creditor have to

incur in trying to recover from the debtor before he can claim from the
guarantor or insurance fund?
Consequently, when analysing any loan guarantee or insurance
scheme, it is important to ensure that the costs to the creditor are
sufficiently high to make rigorous credit analysis necessary but not so
high as to negate the advantages of the guarantee or insurance scheme.
Here we are concerned with explicit guarantees. The assumed or
hoped for guarantees such as those thought to be available from the USSR
regarding Polish debt are not real guarantees. They are no more than
political events, their likelihood of actually existing being part of
political risk analysis.
We must also distinguish between guarantees from financially
independent and sound third parties and guarantees from financially
related guarantors. The country risk of lending to a corporation located
in one country or to the government of that country is similar. If the
bank is concerned with country risk then a government guarantee is not
much help. If, on the other hand, the bank is only concerned with
corporate credit risk, then a government guarantee is useful. Therefore,
a guarantee or insurance scheme whereby the guarantor is financially
independent of the borrower is beneficial because the credit or country
risk is genuinely diversified.
Dorrance fop cit) makes the point that either the insurance
premiums will increase the cost of capital to the developing countries
or if these premiums are reimbursed as a part of aid, then other aid
will be reduced. This may be so but there is clearly some concern that
the markets will, in the future, impose further credit rationing; if the
insurance scheme avoids such credit •rationing, the social benefits of
increased credit availability may exceed the social costs of the
insurance scheme. We already see the costs of credit rising as
individual countries demand more credit. Insuring the loan may reduce
the risk premium required by the bank thereby providing additional

finance at no higher explicit cost to the LDC borrower.
Clearly it is possible for credit insurance or guarantees to be
beneficial to both borrowers and lenders but to be socially beneficial
it must place costs on imprudent banking practice.
A scheme suggested by Zolotas (1978, 1979, 1980) does impose such a
cost in the majority of cases. The proposed International Loans
Insurance Scheme only insures a proportion of each of the loans insured.
As, according to this scheme, the loans are guaranteed by the IMF, IBRD,
OPEC and the industrialised countries or alternatively a cooperative of
private financial institutions, these loans are from the lenders' point
of view prime risks. Therefore the banks should expect only a prime risk
return on such loans. Zolotas therefore suggests that the difference to
the borrower between the return on an insured and an uninsured loan will
be paid to the insurance fund. The borrower therefore pays the spread
and fees combination as if the loan were uninsured. This suggestion has
the merit of not increasing the costs to the developing country
borrower.
However, there are two weaknesses: one is the use of the IBRD as
guarantor; the other is the attempt to make the scheme self-financing on
an insurance basis. With respect to the IBRD as a guarantor, if this
institution issues substantial contingent liabilities, it may be
compromising its credit rating. Such compromising would reduce its
ability to raise development finance, at least at the finest rates, and
would therefore jeopardise its major function, or at least make IBRD
funds more expensive. Thus, the poorer developing countries who rely on
IBRD funds may be financing the richer borrowers from private markets.
This same problem may occur with the IMF if it should wish to raise
finance from the capital markets in the future.
The second point stems from the fact that the fees-spread return on
bank loans tends to be squeezed at periods of high liquidity and these
are generally associated with global payments imbalance. This squeezing

narrows the differentials between prime borrowers and more risky ones.
Thus the revenue going to the insurance scheme will frequently be very
small and may not provide a large enough insurance fund.
Furthermore, if this fund is not sufficient, the individual
guarantors of the funds will be supporting the activities of banks over
which they have no control and countries over which they have no
political influence. There may therefore be a conflict of interests
between the guarantors eg loans to Argentina being insured and the
guarantors being UK and USA.
The problem of supporting banks over which the individual
guarantors have no control is similar to the problem o f the
international lender of last resort, and indeed a similar amount of
regulatory power may have to be transferred to the insurance scheme (see
page 325 below). Indeed if the insurance fund is inadequate, the
guarantors will collectively be lenders of last resort.
It is important to determine which risks the insurance fund would
pay out on. From the discussion on rescheduling above, it would seem
that the only costs to the banks, as far as sovereign loans are
concerned, would be upon a repudiation by the borrower, or a
rescheduling on subsidised terms. Given the infrequency of such
occurrences in recent years, is it necessary to establish a new
institution to cover such a risk? Moreover, as loans to corporate or
individual borrowers can be more easily associated with exports,
projects, etc the existing export credit insurance agencies may be
sufficient for the task.
Any proposed international insurance fund may facilitate better
information flows from LDCs. The fund would be able to carry out country
risk analysis and thus save the efforts of the banks. This may avoid the
problem of confidential information being transmitted to the banks
themselves.
There may be an additional advantage to insured loans, that is that

borrowers may be less willing to default on such loans because of the
political influence of that default upon the guarantors. Furthermore,
the insurance fund may easily stop the flow of new credit to defaulters
or irresponsible debtor countries by refusing to insure their
borrowings.
Haschek (1980 & 1982) suggests that the system of insured buyer
credits should be expanded so as to reduce the risks to the bankers in
international lending. He also suggests that the official export credit
agencies should expand their functions by borrowing in the euromarkets.
In effect they will be engaged in recycling.
With respect to increasing bank lending to developing countries,
the increased use of buyer credit insurance has the merits of being
speedy to implement; because such systems already exist there is no need
to use resources to establish a new institution. However, the existing
official export credit insurance institutions are used as aids to export
competition policy. It would be unfortunate if their work was hindered
because of the multinational nature of the syndicates.
The increased use of such schemes does not obviate the constraints
on future bank lending of capital adequacy and profitability. For such a
constraint to be removed, the regulatory authorities would have to treat
insured loans more favourably when analysing capital adequacy,
liquidity, loan concentration and total exposure.
Haschek's suggestion that the official export financing agencies
should expand their function will only transfer the current problems
from one set of financial intermediaries, generally private, to another
set, official intermediaries.
Six questions on credit insurance and loan guarantee schemes were
included in the writer's survey. The questions asked about bankers'
attitudes to guarantee schemes, whether they would result in less
prudent lending decisions and whether ECGD or similar institutions
should cover programme loans. Questions were also asked about the impact
of loan insurance upon

loan costs, whether availability will lead to tiering in the interbank
market and whether insured loans should be treated preferentially in
bank balance sheets. The responses are reported on pages 348-51 of chapter
seven.
6 .9 Prudential monitoring and regulation of bank lending
There are three types of banking regulation:
1) those designed to implement monetary policy, such as
open market operations and reserve requirements
2) those designed to preserve the safe and stable
functioning of the monetary system
3) those designed to achieve non monetary goals such as
the redistribution of credit.
(Dean & Giddey 1981)
In this section we concentrate upon the regulations of type 2)
above.
A strong argument for bank regulation to safeguard the financial
system arises from the externalities associated with the banking
function of providing the medium of exchange and the function of
intermediating between borrowers and lenders. If the moneyness of bank
liabilities is to be maintained, they must be acceptable. It is
therefore crucial that the financial viability of the banks is
undoubted. To this end it is necessary that the banks are seen to behave
within prudential limits. The social benefits of the function of
financial intermediation are to be found in the bridging of an
information gap between the financial surplus and financial deficit
units in the economy (Furness 1969). If the process of intermediation is
broken, many units of production relying on credit will be forced to
cease production with detrimental effects upon economic welfare. In
other words the role of supervision is to provide the public good of

financial stability. The act of financial intermediation is a fair
weather activity in that the intermediary's liquid reserves are a small
proportion of its assets. If the financial climate deteriorates, the
reserves of a bank are quickly exhausted, assets must be sold; they fall
in value and thereby threaten the bank's solvency (de Vries 1982).
Supervision aims at minimising unwarranted risks and providing liquidity
in times of stress.
Official control of domestic banking operations by domestic
governments of OECD and many other countries is well established.
However, those same countries generally have a looser form of control,
if any, over the foreign currency lending of banks within their borders
including branches of foreign banks. Moreover, there is no supra
national mechanism for control of international banking and therefore
what international control there is, results from the inter-relationship
of the various national controls of individual governments. Yet the
banks engaged in international banking are often also engaged in
domestic banking. Accordingly loss of confidence or a deterioration in
the bank's financial health could as easily be generated from the bank's
domestic activities as from its international activities. It is
therefore invalid to separate the domestic and international supervision
and regulation of banking. Yet this is exactly what governments do. For
example, there are reserve asset ratios in domestic banking, but they
are often non-existent in eurobanking. There are lender of last resort
schemes and deposit insurance schemes for banks' domestic operations but
not for their international operations.
Supervision in the context of both the domestic and the
international banking systems is related to ensuring an adequate minimum
quality of management and balance sheet. This immediately raises the
question of whether officials are better able to judge the quality of
bank management and financial health than the bankers themselves. The
answer lies in the degree to which the officials can be more objective
and have a more complete picture of the global situation.
Officials are likely to have a more objective approach because they
will be free of the competitive pressures between banks, and even
between the functions within a single bank. Where competition manifests
itself in high weightings being given to the growth of balance sheets
and earnings in the banks' utility function, the quality of the banks'
balance sheet may decline. Likewise if the growth of business is
important in assessing the performance of individual functions, any
prudence suggested by the risk analysts may be ignored by those
responsible for marketing the banks' services. This is particularly
pertinent when it is considered that bank staff move between jobs for
career development and the current incumbent of a position may not
expect to be in that position when problems arise.
The central bank officials will also be able to use confidential
information supplied by the whole market when assessing the performance
of an individual bank. Furthermore, those officials could be
instrumental in desseminating details of the best techniques of banking
from the most advanced members of the system to the less advanced. A
good example of such techniques would be those used in country risk
analysis where there may be economies in the provision of information if
it comes from the central bank rather than being researched separately
by the individual banks.
It was seen in chapter three of this thesis that some writers
consider that growth of the euromarkets is associated with an asymmetry
in banking regulations. This means that the eurobanking carried out in a
particular banking centre is relatively less controlled than in domestic
banking in the same centre. It has been shown in chapter four of this
thesis that this lack of regulation gives rise to interest rate
differentials in favour of the euromarkets, and that these differentials
are the main reason for continued separation of euro from domestic
banking.
A good example of this asymmetry explains the growth of London as
the major euromarket centre. London imposed few regulations on
eurobanking whilst maintaining controls over domestic banks. Other
European centres, in contrast, imposed more regulations over the
eurobanking as well as domestic banking (Cohen & Basagni op cit, pi54).
It is clear therefore that national differences in attitudes to bank
regulation have a profound influence upon the competitiveness of banks
in different countries and therefore the growth and stability of
eurobanking in those countries.
The following sections analyse four areas of supervision that are
directly related to the risks associated with international bank
lending. These areas are:-
1) The use of consolidated accounting information
2) Capital adequacy
3) Liquidity
4) International cooperation in supervision and regulations
Consolidated accounts
Clearly prudential supervision should cover a bank's domestic and
foreign operations because failure of an overseas branch or subsidiary
is likely to affect the parent organisation. The degree of effect will
depend on the size of the participation of the parent bank. At one
extreme will be a branch trading under the same name as the parent bank.
Here a loss of confidence or insolvency in the branch will strongly
influence confidence in the parent. At the other extreme is the case
where the bank only has a minority interest in an overseas operation.
If the bank is not responsible for policy, weaknesses in the
operation's business are unlikely to affect the depositor's confidence
in the parent bank.
The use of consolidated accounts stops head offices from directing
bank business to lesser regulated jurisdictions because the prudential
regulation is in the light of the whole of the bank's global business.
In 1979 the President of the BIS wrote to member central banks
asking them to cooperate in the introduction of bank supervision on the
basis of consolidated accounts. Furthermore, there is an EEC Directive
which makes banking supervision based on consolidated accounts
obligatory for EEC members (Thring & Jones 1981).
Consolidated accounts are the most appropriate form of accounts in
the supervision of:
- capital adequacy
- loan concentration
- country risk
- open foreign exchange positions
- liquidity (Colje 1980)
Where bank supervisors place limits upon the level of exposure to
one borrower either in terms of quantity or degree of concentration,
clearly it is the exposure of the bank's global business to that
borrower which is important. Thus consolidated accounts are essential.
Where supervisors monitor country risk exposure then, again, they
are concerned with the degree of exposure of the bank's global
activities and therefore need consolidated accounts.
Foreign exchange exposure and liquidity should also be monitored by
the bank's parent authority to ensure the overall health of the bank.
However, these aspects of bank business must also be monitored in each
national market by the national authorities since local market
conditions and regulations affect liquidity and the stability of foreign
exchange markets.
However, it is not sufficient that there be international agreement
to use consolidated accounts. There must be agreed uniformity regarding
the format of the accounts, definitions and interpretation, and the
parameters of supervision. This need for international cooperation is
discussed in more detail below (see page 313) .
Capital adequacy
The role of capital in a financial intermediary differs from that
in other types of organisation. In these other organisations the capital
provides the initial injection of resources with which to start
business. During the life of that business increases in capital provide
increased resources for investment. However, for a financial
intermediary, the resources for continuing business come from deposits,
which result from depositors having confidence in the intermediary. True
this confidence may be influenced by the existence of the capital stock
but other factors will also be influential. Therefore the role of
capital for a financial intermediary is seen as a cushion or insurance
fund to absorb losses that may occur (Reed 1964). This insurance role is
emphasised when it is remembered that it was traditional for UK banks to
issue partly paid shares or uncalled capital so that the callability
acts as an insurance against capital inadequacy.
Nevertheless, both financial and non-financial companies typically
secure the bulk of their capital resources from their retained earnings.
Reveil (1975) noted that retained earnings and capital adequacy are
substitutes for each other, although he thought that retained earnings
are the first line of defence.
Clearly then as the functioning of financial intermediaries relies
on confidence; adequate capital and profits are required to reassure
depositors, bank supervisors and markets generally.
Definition of capital
Gardner (1981) defines net worth as the book value of shareholders'
interests in the company. The essential components of net worth are paid

up share capital and accumulated reserves. These reserves are increased
by revaluation of assets, transfers from provisions, or from retained
earnings. New share issues will add to net worth by adding to capital.
It is the increased net worth through new issues of share capital
or increased earnings which represent an increased cushion or insurance
fund. However, it should be noted that Gardner refers to the book value
of shareholders' interests. To the extent that published financial and
internal management accounts do not reflect the true value of assets and
liabilities, the book value of shareholders' interests will not reflect
the true value of the insurance fund.
If the bank's net worth is to be used as an insurance fund, it must
be seen to be capable of being used to meet creditors' demands. Clearly
many fixed assets are not in that category and also book values of
relatively liquid assets which are in excess of realisable values
distort the measure of the insurance fund.
The extent to which the net worth constitutes an insurance fund in
the mind of creditors depends upon the liquidity of the assets
represented by the net worth compared with the liquidity of the
creditors' claims. Thus if one is a depositor with expectations of high
liquidity, the insurance fund would only be constituted of those assets
that can quickly be turned into cash. However, if one is a long term
subordinated debt holder one's perception of the insurance fund may
include the whole of the net worth.
Clearly, therefore, at least in the case of financial
intermediaries, the notion of net worth is inadequate as a measure of
capital within the context of capital adequacy. To overcome the
weaknesses of net worth, the concept of Free Capital is used by some
analysts. Free capital comprises Net Worth - Fixed Assets.
However, this concept of free capital is only as valid as the
accounts from which it is calculated. One problem is that many
provisions, such as 'doubtful debts' made against profits are

subjective; excess provision deflates profits and therefore the book
value net worth, while under provision inflates profits and the book
value of net worth. Currently there is debate about the lack of
provision being made against LDC sovereign debt. While the high bad debt
provisions of the UK clearers in 1981 are said to be because of the
current recession, could they not also be a response to the political
concern about high bank profits in 1980?
Given the weakness of using accounts as indicators of capital, the
traditional ways of measuring capital adequacy via balance sheet ratios
must also be suspect when used without additional information.
Capital adequacy and bank supervision
The role of the bank supervisory authorities with respect to
capital adequacy is to ensure that the capital is of adequate quantity
and quality. With respect to quality, the capital must be such that it
is perceived as an insurance fund by depositors and other creditors.
With respect to quantity, this must be sufficient to absorb unforeseen
losses without causing the bank to become insolvent, nor to lose
confidence in its ability to continue functioning.
So, how much is enough capital? The capital to assets ratios of
four leading US banks fell from 5.01% in 1970 to 3.58% in 1979. For the
UK clearing banks the ratio fell from 7.63% to 6.02% over the same
period. Likewise for German banks the figures are 4.26 to 3.93 (Cohen &
Basagni 1981, pl52). The ratio of free capital to deposits for the
London clearing banks fell from 4.1% in 1969 to 2.5 in 1974 rising to
3.0% in 1976 (Willson Committee 1978)1
The reduction in these capital ratios has coincided with increased
liability management and growth of interbank markets, both domestic and
eurocurrency. There have been greater possibilities for portfolio
diversification particularly for US banks after 1973. Improved bank

management systems have also contributed to the relatively more
efficient use of capital. However, increased volatility of interest
rates and exchange rates together with the increased perception of risk
associated with lending to LDC sovereign borrowers make it prudent,
ceteris paribus, to increase the 'cushion' in order to maintain market
confidence.
What is an adequate level of capital depends upon the nature of the
institution's business as reflected in its balance sheet and profit and
loss accounts. It is therefore unlikely that any single measure of
capital adequacy will be equally suitable to all banks. In particular
the riskiness of each bank's assets and the liquidity profile of its
liabilities are important, and yet their significance will probably be
lost by the sole use of ratios complying with fixed predetermined
criteria.
Accordingly, it is necessary for the supervisors to judge capital
adequacy separately for each bank in the light of the constituency of
its balance sheet, level of profitability, the current market conditions
and the efficiency of each bank's management.
In the words of the Bank of England:
"The acceptable relationship of free capital to risk assets to be sought will vary for different categories of banks and even from bank to bank within a category. It will need to take account of each bank's historic experience, the spread of business and other special factors which might affect future profits", (Bank of England 1975b).
The Bank of England looks upon balance sheet ratios "..... only as
adjunct to individual assessment of each bank in the light of its own
particular circumstances", (Bank of England 1975a). The Bank also notes
the importance of adequate earnings in that if these can confidently
cover normal loss experience there will be less need for capital
resources.
Again, like other areas of supervision, there are international
differences in attitudes to capital adequacy. We have only looked at the

attitude of the Bank of England. If other governments are less
concerned, their banks may become the weak link in the chain of
interbank transactions. The insolvency of one bank abroad may reduce
confidence in the whole market, with costly results for the borrowers in
developing countries.
Attitudes to capital adequacy will influence the banks' ability to
lend to the developing countries in two ways. Firstly if the banks
perceive that their capital asset ratios have reached a prudential
minimum, they will not increase their loan portfolio. Secondly if the
banks' capital asset ratio has reached the minimum set by the regulatory
authorities, bank lending will not be increased.
Both these constraints apply if the banks cannot increase their
capital base. However, the ability to increase this base depends upon
what the regulatory authorities consider to be capital, the attitude of
capital markets to banks as investments and the profitability of the
banks. On the first point, shares and subordinated long term debt are
generally accepted as capital by the authorities. However, the issue of
shares by UK and US banks does not seem to be popular. Indeed in the
case of US banks it will be difficult because shares have recently been
trading at below net asset value. Furthermore, US bank bond prices have
recently been falling due to investor concern about bank loan
portfolios.
There is concern that reduced spreads on international lending will
reduce the profitability of this lending and the need to make increased
provisions for bad debts will reduce profits and therefore the ability
to maintain an adequate capital base. This is particularly important
considering the influence of inflation upon the growth of bank assets.
Clearly there is a possibility that there may be a capital
constraint on new lending. The regulatory authorities, therefore, have
three duties:

1) Not to develop prudential attitudes to capital adequacy
that are more stringent than necessary.
2) Not to unduly restrict the banks' ability to raise new
capital.
3) To ensure that excessive competition or imprudent
banking practices do not reduce profitability to
unacceptably low levels. This point confirms the
spuriousness of dichotomising domestic and inter
national banking for supervisory purposes. Reduced
profits on international or domestic business will
have the same influence upon capital adequacy.
Of the nine questions about prudential regulation included in the
survey, four related to capital adequacy. They covered the reasons for
declining capital asset ratios of recent years, whether further decline
will be detrimental and the most appropriate ratio for the respondent's
bank. The results are reported on page 351-54 of chapter seven.
Liquidity
Liquidity is the ability to convert assets at minimal cost into the
means of payment. Thus liquid assets not only comprise cash and demand
deposits held with banks, but also other assets depending upon the costs,
implicit and explicit, involved in their conversion. Clearly the cash
flow of a bank has an important influence on its liquidity. This cash
flow may come from revenue, amortization of loans, maturing debt assets
and sale of assets.
Liquidity is required by banks to maintain confidence by meeting all
demands for withdrawals of deposits and for new loans. It is also
required to meet the unanticipated shortfalls in inward cash flow for any
reason, increased operating or capital expenditure and losses.

Maturity transformation has an important bearing upon a bank's need
for liquidity as does the level of certainty in banking operations. If
banks had perfectly matching maturity structures to their assets and
liabilities and complete certainty as to repayment of their loans, their
need for liquidity would be considerably reduced. Furthermore, greater
liquidity will be required the greater the uncertainty associated with
the inward cash flow of the financial intermediary.
It is important to differentiate between liquidity for an individual
institution and that for a whole market. An asset is liquid because the
holder can sell it easily and without substantial loss. One or two banks
holding, say, treasury bills could sell their holdings without greatly
influencing the price. However, if a whole market is selling treasury
bills to gain liquidity, those assets will lose their liquid properties
because they will be difficult to sell and any sales will be at
substantially discounted prices.
Clearly then, prudential supervision of liquidity, like that of
capital adequacy, should avoid sole reliance on liquidity ratios. In
particular the degree of uncertainty attached to each component of cash
flow and the availability of standby facilities should be taken into
account.
International differences in the degree of supervision of liquidity
increase the possibility that a crisis may affect the euromarkets via the
banks subject to the weakest supervision. However, it is frequently true
that prudential liquidity considerations are closely related to monetary
control regimes which differ between countries and within countries from
time to time. This may render it impossible to develop a framework for
worldwide application of liquidity 'analysis that is internationally
acceptable (Cook 1981).
Both liquidity and capital adequacy are related to the solvency of
the organisation. To the extent that minimum solvency criteria set by
supervisory authorities are greater than those that would be voluntarily
set by the organisation, they constitute a tax on its activities. When
there are geographical differences in the tax being imposed, there will
be pressure on the banks to move, via the establishment of branches and
subsidiaries, to those areas imposing the lowest taxes. This problem can
only be solved by imposing solvency conditions on the basis of worldwide
consolidated accounts for each bank.
Furthermore, these geographical differences in the tax will mean
that those banks located in low tax areas will have a competitive
advantage over banks in high tax areas. There may therefore be pressure
on the authorities imposing stringent regulations to relax those
regulations (Colje 1982). If such regulations are not relaxed, a greater
proportion of new lending will be from less regulated banks, thus also
weakening the whole system. This clearly shows how the weaknesses of the
international financial system are related to the weakest set of
regulations. In order to overcome this problem there is a need for
international agreement as to the stringency and nature of supervisory
practices.
In the survey questions relating to liquidity were asked within the
context of international differences in regulation which is the subject
of the next section.
International cooperation in supervision and regulation
Differences in national attitudes to the methods and stringency of
bank supervision weaken overall control and therefore security of the
global banking system. In particular footloose banks may gravitate to the
least regulated jurisdictions or engage in the least regulated types of
business. Examples of the former include US banks opening branches in
London or banks moving to the 'off-shore' banking centres such as Bahrain
and Singapore.
Furthermore, because of the international nature of the interbank

market, banks in highly regulated jurisdictions may be exposed to the
risks of banks in less regulated jurisdictions (Dale 1982). However, it
must be remembered that the euromarkets are very efficient. It may be
that the differing rigour in regulations leads to a tiering in the
interbank market with strongly regulated banks being perceived as lesser
risks and therefore obtaining funds more cheaply. If the interest rate
differential reduced costs by more than the tighter regulations increased
them, then banks would not gravitate to the least regulated
jurisdictions. In fact, if there were any tiering in the interbank market
because of location, banks would not wish to be identified as being
higher risk institutions and therefore would not locate in the least
regulated jurisdiction.
Differing governmental attitudes regarding the control of euromarket
banking arise not just for prudential reasons, but for macroeconomic
policy reasons. Although it is not intended to discuss this aspect of
banking control, its very existence makes the achievement of a uniform
system of prudential supervision all the more difficult.
An awareness of the dangers of the disparities in bank supervision
and regulation, at least amongst the GlO and Switzerland, lead to the
establishment in 1975 of the BIS Committee on Banking Regulations and
Supervisory Practices (The Cooke Committee). The general guidelines were
published in the so-called Basle Concordat in 1975. A subsequent
communique (15 April 1980) from the BIS stated that closer surveillance
of international banking was to be carried out by the Standing Committee
on euromarkets, meeting at least twice a year. In addition, the GlO
countries and Switzerland instructed the Cooke Committee to step up its
efforts, via member country authorities, to monitor the banks'
international activities using consolidated accounts and to monitor the
methods of assessing country risk exposure and maturity transformation
(BIS 1980).
A very important area of concern, at least until 1983, was the

uncertainty as to which authorities are responsible for taking action in
times of crisis. While it is recognised that a central bank will be
responsible for the supervision of foreign branches of banks whose head
offices are within its jurisdiction, it is by no means clear that the
same applies to subsidiaries and consortium banks (Dale, op cit). This
concept of 'parental responsibility' was, however, not uniformly applied.
This is because countries such as Luxembourg and Switzerland maintain
rigid secrecy laws which prevent foreign supervisory authorities from
obtaining the required information about the activities of their own
banks' operations in these centres (International Currency Review, July
1982).
May 1983 saw the publication of an improved version of the Basle
Concordat. This document noted that banks' operations abroad could be
classified as those of branches, subsidiaries, or joint ventures
(consortia). It also considers that there are two basic principles of
international cooperation in bank regulation between parent and host
authorities. Firstly, no foreign bank should escape supervision and
secondly, that supervision must be adequate. Thus host authorities should
inform parent organisations of any problems regarding a bank's foreign
establishment and parent authorities should inform host authorities of
any problems affecting the parent bank that also influence the bank's
foreign establishment.
Host authorities are to be responsible for foreign bank
establishments operating within their territories, while the parent
authorities, on the other hand, will be responsible for the bank's
general worldwide activities on a consolidated basis.
The 1983 Concordat lays down the host and parent responsibility in
respect of solvency, liquidity and exchange exposure and each of these
items in respect of branches, subsidiaries and joint ventures.
So, with regard to solvency, while the host authorities are
responsible for the financial wellbeing of branches within their

jurisdiction, the parent authority has primary responsibility for the
solvency of branches. This is because branch solvency is
indistinguishable from that of the parent bank. However, the supervision
of solvency of subsidiaries is jointly the responsibility of host and
parent authorities, the latter supervising on a group consolidated basis.
With respect to supervising joint ventures, this should be the
responsibility of the authority in the country of incorporation.
Supervision of liquidity is generally the responsibility of the host
country for branches, subsidiaries and joint ventures, with the parent
authority looking at the consolidated liquidity situation of the whole
bank. The supervision of liquidity in this respect excludes the lender of
last resort facility. The host authority has a duty to inform the parent
authority of any serious liquidity inaccuracy in a parent bank's foreign
establishment.
Supervision of foreign exchange exposure is also the joint
responsibility of parent and host authorities. Host authorities should
supervise the foreign exchange positions of the establishments within
their jurisdiction, while the parent authorities will monitor the
position of the bank on a consolidated worldwide basis.
These statements in the 1983 Concordat assume that both host and
parent authorities have similar views as to what are banking and non
banking companies, as well as mutual respect in regard to supervisory
ability. With regard to this latter point, if the host authority is
unhappy with the ability of the parent authority, the host should
restrict the activities of establishments with such parent authorities.
On the other hand, if a parent authority has reservations about the
ability of a host authority, the parent authority should extend its
supervision to the foreign establishment or discourage the parent bank
from operating any establishment in the host authority's jurisdiction.
The current approach to international banking supervision has
several weaknesses.
The first weakness is that compliance by the national authorities
with the recommendations made under the auspices of the BIS is voluntary.
This results in a lack of uniformity between national regulatory systems
as to definitions of banks and the stringency of regulations.
The second weakness is that only the central banks of the GlO
countries and Switzerland have been covered by these recommendations. Yet
there is a growing presence in the euromarkets of banks from outside this
geographical area. Until the central banks of all countries whose banks
are engaged in international lending adhere to the BIS recommendations,
there may be a weak link in the system. However, it must be noted that
the Cooke Committee is extending its consultations with supervisory
authorities who were not signatories to the Basle Concordats.
Thirdly, there are no recommendations about the functioning of an
International Lender of Last Resort, nor about an International Deposit
Insurance Corporation. This point has lead some commentators to suggest
that neither Italy nor Luxembourg broke the Basle Concordat when they
allowed Banco Ambrosio Holdings to fail in July 1982. Supervisory
responsibility does not necessarily mean Lender of Last Resort
responsibility (Euromoney, October 1982).
Fourthly, national differences in the rigour of bank supervision may
itself produce an inherent instability. This will result from depositors
perceiving that some banking centres are safer havens than others. Thus
at the first signs of a crisis, funds may move from centres of lax
regulation to centres of strong regulation, irrespective of the financial
health of the individual institutions losing the deposits.
There is clearly a need to remove the inherent instability caused by
national differences in the stringency of regulations. However, the
obvious method - that of negotiating internationally uniform regulations
- does not seem to be a practical solution. An alternative approach,
which may at least be partially enforceable by the GlO countries is to
stop banks operating branches overseas and allow them to operate only

Jib
locally incorporated subsidiaries. Furthermore, the concept of parental
responsibility should be limited in its applicability to subsidiaries
operating in overseas centres with a comparable degree of supervision.
This policy would result in the perceived safety of banks being
influenced by the regulatory climate of their location, not that of their
parents. Unless these less regulated locations ,put their supervision on
an internationally comparable basis they would risk losing banking
business.
The survey included five questions about the international
cooperation in supervision. The questions centred on bankers' willingness
to locate in or deal with banks located in less stringently regulated
locations. However, one question was asked about whether the bankers
thought that supervisory responsibility also implied the provision of
lender of last resort facilities. The responses are reported in chapter
seven, pages351-354.
* 10 Lender of last resort
In the domestic context the lender of last resort function is
carried out at two levels. One, in relation to the day-to-day orderly
conduct of financial markets where institutions have access to the
central bank's discount window on a formal and frequent basis. The second
in relation to providing substantial resources, often with the assistance
of other private institutions, to selected institutions who- face a
fundamental financial crisis that threatens their viability as financial
intermediaries. It is this latter function which is discussed here.
Concentration of deposits from a few large depositors increases the
impact of liquidity risk if those deposits are withdrawn from the
euromarkets. Given the degree of maturity transformation by eurobanks,
this may put the intermediating function at risk. However, theoretically,
this risk should only affect one or some banks but not the whole market.

This is because unless the depositor is willing to hold cash instead of a
deposit, the funds must end up in the world banking system somewhere.
Nevertheless, the weakness of one bank may cause such increased
perception of risk in the market so as to create temporary financial
instability. Accordingly the central banks of the GlO countries indicated
in 1974 that they will provide such assistance to the euromarket in their
individual jurisdictions so as to avoid any disruptive consequences.
However, the markets seem to be unclear as to the true meaning of this
statement. Does it mean that no large bank will be forced into
liquidation or does it mean that help will only be granted to the market
as a whole, thereby allowing large and small insolvent banks to fail?
Moreover, the supervisory concept of parental responsibility
discussed on pages 313 to 318 above does not necessarily mean lender of
last resort responsibility. This has resulted in the Bank of England
requiring 'letters of ,comfort' from each of the head offices or parent
organisations of the banks operating in the UK euromarket. Similar action
has also been taken by a number of other central banks.
One weakness of the support system is that to date the one time that
it has been tested, ie the Banco Ambrosio affair, it failed and therefore
cannot engender confidence for the future. Although there was
disagreement.as to whether Banco Ambrosio Holdings was in fact a bank, it
was the differences in supervisory attitudes between Luxembourg and Italy
that resulted in lack of financial support for the ailing institution.
Furthermore, the agreement only covers banks in the GlO countries. There
is some uncertainty regarding parental responsibility for subsidiary and
consortium banks who have shareholders outside these countries.
Therefore, before much confidence can’ be placed upon this system, it is
essential that a uniform policy be established and that central banks
from non GlO countries and in particular Arab countries should be
involved.
It was noted above (page 317) that the differences between national

banking regulations created an inherent instability in the international
banking system. Nowhere is this more obvious than in national differences
in domestic lender of last resort facilities. If a lender of last resort
is desired to add stability to the international banking system, then
either the various national systems must exhibit considerable uniformity
or an international body to carry out such a function will have to be
established.
When considering the establishment of an international lender of
last resort, it should be realised that the domestic equivalent is
accompanied by the power of supervision and regulation. Therefore, an
international system should only be established if the international
organisation has similar and sufficient powers (de Vries 1982). However,
given the differences in national attitudes to supervision and
regulation, an international lender of last resort is unlikely to be
established because the individual member central banks could not be
expected to underwrite the activities of banks over which they had no
control. Thus uniform attitudes to supervision and regulation seem to be
prerequisites to the establishment of an international lender of last
resort.
If such a system were to be established, it may encourage some banks
to take imprudent risks if the banks knew the circumstances and
conditions under which they would get assistance. McMahon suggests that
this problem can be overcome by not publicising these terms and
conditions "Emergency assistance is inherently a process of negotiation
and judgement ....." (McMahon 1977). If the Bank of England's activities
in the UK secondary banks' crisis and the recent building society
failures can be taken as a guide, those negotiations will result in other
private institutions coming to the assistance of the defaulting one.
Similar action has been followed in the USA, in relation to local banks,
under the guidance of the Federal Deposit Insurance Corporation.
If there is to be reliance upon flexibility in the criteria used for

access to a lender of last resort, there must be even greater emphasis on
continuous and uniform supervision and monitoring by central banks.
Indeed monitoring would ideally be executed by the international lender
of last resort organisation. However, banks operating in international
markets also operate in domestic markets, thus this organisation would
need to monitor and have influence over domestic banking as well. This
may prove politically unacceptable and it may be more fruitful for the
international consultations on bank supervision to strive for uniformity
for domestic lender of last resort facilities. If this is combined with
agreement about the concept of parental responsibility, there will be an
effective system of lender of last resort for international banking.
Notwithstanding uniformity of domestic lender of last resort
facilities, there will still be a major weakness of relying on individual
national systems. This weakness stems from the fact that the stock of
international banking debt is large relative to a single nation's
reserves. Therefore a single domestic lender of last resort may have
difficulty supporting the foreign currency operations of banks under its
control without experiencing adverse movements in its exchange rates
(Williams 1982). Therefore international cooperation regarding the
availability of lender of last resort resources is essential.
The problems associated with an international lender of last resort
have been summarised by Dean and Giddy as follows:
1) When should the lender of last resort intervene? If this
institution has autonomy in this respect, central banks'
domestic monetary control may be undermined. Yet without
that autonomy, depositors look to domestic lenders of
last resort.
2) Where would this institution get its funds from? If it
creates its own credit it will, in effect, be a global
central bank.

3) Will this institution support banks from non participating
countries? If it does not, instability will remain;, if it
does, there will be a tremendous free rider incentive.
(Dean & Giddy 1981, p41)
To overcome these problems, they suggest that central banks should
encourage mutually supportive lines of credit commitments between banks
for use in an emergency. A fee would be charged by the central bank on
the difference between total deposits on one hand and insured deposits
and credit lines on the other in order to encourage such a system. This
fee would be in exchange for lender of last resort facilities. Two
problems with this suggestion are that it may result in a cost
differential against some banks unless all countries were within the
system; and secondly, it assumes that there is international agreement
about lender of last resort facilities.
However, to the extent that all banks will suffer if one bank fails,
it is in their interests to provide a system of mutual support. Indeed,
it already exists in a rudimentary way because lines of credit between
banks were shown in chapter two to be one way in which banks attract
funds. The reason why all banks will suffer if one fails is that there
may be a general lack of confidence and loss of deposits or they could
suffer a decline in asset values following a forced sale by some banks.
The suggestions of Dean and Giddy have the advantage of placing a
limit on the support that the central bank would be required to give -
this limit being the difference between total deposits on the one hand
and insured deposits and credit lines on the other.
Furthermore, because the market is providing the credit lines, the
cost of those lines to each bank will be related to the perceived
riskiness of that bank's business. Thus banks' desires for risky assets
will be constrained by the higher cost of credit lines.
Even if an international lender of last resort is established, much
of its success will be difficult to measure because the aim of
establishing such an institution is to maintain depositor confidence. If
it is successful it will not be called upon to act.
Ossola (1980) suggests that the IMF and BIS should combine to enter
into standby swap agreements with the major banks in the euromarket.
These agreements would be activated if the banks suffered liquidity
crises because of defaults, reschedulings or government action. The
requests for support would come from the bank but be judged by the
IMF/BIS.
The IMF/BIS would reimburse themselves by drawing upon the swap
agreements with eurobanks not affected by the liquidity crisis. This
would amount to intra-market recycling. The duration of the assistance
would be limited thus imposing a potential cost to imprudent banking.
It is notable that Ossola gives the IMF/BIS authority to dictate
criteria for capital adequacy, loan concentration and provisions of
reserves against risks. Furthermore, the IMF/BIS would expect collateral
against activated swap agreements.
These suggestions have the advantage of more clearly formalising the
interlocking lines of credit that already exist in the euromarket but
also have one other advantage. Swap agreements between the banks and the
IMF/BIS would not be withdrawn when crisis is impending thus the system
is more durable than the current system of lines of credit.
Four questions about an international lender of last resort were
included in the survey. These questions asked if the bankers were in
favour of an international lender of last resort, the form that they
would most favour and whether such an institution would encourage banks
to engage in more high risk lending. The results are reported on page 354-
356 of chapter seven.
6.11 Bank deposit insurance schemes
Bank deposit insurance was initiated in the USA with the Federal
Deposit Insurance Corporation. A similar scheme has recently been
instituted in the UK under the Banking Act 1979 and a scheme is operated
in Germany by the Federal Association of German Banks.
At first sight it would seem natural to extend the insurance
coverage to the foreign currency deposits with the domestic banks and all
deposits held by domestic banks' branches overseas. However, such a
scheme would mean insuring deposits in localities with varying degrees of
prudential control and differing political climates.
Furthermore, the maximum sum of each deposit insured under the
domestic schemes would be inadequate in the international market.
One criticism made by the UK banks to the proposed UK scheme was
that the undoubted banks had to pay towards insuring the doubtful banks.
This inequity would be compounded if the domestic scheme were simply
extended to overseas branch deposits.
A well known suggestion for an international deposit insurance
scheme was made by Grubel (1979). He proposed an International Deposit
Insurance Corporation. Its proposed features were as follows:
- voluntary membership but with measures to persuade
countries to join;
- the moral hazard problem is reduced through setting
insurance premia according to risk or by having
only partial insurance;
- funds for the IDIC would be guaranteed by member
governments;
- IDIC would impose conditions upon members so as to
eliminate jurisdictional problems.
Grubel notes that if one country refuses to join then banks may
transfer their business to that country to avoid payment of premiums and
would therefore have a cost advantage over other banks. Thus the low
margin in eurobanking would make it necessary for all eurobusiness to be
domiciled in the insurance free country and the scheme would fail.
But would it? Surely an insured deposit is a better quality asset
for the depositor than an uninsured one, ceteris paribus. In a market
with a fear of default eg USA, banks find it worthwhile to advertise the
fact that they are members of the FDIC. So maybe in the euromarkets the
banks would find it good publicity to be insured. The difference is that
the size of deposit covered would have to be very large relative to the
domestic schemes.
Grubel noted that the full value of such a scheme may never be known
because it acts as a deterrent to crises. Probably the greatest quantity
of resources would be used in designing and negotiating a suitable scheme
rather than in bailing out failed banks.
One criticism of such a scheme is that it might make depositors,
including interbank and other wholesale depositors, less prudent. For
instance, banks may increase their exposure limits on interbank dealings.
This can be tempered by insuring only a proportion of the deposit held.
This insurance company would have to protect deposits subject to
widely differing degrees of prudential control; Grubel attempts to
overcome these problems by allowing the insurance company to impose
uniform regulatory standards and set variable insurance premiums related
to risk.
Such a scheme would only work if a considerable amount of regulatory
power were transferred to the IDIC from member governments. Moreover,
because the same banks engage in domestic and eurobusiness, the IDIC
would have to have considerable influence over domestic as well as
foreign banking. Domestic monetary authorities will therefore lose some
of their regulatory autonomy. Furthermore, who is to decide when a crisis
is in the realm of the domestic monetary authority, the IDIC or the
world's central banks? {Dean & Giddy 1981 b) . Thus the establishment of
an IDIC would be more a political than a commercial act.
Many of the problems of establishing an IDIC are similar to those of
establishing an international lender of last resort and uniform standards
of bank regulation. The overriding problem is political in the sense that
domestic banking authorities will have to surrender some of their
autonomy if these systems are to be established.
One question about deposit insurance was included in the survey; it
asked if banks were in favour of deposit insurance generally, whether it
should cover deposits at overseas branches and whether it should cover
interbank deposits. The results are reported on page 356 of chapter
seven.
6.12 Portfolio diversification
It has been shown in chapter five, page 242 that it is possible to
classify portfolio risk as either systematic or unsystematic, and that
under certain conditions it should be possible to increase the efficiency
of an asset portfolio by diversifying away the unsystematic risk.
The efficiency criterion is where the income of the portfolio cannot
be increased without increasing the overall risk of that portfolio. In
order to be able to diversify away the unsystematic risk, the expected
returns on the individual assets must be uncorrelated with each other.
If portfolio diversification is to be useful as a way of reducing
the banks' exposure to LDCs, the portfolios must exhibit considerable
unsystematic risk. Furthermore, the banks must be able to diversify their
portfolios.
It has been noted in chapter five, page 247 o f this thesis that bank
loans to LDCs exhibit considerable systematic risk. The main reasons are:
1) Servicing costs are all related to LIBOR or a
similar rate;
2) Many loans are denominated in one currency and the
majority in only 3-5 currencies, thus there is a
common currency risk;
3) Because foreign exchange is required to service debt, exports depend upon sales to industrialised countries;

4) Many LDCs use loans to produce similar primary products;
thus if the price of a product falls in world markets,
many borrowers are adversely affected.
There is, however, clearly some unsystematic risk in bank loan
portfolios and to the extent that this can be diversified away, more
funds can be lent to LDCs, including a wider range of those countries,
without reducing the efficiency of the bank's portfolio.
To reach the position of an efficient portfolio, the banks must have
unfettered ability to diversify. Currently there seem to be three major
restrictions on portfolio diversification. These are:
1) Lack of detailed knowledge of unsystematic risks by
the banks.
2) Large minimum size of participations combined with
relatively few countries that have had access to the
eurocurrency market.
3) Market imperfections, particularly indivisibility of
the loan asset, and the small secondary market in
loan participations.
Work by Hager (1981) and the Robert Morris Associates (1980)
suggests that bank management do not have the information to assess the
degree of portfolio diversification beyond the country level. Thus a bank
may lend to many countries but if all the borrowers rely on production of
the same commodity to service the debt those loans will be subject to
considerable systematic risk. The above studies did not attempt to assess
as large a number of banks as this study but their findings are
similar to those of the writer reported on page 334 below.
Clearly improved management information systems regarding lending risks
will help reduce the overall unsystematic risk of the loan portfolio.
The current absence of a deep secondary market in loan
participations means that the only way in which a banker may change the

structure of his loan portfolio is to change the exposure limits for each
borrower. This can only be achieved by changing the rate of new lending
relative to amortization payments and will be a time-consuming process.
Although there has been a market in loan participations for some
time, it is a shallow market and considerable transactions costs are
involved. Furthermore, recourse still relates to the original participant
bank and not to the debtor country. As such, selling a participation does
not reduce the original lender's country exposure. Clearly a deep
secondary market and a change in the status of sold participations will
be helpful in portfolio diversification.
Will the banks, however, be willing and able to take losses by
selling participations on fixed spread loans when market spreads are
above those on the loans being sold? What will the secondary market price
of bank loans do to depositor confidence?
It therefore seems clear that for adequate and continuous loan
portfolio diversification to reduce the unsystematic risks to be borne by
the banks, the banks themselves must:
1) Develop management information systems to enable them
to determine the degree of loan diversification at least
down to industry, commodity and conglomerate level.‘
2) Develop a deeper secondary market in loan participations.
This may require the development of floating rate spreads
or at least more frequent predetermined increases in the
spread during the life of the loan.
Question 4 of part one of the survey asked about the ability of the
banks' management information systems to determine the degree of
diversification in the loan portfolios. Diversification was by five
categories of borrowing and determined on a branch only or group
consolidated basis. The results are reported in chapter seven, page 334.
Four questions were included in the survey to ascertain bankers'
attitudes to a deeper secondary market in loan participations and to floating spreads. The results are reported in chapter seven, page 356.

J J
Chapter 7
THE SURVEY
7.1 IntroductionThe aim of this survey was to determine the attitudes of the lending
bankers to the suggestions, detailed in chapter six, for facilitating the
continued flow of new lending to LDCs. At the same time the opportunity
was taken to ask questions about bankers' corporate aims and objectives
with regard to their international lending activities.
The survey population was selected on the basis that the banks
fulfilled three criteria:
that they were included in The Bank of England's list of
Banks and Licensed Deposit Takers;
that they were included in the List of the Top 500 Banks
published by 'The Banker' magazine;
that they were included in the Euromoney/Hambro directory
of Euromarket banks.
This selection procedure resulted in 212 banks being included in the
survey. However, this figure proved to include banks which did not, for
one reason or another, lend to developing countries. Thirty banks
returned the questionnaire uncompleted for this reason. It is therefore
considered that the valid sample size for this survey is 182 at a
maximum.
Of these 182 banks, 62 responded positively, 31 banks said that they
were not willing to partake in the survey, 6 banks made joint responses
with their parent or associate organisation in the United Kingdom. Eighty
three banks failed to respond at all after one reminder and a period of
four months had elapsed since the despatch of the main survey on 28
February 1983.
Prior to this date a pilot survey covering 30 banks was completed
with 10 banks responding. These responses indicated that the

questionnaire only needed minor amendment to the wording of two
questions. These amendments were made and the main survey embarked upon.
The positive responses to both surveys accounted for 33.5% of
those surveyed. Of those that made negative responses 12 said that it was
not their policy to respond to "unofficial questionnaires" and 3 said
that their office did not make corporate policy in these matters, such
policy being dictated from an overseas Head Office.
Of the 83 banks who did not reply to the survey request 19 were
banks from developing countries.
Of the 62 banks responding positively to the survey, 15 were US
banks located in London, 7 were UK merchant banks, 3 were UK clearing
banks, 4 were other British banks, 2 were consortium banks, 7 were
Japanese banks in London and 23 were other overseas banks located in
London. One response could not be classified due to the respondent
mutilating the code number on the questionnaire. The respondents
included the major eurocurrency syndicate leaders of recent years.
The questionnaire itself (see Appendix VII) was divided into two main
sections. Section one asked questions about the constraints and perceived
risks of international lending and asked questions about the corporate
aims and objectives of banks engaged in such lending. Questions 1 , 3 and
4 specifically related to constraints and risks and the answers thus
relate to chapter six of this thesis. Questions 2 and 5 related to
corporate aims and objectives and thus relate to chapter three of this
thesis.
The second section asked questions about methods of reducing the
risks of international bank lending. These questions were grouped under
eight sub headings:

1) Reducing the debt service burden of interest payments
2) Debt restructuring
3) Improving the quality of information about LDCs
4) Co-financing with the IBRD or similar international institutions
5) Credit Insurance and Loan Guarantee Schemes
6) Prudential controls
7) International Lender of Last Resort
8) Miscellaneous
The subsections 1-7 follow sections in chapter six discussing the
benefits and disadvantages of each of the various suggestions. Subsection
8. asks one question about deposit insurance and four questions about the
advantages of a deeper secondary market in syndicated loan
participations.
The responses to the questions which indicated that a limited choice
of response was required eg Yes/No or Important/Not important, etc have
been aggregated and analysed for the whole group of respondents and for
subsections of banks as follows:-
US banks
Japanese banks
UK clearing banks
British merchant banks
Other British banks
Other overseas banks
X2 tests and analysis of adjusted residuals were carried out as
suggested in Everitt (1979) to determine any statistically significant
differences between the responses of subgroups of banks and the overall
group of responses.
In general, the theme of the responses in this chapter is that of
the responses of the whole group but where a subgroup or groups gives
statistically significantly different responses, these are highlighted in

the discussion. The full details of the overall responses are given
in Appendix VII.
It was not considered appropriate to classify the 1 comment'
responses by subgroup because no two responses were exactly similar and
therefore interpreting the "feeling" of such responses is somewhat
subjective. Any subjectivity would, in many instances, be invalidated by
the small number of comment responses received from certain subgroups for
certain questions.
7.2 Section I of the survey
Corporate objectives of banks lending to LDCs Constraints on and risks of lending to LDCs
This section asked five questions. Numbers 2 and 5 related to the
banks' corporate aims and objectives in lending to LDCs. Questions 1 and
3 related to the constraints on and risk in international lending.
Question 4 asks about the level of knowledge that the banks possess about
the degree of diversification of their loan portfolios. The mixed order
of questions was decided upon in order that questions 2 and 5 could be
set apart so that responses to question 5 could be used as checks on
those of question 2.
7.2.1 Constraints and risks
Question 1 in this section showed that doubt about future debt
servicing ability is the major constraint to further bank lending to
LDCs. Full utilisation of exposure limits and capital adequacy were
respectively second and third in importance. Question lii shows that 44
out of the 61 respondents considered debt servicing ability as the main
constraint.
There is little difference in the relative importance accorded to
each constraint by the individual subgroups of banks in the survey. One
exception was that the Japanese banks found utilisation of exposure

limits relatively more important than other banks. This is probably due
to the control exercised by the Japanese central bank over the
international lending of Japanese banks.
Question liii asked about the relative changes in the constraints
over the last five years.
Most respondents considered that debt servicing capacity and capital
adequacy had become relatively more important constraints in recent
years.
However, some thought that capital adequacy was relatively even more
important than debt servicing capacity. This constraint was particularly
exacerbated by reschedulings that distorted debt service flows but also
required fresh lending. Tighter prudential controls were also considered
to exacerbate this constraint.
It was also noted that the exposure limits and capital adequacy
constraints were related to debt servicing ability in that exposure
limits and capital were more likely to increase when debt was being
serviced properly. Poor stock market ratings for the banks due to bad
debt service on LDC loans will make raising capital more difficult.
Some respondents thought that profitability was less of a constraint
now that spreads generally, including those on rescheduled debt, were
rising. However, the overall response to the profitability constraint is
that it was never substantial.
Forced rescheduling was considered by one bank as creating a
constraint of inadequate portfolio diversification. Another respondent
considered that a future constraint would be the crowding out of LDC
borrowers as lending opportunities increased in the industrialised
countries as their economies recovered.
Question 3 was- aimed at ascertaining what type of risk the banks
considered most important. Inability to service debt, corporate credit
risk and concentration of borrowers were most frequently included under
the classification "very important". Interbank credit risk, project risk,
concentration of depositors were most frequently included as "important".
The most important risk was considered to be the inability to
service debt.
With respect to the changing relative importance of these risks, the
inability to service debt was growing in importance as was the
concentration of borrowers, this latter risk being exacerbated by debt
rescheduling.
There were no statistically significant differences between the
groups of banks and their perception of the relative importance of the
various risks except for the US banks’ perception of the importance of
corporate credit risk. Relatively more US banks classified this risk as
"important" and relatively fewer classified it as "very important"
compared with the groups as a whole.
Question 4, relating to portfolio diversification, showed that the
majority of banks had information at the bank group consolidated level
for diversification by country, by industrial classification of the
borrower and by parent organisation. However, sizeable minorities, 18 for
industrial classification and 15 for parent organisation, did not have
such information. Moreover, only 26 respondents indicated that they had
information at the group level regarding diversification by source of
borrowers' income while 6 had such information at the branch level only.
Responses to item e (other forms of diversification) indicated
diversification by maturity, by currency, by guarantor or shareholder of
borrower.
There were no statistically significant differences between the
subgroups of banks.
Clearly there is an undesirable lack of information about the
diversification of loan portfolios particularly regarding the source of
borrowers' income. Some banks will, therefore, be unaware of the extent to
which their loan portfolios are subject to unsystematic risk in this respect.
Lack of such information is a hindrance to the use of bank
consolidated accounts by the regulatory authorities, as without such

supplementary information the usefulness of group consolidated accounting
information must be less than optimal for the task of regulating the
international banking system. The responses to this question indicate that
some improvement in consolidated coverage is required.
7.2.2 Corporate objectives of banks lending to LDCs
Question 2 was the first of two questions aimed at ascertaining
banks' corporate aims and objectives in relation to their lending to LDCs.
Profitability followed by support for home based export industries
were by far the most frequently mentioned aims. New market development and
risk control followed in frequency, while support for local economies and
growth of balance sheets were also mentioned.
In terms of relative importance, as reflected by the answers to 2ii,
profitability was the most important, followed by support of export
customers. Responses to 2iii regarding changes in the relative importance
of these objectives over the last five years, suggested that banks'
objectives were dominated by the need for asset growth and profits growth
in the early years. Furthermore, post 1973 many banks wanted to be seen as
international banks and this lead to an expansionary lending strategy.
Responses to 2iv suggest that objectives change not so much because of a
learning process but because of the achievement of previous objectives.
Here the achievement of a growth objective and the subsequent
concentration on profits or risk/reward relationship was mentioned on
several occasions.
Question 5 listed some aims of firms frequently found in economic
theories of the firm and asked about the relative importance of each aim
to the responding bank.
In the overall response the aims of maximising profits and of
reducing risk were very important with asset growth and asset growth
subject to a profits constraint dominating the "important" category. In
terms of the relative importance the reduction of risk was considered the
most important aim with profit maximisation second.
There was a statistically different response from the US banks and

the Japanese banks compared with the whole sample in respect of the aim of
asset growth. The American banks found asset growth relatively less
important than the sample as a whole and the Japanese found it relatively
more so. This difference can be explained by the relative maturity of each
group as international lenders.
A notable feature of the responses to question 5i is the number of
responses where asset growth or asset growth subject to a minimum profits
constraint were combined with profit maximisation. Subsequent discussion
on this matter with a number of respondents indicated that during the
1970's at least the banks were looking for growing profits from growing
balance sheets and that to the extent that banks were aiming to maximise
profits in the economic sense they were aiming for long run profit
maximisation and that the adjustment to the long run in sovereign lending
was still taking place.
The attitudes of the US banks and Other Overseas banks to the aim of
minimising risk differed from the sample as a whole. The US banks gave
greater weighting to this subject as "important" compared with "very
important", while Other Overseas banks gave greater weighting to this aim
as "very important" compared with "important".
Answers to question 5iii indicated that minimisation of risk was now
the most important aim, as indeed is suggested in responses to question
5ii. However this is a new phenomenon and in the recent past growth of
assets with or without a profits constraint was the most important
objective.
Answers to question 5iv raised the aim of client support particularly
export clients by providing buyer credits. The objective of support for
home based export business was a frequent response to question 2i, such
responses being confirmed by those to question 5iv.
To summarise so far, the responses to section one of the survey
suggest that the bankers perceive the main risk as inability to service
debt and that this risk is seen as the major constraint upon further
lending. The questions in section two of the survey explore some ways of
reducing this risk to the banker and thereby removing the constraint.
The responses to questions 2 and 5 give considerable credence to the
model of lending bank behaviour suggested in chapter three.
Although the banks see maximising of profits as a major objective,
asset growth with or without a profits constraint is also very important.
Profitability does not seem ever, and particularly not currently, to have
been a constraint. However, a new objective of minimising risk is
currently the most important constraint for many banks; this being a
relatively new phenomenon replacing asset growth or profit maximisation.
The relative importance of minimising risk as a constraint in lending to
LDCs is supported by the major risk as being the perceived lack of ability
of the LDCs to service their debt.
The fact that profit has not been a serious constraint on bank
lending to LDCs suggests that the supply function of loans has shifted to
the right more rapidly than the demand function. This seems the
appropriate interpretation given that for at least part of the 1970's
spreads were falling and therefore growth of lending was accompanied by
falling average revenue. This seems to rule out the suggestion that banks
have positively sloped long run cost functions and that the increased
lending resulted from shifts in the demand for loans. This is because
spreads would have had to rise during the whole period under review.
The importance of asset growth for banks as a whole combined with the
lack of a profits constraint during the 1970's indicates that bankers
interpreted maximising profit as compatible with increasing assets in each
time period. Therefore, with falling or zero marginal cost, the
appropriate strategy in the absence of other constraints, was to lend more
in each time period. With constant, positive marginal costs the
appropriate strategy would be to lend, again in the absence of other
constraints, until marginal cost equals marginal revenue in some future
time period in long run profit maximisation. In either case it seems clear
338
that maximising profits in the period under review is compatible with
balance sheet growth. However, there does seem to have been a constraint
in addition to that of MC = MR or of minimum profits and that is a maximum
acceptable level of perceived risk. It was suggested in chapter three that
if this constraint rose, the quantity of lending would fall, ceteris
paribus. The fact that the recent rise in risk minimisation is coinciding
with a slowdown in lending to LDCs at a time when spreads are rising
suggests risk and not profit are the major constraints upon balance sheet
growth.
From this analysis the writer concluded that during the period
1970-1980 bank lending behaviour is best explained by a model where asset
growth subject to a minimum level of profit or maximum level of risk is
the relevant objective. This must throw some doubt upon the explanatory
value of work on eurobank behaviour where the banks were assumed to be
profit maximisers in the short term.
7.3 Section II of the survey
Methods of reducing risk in international bank lending and instability in loan markets
7.3.1 Reducing the debt service burden of interest payments
Question 6 asked if the bankers would like to see aid payments used
to subsidise interest costs on bank loans to LDC borrowers. As expected,
the majority (34 to 22) said 'yes' on the basis that such payments would
make the banks' income from these loans somewhat more certain. However,
there was a sizeable minority which were against such a subsidy. Even
where the subsidies were favoured, the respondents generally thought that
the payments should not be made without adequate control over the use of
subsidised funds by the LDCs.
There was concern that subsidies would reduce risk differentials and
thus hinder the market allocation of risk. Indeed some respondents
considered that such a subsidy scheme could induce politically motivated

credit rationing. Furthermore, subsidising loans would not lift
constraints such as capital adequacy, exposure limits, etc.
There were statistically significant differences in the responses
from the US banks and the Other Overseas banks compared with the whole
group. The majority of US banks (9 to 5) did not want subsidies on
interest payments. On the other hand, the majority (17 to 4) of Other
Overseas banks favoured such subsidies.
Question 7 aimed to determine the influence that any subsidy would
have on increasing the supply of funds to LDCs. The answers to question 7i
indicated that countries that are current borrowers would not receive more
funds despite such a subsidy nor would countries which to date had not
gained access to bank funds. However, for both cases there was a sizeable
minority responding positively, 22 and 23 respectively.
There were statistically significant differences for Japanese banks,
UK merchant banks and UK clearing banks compared with the responses as a
whole. The Japanese banks responding were unanimous that such a subsidy
would not increase the flow of finance. On the other hand, 5 out of 6 UK
merchant banks and 3 out of 3 clearing banks responding suggested that the
financial flow to existing LDC borrowers would be increased by such a
subsidy.
Question 7ii regarding the use of the subsidy to allow LDCs to pay
higher spreads got an overwhelming (37 to 10) negative response. Thus the
suggestion of higher returns for higher risk does not seem on the face of
it to be holding true. However, it must be remembered that spread is not a
true measure of risk because during the late 1970's competition to lend
compressed risk premia.
Generally the comments relating to question 7 were negative in
nature, the common theme being that subsidising interest rates or spreads
does not necessarily make the borrower creditworthy. High interest
payments are only part of the borrower's problems.
It was suggested that the higher spread would not induce sufficient

J4U
additional risk bearing because the risk return trade-off only functions
within a narrow band and bankers are generally risk averse.
The respondents that thought a subsidy would increase the financial
flow to LDCs also noted that the subsidy would have to be in the form of
additional aid and not a reallocation of the present aid budget.
Question 8 suggested a temporary IMF facility to help LDCs finance
the balance of payments burden due to fluctuating interest rates. There
was general support (32 to 23) for this suggestion but safeguards will be
required to ensure that the system does not encourage a lack of discipline
by eligible borrowers. Furthermore, there must be a fair method of
calculating the normal rate of interest from which the deviation can be
calculated.
Respondents showed concern for costs of administering such a scheme,
the financial commitment of the IMF given recent volatility of interest
rates and the ability to ensure that the facility was repaid when interest
rates moved to more favourable levels. There was also concern about the
LDCs dislike for IMF conditionality and therefore whether this facility
would be popular with those countries, particularly as it may result in
more interference by the IMF in their economies and even world financial
markets.
If the IMF had to borrow the resources from the markets, directly or
indirectly, it would exaggerate the volatility of interest rates by
borrowing when rates are high and repaying when rates are low. It was also
noted that for the long term viability of the scheme there should be no
upward trend in interest rates. However this could be overcome by
periodically redefining the normal rate of interest to reflect this trend.
There were no statistically significant differences between the
responses from the subgroups of banks and the group as a whole to question
8.There was an overwhelming negative response (46 to 8) to question 9
about the viability of index linking bank loans. Comments from the

J 4 I
respondents indicated that such loans would not be available until bank
funding was put on the same basis. Additional comments suggested
difficulties in choosing an index appropriate to international lending.
Furthermore, indexing of loans would mean deferring a large element of the
return from bank lending until final payment is received and in
circumstances such as the present that is uncertain.
The bankers1 attitude to subsidies etc on interest rates is that on
their own they will not necessarily increase the flows of bank finance to
LDCs. However, they may tip the balance in favour of more borrowings for
some borrowers. Index linking of loans seems to be out for the present.
However, some sort of interest cost specific facility from the IMF would
seem to have support providing adequate safeguards and an appropriate
formula for the "normal" rate of interest can be developed.
7.3.2 Debt restructuring
Question 10 was the first of seven about debt restructuring.
Responses gave overwhelming support (39 to 15) to the suggestion that
changing the maturity structure of debt is a legitimate aspect of debt
management policy.
However, comments suggest restructuring of debt must be accompanied
by economic adjustment policies aimed at balancing the external account.
Furthermore, any restructuring should be by mutual agreement and not
forced upon the banks as some suggest is happening at present.
It was recognised several times that some of the current
restructuring results from lenders previously granting loans with a
maturity profile inappropriate to the financing of economic development.
Question 11 about the desirability of restructuring the maturity
structure of debt before a crisis looms received an even more definitely
positive response; 46 to 8 with no statistically significant differences
amongst the subgroups of banks. However, respondents thought that
alternative economic policies should be tried before debt is restructured.

It was also frequently noted that a crisis concentrates the mind and that
it may be difficult to get the parties to agree to changes in contractual
terms without an air of crisis.
Question 12 asked the bankers to say which were the major costs to
the banks of debt rescheduling. The most frequent answer, 34 out of 59
respondents, considered staff time, administrative and legal costs as the
most important. This would suggest that any standardisation of procedures,
say along the lines suggested in chapter six, page 281 above would help
reduce these costs.
Other responses to question 12 suggested the following to be
important: loss of opportunity in alternative uses of funds, loss of
independence in determining the make-up of the loan portfolio and possible
increase in funding costs, either by increased perceived risk by
depositors, or increased competition for longer term loans.
The responses to question 13 showed majority support for a code of
conduct for debt rescheduling. The positive respondents nevertheless did
not want such a code to add respectability to rescheduling ie defaulting
on loans. The negative respondents considered that:
- each rescheduling is different from others
- such a code would be difficult to enforce
- such a code would encourage default
Clearly the exact nature of such a code would be crucial. However,
given the responses to question 12 about the resource costs of
rescheduling, it is considered by the writer that further research into
the most appropriate form of such a code of conduct should be undertaken.
Responses to question 14 did not generally favour representation for
all types of creditors at the same rescheduling meeting. The negative
responses emphasised the difficulty of reaching a satisfactory conclusion
with so many different vested interests. This is particularly so where
different creditors have different degrees of power eg official having
more power than private creditors or banks having more power than the many

individual non bank creditors.
Positive responses, on the other hand, emphasised that a joint
meeting of creditors would preclude the debtor playing off one group of
creditors against another.
Note was also made of the fact that recent successful bank
reschedulings had a steering committee of banks from various countries.
Each member of the committee then had the duty to sell the decisions of
the steering committee to the banks it represents. This could be extended
to include representatives of senior non bank creditors who then had the
responsibility to sell the decisions to the other non bank creditors.
The majority response to question 15 was that rescheduled debts still
being serviced in accordance with the renegotiated terms should not be
treated as inferior assets. However, some respondents wanted to
differentiate between countries suffering what the lenders perceived as
temporary difficulties from those countries that had more fundamental
problems of debt servicing.
Responses to question 15i included increasing general bad debt
provisions, writing down the book value to a level that would provide a
buyer for the debt and just disclosing the quantity of rescheduled debt as
a note in the published accounts.
Forty-six positive responses and only seven negative responses were
received to question 16 about the increased willingness of banks to
reschedule if the rescheduling is linked to IMF loan facilities. There
were few comments, none of which added to our understanding of the
advantages or disadvantages of such a link.
It is clear from the responses to the debt restructuring questions
that the major costs to the banks were related to the resource costs of
negotiation. It does, therefore, seem beneficial to both debtors and
creditors for a streamlined negotiating procedure to be developed.
Furthermore, responses also suggest that restructuring of the
maturity profile of the debt as the debtor's circumstances change is

344
acceptable at least to the lenders. Therefore there seems to be a prima
facie case for representatives of the bankers and of the international
organisations to enter into a continuous dialogue with debtor countries in
order to develop an amortisation schedule that is continually adapted to
meet changes in a country's expected foreign currency cash flow over the
life of the debt. Given the greater willingness of banks to reschedule
when that is tied to IMF conditional finance, such a continuous dialogue
may be most productive if the IMF acts as the negotiating catalyst.
7.3.3 Improving the quality of information about LDCs
Question 17 was the first of six about the quality of information
used in assessing the risks of lending to LDCs. The majority (43 to 11)
thought that the information they possessed about the LDCs was not as good
as that of the IMF or IBRD. However, comments suggested that at least some
banks have access to IMF or IBRD data.
Responses to question 18 suggest that, despite the answers to
question 17, the banks have adequate information for risk analysis.
Responses to question 18i indicate the following improvements would
be welcomed by the banks:
- the LDCs to publish more regularly and more up to date figures
- statistics published in a common format
- greater exchange of information between IMF and IBRD and the banks
- more information about short term debt
- more information about the political and diplomatic activities
of the borrowers.
Respondents to questions 18 and 18i emphasised the usefulness of a
branch and/or personal visits as a way of supplementing published
information.
Responses to question 19 indicated that the majority of bankers (42
to 13) considered that informational difficulties lead the LDCs towards
poor economic and debt management policies. However, it must be noted that

in the comments some respondents did not want to generalise across all
LDCs. Some respondents noted that the political cost of good policies, the
political will or administrative ability to follow such policies, were
often as important as the informational shortcomings.
Although the majority of respondents to question 20 (25 to 14)
thought that better quality of information would not lead to greater
lending to LDCs, the comments indicated that the actual outcome would
depend on how different a picture the better information painted and how
that information was used in economic policy making.
To an extent question 21 was unfortunately timed in that shortly
after the questionnaire was despatched it was announced that an
international institute was to be established, one of its objectives being
similar to that suggested in question 21. The majority support, 44 to 12,
for such an institution will be good news for its founders. However, some
respondents cautioned that the institute must be independent of government
and any particular group of banks. It was also noted by some that
centralised information will not be a substitute for individual analysis
and personal visits.
Some respondents thought that common information would reduce
competition between the banks, noting that those banks that invest in a
superior system of credit analysis reap a competitive advantage.
It was also thought that banks have followed the 'herd instinct' in
recent years and such an institution may reinforce that instinct. If so,
what would happen to international financial stability if the central
institution downgraded, one particular borrower? The stability of markets
stems from a variety of views within that market. Reduce that variety and
you reduce the stability.
Although the responses to question 22 about a system of credit rating
for interbank and non bank borrowers, were finely balanced, 27 for and 29
against, all the comments were negative, the main theme being that banks
cannot abrogate their responsibilities for credit analysis, particularly

346
as some have different risk criteria according to their objectives in the
market place. Furthermore, the comments about market stability made in
question 21 above are relevant to question 22.
The responses to questions 17 to 22 suggest that the banks have
sufficient information for the purposes of risk analysis. However, the
lending banks seem to think that informational shortcomings impact upon
the LDCs policy achievements to a greater extent. If improved information
allowed the LDCs to more easily achieve policy objectives compatible with
being a lower credit risk, more finance is likely to be available to those
countries.
It therefore seems useful to both debtors and creditors for the
developing countries to construct, with the assistance of the banks and
international financial institutions, better information systems as an aid
to achieving policy objectives.
7.3.4 Co-financing with IBRD or similar international institutions
Responses to question 23 confirmed the advantages and disadvantages
of co-financing suggested in the literature except that the supposed
savings in risk analysis and loan administration were not supported. It
,was suggested that there would be a probable increase in the complexity of
administration and that banks have little say in the documentation linking
their loan to the IBRD one.
There were statistically significant differences in the responses to
question 23a from US banks and other overseas banks. The majority of US
banks responding 7 to 6 did not agree that co-financing reduced the risk
of default. However, the majority of responses (19 to 1) from Other
Overseas banks supported the suggestion of reduced risk. Moreover, 7 out
of 12 US banks did not think that the IBRD was better at evaluating risk
than they were. This view was supported by 3 out of 4 Other British banks
Advantages additional to those cited in the question included better
control over the destination of funds and the chance that principal may

escape rescheduling because of the established preference given by-
borrowers to IBRD loans. An additional disadvantage mentioned was that fee
income may be reduced for the private banks.
One respondent made the interesting point that co-financing may force
the banks into longer term restructuring of debt if the IBRD's attitudes
towards the timescale of development differed from those of the private
banks.
Question 24 about the ability of co-financing to increase the total
private flow to LDCs was asked in two parts. These parts may have been
mutually exclusive. However, many respondents did not interpret them that
way. Moreover, lack of comment to these questions has not assisted in
their interpretation.
Thus, although a majority of respondents to 24a (35 to 23) thought
that co-financing would increase the flow of credit to LDCs, an even
larger majority, 43 to 17, responding to part b suggested that existing
levels of credit would be switched into co-financing.
Little help can be gleaned from responses to question 23 because,
although co-financing was generally thought to be beneficial, co-financed
loans also showed lower returns thus for example lower risk was matched by
lower returns and therefore lending may not increase.
The responses to question 25 support the view that total lending may
not increase because the majority, 34 to 17, suggested that increased
co-financing would not result in flows to LDCs that to date have been
considered too risky for private bank credit. The general theme of the
comments to this question was that such countries should be financed on
softer terms than those obtaining in the commercial markets. Furthermore,
if there is any reduction in perceived risk by co-financing with the IBRD,
this reduction may not be enough to bring the substantial risk of lending
, to these poorer countries within acceptable bounds. Much would depend upon
how the risk was shared between the banks and the IBRD.
Clearly these responses go some way to explain why co-financing has
not increased as much as some would have liked. However, despite the
negative response, it does appear that it may be fruitful for further
research into an appropriate loan and risk bearing arrangement built
around co-financing.
Although overall co-financing is seen, at least by a large proportion
of bankers, as having some advantages, the impact upon increasing
financial flows to LDCs is doubtful. In particular it does not seem to be
a vehicle for facilitating increased private flows to the poorest LDCs.
7.3.5 Credit Insurance and Loan Guarantee Schemes
Six questions were asked about credit insurance and loan guarantee
schemes beginning with question 26. A majority of 42 to 17 were in favour
of extending independent guarantees to loans not currently covered by
export credit insurance agencies. However many respondents were only in
favour if the guarantors were governments sufficiently strong to be able
to safeguard the banks in time of crisis.
Negative comments centred upon the credit rationing which could
result for unguaranteed borrowers. Moreover, the reliance upon government
or other official guarantees may blunt the bankers' critical judgement in
evaluation of credit risks.
Furthermore, borrowers may show lack of discipline if the guarantor
is a single state. The borrower may be able to bring political pressure to
bear on the guarantor which it could not bring to bear on a market
orientated group of institutions.
The majority of respondents (38 to 19) to question 27 did think that
a system of guarantees would lead to less prudent lending. Comments
qualified the ’yes' responses by adding 'unless the guarantees were only
partial'.
Respondents also raised the question as to whether lending where the
main chance of repayment is from the guarantor is less prudent than
lending to a good credit risk and expecting repayment direct. The original

question was set in the belief that bankers do not lend money if they
expect to have to enforce their security, a point confirmed by other
respondents1 comments.
There was a strong negative response to question 28 asking whether or
not institutions such as ECGD in the UK should insure balance of payments
loans to LDCs. The comments, all negative, suggest that such insurance
would be expensive, that such agencies are instruments of national export
promotion policy and with balance of payments finance insurance they would
be helping the export industries of other countries.
Furthermore, when a borrower defaulted the creditor would claim off
the insurance company who can only try to claim off the debtor while in
the meantime refusing further insurance. There is no incentive for the
banker to be flexible in relation to financing or restructuring the
debtor's finances as his circumstances change, although the withdrawal of
credit insurance may be a strong incentive not to default.
Sixty out of sixty-one respondents to question 29 expected insured
loans to attract lower spreads. However, the reservations were that the
insurer must be visibly stronger than the borrower and that there must be
an acceptable minimum rate of return to cover all costs including bearing
risk.
This is an important point because it means that the reduction in
spread/fees may go some way to covering the insurance premium, if payable
by the borrower.
Interestingly, comments also implied that the spread was a risk
premium, yet responses to other questions in this survey and analysis
elsewhere in this thesis (ref chapter four) suggest that the relationship
between spread and risk is at times not very strong.
Responses to question 30 suggest that there would not be any tiering
in the interbank market according to the proportion of uninsured loans in
a bank's portfolio. The main reasons given were that the proportion of
insured loans in a portfolio would only be one of several factors taken

into account in establishing interbank credit risk. Anyway, it was
generally thought that such information would not be available. However,
some respondents thought that if the information were to become available
it would affect credit risk assessments.
Question 31 asked whether or not insured loans should be treated
preferentially when the prudential authorities analyse the quality of
banks' balance sheets. The response was almost balanced, 29 in favour and
26 against. Again the quality of the insurer was considered an influence.
It was considered that the insurance could only be partially adequate if
it only covered repayment of principal because the banks were concerned
about the quality of earnings as well as the quality of assets. Again
concern was expressed about the potential crowding out of uninsured
lending.
Although the bankers would welcome a system of strong guarantees in
their favour, the nature of the backing of the guarantees should be
multinational when backing balance of payments loans and national when
backing national export contracts.
Concern was expressed about the impact of a system of guarantees
crowding out unguaranteed borrowers and dampening the bankers' risk
analysis skills. It therefore seems probable that a system of guarantees
will increase the flow of bank finance to those LDCs that benefit from
loan guarantees. However, the same system could reduce flows to those
countries not favoured by the guarantee system. Therefore, the extent to
which a system of guarantees facilitates an increase in the flow of bank
credit to LDCs depends upon how wide is the group of countries that are
beneficiaries of guarantees.
The costs of extending insurance cover to the general balance of
payments loans was considered prohibitive despite the suggestion that
insured loans would attract lower spreads. The writer therefore concludes
that the banks favour guarantees to insurance because the former will be
provided without explicit cost to banker or borrower.

351
It was also noted that if the insurance company or the guaranteeing
agency insisted on enforcing their rights against the defaulting debtor
the debtor's ability to continue servicing debt may be reduced.
7.3.6 Prudential controls
Nine questions were asked relating to prudential controls.
The majority of respondents to question 32 thought that less
stringently regulated banks did behave less prudently. However, there were
reservations; the quality of the management was important and it was noted
that some banks in stringently regulated areas eg USA, acted imprudently.
The concept of imprudence was questioned noting that political factors may
cause banks to assess risks differently. Furthermore, the relationship
between the banks and their governments may influence standards in terms
of capital adequacy and liquidity.
The standard of prudence depended less on regulation and more on
local traditions, local standards of management and the intensity of
supervision.
The majority of respondents to question 33 (45 to 12) thought that
differences in national regulations influenced their willingness to lend
to banks in less stringently regulated countries. However, again there
were qualifications. A weak balance sheet made a borrowing bank a poor
risk however well regulated. The quality of management and of balance
sheet were more important than stringency of regulation.
Question 34 asked about the influence of different regulations upon
the price different banks paid for interbank money. The majority of
respondents (36 to 12) suggested that banks in less well regulated
locations paid more for such funds. However, although that may generally
be so, respondents also noted that the bank's reputation was more
important than location and that in respect of reputation, bank ownership
was very important.
Responses to question 35 about the influence of national prudential

regulations upon banks' decisions to locate abroad were finely balanced,
26 respondents thought that such regulations did influence location, 27
respondents said that they did not.
The positive responses emphasised the banks' liking for orderly
markets. The negative responses emphasised that the banks' internal
attitudes to prudence were unlikely to be exceeded by local regulation.
However, if all banks thought that way one would have to ask why
prudential regulations were required.
Question 36 asked whether the bank supervising a particular branch is
morally bound to be lender of last resort to that bank. Thirty-one
respondents thought not, while 26 thought that the supervisory and lender
of last resort functions were synonymous.
The attitudes gleaned from the comments suggest that locally
incorporated organisations are more entitled to lender of last resort
facilities than branches of foreign banks. There was support for the
lender of last resort facility if the disturbance occurred within the
country in question and less or no support if the disturbance came from
outside.
It was thought by some that the head office supervisory authority was
the most appropriate lender of last resort. If the local authority does
not ensure that the head office authority will provide such facilities
then that local authority should provide them if it provides such
facilities for local banks.
The group as a whole responded to question 37a by suggesting that the
decline in the capital asset ratios in recent years was not the result of
a learning process; 38 'no' and 10 'yes'. However, 6 out of 15 US banks
thought that the decline was because of a learning process. Two out of 3
UK clearing banks and 5 out of 6 UK merchant banks responded in similar
vein.
The responses of question 37b suggest that the decline in capital
asset ratios has been forced upon the bank by competition. The subgroups

for US banks, UK clearing banks and UK merchant banks responded in similar
vein as the whole group.
At first sight there seems to be an inconsistency between the
responses to question 37a and 37b. However, this is resolved when it is
suggested that competition has forced the banks to learn how to be more
efficient in the use of capital. This would be particularly so if the
banks have been forced to compete for new business but at the same time
have been deprived of new capital from the major capital markets.
For the UK registered institutions, respondents have suggested that
recently introduced capital adequacy guidelines have allowed them to
reduce their capital asset ratios.
The overwhelming response (37 to 12) to question 38 was that capital
asset ratios will not continue to fall. However, some respondents
suggested that the fall will continue in the short run, say up to two
years, and then reverse itself. Other respondents felt that the decline
may continue depending upon how much involuntary lending (rescheduling)
there is in the future. Yet others felt that cooperation between the
regulatory authorities had ensured that capital asset ratios were
currently at their minimum.
Question 39 received an overwhelming positive response (46 to 6) to
the suggestion that a further decline in capital asset ratios would be
detrimental to the stability of the banking system. There were few
comments to the responses.
The responses to question 40 suggest that the bankers perceive their
optimum capital to assets ratio as between 1:25 and 1:10. The majority (13
out of 21 respondents) suggested 1:20.
With respect to the responses regarding prudential regulation, it
would seem that it is better in terms of other bankers1 perceptions of
risk to come from a stringently regulated area but a bank cannot assume
that because it is in a stringently regulated area that its reputation
will not be strongly influenced by other factors.
354
With respect to capital asset ratios it seems clear that competition
and lack of access to capital markets have caused such a decline. However,
at least for US banks, UK clearing and merchant banks there has been a
learning process allowing the banks to be more efficient in their use of
capital resources.
Having said that, it is generally thought that currently capital
asset ratios are as low as is commensurate with stability of the
international banking system.
The general view regarding lender of last resort facilities is that
the head office supervisory authority should be responsible for such
facilities to branches in foreign centres. However, the bankers consider
that the local supervisory authority should concern itself with the
liquidity of branches of foreign banks.
Clearly the movements towards uniformity of regulatory environment
between countries would seem to have majority support within the banking
community because it is seen by the bankers as being beneficial to
themselves.
7.3.7 International lender of last resort
Question 41, the first of four questions about an international
lender of last resort, showed very strong support for such an institution
(37 to 21) . Yet responses to question 42 indicated that the most popular
form would be national central banks providing such facilities to the
worldwide business of banks registered in their jurisdiction. The
establishment of a supra-national organisation was the second most popular
choice. There was little support for systems utilising formal lines of
credit between institutions.
Respondents that disagreed with the introduction of a lender of last
resort frequently suggested that such a facility will lead to carefree
banking practices and a deterioration in debt management by borrowers. In
effect the facility was seen as analogous to a guarantee. Some bankers did

not like the idea of increased bureaucracy which such a facility may bring
particularly as all banks, good, bad or indifferent, would be treated
equally. Furthermore, some respondents suggested that there should be
conditions attached to such a facility, or the extent of the facility
should be kept secret and should not be aimed at bailing out the bank's
management. It was thought that the extent to which a lender of last
resort facility reduced the risk to bank management was a bad thing - for
risk concentrates the mind.
The majority of respondents (2 3 to 6) to question 43 suggested that
even though the first three forms of facility suggested in question 42
were cost free to the banks, their implementation would not give rise to a
greater proportion of high risk lending. It was particularly emphasised
that such additional high risk lending will not arise if the central banks
have an adequate system of supervision.
No alternative structures of lender of last resort facilities were
suggested in response to question 44.
Clearly the banking community would like some form of lender of last
resort facility to protect depositors and meet crises of liquidity.
However, generally they do not wish to see the risks of banking removed.
In this respect some reticence by the central banks in publishing the
terms under which the facility will be granted was welcomed.
The fact that such a facility was to be made available in a crisis
does not preclude the central banks from maintaining vigilant supervision
over the activities of the banks within their jurisdiction.
Responses to this section are corroborated by the responses to
question 36 in that the majority of bankers prefer the lender of last
resort facility of a head office supervisory authority to the worldwide
business of banks registered in its jurisdiction.
However, given the comments to question 36 that local central banks
should supervise liquidity, the responsibilities of the head office
supervisory authorities as lenders of last resort would seem, logically,

jDb
to be limited to the eurocurrency business of foreign branches. This
however may still impose considerable foreign exchange problems for a
central bank of a small to medium sized country. Therefore international
cooperation and lines of credit between central banks would be required if
such a system was to be strong enough to withstand any substantial shock.
7.3.8 Miscellaneous questions
Question 45 was the first of five miscellaneous questions and
referred to bank deposit insurance. The majority of respondents (42 to 16)
were in favour of such insurance but only for private depositors. The
majority (33 to 18) thought such insurance was inappropriate for foreign
currency deposits and deposits in overseas branches. Furthermore, 45 out
of 52 respondents thought that interbank deposits should not be covered.
The comments indicated that the respondents considered deposit
insurance was to protect the unsophisticated depositor thus the emphasis
upon small domestic depositors. The financial institutions should be able
to make their own credit assessment of the bank where they intend to
deposit funds. Furthermore they should be able to diversify their deposits
- something that the average personal depositor will find it difficult to
do.
The negative responses suggest that adequate supervision and the
lender of last resort facility should be sufficient. Moreover, the
insurance should not cover business at foreign branches because foreign
customs and regulations cannot be controlled.
Question 46 related the desirability of floating rate spreads and a
deeper secondary market in syndicated loans. This question was asked in
the form that it was because the writer thought that a deeper secondary
market required floating spreads. Some of the bankers thought otherwise;
fortunately those bankers generally answered question 46 in two parts.
There was a favourable response to a deeper secondary market although
likely to be sometime before it became much deeper than it is at present.

Indeed it will need a return to more confidence in financial markets
generally. However, the response to floating spreads was unfavourable,
mainly on the grounds of the additional administrative costs involved. It
was suggested that floating rate spread would require a minimum threshold.
Question 47 attempted to gain some idea of the bankers' perception of
the characteristics of a wider secondary market in loan participations. As
a catalyst for the responses the Floating Rate Note Market was used as a
comparison. The respondents noted that the loan participation was not a
negotiable instrument whereas the FRN is treated as such. Therefore
complicated documentation would be required in transferring loan
participations. This would tend to limit the size of the market. Because
of the difference in negotiability the two instruments would be treated
differently in bank balance sheets. In particular selling a participation
may not rid the selling bank of default risk if the LDC should default. In
some cases the borrowers' permission is required to sell participations in
a loan.
It was noted that FRNs were designed to appeal to non bank lenders.
Bank loans on the other hand were designed to develop a banker-customer
relationship in many cases with its attendant fee earning business. Thus
the instrument will be different. The sub-participation market was thought
to be only an interbank market.
Question 48 aimed at eliciting how the banks perceived the use of a
secondary market in loans in helping them diversify their loan portfolios.
A large majority thought that it would be helpful. Many respondents
thought that 'yes' was the obvious response to this question. In fact it
was not because of the 'herd instinct' in bankers; if one banker wanted to
diversify out of one country's loans there is a good chance that others
would want to as well. The result would be difficulty in selling such a
participation at an acceptable price and possibly no further
diversification.
Respondents also noted that the original lending was part of a
358
portfolio diversification exercise so that selling sub-participations may
not significantly reduce the overall portfolio risk. Indeed unless there
are new entrants to the market it may be difficult to sell participations
if the constraints of exposure limit and capital adequacy bite as
suggested in question 1.
However, one advantage of such a market was seen to be the realistic
valuation of rescheduled loans.
There was a statistically significant response to this question by
the Other British banks. All of them thought that a deeper secondary
market would not assist portfolio diversification.
Question 49 asked whether a deeper secondary market would widen the
participation in LDC loans to a) banks who have not loaned to date and b)
to non bank financial intermediaries. Both questions had small majorities
in favour, 49a (28 to 24) and 49b (30 to 23) . There were a few comments
that both developments but especially 49b would be undesirable, but there
were also comments with the opposite attitude.
From the responses to questions 46-49 it would seem that a deeper
secondary market in loan participations may be beneficial to the banks and
the LDC borrowers. However the level of benefit is far from certain.
Therefore, it is considered by this writer, that further research is
required into the economic, legal and practical administrative aspects of
expanding this market.
7.4 Conclusions from the survey
The major constraints upon the further supply of bank finance to the
LDCs seem to be doubts about debt servicing capacity, capital adequacy and
exposure limits. To the extent that the borrowers' servicing of debt, the
banks' ability to raise capital and willingness to increase exposure
limits are all related, adjustment of LDCs1 deficits will be an important
influence on the flow of private funds to those countries.
Adjustment does not have to be by the LDCs alone. As the global
deficit should sum to zero, some adjustment by the surplus countries may
actually increase world financial stability by reducing the perceived risk
of lending to LDCs. However, note must be made of the potential crowding
out of LDC borrowers as demand from OECD based borrowers increases.
However, to the extent that the banks' corporate objectives in
lending to LDCs include incremental profits, asset growth, servicing
export customers' needs, developing new markets and risk minimisation,
banks will probably continue to be willing to lend to LDCs provided that
the risk is at an acceptable level.
As perceived risk is going to be such an important influence on the
flows of bank finance to LDCs, it is not surprising that no single
suggestion for reducing that risk has emerged as a panacea for risk
reduction. Therefore a combination of measures suggested is required.
There was substantial support for restructuring the maturity profile
of debt provided it was carried out on a voluntary basis from the banks'
point of view. It is therefore considered that an urgent review of the
maturity structure of the debt of the LDCs should be carried out with a
view to renegotiating a maturity structure more appropriate to the
economic development prospects of the borrowers.
To complement this review, action should be taken to improve the
quality of information about the LDCs that flows to the banks and the
borrowing governments themselves.
There must also be an improvement in the debt management function of
the borrowers so that bunching of maturities is avoided and the maturity
profile of the debt is made flexible in order to accommodate changes in
economic circumstances. Appropriate debt management should then make
refinancing increasingly frequent and rescheduling less so. There is some
support for a code of conduct for rescheduling. The implementation of such
a code, in an appropriate manner, will reduce the resource costs
associated with negotiations. However, further research into the nature of
this code is required.

Subsidising interest rates by itself will not substantially increase
the flow to developing countries although new aid aimed at assisting the
debt service burden of interest payments would be helpful.
As a matter of urgency a system for financing the unanticipated
increase in interest servicing costs due to rising market rates of
interest must be established. The suggestion of establishing an IMF
facility for such a purpose finds support from those surveyed. The use of
an IMF facility is particularly appropriate as the majority of its
resources come from the developed countries. The increased interest costs
on LDC loans results, in part, from the impact of domestic economic policy
in these richer countries upon the level of interest rates in the world's
financial markets. It is therefore only equitable that some of the burden
of the increased cost be borne by those that cause it.
There are administrative and definitional problems to overcome but
the IMF does have experience in running a similar facility for export
shortfalls and the increased costs of cereal imports.
Co-financing with development banks in the most common forms of the
1970's does not seem to have been popular and therefore it is unlikely to
be a major force increasing flows to LDCs in the 1980's. However, we must
note that the recent linking of the IBRD with commercial banks in
syndicated loans may prove to be promising and it is considered that more
research should be carried out into the most appropriate relationship
between the commercial banks and the development banks.
Guarantees would increase the flow of bank finance to those countries
that are guaranteed provided that the guarantors were the governments,
preferably acting in concert, of the richer industrial countries.
Therefore to increase the flow to LDCs as a group, guarantees would have
to be available to all potential LDC borrowers otherwise unguaranteed LDCs
would be crowded out of the market.
It may be that guarantees could be used in conjunction with the
restructuring of the maturity profile of the debt. In particular, in order

to encourage the banks to reschedule to an appropriate maturity, the
guarantees, may cover only the later years of the debt's life. The
guarantee would have to cover interest and principal. Thus the combination
of a guarantee over the later years of a debt, together with the reduced
annual amortisation payments and thus reduced annual debt service burden,
should reduce the risk of lending and thus increase the flow of bank
finance to those countries that obtain the guarantees and restructure
their debt.
The great weakness of combining guarantees with debt rescheduling is
that the largest borrowers will need the largest guarantees. Yet it is the
richest LDCs which have borrowed most and therefore if these guarantees
are viewed in the same vein as aid, the richest countries will be seen as
receiving the greatest amount of aid. This problem is really a political
one in that the government guarantors may not wish to be seen providing
additional aid to the richer LDCs. However, they are indeed already doing
just that via their export credit insurance agencies.
Furthermore, the distribution of credit will be determined largely by
the distribution • of guarantees. This distribution is likely to be
political. If the guarantor governments do not wish to be seen
guaranteeing the richest LDCs, these countries may be crowded out of
private markets thus exacerbating their current financial situation.
It is clear therefore that the suggestion that loan guarantees be
used to encourage the restructuring of LDC external debt is only viable if
the guarantees are available to all LDC borrowers. Moreover, the
distribution of future guarantees should be flexible enough to ensure that
countries not currently accessing the bank credit market will be able to
if private external finance is an appropriate form of finance for them in
the future.
If the combination of debt restructuring and guarantees reduces the
bankers' perceived risk of lending to LDCs, the incremental profit and
asset growth objectives will ensure the bank funds will flow to the LDCs

unless crowded out by the increased demand for credit from OECD countries.
To avoid this crowding out, it will probably be necessary for the LDCs to
pay higher spreads to make such lending more attractive to the banks.
Although the above suggestions concentrate on reducing the risk and
increasing the reward of bank lending the risks of deposit taking must
also be reduced. In this respect greater uniformity of prudential
regulation and the uniform provision of deposit insurance would be
welcomed by the bankers. These provisions would therefore reduce those
bankers' perceived risk in deposit taking.

Chapter 8
THE EUROBOND MARKET AND DEVELOPING COUNTRIES
8.1 Introduction
Developing countries receive finance from bond markets in two ways;
either directly by issuing bonds themselves or indirectly by borrowing
from supranational organisations which tap the bond markets. Such
organisations include the IBRD. This chapter is only concerned with the
direct access of developing countries to the bond markets, and to the
eurobond market in particular.
There are in fact two types of international bond market. One is the
so-called foreign bond market where a bond is issued by a non-resident in
one market only and denominated in the currency of that market. The other
is the eurobond market where the bond issue is made in several centres
simultaneously and the bond is not denominated in the currency of any of
those markets. An example of a foreign bond would be one issued by/ say,
a developing country in London and denominated in sterling. An example of
a eurobond would be one issued by, say, a developing country in several
European centres but denominated in US dollars.
In order to put the size of the international bond market into
perspective, the following figures compare total international (euro)
bond and foreign bond issues with the total of medium and long term bank
credits.
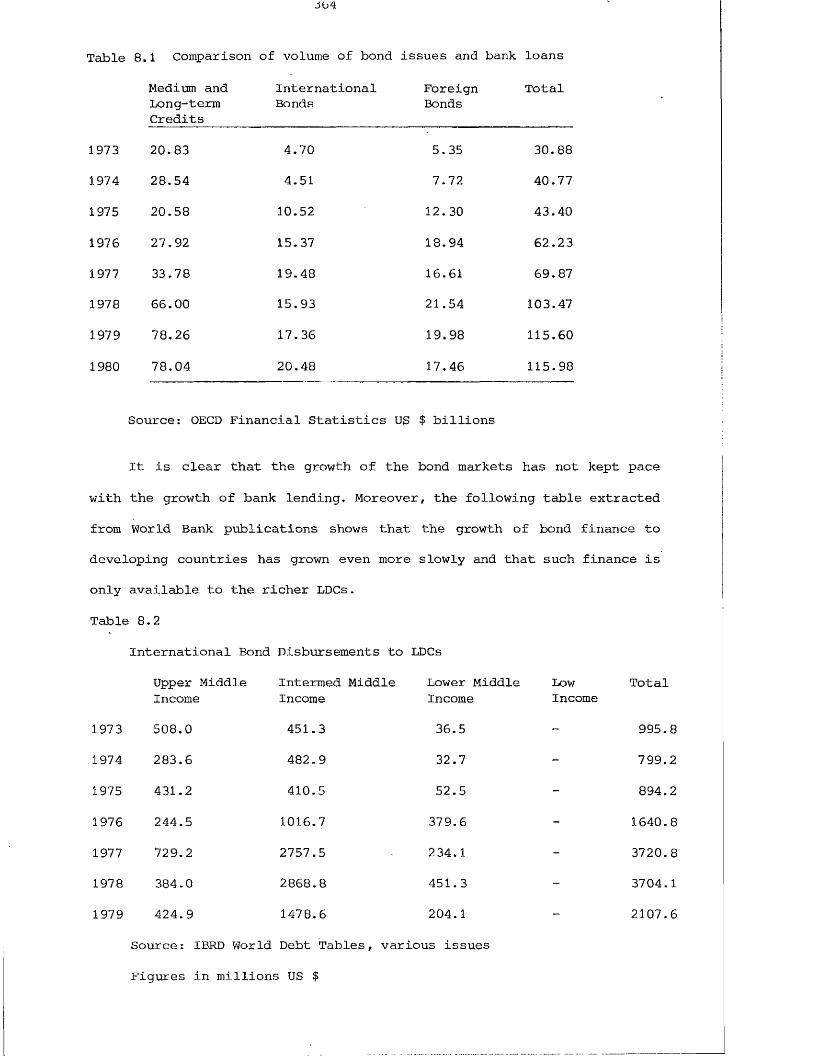
J b 4
Table 8.1 Comparison
Medium andLong-termCredits
of volume of bond issues and bank
International Foreign Bonds Bonds
loans
Total
1973 20.83 4.70 5.35 30.88
1974 28.54 4.51 7.72 40.77
1975 20.58 10.52 12.30 43.40
1976 27.92 15.37 18.94 62.23
1977 33.78 19.48 16.61 69.87
1978 66.00 15.93 21.54 103.47
1979 78.26 17.36 19.98 115.60
1980 78.04 20.48 17.46 115.98
Source: OECD Financial Statistics US $ billions
It is clear that the growth of the bond markets has not kept pace
with the growth of bank lending. Moreover, the following table extracted
from World Bank publications shows that the growth of bond finance to
developing countries has grown even more slowly and that such finance is
only available to the richer LDCs.
Table 8.2
International Bond Disbursements to LDCs
Upper Middle Intermed Middle Lower Middle Low TotalIncome Income Income Income
1973 508.0 451. 3 36.5 995.
1974 283.6 482.9 32.7 799.
1975 431.2 410.5 52.5 894.
1976 244.5 1016.7 379.6 1640.
1977 729.2 2757.5 234.1 3720.
1978 384.0 2868.8 451.3 3704.
1979 424.9 1478.6 204.1 2107.
Source: IBRD World Debt Tables, various issues
Figures in millions US $
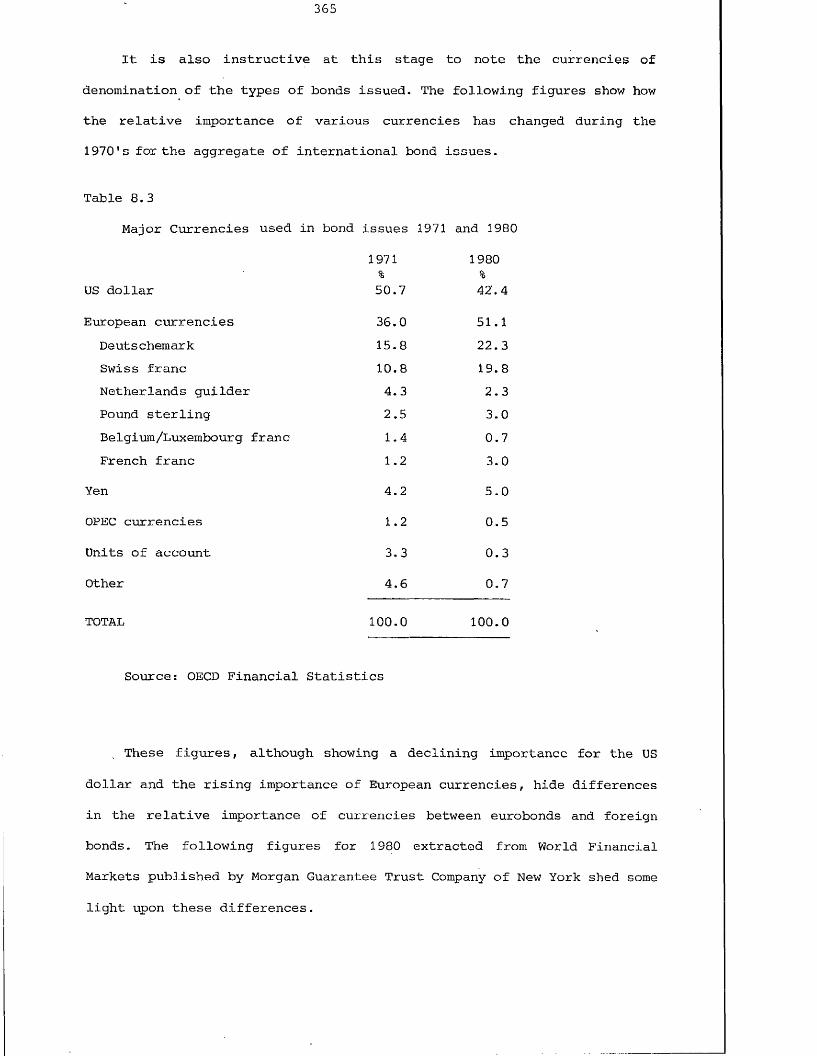
It is also instructive at this stage to note the currencies of
denomination of the types of bonds issued. The following figures show how
the relative importance of various currencies has changed during the
1970's for the aggregate of international bond issues.
Table 8.3
Major Currencies used in bond issues 1971 and 1980
1971 1980% %
US dollar 50.7 42.4
European currencies 36.0 51.1Deutschemark 15.8 22.3Swiss franc 10.8 19.8Netherlands guilder 4.3 2.3Pound sterling 2.5 3.0Belgium/Luxembourg franc 1.4 0.7French franc 1.2 3.0
Yen 4.2 5.0
OPEC currencies 1.2 0.5
Units of account 3.3 0.3
Other 4.6 0.7
TOTAL 100.0 100.0
Source: OECD Financial Statistics
These figures, although showing a declining importance for the US
dollar and the rising importance of European currencies, hide differences
in the relative importance of currencies between eurobonds and foreign
bonds. The following figures for 1980 extracted from World Financial
Markets published by Morgan Guarantee Trust Company of New York shed some
light upon these differences.

Table 8.4 Dominant currencies in the eurobond and foreign bond markets in 1980
Eurobond US $ 51.6
Eurobond DM 37.2
Foreign bonds US $ 28.7
Foreign bonds Swiss Franc 28.3
Foreign bonds DM 18.8
Foreign bonds Yen 19.0
These figures show that the US dollar is still dominant in the
eurobond market but European currencies have a much greater dominance in
the foreign bond markets.
The figures on page 364 above also show that the proportion of bond
finance going to developing countries is small and that only the richer
countries have been able to avail themselves of this finance. In
analysing the reasons why developing countries have not received a larger
proportion of their finance from the bond markets, it is fruitful to
analyse the nature of the eurobond market and the nature of the eurobond
instrument.
However, in this analysis the writer has been hindered by the lack
of data, particularly relating to bond investors and to the size of the
secondary market. These data weaknesses stem directly from the
uncontrolled nature of the market and the bearer nature of the eurobond
instruments. The next two sections therefore establish the theoretical
principles of the eurobond market and eurobond instrument which would
influence the ability of the developing countries to access that market.
These principles are tested in the last section by analysing the
responses to a questionnaire sent by the writer to the major managers of
eurobond syndicates in London.

J b /
8 .2 The Nature of the Eurobond Market
The Primary Market '
The eurobond market in fact consists of two distinct components: the
primary market where new bonds are first issued to investors and the
secondary market, where existing bonds are traded.
New bonds are issued by a syndicate of institutions on behalf of the
borrower. The syndicate will consist of:
1) the lead manager
2) the co-manager
3) the underwriter
4) the selling group
The lead manager will be a major eurobank who has secured the
mandate from the borrower to raise the finance.
The co-managers will be selected by the lead manager because they
are substantial institutions, are market makers in the secondary market
for the type of security in question, or have substantial placing power.
There are often 5-10 co-managers to an issue and together with the lead
managers they form the management group.
The underwriters are substantial banks selected for their placing
power of bond issues or on the basis of reciprocity with members of the
management group.
The selling group will consist of smaller institutions which are
trying to prove their placing power in order to pave the way to their
becoming underwriters.
Generally the lead and co-managers are also members of the selling
and underwriting groups in that they also place bonds.
The bonds are placed with the institutions1 customers so that banks
with a substantial discretionary investment management business have
strong placing power. The Swiss banks are substantial placers for this
reason.

As a consequence of this placing technique, most bonds are owned by
individuals or institutions that are not financial intermediaries eg
trusts or pension funds. Unfortunately, because eurobonds are bearer
instruments, no data are available as to who are the investors in such
instruments.
Where the investors are institutions they are frequently restricted,
by official regulation, as to the quantity of foreign securities in their
portfolios (Ahmad 1976).
The view that the majority of investors in new bond issues are
individuals or restricted institutions is the explanation suggested by
some commentators (Ahmad, op cit; Einzig, 1969 pi97; Scott Quinn, 1975
p221) for the small proportion of bonds being issued by developing
countries.
This explanation suggests that the market is dominated by
individuals who do not have the ability to carry out appropriate risk
analysis and that these individuals are risk averse. However, the same
explanation is compatible with the view that the market is dominated by
investors, individual or institutional, which do carry out the
appropriate risk analysis but perceive the risks to be too great. Both
these suggestions are tested in the questionnaire.
If the eurobond market were dominated by sophisticated individual
and institutional investors, why is it that one group of institutions,
financial intermediaries, have invested substantially in developing
country liabilities - the syndicated loan?
The answer to this question may be found in the differing attitudes
to investment by a financial intermediary on one hand and a wealth holder
on the other. It is the nature of the function of the financial
intermediary to take on the role of risk transformation and maturity
transformation and it earns its reward for fulfilling these roles amongst
others. Both these functions of a financial intermediary assist in
meeting the requirements of savers and those of borrowers. In
369
particular the role of risk transformation ie transforming risky assets
(loans) into riskless liabilities (deposits) satisfies the savers' desire
for a risk-free store of wealth, while providing the borrower with
finance for a risky project (Bain 1981, p50).
The fact that risk transformation does not take place via an
intermediary in the bond market will result in an unsatisfied demand for
credit for risky projects.
The financial intermediary can only continue its. function and thus
earn an income if it has a stream of potential savers and borrowers.
However, considerable maturity transformation is typical of this
intermediating process. Thus, the turnover of deposits is likely to be
greater than that of loans. It is essential therefore that financial
intermediaries maintain a flow of deposits. One important influence on
the size of that flow will be the rate of interest paid on deposits. It
seems reasonable to assume therefore that financial intermediaries are
more concerned with certainty of income than certainty of principal. In
the extreme it does not matter whether a loan is repaid as long as
sufficient interest earnings accrue in order to pay a sufficiently high
rate of interest so as to ensure a flow of deposits to fund the loan,
(refer chapter six, page 271 for a more detailed account of this
argument).
Of course when a borrower defaults income and principal are lost.
However, as chapter six, page 270 has shown, banks are eager to avoid
outright default by engaging in lengthy rescheduling programmes. They are
in effect delaying repayment of principal in return for continuity of
income.
The bond market investor, on the other hand, does not .carry out the
functions of a financial intermediary. He is not rewarded for carrying
out risk and maturity transformation. We would therefore expect the
typical bond market investor to be relatively more risk averse than a
financial intermediary. Thus we would expect bondholders to be relatively
less important investors in assets of a risky nature such as LDC
eurobonds.
Finally, it should be realised that the number of investors in a
typical eurobond issue will be more numerous than the members of a
eurocurrency loan syndicate. Furthermore, many investors are attracted by
the anonymity provided by the bearer nature of the eurobond instrument.
Given these circumstances any concerted renegotiation of eurobond
investment becomes almost impossible. This in itself increases the risks
to the eurobond investor because the terms of the bond issue cannot be
changed as the borrower's financial circumstances change. This reduced
flexibility of bonds compared with say bank finance increases the chances
of default within the terms of the bond agreement.
The Secondary Market
Most eurobond issues are listed on a stock exchange such as London
or Luxembourg. However, very little trading goes on via these exchanges.
The majority of trading transactions in existing eurobond securities take
place in the Secondary Market. This market is truly international, the
trading being carried on via telephones and telexes around the world.
Some operators in the market are dealers operating on behalf of
buyers and sellers. Other operators, usually banks or investment
institutions, trade on their own account. They hold a position in bonds
and act as market makers, being willing to buy and sell at certain
prices. The activities of these market makers ensure that investors can
resell their bonds, albeit at the market price, should funds be required
before the bonds mature. Thus the secondary market provides a degree of
liquidity to what may otherwise be an illiquid investment.
Since liquidity is a factor in favour of any investment, the
attitude of financial institutions to market making in developing country
bonds is an important influence in the ability to issue such bonds.
The size of the secondary market is very important in this respect.

The market makers are analogous to the members of the London Discount
Market in that they suffer considerable fluctuations in the book value of
their portfolios as interest rates change. Yet the eurobond market makers
have no lender of last resort as such. Thus market making is more risky,
this risk being evidenced by higher bid-offer spreads and thus greater
capital value fluctuations for the investors.
Furthermore, because of the riskiness of acting as a market maker,
the secondary market is smaller than it otherwise would be. This factor
alone increases the price fluctuations resulting from a given sale by an
investor.
This situation is exacerbated with regard to LDC bonds because the
secondary market in these bonds is somewhat limited. In several instances
secondary market yield fluctuations have been markedly more pronounced in
the LDC compartment than elsewhere (OECD June 1977, p78).
It is therefore postulated that if the secondary market in
developing country bonds is small, this will contribute to the lack of
popularity of such bonds. In particular the lack of liquidity provided by
a deep secondary market will increase the risk of a forced sale
disproportionately influencing the price against the seller.
Nevertheless, it is also realised that the lack of a deep secondary •
market may be caused by the relatively small volume of new issues by
developing countries, and the small size of those issues that are made.
8.3 The Nature of a Eurobond
Bonds issued by developing countries have either been fixed interest
(straight debt) or variable interest (floating rate debt) instruments.
Floating rate instruments have become increasingly popular accounting for
10.9% of all eurobond issues in 1970 and 19.1% of such issues in 1978
(Fisher 1979, p!42). However, the majority of bonds issued are in the
form of straight debt.
Another feature of eurobonds is that they tend to be long term

instruments with maturities ranging from five to twenty years.
A third feature is that for many investors in eurobonds the bonds
are a foreign currency investment with the attendant problems of foreign
exchange risk.
A useful understanding of the causes of the relatively small role of
the bond market can be gained by comparing the eurobond as a borrowing
and investing instrument with the eurocurrency syndicated loan and
eurocurrency deposit markets.
Taking first the fixed interest nature of the majority of debt
issued: prices of fixed interest debt fluctuate widely as a result of
interest rate changes. In particular the volatility will be greater for a
given change in interest rates a) the lower the coupon rate or b) the
longer the maturity. Thus if investors took a long view that interest
rates were going to rise, they would expect to incur capital losses on
straight debt if sold before maturity. If expectations of rising future
interest rates dominated market thinking the demand for fixed interest
rate instruments would be small.
The fixed rate nature of most eurobonds means that borrowers also
have to take a long view of interest rates. They may find themselves
locked into paying historically high rates of interest, the only relief
coming from any purchase fund or sinking fund arrangements or any call
provision.
Assuming that both investors and borrowers are risk averse in
relation to unforeseen interest rate changes, both would prefer floating
rate instruments to ones bearing fixed rates of interest. We can
postulate, therefore, that during periods of secularly rising interest
rates, investors will be less willing to buy fixed rate bonds.
For many investors a eurobond is a foreign currency investment and
the demand for that investment will be influenced by the investors'
expectations of future exchange rates. It must be remembered that for
most investors, whether individual or institutional, trading in foreign

currencies is not in the ordinary course of their business. Given the
long term nature of most eurobonds, the investors have to bear the
foreign exchange exposure risk because the forward exchange markets are
too thin at the longer maturities.
It is assumed that borrowers do not face such exposure because they
borrow in a currency in which they expect to earn revenues.
On the other hand loans provided by banks can be funded from the
eurocurrency interbank market. This market enables the banks to obtain
foreign currency ie eurocurrency funds for their foreign currency
lending. Thus, for the banks, eurocurrency lending does not of itself
imply foreign currency exposure risk.
Some indication of the influence of exchange rates over investors
may be gleaned from the declining role of the US dollar in denominating
bonds. OECD figures (Financial Market Trends, November 198 , p97) show
that the US dollar was used in 82.8% of eurobond issues at the end of the
1960's but this declined to 54.2% at the end of the 1970's. In contrast
the importance of the German Mark rose, from 13.4% to 33.6% of new issues
over the same period.
It is suggested therefore that the foreign currency nature of the
eurobond investment adds the additional risk to the investor of foreign
exchange risk and that this additional risk deters investors. However,
this only explains the smaller size of the eurobank market generally and
not the small amount of bond finance going to LDCs. However, the small
size of the bond market generally will mean that pro rata only limited
finance is available to LDCs.
Questions relating to the interest rate risk and foreign currency
risk are included in section three of the questionnaire.
Note has already been made of the different risk borne by
intermediating and non intermediating investors. The importance of this
can be seen in the period after the 1973 oil price rise. OPEC members
with substantial US dollar funds required short term liquid investments

while borrowers with structural disequilibrium on their balance of
payment required long term funds. It was natural for the banking system
to carry out the required risk and maturity transformation in order to
meet the requirements of both borrowers and lenders.
The bond markets on the other hand did not satisfy the OPEC
investors' requirements of short maturities. Furthermore, the interest
rate risk associated with the fixed interest bonds and the default risk
did not satisfy their requirements of capital certainty.
The fixed interest nature of the majority of LDC eurobonds precluded
the banks in receipt of OPEC funds from investing in the LDC bonds.
Firstly there was the interest rate risk but also the fact that the fixed
interest rate portfolio of bonds would be funded from deposits bearing
variable (floating) rates of interest. Thus, there is a risk that the
revenue from the portfolio of bonds would be less than the costs of
funding that portfolio. Therefore the banks used the OPEC deposits to
fund floating rate syndicated loans.
In addition to the long term view of interest rates which borrowers
in the bond market must take, there are also administrative factors which
may deter some. One such factor is the use of a credit rating. Another is
the administrative costs of a bond issue. These latter are in addition to
any front-end fees that may be payable.
Taking the case of the credit rating first, there are three rating
agencies located in the United States: Moody's Investors Services Inc,
Standard & Poor's Corporation and Fitch Investors Services Inc. The first
two of these are more important and have relatively wide experience in
rating issues of foreign borrowers (Fisher 1979). Because the lack of a
rating is interpreted as a poor fating, eurobond issuers find it
worthwhile, in terms of interest rate savings, to obtain a rating for the
issue. On the other hand, there is evidence in the US foreign bond market
that developing country issuers have preferred not to obtain a rating
rather than be given one that is not triple A, the top rating.

Accordingly these countries have had to pay higher coupons, (Fisher 1979,
op cit) . The costs of obtaining a rating and the fact that developing
countries may not get top rating may deter sovereign borrowers from using
the eurobond market.
Turning next to the costs associated with a bond issue but not with
a syndicated loan, the credit rating could cost up to US $25000, printing
of bonds and prospectuses US $60000, Stock Exchange listing US $10300,
authentication of bonds US $7000. (These figures were extracted from
Fisher, op cit, and relate to a 50 million dollar bond issue.)
On top of these costs there are front-end fees which according to
Fisher are standard in the eurobond market at 2% for maturities up to
five years, 2.25% for maturities five to seven years and 2.50% for
maturities ten years and over. Mendelsohn (1980) gives the following fees
for euro and foreign bonds of various types:Table 8.5 Fees on euro and foreign bond issues
Eurobonds 2 - 2 i %
New York Foreign Bonds | - 1%
Yen Foreign Bonds 2%
DM Foreign Bonds l|- 2tf%
Dutch Foreign Bonds 2i%
Swiss Foreign Bonds 4%
These figures for front-end fees compare unfavourably with such fees
paid by Brazil, one of the more frequent LDC borrowers on the bond
market, of less than i%.
As well as these technical factors, the ability of developing
countries to tap various foreign bond markets has been influenced by the
attitudes of the regulatory authorities for each foreign bond market.
Such attitudes have even influenced eurobond issues. These regulations
were aimed at a) reducing the internationalisation of a particular
currency, particularly during periods of weakness, or b) to restrict
capital inflows during periods of currency appreciation.

Reducing the internationalisation of a currency was desired by some
countries eg Germany and Japan, because otherwise ".... transactions on
the foreign exchange markets and capital markets ...... may be
disproportionate to the size of their economies", (OECD November 1980,
pl02).
Policies aimed at reducing inflows had the effect of reducing the
pool of investors' funds and thus the demand for a particular bond issue.
The role of these markets as a source of finance for developing countries
was therefore reduced. These controls, generally in the non US dollar
bond markets, were applied at various times during the 1970's. This was a
time when the popularity of the US dollar both with investors and with
borrowers was waning. Therefore the ability of these other markets to
make up for the shortcomings of US dollar markets must have been
restricted.
Where these regulations have not influenced the eurobond market
directly they may have had an indirect influence. In particular, these
regulations have limited the ejsperience which investors have been able to
gain of LDC bond issues. Because of this lack of experience they may
perceive the credit risk to be greater than it actually is.
This section explains why the eurobond in general has not been as
popular a credit instrument as the eurocurrency syndicated loan as
indicated by the figures given on page 364 above. The significance of
this reduced general popularity in explaining the limited access of the
LDCs to the eurobond market lies in the fact that the smaller the total
demand for eurobonds, the smaller will be the quantity available to LDCs
from that source, ceteris paribus.
8.4 The Questionnaire
It can be seen from the previous two sections that the nature of the
primary and secondary bond markets will have a strong influence on the
ability of the developing countries to access those markets. In

particular the nature of the investors, their perception of the risk
associated with lending to developing countries and investors' attitudes
to risk are important. Moreover, the depth of the secondary market in
developing country bonds will influence the attractiveness of new issues
of those bonds.
It is also clear that the fixed interest rate nature of most
eurobond issues, the foreign exchange risk, and the long term maturity of
many issues should theoretically influence investors' willingness to take
eurobonds generally. Widely recognised standard credit ratings and
transactions' costs may also influence borrowers' willingness to issue such
bonds. Any factors that reduce the overall size of the eurobond market
will, ceteris paribus, restrict the access of LDCs to bond finance.
Therefore, the questionnaire was composed of five sections. Section one
consisted of one composite question in four parts enquiring to what
extent the nature of the market and its participants or the nature of
eurobond instruments were the reasons for the limited access of LDCs to
the eurobond market.
Section two consisted of six questions, two relating to the type of
eurobond investor, two about the thinness of the secondary markets, one
about the reluctance of LDC governments to obtain credit ratings and an
open-ended question about other aspects of the eurobond market that
limited the access of LDCs to that market.
Section three asked six questions about the nature of the eurobond
instrument. Three questions related to exchange risk and interest rate
risk of eurobonds, two questions related to the costs of eurobond issues
and one question was open-ended and enquired of any other factors about
the instrument that limited the access of LDCs to this market.
In order to obtain some idea of why developing countries tap the
eurobond market when they already have considerable access to bank
finance, one question to this effect was asked in section four of the
questionnaire. It was felt that the simple question in section four was

sufficient because it was not intended to investigate why developing
countries sought external finance but only why they seek bond finance
when they already have bank finance.
Lastly, in section five, it was hoped that respondents to the
questionnaire would provide a ranking to each answer they gave along the
scale a - very important to c - not important.
8.5 The Results of the Questionnaire
The questionnaire was sent to the chief executive in charge of
eurobond syndications at 53 institutions in London. The population of
institutions consisted of members of the London section of the
Association of International Bond Dealers, a number of merchant banks,
most of which are affiliated with UK clearing banks, and the British
Overseas Banks who have strong connections with developing countries.
All executives were contacted by telephone in advance to get their
agreement to participate in the study, the number of agreements
determining the number of questionnaires despatched. One month after the
date of despatch of the questionnaire telephonic communication was made
with all those executives who had not responded. Within two months of the
original date of despatch, 28 responses were received, 53% of the
population. This encouragingly high response is attributed to getting
previous agreement to participation and the small size of the
questionnaire.
The responses to the questionnaire are divided into two parts for
purposes of analysis. The first part analyses the response to the
questions which provided Yes/No answers, and the ranking of those
answers. The second section analyses the comments, some of which were
very detailed.
Analysis of Yes/No Answers in sections 1 to 3
The exact number of Yes/No answers to each question and the relative

importance of each question is given in appendix VIII with the
questionnaire. The total of Yes and No answers to each question does not
always equal 28 because not every respondent answered all questions. The
same comment applies to the rankings because not all respondents ranked
their answers.
Looking first at the response to section one, the majority response
was that the nature of the market was most important. However, one fifth
of the responses thought that it was a combination of the market and the
instrument which was the cause.
Turning to section two, the majority of respondents did not think
that the eurobond market was dominated by individuals. This runs counter
to a popular theme in the literature (eg Ahmed, op cit; Scott Quin, op
cit) . Twenty three of the respondents considered that the market was not
dominated by individuals but that the investors perceived the developing
countries as being too great a risk. Fifty per cent of the respondents
ranked the risk factor as being ’very important'.
The majority of respondents considered the secondary market to be
disproportionately thin and an even larger proportion of respondents
considered that this was a deterrent to potential investors. However,
considering the importance of these two points, only about 25% of the
respondents considered them to be very important and only one third
considered them to be moderately important.
The question of credit ratings influencing the developing countries'
access to the bond market was closely divided between limiting access and
not limiting access but no respondents thought that this point was
important.
It was noted by some respondents that there is no credit rating
system solely related to the eurobond market and therefore ratings for
the foreign bond and domestic bond markets would have to be used. The
reluctance to obtain these ratings was considered to be due to the fact
that governments do not generally apply for a rating unless they are

certain of getting the highest rating ie 'AAA'. However most developing
countries would only be rated as 1 highly speculative1.
Turning now to section three, only two respondents considered that
the exchange risk deterred investors. Only one respondent considered that
fixed interest rates deterred investors and only one respondent thought
that borrowers were deterred by the long term and fixed interest rate
nature of the eurobond instrument. However, note should be made of the
comments on page .381 below.
Analysis of the responses to section four
Of the 28 responses, 24 respondents answered question 13 asking why
countries which already have access to the syndicated loans market also
tap the bond market. The answers had three common themes a) the need to
tap every possible source of funds, b) to enjoy the certainty of fixed
cost finance and c) prestige.
The comments regarding the need to tap every possible source of
funds often noted the desperate plight of the developing countries in
their search for funds. Other respondents saw the use of the bond market
as a prudential diversification of geographical and sectoral sources of
funds. Some respondents also noted the prudential diversification of
maturities in that eurobonds are traditionally repaid only at maturity.
This gives certainty regarding maturity of commitments which may be
lacking with a roll-over credit.
An interesting comment which is an extension of the diversification
of sources was that "the banks are over-extended to LDCs, therefore if
the banks see an opportunity to share this burden with non bank
investors, they will bring an issue to the market". This indicated that
the banks themselves have an interest in diversifying the sources of
funds to developing countries in order to relieve the pressure on their
own exposure limits.
The many respondents who considered that the bond market was

accessed in order to achieve some fixed cost element in the total
borrowing considered this to be advantageous even if rates were high at
the time of issue. It is also interesting to note that if markets have
expectations of rising interest rates borrowers are encouraged and
investors discouraged from fixed rate issues. This view was confirmed in
comments relating to questions 8 and 9 in section three. The 1970's has
experienced a secular rise in interest rates. As the majority of LDC bond
issues to date have been fixed rate issues (80%) , this may add to the
factors that deter investors.
One respondent noted that although the banks were the only investors
capable of carrying out the necessary risk analysis, they cannot lend on
fixed rate instruments because of the floating rate nature of their
liabilities (deposits). In this respect it should be noted that, with the
growing popularity of floating rate notes, the banks have been willing to
invest more for their own account in the bond market.
The prestige of the borrower figured prominently as a reason for
tapping the bond market* The achievement of a successful bond issue put
the borrower in a select club of good names. There was also an element of
an educating role in that if one bond issue is seen to be successful, and
the borrower meets its commitments, not only will future bond issues be
possible but the borrowers' credit rating in other markets will improve.
The role of publicising the borrower's name via the bond market so that
underwriters and investors alike become familiar with the name was also
considered to be a beneficial reason for tapping the bond market.
Analysis of additional comments in responses to sections 1 to 3 and section 5
Turning now to the additional comments from the respondents, the
overwhelming comments related to reasons why the eurobond market, and
indeed bond markets generally, had been so little used by developing

countries. The main reason for this little use was considered to be the
perception of the credit risk involved. It was considered that investors,
whether institutional or individual, invest only in good quality names.
Some respondents thought that investors in bonds did not have the ability
to carry out sophisticated analysis of the credit and political risks
involved. Furthermore, many investors see the anonymity provided by
eurobonds as beneficial. However, the desire to maintain anonymity
precludes the establishment of bondholder organisations that can seek to
enforce bondholders' rights upon default. A considerable proportion of
eurobonds are bought by discretionary funds which are precluded from
buying into risk situations. Furthermore, although the market was
generally thought to be dominated by institutional investors, at least in
terms of volume of funds, the dominance can shift towards individuals.
For example one respondent considered that in the latter half of 1981
75-80% of fixed rate bonds were bought by Swiss banks on behalf of their
individual clients.
Implicit in the statements that all investors lack the
sophistication to carry out the appropriate risk analysis is the
suggestion that institutional investors also lack that capability. This
seems a surprising conclusion and some doubt as to its validity may be
gleaned from the comments of a few respondents who thought that
institutional investors were less quality conscious than individual
investors. Maybe the institutional investors can carry out the
"appropriate" risk analysis. Again, a few respondents considered that one
reason why banks found LDC risk acceptable is that they could fully
diversify their risks because of the large size of their balance sheets.
However, one would expect the same of many institutional investors but
maybe not of individuals.
The off-shore nature of eurobond issues was considered by some
respondents to make the job of risk analysis and monitoring the condition
of the investment more difficult. This is particularly so when the most

difficult risk to analyse is political risk. Even countries with sound
economies can be politically unstable as changes of government do occur
very rapidly.
A further set of comments may shed more light upon the attitude of
investors to the credit ratings. After all, even individual investors may
feel safe lending money to the same governments as their bank has lent
to. One may think that potential investors would use the credit rating
implicit in the publicised terms of the banks' lending. That this does
not seem to be so may be explained in the differing attitudes to the
principal value of the loan. Several respondents considered that bonds
were treated by both individual and institutional investors as safe
havens for capital. Capital certainty rather than high income is the
desire of the investor. This corroborates the theoretical point made on
pages 8 and 9 above that investors who are not financial intermediaries
are more concerned with capital certainty because the investment is made
with their wealth (equity) and not intermediated funds.
The behaviour of a bank as an investor in syndicated loans is
different in that they need income certainty so that they can cover the
costs of funding their investments. The banks are therefore willing to
roll-over loans, reschedule loans or repay existing loans with new loans
providing income is certain. As banks have to maintain the attractiveness
of deposits and because deposits often come from different sectors of the
economy than those to which loans are made, banks are often under
pressure to take upon themselves the high risks associated with financial
intermediation in order to deploy deposit funds profitably.
Many respondents, considering that banks and not bond investors are
equipped to carry out risk analysis of LDCs, cited the fixed interest
nature of the majority of bonds issued as the reason why banks were not
greater investors in LDC eurobonds. In this respect it is notable that
with the growing use of floating rate note issues the banks are becoming
more important investors and that many LDC FRN issues have been sold to

banks. However, it should be noted that one respondent considered that
FRN issues were more expensive in terms of issue costs than a syndicated
loan on similar terms. Moreover, FRN issues over $100 million were
difficult to make. Thus an FRN issue was inappropriate to the needs of
developing countries.
The thin secondary market, which was commented on by several
respondents, will have a detrimental influence on the ability of
investors to divest themselves of their bonds without suffering capital
losses. The role of a deep secondary market in giving investors
confidence in the liquidity of their bond investments was considered to
be so important that one respondent considered the small secondary market
in LDC eurobonds to be one of the most important factors limiting the
access of LDCs to the eurobond market. Of course there is a 'chicken and
egg' problem here because unless there are substantial issues of LDC
bonds, and that each issue is large, not enough individual bonds will be
traded to establish a secondary market. However, it must be noted that
the ranking of the Yes/No answers implied that the size of the secondary
market was less important than the comments suggest.
The depth of the secondary market is crucial for institutional
investors because they frequently change their investment criteria with
regard to currency and maturity risk. If the secondary market is thin,
there may be considerable implicit transactions costs involved in these
shifts and therefore a thin secondary market will make LDC eurobonds less
than attractive to institutional investors. The dominance of
institutional investors noted earlier will make this factor all the more
important.
It was also suggested earlier that investors in eurobonds were more
interested in low risk rather than high income. Nevertheless, some
respondents did consider the question of the adequacy of compensation for
the risk involved. Three respondents thought that considerably higher
risk premiums than are currently available would be required to make LDC

bonds acceptable. It was also noted that at the appropriate price the
LDCs would perceive the finance as too expensive and would seek
alternative sources of finance. Furthermore, countries that are currently
least attractive to the bond markets can borrow bond market funds at fine
rates via the IBRD, IADB and similar institutions.
Considering the comments that the yield on bond issues whicli
compensated for the risk involved would be perceived as too high, it must
be remembered that the yield on a eurobond is only the coupon yield plus
any change in the secondary market price. Thus, this yield is explicit to
the borrower and investor. However, the yield on a bank loan has an
explicit element - spread plus fees - but also an implicit element in
terms of the other business income that can be generated from the
borrower's wider banking connection. This may even amount to goodwill in
allowing branches to operate in the borrower's country. Thus the explicit
yield on syndicated loans can be lower than the explicit yield on
eurobonds for the same risk. Furthermore, one respondent
considered that the risk premium between, LDC and, say, OECD borrowers is
greater in the bond market than in the syndicated loans market. Therefore
the LDCs may wish to avoid this premium.
In the responses comment was made not only of the small size of the
secondary market, but the small size of the total eurobond market
compared with that of syndicated loans. Two points were made about this
relative size. One was that good quality issues crowded out poorer
quality ones. Secondly, because there was an adequate supply of good
quality paper investors do not have to lend to developing countries. The
corollary of this is that investors do not learn about developing
countries - these countries do not become 'household names'. Thus the
credit reputation of all LDCs is tarred by the defaults of a few. While
this crowding out persists the 'education' of investors will be a slow
process and therefore the bond market will not be generally available to
LDCs for a long time to come.

The slowness of the educating process in the bond market is contrary
to that in the syndicated loans market where, because of a combination of
opportunity and necessity, the banks learned very quickly to assess the
risks of LDC lending*
It is clear that the greater proportion of comment was about the
reluctance of investors to buy LDC eurobonds. However, there were a few
comments about the bond market not being considered desirable by LDCs.
Firstly it was noted that the bond instrument was a very rigid
instrument with many covenants which, when broken, constitute default.
Thus if the developing country's circumstances change such that it cannot
comply with the covenants, it has the choice of repaying the bond or of
defaulting. A syndicated loan on the other hand is much more flexible.
Re-negotiation of the terms of the loan is possible, first because banks
are used to providing a flexible form of finance and, secondly because
relatively few members of a syndicate are involved. This compares with
the impossibility of negotiating with a large number of anonymous
eurobond investors.
It was also suggested that developing countries prefer to borrow
from the banks because they perceive that only the banks are equipped to
carry out a fair and accurate risk assessment. Thus only from a bank will
they get fair (favourable?) terms for the finance. This may reflect the
fact that banks get a greater proportion of implicit yield on syndicated
loans than bondholders do from their bonds. This comment may also reflect
greater competition in syndicated lending following the necessity to
deploy a growing volume of deposits during the 1970's.
Finally one respondent considered the interest cost of eurobonds to
be unfavourably high for LDCs compared with syndicated loans.
J8'/
8.6 Conclusion
This study does not give rise to 'a confident outlook regarding
future increased access of the developing countries to the eurobond
market. Particular features which will preclude access are the perception
of credit risk by investors, legalistic limitations upon institutional
investors and the crowding out of developing country paper because of the
limited size of the eurobond market.
It seems essential to take steps to deepen the secondary market in
these bonds in order to make them more attractive generally. However, it
is realised that this may be difficult until the primary market for LDC
paper is enlarged.
There does seem to be a need to pay substantially higher yields if
the developing countries are to increase access. This in itself may be
unattractive to the borrowers. One way may be to provide some fiscal\benefit to those investors who pay taxes along the lines provided to
banks who make tax-spare loans to developing countries. There may be a
greater role to play by the supranational institutions such as the IBRD
in that they may be able to increase their access to the bond markets and
then engage in more programme finance of the developing countries.
There is clearly the need for an educative process aimed at changing
the attitudes of investors to developing country risks. However, in this
respect, recent publicity regarding the rescheduling of bank debt must
detrimentally affect confidence.

Chapter 9
CONCLUSIONS AND RECOMMENDATIONS
Resume
In chapter one it was shown that growth aspirations, external shocks
and the quantitative inadequacy of official external finance forced the
LDCs to make use of private sources of external finance during the 1970's.
However, this increased access to private finance was not available to all
LDCs and indeed the poorest LDCs were net depositors with the
international banks.
The relative profitability of loans to LDCs, the increased liquidity
of the euromarkets after 1973 and - for the US banks at least - the
relaxation of controls, encouraged the banks to make strategic changes in
their loan portfolios and satisfy the increasing demand for loans by LDCs.
Such was the satisfaction of this demand that banks became the major
suppliers of such finance.
Chapter two showed that the syndicated roll-over loan was well suited
to the supply of the individually large medium to long term credits
required by the LDCs.
Chapter three showed that it is feasible for many of these loans to
be provided at zero or at least very low marginal cost to the banks where
the interest costs of funding the loan are passed directly to the borrower
within the terms of the loan agreement. Because of the low level of
marginal cost and very elastic demand curves for loans due to the degree
of competition in the eurocurrency loan market, the banks were able to
pursue the objective of asset growth without reaching the profit
maximising size of portfolio. The constraints postulated were not the
equality of marginal cost with marginal revenue but a minimum return on
total assets or a maximum level of perceived risk. The existence of this
latter constraint early in the 1980's was confirmed in a survey of bankers

reported more fully in chapter seven.
Chapter four investigated the cost of funds to LDC borrowers by way
of syndicated loans and eurobonds. This chapter showed how interest rates
on both were related to the domestic rates of the countries whose currency
was being used. In particular the US domestic interest rates had a strong
influence upon eurodollar rates and therefore upon the debt servicing
costs of LDC borrowers. Moreover, it was shown that rising interest rates
on floating rate debt that compensate for inflation reduce the real
maturity of that debt such that it may be inappropriate for the
development or adjustment process.
Chapter four showed the magnitude of the substantial risk premia paid
by the relatively few LDCs that have gained access to the eurobond market.
It was also shown that the spread on syndicated loans was a poor indicator
of risk or yield. Firstly, this is because of inadequate information about
fees and secondly, because during periods of high liquidity, spread
differentials between borrowers have narrowed considerably.
The conclusion of chapter four is that the costs of external finance
to LDCs are very strongly influenced by the monetary-fiscal policy stance
of the OECD countries, particularly the USA. As is being experienced at
the time of writing, the level of interest rates in some of these
countries bears little relationship with the level of inflation that the
LDCs experience in their export markets.
Chapter five showed that the growth of worldwide bank lending to LDCs
had been more rapid than the growth of GNP or exports for LDCs
collectively. However, this may be expected where much of the borrowing is
to finance long term projects or macroeconomic adjustment.
It was also noted that loans to LDCs had grown faster than the UK
banks' capital and this phenomenon was presumed to apply to all major
banking centres. However, for the UK banks at least it was shown that
despite this increase between 1978-82 such lending had not grown
significantly as a proportion of total non resident advances and only
slightly in terms of total balance sheet size.
The degree of profitability on bank loans to LDCs was shown to be
greater than on loans to OECD based borrowers. This was because of higher
spreads and lower loan loss ratios than experienced with domestic banking
- at least during the 1970's.
This chapter showed that the debt servicing costs had risen
substantially during the 1970's, not just because of the increasing size
of the debt but because of the movement towards private sources of
finance. In particular the movement towards floating rate debt and the
high nominal and real interest rates experienced towards the end of the
decade considerably increased the ratios of interest payments to GNP and
exports and the proportion of interest going to private financial markets.
Furthermore, this chapter illustrated the weaknesses of assessing
debt service requirements with the currently inadequate data regarding
debt with an original maturity of one year or less. It was shown on page
236 that assuming an average LIBOR for the year in question due on all
bank debt and repayment of all debt due within one year, servicing
commitments were nearly five times as great as that suggested by taking
interest and amortisation due on medium and long term debt as reported by
the IBRD.
Chapter five also indicated the benefits of diversification of loan
portfolios. However it was shown that loans are subject to systematic risk
due to rising interest rates and the attendant impact upon exchange rates.
Although diversification by country seemed to be adequate, when
diversification was looked at from the point of the source of export
revenue, a different picture emerges. LDCs as a group depend upon the
export of primary products to earn foreign exchange. On average 62% of
these exports go to only five markets and the US market accounted for 36%.
.Moreover, several countries had considerable degrees of concentration in
one export commodity. It was therefore considered that the banks'
portfolio of LDC loans was not adequately diversified in terms of source of debt servicing ability.

Chapter six investigated ways of reducing the risk associated with
international bank lending. The suggestions formed two groups: those that
reduced the risks of lending to LDCs specifically and those that reduced
the risks of international financial intermediation generally. The
acceptability to the bankers of the various suggestions was tested by a
questionnaire survey of over 200 banks in London.
In the responses to this survey, reported in chapter seven, there
was considerable support for restructuring the maturity profile of LDC
debt, although the banks generally hoped that it would be voluntary from
their point of view. Furthermore, it was considered that restructuring
should be accompanied by adjustment policies. In this respect there was
substantial support for the writer's suggestion that debt rescheduling
should become a legitimate aspect of debt management policy.
There was also a view that the borrowers' debt management must be
improved in order to avoid bunching of maturities and to make the
maturity profile flexible within the light of the changing circumstances
of the borrower.
Suggestions of direct subsidy of LDC interest payments by richer
countries were not strongly supported. However, there was support for
the writer's suggestion that an IMF facility be established that will
allow countries to finance short term increases in debt servicing costs
caused by upward fluctuations in interest rates provided that these cause
balance of payments difficulties. It was thought that there may be some
definitional problems particularly about interest rate trends and
administrative problems regarding repayment but these are not considered
insurmountable.
It was thought that guarantees would increase the flow of finance to
LDCs provided that the guarantors were the richer industrial countries
acting in concert. It was considered that the guarantees would have to be
available to all LDCs otherwise those that are unguaranteed would be
crowded out of the market.

If a system of guarantees were applied to the later years of a
restructured debt this may encourage a general restructuring to longer
maturities more appropriate to economic development. One problem is that if
the giving of guarantees is perceived as akin to aid, the richer LDCs - who
have borrowed most - will be seen to be receiving the most aid.
Chapter eight investigated, with the aid of a second questionnaire
survey, the reasons for the limited access to the eurobond market for LDCs.
The indicated reasons were that bond investors were more risk averse than
banks and that LDC bonds were perceived to exhibit too great a risk.
9 . 2 Conclusions and Recommendations
Given the level of the LDCs1 external debt and the reasons for the
accumulation of such debt, it is unrealistic to expect any significant
reduction in the level of that debt. Indeed as growth and gradual economic
adjustment are objectives to be achieved within an inflationary environment,
an increase in that debt will be required.
If this increase in debt is to be achieved without jeopardising the
stability of the international financial system, the bankers' perception of
the risk of default on debt servicing must be reduced. If this reduction in
perceived risk can be achieved, the writer is confident that, given the
desire of the banks for asset growth, additional bank finance will be
available to LDCs.
Abstracting from suggestions related to world economic growth and
growth of trade, such as less protection in LDC export markets or additional
growth in OECD economies, it is possible to suggest changes to the current
financial order which will make debt service more certain.
Firstly, a way must be found to remove the interest servicing burden
resulting from upward movement in interest rates, particularly where these
are unrelated to the inflation rates in the LDCs' export markets. Aid
payments would be politically difficult and, moreover, unless such payments
come from additional aid nothing would be gained.
The suggestion that an IMF facility analogous to the Compensatory
Financing Facility but related to higher interest costs of debt is
considered to be in urgent need of investigation and is recommended here

as a subject for further research.
It is also felt that there is a need for a radical review of the role
of official bilateral credits in development finance. In particular, as it
is not the primary function of governments to act as commercial money
lenders and given that such loans are often made for altruistic, political
or export promotion reasons, one must consider the impact of converting
all such debt into grants. In this respect it is recommended that further
research is required into the impact of such a conversion upon the debt
servicing commitments of the borrowers and the public finance of the
lenders.
There is an urgent need for the maturity structure of all debt to be
reviewed. In particular the maturity of loans must be extended, where
appropriate, to match the gestation period of the project financed. The
term project includes macroeconomic adjustment. Moreover, the banks must
be more flexible in their attitude to changing the maturity structure as
borrowers' circumstances change. However, it must be doubted whether it
will be possible to incorporate supplier credits into such a scheme.
When undertaking the review of the maturity profile of the debt, the
reviewers should be mindful of the fact that the risk of default is
reduced if timing of the cash flow of the project financed matches the
amortisation schedule of the loan.
Furthermore, given that bankers do not rely upon the repayment of
loans to meet depositors' claims and that it is natural for financial
intermediaries to engage in risk and maturity transformation, banks are
capable of converting existing debt onto a much longer average maturity
than presently applies. The point for the bankers to note is not whether
the debt will ever be repaid but whether interest payments will remain
current. ■
Hand in hand with the restructuring of the debt, there must be
improved debt management by the borrowers. This will ensure timely payment
of amortisation and interest payments which themselves will create a

better climate for refinancing and may even reduce the rate of interest
required by the banks. Moreover, better debt management should enable the
borrowers to anticipate their refinancing requirements with sufficient
lead time so as to avoid lack of market confidence and the need to
reschedule in crisis conditions.
There may be a role to play in providing guarantees over the later
years to maturity for the poorer countries. However, the decision to
implement such a suggestion should await the findings of the investigation
into the role of official bilateral finance, the reason being that the
poorer LDCs get a greater proportion of their external finance from
official sources. Converting any such loans into grants may obviate the
need for guarantees.
Although the above recommendations relate to debt ie bank assets, any
instability in the financial system will probably manifest itself as a run
on deposits of a particular bank or group of banks. It is therefore
essential that a uniform and adequate system of prudential regulation is
developed, together with a uniform lender of last resort facility that
ensures that banks will not fail just for lack of liquidity. This
suggestion does not include supporting insolvent banks. Nevertheless, the
regulatory authorities and the accounting profession must consider fully
their approach to the treatment of rescheduled debts in bank balance
sheets.
With respect to the eurobond market, the writer considers that little
can be done in the present financial climate to encourage a substantially
larger proportion of development finance directly from investors. However,
the official multilateral institutions must be ever vigilant to tap the
bond markets where the segmentation of the euromarkets makes this possible
without artificially raising interest rates.
In addition to these recommendations several areas of study are
worthy of further research before conclusions can be made about their
benefits to the international financial system. These are:-
research into an appropriate code of conduct
for rescheduling;
- research into the most appropriate form of loan
documentation and risk sharing agreement for
co-financing with multilateral agencies;
- research into the economic, legal and administrative
implications of expanding the secondary market in
eurocurrency loans.
The recommendations made in this chapter will not transform the
international debt problem overnight. They will take time to work, not
least because the attitudes of the bankers, the borrowers and the
authorities need time to change. Nevertheless, the phenomenon of LDCs as
major users of international financial markets is likely to be permanent
and therefore it is essential that it does not have a destabilising
influence on the international monetary system.

396
APPENDIX I : COUNTRY GROUPINGS LIST OF COUNTRIES BY INCOME GROUPS
1980 World Bank Atlas Definitions (Based on 197& GKP Ptr capita in 19?8 US dollars)
Upper Middle Income (/3|CX)D-./6,999)
BahrainGabonGreeceHong KongIsraelSingaporeSpainTrinidad & Tobago
Intermediate Kiddle Income (/?00-/2,999)
Algeria Argentina Barbados Brazil Chile Colombia Costa Rica CyprusDominican RepublicEcuadorFijiGuatemalaIranIraqIvory CoastJamaicaJordanKorea, Republic ofLebanonMalaysiaMaltaMauritiusMexicoNicaraguaOmanPanamaParaguayPortugalSyrian Arab RepublicTaiwanTunisiaTurkeyUruguayV e n e z u e laIugosluvi a
Lower Middle Income 0^300-^699)
BoliviaBotswanaCameroonCongo, People's Republic OfEgypt, Arab Republic ofEl SalvadorGhanaGuyariaHondurasIndonesiaK e n y aLesothoLiberiaMoroccoNigeriaPapua New Guinea PeruPhilippinesSenegalSudanSwazilandThailandTogoYemen, Arab Republic of Yemen, People'a Dem Republic of Zambia
Low Income (less than /300)
AfghanistanBangladeshBonin, People's Republic ofBurmaBurundiCentral African RepublicChadComorosEthiopiaGambiaGuineaHaitiIndiaMadagascarMai awiMaldi vesMaliMauritaniaNepalNiger Paki stan Rwanda Sierra Leone Soc.al i a Sri Lanka Tanzania Uganda Upper Volta 2,u i re
\
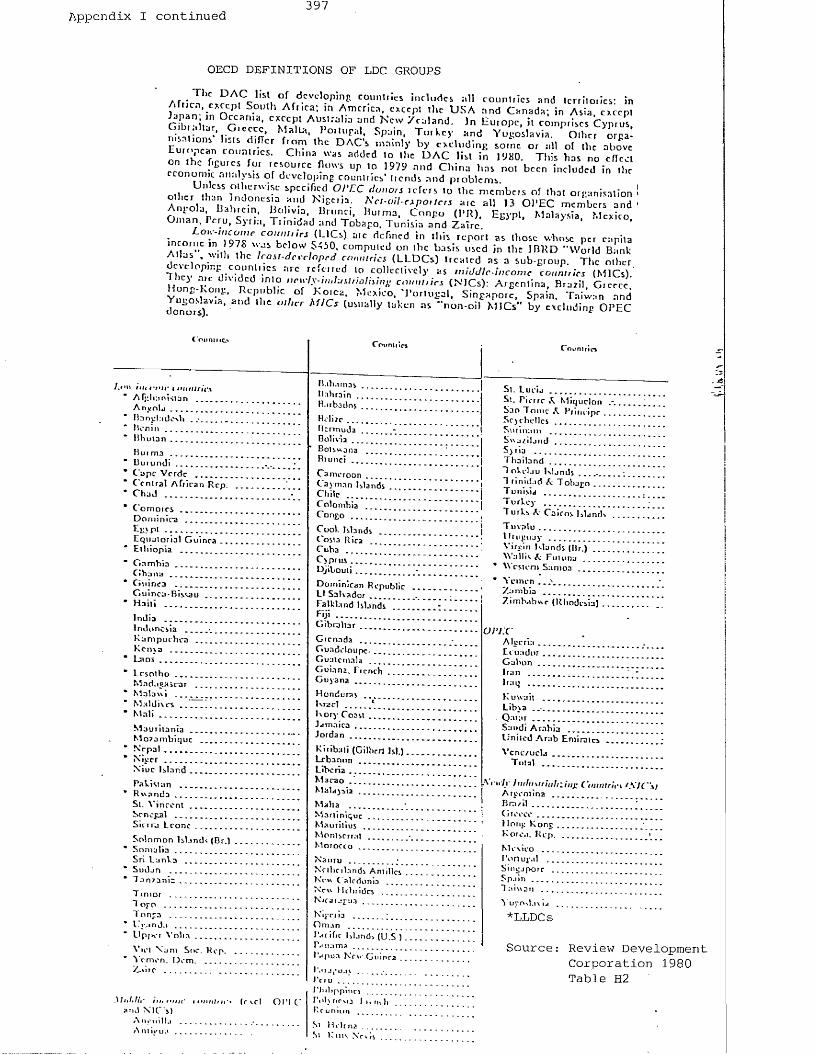
Appendix I continued 397
OECD DEFINITIONS OF LDC GROUPS T lic D A C J is l o f ^developing countries includes a ll countries and territories: in
c'rT"? V ’? i979 "nd CW"» 1,35 "01 been included in .hVe c o n o m ic ni i.i l> ms o f de v e lo p in g co u n tr ies1 I i c n d s n n d p r o b l e m * .
„ UM. rn ."I™*” CO,,"[',rs <U C s > iIC ricr'n^ in ih h rep o rt as those whose per capita A , l a i C O" •>« « « i in the IB R D “ W o .M Bank
«- # - • - j- . v * vi PJLAILU, JUril
doUnors)aVia’ 3nd tl,C °ihCr M1CS CuiUillly as " n o n -o il M J C s " by excluding O P E C
C ’r>nniiio
/..■It n i t i - i ' j f i m m i r i i wA fg h a n is ta n . Bahrain
A m ro la . R-ubadns
B ang ladesh BelizeB e n m . . . . . Berm udaB h u la n . . . Bolivia
B u i m a . . . EolswanaB runei .
C a p e V e rd e C am eroonC c n tra l A fr ic a n R e p C a ym an Islands
* C h a d ........... C h ile
* C o m o r r j . . C o lom biaC ongo . . .
............................................ C o ok IslandsE q u a to r ia l G u in e a . I osia RicaE l li io p ia ___ C uha . .
CvprtisG h a n a . . . . . D j ib o u t i ............................. -______
* G u in e a .G u in e a -B is s a u L I Salvador
* H a it i ____ F alk lan d IslandsF i j i ___G ib ra lta r
K a m p u c h e a . G re n ad a .K e n v a ____ G uadeloupe-
“ Lao s ........... G u atem ala
* L c s n lh o ____ G u ia n a . FicnchG u yan a
M a la w i . HondurasM a ld iv e s . . Israel . 1
‘ M a l i . . . Iv o ry Coasl . . .Jam aica .Jordan
N e p a l ................ K ir ib a ti (G ilb ert I s l )* N i c e r ............................... Lebanon .
N iu e Is lan d L ib eria . . .M a c a o .M alays ia .
S i, V i n c e n t ................ M a lia . .Senegal . M a rtin iq u eS ie rra L eo n e M a u ritiu s
S o lo m o n Island-; (B r ) M ontserratM orocco
S ri L a n k a N a u ru* S u dan . . . . N e il in la n d s A ntilles“ T a n z a n ia . . New C a lrd o n ia
N ew HebridesN 'lraiapua
T n n g a . . . N ip n ia . .* C r a n J a .......... O m a n
Llpf>vr V o l i a .................. B ar.fie Islands ( l i .S )
V i r l N a m Sue. H ep. . . P anam a
Y e m e n . D c m . 1 a jtu a N 'fte G uinea
Z a ire PutJgUJV
Cpuniiin
B.ili.i
M i . U i , - and N IC 's )
A iw ,m I!.j A n lii'u .t .
( r v r l O l ’ I C '
Priu......Philippines ....Pt'h nrMj 1 |, n, J, R r u m n n
S' M e t r n a ............Si K im N r i i i
C ouniritn
S i. L u c ia ..............................S i. JV -tre A. M iq u e lo n . Sao T o m e A P rinc ipe . . S c jc h c l lc s ...........................S n im a in .......................S w a z i la n d......S j r i j ......................................T h a i l a n d ..............................T o k e la u K ljn d s . . . . . . . .T r in id ad A: Tob ag nT u n is ia ....................T u rk e y .................................T u rk s A Caicos Islands
T i n a l u ...................................U ru g u a y ......V irg in K lunds (Hr.) \ \ a l l i s A F u iu n a
* W es ien i Sam oa
* Yemen .. >..........Z a m b ia .................................Z im b a b w e (R hod esia)
UPI.CA lg e r ia .......................Ecuador . . . . . . . . .G a b o n ............................Ira n ......................................Ira q .................................
K u u a ii .............................L ibs a . .Qatar.....S au d i A ra b ia .................L rn iicd A ra b E m ira les
V e n e z u e la ..............................T o ta l . . .
Nrti/i J n r ! u \ i r i i i ! i : i i i x C t t t i t i i r l n / .K fC 's JA rg e n tin a ..........................................B r a z i l ........................................G r e e c e ................... ’ ’I long K o n g .....................................K o re a . H e p .......................................... >
M r s u ’o ..............................Po rtugal ...............................................S ingapore ..................................................S p a i n ..................................................T a iw a n ...Y u g o s la v ia
*LLDCs
Source: Review Development Corporation 1980 Table H2

0 ^ 0
Appendix II*UPPER MIDDLE INCOME
Government
Disbursed debt outstanding
Disbursements
Amortise Netflow
Interest NetTransfer
1973 3359.3 667.3 240.0 427.3 142.0 285.3
1974 3906.8 737.9 316.1 421.8 160.3 261.5
1975 4482.2 1016.1 317.7 698.4 190.3 508.1
1976 5591.8 1377.1 363.0 1014.1 207.1 807.0
1977 6580.1 1190.0 280.8 909.2 234.1 675.1
1978 7868.3 1521.2 353.8 1167.4 265.5 901.9
1979 9220.4 1841.3 541.6 1299.7 391.4 908.3
International Organisations
Disbursed debt outstanding-
Disbursements
Amortise Netflow
Interest Nettransfer
1973 664.5 142.7 42.3 100.4 44.0 56.4
1974 785.7 154.2 47.6 106.6 51.0 55.6
1975 875.1 152.9 53.5 99.3 60.6 38.7
1976 983.7 169.2 72.8 96.4 69.2 27.2
1977 1104.0 158.7 75.0 83.8 76.6 7.21978 1197.8 122.5 83.8 38.6 93.7 -55.1
1979 1229.7 124.8 108.2 16.6 106.1 -89.5
* Amounts in this table are in US $ millions. Source: IBBU World Debt Tables various issues.

399
UPPER MIDDLE INCOME
Financial Institutions
Disbursed debt outstanding
Disbursements
Amortise Netflow
Interest NetTransfer
1973 1715.3 646.1 318.2 327.8 120.0 207.8
1974 3079.6 1552.3 234.3 1318.0 198.2 1120.8
1975 4556.5 1882.7 348.5 1534.2 295.3 1239.9
1976 6046.1 2058.3 467.4 1590.8 357.1 1233.7
1977 8178.4 2658.3 716.3 1942.0 434.7 1507.3
1978 9030.6 2545.5 2009.0 536.5 684.8 48.3
1979 10025.6 1950.6 1064.0 886.5 1013.9 127.4
Bonds
Disbursed debt outstanding
Disbursements
Amortise Netflow
Interest Nettransfer
1973 2318.2 508.0 101.1 406.9 58.5 348.4
1974 2502.0 283.6 165.6 118.0 62.6 55.4
1975 2729.9 431.2 193.1 238.2 74.8 163.4
1976 2981.8 244.5 21.6 222.9 41.1 181.8
1977 3714.9 729.2 151.2 578.0 92.3 486.7
1978 4183.5 384.0 135.9 248.0 161.0 87.0
1979 4381.3 424.9 239.2 185.7 208.7 23.0

UPPER MIDDLE INCOME
Suppliers
Disbursed debt outstanding
Disbursements
Amortise Netflow
Interest NetTransfer
1973 661.3 260.4 121.7 138.7 36.8 101.9
1974 717.6 144.8 115.7 29.1 41.2 -12.1
1975 742.0 186.6 129.6 57.0 37.3 19.7
1976 734.1 141.7 139.3 2.5 39.4 -36.9
1977 821.1 183.3 151.7 31.6 35.9 4.3
1978 762.5 283.3 425.0 -141.6 63.4 -205.0
1979 735.5 181.4 213.8 -32.4 55.6 -88.0

Appendix II continued
INTERMEDIATE MIDDLE INCOME
Government
Disbursed debt outstanding
Disbursements
Amortise Netflow
Interest NetTransfer
1973 13522.8 2500.9 764.1 1736.8 350.3 1386.5
1974 15997.6 2762.8 853.7 1909.0 397.8 1511.2
1975 17702.2 2877.4 987.9 1889.5 592.3 1297.2
1976 19970.1 3256.8 1163.7 2093.1 726.5 1366.6
1977 22723.4 3384.2 1393.7 1990.6 814.4 1176.2
1978 27752.6 4396.6 1721.6 2675.0 979.2 1695.8
1979 30805.7 4792.2 2514.6 2277.6 1154.9 1112.7
International Organisations
Disbursed debt outstanding
Disbursements
Amortise Netflow
Interest Nettransfer
1973 6218.5 1234.5 287.4 947.1 384.0 563.1
1974 7588.3 1678.9 325.1 1353.7 479.2 874.5
1975 9192.2 2026.5 372.1 1654.4 573.3 1081.1
1976 10944.8 2185.5 451.2 1734.3 701.3 1033.0
1977 12946.4 2408.2 601.1 1807.1 885.6 911.5
1978 15526.1 2933.7 673.1 2260.6 1175.0 1085.6
1979 18493.2 3725.4 802.1 2923.3 1365.1 1558.2
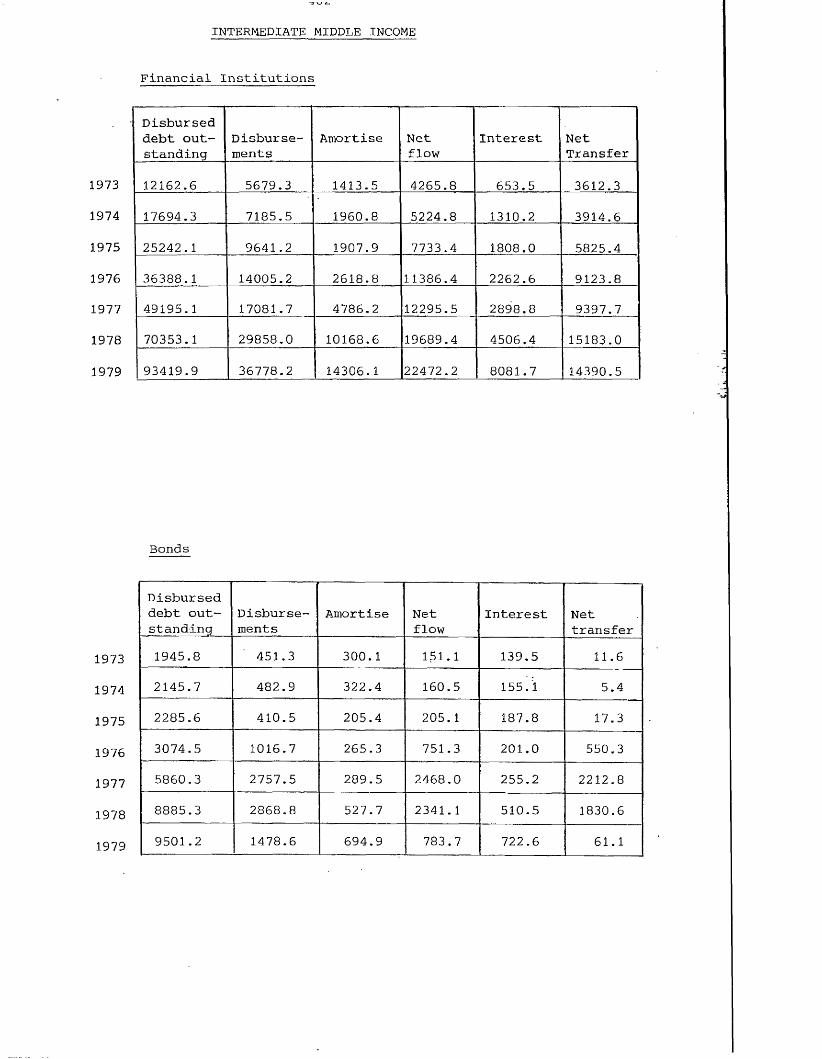
INTERMEDIATE MIDDLE INCOME
Financial Institutions
Disbursed debt outstanding
Disbursements
Amortise Netflow
Interest NetTransfer
1973 12162.6 5679.3 1413.5 4265.8 653.5 3612.3
1974 17694.3 7185.5 1960.8 5224.8 1310.2 3914.6
1975 25242.1 9641.2 1907.9 7733.4 1808.0 5825.4
1976 36388.1 14005.2 2618.8 11386.4 2262.6 9123.8
1977 49195.1 17081.7 4786.2 12295.5 2898.8 9397.7
1978 70353.1 29858.0 10168.6 19689.4 4506.4 15183.0
1979 93419.9 36778.2 14306.1 22472.2 8081.7 14390.5
Bonds
Disbursed debt outstanding
Disbursements
Amortise Netflow
Interest Nettransfer
1973 1 9 4 5 .8 4 5 1 . 3 300 . 1 151 .1 1 3 9 .5 11 .6
1974 2 1 4 5 . 7 4 8 2 . 9 3 2 2 . 4 1 60 .5 155. i 5 . 4
1975 2 2 8 5 . 6 4 1 0 . 5 2 0 5 . 4 205. 1 1 87 .8 17 .3
1976 3 0 7 4 . 5 1 0 1 6 .7 2 6 5 .3 7 5 1 .3 2 0 1 . 0 5 50 .3
1977 5 8 6 0 . 3 2 7 5 7 . 5 2 8 9 . 5 2 4 6 8 . 0 2 5 5 . 2 2 2 1 2 .8
1978 8 8 8 5 . 3 2 8 6 8 . 8 5 2 7 . 7 2 3 4 1 .1 5 1 0 . 5 183 0 .6
1979 9 5 0 1 . 2 1 47 8 .6 6 9 4 . 9 7 8 3 .7 7 2 2 . 6 6 1 .1

INTERMEDIATE MIDDLE INCOME
Suppliers
Disbursed debt outstanding
Disbursements
Amortise Netflow
Interest NetTransfer
1973 6394.9 1884.4 1088.7 795.7 403.2 392.5
1974 7140.8 1739.8 1273.4 466.4 383.1 83.3
1975 7597.9 2281.2 1528.1 753.1 414.5 338.6
1976 8533.6 2748.5 1715.5 1033.0 537.5 495.5
1977 10359.5 3268.3 2033.5 1234.8 586.7 648.1
1978 14159.6 5144.2 2370.9 2773.3 793.1 1980.2
1979 13774.3 2967.0 2998.1 -31.1 953.8 984.9

Appendix II continued
LOWER MIDDLE INCOME
Government
Disbursed debt outstanding
Disbursements
Amortise Netflow
Interest NetTransfer
1973 9884.8 1753.7 574.5 1179.2 214.4 964.8
1974 11728.0 2026.7 554.4 1472.3 220.8 1251.5
1975 14555.7 3849.8 572.8 3277.0 305.8 2972.2
1976 17033.0 2985.3 527.0 2458.3 331.3 2127.0
1977 21036.9 3781.8 695.1 3086.7 607.4 2479.3
1978 24948.2 3691.1 842.3 2848.8 670.4 2178.4
1979 27218.7 4083.5 1088.0 2995.5 789.0 2206.5
International Organisations
Disbursed debt outstanding
Disbursements
Amortise Netflow
Interest Nettransfer
1973 2042.9 398.4 85.7 312.6 103.4 209.2
1974 2535.8 591.7 101.5 490.2 124.4 365.8
1975 3467.1 1038.7 102.5 936.2 155.3 780.9
1976 4603.5 1259.2 123.2 1136.0 204.0 932.0
1977 7212.0 2734.7 145.5 2588.7 306.8 2281.9
1978 9713.0 2646.2 190.9 2455.3 503.1 1952.2
1979 11792.2 2347.1 280.8 2066.4 559.4 1507.0
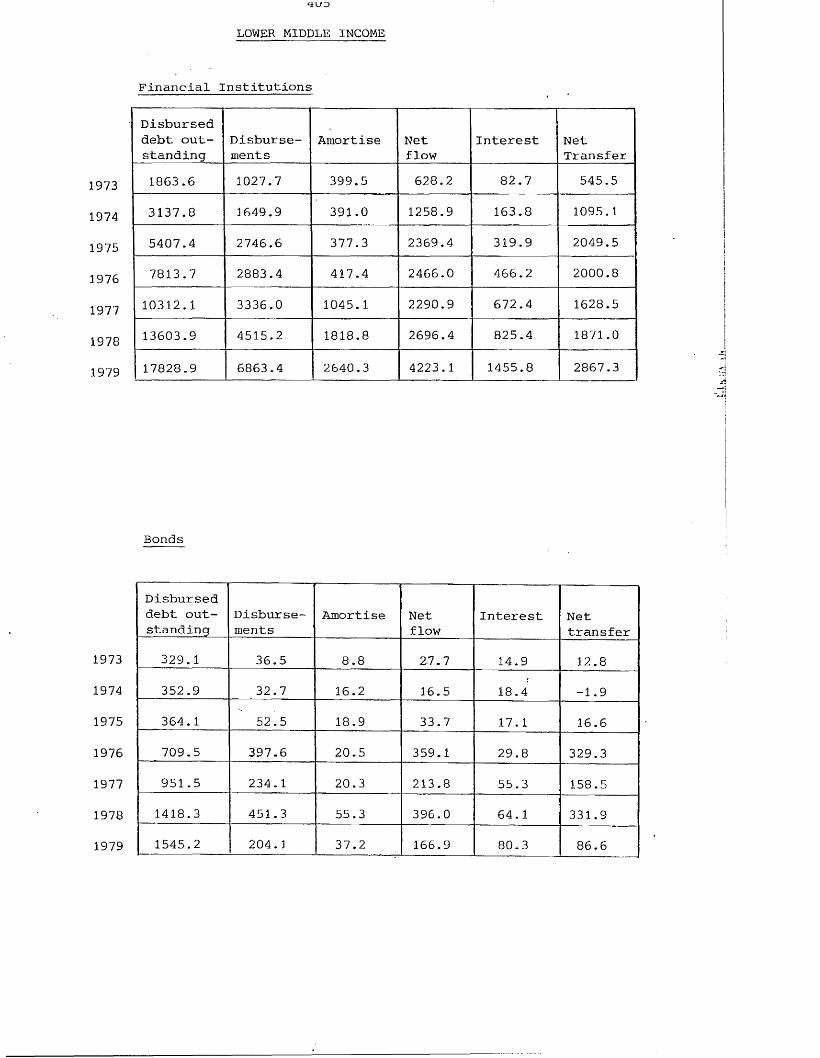
LOWER MIDDLE INCOME
Financial Institutions
Disbursed debt outstanding
Disbursements
Amortise Netflow
Interest NetTransfer
1973 1863.6 1027.7 399.5 628.2 82.7 545.5
1974 3137.8 1649.9 391.0 1258.9 163.8 1095.1
1975 5407.4 2746.6 377.3 2369.4 319.9 2049.5
1976 7813.7 2883.4 417.4 2466.0 466.2 2000.8
1977 10312.1 3336.0 1045.1 2290.9 672.4 1628.5
1978 13603.9 4515,2 1818.8 2696.4 825.4 1871.0
1979 17828.9 6863.4 2640.3 4223.1 1455.8 2867.3
Bonds
Disbursed debt outstanding
Disbursements
Amortise Netflow
Interest Nettransfer
1973 329.1 36.5 8.8 2-7.7 14.9 12.81974 352.9 32.7 16.2 16.5 18.4 -1.9
1975 364.1 52.5 18.9 33.7 17.1 16.6
1976 709.5 397.6 20.5 359.1 29.8 329.3
1977 951.5 234.1 20.3 213.8 55.3 158.5
1978 1418.3 451.3 55.3 396.0 64.1 331.9
1979 1545.2 204.1 37.2 166.9 80.3 86.6
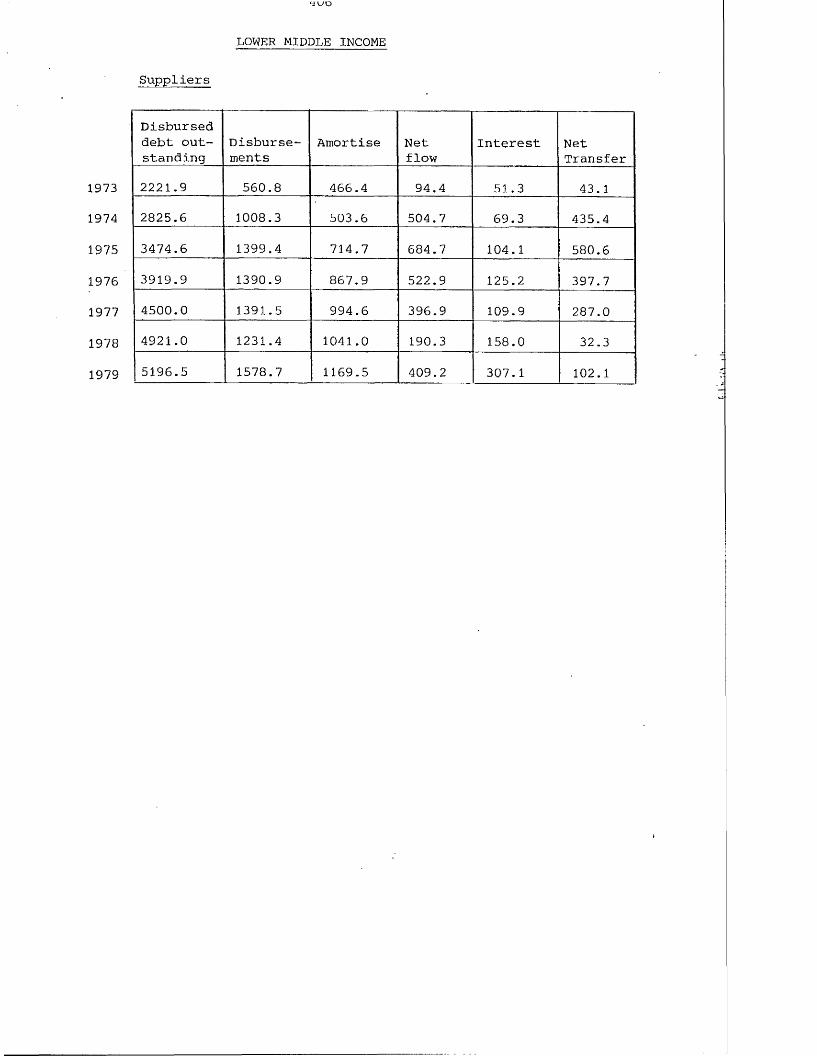
4UD
LOWER MIDDLE INCOME
Suppliers
Disbursed debt outstanding
Disbursements
Amortise Netflow
Interest NetTransfer
1973 2221.9 560.8 466.4 94.4 51.3 43.1
1974 2825.6 1008.3 503.6 504.7 69.3 435.4
1975 3474.6 1399.4 714.7 684.7 104.1 580.6
1976 3919.9 1390.9 867.9 522.9 125.2 397.7
1977 4500.0 1391.5 994.6 396.9 109.9 287.0
1978 4921.0 1231.4 1041.0 190.3 158.0 32.3
1979 5196.5 1578.7 1169.5 409.2 307.1 102.1
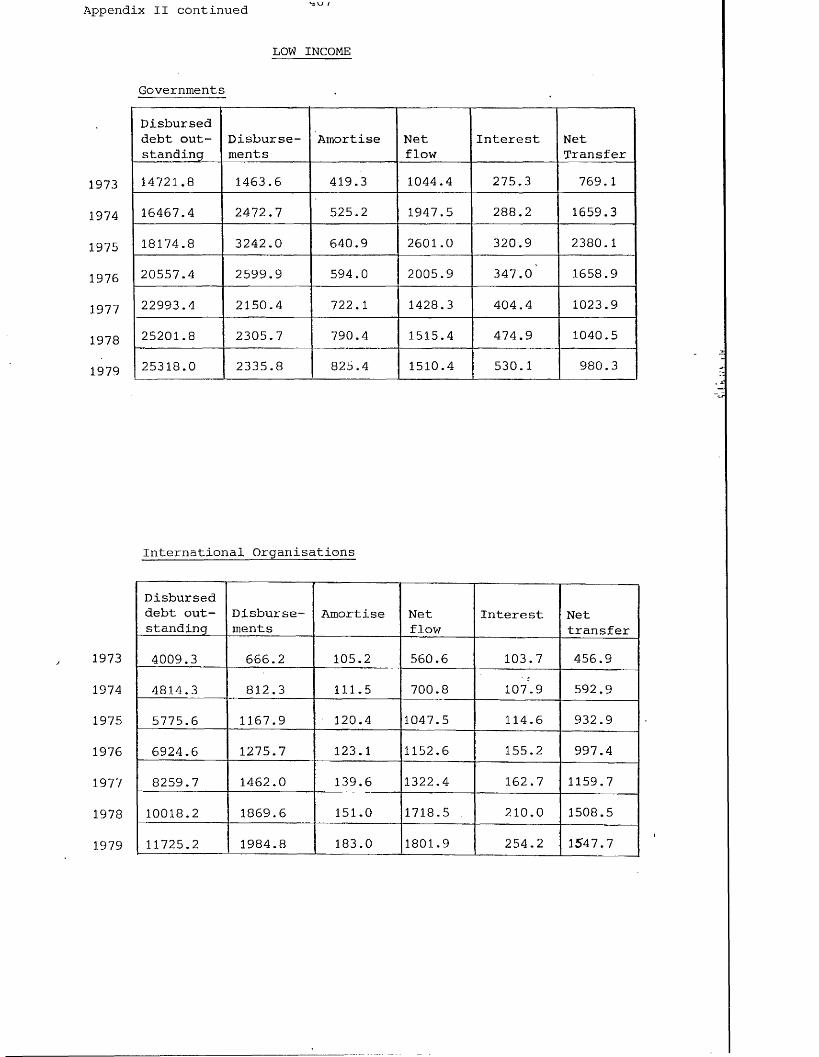
Appendix II continued /
LOW INCOME
Governments
Disbursed debt outstanding
Disbursements
Amortise Netflow
Interest NetTransfer
1973 14721.8 1463.6 419.3 1044.4 275.3 769.1
1974 16467.4 2472.7 525.2 1947.5 288.2 1659.3
1975 18174.8 3242.0 640.9 2601.0 320.9 2380.1
1976 20557.4 2599.9 594.0 2005.9 347.0' 1658.9
1977 22993.4 2150.4 722.1 1428.3 404.4 1023.9
1978 25201.8 2305.7 790.4 1515.4 474.9 1040.5
1979 25318.0 2335.8 825.4 1510.4 530.1 980.3
International Organisations
Disbursed debt outstanding
Disbursements
Amortise Netflow
Interest Nettransfer
1973 4009.3 666.2 105.2 560.6 103.7 456.9
1974 4814.3 812.3 111.5 700.8 107.9 592.9
1975 5775.6 1167.9 ■ 120.4 1047.5 114.6 932.9
1976 6924.6 1275.7 123.1 1152.6 155.2 997.4
1977 8259.7 1462.0 139.6 1322.4 162.7 1159.7
1978 10018.2 1869.6 151.0 1718.5 210.0 1508.5
1979 11725.2 1984.8 183.0 1801.9 254.2 1547.7
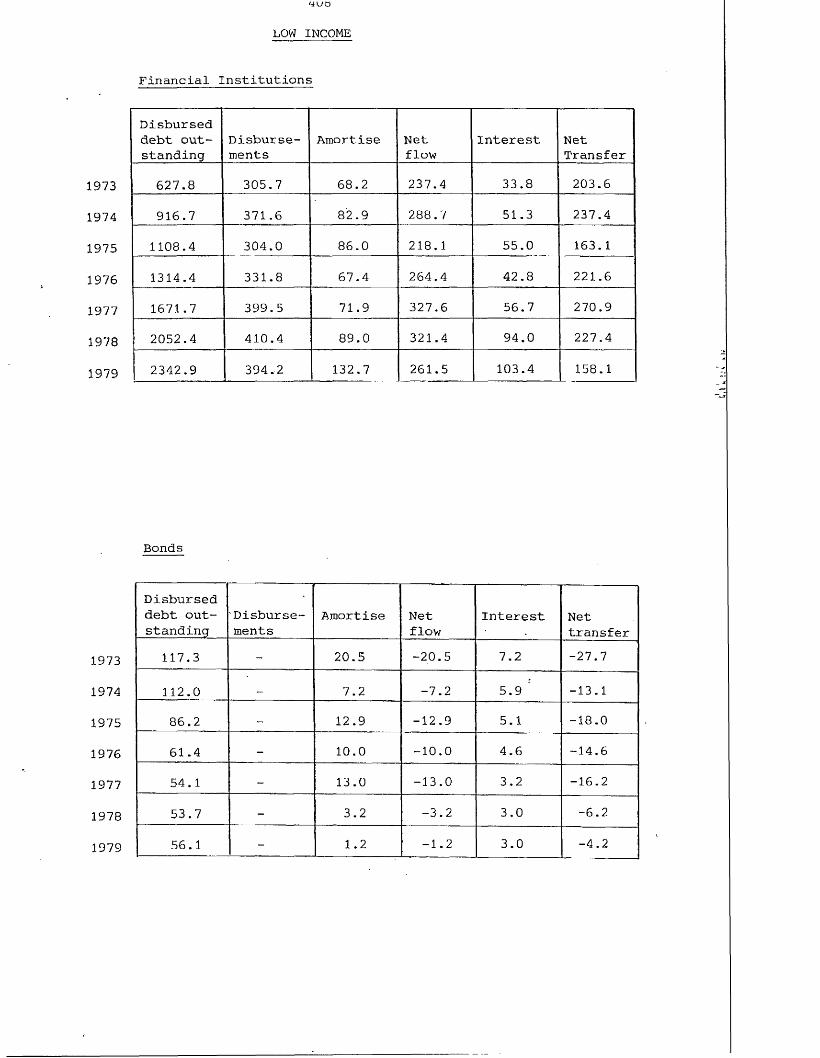
LOW INCOME
Financial Institutions
Disbursed debt outstanding
Disbursements
Amortise Netflow
Interest NetTransfer
1973 627.8 305.7 68.2 237.4 33.8 203.6
1974 916.7 371.6 82.9 288.7 51.3 237.4
1975 1108.4 304.0 86.0 218.1 55.0 163.1
1976 1314.4 331.8 67.4 264.4 42.8 221.6
1977 1671.7 399.5 71.9 327.6 56.7 270.9
1978 2052.4 410.4 89.0 321.4 94.0 227.4
1979 2342.9 394.2 132.7 261.5 103.4 158.1
Bonds
Disbursed debt outstanding
Disbursements
Amortise Netflow
Interest Nettransfer
1973 117.3 - 20.5 -20.5 7.2 -27.7
1974 112.0 7.2 -7.2 5.9 ' -13.1
1975 86.2 12.9 -12.9 5.1 -18.0
1976 61.4 - 10.0 -10.0 4.6 -14.6
1977 54.1 - 13.0 -13.0 3.2 -16.2
1978 53.7 - 3.2 -3.2 3.0 -6.2
1979 56.1 - 1.2 -1.2 3.0 -4.2

LOW INCOME
Suppliers
Disbursed debt outstanding
Disbursements
Amortise Netflow
Interest NetTransfer
1973 1178.0 294.9 187.0 107.9 48.3 59.6
1974 1369.0 429.1 228.3 200.8 54.8 146.0
1975 1365.1 349.6 254.8 94.8 55.5 39.3
1976 1417.5 •385.7 231.2 154.5 48.4 106.1
1977 1592.8 323.0 209.9 113.1 44.8 68.3
1978 1799.2 345.0 212.4 132.6 56.4 76.2
1979 1975.6 229.6 214.7 15 62.4 -47.4

Appendix III
Comparison of Yields on Eurobonds for IBRD and Selected Private UK Issues
Date of issue
Amount of original issue
Yield to maturity Life
IBRD 7/77 250 16.09 0.436/76 250 15.50 4.347/75 200 15.37 3.38
12/75 250 15.50 3.86/80 200 15.41 3.36/81 500 15.42 4.348/81 210 15.40 4.0910/81 300 15.94 4.689/81 130 15.29 4.599/81 100 15.57 6.5910/81 200 16.36 9.68
Barclays Bank International 6/75 50 14.72 0.34
Barclays Bank 0/S Inv 9/77 100 14.26 10.55
NationalWestminster Bank 6/78 75 14.68 4.32
National Westminster Bank Finance 12/81 100 15.25 9.83
3 other issues 1 other issue no other issues
Source: Association of International Bond Dealers Quotations and Yields March 1982 published by Datastream PLC
NB The comparison has been limited to bonds wherethe yield to average life does not apply and where the residual maturity is-similar

APPENDIX IV
Primary and Secondary Commodity Trade as % of Total Trade in 1978* or 1979
Share of primary commodities in total exports
Share of manufactures in total exports
Share of fuel in total exports
Argentina*
Brazil
Chile*Colombia*
Mexico (1974)
Venezuela
Ecuador
Algeria*
Nigeria
Indonesia
Korea S
Philippines (1974)
Thailand
Malaysia
73-6
60.9
44.4
80.5
51.5 97.9
99.2
98.2
94.4
10.? 85.1
67.0
60.7
26.38.255.6
19.248.2 21.1
0.80.5
5-389.2
11.0
30.6
38.5
12.437.1
0.6
1-5
1-9
11.118.6
20.1
21.3
12.0
’Countries marked thus give 1978 figures as most recent
Mexico and Philippines give 1974 figures as most recent
Source UN Yearbook 1979/80

APPENDIX V
Major Export Partners 1978
Country________ Export mitt$ of exports going to individual markets as % of total exports
USA______ Germany Netherlands JapanArgentina Netherlands 10,28
Brazil 9-02USA 8.56 'Italy 7*9*4West Germany 6.*42Other 57.78
Brazil USA 22.6?Germany 8.59Netherlands 6.18Japan 5*1*4France *4.18
. Other 55.*4*4
Chile Germany W 1*4.9USA 15.58Japan 11.97Brazil 10.1?Argentina 6.65Other *45.*t6
Colombia USA 28.62Germany 20.08Venezuela 8-97Netherlands *4.78Sweden 5-61Other 33-9*4
Mexico USA 65.6Germany W 2 .98Brazil 2.93Spain 2.10Japan 1*77Other 2*4.62
8.56
6.*42
22.678.59
6.18
5.1*4
1*4.913.58
11.97
28.6220.08
*4.78
65-62.98
1-77

Appendix V continued
Venezuela
Ecuador
Algeria
Nigeria
Indonesia
Korea S
USA 36.49Belgium 15.78Netherlands 7.28Colombia 5.92Honduras 3.06Other 31.47USA 43.6Panama 9.57Peru 8.50Chile 6.41Germany W 3.92Other 27-99USA 50.7Germany W 13.75France 11.35Italy 7.45Spain 2.61Other 14.13
USA 42.28Netherlands 14.23France 9-66Germany W 9.43UK 6.42Other 17.98
Japan 39.21USA 25.44Singapore Trinidad &
10.66
5-07TobagoNetherlands 3.04Other 16.57
USA 32.09Japan 20.58Saudi Arabia 5.65Germany W 5.22UK 3.10Other 33.36
USA______ Germany
36. i»g
*43.6
3.92
50.71 3 . 7 5
42.28
9.45
25.4*t
32.09
5-22
Netherlands Japan
7.28
14.23
39-21
3.04
20.58

4
Appendix V continued
Philippines USA 3*4.25Japan 22.93Netherlands 8.56Germany W *4.29Indonesia 2.70Other 27.*47
Thailand Japan 20.3Netherlands 1*4.6?USA 11.02Singapore 8.09Hong Kong 5»3*4Other * 40.57
Malaysia Japan 21.66USA 18.62Singapore 16,16Netherlands 5*63UK *4.81Other 33*21
USA______ Germany Netherlands Japan
3*4.2522.93
8.56
*4.29
20.31*4.67
11.02
21.6618.62
5*63
Source: UN Yearbook 1979/80

APPENDIX VI
ExportB by SITC Code - # of Country Total or World Total 1978
SITC % of country total
% ot world total
Argentina 044 9-2 7.6045 6.6 31.0013 4.1 14'.3
19.9 52.9
Brazil 071 15.3 0281 8.if ■ 19.061 8.4 14.2072 6.2 18.9421 2.8 10.1
41.1 62.6
Chile 682 53.^ 16.0
Colombia 071 65.5 16.5
Mexico 331 44.3274 0.9 13.7
45-2 13.7
Venezuela 331 65.5 5-21975 332 27.0 7.8
92.5 13.0
Ecuador 331 4o 0.4071 17. 2.2
57-^ 2.6
Algeria 331 85-9 ■ 7
"18 commodities exported
20 commodities exported
5 commodities exported
8 commodities exported
14 commodities exported
2 commodities exported
4 commodities exported
4 commodities exported
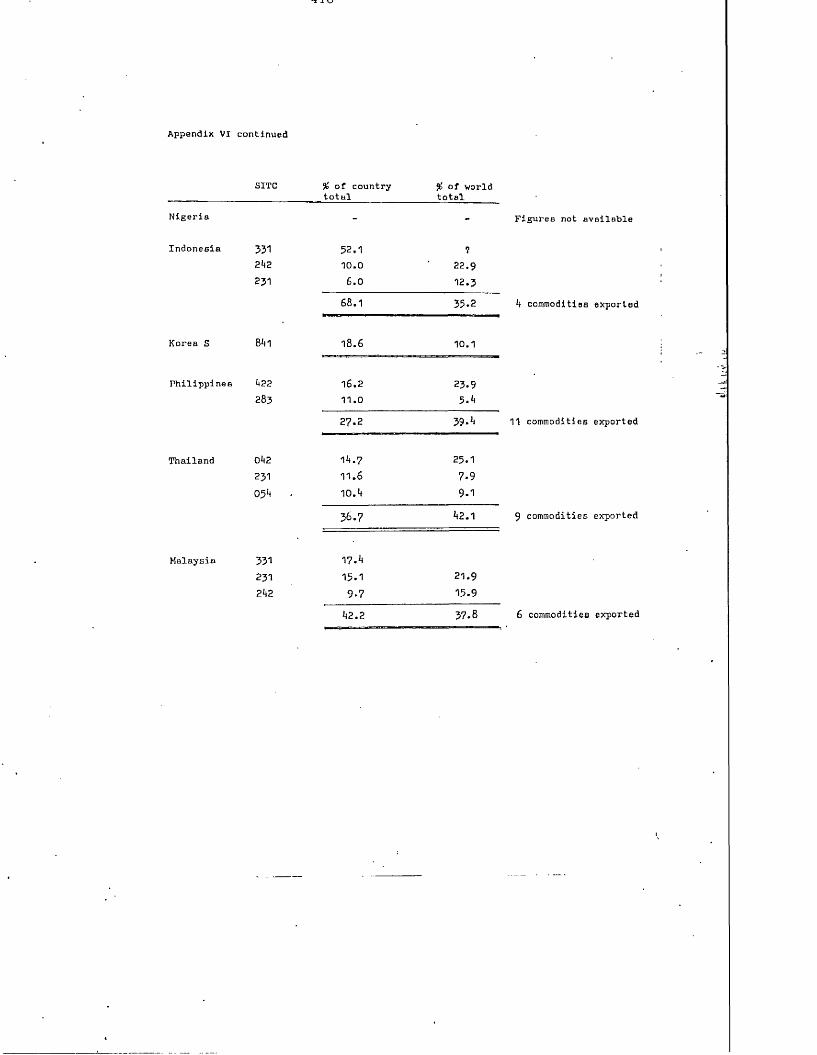
J. \J
Appendix VI continued
SITC % of country total
$ of world total
Nigeria - - Figures not available
Indonesia 331 52.1 ?2h2 1 0 .0 2 2 .9
231 6 .0 1 2 .3
6 8 .1 35.2 ^ commodities exported
Korea S 8i»1 1 8 .6 10.1
Philippines h22 1 6 .2 23.9283 1 1 .0
2 7 .2 39.^ 11 commodities exported
Thailand 01)2 l*t.? 25.1231 1 1 .6 7-903^ 10.4 9.1
36.7 ^2 .1 9 commodities exported
Malaysia 331 1 7.^231 15 .1 2 1 .9
2*i2 9*7 15-9
k2.2 37.8 6 commodities exported

‘i l l
Appendix VII All banks that responded
QUESTIONNAIRE
REDUCING THE RISKS ASSOCIATED WITH INTERNATIONAL BANK LENDING TO THE DEVELOPING COUNTRIES
SECTION I : INTRODUCTION
Constraints to increasing bank lending
1i Please indicate the importance of the following constraints to increasing bank lending to developing countries:
Constraint
a)Current exposure limits are fully utilised
b)Bank capital adequacy
c)Doubt about future debt servicing ability
d)Profitability of LDC loans
e)0thers, please specify:
Veryimportant Important Not
important
30,
,25,
.5A13
.2.5.2,9
..7,32 14
1ii Which of these constraints do you think iB the most important?
a A . b . P. c ,4A d ... e A *
1iii Has the relative importance of these constraints changed in the last five years? If so, please specify:
This space may be used to expand any of the above answers;

2i What do you think are the major corporate objectives of the banking industry in relation to lending to developing countries?
2ii Which of these objectives is the most important?
2iii Has the relative importance of any of these objectives changed in the last five years? If so, please specify:
2iv Do banking firms change their corporate objectives as their experience in the euromarkets increases? If so, please specify:
This space may be used to expand any of the above answers:

Risks In international lending
31 Please indicate the relative importance of the following risks associated with international banking:
Veryimportant Important Not
importfa)Risk of repudiation . 3 9 . ' . 3 9 . . 1 3 .
b)lnability to service debt . 5 9 . . . 3 . . . . .
c)Corporate credit risk .3$. . 3 5 . . . I .
d)Interbank credit risk . 3 2 . . 3 7 . . . 3 .
e)Project risk . 3 1 . . 3 7 . . . 3 .
f)Portfolio risks:i Concentration of borrowers . 3 1 . . 3 9 . . . 1 .
ii Concentration of depositors . 1 7 . . 3 9 . . . 5 .
iii Liquidity risk of banks . 3 5 . . 3 3 . . . 3 .
iv Currency risk . 1 3 . . 3 3 . . 1 4 .
v Interest rate risk . 1 4 . . 3 9 . . 1 5 .
g)Others, please specify: . . . . .... ....
3ii Which of these risks do you consider to be the most important?
a .9. b .39 c ... d .1. e ... fi ... fii ... fiii ... fiv ... fv
3iii Has the relative importance of these risks changed over the last five years If so, please specify:
This space may be used to expand any of the above answers:

Does your bank have a formal management information system which allows you to determine the degree of diversification of your loan portfolio as follows:
For individual branches only
On a group consolidated basis
a) Diversification by country
b) Diversification by industrial classification of borrower
c) Diversification by major sources of borrowers' income eg major sources of export income in the case of sovereign borrowers
d) By parent organisation in the case of corporate borrowers
e) Other degrees of diversification, please specify: ,6.
,w.44
. 26.
5 did not respond
11 did not respond
30 did not respond
15 did not respond
This space may be used to expand any of the above answers:

pi The economic literature regarding the aims of firms generally suggest the following:
Aims Very _ , . NotImportant . P0.3?, important
a)Maximisation of profits .37. ,??p
b)Asset growth .3f. .??.
c)Asset growth subject to aminimum level of profit .?J. .2C. .10.
d)Hinimisation of risk .??. .?0. ....Please tick according to the importance that your bank places on each of these aims.
5ii Which of these objectives is the moBt important?
a .79. b ..1. c d .23.
5iii Has the relative importance of any of theBe objectives changed in the last five years? If so, please specify:
5iv Does your bank have any aims in relation to lending to developing countries which are not listed above? If so, please specify:
This space may be used to expand any of the above answers:

422
SECTION II : METHOD OF REDUCING THE RISKS OF INTERNATIONAL BANK LENDING TO DEVELOPING COUNTRIES “ "
REDUCING THE DEBT SERVICE BURDEN OF INTEREST PAYMENTS
This section assumes that, all other things equal, if the interest element of debt service costs is reduced the risk of default is also reduced.
g. Would you be in favour of a system of official aid payments being used to subsidise the interest costs of bank loans tothe developing countries? yes .34 No .33
Comments:
7i If such subsidies were granted in respect of the LIBOR, or similar, element of loan costs would it result in:
a) Current developing country borrowers being able to borrow more? Yes . 3 3 No . 3 9
b) The poorer developing countries, that have not yet gained access to external bank credit, gaining access to that credit?
7ii Would your answers to question 7i be different if the subsidy allowed borrowers to pay higher spreads on loans? If so, please specify: Y e s . 1 9 No . 9 ?
This space may be used to expand any of the above answers:

Given the volatility of interest rates in recent years, would you favour the establishment of an IMF facility that allowed developing countries to accommodate increased interest costa due to rising interest rates? For example if they could borrow from the IMF to finance increased interest coats when interest rates are rising on condition that interest savingswhen rates fall are used to repay the IMF: YeB No ?.3.
Comment
9. Do you consider the establishment of index linked bankloans to be viable in the near future? Yes . f3. No
Comments:
DEBT RESTRUCTURING
10. Given that financial and economic circumstances changeduring the life of a loan, do you think that restructuring of the maturity structure of debt is a legitimate aspectof debt management policy? Yes 3?. No
Comments:
11. The rescheduling of external debt seems to take place in an air of crisis whereas refinancing seems to attract 3d'Lie comment. Therefore do you think banks and borrowers should cooperate in order to renegotiate the maturity structure of the borrower's debt well before a crisislooms? YeB No .A
Comments:

12. What do you consider to be the major coats to a bank of rescheduling developing country debt?
13. A feature of each recent publicised debt rescheduling hasbeen the protracted period of negotiation and its attendantresource costs for the banks. Would you therefore be infavour of some form of code of conduct for debt reschedulingmaybe under the auspices of the IMF, IBRD or BIS in order toreduce the negotiating costs? Yes PA No PAComments!
14. Do you think that debt rescheduling negotiations shouldinclude representatives of all types of creditors, officialand private, at the same meetings? Yes PP. No PAComments:
15, Should banks treat rescheduled debts which still yield the negotiated rate of interest as inferior assets intheir balance sheets? .Yes PP. No PA
I5i If the answer to question 15 iu Yes, please explain how you would value such assets:
This space may be used to expand answers to questions 1*i and 1*ti:

Would the linking of debt reschedulings to IMF loan agreements with conditionality make banks more willing to reschedule debtB before a crisis occurs?
Comments:
IMPROVING THE QUALITY OF INFORMATION ABOUT LOG'S
Do you consider that the quality of information that your bank possesses regarding the developing countries is at least as good as that possessed by the IBRD, IMF or similar organisations?
Comments:
Do you consider that the information that you do possess is adequate for country risk analysis?
If the answer to question 18 is No, please indicate what improvements you would like to see:
Yes
Yes
Yes
This space may be used to expand answers to questions ?7 and 17i:

19.- For the majority of developing countries do you thinkthat the quality of the information they have abouttheir own economies is adequate for good economic anddebt management policies? Yob A 3. NoComments:
20. If the quality of information available to the bankaand the developing countries improved, would this resultin the banks lending more money to those countries? Yea A 4. No
Comments:
21. Would you like to see the establishment of a central organisation for the collection, analysis and dissemination of data about developing countries? Yes A\ No A2.Comments:
22. Would you like to see the establishment of a system of credit rating for interbank and non-bank borrowers inthe eurocurrency market? Yes A Z No .‘A
Comments:
i

427
CO-FINANCING WITH IBRD OR SIMILAR INTERNATIONAL INSTITUTIONS
23.' The following have been suggested as advantages and disadvantages ofco-financing. If you agree, pleaBe tick Yes, if you disagree tick No,Advantages
a) Reduced risk of default because of cross default clause with IBRD loans:
b) IBRD is better at evaluating projects:
c) Reduction in bank risk analysis effort and loan administration:
d) Gives vicarious access to superior information which IBRD possesses about developing countries:
Disadvantages
a) Reduced spreads therefore less profitability:
Any other advantages or disadvantages, please specify:
This space may be used to expand any of the above answers;
2k. Do you think that increased opportunities for co-financing will result
a) More private credit in total going todeveloping countries? Yes .35
b) Existing levels of credit being switched intoco-financing? Yes .4?
Comments:
Yes .4?
Yes .29
Yea ,19
Yes ,15
Yea .91
No .12
No .21
No .41
No .11
No .23
in:
No 33.
No 33.

Do you think that increased co-financing will result in commercial bank loans being extended to those countries that, to date, have been considered as too risky for private bank credit?
Comments:
CREDIT INSURANCE AND LOAN GUARANTEE SCHEMES
Are you in favour of a system of independent, say OECD government, guarantees being extended to balance of payments loans and other loans not covered by official export credit insurance agencies?
Comments:
Do you think that a system of guarantees may make some banks less prudent in their lending decisions?
Comments:
Would you be in favour of national export credit insurance agencies, such as ECGD in the UK, extending their insurance role to cover medium and long term balance of payments finance to the developing countries?
Comments:

429
29. Would you expect insured loanB to attract lower spreads/fees combination than uninsured loans to the same borrower? Yes ,6.0.Comments:
30. As insured loans will be less risky than uninsured ones, do you think that the establishment of a loan insurance scheme will result in banks being tiered in the interbank market based upon the proportion of insured loans in their loan portfolio? Yes A l
Comments:
31. Do you think that insured loans should be treated preferentially in bank balance sheets when calculating capital assets ratios, liquidity ratios, loan concentration and total exposure? • Yes
Comments:
PRUDENTIAL CONTROLS
32. Do you consider that the current differences between national prudential banking regulations result in the banks in less stringently regulated countries behaving less prudently than banks in more stringently regulated countries? Yes .4? No .15Comments:

430
33* Do these differences in the national banking regulations influence your willingness to lend to banks in the lees stringently regulated countries? ' Yea ,4,5,
Comments!
3*+. Do banks or branches in less stringently regulated centres pay more for interbank deposits than banks in more stringently regulated centres? Yes P.®.
Comments;
35. Do differences in national prudential regulations influencethe location of your bank’s offices abroad? Yes
Comments:
?6. Do you consider that the central bank responsible for the supervision of a particular bank office is morally bound to act as a lender of last resort to that office ifrequired? , Ves .2,6
Comments:
No A 2.
i
No A 2.
No
No JU

37. Do you think that the decline in capital aeBet ratios over recent years has been;
a) The result of a learning process by bank managementand therefore desired by that management? Yes A Q No
b)Not deBired by the bank management but forced uponmanagement by competition? Yes .'A No A Q
Comments;
38. Do you think that the trend of declining capital assetratios will continue? Yes A A No AA
Comments:
39• Do you consider that a further decline will be detrimentalto the stability of the international banking system? Yes A A No .A
Comments:
i+0. What do you consider to be the most appropriate capital asset ratio for your bank?
Comments:

INTERNATIONAL LENDER OF LAST RESORT
Would you like to see some form of lender of last resortoperating in the international banking system? Yes 27.
If the answer to question iB Yes, which of the following formBwould you favour:
a) Supranational institution with international regulatory powers.b) National central banka providing lender of laBt resort facilities
to the total worldwide business of banks registered in their jurisdiction.
c) A system of formal lines of credit from the IMF or BIS to each bank combined with equally formal lines of credit in the reverse direction. Thus banks in difficulty borrow from the IMF/BIS which in turn borrow from banks that are not in difficulties.
d) Officially encouraged formal lines of credit between private banks priced according to the interbank market's perception of each bank's riskiness; official encouragement would be in the formof a penal fee charged by the central bank in each jurisdiction if a bank has negotiated an inadequate quantity of lines of credit in its favour.
a 11. b 12. c .£>. d .2.
Comments: }
Alternative d) of question **2provides a cost to banksengaging in high risk business while alternatives a) to c) donot. Therefore if you have chosen alternatives a), b) or c)do you think that banks generally will be encouraged to engagein more high risk lending? Yes ...
Comments:
Is there an alternative structure of international lender of laBt resort that you favour?

4
MISCELLANEOUS
h5. a) Are you generally in favour of bank deposit insurance? Yes No
b) Do you think that bank deposit insurance should be extended to all non bank deposits of each bank includingthose in foreign currency and at overseas branches? Yes .Vi No PP.
c) Should such insurance also cover interbank deposits? Yes ..1 No ?P.
This space may be used to expand any of the above answers:
k6. Would you favour a movement towards floating spreads onsyndicated loans and the establishment of a deeper secondarymarket in loan participations? Yes . P? No ip.Comments:
^7. If a deeper secondary market were established, do you think that the result will be much different from the floatingrate note market? Yes .2? No 27.
Comments:
*f8. Do you consider that a deep secondary market in loan participations would be helpful in enabling banks todiversify their portfolios? Yes . £2 No 12.
Comments:
^9* Do you think that a deep secondary market in syndicated loans would widen the participation in loans to LDC's beyond the eurobanks to:
a) banks that have not to date engaged in eurobanking? Yes .21* Nu 2P.
b) non bank financial institutions? Yes . PP No ?p.
Comments:
T H A N K Y O U

Appendix VIII
QUESTIONNAIRE
THE EUROBOND MARKET AND DEVELOPING COUNTRIES
Section 1
Do you consider that the main reasons for the relatively small use made of the'eurobond market by developing countries are:
Yes.?Q
YeB..1
YeB..9.d) Other reasons. Please specify: .....................
a) Because of the nature of the eurobond market, itsinvestors and borrowers
b) Because of the nature of the eurobond instrumentsthat could feasibly be issued by developing countries
c) Because of a combination of a) and b) above
No.
No.tt
No.
This space may be used to expand any of the above answers:

Section 2
If you consider the nature of the eurobond market to be important in section 1, please answer the questions in section 2. Please also complete this section if a combination of a) and b) was considered important in section 1.
The eurobond market has not been a greater source Df finance for developing countries because:
1) It is a market dominated by individual investors who Yes..®,perceive developing countries generally as too greata risk a = 8 b = 7 c
2) The market is not dominated by individual investors but Yes.2Athat investors perceive developing countries as toogreat a risk ' a = 1 4 b = 5 C
3) The secondary market in developing country bonds iB Yes.2.®,disproportionately thin compared with such a market forOECD government bonds or corporate bonds a - 6 b ■ 11 c
*0 This thinness of the secondary market seriously reduces Yes,2.2,the liquidity of developing country bonds and thereforedeters investors a >= 7 b = 10 c
5) The reluctance of some developing countries to obtain a YeB.1.®.credit rating seriously limits their access to theeurobond market a *= 0 b = 9 c
6) Are there any other aspects of the nature of the eurobond Yes...market which you think have limited the access of developing countries to that market? Please specify:
a = 5 b = 5 c
This space may be used to expand any of the above answers:

Section 3
If you consider the nature of the eurobond instrument to he important in section 1 above, please answer the questions in this section.Please also complete this section if a combination of a) and b) was considered important in section 1.
7) As the bonds are issued in eurocurrencies, many investors Yes..? No.1.1*,endure exchange risk in addition to the other risksassociated with bond investments. This additional riskdeters investors a = 0 b = 6 c = 10
8) The fixed interest rate nature of the majority of eurobond issues deters investors a =
9) The fixed interest rate nature of the majority of eurobond issues combined with the long term nature of the instrumen deters borrowers a ■ 1
10) In your experience, are the costs of making a eurobond iBsue by a developing country greater than those incurred in raising a syndicated loan * *
11) If the answer to 10) above is Yes, does this deter borrowers a =
12) Are there any other aspects of the nature of the eurobond Yes... No..,instrument that have limited its ubb by developingcountries? Please specify: a » 3 b * 4 0 * 5
Yes.. } No ,15.1 b = 3 c = 11
Yes..} No.1.6.t1 b « 7 c
i= 8
Yes. No..1.1 b “ B c - 7
Yes...5 No.,7.1 b = B c = 4
This space may be used to expand any of the above answers:
cont/..

4 J /
Section *4
13) Pleaae indicate briefly why you think that some developing countries, which have already had considerable accesB to the eurocurrency syndicated loanB market, also raise funds in the eurobond market:
Section 5
1*0 Please assign a meaeure of importance to questions 1 through 12. The measure of importance should be along the Beale a - very important, b - moderately important, c - not important.
15) If you specify other reasons in section 1, please also assign a measure of importance to each reason along the scale a to c as in question 1*0 above.
Reason 1 .... .2 ........3 ........
16) Eo you have any other comments to make about the use of the eurobond market by developing country borrowers:
17) May I contact you again in order to discuss further some of Yes... No your answers?
18) Do you wish to receive a copy of the study to which this Yes... Noquestionnaire relates?
If you are not the person to whom the covering letter was addressed, please give your name and position within the company:
28
3 5 ^ ; 5 i 6 }9 ; 10 ; 11 ; 12 ;
THANK YOU

BIBLIOGRAPHY
Ahmed M M 1976
Aliber R Z 1978
Aliber R Z 1973
Amexbank 1982
Amex Bank Review 1981
Angelini A, Eng M and 1979Lees F A
Ashby D F V 1973
Ashby D F V 1978
Ashby D F V 1982
Ashby D F V 1974
Avramovic D 1982
Avromovic D et al 1964
Bain A D 1981
The Developing Countries and Access to the Capital Markets Finance & Development June.
Exchange Risk and Corporate International Finance MacMillan
The Interest Parity Theorum: AReinterpretationJournal of Political Economy.November/December pp 1451-1459
LDC debt Service - A Tighter Cash FlowAmex Bank Review - April
The Amex Bank Review November 30, p3
International Lending, Risk andthe EuromarketsMacmillan
Analysing the Maturity Structure of the Eurodollar Market The Banker - July
Challenge from the New Euro Centresyhe Banker - January
Eurocurrency Mismatching does matter - up to a point The Banker - January
The $300 Billion Super-Dollar MarketThe Banker - May
The Developing Countries after CancunJournal of World Trade Law January/February
Economic Growth and External DebtBaltimoreThe Johns Hopkins Press
The Economics of the Financial SystemMartin Robertson, Oxford

Baker J C 1978 International Bank Regulations
Baltensperger E 1980
Bance N 1979
Bank for International 1980Settlements
Bank of England (a) 1975
Bank of England (b) 1975
Baumol W J 1959
Beach C M and 1978Mackinnon J G
Beenstock M & Longbottom J A 1981
Bell G 1964
Bell G 1982
Bell W A and Murphy N B 1968
Benston G J 1965
Praeger Publishers New York
The Theory of the Banking Firm Journal of Monetary Economics Part 1
The Country Risk League Table Euromonev - October
Annual Report
Supervision of the UK Banking SystemBank of England QuarterlyBulletin—J un e
The Capital and liquidity adequacy of banks Bank of England QuarterlyBulletln-September
Business Behaviour Value and Growth-Macmillan
A Maximum Likelyhood Procedure for Regression withAutocorrelated Errors Econometrica Vol 46 pp51-58
The term structure of interest rates in a small open economy Journal of Money. Credit and Banking—February
Credit Creation throughEuro-Dollars?The Banker - August
Debt Rescheduling - Can the Banking System ?The Banker - February
Costs in Commercial Banking: AQuantitative Analysis of Bank Behaviour and its Relation to Bank RegulationResearch Report No 41 Federal Reserve Bank of Boston
Economies of Scale and Marginal Cost in Banking Operations National Banking Review - June

44U
Benston G J, Hanweck G A 1982and Humphrey D B
Bierman H & Hass J E 1975
Bierwag G & Grove M 1967
Bird G 1978
Bird G 1982
BIS 1982
Bransom W 1969
Brittain W H B 1977
Buchanan S 1982
Buira A 1983
Burn A L 1979
Buse A 1967
Economies of Scale in Banking Journal of Money Credit and Banking—November
An analytical model of bond risk differentialsJournal of Financial andQuantitative Analysis - December
A Model of the term structure of interest ratesReview of_____Economics andStatistics, February
The International MonetarySystem & the Less DevelopedCountriesMacMillan
The International Monetary Fundand Developing Countries:Retrospect & ProspectMimeograph - April
The Maturity Distribution ofInternational Bank Lending Bank for InternationalSettlements July
The Minimum Covered Interest Differential Needed forInternational Arbitrage Activity Journal of Political Economy, pp 1028 - 1035
Developing Countries' External Debt and the Private Banks Banca Nationale De Latforo Quarterly Review - December
Bedding Down with the World Bank Euromoney-Apri1
IMF Financial Programmes and ConditionalityJournal of Development Economics Part 12
Buttressing the Lender’s Legal PositionThe Banker - January
Interest Rates, the Meiselman model and random numbers Journal of Political Economy -February

Cagan P 1969
Calverly J 1982
Cargil T F 1975
Chamberlin E H 1950
Channon D 1977
Chenery H B & Bruno M 1962
Chenery H B & Strout A M 1966
Cherniavsky M 1977
Clendenning E W 1971
Clendenning E W 1969
Coghlan R 1980
Cohen B J and Basagni F 1982
Colje H 1980
A study of liquidity premium on federal and municipal government securities In Essays onInterest Rates (Cagen and Guttentag eds)National Bureau of Economic Research New York
How the cash flow crisis floored the LDCsEuromoney - August
The term structure of interest rates. A test of theexpectations hypothesis Journal of Finance - June
The Theory of Monopolistic Competition 6th Ed Cambridge Mass: Harvard University Press
British Banking Strategy and the International Challenge Macmillan, - Chapter 7
Development Alternatives in an Open Economy: The Case ofIsreal - Economic Journal - March
Foreign Assistance and Economic DevelopmentThe American Economic Review - September
The World Bank: FinancialAspectsJournal of the Institute of Bankers - April
Euro-Dollars and Credit Creation International Currency Review March/April
The Euro Dollar Market MacMillan
The Theory of Money and Finance MacMillan
Banks and the Balance of Payments •Croom Helm
How Much Capital is Adequate?The Banker - June

Colje H 1982
Cook- W P 1981
Cook T Q & Hendershott P H 1978
Crocket A 1977
Culbertson J M 1957
Dale R 1982
Davis C 1980
Davis S I 1976
Davis S I 1977
Davis S I 1981
Dean J W and Giddy I H 1981
Dean J W and Giddy I H 1981 b
Bank Supervision on a Consolidated Basis The Banker - June
Banking Regulation, Profits and Capital Generation The Banker - August
The impact of taxes, risk and relative security supplies on interest rate differentials Journal of Finance - September
International Money Thomas Nelson & Sons Ltd
The term structure of interest ratesQuarterly Journal of Economics - November
Safeguarding the International Banking System: PresentArrangements and a Framework for ReformA Paper presented to the SUERF Colloquium International Lending in a Fragile World Economy Vienna - April
A New Approach to Rescheduling The Banker - January
The Euro Bank: Its Origins,Management and Outlook Macmillan
How risky is international lending?Harvard Business Review —January/February
International Bank Expansion: Time for a Reassessment? The Banker - May
Averting International Banking Crisis Monograph Series in Finance and Economics —1,Salomon Brothers Centre for the Study of Financial Institutions, New York University
Six Ways to World Banking Safety Euromoney - May

Dell S & Lawrence R 1980
de Leeuw F 1965
Dematte C 1981
De Vries T 1982
Dhonte P 1975
Domar E 1957
Donaldson T J 1979
Dorrance G 1981
Dudler H J 1982
Duesenberry J1 1958
The Balance of PaymentsAdjustment Process in DevelopingCountriesPergamon Press
A Model of Financial Behaviour in Duesenberry et al Brookings Quarterly Economic Model of the United StatesEconomyRand McNally and North Holland
International FinancialIntermediation: Implicationsfor Bankers and Regulators Banca Nazionale del Lavoro Quarterly Review - March
The Stability of theInternational Financial System; Can we cope with the Risk ?A paper presented to the SUERF Colloquium International Lending in a Fragile World Economy, Vienna April
Describing External Debt Situations: A Roll^OverApproachIMF Staff Papers - March
The Effect of Foreign Investment on the Balance of Payments, in Essays,on the Theory of Economic GrowthOxford University Press, New York
Lending_____ in_____ InternationalCommercial Banking The MacMillan Press Ltd
Would Loan Guarantees undermine International Capital Markets ? The Banker - December
Euromarket Growth, Risks in International Bank Lending and Domestic Monetary Management A paper presented to the SUERF Colloguium International Lending in a Fragile World Economy,‘
'Vienna - April
Business cycles and economicgrowthMcGraw-Hill

Duffey & Giddy I H 1978
Duncan P R 1981
Durand D 1942
Durand D 1958
Eaton J and Gersovitz M 1981
Economist 1982
Economist 1979
Einzig P 1969
Ellis J G 1981
Ellis J G 1979
Euromoney 1978
Euromoney 1980
Euromoney 1979
The International Money MarketPrentice Hall IncEnglewood Cliffs, New Jersey
When Mismatching inInternational Lending May Matter The Banker - December
Basic yields on corporate bonds 1900-1942Technical Paper No 3National Bureau of EconomicResearch
A quarterly series of corporate basic yields 1952-57 and some attendant reservations Journal of Finance - September
Debt with Potential Repudiation Theoretical and Empirical AnalysisReview of Economic Studies Vol 48
A Nightmare of Debt - a Survey of International Banking Economist Newspaper, 20 March,
Computing Onshore International Banking Survey, 31 Economist Newspaper 31 March, P15
The Eurobond Market Macmillan
Eurobanks and the Interbank Market-Bank of England Quarterly Bulletin-Sept
Front-end Fees on Medium Term Euro-CreditsBank of England Mimeo - February
Boycott? No, They Just Won't Go Below 3/4%Euromoney - February, p 21
Can the Cooke Committee stand the heat?Euromoney - October
International Capital Markets - an Investors GuideEuromoney Publications

Euromoney 1982 a
Euromoney 1982 b
Evans J L 1970
Everitt B S 1979
Feder G & Just R E 1977
Fieleke N 1977
Fildes R A & Fitzgerald M D 1980
Financial Times 1982
Financial Times 1982
Financial Times 1982
Financial Times 1981
Finnerty J E, Schneeweis T 1980 & Hedge S P
Fisher D 1966
Don’t call the IMF: its running out of quotas Euromoney - August
The Big Shift in Bank Strategies Euromoney - November
Diversification and theReduction of Risk. An Emperical Analysis. Quoted in W F Sharpe Portfolio Theory and Capital MarketsMcGraw Hill, Page 149
The Analysis of Contingency Tables, p46 Chapman and Hall
An Analysis of Credit Terms in the Euro Dollar Market European Economic Review Vol 9 - May
The Growth of US Banking Abroad: An Analytical Survey. In Key Issues in Internaional Banking Federal Reserve Bank of Boston
Efficiency and premiums in the short term money market Journal of Money, Credit and Banking - November
Dangers of Short Term Debt Financial Times 27.4.82 p 28
Debt options for radicals Financial Times 21.10.82 p 23
The IMF Toughens its Brief Financial Times 11.6.82
Willing Lenders on High Fees Financial Times 15.4.1981, p 25
Interest rates in the eurobond marketJournal of Financial andQuantitative______AnalysisSeptember
Expectations, the term structure* ' of interest rates and recent British experience Economica - August

Fisher F G 1979
Fisher I 1896
Fisher L 1959
FNCB 1974
Fratiani M & Savona P 1971
Frazer P 1982
Friedman M 1969
Froewiss K 1977
Furness E L 1972
Gardner E P M 1981
Goldberg L & Saunders A 1980
Goodhart C A E 1975
The Eurodollar Bond Market Euromoney Publications Ltd
Appreciation and interest. Publications of the American Economic Association - August
Determinants of the risk premiums on corporate bonds Journal of Political Economy — June
First National City Bank of New York (FNCB)Money International— June
Eurodollar Creation: Comments on Professor Macklup’s Propositions and DevelopmentsBanca Nazionale del Lavoro Quarterly Review—June
How Not to Measure Bank Productivity^ The Banker - August
The Eurodollar Market: SomeFirst PrinciplesMorgan Guarantee Survey - October
Risk premiums in international securities market: theCanadian-US experience Economic Review, Federal Reserve Bank of San Francisco — Summer
An introduction to financial economicsWilliam Heinemann Ltd
Capital adequacy and banking supervisionBangor Occasional Papers in Economics No 19University of Wales Press
The Causes of US Bank Expansion OverseasJournal of Money Credit & Banking—Nov ember
Money_______Information_______and 1• Uncertainty, MacMillan

447
Goodman L S 1982
Graham B, Dodd D L & 1962Cottle S
Granger C W J & Rees H J B 1968
Grant J A G 1964
Griffith-Jones S 1980
Grubel H G 1979
Grubel H G 1977
Grubel H G 1966
Grubel H G 1968
Gurley J G & Shaw E S 1960
Syndicated eurocurrency credits: pricing & practice Federal Reserve Bank of New York Research Paper 8202 - January
.Security analysis, principlesand techniqueNew York: McGraw-Hill
Spectral analysis of the term structure of interest rates Review of Economic studies - January
Meiselman on the term structure of interest rates: a BritishtestEconomica - February
The Growth of Multinational Banking, the Eurocurrency Market and Their Effects upon Developing Countries Journal of Development Studies January
A proposal for the establishment of an international deposit insurance corporation.Princeton________ Essays________inInternational Finance No 133 - July
A Theory of Multinational Banking, Banca Nazionale del Lavoro Quarterly Review - December
Forward Exchange, Speculation and the International Flow of CapitalStanford: Stanford UniversityPress
Internationally DiversifiedPortfolios, Welfare, Gains and Capital FlowsThe American Economic Review, December
Money in a Theory of Finance The Brookings Institution

440
Gutowski A & 1982Hoithus M
Hager F 1981
Hailwood P 1981
Hamburger M J 1971
Hamburger M J & Platt E N 1975
Hardy C 1981
Harwick N L 1974
Ilaschek H H 1982
Haschek H H 1980
Hayes D 1956
Hayes J P 1964
Limits to International Lending Paper presented to ,SUERF Colloquium - International Bank Lending in a Fragile World Economy,Vienna - April
A mean-variance approach to analysing country risk MPhil Thesis Oriel College, Oxford - April
Oil Prices and Third World DebtNational Westminster BankQuarterly Review - November
Expectations, long term interest rates and monetary policy in the UKBank of England Quarterly Bulletin - September
The expectations hypothesis and the efficiency of the treasury bill marketReview of Economics andStatistics pp 190-199
Rescheduling developing country debtsThe Banker - July
International Banking and the Development of Consortium Banks LSE MPhil Thesis
The inter-relationship between export financing and commercial banking activityA paper presented to the SUERF Colloquium Internatinal Bank Lending in a Fragile World Economy, Vienna - April
What LDCs need are export credit schemesEuromoney - September
Appraisal and management ofsecuritiesNew York Macmillan
Long-Run Growth ' and Debt Servicing Problems: Projectionsof debt Servicing Burden and the Conditions of debt Failure, in Avromovic at al, Economic Growth and External Debt #BaltimoreThe Johns Hopkins Press,

Heller R H 1979
Hewson J 1975
Hewson J & Sakakibara 197A
Hickman W B 19A3
Hick J R 19A6
Hope N C 1982
Horwich G 196A
Hurni B S 1980
IBRD 1976
IBRD 1977
IBRD 1983
IMF 1980
International Currency 1982Review
Why the market isdemand-determinedEuromoney - February
Liquidity______ Creation______ andDistribution in '_______ theEuro-currency Markets Lexington Mass: D C Heath & Co
The Euro-Dollar DepositMultiplier: A Portfolio Approach IMF Staff Papery- July
The term structure of interest rates: an exploratory analysis National Bureau of Economic Research New York
Value and capital (2nd ed)Oxford
Loan Capital in Development Finance - The Role of Banks and Some Implications for Managing DebtPaper presented to the SSRC International Economics Study Group September
Money, capital and prices Richard D Irwin Inc Homewood Illinois
Lending Policy of the World Bank in the 1970*5: Analysis andEvaluation Boulder (Colorado)Westview Press
World Bank Annual Report Washington
World Bank Annual Report Washington
World Debt Tables 1982/83
International Monetary FundAnnual ReportWashington
Bank supervision or lack of it around the worldInternational Currency Review —July

Jaffee D & Modigliani F 1969
Johnson R E 1967
Johnston R B 1982
Johnston R B 1979
Joshi V 1970
Kapur I 1977
Karakitos E 1977
Kennedy C 1968
Kern D 1973
Kessel R A 1965
A Theory and Test of Credit RationingThe American Economic Review, December
The term structures of corporate bond yields as a function of risk of default Journal of Finance - May
Euro-market expansion:Macroeconomic concerns,theoretical models andpreliminary empirical estimates Paper presented to SUERFColloquium________ " InternationalLending in a Fragile World Economy" Vienna — April 22-24
Some Aspects of theDetermination of Eurocurrency Interest RatesBank of England Quarterly Bulletin, March
Savings and Foreign Exchange Constraints.In Streeten P (ed)Unfashionable Economics' Weidenfeld and Nicolson
An Analysis of the Supply of Eurocurrency Finance toDeveloping Countries Oxford Bulletin of Economics and Statistics — August
Expectations and the term structure of interest rates Oxford Bulletin of Economics and Statistics - May
Restraints and the Allocation of ResourcesOxford Economic Papers July,
Interest rates and the currency structure of the euromarkets Euromoney - May
The cyclical behaviour of the 'term structure of interest rates( National Bureau of Economic Research, New York

Keynes J M 1936
Killick T 1981
Kincaid R G 1981
Klopstock F H 1970
Klopstock F H 1968
Lafferty M 1982
Lafont J J & Garcia R 1977
Leeds R S 1980
Lees F A & Eng M 1979
Lee B W 1973
Llewellyn D T 1982
Llewellyn D T 1979
The general theory of employmentinterest and moneyMacmillan
Extent, Causes and Consequences of Disequilibria in Developing Countries.Overseas Development Institute Working Paper No 1 - March
Inflation and the External Debt of Developing Countries Finance and Development December
Money Creation in the Euro-Dollar Market - A note on Professor Friedman's Views Federal Reserve Bank of New York Monthly Review - January
The Euro-Dollar Market: Someunresolved issues Essays in International Finance No 65Princetown University Press
Why banks' finacial information may contribute to their crises Financial Times - September 10
Disequilibrium Econometrics for Business Loans Ecnonometrica July.
Why we need more co-financing The Banker - August
Developing country access to the international capital markets Colombia Journal of World Business—Fall
The Eurodollar Multiplier Journal of Finance - September
Avoiding an International Banking CrisisRational Westminister BankReview-Augus t
International Banks in the 1970’s - An Overview In Frowen S 'A framework of InternationalBanking'Guildford Education Press

Llewellyn D T 1980
Llewellyn D T 1979
Llewellyn D T 1982
Lutz F A 1940
Lutz F A 1974
Macaulay F R 1938
Machlup F 1970
Makin J H 1972
Markowitz H M 1952
Markowitz H 1959
Marris R 1964
Mayer H W 1976
International___________FinancialIntegration (pl25)Ma cmillan
The Eurocurrency Markets andWorld CreditThe Banker - January
The Eurocurrency Markets: Their Credit Effects and the dynamics of monetary policy A paper presented to the .SUERF Colloquium International Lending in a Fragile World Economy, Vienna - April
The structure of interest rates The Quarterly Journal of Economics, November
The Euro-Currency SystemJBanca Nationale del LavoroQuarterly Bulletin - September
The movements of interest rates, bond yields and stock prices in the United States since 1856 National Bureau of Economic Research
Euro Dollar Creation: A Mystery StoryBanca Nationale del Lavora Quarterly Bulletin - September
Demand and Supply Functions for Stocks of Eurodollar Deposits: An Empirical Study.Review of Economics ' andStatistics - November
Portfolio selection Journal of Finance — March
Portfolio Selection: EfficientDiversification of Investments New York, John Wiley & Sons
The Economic Theory ofManagerial Capitalism Macmillan
. The BIS Concept of the Euro-Currency Market Euromoney - May

Maynard G 1982
Maynard G & Davies P A
McKenzie G W 1976
McKinnon R I 1964
McKinnon R X 1977
McMahon C W 1977
Medlar L 1982
Meiselman D 1961
Mendelsohn M S 1980
Merton R C 1974
Metzler L A 1951
The Role of FinancialInstitutionsPaper presented to the SSRC International Economics StudyGroup September
The Evolving Problems ofInternational FinancialIntermediation Unpublished Mimeograph Chase Manhatten Bank NA
The Economics of theEurocurrency SystemMacmillan
Foreign Exchange Constraints in Economic Development andEfficient Aid Allocation Economic Journal— June
The eurocurrency market Essays in International FinanceNo 125 Princeton University Press
Central banks as regulators and lenders of last resort in an international centre Key Issues in International BankingFederal Reserve Bank of Boston
Prime Rate or LIBOR?The Banker - June
The term structure of interest ratesPhD Thesis University of Chicago
Money on the move: The Modern International Capital Markets McGraw-Hill
On the pricing of corporate debt: the risk strucutre ofinterest rates Journal of Finance - May
Wealth, saving and the rate of interestJournal of Political Economy - (April

Modigliani F & Sutch R 1966
Modigliani F & Sutch R 1969
Moore B J 1968
Neihans and Hewson 1976
Nelson C R 1972
Nowzad B 1982
OECD 1977
OECD 1980
OECD 1983
Osborne D K 1982
Ossola R 1980
Overseas Development 1980Institute.
Innovations in interest rate policyAmerican Economic Review - May
The term structure of interet rate: a re-examination of theevidenceJournal of Money, Credit and Banking - February
An introduction to the theory of financeThe Free Press New York
The Eurodollar Market and Monetary TheoryJournal of Money Credit and Banking - February
The term structure of interest ratesNew York Basic Books
Some issues and questions regarding debt of developing countries,; in"Adjustment and financing in the developing world: the role of the International Monetary Fund" Tony Killick Ed IMF/ODI
LDCs and Bond Issues Abroad Financial Market Trends June
The use of National Currencies for External Bond Issues Finacial Market Trends November
Review Department Cooperation Development Assistance Committee OECD Paris
The Cost of Servicing Demand DepositsJournal of Money Credit of Banking-Nov embe r
The vulnerability of the international financial system: international lending and1
■ liquidity risk Banco Nationale del Lavoro Quarterly Review- - September
The IMF and the Third WorldODI Briefing Paper No 5 -October

Pakenham K 1975
Park Y S 1974
Pesek B 1970
Phalen G E 1977
Phillips L & Pippenger J 1976
Pippenger J 1974
Pirzio-Biroli C 1983
Porter M C 1971
Prebisch R 1950
Reed E W 1964
Revel1 J 1975
Robert Morris Associates 1980(F J Matthis & D C Maslin)
The Medium Term Roll-over Credit and Economic Fluctuations Euromoney - November
The eurobond market: functionand structure New York: Praeger
Bank’s Supply Function and the Equilibrium Quantity of Money Canadian Journal of Economics - August
Comments to Fielake in Key Issues in International Banking Federal Reserve Bank of Boston
Preferred habitat v efficient market: a test of alternativehypotheses.Review of the Federal Reserve Bank of St Louis - May
A time series of post-accordinterest rates: CommentJournal of Finance, September
Making Sense of the IMFConditionality Debate Journal of World Trade Law March/April
A theoretical and empiricalframework for analysing the term structure of exchange rate expectationIMF Staff Papers - November
The Economic Development of Latin America and its Principle Problems UN ECLA
Commercial Bank Management Harper International Student Reprint
Solvency and regulation of banks Bangor Occasional Papers in Economics No 5 University of Wales Press
Survey of international loan portfolio systemsMimeo - December

Robinson R I 1960
Roll R 1970
Santomero A M 1975
Sargen N P 1976
Saving T 1977
Schaefer S M 1981
Scott Quinn B 1975
Sealey C W & Lindley J T 1977
Sharpe W F 1964
Shaw E R 1981
Shaw E R, Howcroft J B 1980& Gill C P
Solnik B H & Grail J 1975
Post-war market for state and local government securities Princeton University Press
The behaviour of interet rates New York: Basic Books
The error-learning hypothesis and the term structure of interest rates in eurodollars Journal of Finance - June
Commercial Bank Lending toDeveloping CountriesFederal Reserve Bank of SanFrancisco Economic Review,Spring
A Theory of Money Supply withCompetitive BankingJournal of Monetary Economics -July
Measuring a tex-specific term structure of interest rates in the market for British government securities Economic Journal - June
The New Euromarkets Macmillan
Inputs, Outputs and a Theory of Production and Cost at Depository FinancialInstitutionsJournal of Finance - September
Capital Asset Prices: A Theoryof Market Equilibrium under Conditions of Risk Journal of Finance — September
The London Money Markets William Heinemann Ltd London Third edition
International lending risk Institute of European Finance Research Paper Fin 18 University College of North Wales
■ Determinants of the demand for capital and the international interest rate structure Journal of Bank Research, Winter

4 p /
Soloman R 1977
Spaventa L 1982
Spencer P & Mowl C 1978
Sproas J 1980
Sterling J 1980
Swaboda A K 1968
Theil H & Nagar A L 1961
Thirlwall A P 1976
Tobin J 1967
Tobin J 1958
A Perspective on the Debt of Developing Countries Brookings Papers on Economic Activity
Risks to the Stability of the International Financial System. Some Realities and Some ConventionsPaper presented at SUERFColloquium - InternationalLending in a Fragile World Economy,Vienna - April
The Model of the Domestic Monetary System Government Economic Service Working Paper 17
The Statistical Debate on the Net Barter Terms of Trade between Primary Commodities and ManufacturesEconomic Journal - March
How big is the International Lending Market?The Banker - January
The Euro-dollar Market: anInterpretation. Essays inInternational Finance No 1A Princetown University Press
Testing the Independence ofRegression DisturbancesJournal_____of____the AmericanStatistical Association Vol 56 pp793-806
Financing Economic Development Macmillan
Commercial Banks as Creators of Money; in Hestor & TobinFinancial Markets and Economic ActivityCowles Foundation Monograph 21 Yale University Press
Liquidity Preference asBehaviour Towards Risk .Review of Economic Studies - February
Towey R E 197A Money Creation and the Theory of the Banking Firm; Journal of Finance - March

Tring P & Taylor-Jones M 1981
Tsiang S C 1959
Van Der Bey H 1982
Van Horne J C 1970
Van Horne J C 1965
Williams D 1982
Wood J H 1963
Yawitz J B & Marshall W 1981
Zolotas X 1978
Zolotas X 1978
Zolotas X 1980
Harmonising bank annual accounts in the European community The Banker - June
The Theory of Forward Exchange and the Effects of Government Intervention on the Forward Exchange Market IMF Staff Papers - April
Experience with the reschedulingof international debtA paper presented to the SUERFColloquium International Lendingin a Fragile World Economy,ViennaApril 22-24
Function and analysis of capital _market rates Prentice Hall
Interest rate risk and the term structure of interest rates Journal of Political Economy - August
Opportunities and constraints ininternational lendingA paper presented to the SUERFColloquium~-International Lendingin a Fragile World Economy,ViennaApril 22-24
Expectations, errors and the term structure of interest rates Journal of Political Economy - April
Measuring the effect ofcallability on bond yields Journal of Money, Credit andBanking - February
An International loan insurance schemeBank of Greece Papers andLectures No 39
A proposal for a new fund toinsure against euro-market1 defaultsEuromoney - April
A case for an international loaninsurance fundThe Banker - November