Family Preservation in Udaipur, Rajasthan India - Better Care ...
Upload
khangminh22Category
view
0download
0
COMMUNITY INVOLVEMENT IN HEALTH PROGRAMMES: A GOVERNMENT &
NON-GOVERNMENT PERSPECTIVE; UDAIPUR DISTRICT, RAJASTHAN, INDIA
A Thesis
Presented to
The Faculty of Graduate Studies
of
The University of Guelph
by
ARCHANA DWIVEDI
In partial fulfillment of requirements
for the degree of
Master of Science
August 1994
0 Archana Dwivedi, 1994

ABSTRACT
COMMUNITY INVOLVEMENT IN HEALTH PROGRAMMES: A GOVERNMENT & NON-GOVERNMENT PERSPECTIVE; UDAIPUR DISTRICT, RAJASTHAN, INDIA
Archana Dwivedi University of Guelph, 1994
Advisor: Professor H. Cummings
This thesis investigates the effectiveness, efficiency and the extent of community
involvement in health programmes (CIH). The hypothesis to be tested was that
participatory community health programs are more effective and efficient than less
participatory programmes. Two existing programmes are examined: a government (ICDS)
and non-government (NGO-Seva Mandir) approach. The communities targeted in the two
programmes are among the poorest in India: the Bhils (tribals) of Udaipur District,
Rajasthan. The methodology of the thesis combines both quantitative and qualitative
measurements. The results of the study reveal that the more participatory health
programme (NGO) is not as effective as the non-participatory programme (ICDS) as
indicated by the nutritional status of children and IMR. The ICDS programme also proves
to be more efficient in terms of staff time required to operate the programme, however the
social cost/benefit analysis indicates that for the time and cost, the NGO programme is
more efficient.

ACKNOWLEDGEMENTS
I would like to thank my advisor, Professor Harry Cummings, who guided my research and supported me throughout the process. I would also like to thank my two committee members, Professor Nonita Yap and Professor Bill Leonard, who so generously contributed their expertise and unfailing encouragement. To the friends and faculty members at USRP&D, who have made my experience at the School so rewarding, I owe you my sanity.
I would like to express my gratitude to the staff of the Udaipur District !CDS programme, especially Mrs. Thari and Bharti Ji. I would also like to thank the staff of the NGO, Seva Mandir; A jay Mehta, Mr. Karkare, Dr. Lodha, Ashok Ji, the rest of the Health Unit and my many friends of the Seva Mandir family. Both programmes generously gave their time and knowledge to my research. A special thank you goes to Dr. M.L. Jain, Deputy CMHO, who very graciously spent many hours refining my field methodology.
My fondest memories are of my research assistant, Upama Mishra, who relentlessly stood by me through the heat of the Rajasthan countryside.
The most important people I would like to express my thanks are to the friends and families that were the subjects of my research. They welcomed me into their personal and professional lives without a moments hesitation. Undoubtedly, without them, this research would not have been possible, but more important it would not have been such a rewarding experience.
This research was made possible through financial support provided by the International Development Research Centre (IDRC) in the form of the Young Canadian Researchers Award. Institutional support was provided by the Indian Institute of Health Management Research (IIHMR) in Jaipur. In particular, I would like to graciously acknowledge Dr. Khotari, Dr. Pathak and Dr. Trivedi.
This thesis is dedicated to my parents, who have taught me the value of education and the rewards of perseverance.

TABLE OF CONTENTS
CHAPTER ONE INTRODUCTION . . . . . . . . . . . . . . . . . . . . . . . . . 1 1.1 Introduction . . . . . . . . . . . . . . . . . . . . . . . . . . . . . . . . . . 1 1.2 Health and Nutritional Status of Rajasthan, India . . . . . . . . . . . 2 1. 3 Problem Statement . . . . . . . . . . . . . . . . . . . . . . . . . . . . . . 3 1.4 Research Goal . . . . . . . . . . . . . . . . . . . . . . . . . . . . . . . . 3 1.5 Research Objectives . . . . . . . . . . . . . . . . . . . . . . . . . . . . . 3 1. 6 Organization of Thesis . . . . . . . . . . . . . . . . . . . . . . . . . . . 4
PART 1: BACKGROUND AND METHODS
CHAPTER TWO COMMUNITY INVOLVEMENT IN HEALTH PROGRAMMES: AN OVERVIEW . . . . . . . . . . . . . . 5
2. 1 Introduction . . . . . . . . . . . . . . . . . . . . . . . . . . . . . . . . . . 5 2.2 Review of Health Development Initiatives: A Historical
Perspective . . . . . . . . . . . . . . . . . . . . . . . . . . . . . . . . . . 5 2. 3 Interpretation of Participation . . . . . . . . . . . . . . . . . . . . . . . 9 2.4 Interpretation of CIH . . . . . . . . . . . . . . . . . . . . . . . . . . . . 10 2.5 Supporting Community Participation in Health Programmes:
Govenunent Programmes and Non-govenunental Organizations . . 11
CHAPTER THREE CIH PROGRAMMES: METHODS AND IMPLICATIONS FOR EVALUATIONS . . . . . . . . . . . . . . . . . . . . . . . 15
3.1 Introduction . . . . . . . . . . . . . . . . . . . . . . . . . . . . . . . . . . 15 3.2 Measuring Effectiveness . . . . . . . . . . . . . . . . . . . . . . . . . . 16
3. 2.1 Measuring Nutritional Status . . . . . . . . . . . . . . . . . . . 17 3.2.2 Health Indicators . . . . . . . . . . . . . . . . . . . . . . . . . . 19
3. 3 Measuring Efficiency . . . . . . . . . . . . . . . . . . . . . . . . . . . . 19 3 .4 Measuring Community Involvement (Participation) . . . . . . . . . . 21 3.5 Summary . . . . . . . . . . . . . . . . . . . . . . . . . . . . . . . . . . . 27
CHAPTER FOUR DESCRIPTION OF CURRENT NATIONAL HEALTH SYSTEM AND CIH PROGRAMMES, UDAIPUR DISTRICT, RAJASTHAN .................... 28
4.1 Introduction . . . . . . . . . . . . . . . . . . . . . . . . . . . . . . . . . . 28 4.2 Cultural Context . . . . . . . . . . . . . . . . . . . . . . . . . . . . . . . 32 4. 3 State Health System . . . . . . . . . . . . . . . . . . . . . . . . . . . . . 34 4.4 ICDS: Govenunent Programme . . . . . . . . . . . . . . . . . . . . . . 36 4.5 NGO Initiative . . . . . . . . . . . . . . . . . . . . . . . . . . . . . . . . 37
CHAPTER FIVE METHODOLOGY ......................... 41 5 .1 Introduction . . . . . . . . . . . . . . . . . . . . . . . . . . . . . . . . . . 41 5.2 Data Collection Techniques . . . . . . . . . . . . . . . . . . . . . . . . 45
ii
5.2.1 Secondary Data Collection . . . . . . . . . . . . . . . . . . . . 45 5.2.2 Semi-structured Interviews . . . . . . . . . . . . . . . . . . . . 46 5.2.3 Focus Group Discussions . . . . . . . . . . . . . . . . . . . . . 46 5.2.4 Household Survey . . . . . . . . . . . . . . . . . . . . . . . . . 47 5. 2. 5 Anthropometric Measurements . . . . . . . . . . . . . . . . . . 48 5.2.6 Participant Observation . . . . . . . . . . . . . . . . . . . . . . 49
5.3 Sample selection . . . . . . . . . . . . . . . . . . . . . . . . . . . . . . . 49 5 .4 Sample Size . . . . . . . . . . . . . . . . . . . . . . . . . . . . . . . . . . 50 5.5 Analytical Methods . . . . . . . . . . . . . . . . . . . . . . . . . . . . . 50
5. 5. 1 Effectiveness . . . . . . . . . . . . . . . . . . . . . . . . . . . . . 51 5.5.2 Efficiency . . . . . . . . . . . . . . . . . . . . . . . . . . . . . . 53 5.5.3 Community Involvement . . . . . . . . . . . . . . . . . . . . . 54
5. 6 Summary . . . . . . . . . . . . . . . . . . . . . . . . . . . . . . . . . . . 54
PART II: STUDY RESULTS & DISCUSSION
CHAPTER SIX SOCIO-ECONOMIC DIFFERENCES BETWEEN THE ICDS AND NGO SAMPLE POPULATIONS . . . . . . . . 55
6.1 Introduction . . . . . . . . . . . . . . . . . . . . . . . . . . . . . . . . . . 55 6.2 Differences Between the ICDS and NGO Programme Areas . . . . 55
6.2.2 Survey Population Household Characteristics . . . . . . . . . 56 6. 3 Summary and Discussion . . . . . . . . . . . . . . . . . . . . . . . . . . 64
CHAPTER SEVEN ASSESSMENT OF THE EFFECTIVENESS OF THE ICDS AND NGO HEALTH PROGRAMMES . . . . . . . . . . . . . . . . 66
7. 1 Introduction . . . . . . . . . . . . . . . . . . . . . . . . . . . . . . . . . . 66 7.2 Nutritional Status . . . . . . . . . . . . . . . . . . . . . . . . . . . . . . 66
7 .2.1 Comparison of Growth Status . . . . . . . . . . . . . . . . . . 67
7 .2.2 Bivariate Analysis of Nutritional Status . . . . . . . . . . . . . 68 7.2.3 Correlations . . . . . . . . . . . . . . . . . . . . . . . . . . . . . 75 7 .2.4 Multivariate Analysis . . . . . . . . . . . . . . . . . . . . . . . 77 7 .2.5 Perception of the Nutritional Status of Children
Participating in the ICDS and NGO Health Programmes . . 81 7.2.6 Summary and Discussion . . . . . . . . . . . . . . . . . . . . . 82
7.3 Infant & Under Five Mortality Rates . . . . . . . . . . . . . . . . . . 84 7.4 Immunization . . . . . . . . . . . . . . . . . . . . . . . . . . . . . . . . . 86 7.5 Family Planning Methods . . . . . . . . . . . . . . . . . . . . . . . . . 88 7.6 Summary and Discussion . . . . . . . . . . . . . . . . . . . . . . . . . . 89
CHAPTER EIGHT ASSESSMENT OF EFFICIENCY OF THE ICDS AND NGO HEALTH PROGRAMMES . . . . . . . . . . . . . . . . 91
8.1 Introduction . . . . . . . . . . . . . . . . . . . . . . . . . . . . . . . . . . 91 8.2 Financial Costs . . . . . . . . . . . . . . . . . . . . . . . . . . . . . . . . 91
lll
8. 2. 1 Funding Sources . . . . . . . . . . . . . . . . . . . . . . . . . . 93 8.3 Technical Costs . . . . . . . . . . . . . . . . . . . . . . . . . . . . . . . 94
8.3.1 Number of Staff . . . . . . . . . . . . . . . . . . . . . . . . . . . 95 8.3.2 Staff Time Required . . . . . . . . . . . . . . . . . . . . . . . . 96
8.4 Summary and Discussion . . . . . . . . . . . . . . . . . . . . . . . . . . 98
CHAPTER NINE ASSESSMENT OF THE BREADTH AND FORM OF COMMUNITY INVOLVEMENT IN THE !CDS AND NGO HEALTH PROGRAMMES ................ 100
9.1 Introduction .................................. 100 9.2 Breadth of Community Involvement ................... 100 9.3 Form of Participation ............................ 106 9.4 Organizational Processes . . . . . . . . . . . . . . . . . . . . . . . . . . 108 9.5 Summary ................................... 109
CHAPTER TEN SUMMARY AND CONCLUSIONS . . . . . . . . . . . . . . 110 10. 1 Introduction . . . . . . . . . . . . . . . . . . . . . . . . . . . . . . . . . . 110 10.2 Summary of Findings ............................ 110 10.3 Generalizability ............................... 111 10.4 Interpretation of CIH ............................ 112 10.5 Conclusions . . . . . . . . . . . . . . . . . . . . . . . . . . . . . . . . . . 113
BIBLIOGRAPHY ....................................... 114
APPENDIX A: Household Survey . . . . . . . . . . . . . . . . . . . . . . . . . . . . . 120
APPENDIX B: Household Survey Questionnaire Code Book ............. 128
APPENDIX C: Regression Tables ............................. 131
iv

Table 3.1 Table 3.2
Table 3.3
Table 5.1 Table 5.2 Table 5.3 Table 5.4 Table 6.1
Table 6.2 Table 6.3
Table 6.4
Table 6.5
Table 6.6 Table 6.7
Table 6.8
Table 6.9
Table 6.10
Table 6.11
Table 7.1
Table 7.2
Table 7.3
Table 7.4
Table 7.5
LIST OF TABLES
Framework to Examine Community Participation . . . . . . . . . . . 21 Framework for Judging Community Participation; a ranking system . . . . . . . . . . . . . . . . . . . . . . . . . . . . . . . . . . . . . 23 Table describing the objectives, instruments and intensity of participation. . . . . . . . . . . . . . . . . . . . . . . . . . . . . . . . . . 25 Research questions and techniques used for study. . . . . . . . . . . 43 Number and profile of semi-structured interviews. . . . . . . . . . . 46 Source of group discussions. . . . . . . . . . . . . . . . . . . . . . . . 47 Primary places and sessions attended for participant observation. . 49 Frequencies and percentage of persons present during time of household survey conducted in the ICDS and NGO study areas. . . 56 Family type and caste of ICDS and NGO study areas. . . . . . . . . 57 Household Characteristics of survey populations in ICDS and NGO study areas. . . . . . . . . . . . . . . . . . . . . . . . . . . . . . . . . . . 57 Education levels of male and female heads of households of survey populations in ICDS and NGO study areas. . . . . . . . . . . . . . . 58 Frequency and percentage of literate males and females in the ICDS and NGO study populations. . . . . . . . . . . . . . . . . . . . . 58 Income levels of households in the ICDS and NGO study areas. . . 59 Possession of certain household items by the ICDS and NGO survey population. . . . . . . . . . . . . . . . . . . . . . . . . . . . . . 60 Agricultural data reported by the ICDS and NGO study populations. . . . . . . . . . . . . . . . . . . . . . . . . . . . . . . . . . . 60 House/land characteristics reported by the ICDS and NGO sample populations. . . . . . . . . . . . . . . . . . . . . . . . . . . . . . . . . . . 61 Cooking, Drinking and medical characteristics reported by the ICDS and NGO survey populations. . . . . . . . . . . . . . . . . . . . 62 Health characteristics reported by the ICDS and NGO study populations. . . . . . . . . . . . . . . . . . . . . . . . . . . . . . . . . . 63 Growth status of children from ICDS and NGO sample population. . . . . . . . . . . . . . . . . . . . . . . . . . . . . . . . . . . 67 Comparison of mean Z-scores of height-for-age, weight-for-age, weight-for-height and mid arm circumference for children between the ages of one and five participating in the ICDS and NGO programmes. . . . . . . . . . . . . . . . . . . . . . . . . . . . . . . . . . 69 Comparison of mean Z-scores of height-for-age, weight-for-age, weight-for-height and mid arm circumference for gender. . . . . . . 75 Pearson's correlation scores of height-for-age, weight-for-age, height-for-weight and mid arm circumference Z-scores with income variables. . . . . . . . . . . . . . . . . . . . . . . . . . . . . . . 76 Pearsons correlation scores of individual and household parameters with standardized measures of children's nutritional status. . . . . . 77
v

Table 7.6 Multiple regression of predictors of children's height-for-age status. The dependent variable is height-for-age with number in sample being 161. . . . . . . . . . . . . . . . . . . . . . . . . . . . . . . 78
Table 7.7 Multiple regression of predictors of children's weight-for-age status. . . . . . . . . . . . . . . . . . . . . . . . . . . . . . . . . . . . . . 78
Table 7.8 Multiple regression of predictors of children's weight-for-height status. The dependent variable was weight-for-height with number in sample being 161. . . . . . . . . . . . . . . . . . . . . . . . . . . . . 79
Table 7. 9 Multiple regression of predictors of children's arm circumference status. . . . . . . . . . . . . . . . . . . . . . . . . . . . . . . . . . . . . . 79
Table 7.10 Percentage variation in height-for-age, weight-for-age, weight-for-height and mid arm circumference explained by the combination of age, gender, water source, and per capita income for ICDS children population. . . . . . . . . . . . . . . . . . . . . . . . . . . . . . 80
Table 7.11 Percentage variation in height-for-age, weight-for-age and mid arm circumference explained by age and gender for NGO children population. . . . . . . . . . . . . . . . . . . . . . . . . . . . . . . . . . . 81
Table 7.12 IMR and CMR in the ICDS and NGO sample programme areas .
Table 8.1
Table 8.2
Table 8.3
Table 8.4 Table 8.5
. . . . . . . . . . . . . . . . . . . . . . . . . . . . . . . . . . . . . . . . . 86 Financial costs of operating the ICDS and NGO programmes per village, per household and per person. . . . . . . . . . . . . . . . . . 93 Number of Staff employed by the ICDS and NGO programmes at the village level with average salaries presented. . . . . . . . . . . . 95 Number of ICDS and NGO staff employed at each of the administrative levels. . . . . . . . . . . . . . . . . . . . . . . . . . . . . 96 Time spent by ICDS and NGO staff in the field. . . . . . . . . . . . 97 Cost/benefit table describing the costs incurred to provide the benefits listed. . . . . . . . . . . . . . . . . . . . . . . . . . . . . . . . . 98
vi

Figure 4.1
Figure 4.2 Figure 7.1
Figure 7.2
Figure 7.3
Figure 7.4
Figure 7.5
Figure 7.6
Figure 7.7
LIST OF FIGURES
Political map of Rajasthan State and it's district boundaries, highlighting Udaipur District. . . . . . . . . . . . . . . . . . . . . . . . 29 Map of study area within the District of Udaipur . . . . . . . . . . . 31 Mean height-for-age Z-scores in the ICDS and NGO samples; presented by age ...................................... 70 Mean weight-for-age Z-scores in the ICDS and NGO samples; presented by age. . . . . . . . . . . . . . . . . . . . . . . . . . . . . . . 71 Percentage of ICDS and NGO children lower than the cut-off points -2, -3 and -4 for height-for-age. . . . . . . . . . . . . . . . . . 72 Percentage of ICDS and NGO children lower the cut-off points, -2, -3 and -4 for the indicator weight-for-age. . . . . . . . . . . . . . 73 Percentage of ICDS and NGO children lower than the cut-off points -2,-3 and -4 for the indicator weight-for-height. . . . . . . . . 74 Immunization percentages of children and mothers during pregnancy in ICDS and NGO areas. . . . . . . . . . . . . . . . . . . . 87 Variety and frequency of family planning methods used by ICDS and NGO sample populations. . . . . . . . . . . . . . . . . . . . . . . . 89
vii

AC
ANM
AWW
CDPO
CHW
CIH
CMHO
CMR
HQ
ICDS
IMR
LS
MO
MPW
NCHS
NGO
PEM
PHC
SD
TBA
VHW
WHO
LIST OF ACRONYMS
Arm Circumference
Auxiliary Nurse Midwife
Anganwadi Worker
Child Development Programme Officer
Community Health Worker
Community Involvement in Health Development
Chief Medical Health Officer
Child Mortality Rate
Head Quarters
Integrated Child Development Services
Infant Mortality Rate
Lady Supervisor
Medical Officer
Multi Purpose Worker
National Centre for Health Statistics
Non-governmental Organization
Protein Energy Malnutrition
Primary Health Care
Standard Deviation
Traditional Birth Attendant
Village Health Worker
World Health Organization
Vlll

ANM
Chula
GLOSSARY
Female health worker at the sub-centre level of the national health system.
A mud-made village stove used to cook on. It is usually fuelled by wood and dried cow dung.
Malnutrition Are the effects in the body from not eating enough food. These effects are often made worse by infection.
Matka
PEM
Stunting
A large cauldron made of clay or metal used to store drinking water.
Is a kind of malnutrition which results from insufficient intake of energy, protein and other nutrients. This may cause a range of conditions; failing to grow, underweight or stunting.
Indicates that the child is shorter than the reference child for that age. It represents slowing in linear growth over time or a cumulative deficiency in growth. It is associated with long term biological factors such as chronic insufficiency in protein and or energy intake, frequent infections, clinical factors such as low socio-economic-status of the family, and inappropriate feeding practices.
Underweight Indicates that the child weighs less than the reference child for that age.
Wasting Indicates recent or acute malnutrition, either from failure to gain weight or weight loss. It indicates that the tissue and fat mass are lower than expected for a reference child of that length.
ix

CHAYfER ONE
INTRODUCTION
1.1 Introduction
Many gains have been achieved with regards to health and nutritional status of the
worlds population since WWII. Within the developing world, a significant increase has
been shown in life expectancy, in the control of epidemic diseases such as small pox, and
a reduction in infant mortality rates (UND P, 1993: 12). Despite these gains, there
continues to be an increasing gap between the developed and developing world and
between class structures within the developing world with respect to health and
nutritional status. Although more than 60% of the population of developing countries has
access to health services today, 1.5 billion people are still deprived of primary health
care (UN,1990:27). While the per capita average calorie intake increased by 20%
between 1965 and 1985, 150 million children under five (one in every three) suffer from
serious malnutrition. Finally, despite the tremendous development efforts in the Third
World since WWII, the maternal mortality rate in the South is 12 times that of the North
(UN,1990:27).
The continuing imbalance of health and nutritional status during the past few
decades has resulted in the adoption of community involvement as a strategy in health
development, coinciding with an overall community participation1 approach to planning
and development. Participation or community involvement in health (CIH) development,
1 Community panicipation and community involvement are used virtually interchangeably in this thesis. However, the text does reflect the adoption of
the tenn community involvement by the health sector as a fonn of the more generalized tenn community participation.
1
is constituted by community participation in decision making, implementation, operation,
monitoring and evaluation of health and nutrition programmes. This is ideally fostered
through a decentralized format, that supports self-reliance (Rifkin,1990:2-3). Although
CIH is a widely accepted concept as a strategy for health development, the strategy has
rarely been tested in its practical application despite its formal use by many non
government (NGO) and government agencies (Oakley, 1989: 6).
It has long been recognized in India that the health status of the people cannot be
raised unless the people become actively involved (WH0,1986:64). India has long been
active with NGO programmes based on community participation. Recently government
programmes have attempted the same. With India rating 134th out of a possible 173
countries on the United Nations Human Development Index (UNDP,1993:135-137), it
provides a context for the development of innovative CIH programmes to combat the
many health and nutrition problems facing the population. This in tum provides an
opportunity to observe CIH in action.
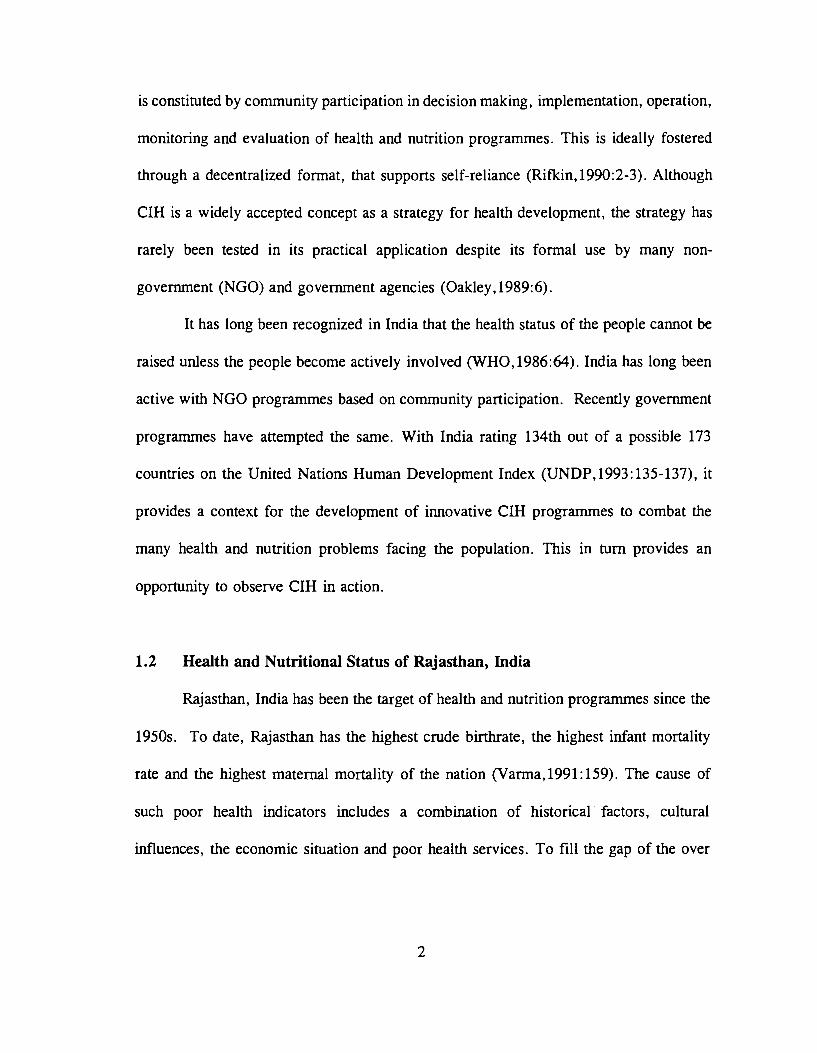
1.2 Health and Nutritional Status of Rajasthan, India
Rajasthan, India has been the target of health and nutrition programmes since the
1950s. To date, Rajasthan has the highest crude birthrate, the highest infant mortality
rate and the highest maternal mortality of the nation (Varma,1991:159). The cause of
such poor health indicators includes a combination of historical factors, cultural
influences, the economic situation and poor health services. To fill the gap of the over
2
strained state health system, many NGOs and government programmes2 have been
implemented, some of which are based on community involvement. Within the District
of Udaipur an NGO initiated health unit and the government sponsored Integrated Child
Development Services (ICDS) are two prominent programmes that attempt to reach the
poorest of the poor through community involvement.
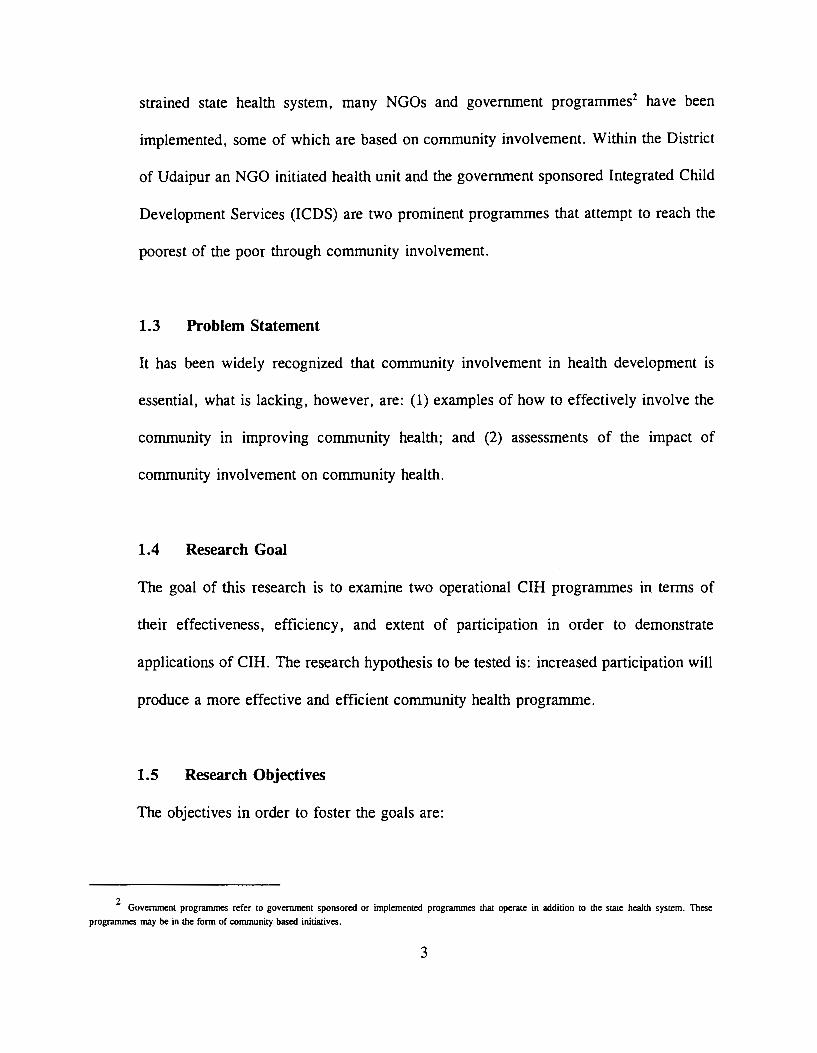
1.3 Problem Statement
It has been widely recognized that community involvement in health development is
essential, what is lacking, however, are: (1) examples of how to effectively involve the
community in improving community health; and (2) assessments of the impact of
community involvement on community health.
1.4 Research Goal
The goal of this research is to examine two operational CIH programmes in terms of
their effectiveness, efficiency, and extent of participation in order to demonstrate
applications of CIH. The research hypothesis to be tested is: increased participation will
produce a more effective and efficient community health programme.
1.5 Research Objectives
The objectives in order to foster the goals are:
2 Government programmes refer to government sponsored or implemented programmes that operate in addition to the state health system. These
programmes may be in the form of community based initiatives.
3

1) To determine the effectiveness3 of an NGO and government-based participatory health
and nutrition programme.
2) To determine the financial cost and technical demand of an NGO and a government-
based participatory programme to indicate the efficiency of both programmes.
3) To determine the extent and characteristics of participation in the NGO and
government-based participatory health programmes.
1.6 Organization of Thesis
This thesis evaluates a government and a non-government community based health
and nutrition programme by describing these programmes with respect to community
involvement and examining their effectiveness and efficiency. Chapter Two reviews how
past health initiatives evolved into today's thinking in planning and development. This
chapter also looks more critically at the perception of community involvement in health
development and contrasts a Government versus an NGO approach. Chapter Three
discusses the framework for analyzing the effectiveness, efficiency and the characteristics
of community involvement in the government and NGO initiated health programmes.
This is followed by Chapter Four, which describes the people and culture participating
in the study. This Chapter also provides an overview of the ICDS and NGO health
programmes. Chapter five describes the methodology utilized for this study with results
being discussed and analyzed in Chapters Six, Seven, Eight and Nine. This thesis
summarizes and concludes with Chapter 10.
3 effectiveness in this context refers to: 1) the goal of achieving better nutritional stanls which may be illustrated by detennining the nutritional stanls of
children; 2) estimating child and infant mortality rates; 3) determining the percentage of children and mothers immunized; and 4) number and methods of family planning.
4

PART 1: BACKGROUND AND METHODS
CHAPTER TWO
COMMUNITY INVOLVEMENT IN HEALTH PROGRAMMES: AN OVERVIEW
2.1 Introduction
Community participation in health programmes is not a new phenomenon; there
was community support for traditional healers in past centuries and it is still a feature of
traditional cultures today. The stress put on community participation as a formal process
evolved through decades of development planning. Health, being an integral component
of development, was and is influenced heavily by development and planning paradigms
(WH0,1991:2). This chapter explores health development and the process by which
participation became an integral part of health programmes. While examining the
different forms of participation, this chapter will also discuss the advantages NGOs and
government agencies offer and the obstacles each must overcome in order to operate with
community involvement.
2.2 Review of Health Development Initiatives: An Historical Perspective
During the mid-nineteenth century, good health was viewed as the absence of
disease (Rifkin,1980:1). This view was due to the remarkable gains achieved through
clinical medicine. This view persisted over one hundred years fuelled by the discovery
of penicillin, vaccinations and sterile techniques (Rifkin, 1980: 1). Priority was placed on
scientific research and the curative side of health. National policies reflected the scientific
curative approach to health development and the needs of the majority of the population,
5

by constructing hospitals and special units mostly in the urban areas. Problems arose
when this practice was emulated by the developing world without the same sanitary and
environmental conditions that were found in the developed world (Hardiman,1986:46).
An era of scientific medicine which realized the potential of control and
eradication of the world's most devastating diseases by the mid-20th century, still had
not radically improved the health of the majority of the world's population. A professor
from the Liverpool School of Tropical Medicine, Rex Fendall summarizes the 20th
century as "brilliant in its discoveries, superb in its technological breakthroughs, but
woefully inept in its application to those most in need" (Dorozyuski, 1975: 8).
Gunner Myrdal was considered a catalyst for planners, both within and outside
the medical field, who diverted the forms of health programmes from individual and
curative expenditures to programmes that would affect large numbers of people
(Rifkin,1980:2). He argued that health was not a bottomless pit for governments but was
an investment in human resources that if improved could add to the productive capacity
of a nation because it would increase person-hours available for work. This brought the
health policy into the fast-growing development debate.
Prior to the 1970s, development strategies were largely dominated by attempts by
development planners and workers to modernize and improve the technical performance
of the physical aspects of a particular country or area (Oakley, 1989: 1). In the health
sector this meant that the basic structure and philosophy of health care were built on a
narrow system of technical specialization and professionalism that put patients in a
subordinate and dependent status (Uphoff et al.,1979:237).
6

During the 1960s those concerned with health care also became concerned about
the characteristics of those who received health care resources. Research showed that
most resources were going to the urban centres in the developing world where most
doctors resided. In addition, the statistics showed that most serious illnesses were being
experienced by the rural poor whose health problems could be alleviated through
preventive measures (Rifkin, 1980:3). This concern resulted in a shift to preventive,
decentralized community care based on epidemiological priorities. Planners believed that
providing people with knowledge through health education would improve health.
However the policy gradually degenerated into the mere provision of knowledge, handed
down from experts resulting in only limited improvements of health. It became apparent
that the involvement of beneficiaries in the planning of health services was required.
A second factor that influenced the adoption of community participation after
WWII was that public health policy was not only concerned with controlling disease but
became an integral part of general development policies (Rifkin, 1980:4). As a result,
health services were no longer the preserve of the medical profession but became an
integral part of all development planning. Thus the debates of basic need, self reliance
and people's participation began to include health care. The 1970's led to the search for
alternative health systems (Oakley,1989:5).
The declaration of Primary Health Care (PH C) by the World Health Organizations
(WHO) member nations, at the Alma-Ata Conference in 1977 prominently featured
community participation (WH0,1981:4). Adoption of this declaration followed growing
concerns about the appropriateness of health policies in developing countries. The
7

declaration emphasized the provision of basic services that would provide basic health
care, preventive services, nutrition, maternal and child health and the utilization of
simple medical technologies. Above all it called for the mobilization of local communities
to take responsibility for their own health (WH0,1991:3).
A summary of the reasons why previous health development plans may have seen
limited success includes (Oakley, 1991 :47):
• failure to encourage people to think or act for themselves in attempting to solve their health problems;
• failure to provide adequate training to local people to enable them to maintain the services that had been set up;
• community contributing resources and labour but not involved in design and implementation; and
• conflict between felt needs of the community and those determined by the professionals.
Although the problems mentioned above may not have been evident in all programmes,
they led to arguments for adopting CIH as a strategy. The main arguments are
summarized below (Oakley,1991:47):
• it is a basic right, builds self esteem and encourages a sense of responsibility;
• health services have limited resources, CIH makes more resources available by drawing on local resources and knowledge thus helping to extend the coverage and to lower overall cost;
• more cost-effective health services in the long-term lead to an adequate return on funds invested in the health sector;
• health programmes will be more appropriate and successful in meeting health needs; and
• CIH breaks dependency and may encourage people to become more involved in the development aspect of their community.
Health professionals seem to support CIH as a basic principle to be followed in
health development. Through the influence of international agencies, governments of
many developing countries have acknowledged the need for greater emphasis on
8

community based development strategies. NGOs have had a significant impact in
promoting participation as a strategy. Academics in development studies have also pushed
for community participation as a viable approach to social development arguing that it
is not only acceptable but essential (Hardiman, 1986: 56).
2.3 Interpretation of Participation
The concept of CIH cannot be divorced from the broader aim of encouraging the
active participation of local people in the development process as a whole. Thus any
understanding of CIH must begin by attempting to understand the concept of participation
(WH0,1991:2).
A review of the practice of participation across the various development sectors,
suggests that participation may be interpreted three ways: 1) participation as contribution;
2) participation as organization; and 3) participation as empowerment (Oakley &
Marsden, 1985:20-25). Participation as contribution is seen as participation in
development programmes consisting of voluntary or other contributions by people to
predetermined programmes. They may take the form of material contributions or
voluntary labour. Participation as organization is how the organization is structured and
thus how the community is represented in the organization so that it influences the
community on how they participate. Recently participation as empowerment has emerged
with wide support. Although empowerment has become an accepted term in development
vocabulary, it is difficult to defme. It may be viewed as the development of skills and
abilities to manage more effectively ones own affairs, and consequently having a say in
9

development matters (projects).
Still others further reduce the interpretation of participation into two categories
or opposite ends of a spectrum: participation as a means and participation as an end
(Oakley, 1989: 1 0-12). Participation as a means is to involve the community to reach a
predetermined goal. In this case the results of participation are more important than the
act of participation. Thus government and development agencies may use participation
as a means of increasing efficiency, a management style intended to benefit both
consumer and provider. This is an indirect form of participation, since the consumer may
influence the delivery system but does not have direct control. Participation as an end
emphasizes a process in which confidence and solidarity among rural people are built up.
It is an active form of participation responding to local needs and changing
circumstances.
Thus participation whether interpreted by contribution, organization and
empowerment, or by a means and an end, has as its ultimate form control. True
participation is seen as an end that results in empowerment. Both interpretations of
participation have a common view in that both distinguish participation in terms of
overall control. CIH tends to consider participation as an end that includes the means.
2.4 Interpretation of ern
While there has been considerable discussion on community participation and
many definitions have been suggested, CIH has not until recently been defined. CIH is
understood to be local participation in the design and delivery of health care services.
10

The literature doubts whether to use CIH or community participation. The health sector
has opted for CIH because of the deeper implication. The term involvement is preferable
to participation because it implies a deeper and more personal identification of members
of the community with PHC. A definition of CIH may prove to be helpful for this
discussion.
"CIH is a process whereby people exercise their right to play an active and direct role in the development of appropriate health services, in ensuring the conditions for sustained better health, and in supporting the empowerment of communities for health development. CIH implies a partnership between people, organizations and health professionals". (WHO Study Group;1991)
The WHO Study Group interprets the practice of CIH as:
• awareness and understanding of health and health problems; and
• access to information and knowledge about health service programmes and
projects (1985).
This allows the community to become actively involved with health development and to
ensure direct access to the health services available. It must be stressed that because
health development is resource based, there will be fundamental differences in practice
between regions.
2.5 Supporting Community Participation in Health Programmes: Government
Programmes and Non-governmental Organizations
Providing health services to the poorest of the poor in the Third World has been
an on going process by both government and non-governmental organizations. Several
writers have argued that NGOs provide effective opportunities for the implementation of
11

community participation ideals. NGOs are claimed to be dynamic, flexible and socially
concerned, staffed by persons who have deep personal commitment to humanitarian and
participatory ideals. NGOs are not inhibited by bureaucratic rules and regulations and
are not accountable to indifferent superiors or corrupt politicians. They thus provide a
more open system for experimentation. NGOs are considered more effective in
promoting community participation because they are innovative and adaptable. Although
NGOs may have limited overall resources, they can raise funds for projects that
governments would not be willing to support. NGOs are also considered to be more
politically aggressive, championing radical programmes that bring about social change
(Midgley et al., 1986: 153-155).
Bureaucracies, on the other hand, have vested interests in maintaining the status
quo. Public agencies are also more responsive to the pressures exerted on them by
organized interest groups. Since the marginalized sectors of society have little
opportunity to influence government, their interests are not likely to be served by state
involvement in community participation. NGOs, however, are more likely to increase
the organizational power and consequently the political pressure that can be exerted by
the poor. Also, government programme staff are constantly mindful of their career
prospects and thus concerned to promote official policies rather than the interests of the
poor (Oakley et al.,1991:176-177).
There are drawbacks to NGOs promoting participation that need to be noted. Not
all NGOs are flexible, and they may carry as many regulations and rigid management
styles as the bureaucracies do. NGOs also may suffer from poor coordination and
12
duplication of services. Often communities with NGOs operating in them feel
disillusionment with projects that were left unfinished. An issue that many NGOs face
is resource constraints despite the amount of funds obtained from the international
community. NGOs are unlikely to mobilize domestic revenues on a scale that even
approaches those of the state. Projects are not replicated or expanded to reach a wider
section of the population thus creating an imbalance (Midgley,1986:155-157).
Government development agencies are big and tend to be linked more directly to
central government development plans and practices. In such projects participation is
seen as an input or characteristic which the project seeks to include in its overall
programming. Government programmes tend to operate within strictly defined goals and
procedures. So can the commitment to participation be really seen within government
programmes which are so closely tied to the political structure? NGOs see participation
as a process and develop this process without the constraints of time and targets.
Participation is linked to wider, structural issues and not limited to contributions or
project management (Oakley et al.,1991:176-178).
However, although the NGO influence in development is widespread, particularly
in participation, one cannot state outright that NGOs are more effective (Milwood; 1980).
NGOs appear to have an advantage in supporting participation specifically where the
following situations exist (Uphoff, 1987):
• NGOs tend to be more administratively and financially stable than government programmes;
• where government is either not interested nor able to work in a particular area;
• where government lacks the technical or other skills to support the process;
13
• where government wishes to support participatory development but lacks the knowledge or capacity to be effective;
• where government is unable to co-ordinate the activities necessary to support participatory projects;
• where government is obliged to work within the pattern of traditional values and relations that is less able to work with groups outside the pattern; and
• where government is favourably disposed towards NGO initiatives in promoting participatory development.
2.6 Summary
Historically health care and health development centred around the curative
process. Only when efforts of successfully increasing the health status of the world's
population were not achieved, did the thinking process in health and indeed all of
development change to one of preventive and participatory. CIH, a term coined by the
international health professionals, was a direct result of a shift in development paradigm.
The advances in community involvement have been pioneered by the NGO community
who tend to have more dedicated staff, innovative techniques and fewer restraints to
experiment with alternative development initiatives. From a discussion of what CIH
entails, the following chapter discusses how one can evaluate CIH programmes.
14

CHAPTER THREE
CIH PROGRAMMES: METHODS AND IM:PLICATIONS FOR EVALUATIONS
3.1 Introduction
CIH programmes should be evaluated to determine the extent and standard of its
implementation and its impact on local health care. In practice, however, CIH brings
with it a series of as yet unsolved conceptual problems in regards to evaluation
(Oakley,1989:62). Since CIH seeks both to improve the provision of health care in the
community and to encourage people's involvement in health and nutrition programmes
it is necessary to evaluate not only the improvement in health at the community level but
also the nature of the community involvement. Similarly in the evaluation of CIH it is
necessary to record and analyze both the quantitative data that can be used to measure
the changes that have occurred as a result of CIH and the qualitative aspects of
participation.
The two complementary but distinct approaches may be summarized as follows:
Quantitative Aspects
Measurement --------------------- > Judgement
Qualitative Aspects
Description --------------------- > Interpretation
Traditionally the evaluation of health programmes have been based on the
quantitative assessment of their value in terms of epidemiological or economic measures
(Oakley et al., 1991 :243). This important but limited measure ignores the perception of
the beneficiaries and does not take into account the descriptive aspects of the programme
15

or the dynamic nature of the community based programme.
Qualitative indicators of CIH are conceptually different from those used in the
evaluation of health services, which focus on activities, productivity, utilization and the
quality of services. Qualitative indicators should describe changes in community
dynamics to show the potential, as well as the actual, acceptance or rejection of a health
programme (WH0,1991:42). They need to describe such things as the type of activities
in which communities participate, the degree and intensity of their participation, who
participates to what extent and why. These indicators include characteristics of the
organization and leadership development.
Quantitative indicators include economic indicators and assessment of benefits.
Indicators need to be identified in light of the objectives of CIH and relating to the goals
and priorities on individual health projects and programmes and to the contexts and
conditions in which they operate (WH0,1991:43).
3.2 Measuring Effectiveness
The factors or indicators measuring effectiveness or benefits of health and
nutrition programmes may be generated by examining the objectives and priorities of the
CIH programmes, determining the appropriate health and nutrition indicators suggested
in the literature for these objectives, and assessing how the programme outputs have
influenced the chosen indicators.
16
3.2.1 Measuring Nutritional Status
Nutritional assessment may be defined as "the interpretation of information
obtained from dietary, biochemical, anthropometric and clinical studies" (Gibson,
1990:4). The information is used to determine the health status of individuals or
population groups as influenced by their intake and utilization of nutrients. Nutritional
assessment systems can take the form of surveys, surveillance and screening. Nutritional
assessment systems use a variety of methods to characterize the development of a
nutritional deficiency state. The methods are based on dietary, laboratory, anthropometric
and clinical measurements.
It has been recommended by the World Health Organization (WHO) that
anthropometric measurements be used to assess the nutritional status of vulnerable
groups. Vulnerable groups include children in impoverished areas (WH0,1983:10). This
methodology is aimed at programmes whose objective is to provide supplementary food
in order to improve nutritional status. Anthropometric assessment is recommended for
children under 10 years of age. Children beyond the age of 10 are advised not to be
included because anthropometric changes associated with puberty may bias the results.
The measurements required for anthropometric assessment of nutritional status are
age, sex, height or length, and weight (Carlson and Wardlaw,1990:6). Often arm
circumference is included. These measurements can be used to calculate standard
deviation scores (Z-scores), which should be compared with international reference
17
values, the NCHS4 growth curves (WHO Working Group: 1986:930).
The indicators of deferent aspects of malnutrition that use anthropometric
measurements are (WHO Working Group: 1986:930):
1) Low weight-for-height (wasting) - indicates recent or acute malnutrition, either
from failure to gain weight or weight loss. It is associated with seasonal patterns,
changes in food availability and disease prevalence. It indicates that the tissue and
fat mass are lower than expected for a reference child of that length.
2) Low height-for-age (stunting)-indicates that the child is shorter than the reference
child for that age. It represents slowing in linear growth over time or a
cumulative efficiency in growth. It is associated with long term biological factors
such as chronic insufficiency in protein and or energy intake, frequent infections,
clinical factors such as low socio-economic status of the family, and inappropriate
feeding practices.
3) Low weight-for-age (underweight) - indicates either stunting, or wasting or a
composite of stunting and wasting, indicating the extent of malnutrition. However
the indicator does not distinguish between wasting and stunting.
4) arm circumference screening for PEM (wasting) resulting from acute malnutrition
and amenable to nutrition intervention (McDowell and Savage King, 1982) when
weight and stature measurements are not possible and precise age of the child is
unknown (Gibson,1991 :257).
4 Although the NCHS dala se1 is comprised of anthropometric measuremen!S of children from the Uniled Sau:s, il is appropria!e for comparison between
and within populations. Populations may refer 1o developing countries as well. A srudy conducled by Agrawal et al. confirmed that the NCHS dala set was no! culrurally biased by concluding that the level of growth performance achieved by children of an affiuen1 section in at leas! one part of the counlry (India), corresponds 1o that represenled by the NCHS dala set (1991:66).
18

The above indicators can be used to describe a child population. In addition, there are
standards for classifying degrees of malnutrition,e.g., moderate malnutrition is weight
for age less than minus two standard deviations from the reference median and severe
malnutrition is weight for age less than minus three standard deviations from the
reference median (Carlson and Wardlaw, 1990:28).
3.2.2 Health Indicators
When Primary Health Care (PCH) was adopted as a strategy by all WHO member
states, health indicators were identified in order to assess the effect or impact of such a
strategy. The indicators included infant mortality, child mortality and immunization. The
annual UN Development report and the more recent World Bank Reports have also
included these as indicators of development. In reviewing health indicators and the
objectives of the Government of India, Rajasthan and the two programmes, it became
clear that family planning methods utilization was a main objective for the area. Thus it
should be included as an indicator in the evaluation. Although there are many other
health indicators, these were identified as the most revealing and significant by
programme officers and government officials in the area.
3.3 Measuring Efficiency
Evaluating efficiency of health and nutrition programmes is essentially comparing
alternative ways of attaining the same goal or objectives. Because resources are scarce,
one naturally wants to attain the objectives using the least amount of resources.
19

Economists use cost/benefit analysis and cost/effectiveness as a tool for comparative
evaluation. Both methods measure inputs as costs in monetary terms however they differ
in measurement of outcomes. Cost/benefit analysis attempts to value all socially relevant
outcomes in monetary terms and cost/effectiveness analysis concentrates on one major
desired outcome or benefit and estimates the cost per patient (or treatment, etc.) of
achieving that objective.
In practice cost/benefit analysis is used to evaluate a particular health service
programme or action. One problem associated with this form of evaluation is the fact that
most benefits in the health sector can not be reduced to monetary values
(WH0,1975:31). This method is most useful for health programmes that have a major
impact on economic development. Cost/effectiveness is useful for evaluating different
methods of attacking a single disease problem (WHO, 1975:31). While this is appealing
for its specificity, the criterion is unable to handle activities producing several different
kinds of benefits simultaneously (Berman, 1985: 36).
Both methods have limitations when dealing with social projects where the nature
of benefits are not amenable to easy measurements in money or quantitative terms
(Mathur,1985:76). Social cost/benefit analysis has emerged as a method that does not
require costs or benefits to be deduced into monetary value. The costs are taken as input
costs meaning time, number of staff and financial burden and benefits are seen as
descriptive. The goals achievement method (GAM) is a tool used by many planners to
determine the most appropriate method of analyzing efficiency (Conyers and
Hi11,1984:139). The purpose of the GAM is to find out whether the projects under
20

consideration will help in achieving the goals that may have been set for the development
in the local area. In GAM benefits are taken to represent progress towards specified goals
and costs to represent retrogression. This method goes on further to establish priorities
and assess which projects satisfy which goals.
Although appraisals of projects are usually undertaken during the identification
stage of the planning cycle, summative or formative appraisal of programmes are
essential when a comparison is being made.
3.4 Measuring Community Involvement (Participation)
Community involvement is the process by which the community participates in
the programme. This may be analyzed in various ways. Traditionally participation has
been measured in terms of quantitative aspects (ie., attendance at meetings, etc.).
Although this is informative, the qualitative aspect will provide much needed insight.
This chapter focuses on the process of participation, namely the breadth and form.
3.4.1 Breadth of Participation
Within the health sector, Rifkin has described a framework for analysis that
involves descriptive factors and action factors (refer to Table 3.1) (Rifkin, 1990: 17).
Table 3.1 Framework to Examine Community Participation
DESCRIPTIVE FACTORS cultural
economic, social and political historical
government policy decentralization local level organization
core/periphery communication
21
ACTION FACTORS assessment of needs
community organization programme management
resource mobilization leadership development
attention to the needs of the poor

From this framework one can deduce the degree to which the descriptive factors
encourage participation. The action factors assess how the programme operates in certain
areas. This is an intuitive measure that combines the organizational structure and
management styles. Rifkin uses these action factors as a ranking system in which a
programme or project may be given a score of one to five on the various action factors.
An example of the ranking system used in a health and nutrition programme is
illustrated by Shrimpton (1989:7) (refer to table 3.2). In this example a framework to
analyze participation has been modified to suit the programmes needs. Rifkin et al. uses
the five issues of leadership, organization, resource mobilization, management and needs
assessment for the evaluation of participation in a Nepalese health project. The Nepal
case study is further developed by plotting the rankings as to visualize the breadth of
participation (Rifkin et.al., 1988:937).
22
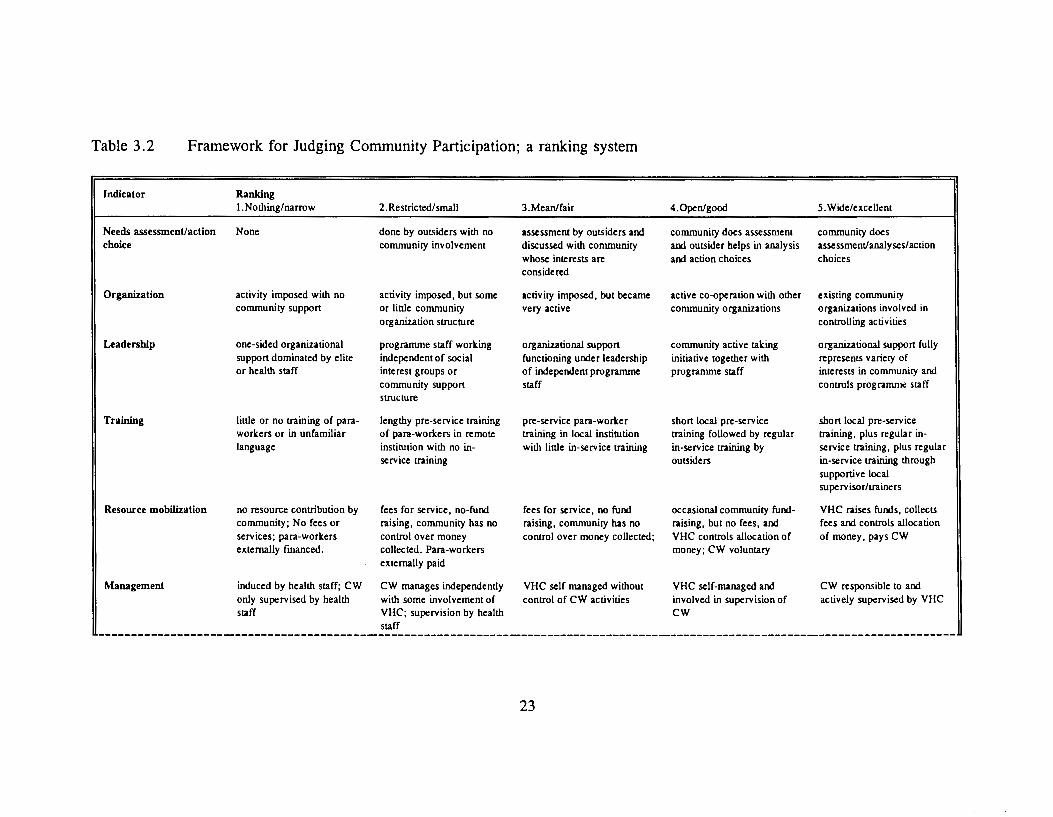
Table 3.2 Framework for Judging Community Participation; a ranking system
Indicator
Needs assessment/action choice
Organization
Leadership
Training
Resource mobilization
Management
Ranking !.Nothing/narrow
None
activity imposed with no community support
one-sided organizational support dominated by elite or health staff
little or no training of paraworkers or in unfamiliar language
no resource contribution by community; No fees or services; para-workers externally fmanced.
induced by health staff; CW only supervised by health staff
2. Restricted/small
done by outsiders with no community involvement
activity imposed, but some or little community organization structure
programme staff working independent of social interest groups or community support structure
lengthy pre-service training of para-workers in remote institution with no inservice training
fees for service, no-fund raising, community has no control over money collected. Para-workers externally paid
CW manages independently with some involvement of VHC; supervision by health staff
3.Mean/fair
assessment by outsiders and discussed with community whose interests are considered
activity imposed, but became very active
organizational support functioning under leadership of independent programme staff
pre-service para-worker training in local institution with little in-service training
fees for service, no fund raising, community has no control over money collected;
VHC self managed without control of CW activities
23
4.0pen/good
community does assessment and outsider helps in analysis and action choices
active co-operation with other community organizations
community active taking initiative together with programme staff
short local pre-service training followed by regular in-service training by outsiders
occasional community fundraising, but no fees, and VHC controls allocation of money; CW voluntary
VHC self-managed and involved in supervision of CW
5. Wide/excellent
community does assessment/analyses/action choices
existing community organizations involved in controlling activities
organizational support fully represents variety of interests in community and controls programme staff
short local pre-service training, plus regular inservice training, plus regular in-service training through supportive local supervisor/trainers
VHC raises funds, collects fees and controls allocation of money. pays CW
CW responsible to and actively supervised by VHC

Orientations of action no clear objectives, no process-oriented objectives, impact-oriented objectives, impact-oriented objectives, impact-oriented objectives, targeting, curative only but no targeting; more but no targeting; more VHW interventions targeted CW interventions targeted to
curative than preventive curative than preventive to at-risk groups. More at-risk groups; preventive curative than preventive. and curative
Monitoring evaluation no MIS, or information information sent to outsiders IS used for routine daily VHC receives information VHC disseminates so that /information exchange used locally; nobody aware who are aware of problem activities/decision-making by necessary for decision- community is aware of
of problem dimension or dimension and programme CW who is aware of making from CW; VHC problems, programme programme progress progress, but not fed back dimension of process and aware of problems, progresslbcnefits
toVHC programme progress programme progresslbcnefits
24

The framework presented above is more detailed and quantifies a qualitative
process which may simplify comparison of two CIH programmes. The issues raised in
the framework, however, may be limiting and thus should be modified to suit each
particular evaluation. Whichever method is utilized description and perception are key
to analyzing the extent of community involvement in health development.
3.4.2 Form of Participation
The distinction between breadth and form of participation lies in the way one
describes participation. The form of participation identifies the type of participation and
what is used by the programmes to achieve that type. Samuel Paul of the World Bank,
proposes a framework for analysis that encompasses the objectives, intensity and
instruments of community participation and their interrelationships (1987:4). He argues
that the mix of objectives, intensity and instruments of participation tends to vary
depending on the nature of projects and their contexts.
In the context of development, participation may be viewed as a process that
serves one or more of the following objectives:
Table 3.3 Table describing the objectives, instruments and intensity of participation.
OBJECTIVES INSTRUMENTS INTENSITY empowerment information sharing field workers of programme
building beneficiary capacity consultation community workers/committees effectiveness decision making user groups
share the costs initiating action efficiency
25

The objectives of participation may overlap, a project or programme may
simultaneously pursue several objectives. A higher level of objective tends to incorporate
some of the lower objectives. For example, empowerment implies capacity enhancement
but the reverse may not necessarily be true or the efficiency objectives may not lead to
empowerment.
Instruments used by the programme to seek participation may come in various
forms. The highest form is one that initiates action. This instrument relies on the
beneficiaries taking their own decisions about developmental issues. The lowest form of
instrument used is information sharing where the programme informs the beneficiaries
about certain aspects and decisions being made. In between lie consultation and decision
making.
The intensity of participation includes three levels. The highest level being user
groups. This occurs rarely since the beneficiaries tend to be large groups of persons in
which case it is unlikely that all are involved in the programme. The second level is the
use of community workers or committees. This involves the community working as staff
or volunteers in the programme. The lowest level of intensity is considered to be
programme field workers. This involves only programme staff connecting at the village
level.
The interrelationships among objectives, intensity and instruments will vary from
one case to the other. Usually the higher the objective the more intense the method and
the more instruments used. It must be emphasized that a programme will use a
combination of objectives, intensity and instrument methods at different times. However,
26

most programmes tend to focus on one specific intensity and instrument use.
3.5 Summary
The evaluation of CIH programmes involves the examination of the effectiveness,
efficiency, emphasizing the breadth and form of participation. The indicators of
effectiveness depend on the goals and objectives of the health programme to be
evaluated. The indicators of efficiency are best described by examining the inputs
required for the outputs gained. To assess the extent and form of community involvement
in health programmes two frameworks have been proposed, each with distinct features.
27

CHAPrER FOUR
DESCRIPTION OF CURRENT NATIONAL HEALTH SYSTEM AND
CIH PROGRAMMES, UDAIPUR DISTRICT, RAJASTHAN
4.1 Introduction
The programmes studied in this thesis are operating in Udaipur District,
Rajasthan, India (see Figure 4.1). Udaipur District is situated in the southern part of
Rajasthan and covers and area of 11,358 km2 • The District is encircled by the Aravali
Ranges from north to south. The eastern part of the District has stretches of fertile plains
while the central and southern parts are covered with rocks, hills and forests that were
once dense. The western portion is referred to as the Hilly Tracts of Mewar composed
of the Aravali Range. Four out of the six rivers that flow through the District are non
perennial and only flow during the rainy season at which time many villages are isolated.
Most of the District is constituted by the Aravali Mountain Range, with the
highest point reaching 4315 feet above sea level. The temperature ranges from a low 4°C
during the winter months to a high of 44°C during the summer, averaging to 25°C.
Climatically, the area is classified as a tropical savanna with average rainfall
accumulating to 600mm (Dutt et al. 1976:22). The soil is predominantly red or yellow
(Dutt et al. 1976:20). The natural vegetation is comprised of the tropical dry deciduous
type, resulting in vast numbers of small trees that are armed with sharp thorns that
develop long roots (Dutt et al. 1976:22). Due to the climatic conditions and soil types,
the area is suited for dry cultivation or rain fed crops.
28

Figure 4.1 Political map of Rajasthan State and it's district boundaries, highlighting Udaipur District.
I Jaisalmer
0 180 km
INDIA
Source: Adapted from Department of Women and Child Development, Government of Rajasthan, Jaipur. 1991. p14.
29

The District is comprised of 10 Thesils or 11 Developmental Blocks with a
population of 2,063,116. Nearly 65% of the District's villages have a scattered
population of 25 to 500 households on hilly or rough terrain (CMHO, 1993: 1).
Seven of the development blocks consist of Tribals whose livelihood revolve
around agriculture and day labour. The particular areas studied consist of tribal
communities who are considered to be one of the poorest communities in the District
(Doshi & Vyas, 1992:5). They are considered poor in terms of social status, economics
and accessibility to education and health services. Both programmes attempt to bridge the
gap between the communities and the State Health System by operating at the local
village level where the health system fails to reach.
The specific study areas selected for this thesis are located just north and south
of Udaipur City (refer to Figure 4.2). Both areas are considered hilly and rocky with
minimal agricultural production. The ICDS programme study area was confined to
Sarada Block, approximately 60km south of Udaipur City. The five villages studied were
within a 20 km radius from the town of Sarada. The NGO programme study area
consisted of villages within the block of Bardgoan, north of Udaipur City. The six
villages or phalas studied are spread throughout a 40 km radius. The areas selected are
inhabited by the Bhils; a Scheduled Tribe.
30

Figure 4.2 Map of study area within the District of Udaipur
I 0 30km
NGO Study Area A Gail B Dangyon Ka Hunder c Moria Kadia 0 Bandario Ka Guda E Raya F Kerawadi
Kherv•ara
ICDS Study Area 1 Phal Sarada 2 Phal Sarada (Ranath Phala) 3 Phal Sapur 4 Balua (Gandhi Chowk) 5 Balua (Agarath Phala)
/
Rajsamandh District
Dhariawad
Source: Adapted from map provided by the office of the Chief Medical & Health Officer. H.O. Udaipur. p3 of Draft. 1993.
31

4.2 Cultural Context
All study areas consisted of households which were of tribal caste, specifically
the Bhils. The Bhils constitute the third largest tribal group of India. The concentration
of Bhils in the country is found in four states; namely Maharashtra, Gujurat, Madhya
Pradesh and Rajasthan. Although the Bhils are spread broadly over Rajasthan state, the
majority reside in the districts of Udaipur, Banswara and Dungarpur.
The Bhils have a long history in the southern part of Rajasthan. It has been
acknowledged that the Bhils were the original inhabitants of the south and south-eastern
part of Rajasthan. Prior to independence (1949), the area was known as Rajputana and
comprised of Rajput princely states. The Rajput kingdoms were established after
defeating the Bhils (Department of Women & Child Development, 1991 : 7).
Like most tribals, the Bhils of Udaipur District live in scattered villages, with a
house erected on a small hillock in the midst of a patch of cultivated land. Each hutment
consists of one or two rooms. The second room is built specifically for the cattle and/or
storage of grains. The hutment is constructed by the owners with walls of stone and mud,
roof of clay tiles placed on sticks and the floor made of mud. The interior is kept clean
with one or two string beds. Cooking, dining, sleeping and living all occur within the
single room(Doshi & Vyas,1992:45).
The village settlement pattern traditionally has been a scattered one, in which
houses are spread throughout the area. Each house has fields for agriculture around them.
Some Bhils reside in compact villages. Their fields are away from their habitation areas.
Both these types of settlement patterns were represented in the study area (Doshi &
32

Vyas, 1992:46) . The staple food of the region is maize. The diet consists of bread made
from maize, lentils if accessible and onions in the summer (Vyas, 1992:57).
The Bhil village in certain respects is different from a caste based village. The
unity of the Bhil village is remarkable (Doshi & Vyas,1992:61). The Bhil family does
not represent in anyway the joint system of the Hindus. When a grown up son marries,
he is separated from his parents and establishes a new family in a new dwelling. The
separation is complete in that the father and son do not work on the common farm but
a separate piece of land is allotted to the son for his maintenance on which he operates
alone. However as with the Hindus, the girl resides in the area of the husband
(Chaudhary: 1978:23).
The Bhils, in the past have been independent earning their livelihood from forest,
forest produce and game. At a later stage the Bhils adopted a settled way of life and
practised agriculture. The land being meagre and devoid of any irrigation system
contributed to them being poor. The Bhils since have passed through a number of
economic stages. Till very recently they were characterized by a subsistence economy.
Today the Bhils by and large have taken to commercial crops. Due to diminishing land
and decreasing quality of land many of the Bhils have entered the market economy in the
form of day labour and small entrepreneurial work such as small tea shops. Some Bhils
have managed through education to obtain professional jobs such as teaching. However,
there are many Bhils who are buried in dire poverty, illiteracy and backwardness.
The Bhils at one stage or another have came into contact with Hindus, Muslims
and Christians. The strongest and lasting effect on Bhils have been the Hindus where
33
today the two may be found living together. Although 40% speak the Bhil language of
Bhili, most have taken on the local dialect of the area they reside in (a dialect of Hindi).
The problems of Bhils today are the problems of village people in general. The
Bhils face the problem of accessible safe drinking water; the scarcity of cooking fuel is
prevalent in which it takes up to four hours to gather the fuel from already severely
depleted forest areas; and accessibility to health care facilities.
4.3 State Health System
India is a sovereign democratic republic and a union of states operating as a
federal system. The Indian constitution divides the functions of the government by lists:
union list, state list and concurrent list. Public health is under the State list meaning that
the State is in control of the health system. Each state formulates five year plans that
coincides with the central plan (Johnson & Anderson,1987 :482). Rajasthan has adopted
the policies and strategies of the Government of India which has been going through a
decentralization in the past few decades. There is a national commitment to attain the
goal of health for all by the year 2000 in accordance with the Alma-Ata Declaration of
September 1978 (GOI,1988:170). Rajasthan and specifically Udaipur District is an
example of how the government health system is attempting to reach the poorest of the
poor.
As in most developing countries, the resources and manpower of the health
system are severely strained and it is those that are most in need who are deprived of
essential services. Primary health care is being provided to the rural population through
34

a network of sub-centres, primary health centres and community health centres. Within
Udaipur district there are 14 community health centres (CHC), 71 primary health centres
(PHC) and eight government dispensaries (CMHO, 1993:2). Private hospitals and centres
operate within the district, however these are mostly located around the larger cities and
thus are not accessible to villagers residing in the hills.
Community Health centres cover a population of 100,000. The CHC houses a
Block Extension Educator, a Malaria Inspector and a Block Health Supervisor. The PHC
covers a population of 30,000 or 20,000 in the in the hilly and tribal areas. Sub-centres
cater to populations of 5,000 or 3,000 in the tribal or hilly areas. The primary unit of
health care for villagers is the Axillary Nurse midwife (ANM) or the Multi Purpose
worker (MPW) who covers an average of 5 to 8 villages.
It has been estimated that 60% of all diseases debilitating the villagers can be
controlled if not eradicated through simple and effective measures that do not require
medical supervision: e.g. improved sanitation. Thus it is felt by government and private
organizations that the gap within the health system may be filled by community
involvement. This is not to say that improvements to the health system and personnel is
not warranted, to improve the overall health and nutritional status of the population
efforts on all fronts must be pursued and is being pursued. An example is the recently
initiated link programmes with the community by the Udaipur District Health System.
35

Table 4.1 Health System of Udaipur District
Community Health Centre(l4) coverage to 100,000 people
starr Compounder
Block EJttension Educator Malaria Inspector
Block Health Supervisor 5 Medical Officers
4 nurses
Primary Health Centres(71) coverage to 30,000 (20,000)
starr Male Supervisor
Female Supervisor sanitary inspector I Medical Officer
Sub-Centre, Dispensaries, Aid Posts(SOO) 5,000 (3.000)
starr Female Worker Male Worker
ANMIMPW 1000(500) 5krn radius
4.4 ICDS: Government Programme
The Integrated Child Development Services (ICDS) program was initiated in India
during the 1970s. The programme in Udaipur District started in 1985. It was thought that
the piecemeal welfare programmes of the 1950's and 1960's were not addressing the
issues on a long term basis and constituted a substantial drain on the human resources
of the country. The ICDS program "extends beyond the existing health and education
systems to reach children and their mothers in Villages and slums and delivers to them
an integrated package of services" (Sadka,1984:3), including;
• non-formal pre-school education • immunization • health check-ups • supplementary nutrition • medical referral services
36

• nutrition and health education (Sadka, 1984: 1 0)
This is accomplished at the village level by an Anganwadi (day-care) run by a local
village woman (A WW) who teaches sanitary practices, plays games and teaches simple
rhymes, numbers to the children, gathers the children for immunization, talks to women
about family planning methods and reports any illnesses to the health officials. The
AWW has an assistant who helps her with her job. The Anganwadi runs from 8:00 am
to 12:00 noon Monday through Saturday. It is held in a house or some allotted building
in the village. The A WW reports directly to a Lady Supervisor (LS) who in tum reports
to the Child Development Project Officer (CDPO). It is the duty of the AWW to record
attendance, measurements, and to distribute food to the children. The target of each
centre is 80 children (Sadka,1984).
In Udaipur District 11 !CDS projects are in operation with 10 in the rural areas
and one in the inner city. The 11 projects total to over 1000 Anganwadis.
4.5 NGO Initiative
Seva Mandir (SM) is an established NGO in the District originally aimed at
promoting literacy and education. Today, SM has expanded to 11 units ranging from
Forestry and Education to the Women's unit. The health unit was established in 1985 and
has gone through many changes. It frequently reviews its strategy and role. The NGO
health programme has very similar objectives to that of the !CDS programme, health
education and supplementary feeding being among the most important objectives. The
health Unit of Seva Mandir covers four blocks of Udaipur District with full services
37

offered in over 100 villages.
The health Unit of Seva Mandir is only one of many activities the organization
is involved in. The main activities are as follows:
• Adult and non-formal education • Wasteland development • Health education and primary health care • Women and children's development • Watershed development • Income generation • People's management • Publication and cultural promotion activities • Rural training centre (Kaya)
Seva Mandir is a project-based organization engaged in a diverse set of activities.
Its approach is integrated in the sense that each unit tries to work towards a common goal
of furthering the development of the poor.
Four types of workers have been trained to carry out the health units programmes
objectives (VHW, HRW, TBA, Pre-school). Health education is a common activity for
all workers. After the initial training each worker is provided with medicine kits and
health education programmes appropriate to his or her function.
The VHW addresses both curative and preventive health. That is, their work
involves health education and treatment of illness. VHWs are required to write reports
and attend monthly meetings at the village and zone levels. On average the VHW is
educated up to the fifth or sixth grade. The traditional dais or TBAs have been retrained
by Seva Mandir to ensure a more hygienic and educated method of child delivery. TBAs
have many functions: educating mothers of the importance of immunization, hygiene,
providing supplementary nutrition to pregnant mothers and discuss family planning
38
methods. HRW differ from VHWs in that they promote traditional remedies. Presently
there are fewer HRWs than VHWs. The preschool programme is a joint programme with
the Women and Child Care Unit. A woman is selected by the villagers to be trained as
a Sanchalika (Pre-school teacher). The Sanchalika provides daily meals to children
between the ages of two and six during the operation of the Balwadi (pre-school). Health
education is taught through the poems and songs and a stress on sanitation and health
checkups by the SM doctor. Minor ailments are also treated by the Sanchalika.
Seva Mandir has also recently opened a referral health centre in Kojwara. The
organization is also involved with immunization camps, cleanliness campaigns and a
health project in government schools.
4.6 Summary
Both the ICDS and NGO programmes attempt to the bridge the gap between the
community and the primary unit of health care by operating at the village level through
community involvement. Table 4.2 illustrates the placements of the ICDS and NGO staff
along with those of the State Health System in terms of political levels.
39

Table 4.2
LEVEL
National
State
District
Block
Sector/Zone
5-8 Villages
Village
Spatial placements of ICDS, NGO and state health system staff.
I CDS
Depanment of Women's Welfare
Director
Program Officer
Chief Development Programme Officer (CDPO)
Lady Supervisor (LS)
Anganwadi• Anganwadi Worker( A W)
Helper
STATE HEALTH SYSTEM
Ministry of Health and Family Welfare
Director of Health Services
Chief Medical Health Officer (CMHO)
Community Health Centre (CHC)
Primary Health Centre (PHC)
Auxiliary Nurse Midwife (ANM) Multi-purpose Worker (MPW)
NGO
Central Office-Health Unit
Health Educator
Zonal Officers
Community Health Worker (CHW) Part-time Motivator
Balwadi• Sanchalika
Village Health Worker (VHW) Traditional Birth Attendant (TBA)
Co-motivator
these are pre-schOol centres operaung m their respected VIllages
40

CHAPTER FIVE
METHODOLOGY
5.1 Introduction
The themes and issues surrounding CIH were discussed in the preceding chapters
to provide a background to the research design, data collection techniques and analysis
outlined in this chapter. Although the research was not based strictly on a quasi-
experimental design, comparison of two CIH programmes was executed using a one
time, cross-sectional approach. The assessment of the two programmes was based on
effectiveness, efficiency and the nature of community involvement using both quantitative
and qualitative techniques.
The problem statement as developed from the literature is as follows:
Problem Statement It has been widely recognized that community involvement in health development is essential, what is lacking, however, are: (1) examples of how to effectively involve the community in improving community health; and (2) assessments of the impact of community involvement on community health.
Research Goal The goal of this research is to examine two operational CIH programmes in terms of their effectiveness, efficiency, and extent of participation in order to demonstrate applications of CIH. The research hypothesis to be tested is: increased participation will produce a more effective and efficient community health programme.
Research Objectives 1) To determine the effectiveness of an NGO and Government based participatory health and nutrition program
2) To determine the financial cost of an NGO and a Government based participatory programme. This will indicate the efficiency of both programmes.
41

3) To identify the characteristics of the NGO and Government based participatory health programmes.
The purpose of the research was to evaluate two programmes in operation in
order to examine how the community is involved in health development and to determine
the effectiveness and efficiency of the health programme. The field research was
conducted from February 1993 to July 1993 in Udaipur District, Rajasthan, India. The
time period covers partially the winter season and the complete summer season.
Table 5.1 summarizes the research issues and techniques used to carry out the
study. A more detailed description of data collection and analysis follows in section 5.2.
42

Table 5.1
Research Objectives
I. Effectiveness
Research questions and techniques used for study.
Indicators
Nutritional status of children
IMR and CMR of the ICDS and NGO sample populations
Questions
Is there a difference in the nutritional status of children participating in the ICDS health programme and those participating in the NGO programme?
Is there a difference in the IMR and CMR of the sample population participating in the !CDS programme and those participating in the NGO programme?
Sub-questions
Is there a significant difference in mean nutritional Z-scores of children participating in the ICDS programme and those participating in the NGO health programmes?
Is there a difference in the prevalence of undernourished and stunted children found in the ICDS and the NGO sample population?
What are the socio-economic indicators that correlate with nutritional status Z· scores?
How much of the variance in nutritional status Z-scores can be attributed to the health programmes?
43
Analysis Techniques
statistical differences (Hest) in height-for-age, weight-for-age, weight-for-height and armcircumference Z-scores for children between the ages of one and five (sample taken from ICDS and NGO health programme participants)· using ANTHRO and SPSS
comparison of !CDS and NGO children falling below -2.00 Z-scores. ANTHRO and SPSS
pearson correlation for continuous variables and the Mann U-Whitney test for nominal variables. SPSS
stepwise forward multiple regression using nutritional starus Z-scores as the dependent variable, and socio-economic and programme variables as the independent variables. SPSS
of the sample population surveyed, divide the number of deaths (up to age I for IMR and up to age 5 for CMR) by the number of children everbom
Data Collection Techniques
anthropometric measurements
household survey, interviews with ANM and MPW
household survey
household survey
household survey, interviews with programme staff, group discussions

2. Efficiency
3. Characteristics of community involvement
Percentage of childrtn and pregnant mothers immunized within tht !CDS and NGO sample population
Percentage of couples using family planning methods
comparison of social cost-benefits of each programme
extent and type of community involvement
Is there a difference in the percentage of childrtn and pregnant mothers immunized in the !CDS programme and those in the NGO health programme?
Is there a difference in the family planning number and methods used by participants in the !CDS health programme and those by the NGO health programme?
What are the difference between the !CDS and NGO health programmes in temls of costs?
What are the benefits in comparison of the costs for both the !CDS and NGO programmes?
What is the difference in the breadth (extent) of community involvement?
What is the difference in the fom1 of community involvement between the !CDS and NGO health programmes?
What are the technical costs (staff time, staff numbers) associated with the !CDS and NGO health programmes?
What are the financial costs associated with the !CDS and NGO health programmes?
Using and adapted GAM, description of the costs incurred for the benefits gained
44
number of children (and pregnant mothers) immunized in the sample population divided by those that were not
record the type of family planning method used from sample populations
comparison of estimated costs
comparison of estimate budget
comparison of GAM
Using an adapted version of Shrimpton's model rank the breadth of community involvement for both the !CDS and NGO health programmes
Using the World Banks model of type of involvement, assess the fonn of participation for both the !CDS and NGO health progranm1es.
household survey, imervic:ws with programmes staff, group discussion
household survey, imervitws with ANM and MPW
!CDS and NGO repons, imervic:ws with programmt staff, panicipant observation
!CDS and NGO repons, interviews, group discussions, panicipant observation

5.2 Data Collection Techniques
The data collected for analysis was obtained primarily from six methods:
1) secondary data collection;
2) household survey;
3) semi-structured interviews with ICDS and NGO programme staff, doctors, nurses
and community workers;
4) anthropometric measurements (height, weight, arm-circumference) of children
ages one to five participating in the CIH programmes;
5) group discussions with villagers, programme staff workers and doctors; and
6) participant observation.
Each of these methods is discussed in greater detail below.
5.2.1 Secondary Data Collection
Prior to field work, an assessment of health and nutrition programmes was
completed. The information for this was obtained by various health and nutrition
documents and papers pertaining to CIH. This was further carried out in Udaipur by
reviewing census data and ICDS and NGO produced documents.
Reports produced by the ICDS and NGO programmes obtained in Udaipur were
used to describe the structure of the programmes and the financial cost of operating the
programmes.
45
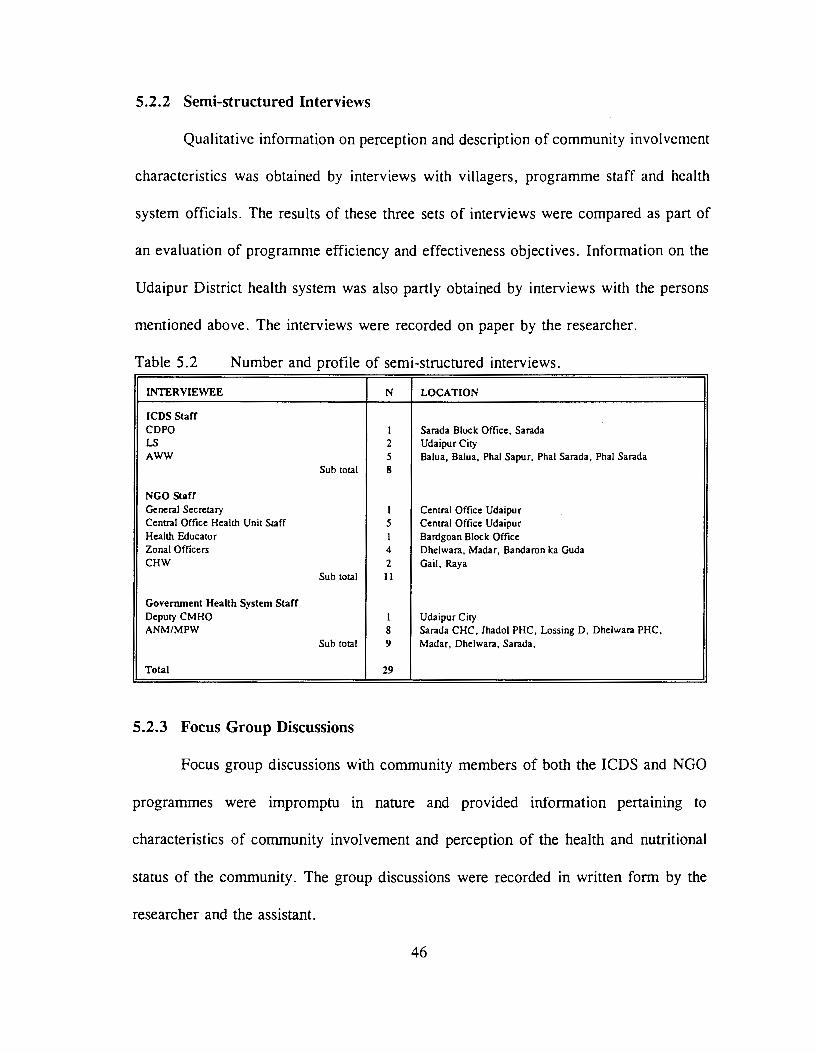
5.2.2 Semi-structured Interviews
Qualitative information on perception and description of community involvement
characteristics was obtained by interviews with villagers, programme staff and health
system officials. The results of these three sets of interviews were compared as part of
an evaluation of programme efficiency and effectiveness objectives. Information on the
Udaipur District health system was also partly obtained by interviews with the persons
mentioned above. The interviews were recorded on paper by the researcher.
Table 5.2 Number and profile of semi-structured interviews.
INTERVIEWEE N LOCATION
ICDS Staff CDPO I Sarada Block Office, Sarada LS 2 Udaipur City AWW 5 Balua, Balua, Phal Sapur, Phal Sarada, Phal Sarada
Sub total 8
NGO Staff General Secretary I Central Office Udaipur Central Office Health Unit Staff 5 Central Office Udaipur Health Educator I Bardgoan Block Office Zonal Officers 4 Dhelwara, Madar, Bandaron ka Guda CHW 2 Gail, Raya
Sub total 11
Govenunent Health System Staff Deputy CMHO I Udaipur City ANM/MPW 8 Sarada CHC, Jhadol PHC, Lossing D, Dhelwara PHC,
Sub total 9 Madar, Dhelwara, Sarada,
Total 29
5.2.3 Focus Group Discussions
Focus group discussions with community members of both the ICDS and NGO
programmes were impromptu in nature and provided information pertaining to
characteristics of community involvement and perception of the health and nutritional
status of the community. The group discussions were recorded in written form by the
researcher and the assistant.
46

Table 5.3 Source of group discussions.
GROUP N LOCATION
I CDS 5 communities In each community a range of 4 to 6 men and Balua (Gandhi Chowk). Balua (Agarath
women were present. A separate discussion was Phala). Phal Sapur. Phal Sarada (Ranath held with the A WW and assistant. Phala). Phal Sarada
NGO 6 communities In each community a range of 4 to 6 men and Gail. Dangyon ka Hunder. Moria Kadia.
women were present. A separate discussion was Bandaron ka Guda, Raya. Kerawadi held with the VHW, Sanchalika and TBA.
Health System Medical officers A group of 5 doctors that specialized in various Jhadol (S) Community Health Centre
aspects of health care.
5.2.4 Household Survey
The information collected during the household survey provided data pertaining
to the effectiveness objective of this thesis. A sample of this survey is shown in
Appendix A. This survey looked at factors that influence nutritional status, specifically
economic resources such as income and occupation, household composition, education,
and ethnic membership (Pelto,P:1989:49-51). The surveys were administered by the
researcher and assistant. The survey was conducted during the early mornings or late
evenings at the houses of children aged one to five who attended the Anganwadi or
Balwadi. The surveyor and respondent communicated using Hindi (Indian language) in
combination with local dialect. The survey responses were written by the surveyor in
English or Hindi (Indian Language).
47

5.2.5 Anthropometric Measurements
To determine the nutritional status of children, anthropometric measurements of
height, weight and arm circumference were used in combination with age and sex of
children between the ages of one and five. The measurements were taken during the
morning sessions of the Anganwadi or Balwadi, the time when the children were
present.
The classification of the data was by sex and age. If a birth certificate was not
readily available and the exact date of birth was not known to the parent, the birth date
was determined by using local festival or seasonal time periods. The anthropometric
measurements were taken by the researcher and the assistant using a suspended scale and
a weighing sling for recording weight for children under two and a spring balance scale
for the older children. The weight was calculated to 0.5 kg with 0.5 kg deducted for
clothing worn by the children. Recumbent length was recorded using a measuring board
for children under two and by a portable stadiometer for children greater than two. Mid
upper-arm circumference was recorded on the left upper arm of the child using a plastic
circumference tape.
Intra-measurement error was minimized by conducting trial measurements on a
given subject. Repeated recording of measurements (height, weight, recumbent length
and arm circumference) on a volunteer by both the researcher and the research assistant
ensured the accuracy and precision of the measurement taken in the field. Inter
measurement error was minimized by training the research assistant in recording and
performing anthropometric measurements.
48
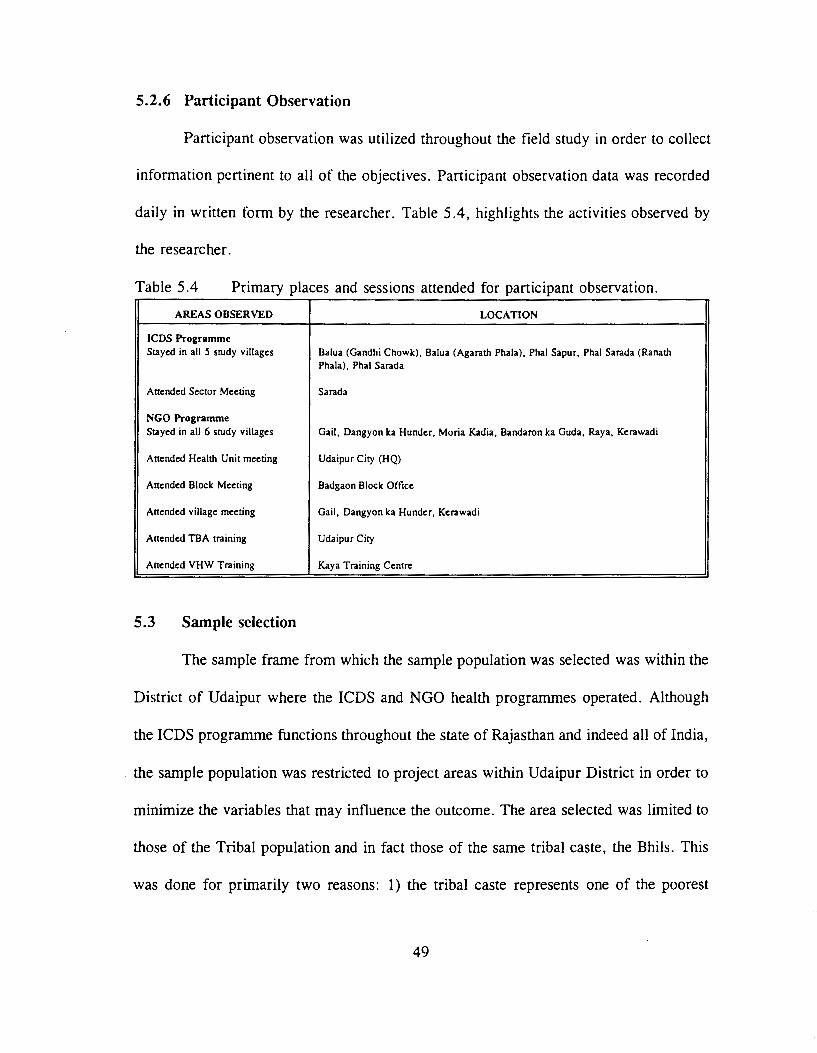
5.2.6 Participant Observation
Participant observation was utilized throughout the field study in order to collect
information pertinent to all of the objectives. Participant observation data was recorded
daily in written form by the researcher. Table 5.4, highlights the activities observed by
the researcher.
Table 5.4 Primary places and sessions attended for participant observation.
AREAS OBSERVED LOCATION
ICDS Programme Stayed in all 5 study villages Balua (Gandhi Chowk), Balua (Agarath Phala), Phal Sapur, Phal Sarada (Ranath
Phala), Phal Sarada
Attended Sector Meeting Sarada
NGO Programme Stayed in all 6 study villages Gail, Dangyon ka Hunder, Moria Kadia, Bandaron ka Guda, Raya, Kerawadi
Attended Health Unit meeting Udaipur City (HQ)
Attended Block Meeting Badgaon Block Office
Attended village meeting Gail, Dangyon ka Hunder, Kerawadi
Attended TBA training Udaipur City
Attended VHW Training Kaya Training Centre
5.3 Sample selection
The sample frame from which the sample population was selected was within the
District of Udaipur where the ICDS and NGO health programmes operated. Although
the ICDS programme functions throughout the state of Rajasthan and indeed all of India,
the sample population was restricted to project areas within Udaipur District in order to
minimize the variables that may influence the outcome. The area selected was limited to
those of the Tribal population and in fact those of the same tribal caste, the Bhils. This
was done for primarily two reasons: 1) the tribal caste represents one of the poorest
49
populations within the district in terms of education, economic situation and accessibility
to health services; and 2) limiting the selection to one type of caste reduces the variability
in food and social habits which may influence the outcome.
Great care was taken in selecting of the sample population to ensure that the
villages selected had very similar lifestyles: livelihood consisting of agriculture and day
labour; similar eating habits, interior location and similar economic potential.
All sample populations from the !CDS programme were selected from Sarada
Block south of the Udaipur city. Five villages or phalas were used in this area. Six
villages or phalas were used from Badgaon Block as sample population for the NGO
programme. It should be noted that additional interviews were taken from persons outside
these respected Blocks to gather more insight on the programmes being evaluated.
5.4 Sample Size
The sample size suggested for determining nutritional status of a population is 75
- 100 children from each of the two programmes (Pelto,P: 1989:46). Eighty-three children
between the ages of one and five were measured in the ICDS programme and 76 children
from the NGO programme. The same numbers respectively constituted the number of
household surveys in each programme.
5.5 Analytical Methods
This section will outline the analytical procedures that were followed to examine
the objectives outlined. The data collected was through survey questionnaires filled out
50

by the researcher and assistants, interviews, group discussion and participant observation.
The closed questions in the household survey were coded and entered on a LOTUS 123
template (refer to Appendix B for code book). The data was then analyzed using the
SPSS software on a personal computer. The anthropometric measurements were analyzed
using the ANTHRO software package then appended to the LOTUS 123 template for
further analysis using the SPSS software. The analysis of effectiveness consisted of
descriptive statistics, bivariate analysis and multivariate analysis.
5.5.1 Effectiveness
To have an understanding of the households existing in both the ICDS and NGO
programmes, descriptive univariate statistics were performed on all variables. The means
and standard deviations were calculated for all continuous variables and the frequency
and percentage occurrence of each level of the categorial variables were calculated. The
preliminary findings were followed by the collapsing of some categorical variables. This
was done if there were too few cases in any level in that category.
The bivariate statistics, through correlations and associations were analyzed. The
student's T-test, the chi square test and the pearson correlation were used to determine
association and independence between the variables of the ICDS and NGO programmes.
The anthropometric measurements taken included weight, height and arm
circumference of children between the ages of one and five. These specific measurements
were recorded in order to establish the indices of height-for-age, weight-for-age, weight
for-height and arm circumference-for-age. Weight-for-height is a sensitive index of
51

present nutritional status (wasting) and height-for-age infers past nutritional status
(stunting) (WH0,1986:931). Mid-upper-arm circumference assesses fat-free mass and
thus will be used to predict total body muscle mass and hence protein nutritional status
(Gibson, 1990:200).
The anthropometric data was analyzed using the ANTHRO software package
which is based on the United States National Centre for Health Statistics reference data
set (NCHS). This included the use of Z-scores (standard deviation from the mean) which
is recommended for analysis of children in developing countries (Waterlow et
al., 1977:493). Arm circumference data was compared to the reference data set of the
NHANES 1 study compiled by the NCHS. The data set has sex, age and race specific
percentiles, means and standard deviations for mid-upper arm circumference for children
(Gibson, 1990:237).
As outlined previously, the indices were then appended to the LOTUS template
for further bivariate and multivariate analysis. A student T-test was used for continuous
variables and chi sq. sig. was used for categorical variables to explore the possibilities
of significant differences between the nutrition indices and other variables of the ICDS
sample population and the NGO population. Pearson's correlation and the Mann-Whitney
U test were used to assess the associations between the nutritional indices and socio
economic variables. Linear regression (multivariate analysis) was used to analyze the
variables that influence the nutritional indices with both programmes combined.
Participant observation, semi-structured interviews and group discussions were used as
perception of nutritional status and for triangulation.
52

The infant and child mortality rates were estimated by dividing the total number
of births by the total number of deaths. The estimated infant and child mortality rates of
the ICDS programme sample was compared to that of the NGO programme sample.
Perception of IMR and CMR of each programme was elicited by doctors and nurses
working in the area, programme staff, community members and health officials.
This issue was explored using percentage frequency and the student T -test
obtained from data collected from the household survey. Perception of child and mother
immunization rates of the ICDS and NGO sample population was elicited from doctors
and nurses working in the area, programme staff, community members and health
officials.
The data obtained from the household survey was used for a chi-square test to
answer this issue with verification and perception measured from discussions with doctors
and nurses working in the area, programme staff, community members and health
officials.
5.5.2 Efficiency
Efficiency was evaluated for data obtained from reports written by the ICDS and
NGO programmes. Recurring annual cost per village was estimated from this
information. The framework described previously for determining technical and financial
costs was used.
53
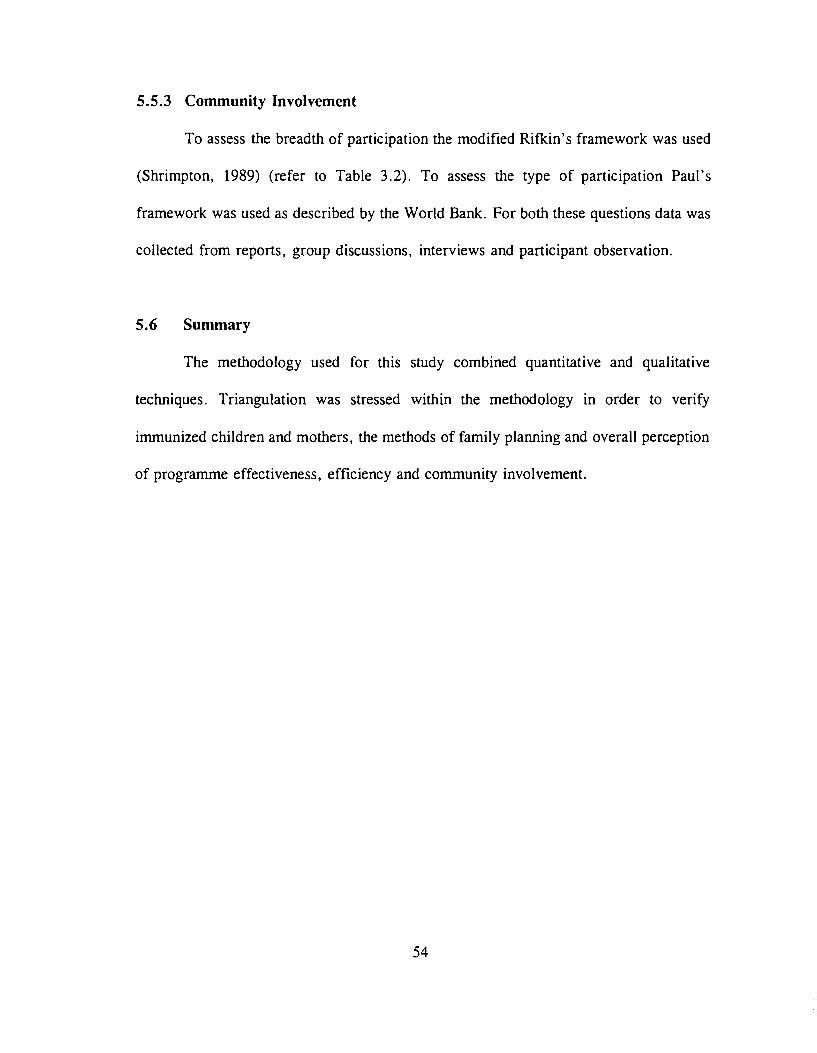
5.5.3 Community Involvement
To assess the breadth of participation the modified Rifkin's framework was used
(Shrimpton, 1989) (refer to Table 3.2). To assess the type of participation Paul's
framework was used as described by the World Bank. For both these questions data was
collected from reports, group discussions, interviews and participant observation.
5.6 Summary
The methodology used for this study combined quantitative and qualitative
techniques. Triangulation was stressed within the methodology in order to verify
immunized children and mothers, the methods of family planning and overall perception
of programme effectiveness, efficiency and community involvement.
54

PART II: STUDY RESULTS & DISCUSSION
CHAPTER SIX
SOCIO-ECONOMIC DIFFERENCES BETWEEN THE ICDS AND NGO
SAMPLE POPULATIONS
6.1 Introduction
This chapter describes the study areas selected for both the ICDS and
NGO programmes using the variables obtained from the household survey. The
descriptions include the differences observed between the two programme areas.
6.2 Differences Between the ICDS and NGO Programme Areas
The household survey was answered by more female than male heads of
households in both the ICDS and NGO communities (77.1% and 66.7% respectively).
Children were not present during most of the survey for both the ICDS and NGO
communities (36.1% and 24.4% respectively). There was however, a significant
difference between the ICDS and NGO community in terms of neighbours present and
an ICDS or NGO staff member present during the household survey. Neighbours and
workers were present more so during the ICDS survey (chi sq. sig. at 0.01 level).
55

Table 6.1 Frequencies and percentage of persons present during time of household survey conducted in the ICDS and NGO study areas.
PERSONS PRESENT DURING SURVEY Frequency Percentage Chi Sq. Sig I CDS NCO ICDS NGO
Male head present during survey yes 50 40 60.2 51.3 0.97 no 33 38 39.8 48.7
Female head present during survey yes 64 52 77.1 66.7 1.69 no 19 26 22.9 33.3
Children present during survey yes 30 19 36.1 24.4 2.11 no 53 59 63.9 75.6
Neighbours present during survey yes 4 18 4.8 23.1 9.87 .. no 79 60 95.2 76.9
Worker of NGO or ICDS present during survey yes 62 24 74.7 30.8 29.44** no 21 54 25.3 69.2
* :SU.U5; •• :SU.UI; •••1 :SU.UUI p p p
6.2.2 Survey Population Household Characteristics
Approximately two thirds of the survey was answered by nuclear families in both
the ICDS and NGO villages. The rest of the households consisted of joint families and
a few extended families. Almost all households participating in the survey were
Scheduled Tribes, with the exception of one family in the ICDS villages being a
Scheduled caste member and three of the NGO households being of a general caste. This
reflects data compiled by other researchers where in Udaipur District, the Bhils reported
nuclear families accounting for approximately 70% of the households
(Chaudhary: 1978:43).
56
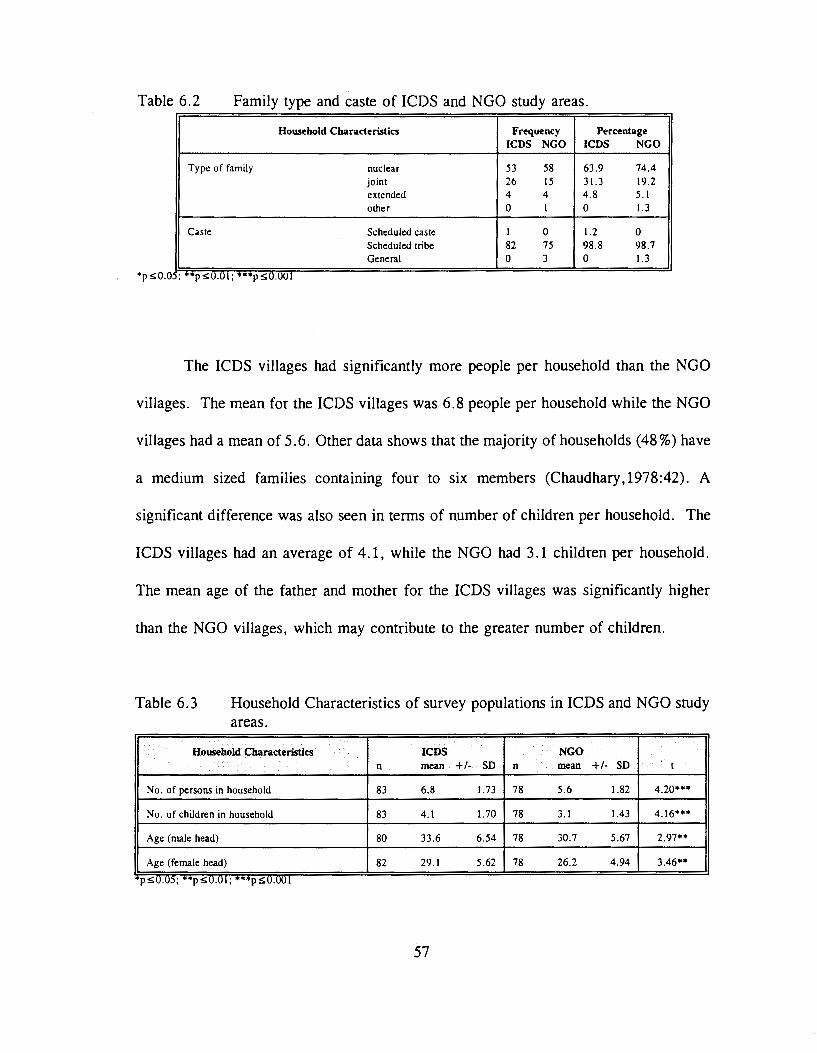
Table 6.2 Family type and caste of ICDS and NGO study areas.
Household Characteristics Frequency Percentage ICDS NGO I CDS NGO
Type of family nuclear 53 58 63.9 74.4 joint 26 15 31.3 19.2 ell tended 4 4 4.8 5.1 other 0 I 0 1.3
Caste Scheduled caste I 0 1.2 0 Scheduled tribe 82 75 98.8 98.7 General 0 3 0 1.3
; .,., :S:U.UI; •••t :S:U.UOI
The ICDS villages had significantly more people per household than the NGO
villages. The mean for the ICDS villages was 6.8 people per household while the NGO
villages had a mean of 5.6. Other data shows that the majority of households (48%) have
a medium sized families containing four to six members (Chaudhary,1978:42). A
significant difference was also seen in terms of number of children per household. The
ICDS villages had an average of 4.1, while the NGO had 3.1 children per household.
The mean age of the father and mother for the ICDS villages was significantly higher
than the NGO villages, which may contribute to the greater number of children.
Table 6.3 Household Characteristics of survey populations in ICDS and NGO study areas.
Household Characteristics ICDS NGO n mean +I- SD n mean +I- SD t
No. of persons in household 83 6.8 1.73 78 5.6 1.82 4.2o•••
No. of children in household 83 4.1 1.70 78 3.1 1.43 4.16*••
Age (male head) 80 33.6 6.54 78 30.7 5.67 2.97**
Age (female head) 82 29.1 5.62 78 26.2 4.94 3.46**
p ~U.U); ••r ~U.UI; "''"•1 ~U.UOI p p
57

Education levels were minimal for male and female heads of household, however
the male mean head of household averaged more years of education than the females.
The number of years of education for males was 1. 75 and 1.37 years respectively for the
ICDS and NGO villages. These figures were considerably lower than the India average
of 3.5 years of schooling for males (UNDP,1990:145). The ICDS and NGO sample
populations recorded a much lower average for years of schooling for females than the
India average of 1.2 years. (refer to Table 6.4)
Table 6.4 Education levels of male and female heads of households of survey populations in ICDS and NGO study areas.
Years of Education I CDS NGO n mean +I- SD n mean +I- SD I
Education - male (yrs) 80 1.75 3.03 78 1.37 2.38 0.87
Education - female (yrs) 82 0.12 0.78 78 0.24 1.24 0.74
p S0.05; ••1 SO.OL; •••1 SO.OOI p p
There were no significant differences found between the two survey populations in terms
of literacy. The numbers tabulated reflect the 1991 census data which indicates that very
low percentage of rural populations are literate and even fewer females are (GOI, 1991).
Table 6.5 Frequency and percentage of literate males and females in the ICDS and NGO study populations.
Uterate Value Frequency Percentage Chi Sq. Sig. ICDS NGO ICDS NGO
Father literate yes 26 28 32.5 35.9 0.08 no 54 50 67.5 64.1
Mother literate yes 2 6 2.4 7.7 1.35 no 80 72 97.6 92.3
*pS0.05; **pSO.OI; ***pSO.OOI
Income and income proxies were used to determine the economic status of
households. The NGO male head of household earned significantly more (787.82 Rp.per
month approximately $32 Canadian) than the ICDS male head of house hold (599.37 Rp.
58

per month approximately $24 Canadian per month)5 • If one examined total family
income, there was no significant difference found between the ICDS and NGO sample
populations. In both areas, most of the income was earned through day labour followed
by government office or clerical related service. Income derived strictly from labour was
significantly higher for the NGO area. Gross income in the form of cash, is earned
during eight months of the year, the remaining months reserved for agricultural
production. The ICDS community on average owns significantly more livestock as
indicated by the increase in livestock units.
Table 6.6 Income levels of households in the ICDS and NGO study areas.
Income Levels ICDS NGO t
n mean +I- SD n mean +I- so
Income - male 80 599.37 547.37 78 787.82 468.08 2.33*
Income · female 82 26.22 88.18 78 19.23 55.38 0.60
Income total 83 724.70 585.76 78 895.26 527.97 1.94
Income per capita from total 83 111.56 85.68 78 171.05 109.22 -3.83* ..
p SU.U5; ••t SU.Ul; •nt SU.UUI p p
The possessions of certain items were surveyed as an income proxy. A bicycle
was reported in the homes of 26.5% of ICDS families and 61.5% of NGO families.
Radios were in 12% of ICDS families, while 26.9% of NGO families possessed radios.
Both these items showed a significant difference between the two areas.
5 At the time of field srudy. one Canadian dollar was approximately equal to 25 Rupees.
59

Table 6.7 Possession of certain household items by the ICDS and NGO survey population.
Income proxy Frequency Percentage Chi Sq. Sig. ICDS NGO I CDS NGO
Possession of radio yes 10 21 12 26.9 4.80* no 73 57 88 73.1
Possession of bicycle yes 22 48 26.5 61.5 18.68••• no 61 30 73.5 38.5
Possession of television yes I 0 1.2 0 .00 no 82 78 98.8 100
Possession of tractor yes I 0 1.2 0 .00 no 82 78 98.8 100
Possession of motorbike yes 6 3 7.2 3.8 .35 no 77 75 92.8 96.2
p::>U.U5; ••p::>U.Ul; **"'p::>U.UUI
There was no significant difference found between the ICDS and NGO villages
with respect to amount of com, wheat and other grains harvested, however the number
of livestock (as calculated by livestock units) owned by the ICDS population was found
to be significantly greater.
Table 6.8 Agricultural data reported by the ICDS and NGO study populations.
Agricultural Data I CDS NGO n mean +I-SD n mean +lSD t
Livestock units 83 2.87 1.79 78 2.06 1.36 3.21**
Total land owned 83 4.15 4.20 78 4.42 3.93 0.42
Cultivated land 83 2.85 2.44 78 2.57 1.85 0.82
Boras of Com Harvested/yr 83 2.49 1.54 78 2.93 1.67 1.70
Boras of Wheat Harvested/yr 83 1.94 1.80 78 2.07 1.93 .43
Extra grains Harvested /y r 83 0.73 2.61 78 0.29 0.69 1.46
*p::>U.U5; **p::>U.U1; ***p::>O.UU1
Houses were owned by 100% of the families in the ICDS community and 97.4%
of the NGO community. There was however a significant difference found in the
number of rooms in a house, with the ICDS community averaging 1.58 rooms and the
NGO community averaging 1.12 rooms per house. The kitchen was separated more in
60

ICDS households than NGO households. There was no significant difference found
between the ICDS and NGO households in terms of type of roof, wall, or floor. Almost
all households used sticks and shingles for roofs, stones and mud for walls and mud for
floors.
A significant difference was seen with respect to electricity in the households.
Forty-one percent of NGO households had electricity in their houses while only 3.6% of
ICDS households had electricity. Of the households that had electricity available, the
majority used it for a single bulb.
Table 6.9 House/land characteristics reported by the ICDS and NGO sample populations.
House/Land Characteristics Frequency Percentage Chi Sq. Slg. ICDS NGO I CDS NGO
Status of house rented 0 2 0 2.6 .57 owned 83 76 100 97.4
Type of roof sticks and shingles 80 75 96.4 96.2 3.01 cement 3 I 3.6 1.3 stones and lime 0 2 0 2.6
Type of wall mud 0 I 0 1.3 2.68 stones 0 I 0 1.3 stones and mud 79 74 95.2 94.9 bricks with cement 4 2 4.8 2.6
Type of floor mud 81 78 97.6 100 .44 cement 2 0 2.4 0
Electricity in the house yes 3 32 3.6 41 30.92··· no 80 46 96.4 59
Land owned 80 75 98.8 96.2 .30 rented I 3 1.2 3.8
p!>0.05; ••p!>O.OI; •••p!>O.OOI
Reported sources of drinking water and non-drinking water were identical in both
the ICDS and NGO sample populations. It was reported that 62.7% ofiCDS households
obtained water from communal handpumps and 33% of NGO households obtained water
from communal handpumps. Seventy-five percent of Indian households have access to
61

safe drinking water (UNDP,1993: 137). More NGO households obtained water from open
wells with stairs than the ICDS households. While all households in both areas strained
the drinking water, 96.4% of the ICDS households used a plastic funnel distributed by
UNICEF, and 100% of NGO households used a double cheesecloth. How households
take water out of the "matka" was found to be significantly different between the ICDS
households and the NGO households. Ninety-three percent of the ICDS households used
a "Iota" (glass) while 64.1% of NGO households use a "danda wallah Iota" (glass with
a long handle).
Table 6.10 Cooking, Drinking and medical characteristics reported by the ICDS and NGO survey populations.
Cooking, Drinking, Medical Frequency Percentage Chi Sq. Slg. Measurements I CDS NGO ICDS NGO
Type of stove Chula 81 76 97.6 97.4 .00 Chula and gas 2 2 2.4 2.6
Ventilation window 3 0 3.6 0 7.19 proper roof 72 71 86.7 91 stove outside 0 3 0 3.8 window &proper roof 8 4 9.6 5.1
Drinking water obtained from handpump 52 25 62.6 32.0 13.89*** well 31 53 37.3 67.9
If well, what type stair 7 32 22.6 60.4 9.77** rope 24 21 77.4 39.6
Drinking water kept matka 83 78 100 100 can not do
Do you strain the drinking water yes 83 78 100 100 can not do
Water is strained through plastic filter 80 0 96.4 0 145.60••• double cheese cloth 3 78 3.6 100
What do you use to take out water Iota 77 28 92.8 35.9 54.86*** from the matka Iota with handle 6 50 7.2 64.1
Does anyone add medicine to the yes 35 21 42.2 26.9 3.47 water no 48 57 57.8 73.1
Where does your family defecate personal latrine 2 5 2.4 6.4 .73 field 81 73 97.6 93.6
p :S0.05: **t :SO.OJ· *** :SO.OO! • p p
No significant difference was found in the number of people who smoke between
62

the ICDS and NGO households. With 60.2% and 60.3% of someone smoking in the
ICDS and NGO households respectively. An average of 0.59 and 0.63 packages of
cigarettes were smoked by the ICDS and NGO households respectively. A lower
percentage of persons in households reported drinking alcohol, with 12% of ICDS
households and 9% of NGO households. Most households in the ICDS and NGO sample
populations brushed their teeth with powder/paste or neem6• Approximately half the
households in both sample populations used soap for bathing. More ICDS households
used a blade to cut fingernails (84.3%) than NGO households (60.3%). The NGO
households used more nail cutters and scissors (0.01 significance).
Table 6.11 Health characteristics reported by the ICDS and NGO study populations.
Health Data Frequency Percentage Chi Sq. Slg ICDS NGO ICDS NGO
Does anyone in the household smoke yes 50 47 60.2 60.3 .00 no 33 31 39.8 39.7
Does anyone in household drink yes 10 7 12 9 .14 alcohol no 73 71 88 91
What do they use to brush their brush/powder/paste 7 14 8.4 17.9 2.42 teeth with neem/rock 76 64 91.6 82.1
What do they use to bathe with soap 40 45 48.2 57.7 3.54 water only 15 17 18.1 21.8 sometimes soap 28 16 33.7 20.5
What do they use to cut the nails blade, knife 76 55 91.6 70.5 10.41** with scissors, nail-cutter 7 23 8.4 29.5
pSU.U5; **pSU.UI; ***pSO.OOI
6.3 Summary and Discussion
Similarities between the selected ICDS and NGO study areas was noted in terms
of livelihood and culture. The differences brought out by the household survey show that
6 The twig off a neem tree has antibacterial effects, and thus when chewed acts as a substitute for brushing (Research Foundation for
Science, Technology and Natural Resource Policy ,1993:3).
63

the average age of the ICDS population is older which may explain the increase in family
size. The NGO community is younger and tend have fewer children. The average years
of education earned by the male head of household is minimal and even worse for female
head of household, indicating the continuing literacy problem facing tribals in Rajasthan.
However, three-times as many females are literate in the NGO sample population as
compared to the ICDS sample population most probably due to the NGOs drive for adult
literacy.
Gross income per capita, is significantly higher for the NGO sample population.
The greater income of the NGO population may explain the increase in possessions such
as radios and bicycles. Although families of the ICDS population have less income, they
own significantly more livestock. The land cultivated by the ICDS households, is slightly
greater than that cultivated by the NGO households.
The difference found in source of drinking water and type of filter system used
is due to a campaign by SWACH. This campaign was initiated due to the outbreak of
guinea worm infestation in parts of Udaipur District. The campaign involved educating
households to the use of filters donated by the UNICEF project and the closing of stair
wells. Thus very few stair wells are left in the ICDS study areas, mostly being converted
to handpumps and virtually all households use the plastic filter. The NGO study area, on
the other hand, has not been the target of the SW ACH project, and thus have not had the
advantage of handpumps being constructed. The NGO has provided cheese cloth to be
used as filters for the households participating in the health programme as filters. The
NGO has also stressed the use of handled glasses to take out the drinking water from the
64

"matka" and thus an increase in use in the NGO study areas was evident.
A significant difference was found in tenns of where households seek consultation
on health matters. While all ICDS households rely on the nearest PHC, 65% of NGO
households approach the VHW in their area. This difference may be attributed to the fact
that the !CDS project in Sarada does not dispense any medicine. This is an exception in
the ICDS pro gramme, where most A WW do treat minor ailments.
65

CHAPTER SEVEN
ASSESSMENT OF THE EFFECTIVENESS OF THE ICDS
AND NGO HEALTH PROGRAMMES
7.1 Introduction
The findings resulting from the effectiveness analysis are presented in this
chapter. Programme effectiveness, as measured by nutritional status, infant and under
five mortality rates, percentage of children and pregnant mothers immunized, and use of
family planning methods, are discussed in terms of both the quantitative and qualitative
methods utilized in the research.
7.2 Nutritional Status
Nutritional status of children is regarded as an indicator of health and is used to
assess the effectiveness and/or impact of health and nutrition programmes. The objective
of anthropometric assessment is to provide an estimate of the prevalence of malnutrition
in a given population. This section examines the raw anthropometric measurements
collected of children participating in the ICDS and NGO programmes, followed by the
assessment of their nutritional status using standardized Z-scores. The Z-scores when
assessed using the NCHS reference data set, help to determine the prevalence of
malnutrition within each programme. Factors that influence nutritional status were
examined using correlations and the percentage of variation explained by the type of
programme was analyzed using multiple linear regression.
66
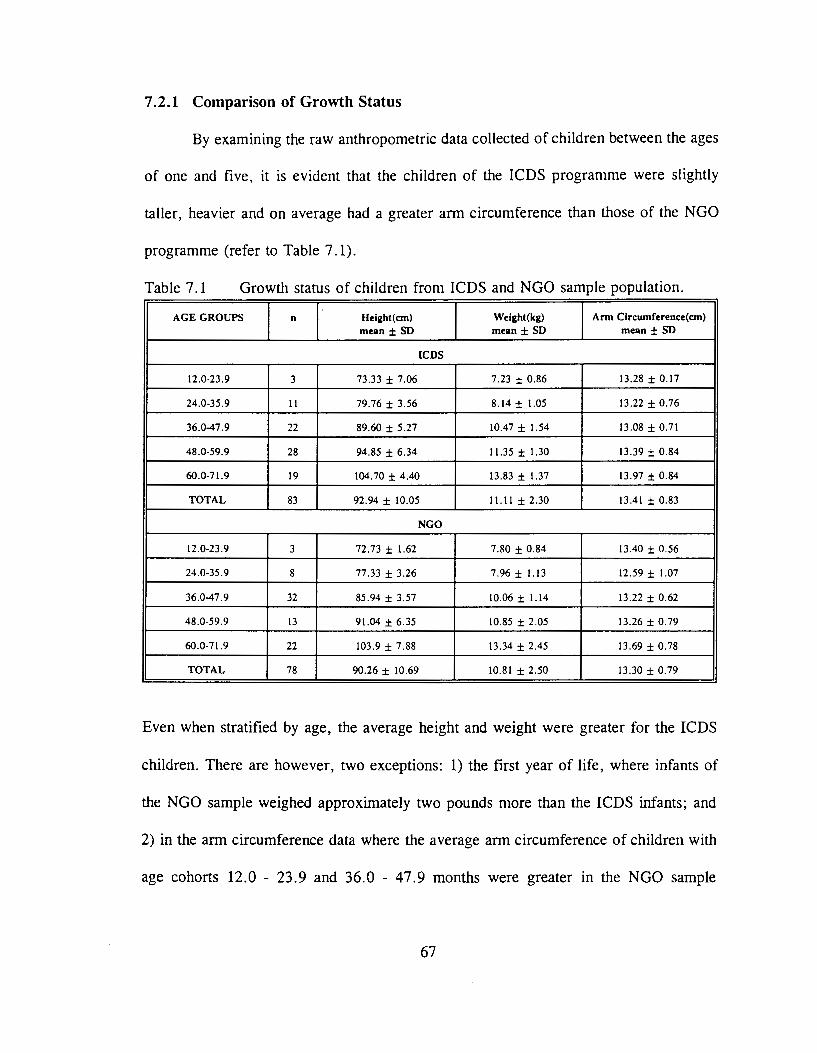
7 .2.1 Comparison of Growth Status
By examining the raw anthropometric data collected of children between the ages
of one and five, it is evident that the children of the ICDS programme were slightly
taller, heavier and on average had a greater arm circumference than those of the NGO
programme (refer to Table 7 .1).
Table 7.1 Growth status of children from ICDS and NGO sample population.
AGE GROUPS n Height( em) Welght(kg) Arm Clrcumference(cm) mean± SD mean± SD mean± SD
I CDS
12.0-23.9 3 73.33 ± 7.06 7.23 ± 0.86 13.28 ± 0.17
24.0-35.9 II 79.76 ± 3.56 8.14 ± 1.05 13.22 ± 0.76
36.0-47.9 22 89.60 ± 5.27 10.47 ± 1.54 13.08 ± 0.71
48.0-59.9 28 94.85 ± 6.34 11.35 ± 1.30 13.39 ± 0.84
60.0-71.9 19 104.70 ± 4.40 13.83 ± 1.37 13.97 ± 0.84
TOTAL 83 92.94 ± 10.05 11.11 ± 2.30 13.41 ± 0.83
NGO
12.0-23.9 3 72.73 ± 1.62 7.80 ± 0.84 13.40 ± 0.56
24.0-35.9 8 77.33 ± 3.26 7.96 ± 1.13 12.59 ± 1.07
36.0-47.9 32 85.94 ± 3.57 10.06 ± 1.14 13.22 ± 0.62
48.0-59.9 13 91.04 ± 6.35 10.85 ± 2.05 13.26 ± 0.79
60.0-71.9 22 103.9 ± 7.88 13.34 ± 2.45 13.69 ± 0.78
TOTAL 78 90.26 ± 10.69 10.81 ± 2.50 13.30 ± 0.79
Even when stratified by age, the average height and weight were greater for the ICDS
children. There are however, two exceptions: 1) the first year of life, where infants of
the NGO sample weighed approximately two pounds more than the ICDS infants; and
2) in the arm circumference data where the average arm circumference of children with
age cohorts 12.0 - 23.9 and 36.0 - 47.9 months were greater in the NGO sample
67

population than that of the ICDS programme. It is also apparent that while height and
weight increase as age increases, mid-arm circumference tends to fluctuate. This is seen
in children participating in both the ICDS and NGO programmes.
7 .2.2 Bivariate Analysis of Nutritional Status
The raw anthropometric measurements were standardized as Z-scores using the
NCHS data set as a reference. The calculated Z-scores, height-for-age, weight-for-age,
weight-for-height and arm circumference for each child, revealed that there was a
significant difference found between the nutritional status of the ICDS children and that
of the NGO children population in terms of height-for-age (Table 7.2). The mean score
for the ICDS children was -1.69 compared to -2.23 for the NGO children. Growth
stunting (height-for-age Z-score ::;; -2.00) was prevalent with NGO children. There was,
however, no significant difference found for the indicator weight-for-height, the
indication of present nutritional status or wasting. The other two indices, weight-for-age
and mid-arm circumference, recognized as measures of protein energy malnutrition
(PEM), were not significantly different either. It must be emphasized that three out of
the four indices are substantially lower than the NCHS norms; one falling a complete
three standard deviations below, indicating a malnourished population especially in terms
of wasting and protein energy malnutrition.
68

Table 7.2
MEASURE
Height-for-age
Weight-for-age
Weight-for-height
Comparison of mean Z-scores of height-for-age, weight-for-age, weightfor-height and mid arm circumference for children between the ages of one and five participating in the ICDS and NGO programmes.
ICDS NGO n mean SD n mean SD t-slg
83 ·1.6969 1.329 78 -2.2317 1.324 2.56•
83 -2.8864 0.917 78 -3.0851 0.897 1.39
83 -2.4771 0.800 78 -2.4315 0.905 0.34
Mid arm circumference 83 -2.7302 0.746 78 -2.8429 .630 1.04
• p S: U.U.:>
When graphed by age, the Z-score height-for-age is shown to have similar
patterns for both the ICDS and NGO populations with the ICDS figures maintaining a
greater Z-score for all age cohorts (Figure 7.1). A steady increase in height-for-age Z-
score is observed with an increases in age until the age cohort of 48 to 59.9 months
where a decline is present. This is seen to be common for nutritionally deprived children
(Choudhry, M and Rao, 1983:18). By the age of three, the ICDS sample population is
found to be greater than the -2.00 Z-score, indicating a lesser degree of stunting. The
NGO sample struggles within the range of -2.5 and -3.0 Z-scores until the age of five.
69

Figure 7.1 Mean height-for-age Z-scores in the !CDS and NGO samples; presented by age.
Z-score 0.5.----------------------------.
0+-------------------------------~
-0.5
-1
-1.5
-2
-2.5
-3
-3.5+-----~~----~------~----~
12-23.9 24-36.9 36-47.9 48-69.9 eo+
Age in months
--...- ICDS -+- NGO
The Z-score weight-for-age, appears to increase with age with the exception of a
decline exhibited for the NGO sample population for children between the age of 24 and
35.9 months (Figure 7.2). This is in contrast to the findings of others who note that a
decline is usually present after the first year of life, but not the second, when breast
feeding no longer meets their nutrient needs and complementary food is inadequate
(Gopaldas, Patel & Bakshi, 1988:31 ). A possible explanation may lie with the time of
weaning. In the area of surveyed, weaning may not start until the child is in the second
year of life. Furthermore, because such a small sample of children was used when
stratified by age (3), it may not reflect the situation accurately. The ICDS population
sample shows a steady incline reaching a plateau between the ages of 36 and 60 months.
70

Both populations still do not reach the cut-off point of -2.00 weight-for-age Z-score,
indicating that the degree of underweight is greater than that of stunting.
Figure 7.2 Mean weight-for-age Z-scores in the ICDS and NGO samples; presented by age.
Z-score
-1
-2
-3
-4
-~+-------.-------.------.~----~
12-23.9 24-35.9 36-47.9 46-~9.9 60-72
Age in months
--*-- ICDS -+- NGO
Prevalence of Malnutrition
Prevalence of malnutrition may be estimated using cut off points of Z-scores.
Using the NCHS as a reference data set, the percentage of children lower than the -2.00
Z-score are considered to be mildly malnourished, those less than -3.00 Z-score are
considered to be moderately malnourished and if a Z-score of less than -4.00 is reported,
the children are considered to be severely malnourished. The form of malnutrition
depends on the variable used (ie. weight-for-age, height-for-age or weight-for-height).
The prevalence of stunting or past nutritional status (height-for-age ::;; -2.00), was
71
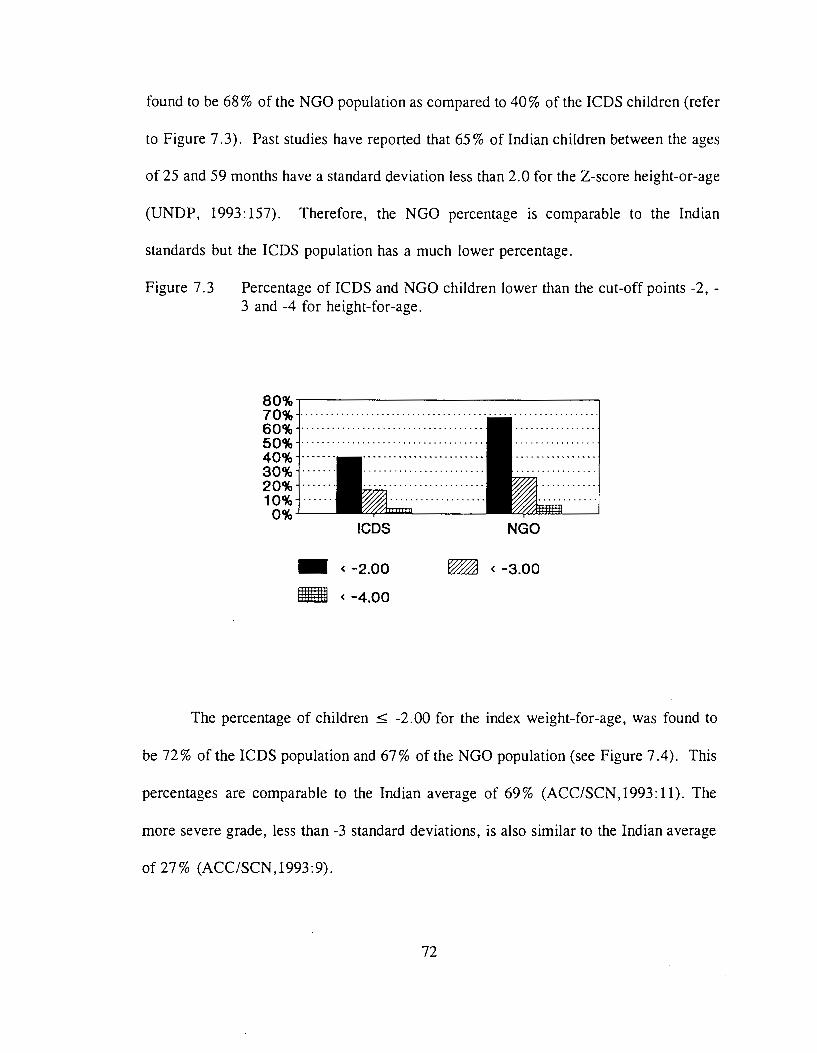
found to be 68% of the NGO population as compared to 40% of the ICDS children (refer
to Figure 7.3). Past studies have reported that 65% of Indian children between the ages
of 25 and 59 months have a standard deviation less than 2.0 for the Z-score height-or-age
(UNDP, 1993: 157). Therefore, the NGO percentage is comparable to the Indian
standards but the ICDS population has a much lower percentage.
Figure 7.3 Percentage of ICDS and NGO children lower than the cut-off points -2, -3 and -4 for height-for-age.
80%~----------------------------~
70% ··································· 60% ···································· 50%···································· 40% 30% 20% 10%
0%...____ !CDS NGO
- < -2.00 ~ < -3.00
- < -4.00
The percentage of children ~ -2.00 for the index weight-for-age, was found to
be 72% of the ICDS population and 67% of the NGO population (see Figure 7.4). This
percentages are comparable to the Indian average of 69% (ACC/SCN,1993:11). The
more severe grade, less than -3 standard deviations, is also similar to the Indian average
of 27% (ACC/SCN,1993:9).
72

Figure 7.4 Percentage of ICDS and NGO children lower the cut-off points, -2, -3 and -4 for the indicator weight-for-age.
80%.------------------------------,
60%
40%
20%
0%-'----I CDS
- < -2.00
- < -4.00
NGO
~ < -3.00
The majority of children in both programmes suffer from wasting as indicated by
present nutritional status (weight-for-height ~ -2.00) (Refer to Figure 7.5). Although
this figure was calculated for children between the ages of one and five it is interesting
to note that the percentage is much higher than that reported elsewhere. The Human
Development Report stated that 27% of Indian children between the ages of 12 and 23
months were reported to be less than -2 standard deviations for the Z-score weight-for-
height (1993: 157). PEM as indicated by arm circumference, also shows that the majority
of children in both programmes suffer this form of malnutrition.
73

Figure 7.5 Percentage of ICDS and NGO children lower than the cut-off points -2,-3 and -4 for the indicator weight-for-height.
100%.-----------------------------~
80%
60%
40%
20%
0% I CDS
- < -2.00
- < -4.00
NGO
~ < -3.00
Gender Differences
Although a preference for boys in India, and specifically Rajasthan, has been well
documented (Dept. of Women and Child Development,1991:10). Table 7.3 shows that
only one nutritional status indicator, mid arm-circumference, demonstrated a significant
difference in the case of gender. However, not in favour of males, but rather females.
The preference of the boy child is not as prominent for the Bhils, as the girl child is an
asset in two ways; when unmarried, she assists in household and agricultural work and
when married brings for her father a considerable amount of bride price (Vyas,1992:62).
74
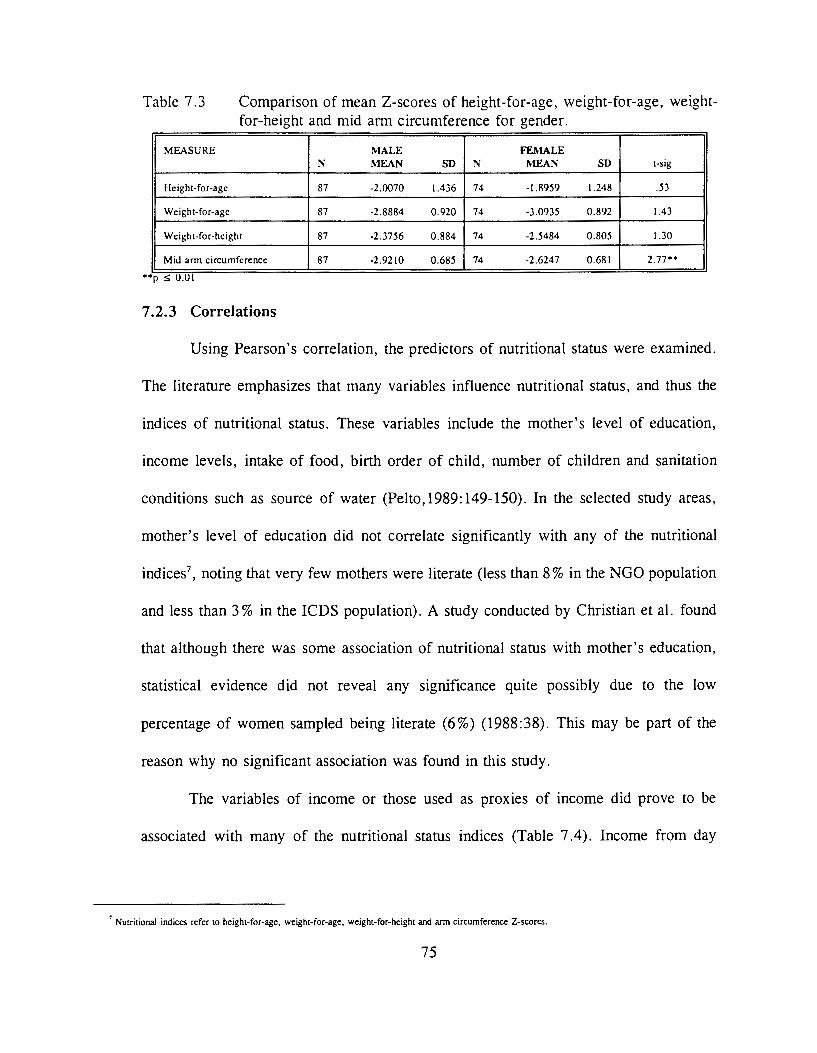
Table 7.3 Comparison of mean Z-scores of height-for-age, weight-for-age, weightfor-height and mid arm circumference for gender.
MEASURE MALE FEMALE N l'ilEAN SD N MEAN SD t-sig
Height-for-age 87 -2.0070 1.436 74 -1.8959 1.248 .53
Weight-for-age 87 -2.8884 0.920 74 -3.0935 0.892 1.43
Weight-for-height 87 -2.3756 0.884 74 -2.5484 0.805 1.30
Mid amt circumference 87 -2.9210 0.685 74 -2.6247 0.681 2.77 ..
7.2.3 Correlations
Using Pearson's correlation, the predictors of nutritional status were examined.
The literature emphasizes that many variables influence nutritional status, and thus the
indices of nutritional status. These variables include the mother's level of education,
income levels, intake of food, birth order of child, number of children and sanitation
conditions such as source of water (Pelto, 1989: 149-150). In the selected study areas,
mother's level of education did not correlate significantly with any of the nutritional
indices7, noting that very few mothers were literate (less than 8% in the NGO population
and less than 3% in the ICDS population). A study conducted by Christian et al. found
that although there was some association of nutritional status with mother's education,
statistical evidence did not reveal any significance quite possibly due to the low
percentage of women sampled being literate (6%) (1988:38). This may be part of the
reason why no significant association was found in this study.
The variables of income or those used as proxies of income did prove to be
associated with many of the nutritional status indices (Table 7.4). Income from day
7 Nutritional indices refer to height-for-age, weight-for-age, weight-for-height and arm circumference Z-scores.
75

labour and electricity (a proxy variable for income) were positively correlated with the
indicator height-for-ag~. For the indicator weight-for-age, income from day labour was
found to be positively associated. Four variables were associated with the weight-for-
height indicator, with three of the four being negative associations. The associations with
arm circumference were minimal and negative.
Table 7.4 Pearson's correlation scores of height-for-age, weight-for-age, height-forweight and mid arm circumference Z-scores with income variables.
VARIABLES Height-for-age Welght-for-age Weight-for- Mid arm Z.score Z.score helght Z.score circumference Z.Score
Father income -.0783 .0017 -.0511 -.1698*
income from day labour .1381* .2060 .. -.1273 .1115
per capita father income -.0640 .0423 -.0814 -.1435*
per capita day labour .0291 . 1787* .1968 .. .1035
*pSU.U5; ••psU.Ul; •••psU.UOl
Other variables that correlated with the standardized measures of nutritional status
are summarized in Table 7.5. The more significant variables associating with height-for-
age include the number of years child has attended the centres and father's age. Weight-
for-age associated positively with years child has attended the centre as well. Weight-for-
height and arm circumference did not significantly correlate with any of the variables (p
~ 0.001).
76

Table 7.5 Pearsons correlation scores of individual and household parameters with standardized measures of children's nutritional status.
VARIABLES Height-for- Weight-for- Weight-for- Mid-ann age Z-score age Z-score height Z.score circumference z-
score
fathers's age .1962 .. .0666 -.1057 .1325•
mother's age .1579• .0279 -.1109 .0985
days per week child attends Anganwadi .1643• .1211 -.0297 -.1409• or Balwadi
Years child has attended Anganwadi or .3022 ... .3176••• .0094 .0116 Balwadi
•p :s: 0.05; .. p :s: 0.01; •••p :s: 0.001
The dichotomous variables such as object used to retrieve drinking water, were
analyzed for predictors of nutritional status using the Man-Whitney U test. It was found
that none of the variables were predictors of nutritional status.
7 .2.4 Multivariate Analysis
To evaluate the contribution of several independent factors to variation in
children's nutritional status, forward stepwise multiple regression was performed. This
was done in two ways: 1) aggregating the ICDS and NGO Z-scores: and 2) a separate
analysis within each of the ICDS and NGO programme areas.
The independent variables used were age of child, sex and those variables
described in Table 7.4 and 7.5. Only one income variable was used in the equation due
to a high auto-correlation factor. The variable, type of programme (ICDS or NGO) was
forced into the equation in order to determine the contribution of that independent
variable. Regression equations were obtained for all indices except weight-for-height. The
final regression models for nutritional status combining the sample populations of both
programmes are described below.
77

Table 7.6 presents the correlates of children's height-for-age variation. Child's
environment, namely type of programme, correlated with the height-for-age status after
controlling for child's age. Thus, children of the ICDS sample population tend to have
a better stature than those of the NGO sample population. Similarly, the older the child
the better stature growth of the child. Overall, the independent variables together account
for 12% of the variation leaving the remaining 88% unaccounted for by this equation.
Table 7.6 Multiple regression of predictors of children's height-for-age status. The dependent variable is height-for-age with number in sample being 161.
Independent variable Regression coefficient ( ± SE) b p
programme (ICDS=O; NGO= I) ·.51131 ± 0.19968 -D.l8994 .0114
child's age (months) 0.39282 ± 0.09608 0.30326 .001
constant -3.15312 ± 0.38234 . .000
R=0.36243; R2 =0.12036; F(2, !58)= 11.94637; p ~0.000 n=161 ( )
Participating in the ICDS or NGO health programme did not vary the correlates fl
for weight-for-age (Table 7. 7). Age was the only independent variable reported as being
significant (p ~ 0. 000) meaning that the older the child is the less underweight.
Table 7.7 Multiple regression of predictors of children's weight-for-age status. The dependent variable is weight-for-age with number in sample being 161.
Independent variable Regression coefficient ( ± SE) b p
age (months) 0.31534 ± 0.06608 0.35679 .000
programme (ICDS=O, NGO= I) -D.l9361 ± 0.13647 -D.10607 .1580
constant -4.04171 ± 0.26071 . .000
R-'U.J7J1 'J; R2 -'U. t:l!SU'J; r(2,1:>4)-12.45ts7U; p ~u.uuu
Table 7.8 presents the correlates of children's weight-for-height variation. While
controlling for age, no independent variables including programme type accounted for
78

variation m wasting. Overall, the independent variable only accounted for 1% in
variation. This implies that wasting could not be found to have any significant relation
to factors identified in this study.
Table 7.8 Multiple regression of predictors of children's weight-for-height status. The dependent variable was weight-for-height with number in sample being 161.
Independent variable Regression coefficient ± SE B p
age 0.03682 ± 0.06681 .13637 .5824
programme (ICDS=O; NGO= I) 0.03678 ± 0.137966 .02145 .7920
constant -2.60261 ± 0.26360 - .000
-'U.lWJU'J; R"~ -.U 1005; r(l,l54)-'U.l!l5l)!l; p < U.!l3U5
The correlates for children's arm circumference presented in Table 7. 9, explain
approximately 6% of the variation. The variable programme type was not significantly
associated with arm-circumference while gender, specifically being female, significantly
correlated with arm-circumference.
Table 7.9 Multiple regression of predictors of children's arm circumference status. The dependent variable is height-for-age with sample size of 161.
Independent variable Regression coefficient ± SE B p
age -.05279 ± 0.05297 -.07818 .3250
Programme (ICDS=O; NGO= I) -.13162 ± 0.10937 -.09438 .2370
sell (Male=O; Female= I) .31172 ± 0.10999 0.22251 .0052
constant -2.95250 ± 0.07240 - .0000
-=U.L4bt:>; R"-.UbU!l!l; r(J,DJ)-=J.JU6J7; p <lJ .Ull\1
Multiple regressiOn is often used as a tool for determining the variance of
nutritional status by factors associated with nutritional status (i.e. child's age, mother's
education). The regression equations determined above do not account for very high
percentages of the variation indicating that factors outside the present study may
contribute more.
79

Within the ICDS population a greater variety of variables were included in the
linear regression equation. For the nutritional status indicator height-for-age Z-score,
increase in age and access to handpump water as opposed to open wells were combined
to explain approximately 9% of the variance. Weight-for-age Z-score added gender
(being male) and higher per capita income to explain 30% of the variance. For the
nutritional indicator weight-for-height, higher per capita income and being male explained
7% of the variance while drinking water from a hand pump was the only variable
associated with the mid ann circumference explaining approximately 6% of the variance
(refer to Table 7 .10).
Table 7.10 Percentage variation in height-for-age, weight-for-age, weight-for-height and mid ann circumference explained by the combination of age, gender, water source, and per capita income for ICDS children population.
Independent Variable height-for- weight-for- weight-for- ann
age age height circumference
age x• X
gender X X
water source X X
per capita income X X X
Total percentage 9% 30% 7% 6%
a: x notes the independent variables that were included in the regression equation. For example, height-for-age had in it's equation the independent variables age and water source combing to explain 9% of the variation. For more details on the regression equation refer to Appendix C.
Within the NGO population increase in age was the only variable that correlated
with the nutritional indicators height-for-age and weight-for-age. No equation was found
for the weight-for-height Z-score. Mid ann circumference also only had one variable
correlate, gender (being female). (refer to Table 7 .11)
80

Table 7.11 Percentage vanat1on in height-for-age, weight-for-age and mid arm circumference explained by age and gender for NGO children population.
Independent Variable height-for- weight-for- arm age age circumference
age ~· ~
gender ~
Total percentage 13% 10% 18%
a: x notes the independent variables that were included in the regression equation. For example. height-for-age had in it"s equation the independent variable age explaining 13% of the variation. For more details on the regression equation refer to Appendix C.
7 .2.5 Perception of the Nutritional Status of Children Participating in the ICDS
and NGO Health Programmes
It was stated by District health professionals that any form of health education and
supplementary food can only enhance the undernourished population of Udaipur District.
In terms of nutrition the community members, programme staff within and outside the
villages, ANMs, MPWs and doctors working in both programme areas, stated that since
the initiation of both programmes children's nutritional status has increased. However,
no judgement could be made as to which programme has been more effective in
increasing the nutritional status or by how much the nutritional status of the children has
increased. It was also emphasized that many other factors have contributed to the
increase in nutritional status of the children in the Tribal belt in the past ten years,
including an increase in economic status in the region and an increase in accessibility to
health services.
81
7.2.6 Summary and Discussion
In terms of nutritional status, the majority of the children measured had some
form of malnutrition. Stunting (low height-for-age) was more prevalent in the NGO
population, while wasting, underweight and PEM were prevalent in both the ICDS and
NGO populations. Stunting, represents chronic malnutrition, meaning that poor intake
of food was experienced by children for an extended period of time. In the case of the
NGO sample population, a mean Z-score of -2.23 for the indicator height-for-age was
reported as compared to -1.70 for the ICDS sample population. These results indicate
that approximately 70% of children had Z-scores less than -2.0 in the NGO population
compared to approximately 40% of the ICDS sample. The fact that an increase in
stunting was apparent for the NGO sample population, suggests that during the past an
event has impeded the intake of food, that lower amounts and possibly lower qualities
of food were given to the children since weaning. Multiple regression analysis suggests
that programme type and age contribute up to 12% of the variation. Although not
significant, the average age of the ICDS sample population is greater than the NGO
sample population (3.71 years and 3.65 years respectively). Programme type contributes
most significantly to the variation in height-for-age Z-score, revealing that children of
ICDS areas tend to have a higher score. If it is assumed that stunting, implies a long
term deprivation of quantity and quality of food, it reasons that the children of the NGO
area have suffered more so than the ICDS sample population without adequate nutrients.
Through observation and discussions by the researcher with programme staff, community
members, ANMs and MPWs it has been stated that the ICDS does deliver supplementary
82

food in a greater quantity and quality. This high protein diet is given consistently to all
children in the ICDS programmes. This may in fact be the reason why there is a
significant difference between the two programme areas in terms of height-for-age Z
score.
The Z-score weight-for-age, indication of overall nutritional status (under weight)
did not significantly differ between the two programme populations, however, the mean
score for the NGO was calculated to be lower than the ICDS sample (-3.08 and -2.89
respectively). The percentage of children with a weight-for-age Z-score less than -2.00,
was higher for the ICDS sample as compared to the NGO sample (77.11% and 66.67%
respectively). Figure 7.2 shows a decrease in weight-for-age for children between the
ages of 24 and 36 months. This decrease is usually seen in children after the weaning
period, when children are taken off the breast milk. In this case it is seen slightly later
in the development stage of the child. Considering that only three children in the first age
cohort were measured, the results may not be representative for that age range. Multiple
regression revealed that 12% of the variation in weight-for-age was attributed to age of
the child. Other socio-economic variables did not appear to be significant.
Weight-for-height, indicator of present nutritional status was shown to be the most
prevalent in children of both the ICDS and NGO populations. The mean Z-score was not
found to be significantly different between the two programme areas, with the NGO
sample having a Z-score of -2.43 slightly higher than the ICDS sample of -2.48. The
overall high prevalence of malnutrition may be attributed to seasonality (Naborro,
1981:23). The measurements were taken at the height of the dry season, just prior to
83

monsoons, when the amount of food available is less, and due to heat less food is eaten.
No significant variations in weight-for-height was predicted using multiple regression.
Height-for-weight is considered to fluctuate due to the influences of short term affects
such as seasonality.
Mid-arm circumference is considered an indicator of PEM. The majority of the
both the ICDS and NGO samples are malnourished. The variations in mid-arm
circumference as calculated by multiple regression reveal that sex, or being female
positively correlates with the indicator.
Other factors that may have contributed to the variation in nutritional status
include breast feeding practices. This data, although not collected for this study, has been
demonstrated to significantly effect children's nutritional status (Grenier and Latham,
1981: 13 7). Longer breast-feeding was associated with higher nutritional status.
The health professionals perception of the nutritional status of children
participating in the ICDS and NGO programmes, indicated that there has been an
increase in nutritional status of children since the initiation of both programmes.
However, the health professionals could not indicate which one was the most successful
programme in alleviating malnutrition.
7.3 Infant & Under Five Mortality Rates
The rates of mortality for infants ( < one year; IMR) and children under five
years, were calculated in two ways: 1) by dividing the number of total deaths by the
number of total births (children under one year of age for IMR, and children one to five
84

years of age for under five mortality rate); and 2) by dividing the number of deaths by
the number of births since the implementation of the ICDS and NGO programmes in the
areas selected. It should be noted that the rates calculated by the second method is not
by the standard means. This was due the fact that the NGO TBA programme was
initiated four years prior to this study, thus five year old children could not be included
in the calculation.
The findings revealed that the overall infant and child mortality rates of the ICDS
population is half of that found in NGO population (Table 7 .12). The 1989 IMR of rural
India as reported by the Department of Women and Child Development, Government of
Rajasthan was 98, comparable to Rajasthan State at 103 (1991:8). Therefore, the ICDS
programme areas have half of that reported in all of Rajasthan, while the NGO
programme population have comparable figures to that of Rajasthan.
The overall under five mortality rate for the NGO programme population is again
comparable to the India's rate of 152 (UNDP, 1993: 143), however, the ICDS rate is
much lower at 97 deaths per 1000 live births.
The IMR and under five mortality rate of the region has steadily decreased over
the past decade, with doctors and health workers claiming that the programmes in
combination with better treatment and education by the health professionals have
contributed to the decline. The TBAs of the NGO villages along with Central office staff,
state that since the training of TBAs in 1989, there are virtually no infant mortalities in
the villages. The ICDS programmes also has been able to attain a lower IMR than that
of reported for India.
85

Table 7.12 IMR and CMR in the ICDS and NGO sample programme areas.
Time Period !CDS NGO per 1000 per 1000
Overall IMR 52.0 101.4 under five mortality rate 97.0 144.9
Post programme implementation mortality rate' 74.4 83.3
a In this incidence CMR. is defined as the rate of child mortality after the implementation of the !CDS and NGO programmes ( 1986 and 1989 respectively).
7.4 Immunization
The percentage of children and pregnant mothers immunized was found to be
significantly higher for those from the NGO sample population than those from the ICDS
population (Figure 7. 6). While approximately 83% of the children surveyed from the
NGO area responded to being immunized, only 65% of the ICDS children were
immunized. In comparison to the India percentage of 92% (UNDP,1993:157), the ICDS
percentage falls lower than the NGO percentage.
Although immunization of mothers during pregnancy has not reached the level as
that demonstrated for children, over half the mothers from the NGO sample population
have been immunized as compared to one third from the ICDS programme.
86

Figure 7.6 Immunization percentages of children and mothers during pregnancy in ICDS and NGO areas.
100%~--------------------------~
80%
60%
40%
20%
0%
-ICDS
mother•
DNGO
Interviews with ANMs and MPWs revealed that the NGO areas have an extremely
good knowledge of the importance of immunization and when it should occur. All MPW
of the area exclaimed that an almost 50% increase in immunization rates of children was
observed after the NGO was operating in the villages. The same was not stated for the
ICDS areas. In fact, many ANMs insisted that it was them not the programme that
encouraged immunization in the area.
The ANM and MPW working in both areas stress the increase in acceptance of
immunization from the NGO areas. Although the ICDS areas have also seen an increase
in immunization in the psst few years, the NGO covered areas have leaped forward. This
87

was verified by the VHW, TBA and community members of the NGO area. All
indicating that since the NGO has been operating in their village an increasing awareness
of the importance of immunization has been observed.
7.5 Family Planning Methods
India, known for it's ever increasing population, has strived to decrease the birth
rate through education on family planning methods. Both the ICDS and NGO
programmes have attempted to educate their communities, working with the ANM and
MPW of the area. The findings show that a greater percentage of NGO programme
couples use birth control methods and a greater variety as compared to the ICDS
population (Figure 7. 7). While 41% of the NGO households surveyed reported to be
using some from of family planning methods, only 18% of the ICDS households
responded yes. Considering the overall percentage in India is reported to be 43% by the
UNDP (UNDP, 1993: 181), (the rural areas being far less), the NGO areas are keeping
par, but the ICDS areas have a lower percentage.
The family planning methods used by the NGO population offer more variety
exceeding the Indian percentage of IUDs by over 12%, and condom and/or pills by 5%
(UN,1989:1). The use of condoms or pills is reported to be nonexistent in the ICDS
population while use of IUDs is minimal. Sterilization is approximately doubled at 14%
in the NGO population still lower than the Indian percentage of 28% (UN, 1989: 1). It is
important to note that the use of 'home remedies' is 10% higher in the ICDS community,
being the most popular form of birth control indicating education of family planning
88

methods have not been as successful in the ICDS areas.
Figure 7.7 Variety and frequency of family planning methods used by !CDS and NGO sample populations.
home remedy 19%
operation IUD 9% 1%
ICDS
7.6 Summary and Discussion
home remedy 8%
condom
nothing 51%
6% operation
14%
NGO
oral pills 4%
The nutritional status of children as depicted by Z-scores revealed that the
majority of both the !CDS and NGO populations were malnourished, however stunting
was found to be significantly greater in the NGO population. The type of programme,
age of child and sex contributed to not more than 12% of the variance of nutritional
status. Overall infant and child mortality rates are more favourable for the !CDS
community, whereas post programme implementation under five mortality rate was
shown to be similar. Immunization and the practice of family planning methods is shown
to be more successful in the NGO programme. The qualitative information analyzed
89

suggested that both programmes have contributed to the overall health of the population
they operate in, with more impacts seen in the NGO population in terms of
immunization, family planning and recently IMR. The overall consensus of professionals
was that the NGO areas tended to be more aware of health issues than the ICDS
programme areas. This was confirmed through group discussions and participant
observation.
90
CHAPTER EIGHT
ASSESSMENT OF EFFICIENCY OF THE ICDS AND
NGO HEALTH PROGRAMMES
8.1 Introduction
The assessment of efficiency consists of an analysis of the· results obtained in
relation to the efforts made and the resources used. The resources used fall into two
categories distinguishing between financial cost and technical costs. The financial cost
refers to the amount of funds needed to complete operations, whereas technical costs
refer to the number of staff and time given by each staff members to operate the
programme.
As with most health programmes there are many objectives thus making a
comparative analysis difficult. Determining the financial cost of operating CIH
programmes is difficult and in many instances impossible. In the case of the ICDS and
NGO health programmes, there is not one health issue. Both programmes attempt to
address many issues. Thus in order to compare the two programmes the most effective
method is to look at the cost of operating in one community and then if possible the cost
per family.
8.2 Financial Costs
For the ICDS programme operating in Rajasthan, an estimated budget for 1991192
was reported to be 245,382,000 Rp ($9,815,280 CAN). With 130 schemes operating in
Rajasthan and assuming each scheme receives an equal share, 1,887,553 Rp. ($75,502
91

CAN) is the estimated budget for each scheme. Within Udaipur district there are 1689
Anganwadi centres in operation resulting in an average expenditure of 12,293 Rp/year
per centre. If the estimated amount of families to be affected numbers 10,000, an average
of 188.75 Rp. per year is to be spent per family. If one were to assume that the
recipients of the programme were each member of the household, then an average of
27.7 Rp/year was spent in 1992 (mean number of persons per household = 6.82).
Although the budget does not indicate whether these costs are recurring, non-recurring
or both, it may be assumed that the budget includes staff salaries, rent for buildings,
training, and transportation. It does indicate that the nutritional supplements given to the
children and the jeep used for transportation are donated. The food is donated by an
international organization, within Udaipur District the World Food Programme is the
donator. The non-recurring costs of the jeeps, are donated by UNICEF.
The estimated total budget for the health unit of the NGO (1992), is 2,804,820
Rp. with recurring costs equalling 2,344,120 Rp. If one were to subtract the amount
spent on vehicles and supplementary food, the budget decreases to 2, 124,120. In the year
1992, services were operating in 188 villages, with the average amount spent for each
village equalling 11,298.51 Rp. It is estimated that 11,553 households were participating
in the health programme, resulting in an average of 184 Rp per year spent on each
household. If the mean number of persons per household was 5.64, then an average of
32.6 Rp per year was spent in 1992. The construction costs of buildings are not included
however the staff, medicines and training were included in the budget.
It must be noted that these are estimates of budgets, and in both programmes the
92

actual expenditure is less. In the case of the ICDS programme, the target is 10,000
children however the actual amount tends to be 65% of the target. In the case of Seva
Mandir, approximately 80% of the yearly budget is actually spent. In no way are these
calculations a true reflection on what amount is spent or where, but the calculations may
be used as a means to differentiate between the two programmes. There is very little
difference between the two programmes in terms of financial costs.
Table 8.1 Financial costs of operating the ICDS and NGO programmes per village, per household and per person.
Parameter ICDS (Rp/year) NGO (Rp/Year)
Cost per village 12,293 11,298
Cost per family 189 184
Cost per person 27.7 32.6
8.2.1 Funding Sources
The source of funding to initiate and operate programmes influence the stability
and sustainability of the programmes which in turn reflect on the efficiency and
effectiveness of the programmes.
The ICDS programme of India is funded by the Central and State Goverrunent
Schemes. Originally, UNICEF provided the initial 15,000 Rp as start up cost for each
project. All costs are now borne by the Central and State Goverrunents. Within Udaipur
District The Central Goverrunent funds seven projects with the remaining four, being
funded by the State Goverrunent. As mentioned previously, transportation vehicles, the
supplementary food and games are donated by international organizations.
93

The NGO's financial support stems from both foreign and governmental
organizations. More than 40% of the NGO's total annual income comes through foreign
contributions with the remaining contributed by Central and State Governments directly
or indirectly and by some non-government agencies in the country. Major foreign
contributors include Interchurch Co-ordination committee (ICCO), Evangelische
Zentralstelle Fur Entwicklungshiffe (EZE), Canada India Village Aid Association
(CIVA), Ford Foundation, Deutscher Volkshochschul Verband (DVV), United Church,
International Association for Religious Freedom (IARF) and other individual donors.
From the Government Seva Mandir has received full financial support from the Ministry
of Education and partially from the national mission for wasteland development (NMWD)
and the Council for Advancement of People's Action Rural Technology (CAPART).
Support is also received from the Sanitation and Community Health (SW ACH) of
Rajasthan. The health Unit of the NGO receives approximately 10% of the NGO's total
annual income. The organizations directly contributing funds to the health unit are CIV A,
ICCO, EZE and the Private Volunteer Organization of Health (PVOH) of India.
8.3 Technical Costs
Technical costs are any resources that do not relate to funds. In the case of health
programmes, technical costs may be seen as number of staff and the time required by
staff members.
94

8.3.1 Number of Staff
Staff refers to the workers paid to carry out certain tasks. For CIH programmes,
the most important staff are the participants and ground staff workers. A contrast can be
seen in the number of villagers hired as staff for the ICDS and NGO programmes (Table
8.2). The ICDS programme requires two employees where as the NGO hires six for
relatively the same jobs but paid less.
Table 8.2
Indicator
Staff
Total
Number of Staff employed by the ICDS and NGO programmes at the village level with average salaries presented.
ICDS NGO Number of Staff Salary /month Number of Staff Salary/month
Anganwadi Worker 375 CHW 50 Assistant 200 VHW 150
Sanchalika 100 Comotivator 50 TBA 15 Part-time worker 50
2 575 6 415
The staff having a more administrative role are situated at the zonal, block and
District levels. The ICDS employs one LS to oversee operations of 20 centres in the rural
areas, 17 in the tribal areas and 25 in an urban setting. Since the areas covered by the
ICDS programme in Sarada block cover rural and tribal areas, the LS is expected to
supervise 20 Anganwadis. At the block level, the CDPO is in charge of the overall
operation and is responsible for the implementation of the project. Supporting staff in the
form of clerks, an accountant, driver, peon and night watchman are employed.
The NGO programme employs two staff for each designated zone, referred to as
95

zonal workers. These workers coordinate the operations of six to ten villages depending
on the human settlement pattern in the Zone. At the Block level, the health educator and
professional assistants such as the forester in charge and public assistant are employed
as full time workers. The central office houses the assistant secretary and the block-
coordinator who oversees the operations and coordinates block programmes. The health
unit consists of the head, a doctor, a person in charge of the TBA programme, two
assistants an accountant and clerk. Since the Health Unit accounts for one of the nine
activities executed by the NGO, only the persons directly related to that unit are
discussed.
Table 8.3 provides the number of staff employed for the ICDS and NGO
programmes at the administrative levels.
Table 8.3 Number of ICDS and NGO staff employed at each of the administrative levels.
Level of Operation ICDS NGO
Zone - 2
Sector 1 -
Block 2 1
District 2 7
TOTAL 5 10
8.3.2 Staff Time Required
The technical cost of time required by staff allows one to assess the input required
to operate the programmes. At the village level the estimated time required by the AWW
is five hours per day in running the centre for six days a week and additional ten hours
96

recording data and surveying the area monthly. The assistant cleans the centre, prepares
the food and assists the A WW, contributing an estimated 120 hours per month.
The NGO employs its para workers part-time at the village level. The CHW, is
responsible for an area that includes four to six villages contributing approximately five
hours to each village per month. The VHW operates in one or two villages spending
approximately 10 hours a week or 40 hours a month running meetings, providing
medicines. The Sanchalika runs the pre-school for two hours a day, six days a week and
prepares the meals, spending approximately 72 hours a month. The TBA and comotivator
spend up to 20 hours a month, depending on the number of births in the village.
A summary of the estimated time spent by ICDS and NGO paraworkers is given
in Table 8.4.
Table 8.4 Time spent by ICDS and NGO staff in the field.
LEVEL ICDS Hours/month NGO Hours/month
Village AWW 130 CHW 5 Assistant 120 VHW 40
Sanchalika 72 TBA 20 Comotivator 20
Total 250 157 hours per household 5 hours per household 5 minutes per person 44 minutes per person 53
At the administrative levels the ICDS and NGO employees work full days and as
described earlier, more staff are involved with the NGO programme indicating more
hours spent on health programming than in the ICDS programme.
97
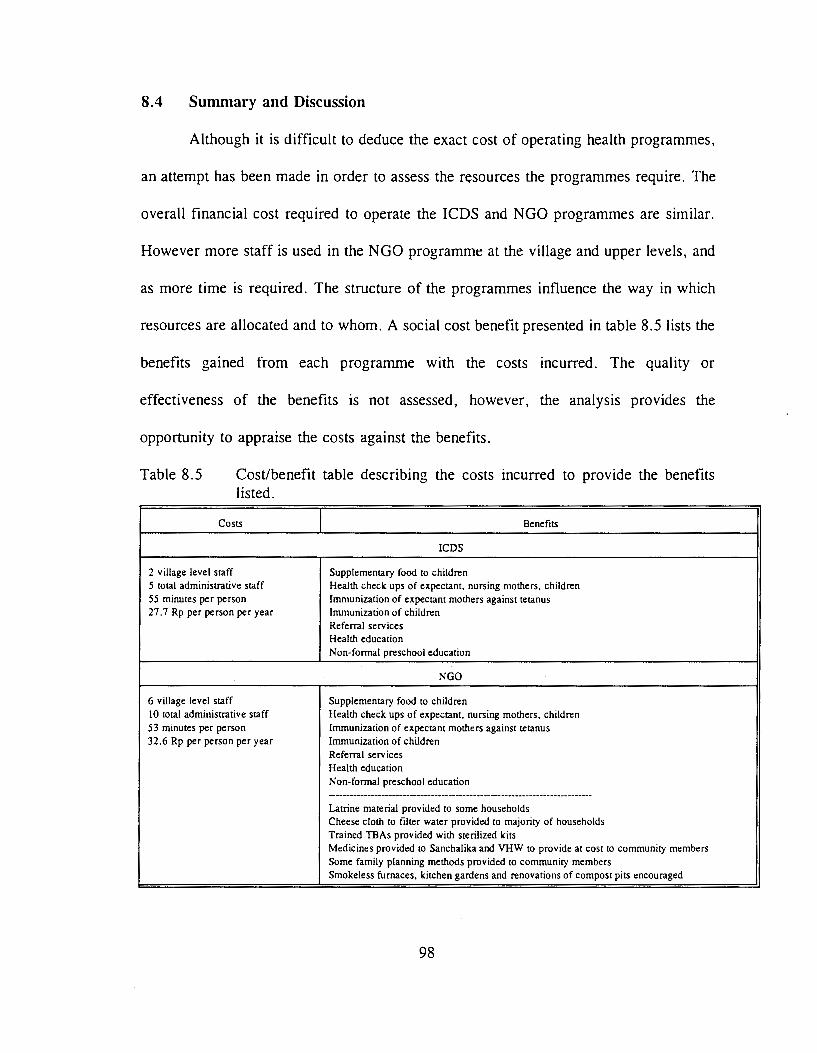
8.4 Summary and Discussion
Although it is difficult to deduce the exact cost of operating health programmes,
an attempt has been made in order to assess the resources the programmes require. The
overall financial cost required to operate the ICDS and NGO programmes are similar.
However more staff is used in the NGO programme at the village and upper levels, and
as more time is required. The structure of the programmes influence the way in which
resources are allocated and to whom. A social cost benefit presented in table 8.5 lists the
benefits gained from each programme with the costs incurred. The quality or
effectiveness of the benefits is not assessed, however, the analysis provides the
opportunity to appraise the costs against the benefits.
Table 8.5 Cost/benefit table describing the costs incurred to provide the benefits listed.
Costs Benefits
ICDS
2 village level staff Supplementary food to children 5 total administrative staff Health check ups of expectant, nursing mothers, children 55 minutes per person Immunization of expectant mothers against tetanus 27.7 Rp per person per year Immunization of children
Referral services Health education Non-formal preschool education
NGO
6 village level staff Supplementary food to children I 0 total administrative staff Health check ups of expectant, nursing mothers, children 53 minutes per person Immunization of expectant mothers against tetanus 32.6 Rp per person per year Immunization of children
Referral services Health education Non-formal preschool education -------------------------------------------------------------------Latrine material provided to some households Cheese cloth to filter water provided to majority of households Trained TBAs provided with sterilized kits Medicines provided to Sanchalika and VHW to provide at cost to community members Some family planning methods provided to community members Smokeless furnaces, kitchen gardens and renovations of compost pits encouraged
98

For the amount of expenditure in terms of time and funds, more benefits are seen
to be delivered to the NGO sample population.
99

CHAPTER NINE
ASSESSMENT OF THE BREADTH AND FORM OF COMMUNITY
INVOLVEMENT IN THE ICDS AND NGO HEALTH PROGRAMMES
9.1 Introduction
Community participation in health development may incorporate the community
in many or all aspects of the development programme. This chapter examines the ways
in which the ICDS and NGO programmes involve the community by using Shrimpton's
framework of analysis (Shrimpton,1989, see Table 3.2).
9.2 Breadth of Community Involvement
Using Shrimpton's framework of analysis for community participation, the NGO
initiative scores considerably higher than the ICDS programme.
INDICATOR ICDS NGO
Needs assessmenUaction choice 1 4 Organization 2 4 Leadership 2 4 Training 3 4 Resource Mobilization 1 3 Management 1 4 Orientation of actions 5 5 Monitoring evaluation/ information exchange 2 5 TOTAL (OUT OF 40) 17 33
Needs Assessment/action Choices
The first indicator, needs assessmenUaction choices, is ranked higher for the NGO
programme than the ICDS. The government programme assessed the need for their
project through specialists located throughout India. This assessment was based on failed
100

sectoral projects of the past and the needs seen by those experts in the field. The project
was then replicated throughout India with refinements. There was no needs assessment
conducted for the study area selected for this research. Through a formula, it has been
calculated that for a Tribal population of 750, one Anganwadi Centre should operate. The
location of the centre was decided by the local government along with staff. Thus a needs
assessment was not conducted when the anganwadi was established in the communities,
nor has one been conducted since. Because a set agenda and method of operation is
instilled in each community, new action choices are not considered unless coming from
the higher ranks, meaning the State or District level.
The NGO programme, on the other hand, evolves objectives and strategies. Needs
assessment is mutually completed by staff and community members with a final decision
made by the community. For example, one community may not want water tanks built
in their village, and thus none are constructed.
Organization
Considering that the communities in the area of study consisted of 30 to 80
households, self contained local organizations where present were informal. Having
stated this, the !CDS programme ranks 2 due to the fact that usually the local political
official of the area (includes up to 5 villages) is the only one consulted. Tribals, who
live on the outskirts of the larger villages, are usually not represented by that politician
and thus not consulted. The NGO initiative on the other hand, must have the
participation of the community as a whole, and groups are formed with the informal
101

leaders of the community who develop plans and plan budgets along with the Zonal
workers.
Leadership
Leadership is seen as a person or a group taking initiative and responsibility for
projects in the community. In the ICDS structure, leadership at the village level is
represented by the A WW herself. She in tum is restricted in the approaches to achieving
set objectives. In the ICDS study area the leadership is in the hands of the programme
staff at the upper levels. The A WWs interviewed felt that although they were in charge
of the centres, the real control was with their supervisors.
Each NGO community varies with respect to what stage of leadership
development was present. Half of the communities studied exhibited control of projects,
however in a more partnership role with the NGO staff at the Zonal and block levels.
Training
In terms of training, the Government programme trains the A WW prior to service
for three months with a refresher course of 10-15 days. Training for upper level staff
such as the Lady Supervisor and the CDPO is for three months and two months
respectively. Although a large number of A WW s are trained in home science colleges,
NGOs have become responsible for the majority of the training. This has resulted in a
more participatory approach to training. The A WW should be a grade eight graduate,
however in the study areas it was apparent that many were illiterate. It was stated that
102

it is difficult to find women in the Tribal belt with education. The three month training
includes courses in child development, community work, identification of disabilities,
record keeping, survey techniques, family planning and training in imparting non-formal,
nutrition and health education.
The training for the NGO para workers or village staff varies depending on the
positions. The VHW has an initial training period of eight days with retraining for three
days every year. The TBA is trained for five days initially and retrained for three days,
four times a year in order to replace birthing kits. The sanchalika (Balwadi Worker), is
trained for five days initially and retrained for three days every year. A participatory
approach is used, with maximum involvement of trainees. The use of visual aids and
plays is especially important to Sanchalikas and TBAs who are illiterate. All courses are
residential and are often conducted in the NGO's own rural training centre in Kaya. In
addition many training sessions are conducted in an ad-hoc manner during village
meetings, zonal meetings, and Block meetings.
Resource Mobilization
Resource mobilization is the process by which the community contributes to the
health programme. In the case of the ICDS programme, the community is encouraged
to participate by donation of money, grains or time in operating the Anganwadi Centre.
Resource may also be in form of a rent free hut or building in which to operate the
Centre. The five centres examined in this study showed little or no resource mobilization
from the community.
103

The NGO programme is based on the principle of villagers paying in kind to
support the food for children at the centres and to provide labour or cash for
infrastructural projects. The community has and is still willing to provide labour and
other resources to any project within the community.
Management
Management can be seen as a supervisor worker relationship or a partnership
relationship. The ICDS has a more supervisor-worker relationship while the NGO tends
to operate more as the latter.
The !CDS programme is structured so that the A WW is directly supervised by the
LS who in tum is supervised buy the CDPO. At all levels, the administrative culture
relies on a person being in charge of another at a lower level, and is thus responsible for
their work. The NGO tends to operate at the partnership level, in where the
responsibility is at every level. The VHW is as responsible for his/her action as is the
Block health educator. Decisions and management is dispersed throughout the levels.
Orientation of Actions
Actions are considered to be impact oriented in curative and preventive terms for
both the ICDs and NGO programmes. The target of both programmes are the most
impoverished communities in the area. Both programmes encourage a curative and
preventive method for attacking health problems in the communities. The !CDS and NGO
programme use education of sanitary practices, immunization, family planning methods
104

and use of nutritive foods as preventive measures for health problems. The process of
providing drugs and ORS to community members and by alerting the staff of illness in
the community are used as curative measures of health.
Monitoring evaluation/ information exchange
Monitoring, evaluation and information exchange is an integral part for both the
ICDS and NGO programmes. For the ICDS programme the AWW takes attendance
daily, weighs and takes the colour coded arm circumference of each child monthly and
records amount of food, oil etc. used during the month. She also takes a survey of the
community and records the number of pregnancies, lactating mothers, births and deaths
in the community. The same sort of information is collected by the VHW, TBA, CHW
and sanchalika of the NGO programme. Additional information collected by the NGO
includes: height of children as well as weight but not arm circumference; construction
of kitchen gardens, compost pits, smokeless furnaces, and number of diseases; and a
variety of other statistics that are relevant to each community in terms of health.
The statistics gathered at the village level are used for different purposes. The
ICDs uses the weight and arm circumference data to locate the severely malnourished
children, in order to provide extra food supplements. The data collected on food and oil
used is to ensure that no extra provisions are being taken for other purposes. The NGO
uses the data to monitor the impacts and then to further evaluate the direction in which
to proceed.
105

9.3 Form of Participation
Using the World Bank model (Samuel,1987, see Table 3.3) participation may be
analyzed in terms of objectives, intensity and instruments used.
OBJECTIVES INTENSITY INSTRUMENTS
I CDS
effectiveness information sharing field workers of the programme efficiency community workers
NGO
empowerment initiating action community workers decision making user groups
Objectives
In the broadest sense participation may be thought to be an instrument of
empowerment. In the case of the NGO, empowerment IS the stated goal of the
organization and thus of each unit including the health unit. Throughout the programme
many of the objectives are linked to the empowerment objective. For example in the long
run, effectiveness, efficiency and building beneficiary capacity are involved. As stated
earlier, cost sharing in terms of cash or labour, has been incorporated in any project
initiated by the health unit.
The objective of participation in the ICDS programme is said to be to create
awareness of the young child's needs by involving the community in planning activities,
and by promoting programme activities and the notion that program services are effective
(USAID, 1989:6). On paper, building beneficiary capacity is sought as an objective but
is not evident in the field. The A WW and not community members are in charge of
maintaining the program. Effectiveness and efficiency are also stated objectives of the
106

program. On paper sharing costs is defined as a means for achieving efficiency and
effectiveness. Empowerment is not mentioned in the reports or by staff as a clear
objective.
Intensity
Intensity is seen as the extent to which beneficiaries are involved in the
programme. This is considered information sharing by the ICDS programme. The ICDS
programme has already been designed and organized, by the time the community is
informed of a Anganwadi centre being proposed to their area, all decisions are made
except for where the centre is to be located and who will run the centre. Although the
community is supposed to become involved in the running of the centre, they rarely do.
The NGO programme operates in the intensity category of decision making and
initiating action. The community decides on projects and indeed initiates projects in their
community. Since the NGO programme varies depending on the community, decisions
are tailored to that particular community.
Instruments
Instruments are the institutional devices used by the programme to organize and
sustain participation (Paul,1987:5). The ICDS programme employs AWW from the
community itself, although one out of the five ICDS centres in the sample survey came
from a community five km away. A committee is responsible for supervising the AWC,
but was not involved in the areas covered by this research. Field workers in the form of
107

LS supervise the centres and visits at least once a month. The A WW, is hired from the
community to execute the programme.
The NGO programme also promotes village committees and staffs workers from
the village. Field workers work closely with the staff at the village level, attaining a
greater level of instrument use.
Interrelationships
As predicted by the World Bank report, the higher the objective the more intense
and the higher the level of instruments of participation used. The !CDS programme states
and practices lower level of objectives as described in the participation model, namely
effectiveness and efficiency, than the NGO programme where empowerment is the
clearly stated and practised objective. It then follows that the instruments used by the
NGO programme are of higher status, namely community workers initiating action.
9.4 Organizational Processes
Besides the instruments described by Paul, the process of meetings, training and
attitudes of staff and community members, dictate response. The NGO programme
stresses the equality of people which is seen in meetings and training sessions. The
structure of seating at meetings, allows one to observe the relationship between staff and
community. The NGO meetings are held at the village, zone, block and central office
levels. At these times everyone is arranged sitting in a circle, where there is no
control/power by the staff. The staff do not sit in chairs. All persons present sit on the
108

floor. Monthly meetings are held separately for men and women in order to allow for
the greatest level of opportunity for interaction.
In the !CDS programme, village level meetings are not conducted. At the sector
(zone) level, there is a clear distinction between the supervisors and the AWW. There
is no circle but rather the A WW sit on the ground, while supervisors are sitting on
chairs.
9.5 Summary and Discussion
As analyzed by Shrimpton's framework, the NGO programme is more
participatory. From project planning and implementation to evaluation the NGO
programme instilled a more participatory process enhanced by a more participatory
organizational structure. A more flexible and partnership oriented process for decision
making is apparent in the NGO programme. The form of participation varied among the
two programmes. The !CDS programme set an objective that is considered a lower level
than that of the NGO programme lending to lower levels of instruments of participation
and lower intensity of participation.
These results reflect the literature in terms of NGO versus government operated
initiatives. The !CDS programme has been well evaluated in terms of participation
indicating that participation is seen as increasing awareness of health and nutrition issues
in the community and particularly women. In practise the programme is supposed to
cater to the diverse variety of areas, but in practise this does not occur. Very few studies
have been done on the NGO, thus a comparison of results cannot be done.
109

10.1 Introduction
CHAPTER TEN
SUMMARY AND CONCLUSIONS
This chapter interprets the findings of the study in an integrative manner,
combining results to provide an insight as to the impacts of the ICDS and NGO
programmes on the intended beneficiaries.
10.2 Summary of Findings
This study, being a one-time cross sectional analysis of health status in terms of
nutritional status of children, IMR, CMR, percentage of children and pregnant mothers
immunized, and family planning does not and can not describe the changes in health
status due to the implementation of the CIH programmes. It however, does provide a
window as to the perceived changes and those seen through data collected. The overall
health status in terms of nutritional status is greater for the !CDS children, however the
immunization rates and family planning methods used are more favourable in the NGO
programme. The indicators are also not independent of each other. For example, IMR
and CMR are influenced by nutritional status, immunization and family planning methods
use. Nutritional status is influenced by immunization and the practice of family planning.
Usually if parents are practising family planning and understand the importance of
immunization, the parents are usually more educated and better informed. These
interaction in health indicators are complex and difficult to decipher.
The increase in knowledge by the NGO households has probably to do with the
110
extra people working at the village level averaging more time than the ICDS areas. The
extra time and staff seem to aid in the process of deciphering information. The extra time
required to attend meetings also add to the increased knowledge of the NGO households.
All the extra time and effort relate directly to the amount of involvement of the
community members of the NGO programme.
As discussed in Chapter Two, NGOs are more likely to be participatory than
government agencies, if the context is favourable and if empowerment is the main
objective, higher levels of instruments and intensity are used therefore a higher ranking
is shown. It was apparent, through group discussions, that the perception of ICDS
beneficiaries is that the government must and should provide services without the
community having to work. Therefore the very fact that the government is involved
dampens community involvement. The organizational structure being hierarchical, the
process and the beneficiaries themselves do not want the involvement.
10.3 Generalizability
Can these findings be interpreted for all ICDS and NGO villages? This question
may be answered by asking the staff of the ICDS and NGO programmes if they feel that
these areas can be considered representatives of all their villages. The answer is that not
all areas are alike. The ICDS CDPO stated that Sarada Block is one of the poorest run
programmes in the district. Due to various obstacles such as no vehicle, the LS not living
in the area and a larger number of A WW that are illiterate,. the A WC are not nearly
operating at their full potential. This impacts the effectiveness, efficiency and community
111

involvement of the !CDS programmes in the area. The NGO staff also mentioned that
the villages selected for this study do not represent all the villages the NGO operates in.
Because of the wide variety of services operating in each village, one may appear to be
working better than the others.
Both !CDS and NGO staff responded that the success of their programme rests
in the hands of the staff and villagers working in that particular village. And because
both programmes attempt to work closely with the doctors and more importantly the
ANMs and MPWs of the area, their influence and dedication to the communities has an
impact on the effectiveness of their programmes. Essentially, success relies on the
dedication of programme staff and the willingness of the community to help themselves.
10.4 Interpretation of ern
The fundamental question remains; does a more participatory programme ensure
increased effectiveness and efficiency? In this study, effectiveness measured in the short
term, favours the less participatory programme (ICDS) in terms of nutritional status and
IMR of the sample populations. Efficiency, measured as time required by staff also
favoors the non-participatory programme (ICDS). This contrasts the literature as
summarized in Chapter Two, that implies NGOs tend to be more effective and efficient.
However, if the goal of development is for people to control the economic, social,
cultural and political process that affect their lives (UNDP,1993:21), the more
participatory NGO programme, in the long run is more effective and efficient because
the ICDS programme is not as effective in empowering its beneficiaries. The impacts of
112

the NGO health programme in terms of community mobilization is just starting to be felt,
if given time and circumstances remain favourable, a true sense of empowerment may
be demonstrated. The ICDS programme does not claim to empower the communities, but
uses participation as a means for involving the community in health issues. Therefore,
as a concept and in practise, CIH is used more so as a means by the ICDS programme
while the NGO programme views it as an end.
10.5 Conclusions
As the goal of health for all by the year 2000 approaches, and the gap between
the rich and the poor in terms of accessibility to health care services widens, all
programmes that improve the situation must be commended. Both the ICDS and NGO
programmes fulfil a service that is essential; attempting to reach persons that the
overstrained health system of Udaipur District can not reach. The time, dedication,
resources and organizational structure to enhance community involvement is somewhat
lacking in the ICDS programme. However, the programme has achieved it's goals of
decreasing malnutrition, decreasing IMR and increasing immunization rates. The NGO
programme staffed with dedicated persons instilled with the concept of empowerment,
has been able to improve living conditions by increasing immunization, increasing family
planning and decreasing mortality rates. However, it does not follow that the more the
participatory the programme is, the more efficient or effective are its outputs.
The ICDS and NGO programmes illustrate two means by which CIH may be
incorporated into health development resulting in two different outcomes.
113

BIBLIOGRAPHY
ACC/SCN (Administrative Committee on Coordination - Subcommittee on Nutrition). 1993. Second Report on the World Nutrition Situation. Voi.II.
Agrawal et al. 1991. "Growth performance of affluent Indian children under five." Scientific Report # 11, Nutrition Foundation of India. New Delhi.
Berman, Peter. 1985. Equity and Cost in the Organization of Primary Health Care in Java. Indonesia (Cornell/International Agriculture Economics Study). Cornell University, Department of Agricultural Economics.
Burke, Mary, Marjorie York and Innis Sande. 1979. Mortality in Childhood. Scientific Publication No. 396. Pan American Health Organization. Washington, DC.
Carlson, B.A. and T.M. Wardlaw. 1990. "A Global, Regional and country assessment of child malnutrition". UNICEF Staff Working Paper Number 7. UNICEF, New York.
Casley, D.J. and D.A. Lury. 1987. Data Collection in Developing Countries. Caledon Press: Oxford.
Chaudhary, M. and K.V. Rao. 1983. "Nutritional status of preschool children and the associated factors." Indian Journal of Nutritional Dietetics. 20(1): 18-29.
Chaudhary, N.D. 1978. "Bhil Family." Tribe. Vol.X.
Christian Medical Commission and the World Council of Churches. 1980. Readings in Health. Development and Community Participation. Special Series Number 3. Geneva, Switzerland.
Christian, Parul et al. 1988. "The role of maternal literacy and nutrition knowledge in determining children's nutritional status." Food and Nutrition Bulletin. 10(4):35-40.
CMHO Office. 1993. Udaipur District at a Glance. (Draft). Udaipur, Rajasthan. May 1993.
Conyers, Diana and Peter hills. 1984. An Introduction to Development Planning in the Third World. John Wiley & Sons Ltd. New York.
Department of Women & Child Development, Ministry of Human Resources, Government oflndia. 1986. A Guide-Book- for Anganwadi Workers. GOI:Delhi.
114

Department of Women & Child Development. 1991. The Girl Child m Rajasthan. Government of Rajasthan, Jaipur.
Doshi, S.L. and N.N Vyas. 1992. Sunshine on the Aravali. Himanshu Publications. Udaipur, Rajasthan, India.
Dorozyuski, Alexander. 1975. Doctors and Healers. IDRC, Canada.
Dutt, Ashok, S.P. Chatterjee and M. Margaret Geib. 1976. India in Maps. Kendall/Hunt Publishing Company: Dubuque, Iowa.
Frisancho A.R. 1974. "Triceps skinfold and upper arm muscle norms for assessment of nutritional status" in American Journal of Clinical Nutrition. 27, 1052-1057
Frisancho A.R. 1990. Anthropometric Standards for the Assessment of Growth and Nutritional Status. The University of Michigan. Ann Arbor.
Gopaldas, T. et al. 1988. "Selected socio-econo~ic, environmental, maternal, and child factors associated with the nutritional status of infants and toddlers." Food and Nutrition Bulletin. 10 (4):29-34.
Gibson, Rosalind S. 1990. Principles of Nutritional Assessment. Oxford University Press: New York.
Government of India (GOI). 1988. India 1987. Director Publications Division, Ministry of Information and Broadcasting:New Delhi.
Government of Rajasthan (GOR). 1972. Approach to the Fifth Five Year Plan. Jaipur, India.
Greiner T. and M. Latham. 1981. "Factors associated with nutritional status among young children in St. Vincent." Ecology of Food and Nutrition. Vol.lO: 135-141.
Haeddrich, Lisa and Marilyn S. Prehm. 1989. An Inventory of Selected Food and Nutrition Rapid Appraisal Methods. International Food and Nutrition Program, Virginia Polytech Institute and State University: Blacksburg, Virginia.
Hodge, Gerald. 1989. Planning Canadian Communities. Nelson Canada. Scarborough, Ontario.
liED (International Institute for Environment and Development), Sustainable Agricultural Programme. 1992. RRA Notes. Number 16: Special Issue on Applications for Health. liED: London.
115

Johnson, Glen and Walter Anderson. 1987. Delury, George E. (ed.) "Republic of India." in World Encyclopedia of Political Systems and Parties. (1)479-497.
Korten, Frances, F. 1981. "Stimulating Community Participation: Obstacles and Options at Agency, Community and Societal Levels." Rural Development Participation Review. Spring 1981: 1-6.
Lackley, Alvin, A. and Larry Dershem. 1992. "The process is Pedagogy: What Does Community Participation Teach." Community Development Journal. 27(3): 220-233.
Martorell, Reynaldo. 1984. "Measuring the impact of nutritional interventions on physical growth". ed. David E. Sahn, Richard Lockwood and Nevin Scrimshaw. United Nations University Press: Japan. 46 - 64.
Mejeres, J. 1977. Popular Participation in Planning and Decision Making for Basic Needs Fulfil lment. International Labour Office, Geneva.
Midgley, James. 1986. Community Participation, Social Development and the State. Methuen and Co. London.
Naborro, David. "Social, Economic, and Envirorunental Determinants of Nutritional Status." Food and Nutrition Bulletin. 6(1): 18-32.
Newell, Kenneth W. 1975. Health by the People. WHO: Geneva.
Oakley, Peter et a!. 1991. Projects with People. International Labour Office: Geneva.
Oakley, Peter and David Marsden. 1984. Approaches to Participation in Rural Development. International Labour Office, Geneva.
Oakley, Peter. 1989. Community Involvement in Health Development: An Examination of Critical Issues. World Health Organization: Geneva.
Pan American Health Organization. 1984. Community Participation in Health and Development in the Americas. Scientific Publication No. 473. Washington, DC.
Pan American Health Organization. 1981. Immunization and Primary Health Care; Problems and Solutions. Scientific Publication No. 417. Washington, DC.
Pathak, Prasant and Archana Dwivedi. Sustainability of a NGO-promoted health programme. implemented at the village level in cooperation with the state health agencies. Indian Institute of Health Management Research: Jaipur, India.
116

Paul, Samuel. 1987. Community Participation in Development Projects. the World Bank Experience. World Bank. Washington, D.C.
Pelto, Pertti J. 1989. "Strategies of Field Research in Nutritional Anthropology" in Research Methods in Nutritional Anthropology. Eds. Gretel H. Pelto, Pertti J. Pelto, and Ellen Messer. The United Nations University. Hong Kong.
Rahnema, M. 1990. "Participatory Action Research: 'The Last Temptation Saint' Development." Alternatives. 15(2). 199-228.
Rifkin, Susan B. 1983. "Primary Health Care in Southeast Asia: attitudes about community participation in community health programmes". Social Science Medicine. 17(19):1489-1496.
Rifkin, Susan B. 1990. Community Participation in Maternal and Child Health/Family Planning Programmes. WHO: Geneva.
Rifkin, Susan B., Frits Muller and Wolfgang Bichmann. 1988. "Primary Health Care: on measuring participation." Social Science Medicine. 26(9):931-940.
Rondinelli, Dennis A. 1983. Development Projects as Policy Experiments. Methuen and Co.: New York.
Sadka, Nancy L. 1984. ICDS Integrated Child Development Services in India. UNICEF: New Delhi.
Shrimpton, R. 1989. Community participation in food and nutrition programmes: An analysis of recent government experiences. Ithica, New York, Cornell University.
Sleighthome, C. 1991. Health Education and Primary Health Care Unit- an Overview. Seva Mandir: Udaipur, Rajasthan.
The Hunger Project. 1986. Ending Hunger: An Idea Whose Time Has Come. Praeger: New York.
The Neem Campaign. 1993. Intellectual Piracy and the Neem Patents. The Research Foundation for Science, Technology & Natural Resource Policy .Delhi.
United Nations: Administrative Committee on Coordination! Subcommittee on Nutrition. 1990. Women and Nutrition. ACC/CAN Symposium Report Nutrition Policy Discussion Paper No. 4.
United Nations: Administrative Committee on Coordination/Subcommittee on Nutrition. 1989. Managing Successful Nutrition Programmes. ACC/CAN Symposium
117

Report Nutrition Policy Discussion Paper No. 8.
UNDP (United Nations Development Programme). 1990. Human Development Report 1990. Oxford University Press: New York.
UNDP (United Nations Development Programme). 1993. Human Development Report 1993. Oxford University Press: New York.
UNESCO (United Nations Educational, Scientific and Cultural Organization). Participation in Development. UNESCO.
UNICEF (United Nations Children Fund). 1978. Assignment Children; Nutrition and Village Resources. No. 35. UNICEF.
UNRISD (United Nations Research Institute for Social Development). 1986. Women and Popular Movements: India and Thailand During the Decade of Women. UNRISD: Geneva.
Uphoff, Norman T., John M. Cohen, and Arthur A. Goldsmith. 1979. Feasibility and Application of Rural Development Participation: A State-of-the-Art Paper. Rural Development Committee, Monograph Series No. 3. Cornell University. Ithica, New York.
Uphoff, Norman T. and John M. Cohen. 1977. Rural Development Participation: Concepts and Measures for Project Design, Implementation and Evaluation. Rural Development Committee, Monograph Series No. 2. Cornell University. Ithica, New York.
Vanna, Sadhir. 1991. "Policy Planning for Women's development at the Provincial Level- The Case of Rajasthan" .in Women and Health, ed. by Patricia Smyke. From the Women and World Development Series. Zed Books Limited: London.
Vyas, N.N. 1992. Sunshine on the Aravali. Himanshu Publications. Udaipur, Rajasthan, India.
Waterlow, J.C., R. Buzina, W. Keller, J.M. Lane, M.Z. Nichman and J.M. Tanner. 1977. "The presentation and use of height and weight data for comparing the nutritional status of groups of children under the age of 10 years." in The Bulletin of the World Health Organization. 55(4):489-498.
Whyte, Anne. 1986. Guidelines for Planning Community Participation Activities in Water Supply and Sanitation Projects. WHO Offset Publication No. 96. WHO: Geneva.
118

Wood, Charles H. and Peggy A. Lovell. 1989. "Indirect measures of Child Mortality: overview and Application to Brazil, 1980." in Social Indicators Research. (23):247-267.
WHO (World Health Organization). 1981. Health for All; Series No 1. WHO: Geneva.
WHO (World Health Organization). 1981. Health Programme Evaluation. WHO: Geneva.
WHO (World Health Organization). 1975. Health Economics. Public Health Papers no. 64. WHO: Geneva.
WHO (World Health Organization). 1981. Development of Indicators for Monitoring Progress Towards Health for All by the Year 2000. WHO: Geneva.
WHO (World Health Organization) Technical Series Report. 1991. Community Involvement m Health Development: Challenging Health Services. WHO: Geneva.
WHO (World Health Organization). 1983. Measuring Change in Nutritional Status. WHO: Geneva.
WHO Working Group. 1986. "Use and interpretation of anthropometric indicators of nutritional status. " Bulletin of the World Health Organization. 64( 6): 929-941.
Zaman, Wasim Alimuz. 1984. Public Participation in Development and Health Programs; Lessons from Bangladesh. University Press of America: New York.
119

APPENDIX A: HOUSEHOLD SURVEY
Date Questionnaire # __ _
1. Village Name 2. Zone Name 3. Block Name--------------4. Thesil Name -------------5. Type of health programme
6. 7. 8.
a) ICDS b) NGO
Enumerator Surname __________ _ Surname of Respondent __________ _ Who responded to questionnaire yes/no
a) male head b) female Head c) child present d) neighbour(s) present e) worker present (ANM or VHW)
A) General Information 1. Family or household number 2. Type of family: a) nuclear
b) joint c) extended d) other
3. Caste: a) scheduled caste b) Scheduled tribe c) General
120

4.
Household Name SeJt Date of Years of Literate Occupation Income
position M/ Birth Education YIN primary secondary Generated F
Father
Mother
Child I
Child 2
Child 3
Child 4
Child 5
Child 6
Child 7
Child 8
Others
5. For children attending the anganwadi/balwadi. How often do they attend and how many years have they been attending?
6. How does the child benefit from attending?
B) Socio-economic Information
1. Status of House a) rented b) owned c) other
121

2. Number of rooms in the house
Is the kitchen separated? a) yes b) no
Where are the animals kept?
3. Type of roof a) grass/sticks b) sticks/ shingles c) tin/corrugated metal d) cement e) other
4. Type of walls a) mud b) stones c) stones/mud d) burnt bricks e) bricks with cement f) other
5. Type of floor a) mud b) stone/brick c) cement d) other
6. Electricity in the house a) yes b) no
If yes, used for what purpose ___________ _
7. Household possessions a) radio b) bicycle c) TV d) tractor e) other
8. Type of stove a) chula with smoke b) chula without smoke c) kerosene stove d) gas stove e) other
122
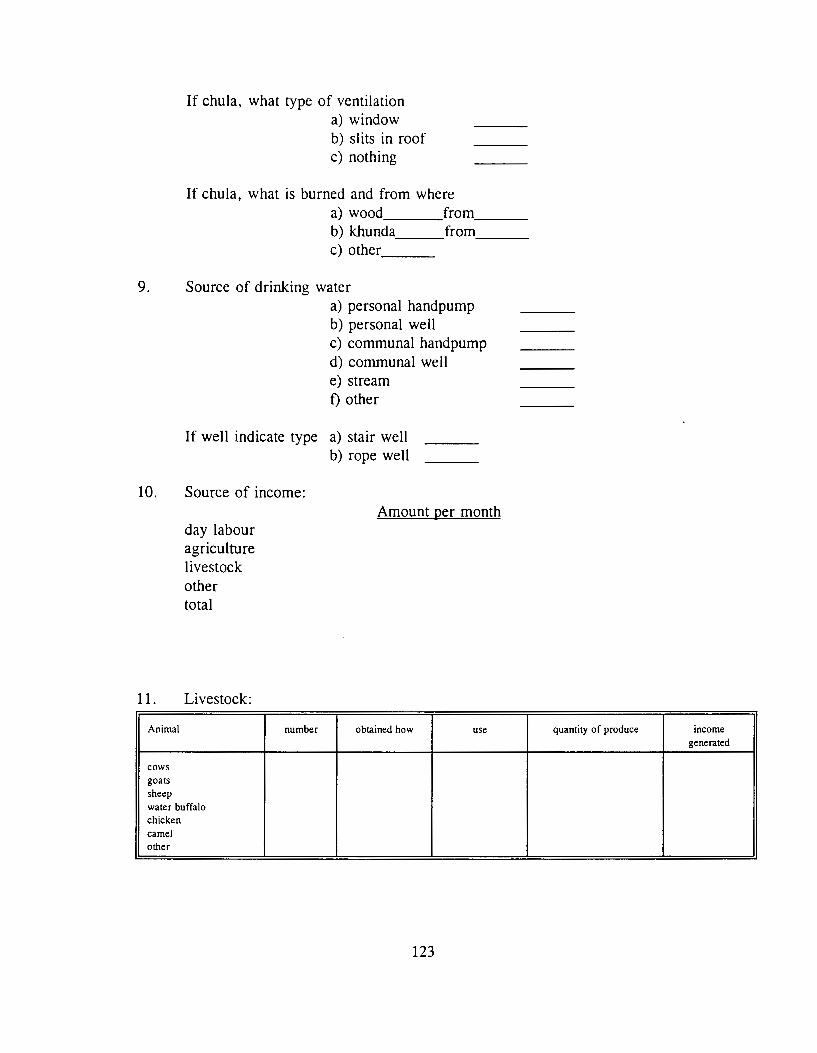
If chula, what type of ventilation a) window b) slits in roof c) nothing
If chula, what is burned and from where a) wood from __ _ b) khunda from __ _ c) other __ _
9. Source of drinking water a) personal handpump b) personal well c) communal handpump d) communal well e) stream f) other
If well indicate type a) stair well b) rope well
10. Source of income:
day labour agriculture livestock other total
11. Livestock:
Animal
cows goats sheep water buffalo chicken camel other
number
Amount per month
obtained how use
123
quantity of produce income generated

14. How much land do you own?
15. How much land do you cultivate?
16. Is this land a) owned ___ or b) rented ___ ?
17. Crops:
Type of crop boras per year Use of produce Income generated
18. Do you have a kitchen garden? a) yes __ _ b) no
c) Health Issues
1. Where do you store your drinking water? __________ _
2. Do you filter your drinking water? ___________ _
3. How do you filter your drinking water? __________ _
4. How do you retrieve the drinking water from place of storage? _______ _
5. Do you are anyone add medicine to the water source to purify it?
6. Where do you defecate a) personal latrine b) communal latrine c) field d) other
If latrine is used is it cleaned regularly? a) yes b) no
124

7 0 When do you wash your hands a) before preparing food b) before eating c) after defecation d) other
80 Does anyone in the household smoke? a) yes __ _ b) no
If yes, how many packs a day
Does anyone in the household drink alcohol a) yes __ _ b) no
9 0 Does your family brush their teeth a) yes __ _ b) no
What is used-------------------How often. ___________________ _
100 What does your family use to bathe with?---------------
110 With what does your family cut their nails with
120 Have your children been immunized name yes/no
130 During pregnancy was the mother immunized? a) yes __ _ b) no
125

14. When household members have health complaints, where IS the first place assistance is sought? a) TBA b) VHW c) ANM d) home remedies e) hospital
Infant and Child Mortality Information
Number of children ever born
number of children survived
Number of children dead
Child sex date born premature date cause mothers age name M/F YIN died @birth
Family Planning Information
Method use: Yes/No
a) Copper T (IUD) b) operation M or F c) contraceptive pills d) condoms e) home remedy f) natural ending of cycle g) nothing
126

Anthropometric Measurements of Child Attending Anganwadi/Balwadi
Child's name
Date of Birth
Sex male or female
Measurements 1 2 3
Height
Weight
Arm Circumference
127

APPENDIX B: Household Survey Questionnaire Code Book
The codes used to calculate the statistics on the Household Survey (see Appendix " "), are as follows:
All questions with no response or missing were coded 99.
All yes/no questions were coded (1) for yes and (2) for no unless otherwise indicated below.
All male and female questions were coded (1) for male and (2) for female.
All numerical data were coded as specified on the survey unless otherwise indicated below.
All multiple choice questions were coded numerically from (1) to (n) depending on the number of choices. For example Question A 2.: a) coded as (1); b) coded as (2); c) coded as (3); and d) coded as (4). This was done for all multiple choice questions unless otherwise indicated below.
5. Type of health programme was coded (1) if ICDS and (2) if NGO.
Part A General Information 4. This section was coded separately for each member of the family. Name was for reference and double checking information and was not used in the statistics.
Occupation was coded as follows: (1) Agriculture (farmer) (2) Day Labourer (3) Permanent service (4) Works at home (5) Student (6) Retired (7) Patchworker
6. This question was coded as follows: (1) food (2) play (3) learn (4) other (5) food and play (6) play and learn (7) food, play and learn (8) food and learn
128

Part B income Status 2. Where are animals kept was coded as follows:
(1) together (not separated) (2) within dwelling but separated (3) outside
6. if have electricity for what purpose: (1) light (one bulb in dwelling) (2) other
8. For the section on type of stove if household used chula with smoke and kerosene stove (a and c) it was coded (7). Also ventilation question was coded (4) if household had window and proper roof.
9. Source of drinking water was coded from (1) to (6) as indicated above with the addition of (7) representing those households with a communal handpump and communal well.
13. All animals were coded by a point system adopted by the Livestock units.
17. Use of produce was coded (1) for household use only and (2) for the combination of household use and market. Extra needed was coded (1) if household requires more and (2) if the household does not require any more grains.
C Health Issues 1. Storage of drinking water was coded (1) for matka.
3. Filtering of drinking water was coded (1) for UNICEF provided plastic filter and (2) for Cheese cloth.
4. Retrieval of drinking water from place of storage was coded (1) from glass and (2) for glass with handle.
9. For this question on brushing your teeth, the products used were coded (1) for brush, powder, paste; (2) fmger with powder or paste; (3) neem or rock; and (4) other.
10. The bathing section question of what does your family bath with was coded (1) for soap and water; (2) only water; (3) sometimes soap.
11. How the family cuts their nails was coded (1) for blade; (2) for scissors; (3) for nailcutter; and (4) for knife.
129

Infant and Child Mortality This section was coded as appears in survey with cause of death coded as follows:
(1) diarrhoea (2) tetanus (3) fever (4) accident (5) umbilical cord around neck (6) chicken pox
130

APPENDIX C
Table I Multiple regression of predictors of !CDS children's height-for-age status.
Independent variable Regression coefficient ± SE b p
age .30024. 14065 .23086 .0360
water source (Hand pump= I; other .66694.29586 .24379 .0271 source=O)
constant -3.05415 .54843 - .000
~0.33355; R'~O.U!S/!!7; r(l,76)-=4./Y/06; p <lJ.011J
Table 2 Multiple regression of predictors of !CDS children's weight-for-age status.
Independent variable Regression coefficient ± SE b p
age .36487.08594 .40362 .0001
sex (male=O; Female= I) -.59614.17715 -.31983 .0012
water source (Handpump = I; other .49982. I 8204 .26285 .0076 source=O)
per captia income .00233.00102 .21915 .0252
constant -4.13423.34960 - .000
-=0.5!!201; R''-'0.30299; 1-'(4,74)--'9.47662; p <O.UUUU
Table 3 Multiple regression of predictors of !CDS children's weight-for-height status.
Independent variable Regression coefficient ± b p SE
per capita income .00201.000099 .21519 .0353
sex (male=O; Female= I) -.36743.17034 -.22794 .0466
constant -2.53872.15658 - .000
-=0.30760; R2 -.07l99; F(2.!!0)-4.1!!037;p<O.OI!!l:l
Table 4 Multiple regression of predictors of !CDS children's mid arm circumference status.
Independent variable Regression coefficient ± b p SE
water source (Handpump= I; other source=O) .40663.16422 .26527 .0154
constant -2.88212.10036 - .0000
R~0.26527; R2 - .0511!!~; t-(.l,I(J)--'6.13103; p <0.0154
131

Table 5 Multiple regression of predictors of NGO children's height-for-age status.
Independent variable Regression coefficient ± SE B p
age 0.47245 0.13390 0.37585 0.0007
constant -3.95855 0.50802 - 0.000
~u.J I)!D; R1 '-'0.i.l~~o; r(l,/6)~ 1..! . .:>0199; p <O.UUUU/
Table 6 Multiple regression of predictors of NGO children's weight-for-age status.
Independent variable Regression coefficient ± SE b p
age .28763 0.09214 0.35679 0.0025
constant -4.13423 0.34960 - 0.000
~U.JJ71U; K"'-'U.IUIY7; r(l,76)~Y.74J.:>J; p<U.UUL5
Table 7 Multiple regression of predictors of NGO children's mid arm circumference status.
Independent variable Regression coefficient ± SE b p
sex (rnale=O; Female= 1) .54446.12963 .43404 .0001
constant -310122.08928 - .0000
~0.43404; R'-.1771; F(l,76)~17.640ll7;p<U.UUU1
132
Copyright © 2022 FDOKUMEN


![[HOFO-2016] - rsmssb@rajasthan](https://static.fdokumen.com/doc/165x107/6327c299051fac18490e6764/hofo-2016-rsmssbrajasthan.jpg)