UC Santa Cruz - eScholarship
185
UC Santa Cruz UC Santa Cruz Electronic Theses and Dissertations Title Synthesis, Design, and Applications of Lanthanide-based Metal-Organic Structures Permalink https://escholarship.org/uc/item/424151n5 Author Chatenever, Ana Rosa Kareh Publication Date 2019 Peer reviewed|Thesis/dissertation eScholarship.org Powered by the California Digital Library University of California
-
Upload
khangminh22 -
Category
Documents
-
view
1 -
download
0
Transcript of UC Santa Cruz - eScholarship

UC Santa CruzUC Santa Cruz Electronic Theses and Dissertations
TitleSynthesis, Design, and Applications of Lanthanide-based Metal-Organic Structures
Permalinkhttps://escholarship.org/uc/item/424151n5
AuthorChatenever, Ana Rosa Kareh
Publication Date2019 Peer reviewed|Thesis/dissertation
eScholarship.org Powered by the California Digital LibraryUniversity of California

UNIVERSITY OF CALIFORNIA SANTA CRUZ
SYNTHESIS, DESIGN, AND APPLICATIONS OF LANTHANIDE-BASED METAL-ORGANIC STRUCTURES
A dissertation submitted in partial satisfaction of the requirements for the degree of
DOCTOR OF PHILOSOPHY
in
CHEMISTRY
by
Ana Rosa Kareh Chatenever
June 2019
The Dissertation of Ana Rosa Kareh Chatenever is approved: _______________________________________ Professor Scott R. J. Oliver _______________________________________ Professor Pradip Mascharak _______________________________________ Professor Yat Li
_______________________________________ Lori Kletzer Vice Provost and Dean of Graduate Studies

Copyright Ó by
Ana Rosa Kareh Chatenever
2019
iii
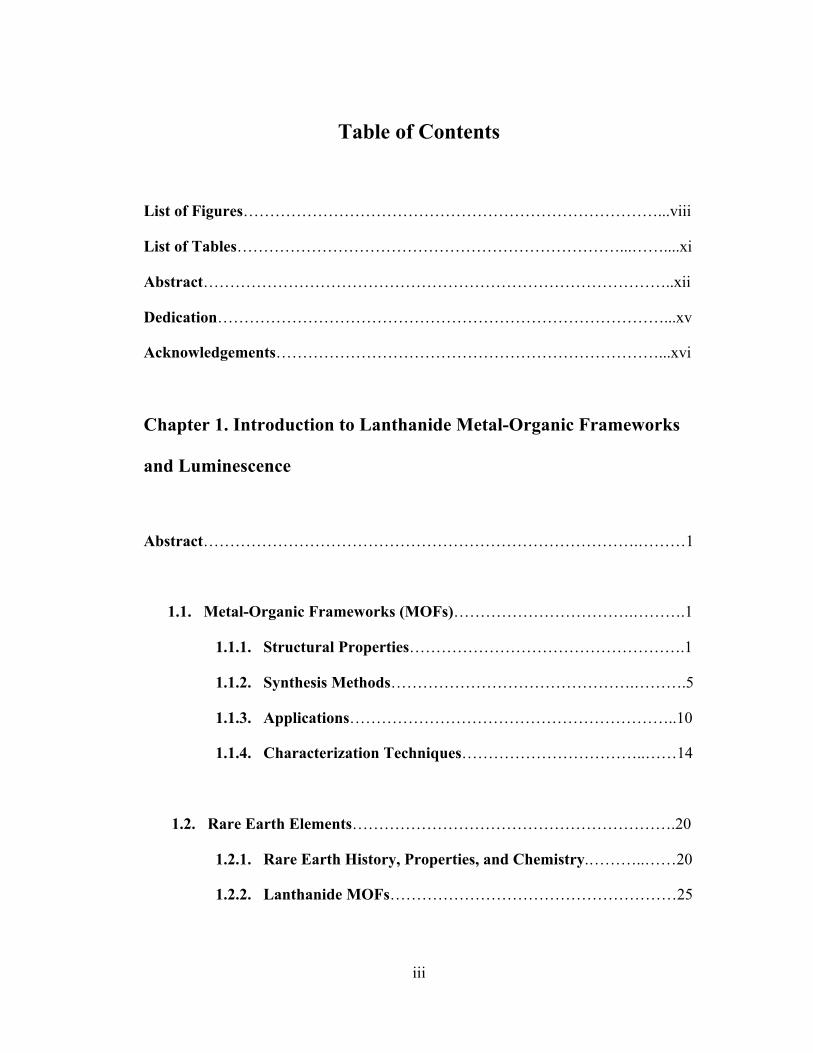
Table of Contents
List of Figures……………………………………………………………………...viii
List of Tables………………………………………………………………...……....xi
Abstract……………………………………………………………………………..xii
Dedication…………………………………………………………………………...xv
Acknowledgements………………………………………………………………...xvi
Chapter 1. Introduction to Lanthanide Metal-Organic Frameworks
and Luminescence
Abstract……………………………………………………………………….………1
1.1. Metal-Organic Frameworks (MOFs)…………………………….……….1
1.1.1. Structural Properties…………………………………………….1
1.1.2. Synthesis Methods……………………………………….……….5
1.1.3. Applications……………………………………………………..10
1.1.4. Characterization Techniques……………………………..……14
1.2. Rare Earth Elements…………………………………………………….20
1.2.1. Rare Earth History, Properties, and Chemistry.………..……20
1.2.2. Lanthanide MOFs………………………………………………25

iv
1.2.3. Layered Rare Earth Hydroxides (LREHs)……………………27
1.3. Luminescent Lanthanide MOFs……………………….…………...……29
1.3.1. Luminescence Background and Pathways……………………29
1.3.2. Applications of Luminescent Lanthanide MOFs………..……34
1.4. Concluding Remarks………………………………………..……………36
1.5. References…………………………………………………………………36
Chapter 2. Experimental Methods of Lanthanide Metal-Organic
Structures
2.1. Solvothermal Syntheses of Ln-BPDC MOFs (SLUG-43–48)…………..50
2.2. Solvothermal Syntheses of Ln-NDC MOFs (SLUG-49– 52)…………...51
2.3. Hydrothermal Syntheses of Nd-ADS LREHs (SLUG-28–30)………….52
2.4. Characterization Methods………………………………………………..53
2.4.1. Single Crystal X-ray Diffraction………………………….……53
2.4.2. Powder X-ray Diffraction………………………………………54

v
2.4.3. Fourier-Transform Infrared Spectroscopy……………...……55
2.4.4. Thermogravimetric Analysis…………………………..………55
2.4.5. Photoluminescence……………………………………...………55
2.5. References…………………………………………………………………56
Chapter 3. Characterizations and Luminescent Properties of
Lanthanide Metal-Organic Structures
Abstract……………………………………………………………………...………57
3.1. Ln-BPDC MOFs (SLUG-43–48)…………………………………………58
3.1.1. Structures………………………………………………………..58
3.1.2. Thermal Characterization……………………………………...65
3.1.3. Vibrational Spectroscopy………………………………………69
3.1.4. Photoluminescence Spectroscopy……………………………...72
3.1.5. Other Investigations…………………………………………….74
3.2. Ln-NDC MOFs (SLUG-49–52)…………………………………………..75
3.2.1. Structures………………………………………………………..75
3.2.2. Thermal Characterization……………………………………...87
3.2.3. Vibrational Spectroscopy……………………………………....91
3.2.4. Photoluminescence Spectroscopy……………………………...93

vi
3.2.5. Other Investigations…………………………………………….95
3.3. Nd-ADS LREHS (SLUG-28–30)…………………………………………96
3.3.1. Structures………………………………………………..………96
3.3.2. Thermal Characterization…………………………...…………99
3.3.3. Anion Exchange……………………………………………….102
3.3.4. Vibrational Spectroscopy…………………………..…………104
3.3.5. Other Investigations……………………………...……………105
3.4. References………………………………………………..………………106
Chapter 4. Insights on 3-Dimensional and Layered Lanthanide
Metal-Organic Structures
Abstract……………………………………………………………….……………108
4.1. 2-D and 3-D Lanthanide-based Materials.…………………………….108
4.2. Conditions contributing toward Isomorphism………….……………..112
4.3. Conclusions………………………………………………………………115
4.4. References…………………………………………….………………….115

vii
Chapter 5. Summary and Future Work
5.1. Summary…………………………………………………..……………..118
5.2. Future Work……………………………………………..………………118
5.2.1. Ln-BPDC and Ln-NDC Projects……………..………………119
5.2.2. Nd-ADS Project……………………………….……………….120
5.3. References……………………………………………………………..…121
Appendix
Tables of Synthesis Conditions and Exchanges…………………………………123

viii
List of Figures
Figure 1.1.1. Schematic of a MOF……………………………………………………2
Figure 1.1.2. Crystallographic images of IRMOFs…………………………………...3
Figure 1.1.3. Crystallographic images of charged and neutral lanthanide SLUG
structures………………………………………………………………………………5
Figure 1.1.4. Different structures resulting from different solvent systems………….7
Figure 1.1.5. Examples of MOF postsynthetic modifications………………………..9
Figure 1.1.6. Examples of MOF applications……………………………………….10
Figure 1.1.7. Derivation of Bragg’s law…………………………………………….16
Figure 1.1.8. Classifications of physisorption isotherms……………………………19
Figure 1.2.1. Periodic table of the elements…………………………………………21
Figure 1.2.2. Depiction of the seven f orbitals………………………………………23
Figure 1.2.3. Partial electronic energy diagrams of the lanthanides………………...24
Figure 1.2.4. Structural diversity of Ln-structures under similar reaction
conditions…………………………………………………………………………….26
Figure 1.2.6. General structure of a LDH …………………………………………..28
Figure 1.2.7. Structure of a LREH…………………………………………………..29
Figure 1.3.1. Jablonski diagram……………………………………………………..31
Figure 1.3.2. Possible pathways of luminescence in MOFs………………………...32
Figure 1.3.3. Schematic of the antenna effect……………………………………….33
Figure 3.1.1. Crystallographic images of SLUG-43 (La)…………………………...59
Figure 3.1.2. Crystallographic images of SLUG-44 (Ce)…………………………...60

ix
Figure 3.1.3. Crystallographic images of SLUG-46 (Eu)…………………………...61
Figure 3.1.4. Crystallographic images of SLUG-47 (Gd)…………………………...62
Figure 3.1.5. PXRD patterns of SLUG-43–48………………………………………64
Figure 3.1.6. Binding mode of BPDC ligand………………………………………..65
Figure 3.1.7. TGA and VT-PXRD of SLUG-43 (La)……………………………….66
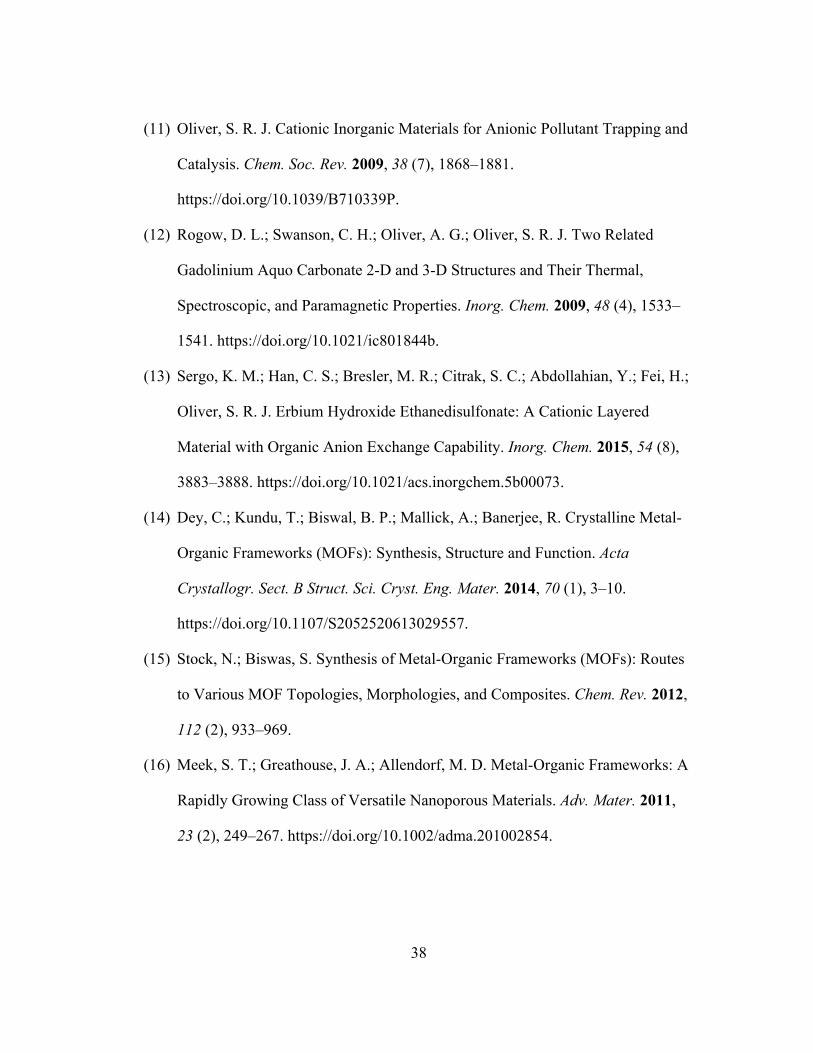
Figure 3.1.8. TGA and VT-PXRD of SLUG-44 (Ce)……………………………….67
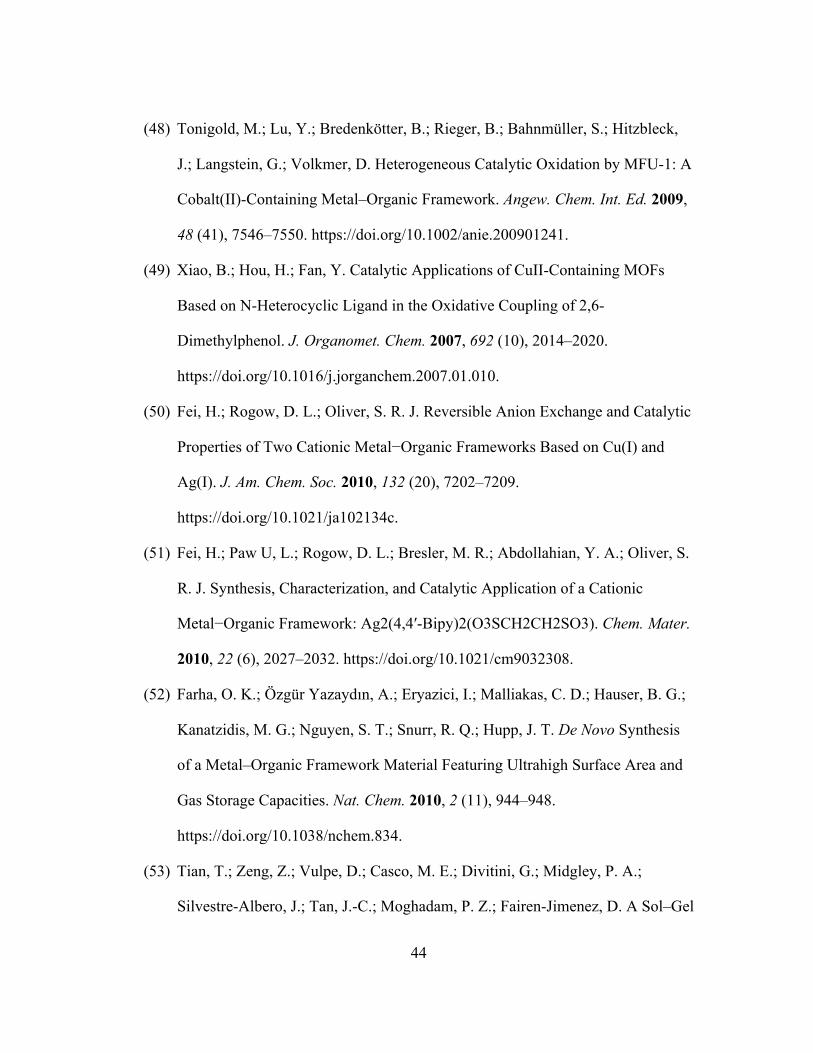
Figure 3.1.9. TGA and VT-PXRD of SLUG-45 (Nd)………………………………67
Figure 3.1.10. TGA and VT-PXRD of SLUG-46 (Eu)……………………………...68
Figure 3.1.11. TGA and VT-PXRD of SLUG-47 (Gd)……………………………..68
Figure 3.1.12. TGA and VT-PXRD of SLUG-48 (Er)……………………………...69
Figure 3.1.13. FTIR spectra of SLUG-43–48……..………………………………...70
Figure 3.1.14. PXRD and FTIR of H2BPDC………………………..………………71
Figure 3.1.15. FTIR of intermediate SLUG-46 (Eu) after heating………………….71
Figure 3.1.16. Fluorescence emission spectrum of SLUG-46 (Eu)…………………73
Figure 3.1.17. Image of SLUG-46 (Eu) luminescence after heating………………..74
Figure 3.2.1. Crystallographic images of SLUG-49 (La)…………………………...76
Figure 3.2.2. Crystallographic images of SLUG-50 (Nd)…………………………...77
Figure 3.2.3. Crystallographic images of SLUG-51 (Eu)…………………………...78
Figure 3.2.4. Crystallographic images of SLUG-52 (Gd)…………………………...79
Figure 3.2.5. Binding modes of NDC ligand………………………………………..81
Figure 3.2.6. PXRD patterns of SLUG-49–52………………………………………83
Figure 3.2.7. PXRD patterns of theoretical and as-synthesized SLUG-49 (La)…….84
Figure 3.2.8. PXRD patterns of theoretical and as-synthesized SLUG-50 (Nd)……85

x
Figure 3.2.9. PXRD patterns of theoretical and as-synthesized SLUG-51 (Eu)…….86
Figure 3.2.10. PXRD patterns of theoretical and as-synthesized SLUG-52 (Gd)…..87
Figure 3.2.11. TGA and VT-PXRD of SLUG-49 (La)……………………………...88
Figure 3.2.12. TGA and VT-PXRD of SLUG-50 (Nd)……………………………..89
Figure 3.2.13. TGA and VT-PXRD of SLUG-51 (Eu)…………………………...…90
Figure 3.2.14. TGA and VT-PXRD of SLUG-52 (Gd)……………………………..91
Figure 3.2.15. FTIR spectra of SLUG-49–52…..…………………………………...92
Figure 3.2.16. PXRD and FTIR of H2NDC…………………………………………93
Figure 3.2.17. Fluorescence emission spectrum of SLUG-51 (Eu)…………………94
Figure 3.2.18. Image of SLUG-51 (Eu) luminescence after heating………………..95
Figure 3.3.1. Crystallographic images of SLUG-28………………………………...97
Figure 3.3.2. PXRD patterns of SLUG-28–30………………………………………99
Figure 3.3.3. TGA and VT-PXRD of SLUG-28…………………………………...101
Figure 3.3.4. TGA and VT-PXRD of SLUG-29………………………………...…101
Figure 3.3.5. TGA and VT-PXRD of SLUG-30…………………………………...102
Figure 3.3.6. PXRD patterns of SLUG-28–30 exchanged with adipate…………...104
Figure 3.3.7. FTIR of SLUG-28 and SLUG-28-adipate…………………………...105
Figure 4.1.1. Crystallographic images of Ln-BPDC, Ln-NDC, and Nd-ADS….…111
Figure 4.2.1. Comparison of binding modes of BPDC and NDC………………….114
xi
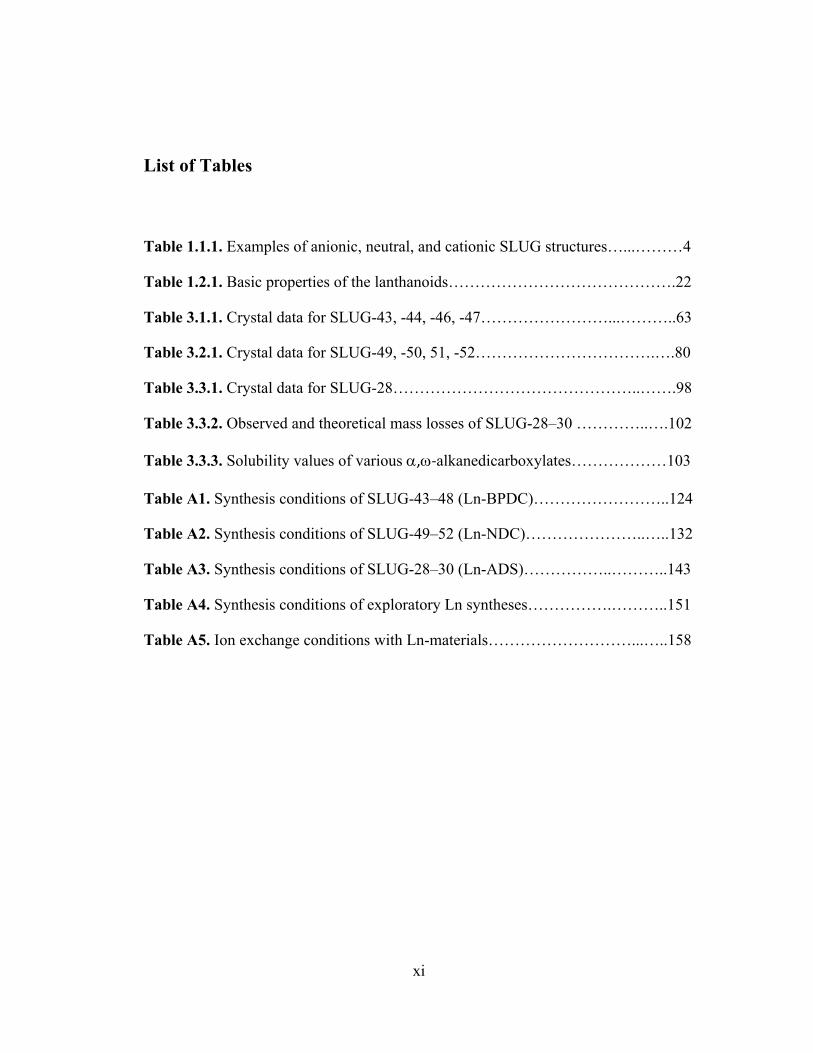
List of Tables
Table 1.1.1. Examples of anionic, neutral, and cationic SLUG structures…...………4
Table 1.2.1. Basic properties of the lanthanoids…………………………………….22
Table 3.1.1. Crystal data for SLUG-43, -44, -46, -47……………………...………..63
Table 3.2.1. Crystal data for SLUG-49, -50, 51, -52…………………………….….80
Table 3.3.1. Crystal data for SLUG-28………………………………………..…….98
Table 3.3.2. Observed and theoretical mass losses of SLUG-28–30 …………..….102
Table 3.3.3. Solubility values of various a,w-alkanedicarboxylates………………103
Table A1. Synthesis conditions of SLUG-43–48 (Ln-BPDC)……………………..124
Table A2. Synthesis conditions of SLUG-49–52 (Ln-NDC)…………………..…..132
Table A3. Synthesis conditions of SLUG-28–30 (Ln-ADS)……………..………..143
Table A4. Synthesis conditions of exploratory Ln syntheses…………….………..151
Table A5. Ion exchange conditions with Ln-materials………………………...…..158

xii
Abstract
Synthesis, Design, and Applications of Lanthanide-based
Metal-Organic Structures
by
Ana Rosa Kareh Chatenever
This work focuses on lanthanide-based inorganic-organic structures. The properties of
lanthanide-based metal organic frameworks (Ln-MOFs) and layered rare earth
hydroxides (LREHs) are reviewed and compared. Three distinct projects are
presented herein: 1) the solvothermal syntheses of a series of Ln-MOFs with the
ligand biphenyl-4,4-dicarboxylate (BPDC), 2) the solvothermal syntheses of a series
of Ln-MOFs with the ligand 2,6-naphthalenedicarboxylate (NDC), and 3) the
hydrothermal syntheses of a series of neodymium-based LREHs with increasing a,w-
alkanedisulfonate (ADS) carbon chain lengths.
The first project, which we refer to as Ln-BPDC (structures SLUG-43–48), is an
isomorphous series of six anionic frameworks with the general structure
[Ln(BPDC)2–][NH2(CH3)2+] (Ln = La, Ce, Nd, Eu, Gd, Er). The Ln(III) metal centers
exhibit eight-coordinate binding to six different BPDC2- ligands. The anionic

xiii
framework is charge-balanced by a dimethylammonium cation. The materials all
possess the same 3-D structure and crystallize in the orthorhombic space group Pbcn.
All exhibit thermal stability up to 300 °C and decompose to Ln2O3 after 800 °C. The
Eu-BPDC structure exhibits strong fluorescence in the 612-620 nm range and a
quantum yield of 2.11%.
The second project, we refer to as Ln-NDC (structures SLUG-49–52). This project
consists of four neutrally charged structures that each crystallize in distinct space
groups. Their formulas are [La6(NDC)9(DMF)3×6 DMF], [Nd2(NDC)3(DMF)2],
[Eu2(NDC)3(DMF)2×DMF], and [Gd4(NDC)6(DMF)4]. The Ln(III) centers exhibit
different coordination numbers (ranging from seven to nine), the NDC ligand exhibits
multiple binding modes, and DMF solvent molecules are found either coordinated or
floating within the structures. Despite these differences, the NDC-based structures
exhibit similar thermal decomposition profiles and infrared spectra. The Eu-NDC
structure exhibits a sharp red-orange luminescence at 613 nm and a quantum yield of
3.56%.
Lastly, the Nd-ADS project (structures SLUG-28–30) consists of three LREHs made
of [Nd2(OH)4(OH2)22+] layers with interlamellar a,w-[–O3S(CH2)nSO3–] anions (n = 2
to 4). These LREHs show an increase in thermal stability with increasing
alkanedisulfonate chain length. As an initial example of anion exchange, all three
materials show exchange for adipate, –O2C(CH2)4CO2–.

xiv
Several insights on the structural differences between Ln-MOFs and LREHs are
proposed. In comparing the mentioned projects, we suggest the differences between
the isomorphous Ln-BPDC series and the diversity of structures in the Ln-NDC series
are due to the rigidity of the NDC ligand and the synthesis temperatures. The
dimensionality of lanthanide-based materials (3-D or 2-D) are affected by reaction
pH. This work expands the chemistry of lanthanide MOFs and LREHs.

xv
Dedication
To my husband
Simon Chatenever
without your love, humor, and support
none of this would be possible

xvi
Acknowledgements
There are countless people I would like to thank for their help and support during my
time at UCSC. Throughout my undergraduate and graduate studies, I have spent
nearly ten years (over a third of my life!) in Santa Cruz. It has become a second home
and I am so lucky to have been able to spend so much time here and have met many
influential people.
I would first like to thank my advisor Professor Scott R. J. Oliver for guiding me in
my projects and for giving me the freedom to pursue the chemistry I found
interesting. To my committee members Distinguished Professor Pradip Mascharak
and Professor Yat Li: thank you for being encouraging, giving advice, and helping me
grow as a chemist. I would also like to thank the faculty that became mentors to me
throughout this journey: Professor Bakthan Singaram, Professor Emeritus Eugene
Switkes, and Professor Alegra Eroy-Reveles.
I would like to thank my two graduate mentors who gave me the confidence as an
undergraduate that I too could complete a PhD in chemistry – Dr. Rachel Snelling
and Dr. Jessica Palomino. I cannot thank my labmates enough for making the lab a
place of support, collaboration, and laughter: Dr. Eaindar Soe, Dr. Susan Citrak, Dr.

xvii
Ian Colinas, Dr. Jesse Hauser, Dr. Yashar Abdollahian, Beatriz Ehlke, and Jerah
Barnett. Thank you to the crystallographers Dr. Eric Reinheimer, Dr. Pierre Le
Magueres, and Dr. Allen Oliver – without your work, this thesis would not be
complete. Thank you to my undergraduates who helped with research and were a joy
to mentor: Louis Warne, Joe Matsuoka, and Stanley Wang. Thank you also to my
graduate cohort who supported each other throughout these past five years.
Lastly, I would like to thank my family for their undying support: my dad for always
offering financial help because he couldn’t help with the academics; my mom for
always listening and keeping me company during my commutes; my brothers for
supporting me and being proud of my work; my mother-in-law and sister-in-law for
always asking the right questions and providing encouragement and emotional help.
Last but certainly not least: thank you to my husband for being with me along this
journey, bearing the brunt of my stresses, and never doubting my abilities for a
second.
…We’re a team. We win together; we lose together. We celebrate and we mourn
together. And defeats are softened and victories sweetened because we did them
together…
1
Chapter 1
Introduction to Lanthanide Metal-Organic Frameworks
Abstract
Metal-organic frameworks (MOFs) are three-dimensional, crystalline materials. The
choice of metal and organic linker can be carefully tailored to produce desired
applications such as ion exchange/adsorption, sensing, catalysis, or gas storage.
Lanthanide-based structures such as MOFs and layered rare earth hydroxides
(LREHs) are relatively new classes of materials that have the advantage of high
coordination numbers and potential luminescent applications for optical sensing. The
luminescent properties of lanthanide-based MOFs and layered metal hydroxides are
described and reviewed herein.
1.1. Metal-Organic Frameworks (MOFs)
1.1.1. Structural Properties
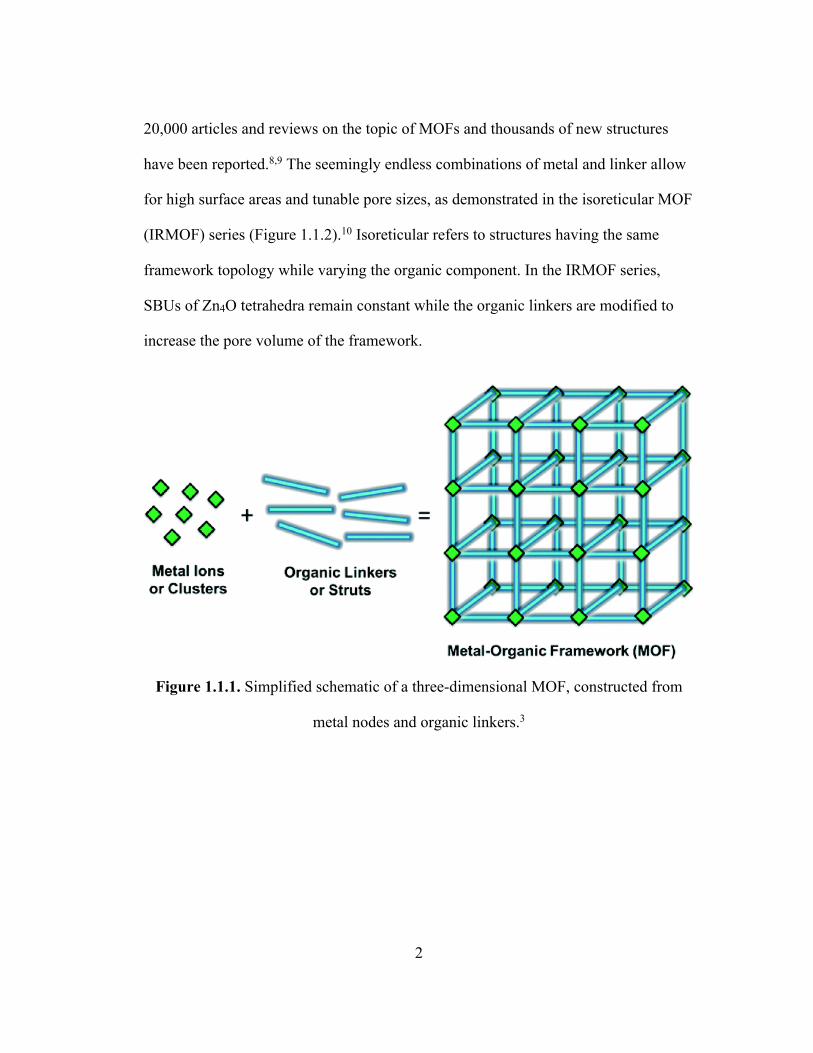
Metal-organic frameworks (MOFs) are a growing class of robust, crystalline, three-
dimensional porous materials.1,2 They are constructed by metal nodes, or MxOy
clusters referred to as secondary building units (SBUs), connected by organic linkers
which give rise to extended frameworks (Figure 1.1.1).3,4 The first MOFs were
reported in the early 1990s by various groups, and were based on transition metals
(e.g. Zn, Cd, Cu) and the organic linker 4,4’-bipyridine.5–7 Currently there are over
2
20,000 articles and reviews on the topic of MOFs and thousands of new structures
have been reported.8,9 The seemingly endless combinations of metal and linker allow
for high surface areas and tunable pore sizes, as demonstrated in the isoreticular MOF
(IRMOF) series (Figure 1.1.2).10 Isoreticular refers to structures having the same
framework topology while varying the organic component. In the IRMOF series,
SBUs of Zn4O tetrahedra remain constant while the organic linkers are modified to
increase the pore volume of the framework.
Figure 1.1.1. Simplified schematic of a three-dimensional MOF, constructed from
metal nodes and organic linkers.3

3
Figure 1.1.2. Crystallographic images of IRMOF-n (n = 1, 8, 10, 14, 16), showing
the tunable pore sizes (represented by yellow spheres) of MOFs by varying the
organic linker and retaining the same Zn4O SBU (Zn = blue, O = red, C = black, H
omitted for clarity).10
The oxidation state of the metal used as well as the charge of the organic linker/ligand
will lead to anionic, neutral, or cationic structures.11 Anionic and cationic frameworks
have potential applications in ion exchange, which will be discussed in section 1.1.3.
The Oliver group has reported a variety of anionic, neutral, and cationic lanthanide-
based structures (Table 1.1.1, Figure 1.1.3).11–13 SLUG-7 is a two-dimensional
anionic material composed of nine-coordinate gadolinium(III) aquacarbonate layers
which are charge-balanced by ammonium. SLUG-8 is a three-dimensional neutral

4
structure, closely related to SLUG-7, but is more condensed and is coordinated by
ammonia and water. SLUG-27 is a cationic two-dimensional material consisting of
seven- and eight-coordinate erbium(III) aquahydroxide layers with a,w-
ethanedisulfonate in the interlamellar space, either doubly-bound, singly-bound, or
floating. Extra-framework species in MOFs include charge-balancing ions or solvent
molecules that help template the pores during synthesis. These species are also
referred to as ‘guest’ species, while the metal-organic framework is referred to as the
‘host’ structure. As has hopefully been demonstrated by this section, MOFs have the
possibility to be carefully designed for their desired structural properties.
Table 1.1.1. Examples of anionic, neutral, and cationic rare earth structures published
by the Oliver group11–13
Name Formula Charge on Frame-work
Extra-Framework Species
SLUG-7 [Gd(CO3)2H2O–] [NH4+]
Anionic NH4+
SLUG-8 Gd2(CO3)3(NH3)(H2O) Neutral N/A SLUG-27 [Er12(OH)29(H2O)57+]
[–O3SCH2CH2SO3–]3.5 · 5H2O
Cationic –O3SCH2CH2SO3–

5
Figure 1.1.3. Crystallographic images of the anionic, neutral, and cationic structures
of A) SLUG-7, B) SLUG-8, and C) SLUG-27, respectively. The unit cell of each
structure is outlined. (SLUG-7 and SLUG-8: Gd = purple, C = gray, N = blue, O =
red, H = light gray; SLUG-27: Er = blue, O = red, S = yellow, C = teal).
1.1.2. Synthesis Methods
A variety of synthesis methods of MOFs have been reported: hydro/solvothermal,
microwave-assisted, mechanochemical, electrochemical, and sonochemical.14–16 Here
we will focus on hydro/solvothermal methods. Hydrothermal and solvothermal
syntheses refer to high temperature conditions in a conventional autoclave and are the
most often practiced synthesis techniques. When water is the reaction solvent, the
term ‘hydrothermal’ is used and for any other solvent the term ‘solvothermal’ is
employed. The use of a Teflon-lined steel autoclave allows a reaction to take place in
a closed vessel under autogenous pressure above the boiling point of the solvent.

6
These conditions mimic the high temperature, high pressure conditions of natural
geologic processes under which minerals form.17 In fact, two naturally occurring
metal oxalate (C2O42-) minerals: stepanovite [NaMgFe(C2O4)3·8-9 H2O] and
zhemchuzhnikovite [NaMg(Fe0.4Al0.6)(C2O4)3·8 H2O], which were discovered in a
Siberian coal mine, exhibit MOF structures.18 Metal oxalate minerals are the largest
group of organic minerals. Each oxalate oxygen has a coordination number of four,
which typically results in layered structures.19 The choice of synthesis solvent plays
many roles: structure direction, solubility, and pH determination.20 This effect is
nicely demonstrated by the characterization of four different structures synthesized
from magnesium nitrate hexahydrate and 3,5-pyridinedicarboxylic acid in four
different solvents [dimethylformamide (DMF), DMF/methanol, ethanol/water, and
DMF/ethanol] (Figure 1.1.4).21 The choice of solvent affected the dimensionality of
the structures and the connectivity of the frameworks. As also demonstrated by this
work, combinations of solvents with different polarities can be used to ensure
dissolution of the starting materials. The final pH of a reaction mixture can influence
the oxidation state of the metal, the extent of solubility of the reagents, and the extent
of deprotonation of the organic linker, thus controlling the final structural
framework.20

7
Figure 1.1.4. Four different structures as a result of differing solvent systems.21
Other factors to consider when synthesizing MOFs are the temperature, synthesis
time, and reagent ratios. By cycling the reaction temperature, a phenomenon known
as crystal ripening occurs: at high temperatures, small crystals formed in solution will
dissolve more readily than larger crystals; as the temperature cools, the dissolved
small crystals then redeposit onto the larger ones previously formed resulting in larger
crystals (crystal growth).15,22 The ratio of metal to organic linker starting material is
important because it can affect the dimensionality of the structures, simply due to
availability of reagents when the frameworks are ordered.20 These parameters must be
fine-tuned for each synthesis in a trial and error process in order to optimize the final
conditions.
Another synthesis technique in MOFs is postsynthetic modification (PSM). This term
refers to the modification of an assembled or synthesized MOF which preserves the
lattice structure.23 Types of PSM include the removal or exchange of guest molecules,

8
removal of auxiliary ligands to leave behind an unsaturated metal center,
functionalization of the organic linker, and metal doping.23,24 One of the reasons for
PSM instead of pre-synthesis is due to the fact that not all functionalizations are
compatible with high temperature and pressure solvothermal conditions.24 These
modifications provide MOFs with specialized functionalities and applications.
Multiple examples of possible ligand functionalizations are provided in Figure
1.1.5.25 The dibromination and triazolation reactions in Figure 1.1.5a-b are ‘proof of
concept’ syntheses that demonstrate the wide possibilities of PSM.26,27 The diamine
and aminoalcohol functionalized MOFs in Figure 1.1.5c-d demonstrated an increased
ability in selective CO2 uptake compared to the parent UiO-66-type MOF.28 Lastly,
the amino/sulfo modification on a MIL-101 framework in Figure 1.1.5e was shown to
produce an efficient acid-base catalyst for tandem deacetalization-Knoevenagel
condensation reactions.29 The area of MOF PSM is still growing, and is
demonstrating the usefulness of these modifications on the potential applications of
MOFs.

9
Figure 1.1.5. Various two-step tandem PSMs to introduce functional groups on the
organic linker such as: a) -dibromine, b) -triazole, c) -diamine, d) a-amino-b-
hydroxy, and e) -sulfonic acid.25–29

10
1.1.3. Applications
The intrinsic pore volume of MOFs lends itself to various applications (Figure 1.1.6):
ion exchange/adsorption, sensing, catalysis, and gas storage.3,30–37 The applications of
ion exchange/adsorption and sensing are particularly attractive for the selective
removal or detection of hazardous pollutants in water, respectively. Exposed metal
nodes in MOFs can act as adsorptive sites or heterogeneous catalysts for organic
reactions. MOFs are appealing candidates for gas storage because their high pore
volumes and surface areas allow the storage of gases at lower pressures than
conventional pressurized tanks. Examples of the various applications of MOFs and
their chemistry will be discussed herein.
Figure 1.1.6. The many applications of MOFs.
MOFs
Ion Exchange
Ion uptake
Ion Adsorption
Catalysis
Photo-luminescence
Sensing
Electro-mechanical
Gas storage

11
As was discussed in section 1.1.1, the combination of metal and organic linker can
lead to an anionic or cationic framework that is charge-balanced by an extra-
framework ion. MOFs can be deliberately designed to exchange their extra-
framework ion for or adsorb a potentially hazardous pollutant. In designing the MOF,
it is important that the exchanged ‘guest’ species is relatively benign and does not
pose a risk if it is released in water. Some pollutants that have been targeted by MOFs
for ion exchange/adsorption are heavy metal cations such as Pb2+, Cd2+, and Hg2+,
and oxyanions such as perchlorate (ClO4-) and dichromate (Cr2O72-).38 A
postsynthetically-modified MOF {[Zn3L3(BPE)1.5]n, L = 4,4’-azoxydibenzoate, BPE
= bis(4-pyridyl)ethylene} was reported to have 99% removal efficiency for Pb2+ ions
from water against background ions, with an uptake capacity of 616 mg Pb2+/g
adsorbent.39 The selective uptake of Pb2+ is attributed to the decoration of the
framework with O- groups. Two MOFs {FJI-H9: [Me2NH2+][Ca2(thb2-)2(CH3COO-)
(DMA)], thb = 2,5-thiophenedicarboxylate, DMA = dimethylacetamide and FJI-H12:
[Co3(Timt)4(NCS)6(H2O)14(EtOH)]n, Timt = 2,4,6-tri(1-imidazolyl)-1,3,5-triazine}
from the Hong group were reported to exhibit over 99% and 86% removal of Cd2+
and Hg2+ ions, respectively.40,41 These removals correspond to uptake capacities of
286 mg Cd2+/g and 439 mg Hg2+/g, respectively. The propensity of FJI-H9 and FJI-
H12 for Cd2+ and Hg2+ is due to the dangling sulfurs from the thiophenyl and NCS-
ligands, respectively. The studies showed that although the two MOFs exhibited
uptake of both Cd2+ and Hg2+, FJI-H9 preferred Cd2+ and FJI-H12 preferred Hg2+.
The authors make the argument that the selectivity is dictated by the shape of the pore
12
channels of the respective MOFs.40 Thus far, these three examples of heavy metal ion
remediation have been for ion adsorption (by the organic linker) but not exchange.
Other factors that make MOFs attractive candidates for pollutant remediation (other
than their selectivity) are their reusability/regenerability. Colinas from the Oliver
group reported anion exchange of NO3- for ClO4- from the two dimensional material
[Ag-4,4’-bipyridine+][NO3-] in 99% efficiency (353 mg ClO4-/g), and the ability for
regeneration of the original material at least seven times with a minimal drop in
exchange efficiency.42 The cationic framework MONT-1 {[Ag(µ3-abtz)+](NO3-)
(H2O)0.125]n, abtz = 1-(4-aminobenzyl)-1,2,4-triazole} showed a 99% ion exchange of
NO3- for Cr2O72- (211 mg Cr2O72-/g) and regenerability of up to five times, retaining
73% in exchange efficiency.43 The MONT-1 material was regenerated by adding the
dichromate exchanged samples to a 200-fold molar nitrate solution; after 24 hours,
almost 95% of the dichromate ions were released back into solution and MONT-1
was regenerated. This section hopefully demonstrates the ability of MOFs to act as
robust ion adsorbents of hazardous aqueous species.
MOFs can be employed as two different types of sensors: luminescent or
electromechanical.35 Luminescent MOFs can be ‘turn-on’ or ‘turn-off’ sensors, which
refer to the luminescence of an otherwise non-emissive framework or the quenching
or shift in signal of an initially luminescence framework upon uptake of an analyte,
respectively. A post-synthetically functionalized Zr-terephthalate-based MOF (UiO-
66@N3) was shown to be a selective turn-on probe for hydrogen sulfide (H2S)
detection within living cells.44 Hydrogen sulfide is an important biological signaling

13
molecule, and its real-time detection could give insight into its physiological role. A
Cd-based MOF {[Cd3(L)(2,2’-bipyridine)2·4 DMA]n, L = hexa[4-
carboxyphenyl)oxamethyl]-3-oxapentanate, DMA = dimethylacetamide} was
reported to have recyclable turn-off capabilities in the presence of benzene (C6H6)
and nitrobenzene (C6H5NO2) vapors.45 The samples were regenerated by heating
under vacuum at 80 °C for three hours. Further examples of luminescent lanthanide-
based MOFs as sensors will be discussed in section 1.3.2. Electromechanical sensing
MOFs are still in their inception. Thin films of the MOF HKUST-1
{[Cu3(BTC)2(H2O)3]n, BTC = 1,3,5-benzenetricarboxylate} were reported to be
grown on a microcantilever surface.46 The cantilever incorporated a built-in
piezoresistive sensor for stress-based detection. The slight distortions in the MOF
crystal structure when water, methanol, or ethanol vapors were adsorbed could be
measured and correlated with the concentrations of the adsorbed molecules. In
another study, a thin film of HKUST-1 was grown on a quartz crystal microbalance
surface.47 The MOF was exposed to pyridine (C5H5N) vapors and analysis of the
measurements resulted in determination of the diffusion coefficient of the gas. These
examples show the ‘proof of concept’ of MOFs as electrochemical sensors. An ideal
MOF sensor should be sensitive to only one analyte. Because many of these examples
of sensors show responses to multiple analytes, more work in fine-tuning the
specificity of analyte detection is needed.
The role of MOFs as catalysts is usually due to unsaturated metal nodes within the
framework that can stabilize an incoming organic molecule for a reaction. One of the

14
first reports of MOF catalysis was the use of Cd(4,4’-bipyridine)2(NO3)2 for the
cyanosilylation of various aldehydes.6 Other organic transformations that have been
reported with MOF catalysts are alkene oxidation, oxidative coupling, ketal
formation, and esterification.48–51 The pores of MOFs may also aid catalysis by
orienting molecules, stabilizing transition states, or excluding larger molecules.33
MOFs can be used to either store gases for alternative fuels (H2, CH4) or separate gas
(CO2) for clean air. In order to increase the pore volume of MOFs for gas adsorption,
long organic linkers with multiple benzene rings are typically employed.32 The Cu-
based MOF, NU-100, was reported to have a substantial surface area of 6,143 m2/g
and storage capacities of 164 mg H2/g and 2,315 mg CO2/g.52 A sol-gel synthesis of
the MOF HKUST-1 was reported to have a surface area of 1,193 m2/g and storage
capacity of 177 mg CH4/g.53 The Department of Energy (DOE) has published
technical targets for hydrogen and methane storage in vehicles outlining parameters
such as kg H2/kg system, system cost, durability and operability conditions, etc.54
MOFs are potential candidates for hydrogen and methane storage systems, but no
material that meets all the DOE criteria has yet to be reported.
1.1.4. Characterization Techniques
Due to the inherent crystallinity and porosity of MOFs, several analytical techniques
are suitable for characterizing their structures: X-ray diffraction (XRD), microscopy,
thermogravimetric analysis (TGA), Fourier-Transform infrared spectroscopy (FTIR),
and gas adsorption analysis.33,55 X-rays are a powerful tool because the wavelength

15
(typically 1.5418 Å for Cu-Ka X-ray source) of this electromagnetic radiation is the
same order of magnitude as the atomic spacing in crystalline solids. Crystals are
solid, repeating units with long-range atomic order. Single crystal X-ray diffraction
(SCXRD) is perhaps the most valuable technique used because it allows the ordered
atomic structure of crystalline materials to be solved. Crystals suitable for SCXRD
must be single (as the name implies) and on the order of at least ~ 50 micrometers.
The diffraction pattern produced by SCXRD is then solved and refined. This
technique requires access to a single crystal facility and the skills of a
crystallographer in solving and refining the final structure.
Another XRD technique is powder X-ray diffraction (PXRD). This is a simpler
technique to use which gives limited but useful information on the structure. When X-
rays interact with a randomly oriented, homogenously ground powder sample, they
diffract and produce a fingerprint powder pattern. The use of Bragg’s law (2d sinq =
nl) allows for the relative determination of d-spacing within a two-dimensional or
three-dimensional structure, as well as insight on additional reflections and structural
information (Figure 1.1.7).55 The values of d and q are inversely proportional, thus in
a PXRD pattern, a smaller q value corresponds to a larger d-spacing. PXRD is a quick
and practical technique that can be used to verify a synthesis or known mineral phase.

16
Figure 1.1.7. Derivation of Bragg’s law, depicting incident X-rays (1, 2) interacting
with the d-spacing of atoms and their resulting reflections (1’, 2’).55
Optical microscopy and scanning electron microscopy (SEM) are useful techniques
for visualizing the crystal morphology and surface texture of a sample. Different
crystal morphologies from a synthesis can indicate multiple crystal structures present.
Transmission electron microscopy (TEM) is capable of identifying the structures of
nanocrystalline MOFs and the distribution of nanoparticles within a sample.56 These
microscopy techniques have different resolution limits: ~ 1 µm for optical, ~ 10 nm
for SEM, and ~ 1 nm for TEM. SEM and TEM both utilize an electron beam as the
source of imaging. In the case of SEM, electrons are bombarded against the sample,
and result in secondary (ionized) and backscattered (reflected) electrons. These types
of electrons are independently detected and provide insight into the sample’s atomic
composition and topography, respectively. In TEM, electrons pass through the sample

17
to produce high resolution images. A combination of these microscopy techniques
complements the data from XRD.
TGA reveals the thermal stability of a structure, i.e. how much temperature the
framework can withstand before collapsing. TGA data is typically graphed as percent
mass loss of a sample versus temperature. The analysis usually first shows the
decomposition of guest and/or coordinated molecules and then the loss of the organic
linker. The final product after heating to ~ 600 °C is typically a metal oxide. In
conjunction with variable temperature (VT)-PXRD, information about how the
structure changes as it is heated can be revealed.
FTIR uses infrared electromagnetic radiation to probe bond vibrations within
molecules. These vibrations occur at characteristic frequencies (wavenumbers, cm-1)
and thus certain bonds or functional groups can be identified using this technique.
FTIR is particularly useful for identifying functional groups on the organic linker, as
well as demonstrating ion exchange.
Gas adsorption isotherms can give pore volume measurements and surface area
measurements of MOFs. There are a few different methods for gas adsorption
volumetry. Simply, a general procedure is as follows: a known volume of pure, inert
gas (such as N2) is admitted to a calibrated and confined volume containing the
adsorbent (MOF).57 As adsorption takes place, the pressure in the confined volume
falls until equilibrium is established. First, a monolayer of adsorbed molecules comes

18
into contact with the surface layer of the adsorbent. The gas molecules continue to fill
the pore volume so more than one layer of molecules is in direct contact with the
adsorbent surface. The amount of gas adsorbed is the difference in the volume of the
container and the volume that the sample takes up in the container. The adsorption
isotherm can then be classified into one of eight characteristic types, which is related
to pore structure and size (e.g. micropore/mesopore/macropore) (Figure 1.1.8).57
Because new characteristic types of isotherms have been identified since the original
six types, two additional isotherms have been added to the types I to VI. Type I
isotherms are indicative of microporous solids with relatively small external surfaces.
Type II isotherms are produced by the physisorption of gases on nonporous or
microporous solids. Type III isotherms are representative of no identifiable
monolayer formation. The adsorbent-adsorbate interactions are relatively weak and
the adsorbed molecules are clustered around favorable sites on the surface of a
nonporous or macroporous solid. Type IV isotherms are given by mesoporous
adsorbents. Type V isotherms are attributed to relatively weak adsorbent-adsorbate
interactions, similar to those in type III isotherms. The adsorbed molecules cluster
around favorable sites on the surface and continue to fill the pores of microporous or
mesoporous adsorbents. Lastly, Type VI isotherms describe a layer-by-layer
adsorption on a highly uniform, nonporous surface. The hysteresis loops observed in
the type IV(a) and V isotherms occur when the adsorption and desorption curves do
not coincide. This can result due to network effects such as pore blocking. Further
calculations using the Brunauer-Emmett-Teller (BET) method can yield internal
surface area measurements of the framework.

19
Figure 1.1.8. Classification of the eight different types of physisorption isotherms.57

20
1.2. Rare Earth Elements
1.2.1. Rare Earth History, Properties, and Chemistry
The rare earth elements (REEs) or rare earth metals (REMs) are comprised of the d-
block elements scandium (Sc) and yttrium (Y) and the fifteen lanthanoid elements in
the first row of the f-block on the periodic table (Figure 1.2.1). The lanthanoid
elements range from lanthanum (La) to lutetium (Lu). The term ‘lanthanoid’ meaning
‘like lanthanum’ is preferred by the International Union of Pure and Applied
Chemistry (IUPAC) as opposed to ‘lanthanide’ when referring to the neutral
elements.58 In this work, ‘lanthanide’ will be used to refer to the 3+ ions of the
lanthanoids. The history of the REEs can be traced back to the late 18th century to a
mine in Ytterby, a village on the Swedish island of Resarö.59 Chemist and
mineralogist Johan Gadolin is credited with discovering the first RE oxide, yttria
(Y2O3), in a mineral that was later named after him as gadolinite.60 Subsequent work
revealed that gadolinite contained the oxides of at least 10 additional REEs.61 It was
not until the early 20th century that the periodic table of the elements was rearranged
by number of protons rather than atomic mass, due to the work of Henry Moseley
with X-ray spectroscopy. It was due to this new way of organizing the periodic table
that left a gap for the fourteen elements between lanthanum and hafnium to be
recognized and discovered. In fact, the term lanthanoid originates from the Greek
word lanthaneien, which means “lying hidden”.62 By 1907, all of the lanthanoid
elements with the exception of radioactive promethium had been identified.59 The
REEs were so difficult to separate from minerals due to the chemical similarities

21
among the elements. These metals are often found in the 3+ oxidation state and have
similar sizes and chemical properties.
Figure 1.2.1. Periodic table of the elements. The rare earth elements are outlined in
green, and the lanthanoids that will be discussed in this work are highlighted in blue.
Some basic properties of the lanthanoids are presented in Table 1.2.1. As can be seen
from their electron configurations, the lanthanides (with the exception of La3+)
contain electrons in the f orbitals (Figure 1.2.2).63 The 4f orbitals lie close to the
nucleus, compared to the surrounding 5s and 5p orbitals. As a result, the 4f orbitals
are typically not involved in bonding, and the lanthanoids first lose the higher energy
6s2 and 5d1 electrons to result in a 3+ oxidation state. The fact that the 4f orbitals are
‘buried’ also gives rise to the lanthanide contraction, a term used to describe the
decrease in atomic radius from La to Lu. The 5s and 5p orbitals penetrate the 4f
subshell and are not shielded from the increasing nuclear charge of the lanthanoids,
thus resulting in the contraction of atomic radius.59
1 H
2 He
3 Li
4 Be
5 B
6 C
7 N
8 O
9 F
10 Ne
11 Na
12 Mg
13 Al
14 Si
15 P
16 S
17 Cl
18 Ar
19 K
20 Ca
21 Sc
22 Ti
23 V
24 Cr
25 Mn
26 Fe
27 Co
28 Ni
29 Cu
30 Zn
31 Ga
32 Ge
33 As
34 Se
35 Br
36 Kr
37 Rb
38 Sr
39 Y
40 Zr
41 Nb
42 Mo
43 Tc
44 Ru
45 Rh
46 Pd
47 Ag
48 Cd
49 In
50 Sn
51 Sb
52 Te
53 I
54 Xe
55 Cs
56 Ba
57 La
72 Hf
73 Ta
74 W
75 Re
76 Os
77 Ir
78 Pt
79 Au
80 Hg
81 Tl
82 Pb
83 Bi
84 Po
85 At
86 Rn
87 Fr
88 Ra
89 Ac
104 Rf
105 Db
106 Sg
107 Bh
108 Hs
109 Mt
110 Ds
111 Rg
112 Cn
113 Nh
114 Fl
115 Mc
116 Lv
117 Ts
118 Og
58 Ce
59 Pr
60 Nd
61 Pm
62 Sm
63 Eu
64 Gd
65 Tb
66 Dy
67 Ho
68 Er
69 Tm
70 Yb
71 Lu
90 Th
91 Pa
92 U
93 Np
94 Pu
95 Am
96 Cm
97 Bk
98 Cf
99 Es
100 Fm
101 Md
102 No
103 Lr

22
Table 1.2.1. Basic properties of the lanthanoids. The elements that will be discussed
in this work are highlighted in blue
Element
Symbol
Atomic Number
Electron
Configuration of Ln3+
Atomic Mass
Effective Ionic
Radius64 (Å)
(C.N. = 8) Lanthanum La 57 [Xe] 138.91 1.160
Cerium Ce 58 [Xe]4f 1 140.12 1.143 Praseodymium Pr 59 [Xe]4f 2 140.91 1.126
Neodymium Nd 60 [Xe]4f 3 144.24 1.109 Promethium Pm 61 [Xe]4f 4 (145) 1.093 Samarium Sm 62 [Xe]4f 5 150.36 1.079 Europium Eu 63 [Xe]4f 6 151.96 1.066
Gadolinium Gd 64 [Xe]4f 7 157.25 1.053 Terbium Tb 65 [Xe]4f 8 158.93 1.040
Dysprosium Dy 66 [Xe]4f 9 162.50 1.027 Holmium Ho 67 [Xe]4f 10 164.93 1.015 Erbium Er 68 [Xe]4f 11 167.26 1.004 Thulium Tm 69 [Xe]4f 12 168.93 0.994
Ytterbium Yb 70 [Xe]4f 13 173.05 0.985 Lutetium Lu 71 [Xe]4f 14 174.97 0.977

23
Figure 1.2.2. Depiction of the seven f orbitals. The general set is made of the orbitals:
fx(x2-3y2), fy(x2-z2), fxz2, fz3, fyz2, fxyz, and fy(3x2-y2).59,63
The light emissive properties of a lanthanide ion are governed by two conditions: 1)
the ease in which its excited states can be populated and 2) the minimization of non-
radiative energy transfer paths.65 To meet the first requirement, sensitization of the
ion via the surroundings is often used (this will be further discussed in section 1.3.1
as the ‘antenna effect’). The second requirement refers to the energy gap between the
lowest lying excited state of the metal ion and the highest sublevel of its ground state
(Figure 1.2.3: the difference between labeled energy states).66 The smaller this gap,
the easier it is to close by non-radiative deactivation processes, such as through
vibrations of bound ligands. The sizeable energy gaps belonging to Eu3+ and Tb3+
correspond to energy differences which fall in the visible region (corresponding to
wavelengths of approximately 620 nm and 550 nm, respectively). The other

24
lanthanides have emissions which correspond to near-infrared or ultraviolet
wavelengths. Lanthanide luminescence will be further discussed in section 1.3.
Figure 1.2.3. Partial electronic energy level diagrams of the lanthanides, showing
possible f-f transitions.66
The lanthanides are classified as ‘hard’ acids and therefore show a preference in
binding to ‘hard’ bases such as oxygen and fluorine rather than ‘soft’ bases with
elements such nitrogen, phosphorus, or sulfur.59 Due to the size of the lanthanides,
they adopt high coordination numbers in their compounds (usually 8-9, but up to
12).61 As a result of these two characteristics, the lanthanides are often found

25
coordinated to hydroxide and water molecules, which are able to fill up the lanthanide
coordination sphere without being too bulky of a ligand. Terminal and bridging
oxygen coordination has been observed.67 Coordination to O-donor ligands such as
carboxylates, alkoxides, nitrates, and sulfates are also well documented.68
1.2.2. Lanthanide MOFs
One of the first lanthanide-based MOFs to be reported was by Yaghi and his group in
1999: the structure of Tb(bdc)NO3·2 DMF (bdc = 1,4-benzenedicarboxylate) was
reported and briefly characterized.69 In this structure, there are two distinct Tb3+
centers, each one coordinated by eight oxygens from a combination of
benzenedicarboxylates, nitrates, and DMF molecules. Due to the similar characteristic
properties of the lanthanides, it is not uncommon for lanthanide MOFs to be
isomorphous, meaning that the structures crystallize in the same space group, have
the same unit cell dimensions, and the positions of atoms within the structure are the
same except for a replacement of one or more atoms.70 An example of this effect is
the isomorphous series of fourteen structures (based on lanthanides = La – Lu, with
the exception of Pm) with the general formula [Ln(TC)3(H2O)2][HPy·TC]n (TC = 2-
thiophenecarboxylate; HPy = pyridinium).71 Each lanthanide center is coordinated by
eight carboxylate oxygens. The authors also demonstrated achieving luminescent
color-tuning from red to green by varying the Eu3+:Tb3+ ratio in a series of
heterobimetallic structures. However, isomorphous structures will not always form
with lanthanides under similar reaction conditions. For example, under similar
reaction conditions, combinations of lanthanide nitrate salts (Ln = La, Pr, Nd, Sm, Eu,
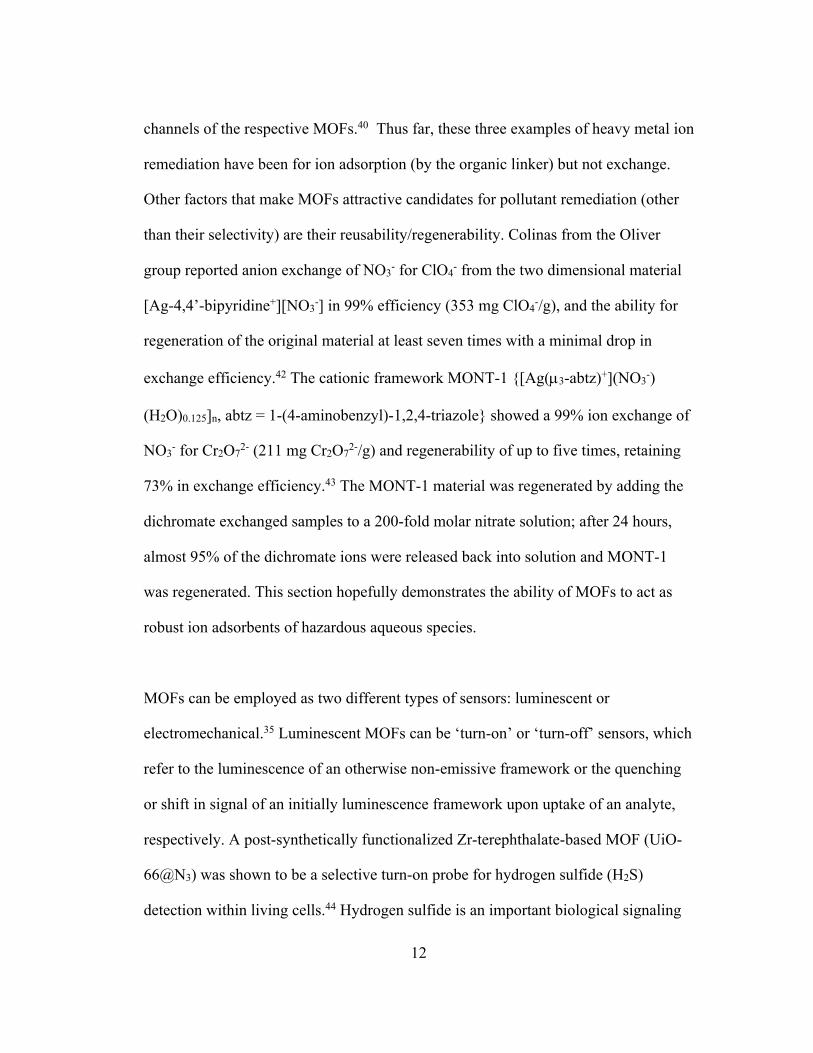
26
Gd, Dy, Er) and the ligand 4,8-disulfonyl-2,6-naphthalenedicarboxylic acid produced
three distinct structures (Figure 1.2.4).72 The authors characterized the eight structures
but do not discuss possible reasons for the structural diversity reported. The authors
also report that syntheses with lanthanide nitrate salts of Tb, Ho, and Yb with the
ligand were explored, but no suitable products were obtained. In chapter 4 of this
work, some insights into the structural diversity of lanthanide-based structures will be
presented.
Figure 1.2.4. Structural diversity of lanthanides with the ligand 4,8-disulfonyl-2,6-
naphthalenedicarboxylic acid under similar reaction conditions.72

27
1.2.3. Layered Rare Earth Hydroxides (LREHs)
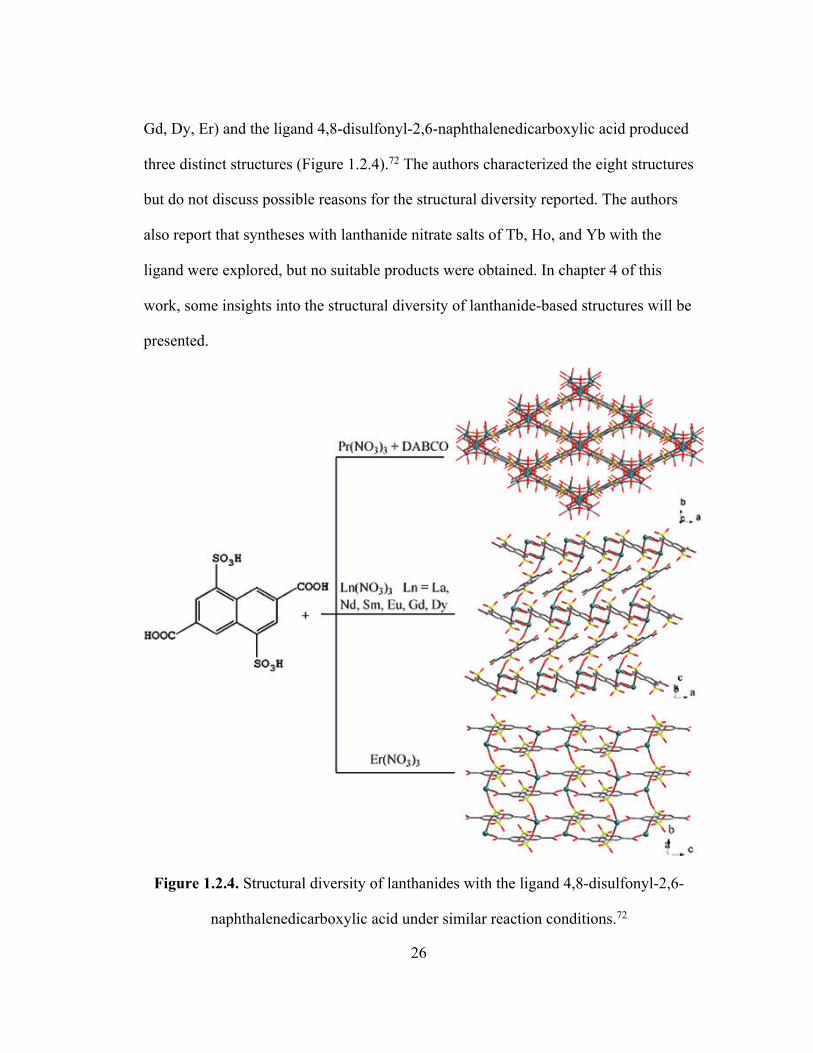
Layered rare earth hydroxides (LREHs) are a subclass of layered double hydroxides
(LDHs). LDHs have the general formula [M2+1-xM3+x(OH)2]x+ [An-x/n·y H2O]x-, where
M is a divalent or trivalent metal, respectively, x is in the range of 0.2 to 0.33, and A
is an n-valent anion.73 LDHs thus consist of two-dimensional cationic layers with
anions in the interlamellar space, which are held by electrostatic forces and hydrogen
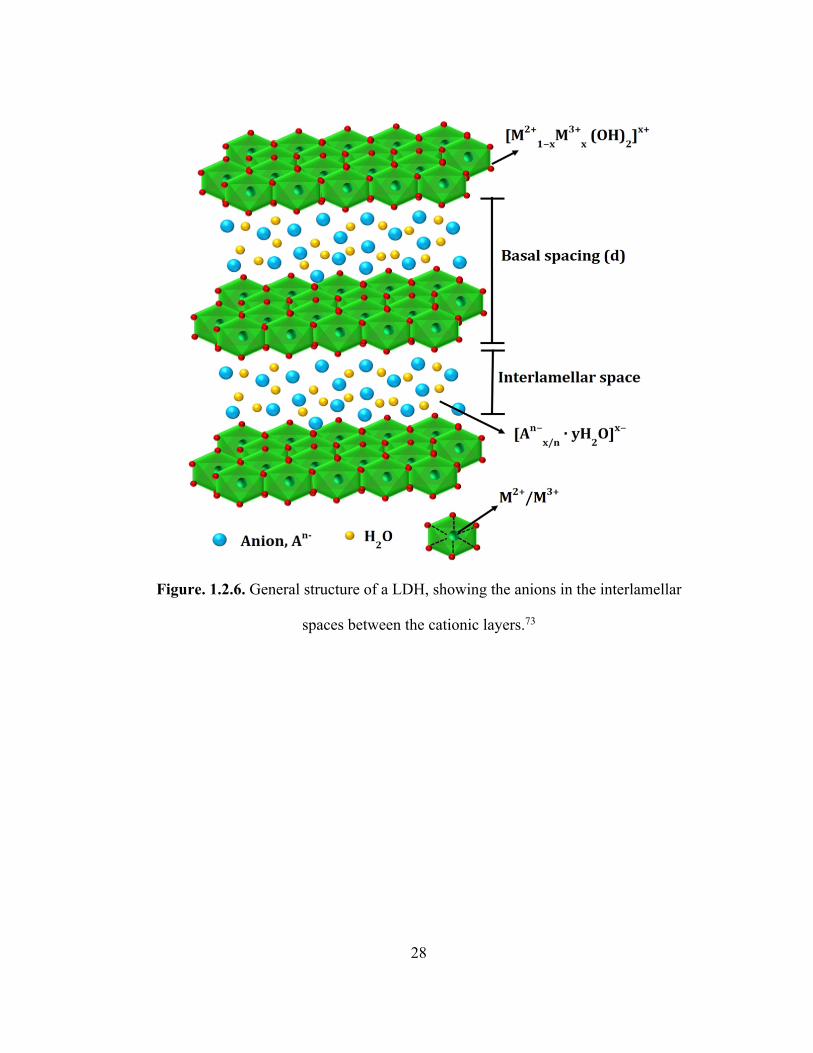
bonding (Figure 1.2.6).73,74 The first family of LREH structures was reported by
Monge and her group in 2006.75 LREHs have the general formula
[RE4(OH)10(H2O)4]nAn, where RE is a rare earth trivalent ion, and A is an intercalated
anion (Figure 1.2.7).75 LREHs are similar to LDHs in that they consist of cationic
metal aquahydroxy layers intercalated by anions, such as halides (Cl-, Br-), nitrate,
sulfate, organodicarboxylates, and organodisulfonates.76 LREHs have applications in
anion exchange, as the anions between the cationic layers are electrostatically bound
and can be readily exchanged. Typically, LREHs are not as robust as MOFs. This is
evidenced by qualitative but not quantitative characterizations of anion exchange.77–79
For example, structures of RE(OH)2.5Cl0.5⋅0.8 H2O (RE = Eu, Tb) were reported to
readily exchange the interlayer chloride ions for various anions {NO3-, SO42-,
dodecylsulfonate (C12H25OSO3−)}.77 The anion exchange was characterized with
PXRD and FTIR. The authors show that this exchange is possible, but do not quantify
the extent of anion uptake by the materials.
28
Figure. 1.2.6. General structure of a LDH, showing the anions in the interlamellar
spaces between the cationic layers.73
29
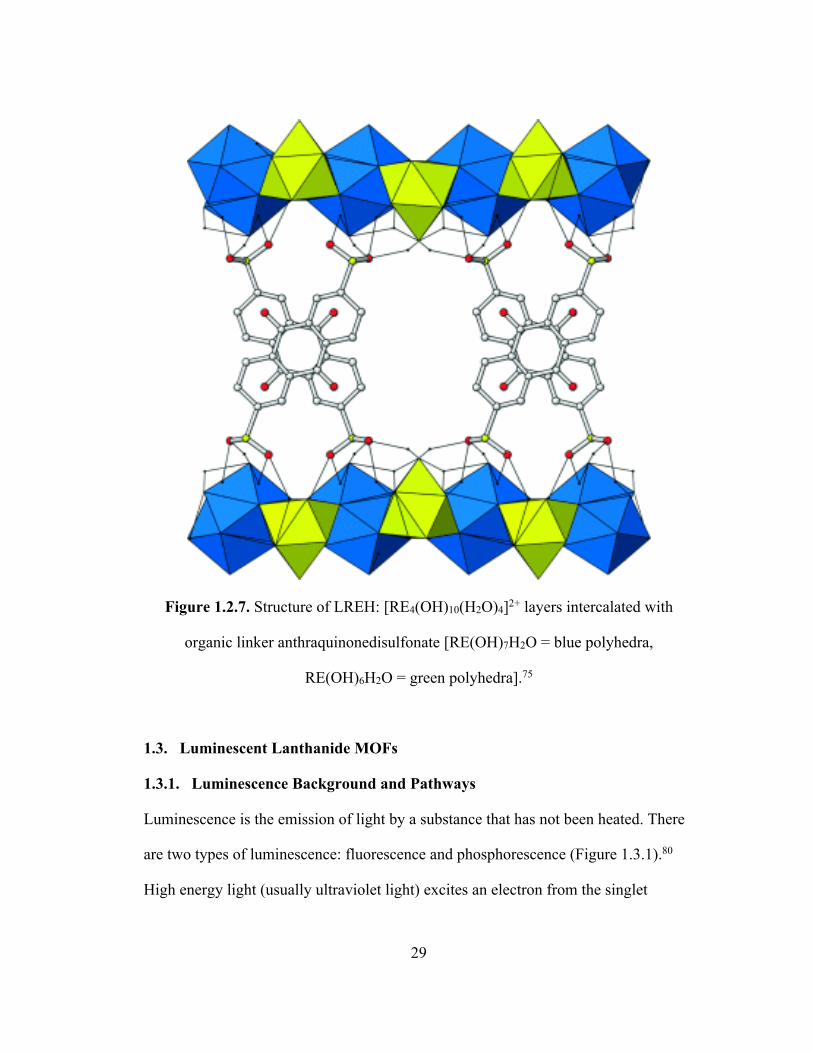
Figure 1.2.7. Structure of LREH: [RE4(OH)10(H2O)4]2+ layers intercalated with
organic linker anthraquinonedisulfonate [RE(OH)7H2O = blue polyhedra,
RE(OH)6H2O = green polyhedra].75
1.3. Luminescent Lanthanide MOFs
1.3.1. Luminescence Background and Pathways
Luminescence is the emission of light by a substance that has not been heated. There
are two types of luminescence: fluorescence and phosphorescence (Figure 1.3.1).80
High energy light (usually ultraviolet light) excites an electron from the singlet

30
ground state to an excited singlet state. In the case of fluorescence, the electron falls
back to a lower energy state, resulting in the emission of a photon of visible light. The
electron in the excited orbital is the opposite spin of the second electron in the ground
state orbital; this is called a spin-allowed transition and occurs rapidly.81 In the case
of phosphorescence, the excited electron will migrate to a lower energy triplet state
(this migration is known as intersystem crossing, which results in the reversal of the
electron spin orientation) before returning to the ground state and emitting light. The
process of intersystem crossing occurs due to spin-orbit coupling. The electron in this
excited triplet state is the same spin as the ground state electron, which makes this a
spin-forbidden transition.81 It is because of this forbidden transition at a lower energy
state that phosphorescence usually has a longer lifetime than fluorescence (typically
on the order of milliseconds or seconds versus nanoseconds, respectively) and emits
at longer wavelengths.

31
Figure 1.3.1. Jablonski diagram depicting the general schematic for fluorescence
and phosphorescence pathways.80
In an insightful review on luminescent MOFs, Allendorf et al. describe five distinct
modes for generating MOF luminescence (Figure 1.3.2).80 The five possible modes
are as follows: 1) conjugated organic linkers can directly emit light after absorbing in
the UV or visible region; 2) framework metal ions (such as Ln3+) in proximity to an
organic fluorophore can produce an antenna effect and emit sharp luminescence; 3)
adsorbed lumiphores can be entrapped in a MOF pore and luminesce in an otherwise
non-emissive framework; 4) lumiphores can be covalently bound to the MOF
framework; 5) exciplex formation can produce broad luminescence due to p-p
interactions between adjacent conjugated linkers or between a linker and guest

32
molecule. The focus in this work will be on the luminescence emitted from lanthanide
ions via the antenna effect.
Figure 1.3.2. Five possible pathways of luminescence in MOFs (metal SBU =
blue polyhedra; organic linker = yellow rectangle; guest species = red circle; light
emission = green wavy arrows; electron transfer = black arrows).80
The antenna effect is further illustrated in Figure 1.3.3. Recall the two conditions for
lanthanide luminescence: 1) the ease in which the excited states can be populated and
2) the minimization of non-radiative energy transfer paths.65 Conjugated organic
linkers such as those with benzene rings are excellent sensitizers which are capable of

33
transferring their excited energy to the lanthanide ion (activator). The electron in the
excited lanthanide energy state may undergo radiative (photoluminescence) or non-
radiative (dropping to a lower energy state without photoluminescence) de-activation.
Figure 1.3.3. Schematic of the antenna effect. An organic linker is excited with
incident, high energy light (hni) and the energy is transferred to a lanthanide ion
excited state which photoluminesces at a longer wavelength (hnPL).
Solid state luminescence is arguably advantageous over solution luminescence due to
the predictability of structure. In the case of MOFs, the organic linkers are stabilized
within the framework which reduce the non-radiative decay rate.66 This also results in
a bound organic linker which can readily charge transfer to the emitting lanthanide. In
a crystalline solid, the ligand-ligand interactions are also rigidly controlled and can
affect the luminescence of a MOF. Luminescent materials can be characterized in

34
three ways: solid state luminescence spectroscopy, quantum yield, and fluorescence
lifetime. Solid state luminescence spectroscopy reveals the atomic transitions that
occur within the lanthanide emitter. The wavelengths of emitted light can be
correlated with the electronic energy diagram and specific transitions can be
identified. In Eu3+-containing materials, the most intense transition typically occurs at
~ 620 nm and corresponds to the 5D0 ® 7F2 transition.82 The quantum yield or
quantum efficiency of a luminescent material is defined as the ratio of photons
emitted to photons absorbed. In a study of 41 different Eu3+ and Tb3+ chelates with
aromatic ligands, the highest quantum yields reported were 0.38 and 0.58 for each
metal, respectively.83 These luminescence experiments were conducted in aqueous
solution and the study also reported lower quantum yields for Ln3+ chelates with less
than nine coordinating atoms as a result of water molecules filling empty coordination
sites. The luminescence lifetime is a measurement of the average time the molecule
stays in its exited state before emitting a photon. The lifetimes of lanthanide emissive
transitions sensitized through the antenna effect are usually on the order of a
millisecond.80
1.3.2. Applications of Luminescent Lanthanide MOFs
The applications of MOFs as luminescent and electromechanical sensors were
previously described in section 1.1.3. Here, new applications of luminescent
lanthanide-based MOFs such as white light emission and thermometry will be
described. Combinations of Eu3+ and Tb3+ within a framework have proven to be an
attractive area for luminescent applications in order to tailor luminescence emissions.

35
Solid-state white light emitting materials have been sought after due to their broad
applications in displays and lighting.84 White light can be produced by the
combination of primary color emissions of red, green, and blue from different
compounds. Qian and his group exploited this idea by constructing a MOF with Eu3+
and Tb3+ (red and green emitters, respectively) and a known blue emitter, the organic
linker pyridine-2,6,-dicarboxylic acid (PDA).85 The MOF La2(PDA)3(H2O)5 was
doped with 1-2% molar amounts of Eu3+ and Tb3+ into the framework, and resulted in
an isomorphous structure with a white light emission very close to pure white light.
The use of lanthanide MOFs as colorimetric luminescent temperature probes are
advantageous due to their fast response, high sensitivity, and noninvasiveness.84 Two
types of isomorphous heterobimetallic Eu3+/Tb3+ structures were reported based on
the dicarboxylate ligands 6-(4-carboxyphenyl)-nicotinic acid and [2,2’-bipyridine]-
5,5’-dicarboxylic acid.86 Each material contains a ratio of Eu0.05Tb0.95 with each
ligand and resulted in a color change from green at 25 K to red at 300 K. The
lanthanide ions are sensitized by the ligands, and Eu3+ is further sensitized by the Tb3+
ions within the framework, as the excited Tb3+ electrons are transferred to the lower
lying Eu3+ excited states. The authors reported that the material with the latter ligand
has a higher temperature-sensitive range due to the higher activation energy of the
deactivation channel between the ligand and Tb3+. The applications of luminescent
lanthanide MOFs continue to grow, and by understanding their structures, we can
gain insight into their functions and properties.

36
1.4. Concluding Remarks
In this chapter, we reviewed the structural details, applications, and characterization
techniques of metal-organic frameworks. We discussed the properties and chemistry
of the lanthanoid elements, as well as their applications in luminescent metal-organic
frameworks and layered rare earth hydroxides. These types of inorganic-organic
hybrid structures based on lanthanide metals are relatively new and thus there are
many possibilities for novel structures and applications to be explored. Combinations
of sensitizers and lanthanide emitters will continue to evolve and as a result, new and
exciting applications of luminescent lanthanide-based materials will likely emerge.
1.5. References
(1) Zhou, H.-C.; Kitagawa, S. Metal–Organic Frameworks (MOFs). Chem. Soc.
Rev. 2014, 43 (16), 5415–5418. https://doi.org/10.1039/C4CS90059F.
(2) Zhou, H.-C.; Long, J.; Yaghi, O. M. Introduction to Metal–Organic
Frameworks. Chem. Rev. 2012, 112 (2), 673–674.
https://doi.org/10.1021/cr300014x.
(3) Howarth, A. J.; Liu, Y.; Hupp, J. T.; Farha, O. K. Metal–Organic Frameworks
for Applications in Remediation of Oxyanion/Cation-Contaminated Water.
CrystEngComm 2015, 17 (38), 7245–7253.
https://doi.org/10.1039/C5CE01428J.
(4) Eddaoudi, M.; Moler, D. B.; Li, H.; Chen, B.; Reineke, T. M.; O’Keeffe, M.;
Yaghi, O. M. Modular Chemistry: Secondary Building Units as a Basis for the

37
Design of Highly Porous and Robust Metal−Organic Carboxylate Frameworks.
Acc. Chem. Res. 2001, 34 (4), 319–330. https://doi.org/10.1021/ar000034b.
(5) Gable, R. W.; Hoskins, B. F.; Robson, R. A New Type of Interpenetration
Involving Enmeshed Independent Square Grid Sheets. The Structure of
Diaquabis-(4,4′-Bipyridine)Zinc Hexafluorosilicate. J. Chem. Soc. Chem.
Commun. 1990, 0 (23), 1677–1678. https://doi.org/10.1039/C39900001677.
(6) Fujita, M.; Kwon, Y. J.; Washizu, S.; Ogura, K. Preparation, Clathration Ability,
and Catalysis of a Two-Dimensional Square Network Material Composed of
Cadmium(II) and 4,4’-Bipyridine. J. Am. Chem. Soc. 1994, 116 (3), 1151–1152.
https://doi.org/10.1021/ja00082a055.
(7) Yaghi, O. M.; Li, H. Hydrothermal Synthesis of a Metal-Organic Framework
Containing Large Rectangular Channels. J. Am. Chem. Soc. 1995, 117 (41),
10401–10402. https://doi.org/10.1021/ja00146a033.
(8) Web of Science Search Results for “Metal-Organic Frameworks.” January 2019.
(9) Kuppler, R. J.; Timmons, D. J.; Fang, Q.-R.; Li, J.-R.; Makal, T. A.; Young, M.
D.; Yuan, D.; Zhao, D.; Zhuang, W.; Zhou, H.-C. Potential Applications of
Metal-Organic Frameworks. Coord. Chem. Rev. 2009, 253 (23), 3042–3066.
https://doi.org/10.1016/j.ccr.2009.05.019.
(10) Eddaoudi, M.; Kim, J.; Rosi, N.; Vodak, D.; Wachter, J.; O’Keeffe, M.; Yaghi,
O. M. Systematic Design of Pore Size and Functionality in Isoreticular MOFs
and Their Application in Methane Storage. Science 2002, 295 (5554), 469–472.
https://doi.org/10.1126/science.1067208.
38
(11) Oliver, S. R. J. Cationic Inorganic Materials for Anionic Pollutant Trapping and
Catalysis. Chem. Soc. Rev. 2009, 38 (7), 1868–1881.
https://doi.org/10.1039/B710339P.
(12) Rogow, D. L.; Swanson, C. H.; Oliver, A. G.; Oliver, S. R. J. Two Related
Gadolinium Aquo Carbonate 2-D and 3-D Structures and Their Thermal,
Spectroscopic, and Paramagnetic Properties. Inorg. Chem. 2009, 48 (4), 1533–
1541. https://doi.org/10.1021/ic801844b.
(13) Sergo, K. M.; Han, C. S.; Bresler, M. R.; Citrak, S. C.; Abdollahian, Y.; Fei, H.;
Oliver, S. R. J. Erbium Hydroxide Ethanedisulfonate: A Cationic Layered
Material with Organic Anion Exchange Capability. Inorg. Chem. 2015, 54 (8),
3883–3888. https://doi.org/10.1021/acs.inorgchem.5b00073.
(14) Dey, C.; Kundu, T.; Biswal, B. P.; Mallick, A.; Banerjee, R. Crystalline Metal-
Organic Frameworks (MOFs): Synthesis, Structure and Function. Acta
Crystallogr. Sect. B Struct. Sci. Cryst. Eng. Mater. 2014, 70 (1), 3–10.
https://doi.org/10.1107/S2052520613029557.
(15) Stock, N.; Biswas, S. Synthesis of Metal-Organic Frameworks (MOFs): Routes
to Various MOF Topologies, Morphologies, and Composites. Chem. Rev. 2012,
112 (2), 933–969.
(16) Meek, S. T.; Greathouse, J. A.; Allendorf, M. D. Metal-Organic Frameworks: A
Rapidly Growing Class of Versatile Nanoporous Materials. Adv. Mater. 2011,
23 (2), 249–267. https://doi.org/10.1002/adma.201002854.

39
(17) Rabenau, A. The Role of Hydrothermal Synthesis in Preparative Chemistry.
Angew. Chem. Int. Ed. Engl. 1985, 24 (12), 1026–1040.
https://doi.org/10.1002/anie.198510261.
(18) Huskić, I.; Pekov, I. V.; Krivovichev, S. V.; Friščić, T. Minerals with Metal-
Organic Framework Structures. Sci. Adv. 2016, 2 (8), e1600621.
https://doi.org/10.1126/sciadv.1600621.
(19) Echigo, T.; Kimata, M. Crystal Chemistry and Genesis of Organic Minerals: A
Review of Oxalate and Polycyclic Aromatic Hydrocarbon Minerals. Can.
Mineral. 2010, 48 (6), 1329–1357. https://doi.org/10.3749/canmin.48.5.1329.
(20) Seetharaj, R.; Vandana, P. V.; Arya, P.; Mathew, S. Dependence of Solvents,
PH, Molar Ratio and Temperature in Tuning Metal Organic Framework
Architecture. Arab. J. Chem. 2016. https://doi.org/10.1016/j.arabjc.2016.01.003.
(21) Banerjee, D.; Finkelstein, J.; Smirnov, A.; Forster, P. M.; Borkowski, L. A.;
Teat, S. J.; Parise, J. B. Synthesis and Structural Characterization of Magnesium
Based Coordination Networks in Different Solvents. Cryst. Growth Des. 2011,
11 (6), 2572–2579. https://doi.org/10.1021/cg200327y.
(22) Myerson, A. S.; Ginde, R. 2 - Crystals, Crystal Growth, and Nucleation. In
Handbook of Industrial Crystallization (Second Edition); Myerson, A. S., Ed.;
Butterworth-Heinemann: Woburn, 2002; pp 33–65.
https://doi.org/10.1016/B978-075067012-8/50004-5.
(23) Wang, Z.; M. Cohen, S. Postsynthetic Modification of Metal–Organic
Frameworks. Chem. Soc. Rev. 2009, 38 (5), 1315–1329.
https://doi.org/10.1039/B802258P.

40
(24) Tanabe, K. K.; Cohen, S. M. Postsynthetic Modification of Metal–Organic
Frameworks—a Progress Report. Chem. Soc. Rev. 2011, 40 (2), 498–519.
https://doi.org/10.1039/C0CS00031K.
(25) Yin, Z.; Wan, S.; Yang, J.; Kurmoo, M.; Zeng, M.-H. Recent Advances in Post-
Synthetic Modification of Metal–Organic Frameworks: New Types and Tandem
Reactions. Coord. Chem. Rev. 2019, 378, 500–512.
https://doi.org/10.1016/j.ccr.2017.11.015.
(26) Wang, Z.; Cohen, S. M. Tandem Modification of Metal–Organic Frameworks
by a Postsynthetic Approach. Angew. Chem. Int. Ed. 2008, 47 (25), 4699–4702.
https://doi.org/10.1002/anie.200800686.
(27) Savonnet, M.; Bazer-Bachi, D.; Bats, N.; Perez-Pellitero, J.; Jeanneau, E.;
Lecocq, V.; Pinel, C.; Farrusseng, D. Generic Postfunctionalization Route from
Amino-Derived Metal−Organic Frameworks. J. Am. Chem. Soc. 2010, 132 (13),
4518–4519. https://doi.org/10.1021/ja909613e.
(28) Kronast, A.; Eckstein, S.; Altenbuchner, P. T.; Hindelang, K.; Vagin, S. I.;
Rieger, B. Gated Channels and Selectivity Tuning of CO2 over N2 Sorption by
Post-Synthetic Modification of a UiO-66-Type Metal–Organic Framework.
Chem. – Eur. J. 2016, 22 (36), 12800–12807.
https://doi.org/10.1002/chem.201602318.
(29) Liu, H.; Xi, F.-G.; Sun, W.; Yang, N.-N.; Gao, E.-Q. Amino- and Sulfo-
Bifunctionalized Metal–Organic Frameworks: One-Pot Tandem Catalysis and
the Catalytic Sites. Inorg. Chem. 2016, 55 (12), 5753–5755.
https://doi.org/10.1021/acs.inorgchem.6b01057.

41
(30) Khan, N. A.; Hasan, Z.; Jhung, S. H. Adsorptive Removal of Hazardous
Materials Using Metal-Organic Frameworks (MOFs): A Review. J. Hazard.
Mater. 2013, 244–245, 444–456. https://doi.org/10.1016/j.jhazmat.2012.11.011.
(31) Langmi, H. W.; Ren, J.; North, B.; Mathe, M.; Bessarabov, D. Hydrogen
Storage in Metal-Organic Frameworks: A Review. Electrochimica Acta 2014,
128, 368–392. https://doi.org/10.1016/j.electacta.2013.10.190.
(32) Suh, M. P.; Park, H. J.; Prasad, T. K.; Lim, D.-W. Hydrogen Storage in Metal–
Organic Frameworks. Chem. Rev. 2012, 112 (2), 782–835.
https://doi.org/10.1021/cr200274s.
(33) Vitillo, J. G.; Atzori, C.; Civalleri, B.; Barbero, N.; Barolo, C.; Bonino, F.
Design and Characterization of MOFs (Metal–Organic Frameworks) for
Innovative Applications. Hybrid Organic‐Inorganic Interfaces 2018.
https://doi.org/10.1002/9783527807130.ch10.
(34) U. Czaja, A.; Trukhan, N.; Müller, U. Industrial Applications of Metal–Organic
Frameworks. Chem. Soc. Rev. 2009, 38 (5), 1284–1293.
https://doi.org/10.1039/B804680H.
(35) Kumar, P.; Deep, A.; Kim, K.-H. Metal Organic Frameworks for Sensing
Applications. TrAC Trends Anal. Chem. 2015, 73, 39–53.
https://doi.org/10.1016/j.trac.2015.04.009.
(36) Lee, J.; K. Farha, O.; Roberts, J.; A. Scheidt, K.; T. Nguyen, S.; T. Hupp, J.
Metal–Organic Framework Materials as Catalysts. Chem. Soc. Rev. 2009, 38 (5),
1450–1459. https://doi.org/10.1039/B807080F.

42
(37) Furukawa, H.; Cordova, K. E.; O’Keeffe, M.; Yaghi, O. M. The Chemistry and
Applications of Metal-Organic Frameworks. Science 2013, 341 (6149),
1230444. https://doi.org/10.1126/science.1230444.
(38) Kumar, P.; Pournara, A.; Kim, K.-H.; Bansal, V.; Rapti, S.; Manos, M. J. Metal-
Organic Frameworks: Challenges and Opportunities for Ion-Exchange/Sorption
Applications. Prog. Mater. Sci. 2017, 86, 25–74.
https://doi.org/10.1016/j.pmatsci.2017.01.002.
(39) Yu, C.; Shao, Z.; Hou, H. A Functionalized Metal–Organic Framework
Decorated with O− Groups Showing Excellent Performance for Lead(II)
Removal from Aqueous Solution. Chem. Sci. 2017, 8 (11), 7611–7619.
https://doi.org/10.1039/C7SC03308G.
(40) Xue, H.; Chen, Q.; Jiang, F.; Yuan, D.; Lv, G.; Liang, L.; Liu, L.; Hong, M. A
Regenerative Metal–Organic Framework for Reversible Uptake of Cd(II): From
Effective Adsorption to in Situ Detection. Chem. Sci. 2016, 7 (9), 5983–5988.
https://doi.org/10.1039/C6SC00972G.
(41) Liang, L.; Chen, Q.; Jiang, F.; Yuan, D.; Qian, J.; Lv, G.; Xue, H.; Liu, L.;
Jiang, H.-L.; Hong, M. In Situ Large-Scale Construction of Sulfur-
Functionalized Metal–Organic Framework and Its Efficient Removal of Hg(II)
from Water. J. Mater. Chem. A 2016, 4 (40), 15370–15374.
https://doi.org/10.1039/C6TA04927C.
(42) Colinas, I. R.; Silva, R. C.; Oliver, S. R. J. Reversible, Selective Trapping of
Perchlorate from Water in Record Capacity by a Cationic Metal–Organic

43
Framework. Environ. Sci. Technol. 2016, 50 (4), 1949–1954.
https://doi.org/10.1021/acs.est.5b03455.
(43) Ding, B.; Guo, C.; Xin Liu, S.; Cheng, Y.; Xia Wu, X.; Mei Su, X.; Yuan Liu,
Y.; Li, Y. A Unique Multi-Functional Cationic Luminescent Metal–Organic
Nanotube for Highly Sensitive Detection of Dichromate and Selective High
Capacity Adsorption of Congo Red. RSC Adv. 2016, 6 (40), 33888–33900.
https://doi.org/10.1039/C6RA03576K.
(44) Nagarkar, S. S.; Saha, T.; Desai, A. V.; Talukdar, P.; Ghosh, S. K. Metal-
Organic Framework Based Highly Selective Fluorescence Turn-on Probe for
Hydrogen Sulphide. Sci. Rep. 2014, 4, 7053. https://doi.org/10.1038/srep07053.
(45) Yi, F.-Y.; Wang, Y.; Li, J.-P.; Wu, D.; Lan, Y.-Q.; Sun, Z.-M. An Ultrastable
Porous Metal–Organic Framework Luminescent Switch towards Aromatic
Compounds. Mater. Horiz. 2015, 2 (2), 245–251.
https://doi.org/10.1039/C4MH00210E.
(46) Allendorf, M. D.; Houk, R. J. T.; Andruszkiewicz, L.; Talin, A. A.; Pikarsky, J.;
Choudhury, A.; Gall, K. A.; Hesketh, P. J. Stress-Induced Chemical Detection
Using Flexible Metal−Organic Frameworks. J. Am. Chem. Soc. 2008, 130 (44),
14404–14405. https://doi.org/10.1021/ja805235k.
(47) Zybaylo, O.; Shekhah, O.; Wang, H.; Tafipolsky, M.; Schmid, R.; Johannsmann,
D.; Wöll, C. A Novel Method to Measure Diffusion Coefficients in Porous
Metal–Organic Frameworks. Phys. Chem. Chem. Phys. 2010, 12 (28), 8093–
8098. https://doi.org/10.1039/B927601G.
44
(48) Tonigold, M.; Lu, Y.; Bredenkötter, B.; Rieger, B.; Bahnmüller, S.; Hitzbleck,
J.; Langstein, G.; Volkmer, D. Heterogeneous Catalytic Oxidation by MFU-1: A
Cobalt(II)-Containing Metal–Organic Framework. Angew. Chem. Int. Ed. 2009,
48 (41), 7546–7550. https://doi.org/10.1002/anie.200901241.
(49) Xiao, B.; Hou, H.; Fan, Y. Catalytic Applications of CuII-Containing MOFs
Based on N-Heterocyclic Ligand in the Oxidative Coupling of 2,6-
Dimethylphenol. J. Organomet. Chem. 2007, 692 (10), 2014–2020.
https://doi.org/10.1016/j.jorganchem.2007.01.010.
(50) Fei, H.; Rogow, D. L.; Oliver, S. R. J. Reversible Anion Exchange and Catalytic
Properties of Two Cationic Metal−Organic Frameworks Based on Cu(I) and
Ag(I). J. Am. Chem. Soc. 2010, 132 (20), 7202–7209.
https://doi.org/10.1021/ja102134c.
(51) Fei, H.; Paw U, L.; Rogow, D. L.; Bresler, M. R.; Abdollahian, Y. A.; Oliver, S.
R. J. Synthesis, Characterization, and Catalytic Application of a Cationic
Metal−Organic Framework: Ag2(4,4′-Bipy)2(O3SCH2CH2SO3). Chem. Mater.
2010, 22 (6), 2027–2032. https://doi.org/10.1021/cm9032308.
(52) Farha, O. K.; Özgür Yazaydın, A.; Eryazici, I.; Malliakas, C. D.; Hauser, B. G.;
Kanatzidis, M. G.; Nguyen, S. T.; Snurr, R. Q.; Hupp, J. T. De Novo Synthesis
of a Metal–Organic Framework Material Featuring Ultrahigh Surface Area and
Gas Storage Capacities. Nat. Chem. 2010, 2 (11), 944–948.
https://doi.org/10.1038/nchem.834.
(53) Tian, T.; Zeng, Z.; Vulpe, D.; Casco, M. E.; Divitini, G.; Midgley, P. A.;
Silvestre-Albero, J.; Tan, J.-C.; Moghadam, P. Z.; Fairen-Jimenez, D. A Sol–Gel

45
Monolithic Metal–Organic Framework with Enhanced Methane Uptake. Nat.
Mater. 2018, 17 (2), 174–179. https://doi.org/10.1038/nmat5050.
(54) DOE Technical Targets for Onboard Hydrogen Storage for Light-Duty Vehicles
https://www.energy.gov/eere/fuelcells/doe-technical-targets-onboard-hydrogen-
storage-light-duty-vehicles (accessed Feb 12, 2019).
(55) West, A. R. Solid State Chemistry and Its Applications, Second Edition.; Wiley,
2014.
(56) Wiktor, C.; Meledina, M.; Turner, S.; Lebedev, O. I.; Fischer, R. A.
Transmission Electron Microscopy on Metal–Organic Frameworks – a Review.
J. Mater. Chem. A 2017, 5 (29), 14969–14989.
https://doi.org/10.1039/C7TA00194K.
(57) Thommes, M.; Kaneko, K.; Neimark, A. V.; Olivier, J. P.; Rodriguez-Reinoso,
F.; Rouquerol, J.; Sing, K. S. W. Physisorption of Gases, with Special Reference
to the Evaluation of Surface Area and Pore Size Distribution (IUPAC Technical
Report). Pure Appl. Chem. 2015, 87 (9–10), 1051–1069.
https://doi.org/10.1515/pac-2014-1117.
(58) Holden, N.; Coplen, T. The Periodic Table of the Elements. Chem. Int. 2009, 26
(1), 8–9. https://doi.org/10.1515/ci.2004.26.1.8.
(59) Cotton, S. Lanthanides and Actinides; Macmillan Physical Science Series;
Macmillan Education LTD: London, 1991.
(60) Voncken, J. H. L. The Rare Earth Elements—A Special Group of Metals. In The
Rare Earth Elements: An Introduction; Voncken, J. H. L., Ed.; SpringerBriefs in

46
Earth Sciences; Springer International Publishing: Cham, 2016; pp 1–13.
https://doi.org/10.1007/978-3-319-26809-5_1.
(61) Kaltsoyannis, N.; Scott, P. The f Elements; Oxford University Press: New York,
1999.
(62) Vuojola, J.; Soukka, T. Luminescent Lanthanide Reporters: New Concepts for
Use in Bioanalytical Applications. Methods Appl. Fluoresc. 2014, 2 (1), 012001.
https://doi.org/10.1088/2050-6120/2/1/012001.
(63) 2.2: Atomic Orbitals and Quantum Numbers
https://chem.libretexts.org/Courses/Oregon_Institute_of_Technology/OIT%3A_
CHE_202_-
_General_Chemistry_II/Unit_2%3A_Electrons_in_Atoms/2.2%3A_Atomic_Or
bitals_and_Quantum_Numbers (accessed Feb 10, 2019).
(64) Shannon, R. D. Revised Effective Ionic Radii and Systematic Studies of
Interatomic Distances in Halides and Chalcogenides. Acta Crystallogr. A 1976,
32 (5), 751–767. https://doi.org/10.1107/S0567739476001551.
(65) Bünzli, J.-C. G.; Piguet, C. Taking Advantage of Luminescent Lanthanide Ions.
Chem. Soc. Rev. 2005, 34 (12), 1048–1077. https://doi.org/10.1039/B406082M.
(66) Cui, Y.; Yue, Y.; Qian, G.; Chen, B. Luminescent Functional Metal–Organic
Frameworks. Chem. Rev. 2012, 112 (2). https://doi.org/10.1021/cr200101d.
(67) Bünzli, J.-C. G. Handbook on the Physics and Chemistry of the Rare Earths:
Including Actinides; Elsevier: Amsterdam, 2016; Vol. 50.

47
(68) Soni, P. L.; Soni, V. Coordination Chemistry: Metal Complexes Transition
Metal Chemistry with Lanthanides and Actinides; CRC Press: Boca Raton, FL,
2013.
(69) Reineke, T. M.; Eddaoudi, M.; O’Keeffe, M.; Yaghi, O. M. A Microporous
Lanthanide–Organic Framework. Angew. Chem. Int. Ed. 1999, 38 (17), 2590–
2594. https://doi.org/10.1002/(SICI)1521-3773(19990903)38:17<2590::AID-
ANIE2590>3.0.CO;2-H.
(70) Isomorphous crystals - Online Dictionary of Crystallography
http://reference.iucr.org/dictionary/Isomorphous_crystals (accessed Feb 19,
2019).
(71) Batrice, R. J.; Adcock, A. K.; Cantos, P. M.; Bertke, J. A.; Knope, K. E.
Synthesis and Characterization of an Isomorphous Lanthanide-
Thiophenemonocarboxylate Series (Ln = La–Lu, except Pm) Amenable to Color
Tuning. Cryst. Growth Des. 2017, 17 (9), 4603–4612.
https://doi.org/10.1021/acs.cgd.7b00400.
(72) Liu, Q.-Y.; Wang, W.-F.; Wang, Y.-L.; Shan, Z.-M.; Wang, M.-S.; Tang, J.
Diversity of Lanthanide(III)–Organic Extended Frameworks with a 4,8-
Disulfonyl-2,6-Naphthalenedicarboxylic Acid Ligand: Syntheses, Structures,
and Magnetic and Luminescent Properties. Inorg. Chem. 2012, 51 (4), 2381–
2392. https://doi.org/10.1021/ic2023727.
(73) Mishra, G.; Dash, B.; Pandey, S. Layered Double Hydroxides: A Brief Review
from Fundamentals to Application as Evolving Biomaterials. Appl. Clay Sci.
2018, 153, 172–186. https://doi.org/10.1016/j.clay.2017.12.021.

48
(74) Duan, X.; Evans, D. G. Layered Double Hydroxides; Springer Science &
Business Media, 2006.
(75) Gándara, F.; Perles, J.; Snejko, N.; Iglesias, M.; Gómez-Lor, B.; Gutiérrez-
Puebla, E.; Monge, M. Á. Layered Rare-Earth Hydroxides: A Class of Pillared
Crystalline Compounds for Intercalation Chemistry. Angew. Chem. Int. Ed.
2006, 45 (47), 7998–8001. https://doi.org/10.1002/anie.200602502.
(76) Liang, J.; Ma, R.; Sasaki, T. Layered Rare Earth Hydroxides (LREHs):
Synthesis and Structure Characterization towards Multifunctionality. Dalton
Trans. 2014, 43 (27), 10355–10364. https://doi.org/10.1039/C4DT00425F.
(77) Geng, F.; Xin, H.; Matsushita, Y.; Ma, R.; Tanaka, M.; Izumi, F.; Iyi, N.; Sasaki,
T. New Layered Rare-Earth Hydroxides with Anion-Exchange Properties.
Chem. – Eur. J. 2008, 14 (30), 9255–9260.
https://doi.org/10.1002/chem.200800127.
(78) Lee, K.-H.; Byeon, S.-H. Extended Members of the Layered Rare-Earth
Hydroxide Family, RE2(OH)5NO3·nH2O (RE = Sm, Eu, and Gd): Synthesis
and Anion-Exchange Behavior. Eur. J. Inorg. Chem. 2009, 2009 (7), 929–936.
https://doi.org/10.1002/ejic.200801052.
(79) Geng, F.; Ma, R.; Sasaki, T. Anion-Exchangeable Layered Materials Based on
Rare-Earth Phosphors: Unique Combination of Rare-Earth Host and
Exchangeable Anions. Acc. Chem. Res. 2010, 43 (9), 1177–1185.
https://doi.org/10.1021/ar900289v.

49
(80) D. Allendorf, M.; A. Bauer, C.; K. Bhakta, R.; T. Houk, R. J. Luminescent
Metal–Organic Frameworks. Chem. Soc. Rev. 2009, 38 (5), 1330–1352.
https://doi.org/10.1039/B802352M.
(81) Principles of Fluorescence Spectroscopy; Lakowicz, J. R., Ed.; Springer US:
Boston, MA, 2006. https://doi.org/10.1007/978-0-387-46312-4.
(82) Binnemans, K. Interpretation of Europium(III) Spectra. Coord. Chem. Rev.
2015, 295, 1–45. https://doi.org/10.1016/j.ccr.2015.02.015.
(83) Latva, M.; Takalo, H.; Mukkala, V.-M.; Matachescu, C.; Rodríguez-Ubis, J. C.;
Kankare, J. Correlation between the Lowest Triplet State Energy Level of the
Ligand and Lanthanide(III) Luminescence Quantum Yield. J. Lumin. 1997, 75
(2), 149–169. https://doi.org/10.1016/S0022-2313(97)00113-0.
(84) Cui, Y.; Chen, B.; Qian, G. Lanthanide Metal-Organic Frameworks for
Luminescent Sensing and Light-Emitting Applications. Coord. Chem. Rev.
2014, 273 (Supplement C), 76–86. https://doi.org/10.1016/j.ccr.2013.10.023.
(85) Rao, X.; Huang, Q.; Yang, X.; Cui, Y.; Yang, Y.; Wu, C.; Chen, B.; Qian, G.
Color Tunable and White Light Emitting Tb3+ and Eu3+ Doped Lanthanide
Metal–Organic Framework Materials. J. Mater. Chem. 2012, 22 (7), 3210–3214.
https://doi.org/10.1039/C2JM14127B.
(86) Zhao, D.; Yue, D.; Jiang, K.; Zhang, L.; Li, C.; Qian, G. Isostructural
Tb3+/Eu3+ Co-Doped Metal–Organic Framework Based on Pyridine-
Containing Dicarboxylate Ligands for Ratiometric Luminescence Temperature
Sensing. Inorg. Chem. 2019, 58 (4), 2637–2644.
https://doi.org/10.1021/acs.inorgchem.8b03225.

50
Chapter 2
Experimental Methods of Lanthanide Metal-Organic
Structures
2.1. Solvothermal Syntheses of Ln-BPDC MOFs (SLUG-43 – 48)
Lanthanum (III) nitrate hexahydrate [La(NO3)3⋅6H2O, Alfa Aesar, 99%], cerium (III)
nitrate hexahydrate [Ce(NO3)3⋅6H2O, Spectrum, 99%], neodymium (III) nitrate
hexahydrate [Nd(NO3)3⋅6H2O, Alfa Aesar, 99.9%], europium (III) nitrate hexahydrate
[Eu(NO3)3⋅6H2O, Strem Chemicals, 99.9%], gadolinium (III) nitrate hexahydrate
[Gd(NO3)3⋅6H2O, Strem Chemicals, 99.9%], erbium (III) nitrate pentahydrate
[Er(NO3)3⋅5H2O, Acros Organics, 99.9%], 4-(4’-carboxy)phenylbenzoic acid
[HO2C(C6H4)2CO2H, Combi-Blocks, 98%] and N,N-dimethylformamide
[(CH3)2NCHO, Macron Fine Chemicals, Analytical Reagent] were used as-received.
[Ln(BPDC)2–][NH2(CH3)2+] (Ln = La, Ce, Nd, Eu, Gd, Er which we denote as
SLUG-43, -44, -45, -46, -47, and -48, respectively, for the University of California,
Santa Cruz – structure number) were synthesized under solvothermal conditions. A
mixture of Ln(NO3)3⋅xH2O (0.200 g), 4,4’-H2BPDC (0.226 g), and 10.0 mL DMF
was stirred until homogeneous, transferred into an autoclave and heated statically
under autogenous pressure for 3 days at 140 to 150 °C, then slow cooled to room

51
temperature at a rate of 0.1 °C/min. After vacuum filtering and rinsing with ethanol,
lustrous, block-shaped crystals suitable for single crystal X-ray diffraction (SCXRD)
were collected among a powder of smaller crystals of the same phase.
2.2. Solvothermal Syntheses of Ln-NDC MOFs (SLUG-49 – 52)
Lanthanum (III) nitrate hexahydrate [La(NO3)3⋅6H2O, Alfa Aesar, 99%], neodymium
(III) nitrate hexahydrate [Nd(NO3)3⋅6H2O, Alfa Aesar, 99.9%], europium (III) nitrate
hexahydrate [Eu(NO3)3⋅6H2O, Strem Chemicals, 99.9%], gadolinium (III) nitrate
hexahydrate [Gd(NO3)3⋅6H2O, Strem Chemicals, 99.9%], 2,6-
naphthalenedicarboxylic acid [HO2C(C10H6)CO2H], TCI America, > 98%] and N,N-
dimethylformamide [(CH3)2NCHO, Macron Fine Chemicals, Analytical Reagent]
were used as-received.
[Ln2(NDC)2(DMF)2⋅x DMF] (Ln = La, Nd, Eu, Gd, which we denote as SLUG-49, -
50, -51, and -52, respectively, for the University of California, Santa Cruz – structure
number) were synthesized under solvothermal conditions. A mixture of
Ln(NO3)3⋅xH2O (0.200 g or equimolar amount of other metal salt), 2,6-H2NDC
(0.197 g) and 10.0 mL DMF was stirred until homogeneous, transferred into an
autoclave and heated statically under autogenous pressure for 3 days at 110 to 125 °C,
then slow cooled to room temperature at a rate of 0.1 °C/min. After vacuum filtering
and rinsing with ethanol, lustrous, block-shaped crystals suitable for SCXRD were
collected among a powder of smaller crystals of the same phase.

52
2.3. Hydrothermal Syntheses of Nd-ADS LREHs (SLUG-28 – 30)
Neodymium (III) nitrate hexahydrate [Nd(NO3)3·6H2O, Alfa Aesar, 99.9%], 1,2-
ethanedisulfonate disodium salt [NaO3S(CH2)2SO3Na, EDS-Na2, Acros Organics,
99%], 1,3-propanedisulfonate disodium salt [NaO3S(CH2)3SO3Na, PDS-Na2, Sigma-
Aldrich], 1,4-butanedisulfonate disodium salt [NaO3S(CH2)4SO3Na, BDS-Na2,
Oakwood Chemical] and sodium hydroxide pellets (NaOH, Fisher Chemical, 99%)
were used as-received for the syntheses. Adipic acid [HO2C(CH2)4CO2H, TCI
America, 99%] was used as-received for the anion exchange reactions.
[Nd2(OH)4(OH2)22+][–O3S(CH2)2SO3–] (which we denote as SLUG-28 for
University of California, Santa Cruz – structure number), [Nd2(OH)4(OH2)22+]
[–O3S(CH2)3SO3–] (SLUG-29) and [Nd2(OH)4(OH2)22+][–O3S(CH2)4SO3–] (SLUG-
30) were synthesized under hydrothermal conditions. A reactant mixture of
Nd(NO3)3·6H2O (2.43 g, 5.55 mmol), the respective α,ω-alkanedisulfonate [EDS-Na2
(1.30 g, 5.55 mmol) / PDS-Na2 (1.37 g, 5.55 mmol) / BDS-Na2 (1.45 g, 5.55 mmol)]
and H2O (10.0 mL, 555 mmol) was adjusted to pH = 7 with NaOH. The mixture was
stirred at room temperature until homogenous before transferring to a 23 mL capacity
Teflon-lined stainless steel autoclave. The autoclave was heated statically at 150 °C
for 3 days under autogenous pressure followed by slow cooling (0.1 °C·min–1) to
room temperature. Vacuum filtration and rinsing with water/ethanol afforded a white
powder of small crystals for all three compounds. Beige-colored rod-shaped crystals
suitable for single crystal XRD analysis were obtained for SLUG-28 from a 1 : 1 :

53
0.75 : 100 molar ratio of Nd(NO3)3·6H2O : EDS-Na2 : 4,4’-bipyridine (C10H8N2) :
H2O, respectively.
Anion exchanges with SLUG-28, -29, and -30 were carried out by placing ~ 200 mg
of the respective SLUG-n material in 50 mL H2O containing an eight-fold molar
excess (with respect to SLUG-28, -29, or -30) of adipic acid. The reaction mixture
was allowed to slowly stir at room temperature for 24 hours. The solid products were
isolated via vacuum filtration and rinsed with H2O and ethanol.
2.4. Characterization Methods
2.4.1. Single Crystal X-ray Diffraction
Pale yellow, almost colorless, crystals of SLUG-43 (La-BPDC), SLUG-44 (Ce-
BPDC), SLUG-46 (Eu-BPDC), SLUG-47 (Gd-BPDC), SLUG-49 (La-NDC), SLUG-
50 (Nd-NDC), SLUG-51 (Eu-NDC), and SLUG-52 (Gd-NDC) were secured to a
Mitegen micromount using Paratone oil. Their SCXRD data was collected at 100 K
using a Rigaku Oxford Diffraction (ROD) Synergy-S X-ray diffractometer equipped
with a HyPix-6000HE hybrid photon counting (HPC) detector and microfocused Mo-
Kα1 radiation (λ = 0.71073 Å). For all samples, data collection strategies to ensure
completeness and desired redundancy were determined using CrysAlisPro.1 Data
processing was performed using CrysAlisPro and included numerical absorption
corrections determined via face-indexing for all samples, applied using the SCALE3
ABSPACK scaling algorithm.2 All structures were solved via intrinsic phasing
methods using ShelXT and refined using ShelXL in the Olex2 graphical user
interface.3–5 Space groups were unambiguously verified by PLATON.6 The final

54
structural refinement included anisotropic temperature factors on all non-hydrogen
atoms. All hydrogen atoms were attached via the riding model at calculated positions
using suitable HFIX commands.
An arbitrary sphere of data was collected on a colorless rod-like crystal of SLUG-28
(Nd-EDS), having approximate dimensions of 0.134 × 0.078 × 0.022 mm3, on a
Bruker APEX-II diffractometer using a combination of ω- and φ-scans of 0.5°.7 Data
were corrected for absorption and polarization effects and analyzed for space group
determination.8 The structure was solved by dual-space methods and expanded
routinely.3 The model was refined by full-matrix least-squares analysis of F2 against
all reflections.4 All non-hydrogen atoms were refined with anisotropic atomic
displacement parameters. Unless otherwise noted, hydrogen atoms were included in
calculated positions. Atomic displacement parameters for the hydrogens were tied to
the equivalent isotropic displacement parameter of the atom to which they are bonded
[Uiso(H) = 1.5Ueq(C) for methyl, 1.2Ueq(C) for all others].
2.4.2. Powder X-ray Diffraction
Powder X-ray diffraction (PXRD) patterns were obtained on a Rigaku Miniflex II
Plus diffractometer with Cu-Kα radiation (l = 1.5418 Å) from 2° to 35° or 60° (2q) at
a rate of 2° per minute and a step size of 0.02°.

55
2.4.3. Fourier-Transform Infrared Spectroscopy
Fourier transform infrared (FTIR) spectroscopy of the materials was collected on a
PerkinElmer spectrophotometer using KBr pellets.
2.4.4. Thermogravimetric Analysis
Thermogravimetric analysis (TGA) was performed on a TA Q500 Thermoanalyzer.
Samples were heated in a platinum pan at a ramp rate of 10 °C/min under nitrogen
flow. The samples for ex situ variable temperature (VT-) PXRD were heated in a tube
furnace to the designated temperature at a rate of 2 °C/min in air.
2.4.5. Photoluminescence
Steady-state photoluminescence spectrum was obtained at room temperature on an
Edinburgh Instruments FLS980 spectrophotometer. Absolute PLQE measurements of
both bulk and microscopic crystals were performed on FLS 920 spectrophotometer
with an integrating sphere (BaSO4 coating) using single photon counting mode. The
focal length of the monochromator was 300 mm. Samples were excited at 320 nm
(Eu-BPDC, SLUG-46) or 362 nm (Eu-NDC, SLUG-51) using a 450W Xenon lamp
with 3 mm excitation slit width and detected by a Hamamatsu R928p photomultiplier
tube. The emission was obtained using 0.2 nm scan step, 0.2 s scan dwell time, and
0.1 mm emission slit width. The PLQEs were calculated by the equation: φ = k𝑓/k𝑎,
in which k𝑓 means the number of emitted photons and k𝑎 means the number of
absorbed photons.

56
2.5. References
(1) CrysAlisPro; Rigaku Oxford Diffraction; 2017.
(2) SCALE3 ABSPACK; Rigaku Oxford Diffraction; 2017.
(3) Sheldrick, G. M. SHELXT – Integrated Space-Group and Crystal-Structure
Determination. Acta Crystallogr. Sect. Found. Adv. 2015, 71 (1), 3–8.
https://doi.org/10.1107/S2053273314026370.
(4) Sheldrick, G. M. Crystal Structure Refinement with SHELXL. Acta Crystallogr.
Sect. C Struct. Chem. 2015, 71 (1), 3–8.
https://doi.org/10.1107/S2053229614024218.
(5) Dolomanov, O. V.; Bourhis, L. J.; Gildea, R. J.; Howard, J. a. K.; Puschmann,
H. OLEX2: A Complete Structure Solution, Refinement and Analysis Program.
J. Appl. Crystallogr. 2009, 42 (2), 339–341.
https://doi.org/10.1107/S0021889808042726.
(6) Spek, A. L. Structure Validation in Chemical Crystallography. Acta Crystallogr.
D Biol. Crystallogr. 2009, 65 (2), 148–155.
https://doi.org/10.1107/S090744490804362X.
(7) APEX-3; Bruker AXS: Madison, Wisconsin, USA, 2016.
(8) Krause, L.; Herbst-Irmer, R.; Sheldrick, G. M.; Stalke, D. J. Appl. Cryst. 2015,
48, 3.

57
Chapter 3
Characterizations and Luminescent Properties of
Lanthanide Metal-Organic Structures
Abstract
In this chapter, the three projects Ln-BPDC, Ln-NDC, and Nd-ADS are presented.
The Ln-BPDC (SLUG-43–48) project consists of six anionic, isomorphous MOFs
with the formula [Ln(BPDC)2–][NH2(CH3)2+] (Ln = La, Ce, Nd, Eu, Gd, Er). The
materials all possess the same 3-D structure and crystallize in the orthorhombic space
group Pbcn. All exhibit thermal stability up to 300 °C and decompose to Ln2O3 after
800 °C. The Eu-BPDC structure exhibits strong fluorescence in the 612-620 nm range
and a quantum yield of 2.11%. The Ln-NDC (SLUG-49–52) project consists of four
neutral structures that each crystallize in distinct space groups. Their formulas are
[La6(NDC)9(DMF)3×6 DMF], [Nd2(NDC)3(DMF)2], [Eu2(NDC)3(DMF)2×DMF], and
[Gd4(NDC)6(DMF)4]. The NDC-based structures exhibit similar thermal
decomposition profiles and infrared spectra. The Eu-NDC structure exhibits a sharp
red-orange luminescence at 613 nm and a quantum yield of 3.56%. Lastly, the Nd-
ADS (SLUG-28–30) project consists of three LREHs made of [Nd2(OH)4(OH2)22+]
layers with interlamellar a,w-[–O3S(CH2)nSO3–] anions (n = 2 to 4). These LREHs
show an increase in thermal stability with increasing alkanedisulfonate chain length.

58
As an initial example of anion exchange, all three materials show exchange for
adipate, –O2C(CH2)4CO2–. This work expands the chemistry of lanthanide MOFs and
LREHs.
3.1. Ln-BPDC MOFs (SLUG-43–48)
3.1.1. Structures
SLUG-43 through 48 were synthesized solvothermally in high yield [80% to 89%
based on Ln(III)] at a synthesis temperature range of 140 to 150 °C. Below this
optimal temperature range, no crystalline product formed. Longer synthesis times
resulted in higher crystallinity and slightly higher yield. The crystals were colorless
blocks among a powder of the same phase. Single crystal structures of the MOFs
based on La, Ce, Eu and Gd (SLUG-43, -44, -46 and -47, respectively) were obtained
and solved (Figures 3.1.1 – 3.1.4). The crystal data for these structures are
summarized in Table 3.1.1. The experimental PXRDs match the theoretical PXRD
calculated from the single crystal data, verifying that this series of MOFs is
isostructural. The similarity of the PXRD patterns for SLUG-45 and -48 (based on Nd
and Er, respectively, Figure 3.1.5) support that they are isomorphous despite forming
crystals too small for SCXRD analysis.

59
Figure 3.1.1. Crystallographic projections of SLUG-43 (La): A) View along the c-
axis, showing the metal centers surrounded by BPDC2– ligands and the charge-
balancing dimethylammonium ions (La – green; O – red; C – black; N – light blue; H
– pink); B) View along the a-axis of one layer of isolated LaO8 centers (C, N, and H
omitted for clarity); C) ORTEP (Oak Ridge thermal ellipsoid plot) diagram of SLUG-
43 and its atomic numbering scheme. Thermal ellipsoids are calculated at 50%
probability.

60
Figure 3.1.2. Crystallographic projections of SLUG-44 (Ce): A) View along the c-
axis, showing the metal centers surrounded by BPDC2– ligands and the charge-
balancing dimethylammonium ions (Ce – yellow; O – red; C – black; N – light blue;
H – pink); B) View along the a-axis of one layer of isolated CeO8 centers (C, N, and
H omitted for clarity); C) ORTEP (Oak Ridge thermal ellipsoid plot) diagram of
SLUG-44 and atomic numbering scheme. Thermal ellipsoids are calculated at 50%
probability.

61
Figure 3.1.3. Crystallographic projections of SLUG-46 (Eu): A) View along the c-
axis, showing the metal centers surrounded by BPDC2– ligands and the charge-
balancing dimethylammonium ions (Eu – orange; O – red; C – black; N – light blue;
H – pink); B) View along the a-axis of one layer of isolated EuO8 centers (C, N, and
H omitted for clarity); C) ORTEP (Oak Ridge thermal ellipsoid plot) diagram of
SLUG-46 and atomic numbering scheme. Thermal ellipsoids are calculated at 50%
probability.

62
Figure 3.1.4. Crystallographic projections of SLUG-47 (Gd): A) View along the c-
axis, showing the metal centers surrounded by BPDC2– ligands and the charge-
balancing dimethylammonium ions (Gd – purple; O – red; C – black; N – light blue;
H – pink); B) View along the a-axis of one layer of isolated GdO8 centers (C, N, and
H omitted for clarity); C) ORTEP (Oak Ridge thermal ellipsoid plot) diagram of
SLUG-47 and atomic numbering scheme. Thermal ellipsoids are calculated at 50%
probability.

63
Table 3.1.1. Crystal Data and Structure Refinement for SLUG-43, -44, -46 and -47
Material SLUG-43 SLUG-44 SLUG-46 SLUG-47
Empirical Formula
LaO8C30H24N CeO8C30H24N EuO8C30H24N GdO8C30H24N
Formula Weight
(g⋅mol–1)
665.42 666.62 678.46 683.75
Temperature (K)
100 100 100 100
Crystal System
Orthorhombic Orthorhombic Orthorhombic Orthorhombic
Space Group Pbcn Pbcn Pbcn Pbcn
a, b, c (Å) 28.1888(18), 11.7883(12),
7.7777(8)
28.0397(16), 11.7767(6), 7.7568(4)
27.844(2), 11.7069(5), 7.7599(4)
27.8139(14), 11.7109(6), 7.7452(4)
a, b, g (°) 90, 90, 90 90, 90, 90 90, 90, 90 90, 90, 90
Volume (Å3) 2584.5(4) 2561.4(2) 2529.5(2) 2522.8(2)
Z 8 8 8 8
rcalc (g⋅cm–3) 1.71 1.729 1.785 1.800
µ (mm–1) 1.709 1.833 2.541 2.686
F(000) 1328 1332 1352 1356
Crystal Dimensions
(mm)
0.017 ´ 0.049 ´ 0.149
0.033 ´ 0.183 ´ 0.239
0.014 ´ 0.070 ´ 0.098
0.046 ´ 0.065 ´ 0.090
Index Ranges -34 £ h £ 35, -14 £ k £ 13,
-9 £ l £ 9
-34 £ h £ 35, -14 £ k £ 14,
-8 £ l £ 9
-34 £ h £ 23, -13 £ k £ 14,
-9 £ l £ 9
-34 £ h £ 34, -14 £ k £ 14,
-9 £ l £ 9
Reflections Collected
8123 9025 8262 9912
Unique Data 2567 [Rint = 0.0849]
2611 [Rint = 0.0357]
2565 [Rint = 0.0349]
2574 [Rint = 0.0319]
Data / Restraints / Parameters
2567 / 0 / 187 2611 / 0 / 187 2565 / 0 / 187 2574 / 0 / 187

64
Goodness of Fit on F2
1.005 1.081 1.200 1.065
Final R Factors
[I > 2s (I)]
R1 = 0.0514 wR2 = 0.1162
R1 = 0.0339 wR2 = 0.0740
R1 = 0.0407 wR2 = 0.0768
R1 = 0.0232 wR2 = 0.0520
Largest Residual
Peak/Hole (e⋅Å–3)
2.02 / -0.90 1.22 / -0.85 1.35 / -0.82 0.872 / -0.339
Figure 3.1.5. PXRD patterns of the isomorphous series SLUG-43-48 (La, Ce, Nd,
Eu, Gd and Er, respectively), with the theoretical pattern for SLUG-43 (La) shown at
the bottom.

65
The SCXRD studies reveal that the asymmetric unit of SLUG-43-48 contains one
Ln(III) ion, two BPDC2– ligands and one dimethylammonium cation. The Ln(III) ion
is eight-coordinated by the oxygens from six different BPDC2– ligands in a distorted
square antiprismatic coordination geometry. The average Ln-O bond distance is
2.44(6) Å, well within the covalent range based on a search of the Cambridge
Structural Database. The ligand BPDC2– is known to adopt up to seven different
coordination modes.1 In the present MOFs, all BPDC2– ligands exhibit the same type
of binding mode (Figure 3.1.6). One end of the ligand participates in h2 binding to
one Ln(III) ion, while the other end µ-2 bridges between two Ln(III) ions, creating a
three-dimensional framework. The Ln(III) ions are independent with no inorganic
connectivity, but are centered about layers in the yz plane (Figure 3.1.1B). The
dimethylammonium cations are electrostatically coordinated to each Ln(III) ion,
balancing the net negative charge from each [Ln3+(BPDC2–)2]– unit.
Figure 3.1.6. Binding mode for all BPDC2– ligands in SLUG-43–48.
3.1.2. Thermal Characterization
The SLUG-43–48 materials decompose similarly (Figures 3.1.7–3.1.12). Ln-BPDC
begins to decompose at approximately 300 °C (Figure 3.1.7A). The first mass loss of

66
19.4% corresponds to a loss of dimethylammonium and likely the hydrocarbon
portion of one of the linkers, with a theoretical mass loss of 19.7%. The VT-PXRD
shows a low angle peak with two higher order reflections after the sample was heated
to 375 °C (Figure 3.1.7B). It is possible that the Ln polyhedra have condensed into a
layered structure. The second decomposition event at ~ 400 °C of 35.8% agrees well
with the loss of an additional BPDC2– ligand (theoretical mass loss of 35.4%). The
final decomposition event at ~ 600 °C of 18.5% agrees with the loss of the remaining
organic (theoretical mass loss of 18.9%). As expected, the final solid is Ln2O3,
confirmed by both PXRD after TGA heating and VT-PXRD (Figure 3.1.7B, top
pattern). As a representative sample, SLUG-46 (Eu) was heated to 1000 °C to obtain
a complete decomposition profile (Figure 3.1.10A).
Figure 3.1.7. A) Thermogravimetric trace of SLUG-43 (La); B) Ex situ VT-PXRD of
SLUG-43 (La), with asterisks denoting peaks due to the aluminum sample holder.
A B
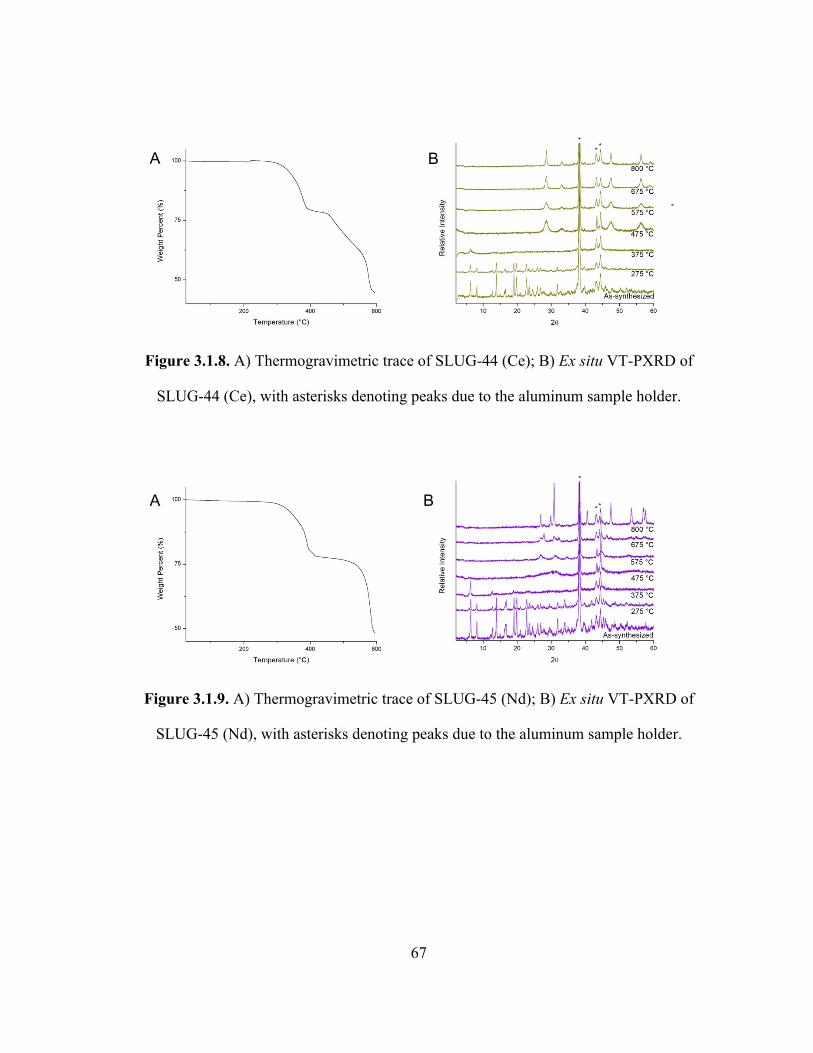
67
Figure 3.1.8. A) Thermogravimetric trace of SLUG-44 (Ce); B) Ex situ VT-PXRD of
SLUG-44 (Ce), with asterisks denoting peaks due to the aluminum sample holder.
Figure 3.1.9. A) Thermogravimetric trace of SLUG-45 (Nd); B) Ex situ VT-PXRD of
SLUG-45 (Nd), with asterisks denoting peaks due to the aluminum sample holder.
A B
A B

68
Figure 3.1.10. A) Thermogravimetric trace of SLUG-46 (Eu); B) Ex situ VT-PXRD
of SLUG-46 (Eu), with asterisks denoting peaks due to the aluminum sample holder.
Figure 3.1.11. A) Thermogravimetric trace of SLUG-47 (Gd); B) Ex situ VT-PXRD
of SLUG-47 (Gd), with asterisks denoting peaks due to the aluminum sample holder.
A B
A B

69
Figure 3.1.12. A) Thermogravimetric trace of SLUG-48 (Er); B) Ex situ VT-PXRD
of SLUG-48 (Er), with asterisks denoting peaks due to the aluminum sample holder.
3.1.3. Vibrational Spectroscopy
All six materials have very similar IR spectra, owing to their isomorphous topology
(Figure 3.1.13). Broad N-H stretching bands are visible centered around ~ 3130 and
3400 cm–1 due to the dimethylammonium countercations.2,3 Four sharp peaks in the
1400 to 1650 cm–1 region are attributed to (C- - -O)2 stretching from the carboxylate in
the BPDC2– ligands. The sharp peak at ~ 770 cm–1 is due to the characteristic C-H
deformation of 1,4-disubstituted aromatics. The PXRD and FTIR of the free ligand
H2BPDC are shown in Figure 3.1.14, to demonstrate the differences with the
synthesized materials. We posit that the luminescence of SLUG-46 (Eu) is due to a
ligand-to-metal charge transfer (LMCT) process. FTIR of Eu-BPDC sample after
heating to 375 °C (Figure 3.1.15) shows the partial loss of the peaks at 3100 cm–1 and
1650 cm–1, corresponding to N-H and (C- - -O)2 stretching, respectively.
A B

70
Figure 3.1.13. FTIR spectra of SLUG-43-48, further underscoring their isomorphous
nature.

71
Figure 3.1.14. Characterizations of the free ligand H2BPDC: A) PXRD pattern of
H2BPDC; B) FTIR spectrum of H2BPDC.
Figure 3.1.15. FTIR spectrum of the intermediate structure after heating SLUG-46
(Eu) to 375 °C.

72
3.1.4. Photoluminescence Spectroscopy
The Eu(III)-based MOF, SLUG-46, exhibits intense luminescence in the visible red-
orange region (Figure 3.1.16–3.1.17). These emission bands are due to 5D0 ® 7FJ (J =
1, 2, 4) electronic transitions. The 5D0 ® 7F3 transition is weakly observed at 660 nm.
These electronic transitions are known to be the most notable for Eu(III) complexes.4
The intense 5D0 ® 7F2 transition is hypersensitive and indicates that Eu(III) is not at a
site with a center of symmetry. SLUG-46 displays a quantum efficiency of 2.11%. As
expected, none of the SLUG-43 (La), -44 (Ce), -45 (Nd), -47 (Gd) or -48 (Er)
materials were fluorescent. The photoluminescence of SLUG-46 is quenched after the
material is heated to 375 °C (Figure 3.1.17). As the organic is evolved, the LMCT
process is likely disrupted and as a result, Eu(III) no longer emits light.

73
Figure 3.1.16. Solid-state fluorescence emission spectrum of SLUG-46 (Eu), excited
at 320 nm.
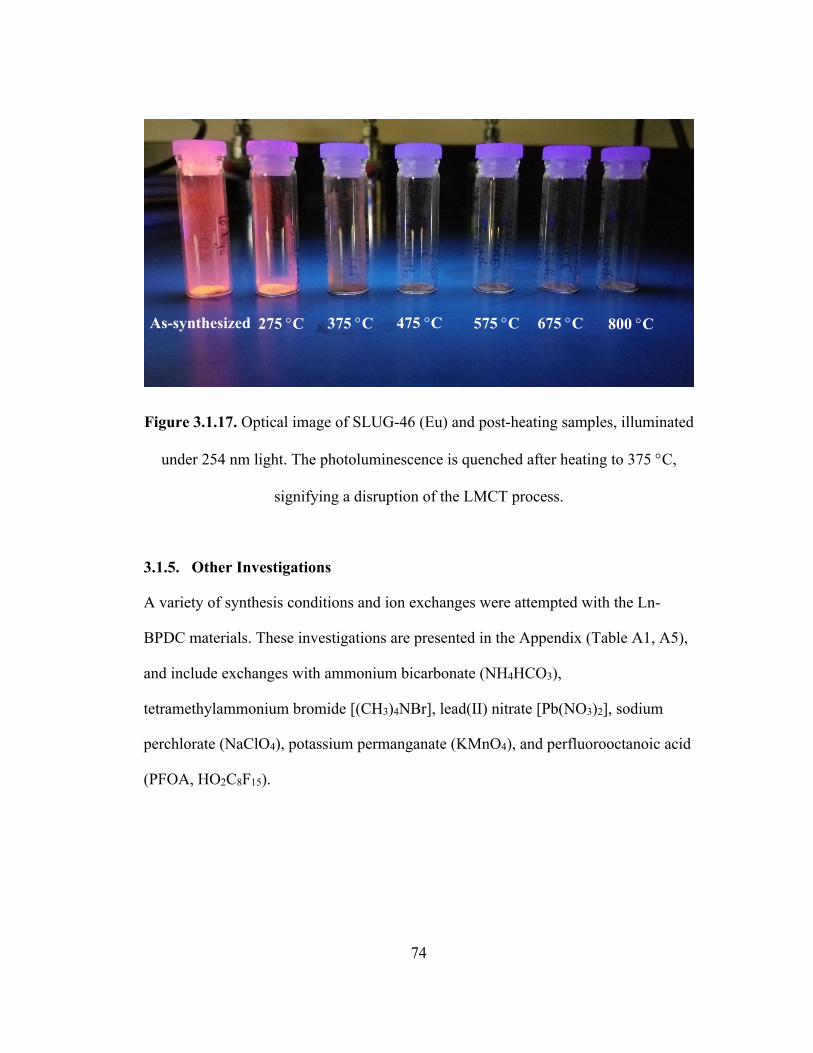
74
Figure 3.1.17. Optical image of SLUG-46 (Eu) and post-heating samples, illuminated
under 254 nm light. The photoluminescence is quenched after heating to 375 °C,
signifying a disruption of the LMCT process.
3.1.5. Other Investigations
A variety of synthesis conditions and ion exchanges were attempted with the Ln-
BPDC materials. These investigations are presented in the Appendix (Table A1, A5),
and include exchanges with ammonium bicarbonate (NH4HCO3),
tetramethylammonium bromide [(CH3)4NBr], lead(II) nitrate [Pb(NO3)2], sodium
perchlorate (NaClO4), potassium permanganate (KMnO4), and perfluorooctanoic acid
(PFOA, HO2C8F15).
675 °C 800 °C As-synthesized 275 °C 375 °C 475 °C 575 °C
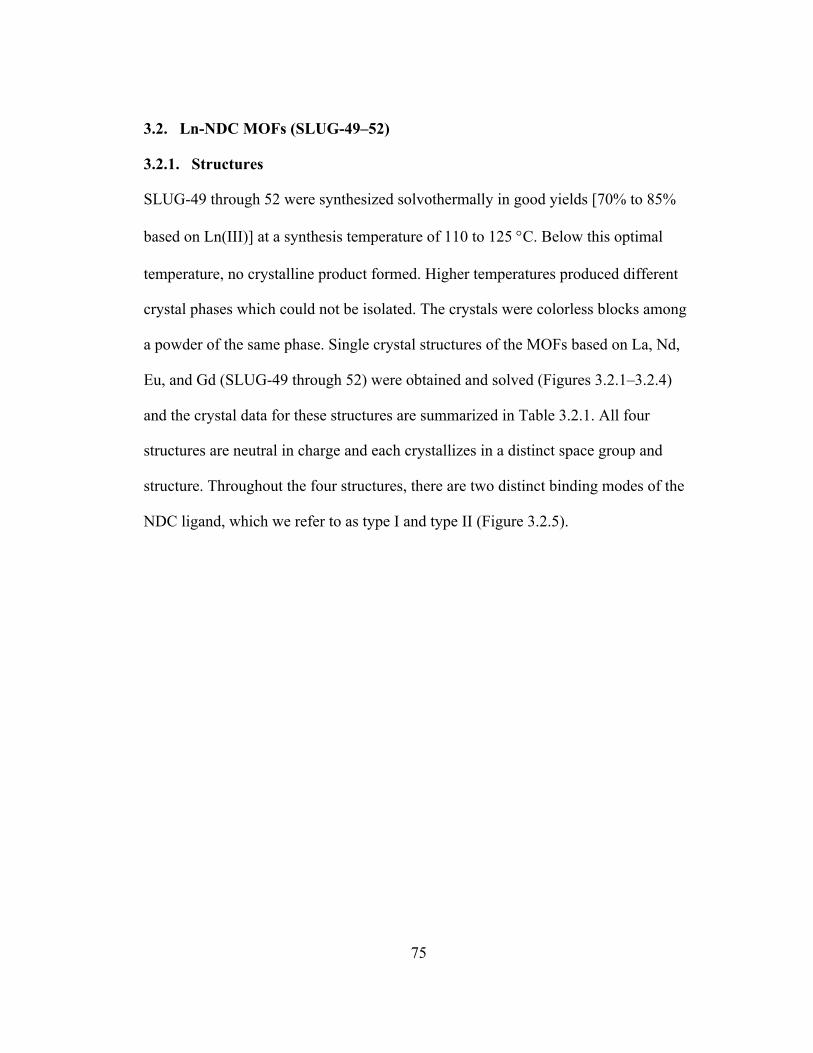
75
3.2. Ln-NDC MOFs (SLUG-49–52)
3.2.1. Structures
SLUG-49 through 52 were synthesized solvothermally in good yields [70% to 85%
based on Ln(III)] at a synthesis temperature of 110 to 125 °C. Below this optimal
temperature, no crystalline product formed. Higher temperatures produced different
crystal phases which could not be isolated. The crystals were colorless blocks among
a powder of the same phase. Single crystal structures of the MOFs based on La, Nd,
Eu, and Gd (SLUG-49 through 52) were obtained and solved (Figures 3.2.1–3.2.4)
and the crystal data for these structures are summarized in Table 3.2.1. All four
structures are neutral in charge and each crystallizes in a distinct space group and
structure. Throughout the four structures, there are two distinct binding modes of the
NDC ligand, which we refer to as type I and type II (Figure 3.2.5).
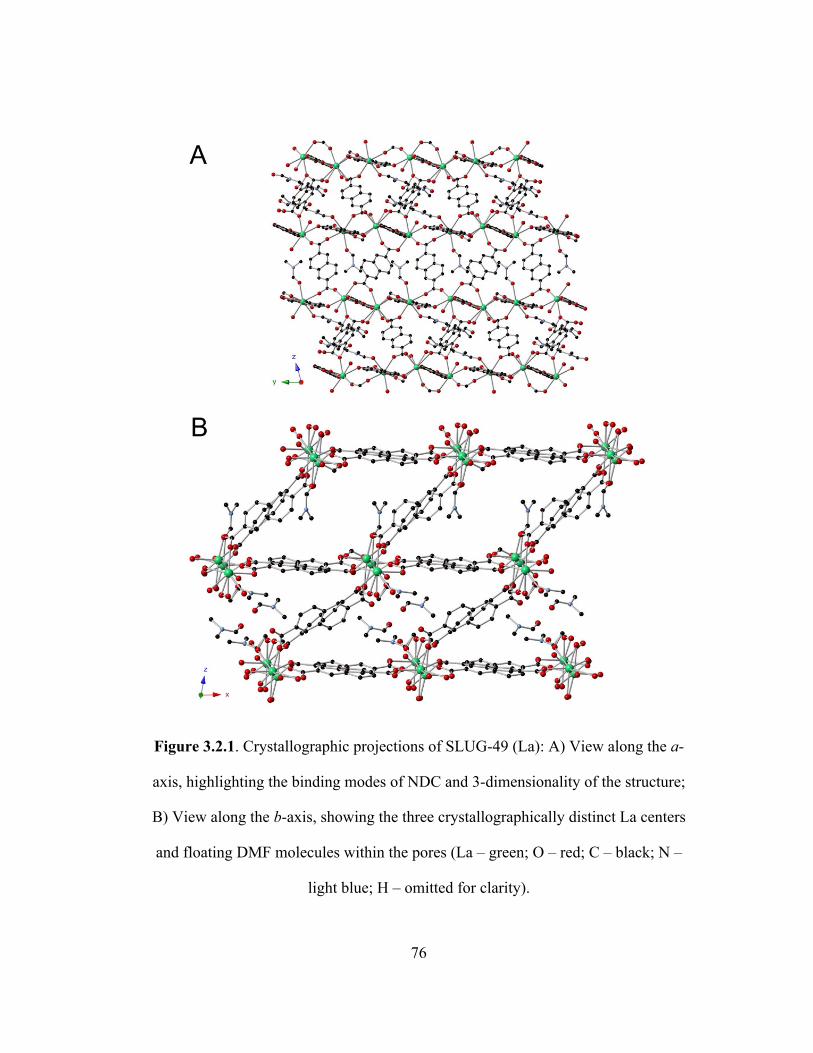
76
Figure 3.2.1. Crystallographic projections of SLUG-49 (La): A) View along the a-
axis, highlighting the binding modes of NDC and 3-dimensionality of the structure;
B) View along the b-axis, showing the three crystallographically distinct La centers
and floating DMF molecules within the pores (La – green; O – red; C – black; N –
light blue; H – omitted for clarity).

77
Figure 3.2.2. Crystallographic projection of SLUG-50 (Nd): A) View along the a-
axis of the 3-dimensional structure; B) View along the c-axis, highlighting the various
binding modes and pi stacking of NDC ligands, as well as the bound DMF molecules
(Nd – purple; O – red; C – black; N – light blue; H – omitted for clarity).

78
Figure 3.2.3. Crystallographic projections of SLUG-51 (Eu): A) View along the a-
axis of the 3-dimensional structure; B) View along the c-axis, highlighting the various
binding modes and pi-stacking of NDC ligands, as well as the bound and floating
DMF molecules (Eu – orange; O – red; C – black; N – light blue; H – omitted for
clarity).

79
Figure 3.2.4. Crystallographic projections of SLUG-52 (Gd); A) View along the a-
axis of the 3-dimensional structure; B) View along the b-axis, showing the various
binding modes of the NDC ligands and the bound DMF molecules (Gd – yellow; O –
red; C – black; N – light blue; H – omitted for clarity).

80
Table 3.2.1. Crystal Data and Structure Refinement for SLUG-49, -50, -51 and -52
Material SLUG-49 SLUG-50 SLUG-51 SLUG-52 Empirical Formula
La6C135H115O47N9
NdC21H16O7.5N
Eu2C45H39O15N3
Gd4C84H64O28N4
Formula Weight
(g⋅mol–1) 3448.81 546.59 1165.71 2206.39
Temperature (K) 100(2) 100(2) 100.01(10) 120(2)
Crystal System Triclinic Monoclinic Monoclinic Orthorhombic
Space Group P1% C2/c P21/n Pca21
a, b, c, (Å) 13.2526(8) 14.3785(8) 19.9214(10)
12.4204(5) 21.5953(7) 16.3081(6)
11.9185(3) 21.8730(5) 16.5342(4)
19.4366(9) 8.7643(4) 45.084(2)
a, b, g (°) 70.927(5) 74.630(5) 75.542(5)
90 102.907(4)
90
90 100.476(2)
90
90 90 90
Volume (Å3) 3403.5(4) 4263.7(3) 4238.51(18) 7679.9(6) Z 1 8 4 4
rcalc (g⋅cm–3) 1.683 1.703 1.827 1.908 µ (mm–1) 14.980 2.480 3.009 3.500 F(000) 1706 2152 2304 4304
Index Ranges -12 £ h £ 15 -16 £ k £ 17 -23 £ l £ 23
-16 £ h £ 16 -27 £ k £ 29 -22 £ l £ 21
-14 £ h £ 14 -26 £ k £ 27 -20 £ l £ 20
-25 £ h £ 24 -11 £ k £ 11 -59 £ l £ 60
Reflections Collected 32919 4360 30302 19057
Unique Data 9215 [Rint = 0.0589]
3954 [Rint = 0.0296]
6543 [Rint = 0.0249]
13636 [Rint = 0.0918]
Data / Restraints / Parameters
11945 / 56 / 1042
4360 / 38 / 316 8660 / 0 / 592 19057 / 25 /
1089
Goodness of Fit on F2 1.043 1.075 1.025 0.875
Final R Factors
[I > 2s(I)]
R1 = 0.0434
wR2 = 0.1043
R1 = 0.0254
wR2 = 0.0675
R1 = 0.0220
wR2 = 0.0462
R1 = 0.0536
wR2 = 0.1267
Largest Residual
Peak/Hole (e⋅Å–3)
1.121 / -1.196 1.043 / -0.640 0.639 / -0.720 2.065 / -1.440
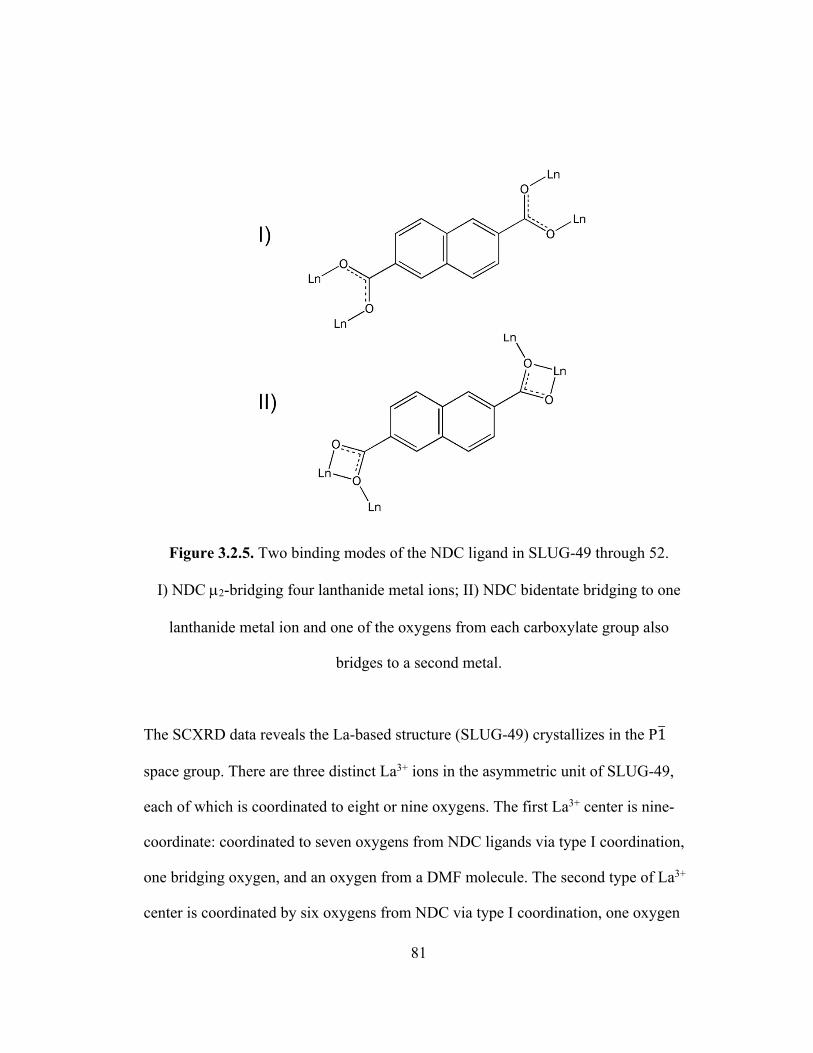
81
Figure 3.2.5. Two binding modes of the NDC ligand in SLUG-49 through 52.
I) NDC µ2-bridging four lanthanide metal ions; II) NDC bidentate bridging to one
lanthanide metal ion and one of the oxygens from each carboxylate group also
bridges to a second metal.
The SCXRD data reveals the La-based structure (SLUG-49) crystallizes in the P1%
space group. There are three distinct La3+ ions in the asymmetric unit of SLUG-49,
each of which is coordinated to eight or nine oxygens. The first La3+ center is nine-
coordinate: coordinated to seven oxygens from NDC ligands via type I coordination,
one bridging oxygen, and an oxygen from a DMF molecule. The second type of La3+
center is coordinated by six oxygens from NDC via type I coordination, one oxygen

82
from a DMF molecule, and one terminal oxygen. The third La3+ center is coordinated
to four NDC ligands via type I coordination, one bridging oxygen, 1 terminal oxygen,
and two DMF molecules. SLUG-49 contains 6 disordered floating DMF molecules
per formula unit. The Nd- and Eu-based structures (SLUG-50 and-51, respectively)
are the most similar to each other. Both are in the monoclinic crystal system, but the
structures crystallize in the C2/c and P21/n space groups, respectively. SLUG-50
contains a nine-coordinate Nd3+ center, surrounded by four NDC ligands with type I
coordination, one NDC ligand with bidentate type II coordination, one bridging type
II coordination, one DMF molecule, and one µ2-bridging oxygen. SLUG-51 is
characterized by an eight-coordinate Eu3+ center. Here, Eu3+ is surrounded by four
NDC ligands with type I coordination, one bidentate type II coordination, one
bridging type II coordination, and one DMF molecule. Another difference between
these two structures is that SLUG-51 contains a floating DMF molecule in addition to
the bound DMF found in SLUG-50. Lastly, the Gd-based SLUG-52 structure
crystallizes in the Pca21 space group. Gd3+ is seven-coordinate, surrounded by six
NDC ligands with type I coordination and one DMF molecule. Syntheses with the
lanthanides cerium and erbium were also attempted but no crystals large enough for
SCXRD could be isolated.
As evidenced by the SCXRD data, this group of structures is not isomorphous. The
PXRD patterns of SLUG-49 through 52 are shown in Figure 3.2.6. Comparisons of
the theoretical PXRDs with the as-synthesized materials are presented in Figures
3.2.7 – 3.2.10. One possible reason behind the diversity of these structures is due to

83
the rigidity of the NDC ligand. As NDC molecules coordinate to the Ln(III) centers,
effects such as pi-stacking and an abundance of available coordinating DMF
molecules compete to fill the coordination sphere of the lanthanides. These factors
will be further discussed in chapter 4.2.
Figure 3.2.6. PXRD patterns of SLUG-49 through 52.

84
Figure 3.2.7. Comparison of the theoretical PXRD of SLUG-49 (La) (bottom) with
as-synthesized (top).

85
Figure 3.2.8. Comparison of the theoretical PXRD of SLUG-50 (Nd) (bottom) with
as-synthesized (top).

86
Figure 3.2.9. Comparison of the theoretical PXRD of SLUG-51 (Eu) (bottom) with
as-synthesized (top).

87
Figure 3.2.10. Comparison of the theoretical PXRD of SLUG-52 (Gd) (bottom) with
as-synthesized (top).
3.2.2. Thermal Characterization
The four materials exhibit similar decomposition profiles, which can be characterized
by the loss of DMF solvent, the loss of coordinated DMF molecules, and finally the
loss of the organic NDC linker (Figures 3.2.11–3.2.14). In the case of SLUG-49 (La),
a 12.7% mass loss by 210 °C is observed (Figure 3.2.11A). This corresponds nicely
with the loss of six free DMF solvent molecules, which corresponds to a theoretical
mass loss of 12.7%. An additional 7.8% mass is lost by 292 °C, which corresponds to

88
a theoretical mass loss of 7.3% of the three coordinated DMF molecules and an
unknown intermediate in the VT-PXRD (Figure 3.2.11B). Lastly, there is a loss of
51.4% mass by 600 °C, which can be attributed to the loss of the organic NDC linkers
(theoretical mass loss of 52.6%). VT-PXRD pattern shows that the final phase is
La2O3 (Figure 3.2.11B, top pattern).
Figure 3.2.11. A) Thermogravimetric trace of SLUG-49 (La); B) Ex situ VT-PXRD
of SLUG-49 (La).
In the case of SLUG-50 (Nd), a mass loss of 3.0% is observed at 180 °C due to the
evolution of solvent DMF molecules. At 290 °C, an additional 13.1% mass loss is
observed which corresponds to the loss of coordinated DMF molecules (theoretical
loss of 13.4%). By 600 °C, the observed mass loss of 39.7% corresponds to the
theoretical mass loss of 41% of the organic component.
A B

89
Figure 3.2.12. A) Thermogravimetric trace of SLUG-50 (Nd); B) Ex situ VT-PXRD
of SLUG-50 (Nd).
SLUG-51 (Eu) is observed to lose 5.5% at 180 °C, which is attributed to the DMF
solvent molecule, with a theoretical mass loss of 6.2%. At 310 °C, a mass loss of
12.4% is observed, which matches nicely with the theoretical loss of 12.5% and
corresponds to the loss of two coordinated DMF molecules. By 600 °C, a mass loss of
29.5% is observed. This last loss corresponds to the loss of the organic component,
with a theoretical mass loss of 38%. It is evident from the TGA and VT-PXRD
(Figure 3.2.13) that not all of the organic component has been completely
decomposed by 600 °C.
A B

90
Figure 3.2.13. A) Thermogravimetric trace of SLUG-51 (Eu); B) Ex situ VT-PXRD
of SLUG-51 (Eu).
By 172 °C, SLUG-52 (Gd) is observed to lose 6.1%, corresponding to the mass loss
of two free DMF solvent molecules, a theoretical loss of 6.6%. The second mass loss
is 10.3%, which is attributed to the loss of three coordinated DMF molecules, with a
theoretical loss of 9.9%. At the final decomposition at 600 °C, a mass loss of 37.7%
is observed. This corresponds to the partial loss of the organic component, which
again is not completely decomposed (Figure 3.2.14).
A B

91
Figure 3.2.14. A) Thermogravimetric trace of SLUG-52 (Gd); B) Ex situ VT-PXRD
of SLUG-52 (Gd).
3.2.3. Vibrational Spectroscopy
Although SLUG-49 through 52 display different structures, their IR spectra are very
similar owing to their similar components: NDC ligands, and bound and floating
DMF molecules (Figure 3.2.15). Between the range of 1680 to 1620 cm–1, two bands
are observed which correspond to the C=O stretch of DMF.2 The peaks at ~ 1600
cm–1 correspond to asymmetrical (C- - -O)2 stretching from the carboxylate group on
NDC. The sharp peaks near 1400 cm–1 are attributed to the C-N stretch of DMF. The
bands between 790 and 770 cm–1 correspond to C-H bands on the b-substituted
naphthalenes. The PXRD and FTIR of the free ligand H2NDC are shown in Figure
3.2.16, to demonstrate the differences with the synthesized materials.
A B

92
Figure 3.2.15. FTIR spectra of SLUG-49 through -52.

93
Figure 3.2.16. Characterizations of the free ligand 2,6-H2NDC: A) PXRD pattern of
H2NDC; B) FTIR spectrum of H2NDC.
3.2.4. Photoluminescence Spectroscopy
The Eu(III)-based MOF, SLUG-51, exhibits intense luminescence in the visible red-
orange region (Figure 3.2.17). These emission bands are due to 5D0 ® 7FJ (J = 1, 2, 4)
electronic transitions. The 5D0 ® 7F3 transition is weakly observed at 660 nm. These
electronic transitions are known to be the most notable for Eu(III) complexes.4
SLUG-51 displays a quantum efficiency of 3.56%. This fluorescence is due to a
ligand to metal charge transfer process that is well-characterized in europium-based
compounds. As expected, none of the SLUG-49 (La), SLUG-50 (Nd), or SLUG-52
(Gd) materials were fluorescent. The photoluminescence of SLUG-51 is quenched
after the material is heated to 500 °C (Figure 3.2.18). As the organic is evolved, the
LMCT process is likely disrupted and as a result, Eu(III) no longer emits light.

94
Figure 3.2.17. Solid state fluorescence emission spectrum of SLUG-51 (Eu), excited
at 362 nm.

95
Figure 3.2.18. Optical image of SLUG-46 (Eu) and post-heating samples, illuminated
under 254 nm light. The photoluminescence is quenched after heating to 500 °C,
signifying a disruption of the LMCT process.
3.2.5. Other Investigations
A variety of synthesis conditions and ion exchanges were attempted with the Ln-NDC
materials. These investigations are presented in the Appendix (Table A2, A5), and
include exchanges with ammonium bicarbonate (NH4HCO3), ammonium nitrate
(NH4NO3), sodium nitrate (NaNO3), tetramethylammonium bromide [(CH3)4NBr],
lead(II) nitrate [Pb(NO3)2], sodium perchlorate (NaClO4), perfluorooctanoic acid
(PFOA, HO2C8F15), malonic acid [CH2(CO2H)2], succinic acid [(CH2)2(CO2H)2],
glutaric acid [(CH2)3(CO2H)2], suberic acid [(CH2)6(CO2H)2], and sebacic acid
[(CH2)8(CO2H)2].
600 °C As-synthesized 200 °C 300 °C 400 °C 500 °C

96
3.3. Nd-ADS LREHs (SLUG-28–30)
3.3.1. Structures
SLUG-28, -29 and -30 were all synthesized hydrothermally in high yields [80 to 86%
based on Nd(III)]. The single crystal structure of SLUG-28 was obtained and solved
(Figure 3.3.1) and the crystal data for this structure is summarized in Table 3.3.1.
SCXRD reveals that SLUG-28 crystallizes in the triclinic space group P-1. SLUG-28
is composed of layers of nine-coordinate neodymium polyhedra linked by six µ3-OH
groups and two µ2-OH2 groups. One sulfonate oxygen from the organosulfonate
completes the neodymium coordination sphere and covalently connects the inorganic
layers together (Figure 3.3.1A). The PXRD patterns of SLUG-28, -29, and -30
demonstrate a clear decrease in low angle (001) peak as the carbon chain length of the
organosulfonate increases (Figure 3.3.2). The structures of SLUG-29 and -30 are
isostructural to those of a lanthanum-based material that was solved by Rietveld
refinement of PXRD data.5

97
Figure 3.3.1. Crystallographic projections of SLUG-28: A) View along the a-axis,
showing the cationic inorganic layers connected by ethanedisulfonate ligands (Nd –
purple; O – red; C – black; S – yellow; H omitted for clarity); B) View along the c-
axis, showing a top-down view of one inorganic layer.

98
Table 3.3.1. Crystallographic Data and Structure Refinement for SLUG-28
Material SLUG-28 Empirical Formula Nd2C2H12O12S2
Formula Weight (g mol–1) 580.72 Temperature (K) 120(2) Crystal system Triclinic Space group P-1 a, b, c (Å) 7.396(3), 7.403(3), 12.251(5) a, b, g (°) 86.666(5), 76.969(5), 63.435(5)
Volume (Å3) 583.8(4) Z 2
rcalc (g·cm-3) 2.712 µ (mm-1) 9.142 F (000) 544
Crystal dimensions (mm) 0.134 ´ 0.078 ´ 0.022 Index ranges -9 £ h £ 9
-9 £ k £ 9 -16 £ l £ 16
Reflections Collected 2903 Unique Data 2177
[Rint = 0.0228] Data / restraints / parameters 2903 / 18 / 228
Goodness of fit on F2 1.021 Final R factors
[I > 2s (I)] R1 = 0.0195
wR2 = 0.0355 Largest Residual Peak/Hole (e⋅Å–3) 0.802 / -0.780

99
Figure 3.3.2. PXRD patterns of SLUG-28 to 30, with the theoretical pattern for
SLUG-28 and main Miller indices shown at the bottom.
3.3.2. Thermal Characterization
Thermogravimetric analysis of SLUG-28 displayed three decomposition events
(Figure 3.3.3A). The first decomposition was at approximately 175 °C, which likely
corresponds to the loss of the µ2-OH2 groups (Table 3.3.2). It can be inferred from the
VT-PXRD that the loss of water results in a free sulfonate oxygen atom filling the
empty coordination site, decreasing the spacing between the inorganic layers (Figure
3.3.3B, 200 °C at which ~ 80% of the material has transformed at this temperature

100
based on the area of first peaks). The second mass loss event at ~ 250 °C is attributed
to the loss of two µ3-OH groups; the theoretical mass loss of 5.86% matches nicely
with the observed loss of 5.80% (Table 3.3.2). The last decomposition around 375 °C
corresponds to the loss of the organic component and one of the sulfonates, resulting
in the formation of Nd2O2SO4 (PDF 00-048-1829). SLUG-29 and SLUG-30 (Figures
3.3.4A, 3.3.5A respectively) exhibit similar thermal profiles compared to SLUG-28.
SLUG-29 maintains the same three decomposition events as SLUG-28 but at slightly
higher temperatures, likely due to the greater amount of van der Waals interaction by
the longer chains. It also loses an additional 4.53% mass after the loss of the organic.
This extra mass loss matches nicely with the theoretical loss of the additional carbon.
Likewise, the decomposition events of SLUG-30 occur at higher temperatures than
those of SLUG-28 and -29. Additionally, SLUG-30 loses the hydrocarbons of the
butanedisulfonate abruptly at ~ 450 °C but the sulfonates remain a part of the
Nd2O2SO4 layers.6 The observed weight losses reasonably match the theoretical mass
losses in all cases, except for the loss of the sulfonate in SLUG-30 (Table 3.3.2).

101
Figure 3.3.3. A) Thermogravimetric trace of SLUG-28 (Nd-EDS); B) Ex situ VT-
PXRD of SLUG-28 (Nd-EDS).
Figure 3.3.4. A) Thermogravimetric trace of SLUG-29 (Nd-PDS); B) Ex situ VT-
PXRD of SLUG-29 (Nd-PDS).
A B
A B
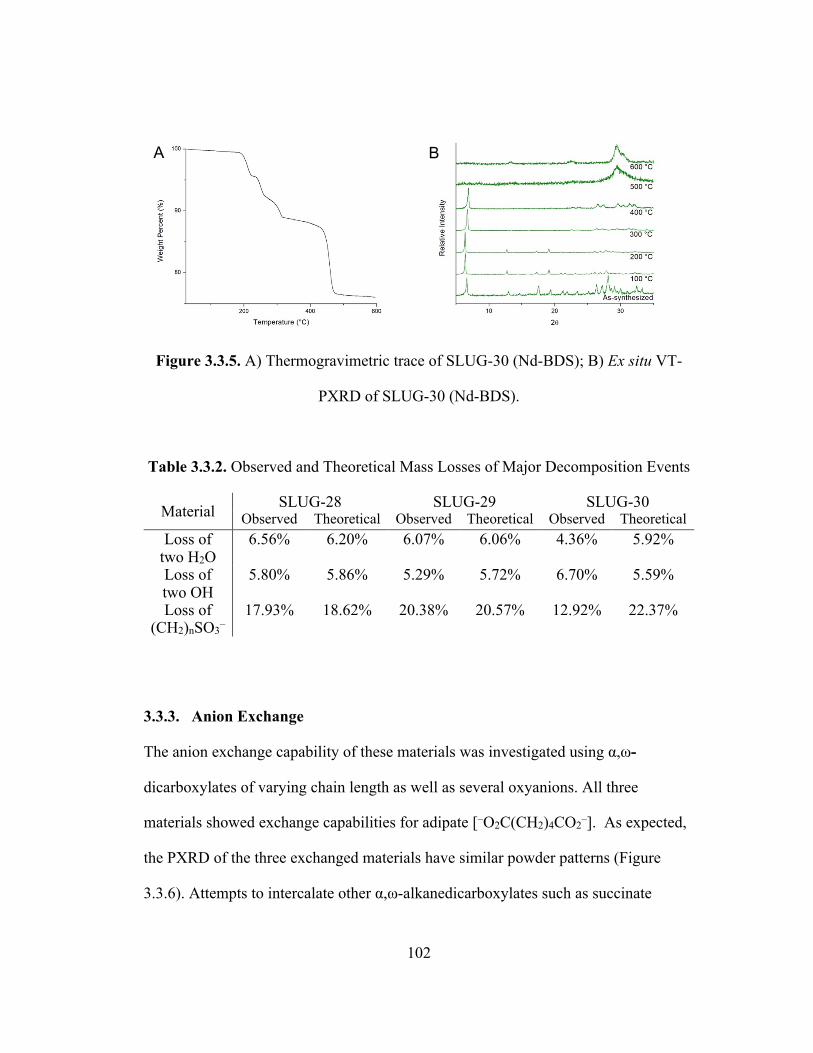
102
Figure 3.3.5. A) Thermogravimetric trace of SLUG-30 (Nd-BDS); B) Ex situ VT-
PXRD of SLUG-30 (Nd-BDS).
Table 3.3.2. Observed and Theoretical Mass Losses of Major Decomposition Events
Material SLUG-28 SLUG-29 SLUG-30 Observed Theoretical Observed Theoretical Observed Theoretical
Loss of two H2O
6.56% 6.20% 6.07% 6.06% 4.36% 5.92%
Loss of two OH
5.80% 5.86% 5.29% 5.72% 6.70% 5.59%
Loss of (CH2)nSO3–
17.93% 18.62% 20.38% 20.57% 12.92% 22.37%
3.3.3. Anion Exchange
The anion exchange capability of these materials was investigated using α,ω-
dicarboxylates of varying chain length as well as several oxyanions. All three
materials showed exchange capabilities for adipate [–O2C(CH2)4CO2–]. As expected,
the PXRD of the three exchanged materials have similar powder patterns (Figure
3.3.6). Attempts to intercalate other α,ω-alkanedicarboxylates such as succinate
A B

103
[–O2C(CH2)2CO2–], suberate [–O2C(CH2)6CO2–], sebacate [–O2C(CH2)8CO2–], and
terephthalate [–O2C(C6H4)CO2–] as well as oxyanions such as perchlorate (ClO4–),
chromate (CrO42–), and permanganate (MnO4-) have been unsuccessful. It is likely
that the solubility of these anions plays a role in facilitating anion exchange between
the alkanedisulfonates and adipate (Table 3.3.3). As the chain length of the
aforementioned α,ω-alkanedicarboxylates increases, their solubility in water
decreases. We speculate that the solubility of adipic acid, which is between that of
succinate and suberate, allows for partial dissolution which promotes solvent-
mediated ion exchange (Table 3.3.3). The solubility of succinate is so great that the
material may be too unstable to form. The carbon chain length of adipate is preferred
over succinate perhaps due to its ability to intercalate the [Nd2(OH)4(OH2)22+] layers.
Table 3.3.3. Solubility Values of various α,ω-Alkanedicarboxylates7
Alkanedicarboxylate Solubility (g / kg H2O)
Temperature (°C)
Succinate
83.5 25
Adipate
15 15
Suberate
2.43 25
Sebacate
1 20
Terephthalate
0.065 25

104
Figure 3.3.6. PXRD patterns of SLUG-28, -29 and -30 exchanged with adipate.
3.3.4. Vibrational Spectroscopy
The FTIR spectra of SLUG-28 through 30 are similar owing to their similar
components. The FTIR spectra of SLUG-28 and SLUG-28-adipate highlight the
sulfonate stretch (1200 cm–1) and carboxylate stretch (1700 cm–1), respectively,
supporting that exchange has occurred (Figure 3.3.7).

105
Figure 3.3.7. FTIR of SLUG-28 as-synthesized (bottom) and after exchange with
adipate (top).
3.3.5. Other Investigations
A variety of synthesis conditions and ion exchanges were attempted with the Nd-ADS
materials. These investigations are presented in the Appendix (Table A3, A5), and
include exchanges with malonic acid [CH2(CO2H)2], succinic acid [(CH2)2(CO2H)2],
glutaric acid [(CH2)3(CO2H)2], adipic acid [(CH2)4(CO2H)2], suberic acid
[(CH2)6(CO2H)2], sebacic acid [(CH2)8(CO2H)2], terephthalic acid [C6H4(CO2H)2],
sodium nitrate (NaNO3), sodium chloride (NaCl), sodium chlorate (NaClO3),

106
potassium chromate (K2CrO4), potassium permanganate (KMnO4), and
perfluorooctanoic acid (PFOA, HO2C8F15).
3.4. References
(1) Sienkiewicz-Gromiuk, J.; Rzączyńska, Z. Structural, Thermal, and Spectral
Investigations of the Lanthanide(III) Biphenyl-4,4′-Dicarboxylates. J. Therm.
Anal. Calorim. 2013, 112 (2), 877–884. https://doi.org/10.1007/s10973-012-
2590-1.
(2) Silverstein, R. M.; Webster, F. X.; Kiemle, D. J. Spectrometric Identification of
Organic Compounds, 7th ed.; John Wiley & Sons, Inc., 2005.
(3) Crystallographic Evidence for Decomposition of Dimethylformamide in the
Presence of Ruthenium(III) Chloride. Inorganica Chim. Acta 2003, 355, 420–
423. https://doi.org/10.1016/S0020-1693(03)00312-8.
(4) Binnemans, K. Interpretation of Europium(III) Spectra. Coord. Chem. Rev.
2015, 295, 1–45. https://doi.org/10.1016/j.ccr.2015.02.015.
(5) Liang, J.; Ma, R.; Ebina, Y.; Geng, F.; Sasaki, T. New Family of Lanthanide-
Based Inorganic–Organic Hybrid Frameworks:
Ln2(OH)4[O3S(CH2)NSO3]·2H2O (Ln = La, Ce, Pr, Nd, Sm; n = 3, 4) and
Their Derivatives. Inorg. Chem. 2013, 52 (4), 1755–1761.
https://doi.org/10.1021/ic301294j.
(6) Golovnev, N. N.; Molokeev, M. S.; Vereshchagin, S. N.; Atuchin, V. V.
Synthesis and Thermal Transformation of a Neodymium(III) Complex
[Nd(HTBA)2(C2H3O2)(H2O)2]·2H2O to Non-Centrosymmetric Oxosulfate

107
Nd2O2SO4. J. Coord. Chem. 2015, 68 (11), 1865–1877.
https://doi.org/10.1080/00958972.2015.1031119.
(7) Haynes, W. M., Ed. CRC Handbook of Chemistry & Physics, 92nd ed.; CRC
Press, 2011.

108
Chapter 4
Insights on 3-Dimensional and Layered Lanthanide Metal-
Organic Structures
Abstract
In comparing the three projects of this thesis [SLUG-43 through 48 (Ln-BPDC),
SLUG-49 through 52 (Ln-NDC), and SLUG-28 through 30 (Nd-ADS)], two main
questions arise: 1) what conditions contribute to forming three-dimensional MOFs
versus two-dimensional LREHs? and 2) why are the NDC-based materials not
isomorphous like those of Ln-BPDC? In this chapter, the factors contributing toward
the dimensionality of lanthanide-based materials will be discussed. A reason for the
lack of isomorphous nature of the NDC-based series is also proposed.
4.1. 2-D and 3-D Lanthanide-based Materials
In this work, we have seen three-dimensional lanthanide-MOF structures and two-
dimensional LREH structures (Figure 4.1.1). As mentioned in chapter 1.2.1, the
lanthanides are hard acids and prefer to react with hard bases such as oxygen.1
Additionally, the high coordination number of the lanthanides favors the coordination
sphere to be filled with small molecules such as hydroxide or water.2 With this
information in hand, it allows us to identify factors that contribute toward the

109
dimensionality of Ln-MOFs versus LREHs. The general formula of LREHs
{[RE4(OH)10(H2O)4]nAn} demonstrates the propensity of hydroxide ions and water
molecules to fill the coordination sphere of the lanthanide ions. The process of
hydroxide molecules reacting with lanthanide ions is solution is known as
alkalization. Methods of homogenous alkalization, in which a reagent undergoes
hydrolysis to slowly produce hydroxide ions, are well documented in LREH
syntheses by the Sasaki group.3–7 Another synthetic strategy to produce LREHs is the
hydrothermal treatment of rare earth reagents to transform them to the hydroxide
forms. In either case, hydroxide ions and water molecules surround the rare earth ion
to produce a positively charged layer; these layers are charge-balanced by
interlamellar anions. These anions have been demonstrated to be small molecules
such as halides, nitrate, and sulfate, and longer organic chains with terminal
disulfonate functionalities.8
In our syntheses of SLUG-28 through 30, we employed a slightly different synthesis
technique: solid NaOH pellets were added to a reagent solution of water, Nd(NO3)3·6
H2O, and disodium a,w-alkanedisulfonate to raise the pH from ~ 4 to ~ 7. The
addition of NaOH produced a gel-like solution, and the solution was transferred to an
autoclave, where it was heated hydrothermally. This synthesis procedure is similar to
that of the sol-gel method. In a general sol-gel process, a metal ion can form a variety
of different oxyhydroxyl species depending on the pH.9 A metal ion that is soluble in
an acidic aqueous environment can form an insoluble polymeric and cationic species
coordinated to hydroxide ions and water molecules as the pH is increased. Sol-gel

110
methods are typically used in zeolite and ceramic syntheses. In our syntheses, the
addition of NaOH provides a rich hydroxide source for the layered
[Nd2(OH)4(OH2)22+][–O3S(CH2)nSO3–] (n = 2 – 4) materials to form. Thus, the
dimensionality of MOFs versus LREHs can be dictated by controlling the pH of the
solution. The starting solutions of Ln-BPDC and Ln-NDC are approximately at pH ~
4 in DMF as the solvent. This acidic and solvothermal environment keeps hydroxide
ions and water molecules in low concentrations. Under these conditions, the ligands
can coordinate to the metal ions and form three-dimensional MOF structures.

111
Figure 4.1.1. Representative crystallographic images of the three different projects
presented in this work: 1) Ln-BPDC; 2A) La-NDC, 2B) Nd-NDC, 2C) Eu-NDC, 2D)
Gd-NDC; 3) Nd-EDS

112
4.2. Conditions contributing toward Isomorphism
The second question that arises when comparing these projects concerns the
difference between the Ln-BPDC and Ln-NDC structures. The Ln-BPDC series is
isomorphous, meaning that the structures crystallize in the same space group and the
only difference between the structures is the replacement of lanthanide ions.10 In the
case of the Ln-NDC materials, each structure crystallizes in a different space group,
and the lanthanide ions are surrounded by different coordination numbers and binding
modes of the organic linker and solvent.
One apparent difference in these structures is the extraframework ion/molecule. In the
case of Ln-BPDC, the anionic framework is charge-balanced by a
dimethylammonium cation [NH2(CH3)2+]. In the Ln-NDC series, the neutral
frameworks contain coordinated and floating dimethylformamide molecules [DMF,
OCHN(CH3)2]. Both of these sets of materials were synthesized solvothermally in
DMF. An explanation for this difference is the reaction temperature. The Ln-BPDC
materials were synthesized at temperatures between 140 and 150 °C, while the Ln-
NDC materials were synthesized at temperatures between 110 and 125 °C. The
boiling point of DMF is approximately 153 °C.11 DMF is known to decompose to
dimethylammonium and formic acid through a hydrolysis reaction.12,13 The higher
temperatures of the Ln-BPDC syntheses likely promotes the decomposition of DMF
to the dimethylammonium cation, which charge-balances the anionic frameworks. At
the lower synthesis temperatures of Ln-NDC, DMF is not decomposed, and thus acts
as a coordinating or floating solvent molecule in the structures. At lower synthesis

113
temperatures for the Ln-BPDC series, no crystalline product formed. At higher
synthesis temperatures for the Ln-NDC series, a different crystal phase which could
not be isolated was formed.
Another argument that can be made to explain the differences in structures is due to
the rigidity of the organic linker. BPDC has a freedom of rotation between the two
aromatic phenyl rings. This allows for twisting of the BPDC ligand to coordinate to
two different metal centers on one carboxylate end, and bidentate coordination to
another lanthanide metal on the other carboxylate end (Figure 4.2.1, 1). This freedom
of rotation between phenyl rings is evidenced in the single crystal data of the Ln-
BPDC series. Slight variations in the torsion angles between the rings ranging from
29 to 32 degrees are observed. The fused rings of NDC, by contrast, are rigid and
multiple coordination modes are observed (Figure 4.2.1, 2A-B). The rigidity of the
NDC ligand is likely responsible for the different structures that form. When a
lanthanide ion is first coordinated to a carboxyl group from the ligand, the lack of
rotation of NDC hinders the possibilities of other lanthanides coordinating on the
other end. Thus, DMF solvent molecules can compete with NDC to fill the lanthanide
coordination sphere. DMF has been shown to have a greater coordinating ability
toward lanthanides than toward transition metals.14 This possibly explains the various
coordination numbers and binding modes of the lanthanides observed in the Ln-NDC
series.

114
Figure 4.2.1. Comparison of the coordination modes and rigidity of 1) BPDC and
2A-B) NDC ligands.
The NDC ligands are observed to undergo p-p stacking. This is most evident in the
Nd-NDC and Eu-NDC structures (Figure 4.1.1, 2B-C). These intermolecular forces
likely play a role in establishing the long-range order among these structures and
stabilizing various lanthanide coordination spheres. So as NDC ligands and DMF
molecules compete for coordination with the lanthanides, the p stacking of the NDC
ligands stabilizes these structures and allow for different structures to form in the Ln-
NDC series.
115
4.3. Conclusions
In this section, the three projects of this thesis were compared, and various factors
identified to explain the differences in dimensionality and structure among the
projects. The main factor identified in controlling the dimensionality of Ln-MOFs
versus LREHs is pH. Lanthanides are hard acids with large coordination numbers.
When hydroxide ions and water molecules are readily available in solution (at an
intermediate pH), they will fill the lanthanide coordination sphere and form layered,
two-dimensional materials. Factors of reaction temperature, ligand rigidity, and
ligand p stacking are possibly responsible for the disparity between the Ln-BPDC and
Ln-NDC series. The decomposition of DMF into dimethylammonium is dependent on
the reaction temperature. At lower temperatures, DMF is more likely to act as a
coordinating solvent. The increased rigidity of the NDC ligand in comparison with
BPDC perhaps explains the different lanthanide coordination numbers and binding
modes in the Ln-NDC series. Effects of the p stacking of the ligands likely contribute
toward stabilizing the structures.
4.4. References
(1) Cotton, S. Lanthanides and Actinides; Macmillan Physical Science Series;
Macmillan Education LTD: London, 1991.
(2) Soni, P. L.; Soni, V. Coordination Chemistry: Metal Complexes Transition
Metal Chemistry with Lanthanides and Actinides; CRC Press: Boca Raton, FL,
2013.

116
(3) Liang, J.; Ma, R.; Sasaki, T. Layered Rare Earth Hydroxides: Structural Aspects
and Photoluminescence Properties. In Photofunctional Layered Materials; Yan,
D., Wei, M., Eds.; Structure and Bonding; Springer International Publishing:
Cham, 2015; pp 69–103. https://doi.org/10.1007/978-3-319-16991-0_2.
(4) Ma, R.; Liu, Z.; Li, L.; Iyi, N.; Sasaki, T. Exfoliating Layered Double
Hydroxides in Formamide: A Method to Obtain Positively Charged Nanosheets.
J. Mater. Chem. 2006, 16 (39), 3809–3813. https://doi.org/10.1039/B605422F.
(5) Ma, R.; Sasaki, T. Nanosheets of Oxides and Hydroxides: Ultimate 2D Charge-
Bearing Functional Crystallites. Adv. Mater. 2010, 22 (45), 5082–5104.
https://doi.org/10.1002/adma.201001722.
(6) Liu, Z.; Ma, R.; Osada, M.; Takada, K.; Sasaki, T. Selective and Controlled
Synthesis of α- and β-Cobalt Hydroxides in Highly Developed Hexagonal
Platelets. J. Am. Chem. Soc. 2005, 127 (40), 13869–13874.
https://doi.org/10.1021/ja0523338.
(7) Ma, R.; Liu, Z.; Takada, K.; Iyi, N.; Bando, Y.; Sasaki, T. Synthesis and
Exfoliation of Co2+−Fe3+ Layered Double Hydroxides: An Innovative
Topochemical Approach. J. Am. Chem. Soc. 2007, 129 (16), 5257–5263.
https://doi.org/10.1021/ja0693035.
(8) Liang, J.; Ma, R.; Sasaki, T. Layered Rare Earth Hydroxides (LREHs):
Synthesis and Structure Characterization towards Multifunctionality. Dalton
Trans. 2014, 43 (27), 10355–10364. https://doi.org/10.1039/C4DT00425F.
(9) West, A. R. Solid State Chemistry and Its Applications, Second Edition.; Wiley,
2014.
117
(10) Isomorphous crystals - Online Dictionary of Crystallography
http://reference.iucr.org/dictionary/Isomorphous_crystals (accessed Feb 19,
2019).
(11) Haynes, W. M., Ed. CRC Handbook of Chemistry & Physics, 92nd ed.; CRC
Press, 2011.
(12) Murphy, C. A.; Cameron, T. S.; Cooke, M. W.; Aquino, M. A. S. Synthesis and
Structure of Trans-Dimethylammonium Bis(Oxalato)Diaquaruthenate(III)
Tetrahydrate. Inorganica Chim. Acta 2000, 305 (2), 225–229.
https://doi.org/10.1016/S0020-1693(00)00137-7.
(13) Kahrovic, E.; Orioli, P.; Bruni, B.; Di Vaira, M.; Messori, L. Crystallographic
Evidence for Decomposition of Dimethylformamide in the Presence of
Ruthenium(III) Chloride. Inorganica Chim. Acta 2003, 355, 420–423.
https://doi.org/10.1016/S0020-1693(03)00312-8.
(14) Díaz-Torres, R.; Alvarez, S. Coordinating Ability of Anions and Solvents
towards Transition Metals and Lanthanides. Dalton Trans. 2011, 40 (40),
10742–10750. https://doi.org/10.1039/C1DT11000D.

118
Chapter 5
Summary and Future Work
5.1. Summary
Three projects have been presented in this thesis: 1) an anionic, isomorphous series of
six lanthanide MOFs based on the linker 4,4’-biphenyldicarboxylate, 2) a neutral
series of four lanthanide MOFs based on the linker 2,6-naphthalenedicarboxylate
which crystallize in distinct space groups, and 3) a series of three cationic, Nd-based
LREHs with increasing chain length a,w-alkanedisulfonates with a potential
application in anion exchange. All structures were characterized via XRD, TGA, and
IR. The solid state luminescence and quantum efficiency of the Eu(III)-based
materials were additionally characterized.
5.2. Future Work
There is future work that can be proposed for each of the three projects presented in
this thesis. Generally, it would be possible for all three projects to be expanded to
include the remaining lanthanide ion series. The lanthanides La, Ce, Nd, Eu, Gd, and
Er were chosen because they were readily available in the Oliver lab chemical
inventory.
119
5.2.1. Ln-BPDC and Ln-NDC Projects
The projects containing Ln-BPDC and Ln-NDC currently do not have applications.
The Ln-BPDC framework is anionic in charge, which would make it a possible
candidate for cation exchange. Based on the previously reported Tb-BPDC material,
the Ln-BPDC series would be a candidate for UO22+ ion exchange in exchange for
NH2(CH3)2+.1 With post-synthetic modification, the neutral Ln-NDC series could
potentially be transformed into an ionic framework.2,3 Otherwise, there would be the
possibility of exchanging floating DMF molecules in the Ln-NDC series with other
neutral, small molecules.
In this work, four crystal structures of Ln-BPDC (Ln = La, Ce, Eu, Gd) and four
crystal structures of Ln-NDC (Ln = La, Nd, Eu, Gd) were presented. Crystals of Nd-
BPDC, Er-BPDC, Ce-NDC, and Er-NDC large enough for SCXRD were unable to be
successfully grown. Conditions for growing these crystal structures can be improved
so that the series may be completed. Longer synthesis times and temperature cycling
in the respective optimal temperature ranges would be suggested.
Due to their luminescent properties, the materials Eu-BPDC (SLUG-46) and Eu-NDC
(SLUG-51) have potential applications as sensors. It would be of interest to attempt to
synthesize a more cost-effective sensor. Europium is a particularly costly element,
typically $400 per 25 grams. By contrast, cerium is the most earth-abundant
lanthanoid, and the 26th most abundant element (roughly $18 per 25 grams).4 Given
the disparity of these abundances and prices, it would be of financial interest to

120
synthesize a heterobimetallic Ln-MOF. This would be especially plausible for the
isomorphous Ln-BPDC series, but more challenging for the Ln-NDC series, since the
latter does not crystallize in the same space group for each structure. Additionally, it
would be worthwhile to explore preparing films of Eu-BPDC and Eu-NDC,
respectively. To be employed as a sensor, it would be useful to have a MOF anchored
to a solid support that could be immersed in solution and easily retrieved.5 MOF thin
films have been grown by multiple methods.6 Perhaps the most straightforward and
promising technique would be via in-situ crystallization from a mother solution. A
substrate is added to a MOF reagent mixture, and the mixture is heated as a whole as
usually required. The substrate(s) should be inserted face down or vertically into the
solution to avoid sedimentation. This technique has been successfully used to grow a
variety of MOF films. The chosen substrate must be compatible with the growing
MOF, thus there are reports of metal oxides, metal slices, textiles, and glass slides
used as substrates.
5.2.2. Nd-ADS Project
The crystal structure of SLUG-28 (Nd-EDS) was solved via SCXRD. We were able
to make claims about SLUG-29 (Nd-PDS) and SLUG-30 (Nd-BDS) based on the
change in d-spacing in comparing the three PXRD patterns. It would be useful to
grow crystals of Nd-PDS and Nd-BDS in order to complete this series and be able to
further compare the details of the structures. Crystals of SLUG-28 were obtained
from a synthesis which used 4,4’-bipyridine as a pH modifier (chapter 2.3). Similar
syntheses with SLUG-29 and -30 reagents did not produce crystals of the intended

121
materials. Therefore, other homogenous alkalization strategies should be explored for
their potential to yield single crystals.
Attempts to synthesize LREHs with lanthanides other than Nd were attempted, but no
structures were formed. Therefore, reaction conditions can be optimized to synthesize
Ln-EDS, -PDS, and -BDS structures. The hydroxide source used for the synthesis of
Nd-EDS was NaOH. Other, perhaps less harsh bases can be explored in these
syntheses.
The three structures SLUG-28 through 30 were shown to exchange their a,w-
alkanedisulfonates for adipic acid. This exchange was characterized qualitatively
through XRD and IR, but it would be of interest to characterize this exchange
quantitatively to report an uptake value in mg g-1. A possible technique to do this
would be with GC-MS.
5.3 References
(1) Ye, J.; Bogale, R. F.; Shi, Y.; Chen, Y.; Liu, X.; Zhang, S.; Yang, Y.; Zhao, J.;
Ning, G. A Water-Stable Dual-Channel Luminescence Sensor for UO22+ Ions
Based on an Anionic Terbium(III) Metal–Organic Framework. Chem. – Eur. J.
2017, 23 (32), 7657–7662. https://doi.org/10.1002/chem.201700713.
(2) Karmakar, A.; Desai, A. V.; Ghosh, S. K. Ionic Metal-Organic Frameworks
(IMOFs): Design Principles and Applications. Coord. Chem. Rev. 2016, 307,
313–341. https://doi.org/10.1016/j.ccr.2015.08.007.

122
(3) Postsynthetic Covalent Modification of a Neutral Metal−Organic Framework. J.
Am. Chem. Soc. 2007, 129 (41), 12368–12369.
https://doi.org/10.1021/ja074366o.
(4) Voncken, J. H. L. Applications of the Rare Earths. In The Rare Earth Elements:
An Introduction; Voncken, J. H. L., Ed.; SpringerBriefs in Earth Sciences;
Springer International Publishing: Cham, 2016; pp 89–106.
https://doi.org/10.1007/978-3-319-26809-5_5.
(5) Kreno, L. E.; Leong, K.; Farha, O. K.; Allendorf, M.; Van Duyne, R. P.; Hupp,
J. T. Metal–Organic Framework Materials as Chemical Sensors. Chem. Rev.
2012, 112 (2), 1105–1125. https://doi.org/10.1021/cr200324t.
(6) Bétard, A.; Fischer, R. A. Metal–Organic Framework Thin Films: From
Fundamentals to Applications. Chem. Rev. 2012, 112 (2), 1055–1083.
https://doi.org/10.1021/cr200167v.

123
Appendix
Tables of Synthesis Conditions and Exchanges
List of abbreviations:
Adipic acid = hexanedioic acid ADS = a,w-alkanedisulfonate
BDS = butane-1,4-disulfonate, disodium salt BPDC = biphenyl-4,4’-dicarboxylic acid BTC = 1,3,5-benzenetricarboxylic acid
CPB = 4-(4-carboxy)phenyl benzoic acid (BPDC) CTAB = cetyl trimethylammonium bromide EDS = ethane-1,2-disulfonate, disodium salt EDSA = 1,2-ethanedisulfonic acid dihydrate
Glutaric acid = pentanedioic acid Malonic acid = propanedioic acid
NDC = 2,6-naphthalenedicarboxylic acid PDS = propane-1,3-disulfonate, disodium salt
PFOA = perfluorooctanoic acid RT = room temperature
Sebacic acid = decanedioic acid Suberic acid = octanedioic acid Succinic acid = butanedioic acid
Terephthalic acid = benzene-1,4-dicarboxylic acid

124
Table A1. SLUG-43 through 48 (Ln-BPDC) Syntheses
Sample ID
Reagents Weight/Volume Used
Temperature (°C)
Time (days)
AK2_05a Nd(NO3)3 × 6 H2O CPB H2O
0.2021 g 0.1115 g 10 mL
150 3
AK2_05c Er(NO3)3 × x H2O CPB H2O
0.2041 g 0.1099 g 10 mL
150 3
AK2_05e La(NO3)3 × 6 H2O CPB H2O
0.2004 g 0.1129 g 10 mL
150 3
AK2_28d
La(NO3)3 × 6 H2O CPB DMF
0.2021 g 0.2247 g 10 mL
140 3
AK2_28e
Nd(NO3)3 × 6 H2O CPB DMF
0.2003 g 0.2262 g 10 mL
140 3
AK2_28f
Gd(NO3)3 × 6 H2O CPB DMF
0.2029 g 0.2260 g 10 mL
140 3
AK2_28g
Er(NO3)3 × x H2O CPB DMF
0.2015 0.2247 g 10 mL
140 3
AK2_35a
Ce(NO3)3 × 6 H2O CPB DMF
0.1998 g 0.2264 g 10 mL
140 4
AK2_35b
Nd(NO3)3 × 6 H2O CPB DMF
0.2007 g 0.2266 g 10 mL
140 4
AK2_35c
Gd(NO3)3 × 6 H2O CPB DMF
0.2034 g 0.2262 g 10 mL
140 4
AK2_35d
Er(NO3)3 × x H2O CPB DMF
0.2008 g 0.2255 g 10 mL
140 4
AK2_37a
Eu(NO3)3 × 6 H2O CPB DMF
0.2018 g 0.2262 g 10 mL
142 3
AK2_37b
Gd(NO3)3 × 6 H2O CPB DMF
0.2030 g 0.2262 g 10 mL
142 3

125
AK2_37c
Er(NO3)3 × 5 H2O CPB DMF
0.2013 g 0.2269 g 10 mL
142 3
AK2_37d
Nd(NO3)3 × 6 H2O CPB DMF
0.2006 g 0.2250 g 10 mL
142 3
AK2_38a
Eu(NO3)3 × 6 H2O CPB DMF
0.2010 g 0.2266 g 10 mL
142 6
AK2_38b
Gd(NO3)3 × 6 H2O CPB DMF
0.2009 g 0.2264 g 10 mL
142 6
AK2_38c
Er(NO3)3 × 5 H2O CPB DMF
0.2019 g 0.2264 g 10 mL
142 6
AK2_38d
Nd(NO3)3 × 6 H2O CPB DMF
0.2015 g 0.2269 g 10 mL
142 6
AK2_42a Nd(NO3)3 × 6 H2O CPB DMF
0.2006 g 0.2247 g 10 mL
140 – 150 6
AK2_42b Er(NO3)3 × 5 H2O CPB DMF
0.2006 g 0.2254 g 10 mL
140 – 150 6
AK2_45a
Eu(NO3)3 × 6 H2O CPB DMF
0.2005 g 0.2281 g 10 mL
145 7
AK2_45b
Eu(NO3)3 × 6 H2O CPB DMF
0.2009 g 0.2265 g 10 mL
145 7
AK2_52a
La(NO3)3 × 6 H2O CPB DMF
0.2001 g 0.2265 g 10 mL
146 19
AK2_52b
Ce(NO3)3 × 6 H2O CPB DMF
0.2008 g 0.2265 g 10 mL
146 19
AK2_52c
Nd(NO3)3 × 6 H2O CPB DMF
0.2007 g 0.2266 g 10 mL
146 19
AK2_52d
Eu(NO3)3 × 6 H2O CPB DMF
0.2008 g 0.2265 g 10 mL
146 19

126
AK2_52e
Gd(NO3)3 × 6 H2O CPB DMF
0.2001 g 0.2265 g 10 mL
146 19
AK2_52f
Er(NO3)3 × 5 H2O CPB DMF
0.2002 g 0.2267 g 10 mL
146 19
AK2_54a
La(NO3)3 × 6 H2O CPB DMF
0.2006 g 0.2263 g 10 mL
200
AK2_54b
Ce(NO3)3 × 6 H2O CPB DMF
0.2008 g 0.2263 g 10 mL
200
LW1_10a
La(NO3)3 × 6 H2O CPB DMF
0.2001 g 0.1128 g 10 mL
175 3
LW1_10c
Nd(NO3)3 × 6 H2O CPB DMF
0.2000 g 0.115 g 10 mL
175 3
LW1_10e
Er(NO3)3 × 5 H2O CPB DMF
0.2006 g 0.1103 g 10 mL
175 3
LW1_22a
La(NO3)3 × 6 H2O CPB DMF
0.2025 g 0.0567 g 10 mL
150 3
LW1_22b
Nd(NO3)3 × 6 H2O CPB DMF
0.2019 g 0.0541 g 10 mL
150 3
LW1_22c
Er(NO3)3 × 5 H2O CPB DMF
0.2036 g 0.0553 g 10 mL
150 3
LW1_25a
La(NO3)3 × 6 H2O CPB DMF
0.2022 g 0.1145 g 10 mL
125 3
LW1_25c
Nd(NO3)3 × 6 H2O CPB DMF
0.2037 g 0.1131 g 10 mL
125 3
LW1_25e
Er(NO3)3 × 5 H2O CPB DMF
0.2016 g 0.1111 g 10 mL
125 3
LW1_30c
Gd(NO3)3 × 6 H2O CPB DMF
0.204 g 0.106 g 10 mL
55 3

127
LW1_31b
Gd(NO3)3 × 6 H2O CPB DMF
0.2019 g 0.1069 g 10 mL
150 3
LW1_32a
Gd(NO3)3 × 6 H2O CPB DMF
0.203 g 0.104 g 10 mL
125 3
LW1_32b
Gd(NO3)3 × 6 H2O CPB DMF
0.202 g 0.105 g 10 mL
100 3
LW1_32d
Er(NO3)3 × 5 H2O CPB DMF
0.214 g 0.103 g 10 mL
100 3
LW1_43a
La(NO3)3 × 6 H2O CPB DMF
0.2008 g 0.1181 g 10 mL
125 3
LW1_43b
Nd(NO3)3 × 6 H2O CPB DMF
0.2016 g 0.1124 g 10 mL
125 3
LW1_43c
Er(NO3)3 × 5 H2O CPB DMF
0.2035 g 0.1112 g 10 mL
125 3
LW1_47a
La(NO3)3 × 6 H2O CPB DMF
0.2020 g 0.1139 g 10 mL
150 3
LW1_47b
La(NO3)3 × 6 H2O CPB DMF
0.2008 g 0.2210 g 10 mL
150 3
LW1_47c
Nd(NO3)3 × 6 H2O CPB DMF
0.2042 g 0.1113 g 10 mL
150 3
LW1_47d
Nd(NO3)3 × 6 H2O CPB DMF
0.2002 g 0.2270 g 10 mL
150 3
LW1_47e
Gd(NO3)3 × 6 H2O CPB DMF
0.2018 g 0.1135 g 10 mL
150 3
LW1_58e
La(NO3)3 × 6 H2O CPB DMF
0.2002 g 0.1158 g 10 mL
125 3
LW1_58f
La(NO3)3 × 6 H2O CPB DMF
0.2006 g 0.2282 g 10 mL
125 3
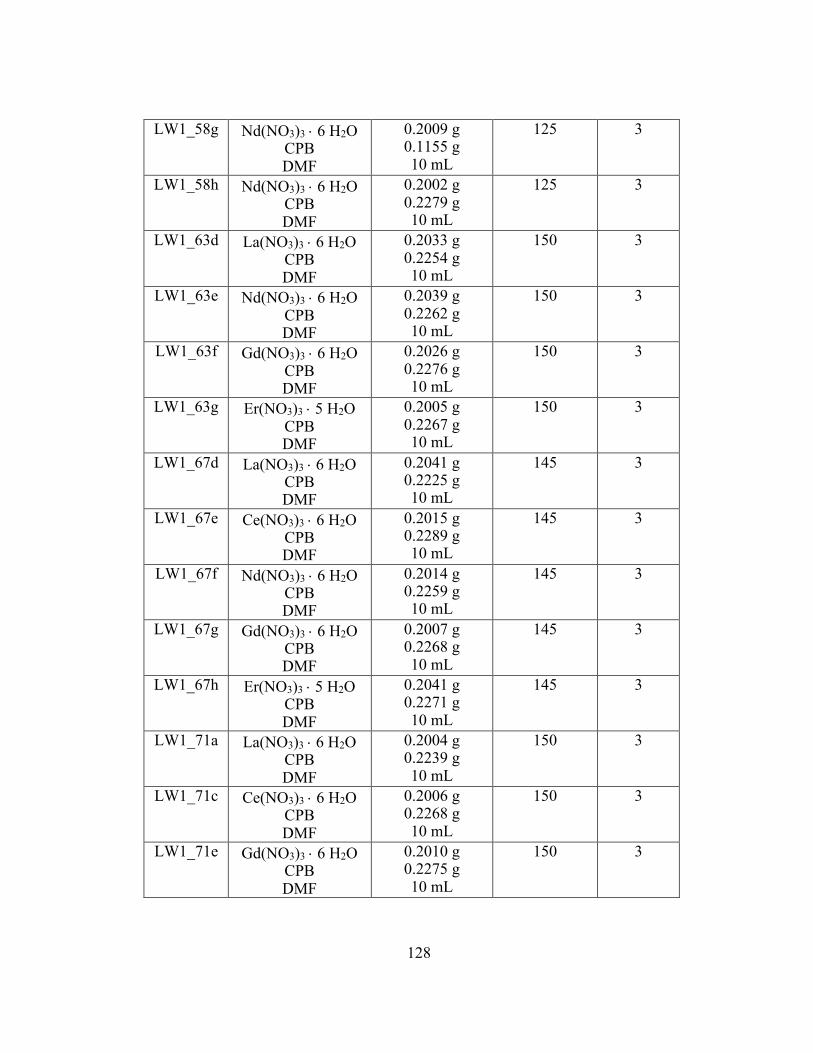
128
LW1_58g
Nd(NO3)3 × 6 H2O CPB DMF
0.2009 g 0.1155 g 10 mL
125 3
LW1_58h
Nd(NO3)3 × 6 H2O CPB DMF
0.2002 g 0.2279 g 10 mL
125 3
LW1_63d
La(NO3)3 × 6 H2O CPB DMF
0.2033 g 0.2254 g 10 mL
150 3
LW1_63e
Nd(NO3)3 × 6 H2O CPB DMF
0.2039 g 0.2262 g 10 mL
150 3
LW1_63f
Gd(NO3)3 × 6 H2O CPB DMF
0.2026 g 0.2276 g 10 mL
150 3
LW1_63g
Er(NO3)3 × 5 H2O CPB DMF
0.2005 g 0.2267 g 10 mL
150 3
LW1_67d
La(NO3)3 × 6 H2O CPB DMF
0.2041 g 0.2225 g 10 mL
145 3
LW1_67e
Ce(NO3)3 × 6 H2O CPB DMF
0.2015 g 0.2289 g 10 mL
145 3
LW1_67f
Nd(NO3)3 × 6 H2O CPB DMF
0.2014 g 0.2259 g 10 mL
145 3
LW1_67g
Gd(NO3)3 × 6 H2O CPB DMF
0.2007 g 0.2268 g 10 mL
145 3
LW1_67h
Er(NO3)3 × 5 H2O CPB DMF
0.2041 g 0.2271 g 10 mL
145 3
LW1_71a
La(NO3)3 × 6 H2O CPB DMF
0.2004 g 0.2239 g 10 mL
150 3
LW1_71c
Ce(NO3)3 × 6 H2O CPB DMF
0.2006 g 0.2268 g 10 mL
150 3
LW1_71e
Gd(NO3)3 × 6 H2O CPB DMF
0.2010 g 0.2275 g 10 mL
150 3

129
LW1_71g
Er(NO3)3 × 5 H2O CPB DMF
0.2005 g 0.2265 g 10 mL
150 3
LW1_75d
La(NO3)3 × 6 H2O CPB DMF
0.2014 g 0.2229 g 10 mL
115 3
LW1_75e
Ce(NO3)3 × 6 H2O CPB DMF
0.2007 g 0.2231 g 10 mL
115 3
LW1_75f
Gd(NO3)3 × 6 H2O CPB DMF
0.2011 g 0.2247 g 10 mL
115 3
LW1_75g
Er(NO3)3 × 5 H2O CPB DMF
0.2004 g 0.2241 g 10 mL
115 3
LW1_76d
Er(NO3)3 × 5 H2O CPB DMF
0.2003 g 0.2286 g 10 mL
155 3
LW1_76f
Gd(NO3)3 × 6 H2O CPB DMF
0.2021 g 0.2252 g 10 mL
145 3
LW1_78d
Er(NO3)3 × 5 H2O CPB DMF
0.2016 g 0.2283 g 10 mL
160 3
LW1_87a
Eu(NO3)3 × 6 H2O CPB DMF
0.2049 g 0.2249 g 10 mL
144 6
LW1_87b
Eu(NO3)3 × 6 H2O CPB DMF
0.2006 g 0.2221 g 10 mL
144 6
LW1_92c
Nd(NO3)3 × 6 H2O CPB DMF
0.2006 g 0.2330 g 10 mL
135 – 155 5
JM1_05a Eu(NO3)3⸱6 H2O CPB DMF
0.2008 g 0.2259 g 10 mL
135 – 155 6
JM1_05b Gd(NO3)3⸱6 H2O CPB DMF
0.1995 g 0.2258 g 10 mL
135 – 155 6
JM1_09a Nd(NO3)3⸱6 H2O CPB DMF
0.1996 g 0.2249 g 10 mL
125 – 135 6

130
JM1_09b Er(NO3)3⸱6 H2O CPB DMF
0.1995 g 0.2255 g 10 mL
125 – 135 6
JM1_11a Nd(NO3)3⸱6 H2O CPB DMF
0.1997 g 0.2249 g 10 mL
115 – 125 7
JM1_11b Er(NO3)3⸱6 H2O CPB DMF
0.1999 g 0.2254 g 10 mL
115 – 125 7
JM1_23c Er(NO3)3⸱6 H2O CPB DMF
0.1996 g 0.2255 g 10 mL
145 5
JM1_25a Er(NO3)3⸱6 H2O CPB DMF
0.2000 g 0.2250 g 10 mL
175 5
JM1_30b Er(NO3)3⸱6 H2O CPB DMF
0.2005 g 0.2250 g 10 mL
145 – 155 5
JM1_31 Nd(NO3)3⸱6 H2O CPB DMF
0.2003 g 0.2256 g 10 mL
145 – 155 4
JM1_77a La(NO3)3⸱6 H2O CPB DMF
0.2009 g 0.2243 g 10 mL
130 5
JM1_77b La(NO3)3⸱6 H2O CPB DMF
0.1996 g 0.2246 g 10 mL
130 5
SW1_07a
Eu(NO3)3 × 6 H2O CPB DMF
0.2015 g 0.2268 g 10 mL
132 6
SW1_12d
Nd(NO3)3 × 6 H2O CPB DMF
0.2016 g 0.2262 g 10 mL
135 – 155 6
SW1_12e
Er(NO3)3 × 5 H2O CPB DMF
0.2014 g 0.2267 g 10 mL
135 – 155 6
SW1_14a
Nd(NO3)3 × 6 H2O CPB DMF
0.2017 g 0.2268 g 10 mL
140 – 150 6
SW1_14b
Er(NO3)3 × 5 H2O CPB DMF
0.2015 g 0.2267 g 10 mL
140 – 150 6

131
SW1_32a
Ce(NO3)3 × 6 H2O CPB DMF
0.2015 g 0.2269 g 10 mL
150 3
SW1_32b
Er(NO3)3 × 5 H2O CPB DMF
0.2017 g 0.2269 g 10 mL
150 3

132
Table A2. SLUG-49 through 52 (Ln-NDC) Syntheses
Sample ID
Reagents Weight/Volume Used
Temperature (°C)
Time (days)
AK2_05b
Nd(NO3)3 × 6 H2O NDC H2O
0.2033 g 0.0986 g 10 mL
150 3
AK2_05d
Er(NO3)3 × x H2O NDC H2O
0.2027 g 0.0981 g 10 mL
150 3
AK2_05f
La(NO3)3 × 6 H2O NDC H2O
0.2008 g 0.0999 g 10 mL
150 3
AK2_19a
La(NO3)3 × 6 H2O NDC
CTAB DMF
0.2014 g 0.1008 g 0.0478 g 10 mL
125 3
AK2_19b
La(NO3)3 × 6 H2O NDC PFOA DMF
0.2001 g 0.1002 g 0.0501 g 10 mL
125 3
AK2_22a
La(NO3)3 × 6 H2O NDC PFOA H2O
0.202 g 0.108 g 0.195 g 10 mL
150 3
AK2_22b
La(NO3)3 × 6 H2O NDC PFOA H2O
0.202 g 0.104 g 0.383 g 10 mL
150 3
AK2_22c
La(NO3)3 × 6 H2O NDC PFOA DMF
0.207 g 0.101 g 0.190 g 10 mL
150 3
AK2_22d
La(NO3)3 × 6 H2O NDC PFOA DMF
0.207 g 0.107 g 0.382 g 10 mL
150 3
AK2_28a
Nd(NO3)3 × 6 H2O NDC DMF
0.2021 g 0.2044 g 10 mL
140 3
AK2_28b
Gd(NO3)3 × 6 H2O NDC DMF
0.2032 g 0.2044 g 10 mL
140 3

133
AK2_28c
Er(NO3)3 × 5 H2O NDC DMF
0.2022 g 0.2056 g 10 mL
140 3
LW1_10b
La(NO3)3 × 6 H2O NDC DMF
0.2009 g 0.0990 g 10 mL
175 3
LW1_10d
Nd(NO3)3 × 6 H2O NDC DMF
0.2004 g 0.1000 g 10 mL
175 3
LW1_10f Er(NO3)3 × 5 H2O NDC DMF
0.2014 g 0.0985 g 10 mL
175 3
LW1_20b
Er(NO3)3 × 5 H2O NDC DMF
0.2052 g 0.0987 g 10 mL
150 3
LW1_20c
Er(NO3)3 × 5 H2O NDC DMF
0.2054 g 0.0489 g 10 mL
150 3
LW1_24b
La(NO3)3 × 6 H2O NDC DMF
0.2046 g 0.0504 g 10 mL
140 – 160 3
LW1_24c
Nd(NO3)3 × 6 H2O NDC DMF
0.2084 g 0.0509 g 10 mL
140 – 160 3
LW1_25b
La(NO3)3 × 6 H2O NDC DMF
0.2078 g 0.1145 g 10 mL
125 3
LW1_25d
Nd(NO3)3 × 6 H2O NDC DMF
0.2013 g 0.1027 g 10 mL
125 3
LW1_26b
Er(NO3)3 × 5 H2O NDC DMF
0.2058 g 0.1076 g 10 mL
125 3
LW1_30d
Gd(NO3)3 × 6 H2O NDC DMF
0.209 g 0.112 g 10 mL
150 3
LW1_32c La(NO3)3 × 6 H2O NDC DMF
0.208 g 0.114 g 10 mL
125 3
LW1_35a
La(NO3)3 × 6 H2O NDC DMF
0.2041 g 0.0511 g 10 mL
125 5

134
LW1_35b
La(NO3)3 × 6 H2O NDC DMF
0.2041 g 0.0759 g 10 mL
125 5
LW1_40a
La(NO3)3 × 6 H2O NDC
Triethylamine HNO3 DMF H2O
0.6655 g 0.2774 g
60 µL 30 µL 8 mL
1.6 mL
110 < 1
LW1_42a
La(NO3)3 × 6 H2O NDC DMF
0.2013 g 0.1102 g 10 mL
125 3
LW1_42b
La(NO3)3 × 6 H2O NDC DMF
0.2004 g 0.1102 g 10 mL
125 3
LW1_42c
La(NO3)3 × 6 H2O NDC DMF
0.2018 g 0.1113 g 10 mL
125 3
LW1_42d
La(NO3)3 × 6 H2O NDC
Triethylamine HNO3 DMF
0.2012 g 0.1104 g
64 µL 32 µL 10 mL
125 3
LW1_42e
La(NO3)3 × 6 H2O NDC DMF
0.2010 g 0.2256 g 10 mL
125 3
LW1_47f
Nd(NO3)3 × 6 H2O NDC DMF
0.2074 g 0.1018 g 10 mL
150 3
LW1_47g
Nd(NO3)3 × 6 H2O NDC DMF
0.2044 g 0.2050 g 10 mL
150 3
LW1_47h
Er(NO3)3 × 5 H2O NDC DMF
0.2007 g 0.1039 g 10 mL
150 3
LW1_51a
La(NO3)3 × 6 H2O NDC DMF
0.2011 g 0.2030 g 10 mL
125 3
LW1_51b
Nd(NO3)3 × 6 H2O NDC DMF
0.2000 g 0.2029 g 10 mL
125 3

135
LW1_51c
Er(NO3)3 × 5 H2O NDC DMF
0.1999 g 0.2028 g 10 mL
125 3
LW1_58a
La(NO3)3 × 6 H2O NDC DMF
0.2011 g 0.2036 g 10 mL
125 3
LW1_58b
Nd(NO3)3 × 6 H2O NDC DMF
0.2000 g 0.2049 g 10 mL
125 3
LW1_58c
Er(NO3)3 × 5 H2O NDC DMF
0.2004 g 0.2059 g 10 mL
125 3
LW1_58d
Gd(NO3)3 × 6 H2O NDC DMF
0.2025 g 0.2049 g 10 mL
125 3
LW1_63a
Nd(NO3)3 × 6 H2O NDC DMF
0.2039 g 0.2119 g 10 mL
150 3
LW1_63b
Gd(NO3)3 × 6 H2O NDC DMF
0.2035 g 0.2115 g 10 mL
150 3
LW1_63c
Er(NO3)3 × 5 H2O NDC DMF
0.2044 g 0.2120 g 10 mL
150 3
LW1_67a
Nd(NO3)3 × 6 H2O NDC DMF
0.2026 g 0.2125 g 10 mL
145 3
LW1_67b
Gd(NO3)3 × 6 H2O NDC DMF
0.2005 g 0.2169 g 10 mL
145 3
LW1_67c
Er(NO3)3 × 5 H2O NDC DMF
0.2009 g 0.2142 g 10 mL
145 3
LW1_71b
Ce(NO3)3 × 6 H2O NDC DMF
0.2006 g 0.2182 g 10 mL
150 3
LW1_71d
Gd(NO3)3 × 6 H2O NDC DMF
0.2013 g 0.2173 g 10 mL
150 3
LW1_71f
Er(NO3)3 × 5 H2O NDC DMF
0.2013 g 0.2192 g 10 mL
150 3

136
LW1_75a
Ce(NO3)3 × 6 H2O NDC DMF
0.2008 g 0.2221 g 10 mL
115 3
LW1_75b
Gd(NO3)3 × 6 H2O NDC DMF
0.2009 g 0.2228 g 10 mL
115 3
LW1_75c
Er(NO3)3 × 5 H2O NDC DMF
0.2015 g 0.2228 g 10 mL
115 3
LW1_76a
Ce(NO3)3 × 6 H2O NDC DMF
0.2009 g 0.2153 g 10 mL
155 3
LW1_76b
Gd(NO3)3 × 6 H2O NDC DMF
0.2007 g 0.2169 g 10 mL
155 3
LW1_76c
Er(NO3)3 × 5 H2O NDC DMF
0.2006 g 0.2187 g 10 mL
155 3
LW1_76e
Gd(NO3)3 × 6 H2O NDC DMF
0.2016 g 0.2162 g 10 mL
145 3
LW1_78a
Ce(NO3)3 × 6 H2O NDC DMF
0.2010 g 0.2121 g 10 mL
160 3
LW1_78b
Gd(NO3)3 × 6 H2O NDC DMF
0.2012 g 0.2136 g 10 mL
160 3
LW1_78c
Er(NO3)3 × 5 H2O NDC DMF
0.2008 g 0.2169 g 10 mL
160 3
LW1_84a
Ce(NO3)3 × 6 H2O NDC DMF
0.2014 g 0.2205 g 10 mL
130 3
LW1_84b
Eu(NO3)3 × 6 H2O NDC DMF
0.2014 g 0.2206 g 10 mL
130 3
LW1_84c
Gd(NO3)3 × 6 H2O NDC DMF
0.2010 g 0.2210 g 10 mL
130 3
LW1_84d
Er(NO3)3 × 5 H2O NDC DMF
0.2003 g 0.2214 g 10 mL
130 3

137
LW1_87c
Eu(NO3)3 × 6 H2O NDC DMF
0.2013 g 0.2147 g 10 mL
144 6
LW1_87d
Eu(NO3)3 × 6 H2O NDC DMF
0.2013 g 0.2152 g 10 mL
144 6
LW1_88a
Eu(NO3)3 × 6 H2O NDC DMF
0.2023 g 0.2138 g 10 mL
150 3
LW1_88b
Eu(NO3)3 × 6 H2O NDC DMF
0.2013 g 0.2153 g 10 mL
150 3
LW1_88c
Ce(NO3)3 × 6 H2O NDC DMF
0.2005 g 0.2157 g 10 mL
150 3
LW1_92a
Ce(NO3)3 × 6 H2O NDC DMF
0.2015 g 0.2174 g 10 mL
135 – 155 5
LW1_92b
Eu(NO3)3 × 6 H2O NDC DMF
0.2019 g 0.2175 g 10 mL
135 – 155 5
JM1_15a Ce(NO3)3⸱6 H2O NDC DMF
0.2001 g 0.2169 g 10 mL
147 7
JM1_15b Gd(NO3)3⸱6 H2O NDC DMF
0.2001 g 0.2032 g 10 mL
147 7
JM1_15c Er(NO3)3⸱6 H2O NDC DMF
0.2003 g 0.2025 g 10 mL
147 7
JM1_16a Ce(NO3)3⸱6 H2O NDC DMF
0.1994 g 0.2185 g 10 mL
110 7
JM1_16b Gd(NO3)3⸱6 H2O NDC DMF
0.2007 g 0.2038 g 10 mL
110 7
JM1_16c Er(NO3)3⸱6 H2O NDC DMF
0.2004 g 0.2029 g 10 mL
110 7
JM1_18a Ce(NO3)3⸱6 H2O NDC DMF
0.2007 g 0.2044 g 10 mL
168 7

138
JM1_18b Gd(NO3)3⸱6 H2O NDC DMF
0.2007 g 0.2037 g 10 mL
168 7
JM1_18c Er(NO3)3⸱6 H2O NDC DMF
0.1994 g 0.2023 g 10 mL
168 7
JM1_19a Ce(NO3)3⸱6 H2O NDC DMF
0.2003 g 0.218 g 10 mL
127 7
JM1_19b Gd(NO3)3⸱6 H2O NDC DMF
0.2006 g 0.2039 g 10 mL
127 7
JM1_19c Er(NO3)3⸱6 H2O NDC DMF
0.1999 g 0.2025 g 10 mL
127 7
JM1_23a Ce(NO3)3⸱6 H2O NDC DMF
0.2008 g 0.2178 g 10 mL
145 7
JM1_23b Er(NO3)3⸱6 H2O NDC DMF
0.2010 g 0.2024 g 10 mL
145 7
JM1_30a Er(NO3)3⸱6 H2O NDC DMF
0.1994 g 0.2020 g 10 mL
145 – 155 5
JM1_38a Ce(NO3)3⸱6 H2O NDC DMF
0.2005 g 0.202 g 10 mL
110 – 125 6
JM1_38b Ce(NO3)3⸱6 H2O NDC DMF
0.1998 g 0.201 g 10 mL
110 – 125 6
JM1_38c Eu(NO3)3⸱6 H2O NDC DMF
0.1997 g 0.201 g 10 mL
110 – 125 6
JM1_38d Eu(NO3)3⸱6 H2O NDC DMF
0.2007 g 0.201 g 10 mL
110 – 125 6
JM1_39a Er(NO3)3⸱6 H2O NDC DMF
0.2005 g 0.202 g 10 mL
110 – 125 6
JM1_39b Er(NO3)3⸱6 H2O NDC DMF
0.2008 g 0.2009 g 10 mL
110 – 125 6
JM1_43a Nd(NO3)3⸱6 H2O NDC DMF
0.201 g 0.205 g 10 mL
110 – 125 5

139
JM1_43b Nd(NO3)3⸱6 H2O NDC DMF
0.199 g 0.205 g 10 mL
110 – 125 5
JM1_43c La(NO3)3⸱6 H2O NDC DMF
0.119 g 0.203 g 10 mL
110 – 125 5
JM1_43d La(NO3)3⸱6 H2O NDC DMF
0.200 g 0.204 g 10 mL
110 – 125 5
JM1_43e Gd(NO3)3⸱6 H2O NDC DMF
0.201 g 0.205 g 10 mL
110 – 125 5
JM1_43f Gd(NO3)3⸱6 H2O NDC DMF
0.200 g 0.205 g 10 mL
110 – 125 5
JM1_44a Er(NO3)3⸱6 H2O NDC DMF
0.2003 g 0.2021 g 10 mL
110 – 125 4
JM1_44b Er(NO3)3⸱6 H2O NDC DMF
0.1999 g 0.2027 g 10 mL
110 – 125 4
JM1_44c Ce(NO3)3⸱6 H2O NDC DMF
0.2001 g 0.2046 g 10 mL
110 – 125 4
JM1_44d Ce(NO3)3⸱6 H2O NDC DMF
0.2006 g 0.2044 g 10 mL
110 – 125 4
JM1_49a La(NO3)3⸱6 H2O NDC DMF
0.2008 g 0.2039 g 10 mL
110 – 125 9
JM1_49b Ce(NO3)3⸱6 H2O NDC DMF
0.2007 g 0.2048 g 10 mL
110 – 125 9
JM1_49c Nd(NO3)3⸱6 H2O NDC DMF
0.2007 g 0.2048 g 10 mL
110 – 125 9
JM1_49d Eu(NO3)3⸱6 H2O NDC DMF
0.2018 g 0.2010 g 10 mL
110 – 125 9
JM1_49e Gd(NO3)3⸱6 H2O NDC DMF
0.2009 g 0.2040 g 10 mL
110 – 125 9
JM1_52a La(NO3)3⸱6 H2O NDC DMF
0.200 g 0.204 g 10 mL
110 – 125 11

140
JM1_52b Ce(NO3)3⸱6 H2O NDC DMF
0.201 g 0.202 g 10 mL
110 – 125 11
JM1_52c Nd(NO3)3⸱6 H2O NDC DMF
0.200 g 0.205 g 10 mL
110 – 125 11
JM1_52d Eu(NO3)3⸱6 H2O NDC DMF
0.201 g 0.201 g 10 mL
110 – 125 11
JM1_52e Gd(NO3)3⸱6 H2O NDC DMF
0.200 g 0.204 g 10 mL
110 – 125 11
JM1_75a Eu(NO3)3⸱6 H2O NDC DMF
0.196 g 0.200 g 10 mL
110 – 125 7
JM1_75b Eu(NO3)3⸱6 H2O NDC DMF
0.201 g 0.201 g 10 mL
110 – 125 7
JM1_78a La(NO3)3⸱6 H2O NDC DMF
0.1999 g 0.1991 g 10 mL
130 5
JM1_78b La(NO3)3⸱6 H2O NDC DMF
0.1999 g 0.1991 g 10 mL
130 5
SW1_03a
Ce(NO3)3 × 6 H2O NDC DMF
0.2007 g 0.2012 g 10 mL
143 6
SW1_03b
Eu(NO3)3 × 6 H2O NDC DMF
0.2002 g 0.2018 g 10 mL
143 6
SW1_03c
Er(NO3)3 × 5 H2O NDC DMF
0.2006 g 0.2015 g 10 mL
143 6
SW1_05a
Ce(NO3)3 × 6 H2O NDC DMF
0.2008 g 0.2014 g 10 mL
132 6
SW1_05b
Ce(NO3)3 × 6 H2O NDC DMF
0.2001 g 0.2018 g 10 mL
132 6
SW1_05c
Eu(NO3)3 × 6 H2O NDC DMF
0.2003 g 0.2017 g 10 mL
132 6

141
SW1_05d
Eu(NO3)3 × 6 H2O NDC DMF
0.2004 g 0.2019 g 10 mL
132 6
SW1_07b
Eu(NO3)3 × 6 H2O NDC DMF
0.2002 g 0.2014 g 10 mL
132 6
SW1_12a
Ce(NO3)3 × 6 H2O NDC DMF
0.2001 g 0.2017 g 10 mL
135 – 155 6
SW1_12b
Eu(NO3)3 × 6 H2O NDC DMF
0.2003 g 0.2015 g 10 mL
135 – 155 6
SW1_12c
Er(NO3)3 × 5 H2O NDC DMF
0.2005 g 0.2016 g 10 mL
135 – 155 6
SW1_18a
Ce(NO3)3 × 6 H2O NDC DMF
0.2003 g 0.2018 g 10 mL
125 – 140 6
SW1_18b
Eu(NO3)3 × 6 H2O NDC DMF
0.2002 g 0.2018 g 10 mL
125 – 140 6
SW1_18c
Er(NO3)3 × 5 H2O NDC DMF
0.2007 g 0.2019 g 10 mL
125 – 140 6
SW1_29a
Ce(NO3)3 × 6 H2O NDC DMF
0.2008 g 0.2015 g 10 mL
175 6
SW1_29b
Er(NO3)3 × 5 H2O NDC DMF
0.2004 g 0.2016 g 10 mL
175 6
SW1_31a
Ce(NO3)3 × 6 H2O NDC DMF
0.2003 g 0.2017 g 10 mL
110 – 125 6
SW1_31b
Ce(NO3)3 × 6 H2O NDC DMF
0.2003 g 0.2016 g 10 mL
110 – 125 6
SW1_31c
Eu(NO3)3 × 6 H2O NDC DMF
0.2000 g 0.2015 g 10 mL
110 – 125 6
SW1_31d
Eu(NO3)3 × 6 H2O NDC DMF
0.2003 g 0.2019 g 10 mL
110 – 125 6

142
SW1_31e
Er(NO3)3 × 5 H2O NDC DMF
0.2008 g 0.2019 g 10 mL
110 – 125 6
SW1_31f
Er(NO3)3 × 5 H2O NDC DMF
0.2001 g 0.2019 g 10 mL
110 – 125 6
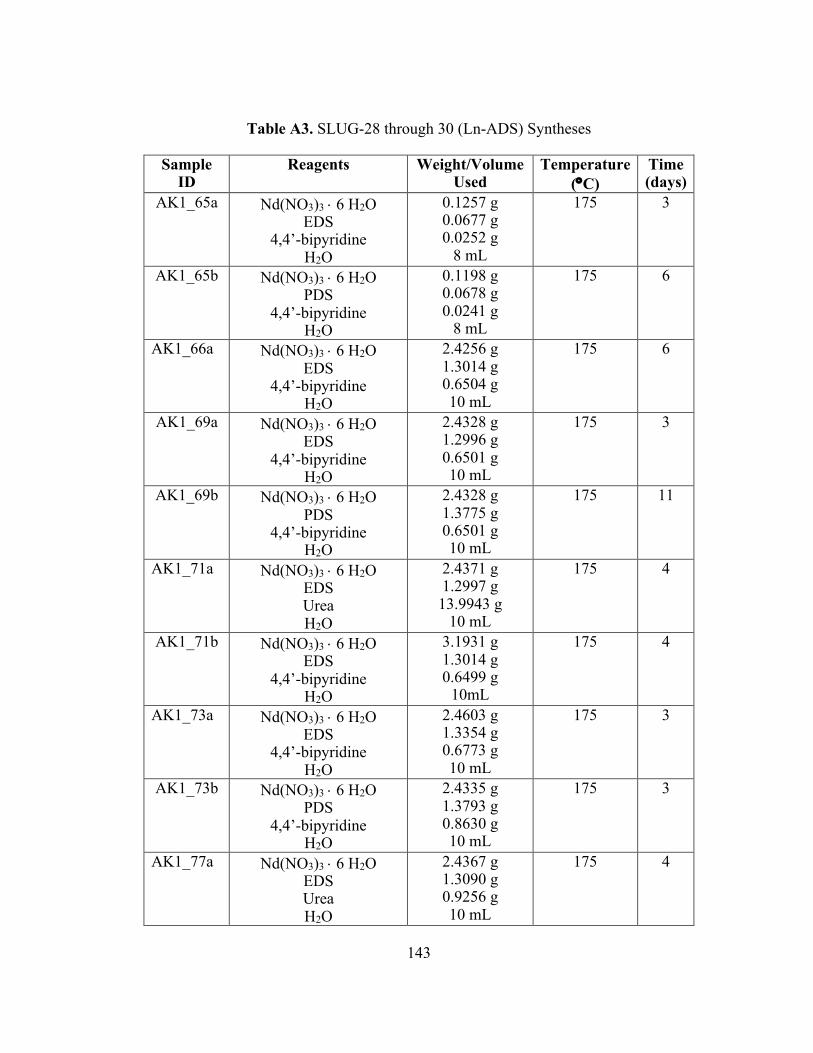
143
Table A3. SLUG-28 through 30 (Ln-ADS) Syntheses
Sample ID
Reagents Weight/Volume Used
Temperature (°C)
Time (days)
AK1_65a
Nd(NO3)3 × 6 H2O EDS
4,4’-bipyridine H2O
0.1257 g 0.0677 g 0.0252 g
8 mL
175 3
AK1_65b Nd(NO3)3 × 6 H2O PDS
4,4’-bipyridine H2O
0.1198 g 0.0678 g 0.0241 g
8 mL
175 6
AK1_66a Nd(NO3)3 × 6 H2O EDS
4,4’-bipyridine H2O
2.4256 g 1.3014 g 0.6504 g 10 mL
175 6
AK1_69a Nd(NO3)3 × 6 H2O EDS
4,4’-bipyridine H2O
2.4328 g 1.2996 g 0.6501 g 10 mL
175 3
AK1_69b
Nd(NO3)3 × 6 H2O PDS
4,4’-bipyridine H2O
2.4328 g 1.3775 g 0.6501 g 10 mL
175 11
AK1_71a Nd(NO3)3 × 6 H2O EDS Urea H2O
2.4371 g 1.2997 g 13.9943 g
10 mL
175 4
AK1_71b Nd(NO3)3 × 6 H2O EDS
4,4’-bipyridine H2O
3.1931 g 1.3014 g 0.6499 g
10mL
175 4
AK1_73a Nd(NO3)3 × 6 H2O EDS
4,4’-bipyridine H2O
2.4603 g 1.3354 g 0.6773 g 10 mL
175 3
AK1_73b Nd(NO3)3 × 6 H2O PDS
4,4’-bipyridine H2O
2.4335 g 1.3793 g 0.8630 g 10 mL
175 3
AK1_77a Nd(NO3)3 × 6 H2O EDS Urea H2O
2.4367 g 1.3090 g 0.9256 g 10 mL
175 4

144
AK1_83a Nd(NO3)3 × 6 H2O EDS Urea H2O
2.5600 g 1.3037 g 1.0052 g 10 mL
175 2
AK1_83b Nd(NO3)3 × 6 H2O EDS Urea H2O
2.4328 g 1.3023 g 1.0094 g 10 mL
150 2
AK1_85a Nd(NO3)3 × 6 H2O EDS Urea H2O
2.4543 g 1.3010 g 0.2929 g 10 mL
175 3
AK1_85b
Nd(NO3)3 × 6 H2O EDS Urea H2O
2.4588 g 1.3023 g 0.2384 g 10 mL
150 3
AK1_92a Nd(NO3)3 × 6 H2O EDS Urea H2O
2.433 g 1.292 g 0.501 g 10 mL
175 3
AK1_97a
Nd(NO3)3 × 6 H2O EDS
4,4’-bipyridine H2O
2.4319 g 1.3014 g 0.6514 g 10 mL
175 3
AK1_99a
Nd(NO3)3 × 6 H2O EDS
NaOH H2O
2.433 g 1.300 g 1 pellet 10 mL
175 3
AK1_99b
Nd(NO3)3 × 6 H2O EDS
NaOH H2O
2.432 g 1.300 g 2 pellets 10 mL
175 3
AK1_104a
Nd(NO3)3 × 6 H2O EDS
NaOH H2O
2.4318 g 1.3011 g 0.0559 g 10 mL
175 3
AK1_104b Nd(NO3)3 × 6 H2O EDS
NaOH H2O
1.2044 g 0.6933 g 0.0664 g 10 mL
175 3
AK1_108a
Nd(NO3)3 × 6 H2O EDS
NaOH H2O
2.4300 g 1.3000 g 0.1141 g 10 mL
150 3
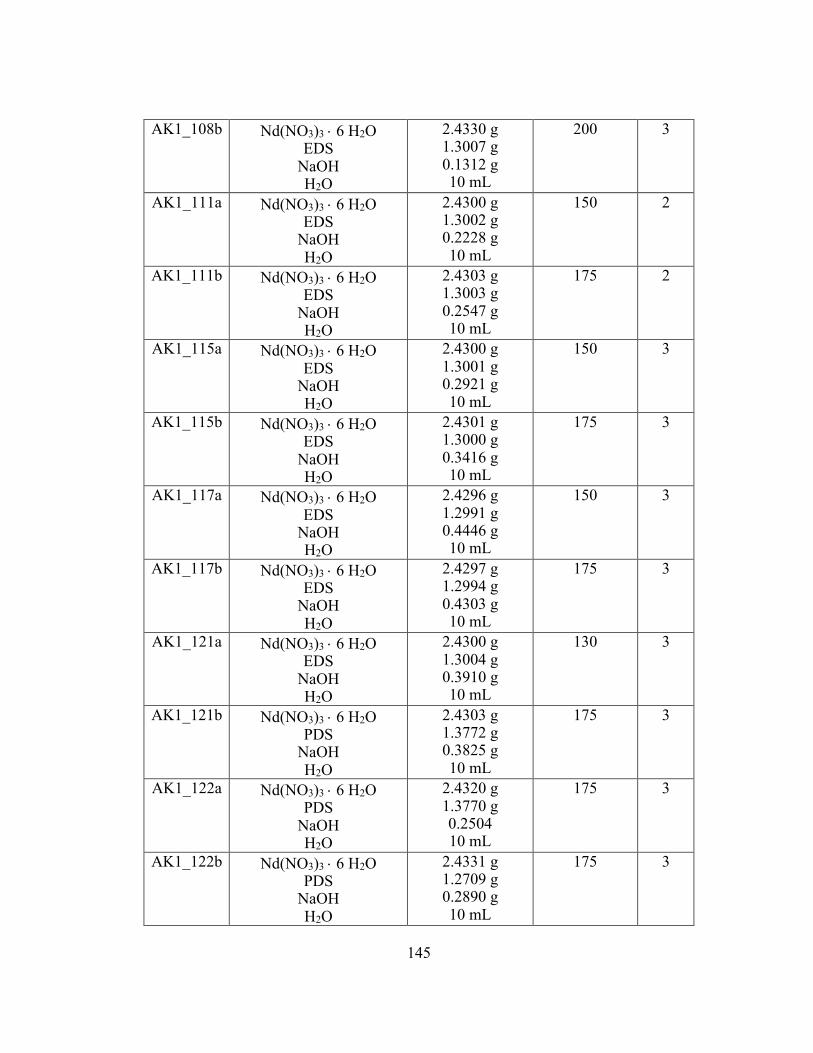
145
AK1_108b
Nd(NO3)3 × 6 H2O EDS
NaOH H2O
2.4330 g 1.3007 g 0.1312 g 10 mL
200 3
AK1_111a
Nd(NO3)3 × 6 H2O EDS
NaOH H2O
2.4300 g 1.3002 g 0.2228 g 10 mL
150 2
AK1_111b
Nd(NO3)3 × 6 H2O EDS
NaOH H2O
2.4303 g 1.3003 g 0.2547 g 10 mL
175 2
AK1_115a
Nd(NO3)3 × 6 H2O EDS
NaOH H2O
2.4300 g 1.3001 g 0.2921 g 10 mL
150 3
AK1_115b
Nd(NO3)3 × 6 H2O EDS
NaOH H2O
2.4301 g 1.3000 g 0.3416 g 10 mL
175 3
AK1_117a
Nd(NO3)3 × 6 H2O EDS
NaOH H2O
2.4296 g 1.2991 g 0.4446 g 10 mL
150 3
AK1_117b
Nd(NO3)3 × 6 H2O EDS
NaOH H2O
2.4297 g 1.2994 g 0.4303 g 10 mL
175 3
AK1_121a
Nd(NO3)3 × 6 H2O EDS
NaOH H2O
2.4300 g 1.3004 g 0.3910 g 10 mL
130 3
AK1_121b Nd(NO3)3 × 6 H2O PDS
NaOH H2O
2.4303 g 1.3772 g 0.3825 g 10 mL
175 3
AK1_122a
Nd(NO3)3 × 6 H2O PDS
NaOH H2O
2.4320 g 1.3770 g 0.2504 10 mL
175 3
AK1_122b Nd(NO3)3 × 6 H2O PDS
NaOH H2O
2.4331 g 1.2709 g 0.2890 g 10 mL
175 3

146
AK1_125a
Nd(NO3)3 × 6 H2O EDS
NaOH H2O
2.4328 g 1.3006 g 0.4435 g 10 mL
150 3
AK1_125b
Nd(NO3)3 × 6 H2O PDS
NaOH H2O
2.4310 g 1.3776 g 0.4277 g 10 mL
175 3
AK1_129a
Nd(NO3)3 × 6 H2O PDS
NaOH H2O
2.4326 g 1.3779 g 0.5014 g 10 mL
150 3
AK1_129b
Nd(NO3)3 × 6 H2O PDS
NaOH H2O
2.4323 g 1.3778 g 0.5772 g 10 mL
150 3
AK1_131a
Nd(NO3)3 × 6 H2O EDS
NaOH H2O
2.4333 g 1.3006 g 0.4491 g 10 mL
150 3
AK1_135a
Nd(NO3)3 × 6 H2O BDS
NaOH H2O
2.4346 g 1.4525 g 0.5207 g 10 mL
150 3
AK1_137a
Nd(NO3)3 × 6 H2O PDS
NaOH H2O
2.4331 g 1.3744 g 0.4999 g 10 mL
175 4
AK1_137b
Nd(NO3)3 × 6 H2O BDS
NaOH H2O
2.4354 g 1.4514 g 0.4798 g 10 mL
175 4
AK1_147a
Nd(NO3)3 × 6 H2O PDS
4,4’-bipyridine H2O
2.4327 g 1.3777 g 0.6501 g 10 mL
175 3
AK1_147b
Nd(NO3)3 × 6 H2O PDS
4,4’-bipyridine H2O
2.4327 g 1.3776 g 0.6494 g 10 mL
175 3
AK1_151a Nd(NO3)3 × 6 H2O BDS
4,4’-bipyridine H2O
2.4379 g 1.4457 g 0.6479 g 10 mL
175 3

147
AK1_152a
Nd(NO3)3 × 6 H2O BDS
4,4’-bipyridine H2O
2.4300 g 1.4515 g 0.6488 g 10 mL
175 3
AK1_152b Nd(NO3)3 × 6 H2O EDS
4,4’-bipyridine H2O
2.4352 g 1.3040 g 0.6496 g 10 mL
175 3
AK1_153a
Nd(NO3)3 × 6 H2O EDS
4,4’-bipyridine H2O
2.4375 g 1.3075 g 0.6461 g 10 mL
175 3
AK1_153b
Nd(NO3)3 × 6 H2O EDS
4,4’-bipyridine H2O
2.4353 g 1.3055 g 0.6497 g 10 mL
175 3
AK2_05g Nd(NO3)3 × 6 H2O BDS
4,4’-bipyridine H2O
2.433 g 1.455 g 0.650 g 10 mL
175 3
AK2_09c
Nd(NO3)3 × 6 H2O EDS
NaOH H2O
2.4333 g 1.3000 g 0.4524 g 10 mL
150 3
AK2_09d
Nd(NO3)3 × 6 H2O EDS
4,4’-bipyridine H2O
2.4334 g 1.3001 g 0.6503 g 10 mL
175 3
AK2_09e
Nd(NO3)3 × 6 H2O EDS
4,4’-bipyridine H2O
2.4332 g 1.3008 g 0.6500 g 10 mL
175 3
AK2_18a
Nd(NO3)3 × 6 H2O EDS
4,4’-bipyridine H2O
2.4337 g 1.3000 g 0.6501 g 10 mL
175 3
AK2_18b
Nd(NO3)3 × 6 H2O EDS
4,4’-bipyridine H2O
2.4335 g 1.2999 g 0.6501 g 10 mL
175 3
AK2_23a
Nd(NO3)3 × 6 H2O EDS
4,4’-bipyridine H2O
2.4339 g 1.3004
0.6500 g 10 mL
175 3

148
AK2_23b
Nd(NO3)3 × 6 H2O EDS
4,4’-bipyridine H2O
2.4345 g 1.3003 g 0.6495 g 10 mL
175 3
AK2_23c
Nd(NO3)3 × 6 H2O EDSA
4,4’-bipyridine H2O
2.4330 g 1.3000 g 0.6494 g 10 mL
175 3
AK2_23d
Nd(NO3)3 × 6 H2O EDSA
4,4’-bipyridine H2O
2.4341 g 1.30000 g 0.6522 g 10 mL
175 3
AK2_25a
Nd(NO3)3 × 6 H2O EDS
4,4’-bipyridine H2O
2.4335 g 1.2996 g 0.6548 g 10 mL
175 3
LW1_50a
Nd(NO3)3 × 6 H2O EDS
4,4’-bipyridine H2O
2.4342 g 1.2996 g 0.6505 g 10 mL
175 3
LW1_50b
Nd(NO3)3 × 6 H2O EDS
4,4’-bipyridine H2O
2.4341 g 1.3001 g 0.6504 g 10 mL
175 3
LW1_50c
Nd(NO3)3 × 6 H2O EDS
4,4’-bipyridine H2O
2.4345 g 1.3003 g 0.5601 g 10 mL
175 3
LW1_50d
Nd(NO3)3 × 6 H2O EDS
4,4’-bipyridine H2O
1.9459 g 1.0402 g 0.5208 g
8 mL
175 3
LW1_50e
Nd(NO3)3 × 6 H2O EDS
4,4’-bipyridine H2O
1.9468 g 1.0408 g 0.5202 g
8 mL
175 3
JM1_55a Nd(NO3)3⸱6 H2O EDS H2O
2.423 g 1.304 g 10 mL
150 4
JM1_55b Nd(NO3)3⸱6 H2O PDS H2O
2.436 g 1.365 g 10 mL
150 4

149
JM1_55c Nd(NO3)3⸱6 H2O BDS H2O
2.439 g 0.680 g 10 mL
150 4
JM1_59a Nd(NO3)3⸱6 H2O EDS H2O
NaOH
2.4261 g 1.2982 g 10.0 mL 0.3610 g
150 4
JM1_59b La(NO3)3⸱6 H2O EDS H2O
NaOH
2.4314 g 1.2999 g 10 mL
0.3793 g
150 4
JM1_60a Nd(NO3)3⸱6 H2O EDS H2O
NaOH
2.4305 g 1.3013 g 10 mL
0.3475 g
150 7
JM1_60b Gd(NO3)3⸱6 H2O EDS H2O
NaOH
2.4297 g 1.3001 g 10 mL
0.3627 g
150 7
JM1_67a Nd(NO3)3⸱6 H2O EDS H2O
NaOH
2.400 g 1.308 g 10 mL 0.361 g
150 5
JM1_67a Nd(NO3)3⸱6 H2O EDS H2O
NaOH
2.413 g 1.291 g 10 mL 0.341 g
150 5
JM1_69a Ce(NO3)3⸱6 H2O EDS H2O
NaOH
2.4296 g 1.3010 g 10 mL
0.3745 g
155 4
JM1_69b Ce(NO3)3⸱6 H2O EDS H2O
NaOH
2.4297 g 1.3014 g 10 mL
0.3705 g
155 4
JM1_71a Nd(NO3)3⸱6 H2O EDS H2O
NaOH
0.1996 g 0.2004 g 10 mL
0.0967 g
150 4
JM1_71b Nd(NO3)3⸱6 H2O EDS H2O
NaOH
0.2010 g 0.2006 g 10 mL
0.1010 g
150 4

150
JM1_73a Nd(NO3)3⸱6 H2O EDS H2O
NaOH
2.000 g 1.001 g 10 mL
5 drops, 1.0 M
150 5
JM1_73b Nd(NO3)3⸱6 H2O EDS H2O
NaOH
2.001g 1.001g 10mL
5 drops, 1.0 M
150 5

151
Table A4. Exploratory Ln Syntheses
Sample ID Reagents Weight/Volume Used
Temperature (°C)
Time (days)
AK1_140a Nd(NO3)3 × 6 H2O Adipic acid
NaOH H2O
2.4375 g 0.8111 g 0.4483 g 10 mL
150 3
AK1_141a
Nd(NO3)3 × 6 H2O Adipic acid
NaOH H2O
2.4370 g 0.8217 g 0.4480 g 10 mL
RT 4
AK1_141b
Nd(NO3)3 × 6 H2O Adipic acid
NaOH H2O
2.4312 g 0.8232 g 0.5221 g 10 mL
150 3
AK1_141c
Nd(NO3)3 × 6 H2O Adipic acid
NaOH H2O
2.4363 g 0.8165 g 0.4350 g 10 mL
175 3
AK1_145a Nd(NO3)3 × 6 H2O Adipic acid
NaOH H2O
1.2169 g 2.7372 g 0.2394 g 10 mL
RT 3
AK1_149a
Nd(NO3)3 × 6 H2O 4,4’-bipyridine
NaOH H2O
0.7299 g 0.1348 g 0.0932 g 10 mL
150 4
AK1_149b
Nd(NO3)3 × 6 H2O 4,4’-bipyridine
NaOH H2O
1.3240 g 0.1977 g 0.3224 g 10 mL
150 4
AK1_154a
Nd(NO3)3 × 6 H2O 4,4’-bipyridine
H2O
0.2017 g 0.0736 g 10 mL
150 4
AK1_154b
Nd(NO3)3 × 6 H2O BTC H2O
0.2023 g 0.0960 g 10 mL
150 4
AK1_154c
La(NO3)3 × 6 H2O 4,4’-bipyridine
H2O
0.2069 g 0.0740 g 10 mL
150 4
AK1_154d
La(NO3)3 × 6 H2O BTC H2O
0.2069 g 0.0981 10 mL
150 4

152
AK1_154e
Er(NO3)3 × x H2O 4,4’-bipyridine
H2O
0.2035 g 0.0720 g 10 mL
150 4
AK1_154f
Er(NO3)3 × x H2O BTC H2O
0.2030 g 0.0975 g 10 mL
150 4
AK2_05h
Nd(NO3)3 × 6 H2O BTC H2O
0.2011 g 0.0960 g 10 mL
RT 1
AK2_05i Er(NO3)3 × x H2O BTC H2O
0.2009 g 0.0988 g 10 mL
RT 1
AK2_05j La(NO3)3 × 6 H2O BTC H2O
0.2005 g 0.0973 g 10 mL
RT 1
AK2_08a
La(NO3)3 × 6 H2O 4,4’-bipyridine
DMF
0.2527 g 0.1033 g 10 mL
150 3
AK2_08b
La(NO3)3 × 6 H2O BTC DMF
0.2607 g 0.1439 g 10 mL
150 3
AK2_08c
Nd(NO3)3 × 6 H2O 4,4’-bipyridine
DMF
0.2548 g 0.1031 g 10 mL
150 3
AK2_08d
Nd(NO3)3 × 6 H2O BTC DMF
0.2416 g 0.1603 g 10 mL
150 3
AK2_08e
Er(NO3)3 × x H2O 4,4’-bipyridine
DMF
0.2185 g 0.1109 g 10 mL
150 3
AK2_08f
Er(NO3)3 × x H2O BTC DMF
0.2579 g 0.1616 g 10 mL
150 3
AK2_16a Er(NO3)3 × x H2O BTC DMF
0.2035 g 0.1011 g 10 mL
140 – 160 4
AK2_20a
La(NO3)3 × 6 H2O Benzene-1,3-
disulfonic acid DMF
0.2000 g 0.1304 g
10 mL
150 3
AK2_20b
Nd(NO3)3 × 6 H2O Benzene-1,3-
disulfonic acid DMF
0.1999 g 0.1287 g
10 mL
150 3

153
AK2_20c
Gd(NO3)3 × 6 H2O Benzene-1,3-
disulfonic acid DMF
0.2009 g 0.1250 g
10 mL
150 3
AK2_20d
Er(NO3)3 × x H2O Benzene-1,3-
disulfonic acid DMF
0.2002 g 0.1276 g
10 mL
150 3
AK2_55a
Gd(NO3)3 Fe(NO3)3 Cr(NO3)3
NaOH
7.5 mL, 0.4 M 1.25 mL, 0.4 M 1.25 mL, 0.4 M
0.3993 g
240 2
AK2_55b
Gd(NO3)3 Fe(NO3)3 Cr(NO3)3
NaOH
7.5 mL, 0.4 M 1.25 mL, 0.4 M 1.25 mL, 0.4 M
0.4005 g
240 2
AK2_58a Gd(NO3)3 Fe(NO3)3 Cr(NO3)3
NaOH
7.5 mL, 0.4 M 1.25 mL, 0.4 M 1.25 mL, 0.4 M
0.3646 g
220 2
AK2_58b Gd(NO3)3 Fe(NO3)3 Cr(NO3)3
NaOH
7.5 mL, 0.4 M 1.25 mL, 0.4 M 1.25 mL, 0.4 M
0.4111 g
220 2
AK2_58c Gd(NO3)3 Fe(NO3)3 Cr(NO3)3
NaOH
7.5 mL, 0.4 M 1.25 mL, 0.4 M 1.25 mL, 0.4 M
0.3744 g
220 2
AK2_58d Gd(NO3)3 Fe(NO3)3 Cr(NO3)3
NaOH
7.5 mL, 0.4 M 1.25 mL, 0.4 M 1.25 mL, 0.4 M
0.3869 g
220 2
AK2_65a Gd(NO3)3 AlCl3 MgCl2 KOH
8.5 mL, 0.4 M 1.25 mL, 0.4 M 1.25 mL, 0.4 M
0.5636 g
230 2
AK2_65b Gd(NO3)3 AlCl3 MgCl2 KOH
8.5 mL, 0.4 M 1.25 mL, 0.4 M 1.25 mL, 0.4 M
0.5607 g
230 2
AK2_65c Gd(NO3)3 AlCl3 MgCl2 KOH
8.5 mL, 0.4 M 1.25 mL, 0.4 M 1.25 mL, 0.4 M
0.5610 g
230 2

154
AK2_65d Gd(NO3)3 AlCl3 MgCl2 KOH
4.5 mL, 0.4 M 1.25 mL, 0.4 M 1.25 mL, 0.4 M
0.5582 g
230 2
LW1_03a
Nd(NO3)3 × 6 H2O 4,4’-bipyridine
H2O
0.2085 g 0.0728 g 10 mL
RT 3
LW1_03b
Er(NO3)3 × 5 H2O 4,4’-bipyridine
H2O
0.2043 g 0.0715 g 10 mL
RT 3
LW1_03c
La(NO3)3 × 6 H2O 4,4’-bipyridine
H2O
0.2018 g 0.0727 g 10 mL
RT 3
LW1_04a
Nd(NO3)3 × 6 H2O 4,4’-bipyridine
Methanol
0.2010 g 0.0724 g 10 mL
RT 2
LW1_04b
Er(NO3)3 × 5 H2O 4,4’-bipyridine
Methanol
0.2030 g 0.0715 g 10 mL
RT 2
LW1_04c
La(NO3)3 × 6 H2O 4,4’-bipyridine
Methanol
0.2001 g 0.0738 g 10 mL
RT 2
LW1_06a
Nd(NO3)3 × 6 H2O BTC H2O
0.2011 g 0.0960 g 10 mL
RT 2
LW1_06b
Er(NO3)3 × x H2O BTC H2O
0.2009 g 0.0988 g 10 mL
RT 2
LW1_06c
La(NO3)3 × 6 H2O BTC H2O
0.2005 g 0.0973 g 10 mL
RT 2
LW1_14a
Er(NO3)3 × x H2O BTC DMF
0.2036 g 0.0991 g 10 mL
150 3
LW1_14c
Er(NO3)3 × x H2O BTC DMF
0.2047 g 0.0997 g 10 mL
175 3
LW1_14d
Er(NO3)3 × x H2O BTC DMF
0.2009 g 0.0505 g 10 mL
150 3
LW1_14e
Er(NO3)3 × x H2O BTC DMF
0.2005 g 0.0496 g 10 mL
175 3

155
LW1_16a
La(NO3)3 × 6 H2O 4,4’-bipyridine
Methanol
0.2046 g 0.0750 10 mL
RT 3
LW1_16b
La(NO3)3 × 6 H2O BTC DMF
0.2003 g 0.0990 g 10 mL
175 3
LW1_16c
La(NO3)3 × 6 H2O BTC DMF
0.2006 g 0.0497 g 10 mL
150 3
LW1_16d
La(NO3)3 × 6 H2O BTC DMF
0.2008 g 0.0500 g 10 mL
175 3
LW1_19a
Nd(NO3)3 × 6 H2O BTC DMF
0.204 g 0.098 g 10 mL
175 3
LW1_19b
Nd(NO3)3 × 6 H2O BTC DMF
0.200 g 0.051 g 10 mL
150 3
LW1_19c
Nd(NO3)3 × 6 H2O BTC DMF
0.202 g 0.049 g 10 mL
175 3
LW1_19d
Er(NO3)3 × 5 H2O 4,4’-bipyridine
DMF
0.208 g 0.074 g 10 mL
175 3
LW1_19e
Er(NO3)3 × 5 H2O 4,4’-bipyridine
DMF
0.201 g 0.036 g 10 mL
150 3
LW1_19f
Er(NO3)3 × 5 H2O 4,4’-bipyridine
DMF
0.208 g 0.039 g 10 mL
175 3
LW1_22d
Er(NO3)3 × 5 H2O BTC DMF
0.2012 g 0.0993 g 10 mL
125 3
LW1_24a
Er(NO3)3 × 5 H2O BTC DMF
0.2082 g 0.1016 g 10 mL
RT 5
LW1_26a
Er(NO3)3 × 5 H2O BTC DMF
0.2082 g 0.1016 g 10 mL
100 3
LW1_26c
Er(NO3)3 × 5 H2O BTC DMF
Ethanol
0.2017 g 0.1052 g 10 mL 2 mL
55 5

156
LW1_27a
Er(NO3)3 × 5 H2O BTC DMF
0.2039 g 0.1004 g 10 mL
150 2
LW1_30a
Gd(NO3)3 × 6 H2O 4,4’-bipyridine
DMF
0.203 g 0.078 g 10 mL
55 3
LW1_30b
Gd(NO3)3 × 6 H2O BTC DMF
0.205 g 0.101 g 10 mL
150 3
LW1_31a Gd(NO3)3 × 6 H2O 4,4’-bipyridine
DMF
0.2015 g 0.0289 g 10 mL
150 3
LW1_35c
Er(NO3)3 × 5 H2O BTC
4,4’-bipyridine DMF
0.2036 g 0.0454 g 0.0792 g 10 mL
150 5
LW1_36a
La(NO3)3 × 6 H2O BTC
4,4’-bipyridine DMF
0.2086 g 0.0476 g 0.799 g 10 mL
150 4
LW1_36b
Nd(NO3)3 × 6 H2O BTC
4,4’-bipyridine DMF
0.2104 g 0.0450 g 0.0798 g 10 mL
150 4
LW1_36c
Gd(NO3)3 × 6 H2O BTC
4,4’-bipyridine DMF
0.2022 g 0.0343 g 0.0809 g 10 mL
150 4
LW1_64a
La(NO3)3 × 6 H2O PFOA H2O
0.2029 g 0.1247 g 10 mL
150 3
JM1_45a Gd(NO3)3 NaOH AlCl3 MgCl2
7.5 mL, 0.4 M 0.4191 g
1.25 mL, 0.4 M 1.25 mL, 0.4 M
220 5
JM1_45b Gd(NO3)3 NaOH AlCl3 MgCl2
7.5 mL, 0.4 M 0.3860 g
1.25 mL, 0.4 M 1.25 mL, 0.4 M
220 5
JM1_45c Gd(NO3)3 NaOH AlCl3 MgCl2
7.5 mL, 0.4 M 0.4206 g
1.25 mL, 0.4 M 1.25 mL, 0.4 M
220 5

157
JM1_45d Gd(NO3)3 NaOH AlCl3 MgCl2
7.5 mL, 0.4 M 0.4203 g
1.25 mL, 0.4 M 1.25 mL, 0.4 M
220 5
JM1_53a Fe(NO3)3 Cr(NO3)3
NaOH 0.4M Dy(NO3)3
1.25 mL, 0.4 M 1.25 mL, 0.4 M
0.4245 g 7.5 mL, 0.4 M
230 2
JM1_53b Fe(NO3)3 Cr(NO3)3
NaOH Dy(NO3)3
1.25 mL, 0.4 M 1.25 mL, 0.4 M
0.4245 g 7.5 mL, 0.4 M
230 2
SW1_26a
Ce(NO3)3 × 6 H2O CPB NDC DMF
0.2005 g 0.1187 g 0.0999 g 10 mL
140 – 150 5
SW1_26b
Nd(NO3)3 × 6 H2O CPB NDC DMF
0.2008 g 0.1175 g 0.0983 g 10 mL
140 – 150 5
SW1_26c
La(NO3)3 × 6 H2O CPB NDC DMF
0.2006 g 0.1191 g 0.0997 g 10 mL
140 – 150 5
SW1_27a
Ce(NO3)3 × 6 H2O CPB NDC DMF
0.200 g 0.119 g 0.099 g 10 mL
135 – 155 6
SW1_27b
Nd(NO3)3 × 6 H2O CPB NDC DMF
0.200 g 0.118 g 0.098 g 10 mL
135 – 155 6
SW1_27c
La(NO3)3 × 6 H2O CPB NDC DMF
0.201 g 0.119 g 0.099 g 10 mL
135 – 155 6

158
Table A5. Attempted Ion Exchanges with Ln-Materials
Sample ID Reagents Weight/Volume Used
Temperature Time (days)
AK1_118a Nd-EDS Succinic acid
H2O
0.1010 g 1.0220 g 50 mL
RT < 1
AK1_118b
Nd-EDS Succinic acid
H2O
0.1010 g 1.0222 g 50 mL
RT < 1
AK1_118c
Nd-EDS Succinic acid
H2O
0.1013 g 1.0218 g 50 mL
RT 1
AK1_119a Nd-EDS Succinic acid
Methanol
0.096 g 1.000 g 10 mL
RT < 1
AK1_123a
Nd-EDS Succinic acid
H2O
0.0542 g 0.3547 g 10 mL
RT 1
AK1_123b
Nd-EDS Adipic acid
H2O
0.0606 g 0.4598 g 10 mL
RT 1
AK1_125c
Nd-EDS Adipic acid
H2O
0.1020 g 0.2511 g 10 mL
RT < 1
AK1_125d
Nd-EDS Adipic acid
H2O
0.1010 g 0.5034 g 10 mL
RT < 1
AK1_125e
Nd-EDS Adipic acid
H2O
0.1038 g 0.2515 g 10 mL
RT < 1
AK1_125f
Nd-EDS Adipic acid
H2O
0.1015 g 0.5030 g 10 mL
RT < 1
AK1_125g
Nd-EDS Sebacic acid
H2O
0.1011 g 1.0446 g 10 mL
RT 1
AK1_127a
Nd-PDS Adipic acid
H2O
0.1019 g 0.2455 g 10 mL
RT < 1
AK1_127b
Nd-PDS Adipic acid
H2O
0.1029 g 0.0250 g 10 mL
RT < 1

159
AK1_127c
Nd-EDS Adipic acid
H2O
0.1009 g 0.0254 g 10 mL
RT < 1
AK1_127d
Nd-PDS Sebacic acid
H2O
0.1029 g 1.2407 g 10 mL
RT 1
AK1_128a
Nd-EDS Glutaric acid
H2O
0.1006 g 0.9090 g 10 mL
RT 1
AK1_128b
Nd-PDS Glutaric acid
H2O
0.1001 g 0.8887 g 10 mL
RT 1
AK1_130a
Nd-EDS Adipic acid
H2O
0.4032 g 1.0065 g 10 mL
RT < 1
AK1_130b
Nd-EDS Glutaric acid
H2O
0.2013 g 0.5919 g 10 mL
RT < 1
AK1_131b
Nd-EDS Terephthalic acid,
disodium salt H2O
0.5056 g 1.8018 g
10 mL
RT < 1
AK1_131c
Nd-EDS NaNO3
H2O
0.3009 g 0.4407 g 10 mL
RT < 1
AK1_131d
Nd-EDS K2CrO4
H2O
0.3009 g 1.0046 g 10 mL
RT < 1
AK1_131e
Nd-EDS KMnO4
H2O
0.3062 g 0.8268 g 10 mL
RT < 1
AK1_131f
Nd-EDS NaClO3 × H2O
H2O
0.3076 g 0.7406 g 10 mL
RT < 1
AK1_132a
Nd-EDS Terephthalic acid,
disodium salt H2O
0.1998 g 0.7148 g
10 mL
RT 1
AK1_132b
Nd-EDS NaNO3
H2O
0.2000 g 0.2888 g 10 mL
RT 1
AK1_132c
Nd-EDS NaClO3 × H2O
H2O
0.2001 g 0.4806 g 10 mL
RT 1

160
AK1_132d
Nd-EDS K2CrO4
H2O
0.2001 g 0.6606 g 10 mL
RT 1
AK1_132e
Nd-EDS KMnO4
H2O
0.2001 g 0.5364 g 10 mL
RT 1
AK1_133a
Nd-EDS Suberic acid
H2O
0.0994 g 0.2994 g 10 mL
RT 1
AK1_133b
Nd-EDS Terephthalic acid,
disodium salt Methanol
0.1062 g 0.3955 g
10 mL
RT 1
AK1_133c
Nd-EDS KMnO4
Methanol
0.1006 g 0.2742 g 10 mL
RT 1
AK1_133d
Nd-EDS K2CrO4
Methanol
0.1062 g 0.3447 g 10 mL
RT 1
AK1_134a
Nd-EDS Terephthalic acid,
disodium salt Acetonitrile
0.1001 g 0.3685 g
10 mL
RT 1
AK1_134b
Nd-EDS K2CrO4
Acetonitrile
0.1023 g 0.3294 g 10 mL
RT 1
AK1_134c
Nd-EDS KMnO4
Acetonitrile
1.004 g 0.2796 g 10 mL
RT 1
AK1_137c
Nd-EDS Adipic acid
H2O
0.1002 g 0.1270 g 10 mL
RT 1
AK1_137d
Nd-PDS Adipic acid
H2O
0.1004 g 0.1231 g 10 mL
RT 1
AK1_137e
Nd-BDS Adipic acid
H2O
0.1003 g 0.1215 g 10 mL
RT 1
AK1_138a
Nd-EDS Adipic acid
H2O
0.1512 g 0.3025 g 10 mL
RT 1
AK1_138b
Nd-PDS Adipic acid
H2O
0.1517 g 0.2950 g 10 mL
RT 1

161
AK1_138c Nd-BDS Adipic acid
H2O
0.1547 g 0.2880 g 10 mL
RT 1
AK2_10c
Nd-EDS PFOA H2O
0.0545 g 0.3556 g 30 mL
RT 1
AK2_48a
Er-CPB NH4HCO3
H2O
0.0400 g 0.2251 g 50 mL
RT 1
AK2_48b
Er-CPB NH4HCO3
DMF
0.0402 g 0.2252 g 50 mL
RT 1
AK2_49a Er-NDC Pb(NO3)2
0.0250 g 50 mL, 100 ppm
RT 1
AK2_71a
Nd-EDS Adipic acid
H2O
0.0304 g 0.0100 g 50 mL
RT 1
AK2_71b
Nd-PDS Adipic acid
H2O
0.0308 g 0.0100 g 50 mL
RT 1
AK2_71c
Nd-BDS Adipic acid
H2O
0.0309 g 0.0101 g 50 mL
RT 1
LW1_11c Nd-EDS PFOA H2O
0.100 g 0.071 g 50 mL
RT < 1
LW1_27b
Er-BTC NaClO4
H2O
0.0254 g 0.1997 g 50 mL
RT 1
LW1_27c
Er-BTC PFOA H2O
0.0255 g 0.2083 g 50 mL
RT 1
LW1_27d
Er-BTC Adipic acid
H2O
0.0259 g 0.2074 g 50 mL
RT 1
LW1_32e
La-NDC NaClO4
H2O
0.0319 g 0.1242 g 50 mL
RT < 1
LW1_32f
La-NDC Adipic acid
H2O
0.0301 g 0.1253 g 50 mL
RT < 1
LW1_32g
La-NDC PFOA H2O
0.0319 g 0.1283 g 50 mL
RT < 1

162
LW1_34a
La-NDC Malonate,
disodium salt H2O
0.0405 g 0.1036 g
50 mL
RT 1
LW1_34b
La-NDC Succinate,
disodium salt H2O
0.0413 g 0.1006 g
50 mL
RT 1
LW1_34c
La-NDC Glutaric acid, disodium salt
H2O
0.0401 g 0.1009 g
50 mL
RT 1
LW1_34d
La-NDC Sebatic acid, disodium salt
H2O
0.401 g 0.1020 g
50 mL
RT 1
LW1_40b
La-NDC PFOA H2O
0.0312 g 0.1288 g 50 mL
RT 1
LW1_40c
La-NDC PFOA H2O
0.0323 g 0.1274 g 50 mL
RT 1
LW1_45a
La-NDC PFOA H2O
0.0303 g 0.1171 g 50 mL
RT 1
LW1_45b
La-NDC PFOA H2O
0.0335 g 0.1162 g 50 mL
RT 1
LW1_45c
La-NDC PFOA H2O
0.0328 g 0.1156 g 50 mL
RT 1
LW1_48a
La-NDC PFOA H2O
0.0297 g 0.1001 g 50 mL
RT 2
LW1_48b
La-NDC PFOA H2O
0.0308 g 0.0506 g 50 mL
RT 2
LW1_48c
La-NDC PFOA H2O
0.0305 g 0.0299 g 50 mL
RT 2
LW1_49a
Nd-NDC PFOA H2O
0.0302 g 0.1256 g 50 mL
RT 1

163
LW1_49b
Er-NDC PFOA H2O
0.0308 g 0.1256 g 50 mL
RT 1
LW1_55a
La-NDC PFOA H2O
0.0305 g 0.0054 g 50 mL
RT 2
LW1_55b
Nd-NDC PFOA H2O
0.0299 g 0.0053 g 50 mL
RT 2
LW1_55c
Er-NDC PFOA H2O
0.0306 g 0.0051 g 50 mL
RT 2
LW1_55d La-NDC PFOA H2O
0.0306 g 0.1251 g 30 mL
40 1
LW1_56a
La-NDC NH4NO3
H2O
0.0259 g 0.1076 g 50 mL
RT 2
LW1_56b
La-NDC NH4NO3
H2O
0.0259 g 0.0582 g 50 mL
RT 2
LW1_56c
La-NDC NaNO3
H2O
0.0249 g 0.1021 g 50 mL
RT 2
LW1_56d
La-NDC NaNO3
H2O
0.0262 g 0.0517 g 50 mL
RT 2
LW1_60a
La-CPB NaClO4
H2O
0.0321 g 0.1036 g 50 mL
RT 1
LW1_60b
Nd-CPB NaClO4
H2O
0.0302 g 0.1064 g 50 mL
RT 1
LW1_60c
Gd-CPB NaClO4
H2O
0.0316 g 0.1061 g 50 mL
RT 1
LW1_60d
Er-CPB NaClO4
H2O
0.0314 g 0.1015 g 50 mL
RT 1
LW1_60e
La-CPB PFOA H2O
0.0318 g 0.1038 g 50 mL
RT 1
LW1_60f
Nd-CPB PFOA H2O
0.0313 g 0.1015 g 50 mL
RT 1

164
LW1_60g
Gd-CPB PFOA H2O
0.309 g 0.1031 g 50 mL
RT 1
LW1_60h
Er-CPB PFOA H2O
0.0304 g 0.1016 g 50 mL
RT 1
LW1_62a
La-NDC PFOA H2O
0.0303 g 0.1261 g 50 mL
33 4
LW1_62b
La(NO3)3 × 6 H2O PFOA H2O
0.0317 g 0.1267 g 50 mL
RT 1
LW1_62c
Gd-NDC PFOA H2O
0.0313 g 0.1027 g 50 mL
RT 2
LW1_69a
La-CPB KMnO4
H2O
0.0305 g 0.1048 g 50 mL
RT 1
LW1_69b
Nd-CPB KMnO4
H2O
0.0310 g 0.1012 g 50 mL
RT 1
LW1_69c
Gd-CPB KMnO4
H2O
0.0312 g 0.1009 g 50 mL
RT 1
LW1_69d
Er-CPB KMnO4
H2O
0.0311 g 0.1021 g 50 mL
RT 1
LW1_74a
Ce-NDC PFOA H2O
0.0303 g 0.1008 g 50 mL
RT 1
LW1_74b
Ce-CPB PFOA H2O
0.0308 g 0.1008 g 50 mL
RT 1
LW1_74c
Ce-CPB PFOA H2O
0.304 g 0.1002 g 50 mL
RT 1
LW1_77a
Ce-CPB PFOA H2O
0.0304 g 0.1012 g 50 mL
RT 6
LW1_77b
Nd-NDC PFOA H2O
0.0302 g 0.1001 g 50 mL
RT 6
LW1_77c
Er-NDC PFOA H2O
0.0303 g 0.1002 g 50 mL
RT 6
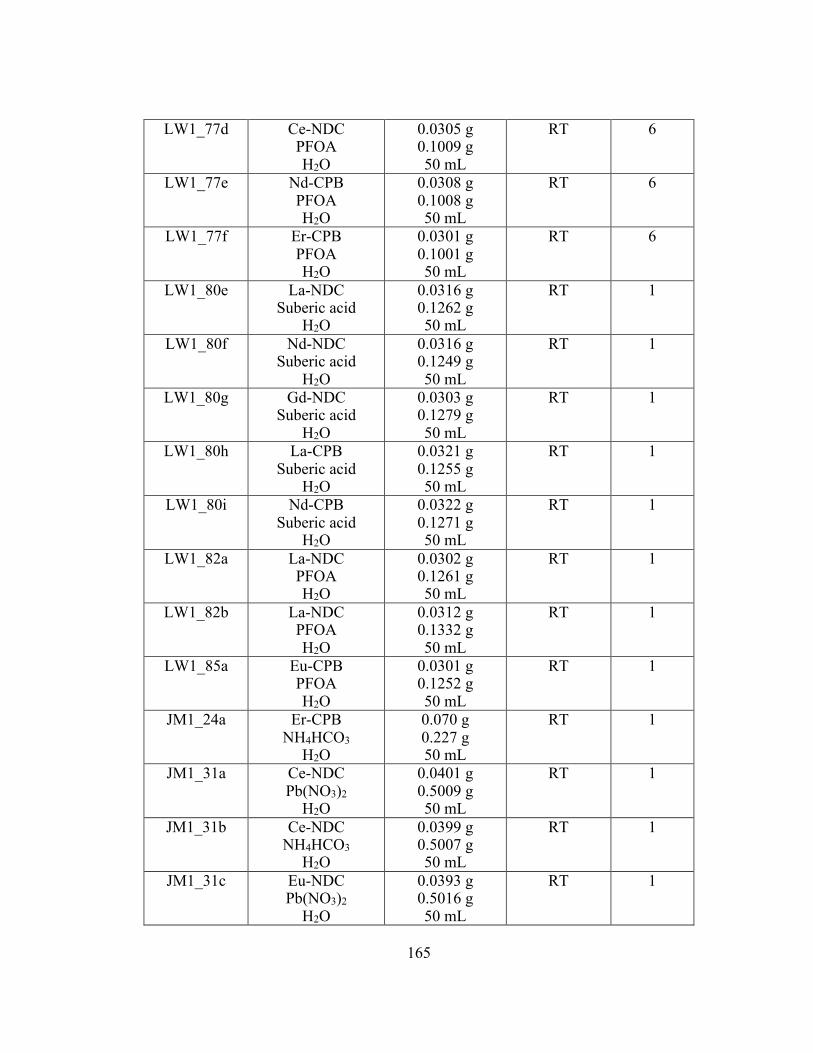
165
LW1_77d
Ce-NDC PFOA H2O
0.0305 g 0.1009 g 50 mL
RT 6
LW1_77e
Nd-CPB PFOA H2O
0.0308 g 0.1008 g 50 mL
RT 6
LW1_77f
Er-CPB PFOA H2O
0.0301 g 0.1001 g 50 mL
RT 6
LW1_80e
La-NDC Suberic acid
H2O
0.0316 g 0.1262 g 50 mL
RT 1
LW1_80f
Nd-NDC Suberic acid
H2O
0.0316 g 0.1249 g 50 mL
RT 1
LW1_80g
Gd-NDC Suberic acid
H2O
0.0303 g 0.1279 g 50 mL
RT 1
LW1_80h
La-CPB Suberic acid
H2O
0.0321 g 0.1255 g 50 mL
RT 1
LW1_80i
Nd-CPB Suberic acid
H2O
0.0322 g 0.1271 g 50 mL
RT 1
LW1_82a
La-NDC PFOA H2O
0.0302 g 0.1261 g 50 mL
RT 1
LW1_82b
La-NDC PFOA H2O
0.0312 g 0.1332 g 50 mL
RT 1
LW1_85a
Eu-CPB PFOA H2O
0.0301 g 0.1252 g 50 mL
RT 1
JM1_24a Er-CPB NH4HCO3
H2O
0.070 g 0.227 g 50 mL
RT 1
JM1_31a Ce-NDC Pb(NO3)2
H2O
0.0401 g 0.5009 g 50 mL
RT 1
JM1_31b Ce-NDC NH4HCO3
H2O
0.0399 g 0.5007 g 50 mL
RT 1
JM1_31c Eu-NDC Pb(NO3)2
H2O
0.0393 g 0.5016 g 50 mL
RT 1

166
JM1_31d Eu-NDC NH4HCO3
H2O
0.0402 g 0.5002 g 50 mL
RT 1
JM1_32a Er-NDC Pb(NO3)2
H2O
0.0396 g 0.5000 g 50 mL
RT 1
JM1_32b Er-NDC NH4HCO3
H2O
0.0404 g 0.5000 g 50 mL
RT 1
JM1_33 Er-CPB NH4HCO3
H2O
0.0402 g 0.2283 g 50 mL
RT 1
JM1_37a Ce-NDC Pb(NO3)2
0.0250 g 50 mL, 100 ppm
RT 1
JM1_37b Eu-NDC Pb(NO3)2
0.0245 g 50 mL, 100 ppm
RT 1
JM1_37c Er-NDC Pb(NO3)2
0.0248 g 50 mL, 100 ppm
RT 1
JM1_42b Ce-NDC Pb(NO3)2
0.0249 g 50 mL, 50 ppm
RT 1
JM1_42d Eu-NDC Pb(NO3)2
0.0253 g 50 mL, 50 ppm
RT 1
JM1_42f Er-NDC Pb(NO3)2
0.0250 g 50 mL, 50 ppm
RT 1
JM1_57a Nd-EDS Adipic Acid
H2O
0.0298 g 0.0499 g 50 mL
RT 1
JM1_57b Nd-EDS Adipic Acid
H2O NaCl
0.0304 g 0.0506 g 10 mL
0.0505 g
RT 1
JM1_65a Nd-EDS Adipic acid
H2O
0.3995 g 0.7003 g 50 mL
RT 1
JM1_65b Nd-EDS Succinic acid
H2O
0.6507 g 0.3997 g 50 mL
RT 1
SW1_06a
Eu-NDC PFOA H2O
0.0301 g 0.1253 g 50 mL
RT 1
SW1_06b
Eu-CPB PFOA H2O
0.0307 g 0.1253 g 50 mL
RT 1
SW1_10a
Nd-NDC PFOA
0.0025 g 50 mL, 1 ppm
RT 1

167
SW1_10b
Nd-NDC PFOA
0.0026 g 50 mL, 1 ppm
RT 1
SW1_10c
La-NDC PFOA
0.0025 g 50 mL, 1 ppm
RT 1
SW1_10d
La-NDC PFOA
0.0027 g 50 mL, 1 ppm
RT 1
SW1_10e
Eu-CPB PFOA
0.0026 g 50 mL, 1 ppm
RT 1
SW1_10f
Eu-CPB PFOA
0.0026 g 50 mL, 1 ppm
RT 1
SW1_15a
Ce-NDC PFOA
0.0505 g 50 mL, 1 ppm
RT 1
SW1_15b
Eu-NDC PFOA
0.0501 g 50 mL, 1 ppm
RT 1
SW1_15c
Er-NDC PFOA
0.0508 g 50 mL, 1 ppm
RT 1
SW1_15d
Nd-CPB PFOA
0.0511 g 50 mL, 1 ppm
RT 1
SW1_20a
Eu-CPB Pb(NO3)2
H2O
0.0502 g 0.2444 g 50 mL
RT 1
SW1_20b
Eu-CPB (CH3)4NBr
H2O
0.0506 g 0.1138 g 50 mL
RT 1
SW1_24a
Eu-CPB Pb(NO3)2
H2O
0.0504 g 1.2204 g 50 mL
70 1
SW1_24b
Eu-CPB (CH3)4NBr
H2O
0.0508 g 0.5675 g 50 mL
70 1