UC Berkeley - eScholarship
101
UC Berkeley UC Berkeley Electronic Theses and Dissertations Title Elucidating Liver Fluke Transmission Dynamics: Synthesizing Lab, Field, and Modeling Methods Permalink https://escholarship.org/uc/item/86105820 Author Leon, Tomas Publication Date 2018 Peer reviewed|Thesis/dissertation eScholarship.org Powered by the California Digital Library University of California
-
Upload
khangminh22 -
Category
Documents
-
view
0 -
download
0
Transcript of UC Berkeley - eScholarship

UC BerkeleyUC Berkeley Electronic Theses and Dissertations
TitleElucidating Liver Fluke Transmission Dynamics: Synthesizing Lab, Field, and Modeling Methods
Permalinkhttps://escholarship.org/uc/item/86105820
AuthorLeon, Tomas
Publication Date2018 Peer reviewed|Thesis/dissertation
eScholarship.org Powered by the California Digital LibraryUniversity of California

Elucidating Liver Fluke Transmission Dynamics:
Synthesizing Lab, Field, and Modeling Methods
by
Tomas M. Leon
A dissertation submitted in partial satisfaction of the
requirements for the degree of
Doctor of Philosophy
in Environmental Health Sciences
and the Designated Emphasis
in
Development Engineering
in the
Graduate Division
of the
University of California, Berkeley
Committee in charge:
Professor Robert C. Spear, Chair Professor Kara Nelson
Professor Travis C. Porco Professor Justin V. Remais
Fall 2018

Elucidating Liver Fluke Transmission Dynamics: Synthesizing Lab, Field, and Modeling Methods
Copyright 2018
by
Tomas M. Leon

1
Abstract
Elucidating Liver Fluke Transmission Dynamics: Synthesizing Lab, Field, and Modeling Methods
By
Tomas M. Leon
Doctor of Philosophy in Environmental Health Sciences
and Designated Emphasis in Development Engineering
University of California, Berkeley
Professor Robert C. Spear, Chair
Opisthorchiasis, infection with the Southeast Asian liver fluke Opisthorchis viverrini, and liver fluke-associated cholangiocarcinoma cause significant disease burden in Southeast Asia. Northeast Thailand is a particular region where this disease is a public health priority, infecting over 50% of the population in some villages and causing 5000 excess cancer cases per year. People acquire the parasite by eating raw or undercooked fish, a deeply embedded local cultural and culinary tradition. Health education is essential to preventing and controlling the disease, but the environment also plays a major role in enabling and catalyzing transmission between hosts. An emphasis on disease ecology and the environmental determinants of transmission is useful and necessary for public health understanding and for informing and designing future treatment and control interventions. This dissertation takes that approach, investigating each disease host and linkage for the role of the environment in influencing transmission. Chapter 1 describes and contextualizes liver fluke transmission and why it matters, introducing Lawa Lake and the Lawa Project, which are the background for the context and data examined herein. Chapter 2 presents lab, field, and modeling results related to infection and ecology of the intermediate host Bithynia snails and cyprinid fish. Chapter 3 introduces and presents results from the single-village mathematical model simulating transmission in six village clusters around Lawa Lake. Chapter 4 discusses the role of reservoir hosts (cats and dogs) in the transmission cycle, adds them to the model framework, and simulates the impact of regular praziquantel treatment on long-term infection prevalence. Chapter 5 introduces the rainfall-runoff hydrology model, whose output is incorporated into a metapopulation disease transmission model to connect the six village clusters around Lawa Lake, and the impacts of connectivity and upstream villages are studied and discussed. Chapter 6 concludes with some comments on engineering and public health perspectives, limitations, progress, and future directions for liver fluke and neglected tropical disease control.

i
Table of Contents List of Figures ........................................................................................................................ iii List of Tables ......................................................................................................................... iv Abbreviations .......................................................................................................................... v Chapter 1: Introduction: The lifecycle and context of liver fluke transmission in northeast Thailand .................................................................................................................. 1 1.1 Structure and significance of dissertation ........................................................................ 1 1.2 Liver fluke transmission and life cycle ............................................................................. 1 1.3 Liver fluke burden of disease with emphasis on northeast Thailand............................ 4 1.4 Environmental context of transmission ............................................................................ 7 1.5 Northeast Thailand, Lawa Lake, and Lawa Model/Lawa Project ................................. 9 Chapter 2: Developing a nuanced understanding of the snail and fish hosts in the liver fluke transmission cycle with modeling investigations .................................................. 12 2.1 Introduction ...................................................................................................................... 12 2.2 Bithynia snail ecology and experimental results ........................................................... 12 2.3 Understanding how O. viverrini cercariae are released from snails and infect fish .. 15 2.4 Catching, distributing, and eating fish in Lawa Lake ................................................... 16 2.5 Diet-based risk assessment for northeast Thai diet and O. viverrini infection ........... 19 2.6 Aquaculture and fish pond experimental results .......................................................... 24 2.7 Fish demography submodel ............................................................................................ 32 2.8 Conclusion ........................................................................................................................ 34 Chapter 3: Single-village model for transmission around Lawa Lake ........................... 35 3.1 Introduction ...................................................................................................................... 35 3.2 Describing the transmission processes ........................................................................... 35 3.3 Local Data ......................................................................................................................... 37 3.4 Mathematical modeling framework ............................................................................... 41 3.5 Modeling results ............................................................................................................... 44 3.6 Discussion ......................................................................................................................... 48 3.7 Conclusion ........................................................................................................................ 49 Chapter 4: The role of reservoir hosts in maintaining transmission .............................. 51 4.1 Cats and dogs in northeast Thailand villages ................................................................ 51 4.2 How they get infected/fit into transmission cycle/available data .............................. 51 4.3 Incorporating reservoir hosts into the modeling framework ....................................... 53 4.4 Regular screening and praziquantel control and the effect of reservoir hosts ........... 55 4.5 Conclusion ........................................................................................................................ 57 Chapter 5: Hydrology-informed metapopulation modeling of liver fluke transmission in the Lawa Lake complex of northeast Thailand ............................................................. 59 5.1 Introduction ...................................................................................................................... 59 5.2 Hydrology model description ......................................................................................... 60 5.3 Metapopulation disease transmission model description ............................................ 64

ii
5.4 Metapopulation model results ........................................................................................ 67 5.5 Reinfection data ................................................................................................................ 70 5.6 Discussion and Conclusion ............................................................................................. 73 5.7 Appendix .......................................................................................................................... 75 Chapter 6: Conclusion .......................................................................................................... 76 6.1 Development Engineering perspective .......................................................................... 76 6.2 Suggested public health policy implications ................................................................. 77 6.3 Ongoing data and research gaps, how to tackle NTDs ................................................. 80 6.4 Limitations, progress, next steps..................................................................................... 81 References .............................................................................................................................. 84
iii
List of Figures 1.2.1: Liver fluke life cycle ....................................................................................................... 2 1.3.1: Southeast Asia map of liver cancer incidence and OV infection ................................ 6 1.5.1: Study area map ............................................................................................................. 10 2.2.1: TRI curves across time and temperature .................................................................... 13 2.2.2: Seasonal TRI curves...................................................................................................... 14 2.3.1: Mekong fish seasonal life cycle ................................................................................... 16 2.4.1: Fermentation times for pla raa and pla som .............................................................. 18 2.4.2: Parasite inactivation in pla som fermentation ........................................................... 18 2.4.3: Koi pla consumption-OV EPG relationship ............................................................... 18 2.5.1: Tradeoff between risk and frequency of at-risk dish consumption ......................... 20 2.5.2: Worm burden contribution by diet and dish type .................................................... 24 2.6.1: Snail density change in Phase I experiment ............................................................... 26 2.6.2: Coliform concentration change in Phase 1 experiment ............................................. 26 2.6.3: E. coli concentration change in Phase 1 experiment .................................................. 27 2.6.4: Fish growth curves in Phase 1 experiment ................................................................. 27 2.6.5: Fish growth curves in Phase 2 experiment ................................................................. 30 2.6.6: Coliform concentration change in Phase 1 experiment ............................................. 31 2.6.7: E. coli concentration change in Phase 1 experiment .................................................. 31 2.7.1: Fish infection prevalence by age group ...................................................................... 33 2.7.2: Transmission parameter-equilibrium fish prevalence relationship ......................... 34 3.3.1: Hydrologic structures around Lawa Lake ................................................................. 39 3.3.2: Rainfall data for Khon Kaen Province ........................................................................ 40 3.3.3: Chi River gauge data .................................................................................................... 40 3.5.1: Single-village model results with human infection survey data .............................. 45 3.5.2: Prevalence values for single-village model at baseline equilibrium ........................ 46 3.5.3: Prevalence values for single-village model with MCMC-derived parameters ....... 47 4.3.1: Transmission pathways framework incorporating reservoir hosts ......................... 53 4.3.2: Modeled reservoir host prevalence in Lawa Lake villages ....................................... 54 4.4.1: Comparison of model runs with and without reservoir hosts ................................. 55 4.4.2: Annual PZQ treatment coverage and equilibrium human infection prevalence ... 56 4.4.3: Biannual PZQ treatment coverage and equilibrium human infection prevalence . 56 5.2.1: Village connectivity around Lawa Lake ..................................................................... 60 5.2.2: Upstream sub-basins map ........................................................................................... 61 5.2.3: Hydrologic flow and connectivity change seasonally............................................... 62 5.2.4: Calibration and validation curves for SWAT-CUP models ...................................... 63 5.3.1: Village connectivity variation across months and years ........................................... 66 5.4.1: Metapopulation model run for human infection prevalence with data .................. 68 5.4.2: Snail prevalence values for metapopulation model run ........................................... 69 5.4.3: Fish prevalence values for metapopulation model run ............................................ 69 5.5.1: Prior PZQ treatments by villagers from 2012 surveys .............................................. 71 5.5.2: Last PZQ treatment by villagers from 2012 surveys ................................................. 72 5.7.1: Connectivity parameters for remaining village cluster connections ....................... 75 6.1.1: Development Engineering framework ....................................................................... 77 6.1.2: Model-guided framework ........................................................................................... 78

iv
List of Tables 1.3.1: GBD estimates of heavy OV infections across age groups ......................................... 5 2.5.1: Average diet risk of OV infection ............................................................................... 21 2.5.2: High-risk diet risk of OV infection ............................................................................. 22 2.5.3: Low-risk diet risk of OV infection .............................................................................. 22 2.6.1: Snail survival over course of Phase 2 experiment ..................................................... 30 3.3.1: Human infection prevalence and intensity data for Lawa Lake villages ................ 38 3.4.1: Single-village model parameter values ...................................................................... 42 3.4.2: Fish infection prevalence baseline data for Lawa Lake villages............................... 43 3.5.1: Beta transmission parameters for single-village model ............................................ 44 3.5.2: Simulated human prevalence values from single-village model ............................. 48 4.2.1: Reservoir host infection prevalence and intensity data for Lawa Lake villages ..... 52 4.3.1: Modeled equilibrium human and reservoir infection prevalence ........................... 55 4.4.1: PZQ treatment coverages needed to meet Thai MOPH targets ............................... 57 5.3.1: Linkages between hydrology model and disease transmission model ................... 66 5.5.1: Infection prevalence values comparing resampled individuals .............................. 71 5.5.2: Infection intensity values comparing resampled individuals .................................. 73

v
Abbreviations C. sinensis = Clonorchis sinensis CCA = cholangiocarcinoma E. coli = Escherichia coli EPG = eggs per gram of feces FAO = Food and Agriculture Organization FECT = formalin ethyl-acetate concentration technique HACCP = Hazard Analysis Critical Control Point KKU = Khon Kaen University IARC = International Agency for Research on Cancer MCMC = Markov Chain Monte Carlo MOPH = Ministry of Public Health NTD = Neglected tropical disease PZQ = Praziquantel OV = O. viverrini = Opisthorchis viverrini WHO = World Health Organization

vi
Acknowledgements It feels good to at last put this dissertation to rest. The journey has been a long and rewarding one that has taken me across fields and continents in search of Truth. First, to my advisor, Bob Spear, who I have had the benefit of knowing and working with since I first arrived in Berkeley in 2012. Even in his “retirement,” he has been happy to advise me and recruit one last engineer to environmental health to bolster our perspective on infectious disease transmission. He has been a source of great stories and wisdom from the field. To many other U.S. professors who provided advice, suggestions, and support at different points of my academic career: John Balmes, Beth Carlton, Jack Colford, John Marshall, Tom McKone, Kara Nelson, Travis Porco, Justin Remais, Lee Riley, and Kirk Smith. The Berkeley Environmental Health Sciences staff are exceptional, and Norma Firestone, Justin Girard, and Terry Jackson deserve special recognition for helping me get stuff done since Day 1. Khon Kaen, Thailand, was a second home to me during my graduate school years, and I will always cherish and visit the community I built there. Thanks to Banchob Sripa, who first invited me and allowed me to come do global health fieldwork and experience the on-the-ground reality of the liver fluke transmission context. Other Khon Kaen University professors who helped me significantly include Sirikachorn Tangkawattana, Paiboon Sithithaworn, Sasithorn Kaewkes, and John Smith. Professors Vichian Plermakamon and Kittiwet Kuntiyawichai were particularly important and helpful for my work presented in Chapter 5. Fellow students and researchers who were instrumental in the success of my research projects are Sujittra Chaiyadet, Qu Cheng, Chalida Chuenchom, Wachiraporn Donsa, Pierre Echaubard, Isabelle Jala, Christina Kim, Xueyuan Ong, Janjiravadee Sripa, and Sutasinee Sripa. Other students in the School of Public Health at Berkeley are too numerous to list but have been great colleagues and friends through classes, seminars, and camping trips. For my fieldwork I am heavily indebted to Sanchai Moncam and his family, who hosted me and allowed me to conduct experiments in their fish ponds, giving me unique insight into Isan culture and the liver fluke transmission cycle. May Pa rest in peace; this dissertation is dedicated to him most of all. I was also supported by the villagers of Nongnangkwan, including Pa Sompong, and the health volunteers of Lawa. Funding for the research presented in this dissertation came from National Science Foundation Graduate Research Fellowship under Grant No. 1106400, the C.C. Chen Fund, a Foreign Language and Area Studies Fellowship for Southeast Asia from the Department of Education, a Fulbright Student Research Grant from the Department of State, the EHS Block Grant at UC-Berkeley, and NIH Grant 5R21AI104513-02. On a personal note, I owe so much to my parents, Debra and Roberto, who have supported and loved me unconditionally since the very beginning, who encouraged my intellectual curiosity even when it brought me into close quarters with a number of

vii
infectious diseases that they would have preferred I stayed away from but in fact did not. To my sister, Elena, who will always be my favorite sister, and who I am so glad to share a coast with for the near future. Most of all, to my wife, Valerie, with whom I am sharing this crazy adventure we call life. Thanks for your love and patience during the preparation and writing of this dissertation.

1
Chapter 1 Introduction: The lifecycle and context of liver fluke transmission in northeast Thailand 1.1 Structure and significance of dissertation This dissertation is comprised of six chapters. Chapter 1 introduces liver flukes, their transmission cycle, their disease burden, and the geographical and public health context of the modeling work described herein. Chapter 2 focuses on the snail and fish intermediate hosts and experimental data informing their role in disease ecology and the role of the environment in transmission. Chapter 3 describes the one-village deterministic disease transmission model for the villages around Lawa Lake and introduces the role of hydrology, development, and control in influencing transmission dynamics. Chapter 4 looks at reservoir hosts and their role in transmission in northeast Thailand with modeling investigations. Chapter 5 expands the model introduced in Chapter 3 into a metapopulation model informed by a hydrologic model governing seasonal transmission and connectivity between village clusters and environmental patches. Chapter 6 concludes the dissertation with comments on a development engineering perspective, public health policy implications, research gaps, limitations, and next steps for disease control of liver fluke infection and other NTDs. 1.2 Liver fluke transmission and life cycle Human liver flukes are waterborne and water-related parasites that cause significant disease burden, notably in East and Southeast Asia. They are classified as fishborne zoonotic trematodes because they are transmitted to human hosts through the consumption of raw, undercooked and fermented fish and the involvement of snails and fish as intermediate hosts and other reservoir hosts for the adult worm in the lifecycle (Figure 1.2.1). There are more than 13 species of liver flukes that have been found to infect humans (Kaewkes 2003). The primary liver fluke species of public health interest are of the genus Fasciola (F. hepatica and F. gigantica) and of the family Opisthorchiidae (Opisthorchis viverrini, O. felineus, and Clonorchis sinensis). Due to taxonomical precedent, C. sinensis is a separate genus though it co-occurs with O. viverrini and is morphologically very similar. Within the context of this dissertation, the liver flukes O. viverrini, known as the Southeast Asian liver fluke, and C. sinensis, known as the Chinese liver fluke, are the pathogens of interest; they are found in East and Southeast Asia, which encompass the region studied herein. O. viverrini is the main focus of this dissertation with some references to C. sinensis; they are often grouped together, notably in their carcinogenic classification by the International Agency for Research on Cancer (IARC). The name liver fluke is a slight misnomer, as the adult worms migrate to and persist in the bile ducts of humans and reservoir hosts rather than truly within the liver itself. The lifecycle and transmission context of O. viverrini are exceptionally complex. The adult worms reside in humans and reservoir hosts, including cats, dogs, civets, rats, and other fish-eating mammals (WHO 2012). The adult O. viverrini worms are

2
hermaphroditic, unlike schistosomes, and can therefore self-fertilize or cross-fertilize (selfing vs. outcrossing). The relative degree of each type of fertilization is unknown, though genetic studies of the parasite suggest a very high degree of self-fertilization because of evidence of heterozygote deficiency at multiple gene loci (Saijuntha et al. 2008). From a modeling perspective, we are therefore not concerned with worm pairing as in the case of schistosomes, as one worm is sufficient to produce eggs that are then shed from the host.
The life cycle of O. viverrini includes freshwater snails as intermediate hosts. The
snails, of the genus Bithynia, ingest O. viverrini eggs excreted in contaminated feces of infected humans and reservoir hosts that have reached an aquatic snail habitat. The miracidium within the egg hatches inside the snail and matures and multiplies into its cercarial form, which is released back into the body of water, where it seeks out as a second intermediate host, a fish of the family Cyprinidae. The cercariae penetrates the flesh of the host fish and encysts itself in its metacercarial form. In its final hosts, humans and other mammals, the metacercariae excysts and navigates to the bile ducts, where it matures into an adult worm and begins releasing up to thousands of eggs per day (Keiser and Utzinger 2009, Petney et al. 2013). Like many helminths, the disease ecology of liver fluke infection is characterized by overdispersion. This pattern signifies that most infected individuals have few worms and shed relatively few eggs while a small number of individuals harbor large numbers of worms and act as “super spreaders” by shedding significant egg counts. In one study, the 10% most infected individuals in a population accounted for 81% of its total worms (Keiser and Utzinger 2009).
Liver flukes are foodborne trematodes, which some researchers have labeled as “among the most neglected of the so-called neglected tropical diseases” (Keiser and Utzinger 2009). Both are classified as Group 1 carcinogens by IARC for triggering and
Figure 1.2.1: Liver fluke life cycle (Sripa et al. 2010)
3
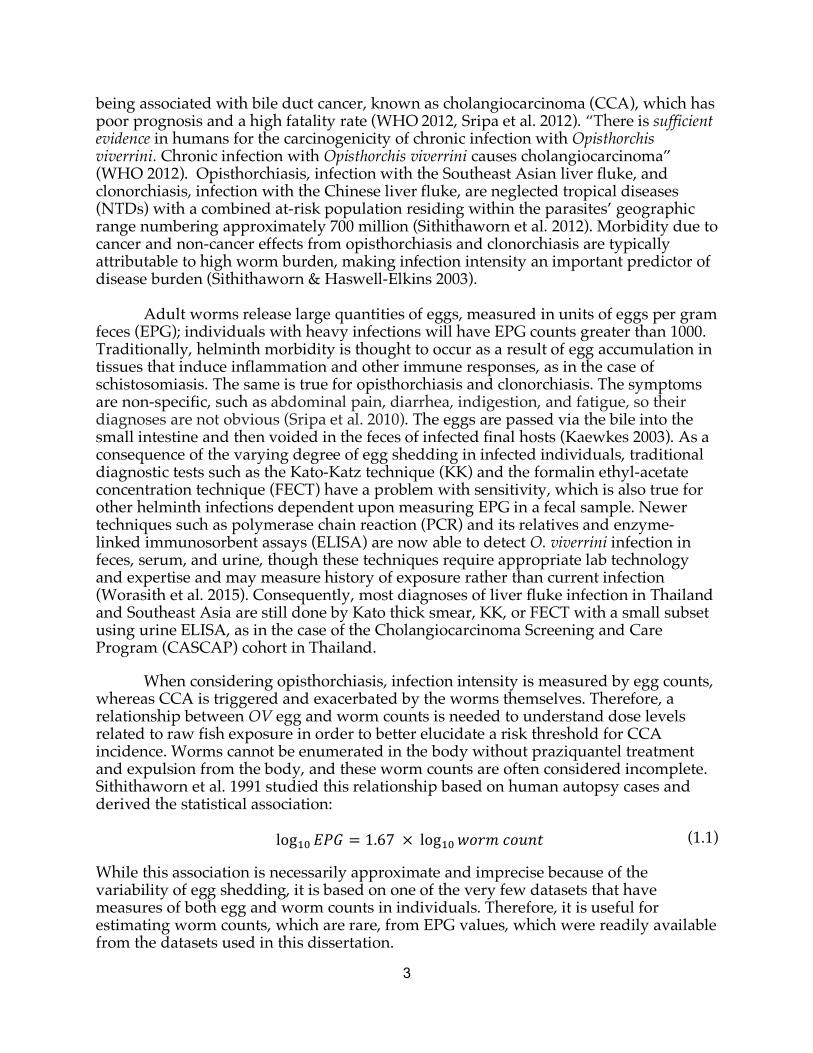
being associated with bile duct cancer, known as cholangiocarcinoma (CCA), which has poor prognosis and a high fatality rate (WHO 2012, Sripa et al. 2012). “There is sufficient evidence in humans for the carcinogenicity of chronic infection with Opisthorchis viverrini. Chronic infection with Opisthorchis viverrini causes cholangiocarcinoma” (WHO 2012). Opisthorchiasis, infection with the Southeast Asian liver fluke, and clonorchiasis, infection with the Chinese liver fluke, are neglected tropical diseases (NTDs) with a combined at-risk population residing within the parasites’ geographic range numbering approximately 700 million (Sithithaworn et al. 2012). Morbidity due to cancer and non-cancer effects from opisthorchiasis and clonorchiasis are typically attributable to high worm burden, making infection intensity an important predictor of disease burden (Sithithaworn & Haswell-Elkins 2003). Adult worms release large quantities of eggs, measured in units of eggs per gram feces (EPG); individuals with heavy infections will have EPG counts greater than 1000. Traditionally, helminth morbidity is thought to occur as a result of egg accumulation in tissues that induce inflammation and other immune responses, as in the case of schistosomiasis. The same is true for opisthorchiasis and clonorchiasis. The symptoms are non-specific, such as abdominal pain, diarrhea, indigestion, and fatigue, so their diagnoses are not obvious (Sripa et al. 2010). The eggs are passed via the bile into the small intestine and then voided in the feces of infected final hosts (Kaewkes 2003). As a consequence of the varying degree of egg shedding in infected individuals, traditional diagnostic tests such as the Kato-Katz technique (KK) and the formalin ethyl-acetate concentration technique (FECT) have a problem with sensitivity, which is also true for other helminth infections dependent upon measuring EPG in a fecal sample. Newer techniques such as polymerase chain reaction (PCR) and its relatives and enzyme-linked immunosorbent assays (ELISA) are now able to detect O. viverrini infection in feces, serum, and urine, though these techniques require appropriate lab technology and expertise and may measure history of exposure rather than current infection (Worasith et al. 2015). Consequently, most diagnoses of liver fluke infection in Thailand and Southeast Asia are still done by Kato thick smear, KK, or FECT with a small subset using urine ELISA, as in the case of the Cholangiocarcinoma Screening and Care Program (CASCAP) cohort in Thailand.
When considering opisthorchiasis, infection intensity is measured by egg counts, whereas CCA is triggered and exacerbated by the worms themselves. Therefore, a relationship between OV egg and worm counts is needed to understand dose levels related to raw fish exposure in order to better elucidate a risk threshold for CCA incidence. Worms cannot be enumerated in the body without praziquantel treatment and expulsion from the body, and these worm counts are often considered incomplete. Sithithaworn et al. 1991 studied this relationship based on human autopsy cases and derived the statistical association:
log$% 𝐸𝑃𝐺 = 1.67 × log$% 𝑤𝑜𝑟𝑚𝑐𝑜𝑢𝑛𝑡 (1.1)
While this association is necessarily approximate and imprecise because of the variability of egg shedding, it is based on one of the very few datasets that have measures of both egg and worm counts in individuals. Therefore, it is useful for estimating worm counts, which are rare, from EPG values, which were readily available from the datasets used in this dissertation.

4
1.3 Liver fluke burden of disease with emphasis on northeast Thailand
The main pathology of interest for liver fluke infection is CCA, a form of bile duct cancer with poor prognosis upon diagnosis. CCA is more commonly seen after age 40 and in males. The precursors to CCA are hepatic abnormalities, specifically including primary sclerosing cholangitis, or inflammation and fibrosis of the bile ducts, and periductal fibrosis. These impacts are not easily discernible beyond examination by trained specialists. Notably, periductal fibrosis is often seen in advanced opisthorchiasis cases and is regarded as a cancer pre-cursor to CCA (Sripa et al. 2010). Obstructive jaundice is the most common symptom related to CCA that causes people to seek treatment. By the time it manifests though, the vast majority of cases are beyond treatment, as the cancer is well advanced. CCA kills 90% of patients within a year of diagnosis. Surgery only has a 20% success rate in the few cases that are not deemed untreatable by doctors (Khan et al. 2002). The disease burden in northeast Thailand in particular is significant- an estimated 5000 cases per year, far in excess of the 100-1000 cases that would be expected in this region in the absence of liver fluke exposure (B. Sripa, personal communication). CCA has long been a recognized cause of mortality in the region, and it is a part of local Thai and Isan culture to accept this form of death as a part of their life and reality (Samiphak 2014). Efforts are being made in Thailand through CASCAP to screen people for risk factors related to CCA, including liver fluke infection (Khuntikeo et al. 2015). Despite control efforts, local public health officials believe CCA incidence will continue to rise until at least 2020, given changing demographics and the lag in response times to cancer’s long development horizon.
Estimates suggest that between 0.1-1% of OV-infected individuals develop CCA and most infected individuals (up to 90%) are asymptomatic (Sithithaworn et al. 2014). In the Global Burden of Disease 2016 study, the disability weight for “heavy opisthorchiasis,” defined as having a burden threshold of 10,000 EPG, was 0.114 (Lancet 2017). Their estimates for what percent of infections were heavy ranged from 10% in 0-9 to 29% in 50-59 (Table 1.3.1). The variability in these estimates highlights the difficulty of evaluating the scale of disease burden attributable to liver flukes regionally and globally, considering both opisthorchiasis and liver fluke-associated CCA. A separate study aiming to determine disability weights for C. sinensis infection calculated 0.101 for males and 0.050 for females and also varied by age with a positive correlation (Qian et al. 2015). The higher value for males is likely related to concomitant alcohol consumption, and older individuals have generally experienced a longer period of infection and may have accumulated bile duct and liver damage.
Given the known disease burden in Thailand, O. viverrini has been a public health priority there, where it is transmitted to humans via the consumption of popular local raw and fermented fish dishes such as koi pla and pla som. The highest prevalence of opisthorchiasis and CCA are found in northeast Thailand in the region surrounding Khon Kaen (Sithithaworn et al. 1997). Through research done at Khon Kaen University (KKU) and other institutions, a greater understanding of the lifecycle of O. viverrini has been achieved. Despite these advances in knowledge and prior control efforts, infection prevalence in humans remain relatively high. While much research has been conducted on the pathology of opisthorchiasis and CCA, there is limited literature addressing the ecological and hydrological aspects of parasite transmission in the environment (Wang et al. 2017, Grundy-Warr et al 2012). Chapters 2, 3, and 5 of this dissertation will

5
describe why elucidating these drivers of water-related transmission are important for informing prevention and control strategies.
Thailand is adjacent to Lao PDR and Cambodia and near Vietnam, the other
countries with high endemic levels of opisthorchiasis (Traub et al. 2009). The epidemiology of opisthorchiasis in countries outside of Thailand remains understudied. The official figure of 10 million infections worldwide includes only 8 million from Thailand and 2 million in Lao PDR, completely ignoring infections in Cambodia, Vietnam, and other neighboring countries (Fürst et al. 2012). Figure 1.3.1 shows liver cancer incidence and O. viverrini prevalence, highlighting the linkage of the parasite-disease system; countries and provinces colored white (for 0% prevalence) include places where no studies or data are available, so the problem is almost certainly more widespread than currently known. Within-country and between-country variation related to Thailand in liver cancer incidence and O. viverrini infection demonstrate the overlap between the two health outcomes, particularly in Northeast Thailand, where liver cancer incidence is up to 25 times greater than Western countries (Sithithaworn et al. 2014, WHO 2012).
Initial surveys in the 1950s in northeast Thailand, known as Isan, revealed near
100% prevalence of O. viverrini infection in some districts (Sithithaworn et al. 2012). As a region, prevalence was about 35% in the 1980s and has since fallen and stabilized to around 16% as reported in two surveys carried out in 2000 and 2009 (Sithithaworn et al. 2012). Nonetheless, some villages and districts still see infection prevalence up to 60-70% (B. Sripa, personal communication). Control programs in villages around Lawa Lake, the primary area of study for this dissertation, have reduced infection levels to 10-20%, contingent upon regular screening and treatment with praziquantel (Sripa et al. 2015). Another issue of interest is the contrasting patterns of disease burden in Thailand and Lao PDR. In Lao PDR, opisthorchiasis infection levels are very high (70-80%)—similar to Thailand’s levels prior to its intensive control programs. However, Lao PDR
Age Category Clonorchiasis Opisthorchiasis Mean Low High Mean Low High
0-9 30% 17% 44% 10% 0% 29%
10-19 15% 0% 43% 15% 0% 69%
20-29 18% 10% 29% 16% 0% 52%
30-39 17% 5% 34% 21% 0% 56%
40-49 22% 13% 32% 28% 1% 68%
50-59 18% 0% 49% 29% 0% 75%
60+ 32% 18% 47% 25% 0% 64%
Table 1.3.1: Global Burden of Disease estimates for percent of O. viverrini infections that are heavy (> 10000 EPG) in different age categories

6
sees significantly fewer cases of CCA in their populations (Sripa et al. 2011). This is a matter of epidemiological interest that is not well understood.
O. viverrini’s life cycle reflects an earlier evolutionary iteration of transmission pathways of the Schistosoma parasites, which are also snail-borne. Evolutionary ecology suggests that the two-host system that cuts out the fish intermediate host is more efficient, as the former need to accumulate and concentrate parasites in a fish host to reach a final host was no longer needed and was therefore dropped in the Schistosoma life cycle. The fish previously served as a means to extend the viability of cercariae through encystation into metacercariae, which extends the time for the final host to be exposed from hours to months. This development reminds us that parasite fitness is achieved through longevity and reproduction. It has only been a fairly recent development, in alignment with Thailand’s growing life expectancy, that the incidence of and mortality attributable to liver fluke-induced CCA has become notable. This increase seems to be because development of the bile duct cancer occurs over long-term and/or repeated exposures, presumably over the course of decades since most cases are showing up when people are in their 40s or older (Khuntikeo et al. 2015). In former times, when human life expectancy was lower (notably, 55 in 1960 compared with 75 in 2015, according to the World Bank), fewer cancer cases would be both experienced and diagnosed. This is a partial demographic explanation for the documented uptick in CCA cases that instigated IARC’s classification of liver flukes O. viverrini and C. sinensis as Group 1 carcinogens. This pattern also helps explain the disparity noted between Thailand and Lao PDR in CCA case-diagnosis levels. Lao PDR lags behind Thailand
Figure 1.3.1: Liver cancer incidence globally and O. viverrini prevalence in Southeast Asia

7
developmentally. Compare, for example, Lao PDR’s life expectancy in 1960 of 43 years and in 2015 of 66 years with Thailand’s numbers. These data show an almost 30-year lag between when Thailand and Lao PDR attain the same life expectancy, so we would expect Lao PDR to start seeing a notable increase in CCA cases in the 2020s, notwithstanding the increased cancer surveillance network attributable to CASCAP and other efforts. A recent major point of contention is the causal linkage between O. viverrini and cholangiocarcinoma that prompted IARC to classify the parasite (and C. sinensis) as Group 1, “carcinogenic to humans” (WHO 2012). This was last restudied in 2012 based on extensive evidence developed at KKU and in other research groups. However, the relationship is complicated by many covariates that increase risk, including the most significant for a helminth infection, intensity. Other relevant covariates include, notably, alcohol consumption, but also smoking, sex, age, hepatitis B and C. It has been noted that the local habit in northeast Thailand of eating raw fish and drinking rice whiskey, while casually thought to kill the parasite, actually increases risk through liver and bile duct damage. Recent evidence has suggested that low intensity infections may have beneficial health effects through “helminthic therapy.” Worm helminth therapy clinical trials are currently occurring around the world, such as the WiRMS (Worms for Immune Regulation in Multiple Sclerosis) trial. Liver flukes are not currently being used for this purpose. However, epidemiologic studies have found potentially protective effects of harboring liver fluke infection, which reduces fatty liver and cholesterol and consequently risk for diabetes and other diseases that may be risk factors for CCA development, though the evidence is not robust (Saengboonmee et al. 2015, Sripa & Echaubard 2017). This effect is achieved through immunosuppression via mechanisms similar to those in other helminths. Additionally, it is believed that maintaining a low level chronic infection causes less liver damage than multiple infections interspersed with praziquantel treatment that triggers a stronger Th1 inflammatory response upon reinfection versus an ongoing Th2 response (McSorley et al. 2013). However, treating an individual with low burden is advantageous for the community if the individual is actively shedding parasite eggs into the natural environment even if there is no benefit for the individual. It would be difficult to determine a threshold below which an infection would be considered “safe” given nonlinearities in the OV-CCA dose-response and challenges accurately quantifying infection with current diagnostic techniques. 1.4 Environmental context of transmission Because serious liver and bile duct damage results from heavy and/or repeated infections, the primary method of prevention and control of transmission is reducing environmental exposure, both by reducing consumption of raw fish of the species of interest, and by intervening in the environment to disrupt the transmission cycle. Multiple sources have documented the challenges related to the former aspect (Grundy-Warr et al., 2012, Samiphak 2014). The trend and expectation is that development and Westernization/modernization of Thailand and other countries affected by O. viverrini and C. sinensis will result in raw cyprinid fish being a much smaller component of diet for younger generations. However, the role of the dishes (koi pla, pla som, etc.) in

8
traditional celebrations and/or in rural villages in exposing young people to the parasite when they return to their hometowns to visit family cannot be discounted. While these young people likely will not practice open defecation (or other sub-optimal sanitation practices) in Bangkok and other cities of their residence and employment and therefore will not contribute to transmission, they may harbor the parasites for years, as the infection can be asymptomatic. Consequently, cholangiocarcinoma incidence may be elevated because of these isolated exposure events. Sanitation practices have a significant impact on the life cycle of liver flukes because of the need for an infected definitive host such as humans to excrete infected waste in such a way that eggs contained within the feces are able to reach a body of water inhabited by susceptible snails. This is complicated by the fact that cats, dogs, cattle, and other fish-eating mammals also serve as definitive hosts for the parasites (Wang et al. 2013). Therefore, not even a 100% successful improved sanitation campaign will completely disrupt the transmission cycle, assuming that human O. viverrini infection and reservoir host O. viverrini infection transmission overlap, which is not currently known. It is known that fishermen will defecate in close proximity to Lawa Lake, and if fluke eggs are present in their waste, the eggs can easily reach a main water body where Bithynia snails reside. While most homes have sealed septic pits or latrines that qualify as “improved sanitation”, it is also known that use of “nightsoil,” i.e., human fecal waste, for crop fertilization persists in parts of northeast Thailand. Trucks that pump out waste from septic systems have been observed to spray the contents onto fields and rice paddies, as requested by farmers, or into open channels of water. This potentially injects millions of O. viverrini and other fecal-related parasite eggs into the environment on a regular basis. This is a common practice in East and Southeast Asia and elsewhere. Especially in the context of poorer rural livelihoods, artificial fertilizers are expensive and may be deemed unnecessary if a free source (nightsoil) is available. Previous research (Wang et al. 2013, Wang 2012) has identified landscape determinants as important risk factors for O. viverrini transmission. Spatial mapping techniques and environmental sampling have attempted to explain the role that water quality, water availability, seasonality, topography, land use, and irrigation practices play in modulating the parasite’s life cycle. All of these issues are relevant to the project at hand and highlight the complexity of the environment’s role in facilitating parasite transmission. Water is the important media for all stages of the O. viverrini life cycle: it transports eggs from contaminated feces to susceptible snails, mobilizes released cercariae from snails to susceptible fish, and facilitates the habitat in which fish are caught and consumed by definitive hosts. Other studies have also examined environmental influences on snail and fish ecology (Suwannatrai et al. 2011, Wang et al. 2015, Echaubard et al. 2017). Recent increases in demand for fish protein due to population growth and development, pressure in the region to transition from wild fisheries to aquaculture because of hydropower development, and other factors have resulted in a surge in the number of fish ponds and farms that are operating. Limited research has been done on this change, and limited understanding exists with regards to aquaculture’s influence more generally on food safety and fishborne zoonotic parasites. Fish ponds are versatile and can quickly change which fish species are grown and how they are managed. The conditions of fish ponds are ideal for Bithynia snails due to their shallowness, sparse

9
vegetation, and abundant supplies of nutrients. They also guarantee spatial proximity between snails and fish, making fluke transmission possible.
1.5 Northeast Thailand, Lawa Lake, and Lawa Model/Lawa Project The northeast region of Thailand, known as Isan, is considerably poorer than the rest of Thailand and lags behind in several indicators of wealth and infrastructure (Dixon 1977). As a result, opisthorchiasis is often considered a “disease of the poor” because of the particular spatial distribution of the disease in Thailand (Sithithaworn et al. 2012). One explanation for this situation is the greater importance and value of agriculture and aquaculture in Isan compared to the rest of Thailand (Dixon 1977). Increased contact with fish through the growing, catching, and processing stages contributes significantly to the higher prevalence of liver fluke infection and CCA. As discussed above, another reason for the high prevalence of opisthorchiasis in northeast Thailand is the cultural tradition associated with consuming koi pla and pla som, among other raw and fermented fish dishes. Despite several public health campaigns and programs to curb this practice, human infection has persisted and not decreased significantly in response to public health efforts over the past several decades. While mass drug administration (MDA) and screening to deworm people is available, albeit not systematically and uniformly, the lack of conferred immunity means that as long as the risky eating behavior continues people will continually be re-infected soon after treatment. The lack of success on this front supports the need to seek an approach focused on the environmental determinants of transmission. This region is also of particular interest because of proposals for and active construction on hydropower development along the Lower Mekong Basin. Lao PDR and Cambodia have a number of dams planned or under construction that, among other concerns, will have indeterminate effects on water-related disease transmission (Ziegler et al. 2013). This development could potentially have enormous implications for the transmission dynamics of liver flukes and other parasites because of impacts on hydrology and climate resiliency. Additionally, the strengthening of the Association of Southeast Asian Nations (ASEAN) with the formation of the ASEAN Economic Community (AEC) has instituted free trade agreements that will increase mobility and trade of foodstuffs including potentially infective fish. As a key hub of ASEAN, Khon Kaen has close access to both Lao PDR and Cambodia, a situation leading to speculation that O. viverrini may infect or re-infect new ecosystems as a result of increased transit movements and trade across borders. It is also possible that the parasite may reemerge in parts of Thailand from hosts originating from Lao PDR and Cambodia, which have less robust control and surveillance programs for infectious diseases than Thailand. One challenge inherent in addressing liver fluke control is the inevitable friction between “Western” approaches to biomedicine and “Eastern,” specifically Thai, approaches to health, the body, and causality. This tension and the Thai paradigm is comprehensively described and documented in the dissertation of Sara Samiphak (2014), who worked in Khon Kaen province on villagers’ attitudes towards the disease and its risks related to their health. In the university setting, the analogous situation had to do with approach towards disease prevention and control. The main research groups in the world on O. viverrini are located at KKU. The lead scientists are pathologists and parasitologists, so the main thrust of their research has been focused on carcinogenesis

10
and the liver fluke’s impact on the body. Beyond the biomedical focus, this agenda has also been driven by global health funding mechanisms such as the US National Institute of Health. In the last several years, public health researchers and ecologists have come to study the system and consider matters of control and prevention (Grundy-Warr et al. 2012, Sripa & Echaubard 2017).
Lawa Lake is an approximately 4000-acre body of water that is highly vegetated and subject to significant hydrologic changes caused by seasonal variation in northeast Thailand. A peak in liver fluke infections is seen with lag following the rainy season in Thailand, as flooding facilitates the spread of fecal contamination and coincides with the rapid increase in snail populations (Sithithaworn et al. 1997). Since several weeks are required for the parasite to mature through its life stages, high infection rates in fish are seen in the late rainy season and summer (July-January). Low infection risks occur in the dry season and summer (March-June). A primary industry on the lake is fishing, which contributes to the environment mediating ongoing liver fluke transmission in the local area (Aunpromma et al. 2012). The hydrology of the Lawa Lake region is exceedingly complex and disturbed, as significant changes have occurred in recent years due to construction of new irrigation canals and ditches, new culverts and spillways that are opened and closed in the flooding season, and fish ponds that have become increasingly popular as a source of food and revenue.
Figure 1.5.1: Lawa Lake, the Chi River, the six village clusters of modeling interest surrounding the lake with 2 km radius buffers, and the E9 gauge (Google Earth Pro)

11
The Lawa Project, initiated in 2008 in the villages around Lawa Lake (Figure 1.5.1), is described in detail in Sripa et al. (2015). The control and treatment program has also been called the Lawa Model; to avoid confusion with mathematical models, I refer to it in this dissertation as the Lawa Project. By 2016, Lawa Project public health control programs had contributed significantly to reducing infection levels in most villages to 10-20% from baseline prevalence values of up to 74%, contingent upon regular screening and treatment of villagers. The program included intensive health education of villagers, technical training of health staff and volunteers, school-based curriculum, and disease surveillance and treatment, a multicomponent approach to preventing and controlling the spread of O. viverrini. It is currently unknown what the contribution of each of these components was to prevalence reduction, or how the results compared to a single intervention or a standard mass drug administration campaign. Insofar as there is increasing interest in the benefits or lack thereof in multi-pronged public health interventions, particularly those that target the same exposure pathways (Luby et al. 2018) an objective of the studies reported here is to better understand the potential and roles of these various elements of a disease control program in this setting.

12
Chapter 2: Developing a nuanced understanding of the snail and fish hosts in the liver fluke transmission cycle 2.1 Introduction This chapter will summarize theoretical and experimental studies I have conducted or participated in that elucidate transmission dynamics and disease ecology of the intermediate hosts of the O. viverrini transmission cycle, Bithynia snails and Cyprinidae fish in and around the Lawa ecosystem. These include research on the impact of temperature on viable O. viverrini eggs and successful snail infection, a summary of current local knowledge on O. viverrini cercariae, the linkage process between snails and fish, and a diet-based risk assessment of how many worms a Thai diet that includes koi pla and pla som introduces into the body under ideal circumstances. In addition, experimental results are presented of an aquaculture pond experiment to test the effects of snail control on Bithynia density and explore the exposure-response relationship in a common Thai aquaculture species to cercarial exposure at different levels. These results advance current understanding and knowledge of the environmental stages of the O. viverrini transmission cycle and can be used to inform model parameterization en route to determining environmental control strategies targeting the intermediate hosts. 2.2 Bithynia snail ecology and experimental results Recent experimental results on aspects of Bithynia snail ecology are presented in full in Echaubard et al. (2017) and are summarized here. Dr. Echaubard and I conducted lab experiments to assess the effects of temperature (treatment groups at 25°C, 30°C, 35°C, and 40°C) on miracidia (the parasite form that first emerges from the egg) motility and mortality and on the snails’ egg ingestion and infection success. Motility results showed no viable miracidia at 40°C with optimal motility at 30°C. Mortality results showed increased miracidia death at 35°C and 40°C compared with 25°C and 30°C. Snail ingestion and hatching results were inconclusive with respect to temperature other than, following the expected results from a degree-days paradigm of egg hatching and infection, miracidia hatched and infected snails sooner (within three weeks) at higher temperatures (35°C and 40°C) and across a longer time span (up to ten weeks) at lower temperatures (25°C and 30°C). The detailed data and figures for these individual process results are included in Echaubard et al. (2017). Based on this outcome data, I produced the transmission risk index (TRI) curves shown in Figure 2.2.1, which represent the likelihood of successful infection of a snail from an egg (encompassing mortality, motility, hatching and infection success processes together) at a certain temperature and time. Each graph shows infection success over time under different assumptions, which vary in producing results that predict between zero and one-third of viable eggs successfully infecting snails. The general equation that governs these curves is:
𝑇𝑅𝐼;<=><?@AB?< = 𝑃(𝑆𝑢𝑟𝑣𝑖𝑣𝑎𝑙) × 𝑃(𝑀𝑜𝑡𝑖𝑙𝑖𝑡𝑦)× 𝑃(𝐼𝑛𝑔𝑒𝑠𝑡𝑖𝑜𝑛) × 𝑃(𝐻𝑎𝑡𝑐ℎ𝑖𝑛𝑔) (2.1)

13
where 𝑃(𝑃𝑟𝑜𝑐𝑒𝑠𝑠) represents the probability of success for that process at a given temperature. I have assumed independence between the processes because each consecutive step requires success at the prior one. However, in reality, at least survival and motility are clearly related, though they have different temperature-related patterns. Future work should account for these interdependencies.
Figure 2.2.1: Transmission risk index (TRI) curves across time and temperature: (a) Constant ingestion rate with motility; (b) constant ingestion rate without motility; (c) variable ingestion rate with motility; (d) like (a) but with extrapolated temperatures 20°C and 45°C; (e) like (b) with extrapolated temperatures 20°C and 45°C; (f) like (c) but with extrapolated temperatures 20°C and 45°C; (g) combined low (25°C and 30°C) and high (35°C and 40°C) temperatures with motility and constant ingestion rate; (h) combined low (25°C and 30°C) and high (35°C and 40°C) temperatures without motility and constant ingestion rate (Echaubard et al. 2017)

14
A follow-on from this work provided estimates of TRI across seasons and in response to climate change. Figure 2.2.2 graphs the resulting seasonal curves for 2010 and 2060, which show the peaks in September or October being timed with lag from the start of the rainy season and suggests that TRI will drop locally in response to climate change when comparing 2060 with 2010 (the data for each variable and the index are normalized). This climate-related environmental TRI was informed by host infection prevalence, temperature, and rainfall data from around Lawa Lake and by climate change model predictions for impacts on temperature and rainfall (Babel et al. 2011, Brockelman et al. 1985, Kawasaki & Herath 2011, Kim et al. 2016, Sithithaworn et al. 1997, Thailand Meteorological Department). Environmental TRI is predicted to decrease due to climate change in this environment because of predicted warming that decreases likelihood of snail infection success and because of a shift in precipitation patterns that is predicted to decrease snail exposure to O. viverrini eggs. The equation for these curves is: 𝐸𝑛𝑣𝑖𝑟𝑜𝑛𝑚𝑒𝑛𝑡𝑎𝑙𝑇𝑅𝐼QRSAT,V<@? = 𝑅𝑎𝑖𝑛𝑓𝑎𝑙𝑙QRSAT,V<@? × 𝑆𝑛𝑎𝑖𝑙𝐴𝑏𝑢𝑛𝑑𝑎𝑛𝑐𝑒QRSAT ×𝐸𝑔𝑔𝐴𝑣𝑎𝑖𝑙𝑎𝑏𝑖𝑙𝑖𝑡𝑦QRSAT × 𝑇𝑅𝐼;<=><?@AB?< (2.2)
where rainfall amplifies or reduces predicted snail density from the baseline year of 2010 and TRI governs the likelihood of successful snail infection for each egg-to-snail exposure.
Figure 2.2.2: Seasonal variation in environmental TRI for 2010 and with a climate projection for 2060 (Echaubard et al. 2017)

15
2.3 Understanding how O. viverrini cercariae are released from snails and infect fish Eggs released into the environment become available to susceptible host snails because of a lack of or breakdown in waste collection and treatment. Example behaviors that release contaminated feces into the environment are: open defecation, practiced by some fishermen and farmers who are not able to return home or to a latrine in the midst of working in the fields, ponds, and lakes; pumping feces out of septic systems and application via spraying onto agricultural fields or into waterways; and stray or outdoor cats and dogs whose waste is released directly into the environment. The risky human activities occur in spite of Thailand nationally having very high improved sanitation coverage, as measured by WHO and UNICEF’s Joint Monitoring Programme (2017). According to WHO, Thailand had 95% coverage with basic sanitation in 2000 and 2017. In both years of reporting, this consisted of 88% septic tanks (and some latrines) and 7% sewer connections, suggesting little change recently with respect to sanitation infrastructure. The reliance on septic tanks and their need for pumping enables continued risk for O. viverrini egg introduction back into the environment despite a relatively improved sanitation situation across Thailand. Three families of freshwater snails are the first intermediate hosts for O. viverrini and the related C. sinensis: Hydrobiidae, Bithyniidae, and Melaniidae (WHO 2012). Freshwater snails of the genus Bithynia are the intermediate host species susceptible to O. viverrini infection in Thailand, and the main relevant species to northeast Thailand is Bithynia siamensis goniomphalos (Kaewkes 2003). Snails younger than three months are considered to be the most susceptible; they produce offspring starting at six months and are believed to have a life span of about two years (Kaewkes 2003). Infection-related mortality in Bithynia snails occurs, though it has never been properly quantified. In my disease transmission model estimates, I have estimated average lifespan of infectious snails to be one year because it is believed that an infected snail does not shed cercariae for more than one season. Bithynia are aquatic snails that prefer shoreline habitat between depths of 0 and 0.3 m, though they can be found in deeper water. They can bury themselves in mud to avoid desiccation and move between under-water and open-air environments. Cercariae take about 30 days to mature from ingested egg to miracidia to sporocysts to rediae to cercariae that are released into the environment. A major challenge is the very low prevalence observed in snails – usually less than 1%. In Lawa Lake, observed prevalence values in the last decade have been about 0.2%, or 1 in 500 snails infected. This is particularly challenging with respect to the diagnostic protocol used with snails, which involves manually exposing snails to lamps to induce cercarial exit. The snail protocol I used for shedding O. viverrini cercariae is the one practiced by researchers at Khon Kaen University. Snails are collected from accessible spots on the banks of the ponds, lakes, and rivers sampled. Snails are then screened for morphological characteristics, and only the species of interest (Bithynia siamensis goniomphalos) is collected. In the lab, live snails are transferred to cups filled with dechlorinated water. At this point, the snail cups are placed in trays for “shedding” under 25W fluorescent lamps for 1-2 hours. After shedding is completed, the cups are examined for cercariae under a microscope. If cercariae are observed, 50 !L samples are concentrated and plated on microscope slides, and the number of cercariae in each sample is counted. If necessary, neutral red dye is used to increase visibility of the

16
cercariae. These cercariae are released from snails into bodies of water, where they penetrate and encyst into fish, the second intermediate hosts. These susceptible fish almost entirely are part of the family Cyprinidae and include 48 species susceptible to O. viverrini, most commonly in the genera Cyclocheilichthys, Hampala, and Puntius (Petney et al. 2018). The seasonal cycle of Mekong riverine fish species is shown in Figure 2.3.1. While the specific timing around Lawa Lake is offset to be about 1-2 months later, the general trends hold for the wet season, dry season, and transition between the two. Considering other phenomena of interest, the interactions between O. viverrini and other trematode metacercariae in fish is unstudied, and the presence of genetically distinct O. viverrini sensu lato populations in different fish species may be relevant for transmission dynamics and control but is not presently well elucidated (Pitaksakulrat et al. 2017).
2.4 Catching, distributing, and eating fish in Lawa Lake
A major complication for estimating human exposure in a disease transmission model is the way in which O. viverrini infection is acquired: via consumption of fish with infective metacercariae, rather than water or air exposure or direct contact with other infected humans. Diet is difficult to reconstruct and can vary significantly between individuals in close proximity to each other, so common environmental measures of contamination are not easily applied to groups of individuals for this type of exposure. Because infection is attributable to an eating behavior for a pathogen that is 100% inactivated by proper and complete cooking, such as grilling or baking, information about dietary patterns and trends is useful for estimating risk.
Figure 2.3.1: General seasonal life cycle of Mekong riverine fish species (Poulsen et al. 2004)

17
Additionally, cyprinid fish are often used in fermented dishes and condiments such as pla raa, a fish paste that is commonly consumed daily. Pla raa can be fermented on the orders of days, weeks, months, and even years. Dishes fermented on a shorter time scale, such as pla som, are less commonly consumed but are at higher risk of containing viable O. viverrini metacercariae. Differences in fermentation time distribution documented in Onsurathum et al. (2016a) for pla raa and pla som are shown in Figure 2.4.1. Lab experiments attempting ideal fermentation produced the inactivation response curve for metacercariae and worms shown in Figure 2.4.2 (Onsurathum et al. 2016b). Four days of lab fermentation reduced worm yield to about 1%; by day 5 no worms were recovered from the infected hamsters. Given these experiments and other anecdotal evidence, pla raa is believed not to be a risk for causing O. viverrini infection. Given the incomplete activation in preparation of pla som, that dish is still considered a hazard for transmitting O. viverrini metacercariae to humans. Koi pla, which is the most raw of the three types of dishes, is intuitively the highest risk, though it is eaten the least frequently (Grundy-Warr et al. 2012). Numerous surveys have attempted to document how often villagers in northeast Thailand consume pla raa (ปลารา้), pla som (ปลาสม้), and koi pla (ก้อยปลา). There are of course other dishes that include raw or fermented fish, such as pla faak (ปลาฟัก), but around Lawa Lake and in northeast Thailand the literature recognizes these three to be the most commonly consumed. In the 1980s, between 70% and 90% of individuals in different age strata were eating koi pla, with older generations more likely to be eating it (Upatham et al. 1984). These days, prevalence of raw fish consumption is much lower. Dietary habits have undoubtedly changed to some degree due to health education and public health treatment and control programs. The most recent surveys suggest that health literacy around the O. viverrini – opisthorchiasis – CCA linkage is increasing (B. Sripa, unpublished data). Recent published surveys of raw fish consumption found odds ratios of 1.8 and 2.1 for O. viverrini infection for those who consumed koi pla compared with those who did not, 1.4 and 1.2 for those who consumed pla som, and 1.0 and 1.1 for those who consumed pla raa (Suwannahitatorn et al. 2013, Rangsin et al. 2009). Other studies of villagers who had consumed raw or unsafely prepared fish found odds ratios for O. viverrini infection ranging from 1.02 to 7.15, so the relationship is likely modified by other factors (Saengsawang et al. 2013, Chaiputcha et al. 2015). Early research had already established the link between koi pla consumption and high EPG burden, shown in Figure 2.4.3. A recent survey found 31% of villagers in another part of Khon Kaen province to still be consuming koi pla or pla som, with significantly more men than women consuming raw fish (Ong et al. 2016). The survey results reinforced the notion of pla raa being consumed daily, pla som being consumed monthly, and koi pla being consumed only on special occasions. The main reason for eating raw fish given by 80% of surveyed villagers was simply that it was delicious. Between villages, the percent of villagers who were eating koi pla or pla som ranged from 17-75%, so there was significant inter-village variability. Thinking about foodborne transmission is further complicated by food sharing, which is common in northeast Thailand village culture and well documented in Saenna et al. (2017). Because food is commonly eaten communally with many shared dishes contributed by multiple persons, villagers are not always aware of the source of the fish and how long they have been cooked or fermented in their meals. Food sharing occurs

18
at many if not most meals, so this uncertainty about personal dietary risk (assuming knowledge of the link between cyprinid fish and opisthorchiasis) is compounded. Phimpraphai et al. (2018) describes the use of social network analysis to understand the relationship between food sharing and liver fluke transmission, which has produced mixed results about whether high degrees of connectedness are linked with increased
Figure 2.4.3: Relating koi pla consumption with OV EPG (Upatham et al. 1984)
0
2
4
6
8
10
12
14
16
< 1 week 1 week 2 weeks > 3 weeks > 2months
Coun
t
Fermentation Time Distribution
pla raa pla som
0%
20%
40%
60%
80%
100%
120%
Uncooked…
Day 1
Day 2
Day 3
Day 4
Day 5
Day 6
Day 7
Pla Som Lab Fermentation
% Degeneration of OVMC % Worm recovery
Figure 2.4.2: Parasite inactivation in pla som fermentation (Onsurathum et al. 2016b)
Figure 2.4.1: Fermentation times for pla raa and pla som (Onsurathum et al. 2016a)
0%
10%
20%
30%
40%
50%
60%
70%
80%
0-4 5-9 10-14 15-19 20-29 30-39 40-49 50-59 >= 60 All ages
Koi pla consumption and High OV EPG burden ( > 10000)
No koi pla Koi pla All

19
or decreased liver fluke infection. If infected fish dishes are shared, metacercariae are likely to infect more villagers but at lower doses because a smaller mass of fish is consumed per person. Over time, this reduction in per-event metacercarial dose would matter less as individuals start to reach their worm carrying capacity due to negative density-dependent processes (crowding and competition), but if transmission is mostly driven by so-called “super-spreaders,” then food sharing makes it more likely that infected fish are consumed by these susceptible people, who generate most of the eggs released into the environment, compared with a scenario in which individuals do not share food (Keiser and Utzinger 2009). 2.5 Diet-based risk assessment for northeast Thai diet and O. viverrini infection
An elementary diet-based risk assessment can provide a picture of the risk produced by representative Thai diets. Calculating this requires several fish-related assumptions. One is the proportion of viable metacercariae (MC) that become worms in the liver. Based on Sripa and Kaewkes (2000), about 50% of viable metacercariae that enter the body mature into worms given the recovery rates seen in their experiments. According to the U.S. EPA Exposure Factors Handbook (2011), the mean finfish intake for fish-consuming adults between ages 21 and 50 is 0.65 g/kg-day and 95th percentile intake is 2.1 g/kg-day (the values are similar for both teenagers and adults older than 50). The mean body weight for adults is 80 kg. Use of mean fish intake for American adults probably underestimates fish consumption by Thai adults due to the greater prominence of fish in Thai diet than in the U.S. diet, but the mean body weight of Americans is greater than of Thais; therefore, these two factors somewhat offset each other in the calculation of per-person fish consumption. Because of food sharing practices common in Thai culture, I consider the smaller consumption numbers reasonable given that many smaller dishes are consumed per meal rather than only one. Using the mean fish intake, I calculate a daily intake of 52 g/day and the 95th percentile intake at 168 g/day.
There is an inverse relationship for at-risk dishes between the frequency of
consumption and likelihood of harboring viable metacercariae, with koi pla being the highest risk for containing infectious metacercariae and least frequently consumed and pla raa being the most commonly eaten but with the lowest risk of containing viable parasites. Figure 2.5.1 illustrates this pattern. Based on food behavior surveys, I will assume that koi pla is consumed on a monthly basis (every 30 days), pla som is consumed on a weekly basis, and pla raa is consumed on a daily basis. The conversion factor is representative of the fraction of metacercariae that progress to viable worms.
Another important assumption to consider is what fraction of ingested fish make
up the at-risk dishes koi pla, pla som, and pla raa. For koi pla, since it is raw, I will assume that all koi pla consumed has viable metacercariae and 50% worm recovery (explained above). Pla som, based on Onsurathum et al. (2016b), is expected to have 11% worm recovery after 3 days and 1% worm recovery after 4 days (Figure 2.4.2). Although surveys suggest that most pla som is fermented for a week or so (Figure 2.4.1), field experience suggests that the fermentation is incomplete and does not perfectly inactivate OV metacercariae. Therefore, I will consider both of these worm recovery rates. For pla raa, which will be assumed to be consumed daily, I will use 8 g/day as the intake rate, as pla raa acts as a condiment and is eaten with many dishes. Because pla ra

20
is made with salt, rice, and other ingredients, actual fish consumption via pla raa will be estimated at 4 g/day. Given that pla raa is well fermented usually on the order of months, I estimate that 0.01%-0.05% of pla raa samples contain viable metacercariae.
Other important factors to include are the percent of susceptible fish that are actually infected and their metacercarial loads. Based on the most complete fish survey, published in Sithithaworn et al. 1997, a metacercarial intensity of 127 per kg is used for the high-risk estimate (Table 2.5.1), and intensities of 100 and 50 per kg are input for the average and low-risk diet scenarios (Tables 2.5.2 and 2.5.3). In the high-risk scenario, 70% prevalence of OV in fish is used, while 12% prevalence is estimated for the average and low-risk diets (Sithithaworn et al. 2012).
Given that Upatham et al. 1984 suggests that few children under 5 are infected, I
assume age of susceptibility to infection begins at 5. As an average age of cancer diagnosis for CCA is around 55 and it is broadly estimated that cancer development takes about a decade, I will focus on infection occurring during the 40 years of age between 5 and 45 (Kamsa-ard et al. 2011). To identify a high-risk diet and based on demarcations of worm burdens in the epidemiological study discussed in Sithithaworn et al. (1991), I establish the high-risk cut point at 200 worms, which corresponds to an EPG count around 7000 and a rate of about 35 EPG per worm. Assuming diet remains more or less constant, I am therefore interested in estimating a diet that causes individuals to acquire approximately 5 worms per year. For now, density-dependent effects are ignored due to the lack of data and understanding of OV worm colonization. If these effects were known and considered, a likelihood function governing successful
Figure 2.5.1: Tradeoff between risk of infection related to presence of viable metacercariae and frequency of fish dish consumption
0
0.2
0.4
0.6
0.8
1
koi pla pla som pla raa
RELA
TIV
E RI
SK/F
REQ
UEN
CY
Comparing At-Risk Dishes
Risk Frequency

21
worm colonization based on existing worm population number would be included. Most likely, this function would be logistic in nature, reflecting an individual’s worm carrying capacity.
Using these assumptions described and parameters estimated, I calculate what an
“average” diet exposes individuals to in terms of OV worm burden in Table 2.5.1. Table 2.5.2 shows a conservative estimate based on highest-risk exposure documented. The equation to derive the worm dose is:
𝑊𝑜𝑟𝑚𝐷𝑜𝑠𝑒/𝑦𝑒𝑎𝑟 = ∑ 𝐴𝑛𝑛𝑢𝑎𝑙𝐶𝑜𝑛𝑠𝑢𝑚𝑝𝑡𝑖𝑜𝑛 abcdefT
g<@?h ×defTiefT
𝐹𝑖𝑠ℎ𝐼𝑛𝑓𝑒𝑐𝑡𝑖𝑜𝑛𝑃𝑟𝑒𝑣𝑎𝑙𝑒𝑛𝑐𝑒(%) × 𝑀𝐶𝐿𝑜𝑎𝑑(=<A@m<?m@?e@<bcdefT
) ×
𝐶𝑜𝑛𝑣𝑒𝑟𝑠𝑖𝑜𝑛𝐹𝑎𝑐𝑡𝑜𝑟defTiefT(nR?=
=<A@m<?m@?e@<)
(2.3)
Based on Table 2.5.1, an average diet as characterized here will contribute 78% (3.9 out of 5 worms per year) of the OV worms over a 40-year period toward the high-risk cut point designated as 200 worms that will predispose an individual for CCA. With this average diet, even infrequent MDA with praziquantel will keep an individual’s worm count well below a high burden. However, based on Table 2, with a high-risk diet an individual gets 89% of the worms (178 out of 200) needed to reach the high-risk cut point for CCA every year. For individuals with this type of diet, annual MDA will not be sufficient to keep their worm counts low. In the average-diet scenario, most of the worms are contributed by koi pla because of the assumption based on data that fermentation is inactivating most of the cercariae in pla som and pla ra. However, in the high-risk scenario, koi pla and pla som are contributing relatively equally to the worm count based on a less conservative estimate of how many metacercariae survive the fermentation process (11% vs. 1% in the average diet). More field studies are needed to truly determine the relative contamination levels of koi pla, pla som, and pla ra. These two different estimates suggest different priorities about which dishes should be focused on, although both agree that pla ra contributes relatively little to metacercarial and worm burden. However, the role of pla som in OV infection should be better elucidated to determine whether interventions that improve fermentation processing should be included in health outreach to villagers.
Dish
Daily Consumption
(g)
# of Days consumed per
year
Annual consumption
(g) Exposure
factor Contaminated
fish (g) MC load (per kg)
MC from dish Worms
Koi pla 52 12 624 0.12 75 100 7 3.7
Pla som 52 26 1352 0.12 162 100 16 0.2
Pla raa 4 180 720 0.12 86 50 4 0.0
Total 3.9
Table 2.5.1: Average diet scenario

22
Table 2.5.3 shows a low-risk diet scenario which keeps worm burden acquired over 40 years below 25% of the high-risk cut point (48 out of 200). The only difference is a 75% reduction in koi pla consumption events, from 12 times a year to 3. This simulates a cooking intervention that has people cook koi pla before eating it with some allowance for improper cooking that does not kill all of the metacercariae every time. This low- level acquisition of OV worms potentially has the benefits previously detailed for liver-related conditions that result from long-term parasite-host co-evolution without the potential added risk of frequent praziquantel MDA as a CCA risk factor (Kamsa-ard et al. 2013).
This risk assessment presents a first attempt at evaluating human health risk attributable to consumption of raw and fermented fish containing foodborne parasites, specifically the Southeast Asian liver fluke Opisthorchis viverrini. Limitations and uncertainty in this analysis include limited epidemiological data examining associations between worm burden and severity of human infection, limited understanding of the relationship between the carcinogenic mechanisms and body burden of worms, limited information about how worm burden accumulates over time and the impact of mass treatment with drugs, and difficulty monitoring metacercarial loads in fish in the environment. These complex interactions threaten our ability to evaluate cancer risk (CCA) attributable to these specific zoonotic exposures. Nonetheless, this risk assessment seeks to start a conversation about risk of liver cancer in this population as it relates to diet in order to inform public health interventions related to O. viverrini.
Dish
Daily Consumption
(g)
# of Days consumed per
year
Annual consumption
(g) Exposure
factor Contaminated
fish (g) MC load (per kg)
MC from dish Worms
Koi pla 168 12 2016 0.70 1411 127 179 90
Pla som 168 52 8736 0.70 6115 127 777 85
Pla raa 4 365 1460 0.70 1022 127 130 0
Total 175
Dish
Daily Consumption
(g)
# of Days consumed per
year
Annual consumption
(g) Exposure
factor Contaminated
fish (g) MC load (per kg)
MC from dish Worms
Koi pla 52 3 156 0.12 19 100 2 0.9
Pla som 52 26 1352 0.12 162 100 16 0.2
Pla raa 4 180 720 0.12 86 50 4 0.0
Total 1.1
Table 2.5.3: Low-risk diet scenario
Table 2.5.2: High-risk diet scenario

23
As this analysis has demonstrated, the traditional fish dishes koi pla (raw), pla som (briefly fermented), and pla ra (fermented for a long time), pose different risks based on their differential frequency of consumption and probability of harboring viable OV metacercariae (Figure 2.5.1). Based on this risk assessment, koi pla and pla som equally contribute to worm burden in a high-risk diet, and koi pla predominately drives worm burden in average and low-risk diets (Figure 2.5.2). High-risk diets have the potential to reach high-risk worm counts in about a year, whereas the average diet will accumulate a high-risk worm count over the course of 40 years. The low-risk diet proposed concentrates its changes on reducing consumption of truly raw koi pla by either reducing the number of consumption events or by cooking the fish to inactivate most metacercariae. Understanding that assessing cancer risk as it relates to an exposure described above is fraught with complexity and uncertainty, further research is needed to better inform a more accurate risk assessment. There is already a literature on the role of environmental drivers and geography in differential risk of exposure to O. viverrini (Wang et al. 2013). Local and regional governments in northeast Thailand have already undertaken extensive public health campaigns resulting in reduced prevalence (but with little information on the effects on burden) and without success in bringing prevalence much below 10%. Transmission dynamics still need to be better elucidated; this will help us understand the fish side of the fish-to-human transmission process. As mentioned, there is increasing evidence that low level infection burden has some beneficial effects. Currently, treatment policy is to give praziquantel to all people with detectable O. viverrini infections via massive campaigns that do not always successfully educate people about risky behaviors and how to limit their own exposure. While there is a movement within Thailand to do this health education in a more nuanced way, traditional health messaging still dominates over the transdisciplinary use of ecology and sociology to design these prevention programs. Beyond all of these data gaps, there is also a significant need to properly document and evaluate the impact of interventions such as MDA, health education in school-age children, and cooking-based programs (training villagers how to cook related fish dishes that are still delicious to local tastes). This risk assessment suggests a focus on koi pla and fully raw dishes as being highest risk for the average person but also emphasizes pla som’s role in individuals at greatest risk, advocating for further study of and education around proper fermentation procedures. Climate change and development are other high-level drivers that will influence O. viverrini transmission and intersect with the role of diet in the parasite’s life cycle and should be considered in future analyses.

24
2.6 Aquaculture and fish pond experimental results This set of experiments tested: 1) whether an exposure-dose relationship existed between different densities of infectious Bithynia siamensis goniomphalos snails (and their naturally shed O. viverrini cercariae) and juvenile fish infection in a fish pond environment; and 2) whether snail control techniques commonly used in the field of aquaculture would effectively reduce Bithynia densities in a representative Lawa Lake fish pond. The hypotheses were that increasing numbers of infectious Bithynia snails should result in both greater infection prevalence and greater metacercarial burden in aquaculture fish, and that excess liming and molluscivorous fish should both demonstrably decrease Bithynia (and other species of snail) densities in fish ponds. These experiments were conducted between 2014 and 2015. Both sets of experiments followed a similar preparation process. I rented a medium-sized aquaculture pond (240 sq m) from a local fish farmer and had concrete walls built to divide the pond into four equal quadrants to control for unmeasured variation in environmental factors. When this construction was complete, collaborating fish farmers and I:
1) Drained the pond 2) Removed all snails and vegetation from the pond floor 3) Evened out the slope grading of the pond floor as much as possible
Figure 2.5.2: Worm burden contributions by diet and dish type
0
0.2
0.4
0.6
0.8
1
Koi pla Pla som Pla raa
Comparing At-Risk Dishes: Worm Burden Contribution
High-risk diet Average diet Low-risk diet

25
4) Implemented interventions (stocking snails, liming, etc.) 5) Filled ponds with water 6) Took pre-experiment water quality measurements 7) Stocked fish (including molluscivorous fish) 8) Started and conducted experiment for three months
a. Phase 1: November 2014 – January 2015 b. Phase 2: March 2015 – May 2015
9) Monitored snail and fish health and infection and water quality bi-weekly until end of experiment
10) Caught remaining fish for testing in the lab as the endpoint In Phase 1, I used the following interventions for Bithynia control:
I) Control (no intervention) II) Excess liming (twice what was applied to other quadrants) III) Snail-eating carp (ปลาจีน) stocked at appropriate density (see: Hung et al. 2013) IV) Inlet water filtering with 50 µm mesh filter (to prevent introduction of
Bithynia snails and cercariae into pond. Unfortunately, eggs were too small to be removed by the filter, as the water was too turbid and susceptible to clogging and fouling to use a smaller pore size mesh.)
Snail density results from Phase 1 are shown in Figure 2.6.1. All methods were reasonably successful in suppressing snail population growth after one month in December, but after three months in February the pond quadrant with snail-eating carp was the only treatment with sustained control of snail population growth. Excess liming and inlet water filtering treatments had lower snail densities but not significantly so. Water quality results from biweekly assessment with PetrifilmÔ plates (3MÔ) are shown in Figures 2.6.2 and 2.6.3. No discernible trend is apparent other than the inability of inlet water filtering to prevent contamination of pond water with coliform bacteria, possibly originating from roaming cats, dogs, and other animals, or from overland flooding or infiltration from neighboring ponds. Figure 2.6.4 shows growth curve results from each of the four treatment groups and each of the two species stocked in Phase 1. Previous experimental work I conducted had determined that sea bass (ปลากะพง), an increasingly popular aquaculture species in northeast Thailand, were not likely to be susceptible to O. viverrini infection, but local researchers were interested in whether Nile tilapia (ปลานิล) were susceptible to infection. Silver barb (ปลาตะเพียน) are a local species of cyprinid cultivated in aquaculture and known to be susceptible to O. viverrini infection. In Phase 1 without any experimentally introduced cercariae, no fish were found to be infected with O. viverrini or any other type of metacercariae. The different ponds and species have diverging growth curves which may be due to treatment effects or to chance. Notably, all of the silver barbs in the snail-eating carp treatment pond were dead by the end of the experiment. It may be that the introduced control species also eats smaller fish and may have eaten most of the silver barb fish.

26
0
50
100
150
200
250
300
November December January February
# of
Bith
ynia
sna
ils c
olle
cted
2014-2015
Change in Snails Concentrations
I
II
III
IV
Figure 2.6.1: Changes in snail density in 1 sq m area of quadrant (I: control; II: excess liming; III: snail-eating carp; IV: inlet water filtering)
0
1000
2000
3000
4000
5000
6000
7000
8000
17-N
ov
24-N
ov
1-D
ec
8-D
ec
15-D
ec
22-D
ec
29-D
ec
5-Ja
n
12-J
an
19-J
an
26-J
an
2-Fe
b
9-Fe
b
16-F
eb
Col
ifor
om/1
00m
L
2014-2015
Coliform Concentrations
I
II
III
IV
Figure 2.6.2: Changes in coliform concentration in the water of each quadrant

27
0
100
200
300
400
500
600
700
800
17-N
ov
24-N
ov
1-D
ec
8-D
ec
15-D
ec
22-D
ec
29-D
ec
5-Ja
n
12-J
an
19-J
an
26-J
an
2-Fe
b
9-Fe
b
16-F
eb
E. c
oli/1
00m
L
2014-2015
E. coli Concentrations
I
II
III
IV
Figure 2.6.3: Changes in E. coli concentration in the water of each quadrant
0
20
40
60
80
100
120
November December January February
Ave
rage
fish
mas
s (g
)
Average fish growth curves over course of experiment #1
Tilapia I Tilapia II Tilapia III Tilapia IV
Silver barb I Silver barb II Silver barb III Silver barb IV
Figure 2.6.4: Change in average fish mass by month per species per pond

28
The pond was emptied and treated with lime after Phase 1 and prepared for Phase 2, which commenced from March 2015 through June 2015. Since the likelihood of tilapia being infected was determined to be zero or extremely low, I stocked only silver barbs. Each quadrant was stocked with 250 fish fry. Believing that we established a baseline for the ponds being naturally free of the parasite, we introduced OV-infected snails into three quadrants of the pond in different quantities, with the last quadrant being maintained as a control. The goal for Phase 2 was to understand how easily fish become infected when OV-infected snails enter aquaculture systems and what that tells us about transmission dynamics (the parameter governing snail-to-fish transmission). We introduced 0, 25, 75, and 125 lab-infected snails into the four quadrants. These population numbers were chosen to mirror snail infection prevalence in the environment. Using the snail densities observed in Phase 1 and published and observed data on snail infection, 25 snails roughly simulated 0.2% OV prevalence commonly seen in Lawa Lake and elsewhere. The quadrant with 125 snails simulated the high end of OV prevalence observed in the environment, or around 1% infection prevalence. The snails were introduced in cages in small groups of about 15 per cage, so mortality could be periodically checked and the snails could be removed at the end of the experiment. No experiment of this nature is mentioned in the research literature, but it addresses the snail-to-fish transmission process, about which little is known. Because all of the fish were removed from the pond and none were given or sold for animal consumption, followed by treatment of the pond to remove snails, I was confident that the experiment contributed zero or a very negligible amount to environmental contamination with the parasite. Snails were infected with O. viverrini in the lab prior to introduction into the ponds. OV eggs were harvested and processed from the feces of OV-infected hamsters. These eggs were fed to the snails in a manner consistent with optimal infection and survival using methods described in Echaubard et al. (2017). A subset of snails were maintained in the lab to compare and estimate snail mortality and shedding rates, giving us estimates of cercarial exposure in the ponds. A week before the snails were introduced into the ponds, the fish fry were released, giving them time to adapt to their environment and establish normal behavior. Water samples were collected from the four quadrants, two adjacent ponds, and the adjacent canal and analyzed for E. coli and other water quality parameters every two weeks. Bithynia snails were collected and shed from the four quadrants, two adjacent ponds, and the adjacent canal every two weeks and examined for cercariae. The OV-infected snails were checked every two weeks for mortality. Fish were collected from the four quadrants at 3 weeks, 6 weeks, and 9 weeks and digested and examined for metacercariae. A sample of fish fry were also digested to confirm their lack of parasites at the start of the experiment. Phase 2 concluded after 9 weeks, a time when the fish have reached a level of maturity where they are unlikely to be further susceptible to OV infection. In addition, four cats that lived in proximity to the fish ponds were tested for O. viverrini infection. All four were positive for OV with EPG values of 600, 1454, 3318, and

29
4539 using the formalin concentration technique (FECT) and averaging across two samples. While this was a small sample size, the result agrees with high reservoir host prevalence in the area and supports the belief that cats meaningfully contribute to maintaining the transmission cycle. In total, 129, 278, 233, and 207 fish were caught and digested from Ponds I, II, III, and IV, respectively. Together, this adds up to 847 fish, or about 85% of the fish originally stocked in the ponds. Based on the numbers though, it seems that some fish were able to move between ponds, notably out of Pond I and into Pond II. This may have been possible due to incomplete containment from the walls or because of holes dug by eels (ปลาไหล) underneath the pond floor (eels were an ongoing problem causing drainage issues and requiring certain ponds to be filled up with more water to compensate for the loss). Figure 2.6.5 shows the growth curve for silver barb fish during the Phase 2 experiment. There was no significant difference between the four pond groups, and results aligned with Phase 1 experiment results for silver barbs not in the snail-eating carp treatment pond. Figures 2.6.6 and 2.6.7 show the water quality trends during the course of the Phase 2 experiment. Results are similar between ponds and with Phase 1 water quality results with the exception of some contamination event that may have preceded the sampling on June 3, 2015, which produced the highest coliform and E. coli measurements in quadrants I and IV. Table 2.6.1 shows snail counts during Phase 2. While snail mortality occurred, population numbers went up between time points, presumably due to snail reproduction. It was unlikely that snails born during the experiment became infected because of the difficulty of O. viverrini eggs getting into the cages. At the end of Phase 2 and the intermediate time points, I processed all of the fish to test for metacercarial infection. Surprisingly, at all time points and in all ponds none of the fish had any metacercarial infection. Therefore, it was not possible to define a relationship between cercarial exposure and fish infection. Upon reflection, this result may have happened for a number of reasons. The challenge of experimentally infecting cyprinid fish with O. viverrini is documented (Manpratum et al. 2017). Although the fish fry were small when stocked (average mass of 1.4 g each and length of 5 cm), they may have already developed enough scales to be resistant to infection. The only documented successful laboratory infection of fish with O. viverrini used the same species but when they were smaller (2-3 cm) (Maleewong et al. 2003). Additionally, the cages meant to contain the snails to prevent their spread into the environment may also have restricted cercarial movement from extending much beyond the cages. Although the holes in the cage were sized to allow cercariae but not snails out, the hindrance may still have reduced transmission efficiency.

30
The failure of the Phase 2 experiment highlights the limited spatiotemporal window in which snails transmit infection to fish. Although we produced a negative result, the aquaculture growth curves and demonstration of snail control method effectiveness provides useful data for fish farms concerned about food safety related to fish-borne parasites, particularly those applying the hazard analysis critical control point (HACCP) concept recommended by FAO and WHO (Khamboonruang et al. 1997).
Pond April 8 April 22 May 6 May 19 June 5 June 16
I 125 102 108 108 73 69
II 75 68 89 61 61 54
III 25 Not measured
Not measured 29 32 23
IV Control
0
10
20
30
40
50
60
70
80
1-Apr 8-Apr 15-Apr 22-Apr 29-Apr 6-May 13-May 20-May 27-May 3-Jun 10-Jun
Average fish growth curves over course of experiment #2
I II III IV
Figure 2.6.5: Silver barb growth over course of Phase 2 experiment
Table 2.6.1: Snail survival over course of Phase 2 experiment (# of live Bithynia snails)

31
Figure 2.6.7: E. coli concentration results from Phase 2 experiment
0
1000
2000
3000
4000
5000
6000
7000
8-Apr 15-Apr 22-Apr 29-Apr 6-May 13-May20-May27-May 3-Jun 10-Jun
E. c
oli/1
00 m
L
2015
E. coli Concentrations
I
II
III
IV
0
2000
4000
6000
8000
10000
12000
8-Apr 15-Apr 22-Apr 29-Apr 6-May 13-May20-May27-May 3-Jun 10-Jun
Col
ifor
m/1
00 m
L
2015
Coliform Concentrations
I
II
III
IV
Figure 2.6.6: Coliform concentration results from Phase 2 experiment

32
2.7 Fish demography submodel Extensive laboratory work to induce fish infection with O. viverrini cercariae, much of which remains unpublished, has highlighted the difficulty of artificially triggering this process and the resistance of mature fish to cercarial penetration. Carp, cyprinus carpio, when newly hatched from larvae are 5-6 mm in length (McCrimmon & Boon Swee 1967). Scales begin to form on the body of juvenile carp when they are 16-18 mm in total length and finish forming when they are 22-26 mm in length. In this window of development between hatching and full scale development, juvenile cyprinids are most susceptible to cercarial penetration (Gozlan, Copp, & Tourenq 1999). The length of the time period during which scales form is characterized by a high level of individual variability but occurs on the order of days and weeks. In fish ecology, these are referred to as age 0+ fish, indicating that there are under one year old and given the difficulty of determining a more exact age (NOAA Fisheries Glossary). The loss of scales is often used as a means of aging fish but does not apply at that small size when the scales are not yet fully developed. Fish ecology literature from Thailand is sparse, so it is challenging to estimate a lifespan for fish in the Lawa Lake system. Informal discussions with fishermen and researchers led me to select four years as the maximum lifespan in a fish demography submodel. Because I am working with a compartmental model, with fish demography equations (2.4) – (2.8) given below, each year in July each age stratum (0-1, 1-2, 2-3, 3-4) transitions together to the next highest age stratum. The remaining fish aged 3-4 die off, and fish spawn for the months of July and August, when the rainy season is ramping up. In this model, 200 fish are born per village per day for 60 days, resulting in 12000 fish born per cohort in each cluster. For four months between July and October, the newly born fish fry are susceptible to being infected with O. viverrini cercariae at a certain constant transmission rate (0.01/day in Figure 2.7.1). After four months, each fish’s infection status is locked in for the rest of its lifetime. Fish then die with a mortality rate assuming an average lifespan of three years and are caught at an annual probability of 28% that was attained using Metropolis-Hastings MCMC to reproduce infection prevalence in the six villages consistent with the baseline infection surveys that found values between 9-50%. The function 𝜆(𝑡) governs birth events, 𝜙(𝑡) is the seasonal presence of cercariae from shedding snails, 𝛽rs is the force of infection, 𝜇s is fish mortality, and 𝛾 is fish getting caught.
𝑑𝑆s%
𝑑𝑡 = 𝜆(𝑡) − (𝛽rs𝜙(𝑡) + 𝜇s)𝑆s% (2.4)
𝑑𝐼s%
𝑑𝑡 = 𝛽rs𝜙(𝑡)𝑆s% − 𝜇s𝐼s (2.5)
𝑑𝑆s$xy
𝑑𝑡 = −(𝛾 + 𝜇s)𝑆s$xy (2.6)
𝑑𝐼s$xy
𝑑𝑡 = −(𝛾 + 𝜇s)𝐼s$xy (2.7)

33
Figure 2.7.1 shows the equilibration of fish infection in this fish demography model. With these parameters, the equilibrium fish infection prevalence is 67%, which is close to the highest fish prevalence recorded in the area of 70% in NNK. The equilibrium prevalence is impacted by the choice of the transmission rate parameter. Figure 2.7.2 gives the relationship between this parameter and equilibrium fish prevalence in this fish demography model. The 0+ cohort tends toward 10000-16000 fish, the 1+ cohort to 3000-6000, the 2+ cohort to 2000-4000, and the 3+ cohort to 1000-3000 with the given parameters. Given the uncertainty around per-patch fish populations, this tally of 16000-29000 seems reasonable, as I generally use 20000 or 30000 fish as the initial condition for the model without fish demography. The total population number is sensitive to the catch and mortality rates, as these are the only processes through which die-off is accounted for by the differential equations. The age structure cannot be better validated or calibrated because of the lack of local data, much less any data worldwide about cyprinid population age structure (Boy and Crivelli [1988] document a similar trend, albeit in Greece). Given the number of small fish that I and other researchers have observed and documented being caught and consumed around Lawa Lake, we can assume that this population structure is relatively correct.
Figure 2.7.1: Fish infection prevalence by age group over 50 years in fish demography model

34
2.8 Conclusion In this chapter, I presented numerous pieces of research relevant to the intermediate host snails and fish that elucidate host ecology and environmental transmission and are useful for determining parameter values and transmission dynamics in mathematical models. I presented results about snail infection likelihood over time and temperatures given impacts on miracidia motility and mortality, egg ingestion, and infection success. I discussed current knowledge about the linkage between Bithynia siamensis goniomphalos snails, the O. viverrini cercariae they shed, and the cyprinid fish where the cercariae become metacercariae. I used knowledge about diet behavior in northeast Thailand to conduct a risk assessment for O. viverrini worm acqusition. I presented a set of aquaculture fish pond experiments that provided information about snail control interventions and fish and snail population dynamics. These results informs the mathematical models developed and implemented in Chapters 4 and 5 in this dissertation and advance knowledge about the understudied roles of the intermediate hosts in the liver fluke transmission cycle.
Figure 2.7.2: Relationship between transmission parameter and equilibrium fish prevalence

35
Chapter 3: Single-village model for transmission around Lawa Lake 3.1 Introduction Mathematical modeling of infectious disease transmission is an important tool for understanding the environmental context of diseases and studying the impacts of changes to transmission dynamics. These approaches can predict human and animal health effects related to climate change and development as well as inform design and implementation of effective treatment and control programs. Mathematical models should balance sufficient model parsimony with the biological and ecological complexity of reality, leveraging available data to better fit and predict past, present, and future trends in disease transmission, as measured by infection prevalence, incidence, or intensity, and how they relate to other types of measurements mechanistically and statistically. Use of mathematical modeling for neglected tropical diseases (NTDs) has been limited but increasing in recent years and appears to show great promise (Basáñez and Anderson 2016). The field has drawn on extensive research and methods developed to study malaria, HIV, and other major diseases (Anderson and May 1991). In this chapter, I propose a deterministic compartmental model for O. viverrini transmission and apply it to longitudinal host infection data for the villages around Lawa Lake in northeast Thailand. The objective of developing this model is to estimate the differential effects of development, control activities, meteorological factors, and hydrologic flows on the recent history of disease prevalence in humans, snails and fish. I incorporate known praziquantel treatment of villagers in the region and consider environmental impacts on transmission by introducing and reflecting on the disease ecology of each stage of transmission. 3.2 Describing the transmission processes Human-to-snail linkage
The human-to-snail transmission process requires that O. viverrini worms within an infected human or reservoir host are actively shedding eggs, which can number in the thousands per day (Petney et al. 2013). Such shedding does not occur at a constant rate and, in cases of extreme worm burden, bile duct obstruction in humans may be so severe that eggs cannot be released into the intestinal tract. Safe sanitation is sufficient to treat human waste and render the eggs unviable; however, not all people have access, and other practices can bypass proper treatment. In the Lawa Lake complex, where the vast majority of villagers have improved sanitation, fecal waste may enter the environment either by open defecation by farmers and fishermen or via septic trucks pumping out waste from sealed latrines and applying it untreated onto agricultural fields for crop fertilization or into open bodies of water. These means of bypassing proper sanitation potentially injects large quantities of O. viverrini and other fecal-related parasite eggs into the environment on a regular basis.

36
After release into the Lawa environment, the egg-containing feces may reach active Bithynia snails, which consume the eggs. Egg viability is estimated to last a month, limiting the success of this process (Echaubard et al. 2017). Hydrologic data allow us to describe potential and active Bithynia snail habitat in proximity to infected humans and reservoir hosts. The location of such habitats changes seasonally in monsoon-influenced climates like that of northeast Thailand. Hydrologic data can also help us understand the temporal and spatial linkages between the release of egg-containing feces into the environment and their contact with snails. As the eggs are not motile, any mobility is due to water flows, such as from rainfall, rice field irrigation, or river and lake currents. Modeling this hydrologic activity will help predict fate and transport of parasite eggs.
Snail-to-fish linkage The snail-to-fish transmission process occurs after the egg has hatched into a miracidium and matured through the sporocyst and rediae stages into cercariae. Research suggests that this process takes on average 30 days before viable cercariae are released (WHO 2012). The snail must survive this pre-patent period without being killed by the parasite or other means (WHO 2012). Snail survival requires an aqueous or amphibious habitat, which may not persist locally, especially in the dry season. When the cercariae are released, they are estimated to have 24–48 hours to find and penetrate a susceptible fish host. However, in the laboratory work that my KKU colleagues and I have conducted, experimentally released cercariae appear to become moribund after just a few hours, suggesting that this window may be even narrower. Because older and more developed fish are fairly resistant to cercarial penetration, the targeted fish are fish fry or very young fingerlings before their scales have fully developed and provide greater resistance to the O. viverrini cercariae. This process requires that the snails dwell in close proximity to fish spawning and that the cercariae are released when the fish are hatched but not yet mature. This results in a small spatiotemporal window, somewhat offset by the large quantity of cercariae (in the thousands) that can be released by each infected snail in a day. Most snail surveys find snail infection prevalence to be 0.2% or below, even when human infection prevalence is greater than 50%. Consequently, fish spawning sites likely only have a few infectious snails in their vicinities. When the cercariae encyst, they become metacercariae, and wild fish have been found to contain up to hundreds of metacercariae (S. Kaewkes and W. Kaewkes, unpublished data). Evolutionarily, this process allowed the bioaccumulation of the parasite in the fish host to bypass the difficulties of contact between snails and susceptible definitive hosts, as in the case of schistosomiasis. Hydrology is important in this linkage because of the potential for flows to increase the range where cercariae might contact susceptible spawning cyprinid fish. This linkage expands the zone from a radius of a few meters to tens or hundreds of meters, depending upon meteorological and landscape factors, resulting in an exponential increase in spatial hotspot area where possible transmission occurs. Fish-to-human/cat/dog linkage This transmission process requires that the fish survive to maturity to be eaten by a definitive host after being caught by a fisherman. Cats and other reservoir hosts may catch and consume some infected fish, but no published study has yet documented or
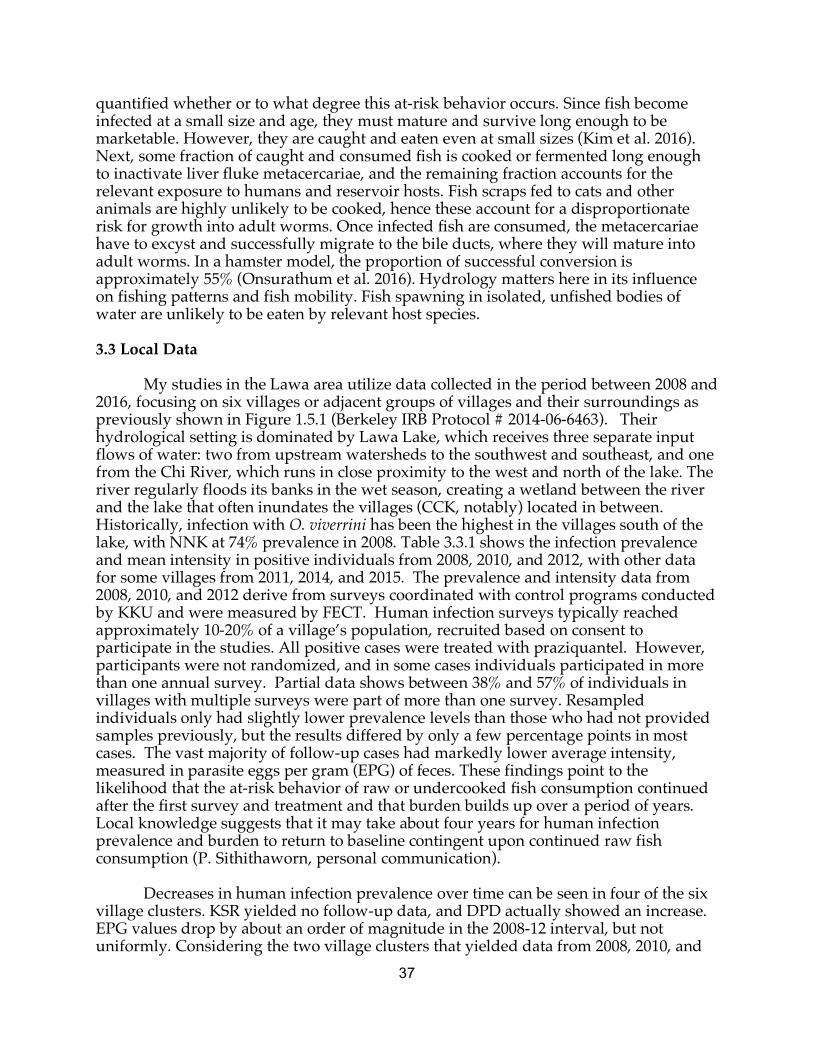
37
quantified whether or to what degree this at-risk behavior occurs. Since fish become infected at a small size and age, they must mature and survive long enough to be marketable. However, they are caught and eaten even at small sizes (Kim et al. 2016). Next, some fraction of caught and consumed fish is cooked or fermented long enough to inactivate liver fluke metacercariae, and the remaining fraction accounts for the relevant exposure to humans and reservoir hosts. Fish scraps fed to cats and other animals are highly unlikely to be cooked, hence these account for a disproportionate risk for growth into adult worms. Once infected fish are consumed, the metacercariae have to excyst and successfully migrate to the bile ducts, where they will mature into adult worms. In a hamster model, the proportion of successful conversion is approximately 55% (Onsurathum et al. 2016). Hydrology matters here in its influence on fishing patterns and fish mobility. Fish spawning in isolated, unfished bodies of water are unlikely to be eaten by relevant host species. 3.3 Local Data My studies in the Lawa area utilize data collected in the period between 2008 and 2016, focusing on six villages or adjacent groups of villages and their surroundings as previously shown in Figure 1.5.1 (Berkeley IRB Protocol # 2014-06-6463). Their hydrological setting is dominated by Lawa Lake, which receives three separate input flows of water: two from upstream watersheds to the southwest and southeast, and one from the Chi River, which runs in close proximity to the west and north of the lake. The river regularly floods its banks in the wet season, creating a wetland between the river and the lake that often inundates the villages (CCK, notably) located in between. Historically, infection with O. viverrini has been the highest in the villages south of the lake, with NNK at 74% prevalence in 2008. Table 3.3.1 shows the infection prevalence and mean intensity in positive individuals from 2008, 2010, and 2012, with other data for some villages from 2011, 2014, and 2015. The prevalence and intensity data from 2008, 2010, and 2012 derive from surveys coordinated with control programs conducted by KKU and were measured by FECT. Human infection surveys typically reached approximately 10-20% of a village’s population, recruited based on consent to participate in the studies. All positive cases were treated with praziquantel. However, participants were not randomized, and in some cases individuals participated in more than one annual survey. Partial data shows between 38% and 57% of individuals in villages with multiple surveys were part of more than one survey. Resampled individuals only had slightly lower prevalence levels than those who had not provided samples previously, but the results differed by only a few percentage points in most cases. The vast majority of follow-up cases had markedly lower average intensity, measured in parasite eggs per gram (EPG) of feces. These findings point to the likelihood that the at-risk behavior of raw or undercooked fish consumption continued after the first survey and treatment and that burden builds up over a period of years. Local knowledge suggests that it may take about four years for human infection prevalence and burden to return to baseline contingent upon continued raw fish consumption (P. Sithithaworn, personal communication).
Decreases in human infection prevalence over time can be seen in four of the six village clusters. KSR yielded no follow-up data, and DPD actually showed an increase. EPG values drop by about an order of magnitude in the 2008-12 interval, but not uniformly. Considering the two village clusters that yielded data from 2008, 2010, and

38
2012 (Lawa and BT), in Lawa EPG drops by a factor of approximately 30. However, in BT average EPG value declined by only a factor of approximately 2.5, with minimal drop between 2010 and 2012. The data for other villages is less complete, but generally suggest decreased intensity in infected individuals, though the trend is far from linear. The most recent data available is from local clinic surveys conducted in 2015 from villages in three of the clusters (Lawa, BT, and DPD); prevalence values ranged from 9 to 15%, though these surveys are based on less sensitive diagnostic techniques (Kato-Katz and Kato thick smear) than FECT, which was used in the 2008, 2010, and 2012 surveys. EPG values were not available, but the general picture is one of continued transmission, but at much reduced levels of both prevalence and intensity in humans from the 2008 baseline levels. Most of this data was excluded from model fitting because it dramatically underestimates infection prevalence and provides no intensity information.
The reductions in human infection are also reflected in recent environmental host data. The most thorough study of the environmental conditions in the Lawa area linked to this infection pattern is that of Kim et al. (2016), who found in 2013-2014 geographically widespread paucity of infected snails and fish. There was continued evidence that the southernmost village clusters in the Lawa system supported higher levels of transmission though, as earlier data demonstrates more clearly. One environmental justification for this pattern that they made was “a nitrogen-salinity gradient where higher levels in the lake's southern region predicted higher Bithynia relative abundance and lower snail and fish species diversity.” Changing agricultural practices and other development have modified the environment to meet water management needs in the area. Figure 3.3.1 shows the hydrologic structures of relevance that existed in 2016. They are all culverts constructed below the main road (red line) that connect the villages on the west side of Lawa Lake. Some of these culverts were constructed between the start of the control program in 2008 and 2016 to facilitate more intensive irrigation and to ease flooding in certain areas. This construction has altered the impacts of flooding on the surrounding environment.
Village Cluster 2008 2010 2011 2012 2014 2015
CCK 54.9% (593) 33.0%* 44.3% (139)
Lawa 67.1% (501) 63.1% (108) 19.0%* (16) 8.7%*
BT 61.9% (346) 37.2% (131) 35.0% (136) 9.0%* 14.2%*
NNK 74.1% (499) 50.0% (61)
KSR 16.4% (101)
DPD 22.1% (112) 36.5% (82) 14.6%*
Table 3.3.1: Infection prevalence (%) and mean intensity in positive individuals (EPG) for six village clusters around Lawa Lake. * indicates less sensitive diagnostic method (Kato-Katz or Kato thick smear).

39
Precipitation has also varied widely from year to year in this time period as demonstrated in Figure 3.3.2. Figure 3.3.3 shows the monthly response to this rainfall pattern over the same period at gauge E9 on the Chi River, which is the closest and most relevant gauge to the Lawa Lake complex. The pattern differs markedly, as flow volume in the Chi River is impacted by rainfall and runoff across a larger catchment basin than just Lawa Lake and may have been affected by dam operations upstream that were different by year. In addition to the complexities of the hydrologic system in this region, O. viverrini exhibits a complex transmission cycle, as previously described. While the structure of the cycle is well understood, that alone is insufficient to understand the importance of certain characteristics of places and populations that contribute to infection and thereby are targets for effective interventions. In this context, mathematical models have been used in studying various aspects of infectious disease transmission, most commonly to assess the effects of mass drug administration strategies (Anderson, Truscott, Hollingsworth 2014, Anderson and Basañez 2016). Modeling has been less commonly applied to study the environmental determinants of infectious disease transmission, but for diseases like opisthorchiasis, the approach provides a platform for the integration of disparate information relevant to understanding the potential of non-medical interventions (Liang et al. 2002, Michael & Gambhir 2010, Cheng et al. 2016).
Figure 3.3.1: Hydraulic structures along Lawa Lake.
These are culverts, some of which have gates that can be opened or closed to control spillway flows.
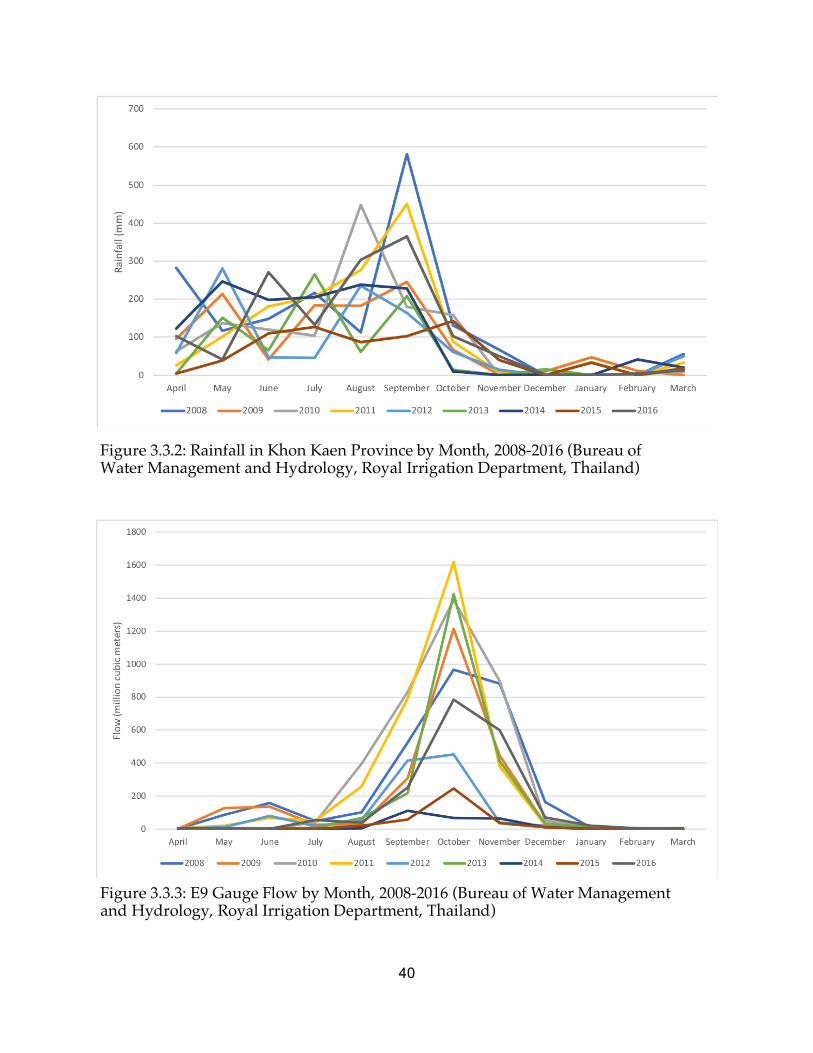
40
Figure 3.3.3: E9 Gauge Flow by Month, 2008-2016 (Bureau of Water Management and Hydrology, Royal Irrigation Department, Thailand)
Figure 3.3.2: Rainfall in Khon Kaen Province by Month, 2008-2016 (Bureau of Water Management and Hydrology, Royal Irrigation Department, Thailand)

41
3.4 Mathematical modeling framework The model used here is an elaboration and modification of a differential equation model derived from Boerlage et al. (2013), adapting their model to describe the aforementioned structure. The model will be used to integrate quantitative data available to estimate rates of transmission of the various forms of the parasite between the four populations involved. The Boerlage model is a deterministic compartmental SI model for fishborne zoonotic trematodes, a class of parasites that includes liver flukes. There are four state variables: humans (H), mammalian reservoirs (R) including cats and dogs, snails (S), and fish (F). The modified differential equations are given in (3.1) – (3.4).
I signifies infection prevalence in the state variable populations indicated by the subscripts. The model has been expanded to account for the spatial/metapopulation structure of the Lawa Lake complex in the multi-village form presented in Chapter 5. I have reduced the number of parameters in the model for parsimony and because of the lack of available data for O. viverrini specifically; I condensed several parameters into the transmission parameters 𝛽 because of the uncertainty around values used in the original Boerlage model, which spanned multiple parasite species. Parameter values used in the model are listed in Table 3.4.1. The single-village form of the model assumes each village has unique populations of the four host states but neither imports nor exports parasites to other villages. Hence, the simulations of transmission using the single-village model are aimed at exploring the plausibility of the assumption that all transmission between the infected populations are restricted to be within the village and its immediate hydrologic environment. In the scenario presented in this chapter, reservoir host populations were excluded due to limited local data relevant to their contribution to the transmission cycle. The same model run with reservoir host populations included produces similar dynamics, only with increased fish prevalence values for BT. Human population values NH were set based on data provided by the village clinics around baseline (2008). Human population sizes are assumed to remain constant over time, because of minimal changes over the timespan of simulation. Two parameters difficult to estimate were the snail and fish populations, 𝑁rand 𝑁s, respectively. Methods for estimating fish populations are inexact, and subject to landscape heterogeneities such as those in the Lawa Lake system (Kim et al. 2016, Wang et al. 2017). Beyond estimating the total fish population relevant to a village, for the model the partition of the total that is
𝑑𝐼{𝑑𝑡 = 𝛽s{|1 − 𝐼{(𝑡)}𝐼s(𝑡)𝑁s(𝑡) − (𝜇{ + 𝛼���)𝐼{(𝑡) (3.1)
𝑑𝐼�𝑑𝑡 = 𝛽s�|1 − 𝐼�(𝑡)}𝐼s(𝑡)𝑁s(𝑡) − (𝜇� + 𝛼���,�)𝐼�(𝑡) (3.2)
𝑑𝐼r𝑑𝑡 = 𝛽{r|1 − 𝐼r(𝑡)}(𝑊{𝐼{(𝑡)𝑁{(𝑡) +𝑊�𝐼�(𝑡)𝑁�(𝑡)) − (𝜇r + 𝛼r)𝐼r(𝑡) (3.3)
𝑑𝐼s𝑑𝑡 = 𝛽rs|1 − 𝐼s(𝑡)}𝐼r(𝑡)𝑁r(𝑡) − (𝜇s + 𝛼s)𝐼s(𝑡) (3.4)

42
Parameter Value Units Source Symbol
Natural mortality of snails 1.37E-03 per day Kruatrachue et al. 1982 𝜇r
Parasite dependent mortality of snails 1.37E-03 per day Chanawong & Waikagul
1991 𝛼r
Mortality of fish 6.85E-04 per day Suvarnaraksha et al. 2011 𝜇s
Parasite dependent mortality of fish 0 per day Assumption (unstudied) 𝛼s
Natural mortality of humans 3.69E-05 per day CIA 2015 (Factbook) 𝜇{
Human infection clearance by praziquantel
Variable Episodic Treatment data from clinics 𝛼���
Mortality of reservoir host 2.74E-04 per day Local interview data 𝜇�
Reservoir infection clearance by praziquantel
Variable Episodic Cat/dog treatment data from veterinarians 𝛼���,�
Transmission parameters (fish-to-
human, fish-to-reservoir, human-to-snail, snail-to-fish)
See Table 3.5.1
per day per infectious
host/worm Equilibrium conditions
and MCMC 𝛽s{𝛽s�, 𝛽{r, 𝛽rs
Fish population 3000 fish Estimate 𝑁s
Snail population 30000 snails Estimate 𝑁r
Human population Variable humans Village censuses 𝑁{
Cat and dog population 100 reservoir
hosts Estimate from village
censuses 𝑁�
Mean human worm count Variable worms Infection survey data 𝑊{
Mean reservoir worm count Variable worms Infection survey data 𝑊�
Table 3.4.1: Parameter values for single-village model

43
susceptible to O. viverrini should also be determined. While some capture and diet data hints at this proportion, spatial differences are not known or understood, so a partition parameter has not been applied in this model. For snail populations, the challenge increases because of competition between snail species, some susceptible to infection and some not. Bithynia snails tend to congregate in high densities in some habitats and be completely absent from others, so the spatial heterogeneities are consequential. Results from hydrologic modeling that better elucidate extent of viable habitat for both types of hosts could improve estimation of NS and NF. For the preliminary runs of the single village model reported here, I assumed 𝑁r = 30000 and 𝑁s = 3000, a ratio of 10 snails:1 fish. On the village scale, a better estimation is complicated by determination of what extent of host habitat is relevant to the liver fluke transmission cycle. Relevant habitat would overlap between villages, and how to most realistically separate contributions to each village’s transmission is difficult. Considering initial conditions for snail and fish prevalence values, I utilized snail and fish survey data from 2009, since these were the results available from closest to baseline (S. Kaewkes and W. Kaewkes, unpublished data). For snail prevalence, the initial values were set at 0.2% prevalence for all villages. This is consistent with other snail surveys from around this time period but ignores heterogeneities between villages because of the lack of sufficient data to substantiate any differentiation. In the 2009 data, the only infected snails found were in NNK in May 2009 with 0.6% prevalence. However, most of the surveys collected fewer than 500 snails, so they would be unlikely to detect infection prevalence below 0.2%. Nonetheless, extent of snail hotspot areas would contribute significantly to transmission potential for affected villages. Table 3.4.2 summarizes the fish infection data; the rainy season values were used as the initial conditions because the Lawa Project began in the rainy season.
There are significant uncertainties in the local data and inherent variability of
the parametric estimates from the literature. Nonetheless, this modeling exercise represents an initial effort for compiling available knowledge to best understand environmental transmission and reconstruct historical trends in infection prevalence. I anticipate these patterns will be better elucidated when hydrologic data is integrated into the modeling schema. At this point, however, interest is focused on the patterns of
Village Cluster May 2009 September 2009
CCK 16.4% (61) 13.5% (74)
Lawa 7.7% (39) 23.5% (34) BT 3.7% (27) 8.9% (45)
NNK 25.9% (116) 50.0% (110) KSR 10.6% (66) 23.7% (38)
DPD 2.9% (35) 14.6% (103)
Table 3.4.2: Fish infection prevalence surveys from May 2009 (dry season) and September 2009 (rainy season). Sample sizes presented in parentheses.

44
response within village clusters. With these caveats, the three parameters remaining to be estimated in the single village model are bFH, bHS, and bSF, which govern the transmission between the different host stages internal to each village cluster. Specifically, in contrast to Boerlage et al. (2013), wherein the r parameters govern the likelihood of a single parasite (whether egg, cercaria, or metacercaria) causing successful infection in the next stage host, here b governs the likelihood of successful transfer of parasitic infection given contact between two hosts in consecutive stages of the transmission cycle. 3.5 Modeling results
Table 3.5.1 contains the values of the b model transmission parameters that were used in simulation runs. These model parameters could not be estimated from field data or the literature, so the first set of estimates for these parameters was obtained by assuming that the system was in equilibrium in 2008. Simulation results under this assumption are shown in Figure 3.5.2. The patterns produced by the model using these parameter estimates do not match the field data. For example, human prevalence bounces back quickly after praziquantel treatment as expected due to the small number of those diagnosed and treated, and fish prevalence remains largely unchanged. Snail prevalence declines in most villages but remains substantially higher than reported values.
A second set of b parameter values, also shown in Table 3.5.1, was estimated using a Markov Chain Monte Carlo (MCMC) procedure (Metropolis-Hastings algorithm) for the model output to fit the three transmission parameters between each host using the equilibrium values as priors and with a long burn-in period. Figure 3.5.1 shows the model run output for human infection prevalence using the MCMC-derived values with data points from the human infection surveys, distinguishing between the more sensitive FECT surveys and less sensitive Kato method surveys (additional graphs
Equilibrium CCK Lawa BT NNK KSR DPD
Fish to Human 2.50E-10 7.24E-11 2.53E-10 1.81E-11 3.32E-07 2.68E-07
Human to Snail 8.90E-09 1.01E-08 4.92E-09 8.92E-09 6.56E-12 1.18E-11
Snail to Fish 7.34E-06 7.10E-06 3.40E-06 8.96E-06 1.67E-05 1.35E-05
MCMC CCK Lawa BT NNK KSR DPD
Fish to Human 2.95E-07 3.45E-07 7.26E-07 2.28E-07 3.30E-08 7.75E-08
Human to Snail 1.25E-08 2.53E-09 3.45E-09 2.26E-08 1.28E-08 1.48E-08
Snail to Fish 4.48E-06 7.03E-06 2.23E-06 2.28E-05 7.08E-06 3.89E-06
Table 3.5.1: Beta transmission parameters for single village model
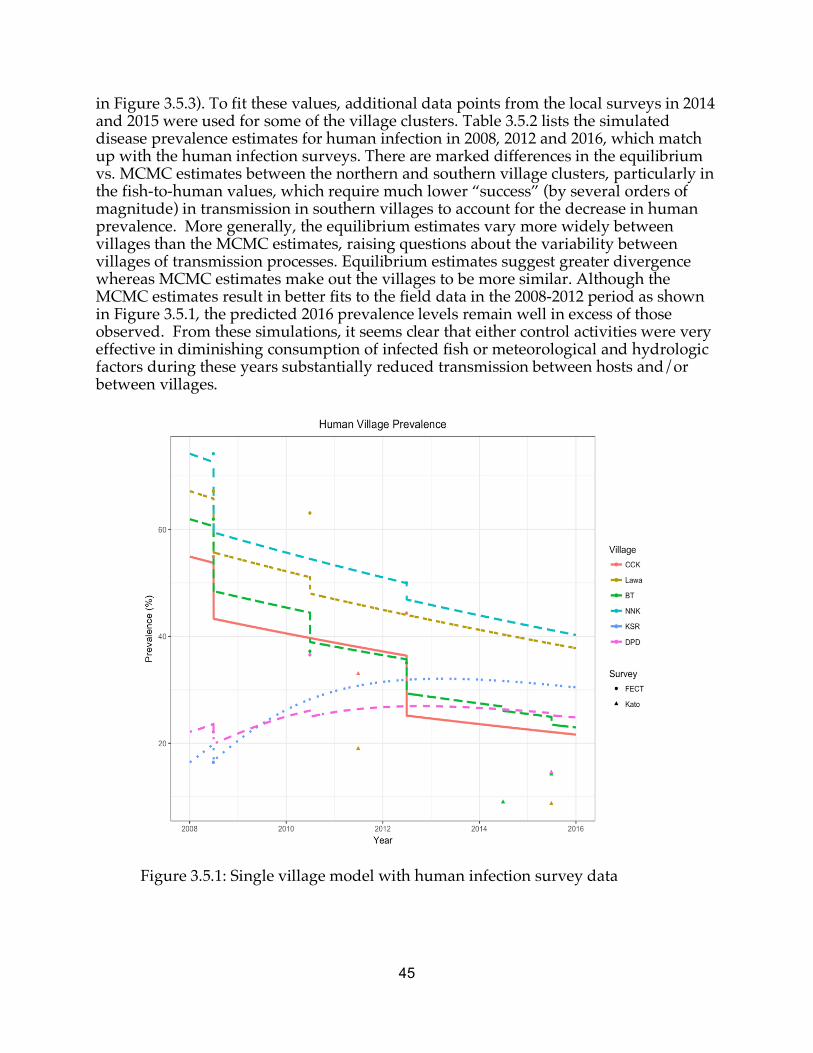
45
in Figure 3.5.3). To fit these values, additional data points from the local surveys in 2014 and 2015 were used for some of the village clusters. Table 3.5.2 lists the simulated disease prevalence estimates for human infection in 2008, 2012 and 2016, which match up with the human infection surveys. There are marked differences in the equilibrium vs. MCMC estimates between the northern and southern village clusters, particularly in the fish-to-human values, which require much lower “success” (by several orders of magnitude) in transmission in southern villages to account for the decrease in human prevalence. More generally, the equilibrium estimates vary more widely between villages than the MCMC estimates, raising questions about the variability between villages of transmission processes. Equilibrium estimates suggest greater divergence whereas MCMC estimates make out the villages to be more similar. Although the MCMC estimates result in better fits to the field data in the 2008-2012 period as shown in Figure 3.5.1, the predicted 2016 prevalence levels remain well in excess of those observed. From these simulations, it seems clear that either control activities were very effective in diminishing consumption of infected fish or meteorological and hydrologic factors during these years substantially reduced transmission between hosts and/or between villages.
Figure 3.5.1: Single village model with human infection survey data

46
Figure 3.5.2: Prevalence values for single village model with equilibrium b values at baseline

47
Figure 3.5.3: Prevalence values for single village model with MCMC-derived b values at baseline. The top graph is the same as Figure 3.5.1.

48
Equilibrium 2008 2012 2016 CCK 54.9% 47.0% 39.7% Lawa 67.2% 57.9% 60.6%
BT 61.9% 48.5% 44.6% NNK 74.1% 66.4% 67.7% KSR 16.4% 13.7% 13.9% DPD 22.1% 17.9% 17.8%
MCMC 2008 2012 2016 CCK 54.9% 37.2% 21.6% Lawa 67.2% 45.0% 37.8%
BT 61.9% 36.5% 23.0% NNK 74.1% 51.0% 40.3% KSR 16.4% 31.5% 30.5% DPD 22.1% 17.9% 17.8%
3.6 Discussion The transmission parameters in Table 3.5.1 differ between villages by three to four orders of magnitude for the equilibrium case. For fish-to-human transmission, KSR and DPD are much higher, indicating that their village systems convert fish infection to human infection at a greater rate than the other villages. This pattern means that at baseline in 2008 lower fish infection prevalence could sustain transmission in this cluster of villages compared with the rest of the Lawa Lake system, which agrees with the lower prevalence levels simulated and shown in Table 3.5.2. For human-to-snail transmission, parameter variability may represent different levels of egg inputs, either from flooding, upstream watersheds, or unsafe sanitation practices. In this case, KSR and DPD also have lower values as a cluster. This phenomenon will be explored and explained in greater detail in Chapter 5 with the inclusion of hydrologic data. The MCMC-derived transmission parameter values are much more similar between villages compared with the equilibrium case. These differ by about an order of magnitude for each of the three processes. Their relative similarity may reflect common trends in the Lawa Lake system as hydrologic change and control activities became more active and pronounced after 2008. They are also fitted to data that reflected decreased infection prevalence in humans in most villages over the course of 2008-2016. Table 3.5.2 shows that use of these parameters in the models produced simulated infection prevalence results in 2012 and 2016 that were closer to reality but still overestimated, assuming the data is correct. These MCMC-based results also suggest a more interconnected system with villages influenced by infectious hosts in neighboring
Table 3.5.2: Simulated human prevalence values for single village model with equilibrium and MCMC-derived transmission parameters. The year
2008 is the baseline prevalence from study data, and 2012 and 2016 are simulated forward based on parameters and equations presented in this
chapter.

49
village systems because of the way in which their transmission parameter values converged. This, too, will be explored in greater detail in Chapter 5.
A central issue for this analysis is the relative contribution of different factors to the decrease in infection prevalence and intensity among human, snail, and fish host populations. Based on the individual-village model framework described, deterministic simulations could not replicate the drops shown in field survey data without introducing changes in parameters or the model structure after 2012. The observed changes in prevalence far outpaced the effects of documented treatment with praziquantel and worm mortality. Several questions remain. The fragmentary and limited nature of the infection surveys could have misrepresented the true population infection status through sampling bias through survey methodologies that may have been more likely to include infected humans but less likely to find infected snails and fish, thus thwarting the ability of the simulations to accurately capture the dynamics. The significant role of hydrology was not accounted for but changes in irrigation, agriculture, aquaculture, and other aspects of development clearly disturbed and changed the environment between 2008 and 2016. In addition, spillover effects related to screening and health education in the Lawa Project control programs could have contributed to unobserved use of praziquantel and changes in diets, which would also account for the unexplained drops in prevalence between 2008 and later surveys. Some combination of these factors is likely, so it is worthwhile to attempt to account for each one’s relative contribution and impact on transmission potential given the objective of designing treatment and control programs, both for opisthorchiasis control in northeast Thailand and for similar systems more generally. If the historic patterns of infection prevalence are adequately replicated by an expanded model, greater confidence might be placed on its predictions in forecasting the impacts of different control and treatment strategies and environmental variables.
Synthesizing diverse and fragmentary data poses many challenges but is
important to understanding infectious disease transmission in complicated circumstances. Recent studies have highlighted that even “simple” exposure pathways do not easily yield to treatment and control strategies (Luby et al. 2018). In developing contexts, the influence of increasing individual and state wealth is likely to precede or at least coincide with “big data” approaches that provide opportunities to gain better sources of environmental and epidemiologic data for use in modeling. Yet, infectious diseases will continue to disproportionately impact the poor and resource-limited contexts (Hotez 2017). Models can be useful platforms for leveraging available but incomplete data to better inform environmental control strategies and interventions coupled with treatment and clinical approaches. 3.7 Conclusion In this chapter, I introduced a single-village disease transmission model parameterized for O. viverrini and incorporating available longitudinal data for human, snail, and fish infection in Lawa Lake and its surrounding villages. Based on my results, the decrease in prevalence is unlikely to be due solely to praziquantel treatment but as a result of changes in the environment and eating behaviors. An unusually wet period between 2008 and 2011 and changes to the hydroscape via more intensive irrigation,

50
increased aquaculture, and flood management all impacted how the parasite and its hosts moved in the environment. These insights support increased attention to hydrological and ecological changes and their impacts on disease transmission. In Chapter 4, the complexity of the model will be expanded by considering and incorporating the role of reservoir hosts in O. viverrini transmission in the Lawa Lake system. This elaboration will further lead to Chapter 5, when the hydrology model is introduced and its output incorporated into a metapopulation disease transmission model addressing connectivity between the villages and their associated environmental patches.

51
Chapter 4: The role of reservoir hosts in maintaining transmission 4.1 Cats and Dogs in Northeast Thailand Villages The number of known reservoir host species for O. viverrini is small and includes “cats, civets, dogs, house rats, pigs, minks, and weasels” (S. Tangkawattana & P. Tangkawattana 2018). Vietnamese researchers published a paper suggesting that O. viverrini could also be an avian liver fluke (Dao et al. 2013), but other researchers examining the evidence found it to be unlikely, suggesting instead that the fluke of interest was a different species, Opisthorchis parageminus (Nawa, Doanh, & Thaenkham 2015). Veterinary researchers have tested several other sylvatic animal species for O. viverrini infection, including long-tailed macaques, but have found infection in few of them; a notable exception is a fishing cat (Prionailurus viverrinus) in southern Thailand, where O. viverrini infection is uncommon in humans (S. Tangkawattana, personal communication). This limited literature suggests that the O. viverrini transmission cycle may be maintained in the environment without human involvement. Recently, my colleagues and I have come to believe that, based on survey data consistently showing high infection prevalence and intensity, cats are the most important reservoir host in northeast Thailand for O. viverrini. Whether this is true for other regions depends on the local society’s history with cats and their movement and behavior. In northeast Thailand, dogs were the valued pet of villagers, reflecting the venerated King Bhumibol Adulyadej’s love of dogs, including his own Thong Daeng, who had a biography written by the king about her and was featured on Thai postage stamps. This relationship of the Thai monarchy with canine companions presumably continues with current-King Maha Vajiralongkorn, who was known to have given his dog Fufu a position in the Royal Thai Air Force. Based on reservoir host cat and dog surveys in the region, dogs are named and are typically claimed by specific individuals or households in Thai villages. Cats, meanwhile, are often stray or feral and unclaimed. Survey data mostly names them as “Meow [แมว] #3,” the Thai word for cat. Because of these differing attitudes towards dogs and cats, cats are more difficult to survey and control and are more likely to pose a risk as a source of infection transmission. 4.2 How they get infected/fit into the transmission cycle/available data O. viverrini was first identified in the Indian civet cat (Felis viverrina) and has since been found in the fishing cat P. viverrinus, both of which are known to fish (Sripa et al. 2017). Domestic and wild cats are considered to be the reservoir hosts of greatest import in the lifecycle of O. viverrini although often cats and dogs are both tested in reservoir host infection surveys. Comparing cats and dogs, cats generally show much higher infection prevalence and intensity, ranging in some studies from 20 to 40% for cats and 0 to 4% for dogs, with much higher distributions of eggs per gram (EPG) values in cats (Aunpromma et al. 2012, S. Tangkawattana & P. Tangkawattana 2018). Cats, dogs, and other reservoir host species get infected from the same transmission route as humans: by eating raw, undercooked, or incompletely fermented cyprinid fish containing viable O. viverrini metacercariae. Cats and dogs most likely get infected by eating fish scraps and entrails discarded by humans as they clean and prepare fish for

52
their own meals. These scraps, which often include the most infectious parts of the fish (which tend to be on the exterior of the fish), are also fed deliberately to cats and dogs as their meals, though they can also be scavenged from the trash or other dumping grounds (Donthaisong et al. 2014). In a 2008 survey, 94% of surveyed pet owners said they fed their animals leftover food rather than special cat and dog food. In a 2016 survey, only 23% of cats were fed leftovers by their owners. However, an additional 33% of cats got their food from another source, which may include scavenging. About 35% of cats in the 2016 survey ate predominantly fish. Of cats reported to eat predominantly fish, 56% were infected with O. viverrini; 12% of cats reported not to eat fish were also infected. All of the cats surveyed defecated outside of the house in the natural environment or in an unknown location. Available data of any reservoir host surveys is extremely limited and is best summarized in Table 2 of S. Tangkawattana & P. Tangkawattana (2018). The most recent survey data for the villages around Lawa Lake are from 2008 and 2012 (2008 data is from Aunpromma et al. 2012) and is presented in Table 4.2.1 Like all other reservoir host surveys, O. viverrini cat infection surveys show much higher prevalence values than those for dogs. While the sample sizes are small (see Table 4.2.1), the results do show that reservoir host infection has persisted even as human infection prevalence and intensity have decreased. A more recent cat infection survey from around Lawa Lake in 2016 found 35% prevalence with an average EPG of 205, not very dissimilar from the 2008 and 2012 results (Makoto Sakamoto, unpublished data). To demonstrate the difficulties of tracking reservoir host infection, 22 of the cats from the 2016 survey were followed up six months after treatment for liver fluke infection with praziquantel (S. Tangkawattana, unpublished data). Three had died and eight were missing. Of the eight that could be retested, five were reinfected (62.5%). The average EPG of reinfected cats was 179, compared with an average EPG of 384 in the first round of the infection survey. As long as the zoonotic reservoir host is relevant to transmission dynamics, as in the case of many other helminths, local disease elimination seems highly unlikely. Prior exposure does not confer appreciable immunity for a long-term period. Reservoir hosts
Cats Dogs Village 2008 2012 2008 2012 CCK 53% (571) [15] 75% [4] 0% [68] 2% [49] Lawa 32% (161) [31] Missing 0% [76] Missing BT 24% (132) [25] 27% [30] 1% (49) [83] 8% [24] NNK 48% (419) [33] 21% [14] 0% [20] 0% [7] KSR 0% (0) [9] Missing 0% [33] Missing DPD 38% (742) [16] Missing 0% [63] Missing
Table 4.2.1: O. viverrini infection survey data for cats and dogs from 2008 and 2012. Percentage values represent infection prevalence. Values in parentheses are mean intensity (EPG) for positive cases. Values in brackets are sample sizes.

53
interact with many identified and hypothesized human and environmental drivers and move between the domestic and natural environments, potentially serving as a link to enable transmission (Ziegler et al. 2016). As time progresses, the role of reservoir hosts (notably, cats, but also dogs and other piscivorous animals) should become better defined through observation and research. Because of the difference in fecal volume, an infectious human who is openly defecating can shed an order of magnitude more eggs into the environment than an infectious cat. With a shrinking infectious human population capable of disseminating parasite eggs though, cats’ relative contribution to the egg burden released into the environment will increase. Great uncertainty underlies how much cats and dogs matter to transmission; other modelers have used the R0
concept to propose that transmission cannot be sustained by reservoir hosts alone (Bürli et al. 2018). However, with cat infection prevalence being documented at greater than 30%, and a non-negligible number of dogs also being infected, these reservoir hosts are being actively exposed to and acquiring infection with the parasite. Additionally, given their indiscriminate approach to defecation, a much higher proportion of the feces of infectious reservoir hosts is entering the natural environment compared with human hosts. 4.3 Incorporating reservoir hosts into the modeling framework Researchers speculate about the role and importance of reservoir hosts in transmitting zoonotic diseases to humans. In the case of opisthorchiasis, little is known about whether the transmission cycles involving humans and cats and dogs are distinct or overlapping. Using the model developed in Chapter 3, scenarios with and without reservoir hosts can be compared. Even though little data exists about transmission parameters involving reservoir hosts, such as whether metacercariae excyst on same time frame as in human hosts and have similar conversion rates into adults worms, they can be added to the framework of the disease transmission model in the host stage alongside humans (Figure 4.3.1).
Figure 4.3.1: Transmission pathways framework incorporating reservoir hosts (cats and dogs)

54
Figure 4.3.2 shows the simulated dynamics within reservoir host populations in the six village clusters around Lawa Lake using existing parameter values from the single-village model (Table 3.4.1). Notably, the b transmission parameters governing fish-to-human transmission and human-to-snail transmission were copied over onto fish-to-reservoir and reservoir-to-snail parameters, respectively. In reality, these values should be higher since cats eat a larger percentage of fish raw than humans and defecate into the environment more often (or all the time) compared with humans. However, not enough data exists currently to fit or justify a new set of transmission parameters. Reservoir host populations were set at 100 per village based on an approximation of one or two cats or dogs per household, and the mortality rate was based on an average lifespan of three years, though some “indoor” animals may live much longer. Initial conditions were based on the 2008 cat survey previously discussed. Effectively, the reservoir dynamics refer to the role of cats in this transmission system. The six villages show surprising trends in dynamics. The transmission parameters that helped fit the human infection data drive these differences and produce interesting results in the cat prevalence curves given the absence of treatment of cats in the model (which is attempted in reality but is difficult). The villages sort themselves into the same order of equilibrium prevalence as for human infection but at a lower level due to the underlying transmission dynamics (Table 4.3.1).
Figure 4.3.2: Reservoir host prevalence in six villages over eight years

55
Village Human Reservoir
CCK 49.1% 22.5%
Lawa 58.1% 29.4%
BT 17.9% 6.0%
NNK 72.1% 43.7%
KSR 28.6% 10.7%
DPD 39.0% 16.1% 4.4 Regular screening and praziquantel control and the effect of reservoir hosts A major question addressed by Bürli et al. (2018) and other models of transmission systems with both human and animal hosts is whether transmission can be sustained with only humans or only animals. Because of the framework of the single-village model, we have already assumed that humans alone can sustain transmission. By removing humans from the system and having only reservoir hosts as the final hosts, I simulated the dynamics shown in Figure 4.4.1. A couple of things are happening to shift the prevalence curves. Including reservoir hosts takes some of the “available” fish away from the human population in the model, suppressing human prevalence.
Figure 4.4.1: Side-by-side comparisons of model run without (left) and with (right) reservoir hosts
Table 4.3.1: Equilibrium human and reservoir infection prevalence for six village clusters in the absence of treatment for an example set of parameters

56
The snail curves change in response to two different host populations shedding pathogens eggs into the environment. Reservoir host inclusion results in greater fish consumption, which decreases the population and shifts prevalence down slightly. The corresponding prevalence curve for reservoir hosts was shown in Figure 4.3.2. Considering reservoir and human hosts and their relative contribution to maintaining the O. viverrini transmission cycle is relevant for designing and maintaining control and treatment programs. An area of major interest for Thai public health researchers and practitioners is the level of praziquantel coverage necessary to reduce disease prevalence below 1% or 5%, based on the Thailand Ministry of Public Health (MOPH) targets moving towards disease elimination. I modeled these results under two scenarios: annual and biannual screening and treatment of infected individuals. While public health practitioners might be interested in screening at longer time intervals like multiple years, the results for annual and biannual control already require a high level of coverage, so waiting longer makes control below 5% untenable. Figures 4.4.2 and 4.4.3 shows coverage vs. equilibrium infection prevalence for annual and biannual praziquantel treatment, respectively, assuming 100% praziquantel efficacy. Table 4.4.1 shows the coverage percentages (to the closest 5%) needed to attain the Thai MOPH goals. Each village has different response curves, and some villages prove in the model to be more resistant to treatment than others. BT and NNK require much higher levels of coverage; each would need 55% annual coverage for reductions below 1% or 20% coverage to get below 5%. CCK and Lawa require 15% coverage to get below 5% and about 30% to get below 1%. KSR and DPD need 20% coverage for reduced prevalence below 5% and 45% for below 1%. When reservoir host treatment is included at a comparable level, the coverage needed only decreases slightly for some targets in some villages (Table 4.4.1). These numbers highlight the challenge with the
Figure 4.4.2: Praziquantel treatment coverage one time annually and corresponding equilibrium infection prevalence in six village clusters
Figure 4.4.3: Praziquantel treatment coverage twice annually and corresponding equilibrium infection prevalence in six village clusters

57
“last mile” that all disease elimination efforts face, particularly when using drug treatment alone without environmental intervention. Biannual treatment requires lower coverage to attain the targets; 10% coverage in all villages to reduce infection prevalence below 5%, and 15-25% for below 1% human prevalence.
4.5 Conclusion Like much else about this disease system, major gaps remain in our knowledge of the role that reservoir hosts play in O. viverrini transmission. Existing knowledge suggests that cats are the most important species; O. viverrini’s first discovery in a sylvatic cat species foreshadowed this reality. Unfortunately, we do not yet know if human O. viverrini and cat O. viverrini are cryptic species or not, i.e., if the same parasites that infect cats can infect humans; this is not always the case (Petney et al. 2016). Genetic research remains to test this hypothesis. The confirmation of the interchangeability of human and cat parasites would support a stronger control effort for cat infection and complicate elimination efforts, as has recently been the case with Guinea worm eradication and the role of reservoir dogs (Molyneux & Sankara 2017). I showed results from the application of regular screening and praziquantel treatment for sufficient disease suppression in the Lawa Lake complex. Some high-risk villages may theoretically need over 50% annual coverage or more, a significant challenge with all of the logistical constraints involved in any public health program. A more modest and attainable could be 10% coverage with biannual treatment, which would reduce equilibrium infection prevalence below 5% in all villages. The six villages cluster into three groups (BT and NNK; CCK and Lawa; KSR and DPD) that require similar coverage levels to achieve the MOPH targets. These clusters will come into play again in the next chapter. These simulations were run with the single-village model
Village < 5% prevalence < 1% prevalence
Annual PZQ
Biannual PZQ
Annual PZQ
Biannual PZQ
CCK 15% (10%) 10% 30% 15% Lawa 15% 10% (5%) 30% 15%
BT 20% 10% 55% 25% NNK 20% 10% 55% 25% KSR 20% 10% 45% 25% DPD 20% 10% 45% (40%) 20%
Table 4.4.1: PZQ treatment coverage percentages required by villages to suppress transmission below 5% and 1% prevalence without reservoir host treatment. Percentages in parentheses reflect decreased coverage targets needed if reservoir host treatment at an equivalent level is included.

58
framework, which overestimates long-term prevalence, so praziquantel coverage levels may not need to be as high as the model predicts to reach the 1% and 5% prevalence targets. These simulations were also run under the assumption that reservoir host dynamics are similar to humans. In fact, as discussed, reservoir hosts are probably more important than these simulations results suggest, which would make their treatment with praziquantel more impactful on overall system dynamics.

59
Chapter 5: Hydrology-informed metapopulation modeling of liver fluke transmission in the Lawa Lake complex of northeast Thailand 5.1 Introduction Building on the single-village model introduced in Chapter 3, the model structure will now be expanded to account for exchange of parasites and hosts between village clusters and their associated environments. To study the influence of population-level factors and spatial heterogeneity I use a metapopulation model framework, which considers multiple groups (or patches) of hosts and their degrees of connectedness. Metapopulation modeling is especially powerful in understanding pathogen transmission in complex, interrelated environments, where contiguous areas and their inhabitants influence each other. Connectedness between these environmental and host patches can occur in multiple ways, including migration of humans between villages and movement of a waterborne pathogen from a section of river or lake adjacent to one population to another section adjacent to a separate population. The second example demonstrates hydrological influence on a disease transmission system, as waterborne diseases as diverse as cholera and schistosomiasis rely on advective transport to expose new susceptible individuals with pathogens excreted or shed by infected individuals. Hydrologic patterns are time-varying and markedly local in nature. Given this environmental complexity, hydrologic fate and transport of pathogens remain not well understood or studied. In addition, motile waterborne parasitic forms, such as liver fluke and schistosome cercariae, have independent mobility behaviors, making hydrologic flows not entirely representative of how these parasites are dispersed (Haas et al. 1990, Krishnamurthy et al. 2017). Research connecting hydrology with waterborne disease transmission is an emerging field with recent work on cholera and schistosomiasis (Remais et al. 2008, Rinaldo et al. 2012, Perez-Saez et al. 2016). Tracing the spread of pathogens in the environment is challenging, and countervailing forces make it difficult to ascribe an increase or decrease in human infection to trends in meteorology and climate or consequent hydrology. Long-term studies of climatic changes in rainfall patterns or influence of dams allow more definitive statements about impacts on disease transmission, though these are also complicated by shifts in host and vector habitat and in seasonal patterns that may disrupt or exacerbate host and vector growth and reproduction (Tompkins and Ermert 2013, Ziegler et al. 2013).
This metapopulation model leverages information about hydrologic connectivity between village and host clusters to understand the movement of the liver fluke parasite’s various forms in the environment as mediated by water. Considering local hydrologic impacts on the liver fluke transmission cycle, I target and elucidate five main factors: 1) egg inputs into system from upstream watersheds; 2) egg inputs into system from overland flooding; 3) snail and fish mobility due to hydrologic connectivity; 4) snail and fish available habitat; and 5) hotspots where infectious snails come into contact with susceptible fish. These factors are modeled with seasonality to

60
account for changing patterns throughout the year. Understanding liver fluke transmission in this seasonal, hydrologically connected environment with modeling can help optimize environmental control and treatment to have maximum impact on reducing disease transmission.
5.2 Hydrology model description The metapopulation model consists of six villages or geographically proximate village clusters shown in Figure 5.2.1 around Lawa Lake in Khon Kaen Province of northeast Thailand. The villages or village clusters described here are CCK, Lawa, BT (cluster of 5 villages), NNK, KSR, and DPD (cluster of 2 villages), which were chosen and clustered based on geographical location and existence of historical human infection survey data. The six clusters further sort into three groups based on impact or lack thereof of flooding and upstream watersheds. The two upstream watersheds (Figure 5.2.2) flow into Lawa Lake at locations adjacent to NNK and BT and contribute to egg input there. Villages CCK and Lawa are in proximity to the Chi River and are most susceptible to seasonal overland flooding. KSR and DPD are the villages most “downstream” and are relatively isolated from major flooding or upstream drainage impacts. Villages within the upstream watershed have not had as significant treatment and control programs as the villages around Lawa Lake, and reports suggest that
Figure 5.2.1: Connectivity between six village clusters around Lawa Lake

61
upstream villages still have high infection prevalence values over 30% (B. Sripa, unpublished data).
To understand the effects of complex hydrologic factors on snail habitat, fish access to these habitats, and the pathways of parasite transmission, a hydrologic model of the Lawa Lake system was utilized to simulate flow patterns and changes in water levels over time. This model is a rainfall/runoff model common in hydrology that considers the transport of water through a system originating from upstream in the catchment basin or from precipitation. For the hydrologic model, hydrologic structures and Lawa Lake were surveyed for elevation in the digital elevation model (DEM) at 5m x 5m resolution using satellite imagery and drone data, and a 2D model integrating meteorology data from 2008 to 2016 was developed using PCSWMM (Computational Hydraulics International 2018). Inputs include the DEM, meteorological data (rainfall, temperature, relative humidity, and windspeed) from the Thai Meteorological Department, and known hydrologic structures and water features. Outputs include water level and flow vectors for the time points modeled between 2008 and 2016. Calibration was conducted with available precipitation and gauge data in the area from the Bureau of Water Management and Hydrology, Royal Irrigation Department, in Thailand. Figure 5.2.3 demonstrates an example of the variation in flows predicted by the model over the course of a calendar year encompassing the rainy and dry seasons; arrow direction and thickness represent the relative change in flow vectors. While all of the villages are adjacent to Lawa Lake, inflows and outflows as well as the relevant
Figure 5.2.2: Two upstream sub-basins flow into Lawa Lake near NNK and BT, respectively.

62
snail and fish populations are not static, homogeneously distributed, or relevant to each village. The rainy season is characterized by high and active flows that generally peak in October with flooding from the Chi River varying from year to year. The dry season has relatively little hydrologic activity establishing connectivity between village clusters.
Because gauge data was not available for the sub-basins upstream of Lawa Lake,
a SWAT-CUP model was used to calibrate and validate runoff into the Lawa Lake system from these sources. Inputs for the upstream sub-basins included a 30m x 30m DEM, land use data, and soil type data from the Land Development Department of Thailand. To map the hydrologic features of Lawa Lake and finer scale structures, a drone was used to chart these areas in greater detail and determine elevations where water was flowing into or out of Lawa Lake. Sub-basin calibration and validation graphs are shown in Figure 5.2.4; 2006-2010 data was used for calibration, and 2011-2013 data was used for validation. The R2 values range from 0.61 to 0.81; both the calibration and validation models miss late peaks in their runs. In the case of calibration, fitting the less extreme peaks may have disadvantaged the model from predicting the major discharge in 2010. In the case of validation, the 2011 peak discharge was better modeled, but 2013 was missed by a large margin for reasons that are not entirely clear but may be related to the different timing of precipitation-driven flooding in 2013 compared with other years.
Based on these data and tools, I assessed the presence/absence of connections
between parcels of water associated with different village clusters. For example, year-round we would not expect KSR to contribute to transmission in Lawa or NNK, but we would expect the reverse to be true. In March, when less rainfall and flooding occur, we would expect each village cluster to be relatively isolated, with the exception perhaps of the weak influence of near neighbors (Lawa to CCK or BT to DPD). The origin of flows is also subject to a differential dilution effect; contaminated waste from the upstream watershed (Figure 5.2.3) would more strongly impact NNK than DPD or KSR and would experience the effects sooner.
Figure 5.2.3: Hydrologic flows change dynamically throughout the year (semiquantitative interpretation of hydrology model results for an annual cycle).

63
(i)
(ii)
(iii)
(iv)
Figure 5.2.4: (i) Calibration curve for sub-basin 1 (2006-2010); (ii) validation curve for sub-basin 1 (2011-2013); (iii) calibration curve for sub-basin 2 (2006-2010); (iv) validation curve for sub-basin 2 (2011-2013); green is prediction uncertainty, blue is observed discharge, red is estimated discharge

64
5.3 Metapopulation disease transmission model description The mathematical model of disease transmission (which incorporates data from the hydrologic model as variables and parameters) is an expansion of the single-village model described in Chapter 3 to connect the six village clusters and uses as its state variables the infection prevalence in humans, reservoir hosts (cats and dogs), snails, and fish. Base equations are included below in Equations (5.1) – (5.5). Initial values were set from the baseline surveys in 2008, and base transmission parameters are carried over from the single-village model found using Markov chain Monte Carlo (MCMC) methods to fit the model onto known infection prevalence data as described below. Within the fish state variable is the fish demography model discussed in Chapter 2 that captures the small window of time in the first few months of a fish’s life when it is susceptible to cercarial infection (before its scales harden and it becomes more resistant). This model assumes a maximum fish lifespan of 4 years before either being caught or natural death.
Using this approach, the fish differential equations (5.4) and (5.5) solve for the number of infected fish in a cluster, whereas the human (5.1), reservoir host (5.2), and snail (5.3) differential equations solve for infection prevalence as in the single-village model. The egg inputs come from the Chi River and the two upstream watersheds and affect the snail state variable, contributing to the force of infection in that linkage; these time-varying parameters are derived on a monthly basis from the rainfall-runoff model. Other egg inputs from open defecation and disposal of septic tank sludge are not modeled due to lack of information about where and when they occur. The egg inputs from overland flooding of the Chi River were assumed to affect CCK and Lawa villages equally and were calculated by using flow measurements from the river and multiplying by a scalar to relate the impact of that water source with the upstream sub-basins. The first and second upstream sub-basins’ outflow were modeled to contribute eggs to the systems in BT and NNK exclusively and multiplied by their own scalars to translate those flows into contributions to human and reservoir host infection.
Connectivity rates between patches were varied on a monthly basis between
2008 and 2016 based on the hydrology model results to account for snail and fish mobility due to hydrologic connectivity. These connectivity parameters were derived by assessing the fate and transport of parcels of water in a village cluster’s area and what proportions reached other village clusters in the Lawa Lake system. These 𝑟 parameters are unitless and vary from 0 to 1, describing the proportion of each village cluster’s force of infection for that host stage that affects each other village. Many parameters are carried over from Table 3.4.1. The 𝛽 values are transmission parameters and are village cluster-specific (values in Table 3.5.1). The 𝑟 connectivity parameters are specific to each patch-to-patch relationship (Figure 5.3.1), 𝛾 is the fish catch rate as described in Chapter 4, 𝜆(𝑡) is a gating function to control fish birth, death, and aging processes, 𝜇 are mortality rates, and 𝛼��� are PZQ treatment events.

65
𝑑𝐼{,e𝑑𝑡 = 𝛽s{,e a1 − 𝐼{,e(𝑡)h�𝑟s{�,�(𝑡)
S
��$
∗ 𝛾� 𝐼s�,�(𝑡)y
b�$
− (𝜇{ + 𝛼���(𝑡))𝐼{,e(𝑡) (5.1)
𝑑𝐼�,e𝑑𝑡 = 𝛽s�,e a1 − 𝐼�,e(𝑡)h�𝑟s��,�(𝑡)
S
��$
∗ 𝛾� 𝐼s�,�(𝑡)y
b�$
− (𝜇� + 𝛼���,�(𝑡))𝐼�,e(𝑡) (5.2)
𝑑𝐼r,e𝑑𝑡 = 𝛽{r,e a1 − 𝐼r,e(𝑡)h (�𝑟{r�,�𝐼{,�(𝑡)𝑁{,�(𝑡) +
S
��$
�𝑟�r�,�𝐼�,�(𝑡)𝑁�,�(𝑡)S
��$
) − 𝜇r𝐼r,e(𝑡) (5.3)
𝑑𝐼s,e%
𝑑𝑡 = 𝛽rs,e a𝑁s,e% (𝑡) − 𝐼s,e% (𝑡)h 𝜆(𝑡)�𝑟rs�,�𝐼r,�(𝑡)𝑁r,�(𝑡)S
��$
− 𝜇s𝐼s,e% (𝑡) (5.4)
𝑑𝐼s,e$xy
𝑑𝑡 = −(𝛾 + 𝜇s)𝐼s,e$xy(𝑡) (5.5)
While a daily time scale could be preferable for assessing hydrologic impact, historical data only captured month-to-month variability. Because human infection survey data only measures prevalence and not incidence, this time scale is reasonable for this study. Using the hydrology model, I was also able to find the extent of water surface area at a suitable depth (under 0.3m) for the contact events between juvenile cyprinid fish and the aquatic snail intermediate hosts (“hotspots” for infection transfer) and to estimate NS and NF. I looked at the transport time for a parcel of water between each village cluster to estimate the time scale of movement between the locations, but these interactions happened on the order of days and not months and therefore the model’s time scale was not granular enough to introduce a time lag component. There was insufficient data to track fish mobility between patches, so I used fishermen’s movement data from Kim et al. (2017) to inform the exchange of fish in inter-village commerce as contributing to human infection from other village clusters. Table 5.3.1 summarizes these linkages and use of hydrology-related data in the disease transmission model. Figure 5.3.1 shows examples of the variability between village connectivity across months and years for the human/reservoir-to-snail and snail-to-fish transmission processes (the remaining connectivity parameter graphs are shown in the Appendix). The general trends persist from year to year, but the timing of peaks differ and affect village connections differently. The year 2008 produced stronger connectivity for BT-DPD and NNK-BT, while 2010 had stronger connectivity for CCK-Lawa.

66
Hydrology-related transmission impact Quantification method
Retained in
model?
Egg inputs from overland flooding
Rainfall-runoff model output from Chi River summarized on monthly basis Yes
Egg inputs from upstream water
basins Sub-basin model output summarized on
monthly basis Yes
Snail and fish mobility
Snail: Patch connectivity from rainfall-runoff model; Fish: fishermen catch data Yes
Snail and fish available habitat
Snail: Rainfall-runoff model output and GIS analysis; Fish: N/A Yes
Hotspots for snail-to-fish contact
Rainfall-runoff model output and GIS analysis No
Table 5.3.1: Description of linkages between hydrology model and disease transmission model
Figure 5.3.1: Village connectivity for BT-DPD, CCK-Lawa, and NNK-BT in 2008, 2012, and 2012

67
5.4 Metapopulation model results Figure 5.4.1 shows the metapopulation model results for the six villages in the base scenario with the metapopulation model establishing relative connectivity between villages. Prevalence data points are included, distinguishing between the more sensitive FECT surveys and the less sensitive Kato method surveys. The heterogeneity of outcomes reflects the data: some villages saw reductions in infection prevalence to less than 10% (KSR, DPD), yet a few villages continued to have predicted prevalence values greater than 20% (BT and NNK). The steep drops in the graph were treatment events, when a subgroup of villagers was tested for infection and given praziquantel if they tested positive (the model assumes 100% drug efficacy). Model simulations were run for eight years between 2008 and 2016. Compared with the single-village model presented in Chapter 3, the metapopulation model no longer over-predicts final infection prevalence for the villages in 2016. Instead, the model now occasionally under-predicts prevalence for some data points, notably, CCK in 2012. This specific issue can be partially accounted for by the number of treatment-naïve individuals included in the 2012 infection surveys (discussed in 5.5 and shown in Figures 5.5.1 and 5.5.2). Interpretation of the data leads to some specualtion about the meaning of the surveys and their different diagnostic methods. BT stands out as the modeled village with the least improvement. Anecdotally, BT villagers were the least participatory in the Lawa Project and may therefore have reaped the least benefit from the control program (B. Sripa, personal communication). Given that this mathematical model is primarily concerned with infectious indviduals actively shedding parasites into the environment rather than asymptomatic cases, the Kato-based surveys from 2011, 2014, and 2015 may actually capture the most infectious and relevant individuals in the system and therefore be useful for thinking about infection prevalence patterns. However, fitting all of the data points accurately would be nearly impossible since most villages show non-monotonic patterns, and infection burden builds up over time. No parameters were fit for the metapopulation model because of the increase in model complexity and number of parameters (eighteen transmission parameters alone compared with three per single-village model, plus seventy-two time-varying connectivity parameters between the six village clusters). For this reason, the transmission parameters were carried over from the single-village model and the connectivity parameters were derived from hydrology model results. The metapopulation model is more believable than the single-village model in part because of its inclusion of external hydrologic influences and connecitivity and in part because the modeled behavior is more nuanced in the clustered patterns of village prevalence change it exhibits. The lack of parameters fitted to this model structure and the higher quality data that informed the hydrology model lend a realism to the underlying mechanics of the metapopulation model that improves upon the relatively straightforward transmission framework of the single-village model. Nonetheless, the lack of information about differences in snail infection and raw fish eating patterns between villages remains a weakness. Better data on these aspects of the transmission cycle would further strengthen the modeling framework and bring it into greater alignment with reality.

68
Figures 5.4.2 and 5.4.3 show infection prevalence values for intermediate snail and fish hosts. In snails, the prevalence cycles seasonally with most patch populations decreasing to 0.1% from initial values of 0.2% (with the exception of Lawa where prevalence approaches 0%). NNK has the highest final snail prevalence value at 0.18%, which is well within the range of what would be expected in this type of environment. For fish prevalence, because the initial conditions are disparate and based on baseline survey data, the model behavior is quite different. There is a seasonal aspect to their dynamics though this is dampened for most villages except NNK, where it is readily apparent. The end prevalence values range from 8-41%, with CCK, Lawa, BT, and DPD having the lowest values and NNK having the highest. These results support the sorting of the six village clusters into three geographical clusters that exhibit different patterns and trends based on human prevalence values. The first cluster, consisting of CCK and Lawa, is in close proximity to the Chi River and is most susceptible to overland flooding experienced during the rainy season. Its villages had high human prevalence values at the start of the control program, which decreased sharply during the period of treatment and control activity. These villages were the headquarters and major focal area of Lawa Project activities, suggesting that they benefited the most from health education and health volunteer engagement. The model is able to accurately account for the decrease in prevalence without making any assumptions about reinfection. Additionally, these villages are in close proximity to heavily fished waters in the lake, as supported by GPS evidence and interviews described in Kim et al. (2017).
Figure 5.4.1: Metapopulation model run for human infection prevalence in villages around Lawa Lake

69
The second cluster consists of BT and NNK, the villages to the south and southeast of the lake. These village also had high prevalence values at the start of the treatment and control program but experienced much more modest decreases when comparing data from later infection surveys. These villages are most impacted by upstream watersheds draining into Lawa Lake (Figure 5.2.2), where some villages still have over 50% O. viverrini infection prevalence (B. Sripa, unpublished data). Consequently, if open defecation or unsafe disposal of human or reservoir waste is occurring in these watersheds, the runoff will disperse parasite eggs into the canals, ponds, and sections of the lake in close proximity to the second cluster’s villages. These villages are also adjacent to the highest concentration of fish ponds in the system and were not a focus of major emphasis for Lawa Project activities. The third cluster is KSR and DPD, which are located to the northeast of Lawa Lake. At the start of the control program, these villages had significantly lower prevalence values, which may be attributable to a lower degree of baseline environmental contamination. These villages were significantly affected by neither the Chi River nor the upstream watersheds, so they experienced fewer external inputs of infectious individuals or waterborne forms of the parasite into their local systems. These villages were not adjacent to high concentrations of fish ponds or fishing activity in their local waters and received less emphasis by the Lawa Project compared to the first cluster. Because of the low prevalence of snail infection, the lack of field survey data, and the difficulty measuring snail prevalence precisely, strong claims cannot be made about the model results for the snail intermediate host. However, most field surveys indicate that snail prevalence in this region ranges between 0 and 0.2%, agreeing with the model results (Kim et al. 2016). With current diagnostic methods, differentiating between the clusters would require surveys of tens of thousands of snails at least. In recent years, the highest snail prevalence values found are still less than 10% (Kiatsopit et al. 2012). Much like other snail-borne diseases such as schistosomiasis though, only a few snails are required to maintain transmission in an area because of the high number of
Figure 5.4.2: Snail prevalence values for metapopulation model
Figure 5.4.3: Fish prevalence values for metapopulation model

70
cercariae they shed into water bodies. Further understanding of where snails are most likely to be infected will help with environmental measurement and control. Bottlenecks of water flow, such as certain ditches and culverts, would concentrate fecal waste and parasite eggs and be zones of likely contact with susceptible snail hosts. Eliminating or protecting these areas could be an effective method of environmental control subject to proper coverage in the environment of interest and patch/cluster connectivity. Considering fish, infection prevalence is much higher and therefore it is easier to discern differences between clusters. Because transmission is foodborne, we are interested in the supply chain of food to consumers, which is not necessarily related to proximity between where fish lived and where they are eaten. Fishermen, middlemen, and merchants are all mobile and may choose to sell and distribute fish to other villages to expand their market. In the model simulation, the relative ordering of low to high fish prevalence values in fish hosts differ considerably from the results in humans, with NNK and KSR having the highest infection prevalence. NNK’s is driven largely by the initial value, but KSR’s is driven by dynamics, as its outcome is quite different from Lawa’s, which started with a similar prevalence level. Fish are infected by having infectious snails releasing cercariae into areas with juvenile fish, so KSR is the cluster with the greatest magnitude of this process taking place. Paying attention to fish prevalence results and how they interact with patterns of fish commerce can help identify where to target health education interventions related to cooking. 5.5 Reinfection data The contrast between the first two clusters and the third cluster provides evidence that environmental contamination strongly drives the equilibrium values of infection prevalence in the absence of praziquantel treatment and environmental controls. However, praziquantel treatment for opisthorchiasis has been happening in this region since at least 1977, according to the villagers, and those surveyed had experienced up to six prior treatments for infection (see Figures 5.5.1 and 5.5.2). I assumed 2008 to be the natural equilibrium because of how infrequently people were treated prior to that year, which was the baseline of the Lawa Project; Figure 5.5.2 shows a major uptick in reported PZQ treatment events starting in 2007-2008. The differentiation in outcomes of the two high baseline prevalence clusters shows the benefits of intensive treatment and control programs and may support the additional benefits of health education that decrease reinfection rates. Infection data for resampled individuals (Table 5.5.1) shows a stronger impact on high baseline prevalence villages compared with low baseline prevalence villages (i.e., high prevalence villages see a greater relative decrease in reinfection). In Table 5.5.1, NLM, BT, KS, and PAO are all constituent villages of the same village cluster (BT) and are geographically proximate, demonstrating the heterogeneity of human behavior related to infection and re-infection, even very locally. Table 5.5.1 compares, within villages, “treatment-naïve” individuals (in the context of KKU control programs) with resampled individuals. The results for treatment-naïve individuals (in parentheses in Table 5.5.1) show that large proportions of those populations were infected with O. viverrini; in fact, their prevalence values are very similar to those found in the 2008 baseline survey (compare with Table 3.3.1).

71
Participated in 2008, 2010, and 2012 surveys
Participated in 2008 and 2012
surveys
Participated in 2010 and 2012
surveys CCK 45% (44%) NLM 17% (49%) 31% (55%) 26% (50%)
BT 10% (20%) 5% (28%) 8% (18%) NNK 36% (67%)
KS 16% (19%) PAO 37% (61%) 36% (66%) 42% (65%)
0%
5%
10%
15%
20%
25%
30%
35%
40%
45%
0 1 2 3 4 5 6
# of PZQ Treatments
BT CCK NNK
Figure 5.5.1: Number of prior PZQ treatments by percentage of villagers from 2012 surveys
Table 5.5.1: Infection prevalence in 2012 survey for resampled individuals who were previously tested in 2008 and/or 2010 surveys (prevalence for individuals not resampled)

72
This reinfection data tells a startling story: a large number of villagers who tested positive and are “treated” for infection with praziquantel also test positive at the next infection survey. Given that little or no immunity is conferred by prior exposure, this pattern can be explained by a combination of three factors. Either villagers are not taking the provided drugs, the drugs are not 100% effective at clearing infection, or villagers are continuing to eat contaminated raw fish and are getting rapidly reinfected. To address the second and third factors, Table 5.5.2 shows median eggs per gram (EPG) values for reinfected individuals and uniquely sampled individuals. The decrease in EPG suggests that villagers were taking the drugs, but that treatment was incomplete, or they were getting reinfected in the interim period. Given the well-documented effectiveness of praziquantel, I favor true reinfection as the explanation for the data trend (Keiser & Utzinger 2004, Soukhathammavong et al. 2011). Interpreting the results is complicated by the sampling technique though, which relies on counting eggs in feces. Because worms (and the body) shed eggs at a variable rate, an individual tested on separate days could produce radically different results, even showing no infection when in fact heavy infection is causing bile duct obstruction, preventing eggs from reaching the intestinal tract. Nonetheless, the more likely reality is that the pattern is true even with uncertainty around the specifics. Infection burden with helminths builds up over time when people continue to practice an at-risk behavior, so the high EPG values characteristic of a large worm load is likely due to a person who has been infected cumulatively over time from eating many at-risk fish dishes. Ethnography in these villages supports this notion, as many villagers, particularly the elderly, continue this traditional practice despite health education and its known connection with cholangiocarcinoma (Samiphak and Syme 2017).
0%
10%
20%
30%
40%
50%
60%
70%
80%
1977 1982 1987 1989 1990 1992 1996 1997 1999 2001 2002 2004 2005 2006 2007 2008 2009 2010 2011 2012
Last PZQ Treatment by Village
BT CCK NNK
Figure 5.5.2: Last PZQ treatment year for by percentage of villagers from 2012 surveys

73
Participated in 2008, 2010, and 2012 surveys
Participated in 2008 and 2012
surveys
Participated in 2010 and 2012
surveys
CCK 34.8 (23.5)
NLM 9.5 (24.8) 122.6 21.0
BT 16.5 (17.0) 16.5 (17.0) 16.5 (17.0)
NNK 28.5 (59.4)
KS 12.5 (26.5)
PAO 21.3 (58.0) 49.5 31.0 5.6 Discussion and Conclusion This work highlights two major drivers of persistent O. viverrini infection in northeast Thailand: 1) a disturbed and dynamic hydrologic environment that mediates parasite transmission between connected village clusters and environments; and 2) consequent exposure and continuing practice of risky eating behaviors that enable rapid reinfection. I have shown by discussing and modeling five different means of hydrology influencing parasite transmission that its effects are significant and complex, acting heterogeneously across the Lawa Lake system. By examining reinfection data and the literature, I have concluded that villagers are continuing to eat raw, undercooked, and fermented cyprinid fish dishes and getting reinfected after treatment. These findings suggest that the short-term, hard-won gains by the Lawa Project could be easily undone in a few years if prevention and control programs do not continue in those villages. While local infection and contamination may be the main factor driving transmission at higher prevalence levels, as prevalence declines and villages move toward elimination connectivity will play a bigger role in maintaining the transmission cycle and preventing local elimination of the parasite. The connectivity between water bodies and villages ensures that elimination of local infection is not possible without addressing upstream and adjacent environments. If infectious fecal waste from human and reservoir hosts is continually flushed downstream and the source is not treated, transmission will be restarted even if previously disrupted. This argument supports an approach that first targets villages and populations near headwaters and then proceeds further downstream while still accounting for human mobility and migration that could reintroduce infection into a previously cleared environment. Flood pulses and overland flooding also risk moving parasites into isolated and disconnected environmental patches on an annual basis,
Table 5.5.2: Median reinfection EPG values when comparing resampled individuals between the 2008, 2010, and 2012 surveys (median EPG values for individuals not resampled)

74
which requires constant treatment and attention to infection status of individuals in those patches. Snail and fish mobility remain little understood but have major relevance for O. viverrini’s life cycle, specifically how infection propagates in the environment. Targeting the locations where snails and juvenile fish come into close proximity with each other could be a promising environmental control technique but requires greater knowledge about the conditions that enable this transmission process. The model and the data that inform the model have limitations due to their fragmentary nature. Other model assumptions ignore the impact of different parasite burden levels in hosts and the age structure of human populations. The hydrology model was calibrated and validated against available data, leading to a plausible interpretation of the observed hydrologic behavior of the system. However, it could not account for very local effects that eluded its time and spatial scale and may have relevance for the points of contact between stages of the life cycle. The infection survey data may not be representative of the host populations because of sampling bias, but its overall spatial and temporal patterns align with local understanding and experience. I introduced a linked epidemiologic-hydrologic modeling approach that uses hydrology model outputs as time-varying inputs in the disease transmission model to account for seasonal effects of flooding and water movement relevant to the intermediate hosts and waterborne forms of O. viverrini. Based on model results, I grouped village clusters into three disease prevalence curve patterns based on presence/absence of upstream and flooding impacts and history of control program intensiveness. I examined reinfection data in light of the model framework and suggested that many villagers in this region were likely continuing to eat raw and undercooked fish. Considering these findings, I argue for the use of this modeling approach and its results to inform environmental control of O. viverrini and for the need for environmental surveillance. While the specifics of the hydrology, population structure, and pathogen transmission cycle are local and specific in nature, this approach can be replicated across a variety of disease systems that are impacted by seasonally dynamic water movement.

75
5.7 Appendix Figure 5.7.1: Connectivity parameters for remaining village cluster connections scaled against maximum connectivity in this time span (extension of Figure 5.3.2)

76
Chapter 6: Conclusion 6.1 Development Engineering Perspective Through my coursework in the Designated Emphasis in Development Engineering, I studied design thinking, intervention program design and implementation, control of water-related pathogens, and the nexus of climate, energy, and development. These topics informed my approach to this dissertation’s content, which intersects with many fields: public health, environmental engineering, epidemiology, ecology, development, and the underlying mathematical models, to name the major ones. My education and fieldwork taught me that no one person can be a master of all of these approaches in our age of highly specialized, advanced knowledge; multidisciplinary teams are required for successful, sustainable interventions that meaningfully reduce disease burden and are responsive to the community and environment’s needs. This dissertation is one piece of that process for both O. viverrini control and understanding environmental transmission of water-related pathogens more generally. Northeast Thailand is a rapidly changing region that has served as the backdrop for the major advances in our understanding of O. viverrini and the linkage between opisthorchiasis and cholangiocarcinoma. The OV-CCA connection is a regional problem affecting East and Southeast Asia, so it has not drawn the same level of attention that aid work and research in Africa and other parts of the world have brought to malaria, HIV/AIDS, or tuberculosis. Opisthorchiasis disease burden is likely underestimated, and changing demographics may exacerbate the associated cancer burden, as discussed in Chapter 1. Throughout this dissertation, I have given evidence of the historical and present disease burden of O. viverrini infection, which is largely preventable and amenable to intervention. Better understanding of O. viverrini disease ecology also leads us to generalizable lessons about the nexus of environmental, animal, and human health (often called One Health). Northeast Thailand was a rural backwater for the Kingdom of Thailand for a long time, having become part of Thailand despite historical identification with modern-day Laos as the result of complex colonial and geopolitical forces. Thailand sponsored and continues to sponsor students to study abroad, notably in Australia, and many have returned to northeast Thailand to bring scientific approaches they honed at foreign institutions to bear on local, relevant problems to their region, including opisthorchiasis. The confluence of expanding lifespans in the 20th century that rendered OV-associated cholangiocarcinoma more likely to afflict people and environmental perturbation through increased land and water management and intensified irrigation made the parasite and its pathogenesis an increasingly important problem for these Thai researchers to solve. Yet, while understanding of the carcinogenesis and pathology increased, public health programs were vexed by the same factor that has made infectious disease control difficult across the globe in different contexts: human behavior. Dietary habits are like sexual behaviors: we often lie about them in surveys, exaggerating or downplaying our responses to put ourselves in a more favorable light. In this context, that meant that

77
proper accounting of consumption of “delicious” raw koi pla and pla som became more complicated as it was stigmatized. Today, researchers often doubt survey results of raw fish consumption and prefer direct observation. These studies are laborious and difficult to conduct, as koi pla and pla som may only be consumed sporadically or late at night while drinking alcohol, away from the eyes of researchers. Figure 6.1.1 shows the Development Engineering framework, adapted from the ideas of constant iteration and “fail fast, fail often” espoused by Silicon Valley (Levine et al. 2016). I used this approach to guide my thinking about how to reduce liver fluke transmission with environmental control. While this schema is product-oriented, the approach remains relevant for understanding environmental interventions to improve public health. Observations produce data about development-related problems and help generate insights about ideas that lead to solutions that can be tested. Modeling fits well into this cycle; Figure 6.1.2 shows a framework for “model-guided fieldwork” that I have used to think about how mathematical modeling can inform and support public health efforts (Restif et al. 2012). Basic models can explore the parameter space and different versions of interactions and mechanistic implementations, allowing modelers to inform experiment and study designs that produce better parameter estimates, support model validation, and suggest new research directions.
6.2 Suggested Public Health Policy Implications To date, assessments of the consequences of anthropogenic environmental change have often excluded nonlinear health impacts for the justifiable reason that we simply do not adequately understand these phenomena. A lack of data and study of pathogens with complex life cycles and their fate and transport make them difficult to model and estimate. However, the world of mathematical modeling has exploded since
Figure 6.1.1: Development Engineering framework

78
Anderson and May (1991), and access to high-quality, high-resolution data has increased. Nonetheless, major data gaps remain for even the most serious infectious diseases around the globe. As an example, the dataset for the Garki Project conducted by the WHO in the 1970s continues to be used extensively for modeling of malaria epidemiology and control strategies (Molineaux and Gramiccia 1980). Despite advances in control and treatment, no modern dataset has been produced that displaces the Garki Project for its completeness in measuring important environmental and epidemiological covariates related to disease transmission and ecology. The same can easily be said for opisthorchiasis, an NTD. Our best dataset about snail infection and ecology remains Brockelman et al. (1986), which, while useful and interesting, reflects the environment of the early 1980s. The environment of the late 2010s is quite different and should be informed by modern snail ecology studies to update our models and implementation of environmental control. Fish ecology is even less well studied; it is difficult to point to one manuscript or report that captures the environmental context of cyprinid fish and their role in the transmission cycle. There are numerous reviews of liver fluke biology, but they skim over important ecological details for lack of knowledge (Kaewkes 2003, WHO 2012, Petney et al. 2018). While we have a pretty good idea of what happens inside infected humans (though diagnosing them accurately in a non-invasive way remains a challenge), the rest of the transmission cycle remains a relative mystery. A properly designed multiyear surveillance research project would produce useful data for understanding the environmental transmission context of O. viverrini and also C. sinensis. This effort would entail collecting local meteorological and hydrological data alongside infection surveys of all hosts with sufficient population sizes and proper methodologies. Remote sensing data would aid with the characterization of macrotrends alongside the local aspects of parasite transmission.
Figure 6.1.2: Model-guided fieldwork framework (Restif et al. 2012)

79
Research produced from projects of this nature would inform public health treatment and control program design. It would also necessitate the inclusion of agriculture and aquaculture workers, engineers, and politicians into the process for tackling such a complex transmission system. A current weakness in the prospects for such research lies in diagnostic and infection survey methods. Currently, the gold standard for measuring infection prevalence in snails is shedding via exposure to light. PCR-based methods for O. viverrini cercarial DNA exist and detect higher infection rates than shedding methods but are prohibitively expensive considering the large number of snails that have to be processed (Saijuntha et al. 2018). The gold standard for measuring fish infection is the pepsin digestion method followed by morphological identification, which requires trained parasitologists and sometimes PCR confirmation to identify. This method is time-consuming and requires sacrificing large numbers of fish, neither of which is ideal. A recent paper described an effort at detecting O. viverrini environmental DNA (eDNA) in water samples (Hashizume et al. 2017), which is the first published study measuring water contamination by the parasite. While promising and positive progress for the field, their method was plagued by the same problems that affect other eDNA methods: cross-reactivity, low water volume samples, and cost, equipment, and training required to employ this method. Notably, the study did not detect egg or cercarial DNA in their samples, only fragmented cells or tissues of O.viverrini. While in Thailand, I ran a set of exploratory experiments to filter hundreds and thousands of liters of water through a mesh material with pore size of 50 µm, which should have been sufficient to capture cercariae but not eggs. I identified one site out of four as positive for the presence of O. viverrini cercarial DNA. Unfortunately, funding and logistical challenges prevented me from developing this method further, but the result remains as a proof-of-concept of the plausibility of collecting and measuring cercarial concentrations from flowing bodies of water. This approach with a mesh filter in the field rather than a grab sample brought back to a lab allows for the analysis of hundreds to thousands of liters of water, compared with less than 1 L for the method presented in Hashizume et al. (2017). Considering policy recommendations, the most straightforward approach to breaking the transmission cycle is at the fish-human/reservoir and reservoir/human-snail linkages. Considering that, to the best of our knowledge, few other reservoir hosts are contributing significantly to snail infection, focusing on humans and cats is the most effective approach, given the lack of control that can be exerted over snail and fish populations. For humans, health education has to continue to teach the risk posed by raw fish for developing opisthorchiasis and cholangiocarcinoma while providing cultural support and substitutes for other dietary practices. The Lawa Project incorporated cooking demonstrations that produced an analog of koi pla with cooked fish to show its feasibility and deliciousness to satisfy local tastes and traditions. Villagers should be taught to be careful about disposing raw fish scraps so that they are not accessible to cats. Because cats roam and are not always claimed by one family, this approach has to be a community effort to prevent any access to contaminated fish. In Thailand and in Southeast Asia more generally, many cats and dogs are not spayed or neutered, for reasons ranging from considerations of Buddhist kamma to being stray or abandoned. Consequently, cats will continue to contribute meaningfully to the transmission cycle absent significant government efforts to reduce their populations. As

80
much of northeast Thailand has not transitioned to a paradigm of indoor cats using litter boxes, they will continue to defecate in the environment in locations where their egg-containing feces could be washed or spread into snail habitat. Human waste should be adequately treated for pathogen inactivation before it is applied to rice fields or otherwise spread back into the environment in proximity to snail habitat. This treatment could be partially accomplished by waiting a longer time before pumping out feces from a septic tank, which is limited by its size; however, most households will not have alternative means of improved sanitation while pathogens are sufficiently inactivated. Another approach would be to pump out human waste from septic tanks and then bring it to a treatment facility, where it can be properly treated and processed into biosolids for application on rice paddies and in fish farms. Unfortunately, this would generate added costs, which many farmers may avoid due to limited finances, and they may circumvent proper treatment of the waste before use on their fields. Environmental engineers and farmers in northeast Thailand and more generally would benefit from considering the impacts of their irrigation and flood mitigation strategies on infectious disease transmission. While the trend of disease exacerbation has been studied extensively in connection with dam projects, localized effects of a new irrigation canal or culvert are not studied or understood (Patz et al. 2004, Ziegler et al. 2013). Increasingly intensive rice cultivation and the accompanying irrigation schemes may be creating year-round Bithynia snail habitat, fracturing the natural seasonal break in the lifecycle and allowing transmission to continue perpetually. Other activities with unintended consequences that could be exacerbating disease transmission include pumping water into and out of shared canals without filtering, wildlife conservation efforts protecting native fish species, and creating new hydrologic structures that allow connectivity where it previously did not exist. 6.3 Ongoing data and research gaps, how to tackle NTDs While this dissertation has sought to put the pieces together in integrating environmental and epidemiological data for use with transmission models, there remain basic biological questions about the parasite’s ecology that are not known or easily answered. Ecological information about cyprinid fish intermediate hosts remains notably lacking. Existing low prevalence levels in snails mean that snail control would require close to 100% population coverage to have an impact on transmission dynamics. Since fish prevalence levels remain higher (> 10% in many contexts) and only a fraction of fish are consumed raw, fish-related environmental control could have a significant impact on restricting transmission. In this dissertation, I described current knowledge about how they are infected, but the hotspot concept remains to be indisputably proven in the natural environment. Laboratory experiments on cyprinids are difficult to conduct because the species do not thrive in captivity, so any work will probably have to take place in a hybrid lab-field setting. NTDs are infectious diseases of poverty and may continue to lag behind the “Big Three” (HIV/AIDS, malaria, tuberculosis) in terms of funding, research focus, and control program coverage. However, opportunities exist to leverage existing knowledge and lessons learned from more highly-studied diseases to leapfrog intermediate knowledge and control methods for NTDs. Examples include the history of snail control to combat schistosomiasis that can be applied to O. viverrini, C. sinensis, and other

81
parasites with a snail intermediate host. CRISPR-Cas9 gene drives that are being tested in the mosquito vectors Aedes aegypti and Anopheles gambiae will yield useful information for other mosquito species and other types of vectors and hosts. While the gene drive will have to be redesigned in each situation, the underlying science and mathematics remains relatively constant and does not require development of separate methods. Already other parasites such as Schistosoma mansoni and Leishmania major are being edited (Ittiprasert et al. 2018, Sollelis et al. 2015). While gene editing with CRISPR-Cas9 is not a complicated technique, it still requires equipment, expertise, and funding that will not be available to many researchers and public health scientists working against NTDs. Depending on results with current target organisms, enough success and interest may allow global health funders to create large-scale gene editing projects for parasites such as O. viverrini. 6.4 Limitations, Progress, Next Steps An obvious limitation of this work, particularly the modeling, is the fragmentary and incomplete data available about the state of infection in the Lawa Lake system over time. This dissertation has compiled the most complete collection of data about O. viverrini infection in all hosts available for more than one time point in any region. Still, this record only captures 2-5 samples between 2008 and 2016 of measurement for human populations, and only 2-3 for snail, fish and reservoir host populations. With this quality of data, it is difficult to say anything more than describing the most fundamental patterns, coupled with qualitative observations of changes in the environment and human behavior. I was not able to prospectively collect human infection data because of ethical, logistical, and temporal constraints, so I used previously collected human, animal, and environmental data along with animal and environmental data I collected myself. Because of the nature of liver fluke infection, I could not get incidence data or an understanding of how burden builds up in individuals over time to measure how many worms were acquired in a month or year. This is valuable knowledge that still eludes researchers not only for opisthorchiasis but also for other helminth infections. The modeling primarily uses prevalence as its outcome measure though many other models of similar infections, like schistosomiasis, use worm burden or other endpoints as the outcome measure. Worm burden was not used as the state variable but was included as a parameter of interest because even fewer of the human infection survey data points included EPG measurements, and the methods of counting varied and were not necessarily directly comparable. The model assumptions previously discussed are defensible but not guaranteed to be true. Nonetheless, important progress has been made toward using mathematical modeling as a tool to understand environmental transmission of O. viverrini. In this dissertation, I have laid out the basic framework for using deterministic ODEs to simulate liver fluke transmission. I then described model modifications that included the reservoir hosts, complexified the intermediate host dynamics, and introduced praziquantel treatment regimens. Next, I linked in a rainfall-runoff hydrology model to use environmental data of precipitation, flow, and flooding to simulate seasonal transmission dynamics for five different domains of impact. I discussed how this approach allows us to better understand water-related disease transmission and how it

82
responds to changes in the environment. I discussed aspects of the ecological situation and how to model future changes alongside potential public health treatment, control, and education strategies. Next steps for potential work in this area follow two threads: precedent set by better modeled systems and new directions unique to this system or any system. Disease modelers for malaria and schistosomiasis have leveraged higher resolution data to hone in on finer scale spatial, temporal, and social effects. Increased knowledge about food sharing practices and social networks could inform an individually-based model with village population structures to examine the implications of different means of acquiring and sharing infected fish. Different flood management strategies and alterations in the hydroscape could be designed into the hydrology model to see the long-term disease transmission implications of such changes. More generally, pathogens and diseases are usually considered and modeled in isolation, when in reality they interact in meaningful ways in the environment and within individuals. Parasites modify host behavior and fitness in myriad ways though their long-term interest is in host survival. Co-infections may or may not occur in different organisms, and one infection can protect against or enable another. Infection survey results of all stages of the lifecycle show that the relevant hosts (humans, cats, snails, and fish) in the Lawa Lake complex are highly parasitized by numerous species, not just O. viverrini. Many of these parasites are not well studied or even speciated. One clinically relevant recent finding is that the carcinogenicity of O. viverrini may be connected with Helicobacter pylori that colonize O. viverrini and survive the human gastrointestinal tract within the metacercariae before accessing the bile ducts where they wreak their damage (Dangtakot et al. 2017, Deenonpoe et al. 2017). This finding suggests different approaches for preventing severe disease in the form of CCA, as from a public health perspective we become less interested in preventing O. viverrini infection than in preventing H. pylori colonization of O. viverrini. This relationship needs to be further studied. Just as chemical risk assessment is moving towards cumulative risk assessment that incorporates synergistic and antagonistic effects in a framework that thinks about the totality of exposure rather than its individual parts in isolation, so must infectious disease modeling and research move in this direction, at least in considering chronic co-infections that affect large swaths of the developing world (NRC 2009). Risk factors like unsafe water and sanitation and environmental conditions are rarely implicated in only one transmission pathway but in a host of pathogen transmission routes through air, water, and other media. With new tools and technologies coming into the pipeline to measure numerous pathogens of interest simultaneously and Big Data techniques and computing power to process large datasets, we have an opportunity to develop meaningful surveillance approaches that integrate with environmental and epidemiological data for improved modeling and prediction of disease presence, spread, and severity. While this dissertation did not extensively discuss within-host dynamics of O. viverrini infection, other disease modelers have paved the way for incorporation of intra-host and inter-host dynamics together for a more complex paradigm of infectious disease ecology.

83
Why do I do what I do? I want to understand the human-environment nexus in the public health context and produce and use models that provide insights into how we can reduce disease burden and increase livelihoods and human thriving. Many aspects of the current research and funding environment may not value this kind of work, and I have repeatedly highlighted the need for the types of information that were more often collected in the 1960s and 1980s than are collected today. Yet, I will continue to research and act with hope and optimism in preventing O. viverrini and other infectious diseases, believing that a healthier and more sustainable world is a worthy goal of my vocation.

84
References
1. Anderson, R.M., & May, R.M., 1991. Infectious Diseases of Humans: Dynamics and Control. Oxford University Press.
2. Anderson, R., Truscott, J., & Hollingsworth, T. D. (2014). The coverage and frequency of mass drug administration required to eliminate persistent transmission of soil-transmitted helminths. Phil. Trans. R. Soc. B, 369(1645), 20130435.
3. Aunpromma, S., Tangkawattana, P., Papirom, P., et al. (2012). High prevalence of Opisthorchis viverrini infection in reservoir hosts in four districts of Khon Kaen Province, an opisthorchiasis endemic area of Thailand. Parasitology International, 61(1), 60-64.
4. Babel, M. S., Agarwal, A., Swain, D. K., et al. (2011). Evaluation of climate change impacts and adaptation measures for rice cultivation in Northeast Thailand. Climate Research, 46(2), 137.
5. Basañez, M. G., & Anderson, R. M. (2016). Mathematical Models for Neglected Tropical Diseases: Essential Tools for Control and Elimination (Vol. 94). Academic Press.
6. Boerlage, A. S., Graat, E. A., Verreth, J. A., et al. (2013). Effect of control strategies on the persistence of fish-borne zoonotic trematodes: A modelling approach. Aquaculture, 408, 106-112.
7. Boy, V., & Crivelli, A. J. (1988). Simultaneous determination of gillnet selectivity and population age-class distribution for two cyprinids. Fisheries Research, 6(4), 337-345.
8. Brockelman, W. Y., Upatham, E. S., Viyanant, V., et al. (1986). Field studies on the transmission of the human liver fluke, Opisthorchis viverrini, in northeast Thailand: population changes of the snail intermediate host. International Journal for Parasitology, 16(5), 545-552.
9. Bürli, C., Harbrecht H., Odermatt P., et al. (2018). "Mathematical analysis of the transmission dynamics of the liver fluke, Opisthorchis viverrini." Journal of Theoretical Biology 439, 181-194.
10. Chaiputcha, K., Promthet, S., & Bradshaw, P. (2015). Prevalence and risk factors for infection by Opisthorchis viverrini in an urban area of Mahasarakham Province, Northeast Thailand. Asian Pac J Cancer Prev, 16(10), 4173-6.
11. Computational Hydraulics International [CHI] (2018). PCSWMM Modeling Software. Available at: https://www.pcswmm.com
12. Cheng, Q., Jing, Q., Spear, R.C., et al. (2016). Climate and the timing of imported cases as determinants of the dengue outbreak in Guangzhou, 2014: Evidence from a mathematical model, PLoS NTDs, DOI:10.1371/journal.pntd.0004417.
13. Dangtakot, R., Pinlaor, S., Itthitaetrakool, U., et al. (2017). Co-infection of Helicobacter pylori and Opisthorchis viverrini enhances the severity of hepatobiliary abnormalities in hamsters. Infection and immunity, IAI-00009.
14. Dao, T. H., Nguyen, T. G., Victor, B., et al. (2014). Opisthorchis viverrini-like liver fluke in birds from Vietnam: morphological variability and rDNA/mtDNA sequence confirmation. Journal of Helminthology, 88(4), 441-446.
15. Deenonpoe, R., Mairiang, E., Mairiang, P., et al. (2017). Elevated prevalence of Helicobacter species and virulence factors in opisthorchiasis and associated hepatobiliary disease. Scientific Reports, 7, 42744.
16. Dixon, C. J. (1977). Development, regional disparity and planning: The experience of Northeast Thailand. Journal of Southeast Asian Studies, 8(2), 210-23.

85
17. Donthaisong, C., Arunsan, P., Suwannatrai, K., et al. (2014). Experimental infection of Opisthorchis viverrini cercariae to the cyprinid fish, Barbonymus gonionotus. Acta Tropica, 136, 118-122.
18. Echaubard, P., León, T., Suwanatrai, K., et al. (2017). Experimental and modelling investigations of Opisthorchis viverrini miracidia transmission over time and across temperatures: implications for control. International Journal for Parasitology, 47(5), 257-270.
19. Fürst, T., Keiser, J., & Utzinger, J. (2012). Global burden of human food-borne trematodiasis: a systematic review and meta-analysis. The Lancet Infectious Diseases, 12(3), 210-221.
20. Gozlan, R. E., Copp, G. H., & Tourenq, J. N. (1998). Comparison of growth plasticity in the laboratory and field, and implications for the onset of juvenile development in sofie, Chondrostoma toxostoma. In When do fishes become juveniles? (pp. 153-165). Springer, Dordrecht.
21. Grundy-Warr, C., Andrews, R. H., Sithithaworn, P., et al. (2012). Raw attitudes, wetland cultures, life-cycles: socio-cultural dynamics relating to Opisthorchis viverrini in the Mekong Basin. Parasitology International, 61(1), 65-70.
22. Haas, W., Granzer, M., & Brockelman, C. R. (1990). Opisthorchis viverrini: finding and recognition of the fish host by the cercariae. Experimental Parasitology, 71(4), 422-431.
23. Hashizume, H., Sato, M., Sato, M. O., et al. (2017). Application of environmental DNA analysis for the detection of Opisthorchis viverrini DNA in water samples. Acta Tropica, 169, 1-7.
24. Hotez, P. J. (2017). Ten failings in global neglected tropical diseases control. PLoS NTDs, 11(12), e0005896.
25. Hotez, P. J., Bottazzi, M. E., Strych, U., et al. (2015). Neglected tropical diseases among the Association of Southeast Asian Nations (ASEAN): overview and update. PLoS NTDs, 9(4), e0003575.
26. Hung, N. M., Duc, N. V., Stauffer, J. R., et al. (2013). Use of black carp (Mylopharyngodon piceus) in biological control of intermediate host snails of fish-borne zoonotic trematodes in nursery ponds in the Red River Delta, Vietnam. Parasites & Vectors, 6(1), 142.
27. Hung, Y. W., & Remais, J. (2008). Quantitative detection of Schistosoma japonicum cercariae in water by real-time PCR. PLoS NTDs, 2(11), e337.
28. Ittiprasert, W., Mann, V. H., Karinshak, S. E., et al. (2018). Functional genomics and programmed genome editing of omega-1 of the blood fluke Schistosoma mansoni. bioRxiv, 358424.
29. Jongsuksuntigul, P., & Imsomboon, T. (2003). Opisthorchiasis control in Thailand. Acta Tropica, 88(3), 229-232.
30. Kaewkes, S. (2003). Taxonomy and biology of liver flukes. Acta Tropica, 88(3), 177-186.
31. Kamsa-ard, S., Wiangnon, S., Suwanrungruang, K., et al. (2011). Trends in liver cancer incidence between 1985 and 2009, Khon Kaen, Thailand: cholangiocarcinoma. Asian Pac J Cancer Prev, 12(9), 2209-2213.
32. Kamsa-ard, S., Laopaiboon, M., Luvira, V., et al. (2013). Association between praziquantel and cholangiocarcinoma in patients infected with Opisthorchis viverrini: a systematic review and meta-analysis. Asian Pacific J Cancer Prev, 14, 7011-7016.

86
33. Kawasaki, J., & Herath, S. (2011). Impact assessment of climate change on rice production in Khon Kaen province, Thailand. Journal of ISSAAS, 17, 14-28.
34. Keiser, J., & Utzinger, J. (2004). Chemotherapy for major food-borne trematodes: a review. Expert Opinion on Pharmacotherapy, 5(8), 1711-1726.
35. Keiser, J. and Utzinger, J. (2005). Emerging Foodborne Trematodiasis. Emerging Infectious Diseases, 11(10), 1507-1514.
36. Keiser, J., & Utzinger, J. (2009). Food-Borne Trematodiases. Clinical Microbiology Reviews, 22(3), 466-483.
37. Khamboonruang, C., Keawvichit, R., Wongworapat, K., et al. (1997). Application of hazard analysis critical control point (HACCP) as a possible control measure for Opisthorchis viverrini infection in cultured carp (Puntius gonionotus). Southeast Asian Journal of Tropical Medicine and Public Health, 28, 65-72.
38. Khan, S. A., Davidson, B. R., Goldin, R., et al. (2002). Guidelines for the diagnosis and treatment of cholangiocarcinoma: consensus document. Gut, 51 (suppl 6), vi1-vi9.
39. Khuntikeo, N., Chamadol, N., Yongvanit, P., et al. 2015). Cohort profile: cholangiocarcinoma screening and care program (CASCAP). BMC Cancer, 15(1), 459.
40. Kiatsopit, N., Sithithaworn, P., Saijuntha, W., et al. (2012). Exceptionally high prevalence of infection of Bithynia siamensis goniomphalos with Opisthorchis viverrini cercariae in different wetlands in Thailand and Lao PDR. AJTMH, 86(3), 464-469.
41. Kim, C. S., Echaubard, P., Suwannatrai, A., et al. (2016). Seasonal and spatial environmental influence on Opisthorchis viverrini intermediate hosts, abundance, and distribution: insights on transmission dynamics and sustainable control. PLoS NTDs, 10(11), e0005121.
42. Kim, C. S., Smith, J. F., Suwannatrai, A., et al. (2017). Role of socio-cultural and economic factors in cyprinid fish distribution networks and consumption in Lawa Lake region, Northeast Thailand: Novel perspectives on Opisthorchis viverrini transmission dynamics. Acta Tropica, 170, 85-94.
43. Krishnamurthy, D., Katsikis, G., Bhargava, A., et al. (2017). Schistosoma mansoni cercariae swim efficiently by exploiting an elastohydrodynamic coupling. Nature Physics, 13(3), 266.
44. Levine, D. I., Agogino, A. M. & Lesniewski, M. A. 2016 Design thinking in development engineering. International Journal of Engineering Education 32 (3B), 1396–1406.
45. Liang, S., Maszle, D.M., & Spear, R.C. (2002). A Quantitative Framework for a Multi-Group Model of Schistosomiasis japonicum Transmission Dynamics and Control in Sichuan, China, Acta Tropica, 82, 263–277.
46. Luby, S. P., Rahman, M., Arnold, B. F., et al. (2018). Effects of water quality, sanitation, handwashing, and nutritional interventions on diarrhoea and child growth in rural Bangladesh: a cluster randomised controlled trial. The Lancet Global Health, 6(3), e302-e315.
47. Maleewong, W., Intapan, P. M., Wongkham, C., et al. (2003). Detection of Opisthorchis viverrini in experimentally infected bithynid snails and cyprinoid fishes by a PCR-based method. Parasitology, 126(1), 63-67.
48. Manpratum, Y., Kaewkes, W., Echaubard, P., et al. (2017). New locality record for Haplorchoides mehrai and possible interactions with Opisthorchis viverrini metacercariae in cyprinid fishes in Northeast Thailand. Parasitology Research, 116(2), 601-608.
87
49. McCrimmon, H. R., & Swee, U. B. (1967). Scale formation as related to growth and development of young carp, Cyprinus carpio L. Journal of the Fisheries Board of Canada, 24(1), 47-51.
50. McSorley, H. J., Hewitson, J. P., & Maizels, R. M. (2013). Immunomodulation by helminth parasites: defining mechanisms and mediators. International Journal for Parasitology, 43(3-4), 301-310.
51. Michael, E. & Gambhir, M. (2010) Transmission models and management of Lymphatic Filariasis elimination. Advances in Experimental Medicine and Biology, 673: 157-171.
52. Molineaux, L., & Gramiccia, G.(1980). The Garki project: research on the epidemiology and control of malaria in the Sudan savanna of West Africa. Published by the World Health Organization.
53. Molyneux, D., & Sankara, D. P. (2017). Guinea worm eradication: Progress and challenges—should we beware of the dog?. PLoS NTDs, 11(4), e0005495.
54. National Research Council. (2009). Science and Decisions: Advancing Risk Assessment. National Academies Press.
55. Nawa, Y., Doanh, P. N., & Thaenkham, U. (2015). Is Opisthorchis viverrini an avian liver fluke?. Journal of Helminthology, 89(2), 255-256.
56. Ong, X., Wang, Y. C., Sithithaworn, P., et al. (2016). Dam influences on liver fluke transmission: Fish infection and human fish consumption behavior. Annals of the American Association of Geographers, 106(4), 755-772.
57. Onsurathum, S., Pinlaor, P., Charoensuk, L., et al. (2016a). Contamination of Opisthorchis viverrini and Haplorchis taichui metacercariae in fermented fish products in northeastern Thailand markets. Food Control, 59, 493-498.
58. Onsurathum, S., Pinlaor, P., Haonon, O., et al. (2016b). Effects of fermentation time and low temperature during the production process of Thai pickled fish (pla-som) on the viability and infectivity of Opisthorchis viverrini metacercariae. International Journal of Food Microbiology, 218, 1-5.
59. Perez-Saez, J., Mande, T., Ceperley, N., et al. A. (2016). Hydrology and density feedbacks control the ecology of intermediate hosts of schistosomiasis across habitats in seasonal climates. PNAS, 113(23), 6427-6432.
60. Petney, T. N., Andrews, R. H., Saijuntha, W., et al. (2013). The zoonotic, fish-borne liver flukes Clonorchis sinensis, Opisthorchis felineus and Opisthorchis viverrini. International Journal for Parasitology, 43(12), 1031-1046.
61. Phimpraphai, W., Tangkawattana, S., Kasemsuwan, S., et al. (2018). Social Influence in Liver Fluke Transmission: Application of Social Network Analysis of Food Sharing in Thai Isaan Culture. Advances in Parasitology.
62. Pitaksakulrat, O., Kiatsopit, N., Laoprom, N., et al. (2017). Preliminary genetic evidence of two different populations of Opisthorchis viverrini in Lao PDR. Parasitology Research, 116(4), 1247-1256.
63. Poulsen, A. F., Hortle, K. G., Valbo-Jorgensen, J., et al. (2004). Distribution and ecology of some important riverine fish species of the Mekong River Basin. MRC Technical Paper, 10, 116.
64. Rangsin, R., Mungthin, M., Taamasri, P., et al. (2009). Incidence and risk factors of Opisthorchis viverrini infections in a rural community in Thailand. The American Journal of Tropical Medicine and Hygiene, 81(1), 152-155.
65. Remais, J., Liang, S., & Spear, R. C. (2008). Coupling hydrologic and infectious disease models to explain regional differences in schistosomiasis transmission in southwestern China. ES&T, 42(7), 2643-2649.
88
66. Remais, J., Zhong, B., Carlton, E. J., et al. (2009). Model approaches for estimating the influence of time-varying socio-environmental factors on macroparasite transmission in two endemic regions. Epidemics, 1(4), 213-220.
67. Restif, O., Hayman, D. T., Pulliam, J. R., et al. (2012). Model-guided fieldwork: practical guidelines for multidisciplinary research on wildlife ecological and epidemiological dynamics. Ecology Letters, 15(10), 1083-1094.
68. Rinaldo, A., Bertuzzo, E., Mari, L., et al. (2012). Reassessment of the 2010–2011 Haiti cholera outbreak and rainfall-driven multiseason projections. PNAS, 109(17), 6602-6607.
69. Saengboonmee, C., Seubwai, W., Wongkham, C., et al. (2015). Diabetes mellitus: Possible risk and promoting factors of cholangiocarcinoma: Association of diabetes mellitus and cholangiocarcinoma. Cancer epidemiology, 39(3), 274-278.
70. Saengsawang, P., Promthet, S., & Bradshaw, P. (2013). Infection with Opisthorchis viverrini and use of praziquantel among a working-age population in northeast Thailand. Asian Pacific Journal of Cancer Prevention, 14(5), 2963-2966.
71. Saenna, P., Hurst, C., Echaubard, P., et al. (2017). Fish sharing as a risk factor for Opisthorchis viverrini infection: evidence from two villages in north-eastern Thailand. Infectious diseases of poverty, 6(1), 66.
72. Saijuntha, W., Sithithaworn, P., Wongkham, S., et al. (2008). Genetic variation at three enzyme loci within a Thailand population of Opisthorchis viverrini. Parasitology Research, 103(6), 1283.
73. Samiphak, S., & Syme, S. L. (2017). The Battle of Worldviews: A Case Study of Liver Fluke Infection in Khon Kaen, Thailand. Journal of Evidence-based Complementary & Alternative Medicine, 22(4), 902-908.
74. Sithithaworn, P., Andrews, R. H., Van De, N., et al. (2012). The current status of opisthorchiasis and clonorchiasis in the Mekong Basin. Parasitology International, 61(1), 10-16.
75. Sithithaworn, P., & Haswell-Elkins, M. (2003). Epidemiology of Opisthorchis viverrini. Acta Tropica, 88(3), 187-194.
76. Sithithaworn, P., Pipitgool, V., Srisawangwong, T., et al. (1997). Seasonal variation of Opisthorchis viverrini infection in cyprinoid fish in north-east Thailand: implications for parasite control and food safety. Bulletin of the World Health Organization, 75(2), 125-131.
77. Sithithaworn, P., Tesana, S., Pipitgool, V., et al. (1991). Relationship between faecal egg count and worm burden of Opisthorchis viverrini in human autopsy cases. Parasitology, 102 (Pt 2), 277-281.
78. Sithithaworn, P., Yongvanit, P., Duenngai, K., et al. (2014). Roles of liver fluke infection as risk factor for cholangiocarcinoma. Journal of Hepato-Biliary-Pancreatic Sciences, 21(5), 301-308.
79. Sohn, W. M. (2009). Fish-borne zoonotic trematode metacercariae in the Republic of Korea. The Korean Journal of Parasitology, 47(Suppl), S103-S113.
80. Sollelis, L., Ghorbal, M., MacPherson, C. R., et al. (2015). First efficient CRISPR-Cas9-mediated genome editing in Leishmania parasites. Cellular Microbiology, 17(10), 1405-1412.
81. Soukhathammavong, P., Odermatt, P., Sayasone, S., (2011). Efficacy and safety of mefloquine, artesunate, mefloquine–artesunate, tribendimidine, and praziquantel in patients with Opisthorchis viverrini: a randomised, exploratory, open-label, phase 2 trial. The Lancet Infectious Diseases, 11(2), 110-118.

89
82. Sriamporn, S., Pisani, P., Pipitgool, V., et al. (2004). Prevalence of Opisthorchis viverrini infection and incidence of cholangiocarcinoma in Khon Kaen, Northeast Thailand. Tropical Medicine & International Health, 9(5), 588-594.
83. Sripa, B., Brindley, P. J., Mulvenna, J., et al. (2012). The tumorigenic liver fluke Opisthorchis viverrini–multiple pathways to cancer. Trends in Parasitology, 28(10), 395-407.
84. Sripa, B., Bethony, J. M., Sithithaworn, P., et al. (2011). Opisthorchiasis and Opisthorchis-associated cholangiocarcinoma in Thailand and Laos. Acta Tropica, 120, S158-S168.
85. Sripa, B., & Echaubard, P. (2017). Prospects and challenges towards sustainable liver fluke control. Trends in Parasitology, 33(10), 799-812.
86. Sripa, B., & Kaewkes, S. (2000). Relationship between parasite-specific antibody responses and intensity of Opisthorchis viverrini infection in hamsters. Parasite Immunology, 22(3), 139-145.
87. Sripa, B., Kaewkes, S., Intapan, P. M., et al. (2010). Food-borne trematodiases in Southeast Asia: epidemiology, pathology, clinical manifestation and control. Advances in Parasitology, 72, 305-350.
88. Sripa, B., Tangkawattana, S., Laha, T., et al. (2015). Toward integrated opisthorchiasis control in northeast Thailand: the Lawa project. Acta Tropica, 141, 361-367.
89. Sripa, B., Tesana, S., Yurlova, N., et al. (2017). A historical review of small liver fluke infections in humans. Parasitology international, 66(4), 337.
90. Statistics and Information Branch of the FAO Fisheries and Aquaculture Department (2013). FAO yearbook- Fishery and Aquaculture Statistics 2011. FAO, Rome. 1-76.
91. Suwannahitatorn, P., Klomjit, S., Naaglor, T., et al. (2013). A follow-up study of Opisthorchis viverrini infection after the implementation of control program in a rural community, central Thailand. Parasites & Vectors, 6(1), 188.
92. Suwannatrai, A., Suwannatrai, K., Haruay, S., et al. (2011). Effect of soil surface salt on the density and distribution of the snail Bithynia siamensis goniomphalos in northeast Thailand. Geospatial Health, 5(2), 183-190.
93. Tangkawattana, S., & Tangkawattana, P. (2018). Reservoir Animals and Their Roles in Transmission of Opisthorchis viverrini. Advances in Parasitology.
94. Tompkins, A. M., & Ermert, V. (2013). A regional-scale, high resolution dynamical malaria model that accounts for population density, climate and surface hydrology. Malaria Journal, 12(1), 65.
95. Traub, R. J., Macaranas, J., Mungthin, M., et al. (2009). A new PCR-based approach indicates the range of Clonorchis sinensis now extends to Central Thailand. PLoS NTDs, 3(1), e367, 1-7.
96. Upatham, E. S., Viyanant, V., Kurathong, S., et al. (1984). Relationship between prevalence and intensity of Opisthorchis viverrini infection, and clinical symptoms and signs in a rural community in north-east Thailand. Bulletin of the World Health Organization, 62(3), 451.
97. U.S. EPA (2011). Exposure Factors Handbook 2011 Edition (Final). Washington, DC, EPA/600/R-09/052F.
98. Wang, S., & Spear, R. C. (2016). Exposure versus Susceptibility as Alternative Bases for New Approaches to Surveillance for Schistosoma japonicum in Low Transmission Environments. PLoS NTDs, 10(3), e0004425.

90
99. Wang, Y. C. (2012). Examining landscape determinants of Opisthorchis viverrini transmission. EcoHealth, 9(3), 328-341.
100. Wang, Y. C., Feng, C. C., and Sithithaworn, P. (2013). Environmental determinants of Opisthorchis viverrini prevalence in northeast Thailand. Geospatial Health, 8(1), 111-123.
101. Wang, Y. C., Ho, R. C. Y., Feng, C. C., et al. (2015). An ecological study of Bithynia snails, the first intermediate host of Opisthorchis viverrini in northeast Thailand. Acta Tropica, 141, 244-252.
102. Wang, Y. C., Yuen, R., Feng, C. C., et al. (2017). Assessing the role of landscape connectivity on Opisthorchis viverrini transmission dynamics. Parasitology International, 66(4), 402-412.
103. World Health Organization. (2012). IARC monographs on the evaluation of carcinogenic risks to humans: Volume 100B-Biological Agents. A Review of Human Carcinogens.
104. World Health Organization and UNICEF (2017). Progress on drinking water, sanitation and hygiene: 2017 update and SDG baselines.
105. Worasith C, Kamamia C, Yakovleva A, et al. (2015) Advances in the Diagnosis of Human Opisthorchiasis: Development of Opisthorchis viverrini Antigen Detection in Urine. PLoS NTDs 9(10): e0004157. doi:10.1371/journal. pntd.0004157
106. Worrell, C., Xiao, N., Vidal, J. E., et al. (2011). Field detection of Schistosoma japonicum cercariae in environmental water samples by quantitative PCR. Applied and Environmental Microbiology, 77(6), 2192-2195.
107. Ziegler, A. D., Echaubard, P., Lee, Y. T., et al. (2016). Untangling the complexity of liver fluke infection and cholangiocarcinoma in NE Thailand through transdisciplinary learning. EcoHealth, 13(2), 316-327.
108. Ziegler, A. D., Petney, T. N., Grundy-Warr, C., et al. (2013). Dams and Disease Triggers on the Lower Mekong River. PLoS NTDs, 7(6), e2166, 1-4.