Type of soil and temperature range explain the preferred habitat and current distribution of the...
8
Type of soil and temperature range explain the preferred habitat and current distribution of the endemic lizard Aspidoscelis hyperythra in southern Baja California peninsula Miguel E. J acome-Flores a , M.Carmen Blazquez b, * , Vinicio J. Sosa c , Yolanda Maya b a Estaci on Biol ogica de Do~ nana (CSIC), Av. Am erico Vespucio s/n, 41092 Sevilla, Spain b Centro de Investigaciones Biol ogicas del Noroeste, Av. Instituto Polit ecnico Nacional 195, La Paz, B.C. S. 23096, Mexico c Instituto de Ecología, A.C. Carretera Antigua a Coatepec 351, El Haya, Xalapa, Veracruz 91070, Mexico article info Article history: Received 24 September 2013 Received in revised form 8 October 2014 Accepted 10 October 2014 Available online Keywords: Conservation Desert reptiles Ecological model Habitat suitability Tropical dry forest abstract The Baja California peninsula herpetofauna is composed by more than 160 species, many of them endemic. In the last years the region is experiencing an accelerating population growth and land use change, specially in the lowlands and coastal areas. Based on GLM models we described and predicted the distribution patterns of the regional endemic whiptail lizard, Aspidoscelis hyperythra Cope, 1863 (Sauria: Teiidae). We verified the accuracy of the predictive occurrence map in the field and then we generated a final suitable habitat model for the species. The soil characteristics have a great influence on occurrence probability. The highest values correspond to sandy areas with low slope, temperatures between 18 and 22 C, annual range temperature below 15 C, NDVI values ranged 0.60e0.73, rainfall between 200 and 400 mm, and altitude lower than 800 m. Vegetation was also important; the estab- lishment of the species requires woody plants that produce (a) plant litter where the lizards find prey; (b) burrowing sites for clutches, daily shelter, or hibernation and (c) open areas with light shade available for effective thermoregulation. These areas where natural tropical deciduous forest and sarcocaulescent scrub are stablished are also the most attractive to human settlements; so the conflict between con- servation and development is stronger there. © 2014 Elsevier Ltd. All rights reserved. 1. Introduction The detailed knowledge of the evolutionary and ecological de- terminants of space pattern distribution, ecological niche, and habitat suitability of animal species are essential information for effective conservation planning (Elith et al., 2006; Graham et al., 2006; Hirzel and Le Lay, 2008; Newbold et al., 2010). The precise distribution patterns of the currently existing species in an area reflect the phylogeography of their populations (Wiens et al., 2013), but local distribution is also influenced by environmental variables and specieseenvironmental relationships (Peres-Neto et al., 2001; Pastro et al., 2013). The variables affecting species distributions could be summarized as: restrictive (factors controling or regu- lating the species ecophysiology); disturbances (all types of disturbance affecting environmental systems); and resources, all of which can be used or assimilated by organisms (Guisan and Thuiller, 2005). In the case of reptile species living in deserts or arid areas, their distribution could be strongly determined by phylogeography and time of residence in those environments (Wiens et al., 2013) but locally the optimal niche would be defined by suitable conditions for thermoregulation (Kearney et al., 2009), protection or food availability (Heithaus, 2001; Beck and Jennings, 2003; Christian et al., 2003) as well as intra or interspecies relationships (Kearney, 2003; Greenville and Dickman, 2009; Read et al., 2012, Pastro et al., 2013). About 80% of the Baja California peninsula has an arid climate and is covered by sarcocaulescent vegetation. However, as a result of its dynamic geological history, it is not homogeneous, but formed by a mosaic of ecoregions with different topographic, climatic and vegetation characteristics (Gonz alez-Abraham et al., 2010). The convergence of these factors creates a great biodiversity with more than 3700 species of vascular plants and at least 140 species of terrestrial reptiles, many of them endemic (Riddle et al., 2000; Grismer, 2002; Riemann and Ezcurra, 2007). The ecoregions have * Corresponding author. E-mail addresses: [email protected] (M.E. J acome-Flores), blazquez@cibnor. mx, [email protected] (M.Carmen Blazquez), [email protected] (V.J. Sosa), [email protected] (Y. Maya). Contents lists available at ScienceDirect Journal of Arid Environments journal homepage: www.elsevier.com/locate/jaridenv http://dx.doi.org/10.1016/j.jaridenv.2014.10.008 0140-1963/© 2014 Elsevier Ltd. All rights reserved. Journal of Arid Environments 113 (2015) 126e133
Transcript of Type of soil and temperature range explain the preferred habitat and current distribution of the...
lable at ScienceDirect
Journal of Arid Environments 113 (2015) 126e133
Contents lists avai
Journal of Arid Environments
journal homepage: www.elsevier .com/locate/ jar idenv
Type of soil and temperature range explain the preferred habitat andcurrent distribution of the endemic lizard Aspidoscelis hyperythra insouthern Baja California peninsula
Miguel E. J�acome-Flores a, M.Carmen Blazquez b, *, Vinicio J. Sosa c, Yolanda Maya b
a Estaci�on Biol�ogica de Do~nana (CSIC), Av. Am�erico Vespucio s/n, 41092 Sevilla, Spainb Centro de Investigaciones Biol�ogicas del Noroeste, Av. Instituto Polit�ecnico Nacional 195, La Paz, B.C. S. 23096, Mexicoc Instituto de Ecología, A.C. Carretera Antigua a Coatepec 351, El Haya, Xalapa, Veracruz 91070, Mexico
a r t i c l e i n f o
Article history:Received 24 September 2013Received in revised form8 October 2014Accepted 10 October 2014Available online
Keywords:ConservationDesert reptilesEcological modelHabitat suitabilityTropical dry forest
* Corresponding author.E-mail addresses: [email protected] (M.E. J�aco
mx, [email protected] (M.Carmen Blazqu(V.J. Sosa), [email protected] (Y. Maya).
http://dx.doi.org/10.1016/j.jaridenv.2014.10.0080140-1963/© 2014 Elsevier Ltd. All rights reserved.
a b s t r a c t
The Baja California peninsula herpetofauna is composed by more than 160 species, many of themendemic. In the last years the region is experiencing an accelerating population growth and land usechange, specially in the lowlands and coastal areas. Based on GLM models we described and predictedthe distribution patterns of the regional endemic whiptail lizard, Aspidoscelis hyperythra Cope, 1863(Sauria: Teiidae). We verified the accuracy of the predictive occurrence map in the field and then wegenerated a final suitable habitat model for the species. The soil characteristics have a great influence onoccurrence probability. The highest values correspond to sandy areas with low slope, temperaturesbetween 18 and 22 �C, annual range temperature below 15 �C, NDVI values ranged 0.60e0.73, rainfallbetween 200 and 400 mm, and altitude lower than 800 m. Vegetation was also important; the estab-lishment of the species requires woody plants that produce (a) plant litter where the lizards find prey;(b) burrowing sites for clutches, daily shelter, or hibernation and (c) open areas with light shade availablefor effective thermoregulation. These areas where natural tropical deciduous forest and sarcocaulescentscrub are stablished are also the most attractive to human settlements; so the conflict between con-servation and development is stronger there.
© 2014 Elsevier Ltd. All rights reserved.
1. Introduction
The detailed knowledge of the evolutionary and ecological de-terminants of space pattern distribution, ecological niche, andhabitat suitability of animal species are essential information foreffective conservation planning (Elith et al., 2006; Graham et al.,2006; Hirzel and Le Lay, 2008; Newbold et al., 2010). The precisedistribution patterns of the currently existing species in an areareflect the phylogeography of their populations (Wiens et al., 2013),but local distribution is also influenced by environmental variablesand specieseenvironmental relationships (Peres-Neto et al., 2001;Pastro et al., 2013). The variables affecting species distributionscould be summarized as: restrictive (factors controling or regu-lating the species ecophysiology); disturbances (all types ofdisturbance affecting environmental systems); and resources, all of
me-Flores), [email protected]), [email protected]
which can be used or assimilated by organisms (Guisan andThuiller, 2005).
In the case of reptile species living in deserts or arid areas, theirdistribution could be strongly determined by phylogeography andtime of residence in those environments (Wiens et al., 2013) butlocally the optimal niche would be defined by suitable conditionsfor thermoregulation (Kearney et al., 2009), protection or foodavailability (Heithaus, 2001; Beck and Jennings, 2003; Christianet al., 2003) as well as intra or interspecies relationships(Kearney, 2003; Greenville and Dickman, 2009; Read et al., 2012,Pastro et al., 2013).
About 80% of the Baja California peninsula has an arid climateand is covered by sarcocaulescent vegetation. However, as a resultof its dynamic geological history, it is not homogeneous, but formedby a mosaic of ecoregions with different topographic, climatic andvegetation characteristics (Gonz�alez-Abraham et al., 2010). Theconvergence of these factors creates a great biodiversity with morethan 3700 species of vascular plants and at least 140 species ofterrestrial reptiles, many of them endemic (Riddle et al., 2000;Grismer, 2002; Riemann and Ezcurra, 2007). The ecoregions have
M.E. J�acome-Flores et al. / Journal of Arid Environments 113 (2015) 126e133 127
distinctive plant communities including coastal scrub, desert scrub,montane woodlands and forests, and subtropical thornscrub(Wiggins, 1980), and each of these plant communities has adistinctive assemblage of herpetofauna (Lovich et al., 2009).
Following the Grinnell (1917) concept of ecological niche as “theenvironmental requirements needed for a species to subsistwithout immigration”, a habitat suitability model of any specieswould require a carefully selected set of environmental variables(Kearney, 2006; Hirzel and Le Lay, 2008).
Here we describe and predict the distribution patterns of Aspi-doscelis hyperythra Cope 1863 (Sauria: Teiidae), an endemic andwidely distributed lizard in the Baja California peninsula, andidentify the ecological characteristics of its suitable habitat.
For this, (1) we assessed the habitat characteristics where thespecies occurs in the southern half of the Baja California peninsula,(2) we generated a spatial model and an occurrence map for theknown distribution of A. hyperythra, (3) we verified the accuracy ofthe predictive occurrence map in the field, and (4) we generated afinal model of potential suitable habitat distribution for the speciesin the area.
Our final goal was to identify the areaswith higher probability ofoccurrence for the species, focusing on its habitat conservationfrom the forthcoming human activities.
2. Methods
2.1. Species characteristics
A. hyperythra is a small insectivorous, oviparous whiptailranging from 3 to 7 cm from snout to vent length and weighs about6 g. The life expectancy is three to seven years (Stebbins andMcGinnis, 2012). It is an active forager that feeds primarily ontermites, other small insects (larvae and adults), and spiders(Galina-Tessaro,1994). It is common to observe themmoving underthe litter of shrubs Cyrtocarpa edulis, Jatropha cinerea and the cactiStenocereus gummosus and Cylindropuntia cholla, searching for food(Grismer, 2002; pers. obs). It reproduces from August to October,after the summer rains. Their daily energy expenditure (DEE) is oneof the highest of the North American desert lizards (Karasov andAnderson, 1984) and the length of daily activity is dependent onbody temperature and feeding rate. Individuals are able tomaintaintheir mean body temperature (38e39 �C) ranging from 33.4 to42.2 �C. The range of air and substrate temperatures to registeractivity is 21�Ce36 �C, and 32e50 �C, respectively. They spend thenight and periods of unfavorable temperatures in shallow tunnelsdug by the lizards in sandy loose soils (Bostic, 1966).
All these factors are important in the life history and fitness ofthe species: lizards need shade for effective thermoregulation. Thelizards dig under plant litter for shelter as well as foraging for foodunder the litter. We propose that this species may depend on amedium vegetation cover. Big differences in activity hours, feedingand growth rate, and population numbers have been reported be-tween neighboring sites with different plant cover (Karasov andAnderson, 1984).
The general distribution of the species ranges from southernCalifornia (USA) to the whole length of Baja California peninsulaand several islands of the Gulf of California and the Pacific Bajacoast (Grismer, 2002). It is listed in the International Union for theConservation of Nature (IUCN) (Hollingsworth and Hammerson,2007) and catalogued in Mexico as threatened (NOM59-2001-SEMARNAT). In the Baja California peninsula its distributionranges throughout most regions except for the Vizcaino Desert incentral Baja, and the pine forest at high elevations of Sierra de laLaguna in the south. Its phylogeography is not well known. Thereare up to six sister species recognized in the Aspidoscelis hyperythra
complex through its distribution area (Radtkey et al., 1997; Grismer,1999; Reeder et al., 2002). There is no precise previous informationabout what climate and ecological variables influence its distribu-tion pattern. However, Delibes et al. (2011) suggest it could besensitive to human disturbance. It is more common in open spaceswith clumps of thick vegetation, on fine or loose soils that it needsfor oviposition (Grismer, 2002). In the southern part of the BajaCalifornia peninsula, A. hyperythra has been reported active almostall year round (Bl�azquez and Ortega-Rubio, 1996).
2.2. Study area and soil characteristics
The study area is themexican state of Baja California Sur (BCS). Itranges between 22.8� N and 28� N latitude in the southern half ofthe Baja California peninsula, Mexico (Fig. 1a). The surface is71.480 km2, altitude ranges from sea level to 2200masl. Most of thestudy area is considered “thermotropical” with annual mean tem-perature of 23 �C. Rains, concentrated mainly in the summer, arevery scarce and uncertain at the northern increasing towards thesouth where they are monsoonal.
Along the peninsula soils are very closely related with thegeological origin and substrate. We obtained soils layers (INIFAP-CONABIO, 1995; INEGI, 2003), and overlapped them to a modifiedGonz�alez-Abraham et al. (2010) map of the ecopregions for ourstudy area (Fig. 1b). Only the eight predominant soil types wereconsidered (See Table 1). At the Desierto de Vizcaino and DesiertoCentral (ecoregions 6 and 7, Fig. 1b) soils are sandy and loose, withvariable content of mineral salts and sodium; Arenosols and Sol-onchaks (IUSS, 2007) are representative of this region. Arenosolsare soils with poor moisture retention and very low organic mattercontent that do not allow the construction of durable lizard shel-ters. Solonchaks are characterized by a strong salt chemical phasethat restricts the vegetation establishment. At the Provincia ofMagdalena (ecoregion 5), there are Arenosols but also Calcisols andCambisol soils which are mainly deep, sandy, with good particleaggregation and stability; Vertisol soils with a high clay content arealso found there. These soils are rich in nutrients for plant growth.The mountains of Sierra de la Giganta from the Central Gulf coast(Ecoregion 4) have shallow loamy soils (Leptosols) overlaying acontinuous rock substrate; and in this region areas with a highcontent of expansive clays (Vertisols) are also found. At thesouthern tip of the peninsula, (in Ecoregion 2 and 3), soils aresandy, with variable thickness and structure depending on thephysiography, i.e. they are depth but well structured on plains(Calcisols, Cambisols, Arenosols). At the rocky Sierra de la Lagunaslopes (Ecoregion 1), soils are shallow and with brittle aggregates(Leptosols).
2.3. Data collection
Several studies recording reptile biodiversity of the region and aphylogeographic study of the species throughout the area duringthe period 2003e2008 resulted in 312 localities whereA. hyperythrawas recorded (Fig. 1a). We added 59 new localities formodel evaluation (see text below and Fig. 1a). In all cases censuseswere conducted from 9:00 to17:00 h by two people walking slowly10 m apart from each other, covering about 500 m long, and lastingfrom 45 to 60 min. The total area sampled in each census wasapproximately one hectare.
2.4. Environmental variables
A variety of statistical models may be used to emulate the spe-cies spatial distribution. For this study we used Generalized LinearModels (GLM) that give results with high levels of certainty, in
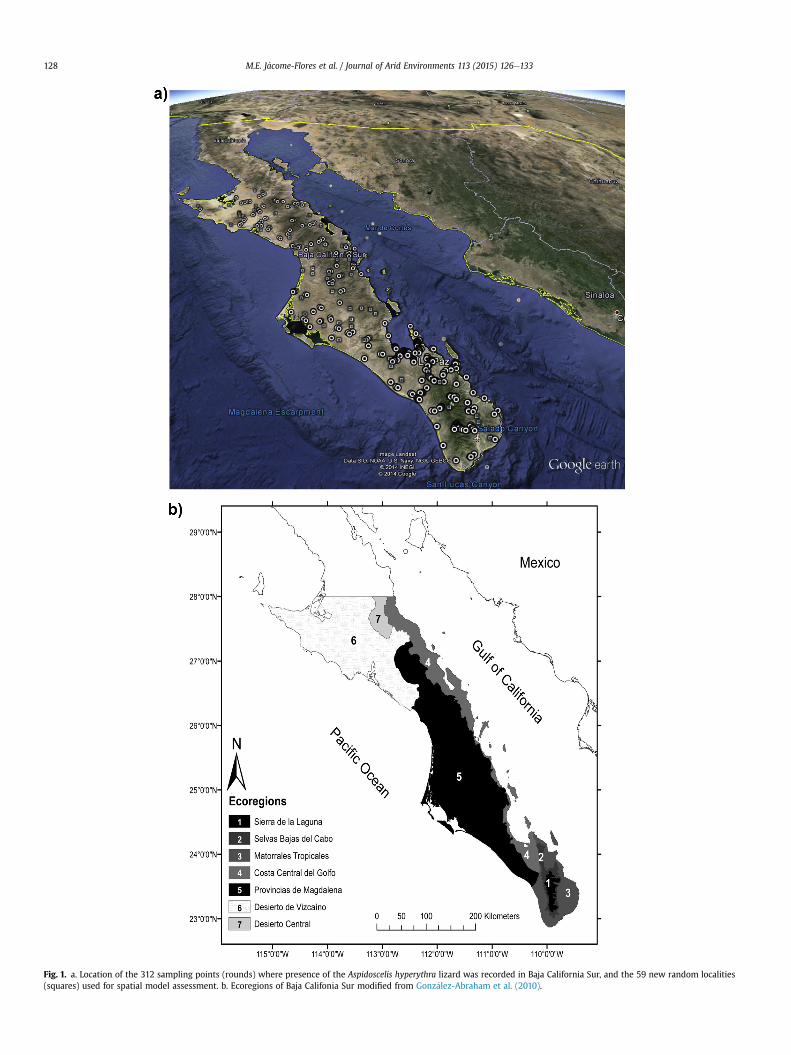
Fig. 1. a. Location of the 312 sampling points (rounds) where presence of the Aspidoscelis hyperythra lizard was recorded in Baja California Sur, and the 59 new random localities(squares) used for spatial model assessment. b. Ecoregions of Baja Califonia Sur modified from Gonz�alez-Abraham et al. (2010).
M.E. J�acome-Flores et al. / Journal of Arid Environments 113 (2015) 126e133128
M.E. J�acome-Flores et al. / Journal of Arid Environments 113 (2015) 126e133 129
addition to being repeatable (Guisan et al., 2002). The GLM resultscan also be incorporated into a Geographic Information System(GIS) (Corsi et al., 2000). The combination model/digital environ-mental information data allows us to identify the most importantvariables to predict the distribution of the species in the area ofstudy, describing the values of those variables (vegetation, climate,soil, etc.) that make the best combination for the occurrence of thespecies in the habitat (Hirzel and Guisan, 2002; Kearney, 2006;Hirzel and Le Lay, 2008).
The variables we used are summarized in Table 1. We usedannual average temperature (AAT), annual temperature range(ATR), and annual average precipitation (AAP) derived from theWORLDCLIM Ver. 1.2 database (Hijmans et al., 2005).
The Normalized Difference Vegetation Index (NDVI, Lillesandand Kiefer, 1994) correlates well with plant cover: a high NDVIaverage value indicates higher plant biomass and cover, which areimportant for shade, shelter, and insect availability. Consideringthat arid areas are subjected to the greatest variations of vegetationbiomass throughout the year we obtained NDVI 7-year values from168 monthly images from the “Global Land Cover Facility” (GLCF)web page of Maryland University (Carroll et al., 2006) and madetwo calculations with ArcGis 9.2: (1) NDVI 7-year average for eachsampling point; (2) NDVI 7 year-average just during the 4 months(JuneeSeptember), showing the highest NDVI values in the studyarea; we call this second variable: NDVI maximum.
Pertinent environmental explanatory variables at the samplingpoints, such as latitude, longitude, elevation (E), as well as soil (S)and vegetation (V) type, were obtained from thematic layers of thearea, with a resolution of 1:250,000 (INIFAP-CONABIO, 1995; INEGI,2003). The vegetationwas classified in nine categories (see Table 1).
2.5. Model fitting
We constructed a correlation matrix to establish the possiblecorrelations between all the potential numerical explanatory vari-ables; then we discarded those strongly correlated to each other(R > 0.85). To remove the potential effects of some spatial auto-correlation, latitude and longitude were included as explanatoryvariables.
We entered the environmental variables as independent in GLMwith logistic link function and binomial error distribution. Themain effect of each variable and its interactions with other variableson species occurrence (1) or absence (0) in the sampling localities(response variable) were evaluated. The R statistical packageversion 2.12.2 (R Foundation for Statistical Computing, Vienna, AT)was used to fit models.
To obtain the minimum suitable model, we followed anInformation-Theoretic approach (Burnham and Anderson, 2002).First, we eliminated variables or their interactions by analysis ofdeviance tests. Simultaneously, we made a critical examination ofminimum Akaike Information Criterion (AIC), D2 values, andecological meaning among alternative models. The D2 coefficient isthe difference of null and residual deviance, divided by the nulldeviance. The result obtained is analogous to a determination co-efficient (R2) that predicts a greater adjustment when values arenear 1. Finally, we chose the model that had the lowest over-dispersion (dispersion value closest to 1).
We used the indexes proposed by Fielding and Bell (1997) tomeasure model accuracy, and a confusion matrix to obtain thevalues for the indexes. We considered 0.5 as presence value.
2.6. Occurrence map
The results from the model were incorporated to a GIS (ArcGis9.2) to make a Kriging interpolation with a spherical adjustment
function. We used this interpolation because it calculates autocor-relation and statistic dependence between the nearest points anddrawing areas between these pair of points. The spherical adjust-ment made these calculations until the autocorrelation turned into0 between the points. Thus, we obtained an occurrence probabilityvalue for each pixel (100 � 100 m). We overlapped our occurrencemap over the map of geographic ecoregions based on Gonz�alez-Abraham et al. (2010) using ArcMap 10.1. (Fig. 1b).
2.7. Model field evaluation
To validate the accuracy of the first model we used new recordsfrom new surveys as Newbold et al. (2010) proposed. We generated59 new random points in the area (equivalent to 18.9% of the total312 points), with the ArcMap 10.1software. Then, we surveyedthese new localities from MarcheMay of 2010, to assess the pres-ence of A. hyperythra, exactly in the same way that we did in thecensuses for the first model.
The values of precipitation, temperature, annual/maximumNDVI, soil, and vegetation type for the new localities were obtainedfrom the same sources used for the first fitted model.
We performed a Wilcoxon test (a ¼ 0.05) between the occur-rence probability values that the model assigned to these 59 newrandom localities, and the probability that could be obtained fromthe occurrence map where we projected the localities. Becausethere were no differences between both data sets, we finallycalculated a newmodel, the second or final model, with the resultsof all the 371 points (312 plus 59).
3. Results
3.1. First model
Based on the correlation matrix we eliminated longitudebecause of its colinearity with latitude in the study area. The fittedfirst model had 21 significant variables related to A. hyperythraoccurrence and had D2 ¼ 0.58, AIC ¼ 322.3, and Dispersion ¼ 0.76.The most significative deviance corresponded to soil type (S), (58.8,P ≪ 0.0001), the interaction of annual average temperature (AAT)with annual average precipitation (AAP) (21.4, P ≪ 0.0001), andAAP with elevation (13.1, P ¼ 0.0003; Table 2).
The values of the most important parameters of the modelcorresponded to (a) soil types: Arenosol, Leptosol, Solonchak andVertisol with a negative influence over occurrence probability;Calcisol soil with a positive effect, and (b) the interaction of AAPwith E related negatively with occurrence (See Appendix 1 inOnline Supplement).
3.1.1. Occurrence probability map predicted by the first modelThe occurrence probability showed a clear trend to be higher
towards the Gulf coast and towards the south of the peninsula(Fig. 2a). The maximum probability values (0.96e0.97) were onEcoregions 2, 3, and south of Ecoregion 5, corresponding to thetropical deciduous dry forest and tropical shrubs, respectively(Fig. 1b). In the central part of the study area (Ecoregion 5), prob-ability values ranged from 0.4 to 0.6. Finally, the lowest occurrencevalues happened at the high elevations of Sierra de la Laguna forest(1900 m.a.s.l (Ecoregion 1) and into the Vizcaíno desert (Ecoregions6 and 7), in the north.
The islands of the Gulf of California showed high values ofoccurrence (0.89), except for Tortuga and San Marcos islands withmid-low values (0.34). On the Pacific ocean, only the SantaMargarita island resulted with a high occurrence probability (>0.7)(Fig. 2a).
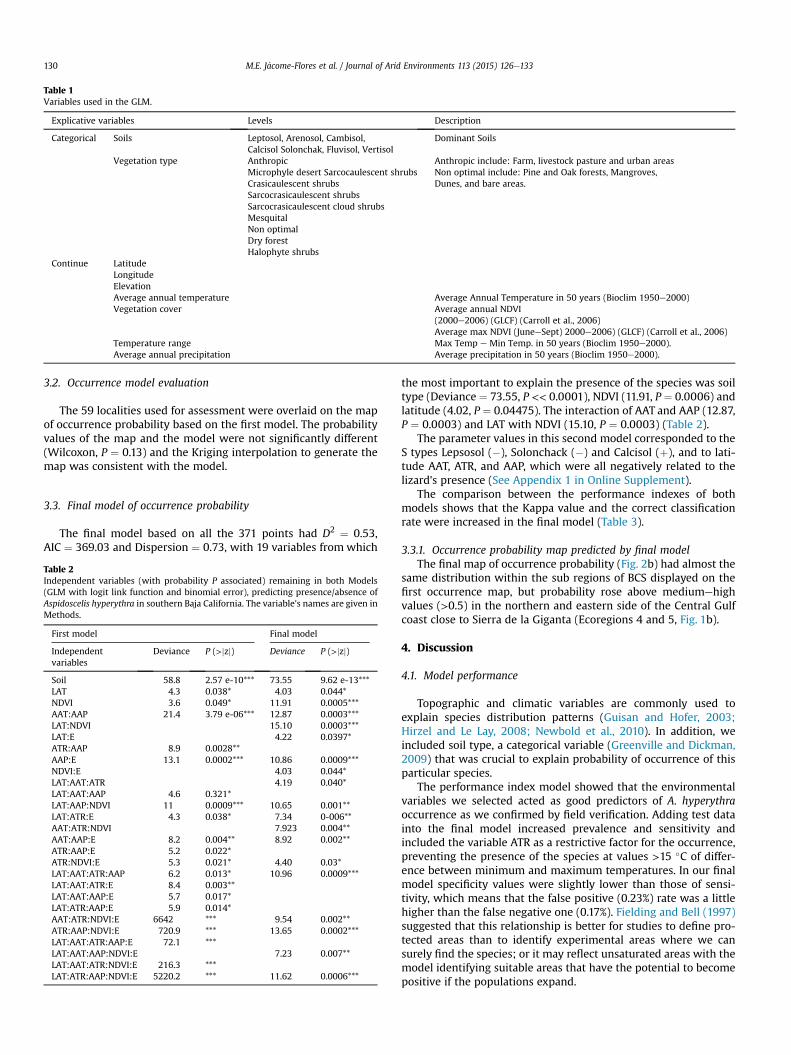
Table 1Variables used in the GLM.
Explicative variables Levels Description
Categorical Soils Leptosol, Arenosol, Cambisol,Calcisol Solonchak, Fluvisol, Vertisol
Dominant Soils
Vegetation type AnthropicMicrophyle desert Sarcocaulescent shrubsCrasicaulescent shrubsSarcocrasicaulescent shrubsSarcocrasicaulescent cloud shrubsMesquitalNon optimalDry forestHalophyte shrubs
Anthropic include: Farm, livestock pasture and urban areasNon optimal include: Pine and Oak forests, Mangroves,Dunes, and bare areas.
Continue LatitudeLongitudeElevationAverage annual temperature Average Annual Temperature in 50 years (Bioclim 1950e2000)Vegetation cover Average annual NDVI
(2000e2006) (GLCF) (Carroll et al., 2006)Average max NDVI (JuneeSept) 2000e2006) (GLCF) (Carroll et al., 2006)
Temperature range Max Temp e Min Temp. in 50 years (Bioclim 1950e2000).Average annual precipitation Average precipitation in 50 years (Bioclim 1950e2000).
M.E. J�acome-Flores et al. / Journal of Arid Environments 113 (2015) 126e133130
3.2. Occurrence model evaluation
The 59 localities used for assessment were overlaid on the mapof occurrence probability based on the first model. The probabilityvalues of the map and the model were not significantly different(Wilcoxon, P ¼ 0.13) and the Kriging interpolation to generate themap was consistent with the model.
3.3. Final model of occurrence probability
The final model based on all the 371 points had D2 ¼ 0.53,AIC ¼ 369.03 and Dispersion ¼ 0.73, with 19 variables from which
Table 2Independent variables (with probability P associated) remaining in both Models(GLM with logit link function and binomial error), predicting presence/absence ofAspidoscelis hyperythra in southern Baja California. The variable's names are given inMethods.
First model Final model
Independentvariables
Deviance P (>jzj) Deviance P (>jzj)
Soil 58.8 2.57 e-10*** 73.55 9.62 e-13***LAT 4.3 0.038* 4.03 0.044*NDVI 3.6 0.049* 11.91 0.0005***AAT:AAP 21.4 3.79 e-06*** 12.87 0.0003***LAT:NDVI 15.10 0.0003***LAT:E 4.22 0.0397*ATR:AAP 8.9 0.0028**AAP:E 13.1 0.0002*** 10.86 0.0009***NDVI:E 4.03 0.044*LAT:AAT:ATR 4.19 0.040*LAT:AAT:AAP 4.6 0.321*LAT:AAP:NDVI 11 0.0009*** 10.65 0.001**LAT:ATR:E 4.3 0.038* 7.34 0-006**AAT:ATR:NDVI 7.923 0.004**AAT:AAP:E 8.2 0.004** 8.92 0.002**ATR:AAP:E 5.2 0.022*ATR:NDVI:E 5.3 0.021* 4.40 0.03*LAT:AAT:ATR:AAP 6.2 0.013* 10.96 0.0009***LAT:AAT:ATR:E 8.4 0.003**LAT:AAT:AAP:E 5.7 0.017*LAT:ATR:AAP:E 5.9 0.014*AAT:ATR:NDVI:E 6642 *** 9.54 0.002**ATR:AAP:NDVI:E 720.9 *** 13.65 0.0002***LAT:AAT:ATR:AAP:E 72.1 ***LAT:AAT:AAP:NDVI:E 7.23 0.007**LAT:AAT:ATR:NDVI:E 216.3 ***LAT:ATR:AAP:NDVI:E 5220.2 *** 11.62 0.0006***
the most important to explain the presence of the species was soiltype (Deviance ¼ 73.55, P << 0.0001), NDVI (11.91, P ¼ 0.0006) andlatitude (4.02, P ¼ 0.04475). The interaction of AAT and AAP (12.87,P ¼ 0.0003) and LAT with NDVI (15.10, P ¼ 0.0003) (Table 2).
The parameter values in this second model corresponded to theS types Lepsosol (�), Solonchack (�) and Calcisol (þ), and to lati-tude AAT, ATR, and AAP, which were all negatively related to thelizard's presence (See Appendix 1 in Online Supplement).
The comparison between the performance indexes of bothmodels shows that the Kappa value and the correct classificationrate were increased in the final model (Table 3).
3.3.1. Occurrence probability map predicted by final modelThe final map of occurrence probability (Fig. 2b) had almost the
same distribution within the sub regions of BCS displayed on thefirst occurrence map, but probability rose above mediumehighvalues (>0.5) in the northern and eastern side of the Central Gulfcoast close to Sierra de la Giganta (Ecoregions 4 and 5, Fig. 1b).
4. Discussion
4.1. Model performance
Topographic and climatic variables are commonly used toexplain species distribution patterns (Guisan and Hofer, 2003;Hirzel and Le Lay, 2008; Newbold et al., 2010). In addition, weincluded soil type, a categorical variable (Greenville and Dickman,2009) that was crucial to explain probability of occurrence of thisparticular species.
The performance index model showed that the environmentalvariables we selected acted as good predictors of A. hyperythraoccurrence as we confirmed by field verification. Adding test datainto the final model increased prevalence and sensitivity andincluded the variable ATR as a restrictive factor for the occurrence,preventing the presence of the species at values >15 �C of differ-ence between minimum and maximum temperatures. In our finalmodel specificity values were slightly lower than those of sensi-tivity, which means that the false positive (0.23%) rate was a littlehigher than the false negative one (0.17%). Fielding and Bell (1997)suggested that this relationship is better for studies to define pro-tected areas than to identify experimental areas where we cansurely find the species; or it may reflect unsaturated areas with themodel identifying suitable areas that have the potential to becomepositive if the populations expand.
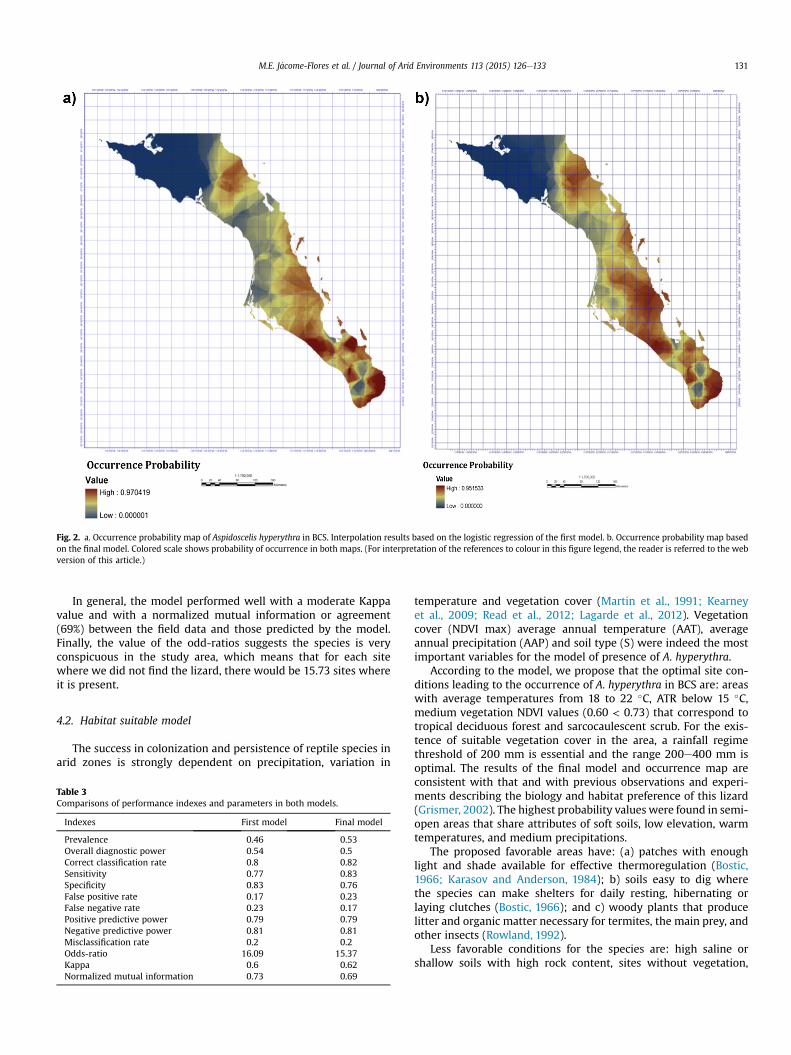
Fig. 2. a. Occurrence probability map of Aspidoscelis hyperythra in BCS. Interpolation results based on the logistic regression of the first model. b. Occurrence probability map basedon the final model. Colored scale shows probability of occurrence in both maps. (For interpretation of the references to colour in this figure legend, the reader is referred to the webversion of this article.)
M.E. J�acome-Flores et al. / Journal of Arid Environments 113 (2015) 126e133 131
In general, the model performed well with a moderate Kappavalue and with a normalized mutual information or agreement(69%) between the field data and those predicted by the model.Finally, the value of the odd-ratios suggests the species is veryconspicuous in the study area, which means that for each sitewhere we did not find the lizard, there would be 15.73 sites whereit is present.
4.2. Habitat suitable model
The success in colonization and persistence of reptile species inarid zones is strongly dependent on precipitation, variation in
Table 3Comparisons of performance indexes and parameters in both models.
Indexes First model Final model
Prevalence 0.46 0.53Overall diagnostic power 0.54 0.5Correct classification rate 0.8 0.82Sensitivity 0.77 0.83Specificity 0.83 0.76False positive rate 0.17 0.23False negative rate 0.23 0.17Positive predictive power 0.79 0.79Negative predictive power 0.81 0.81Misclassification rate 0.2 0.2Odds-ratio 16.09 15.37Kappa 0.6 0.62Normalized mutual information 0.73 0.69
temperature and vegetation cover (Martin et al., 1991; Kearneyet al., 2009; Read et al., 2012; Lagarde et al., 2012). Vegetationcover (NDVI max) average annual temperature (AAT), averageannual precipitation (AAP) and soil type (S) were indeed the mostimportant variables for the model of presence of A. hyperythra.
According to the model, we propose that the optimal site con-ditions leading to the occurrence of A. hyperythra in BCS are: areaswith average temperatures from 18 to 22 �C, ATR below 15 �C,medium vegetation NDVI values (0.60 < 0.73) that correspond totropical deciduous forest and sarcocaulescent scrub. For the exis-tence of suitable vegetation cover in the area, a rainfall regimethreshold of 200 mm is essential and the range 200e400 mm isoptimal. The results of the final model and occurrence map areconsistent with that and with previous observations and experi-ments describing the biology and habitat preference of this lizard(Grismer, 2002). The highest probability values were found in semi-open areas that share attributes of soft soils, low elevation, warmtemperatures, and medium precipitations.
The proposed favorable areas have: (a) patches with enoughlight and shade available for effective thermoregulation (Bostic,1966; Karasov and Anderson, 1984); b) soils easy to dig wherethe species can make shelters for daily resting, hibernating orlaying clutches (Bostic, 1966); and c) woody plants that producelitter and organic matter necessary for termites, the main prey, andother insects (Rowland, 1992).
Less favorable conditions for the species are: high saline orshallow soils with high rock content, sites without vegetation,
M.E. J�acome-Flores et al. / Journal of Arid Environments 113 (2015) 126e133132
those with poor vegetation cover or mangroves, and differences oftemperatures above 15 �C.
Recently Wiens et al. (2013) found that some reptile lineagesthat have evolved in deserts and that have been living for long time(more than 50 millions years) in desert conditions have narrowerecological niches in arid zones and broader in more mesic habitats.A hyperythra belongs to the Aspidoscelis deppii group, one of thebasal groups of North American Cnemidophorus clade (Reeder et al.,2002) and it is an endemic taxa of the peninsula. There is not cer-tainty about how long the species has been living on arid conditionsin the peninsula. Although its distribution is more or less contin-uous (Grismer, 2002) with no deep break along the same(Munguía-Vega, 2011), it would be very interesting to compare itsniche breadth through the whole distribution specially in the moremesic environments close to California (USA), or to make a pro-jection to the Last Glacial Maximum (aprox. 21,000 years ago)conditions to discover its historical distribution since the Pleisto-cene along the peninsula.
Besides the climatic variables, interaction with other simpatricspecies is also important affecting lizard density in arid zones (Readet al., 2012). We did not consider the abundance of whipatils in ourmodels, nevertheless it worths to study if competition with othersmall Phrynosomatid insectivorous or with conspecific Aspidoscelistigra might displace A. hyperythra from their optimum habitat tosub-optimal habitats in a number of sites, especially in the islands(Radtkey et al., 1997).
4.3. Implications for conservation
In conclusion, our spatial model is a good predictor of the dis-tribution of the endemic A. hyperythra in southern Baja Californiapeninsula, as verified in the field.
The conditions for species presence are optimal in areas wherecrasicaulescent and sarcocaulescent scrubs dominate, within thecentral part and gulf coast (Ecoregions 4 and 5), and specially inCabo dry forest Ecoregions 2 and 3. There is a decrease in occur-rence towards the west and northern part of the half peninsula,which could be related to a decrease in mean annual precipitationand vegetation cover, and to an increase in temperature range,resulting in an increasing aridity. Thus, the distribution of thespecies towards the north has channeled through the corridors ofSierra de la Giganta valleys, in the west part of Ecoregion 4 whichhas medium vegetation cover, temperatures from 18 to 20 �C, andprecipitation ranging from 200 to 300 mm.
The peninsula has low human population density. About 40% ofits territory (including the Gulf of California islands) is under someprotection regime such as natural reserves. Nevertheless, severalanalyses have revealed that spots of high richness and biodiversityremain in vulnerable status (Riemann and Ezcurra, 2007; Pradoet al., 2010; Ramirez-Acosta et al., 2012). According to the charac-teristics of the A. hyperythra optimal ecological niche, we considerthat its presence could function as an indicator of soils capable ofsupporting vegetation such as the tropical deciduous forest and thesarcocaulescent scrub, that indicates habitats of high ecologicalrichness.
Economic activities and an accelerating rate of land use changehave been triggered in the last decades (Lovich et al., 2009; Cari~noet al., 2012), and as a consequence, anthropogenic disturbance, towhich arid ecosystems are especially sensitive, is increasing(Martorell et al., 2012). Althought we found Aspidoscelis hypreythrais a rather conspicuous animal in the south part of the peninsula, itis uncertain how the species will respond if suitable characteristicsof its habitat aremodified by human activities that might disrupt itshabitat such as crops, roads, or urban areas that might interrupt theflux between populations (Cianfrani et al., 2010).
Acknowledgments
Research was supported by the CONACYT project: “Evolutionand conservation of the Aspidoscelis deppei (REPTILIA, TEIIDAE)group in California's Golf region. Distribution and evolutionaryaspects” (SEP-CONACyT-80219). Survey points were obtainedthrough the following projects: 2002-C01-0318 (Semarnat-CON-ACYT); J200-450/2004 and 156/03/05 (Mixed fund M�exico-SpainFOMIX-CONACYT-AECI); J110-374/2007 (AECID-CONACYT). We areindebted to Abelino Cota for his invaluable help in fieldwork; alsoto M. Delibes, L. Soriano, J. A. Godoy, C. Estrada, and D. Vega whohelped in fieldwork; to D. Dorantes for English editing.
Appendix A. Supplementary data
Supplementary data related to this article can be found at http://dx.doi.org/10.1016/j.jaridenv.2014.10.008.
References
Beck, D.D., Jennings, R.D., 2003. Habitat use by Gila monsters: the importance ofshelters. Herpetol. Monogr. 17, 111e129.
Bl�azquez, M.C., Ortega-Rubio, A., 1996. Lizard winter activity at Baja California Sur,Mexico. J. Arid Environ. 33, 247e253.
Bostic, D.L., 1966. Food and feeding behavior of the teiid lizard, Cnemidophorushyperythra beldingi. Herpetologica 22, 81e90.
Burnham, K.P., Anderson, D.A., 2002. Model Selection and Multivariate Inference: aPractical Information e Theoretic Approach, second ed. Springer, New York.
Cari~no, M., Castorena, L., Maya, Y., Wurl, J., Urciaga, J., Breceda, A., 2012. Trans-formaci�on de los ecosistemas �aridos para su uso agrícola en Baja California Sur,M�exico. Un an�alisis desde la historia ambiental. Hist. Agrar. 56, 81e106.
Carroll, M.L., DiMiceli, C.M., Sohlberg, R.A., Townshend, J.R.G., 2006. 250 m MODISNormalized Difference Vegetation Index, Collection 4. University of Maryland,Maryland.
Christian, K.A., Webb, J.K., Schultz, T.J., 2003. Energetics of bluetongue lizards(Tiliqua scincoides) in a seasonal tropical environment. Oecologia 136, 515e523.
Cianfrani, C., Le Lay, G., Hirzel, A.H., Loy, A., 2010. Do habitat suitability modelsreliably predict the recovery areas of threatened species? J. Appl. Ecol. 47,421e430.
Corsi, F., De Leeuw, J., Skidmore, A., 2000. Modelling species distribution with GIS.In: Boitani, L., Fuller, T. (Eds.), Research Techniques in Animal Ecology. ColumbiaUniversity Press, New York, pp. 389e434.
Delibes, M., Bl�azquez, M.C., Soriano, L., Revilla, E., Godoy, J.A., 2011. High anti-predatory efficiency of insular lizards: a warning signal of excessive specimencollection? PLoS One 6, e29312.
Elith, J., Graham, C.H., Anderson, R.P., Dudik, M., Ferrier, S., Guisan, A., Hijmans, R.J.,Huettmann, F., Leathwick, J.R., Lehmann, A., Li, J., Lohmann, L.G., Loiselle, B.A.,Manion, G., Moritz, C., Nakamura, M., Nakazawa, Y., Overton, J., Peterson, A.T.,Phillips, S.J., Richardson, K.S., Scachetti-Pereira, R., Schapire, R.E., Sober�on, J.,Williams, S., Wisz, M.S., Zimmermann, N.E., 2006. Novel methods improveprediction of species' distributions from occurrence data. Ecography 29,121e151.
Fielding, A.H., Bell, J.F., 1997. A review of methods for the assessment of predictionerrors in conservation presence/absence models. Environ. Conserv. 24, 38e49.
Galina-Tessaro, P., 1994. Estudio comparativo de tres especies de lacertilios en unmatorral des�ertico de la Regi�on del Cabo, B.C.S., M�exico. Tesis de Maestría.CIBNOR.
Gonz�alez-Abraham, C., Garcill�an, P., Ezcurra, E., Grupo de trabajo Ecorregiones,2010. Ecorregiones de la península de Baja California: Una síntesis. Boletín Soc.Bot�anica Mex. 87, 69e82.
Graham, C.H., Moritz, C., Williams, S.E., 2006. Habitat history improves prediction ofbiodiversity in rainforest fauna. Proc. Natl. Acad. Sci. 103, 632e636.
Greenville, A.C., Dickman, C.R., 2009. Factors affecting habitat selection in aspecialist fossorial skink. Biol. J. Linn. Soc. 97, 531e544.
Grinnel, J., 1917. Field tests of theories concerning distributional control. Am. Nat.51, 115e128.
Grismer, L.L., 1999. Phylogeny, taxonomy, and biogeography of Cnemidophorushyperythrus and C. ceralbensis (Squamata: Teiidae) in Baja California, Mexico.Herpetologica 55, 28e42.
Grismer, L.L., 2002. Amphibians and Reptiles of Baja California: Including its PacificIslands and the Islands in the Sea of Cortez. University of California Press, LosAngeles.
Guisan, A., Edwards, J., Thomas, C., Hastie, T., 2002. Generalized linear and gener-alized additive models in studies of species distributions: setting the scene.Ecol. Model. 157, 89e100.
Guisan, A., Hofer, U., 2003. Predicting reptile distribution at the mesoscale: relationto climate and topography. J. Biogeogr. 30, 1233e1243.
Guisan, A., Thuiller, W., 2005. Predicting species distribution: offering more thansimple habitat models. Ecol. Lett. 8, 993e1009.
M.E. J�acome-Flores et al. / Journal of Arid Environments 113 (2015) 126e133 133
Heithaus, M.R., 2001. Habitat selection by predators and prey in communities withasymmetrical intraguild predation. Oikos 92, 542e554.
Hijmans, R.J., Cameron, S.E., Parra, J.L., Jones, P.G., Jarvis, A., 2005. Very high reso-lution interpolated climate surfaces for global land areas. Int. J. Climatol. 25,1965e1978.
Hirzel, A.H., Guisan, A., 2002. Which is the optimal sampling strategy for habitatsuitability modeling? Ecol. Model. 157, 331e341.
Hirzel, A.H., Le Lay, G., 2008. Habitat suitability modelling and niche theory. J. Appl.Ecol. 45, 1372e1381.
Hollingsworth, B., Hammerson, G., 2007. Aspidoscelis Hyperythra. IUCN Red List ofThreatened Species. Version 2012.2. www.iucnredlist.org.
INIFAP-CONABIO, 1995. Cartas Edafol�ogicas escalas 1:250 000 de INEGI. INIFAP-CONABIO, M�exico.
Instituto Nacional de Estadística, Geografía e Inform�atica (INEGI), 2003. Carta deuso actual del suelo y vegetaci�on Serie III (M�exico).
IUSS Grupo de Trabajo WRB, 2007. Base Referencial Mundial del Recurso Suelo.Primera actualizaci�on 2007. In: Informes sobre Recursos Mundiales de Suelos,vol. 103. FAO, Roma.
Karasov, W.H., Anderson, R.A., 1984. Interhabitat differences in energy acquisitionand expenditure in lizard. Ecology 65, 235e247.
Kearney, M.R., 2003. Why is sex so unpopular in the Australian desert? Trends Ecol.Evol. 18, 605e607.
Kearney, M.R., 2006. Habitat, environment and niche: what are we modelling?Oikos 115, 186e191.
Kearney, M., Shine, R., Porter, W., 2009. The potential for behavioral thermoregu-lation to buffer “cold-blooded” animals against climate warming. Proc. Natl.Acad. Sci. PNAS 106, 3835e3840.
Lagarde, F., Louzizi, T., Slimani, T., El Mouden, H., Ben Kaddour, K., Moulherat, S.,Bonnet, X., 2012. Bushes protect tortoises from lethal overheating in arid areasof Morocco. Environ. Conserv. 39, 172e182.
Lillesand, T.M., Kiefer, R.W., 1994. Remote Sensing and Image Interpretation. Wiley,New York.
Lovich, R.E., Grismer, L.L., Danemann, G., 2009. Conservation status of the herpe-tofauna of Baja California, Mexico and associated islands in the Sea of Cortezand Pacific Ocean. Herpetol. Conserv. Biol. 4, 358e378.
Martín, J., L�opez, P., Salvador, A., 1991. Microhabitat selection of the amphisbaenianBlanus cinereus. Copeia 1142e1146.
Martorell, C., Garcill�an, P.P., Casillas, F., 2012. Ruderality in extreme-desert cacti?Population effects of chronic anthropogenic disturbance on Echinocereus lind-sayi. Popul. Ecol. 54, 335e346.
Munguía-Vega, A., 2011. Pervasive Deep Phylogeographic Breaks in the Baja Cali-fornia Peninsula's Biota. Conservation Genetics Laboratory, School of NaturalResources, The University of Arizona, Tucson, AZ, 85721, USA.
Newbold, T., Reader, T., El-Gabbas, A., Berg, W., Shohdi, W.M., Zalat, S., El Din, S.B.,Gilbert, F., 2010. Testing the accuracy of species distribution models usingspecies records from a new field survey. Oikos 119, 1326e1334.
Norma Oficial Mexicana NOM-059-ECOL-2001, 2001. Protecci�on ambiental-Especies nativas de M�exico de flora y fauna silvestres-Categorías de riesgo yespecificaciones para su inclusi�on, exclusi�on o cambio-Lista de especies enriesgo. M�exico D.F. http://dof.gob.mx/nota_detalle.php?codigo¼5173091&fecha¼30/12/2010.
Pastro, L.A., Dickman, C.R., Letnic, M., 2013. Effects of wildfire, rainfall and region ondesert lizard assemblages: the importance of multi-scale processes. Oecologia173, 603e614.
Peres-Neto, P.R., Olden, J.D., Jackson, D.A., 2001. Environmentally constrained nullmodels: site suitability as occupancy criterion. Oikos 93, 110e120.
Prado, A., Hawkins, J.A., Yesson, C., B�arcenas, R.T., 2010. Multiple diversity measuresto identify complementary conservation areas for the Baja California peninsularcacti. Biol. Conserv. 143, 1510e1520.
Radtkey, R.R., Fallon, S.M., Case, T.J., 1997. Character displacement in some Cnemi-dophorus lizard revisited: a phylogenetic analysis. Proc. Natl. Acad. Sci. U. S. A.94, 9740e9745.
Ramírez-Acosta, J., Castellanos, A., Arnaud, G., Breceda, A., Rojas-Soto, O., 2012.Conservation of endemic terrestrial vertebrates in the protected areas of theBaja California Peninsula, Mexico. Nat. Areas J. 32, 15e30.
Read, J.L., Kovacb, K., Brooka, B.W., Fordhama, D.A., 2012. Booming during a bust:asynchronous population responses of arid zone lizards to climatic variables.Acta Oecol. 40, 51e61.
Reeder, T., Cole, C.J., Dessauer, H.C., 2002. Phylogenetic relationships of whiptaillizards of the genus Cnemidophorus (Squamata: Teiidae): a test of monophylyreevaluation of kariotypic evolution, and review of hybrid origins. Am. Mus.Novit. 3365, 1e61.
Riemann, H., Ezcurra, E., 2007. Endemic regions of the vascular flora of thepeninsula of Baja California, Mexico. J. Veg. Sci. 18, 327e336.
Riddle, B.R., Hafner, D.G., Alexander, L.F., Jaeger, J.R., 2000. Cryptic vicariance in thehistorical assembly of a Baja California peninsular biota. Proc. Natl. Acad. Sci. U.S. A. 97, 14438e14443.
Rowland, S.D., 1992. Activity, Behavior, Ecology and Home Range of the OrangeThroated Whiptail, Cnemidophorus Hyperythra Beldingi Cope. Master. Thesis.California State University.
Stebbins, R.C., McGinnis, S.M., 2012. Field Guide to Amphibians and Reptiles ofCalifornia, vol. 103. Univ of California Press.
Wiens, J.J., Kozak, K.H., Silva, N., 2013. Diversity and niche evolution along ariditygradients in North American lizards (Phrynosomatidae). Evolution 67,1715e1728.
Wiggins, I.L., 1980. Flora of Baja California. Stanford University Press, Stanford.