Nature and cause of compositional variation among the alkalic cap lavas of Mauna Kea Volcano, Hawaii

Originally published as:
Fliegel, D., Wirth, R., Simonetti, A., Schreiber, A., Furnes, H., Muehlenbachs, K. (2011): Tubular
textures in pillow lavas from a Caledonian west Norwegian ophiolite: A combined TEM, LA‐ICP‐MS,
and STXM study. ‐ Geochemistry, Geophysics, Geosystems, 12, Q02010
DOI: 10.1029/2010GC003255
Article
Volume 12, Number 2
25 February 2011
Q02010, doi:10.1029/2010GC003255
ISSN: 1525‐2027
Tubular textures in pillow lavas from a Caledonian westNorwegian ophiolite: A combined TEM, LA–ICP–MS,and STXM study
Daniel FliegelEarth and Atmospheric Sciences, University of Alberta, Edmonton, Alberta T6G 2R3, Canada([email protected])
Department of Earth Sciences and Centre for Geobiology, University of Bergen, Allegaten 41,N‐5007 Bergen, Norway
Richard WirthHelmholtz Centre Potsdam, GFZ German Research Centre for Geosciences, Telegrafenberg C120,D‐14473 Potsdam, Germany
Antonio SimonettiDepartment of Civil Engineering and Geological Sciences, University of Notre Dame, 156 FitzpatrickHall, Notre Dame, Indiana 46556, USA
Anja SchreiberHelmholtz Centre Potsdam, GFZ German Research Centre for Geosciences, Telegrafenberg C120,D‐14473 Potsdam, Germany
Harald FurnesCentre for Geobiology, Department of Earth Sciences, University of Bergen, Allegaten 41,N‐5007 Bergen, Norway
Karlis MuehlenbachsEarth and Atmospheric Sciences, University of Alberta, Edmonton, Alberta T6G 2R3, Canada
[1] Tubular alteration textures, mineralized by titanite, in glassy rims of pillow lavas from a Norwegianophiolite (Solund‐Stavfjord ophiolite complex (SSOC)) are described and characterized by a multimethodapproach. Tubular alteration textures, mineralized by titanite, have been previously proposed to result frombioalteration. The microstructure of the titanite and the tubes is investigated using focused ion beam millingin combination with transmission electron microscopy (TEM) and scanning transmission X‐ray microscopy(STXM). These indicate an assemblage of submicrometer‐sized (about 500 nm) titanite single crystals withno organic film or residue in between the grains. In situ U‐Pb radiometric dating of the titanite, using laserablation–multicollector–inductively coupled plasma–mass spectrometry (LA–MC–ICP–MS), yielded ametamorphic age of 442 ± 13 Ma. An isotope dilution–thermal ionization mass spectrometric age obtainedpreviously for zircons from the SSOC plutonic rocks yielded a magmatic age of 443 ± 3 Ma. The overlap inages indicates that subseafloor metamorphism, responsible for titanite formation, occurred during seaflooror subseafloor formation of the tubular alteration textures. The rare earth element contents of the titanitewere determined using LA–ICP–MS and chondrite‐normalized patterns are similar to those of the SSOCvolcanics; hence these do not reflect hydrothermal or seawater influence. The Y/Ho ratio of ∼20–30 in thetitanite is also consistent with an upper mantle–derived origin. The sum of all of the spatial resolved datareported here neither supports nor refutes a biogenic origin for the tubular textures.
Copyright 2011 by the American Geophysical Union 1 of 21
Components: 10,200 words, 19 figures.
Keywords: Solund‐Stavfjord ophiolite complex; tubular alteration; STXM; FIB/TEM; biogenicity; U‐Pb dating.
Index Terms: 0424 Biogeosciences: Biosignatures and proxies.
Received 14 June 2010; Revised 18 November 2010; Accepted 2 December 2010; Published 25 February 2011.
Fliegel, D., R. Wirth, A. Simonetti, A. Schreiber, H. Furnes, and K. Muehlenbachs (2011), Tubular textures in pillow lavasfrom a Caledonian west Norwegian ophiolite: A combined TEM, LA–ICP–MS, and STXM study, Geochem. Geophys.Geosyst., 12, Q02010, doi:10.1029/2010GC003255.
1. Introduction
[2] It has been stated recently that the biosphereextends into the upper oceanic crust up to at least1600 m below the rock‐water interface [Rousselet al., 2008]. Microbial communities supposedlylive on the surface of freshly erupted volcanic,subocean glass and in cracks therein [Santelli et al.,2008; Templeton et al., 2009]. It has been assumedby several authors that these communities alter theglass, which results in microholes within the rocksurface [Staudigel et al., 2008; Thorseth et al.,1995; Torsvik et al., 1998], and are commonlyexpressed in two different types of alteration tex-tures. The majority are granular textures rooted infractures in the glass, and less abundant tubulartextures that are up to several hundreds of mm inlength and tens of mm in diameter [Furnes et al.,2001c; Staudigel et al., 2004]. The biogenicity ofsuch textures has been discussed using variousapproaches such as morphology [McLoughlin et al.,2009b], elemental distributions (C, N, S and P)[Banerjee et al., 2007; Banerjee and Muehlenbachs,2003], DNA staining [Banerjee and Muehlenbachs,2003], organic carbon analysis [Benzerara et al.,2007], and stable isotope signatures [Furnes et al.,2002; Torsvik et al., 1998]. Such textures havebeen described within glassy pillow lava rims fromin situ oceanic crust [Banerjee and Muehlenbachs,2003], ophiolites [Furnes et al., 2002, 2008], andeven fromArchean greenstone belts [Banerjee et al.,2004, 2007; Furnes et al., 2004; McLoughlin et al.,2009a; Staudigel et al., 2008] that represent someof the oldest oceanic crustal fragments on Earth[Staudigel et al., 2008].
[3] In the older crustal fragments and ancientoceanic crust preserved in greenstones belts, thetubular textures are infilled with secondary minerals(commonly titanite) and preserved over billions ofyears in the rock record. Titanite is a mineral thatcan be used for radiometric U‐Pb dating, andthus age constraints have been determined for
bioalteration textures in Proterozoic and Archeanpillow lavas [Fliegel et al., 2010a]. The processesof mineralization of tubular textures by titanite isstill not very well defined. In an earlier work,putative granular textures in chilled margins ofpillow lavas from the island of Kattøy weredescribed [Furnes et al., 2002] and linked tobioalteration processes. The main evidences for thebiogenicity of the granular textures were low d13Cvalues and the distribution of possible biogenicelements within the textures [Furnes et al., 2002].
[4] In this study, we expand the investigation ofalteration textures in pillow lavas from the Solund‐Stavfjord ophiolite complex (SSOC) to tubularalteration textures. Titanite mineralization ages ofthe alteration textures are evaluated in relation tothe microstructure of the titanite via a combinedscanning electron microscopy (SEM), transmissionelectron microscopy (TEM) and scanning trans-mission X‐ray microscopy (STXM) approach. Themajor goal was thus to investigate whether themineralization history at the micrometer scalecombined with spectroscopy at high spatial reso-lution can be used as a biogenicity proxy for suchtextures. Furthermore, the Yttrium (Y) and rareearth element (REE) chondrite‐normalized patterns(YREE) are used to help determine the origin of thetitanite.
2. Geological Setting and MaterialsInvestigated
[5] The age of the magmatic sequence in the SSOCis of Late Upper Ordovican/Early Silurian [Furneset al., 2003, 2006]. The downward pseudostrati-graphy of the ophiolite consists of basaltic pillowlavas with massive flows and pillow breccias, fol-lowed by a sheeted dyke complex and finallymassive gabbros. Based on investigations of thearchitecture, morphology, geochemistry and ther-mal history, it has been proposed that the SSOC
GeochemistryGeophysicsGeosystems G3G3 FLIEGEL ET AL.: TEXTURES IN A NORWEGIAN OPHIOLITE 10.1029/2010GC003255
2 of 21

represents an ancient analog to the volcanic andplutonic rocks present within the modern mid‐ocean intermediate spreading of the Costa Rica rift[Furnes et al., 2000; Muehlenbachs et al., 2003].The hydrothermal history of the SSOC has beeninvestigated on the Island of Oldra (NNE ofKattøy, Figure 1), giving peak temperatures of260–290°C (18O values of quartz‐epidote) for thevolcanic rocks [Fonneland‐Jorgensen et al., 2005].The influence of Ordovician seawater on the SSOChas been investigated using 87Sr/86Sr ratios[Muehlenbachs et al., 2003]. Whole rock Sr isotopeanalyses from the island of Oldra (Figure 1) donot coincide with the proposed composition forOrdovician seawater [Furnes et al., 2000]. Thelatter interpreted the oxygen and strontium isotopecompositions of the volcanic rocks in the SSOC toreflect hydrothermal alteration in a subseafloorsetting.
[6] The volcanic sequence of the SSOC is overlainby metasediments and intruded byMORB‐type sillsand dykes. An estimate of the proportion betweenmassive flows and pillow lava suggests that theSSOC developed at an intermediate spreading rate,with the plutonic components of the crust exposed
approximately 20 km north of the sampling site ofthis study on the island of Tviberg [Skjerlie andFurnes, 1990] (Figure 1) The emplacement of theSSOC onto the sedimentary cover of the NorwegianWestern Gneiss Region took place during theCaledonian orogeny, post Wenlock (428–423 Ma)time [Andersen et al., 1990, 1998; Pedersen et al.,1992].
[7] Samples for this study were collected duringtwo field trips in 2000 and 2008 and their strati-graphic locations are indicated in Figure 2. Despiteseveral recorded phases of deformation within theSSOC [Furnes et al., 2001a], the pillow lavas fromthe sampling site in the southwest region of theSSOC, on the island of Kattøy, are little deformedas shown in Figure 3.
[8] The pillows consist of a greenschist assemblagewith typical minerals such as chlorite, epidote,albite, and titanite; quartz and calcite are found inveins. The pillows show clear quenched glassymargins with a variolitic zone and a crystalline core(Figures 3b and 3c). The matrix of the originalglassy rim is now mainly fine‐grained chlorite withstrings of epidote. Further long bands of titanite canbe found in the margins of the pillows.
Figure 1. Geological map of the study area. (a) An overview of west Norway. (b) The regional scale of Figure 1a;indicates the area of the Solund‐Stavfjord ophiolite. (c) A geological map of the Solund‐Stavfjord area including theisland of Kattøy, where the samples from this study were collected. Modified from Furnes et al. [2002].
GeochemistryGeophysicsGeosystems G3G3 FLIEGEL ET AL.: TEXTURES IN A NORWEGIAN OPHIOLITE 10.1029/2010GC003255
3 of 21
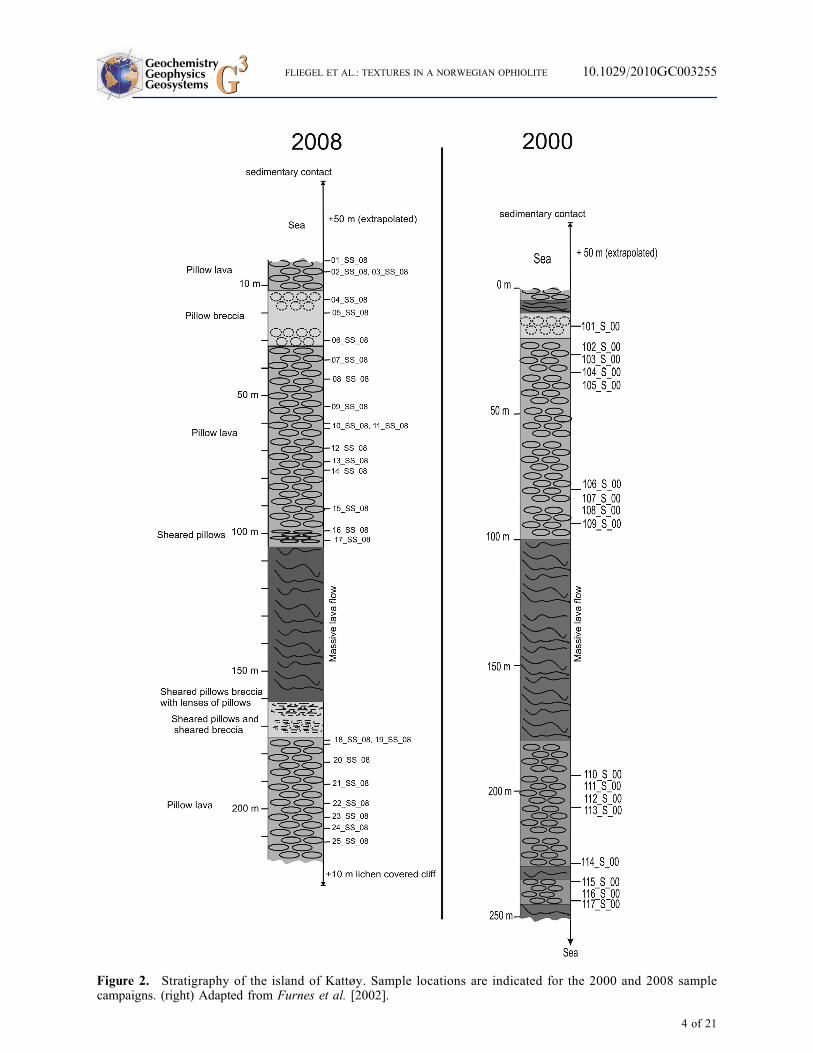
Figure 2. Stratigraphy of the island of Kattøy. Sample locations are indicated for the 2000 and 2008 samplecampaigns. (right) Adapted from Furnes et al. [2002].
GeochemistryGeophysicsGeosystems G3G3 FLIEGEL ET AL.: TEXTURES IN A NORWEGIAN OPHIOLITE 10.1029/2010GC003255
4 of 21

[9] To investigate possible microbial carbon oxi-dizing processes, the d13Ccarbonate values (expressedin ‰) of pillow rims and crystalline cores wereinvestigated previously by Furnes et al. [2002] andKonhauser [2009]. The d13Ccarbonate values of thecrystalline cores for the investigated samples(Figure 4a) are distributed normally (statistical test:TestDavid on normality with significance level 5%,test criteria = (xmax − xmin)/s) around the typicalmantle values (−7 to −5 ‰). All investigatedsamples except one record a lower d13Ccarbonate
value in the pillow rim compared to the pillow core(Figure 4b). This was interpreted by Furnes et al.[2002] as a proxy for possible oxidation of organicmatter possibly generated by microbial metabo-lisms in the pillow rims of the SSOC [Furnes et al.,2002]. Notably, the sample investigated by bothmicrobeam and nanobeam techniques and hostingtubular textures shows the largest spread ind13Ccarbonate (D around −20) of all studied samples(Figure 4b), and the main reason for its detailed
investigation. However, coarse‐grained carbonatescould not be located within the tubular texturesinvestigated here and thus could be finely dissem-inated within the sample.
3. Analytical Procedures
3.1. Optical Microscopy
[10] Nikon Eclipse LV100POL (Nikon, Japan)petrographic microscope was used for transmittedlight microscopy. The microscope was equippedwith a Nikon DS‐Fi1 camera and pictures weretaken using the NIS Elements BR (Nikon, Japan)software package.
3.2. Scanning Electron Microscopy
[11] The SEM images were taken using a Zeisssupra 55VP SEM. The SEM images were acquiredusing carbon coated petrographic thin sections.Typical backscattered electron (BSE) images areshown, acquired with an acceleration voltage of15 kV and at a working distance of 15 mm at anaperture size of 60 mm. XRF spectra were takenusing an EDX detector (Thermo Noran EDS)measuring all elements in one overnight run toensure good counting statistics.
3.3. Focused Ion Beam Milling andTransmission Electron Microscopy
[12] Focused ion beam (FIB) milling was used assite specific sample preparation method for TEMand XANES measurements. FIB was obtainedusing a FEI FIB200TEM with a Ga ion source forsputtering at GeoForschungsZentrum Potsdam(GFZ), Germany. FIB slides are approximately15 × 10 × 0.15 micron in size. FIB slides werelifted out of the FIB milling site and were placed onstandard Cu TEM grids covered with perforatedamorphous carbon film (lacey carbon) to allowcarbon analysis without significant carbon back-ground. Details of the FIB preparation are given byWirth [2004]. Transmission electron microscopywas also conducted at the GeoForschungsZentrumPotsdam (GfZ), Germany. The TEM used for thisstudy was a FEI TecnaiG2 F20 X‐TWIN equippedwith a Gatan Imaging Filter GIF (Gatan Tridiem),EDAX X‐ray analyzer and a Fishione high angleannular dark field detector (HAADF). The electronsource of the TEM was a field emission gun emitterand was operated at 200 kV acceleration voltage.
Figure 3. (a) The island of Kattøy. Point of view isapproximately at position 60 m on the stratigraphycolumn from 2008. (b) Typical well preserved pillows(P) with a triple junction. In between the pillow interpil-low breccias and hyaloclastite can be found. (c) Magni-fied view of the glassy chilled margin of the pillow. Thevariolitic zone is visible as the whitish lower right area atthe margin of the pillows and marked in the photograph.
GeochemistryGeophysicsGeosystems G3G3 FLIEGEL ET AL.: TEXTURES IN A NORWEGIAN OPHIOLITE 10.1029/2010GC003255
5 of 21

3.4. Scanning Transmission Soft X‐RayMicroscopy
[13] For the STXM measurements one FIB foil wasused after TEM measurements. The PoLux beamline at the Swiss light source was used as an X‐raymicroscope. An overview image was taken at500 eV to locate the titanite‐chlorite boundary.Subsequently XANES line scans from 280 to380 eV with spatial resolution of 50 nm were taken,probing the C 1s edge with energy steps of 0.25 eV.Additionally stacks at 280 eV and 320 eVwere takenat selected areas to probe C 1s pre‐edge and C 1son‐edge. Fe L2/3 edge (Fe
II/III) analysis was done attwo spots, one in the chlorite and one in the titaniterecording spectras from 700 to 720 eV with 0.25 eVstepsize. Data was reduced using aXis softwarepackage and XANES data is presented as −ln(I/I0).
3.5. Radiometric Dating Using LaserAblation MC–ICP–MS
[14] LA–MC–ICP–MS in situ radiometric titanitedating was conducted using a UP213 nm New
Wave laser ablation system coupled to a Nu PlasmaMC–ICP–MS at University of Alberta, Edmonton,Canada. The data acquisition followed the protocoldescribed by Simonetti et al. [2006]. Ablationexperiments were conducted in single spot analysiswith a laser fluence of ∼2 J/cm2 and 4 Hz repetitionrate. Pb isotopes were measured on ion counters,U and Tl (mass bias correction) were measured onFaraday cups. The Khan titanite [Heaman, 2009]was used as the external standard and to monitorinstrumental drift of the measured U/Pb ratios.
3.6. Trace Element Analysis UsingLA–ICP–MS
[15] Rare earth element abundance in the titanitewere determined using a UP213 nm New WaveLaser ablation system coupled to a Thermo-Finnigan Element2 ICP–MS at University ofBergen, Norway. Ablation was carried out usingscanning mode ablation directly on thin sections.Laser beam size was 80 mm, 10 Hz repetition rateat a scanning speed of 10 mm/s and an appliedfluence of approximately 2 J/cm2. Analyses were
Figure 4. Stable carbon isotope data for the sample collected on Kattøy, adapted from Furnes et al. [2002]. (a) Thecircles show the d13C value (‰) of the crystalline core samples. Further indicated in Figure 4a are the mantle d13Csignature (−7 to −5) and the range of marine carbonates (−1 to 1). (b) The diamonds illustrate the difference betweenthe d13C value of the rim and the core. For detailed stratigraphy compare Figure 3.
GeochemistryGeophysicsGeosystems G3G3 FLIEGEL ET AL.: TEXTURES IN A NORWEGIAN OPHIOLITE 10.1029/2010GC003255
6 of 21
done in standard‐sample bracketing using the Khantitanite as the external standard for drift correctionand quantification. Trace element concentrationsfor the Khan titanite are taken from Heaman[2009]. For imaging purposes, the SRM NIST610 was used as external standard. The ICP–MSwas tuned prior to analysis using SRMNIST 610 onmaximum signal (238U, min. 700,000 cps), mini-mum elemental fractionation (238U/232Th, approxi-mately 1) and low oxide rate (232Th16O, <0.2%).SRM NIST 610 served additionally as externalquality control standard to monitor the instrumentalperformance (drift, uncertainty, and trueness).Analyses were carried out in low‐resolution modemeasuring. As isotopes, 49Ti (used as internalstandard) and 57Fe as matrix elements, 89Y, 139La,140Ce, 141Pr, 146Nd, 147Sm, 153Eu, 157Gd, 159Tb,163Dy, 165Ho, 166Er, 169Tm, 172Yb, 175Lu, 208Pb,232Th, 238U and 140Ce16O (oxide formation), weremeasured. The method was optimized for maxi-mum scan speed. The concentration of Ti (mainelement) was measured using EDX analyses (n =50 spots per sample) using the Thermo Norandetector at a Zeiss Supra 55VP SEM (at Universityof Bergen). Data was reduced using the Glitter datareduction software and normalized against REEchondrite values [McLennan, 1989]. Only analysesexceeding a Ti/Fe ratio of 1.5 were regarded
as titanite; analyses with Ti/Fe ratio < 1.5 werediscarded.
4. Results
4.1. Morphological Description of theTitanite and the Tubular AlterationTextures
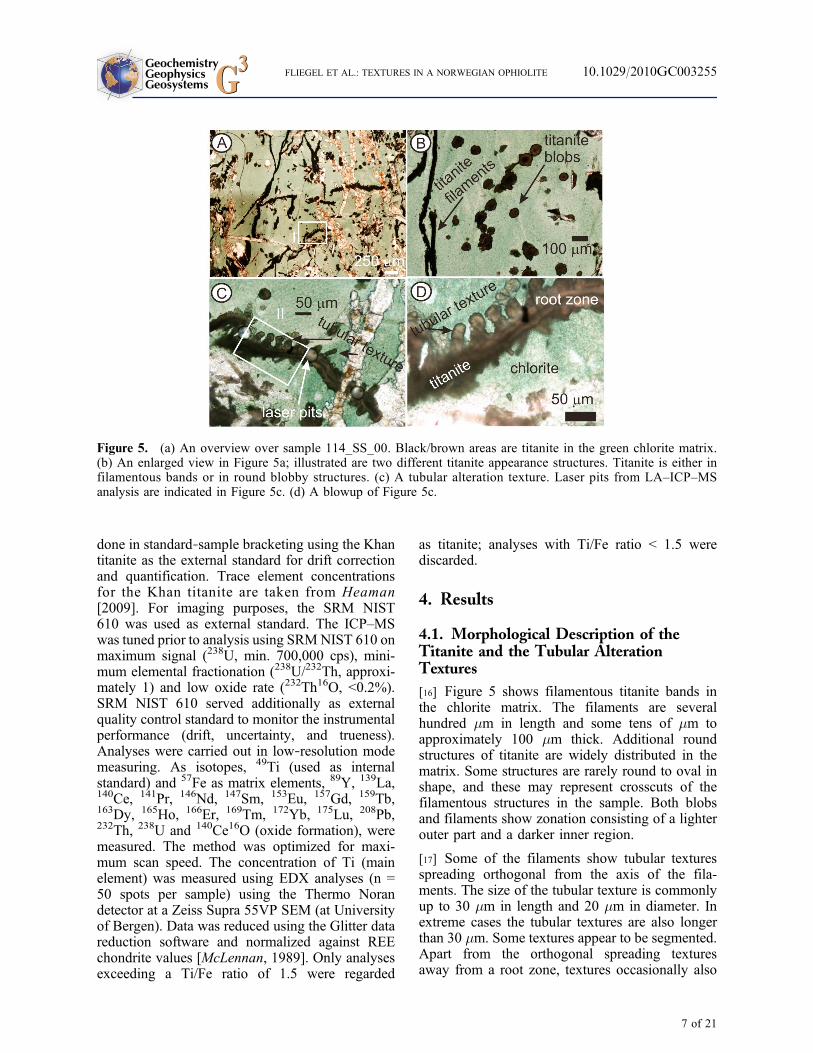
[16] Figure 5 shows filamentous titanite bands inthe chlorite matrix. The filaments are severalhundred mm in length and some tens of mm toapproximately 100 mm thick. Additional roundstructures of titanite are widely distributed in thematrix. Some structures are rarely round to oval inshape, and these may represent crosscuts of thefilamentous structures in the sample. Both blobsand filaments show zonation consisting of a lighterouter part and a darker inner region.
[17] Some of the filaments show tubular texturesspreading orthogonal from the axis of the fila-ments. The size of the tubular texture is commonlyup to 30 mm in length and 20 mm in diameter. Inextreme cases the tubular textures are also longerthan 30 mm. Some textures appear to be segmented.Apart from the orthogonal spreading texturesaway from a root zone, textures occasionally also
Figure 5. (a) An overview over sample 114_SS_00. Black/brown areas are titanite in the green chlorite matrix.(b) An enlarged view in Figure 5a; illustrated are two different titanite appearance structures. Titanite is either infilamentous bands or in round blobby structures. (c) A tubular alteration texture. Laser pits from LA–ICP–MSanalysis are indicated in Figure 5c. (d) A blowup of Figure 5c.
GeochemistryGeophysicsGeosystems G3G3 FLIEGEL ET AL.: TEXTURES IN A NORWEGIAN OPHIOLITE 10.1029/2010GC003255
7 of 21

propagate with angles other than 90 degrees intothe chlorite. The interface between texture and hostchlorite appear to be nonlinear in optical micros-copy. Additionally, some terminations of the tubulartextures are broader compared to the rooted area.
[18] Titanite mineralized textures from withinancient greenstone belts consist of longer tubes,sometimes also with branching and twisting fea-tures [Banerjee et al., 2006; Furnes et al., 2004;McLoughlin et al., 2009b]. The length to diameterratio is higher for these textures compared to thosefrom the SSOC textures. Furthermore, the texturesdescribed here lack a level of complexity describedpreviously [Banerjee et al., 2006; Furnes et al.,2004; McLoughlin et al., 2009b]. SSOC tubular tex-tures are not crosscut by chlorite, such as describedfor titanite mineralized textures in Archean green-stone belts [Banerjee et al., 2006; Furnes et al., 2004].The presence of crosscutting chlorite has been usedas argument for the antiquity of the tubes in
Archean samples [Furnes et al., 2004]. The lack ofthe crosscutting chlorite does not provide an ageconstraint of the titanite mineralization based on thetiming of chlortitization of the sample; hencenecessitating the in situ U‐Pb age dating of titanitein order to delineate the timing of metamorphism.
4.2. SEM–EDX
[19] The titanite records zoning with an iron richinner section and an iron depleted outer region,which is especially visible in the filamentous areasand in the blobs. This is seen in EDX analysis withlong dwell times (Figure 6). The inner part of thefilaments is also characterized by elevated Alconcentrations. Ti and Ca as main phase elementsfor the titanite are depleted in these areas. Based onEDX analysis, there are no apparent differencesbetween the titanite mineralizing the filaments andthe tubular textures.
Figure 6. XRF elemental maps of a titanite filament with orthogonal tubular alteration textures (sample 114_SS_00).Acceleration voltage is 15 kV.
GeochemistryGeophysicsGeosystems G3G3 FLIEGEL ET AL.: TEXTURES IN A NORWEGIAN OPHIOLITE 10.1029/2010GC003255
8 of 21
4.3. TEM Investigations
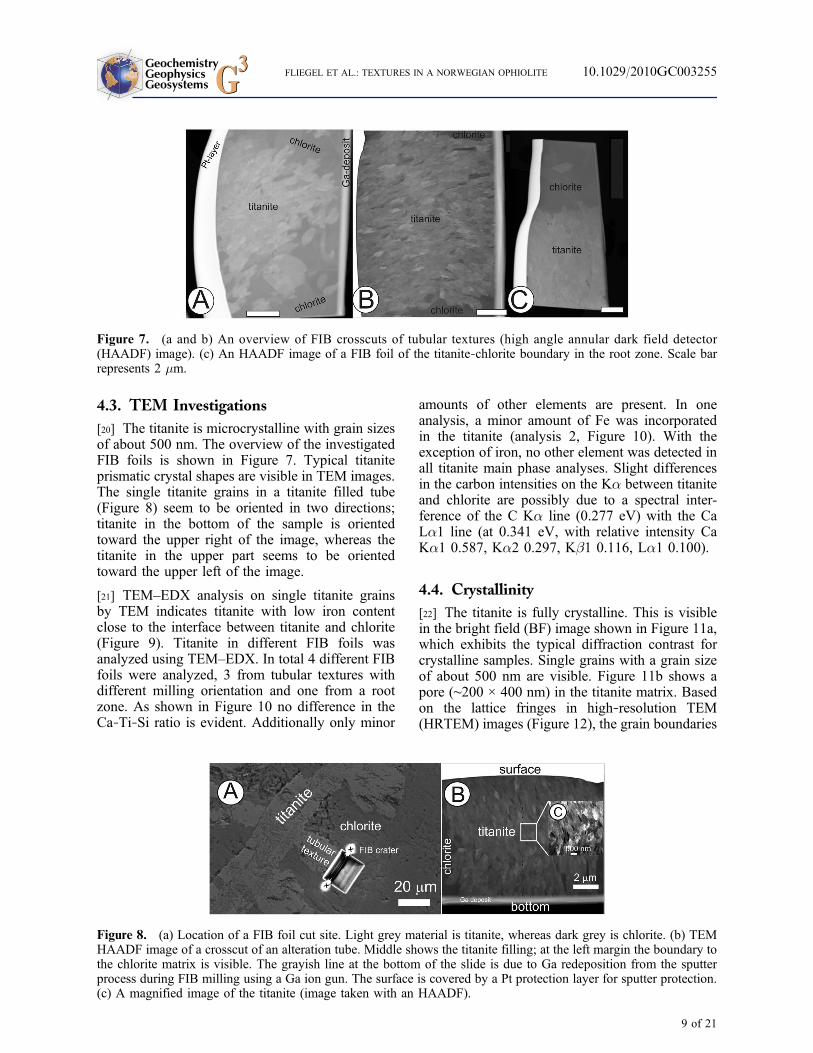
[20] The titanite is microcrystalline with grain sizesof about 500 nm. The overview of the investigatedFIB foils is shown in Figure 7. Typical titaniteprismatic crystal shapes are visible in TEM images.The single titanite grains in a titanite filled tube(Figure 8) seem to be oriented in two directions;titanite in the bottom of the sample is orientedtoward the upper right of the image, whereas thetitanite in the upper part seems to be orientedtoward the upper left of the image.
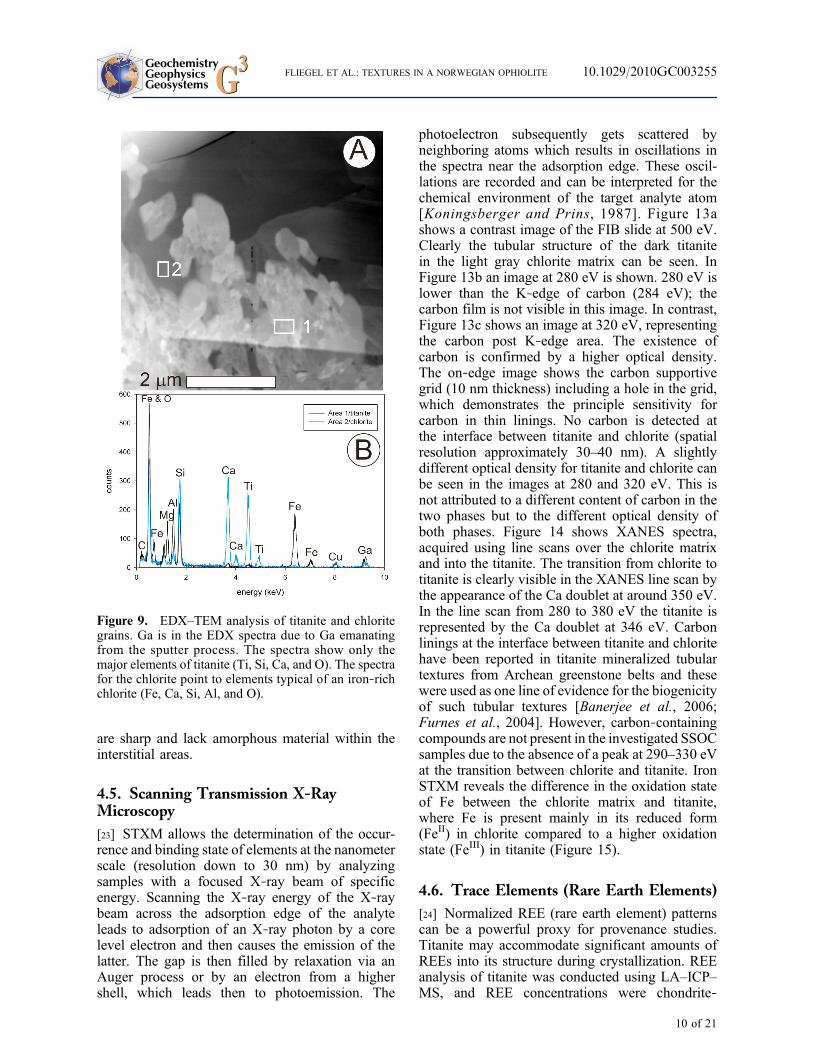
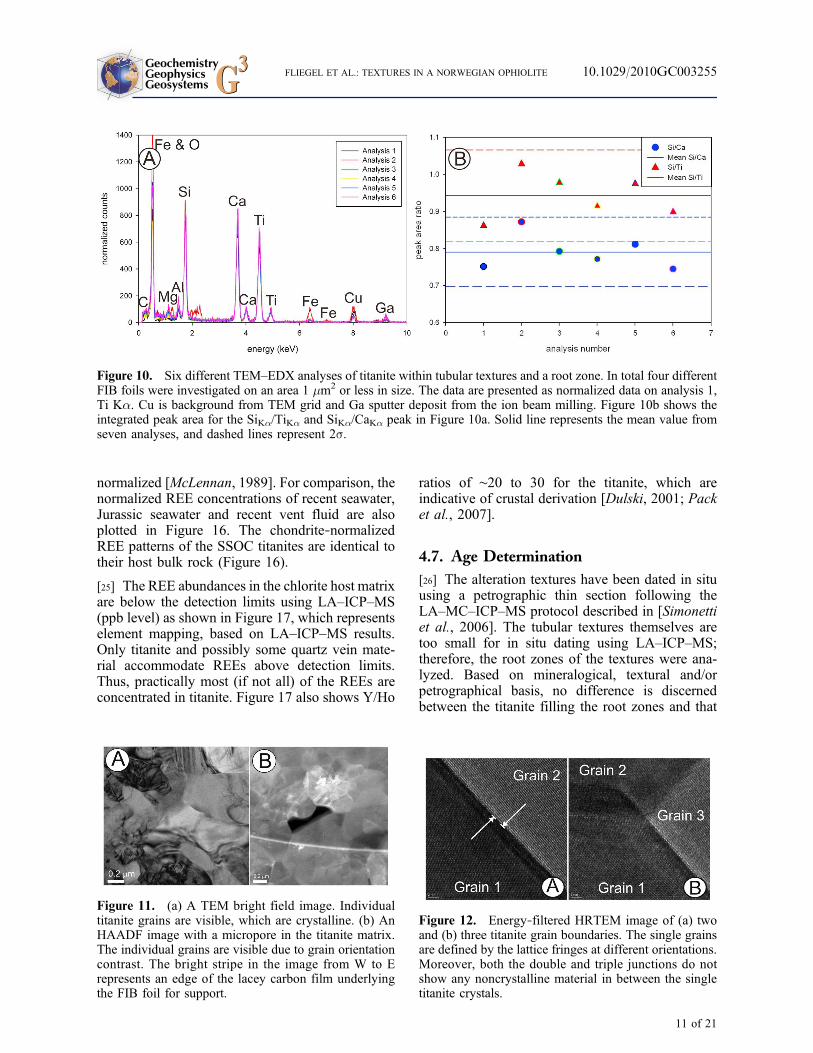
[21] TEM–EDX analysis on single titanite grainsby TEM indicates titanite with low iron contentclose to the interface between titanite and chlorite(Figure 9). Titanite in different FIB foils wasanalyzed using TEM–EDX. In total 4 different FIBfoils were analyzed, 3 from tubular textures withdifferent milling orientation and one from a rootzone. As shown in Figure 10 no difference in theCa‐Ti‐Si ratio is evident. Additionally only minor
amounts of other elements are present. In oneanalysis, a minor amount of Fe was incorporatedin the titanite (analysis 2, Figure 10). With theexception of iron, no other element was detected inall titanite main phase analyses. Slight differencesin the carbon intensities on the Ka between titaniteand chlorite are possibly due to a spectral inter-ference of the C Ka line (0.277 eV) with the CaLa1 line (at 0.341 eV, with relative intensity CaKa1 0.587, Ka2 0.297, Kb1 0.116, La1 0.100).
4.4. Crystallinity
[22] The titanite is fully crystalline. This is visiblein the bright field (BF) image shown in Figure 11a,which exhibits the typical diffraction contrast forcrystalline samples. Single grains with a grain sizeof about 500 nm are visible. Figure 11b shows apore (∼200 × 400 nm) in the titanite matrix. Basedon the lattice fringes in high‐resolution TEM(HRTEM) images (Figure 12), the grain boundaries
Figure 7. (a and b) An overview of FIB crosscuts of tubular textures (high angle annular dark field detector(HAADF) image). (c) An HAADF image of a FIB foil of the titanite‐chlorite boundary in the root zone. Scale barrepresents 2 mm.
Figure 8. (a) Location of a FIB foil cut site. Light grey material is titanite, whereas dark grey is chlorite. (b) TEMHAADF image of a crosscut of an alteration tube. Middle shows the titanite filling; at the left margin the boundary tothe chlorite matrix is visible. The grayish line at the bottom of the slide is due to Ga redeposition from the sputterprocess during FIB milling using a Ga ion gun. The surface is covered by a Pt protection layer for sputter protection.(c) A magnified image of the titanite (image taken with an HAADF).
GeochemistryGeophysicsGeosystems G3G3 FLIEGEL ET AL.: TEXTURES IN A NORWEGIAN OPHIOLITE 10.1029/2010GC003255
9 of 21
are sharp and lack amorphous material within theinterstitial areas.
4.5. Scanning Transmission X‐RayMicroscopy
[23] STXM allows the determination of the occur-rence and binding state of elements at the nanometerscale (resolution down to 30 nm) by analyzingsamples with a focused X‐ray beam of specificenergy. Scanning the X‐ray energy of the X‐raybeam across the adsorption edge of the analyteleads to adsorption of an X‐ray photon by a corelevel electron and then causes the emission of thelatter. The gap is then filled by relaxation via anAuger process or by an electron from a highershell, which leads then to photoemission. The
photoelectron subsequently gets scattered byneighboring atoms which results in oscillations inthe spectra near the adsorption edge. These oscil-lations are recorded and can be interpreted for thechemical environment of the target analyte atom[Koningsberger and Prins, 1987]. Figure 13ashows a contrast image of the FIB slide at 500 eV.Clearly the tubular structure of the dark titanitein the light gray chlorite matrix can be seen. InFigure 13b an image at 280 eV is shown. 280 eV islower than the K‐edge of carbon (284 eV); thecarbon film is not visible in this image. In contrast,Figure 13c shows an image at 320 eV, representingthe carbon post K‐edge area. The existence ofcarbon is confirmed by a higher optical density.The on‐edge image shows the carbon supportivegrid (10 nm thickness) including a hole in the grid,which demonstrates the principle sensitivity forcarbon in thin linings. No carbon is detected atthe interface between titanite and chlorite (spatialresolution approximately 30–40 nm). A slightlydifferent optical density for titanite and chlorite canbe seen in the images at 280 and 320 eV. This isnot attributed to a different content of carbon in thetwo phases but to the different optical density ofboth phases. Figure 14 shows XANES spectra,acquired using line scans over the chlorite matrixand into the titanite. The transition from chlorite totitanite is clearly visible in the XANES line scan bythe appearance of the Ca doublet at around 350 eV.In the line scan from 280 to 380 eV the titanite isrepresented by the Ca doublet at 346 eV. Carbonlinings at the interface between titanite and chloritehave been reported in titanite mineralized tubulartextures from Archean greenstone belts and thesewere used as one line of evidence for the biogenicityof such tubular textures [Banerjee et al., 2006;Furnes et al., 2004]. However, carbon‐containingcompounds are not present in the investigated SSOCsamples due to the absence of a peak at 290–330 eVat the transition between chlorite and titanite. IronSTXM reveals the difference in the oxidation stateof Fe between the chlorite matrix and titanite,where Fe is present mainly in its reduced form(FeII) in chlorite compared to a higher oxidationstate (FeIII) in titanite (Figure 15).
4.6. Trace Elements (Rare Earth Elements)
[24] Normalized REE (rare earth element) patternscan be a powerful proxy for provenance studies.Titanite may accommodate significant amounts ofREEs into its structure during crystallization. REEanalysis of titanite was conducted using LA–ICP–MS, and REE concentrations were chondrite‐
Figure 9. EDX–TEM analysis of titanite and chloritegrains. Ga is in the EDX spectra due to Ga emanatingfrom the sputter process. The spectra show only themajor elements of titanite (Ti, Si, Ca, and O). The spectrafor the chlorite point to elements typical of an iron‐richchlorite (Fe, Ca, Si, Al, and O).
GeochemistryGeophysicsGeosystems G3G3 FLIEGEL ET AL.: TEXTURES IN A NORWEGIAN OPHIOLITE 10.1029/2010GC003255
10 of 21
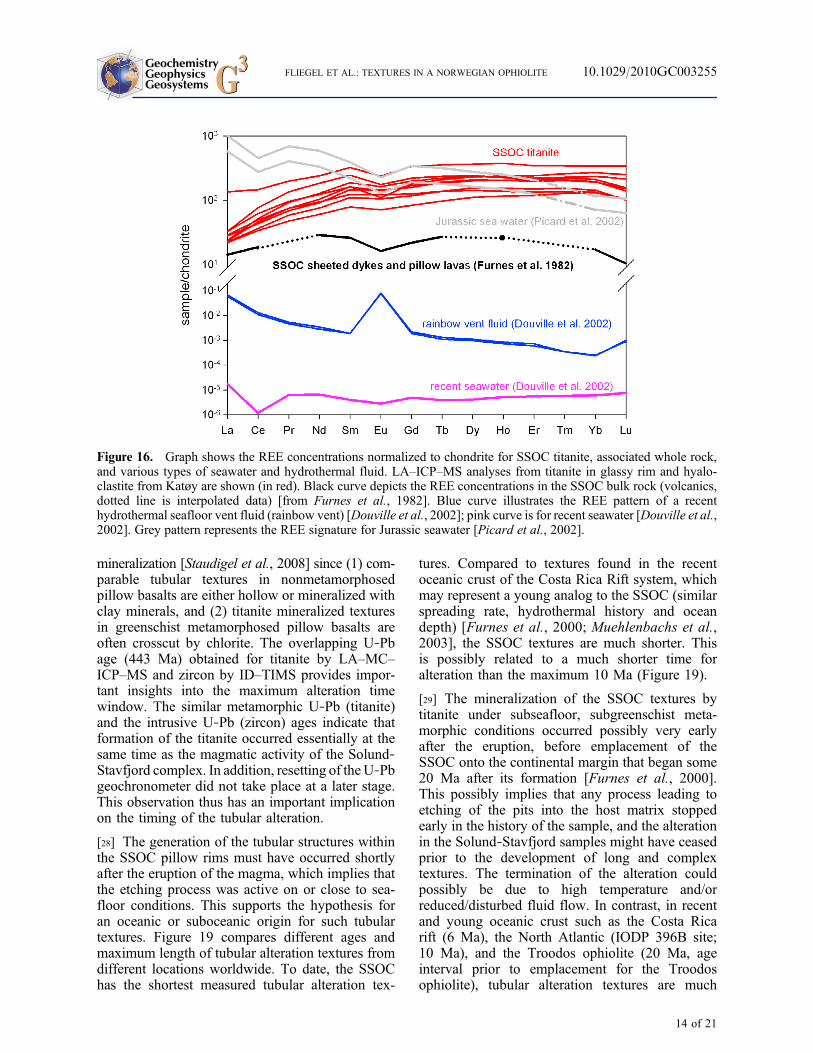
normalized [McLennan, 1989]. For comparison, thenormalized REE concentrations of recent seawater,Jurassic seawater and recent vent fluid are alsoplotted in Figure 16. The chondrite‐normalizedREE patterns of the SSOC titanites are identical totheir host bulk rock (Figure 16).
[25] The REE abundances in the chlorite host matrixare below the detection limits using LA–ICP–MS(ppb level) as shown in Figure 17, which representselement mapping, based on LA–ICP–MS results.Only titanite and possibly some quartz vein mate-rial accommodate REEs above detection limits.Thus, practically most (if not all) of the REEs areconcentrated in titanite. Figure 17 also shows Y/Ho
ratios of ∼20 to 30 for the titanite, which areindicative of crustal derivation [Dulski, 2001; Packet al., 2007].
4.7. Age Determination
[26] The alteration textures have been dated in situusing a petrographic thin section following theLA–MC–ICP–MS protocol described in [Simonettiet al., 2006]. The tubular textures themselves aretoo small for in situ dating using LA–ICP–MS;therefore, the root zones of the textures were ana-lyzed. Based on mineralogical, textural and/orpetrographical basis, no difference is discernedbetween the titanite filling the root zones and that
Figure 11. (a) A TEM bright field image. Individualtitanite grains are visible, which are crystalline. (b) AnHAADF image with a micropore in the titanite matrix.The individual grains are visible due to grain orientationcontrast. The bright stripe in the image from W to Erepresents an edge of the lacey carbon film underlyingthe FIB foil for support.
Figure 12. Energy‐filtered HRTEM image of (a) twoand (b) three titanite grain boundaries. The single grainsare defined by the lattice fringes at different orientations.Moreover, both the double and triple junctions do notshow any noncrystalline material in between the singletitanite crystals.
Figure 10. Six different TEM–EDX analyses of titanite within tubular textures and a root zone. In total four differentFIB foils were investigated on an area 1 mm2 or less in size. The data are presented as normalized data on analysis 1,Ti Ka. Cu is background from TEM grid and Ga sputter deposit from the ion beam milling. Figure 10b shows theintegrated peak area for the SiKa/TiKa and SiKa/CaKa peak in Figure 10a. Solid line represents the mean value fromseven analyses, and dashed lines represent 2s.
GeochemistryGeophysicsGeosystems G3G3 FLIEGEL ET AL.: TEXTURES IN A NORWEGIAN OPHIOLITE 10.1029/2010GC003255
11 of 21

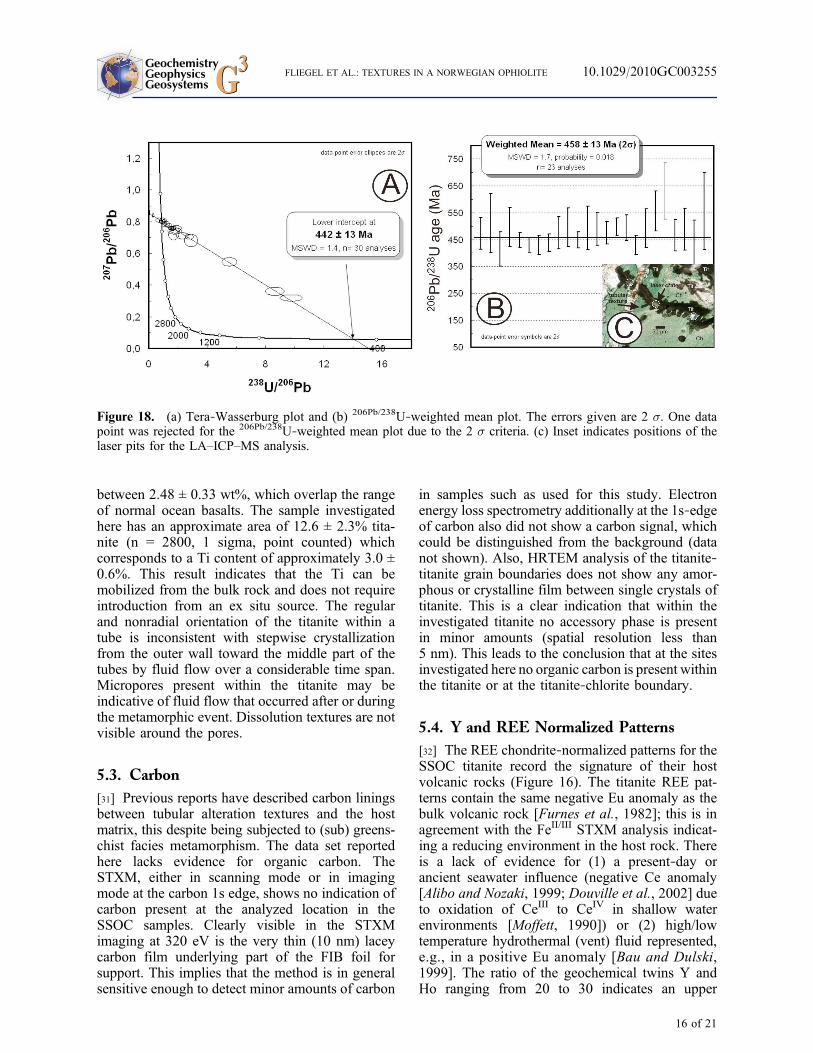
found within the tubes. This may indicate that thereis no significant time difference between formationof the titanite in the root zones and that in the tubulartextures. The data is plotted as noncommon leadcorrected data on a Tera‐Wasserburg plot [Tera andWasserburg, 1972]. As shown in Figure 18, thedata from the Solund‐Stavfjord ophiolite definea well‐constrained mixing line between the com-mon lead compound (y axis intercept) and thelower intercept with the Concordia curve, whichrepresents the composition and age of the radio-genic component. The age of the sample is definedby the lower intercept of the mixing line withthe Concordia curve in the 207Pb/206Pb‐238U/206Pbplot (Figure 18a), which yields an age of 443 ±13 Ma (95.4% confidence). The 207Pb/206Pb com-position of the common lead compound (y axisintercept value in Figure 18a) was subsequentlyused for the common lead correction of the indi-vidual analyses and calculation of the resultantweighted mean 206Pb/238U age (Figure 17b). Theweighted mean 206Pb/238U age, including full errorpropagation, is 458 ± 13 Ma (with one analysisrejected due to 2 s criterion). Given the associateduncertainties, this age is indistinguishable comparedto the 443 ± 3 Ma isotope dilution–thermal ioni-zation mass spectrometric (ID–TIMS) age obtained
for zircons from a quartz diorite from the sameophiolite complex [Pedersen et al., 1991].
5. Discussion
5.1. Age and Implications on theMorphology
[27] The strings and blobs of titanite most probablyrepresent mineralization within initial cracks in theglass matrix. Different phases in the titanite areobserved, such as a darker inner core zone and alighter outer region. These two phases possiblyrepresent different stages of titanite mineralization;however, it is impossible to constrain the ages ofthese two events given our current spatial resolu-tion capacity for in situ U‐Pb analysis. The raretubular textures spreading orthogonally from a rootzone are interpreted as initial tubular alterationtextures. Compared to tubular alteration texturesdescribed in younger ophiolites [Furnes et al., 2001b;McLoughlin et al., 2009b] and older greenstonebelts [Banerjee et al., 2007; Furnes et al., 2004;Staudigel et al., 2008] the textures shown heredo not exhibit the same complexity and length(Figure 18). The etching of the glass to producethe initial tubes must have occurred prior to any
Figure 13. (a) An STXM overview of the FIB slide imaged at 500 eV. The titanite in the tubular texture is repre-sented by the strong contrast (Ti L2/3‐edge at 453–460 eV). The light gray is the chlorite matrix. The FIB slide islaying on a 10 nm amorphous carbon film with holes in it (lightest part of the image), and the arrow represents a holein the carbon film where a carbon map was generated. The dashed circle indicates an area where an XANES scan(indicated by the arrow in the circle) was conducted (data shown in Figure 14). (b) An image at the area aroundthe arrow in Figure 13a acquired at 280 eV. This is the carbon “pre‐edge” picture (C K‐edge at 284 eV). (c) A carbon“on‐edge” picture of the same area taken at 320 eV. Clearly the carbon film and the hole in the carbon film are visible.The dark rim at the top represents the protective Pt coating, whereas the bottom darker area represents redeposition ofGa from the sputtering.
GeochemistryGeophysicsGeosystems G3G3 FLIEGEL ET AL.: TEXTURES IN A NORWEGIAN OPHIOLITE 10.1029/2010GC003255
12 of 21

Figure 14. (a) XANES spectra from 280 eV to 390 eV. The XANES scan was conducted as a line scan from 280 eVto 380 eV. The position for the XANES line scan was chosen in a hole of the supporting carbon foil, resulting in zerobackground adsorption from the carbon foil. Ca is represented by the doublet at 346 eV. (b) The evolution of XANESspectra crossing a titanite grain from chlorite (position 0 nm) to titanite (position 400–1100 nm) and back to chlorite(position 1400 nm). The spatial resolution is <100 nm. Spectra are shown as background corrected spectra (−lnI/I0).
Figure 15. Two Fe L2/3‐edge STXM analyses. Dashed line is an STXM analysis on the chlorite, solid line on thetitanite. Data is presented as background corrected spectra (−lnI/I0). Higher optical density at lower energy (708 eV) isindicative for FeII, while higher optical density at higher energy (709.8 eV) is indicative for FeIII.
GeochemistryGeophysicsGeosystems G3G3 FLIEGEL ET AL.: TEXTURES IN A NORWEGIAN OPHIOLITE 10.1029/2010GC003255
13 of 21
mineralization [Staudigel et al., 2008] since (1) com-parable tubular textures in nonmetamorphosedpillow basalts are either hollow or mineralized withclay minerals, and (2) titanite mineralized texturesin greenschist metamorphosed pillow basalts areoften crosscut by chlorite. The overlapping U‐Pbage (443 Ma) obtained for titanite by LA–MC–ICP–MS and zircon by ID–TIMS provides impor-tant insights into the maximum alteration timewindow. The similar metamorphic U‐Pb (titanite)and the intrusive U‐Pb (zircon) ages indicate thatformation of the titanite occurred essentially at thesame time as the magmatic activity of the Solund‐Stavfjord complex. In addition, resetting of the U‐Pbgeochronometer did not take place at a later stage.This observation thus has an important implicationon the timing of the tubular alteration.
[28] The generation of the tubular structures withinthe SSOC pillow rims must have occurred shortlyafter the eruption of the magma, which implies thatthe etching process was active on or close to sea-floor conditions. This supports the hypothesis foran oceanic or suboceanic origin for such tubulartextures. Figure 19 compares different ages andmaximum length of tubular alteration textures fromdifferent locations worldwide. To date, the SSOChas the shortest measured tubular alteration tex-
tures. Compared to textures found in the recentoceanic crust of the Costa Rica Rift system, whichmay represent a young analog to the SSOC (similarspreading rate, hydrothermal history and oceandepth) [Furnes et al., 2000; Muehlenbachs et al.,2003], the SSOC textures are much shorter. Thisis possibly related to a much shorter time foralteration than the maximum 10 Ma (Figure 19).
[29] The mineralization of the SSOC textures bytitanite under subseafloor, subgreenschist meta-morphic conditions occurred possibly very earlyafter the eruption, before emplacement of theSSOC onto the continental margin that began some20 Ma after its formation [Furnes et al., 2000].This possibly implies that any process leading toetching of the pits into the host matrix stoppedearly in the history of the sample, and the alterationin the Solund‐Stavfjord samples might have ceasedprior to the development of long and complextextures. The termination of the alteration couldpossibly be due to high temperature and/orreduced/disturbed fluid flow. In contrast, in recentand young oceanic crust such as the Costa Ricarift (6 Ma), the North Atlantic (IODP 396B site;10 Ma), and the Troodos ophiolite (20 Ma, ageinterval prior to emplacement for the Troodosophiolite), tubular alteration textures are much
Figure 16. Graph shows the REE concentrations normalized to chondrite for SSOC titanite, associated whole rock,and various types of seawater and hydrothermal fluid. LA–ICP–MS analyses from titanite in glassy rim and hyalo-clastite from Katøy are shown (in red). Black curve depicts the REE concentrations in the SSOC bulk rock (volcanics,dotted line is interpolated data) [from Furnes et al., 1982]. Blue curve illustrates the REE pattern of a recenthydrothermal seafloor vent fluid (rainbow vent) [Douville et al., 2002]; pink curve is for recent seawater [Douville et al.,2002]. Grey pattern represents the REE signature for Jurassic seawater [Picard et al., 2002].
GeochemistryGeophysicsGeosystems G3G3 FLIEGEL ET AL.: TEXTURES IN A NORWEGIAN OPHIOLITE 10.1029/2010GC003255
14 of 21

longer in size. In addition, titanite mineralizedtextures from Archean greenstone belts also show asignificantly younger titanite mineralization agecompared to the eruptive age of the host rock(Figure 18). However, as demonstrated in Figure 19,the maximum lengths of the alteration texturesare not correlated with the maximum ages ofalteration. Factors beyond the maximum time spancontrol the time window and intensity of tubularalteration and these factors have not been identifiedyet. Further constrains on the maximum time spanfor the alteration based on the geological historyand the absolute radiometric ages for the SSOC arecurrently not possible.
5.2. Titanite Structure by TEM Analysis
[30] Both the uniform size and direction of thepolycrystalline titanite are indicative of a singlecrystallization event based on a precursor matrixduring one metamorphic event. TEM analysis didnot indicate different generations of titanite.Titanium was clearly mobile during greenschistmetamorphism and was removed from the glassduring its chlortitization, and was then concentratedwithin hollow structures such as cracks and tubulartextures with the aid of metamorphic fluid flow(possibly within a very short distance). This isalso supported by the fact that the Ti bulk rockconcentrations of the SSOC extrusive lavas are
Figure 17. Elemental mapping using LA–ICP–MS. The spot size was adjusted to 30 mm. Location of the lasercraters are indicated in lowermost transmitted light image (by black spots). The two red spots represent an invalidanalysis (spectrometer missed the laser trigger signal). The contour plots are generated by interpolating the elementalconcentration data using sigma plot and coordination based on the center point of a laser ablation spot. SRM NIST610 was used as the external calibration standard during elemental mapping for chlorite, quartz, and titanite.
GeochemistryGeophysicsGeosystems G3G3 FLIEGEL ET AL.: TEXTURES IN A NORWEGIAN OPHIOLITE 10.1029/2010GC003255
15 of 21
between 2.48 ± 0.33 wt%, which overlap the rangeof normal ocean basalts. The sample investigatedhere has an approximate area of 12.6 ± 2.3% tita-nite (n = 2800, 1 sigma, point counted) whichcorresponds to a Ti content of approximately 3.0 ±0.6%. This result indicates that the Ti can bemobilized from the bulk rock and does not requireintroduction from an ex situ source. The regularand nonradial orientation of the titanite within atube is inconsistent with stepwise crystallizationfrom the outer wall toward the middle part of thetubes by fluid flow over a considerable time span.Micropores present within the titanite may beindicative of fluid flow that occurred after or duringthe metamorphic event. Dissolution textures are notvisible around the pores.
5.3. Carbon
[31] Previous reports have described carbon liningsbetween tubular alteration textures and the hostmatrix, this despite being subjected to (sub) greens-chist facies metamorphism. The data set reportedhere lacks evidence for organic carbon. TheSTXM, either in scanning mode or in imagingmode at the carbon 1s edge, shows no indication ofcarbon present at the analyzed location in theSSOC samples. Clearly visible in the STXMimaging at 320 eV is the very thin (10 nm) laceycarbon film underlying part of the FIB foil forsupport. This implies that the method is in generalsensitive enough to detect minor amounts of carbon
in samples such as used for this study. Electronenergy loss spectrometry additionally at the 1s‐edgeof carbon also did not show a carbon signal, whichcould be distinguished from the background (datanot shown). Also, HRTEM analysis of the titanite‐titanite grain boundaries does not show any amor-phous or crystalline film between single crystals oftitanite. This is a clear indication that within theinvestigated titanite no accessory phase is presentin minor amounts (spatial resolution less than5 nm). This leads to the conclusion that at the sitesinvestigated here no organic carbon is present withinthe titanite or at the titanite‐chlorite boundary.
5.4. Y and REE Normalized Patterns
[32] The REE chondrite‐normalized patterns for theSSOC titanite record the signature of their hostvolcanic rocks (Figure 16). The titanite REE pat-terns contain the same negative Eu anomaly as thebulk volcanic rock [Furnes et al., 1982]; this is inagreement with the FeII/III STXM analysis indicat-ing a reducing environment in the host rock. Thereis a lack of evidence for (1) a present‐day orancient seawater influence (negative Ce anomaly[Alibo and Nozaki, 1999; Douville et al., 2002] dueto oxidation of CeIII to CeIV in shallow waterenvironments [Moffett, 1990]) or (2) high/lowtemperature hydrothermal (vent) fluid represented,e.g., in a positive Eu anomaly [Bau and Dulski,1999]. The ratio of the geochemical twins Y andHo ranging from 20 to 30 indicates an upper
Figure 18. (a) Tera‐Wasserburg plot and (b) 206Pb/238U‐weighted mean plot. The errors given are 2 s. One datapoint was rejected for the 206Pb/238U‐weighted mean plot due to the 2 s criteria. (c) Inset indicates positions of thelaser pits for the LA–ICP–MS analysis.
GeochemistryGeophysicsGeosystems G3G3 FLIEGEL ET AL.: TEXTURES IN A NORWEGIAN OPHIOLITE 10.1029/2010GC003255
16 of 21

mantle–derived origin for the Y+REE accommo-dated within the titanite [Pack et al., 2007]. Titaniteoriginating from an aqueous system is typicallycharacterized by a Y/Ho ratio of 40 to 70 [Bau andDulski, 1999;Nozaki et al., 1997; Pack et al., 2007].This latter feature is independent from the nature ofthe fluid system since the Y/Ho ratio is controlledby complexation and sorption processes at solid‐fluid interfaces [Bau and Dulski, 1999]; whereas inigneous rocks, the Y/Ho ratio is controlled bycharge and ratio dependent fractionation processes[Pack et al., 2007]. The most probable scenario istherefore mobilization of Y+REE during the
chloritization of the host rock and the titanitesubsequently scavenging these elements during themetamorphism. This indicates that the titanitemineralization of the tubular textures occurredduring the subgreenschist metamorphism, and noconclusion, based on the analysis of the titanite,can be drawn on the primary generation mechanismof these textures. Since the titanite further showsequal crystal shape and size in all investigated FIBfoils, it is unlikely that the crystallization of thetitanite preserves the primary mineralization struc-ture of these alteration textures.
Figure 19. Compilation of different tubular alteration textures. The maximum length of the tubes is indicated versusthe maximum alteration time span. The maximum alteration time span is defined as the maximum age (subseafloorexamples), the difference between eruption and emplacement (zeolite facies), and the difference between eruption andmetamorphic age (Prehnite‐pumpellyite and greenschist facies). The different ages are compiled from the followingreferences: a, Furnes et al. [2001c]; b, Robinson et al. [1980]; c, Robinson et al. [1980]; d, Banerjee andMuehlenbachs [2003]; e, Robinson and Malpas [1990]; f, Dilek et al. [2005]; g, Fliegel et al. [2010b]; h, thiswork; i, McLoughlin et al. [2009a]; j, Banerjee et al. [2007]; k, Fliegel et al. [2010a]. The length has been measuredusing petrographic microscopy on thin sections.
GeochemistryGeophysicsGeosystems G3G3 FLIEGEL ET AL.: TEXTURES IN A NORWEGIAN OPHIOLITE 10.1029/2010GC003255
17 of 21

5.5. Evidence for an Ancient BiogenicOrigin of the Tubular Textures
[33] Previous studies have attributed tubular, tita-nite mineralized textures in (meta) volcanic glass tobioalteration processes based on various lines ofevidence [Staudigel et al., 2008]. Moreover, for thelocation described here, granular textures in pillowmargins have also been described as being of bio-genic origin, supported by the low d13Ccarbonate
value of the pillow rims compared to the pillowcores and their chemical signature [Furnes et al.,2002]. The lines of evidence reported in the liter-ature for the biogenicity of potential trace fossilstructures include (1) the antiquity of the struc-ture, (2) morphology [McLoughlin et al., 2009b],(3) chemical signatures [Banerjee et al., 2006],(4) isotopic evidence [Furnes et al., 2002, 2008],and (5) the mineralization history. In the followingsection, these points will be assessed for the tubulartextures described here.
[34] 1. The antiquity of the tubular textures isconfirmed by absolute radiometric dating of thetitanite that is mineralizing the tubes. The radio-metric age confirms a minimum date for the for-mation of the tubes prior to the disconnection of thehost rock sequence with the subseafloor environ-ment. It is therefore plausible that the alteration ofthe volcanic glass took place during hydrothermalactivity of the volcanic crust, which would alsopossibly imply that the rocks were in contact withthe suboceanic deep biosphere.
[35] 2. Previously described tubular textures insamples from ancient greenstone belts metamor-phosed to greenschist facies conditions are alsomineralized by titanite [Banerjee et al., 2007;Furnes et al., 2004; McLoughlin et al., 2009a].However, these textures are much longer and showa more complex substructure. These textures fromancient crust often exhibit a puzzling variety ofcomplex morphologies. Some of the morphologicalfeatures reported are tunneling, true branching,helicoidal structure, and annulation [McLoughlinet al., 2007, 2009b]. The textures described heredo not show these varieties of substructures.Therefore, assessing the biogenicity of the texturesdescribed here based on their morphology may bequestionable. An additional argument for the bio-genicity of tubular textures in ancient (meta) vol-canic glass has been the propagation of the tubes inone direction away from a root zone. This obser-vation seems to support the model of directedetching by microbiota of the tubes beginning froman open surface. The tubes described here spread in
some occasions symmetrically in both directionsfrom a root zone. In such instances, it is difficult toaccess whether the root zone or the texture was theprimary structure.
[36] 3. Chemical evidence has been described as abiogenicity proxy of alteration textures of any age.The correlation of the occurrence of biogenicelements such as C, P, S and N with alterationtextures has been documented [Banerjee et al.,2007; Furnes et al., 2004]. Focused ion beammilling in combination with transmission electronmicroscopy prepare fresh sampling surfaces from aspecified depth below the surface of a standard thinsection. Despite the use of this sophisticated ana-lytical technique for the investigated areas of thetextures described here, no evidence was found forthe enrichment in such elements associated with thetubular textures. Moreover, the REE data clearlyindicate the incorporation of these elements into thetitanite during metamorphic growth of new mineralphases. It is also possible that other elementsredistribute and are concentrated in newly formed(metamorphic) minerals. An elevated concentrationof “biogenic” elements such as P, N and S couldresult from induced element mobility duringmetamorphism. Further chemical evidence for thebiogenicity of such structures has been the presenceof carbon linings around the boundary betweenhost rock and titanite [Banerjee et al., 2006]. Thishas been interpreted as residual material resultingfrom the organic matter derived from microbiotaassumed to have etched the tubes. Three differentapproaches such as electron energy loss spectros-copy (EELS), scanning transmission (soft) X‐raymicroscopy (STXM), and high‐resolution trans-mission electron microscopy (HRTEM) have allfailed to identify (organic) carbon, carbonate, or anamorphous phase at phase boundaries within thesamples investigated. EELS is capable of identi-fying carbon layers < 10 nm and STXM has a spatialresolution < 40 nm, whereas HRTEM has a spatialresolution to detect amorphous layers < 5 nm.
[37] 4. The occurrence of d13Ccarbonate signatures inSSOC pillow rims lower than the range of typicalmantle values (−7 to −5 ‰) has been attributed inthe past to the oxygenation of organic matterderived from a biogenic metabolism [Furnes et al.,2002]. The sample from the island of Kattøy,which exhibits the lowest d13C values of allinvestigated samples, is also the sample where thetubular textures are present. This feature possiblyprovides evidence for a biologically mediatedprocess within the pillow rims; however, clearlydistinguishing between inorganic and organic pro-
GeochemistryGeophysicsGeosystems G3G3 FLIEGEL ET AL.: TEXTURES IN A NORWEGIAN OPHIOLITE 10.1029/2010GC003255
18 of 21

cesses that lead to isotopically “light” carbona-ceous matter is a difficult task.
[38] 5. The mineralization history of the SSOCtubular textures derived from the titanite micro-structure and the Y+REE patterns within the tita-nite clearly indicate that titanite mineralizationoccurred as a one step process; at a time when P‐Tconditions were suitable for titanite mineralization.Furthermore, several studies have shown a preser-vation of biological features, such as cell mem-branes or cell walls despite having experiencedmetamorphism [Bernard et al., 2007]. The preser-vation of biological features in such cases canoccur by graphitization or formation of mineralphases that template the original biostructure. Thesample investigated lacks any indication of a pre-cursor phase from the active times of alteration asevidenced using nanoscale analysis (TEM–BF,HAADF and HRTEM). Therefore, it is unlikelythat the titanite mineralization reported here recordsa template from the initial process of alteration.Based on the mineralogy investigated here, bio-genicity of the tubular textures can therefore neitherbe supported nor rejected.
[39] In summary, the titanite tubular textures in theSSOC lack clear multiline evidences for their bio-genicity. Only two (d13C and possibly morphology)of the five (possibly morphology, isotope, miner-alization, chemical and speciation information)biogenicity criteria could be linked to a biologicalorigin of the tubular textures described here.
6. Conclusion
[40] Titanite mineralization within tubular alter-ation textures in the Solund Stavfjord ophioliteoccurred at 443 ± 13 Ma ago. This result indicatesthat the mineralization of the alteration textures wasproximal in time relative to the eruption of theSSOC sequence. The tubular textures are consid-erably shorter compared to alteration textures fromother ophiolite complexes and greenstone belts,possibly indicating the limited available time foralteration at or below the seafloor from eruption tomineralization of the textures. The Y+REE patternsof the titanite from the SSOC resemble that of theirvolcanic host rock, indicating a mobilization of thetitanite precursors from the host rock duringmetamorphism. No indication of a seawater orhydrothermal signature in the Y+REE patterns ofthe titanite is observed. Nanoscale mineralogicaland chemical analysis of the titanite revealed itsmicrocrystallinity. Despite previous reports, the
samples investigated here are devoid of organiccarbon or other elements of biogenic origin; thisobservation is based on using contamination‐freesample preparation and analysis by XRF, STXMand EELS. The new data presented here thusneither supports nor refutes a biotic origin for thesmall tubular textures in the SSOC. However, therequired nanoscale characterization of such texturesis a step toward constraining the chemical, geo-logical and mineralogical window under whichpotential biogenicity proxies in altered volcaniccrust can be preserved over the geological timescale.
Acknowledgments
[41] We acknowledge funding from the Norwegian ResearchCouncil. SLS and EU are gratefully acknowledged for thefinancial support during the beam time (proposal 20080315).The extensive TEM and FIB instrument time granted at GfZPotsdam is greatly appreciated. The help of N. McLoughlinduring fieldwork is acknowledged. The paper benefited fromthe substantial comments of two anonymous reviewers.
References
Alibo, D. S., and Y. Nozaki (1999), Rare earth elements inseawater: Particle association, shale‐normalization, and Ceoxidation, Geochim. Cosmochim. Acta, 63, 363–372,doi:10.1016/S0016-7037(98)00279-8.
Andersen, T. B., K. P. Skjerlie, and H. Furnes (1990), TheSunnfjord Melange, evidence of silurian ophiolite accretionin the west Norwegian Caledonides, J. Geol. Soc., 147,59–68, doi:10.1144/gsjgs.147.1.00.
Andersen, T. B., H. N. Berry, D. R. Lux, and A. Andresen(1998), The tectonic significance of pre‐Scandian Ar‐40/Ar‐39 phengite cooling ages in the Caledonides of westernNorway, J. Geol. Soc., 155, 297–309, doi:10.1144/gsjgs.155.2.0297.
Banerjee, N. R., and K. Muehlenbachs (2003), Tuff life: Bioal-teration in volcaniclastic rocks from the Ontong Java Plateau,Geochem. Geophys. Geosyst., 4(4), 1037, doi:10.1029/2002GC000470.
Banerjee, N. R., H. Furnes, K. Muehlenbachs, H. Staudigel,and M. De Wit (2004), Pillow lavas as a habitat for early lifeon Earth, Geochim. Cosmochim. Acta, 68, A402.
Banerjee, N. R., H. Furnes, K. Muehlenbachs, H. Staudigel,and M. De Wit (2006), Preservation of similar to 3.4–3.5 Gamicrobial biomarkers in pillow lavas and hyaloclastites fromthe Barberton Greenstone Belt, South Africa, Earth Planet.Sci. Lett., 241, 707–722, doi:10.1016/j.epsl.2005.11.011.
Banerjee, N. R., A. Simonetti, H. Furnes, K. Muehlenbachs,H. Staudigel, L. Heaman, and M. J. Van Kranendonk (2007),Direct dating of Archean microbial ichnofossils, Geology,35, 487–490, doi:10.1130/G23534A.1.
Bau, M., and P. Dulski (1999), Comparing yttrium and rareearths in hydrothermal fluids from the Mid‐Atlantic Ridge:Implications for Y and REE behaviour during near‐ventmixing and for the Y/Ho ratio of Proterozoic seawater,
GeochemistryGeophysicsGeosystems G3G3 FLIEGEL ET AL.: TEXTURES IN A NORWEGIAN OPHIOLITE 10.1029/2010GC003255
19 of 21
Chem. Geol., 155, 77–90, doi:10.1016/S0009-2541(98)00142-9.
Benzerara, K., N. Menguy, N. R. Banerjee, T. Tyliszczak,G. E. Brown, and F. Guyot (2007), Alteration of submarinebasaltic glass from the Ontong Java Plateau: A STXM andTEM study, Earth Planet. Sci. Lett., 260, 187–200,doi:10.1016/j.epsl.2007.05.029.
Bernard, S., K. Benzerara, O. Beyssac, N. Menguy, F. Guyot,G. E. Brown, and B. Goffe (2007), Exceptional preservationof fossil plant spores in high‐pressure metamorphic rocks,Earth Planet. Sci. Lett., 262, 257–272, doi:10.1016/j.epsl.2007.07.041.
Dilek, Y., M. Shallo, and H. Furnes (2005), Rift‐drift, seafloorspreading, and subduction tectonics of Albanian ophiolites,Int. Geol. Rev., 47, 147–176, doi:10.2747/0020-6814.47.2.147.
Douville, E., J. L. Charlou, E. H. Oelkers, P. Bienvenu, C. F. J.Colon, J. P. Donval, Y. Fouquet, D. Prieur, and P. Appriou(2002), The rainbow vent fluids (36°14′N, MAR): The influ-ence of ultramafic rocks and phase separation on trace metalcontent in Mid‐Atlantic Ridge hydrothermal fluids, Chem.Geol., 184, 37–48, doi:10.1016/S0009-2541(01)00351-5.
Dulski, P. (2001), Reference materials for geochemical studies:New analytical data by ICP‐MS and critical discussionof reference values, Geostand. Newsl., 25, 87–125,doi:10.1111/j.1751-908X.2001.tb00790.x.
Fliegel, D., J. Kosler, N. McLoughlin, A. Simonetti, M. J.de Wit, R. Wirth, and H. Furnes (2010a), In‐situ dating ofthe Earth’s oldest trace fossil at 3.34 Ga, Earth Planet. Sci.Lett., 299, 290–298, doi:10.1016/j.epsl.2010.09.008.
Fliegel,D., R.Wirth,A. Simonetti,H. Staudigel,K.Muehlenbachs,and H. Furnes (2010b), Septate tubular textures in 2.0 Gapillow lavas from the Pechenga Greenstone Belt, a nano‐spectroscopic approach to investigate their biogenicity,Geobiology, doi:10.1111/j.1472-4669.2010.00252.x.
Fonneland‐Jorgensen, H., H. Furnes, K. Muehlenbachs, andY. Dilek (2005), Hydrothermal alteration and tectonic evolu-tion of an intermediate‐to fast‐spreading back‐arc oceaniccrust: Late Ordovician Solund‐Stavfjord ophiolite, westernNorway, Isl. Arc, 14, 517–541, doi:10.1111/j.1440-1738.2005.00481.x.
Furnes, H., A. Thorn, J. Nordås, and L. B. Garmann (1982),Geochemistry of Caledonian metabasalts from some Norwe-gian ophiolite fragments, Contrib. Mineral. Petrol., 79,295–307, doi:10.1007/BF00371521.
Furnes, H., K. P. Skjerlie, and Y. Dilek (2000), Petrology,tectonics, and hydrothermal alteration of a fossil backarcoceanic crust: Solund‐Stavfjord ophiolite complex of thewestern Norwegian Caledonides: A review, in Ophiolitesand Oceanic Crust: New Insights from Field Studies andthe Ocean Drilling Program, edited by Y. Dilek, E. M.Moores, D. Elthon, and A. Nicolas, pp. 443–460, Geol.Soc. of Am., Boulder, Colo.
Furnes, H., B. Hellevang, and Y. Dilek (2001a), Cyclic volca-nic stratigraphy in a Late Ordovician marginal basin, westNorwegian Caledonides, Bull. Volcanol., 63, 164–178,doi:10.1007/s004450100132.
Furnes, H., K. Muehlenbachs, O. Tumyr, T. Torsvik, andC. Xenophontos (2001b), Biogenic alteration of volcanicglass from the Troodos ophiolite, Cyprus, J. Geol. Soc.,158, 75–84, doi:10.1144/jgs.158.1.75.
Furnes, H., H. Staudigel, I. H. Thorseth, T. Torsvik,K. Muehlenbachs, and O. Tumyr (2001c), Bioalterationof basaltic glass in the oceanic crust, Geochem. Geophys.Geosyst., 2(8), 1049, doi:10.1029/2000GC000150.
Furnes, H., K. Muehlenbachs, T. Torsvik, O. Tumyr, andL. Shi (2002), Bio‐signatures in metabasaltic glass of a Cale-donian ophiolite, west Norway, Geol. Mag., 139, 601–608.
Furnes, H., H.Hellevang, B.Hellevang, K. P. Skjerlie, B. Robins,and Y. Dilek (2003), Volcanic evolution of oceanic crust in aLate Ordovician back‐arc basin: The Solund‐Stavfjordophiolite complex, west Norway, Geochem. Geophys.Geosyst., 4(10), 1088, doi:10.1029/2003GC000572.
Furnes, H., N. R. Banerjee, K. Muehlenbachs, H. Staudigel,and M. De Wit (2004), Early life recorded in Archean pillowlavas, Science, 304, 578–581, doi:10.1126/science.1095858.
Furnes, H., B. Hellevang, H. Hellevang, and B. Robins (2006),Evolution of lavas in the Late Ordovician/Early SilurianSolund‐Stavfjord ophiolite complex, west Norway,Geochem.Geophys. Geosyst., 7, Q08011, doi:10.1029/2005GC001154.
Furnes, H., N. McLoughlin, K. Muehlenbachs, N. Banerjee,H. Staudigel, Y. Dilek, M. De Wit, M. Van Kranendonk,and P. Schiffman (2008), Oceanic pillow lavas and hyalo-clastites as habitats for microbial life through time: Areview, in Links Between Geological Processes, MicrobialActivities and Evolution of Life, edited by Y. Dilek, H. Furnes,and K. Muehlenbachs, Mod. Approaches Solid Earth Sci.,4, 68.
Heaman, L. M. (2009), The application of U‐Pb geochronologyto mafic, ultramafic and alkaline rocks: An evaluation of threemineral standards, Chem. Geol., 261, 43–52, doi:10.1016/j.chemgeo.2008.10.021.
Konhauser, K. (2009), Introduction to Geomicrobiology,Blackwell, Oxford, U. K.
Koningsberger, D. C., and R. Prins (1987), X‐Ray Absorption:Principles, Applications, Techniques of EXAFS, SEXAFSand XANES, John Wiley, New York, N. Y.
McLennan, S. M. (1989), Rare Earth elements in sedimentaryrocks: Influence of provenance and sedimentary processes,in Geochemistry and Mineralogy of Rare Earth Elements,edited by B. R. Lipin and G. A. McKay, pp. 169–200,Mineral. Soc. of Am., Washington, D. C.
McLoughlin, N., M. D. Brasier, D. Wacey, O. R. Green, andR. S. Perry (2007), On biogenicity criteria for endolithicmicroborings on early earth and beyond, Astrobiology, 7,10–26, doi:10.1089/ast.2006.0122.
McLoughlin, N., D. Fliegel, H. Furnes, H. Staudigel, A. Simonetti,G. C. Zhao, and P. T. Robinson (2009a), Assessing the bio-genicity and syngenicity of candidate bioalteration texturesin pillow lavas of the ∼2.52 Ga Wutai greenstone terrane ofChina, Chin. Bull. Sci., 55, 188–199, doi:10.1007/s11434-009-0448-0.
McLoughlin, N., H. Furnes, N. R. Banerjee, K. Muehlenbachs,and H. Staudigel (2009b), Ichnotaxonomy of microbial tracefossils in volcanic glass, J. Geol. Soc., 166, 159–169,doi:10.1144/0016-76492008-049.
Moffett, J. W. (1990), Microbially mediated cerium oxidationin sea‐water, Nature, 345, 421–423, doi:10.1038/345421a0.
Muehlenbachs, K., H. Furnes, H.C. Fonneland, andB.Hellevang(2003), Ophiolites as faithful record of the oxygen isotoperatio of ancient seawater: The Solund‐Stavfjord ophiolitecomplex as a Late Ordovician example, in Ophiolites inEarth’s History, edited by Y. Dilek and P. T. Robinson,Geol.Soc. Spec. Publ., 218, 401–414.
Nozaki, Y., J. Zhang, and H. Amakawa (1997), The fraction-ation between Y and Ho in the marine environment, EarthPlanet. Sci. Lett., 148, 329–340, doi:10.1016/S0012-821X(97)00034-4.
Pack, A., S. S. Russell, J. M. G. Shelley, and M. van Zuilen(2007), Geo‐ and cosmochemistry of the twin elements
GeochemistryGeophysicsGeosystems G3G3 FLIEGEL ET AL.: TEXTURES IN A NORWEGIAN OPHIOLITE 10.1029/2010GC003255
20 of 21
yttrium and holmium, Geochim. Cosmochim. Acta, 71,4592–4608, doi:10.1016/j.gca.2007.07.010.
Pedersen, R. B., H. Furnes, and G. Dunning (1991), A U/Pbage for the Sulitjelma Gabbro, north Norway: Further evi-dence for the development of a Caledonian marginal basinin Ashgill‐Llandovery time, Geol. Mag., 128, 141–153,doi:10.1017/S0016756800018331.
Pedersen, R. B., D. Bruton, and H. Furnes (1992), Ordovicianfaunas, island arcs and ophiolites in the ScandinavianCaledonides, Terra Nova, 4, 217–222, doi:10.1111/j.1365-3121.1992.tb00475.x.
Picard, S., C. Lecuyer, J. A. Barrat, J. P. Garcia, G. Dromart,and S. M. F. Sheppard (2002), Rare earth element contentsof Jurassic fish and reptile teeth and their potential relationto seawater composition (Anglo‐Paris Basin, France andEngland), Chem. Geol., 186, 1–16, doi:10.1016/S0009-2541(01)00424-7.
Robinson, P. T., and J. Malpas (1990), The Troodos ophioliteof Cyprus: New perspectives on its origin and emplacement, inOphiolites, Oceanic Crustal Analogues, edited by J. Malpas,E. M. Moores, A. Panayiotou, and C. Xenophontos,pp. 13–26, Geol. Surv. Dept., Nikosia.
Robinson, P. T. M., F. J. Flower, D. A. Swanson, andH. Staudigel (1980), Lithology and eruptive stratigraphy ofCretaceous oceanic crust, western Atlantic Ocean, InitialRep. Deep Sea Drill. Proj., 51/52/53, 1535–1555, doi:10.2973/dsdp.proc.515253.174.1980.
Roussel, E. G., M. A. C. Bonavita, J. Querellou, B. A. Cragg,G. Webster, D. Prieur, and J. Parkes (2008), Extending thesub‐sea‐floor biosphere, Science, 320, 1046.
Santelli, C. M., B. N. Orcutt, E. Banning, W. Bach, C. L.Moyer, M. L. Sogin, H. Staudigel, and K. J. Edwards,(2008), Abundance and diversity of microbial life in oceancrust, Nature, 453, 653–656.
Simonetti, A., L. M. Heaman, T. Chacko, and N. R. Banerjee(2006), In situ petrographic thin section U‐Pb dating ofzircon, monazite, and titanite using laser ablation‐MC‐
ICP‐MS, Int. J. Mass Spectrom., 253, 87–97, doi:10.1016/j.ijms.2006.03.003.
Skjerlie, K. P., and H. Furnes (1990), Evidence for a fossiltransform fault in the Solund‐Stavfjord ophiolite complex:West Norwegian Caledonides, Tectonics, 9, 1631–1648,doi:10.1029/TC009i006p01631.
Staudigel, H., B. E. Bailey, H. Furnes, B. Tebo, andA. Templeton (2004), The ocean crust as a bioreactor,Geochim. Cosmochim. Acta, 68, A401.
Staudigel, H., H. Furnes, N. McLoughlin, N. Banerjee, L. B.Connell, and A. Templeton (2008), 3.5 billion years of glassbioalteration: Vulcanic rocks as a basis for microbial life,Earth Sci. Rev., 89, 156–176, doi:10.1016/j.earscirev.2008.04.005.
Templeton, A. S., E. J. Knowles, D. L. Eldridge, B. W. Arey,A. C. Dohnalkova, S. M. Webb, B. E. Bailey, B. M. Tebo,and H. Staudigel (2009), A seafloor microbial biome hostedwithin incipient ferromanganese crusts, Nat. Geosci., 2,872–876, doi:10.1038/ngeo696.
Tera, F., and G. J. Wasserburg (1972), U‐Th‐Pb systematics in3 Apollo 14 basalts and problem of initial Pb in lunar rocks,Earth Planet. Sci. Lett., 14, 281, doi:10.1016/0012-821X(72)90128-8.
Thorseth, I. H., T. Torsvik, H. Furnes, and K. Muehlenbachs(1995), Microbes play an important role in the alteration ofoceanic crust, Chem. Geol., 126, 137–146, doi:10.1016/0009-2541(95)00114-8.
Torsvik, T., H. Furnes, K. Muehlenbachs, I. H. Thorseth, andO. Tumyr (1998), Evidence for microbial activity at theglass‐alteration interface in oceanic basalts, Earth Planet.Sci. Lett., 162, 165–176, doi:10.1016/S0012-821X(98)00164-2.
Wirth, R. (2004), Focused Ion Beam (FIB): A novel technol-ogy for advanced application of micro‐ and nanoanalysisin geosciences and applied mineralogy, Eur. J. Mineral.,16, 863–876, doi:10.1127/0935-1221/2004/0016-0863.
GeochemistryGeophysicsGeosystems G3G3 FLIEGEL ET AL.: TEXTURES IN A NORWEGIAN OPHIOLITE 10.1029/2010GC003255
21 of 21
Copyright © 2022 FDOKUMEN