Trends in women's health: Results from the ALSWH - priority conditions, risk factors and health...
180
Transcript of Trends in women's health: Results from the ALSWH - priority conditions, risk factors and health...
Australian Longitudinal Study on Women's Health TRENDS IN WOMEN’S HEALTH 2006
FOREWORD The Longitudinal Study on Women's Health, funded by the Commonwealth Government, is the most comprehensive study ever conducted on the health of Australian women. When completed in 2016 it will be one of the most complete surveys of its kind in the world. Some 40,000 women across the nation have generously agreed to take part in the study. As a result, this report provides a unique insight into chronic diseases and the influence of lifestyle risk factors such as smoking, poor nutrition, alcohol misuse, physical inactivity and obesity. In particular, the report shows the very strong correlation between obesity and many of these diseases. Chronic diseases already account for nearly 80 per cent of the total burden of disease and injury in Australia, and more than two thirds of all health expenditure. Unless people choose to eat less and exercise more, the situation will worsen as the population continues to age. This report should enable government to devise better strategies to support lifestyles which give women the best chance of enjoying life long good health. TONY ABBOTT
MINISTER FOR HEALTH AND AGEING

i
TABLE OF CONTENTS
LIST OF FIGURES .................................................................................................. IV
LIST OF TABLES ......................................................................................................X
SECTION 1: EXECUTIVE SUMMARY ................................................................. 1 1.1 AIMS OF THIS REPORT ......................................................................................... 1 1.2 SUMMARY OF MAJOR FINDINGS ........................................................................... 2 1.3 DISCUSSION......................................................................................................... 8
SECTION 2: CHRONIC CONDITIONS AND RISK FACTORS....................... 10 2.1 KEY FINDINGS ................................................................................................... 10 2.2 INTRODUCTION.................................................................................................. 10 2.3 HYPERTENSION ................................................................................................. 11
2.3.1 Trends in prevalence ............................................................................................................11 2.3.2 Risk factors ..........................................................................................................................12
2.4 HEART DISEASE ................................................................................................ 13 2.4.1 Trends in prevalence ............................................................................................................13 2.4.2 Risk factors ..........................................................................................................................14
2.5 DIABETES .......................................................................................................... 15 2.5.1 Trends in prevalence ............................................................................................................15 2.5.2 Risk factors ..........................................................................................................................16
2.6 ASTHMA ............................................................................................................ 17 2.6.1 Trends in prevalence ............................................................................................................17 2.6.2 Risk factors ..........................................................................................................................18
2.7 OSTEOPOROSIS .................................................................................................. 19 2.7.1 Trends in prevalence ............................................................................................................19 2.7.2 Risk factors ..........................................................................................................................20
2.8 ARTHRITIS......................................................................................................... 21 2.8.1 Trends in prevalence ............................................................................................................21 2.8.2 Risk factors ..........................................................................................................................22
SECTION 3: RISK FACTOR TRENDS ................................................................ 23 3.1 CHANGES IN WEIGHT ......................................................................................... 23
3.1.1 Key findings.........................................................................................................................23 3.1.2 Introduction..........................................................................................................................23 3.1.3 Weight, height and BMI in 1996..........................................................................................23 3.1.4 BMI categories in 1996........................................................................................................24 3.1.5 Changes in weight, height and BMI over time.....................................................................24 3.1.6 Changes in BMI categories over time ..................................................................................30 3.1.7 Discussion ............................................................................................................................31 3.1.8 References............................................................................................................................33
3.2 PHYSICAL ACTIVITY .......................................................................................... 33 3.2.1 Key findings.........................................................................................................................33 3.2.2 Introduction..........................................................................................................................34 3.2.3 Time trends for physical activity..........................................................................................34 3.2.4 Patterns of physical activity .................................................................................................37 3.2.5 Walking................................................................................................................................38 3.2.6 Changes in the proportions of women categorised as 'active' ..............................................41 3.2.7 A closer look at the changes in PA ......................................................................................42 3.2.8 Discussion ............................................................................................................................44 3.2.9 References............................................................................................................................44
3.3 FRUIT AND VEGETABLES.................................................................................... 45 3.3.1 Key findings.........................................................................................................................45 3.3.2 References............................................................................................................................48

ii
3.4 TRENDS IN TOBACCO SMOKING, ALCOHOL CONSUMPTION AND ILLICIT DRUG USE....................................................................................................... 49
3.4.1 Key findings.........................................................................................................................49 3.4.2 Tobacco smoking .................................................................................................................50 3.4.3 Alcohol consumption ...........................................................................................................53 3.4.4 Illicit drug use ......................................................................................................................61 3.4.5 Discussion ............................................................................................................................63 3.4.6 References............................................................................................................................65
SECTION 4: SUMMARY MEASURES OF PHYSICAL AND MENTAL HEALTH................................................................................... 66
4.1 KEY FINDINGS ................................................................................................... 66 4.2 INTRODUCTION.................................................................................................. 66 4.3 TIME AND AREA OF RESIDENCE TRENDS IN PHYSICAL AND MENTAL
HEALTH.......................................................................................................... 67 4.4 TIME TRENDS IN PHYSICAL AND MENTAL HEALTH IN RELATION TO
STABILITY OR CHANGE IN MARITAL STATUS................................................... 70 4.5 DISCUSSION OF TRENDS IN PHYSICAL AND MENTAL HEALTH ............................. 73 4.6 REFERENCES...................................................................................................... 73
SECTION 5: TRENDS IN EARLY DETECTION MEASURES ........................ 75 5.1 KEY FINDINGS ................................................................................................... 75 5.2 BLOOD PRESSURE MEASUREMENT ..................................................................... 75 5.3 CHOLESTEROL TESTING ..................................................................................... 76 5.4 PAP TESTS.......................................................................................................... 77 5.5 MAMMOGRAPHY ............................................................................................... 83 5.6 BREAST EXAMINATION BY A DOCTOR AND BREAST SELF-
EXAMINATION................................................................................................ 86 5.7 REFERENCES...................................................................................................... 88
SECTION 6: HEALTH SERVICE USE................................................................. 89 6.1 KEY FINDINGS ................................................................................................... 89 6.2 GENERAL PRACTICE CONSULTATIONS................................................................ 90
6.2.1 Introduction..........................................................................................................................90 6.2.2 Time trends ..........................................................................................................................90 6.2.3 Area of residence trends.......................................................................................................90
6.3 SPECIALIST CONSULTATIONS ............................................................................. 91 6.3.1 Introduction..........................................................................................................................91 6.3.2 Time trends ..........................................................................................................................91 6.3.3 Area of residence trends.......................................................................................................92
6.4 ADMISSION TO HOSPITAL................................................................................... 93 6.4.1 Introduction..........................................................................................................................93 6.4.2 Time trends ..........................................................................................................................93 6.4.3 Area of residence trends.......................................................................................................93
6.5 CONTINUITY OF GENERAL PRACTICE CARE ........................................................ 96 6.5.1 Introduction..........................................................................................................................96 6.5.2 Time trends ..........................................................................................................................96 6.5.3 Area of residence trends.......................................................................................................97
6.6 ACCESS TO BULK BILLING.................................................................................. 97 6.6.1 Introduction..........................................................................................................................97 6.6.2 Time trends ..........................................................................................................................97 6.6.3 Area of residence trends.......................................................................................................98
6.7 RATING OF EASE OF SEEING THE GP OF CHOICE................................................. 99 6.7.1 Introduction..........................................................................................................................99 6.7.2 Time trends ..........................................................................................................................99 6.7.3 Area of residence trends.....................................................................................................100

iii
6.8 DISCUSSION..................................................................................................... 101
SECTION 7: CHRONIC CONDITIONS ............................................................. 103 7.1 KEY FINDINGS ................................................................................................. 103 7.2 INTRODUCTION................................................................................................ 103 7.3 HYPERTENSION ............................................................................................... 104
7.3.1 Prevalence ..........................................................................................................................104 7.3.2 Incidence ............................................................................................................................104 7.3.3 PCS and MCS trends..........................................................................................................105 7.3.4 Area of residence trends.....................................................................................................108 7.3.5 Health service use ..............................................................................................................108
7.4 HEART DISEASE ............................................................................................... 111 7.4.1 Prevalence ..........................................................................................................................111 7.4.2 Incidence ............................................................................................................................111 7.4.3 PCS and MCS trends..........................................................................................................112 7.4.4 Area of residence trends.....................................................................................................115 7.4.5 Health service use ..............................................................................................................115
7.5 DIABETES ........................................................................................................ 118 7.5.1 Prevalence ..........................................................................................................................118 7.5.2 Incidence ............................................................................................................................118 7.5.3 PCS and MCS trends..........................................................................................................119 7.5.4 Area of residence trends.....................................................................................................122 7.5.5 Health service use ..............................................................................................................122
7.6 ASTHMA .......................................................................................................... 124 7.6.1 Prevalence ..........................................................................................................................124 7.6.2 Incidence ............................................................................................................................124 7.6.3 PCS and MCS trends..........................................................................................................125 7.6.4 Area of residence trends.....................................................................................................128 7.6.5 Health service use ..............................................................................................................128
7.7 OSTEOPOROSIS ................................................................................................ 130 7.7.1 Prevalence ..........................................................................................................................130 7.7.2 Incidence ............................................................................................................................130 7.7.3 PCS and MCS trends..........................................................................................................131 7.7.4 Area of residence trends.....................................................................................................133 7.7.5 Health service use ..............................................................................................................134
7.8 ARTHRITIS....................................................................................................... 136 7.8.1 Prevalence ..........................................................................................................................136 7.8.2 Incidence ............................................................................................................................136 7.8.3 PCS and MCS trends..........................................................................................................137 7.8.4 Area of residence trends.....................................................................................................140 7.8.5 Health service use ..............................................................................................................140
SECTION 8: APPENDICES.................................................................................. 143 APPENDIX 1: THE AUSTRALIAN LONGITUDINAL STUDY ON WOMEN’S
HEALTH ....................................................................................................... 144 A 1.1 Area of residence...............................................................................................................149 A 1.2 References.........................................................................................................................149
APPENDIX 2: DEFINITIONS OF PREVALENCE AND INCIDENCE................................. 151 A 2.1 Definition of prevalence at Survey 1.................................................................................151 A 2.2 Definition of prevalence at Survey 2.................................................................................152 A 2.3 Definition of incidence......................................................................................................152
APPENDIX 3: TABLES FOR INCIDENCE AND PREVALENCE OF CHRONIC CONDITIONS AND RISK FACTORS .................................................................. 154
A 3.1 Hypertension .....................................................................................................................154 A 3.2 Heart Disease ....................................................................................................................156 A 3.3 Diabetes.............................................................................................................................158 A 3.4 Asthma ..............................................................................................................................160 A 3.5 Osteoporosis......................................................................................................................162 A 3.6 Arthritis .............................................................................................................................164

v
Figure 3.11 Changes in Physical Activity for the Younger (a), Mid-aged (b) and Older (c) cohorts............................................................................................... 43
Figure 3.12 Pieces of fruit eaten per day by the Younger and Mid-aged cohorts at Survey 3........................................................................................................ 46
Figure 3.13 Number of different vegetables eaten each day by the Younger and Mid-aged cohorts at Survey 3. ......................................................................... 47
Figure 3.14 Number of different fruits eaten each day by the Younger and Mid-aged cohorts at Survey 3 by area of residence................................................ 47
Figure 3.15 Number of different vegetables eaten each day by the Younger and Mid-aged cohorts at Survey 3 by area of residence......................................... 48
Figure 3.16 Trends in the prevalence of smoking behaviour: data from Surveys 1 to 3 for the Younger and 1 to 4 for the Mid-aged cohort. ................................ 50
Figure 3.17 Prevalence of smoking behaviour by area: data from Survey 3 for Younger women (a) and Survey 4 for Mid-aged women (b). ........................... 52
Figure 3.18 Alcohol consumption among participants in all surveys....................................... 55 Figure 3.19 Alcohol consumption by Younger women at Survey 3 (2003) by area
of residence. ..................................................................................................... 58 Figure 3.20 Alcohol consumption by Mid-aged women at Survey 4 (2004) by
area of residence.............................................................................................. 58 Figure 3.21 Alcohol consumption by Older women at Survey 3 (2002) by area of
residence. ......................................................................................................... 59 Figure 3.22 Patterns of illicit drug use: data from Surveys 2 and 3......................................... 62 Figure 3.23 Illicit drug use by area: data from Survey 3 (2003). ............................................. 63 Figure 4.1 Physical health component scores (PCS) in the Younger cohort for
Surveys 1, 2 and 3, by area of residence, from 1996 to 2003. ........................ 68 Figure 4.2 Physical health component scores (PCS) in the Mid-aged cohort for
Surveys 1, 2 and 3, by area of residence, from 1996 to 2004. ........................ 68 Figure 4.3 Physical health component scores (PCS) in the Older cohort for
Surveys 1, 2 and 3, by area of residence, from 1996 to 2002. ........................ 68 Figure 4.4 Mental health component scores (MCS) in the Younger cohort for
Surveys 1, 2 and 3, by area of residence, from 1996 to 2003. ........................ 69 Figure 4.5 Mental health component scores (MCS) in the Mid-aged cohort for
Surveys 1, 2 and 3, by area of residence, from 1996 to 2004. ........................ 69 Figure 4.6 Mental health component scores (MCS) in the Older cohort for
Surveys 1, 2 and 3, by area of residence, from 1996 to 2002. ........................ 69 Figure 4.7 Physical health component scores (PCS) for the Younger cohort for
most commonly occurring marital status patterns from 1996 to 2003: M=Married D=DeFacto S=Single. .......................................................... 71
Figure 4.8 Physical health component scores (PCS) for the Mid-aged cohort for most commonly occurring marital status patterns from 1996 to 2004: M=Married/DeFacto D=Divorced/Separated/Widowed S=Single. .......................................................................................................... 71
Figure 4.9 Physical health component scores (PCS) for the Older cohort for most commonly occurring marital status patterns from 1996 to 2002: M=Married/DeFacto D=Divorced/Separated W=Widowed S=Single/Never Married. .................................................................................. 71
Figure 4.10 Mental health component scores (MCS) for the Younger cohort for most commonly occurring marital status patterns from 1996 to 2003: M=Married D=DeFacto S=Single. .......................................................... 72
Figure 4.11 Mental health component scores (MCS) for the Mid-aged cohort for most commonly occurring marital status patterns from 1996 to 2004: M=Married/DeFacto D=Divorced/Separated/Widowed S=Single. .......................................................................................................... 72
iv
LIST OF FIGURES
Figure 2.1 Prevalence of self-reported hypertension in each cohort by survey, from 1996 to 2004. ........................................................................................... 12
Figure 2.2 Prevalence of self-reported heart disease for each cohort group by survey, from 1996 to 2004................................................................................ 14
Figure 2.3 Prevalence of self-reported diabetes for each cohort group by survey, from 1996 to 2004. ........................................................................................... 16
Figure 2.4 Prevalence of self-reported asthma for each cohort group by survey, from 1996 to 2004. ........................................................................................... 18
Figure 2.5 Prevalence of self-reported osteoporosis for the Mid-aged and Older cohort, by survey, from 1996 to 2004............................................................... 20
Figure 2.6 Prevalence of self-reported arthritis for the Mid-aged and Older cohort, by survey, from 1996 to 2004............................................................... 21
Figure 3.1 Average self-reported weight, height and calculated BMI with 95% Confidence Intervals for each cohort group (Younger, Mid-aged, Older) for Surveys 1, 2, 3 and 4a, from 1996 to 2004, (a) only Mid-aged cohort has fourth survey data included. .................................................. 26
Figure 3.2 Average self-reported weight with 95% Confidence Intervals by area of residence for the Younger (a), Mid-aged (b) and Older(c) cohorts, at Surveys 1, 2 and 3, from 1996 to 2004. .........................................27
Figure 3.3 Average self-reported height with 95% Confidence Intervals by area of residence for the Younger (a), Mid-aged (b) and Older(c) cohorts, at Surveys 1, 2 and 3, from 1996 to 2004. ....................................................... 28
Figure 3.4 BMI based on self-reported data with 95% Confidence Intervals, by area of residence for the Younger (a), Mid-aged (b) and Older(c) cohorts, at Surveys 1, 2 and 3, from 1996 to 2004. .........................................29
Figure 3.5 Proportions of women in each of the BMI categories based on self-reported height and weight for each age cohort for Surveys 1, 2 and 3, from 1996 to 2004. ................................................................................ 31
Figure 3.6 Average self-reported physical activity with inter-quartile ranges for each cohort group for Surveys 2, 3 for the Younger and Older cohort, and for Survey 3, 4 for the Mid-aged cohort, from 1999 to 2004. Physical activity was measured in MET.mins/week. MET.mins are units of energy expenditure – 600 MET.mins is equivalent to 150 minutes of moderate intensity (4 METs) physical activity per week ............................................................................................... 35
Figure 3.7 Physical Activity based on self-reported data with inter-quartile ranges, by area of residence for each cohort group: for Surveys 2, 3 for the Younger (a) and Older (c) cohort, and for Survey 3, 4 for the Mid-aged cohort (b), from 1999 to 2004.. Physical activity was measured in MET.mins/week. MET.mins are units of energy expenditure – 600 MET.mins is equivalent to 150 minutes of moderate intensity (4 METs) physical activity per week .................................. 36
Figure 3.8 Average self-reported time spent walking with inter-quartile ranges for each cohort group for Surveys 2, 3 and 4a, from 1999 to 2004, (a) only Mid-aged cohort has fourth survey data included..................................... 38
Figure 3.9 Average time spent walking based on self-reported data with inter-quartile ranges, by area of residence for the Younger (a), Mid-aged (b) and Older (c) cohort at Surveys 2, 3 and 4*, from 1999 to 2004, (*) only Mid-aged cohort has Survey 4 data included. ........................... 40
Figure 3.10 Proportions of active women over time, separately for Younger, Mid-aged and Older women. ................................................................................... 41

vi
Figure 4.12 Mental health component scores (MCS) for the Older cohort for most commonly occurring marital status patterns from 1996 to 2002: M=Married/DeFacto D=Divorced/Separated W=Widowed S=Single/Never Married. .................................................................................. 72
Figure 5.1 Area of residence trends in percentages of Mid-aged women reporting blood pressure testing: data from Survey 4 (2004). ......................................... 76
Figure 5.2 Area of residence trends in percentages of Mid-aged women reporting cholesterol testing: data from Survey 4 (2004)................................................. 77
Figure 5.3 Time since last Pap test: data from Surveys 1, 2 and 3 for the Younger women and Surveys 1, 3 and 4 for the Mid-aged women. ................ 78
Figure 5.4 Time since last Pap test by area: data from Survey 3 (2003) for the Younger women and Survey 4 (2004) for the Mid-aged women...................... 79
Figure 5.5 Time trends in prevalence of ever having had an abnormal Pap test result: data from Surveys 1, 2 and 3 for the Younger women and Surveys 3 and 4 for the Mid-aged women........................................................ 80
Figure 5.6 Trends in prevalence of ever having had an abnormal Pap test result by area: data from Survey 3 (2003) for the Younger women and Survey 4 (2004) for the Mid-aged women. ....................................................... 80
Figure 5.7 Ease of access to Pap tests by time: data from Surveys 2 and 3 for the Younger women and Surveys 2, 3 and 4 for the Mid-aged women. ............................................................................................................. 81
Figure 5.8 Ease of access to Pap tests by area: data from Survey 3 (2003) for the Younger women and Survey 4 (2004) for the Mid-aged women. ............................................................................................................. 82
Figure 5.9 Time since last mammogram: data from Surveys 1, 3 and 4 for the Mid-aged women. ............................................................................................. 84
Figure 5.10 Time since last mammogram by area: data from Survey 4 (2004) for the Mid-aged women. ....................................................................................... 84
Figure 5.11 Ease of access to mammography services by time: data from Surveys 2, 3 and 4 for the Mid-aged women.................................................... 85
Figure 5.12 Ease of access to mammography services by area: data from Survey 4 (2004) for the Mid-aged women. ....................................................... 85
Figure 5.13 Area of residence trends in percentages of Mid-aged women reporting a) Breast examination by a doctor and b) Breast self-examination: data from Survey 4 (2004). ......................................................... 87
Figure 6.1 Percentage of women who reported having more than four GP consultations in the previous year in each cohort by survey from 1996 to 2004..................................................................................................... 90
Figure 6.2 Percentage of women who reported having more than four GP consultations in the previous year in each cohort, by area of residence; data from 2003 for the Younger, from 2004 for the Mid-aged and from 2002 for the Older cohort. ........................................................ 91
Figure 6.3 Percentage of women who reported having at least one specialist consultation in the previous year in each cohort, by survey, from 1996 to 2004..................................................................................................... 92
Figure 6.4 Percentage of women who reported having consulted a specialist in the previous year in the previous year for each cohort group by area of residence in 2003 for the Younger, in 2004 for the Mid-aged and in 2002 for the Older cohort.............................................................. 92
Figure 6.5 Percentage of women who reported having been admitted to hospital in the previous year for each cohort group by survey from 1996 to 2004..................................................................................................................93
Figure 6.6 Percentage of women who reported been admitted to hospital in the previous year for each cohort group by area of residence in 2003

vii
for the Younger, in 2004 for the Mid-aged and in 2002 for the Older cohort. ..................................................................................................... 95
Figure 6.7 Percentage of Younger women at Survey 3 in 2003 who reported having been admitted to hospital in the previous year, by area of residence and reason for admission. ............................................................... 95
Figure 6.8 Percentage of women who reported always seeing the same GP and always/mostly going to the same place for the Younger and Mid-aged cohort from 2000 to 2004. .......................................................................96
Figure 6.9 Percentage of women who reported always seeing the same GP and always/mostly going to the same place for the Younger and Mid-aged cohort group by area of residence in 2003 for the Younger and in 2004 for the Mid-aged cohort. ............................................................... 97
Figure 6.10 Percentage of women who reported being dissatisfied with their access to a GP who bulk billed for each cohort by survey from 1999 to 2004..................................................................................................... 98
Figure 6.11 Percentage of women who reported being dissatisfied with their access to a GP who bulk billed for each cohort by area of residence in 2003 for the Younger and in 2004 for the Mid-aged cohort................................................................................................................ 99
Figure 6.12 Percentage of women who reported being dissatisfied with their ease of seeing the GP of their choice for each cohort by survey from 1999 to 2004...................................................................................................100
Figure 6.13 Percentage of women who reported being dissatisfied with their ease of seeing the GP of their choice for each cohort by area of residence in 2003 for the Younger and in 2004 for the Mid-aged cohort..............................................................................................................101
Figure 7.1 Trends in Physical Health by self-reported hypertension status for the Younger (a), Mid-aged (b) and Older (c) cohort, by survey from 1996 to 2004...................................................................................................106
Figure 7.2 Trends in Mental Health by self-reported hypertension status for the Younger (a), Mid-aged (b) and Older (c) cohort by survey from 1996 to 2004...................................................................................................107
Figure 7.3 Prevalence of self-reported hypertension for each cohort group area of residence, in 2003 for the Younger, in 2004 for the Mid-aged and in 2002 for the Older cohorts...................................................................108
Figure 7.4 Percentage of women who reported having more than four GP consultations in the previous year by hypertension status, in each cohort, from 1996 to 2004. .............................................................................109
Figure 7.5 Percentage of women who reported having consulted a specialist in the previous year by hypertension status for each cohort group from 1996 to 2004. .........................................................................................110
Figure 7.6 Percentage of women who reported been admitted to hospital in the previous year by hypertension status for each cohort group from 1996 to 2004...................................................................................................111
Figure 7.7 Trends in Physical Health by heart disease status for the Younger (a), Mid-aged (b) and Older (c) cohort, by survey from 1996 to 2004. .................113
Figure 7.8 Trends in Mental Health by heart disease status for the Younger (a), Mid-aged (b) and Older (c) cohort by survey from 1996 to 2004. ..................114
Figure 7.9 Prevalence of self-reported heart disease for each cohort group by area of residence............................................................................................115
Figure 7.10 Percentage of women who reported having more than four GP consultations in the previous year by heart disease status for each cohort group from 1996 to 2004. ....................................................................116
viii
Figure 7.11 Percentage of women who reported having consulted a specialist in the previous year by heart disease status for each cohort group by from 1996 to 2004. .........................................................................................117
Figure 7.12 Percentage of women who reported having been admitted to hospital in the previous year by heart disease status for each cohort group from 1996 to 2004. .........................................................................................118
Figure 7.13 Trends in Physical Health by diabetes status for the Younger (a), Mid-aged (b) and Older (c) cohort by survey from 1996 to 2004. ..................120
Figure 7.14 Trends in Mental Health by diabetes status for the Younger (a), Mid-aged (b) and Older (c) cohort by survey from 1996 to 2004. .........................121
Figure 7.15 Prevalence of self-reported diabetes for each cohort group by area of residence in 2003 for Younger, in 2004 for Mid-aged and in 2002 for the Older cohort................................................................................122
Figure 7.16 Percentage of women who reported more than four GP consultations in the previous year by diabetes status for each cohort group from 1996 to 2004...................................................................................................123
Figure 7.17 Percentage of women who reported having consulted a specialist in the previous year by diabetes status for each cohort group from 1996 to 2004...................................................................................................123
Figure 7.18 Percentage of women who reported having been admitted to hospital in the previous year by diabetes status for each cohort group from 1996 to 2004...................................................................................................124
Figure 7.19 Trends in Physical Health by asthma status for the Younger (a), Mid-aged (b) and Older (c) cohort by survey from 1996 to 2004. .........................126
Figure 7.20 Trends in Mental Health by asthma status for the Younger (a), Mid-aged (b) and Older (c) cohort by survey from 1996 to 2004. .........................127
Figure 7.21 Prevalence of self-reported asthma for each cohort group by area of residence in 2003 for Younger, in 2004 for Mid-aged and in 2002 for the Older cohort.........................................................................................128
Figure 7.22 Percentage of women who reported having more than four GP consultations in the previous year by asthma status for each cohort group from 1996 to 2004. ...................................................................129
Figure 7.23 Percentage of women who reported consulted a specialist in the previous year by asthma status for each cohort group from 1996 to 2004............................................................................................................129
Figure 7.24 Percentage of women who reported having been admitted to hospital in the previous year by asthma status for each cohort group from 1996 to 2004...................................................................................................130
Figure 7.25 Trends in Physical Health by osteoporosis status for Mid-aged (a) and Older (b) cohort by survey from 1996 to 2004. .......................................132
Figure 7.26 Trends in Mental Health by osteoporosis status for Mid-aged (a) and Older (b) cohort by survey from 1996 to 2004................................................133
Figure 7.27 Prevalence of self-reported osteoporosis for each cohort group by area of residence in 2003 for Younger, in 2004 for Mid-aged and in 2002 for the Older cohort............................................................................134
Figure 7.28 Percentage of women who reported having more than four GP consultations in the previous year by osteoporosis status for each cohort group from 1996 to 2004. ...................................................................135
Figure 7.29 Percentage of women who reported having consulted a specialist in the previous year by osteoporosis status for each cohort group from 1996 to 2004. .........................................................................................135
Figure 7.30 Percentage of women who reported having been admitted to hospital in the previous year by osteoporosis status for each cohort group from 1996 to 2004. .........................................................................................136

ix
Figure 7.31 Trends in Physical Health by arthritis status for Mid-aged (a) and Older (b) cohort by survey from 1996 to 2004................................................138
Figure 7.32 Trends in Mental Health by arthritis status for Mid-aged (a) and Older (b) cohort by survey from 1996 to 2004. ........................................................139
Figure 7.33 Prevalence of self-reported arthritis for each cohort group by area of residence in 2003 for Younger, in 2004 for Mid-aged and in 2002 for the Older cohort.........................................................................................140
Figure 7.34 Percentage of women who reported having more than four GP consultations in the previous year by arthritis status for each cohort group from 1996 to 2004. ....................................................................141
Figure 7.35 Percentage of women who reported having consulted a specialist in the previous year by arthritis status for each cohort group from 1996 to 2004...................................................................................................141
Figure 7.36 Percentage of women who reported having been admitted to hospital in the previous year by arthritis status for each cohort group from 1996 to 2004...................................................................................................142

x
LIST OF TABLES
Table 1.1 Schedule of Surveys for the Australia Longitudinal Study on Women’s Health ................................................................................................................. 1
Table 1.2 Relationships of risk factors to chronic conditions for those in Younger (Y), Mid-aged (M) and Older (O) cohorts of the Study, from Surveys 1 to 3 in the Younger and Older cohorts and Surveys 1 to 4 in the Mid-aged cohort, 1996 to 2004.............................................................. 3
Table 1.3 Reduction in physical and mental health associated with chronic conditions............................................................................................................ 7
Table 3.1 Changes in smoking behaviour: data from Surveys 1 to 3 for Younger women (a) and 1 to 4 for Mid-aged women (b). ............................................... 51
Table 3.2 Definition of levels of risk for alcohol consumption among women (standard drinks)............................................................................................... 53
Table 3.3 Categories of long-term risk for alcohol consumption in the Australian alcohol guidelines and ALSWH. ....................................................................... 53
Table 3.4 Frequency of short-term risk drinking (5 or more standard drinks on one occasion). .................................................................................................. 54
Table 3.5 Changes in alcohol consumption among 7790 Younger women over time. .................................................................................................................. 56
Table 3.6 Changes in alcohol consumption among 10087 Mid-aged women over time. .................................................................................................................. 56
Table 3.7 Changes in alcohol consumption among 8646 Older women over time................. 57 Table 3.8 Changes in illicit drug use: data from Surveys 2 and 3 (weighted
percent of 7 093 women).................................................................................. 62 Table 5.1 Breast examination by a doctor and breast self-examination for the
Mid-aged cohort in Survey 3 and Survey 4. ..................................................... 86 Table 7.1 Incidence of Hypertension. ....................................................................................104 Table 7.2 Incidence of Heart Disease. ..................................................................................112 Table 7.3 Incidence of Diabetes. ...........................................................................................119 Table 7.4 Incidence of Asthma. .............................................................................................125 Table 7.5 Incidence of Osteoporosis. ....................................................................................131 Table 7.6 Incidence of Arthritis. .............................................................................................137
Table A 1.1 Participation and retention of Younger women..................................................145 Table A 1.2 Participation and retention of Mid-aged women. ...............................................146 Table A 1.3 Participation and retention of Older women.......................................................147 Table A 1.4 Completion of surveys by Younger women (n=14247) .....................................148 Table A 1.5 Completion of Surveys by Mid-aged women (n=13716)....................................148 Table A 1.6 Completion of Surveys by Older women (n=12432) *........................................149 Table A 2.1 Calculation of incidence. ....................................................................................152 Table A 3.1 Hypertension prevalence (%) for each cohort at all surveys. ............................154 Table A 3.2 Hypertension by body mass index. ....................................................................154 Table A 3.3 Hypertension by level of physical activity...........................................................155 Table A 3.4 Hypertension by tobacco smoking. ....................................................................155 Table A 3.5 Hypertension by alcohol consumption. ..............................................................155 Table A 3.6 Hypertension by level of education. ...................................................................156 Table A 3.7 Heart disease prevalence (%) for each cohort at all surveys. ...........................156 Table A 3.8 Heart disease by body mass index. ...................................................................156
xi
Table A 3.9 Heart disease by level of physical activity..........................................................157 Table A 3.10 Heart disease by tobacco smoking. .................................................................157 Table A 3.11 Heart disease by alcohol consumption. ...........................................................157 Table A 3.12 Heart disease by level of education. ................................................................158 Table A 3.13 Diabetes prevalence (%) for each cohort by all surveys..................................158 Table A 3.14 Diabetes by body mass index. .........................................................................158 Table A 3.15 Diabetes by level of physical activity................................................................159 Table A 3.16 Diabetes by tobacco smoking. .........................................................................159 Table A 3.17 Diabetes by alcohol consumption. ...................................................................159 Table A 3.18 Diabetes by level of education. ........................................................................160 Table A 3.19 Asthma prevalence (%) for each cohort at all surveys. ...................................160 Table A 3.20 Asthma by body mass index. ...........................................................................160 Table A 3.21 Asthma by level of physical activity..................................................................161 Table A 3.22 Asthma by tobacco smoking. ...........................................................................161 Table A 3.23 Asthma by alcohol consumption. .....................................................................161 Table A 3.24 Asthma by level of education. ..........................................................................162 Table A 3.25 Osteoporosis prevalence (%) for the Mid-aged and Older cohort at
all surveys.......................................................................................................162 Table A 3.26 Osteporosis by body mass index. ....................................................................162 Table A 3.27 Osteoporosis by level of physical activity.........................................................163 Table A 3.28 Osteoporosis by tobacco smoking. ..................................................................163 Table A 3.29 Osteoporosis by alcohol consumption. ............................................................163 Table A 3.30 Osteoporosis by level of education. .................................................................164 Table A 3.31 Arthritis prevalence (%) for the Mid-aged and Older cohort at all
surveys. ..........................................................................................................164 Table A 3.32 Arthritis by body mass index. ...........................................................................164 Table A 3.33 Arthritis by level of physical activity..................................................................165 Table A 3.34 Arthritis by tobacco smoking. ...........................................................................165 Table A 3.35 Arthritis by alcohol consumption. .....................................................................165 Table A 3.36 Arthritis by level of education. ..........................................................................166

1
Section 1: Executive summary
1.1 Aims of this Report The Australian Longitudinal Study on Women’s Health (ALSWH) is a longitudinal population-based survey funded by the Australian Government Department of Health and Ageing. The project began in 1996 and involves three large, nationally representative, cohorts of Australian women representing three generations:
• Younger women, aged 18 to 23 years when recruited in 1996 (n=14247)
• Mid-aged women, aged 45 to 50 years in 1996 (n=13716)
• Older women, aged 70 to 75 years in 1996 (n=12432) (Lee et al. 2005).
The women have now been resurveyed at least four times over the past 10 years providing a large amount of data on the women’s lifestyles and health outcomes.
Table 1.1 Schedule of Surveys for the Australia Longitudinal Study on Women’s Health
Survey 1 Survey 2 Survey 3 Survey 4 Survey 5 Survey 6 Survey 7 Young (1996)
18-23 yrs (2000)
22-27 yrs (2003)
25-30 yrs (2006)
28-33 yrs (2009)
31-36 yrs (2012)
34-39 yrs (2015)
37-42 yrs Mid (1996)
45-50 yrs (1998)
47-52 yrs (2001)
50-55 yrs (2004)
53-58 yrs (2007)
56-61 yrs (2010)
59-64yrs (2013)
62-67 yrs Older (1996)
70-75 yrs (1999)
73-78 yrs (2002)
76-81 yrs (2005)
79-84 yrs (2008)
82-87 yrs (2011)
85-90 yrs (2014)
88-93 yrs
This report has been prepared on the basis of discussions between the ALSWH research team and staff of the Department of Health and Ageing. On this basis, specific topics were selected for this report.
Using data from the ALSWH for the period 1996-2004, the following research questions are addressed in this report:
• What are the prevalence and incidence rates of selected chronic conditions among the three age groups of participants in the ALSWH, and how have these changed over the first nine years of the study?
• What are the characteristics of women with different chronic conditions?
• What long-term effects do risk factors have on women’s health?
Using Australia’s National Health Priority Areas (AIHW 2004) and data collected on chronic conditions in the ALSWH surveys, the following conditions were selected for this report: heart disease, hypertension, osteoporosis, diabetes, asthma and arthritis. In addition trends are presented for summary measures of mental and physical health, use of health services, activities aimed at disease prevention, and some behavioural risk factors.
2
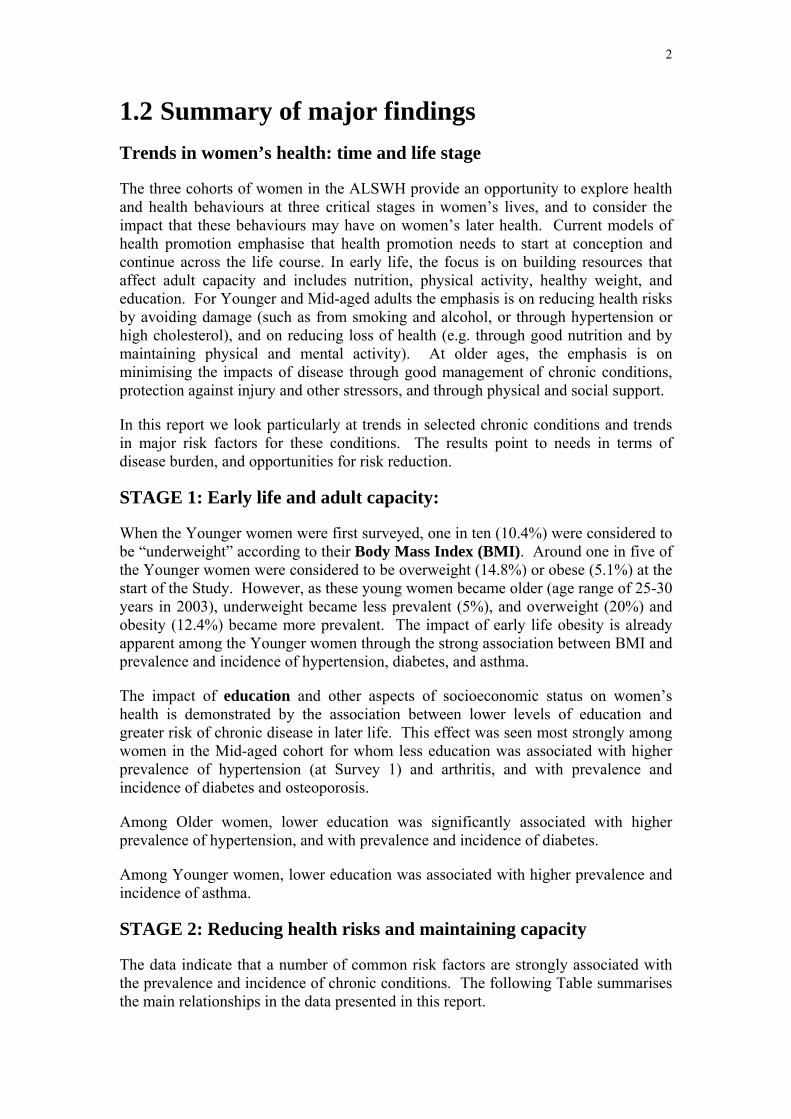
1.2 Summary of major findings Trends in women’s health: time and life stage
The three cohorts of women in the ALSWH provide an opportunity to explore health and health behaviours at three critical stages in women’s lives, and to consider the impact that these behaviours may have on women’s later health. Current models of health promotion emphasise that health promotion needs to start at conception and continue across the life course. In early life, the focus is on building resources that affect adult capacity and includes nutrition, physical activity, healthy weight, and education. For Younger and Mid-aged adults the emphasis is on reducing health risks by avoiding damage (such as from smoking and alcohol, or through hypertension or high cholesterol), and on reducing loss of health (e.g. through good nutrition and by maintaining physical and mental activity). At older ages, the emphasis is on minimising the impacts of disease through good management of chronic conditions, protection against injury and other stressors, and through physical and social support.
In this report we look particularly at trends in selected chronic conditions and trends in major risk factors for these conditions. The results point to needs in terms of disease burden, and opportunities for risk reduction.
STAGE 1: Early life and adult capacity:
When the Younger women were first surveyed, one in ten (10.4%) were considered to be “underweight” according to their Body Mass Index (BMI). Around one in five of the Younger women were considered to be overweight (14.8%) or obese (5.1%) at the start of the Study. However, as these young women became older (age range of 25-30 years in 2003), underweight became less prevalent (5%), and overweight (20%) and obesity (12.4%) became more prevalent. The impact of early life obesity is already apparent among the Younger women through the strong association between BMI and prevalence and incidence of hypertension, diabetes, and asthma.
The impact of education and other aspects of socioeconomic status on women’s health is demonstrated by the association between lower levels of education and greater risk of chronic disease in later life. This effect was seen most strongly among women in the Mid-aged cohort for whom less education was associated with higher prevalence of hypertension (at Survey 1) and arthritis, and with prevalence and incidence of diabetes and osteoporosis.
Among Older women, lower education was significantly associated with higher prevalence of hypertension, and with prevalence and incidence of diabetes.
Among Younger women, lower education was associated with higher prevalence and incidence of asthma.
STAGE 2: Reducing health risks and maintaining capacity
The data indicate that a number of common risk factors are strongly associated with the prevalence and incidence of chronic conditions. The following Table summarises the main relationships in the data presented in this report.

3
Table 1.2 Relationships of risk factors to chronic conditions for those in Younger (Y), Mid-aged (M) and Older (O) cohorts of the Study, from Surveys 1 to 3 in the Younger and Older cohorts and Surveys 1 to 4 in the Mid-aged cohort, 1996 to 2004.
Hypertension Heart disease Diabetes Asthma Osteoporosis* Arthritis** Existing New Existing New Existing New Existing New Existing New Existing New BMI #
Y,M,O Y,M M,O M,O Y,M,O
Y,M,O Y,M,O Y,M,O
M,O
M,O M,O
Physical activity
M,O
M,O
M,O
O
O
M,O
M,O
O
M
O
Smoking Y
Y
M
M
M
M
Y,M
M
Alcohol M,O (U-shaped)
M (U-shaped)
M,O (higher among non-drinkers)
O (higher among non-drinkers)
M,O (higher among non-drinkers)
M (higher among non-drinkers) O (U-shaped)
M,O (U-shaped)
M,O (U-shaped)
M (higher among non-drinkers)
M
Education M,O (negative)
M,O (negative)
M,O (negative)
Y (negative)
Y (negative)
M (negative)
M (negative)
M (negative)
# Crosses represent the strength of association between risk factors and chronic conditions, while initials indicate which cohorts exhibit the relationship. All associations are positive unless indicated otherwise. Empty cells indicate that there is no relationship between the risk factor and condition for any of the cohorts. * Items on osteoporosis were not included in the surveys for the Younger cohort **Items on arthritis were not included in the surveys for the Younger cohort.

4
Overweight and obesity were major risk factors among women in the Study and were strongly associated with prevalence and incidence of hypertension, heart disease, diabetes, asthma, and with the prevalence of arthritis. The prevalence of overweight/obesity was highest in the Mid-aged cohort with around 2 in 3 women being rated as overweight or obese at the time of Survey 4. However, if trends observed among the Younger women continue, obesity and overweight will be even more prevalent among these women when they reach mid-age.
The prevalence of cigarette smoking varied greatly across the cohorts. At Survey 1, most of the Older women were non-smokers and there was little change between Surveys 1 and 2, and so this question was not repeated in subsequent surveys for the Older cohort. Survey 1 smoking prevalence was highest among the Younger women with almost 3 out of 10 of these women reporting to be current smokers, whereas current tobacco smoking was reported by around 1 in 8 (13%) of women in the Mid-aged cohort.
The proportion of Younger women who changed their smoking habits between surveys was greater than the proportion who remained current smokers (around 15% of women reported current smoking on all three surveys). Younger women were more likely to take up smoking between Survey 1 and Survey 2 (around 1 in 20 women took up smoking) than they were to quit (around 1 in 25 women quit). Between Survey 2 and Survey 3 Younger women were just as likely to take up smoking as they were to quit (around 3% of women in each category). In contrast, there were very few changes in smoking status among the Mid-aged women.
Among Younger women, smoking was associated with higher prevalence and incidence of hypertension, and prevalence of asthma.
Among Mid-aged women, smoking was significantly associated with existing and new cases of heart disease and diabetes, existing asthma, and existing arthritis.
Survivor effects, whereby women who smoked and had chronic diseases were less likely to remain in the surveys, may be apparent among the women in the Older cohort. This could account for the low levels of smoking reported by these women. The ALSWH uses standard instruments for obtaining information on alcohol consumption. The definitions used in this report are provided on page 53. At all ages and at all surveys, the majority of women (over 90%) did not regularly drink alcohol at risky levels for long term harm. Most women maintained the same level of alcohol consumption across all surveys. Younger women and Mid-aged women were more likely to increase alcohol consumption (usually moving from “occasional drinker” to “low risk drinker”) than they were to decrease alcohol consumption, whereas Older women were more likely to decrease than to increase their alcohol consumption.
A U-shaped association between alcohol consumption and risk of illness was consistently seen in the data, indicating that risk of disease was higher for non-drinkers and risky drinkers, but lower for moderate drinkers. This pattern was seen for prevalence and incidence of hypertension and asthma among the Mid-aged women. Among the Older women this same relationship was evident in the prevalence of asthma and hypertension and the incidence of asthma and diabetes. Also among
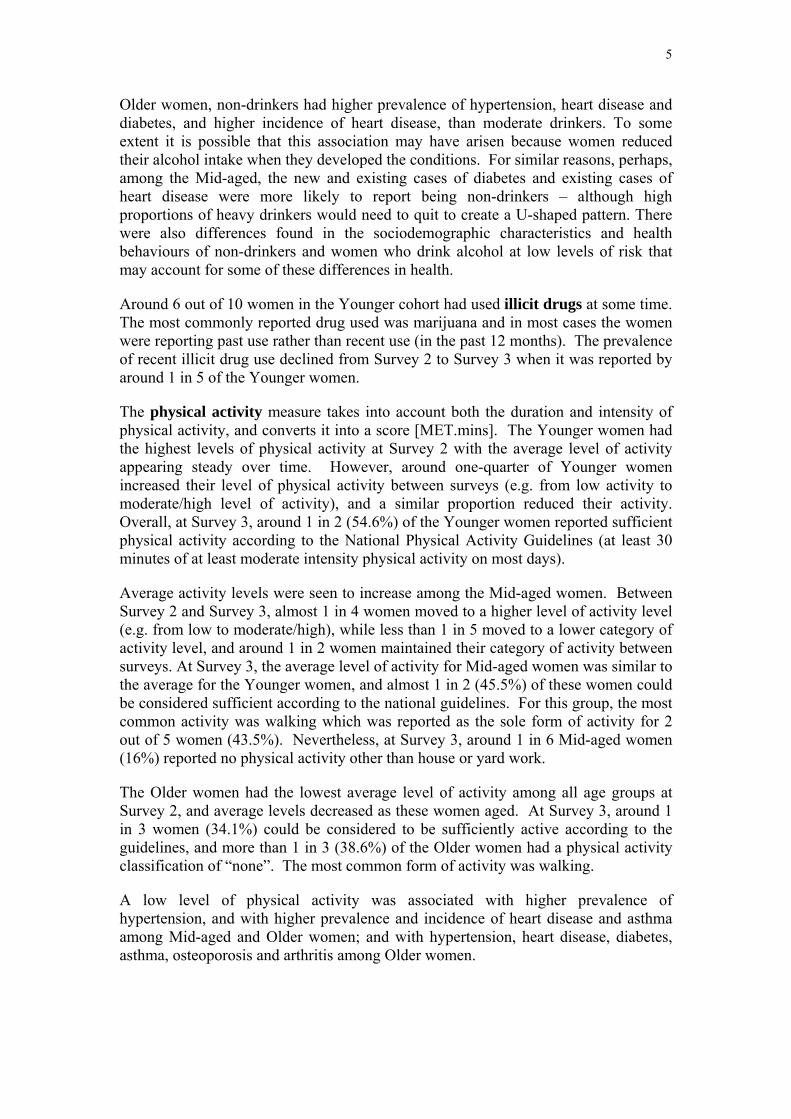
5
Older women, non-drinkers had higher prevalence of hypertension, heart disease and diabetes, and higher incidence of heart disease, than moderate drinkers. To some extent it is possible that this association may have arisen because women reduced their alcohol intake when they developed the conditions. For similar reasons, perhaps, among the Mid-aged, the new and existing cases of diabetes and existing cases of heart disease were more likely to report being non-drinkers – although high proportions of heavy drinkers would need to quit to create a U-shaped pattern. There were also differences found in the sociodemographic characteristics and health behaviours of non-drinkers and women who drink alcohol at low levels of risk that may account for some of these differences in health.
Around 6 out of 10 women in the Younger cohort had used illicit drugs at some time. The most commonly reported drug used was marijuana and in most cases the women were reporting past use rather than recent use (in the past 12 months). The prevalence of recent illicit drug use declined from Survey 2 to Survey 3 when it was reported by around 1 in 5 of the Younger women.
The physical activity measure takes into account both the duration and intensity of physical activity, and converts it into a score [MET.mins]. The Younger women had the highest levels of physical activity at Survey 2 with the average level of activity appearing steady over time. However, around one-quarter of Younger women increased their level of physical activity between surveys (e.g. from low activity to moderate/high level of activity), and a similar proportion reduced their activity. Overall, at Survey 3, around 1 in 2 (54.6%) of the Younger women reported sufficient physical activity according to the National Physical Activity Guidelines (at least 30 minutes of at least moderate intensity physical activity on most days).
Average activity levels were seen to increase among the Mid-aged women. Between Survey 2 and Survey 3, almost 1 in 4 women moved to a higher level of activity level (e.g. from low to moderate/high), while less than 1 in 5 moved to a lower category of activity level, and around 1 in 2 women maintained their category of activity between surveys. At Survey 3, the average level of activity for Mid-aged women was similar to the average for the Younger women, and almost 1 in 2 (45.5%) of these women could be considered sufficient according to the national guidelines. For this group, the most common activity was walking which was reported as the sole form of activity for 2 out of 5 women (43.5%). Nevertheless, at Survey 3, around 1 in 6 Mid-aged women (16%) reported no physical activity other than house or yard work.
The Older women had the lowest average level of activity among all age groups at Survey 2, and average levels decreased as these women aged. At Survey 3, around 1 in 3 women (34.1%) could be considered to be sufficiently active according to the guidelines, and more than 1 in 3 (38.6%) of the Older women had a physical activity classification of “none”. The most common form of activity was walking.
A low level of physical activity was associated with higher prevalence of hypertension, and with higher prevalence and incidence of heart disease and asthma among Mid-aged and Older women; and with hypertension, heart disease, diabetes, asthma, osteoporosis and arthritis among Older women.

6
Data on fruit and vegetable intake indicated that Younger women ate less fruit and vegetables than recommended, and that vegetable consumption among Mid-aged women was also lacking.
STAGE 3: Minimising the impact of chronic conditions:
The prevalence and incidence of chronic conditions increased markedly across the three cohorts and over time.
The most common among the chronic conditions considered in this report was hypertension which was reported by almost 2 out of 3 Older women by Survey 3 (when they were aged 76-81 years). However, there has also been a steep increase in the reported prevalence of hypertension among Mid-aged women with around 1 in 3 reporting this condition by Survey 4 (when the women were aged 53-58 years). Women continued to report new diagnoses of hypertension as they aged, with the highest incidence rate observed among the women in the Oldest cohort.
The importance of hypertension is in its relationship to cardiovascular disease. Among the women in the Study, the prevalence of heart disease was low (less than 5%) among Younger women and for women in the first three surveys of the Mid-aged cohort. However there was a large increase in heart disease by Survey 4 of the Mid-aged cohort. Among the Older women, the incidence rates of heart disease were between 46-60 new cases per thousand women for each three year interval, and almost 1 in 4 women reported heart disease by Survey 3. The Older women also showed a steady incidence rate of stroke over the survey periods (around 20 new cases per 1000 women for each survey).
The second most common condition affecting women in the Study was arthritis. This condition was reported by 1 in 5 Mid-aged women at Survey 3, and by almost 2 out of 3 Older women at Survey 3. This condition also had the highest incidence rate.
Diabetes, asthma, and osteoporosis were less common, but still important causes of morbidity among the women in the Study. Diabetes and osteoporosis showed clear increases in prevalence across cohorts and over time. The pattern for asthma was more complex with highest prevalence reported by the Younger cohort, but increasing prevalence within each cohort at successive surveys.
Changes in women’s general physical health and mental health over time were assessed using the SF-36 measure, with higher scores reflecting better health. The SF-36 scores for physical health for Younger women did not change over time, whereas physical health scores declined for Mid-aged and Older women. In contrast, mental health scores increased among Younger and Mid-aged women and remained high among the Older women.
Physical and mental health scores were associated with changes in marital status, and also varied according to whether the women had chronic conditions. The association between chronic conditions and physical and mental health scores is shown in Table 1.3.
7
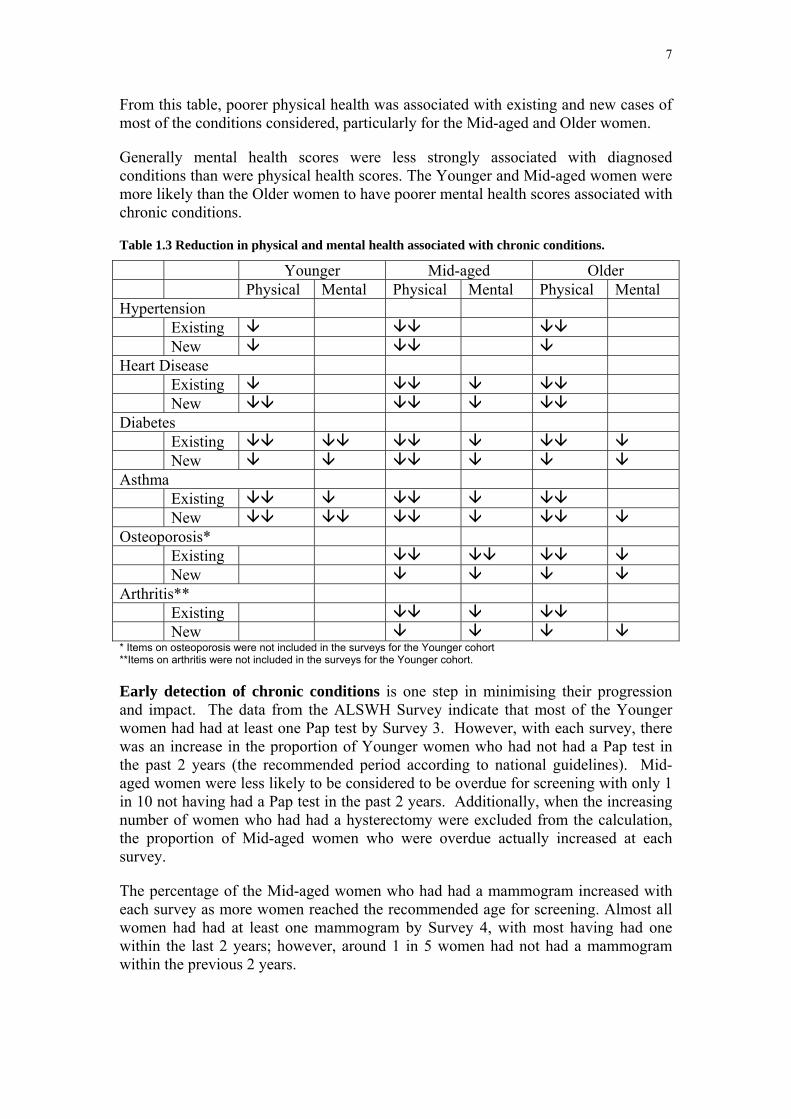
From this table, poorer physical health was associated with existing and new cases of most of the conditions considered, particularly for the Mid-aged and Older women.
Generally mental health scores were less strongly associated with diagnosed conditions than were physical health scores. The Younger and Mid-aged women were more likely than the Older women to have poorer mental health scores associated with chronic conditions.
Table 1.3 Reduction in physical and mental health associated with chronic conditions.
Younger Mid-aged Older Physical Mental Physical Mental Physical Mental Hypertension Existing New Heart Disease Existing New Diabetes Existing New Asthma Existing New Osteoporosis* Existing New Arthritis** Existing New * Items on osteoporosis were not included in the surveys for the Younger cohort **Items on arthritis were not included in the surveys for the Younger cohort.
Early detection of chronic conditions is one step in minimising their progression and impact. The data from the ALSWH Survey indicate that most of the Younger women had had at least one Pap test by Survey 3. However, with each survey, there was an increase in the proportion of Younger women who had not had a Pap test in the past 2 years (the recommended period according to national guidelines). Mid-aged women were less likely to be considered to be overdue for screening with only 1 in 10 not having had a Pap test in the past 2 years. Additionally, when the increasing number of women who had had a hysterectomy were excluded from the calculation, the proportion of Mid-aged women who were overdue actually increased at each survey.
The percentage of the Mid-aged women who had had a mammogram increased with each survey as more women reached the recommended age for screening. Almost all women had had at least one mammogram by Survey 4, with most having had one within the last 2 years; however, around 1 in 5 women had not had a mammogram within the previous 2 years.

8
Participation in other early detection activities varied. While a majority of women (over 90%) in the Mid-aged cohort had had their blood pressure measured in Surveys 3 and 4, fewer (around 70%) reported cholesterol testing.
Trends in health service use showed highest use of general practitioner (GP) services by Older women, and lowest use by Mid-aged women. Use increased among the Older women as they aged. Although lower than at Survey 1 and Survey 2 there was an increase in the use of GP services by Younger women at Survey 3.
There was more uniform use of specialist medical services across the cohorts. However there was slight trend for increasing use of specialist services over time for Younger and Mid-aged women, and for decreasing use of specialist services among Older women. Hospitalisation was more common among Older women, and increased as the women aged.
Among the Younger and Older women, use of GP services, specialist consultations and admission to hospital were higher among women with hypertension, heart disease, diabetes and asthma. These trends were less clear among the Mid-aged women. Older women who reported osteoporosis and those who reported arthritis also tended to have higher use of health care services.
Trends in women’s health: urban, rural and remote areas
There were very few differences in health across urban, rural and remote areas. There was a higher prevalence of osteoporosis in the Mid-aged and Older women from urban areas. However this association is likely to be affected by higher rates of bone density assessment in urban areas. The only other condition for which the prevalence varied by area of residence was diabetes in the Younger women, where there was a much higher prevalence in small rural centres.
Among the Mid-aged and Older cohorts, consultations with medical practitioners were more frequent in urban areas than in non-urban areas, and women in urban areas were more likely to be satisfied with their ease of access to bulk billing medical services.
Younger women living outside urban and large rural areas were more likely to be current smokers or ex-smokers than their urban counterparts. On the other hand, women living in urban areas were more likely than rural women to have tried illicit drugs at some time in their lives, and had the highest level of recent multiple drug use.
1.3 Discussion The most striking feature of the results presented in this Section is the adverse effect of overweight and obesity on the prevalence and incidence of vascular disease (hypertension, heart disease and diabetes) as well as asthma. In light of the increasing weight in all age groups documented in detail in Section 6, weight gain clearly poses a major threat to the health of Australian women.
In comparison none of the other risk factors examined showed such consistent and strong associations with chronic conditions. For example, while higher levels of

9
physical activity were generally protective (possibly by moderating the effects of weight) the direction of causation was sometimes unclear with the onset of chronic conditions such as arthritis potentially limiting physical activity.
Alcohol consumption showed either a U-shaped or an inverse relationship with hypertension and heart disease. It is possible that some women may have given up drinking alcohol due to the onset of a chronic condition (sick quitters). The finding may also be due to the hypothesised association that low levels of alcohol may be protective against vascular conditions.
Level of education (as a marker of socio-economic status) showed much weaker, inconsistent or no associations with the chronic conditions examined in this report. In part this may have been due to relative homogeneity within the ALSWH samples; for example in the Older cohort few had post-school education. In these circumstances there were not large groups with very different risk factor levels who could be compared with respect to prevalence or incidence of chronic conditions. Additionally, from a life course perspective, level of education is a more distant determinant of health than proximal factors such as body mass index. Tobacco smoking was associated with hypertension, heart disease, diabetes, asthma and osteoporosis. Survivor bias among the Older cohort, where women with lower socio-economic status may not have lived long enough to be included in the cohort, may also have limited the observed associations.
All the conditions reported here are unconfirmed self reports of a diagnosis by a doctor. While some of the data may be unreliable they are unlikely to be systematically biased except, as discussed in Section 2 where there are other factors that may affect diagnosis, such as clinical uncertainty about asthma in older people or access to bone density testing which forms the basis for a diagnosis of osteoporosis. Analyses of associations between risk factors and these conditions may be misleading due to these diagnostic issues.
In summary, the adverse effects of weight gain are the most important findings in this Report.
10
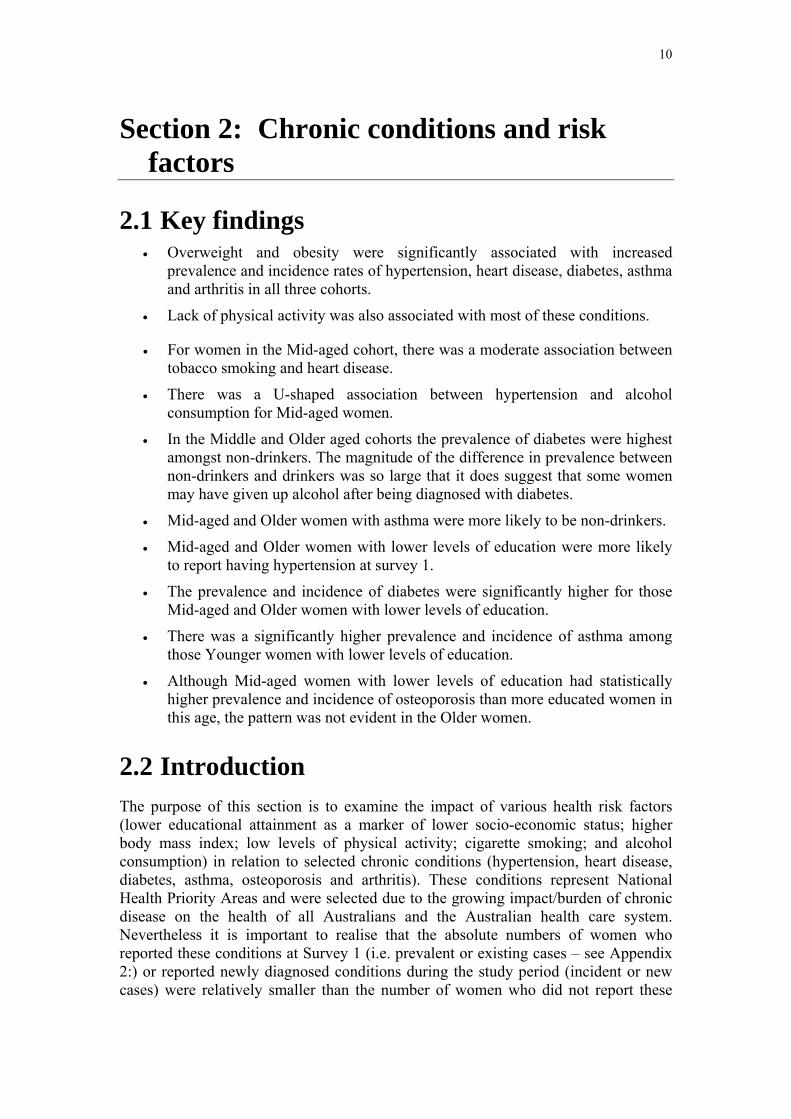
Section 2: Chronic conditions and risk factors
2.1 Key findings • Overweight and obesity were significantly associated with increased
prevalence and incidence rates of hypertension, heart disease, diabetes, asthma and arthritis in all three cohorts.
• Lack of physical activity was also associated with most of these conditions.
• For women in the Mid-aged cohort, there was a moderate association between tobacco smoking and heart disease.
• There was a U-shaped association between hypertension and alcohol consumption for Mid-aged women.
• In the Middle and Older aged cohorts the prevalence of diabetes were highest amongst non-drinkers. The magnitude of the difference in prevalence between non-drinkers and drinkers was so large that it does suggest that some women may have given up alcohol after being diagnosed with diabetes.
• Mid-aged and Older women with asthma were more likely to be non-drinkers.
• Mid-aged and Older women with lower levels of education were more likely to report having hypertension at survey 1.
• The prevalence and incidence of diabetes were significantly higher for those Mid-aged and Older women with lower levels of education.
• There was a significantly higher prevalence and incidence of asthma among those Younger women with lower levels of education.
• Although Mid-aged women with lower levels of education had statistically higher prevalence and incidence of osteoporosis than more educated women in this age, the pattern was not evident in the Older women.
2.2 Introduction The purpose of this section is to examine the impact of various health risk factors (lower educational attainment as a marker of lower socio-economic status; higher body mass index; low levels of physical activity; cigarette smoking; and alcohol consumption) in relation to selected chronic conditions (hypertension, heart disease, diabetes, asthma, osteoporosis and arthritis). These conditions represent National Health Priority Areas and were selected due to the growing impact/burden of chronic disease on the health of all Australians and the Australian health care system. Nevertheless it is important to realise that the absolute numbers of women who reported these conditions at Survey 1 (i.e. prevalent or existing cases – see Appendix 2:) or reported newly diagnosed conditions during the study period (incident or new cases) were relatively smaller than the number of women who did not report these

11
conditions, and the numbers who also reported having the selected risk factors were likewise small.
A strength of longitudinal studies is the potential to clarify the time order of causation factors. For behavioural risk factors, however, this can be complicated by the continuation of behaviour both before and after a related condition is diagnosed (e.g., women with heart disease who continue to smoke). Alternatively risk factor modification may occur when early warning signs of a condition appear; for example, dieting to control weight in response to evidence of glucose intolerance but the actual weight loss achieved or maintained is insufficient to avoid subsequent diagnosis of diabetes.
For these reasons we have concentrated on risk factor levels at Survey 1 (except for physical activity where Survey 2 data were used), prevalence (existing cases) at Survey 1 and incidence (new cases) between Survey 1 and the most recent Survey.
Risk factor levels have been categorised according to level of risk. Education was categorised according to whether or not the women had any post-high school qualifications (labelled Year 12 or below in the Tables although this term really only applied for the Younger women).
Body mass index (weight (kg) divided by the square of height (m) was categorised as obese (BMI > 30), overweight (25 < BMI ≤ 30), or not overweight/ obese.
Level of physical activity at Survey 2 was calculated according to the MET.MINS classification (Section 3.2.2) and categorised as “Nil or low” (<600MET.MINS/ week) or “Moderate or High” (≥ 600 MET.MINS/ week).
Smoking was dichotomised according to current smoking (at Survey 1). Alcohol consumption was measured by self-report as described in Section 3.4.3 and categorised according to risk to long-term health. The ALSWH uses standard instruments for obtaining information on alcohol consumption. The definitions used in this report are provided on page 53. In the analysis of risk factors for chronic disease presented in this section, the group of women who drank alcohol occasionally was combined with the women who drank at low levels of risk, making the “low risk” group consistent with the Australian Alcohol Guidelines developed by the NHMRC. The non-drinkers may have included both lifetime abstainers and ex-drinkers.
Detailed tables are provided in Appendix 3 and the results are summarised in this section.
2.3 Hypertension
2.3.1 Trends in prevalence Hypertension was reported by less than 10% of the Younger women, although there was an increase in the prevalence of this condition as these women became older (Figure 2.1). A higher prevalence was observed among the Mid-aged cohort. Among these women, 20% reported having hypertension at Survey 1, with an increasing

12
prevalence with each successive survey. The highest prevalence of hypertension was observed among the Older cohort. By Survey 3, when these women were aged 76-81 years, 61% had reported hypertension on at least one of the three surveys. Note, that women who were taking medications for high blood pressure were categorised as having hypertension.
Figure 2.1 Prevalence of self-reported hypertension in each cohort by survey, from 1996 to 2004.
2.3.2 Risk factors
a) Body mass index
There were very strong trends in prevalence of hypertension with increasing body mass index for all three age cohorts (with prevalence approximately doubling across categories in the Younger women). Incidence of hypertension also increased markedly with body mass index in the Younger and Mid-aged women (but not in the Older women) (Table A 3.2).
b) Physical activity
Prevalence of hypertension was significantly higher among Mid-aged and Older women who were not physically active compared with those who reported moderate or high levels of physical activity at Survey 2; for the Younger women however the difference was small and not statistically significant. Incidence of hypertension was not consistently related to level of physical activity (Table A 3.3).
13
c) Smoking
Among the Mid-aged and Older women there was no apparent association between smoking and hypertension. A higher prevalence of hypertension in the Younger women who were current smokers was observed (Table A 3.4).
This observation could have been related to smokers having children earlier and hence being at risk of hypertension associated with pregnancy.
d) Alcohol
There was a U shaped association between hypertension and alcohol consumption for the Mid-aged women. Prevalence and incidence of hypertension were higher among the non-drinkers and among the small group of risky drinkers than among the low risk drinkers. This pattern was not apparent among the Younger women (among whom the numbers of existing or new cases of hypertension were small especially among the small groups of non-drinkers or risky drinkers). Among the Older women, the prevalence of hypertension was significantly higher among the non-drinkers (Table A 3.5).
The higher prevalence of hypertension among the non-drinkers in the Older cohort may be due to women who have given up alcohol consumption following this diagnosis (or other related conditions) being included in this group. There were also differences found in the sociodemographic characteristics and health behaviours of non-drinkers and women who drink alcohol at low levels of risk that may account for some of these differences in the prevalence of hypertension.
e) Education
Women with lower levels of education were more likely to report having hypertension at Survey 1, particularly for the Mid-aged and Older cohorts. Incidence rates during the study period however were not significantly different (Table A 3.6).
2.4 Heart Disease
2.4.1 Trends in prevalence The prevalence of heart disease was less than 5% among women in the Younger and Mid-aged cohorts, although there was a steady increase in the prevalence of this condition as the women aged (Figure 2.3). Among the women in the Older cohort, the prevalence of heart disease was 17% at Survey 1, when the women were 70-75 years of age, and increased to 24% by Survey 3 when the women were aged 78-81 years.

14
Figure 2.2 Prevalence of self-reported heart disease for each cohort group by survey, from 1996 to 2004.
2.4.2 Risk factors
a) Body mass index
For both the Mid-aged and Older cohorts there were very strong and statistically significant trends with prevalence and incidence of reported heart disease increasing with body mass index (Table A 3.8).
b) Physical activity
For the Mid-aged and Older cohorts, but not the Younger cohort, both prevalence and incidence of heart disease were statistically significantly higher among women who reported low levels of physical activity compared with those who reported at least a moderate level of physical activity, which is required to achieve health benefits (Table A 3.9).
c) Smoking
In the Mid-aged cohort the prevalence of heart disease was significantly higher among smokers than non-smokers. For prevalence of heart disease in the Older cohort the pattern was less clear with relatively more existing cases among non-smokers than among smokers (Table A 3.10).
This finding suggests that non-smokers in the Older cohort with a history of heart disease who once smoked may have given up before Survey 1.

15
d) Alcohol
Prevalence of heart disease was highest among non-drinkers. This pattern was also apparent for incidence among the Older women. These data show a strong and statistically significant association of higher prevalence and incidence of heart disease among non-drinkers/ex-drinkers. The same pattern was apparent in the Mid-aged cohort (Table A 3.11).
While some of this effect may be due to women with heart disease giving up alcohol, the data suggest that women who consume low levels of alcohol are less likely to develop cardiovascular disease. Whether the lower prevalence of heart disease is due to a protective effect of alcohol or the combination of other lifestyle factors that these women experience cannot be easily determined. There were differences found in the sociodemographic characteristics and health behaviours of non-drinkers and women who drink alcohol at low levels of risk that may account for some of these differences in the prevalence of heart disease.
The NHMRC Australian Alcohol Guidelines (2001, pg 40) states that there is no evidence that drinking at risky or high risk levels has “any additional benefit in relation to heart disease, and any benefits are outweighed by the other risks associated with alcohol.”
e) Education
The numbers of women who reported heart disease at Survey 1 or subsequently, were very small for the Younger and Mid-aged cohorts. Although prevalence (existing cases) and incidence (new ones) were slightly higher among the women with lower levels of education the difference was not statistically significant in any of the cohorts (Table A 3.12).
2.5 Diabetes
2.5.1 Trends in prevalence There was a steady increase in the prevalence of diabetes with age (Figure 2.3). Among Younger women, the prevalence of diabetes was 1% at Survey 1 and increased to 1.5% at Survey 2. From Survey 2 onwards this item in the list of conditions was specifically re-designed to exclude gestational diabetes which may have otherwise inflated the estimate among women of reproductive age. Among the Mid-aged women the prevalence increased from less than 3%, when the women were aged 45-50 years, to 8% by the time the women were aged 53-58 years. Women in the Older cohort had a much higher prevalence of diabetes. At the start of the Study, when they were aged 70-75 years, 9% of the women in the Older cohort reported they had ever been told they had diabetes and this proportion increased to 12% at the time of the third survey.

16
Figure 2.3 Prevalence of self-reported diabetes for each cohort group by survey, from 1996 to 2004.
2.5.2 Risk factors
a) Body mass index
The increases in both prevalence and incidence of diabetes with increasing body mass index were striking and statistically very significant in all three age cohorts. These associations were among the strongest in this section of the Report and provide unambiguous evidence of the graded risk of diabetes associated with weight (Table A 3.14).
b) Physical activity
Prevalence of diabetes was significantly higher among the Older women who undertook little or no physical activity compared with those who achieved at least moderate levels (Table A 3.15). Among the Mid-aged and Younger cohorts the numbers of cases were small and associations with physical activity were not apparent.
c) Smoking
Only among the Mid-aged women there was evidence of an association between prevalence or incidence of diabetes and tobacco smoking. In this cohort both prevalence and incidence were higher among current smokers than among non-smokers (Table A 3.16).
17
d) Alcohol
For the Mid-aged women prevalence and incidence of diabetes were highest among non-drinkers, considerably lower among low risk drinkers and lower still among surviving risky drinkers. This same relationship was also apparent in diabetes incidence in the Older women. But this pattern was not apparent in the Younger women (Table A 3.17).
The magnitude of the differences in prevalence between non-drinkers and drinkers was so large (especially compared to differences in incidence) that it does suggest that some women may have given up alcohol after being diagnosed with diabetes (i.e. “reverse causation” with disease causing change in risk behaviour). There were also differences found in the sociodemographic characteristics and health behaviours of non-drinkers and women who drink alcohol at low levels of risk that may account for some of these differences in the prevalence of diabetes.
e) Education
Among the Mid-aged and Older women both prevalence and incidence of diabetes were significantly higher for those with lower levels of education. This effect was not apparent for the Younger women among whom there were only small numbers of cases (Table A 3.18).
2.6 Asthma
2.6.1 Trends in prevalence At Survey 1, the prevalence of asthma was greatest among the Younger women, lower among the Mid-aged women, and lowest among the Older women (Figure 2.4). However, within each cohort the prevalence of asthma increased as the women aged.
The pattern of trends may be due to cohort differences in underlying risk of asthma, or differences in the probability that women with symptoms will receive a diagnosis of asthma. The figures may also represent improvements in survival from asthma, whereby Older women who had asthma in childhood or early adult life may not have survived to be included in these cohorts.
Among Older women, there may also be some mislabelling as there is little consensus on when older people with airway problems should be diagnosed as having asthma and when they should be given a diagnosis of Chronic Obstructive Lung Disease.
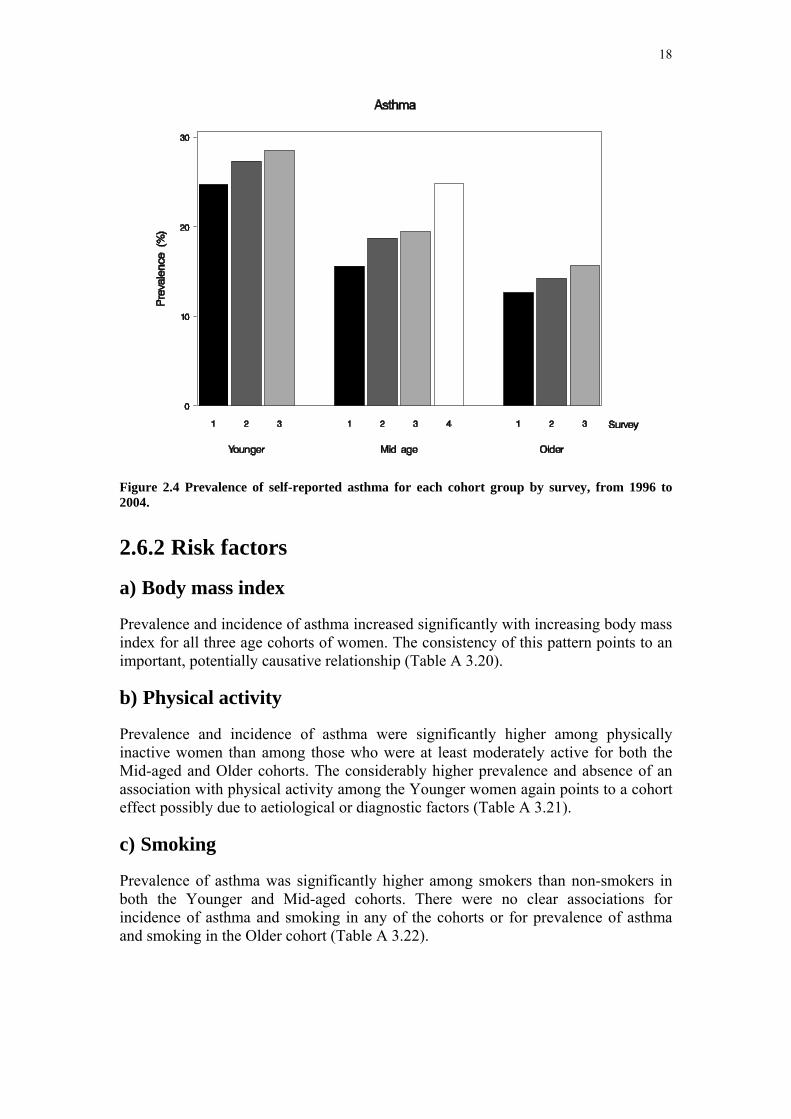
18
Figure 2.4 Prevalence of self-reported asthma for each cohort group by survey, from 1996 to 2004.
2.6.2 Risk factors
a) Body mass index
Prevalence and incidence of asthma increased significantly with increasing body mass index for all three age cohorts of women. The consistency of this pattern points to an important, potentially causative relationship (Table A 3.20).
b) Physical activity
Prevalence and incidence of asthma were significantly higher among physically inactive women than among those who were at least moderately active for both the Mid-aged and Older cohorts. The considerably higher prevalence and absence of an association with physical activity among the Younger women again points to a cohort effect possibly due to aetiological or diagnostic factors (Table A 3.21).
c) Smoking
Prevalence of asthma was significantly higher among smokers than non-smokers in both the Younger and Mid-aged cohorts. There were no clear associations for incidence of asthma and smoking in any of the cohorts or for prevalence of asthma and smoking in the Older cohort (Table A 3.22).

19
d) Alcohol
As for other risk factors, associations between asthma and alcohol consumption were different for the Younger women than for the Mid-aged or Older women. For the Younger women there was some evidence of increasing prevalence with increasing alcohol consumption but this was not statistically significant, nor was it reflected in the pattern of incidence. In contrast, for the Mid-aged and Older cohorts both prevalence and incidence showed statistically significant U-shaped associations with alcohol consumption. Mid-aged and Older women with asthma were more likely to be non-drinkers (Table A 3.23).
These women may have been lifetime abstainers or may have decided to stop consuming alcohol consumption because it aggravated their condition or interacted with their medications. There were also differences found in the sociodemographic characteristics and health behaviours of non-drinkers and women who drink alcohol at low levels of risk that may account for some of these differences in the prevalence of asthma.
e) Education
Among the Younger women there was significantly higher prevalence and incidence of asthma among those with lower levels of education. However, there was no consistent pattern for the Mid-aged and Older women (Table A 3.24).
2.7 Osteoporosis
2.7.1 Trends in prevalence Osteoporosis was not included among the lists of conditions provided to women in the Younger cohort, however it was asked at all surveys in the Mid-aged and Older cohorts. The diagnosis of osteoporosis is heavily dependent upon women undergoing assessment of bone density. Participation in bone density testing was not uniform across age groups or geographical areas.
Figure 2.5 shows the increase in prevalence of osteoporosis as women age. At Survey 1 there was marked difference in the prevalence of osteoporosis between the Mid-aged and Older cohorts. The increase in prevalence among women in the Mid-aged cohort was small. However, there was a more marked increase in the prevalence of this condition with each survey of the Older cohort. At Survey 1, 21% of women in the Older cohort reported that they had osteoporosis, and this prevalence increased over six years to 32%.
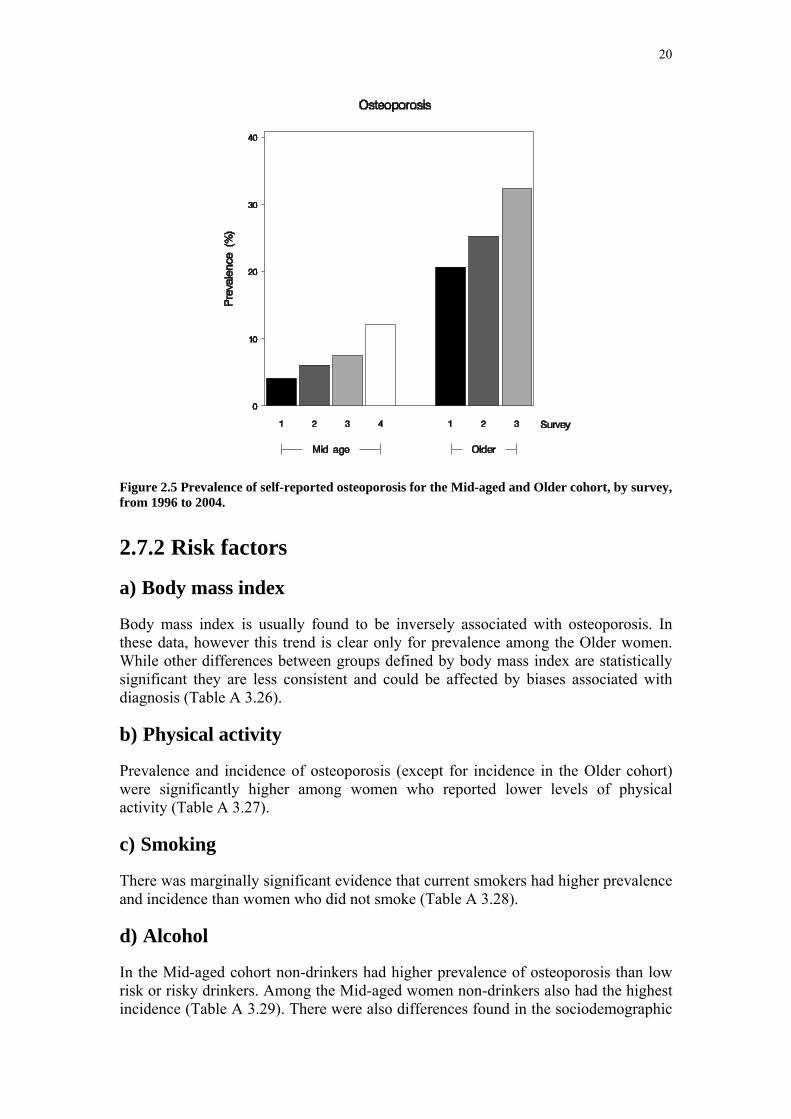
20
Figure 2.5 Prevalence of self-reported osteoporosis for the Mid-aged and Older cohort, by survey, from 1996 to 2004.
2.7.2 Risk factors
a) Body mass index
Body mass index is usually found to be inversely associated with osteoporosis. In these data, however this trend is clear only for prevalence among the Older women. While other differences between groups defined by body mass index are statistically significant they are less consistent and could be affected by biases associated with diagnosis (Table A 3.26).
b) Physical activity
Prevalence and incidence of osteoporosis (except for incidence in the Older cohort) were significantly higher among women who reported lower levels of physical activity (Table A 3.27).
c) Smoking
There was marginally significant evidence that current smokers had higher prevalence and incidence than women who did not smoke (Table A 3.28).
d) Alcohol
In the Mid-aged cohort non-drinkers had higher prevalence of osteoporosis than low risk or risky drinkers. Among the Mid-aged women non-drinkers also had the highest incidence (Table A 3.29). There were also differences found in the sociodemographic

21
characteristics and health behaviours, such as physical activity, of non-drinkers and women who drink alcohol at low levels of risk that may account for some of these differences in prevalence of osteoporosis.
e) Education
Although Mid-aged women with lower levels of education had statistically higher prevalence and incidence of osteoporosis than more educated women in this age group, the same pattern was not evident in the Older women. Also differences were relatively small and could be affected by several of the factors relating to bone density testing (Table A 3.30).
2.8 Arthritis
2.8.1 Trends in prevalence A question about arthritis/rheumatism was added from Survey 2 onwards for the Older cohort and from Survey 3 onwards for the Mid-aged cohort. This question has not yet been included in surveys for the Younger women.
As each cohort became older there were large increases in the prevalence of arthritis (Figure 2.6). Among the Mid-aged women, 21% reported having arthritis at Survey 3 and 34% reported having this condition at Survey 4 (when they were aged 53-58 years). When the Older women were aged 73-78 years, 41% reported having arthritis and this percentage increased to 60% when the women were 76-81 years (Survey 3).
Figure 2.6 Prevalence of self-reported arthritis for the Mid-aged and Older cohort, by survey, from 1996 to 2004.

22
2.8.2 Risk factors
a) Body mass index
Prevalence of arthritis at Survey 1 increased significantly with increasing body mass index for both the Mid-aged and Older women. This pattern was not apparent however for incidence in either cohort, which is difficult to explain (unless women gained weight after a diagnosis of arthritis, possibly due to difficulty taking sufficient exercise) (Table A 3.32).
b) Physical activity
While prevalence of arthritis was associated with lower levels of physical activity, significantly so for the Older women, there was no pattern for incidence (Table 10.28).
These data, like those for body mass index in Table A 3.32, suggest that arthritis may limit physical activity rather than level of physical activity having a causative role in onset of arthritis (Table A 3.33).
c) Smoking
Associations between arthritis and tobacco smoking were inconsistent in these data. While prevalence was significantly higher among Mid-aged smokers than non-smokers a reverse but non-significant pattern occurred for the Older cohort and there were no differences in incidence (Table A 3.34).
d) Alcohol
While there was some evidence that prevalence of arthritis decreased with increasing alcohol consumption this effect was not statistically significant for either cohort nor was it apparent for incidence of the condition (Table A 3.35).
e) Education
Prevalence, but not incidence, of arthritis was higher among women with lower levels of education, especially among the Mid-aged cohort where this effect was statistically significant (Table A 3.36).

23
Section 3: Risk factor trends
3.1 Changes in weight
3.1.1 Key findings • In Survey 1, Younger women had the lowest average weight and BMI.
Mid-aged women had the highest average weight and BMI.
• Younger and Mid-aged women experienced weight and BMI increases over time. At survey 1, 1 in 10 of Younger women were underweight but halved to 1 in 20 by survey 3.
• At Survey 1, 2 in 10 Younger women and more than 4 in 10 Mid-aged women were classified as overweight or obese. This increased to more than 3 in 10 and almost 6 in 10 respectively during the first 9 years of the study.
• Between the last two surveys, the average rate of weight gain in Younger women was double that of the Mid-aged women.
• Older women lost weight and became shorter over time, resulting in a relatively stable BMI.
• Younger, Mid-aged and Older women in rural areas displayed a higher average weight and BMI than urban women.
3.1.2 Introduction Women in all three cohorts have reported their height and weight in every survey since the Study began in 1996. These data give important insights into changes in weight and BMI (calculated as weight (kg) divided by the square of height (m2)) which are associated with the onset and outcomes of many chronic health problems.
Data are presented here as means and 95% confidence intervals (CI) for the Younger (N= 5609), Mid-aged (N= 7507) and Older women (N= 6264) who have reported their height and weight at all surveys. Mid-aged and Older women who have reported their height and weight at all surveys were more likely to be categorised as 'healthy weight' at baseline than those women who did not answer these questions at all surveys and those who did not continue responding to the surveys. The implications of this observation are that the findings reported here for the younger women are more likely to be representative of the entire starting cohort, while the reported proportion of women categorized as ‘healthy weight’ in the Mid-aged and Older cohorts are likely to be overestimated.
3.1.3 Weight, height and BMI in 1996 In 1996, the Younger women had the lowest average weight [62.2 (95% CI: 61.86, 62.45) kg] while the Mid-aged women were heaviest [67.8 (67.52, 68.12) kg], a difference of almost 6 kg. The average weight of the Older women was mid-way

24
between that of the other two cohorts [65.6 (65.34, 65.87) kg]. There were also considerable differences in height; with the Younger women being tallest (165.9 cm) followed by the Mid-aged (163.1 cm) and Older (161.1 cm) women. Consequently, average BMI was highest in the Mid-aged women [25.5 (25.35, 25.57)], followed by the Older [25.2 (25.14, 25.35)] and Younger [22.5 (22.41, 22.62)] women.
In all three cohorts the average weight of women living in rural and remote areas was higher than that of the women in urban centres. For example, the average weight of Younger women living in small rural centres was 2.73 kg heavier, and the average weight of Mid-aged women living in other rural and remote areas was 2.65 kg heavier than their urban counterparts. The differences were smaller for the Older women; the average weight for Older rural/remote area women was 1.14 kg greater than that of the urban Older women.
Although the women living in rural and remote areas tended to be slightly taller than the urban women, there were also differences in BMI across the different locations. For example, average BMI was 0.96 and 0.89 higher in the 'other rural/remote' area for Younger and Mid-aged women respectively, than in the urban women in these two cohorts. Geographical differences in BMI were less marked in the Older women.
3.1.4 BMI categories in 1996 In this report the following BMI categories have been used: underweight = BMI ≤ 18.5; healthy weight = 18.5 < BMI ≤ 25; overweight = 25 < BMI ≤ 30; obese = BMI > 30 (WHO).
In 1996, the highest proportion of women in the healthy weight range was found in the Younger cohort (69.7%, compared with 54.8% of the Mid-aged and 51.1% of the Older women). The Younger cohort also had a much higher proportion of underweight women (10.4%, compared with only 1.7% and 2.6% of the Mid-aged and Older women respectively). In contrast, the proportion of women categorised as obese was highest in the Mid-aged cohort (15.9%), followed by the Older (12.7%) and Younger (5.1%) cohorts. More than one third of the Older cohort were overweight at Survey 1 (33.6%, compared with 27.6% of the Mid-aged women and 14.8% of the Younger women).
3.1.5 Changes in weight, height and BMI over time Changes in weight, height and BMI for each cohort from 1996 to 2004 are shown in Figure 3.1.
a) Weight
Between the first and most recent surveys, there were clear increases in weight in the Younger and Mid-aged cohorts and a decline in the Older cohort (Figure 3.1). Average weight increased most in the Younger cohort. Over the seven year period between Survey 1 and Survey 3 , the average weight of the Younger women increased by 4.66 kg, and the rate of weight gain increased from 615 g/year between Survey 1 and Survey 2 to 733 g/year between Survey 2 and Survey 3 . In contrast,
25
the average weight of the Mid-aged women increased by 3.51 kg during the eight years from Survey 1 to Survey 4, and the rate of weight gain decreased from 585 g/year between Survey 1 and Survey 2 to only 300g/year between Survey 3 and Survey 4. Therefore, between the last two surveys, the average rate of weight gain in the Younger women was more than double that of the Mid-aged women. Over six years from Survey 1 to Survey 3, the average weight of the Older women decreased by 1.03kg, with a similar rate of weight loss in each of the two three year periods.
In general, rates of weight gain were higher in women living in rural and remote locations than in urban women (Figure 3.2). For example, in the Younger cohort, women from small rural centres and those living in other rural and remote areas gained an average of 5.49 kg and 5.67 kg respectively in seven years, compared with an average weight gain of 4.65 kg among women living in urban areas. Women from large rural centres gained an average of 4.94 kg. By Survey 3 (in 2003 when they were 25 – 31 years old ), the average weight of Younger women living in small rural areas was 1.39 kg greater than that of the Mid-aged women living in the same location at Survey 1 (who were 45 -50 years old in 1996).
In the Mid-aged women, those from large rural centres gained most weight – an average of 4.41 kg, compared with 3.41 kg for the urban Mid-aged women. (Women from small rural centres gained an average of 3.69 kg and women from other rural and remote areas gained an average of 3.33 kg).

26
Figure 3.1 Average self-reported weight, height and calculated BMI with 95% Confidence Intervals for each cohort group (Younger, Mid-aged, Older) for Surveys 1, 2, 3 and 4a, from 1996 to 2004, (a) only Mid-aged cohort has fourth survey data included.

27
Figure 3.2 Average self-reported weight with 95% Confidence Intervals by area of residence for the Younger (a), Mid-aged (b) and Older(c) cohorts, at Surveys 1, 2 and 3, from 1996 to 2004.
a)
c)
b)
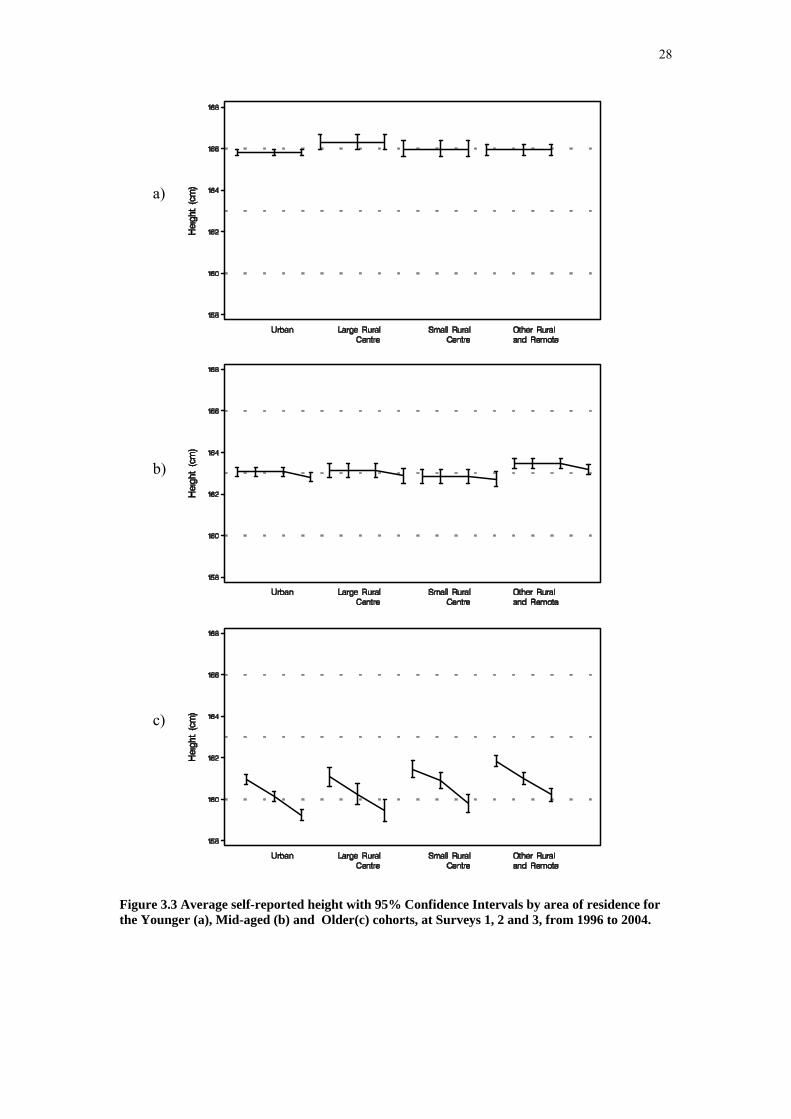
28
Figure 3.3 Average self-reported height with 95% Confidence Intervals by area of residence for the Younger (a), Mid-aged (b) and Older(c) cohorts, at Surveys 1, 2 and 3, from 1996 to 2004.
a)
c)
b)

29
Figure 3.4 BMI based on self-reported data with 95% Confidence Intervals, by area of residence for the Younger (a), Mid-aged (b) and Older(c) cohorts, at Surveys 1, 2 and 3, from 1996 to 2004.
c)
a)
b)
30
b) Height
The average reported height of the Young and Mid-aged women did not change over the first three surveys (Figure 3.3). However, at Survey 4, the average height of the Mid-aged women was 0.26cm less than at Survey 3. The average height of the Older women decreased by 1.68 cm over the six years between Survey 1 and Survey 3.
c) BMI
Changes in BMI over the first eight years of the study are shown in Figure 3.4. Between Survey 1 and Survey 3, the average BMI of the Younger women increased by 1.68 (from 22.5 at Survey 1), with a higher rate of increase between surveys 2 and 3 than between Surveys 1 and 2. Average BMI changed more slowly in the Mid-aged cohort, increasing by 1.38 (from 25.5 at Survey 1) over the eight years between Survey 1 and Survey 4. In the Older women, average BMI remained largely unchanged over the three surveys, reflecting the decreases in weight and height in this cohort (Figure 3.1).
Patterns of change in BMI for women living in the four different locations are also shown in Figure 3.4. In the Younger cohort, rates of change in BMI were higher in women living in small rural centres and in other rural and remote locations. There was a similar pattern in the Mid aged cohort, but the highest rate of change in BMI was seen in women from large rural centres. Notwithstanding, by Survey 4 in 2004, average BMI was highest in Mid-aged women from rural/remote areas, as it had been in 1996. BMI changes were less marked in the Older cohort, with the highest rate of change observed in the women from small rural centres (average increase 0.34 compared with 0.08 for the urban women) (Figure 3.4).
3.1.6 Changes in BMI categories over time Changes in the proportions of women in each of the BMI categories since the beginning of the Study are shown in Figure 3.5.
In the young cohort the proportion of women in the healthy weight range decreased from 69.7% at Survey 1 to 62.6% at Survey 3. While the proportion of underweight young women also decreased markedly (from 10.4% to 5.0%), the proportion of young women in the overweight category increased from 14.8% to 20.0%. In the same period, the proportion of young women categorized as obese more than doubled, from 5.1% at Survey 1 to 12.4 % at Survey 3. It is evident from Figure 3.5 that the pattern of distribution of BMI in the Younger women at Survey 3 (when they were 25 – 30 years old) is approaching that of the Mid-aged cohort at Survey 1 (who were 45 – 50 years old in 1996).
The changes in the distribution of BMI categories in the Mid-aged women show a slow decrease in the proportion of healthy weight women at each survey. Even so, by Survey 4, only 41.8% of this cohort was in the healthy weight range, with 33.8% overweight and 23.2% obese.

31
Figure 3.5 Proportions of women in each of the BMI categories based on self-reported height and weight for each age cohort for Surveys 1, 2 and 3, from 1996 to 2004.
There was much less change in the distribution of BMI categories in the Older cohort. At Survey 1 just over half the Older women (51.1%) were in the healthy weight range and 12.7% were categorized as obese. By Survey 3 the proportion of healthy weight Older women had declined to 48.4% and the proportion who were obese had increased to 15.0%. The proportion of overweight women has remained stable throughout the Study (33 – 34%) while the proportion of underweight Older women has increased from 2.6% to 4.1% (Figure 3.5).
3.1.7 Discussion The data presented here show a trend of increasing weight in both the Younger and Mid-aged women. This trend is most marked in the Younger cohort, who gained an average of 733 g/year between Survey 2 and Survey 3.
An earlier analysis (Ball et al., 2002) of the factors associated with weight maintenance between Survey 1 & Survey 2 found that fewer than half (44%) of the Younger cohort reported their BMI at follow-up to be within 5% of their baseline BMI, while 41% had gained weight (more than 5% of baseline) and 15% had lost weight. Weight maintainers were more likely to be in managerial or professional occupations; to have never married; to be currently studying; and to not be mothers. Controlling for socio-demographic factors, weight maintainers were more likely to be in a healthy weight range at baseline; and to report that they spent less time sitting, and consumed less takeaway food, than women who gained weight. Weight gain was more marked among those who were already overweight, including women living in rural areas, though location was not independently associated with weight gain.
32
As more of the Younger cohort have become mothers between Survey 2 and Survey 3, ongoing analyses are exploring the impact of this life event on weight gain. The weight gain data presented here suggest that strategies for maintenance of healthy weight and prevention of further weight gain at this life stage are now urgently required, if these Younger women are to avoid the early onset of weight-related chronic health problems.
Weight gain was also notable in the Mid-aged cohort, although the decline in the rate of weight gain between Survey 3 and Survey 4 is encouraging. An analysis of the factors associated with weight gain between Survey 1 and Survey 3 found that on average the women gained almost 0.5 kg per year (average 2.42 kg (95% CI:2.29-2.54) in the first five years of the Study (Brown et al., 2005)). In multivariate analyses, variables associated with energy balance (physical activity, sitting time and energy intake), as well as quitting smoking, menopause / hysterectomy, and baseline BMI category were significantly associated with weight gain, but other behavioural and demographic characteristics were not. There were independent relationships between the odds of gaining >5kg and (1) lower levels of habitual physical activity; (2) more time spent sitting; (3) energy intake, (but only in women with BMI > 25 at baseline); (4) menopause transition and (5) hysterectomy.
The data from this analysis suggest that small sustained changes in modifiable behavioural variables might prevent further weight gain. It is therefore interesting to note (Section 3: Risk factor trends, 3.2 Physical activity) that among the Mid-aged women there was a median increase of 180 MET.mins per week for all forms of physical activity between Survey 3 and Survey 4. This is equivalent to about 45 minutes of moderate intensity physical activity; of which we attribute 30 minutes to increases in time spent walking. During the same period (Survey 3 to Survey 4) the rate of weight gain in this cohort was about half (300 g/year) that seen between Survey 1 and Survey 2 (585 g/year).
Ongoing analyses are exploring the factors associated with increasing physical activity and decreasing rate of weight gain in the Mid-aged cohort. It is hypothesised that factors relating to the availability of time for PA, such as children leaving home, changes in patterns of paid work may be associated with increasing physical activity and decreasing rate of weight gain at this life stage. Other analyses are exploring the associations between rate of weight gain and health outcomes such as high blood pressure, diabetes and back pain in this cohort.
The pattern of weight change was different in the Older cohort, with a small decrease in average weight over the first six years of the survey. Ongoing analyses are exploring the associations between weight, weight change and health outcomes in this cohort.

33
3.1.8 References Ball K, Brown W & Crawford D. Who does not gain weight? Prevalence and predictors of weight maintenance in young women. International Journal of Obesity, 2002 (26): 1570-1578
WHO Consultation on Obesity (1999: Geneva, Switzerland) Obesity: preventing and managing the global epidemic: report of a WHO consultation. (WHO technical report series; 894)
Brown WJ, Williams L, Ford JH, Ball K, Dobson AJ. Identifying the energy gap: magnitude and determinants of 5-year weight gain in midage women. Obes Res. 2005 Aug;13(8):1431-41
3.2 Physical activity
3.2.1 Key findings Younger Women
• More than 1 in 2 women in the Younger cohort (55%) were classified as 'active' according to the National Physical Activity Guidelines for Australians.
• While the population prevalence of physical activity appeared to be constant over time in this group, (55% 'active' in 2000 and 2003), about 1 in 4 women (22.3%) changed their activity status from 'inactive' to 'active', and the same proportion (22.4%) moved from being 'active' to 'inactive.' Only one third (36.4%) were classified as 'active' in both 2000 and 2003.
Mid-aged women
• Women in this cohort were becoming more active over time.
• While the proportion of Mid-aged women classified as 'active' at Survey 3 (2001: 46%) was lower than the proportion of Younger women classified as 'active' at Survey 2 (2000: 55%), at the subsequent surveys (2004, 2003 respectively) the proportion of Mid-aged and Younger women classified as “active” was almost the same (Mid-aged 2004: 54%; Younger 2003: 55%) .
• The increasing levels of physical activity in the Mid-aged women can be largely attributed to an increase in time spent walking.
Older Women
• Population levels of physical activity decreased in the Older cohort. This was driven by an increasing number of women who were in the 'none' category, rather than a decrease in activity time in those women who remained active.
34
3.2.2 Introduction Women in all three cohorts have answered questions about physical activity (PA) in all surveys. At Survey 1 in 1996, there were two questions about physical activity. They asked how many times in a normal week women engaged in vigorous exercise (e.g. aerobics, jogging) or less vigorous exercise (e.g. walking, swimming) lasting for 20 minutes or more (Brown et al. 2004). Responses were used to derive a PA score based on frequency of participation in 'vigorous' (7.5 METs) and 'less vigorous' (4 METs) physical activity lasting at least 20 minutes. [PA score = ∑{frequency * 20mins * 4 (less vigorous) + frequency * 20mins * 7.5 (vigorous)}]. MET.mins are units of energy expenditure – 600 MET.mins is equivalent to 150 minutes of moderate intensity (4 METs) physical activity per week.
At Survey 2, Survey 3 and Survey 4, PA was assessed using questions based on those developed for the evaluation of the national Active Australia campaign in 1997, and for national monitoring of PA in Australia (National physical activity guidelines for Australians, 1999). The questions asked about the frequency and total duration of walking (for recreation or transport), and of vigorous (e.g. aerobics, jogging) and moderate intensity activity (e.g. swimming, golf) in the last week. In Survey 2 for Mid-aged women gardening was also included as an example of moderate intensity PA. These items have been shown to have acceptable reliability and validity for population measurement of physical activity (Sallis et al., 1999; Trost et al., 2002). A PA score was derived from reported duration of time spent in each form of physical activity during the last week [∑ {(walking mins * 3.5) + (moderate mins * 4.0) + (vigorous mins * 7.5)} MET.mins] (Australia’s Health, 2004).
Data are presented here from the Younger (N= 7498), Mid-aged (N= 9167) and Older women (N= 7137) who responded to the PA questions at all surveys. These women were more likely to be categorised as 'active' at baseline than those women who did not answer the PA questions at all surveys and those who did not continue responding to the surveys.
3.2.3 Time trends for physical activity As different questions were used at Survey 1 , and because there was variation in the wording in one of the Physical Activity (PA) items in Survey 2 for the Mid-aged cohort, trend data for PA can only reliably be reported from Survey 2 to Survey 3 (Younger and Older cohorts) and from Survey 3 to Survey 4 (Mid-aged cohort). As the distribution of PA data is heavily skewed, medians and inter-quartile ranges (IQR) for each cohort are shown in Figure 3.6.

35
Figure 3.6 Average self-reported physical activity with inter-quartile ranges for each cohort group for Surveys 2, 3 for the Younger and Older cohort, and for Survey 3, 4 for the Mid-aged cohort, from 1999 to 2004. Physical activity was measured in MET.mins/week. MET.mins are units of energy expenditure – 600 MET.mins is equivalent to 150 minutes of moderate intensity (4 METs) physical activity per week
At the first time for each cohort, median values for total MET.mins, were highest in the Younger cohort [Survey 2 (2000) median 705 (IQR 255-1440)], lower in the Mid-aged cohort [Survey 3 (2001) median 540 (IQR 150-1170] and lower again in the Older cohort [Survey 2 (1999) median 360 (IQR 0-1050)]. Among the Younger women, there was little change in total MET.mins over the three years to Survey 3 in 2003 [median 690 (IQR 270-1470) MET.mins/week]. In contrast, among the Mid-aged women, physical activity increased between Survey 3 and Survey 4 [Survey 4 median 720 (IQR 270-1440)], so that in 2004 (Survey 4), total PA time reported by the Mid-aged women was slightly higher than for the Younger women in 2003 (Survey 3). In contrast, among the Older women median total MET.mins decreased between Survey 2 and Survey 3 [Survey 3 median 240 (IQR 0-900)].
These overall patterns of 'no change' in the Younger cohort, increasing PA in the Mid-aged cohort and declining PA in the Older cohort were largely consistent across geographic areas (Figure 3.7). In the Younger cohort, PA decreased slightly among women living in small rural centres.

36
Figure 3.7 Physical Activity based on self-reported data with inter-quartile ranges, by area of residence for each cohort group: for Surveys 2, 3 for the Younger (a) and Older (c) cohort, and for Survey 3, 4 for the Mid-aged cohort (b), from 1999 to 2004. Physical activity was measured in MET.mins/week. MET.mins are units of energy expenditure – 600 MET.mins is equivalent to 150 minutes of moderate intensity (4 METs) physical activity per week
c)
a)
b)
37
3.2.4 Patterns of physical activity The contributions of walking, moderate and vigorous activity to total PA differed for each cohort.
a) Younger women
Survey 2 data from the Younger women show that the majority (55.3%) reported a mixture of all three types of PA. The median time spent in PA in this group was 270 mins/week (IQR 165-420), indicating that this pattern of activity was associated with compliance with the national PA guidelines. Almost one third of the Younger women reported only walking [30.2%; median 90 (45-180) mins], while very few reported only moderate [2.5%; median 90 (60-150)] or vigorous [3%; median 120 (60-210)] activity. Nine percent of the Younger women reported no activity in response to these PA questions, but about half of these indicated that they did some activity in association with house and yard work. These patterns were largely unchanged at Survey 3, but time spent walking increased slightly at Survey 3 [median 100 (60-180) mins] with commensurate declines in time spent in moderate and vigorous activity.
b) Mid-aged women
Mid-aged women show that the most common pattern of activity in the Mid-aged cohort was only walking, (reported by 43.5%), with a smaller proportion reporting a combination of all three types of activity (35.5%). Few women reported only moderate (3.4%) or vigorous (1.4%) activity. Those who reported a combination of walking and other activities reported higher total PA time [Survey 3 median 300 (180-480)] than those who reported only walking [Survey 3 median 120 (60-240)], or only moderate (Survey 3 median 120 (60-240)] or vigorous activity [Survey 3 median 135 (70-240)]. Almost 16% of the Mid-aged women reported no walking, moderate or vigorous activity, but half of these did report some activity associated with house and yard work.
At Survey 4 the proportions of women reporting each activity pattern (walking only 42.6%; 'mixed' activities 38%; moderate only 3.2%; vigorous only 0.9%) were essentially unchanged, but the median total activity time reported by women who only walked and by those who reported 'mixed' activities increased by a median of 60 minutes [walking only: Survey 3 median 120 (60-240); Survey 4 median 180 (90-300); mixed: Survey 3 median 300 (180-480); Survey 4 median 360 (230-570)].
c) Older women
Among the Older women the most common pattern of PA was also only walking. At Survey 2 almost 40% of the Older women reported only walking [median time 120 (60-240) mins], while 21.2% reported 'mixed' activities [median time 360 (25-595) mins]. Once again, women in this 'mixed' group were more likely to be meeting national PA guidelines. Almost ten percent reported doing only moderate [8.6%, median time 240 (120-465) mins] or only vigorous [0.8%, median time 120 (60-180) mins] activities. In this Older cohort 29.5% reported no activity in response to the walking, moderate and vigorous activity questions, and 60% of these women reported
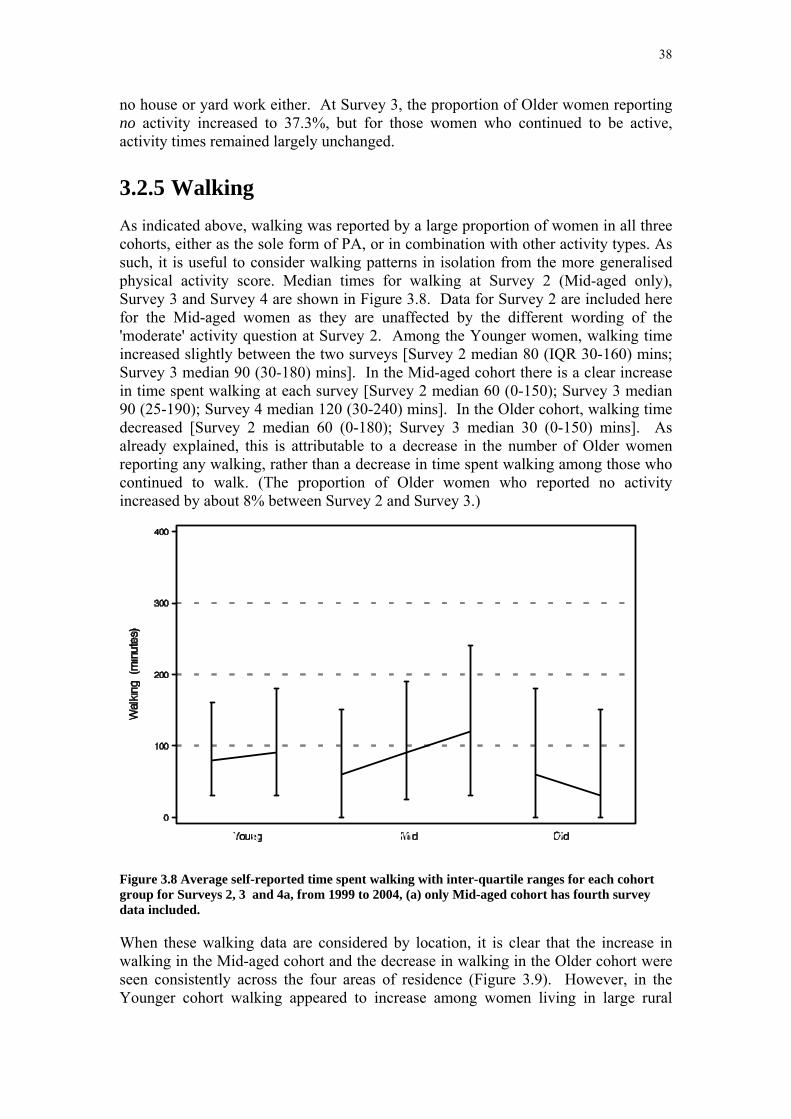
38
no house or yard work either. At Survey 3, the proportion of Older women reporting no activity increased to 37.3%, but for those women who continued to be active, activity times remained largely unchanged.
3.2.5 Walking As indicated above, walking was reported by a large proportion of women in all three cohorts, either as the sole form of PA, or in combination with other activity types. As such, it is useful to consider walking patterns in isolation from the more generalised physical activity score. Median times for walking at Survey 2 (Mid-aged only), Survey 3 and Survey 4 are shown in Figure 3.8. Data for Survey 2 are included here for the Mid-aged women as they are unaffected by the different wording of the 'moderate' activity question at Survey 2. Among the Younger women, walking time increased slightly between the two surveys [Survey 2 median 80 (IQR 30-160) mins; Survey 3 median 90 (30-180) mins]. In the Mid-aged cohort there is a clear increase in time spent walking at each survey [Survey 2 median 60 (0-150); Survey 3 median 90 (25-190); Survey 4 median 120 (30-240) mins]. In the Older cohort, walking time decreased [Survey 2 median 60 (0-180); Survey 3 median 30 (0-150) mins]. As already explained, this is attributable to a decrease in the number of Older women reporting any walking, rather than a decrease in time spent walking among those who continued to walk. (The proportion of Older women who reported no activity increased by about 8% between Survey 2 and Survey 3.)
Figure 3.8 Average self-reported time spent walking with inter-quartile ranges for each cohort group for Surveys 2, 3 and 4a, from 1999 to 2004, (a) only Mid-aged cohort has fourth survey data included.
When these walking data are considered by location, it is clear that the increase in walking in the Mid-aged cohort and the decrease in walking in the Older cohort were seen consistently across the four areas of residence (Figure 3.9). However, in the Younger cohort walking appeared to increase among women living in large rural

39
centres. As these women had lower median walking times at Survey 2, by Survey 3 time spent walking was remarkably consistent across the four areas.

40
Figure 3.9 Average time spent walking based on self-reported data with inter-quartile ranges, by area of residence for the Younger (a), Mid-aged (b) and Older (c) cohort at Surveys 2, 3 and 4*, from 1999 to 2004, (*) only Mid-aged cohort has Survey 4 data included.
c)
a)
b)

41
3.2.6 Changes in the proportions of women categorised as 'active'
The National Physical Activity Guidelines suggest that, for health benefit, all Australians should accumulate at least 30 minutes of at least moderate intensity physical activity on most, if not all, days of the week (National physical activity guidelines for Australians.). The ALSWH researchers use a cut-off of 600 MET.mins per week (30 minutes X 5 sessions X 4 METs) to define whether women are accumulating sufficient PA for health benefit. At Survey 3, 54.6% of the Younger women (in 2000), 45.5% of the Mid-aged women (in 2001), and 34.1% of the Older women were categorised as 'active' using this criterion. This proportion was unchanged from Survey 2 in the Younger cohort (54.6%), but lower than at Survey 2 for the Older cohort (38.7%). The proportion of Mid-aged women categorised as active at Survey 4 (54.5%) was however almost 10% greater than at Survey 2 (45.5%).
The proportions of women in each cohort in each of five PA categories (none: < 40; very low 40 - <300; low: 300 - <600; moderate 600 - < 1200; high ≥ 1200 MET.mins/week) are shown for Survey 2 and Survey 3 (Younger and Older) and for Survey 3 and Survey 4 (Mid-aged) in Figure 3.10. There were no changes in the proportions of Younger women in each category from Survey 2 to Survey 3. In the Mid-aged cohort, the proportions categorised as 'moderate' and 'high' activity increased markedly (moderate: Survey 3 20.7%, Survey 4 23.1%; high: Survey 3 24.8%, Survey 4 31.4%), while the proportions in the 'none' 'very low' and 'low' categories decreased. Among the Older women there was a large increase in the proportion in the 'none' category (Survey 2 30.1%; Survey 3 38.6%) and smaller decreases (about 2%) in the proportions in all the other categories (Figure 3.10).
Figure 3.10 Proportions of active women over time, separately for Younger, Mid-aged and Older women.

42
3.2.7 A closer look at the changes in PA
a) Younger women
Although the categorical data presented in section 3.2.6 suggest that the overall proportions of Younger women in each activity category did not change between Survey 2 and Survey 3, only about half the Younger women (55.3%) actually remained in the same PA category at both times. After combining the 'very low' and 'low' categories (now defined as 'low') and the 'moderate' and 'high' categories (now defined as 'modhigh'), the mosaic plots shown in Figure 3.11 demonstrate that only 36.5% of the Younger cohort were categorised as 'active' at both surveys, with 16.3% remaining in the 'low' and 2.6% remaining in the 'none' category at both surveys. Almost one quarter (22.3%) of the young women moved into a higher PA category during this period (from 'none' to either 'low' or 'modhigh', or from 'low' to 'modhigh') while 22.4% moved into a lower category (Figure 3.11).
Previous analyses have shown that there were similar category changes between Survey 1 and Survey 2, and the factors independently associated with a decreasing PA category at that stage included starting work, getting married, and birth of first or subsequent child (Brown and Trost, 2003). Analyses of the factors associated with changes in PA between Survey 2 and Survey 3 are ongoing.
b) Mid-aged women
There were similar patterns of change in PA category between Survey 3 and Survey 4 for the Mid-aged cohort (see Figure 3.11). Once again, just over half (56%) the women remained in the same category, with about one third of the women categorised as 'active' at both times. However, while a higher proportion than in the Younger cohort remained in the 'none' category (7%), a smaller proportion of the Mid-aged women (17.6%) moved into a lower PA category, and a greater proportion (26.4%) moved into a higher category (see Figure 3.11). This is commensurate with the overall increase in PA reported for the Mid-aged group in Sections 3.3.3 and 3.3.4. Factors associated with these increases in PA at this life stage are currently being investigated.
c) Older women
The mosaic plot showing changes in PA categories for the Older women from Survey 2 to Survey 3 is markedly different from that of the other two cohorts (see Figure 3.11). Although a similar proportion of women remained in the same category at both Survey 2 and Survey 3 (57.3%), 26.1% of the Older women moved into a lower category, while 16.6% moved into a higher category. (Note that these proportions are almost exactly opposite to those reported for the Mid-aged women). More than one fifth of this cohort remained in the 'none' category at Survey 2 and Survey 3. Factors associated with these changes, and the health outcomes of PA in this cohort are currently being explored for a separate report.

43
Figure 3.11 Changes in Physical Activity for the Younger (a), Mid-aged (b) and Older (c) cohorts.
c)
a)
b)

44
3.2.8 Discussion The data presented here confirm previous findings of decreasing physical activity with increasing age. At Survey 3 (2001 for the Mid-aged women, 2002 for the Older women, 2003 for the Younger women), 54.6%, 45.5% and 34.1% of the Younger, Mid-aged and Older women were categorised as 'active' respectively.
While there is, in consecutive surveys, considerable movement between PA categories in all three cohorts, the data suggest that, on a population basis, overall levels of physical activity are increasing in Mid-aged women, decreasing in Older women, and remaining unchanged in the Younger women.
A remarkable increase in PA among the Mid-aged cohort between Survey 3 and Survey 4 has resulted in the proportion categorised as 'active' in this cohort at Survey 4 (2004 when they were 53 – 58 years old) being the same (54.5%) as that reported at Survey 3 for the Younger cohort (54.6% in 2003 when they were 25 – 31 years old). This increase is underpinned by increases in walking, which were observed in this cohort between Survey 2 (1998) and Survey 3 (2001) and continued at Survey 4 (2004). The increase in walking is consistent for women living in urban areas, large and small rural centres and in other rural and remote locations, and probably reflects the changing life circumstances of the Mid-aged women which may be allowing some of them more time to walk.
The static picture for PA among the Younger women is not surprising, given the time constraints faced by women at this life stage. There appears to be some increase in walking among the Younger women in urban and large rural centres, which may be off-setting the effects of dropping out of more organised recreational activities at this life stage. It remains to be seen whether it is the women who are 'settling down' and having children who continue to report decreasing PA, while those who remain largely independent of family caring responsibilities are able to maintain or increase their PA.
For the Older women it is apparent that PA levels are decreasing. While those who have managed to remain active are still reporting similar amounts of time in physical activity in consecutive surveys, the increasing numbers of women in this cohort who are now in the 'none' category for physical activity is concerning. As the Older women were aged 76-81 at Survey 3, it would not be surprising to find that increasing health problems underpin this decline. It is however important that Older women who are diagnosed with chronic health problems such as heart disease, diabetes and arthritis are encouraged to maintain some form of physical activity. Analyses of the associations between PA and health outcomes in this cohort are ongoing, but initial findings suggest that even quite small amounts of physical activity may be beneficial to health at this life stage. This work will be reported in a subsequent report.
3.2.9 References Australian Institute of Health and Welfare. Australia’s health 2004. Canberra: Australian Institute of Health and Welfare, 2004
45
Brown WJ, Trost SG. Life transitions and changing physical activity patterns in young women. Am Journal of Preventive Medicine 2003; 25(2): 140-143.
Brown WJ, Trost SG, Baumann A, Mummery K, Owen N. Test-retest reliability of four physical activity measures used in population surveys. J Sci Med Sport 2004; 36:1181-6.
Commonwealth Department of Health and Aged Care. National physical activity guidelines for Australians. Canberra: Department of Health and Aged Care (1999)
Sallis JF, Owen N. Physical activity and behavioural medicine. Thousand Oaks CA: Sage (1999).
Trost SG, Owen N, Baumann A, Sallis JF, Brown WB. Correlates of adults’ participation in physical activity: review and update. Med Sci Sports Exerc 2002;34:1996-2001.
3.3 Fruit and vegetables
3.3.1 Key findings • Less than 2 in 5 Younger women ate 2 or more pieces of fresh fruit per day,
the amount recommended by the Australian Government Department of Health and Ageing’s Go for 2&5™ campaign.
• More than half of the Mid-aged women ate 2 or more pieces of fresh fruit per day.
• Younger and Mid-aged women in urban areas ate more fruit than women in other areas.
• Only 9% of Younger women and 11% of Mid-aged women ate the recommended 5 or more different vegetables per day.
• Younger and Mid-aged women in rural areas ate more different vegetables than women in urban areas.
a) Introduction
The dietary questionnaire used in the ALSWH is known as the Dietary Questionnaire for Epidemiological Studies (DQES) Version 2, which was developed by the Cancer Council of Victoria. It has been included on Survey 3 of the Younger and Mid-aged cohorts. The DQES is a food frequency questionnaire comprising 116 items enquiring about the quantity and frequency of the consumption of various food types. Food frequency questionnaires are designed to rank individuals in relation to their intake of macro- and micro-nutrients and are often used to assess associations between nutrients and disease. These instruments do not deliver reliable measures of absolute nutrient intake and items from the questionnaire have not been validated for individual use, but only for comparisons of groups (Hodge, et al., 2000).
For this report we have chosen to use 2 items from the DQES that have face validity and can be compared with the recommendations of the Go for 2&5™ campaign
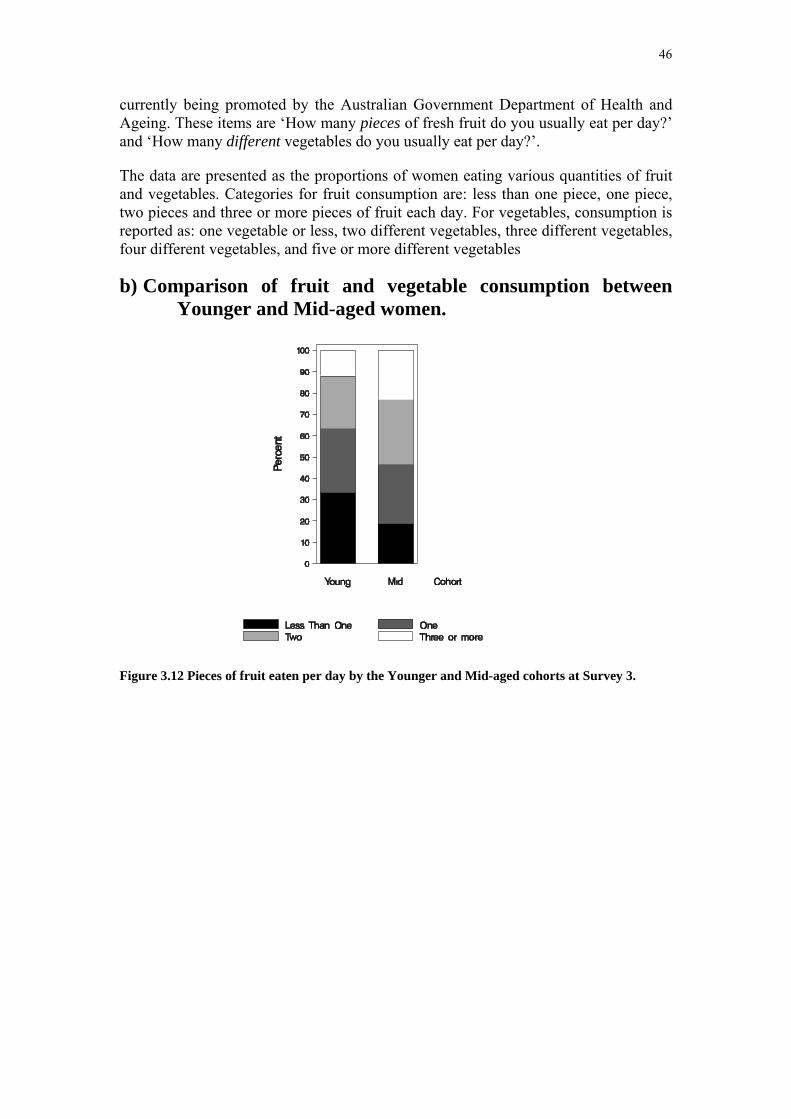
46
currently being promoted by the Australian Government Department of Health and Ageing. These items are ‘How many pieces of fresh fruit do you usually eat per day?’ and ‘How many different vegetables do you usually eat per day?’.
The data are presented as the proportions of women eating various quantities of fruit and vegetables. Categories for fruit consumption are: less than one piece, one piece, two pieces and three or more pieces of fruit each day. For vegetables, consumption is reported as: one vegetable or less, two different vegetables, three different vegetables, four different vegetables, and five or more different vegetables
b) Comparison of fruit and vegetable consumption between Younger and Mid-aged women.
Figure 3.12 Pieces of fruit eaten per day by the Younger and Mid-aged cohorts at Survey 3.

47
Figure 3.13 Number of different vegetables eaten each day by the Younger and Mid-aged cohorts at Survey 3.
Mid-aged women ate more fruit and vegetables than Younger women (Figure 3.12 and Figure 3.13). Compared with the Go for 2&5™ recommendations, 63% of Younger women and 46% of Mid-aged women ate less than the two pieces each day; few women from either age group ate 5 different vegetables each day (8.9% and 10.6% respectively).
c) Area of residence trends in fruit and vegetable consumption
Figure 3.14 Number of different fruits eaten each day by the Younger and Mid-aged cohorts at Survey 3 by area of residence.

48
Figure 3.15 Number of different vegetables eaten each day by the Younger and Mid-aged cohorts at Survey 3 by area of residence.
There was evidence of small differences in fruit consumption according to area of residence for both Younger and Mid-aged women (Figure 3.14). Amongst Younger women, those living in large rural centres most commonly reported low fruit consumption with 39% eating less than one piece per day. Women from urban areas were more likely to eat two or more pieces each day (38%).Amongst Mid-aged women there was a small gradient of increasing fruit consumption from remote to urban areas.
The number of different vegetables eaten differed according to area of residence for both Younger and Mid-age women (Figure 3.15). There was a gradient from less to more different vegetables with increasing rurality. Among Younger women from urban areas 11.5% met the Go for 2&5™ recommendations, rising to 16.3% in remote locations; similarly for Mid-aged women the proportions increased from 13.6% to 17.6%.
3.3.2 References Hodge A, Patterson A, Brown W, Ireland P, Giles G. The Anti Cancer Council of Victoria FFQ. Relative validity of nutrient intakes compared with diet diaries in young to middle-aged women in a study of iron supplementation. Australian and New Zealand Journal of Public Health, 2000, 24(6):576-583.

49
3.4 Trends in tobacco smoking, alcohol consumption and illicit drug use
3.4.1 Key findings Tobacco Smoking
• The proportion of smokers in the Younger cohort decreased over time. At Survey 3, fewer than 1 in 4 Younger women were classified as smokers.
• 1 in 4 Younger women changed their smoking habits over time.
The smoking habits of Mid-aged women were fairly consistent over time.
Younger women living in small rural and remote areas were more likely to be current or ex-smokers than those women in larger rural or urban centres.
Alcohol Consumption
• A clear majority of respondents to the surveys were non-drinkers or drank at low levels of long-term risk, although some of these women reported short-term risk drinking (having five or more drinks on one occasion).
• Among Younger and Mid-aged women, half were low risk drinkers, one third occasionally drank and only 5% drank at levels that were risky to their long-term health.
• Among Older women, one third were low risk drinkers, one quarter occasionally drank, and almost one third were non-drinkers. Only 3% drank at risky levels.
• Consuming alcohol at levels of risk to short-term health (five or more drinks on one occasion) at least weekly was more common among Younger women (18%) than Mid-aged (6%) or Older women (2%).
• Younger women were more likely than Mid-aged or Older women to decrease their alcohol consumption from levels that were risky to their health.
• Non-drinkers were more likely to be non-smokers and from a non-English speaking background and among Younger women, to be pregnant or mothers.
• Low risk drinkers (up to two drinks a day) had more education, exercised more often and had better self-rated health than non-drinkers.
• Women who drank three or more drinks a day tended to be smokers, had poorer mental health and among Younger women, were more likely to have used illicit drugs.
Illicit Drug Use
• 2 in 5 women in the Younger cohort had never used illicit drugs of any kind.

50
• Of those Younger women who had used drugs, a majority exclusively used marijuana.
• There was an overall trend of decreased drug use in the Younger cohort with the number of past users increasing from 29% to 41%.
• The prevalence of multiple drug use was relatively consistent over time at around 15%. Around 2 in 3 women who were recent multiple drug users at Survey 2 reported being a recent user at Survey 3 also.
• Women in rural areas were less likely to have ever used drugs or to have been multiple drug users than their urban counterparts.
3.4.2 Tobacco smoking
a) Introduction
Younger and Mid-aged women have answered questions about tobacco smoking at all surveys, while Older women were not asked beyond Survey 2 as the vast majority (about 95%) did not smoke tobacco. Data are presented here for Younger and Mid-aged women reporting tobacco smoking behaviour at all surveys; these women were more likely to be non-smokers at baseline than those women who did not continue responding to the surveys or who did not provide details of their tobacco smoking behaviour.
b) Time trends
Figure 3.16 Trends in the prevalence of smoking behaviour: data from Surveys 1 to 3 for the Younger and 1 to 4 for the Mid-aged cohort.
Figure 3.16 shows the percentages of Younger and Mid-aged women who reported never having smoked, currently smoking or having quit smoking. For Younger

51
women, the prevalence of smoking was similar at Surveys 1 and 2 (28% and 27%) then declined to 23% at Survey 3, while the average age increased from 24 to 27 years. The prevalence of smoking among Mid-aged women was relatively stable, ranging from 13% to 15% at all four surveys. While the number of women who had never smoked appears to be increasing over time, this can be attributed to irregularities in reporting: women who were previously ex-smokers often reclassified themselves as never smokers in subsequent surveys.
Changes in the smoking behaviour of individual women between any two surveys were defined as the following seven categories: Never Smoker (a non-smoker at both surveys), Ex-Smoker (an Ex-smoker at both surveys), Initiate and quit (a non-smoker at the first survey and an Ex-smoker at the second), Quitter (smoker at the first survey and a non-smoker at the second), Re-starter (an ex-smoker at the first survey and a smoker at the second), New Adopter (a non-smoker at the first survey and an smoker at the second) and Continuing Smoker (a smoker at both surveys).
Table 3.1 Changes in smoking behaviour: data from Surveys 1 to 3 for Younger women (a) and 1 to 4 for Mid-aged women (b).
Survey 1 to 2
(%) Survey 2 to 3
(%) Survey 3 to 4
(%) Younger women
Never Smoker 59.3 56.6
Ex-Smoker 6.2 11.1
New Adopter 1.9 1.7
Initiate and quit 6.1 8.1
Quitter 3.4 3.0
Re-starter 3.9 1.1
Continuing Smoker 19.3 18.5
Mid-aged women
Never Smoker 54.3 54.1 53.9
Ex-Smoker 27.8 29.7 31.2
New Adopter 1.4 0.1 0.3
Initiate and quit 1.6 3.1 1.9
Quitter 2.0 1.2 1.4
Re-starter 0.1 0.2 <0.01
Continuing Smoker 12.8 11.8 11.1
Smoking habits were reasonably well established by Survey 1, with only 24.1% of Younger and 14.8% of Mid-aged women changing smoking behaviour during the period surveyed (7 years for Younger women; 8 years for Mid-aged women).
Between Surveys 1 and 2 (Table 3.1), the percentage of Younger women who started to smoke tobacco (adopters and re-starters) exceeded the percentage who quit (5.8%

52
vs. 3.4 %). Between Surveys 2 and 3, as these women aged by 3 years, similar percentages quit and commenced smoking (both around 3%). This pattern of changes in tobacco smoking behaviour, which characterised 14-18% of young women, was more common than consistent tobacco smoking at all 3 surveys (15%). In contrast, tobacco smoking patterns were very stable for the Mid-aged women, among whom starting to smoke for the first time was rare; and initiation and quitting between surveys together with adoption and restarting smoking never exceeded 2.5%.
c) Area of residence trends
Figure 3.17 Prevalence of smoking behaviour by area: data from Survey 3 for Younger women (a) and Survey 4 for Mid-aged women (b).
There were no statistically significant differences in smoking patterns according to area of residence for Mid-aged women (Figure 3.17b). Younger women living outside
a) a)
b)

53
urban and large rural areas were more likely to be current smokers or ex-smokers than their urban counterparts (Figure 3.17a).
3.4.3 Alcohol consumption
a) Introduction The Australian alcohol guidelines developed by the National Health & Medical Research Council (NHMRC) classify alcohol use in terms of level of risk: low risk, risky and high risk levels of drinking (National Health & Medical Research Council, 2001). Low risk describes a level of drinking at which there is only a minimal risk of harm and there may be health benefits. Risky levels are those at which the risk of harm is significantly increased beyond any possible benefits. High risk drinking levels are those where there is substantial risk of serious harm. Risk is also assessed in terms of long-term and short-term risk. Long-term risk is defined by the total amount of alcohol typically consumed per week. Short-term risk is associated with levels of drinking on a single day. The number of standard drinks for levels of drinking for adult women of average size is shown in Table 3.2.
Table 3.2 Definition of levels of risk for alcohol consumption among women (standard drinks).
Low risk Risky High risk Short-term risk
Up to 4 on any one day, no more than 3 days per week
5 to 6 on any one day
7 or more on any one day
Long-term risk
Up to 2 per day OR
3 to 4 per day OR
5 or more per day OR
Up to 14 per week 15 to 28 per week 29 or more per week
Each survey for each cohort has included questions on the frequency and quantity of alcohol consumed by the respondents. The ALSWH has defined four categories of long-term risk, based on the Australian alcohol guidelines, and a fifth category of non-drinkers was added (Table 3.3). The Australian alcohol guidelines’ definitions for risky and high risk drinking are adopted in full. For women defined as low risk by the Australian alcohol guidelines, the ALSWH has defined two subgroups: those who are occasional drinkers (those who report they drink only rarely, i.e. less than once per month) and the remainder of this group who are classified as low risk. The categories of risky and high risk have been combined due to small numbers.
Table 3.3 Categories of long-term risk for alcohol consumption in the Australian alcohol guidelines and ALSWH.
Australian alcohol guidelines
ALSWH
Non-drinker
Low risk ⎨ Occasional drinker Low risk
Risky Risky High risk High risk
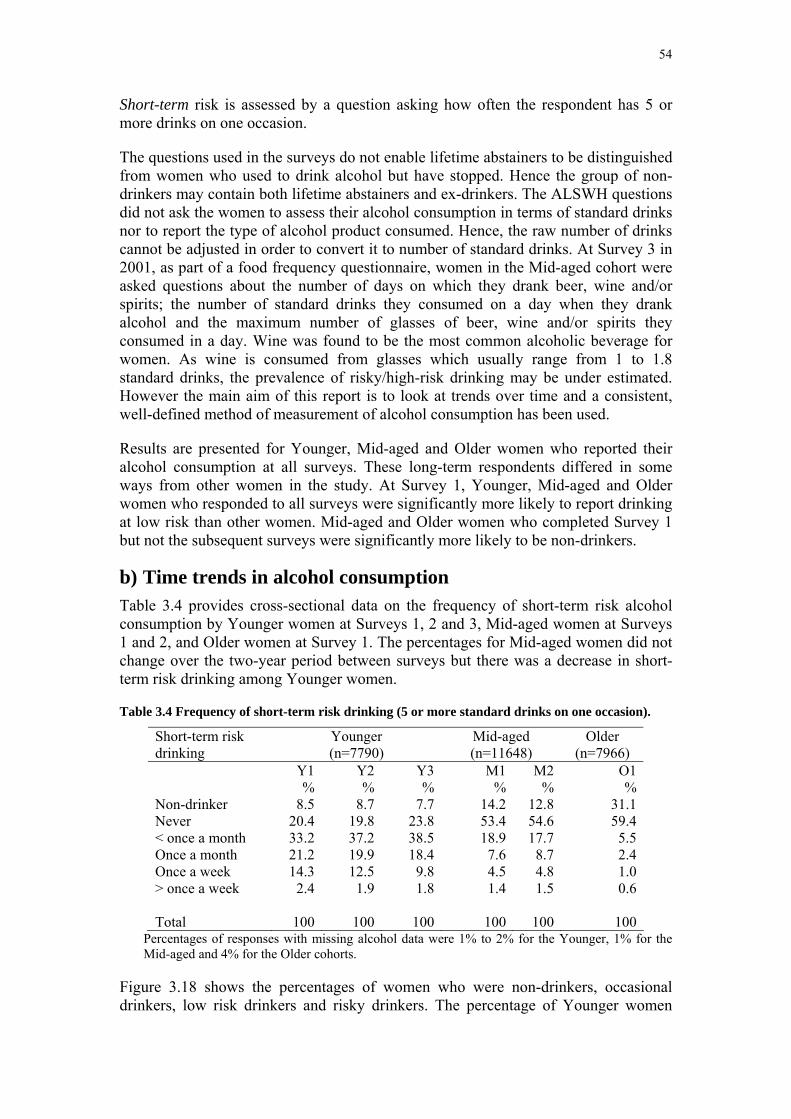
54
Short-term risk is assessed by a question asking how often the respondent has 5 or more drinks on one occasion.
The questions used in the surveys do not enable lifetime abstainers to be distinguished from women who used to drink alcohol but have stopped. Hence the group of non-drinkers may contain both lifetime abstainers and ex-drinkers. The ALSWH questions did not ask the women to assess their alcohol consumption in terms of standard drinks nor to report the type of alcohol product consumed. Hence, the raw number of drinks cannot be adjusted in order to convert it to number of standard drinks. At Survey 3 in 2001, as part of a food frequency questionnaire, women in the Mid-aged cohort were asked questions about the number of days on which they drank beer, wine and/or spirits; the number of standard drinks they consumed on a day when they drank alcohol and the maximum number of glasses of beer, wine and/or spirits they consumed in a day. Wine was found to be the most common alcoholic beverage for women. As wine is consumed from glasses which usually range from 1 to 1.8 standard drinks, the prevalence of risky/high-risk drinking may be under estimated. However the main aim of this report is to look at trends over time and a consistent, well-defined method of measurement of alcohol consumption has been used.
Results are presented for Younger, Mid-aged and Older women who reported their alcohol consumption at all surveys. These long-term respondents differed in some ways from other women in the study. At Survey 1, Younger, Mid-aged and Older women who responded to all surveys were significantly more likely to report drinking at low risk than other women. Mid-aged and Older women who completed Survey 1 but not the subsequent surveys were significantly more likely to be non-drinkers.
b) Time trends in alcohol consumption Table 3.4 provides cross-sectional data on the frequency of short-term risk alcohol consumption by Younger women at Surveys 1, 2 and 3, Mid-aged women at Surveys 1 and 2, and Older women at Survey 1. The percentages for Mid-aged women did not change over the two-year period between surveys but there was a decrease in short-term risk drinking among Younger women.
Table 3.4 Frequency of short-term risk drinking (5 or more standard drinks on one occasion).
Short-term risk drinking
Younger (n=7790)
Mid-aged (n=11648)
Older (n=7966)
Y1 %
Y2 %
Y3 %
M1 %
M2 %
O1 %
Non-drinker 8.5 8.7 7.7 14.2 12.8 31.1 Never 20.4 19.8 23.8 53.4 54.6 59.4 < once a month 33.2 37.2 38.5 18.9 17.7 5.5 Once a month 21.2 19.9 18.4 7.6 8.7 2.4 Once a week 14.3 12.5 9.8 4.5 4.8 1.0 > once a week 2.4 1.9 1.8 1.4 1.5 0.6 Total 100 100 100 100 100 100
Percentages of responses with missing alcohol data were 1% to 2% for the Younger, 1% for the Mid-aged and 4% for the Older cohorts.
Figure 3.18 shows the percentages of women who were non-drinkers, occasional drinkers, low risk drinkers and risky drinkers. The percentage of Younger women
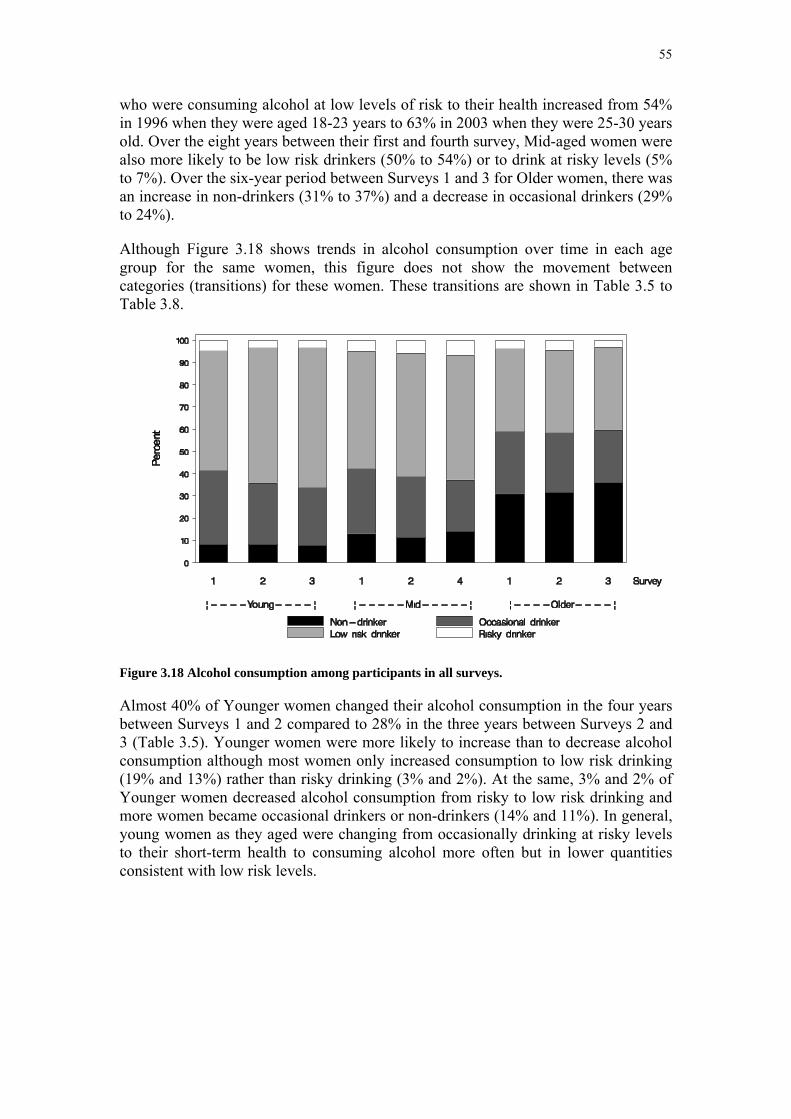
55
who were consuming alcohol at low levels of risk to their health increased from 54% in 1996 when they were aged 18-23 years to 63% in 2003 when they were 25-30 years old. Over the eight years between their first and fourth survey, Mid-aged women were also more likely to be low risk drinkers (50% to 54%) or to drink at risky levels (5% to 7%). Over the six-year period between Surveys 1 and 3 for Older women, there was an increase in non-drinkers (31% to 37%) and a decrease in occasional drinkers (29% to 24%).
Although Figure 3.18 shows trends in alcohol consumption over time in each age group for the same women, this figure does not show the movement between categories (transitions) for these women. These transitions are shown in Table 3.5 to Table 3.8.
Figure 3.18 Alcohol consumption among participants in all surveys.
Almost 40% of Younger women changed their alcohol consumption in the four years between Surveys 1 and 2 compared to 28% in the three years between Surveys 2 and 3 (Table 3.5). Younger women were more likely to increase than to decrease alcohol consumption although most women only increased consumption to low risk drinking (19% and 13%) rather than risky drinking (3% and 2%). At the same, 3% and 2% of Younger women decreased alcohol consumption from risky to low risk drinking and more women became occasional drinkers or non-drinkers (14% and 11%). In general, young women as they aged were changing from occasionally drinking at risky levels to their short-term health to consuming alcohol more often but in lower quantities consistent with low risk levels.

56
Table 3.5 Changes in alcohol consumption among 7790 Younger women over time.
Changes in alcohol consumption Survey 1 to 2
%
Survey 2 to 3
% No change Remained non-drinker 4.3 5.1 Remained occasional drinker 14.7 15.5 Remained low risk drinker 41.4 50.3 Remained risky drinker 0.8 1.1 Sub-total no change 61.2 72.0Decreased consumption Occasional drinker to non-drinker 2.9 2.1 Low risk drinker to non-drinker/ occasional drinker 10.2 8.4 Risky drinker to non-drinker/ occasional drinker 1.0 0.2 Risky drinker to low risk drinker 3.0 2.0 Sub-total decreased consumption 17.1 12.7Increased consumption Non-drinker to occasional/ low risk drinker 3.9 3.2 Occasional drinker to low risk drinker 15.2 9.8 Non-drinker/ occasional/ low risk drinker to risky
drinker 2.6 2.4
Sub-total increased consumption 21.7 15.4 Percentages of Younger women with missing alcohol data were 1% to 2%
Table 3.6 Changes in alcohol consumption among 10087 Mid-aged women over time.
Changes in alcohol consumption Survey 1 to 2
%
Survey 2 to 4
% No change Remained non-drinker 9.6 9.6 Remained occasional drinker 19.8 15.7 Remained low risk drinker 46.0 45.9 Remained risky drinker 3.6 3.8 Sub-total no change 79.0 75.0Decreased consumption Occasional drinker to non-drinker 1.8 3.8 Low risk drinker to non-drinker/ occasional drinker 4.5 6.6 Risky drinker to non-drinker/ occasional drinker 0.1 0.1 Risky drinker to low risk drinker 1.3 1.7 Sub-total decreased consumption 7.7 12.2Increased consumption Non-drinker to occasional/ low risk drinker 3.3 2.0 Occasional drinker to low risk drinker 7.8 7.8 Non-drinker/ occasional/ low risk drinker to risky
drinker 2.1 2.9
Sub-total increased consumption 13.2 12.7 Percentages of Mid-aged women with missing alcohol data were 1% to 2%

57
Twenty one percent of Mid-aged women changed their alcohol consumption over the two year period between Surveys 1 and 2 and 25% over the six years between Surveys 2 and 4 (Table 3.6). Thirteen percent of Mid-aged women increased their alcohol consumption, mainly increasing consumption from occasional drinking to low risk drinking, although 2% to 3% increased to risky drinking. At the same time, 1% to 2% decreased alcohol consumption from risky to low risk drinking.
Alcohol consumption was stable for three quarters of the Older women over the six years between Survey 1 and Survey 3 (Table 3.7). Older women who did change their alcohol consumption tended to move between the categories of low risk drinking, occasional drinking and not drinking, with few women taking up or ceasing risky drinking. In the second three-year period, Older women were more likely to decrease (15%) rather than increase their alcohol consumption (9%).
Table 3.7 Changes in alcohol consumption among 8646 Older women over time.
Changes in alcohol consumption Survey 1 to 2
%
Survey 2 to 3
% No change Remained non-drinker 26.4 29.8 Remained occasional drinker 17.4 15.2 Remained low risk drinker 28.9 28.6 Remained risky drinker 2.7 2.3 Sub-total no change 75.4 75.9Decreased consumption Occasional drinker to non-drinker 4.2 5.8 Low risk drinker to non-drinker/ occasional drinker 6.6 7.4 Risky drinker to non-drinker/ occasional drinker 0.2 0.1 Risky drinker to low risk drinker 0.9 1.8 Sub-total decreased consumption 11.9 15.1Increased consumption Non-drinker to occasional/ low risk drinker 4.4 2.6 Occasional drinker to low risk drinker 6.7 5.6 Non-drinker/ occasional/ low risk drinker to risky
drinker 1.6 0.8
Sub-total increased consumption 12.7 9.0 Percentages of Older women with missing alcohol data were 4% to 6%
c) Area of residence trends
Figure 3.19 to Figure 3.21 show that Younger, Mid-aged and Older women living in urban areas were more likely to be low risk drinkers than women living in other areas of Australia (p<0.002). Mid-aged and Older women living in other areas of Australia were more likely to be non-drinkers than women living in urban areas (p<0.002).

58
Figure 3.19 Alcohol consumption by Younger women at Survey 3 (2003) by area of residence.
Figure 3.20 Alcohol consumption by Mid-aged women at Survey 4 (2004) by area of residence.
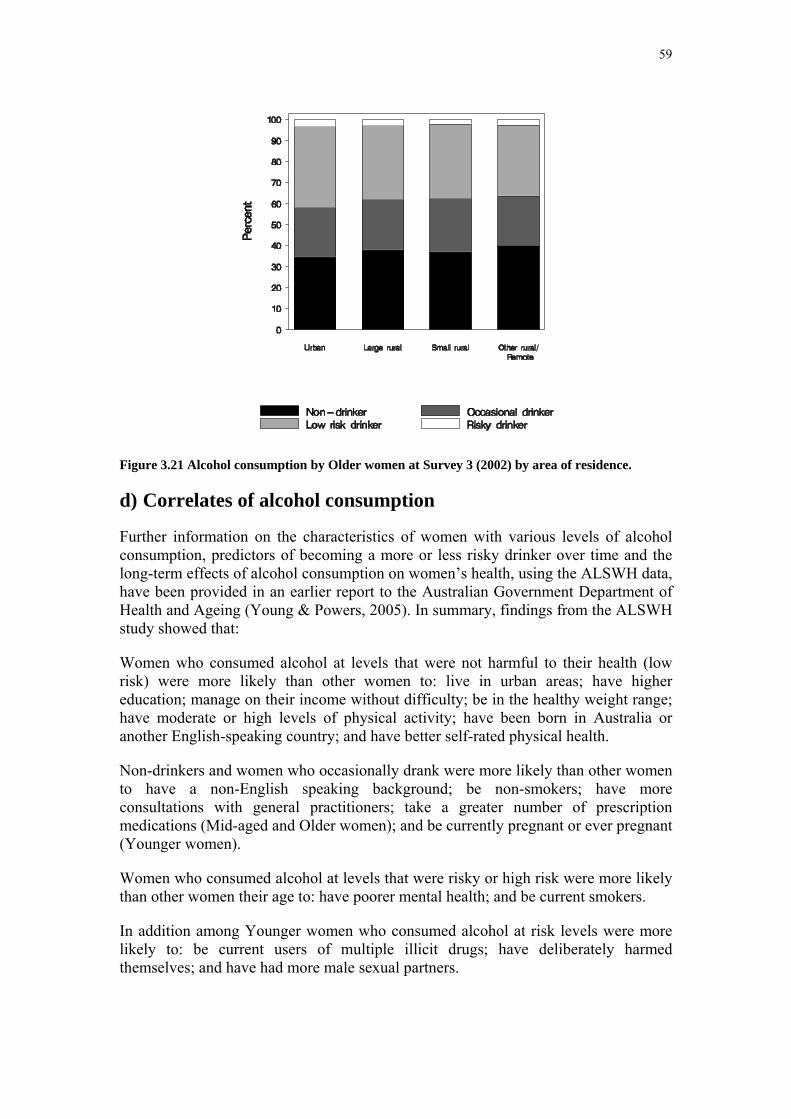
59
Figure 3.21 Alcohol consumption by Older women at Survey 3 (2002) by area of residence.
d) Correlates of alcohol consumption
Further information on the characteristics of women with various levels of alcohol consumption, predictors of becoming a more or less risky drinker over time and the long-term effects of alcohol consumption on women’s health, using the ALSWH data, have been provided in an earlier report to the Australian Government Department of Health and Ageing (Young & Powers, 2005). In summary, findings from the ALSWH study showed that:
Women who consumed alcohol at levels that were not harmful to their health (low risk) were more likely than other women to: live in urban areas; have higher education; manage on their income without difficulty; be in the healthy weight range; have moderate or high levels of physical activity; have been born in Australia or another English-speaking country; and have better self-rated physical health.
Non-drinkers and women who occasionally drank were more likely than other women to have a non-English speaking background; be non-smokers; have more consultations with general practitioners; take a greater number of prescription medications (Mid-aged and Older women); and be currently pregnant or ever pregnant (Younger women).
Women who consumed alcohol at levels that were risky or high risk were more likely than other women their age to: have poorer mental health; and be current smokers.
In addition among Younger women who consumed alcohol at risk levels were more likely to: be current users of multiple illicit drugs; have deliberately harmed themselves; and have had more male sexual partners.
60
The associations between alcohol consumption at levels of short-term risk and health and socio-demographic characteristics among Younger women were explored. The findings for frequency of short-term risk drinking, by long-term risk drinking, were 93% of risky drinkers participated in short-term risk drinking at least weekly. One third of low risk drinkers participated in short-term risk drinking about once a month and 24% did so at least weekly.
Factors associated with short-term risk drinking among Younger women were explored. In summary short-term risk drinking occurred more often among Australian-born women and those of English-speaking background; separated, divorced and widowed Younger women; women who have difficulty managing on available income; current smokers; women who were not or have never been pregnant; women who reported deliberately harming themselves; current users of illicit drugs; and women who had had more male sexual partners.
Factors associated with change in alcohol consumption over time were explored. For women in all three age groups, the most consistent and largest associations over time were between smoking and drinking habits. Women who smoked had consistently higher odds of remaining risky drinkers or changing from low risk to risky drinking.
Changes in marital status were associated with changes in alcohol consumption. Younger women who became married or formed de facto relationships between Survey 1 and Survey 2 had decreased odds of continuing to drink at risky levels or of becoming risky drinkers. Older women who were widowed by Survey 2 had decreased odds of remaining risky drinkers. Although Mid-aged women without partners had decreased odds of remaining risky drinkers, those in de facto relationships had increased odds of remaining risky drinkers or changing their drinking habits.
Changes in health were also associated with changes in alcohol consumption in Mid-aged women. Mid-aged women whose mental health had deteriorated by Survey 2 had higher odds of beginning to drink at levels of risk, whereas those whose mental health had improved had higher odds of changing from risky to low risk drinkers, or of remaining risky drinkers.
Younger women who were mothers at both Survey 1 and Survey 2 had lower odds of remaining risky drinkers. Those who had become new mothers by Survey 2 had lower odds of becoming risky drinkers or remaining risky drinkers.
The long-term effects of alcohol consumption on women’s health were investigated. The association between alcohol consumption and withdrawing from the Study or dying was investigated in each age group with adjustment for area of residence, education, smoking and comorbidity. Younger women who were non-drinkers were more likely to withdraw from the study than low risk drinkers. Mid-aged women who were non-drinkers or occasionally drank had a significantly higher risk of withdrawing from the Study during the survey period than low risk drinkers. Older women who were non-drinkers had a significantly higher risk of withdrawing from the Study during the survey period than low risk drinkers. Older women who were non-drinkers or occasionally drank had a significantly higher risk of dying during the survey period than low risk drinkers.
61
The association between alcohol consumption and health related quality of life was investigated in each age group with adjustment for area of residence, education, smoking, BMI and comorbidity. Alcohol consumption among the Younger women over the seven-year period was significantly associated with three health outcomes. Compared with low risk drinkers, non-drinkers had poorer physical functioning and lower physical health summary score; compared with low risk drinkers, women who remained risky drinkers had poorer mental health.
Alcohol consumption was associated with many aspects of health for the Mid-aged women over the five-year period. Being a non-drinker or occasionally drinking was associated with a reduction in all dimensions of physical health, whereas being a risky drinker, compared with a low risk drinker, was associated with poorer mental health and general health.
A strong relationship was found between alcohol consumption and health-related quality of life among the Older women. Compared with being a low risk drinker, Older women who were non-drinkers also had significantly poorer health on the physical health summary measure and the eight dimensions of physical and mental health. The findings for Older women who occasionally drink were similar but not as strong with lower scores on the physical health summary measure and five of the eight dimensions. The reasons for being a non-drinker may be related to factors such as family history, social or even health conditions that may decrease health related quality of life.
3.4.4 Illicit drug use
a) Introduction
Only women in the Younger cohort were asked about illicit drug use, and this enquiry was reserved until the second survey when some trust had been established between the ALSWH researchers and participants. At Surveys 2 and 3 women were asked ”Have you ever tried ..?”, “At about what age did you first try ..?” and “Have you used it in the last 12 months?” in relation to the 10 drug classes: marijuana, amphetamines, LSD, natural hallucinogens, tranquillisers, cocaine, ecstasy/designer drugs, inhalants, heroin and barbiturates.
Too few women used any single drug type or group of drugs, except marijuana, to allow meaningful analyses of trends. The major patterns of drug use were identified as exclusive use of marijuana and multiple drug use (which may or may not include marijuana use). Women with these two patterns of use were further categorised as recent or past users, based on whether or not they had used a drug during the previous twelve months.
Data for women responding to both surveys and providing information on drug use are included here (N=7093).

62
b) Time trends
Figure 3.22 Patterns of illicit drug use: data from Surveys 2 and 3.
Figure 3.22 shows that by Survey 3, when the women were, on average, 27 years of age, 37% had never used an illicit drug, and that most who had used drugs restricted their use to marijuana. Some women tried illicit drugs for the first time between Surveys 2 and 3, leading to an increase of 7% in women who had used drugs at some time during their lives. However, recent drug use (i.e. in the last 12 months) declined from 27% to 22% and past use increased from 29% to 41%, indicating an overall trend of decreased use. While the prevalence of recent multiple drug use remained relatively stable, recent marijuana use declined from 10% to 5%.
Table 3.8 Changes in illicit drug use: data from Surveys 2 and 3 (weighted percent of 7093 women).
Survey 3
Survey 2
Never used any drug
Past marijuana
use
Recent marijuana
use
Past multiple drug use
Recent multiple drug use
Never used any drug 37.9 5.1 1.0 1.0 0.7 Past marijuana use 19.3 1.6 1.3 1.1 Recent marijuana use 4.6 2.9 0.6 1.7 Past multiple drug use 4.7 1.3 Recent multiple drug use 4.9 10.4
Table 3.8 shows that just over a third of Younger women (38%) reported lifetime avoidance of illicit drugs. In contrast, about 10% of women were multiple drug users
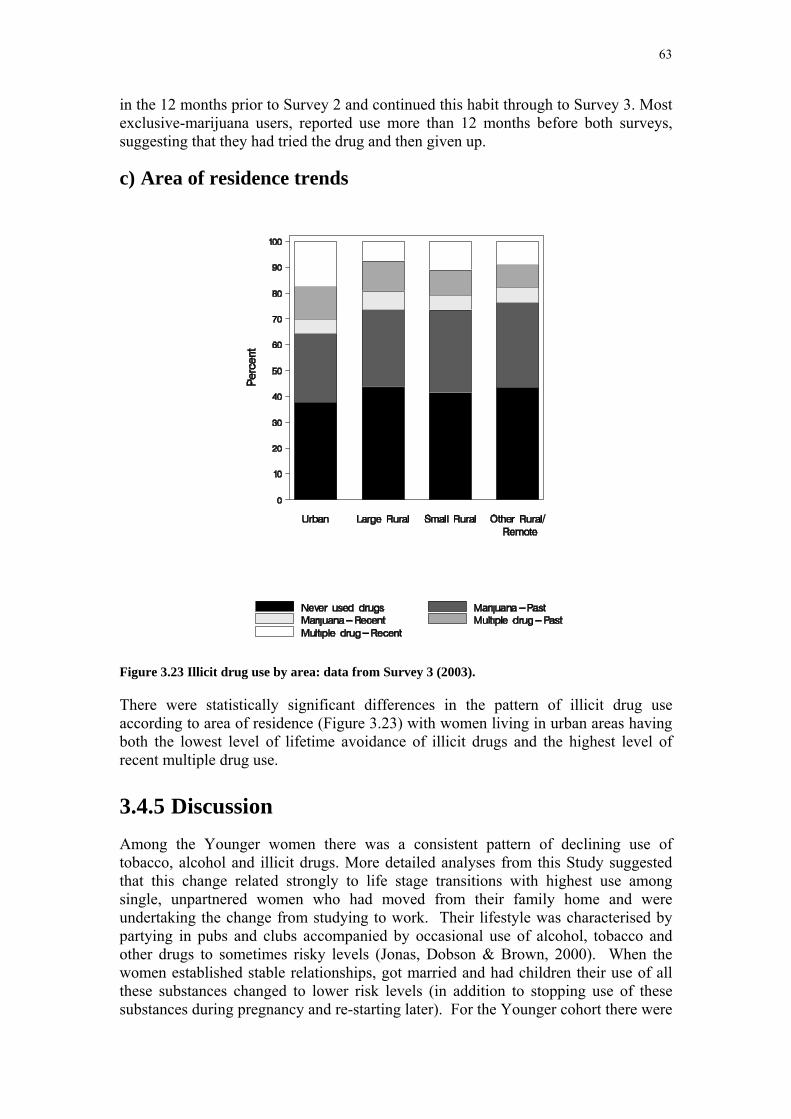
63
in the 12 months prior to Survey 2 and continued this habit through to Survey 3. Most exclusive-marijuana users, reported use more than 12 months before both surveys, suggesting that they had tried the drug and then given up.
c) Area of residence trends
Figure 3.23 Illicit drug use by area: data from Survey 3 (2003).
There were statistically significant differences in the pattern of illicit drug use according to area of residence (Figure 3.23) with women living in urban areas having both the lowest level of lifetime avoidance of illicit drugs and the highest level of recent multiple drug use.
3.4.5 Discussion Among the Younger women there was a consistent pattern of declining use of tobacco, alcohol and illicit drugs. More detailed analyses from this Study suggested that this change related strongly to life stage transitions with highest use among single, unpartnered women who had moved from their family home and were undertaking the change from studying to work. Their lifestyle was characterised by partying in pubs and clubs accompanied by occasional use of alcohol, tobacco and other drugs to sometimes risky levels (Jonas, Dobson & Brown, 2000). When the women established stable relationships, got married and had children their use of all these substances changed to lower risk levels (in addition to stopping use of these substances during pregnancy and re-starting later). For the Younger cohort there were
64
strong associations between use of tobacco, alcohol and illicit drugs and these would have been strongly affected by the social environment (Jonas, Dobson & Brown, 2000; McDermott, Dobson & Russell, 2004).
The Mid-aged women showed very stable patterns of tobacco and alcohol use over time and by area of residence. Most were non-smokers and occasional or low risk drinkers although women in rural areas were somewhat more likely than urban women to be non-drinkers or occasional drinkers. The characteristics of women with various levels of alcohol consumption, predictors of becoming a more or less risky drinker over time and the long-term effects of alcohol consumption on women’s health were examined using the ALSWH data. Findings from this study were that non-drinkers were more likely to be non-smokers and from a non-English speaking background and among Younger women, to be pregnant or mothers. Those who drank up to two drinks a day had more education, exercised more often and had better self-rated health than non-drinkers. At the other end of the scale those who drank three or more drinks a day tended to be smokers, had poorer mental health and among Younger women, were more likely to have used illicit drugs (Young & Powers, 2005).
The public health lessons from these data relate to Younger women (as there was very little change and very little risky behaviour in the other two cohorts). Younger women’s lives are characterised by change. Some of them first start using tobacco, alcohol and illicit drugs in their early 20’s. Although there is considerable attention to preventive messages and interventions when they are at high school, the ALSWH data show that strategies are also needed to target young adults. While they may only be occasional users, they are at risk of addiction and associated consequences for their future health. Lifestyle changes, especially motherhood, offer major opportunities for ceasing cigarette smoking, risky use of alcohol, and illicit drug use. Prevention strategies focussed on pregnant women and mothers of young children have the potential to be very good public health investments.
There is a substantial literature supporting the hypothesis that the incidence of coronary heart disease is lower among people who consume alcohol (Fillmore et al, 2006). In particular a “J-shape” mortality curve is often found whereby abstainers from alcohol and particularly heavier drinkers are at higher risk. Fillmore et al reviewed 54 published studies on alcohol use and mortality risk. Their meta-analysis considered only the results of studies where people who had reduced or stopped drinking were not classified as abstainers. They found no significant benefits of alcohol for either all-cause or cardiac mortality. According to the ‘reverse causation’ hypothesis, people who develop illness or need to take particular medications, decrease their alcohol consumption or stop drinking completely. Hence the association observed between non-drinking and higher rates of illness or death is a reflection of the illness causing the change in consumption (rather than the reverse). However other authors have excluded ex-drinkers from analysis and still found a protective association (Jackson et al, 2005).
There are also misclassification problems in studies that include occasional drinkers in the abstainer category. In this report we examined the prevalence and incidence of doctor-diagnosed chronic conditions, rather than mortality, and the association of these conditions with alcohol consumption and other risk factors. The non-drinker group did not include the occasional drinkers (they were included in the low risk
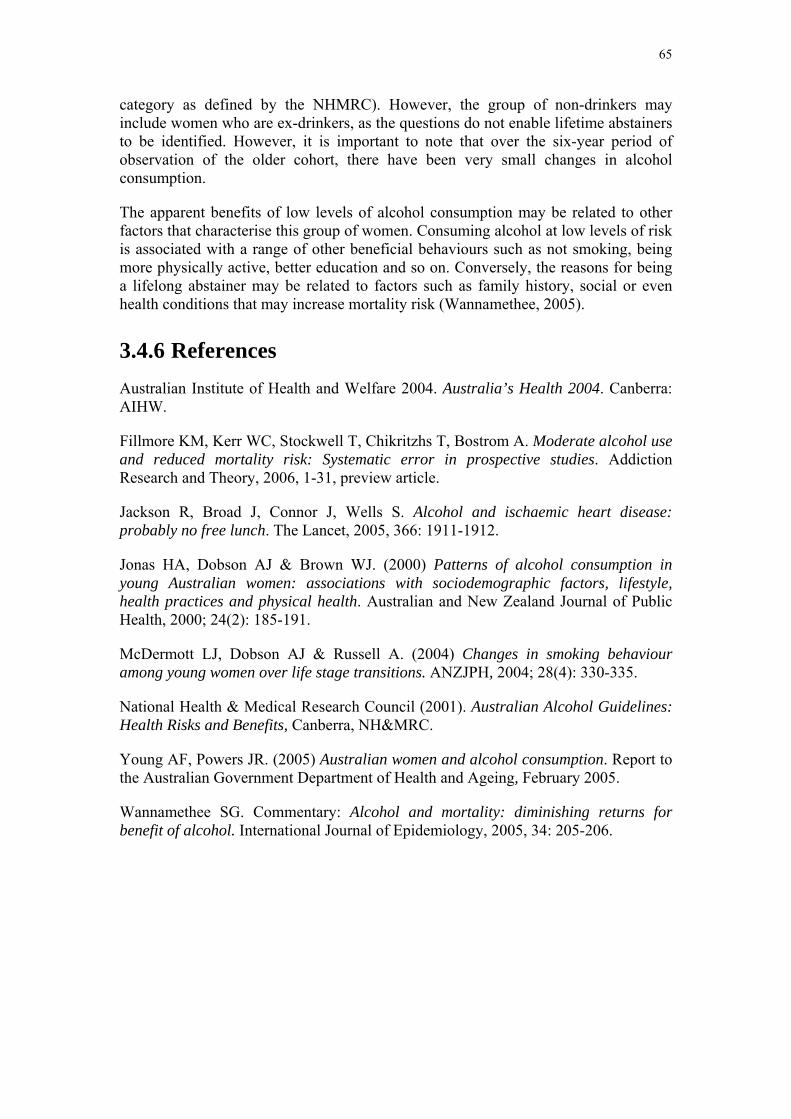
65
category as defined by the NHMRC). However, the group of non-drinkers may include women who are ex-drinkers, as the questions do not enable lifetime abstainers to be identified. However, it is important to note that over the six-year period of observation of the older cohort, there have been very small changes in alcohol consumption.
The apparent benefits of low levels of alcohol consumption may be related to other factors that characterise this group of women. Consuming alcohol at low levels of risk is associated with a range of other beneficial behaviours such as not smoking, being more physically active, better education and so on. Conversely, the reasons for being a lifelong abstainer may be related to factors such as family history, social or even health conditions that may increase mortality risk (Wannamethee, 2005).
3.4.6 References Australian Institute of Health and Welfare 2004. Australia’s Health 2004. Canberra: AIHW.
Fillmore KM, Kerr WC, Stockwell T, Chikritzhs T, Bostrom A. Moderate alcohol use and reduced mortality risk: Systematic error in prospective studies. Addiction Research and Theory, 2006, 1-31, preview article.
Jackson R, Broad J, Connor J, Wells S. Alcohol and ischaemic heart disease: probably no free lunch. The Lancet, 2005, 366: 1911-1912.
Jonas HA, Dobson AJ & Brown WJ. (2000) Patterns of alcohol consumption in young Australian women: associations with sociodemographic factors, lifestyle, health practices and physical health. Australian and New Zealand Journal of Public Health, 2000; 24(2): 185-191.
McDermott LJ, Dobson AJ & Russell A. (2004) Changes in smoking behaviour among young women over life stage transitions. ANZJPH, 2004; 28(4): 330-335.
National Health & Medical Research Council (2001). Australian Alcohol Guidelines: Health Risks and Benefits, Canberra, NH&MRC.
Young AF, Powers JR. (2005) Australian women and alcohol consumption. Report to the Australian Government Department of Health and Ageing, February 2005.
Wannamethee SG. Commentary: Alcohol and mortality: diminishing returns for benefit of alcohol. International Journal of Epidemiology, 2005, 34: 205-206.
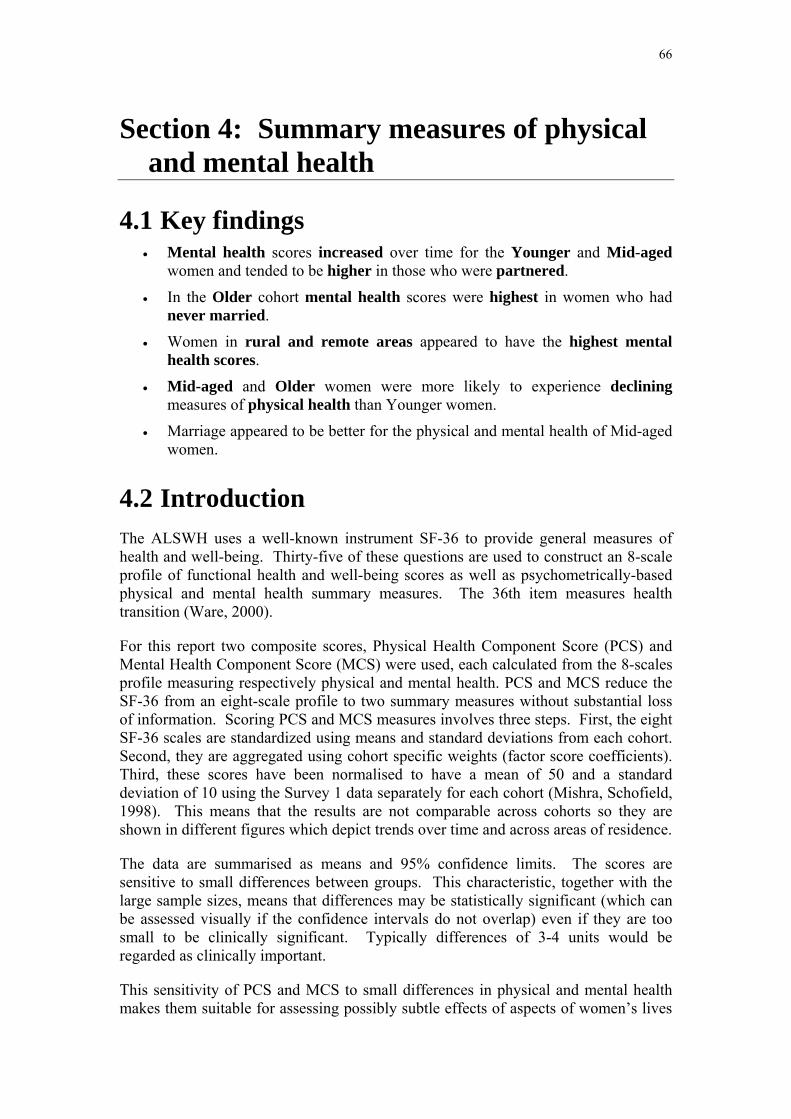
66
Section 4: Summary measures of physical and mental health
4.1 Key findings • Mental health scores increased over time for the Younger and Mid-aged
women and tended to be higher in those who were partnered.
• In the Older cohort mental health scores were highest in women who had never married.
• Women in rural and remote areas appeared to have the highest mental health scores.
• Mid-aged and Older women were more likely to experience declining measures of physical health than Younger women.
• Marriage appeared to be better for the physical and mental health of Mid-aged women.
4.2 Introduction The ALSWH uses a well-known instrument SF-36 to provide general measures of health and well-being. Thirty-five of these questions are used to construct an 8-scale profile of functional health and well-being scores as well as psychometrically-based physical and mental health summary measures. The 36th item measures health transition (Ware, 2000).
For this report two composite scores, Physical Health Component Score (PCS) and Mental Health Component Score (MCS) were used, each calculated from the 8-scales profile measuring respectively physical and mental health. PCS and MCS reduce the SF-36 from an eight-scale profile to two summary measures without substantial loss of information. Scoring PCS and MCS measures involves three steps. First, the eight SF-36 scales are standardized using means and standard deviations from each cohort. Second, they are aggregated using cohort specific weights (factor score coefficients). Third, these scores have been normalised to have a mean of 50 and a standard deviation of 10 using the Survey 1 data separately for each cohort (Mishra, Schofield, 1998). This means that the results are not comparable across cohorts so they are shown in different figures which depict trends over time and across areas of residence.
The data are summarised as means and 95% confidence limits. The scores are sensitive to small differences between groups. This characteristic, together with the large sample sizes, means that differences may be statistically significant (which can be assessed visually if the confidence intervals do not overlap) even if they are too small to be clinically significant. Typically differences of 3-4 units would be regarded as clinically important.
This sensitivity of PCS and MCS to small differences in physical and mental health makes them suitable for assessing possibly subtle effects of aspects of women’s lives

67
that may impact in often non-specific aspects of health. In this report trends in PCS and MCS are reported for women who experience stability or changes in their marital status over time, for example those who became divorced or widowed during the first ten years of the study compared with those who remained married.
4.3 Time and area of residence trends in physical and mental health
For the Younger women there was no evidence of changes over time or of area of residence differences in the mean physical health component scores, PCS (Figure 4.1). In contrast, for the Mid-aged and Older women PCS declined over time (Figure 4.2 and Figure 4.3); the magnitude of the average decline was possibly clinically important. For these cohorts there was little consistent evidence of differences in PCS by area of residence.
Mental health component scores, MCS, tended to increase over time for the Younger and Mid-aged cohorts and between Surveys 1 and 2 for the Older cohort, but there is some possible evidence of declining MCS means at Survey 3 for the Older women (who were aged 76-81 years) (Figure 4.4, Figure 4.5 and Figure 4.6). These scores of mental health tended to be higher among women living in rural and remote areas than among urban women, but this could be due to effects of differing expectations or cultural backgrounds rather than clinical or sub-clinical differences.
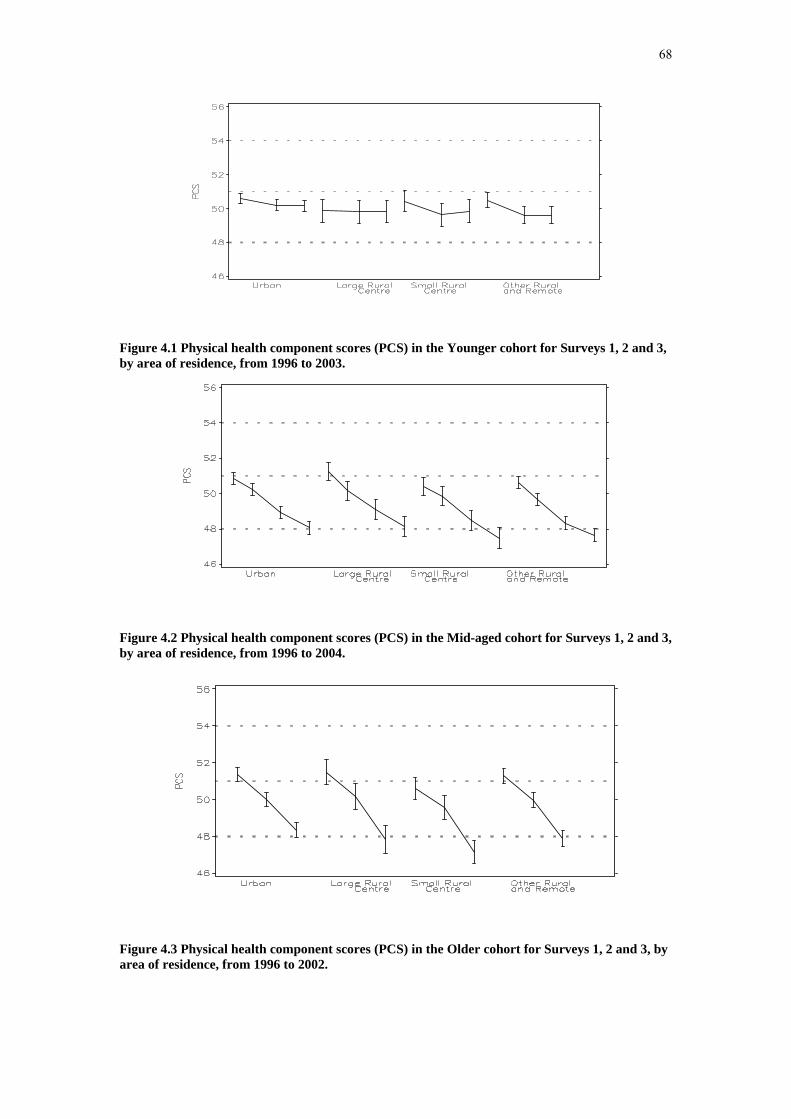
68
Figure 4.1 Physical health component scores (PCS) in the Younger cohort for Surveys 1, 2 and 3, by area of residence, from 1996 to 2003.
Figure 4.2 Physical health component scores (PCS) in the Mid-aged cohort for Surveys 1, 2 and 3, by area of residence, from 1996 to 2004.
Figure 4.3 Physical health component scores (PCS) in the Older cohort for Surveys 1, 2 and 3, by area of residence, from 1996 to 2002.
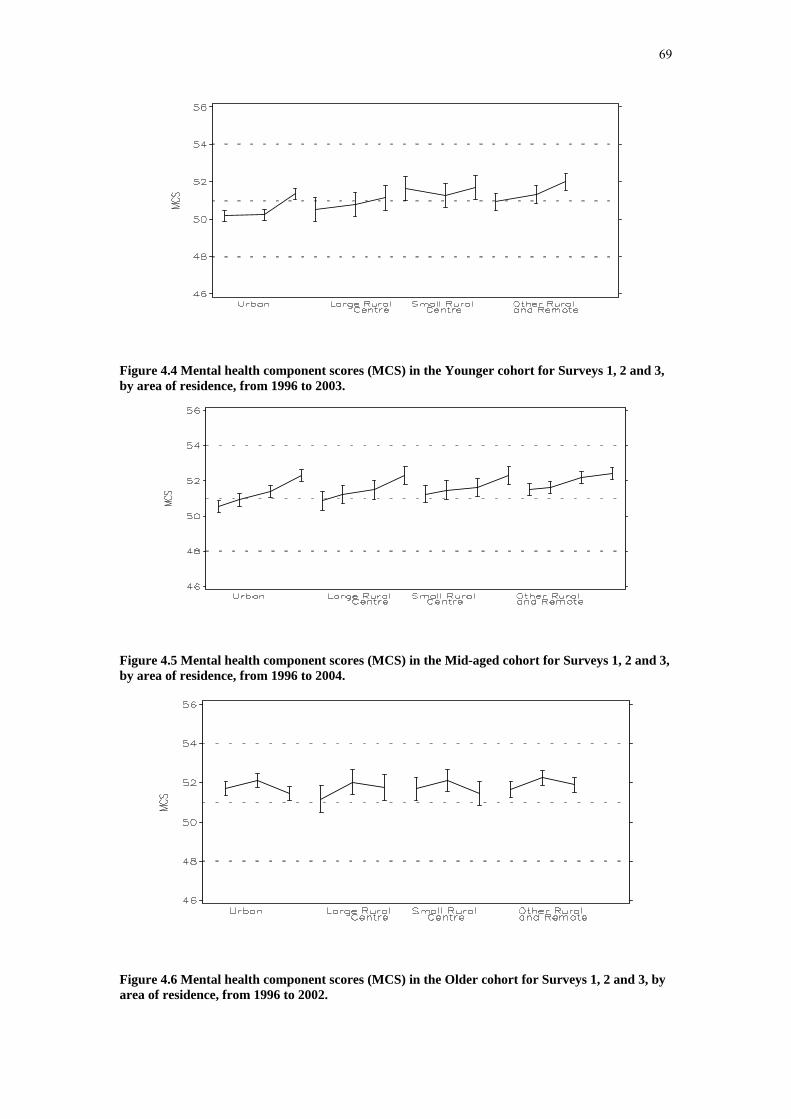
69
Figure 4.4 Mental health component scores (MCS) in the Younger cohort for Surveys 1, 2 and 3, by area of residence, from 1996 to 2003.
Figure 4.5 Mental health component scores (MCS) in the Mid-aged cohort for Surveys 1, 2 and 3, by area of residence, from 1996 to 2004.
Figure 4.6 Mental health component scores (MCS) in the Older cohort for Surveys 1, 2 and 3, by area of residence, from 1996 to 2002.

70
4.4 Time trends in physical and mental health in relation to stability or change in marital status
Figure 4.7 to Figure 4.12 show trends in mean PCS and MCS among women classified by their marital status over the study period to date. These figures show data only for the most common trajectories of relationships. For example in Figure 4.7 which shows mean physical health scores among the Younger women, the group with the highest scores were those who remained single throughout the period (SSS, second block). The groups with the lowest scores were those who remained married (MMM, first block) and those who were initially in a de facto relationship and then became married (DMM, third group). In all groups moving into a de-facto relationship or becoming married was associated with declines in self-reported physical health. To interpret these findings it is important to realise that these relationship changes are often related to pregnancy and having children so that child-bearing, rather than the marital status may be the factor related to lower PCS.
Most of the Mid-aged women remained married throughout the period – this group (MMM, first block) was substantially larger than any other group and effectively acts as a reference group for other patterns of marital status. Although PCS declined among those married women over time, for most other groups the rate of decline was more rapid and mean PCS at Survey 4 was lower (except those who became divorced towards the end of the period, e.g. MMMD, fourth block). These data tend to suggest that marriage was beneficial for the physical and mental health of Mid-aged women.
For Older women initial values and declines in mean PCS were fairly similar over all the groups shown in Figure 4.9.
The results for mental health (Figure 4.10 to Figure 4.12) show different patterns from those for physical health. For example Younger women who remained single (SSS, second block, Figure 4.10) had worse mental health than other groups even though they reported better physical health (Figure 4.7). Younger women who entered de facto relationships or became married experienced increases in MCS.
For the Mid-aged women the large group who remained married (MMM, first block, Figure 4.11) had higher mean MCS at Survey 1 and their mental health improved steadily. Those women who became married (DDMM and DMMM) also experienced improvements in MCS. While those who became divorced (MMMD, MMDD and MDDD) reported lower mental health around the time of divorce but showed signs of subsequent improvements.
For the Older women, MCS was highest among those who never married (SSS, fourth block, Figure 4.12). In contrast those women who were widowed during the study period (MMW and MWW, last two blocks) had the lowest mental health scores. Women who did not experience any change in their marital status (MMM, DDD, WWW and SSS) did not experience any consistent changes in mean MCS.
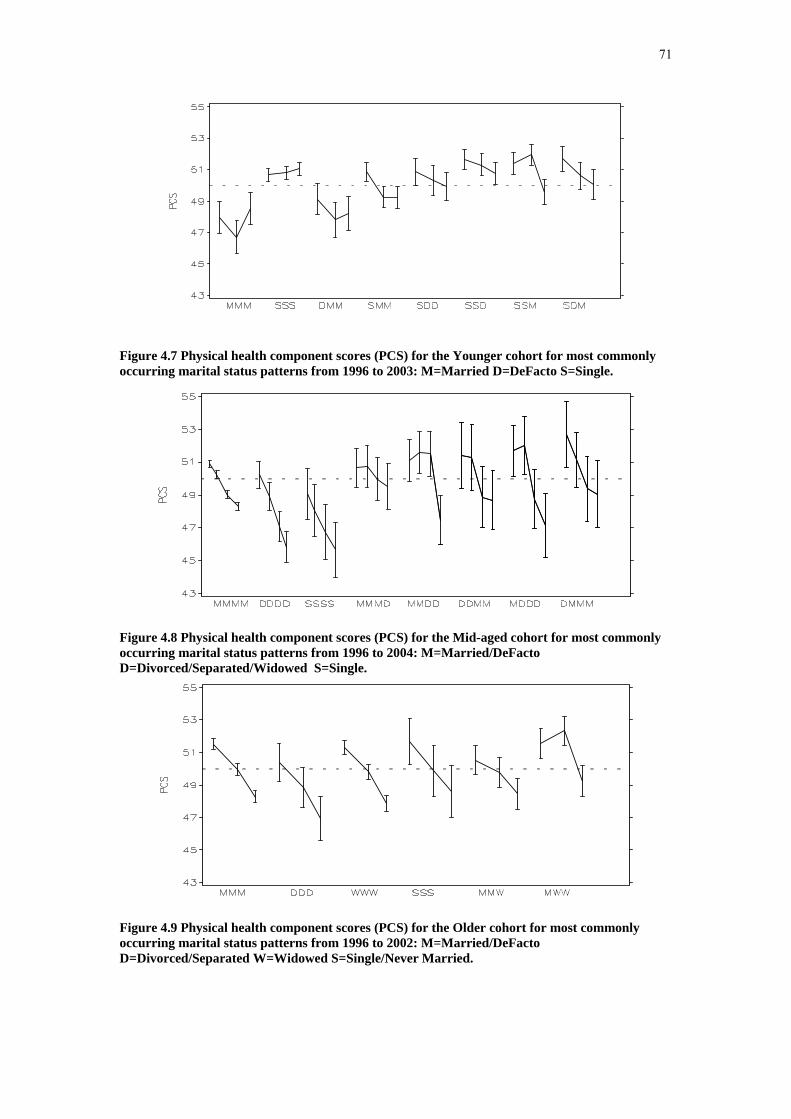
71
Figure 4.7 Physical health component scores (PCS) for the Younger cohort for most commonly occurring marital status patterns from 1996 to 2003: M=Married D=DeFacto S=Single.
Figure 4.8 Physical health component scores (PCS) for the Mid-aged cohort for most commonly occurring marital status patterns from 1996 to 2004: M=Married/DeFacto D=Divorced/Separated/Widowed S=Single.
Figure 4.9 Physical health component scores (PCS) for the Older cohort for most commonly occurring marital status patterns from 1996 to 2002: M=Married/DeFacto D=Divorced/Separated W=Widowed S=Single/Never Married.

72
Figure 4.10 Mental health component scores (MCS) for the Younger cohort for most commonly occurring marital status patterns from 1996 to 2003: M=Married D=DeFacto S=Single.
Figure 4.11 Mental health component scores (MCS) for the Mid-aged cohort for most commonly occurring marital status patterns from 1996 to 2004: M=Married/DeFacto D=Divorced/Separated/Widowed S=Single.
Figure 4.12 Mental health component scores (MCS) for the Older cohort for most commonly occurring marital status patterns from 1996 to 2002: M=Married/DeFacto D=Divorced/Separated W=Widowed S=Single/Never Married.

73
4.5 Discussion of trends in physical and mental health
PCS and MCS provide fairly general measures of physical and mental health not related to specific medical conditions. As might be expected physical health declined in the Mid-aged (45-50 years at Survey 1 and 53-58 years at Survey 4) and Older women (70-75 years at Survey 1 and 76-81 years at Survey 3). There was no consistent evidence of urban-rural differences even though there are well-known differences in use of health services and associated costs (Young & Dobson, 2003).
In contrast to physical health, mental health among those women who participated in every survey so far, increased consistently over time and was higher in rural and remote areas than major metropolitan centres.
It is important to emphasise that these data were only for women who participated in every survey so changes in scores over time were not due to less healthy women dropping out of the study (or even dying, especially in the Older cohort).
The two scores, like the conditions they portray, are not independent. Thus, for example, women who lived in rural areas may have been psychologically or culturally more likely to report better mental health and this might have been associated with more optimistic reporting of physical health even if, objectively, their physical health was not as good as that of urban women.
Despite such possible limitations of these measures, PCS and MCS show remarkable differences associated with marital status. Among the Younger women, being partnered appeared to be beneficial to mental health and any association with poorer physical health may be related to having children. Likewise for the Mid-aged and Older women being married appeared to be beneficial for health with one exception. Older women who never married experienced very different lives from those women in younger generations who did marry (Smith, Young & Lee, 2004) have shown that the socioeconomic conditions of single Older women were also very different so that multiple factors were likely to have contributed to their better health.
4.6 References Mishra G and Schofield MJ. Norms for the physical and mental health component summary scores of the SF-36 for young, middle-aged and older Australian women. Quality of Life Research, 1998, Vol 7, pp. 215-220.
Smith N, Young A & Lee C. Optimism, health-related hardiness and well-being among older Australian women. Journal of Health Psychology, 2004; 9: 741-752.
Ware, J., Snow, K., Kosinski, M. et al.: SF-36 health survey: Manual and interpretation guide. Boston: Nimrod Press, 1993.
Ware JE. SF-36 Health Survey Update. QualityMetric, Inc.; Lincoln, Rhode Island, 2000, Vol 25(24), pp 3130-9.

74
Young AF & Dobson AJ. The decline in bulk billing and increase in out-of-pocket costs for general practice consultations in rural areas of Australia. Medical Journal of Australia, 2003, Vol. 178; pp122-126.

75
Section 5: Trends in early detection measures
5.1 Key findings • 9 out of 10 Mid-aged women reported having had their blood pressure
measured in the past three years at both Survey 3 (2001) and Survey 4 (2004). Prevalence of blood pressure checking was consistent across geographic areas.
• 6 out of 10 Mid-aged women in Survey 3 (2001) and 7 out of 10 Mid-aged women in Survey 4 (2004) reported having had their cholesterol checked by a doctor. Cholesterol testing was more common among urban women than women in other areas.
• There was an increasing uptake of Pap testing in the Younger cohort but at Survey 3 (2003) 1 in 10 women had still never had the test.
• For Mid-aged women the ALSWH obtains data on hysterectomies so it is able to correctly estimate the proportion of eligible women who have Pap tests (i.e. the rates or testing among women who have not had a hysterectomy).
• 9 out of 10 Mid-aged women eligible for a Pap test had had one within the last 2 years.
• The proportion of women who had never had a Pap test or were overdue for testing was highest among Younger women in small rural areas. There was little geographical difference in Pap testing in the Mid-aged cohort.
• Around 1 in 4 Younger and Mid-aged women reported ever having had an abnormal Pap result.
• An increasing number of Younger and Mid-aged women were becoming less satisfied with their ease of access to Pap testing over time. Ease of access was poorer in small rural and remote areas.
• Almost 1 in 3 Mid-aged women had never had a mammogram at Survey 1 (1996) but this decreased to 1 in 20 by Survey 4 (2004). Mid-aged women in small rural areas reported poor ease of access to mammogram services compared with other geographic locations.
5.2 Blood pressure measurement Time and area trends
Among the early detection activities measures included in the ALSWH surveys, the most commonly performed test was blood pressure measurement. At Survey 3 (2001) and Survey 4 (2004) women in the Mid-aged cohort were asked if in the past three years they had had their blood pressure checked by a doctor. Blood pressure measurement has long been recommended for all adults and should be performed at least every two years, and more frequently with increasing age (>50 years) and other risk factors.
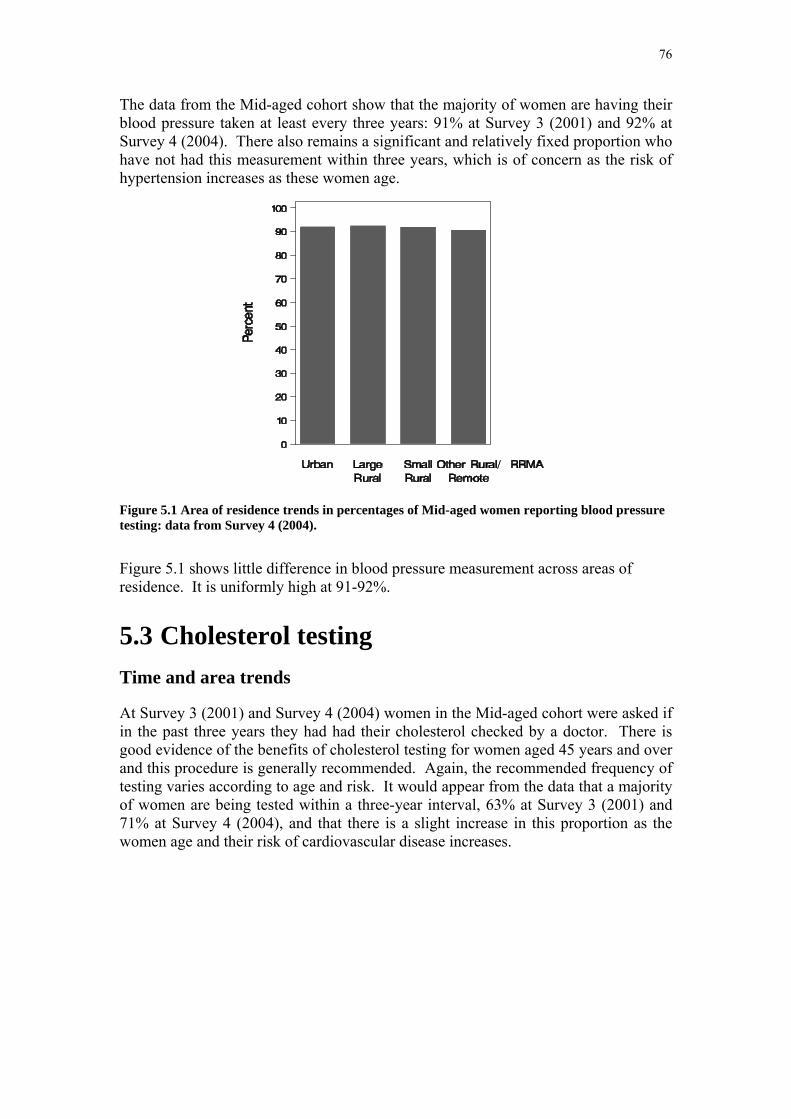
76
The data from the Mid-aged cohort show that the majority of women are having their blood pressure taken at least every three years: 91% at Survey 3 (2001) and 92% at Survey 4 (2004). There also remains a significant and relatively fixed proportion who have not had this measurement within three years, which is of concern as the risk of hypertension increases as these women age.
Figure 5.1 Area of residence trends in percentages of Mid-aged women reporting blood pressure testing: data from Survey 4 (2004).
Figure 5.1 shows little difference in blood pressure measurement across areas of residence. It is uniformly high at 91-92%.
5.3 Cholesterol testing Time and area trends
At Survey 3 (2001) and Survey 4 (2004) women in the Mid-aged cohort were asked if in the past three years they had had their cholesterol checked by a doctor. There is good evidence of the benefits of cholesterol testing for women aged 45 years and over and this procedure is generally recommended. Again, the recommended frequency of testing varies according to age and risk. It would appear from the data that a majority of women are being tested within a three-year interval, 63% at Survey 3 (2001) and 71% at Survey 4 (2004), and that there is a slight increase in this proportion as the women age and their risk of cardiovascular disease increases.

77
Figure 5.2 Area of residence trends in percentages of Mid-aged women reporting cholesterol testing: data from Survey 4 (2004).
Figure 5.2 shows only small differences in cholesterol testing across areas of residence. Testing is more common among urban women (72%) than women in other areas (67-68%).
5.4 Pap tests a) Introduction
Women in the Younger and Mid-aged cohorts are asked “When did you have your last Pap test?” and also if they have ever had an abnormal test result. For the frequency of Pap tests we focus on the recommended period of 2 years.
The major issue for the Mid-aged women is that many have had a hysterectomy. Because the ALSWH asks about hysterectomies it is possible to include this information, so that Pap testing results can give an accurate picture of screening of women “at risk” of developing cervical cancer in the community in a way that is not possible from most other data sources.
Due to question differences, data from the second survey for the Mid-aged cohort are not comparable with other surveys so they have been omitted from the results shown here.

78
b) Time trends in Pap testing
Figure 5.3 Time since last Pap test: data from Surveys 1, 2 and 3 for the Younger women and Surveys 1, 3 and 4 for the Mid-aged women.
For the Younger women Figure 5.3 shows that the percentage who reported never having had a Pap test decreased from 49% at Survey 1 to 10% at Survey 3. While this might represent under-screening of young women, it is also consistent with age-related increases in the proportion of women who had ever been sexually active and who were therefore eligible for testing at each survey point. However the percentage of women whose last Pap test was more than 2 years ago also increased.
For the Mid-aged women there was a steady increase in the percentage who had had a hysterectomy and were therefore no longer at risk. Most women in this age group had had a Pap test within the last 2 years but over the three surveys, a consistent 11-12% had not been tested within the last 2 years. Even though this percentage was relatively fixed, with the increasing numbers of women who no longer require Pap tests there is a trend for the proportion of eligible women who are overdue for screening to increase with each survey.

79
c) Area of residence trends in Pap testing
Figure 5.4 Time since last Pap test by area: data from Survey 3 (2003) for the Younger women and Survey 4 (2004) for the Mid-aged women.
Figure 5.4 shows clear differences (which for the Younger women were statistically significant) in Pap testing patterns by the area of residence. For the Younger women the percentage who had never had a Pap test at Survey 3 was higher in urban areas (10.8%) then in other areas (6.5% - 8.5%) and the percentage who had had a Pap test in the last two years was highest in larger rural centres and remote areas (76.4% and 78%) compared to other areas (<72%). These differences were statistically significant but could be affected by differences in levels of sexual activity and in access to testing services.

80
d) Abnormal Pap test results
Figure 5.5 Time trends in prevalence of ever having had an abnormal Pap test result: data from Surveys 1, 2 and 3 for the Younger women and Surveys 3 and 4 for the Mid-aged women.
Figure 5.6 Trends in prevalence of ever having had an abnormal Pap test result by area: data from Survey 3 (2003) for the Younger women and Survey 4 (2004) for the Mid-aged women.
Among the Younger women, the numbers who had ever had an abnormal Pap test result increased from Survey 1 to Survey 3 (Figure 5.5). However these numbers were, to some extent, affected by the proportion who had not had a Pap test at Survey
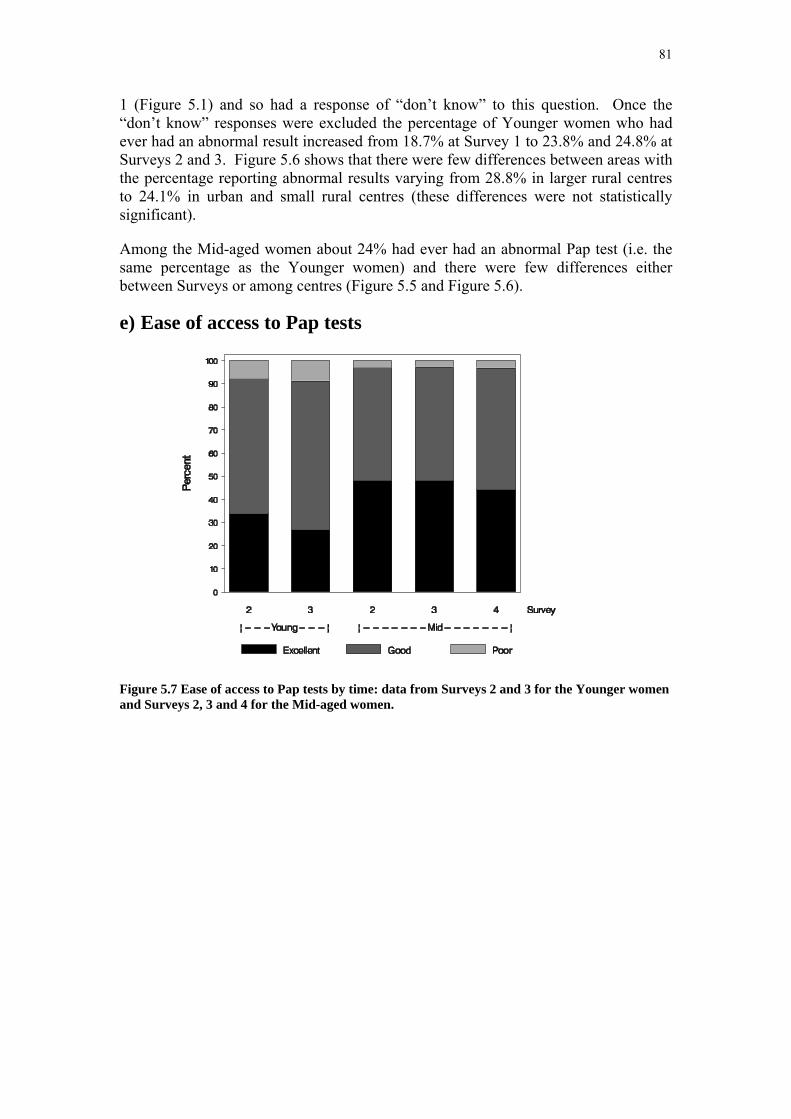
81
1 (Figure 5.1) and so had a response of “don’t know” to this question. Once the “don’t know” responses were excluded the percentage of Younger women who had ever had an abnormal result increased from 18.7% at Survey 1 to 23.8% and 24.8% at Surveys 2 and 3. Figure 5.6 shows that there were few differences between areas with the percentage reporting abnormal results varying from 28.8% in larger rural centres to 24.1% in urban and small rural centres (these differences were not statistically significant).
Among the Mid-aged women about 24% had ever had an abnormal Pap test (i.e. the same percentage as the Younger women) and there were few differences either between Surveys or among centres (Figure 5.5 and Figure 5.6).
e) Ease of access to Pap tests
Figure 5.7 Ease of access to Pap tests by time: data from Surveys 2 and 3 for the Younger women and Surveys 2, 3 and 4 for the Mid-aged women.

82
Figure 5.8 Ease of access to Pap tests by area: data from Survey 3 (2003) for the Younger women and Survey 4 (2004) for the Mid-aged women.
From Survey 2 women were asked about ease of access to Pap tests – see Figure 5.7 and Figure 5.8. Among the Younger women the percentage who rated their ease of access as “excellent” declined from 33.8% to 26.8% from Survey 2 to Survey 3. Among the Mid-aged women the percentage who rated their access as “excellent” also declined from 48% at Survey 2 and 3 to 44% at Survey 4. These changes were statistically significant and consistent across both age groups which suggests that ease of access to Pap tests did indeed decline. Figure 5.8 shows that ease of access was poorer in small rural and remote areas. Barriers to access were not explored in detail by the ALSWH but the results shown here are consistent with reductions in bulk-billing.
f) Discussion of trends in Pap testing
The collection of data on hysterectomies allows the ALSWH to provide valuable information on Pap testing in the population at risk in a way that is not possible from most other data sources. The data indicate that around 12% of Mid-aged women reported not having Pap tests within the recommended two-year screening interval. Allowing for some inaccuracy in self-report this percentage may be an underestimate. Also, when the proportions of women who have had a hysterectomy are discounted, then the proportions of eligible women in this cohort who were not having Pap tests within the last two years increased with age.
The data for Younger women are confounded by the issue of sexual activity, and whether the women were indeed at-risk of cervical cancer due to potential exposure to HPV infection. While the uptake of sexual activity may explain the declining proportions of those who had never had a Pap test, there remained a large proportion
83
of women in their late 20’s who had either never had a Pap test or who were overdue for screening. Furthermore, the proportion of women who were overdue for screening increased as these women age and as the risk of cervical cancer increased.
The proportion of women who were overdue for testing was highest among Younger women in small rural areas. However, organisation of Pap testing varies across jurisdictions. In this Study, the proportions of women classified as living in urban, large rural, small rural and other rural and remote locations varies across States and Territories. This makes interpretation of Pap testing data by area difficult. About 24% of women (Younger or Mid-aged across all areas) reported ever having had an abnormal Pap test. According to recently approved NHMRC guidelines Screening to Prevent Cervical Cancer: Guidelines for the Management of Asymptomatic Women with Screen Detected Abnormalities (the Guidelines), an abnormal Pap test result is most likely to be due to a HPV infection which will resolve naturally without intervention, or it may be due to pre-cancerous cells or cancer. The Guidelines, which aim to address possible over-investigation of women with abnormal findings, was implemented from July 2006.
The reported decline in ease of access to Pap tests in more recent times and in smaller rural centres suggests that costs and lack of bulk-billing may be contributing factors but further investigation would be needed to confirm or reject this possible explanation.
5.5 Mammography a) Introduction
Women in the Mid-aged cohort were asked about mammography in all surveys; however questions were only consistent across Surveys 1, 3 and 4. During this period women moved into the age range recommended for screening (they were aged 45-50 at Survey 1, 47-52 at Survey 2, 50-55 at Survey 3 and 53-58 at Survey 4).
b) Time trends in mammography
Figure 5.9 illustrates the increasing uptake of mammography as women reach the age of 50 years when screening is recommended. By Survey 4 in 2004 only 5% reported never being screened and about 13% reported last being screened more than 2 years ago.
At Survey 3 19% reported ever having had an abnormal mammogram and this increased to 23% by Survey 4.
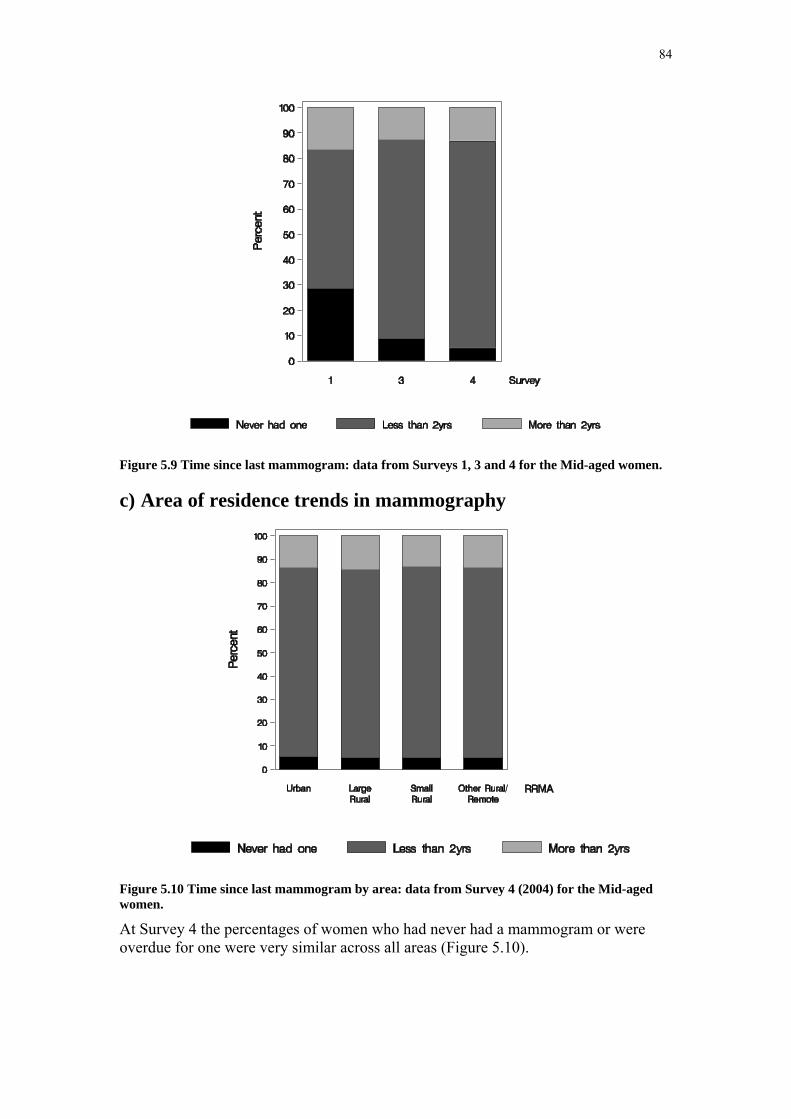
84
Figure 5.9 Time since last mammogram: data from Surveys 1, 3 and 4 for the Mid-aged women.
c) Area of residence trends in mammography
Figure 5.10 Time since last mammogram by area: data from Survey 4 (2004) for the Mid-aged women.
At Survey 4 the percentages of women who had never had a mammogram or were overdue for one were very similar across all areas (Figure 5.10).

85
d) Ease of access to mammography
Figure 5.11 Ease of access to mammography services by time: data from Surveys 2, 3 and 4 for the Mid-aged women.
Figure 5.12 Ease of access to mammography services by area: data from Survey 4 (2004) for the Mid-aged women.
Ease of access to mammography did not differ much across Surveys (Figure 5.11) but was rated poorer by women in smaller rural centres and remote areas (Figure 5.12).
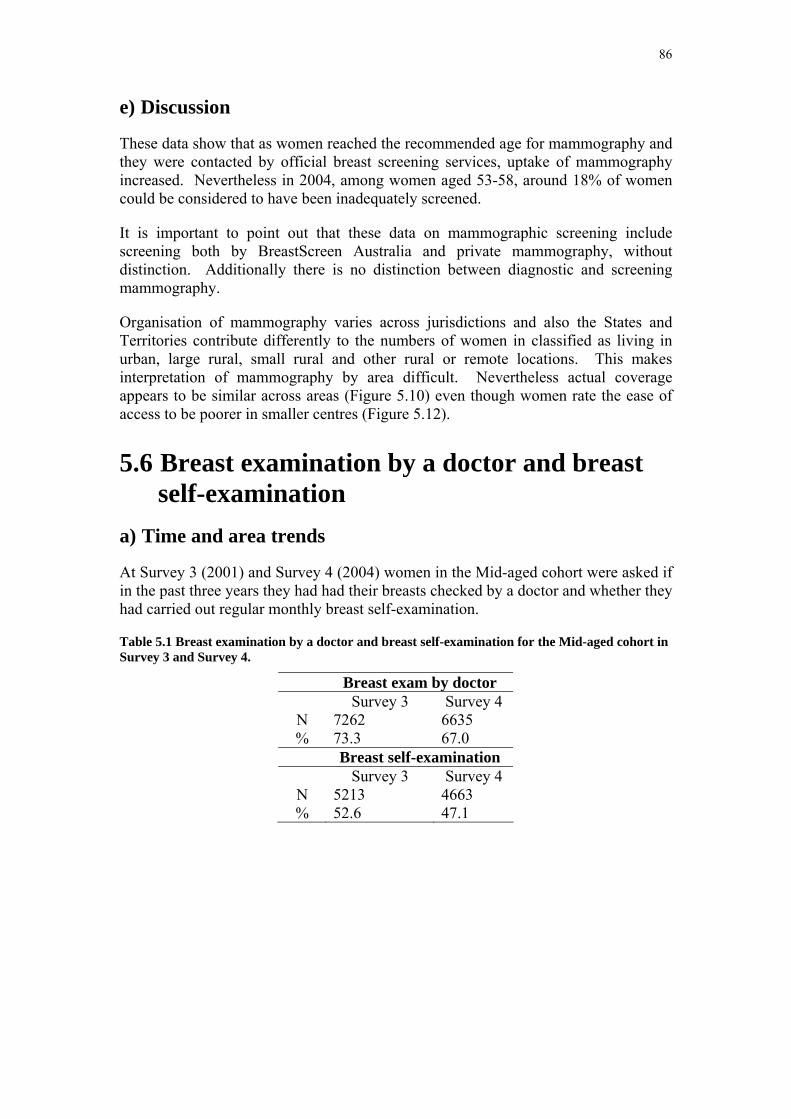
86
e) Discussion
These data show that as women reached the recommended age for mammography and they were contacted by official breast screening services, uptake of mammography increased. Nevertheless in 2004, among women aged 53-58, around 18% of women could be considered to have been inadequately screened.
It is important to point out that these data on mammographic screening include screening both by BreastScreen Australia and private mammography, without distinction. Additionally there is no distinction between diagnostic and screening mammography.
Organisation of mammography varies across jurisdictions and also the States and Territories contribute differently to the numbers of women in classified as living in urban, large rural, small rural and other rural or remote locations. This makes interpretation of mammography by area difficult. Nevertheless actual coverage appears to be similar across areas (Figure 5.10) even though women rate the ease of access to be poorer in smaller centres (Figure 5.12).
5.6 Breast examination by a doctor and breast self-examination
a) Time and area trends
At Survey 3 (2001) and Survey 4 (2004) women in the Mid-aged cohort were asked if in the past three years they had had their breasts checked by a doctor and whether they had carried out regular monthly breast self-examination.
Table 5.1 Breast examination by a doctor and breast self-examination for the Mid-aged cohort in Survey 3 and Survey 4.
Breast exam by doctor Survey 3 Survey 4
N 7262 6635 % 73.3 67.0 Breast self-examination Survey 3 Survey 4
N 5213 4663 % 52.6 47.1
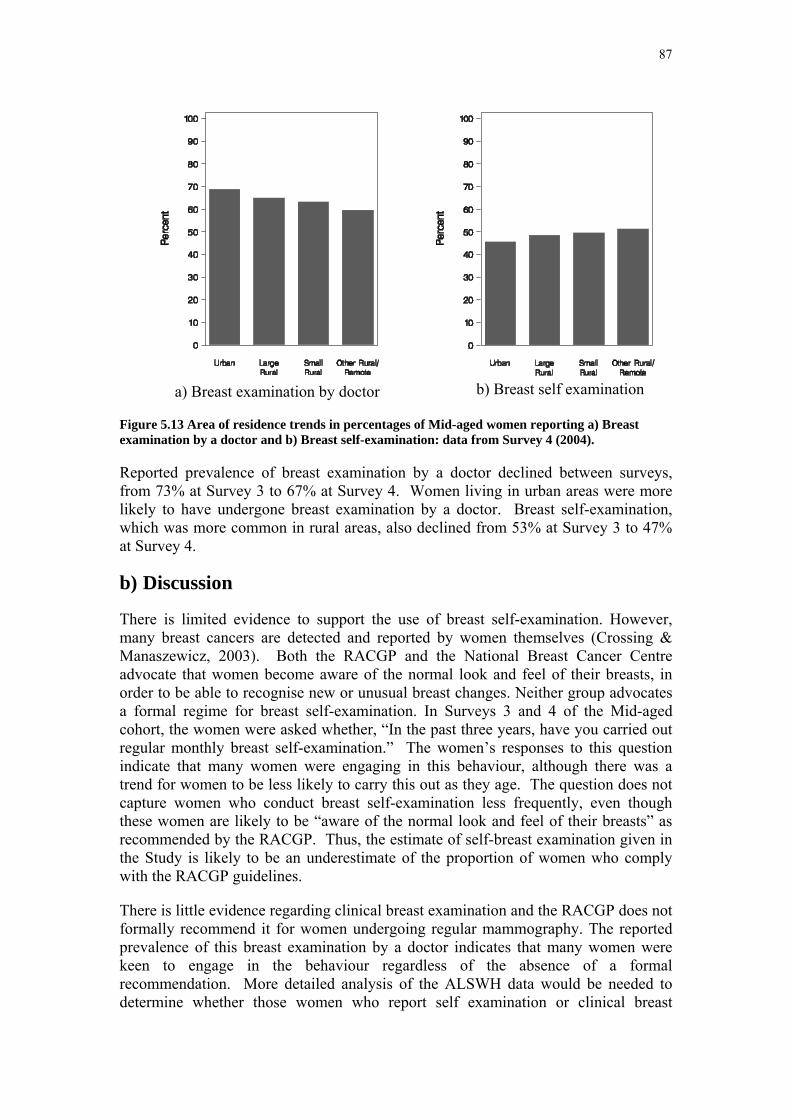
87
a) Breast examination by doctor
Figure 5.13 Area of residence trends in percentages of Mid-aged women reporting a) Breast examination by a doctor and b) Breast self-examination: data from Survey 4 (2004).
Reported prevalence of breast examination by a doctor declined between surveys, from 73% at Survey 3 to 67% at Survey 4. Women living in urban areas were more likely to have undergone breast examination by a doctor. Breast self-examination, which was more common in rural areas, also declined from 53% at Survey 3 to 47% at Survey 4.
b) Discussion
There is limited evidence to support the use of breast self-examination. However, many breast cancers are detected and reported by women themselves (Crossing & Manaszewicz, 2003). Both the RACGP and the National Breast Cancer Centre advocate that women become aware of the normal look and feel of their breasts, in order to be able to recognise new or unusual breast changes. Neither group advocates a formal regime for breast self-examination. In Surveys 3 and 4 of the Mid-aged cohort, the women were asked whether, “In the past three years, have you carried out regular monthly breast self-examination.” The women’s responses to this question indicate that many women were engaging in this behaviour, although there was a trend for women to be less likely to carry this out as they age. The question does not capture women who conduct breast self-examination less frequently, even though these women are likely to be “aware of the normal look and feel of their breasts” as recommended by the RACGP. Thus, the estimate of self-breast examination given in the Study is likely to be an underestimate of the proportion of women who comply with the RACGP guidelines.
There is little evidence regarding clinical breast examination and the RACGP does not formally recommend it for women undergoing regular mammography. The reported prevalence of this breast examination by a doctor indicates that many women were keen to engage in the behaviour regardless of the absence of a formal recommendation. More detailed analysis of the ALSWH data would be needed to determine whether those women who report self examination or clinical breast
b) Breast self examination
88
examination were the same women who also had regular mammograms or if these less effective methods were being used instead of mammography.
5.7 References Crossing, S., Manaszewicz, R. (2003), Breast self examination: be alert but not alarmed? Med J Aust, 178 (12): 646-647

89
Section 6: Health service use
6.1 Key findings • Use of health services by women is based on self-reported data from 2000-
2004 and generally increased over time in all three age cohorts.
• Increasing use of health care services by Younger women was probably related to need for pregnancy-related health care.
• Among Younger women, rates of use of general practitioners and specialists were similar in urban and non-urban areas.
• Mid-aged women were the lowest users of health care services and the Older women were the highest users.
• Among Mid-aged and Older women, consultations with GPs and specialist medical practitioners were more frequent for women living in urban areas.
• The percentage of Younger women admitted to hospital increased with increasing remoteness due to obstetric related admissions.
• There were no differences in the percentage of Mid-aged and Older women admitted to hospital according to area of residence.
• Almost half the Mid-aged women visited the same GP and the same GP practice always or most of the time
• Only one quarter of Younger women visited the same GP and the same place always or most of the time.
• Continuity of GP care was generally better in non-urban areas, particularly for women living in large rural centres.
• Younger women tended to be the most dissatisfied with health care services, followed by Mid-aged women and Older women.
• Access to a GP who bulk billed became worse over time, particularly among Younger and Mid-aged women.
• Levels of dissatisfaction with access to a GP who bulk billed doubled among Younger women (from 25% to 50%) and Mid-aged women (from 20% to 40%) over the time period studied.
• Access to a GP who bulk billed was significantly worse for women living in non-urban areas than urban areas, for all age groups.
• Being able to see the GP of choice became more difficult over time among all age groups.
• One in three of the Younger women found it difficult to see the GP of their choice.
• Being able to see the GP of choice was more difficult for women in non-urban areas and became worse as remoteness increased.

90
6.2 General practice consultations
6.2.1 Introduction General medical practice is the first point of contact for access to most health services in Australia. General practitioners (GPs) provide a range of primary care services and referral to consultant physicians and specialists. Patients can visit any GP at any time - they are not committed to one practice, practitioner or location. In the ALSWH surveys women were asked how many times they had consulted a family doctor or another general practitioner (GP) for their own health in the last 12 months. The figures presented in this section show the percentage of women who reported having consulted a GP more than four times in the previous year.
6.2.2 Time trends Figure 6.1 shows that the Older women reported more frequent GP visits as they age. Lowest use was reported among Mid-aged women. The percentage of Younger women who reported more than four visits has increased over time, and may reflect their need for pregnancy-related health services.
Figure 6.1 Percentage of women who reported having more than four GP consultations in the previous year in each cohort by survey from 1996 to 2004.
6.2.3 Area of residence trends Figure 6.2 shows the percentage of women who reported more than four GP consultations by their area of residence. Mid-aged and Older women in urban areas tended to report higher use of GP services than women in non-urban areas.

91
Figure 6.2 Percentage of women who reported having more than four GP consultations in the previous year in each cohort, by area of residence; data from 2003 for the Younger, from 2004 for the Mid-aged and from 2002 for the Older cohort.
6.3 Specialist consultations
6.3.1 Introduction The geographic maldistribution of medical practitioners in Australia has been identified as a key medical workforce issue. The imbalance in the distribution of practitioners applies to many specialties as well as general practice. There is a “critical mass” of the population which is necessary to support specialist practitioners, and this restricts distribution in non-urban areas. A number of policies and programs have been implemented by both government and professional bodies with the aim of redressing specialist shortages. In the ALSWH surveys women were asked whether they had consulted a specialist doctor for their own health in the last 12 months. The figures presented in this section show the percentage of women who reported having consulted a specialist at least once in the previous year.
6.3.2 Time trends Figure 6.3 shows the increasing use of specialists reported by Younger women as they aged and moved through their reproductive years. Reported use of specialists by Mid-aged women also increased over the last two surveys. Around half the Older women reported having consulted a specialist in the last year.
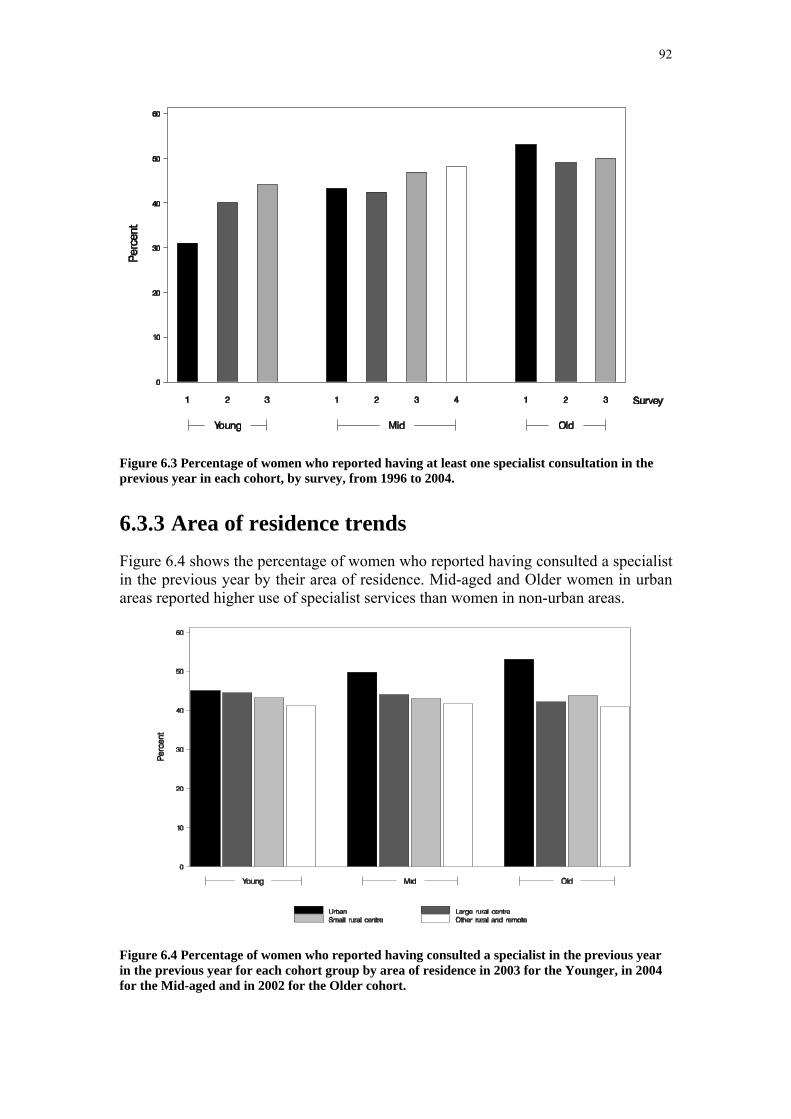
92
Figure 6.3 Percentage of women who reported having at least one specialist consultation in the previous year in each cohort, by survey, from 1996 to 2004.
6.3.3 Area of residence trends Figure 6.4 shows the percentage of women who reported having consulted a specialist in the previous year by their area of residence. Mid-aged and Older women in urban areas reported higher use of specialist services than women in non-urban areas.
Figure 6.4 Percentage of women who reported having consulted a specialist in the previous year in the previous year for each cohort group by area of residence in 2003 for the Younger, in 2004 for the Mid-aged and in 2002 for the Older cohort.

93
6.4 Admission to hospital
6.4.1 Introduction In the ALSWH surveys women were asked whether they had been admitted to hospital in the last 12 months. The figures presented in this section show the percentage of women who reported having been admitted to hospital in the previous year. Note that this question was only asked at Survey 1 for the Mid-aged cohort. Younger women were asked a more detailed question in Survey 2 and Survey 3 about whether they had been admitted to hospital in the last 12 months for normal childbirth, problems during pregnancy or for other reasons.
6.4.2 Time trends
Figure 6.5 Percentage of women who reported having been admitted to hospital in the previous year for each cohort group by survey from 1996 to 2004.
Figure 6.5 shows the increasing percentage of Older women reported having been admitted to hospital as they age. The Younger women also were more likely to report having been admitted to hospital by Survey 3 than in the earlier surveys, with 10% reported having been admitted for a normal childbirth.
6.4.3 Area of residence trends There was no significant difference across area of residence in the percentage of Mid-aged and Older women who reported having been admitted to hospital. Admission to hospital reported among Younger women was strongly related to area of residence (Figure 6.6). Among Younger women, being hospitalised was associated with having children. The percentage of Younger women who reported having been admitted to
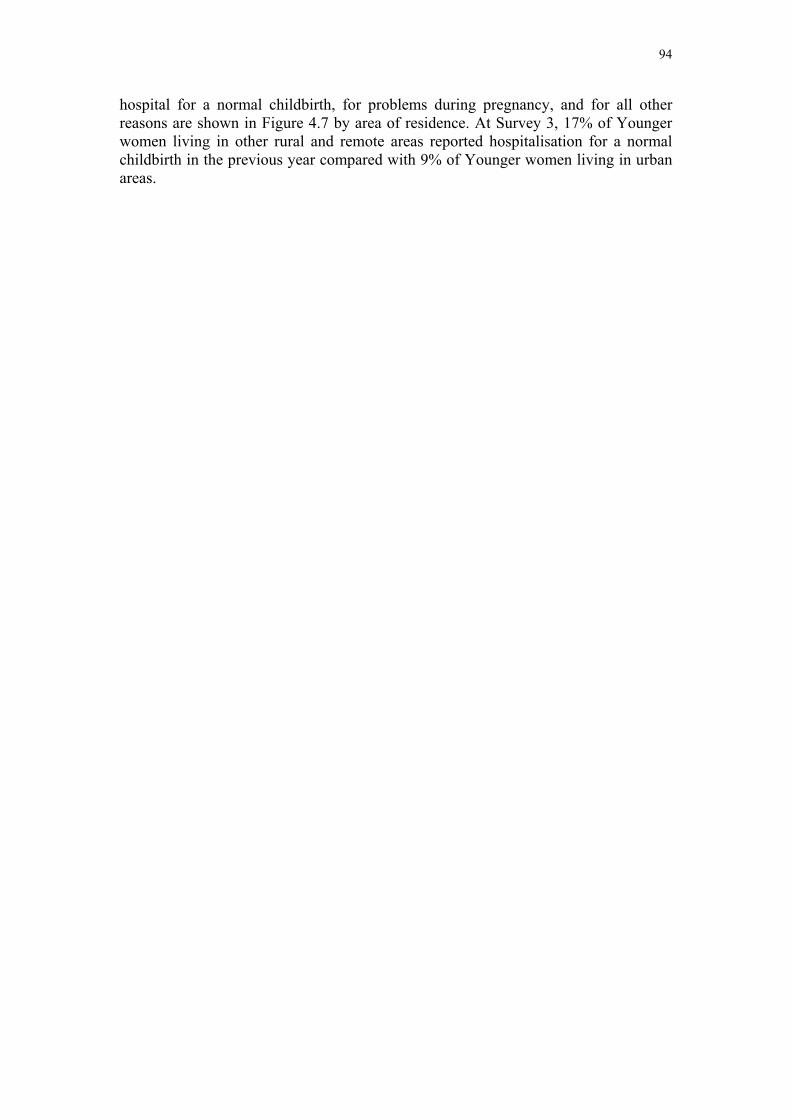
94
hospital for a normal childbirth, for problems during pregnancy, and for all other reasons are shown in Figure 4.7 by area of residence. At Survey 3, 17% of Younger women living in other rural and remote areas reported hospitalisation for a normal childbirth in the previous year compared with 9% of Younger women living in urban areas.
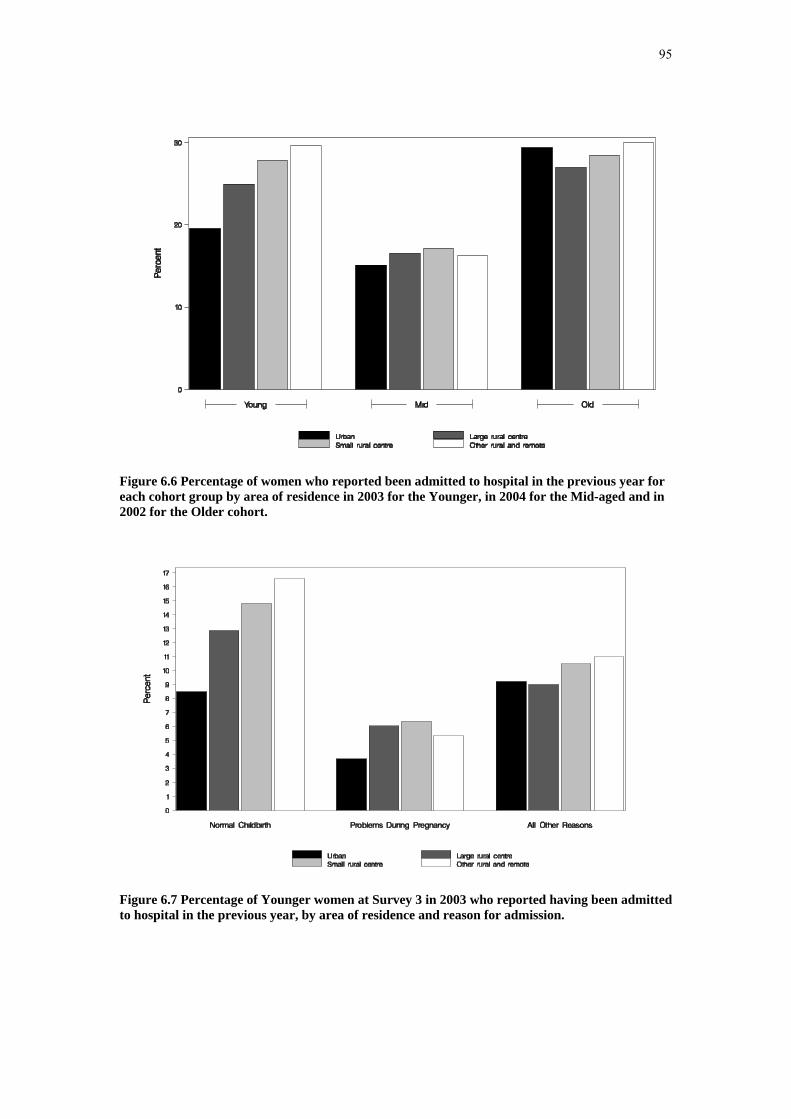
95
Figure 6.6 Percentage of women who reported been admitted to hospital in the previous year for each cohort group by area of residence in 2003 for the Younger, in 2004 for the Mid-aged and in 2002 for the Older cohort.
Figure 6.7 Percentage of Younger women at Survey 3 in 2003 who reported having been admitted to hospital in the previous year, by area of residence and reason for admission.
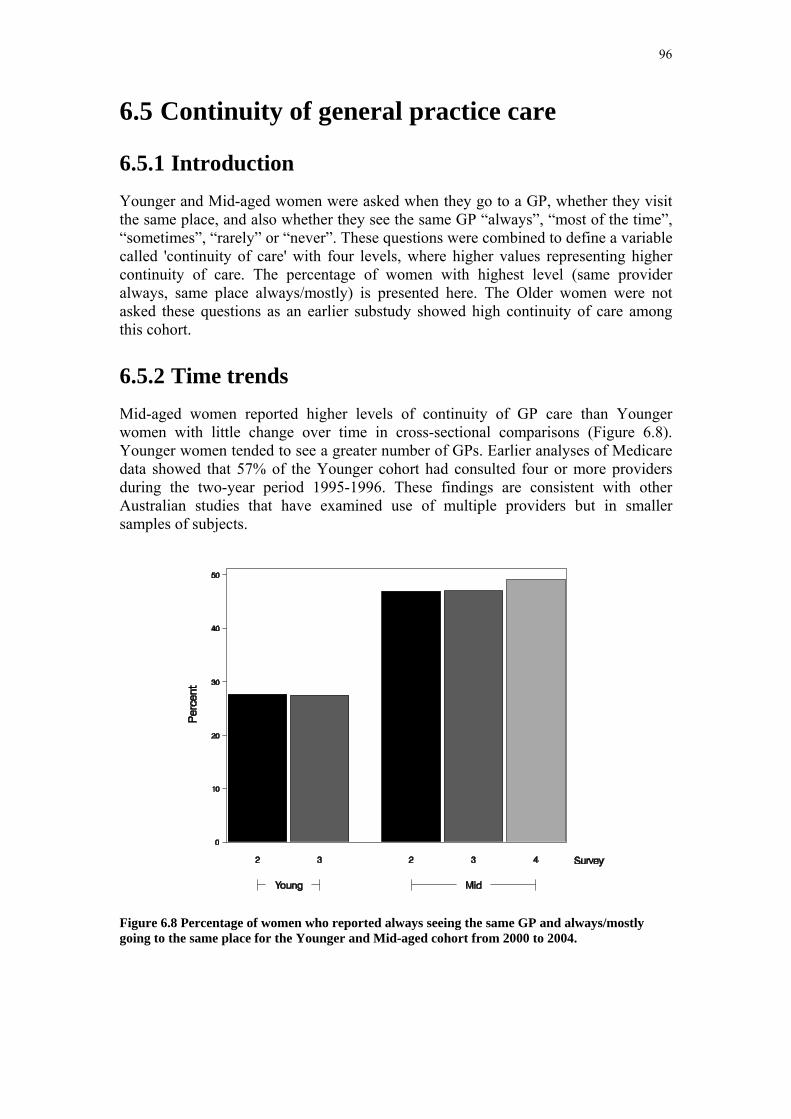
96
6.5 Continuity of general practice care
6.5.1 Introduction Younger and Mid-aged women were asked when they go to a GP, whether they visit the same place, and also whether they see the same GP “always”, “most of the time”, “sometimes”, “rarely” or “never”. These questions were combined to define a variable called 'continuity of care' with four levels, where higher values representing higher continuity of care. The percentage of women with highest level (same provider always, same place always/mostly) is presented here. The Older women were not asked these questions as an earlier substudy showed high continuity of care among this cohort.
6.5.2 Time trends Mid-aged women reported higher levels of continuity of GP care than Younger women with little change over time in cross-sectional comparisons (Figure 6.8). Younger women tended to see a greater number of GPs. Earlier analyses of Medicare data showed that 57% of the Younger cohort had consulted four or more providers during the two-year period 1995-1996. These findings are consistent with other Australian studies that have examined use of multiple providers but in smaller samples of subjects.
Figure 6.8 Percentage of women who reported always seeing the same GP and always/mostly going to the same place for the Younger and Mid-aged cohort from 2000 to 2004.
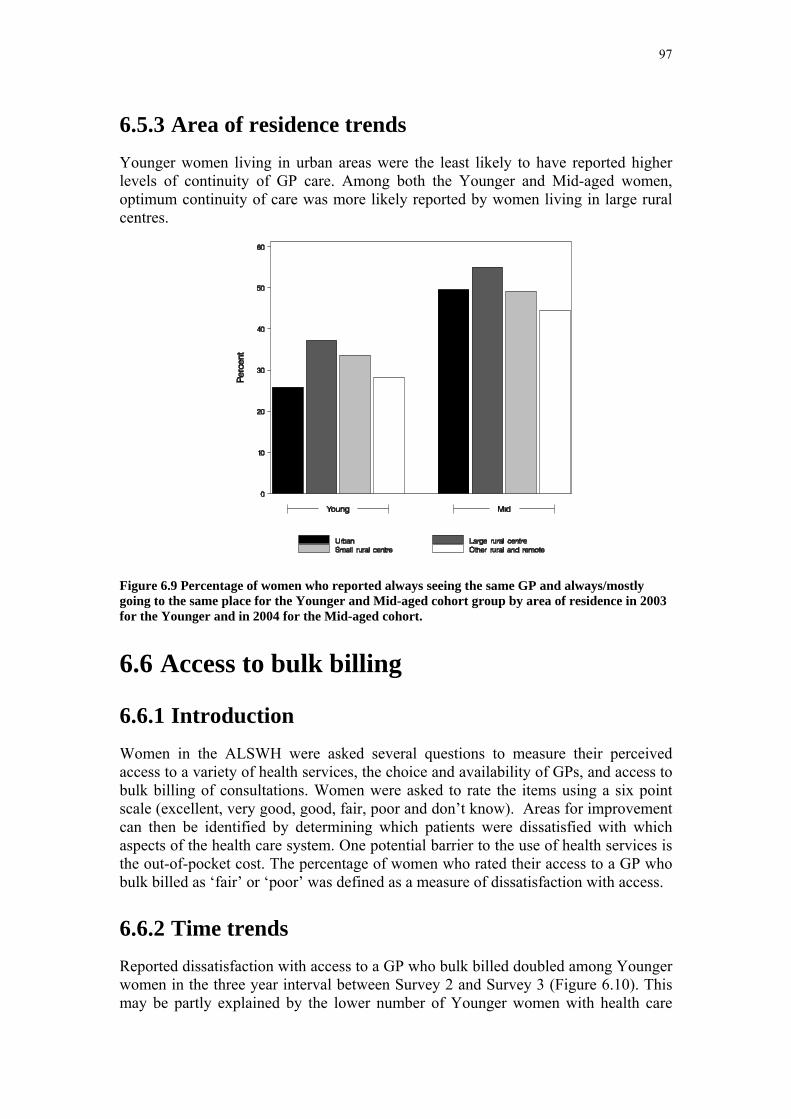
97
6.5.3 Area of residence trends Younger women living in urban areas were the least likely to have reported higher levels of continuity of GP care. Among both the Younger and Mid-aged women, optimum continuity of care was more likely reported by women living in large rural centres.
Figure 6.9 Percentage of women who reported always seeing the same GP and always/mostly going to the same place for the Younger and Mid-aged cohort group by area of residence in 2003 for the Younger and in 2004 for the Mid-aged cohort.
6.6 Access to bulk billing
6.6.1 Introduction Women in the ALSWH were asked several questions to measure their perceived access to a variety of health services, the choice and availability of GPs, and access to bulk billing of consultations. Women were asked to rate the items using a six point scale (excellent, very good, good, fair, poor and don’t know). Areas for improvement can then be identified by determining which patients were dissatisfied with which aspects of the health care system. One potential barrier to the use of health services is the out-of-pocket cost. The percentage of women who rated their access to a GP who bulk billed as ‘fair’ or ‘poor’ was defined as a measure of dissatisfaction with access.
6.6.2 Time trends Reported dissatisfaction with access to a GP who bulk billed doubled among Younger women in the three year interval between Survey 2 and Survey 3 (Figure 6.10). This may be partly explained by the lower number of Younger women with health care
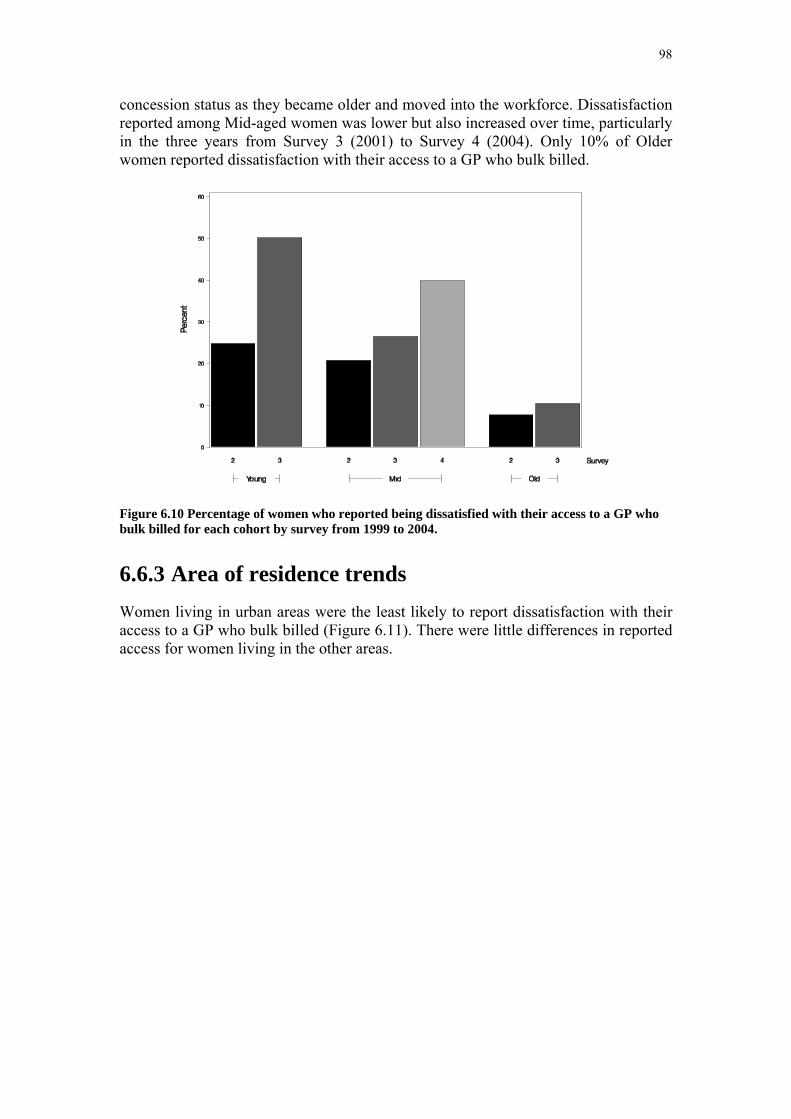
98
concession status as they became older and moved into the workforce. Dissatisfaction reported among Mid-aged women was lower but also increased over time, particularly in the three years from Survey 3 (2001) to Survey 4 (2004). Only 10% of Older women reported dissatisfaction with their access to a GP who bulk billed.
Figure 6.10 Percentage of women who reported being dissatisfied with their access to a GP who bulk billed for each cohort by survey from 1999 to 2004.
6.6.3 Area of residence trends Women living in urban areas were the least likely to report dissatisfaction with their access to a GP who bulk billed (Figure 6.11). There were little differences in reported access for women living in the other areas.

99
Figure 6.11 Percentage of women who reported being dissatisfied with their access to a GP who bulk billed for each cohort by area of residence in 2003 for the Younger and in 2004 for the Mid-aged cohort.
6.7 Rating of ease of seeing the GP of choice
6.7.1 Introduction Women in the ALSWH were asked to rate the ease of seeing the GP of their choice using a six point scale (excellent, very good, good, fair, poor and don’t know). The percentage of women who rated their access as ‘fair’ or ‘poor’ was defined as a measure of dissatisfaction.
6.7.2 Time trends Since Survey 2, women in all age groups reported an increased difficulty in seeing the GP of their choice. The most difficulty was expressed among Younger women, where more than one third reported to be dissatisfied at Survey 3 (2003) (Figure 6.12).
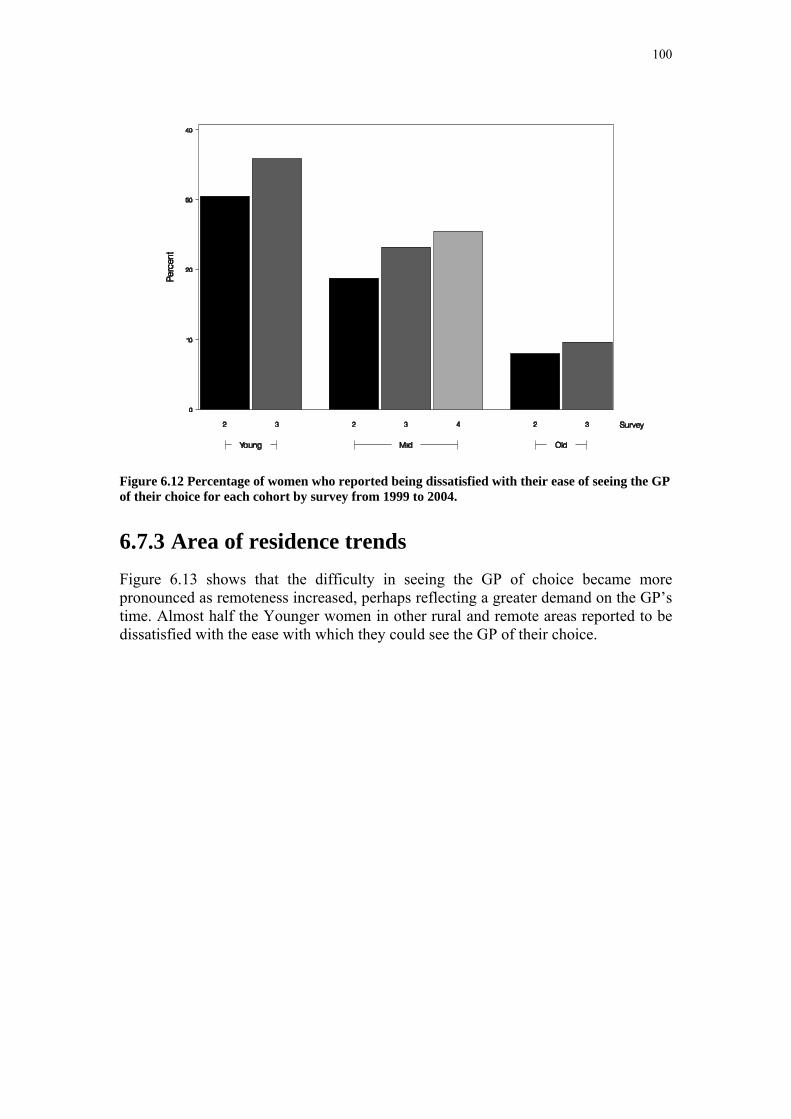
100
Figure 6.12 Percentage of women who reported being dissatisfied with their ease of seeing the GP of their choice for each cohort by survey from 1999 to 2004.
6.7.3 Area of residence trends Figure 6.13 shows that the difficulty in seeing the GP of choice became more pronounced as remoteness increased, perhaps reflecting a greater demand on the GP’s time. Almost half the Younger women in other rural and remote areas reported to be dissatisfied with the ease with which they could see the GP of their choice.
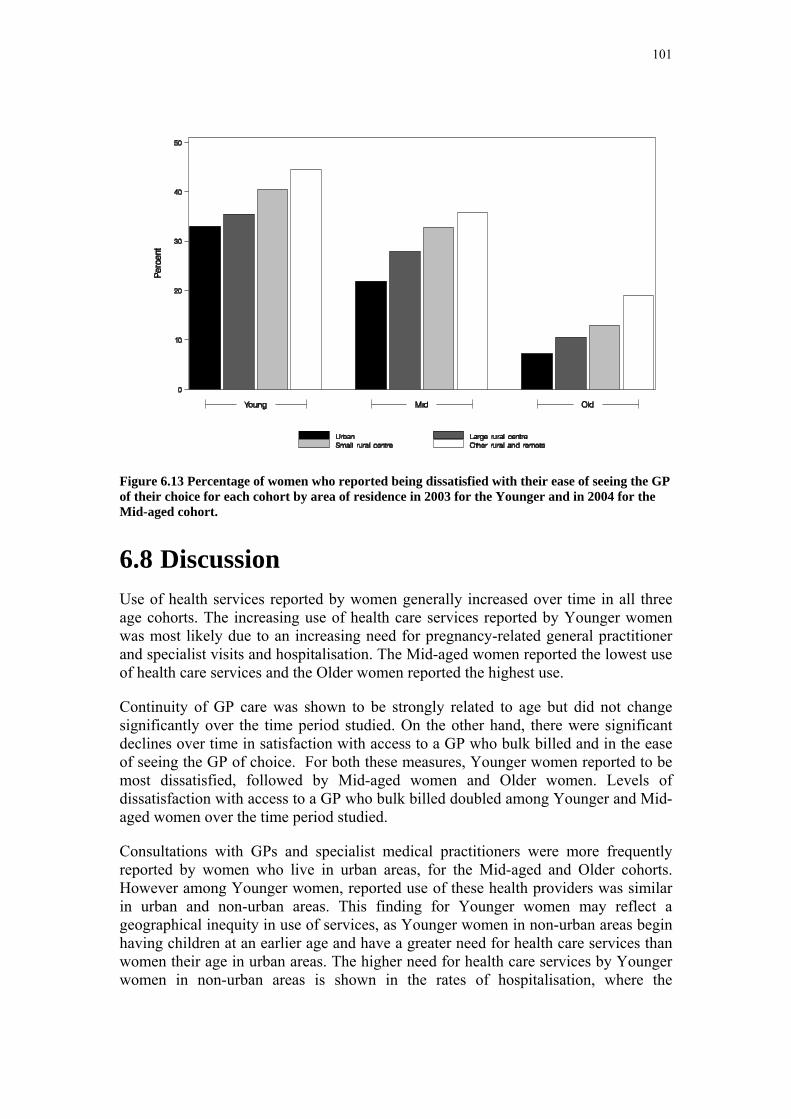
101
Figure 6.13 Percentage of women who reported being dissatisfied with their ease of seeing the GP of their choice for each cohort by area of residence in 2003 for the Younger and in 2004 for the Mid-aged cohort.
6.8 Discussion Use of health services reported by women generally increased over time in all three age cohorts. The increasing use of health care services reported by Younger women was most likely due to an increasing need for pregnancy-related general practitioner and specialist visits and hospitalisation. The Mid-aged women reported the lowest use of health care services and the Older women reported the highest use.
Continuity of GP care was shown to be strongly related to age but did not change significantly over the time period studied. On the other hand, there were significant declines over time in satisfaction with access to a GP who bulk billed and in the ease of seeing the GP of choice. For both these measures, Younger women reported to be most dissatisfied, followed by Mid-aged women and Older women. Levels of dissatisfaction with access to a GP who bulk billed doubled among Younger and Mid-aged women over the time period studied.
Consultations with GPs and specialist medical practitioners were more frequently reported by women who live in urban areas, for the Mid-aged and Older cohorts. However among Younger women, reported use of these health providers was similar in urban and non-urban areas. This finding for Younger women may reflect a geographical inequity in use of services, as Younger women in non-urban areas begin having children at an earlier age and have a greater need for health care services than women their age in urban areas. The higher need for health care services by Younger women in non-urban areas is shown in the rates of hospitalisation, where the

102
percentage of Younger women who reported to be admitted to hospital increased with increasing remoteness.
There were no differences in the percentage of Mid-aged and Older women who reported to be admitted to hospital according to area of residence, although Older women were more likely than Mid-aged women to report having been hospitalised. Continuity of GP care was generally better in non-urban areas, particularly for women living in large rural centres. Only one quarter of Younger women in urban areas reported having visited the same GP and the same place most of the time compared with more than half the Mid-aged women living in large rural centres.
Reported access to a GP who bulk billed was significantly better for women living in urban areas than non-urban areas, for all age groups. However the level of satisfaction was also strongly related to age, with Older women being the most satisfied. Being able to see the GP of choice was reported to be more difficult for women in non-urban areas and the dissatisfaction was strongly related to the degree of remoteness of the area of residence.
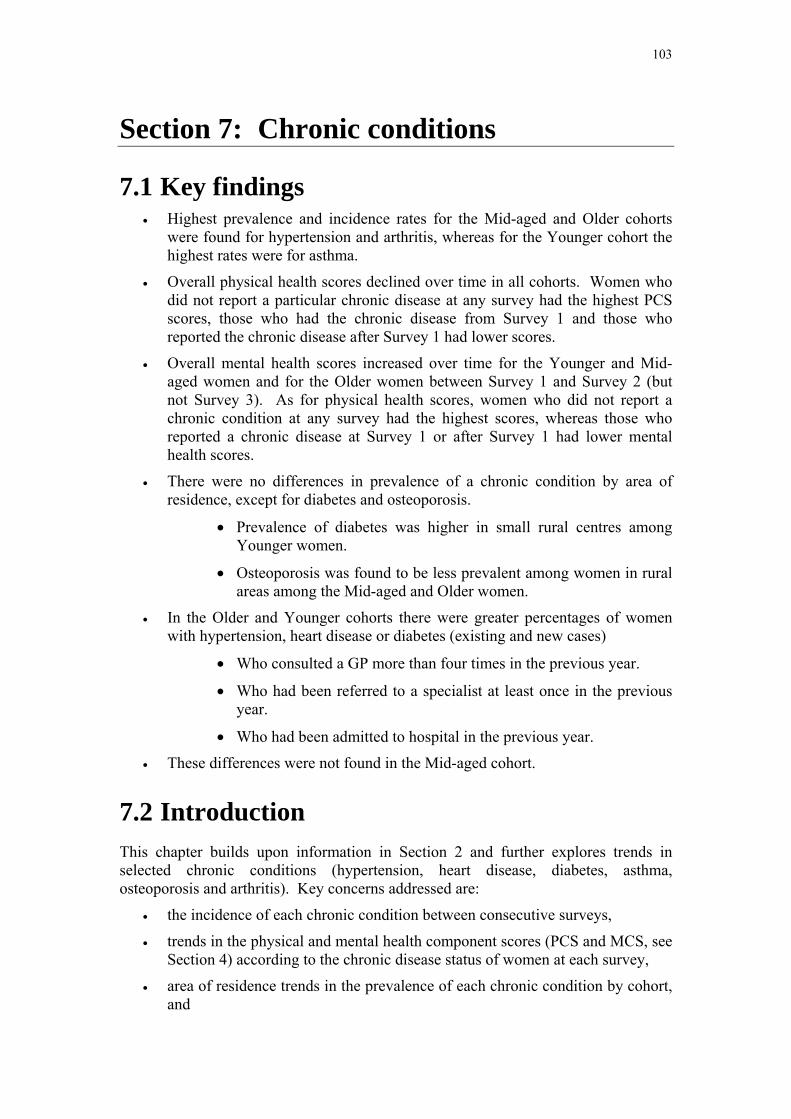
103
Section 7: Chronic conditions
7.1 Key findings • Highest prevalence and incidence rates for the Mid-aged and Older cohorts
were found for hypertension and arthritis, whereas for the Younger cohort the highest rates were for asthma.
• Overall physical health scores declined over time in all cohorts. Women who did not report a particular chronic disease at any survey had the highest PCS scores, those who had the chronic disease from Survey 1 and those who reported the chronic disease after Survey 1 had lower scores.
• Overall mental health scores increased over time for the Younger and Mid-aged women and for the Older women between Survey 1 and Survey 2 (but not Survey 3). As for physical health scores, women who did not report a chronic condition at any survey had the highest scores, whereas those who reported a chronic disease at Survey 1 or after Survey 1 had lower mental health scores.
• There were no differences in prevalence of a chronic condition by area of residence, except for diabetes and osteoporosis.
• Prevalence of diabetes was higher in small rural centres among Younger women.
• Osteoporosis was found to be less prevalent among women in rural areas among the Mid-aged and Older women.
• In the Older and Younger cohorts there were greater percentages of women with hypertension, heart disease or diabetes (existing and new cases)
• Who consulted a GP more than four times in the previous year.
• Who had been referred to a specialist at least once in the previous year.
• Who had been admitted to hospital in the previous year.
• These differences were not found in the Mid-aged cohort.
7.2 Introduction This chapter builds upon information in Section 2 and further explores trends in selected chronic conditions (hypertension, heart disease, diabetes, asthma, osteoporosis and arthritis). Key concerns addressed are:
• the incidence of each chronic condition between consecutive surveys,
• trends in the physical and mental health component scores (PCS and MCS, see Section 4) according to the chronic disease status of women at each survey,
• area of residence trends in the prevalence of each chronic condition by cohort, and

104
• health service use according to chronic disease status.
Where trends were explored according to chronic disease status, namely the PCS and MCS trends and also the health service use trends, the following definition was employed. Chronic disease status was defined by three categories: women who reported not having the disease (never case), women who were diagnosed with the disease since Survey 1 (new case), and women who were diagnosed with the disease before Survey 1 (existing case) (Appendix 2:).
7.3 Hypertension
7.3.1 Prevalence Table 7.1 shows that the prevalence of hypertension at Survey 1 (rates of existing cases) increased substantially with age, especially between the Younger women (aged 18-23 at Survey 1) and the Mid-aged women (aged 45-50) at Survey 1.
7.3.2 Incidence The incidence of hypertension increased with age, with the highest incidence rate being observed among the Older women between Survey 2, when they were aged 73-78 years, and Survey 3 when they were aged 76-81 years (Table 7.1).
There was a relatively high incidence rate of hypertension among the Mid-aged women between Survey 1 and Survey 2, especially considering that there was only a two-year interval between these Surveys for the Mid-aged women. This higher incidence rate may have been due to a reporting anomaly caused by the change in the question format at Survey 2, or may represent more frequent measurement of blood pressure as women pass the age of 50 years.
Table 7.1 Incidence of Hypertension.
Cohort
Young Mid Old Hypertension
rate per
1000
rate per
1000
rate per
1000
Existing case 47.7 202.5 471.5
Incident S1-S2 15.5 51.7 92.0
Incident S2-S3 7.9 46.4 179.9
Incident S3-S4 . 51.4 .# Time period between Survey 1 and Survey 2 varies by cohort: 4 years between surveys for Younger women, 2 years between surveys for Mid-aged women, 3 years between surveys for Older women.
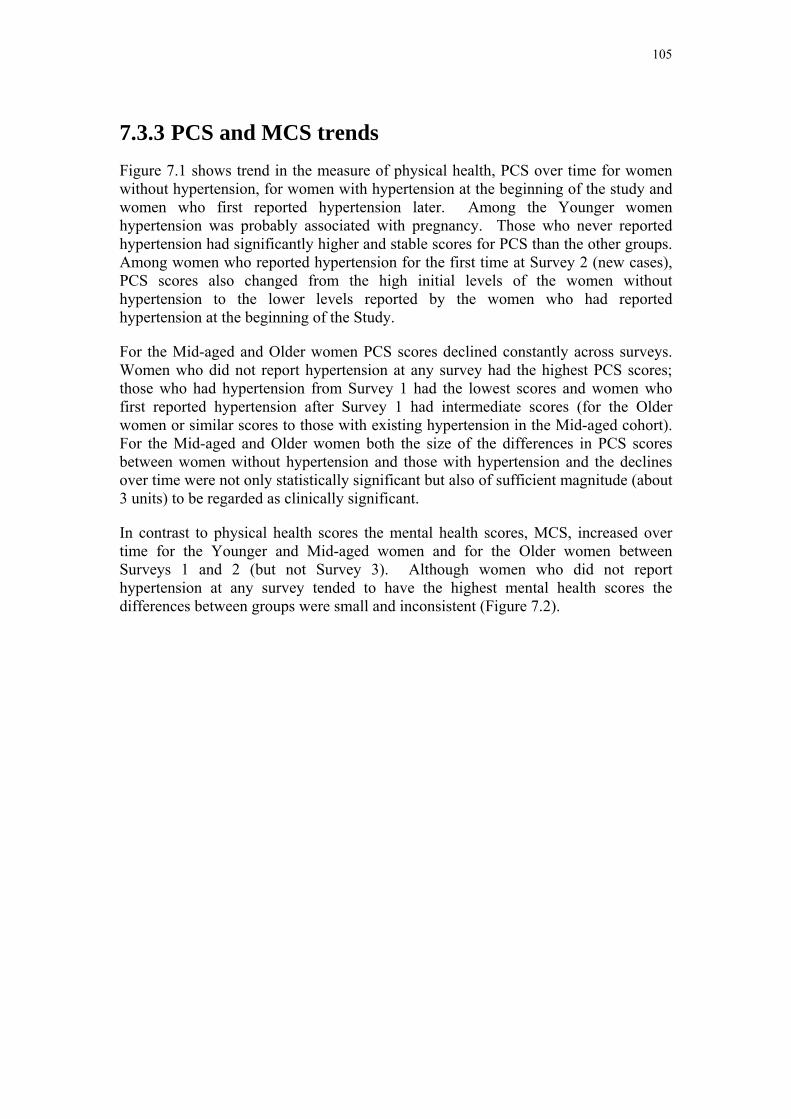
105
7.3.3 PCS and MCS trends Figure 7.1 shows trend in the measure of physical health, PCS over time for women without hypertension, for women with hypertension at the beginning of the study and women who first reported hypertension later. Among the Younger women hypertension was probably associated with pregnancy. Those who never reported hypertension had significantly higher and stable scores for PCS than the other groups. Among women who reported hypertension for the first time at Survey 2 (new cases), PCS scores also changed from the high initial levels of the women without hypertension to the lower levels reported by the women who had reported hypertension at the beginning of the Study.
For the Mid-aged and Older women PCS scores declined constantly across surveys. Women who did not report hypertension at any survey had the highest PCS scores; those who had hypertension from Survey 1 had the lowest scores and women who first reported hypertension after Survey 1 had intermediate scores (for the Older women or similar scores to those with existing hypertension in the Mid-aged cohort). For the Mid-aged and Older women both the size of the differences in PCS scores between women without hypertension and those with hypertension and the declines over time were not only statistically significant but also of sufficient magnitude (about 3 units) to be regarded as clinically significant.
In contrast to physical health scores the mental health scores, MCS, increased over time for the Younger and Mid-aged women and for the Older women between Surveys 1 and 2 (but not Survey 3). Although women who did not report hypertension at any survey tended to have the highest mental health scores the differences between groups were small and inconsistent (Figure 7.2).
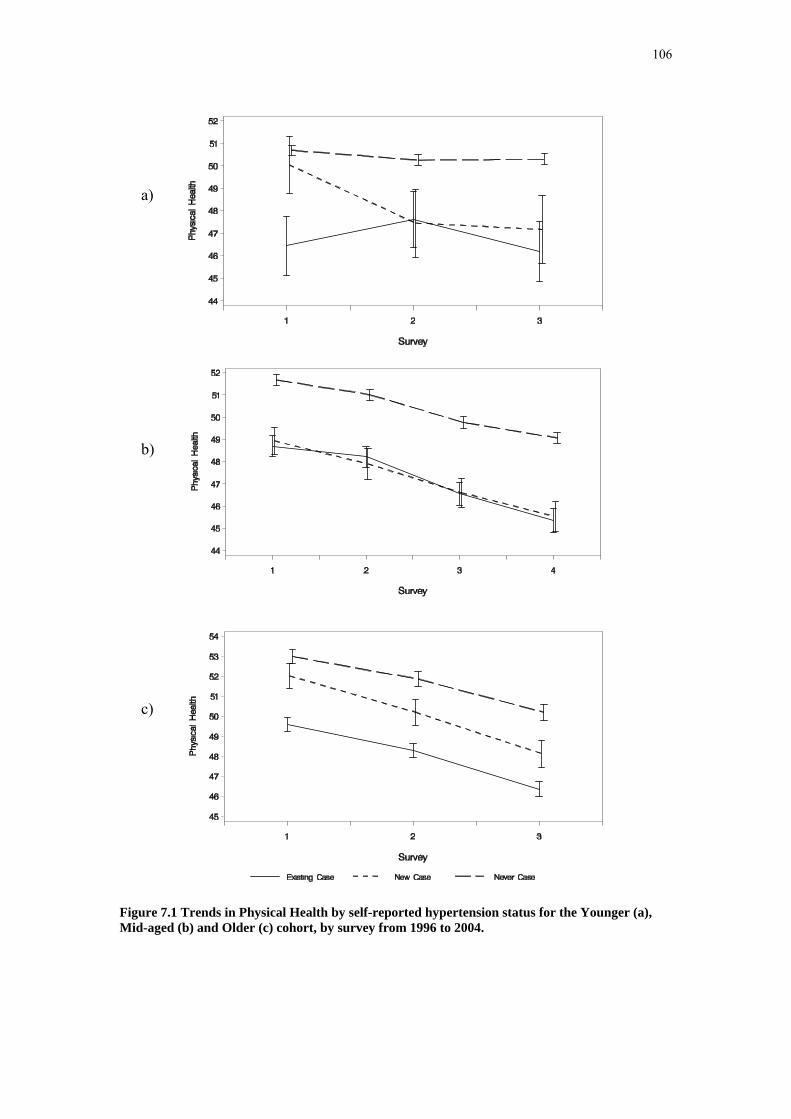
106
Figure 7.1 Trends in Physical Health by self-reported hypertension status for the Younger (a), Mid-aged (b) and Older (c) cohort, by survey from 1996 to 2004.
c)
a)
b)
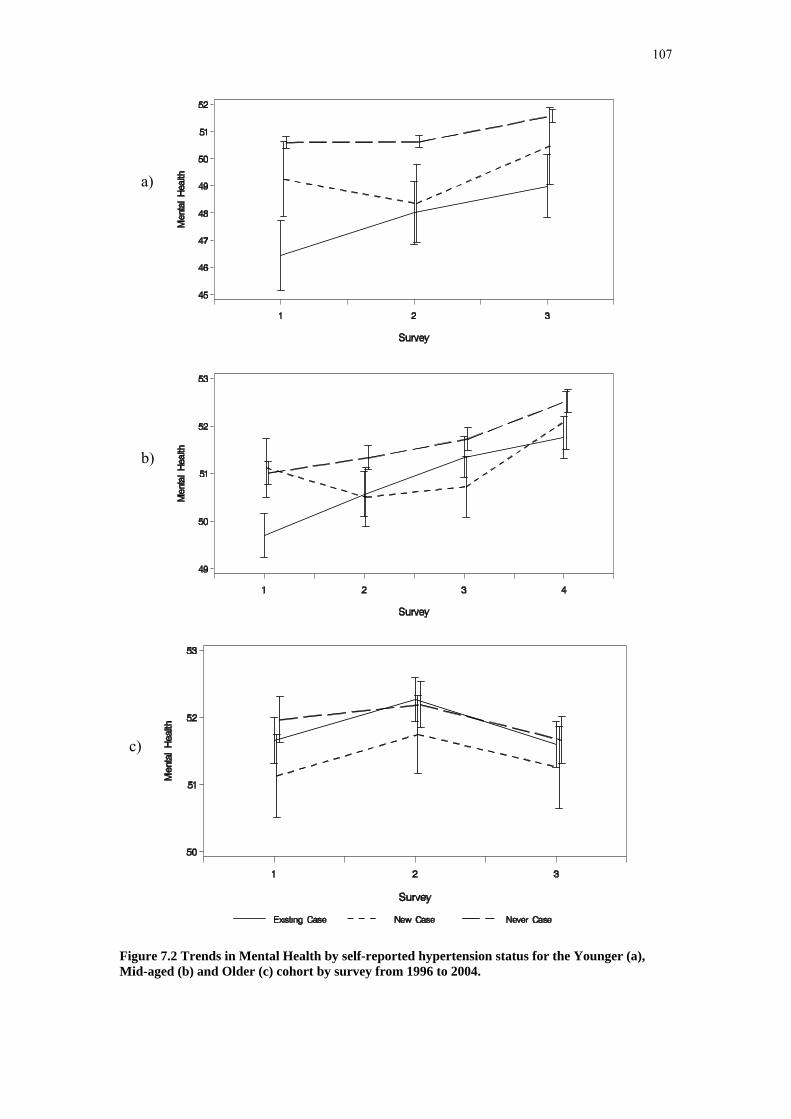
107
Figure 7.2 Trends in Mental Health by self-reported hypertension status for the Younger (a), Mid-aged (b) and Older (c) cohort by survey from 1996 to 2004.
c)
a)
b)

108
7.3.4 Area of residence trends
Figure 7.3 Prevalence of self-reported hypertension for each cohort group area of residence, in 2003 for the Younger, in 2004 for the Mid-aged and in 2002 for the Older cohorts.
There were no differences in the prevalence of hypertension at the most recent survey among women living in urban, rural or remote areas, for any of the age cohorts (Figure 7.3). The differences in prevalence between the cohorts reflect the prevalence and incidence rates shown in Table 7.1.
7.3.5 Health service use
a) General practice consultations
Figure 7.4 shows the percentage of women who had consulted a family doctor or another general practitioner (GP) more than four times in the previous year. There was a greater percentage of Younger and Older women with hypertension, both existing cases at Survey 1 and new cases, who consulted a GP more than four times in the previous year than women without hypertension. Use of GP services was highest by the Older women with hypertension, which may reflect comorbid conditions and complications of the disease.

109
Figure 7.4 Percentage of women who reported having more than four GP consultations in the previous year by hypertension status, in each cohort, from 1996 to 2004.
b) Specialist consultations
Figure 7.5 shows the percentage of women who reported having consulted a specialist at least once in the previous year, by their hypertension status. There were greater percentages of Younger and Older women with hypertension who had seen a specialist than those without hypertension, but no differences were found among Mid-aged women.

110
Figure 7.5 Percentage of women who reported having consulted a specialist in the previous year by hypertension status for each cohort group from 1996 to 2004.
c) Admission to hospital
Figure 7.6 shows the percentage of women who reported having been admitted to hospital in the previous year. Note that this question was only asked at Survey 1 for the Mid-aged cohort. Younger and Older women with hypertension were more likely to have been admitted to hospital than women without hypertension.
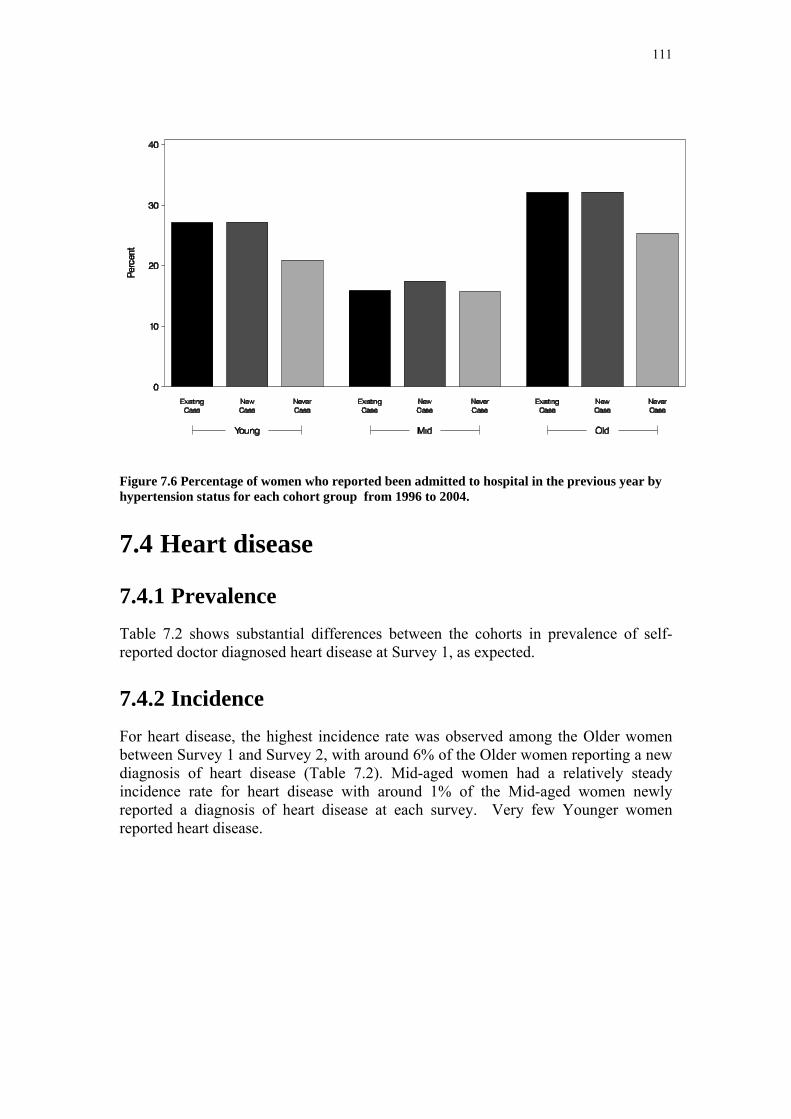
111
Figure 7.6 Percentage of women who reported been admitted to hospital in the previous year by hypertension status for each cohort group from 1996 to 2004.
7.4 Heart disease
7.4.1 Prevalence Table 7.2 shows substantial differences between the cohorts in prevalence of self-reported doctor diagnosed heart disease at Survey 1, as expected.
7.4.2 Incidence For heart disease, the highest incidence rate was observed among the Older women between Survey 1 and Survey 2, with around 6% of the Older women reporting a new diagnosis of heart disease (Table 7.2). Mid-aged women had a relatively steady incidence rate for heart disease with around 1% of the Mid-aged women newly reported a diagnosis of heart disease at each survey. Very few Younger women reported heart disease.
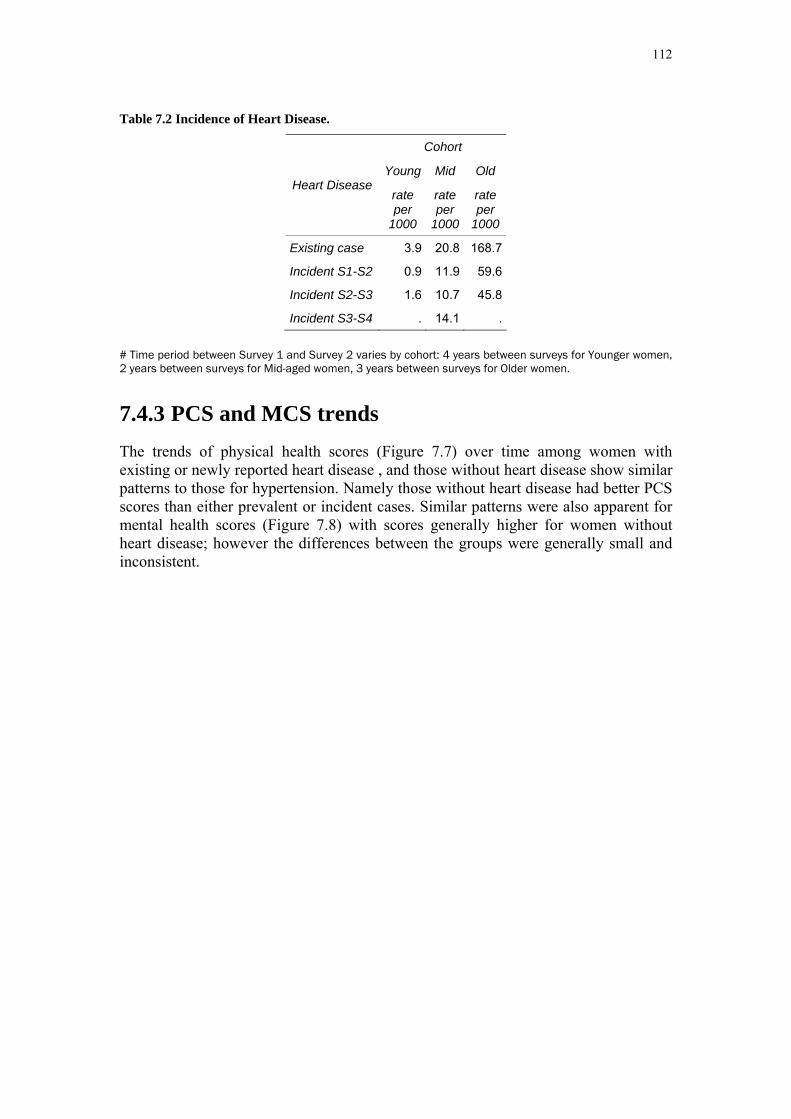
112
Table 7.2 Incidence of Heart Disease.
Cohort
Young Mid Old Heart Disease
rate per
1000
rate per
1000
rate per
1000
Existing case 3.9 20.8 168.7
Incident S1-S2 0.9 11.9 59.6
Incident S2-S3 1.6 10.7 45.8
Incident S3-S4 . 14.1 .
# Time period between Survey 1 and Survey 2 varies by cohort: 4 years between surveys for Younger women, 2 years between surveys for Mid-aged women, 3 years between surveys for Older women.
7.4.3 PCS and MCS trends The trends of physical health scores (Figure 7.7) over time among women with existing or newly reported heart disease , and those without heart disease show similar patterns to those for hypertension. Namely those without heart disease had better PCS scores than either prevalent or incident cases. Similar patterns were also apparent for mental health scores (Figure 7.8) with scores generally higher for women without heart disease; however the differences between the groups were generally small and inconsistent.

113
Figure 7.7 Trends in Physical Health by heart disease status for the Younger (a), Mid-aged (b) and Older (c) cohort, by survey from 1996 to 2004.
c)
a)
b)

114
Figure 7.8 Trends in Mental Health by heart disease status for the Younger (a), Mid-aged (b) and Older (c) cohort by survey from 1996 to 2004.
c)
a)
b)
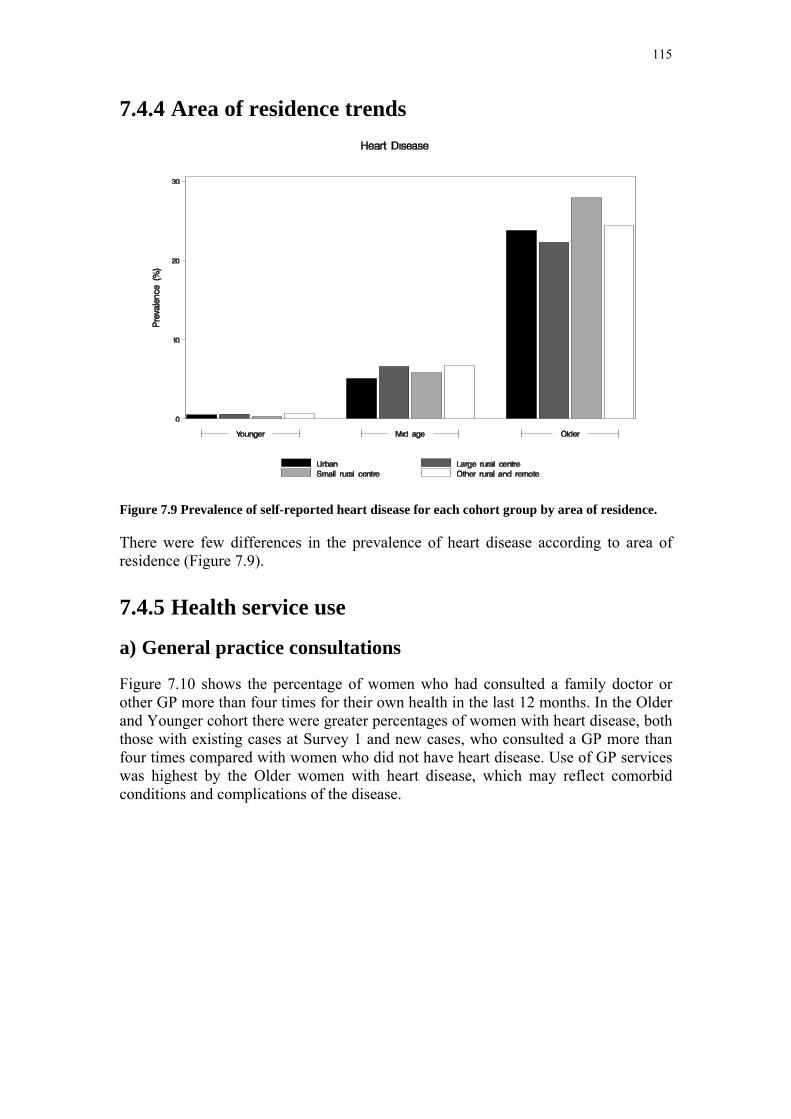
115
7.4.4 Area of residence trends
Figure 7.9 Prevalence of self-reported heart disease for each cohort group by area of residence.
There were few differences in the prevalence of heart disease according to area of residence (Figure 7.9).
7.4.5 Health service use
a) General practice consultations
Figure 7.10 shows the percentage of women who had consulted a family doctor or other GP more than four times for their own health in the last 12 months. In the Older and Younger cohort there were greater percentages of women with heart disease, both those with existing cases at Survey 1 and new cases, who consulted a GP more than four times compared with women who did not have heart disease. Use of GP services was highest by the Older women with heart disease, which may reflect comorbid conditions and complications of the disease.
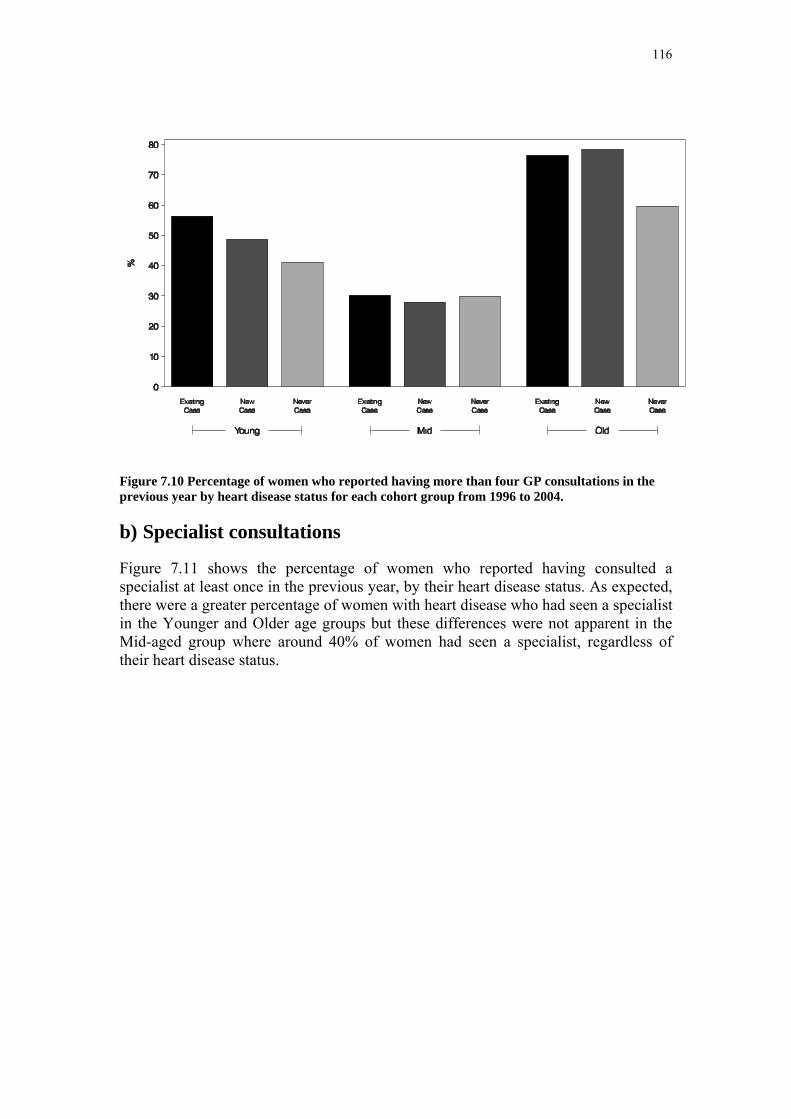
116
Figure 7.10 Percentage of women who reported having more than four GP consultations in the previous year by heart disease status for each cohort group from 1996 to 2004.
b) Specialist consultations
Figure 7.11 shows the percentage of women who reported having consulted a specialist at least once in the previous year, by their heart disease status. As expected, there were a greater percentage of women with heart disease who had seen a specialist in the Younger and Older age groups but these differences were not apparent in the Mid-aged group where around 40% of women had seen a specialist, regardless of their heart disease status.

117
Figure 7.11 Percentage of women who reported having consulted a specialist in the previous year by heart disease status for each cohort group by from 1996 to 2004.
c) Admission to hospital
Figure 7.12 shows the percentage of women who reported having been admitted to hospital in the previous year. Note that this question was only asked at Survey 1 for the Mid-aged cohort. There was a gradient in the percentage of Younger women admitted to hospital according to the time since their heart disease had been diagnosed, with women who reported the disease at Survey 1 being the most likely to have been in hospital.

118
Figure 7.12 Percentage of women who reported having been admitted to hospital in the previous year by heart disease status for each cohort group from 1996 to 2004.
7.5 Diabetes
7.5.1 Prevalence Prevalence of diabetes increased with age (see rates for existing cases in Table 7.3). this is of course as expected but the actual rates of prevalence and incidence could be affected to some extent by differences in wording of questions among surveys as increasing efforts were made to distinguish gestational diabetes, type I diabetes and type II diabetes.
7.5.2 Incidence The highest incidence rate for diabetes was observed among the Older women with 3% newly reporting diabetes between Survey 2 and Survey 3 (Table 7.3). The incidence rate was steady between surveys at under 1% per annum. A lower incidence rate was observed among Mid-aged women, and a much lower rate was observed among Younger women.

119
Table 7.3 Incidence of Diabetes.
Cohort
Young Mid Old Diabetes
rate per
1000
rate per
1000
rate per
1000
Existing case 9.6 29.4 87.4
Incident S1-S2 6.4 12.3 25.7
Incident S2-S3 3.4 11.8 30.6
Incident S3-S4 . 16.7 .
# Time period between Survey 1 and Survey 2 varies by cohort: 4 years between surveys for Younger women, 2 years between surveys for Mid-aged women, 3 years between surveys for Older women.
7.5.3 PCS and MCS trends Trends in physical and mental health scores (Figure 7.13 and Figure 7.14) for women without diabetes and prevalent and incident cases showed similar patterns for women who reported hypertension. Generally women who never reported diabetes had the highest scores; women who reported diabetes at Survey 1 had the lowest scores and women who first reported diabetes after Survey 1 had intermediate scores. However, the differences were more pronounced for physical health than for mental health. Also physical health scores tended to decline over time whereas mental health scores increased, except for the Older cohort between Survey 2 and Survey 3.
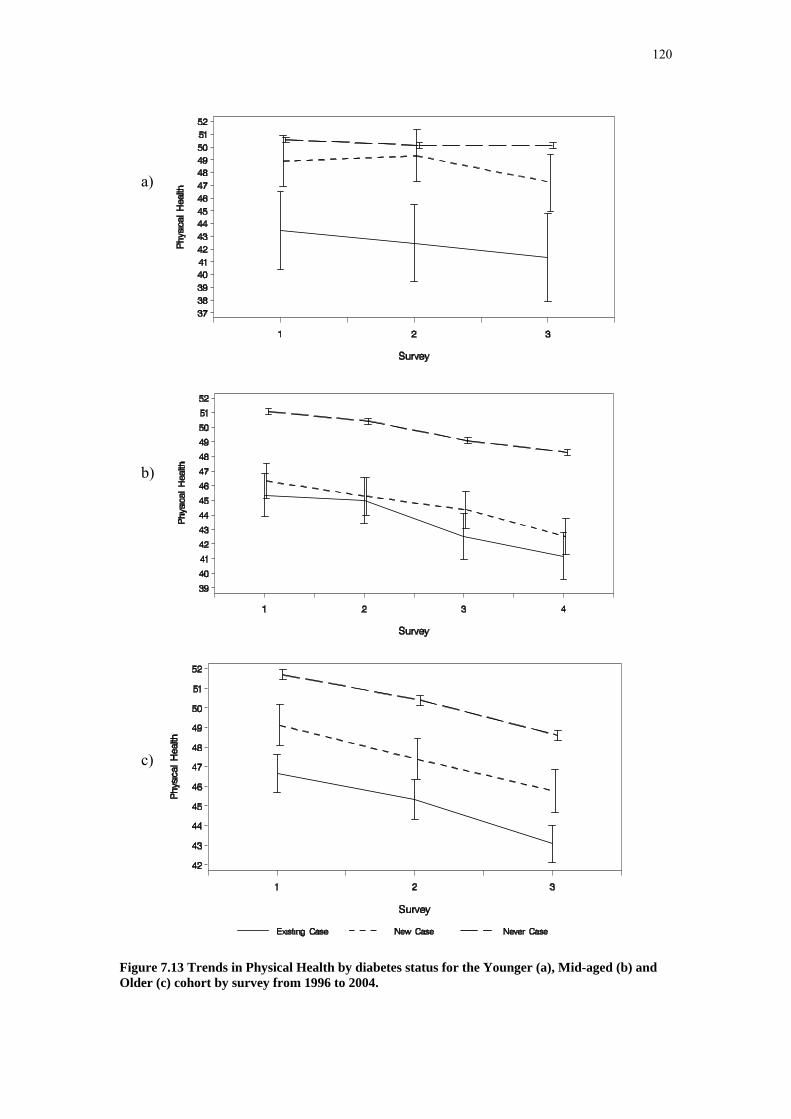
120
Figure 7.13 Trends in Physical Health by diabetes status for the Younger (a), Mid-aged (b) and Older (c) cohort by survey from 1996 to 2004.
c)
a)
b)

121
Figure 7.14 Trends in Mental Health by diabetes status for the Younger (a), Mid-aged (b) and Older (c) cohort by survey from 1996 to 2004.
c)
a)
b)

122
7.5.4 Area of residence trends
Figure 7.15 Prevalence of self-reported diabetes for each cohort group by area of residence in 2003 for Younger, in 2004 for Mid-aged and in 2002 for the Older cohort.
There were no consistent trends in the prevalence of diabetes across urban, rural and remote areas of residence. Among Younger women, however, there was a significant difference in prevalence across areas (p<0.001) with a much higher prevalence evident in small rural centres.
7.5.5 Health service use
a) General practice consultations
In the ALSWH surveys women were asked how many times they had consulted a family doctor or other GP for their own health in the last 12 months. There were a greater percentage of Younger and Older women with diabetes, both existing cases at Survey 1 and new cases, who consulted a GP more than four times in the previous year (Figure 7.16). Use of GP services was highest by the Older women with diabetes, which may reflect comorbid conditions and complications of the disease. High use of GP services did not appear to be related to having diabetes among Mid-aged women.

123
Figure 7.16 Percentage of women who reported more than four GP consultations in the previous year by diabetes status for each cohort group from 1996 to 2004.
b) Specialist consultations
In the ALSWH surveys women were asked whether they had consulted a specialist doctor for their own health in the last 12 months. Figure 7.17 shows the percentage of women who reported having consulted a specialist at least once in the previous year, by their diabetes status. As expected, there were a greater percentage of women in the Older and Younger cohort with diabetes who had seen a specialist.
Figure 7.17 Percentage of women who reported having consulted a specialist in the previous year by diabetes status for each cohort group from 1996 to 2004.
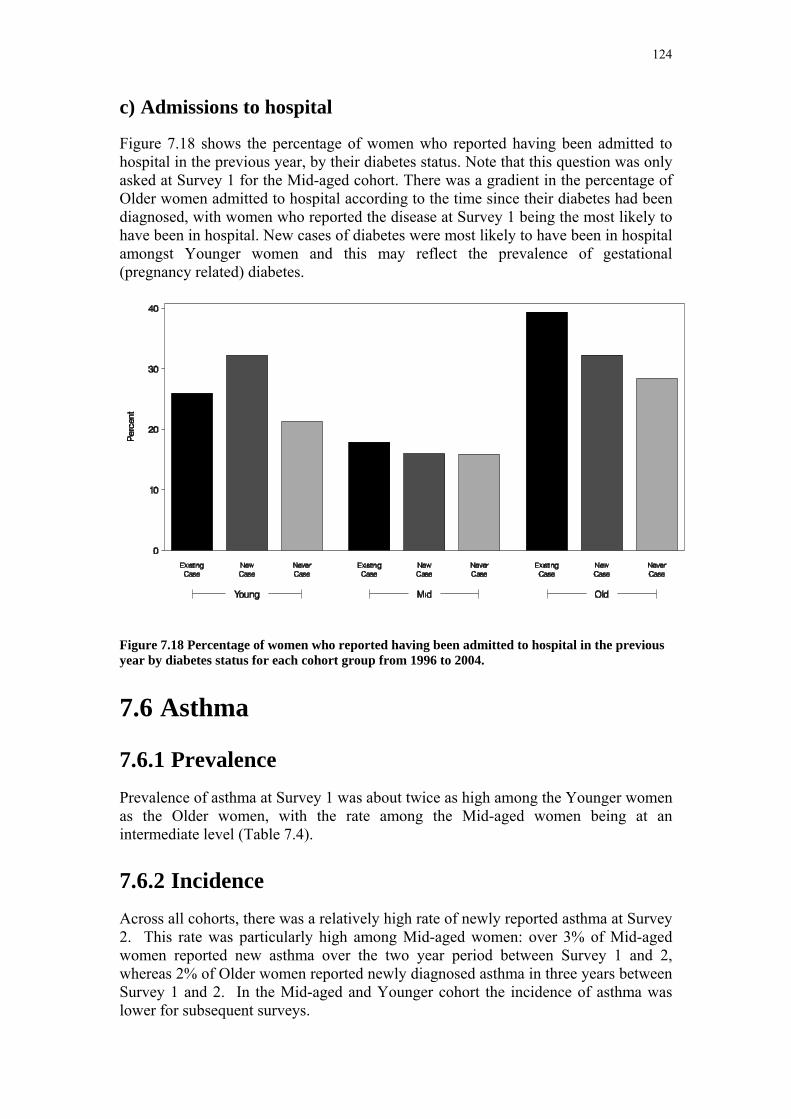
124
c) Admissions to hospital
Figure 7.18 shows the percentage of women who reported having been admitted to hospital in the previous year, by their diabetes status. Note that this question was only asked at Survey 1 for the Mid-aged cohort. There was a gradient in the percentage of Older women admitted to hospital according to the time since their diabetes had been diagnosed, with women who reported the disease at Survey 1 being the most likely to have been in hospital. New cases of diabetes were most likely to have been in hospital amongst Younger women and this may reflect the prevalence of gestational (pregnancy related) diabetes.
Figure 7.18 Percentage of women who reported having been admitted to hospital in the previous year by diabetes status for each cohort group from 1996 to 2004.
7.6 Asthma
7.6.1 Prevalence Prevalence of asthma at Survey 1 was about twice as high among the Younger women as the Older women, with the rate among the Mid-aged women being at an intermediate level (Table 7.4).
7.6.2 Incidence Across all cohorts, there was a relatively high rate of newly reported asthma at Survey 2. This rate was particularly high among Mid-aged women: over 3% of Mid-aged women reported new asthma over the two year period between Survey 1 and 2, whereas 2% of Older women reported newly diagnosed asthma in three years between Survey 1 and 2. In the Mid-aged and Younger cohort the incidence of asthma was lower for subsequent surveys.
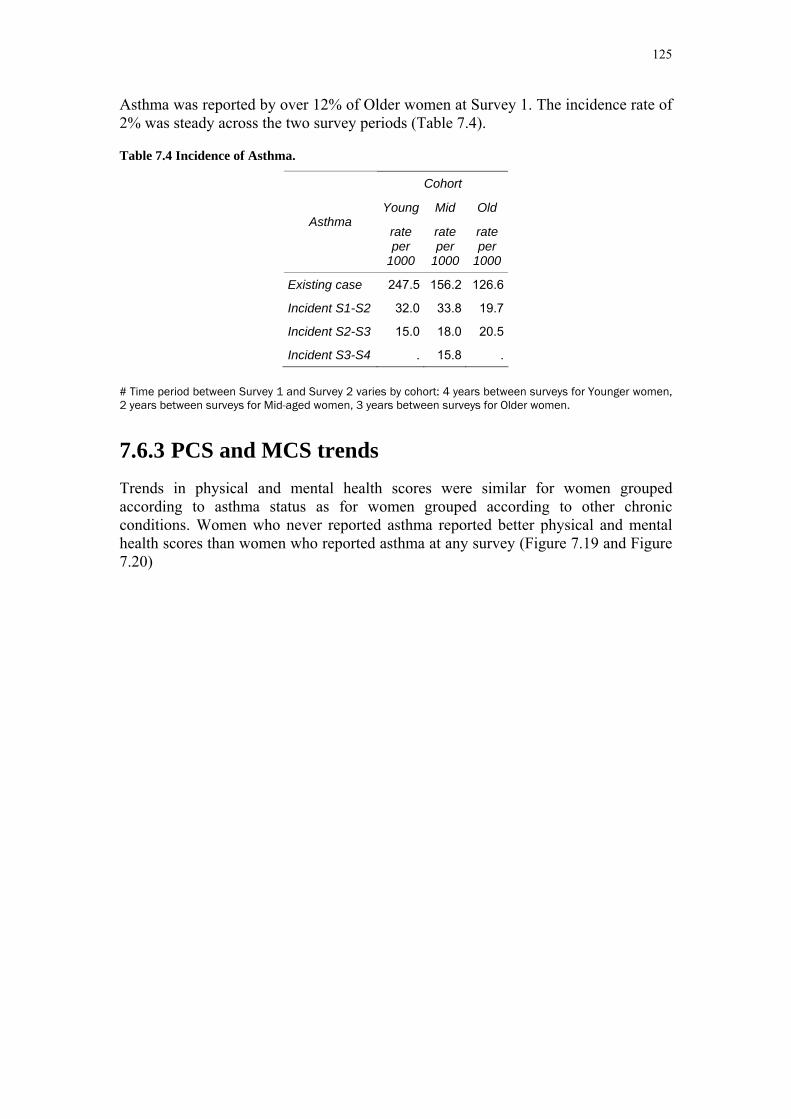
125
Asthma was reported by over 12% of Older women at Survey 1. The incidence rate of 2% was steady across the two survey periods (Table 7.4).
Table 7.4 Incidence of Asthma.
Cohort
Young Mid Old Asthma
rate per
1000
rate per
1000
rate per
1000
Existing case 247.5 156.2 126.6
Incident S1-S2 32.0 33.8 19.7
Incident S2-S3 15.0 18.0 20.5
Incident S3-S4 . 15.8 .
# Time period between Survey 1 and Survey 2 varies by cohort: 4 years between surveys for Younger women, 2 years between surveys for Mid-aged women, 3 years between surveys for Older women.
7.6.3 PCS and MCS trends Trends in physical and mental health scores were similar for women grouped according to asthma status as for women grouped according to other chronic conditions. Women who never reported asthma reported better physical and mental health scores than women who reported asthma at any survey (Figure 7.19 and Figure 7.20)

126
Figure 7.19 Trends in Physical Health by asthma status for the Younger (a), Mid-aged (b) and Older (c) cohort by survey from 1996 to 2004.
c)
a)
b)

127
Figure 7.20 Trends in Mental Health by asthma status for the Younger (a), Mid-aged (b) and Older (c) cohort by survey from 1996 to 2004.
c)
a)
b)
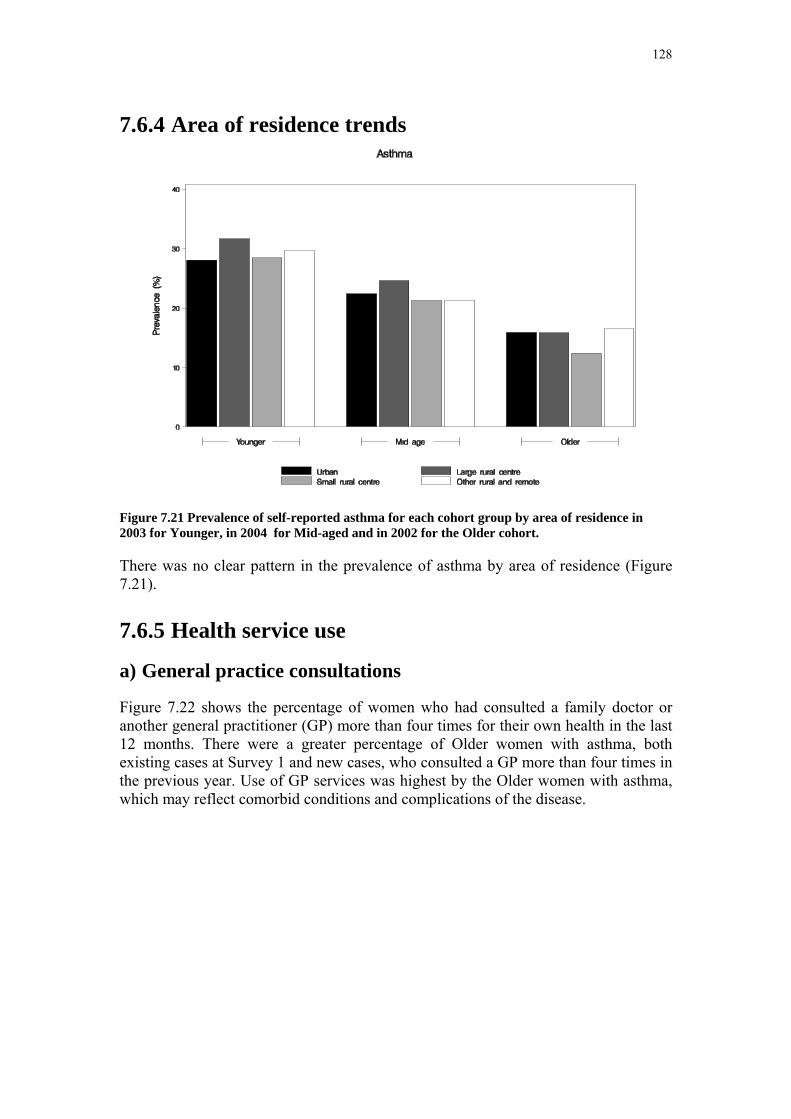
128
7.6.4 Area of residence trends
Figure 7.21 Prevalence of self-reported asthma for each cohort group by area of residence in 2003 for Younger, in 2004 for Mid-aged and in 2002 for the Older cohort.
There was no clear pattern in the prevalence of asthma by area of residence (Figure 7.21).
7.6.5 Health service use
a) General practice consultations
Figure 7.22 shows the percentage of women who had consulted a family doctor or another general practitioner (GP) more than four times for their own health in the last 12 months. There were a greater percentage of Older women with asthma, both existing cases at Survey 1 and new cases, who consulted a GP more than four times in the previous year. Use of GP services was highest by the Older women with asthma, which may reflect comorbid conditions and complications of the disease.

129
Figure 7.22 Percentage of women who reported having more than four GP consultations in the previous year by asthma status for each cohort group from 1996 to 2004.
b) Specialist consultations
Figure 7.23 shows the percentage of women who reported having consulted a specialist at least once in the previous year, by their asthma status. There were a greater percentage of Younger and Older women with asthma who had seen a specialist but there were no differences among Mid-aged women.
Figure 7.23 Percentage of women who reported consulted a specialist in the previous year by asthma status for each cohort group from 1996 to 2004.
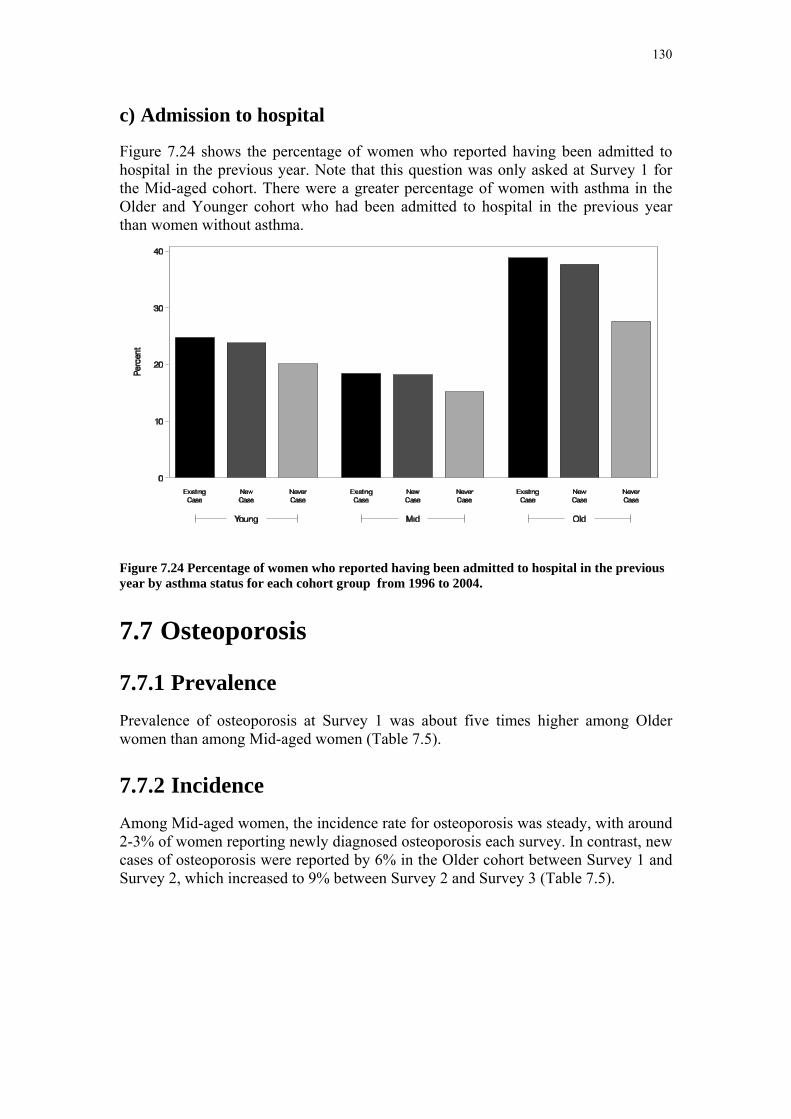
130
c) Admission to hospital
Figure 7.24 shows the percentage of women who reported having been admitted to hospital in the previous year. Note that this question was only asked at Survey 1 for the Mid-aged cohort. There were a greater percentage of women with asthma in the Older and Younger cohort who had been admitted to hospital in the previous year than women without asthma.
Figure 7.24 Percentage of women who reported having been admitted to hospital in the previous year by asthma status for each cohort group from 1996 to 2004.
7.7 Osteoporosis
7.7.1 Prevalence Prevalence of osteoporosis at Survey 1 was about five times higher among Older women than among Mid-aged women (Table 7.5).
7.7.2 Incidence Among Mid-aged women, the incidence rate for osteoporosis was steady, with around 2-3% of women reporting newly diagnosed osteoporosis each survey. In contrast, new cases of osteoporosis were reported by 6% in the Older cohort between Survey 1 and Survey 2, which increased to 9% between Survey 2 and Survey 3 (Table 7.5).
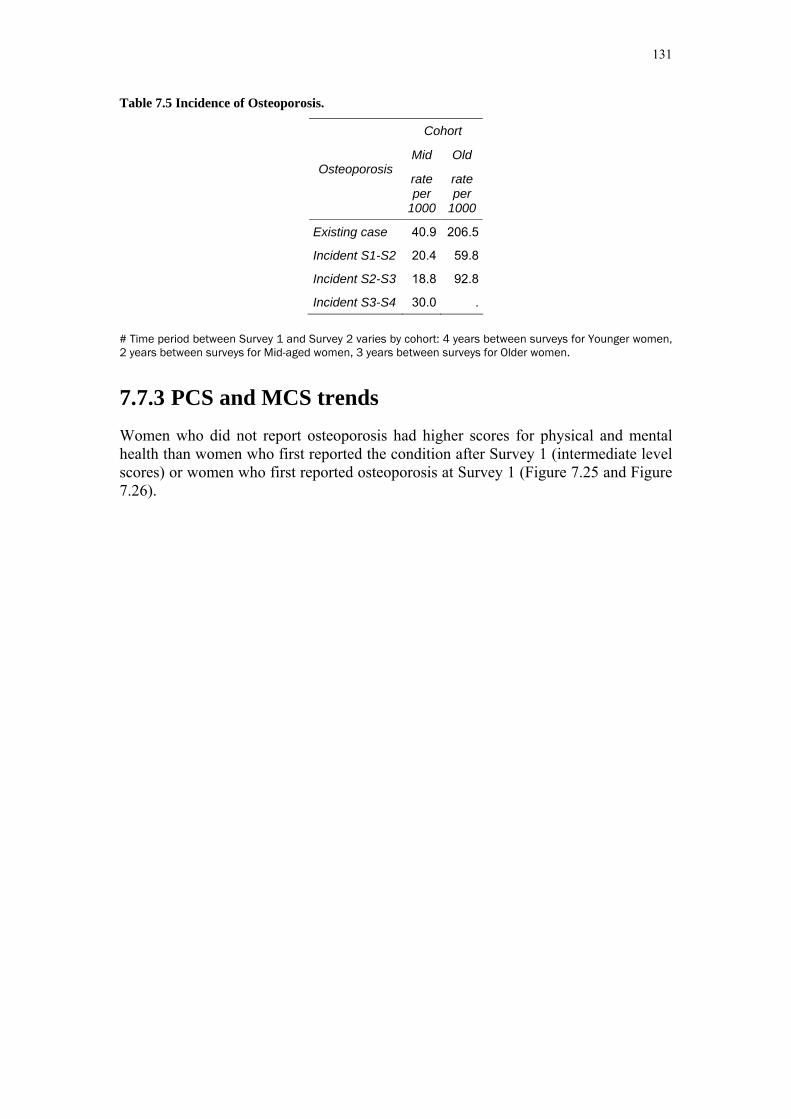
131
Table 7.5 Incidence of Osteoporosis.
Cohort
Mid Old Osteoporosis
rate per
1000
rate per
1000
Existing case 40.9 206.5
Incident S1-S2 20.4 59.8
Incident S2-S3 18.8 92.8
Incident S3-S4 30.0 .
# Time period between Survey 1 and Survey 2 varies by cohort: 4 years between surveys for Younger women, 2 years between surveys for Mid-aged women, 3 years between surveys for Older women.
7.7.3 PCS and MCS trends Women who did not report osteoporosis had higher scores for physical and mental health than women who first reported the condition after Survey 1 (intermediate level scores) or women who first reported osteoporosis at Survey 1 (Figure 7.25 and Figure 7.26).
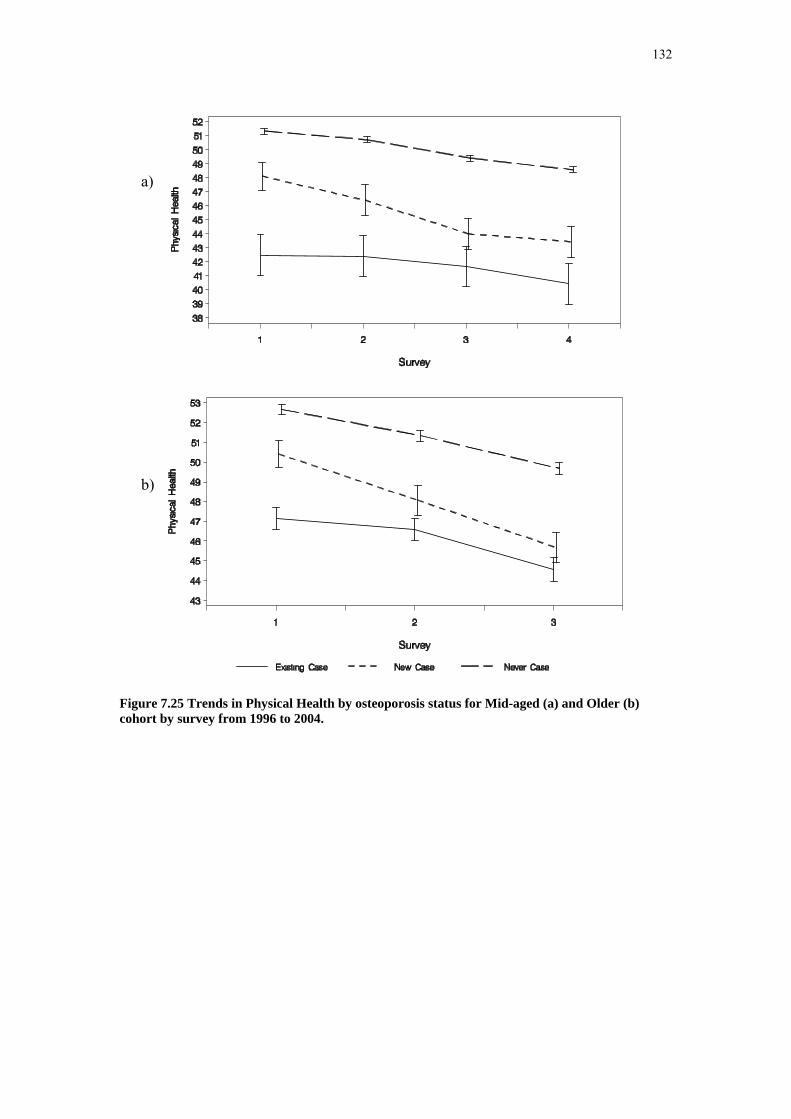
132
Figure 7.25 Trends in Physical Health by osteoporosis status for Mid-aged (a) and Older (b) cohort by survey from 1996 to 2004.
a)
b)

133
Figure 7.26 Trends in Mental Health by osteoporosis status for Mid-aged (a) and Older (b) cohort by survey from 1996 to 2004.
7.7.4 Area of residence trends There is a trend for osteoporosis to be less prevalent among women in rural areas (p<0.001) (Figure 7.27). However, this trend is likely to be affected by variations in measurement of bone density with access to such measurement being greater in urban areas.
a)
b)
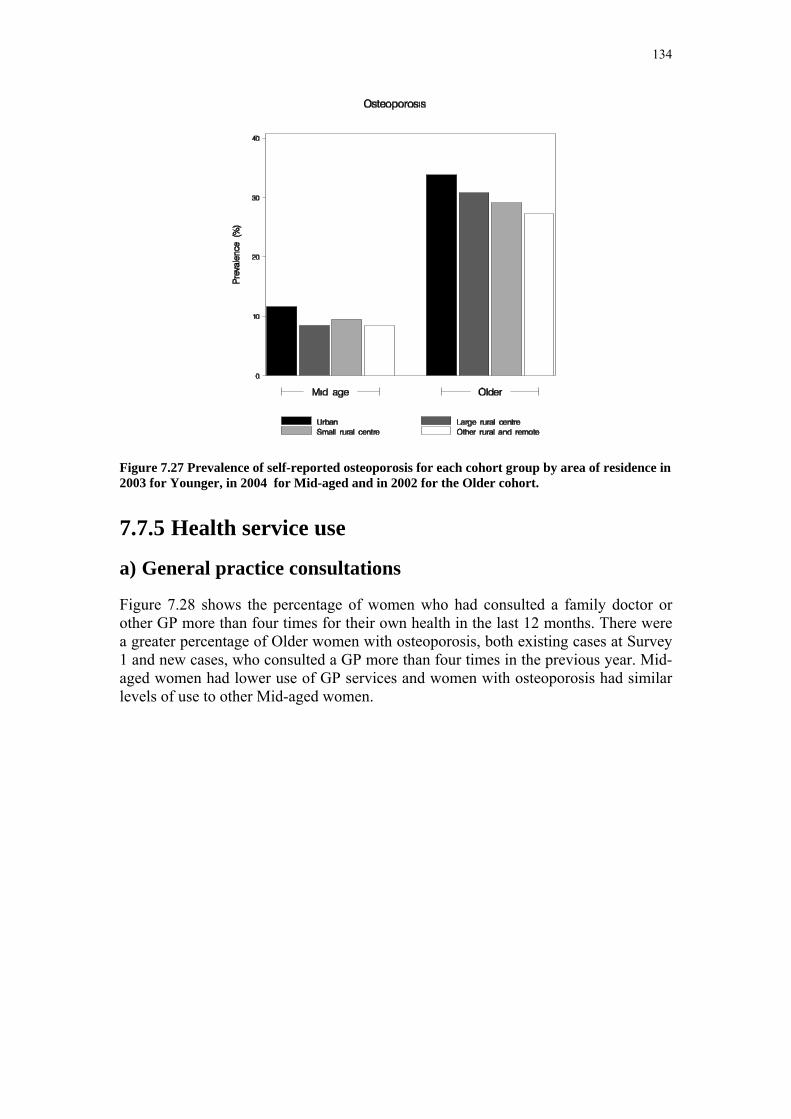
134
Figure 7.27 Prevalence of self-reported osteoporosis for each cohort group by area of residence in 2003 for Younger, in 2004 for Mid-aged and in 2002 for the Older cohort.
7.7.5 Health service use
a) General practice consultations
Figure 7.28 shows the percentage of women who had consulted a family doctor or other GP more than four times for their own health in the last 12 months. There were a greater percentage of Older women with osteoporosis, both existing cases at Survey 1 and new cases, who consulted a GP more than four times in the previous year. Mid-aged women had lower use of GP services and women with osteoporosis had similar levels of use to other Mid-aged women.
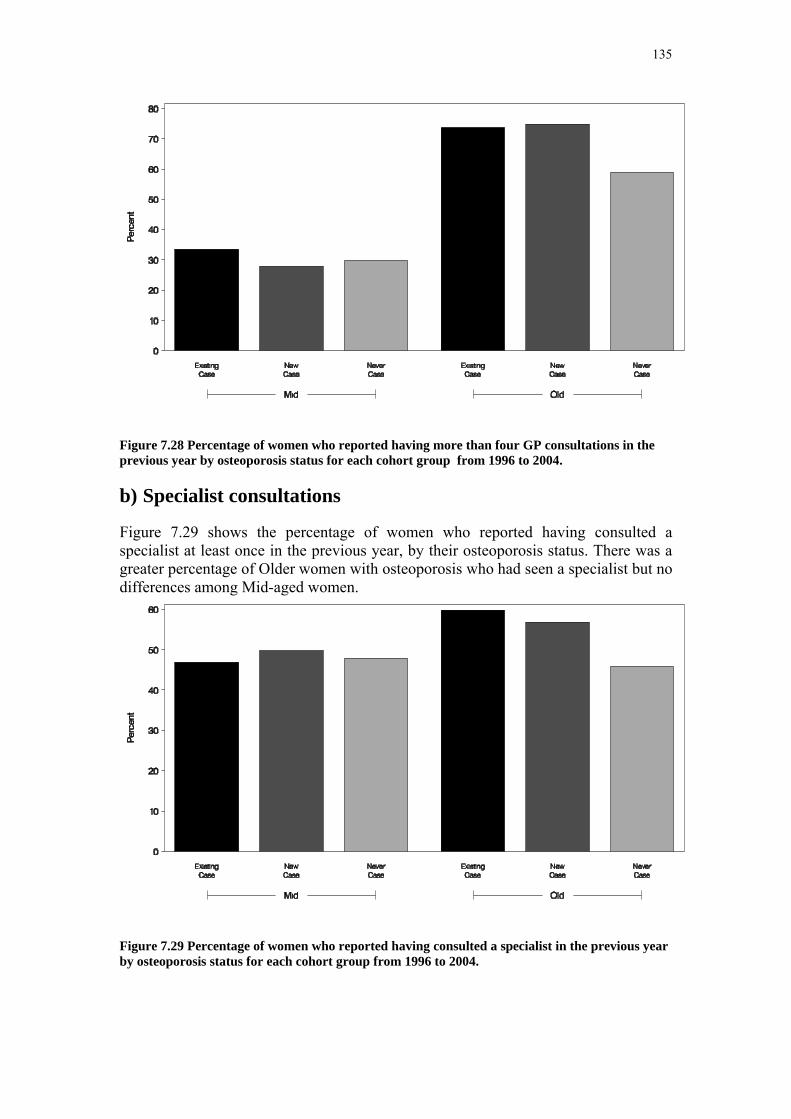
135
Figure 7.28 Percentage of women who reported having more than four GP consultations in the previous year by osteoporosis status for each cohort group from 1996 to 2004.
b) Specialist consultations
Figure 7.29 shows the percentage of women who reported having consulted a specialist at least once in the previous year, by their osteoporosis status. There was a greater percentage of Older women with osteoporosis who had seen a specialist but no differences among Mid-aged women.
Figure 7.29 Percentage of women who reported having consulted a specialist in the previous year by osteoporosis status for each cohort group from 1996 to 2004.

136
c) Admission to hospital
Figure 7.30 shows the percentage of women who reported having been admitted to hospital in the previous year. Note that this question was only asked at Survey 1 for the Mid-aged cohort. There was a gradient in the percentage of women admitted to hospital according to the time since their osteoporosis had been diagnosed, with women who reported the disease at Survey 1 being the most likely to have been in hospital.
Figure 7.30 Percentage of women who reported having been admitted to hospital in the previous year by osteoporosis status for each cohort group from 1996 to 2004.
7.8 Arthritis
7.8.1 Prevalence Arthritis was only ascertained at Survey 2 and Survey 3 for the Older women and Survey 3 and Survey 4 for the Mid-aged women. Prevalence of arthritis among the Older women was approximately double the rate among Mid-aged women (Table 7.6).
7.8.2 Incidence Between Survey 2 and Survey 3 23% of disease free women in the Older cohort reported they had been newly diagnosed with or treated for arthritis (Table 7.6). The corresponding incidence between Survey 3 and Survey 4 for the Mid-aged women was almost 13%.
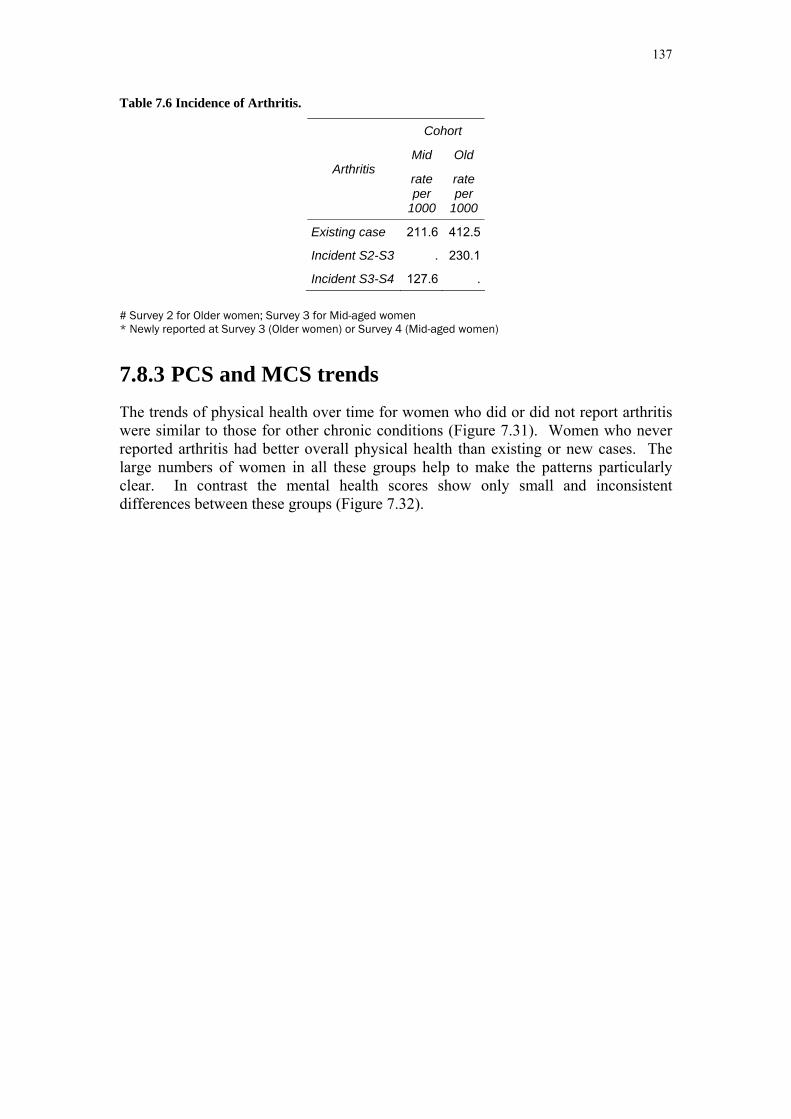
137
Table 7.6 Incidence of Arthritis.
Cohort
Mid Old Arthritis
rate per
1000
rate per
1000
Existing case 211.6 412.5
Incident S2-S3 . 230.1
Incident S3-S4 127.6 .
# Survey 2 for Older women; Survey 3 for Mid-aged women * Newly reported at Survey 3 (Older women) or Survey 4 (Mid-aged women)
7.8.3 PCS and MCS trends The trends of physical health over time for women who did or did not report arthritis were similar to those for other chronic conditions (Figure 7.31). Women who never reported arthritis had better overall physical health than existing or new cases. The large numbers of women in all these groups help to make the patterns particularly clear. In contrast the mental health scores show only small and inconsistent differences between these groups (Figure 7.32).

138
Figure 7.31 Trends in Physical Health by arthritis status for Mid-aged (a) and Older (b) cohort by survey from 1996 to 2004.
a)
b)

139
Figure 7.32 Trends in Mental Health by arthritis status for Mid-aged (a) and Older (b) cohort by survey from 1996 to 2004.
a)
b)

140
7.8.4 Area of residence trends
Figure 7.33 Prevalence of self-reported arthritis for each cohort group by area of residence in 2003 for Younger, in 2004 for Mid-aged and in 2002 for the Older cohort.
There were no clear trends in prevalence of arthritis by area (Figure 7.33).
7.8.5 Health service use
a) General practice consultations
Figure 7.34 shows the percentage of women who had consulted a family doctor or another general practitioner (GP) more than four times for their own health in the last 12 months. There were greater percentages of Older women with arthritis, both existing and new cases, who consulted a GP more than four times in the previous year. There were no differences in GP use by Mid-aged women according to whether they had arthritis.

141
Figure 7.34 Percentage of women who reported having more than four GP consultations in the previous year by arthritis status for each cohort group from 1996 to 2004.
b) Specialist consultations
Figure 7.35 shows the percentage of women who reported having consulted a specialist at least once in the previous year, by their arthritis status. There were a greater percentage of women in the Older cohort with arthritis who had seen a specialist.
Figure 7.35 Percentage of women who reported having consulted a specialist in the previous year by arthritis status for each cohort group from 1996 to 2004.
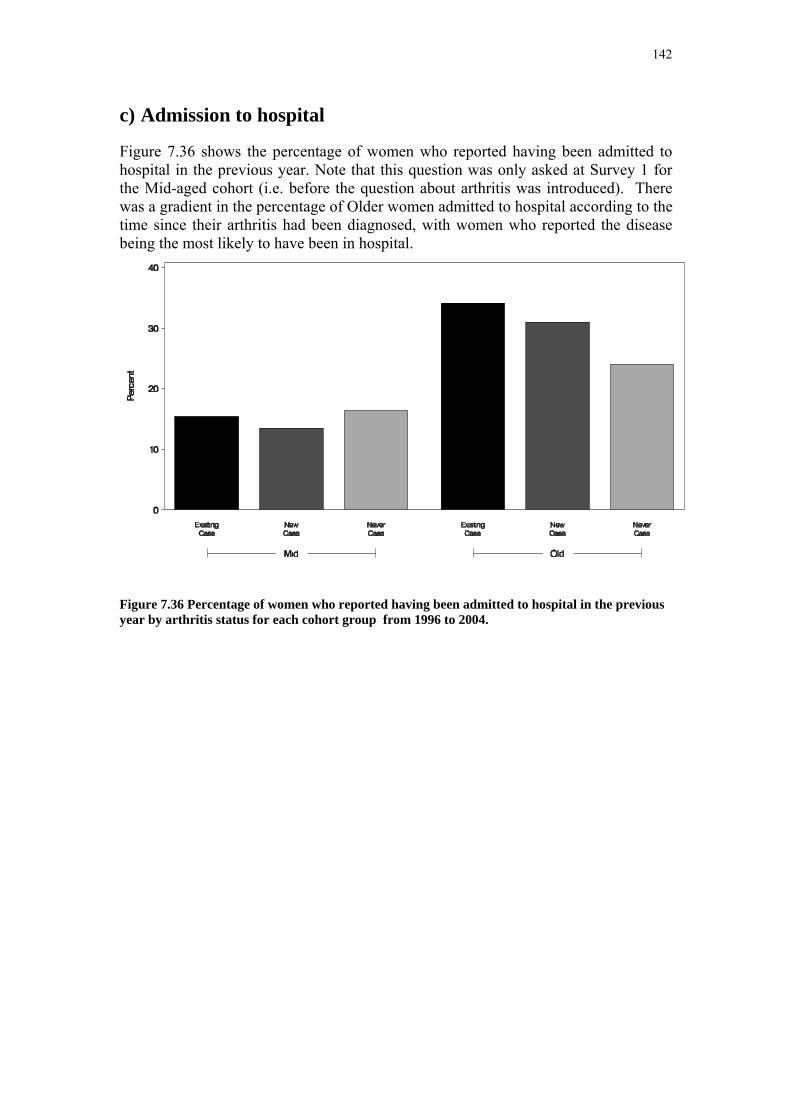
142
c) Admission to hospital
Figure 7.36 shows the percentage of women who reported having been admitted to hospital in the previous year. Note that this question was only asked at Survey 1 for the Mid-aged cohort (i.e. before the question about arthritis was introduced). There was a gradient in the percentage of Older women admitted to hospital according to the time since their arthritis had been diagnosed, with women who reported the disease being the most likely to have been in hospital.
Figure 7.36 Percentage of women who reported having been admitted to hospital in the previous year by arthritis status for each cohort group from 1996 to 2004.
143
Section 8: Appendices
APPENDIX 1: THE AUSTRALIAN LONGITUDINAL STUDY ON WOMEN’S HEALTH ....................................................................................................... 144
A 1.1 Area of residence...............................................................................................................149 A 1.2 References.........................................................................................................................149
APPENDIX 2: DEFINITIONS OF PREVALENCE AND INCIDENCE................................. 151 A 2.1 Definition of prevalence at Survey 1.................................................................................151 A 2.2 Definition of prevalence at Survey 2.................................................................................152 A 2.3 Definition of incidence......................................................................................................152
APPENDIX 3: TABLES FOR INCIDENCE AND PREVALENCE OF CHRONIC CONDITIONS AND RISK FACTORS .................................................................. 154
A 3.1 Hypertension .....................................................................................................................154 A 3.2 Heart Disease ....................................................................................................................156 A 3.3 Diabetes.............................................................................................................................158 A 3.4 Asthma ..............................................................................................................................160 A 3.5 Osteoporosis......................................................................................................................162 A 3.6 Arthritis .............................................................................................................................164

144
Appendix 1: The Australian Longitudinal Study on Women’s Health The Australian Longitudinal Study on Women’s Health (ALSWH) – widely known as Women’s Health Australia - is a longitudinal population-based survey, funded by the Australian Government Department of Health and Ageing. The Project began in 1996 and examines the health of over 40,000 Australian women (Brown et al., 1998).
The ALSWH involves three large, nationally representative, cohorts of Australian women representing three generations:
• The Younger women, aged 18-23 when first recruited in 1996 (n=14247), are in their late 20s, the peak years for relationship formation, childbearing, and establishing adult health habits (e.g. physical activity, diet) and paid and unpaid work patterns.
• The Mid-aged women, initially aged 45-50 (n=13716), are experiencing menopause, as well as changes in household structure, family care giving, and impending retirement, which are common at this life stage. Some are showing early signs of age-related physical decline, while some are adopting new health behaviours in preparation for a healthy old age.
• The Older women, aged 70-75 when first recruited (n=12432), are moving into their 80s and facing the physical, emotional and social challenges of old age.
Features of the Study design include:
• Women were randomly selected from the Medicare Australia database and invited to participate in the longitudinal Study.
• Women in rural and remote areas of Australia were intentionally over-sampled to ensure adequate numbers for statistical analysis.
• After Survey 1 in 1996, the three age cohorts have been surveyed sequentially, one cohort per year, on a rolling basis since 1998.
The Study was designed to explore factors that influence health among women who are broadly representative of the entire Australian population. The Study assesses:
• Physical and emotional health (including well-being, major diagnoses, symptoms)
• Use of health services (GP, specialist and other visits, access, satisfaction)
• Health behaviours and risk factors (diet, exercise, smoking, alcohol, other drugs)
• Time use (including paid and unpaid work, family roles, and leisure)
• Socio-demographic factors (location, education, employment, family composition)
• Life stages and key events (such as childbirth, divorce, widowhood).

145
The Project provides a valuable opportunity to examine associations over time between aspects of women’s lives and their physical and emotional health. It provides an evidence base to the Australian Government Department of Health and Ageing – as well as other Australian and State/Territory Departments – for the development and evaluation of policy and practice in many areas of service delivery that affect women. An overview of the Study and investigators, copies of the questionnaires, and abstracts of publications and presentations can be located on the study’s website www.alswh.org.au
Response rates to Survey 1 (1996) cannot be exactly specified as some women selected for the sample may not have received the invitation. For example, deaths or changes of address may not have been notified to the Health Insurance Commission (now Medicare Australia). It is estimated that 41-42% of the Younger women, 53-56% of the Mid-aged women and 37-40% of the Older women agreed to participate in the longitudinal Study. Comparison with the 1996 Census showed that the respondents were broadly representative of the general population of women of the same age, with some over-representation of women with tertiary education and under-representation of immigrant women of non-English speaking background.
The Project has been able to retain a very high proportion of the original participants, particularly among the Mid-aged and Older women.
Table A 1.1 Participation and retention of Younger women.
Survey 1 Survey 2 Survey 3 Eligible at previous survey 14247 14112Ineligible deceased between surveys 22 10 frailty (e.g. dementia, stroke) 3 6 withdrawn before mailout survey date 110 216Total ineligible 135 232Eligible at current survey 14112 13880Non-respondents withdrawn from the study 124 199 contacted but did not return 1332 653 unable to contact participant 2968 3947Total non-respondents 4424 4799Respondents completed survey 14247 9688 9081Retention rate as % eligible 68.7% 65.4%
Among the Younger women, 69% responded to Survey 2 in 2000 and 65% to Survey 3 in 2003 (Table A 1.1). This retention compares well with other surveys of this highly mobile age group. The major reason for non-response among the Younger women was that the research team was unable to contact the women (21% of eligible women at Survey 2 and 28% at Survey 3), despite using all possible methods of maintaining contact (Lee et al., 2000; Lee et al., 2005). Younger women in their twenties are characterised by high levels of mobility, change of surnames on marriage, often not having telephone listings and not being registered to vote, and making extended trips outside Australia for work, education or recreation.
Demographic characteristics (country of birth, marital status, education, employment and living arrangements) of the Younger respondents at Survey 1 (1996) and Survey 2
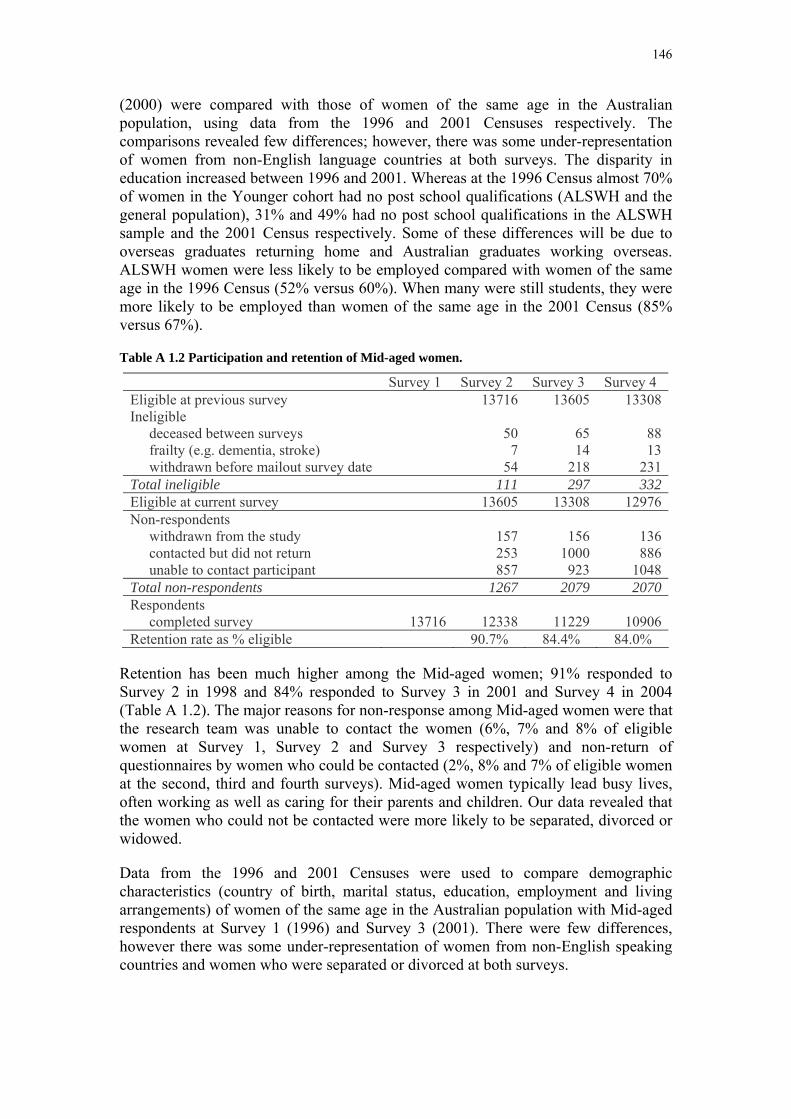
146
(2000) were compared with those of women of the same age in the Australian population, using data from the 1996 and 2001 Censuses respectively. The comparisons revealed few differences; however, there was some under-representation of women from non-English language countries at both surveys. The disparity in education increased between 1996 and 2001. Whereas at the 1996 Census almost 70% of women in the Younger cohort had no post school qualifications (ALSWH and the general population), 31% and 49% had no post school qualifications in the ALSWH sample and the 2001 Census respectively. Some of these differences will be due to overseas graduates returning home and Australian graduates working overseas. ALSWH women were less likely to be employed compared with women of the same age in the 1996 Census (52% versus 60%). When many were still students, they were more likely to be employed than women of the same age in the 2001 Census (85% versus 67%).
Table A 1.2 Participation and retention of Mid-aged women.
Survey 1 Survey 2 Survey 3 Survey 4 Eligible at previous survey 13716 13605 13308Ineligible deceased between surveys 50 65 88 frailty (e.g. dementia, stroke) 7 14 13 withdrawn before mailout survey date 54 218 231Total ineligible 111 297 332Eligible at current survey 13605 13308 12976Non-respondents withdrawn from the study 157 156 136 contacted but did not return 253 1000 886 unable to contact participant 857 923 1048Total non-respondents 1267 2079 2070Respondents completed survey 13716 12338 11229 10906Retention rate as % eligible 90.7% 84.4% 84.0%
Retention has been much higher among the Mid-aged women; 91% responded to Survey 2 in 1998 and 84% responded to Survey 3 in 2001 and Survey 4 in 2004 (Table A 1.2). The major reasons for non-response among Mid-aged women were that the research team was unable to contact the women (6%, 7% and 8% of eligible women at Survey 1, Survey 2 and Survey 3 respectively) and non-return of questionnaires by women who could be contacted (2%, 8% and 7% of eligible women at the second, third and fourth surveys). Mid-aged women typically lead busy lives, often working as well as caring for their parents and children. Our data revealed that the women who could not be contacted were more likely to be separated, divorced or widowed.
Data from the 1996 and 2001 Censuses were used to compare demographic characteristics (country of birth, marital status, education, employment and living arrangements) of women of the same age in the Australian population with Mid-aged respondents at Survey 1 (1996) and Survey 3 (2001). There were few differences, however there was some under-representation of women from non-English speaking countries and women who were separated or divorced at both surveys.

147
Table A 1.3 Participation and retention of Older women.
Survey 1 Survey 2 Survey 3 Eligible at previous survey 12432 11545Ineligible deceased between surveys 518 564 frailty (e.g. dementia, stroke) 102 262 withdrawn before mailout survey date 267 524Total ineligible 887 1350Eligible at current survey 11545 10195Non-respondents withdrawn from the study 316 386 contacted but did not return 486 866 unable to contact participant 309 296Total non-respondents 1111 1548Respondents completed survey 12432 10434 8647Retention rate as % eligible 90.4% 84.8%
Of the Older women, 90% responded to Survey 2 in 1999 and 85% to Survey 3 in 2002 (Table A 1.3). Among Older women the major reason for non-response was non-return of the questionnaire (4% of eligible women at Survey 2 and 8% at Survey 3). These and other non-respondents tended to report poorer self-rated health at Survey 1 than respondents.
Demographic characteristics (country of birth, marital status, education and living arrangements) of the Older respondents at Survey 1 (1996) and Survey 3 (2002) were compared with those of women of the same age in the Australian population, using data from the 1996 and 2001 Censuses respectively. Comparisons showed few differences. There was some under-representation of women from non-English speaking countries in the ALSHW sample at both surveys. The high level of missing data in the Census made comparisons difficult for marital status and educational qualifications.
Data are available for the Younger cohort at Survey 1 (1996), Survey 2 (2000) and Survey 3 (2003), for the Mid-aged cohort at Survey 1 (1996), Survey 2 (1998), Survey 3 (2001) and Survey 4 (2004) and for the Older cohort at Survey 1 (1996), Survey 2 (1999) and Survey 3 (2002). The following tables provide information on completion of surveys.
The numbers of Younger women who completed different surveys are shown in Table A 1.4. Fifty-five percent completed Surveys 1, 2 and 3 and a further 22% completed two of the three surveys. Few Younger women were deceased (n=32) and only nine were too ill to complete further surveys.

148
Table A 1.4 Completion of surveys by Younger women (n=14247).
Completion of surveys n Respondent at all surveys 7790 Respondent at Survey 2, deceased/ withdrawn due to frailty at Survey 3 9 Respondent at Survey 2, other ineligible at Survey 3 30 Respondent at Survey 2, non-respondent at Survey 3 1859 Non-respondent at Survey 2, respondent at Survey 3 1291 Non-respondent at Survey 2, deceased/ withdrawn due to frailty at Survey 3 7 Non-respondent at Survey 2, other ineligible at Survey 3 186 Non-respondent at Survey 2 and Survey 3 2940 Deceased/ withdrawn due to frailty by Survey 2 25 Other ineligible by Survey 2 110
Table A 1.5 Completion of Surveys by Mid-aged women (n=13716).
Completion of Surveys n
Respondent at Surveys 2, 3 and 4 9878Respondent at Surveys 2 and 3, non-respondent at Survey 4 820Respondent at Surveys 2 and 3, deceased/ withdrawn due to frailty at Survey 4 73Respondent at Surveys 2 and 3, other ineligible at Survey 4 39Respondent at Survey 2, non-respondent at Survey 3, respondent at Survey 4 576Respondent at Survey 2, non-respondent at Surveys 3 and 4 701Respondent at Survey 2, non-respondent at Survey 3, deceased/ withdrawn due to frailty at Survey 4
16
Respondent at Survey 2, non-respondent at Survey 3, other ineligible at Survey 4 123Respondent at Survey 2, deceased/ withdrawn due to frailty by Survey 3 62Respondent at Survey 2, other ineligible by Survey 3 50Non-respondent at Survey 2, respondent at Surveys 3 and 4 300Non-respondent at Survey 2, respondent at Survey 3, non-respondent at Survey 4 107Non-respondent at Survey 2, respondent at Survey 3, deceased/ withdrawn due to frailty at Survey 4
5
Non-respondent at Survey 2, respondent at Survey 3, other ineligible at Survey 4 7Non-respondent at Surveys 2 and 3, respondent at Survey 4 152Non-respondent at Surveys 2, 3 and 4 442Non-respondent at Surveys 2 and 3, deceased/ withdrawn due to frailty at Survey 4 7Non-respondent at Surveys 2 and 3, other ineligible at Survey 4 62Non-respondent at Survey 2, deceased/ withdrawn due to frailty at Surveys 3 and 4 17Non-respondent at Survey 2, other ineligible at Surveys 3 and 4 168Deceased/ withdrawn due to frailty by Survey 2 57Other ineligible by Survey 2 54
Table A 1.5 shows the numbers of Mid-aged women who were enrolled in Survey 1 according to their history of completing Surveys 2, 3 and 4. Seventy-two percent of the Mid-aged women completed all four surveys. A further 13% completed three of the four surveys and 8% completed two of the four surveys. Women were mainly ineligible to continue in the Study due to withdrawal.
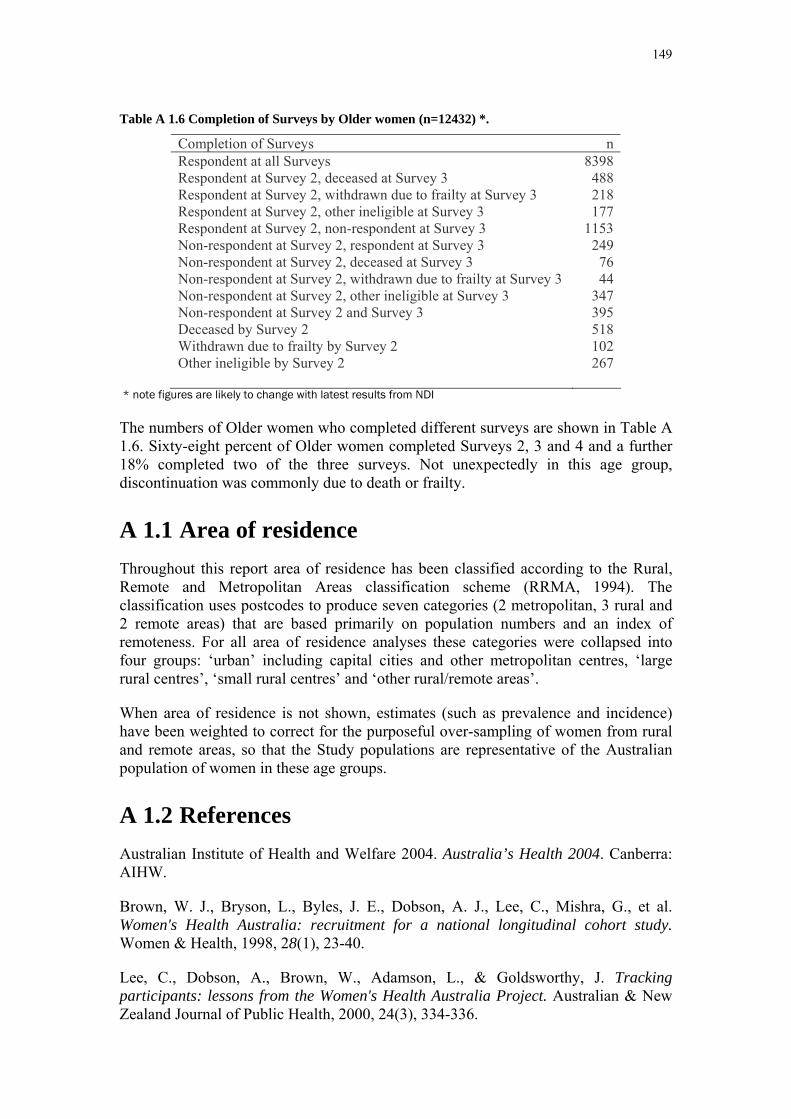
149
Table A 1.6 Completion of Surveys by Older women (n=12432) *.
Completion of Surveys n Respondent at all Surveys 8398 Respondent at Survey 2, deceased at Survey 3 488 Respondent at Survey 2, withdrawn due to frailty at Survey 3 218 Respondent at Survey 2, other ineligible at Survey 3 177 Respondent at Survey 2, non-respondent at Survey 3 1153 Non-respondent at Survey 2, respondent at Survey 3 249 Non-respondent at Survey 2, deceased at Survey 3 76 Non-respondent at Survey 2, withdrawn due to frailty at Survey 3 44 Non-respondent at Survey 2, other ineligible at Survey 3 347 Non-respondent at Survey 2 and Survey 3 395 Deceased by Survey 2 518 Withdrawn due to frailty by Survey 2 102 Other ineligible by Survey 2 267
* note figures are likely to change with latest results from NDI
The numbers of Older women who completed different surveys are shown in Table A 1.6. Sixty-eight percent of Older women completed Surveys 2, 3 and 4 and a further 18% completed two of the three surveys. Not unexpectedly in this age group, discontinuation was commonly due to death or frailty.
A 1.1 Area of residence Throughout this report area of residence has been classified according to the Rural, Remote and Metropolitan Areas classification scheme (RRMA, 1994). The classification uses postcodes to produce seven categories (2 metropolitan, 3 rural and 2 remote areas) that are based primarily on population numbers and an index of remoteness. For all area of residence analyses these categories were collapsed into four groups: ‘urban’ including capital cities and other metropolitan centres, ‘large rural centres’, ‘small rural centres’ and ‘other rural/remote areas’.
When area of residence is not shown, estimates (such as prevalence and incidence) have been weighted to correct for the purposeful over-sampling of women from rural and remote areas, so that the Study populations are representative of the Australian population of women in these age groups.
A 1.2 References Australian Institute of Health and Welfare 2004. Australia’s Health 2004. Canberra: AIHW.
Brown, W. J., Bryson, L., Byles, J. E., Dobson, A. J., Lee, C., Mishra, G., et al. Women's Health Australia: recruitment for a national longitudinal cohort study. Women & Health, 1998, 28(1), 23-40.
Lee, C., Dobson, A., Brown, W., Adamson, L., & Goldsworthy, J. Tracking participants: lessons from the Women's Health Australia Project. Australian & New Zealand Journal of Public Health, 2000, 24(3), 334-336.

150
Lee, C., Dobson, A. J., Brown, W. J., Bryson, L., Byles, J., Warner-Smith, P., et al. Cohort Profile: the Australian Longitudinal Study on Women's Health. Int J Epidemiol, 2005, 34(5), 987-991.
Rural, remote and metropolitan areas of classification 1991 Census edition. Canberra: Australian Government Publishing Service; 1994.
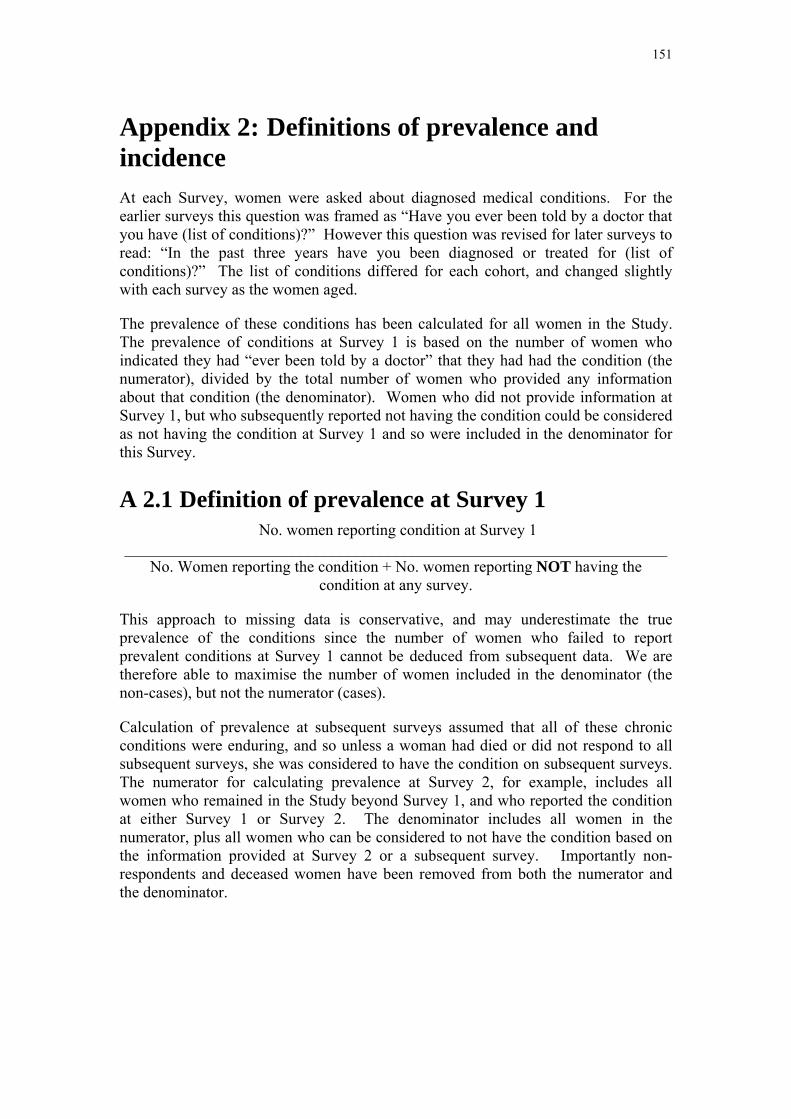
151
Appendix 2: Definitions of prevalence and incidence At each Survey, women were asked about diagnosed medical conditions. For the earlier surveys this question was framed as “Have you ever been told by a doctor that you have (list of conditions)?” However this question was revised for later surveys to read: “In the past three years have you been diagnosed or treated for (list of conditions)?” The list of conditions differed for each cohort, and changed slightly with each survey as the women aged.
The prevalence of these conditions has been calculated for all women in the Study. The prevalence of conditions at Survey 1 is based on the number of women who indicated they had “ever been told by a doctor” that they had had the condition (the numerator), divided by the total number of women who provided any information about that condition (the denominator). Women who did not provide information at Survey 1, but who subsequently reported not having the condition could be considered as not having the condition at Survey 1 and so were included in the denominator for this Survey.
A 2.1 Definition of prevalence at Survey 1 No. women reporting condition at Survey 1
____________________________________________________________________ No. Women reporting the condition + No. women reporting NOT having the
condition at any survey.
This approach to missing data is conservative, and may underestimate the true prevalence of the conditions since the number of women who failed to report prevalent conditions at Survey 1 cannot be deduced from subsequent data. We are therefore able to maximise the number of women included in the denominator (the non-cases), but not the numerator (cases).
Calculation of prevalence at subsequent surveys assumed that all of these chronic conditions were enduring, and so unless a woman had died or did not respond to all subsequent surveys, she was considered to have the condition on subsequent surveys. The numerator for calculating prevalence at Survey 2, for example, includes all women who remained in the Study beyond Survey 1, and who reported the condition at either Survey 1 or Survey 2. The denominator includes all women in the numerator, plus all women who can be considered to not have the condition based on the information provided at Survey 2 or a subsequent survey. Importantly non-respondents and deceased women have been removed from both the numerator and the denominator.
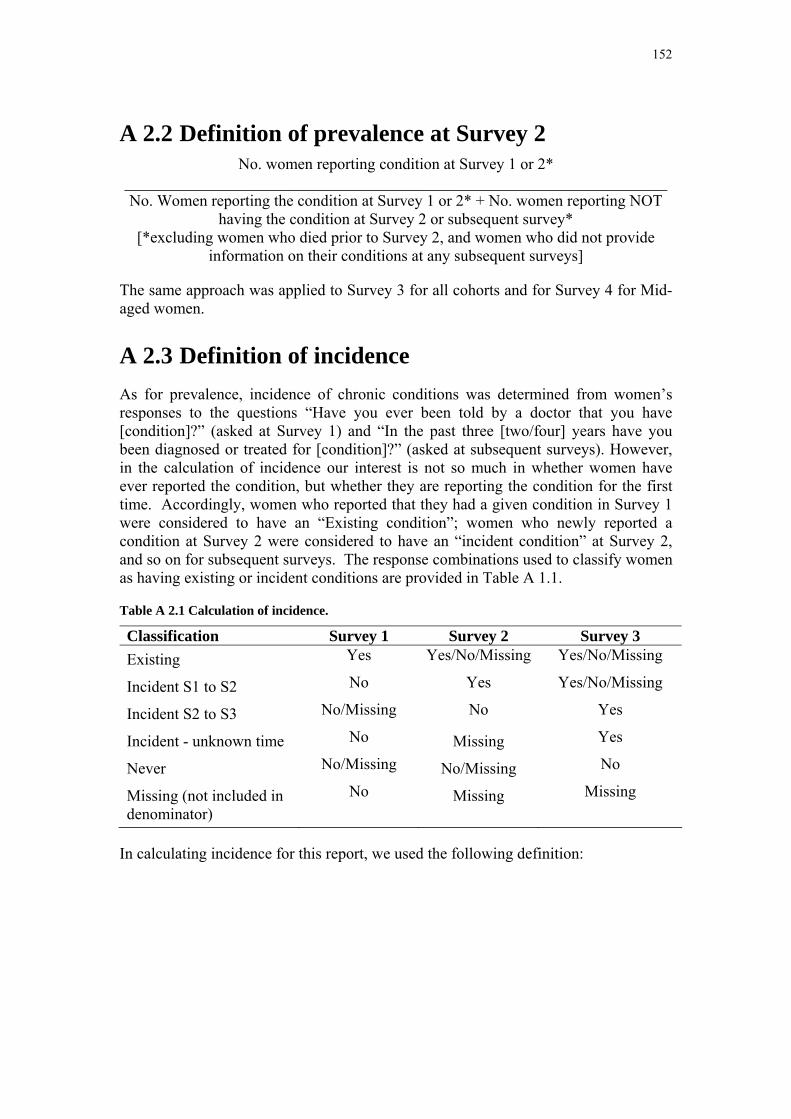
152
A 2.2 Definition of prevalence at Survey 2 No. women reporting condition at Survey 1 or 2*
____________________________________________________________________ No. Women reporting the condition at Survey 1 or 2* + No. women reporting NOT
having the condition at Survey 2 or subsequent survey* [*excluding women who died prior to Survey 2, and women who did not provide
information on their conditions at any subsequent surveys]
The same approach was applied to Survey 3 for all cohorts and for Survey 4 for Mid-aged women.
A 2.3 Definition of incidence As for prevalence, incidence of chronic conditions was determined from women’s responses to the questions “Have you ever been told by a doctor that you have [condition]?” (asked at Survey 1) and “In the past three [two/four] years have you been diagnosed or treated for [condition]?” (asked at subsequent surveys). However, in the calculation of incidence our interest is not so much in whether women have ever reported the condition, but whether they are reporting the condition for the first time. Accordingly, women who reported that they had a given condition in Survey 1 were considered to have an “Existing condition”; women who newly reported a condition at Survey 2 were considered to have an “incident condition” at Survey 2, and so on for subsequent surveys. The response combinations used to classify women as having existing or incident conditions are provided in Table A 1.1.
Table A 2.1 Calculation of incidence.
Classification Survey 1 Survey 2 Survey 3 Existing Yes Yes/No/Missing Yes/No/Missing
Incident S1 to S2 No Yes Yes/No/Missing
Incident S2 to S3 No/Missing No Yes
Incident - unknown time No Missing Yes
Never No/Missing No/Missing No
Missing (not included in denominator)
No Missing Missing
In calculating incidence for this report, we used the following definition:
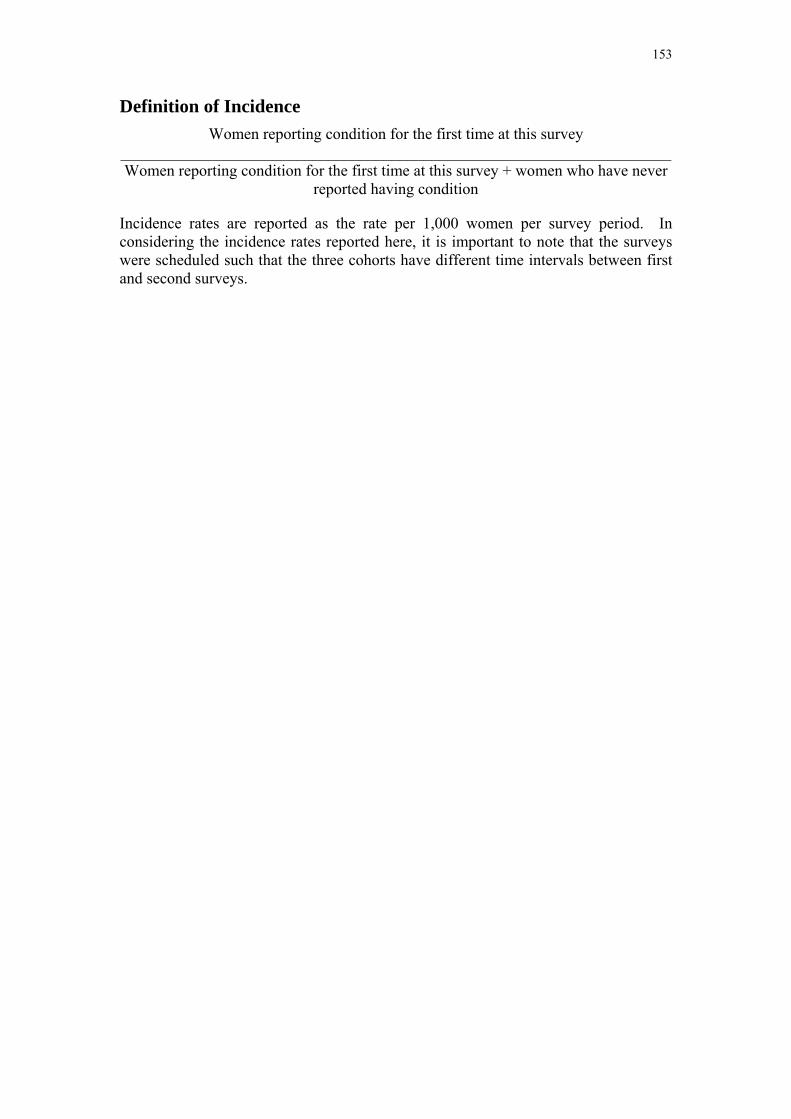
153
Definition of Incidence Women reporting condition for the first time at this survey
_____________________________________________________________________ Women reporting condition for the first time at this survey + women who have never
reported having condition
Incidence rates are reported as the rate per 1,000 women per survey period. In considering the incidence rates reported here, it is important to note that the surveys were scheduled such that the three cohorts have different time intervals between first and second surveys.

154
Appendix 3: Tables for incidence and prevalence of chronic conditions and risk factors
A 3.1 Hypertension Table A 3.1 Hypertension prevalence (%) for each cohort at all surveys.
Cohort
Young Mid Old Hypertension
Prev (%)Prev (%)
Prev (%)
Survey
1 4.8 20.2 47.1
2 6.0 24.5 51.9
3 6.8 26.9 60.6
4 . 35.6 .
Table A 3.2 Hypertension by body mass index.
Cohort
Young Mid Old
BMI BMI BMI
Not over
weight Over
weight Obese
Not over
weightOver
weight Obese
Not over
weightOver
weight Obese
N 6327 1203 431 5668 2979 1896 5088 3320 1410
Existing Case 5.3 11.0 20.6 16.1 27.0 45.4 48.6 59.3 69.7
New Case 2.4 4.2 6.7 8.8 14.7 18.0 12.7 13.1 11.1
Never Case 92.3 84.8 72.8 75.2 58.3 36.6 38.6 27.6 19.2
Total 100.0 100.0 100.0 100.0 100.0 100.0 100.0 100.0 100.0
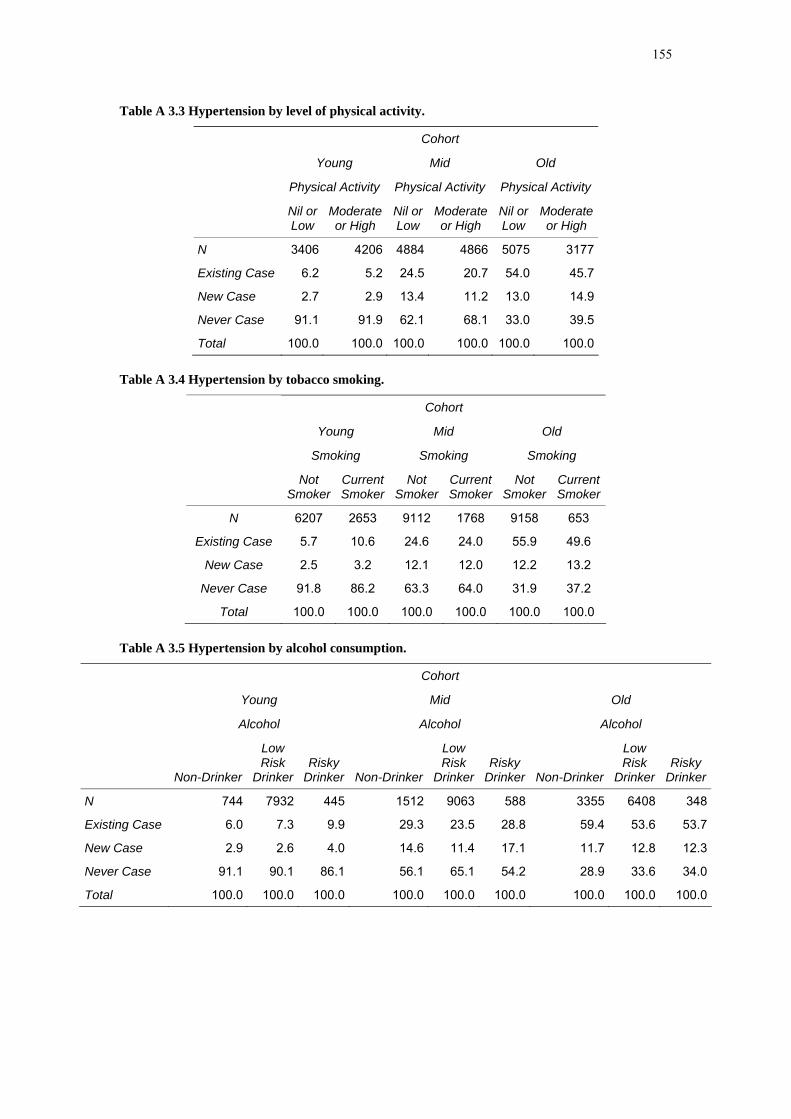
155
Table A 3.3 Hypertension by level of physical activity.
Cohort
Young Mid Old
Physical Activity Physical Activity Physical Activity
Nil or Low
Moderate or High
Nil or Low
Moderate or High
Nil or Low
Moderate or High
N 3406 4206 4884 4866 5075 3177
Existing Case 6.2 5.2 24.5 20.7 54.0 45.7
New Case 2.7 2.9 13.4 11.2 13.0 14.9
Never Case 91.1 91.9 62.1 68.1 33.0 39.5
Total 100.0 100.0 100.0 100.0 100.0 100.0
Table A 3.4 Hypertension by tobacco smoking.
Cohort
Young Mid Old
Smoking Smoking Smoking
Not Smoker
Current Smoker
Not Smoker
Current Smoker
Not Smoker
Current Smoker
N 6207 2653 9112 1768 9158 653
Existing Case 5.7 10.6 24.6 24.0 55.9 49.6
New Case 2.5 3.2 12.1 12.0 12.2 13.2
Never Case 91.8 86.2 63.3 64.0 31.9 37.2
Total 100.0 100.0 100.0 100.0 100.0 100.0
Table A 3.5 Hypertension by alcohol consumption.
Cohort
Young Mid Old
Alcohol Alcohol Alcohol
Non-Drinker
Low Risk
Drinker Risky
Drinker Non-Drinker
Low Risk
DrinkerRisky
Drinker Non-Drinker
Low Risk
DrinkerRisky
Drinker
N 744 7932 445 1512 9063 588 3355 6408 348
Existing Case 6.0 7.3 9.9 29.3 23.5 28.8 59.4 53.6 53.7
New Case 2.9 2.6 4.0 14.6 11.4 17.1 11.7 12.8 12.3
Never Case 91.1 90.1 86.1 56.1 65.1 54.2 28.9 33.6 34.0
Total 100.0 100.0 100.0 100.0 100.0 100.0 100.0 100.0 100.0

156
Table A 3.6 Hypertension by level of education.
Cohort
Young Mid Old
Education Education Education
Year 12 & below
Above Year 12
Year 12 & below
Above Year 12
Year 12 & below
Above Year 12
N 6309 2855 6977 4153 8336 1623
Existing Case 7.8 6.4 27.1 20.1 56.6 50.4
New Case 2.5 3.1 12.6 11.4 12.3 13.3
Never Case 89.8 90.5 60.3 68.5 31.1 36.4
Total 100.0 100.0 100.0 100.0 100.0 100.0
A 3.2 Heart Disease Table A 3.7 Heart disease prevalence (%) for each cohort at all surveys.
Cohort
Young Mid Old Heart Disease
Prev (%)Prev (%)
Prev (%)
Survey
1 0.4 2.1 16.9
2 0.4 3.3 21.5
3 0.5 3.9 24.1
4 . 6.5 .
Table A 3.8 Heart disease by body mass index.
Cohort
Young Mid Old
BMI BMI BMI
Not over weight
Over weight Obese
Not over weight
Over weight Obese
Not over weight
Over weight Obese
N 6179 1146 400 5449 2770 1700 4678 2916 1197
Existing Case 0.5 0.7 1.1 2.2 2.9 3.8 20.3 21.9 27.9
New Case 0.3 0.1 0.7 3.0 4.7 7.1 8.2 9.5 11.5
Never Case 99.2 99.2 98.2 94.7 92.4 89.1 71.5 68.5 60.6
Total 100.0 100.0 100.0 100.0 100.0 100.0 100.0 100.0 100.0

157
Table A 3.9 Heart disease by level of physical activity.
Cohort
Young Mid Old
Physical Activity Physical Activity Physical Activity
Nil or Low
Moderate or High
Nil or Low
Moderate or High
Nil or Low
Moderate or High
N 3345 4146 4651 4728 4772 3039
Existing Case 0.4 0.4 2.4 2.3 20.1 14.1
New Case 0.3 0.3 4.8 3.1 10.3 7.9
Never Case 99.3 99.3 92.8 94.6 69.6 78.1
Total 100.0 100.0 100.0 100.0 100.0 100.0
Table A 3.10 Heart disease by tobacco smoking.
Table A 3.11 Heart disease by alcohol consumption.
Cohort
Young Mid Old
Alcohol Alcohol Alcohol
Non-Drinker
Low Risk
Drinker Risky
Drinker Non-Drinker
Low Risk
DrinkerRisky
Drinker Non-Drinker
Low Risk
DrinkerRisky
Drinker
N 723 7684 425 1366 8599 533 2969 5782 320
Existing Case 1.0 0.6 0.8 4.2 2.5 1.6 26.2 20.2 18.1
New Case 0.1 0.3 0.2 5.8 3.9 4.7 10.3 8.7 5.2
Never Case 98.9 99.1 99.0 90.0 93.6 93.7 63.5 71.2 76.7
Total 100.0 100.0 100.0 100.0 100.0 100.0 100.0 100.0 100.0
Cohort
Young Mid Old
Smoking Smoking Smoking
Not Smoker
Current Smoker
Not Smoker
Current Smoker
Not Smoker
Current Smoker
N 6064 2525 8608 1633 8233 573
Existing Case 0.7 0.5 2.4 4.0 22.2 19.2
New Case 0.2 0.2 3.6 6.7 8.8 13.0
Never Case 99.1 99.3 94.0 89.3 69.0 67.8
Total 100.0 100.0 100.0 100.0 100.0 100.0

158
Table A 3.12 Heart disease by level of education.
Cohort
Young Mid Old
Education Education Education
Year 12 & below
Above Year 12
Year 12 & below
Above Year 12
Year 12 & below
Above Year 12
N 6087 2790 6506 3969 7398 1524
Existing Case 0.6 0.6 3.0 2.2 22.6 19.6
New Case 0.3 0.3 4.4 3.7 9.0 8.9
Never Case 99.1 99.1 92.6 94.1 68.4 71.5
Total 100.0 100.0 100.0 100.0 100.0 100.0
A 3.3 Diabetes Table A 3.13 Diabetes prevalence (%) for each cohort by all surveys.
Cohort
Young Mid Old Diabetes
Prev (%)Prev (%)
Prev (%)
Survey
1 1.0 2.9 8.7
2 1.5 4.1 10.3
3 1.8 4.9 12.2
4 . 8.0 .
Table A 3.14 Diabetes by body mass index.
Cohort
Young Mid Old
BMI BMI BMI
Not over
weight Over
weight Obese
Not over
weightOver
weight Obese
Not over
weightOver
weight Obese
N 6202 1154 402 5426 2785 1720 4449 2853 1168
Existing Case 1.2 2.1 2.9 1.9 3.7 9.5 8.8 12.1 20.5
New Case 0.9 1.0 3.7 1.6 5.3 12.1 3.3 6.6 11.3
Never Case 97.9 96.9 93.4 96.5 91.0 78.4 87.9 81.2 68.2
Total 100.0 100.0 100.0 100.0 100.0 100.0 100.0 100.0 100.0

159
Table A 3.15 Diabetes by level of physical activity.
Cohort
Young Mid Old
Physical Activity Physical Activity Physical Activity
Nil or Low
Moderate or High
Nil or Low
Moderate or High
Nil or Low
Moderate or High
N 3355 4158 4648 4738 4638 3023
Existing Case 1.4 0.9 3.7 2.7 9.9 5.8
New Case 1.3 1.3 5.0 3.9 6.1 4.8
Never Case 97.3 97.8 91.3 93.3 84.0 89.4
Total 100.0 100.0 100.0 100.0 100.0 100.0
Table A 3.16 Diabetes by tobacco smoking.
Cohort
Young Mid Old
Smoking Smoking Smoking
Not Smoker
Current Smoker
Not Smoker
Current Smoker
Not Smoker
Current Smoker
N 6086 2545 8630 1631 7939 536
Existing Case 1.3 1.7 3.5 5.4 11.5 10.7
New Case 1.2 1.2 4.4 5.2 5.8 4.5
Never Case 97.5 97.1 92.2 89.5 82.7 84.8
Total 100.0 100.0 100.0 100.0 100.0 100.0
Table A 3.17 Diabetes by alcohol consumption.
Cohort
Young Mid Old
Alcohol Alcohol Alcohol
Non-Drinker
Low Risk
Drinker Risky
Drinker Non-Drinker
Low Risk
DrinkerRisky
Drinker Non-Drinker
Low Risk
DrinkerRisky
Drinker
N 724 7726 428 1399 8595 526 2841 5572 301
Existing Case 2.1 1.5 1.3 10.0 2.8 2.3 17.9 8.7 3.7
New Case 1.3 1.1 1.9 6.7 4.2 3.7 6.6 5.1 7.5
Never Case 96.6 97.4 96.8 83.3 93.0 94.0 75.5 86.2 88.9
Total 100.0 100.0 100.0 100.0 100.0 100.0 100.0 100.0 100.0

160
Table A 3.18 Diabetes by level of education.
Cohort
Young Mid Old
Education Education Education
Year 12 & below
Above Year 12
Year 12 & below
Above Year 12
Year 12 & below
Above Year 12
N 6122 2800 6518 3970 7139 1463
Existing Case 1.6 1.3 4.2 2.9 12.4 8.9
New Case 1.1 1.2 5.6 2.7 5.6 5.4
Never Case 97.3 97.5 90.2 94.4 82.0 85.7
Total 100.0 100.0 100.0 100.0 100.0 100.0
A 3.4 Asthma Table A 3.19 Asthma prevalence (%) for each cohort at all surveys.
Cohort
Young Mid Old Asthma
Prev (%)Prev (%)
Prev (%)
Survey
1 24.7 15.6 12.7
2 27.4 18.7 14.2
3 28.5 19.4 15.7
4 . 24.9 .
Table A 3.20 Asthma by body mass index.
Cohort
Young Mid Old
BMI BMI BMI
Not over
weight Over
weight Obese
Not over
weightOver
weight Obese
Not over
weightOver
weight Obese
N 7045 1320 486 5621 2893 1787 4497 2858 1161
Existing Case 32.2 39.4 41.7 17.0 21.2 24.7 15.2 17.9 22.0
New Case 3.6 4.9 5.0 5.0 6.9 9.7 3.2 4.1 5.9
Never Case 64.2 55.7 53.3 78.0 71.9 65.6 81.6 78.0 72.1
Total 100.0 100.0 100.0 100.0 100.0 100.0 100.0 100.0 100.0
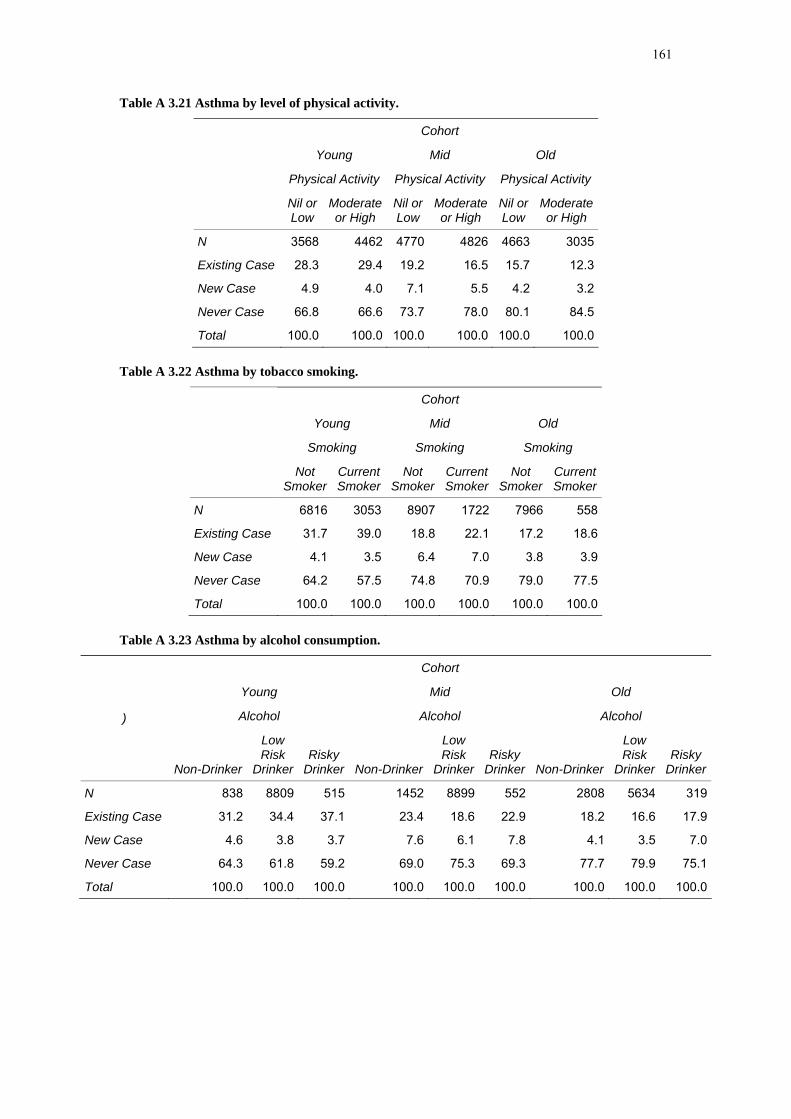
161
Table A 3.21 Asthma by level of physical activity.
Cohort
Young Mid Old
Physical Activity Physical Activity Physical Activity
Nil or Low
Moderate or High
Nil or Low
Moderate or High
Nil or Low
Moderate or High
N 3568 4462 4770 4826 4663 3035
Existing Case 28.3 29.4 19.2 16.5 15.7 12.3
New Case 4.9 4.0 7.1 5.5 4.2 3.2
Never Case 66.8 66.6 73.7 78.0 80.1 84.5
Total 100.0 100.0 100.0 100.0 100.0 100.0
Table A 3.22 Asthma by tobacco smoking.
Cohort
Young Mid Old
Smoking Smoking Smoking
Not Smoker
Current Smoker
Not Smoker
Current Smoker
Not Smoker
Current Smoker
N 6816 3053 8907 1722 7966 558
Existing Case 31.7 39.0 18.8 22.1 17.2 18.6
New Case 4.1 3.5 6.4 7.0 3.8 3.9
Never Case 64.2 57.5 74.8 70.9 79.0 77.5
Total 100.0 100.0 100.0 100.0 100.0 100.0
Table A 3.23 Asthma by alcohol consumption.
Cohort
Young Mid Old
Alcohol Alcohol Alcohol )
Non-Drinker
Low Risk
Drinker Risky
Drinker Non-Drinker
Low Risk
DrinkerRisky
Drinker Non-Drinker
Low Risk
DrinkerRisky
Drinker
N 838 8809 515 1452 8899 552 2808 5634 319
Existing Case 31.2 34.4 37.1 23.4 18.6 22.9 18.2 16.6 17.9
New Case 4.6 3.8 3.7 7.6 6.1 7.8 4.1 3.5 7.0
Never Case 64.3 61.8 59.2 69.0 75.3 69.3 77.7 79.9 75.1
Total 100.0 100.0 100.0 100.0 100.0 100.0 100.0 100.0 100.0

162
Table A 3.24 Asthma by level of education.
Cohort
Young Mid Old
Education Education Education
Year 12 & below
Above Year 12
Year 12 & below
Above Year 12
Year 12 & below
Above Year 12
N 7097 3119 6785 4096 7153 1480
Existing Case 35.3 32.0 19.5 19.4 17.2 17.0
New Case 4.1 3.3 6.6 5.8 3.6 4.7
Never Case 60.6 64.7 73.9 74.8 79.2 78.3
Total 100.0 100.0 100.0 100.0 100.0 100.0
A 3.5 Osteoporosis Table A 3.25 Osteoporosis prevalence (%) for the Mid-aged and Older cohort at all surveys.
Cohort
Mid Old OsteoporosisPrev (%)
Prev (%)
Survey
1 4.1 20.7
2 6.1 25.2
3 7.5 32.3
4 12.1 .
Table A 3.26 Osteoporosis by body mass index.
Cohort
Mid Old
BMI BMI
Not over
weightOver
weight Obese
Not over
weightOver
weight Obese
N 5514 2797 1694 4715 2939 1186
Existing Case 4.6 5.6 6.5 28.3 25.6 24.6
New Case 8.5 5.8 6.7 13.2 10.3 13.1
Never Case 86.9 88.6 86.8 58.5 64.1 62.4
Total 100.0 100.0 100.0 100.0 100.0 100.0

163
Table A 3.27 Osteoporosis by level of physical activity.
Table A 3.28 Osteoporosis by tobacco smoking.
Cohort
Mid Old
Smoking Smoking
Not Smoker
Current Smoker
Not Smoker
Current Smoker
N 8668 1651 8267 597
Existing Case 5.0 6.4 26.5 33.3
New Case 7.2 8.2 12.1 11.8
Never Case 87.8 85.4 61.4 54.9
Total 100.0 100.0 100.0 100.0
Table A 3.29 Osteoporosis by alcohol consumption.
Cohort
Mid Old
Alcohol Alcohol
Non-Drinker
Low Risk
DrinkerRisky
Drinker Non-Drinker
Low Risk
Drinker Risky
Drinker
N 1376 8677 533 2906 5888 329
Existing Case 7.5 4.9 4.8 27.6 26.8 26.6
New Case 8.6 7.1 6.4 12.3 11.7 13.9
Never Case 83.9 88.0 88.8 60.2 61.5 59.5
Total 100.0 100.0 100.0 100.0 100.0 100.0
Cohort
Mid Old
Physical Activity Physical Activity
Nil or Low
Moderate or High
Nil or Low
Moderate or High
N 4684 4743 4761 3071
Existing Case 5.0 4.5 25.2 20.2
New Case 7.9 6.1 12.3 12.3
Never Case 87.1 89.4 62.5 67.5
Total 100.0 100.0 100.0 100.0

164
Table A 3.30 Osteoporosis by level of education.
Cohort
Mid Old
Education Education
Year 12 & below
Above Year 12
Year 12 & below
Above Year 12
N 6573 3994 7427 1544
Existing Case 5.9 4.2 26.8 27.4
New Case 7.4 7.1 11.9 12.5
Never Case 86.7 88.7 61.3 60.1
Total 100.0 100.0 100.0 100.0
A 3.6 Arthritis Table A 3.31 Arthritis prevalence (%) for the Mid-aged and Older cohort at all surveys.
Cohort
Mid Old ArthritisPrev (%)
Prev (%)
Survey
1 . .
2 . 41.3
3 21.2 60.0
4 34.5 .
Table A 3.32 Arthritis by body mass index.
Cohort
Mid Old
BMI BMI
Not over
weightOver
weight Obese
Not over
weightOver
weight Obese
N 5374 2743 1672 4557 2839 1188
Existing Case 18.3 25.8 34.6 41.1 50.0 62.3
New Case 9.6 10.3 9.4 11.6 13.5 11.3
Never Case 72.1 63.8 56.0 47.3 36.5 26.4
Total 100.0 100.0 100.0 100.0 100.0 100.0

165
Table A 3.33 Arthritis by level of physical activity.
Cohort
Mid Old
Physical Activity Physical Activity
Nil or Low
Moderate or High
Nil or Low
Moderate or High
N 4641 4691 4949 3119
Existing Case 24.1 22.0 52.2 41.3
New Case 10.0 9.8 11.8 11.9
Never Case 65.9 68.2 36.0 46.8
Total 100.0 100.0 100.0 100.0
Table A 3.34 Arthritis by tobacco smoking.
Cohort
Mid Old
Smoking Smoking
Not Smoker
Current Smoker
Not Smoker
Current Smoker
N 8513 1599 8023 570
Existing Case 22.7 27.0 47.5 42.5
New Case 10.1 9.2 12.2 12.3
Never Case 67.2 63.8 40.3 45.2
Total 100.0 100.0 100.0 100.0
Table A 3.35 Arthritis by alcohol consumption.
Cohort
Mid Old
Alcohol Alcohol
Non-Drinker
Low Risk
DrinkerRisky
Drinker Non-Drinker
Low Risk
Drinker Risky
Drinker
N 1341 8498 529 2814 5702 308
Existing Case 26.0 22.9 20.8 49.0 46.2 42.2
New Case 10.1 9.7 10.7 11.2 12.6 13.4
Never Case 63.9 67.4 68.5 39.8 41.2 44.4
Total 100.0 100.0 100.0 100.0 100.0 100.0

166
Table A 3.36 Arthritis by level of education.
Cohort
Mid Old
Education Education
Year 12 & below
Above Year 12
Year 12 & below
Above Year 12
N 6416 3929 7217 1491
Existing Case 25.3 20.0 47.4 44.3
New Case 9.8 9.8 12.4 12.1
Never Case 64.9 70.2 40.2 43.5
Total 100.0 100.0 100.0 100.0