Trends in Fruit and Vegetable Consumption Among Adults in the United States: Behavioral Risk Factor...
10
VOLUME 5: NO. 2 APRIL 2008 Trends in Fruit and Vegetable Consumption Among U.S. Men and Women, 1994–2005 ORIGINAL RESEARCH Suggested citation for this article: Blanck HM, Gillespie C, Kimmons JE, Seymour JD, Serdula MK. Trends in fruit and vegetable consumption among U.S. men and women, 1994–2005. Prev Chronic Dis 2008;5(2). http://www.cdc. gov/pcd/issues/2008/apr/07_0049.htm. Accessed [date]. PEER REVIEWED Abstract Introduction Eating a diet high in fruits and vegetables as part of an overall healthful diet can help lower chronic disease risk and aid in weight management. Increasing the percentage of Americans who consume enough fruits and vegetables every day is part of the Healthy People 2010 objectives for the nation. Assessing trends in consumption of these foods is important for tracking public health initiatives to meet this goal and for planning future objectives. Methods We assessed total and sex-specific changes in daily con- sumption of fruits and vegetables among 1,227,969 adults in the 50 U.S. states and the District of Columbia who participated in the Behavioral Risk Factor Surveillance System from 1994 through 2005. To estimate changes in consumption according to dietary recommendations that were in place during the years examined, we used geomet- ric mean and the percentage of people eating fruits or veg- etables or both five or more times per day. Estimates were standardized for sex, age, and race/ethnicity and analyzed by multivariate regression. Results From 1994 through 2005, the geometric mean frequency of consumption of fruits and vegetables declined slightly (standardized change: men and women, −0.22 times/day; men, −0.26 times/day; women, −0.17 times/day). The pro- portion of men and women eating fruits or vegetables or both five or more times per day was virtually unchanged (men, 20.6% vs 20.3%; women, 28.4% vs 29.6%); however, we found small increases for men aged 18 to 24 years and for women who were aged 25 to 34 years, non-Hispanic black, or nonsmokers. Consumption of fruit juice and non- fried potatoes declined for both sexes. Conclusions The frequency of fruit and vegetable consumption changed little from 1994 through 2005. If consumption is to be increased, we must identify and disseminate prom- ising individual and environmental strategies, including policy change. Introduction Fruits and vegetables contain essential vitamins, miner- als, fiber, and other bioactive compounds, and a diet high in these foods is associated with lower risk for numerous chronic diseases, including certain cancers and cardiovas- cular disease (1-3). Because of their low energy density, fruits and vegetables are also beneficial in weight manage- ment when eaten as part of a reduced-energy diet (4). In 1990, the Dietary Guidelines for Americans recom- mended eating at least two servings of fruits and three of vegetables daily (5). In 1991, the National Cancer The opinions expressed by authors contributing to this journal do not necessarily reflect the opinions of the U.S. Department of Health and Human Services, the Public Health Service, the Centers for Disease Control and Prevention, or the authors’ affiliated institutions. Use of trade names is for identification only and does not imply endorsement by any of the groups named above. www.cdc.gov/pcd/issues/2008/apr/07_0049.htm • Centers for Disease Control and Prevention Heidi Michels Blanck, PhD, Cathleen Gillespie, MS, Joel E. Kimmons, PhD, Jennifer D. Seymour, PhD, Mary K. Serdula, MD, MPH
-
Upload
independent -
Category
Documents
-
view
1 -
download
0
Transcript of Trends in Fruit and Vegetable Consumption Among Adults in the United States: Behavioral Risk Factor...
VOLUME 5: NO. 2 APRIL 2008
Trends in Fruit and Vegetable Consumption Among U.S. Men and
Women, 1994–2005
ORIGINAL RESEARCH
Suggested citation for this article: Blanck HM, Gillespie C, Kimmons JE, Seymour JD, Serdula MK. Trends in fruit and vegetable consumption among U.S. men and women, 1994–2005. Prev Chronic Dis 2008;5(2). http://www.cdc.gov/pcd/issues/2008/apr/07_0049.htm. Accessed [date].
PEER REVIEWED
Abstract
IntroductionEating a diet high in fruits and vegetables as part of an
overall healthful diet can help lower chronic disease risk and aid in weight management. Increasing the percentage of Americans who consume enough fruits and vegetables every day is part of the Healthy People 2010 objectives for the nation. Assessing trends in consumption of these foods is important for tracking public health initiatives to meet this goal and for planning future objectives.
MethodsWe assessed total and sex-specific changes in daily con-
sumption of fruits and vegetables among 1,227,969 adults in the 50 U.S. states and the District of Columbia who participated in the Behavioral Risk Factor Surveillance System from 1994 through 2005. To estimate changes in consumption according to dietary recommendations that were in place during the years examined, we used geomet-ric mean and the percentage of people eating fruits or veg-etables or both five or more times per day. Estimates were standardized for sex, age, and race/ethnicity and analyzed by multivariate regression.
ResultsFrom 1994 through 2005, the geometric mean frequency
of consumption of fruits and vegetables declined slightly (standardized change: men and women, −0.22 times/day; men, −0.26 times/day; women, −0.17 times/day). The pro-portion of men and women eating fruits or vegetables or both five or more times per day was virtually unchanged (men, 20.6% vs 20.3%; women, 28.4% vs 29.6%); however, we found small increases for men aged 18 to 24 years and for women who were aged 25 to 34 years, non-Hispanic black, or nonsmokers. Consumption of fruit juice and non-fried potatoes declined for both sexes.
ConclusionsThe frequency of fruit and vegetable consumption
changed little from 1994 through 2005. If consumption is to be increased, we must identify and disseminate prom-ising individual and environmental strategies, including policy change.
Introduction
Fruits and vegetables contain essential vitamins, miner-als, fiber, and other bioactive compounds, and a diet high in these foods is associated with lower risk for numerous chronic diseases, including certain cancers and cardiovas-cular disease (1-3). Because of their low energy density, fruits and vegetables are also beneficial in weight manage-ment when eaten as part of a reduced-energy diet (4).
In 1990, the Dietary Guidelines for Americans recom-mended eating at least two servings of fruits and three of vegetables daily (5). In 1991, the National Cancer
The opinions expressed by authors contributing to this journal do not necessarily reflect the opinions of the U.S. Department of Health and Human Services, the Public Health Service, the Centers for Disease Control and Prevention, or the authors’ affiliated institutions. Use of trade names is for identification only
and does not imply endorsement by any of the groups named above.
www.cdc.gov/pcd/issues/2008/apr/07_0049.htm • Centers for Disease Control and Prevention �
Heidi Michels Blanck, PhD, Cathleen Gillespie, MS, Joel E. Kimmons, PhD, Jennifer D. Seymour, PhD, Mary K. Serdula, MD, MPH
VOLUME 5: NO. 2APRIL 2008
Institute and the Produce for Better Health Foundation jointly established the national 5 A Day for Better Health Program (6). In 2005, the Centers for Disease Control and Prevention (CDC) became the lead federal agency and health authority for the program, which is a partnership between government, nonprofit organizations, businesses, and communities.
The Healthy People 2010 objectives for the nation include increasing the percentage of Americans who eat enough fruits and vegetables daily (7). Assessing trends in consumption of these foods is important for tracking public health initiatives to meet this goal and for planning future objectives. An earlier trend analysis that used data from the state-based Behavioral Risk Factor Surveillance System (BRFSS) found that fruit and vegetable consump-tion by American adults was essentially unchanged from 1994 through 2000 and that a low proportion of Americans ate five or more fruits and vegetables per day (8). However, this analysis did not examine differences in consumption between men and women. Our study updates this ear-lier work with BRFSS data from the current decade and expands the scope by providing sex-specific results and examining changes in consumption by selected sociodemo-graphic and behavioral characteristics.
Methods
A continuous telephone survey conducted by state health departments in collaboration with CDC, the BRFSS pro-vides state-specific estimates of behaviors that relate to the leading causes of death among adults in the United States. In each state, random-digit dialing is used to select an independent probability sample of residents aged 18 years or older, and trained interviewers administer identi-cal core questionnaires. Data are weighted by race/ethnic-ity, age, and sex to reflect the respondents’ probability of selection and the state’s population. A detailed description of BRFSS methods is available elsewhere (9,10).
We used data from all 50 U.S. states and the District of Columbia that participated in the BRFSS for the years from 1994 through 2005 in which the fruit and vegetable module was part of the core questionnaire: 1994, 1996, 1998, 2000, 2002, 2003, and 2005. We aggregated state estimates to analyze overall and sex-specific consumption over time of fruit juices, whole fruits, green salad, carrots, nonfried potatoes, and “all other” vegetables. We also used
BRFSS data to calculate body mass index (BMI), and to evaluate consumption by participation in leisure-time activity and by smoking status.
The BRFSS module on fruits and vegetables has six ques-tions that have remained the same over time. Interviewers begin the module with the following statement: These next questions are about the foods you usually eat or drink. Please tell me how often you eat or drink each one: for example, twice a week, three times a month, and so forth. Respondents are then asked the following questions: 1) How often do you drink fruit juices such as orange, grape-fruit, or tomato? 2) Not counting juice, how often do you eat fruit? 3) How often do you eat green salad? 4) How often do you eat potatoes, not including french fries, fried potatoes, or potato chips? 5) How often do you eat carrots? and 6) Not counting carrots, potatoes, or salad, how many servings of vegetables do you usually eat? Participants are not given a definition of serving size. At the end of the fruits and vegetables interview, respondents are asked to report their weight and their height without shoes.
To create an index of fruit and vegetable consumption, we summed the daily frequency of consumption of food items mentioned in the module (11). We calculated total daily fruit consumption from responses to questions 1 and 2 and total daily vegetable consumption from responses to questions 3–6. To calculate consumption in times per day, we divided weekly frequencies by 7, monthly frequencies by 30, and yearly frequencies by 365. For consistency with past analyses, the answer to question 6 was treated as times per day. We calculated BMI as self-reported weight in kilograms divided by height in meters squared and grouped respondents into three categories: normal weight (BMI <25), overweight (BMI 25 to <30), and obese (BMI ≥30) (12).
About leisure-time activity, BRFSS respondents are asked: During the past month, other than during your regular job, did you participate in any physical activities or exercises such as running, calisthenics, golf, gardening, or walking for exercise? We classified smoking status as current smoker, former smoker, and nonsmoker (never smoked). We used the U.S. Census Bureau definition for regions of the United States: Northeast, South, Midwest, and West (13).
A total of 1,394,471 people completed the interviews. We excluded people not reporting race/ethnicity (n = 11,217),
2 Centers for Disease Control and Prevention • www.cdc.gov/pcd/issues/2008/apr/07_0049.htm
The opinions expressed by authors contributing to this journal do not necessarily reflect the opinions of the U.S. Department of Health and Human Services, the Public Health Service, the Centers for Disease Control and Prevention, or the authors’ affiliated institutions. Use of trade names is for identification only
and does not imply endorsement by any of the groups named above.
education level (n = 2898), smoking status (n = 4138), leisure-time physical activity (n = 5989), and weight or height (n = 58,781) and people who did not answer more than one question in the fruit and vegetable module (n = 103,808) or who reported eating 25 or more fruits and veg-etables per day (n = 229). Because some individuals were missing more than one covariate, we had 1,227,969 people in our final sample: 95,571 from 1994; 107,522 from 1996; 130,086 from 1998; 157,179 from 2000; 211,507 from 2002; 224,807 from 2003; and 301,297 from 2005.
To allow comparison with earlier dietary recommen-dations (14) and previous reports of BRFSS data (7,15), we calculated the percentage of respondents who ate five or more fruits or vegetables or both per day and the mean daily consumption. Because the frequency of consumption was skewed, we calculated geometric mean daily consumption to provide a valid measure of center. Participants who reported not eating any fruits or veg-etables were assigned 0.1 times per day to allow for their inclusion in the analysis.
We used state census population estimates for the survey years to weight data for age, race/ethnicity, and sex. Because of the large sample size, we set statistical significance at P < .01. To account for the complex sam-pling design and to report weighted findings, we used SAS 9.1 (SAS Institute, Inc, Cary, North Carolina) and SAS-Callable SUDAAN 9.0 (RTI International, Research Triangle Park, North Carolina). Changes in the geometric mean frequency of daily consumption and in the percent-age of respondents eating fruits and vegetables five or more times daily from 1994 through 2005 were standardized to the sex, age, and racial/ethnic distribution of the 2000 BRFSS population. To analyze temporal changes in the geometric mean frequency, we used multivariable regres-sion that controlled for year, age, sex, and race/ethnicity for both linear and quadratic time effects (16). Quadratic trends can be statistically significant but nonlinear over time because of a leveling off or significant change in direc-tion, whereas trends with significant linear and quadratic components demonstrate nonlinear variation along with an overall increase or decrease over time.
Results
For all survey years combined, 49.2% of respondents were male and 50.8% were female. Seventy-five percent
were non-Hispanic white, 9.2% were non-Hispanic black, 10.7% were Hispanic, and 5.1% were of other race/ethnic-ity. Slightly more than half (56.7%) had at least some col-lege education. By age, 32.7% of respondents were 18 to 34 years; 38.7%, 35 to 54 years; and 28.6%, 55 years or older. Nearly one-quarter of respondents (22.6%) were current smokers, and most (74.3%) had engaged in some leisure-time physical activity in the month preceding their inter-view. Nearly half (43.6%) reported being of normal weight; 36.4%, being overweight; and 20.0%, being obese.
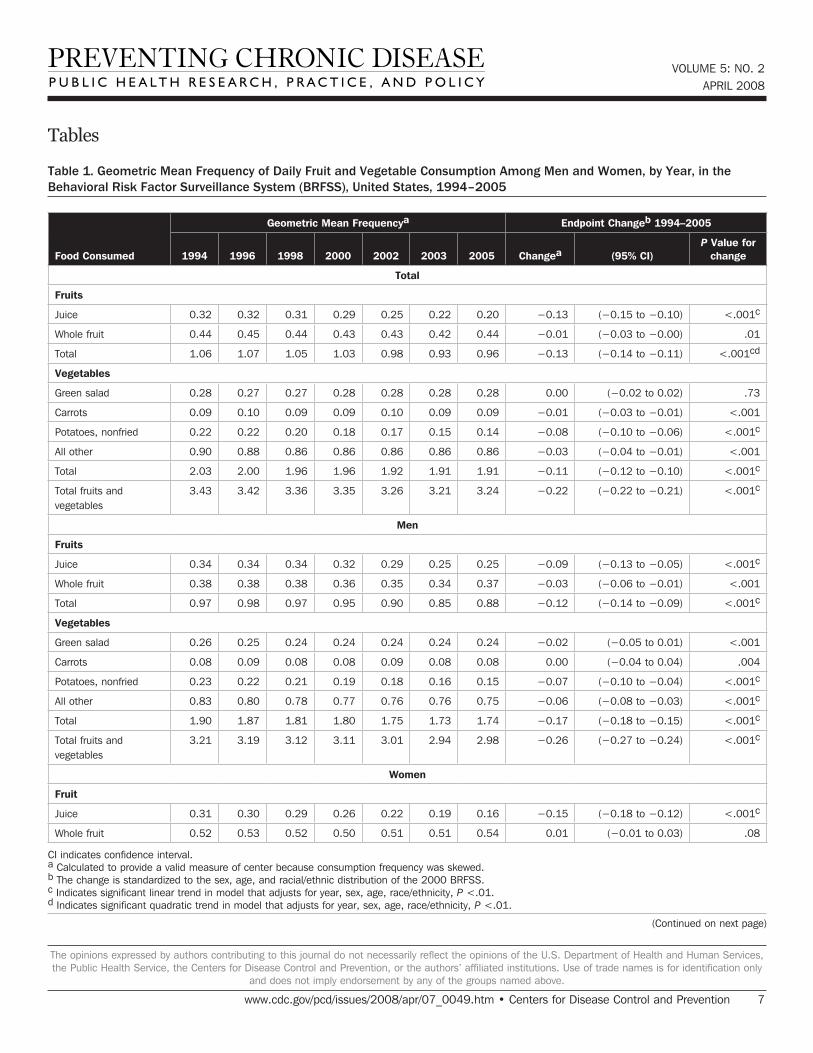
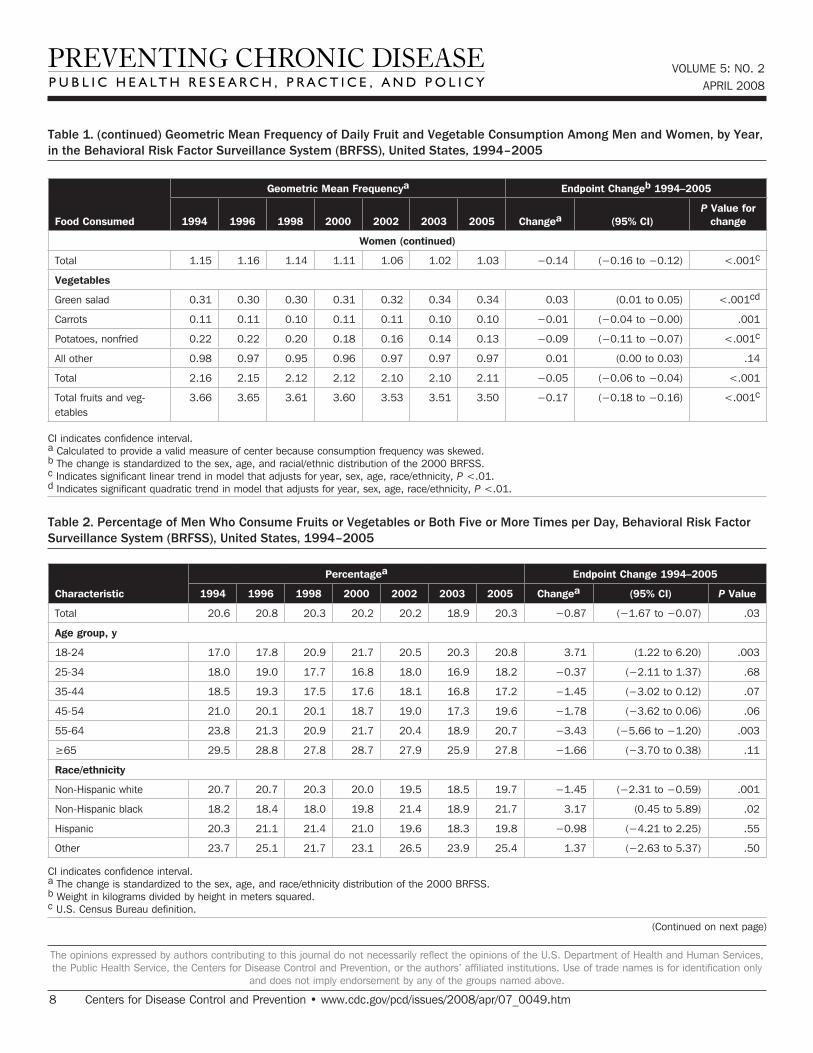
From 1994 through 2005, the total geometric mean frequency of fruit and vegetable consumption declined slightly, from 3.43 times per day in 1994 to 3.24 times per day in 2005 (standardized change, −0.22 times/day) (Table 1). The geometric mean frequency for men changed from 3.21 to 2.98 times per day (standardized change, −0.26 times/day); women went from 3.66 to 3.50 times per day (standardized change, −0.17 times/day). Overall, total fruit and total vegetable consumption declined slightly. Of the six fruit and vegetable categories, fruit juice (−0.13) and nonfried potatoes (−0.08) showed slight declines in consumption. When stratified by sex, the data showed that men had small declines in the consumption of fruit juice (−0.09), nonfried potatoes (−0.07), and “all other” veg-etables (−0.06); women had small declines in the consump-tion of fruit juice (−0.15) and nonfried potatoes (−0.09). Linear trends were similar to endpoint changes with one exception: the total sample had no significant linear trend for “all other” vegetables. For the total sample, quadratic trends were significant for total fruits; for women, they were significant for green salad. Men had no significant quadratic trends.
The overall prevalence of consumption of fruits or veg-etables or both five or more times per day was 24.7%, with no appreciable change between 1994 (24.6%) and 2005 (25.0%) (data not in table). Men’s prevalence of this level of consumption did not change significantly from 1994 through 2005 (−0.87 percentage points, P = .03) (Table 2). Subgroup analysis, however, found a significant increase (+3.71 percentage points, P = .003) among men aged 18 to 24 years and a significant decrease (−3.43 percent-age points, P = .003) among men aged 55 to 64 years. Significant decreases also were found for non-Hispanic white men (−1.45 percentage points, P = .001), men report-ing any leisure time physical activity (−1.65 percentage points, P = .001), and men residing in the South (−1.81 percentage points, P = .01).
VOLUME 5: NO. 2APRIL 2008
www.cdc.gov/pcd/issues/2008/apr/07_0049.htm • Centers for Disease Control and Prevention �
The opinions expressed by authors contributing to this journal do not necessarily reflect the opinions of the U.S. Department of Health and Human Services, the Public Health Service, the Centers for Disease Control and Prevention, or the authors’ affiliated institutions. Use of trade names is for identification only
and does not imply endorsement by any of the groups named above.
VOLUME 5: NO. 2APRIL 2008
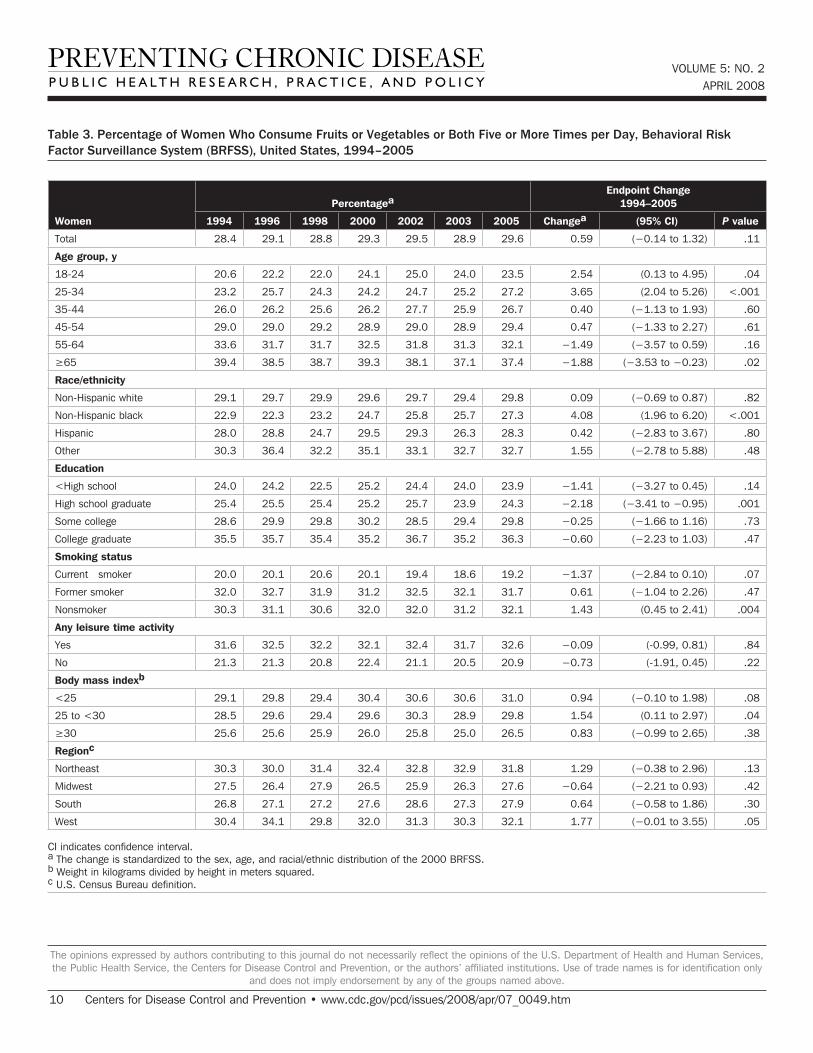
Among women, the overall prevalence of eating fruits or vegetables or both five or more times per day did not change significantly from 1994 through 2005 (+0.59 per-centage points, P = .11). However, several groups had significant increases: women aged 25 to 34 years (+3.65 percentage points, P < .001), non-Hispanic black women (+4.08 percentage points, P = .0002), and women who were nonsmokers (+1.43 percentage points, P = .004) (Table 3). High school graduates showed a significant decrease (−2.18 percentage points, P = .001). Significant changes were not observed for women by region or by BMI.
Discussion
Our findings show that fruit and vegetable consump-tion among American adults remained relatively stable from 1994 through 2005. The small decrease in vegetable consumption among men was attributable to declines in eating nonfried potatoes and “all other” vegetables and among women, to a decline in eating nonfried potatoes. The decrease among both sexes in total fruit consumption was driven by reduced consumption of fruit juice, not of whole fruit, which remained stable. The decreases in con-sumption of nonfried potatoes and fruit juice could reflect food transitions among Americans.
Consumption estimates based on abbreviated food fre-quency questionnaires, such as the BRFSS module, are generally lower than those from studies using other meth-ods (17-19). In fact, BRFSS-based estimates of the propor-tion of adults eating five or more fruits or vegetables or both per day are consistently lower than estimates based on data from studies that use multiple 24-hour recalls or food records and that include food combinations (e.g., veg-etarian pizza, stir fry) and condiments as well as informa-tion on serving sizes. The exclusion of fried potatoes in the BRFSS module also contributes to lower estimates. These differences should be considered in interpreting findings.
The new national objectives, which were put into place in 2005, are based on age, sex, and physical activity level and are expressed as cups per day, with the amount that counts as 1 cup being based on form (e.g., 1 small apple; 1 large banana or orange; ½ cup dried fruit; 1 cup chopped, cooked, or canned fruit; 1 cup fruit or vegetable juice; 2 cups raw leafy vegetables; 1 cup raw or cooked other veg-etables) (20). Because this analysis reports consumption according to the number of times per day that fruits and
vegetables are eaten, the results may over- or underesti-mate the proportion of people meeting the new objectives. Assuming the accuracy of reporting remains similar across time, however, BRFSS data should correctly reveal trends in consumption frequency, given that the questionnaire has remained the same and that the module has been validated in diverse samples (13).
Considering the health benefits of fruits and vegetables, the lack of an overall increase in consumption is disap-pointing. Fruits, vegetables, whole grains, and low-fat dairy products are related to high dietary quality and reduced caloric intake when they replace energy-dense, nutrient-poor foods (8,21). Focused interventions can increase fruit and vegetable intake in the short term at the local level (22,23), but the long-term effectiveness of interventions at the state and national levels has not been determined. Reviews of intervention studies to increase fruit and vegetable consumption have found average increases of about 0.6 servings per day (22) with a range of about 0.1 to 1.4 daily servings (23), but few of these studies followed participants for more than 1 year.
National public health goals for fruit and vegetable consumption among all Americans include the Healthy People 2010 objectives of increasing to 75% the proportion of people aged 2 years or older who eat at least two daily servings of fruit and to 50% the proportion of people aged 2 years or older who eat at least three daily servings of vegetables, with at least one-third being dark green or orange vegetables (7). The most recent Dietary Guidelines for Americans recommends that the number of daily serv-ings of fruits and vegetables should reflect one’s sex, age, and physical activity level (20). For adults, 3½ to 6½ cups of fruits and vegetables each day are now recommended. Using responses from a single 24-hour recall, Guenther et al (17) recently found that less than 11% of Americans in most sex-age subgroups met the new recommendations in 1999 through 2000, with an exception being older women (17%). Results from a recent trend analysis by Casagrande et al (24) using data from the NHANES surveys, which employ a 24-hour recall and include serving size and food combinations, were consistent with our finding that the percentage of American adults who eat fruits and veg-etables has reduced slightly. They found that, in general, 25% of American adults ate five or more servings of fruits and vegetables daily and that mean daily servings were relatively stable during 1988 through 1994 (3.06) and 1999 through 2000 (3.04) (P = .75).
4 Centers for Disease Control and Prevention • www.cdc.gov/pcd/issues/2008/apr/07_0049.htm
The opinions expressed by authors contributing to this journal do not necessarily reflect the opinions of the U.S. Department of Health and Human Services, the Public Health Service, the Centers for Disease Control and Prevention, or the authors’ affiliated institutions. Use of trade names is for identification only
and does not imply endorsement by any of the groups named above.
The national findings of Guenther et al (17), Casagrande et al (24), and our analysis underscore the need for broad-ening interventions beyond increasing individual aware-ness of the value of fruits and vegetables and education toward changing eating behavior. These broader interven-tions may require interpersonal, community-level, and environmental approaches. Possibilities include increas-ing access to fruits and vegetables at daycare centers, schools, universities, and worksites (25,26) and at local farmers’ markets through vouchers for seniors (27) and the Special Supplemental Nutrition Program for Women, Infants, and Children (28). Farm-to-school programs (29), school gardening projects (30), and other community proj-ects (31) are also good avenues for encouraging changes in eating behavior.
A new national fruit and vegetable initiative, built on the earlier 5 A Day partnership, is under way. The Fruits and Veggies — More Matters initiative will continue the goal of increasing awareness of the need for people to consume these foods (32,33). With this new initiative comes the need for research and evaluation to identify promising individual and environmental strategies, including policy changes, to increase Americans’ consumption of fruits and vegetables.
Acknowledgments
We acknowledge Mary Kay Solera for her expertise on fruit and vegetable initiatives and the state BRFSS coordi-nators, whose cooperation made this survey possible.
Author Information
Corresponding Author: Heidi Michels Blanck, PhD, Centers for Disease Control and Prevention, National Center for Chronic Disease Prevention and Health Promotion, Division of Nutrition, Physical Activity, and Obesity, 4770 Buford Hwy, NE, Mailstop K-26, Atlanta, GA 30341. Telephone: 770-488-5638. E-mail: [email protected].
Author Affiliations: Cathleen Gillespie, Joel E. Kimmons, Jennifer D. Seymour, Mary K. Serdula, Centers for Disease Control and Prevention, National Center for Chronic Disease Prevention and Health Promotion, Division of Nutrition, Physical Activity, and Obesity, Atlanta, Georgia.
References
1. World Cancer Research Fund, American Institute for Cancer Research. Expert report, food, nutrition, physical activity and the prevention of cancer: a glob-al perspective. http://www.dietandcancerreport.org/. Accessed November 26, 2007.
2. Liu S, Manson JE, Lee IM, Cole SR, Hennekens CH, Willett WC, et al. Fruit and vegetable intake and risk of cardiovascular disease: the Women’s Health Study. Am J Clin Nutr 2000;72(4):922-8.
3. Van Duyn MA, Pivonka E. Overview of the health benefits of fruit and vegetable consumption for the dietetics professional: selected literature. J Am Diet Assoc 2000;100(12):1511-21.
4. Rolls BJ, Ello-Martin JA, Tohill BC. What can inter-vention studies tell us about the relationship between fruit and vegetable consumption and weight manage-ment? Nutr Rev 2004;62(1):1-17.
5. Report of the Dietary Guidelines Advisory Committee on the Dietary Guidelines for Americans, 1990, to the Secretary of Health and Human Services and the Secretary of Agriculture. Hyattsville (MD): U.S. Department of Agriculture; 1990.
6. Heimendinger J, Van Duyn MA, Chapelsky D, Foerster S, Stables G. The national 5 A Day for Better Health Program: a large-scale nutrition intervention. J Public Health Manag Pract 1996;2(2):27-35.
7. Healthy people 2010. Conference ed. 2 vols. Washington (DC): U.S. Department of Health and Human Services; 2000. http://www.health.gov/healthypeople.
8. Serdula MK, Gillespie C, Kettel-Khan L, Farris R, Seymour J, Denny C. Trends in fruit and vegetable consumption among adults in the United States: behavioral risk factor surveillance system, 1994-2000. Am J Public Health 2004;94(6):1014-8.
9. Nelson DE, Holtzman D, Bolen J, Stanwyck CA, Mack KA. Reliability and validity of measures from the Behavioral Risk Factor Surveillance System (BRFSS). Soz Praventivmed 2001;46 Suppl 1:S3-42.
10. Mokdad AH, Bales VS, Greenlund KJ, Mensah GA. Public health surveillance for disease prevention: lessons from the behavioral risk factor surveillance system. Ethn Dis 2003;13(2 Suppl 2):S19-23.
11. Serdula M, Coates R, Byers T, Mokdad A, Jewell S, Chávez N, et al. Evaluation of a brief telephone questionnaire to estimate fruit and vegetable con-sumption in diverse study populations. Epidemiology 1993;4(5):455-63.
VOLUME 5: NO. 2APRIL 2008
www.cdc.gov/pcd/issues/2008/apr/07_0049.htm • Centers for Disease Control and Prevention 5
The opinions expressed by authors contributing to this journal do not necessarily reflect the opinions of the U.S. Department of Health and Human Services, the Public Health Service, the Centers for Disease Control and Prevention, or the authors’ affiliated institutions. Use of trade names is for identification only
and does not imply endorsement by any of the groups named above.
VOLUME 5: NO. 2APRIL 2008
12. National Heart, Lung, and Blood Institute, National Institute of Diabetes and Digestive and Kidney Diseases. Obesity education initiative. In: Clinical guidelines on the identification, education, and treat-ment of overweight and obesity in adults: the evidence report. NIH publication no. 98-4083. Bethesda (MD): National Institutes of Health; 1998.
13. The Hispanic population in the United States: March 2002. Washington (DC): U.S. Department of Commerce, Economics and Statistics Administration, U.S. Census Bureau; 2003. http://www.census.gov/prod/2003pubs/p20-545.pdf.
14. The food guide pyramid. Home and garden bulle-tin no. 252. Washington (DC): U.S. Department of Agriculture; 1992.
15. Li R, Serdula M, Bland S, Mokdad A, Bowman B, Nelson D. Trends in fruit and vegetable consumption among adults in 16 US states: Behavioral Risk Factor Surveillance System, 1990–1996. Am J Public Health 2000;90(5):777-81.
16. Hinkle DE, Wiersma W, Jurs SG. Applied statistics for the behavioral sciences. 5th ed. Boston (MA): Houghton Mifflin; 2003.
17. Guenther PM, Dodd KW, Reedy J, Krebs-Smith SM. Most Americans eat much less than recommended amounts of fruits and vegetables. J Am Diet Assoc 2006;106(9):1371-9.
18. Smith-Warner SA, Elmer PJ, Fosdick L, Tharp TM, Randall B. Reliability and comparability of three dietary assessment methods for estimating fruit and vegetable intakes. Epidemiology 1997;8(2):196-201.
19. Thompson FE, Subar AF. Dietary assessment meth-odology. In: Coulston AM, Rock CL, Monsen ER, eds. Nutrition in the prevention and treatment of disease. San Diego (CA): Academic Press; 2001.
20. Dietary guidelines for Americans, 2005. 6th ed. Washington (DC): U.S. Department of Agriculture, U.S. Department of Health and Human Services;2005. http://www.healthierus.gov/dietaryguidelines/.
21. Ledikwe JH, Blanck HM, Khan LK, Serdula MK, Seymour JD, Tohill BC, Rolls BJ. Low-energy-density diets are associated with high diet quality in adults in the United States. J Am Diet Assoc 2006;106(8):1172-80.
22. Ammerman A, Lindquist C, Hersey J, Jackman AM, Gavin NI, Garces C, et al. Efficacy of interventions to modify dietary behavior related to cancer risk. Evidence report/technology assessment No. 25. AHRQ publication no. 01-E029. Rockville (MD): Agency for
Healthcare Research and Quality; 2001.23. Pomerleau J, Lock K, Knai C, McKee M. Interventions
designed to increase adult fruit and vegetable intake can be effective: a systematic review of the literature. J Nutr 2005;135(10):2486-95.
24. Casagrande SS, Wang Y, Anderson C, Gary TL. Have Americans increased their fruit and vegetable intake? The trends between 1988 and 2002. Am J Prev Med 2007;32(4):257-63.
25. Healthier Worksite Initiative: garden market. Atlanta (GA): Centers for Disease Control and Prevention;2007. http://www.cdc.gov/nccdphp/dnpa/hwi/toolkits/ gar-denmarket/index.htm. Accessed February 21, 2007.
26. Morland K, Wing S, Diez Roux A. The contextual effect of the local food environment on residents’ diets: the atherosclerosis risk in communities study. Am J Public Health 2002;92(11):1761-7.
27. Senior Farmers’ Market Nutrition Program (SFMNP). Alexandria (VA): U.S. Department of Agriculture, Food and Nutrition Services;2007. http://www.fns.usda.gov/wic/SeniorFMNP/SFMNPmenu.htm. Accessed February 21, 2007.
28. WIC Farmers’ Market Nutrition Program (FMNP). Alexandria (VA): U.S. Department of Agriculture, Food and Nutrition Services;2007. http://www.fns.usda.gov/wic/FMNP/FMNPfaqs.htm. Accessed February 21, 2007.
29. National Farm to School online. Los Angeles (CA): Center for Food & Justice, Community Food Security Coalition;2006. http://www.farmtoschool.org/. Accessed February 21, 2007.
30. Graham H, Zidenberg-Cherr S. California teachers perceive school gardens as an effective nutritional tool to promote healthful eating habits. J Am Diet Assoc 2005;105(11):1797-800.
31. 5 a day works! Atlanta (GA): U.S. Department of Health and Human Services, Centers for Disease Control and Prevention; 2005. http://www.cdc.gov/nccdphp/dnpa/nutrition/ health_professionals/programs/5aday_works.pdf. Accessed February 21, 2007.
32. Fruits and veggies matter. Atlanta (GA): U.S. Department of Health and Human Services, Centers for Disease Control and Prevention, National Cancer Institute. http://www.fruitsandveggiesmatter.gov/index.html. Accessed November 26, 2007.
33. Fruits and veggies — more matters. Wilmington (DE): Produce for Better Health Foundation;2007. http://www.fruitsandveggiesmorematters.org/. Accessed November 26, 2007.
� Centers for Disease Control and Prevention • www.cdc.gov/pcd/issues/2008/apr/07_0049.htm
The opinions expressed by authors contributing to this journal do not necessarily reflect the opinions of the U.S. Department of Health and Human Services, the Public Health Service, the Centers for Disease Control and Prevention, or the authors’ affiliated institutions. Use of trade names is for identification only
and does not imply endorsement by any of the groups named above.
Tables
Table 1. Geometric Mean Frequency of Daily Fruit and Vegetable Consumption Among Men and Women, by Year, in the Behavioral Risk Factor Surveillance System (BRFSS), United States, 1994–2005
Food Consumed
Geometric Mean Frequencya Endpoint Changeb 1994–2005
1994 1996 1998 2000 2002 2003 2005 Changea (95% CI)P Value for
change
Total
Fruits
Juice 0.�2 0.�2 0.�� 0.29 0.25 0.22 0.20 −0.13 (−0.15 to −0.10) <.00�c
Whole fruit 0.44 0.45 0.44 0.4� 0.4� 0.42 0.44 −0.01 (−0.03 to −0.00) .0�
Total �.0� �.07 �.05 �.0� 0.98 0.9� 0.9� −0.13 (−0.14 to −0.11) <.00�cd
Vegetables
Green salad 0.28 0.27 0.27 0.28 0.28 0.28 0.28 0.00 (−0.02 to 0.02) .7�
Carrots 0.09 0.�0 0.09 0.09 0.�0 0.09 0.09 −0.01 (−0.03 to −0.01) <.00�
Potatoes, nonfried 0.22 0.22 0.20 0.�8 0.�7 0.�5 0.�4 −0.08 (−0.10 to −0.06) <.00�c
All other 0.90 0.88 0.8� 0.8� 0.8� 0.8� 0.8� −0.03 (−0.04 to −0.01) <.00�
Total 2.0� 2.00 �.9� �.9� �.92 �.9� �.9� −0.11 (−0.12 to −0.10) <.00�c
Total fruits and vegetables
�.4� �.42 �.�� �.�5 �.2� �.2� �.24 −0.22 (−0.22 to −0.21) <.00�c
Men
Fruits
Juice 0.�4 0.�4 0.�4 0.�2 0.29 0.25 0.25 −0.09 (−0.13 to −0.05) <.00�c
Whole fruit 0.�8 0.�8 0.�8 0.�� 0.�5 0.�4 0.�7 −0.03 (−0.06 to −0.01) <.00�
Total 0.97 0.98 0.97 0.95 0.90 0.85 0.88 −0.12 (−0.14 to −0.09) <.00�c
Vegetables
Green salad 0.2� 0.25 0.24 0.24 0.24 0.24 0.24 −0.02 (−0.05 to 0.01) <.00�
Carrots 0.08 0.09 0.08 0.08 0.09 0.08 0.08 0.00 (−0.04 to 0.04) .004
Potatoes, nonfried 0.2� 0.22 0.2� 0.�9 0.�8 0.�� 0.�5 −0.07 (−0.10 to −0.04) <.00�c
All other 0.8� 0.80 0.78 0.77 0.7� 0.7� 0.75 −0.06 (−0.08 to −0.03) <.00�c
Total �.90 �.87 �.8� �.80 �.75 �.7� �.74 −0.17 (−0.18 to −0.15) <.00�c
Total fruits and vegetables
�.2� �.�9 �.�2 �.�� �.0� 2.94 2.98 −0.26 (−0.27 to −0.24) <.00�c
Women
Fruit
Juice 0.�� 0.�0 0.29 0.2� 0.22 0.�9 0.�� −0.15 (−0.18 to −0.12) <.00�c
Whole fruit 0.52 0.5� 0.52 0.50 0.5� 0.5� 0.54 0.0� (−0.01 to 0.03) .08
VOLUME 5: NO. 2APRIL 2008
www.cdc.gov/pcd/issues/2008/apr/07_0049.htm • Centers for Disease Control and Prevention 7
The opinions expressed by authors contributing to this journal do not necessarily reflect the opinions of the U.S. Department of Health and Human Services, the Public Health Service, the Centers for Disease Control and Prevention, or the authors’ affiliated institutions. Use of trade names is for identification only
and does not imply endorsement by any of the groups named above.
CI indicates confidence interval. a Calculated to provide a valid measure of center because consumption frequency was skewed. b The change is standardized to the sex, age, and racial/ethnic distribution of the 2000 BRFSS. c Indicates significant linear trend in model that adjusts for year, sex, age, race/ethnicity, P <.0�. d Indicates significant quadratic trend in model that adjusts for year, sex, age, race/ethnicity, P <.0�.
(Continued on next page)
VOLUME 5: NO. 2APRIL 2008
Food Consumed
Geometric Mean Frequencya Endpoint Changeb 1994–2005
1994 1996 1998 2000 2002 2003 2005 Changea (95% CI)P Value for
change
Women (continued)
Total �.�5 �.�� �.�4 �.�� �.0� �.02 �.0� −0.14 (−0.16 to −0.12) <.00�c
Vegetables
Green salad 0.�� 0.�0 0.�0 0.�� 0.�2 0.�4 0.�4 0.0� (0.01 to 0.05) <.00�cd
Carrots 0.�� 0.�� 0.�0 0.�� 0.�� 0.�0 0.�0 −0.01 (−0.04 to −0.00) .00�
Potatoes, nonfried 0.22 0.22 0.20 0.�8 0.�� 0.�4 0.�� −0.09 (−0.11 to −0.07) <.00�c
All other 0.98 0.97 0.95 0.9� 0.97 0.97 0.97 0.0� (0.00 to 0.03) .�4
Total 2.�� 2.�5 2.�2 2.�2 2.�0 2.�0 2.�� −0.05 (−0.06 to −0.04) <.00�
Total fruits and veg-etables
�.�� �.�5 �.�� �.�0 �.5� �.5� �.50 −0.17 (−0.18 to −0.16) <.00�c
CI indicates confidence interval. a Calculated to provide a valid measure of center because consumption frequency was skewed. b The change is standardized to the sex, age, and racial/ethnic distribution of the 2000 BRFSS. c Indicates significant linear trend in model that adjusts for year, sex, age, race/ethnicity, P <.0�. d Indicates significant quadratic trend in model that adjusts for year, sex, age, race/ethnicity, P <.0�.
Table 2. Percentage of Men Who Consume Fruits or Vegetables or Both Five or More Times per Day, Behavioral Risk Factor Surveillance System (BRFSS), United States, 1994–2005
Characteristic
Percentagea Endpoint Change 1994–2005
1994 1996 1998 2000 2002 2003 2005 Changea (95% CI) P Value
Total 20.� 20.8 20.� 20.2 20.2 �8.9 20.� −0.87 (−1.67 to −0.07) .0�
Age group, y
�8-24 �7.0 �7.8 20.9 2�.7 20.5 20.� 20.8 �.7� (1.22 to 6.20) .00�
25-�4 �8.0 �9.0 �7.7 ��.8 �8.0 ��.9 �8.2 −0.37 (−2.11 to 1.37) .�8
�5-44 �8.5 �9.� �7.5 �7.� �8.� ��.8 �7.2 −1.45 (−3.02 to 0.12) .07
45-54 2�.0 20.� 20.� �8.7 �9.0 �7.� �9.� −1.78 (−3.62 to 0.06) .0�
55-�4 2�.8 2�.� 20.9 2�.7 20.4 �8.9 20.7 −3.43 (−5.66 to −1.20) .00�
≥65 29.5 28.8 27.8 28.7 27.9 25.9 27.8 −1.66 (−3.70 to 0.38) .��
Race/ethnicity
Non-Hispanic white 20.7 20.7 20.� 20.0 �9.5 �8.5 �9.7 −1.45 (−2.31 to −0.59) .00�
Non-Hispanic black �8.2 �8.4 �8.0 �9.8 2�.4 �8.9 2�.7 �.�7 (0.45 to 5.89) .02
Hispanic 20.� 2�.� 2�.4 2�.0 �9.� �8.� �9.8 −0.98 (−4.21 to 2.25) .55
Other 2�.7 25.� 2�.7 2�.� 2�.5 2�.9 25.4 �.�7 (−2.63 to 5.37) .50
8 Centers for Disease Control and Prevention • www.cdc.gov/pcd/issues/2008/apr/07_0049.htm
The opinions expressed by authors contributing to this journal do not necessarily reflect the opinions of the U.S. Department of Health and Human Services, the Public Health Service, the Centers for Disease Control and Prevention, or the authors’ affiliated institutions. Use of trade names is for identification only
and does not imply endorsement by any of the groups named above.
Table 1. (continued) Geometric Mean Frequency of Daily Fruit and Vegetable Consumption Among Men and Women, by Year, in the Behavioral Risk Factor Surveillance System (BRFSS), United States, 1994–2005
CI indicates confidence interval. a The change is standardized to the sex, age, and race/ethnicity distribution of the 2000 BRFSS. b Weight in kilograms divided by height in meters squared. c U.S. Census Bureau definition.
(Continued on next page)
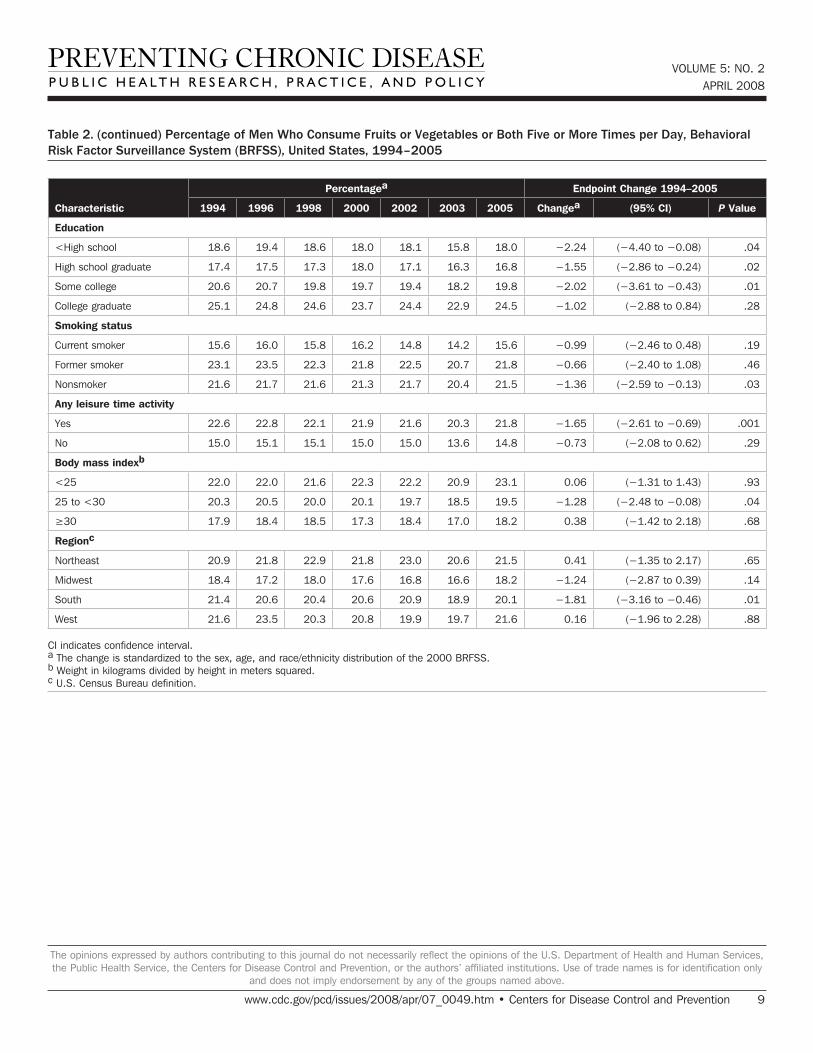
Characteristic
Percentagea Endpoint Change 1994–2005
1994 1996 1998 2000 2002 2003 2005 Changea (95% CI) P Value
Education
<High school �8.� �9.4 �8.� �8.0 �8.� �5.8 �8.0 −2.24 (−4.40 to −0.08) .04
High school graduate �7.4 �7.5 �7.� �8.0 �7.� ��.� ��.8 −1.55 (−2.86 to −0.24) .02
Some college 20.� 20.7 �9.8 �9.7 �9.4 �8.2 �9.8 −2.02 (−3.61 to −0.43) .0�
College graduate 25.� 24.8 24.� 2�.7 24.4 22.9 24.5 −1.02 (−2.88 to 0.84) .28
Smoking status
Current smoker �5.� ��.0 �5.8 ��.2 �4.8 �4.2 �5.� −0.99 (−2.46 to 0.48) .�9
Former smoker 2�.� 2�.5 22.� 2�.8 22.5 20.7 2�.8 −0.66 (−2.40 to 1.08) .4�
Nonsmoker 2�.� 2�.7 2�.� 2�.� 2�.7 20.4 2�.5 −1.36 (−2.59 to −0.13) .0�
Any leisure time activity
Yes 22.� 22.8 22.� 2�.9 2�.� 20.� 2�.8 −1.65 (−2.61 to −0.69) .00�
No �5.0 �5.� �5.� �5.0 �5.0 ��.� �4.8 −0.73 (−2.08 to 0.62) .29
Body mass indexb
<25 22.0 22.0 2�.� 22.� 22.2 20.9 2�.� 0.0� (−1.31 to 1.43) .9�
25 to <�0 20.� 20.5 20.0 20.� �9.7 �8.5 �9.5 −1.28 (−2.48 to −0.08) .04
≥30 �7.9 �8.4 �8.5 �7.� �8.4 �7.0 �8.2 0.�8 (−1.42 to 2.18) .�8
Regionc
Northeast 20.9 2�.8 22.9 2�.8 2�.0 20.� 2�.5 0.4� (−1.35 to 2.17) .�5
Midwest �8.4 �7.2 �8.0 �7.� ��.8 ��.� �8.2 −1.24 (−2.87 to 0.39) .�4
South 2�.4 20.� 20.4 20.� 20.9 �8.9 20.� −1.81 (−3.16 to −0.46) .0�
West 2�.� 2�.5 20.� 20.8 �9.9 �9.7 2�.� 0.�� (−1.96 to 2.28) .88 CI indicates confidence interval. a The change is standardized to the sex, age, and race/ethnicity distribution of the 2000 BRFSS. b Weight in kilograms divided by height in meters squared. c U.S. Census Bureau definition.
VOLUME 5: NO. 2APRIL 2008
www.cdc.gov/pcd/issues/2008/apr/07_0049.htm • Centers for Disease Control and Prevention 9
The opinions expressed by authors contributing to this journal do not necessarily reflect the opinions of the U.S. Department of Health and Human Services, the Public Health Service, the Centers for Disease Control and Prevention, or the authors’ affiliated institutions. Use of trade names is for identification only
and does not imply endorsement by any of the groups named above.
Table 2. (continued) Percentage of Men Who Consume Fruits or Vegetables or Both Five or More Times per Day, Behavioral Risk Factor Surveillance System (BRFSS), United States, 1994–2005
VOLUME 5: NO. 2APRIL 2008
Table 3. Percentage of Women Who Consume Fruits or Vegetables or Both Five or More Times per Day, Behavioral Risk Factor Surveillance System (BRFSS), United States, 1994–2005
Women
PercentageaEndpoint Change
1994–2005
1994 1996 1998 2000 2002 2003 2005 Changea (95% CI) P value
Total 28.4 29.� 28.8 29.� 29.5 28.9 29.� 0.59 (−0.14 to 1.32) .��
Age group, y
�8-24 20.� 22.2 22.0 24.� 25.0 24.0 2�.5 2.54 (0.13 to 4.95) .04
25-�4 2�.2 25.7 24.� 24.2 24.7 25.2 27.2 �.�5 (2.04 to 5.26) <.00�
�5-44 2�.0 2�.2 25.� 2�.2 27.7 25.9 2�.7 0.40 (−1.13 to 1.93) .�0
45-54 29.0 29.0 29.2 28.9 29.0 28.9 29.4 0.47 (−1.33 to 2.27) .��
55-�4 ��.� ��.7 ��.7 �2.5 ��.8 ��.� �2.� −1.49 (−3.57 to 0.59) .��
≥65 �9.4 �8.5 �8.7 �9.� �8.� �7.� �7.4 −1.88 (−3.53 to −0.23) .02
Race/ethnicity
Non-Hispanic white 29.� 29.7 29.9 29.� 29.7 29.4 29.8 0.09 (−0.69 to 0.87) .82
Non-Hispanic black 22.9 22.� 2�.2 24.7 25.8 25.7 27.� 4.08 (1.96 to 6.20) <.00�
Hispanic 28.0 28.8 24.7 29.5 29.� 2�.� 28.� 0.42 (−2.83 to 3.67) .80
Other �0.� ��.4 �2.2 �5.� ��.� �2.7 �2.7 �.55 (−2.78 to 5.88) .48
Education
<High school 24.0 24.2 22.5 25.2 24.4 24.0 2�.9 −1.41 (−3.27 to 0.45) .�4
High school graduate 25.4 25.5 25.4 25.2 25.7 2�.9 24.� −2.18 (−3.41 to −0.95) .00�
Some college 28.� 29.9 29.8 �0.2 28.5 29.4 29.8 −0.25 (−1.66 to 1.16) .7�
College graduate �5.5 �5.7 �5.4 �5.2 ��.7 �5.2 ��.� −0.60 (−2.23 to 1.03) .47
Smoking status
Current smoker 20.0 20.� 20.� 20.� �9.4 �8.� �9.2 −1.37 (−2.84 to 0.10) .07
Former smoker �2.0 �2.7 ��.9 ��.2 �2.5 �2.� ��.7 0.�� (−1.04 to 2.26) .47
Nonsmoker �0.� ��.� �0.� �2.0 �2.0 ��.2 �2.� �.4� (0.45 to 2.41) .004
Any leisure time activity
Yes ��.� �2.5 �2.2 �2.� �2.4 ��.7 �2.� −0.09 (-0.99, 0.81) .84
No 2�.� 2�.� 20.8 22.4 2�.� 20.5 20.9 −0.73 (-1.91, 0.45) .22
Body mass indexb
<25 29.� 29.8 29.4 �0.4 �0.� �0.� ��.0 0.94 (−0.10 to 1.98) .08
25 to <�0 28.5 29.� 29.4 29.� �0.� 28.9 29.8 �.54 (0.11 to 2.97) .04
≥30 25.� 25.� 25.9 2�.0 25.8 25.0 2�.5 0.8� (−0.99 to 2.65) .�8
Regionc
Northeast �0.� �0.0 ��.4 �2.4 �2.8 �2.9 ��.8 �.29 (−0.38 to 2.96) .��
Midwest 27.5 2�.4 27.9 2�.5 25.9 2�.� 27.� −0.64 (−2.21 to 0.93) .42
South 2�.8 27.� 27.2 27.� 28.� 27.� 27.9 0.�4 (−0.58 to 1.86) .�0
West �0.4 �4.� 29.8 �2.0 ��.� �0.� �2.� �.77 (−0.01 to 3.55) .05 CI indicates confidence interval. a The change is standardized to the sex, age, and racial/ethnic distribution of the 2000 BRFSS. b Weight in kilograms divided by height in meters squared. c U.S. Census Bureau definition.
�0 Centers for Disease Control and Prevention • www.cdc.gov/pcd/issues/2008/apr/07_0049.htm
The opinions expressed by authors contributing to this journal do not necessarily reflect the opinions of the U.S. Department of Health and Human Services, the Public Health Service, the Centers for Disease Control and Prevention, or the authors’ affiliated institutions. Use of trade names is for identification only
and does not imply endorsement by any of the groups named above.