TRENDS IN BIOSCIENCES JOURNAL 6-2 APRIL 2013 ISSUE
105
Volume 6 Trends in Biosciences Online version available at www.trendsinbiosciencesjournal.com A Bimonthly International Journal Number 2 April, 2013 Print : ISSN 0974-8 Online : ISSN 0976-2485 NAAS Rating : 2.7 Dheerpura Society for Advancement of Science and Rural Development
-
Upload
trendsinbiosciencesjournal -
Category
Documents
-
view
0 -
download
0
Transcript of TRENDS IN BIOSCIENCES JOURNAL 6-2 APRIL 2013 ISSUE

Volume 6
Trendsin
Biosciences
Online version available at www.trendsinbiosciencesjournal.com
A Bimonthly International Journal
Number 2 April, 2013
Print : ISSN 0974-8Online : ISSN 0976-2485NAAS Rating : 2.7
Dheerpura Society for Advancement of Science and Rural Development

Trendsin
Biosciences
Dheerpura Society for Advancement of Science and Rural Development
Branch Office : Kanpur (U.P.) 208 018, India
Volume 6 Number 2
Online version available at www.trendsinbiosciencesjournal.com
A Bimonthly International Journal
SPECIAL OFFER
Life MembershipJournal Membership – Rs. 1000
Benefit : Online access of journal for lifetime along with certificate of membershipJournal Membership with free authorship – Rs. 4000
Benefits : Authorship charges for publishing research papers in Trends in Biosciences Journal is nil (No authorship charges) for lifetime.
Award of fellow of DSAS&RD society
Print : ISSN 0974-8Online : ISSN 0976-2485NAAS Rating : 2.7
April, 2013

Trends in BiosciencesA Bimonthy International Scientific Journal
www.trendsinbiosciencesjournal.comInternational Advisory BoardDr. A. Coomans, Ex-Professor, State University of Ghent, BelgiumDr. Randy Gaugler, Director, Centre for Vector Biology, Rutgers University, USADr. S.B. Sharma, Director, Plant Security, South Perth, AustraliaDr. Zahoor Ahmad, Professor, Jubail Industrial College, Saudi Arabia
Advisory BoardDr. G.N. Qazi, Vice Chancellor, Jamia Hamdard University, New DelhiDr. A.S. Ninawe, Advisor, Deptt. of Biotechnology, New DelhiDr. I. Ahmad, Ex-Director, Department of Science & Technology, New DelhiDr. N. Nadarajan, Director, Indian Institute of Pulses Research (IIPR), KanpurDr. Masood Ali, Ex-Director, Indian Institute of Pulses Research (IIPR), Kanpur
Editorial Board
Editor in Chief : Dr. S.S. Ali, Emeritus Scientist, (DST) Indian Institute of Pulses Research (IIPR), KanpurDr. Erdogan Esref Hakki, Department of Soil Science and Plant Nutrition, Selcuk University Konya TurkeyDr. S. K. Agarwal, Principal Lentil Breeder, ICARDA, Aleppo, SyriaDr. H.S. Gaur, Dean & Director (Education), IARI, New DelhiDr. B.B. Singh, Assistant Director General Oilseed & Pulses, ICAR, New DelhiDr. Absar Ahmad, Senior Scientist, National Chemical Laboratory, PuneDr. N.P. Singh, Coordinator, AICRP Chickpea, IIPR, KanpurDr. Raman Kapoor, Head, Dept. of Biotechnology, Indian Sugarcane Research Institute, LucknowDr. S.K. Jain, Coordinator, AICRP Nematode IARI, New DelhiDr. Sanjeev Gupta, Coordinator, MULLaRP, IIPR, KanpurDr. Naimuddin, Sr. Scientist (Plant Pathology), IIPR, KanpurDr. Rashid Pervez, Sr. Scientist, Indian Institute of Spices Research, Khozicod, KeralaDr. Badre Alam, Associate Prof. Gorakhpur University, U.P.Dr. Shamsa Arif (English editor), Barkatullah University, Bhopal, M.P.Er. Sobia Ali, Genetic Aisa Pvt. Ltd., New DelhiBusiness Manager, Er. S. Osaid Ali, Biotechnology Research Foundation, Kanpur
Trends in Biosciences abstracted in CABI abstract, U.K. & Other abstracting agencies.
Subscription Rates for 2014:
Individual Institutional Single article Version INDIAN**
in Rs./issue FOREIGN
in US$/issue INDIAN
in Rs. FOREIGN
in US$ INDIAN
in Rs. FOREIGN
in US$ *Print /Number **1000* 50 3000 250 50 10 **Online 1000 50 3000 250 150 25 *Author’s Contribution : Rs. 1000/paper (minimum upto 2 authors) and Rs. 600/paper for additional authors. **Same for SAARC,countries only soft copy.*Payment must be made through Demand Draft payable to State Bank of India, Kalyanpur Branch, (Branch code 01962)Kanpur, U.P. India, in favour of Trends in Biosciences (Ac/No. 31575871348) along with manuscript and sent to Dr. S.S. Ali,Editor in Chief, H-1312, VIP Lane, Satyam Vihar, Avas Vikas No.1, Kalyanpur, Kanpur- 208 018, U.P. India. In case ofoutstation cheque an extra amount of Rs. 50/- may be paid as clearance of cheque. For e-banking add Rs. 25/- (contact:[email protected]).

Trendsin
Biosciences
Dheerpura Society for Advancement of Science and Rural Development
Branch Office : Kanpur (U.P.) 208 018, India
Volume 6 Number 2
Online version available at www.trendsinbiosciencesjournal.com
A Bimonthly International Journal
SPECIAL OFFER
Life MembershipJournal Membership – Rs. 1000
Benefit : Online access of journal for lifetime along with certificate of membershipJournal Membership with free authorship – Rs. 4000
Benefits : Authorship charges for publishing research papers in Trends in Biosciences Journal is nil (No authorship charges) for lifetime.
Award of fellow of DSAS&RD society
Print : ISSN 0974-8Online : ISSN 0976-2485NAAS Rating : 2.7
April, 2013

Trends in Biosciences Volume 6 Number 2 April, 2013
CONTENTSMINI REVIEW1. Mechanism of Cadmium Induced Hepatocellular Carcinoma 125
Sundas Asghar, Muhammad Saif Ur Rahman and Usman Ali Asfaq2. Role of Herbal Ice Cream in Human Health: A Review 130
Swashankh Kumar, D.C. Rai and Dinker Singh3. Management of Stored-product Insect Pests Through Biorational Approaches: A review 133
S. Murali
RESEARCH PAPERS4. Preliminary Studies of Phenology of Some Selected Tree Species from Ngel-Nyaki Forest reserve 138
Mohammed, S., Aliyu, B., Umar, M.D.5. In Vitro Evaluation of Antibacterial Activity of A Novel Polyenzyme Preparation Immunoseb 142
Anita Joshi, Varsha Shahane, Varsha Gore, Anju Kagal, Shilpa Risbud and Renu Bharadwaj6. Comparative Analysis of Morphological and Molecular Diversity in Mungbean (Vigna radiata L. Wilczek) 146
G. Roopa Lavanya and Shirish A. Ranade7. Efficient Protocol for In Vitro Regeneration in Pigeonpea (Cajanus cajan (L.) Millsp.) 152
Tushita Gargi, S. Acharya, J.B. Patel and Vandana Thakkar8. Study on Two Edible Spiders of the Genus: Nephila (Fam. Nephilidae) of Manipur, India 154
A.Kananbala, M. Bhubaneshwari and Manju Siliwal9. Effect of Coagulants on Nutrient and Antinutrient Parameters of Soy Tofu 158
M.K.Tripathi, S.mangaraj10. Integrated Weed Management Studies on Weed Flora and Yield in Kharif Maize 161
Birendra Kumar, Ranvir Kumar, Suman Kalyani and Mizzanul Haque11. Influence of Pseudomonas putida on the Yield of Agaricus bisporus (Lange) Imbach 165
Prabhat Kumar Singh, Abhilasha A. Lal , Sobita Simon and Satish Sharma12. Effect of Varying NPK Levels and Bio-fertilizers on Growth and Yield of Okra
[Abelmoschus esculentus (L.) Moench] under Sustainable Condition 167Param Hans Prasad and Abhishek Naik
13. Breeding Periodicity of the Mullet, Liza macrolepis from Mangalore Waters 170H.N. Anjanayappa1, S. Benakappa, S., M. Shivaprakash, S.R. Somashekara, A. S. Kumar Naik,Jitendra Kumar, Mahesh, V.
14. Effect of Biofertilzers on Growth and Yield Attributes of Pea (Pisum sativum L.) 174Pushkar Singh Patel, R.B. Ram , Jayprakash and M.L.Meena
15. Studies of Quality Characteristics in Short Grain Scented Rice (Oryza sativa L.) Varieties accessions 177Sunita Kumari1, R.N.Kewat, R.P.Singh and Pratibha Singh
16. Studies on the Association of Plant Parasitic Nematodes Associated with Root-knot Nematode InfectingPotato (Solanum tuberosum) 180Zenith N.G., Joymati L and Ronibala K.H.
17. Taxonomic Study on Fishes in the Rivers of Imphal Valley 182N. Mohendra Singh
18. Analyses of the Forest Cover Change in Rani and Garbhanga Reserve forest, Assam, North EastIndia Using Geospatial Technique 185H Suchitra Devi, A. Pinokiyo1 and S.K. Borthakur
19. Effect of Different Levels of Boron and Sulphur on Growth of Chickpea with Mustard Intercropping System 188Sunil Kumar, S.K. Patel and Gautam Ghosh
20. Efficacy of Fungicides on In Vitro Growth of Pigeonpea against Stem canker 190Srujani Behera, R. B. Singh and Laxman Prasad Balai
21. Influence of Microbial Inoculants and Nutrients on Morpho-Physiological, Growth Parameters andYield Potential in Tomato (Lycopersicon esculentum L. Mill.) 192Mohan Kumar, K.G., and Chetti M.B.
22. Sensory Quality Evaluation of MA Packaged Fruits Applying Fuzzy Logic 195S. Mangaraj, M.K. Tripathi
23. Effect of Menopause on Serum Lipid Profile Pattern in Women 200Ekta A.Andriyas, Sapna Smith Lal
24. Sensory Evaluation of Vegetables Grown Under Organic and Inorganic Conditions 203Bajpai Preeti and Punia Darshan
25. Hypolipidemic Potential of Bacopa monniera in Cholesterol Fed Rats 206Syed Mansoor Ali and Gyan Chand Jain
26. Chemoattraction in Entomopathogenic Nematodes 210Rashid Pervez and S. S. Ali
27. Effectiveness and Economics of Integrated Weed Management in Transplanted Rice (Oryza sativa) 212Birendra Kumar, Ranvir Kumar, Suman Kalyani and M. Haque
28. Biology of Mango - Hopper, Amritodus atkinsoni (Leth.) (Jassidae : Hemiptera) in Agro - ecosystem of Manipur 216M. Bhubaneshwari Devi
SHORT COMMUNICATIONS29. A New Blight Disease of Rice Caused by Curvularia sp. from U.P. 218
Kamaluddeen, Sobita Simon and Abhilasha A. Lal30. Exploring Precision Agriculture Approaches for Insect Pest Management 219
Prashant Kumar and Ashutosh Kumar
Subscription Order FormInstructions to the Authors

Trends in Biosciences 6 (2): 125-129, 2013
Sundas AsgharSundas Asghar completed MS in Molecular
Biology/Biomedicine from University of Skövde(HIS) Sweden, with research projects in“Investigation on gene regulation and signaltransduction in cadmium induced carcinogenesis” and“An in vitro cell system based approach to clarifythe specific molecular mechanisms behind the proposed estrogeniceffects of cadmium in estrogen responsive tissues/cells” fromDepartment of Environmental Medicines (IMM), KarolinskaInstitute, Stockholm, Sweden. She was haveing working experienceas researcher with project in “Molecular genetics of sediment andC. metallidurans (CH3)” at Laboratory of Applied Microbiology-Bioengineering (GEBI), Earth and Life Institute (ELIM), UCL,Belgium. Presently working as lecturer in Department ofBioinformatics and Biotechnology at Government CollegeUniversity, Faisalabad, Pakistan. Presently she is workingexperience on effects of heavy metals in fish, as well as on aquatictoxicity and health, health risk assessments of environmentalcarcinogens and molecular biology of environmental toxicantsleading to carcinogenesis.Usman Ali Ashfaq
Dr. Usman Ali Ashfaq has done Research on“Studies on the therapeutic effect of selectedphytochemicals against Hepatitis C Virus” at Centerof Excellence in Molecular Biology, University of thePunjab, Lahore. He has worked at a Center ofExcellence in Molecular Biology, University of thePunjab also post Ph.D. Research Experience He has worked atAllama Iqbal Medical College and Research center. Presently, he isworking as Assistant Professor at Department of Bioinformaticsand Biotechnology at Government College University, Faisalabad.Dr. Asfaq also worked on antiviral drugs against HCV, siRNAsagainst viral and cellular genes. He has 28 research paper to hiscredit published and foreign journals.Muhammad Saifur Rahman
Mohd. Saifun Rahman, doing research projecton “Investigating the cadmium induced hepatocellularand nephrotoxic effects in mice” at Department ofBioinfomatics and Biotechnology, GovernmentCollege University Faisalabad, Pakistan. Earlier hewas engaged on research progress of “Biodiversity of snails fromthe agro-ecosystem of tehsil Faisalabad city”. He was workingexperience on projects in “Heavy metal toxicity in fish” and“Toxicity of various insecticides on various developmental stagesof Trichogramma” at Govt. College University Faisalabad, Pakistan.He is co-author of two books namely1. Toxic effects of different insecticides on Trichogramma
cholini.2. Blood and renal pathology in labeo rohita exposed to
mercuric chloride.
Mechanism of Cadmium Induced Hepatocellular CarcinomaSUNDAS ASGHAR, MUHAMMAD SAIFUR RAHMAN AND USMAN ALI ASFAQ
Govt. College University Faisalabad, Allama Iqbal Road, Faisalabad Pakistan 38000.e-mail: [email protected]
ABSTRACT
Cadmium (Cd) is an important environment pollutant havingcarcinogenic properties. This heavy metal poses serious threatsto the animals and human beings. From the environment itenters into the animals and human bodies and destroyed thebasic organs of the body including lungs, pancreas, testis, liverand kidney. Liver is the basic primary organs involved in theelimination of toxic effects and removal of wastes from thebody. This organ is more prone to the adverse effects of thismetal than any other organ. Cd causes oxidative stress andapoptosis which eventually lead to hepatocellular dysfunction.The review is to highlight the current data available regardingthe Cd induced cellular and molecular mechanisms involvedin apoptosis, necrosis and hepatocellular carcinoma.
Key words Cadmium, Hepatotoxicity, Hepatocytes, Mitochondria,Metallothionien, Oxidative Stress, Apoptosis, Hepatocellularcarcinoma.
Cd is ranked seventh in the Top 20 Hazardous substancepriority list published by U.S. Environmental ProtectionAgency and “Agency for Toxic Substances and DiseaseRegistry” (Fay and Mumtaz, 1996). International agency ofresearch on cancer (IARC) has classified Cd as the category1 carcinogen. Cadmium(Cd) enters in the environment byvarious human activities or natural activities e.g. volcanicactivity, erosion and weathering,river transport, tobaccosmoke,smelting, mining, non-ferrous metals. Moreover,municipal wastes, Fossil fuels combustion, refining, plasticwastes, Cd containing batteries, fertilizers manufacturers,Cd plated steel scrap recycling electrical and electronic wasteare also important sources of Cd induced toxicity (UNEP 2008).Nanotechnology having Cd containing non particles can alsobe source of Cd accumulation.
General Effect of Cadmium to the Human Health :
Cd is toxic and non-essential but is taken into the cell bythe process termed as ionic and molecular mimicry. Cd has noknown beneficial effects in humans. Individuals exposed toCd can show serious effects such as pulmonary edema, renaland hepatic dysfunction, osteomalacia, testicular damage(IARC, 1993). Cd effects number of tissues and organs inhumans including lungs, pancreas, testis, placenta, bone,kidney and liver (Zalups and Ahmad, 2003). Cd causedoxidative DNA damage, DNA protein cross linkage, inhibitionof DNA repair and apoptosis (Filipic and Hei, 2004). Cd toxicity
MINI REVIEW

126 Trends in Biosciences 6 (2), 2013
increases the negative effects on the anti-oxidants defensesystem. Cd and Cd-Mg causes oxidative stress in liver(Matovic, et. al., 2012). Cd is very toxic and harmful pollutantand bio-accumulation in various levels of food chain. Cdexposure damages various organs of the body especially inliver and kidney (Jihen, et. al., 2009).
Damage to Liver :
Hepatic Response :
Cd either taken orally or via pulmonary route or parentalexposure, liver is the primary organ that encounters with theexcess level of Cd in the early hours after the exposure asshown in Fig 1. It has been investigated that Cd induceshepatotoxicity injury and ischemia due to endothelial cellsinjury by the activation of inflammatory cytokines (Yamano,et al., 2000). Cd exposure results in severe glycogen depletion,cellular degradation necrosis and other effects to the liver i.e.loss of normal architecture of the parenchymatous tissues,cytoplasm vacuolization, cellular degeneration, necrosis,congested blood vessels, destructed Mitochondrial cristae,fat globules, severe glycogen depletion, lipofuscin pigmentsand collagenous fibers formation are observed in liver tissueson exposure to Cd (El-Sokkary, et. al., 2010). These cellularchanges result in necrosis and apotosis. Hepatic injury isappeared to be caused by the association of sulfhydral groups,membrane and cytoplasmic proteins and enzymes. Cd is nonredox metal and can deplete the cellular level of glutathionewhich can induce oxidative stress(Martelli, et. al., 2006). Cdinterfering with cellular processes that are energy metabolismand metal membrane transport. Cd affectsvarious cellularfunctions, enzyme activities; redox state of cells; signaltransduction and DNA repair system (Van, et. al., 2010). Itdisassembles E-Cadherin/beta-catenin complex and changescell to cell adhesion. Cd affects the translational machinery in
liver cells. Cd shows the increased; DNA damage, level oflipid per oxidation in liver, apoptosis and altered histology.Cd effects the metallothionein gene expression in liver. It hasgreater interaction with Mt-mRNA and proteins as comparedto other heavy metals (Zhang, et. al., 2012).
Cd infiltrated by polymorphonuclear neutrophil(PMN)and Kupffer cells causes hepatotoxicity by enhancingthe necrosis and promoting inflammation in the liver(Horiguchi, et. al., 2000). Variety of cytotoxic mediator i.e.nitricoxide, cytokines and reactive oxygen species (ROS) areactivated by Kupffer cellswhich damage thehepatocytesdirectly as shown in Fig 2. Tumor necroses factor also playsanimportantrole in Cd toxicity (Mousa, 2004). It is thoughtthat for the Cd induced hepatotoxicitythe hepatic endothelialcells might be the first cellular target. Cd induced hepaticendothelial degeneration was observed after the early hoursof exposure.
Damaged liver cells enter into Capillary lumen whichleads to Ischemia(Rikans and Yamano, 2000). The injuredendothelial cells impede the capillary lumen and developischemia which in turn may induct molecular and cellularevents accompanied by the activation of Kupffer cells, bringout inflammatory mediator and enlisting of inflammatory cellschiefly PMN and leukocytes. In liver inflammatory cellscumulate in sinusoidal andcohere to endothelial cells. This isfacilitated by the E-selectin, Mac-1 and ICAM-1. Platelet-endothelial adhesion molecule-1 (PECAM-1) has an implicativerole during hepatotoxicity in adhesion molecule (Mousa, 2004)as shown in Fig 2. ROS also enhance inflammation byactivating the transcription factors i.e.; activator protein-1(AP-1) and nuclear factor-kB (NF-kB) which caters signalsresponsible for the expression of adhesion molecule andpro-inflammatory genes (Jaeschke, 2000; Souza, et. al., 2004).
Fig. 1. Cd entres into the body by the following routes. Cdthrough food enters into GIT from where it enters intothe Liver through blood. Cd enters into Blood and thento liver through skin and through lungs via respiratoryinhalation.
Fig. 2. It is shown that how Cd indduces inflammatoryresponse in Kupffer cells cells which activate ROS andCytokines damage hepatocytes PMN also effected byinflammatory response and affirms.

ASGHAR et. al.,: Mechanism of Cadmium Induced Hepatocellular Carcinoma 127
Cd and cellular Cd traffic deregulates the metalhomeostasis and thus contributes to Cd toxicity. Cd and Znhas same chemical group and do not change their oxidationstate. In biological environment they are in the form of cations.Cd in metalloprotien binds with sulfur exclusively but Cd alsobinds with Zn in coordination in alcohol dehydrogenase site.This is also explained as the molecular mechanism responsiblefor Cd hepatotoxicity (Moulis, 2010).
MT is involved in Zn exchange between proteins ad Znbuffering. Cd bound tightly with MT and produce stress whichin result mediate Cd toxicity because of highly sensitiveexpression of MT genes under stress. Improper expressiondecreases the ability of Zn buffering by decreasing theantioxidant cellular defense and changing the Zn exchange.Cd accumulation can destroy Zn homeostasis and can increasehepatic Zn by redistributing the Zn from non hepatic tissuesby increasing hepatic and aminolevulinate dehydratase (andALA-D). Cd is non essential metal and it is assumed that it istransported by the transport system of essential metals Zn,Fe, Ca, Mn and Mg transporters are involved in the transportof Cd to liver cells (Zhang, et. al., 2001).
Cd has almost the same ionic radius as that of Ca whichis helpful in the transport of cadmium. Cadmium replaces Caand binds with the calcium bindingproteins and via these Cachannels Cd makes its way into the cells. After entrance inhepatocytes Cd alters the intracellular concentration of Ca bythe mobilization of Ca from its storage site in the cells. Cdmodulate extracellular calcium sensing receptor (CaSR), CaSRproteins are G proteins-coupled receptors which express inhepatocytes by this mechanism Cd interferes with CaHomeostasis (Chang and Shoback, 2004).The activation ofCaSR leads to cell signaling via different pathways; by couplingwith G protein and activate Phospholipase C. PhospholipaseC affects the phosphatidyl inositol 1, 4, 5-triphosphate (IP3),also mobilize Ca ions from the cell storage activation of proteinkinase K and production of di-acylglycerol. Either acute orchronic exposure Cd ultimately modulates CaSR activities. Cdalso inhibits Ca-ATPase activity. Na+, K+-ATPase is affectedby Cd which ultimately leads to the general decrease in thecell membrane transport (Karthikeyan and Bavani, 2009).
Cd shows higher affinity with sulfhydral group thanphosphate, carbonyl, chloride or amino groups and as a resultcadmium induces hepatotoxicity. By disrupting theintracellular redox state, toxicity can be produced by theactivation of both protein and non-protein thiol group and asa result number of biological processes is affected. Redoxbalance shifts toward the oxidative state and oxidative stressis induced which cause number of deleterious effects.Oxidative stress is an imbalance state between theconcentration of antioxidants defense mechanism and ROSconcentration. Oxidative stress causes liver damage and Cdcauses oxidative stress in liver. This also affects the pro-oxidantant and lipids per-oxidation balance by damaging the
antioxidant barriers as shown in Fig 3. Non enzymatic anti-oxidants including total sulfhydral groups and GSH level isdecreased by the Cd. As a result super dismutase, glutathionereductase, catalase and glutathione per-oxidase is inactivated.Amount of unbound free chelated Fe and Cu ions responsiblefor the promotion of oxidative stress also resulted by the Cd.By this way oxidative stress is induced in biological systemsresulting in over production of ROS i.e.; hydroxyl radicals,hydrogen peroxide and superoxide ions. Very little knowledgeis there about the exact mechanism and the evidences aboutfree radical generation induced by Cd. Glutothionine isconsidered as the main thiol-disulphide redox buffer in thecells (Masella, et. al., 2005).
GHS and heavy metal ion complex formation has entailedas the initiation of biological detoxification before the transferto the cysteine rich peptides such as MT. the GHS capacity toregenerate antioxidant is linked to the redox state of GSSG/2GSH. The decrease in hepatic GHS increases GSSG anddecreased level of GHS/GSSG ratio increases Cd inducedmortality and hepatotoxicity as shown in Fig 3. Cell death andGHS is lost in rat hepatocytes and in HepG2 cells on Cdexposure which indicate that GHS is the major element in theliver damage (Gebhardt, 2009). In normal conditions GSSG isregenerated to GHS by the help of flavor protein glutathionereductase which uses NADPH as electron donor. Cd inhibitedGR activity is non competitive with respect to NADPH andGSSG and enhance Cd hepatotoxicity and mortality.Xenobiotics and their metabolites are detoxified by GSH whichform compounds in conjugation with GHS either enzymaticallyor spontaneously with glutathione s-transferase (Mah andJalilehvand 2010). Activity of antioxidant enzymes in the livere.g.; SOD, CAT and GPx is also decreased with Cd. Possiblemechanism which can explain increase in Fe is caused by Cdis the redistribution of Fe in the organism. Cd also binds withapoferritin and ferritin and displaces Fe from cellular sites (Lai
Fig. 3. Cd decreases hepatic GSH which induce oxidativestress, which inhibit lipid per-oxidation as resulthepatocellular damage is done. One the other hand Cdinduced ROS block ETC in Mitochondria as a resultless energy is produced and effects cellular functions.

128 Trends in Biosciences 6 (2), 2013
and Loo, 2011). It has also been reported that stress genesand haem-oxygenase are unable to express fully by Fe afterexposure to the Cadmium.
There are several evidences that mitochondrion is theKey target on exposure to Cd (Belyaeva, et. al., 2011, Zhang,et. al., 2011). Mitochondria is chief source of Cd induced ROSproduction by blocking the electron transport chain inMitochondria and by the acceleration of H+ influx throughuncoupling oxidative stress. Mitochondrion is responsiblefor the production of energy. It interferes with the normaloxidative metabolism resulting in energy deficiency whichaffects various cell functions. Cd affects membrane’s structurefunction relationship by changing the lipids/Phospholipidsprofile and inhibits oxidative phosphorylation by changingfunction of Mitochondria (Modi and Katyare, 2009). Cdinteracts with Mitochondrial membrane and producesconformational changes. As a result uptake of Ca uniporter–mediated cations is activated and Mitochondrial permeabilitytransition is affected. The liver Mitochondria are consideredas the major source of Cd induced ROS production (Belyaeva,et. al., 2006).
Cadmium Induced Apoptosis :
Regulated form of cell death is called apoptosis.Apoptosis plays an important role in the maintenance anddevelopment of tissues and homeostasis in multicellularorganisms. Cd induces apoptosis in liver which leads tohepatotoxicity (Lasfer, et. al., 2008) (Pham, et. al., 2006) (Yu,et. al., 2011). It is assumed that toxicity might be caused bythe binding of thio-group to Cd in Mitochondria, which resultsMitochondrial dysfunction leading to hepatotoxicity. Cd canalso inhibit Mitochondrial functions i.e.; inhibition of
respiration, MPT loss of trans-membrane potential, release ofcyt-c. Cd may enter in Mitochondria through Ca uniporterand reacts with thiol group of adenine nucleotide translocatorANT which induces the MPT, cyt c release and apoptosis.Cyt c release and dysfunction of Mitochondria can suppressand delay in apoptosis (Oh and Lim, 2006). It is suggestedthat Mitochondrial mediated caspase independent pathwaydon’t inhibit apoptosis (Pham, et. al., 2006). In hepatoma cellline Hep-3 B Mitochondrial derived protein endonuclase-G(Endo G) is identified as potential caspase independentmediator in Cd induced apoptosis. This is done by thesubsequent alteration in Ca and ROX of Mitochondrialhomeostasis and release of Endo G and AIF (Lemarie, et al.,2004). It is shown that Cd induced apoptosis is mediated bythe release of Ca from the intracellular Ca storage but not aninflux of extracellular Ca. Cd induces ER stress in vitro and invivo and induces apoptosis (Kitamura and Hiramatsu, 2010).However, no exact data is present regarding the mechanism ofCd induced ER stress and its relationship with hepatocytesapoptosis (Biagioli, et al., 2008) as shown in Fig 4.
Several studies have revealed that Cd is a toxic metaland caused imbalance in the redox state and as a resulthepatocellular damage is done. Oxidative stress is due toimbalance in redox state. It is also thought that Cd is probablecarcinogenic. Several questions are unaddressed regardingthe exact mechanism of Cd induced damages. Cd competeswith other metals in our body system and transported anddisturbs the activities of or loss in antioxidant defensemechanism. Cd disturbs Ca homeostasis and leads toapoptosis. Cd also blocks ETC in mitochondria and effectsthe energy production. GHS production is depleted by Cdwhich leads to the aggravation of oxidative stress. Cd damagesall liver cells. In order to set up proper therapeutic approacheswe must know the proper mechanisms that how Cd causechronic and acute toxicity.
LITERATURE CITED
Belyaeva, E.A., Korotkov, S.M., Saris, N.E. 2011. In vitro modulationof heavy metal-induced rat liver mitochondria dysfunction: Acomparison of copper and mercury with cadmium. J. Trace. Elem.Med. Biol., 25: 63-73.
Belyaeva, E.A., Dymkowska, D., Wieckowski, M.R., Wojtczak, L.2006. Reactive oxygen species produced by the mitochondriarespiratory chain are involved in Cd2+ induced injury of rat asciteshepatoma AS-30D cells. Biochim. Biophys. Acta, 1757: 1568-1574.
Biagioli, M., Pifferi, S., Ragghianti, M., Bucci, S., Rizzuto, R. 2008.Endoplasmic reticulum stress and alteration in calcium homeostasisare involved in cadmium-induced apoptosis. Cell Calcium,43: 184-195.
Chang, W., Shoback, D. 2004. Extracellular Ca2+-sensing receptors-anoverview. Cell Calcium, 35: 183-196.
El-Sokkary, G.H., Nafady, A.A., Shabash, E.H. 2010. Melatoninadministration ameliorates cadmium-induced oxidative stress andmorphological changes in the liver of rat. Ecotoxicol Environ.Saf., 73: 456-463.
Fig. 4. Cd interefers with Ca and inhibit Ca dependent ATPases in endoplasmic reticulum. Ca level is increasedwhich by dissipating Mitochondrial membrane potentialand oxidative phosphorylation uncoupling can causeApoptosis. In Mitochondria release of cyt c by Cdleads to apoptosis. ROS is released in response to Cdfrom Mitochondria and GSH level decreases. GSHinduces oxidative stress which leads to Apoptosis.

ASGHAR et. al.,: Mechanism of Cadmium Induced Hepatocellular Carcinoma 129
Fay, R.M., Mumtaz, M.M. 1996. Development of a priority list ofchemical mixtures occurring at 1,188 hazardous waste sites, usingthe HazDat database. Food. Chem. Toxicol., 34: 1163-1165.
Filipic, M., Hei, T.K. 2004. Mutagenicity of cadmium in mammaliancells: implication of oxidative DNA damage. Mutat Res., 546:81-91.
Gebhardt, R. 2009. Prevention of cadmium-induced toxicity in liver-derived cells by the combination Heppeel. Environ. Toxicol. Pharm.,26: 402-409.
Horiguchi, H., Harada, A., Oguma, E., Sato, M., Y., Homma, E.A.2000. Cadmium- induced acute hepatic injury is exacerbated inhuman interleukin-8 transgenic mice. Toxicol. Appl. Pharmacol.,163: 231-240.
IARC. 1993. Monographs on the Evaluation of the Carcinogenic Risksto Humans Beryllium, Cadmium, Mercury and Exposures in theGlass Manufacturing Industry. IARC Scientific Publications, Lyon,France: pp. 119-139.
Jaeschke, H. 2000. Reactive oxygen and mechanism of inflammatoryliver injury. J. Gastroenterology, 15: 718-724.
Jihen, el. H., Imed, M., Fatima, H., Abdelhamid, K. 2009. Protectiveeffects of selenium (Se) and zinc (Zn) on cadmium (Cd) toxicity inthe liver of the rat: effects on the oxidative stress. EcotoxicolEnviron Saf., 72: 1559-1564.
Karthikeyan, J. Bavani, G. 2009. Effect of cadmium on lactatedehyrogenase isoenzyme, succinate dehydrogenase and Na(+)-K(+)-ATPase in liver tissue of rat. J. Environ. Biol., 30: 895-898.
Kitamura, M., Hiramatsu, N. 2010. The oxidative stress: endoplasmicreticulum stress axis in cadmium toxicity. Biometals, 23: 941-950.
Lai, C., Loo, G. 2011. Cellular iron depletion weakens induction ofheme oxygenase-1 by cadmium. Int. J. Biochem. Cell Biol., 43: 88-97.
Lasfer, M., Vadrot, N., Aoudjehane, L., Conti, F., Bringuier, A.F. 2008.Cadmium induces mitochondria-dependent apoptosis of normalhuman hepatocytes. Cell Biol. Toxicol., 24: 55-62.
Lemarie, A., Legadic-Gossmann, D., Morzadec, C., Allain, N., Fardel,O. 2004. Cadmium induces caspase-independent apoptosis in liverHep3B cells: role for calcium in signaling oxidative stress-relatedimpairment of mitochondria and relocation of endonuclease G andapoptosis-inducing factor. Free Radic. Biol. Med., 36: 1517-1531.
Mah, V., Jalilehvand, F. 2010. Cadmium (II) complex formation withglutathione. J. Biol. Inorg. Chem., 15: 441-458.
Martelli, A., Rousselet, E., Dycke, C., Bouron, E., Moulis, J.M. 2006.Cadmium toxicity in animal cells by interference with essentialmetals. Biochimie., 88: 1807-1814.
Masella, R., Benedetto, D., Vari, R., Filesi, C., Giovannini, C. 2005.Novel mechanisms of natural antioxidant compounds in biologicalsystems: involvement of glutathione and glutathione-related
enzymes. J. Nutr. Biochem., 16: 577-586.
Matovic, V., Buha, A., Bulat, Z., Ethukic-Cosic, D., Miljkovic, M.,Ivanisevic, J., Kotur-Stevuljevic, J. 2012. Route-dependent effectsof cadmium/cadmium and magnesium acute treatment on parametersof oxidative stress in rat liver. Food Chem. Toxicol., 50: 552-557.
Modi, H.R., Katyare, S.S. 2009. Effect of treatment with cadmium onstructurefunction relationships in rat liver mitochondria: Studieson oxidative energy metabolism and lipid/phospholipids profiles.J. Membr., Biol., 232: 47-57.
Moulis, J.M. 2010. Cellular mechanisms of cadmium toxicity related tothe homeostasis of essential metals. Biometals, 23: 877-896.
Mousa, S.A. 2004. Expression of adhesion molecules during cadmiumhepatotoxicity. Life Sci., 75: 93-105.
Oh, S.H., Lim, S.C. 2006. A rapid and transient ROS generation bycadmium triggers apoptosis via caspase-dependent pathway inHepG2 cells and this is inhibited through N-acetylcysteine-mediatedcatalase upregulation. Toxicol. Appl. Pharmacol., 212: 212-223.
Pham, T.N.D., Marion, M., Denizeau, F., Jumarie, C. 2006. Cadmium-induced apoptosis in rat hepatocytes does not necessarily involvecaspase-dependent pathways. ToxicolIn Vitro., 20: 1331-1342.
Rikans, L., Yamano, T. 2000. Mechanisms of cadmium-mediated acutehepatotoxicity. J. Biochem. Mol. Toxicol., 14: 110-117.
Souza, V., Escobar, M., Gómez-Quiroz L., Bucio, L., Hernández, E.2004. Acute cadmium exposure enhances AP-1 DNA binding andinduces cytokines expression and heat shock protein 70 in HepG2cells. Toxicology. 197: 213-228.
UNEP. 2008. Draft final review of scientific information on cadmium.United Nations Environment Programme, Chemicals Branch.
Van, K.E., E. K., Q.P.S. 2010. Cadmium and transport of ionsand substances across cell membranes and epithelia. Biometals, 23:823-855.
Yamano, T., DeCicco, L.A., Rikans, L.E. 2000. Attenuation of cadmium-induced liver injury in senescent male fischer 344 rats: role ofKupffer cells and inflammatory cytokines. Toxicol. Appl.Pharmacol., 162: 68-75.
Yu, X, Sidhu, J.S., Hong, S., Robinson, J.F., Al. R.A.E. 2011. Cadmiuminduced p53-dependent activation of stress signaling, accumulationof ubiquitinated proteins, and apoptosis in mouse embryonicfibroblast cells. Toxicol. Sci., 120: 403-411.
Zalups, R.K., Ahmad, S. 2003. Molecular handling of cadmium intransporting epithelia. Toxicol., Appl., Pharmacol., 186: 163-188.
Zhang, Y. Li, Liu, J.H., Jiang, X.R. F.L., Tian, F.F. 2011. Spectroscopicand microscopic studies on the mechanisms of mitochondrialtoxicity induced by different concentrations of cadmium. J. Membr.Biol., 241: 39-49.
Received on 27.12.2012 Accepted on 15.02.2013

Trends in Biosciences 6 (2): 130-132, 2013
Role of Herbal Ice Cream in Human Health: A ReviewSWASHANKH KUMAR1, D C RAI AND DINKER SINGH
Department of Animal Husbandry and Dairying, Institute of Agricultural Sciences, Banaras Hindu University,Varanasi 221 005, U.P., India.e-mail: [email protected]
ABSTRACT
Ice cream is a frozen dairy dessert that is made from productssuch as cream (or substituted ingredients) combined withflavourings and sweeteners. Herbal ice cream is gaining morepopularity over synthetic products because of their functional,nutritional and pharmacological activities like gastrointestinalhealth, hypoglycaemic, immunomodulatory, anti-stress,analgesic, antipyretic, anti-inflammatory, antiulcerogenic,antihypertensive, radioprotective, antitumor and reinforcementof the immunological system.
Key words: Herbal, Functional, Nutritional and PharmacologicalActivities
Ice cream is a frozen dessert that is delicious, nutritiousand relatively cheap. The ice-cream industry in India isestimated to be worth 2000 cr, in which the branded market is100 million litres annually valued at 800 cr. The global marketof ice-creams was pegged at US$61 billion in terms of retailvalue or 15 billion litres in terms of volume. The per capitaconsumption of ice-cream in India is just 300 ml/annumcompared to 22 litres in the US or the world average of 2.3litres/annum (Soni, 2009).
Ice Cream :
Ice cream is a frozen dessert that is made from dairyproducts such as cream (or substituted ingredients) combinedwith flavourings and sweeteners such as sugar (Arbuckle,1986).Goff,et al., 1999, defined ice cream as a complex foodcolloid, containing fat globules, air bubbles and ice crystalsdispersed in a freeze-concentrated dispersion D solution ofproteins, salts, polysaccharides and sugars.
History of Ice Cream :
Ice cream had its origin in Europe and was introducedlater in the United States where it is developed into industry.It is widely believed that ice cream evolved from iced beverageand water ices that were popular in the medieval period. It isknow that wines and fruits juices were cooled with ice andsnow brought from mountains to the court of the RomanEmperor Nero in the first century. Unfortunately, no definitedescription exits, except that snow and ice were used to cool,and possibly, to freeze sweet dessert. Over time, these waterices evolved into the popular frozen desserts of today.
Preparation of Herbal Ice Cream :
A detailed flowchart with mass balance and processdetails is given in Figure 1.
Composition of Ice Cream :
The composition of ice cream, which usually isexpressed as a percentage of the constituents, variesdepending on the market requirements and processingconditions.Approximate composition of commercial ice cream(%) given by Arbuckle, 1986 presented in Table 1. TheStandards for microbiology analysis of ice cream is given inTable 2.
Milk fat Milk solid-not-fat/ Serum Solids Sugar Stabilizer &
Emulsifier Total Solids
Economy Ice Cream 10 10 to 11 13 to 15 0.30 to 0.50 35 to 37
Good Average Ice Cream 12 11 15 0.30 37.5 to 39
Table 1. Approximate composition of commercial ice cream(%) given by Arbuckle, 1986
Table 2. Standards for microbiology analysis of ice creamParameter PFA rules 1955
Total plate count < 2,50,.000 Coliform count < 10/im
E. coli Absent in 1 gm Salmonella Absent in 25 gm
Stablylococcus aureus Absent in 25gm Yeast and mold count Absent in 1 gm Anaerobic spore count Absent in 1 gm Listeria monocytogens Absent in 1 gm
Swashankh Kumar is a ResearchScholar at Department of Animal Husbandryand Dairying, Institute of AgriculturalSciences in Banaras Hindu University (BHU).He received M.Sc. Degree in DairyTechnology in 2007 from Institute ofAgricultural Sciences, BHU, Varanasi, UP, India. His researchinterests include process optimization of herbal ice cream,development of a traditional product Malaeo.
MINI REVIEW
KUMAR et. al., : Role of Herbal Ice Cream in Human Health: A Review 131
Health Benefits Provided by Ice Cream :
Ice cream manufacturers and researchers have focusedon producing highly palatable fat-reduced ice cream that meetsthe demand of health-conscious consumers (Prindiville,et al.,2000).Ice cream fortified with fish protein (FP) can be a novelfunctional dessert with high nutritional value giving additionalhealth benefits to a well-accepted traditional product.
Davies, and Obafemi, 1985 investigated ice cream seemssuitable for delivering probiotics in human diet because of itspleasant taste and attractive texture.Themechanism behindthe specific health benefits of probiotic ice cream are relatedto gut micro flora modification, the strengthening the gutmucosal barrier, e.g. Adherence, pathogens inactivation,modification of dietary proteins by intestinal microfloramodification of bacterial enzyme activity and influence on gutmucosal permeability and regulation of the immune system.Duthie,et al., 1981,reported ice cream might be the ideal dairyproduct to serve as a carrier for Lactobacillus acidophilusand is a better vehicle than milk.
Now the trends to use of dietary fibre in ice creamincreasing. Dietary fibre consists of nondigestiblecarbohydrates and lignin that are intrinsic and intact in plants.There are little data dealing with the study of the functionalityof dietary fibres in ice creams (Thebaudin, et al., 1997).Thephysiological actions promoted by fibre addition in foodssuch as ice cream include the maintenance of gastrointestinalhealth, reduction of intestine transit time, protection againstcolon cancer, lowering of total and low-density lipoproteincholesterol in the blood serum, reduction of postprandial bloodglucose levels, increase of calcium Bioavailability andreinforcement of the immunological system (Tungland,andMeyer, 2002).
The use of citrus fibre has led to significant improvementof melting quality of ice cream but failed to improve viscosity,overrun and texture (Dervisoglu,andYazici, 2006). In a similarstudy, the addition of rice flour was found to be a satisfactoryfat replacer, though it imparted a powdery mouthfeel. However,there are limited data concerning the impact of dietary fibre onice crystallisation and rubbery to glassy state transitionphenomena.
It is interesting to note that herbal ice cream containssimilar health-promoting photochemical as do fruits andvegetables (Watson, 2001). Some studies were carried out todetermine the minerals content of plants. Zengin,et al., 2008,concluded that aromatic plants are important sources ofnutrients and essential elements. Some plants containedappreciable amounts of calcium, iron, zinc and potassium.Minerals such as Calcium is required for normal growth andskeleton development, aid in transmission of nerve impulsesthroughout the body; it is also required in association withphosphorus, sodium and potassium for water balance(Wardlaw, and Kessel, 2002). On the other hand, basil, fennel
and yastimadhu contain appreciable amounts of minerals andtrace elements. The role of minerals in our general health isnow well demonstrated, on the other hand, the demand forherbs and spices is increasing now a days for their safety andculinary appeal (Vasudevan, and Sreekumari, 2007).
Overrun :
The overrun in ice-cream affects the body, texture andpalatability of the final product. It is also related to the yieldand profit.
The addition of Herbal (Tulsi) extract intended todecrease the overrun significantly. All the samples could bestatistically differentiated from each other. The lower overrunencountered in the experimental samples may be ascribed tothe relatively higher viscosity associated with such samples(Das, et. al., 1989).
Melting Resistance :
Meltdown is also an important property of ice-creamaffecting its sensory quality. It is important from at least twoviewpoints (a) eye appeal and (b) mouth feel (Flack, 1988).Deviation in the melting property from ideal condition canmake the ice-cream defective. Melting time was dependent onthe ice-cream formulation and especially on the nature of theemulsifier. Fat aggregation appeared to be the majorcontributor to the melting resistance of ice-cream (Pelan,et al., 1997; Bolliger, et al., 2000; Goff, and Spagnuolo, 2001)through the existence of networks resulting from the presenceof fat, proteins or other stabilizer. The melting of the ice wasalso controlled by the outside temperature and the rate ofheat transfer.
Melting resistance was obtained using the followingequation:
In general, as the viscosity increases, the resistance tomelting and smoothness increases (Arbuckle, 1986). Slowmelting generally indicates over stabilization and suchcondition can be corrected by reducing the amount ofstabilizer and/or emulsifier.
Structural Properties of Ice Cream :
Ice cream is produced by freezing liquid ice cream mix.Ice cream has a complex physicochemical system (Koxholt,etal., 2001), containing fat globules, air bubbles and ice crystalsdispersed in a freeze-concentrated dispersion of proteins, saltsand polysaccharides (Goff, 1997). In particular, fat plays animportant role in the stabilisation of ice cream structure byforming networks of fat globules surrounding the air bubbles(Koxholt,et al., 2001). The structure of the fats and their thermalcharacteristics is important factors in the behaviour of icecream during freezing. In particular the destabilization of thefats is responsible for the creation of a network of fat globules,more or less coalesced, which contributes to the texture of theice cream (Lucas,et al., 2005).

132 Trends in Biosciences 6 (2), 2013
Air in ice cream provides a light texture and influencesthe physical properties of melt down and hardness andbecause of air incorporated in the ice cream mixture, the volumeof the ice cream increases. Overrun is a measurement thatshows increase in the volume of ice cream (Marshall, andArbuckle, 1996). The percentage of overrun for ice cream isbetween 30 and 60% depending on total solids used in theformulation. Percentage of overrun increases with the amountof total solid (Marshall, and Arbuckle, 1996).
Herbal ice cream has very high nutritive, characteristicsflavor, taste, palatable nature and possible therapeutic value.Herbalice creamis very refreshing frozen dairy dessertparticularly during summer months which improves thegastrointestinal health, hypoglycaemic, immuno-modulatory,anti-stress, analgesic, antipyretic, anti-inflammatory,antiulcerogenic, antihypertensive, radio-protective, antitumorand reinforcement of the immunological system. Keeping allthe above nutritional benefit in mind we can say that herbalice cream is the health food.
LITERATURE CITED
Arbuckle, W. S.1986. Ice Cream, 4th edn. Westport, CT: The AVIPublishing Company, Inc.
Bolliger, S., Goff, H. D. and Tharp, B. W. 2000.Correlation betweencolloidal properties of ice-cream mix and ice-cream. Int. Dairy J.,10: 303–309.
Das, T. C., Rao, M. R., Reddy, C. R., Krishnaiah, N. and Sudhakar, K.1989.Ice-cream Made by Incorporation of Different Levels ofPotato Pulp. Indian J. Dairy Sci., 42: 295-297.
Davies, R. and Obafemi, A. 1985.Response of microorganisms to freezethan stress. In: Robinson, R. K. Microbiology of frozen foods ed..London, U. K. Elsevier applied Science Publisher. pp. 83-107.
Dervisoglu, M., and Yazici, F. 2006.The effect of citrus fibre on thephysical, chemical and sensory properties of ice cream. Food Scienceand Technology International, 12: 159–164.
Duthie, A. H., Duthie, A. E., Nilson, K. M. and Atherton, H. V. 1981.An ideal vehicle for lactobacillus acidophilus. Dairy Field, 164:139-140.
Flack, E. 1988.Factors which influence the melting Properties of Ice-cream. Ice-cream and Frozen Confectionery, 39: 232-235.
Goff, H. D. and Spagnuolo, P. 2001. Effect of stabilizer on fatdestabilization measurements in ice-cream. Milchwissenschaft,56: 450–453.
Goff, H. D.,Verespaj, E. and Smith, A. K. 1999.A study of fat and airstructures in ice cream.Int. Dairy J., 9: 817–829.
Koxholt, N. M. R., Eisenmann, B. and Hinrichs, J. 2001. Effect of thefat globule sizes, on meltdown of ice cream. J. Dairy Sci., 84: 31–37.
Lucas, T., Ray, D. L., Barey, P. and Mariette, F. 2005. NMR assessmentof ice cream: Effect of formulation on liquid and solid fat. Int.Dairy J., 15:1225–1233.
Marshall, R. T. and Arbuckle, W. S. 1996.Ice Cream, 5th edn. NewYork: International Thompson Publishing.
Pelan, M. C., Watts, K. M., Campbell, I. J. and Lips, A. 1997. Thestability of aerated milk protein emulsions in the presence of smallmolecule surfactants. J. Dairy Sci., 80: 2631–2638.
PFA.1954. Prevention of Food Adulteration Act.16 thedn.Lucknow: EBCPublications Pvt. Ltd.
Prindiville, E. A., Marshall, R. T. and Heymann, H. 2000. Effect ofmilk fat, cocoa butter, and why protein fat replacers on the sensoryproperties of low fat and nonfat chocolate ice cream. J. Dairy Sci.,83: 2216-2223.
Soni, S. 2009. The story of ice-cream. Indian Dairy Man., 61 (11): 51-53.
Thebaudin, J. Y., Lefebvre, A. C., Harrington, M. and Bourgeois, C. M.1997. Dietary fibres: Nutritional and technological interest. Trendsin Food Science and Technology, 8: 41–49.
Tungland, B. C., and Meyer, D. 2002.Nondigestibleoligo andpolysaccharides (dietary fibre): Their physiology and role in humanhealth and food: Comprehensive Reviews.Food Science and FoodSafety, 1: 73–92.
Vasudevan, D.M. and S. Sreekumari, 2007.Textbook of biochemistryfor medical students.5th ed., Jaypee Brothers Medical PublishersLTD., New Delhi. pp. 316-317.
Wardlaw, G.M. and Kessel, M.W. 2002.Perspective in nutrition.5th ed.,McGrow Hill.
Watson, R.R. 2001. Vegetables, fruits and herbs in health promotion.CRC Press LLC. 73: 180.
Zengin, M., Özcan, M.M.,Çetin, Ü. and Gezgin, S. 2008. Mineral contentsof some aromatic plants, their growth soils and infusions. J. Sci.Food and Agriculture, 88(4): 581-589.
Received on 17.01.2013 Accepted on 12.03.2013

Trends in Biosciences 6 (2): 133-137, 2013
Management of Stored-product Insect Pests Through Biorational Approaches:A ReviewS. MURALI
Department of Entomology, UAS, GKVK, Bangalore 560 065, Karnataka, Indiae-mail: [email protected]
ABSTRACT
Stored-product insects are serious pests of dried, stored, durableagricultural commodities and of many value-added foodproducts and non-food derivatives of agricultural productsworldwide. The effect of diatomaceous earth on mortality ofadults of Sitophilus oryzae clearly revealed the importance oftemperature and relative humidity and found hundred per centmortality even at highest RH (90%) at both highest temperatures(30 and 35ºC) and at combinations of 20 and 25ºC with onlylower RH (30 and 50%). The exposed adults of Sitophilus oryzaeand Rhyzopertha dominica and adults and eggs of Corcyracephalonica to essential oils of geranium, lemongrass andpeppermint in the fumigation chamber noticed that completemortality of adults of S. oryzae at 100 and 150 ìl/250 ml ofpeppermint oil. Whereas, in case of R. dominica, 100% mortalitywas observed in all the doses (50, 100, 150 & 200 ìl/250 ml). Theeffectiveness of controlled atmosphere (decreased oxygen at1± 0.5%) at elevated temperature (41ºC) in controlling themajor storage pests, fig moth (Ephestia cautella), Indian mealmoth (Plodia interpunctella), and dried fruit beetle (Carpophilussp.) showed effective control.
Key words Stored-product insects, biorational pest management,Temperature, Relative humidity, Controlled atmosphere.
Stored-product insects are serious pests of dried, stored,durable agricultural commodities and of many value-addedfood products and non-food derivatives of agriculturalproducts worldwide. Stored-product insects can cause seriouspostharvest losses, estimated from up to 9 per cent indeveloped countries to 20 per cent or more in developingcountries, but they also contribute to contamination of foodproducts through the presence of live insects, insect productssuch as chemical excretions or silk, dead insects and insectbody fragments, general infestation of buildings and otherstorage structures and accumulation of chemical insecticideresidues in food, as well as human exposure to dangerouschemicals as a result of pest control efforts against them(Rajendran, 2002).
Stored product Insects:
They are categorised as Internal feeders, Externalfeeders, Scavengers and Secondary pests. Stored product
MINI REVIEW
Murali, S. presently pursueing Ph.D.degree in the Department of AgriculturalEntomology at UAS, GKVK, Bangalore. He hasbeen completed masters degree at Bangalore,GKVK. During M. Sc. my research onprospecting antimicrobial peptides from aculeateHymenoptera: In vivo screening of antimicrobial peptidesfrom bees and wasps. Now presently working onmanagement of Brinjal shoot ant fruit borer at NBAII,Bangalore.
insects causes to dried-stored durable agriculturalcommodities, Value-added food products and Non-foodderivatives of agricultural products.
Economic loss in Stored grains:
There is estimation of annual loss -14 million tonnes.i.e., Rs. 7,000 crores and Insects alone causes Rs.1, 300 croresand estimated to cause 600 species of beetle pests and 70species of moths & about 355 species of mites.
External Feeders:
Khapra beetle (Trogodermagranarium)
Saw toothed grainbeetle
(Oryzaephilussurinamensis)
Red flour beetle(Triboliumcastaneum)
Internal Feeders:
Rice weevil(Sitophilus oryzae)
Lesser grain borer(Rhizopertha
dominica)
Pulse beetle(Callosobruchus
chinensis)

134 Trends in Biosciences 6 (2), 2013
High Temperature: Temperature above 45 C - insectsdie within 24 h, Monitoring of the temperatures is often doneby handheld electronic thermometer and super heating systemby infrared heaters in storage godowns at 55-600 C for 10 to 20minutes.
Biorational Approaches:
Safe, Effective and Relatively simple.
Monitoring:
Mainly it helps to avoid unnecessary pest managementexpenses, Determining when and where insect pestsuppression will be needed. Sampling – Best tool to providethis information and no. of insects in samples or % of samplesinfested is used to estimate overall level of insect infestation.
Sanitation and Exclusion:
Sanitation of grain and food storage facilities and theeffective exclusion of stored-product insects from suchstructures and from food packages are the keys to preventivemanagement of storage insects. For bulk-stored grain it isimperative that newly harvested commodities be stored inclean bins and not be loaded into bins that contain olderproducts that may harbour insects.
Temperature Management:
Insect populations can be managed by manipulatingthe temperature of their environment. The maximum rate ofgrowth and reproduction for most insects occurs between 25and 33æ%C and is reduced at temperatures above and belowthis range, with complete cessation of development andeventual death at approximately 13 and 35æ%C. Maximumrate of growth & reproduction for insects 25 and 33 °C,Cessation of development & eventual death 13 and 35 °C andtwo ways of temperature - Low Temperature and HighTemperature.
Low Temperature: Mainly through turning grain over,ambient air aeration or chilled aeration and Force cool airthrough the grain bulk.
Zone Temperature Effect Lethal 50-60 Death in minutes 45-50 Death in hours Sub optimal 35 Development stops 33-35 Development slow optimal 25-33 Max Rate of devt Development stops 13-25 Development slow 13-20 Development stops Lethal 5 Death in week -10- -5 Death in days -25 - -15 Death in minutes
Response To Stored Product Insects To Temperature: (Fields,1992)
Irradiation:
Irradiation of durable stored products is legal in mostcountries and can be conducted using ionizing radiation suchas gamma rays, which have the potential to dislodge electronsfrom chemical bonds in molecules, and nonionizing radiationsuch as radio frequencies, microwaves, or infrared rays, whichdo not break bonds but essentially heat the product and theinsects by vibrating bonds in water. Irradiation could be usedto disinfest product entering a grain storage system or as aremedial treatment for infested product in a storage system.Irradiation technqnics used storage pest control mainlyincludes Infra red, Ultra violet lights (<1 kGy), X-Rays,Gammarays, Audio sounds and Ultra sonic sounds- increasedabsorption.
Uses Of Radiation: Mainly to check the mortality, sterilityand Reduction in the fecundity of the pests.
Controlled Atmospheric Storage (CAS):
An alternative mixture of atmospheric gases that isinsecticidal, due to having very low oxygen levels or highcarbon dioxide and nitrogen imposed on an infestedcommodity in gas tight chamber. Application of controlled ormodified atmospheres presents several logistical challenges,although once overcome the methods present opportunities.Paramount to the success of these methods is having a gas-tight or minimally permeable chamber or storage structure inwhich to treat the infested commodity.
Use of CAS:
The can be effectively controlled by using CAStechnology with Low oxygen (0.5, 1, 2, or 5 %), High carbondioxide (60, 90, 95 or 98%) and High Nitrogen gas (38, 40 or 42 %).

MURALI : Management of stored-product insect pests through biorational approaches: A review 135
Advantages:
Mainly includes no residues in treated products, workerssafety issues, environmentally safe and Low risk for resistancedevelopment.
Disadvantages:
Mainly includes high gas tightness required, longertreatment times, increased production (GAS) costs andlogistical problems related to material availability and supply.
Insect Growth Regulators (IGRS):
Insect growth regulators (IGRs) used in stored productsystems in the United States and elsewhere include the insectjuvenile hormone analogs methoprene, hydroprene, andpyriproxyfen. All three compounds mimic the effects ofsustained increased titer of insect juvenile hormone bydisrupting normal development between larval instars and inmetamorphosis from larvae to pupae and then from pupae tonormal adults. These IGRs are not directly toxic to adults,although their potential effects on reproductive sterility havenot been fully investigated. Another key attribute to theseIGRs is their low levels of toxicity to mammals and inherenthigh level of food safety.
Insect juvenile hormone analogs methoprene,hydroprene and pyriproxyfen and they act by disruptingnormal development – Between larval instars, metamorphosisfrom larvae to pupae and from pupae to normal adult.
Application Of IGR’S:
Hydroprene (Gentrol) - effective against late-instars ofPlodia interpunctella, Tribolium castaneum and T. confusum.As surface treatments to flooring structures of mills,warehouses and processing plants for example Methopreneand Pyriproxyfen and Used as aerosol spray treatments.
Biological Control: It includes mainly Pathogens,Parasitoids and Predators.
Microbial Insecticides:
Natural occurrence of entomopathogenic fungi andbacteria has been reported among storage pests. Commerciallyavailable fungi Beauveria bassiana, Metarhizium anisopliaeand Bacillus thuringiensis alone or in conjunction with otherscan control some stages of storage pest species.
Spinosad:
Spinosad is an insecticide derived from metabolites inthe fermentation of the actinomycete bacterium,Saccharopolyspora spinosa Mertz and Yao (Actinomycetales:Actinomycetaceae). Spinosad is currently registered by theU.S. There is much interest in the use of spinosad on storedgrain because other residual insecticides registered in theUnited States and elsewhere have limited efficacy against themajor pest of stored wheat, R. dominica, either because of
simple lack of efficacy or because of development ofresistance. Spinosad is effective for season long control of R.dominica in stored wheat; it is highly toxic to larvae of manystored-product insects and shows good compatibility withinsect natural enemies. It is a bacterial fermentation product -Saccharopolyspora spinosa and it acts by Ingestion andcontact poison; Effective for season long control of R.dominica in stored wheat.
Important Parasitoids:
Several species of parasitoid wasps from thePteromalidae are solitary ectoparasitoids of internal-feedinggrain-infesting species of beetles, and similarly there areseveral common species of Ichneumonidae and Braconidaeas ecto- and endoparasitoids associated with stored-productLepidoptera. Some species of free-living predatory beetles,true bugs (Heteroptera: Anthocoridae), and mites prey on anylife stage of numerous species of stored-product insect peststhat they can subdue and consume. Populations of parasitoidsand predators in storage systems display delayed densitydependency in their dynamics that are typical of other predator-prey and parasitoid-host systems in other insect communities,and population declines of stored product pest species aretypically followed by increase in these natural enemypopulation. It includes Braconidae, Ichneumonidae,Pteromalidae and Bethylidae. The Parasitic wasp,Anisopteromalus calandrae - reduced rice weevil infestationof spilled wheat by 90% in a simulated warehouse. Almondmoth, Cadra cautella populations were supressed to extendof 97.3% of due to B. hebetor release and Egg parasitoid,Trichogramma pretiosum - against Cadra cautella, Ephestiaspp. and P. interpunctella and T. pretiosum suppressedC. cautella upto 42% and P. interpunctella upto 57%.
Botanicals:
Farmers often use homegrown or naturally occurringplant materials for insect control in developing countries.Problems with botanical insecticides are lack of consistency,safety concerns, and sometimes odor. It is often falselyassumed that because a plant material is used as a foodflavoring or medicine that extracts from the material will besafe for human consumption. Various extracts from the neemtree, Azardirachta indica, collectively referred to as theinsecticide Neem, are commercially available botanicalinsecticides, and local formulations have been widely used insome parts of the world for stored-product insect control.Plant derived compounds acts as ovicidal, repellent,antifeedant, sterilization and toxic effects in insects.
Plant extracts:
Root powder of sweet flag, Acorus calamus L., withactivity against stored grain beetles and leaves of Azadirachtaindica with protectant properties against stored grain beetlesand Angoumois grain moth, Sitotroga cerealella in wheat.

136 Trends in Biosciences 6 (2), 2013
Varietal Resistance:
Hull integrity is the best predictor of rice resistance toR. domnica and Phenolic content (corn) related to kernelhardness - resistance to the maize weevil, S. zeamais and thelarger grain borer, Prostephanus truncates.
Edible Oils:
Obtained from leaves or seeds of plants are often appliedto stored products and volatility and insecticidal efficiency ofessential oils – act as “fumigant”.
Inert Dusts (ID’S):
IDs are powders that render the insects more sensitiveto desiccation and divided into four group’s viz., Clays andashes, Minerals, Diatomaceous earth (DE) and Synthetic silicaaero gels.
Modes of action:
Mainly acts by Asphyxiation through blocking ofspiracles leads to the insects killing, Abrasion of cuticle leadsto increase water loss and dusts absorb water and epicuticularlipids of arthropods leading to excessive water loss throughthe cuticle.
Diatomaceous Earth (DE):
Many tests have been conducted to synergizepathogens with other control technologies, particularly thosethat might be expected to increase efficacy of pathogens, suchas DE by presumably abrading the cuticle, or grain varietalresistance by delaying larval development, both of whichmight make the insect more susceptible to the pathogen.
Fossilized remains of the silicon dioxide skeletons ofdiatoms, which are aquatic algae that are insecticidal asdesiccants. Mode of action through killing of insects byabsorbing hydrocarbons from their cuticles causesdehydration and death; has very low mammalian toxicity andadd 3-4 Kg. of Diatomaceous Earth to each tonne of grain foreffective control of pests in storage.
Activated Clay:
Raw clay (Kaolinate clay) is used in the ratio of 45%silicon dioxide + 38% aluminium oxide for effective control ofpests; Grain purpose use activated kaolin 1 kg/100 kg of grainand Seed purpose mix 1 Kg of Activated Kaolin with every100 Kg of seed and pack it.
Pheromones:
Attractant pheromones, which are intraspecific chemicalsignals, and other attractant semiochemicals have beenidentified for over 40 species of stored-product insects overthe past 40 years. There are two broad categories ofpheromone systems recognized in stored-product insects,which follow life-history models for insects in general. Species
with short-lived, usually nonfeeding adult stages utilize female-produced sex pheromones in which a receptive adult female“calls” by releasing one or more attractant compounds andone or more males respond upwind to the pheromone afterwhich mating occurs.
Categories:
1. Species with short-lived (< 1 month)2. Species with long-lived (> 1 month)
Short-lived:
Non-feeding adult stages utilize female-produced sexpheromones to attract males
Eg: Pyralidae, Anobiidae, Bruchidae and Dermestidae
Long-lived:
Feeding adults utilize male produced aggregationpheromones to attract both males and females
Eg:Bostrichidae, Curculionidae, Cucujidae, Sylvanidaeand Tenebrionidae.
Insects Lures Trogoderma sp. Trogodermal Rhizopertha dominica, Protsephanus truncatus Dominicalure Sitophilus oryzae Sitophilure Cadra cautella, Plodia interpunctella TDA Lasioderma serricorne Serricornin
Pheromones Based On Chemical Groups:
Traps:
Traps are designed to sit on a floor or flat surface andcapture insects that walk into the trap, which eventuallybecome stuck to the trapping surface or ensnared inside thetrapping receptacle.
Barak and Burkholder developed a trap with horizontallayers of corrugated cardboard in which responding beetleswalked through the tunnels of corrugations to reach a cup ofoil into which they fell and became suffocated. Traps can beused to monitor or directly reduce insect populations andtypically use food, visual lures, chemical attractants andpheromones as bait.
Impact and Removal:
Internal and external feeding insects killed by impactand Entoleters & pneumatic conveyers used to move grainsfrom one bin to another. Mechanism of impact throughcommodities are fed into the center of rotor of an impact machinethis can be accelerated by centrifugal force thus insects killedwhen they hit the pegs on rotor and removed by aspiration orsieving.
Thomas and James 2010 reported that stored-productinsects are ubiquitous, essentially cosmopolitan, occurringin feral habitats as well as in human-made facilities and

MURALI : Management of stored-product insect pests through biorational approaches: A review 137
infestation can be a continual year-round process that makespest control difficult. Bio-based pest management methods isavailable for stored-product systems, including inertdiatomaceous earth (DE) as an insecticidal desiccant, themicrobial insecticide spinosad, highly safe synthetic insectgrowth regulators (IGRs), controlled and modifiedatmospheres as alternatives to traditional chemical fumigants,insect natural enemies that can regulate or control pestpopulations, pheromones and other semio-chemicals that canbe used in traps for monitoring or applied as control tactics inmating disruption or attract-and-kill.
Studies of Poornima and Avaknavar 2008 on the effectof DE on mortality of adults of Sitophilus oryzae clearlyrevealed the importance of temperature and relative humidity.They found hundred per cent mortality even at highest RH(90%) at both highest temperatures (30 and 35ºC) and atcombinations of 20 and 25ºC with only lower RH (30 and 50%).Michaelraj, et al. 2008 in their studies exposed the adults ofSitophilus oryzae and Rhyzopertha dominica and adults andeggs of Corcyra cephalonica to essential oils of geranium,lemongrass and peppermint in the fumigation chamber. Theynoticed complete mortality of adults of S. oryzae at 100 and150 ìl/250 ml of peppermint oil. Whereas, in case of R. dominica,100% mortality was observed in all the doses (50, 100, 150 &200 ìl/250 ml).
Fatih, et al., 2010 reported the effectiveness of controlledatmosphere (CA) (decreased oxygen at 1± 0.5%) at elevatedtemperature (41º C) in controlling the major storage pests, figmoth (Ephestia cautella), Indian meal moth (Plodiainterpunctella), and dried fruit beetle (Carpophilus sp.). TheCA treatment can be recommended as a post-harvest methylbromide (MB) alternative for dried figs since it provided 100%control of the pest species tested, had neutral or positiveeffects on dried fruit quality and required comparatively shorttreatment times compared with other MB alternatives.
LITERATURE CITED
Fatih Sen., Kamer, B., Ferit Turanli. and Yugun Aksoy., 2010, Effectsof short term controlled treatment at elevated temperature ondried fig fruit. Journal of Stored Products Research., 46: 28-33.
Grenier, A. M., Pintareau, B. and Nardo, P., 1994, Enzymatic variabilityin three species of Sitophilus oryzae (Coleoptera: Curculionidae).J. Stor. Prod. Res., 6: 201-213.
Michaelraj, S., Kirti Sharma. and Sharma, R. K., 2008, Fumigant toxicityof essential oils against key pests of stored maize. Ann. Pl. Protec.Sci., 16: 356-359.
Poornima, V. and Avaknavar, J. S., 2008, Effect of temperature andrelative humidity on efficacy of diatomaceous earth on mortalityof rice weevil, Sitophilus oryzae. Karnataka J. Agric. Sci., 22: 99-103.
Thomas, W. and James, E., 2010, Biorational approaches to managestored-product insects. Annu. Rev. Entomol., 55: 375-397.
Received on 18.01.2013 Accepted on 10.02.2013

Trends in Biosciences 6 (2): 138-141, 2013
Preliminary Studies of Phenology of Some Selected Tree Species from Ngel-NyakiForest ReserveMOHAMMED, S., ALIYU, B., UMAR, M.D.
*Department of Biological Sciences, Gombe State University, PMB 0127. Nigeria.e-mail: [email protected], [email protected] and [email protected]
A checklist of some selected tree species as data bank on plant phenology (i.e. leafing, flowering and fruiting) at Ngel-Nyaki forestreserve was carried out. Sixteen individual trees belonging to eight species of angiosperm were selected for the study through sixmonths duration. Variation in flowering related to leaf flushing revealed three flowering types; Nov-Dec, Dec-Mar and Jan-Mar. Awide range of producton of new leaves were seen in some species and reproductive phase were correlated to see the relation.Available phenological information on the sixteen individual trees showed that Nov-Dec flowering species were most abundantamong the three types recognize. Among species are; Anthocleista vogellii, Bridelia speciosa, Trema orientalis and Dombeyaledermannii. Period of production of new leaves, flowering and fruiting were positively correlated in seven species. Correlation ofsame in Anthonotha noldeae was insignificant (r=-0.0095).
Key words Preliminary, Phenology, Ngel-Nyaki, montane, Forest reserve
Phenology is an area of science that has receive arenewed interest in recent years. It is defined as the study ofcyclic and seasonal natural phenomena, especially in relationto climatic and animal life (Primack, 1987). The return ofmigratory songbirds, the blooming of wild flower and woodylandscape plants and the development of locally indigenousinsect are all examples of phenological events which are easilyobserved each spring in any location.
Changes in timing of such events; leafing, floweringand fruiting can indicate climatic change. For instance,thedata on Anthonotha noldeae, showed flowering on-set everyNov through Feb. But in 2008, June at Ngel-Nyaki main forestthree individual trees have been spotted with flowers, while afew with flower buds (NMFP Station,2008). Climate changeaffects individual plants species by changing the speed andduration of physiological (life) processes such as growth rate,the degree of evaporation of available water and theirinteraction with birds and other insects. Phenology hasrecently become very popular in climatic change studies world-wide (Chapman, et al., 2004).
Many of these are endemic to Afromontane region, fourtree species, including Anthonotha noldeae were new to westAfrica and other new to Nigeria. Diversity is reflected in thehigh number of primates and other animal diversity (Chapmanand Chapman, 2001).
Complete phenology study must be all year round andthis research was carried out for a period of six months as apreliminary. As the data are scanty with respect to checklist ofNigerian montane forest, so the aim of this work is to establisha checklist of some selected tree species as data bank onphenology (onset of leaf development, flowering and fruitingduration) at Ngel-Nyaki forest so as to facilitate anunderstanding of their growth cycle within the forest andsurrounding fragments.
MATERIALS AND METHODS
Study Area
The study was conducted at Ngel-Nyaki forest reserveand it’s surrounding riverside fragments. It is the most diverseforest on Mambilla Plateau. Ngel-Nyaki forest is locatedbetween Longitude 11000’ and 11030’ East and Latitude 6030’and 7015’ North and has 1,400-1,500m elevation on the Westernescarpment of Mambilla Plateau. It located in the South-Eastcorner of Taraba State Nigeria and mesures about 3100km2.
The reserve experiences an avearge rainfall of 250days,between the months of March and October. Mean annualrainfall of 1,780mm peaks between the the months of June andJuly. Temperature has never exceeded 300c. Over 146 vascularplant species were collected, many of which are endemic tothe Afromontane region (Chapman and Chapman, 2001).
The reserve lies on the West facing slopes of an oldvolcano, between 1,650m to 1,450m elevation and it is 6.6km2inarea (actual forest), while Ngel-Nyaki forest reserve is 46km2.Apart from plant diversity which is reflected in the high numberof primates and other animal species (Beck and Chapman,2008). Ngel-Nyaki forest is also home to a good number ofbirds (e.g. collared songbird, green headed songbird, northern-double collared songbird,turacos, barbets, bulbuls etc.) andwintering site to some paleactic and neactic migrants(Chapman and Chapman,2001, Hamilton, 1975 and Richards,1957).
Experimental design and selected tree species with theirrespective sites :
A total of 16 individual trees of 8-species (i.e. duplicate)belonging to the seven-families of Angiosperm werephenologically censured. The plants were selected randomlyin both main forest and two surrounding fragments (i.e.

MOHAMMED et. al., : Preliminary studies of phenology of some selected tree species from Ngel-Nyaki forest reserve 139
fragment B and C). Method of data collection differs based onresearch interest (Newstrom, et al., 1994 and Schwartz, 2003).
The plants are selected randomly in both the main forestand two surrounding fragments and tagged for observationon leafing, flowering and fruiting. Each tree species isreplicated twice (i.e. two stand per species).
The location of the plant species are identified as follows:1, tree species in the fragment A and B;Anthocleista vogelliiCroton macrostachyusDombeya ledermanniiSyzygium guineenceTrema orientalis2, tree species occur in both main forest and fragments;Albizia gummiferaAnthonotha noldeaeBridelia speciosa
Data collection/Record of reproductive events :
A scale of 1-4 was employed insuring at two weeksinterval for record of events i.e. Leafing, flowering and fruiting,where 1 is 25% and 4 is 100% of the events. A pair of Binocularwas used for viewing and a record sheet. Each tree was scoredas new/no leaf, flower bud, flower, immmature fruit and maturefruit. Correlation Co-efficient statistical analysis was usedbetween two individual thesame species (i.e. r=)
RESULTS AND DISCUSSION
Discription of the Result, best on the two individualtrees of thesame species and their phenological relation.
Albizia gummifera
Fragment C tree: in Nov.; 37% no leaf and 62.5% newleaf, Dec.; 62.5% new leaf, Jan; 25% no leaf, Feb.; 12.5% noleaf, Mar.; 12.5 no and new leaf and Apr.; 25% new leaf.
Main forest tree: Nov.; 75% new leaf and 25% flowerbud, Dec.; 50% no leaf and 37.5% new leaf, Jan.; 25% newleaf, 37.5% flower bud and 12.5% flower, Feb.; 50% flower,Mar.; 37.5% flower bud, 25% flower and 25% immature fruit,Apr.; 12.5% immature and mature fruit.
The species in fragment C and main forest; r= 0.5799
Anthocleista vogellii
Fragment B tree: Nov.; 12.5% no leaf and flower bud,37.5% immature and mature fruit, Dec.; 25% flower bud, 37.5%flower, 25% immature fruit and 12.5% mature fruit, Jan. 37.5%flower bud, 12.5% flower and 25% immature and mature fruit,
Feb.; 25% flower, 50% immaature and 25% mature fruit, alsothe same in March and April.
Fragment C tree: Nov.; 12.5% new leaf and flower budand 37.5% immature and mature fruit, Dec.; 12.5% new leafand 50% mature fruit, Jan.; 12.5% new leaf and flower and50% mature fruit, Feb.; 12.5% flower and immature fruit and50% mature fruit, Mar.; 25% flower, immature and mature fruit,April; 25% flower, 50% immature fruit and 25% mature fruit.
The species in fragment B and C, r=0.6725
Anthonotha noldeae
Fragment C tree: 25% flower bud and flower in Nov.,Dec., Jan., Feb. and Mar. The individual shed its leaf about12.5% and resting period in April.
Main forest tree: Nov.; 37.5% flower bud and 50% flower,Dec.; 62.5% flower and 25% immature fruit, Jan.; 25% no leafand 50% immature fruit, Feb.; 25% no leaf, 12.5% new leaf and50% immature fruit, Mar.; 12.5% no leaf and new leaf and 50%immature fruit, Apr.; 25% no leaf and new leaf and 50% immaturefruit.
The species in fragment C and main forest; r= - 0.0095
Bridelia speciosa
Fragment C tree: Nov.; 12.5% new leaf, 50% flower budand 37.5% flower, Dec.; 12.5% flower bud, 50% flower and12.5% immature fruit, Jan. and Feb.; 12.5% no leaf and immaturefruit, Mar.; 12.5% no leaf and 50% immature fruit, Apr.; 50%immature fruit.
Main forest tree: Nov.; 50% flowerbud and flower, Dec.;37.5% flower bud, 25% flower and immature fruit, Jan. 25%immature fruit, Feb.; 50% immature fruit, Mar.; 12.5% immaturefruit, Apr.; 62.5% new leaf.
The species in fragment C and main forest, r= 0.9197
Croton macrostachyus
Fragment B tree: Nov. and Dec.; 25% new leaf, Jan.;12.5% no leaf and new leaf, Feb.; 25%no leaf and 12.5% newleaf, Mar.; 25% no leaf and Apr.; 50% no leaf.
Fragment C tree: Nov.; 37.5% no leaf and 25% new leaf,Dec.; 50% new leaf, Jan.; 12.5% no leaf and 37.5% new leaf,Feb.; 37.5% no leaf and 12.5% new leaf, Mar. and Apr.; 12.5%new leaf and 50% no leaf.
The species in fragment B and C, r=0.9855Dombeya ledermannii
Fragment B tree: Nov.; 37.5% new leaf, 25% flower budand 12.5% flower, Dec.; 37.5% flower bud, 50% flower and12.5% immature fruit, Jan.; 62.5% immature fruit and 37.5%mature fruit, Feb.; 75% mature fruit, Mar.; 25% no leaf and25% mature fruit and 50% no leaf in April.

140 Trends in Biosciences 6 (2), 2013
Fragment C tree: all the reproductive events are thesameas the above fragment B tree.
So, r = 1Syzygium guineense
Fragment B tree: Nov.; 37.5% no leaf and 12.5% newleaf, Dec.; 25% no leaf and 75% new leaf, Jan.; 50% new leafand 25% flower bud, Feb.; 50% flower bud and 37.5% flower,Mar.; 37.5% flower bud and flower and 25%immature fruit,Apr.; 25% flower and 50% immature fruit.
Fragment C tree: Nov.; 37.5% no leaf and 12.5% newleaf, Dec.; 25% no leaf and 62.5% new leaf, Jan. and Feb.; 25%new leaf and 50% flower bud, Mar.; 37.5% flower bud, 50%flower and 12.5% immature fruit, Apr.; 25% flower and 50%immature fruit.
The species in fragment B and C, r=0.7988Trema orientalis
Fragment B tree: Nov.; 12.5% flower bud and flower,50% immature fruit and 12.5% mature fruit, Dec.; 12.5% flower,62.5% immature fruit and 25% mature fruit, Jan.; 12.5% flowerbud, 25% flower and 62.5% immature fruit, Feb.; 12.5% flowerbud, 37.5% flower and 50% immature fruit, Mar.; 12.5% flower,62.5% immature fruit and 25% mature fruit, Apr.; 37.5%immature fruit and 62.5% mature fruit.
Fragment C tree: Nov.; 12.5% flower bud, 37.5% flower,37.5% immature fruit and 12.5% mature fruit, Dec.; 50% immatureand mature fruit, Jan., Feb. and Mar.; 12.5% flower, 62.5%immature fruit and 25% mature fruit, Apr.; 37.5% immaturefruit and 62.5% mature fruit.
The specie sin fragment B and C, r=0.8832Anthonotha noldeae
Bridelia speciosaAlbizia gummiferaFig. 1, reproductive events among individual trees in
main forest of Ngel-Nyaki forest between the months of Nov.-April.
KeysAnthocleista vogelliiCroton macrostahyusDombeya ledermanniiSyzygium guineenseTrema orientalisFig. 2, reproductive events among individual trees in
fragment B of Ngel-Nyaki forest between the months of Nov.-April.
KeysAlbizia gummifera
Anthocleista vogelliiAnthonotha noldeaeBridelia speciosaFig. 3i.KeysDombeya ledermanniiCroton macrostachyusSyzygium guineenseTrema orientalisFig. 3ii.Fig. 3 (i and ii), reproductive events among individual
trees in fragment C of Ngel-Nyaki forest between the monthsof Nov.-April.
The occurence of leaf/leaf flushing (vegetative phase)and flowering (reproductive phase) requires the availabilityof substantial amount of resources within the trees. Flowerproduction and maintenance requires considerable expenseof energy to form non-photosynthetic tissue and nectar(Knight, et al., 2005).
The result of this research work, agrees with the findingsof (Hamza, 1990 and Keay, 1989) which indicates that Albiziagummifera, Anthocleista vogellii and Croton macrostachyusleaf in the months of Nov. and Feb. The duration of leafshedding (no leaf) and time lag between the onset of leafingand flowering help in making use of available resources forgrowth and reproduction.
Flowering and fruiting in fragment B, C and main forestin tree species typically occur throughout the six months,may be on one species or another. Synchronization offlowering with a particular season of the annual cycle byAnthocleista vogellii and Trema orientalis appear to be underthe control of prevailing climatic conditions of the season.The detection of the several flowering types in fragment B, Cand main forest trees revealed that Bridelia speciosa, Crotonmacrostachyus, Syzygium guineense and Trema orientalisflowered at the end of rainy season. This result agrees withthe findings of Hamza 1990 and Keay 1989. The proportion ofspecies flowering during dry period of the year varies widelyamong tropical deciduous forest trees bearing differentintensity of drought. As the case of Albizia gummifera,Bridelia speciosa, Dombeya ledermannii and Tremaorientalis.
Fruit maturation and suitable condition(s) for dispersalare closely synchronized in tropical dry forest because of thepronounced differences of abiotic and biotic conditionsbetween dry and rainy seasons. As Trema orientalis andAnthonotha noldeae flower in Nov, produce fruit in Dec.-April. This result agrees with the findings of Chapman andChapman 2001 and Lieberman and Lieberman, 1987 who

MOHAMMED et. al., : Preliminary studies of phenology of some selected tree species from Ngel-Nyaki forest reserve 141
reported that different flowering are types related to varyingduration of fruiting phenophase. Thus; all flowering typescomplete the fruiting phenophase before the onset of thesucceeding rainy season, ensuring that some (if not all) seedsare available for germination when the soil is sufficiently moist.
Phenological events in tropical trees may defend onpreceeding and successive stages; hence the fruiting durationmay impose constraints on flowering time. Although, fruitingduration is related to flowering time, especially in speciesflowering in dry season of the year. As the case of Albiziagummifera and Syzygium guineense (Hamza, 1990).
The variety of seasonal flowering of the tree species atNgel-Nyaki forest with linkages to leaf flush time and leaflessperiod reflect the fact that variable reproductive and survivalstrategies evolved in tree species under climatic condition.Determine the flowering and fruting period of the tree specieswill help to devise appropriate strategies for conserving theplants at Ngel-Nyaki forest which are of positive value.
LITERATURE CITED
Beck, J. and Chapman, H. 2008. A population estimate of the endangeredchimpanzee Pan troglodytes vellerosus in a Nigerian montane forest:implications for conservation. Oryx, 42: 448-451.
Chapman, H. M., Olson, S. M. and Trumm, D. 2004. An assessment ofchanges in the montane forests of Taraba State, Nigeria, over thepast 30 years. Oryx, 38, 282-290.
Chapman, J. D. and Chapman, H. 2001. The forests of Taraba andAdamawa States, Nigeria: an ecological account and plant specieschecklist, Dept. of Plant and Microbial Sciences, University ofCanterbury.
Hamilton, A. C. 1975. The significance of patterns of distributionshown by forest plants and animals in tropical Africa for thereconstruction of palaeoenvironments: a review, AC Hamilton.
Hamza, M. 1990. Trees and shrubs of the Sudan. Ithaca Press, Exeter, UK.
Keay, R. W. J. 1989. Trees of Nigeria, Clarendon Press.
Knight, T. M., Steets, J. A., Vamosi, J. C., Mazer, S. J., Burd, M.,Campbell, D. R., Dudash, M. R., Johnston, M. O., Mitchell, R. J.and Ashman, T.-l. 2005. Pollen limitation of plant reproduction:pattern and process. Annual Review of Ecology, Evolution, andSystematics, 467-497.
Lieberman, D. and Lieberman, M. 1987. Forest tree growth and dynamicsat La Selva, Costa Rica (1969-1982). Journal of tropical ecology,3: 347-358.
Newstrom, L., Frankie, G. W. and Baker, H. 1994. A new classificationfor plant phenology based on flowering patterns in lowland tropicalrain forest trees at La Selva, Costa Rica. Biotropica, 141-159.
Primack, R. B. 1987. Relationships among flowers, fruits, and seeds.Annual Review of Ecology and Systematics, 18, 409-430.
Richards, P. 1957. Ecological Notes on West African Vegetation: I.The Plant Communities of the Idanre Hills, Nigeria. The Journal ofEcology, 563-577.
Schwartz, M. D. 2003. Phenology: an integrative environmental science,Springer.
Received on 12.12.2013 Accepted on 19.03.2013
Trends in Biosciences 6 (2): 142-145, 2013
In Vitro Evaluation of Antibacterial Activity of A Novel Polyenzyme PreparationImmunosebANITA JOSHI2, VARSHA SHAHANE1, VARSHA GORE1, ANJU KAGAL1, SHILPA RISBUD2 AND RENUBHARADWAJ1
1B. J. Medical College, Pune, India. 2Advanced Enzyme Technologies Ltd. Thane, India and Specialty EnzymesCo., USA, Group of companiese-mail : [email protected]
ABSTRACT
Novel polyenzyme formulations which are proprietary blendsof different enzymes such as bromelain, papain, acid andalkaline proteases, serratiopeptidase, lysozyme etc. have beendeveloped by Advanced Enzyme Technologies Ltd., Thane andSpecialty Enzymes Co. USA, group of Companies, Screeningfor antibacterial activity of Immunoseb, a novel polyenzymeformulation under development, was done using ATCC strainsand clinical isolates of Salmonella typhi, Pseudomonasaeruginosa, E. coli, Staphylococcus aureus, Streptococcus pyogenesand S. pneumoniae employing a modif ied antibioticsusceptibility test. The polyenzyme formulation was found tohave activity against P. aeruginosa S. aureus, S. pyogenes and S.pneumoniae at the test concentration. Synergistic effect wasestablished when Immunoseb was used in conjunction withAmpicillin against E. coli and with Penicillin againstStreptococcus pyogenes. Partial synergy was established when itwas used in conjunction with Ceftazidime against Pseudomonasaeruginosa and with Ciprofloxacin against Salmonella typhi.Antagonism was established when it was used in combinationwith Ceftazidime against S. typhi and with Ciprofloxacin againstboth, coagulase negative staphylococcal strain andStaphylococcus aureus. Immunoseb has antibacterial activityagainst some commonly encountered pathogens and thereforehas the potential of being a novel broad range antibacterialdrug. It can be used in conjunction with those antibiotics withwhich a synergistic effect or partial synergy could bedemonstrated since their MIC levels could be decreased. Thusthey appear to have good potential as potentiators of currentlyused antibiotics. In cases where antagonism was established, itshould not be used in combination with that particularantibiotic.
Key words Polyenzyme formulation, novel antimicrobial, broadspectrum antimicrobial, MIC.
The discovery of antibiotics in the 1940’s is regarded asa major milestone in medical research, one which wasresponsible for controlling morbidity and mortality of severaldiseases. The next few years saw development of differentantibiotics leading to a rapid decline in death rate and increasedlife spans. However, over the years, the indiscriminate use ofantibiotics has led to an increased emergence of multi drugresistant pathogenic strains that do not respond to the usualline of treatment. In their fight for survival, bacteria have
developed their own mechanisms to confront antibiotics andin the process have emerged much more stronger and resilient.Consequently, those infections that were once curable arenow on the verge of becoming incurable. The situation issuch that we are now facing a threat of epidemics of resistantbacteria.
Therefore, it has become imperative to search for newantimicrobials so as to combat this problem and provideeffective treatment. In addition to antibiotics and chemicallysynthesized drugs, the trend to look out for alternativemedicines such as natural or herbal medicines is increasingbecause they may have fewer side effects or toxicity and maybe more acceptable to the body owing to their natural source.Being much more complex as compared with synthetic drugsand antibiotics, bacteria would find it difficult to buildresistance to them.
The following study aims at exploring the possibility ofusing a polyenzyme formulation, Immunoseb, developed byAdvanced Enzyme Technologies Thane / Specialty EnzymesCo. USA, both, as an antibacterial agent or as a potentiator ofexisting antimicrobial agents. These polyenzyme formulationsare blends of purified mixtures of enzymes obtained fromanimal glands, plants, bacteria and fungi.
MATERIALS AND METHODS
Part 1: Screening of polyenzyme formulation forantibacterial activity by a modified agar based antibioticsusceptibility test
To test whether the polyenzyme mixture possessed anyantibacterial properties, a modified antibiotic susceptibilitymethod was used. The method involved inoculation ofstandardized bacterial cultures (matched with 0.5 Macfarlandstandard) on Mueller Hinton agar (MH agar, Qualigens FineChemicals, GlaxoSmithKline, Mumbai) so as to obtain lawncultures after which 10 ml of enzyme formulation (20mg/ml innormal saline) was applied directly as a drop, onto the culturesand incubated appropriately (Miles, et. al., 1938 b). In case ofstreptococci, Blood Agar Base no. 2 (Oxoid) supplementedwith sheep blood was used. Zones of clearing in the lawn ofbacteria indicated antibacterial activity of the enzyme

JOSHI et. al., : In Vitro Evaluation of Antibacterial Activity of A Novel Polyenzyme Preparation Immunoseb 143
formulation. The zones of clearance were graded as per thescheme given in the results section.
Organisms used :
For the study 5 strains of each of the 5 organismsmentioned below were used. Thus, a total of 25 strains wereused for the study. These were as follows: Staphylococcusaureus ATCC 25923 and 4 clinical isolates Pseudomonasaeruginosa ATCC 27853 and 4 clinical isolates, E. coli ATCC25922 and 4 clinical isolates; Streptococcus pneumoniae ATCC49619 and 4 clinical isolates of Streptococcus pyogenes and 5clinical isolates of Salmonella typhi. These are the pathogensthat are most commonly encountered in nature. Moreover,these are also organisms that are routinely used in a primaryscreen for a new antimicrobial (Victor, et. al., 1991).
Part 2: Study of interaction between formulation andcurrently used antibiotic by checker board MIC method:
The checkerboard Minimum Inhibitory Concentration(MIC) method using the Mueller Hinton broth (Qualigens FineChemicals, then GlaxoSmithKline Pharmaceuticals Ltd.,Mumbai) was used to study the combined effect of currentlyused antibiotic with the enzyme formulation against organismsof choice (Victor, 1991) Results were recorded as positive ifgrowth or turbidity/ button formation (where bacteria settleto form a tight pellet):could be seen and negative if no growthor clear medium was seen. MIC is the highest dilution wherethere is no button formation.
Organisms used :
E. coli ATCC 25922, P. aeruginosa ATCC 27853, S. typhi,Staphylococcus (coagulase negative): emerging opportunisticpathogen, Staphylococcus aureus, Streptococcus pyogenes
Interpretation :
l If FIC < 0.5: synergistic effect of 2 drugsl If FIC = 0.5-1: partial synergy or additionl If FIC lies between 0.5-2.0: indifferencel If FIC > 2: antagonistic effect of 2 drugs
Synergy: Synergistic action of a combination ofantibiotics is present if the effect of the combination exceedsthe additive effects of the individual components.
Partial synergy/ addition: The additive effect ofcombination is equal to that of the sum of the effects of theindividual components.
Indifference: An indifferent effect of a combination isone that is equal to the effects of the most active component.
Antagonism: Antagonism is present if a reduced effectof a combination of antibiotics is observed in comparisonwith the effect of the most effective individual substance.(Victor, et. al., 1991, Bharadwaj, 2013).
Part 3: Studies with Streptococcus pyogenes
An agar-based method was used to study the interactionbetween Penicillin and Immunoseb. On the first Blood agarbase no. 2 (Oxoid) plate inoculated with a standardizedsuspension of S. pyogenes, two penicillin disks (potency 10units; HiMedia Laboratories, Mumbai) were placed and a dropof (7 ml) of 20mg/ml solution of Immunoseb was applied ontoone of the two disks. Thus the first served as a control whilecombined effect could be observed on the second disk. On asecond plate inoculated with S. pyogenes, a penicillin diskwas placed along with another disk impregnated with 7 ml of20mg/ml Immunoseb at a distance of 1.5cm from the penicillindisk. Similarly, a disk impregnated with 7 ml of anotherformulation under development was placed at a distance of1.5cm from the penicillin disk Fig. 1. If the zone size of thecombination disk is ³ 2mm larger than the largest zone sizeproduced by either substance alone, synergy has occurred.
MIC of Penicillin along with Immunoseb against S.pyogenes :
Fixed concentration (40 mg/ml) of Immunoseb was addedto serial dilutions of penicillin in glucose broth, and the tubeswere inoculated with a standardized suspension of S pyogenes.After appropriate incubation, all the suspensions werestreaked onto Blood Agar plates ad incubated appropriately.
RESULTS AND DISCUSSION
Part 1: Screening for antibacterial activity of novelpolyenzyme formulation using modified antibioticsensitivity method:
For recording the results, the following scheme was used:Clear zone 3+ < or equal to 5 colonies in the zone 2+ > or equal to 5 colonies in the zone 1+ Lawn culture with no zone 0
Gradation of zones:
Interpretation: 0 and 1+ were considered as negative orresistant to the formulation.
The results obtained were as follows:1. Staphylococcus aureus :
ATCC strain: 3+4 Clinical isolates: 3+
2. Pseudomonas aeruginosaATCC strain: 3+4 Clinical isolates (including 2 MDR strains): 3+ (SeeFigure 1).
3. E. coliATCC strain: 1+3 Clinical isolates: ‘0’, 1 showed 1+ zone

144 Trends in Biosciences 6 (2), 2013
4. Salmonella typhi
3 clinical isolates: ‘0’; 2 showed 1+ gradation
5. Streptococcus pyogenes: all 4 clinical isolates 3+
Streptococcus pneumoniae ATCC 49619: 3+ zones
The polyenzyme preparation, Immunoseb shows broad-spectrum antibacterial properties. The standard and sensitiveATCC strains viz., Staphylococcus aureus ATCC 25923,Pseudomonas aeruginosa ATCC 27853 and Streptococcuspneumoniae ATCC 49619 are clearly sensitive to Immunosebat the test concentration of 20 mg/ml, as was evident from theclear zones obtained. E. coli ATCC 25922 and S. typhi isolateused as a standard sensitive strain produced zones of inhibitionwhich had >5 colonies in the zones. This shows that the twostrains are resistant at 20mg/ml concentration to Immunoseb.
All 4 clinical isolates of S. aureus were found to besensitive to the formulation at the 20mg/ml concentrationproducing distinct and clear zones.
All 4 clinical isolates of P. aeruginosa were found to besensitive to Immunoseb at the 20mg/ml concentration. Twomulti drug resistant strains of P. aeruginosa were found to besensitive to Immunoseb at 20mg/ml concentration. (fig. 1)
All 4 clinical isolates of E. coli and S. typhi producedzones with >5 colonies (1+ gradation) or no zones at allindicating resistance to Immunoseb at the 20 mg/mlconcentration.
Part 2: Checkerboard MIC: With the help of the formula,FIC values were calculated and the interaction betweenantibiotic and polyenzyme formulation was classified as“synergy”, “antagonism” or “partial synergy” (Table 1).
MIC values of the formulation could be obtained for allthe strains studied. Synergistic effect was obtained whenImmunoseb was used in combination with Ampicillin againstE. coli ATCC 25922. Partial synergy was observed whenImmunoseb was used in combination with Ceftazidime againstPseudomonas aeruginosa ATCC 27853. Antagonistic effectwas observed when Immunoseb was used in combinationwith Ceftazidime against Salmonella typhi. Here, the MIC ofCeftazidime was increased although the MIC of polyenzymedecreased. However independently Immunoseb is effectiveagainst Salmonella typhi. Partial synergy was observed whenImmunoseb was used in combination with Ciprofloxacinagainst Salmonella typhi. In this case the MIC of Ciprofloxacinwas lowered but that of Immunoseb remained the same.Independently, Immunoseb has MIC = 1.25mg/ml against thisclinical isolate of Salmonella.
In case of Staphylococcus aureus for the checker boardtitrations, two Staphylococcus strains were used: coagulase–ve strain which is being considered as an emergingopportunistic pathogen and a sensitive Staphylococcusaureus (MSSA) clinical isolate. Both strains showedantagonism with Ciprofloxacin.
Part 3: Studies with Streptococcus pyogenes: Synergycould be established by all methods employed betweenPenicillin and Immunoseb as seen by enhanced zone ofinhibition (Fig. 2) against S. pyogenes. The MIC of penicillindropped from 0.12 mg/ml. to 0.031 mg/ml as seen by growthon the blood agar plates, confirming synergistic effect ofImmunoseb with penicillin against S. pyogenes. A four-folddecrease in MIC value of penicillin was established clearlyindicating synergy.
All 4 clinical isolates of S. pyogenes were found to besensitive against the formulation at the 20 mg/mlconcentration producing distinct zones.
Fig. 1. Action of polyenzyme formulation against two strainsof Pseudomonas aeruginosa.
Table1. Interaction between antibiotics and polyenzyme formulationMIC of antibiotic (g/ml) MIC of enzyme
(mg/ml) Organism Antibiotic
Alone Combination Alone Combination
FIC value
Interpretation
E. coli ATCC 25922 Ampicillin 4 1 20 5 0.5 Synergy P. aeruginosa ATCC 28753 Ceftazidime 4 2 10 5 1.0 Partial synergy S. typhi Ceftazidime 0.5 1.0 2.5 1.25 2.5 Antagonism S. typhi Ciprofloxacin 2 0.5 1.25 1.25 1.25 Partial synergy Staphylococcus (coagulase –ve) Ciprofloxacin 0.25 2 0.62 1.25 10.0 Antagonism Staphylococcus aureus (coagulase +ve)
Ciprofloxacin 0.5 2 0.31 0.15 4.48 Antagonism
Streptococcus pyogenes Penicillin Disc Diffusion Method
Synergy
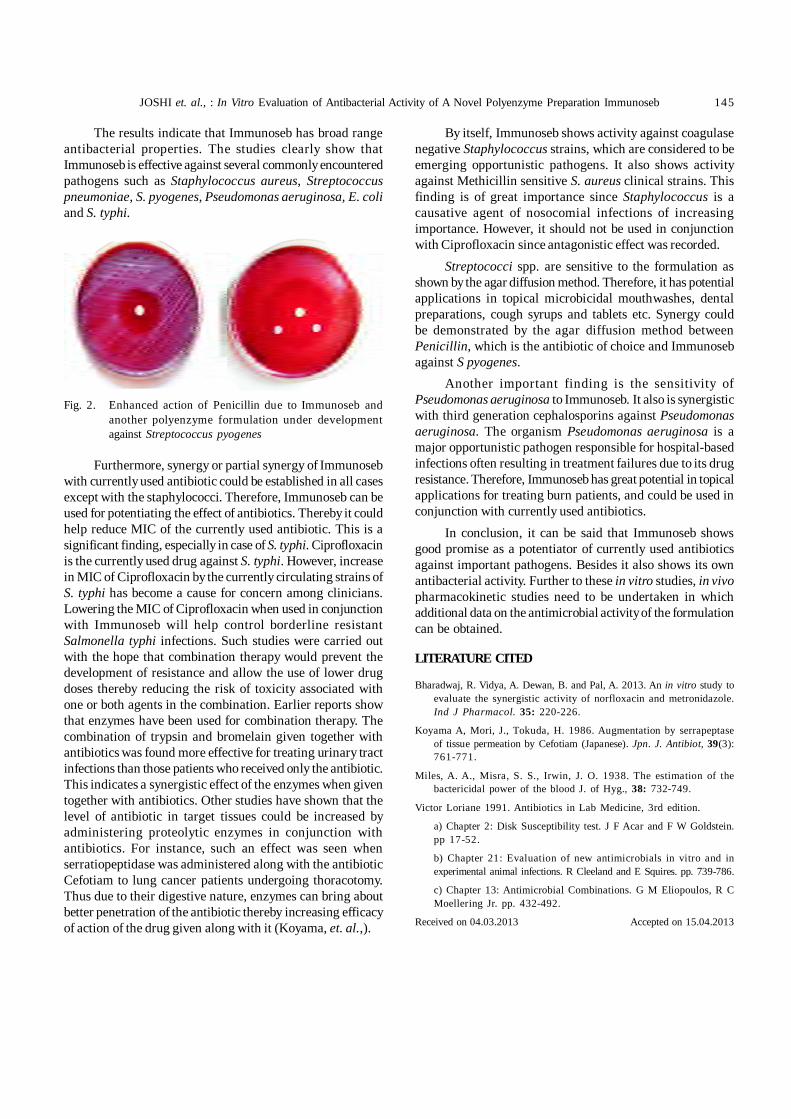
JOSHI et. al., : In Vitro Evaluation of Antibacterial Activity of A Novel Polyenzyme Preparation Immunoseb 145
By itself, Immunoseb shows activity against coagulasenegative Staphylococcus strains, which are considered to beemerging opportunistic pathogens. It also shows activityagainst Methicillin sensitive S. aureus clinical strains. Thisfinding is of great importance since Staphylococcus is acausative agent of nosocomial infections of increasingimportance. However, it should not be used in conjunctionwith Ciprofloxacin since antagonistic effect was recorded.
Streptococci spp. are sensitive to the formulation asshown by the agar diffusion method. Therefore, it has potentialapplications in topical microbicidal mouthwashes, dentalpreparations, cough syrups and tablets etc. Synergy couldbe demonstrated by the agar diffusion method betweenPenicillin, which is the antibiotic of choice and Immunosebagainst S pyogenes.
Another important finding is the sensitivity ofPseudomonas aeruginosa to Immunoseb. It also is synergisticwith third generation cephalosporins against Pseudomonasaeruginosa. The organism Pseudomonas aeruginosa is amajor opportunistic pathogen responsible for hospital-basedinfections often resulting in treatment failures due to its drugresistance. Therefore, Immunoseb has great potential in topicalapplications for treating burn patients, and could be used inconjunction with currently used antibiotics.
In conclusion, it can be said that Immunoseb showsgood promise as a potentiator of currently used antibioticsagainst important pathogens. Besides it also shows its ownantibacterial activity. Further to these in vitro studies, in vivopharmacokinetic studies need to be undertaken in whichadditional data on the antimicrobial activity of the formulationcan be obtained.
LITERATURE CITED
Bharadwaj, R. Vidya, A. Dewan, B. and Pal, A. 2013. An in vitro study toevaluate the synergistic activity of norfloxacin and metronidazole.Ind J Pharmacol. 35: 220-226.
Koyama A, Mori, J., Tokuda, H. 1986. Augmentation by serrapeptaseof tissue permeation by Cefotiam (Japanese). Jpn. J. Antibiot, 39(3):761-771.
Miles, A. A., Misra, S. S., Irwin, J. O. 1938. The estimation of thebactericidal power of the blood J. of Hyg., 38: 732-749.
Victor Loriane 1991. Antibiotics in Lab Medicine, 3rd edition.
a) Chapter 2: Disk Susceptibility test. J F Acar and F W Goldstein.pp 17-52.
b) Chapter 21: Evaluation of new antimicrobials in vitro and inexperimental animal infections. R Cleeland and E Squires. pp. 739-786.
c) Chapter 13: Antimicrobial Combinations. G M Eliopoulos, R CMoellering Jr. pp. 432-492.
Received on 04.03.2013 Accepted on 15.04.2013
The results indicate that Immunoseb has broad rangeantibacterial properties. The studies clearly show thatImmunoseb is effective against several commonly encounteredpathogens such as Staphylococcus aureus, Streptococcuspneumoniae, S. pyogenes, Pseudomonas aeruginosa, E. coliand S. typhi.
Fig. 2. Enhanced action of Penicillin due to Immunoseb andanother polyenzyme formulation under developmentagainst Streptococcus pyogenes
Furthermore, synergy or partial synergy of Immunosebwith currently used antibiotic could be established in all casesexcept with the staphylococci. Therefore, Immunoseb can beused for potentiating the effect of antibiotics. Thereby it couldhelp reduce MIC of the currently used antibiotic. This is asignificant finding, especially in case of S. typhi. Ciprofloxacinis the currently used drug against S. typhi. However, increasein MIC of Ciprofloxacin by the currently circulating strains ofS. typhi has become a cause for concern among clinicians.Lowering the MIC of Ciprofloxacin when used in conjunctionwith Immunoseb will help control borderline resistantSalmonella typhi infections. Such studies were carried outwith the hope that combination therapy would prevent thedevelopment of resistance and allow the use of lower drugdoses thereby reducing the risk of toxicity associated withone or both agents in the combination. Earlier reports showthat enzymes have been used for combination therapy. Thecombination of trypsin and bromelain given together withantibiotics was found more effective for treating urinary tractinfections than those patients who received only the antibiotic.This indicates a synergistic effect of the enzymes when giventogether with antibiotics. Other studies have shown that thelevel of antibiotic in target tissues could be increased byadministering proteolytic enzymes in conjunction withantibiotics. For instance, such an effect was seen whenserratiopeptidase was administered along with the antibioticCefotiam to lung cancer patients undergoing thoracotomy.Thus due to their digestive nature, enzymes can bring aboutbetter penetration of the antibiotic thereby increasing efficacyof action of the drug given along with it (Koyama, et. al.,).
Trends in Biosciences 6 (2): 146-151, 2013
Comparative Analysis of Morphological and Molecular Diversity in Mungbean(Vigna radiata L. Wilczek)G. ROOPA LAVANYA1* AND SHIRISH A. RANADE2
1Department of Genetics and Plant Breeding, Allahabad School of Agriculture, Sam Higginbottom Institute ofAgriculture, Technology and Sciences, Deemed-to-be-University, Allahabad 211 007(e-mail: [email protected])1
2PMB (Genomics), CSIR-National Botanical Research Institute, Rana Pratap Marg, Lucknow 226 001(e-mail: [email protected])2
ABSTRACT
Estimation of genetic diversity in a crop is a prerequisite for itsimprovement. Fifty four accessions of mungbean were comparedthrough RAPD profiles and morphological traits. Field data ofconsecutive years was subjected to multivariate analysis andnon hierarchical Euclidean analysis. The 54 accessions weregrouped into 10 and five clusters on the basis of morphologicaland RAPD data respectively. The clusters, though not congruentto each other, revealed interesting trends for RAPD data andmean performance under the 10 morphological traits. Plantswith above average performance for plant height and numberof seeds per pod clustered together in RAPD analysis and werein general the superior performing accessions. Amongmorphological traits, the maximum Euclidean distance wasbetween clusters IV and VIII, in good agreement with four outof the five RAPD data clusters. Thus by combining the RAPDand Euclidean analyses it would be possible to compile a panelof contrasting parental accessions for a meaningful mungbeanimprovement program.
Key words Distances, Genetic diversity, mungbean, Neighbour-Joining dendrogram, Non-hierarchical Euclidean cluster analysis.
Low productivity of Mungbean crop has been attributedto narrow genetic base (resulting in low yield potential andsusceptibility to biotic and abiotic stresses) as well as to lackof suitable plant types for different cropping conditions(Dikshit, et al., 2009). The genetic reconstruction of plant typeis therefore, required for developing high yielding varieties(incorporating and improving yield component traits) suitablefor cultivating in several different agro-climatic regions of thecountry. The crosses between parents with maximum geneticdivergence are generally the most responsive for such geneticreconstruction and improvement (Arunachalam 1981). Theavailable germplasm serves as the most valuable naturalreservoir for providing the required plant attributes forobtaining the high yielding crop varieties (Hawkes 1981). Inorder to utilize such accessions with maximum required plantattributes, it is necessary to screen and characterize thegermplasm for the nature and extent of genetic diversityincluded in it. Characterization and cataloguing of germplasmhave been traditionally carried out using morpho-agronomictraits while in the last two decades or so the molecular markers
have also been used for germplasm characterization. Themolecular markers, highly heritable and available in largenumbers are often polymorphic enough to enablediscrimination of closely related genotypes. Of the severalmolecular methods possible, using Random AmplifiedPolymorphic DNA (RAPD) profiles (Williams, et al., 1990)offers a rapid and reliable identification and characterizationof genotypes by generating markers for comparative analysisthat are quick, easy to use, free from environmental influences,unlimited in number, random but wide coverage of genomeand have a relatively higher level of polymorphism (Newburyand Ford-Lloyd 1993). Studies have been carried out earlierusing RAPD profiles alone or in combination with ISSR profiles(Bisht, et al., 1998; Santalla et al. 1998; Lakhanpaul, et al.,2000; Afzal, et al., 2004 and Lavanya, et al., 2008) in mungbean.The present study was carried out to assess relationship, ifany, between the molecular and morphological traits in a setof mungbean accessions representing a number of local landraces and varieties released by the different centers with anobjective to select divergent parents for further use inimprovement of mungbean.
MATERIALS AND METHODS
Plant material, Morphological characterization: Fiftyfour mungbean accessions representing diverse agro ecologieswere selected for the present study. The accessions wereobtained from different locations of India and from AsianVegetable Research and Development Centre (AVRDC),Taiwan (Table 1). The morphological data were generated byevaluating the germplasm during kharif seasons over the past5 years at Field Experimentation Centre, Department ofGenetics and Plant Breeding, SHIATS, Allahabad. Theexperiment was laid in randomized complete block design inthree replications of plot size 1x1 m2 with 30cm and 10cm inter-and intra- row spacing, respectively. Ten plants were randomlyselected to record the data on 10 morphological traits viz.,plant height (cm), number of primary branches, number ofclusters per plant, number of pods per cluster, number of podsper plant, number of seeds per pod, pod length (cm), days tomaturity, seed index (g) and seed yield per plant (g). Theobservations on days to 50% flowering and maturity wererecorded on plot basis. The pooled data was subjected to

LAVANYA & RANDADE : Comparative Analysis of Morphological and Molecular Diversity (Vigna radiata L. Wilczek) 147
multivariate analysis as suggested by Mahalanobis, 1936 andaccessions were grouped into different clusters based onEuclidean distances by non- hierarchical cluster analysis(Spark, 1973).
DNA isolation: Young leaf tissue from plants raised inthe field was used for DNA extraction. It was harvested fromthe plants, washed free of dust and then quickly mopped dryon blotting sheets. The leaves were de-ribbed and wrapped intissue paper. The packed leaf tissue was kept in Ziplock bagsalong with fine mesh blue silica gel for rapid dehydration. Thedried leaf tissue was used for extracting the genomic DNAextraction. Genomic DNA was isolated using Plant DNAisolation kit (Bangalore Genei, Bangalore, India). Bauhiniapurpurea L. was randomly selected as the non-Vignaleguminous out-group for all studies to test whether ourreaction conditions were optimized to resolve it as distinctfrom the rest of the mungbean accessions.
RAPD primers, reactions and agarose gelelectrophoresis: The PCR conditions, primers used andagarose gel electrophoresis conditions were as reportedpreviously by Lavanya, et al., 2008.
Scoring and analysis of bands: Clear and well markedbands were coded in a binary form by denoting ‘0’ and ‘1’intended for absence and presence of bands, respectively ineach accession and these data then were used as input forfurther calculations. In order to describe genetic relationshipsamong the mungbean accessions, RAPD band data were usedto estimate genetic distances, based on Jaccard coefficientscomputed using the Free Tree (ver. 0.9.1.50) program (Pavlicek,et al., 1999). Cluster analysis was carried out based on geneticdistances using Neighbour Joining (NJ) program in the FreeTree package. The resulting clusters were represented as adendrogram and viewed and printed in the program Tree View(ver. 1.6.5; Page 2001). The AMOVA and PCoA analysis werecarried out using GenAlEx software (Peakall and Smouse, 2012)by considering the mungbean accessions in five groups asresolved by the NJ dendrogram for the RAPD data.
RESULTS AND DISCUSSION
Cluster formation based on non-hierarchical Euclideananalysis of field data on all traits generated 10 clusters, ClusterV had 11 accessions, followed by cluster I with nine accessionswhile, cluster IV included only one accession i.e., EC-398889.The accessions developed at or released from same or differentlocations were not always grouped into the same cluster. Fourvarieties developed at Regional Agricultural Research Station,Lam, Guntur, Andhra Pradesh was grouped into cluster VIIIand one variety (LGG 478) in cluster X. Similarly, three varietiesnamely PDM 84-139, PDM 11 and PDM 1 from IIPR, Kanpurdistributed in cluster V but the other two varieties, also fromsame source, PDM 84-143 and PDM 89-226 were included incluster VII and IX, respectively. Interestingly clusters III, IXand X comprised varieties developed at different locations
Table 1. Mungbean accessions used for Euclidean andRAPD analysis
Sample No. Name of the accession Source MB1 PDM 84-139 IIPR, Kanpur MB2 Narendra Mung 1 NDUAT, Faizabad MB3 LGG 478 RARS, Guntur, AP. MB4 EC 30400 AVRDC, Taiwan MB5 MSO 9 AVRDC, Taiwan MB6 LGG 499 RARS, Guntur, AP. MB7 IPRM 90 IIPR, Kanpur MB8 T1 IIPR, Kanpur MB9 Pusa Bold 2 IARI, New Delhi MB10 LM 497 PAU, Ludhiana MB11 OUM 11-5 OUAT, Bhubaneswar MB12 PDM 84-143 IIPR, Kanpur MB13 HUM 1 BHU, Varanasi MB14 V 557 AVRDC, Taiwan MB15 LLR 1 Local Land Race 1 MB16 ML 287 PAU, Ludhiana MB17 V 4512 AVRDC, Taiwan MB18 AKM 9601 PKV, Akola MB19 Lam M2 RARS, Guntur, AP. MB20 ML 583 PAU, Ludhiana MB21 LGG 491 RARS, Guntur, AP. MB22 MH 309 PAU, Ludhiana MB23 LGG 477 RARS, Guntur, AP. MB24 PDM89-226 IIPR, Kanpur MB25 K851 IIPR, Kanpur MB26 LM 1119 PAU, Ludhiana MB27 PS 10 IARI, New Delhi MB28 ML 406 PAU, Ludhiana MB29 K 2192 Kanpur Local germplasm MB30 PUSA 9332 IARI, New Delhi MB31 MUM 1-1 CCSMU, Meerut MB32 K 1284 Kanpur Local germplasm MB33 EC 398889 AVRDC, Taiwan MB34 NARP 280 PAU, Ludhiana MB35 DMG 1103 Kanpur Local germplasm MB36 TARM 1 BARC, Mumbai/ PKV, Akola MB37 WGG 37 RARS, Warangal, AP. MB38 SUJATA OUAT, Bhubaneshwar MB39 PIMS-11/99 PAU, Ludhiana MB40 EC 393407 AVRDC, Taiwan MB41 PDM 11 IIPR, Kanpur MB42 DMG 1098-1 Kanpur Local germplasm MB43 MARP 280 PAU, Ludhiana MB44 AKM 8802 PKV, Akola MB45 TARM 2 BARC, Mumbai/ PKV, Akola MB46 EC 398888 AVRDC, Taiwan MB47 ML 131 PAU, Ludhiana MB48 PM 9001 Kanpur Local germplasm MB49 OBGG 11 OUAT, Bhubaneshwar MB50 LM 23 PAU, Ludhiana MB51 MGG 47 RARS, Madhira MB52 OBGG 40 OUAT, Bhubaneshwar MB53 PDM 1 IIPR, Kanpur MB54 OBGG 52 OUAT, Bhubaneshwar OUT Bauhinia purpurea L. NBRI, Lucknow

148 Trends in Biosciences 6 (2), 2013
clusters IV and VII (104.04) followed by clusters I and IV(91.413) and clusters II and IV (91.394). Clusters with maximuminter cluster distance were found to be highly divergentgroups. Recombination among accessions of diverse clustersis necessary to obtain desirable plant types. Hence intercluster distance must be taken into consideration whileselecting the parents for hybridization program.
Fig. 1. NJ tree for the RAPD band data in case of themungbean accessions and outgroup DNA (indicated bythe underscored label OUT) and its separation from themungbean accessions is indicated by a thick line. TheOTU labels are to the right of the branches and are asgiven in Table 1. The branch lengths are based on thedistances between the accession pairs. The distributionof the accessions into different clusters is indicated byoval labels on the corresponding branches of thedendrogram.
Table 2. Intra-cluster (diagonal shaded cells) and inter-cluster average distances (D2) for 10 traits in mungbean with thehighest values of distances indicated in bold
aThe cluster IV had just a single accession and hence no Intra-cluster distance could be computed.
Cluster No. I II III IVa V VI VII VIII IX X I 2.880 11.820 4.486 91.413 8.556 7.801 24.780 28.558 10.916 29.149 II 2.554 7.290 91.394 8.744 4.844 15.682 15.809 6.760 8.375 III 2.329 85.933 5.058 6.497 10.530 14.478 9.157 15.856 IVa 0.000a 73.943 86.583 104.04 70.560 87.984 83.466 V 2.088 3.968 15.666 9.647 9.616 13.126 VI 3.320 20.857 15.194 11.069 16.443 VII 3.010 15.531 12.397 12.278 VIII 5.988 21.988 11.089 IX 3.280 12.103 X 2.772
(Table 2). Cluster VIII exhibited maximum intra-cluster distance(D2) and the accessions of this cluster were diverse (Table 2).Inter-cluster distance (D2) was found maximum between
NJ dendrogram cluster number Character (Mean value) I IIA IIB IIC IID
Plant height (47.65 cm) 58.87 40.5 42.56 49.27 58.16 No. of primary branches (3.66) 3.79 3.33 3.56 3.58 3.95 No. of clusters / plant (15.41) 15.73 14.83 4.48 13.75 17.67 No. of pods / cluster (3.29) 3.67 3.11 3.37 3.19 3.25 No. of pods / plant (40.57) 45.91 36.83 40.19 34.38 48.47 No. of seeds / pod (9.65) 10.12 7.78 9.85 9.24 9.58 Pod length (6.57 cm) 7.22 5.82 6.50 6.85 7.27 Days to maturity (77.39) 77.61 73.00 75.33 77.31 78.26 Seed index (3.82 g) 3.92 3.13 3.95 3.42 3.81 Seed yield / plant (11.04 g) 13.96 9.47 9.82 10.96 12.90
Table 3. Mean performance for 10 characters of mungbeanaccessions included in five clusters as in NJdendrogram (Figure 1) by RAPD analysis
High (>20%) genotypic coefficient of variation (GCV)and phenotypic coefficient of variation (PCV) were recordedfor plant height, number of clusters plant-1, number of podscluster-1, number of pods plant-l, seed index and seed yieldplant-1. High genotypic and phenotypic coefficient of variationfor seed yield plant-l, number of branches plant-l and numberof pods plant-1 were also reported earlier by Reddy 1997 andLoganathan et al., 2001 while for 100-seed weight by Samadand Lavanya 2005 reported a high genotypic and phenotypiccoefficient. A scrutiny of Table 5 revealed that all charactersrecorded moderate (30-60%) to high (above 60%) heritabilityexcept number of primary branches. Burton 1952 has suggestedthat genetic variation along with the heritability estimateswould give a better idea about the expected efficiency ofselection. Thus, a character possessing high GCV along withthe high heritability will be valuable in a selection program.Seed yield plant-1 and number of pods plant-1 recorded highestimates of GCV coupled with high heritability in the present

LAVANYA & RANDADE : Comparative Analysis of Morphological and Molecular Diversity (Vigna radiata L. Wilczek) 149
study. Maximum genetic advance was recorded for plant heightfollowed by number of pods plant-1. However, high (30%)estimates of genetic gain were registered for plant height,number of clusters plant-1, number of pods cluster-1, numberof pods plant-1, pod length and seed yield plant-1. Low geneticadvance as per cent of mean was observed for days to maturity,indicating the involvement of non additive gene action incontrolling this trait and heterosis breeding may be useful forfurther generation of variability for this character. Heritabilityestimates along with genetic advance are more useful thanheritability alone in predicting the effectiveness of selection.Further, the heritability estimates coupled with genetic gain,indicate the mode of gene action in choosing an appropriatebreeding methodology. High genetic advance as per cent ofmean coupled with high heritability recorded for plant height,seed yield plant-1 and number of pods plant-1. This situationindicates that the genetic variances for these traits areprobably owing to their high additive gene effects (Johnson,et. al., 1955) and thus there is better scope for improvement ofthese traits through direct selection.
Significant morphological variation was present amongthe accessions for all traits studied. Fifty four accessions weredistributed into 10 clusters and distribution of accessionsinto different clusters, suggested the presence of substantialgenetic divergence among the germplasm lines screened inthe present investigation and further, indicated that thismaterial may serve as good source for selecting the diverseparents for hybridization program, aimed at isolating desirablerecombinants for seed yield as well as other traits (Naidu andSatyanarayana, 1991 and Manivannan, et. al., 1998). Choiceof parents plays a vital role in hybridization program. Bestperforming accessions from distant clusters like IV, VII, I andII in the present study should be selected for further breedingprogram. Progenies of genetically diverse parents are likely toproduce a broad spectrum of variability in segregatinggenerations which will facilitate the isolation of transgressivesegregants in a hybridization program.
The perusal of clustering pattern of the accessionsclearly revealed the lack of relationship between geographicdistribution and genetic diversity as the distribution ofaccessions into various clusters was fairly random (Reddy,1997 and Loganathan, et. al., 2001). The grouping ofaccessions originating from different eco-geographical regionsinto one cluster could be attributed to frequent exchange ofbreeding material and due to operation of similar forces ofnatural and artificial selection resulting in perpetuation,adaptation and stabilization of similar accessions (Murty andArunachalam, 1966). In case of mungbean, Singh, et al., 2010have estimated genetic variability in over 200 hundred varietiesby Euclidean hierarchical analysis and have reported a widediversity among the germplasm that resulted in grouping ofall the accessions into eight clusters. However, they havealso observed that genetic diversity and geographical originof the accessions were not congruent.
In the present study, data from seven primers (174 bandswith an average of 24.84 bands per primer) were used for thecomputation of NJ dendrogram and for AMOVA and PCAanalysis as described. In the pairwise distances measure forcomputation of the NJ dendrogram, the lowest distance was0.524 between the accessions, LLR 1 and ML 287 while theaccessions WGG 37 and PDM 1 and WGG 37 and OBGG 52exhibited the greatest distance 1.0 from each other (data notshown). The NJ dendrogram (Fig. 1) distributed all 54mungbean accessions into two broad clusters, I (with 11accessions) and II (with remaining 43 accessions). The lattercluster was further composed of four subclusters (II A withsix, II B with nine, II C with 15 and II D with 13 accessions), asshown in Figure 1. The out group genotype, B. purpurea wasclearly distinguished from all mungbean accessions andseparated from them in the NJ dendrogram. The AMOVA andPCoA are analyses are shown in Figure 3.
The accessions were arranged in order of theiroccurrence in the NJ dendrogram clusters and theirperformances for 10 characters were recorded. Cluster I plantswere found to be above average for all 10 characters; ClusterIIA plants were distinctly below average for all 10 characters;Cluster IIB plants were above average pods/ cluster, seeds/pod and seed index. Cluster IIC and IID plants were mostly
Fig. 2. The Principal Coordinates (PCoA) plot for all the 54mungbean accessions considered as five groups as in NJdendrogram (Fig. 1) are indicated by colour codedsymbols as shown in the figure. The numbers by eachsymbol correspond to the sample numbers as inTable 1.
150 Trends in Biosciences 6 (2), 2013
medium performers but distinguished from each other in thatcluster IIC plants show greater plant height, fewer days tomaturity and higher seed yield per plant than the plants ofcluster IID (Table 3). Plants of cluster I in general show superiorperformance in most of the traits examined except days tomaturity where more than half the plants have below averageperformance. Such a distribution of plants based on agronomicperformance and supported by RAPD proûle analyses are avery good starting point for further breeding eûorts involvingcontrasting parental lines. Since the plants of the cluster I arein general, superior performing varieties, it is these varietiesthat should be used not only for commercialization but alsoas, the starting material for further improvement by breeders.
Random Amplified Polymorphic DNA, a method widelyused to study genetic polymorphism revealed a wide anddiverse genetic base of the germplasm accessions analyzed.Earlier, low to moderate polymorphism was observed whileanalyzing 32 Indian mungbean cultivars using 21 RAPDprimers where genetic didstances ranged from 0.06 – 0.30(Lakhanpaul, et al., 2000). However, as has been stated earlier,the present study with a larger number of accessionsrepresenting more geographical regions is more efficient inresolving the extent of genetic diversity amongst theseaccessions. The different accessions may have commonpedigrees (whole or partial) and may have been subjected tosame selection during their breeding but are stilldistinguishable from each other on the basis of their RAPDprofiles. On the basis of distances and cluster analysis,accessions WGG 37, PDM 1and OBGG 52 were found to bequite distinct and these can be used for their desirablecharacteristics in breeding programs for mungbeanimprovement. The genetic similarities obtained from theanalysis can also be used for the selection of the parents togenerate mapping populations and for selecting parents forbreeding purposes.
Clustering of cultivars into five clusters showedreasonable variability that may be exploited for yieldimprovement (Afzal, et al., 2004). The tree obtained by the NJclustering method did not show any significant correlationbetween the genetic divergence and geographical distribution.In contrast, the varieties developed from differentgeographical regions grouped into same cluster. For examplecluster II B included PS 10, TARM 1, K 1284 and ML 406 andII D included K 851, ML 583, AKM 9601, LGG 491. Suchclustering of cultivars of different locations ignored theinfluence of geographic variations within the genetic diversityof mungbean. Such a lack of correlation between geographicdiversity and genetic diversity in mungbean has also beenreported by earlier workers (Bisht, et al., 1998 andManivannan, et al., 1998). The overall levels of geneticdiversity in mungbean in the present study is also supported
AMOVA analysis where within group variations wereapproximately five-fold more than those between groups.These results suggest that the individuals in each populationare likely to be as different from each other as from any othermungbean accession selected at random. Similarly in case ofthe PCA analysis (Figure 2), the different groups of accessionsare not well resolved from each other, indicating overlap ofgenetic relatedness among individual accessions of thedifferent groups. Thus the accessions appear to be discretegenotypes with very little or no common parents andpedigrees. Despite this, the accessions are grouped togetherfor common traits (morphological as well as RAPD profiles)which will allow efficient screening of these genotypes forthe presence of common alleles for use in molecular breedingprogram. RAPD markers have been used for the identificationof cultivars and determination of the genetic relationshipsamong cultivars of other leguminous crops includingPhaseolus vulgaris (Skroch, et al., 1992), cowpea (Mignouna,et al., 1998) and Vigna angularis (Yee, et al., 1999). The presentstudy has also shown the usefulness of the method to notonly assess the range of genetic diversity in the germplasm.The present study showed that the clustering pattern ofaccessions is different when analyzed through non hierarchicalEuclidean cluster analysis based on morphological traits andmolecular marker (RAPD) analysis. The 54 accessions weregrouped into 10 clusters based on Euclidean cluster analysisand five clusters on RAPD analysis. The environment mighthave influenced the expression of morphological traits to someextent, resulted in formation of more number of clusters. Highestimates of genotypic coefficient of variation and heritabilityand genetic advance as per cent of mean indicate thepredominance of additive gene action in controlling thesecharacters and simple directional selection may be effectiveto improve these characters. The accessions MB 37, MB 42and MB 45 grouped in IIC cluster and MB 51, MB 52 andMB54 grouped into cluster IIA together were included incluster I based Euclidean cluster analysis. Similarly clusterIID included MB 14, MB 19, MB 21 and MB 23 were groupedinto cluster VIII based on cluster Euclidean cluster analysis.Further, the accessions included in cluster III (MB29 andMB 36) and cluster V (MB 27 and MB 28) were grouped intoIIB based on RAPD analysis. These results suggested thatEuclidean cluster analysis largely corresponded to molecularanalysis. Diverse accessions observed in the present studycould be a good alternative for successful mungbean breedingprogram.
ACKNOWLEDGEMENT
Authors are grateful to the Director Research, SamHigginbottom Institute of Agriculture, Sciences andTechnology, Allahabad and Director, CSIR-National BotanicalResearch Institute, Lucknow for facilitating the present study.

LAVANYA & RANDADE : Comparative Analysis of Morphological and Molecular Diversity (Vigna radiata L. Wilczek) 151
LITERACTURE CITED
Afzal, M. A., Haque, M. M. and Shanmugasundaram, S. 2004. RandomAmplified Polymorphic DNA (RAPD) analysis of selected mungbean(Vigna radiata L. Wilczek) cultivars. Asian J. Plant Sci., 3: 20-24.
Arunachalam, V. 1981. Genetic distance in plant breeding. Indian J.Genet., 14: 226-236.
Bisht, I. S., Mahajan, R. K and Kawalkar, T. G. 1998. Diversity inmungbean (Vigna radiata L. Wilczek) germplasm collection and itspotential use in crop improvement. Annals of Applied Biol., 132:301-312.
Burton, G.W. 1952. Quantitative inheritance of grasses. Proc. of 6 th
Intl. Grassland Cong. 1: 277-283.
Dikshit, H. K., Sharma, T. R., Singh, B. B. and Kumari J. 2009. Molecularand morphological characterization of fixed lines from diversecross in mungbean (Vigna radiata (L.) Wilczek). J. Genet., 88:341–344.
Hawkes, J. G. 1981. Germplasm collection, preservation and use. In:Plant Breeding (11th ed., K.J. Frey) Iowa State University press,Iowa. pp: 57-84.
Johnson, H. W., Robinson, H. F. and Comstock, R. E. 1955. Genotypicand phenotypic correlations in soybean and their implications inselection. Agron. J., 47: 477-483.
Lakhanpaul, S., Chadha, S., Bhat, K. V. and Chadha, S. 2000. Randomamplified polymorphic DNA analysis in Indian mungbean (Vignaradiata L. Wilczek) cultivars. Genetica, 109: 227-234.
Lavanya, G. R., Srivastava, J. and Ranade, S. A. 2008. Molecularassessment of genetic diversity in Mungbean germplasm. J. Genet.,87: 65-74.
Loganathan, P., Saravanan, K. and Ganesan, J. 2001. Genetic divergencein greengram. Res. on Crops, 2: 386-389.
Mahalanobis, P. C. 1936. On the generalized distance in statistics.Proc. of Natl. Inst. of Sci., India pp: 12-49.
Manivannan, N., Murugan, E., Viswanathan, P. L. and Dhanakodi, C. V.1998. Genetic divergence in greengram. Legume Res., 21: 131-133.
Mignouna, H. D., Ng, N. Q., Ikea, J. and Thotapilly, G. 1998. Geneticdiversity in cowpea as revealed by random amplified polymorphicDNA. J. Genet. and Breed., 53: 151-159.
Murthy, B. R. and Arunachalam, A.V. 1966. The nature of geneticdivergence in relation to breeding system in crop plants. Indian J.Genet., 26: 188-198.
Naidu, N. V. and Satyanarayana, A. 1991. Studies on genetic divergenceover environments in mungbean. Indian J. of Genet., 51: 454-460.
Newbury, H. J. and Ford-Llyod, B. V. 1993. The use of RAPD forassessing variation in plants. Plant Growth Regulation 12: 43-51.
Pavlicek, A., Hrda, S. and Flegr, J. 1999. Free Tree – Freeware programfor construction of phylogenetic trees on the basis of distance dataand bootstrapping / jackknife analysis of the tree robustness.Application in the RAPD analysis of the genus Frenkelia. FoliaBiologica 45: 97-99.
Peakall, R. and Smouse, P. E. 2012. GenAlEx 6.5: genetic analysis inExcel. Population genetic software for teaching and research - anupdate. Bioinformatics, 28: 2537–2539.
Reddy, K. P. H. 1997. Genetic divergence in greengram (Vigna radiataL. Wilczek). Annals of Agric. Res., 18: 493-497.
Samad S. S. and Lavanya G. R. 2005. Variability studies for yieldparameters in mungbean (Vigna radiata L. Wilczek). J. MaharastraAgric. Univ. 30: 168-170.
Santalla, M., Power, J. B. and Davey, M. R. 1998. Genetic diversity inmungbean germplasm revealed by RAPD markers. Plant Bred.,117: 473-478.
Singh, R., Ali, H. and Pathak, V. 2010. Non-Hierarchical EuclideanCluster Analysis in Mungbean. Trends in Biosciences, 3: 135-136.
Skroch, P. W., dos Santos, J. B. and Nienhuis, J. 1992. Geneticrelationships among Phaseolus vulgaris genotypes based on RAPDmarker data. Annu. Rep. Bean Improv. Coop., 35: 23- 24.
Spark, D. N. 1973. Euclidean cluster analysis algorithm. Appl. Statistics,22: 126-130.
Williams, J. G. K., Kubelik, A. R., Livak, K. J., Rafalski, J. A. andTingey, S. V. 1990. DNA polymorphisms amplified by arbitraryprimers are useful as genetic markers. Nucl. Acids Res., 18: 6231-6235.
Yee, E., Kidwell, K. K., Sills, G. R. and Lumpkin, T. A. 1999. Diversityamong selected Vigna angularis (Azuki) accessions on the basis ofRAPD and AFLP markers. Crop Sci., 39: 268- 275.
Received on 18.01.2013 Accepted on 15.03.2013

Trends in Biosciences 6 (2): 152-153, 2013
Efficient Protocol for In Vitro Regeneration in Pigeonpea (Cajanus cajan (L.) Millsp.)TUSHITA GARGI, S. ACHARYA, J.B. PATEL AND VANDANA THAKKAR
Centre of Excellence for Research on Pulses, S. D. Agricultural University, Sardarkrushinagar,385 506 (Gujarat)e-mail: [email protected]
ABSTRACT
The present study precisely emphasized on the establishmentof a reproducible regeneration protocol through differentexplants in pigeonpea [Cajanus cajan (L.) Millsp.] usingdifferent explants like primary leaf, epicotyls, cotyledonarynode and embryonic axis in variety ‘GT 100’. In vitro raisedfourteen days old seedlings grown aseptically on Murashigeand Skoog’s medium were most efficient in producing multipleadventitious shoot from cotyledonary node explants and shootbud originated from the petiolar cut end of explants. Efficientregeneration in pigeonpea from callus was obtained using MSmedium supplemented with growth regulator viz; 5 ìMGibberellins for shoot elongation, precise combination of BAP(22 ìM) and kinetin (10 ìM) for formation of shoot buds and10ìM NAA for root initiation under precise conditions.
Key words Callus induction, Cajanus cajan, BAP–6-benzylaminopurine, Murashige and Skoog’s medium, Kin – kinetin.
Pigeonpea is an important grain legume that dominatesthe vegetarian diet particularly in semi-arid tropics due to richsource of protein and minerals (Nene and Sheila, 1990). Theproductivity of pigeonpea has been static for the last fourdecades mainly due to narrow genetic base. The gene miningthrough conventional methods is rather difficult due tocrossing barriers among different species. The availability ofa genetic transformation system could precisely facilitate thetransfer of genes across crossing barriers affecting bothquantitative and qualitative production efficiency inpigeonpea (Lawrence and Koundal, 2001, Singh, et. al., 2003).The regeneration protocols are prerequisite for genetictransformation and have been vividly reported in pigeonpea(Naidu, et al., 1995; Geetha, et al., 1998; Mohan andKrishnamurthy, 1998, Venkatachalam, et al., 1999, and GuruPrasad, et. al., 2011). The present study precisely emphasizedon the establishment of a reproducible regeneration protocolthrough different explants in pigeonpea.
MATERIALS AND METHODS
The present study was carried out at the Centre ofExcellence for Research on Pulses, SardarkrushinagarDantiwada Agricultural University, Sardarkrushinagar, Gujarat,India using genetically pure seed of a variety havingdeterminate growth habit viz., GT 100 of pigeonpea.
Culture medium and conditions
Seeds were soaked in tap running water for 15 minutes,rinsed in 70% alcohol for 10 minutes and surface sterilizedwith 0.1% aqueous mercuric chloride solution for 15 minutesfollowed by further rinsing five times with sterile distilled water.Five surface sterilized seeds were germinated in conical flask(100ml) containing 40 ml of MS basal medium containing 3 %sugar under16h photoperiod condition under asepticcondition after removing its seed coat. Fourteen days oldseedlings were used as a source of auxiliary leaf, shoot tip,cotyledonary node and hypocotyls explants. Transversesections of each types of explants measuring approximately2mm in length were cultured in culture tubes (25X150 mm)containing 20 ml culture medium. The explants were culturedon MS medium containing 3% sucrose, 0.8% extra pure agarpowder and 0.044% calcium chloride supplemented with6-benzylaminopurine (5, 10, 15, 20 and 22 ìM).
For shoot initiation twenty days old callus weretransferred in culture tubes (25X150 mm) containing 20 ml MSmedium containing 3% sucrose, 0.8% extra pure agar powderand 0.044% calcium chloride supplemented with differentcombinations of concentrations of growth regulators viz;6-benzylaminopurine (5, 10, 15, 20 and 22 ìM) in combinationwith Kinetin (2, 5, 7, 10 and 15 ìM) and Gibberellins (1, 2, 3, 4and 5 ìM).
Thirty days old multiple shoots were transferred inrooting medium containing MS medium with 3% sucrose, 0.8%extra pure agar powder and 0.044% calcium chloridesupplemented with different concentrations of Naphthaleneacetic acid (2, 4, 6, 8 and 10ìM). The uniform incubationconditions were kept as 260 C under 16h photoperiod for allcultures. The plantlets with inducted roots were transferredto greenhouse for hardening.
RESULTS AND DISCUSSION
The experiment evinced callus initiation from the cutends of the cotyledonary node, hypocotyls and shoot tipwithin 10-15 days of incubation, while no callusing wasobserved on control media. Among the various auxins andcytokinins studied BAP (22 ìM) and Kinetin (10 ìM) wasobserved to be highly potent for callus induction whilecotyledonary node was most efficient among the explantsthat produced multiple adventitious shoot. Further the shoot

GARGI et al., Efficient Protocol for In Vitro Regeneration in Pigeonpea (Cajanus cajan (L.) Millsp.) 153
bud originated from the petiolar cut end of explants. Amongthe different concentrations of Gibberellins (1, 2, 3, 4 and 5ìM) used for shoot elongation, 5 ìM was observed most potentfor multiple shoot elongation. For root induction from multipleshoot plantlets, 10ìM of the different concentrations of NAA(2, 4, 6, 8 and 10 ìM) was found to be the best.
The nodular calli obtained from distal cotyledonarysegments on MS basal medium supplemented with BAP (22ìM) and 10 ìM kinetin were separated from the explants andtransferred to MS medium supplemented with differentconcentrations of BAP (5, 10, 15, 20 and 22 ìM) and Kinetin (2,5, 7, 10 and 15 ìM) to evaluate the differentiation of the callusinto shoots/shoot buds. All the cultures were incubated at260 C under 16h photoperiod for 4 weeks. The calli weretransferred to freshly prepared medium 4 times at an intervalof 4 weeks each. Though shoot bud initiation was observedin all concentration combinations, yet the formation of shootbuds were obtained in media with precise combination of BAP(22 ìM) and kinetin (10 ìM). The cotyledonary segments swelland turn green after 4 weeks in culture, producing small, green,dome-like structures (Fig. a) all over the surface of thecotyledonary segment. After 5 weeks of culture thesestructures developed into shoot buds (Fig. b, c, d, e and f).
The shoot buds obtained from cotyledonary segmentson MS basal medium supplemented with BAP (22 ìM), kinetin(10 ìM) along with explants were transferred as a mass to testtubes containing various media combinations for shootelongation. The elongation of shoot buds had been achievedwhen MS basal medium was supplemented with GA3 (5 ìM)(Fig. g and h).
Among the different concentrations of NAA (2, 4, 6, 8and 10ìM) used for root initiation, 10 ìM NAA revealed thehighest rooting. Thus, at regeneration in pigeonpea fromcallus can be had by using MS medium supplemented withgrowth regulator viz; 5 ìM Gibberellins for multiple shootelongation, precise combination of BAP (22 ìM) and kinetin(10 ìM) for formation of shoot buds and 10 ìM NAA for rootinitiation under precise conditions.
LITERATURE CITED
Geetha, N. Venkatachalam, P. Prakash, V. and Lakshmisita, G. 1998.High frequency induction of multiple shoots and plant regenerationfrom seedling explants of pigeonpea (Cajanus cajan L.) CurrentScience, 17:1036–1041.
Guru Prasad, M. Prasad, T.N.V.K.V. and Sudhakar, P. 2011. In vitroproliferation of shoot regeneration from embryo of Cajanus cajanL (var.LGG-29). Journal of Developmental Biology and TissueEngineering, 3(5): 62-65.
Lawrence, P.K. and Koundal, K.R. 2001. Agrobacteriumtumefaciansmediated transformation of pigeonpea (Cajanus cajan(L.) Millsp,) and molecular analysis of regenerated plants CurrentScience 80: 1428-1432.
Mohan, M.L. and Krishnamurthy, K.V. 1998. Plant regeneration inpigeonpea [Cajanus cajan (L.) Millsp.] by organogenesis. PlantCell Report, 17:705–710
Naidu, R.B., Kulkarni, D.D. and Krishnamurthy, K.V. 1995.Genotypedependent morphogenetic potentiality of various explantsof a food legume, the pigeonpea (Cajanus cajan L.). In Vitro Cellular& Developmental Biology. Plant 31: 26–30.
Nene, Y.L. and Sheila, V.K. 1990. Pigeonpea: geography and importance.In: The pigeonpea eds. Nene Y.L, Hall S.D., Sheila, V.K. CAB,Wallingford, UK, pp. 1–14.
Singh, N.D., Sahoo, L. Sonia and Jaiwal, P.K. 2003. In vitro shootorganogenesis and plant regeneration from cotledonary node andleaf explants of pigeonpea (Cajanus cajan (L.) Millsp.), MolecularBreeding, 11: 159-168.
Venkatachalam, P. Geetha, N. Khandelwal, A. Shaila, M.S. and LakshmiSita, G. 1999. Induction of direct somatic embryogenesis and plantregeneration from mature cotyledon explants of Arachis hypogaeaL. Current Science, 77: 269-273.
Received on 25.02.2013 Accepted on 15.03.2013
Fig. 1: Callus initiation (a), shoot initiation (b), shootelongation (c & d) and multiple shoots development(e, f, g & h) from callus obtained from cotyledonarynode explants in (Cajanus cajan (L.) Millsp.)

Trends in Biosciences 6 (2): 154-157, 2013
Study on Two Edible Spiders of the Genus: Nephila (Fam. Nephilidae) of Manipur,India1A.KANANBALA, 2M. BHUBANESHWARI AND MANJU SILIWAL1,2
Entomology Research Laboratory, P.G. Department of Zoology,D.M. College of science Imphal 795 001Wildlife Information Liaison Development Society, 9-A, Lal Bahadar Colony, Peelamedu,Coimbatore 641 004, Tamil Nadu, Indiae-mail: [email protected]
ABSTRACT
This paper deals with an account of two edible spiders belongingto the genus Nephila (Family: Nephilidae Simon, 1894) fromManipur , India. The two species are N. pilipes Fabricus 1793and N. clavata L. Koch 1878. These two species are reported forthe first time from Manipur.
Key words Nephila pilipes, Nephila clavata Manipur, edible spider
The family Nephilidae Simon, 1894 includes long-leggedorb weave spiders. These orb-weavers occupy a variety ofhabitats and are important predators of large arthropod preyin most tropical and subtropical ecosystem worldwide(Sebastian and Peter, 2009). N. maculata (Fab.) were found tobe one of the most effective bioagents to control the insectpest of vegetable crops of Eastern Himalayas (Satpathi, 2004).They are easily identified by their long legs and colourful.Females are larger than males. The genus Nephila Leach 1815are commonly known as Banana spider, containing 27 differentspecies.Several species of banana spider are eaten in NewGuinea after roasting over open fire. In Austria and Caledonia,N. edulis is also eaten. A total of 6 species of this genusNephila are reported from India so far.
In Manipur two species of Nephila, N. clavata and N.pilipes are commonly found in the forest of hill and nearbyadjoining valley areas. The local people after collectingbuckets ful, smoked and sometimes dried in the pan in openfire and a popular dish was made.
The present paper contains the description of two ediblespider species, N. clavata , N. pilipes found in the differenthill districts as well as small hillock area of valley district ofManipur.
MATERIALS AND METHODS
Altogether 5@&N. pilipes and 5@& and 1 B& of N.clavata were collected from different districts of Manipur andstudied in the Entomology Research Laboratory of ZoologyDepartment; D.M. College of Science, Imphal. The collectedspecimens are kept in 70% alcohol, photographed anddeposited in the Entomology Research Laboratory Museumof Department of Zoology, D. M. College of Science.Morphometry of the spider was taken with vernier caliper andocular meter. All measurements are in millimeter.
RESULTS AND DISCUSSION
Nephila pilipes Fabricius. 1793 [Fig. 1 and 2]Aranea pilipes Fabricius, 1793, Ent.sys., 2:407-428Description of female from Ukhrul District.Total length- 27.47, Cephalothorax- 8.80 long, 7.02 wide,
Abdomen- 18.67 long, 8.41 wide.Colour in alcohol : Carapace grayish-black, cheliceral-
dark brown, labium brown with yellowish distal margin, maxilladark brown with yellowish margin. Sternum dark brown, legsdark brown, palp dark , ventral femur to patella light yellow,tibia and tarsus black. Abdomen- Dorsum yellowish in themiddle with lateral brownish colour and ventrum with yellowand dark brown spots.
Cephalothorax : Greyish black, longer than wide, slightlynarrower in front, cephalic region higher than thoracic regionand provided with a pair of sharp tubercles posteriorly.Thoracic region flat with a deep circular fovea. Clypeus 0.55long.
Eyes : Eight eyes in two rows, both rows recurved. Ocularregion 3.68 long, 0.91 wide, median eyes equal in size, lateraleyes small and subequal in size, close and situated onprominient tubercles. Maxillae :2.88 long, 1.71 wide. Elongated,broader distally, dark brown with yellowish outer margins,provided with distinct scopulae. Labium : 1.72 wide, 1.37 long,deep brown with yellowish distal margin. Chelicera :5.28 long,strong, stout darkbrown with 4 retromarginal and 3 promarginalteeth respectively.
Legs : Legs very long, strong, clothed with hairs andspines; coxae of legs and proximal half of palpus yellowish incolour ventrally. All legs are with 2 claws. Pedipalp providedwith trichobothria on the lateral side in all the segments. Legformla 1423.
Spination :Abbreviation: fe = femur, pat = patella, tib = tibia, P =
prolateral, met = metatarsus, r = retrolateral, d=dorsal v=ventral, mm = millimeter.
Leg I: Fe- p=12, r=10, pat-r=1, ti- p=2, r=6, a=2, mt- p=18,r=13, Leg II: Fe- p=3, r=6, ti- p=1, r=6, mt- p=11, r=5. Leg III: Fe-p=2, r=2, pat- r=1, ti- p=3, r=3, mt- p=7, r=6. Leg IV: Fe- p=3,r=2, pat- p=2, ti- p=5, r=3, mt- p=7, r=2.

Kananbala et. al., : Study on two edible spiders of the Genus: Nephila (Fam. Nephilidae Simon 1894) of Manipur, India 155
Measurements of legs segments Colour in alcohol : Carapace brown chelicerae reddish-brown, labium dark brown with pale distal margins. Sternumdark brown with yellowish patch. Legs black, femur and tibiawith yellowish bands. Abdomen dorsum yellowish brown,ventrum olive brown with some yellowish patches.
Cephalothorax : Longer than wide slightly narrower infront, cephalic region provided with v-shaped yellowish patchposteriorly and lighter in colour than thoracic region; darkrow with shallow fovea. Eyes : Eight eyes in two rows, slightlynarrower in front than behind, median eyes equal in size, lateraleyes sub-equal in size, Closer than median eyes and situatedon prominient tubercles. Maxillae : 1.86 long, 1.13 wide, broaderdistally, provided with distinct scapulae Labium : 1.23 long,1.13 wide, dark brown with pale distal margin. Chelicera : 3.76long, strong, stout, reddish brown with 3 promargin and 4retromargin teeth on cheliceral furrow.
Sternum : 2.65 long, 2.36 wide, triangular, a dark-brownwith a J- shaped, yellowish patch clothed with pubescenceand hairs. Legs : Legs very long, strong, black but femorabrown ; femora & tibiae with distinct yellowish bands in middleand clothed with hairs & spines. Leg formula 1243
Spination :Leg I : Fe- p=4, r=1, ti- p=7, r=4, met- p=9, r=5,Leg II : Fe- p=1, r=1, ti- p=6, r=2,Leg III : pat- r=1, ti- p=2, r=2, met- p=4, r=3; LegIV : pat- r=1, ti- p=2, r=1, met- p=2, r=1.Palp – Trichobothria are arranged laterally.
Measurements of legs segments :
Leg Femur Patella Tibia Metatarsus Tarsus Total I 17.10 3.10 13.85 21.45 3..80 59.30 II 14.95 2.85 10.75 16.95 3.20 48.70 III 9.40 2.25 5.60 9.35 2.60 29.20 IV 17.25 2.90 11.30 16.80 3.85 52.10 Leg formula 1423 Pedipalp 3.51 1.48 1.95 - 3.58 10.52
Abdomen : Abdomen long, cylindrical, clothed with hairs,
slightly over lapping on the cephalothorax. Dorsum with apair of mid- longitudinal yellowish lines decorated yellowpatches, laterally with some weavy yellowish lines. Five pairsof sigilla arrange mid-dorsally. Ventrum provided with a broadlongitudinal olive-brown patch between epigastric furrow andspinnerets.Anterior spinneret 0.64. Epigynum heavilysclerotised, having a transverse concave groove with distinctanterior ridge.Male not found.
Diagnosis : Cephalic region convex, more elevated thanthoracic region and generally armed posteriorly with twotubercles; labium longer than wide, maxillae elongated. Ocularquadrangle nearly square a slightly wider behind. Legs verylong and strong, clothed with spines, metatarsi longer thantibiae and patella together. Epigynum sclerotised.
Materials examined : 1@&, 2.XI.2009, Ukhrul district. Coll. Bhubaneshwari, Noren
2@&, 25.XI.2010, Moreh, Chandel district.Coll. Bhubaneshwari, Manoj1@& , 4.XII.2010, koubru Leikha, Senapati district.Coll.Manoj Bhubaneshwari, Binarani1@&, 23.XI.2010, Leimaram, Waroiching, Bishenpur
district.Coll. Kanan, Bhubaneshwari, ManojDistribution : INDIA : Manipur (Dist. Ukhrul, Senapati,
Chandel, Bishenpur); Tamil Nadu, Karnataka, Uttar Pradesh,Madhya Pradesh, Assam, Sikkim, West Bengal,Maharashtra,Gujarat, Andaman & Nicobar Island. Myanmar,Shri Lanka, China, Australia, Malaysia, Japan, New Guinea.
Habitat : Commonly found in deep forests and constructlarge webs between the branches of large tall trees on thebushes. Commonly found in deep forest and construct largewebs between the branches of tall trees on the bushes.
Nephila clavata L. Koch [Fig. 1 & 2]Nephila clavata Koch, L., 1878, Ver. Zool.-bot. Ges.
Wien. 27:741.Description female from Ukhrul and male from
Waroiching.FemaleTotal length – 18.10; Cephalothorax – 5.40 long, 3.30
wide; Abdomen – 14.35 long, 7.20 wide
Leg Femur Patella Tibia Metatarsus Tarsus Total I 12.35 2.30 10.15 14.85 3.05 42.70 II 10.50 1.80 7.35 11.70 2.60 33.95 III 5.75 1.20 2.80 4.85 1.85 16.45 IV 10.20 1.45 5.75 9.80 2.20 29.40 Leg formula 1243 Pedipalp 1.84 0.50 1.14 - 2.01 5.49
Abdomen : Abdomen oval, longer than cephalothorax,dorsum-yellow in colour, decorated with 4 dark green bandsarranged horizontally. A dark mid band extending from theanterior end of the abdomen upto the posterior endintersecting the horizontal bands, 5 pairs of sigilla arrangedmid-longitudinally. Ventrum olive brown with some yellowishpatches and reddish brown posteriorly. Spinneret beyond theapex of the abdomen, anterior spinnerets length 0.63. Epigynalplate small with indistinct curved-ridge.
Descrpition of male from Waroiching :
Total length - 7.4; Cephalothorax - 2.79 long, 2.15 wide;Abdomen – 4.61 long, 1.39 wide.
Cephalothorax : Cephalothorax light yellow, laterally darkbrown, ocular quad 0.82 long; 2.38 wide. PME light yellow in

156 Trends in Biosciences 6 (2), 2013
Fig. 1

Kananbala et. al., : Study on two edible spiders of the Genus: Nephila (Fam. Nephilidae Simon 1894) of Manipur, India 157
colour, PLE and AME dark in colour, trichobothria presentjust above each of the PLE, anterior row of eyes stronglyrecurved, posterior slightly recurved. Maxilla- 2.11 long, 1.42wide; light yellow directed towards each other with brownlateral sides covered with small hairs. Labium : 1.41 long, 1.31wide; light yellow broad at the middle with few hairs at thebase. Chelicera : Light yellow, fang dark brown, 0.85 longwith each 3 retomargin and promargin teeth. Sternum : Slightlyheart-shaped, 1.42 long, 0.83 wide. Legs : Yellow colour uptopatella, red and dark band extending upto tarsus with 3 claws.Leg formula 1243. Pedipalp : Light yellow upto patella, tibiadark brown in colour, trichobothria present in the femur andpatella, embolus long coiled, papal organ compex type withdark colour.
Spination :
Leg I : Fe- p=5, r=1, pat- r=1, d=1, ti- p=3, r=4, met- r=1.Leg II : Fe- r=2, pat-p=2, r=2, ti- p=2,r=2, met- p=2,r=2. Leg III: a==2, r=2, pat- r=1, ti- p=2, r=1, met- p=1, r=1. Leg IV : Fe- p=3,r=1, pat- a=1, ti- p=3, r=2, met- p=3, r=1.
Materials examined : 3@&, 23.XI.2009, Ukhrul District.Coll. Bbubaneshwari, Noren1B& & 3@&, 23.XI.2010, Waroiching, Bishenpur District.Coll. Bhubaneshwari, Manoj, Binarani2@&, 25.XI.2010, Chandel District (Moreh)Coll. Bhubaneshwari, Manoj, BinaraniDistribution : INDIA : Manipur ( Ukhrul District,
Bishenpur District, Chandel District), Sikkim, West Bengal,Meghalaya, Andaman & Nicober Island, Laccadive Island;Bhutan; Myanmar; Thailand; Pakistan; Japan; China;Formosa.
Habitat : Commonly found in the branches of trees inthe forest area.
Diagnosis : Cephalic region convex, and elevatedwithout tubercles provided with v-shaped yellow patch.Abdomen yellowish in colour, longer than wide.
ACKNOWLEDGEMENT
The authors thanks to UGC for the financial assistanceand thanks to the principal, D.M. College of Science, Imphalfor providing the laboratory facilities.
LITERATURE CITED
Sebastian, P.A and K. V. Peter 2009. Spiders of India.
Satpathi, C. R. 2004. Predacious spiders of crop pests.
Received on 21.03.2013 Accepted on 18.04.2013
Leg Femur Patella Tibia Metatarsus Tarsus Total I 7.61 1.55 6.55 9.85 2.66 28.22 II 6.85 1.50 4.75 7.88 2.23 23.21 III 3.56 0.69 1.51 2.56 1.34 9.66 IV 6.19 0.89 3.36 5.76 1.59 17.79 Leg formula 1243 Pedipalp 0.83 0.37 0.35 - 0.82 2.37
Measurements of legs segments :
Abdomen : Dorsum yellow extending from anterior toposterior decorated with dark brown mid-dorsal band. Ventrumwith dark brown, mid-ventral band with shining yellow colourventro-laterally.

Trends in Biosciences 6 (2): 158-160, 2013
Effect of Coagulants on Nutrient and Antinutrient Parameters of Soy TofuM.K.TRIPATHI, S.MANGARAJ
Agro Produce Processing Division, Centra Institute of Agricultural Engineering, Nabi Bagh, Baresia Road,Bhopal, M.P. Indiae-mail: [email protected]
ABSTRACT
Soymilk has always been a rich source of protein which isinexpensive and abundantly available. Tofu is one of the mostpopular soy-products and is prepared by coagulating soymilk.The effects of four coagulating agents (CaCl2, MgCl2, CaSO4and MgSO4), on the yield, nutrient, and anti-nutrientcomposition of tofu samples produced was studied. Thepercentage yield for tofu coagulated with CaSO4 wassignificantly different (p<0.05) with MgCl2. The tofu had 51.90-62.78% protein, 7.87-15.39% fat, 6.67-9.75% fiber, 5.80- 8.80%ash and 10.8-20.24% carbohydrate, on dry weight basis. Resultsindicated that the four coagulants significantly (p<0.05)modulated the various proximate parameters evaluated, withtofu coagulated by MgSO4 yielding the highest contents ofprotein, fiber and ash. Further analysis revealed the level oftrypsin inhibitor in the tofu was (1.46-1.94 TIU/mg protein), onwet weight basis. These results suggest that the coagulantsmodulated the yield, nutrient and anti-nutrient compositionsof tofu produced.
Key words Coagulants, tofu, nutrient, Yield, Trypsin inhibitor.
The consumption of soy products is increasing, becauseof their high nutritional and health benefits, such as reductionof cardiovascular disease, osteoporosis, diabetes and cancerrisks (FDA, 1999, Messina, 1997). Tofu, also known as soybeancurd, is a soft cheese-like food made by coagulating soymilkwith an acidic, salt or natural coagulants (Messina, 1999).Traditionally, it is prepared by coagulating fresh hot soymilkwith either salt (CaCl2 or CaSO4) or an acid (glucuno-ä-lactoneor citric acids). Tofu is low in calories, rich in essential aminoacids, contains beneficial amounts of iron and has no saturatedfat or cholesterol (Descheemaeker, and Debruyne, 2001). Thequality and yield of tofu have been found to be influenced bysoybean varieties, processing conditions (concentration,temperature and coagulation time) and coagulants (Cai, et.al., 1997). Coagulants have been reported to modulatehypocholesterolemic effect on experimental rats (Oboh, 2006).The types of coagulants have been reported to influence thebiochemical and micronutrient contents of Tofu (Shokunbi,et al., 2011). This study was carried out to determine the effectof four coagulants on the yield, nutrient and anti-nutrientcontents of Tofu.
MATERIALS AND METHODS
Soybean (JS 335) was obtained from Central Institute ofAgricultural Engineering farm and stored at room temperaturewith 8±9%moisture before processing. Food grade coagulantswere used in the study.
Preparation of soymilk from soybeans :
One hundred grams of soybeans were first rinsed andsoaked in 500 ml of deionized water for 4 h at room temperature.Hydrated soybeans were drained, rinsed and ground in agrinder for 5 min on high speed with hot water (1:6 soybeanand water ratio). The slurry was boiled for 15 min at 90-94°Cand filtered to remove the coarse material (okara) from thesoymilk slurry. The volume of the final soymilk was set to500ml using deionized water.
Preparation of Tofu using chemical coagulants
Two hundred ml of freshly prepared soymilk (20°C) fromboth sources was transferred to a plastic container andmaintained in a 90°C water bath for 15 min. The hot soymilkwas removed from the water bath and transferred to a beaker.The following coagulants were used: CaCl2 (A), MgCl2 (B),CaSO4 (C) and MgSO4 (D). The coagulant was added tosoymilk at 90°C, for each concentration of coagulants and themixture was stirred five times (Fig. 1). The solution was allowedto coagulate undisturbed for 15 minutes at 90°C temperature.The curd was then transferred into a laboratory-designedTofu box (steel mould) lined with Miracloth for pressing andTofu whey removal. The cloth was folded over the top of thecurd and pressing was achieved with a pressing 30 min. TheTofu was then unwrapped from the Miracloth and the weightof the fresh Tofu brick recorded. Textural analysis wasconducted promptly. Tofu was stored in water underrefrigerated conditions.Textural analysis was conductedpromptly.
Determination of Tofu yield and moisture :
Tofu yield was determined by weighing the Tofu brickimmediately after removing from the tofu-box and wasexpressed as fresh tofu produced per 100 grams of soymilk.The total solid content of tofu sample was determined bydrying the sample to constant at 85°C in an air oven.

TRIPATHI & MANGARAJ : Effect of Coagulants on Nutrient and Antinutrient Parameters of Soy Tofu 159
Chemical Analysis :
Tofu samples were analyzed in triplicates for moisture,protein, lipid, fiber and ash using standard methods of analysis.The chemical composition was estimated according to AOAC(AOAC 2005): Moisture (AOAC, 967.08); Protein by Kjeldahl(AOAC, 988.05); Fat by Soxhlet (AOAC, 2003.06); Fiber(AOAC, 958.06) and Ashes (AOAC, 942.05). Carbohydratewas estimated by difference. Trypsin inhibitory activity wasdetermined by the method of Kakade, et al., 1969.
Determination of textural properties of Tofu :
Texture Profile Analysis uses mechanical parameters oftexture, which imitate the action of jaws, and the textureanalyser is programmed to compress a bite-size piece twice ina reciprocating motion. Samples of 2x2 cm dia. cylinders oftofu, cut from the main block with a cork borer, then trimmedto length by cutting with fine wires set in a frame 2 cm apartwere used for texture measurement. A two-cycle compressiontest was used, in which the probe touched the sample andcompressed it to 75% of the brick height (15 mm) at a cross-head speed 18 mm/min, returned and repeated the test usingthe same parameters and recorded the fracturability, hardness,cohesiveness, gumminess, springiness, chewiness andresilience as forces.
Total bacterial count (TBC) :
Plate count agar was used for the determination of totalviable counts. All plates were triplicated, incubated at 370Cfor 48 h, and viable cell numbers were determined as colonyforming units (CFU) per mL.
RESULTS AND DISCUSSION
The Tofu yield was found to affected by nature ofcoagulants used. The % yield was modulated by thecoagulants is presented in Fig. 2. It varied from 64% (for Tofucoagulated with CaSO4) to 69 % (for Tofu coagulated withMgCl2). Highest yield was found with coagulant B which ishigher than any other coagulants at used concentration andtemperature and similar result was also reported by Oboh,2006. The processing conditions and soybean varieties usedin tofu preparation might have affect on Tofu Yield.
Proximate analysis of Tofu :
The proximate composition of the Tofu prepared by allfour coagulants is presented in Table 1. The moisture contentof Tofu samples varied from 72.01 % to 75.18%. The variationin the moisture content of Tofu prepared with differentcoagulants is probably due to the differences in gel networkwithin the Tofu particles that is influenced by different anionsand its ionic strengths towards the water holding capacity ofsoy protein gels. It may also be due to the unique coagulatingproperties of the coagulants used. Tofu is relatively high inprotein, about 10.7% for firm Tofu and 5.3% for soft silken tofuwith about 5% and 2% fat respectively as a percentage ofweight. The protein content Tofu sample in experiments wasfound 8.53 % to 10.5% of weight (Table 1).
Fig.1. Detail steps for coagulation of soymilk Fig. 2 Yield of Tofu processed with coagulants (A, B, C and D)
Coagulants
Concentration (mM)
Tempera-ture (°c)
Moisture* (%)
Fat* (%)
Ash* (%)
Protein* (%)
Carbohydrate*
(%) CaCl2 50 mM 900 C 73.93 6.95 2.87 10.5 5.75 MgCl2 50 mM 900 C 73.45 7.51 4.32 9.28 5.44 Ca SO4 50 mM 900 C 75.18 5.82 3.92 9.75 5.33 MgSO4 50 mM 900 C 72.01 7.58 4.54 8.53 7.34
Table 1. Proximate composition of Tofu (% dry weight)
*Average of 3 replicates
Textural characteristics of Tofu :
Hardness and gumminess were shown to be the mostsignificant indicators of Tofu texture. For tested chemicalcoagulants, significant correlations were found between Tofuhardness and volume of separated whey. No correlationbetween the pH of Tofu whey and any of the studied texture
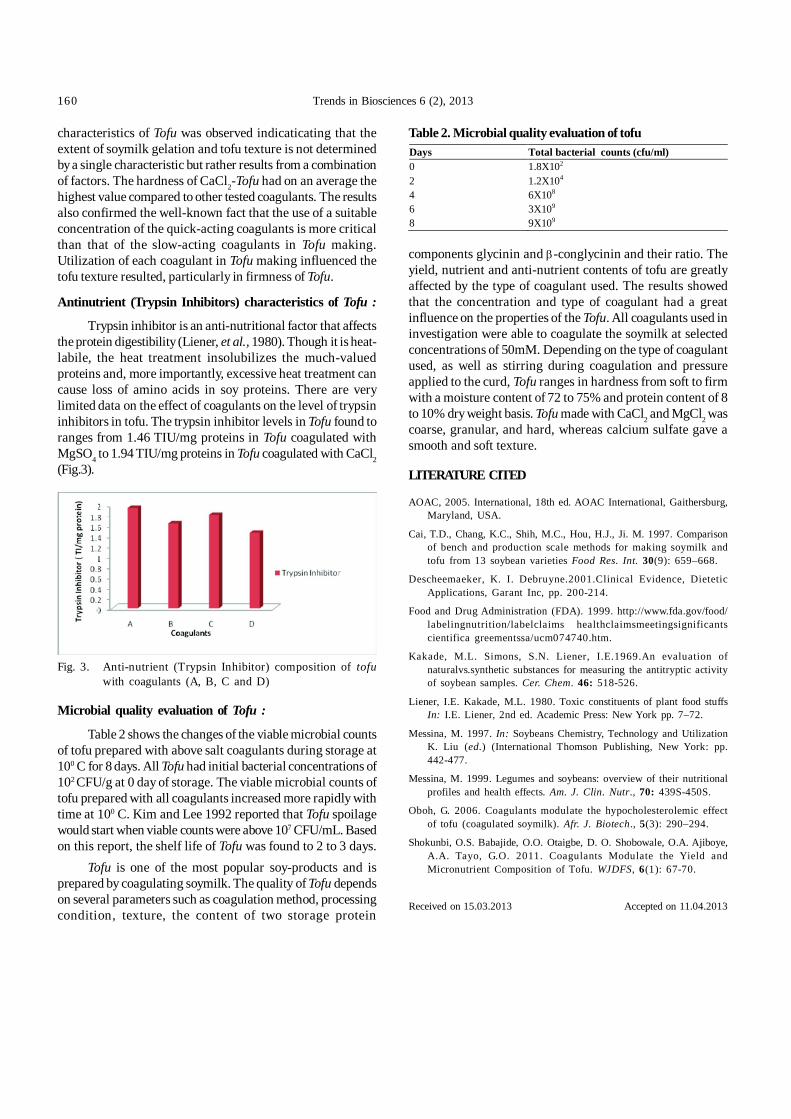
160 Trends in Biosciences 6 (2), 2013
characteristics of Tofu was observed indicaticating that theextent of soymilk gelation and tofu texture is not determinedby a single characteristic but rather results from a combinationof factors. The hardness of CaCl2-Tofu had on an average thehighest value compared to other tested coagulants. The resultsalso confirmed the well-known fact that the use of a suitableconcentration of the quick-acting coagulants is more criticalthan that of the slow-acting coagulants in Tofu making.Utilization of each coagulant in Tofu making influenced thetofu texture resulted, particularly in firmness of Tofu.
Antinutrient (Trypsin Inhibitors) characteristics of Tofu :
Trypsin inhibitor is an anti-nutritional factor that affectsthe protein digestibility (Liener, et al., 1980). Though it is heat-labile, the heat treatment insolubilizes the much-valuedproteins and, more importantly, excessive heat treatment cancause loss of amino acids in soy proteins. There are verylimited data on the effect of coagulants on the level of trypsininhibitors in tofu. The trypsin inhibitor levels in Tofu found toranges from 1.46 TIU/mg proteins in Tofu coagulated withMgSO4 to 1.94 TIU/mg proteins in Tofu coagulated with CaCl2(Fig.3).
components glycinin and -conglycinin and their ratio. Theyield, nutrient and anti-nutrient contents of tofu are greatlyaffected by the type of coagulant used. The results showedthat the concentration and type of coagulant had a greatinfluence on the properties of the Tofu. All coagulants used ininvestigation were able to coagulate the soymilk at selectedconcentrations of 50mM. Depending on the type of coagulantused, as well as stirring during coagulation and pressureapplied to the curd, Tofu ranges in hardness from soft to firmwith a moisture content of 72 to 75% and protein content of 8to 10% dry weight basis. Tofu made with CaCl2 and MgCl2 wascoarse, granular, and hard, whereas calcium sulfate gave asmooth and soft texture.
LITERATURE CITED
AOAC, 2005. International, 18th ed. AOAC International, Gaithersburg,Maryland, USA.
Cai, T.D., Chang, K.C., Shih, M.C., Hou, H.J., Ji. M. 1997. Comparisonof bench and production scale methods for making soymilk andtofu from 13 soybean varieties Food Res. Int. 30(9): 659–668.
Descheemaeker, K. I. Debruyne.2001.Clinical Evidence, DieteticApplications, Garant Inc, pp. 200-214.
Food and Drug Administration (FDA). 1999. http://www.fda.gov/food/labelingnutrition/labelclaims healthclaimsmeetingsignificantscientifica greementssa/ucm074740.htm.
Kakade, M.L. Simons, S.N. Liener, I.E.1969.An evaluation ofnaturalvs.synthetic substances for measuring the antitryptic activityof soybean samples. Cer. Chem. 46: 518-526.
Liener, I.E. Kakade, M.L. 1980. Toxic constituents of plant food stuffsIn: I.E. Liener, 2nd ed. Academic Press: New York pp. 7–72.
Messina, M. 1997. In: Soybeans Chemistry, Technology and UtilizationK. Liu (ed.) (International Thomson Publishing, New York: pp.442-477.
Messina, M. 1999. Legumes and soybeans: overview of their nutritionalprofiles and health effects. Am. J. Clin. Nutr., 70: 439S-450S.
Oboh, G. 2006. Coagulants modulate the hypocholesterolemic effectof tofu (coagulated soymilk). Afr. J. Biotech., 5(3): 290–294.
Shokunbi, O.S. Babajide, O.O. Otaigbe, D. O. Shobowale, O.A. Ajiboye,A.A. Tayo, G.O. 2011. Coagulants Modulate the Yield andMicronutrient Composition of Tofu. WJDFS, 6(1): 67-70.
Received on 15.03.2013 Accepted on 11.04.2013
Fig. 3. Anti-nutrient (Trypsin Inhibitor) composition of tofuwith coagulants (A, B, C and D)
Microbial quality evaluation of Tofu :
Table 2 shows the changes of the viable microbial countsof tofu prepared with above salt coagulants during storage at100 C for 8 days. All Tofu had initial bacterial concentrations of102 CFU/g at 0 day of storage. The viable microbial counts oftofu prepared with all coagulants increased more rapidly withtime at 100 C. Kim and Lee 1992 reported that Tofu spoilagewould start when viable counts were above 107 CFU/mL. Basedon this report, the shelf life of Tofu was found to 2 to 3 days.
Tofu is one of the most popular soy-products and isprepared by coagulating soymilk. The quality of Tofu dependson several parameters such as coagulation method, processingcondition, texture, the content of two storage protein
Days Total bacterial counts (cfu/ml) 0 1.8X10² 2 1.2X10⁴ 4 6X10⁸ 6 3X10⁹ 8 9X10⁹
Table 2. Microbial quality evaluation of tofu

Trends in Biosciences 6 (2): 161-164, 2013
Integrated Weed Management Studies on Weed Flora and Yield in Kharif MaizeBIRENDRA KUMAR1 RANVIR KUMAR2 SUMAN KALYANI2 AND MIZZANUL HAQUE1
1Deptt. of Agronomy, Bihar Agricultural College, Sabour, Bhagalpur, Bihar 813 2102B.P.S. Agricultural College, Purnea City, Purnea, Bihar 854 302e-mail: [email protected]
ABSTRACT
A field experiment was conducted during the Kharif season of2011-12 at Bihar Agricultural University, Sabour, ( Bihar) toevaluate the effectiveness and economically integrated weedmanagement method in maize (Zea mays L.) .Weed managementhad a positive influence on growth, yield attributes and yield ofthe maize. Manual weeding at 15 and 30 days after sowing(DAS) with in Zero tillage ( ZT) - Glyphosate Pre Plant followedby Atrazine+ Halosulfuran (1.0 kg + 90 g a.i./ha) as Postemergence, Conventional tillage( CT) - Atrazine +Halosulfuran @ (1.5kg+90 g a.i/ha) as Post emergence andZero tillage (ZT) - Glyphosate Pre plant followed byTopramezone+Atrazine @( 40 ml + 500 g a.i/ha) as Postemergence proved equally effective in increasing most of thegrowth parameters, yield attributes, yield and economicadvantage. The effect due to different weed managementpractices on grain yield of maize was found to be statisticallysignificant. The maximum mean grain yield of (68.2 q/ha) wasrecorded from the plots where two hand weeding at 15 and 30DAS was performed and was statistically at par with the meangrain yield obtained under different weed managementpractices i.e. ZT - Glyphosate Pre Plant followed by Atrazine+Halosulfuran (1.0 kg + 90 g a.i./ha) as POE (67.1 q/ha), CT-Atrazine + Halosulfuran @ (1.5kg+90 g a.i/ha) as POE (64.1 q/ha), ZT-Glyphosate Pre plant followed byTopramezone+Atrazine @( 40 ml + 500 g a.i/ha) as POE (63.6q/ha), and the grain yield obtained these were significantlysuperior to the grain yield obtained under rest of the weedmanagement practices. Yield advantages due to different weedmanagement practices over weedy check were mainly attributeddue to enhance yield attributing parameters as a result of lowerweed population, biomass along with higher weed controlefficiency. The highest net return Rs, 34856/ha and maximumbenefit: cost ratio of 1.2 was noted in treatment ZT-GlyphosatePre plant followed by Topramezone+Atra zine @( 40 ml + 500g a.i/ha) POE and lower value of net return Rs, 22980/ha andbenefit: cost ratio of (0.82) were recorded under weedy check.
Key words Conventional tillage, Economics, Maize, Weed density,Yield, Zero tillage
In Bihar, total area under Maize (Zea mays L.) is 6.98lakhs ha, producing 21.11 matric tons and with averageproductivity of 3025 kg/ha (Anon., 2012). The area under maizeis increasing in Bihar due to favorable prices and increasingin demand. Tillage is a critical practice in crop production as itprovides favourable condition for crop growth anddevelopment. It is reported that the normal tillage may not be
required for getting optimum crop yield. Rainy season maizesuffers from severe weed competition and depending uponthe intensity, nature, stages and duration of weed infestationcauses yield losses varying from 28-100% (Patel, et. al., 2006).A wide spaced crop suffers from heavy weed infestation dueto slow initial growth particularly under Kharif season. Weedinfestation is one of the major constraints for low yield ofmaize as weeds compete with crop plants for essentials inputs.Weed depletes 30-40% of applied nutrients from the soil. Thelosses caused by weeds exceed the losses from any othercategory of agricultural pests was noticed by Padhi andPanigrahi, 2006 and Sharma and Behera, 2009. Under such asituation, the concept of zero tillage offers ample scope forcombating weeds without any threat to eco-system.
To realize the maximum benefit of applied costly inputsand high yields, control of weeds is inevitable. Growingintercrops in widely spaced maize crop not only reduceintensity of weeds but also gives additional yield was noticedby Hussain Nazim, et. al., 2003. Hence, keeping the above factin mind, the present investigation was carried out to assessthe possibility of increasing crop production per unit area byintroducing effective tillage and weed control method in rainyseason maize.
MATERIALS AND METHODS
A field experiment was carried out during rainy seasonof 2011-12 at Bihar Agricultural University, Sabour, Bihar(25O 04’ N Latitude, 87O 04’ E Longitude and 37.19 meter abovemean sea levels), in a randomized block design with threereplications. In conventional tilled treatment three ploughingfollowed by planking was done. Under zero tilled condition,crop was sown directly and glyphosate @ 1.0 kg a.i/ha wassprayed one week before sowing of the crop to kill the existingweeds. The treatments comprised 10 weed managementpractices i.e., weed control treatments were : Un-weeded check,CT- HW at 15 and 30 DAS,CT- Maize+ black gram as intercrop,CT- [email protected] a.i/ha as Pre-em., CT- Atrazine +Halosulfuran @ (1.5kg+90 g a.i/ha) as Post emergence, CT-Halosulfuran @ 90 g a.i/ha as POE, CT- Topramezone+Atrazine@( 40 ml + 500 g a.i/ha) as POE, ZT-Glyphosate Pre plantfollowed by Atrazine +Halosulfuran(1.0 kg + 90 g a.i/ha) asPOE, ZT-Glyphosate Pre plant followed by Topramezone +Atrazine @ (40 ml + 500 g a.i/ha) as POE, ZT-Glyphosate Preplant followed by Maize+ black gram as intercrop ‘DHM 117’

162 Trends in Biosciences 6 (2), 2013
maize was sown on 01 July in 2011-12. In maize, 1/3 N wasapplied basal along with P and K and the remaining nitrogenwere applied in two splits only in rows of maize each at kneehigh and pre-taselling stage. Pre-emergence and Post-emergence herbicides were applied at next day and 30 daysafter sowing using water volume of 800 liters/ha. The data onweed population, weed density and weed control efficiencywere recorded at different stages of crop. The experimentalsoil was sandy-loam in texture with pH 7.2. The organic carbon,electrical conductivity and available nitrogen, phosphorusand potash were 0.58%, 0.107ds/m, 270.6, 15.36 and 290.15 kg/ha, respectively. The rainfall received during the crop seasonof respective years was 1202 mm. Cost of cultivation and grossreturn were calculated on the basis of prevailing market pricesof different inputs and produces, respectively.
RESULTS AND DISCUSSION
Weed growth, Density and weed dry weight
Dominant weed species present in the experimental sitewere Cynodon dactylon L, Cyperus rotundus L., Echinochloacolonum L, Echinochloa crusgalli L, Eleusine indica L,Phyllanthus niruri L, Euphorbia hirta L , Amaranthus viridisL,Commelina benghalensis L and Parthenium hysterophorus L.
Weed density was significantly affected due to differenttillage systems. There was reduction in total weed density inZT when compared with CT. Higher weed density in CT maybe due to better tilth and exposure of weed seeds to the uppersoil layers (Singh, et. al., 2001). Density of all grasses wasmaximum in CT system. All the herbicides reduced weeddensity and weed dry weight over weedy check. Minimumpopulation of all major weed species were significantly reducedue to two hand weedings at 15 and 30 DAS.
Growth and yield attributes of maize
Different weed management practices significantlyinfluenced the growth, yield attributes and yield of maize crop(Table1) .Two hand weeding at 15 and 30 days after sowingbeing statistically at par with the weed control treatment,ZT-Glyphosate Pre Plant followed by Atrazine+ Halosulfuran(1.0 kg + 90 g a.i./ha) as POE recorded significantly highervalues of growth, yield attributes and yield to the rest of theweed control treatments. This might be probably due to thecreation of modified micro-climate inturns of physicalenvironment for mechanical manipulation of soil and lowercrop –weed competition under two hand weeding might haveled to better yield components and thus resulted in higheryield (Mundra, et. al., 2003).during hand weeding and beingpersistence and broad spectrum control of weeds keep thepopulation of weed under check by arresting or inhibiting thegermination of weed seeds and arresting the growth anddevelopment of weeds which provide weed-free environmentto the crop resulted into better manifestation of growth andyield attributes and ultimately enhanced the crop yield. Theresults are in conformity with those reported by Singh, et. al.,2005. Yield advantage due to different weed managementpractices over weedy check were mainly attributed for betteryield attributing parameters and cooperatively less weedpopulation weed biomass along with higher weed controlefficiency. Interaction effect of tillage and weed control methodon grain yield was found significant.
Total productivity
Different weed management practices significantlyinfluenced the maize-equivalent yield. Hand weeding at 15and 30 DAS being statistically at par with ZT-Glyphosate PrePlant followed by Atrazine+ Halosulfuran (1.0 kg + 90 g a.i./ha) as POE recorded significantly higher grain yield to therest of the weed control treatments.
Treatment Plant height (cm)
Weight of one cob(gm)
100 grains weight (g)
Mean Grain Yield ( q/ha) &MEY
W1-Un-weeded check 140.4 210 30 51.0
W2- CT-HW at 15 & 30 DAS 157.8 216 36 68.2
W3- CT-Maize+ black gram as intercrop. 145.6 212 33 56.5 (65.5)
W4- [email protected] a.i/ha as Pre-em 148.3 213 34 61.4
W5- CT-Atra [email protected] a.i followed by Halosulfuron @ 90 g a.i/ha as POE 150.6 214 35 64.1
W6- CT-Halosulfuron @ 90 g a.i/ha as POE 149.5 213 34 62.6
W7- CT- Topramezone+Atrazine @ ( 40 ml + 500 g a.i/ha) as POE 149.8 213 34 62.7
W8- ZT-Glyphosate Pre plant followed by Atrazine +Halosulfuron(1.0 kg+90 g a.i/ha)
as POE 156.1 215 35 67.1
W9- ZT-Glyphosate Pre plant followed by Topramezone+Atra zine @( 40 ml + 500 g
a.i/ha) POE 150.3 214 34 63.6
W10- ZT-Glyphosate Pre plant followed by Maize+ black gram as intercrop 148.4 212 34 57.7 (66.4)
SEm± 0.84 0.21 0.93 3.9 CD (P=0.05) 1.8 0.45 1.93 8.3
Table 1. Effect of weed management on growth, yield attributes and yield of maize.

KUMAR et. al., : Integrated Weed Management Studies on Weed Flora and Yield in Kharif Maize 163
Table 2. Effect of weed management on growth, yield attributes and yield of maize.Treatment Cob length
(cm) Cob diameter
(cm) Number of grain
row per cob Number of
grain per row W
1-Un-weeded check 12.4 4.3 13 35
W2- CT-HW at 15 & 30 DAS 17.0 5.3 15 42
W3- CT-Maize+ black gram as intercrop. 13.6 4.4 13 39
W4- [email protected] a.i/ha as Pre-em 14.2 4.5 14 40
W5- CT-Atra [email protected] a.i followed by Halosulfuron @ 90 g a.i/ha as POE 16.1 4.8 14 41
W6- CT-Halosulfuron @ 90 g a.i/ha as POE 15.0 4.6 14 40
W7- CT- Topramezone+Atrazine @ ( 40 ml + 500 g a.i/ha) as POE 15.0 4.6 14 40
W8- ZT-Glyphosate Pre plant followed by Atrazine +Halosulfuron(1.0 kg+90 g a.i/ha) as
POE 16.5 5.1 15 41
W9- ZT-Glyphosate Pre plant followed by Topramezone+Atra zine @( 40 ml + 500 g
a.i/ha) POE 15.6 4.7 14 40
W10- ZT-Glyphosate Pre plant followed by Maize+ black gram as intercrop 13.7 4.5 14 39
SEm± 0.21 0.17 0.61 0.78
CD (P=0.05) 0.45 0.36 1.2 1.65
Table 3. Effect of weed management on weed biomass ,weed density, weed control efficiency .
Intercropping systems significantly reduced the weedpopulation and weed dry weight than sole cropping (Table2). Intercropping with maize + black gram was the moreeffective in suppressing weeds and recorded the less weedpopulation and weed dry weight. The reduction in weedpopulation and weed dry biomass in intercropping systemsmay be attributed to shading effect and competition stresscreated by the canopy of more number of crop plants in anunit area having suppressive effect on associated weeds, thuspreventing the weeds to attain full growth. Intercroppingsystem of maize + black gram exhibited land equivalent ratiogreater than sole cropping, indicating greater biological
efficiency of intercropping system and thereby resulting inhigher productivity per unit of space. Planting of maize andblack gram recorded the higher land equivalent ratio. All theweed control treatments significantly reduced the density anddry weight of weeds compared with weedy check. Handweeding at 15 and 30 DAS proved most effective in reducingthe population of weeds and weed dry matter production.The performance of hand weeding, ZT-Glyphosate Pre Plantfollowed by Atrazine+ Halosulfuran (1.0 kg + 90 g a.i./ha) asPOE, CT- Atrazine + Halosulfuran @ (1.5kg+90 g a.i/ha) asPOE and ZT-Glyphosate Pre plant followed byTopramezone+Atrazine @( 40 ml + 500 g a.i/ha) as POE was
Treatment Weed population (No/m2) at 30
DAS
Weed population (No/m2) at
60 DAS
Dry wt of weed (gm/m2)at 30
DAS
Dry wt of weed (gm/m2) at
60 DAS
Weed control
efficiency at 30 DAS
Weed control
efficiency at 60 DAS
W1-Un-weeded check 235 238 71.97 81.27 - -
W2- CT-HW at 15 & 30 DAS 57 67 24.00 27.03 66.5 66.7
W3- CT-Maize+ black gram as intercrop. 92 115 40.00 44.53 44.4 45.2
W4- [email protected] a.i/ha as Pre-em 72 80 28.00 32.07 61.0 60.5
W5- CT-Atra [email protected] a.i followed by Halosulfuron @
90 g a.i/ha as POE 60 72 25.43 29.10 64.6 64.1
W6- CT-Halosulfuron @ 90 g a.i/ha as POE 76 86 28.30 31.50 60.6 61.2
W7- CT- Topramezone+Atrazine @ ( 40 ml + 500 g
a.i/ha) as POE 68 77 26.07 30.33 63.7 62.6
W8- ZT-Glyphosate Pre plant followed by Atrazine
+Halosulfuron(1.0 kg+90 g a.i/ha) as POE 59 71 25.00 28.57 65.2 64.8
W9- ZT-Glyphosate Pre plant followed by
Topramezone+Atra zine @( 40 ml + 500 g a.i/ha) POE 62 82 26.80 29.50 62.7 63.7
W10- ZT-Glyphosate Pre plant followed by Maize+ black
gram as intercrop 90 110 28.30 31.93 60.6 60.7
SEm± 8.4 6.7 1.9 2.3 - - CD (P=0.05) 17.8 14.2 4.0 4.8 - -

164 Trends in Biosciences 6 (2), 2013
statistically alike and inturn were significantly superior to theremaining weed control treatments (Table 2).
Significant reduction of weed density and weed drybiomass under hand weeding and mixed herbicides Atrazine+Halosulfuran, Topramezone+Atrazine might be due to the factthat these weed control treatments gave almost season-longcontrol of weeds obviously due to their persistence in soil fora sufficiently long time and broad spectrum control of weeds.The results are in conformity with those reported by Ram, et.al., 2003. All the weed control methods resulted significantincrease in grain and biological yield over weedy check.Economics
Atra zine @( 40 ml + 500 g a.i/ha) POE had the highestnet return(Rs,34856/ha) and B:C ratio (1.21) as compared torest of the weed control methods.
It may be concluded that Zero tillage and two handweeding at 15 & 30 days after sowing appeared to be the bestin reducing weed growth and producing maximum grain yieldin maize.
LITERATURE CITED
Hussain, Nazim, Imran Haider, Shamsi, Khan Sherin, Habib Akbar andWajid Ali, Shah: 2003. Effect of legume intercrops and nitrogenlevels on the yield performance of maize. Asian Journal of PlantScience 2(2): 242–46.
Mundra, S.L., Vyas, A.K and Maliwal, P.L. 2003. Effect of weed andnutrient management on weed growth and productivity of maize(Zea mays L.). Indian Journal of weed science 35 (1 & 2):57-61.
Padhi, A.K. and Panigrahi, R.K. 2006. Effect of intercrop and cropgeometry on productivity, economics, energetic and soil fertilitystatus of maize based intercropping systems. Indian Journal ofAgronomy 51(3):65-67.
Patel, V.J., Upadhyay, P.N., Patel, J.B and Meisuriya, M.I. 2006. Effectof herbicide mixture on weeds in Kharif maize(Zea mays L.) undermiddle Gujarat conditions. Indian Journal of Weed science 38(1 &2): 54-57.
Ram, B., Choudhary, A.S. Jat, A.S. and Jat, M.L. 2003. Effect ofintegrated weed management and intercropping systems on growthand yield of pearlmillet (Pennisetum glaucum). Indian Journal ofAgronomy 48(4): 254–56.
Sharma, A.R. and Behera, U.K. 2009. Recycling of legume residues fornitrogen economy and higher productivity in maize-wheat croppingsystem. Nutrition Cycling Agroecosystem, 83: 197–10.
Singh, Mahender, Singh, Pushpendra and Nepalia, V. 2005. Integratedweed management studies in maize based intercropping system.Indian Journal of Weed Science, 37(3 & 4): 205–08.
Received on 20.02.2013 Accepted on 15.03.2013
Table 4. Effect of weed management on yield of maize, maize equivalent yield, cost of cultivation, gross return, net return,benefit : cost ratio.
Treatment Mean grain &maize equivalent yield (t/ha)
General cost of cultivation + Cost due to herbicides (Rs./ha)
Gross return (Rs./ha)
Net return (Rs./ha)
Benefit : cost ratio (Rs.)
W1-Un-weeded check 51 28020
W2- CT-HW at 15 & 30 DAS 68.2 28020+8640= 36,660 68200 31540 0.86
W3- CT-Maize+ black gram as intercrop. 56.5(65.5) 28020+1632=29652 56500(65500) 26848(35848) 0.90(1.20)
W4- [email protected] a.i/ha as Pre-em. 61.4 28020+1392=29412 61400 31988 1.08
W5- CT-Atra [email protected] a.i followed by
Halosulfuron @ 90 g a.i/ha as POE . 64.1 28020+1692=29712 64100 34388 1.15
W6- CT- Halosulfuron @ 90 g a.i/ha as POE . 62.6 28020+300=28320 62600 34280 1.21
W7- CT- Topramezone+Atrazine @ ( 40 ml +
500 g a.i/ha) as POE . 62.7 28020+4724=32744 62700 29956 0.91
W8- ZT-Glyphosate Pre plant followed by
Atrazine +Halosulfuron(1.0 kg+90 g a.i/ha) as POE
67.1 24020+9213=33233 67100 33867 1.01
W9- ZT-Glyphosate Pre plant followed by
Topramezone+Atra zine @( 40 ml + 500 g a.i/ha) POE
63.6 24020+4724=28744 63600 34856 1.21
W10- ZT-Glyphosate Pre plant followed by
Maize+ black gram as intercrop 57.7(66.4) 24020+1632=25652 57700(66400) 32048(40748) 1.24(1.58)
SEm± 3.9 688.5 3256.6 1121.5 0.091 CD (P=0.05) 8.2 2162 9896 3398 0.29

Trends in Biosciences 6 (2): 165-166, 2013
Influence of Pseudomonas putida on the Yield of Agaricus bisporus (Lange) ImbachPRABHAT KUMAR SINGH, ABHILASHA A. LAL , SOBITA SIMON AND SATISH SHARMA1
Department of Plant Protection, SHIATS (Deemed to- be University) Allahabad, U.P., India.1School of Bio-technology (FOA), Sher-e-Kashmir University of Agriculture Sciences and Technology,Kashmir, India.e:mail: [email protected], [email protected]
ABSTRACT
In cultivation of button mushroom [Agaricus bisporus (Lange)Imbach], casing layer that is nutritionally deficient to compostis believed to trigger the fruit body formation and this isconducted by the bacterial community residing in casing layer.Therefore, relationship between different concentrations (1x104,1x 106,1x 108,1x 1010, 1x 10¹²) of bacterial inoculants(Pseudomonas putida) and yield of Agaricus bisporus weredetermined. Available data showed a significant difference inyield in respect to concentration of bacterial inoculant added.In addition, concentration 1x 10⁸cfu/ml was found to be highyielding concentration, which took minimum case run periodtogether with higher biological efficiency compared to other.
Key words White button mushroom, Pseudomonas putida, Bacterialinoculants, Yield.
Agaricus bisporus is the most cultivated species ofedible mushroom and it is the most popular cultivar amongthe artificially grown fungi of the world that contributes about31.8% to the global mushroom cultivation and 85% of thetotal produce in india (Angrish et al.,2003). In commercialmushroom cultivation, it is necessary to cover the vegetativegrowth of Agaricus bisporus, which takes place in the compost(consisting of composted straw and other plant derivedmaterials),with a layer of soil and FYM or various combinationof similar materials. Among these use of farm yard manure(FYM) as a casing medium for mushroom cultivation has beenvogue in Indian subcontinent because of its easy availabilityand non-availability of peat moss generally used for casing inEurope and USA. The application of these materials, termedthe casing layer, is essential for initiation of basidiomata(Eger,1972; Flegg et al., 1985). Bacteria present in casing layerconsiderably influence the growth and morphogenesis ofAgaricus bisporus production. It supports beneficial microbialpopulations that release growth stimulating substances whichare reportedly involved in stimulating the initiation ofpinheads. Several reports are available on the beneficial effectsof casing soil microbes, especially Pseudomonas putida andAlcalgenes faccalis, on Agaricus bisporus (Rainey et al., 1990).
This work describes the role of population density ofPseudomonas putida in the production of Agaricus bisporus.
MATERIALS AND METHODS
Cultivation of Agaricus bisporus :
Long method of composting (LMC) was adopted usingthe method proposed by Mantel et. al., 1972 using newlyharvested wheat straw. The formulation given by Singh andMishra, 2006 was modified depending on the availability ofingredients locally.
Spawn was procured from Department of PlantPathology, Chandra Shekher Azad University of Agricultureand Technology, Kanpur (U.P). Having completed thecomposting process, thorough spawning was done @75gm/10kg compost. The spawned compost weight 7kg was filled inthe bags at Mushroom Crop Room, Department of PlantProtection, SHIATS, Allahabad. Room temperature, conditionof spawn run of each bag recorded separately.
A mixture of FYM and garden soilin the proportion of2:1 was used as casing mixture. The mixture was pre- treatedwith 2% formalin two weeks before to eliminate undesirablemicroorganisms. Casing was done at a thickness of 2-3 cmand again bags were kept in the dark crop room. Thetemperature and relative humidity were maintained at 14- 180Cand 80-90% respectively. Temperature during cropping, timetaken to complete case run, relative humidity in the crop roomand number of days to pinhead initiation were recorded.
Inocula preparation :
The culture of bacterial inoculum (Pseudomonas putida)was procured from Department of Plant Pathology, IARI, NewDelhi, India.
Inocula were prepared by growing the selective strainsin King,s B broth medium. After incubation at 300C for 72h, thedensities of culture were determined. Then cultures werediluted further in King,s B broth until final bacterial cellnumbers were 1x104,1x106,1x108,1x1010,1x1012cells/ml . Bacterialsuspension (77ml/bag) was sprayed in different treatments atthe time of casing. The harvesting began when buttons werefully-grown (but not yet open), and total harvest was recordedin each bag.Biologicalefficiency (BE) of the compost wascalculated using the following formula.

166 Trends in Biosciences 6 (2), 2013
RESULTS AND DISCUSSION
The results of this study showed that there is closerelation between population density of Pseudomonas putidain the casing soil and yield of Agaricus bisporus.
Concentrations inoculated in casing soil,1x108cfu/mlrecorded significantly superior over all concentrations,required minimum average number of days (13.4) for myceliumrun in casing soil, highest yield (1.268 kg/bag) and highestbiological efficiency(27.806%) followed by 1 x 10¹⁰, 1 x 10¹², 1x 10⁶ and 1 x 10⁴cfu/ml as compared to control. Number ofdays for mycelium run increased with the incensement (1 x10¹⁰, 1 x 10¹² cfu/ml) of inocula concentration and also withdecreasment (1 x 10⁶, 1 x 10⁴cfu/ml) of inocula concentration.
efficiency of compost can be improved by inoculation ofPseudomonas putida in the casing mixture (Table 1). Theseresults are in accordance with the earlier work of Hossein etal. (2011), which reported the role of bacterial and cyano-bacterial culture on growth and yield of Agaricus bisporus.
In cultivation of Agaricus bisporus, casing soil is majorelement. Population of Pseudomonas in the casing layer onwhich the mushroom fruit body develops is very important.We conclude that inoculation of Pseudomonas putida incasing soil in 1x10⁸cfu/ml concentration is very efficient forincreasing yield and biological efficiency (BE) of compost.
ACKNOWLEDGEMENT
The authors are thankful to Hon’ble Vice-Chancellor,SHIATS for the facilities provided during the experiment.
LITERATURE CITED
Angrish, M., Sodhi, H.S., Khanna, P.K. and Arora, C. L. 2003. Idealcasing material for Agaricus bisporus cultivation under the naturalclimatic condition of Punjab. Mushroom Research, 12: 93-96.
Eger, G. 1972. Experiments and comments on the action of the bacteriaon sporophore initiation in Agaricus bisporus.Mushroom Science,8: 719-725.
Flegg,P.B., Spencer, D.M. and Wood, D. A. 1985. The biology andtechnology of cultivated mushroom. John Wiley sons. pp.347.
Hossein, R. Eskash, A. and Shariatmadari, Z. 2011. Effect of bacterialand cyanobacterial culture on growth, quality and yield of Agaricusbisporus .International conference on mushroom biology andmushroom products. pp. 411- 416.
Mantel, E.F.K. and Agarwal, P.K. 1972. A guide to mushroom cultivationunit, Directorate of Extension. Ministry of Agriculture, New Delhi.
Rainey, P.B. and Cole, A.L. 1990. A model system for examininginvolvement of nbacteria in basidiome initiation of Agaricusbisporus. Mycol. Res., 94: 191-195.
Singh, R. P. and Mishra, K. K. 2006. Mushroom cultivation, Mushroomresearch and training center, GBPUAT, Pantnagar.pp. 13.
Received on 19.03.2013 Accepted on 03.04.2013
*Average of five replications
Table1. Effect of bacterial inoculant (Pseudomonasputida) on the number of days required formycelium run in the casing, yield of Agaricusbisporus and on the biological efficiency of compost
Concentration Av. No. of days* Yield (kg/bag)* BE (%)* Control 17.20 0.316 8.391 1x10¹²cfu/ml 15.00 0.698 17.868 1x10¹⁰cfu/ml 14.60 0.756 19.128 1x10⁸cfu/ml 13.40 1.268 27.806 1x10⁶cfu/ml 15.20 0.575 16.478 1x10⁴cfu/ml 15.60 0.492 13.776 CD at 5% 0.719 0.184 3.149
Mushroom yield dramatically increased in concentrationof 1x10⁸cfu/ml but decreased with increasment of concentration(1x10¹⁰, 1x10¹²cfu/ml) and also with decreasment ofconcentration (1x10⁶, 1x10⁴cfu/ml).
Biological efficiency of compost prepared by LMCranged between 13-28%. Highest biological efficiency wasrecorded in bags where concentration inoculated 1x10⁸cfu/ml(27.806) followed by 1x1010,1x1012,1x106 and 1x10⁴ as comparedto control (Plates 1 and 2). This indicates that the biological
Fig. 1. Control bag
Fig. 2. Treated bag with Pseudomonas putida (108 cfu/ml)

Trends in Biosciences 6 (2): 167-169, 2013
Effect of Varying NPK Levels and Bio-fertilizers on Growth and Yield of Okra[Abelmoschus esculentus (L.) Moench] under Sustainable ConditionPARAM HANS PRASAD AND ABHISHEK NAIK
Department of Vegetable Crops, Faculty of Horticulture,Bidhan Chandra Krishi Viswavidyalaya, Mohanpur,Nadia 741 252, Indiae-mail: [email protected]
ABSTRACT
An experiment was conducted at Horticultural Research Station,Mondouri, Bidhan Chandra Krishi Viswavidyalaya, Mohanpur,Nadia in West Bengal during rabi season of 2007-08 withobjectives to find out the suitable combination of biofertilizers[Azotobacter, Azospirillium and Phospho Solubilizing Bacteria(PSB)] in presence or absence of FYM (15 t/ha) and two levelsof graded NPK fertilizers (80-60-50 and 40-30-25 N, P2O5,K2Okg/ha) on the growth and fruit yield of okra cv. Arka Anamika[Abelmoschus esculentus (L.) Moench] and the availability statusof N, P and K in soil considering the growth, yield and qualityparameters data revealed that significantly minimum heightof plant was recorded by the application of PSB + FYM. Inrespect of plant height at 30 days, plant height at 60 days,number of branches, number of leaves, number of fruits, fruitlength, fruit diameter, fruit yield per plot and fruit yield per hawere significantly maximum in the plant receiving 50%recommended dose of fertilizer (RDF) + Azotobactor +Azospirillum + PSB + FYM with good yield (196.97 q/ha) andexport fruit quality of Okra.
Key words Okra, Bio-fertilizer, PSB, NPK, Growth, Yield
Sustainable crop production requires a judiciousmanagement of all nutrient sources such as organics, chemicalfertilizers and biofertilizer available to farmers including preciseapplication of need-based irrigation to the crops. The mainobjectives of integrated plant nutrient management (IPNM)are to maintain and possibly enhance soil fertility through abalanced use of chemical fertilizers combined with organicand biological sources to improve efficiency of plant nutrients,increase crop productivity and minimizing losses to theenvironment. Nutrient management is one of the primeconsiderations for getting higher yield of any crop. Sustainablecrop production requires a judicious management of all nutrientsources such as organic manure, chemical fertilizers andbiofertilizer available to farmers including precise applicationof need-based irrigation to the crops. Okra or Bhindi[Abelmoschus esculentus (L.) Moench] is one of the mostimportant vegetables in New Alluvial Zone of West Bengal.Keeping in view the important of the above facts and lack ofsufficient information, the present experiment was undertakenwith the following objectives: (i) To find out the suitable
combination of bio-fertilizer in presence or absence of FYMand two levels of graded NPK fertilizers on the growth andfruit yield of Lady’s finger (ii) To determine the availabilitystatus of N, P and K in soil considering the growth, yield andquality attributes of crop.
MATERIALS AND METHODS
The experiment was carried out at Horticultural ResearchStation (HRS), Mondouri, Bidhan Chandra KrishiViswavidyalaya, Mohanpur, Nadia in West Bengal. Theexperiment was laid out in Randomized Block Design (RBD)having nine different nutritional management with threereplications. The Treatment details are as follows-T1 : Recommended dose of fertilizer (RDF) + FYM (15 t/ha).
T2 : Biofertilizer (Azotobacter) + FYM (15 t/ha).
T3: Biofertilizer (Azospirillum) + FYM (15 t/ha).
T4 : Biofertilizer (Phospho Solubilizing Bacteria) + FYM (15t/ha) .
T5 : Biofertilizer (Azotobacter) + FYM (15 t/ha) + RDF (50%).
T6: Biofertilizer (Azospirillum) + FYM (15 t/ha) + RDF (50%).
T7 : Biofertilizer (Phospho Solubilizing Bacteria) + FYM (15t/ha) + RDF (50%).
T8 : Biofertilizer (Azotobacter + Azospirillum + PhosphoSolubilizing Bacteria) + FYM (15 t/ha) + RDF (50%).
T9 : Biofertilizer (Azotobacter + Azospirillum + PhosphoSolubilizing Bacteria) + FYM (15t/ha).
Before preparation of beds well decomposed farm yardmanure (FYM) was applied and it was evenly mixed with thesoil. Okra seed was shown directly at a planting distance of 45x 30cm. Irrigation and other intercultural operation were doneas when required. Observation regarding growth viz., plantheight cm (30 and 60 DAS), number of branch per plant,number of leaves per plant and yield contributing characterslike number of fruit per plant, fruit length (cm), fruit diameter(cm), fruit yield per plot and yield of fruits per hectare (q) wererecorded and statistically analyzed.

168 Trends in Biosciences 6 (2), 2013
RESULTS AND DISCUSSION
Plant height (cm)
The data presented in Table 1 revealed significant effecton plant height at 30 days after sowing and 60 days aftersowing under different nutrient management practices. Theplants of the treatment with Biofertilizer (Azotobacter +Azospirillum + Phospho Solubilizing Bacteria) + FYM (15 t/ha) + RDF (50%) were recorded the maximum plant height of46.96cm (at 30 DAS) and 72.05cm (at 60DAS). The minimumplant height of 41.85cm (at 30DAS) and 51.59cm (at 60DAS)were recorded in treatment Biofertilizer (Phospho SolubilizingBacteria) + FYM (15 t/ha). Similarly, in both the studies,integrated application of FYM (15t/ha) +RDF (50%) along withbiofertilizers (Azotobacter, Azospirillum and PSB)significantly increased the plant height over control. This isprobably due to the fact that Integrated Nutrient Management(INM) practices might have induced favorable conditions forproper growth and development of plants. Application of bothnitrogen and phosphorus from inorganic fertilizer, acceleratethe synthesis of chlorophyll and amino acid those areinvolved in the major plant processes. The consequence ofwhich might be increased the plant height in okra. Similareffect has also been reported by Arora, et al. 1991. Integratedapplication of inorganic fertilizers, organic manures and seedtreatment with bio-fertilizers might have lead to enhance thecell division and cell elongation, resulting in better rootdevelopment, increased the uptake of water and nutrients etc.,leading to increased in plant height in Okra. Similar result hasalso been recorded by Anburani and Manivannan, 2002.Significant improvements in plant height due to combinedapplication of both organic and inorganic nutrients have alsobeen reported by Barani and Anburani, 2004.
Number of branches and number of leaves/plant
Data presented in table 1clearly revealed that differenttreatments have significant effect on number of branches andnumber of leaves / plant. The maximum number of branch(3.97) and leaves (41.32) was obtained by the application of
biofertilizer (Azotobacter+ Azospirillum + PSB) +FYM (15t/ha) +RDF (50%) NPK /ha followed by (3.47 and 34.73)respectively with application of RDF+FYM (15t/ha) andbiofertilizer (Azotobacter) +FYM (15t/ha). Among the differenttreatments, biofertilizer (PSB) + FYM (15t/ha) producedminimum number of branch (2.58/plat) and minimum numberof leaves (26.15/plant) at par (2.89 and 28.46), with bio-fertilizer(Azospirillum) +FYM (15t/ha). INM as whole stimulated theassimilation of carbohydrates and proteins which in turnenhanced the cell division and cell elongation in the regionsof auxiliary buds. Similar results have also been reported byRafi et. al., 2002 and Prabhu, et. al., 2003. Increased number ofbranch/plant by application of inorganic fertilizer and bio-fertilizer was also observed by Dange, et. al., 2003. In respectof number of branches and number of leaves per plant, themaximum number of branches and leaves/plant reported inthe plant treated with 50% RDF +Azotobacter + 1300ppmCycocel with export quality fruits in okra Nawalkar, et. al.2007.
Number of fruits per plant :
Biofertilizers and FYM with reduced dose of RDF havesignificant influence on marketable green fruit yield of okra(Table 1). The highest number of fruits (21.13/plant) wereobtained from treatment with biofertilizer (Azotobacter+Azospirillum + PSB) +FYM (15t/ha) +RDF (50%) followed by(16.44/plant) in biofertilizer (Azotobacter) +FYM (15t/ha) +RDF(50%). However, the minimum number of fruits (11.65/plant)were obtained with the treatment biofertilizer (PSB) + FYM(15t/ha). Similar findings of significantly higher number offruits/plant by integrated application of chemical fertilizer,organic manures and bio-fertilizers have also been reportedby Prabhu, et. al., 2003 in okra.
Fruit length (cm)
Significant effects on variation in fruit length have beenrecorded due to different treatment. The longest fruit (11.62cm)were obtained with biofertilizer (Azotobacter+ Azospirillum+ PSB) +FYM (15t/ha) +RDF (50%) followed by (10.79cm) in
Table 1. Effect of nutrient management on growth & yield attributing characters of okraTreatments Plant height
(30 DAS) cm
Plant height (60 DAS) cm
Number of branch /plant
Number of leaves/plant
Number of fruit/plant
Fruit length (cm)
Fruit diameter
(cm)
Fruit yield/plot
(kg)
Fruit yield (q/ha)
T1 44.46 57.54 3.47 33.03 15.85 10.53 1.70 6.60 132.00 T2 45.12 56.80 3.15 31.97 13.99 8.87 1.49 7.06 141.20 T3 42.14 54.88 2.89 28.46 12.63 8.32 1.42 6.26 125.27 T4 41.85 51.59 2.58 26.15 11.65 7.27 1.35 5.56 111.20 T5 46.63 70.91 3.21 34.73 16.44 10.79 1.76 8.07 161.47 T6 43.02 56.08 3.12 31.88 15.07 9.58 1.57 7.41 148.27 T7 43.65 54.96 2.99 31.45 14.38 8.34 1.45 7.26 145.27 T8 46.98 72.05 3.97 41.32 21.13 11.62 1.88 9.76 196.07 T9 44.14 55.24 3.31 32.82 15.19 9.35 1.49 8.14 162.80
SEm (±) 0.560 0.944 0.088 0.559 0.417 0.318 0.029 0.205 0.204 CD (P=0.05) 1.188 2.001 0.187 1.184 0.886 0.674 0.063 0.434 0.433

PRASAD & NAIK : Effect of Varying NPK Levels and Bio-fertilizers on Growth and Yield of Okra 169
treatment with biofertilizer (Azotobacter) +FYM (15t/ha) +RDF(50%). However, the shortest fruit (7.27cm) were obtained bythe treatment biofertilizer (PSB) + FYM (15t/ha). Similarsignificant effects with longest fruits have also been reportedby Kabura, et al. (2001) with the application of organic manuresand bio-fertilizers.
Fruit diameter (cm)
Significantly maximum fruit diameter (1.88cm) wereobtained by biofertilizer (Azotobacter+ Azospirillum + PSB)+FYM (15t/ha) +RDF (50%) followed by (1.76) with biofertilizer(Azotobacter) +FYM (15t/ha) +RDF (50%). However,significantly the minimum diameter of fruit were obtained bythe treatment with bio-fertilizer (PSB) + FYM (15t/ha) (1.35cm).Better fruit diameter of okra was due to integrated applicationof 50% RDF + organic manure +Biofertilizer have also beenreported by Naidu, et al., 2002.
Fruit yield /plot (kg)
The crop yields/plot varied significantly due to differenttreatments. The yields were increased by 5.56 kg to 9.76 kgper plot due to application of graded recommended dose offertilizer (50%) levels with FYM (15t/ha), biofertilizer or both.Application of biofertilizer (Azotobacter+ Azospirillum + PSB)+FYM (15t/ha) +RDF (50%) significantly produced the highestfruit yield per plot (6.76 kg/plot) followed by (8.07 kg/plot)with application of biofertilizer (Azotobacter) +FYM (15t/ha)+RDF (50%). However, lowest yield of fruits/plot were obtainedby the treatment of biofertilizer (PSB) + FYM (15t/ha) (5.56kg).Similar results have also been found by Gowda and Gowda,1983 in okra.
Fruit yield (q/ha)
The crop yields due to application of gradedrecommended dose of chemical fertilizer (50%) levels with FYM(15t/ha), biofertilizers or both were varies significantly andincreased by 111.20 to 196.07 (q/ha). Application of bio-fertilizer (Azotobacter+ Azospirillum + PSB) +FYM (15t/ha)+RDF (50%) significantly produced maximum fruit yield(196.07q/ha) followed by (161.47q/ha) with bio-fertilizer(Azotobacter) +FYM (15t/ha) +RDF (50%) yield. However,significantly minimum fruit yield (111.20q /ha) were obtainedby the application of biofertilizer (PSB) + FYM (15t/ha). Similarreports of significantly higher total fruit yield due to integrated
application of organic and inorganic sources of nutrients thanthe sole application of inorganic fertilizers have also beenreported in okra by Patil, et al., 2000 and Ray, et al., 2005.
LITERATURE CITED
Anburani, A. and Manivannan, K. 2002. Effect of intergrated nutrientmanagement on growth in brinjal (Solanum melongena L).cv.annamalai. S. Indian Hort., 50(4-6): 377-386.
Arora, S.K.; Kumar, N. and Sharma, B.R. 1991. Effect of nitrogen andphosphorus fertilizers on growth and yield component in okra(Abelmoschus esculentus (L.)Moench). Haryana J. Hort., 20(3-4): 261-266.
Barani, P. and Anburani, A. 2003. Influence of vermi composting onmajor nutrients in bhindi (Abelmoschus esculentus (L.)Moench).var.Arka Anamika. S. Indian Hort., 52(1-6): 351-354.
Dange, R. G.; Naik, D. M. and Prabhu, T. 2002. Effect of organic andinorganic fertilizers on growth, yield and quality of chilli ( Capsicumannum L.) S. Indian Hort., 50(4-6): 578-583.
Gowda,N. N.C.and Gowda, P.M. 1983. Effect of inter row and cycocelon growth and yield of Bhindi. S. Indian Hort., 31 (4/5): 210-214.
Kabura, B.H.; Kwari, J.D. and Mainu, I. 2001. Response of okra varietiesto FYM in the semi- arid zone of northeastern Nigeria. J. Sustain.Agric. Envrt. 3(1): 63-69.
Naidu, A.K.; Kushwah, S.S. and Dwivedi, Y.C. 2002. Influence of organicmanures, chemical and biofertilizers on growth, yield and economicsof brinjal. S. Indian Hort., 50(4-6): 370-376.
Nawalkar, L.R.;Khiratkar, S.D.;Badge, S.A.; Chopde,N.K. and Dadgal,S.S. 2007. Effect of biofertilizers and growth regulator with reduceddoses of NPK on growth and yield of okra. J. Soils and Crops.17(1): 145-149.
Patil, M.B.; Jogdand, S.D. and Jadhar, A.S. 2000. Effect of organic andbiofertilizers on yield and quality of okra. J. Maharashtra Agric.Univ., 25(2): 213-214.
Prabhu, T.; Narwadekar, P. R.; Sannindranath, A.K. and Rafi, Mahd.2003. Effect of intergrated nutrient management on growth andyield of okra. (Abelmoschus esculentus (L.)Moench) cv. ParbhaniKranti. The Orissa J. Hort., 31(1): 17-21.
Rafi, Mahd.; Narwadekar, P.R.; Prabhu, T. and Sannindranath, A.K.2002. Effect of organic and inorganic fertilizers on yield and qualityof Tomato( Lycopersocon esculetum Mill.) J. Soils and Crops.,12(2): 167-169.
Roy, R., Patra, S.K., Ghosh, K.K. and Sahoo, S.K. 2005. Intergratednutrient management in okra(Abelmoschus esculentus (L.)Moench)in a river basin. Indian J. Hort., 62(3): 260-264.
Received on 04.03.2013 Accepted on 02.04.2013

Trends in Biosciences 6 (2): 170-173, 2013
Breeding Periodicity of the Mullet, Liza macrolepis from Mangalore WatersH.N.ANJANAYAPPA1, S. BENAKAPPA, S.M. SHIVAPRAKASH, S.R. SOMASHEKARA, A. S. KUMARNAIK, JITENDRA KUMAR, MAHESH, V.
Dept. of Fisheries Resources and Management, Karnataka Veterinary, Animal and Fisheries Sciences University,College of Fisheries, Mangalore 575 002e-mail: [email protected], [email protected]
ABSTRACT
Studies on breeding periodicity of Liza macrolepis inhabitingMangalore waters indicated that this species spawns only oncein a year over a period extending from June to November witha peak during July to August. Data on the size at first maturityof Liza macrolepis using cumulative frequency method showedthat male attained first maturity at 223.64 mm T.L., while thefemale at 236.36 mm T.L. Male always recorded lower Gonado-Somatic Index (GSI) values than female due to higher ovaryweight compared to testis. The GSI values were high duringJune to November with peaks in July and August indicatingthe spawning period of this fish. The fecundity of fish rangedfrom 1, 22,278 to 6, 74,232 eggs, with an average of 2, 84,146eggs. Log linear relationships were established betweenfecundity and total length, fecundity and body weight of thefish as well as fecundity and gonad weight. The sex-ratio ofmale to female was 1:0.85. There was an overall male dominancein the population.
Key words Breeding periodicity, Liza macrolepis, Mangalore.
Mullets form one of the important fisheries of theestuaries and coastal waters of India.Though the catch ofgrey mullets is negligible (0.24%) in the total marine fishproduction of India, they are highly valuable and are in greatdemand. There is also a considerable scope to increase theirproduction through aquaculture practices like extensive andintensive culture, poly or monoculture. The mullet, Lizamacrolepis is one of the most important species alongDakshina Kannada coast, very little information is availableon the spawning area, time of spawning and other relatedparameters hence, the present study was undertaken toinvestigate spawning, fecundity and sex-ratio of this speciesfrom Mangalore region. It is hoped that this information wouldhelp in rational exploitation and management of Lizamacrolepis along this part of the coast.
MATERIALS AND METHODS
The study is based on the random samples totaling to1100 individuals in the size range of 95 to 300 mm total length(TL) comprising 594 male and 506 female. Fortnightly sampleswere collected from the markets and commercial fish landingcentres along the Mangalore coast during the period betweenApril 2003 and March 2004. The commercial catches are landedby using cast nets, seine nets and gill nets from the estuariesof Netravati, Gurpur, Pavanje and Shambhavi.
In the laboratory, the total length (mm), weight (g), sexand maturity stage of individual fish were noted. The ovariesof matured females were preserved in 5% formalin for furtherstudies. Six stages of maturity (immature, maturing, earlymature, late mature, gravid and spent) were recognized on themacroscopic appearance of the ovary and microscopiccharacteristics of ova. Eggs were measured by an occularmicrometer. Frequency polygons were drawn for all the stagesof maturity to find out the frequency of spawning. GonadoSomatic Index (GSI) was calculated by using the formula,gonad weight x 100/ fish weight. Size at first maturity (50%)was determined by using fish with gonads from stage IVonwards and the relative condition factor (Kn) values at varioussize groups. Fecundity was estimated by using ovaries ofstages IV and V. Sex-ratio was calculated for different monthsand different size groups of fish.
RESULTS AND DISCUSSION
Development of ova to maturity:
Ova diameter frequency polygons of Liza macrolepisin various stages of maturity are given in Fig. 1.The size ofova ranged between 0.02 and 0.64 mm (Table 1).In stage I, thesize of ova ranged from 0.02 mm to 0.10 mm, majority of themranging in size from 0.02 mm to 0.06 mm. In stage II, a batch ofmaturing eggs is withdrawn from the general egg stock. Thematuring group had a modal value at 0.06 mm, while the largestova measures at 0.24 mm. In stage III, this progresses to 0.18mm, the maximum size being 0.32 mm. The mode at 0.18 mm ofstage III moves to 0.32 in stage IV with a maximum size at 0.44mm. In stage V, there was only one group of mature eggsforming the mode at 0.52 mm. However, maximum size of ovameasured up to 0.64 mm. In stage VI, there was a mode at 0.02mm, maximum size of the ova being 0.16 mm. This stageresembles I or II stage. The fish seems to remain in thiscondition until the maturation cycle commences again.
Stages of maturity
Description of ova
Mode of largest group of ova (mm)
Maximum size of ova (mm)
I Immature 0.02 0.10 II Maturing 0.06 0.24 III Early mature 0.18 0.32 IV Late mature 0.32 0.44 V Gravid 0.52 0.64 VI Spent 0.02 0.16
Table 1. Classification of maturity stages of Lizamacrolepis

ANJANAYAPPA et. al.,: Breeding Periodicity of the Mullet, Liza macrolepis from Mangalore Waters 171
Frequency of spawning:
It was observed from the ova diameter studies that thereare two groups of ova, viz., immature and mature in a matureovary. A batch of the immature stock of ova develops to forma distinct group of mature eggs to be spawned in the ensuingspawning season. The unspawned larger eggs in spent ovariesare resorbed as evidenced by the presence of thin shell likestructure left over in such ovaries. This fish seems to remainin this condition until the maturation cycle commences again.Hence, it appears that the individual spawns only once a year.Single spawning was also reported by Sarojini, 1957 in Mugil
Fig. 1. Ova diameter frequency polygons of Liza macrolepisin various stages of maturity.
Maturity stages Months No. of fish Sex I II III IV V VI
52 M 51.92 32.69 15.38 - - - Apr 2003 51 F 47.06 19.61 33.33 - - -
47 M 40.43 25.53 27.66 6.38 - - May 45 F 44.44 28.88 26.67 - - -
50 M 46.00 26.00 14.00 10.00 4.00 - Jun. 49 F 20.41 24.49 26.53 22.45 6.12 -
41 M 31.71 21.95 19.51 21.95 4.89 - Jul. 52 F 7.69 15.38 15.38 28.85 32.69 -
44 M 20.45 4.55 19.91 29.55 27.27 2.27 Aug. 51 F 9.80 11.76 15.69 39.22 21.57 1.96 50 M 10.00 22.00 14.00 26.00 24.00 4.00 Sep. 41 F 21.95 7.32 17.07 34.15 14.63 4.88 39 M 17.95 33.33 25.64 12.85 7.69 2.56 Oct. 26 F 30.77 30.77 19.23 11.54 7.69 - 54 M 27.78 16.67 18.52 20.37 14.81 1.85 Nov. 34 F 35.29 47.06 8.82 5.88 2.94 - 48 M 54.17 27.08 16.67 2.08 - - Dec. 36 F 61.11 38.89 - - - - 56 M 44.64 42.86 10.71 1.79 - - Jan. 2004 38 F 52.63 47.37 - - - - 60 M 68.33 31.67 - - - - Feb. 42 F 61.90 38.09 - - - - 53 M 45.28 41.51 13.21 - - - Mar. 41 F 53.65 34.15 12.19 - - -
Table 2. Month-wise percentage of gonads in differentstages of maturity of Liza macrolepis
Fig.3. Monthly variation in the Gonado-Somatic Index in Lizamacrolepis
0
10
20
30
40
50
60
70
80
90
100
90 110 130 150 170 190 210 230 250 270 290
MaleFemale
Total length (mm)
Cum
ulat
ive
perc
enta
ge
of m
atur
e fis
h
Fig.2. Size at first maturity of Liza macrolepis

172 Trends in Biosciences 6 (2), 2013
parsia and Liza macrolepis and Mugil cephalus by Luther,1963 concluded that mullets exhibited non intermittent andsingle spawning per season because of the production ofonly one set of ova per year.
Spawning season:
Percentage occurrence of different stages of gonads ofLiza macrolepis in different months are given in Table 2.Spawning stages of gonads first occurred during the monthof June. From the Table 2 it is clear that the species Lizamacrolepis spawned only once in a year over a prolongedperiod extending from June to November with a peak duringJuly to August along the Mangalore coast. The gonado-somatic index values also revealed (Fig.3) that the spawningseason extended from June to November. The average GSIobserved was more in female than in male perhaps due to agreater ovary weight compared to testes and subsequent dropin GSI indicates the release of gamets. According to Luther,1963 the spawning season of L. macrolepis and Mugil cephalusin Mandapam waters extended from June to February with apeak during July and August. Such extended spawning seasonwas also reported in L. tade (Reddy, 1985), V. speigleri(Baburaj, 1987) and V. seheli (Moorthy, 2000) from Mangalorewaters.
Size at first maturity:
Data on the size at first maturity of L. macrolepis usingcumulative frequency method (Fig.2) showed that maleattained first maturity at 223.64 mm TL. While for female, thesize at first maturity was 236.36 mm TL. According to theobservations of Luther, 1963, male and female of L. macrolepisattained first maturity at about 160 and 170 mm respectively.Jhingran and Natarajan, 1970 reported that the size at firstmaturity for the male and female of M. macrolepis was 212 mmand 237 mm respectively. Wijayarathne and Costa, 1987reported that L. macrolepis Negombo lagoon, attainedmaturity at 16 and 21 cm TL of in male and female respectively.Krishna kumar and Balakrishnan Nair, 1995 worked on breeding
biology of V. cunnesius inhabiting the Ashtamudi estuary.According to them the size at first maturity for male was around139 mm and for female 148 mm TL.
Fecundity
Knowledge of total number of eggs produced by a fishin a year is important for determining the spawning potentialof a fish. Fecundity is usually determined from the number ofova of the mature group in the ovary. The details are presentedin Table 3. In the present study, fecundity of L. macrolepisfound to vary from 1,22,278 to 6,74,232 eggs depending uponthe size of fish (215 mm to 300 mm TL.). Luther, 1963 reportedthat in case of L. macrolepis the fecundity ranged from 1,51,920to 6,76,200 eggs. Das 1977b observed the fecundity of greymullet, M. cephalus at 43,000 to 5,13,000 in fishes varying inlength from 140 to 315 mm. Baburaj, 1987 reported thatfecundity in V. speigleri varied from 1,34,327 to 8,39,492 forthe fish ranging between 150 and 415 mm in total length.Logarithmic relations of fecundity (F), with length of fish (L),weight of fish (W), and gonad weight (GW) are given inTable 4. The Logarithmic relations between fecundity andlength of fish, fecundity and weight of fish and fecundity andgonad weight were found to be linear indicating that thefecundity generally increased with increasing length, weightand gonad.Sex ratio:
Sex-ratio studies (Table 4) indicated that there was anoverall predominance of male in the population. The sex-ratiobetween male and female was 1.00: 0.85 during the period.Chi-square test (5%) showed no significant deviation fromthe theoretical ratio of 1: 1 except November.
Table 3. Number of mature ova in individuals of L Lizamacrolepis
Sl. No.
Total length (mm)
Body weight (g)
Gonad weight (g) Fecundity Stage of
maturity 1 215 79 4.18 1,22,278 IV 2 220 81.5 4.24 1,37,262 IV 3 225 84.5 5.16 1,51,549 IV 4 245 129 5.98 2,27,240 IV 5 250 139 6.12 2,20,320 V 6 255 125 4.79 1,57,942 IV 7 265 180 6.81 2,35,444 V 8 275 187 9.87 2,53,066 IV 9 275 189 10.45 2,36,170 IV
10 280 200 12.38 2,58,907 V 11 285 20 15.96 2,92,919 V 12 290 207 16.48 3,12,460 V 13 295 25 10.50 3,46,920 IV 14 300 300 16.41 6,74,232 V 15 300 295 14.54 6,35,494 IV
Table 4. Logarithmic relationship of fecundity with length(L), weight (W), and gonad weight (GW) of Lizamacrolepis
Statistical relationship Logarithmic form Power equation form
Correlation coefficient (r)
F = -3.8713 + 3.8271 L F = -3.8713 + L 3.8271 0.8634 F = 3.0492 + 1.0604 W F = 3.0492 + W 1.0604 0.9173
F = 4.6016 + 0.8512 GW F = 4.6016 + GW 0.8512 0.8539
Study on spawning periodicity of Liza macrolepis
indicated that this species spawned only once in a year overa prolonged period extending from June to November with apeak during July to August. Data on the size at first maturityof L. macrolepis using cumulative frequency method showedthat male attained first maturity at 223.64 mm T.L., while forfemale, the size at first maturity was 236.36 mm T.L. Male alwaysrecorded lower gonado-somatic index (GSI) values than femaledue to greater ovary weight compared to testes. The GSIvalues were high during June to November with peaks in Julyand August indicating the spawning period of this fish alongMangalore coast. The fecundity of fish ranged from 1,22,278to 6,74,232 eggs, with an average of 2,84,146 eggs. Log linear

ANJANAYAPPA et. al.,: Breeding Periodicity of the Mullet, Liza macrolepis from Mangalore Waters 173
relationships were established between fecundity and totallength, fecundity and body weight of the fish as well asfecundity and gonad weight. The sex ratio of male: female was1: 0.85. There was an overall predominance of male in thepopulation.
LITERATURE CITED
Baburaj, D. 1987. Some aspects of biology of the mullet, Valamugilspeigleri (Bleeker) from Mangalore region. M.F.Sc. thesis, Univ.
Agril. Sci., Bangalore. pp.155.
Das, H. P. 1977 (b). Length - weight relationship and relative conditionof grey mullet, M. cephalus. Mahasagar., 10(3-4): 145-149.
Jhingran, V.G. and Natarajan, A. V. 1970. Study on the fisheries and fishpopulations of the Chilka lake for breeding. Curr. Sci., 27(5):181-182.
Krishnakumar, K. and Balakrishnan Nair, N.B. 1995. Breeding biologyof the grey mullet Valamugil cunnesius from the Astamudi estuary,South-west coast of India. Fish. Technol. Soc. Fish. Technol (India).,32(1): 1-5.
Luther, G. 1963. Some observations on the biology of Liza macrolepis(Smith) and M. cephalus Linnaeus (Mugilidae) with notes on thefishery of grey mullets near Mandapam. Indian J. Fish., 10: 642-665.
Moorthy K.S.V. 2000. Feeding ecology and population characteristicsof the mullet, Valamugil seheli (Forskal) from Mangalore coast.Ph. D. thesis, Univ. Agril. Sci., Bangalore. pp.190
Reddy, S. 1985. Some aspects of biology of the mullet, Liza tade (Forskal)from Mangalore region. M.F.Sc. thesis, Univ. Agril. Sci., Bangalore.pp.125.
Sarojini, K.K. 1957. Biology and fisheries of the grey mullets of Bengal.1. Biology of Mugil parsia (Hamilton) with notes on its fishery inBengal. Indian J. Fish., 4: 160-205.
Wijeyaratne, M.J.S. and Costa, H.H. 1987 (b). The food, feeding andreproduction of the Borneo mullet, Liza macrolepis (Smith) in acoastal estuary in Srilanka. Indian J. Fish., 34(3): 283-291.
Received on 13.02.2013 Accepted on 19.03.2013
Table 5. Sex ratio in different size groups of Lizamacrolepis
Male Female Months Total no. of fishes n N
Chi – square values
Male : Female
Apr. 2003 103 52 51 0.0098 1 : 0.98 May 92 47 45 0.0434 1 : 0.96 Jun. 99 50 49 0.0102 1 : 0.98 Jul. 93 41 52 1.3010 1 : 1.27 Aug. 95 44 51 0.5158 1 : 1.16 Sep. 91 50 41 0.8902 1 : 0.82 Oct. 65 39 26 2.6000 1 : 0.67 Nov. 88 54 34 4.5454* 1 : 0.63 Dec. 84 48 36 1.7142 1 : 0.75
Jan. 2004 94 56 38 3.4468 1 : 0.68 Feb. 102 60 42 3.1764 1 : 0.70 Mar. 94 53 41 1.5318 1 : 0.77 Total 1100 594 506 7.0400 1 : 0.85

Trends in Biosciences 6 (2): 174-176, 2013
Effect of Biofertilzers on Growth and Yield Attributes of Pea (Pisum sativum L.)PUSHKAR SINGH PATEL, R.B. RAM, JAYPRAKASH AND M.L.MEENA
Department of Applied Plant Science (Horticulture),Babasaheb Bhimrao Ambedkar (Central University),Vidya Vihar Raebareli Road, Lucknow, Uttar Pradesh 226 025e-mail: [email protected]
ABSTRACT
A field experiment was carried out to assess the growth andyield characters of pea cv Arkel. The experiment was laid out inrandomized block design with three replications for pea cropconsisting 15 treatments namely, RDF of NPK (25: 70: 50 ) kg/ha, Azospirillum+50% N and RDF of P and K, Azospirillum+75% N and RDF of P and K, Azospirillum+ RDF of NPK, PSB+50% P and RDF of N &K, PSB+ 75% P and RDF of N&K, PSB+RDF of NPK, Rhizobium+50% N RDF of N&K, Rhizobium+75% N and RDF of P&K, Rhizobium+ RDF of NPK, VAM+ 50%P and RDF of N&K, VAM+ 75% P and RDF and N&K, VAM+RDF of NPK, PSB+ Rhizobium +50% NPK, PSB+ Rhizobium+50% NP & full dose of K to find out the effect of bio fertilizers,inorganic and its combinations on days to germination, numberof plants per plot, plant height (cm), days to flowering, numberof flowers per plant, days to first fruit harvest, number of podsper plant, number of seeds per pod, length of leaf (cm), shellingpercentage, weight of 10- pods (g), seed weight (g), yield perplot, length of pod (cm).However, The application of inorganicand biofertilizers, treatment – T1- (Rhizobium and RDF ofNPK), showed superior among all treatments underinvestigation.
Key words Biofertilizer, Pea, VAM, Rhizobium, Azospirillum
The progressive use of fertilizers along with inorganicfertilizer may be the right answer in the recent year and use ofmicrobial inoculants as source of biofertilizers have become ahope for most of the countries as for as economically andenvironmental point of voice are concerned. Bio-fertilizers areeconomically, attractive and ecologically sound means offertilization. Therefore, is developing countries like India itcan solve the problem at highest cost of fertilizers and help insaving the economy of the country. The biofertilizers denoteall the nutrients are part of biological origin for plant growth.They passes unique ability to enhance productivity bybiological nitrogen fixation are solubilization at insolublephosphate or producing hormones vitamins are other growthfactor require for plant growth. The beneficial microbes whichare of great significant are biological nitrogen fixationphosphate solubilizers and mycorrhizal fungi Azotobacter isthe bacterial which have been known to fix nitrogenbiologically use of these microbial fertilizer cut down thequantity of nitrogenous fertilizer with some improvement inthe crop field. They are also reported to have an effective rolein improving disease resistant in the crop by producing anti
bacterial and fungal compounds and also produce growthregulators. Azospirillum is a group of bacteria which fixes N2in loose association with plant. It fixes nitrogen equivalent to40-50 Kg/ ha and also produces IBA, GA3 and cytokinins likesubstances. It also increases root biomass in the inoculatedplants, thereby it helps in greater absorption of nutrients. Aswell as resulting is higher yield. Around 95 to 99% of the totalsoil phosphorus is insoluble which is not directly available toplants. The phosphate solubilizing bacteria may convert itinto soluble form for by producing organic acids about 15 to25% of insoluble phosphate can be solubilized saving chemicalfertilizers significantly. The endomycorrhizae otherwise knownas the vesicular arbuscular mycorrhizae (VAM) are the mostubiquitous fungal association among angiosperms. Theimportance of VAM fungi is well appreciated due to their abilityto improve nutrient uptake, disease resistant and droughtresistant etc.
MATERIALS AND METHODS
The present investigation entitled “Effect of biofertilizers on growth and yield traits of pea (Pissum sativum Lsp. hortense) cv. Arkel” was carried out at the HorticultureResearch Farm of the Department of Applied Plant Science(Horticulture), Babasaheb Bhimrao Ambedkar University,Vidya Vihar, Rae Bareli Road Lucknow (U. P.) in randomizedblock design with three replications in plot size of 1.5 x1.0 mwith spacing of 30 x10 cm during Rabi season of 2011-12.Experimental field was laid out in randomized block designwith 15 treatments and replicated thrice. The treatmentcombinations comprised namely, T1- RDF of NPK (25:70:50)kg /ha, T2- Azospirillum + 50% N and RDF of P&K, T3-Azospirillum +75% N and RDF of P&K, T4- Azospirillum +RDF, T5- PSB+ 50% P and RDF of N&K, T6- PSB+ 75% P andRDF of N&K, T7- PSB+ RDF, T8- Rhizobium+ 50% N and RDFof P&K, T9- Rhizobium+ 75% N and RDF of P&K, T10-Rhizobium+RDF, T11- VAM+50% P and RDF of N&K, T12-VAM+ 75% P and RDF of N&K, T13- VAM+ RDF, T14-PSB+Rhizobium + 50% NPK, T15- PSB+ Rhizobium+ 50% NPand full dose of K. Other cultural practices like mulching,irrigation, hoeing, insect-pest and disease management werecommon for the each treatment. Observations were record on14 characters including vegetative and yield attributingcharacters viz., days to germination, number of plants perplot, plant height (cm), days to flowering, number of flowers
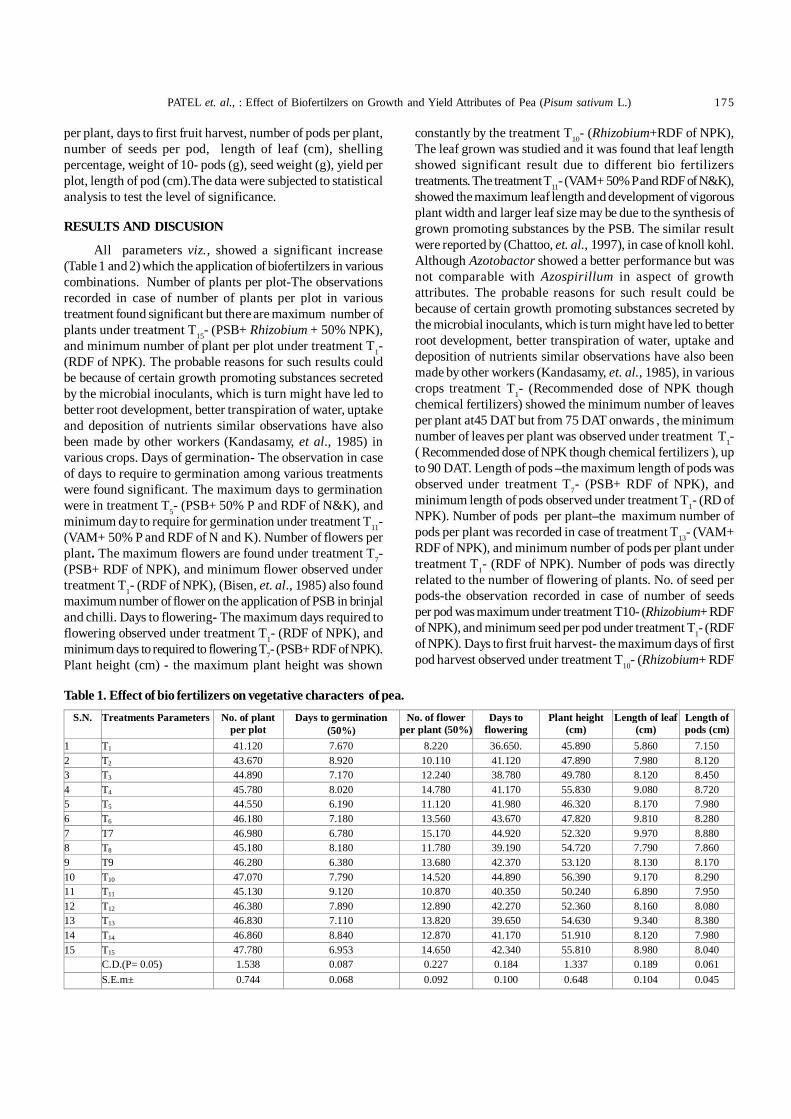
PATEL et. al., : Effect of Biofertilzers on Growth and Yield Attributes of Pea (Pisum sativum L.) 175
per plant, days to first fruit harvest, number of pods per plant,number of seeds per pod, length of leaf (cm), shellingpercentage, weight of 10- pods (g), seed weight (g), yield perplot, length of pod (cm).The data were subjected to statisticalanalysis to test the level of significance.
RESULTS AND DISCUSION
All parameters viz., showed a significant increase(Table 1 and 2) which the application of biofertilzers in variouscombinations. Number of plants per plot-The observationsrecorded in case of number of plants per plot in varioustreatment found significant but there are maximum number ofplants under treatment T15- (PSB+ Rhizobium + 50% NPK),and minimum number of plant per plot under treatment T1-(RDF of NPK). The probable reasons for such results couldbe because of certain growth promoting substances secretedby the microbial inoculants, which is turn might have led tobetter root development, better transpiration of water, uptakeand deposition of nutrients similar observations have alsobeen made by other workers (Kandasamy, et al., 1985) invarious crops. Days of germination- The observation in caseof days to require to germination among various treatmentswere found significant. The maximum days to germinationwere in treatment T5- (PSB+ 50% P and RDF of N&K), andminimum day to require for germination under treatment T11-(VAM+ 50% P and RDF of N and K). Number of flowers perplant. The maximum flowers are found under treatment T7-(PSB+ RDF of NPK), and minimum flower observed undertreatment T1- (RDF of NPK), (Bisen, et. al., 1985) also foundmaximum number of flower on the application of PSB in brinjaland chilli. Days to flowering- The maximum days required toflowering observed under treatment T1- (RDF of NPK), andminimum days to required to flowering T7- (PSB+ RDF of NPK).Plant height (cm) - the maximum plant height was shown
constantly by the treatment T10- (Rhizobium+RDF of NPK),The leaf grown was studied and it was found that leaf lengthshowed significant result due to different bio fertilizerstreatments. The treatment T11- (VAM+ 50% P and RDF of N&K),showed the maximum leaf length and development of vigorousplant width and larger leaf size may be due to the synthesis ofgrown promoting substances by the PSB. The similar resultwere reported by (Chattoo, et. al., 1997), in case of knoll kohl.Although Azotobactor showed a better performance but wasnot comparable with Azospirillum in aspect of growthattributes. The probable reasons for such result could bebecause of certain growth promoting substances secreted bythe microbial inoculants, which is turn might have led to betterroot development, better transpiration of water, uptake anddeposition of nutrients similar observations have also beenmade by other workers (Kandasamy, et. al., 1985), in variouscrops treatment T1- (Recommended dose of NPK thoughchemical fertilizers) showed the minimum number of leavesper plant at45 DAT but from 75 DAT onwards , the minimumnumber of leaves per plant was observed under treatment T1-( Recommended dose of NPK though chemical fertilizers ), upto 90 DAT. Length of pods –the maximum length of pods wasobserved under treatment T7- (PSB+ RDF of NPK), andminimum length of pods observed under treatment T1- (RD ofNPK). Number of pods per plant–the maximum number ofpods per plant was recorded in case of treatment T13- (VAM+RDF of NPK), and minimum number of pods per plant undertreatment T1- (RDF of NPK). Number of pods was directlyrelated to the number of flowering of plants. No. of seed perpods-the observation recorded in case of number of seedsper pod was maximum under treatment T10- (Rhizobium+ RDFof NPK), and minimum seed per pod under treatment T1- (RDFof NPK). Days to first fruit harvest- the maximum days of firstpod harvest observed under treatment T10- (Rhizobium+ RDF
Table 1. Effect of bio fertilizers on vegetative characters of pea.S.N. Treatments Parameters
No. of plant
per plot Days to germination
(50%) No. of flower
per plant (50%) Days to
flowering Plant height
(cm) Length of leaf
(cm) Length of pods (cm)
1 T1 41.120 7.670 8.220 36.650. 45.890 5.860 7.150 2 T2 43.670 8.920 10.110 41.120 47.890 7.980 8.120 3 T3 44.890 7.170 12.240 38.780 49.780 8.120 8.450 4 T4 45.780 8.020 14.780 41.170 55.830 9.080 8.720 5 T5 44.550 6.190 11.120 41.980 46.320 8.170 7.980 6 T6 46.180 7.180 13.560 43.670 47.820 9.810 8.280 7 T7 46.980 6.780 15.170 44.920 52.320 9.970 8.880 8 T8 45.180 8.180 11.780 39.190 54.720 7.790 7.860 9 T9 46.280 6.380 13.680 42.370 53.120 8.130 8.170 10 T10 47.070 7.790 14.520 44.890 56.390 9.170 8.290 11 T11 45.130 9.120 10.870 40.350 50.240 6.890 7.950 12 T12 46.380 7.890 12.890 42.270 52.360 8.160 8.080 13 T13 46.830 7.110 13.820 39.650 54.630 9.340 8.380 14 T14 46.860 8.840 12.870 41.170 51.910 8.120 7.980 15 T15 47.780 6.953 14.650 42.340 55.810 8.980 8.040 C.D.(P= 0.05) 1.538 0.087 0.227 0.184 1.337 0.189 0.061 S.E.m± 0.744 0.068 0.092 0.100 0.648 0.104 0.045
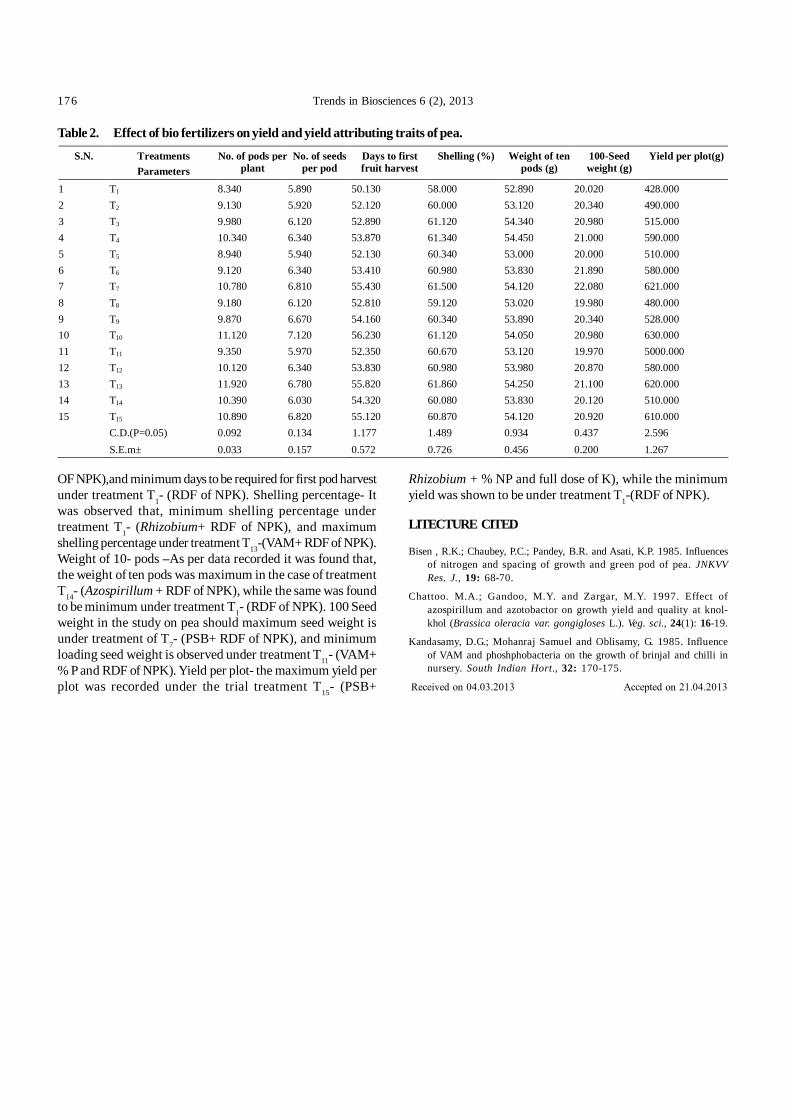
176 Trends in Biosciences 6 (2), 2013
OF NPK),and minimum days to be required for first pod harvestunder treatment T1- (RDF of NPK). Shelling percentage- Itwas observed that, minimum shelling percentage undertreatment T1- (Rhizobium+ RDF of NPK), and maximumshelling percentage under treatment T13-(VAM+ RDF of NPK).Weight of 10- pods –As per data recorded it was found that,the weight of ten pods was maximum in the case of treatmentT14- (Azospirillum + RDF of NPK), while the same was foundto be minimum under treatment T1- (RDF of NPK). 100 Seedweight in the study on pea should maximum seed weight isunder treatment of T7- (PSB+ RDF of NPK), and minimumloading seed weight is observed under treatment T11- (VAM+% P and RDF of NPK). Yield per plot- the maximum yield perplot was recorded under the trial treatment T15- (PSB+
Table 2. Effect of bio fertilizers on yield and yield attributing traits of pea.
S.N.
Treatments Parameters
No. of pods per plant
No. of seeds per pod
Days to first fruit harvest
Shelling (%) Weight of ten pods (g)
100-Seed weight (g)
Yield per plot(g)
1 T1 8.340 5.890 50.130 58.000 52.890 20.020 428.000 2 T2 9.130 5.920 52.120 60.000 53.120 20.340 490.000 3 T3 9.980 6.120 52.890 61.120 54.340 20.980 515.000 4 T4 10.340 6.340 53.870 61.340 54.450 21.000 590.000 5 T5 8.940 5.940 52.130 60.340 53.000 20.000 510.000 6 T6 9.120 6.340 53.410 60.980 53.830 21.890 580.000 7 T7 10.780 6.810 55.430 61.500 54.120 22.080 621.000 8 T8 9.180 6.120 52.810 59.120 53.020 19.980 480.000 9 T9 9.870 6.670 54.160 60.340 53.890 20.340 528.000 10 T10 11.120 7.120 56.230 61.120 54.050 20.980 630.000 11 T11 9.350 5.970 52.350 60.670 53.120 19.970 5000.000 12 T12 10.120 6.340 53.830 60.980 53.980 20.870 580.000 13 T13 11.920 6.780 55.820 61.860 54.250 21.100 620.000 14 T14 10.390 6.030 54.320 60.080 53.830 20.120 510.000 15 T15 10.890 6.820 55.120 60.870 54.120 20.920 610.000 C.D.(P=0.05) 0.092 0.134 1.177 1.489 0.934 0.437 2.596
S.E.m± 0.033 0.157 0.572 0.726 0.456 0.200 1.267
Rhizobium + % NP and full dose of K), while the minimumyield was shown to be under treatment T1-(RDF of NPK).
LITECTURE CITED
Bisen , R.K.; Chaubey, P.C.; Pandey, B.R. and Asati, K.P. 1985. Influencesof nitrogen and spacing of growth and green pod of pea. JNKVVRes. J., 19: 68-70.
Chattoo. M.A.; Gandoo, M.Y. and Zargar, M.Y. 1997. Effect ofazospirillum and azotobactor on growth yield and quality at knol-khol (Brassica oleracia var. gongigloses L.). Veg. sci., 24(1): 16-19.
Kandasamy, D.G.; Mohanraj Samuel and Oblisamy, G. 1985. Influenceof VAM and phoshphobacteria on the growth of brinjal and chilli innursery. South Indian Hort., 32: 170-175.
Received on 04.03.2013 Accepted on 21.04.2013

Trends in Biosciences 6 (2): 177-179, 2013
Studies of Quality Characteristics in Short Grain Scented Rice (Oryza sativa L.)Varieties AccessionsSUNITA KUMARI1, R.N.KEWAT, R.P.SINGH AND PRATIBHA SINGH
Department of Biochemistry, N.D.University of Agriculture & Technology, Kumarganj, Faizabade-mail: [email protected]
ABSTRACT
The present investigation on Studies of quality characteristicsin short grain scented rice varieties/accessions was conductedat Crop Research Station, Masodha, Faizabad during kharifseason. Twelve varieties/strains namely V1, (NDR 6279), V2(NDR 6265), V3 (Badshah Bhog), V4 (NDR 6257), V5 (BadshahPasand), V6 (Bhanta Phool A), V7 (IET 19800), V8 Kalanamak A,V9 (Kanak Jeer), V10 (Rambhog B), V11 (Kalanamak Berdpur)and V12 (Lalmati) were screened out on the basis of physicaland biochemical traits. Maximum kernel length was observedin (7.07 mm ) NDR 6265 and kernel breadth was (1.81 mm) inNDR 625. Maximum elongation ratio was observed in (1.88mm)Kankjeer and Banta Phool A and kernel length after cookingwas maximum in (11.4mm) NDR 6265. Maximum carbohydratecontent was found in Kalanamak Berdpur (79.4%). Maximumamylose content was found in variety Kalanamak Berdpur(19.8%). Highest total sugar content and non reducing sugarcontent was Badshah Pasonda 1.92 g/100g and 1.72g/100grespectively whereas reducing sugar content was highest inKalanamak Berdpur .32 g/100g. On the basis of aboveparameters variety Kalanamak Berdpur, Badshah pasonda, NDR6265 and NDR 625 were rated superior among the all varieties/accessions tested in the present investigation.
Key words Aromatic rice, kernel length, kernel breadth, Elongationratio, Carbohydrate, Amylose and Sugars content.
Aromatic rice (Oryza sativa L.)contains severalbiochemicals, but the most significant one is identified as 2-acetyl pyrroline (2AP). The popcorn-like smell of aromaticrice, stemming primarily from its 2-acetyl-1-pyrroline content(Bhattacharjee, et al., 2002) or pandan (Pandanusamaryllifolius)-like odour. Aromatic rice fetches high pricesin some international markets including south Asia, the MiddleEast, and particularly India, Pakistan, and Thailand (Kaosa-ard and Juliano, 1992). Thailand, India, and Pakistan arecompetitive producers and developers of aromatic rice in theworld. However, many of farmers in these countries growspecific varieties mainly for export markets. One of the reasonsis the limitation in aromatic rice production is yieldimprovement. The first high-yielding Basmati rice cultivarsare Pusa Basmati1 and Kasturi; they yield 4.5 and 4.0 ton/ha(about 1.5 and 1.0 tons/ha) higher than traditional Basmativarieties (Bhattacharjee, et al., 2002). Until 2007, it wasaccounted for 40- 60% of Basmati rice exports from India(Siddiq, et al., 2012).
There are significant cultural differences in qualitypreferences and the most important acceptance factors forAsian consumers living in the United States are cooked riceappearance and aroma (Meullenet, et al., 2001). Starch is themajor constituent of milled rice at about 90% of the dry matter.Cooking characteristics, texture, water absorption ability,stickiness, volume expansion, hardness and even thewhiteness and gloss of the cooked milled rice are affected bythe amylose content (Juliano, 1985b). Carbohydrate is one ofthe major constituents of rice and it also affects their cookingqualities which reflect its functional property in rice. Keepingin view of above facts, the present investigation wasconducted.
MATERIALS AND METHODS
The field experiment was conducted during kharif,season in completely randomized block design with threereplications at Crop Research Station Masodha, Faizabad(U.P.). All the agronomical practices were done to achievegood crop in relation to biochemical content. Healthy scentedrice seeds were hulling and milling in CRS, Masodha by hullingand milling machine. After that all the varieties were broughtto the laboratory of Biochemistry in N.D.U.A.&T. forbiochemical analysis. After threshing all varieties were broughtto laboratory of biochemistry for biochemical analysis.Vernaearcalipers was used for calculation of length andbreadth. Carbohydrate content in grain was determined bythe method of (Mc cready, et al., 1950). Amylose content ingrain was determined by the method of Juliano 1979. Totalsugar content in grain was determined by the method ofDubois, et al., 1950. Reducing sugar content in grain wasdetermined by the method of Miller, 1959. The non –reducingsugar was obtained by subtraction of reducing sugar fromtotal sugar.
Non- reducing sugar =Total sugar –reducing sugar
RESULTS AND DISCUSSION
Kernel length, Kernel breath, elongation ratio and kernellength after cooking have been represented in Table 1. Thekernel length in varieties ranged from 3.96-7.07 mm. Maximumkernel length was found 7.07 mm in NDR 6265 which wassignificantly higher over the rest varieties. Kernel length ofvariety is governed by its genetic potential. Hence, varieties

178 Trends in Biosciences 6 (2), 2013
differed significantly with each other in respect of kernellength. The result is supported by Trivedi, 2007 evaluatedmaximum length of rice kernel was found in Pusa Basmati 7.5mm. The results are close favors with Singh, et. al., 2005 asfound the variation in kernel length in range from 4-5.60 mmfor forty Kalanamak germplasm.
The kernel breadth in varieties ranged from 1.33-1.81mm. maximum kernel breadth was found 1.81 mm in NDR-6265which was significantly more over the rest varieties. In respectof undertaken varieties differ significantly with each other inrespect of kernel breadth. The result is supported by Trivedi,2007 examined the kernel breadth from 1.74-1.94 mm whereasSingh, et al., 2005 witnessed in range from 1.5-2.1 mm.
Elongation ratio in short grain scented rice ranged from1.44-1.88. maximum elongation ratio was found 1.88 in varietiesBhonta-Phool A and Kanak-Jeer which was better over therest of the varieties. This result was supported by Singh,et al. (2005).
Kernel length after cooking ranged from 6.68-11.40 mm.Maximum kernel length after cooking was found 11.40 mm inNDR 6265 which was significantly higher over the restvarieties. Similar findings have also been reported by Horuichi,1966 and Singh, et al. 2005.
Data pertaining to carbohydrate content, amylosecontent, total sugar content, reducing sugar content and nonreducing sugar content have been shown in Table 2.Thecarbohydrate content in various short grain scented ricevarieties varies from 64.28-79.54 per cent. Maximumcarbohydrate content was observed 79.54 per cent in varietykalanamak- Berdpur. These results have been supported byMangkaeo et al. (2005).
Amylose content in various short grain scented ricevarieties ranged from 19.81-23.97 per cent. Maximum amylosecontent was observed 23.97 per cent in variety Kalanamak-A. The variation among the varieties is non-significant. Theseresults have been close coherent from Dipti et al., 2002,Rayaguru, and Pandey, 2007 and Shabbir, et al., 2008.
Table 1. Physical characteristics of different varieties/accessions of short grain aromatic rice kernel
Fig.1. Physical characteristics of different varieties/strain ofshort grain aromatic rice kernel
Table 2. Variability in carbohydrate, Amylose and sugarcontent of different varieties/strains of short grainaromatic rice
Fig. 2. Variability in carbohydrate, Amylose and sugar contentof different varieties/strains of short grain aromatic rice.
Varieties Treatment
Kernel length (mm)
Kernel breadth
(mm)
Elongation ratio
Kernel length after
cooking NDR 6279 6.30** 1.78** 1.44* 9.12 NDR 6265 7.07*** 1.66 1.61 11.4*** 3.96* 1.57 1.68 6.68* NDR 625 5.67 1.81*** 1.56 8.86 5. 64 1.69 1.63 9.12 Bhanta Phool A 4.26 1.64 1.88*** 8.02 IET-19800 5.05 1.44 1.65 8.37 Kalanamak A 5.47 1.72 1.70 9.34 Kanak-Jeer 5.07 1.60 1.88*** 9.54 Ram-Bhog-B 5.6 0 1.62 1.59 9.85** Kalanamak Berdpur 5.19 1.48 1.72 8.92 Lalmati 5.36 1.33* 1.75** 9.43 CD at 5% 0.770 0.220 0.205 1.388 SEm± 0.264 0.075 0.070 0.475
Varieties Treatment
Carbohydrate content
(%)
Amylose content
(%)
Total sugar
content (g/100g)
Reducing sugar
content (g/100g)
Non-reducing
sugar (g/100g)
NDR 6279 67.85 21.78 1.72 0.26 1.46 NDR 6265 69.53 22.30 1.66* 0.21 1.45 Badshah-Bhog 78.69** 23.77 1.69 0.24 1.45 NDR 625 73.69 22.75 1.91 0.22 1.69 Badshah-Pasonda 69.09 21.62 1.98*** 0.26 1.72*** Bhanta-Phool A 64.28* 21.93 1.77 0.18* 1.59 IET 19800 67.44 20.15 1.72 0.25 1.47 Kalanamak A 77.61 23.97*** 185 0.20 1.65 Kanak-Jeer 71.42 21.78 1.75 0.31** 1.44* Ram-Bhog B 68.07 21.62 1.86 0.29 1.57 Kalanamak-Berdpur 79.54*** 22.92 1.94 0.32*** 1.62
Lalmati 72.27 19.81* 1.97** 0.27 1.70** CD at 5% 12.584 3.213 0.329 0.025 0.245 SEm± 4.311 1.100 0.113 0.008 0.084

KUMARI et. al., : Studies of quality characteristics in short grain scented rice (Oryza sativa L.) varieties/strains 179
Total sugar content in various short grain scented ricevarieties ranged from 1.66-1.98 per cent. Maximum total sugarcontent was observed 1.98 per cent in variety Badshah-Pasonda which was significantly higher over the rest varieties.These results are in agreement to Borua, et al., 2003.
Reducing sugar content in various scented rice varietiesvaried from .18-.32 g/100g. Maximum reducing sugar contentwas observed in kalanamak-Berdpur (.33 g/100g) which wassignificantly superior over the rest of varieties. These resultshave been supported by Borua et al. (2003).
Non-reducing sugar content was in ranged from 1.44-1.72 g/100g. Maximum non-reducing sugar content wasobserved in Badshah-Pasonda (1.72 g/100g) which was nonsignificantly superior over the rest of varieties. These resultshave been favoured by Borua, et al., 2003.
LITERATURE CITED
Bhattacharjee, P., Singhal, R.S. and Kulkarni, P.R., 2002. ‘Basmatirice: a review, International Journal of Food Science andTechnology, 37: 1-12.
Borua, I., Ahmed, S.A., Sarkar, C.R. and Das, D. 2003. Biochemicalevaluation of scented rice of North India Bio-prospecting ofcommercially important plants. In: Proceeding of the nationalsymposium on “Biochemical approaches for utilization andexploitation of commercially important plant, Jorhat, India. 12-14 Nov. pp. 79-85.
Dipti, S.S.; Hossain, S.T.; Bari, S.W.; and Kabir, K.A. 2002.Physiochemical and cooking properties of some fine rice varieties.Pakistan J. Nutri., 1:188-190.
Dubois, M., Cilles, R.A., Hamilton, J.K., Raverm, P.A. and Smith, F.1950. Chemistry, pp. 28-35.
Horiuchi, H. 1966. Studies on the cereals starch (part-v) serologicalproperties of the starch of rice. Agri. Biol. Chem., 30:457-465
Juliano, B.O. 1985b. Criteria and tests for rice grain qualities. In: RiceChemistry and Technology (edited by B.O. Juliano). Pp. 443–524.St Paul, Minnesota: American Association of Cereal Chemists.
Juliano, B.O. 1979. The chemical basis of rice grain quality inproceedings of the workshop on chemical aspects of rice grainquality, IRRI, Los Banos, Philippines, pp. 69-90.
Kaosa-ard, M. and Juliano B., 1992. Assessing quality characteristicsand price of rice in selected international markets. In: ConsumerDemand for Rice Grain Qualily, eds. (L.J. Unnevehr, B. Duft, andB.Juliano) International Rice Research Institute, Manila
Mangkaeo, R., Srichuwong and Vearasilip, S. 2005. Influence ofpackaging material and storage time on seed viability and chemicalcomponent of rice seed, Conference on International AgriculturalResearch for Development, October, 11-13.
Mccready, R.M., Guggolz, J., Silviera, V. and Owens, H.S. 1950.Determination of starch and amylose rice. Analytical Chemistry,22:1156-1158.
Meullenet, J.F., Griffin, V.K., Carson, K. 2001. Rice external preferencemapping for Asian consumers living in the United States. Journalof Sensory Studies, 16: 73–94.
Miller, G.L. 1959. Use of DNS reagent for determining of reducingsugar. Analytical Chenistry, 31: 426-428.
Rayagauru, K. and Pandey, J.P. 2007. Influence of extended milling onquality characteristics of Aromatic rice. Society for Engineering inAgriculture 2007. National Conference: pp. 305-312.
Shabbir, M.A., Anjum, F.M., Zahoor, T. and Haqnawaz, 2008. Mineraland pasting characterization of India rice varieties with differentmilling fractions. Inter. J. Agri. Bio., 10(5):556-5650
Siddiq, E.A., Vemireddy, L.R., and Nagaraju, J. 2012. Basmati rices:genetics, breeding and trade’, Agricultural Research, (1): 25-36.DOI 10.1007/s40003-011-0011-5.
Singh, U.S., Singh, Neelam, Singh, H.N.; Singh, O.P. and Singh, R.K.2005. Rediscovering scented rice cultivar kalanamak, Asion Agri.History, 9(3): 211-219.
Singh, V.P., Khush, G.S. and Dela Cruz, N. 1997. Variability and qualityindices in aromatic rice germplasm. IRRN, pp. 22: 22.
Trivedi, V. 2007. Biochemical compostion of aromatic rice. M.Sc.(Ag.) Thesis Department of Biochemistry, N.D.U.A.&T.,Kumarganj, Faizabad.
Received on 23.01.2013 Accepted on 11.03.2013

Trends in Biosciences 6 (2): 180-181, 2013
Studies on the Association of Plant Parasitic Nematodes Associated with Root-knotNematode Infecting Potato (Solanum tuberosum)ZENITH N.G., JOYMATI L AND RONIBALA K.H.
Post Graduate Department of Zoology, D. M. College of Science, Imphale-mail: [email protected], [email protected]
ABSTRACT
An extensive survey was undertaken to determine the diversityand abundance of endemic nematodes in the potato fields of 15villages in Thoubal district of Manipur. The most obvious hostresponse was shown by the root-knot nematode i,e Meloidogyneincognita in the Awang Takyenjam Leikai associated with 3other plant parasitic nemotodes. It was followed by the Potatocyst nematode Globodera spp. in Dolaithabi and Helicotylenchusspp. in Langmeidong area.
Key words Diversity, nematode, Meloidogyne incognita, Potato andThoubal
Potato is one of the most important food crops in theworld and forms the staple food for more than half of thepopulation. It is popularly known as the king of vegetableand is very susceptible to root knot nematode (RKN). It isalso found to be parasitized by various plant parasiticnematodes (PPN). In Manipur, the root knot nematode orMeloidogyne spp. are economically important pests of manycrop plants, including potato. The root knot nematodes aresoil borne and feed on roots. Their life cycle includes egg,juvenile and adult stage; moreover the plant parasiticnematodes are also soil borne pest that causes significantchanges to agricultural and horticultural crops worldwide. Sofar, not much is known about the occurrence of plant parasiticnematodes associated with potato plant in this region.Therefore, the present study was undertaken in order to assessthe nematode community, especially the root knot nematodeinfecting potato plant of Thoubal district. The paper highlightsthe association of 3 plant parasitic nematodes identified up totheir generic level.
MATERIALS AND METHODS
Observations were made on the survey of rootknot nematode in 15 different localities of Thoubal district,viz., Chagoning loupham, Mamang loupham, Dolaithabi,Khekman-mayai leikai, Waithou, Kopalli, Moijing, Keibung,Leisangthem-khong Manung, Leisangthem-khong Maning,Leisangthem –khong Mamang, Awang-Takyenjam Leikai,Langmeidong, Lilong chajing and Lilong haoreibi in Manipurfrom January to June, 2012. From the potato fields, the tubersas well as soil samples about 500gms were collected fromaround the rhizospheric regions of potato plants. Detailsrelevant to the study like locality, month, date and time of
collection were also noted. The soil samples collected inpolythene bags were brought to the laboratory for processing,root samples and tubers were washed with tap water and theprocessing of the soil samples were done following theextraction of nematodes by Cobb’s sieving and decantingmethod followed by Baermann’s funnel method (Southey,1986). The nematodes collected were also processed furtherfor identification and their population or counts were noted.Root knot species was identified as M .incognita up to theirspecies level by seeing cuticular perennial pattern of gravidfemale (Norton ,1978).
RESULTS AND DISCUSSION
The result presented in Table 1 indicate that 3 genera ofplant parasitic nematodes were found associated with potatoand the root knot nematode is well distributed in a wider rangecomparing to the other plant parasitic nematodes which infectpotato. Out of the 15 localities investigated, the root knotnematode has been encountered in 13 localities, except in the2 localities namely Kopalli and Keibung of Thoubal district.The highest rate of root knot nematode infection was recordedin Awang-Takyenjam Leikai followed by Chagoning louphamand medium rate of infection was seen in Leisangthem–khongMamang. Globodera spp. and Helicotylenchus spp. alsoshowed medium rate of infection whereas the lowest rate ofinfection was done by Tylenchus spp. The results of theinvestigation co-relates with the works of Mani and Prakash1992 , who reported about the association of plant parasiticnematodes associated with certain vegetable crops in AndhraPradesh. Krishna Prasad 2006 also worked out on potato cystnematodes and their management which can adjustableconformity with the present findings. Our results also supportthe findings of Seenivasan, et. al., 2007 investigated onmanagement of potato cyst nematode through biologicalcontrol and increased in yield production .The presentinvestigation also support the findings of Joymati, et. al.,2011 about the community analysis of plant parasiticnematodes in different villages of Bisnupur Districts ofManipur.
The present study revealed lesser knowledge, high levelof ignorance of the farmers of this district about plant parasiticnematodes associated with potato in spite of their commonoccurrence. Further, it implied that rigorous efforts are neededto be undertaken by all extensive agencies by using the

ZENITH el. al.,: Studies on the association of plant parasitic nematodes associated with root-knot nematode infecting 181
modern methods in order to disseminate the knowledge ofthese infections and their management among the farmers.
ACKNOWLEDGEMENT
The authors are grateful to the Head, Department ofZoology, D.M College of Science, Imphal for providingnecessary laboratory facilities. They are also thankful to theDepartment of Biotechnology, Indian Institute of Science,Bangalore for providing financial assistance during the courseof studies.
LITERATURE CITED
Brown, E.B 1969. Assessment of the damage caused to potatoes bypotato cyst eelworm, Heterodera rostochiensis. Annals of AppliedBiology. 53: 493-502.
Kaushal, K.K., Srivastava, A.N., Pankaj, Chawla, G. and Khajan Singh2007. Cyst forming nematodes in India – A review. Indian journalof Nematology 37: 1-7.
Sl. No. Localities RKN (Meloidogyne spp.) Globodera spp. Helicotylenchus spp. Tylenchus spp. 1 Chagoning loupham +++ ++ + _ 2 Mamang loupham + _ + _ 3 Dolaithabi + +++ + _ 4 Khekman-mayai leikai ++ _ _ + 5 Waithou + ++ ++ _ 6 Kopalli _ _ + + 7 Moijing ++ _ _ _ 8 Keibung _ + _ + 9 Leisangthem-khong Manung ++ ++ + _ 10 Leisangthem-khong Maning _ + _ _ 11 Leisangthem –khong Mamang +++ _ + _ 12 Awang-Takyenjam Leikai +++ ++ + + 13 Langmeidong + _ ++ _ 14 Lilong chajing + _ + _ 15 Lilong haoreibi + _ _ _
Table 1. Association of plant parasitic nematode associated with M. incognita infecting potato plant in Thoubal diatrict ofManipur
****The symbols +++ indicates high incidence or infection by the species in the particular area, ++ indicates medium infection, + indicates lowestinfection rate and – sign indicates the absence of the species in the areas.
Joymati L, Christina Kh., Jennifer O. and Bibi K. 2011. Communityanalysis of plant parasitic nematodes associated with agriculturalcrop in Bishnupur district of Manipur. Indian journal of Nematology,41: 220-221.
Krishna Prasad, K.S. 2006. Potato cyst nematodes and theirmanagement in the Nilgiris (India). Technical bulletin No.77, CentralPotato Research Institute (ICAR). Shimla, H.P., India, pp. 22.
Mani, A. and Prakash, K.S. 1992. Distribution of plant parasitic20nematodes associated with certain principal crops in AndhraPradesh. Current Nematology, 3: 21-26.
Seenivasan, N., Devrajan, K. and Selvaraj N. 2007. Management ofpotato cyst nematodes, Globodera spp. through biological control.Indian journal of Nematology, 37: 21-26.
Norton, D.C. 1978. Ecology of plant parasitic nematodes. John Wiley,New York. pp 266.
Southey, J.F. 1986. Laboratory method for work with plant and soilnematodes, Min. Agric. Fish @ Fa., No. 402/London, HMSO. pp. 202.
Received on 21.03.2013 Accepted on 17.04.2013

Trends in Biosciences 6 (2): 182-184, 2013
Taxonomic Study on Fishes in the Rivers of Imphal ValleyN. MOHENDRA SINGH
P.G. Department of Zoology Laboratory of Fishery D.M. College of Science, Imphal 795 001e-mail: [email protected]
ABSTRACT
Altogether 53 fish specimen have been collected from differentsapling stations of each river. The identified species belong tocyprinidae, Bagridae, Cobitidae, Belontidae, Channidae,Metacembelidae, Notopteridae, Heteropneustidae, Sisoridae,Belonidae, Ambassidae, Anabantidae, Claridae, Anguilla, andClupeidae families.
Key words Fishes taxonamy, Imphal
The present study has been conducted from May 2011to August 2012 in the rivers of Imphal Valley. For present workImphal River is selected from Chindwind River system whileNambul and Thoubal Rivers are the principal tributaries ofImphal River.
Stations Months 1 2 3 4
Total
May 3 5 - 2 10 June 6 7 3 - 16 July - 2 10 - 12 August 10 2 1 8 21 Sept. 12 - 6 7 25 Oct. 4 5 - 2 11 Nov. - 3 6 6 15 Dec. 2 4 6 3 15 Jan. 3 4 2 3 12 Feb. 3 5 6 - 14 March 2 1 - 10 13 April - 10 9 6 25 May 36 2 5 4 14 Total 40 50 54 51 203
Table 1. Total Nos. of fish samples in imphal river indifferent sampling stations
Stations Months 1 2 3 4
Total
May 3 - 1 9 13 June 15 36 4 6 28 July - 5 3 3 11 August 2 3 6 - 11 Sept. 2 1 - 3 6 Oct. - 4 5 - 9 Nov. 10 - 6 4 20 Dec. 5 2 2 - 9 Jan. - 15 - 5 20 Feb. - 3 6 87 16 March 2 1 3 8 14 April 1 3 3 7 14 May 3 - 6 9 18 Total 42 40 45 60 189
Table 2. Total Nos. of fish samples in thoubal river indifferent sampling station in different months
Table 3. Total Nos. of fish samples in nambul river indifferent sampling station in different months
Stations Months 1 2 3 4
Total
May 2 3 - - 5 June - 1 - 3 4 July 3 - 2 4 9 August - - - - - Sept. - 2 1 5 8 Oct. 2 4 3 2 11 Nov. 1 - - 6 7 Dec. - 2 - 4 6 Jan. - 1 - - 1 Feb. 3 2 - 3 8 March 1 1 - 2 4 April - 3 - 5 8 May - - - 2 2 Total 12 19 6 36 73

SINGH : Taxonomic study on fishes in the rivers of imphal valley 183
The aim of the project was to collect the fishes from therivers in the valley as much as possible in 15 months. Theother objective of the study was establish the correlationbetween the physico chemical parameter of the water and fishfauna in the state for academical & research purposes.
MATERIALS AND METHODS
Fishes were mostly collected from every sampling stationrandomly once in a month with the help of fisherman by usingcast net, dip net. The collected fishes were preserved in 4-6%formaldehyde or10% formaline in glassware as described in
Scientific Name Local Name Habitate Chitala chetala Ngapai Imphal River, Nambul River (upper region) Notopterus notopterus Kandla Thoubal River (Kshetri Leikai) Anguila bengalensis Ngaril laina Imphal River Gudusia chapra Wana manbi Imphal River (Koirengei) Labeo rohita Rou Thoubal River (Haokha) Labeo calbasu Ngathi Nambal River (Mantrikhong) Labeo gonius Kuri Imphal, Thoubal River Labeo pangusia Ngatin Thoubal, Imphal River Labeo boga Nathi Thoubal, Imphal River Labeo bata Ngaton Thoubal, Imphal and Nambul Catla catla Bao Imphal River Cirrhinus mrigala Mirgal Thoubal River Chagunius chagunio Thangol pubi Imphal River Tor putitora Ngara Thoubal, Imphal River Puntius sarana Nganoi Thoubal, Imphal, Nambul River Puntius sophore Phabounga Most of the study areas Puntius chola Phabounga Most of the study areas Puntius ticto Phabounga Most of the study areas Puntius conchonius Phabounga Most of the study areas Osteobrama Sps. Pengba Imphal River Cyprinus carpio Puklaobi Most of the study areas Cyprinus sps. Puklaobi Thoubal River Amblypharyngodon Mola Mukanga Most of the study areas Barilius barna Ngawa Thoubal River Barilius bandelisis Ngawa Thoubal River Barilius vagra Ngawa Imphal River Esomus denricus Ngasang Most of the study areas Rasbora rasbora Nunga Thoubal River Hypoathalmichthys molitrix Silver carp Nambul, Thoubal River Ctenopharyngodon idella Napichabi Thoubal River Botia dero Sarengkhoibi Most of the study areas Lepidocephalus guntea Ngankijou Most of the study sites Mystus bleekeri Ngasep Most of the study areas Mystus cavasus Ngasep Most of the study sites Wallago attu Sareng Imphal, Thoubal River Ompok bimaculatus Ngaten Thoubal River Gangata cenia Ngarang Imphal River Glyptothorax cavia Ngapang Imphal River Clarius batrachus Ngakra Nambul, Thoubal River Xenentodon cancila Nga Cheklaobi Thoubal River Chanda nama Ngamhai Most of the study areas Anabas testudineus Ukabi Most of the study areas Colisa fasciatus Ngabemba Most of the study areas Colisa lalia Phetin Imphal River Channa punctatus Ngamu bogra Nambul River Channa striatus Porom Nambul River Channa marulius Porom Thoubal River Macrgnathus aral Ngaril Pokchaobi Imphal River Mastacembelus armetus Ngaril arangba Imphal River
Table 4. Check list of collected fishes in the rivers of Imphal valley

184 Trends in Biosciences 6 (2), 2013
Shrivastava, 1968 and carried to the P.G. Fishery lab. in theDepartment of Zoology D.M. College of Science, foridentification of fish were followed after Shrestha 1981, andVishwanath (2002).
RESULTS AND DISCUISSION
From the present study, it was found 53 Species of fishand rivers in the Imphal Valley. The study would give therequired information/data to our understanding of the riverecosystem in Imphal Valley which can be utilized for formationof suitable management policies to help conserve andsustainable effective productivity of this river system for fishand fisheries.
ACKNOWLEDGMENT
Author grateful for the financial assistance extended by
UGC, (NERO), Guwahati in the form of Minor Research Project,I also thankful to the Director, Environment and Ecology wing,Manipur for helping water analysis and Head, Department ofZoology, D.M. College of Science, Imphal for providingLaboratory facilities. Thanks are also due to Dr. Kh. RajmaniSingh, Associate Professor, Department of Zoology (PGSection) D.M. College of Science for his suggestions andhelp during the study period.
LITERATURE CITED
Shrestha J. 1981. Fishes of Nepal CDS, Tribhuvan University Kathmandu,Nepal
Srivastava, G.J. 1986. Fishes of Eastern UP and Bihar, RajkamalPrakashan, Varanashi (U.P.) India.
Vishwanath, W. 2002. Fishes of North East India.
Received on 21.03.2013 Accepted on 05.04.2013

Trends in Biosciences 6 (2): 185-187, 2013
Analyses of the Forest Cover Change in Rani and Garbhanga Reserve Forest, Assam,North East India Using Geospatial TechniqueH SUCHITRA DEVI, A. PINOKIYO1 AND S.K. BORTHAKUR2
North Eastern Space Applications Centre, Govt. of India, Dept. of Space, Umiam 793 103, Meghalaya, IndiaP.G. Department of Botany, D.M. College of Science, Imphal, Manipur, IndiaDepartment of Botany, Gauhati University, Assam, Indiae-mail: [email protected]
ABSTRACT
The present study was taken up for quick assessment of forestcover. During the study Landsat TM (1991), IRS-1D LISS-IIIsensor data (2000) and IRS P6 LISS-IV (MX) data of 2009 wereinterpreted and mapped to assess the change in the forest cover.The study revealed that prominent changes were observed inforest blank during 1991 and 2000 in Rani reserve forest. It hasbeen observed that the most remarkable changes took place inforest blank which was 10.71% of the total area during 1991-2000. It was reduced to 5.65% during 1991-2009. There werenot many changes in the forest area. However the open moistdeciduous forest is gradually increasing during the studyperiod. Similarly, in Garbhanga reserve forest prominentchanges were observed in forest blank during 1991 and 2000which was 10.4% of the total area but reduced to 5.91 during1991-2009. Bamboo brakes were also increased during the studyperiods especially during the period 1991 and 2000. Scrub forestwas increased only by 1.02% during 1991 and 2009. The studyclearly showed that there has been noticeable increase in forestblank and reduction in medium moist deciduous forest in boththe reserves. Built up area has also increased prominently inRani reserve forest. A gradual increase in scrub forest was alsoseen in both the reserve forests.
Key words Vegetation, deforestation, landscape.
The rapid changes in the land utilization for variousdevelopmental activities from time to time necessitate acompletely updated knowledge of the forest area and itschanges for better management. The conventional methodsof survey have many constraints, time consuming, costly,and inaccessibility to remote and difficult terrains, etc. Withthe advent of modern space technology, especially remotesensing, it is possible to provide synoptic view and frequentrepetitive coverage which enables the observation of subtlechanges. Many users world over are using remote sensing asan appropriate tool for data collection on land use and changemonitoring (Green, et al., 1994, Homer, et al., 1997, Talukdarand Roy, 2001, Bartholome and Belward, 2005).
The study was taken up to map the vegetation cover inRani and Garbhanga reserve forest that lie close vicinity toGuwahati city, which has undergone rapid urban growth. Thestudy presented here thus analyses the vegetation and forestcover changes in both the reserves so as to provide a detailed
data on pattern of changes in forests cover for planning andmanagement.
MATERIALS AND METHODS
The study was carried out for Rani and Garbhangareserve forests, located in Kamrup district of Assam and thestate of Meghalaya lies toward the southern portion of boththe reserves. Rani reserved forest is located between 91° 35'16'’E to 91° 42' 24'’E Longitude and 26° 06' 41'’N to 26° 01'15'’N latitude, while Garbhanga reserve forest is locatedbetween 91° 36 25'’E to 91° 47' 45'’E longitude and 26° 05' 31'’Nto 25° 54' 12'’N latitude (Fig. 1).
Rani reserve forest is situated at a moderate altituderanging from 60m to 401m above mean sea level and Garbhangareserved forest altitude ranges from 80m to 670m above themean sea level. Both the reserved forests fall on the Easternpart of the Kamrup district of Assam state. The rock types inaround Rani and Garbhanga reserve forest derived form gneiss,quartzite or conglomerate. The soils are gravely on crests andupper slopes, deep red and clayey in the foot hills and alluviallower down.
Multi-date satellite data of LANDSAT-TM imagery ofpath and row no.137/42(26-11-1991), IRS ID LISS-III imageryof path and row no. 110/53 (07-01-2000), IRS P6 LISS-IV (MX)(21-08-2006) imagery were used in the study. Satellite data ofdifferent time period (1991,2000 and 2009) are visuallyinterpreted based on the tone, texture, size, shape and patternseen on imagery (Lillisand and Keifer, 1996).
The following vegetation and land cover types wereidentified and delineated on screen using the standard visualimage interpretation techniques.
1. Moist deciduous forest-Closed (density >70%)2. Moist deciduous forest-Medium (density 40 to 70%)3. Moist deciduous forest-Open (density 10% to 40%)4. Forest- Scrub forest (Tree cover <10%)5. Bamboo brakes6. Forest blank7. Agriculture land8. Built up-Rural9. Water bodies-River

186 Trends in Biosciences 6 (2), 2013
Ground truth survey was carried out during to verifythe interpreted areas. Land use/cover maps were prepared on1:25,000 (LISS-IV (MX)) and 1:50,000 (LISS-III) scales.
RESULTS AND DISCUSSION
Closed moist deciduous contributes the major area inboth the reserve forest. The reserves are dominated by Shorearobusta that grows in association with Schima wallichii,Adina cordifolia, Gmelina arborea, Lagerstroemiaparviflora, Dillenia pentagyna, Vitex peduncularis,Terminalia bellerica, Emblica officinalis, Premna latifolia,Aporosa roxburghii, Aphanamixis polystachya, Garcinia sp.,Careya arborea, Dendrocalamus hamiltonii, Desmodiumspp., Eupatorium odoratum, Zizyphus mauratiana,Microstegium ciliatum, Imperata cylindrical, Thyanolaenamaxima, Carex stroementitia, Zizyphus oenoplia, Entadaphaseoloides, butea parviflora, Artocarpus chaplasha,Michelia champaca and Amoora spectabilis , etc. Carex spp.occur under dense canopy.
From the study it is found that deforestation is the mainfactor responsible for land cover change. The process ofdeforestation is illustrated in figure 2.
It is observed that change is prominent and continuousfrom 1991 to 2009(fig 3) in the forest fringes parts surroundingGuwahati city due to expansion of urban area. Details of changein vegetation cover and land cover types are shown inTable 1 and Table 2. It shows the dynamics of change amongvegetation and land cover types in Rani and Garbhangareserve forest. The three sets of satellite data used for themonitoring the vegetation and land cover types reflected thatchanges are distinct during the period of 1991-2000 than 2000-2009. Further, it is evident that the blank forest contributes
10.71 % and 10.40% during the year 1991-2000 respectively inRani and Garbhanga reserve forest. In reserve bamboo brakesalso shows an increasing trend in both the reserves. However,an insignificant changed was observed in closed moistdeciduous forest. The major changes in the vegetation andland cover has taken place in the forest fringe area. An exampleof major deforestation i.e., complete conversion of forest tobuilt up area was observed in the forest fringes (Fig. 2) in boththe reserves. In Rani reserve forest, the most remarkablechanges has taken place in forest blank where it was increasedby 10.71% during 1991-2000. It has been reduced to 5.65%during 1991-2009. The growth in built up area changes is seenshowing an increasing trend from 0.6 % to 34.9% during 1991-2000 and 2000-2009 respectively. Open moist deciduous forestis a gradually increasing trend during the study period.
It was also observed during the study period inGarbhanga reserve forest that there were not many in closedand medium moist deciduous forest. However, prominentchanges were observed in forest blank during 1991 and 2000which was 10.4% of the total area but reduced to 5.91 during1991-2009. Bamboo brakes were also increased during the studyperiods especially during the period 1991 and 2000. Scrubforest was increased only by 1.02% during 1991 and 2009.The major cause of deforestation seems to be more a societalneed and for additional income from land. The main indirectstimulus for deforestation seems to be building of roads,transportation and communication infrastructure and
Fig. 1. Location map of the study area
Fig. 2. Vegetation and land cover types in 2009

DEVI et. al., : Analyses of the forest cover change in Rani and Garbhanga reserve forest, Assam, North East India 187
accompanying speculated land value. The Guwahati city hasalso experienced spurt in urban sprawl due to populationgrowth and rural-urban migration. Highly skewed distributionof income and property has generated centrifugal forcespushing people outward from the centre to the periphery, thusputting more pressure on the forest.
ACKNOWLEDGEMENT
The authors are thankful to Director, NESAC, Shillongfor facilities and encouragement and to the Assam ForestDepartment, Govt. of Assam for cooperation.
Table. 1. Vegetation and associated land cover change in Rani reserve forestCategories Area in ha (1991) Area in ha
(2000) Change in per
cent (1991-2000)
Area in ha(2009)
Change in per cent
(2000-2009)
Change in per cent (1991-2009)
Moist deciduous Forest-Closed 1799.88 1759.46 -0.02 1794.34 0.02 0.00 Moist Deciduous Forest-Medium 1393.00 1122.00 -0.19 501.81 -0.55 -0.64 Moist deciduous Forest-Open 766.84 991.64 0.29 1397.88 0.41 0.82 Bamboo Brakes 131.72 154.60 0.17 195.39 0.26 0.48 Forest-Scrub Forest 274.95 285.23 0.04 397.64 0.39 0.45 Forest Blank 4.94 57.83 10.71 32.87 -0.43 5.65 Agriculture land 72.49 73.00 0.01 73.03 0.00 0.01 Built-Up area (Rural) 1.27 1.34 0.06 48.10 34.90 36.87 Waterbodies-River - - - 4.04 - -
Table. 2. Vegetation and associated land cover change in Garbhanga reserve forest
Categories Area in ha (1991)
Area in ha (2000)
Change in per cent
(1991-2000)
Area in ha(2009) Change in per cent
(2000-2009)
Change in per cent (1991-2009)
Moist deciduous Forest-Closed 7104.47 6545.87 -0.08 7497.74 1.23 0.06 Moist Deciduous Forest-Medium 7369.10 4237.85 -0.42 3191.40 1.49 -0.57 Moist deciduous Forest-Open 2499.81 3057.69 0.22 3148.94 0.85 0.26 Bamboo Brakes 52.34 1570.57 29.01 1364.56 -0.10 25.07 Forest-Scrub Forest 929.85 1405.20 0.51 1880.71 1.00 1.02 Forest Blank 108.45 1235.82 10.40 748.96 -0.31 5.91 Agriculture land 289.82 300.83 0.04 343.55 1.11 0.19 Built-Up area (Rural) - - - 169.06 - - Waterbodies-River - - - 8.91 - -
LITERATURE CITED
Bartholome, E. and Belward, A.S., 2005, GLC 2000: a new approach toglobal land cover mapping from Earth observation data.International Journal of Remote Sensing Vol. 26. No. 9, 10 May2005, pp. 1959-1977.
Green, K., Kempka,D. and Lackley, L. 1994. Using remote sensing todetect and monitor land cover and land use changes. Photogramm.Engg. And Remote Sensing, 60(3): 331-337.
Lillisand, T.M. and Keifer, R.W. 1994. Remote sensing and imageinterpretation. John Wiley, New York.
Talukdar, G. and Roy, P.S. 2001, Mapping of open Bamboo brakes andForest Areas Using Satellite Remote Sensing in Meghalaya.Unpublished NE-SAC Report.
Received on 21.03.2013 Accepted on 13.04.2013

Trends in Biosciences 6 (2): 188-189, 2013
Effect of Different Levels of Boron and Sulphur on Growth of Chickpea with MustardIntercropping SystemSUNIL KUMAR1, S.K. PATEL1 AND GAUTAM GHOSH2
Department of Agronomy, 2. Deptt. of Agronomy, Alld. School of Agriculture, Sam Higginbottom Institute ofAgriculture, Technology & Sciences (Deemed-to-be-University), Allahabad - 211 007e-mail: [email protected]
ABSTRACT
A field experiment was conducted during the two consecutivepost rainy seasons (rabi) of 2009-2010 and 2010-2011 at CropResearch Farm, Department of Agronomy, SHIATS, Allahabad,to study the effect of Boron and Sulphur on growth and yield ofchickpea under chickpea + mustard cropping system, theexperiment was conducted in factorial randomized block designwith 3 replications. The combinations of treatments consistedof 4 intercropping system viz., sole chickpea, sole mustard,chickpea + mustard 4:1(row ratio) and chickpea + mustard5:1(row ratio) and consisted of 6 boron and sulphur levels viz.,control, borax 10 kg ha-1, boric acid 0.25% foliar spray at 30, 45and 60 DAS, sulphur 30 kg ha-1, borax 10 kg ha-1 + sulphur 30kg ha-1, boric acid 0.25% foliar spray at 30, 45 and 60 DAS +sulphur 30 kg ha-1. Significantly increased plant height due tointercropping of chickpea with mustard 4:1 rows ratio and no.of branches, no. of nodules and dry weight were obtained insole chickpea than intercropping of chickpea with mustard 4:1and 5:1 were on par. Borax 10 kg ha-1 + sulphur 30 kg ha-1 gavethe significantly highest plant height, no. of branch, no. ofnodules and dry weight of chickpea and mustard and it was onpar with boric acid 0.25% trice spray + sulphur 30 kg ha -1
followed by different borax and sulphur levels were on par overthe control.
Key words intercropping, boron, sulphur, growth attributes, chickpeaand mustard
Chickpea (Cicer arietinum L.) is a leading pulse crop inIndia, grown in 8.21 million hectares with produced of 7.48million tonnes during 2010 (FAOSTAT, 2012). Mustard is in5.77 million hectares with production of 6.59 million tonnesaverage productivity of 1142 kg ha-1 during 2009-010 (DRMR,2010). In India chickpea and mustard are commonly growneither in sole or intercropping system. Scientific approach ofintercropping of these two crops increases the productivityper unit area per unit time (Ali., 1998) under a situation wheretwo crops are grown in intercropping at a certain proportionand row ratio increase the cropping intensity, productivityand profitability under optimum utilization of nutrients. Theincreasing cropping intensity with higher energy requiringcrop coupled with the use of higher used fertilizer result in todeficiency of boron and sulphur micronutrients, which improvethe productivity of pulses and oil crops to a great extent. Theimportant micronutrients that have been found deficient withmajor chickpea and oil crops are boron and sulphur. However,not much research effort has been made to augment growth
of chickpea + mustard intercropping system. Hence, anexperiment was conducted to study the boron and sulphur ongrowth of chickpea under chickpea + mustard croppingsystem.
MATERIALS AND METHODS
A Field experiment was conducted during post rainyseason (rabi) of 2009-010 and 2010-011 at the Crop ResearchFarm, Department of Agronomy, SHIATS, Allahabad. The soilwas sandy loam in texture, well drained, poor in organic carbon(0.34%) with pH 7.4. The available N was 114 kg, P2O5 25 kg,K2O5 223 kg ha-1 and available boron and sulphur 11.70, 0.098ppm, respectively. The treatments consisted of 4 intercroppingsystem viz., sole chickpea, sole mustard, chickpea + mustard4:1(row ratio), chickpea + mustard 5:1(row ratio) and 6 boronand sulphur levels viz., control, borax 10 kg ha-1, boric acid0.25% foliar spray, sulphur 30 kg ha-1, borax 10 kg ha-1 + sulphur30 kg ha-1, boric acid 0.25% foliar spray + sulphur 30 kg ha-1.The treatment was conducted in factorial randomized blockdesign with 3 replications.
The crop was sown on 6 November in 2009 and 1November 2010, and harvested 10 March 2010 and 14 March2011. A spacing 30 X 10 cm of chickpea and 45 X 15 spacing ofmustard, in intercropping chickpea + mustard 4:1 and 5:1 rowratio adapted replacement series. Fertilizers were applied asper the treatment, in chickpea 20 kg N ha-1 and 50 P2O5 kg, inmustard sole 90 kg N ha-1, 40 P2O5 kg and 40 K2O5, in the formof urea, DAP and MOP. Application of boron and sulphurwere application according to treatment basal does and foliarapplication of boric acid done at 30, 45 and 60 DAS. The testvariety was used Pusa 362 (chickpea) and mustard (Varuna).
RESULTS AND DISCUSSION
Effects on chickpea :
Intercropping systems, boron and sulphur levels wassignificant effect on plant height, no. of branches, no. ofnodules and dry weight of chickpea (Table 1). The significantlyhighest Plant height was recorded under chickpea + mustard(4:1 row ratio) intercropping followed by intercropping ofchickpea with mustard (5:1 row ratio) as compared to solechickpea. Higher plant height was ascribed to shading effectof mustard on chickpea due to different plant architecture.Significantly increased no. of branches, no. of nodules and

KUMAR et al., Effect of Different Levels of Boron and Sulphur on Growth of Chickpea with Mustard Intercropping System 189
dry weight were recorded in sole chickpea than intercroppingof chickpea with mustard 5:1 row ratio. However, intercroppingof chickpea with mustard 4:1 row ratio recorded the minimumof these parameters this could be attributed to more spaceavailable to individual plant for lateral spread.
Boron and sulphur levels gave the significantlyincreased plant height, no. of branches, no. of nodules anddry weight compared to control. Significantly the highest ofthis parameters was obtained from application of borax 10 kgha-1 + sulphur 30 kg ha-1 than application of boric acid 0.25%spray + sulphur 30 kg ha-1 but it was statistically equivalent toborax 10 kg ha-1 and sulphur 30 kg ha-1, respectively. It mightbe ascribed to addition of boron and sulphur is attributed totheir role in carbohydrates metabolism, protein synthesis andactivation of number of enzymes in the soil which deficienciesoccur these nutrients and increased growth components ofchickpea. These results are in conformity with those of Meena,et.al., 2005.
Effects on mustard :
Intercropping systems, boron and sulphur levels hadsignificant effect on plant height, no. of branches and dryweight of mustard (Table 1). Sole mustard gave the significantlyhighest plant height than mustard intercropped in chickpea(4:1 row ratio), but no. of branches and dry weight was foundhighest in mustard intercropped in chickpea (5:1 row ratio)followed by mustard intercropped in chickpea (4:1 row ratio).This may be owing to more plant per unit area and less intera-space competition posed by sole mustard and plant heightdecreased by different row proportion through wide space ofmustard with chickpea due to different plant architecture.
Among the boron and sulphur levels gave thesignificantly increased plant height, no. of branches and dryweight over the control. Application of borax 10 kg ha-1 +sulphur 30 kg ha-1 gave the significantly highest plant height,no of branches and dry weight, followed by boric acid 0.25%spray + sulphur 30 kg ha-1 but it was statistically on par withborax 10 kg ha-1 and boric acid 0.25% spray, respectively. Thismay be probably due to adequate application of boron andsulphur which were directly involved in better absorption ofapplied nutrients and cell multiplication as well as expansionof deep green color of leaves due to better chlorophyllsynthesis in comparison with plants deficient in boron andsulphur. These results were confirmed by Kumar et al. (2006).
LITERATURE CITED
Ali, M. 1998. Chickpea-based intercrops for command areas of differentagro-ecological zones of India. In: Proceeding of nationalsymposium on efficient cropping system zone of India held duringof 7-10 January at University of Agricultural Science, Bangalore,pp. 53.
D.R.M.R. 2010. Directorate of Rapeseed-Mustard Bharatpur(Rajasthan), India. (http://www.drmr.res.in).
FAOSTAT. 2012. Food and Agriculture Organization of the UnitedNations, Rome, Italy; Crop Production Database (http://fao.org).
Meena, S.K., Sharma, S. and Meena, H.S. 2005. Effect of sulphur andzinc fertilization on yield, quality and nutrient content and uptakeof chickpea (Cicer arietinum L.) under semi arid tropics. Ann.Agric. Res. News Series, 26 (1): 45-47.
Kumar, A., Prasad, S. and Kumar, S.B. 2006. Effect of boron andsulphur on performance of gram (Cicer arietinum). Indian J. Agron.,51 (1): 57-59.
Received on 02.04.2013 Accepted on 22.04.2013
Chickpea Mustard Treatments Plant height
(cm) No. of
branches No. of
nodules Dry weight
(g) Plant height
(cm) No. of
branches Dry weight
(g) Intercropping systems Sole chickpea 49.17 4.03 11.65 42.1 -- -- -- Sole mustard -- -- -- -- 163.91 5.59 77.22 Chickpea + mustard (4:1) 52.92 3.7 8.81 32.24 161.88 5.73 79.28 Chickpea + mustard (5:1) 51.26 3.82 9.84 35.05 159.53 5.94 81.25 F-test S NS S S S S S SE (d) 0.2799 -- 0.1379 0.3859 0.371 0.0525 0.043 CD (p=0.05) 0.5905 -- 0.291 0.8142 0.7828 0.1108 0.0906 Boron and Sulphur Levels Control 49.13 3.41 8.96 34.15 157.89 5.36 78.35 Borax 10 kg/ha 51.54 3.91 10.26 36.67 162.5 5.87 79.44 Boric acid 0.25% spray 51.13 3.67 10.11 36.19 159.56 5.7 79.07 Sulphur 30 kg/ha 50.44 3.53 9.61 35.44 158.76 5.63 78.74 Borax 10 kg/ha+ sulphur 30 kg/ha 52.4 4.46 11.06 38.62 167.14 6.07 80.15 Boric acid 0.25% spray+ sulphur 30 kg/ha 52.02 4.12 10.59 37.7 164.81 5.92 79.74 F-test S S S S S S S SE (d) 0.3958 0.1954 0.1951 0.5457 0.5247 0.0742 0.0608 CD (p=0.05) 0.8351 0.4123 0.4116 1.1514 1.107 0.1566 0.1282
Table1. Effect of intercropping systems, boron and sulphur levels on growth of chickpea and mustard mean of two years

Trends in Biosciences 6 (2): 190-191, 2013
Efficacy of Fungicides on In Vitro Growth of Pigeonpea against Stem Canker1SRUJANI BEHERA, 2R. B. SINGH AND 2LAXMAN PRASAD BALAI1Department of Plant Pathology, Bidhan Chandra Krishi Viswavidyalaya Mohanpur, Nadia,West Bengal - 741 252,2Mycology and Plant Pathology, Institute of Agriculture Sciences, Banaras Hindu University, Varanasi 221005e-mail : [email protected]
ABSTRACT
Phoma stem canker of pigeonpea caused by Phoma cajani is asporadic disease but occasionally attains highly destructiveproposition and becomes epidemic highly conduciveenvironmental condition. Four fungicides viz., SAAF(Carbendazim 12% + Mancozeb 63%), Benfil (Carbendazim50%), Vitavax (Carboxine 75%), and Dithane M-45 (Mancozeb75%) were evaluated against Phoma cajani under in vitrocondition by poison food technique. The results indicated thatSAAF was found to be the most effective in suppressing thegrowth followed by Benfil. Among the different concentrationstested, SAAF at 350 ppm and Benfil at 400 ppm were found tobe optimum for the control of pathogen’s growth.
Key words Phoma stem canker, poison food technique.
Phoma stem canker of pigeonpea (Cajanus cajan (L)Millsp.) incited by Phoma cajani, when it was considered tobe a minor disease previously but become progressively severein past years causing more economic losses to pigeonpeaproduction in recent years. The disease was repeatedly seenin experimental plots and farmers fields causing 5-50 %mortality in plants at maturity stage during periodical surveysand critical observations. During the year 2009-2010 pigeonpeahas a role in pulse production in India. The stem canker diseaseis a great obstacle in the way pivot able and presentlymanagement of this devastating disease is of prime importance.In the present study a few fungicides were screened for theirfungitoxic activity against P. cajani. An in vitro effect oncolony diameter was initially investigated. In vitro screeningof fungicides has been employed by many plant pathologists(Mostert, et al., 2000; Ponmurugan, et al., 2006; Girishab,et. al., 2009).
MATERIALS AND METHODS
Poison food technique (Dhingra and Sinclair, 1995) wasadopted to elucidate the efficacy of different fungicide viz.SAAF (Carbendazim 12% W.P. + Mancozeb 63% W.P.), Benfil(Carbendazim 50% W.P), Vitavax (Carboxine75% W.P.) andDithane M-45 (Mancozeb 75% W.P.). Required amount ofdifferent fungicides were added to 250 ml Erlenmeyer flaskscontaining 100 ml of melted PDA medium to make 50, 100, 150,200, 250, 300, 350, 400, 450, 500 ppm concentrations,respectively. The medium of each flask was poured into Petridishes and allowed to solidify. Mycelium disc (5mm dia.) were
cut with the help of cork borer from the growing edge of 6-7days old culture of the fungus grown on PDA and transferredin to the centre of each petridishes. The petridishes containingmedium without fungicides served as control. The experimentwas repeated with four replications and the petridishes wereincubated at 250 ± 20C temperature. Radial growth of the funguswas measured at an interval of 24 hrs till it reached the edge ofthe petri plate (Dhingra and Sinclair, 1995; Nene and Thapliyal,2001). Relative growth of fungus at each concentration wasevaluated by comparing it with the control for each fungus-fungicide combination. The per cent inhibition (PI) of thefungus over control was calculated using the (Ponmurugan,et al., 2006) following formula:
PI =
A B) -(A
×100
Where, A is colony diameter of the fungus in controlplates (mm)
B is colony diameter of the fungus in treated plates (mm).
RESULTS AND DISCUSSION
Response of Phoma cajani to ten concentrations (i.e.,50, 100, 150, 200, 250, 300, 350, 400, 450 and 500 ppm) of differentfungicides viz., SAAF, Benfil, Vitavax and Dithane M 45, wasstudied to determine differences in tolerance of the fungicideto various toxicants. Table 1. elucidates that differentfungicides have profound inhibitory effect on isolate ofP. cajani at its different concentrations. There was significantdifference among the mycelial growth of P. cajani obtained atdifferent dosages of fungicides. Pronounced reduction ofgrowth occurred in medium with increasing concentrations offungicides. Maximum per cent inhibition of radial growth ofthe fungus was observed at a concentration of 300 ppm(83.33%) of SAAF, 350 ppm (80%) of Benfil, respectively.However Vitavax and Dithane M 45 were required at equalconcentrations (400 ppm) for maximum per cent inhibition ofradial growth (86.38%, 81.94% respectively) of the fungus.The growth of stem containing pathogen was inhibitedcompletely at one or another concentration. SAAF mosteffectively controlled P. cajani at 350 ppm. In contrast, Benfil,Vitavax and Dithane M 45 required comparatively higherconcentrations (400 ppm, 450 ppm and 450 ppm respectively)than SAAF for complete inhibition of mycelial growth.

MURALI : Nematode Infecting Thrips and Their Utilization In Pest Management: A Review 191
In present studies SAAF, Benfil, Vitavax and DithaneM-45 completely suppressed radial growth of P. cajani at aparticular concentration. Significant decrease in mycelialgrowth with higher concentration of different fungicides wasrecorded. Among the 4 chemical fungicides used, SAAF(Carbendazim 12% + Mancozeb 63%) was found to be mosteffective at a comparatively lower concentration (300 ppm)followed by Benfil (Carbendazim 50%) whereas Vitavax andDithane M 45 required equal concentrations (400 ppm) formaximum percent inhibition of radial growth of the fungus.
In present study, Benfil (Carbendazim 50%) was moreeffective than Dithane M 45. These in formations corroboratethe findings of Potdukhe, 1998. Out of six fungicides tested,he found carbendazim (0.1 and 0.25%) was best in vitrofollowed by Dithane M 45 (0.4 and 0.25%) for inhibiting thegrowth of pathogen.
In previous observations amongst the chemicals tested,Calixin was most effective followed by Dithane M 45 (Somaniand Rout, 988) but in the present investigation instead ofCalixin, Vitavax was taken and it was deduced that Vitavax andDithane M-45 have same effect at one concentration butVitavax (86.38%) had advanced radial growth than Dithane M45(81.94%).
Table 1. Effect of different fungicides on radial growth of P. cajani
*On 5th day after inoculation
Per cent inhibition of radial growth* Concentration (ppm)
Fungicides 50 100 150 200 250 300 350 400 450 500 Mean SAAF 40.27 48.61 55.55 71.38 78.04 83.33 100.00 100.00 100.00 100.00 77.72 Benfil 30.83 40.83 49.44 60.83 69.16 74.44 80.00 100 100.00 100.00 70.55 Vitavax 16.93 29.16 39.16 54.44 63.88 73.88 78.88 86.38 100.00 100.00 64.27 Dithane M 45 14.44 25.27 31.38 39.99 50.27 62.22 71.94 81.94 100.00 100.00 57.74 SEm± 1.92 1.85 1.73 1.34 2.54 1.26 0.92 1.00 0.00 0.00 0.00 CD (P=0.05) 4.2 4.04 3.78 2.93 5.53 2.74 2.02 2.18 0 0 0 CD (P=0.01) 5.89 5.67 5.3 4.12 7.76 3.85 2.83 3.06 0 0 0
After computing it is concluded that is our findings thecommercial fungicide i.e., SAAF (Carbendazim 12% +Mancozeb 63%), which was a mixture of both systemic andcontact fungicides was best among all the chemicals used.There is no earlier findings regarding this hence, furtherresearch is needed to confirm the aforsaid previous results.
LITERATURE CITED
Dhingra, O.D. and Sinclair, J.B. 1995. Basic plant pathology methods.2nd ed. Boca Raton, FL: CRC Press. pp. 267-285.
Girishab, K., Shankara, B.S. and Raveesha, K. A. 2009. In vitro screeningof systemic fungicides against Phomopsis azadirachtae, the incitantof die-back of neem. Archives of Phytopathology and PlantProtection, 42(3): 256–264.
Mostert, L., Denman, S and Crous, P.W. 2000. In vitro screening offungicides against Phomopsis viticola and Diaporthe perjuncta.S. Afr. J. Enol. Vitic., 21: 62 – 65.
Nene, Y.L and Thapliyal, P.N. 2001. Fungicides in Plant DiseaseControl. New Delhi: Oxford and IBH Publications.
Ponmurugan, P, Baby, U.I. and Gopi, C. 2006. Efficacy of certainfungicides against Phomopsis theae under in vitro conditions. Afr. J.Biotechnol., 5: 434 – 436.
Potdukhe, P.A. 1998. Fungal diseases of root and stem. Published in thebook. Diseases of pigeonpea. pp. 72-77.
Somani, R.B. and Raut, B.T. 1988. Efficacy of different fungicides III.Pigeonpea stem canker. PKV Research Journal, 12(2):, 171-173.
Received on 20.7.2012 August 28.09.2012
Trends in Biosciences 6 (2): 192-194, 2013
Influence of Microbial Inoculants and Nutrients on Morpho-Physiological, GrowthParameters and Yield Potential in Tomato (Lycopersicon esculentum L. Mill.)MOHAN KUMAR, K.G., AND CHETTI M.B.
Department of Crop Physiology, University of Agricultural Sciences, Dharwad,e-mail: [email protected]
ABSTRACT
A field experiment was conducted during kharif, 2002 at MainAgricultural Research Station, University of AgriculturalSciences, Dharwad, to study the influence of microbialinoculants and nutrients on morpho- physiological traits andyield potential in tomato cultivar Mega (L. 15). The experimentswere laid out in randomized block design with threereplications. The experiment consisted of three levels ofnitrogen (30, 45 and 60 kg/ha), three levels of phosphorus(25,37.5 and 50 kg/ha) and inoculation with Azospirillumbrasilense, Pseudomonas striata individually and in combinationto seed, and seedling . The results reveled that the treatmentreceived RDF along with both inoculants recorded significantlyhigher values for morpho-physiological, yield and yieldcomponents.
Key words microbial inoculants, Azospirillium, Pseudomonas, yield.
Tomato is fertilizer responsive crop, the frequentapplication of chemical fertilizers leads to environmentalhazards especially nitrate, which is major threat causingserious health hazards viz., methaemoglobinaemia ,stomachcancer etc.and also affecting natural waters byeutrophication(Hester and Harrison.1996). Therefore thecurrent trend is to explore the possibility of supplementingchemical fertilizers with biofertilizers, more particularly ofmicrobial origin along with organics. Microbial processes arenot only quick but also consume relatively less energy thanindustrial processes, secondly they have the advantage ofbeing diversified into small units to meet the demands of thespecific problems of location which is apt to come across inthe agricultural practice of nations which are not mechanizedin farming (Subba Rao,1998).Therefore the presentinvestigation was under taken to study the effect of microbialinoculants and nutrients on morpho- physiological traits andyield potential in tomato.
MATERIALS AND METHODS
The experiment was conducted during kharif,2002 atCollege of Agriculture, University of Agricultural Sciences,Dharwad. The experiment consisted of fourteen treatments(Table 1).
RDN = Recommended dose of nitrogen, RDP =Recommended dose of phosphorus, RDK = Recommendeddose of potassium
The experiment was laid out in randomized block designwith three replication. The seeds of variety Mega (L. 15) weretreated with captan and were inoculated separately withAzospirillum brasilense, Pseudomonas striata and mixtureof Azospirillum brasilense and Pseudomonas striata. Afterfour weeks healthy and uniform seedlings were selected fortransplanting. Seed inoculated seedlings were dipped inrespective biofertilizer slurry for 30 minutes. Inoculated andun inoculated seedlings were transplanted to the main field atspacing of 75 cm x 60 cm. Five plants were selected randomlyand tagged in each plot for recording various observation atdifferent stages.
RESULTS AND DISCUSSION
The data with respective to morpho-physiological traitsviz., plant height, number of branches per plant, number ofleaves per branch and leaf area showed significant differencesdue to microbial inoculants and nutrients at all stages. Amongthe treatments RDF + Azospirillum brasilense + Pseudomonasstriata recorded significantly higher values for these traits atall stages. The growth parameters such as Leaf area index,leaf area duration, total dry matter, crop growth rate, absolutegrowth rate, net assimilation rate relative growth rate werediffered significantly within the treatments, maximum valuesfor all these parameters were recorded in the treatment whichreceived RDF + Azospirillum brasilense + Pseudomonas striata(Table 2).
The data on yield and yield components presented inTable 2 indicated significant differences between treatmentswith respect to all the paramters viz., 100 – seed weight, numberof fruits per plant, fresh weight per fruits, fruit yield per plantand fruit yield per hectare. Among the treatments RDF +Azospirillum brasilense + Pseudomonas striata recordedsignificantly higher values for these components. Thesignificant differences were observed due to dual inoculationof Azospirillum brasilense and Pseudomonas striata withRDF in all morpho-physiological traits studied. The increasein plant height at all the stages might be attributed to N2-fixation by Azospirillum and P – solubilization byPseudomonas striata which in turn make these two essentialnutrients available to the plant growth and development.These substances have also been reported to increase theactivity of cell division and cell elongation ultimately leadingto increased plant height. Similar results have also been

KUMAR et. al., : Influence of Microbial Inoculants and Nutrients on Morpho-Physiological, Growth Parameters 193
reported by Fallik and Okon, 1996 in Setaria italica and coffeeand tea seedlings Merina, 1995. The increased number ofbranches and number of leaves could be because of certaingrowth promoting substances secreted by microbialinoculants and the availability of more nitrogen andphosphorus which in turn lead to better root development,better translocation of water uptake and deposition ofnutrients.
It is well established that the infrastructure of the plantis decided by the growth parameters like leaf area, LAI, LAD,TDM, CGR,RGR,NAR and AGR. In the present investigation,
Table 1. Influence of microbial inoculants and nutrients on growth parameters in tomatoDays after transplanting
Total dry matter (g/plant)
Crop growth rate (CGR, g/m2/day)
Absolute growth rate (AGR, g/day) Treatments
30 60 90 At harvest 30-60 60-90 90-harvest 30-60 60-90 90-harvest T1 – Recommended dose of fertilizer 14.2 47.9 86.1 139.6 2.61 2.71 3.90 1.17 1.22 1.75 T2 – 50%RDN + RDP + RDK 10.0 34.0 69.9 110.8 1.78 2.41 3.02 0.80 1.09 1.36 T3 – 75% RDN +RDP + RDK 11.8 38.7 73.9 118.3 1.98 2.56 3.29 0.89 1.18 1.49 T4 – 50% RDN +RDP + RDK + Azo. 12.7 43.4 76.1 124.6 2.27 2.63 3.50 1.02 1.19 1.57 T5 – 75% RDN +RDP + RDK + Azo. 13.0 47.0 83.1 135.4 2.43 2.68 3.87 1.09 1.20 1.74 T6 – RDF + Azo. 16.4 58.4 97.4 153.0 23.11 2.86 4.12 1.40 1.29 1.86 T7 – RDN + 50% RDP + RDK 11.8 38.3 73.2 117.7 1.97 2.55 3.29 0.89 1.15 1.48 T8 – RDN + 75% RDP + RDK 12.0 41.5 76.0 123.2 2.20 2.62 3.46 0.99 1.18 1.56 T9 – RDN +50%RDP + RDK + Pseu. 12.7 43.7 79.1 126.0 2.27 2.63 3.59 1.02 1.19 1.62 T10 – RDN +75%RDP + RDK +Pseu. 13.0 44.5 80.1 131.6 2.34 2.64 3.82 1.05 1.20 1.72 T11– RDF + Pseu. 14.5 54.3 89.9 146.3 2.89 2.83 4.11 1.30 1.28 1.85 T12 – 50%RDN +50%RDP + RDK+ Azo.+ Pseu. 15.3 51.0 90.8 142.5 2.71 2.78 3.95 1.22 1.25 1.78 T13 – 75%RDN +75%RDP + RDK + Azo. + Pseu 18.0 62.2 99.7 157.1 3.28 2.89 4.24 1.47 1.30 1.91 T14 – RDF + Azo. + Pseu. 19.4 64.9 103.5 160.8 3.37 2.89 4.25 1.52 1.30 1.91 Mean 13.90 47.80 84.20 134.80 2.52 2.69 3.74 1.13 1.22 1.69 SEm ± 0.83 2.41 3.24 4.78 0.05 0.33 0.41 0.08 0.19 1.19 CD at 5% 2.42 6.99 9.41 13.90 0.18 NS NS 0.24 NS NS
Table 2. Influence of microbial inoculants and nutrients on growth, yield and yield components in tomato
it was observed that the treatments differed significantly withrespect to LA,LAI,LAD and TDM at all the growth stagesand not differed significantly with respect to CGR,AGR andNAR at later stages and RGR at all growth stages due to dualinoculation of Azospirillum brasilense and Pseudomonasstriata with RDF. The increase LA and LAI could be attributedto increased cell division and cell elongation resulting inincreased leaf expansion, more number of leaves and branchesper plant due to beneficial influence of biofertilizers whichrelease growth promoting substances and enhance theavailability of both nitrogen and phosphorus.
Net assimilation rate Relative growth rate (NAR, g/m2/day X 10-2) (RGR, g/g/day)
Yield and yield components
Treatments 30-60 DAT
60-90 DAT
90-harvest
30-60 DAT
60-90 DAT
90 -harvest
100-seed weight (mg)
No. of fruits per
plant
Fresh weight
(g/fruit)
Fruit Yield
(g/plant)
Fruit Yield (t/ha)
T1 – Recommended dose of fertilizer 0.916 0.369 0.56 0.042 0.02 0.016 324.0 22.0 50.0 891.7 19.83 T2 – 50%RDN + RDP + RDK 0.683 0.3 0.442 0.039 0.016 0.01 282.0 18.4 38.0 681.0 15.13 T3 – 75% RDN +RDP + RDK 0.72 0.332 0.517 0.04 0.017 0.017 298.0 19.7 42.0 790.8 16.61 T4 – 50% RDN +RDP + RDK + Azo. 0.81 0.346 0.526 0.04 0.019 0.015 307.0 20.0 45.0 801.5 17.80 T5 – 75% RDN +RDP + RDK + Azo. 0.841 0.356 0.557 0.041 0.02 0.016 322.0 21.5 48.0 889.4 19.75 T6 – RDF + Azo. 1.003 0.379 0.584 0.042 0.021 0.016 336.0 22.4 55.0 1120.1 24.88 T7 – RDN + 50% RDP + RDK 0.713 0.33 0.489 0.039 0.016 0.015 295.0 19.1 40.0 780.6 17.34 T8 – RDN + 75% RDP + RDK 0.83 0.34 0.525 0.04 0.017 0.015 305.0 19.8 43.0 793.2 17.66 T9 – RDN +50%RDP + RDK + Pseu. 0.813 0.354 0.531 0.041 0.019 0.015 312.0 20.2 45.3 837.8 18.61 T10 – RDN +75%RDP + RDK +Pseu. 0.83 0.355 0.532 0.041 0.019 0.016 318.0 20.2 47.7 862.9 19.17 T11– RDF + Pseu. 0.96 0.377 0.58 0.042 0.02 0.016 333.0 22.3 51.3 1006.2 22.35 T12 – 50%RDN +50%RDP + RDK+ Azo.+ Pseu. 0.915 0.37 0.572 0.042 0.02 0.016 328.0 22.2 51.0 898.7 19.92 T13 – 75%RDN +75%RDP + RDK + Azo. + Pseu 1.055 0.385 0.588 0.042 0.022 0.017 338.0 24.7 60.0 1169.5 24.88 T14 – RDF + Azo. + Pseu. 1.066 0.426 0.592 0.044 0.024 0.018 352.0 26.0 64.0 1280.9 28.46 Mean 0.866 0.358 0.542 0.041 0.019 0.015 317.93 21.30 48.60 914.60 20.17 SEm ± 0.067 0.048 0.6 0.003 0.002 0.002 10.36 1.18 2.03 37.99 0.83 CD at 5% 0.196 NS NS NS NS NS 30.11 3.42 5.89 110.37 2.43

194 Trends in Biosciences 6 (2), 2013
More LAD might be attributed to the greenness due todual inoculation of Azospirillum and Pseudomonas with RDF.The increased TDM in the plants which received both theinoculants and the RDF could be attributed to their influenceon leaf area, LAI, CGR, AGR, RGR and NAR. In the presentinvestigation the fruit yield per plant and per hectare weresignificantly higher in the treatment of RDF with dualinoculation of Azospirillum and pseddomonas. This might bedue to the production of more lateral roots, increased symbioticactivity of nitrogen fixation and P-solubilization which havehelped in getting higher nitrogen and phosphorus requiredfor growth and development. In the present investigation it isseen from the results that there was a significant increase inall the morphological, growth, yield and yield componentsdue to RDF with dual inoculation of Azospirillum andPsedomonas thus signifying the role of biofertilisers.
LITERATRURE CITED
Fallik and Okon, Y., 1996, Inoculation effect of Azospirillum brasilenseon biomass production, survival and growth promotion to setariaitalica and Zea mays. Soil Biology and Biochemistry, 128:123-126.
Hester, R.E. and Harrison, R.M., 1996, Agriculture chemicals andenvironment, pp. 1.
Merina, P.S., 1995, Response of certain horticultural crops to inoculationwith fungi azospirrilum and phosophobacteria. M.Sc.(Agri.) Thesis.Tamil Nadu Agricultural university, Coimbatore.
Subbarao, N.S., 1998, Nitrogen fixing bacteria associated with plantationand orchid plants. Canadian Journal of Microbiology, 29: 863-866.
Received on 07.03.2013 Accepted on 18.04.2013

Trends in Biosciences 6 (2): 195-199, 2013
Sensory Quality Evaluation of MA Packaged Fruits Applying Fuzzy LogicS.MANGARAJ1, M.K.TRIPATHI2
Agro Produce Processing Division, Central Institute of Agriculture Engineering, Nabi Bagh, Baresia Road,Bhopal, M.P. Indiae-mail: [email protected]
ABSTRACT
The laminated MA packed apple, guava and litchi were takenafter specific storage periods and kept at the recommendedripening temperatures and RH for determining the sensoryqualities like color, texture, aroma and taste. Eleven judgeswere selected based on good health, interests and knowledgein sensory evaluation, ability to concentrate, learned andfamiliarity with the fruits. They were asked to judge fruitsamples quickly but not in hurry. Sensory scale factors assignedto each of the quality attributes (viz., color, texture, aroma andtaste) were not satisfactory, fair, medium, good and excellent.The panelists were asked to rank the fruit samples by givingtick marks to appropriate scale factor for each of the qualityattributes. The data obtained from the judges were processedapplying Fuzzy logic modeling using MATLAB programme.The results indicated that the similarity in values under verygood and good category is the highest for MA packaged apple,guava and litchi. Hence the overall quality of these sampleswere ranked first / best as compared to the control storagefruits. The important / order of preference of quality attributesfor apple, guava and litchi fruits, in general, was rated as taste> aroma > color > mouth feel; taste > mouth feel > aroma >color; and colour > aroma > taste > mouth feel, respectively.
Key words MA packaging, fuzzy logic, modelling, sensory evaluation
Sensory evaluation is the science of judging andevaluating the quality of a food by the use of the senses, i.e.taste, smell, sight, touch and hearing (Das, 2005; Falade andOmojola, 2008). Fuzzy logic is an important tool by whichvague and imprecise data can be analyzed and importantconclusions regarding acceptance, rejection, ranking, strongand weak attributes of food can be drawn.
MA packaging is a food packaging method in which theproportion of CO2, O2 and N2 in a sealed container are differentfrom those in the normal air to enhance the food shelf-life(Kader, et. al., 1989, Mangaraj, et, al., 2011). It involves theexposure of produce to the atmosphere generated in a packageby the interaction of the produce, the package and the externalatmosphere (Mangaraj and Goswami, 2008; Mangaraj et al.,2009; Montanez, et al., 2010). The higher CO2 and lower O2atmosphere surrounding the commodity, potentially reducerespiration rate, ethylene sensitivity, and production,physiological changes and decay (Mahajan, et al., 2007;Mangaraj and Goswami, 2009a). The fruits apple (cv. RoyalDelicious), guava (cv. Baruipur) and Litchi (cv. Shahi)
harvested from the orchard at their commercial maturity(Mangaraj and Goswami, 2009d), were sealed in laminated MApackages and kept for storage study at different temperatures.Though the quality attributes were determined objectively atregular intervals, various sensory attributes such as color,texture, taste and mouth feel of fruit samples were evaluatedand Fuzzy logic model was developed for the sensoryevaluation of stored fruits (Mangaraj, et. al., 2005; Mangaraj,et. al., 2006). The main objective of this study was to evaluatethe sensory scores of different MA packaged and unpackagedfruit samples using fuzzy logic and grade the samples as pertheir sensory qualities to find out the strength and weaknessof individual sample, preference of quality attributes of fruitsin general and ranking of fruits.
MATERIALS AND METHODS
Raw materials :
The fruits apple (cv. Royal Delicious), guava (cv.Baruipur) and Litchi (cv. Shahi) were harvested from theorchard at their commercial maturity. It was ensured to maintainuniformity in terms of size and weight of individual fruits inthe whole lot of samples.
Selection of polymeric films :
With the objective of meeting MAP requirements thepolymeric films namely LDPE, BOPP, PVC, PVDC wereprocured considering various film characteristics such as gastransmission rates for O2 and CO2, WVTR, clarity, strength,printability and cost effectiveness (Exama, et al., 1993; Costa,et al., 2011). The gas transmission rates of films were measuredusing standard methods (Mangaraj, et al., 2012 a and b).
Development of MA packages :
The different combination of PVC and BOPP as well asthat of PVC and LDPE was tailored for lamination to bring thegas transmission characteristics of the laminates close to therequired values. Using these combinations five types of filmlaminates for MA packages viz., PCG-LFR-1 and PCG-LFR-2for apple; PCG-LFR-3 and PCG-LFR-4 for guava; and PCG-LFR-5 for litchi were developed. A package size of 24 cm x 19cm, 19 cm x 19 cm, and 28 cm x 22 cm for a fill weight of 1.00 kg± 100 g was found to be appropriate for MA packaging apples,guava and litchi (Mangaraj, et. al., 2012a,b, 2013)
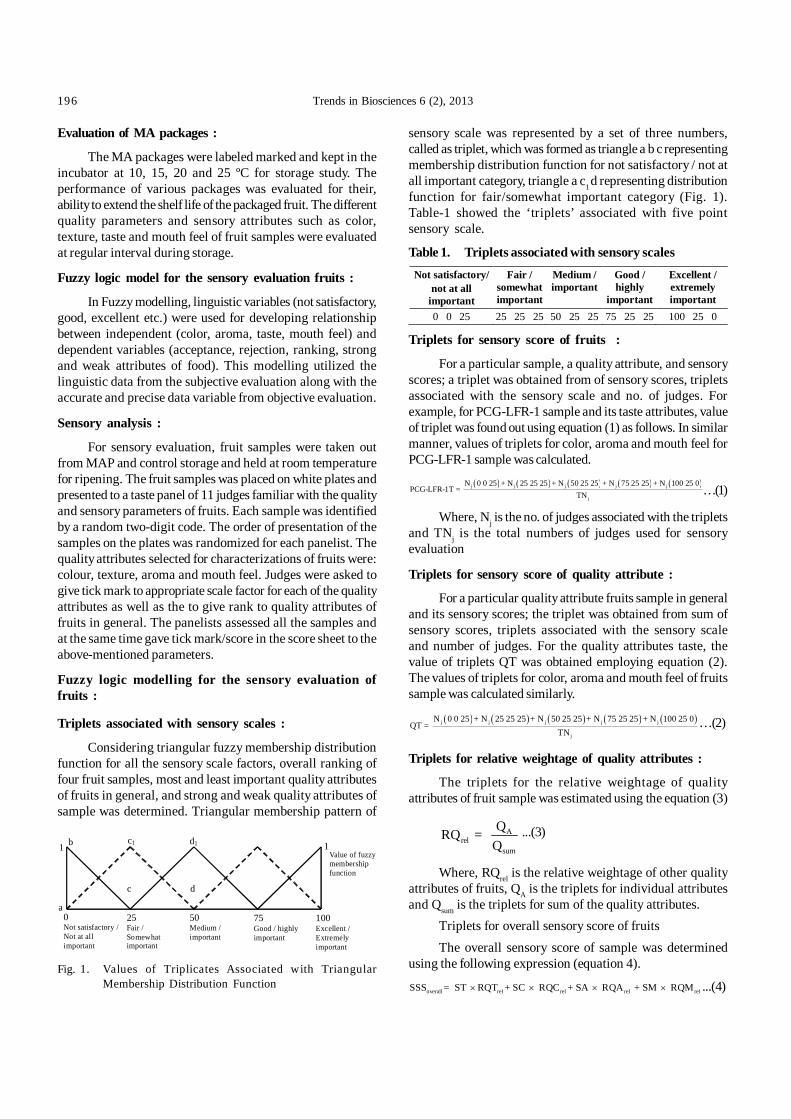
196 Trends in Biosciences 6 (2), 2013
Evaluation of MA packages :
The MA packages were labeled marked and kept in theincubator at 10, 15, 20 and 25 ºC for storage study. Theperformance of various packages was evaluated for their,ability to extend the shelf life of the packaged fruit. The differentquality parameters and sensory attributes such as color,texture, taste and mouth feel of fruit samples were evaluatedat regular interval during storage.
Fuzzy logic model for the sensory evaluation fruits :
In Fuzzy modelling, linguistic variables (not satisfactory,good, excellent etc.) were used for developing relationshipbetween independent (color, aroma, taste, mouth feel) anddependent variables (acceptance, rejection, ranking, strongand weak attributes of food). This modelling utilized thelinguistic data from the subjective evaluation along with theaccurate and precise data variable from objective evaluation.
Sensory analysis :
For sensory evaluation, fruit samples were taken outfrom MAP and control storage and held at room temperaturefor ripening. The fruit samples was placed on white plates andpresented to a taste panel of 11 judges familiar with the qualityand sensory parameters of fruits. Each sample was identifiedby a random two-digit code. The order of presentation of thesamples on the plates was randomized for each panelist. Thequality attributes selected for characterizations of fruits were:colour, texture, aroma and mouth feel. Judges were asked togive tick mark to appropriate scale factor for each of the qualityattributes as well as the to give rank to quality attributes offruits in general. The panelists assessed all the samples andat the same time gave tick mark/score in the score sheet to theabove-mentioned parameters.
Fuzzy logic modelling for the sensory evaluation offruits :
Triplets associated with sensory scales :
Considering triangular fuzzy membership distributionfunction for all the sensory scale factors, overall ranking offour fruit samples, most and least important quality attributesof fruits in general, and strong and weak quality attributes ofsample was determined. Triangular membership pattern of
sensory scale was represented by a set of three numbers,called as triplet, which was formed as triangle a b c representingmembership distribution function for not satisfactory / not atall important category, triangle a c1 d representing distributionfunction for fair/somewhat important category (Fig. 1).Table-1 showed the ‘triplets’ associated with five pointsensory scale.
Fig. 1. Values of Triplicates Associated with TriangularMembership Distribution Function
c1
c
b
0 Not satisfactory / Not at all important
25 Fair / Somewhatimportant
50 Medium / important
75 Good / highly important
100 Excellent / Extremely important
a
1 d1
d
Value of fuzzy membership function
1
Table 1. Triplets associated with sensory scalesNot satisfactory/
not at all important
Fair / somewhat important
Medium / important
Good / highly
important
Excellent / extremely important
0 0 25 25 25 25 50 25 25 75 25 25 100 25 0
Triplets for sensory score of fruits :
For a particular sample, a quality attribute, and sensoryscores; a triplet was obtained from of sensory scores, tripletsassociated with the sensory scale and no. of judges. Forexample, for PCG-LFR-1 sample and its taste attributes, valueof triplet was found out using equation (1) as follows. In similarmanner, values of triplets for color, aroma and mouth feel forPCG-LFR-1 sample was calculated. j j j j j
j
N 0 0 25 + N 25 25 25 + N 50 25 25 + N 75 25 25 + N 100 25 0PCG-LFR-1T =
TN …(1)
Where, Nj is the no. of judges associated with the tripletsand TNj is the total numbers of judges used for sensoryevaluation
Triplets for sensory score of quality attribute :
For a particular quality attribute fruits sample in generaland its sensory scores; the triplet was obtained from sum ofsensory scores, triplets associated with the sensory scaleand number of judges. For the quality attributes taste, thevalue of triplets QT was obtained employing equation (2).The values of triplets for color, aroma and mouth feel of fruitssample was calculated similarly.
j j j j j
j
N 0 0 25 + N 25 25 25 + N 50 25 25 + N 75 25 25 + N 100 25 0QT =
TN…(2)
Triplets for relative weightage of quality attributes :
The triplets for the relative weightage of qualityattributes of fruit sample was estimated using the equation (3)
Arel
sum
QRQ = Q
...(3)
Where, RQrel is the relative weightage of other qualityattributes of fruits, QA is the triplets for individual attributesand Qsum is the triplets for sum of the quality attributes.
Triplets for overall sensory score of fruitsThe overall sensory score of sample was determined
using the following expression (equation 4).
overall rel rel rel relSSS = ST RQT + SC RQC + SA RQA + SM RQM ...(4)

RAJ & TRIPATHI : Sensory Quality Evaluation of MA Packaged Fruits Applying Fuzzy Logic 197
Where, SSSoverall is the overall sensory score of anysample, ST, SC, SA and SM are values of triplets for taste,color, aroma and mouth feel, RQTrel, RQCrel, RQArel and RQMrelare the triplets for the relative weightage of quality attributesnamely taste, color, aroma and mouth feel, respectively. Eachterm of the right hand of the equation (4) represents a triplet.The following rule was applied (equation 5) for multiplicationof triplet (a b c) with (d e f).
(a b c) x (d e f) = (a x d a x e + d x b a x f + d x c) …(5)
Values of Membership Function of Standard Fuzzy Scale
The triangular distribution pattern of 6-point sensoryscale, called standard fuzzy scale is shown in Fig. 2. SymbolsF1, F2, F3, F4, F5, and F6 represent sensory scales of fruits as:not satisfactory / not at all satisfactory, fair / somewhatnecessary, satisfactory / necessary, good / important,very good / highly important and excellent / extremely importantrespectively. Values of membership function for F1 to F6 weredefined by a set of 10 numbers between 0 - 100 in thestep of 10.
Fig. 3. Graphical Representation of Triplet (a b c) and itsMembership Function
x
b
a c
Bx 1
100
Val
ueof
mem
bers
hip
func
tion
represented a row matrix having 10 elements. Similarity valuesof fruit samples, Sm (F, B) is defined as equation (7) (Das,2005; Sinija and Mishra, 2011).
F o BSm F, B =
Maximum of F o F and B o B …(7)
where, F o B is the product of matrix F with transpose ofmatrix B, F o F is the product of matrix F with transpose of F, Bo B is the product of matrix B with its transpose, and B is thevalues of overall membership function of sensory score forfruit samples on standard Fuzzy Scale.
The MATLAB programme was run to obtain thesimilarity values of different fruit samples.
RESULTS AND DISCUSSION
Performance of MA packages :
Apples packed in MA packages shown reduced weightloss, retarded the amount of starch formation, preserved goodcolour and firmness in original than fruits stored in normalatmosphere (Mangaraj, et. al., 2011b). The modifiedatmosphere of 5% O2 and 4% CO2 was found to be suitable forpreservation of guava (cv. Baruipur) (Mangaraj, et al., 2012b).MA packaging of EDTA treated litchi fruits enabled thereduction of weight loss, prevention of browning, retentionof good color and sweet taste during extended storage(Mangaraj, et. al., 2013). The main constituent of litchi is waterand its preservation became essential for maintaining fruitcolor and quality. MA packaging reduced the rate of waterloss from the pericarp by increasing relative humidity aroundthe package. Under lower O2 and higher CO2 (3% O2 and CO2)storage condition the metabolic and enzymatic activity wasreduced.
Fuzzy Logic analysis of sensory data for qualityevaluation of fruits :
The sensory data obtained from the judges wereprocessed applying Fuzzy logic modeling by developingMATLAB programme and important conclusions regardingacceptance, ranking, strong and weak attributes of fruit samplewas drawn.
Fig. 2. Standard Fuzzy Scale
F6Excellent /Extremelyimportant
F5
Very good / highlyimportant
F3
Satisfactory / necessary
40
F4
Good / important
F2Fair / Somewhat necessary
F1Not satisfactory /Not at all necessary
1 1Value of Fuzzy membership function
1009080
70
60
50
30
20100
From Fig. 2, the value of membership function for F1(Not satisfactory/not at all necessary) was represented as,
The membership values for MF2, MF3, MF4, MF5 andMF6 was obtained
Values of overall membership function of sensory scoreson standard fuzzy scale
The graphical representation of membership functionof a triplet (a b c) was shown in Fig. 3. It shows that when thevalue of abscissa is ‘a’, value of membership function is 1 andwhen it is less than (a - b) or greater than (a + c), the value iszero. For a given value of x on abscissa, value of membershipfunction Bx is expressed by the equation (6) as follows,
x
x- a-bB = for a-b < x < a
b ;
x
a+c -xB = for a < x < a+c
c ; ...(6)
For each samples, membership functions (viz. B1, B2,B3, and B4) were compared with the membership function ofstandard fuzzy scale (viz., F1, F2, F3, F4, F5, and F6)

198 Trends in Biosciences 6 (2), 2013
Apple (cv. Royal Delicious) :
The similarity value for all the quality attributes of appleis shown in Table 2. It was found that the similarity value forsample 1 (PCG-LFR-1) under not satisfactory category (0.0),while the same under fair (0.056), satisfactory (0.27698), good(0.5408), very good (0.7223) and excellent (0.3516) (Table 2).Since similarity value under very good category is the highest(0.7223), the overall quality of sample 1 can be considered asvery good. Using similar reasoning, overall quality of sample2 (PCG-LFR-2) is considered as very good having similarityvalue of 0.6918, sample 3 as satisfactory having similarity valueof 0.72199). Comparing the similarity values of sample 1 andsample 2 under very good category it is inferred that sample 1is slightly superior to sample 2. Thus the order of ranking ofMA packed and unpacked apples are sample 1 (very good) >sample 2 (very good) > sample 3 (satisfactory). From Table 3 itis observed that the similarity value for taste (0.89671) underhighly important category is the highest. This is followed byaroma (important, 0.9545), color (important, 0.9236) and mouthfeel (necessary, 0.81037). Also the sensory score for aroma ishigher than that of colour (Table 3). Thus, the order of rankingof quality attributes of apple fruit, in general is taste (highlyimportant) > aroma (important) > color (important) > mouthfeel (necessary).
category (0.8932) is the highest followed by mouth feel(important, 0.9026), aroma (important, 0.8874) and color(necessary, 0.7924) (Table 5). The sensory score for mouthfeel was found to be higher than that of aroma. Thus the orderof preference of quality attributes of guava fruit, in general istaste (highly important) > mouth feel (important) > aroma(important) > color (necessary). Therefore, these sensoryattributes are the most desirable characteristics of guava forits acceptability and marketing.
Table 2. Similarity values of MA packed and unpackedApple fruit sample
Table 3. Similarity values for quality attributes of apple ingeneral
Scale factors Sample 1 (PCG-LFR-1)
Sample 2 (PCG-LFR-2)
Sample 3 (CS)
Not satisfactory, F1 0.0002 0.0005 0.1182 Fair, F2 0.0559 0.0712 0.4586 Satisfactory, F3 0.2698 0.2967 0.7199 Good, F4 0.5408 0.5592 0.5581 Very good, F5 0.7223 0.6918 0.1912 Excellent 0.3516 0.3090 0.0116
Scale factors Color Aroma Taste Mouth feel Not at all necessary F1 0.0007 0.0013 0.0020 0.0031 Some what necessary F2 0.0444 0.0641 0.0182 0.1725 Necessary F3 0.5162 0.6091 0.1345 0.8037 Important F4 0.9236 0.9545 0.7709 0.6539 Highly important F5 0.4061 0.3331 0.8671 0.2603 Extremely important F6 0.0150 0.0214 0.1925 0.0168
Scale factors Sample 4 (PCG-LFR-3)
Sample 5 (PCG-LFR-4)
Sample 6 (CS)
Not satisfactory, F1 0.0148 0.0211 0.4268 Fair, F2 0.1720 0.2047 0.7036 Satisfactory, F3 0.4562 0.4991 0.3801 Good, F4 0.6702 0.6646 0.2033 Very good, F5 0.5413 0.4772 0.0633 Excellent 0.1796 0.1434 0.0026
Table 4. Similarity values of MA packed and unpackedguava sample
Guava (cv. Baruipur)
From Table 4 it is found that for sample 4 and 5, thesimilarity value under good category (0.6701 and 0.6646) isthe highest. Hence the overall quality of these samples isgood. However, overall quality of sample 6 is fair havingsimilarity value of 0.71036. Sample 4 was found to be slightlysuperior to sample 5 in terms of similarity value (Table 4).Thus, the order of ranking of guava fruit is sample 4 (good) >sample 5 (good) > sample 6 (fair). The comparison of valuesshows that similarity value for taste under highly important
Litchi (cv. Shahi)
The highest similarity values for sample 7, 8, 9 and 10are 0.6919, 0.66591, 0.6726 and 0.74389 lie in the overall qualitycategory of good, satisfactory, satisfactory and fair,respectively (Table 6). On the basis of comparison of thesimilarity values of samples, they are ranked as sample 7 (good)> sample 9 (satisfactory) > sample 8 (satisfactory) > sample 10(fair). It is observed that (Table 7) the similarity value for color,aroma, taste and mouth feel under the category, highlyimportant (0.9132), important (0.9705), important (0.91036) andnecessary (0.81065), respectively is the highest. The similarityvalue for aroma is higher than that of taste both placed inimportant category. Therefore, the order of ranking of qualityattributes of litchi fruits, in general is colour (highly important)> aroma (important) > taste (important) > mouth feel
Table 5. Similarity values of quality attributes of guava fruitin general
Scale factors Color Aroma Taste Mouth feel Not at all necessary F1 0.0009 0.0013 0.0046 0.0029 Some what necessary F2 0.3186 0.0108 0.0138 0.0542 Necessary F3 0.7924 0.3691 0.2402 0.3250 Important F4 0.6183 0.8874 0.7231 0.9026 Highly important F5 0.2549 0.5913 0.8932 0.7231 Extremely important F6 0.0482 0.0552 0.0836 0.0833
Table 6. Similarity Values of Litchi fruit sample duringScale factors Sample 7
(PCG-LFR-5T)
Sample 8 (PCG-LFR-
5UT)
Sample 9 (CS-T)
Sample 10(CS-UT)
Not satisfactory, F1 0.0197 0.0668 0.0746 0.2414 Fair, F2 0.2023 0.3380 0.3574 0.7389 Satisfactory, F3 0.5070 0.6591 0.6726 0.7149 Good, F4 0.6919 0.6442 0.6365 0.2459 Very good, F5 0.4826 0.2846 0.2716 0.0129 Excellent 0.1322 0.0306 0.0276 0.00

RAJ & TRIPATHI : Sensory Quality Evaluation of MA Packaged Fruits Applying Fuzzy Logic 199
doi:10.1007/s11947-008-0126-2 .
Kader, A.A., Zagory, D. Kerbel, E.L. 1989. Modified atmospherepackaging of fruits and vegetables. CRC Critical Reviews in FoodScience and Nutrition, 28: 1-30.
Mahajan, P.V.; Oliveira, F.A.R., Montanez, J.C., Frias, J. 2007.Development of user-friendly software for design of modifiedatmosphere packaging for fresh and fresh-cut produce. InnovativeFood Science and Emerging Technology, 8: 84-92
Mangaraj, S., Agrawal, S., Gandhi, A.P. 2005. Studies on physico-chemical changes in selected fruits during storage. Bev. Food World,32(11): 72-75.
Mangaraj, S., Singh, R., Singh, S.P. 2006. Studies on measurement andanalysis of colors of fruits during storage. Ind. Food Pack. 60(6):133-140.
Mangaraj, S. and Goswami, T.K. 2008. Respiration rate modelling ofroyal delicious apple at different temperature. Fresh Produce,2(2):72-80.
Mangaraj, S., Goswami, T.K. 2009a. Modified atmosphere packaging –An ideal food preservation technique. Journal of Food Scienceand Technology, 46(5): 399-410
Mangaraj, S. and Goswami, T.K. 2009d. Determination of maturityindices of fruits based on physico-chemical properties. Ind. FoodPack., 63(1): 67-79.
Mangaraj, S., Goswami, T.K. and Mahajan, P.V. 2009. Application ofplastic films in modified atmosphere packaging of fruits andvegetables - A review. Food Eng. Rev., 1: 133-158.
Mangaraj, S. and Goswami, T.K. (2011b). Modelling of respirationrates of litchi fruit under aerobic condition. Food BioprocessTechnol., 4: 272–281.
Mangaraj, S., Sadawat, I.J. and Prasad, S, 2011. Assessment of quality ofpears stored under laminated modified atmosphere packages. Int. J.Food Properties. 14: 1-14
Mangaraj, S., Goswami, T.K., Giri, S.K., Chandra, P. and Pajnoo, R.K.2013. Development and Evaluation of MA Packages EmployingLamination Technique for Royal Delicious Apple. Emirates Journalof Food and Agriculture, 25(5): 358-375.
Mangaraj, S., Goswami, T.K., Giri, S.K. and Joshy C.G. 2012a. Designand develoepeemnt of a modified atmosphere packaging systemfor guava (cv. Baruipur). Journal of Food Science and Technology.DOI: 10.1007/s13197-012-0860-3.
Mangaraj, S., Goswami, T.K., Giri, S.K. and Tripathi, M.K. 2012b.Permselective MA packaging of litchi (cv. Shahi) for preservingquality and extension of shelf-life. Postharvest Biology andTechnology, 71: 1-12.
Montanez, J.C.; Rodriguez, F.A.S., Mahajan, P.V., Frias, J.M. 2010.Modeling the effect of gas composition on the gas exchange rate inPerforation-Mediated Modified Atmosphere Packaging. Journalof Food Engineering, 96: 348-355
Sinija, V.R. Mishra, H.N. 2011. Fuzzy Analysis of Sensory Data forQuality Evaluation and Ranking of Instant Green Tea Powder andGranules. Food and Bioprocess, 4: 408–416
Sivakumar, D. Korsten, L. Zeeman, K. 2007. Postharvest managementon quality retention of litchi during storage. Fresh Produce, 1: 66-75
Zadeh, L. 1965. Fuzzy sets. Information and Control, 8: 338-353
Received on 21.03.2013 Accepted on 15.04.2013
(necessary). It is inferred that colour, taste, and aroma are themajor quality attributes of litchi. The retention of attractivered colour in litchi improves its quality during storage andfetches high value in the market (Sivakumar, et al., 2006).
It was seen that the similarity value for colour undervery good category (0.65494) is the highest, followed by aroma(good, 0.69891), taste (good, 0.6706) and mouth feel(satisfactory, 0.71074). Colour is therefore the strongest qualityof sample 7 followed by aroma and taste. Preserving theoriginal colour or improving the same of the litchi fruits canenhance its marketability. Thus the quality attributes rankingof sample 7 is colour (very good) > aroma (good) > taste(good) > mouth feel (satisfactory).
The sensory data obtained from the judges wereprocessed applying Fuzzy logic modeling by developingMATLAB programme. The order of ranking of MA packedand control stored apple; guava; and litchi were found to besample 1 (very good) > sample 2 (very good) > sample 3(satisfactory); sample 1 (good) > sample 2 (good) > sample 3(fair); and sample 1 (good) > sample 3 (satisfactory) > sample2 (satisfactory) > sample 4 (fair), respectively. The ranking ofquality attributes of fruits in general were found to be taste(highly important) > aroma (important) > color (important) >mouth feel (necessary); taste (highly important) > mouth feel(important) > aroma (important) > colour (necessary); and color(highly important) > aroma (important) > taste (important) >mouth feel (necessary) for apple; guava; and litchi,respectively. The MA packaged fruits ranked first than that ofunpacked fruits.
LITERATURE CITED
Costa, C. Lucera, A. Conte, A. Mastromatteo, M. Speranza, B. Antonacci,A. Del, Nobile, M.A. 2011. Effects of passive and active modifiedatmosphere packaging conditions on ready-to-eat table grape.Journal of Food Engineering, 102: 115-121
Das, H. 2005. Food processing operations analysis, Asian Books PrivateLimited, New Delhi. pp. 406
Exama, A. Arul, J. Lencki, R.W. Lee, L.Z. Toupin, C. 1993. Suitabilityof plastic films for modified atmosphere packaging of fruits andvegetables. Journal of Food Science, 58: 1365-1370
Falade, K.O. Omojola, B.S. 2008. Effect of processing methods onphysical, chemical, rheological, and sensory properties of okra(Abelmoschus esculentus). Food and Bioprocess Technology .
Table 7. Similarity values of Quality Attributes of Litchifruits (in general)
Scale factors Color Aroma Taste Mouth feel Not at all necessary F1 0.0032 0.0018 0.0037 0.0012 Some what necessary F2 0.0040 0.0109 0.0052 0.1833 Necessary F3 0.0618 0.3745 0.2436 0.8065 Important F4 0.6073 0.9705 0.9036 0.7771 Highly important F5 0.9132 0.5556 0.7000 0.1466 Extremely important F6 0.2642 0.0407 0.0712 0.0090

Trends in Biosciences 6 (2): 200-202, 2013
Effect of Menopause on Serum Lipid Profile Pattern in WomenEKTA A.ANDRIYAS, SAPNA SMITH LAL1Biochemistry2Deptt. of Clinical biochemistry, Deptt. of BiochemistryHigginbottom, Institute of Agriculture : Technology of Science Allahabad, U.P.e-mail : [email protected]
ABSTRACT
The present study is aimed at comparing the levels of totalserum cholesterol including their subunits in among the threestages of menopause with that of post menopausal women. Onehundred Fifty apparently healthy, non pregnant female 50perimenopausal in Group I, 50 Menopausal in Group II and 50postmenopausal Group in III were recruited for the study ofserum total cholesterol and their sub fractions HDL,LDL, VLDL& triglyceride were estimated using enzymatic & establishedmathematical method. There was Significant difference inthe serum total cholesterol and triglyceride between the threegroups. There was significant reduction of HDL and VLDL inthe post menopausal group and a significant increase in thelevel of LDL in the postmenopausal group. The elevated LDLand the reduction of cardio protective HDL and VLDL is anindication that menopause is an independent risk factor fordeveloping CHD in our environment.
Key word Menopause, CHD, Cholesterol, HDL-Cholesterol, VLDL-Cholesterol, LDL-Cholesterol.
Menopause is a natural event in aging process it signifiesthe end of reproductive phase of life with the cessation ofcyclic ovarian function manifested by cyclic menstruation(Burger, et.al., 2002). This term was originally used to describethe reproductive change in human female fertility where theend of fertility is traditionally indicated by the permanentstoppage of menstruation or mensus. The average age ofmenopause in females is 51 years. Less than 1 % womenexperience it before age of 40 years, with some women undergoing premature menopause at a very early age affecting theirability to have children (Derek, 990). Menopause is a normalpart of life. Changing level of estrogen and progesterone,which are the two hormones produced in the ovaries of afemale may lead to some symptoms which may last for monthsor years.
After menopause, there is loss of ovarian function. Thisresult in adverse change in glucose and insulin metabolism,body fat distribution, Coagulation, Fibrinolysis and vascularendothelial dysfunction (Spencer. et.al., 1997)There is alsoderanged of lipoprotein profile independent of age(Bales,2000).A number of changes that occur in the lipid profileafter menopause are associated with increased cardiovasculardisease risk. Lack of estrogen is an essential factor in thismechanism. Apart from maintaining friendly lipid profile,
estrogen changes the vascular tone by increasing nitrousoxide production. It stabilizes the endothelial cells, enhancesantioxidant effects and alters fibrinolytic protein (Taddec,et. al., 1996). All these are cardio protective mechanisms, whichare lost in menopause.
MATERIALS AND METHODS
All experiments was done at laboratory of Faculty ofHealth and Medical Sciences Indigenous System of Medicine,Sam Higginbottom Institute of Agriculture Technology andSciences Allahabad. About 5 ml of fasting blood was collectedfrom 150 female having age group 40-45 for perimenopausestage, 45-50 for menopausal stage, 50 and above for postmenopausal stage attending the different hospitals ofAllahabad using sterilized disposable syringe. The blood wasput into centrifuge tubes; this was allotted to clot and thencentrifuge at 3000 rpm for 15 min at room temperature. Theserum obtained was pipetted into clean blood sample andanalyzed on the day of collection. The serum was analyzedfor for Serum Total Cholesterol, Serum HDL-Cholesterol, SerumLDL-Cholesterol, Serum triglyceride estimation.
RESULTS AND DISCUSSION
In the present study effect of menopause on lipid profilepattern all the three groups were analysed for serum totalcholesterol, LDL cholesterol and their sub fractions HDL, LDL,VLDL and triglyceride.
The mean, standard deviation and the p valuesignificance and t test value for the three stages of menopausefor Total cholesterol, LDL cholesterol and their sub fractionsHDL ,LDL, VLDL and triglyceride is shown in Table 1 and thep value and t test value for Total cholesterol, LDL cholesteroland their sub fractions HDL ,LDL, VLDL and triglyceride incomparison to all the three groups is shown in Table 1b, 2b,3b, 4b, 5b respectively. During the study it was found thatthere was significant difference in the serum Total cholesterol,LDL cholesterol and their sub fractions HDL, LDL, VLDLand triglyceride between the three groups. There was asignificant increase in the Serum Cholesterol, SerumTriglyceride, Serum LDL-C, Serum VLDL-C in the threemenopausal stages. The table shows the increase in themenopausal group when compared with the pre menopausalgroup (p value > .000.1 highly significant) and there was alsoincrease in the serum total cholesterol, Serum triglyceride,

ANDRIYAS & LAL : Effect of Menopause on Serum Lipid Profile Pattern in Women 201
Serum LDL-C, Serum VLDL-C concentrations in thepostmenopausal women when compared with menopausalwomen (p value > .000.1 highly significant).
But on the other hand the study shows significantdecrease in the Serum HDL-Cholesterol in the three menopausalstages. The Table 1 shows the decrease in the menopausal
group when compared with the pre menopausal group(p value > .000.1 highly significant) and there was also decreaseserum HDL-Cholesterol in the concentrations in thepostmenopausal women when compared with menopausalwomen. (p value > .000.1 highly significant).
Lipid profiles are affected by metabolic conditions andalteration in lipid metabolism have been implicated inatherosclerosis and coronary heart disease .results from thisstudy on lipid profile indicate that menopause alter the lipidprofile in women .the total cholesterol, LDL-C Triglycerideand VLDL-C were significantly higher and HDL-C lower in thepost menopausal women a similar observation. Barett andBush 1993 in post, menopausal Caucasians. The elevatedTC,LDL-C in post menopausal women and women greaterthan 45 yrs has been attributed to hormonal changes andfailure of follicular development ,where the plasma estradoillevels that reduces the risk of coronary heart disease
Table 1. Effect of menopause on total cholesterol and its sub fractions HDL ,LDL, VLDL and triglycerideMean ± S.D. Groups
Serum Cholesterol Serum Triglyceride Serum HDL-Cholesterol Serum LDL Cholesterol Serum VLDL Cholesterol Group I 211.62±18.17 112.7± 16.42 49.58± 18.17 139.5±18.704 42.324± 3.486 Group II 255.54±17.35 176.6± 24.23 36.16± 17.35 184.06±18.461 51.108± 3.471 Group III 296.94±25.31 207.64±16.83 22.26± 25.31 233.15±28.328 59.388± 5.072
Table 2. The p value significance and t-test values of serum
total cholesterolStages P values significance T-Test Perimenopausal : Menopausal Statistically significant
(>0.0001) 12.1756
Perimenopausal:Postmenopausal Statistically significant (>0.0001)
19.1847
Perimenopausal: Menopausal Statistically significant (>0.0001)
9.5484
Table 3. The p value significance and t-test values of serum
HDL cholesterolStages P values significance T-Test Perimenopausal : Menopausal Statistically significant
(>0.0001) 10.3946
Perimenopausal:Postmenopausal Statistically significant (>0.0001)
19.2415
Perimenopausal: Menopausal Statistically significant (>0.0001)
16.1956
Table 4. The pValue and t Test value of Serum Triglyceride Stages P values significance T-Test Perimenopausal : Menopausal Statistically significant
(>0.0001) 15.3724
Perimenopausal:Postmenopausal Statistically significant (>0.0001)
28.5525
Perimenopausal: Menopausal Statistically significant (>0.0001)
26.6645
Table 5. The pValue and t Test value of Serum LDLCholesterol
Table 6: Showing the pValue and t Test value of SerumVLDL Cholesterol
Stages P value significance T Test Perimenopausal : Menopausal Statistically
significant (>0.0001) 12.0143
Perimenopausal:Postmenopausal Statistically significant (>0.0001)
19.6438
Perimenopausal: Menopausal Statistically significant (>0.0001)
10.3835
Stages P values significance T-Test Perimenopausal : Menopausal Statistically significant
(>0.0001) 12.6276
Perimenopausal :Postmenopausal Statistically significant (>0.0001)
19.6096
Perimenopausal: Menopausal Statistically significant (>0.0001)
9.5309
211.62
255.54
296.94
0
50
100
150
200
250
300
Mea
n va
lues
Pre-M Meno Post-m
Stages of menopause
Fig. 1. Effect of menopause on Serum Total Cholesterol
49.58
36.16
22.26
0
5
10
15
20
25
30
35
40
45
50
Mea
n va
lues
Pre-M Meno Post-m
Stages of menopause
Fig. 2. Effect of menopause on Serum HDL-Cholesterol

202 Trends in Biosciences 6 (2), 2013
falls below the levels seen in the premenopausal women.Unfavorable Changes in HDL-C,LDL-C after menopause havebeen independently reported by (Pascot et. al., 1999: Gardyet. al., ,1992).The TC and LDL-C were significantly higherand HDL-C Lower in women above 45 yrs when compared tothose of women aged between 25-45 yrs. Increasing age hasbeen associated with higher plasma LDL-C ,where significantlyhigher LDL-C was observed in postmenopausal women thanin premenopausal women (Schaefer, et. al., 1994) also,observed high total cholesterol, LDL-C and VLDL-C as wellas triglyceride levels with increasing age.
In the present study there was significant differences inthe total cholesterol going to the higher side with the increasein age but there was significant reduction in the in the cardioprotective HDL-C and significant increase in theatherosclerotic LDL-C and VLDL-C. This is in agreement withfindings in other studies (Jenson, et. al., 1990, Edr and Gidez,1992, Igweh and Aloamaa, et. al., 2003). It has been alsoestimated that for any 1mg/dl(0.026mmol/ml) increase in HDL-C there is a 3% decrease in the risk of coronary artery diseaseand a 4.7% decrease of mortality from cardio vascular disease(Okonofua, 1990.)
Several studies have shown the beneficial effect ofhormonal replacement therapy on the lipid profile ofmenopausal women (Abbot, et. al., 1988. Stampfer, et al.,1991).
Observational studies over years have touted thebeneficial effects of hormone replacement therapy (HRT)inpreventing coronary artery disease in the post menopausalwomen (Hulley et. al., 1998). More recent studies havehowever ,cast some doubts on the beneficial effect of HRTespecially in patient with established cardiovascular disease(Cheng, 2000). Further studies are needed in this area.
It should be noted that post menopausal women haveunfriendly lipid profile, it is thus to counsel or proper dietary,social and physical habits.
ACKNOWLEDGEMENT
I am highly grateful to Prof. Dr. R. B. Lal, Vice Chancellorof Sam Higginbottom Institute of Agriculture Technology andSciences Allahabad, for providing me necessary facilities forresearch work. I am also grateful to staff of Hays MemorialMission Hospital for providing me samples and otherinformation.
LITERATURE CITED
Abbot, R.D., Wilson, P.W.F., Kannel, W.B. and B. Castelli, W.P. 1988.High- density lipoprotein cholesterol, total cholesterolscreeningand myocardial infarction. The Framingham study. Arterosclerosis;8: 207.
Bales, A.C. 2000. In search of lipid balance in older women; New studiesraise questions about what works best.Postgrad. Med.; 108(7): 57-72.
Barrett Connor, E.,T. L. Bush 1993. Estrogen therapy and Coranoryheart disease in women. JAMA, 265: 1861-1867.
Burger E.F., Kustin A.A. and Baron, D.C. 2002. Endocinology andmetabolism. Ann. Int. Med. 251: 872-942.
Cheng, G.S. 2000. Cardiac events increased in the first 2 years of HRT.Intern. Med. News; 33(9): 1-2.
Derek L.J., 1990. Menopause. Fundamentals of Obstetrics andgynaecology, Springfield Illinois, U.S.A. 2nd edition, pp. 71-72.
Edr, H.A., and Gidez, L.L. 1982. The Clinical significance of the plasmahigh density lipoprotein. Med. Clin. North Am., 66: 431-434.
Gardy. D.S.M. Robin, and Petitti D.B. 1992. Expert panel on detectionand evaluation and treatment of high blood cholesterol in adults.Arch.int.med. 148: 36-69.
Hulley, S., Grady, D., Bush, T. 1998. The randomized trial of estrogenplus progestin for secondary prevention of coronary heart diseasein postmenopausal women: Heart and Estrogen/progestinreplacement study (HERS) Research group. JAMA 7: 605-13.
Igweh, J.C., Aloamaka, C.P., 2003. HDL/LDL Ratio- A Significant,Predisposition to the Onset of Atherosclerosis. njhbs, 2:(2) 78-82.
Jensen, J., Nilas, L., Christiansen, C. 1990. Influence of menopause onserum lipid and lipoprotein. Matruita, 12: 321-31.
Okonofua, E.E., Lawal, A., Bamgbose, J.K. 1990. Features ofMenopause and Menopausal age in Nigerian women. Int. J. Gynaecol.Obstet., 31(4): 341-5.
Pascot. A., Lemieux. S., Lemieux. I., Prudhomme, Tremblay. A.,Bouchard. C., Nadeau. A., Oulliard. C., Tchemof. A., Bergeron. J.and Despres. J. P. 1999. Influence of perimenopause oncardiovascular risk factors and symptoms of middle age healthywomen. Arch.int.Med., 154: 2349-2355.
Schaefer, E. J., Lamon-Fava, S., Johnson, S., Ordovas, J.M., Schaefer,M.M., Castelli, W.P. and Wilson, P.W. 1994. Effects of gender andmenopausal status on the association of apolipoprotein Ephenotypewith plasma lipoprotein levels J. American Heart Association ,14: 1105-1113
Spencer, C.P., Godsland, H, Stevenson 1997. There a menopausalmetabolicsyndrome Gynecol.Endocrinol.; 11: 341-355.
Stampfer, M.J., Colditz, G.A., Willet, W.C. 1991. Postmenopausalestrogen therapy and cardiovascular disease. Ten year follow upfrom Nurses Health Study.N. Engl. J.Med., 325(11): 956-62
Taddec, S., Virdis, A., Ghiadoni, L., Mattec, P., Sudano, I., Bernini,G. 1996. Menopause is associated with endothelial dysfunction inwomen. Hypertension. 28: 576-582.
Received on 19.01.2013 Accepted on 27.02.2013

Trends in Biosciences 6 (2): 203-205, 2013
Sensory Evaluation of Vegetables Grown Under Organic and Inorganic Conditions1BAJPAI PREETI AND 2PUNIA DARSHAN1Dept. of Foods and Nutrition, College of Home Science, MPUAT, Udaipur, Rajasthan 313 0012Department of Foods and Nutrition, I. C. College of Home Science, Chowdhry Charan Singh (CCS) HaryanaAgricultural University, Hisar Haryana 125 004e-mail: [email protected]
ABSTRACT
The present investigation was carried out with the objectivesto study sensory characteristics of vegetables grown underorganic and inorganic conditions. The recipes i.e. carrotvegetable, fenugreek leaves vegetable, garlic pickle, okravegetable, Singare vegetable, tomato chutney and tomato pureeprepared by using organically grown , inorganically grownand conventionally grown vegetables were subjected to sensoryevaluation by a panel of ten judges using 9-point hedonic scaleThe results of the present study revealed significant differencesfor the sensory characteristics between organically andinorganically grown vegetables Sensory evaluation of vegetablerevealed that recipes prepared using organically, grownvegetables scored better scores for some of the characteristicsas compared to their inorganically and conventionally growncounterparts
Key words Vegetables, Nutritional evaluation, Organic, Inorganic
Organic agriculture is a unique production managementsystem which promotes and enhances agro-ecosystem health,including biodiversity, biological cycles and soil biologicalactivity. Organic agriculture excludes the use of syntheticpesticides, conventional fertilizers, pharmaceuticals and bydefinition excludes genetically modified plants and animals(Roitner-Schobesberger, et. al., 2008).
Public interest is increasingly focusing on the problemof the quality of foods because of people’s growing awarenessof health and the environment. Organic food products withhigh nutritive value and without chemicals (with potentialcarcinogenic and mutagenic properties) are being increasinglypreferred over conventional agro products, which arecultivated using insecticides, pesticides and chemicalfertilizers.
Survey indicates that consumers purchase organicproduce because of the belief that they are more nutritiousthan conventionally grown foods (Winter and Davis, 2006).Fresh organic foods are even more nutritious because of higherpercentage of vitamins and minerals. Most importantly, freshorganic foods are free from any kind of chemical residues .Onan average, organic food contain higher level of Vitamin Cand essential minerals such as calcium, magnesium, iron andchromium. Organic spinach, lettuce, cabbage and potatoescontain particularly high levels of minerals (Worthington 2001).
Numerous studies confirm that many people believe thatorganic foods are healthier and safer than inorganicallyproduced foods and are produced in a more environmentallycompatible manner (Rembialkowska, 2007; Roitner-Schobesberger, et. al., 2008). Although the interest in theorganically grown foods has been on increase, there have notbeen substantial studies to substantiate convincingly thatorganically grown foods are nutritionally superior to theirinorganically grown counterparts.
Owing to the nutritional importance of vegetables inour diet and increasing concern toward health and organicfarming of people’s it becomes important to evaluate thenutrient composition of vegetables grown under organic andinorganic conditions.
The present investigation tried to determine the sensorycharacteristics of vegetables grown under organic andinorganic conditions.
MATERIALS AND METHODS
Procurement of vegetables :
The samples of the vegetables viz. tomato, okra, garlicand fenugreek leaves grown under organic and inorganicconditions were procured from Vegetables Farm, ChaudhryCharan Singh Haryana Agricultural University, Hisar. Thevegetable viz. carrot and singare (Siliqua of radish) wereprocured from Domestic Farm, College of Home Science,Chaudhry Charan Singh Haryana Agricultural University,Hisar. The vegetable above mentioned vegetables were alsoprocured from the local market for comparative study.
Product development and sensory evaluation :
Development of products :
The recipes i.e. Singare veg., carrot veg., garlic pickle.,fenugreek leaves veg., okra veg., tomato chutney, and tomatopuree were prepared from the vegetables viz. Singare, carrot,garlic, fenugreek leaves, okra and tomato, grown organically,inorganically and conventionally.Sensory evaluation :
The recipes i.e. Singare vegetable, carrot vegetable,fenugreek leaves vegetable, garlic pickle, okra vegetable,tomato chutney and tomato puree prepared by using

204 Trends in Biosciences 6 (2), 2013
organically grown , inorganically grown and conventionallygrown vegetables were subjected to sensory evaluation by apanel of ten judges using 9-point hedonic scale where: 1 =dislike extremely, 2 = Dislike very much, 3 = Dislike moderately,4 = Dislike slightly, 5 = neither like nor dislike, 6 = Like slightly,7 = Like moderately, 8 = Like very much and 9 = like extremely.Panelists were asked to comment on liking of color, texture,flavor and overall acceptability in morning time.
RESULTS AND DISCUSSION
The recipes viz., Singare vegetable, carrot vegetable,fenugreek leaves vegetable, garlic pickle, okra vegetable,tomato chutney and tomato puree were prepared usingorganically grown , inorganically grown and conventionallygrown vegetables and were organoleptically evaluated. Theresults obtained on the sensory characteristics of variousproducts are discussed below.
Carrot vegetable prepared from organically grown carrotwas liked very much in terms of all sensory parameters,including color, appearance, aroma, texture, taste and overallacceptability. However vegetable prepared from inorganicallyand conventionally grown carrot were ‘liked moderately’ interms of all sensory attributes. Carrot vegetable prepared fromorganically grown carrot was found superior in terms of itscolor, appearance, aroma, texture, taste and overallacceptability as compared to carrot vegetable, prepared frominorganically and conventional grown carrot.
Mean scores of sensory characteristics revealed thatpickle made from organically grown, inorganically grownconventionally grown garlic was “liked moderately” in termsof color, appearance, aroma, texture, taste and overallacceptability by the judges.
Mean scores of sensory characteristics indicated thatvegetable prepared using organically, inorganically andconventionally grown Singare was “liked moderately” in terms
Table 1. Sensory characteristics of vegetable recipes
Values are mean ± SE of ten independent observations.NS = Not significant
Conditions
Color Appearance Aroma Texture Taste Overall Acceptability
Organic 8.40 ± 0.22 8.20 ± 0.25 8.30 ± 0.16 81.00 ± 0.28 8.20 ± 0.25 8.24 ± 0.09 Inorganic 7.60 ± 0.16 7.50 ± 0.17 7.40 ± 0.16 74.00 ± 0.16 7.50 ± 0.17 7.48 ± 0.04
Conventional 7.60 ± 0.16 7.60 ± 0.22 7.60 ± 0.16 74.00 ± 0.28 7.30 ± 0.15 7.50 ± 0.07
Carrot vegetable
CD(P?0.05) 0.53 0.62 0.58 0.7 0.56 0.2 Organic 8.00 ± 0.33 7.90 ± 0.31 7.80 ± 0.36 7.80 ± 0.35 8.0 ± 0.33 7.90 ± 0.24
Inorganic 7.30 ±0.33 7.10 ± 0.31 7.30 ± 0.30 7.50 ± 0.27 7.30 ± 0.30 7.30 ± 0.24 Conventional 7.50 ±0.22 7.40 ± 0.22 7.30 ± 0.30 7.10 ± 0.28 7.20 ± 0.36 7.30 ± 0.23
Garlic pickle
CD NS NS NS NS NS NS Organic 7.90 ± 0.10 7.90 ± 0.10 7.60 ± 0.22 7.50 ± 0.17 7.50 ± 0.17 7.70 ± 0.10
Inorganic 7.30 ± 0.33 7.80 ± 0.13 7.80 ± 0.13 7.50 ± 0.17 7.80 ± 0.20 7.74 ± 0.09 Conventional 7.50 ± 0.22 7.90 ± 0.10 7.90 ± 0.18 7.90 ± 0.10 7.40 ± 0.16 7.78 ± 0.09
Singare vegetable
CD(P?0.05) 0.36 NS NS NS NS NS Organic 7.80 ± 0.20 8.00 ± 0.15 7.60 ± 0.27 7.60 ± 0.22 7.70 ± 0.21 7.68 ± 0.18
Inorganic 7.50 ± 0.17 7.40 ± 0.16 7.40 ± 0.16 7.30 ± 0.15 7.40 ± 0.16 7.40 ± 0.15 Conventional 7.50 ± 0.17 7.70 ± 0.14 7.40 ± 0.16 7.30 ± 0.15 7.30 ± 0.15 7.50 ± 0.11
Fenugreek leaves vegetable
CD(P?0.05) NS 0.45 NS NS NS NS Organic 7.90 ± 0.23 8.10 ± 0.18 7.90 ± 0.23 8.00 ± 0.21 8.20 ± 0.20 8.02 ± 0.19
Inorganic 7.60 ± 0.16 7.60 ± 0.22 7.60 ± 0.16 7.50 ± 0.17 7.80 ± 0.13 7.62 ± 0.14 Conventional 7.50 ± 0.17 7.50 ± 0.17 7.40 ± 0.16 7.20 ± 0.20 7.50 ± 0.17 7.42 ± 0.12
Okra vegetable
CD(P?0.05) NS 0.55 NS 0.56 0.5 0.45 Organic 7.80 ± 0.20 7.70 ± 0.15 7.70 ± 0.15 7.80 ± 0.20 8.00 ± 0.21 7.80 ± 0.17
Inorganic 7.40 ± 0.22 7.30 ± 0.15 7.20 ± 0.13 7.20 ± 0.14 7.40 ± 0.22 7.30 ± 0.14 Conventional 7.80 ± 0.20 7.80 ± 0.20 7.60 ± 0.16 7.70 ± 0.21 7.74 ± 0.20 7.74 ± 0.13
Tomato chutney
CD(P?0.05) NS NS 0.44 0.54 NS 0.44 Organic 8.20 ± 0.21 8.10 ± 0.27 7.80 ± 0.20 7.50 ± 0.17 7.50 ± 0.17 7.98 ± 0.16
Inorganic 7.30 ± 0.13 7.40 ± 0.18 7.80 ± 0.20 7.90 ± 0.18 7.90 ± 0.05 7.50 ± 0.05 Conventional 7.80 ± 0.13 7.70 ± 0.21 7.80 ± 0.20 7.50 ± 0.17 7.60 ± 0.16 7.68 ± 0.10
Tomato puree
CD(P?0.05) 0.47 0.64 NS NS NS 0.34

PREETI & DARSHAN : Sensory Evaluation of Vegetables Grown Under Organic and Inorganic Conditions 205
appearance, aroma, texture, taste and overall acceptabilitydiffered significantly except the scores for the color ofvegetable made from organically grown Singare significantlyhigher as compared to vegetable made from inorganicallygrown Singare. Though the color of Singare vegetableprepared from organically grown Singare scored significantlyhigher score than that of inorganically and conventionallygrown singare yet the color of the vegetables liked moderately
The mean score presented in Table 1 showed thatappearance of the vegetable prepared from fenugreek leavesobtained organically grown leaves ‘liked very much’. Thescores for all other sensory attributes of the vegetables werealmost similar and all the three types of vegetables were ‘likedmoderately’.
The okra vegetable prepared from organically grownokra was ‘liked very much’ in terms of appearance, texture,taste and overall acceptability but the color and aroma of thevegetable were “liked moderately” by the judges. Okravegetable prepared from inorganically and conventionallygrown okra were liked moderately in terms of all sensorycharacteristics.
Chutney prepared from organically grown tomatoes was‘liked moderately’ by the panel member in terms of color andappearance, aroma texture and overall acceptability but it was‘liked very much’ in terms of taste; However, chutney preparedfrom inorganically grown and conventionally grown tomatoeswas ‘liked moderately’ in terms of all sensory characteristicsby a panel of ten judges. Tomato chutney made from organicallygrown tomatoes was found superior in terms of aroma, texture,and overall acceptability as compared to the chutney preparedusing inorganically grown tomatoes.
On the basis of mean scores of sensory characteristicsit was found that puree prepared from inorganic tomatoeswas “liked moderately” in terms of all the sensory attributes,whereas puree prepared from organic tomatoes was found tobe “liked very much” in terms of color and appearance but itwas “liked moderately” in terms of aroma, taste, texture andoverall acceptability. Tomato puree prepared fromconventional tomatoes was “liked moderately” by the judgesin terms of all sensory attributes including color, appearance,aroma, texture and taste.
Rembialkowska, 2007 found better scores for the tasteand other organoleptic attributes of the organically growncarrots. Better total flavor strength, sweet taste in organicallygrown carrot was reported by Hogstad, et al., 1997. Soupsmade from organic fertilized okra were judged more acceptable(Taiwo, et al., 2002). Organically grown tomatoes wereperceived by the panelist to be superior for their taste, textureand flavor as compared to inorganically grown (McCollum et
al., 2005 and Heeb, et.al., 2004). Shankaro and Sumathi, 2008reported similar findings for tomato puree made fromorganically grown and inorganically grown tomatoes.
Better sensory scores for the color of Singare vegetablemade from organically grown, Singare (7.90) were observedthan theirs inorganically grown (7.30) counterparts. Meanscores for the appearance of the organically grown fenugreekleaves vegetable was significantly higher (8.00) as comparedto mean scores of their inorganic counterparts (7.40).Organically grown okra vegetable had significantly highersensory scores for its appearance (8.10), texture (8.00), taste(8.20) and overall acceptability (8.02) as compared to itsconventional (7.5, 7.4, 7.2, 7.5, and 7.42, respectively)counterpart. Tomato chutney made from organically growntomatoes found significantly superior in terms of aroma (7.70),texture (7.8) and overall acceptability (7.8) as compared to thechutney prepared using inorganically grown tomatoes (7.2,7.2, and 7.30, respectively). On the basis of mean scores ofsensory characteristics it was found that puree prepared usingorganic tomatoes had significantly better sensory scores forcolor, appearance and overall acceptability as compared tothe scores of their inorganic counterparts.
LITERATURE CITED
Heeb, A., Lundegardh, B., Ericsson, T. and Savage, G. P. 2004. Nitrogenform affects yield and taste of tomatoes. Journal of the Science ofFood and Agriculture, 85(8): 1405-1414.
Hogstad, S., Risvik, E., and Steinsholt, K. 1997. Sensory quality andchemical composition in carrots: a multivariate study. ActaAgriculturae Scandinavica, 47: 53-264.
McCollum, T. G., Chellemi, D. O., Rosskopf, E. N., Church, G. T.and Plotto, A. 2005. Postharvest quality of tomatoes produced inorganic and conventional production systems. Hort. Science, 40(4):959-963.
Rembialkowska, E. 2007. Quality of plant products from organicagriculture. J. Sci .Food Agri., 87: 2757-2762.
Roitner-Schobesberger, B., Darnhofer, I., Somsook, S. and Vogl, C.2008. Consumer perceptions of organic foods in Bangkok, Thailand.Food Policy., 33:112–121.
Shankaro, K. and Sumathi, S. 2008. Effect of organic farming onnutritional profile of selected vegetable crops. Karnataka J. Agric.Sci., 20 (3):586-588.
Taiwo, L. B., Adediran, J. A., Ashaye, O. A., Odofin, O. F., and Oyadoyin,A. J. 2002. Organic okro (Abelmoschus esculentus): its growth,yield and organoleptic properties. Nutrition & Food Science, 32(5):180-183.
Winter, C. K. and Devis, S. F. 2006. Organic foods. J. Sci. Food Agri.71: 117-124
Worthington, V. 2001. Nutritional quality of organic versus conventionalfruits, vegetables and grains. J. Alt. Compl. Med., 7(2):161–173.
Received on 3.02.2013 Accepted on 15.03.2013
Trends in Biosciences 6 (2): 206-209, 2013
Hypolipidemic Potential of Bacopa monniera in Cholesterol Fed RatsSYED MANSOOR ALI AND GYAN CHAND JAIN1
Department of Zoology, University of Rajasthan, Jaipur 302 004, Indiae-mail: [email protected]
ABSTRACT
In the present study the effect of 70% ethanolic extract of Bacopamonniera Linn. (Scrophulariaceae) whole plant was evaluatedon serum and hepatic lipid profiles of hyperlipidemic rats.Experimental hyperlipidemia was induced by feedingcholesterol (500 mg/kg b.wt./day) suspended in coconut oil for60 days. Feeding with cholesterol resulted in a significant(P<0.001) increase in total cholesterol, triglycerides andphosphotipid levels in serum and liver of rats. Serum LDL-cholesterol was also raised significantly (P<0.001). Serum HDL-cholesterol remained significantly unchanged. However, theHDL-cholesterol: total cholesterol ratio declined compared tonormal rats. Co-administration of B. monniera extract (100,250 and 500 mg/kg b.wt.) for 60 days significantly prevented thecholesterol induced rise in the levels of all those parameters inserum and liver dose dependently. The amount of fecalcholesterol excretion was significantly (P<0.05) higher thanthat rats fed with cholesterol alone. The results of the presentinvestigation suggest that B. monniera extract possesseshypolipidemic activity and could be beneficial in managementof hyperlipidemia.
Key words Bacopa monniera, hypolipidemia, rats.
Medicinal plants are an important source of a largenumber of active novel compounds which offer themselvesas promising substances for development of novelhypolipidemic drugs (Wang and Ng, 1999; Fugh Berman, 2000).A number of plants have been reported to be beneficial incoronary artery disease. They have been reported to possesslipid lowering, antioxidant and cardio-protective effects (Anilaand Viajyalakshymi, 2002).
Phytochemical studies of B. monniera have revealedthe presence of a large number of active components includingsaponins, D-mannitol, betulic acid, beta-sitosterols,stigmasterol, flavonoids and different alkaloids (Chopra,et. al., 1956; Joshi, 2000; Chakravarty, et. al., 2002; 2003; Hou,et. al., 2002).
As this plant is traditionally used as a cardio tonic andcontains important phytochemicals such as saponins,flavonoids and â- sitosterol which are known to havehypolipidemic and antioxidant activities. Therefore, thepresent investigation was undertaken to evaluatehypolipidemic action of B. monniera on cholesterol fed rats.
MATERIALS AND METHODS
Collection and preparation of plant extract :
The plant material was collected from Nahargarh century,Jaipur: botanical identification was performed at the Herbarium,Department of Botany, University of Rajasthan, Jaipur(Vaucher specimen no. RUBL 19878). The plant material wasdried in the shade and ground to coarse powder and extractedby 70% ethanol for 36 hour at 60-800C. The crude extract thusobtained was filtered and evaporated to dryness under lowtemperature (40-600C) and reduced pressure. The residue wasweighed and used for experimental purpose by suspending inappropriate volume of distilled water.
Animal :
Colony bred, healthy, adult, male Wistar albino ratsweighing 175-225g, were used in the present study. The ratswere housed in polypropylene cages under controlledconditions of temperature (22 ± 30C) and light (12 h light/darkcycle). They were provided with a nutritionally adequatestandard laboratory diet (Lipotn, India Ltd.) and tap water adlibitum.
Experimental design :
The rats were randomly divided into following groupseach having 7 rats.Group I : Rats were fed on normal pallet diet and distilled
water as vehicle (0.5 ml/rat)Group II : Rats were orally administered with cholesterol
(500 mg/kg bwt./day) suspended in coconut oil(0.5 ml/rat) and distilled water as vehicle (0.5 ml/rat). These served as cholesterol fed controls.
Group III : Rats were orally administered with cholesterol(500 mg/kg bwt./day) + B. monniera 70%ethanolic extract (100 mg/kg.b.wt./day)suspended in distilled water (0.5 ml/rat).
Group IV : Rats were orally administered with cholesterol(500 mg/kg bwt./day) + B. monniera 70%ethanolic extract (250 mg/kg.b.wt./day)suspended in distilled water (0.5 ml/rat).
Group V : Rats were orally administered with cholesterol(500 mg/kg bwt./day) + B. monniera 70%ethanolic extract (500 mg/kg.b.wt./day)suspended in distilled water (0.5 ml/rat).
All the rats received treatment for duration of 60 days.

ALI & JAIN et. al., : Hypolipidemic Potential of Bacopa monniera in Cholesterol Fed Rats 207
Autopsy :
At the end of the experiment rats were weighed andfasted overnight. These were sacrificed under mild etheranesthesia. Blood sample was collected by cardiac puncture.The blood was allowed to clot at room temperature and theserum was separated by centrifugation and stored at - 200Cuntil assayed.
Liver was quickly excised, cleaned, washed by chillednormal saline, and immediately frozen at -700C for biochemicalanalysis.
Serum biochemistry :
Serum samples were analyzed for total cholesterol (TC)(Zlatkis, et. al., 1953), Low density lipoprotein cholesterol(LDL-cholesterol) (Friedwald, et. al., 1972), high densitylipoprotein cholesterol (HDL-cholesterol) (Burnstein, et. al.,1970) triglycerides (TG) (Gottfried and Rosenberg, 1973) andphospholipid (Zilversmit and Davis, 1950). Atherogenic indexwas calculated from the following formula:
Atherogenic index = HDL - cholesterol : total cholesterol.
Tissue biochemistry :
Liver total cholesterol, triglycerides and phospholipidwere measured by the methods as described above for serum.
Fecal cholesterol :
Fecal matter of control and treated rats was collecteddaily during the last week of the experiment and dried at 400C.The dried fecal matter was used for the analysis of totalcholesterol (Zlatkis, et. al., 1953).
The results are expressed as mean + SEM Student “t”test was used to determine the significance of differencesbetween various groups. Values of P<0.05 were considered tobe statistically significant.
RESULTS AND DISCUSSION
Food consumption, body and organ weights :
Changes in serum lipid profiles are shown in Fig. 1. Theresults indicate that there was significant increase (P<0.001)in serum total cholesterol (+70.8%) and LDL-cholesterol(+104.06%) levels after 60 days of cholesterol feeding. TheHDL-cholesterol level remained significantly unaltered butthe HDL-cholesterol: total cholesterol ratio was declined (-36.69%) as compared to rats of normal group. Simultaneousadministration of B. monniera extract reduced the enhancedlevels of serum total cholesterol and LDL-cholesterolsignificantly (P, 0.05 to P<0.001) in a dose dependent manner.Maximum protective effect observed on serum total and LDL-cholesterol was -30.48% and -44.12% respectively. Although,there was no significant effect on serum HDL-cholesterol levelbut a dose dependent increase in the HDL-cholesterol: total
cholesterol ratio was observed as compared with cholesterolfed control rats.
Fig. 1. Changes in Serum lipid parameters after administrationof B. monniera extract in rats
**P < 0.001 Cholesterol fed group compared with normal grupa P < 0.05, b = P < 0.01, c = P < 0.001 Cholesterol + B. monniera fedgroup compared with cholesterol fed group
Circulating phospholipid (+44.38%) and triglycerides(+45.07%) were significantly (P<0.001) elevated in cholesterolfed control rats in comparison with normal rats. Administrationof B. monniera extract (100, 250 and 500 mg/kg b.wt./day) tohypercholesterolemic rats decreased both serum phospholipid(P<0.01) and triglycerides (P<0.05 to P<0.01) levels in a dosedependent manner.
Tissue biochemistry :
Fig. 2 represents the changes in hepatic lipid parametersof rats receiving various treatments. Cholesterol feeding inrats caused a significant increase (P<0.001) in hepatic totalcholesterol, phospholipid and triglycerides contents incomparison with normal rats. Concurrent administration of B.monniera extract (100, 250 and 500 mg/kg. b.wt./day) withcholesterol caused a significant (P<0.05 to P<0.001) dosedependent decline in these hepatic lipid parameters ascompared to cholesterol fed control rats.
Fig. 2. Changes in Liver lipid parameters after administrationof B. monniera extract in rats
**P < 0.001 Cholesterol fed group compared with normal groupa P < 0.05, b = P < 0.01, c = P < 0.001 Cholesterol + B. Monniera fedgroup compared with cholesterol fed group

208 Trends in Biosciences 6 (2), 2013
Fecal cholesterol :
There was significant (P<0.001) increase in the fecalexcretion of total cholesterol in cholesterol fed control rats ascompared to normal. Co-treatment of B. monniera extract (250and 500 mg/kg.b.wt./day) further enhanced (P<0.05) theexcretion of cholesterol in feces of rats. However, in ratsreceiving 100 mg/kg.b.wt./day extract dose, no significantchange in fecal cholesterol concentration was observed ascompared to cholesterol fed control rats (Fig. 3).
Elevated serum concentration of cholesterol, especiallyin low density lipoproteins (LDL) is recognized as the majorcoronary risk factor. The beneficial effects of lowering elevatedserum total cholesterol or LDL-cholesterol in prevention ofcoronary heart disease is well established (Gotto, 1999).
Feeding of cholesterol in rats raised the levels of serumand hepatic cholesterol, phospholipid and triglyceridessignificantly. Serum LDL-cholesterol concentration was alsoincreased significantly without depicting any significant effect
As compared to cholesterol fed control rats, B. monnieraextract receiving rats were found to have a significantly lowerserum total and LDL-cholesterol, while the level of HDL-cholesterol remained significantly unchanged. Thus theobserved reduction in total cholesterol was associated with alowering of LDL-cholesterol levels. In general, a combinedreduction in the levels of both total and LDL-cholesterol wouldreduce the risk factor of coronary heart disease (Lipid ResearchClinics Program, 1984a,b). The values of serum-HDL-cholesterol:Total cholesterol ratios in all the rats receivingthree doses of B. monniera extract were higher than that ofcholesterol fed control rats. A high HDL-cholesterol: Totalcholesterol ratio is considered to be antiatherogenic (Kinosen,et. al., 1995). HDL-cholesterol mediates reverse cholesteroltransport and exhibit beneficial properties includingantioxidant, antinflammatory and antithrombotic effect onvasculature (Young, et. al., 2004).
Concurrent administration of B. monniera extract alongwith cholesterol also significantly lowered serum triglycerides.Recent studies- indicate that higher serum triglycerides areindependent risk factor for coronary heart disease (AsiaPacific Cohort Studies Collaboration, 2004). Therefore, loweringof serum triglyceride may lower the risk of coronary heartdisease.
Administration of extract also lowered hepatic contentsof cholesterol, phospholipid and triglycerides indicatingmodulatory effect on the lipid metabolism. The presence ofhigher amounts of cholesterol in feces of extract treated ratssuggests reduced absorption or enhanced excretion ofcholesterol or its metabolites from the gut, which might beresponsible, partially, for the observed hypocholesterolemicactivity of the extract (Devi and Sharma, 2004).
Phytochemical studies have revealed that B. monnieracontains a large number of active components like triterpenoidsaponins, flavonoids, â-sitosterol, stigmasterol and differentalkaloids (Chopra et. al., 1956;) B. monniera possesses calciumantagonistic activity (Dar and Channa, 1999) which might beresponsible for hypocholesterolemic effect (Feuerstein, et. al.,1997).
Thus the hypolipidemic effect of B. monniera might bedue to individual or synergistic action of these activecompounds at various target sites. The exact mechanism ofhypolipidemic effect is yet to be understood.
In conclusion, the result of present study suggests thatB. monniera effectively lowers serum and tissue lipid levelsin hyperlipidemic rats, which could be useful in treatment ofhyperlipidemia and arteriosclerosis.
Conclusively, the observed cholesterol-reducing actionof the crude leaf extract of B. monniera indicates that thisleafy plant possesses some potential medicinal value andcould validate and explain its ethnomedical use on the obeseand heart patients in India. We plan to conduct further studies
on serum HDL-cholesterol concentration. However, the HDL-cholesterol: total cholesterol ratio was reduced. Theseobservations are consistent with many earlier reports (Anilaand Vijayalakshmi, 2002; Khanna, et. al., 2002; Shin et. al.,2004).
Crude extract of leaf of Bacopa monniera has beenshown to possess hypocholesterolemic activity. Bacopamonniera extract when co-administered with cholesterol, dailyfor a period of 60 days, had a cholesterol -reducing effect inserum and liver dose dependently as compared to thecholesterol fed group. The decrease was very significant inserum (P<0.001) and statistically significant in liver (P<0.1).
The results of the Lipid Research Clinics PrimaryPrevention Trial indicate that there is a positive correlationbetween plasma concentrations of LDL-cholesterol and riskof coronary artery disease (Lipid Research Clinics Program,1984a,b)
Fig. 3. Changes ion Fecal cholesterol concentration afteradministration of B. monniera extract in rats
**P < 0.001, Cholesterol fed grup compared with normal groupa = P < 0.05, Cholesterol + B. monniera fed grup compared withcholesterol fed I group

ALI & JAIN et. al., : Hypolipidemic Potential of Bacopa monniera in Cholesterol Fed Rats 209
to better understand the mechanisms of action of this medicinalplant.
ACKNOWLEDGEMENT
The authors are grateful to Prof. N.P. Singh, Head of theDepartment and Prof. N. K. Lohiya, Coordinator, SAP-UGC,Department of Zoology, University of Rajasthan, Jaipur forproviding necessary facilities and for the award of SAP-JRFto S. M. Ali.
LITERATURE CITED
Anila, L., Vijayalakshmi, N. R. 2002. Flavonoids from Emblica officinalisand Mangifera indica, effectiveness for dyslipidaemia. JEthnopharmacol., 79: 81 - 92.
Asia Pacific Cohort Studies Collaboration 2004: Serum triglycerides asa risk factor for cardiovascular diseases in the Asia-Pacific Region.Circulation, 110: 2678 - 2686.
Burnstein, M., Schalmic, M.R., Morphin, R. 1970 Rapid method ofisolation of lipoproteins from human serum by precipitation withamines. J Lipid Res. 11: 583 - 587.
Chakravarty, A. K., Sarkar, T., Nakane, T., Kawahara, N., Masuda, K.2002: New Phenylethanoid glycosides from Bacopa monniera.Chem Pharm Bull., (Tokyo), 50: 1616 - 1618.
Chakravarty, A. K., Garai, S. Masuda, K., Nakane, T., Kawahara, N.2003: Bacopasides III - V : three new triterpenoid glycosides fromBacopa monniera. Chem Pharm Bull (Tokyo) 51: 215 - 217.
Chopra, R. N., Nayan, S. L. and Chopra, I. C. 1956: Glossary of IndianMedicinal Plants. CSIR, New Delhi, pp. 32.
Dar, A. Channa, S. 1999: Calcium antagonistic activity of Bacopamonniera on vascular and intestinal smooth muscles of rabbit andguinea pig. J Ethnopharmacol, 66: 167 - 174.
Devi R. and Sharma, D. K. 2004: Hypolipidemic effect of differentextracts of Clerodendron Colebrookianum walp in normal andhigh fat diet fed rats. J. Ethnopharmacol., 90: 63 - 68.
Dominiczak, M. H. 1998. Hyperlipidemia and cardiovascular disease.Curr. Opin. Lipidol., 9: 609 - 611.
Feuerstein, G. Z., Fisher, M., Nunnart, J., Ruffolo, R. R. J. 1997:Carvedilol inhibits aortic lipid deposition in thehypercholesterolemic rat. Pharmacology, 54: 24-32.
Friedwald, W. T., Levy, R.I. and Fredrickson D.S. 1972 Estimation ofthe concentration of low-density lipoprotein cholesterol in plasmawithout use of the preparative ultra centrifuge. Clin. Chem., 18: 499-502
Fugh Berman, A. 2000: Herbs and dietary supplements in the preventionand treatment of cardiovascular disease. Prev Cardiol Winter, 3: 24 -32.
Gottfried, S. P. and Rosenberg, B. 1973: Improved manualspectrophotometric procedure for determination of serumtriglycerides. Clin. Chem., 19: 1077-1078.
Gotto, A. M. 1999: Lowering LDL cholesterol. Circulation, 99: E1 - E7.
Hou, C. C., Lin, S. J., Cheng, J. T., Hsu, F. L. 2002: Bacopaside III,bacopasaponin G, and bacopasides A, B and C from Bacopamonniera. J. Nat. Prod. 65: 1759-1763.
Joshi, S. G. 2000: Medicinal Plants. Oxford and IBH publish Co. Pvt.Ltd., New Delhi, pp. 363-364.
Khanna, A. Rizion, F. and Chadu, R. 2002: Lipid lowering activity ofPhyllanthus niruri in hyperlipidemic rats. J. Ethnopharmacol.,82: 19-23.
Kinosen, B. Glick, H. Preiss, L., Puder, K. L. 1995: Cholesterol andcoronary heart disease : predicting risk in men by changes in levelsand ratios. J. Invest Med., 43: 443 - 450.
Lipid Research Clinics Program 1984. The lipid research clinics coronaryprimary prevention trial results.1. Reduction in incidence ofcoronary heart disease. Journal of American Medical Association,251: 251–364
Shin, D. H., Heo, H. J., Lee, Y. J., Kim, H. K. 2004: Amaranth squelenereduces serum and liver lipid levels in rat fed a cholesterol diet. BrJ Biomed Sci., 61: 11-14.
Shinomol, G.K., Bharath, M.M., Muralidhara, 2012: Neuromodulatorypropensity of Bacopa monnieri leaf extract against 3-nitropropionicacid-induced oxidative stress: in vitro and in vivo evidences. NeurotoxRes., 22(2):102-14
Wang, H. X. and Ng, T. B. 1999: Natural products with hypoglycemic,hypotensive, hypocholesterolemic, antiatherosclerotic andantithrombotic activities. Life Sci, 65: 2663 - 2677.
WHO. The Word Health Organization Report 2000: Health systems -improving performance Geneva.
Young, C. E., Karas, R. H., Kavin, J. T. 2004: High density lipoproteincholesterol and coronary heart disease. Cardiol. Rev., 12: 107 -119.
Zilversmit, D. B. and Davis A. K. 1950: Microdetermination of plasmaphospholipid by trichloroacetic acid precipitation. J. Lab. Clin.Invest. 35: 155-160.
Zlatkis, A. Zak, B. and Boyle, A. J. 1953. A new method for the directdetermination of serum cholesterol J. Lab. Clin. Med. 41:486 - 492.
Received on 04.03.2013 Accepted on 15.04.2013

Trends in Biosciences 6 (2): 210-211, 2013
Chemoattraction in Entomopathogenic NematodesRASHID PERVEZ1 AND S. S. ALI2
2Indian Institute of Pulses Research, Kanpur (U.P.) India 208 0241Indian Institute of Spices Research, Kozhikode (Kerala) - 673 012e-mail: [email protected], [email protected]
ABSTRACT
Attraction of infective juveniles of entomopathogenicnematodes, Steinernema seemae and S. carpocapsae towardslepidopteran insect pests viz., 2nd instar larva of gram pod borer,Helicoverpa armigera, legume pod borer, Maruca vitrata and bluebutterfly, Lampides boeticus were tested in petridish. Resultsshow that, both species of EPNs were found positive attractionresponses towards test insects. Among test EPNs, S. seemae wasfound more responsive towards insect pests than S. carpocapsae.The maximum attraction of S. seemae was recorded towards H.armigera (81 %), followed by L. boeticus (62 %) and M. vitrata(41%). In case of S. carpocapsae, maximum attraction responsestowards H. armigera (60 %), whereas least towards M. vitrata(41 %). The attraction behaviour of entomopathogenicnematodes vary between species to species.
Key words Entomopathogenic nematodes, Attraction, Behaviour.
Host recognition by EPNs is due to various biotic andabiotic stimuli. Chemicals cues and behavioural responses tothese cues play a major role in inter specific interactions andhost finding activities of EPNs. Bilgrami 2004 reported that,attraction, aggregation and preferential behaviour of EPNsinvolving sensory responses are vital steps in their life cycle.
EPNs utilize and recognize signals from both categoriesto find their host, depending upon their action on receiverinsect, allelochemicals may be categorised into allomones,synomones and kairomones (Bilgrami, 2004). Role of allomonesand kairomones has been well defined for host searching,attraction and aggregation behaviour of nematodes is stillmistily known.
In view of the sparse knowledge on the attractionbehaviour of EPNs, present studies on the attraction andpreferential behaviour of S. seemae (Ali, et al., 2005a) and S.carpocapsae (Weiser, 1955) Wouts et al., 1982 towards 2nd
instar larva of gram pod borer, Helicoverpa armigera, legumepod borer, Maruca vitrata and blue butter fly Lampidesboeticus.
MATERIALS AND METHODS
Nematode and insect cultures: S. seemae andS. carpocapsae were taken from Nematology laboratory ofthis institute and test insects, H. armigera, M. vitrata andL. boeticus larvae were collected from standing crop from the
IIPR Experimental Farm and CSAU & T experimental field.The larvae were sorted out and those of same size were takenfor present study.
Bioassay: The attraction of S. seemae andS. carpocapsae towards 2nd instar larva of H. armigera,M. vitrata and L. boeticus was worked out through petridishmethod. A Petridish 5.5 cm in diameter was divided into threezones by drawing two concentric circles of 0.5 cm and 2.5 cmin diameter. The later circle was termed as reference circle. Aplastic straw pipe with a small piece of filter paper glued atone end was placed vertically in the inner circle of petri-dishes.Water agar (1.5 %) is poured into the petridishes and strawpipe to make a required thickness (4 mm) of agar. One larva oftest insect was placed in straw pipe and seal with cellotape.Five infective juveniles of test species of EPN was released atvarious places at the periphery of the middle circle (referencecircle) and their distribution was recorded after 2 h. Allexperiment was done at room temperature along with control(without insect) and replicated ten times.
The area of each zone and weighting factors wascalculated (Table 1) by dividing the area of outer zone witheach of the three zones and score were obtained by summingup the product of the number of worms in each zone with theircorresponding weighting factors. These scores were thenconverted into percentage (Table 2).
RESULTS AND DISCUSSION
Results show that, both species of EPNs were foundpositive attraction responses towards H. armigera, M. vitrataand L. boeticus. Among test EPNs, S. seemae was found moreresponsive towards insect pests compared to S. carpocapsae.The maximum attraction of S. seemae was found towards H.armigera (81 %), followed by L. boeticus (62 %) and M. vitrata(42%). In case of S. carpocapsae, maximum attractionresponses was recorded towards H. armigera (62 %), whereasleast attraction responses towards L. boeticus (42 %) and M.vitrata (41 %) (Fig. 1).
The attraction behaviour of entomopathogenicnematodes vary between species to species and individual toindividual. They use strategies to find hosts on the basis ofambusher and cruiser behaviour (Campbell, et al., 2002).Among ambusher, some EPNs species nictate, or raise theirbodies off the soil surface so they are better poised to attach

PERVEZ & ALI : Chemoattraction in entomopathogenic nematodes 211
Table 1. Area and weighting factors for the zones markedon the agar plates
Inner zone Middle zone Outer zone Area (Sq cm) 0.20 4.90 23.74 Weighting factors 118.70 4.84 1.0
Position Inner zone
Middle zone
Outer zone
Ranks zone
Scores Attraction responses (%)
1. 5 0 0 21 593 100 2. 4 1 0 20 479 81 3. 4 0 1 19 475 80 4. 3 2 0 18 366 62 5. 3 1 1 17 362 61 6. 3 0 2 16 358 60 7. 2 3 0 15 252 42 8. 2 2 1 14 247 42 9. 2 1 2 13 244 41 10. 2 0 3 12 240 41 11. 1 4 0 11 138 23 12. 1 3 1 10 134 23 13. 1 2 2 9 130 22 14. 1 1 3 8 126 21 15. 1 0 4 7 123 21 16. 0 5 0 6 24 4 17. 0 4 1 5 20 4 18. 0 3 2 4 16 3 19. 0 2 3 3 13 2 20. 0 1 4 2 9 2 21. 0 0 5 1 5 1
Table 2. Twenty one positions nematodes can occupy withtheir ranks and score
to passing insects (Campbell and Gaugler, 1997), while, manyEPNs are able to jump by forming a loop with their bodies thatcreates stored energy (Campbell and Kaya, 2000). Otherspecies adopt a cruising strategy and rarely nictate. Instead,they roam through the soil searching for potential hosts. Theseforaging strategies influence which hosts the nematodesinfect.
ACKNOWLEDGEMENT
The authors expresses their gratitude’s to Director,Indian Institute of Pulses Research, Kanpur, for providing allthe facilities for this study. This study was supported by agrant from the Department of Science and Technology (DST),
Fig. 1. Attraction of entomopathogenic nematodes towardslepidopteran insect pests
Ministry of Science & Technology, Government of India, NewDelhi, which is gratefully acknowledged.
LITERATURE CITED
Ali, S. S., Shaheen, A., Pervez, R. and Hussain, M. A. 2005a. Steinernemamasoodi sp. n. and Steinernema seemae sp. n. (Rhabditida:Steinernematidae) from Uttar Pradesh, India. International Journalof Nematology, 15(1) : 89 – 99.
Bilgrami, A. L. 2004. Host searching and attraction behaviour ofentomopathogenic nematodes. International Journal ofNematology, 14(1): 23- 29.
Bilgrami, A. L. and Pervez, R. 2000. Prey searching and attractionbehavior of Mesodorylaimus bastiani and Aquatides thornei(Nematoda: Dorylaimida). International Journal of Nematology,10 (2): 199- 206.
Campbell, J. F. and Gaugler, R. R. 1997. Inter-specific variation inentomopathogenic nematode foraging strategy: dichotomy orvariation along a continuum. Fundamental and AppliedNematology. 20(4): 393-398.
Campbell, J. F. and Kaya, H. K. 2000. Influence of insect associatedcues on the jumping behavior of entomopathogenic nematodes(Steinernema spp,). Behaviour, 137(5): 591-609.
Received on 03.08.2012 Accepted on 05.09.2012

Trends in Biosciences 6 (2): 212-215, 2013
Effectiveness and Economics of Integrated Weed Management in Transplanted Rice(Oryza sativa)BIRENDRA KUMAR1, RANVIR KUMAR2, SUMAN KALYANI3 AND M. HAQUE4
1,4Department of Agronomy, Bihar Agricultural College, Sabour, Bhagalpur, Bihar 813 2102Deptt. of Agril. Economics, B.P.S. Agricultural College, Purnea City, Purnea, Bihar 854 3023Deptt. of Plant Breeding & Genetics, B.P.S. Agril. College, Purnea City, Purnea, Bihar 854 302e-mail : [email protected]
ABSTRACT
In experimental field, Cyperus rotundus (L)., Cyperus iria (L),Cyperus difformis (L)., Fimbristylis miliacea (L) Vaha.,Echinochloa colona ( L).Link, Echinochloa crus-galli (L)P. Beauv, and Commelina benghalensis (L) were the dominantweed flora species in rice fields. Manual weeding at 20 and 40days after transplanting (DAT), butachlor @1.5 kg a.i/ha pre-em followed by (fb) 2,4-D easter 0.5 kg a.i./ha Post Emergence(POE), butachlor @ 1.5 kg a.i/ha as pre-em fb azimsulfuron @25.0 g a.i/ha POE, bispyribac 12.5 g a.i/ha + azimsulfuron 12.5g a.i/ha POE, butachlor @ 1.5 kg a.i/ha as pre-em fbethoxysulfuron @ 15 g a.i/ha as POE proved equally effectivein increasing most of the growth parameters, yield attributes,yield and economic advantage. The maximum mean grain yieldof (5.91 t/ha) was recorded from the plots where two handweeding at 20 and 40 DAT was performed and was statisticallyat par with the mean grain yield obtained under different weedmanagement practices i.e butachlor @ 1.5 kg a.i/ha as pre-emfb azimsulfuron @ 25.0 g a.i/ha POE(5.51t/ha), bispyribac 12.5g a.i/ha + azimsulfuron 12.5 g a.i/ha POE (5.56t/ha), butachlor@ 1.5 kg a.i/ha as pre-em fb ethoxysulfuron @ 15 g a.i/ha asPOE(5.65 t/ha) and the grain yield obtained these weresignificantly superior to the grain yield obtained under rest ofthe weed management practices. Significantly lowest meangrain yield of (4.21 t/ha) was obtained from weedy checktreatment. The highest net return Rs, 43083/ha was noted intreatment butachlor @ 1.5 kg a.i/ha as pre-em fb ethoxysulfuron@ 15 g a.i/ha as POE and maximum benefit: cost ratio of 1.92was obtained in treatment bispyribac 12.5 g a.i/ha +azimsulfuron 12.5 g a.i/ha POE and lower value of net returnRs, 28488/ha and benefit: cost ratio of (1.29) were recordedunder treatment weedy check.
Key words Grain yield, Herbicides, Rice, Weed density, Economics.
Rice (Oryza sativa) is one of the most important cerealscrops grown over diverse environment and geographicalranges for human food, feed, fodder and raw materials forindustries. In Bihar, total area under this crop is 33.37 lakhsha, producing 83.05 metric tons and with average productivityof 2489 kg/ha (Anon., 2011-12). Transplanted rice is infestedby heterogeneous types of weed flora consisting of grassy,broadleaf weeds and sedges causing yield reduction up to76% (Singh, et. al., 2004). About 60% of the weeds emergeduring 7-30 day after transplanting and strongly compete with
rice plants up to maximum tillering stage (Saha and Rao, 2010).Therefore, timely weed control at early stage is imperative forrealizing desired level of productivity from transplanted rice.The use of herbicides offers selective and economic controlof weeds right from the beginning, giving crop an advantageof good start and competitive superiority. A number of pre-emergence herbicides like butachlor, pretilachlor, anilophosetc. have been recommended for the control of early flushesof grassy weeds in transplanted rice field. The intensive useof such herbicides year after year has resulted in herbicideresistance problems and consequently, management of weedsis becoming increasingly more difficult and complex.Moreover, continuous use of these herbicides leads to a shiftof weed flora from grassy to non grassy broadleaf weeds andannual sedges (Rajkhowa, et al., 2006).
Hence, keeping in view the above fact there is a need toreduce the evolution of herbicide resistance in weeds and theshift towards problematic weeds by avoiding the continuoususe of a single herbicide or herbicides with similar mechanismsof action. Given that herbicide resistance is likely to increase,research is needed to evaluate the performance of differentherbicides, which can provide effective weed control undertransplanted rice
MATERIALS AND METHODS
A field experiment was carried out during rainy seasons(kharif) of 2011 and 2012 at Bihar Agricultural University,Sabour, Bihar campus in a randomized block design with threereplications. The treatments comprised 12 weed managementpractices viz., Un-weeded check, Hand Weeding (HW) at 20and 40 Days After Transplanting(DAT), butachlor @ 1.5 kga.i./ha as pre-emergence, butachlor @1.5 kg a.i/ha pre-emergence followed by (fb) 2,4-D easter 0.5 kg a.i./ha postemergence, bispyribac sodium @ 20 g a.i/ha as post emergence,bispyribac sodium @ 25 g a.i/ha as post emergence, bispyribacsodium @ 30 g a.i/ha as post emergence, butachlor @ 1.5 kga.i/ha as pre-emergence fb azimsulfuron @ 25.0 g a.i/ha postemergence, penoxsulam @ 22.5 g a.i/ha as post emergence,bispyribac 12.5 g a.i/ha + azimsulfuron 12.5 g a.i/ha postemergence, oxadiargyl @ 90 g a.i/ha as pre-emergence.,butachlor @ 1.5 kg a.i/ha as pre-emergence fb ethoxysulfuron@ 15 g a.i/ha as post emergence. Twenty one days old

KUMAR et. al., : Effectiveness and Economics of Integrated Weed Management in Transplanted Rice (Oryza sativa) 213
seedlings of the test variety ‘Rajendra Bhagwati’ wastransplanted at 20x10cm row spacing on 25 and 28 June, 2011and 2012 respectively. In Rice, half recommended dose of N(60 Kg/ha) and full dose of P, K and Zn were applied beforetransplanting at final land preparation and the remainingnitrogen (60kg/ha) were applied in two splits dose, half atactive tillering and the rest half at panicle initiation stage. Allthe other recommended agronomic and plant protectionmeasures were adopted to raise the crop. Pre-emergence andPost-emergence herbicides were applied in saturated soilmoisture as per the protocol of application time usingknapsack sprayer fitted with flat fan nozzle at spray volume of600 liters/ha. The experimental soil was sandy-loam in texturewith pH 7.1. The organic carbon, electrical conductivity,available nitrogen, phosphorus and potash were 0.59%,0.106ds/m, 271.3, 16.41 and 289.36 kg/ha, respectively. Therainfall received during the crop season of respective yearswas 1202 mm and 670 mm respectively. The data on weedpopulation, weed dry weight and weed control efficiency wererecorded at different stages of rice crop with the help of aquadrate (0.5mx0.5m) at three places and then converted intoper m2. These were subjected to squire root transformation tonormalize their distribution. Weeds were cuts at ground level,washed with tap water. The biomass was determined afterdrying the samples in an oven at 70 0C for 72 hrs. Weed controlefficiency (WCE) was calculated by using the formula: WCE%=( weed biomass weedy check-weed biomass in managedtreatment)/weed biomass in weedy check×100.Grain yield ofrice along with other yield attributing characters like effectivepanicles/m2 were recorded at harvest. Grain yield was convertedto t ha-1 at 14% moisture content. Cost of cultivation and grossreturn were calculated on the basis of prevailing market pricesof different inputs and produces, respectively.
RESULTS AND DISCUSSION
Weed flora
The most predominant weed species present in the
experimental site were Cynodon dactylon (L) Pers, Cyperusrotundus (L)., Cyperus iria (L), Cyperus difformis(L).,Digitaria sanguinalis (L) ., Fimbristylis miliacea (L)Vaha., Eclipta alba (L).,Echinochloa colona ( L).link,Echinochloa crus-galli (L) P. Beauv, Marsilea quadrifoliata(L).,Eleusine indica , (L) Phyllanthus niruri (L), Euphorbiahirta (L), Amaranthus viridis (L), and Commelinabenghalensis (L). The combination of grasses, sedges andbroad leaf weeds in weedy check plot were 20, 32, and 48%respectively. Emergence of broad leaf weeds was noticedearlier than of sedges and grasses.
Weed density and weed dry weight were higher at 30days after transplanting (DAT) then 60 DAT. This was probablybecause of death of some of the weeds like), Cyperus difformis,Echinochloa crus-galli,, Marsilea quadrifoliata andCommelina benghalensis and the shading effect of the tallweeds like Echinochloa crus-galli and crop plant on shortnature weeds. At both the stages of observation unweedycheck recorded significantly higher weed population and weeddry weight than any other treatment (Table 2). Two handsweeding at 20 and 40 DAT recorded the minimum weedpopulation and dry weight and the highest weed controlefficiency at both the stages. Among the herbicidal treatments,application of butachlor @ 1.5 kg a.i/ha as pre-em fbazimsulfuron @ 25.0 g a.i/ha POE and bispyribac 12.5 g a.i/ha+ azimsulfuron 12.5 g a.i/ha POE, recorded the highest grainyield which was on par with application of butachlor @ 1.5 kga.i/ha as pre-em fb ethoxysulfuron @ 15 g a.i/ha as POE andthese three treatments were comparable with 2 hand weedings.The reduction weed density and dry weight may be attributedto broad spectrum and season long weed control propertiesexhibited by the herbicide mixture or sequential application.Unweeded control plots recorded the highest weed populationand dry weight and lowest weed control efficiency. Amongthe herbicides treatments, application of oxadiargyl @ 90 ga.i/ha as Pre–em. recorded higher weed population dry weightand lower weed control efficiency, indicating itsineffectiveness. Application of butachlor @1.5 kg a.i/ha pre-
Table 1. Effect of weed management practices on growth, yield attributes of Rice (Pooled data of two years)Treatments Dose (g ai/ha) Stage of application
(DAS) Plant height
(cm) Panicle/m2 Panicle
length (cm) Grain /panicle Test
weight(g) Weedy check - - 108.2 158 20.1 99 27.21 HW at 20 and 40 DAT - 20fb40 116.2 194 25.2 119 28.85 Butachlor 1500 3 110.6 164 21.6 106 28.51 Butachlor fb 2,4-D Easter 1500fb500 3fb20 114.3 182 22.7 114 28.66 Bispyribac sodium 20 20 112.5 168 22.1 109 28.61 Bispyribac sodium 25 20 113.4 178 22.3 111 28.62 Bispyribac Sodium 30 20 113.6 181 22.5 111 28.62 Butachlor fb Azimsulfuron 1500fb25 3fb20 114.5 189 23.2 112 28.80 Penoxsulam 22.5 20 113.0 174 22.0 107 28.50 Bispyribac + Azimsulfuron 12.5+12.5 20 115.4 191 24.3 116 28.83 Oxadiargyl 90 3 111.3 165 22.2 110 28.68 Butachlor fb Ethoxysulfuron 1500fb15 3fb20 115.6 192 24.4 117 28.84 SEm± - - 3.4 4.69 0.73 1.94 1.22 CD (P=0.05) - - 11.34 17.57 2.32 6.51 NS

214 Trends in Biosciences 6 (2), 2013
em fb 2,4-D easter 0.5 kg a.i./ha POE , bispyribac sodium @ 20g a.i/ha as POE , bispyribac sodium @ 25 g a.i/ha as POE andbispyribac sodium @ 30 g a.i/ha as POE were also equallyeffective.
Effect on rice
All the weed control treatment combinationssignificantly reduced the weeds as compared to weedy checkand recorded higher grain yield of rice. Among weed controlmeasures, the hand weeding twice, butachlor @ 1.5 kg a.i/haas pre-em fb azimsulfuron @ 25.0 g a.i/ha POE, bispyribac 12.5g a.i/ha + azimsulfuron 12.5 g a.i/ha POE and butachlor @ 1.5kg a.i/ha as pre-em fb ethoxysulfuron @ 15 g a.i/ha as POEincreased the grain yield by 40.38, 30.95,32.0 and 34.20%respectively, over the unweedy check. The increased grainyield in these treatments were owing to reduced weed density,weed dry weight and better weed control efficiency and higher
Table 2. Effects of weed management practices on weed biomass weed density and weed control efficiency in Rice (Pooled dataof two years)
Data subjected to sq.root (“x+0.5) transformation. Figures in parentheses are Transformed value.
Treatment Dose(g/ha) Stage of application
(DAS)
Weed Population (No/m2) at 30
DAS
Weed Population (No/m2) at
60 DAS
Dry Wt. of Weed (g/m2) at 30 DAS
Dry Wt. of Weed (g/m2)
at 60 DAS
Weed control Efficiency
(%) at 60 DAS Weedy check - - 151(12.78) 200(14.64) 13.1(4.11) 18.1(4.75)) - HW at 20 and 40 DAT - 20fb40 18(4.74) 24(5.39) 1.1(1.54 1.2(1.59) 93.3 Butachlor 1500 3 24(5.39) 48(7.42) 1.2(1.59) 2.4(2.04) 86.7 Butachlor fb 2,4-D Easter 1500fb500 3fb20 20(4.97) 43(7.05) 1.1(1.54) 2.3(2.01) 87.2 Bispyribac sodium 20 20 46(7.28) 39(6.74) 2.2(1.98) 2.3(2.01) 87.2 Bispyribac sodium 25 20 44(7.13) 36(6.5) 2.3(2.01) 2.3(2.01) 87.2 Bispyribac Sodium 30 20 42(6.98) 32(6.15) 2.0(1.91) 2.1(1.94) 88.3 Butachlor fb Azimsulfuron 1500fb25 3fb20 22(5.19) 28(5.79) 1.2(1.59) 1.4(1.68) 92.2 Penoxsulam 22.5 20 55(7.91) 34(6.33) 2.6(2.11) 2.1(1.94) 88.3 Bispyribac + Azimsulfuron 12.5+12.5 20 28(5.79) 30(5.97) 1.7(1.80) 1.4(1.68) 92.2 Oxadiargyl 90 3 36(6.5) 54(7.84) 2.1(1.94) 3.8(2.44) 79.0 Butachlor fb Ethoxysulfuron 1500fb15 3fb20 27(5.69) 35(6.41) 1.7(1.80) 2.2(1.98) 87.8 SEm± - - 4.24 3.4 0.32 0.35 - CD (P=0.05) - - 9.1 7.1 0.66 0.74 -
panicles/unit area (Table 2). This might due to better controlof broad leaf and sedges which were prevalent in the rice fieldduring both the year.. The minimum yield and yield attributesin unweeded check were the result of severe weed competitionby the uncontrolled weed growth. Nawal, et. al., 2002 reportedincreased grain yield by herbicide mixture and sequentialherbicide application respectively. There was no phytotoxiceffect of any herbicides at any of doses applied alone or tankmixture in transplanted rice crop. Application of the handweedings twice, butachlor @ 1.5 kg a.i/ha as pre-em fbazimsulfuron @ 25.0 g a.i/ha POE, bispyribac 12.5 g a.i/ha +azimsulfuron 12.5 g a.i/ha POE and butachlor @ 1.5 kg a.i/haas Pre-em fb ethoxysulfuron @ 15 g a.i/ha as POE recordedthe highest net return and maximum benefit: cost ratio (Table3). This may be due to high weed control efficiency and highergrain yield obtained owing to application of effective herbicidedose and combination. Thus application of butachlor @ 1.5
Table 3. Effect of weed management practices on grain yield, gross return, net return and benefit: cost ratio of Rice (Pooleddata of two years)
Treatment Dose (g/ha)
Stage of application (DAS)
Grain Yield( t/ha)
Gross return (Rs./ha)
Net return (Rs./ha)
Benefit : cost ratio (Rs.)
Weedy check - - 4.21 50520 28488 1.29 HW at 20 and 40 DAT - 20fb40 5.91 70920 42888 1.52 Butachlor 1500 3 4.63 55560 31848 1.34 Butachlor fb 2,4-D Easter 1500fb500 3fb20 5.30 63600 39568 1.64 Bispyribac sodium 20 20 4.93 59160 36128 1.56 Bispyribac sodium 25 20 5.14 61680 38148 1.62 Bispyribac Sodium 30 20 5.27 63240 39208 1.63 Butachlor fb Azimsulfuron 1500fb25 3fb20 5.51 66120 42108 1.75 Penoxsulam 22.5 20 5.04 60480 37448 1.62 Bispyribac + Azimsulfuron 12.5+12.5 20 5.56 66720 43938 1.92 Oxadiargyl 90 3 4.85 58200 35388 1.55 Butachlor fb Ethoxysulfuron 1500fb15 3fb20 5.65 67800 43083 1.74 SEm± - - 0.27 907.3 696.7 0.063 CD (P=0.05) - - 0.83 1981.8 1445.1 0.131

KUMAR et. al., : Effectiveness and Economics of Integrated Weed Management in Transplanted Rice (Oryza sativa) 215
kg a.i/ha as pre-em fb azimsulfuron @ 25.0 g a.i/ha POE,bispyribac 12.5 g a.i/ha + azimsulfuron 12.5 g a.i/ha POE andbutachlor @ 1.5 kg a.i/ha as pre-em fb ethoxysulfuron @ 15 ga.i/ha as POE proved more effective in checking the weedpopulation and their growth and increasing the grain yield intransplanted rice. All the weed control methods resultedsignificant increase in grain and biological yield over weedycheck.
LITERATURE CITED
Anonymous, 2012. Statistcs Department of Agriculture, Govt. of Bihar(2011-2012)
Nawal, Sandeep, Singh, Samar, Panwar, K.S. andMalik, R.K. 2002.Performance of acetochlor and anilofos + ethoxysulfuron for weedcontrol in transplanted rice (Oryza sativa). Indian Journal ofAgronomy, 47(1):67-71.
Rajkhowa, D.J., Borah.N, Barua.I.C and Deka, N.C.2006. Effect ofpyrazosulfuron ethyl on weed and productivity of transplanted riceduring rainy season. Indian Journal of Weed science, 38(1& 2): 25-28.
Saha, Sanjoy and Rao. K.S. 2010.Efficacy of metsulfuron methyl forcontrolling broadleaf weeds in transplanted rice (Oryza sativa) underrainfed shallow lowland .Indian Journal of Agricultural Sciences,80 (6):522-26.
Singh, V.P., Singh Govindra and Singh Mahendra. 2004. Effect offenoxaprop-p-ethyl in transplanted rice and associated weeds.Indian Journal of Weed Science, 36 (3 & 4): 190–192.
Received on 14.04.2013 Accepted on 20.05.2013

Trends in Biosciences 6 (2): 216-217, 2013
Biology of Mango – Hopper, Amritodus atkinsoni (Leth.) (Jassidae : Hemiptera) inAgro – ecosystem of ManipurM. BHUBANESHWARI DEVI
P. G. Department of Zoology, Laboratory of Entomology, D.M. College of Science, Imphale-mail: [email protected]
ABSTRACTS
The mango-hopper, Amritodus atkinsoni (Leth.) (Jassidae :Hemiptera) is one of the most serious pests of mango trees inManipur. The maximum infestation is seen during the(February and March) flowering season when the temperatureis 280C (Max.), 250C (Min.); R.H. 85% (Max.), and 75% (Min.);Rainfall almost nil. During other months, they are very few innumber and confine themselves in cracks and crevices of thebark of trees. The life cycle continues from February / Marchto April / May. The eggs are laid on rachis of inflorescence,having incubation period from 8 to 12 days. There are fivelarval instars with four moultings, the total nymphal periodincluding five instars lasted from 15 to 20 days and the totallife cycle from egg to adult ranged from 25 to 28 days under thelaboratory conditions.
Key words Biology, Amritodus atkinsoni, mango pest, Manipur.
Mango, the king of the fruits, Mangifera indica Linn.(Anacardiaceae) is known due to its attractive colour, odourand a nice delicacy. It is the most important fruit crop ofManipur. But this important fruit of mango is infested byseveral pests. It has been reported that over 175 species ofinsects infests damage mango regularly (Fletcher, 1920, Veva,1969 and Nayar, et.al., 1976). These pests damage severalparts of the mango tree. Reddy 1968 reported that extent ofdamage and the loss in yield of mangoes due to this pestvaried in the different areas while Wadhi and Batra 1964reported 25% – 60% loss in general. Anufriew 1970 reportedthat the mango hopper Amritodus atkinsoni is one of themost serious pests of mango trees in Punjab, Bihar, southernIndia and Gujarat. The life cycle of the pest is significant tomake effective IPM measures to suppress the pestmanifestation in Manipur.
MATERIALS AND METHODS
The mango hoppers were collected from the field andkept in glass rearing jars/Plastic rearing jars covered with finemuslin cloth. Inside the rearing jars small plastic boxes fittedwith water containing fresh mango spikes were kept for egglaying. These spikes were changed twice daily to get thenymph enough pest food. The observations were carried outat room temperature (25±30C and 80±5% R.H.).
RESULTS AND DISCUSSION
Life history :
Egg:
The eggs were laid singly but embedded in the tissueand only blunt end was visible. The eggs were smooth, creamywhite and oblong in shape. It measure on an average 0.70 ±0.07 mm in length and 0.50 ± 0.02 mm in diameter. They arepointed at one end and blunt at the other end. The incubationperiod ranged from 8 – 12 days. Reddy, 1968 observed thatthe egg stage occupied 7 – 10 days while according to Pateland Talgiri 1950, it ranged from 8 – 10 days. Patel, et.al., 1975reported that the incubation period ranged from 7 – 9 days.First instar larva:
There are five nymphal instars within a period of 17 – 20days. The nymphs are voracious eaters and excreted semi-liquid sticky substances, the honey dew.
The newly hatched nymph is very delicate and paleyellow in colour. It conspicuous bulging red compound eyes.It measured on an average 1.04 ± 0.02 mm in length and 0.49 ±0.05 mm in breadth. The duration of this instar ranged from 4– 5 days. Patel, et.al., 1975 reported that the first instar rangedfrom 3 – 4 days.Second instar larava:
The first instar larva after 4 – 5 days moulting changedinto second instar larva. It is yellowish in colour but later onchanged into dark brown. The head is relatively larger thanthe remaining parts of the body. It measured on an average of2.0 ± 0.03 mm in length and 0.60 ± 0.04 mm in breadth. Theduration of the second instar larva ranged from 4 – 6 days(table 1). Patel et.al (1975) reported the duration of the secondinstar larva from 3 – 4 days.Third instar larva:
The second instar larva after 3 – 4 days, metamorphosedinto the third instar larva. It is of yellowish colour at first butthe dorsal side is dark brown whereas the ventral side is paleyellow in colour. The three notum of the thorax are welldeveloped and the pronotum overlapped the head. Therudiments of two pairs of wings appeared on mesonotum andmetanotum. Abdominal segments are well differentiated. It

DEVI : Biology of mango – hopper, Amritodus atkinsoni (Leth.) (Jassidae : Hemiptera) in agro – ecosystem of Manipur 217
Adult:
The adults are cream coloured after just emergence butlater on changed to brown dorsally and pale yellowishventrally. The adult survived 4 – 5 days on natural food underlaboratory condition. The females are longer than the males.The female adult measured on an average of 4.80 ± 0.03 mm inlength whereas the male measured on an average of 4.51 ±
Stage No. of insects Length (mm) Breadth (mm) Egg 1st instar 2nd instar 3rd instar 4th instar 5th instar
10 10 10 10 10 10
0.70 ± 0.07 1.04 ± 0.02 2.0 ± 0.03 2.4 ± 0.03 3.2 ± 0.05 5.0 ± 0.02
0.50 ± 0.02 0.49 ± 0.05 0.60 ± 0.04 0.80 ± 0.03 0.120 ± 0.02 0.141 ±0.05
Table 1. Measurement of the different instars of Amritodusatkinsoni (Leth.) in mm
Table 2. Duration of different stages of Amritodus atkinsoni (Leth.)1st instar 2nd instar 3rd instar 4th instar 5th instar
Dates No. of days Dates No. of days Dates No. of days Dates No. of days Dates No. of days 10th – 13th March 4 13th – 17th March 4 17th – 22nd March 5 22nd – 27th March 5 27th – 31st March 4 12th – 14th March 3 14th – 18th March 4 18th – 21st March 3 21st – 25th March 4 25th – 29th March 4 17th – 20th March 4 20th – 23rd march 3 23rd – 27th March 4 27th – 30th March 3 30th – 2nd April 3
measured on an average 2.4 ± 0.03 mm in length and 0.80 ±0.03 mm in breadth. The duration of the third instar larva rangedfrom 4 – 5 days. Patel, et. al., 1975 reported the duration of thethird instar larva 3 – 4 days.Fourth instar larva:
The fourth instar larva is also of yellow colour in thebeginning but changed to dark brown later. The head isconspicuously bulging when compared with thorax. Thecompound eyes are dark black in colour. The larvae are moreactive and moved here and there on the inflorescence, budsand leaves of mango. They shared diagonal walkingmovements. The wing pads are enlarged and distinct. Thesizes are differentiated from this stage onwards. It measuredon an average of 3.2 ± 0.05 mm in length and 0.12 ± 0.02 mm inbreadth. The duration of the fourth instar larva ranged from 4– 5 days (Table 1). Patel, et.al., also observed that the variationof 3 – 4 days in this stage.Fifth instar larva:
This fifth instar larva is pale yellow in colour but later onthe dorsal side changed to dark grey. The wing pads are verylarge and very active. They move in a diagonal way. The sizeof the body is little increase than the previous one. It measuredon an average 5.0 ± 0.02 mm in length and 0.14 ± 0.05 mm inbreadth. The duration of this stage ranged from 3 – 4 days butPatel, et.al., 1925 observed 2 – 3 days in this experiment.
Thus the total larval period ranged from 17 – 20 days inthe climate condition of Manipur. Patel and Talgiri, 1950observed the variation from 15 – 17 days.
0.05 mm in length. The present observations are at par withPatel, et.al., 1975 who reported the female’s body length 4.86mm and the male’s body length 4.50 mm.
ACKNOWLEDGEMENT
The author is grateful to the Principal, D.M. College ofScience, Imphal and Head of Department of Zoology, D.M.College of Science, Imphal for giving me laboratory facilities.The author remains thanks to the UGC for giving me financialassistance.
LITERATURE CITED
Anufrieu, G.A. 1970. Description of a new genus, Amritodus for Idiocerusatkinsoni leth. From India (Hemiptera : Cicadellidae). J. nat.Hist.,4: 375 – 376.
Fletcher, B.T. 1970. Fruit trees. Report Proc. 2nd. Ent.Mtg. Pusa (Bihar)February. Calcutta (9,43,94,278).
Nayar, K.K.; T.N. Ananthakryshnan and B.V.David 1976. General andApplied Entomology. Tata Mc Graw Hill Publishing Co. Ltd. NewDelhi pp. 589.
Patel, G.A. and Talgiri, G.M. 1950. Crop pests and how to fight them.Government of Bombay, pp. 126–145.
Patel, R.K., Patel, S.R., and Shah. A.H., 1975. Biology of mangohopper, Amritodus atkinsoni (Leth.) (Jassidae : Hemiptera) in southGujarat. Indian J. Ent., 37(2): 150–153.
Reddy, D.B. 1968. Plant Protection in India. Allied Publications, NewDelhi. pp. 238-239.
Wadhi, S.R. and Batra, H.N. 1964. Pests of tropical and sub tropicalfruit trees. In: Entomology in India, (ed. N.C. Pant). TheEntomological Society of India. New Delhi, 227–260 pp.
Veva, E.J. 1969c. Know your crop, its pest problem and control. MangoPesticides. 3(12): 21 – 31.
Received on 21.03.2013 Accepted on 17.04.2013

Trends in Biosciences 6 (2): 218, 2013
A New Blight Disease of Rice Caused by Curvularia sp. from U.P.KAMALUDDEEN1, SOBITA SIMON AND ABHILASHA A. LAL
Department of Plant Protection, Sam Higginbottom Institute of Agriculture, Technology & Sciences ,(Formerly(Deemed-to-be-University), Allahabad - 211 007 (U.P.) Indiae-mail : [email protected]
Rice is the most important cereal crop grown all overthe world. During cultivation of rice variety Pant-12, at thetillering stage a new disease was observed at central fieldof Sam Higginbottom Institute of Agriculture, Technology& Sciences Allahabad. The rice plants were cultivatedusing standard agronomicpractices (Singh, 2005).
The first symptomsappeared on the leaves aselliptical brown spots whichincreased in size. Graduallythe colour of the spotschanged to brownish black.The length of spots rangedfrom 0.2 to 1cm (Fig.1). Laterthe spots appeared on leafsheath which were darkbrown initially with yellowmargin and the diseasedsheath became yellow andblighted. Initially thesespots were similar to theones on the leaf but latercovered the whole leafsheath (Fig.2). Gradually thedisease spread to thekernels. Glumes werediscoloured and in severeinfection, the rice kernelshowed black discoloration(Fig. 3).
M i c r o - s c o p i c a lexamination revealed thepresence of conidia of thefungus. The conidia werefour celled and generally curved, with two middle cellsdarker than the paler end cells. Conidiophores werebranched, septate and dark in colour.
Isolation of the fungus from the infected parts wascarried out on PDA (Potato Dextrose Agar) plates followingthe standard methodology (Aneja, 2003). After two-threedays whitish mycelial growth appeared which graduallybecame greyish black in colour (Fig.4).
Microscopical examination of fungal culture againshowed the presence of conidia and conidiophores typicalof Curvularia (Mehrotra and Aneja, 2008). The fungus wastherefore identified as Curvularia sp. (Fig.5).
Fig. 3. Disease symptoms onthe kernels
Fig. 2. Disease symptoms onthe leaf sheath
Fig.1. Disease symptomson the leaves
Fig. 4. Pure cultureof Curvularia sp.
Perusal of literature revealed that incidence ofCurvularia sp. have been reported on rice grains by Raoand Salam 1954 from Hyderabad. This seems to be firstreport of a new blight disease of rice from India.
LITERATURE CITED
Aneja, K. R. 2003. Experiment in Microbiology, Plant Pathology andBiotechnology. New Age International (P) Limited, Publishers. NewDelhi. pp. 439.
Mehrotra, R. S. and Aneja K.R. 2008. An Introduction to Mycology.New Age International (P) Limited, Publishers. New Delhi. pp.599.
Rao, P. N. and Salam, M.A. 1954. Curvularia sp. from discoloredgrains from Hyderabad. Journal Ind. Bot. Soc., 33: 268-271.
Singh, S. S. 2005. Crop Management. Kalyani Publishers. Ludhiana.pp. 50.
Received on 19.3.2013 Accepted on 15.04.2013
Fig. 5. Conidiophores & conidiaof Curvularia
SHORT COMMUNICATION

Trends in Biosciences 6 (2): 219-220, 2013
Exploring Precision Agriculture Approaches for Insect Pest Management1PRASHANT KUMAR AND 2ASHUTOSH KUMAR1Department of Vegetable Science Punjab Agriculture University (PAU), Ludhiana2Department of Botany PAU, Ludhianae-mail: [email protected]
SHORT COMMUNICATION
New tools are needed for the monitoring of insect pestson a small spatial scale (Fleischer, et. al., 1999) for the deliveryof variable rates of insect pest management other thanpesticides, such as mass release of biological control agents,and for geo-statistical analyses to detect spatial relationsbetween variables in the environment (Liebhold, et. al., 1993).Goal of precision agriculture is to vary management inputs indifferent parts of the field so that crop response is optimised.The efficacy of pest control measures could be improved andadverse environmental impact be minimised by consideringthe spatial variability in pest occurrence and their habitat(Lan, et. al., 2010). The results are used to illustrate how thesenew tools could be used to optimally arrange crop plants inorder to reduce insect pest-inflicted damage.
The main tools used in precision agriculture for insectpest management mainly includes yield monitors (YM), sensorsused to monitor yield during the harvest in order to quantifyyields across the field, variable rate technologies (VRT) thatare mounted on application equipment such as sprayers tocontrol their delivery rates (Ravi and Jagadeesha, 2002). Globalpositioning system (GPS), a satellite-based locating systemwhich identifies an earth-based position using longitude andlatitude. Geographic information system (GIS), adata-management system designed to store spatial data andcreate variable-intensity maps. These allow the delivery ofvariable levels of a specific management practice to variousparts of the field and in a single field operation. For precisioninsect-pest control, these tools should be combined with adecision-support system.
Remote sensing (RS) is being used with GPS, GIS, andVRT to ultimately help farmers maximize the economic andenvironmental benefits of crop pest managementthrough precision agriculture (Lan, et. al., 2009). In the past,pests were hand-picked with the ultimate in precision pestcontrol. For many years integrated pest management (IPM)has been the approach of choice for pest control. Yet IPMlacks the spatial component so central to precision agriculture(Fleischer, et. al., 1999). Precision agriculture, because it hasbeen designed for use in crop production, must be adaptedfor use in insect pest management. Various authors havediscussed the application of remote sensing to insect pestmonitoring (Pathak and Dhaliwal, 1985) and plant protectionin general (Hatfield and Pinter, 1993). In spite of this, the
clustered distribution of insect pests does make them suitablefor this type of management. RS may be advantageous as itcan detect infested hot-spots by monitoring either the healthof the plants or visible by-products of infestations, such asdefoliation and sooty mould-contaminated honeydew that issecreted by homopteran pests (Hart and Myers, 1968, Chaing,et. al., 1976). Detection of consistent patterns of insect pestinfestation over several years will enable the preparation ofmulti-year management maps that could be used to apply pre-emptive control measures (Blackmore, 2000). Data collectedthrough RS are transferred to a GIS and used to create, forexample, maps of defoliation attributable to a pest such as theGypsy moth. If indeed particular areas of the forest are seento be defoliated repeatedly over several years, controlmeasures could be applied to these susceptible areas beforeinsect pest populations reach damaging levels (Liebhold,et. al., 1998). GIS is also highly suitable tool for detectingsuch consistent infestation patterns. GIS and GPS-linked datacollection could be used to optimally arrange crops in an area.
The small size, cryptic nature, rapid change in spatialoccurrence and dynamic infestation pattern characteristic ofinsect pest present exceptional challenges. Precisionagriculture uses new technologies to provide us with a uniqueopportunity to add a spatial dimension to our pest controlmeasures. Although the cost of these technologies is currentlyprohibitive, they may become standard farm equipment in thefuture. Small farmers could use precision agriculturetechnologies by a cooperative system to urgently deal withsome area wide pest management issues. However, site-specific control of insect pest may be possible based on pestbiology and parameters correlated with pest infestation.Finally, precision agriculture methodologies, such as the GPS,RS and GIS, may be used for area-wide management of insectpests through farm landscaping. Thus, biologicalcharacteristics of insect pest infestation in a particular system,together with economic criteria, will point to the most effectiveapproach.
LITERATURE CITED
Blackmore, B. S. 2000. The interpretation of trends from multipleyield maps. Computers and Electronics in Agriculture, 26: 37–51.
Chaing, H. C., Meyer, M. P. and Jensen, M. S. 1976. Armywormdefoliation in corn as seen on IR aerial photographs. EntomologiaExperimentalis et Applicata, 20: 301–03.

220 Trends in Biosciences 6 (2), 2013
Fleischer, S. J., Blom, P. E. and Weisz, R. 1999 Sampling in precisionIPM : When the objective is a map. Phytopathology, 89: 1112–18.
Hart W. G. and Myers V. I. 1968 Infrared aerial colour photography fordetection of populations of brown soft scale in citrus groves. Journalof Economic Entomology, 61: 617–24.
Hatfield, J. L. and Pinter, P. J. 1993. Remote sensing for crop protection.Crop Protection, 12: 403–13.
Landis D A and Marino P C (1999) Landscape structure and extrafieldprocesses: impact on management of pests and beneficials. InHandbook of Pest Management. Marcel Dekker, New York pp.74–104.
Lan, Y. Thomson, S. J., Huang, Y. Hoffmann, W. C., Zhang, H. 2010.Current status and future directions of precision aerial applicationfor site speciûc crop management in the USA. Computers andElectronics in Agriculture, 74: 34–38
Liebhold, A. M., Rossi, R. E. and Kemp, W. P. 1993. Geostatistics andgeographic information systems in applied insect ecology. AnnualReview of Entomology, 38: 303–27.
Liebhold, A., Luzaader, E., Reardon, R. Roberts, A. Ravlin, F. W., Sharov,A. and Zhou, G. 1998. Forecasting Gypsy moth defoliation with aGeographical Information System. Journal of EconomicEntomology, 91: 464–72.
Pathak, M. D. and Dhaliwal, G. S. 1985. Remote sensing and monitoringof insect pest problems in rice. In: Application of Remote Sensingfor Rice Production pp: 77–87.
Ravi, N. and Jagadeesha, C. J. 2002. Precision Agriculture, Trainingcourse on Remote Sensing and GIS. Applications in Agriculture,RRSSC-Bangalore, pp: 225-28.
Received on 23.01.2013 Accepted on 15.03.2013
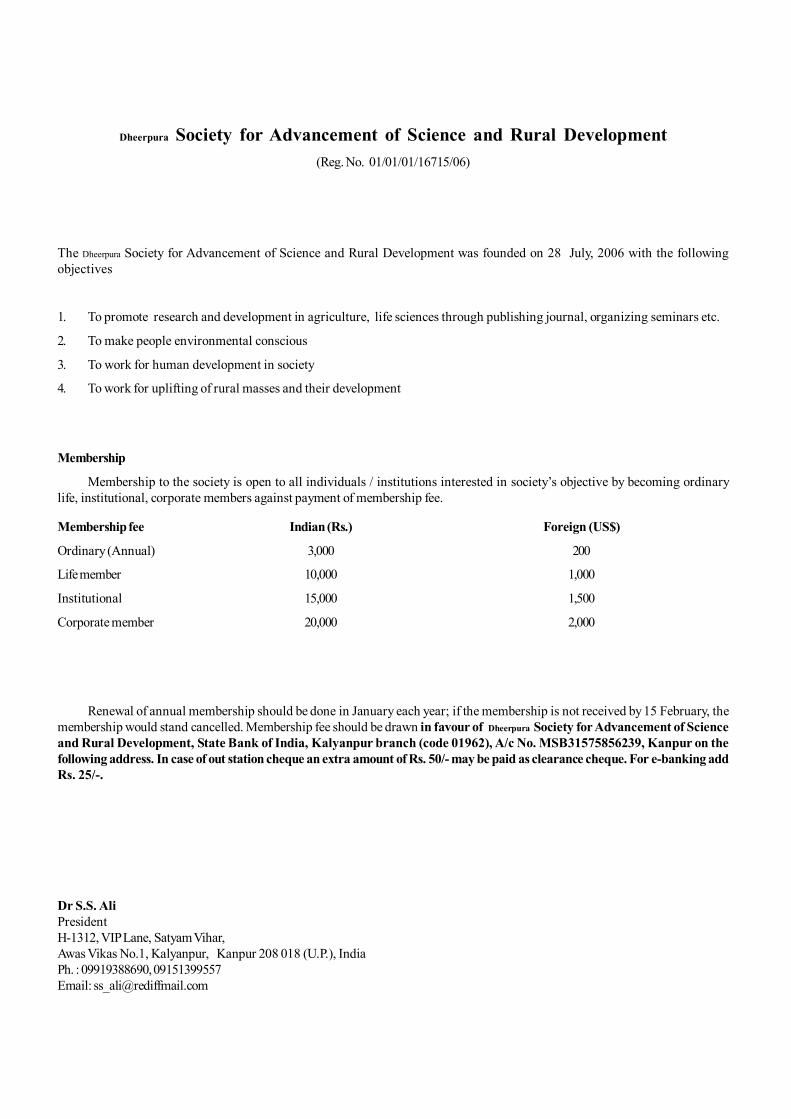
Dheerpura Society for Advancement of Science and Rural Development(Reg. No. 01/01/01/16715/06)
The Dheerpura Society for Advancement of Science and Rural Development was founded on 28 July, 2006 with the followingobjectives
1. To promote research and development in agriculture, life sciences through publishing journal, organizing seminars etc.
2. To make people environmental conscious
3. To work for human development in society
4. To work for uplifting of rural masses and their development
Membership
Membership to the society is open to all individuals / institutions interested in society’s objective by becoming ordinarylife, institutional, corporate members against payment of membership fee.
Membership fee Indian (Rs.) Foreign (US$)
Ordinary (Annual) 3,000 200
Life member 10,000 1,000
Institutional 15,000 1,500
Corporate member 20,000 2,000
Renewal of annual membership should be done in January each year; if the membership is not received by 15 February, themembership would stand cancelled. Membership fee should be drawn in favour of Dheerpura Society for Advancement of Scienceand Rural Development, State Bank of India, Kalyanpur branch (code 01962), A/c No. MSB31575856239, Kanpur on thefollowing address. In case of out station cheque an extra amount of Rs. 50/- may be paid as clearance cheque. For e-banking addRs. 25/-.
Dr S.S. AliPresidentH-1312, VIP Lane, Satyam Vihar,Awas Vikas No.1, Kalyanpur, Kanpur 208 018 (U.P.), IndiaPh. : 09919388690, 09151399557Email: [email protected]

Subscription Order Form
Name : …………………………………………………………………………..............................................................
Designation : …………………………………………………………………………..............................................................
Organization : …………………………………………………………………………..............................................................
Mailing Address : …………………………………………………………………………..............................................................
City ............................................................................ State .........................................................................................
Pin .............................................................................. Country ...................................................................................
Phone ........................................................................ Mobile .....................................................................................
E-mail ........................................................................ Fax ............................................................................................
Subscription period January- December (Year)
Annual Subscription Rates for 2013 :
Author’s Contribution : Rs. 1000/paper (minimum upto 2 authors) and Rs. 600/paper for additional authors. **Same for SAARC,countries only soft copy.
I herewith enclosed the DD/Cheque No. .................................................................................................... Dated : .......................................
for an amount of Rs. ......................................................... Drawn on : ................................................................................................... Bank.
Terms and Conditions:
1. Online subscription includes online access
2. Print subscription is volume based where as online subscription is Calendar year based
3. Online subscription includes current subscription + Back Files (for last two years)
4. Please add Rs. 50 for non-Delhi cheque and for non-Kanpur cheque Rs. 50
5. The online subscription should be send to : Print subscription and manuscript should be sent toindianjournals.com Dr. S. S. AliB-9, Local Shopping Complex, ‘A’ Block Editor in Chief, H- 1312, VIP lane,Naraina Vihar, Ring Road Satyam Vihar, Avas Vikas No.1New Delhi 110 028, India Kalyanpur, Kanpur- 208 018, U.P. IndiaPhone: +91-11-45055555, 45055500 Mob. 09919388690, 09151175565Fax: + 91-11-25778876 E-mail: [email protected]: [email protected] DD should be in favour of “Trends in Biosciences” for print version
(State Bank of India, Kalyanpur, Kanpur, U.P. Branch Code 01962,A/c No. 31575871348)
Kindly Note :All queries and complaints regarding online access of the journal should be addressed to Indianjournals.com while for printversion to Editor in chief.For prompt delivery and communication please provide e-mail ID, mobile no. and complete contact details with pincode.
Individual Institutional Single article Version INDIAN**
in Rs./issue FOREIGN
in US$/issue INDIAN
in Rs. FOREIGN
in US$ INDIAN
in Rs. FOREIGN
in US$ *Print /Number **1000* 50 2500 200 50 10 **Online 1000 50 2500 200 150 25

Instruction to the Authorswww.trendsinbiosciencesjournal.com
The journal of Trends in Biosciences is essentially devoted to the publication of original research papers on all aspects ofbiosciences. All papers and short communication submitted to Trends in Biosciences must be unpublished original works. Themanuscripts in English should be in a finished form and typed on one side of A4 size paper and double spaced throughout withample margins. Pages should be numbered consecutively beginning from the title page. Text in any format (tables and figureincluded or separately) on CD in MS word with two hard copies or sent through email to [email protected] as attached file(s) is preferred since it saves retyping.
Research Papers: Each full length of research papers should be covered within 1500 words including tables and illustrations.Short communication should be within 175 words including tables, figures and references, in case of exceeding the limit, paymenthas to be made for extra materials by the authors. Correct language is the responsibility of the author. No editing or materialschanges at the proof stage will be permitted. While short communication will have only title, authors name, address and e-mailfollowed by text and references. In case of full length paper authors should have the following headings.
Title : The title to be typed in capital and small letters, author names (all capital) and affiliation (capital and small letters withitalics fonts). Give e-mail address in italic fonts also. Manuscript must confirm to the journal style (see latest issue)
ABSTRACT : The abstract should indicate the main findings of the papers and typed in bold, single space. It should be notmore than 150 words. The abstract should be typed before the main text and intended ca. 2cm to the right of it.
Key words 5-6 key words in italics should be given.Tables and figures : Table should be descriptive without and references to the text with heading in bold letters. Each table
should be typed on a separate sheet. Figures whether line drawing or graph should be of good quality. Legends to figures shouldbe given on a separate sheet. Tables and figures should be numbered consequently in Arabic numerals (Table 1., Table 2., Fig.1.,Fig.2.- 3) can be identified on the back by name (s) of the author(s).
Introduction : This should be brief and related to aim of the study. The review of the literature should be pertinent to thetheme of the paper. Extensive review and unnecessary details of earlier work should be avoided. Heading “introduction” shouldnot be written.
MATERIALS AND METHODS : When methods are well known, citation of the standard work is sufficient. All measurementshould be in metric units.
RESULTS AND DISCUSSION : The result should be supported by brief and adequate tables, graphs and charts, whereverneeded.
LITERATURE CITED : In the text, references should be cited as follows: two authors (Ali, and Pervez, 2005), three or moreauthors (Gaugler, et al., 2001). All references made in the text must be listed under LITERATURE CITED at the end of the text.References should be listed alphabetically by the authors, followed by the year of the publication. Journal titles should be citedin full and in italics, while for books the place of the publication should precede the name of the publisher, Example Strong, D.R.2002. Population of entomopathogenic nematodes in food webs. In: Entomopathogenic Nematology, (ed.Randy Gaugler) CABInternational, ix + 387. pp. 225-240.
Fox, P.C. and Atkinson, H.J. 1984. Glucose phosphate isomerase polymorphism in field population of the potato cystnematode, Globedera rostochiensis and G. pallida. Annals of Applied Biology, 104(1):503-506.
Submission of manuscript : Duplicate copy of manuscript along with soft copy (CD) should be submitted to the Editor inChief, Dr. S.S. Ali, H-1312, VIP Lane, Satyam Vihar, Avas Vikas No. 1, Kalyanpur, Kanpur 208 018, India. The text may sent throughe-mail to [email protected]. Payment must be made through Demand Draft/e-banking payable to State Bank of India,Kalyanpur Branch, (Branch code 01962, IFSC : SBIN0001962) Kanpur, U.P. India, in favour of account of “Trends in Bioscience”(Account number 31575871348) along with manuscript and send to Dr. S. S. Ali, Editor in Chief. For online subscription ofjournal contact [email protected]
Copyright : copyright © of all papers published in Trends in Biosciences, acceptance of manuscript for Trends in Biosciences,automatically transfers the copyright to Trends in Biosciences The use of trade name or a propriety product does not constitutea guarantee of the product by the author (s) or the society and does not simply its approval to the exclusion of the products thatmay be suitable.