TRENDS IN BIOSCIENCES 6-6-DECEMBER-2013
201
Volume 6 Number 6 December, 2013 Trends in Biosciences Dheerpura Society for Advancement of Science and Rural Development Print : ISSN 0974-8 Online : ISSN 0976-2485 NAAS Rating : 2.7 Online version available at www.trendsinbiosciencesjournal.com A International Journal Bimonthly
-
Upload
trendsinbiosciencesjournal -
Category
Documents
-
view
0 -
download
0
Transcript of TRENDS IN BIOSCIENCES 6-6-DECEMBER-2013

Volume 6 Number 6 December, 2013
Trendsin
Biosciences
Dheerpura Society for Advancement of Science and Rural Development
Print : ISSN 0974-8Online : ISSN 0976-2485NAAS Rating : 2.7
Online version available at www.trendsinbiosciencesjournal.com
A International JournalBimonthly

Trendsin
Biosciences
Dheerpura Society for Advancement of Science and Rural Development
Branch Office : Kanpur (U.P.) 208 018, India
Print : ISSN 0974-8Online : ISSN 0976-2485NAAS Rating : 2.7
Volume 6 Number 6 December, 2013
Online version available at www.trendsinbiosciencesjournal.com
SPECIAL OFFERLife Membership
Journal Membership - Rs. 500Benefit : Online access of Journal for lifetime alongwith certificate of membership
Journal Membership with free authorship - Rs. 4000Benefits : Authorship charges for publishing research papers in
Trends in Biosciences Journal is nil (No authorship charges) for lifetime.Award of fellow of DSAS&RD Society
A Bimonthly International Journal

Trends in BiosciencesA Bimonthly International Scientific Journal
www.trendsinbiosciencesjournal.comInternational Advisory BoardDr. A. Coomans, Ex-Professor, State University of Ghent, BelgiumDr. Randy Gaugler, Director, Centre for Vector Biology, Rutgers University, USADr. S.B. Sharma, Director, Plant Security, South Perth, AustraliaDr. Zahoor Ahmad, Professor, Jubail Industrial College, Saudi ArabiaAdvisory BoardDr. G.N. Qazi, Vice Chancellor, Jamia Hamdard University, New DelhiDr. A.S. Ninawe, Advisor, Deptt. of Biotechnology, New DelhiDr. I. Ahmad, Ex-Director, Department of Science & Technology, New DelhiDr. N. Nadarajan, Director, Indian Institute of Pulses Research (IIPR), KanpurDr. Masood Ali, Ex-Director, Indian Institute of Pulses Research (IIPR), KanpurDr. H.S. Gaur, Vice-Chancellor, Sardar Vallabbhai Patel Agricultural University, MeerutEditorial BoardEditor in Chief : Dr. S.S. Ali, Emeritus Scientist, Indian Institute of Pulses Research (IIPR), KanpurDr. Erdogan Esref HAKKI, Department of Soil Science and Plant Nutrition, Selcuk University Konya TurkeyDr. S. K. Agarwal, Principal Lentil Breeder, ICARDA, Aleppo, SyriaDr. B.B. Singh, Assistant Director General Oilseed & Pulses, ICAR, New DelhiDr. Absar Ahmad, Senior Scientist, National Chemical Laboratory, PuneDr. N.P. Singh, Coordinator, AICRP Chickpea, IIPR, KanpurDr. Raman Kapoor, Head, Dept. of Biotechnology, Indian Sugarcane Research Institute, LucknowDr. S.K. Jain, Coordinator, AICRP Nematode, IARI, New DelhiDr. Sanjeev Gupta, Coordinator, MULLaRP, IIPR, KanpurDr. Naimuddin, Sr. Scientist (Plant Pathology), IIPR, KanpurDr. Rashid Pervez, Sr. Scientist, Indian Institute of Spices Research, Khozicod, KeralaDr. Badre Alam, Associate Prof. Gorakhpur University, U.P.Dr. Veena B Kushwaha, Associate Professor, Department of Zoology, DDU Gorakhpur University, GorakhpurDr. Savita Gangwar, Department of Plant Science, Faculty of Applied Science, M.J.P. Rohilkhand University, BareillyDr. Vijay Pratap Singh, Assistant Professor, Govt. R.P.S. Post Graduate College, KoreaDr. Durgesh KumarTripathi, Department of Botany, Banaras Hindu University, VaranasiDr. Shamsa Arif (English Editor), Barkatullah University, Bhopal, M.P.Er. Sobia Ali, Genetic Asia Pvt. Ltd., New DelhiDr. N.R. Panwar,Sr. Scientist, Division of Natural Resources & Environmental , Central Arid Zone Research Institue, JodhpurBusiness Manager, Er. S. Osaid Ali, Biotechnology Research Foundation, KanpurTrends in Biosciences abstracted in CABI Abstract, U.K.
Subscription Rates for 2014:
Individual Institutional Single article Version INDIAN
in Rs./issue FOREIGN
in US$/issue INDIAN
in Rs. FOREIGN
in US$ INDIAN
in Rs. FOREIGN
in US$ *Print /Number **1000* 50 3000 250 150 10 **Online 1000 50 3000 250 150 25 *Author’s Contribution : Rs. 1000/paper (for single author) and Rs. 600/paper for additional authors. **Same for SAARCcountries only soft copy.*Payment must be made through Demand Draft payable to State Bank of India, Kalyanpur Branch, (Branch Code 01962)Kanpur, U.P. India, in favour of Trends in Biosciences (Ac/No. 31575871348) along with manuscript and sent to Dr. S.S. Ali,Editor in Chief, H-1312, VIP Lane, Satyam Vihar, Avas Vikas No.1, Kalyanpur, Kanpur- 208 018, U.P. India. In case ofoutstation cheque an extra amount of Rs. 50/- may be paid as clearance of cheque. For e-banking add Rs. 25/-(Contact: [email protected]; [email protected])
List of Members
Dr Atul Kumar Misra, Department of Zoology, DAV College, KanpurDr Shabbir Ashraf, Department of Plant Protection Faculty of Agricultural Sciences, Aligarh Muslim University, AligarhDr Badre Alam Ansari, Department of Zoology, D.D.U. Gorakhpur University, GorakhpurDr Farog Tayyab, Department of Medical Laboratory Technology, Faculty of Health Science, SHAITS, AllahabadDr Adesh Kumar, Department of Plant Molecular Biology and Genetic Engineering, NDUAT, FaizabadDr Chandresh Kumar Chandrakar, Indira Gandhi Krishi Vishwa Vidyalaya, Raipur, ChhattisgarhDr R. Sellammal, Centre for Plant Breeding and Genetics, Tamil Nadu Agricultural University, CoimbatoreDr Jagdish Kishore, Plant Pathology, CSA University of Agriculture Technology, KanpurMs Syeda Huma, Dr. Rafiq Zakaria, Center for Higher Learning & ResearchMr Chandan Singh Ahirwar, Department of Vegetable Science, G.B. Pant University of Agriculture and Technology, PantnagarMs Gupta Bhavna, Department of Foods and Nutrition, Ethelind School of Home Science, SHIATS, AllahabadDr Karma Beer, Department of Horticulture, Institute of Agricultural Sciences, Banaras Hindu University, VaranasiDr Kishor K. Shende, Department of Biotechnology and Bioinformatics Center, Barkatullah University, BhopalMr Ashish Kumar Chandrakar, Department of Agronomy, JNKVV, JabalpurDr P N Verma, Genetics and Plant Breeding, CSA University of Agriculture and Technology, KanpurDr Chinmayi Joshi, Mahyco Research Center, MaharashtraMr Gourish Karanjalker, College of Horticulture, PG Centre (UHS Bagalkot), GKVK Campus, BengaluruDr Anita Mishra, Department of Biotechnology and Bioinformatics Center, Barkatullah University, BhopalMr Murali, S, Agril. Entomology, University of Agricultural Sciences, GKVK, BangaloreDr Hema Swaminathan, Department of Soil Science & Agricultural Chemistry, Tamil Nadu Agricultural University, CoimbatoreDr Sellammal Raja, Centre for Plant Breeding and Genetics, Tamil Nadu Agricultural University, CoimbatoreMr Samir Singh, Department of Plant Pathology, Narendra Deva University of Agriculture and Technology, FaizabadDr Krishna Murari, Department of Dairy Engineering, Sanjay Gandhi Institute of Dairy Technology, Bihar Agriculture University, PatnaDr T. Sravan, Department of Genetics and Plant Breeding, Institute of Agricultural Sciences, BHU, VaranasiDr Ranvir Kumar, Department of Agricultural Economics, B.P.S. Agricultural College, BiharDr K. K. Chaturvedi, Centre for Agricultural Bioinformatics, Indian Agricultural Statistics Research Institute, New DelhiDr Raman A. Gami, Department of Genetics and Plant Breeding, C.P. College of Agriculture, S.D. Agricultural University, GujaratDr Savita Gangwar, Department of Plant Science, M.J.P., Rohilkhand University, BareillyDr Rajkumar Mishra, Department of Genetics & Plant Breeding, Allahabad School of Agriculture, SHIATS, AllahabadDr C. Prabha, Department of Biochemistry, Kempe Gowda Institute of Medical SciencesDr Pisal Rahhul Ramdas, Department of Agronomy, Navsari Agricultural University, Navsari, GujaratDr Sunil Suresh Patil, Genetics and Plant Breeding, College of Agriculture, NashikMs Kiran Tigga, Genetics and Plant Breeding, RMD College of Agriculture & Research Station, Ambikapur ChhattisgarhMrs Smita Bala Rangare, Dept. of Horticulture, College of Agriculture, Indira Gandhi Krishi Vishwavidhyalaya, RaipurMr P Ashok Reddy, Department of Genetics and Plant Breeding, Allahabad School of Agriculture, SHIATS, AllahabadDr Anjum N. Rizvi, Zoological Survey of India, Dehradun, UttarakhandMr Venkata R Prakash Reddy, Department of Genetics and Plant Breeding, S.V. Agricultural College Acharya N G Ranga Agricultural
University, TirupatiDr Deepika Baranwal, Department of Food and Nutrition, College of Homescience, Mpuat, Udaipur, RajasthanDr Sankaran K, National Institute of Technology, Tiruchirappalli (NIT-T)Ms Shakti Chaudhary, Department of Food Science and Nutrition, Ethelind School of Home Science, SHIATS, AllahabadDr Mithu Mahmud, Stamford University, BangladeshMs Latika Yadav, Dept. of Foods & Nutrition, College of Home Science, Maharana Pratap University of Agriculture & Technology
(MPUAT), UdaipurDr Debosri Bhowmick, Department of Veterinary Surgery & Radiology, College of Veterinary Science & A.H., N.D.V.S.U., JabalpurDr Srinivasulu Ch., Department of Zoology, SR&BGNR Govt. Degree College, Khammam, Andhra Pradesh.

Dr Sonal Shrivastava, Department of Veterinary Medicine, College of Veterinary Science & A.H., N.D.V.S.U., JabalpurMr Bhupendra Kumar Singh, Department of Genetics & Plant Breeding, NDUA&T, FaizabadMs Zareena Shaikh, Maulana Azad College, AurangabadMr Manoj Yadav, Department of Mycology and Plant Pathology, Institute of Agricultural Sciences (IAS), B.H.U., VaranasiDr Komma Renuka Devi, Department of Plant Physiology, ANGRAU, HyderabadDr Amit Alexander Charan, Department of Molecular & Cellular Engineering, Jacob School of Biotechnology & Bioengineering,
SHIATS, AllahabadMrs Bela Turkey Kaushal, Department of Applied Animal Sciences, School of Biosciences & Biotechnology, Dr. Babasaheb
Bhimrao Ambedkar, University, LucknowMr Amit Kumar Mukherjee, Department of Food Technology, Haldia Institute of Technology, West Bengal.Dr T.G. Nagaraja, Department of Botany, The New College, Kolhapur, MaharashtraDr, Hasansab Nadaf , RARS Bijapur, UAS Dharwad, KarnatakaMr Ajay Tiwari, Department of Genetics and Plant Breeding, College of Agriculture, IGKV RaipurDr Prashant Ankur Jain, Department of Computational Biology& Bioinformatics, JSBB, SHIATS, AllahabadMs Laitonjam Ishwori, Department of Biotechnology, S.Kula Womens College, Nambol, ManipurMr Savanta V. Raut, Department of Microbiology, Bhavan's College, MumbaiMr Swami Rakesh Mohanlal, Department of Agricultural Biotechnology, B.A. College of Agriculture, Anand Agricultural University,
Anand, Gujarat.Mr Vijay Sharma, Department of Genetics & Plant Breeding, Narendra Deva University of Agriculture & Technology, FaizabadMs Ankita Gautam, Warner School of Food and Dairy Technology, SHIATS (Deemed University), AllahabadMr Dinker Singh, Department of Animal Husbandry & Dairying, Institute of Agricultural Sciences, B.H.U., VaranasiMr Swapanil Yadav, Department of Biotechnology, Gandhi Faiz E Aam College, Shahjahanpur, U.P.Mr Vinay Kumar Singh, Department of Dairy Microbiology, SHIATS, AllahabadMr Pandya Mihirkumar Maheshbhai, Department of Plant Breeding & Genetics, Navsari Agricultural University, Navsari ,GujaratMs Asmat Jahan, Department of Biotechnology, Gandhi Faiz E Aam College, Shahjahanpur, U.P.Mr Mohsin Rahman, Department of Biotechnology, Gandhi Faiz E Aam College, Shahjahanpur, U.P.Mr Vivek Kumar, Department of Biotechnology, Gandhi Faiz E Aam College, Shahjahanpur, U.P.Ms Anchal Sharma, Department of Biotechnology, Gandhi Faiz E Aam College, Shahjahanpur, U.P.Ms Farha Syed, P.G. Department of Zoology, Gandhi Faiz E Aam College, Shahjahanpur, U.P.Dr Ashish Kumar Gupta, Subash Degree College, Kanpur, U.P.Mr Chaudhari Dhavalkumar Raghjibhai, Department of Genetics and Plant Breeding, N. M. College of Agriculture, Navsari
Agricultural University, Navsari , GujaratDr Sabina Kahnam, Dayanand Girls P.G. College, KanpurDr Mehvash Ayeshah Hashmi, Dayanand Girls P.G. College, KanpurDr Ashish Kumar Dwivedi, Indian Institute of Technology, KanpurMr Sujeet Kumar, Department of Crop Improvement, Indian Institute of Pulses Research, KanpurMs Shrasti Gupta, B.I.F.C. (D.B.T.), Dayanand Girls P.G. College, KanpurDr Mohammad Shahid, Department of Plant Pathology, C.S. Azad University of Agriculture and Technology, KanpurDr Mohd. Saeed, Department of Bioscience, Integral University, LucknowMr Chirag Mansukhbhai Bhaliya, Department of Plant Pathology, Junagadh Agriculture University, Junagadh, GujaratMs Nisha Khatri, Department of Botany, University of Delhi, DelhiDr Anamika Pandey, Selcuk University, TurkeyDr Mohd. Kamran Khan, Selcuk University, TurkeyDr Anjali Srivastava, Department of Zoology, Dayanand Girls P.G. College, KanpurDr Sunita Arya, Department of Zoology, Dayanand Girls P.G. College, KanpurDr Amita Srivastava, Department of Zoology, Dayanand Girls P.G. College, KanpurDr Rachana Singh, Department of Zoology, Dayanand Girls P.G. College, KanpurDr Seema Pandey, Department of Zoology, Dayanand Girls P.G. College, Kanpur

Dheerpura Society for Advancement of Science and Rural Development(Reg. No. 01/01/01/16715/06)
The Dheerpura Society for Advancement of Science and Rural Development was founded on 28 July, 2006 with the followingobjectives
1. To promote research and development in agriculture, life sciences through publishing journal, organizing seminars etc.
2. To make people environmental conscious
3. To work for human development in society
4. To work for uplifting of rural masses and their development
Membership
Membership to the society is open to all individuals / institutions interested in society’s objective by becoming ordinarylife, institutional, corporate members against payment of membership fee.
Membership fee Indian (Rs.) Foreign (US$)
Ordinary (Annual) 3,000 200
Life member 10,000 1,000
Institutional 15,000 1,500
Corporate member 20,000 2,000
Renewal of annual membership should be done in January each year; if the membership is not received by 15 February, themembership would stand cancelled. Membership fee should be drawn in favour of Dheerpura Society for Advancement of Scienceand Rural Development, State Bank of India, Kalyanpur branch (code 01962), A/c No. MSB31575856239, Kanpur on thefollowing address. In case of out station cheque an extra amount of Rs. 50/- may be paid as clearance cheque. For e-banking addRs. 25/-.
Dr S.S. AliPresidentH-1312, VIP Lane, Satyam Vihar,Awas Vikas No.1, Kalyanpur, Kanpur 208 018 (U.P.), IndiaPh. : 09919388690, 09696499966Email: [email protected], [email protected]

MINI REVIEW1. Fruit Juices: Their Nutritional Significance, Effect of Storage and Correlation with Certain Disease 697
Latika Yadav and Archana Chakravarty2. Developments in Microbial Fuel Cell System for Electricity Generation 701
Sam A Masih and Mercy Devasahayam3. Peanut Allergy in Need of Review 705
Deepika Baranwal and Preeti BajpaiRESEARCH PAPERS4. Assessment of Genetic Diversity in Sesame (Sesamum indicum L.) using Morphological and Molecular 710
ApproachesS.L Kiranmayi, V Roja, K Padmalatha, N Sivaraj and S Sivaramakrishnan
5. Estimation of Heterosis for Yield and Yield attributing traits in Diallel Crosses of Maize 719Dhairyashil M. Langade J. P. Shahi, Prabhat Kumar and Amita Sharma
6. Study of Variability, Diversity and Association Analysis of Chickpea (Cicer arietinum L.) Germplasm under 723Normal and Late Sown Condition of Chhattisgarh State.M. K. Puri, P.l. Johnson and R.n. Sharma
7. Effect of Elevated Temperature on Quality Parameters of Rice 732Arthi Rani B. and N. Maragatham
8. Genotypic Variability for Intrinsic and Acquired Thermotolerance in Rice Genotypes Screened by Tir Technique 735K. Renuka Devi, A. Siva Sankar, P. Sudhakar
9. Genetic Variability and Character Association in Chickpea Germplasm (Cicer arietinum L.). 742Neelu Kumari, Suresh Babu, G. Roopa Lavanya
10. Evaluation of Tomato Hybrid (Lycopersicon esculentum Mill.) in Allahabad Agro Climatic Conditions 744Ashutosh Singh, Chandan Singh Ahirwar and V. M. Prasad
11. Genetic Studies for Yield and Component Traits in Wheat (T. aestivum L.) Lines under Sodic Soils 747P N Verma, R K Yadav, B N Singh, S R Vishwakarma
12. Fertility Restoration Pattern of New Interspecific Derived Restorer Lines in Sunflower 751Venkata R Prakash Reddy and H. L. Nadaf
13. Assessment of Food Consumption Pattern and Nutritional Status of School Going Children of Faizabad District 755Shakti, Ritu Prakash Dubey and Sarita Sheikh
14. Variability Patern in Agromorphological Characters in Tomato Genotypes (Lycopersicon esculentum Mill.). 758Chandan Singh Ahirwar and V. M. Prashad
15. Exploitation of Heterosis in Sunflower (Helianthus annuus L) 762Venkata R Prakash Reddy and H. L. Nadaf
16. Effect of Grafting Time and Environment on the Graft Success of Guava (Psidium guajava L.) under 770Wedge GraftingKarma Beer, A. L. Yadav and Akhilendra Verma
17. Effect of Planting Geometry on the Yield, Nutrient Availability and Economics of Pigeonpea Genotypes 773Ravikumar Bhavi, B. K. Desai and Vinodakumar, S. N.
Trends in Biosciences Volume 6 Number 6 December, 2013
CONTENTS

18. Combining Ability Analysis for Salt Tolerance in Rice (Oryza sativa L.) under Costal Salt Affected Soil 776Yashlok Singh, P. B. Patel, P.K. Singh and Vinod Singh
19. Chemical Control of Wilt of Brinjal (Solanum melongena L.) Caused by Fusarium oxysporium 781F.Sp. melongenae (Schlecht) Mutuo and IshigamiNarendra Kumar Jatav, K. S. Shekhawat and Laxman Prasad Balai
20. Status of Chilli Murda Disease in Northern Karnataka and Its Management 784Pradeep Manyam and A. S. Byadgi
21. Field Evaluation of Fungicides for Management of Maydis Leaf Blight of Maize Caused by Dreschslera maydis 789(Nisikado) Subram. and Jain.Hulagappa, S.i. harlapur, R.s. roopa and Venkatesh M. Dore
22. Enhancement of Chitinase Enzyme Producing Ability of Trichoderma viride Mutants and Dual Culture 792Studies against Soil Borne Plant Pathogen Sclerotium rolfsii.K. K. Suryawanshi, S. P. Patole and A. A. Awale
23. Evaluation of the Bio-efficacy of Fungicides as Potato Tuber Treatment against Black Scurf Disease 797Caused by Rhizoctonia solaniS. P. Singh, L. P. Awasthi and A. N. Chuabey
24. Antagonistic Effect of Rhizospheric Mycoflora against Fusarium solani Causing Coriander 800(Coriandrum sativum L.) Root RotC. M. Bhaliya and K. B. Jadeja
25. Bacterial Surveillance Associated with Water from River Ganga 802Vinay Kumar Singh, Anil Chaturvedi, Sangeeta Shukla, and Ankita Gautam
26. Bacterial Activity of Scent Components of Certain Heteropteran Bugs 805Ch. Srinivasulu, C. Janaiah
27. Effect of Different Farming Methods on Maize (Zea mays. L) Productivity and Soil Microbial Status 808Vijaya. N, Vinayak Hosamani, Vinodakumar, S. N and Raghavendra, S
28. Effect of Nitrogen Level and Cutting Interval on Fodder Yield of Oat Genotypes 811Smitha Patel P. A. and Alagundagi S.c.
29. Effect of Organic Fertilizers on the Growth and Yield of Garlic (Allium sativum) under 815Teak (Tectona grandis) Based Agroforestry SystemRajiv Umrao, Setso Meyase, Neelam Khare and R. K. Anand
30. Effect of Planting Dates on Incidence of Insect-pests and Their Predators in Rice Field 818A.P. Singh, R.B. Singh, M.N. Lal and R.C. Sharma
31. Effect of Salinity on Germination and Early Seedling Growth Stages of Urdbean (Vigna mungo L. Hepper) 820Bhupendra Kumar, Arvind Shukla, and Yashlok Singh
32. Efficacy and Economics of Some Modern Insecticides against Aphid, Aphis gossypii L. in Cotton 823Yogesh Patel
33. Biology of Mallada boninensis (Okamoto) [Chrysopidae: Neuroptera] on Aphids and Neonate Noctuids 827M. Nagamallikadevi, D.B. Undirwade, B. Nagendra Reddy, A. Ramadevi and Srasvankumar.G
34. Studies on Antimicrobial Compounds of Extract of Bark of Sonneratia alba 831Savanta V. Raut, P.D. Anthappan
35. Seed Cotton Yield, Uptake of NPK and Economics of Bt Cotton (Gossypium hirsutum L.) as Influenced 838by Different Bio-fertilizers and In-situ Green Manuring under IrrigationThimmareddy, K., B. K. Desai and Vinodakumar, S. N.
36. To studies on Efficacy of Newer Insecticides against Yellow Stem Borer (Scerpophaga incertulus) in 842Faizabad DistrictA.P. Singh, R.B. Singh, M.N. Lal and R.C. Sharma
37. Bioremediation and Decolorization of Distillery Effluent by Aspergillus niger and A Novel Fungal 844Strain Curvularia andropogonis.Shubhnagini Sharma1, Pallavi Mittal and Manju Rai

38. Diversity and Abundance of Bacterivore and Fungivore nematodes in Mango Orchards of 850Dehradun (Uttarakhand), IndiaAnjum Nasreen Rizvi and Shreyansh Srivastava
39. Studies on the Effect of Butter Milk Solids and Vegetable Oil on Preparation of “Filled Chhana” 854Upendra Singh, Rajni Kant Saurabh Prakash and Sonia Kumari
40. Evaluation and Characterization of Germplasm Accessions of Urdbean (Vigna mungo L. Hepper) 858Bhupendra Kumar, Arvind Shukla, and Yashlok Singh
41. Fungicidal Management of Cercospora Leaf Spot of Mungbean (Vigna radiata) 861S. P. Singh, S.K. Singh and V. Shukla
42. Indian Plants in Medicine- Green Economics 864Krishna Murari, Binod Kumar Bharti, Sudhanshu Kumar Bharti
43. Genotypic Variability for Spikelet Sterility under Moisture Stress and Aerobic Conditions in Rice 866K. Renuka Devi, A. Siva Sankar, and P. Sudhakar
44. Enrinchment of Iron and Zinc Concentration in Introgression Lines of Brown Rice 870Roja V, Kiranmayi S. L and Sarla N
45. Assessment of Yield Loss due to Finger Millet Blast Caused by Pyricularia grisea (Cooke) Sacc. 876V. P. Prajapati, A. N. Sabalpara And D. M. Pawar 876
46. A Comparative Study on Final Quality of Smoked Product Prepared using Iced 879Mackerel (Rastrelliger kanagurta) and Pink Perch (Nemipterus japonicus) during Summer SeasonJaya Naik, C.V. Raju, B. Hanumanthappa, Manjunatha A.R., Mohan Kumar K.C.
Subscription Order FormInstructions to the Authors

Trends in Biosciences 6 (6): 697-700, 2013
MINI REVIEW
Fruit Juices: Their Nutritional Significance, Effect of Storage and Correlation withCertain Disease1LATIKA YADAV AND 2ARCHANA CHAKRAVARTY1Department of Home Science,Faculty of Science, Mahila Mahavidyalaya, Banaras Hindu University,Varanasi(U.P)-2210052Dept. of Foods and Nutrition, College of Home Science, MPUAT, Udaipur, Rajasthan -313001.,email: [email protected]
ABSTRACT
This review deals with the numerous nutritional and healthbenefits of fruit juices intake. It reviews nutritional significanceand nutritive values of different fruit juices and describe thecorrelation of fruit juices with certain diseases. Nutritive valueof fruit juices as per the USDA nutrient data base aresummarized. The effect of storage condition on the chemicalattributes of the fruit juices are discussed. Data from variousnutritional studies, which provide evidence regarding thephysio-chemical and microbial characteristics of fruit juicesare also summarized.
Key words Fruit juices, keeping quality, physio-chemical andmicrobial.
In India, there is always a great demand for freshvegetables and fruit juices. Being tropical in location hotweather continues for a greater part of the year (February-September) increasing the need for these commodities. Juicesare often consumed for their perceived healths benefits. Forexample, orange juices is rich in vitamin C , folic acid ,potassium, is an excellent source of bioavailable antioxidantphytochemicals and significantly improves blood lipid profilesin people affected with hypercholesterolemia. Prune juice isassociated with a digestive health benefit . canberry juice haslong been known to help prevent or even treat bladderinfections and it is now know that a substance in cranberriesprevents bacteria from binding to the bladder. The highsugar content of fruit juices is often not realize – many fruitjuices have a higher sugar (fructose) content than sweetenedsoft drinks; e.g., typical grape juice has 50 % more sugar thancoca cola. Fruit juice consumption overall in Europe, Australia,New Zealand and the USA has increased in recent years,probably due to public perception of juices as a healthy naturalsource of nutrients and increased public interest in healthissues. Indeed, fruit juice intake has been consistentlyassociated with reduced risk of many cancers types, might beprotective against stroke and delay the onset of Alzheimer’sdisease. The perception of fruit juices as equal in health benefitto fresh fruit has been questioned, mainly because it lacksfiber and has often been highly processed. High – fructosecorn syrup, an ingredient of many juice cock tails, has been
linked to the increased incidence of type II diabetes. Highconsumption of juice is also linked to weight gain, but fruitjuice consumption in moderate amounts can help childrenand adults meet the daily recommendations for fruitconsumption. Popular juices include, but are not limited toapple, orange, grapes, pineapple, tomato, mango, carrot,cranberry and pomegranate.
According to the Department of Zoology, AndhraUniversity, India, contamination of ready-to-eat foods andbeverages sold by street vendors and hawkers rendering themunacceptable for human consumption have become a globalhealth problem. In tropical countries, fruit juices are commonman’s beverages and are sold at public places are roadsideshops . However in view of their ready consumption , quickmethod of handling, cleaning and extraction they could oftenproven to be a health threat , improper washing of fruits andthese bacteria to extract leading to contamination. In addition, use of unhygienic water for dilution, dressing with ice,prolong preservation without refrigeration , unhygienicsurroundings often with swarming house flies and fruit fliesand air bone dust can also act as source of contaminationsuch juices have shown to be potential source of bacterialpathogen notably E.coli, Salmonella, Shigella andStaphylococcus aureus. The bacterial strain that spoil fruitjuices includes, Bacillus licheniformis, Aeromnas hydrophila,Bacillus circulans, Proteus morganii, Pseudomonascholoraphis, Bacillus alevi, Pseudomonas cepacia and soontheir presence may pose risks to consumer’s health and shouldnot be taken for granted.
Nutritional significance of fruits:
Fruit juices are well recognized for their nutritive value,mineral, and vitamin content in many tropical countries theyare common man’s beverages and are sold at all public placesand roadside shops. These are reports of food borne illnessassociated with the consumption of fruit juices at several placesin India and elsewhere. The 2000 Ditetary Guide lines forAmericans, 2005 recommended consumption of several cupsper day of fruits and vegetable. Fruit juices are well recognizedfor their nutritive value , mineral and vitamin content. Theyare beverages that are consumed for their nutritional value,

698 Trends in Biosciences 6 (6), 2013
conversion of L-arginine to L- citrulline. Administration ofthese compounds to hypercholesterolemic mice significantlyreduced the progression of atherosclerosis and isoprostanelevels and increase nitrates . This protective effect was relevantwith PFE. Proatherogenic effects induced by perturbed shearstress can be also reversed by chronic administration of PFE(Nigris, et al.,2007).Commonly consumed fruit juices andcarbohydrates effect on redox status and anticancerbiomarkers in female rats. Commonly consumed fruit juicescan alter lipid and protein oxidation biomarkers in the bloodas well as hepatic quinone reductase activity, and thatquercetin may not be the major active principle (Breinholt, etal.,2003).
The role of citrus juices in providing important nutrientsto children, and of flavonoids, ascorbic acid, folic acid andpotassium found in citrus juices in cancer and cardiovasculardisease prevention . health promoting effects of citus juicessuch as cognitive function improvement , reduction of certainbirth defects risk and cataract prevention (Fulgoni, et al.,2001).
Effect of storage condition on the chemical attributes ofthe fruit juices:
The storage temperature was the prime limiting factorof shelf life of orange juice . The shelf life of the natural freshorange juices stored at room temperature (250C ) , 40c and -18OC could be extended only 16 and 21 days, respectivelybecause beyond these periods, both their total colony countswere higher than the standard limit and their odor and theirchemical changes are unacceptable .In mango juice thepercentage ascorbic acid loss, non enzymatic browning andtitratable acidity increased with storage time in all packagingmaterials. However, pH decreased with storage time and solublesolids remained constant . higher percentage ascorbic acid
Table 1.1. Nutritional value of fruits (USDA nutrient data base)
thirst quenching properties and stimulating effect or of theirmedicinal values . Fruits and vegetables form an importantpart of diet and are usually regarded as ‘good foods’. Theyare major sources of vitamin C, folic acid and fibers but notrich in other nutrients .Fruits and vegetables are nutritionallyimportant because they contain large amount of vitamins andminerals .Fruit juices have a low pH, because they containhigh levels of organic acids. Some of the major acids in fruitsinclude citric, malic and tartaric acids. Organic acids alsoinfluence the growth of microorganisms in fruit juices andtherefore affect the keeping quality of the products .
Correlation of fruit juices with human physiology andcertain diseases:
Protective effect of pomegranate fruit juice againstAeromonas hydrophila-induced intestinal histopathologicalalterations as one of the edible natural safe products. Thetreatment with pomegranate juice significantly andsubstantially prevented the intestinal histopathologicalchanges and normalized its morph metric parameters.Pomegranate juice holds great promise an antimicrobial andanti-inflammatory new therapeutic. Aeromonas hydrophila isa very prevalent species. It can cause both intestinal andnon-intestinal infections in humans and can often be fatal.Moreover, in the recent years, naturally occurring antioxidantscompounds have gained considerable attention asantibacterial agents (Belal, et al.,2009). Pomegranate fruitextract(PFE) and the CREB and increased eNOSexpression(which was decreased by perturbed shear regularpomegranate juice concentrate reduced the activation of ELK-1 and p- stress) in cultured human endothelial cells and inatherosclerosis-prone areas of hypercholesterolemic mice. PFEand pomegranate juice increased cyclic GMP levels while therewas no significant effect of both compounds on the
Nutrients Nutritional value per 100 g (3.5 oz) Orange Mosambi Mango Papaya Lemon
Energy 192 KJ (46 Kcal) 43 K cal 272 KJ (65 K cal) 163KJ(39 Kcal) 121KJ(29Kcal) Carbohydrates 11.54 g 11g 17.00g 9.81 g 9.32g Sugars 9.14 g 1.7g 14.8g 5.90 g 2.50 g Dietary fiber 2.4 g 3g 1.8 g 1.8 g 2.8g Fat 0.21 g 0.2g 0.27g 0.14g 0.30g Protein 0.70g 0.7g .51g 0.61g 1.10g Vitamin A equiv. - - 38µg(4%) 55µg(6%) - -beta-carotene - - 445µ g(4%) 276µg(3%) - Thiamine(Vit. B1) 0.100mg(8%) - 0.058mg(4%) 0.04 mg(3%) 0.040mg(3%) Riboflavin (Vit.B2) 0.040mg(3%) - 0.057mg(4%) 0.05 mg(3%) 0.020mg(1%) Niacin (Vit. B3) 0.400mg(3%) - 0.584mg(4%) 0.338mg(2%) 0.100mg(1%) Pantothenic acid(B5) 0.250mg(5%) - 0.160mg(3%) - 0.190mg(4%) Vitamin B6 0.051 mg (4%) - 0.134mg(10%) 0.1mg(8%) 0.080mg(6%) Folate(Vit.B9) 17µg (4%) - 14 µg(4%) - 11µg(3%) Vitamin C 45 mg(75%) 48% 27.7 mg(46%) 61.8mg(103%) 53.0mg(88%) Calcium 43mg(4%) - 10 mg (1%) 24mg(2%) 26 mg(3%) Iron 0.09 mg(1%) - 0.13 mg (1%) 0.10mg(1%) 0.60mg(5%) Magnesium 10 mg(3%) - 9mg(2%) 10mg(3%) 8 mg(2%) Phosphorus 12 mg(2%) - 11 mg (2%) 5mg(1%) 16mg(2%) Potassium 169mg(4%) - 156mg(3%) 257mg(5%) 138 mg(3%) Zinc 0.08mg(1%) - 0.04mg(0%) - 0.06 mg(1%)

YADAV AND CHAKRAVARTY, Fruit Juices: Their Nutritional Significance, Effect of Storage and Correlation 699
loss, browning index and titratable acidity occurred in juicespackaged in polyethylene film, than in PET and glass bottles.Percentage ascorbic acid, browning index and pH increasedwith increased storage temperature. However, titratable aciditydecreased with increased storage temperature and solublesolids remained constant though out the period of storage(Alaka. O.O., et al .,2004).
In sweet orange juice (mosambi) ascorbic acid (AA)content was reduced by 7.26% after pasteurization. refrigeratedstorage of pasteurized juice could retain more than 70% of theoriginal AA only up to the 4th day. A reduction of 42-48% inAA content was observed in pasteurized juice stored at roomtemperature within 4 days. On the other hand, ~ 22% of AAwas destroyed in raw juices stored at room temperature within2 hours. Refrigerated raw juices was left with only 5% of theinitial AA content by the end of 12 hours. Color and appearanceof all the juice samples were maintained within a highlyacceptable range during the entire storage period; however,deterioration in taste and flavor occurred which adverselyaffected the overall acceptability of orange juice (Shailja, etal.,2003). Untreated lime juice could not be stored for morethan one week. Among the various treatments, the use of0.1%KMS was effective in preserving lime juices and inextending itself life up to 75 days. Total and reducing sugars,pH and TSS increased, where as acidity and ascorbic acidcontent decreased throughout the storage. Browning alsoincreased with an increased with an increase in storage period(Sarolia, et al., 2002).
Change in quality of mango-pineapple spiced beverageduring storage. Mango-pineapple spiced beverages wereprepared from ‘Dashehari’ mango and ‘Kew’ pineapple. 15%blended juices(85:15) were used for preparation of ready-to-serve(RTS) beverages having 10 degrees Brix, 0.2% acidity
and 0.006% cardamom spice drops. The RTS beverages storedin white and amber coloured bottles for 6 months under 3different storage environment viz., ambient temperature(12.5-36 degrees C), cool chamber (10-29.6 degrees C) and lowtemperature (4+or-1 degrees C) showed a gradual decrease insensory quality ,acidity, ascorbic acids and tannins. Retentionof ascorbic acid was more in beverages stored in amber coloredbottles under low temperature (Durgesh, et al., 2008).
Physio-chemical and Microbial characteristics of fruitjuices:
The colour of orange juice is one of the main factorsrelated to their acceptability. Their colour is mainly due tocaroteniods, with particularly that the major ones, theexpoxycarotenoids, can isomerise into differently colouredisomerms in the presence of acid. Since acidity is one of themain characteristics of citrus, carried out a simple experimentto ascertain whether large changes in this parameter can affectsignificantly their colour. The addition of citric acid to increasethe acidity of the control by roughly 50% speeded up theisomerisations initially, although it did not lead to markedlyappreciable colour changes. Lime juice samples preserved bypasteurization and KMS (0.1%) were stored both at roomtemperature and low temperature (-4 degrees C), where assamples preserved by freezing + KMS (0.1%) and freezingalone were stored at -18 degree C. PH of kagzi lime juice showedincreasing trend with increase in storage period, where asacidity decreased with increase in storage period. Decrease inacidity and increase in PH was more pronounced at hightemperature as compared to low temperature and freezingtemperature. Ascorbic acid and tannin contents were decreasedin stored lime juice but browning showed an increasing trendwith increase in storage period (Arti and Singh,2004).
Table 1.2: Nutritional value of fruits (USDA nutrient data base
Nutrients Nutritional value per 100 g (3.5 oz) Black grapes Green grapes Apple Pineapple Pomegranate
Energy 288 KJ(69Kcal) 288 KJ(69Kcal) 218KJ (52 K cal) 202 KJ(48Kcal) 285KJ (68 kcal) Carbohydrates 18.1g 18.1g 13.81 g 12.63g 17.17 g Sugars 15.48g 15.48g 10.39 g 9.26g 16.57 g Dietary fiber 0.9 g 0.9 g 2.4 g 1.4 g 0.6 g Fat 0.16 g 0.16 g 0.17 g 0.12g 0.3 g Protein 0.72 g 0.72 g 0.26g 0.54g 0.95 g Vitamin A equiv. - - 3 µg (0%) - - Thiamine(Vit. B1) 0.069 g(5%) 0.069 g(5%) 0.017 mg (1%) 0.079mg(6%) 0.030 mg (2%) Riboflavin (Vit.B2) 0.07 mg (5%) 0.07 mg (5%) 0.026 mg(2%) 0.031mg(2%) 0.063 mg (4%) Niacin (Vit. B3) 0.188mg(1%) 0.188mg(1%) 0.091mg(1%) 0.489mg(3%) 0.300 mg (2%) Pantothenic acid (B5) 0.05mg(1%) 0.05mg(1%) 0.061 mg(1%) 0.205 mg (4%) 0.596 mg (12%) Vitamin B6 0.086 mg (7%) 0.086 mg (7%) 0.041mg(3%) 0.110mg(8%) 0.105 mg (8%) Folate(Vit.B9) 2µg(1%) 2µg(1%) 3µg(1%) 15 µg(4%) 6 µg (2%) Vitamin C 10.8mg(18%) 10.8mg(18%) 4.6mg(8%) 36.2 mg (1%) 6.1 mg (10%) Calcium 10 mg(1%) 10 mg(1%) 6 mg(1%) 13 mg(1%) 3 mg (0%) Iron 0.36mg(3%) 0.36mg(3%) 0.12mg(1%) 0.28 mg(2%) 0.30 mg (2%) Magnesium 7mg(2%) 7mg(2%) 5 mg(1%) 12 mg(3%) 3 mg (1%) Phosphorus 20 mg(3%) 20 mg(3%) 11 mg(2%) 8 mg(1%) 8 mg (1%) Potassium 191mg(4%) 191mg(4%) 107 mg(2%) 115 mg(2%) 259 mg (6%) zinc 0.07mg(1%) 0.07mg(1%) 0.04 mg(0%) 0.10mg(1%) 0.12 mg (1%)

700 Trends in Biosciences 6 (6), 2013
Food borne illness associated with the consumption offruit juices at several places in india and elsewhere. Hence arapid review of the street vended fruit juices was undertakento assess the safety for human consumption and as a possiblesources of bacterial pathogens. A total of 52 samples wereanalyzed and dominant bacterial pathogen recorded was E.coli (40%), followed by Ps. Aeruginosa (25%), Salmonellaspp. (16%), Proteus spp. (9%), S. aureus (6%), Klebiellaspp.(3%) and Enterobacter spp.(1%). The highest bacterialcontamination was observed in sweet lemon (35%), pineapple(29%), and pomegranate, apple, orange (12% each) (TambekarD.H., et al.,2009).
LITERATURE CITED
Aarti Sharma, Kartar Singh 2004. Effect of different treatments onphysico- chemical changes in lime juices during storage. HaryanaJournal of Horticultural Sciences,India.33:3/4, 207-208.
Alaka,O.O., Aina,J.O., Falade, K.O. 2004. Effect of storage conditionson the chemical attributes of Ogbomoso mango juice. EuropeanFood Research and Technology. 218:1,79-82.
Belal,S.K.M., Abdel-Rahman.A.H., Mohamed.D.S., Osman.H.E.H.,Hassan.N.A. 2009 Protective effect of pomegranate fruit juiceagainst Aeromonas hydrophila-induced intestinal histopathologicalchanges in mice. World Applied Sciences Journal,.7:2,245-254.
Breinholt.V.M., Nielsen. S.E., Knuthsen.P., Lauridsen.S.T., Daneshvar.B.,
Sorensen.A. 2003. Effects of commonly consumed fruit juices andcarbohydrates on redox status and anticancer biomarkers in femalerats. Nutrition and Cancer, 45:1,46-52.
Durgesh P.Mahale, Ranjan G.Khade, Varsha K.Vaidya 2008. Microbialanalysis of street vended fruit juices from Mumbai city, India.Internet Journal of Food Safety,10: 31-34.
Fulgoni.V.L.,III, Alabaster.O., Papanikolaou.Y. 2001. The health andnutrition benefits of citrus juices. Geriatrics,USA,56:5 Supplement,pp. 21.
Nigris.F.De, Williams-Ignarro.S., Sica.V., Lerman.L.O., D’Armiento.F.P., Byrns.R.E., Casamassimi.A., Carpentiero.D., Schiano.C.,Sumi.D., Fioritoa.C., Ignarro.L.J., Napoli. C. 2007. Effect of aPomegranate Fruit Extract rich in punicalagin on oxidation –sensitive genes and eNOS activity at sites of perturbed shear stressand atherogenesis. Cardiovascular Research, 73:2,414-423.
Sarolia. D.K., Mukherjee,S. 2002. Comaparative efficacy of differentpreservation methods in keeping quality of lime(Citrus aurantifoliaSwingle(L.)) juice during storage. Haryana Journal of HorticulturalSciences,31:3/4.185-188.
Shailja jain, Aarti Sankhla, Dashora, P.K., Sankhla, A.K. 2003. Effectof pasteurization, sterilization and storage conditions on quality ofsweet orange (Mosambi) juice. Journal of Food Science andTechnologists,40:6,656-659.
Tambekar D.H., V.J.Jaiswal, D.V.Dhanorkar, P.B.Gulhane andM.N.Dudhane (2009). Microbial quality and safety of street vendedfruit juices: Acase study of Amravati city. Internet Journal of FoodSafety, 10: 72-76.
Recieved on 03-02-2013 Accepted on 25-10-2013

Trends in Biosciences 6 (6): 701-704, 2013
MINI REVIEW
Developments in Microbial Fuel Cell System for Electricity GenerationSAM A MASIH AND MERCY DEVASAHAYAM
Centre for Transgenic Studies, Sam Higginbottom Institute of Agriculture, Technology and Sciences, Naini,Allahabad 211007, Uttar Pradesh, Indiaemail: [email protected]
ABSTRACT
Over the last few years, world is facing problem of alternateenergy source that has to be environmental friendly also.Microbes are present everywhere in environment that canoxidize different organic material and converts their chemicalenergy into electrical energy with the help of Microbial FuelCell (MFC) system through different catalytic reactions. Severalcultures of microorganism like E.coli, Enterobacter aerogene,Geobacter sulfurreducens, Shewanella putrefaciens etc. have beentested for this and showed that energy can be obtained by themusng MFC system. Apart from the pure cultures waste watersamples also showed to produce electrical energy with wastewater treatment that improved the application of MFC. In thisarticle several components and materials have been discussedthat play key role for the performance of this system so thatapplications of MFC can be improved much and practical use ofMFC can be a preferred option for the sustainable bioenergysource.
Key words Microbial Fuel Cell, Bioelectricity, Microbes,Remediation.
The world wrestles with the energy crisis for a longtime. There is need for different alternatives to provide energyin various situations. Recently discoveries imply that microbescan be used as viable option to make electricity. Such a systemusing microbes as a source for electricity generation is calledMicrobial Fuel Cell System. According to TIMES magazine,Microbial Fuel Cells (MFC) is among the top 50 most importantinventions in 2009.
Microbial Fuel cell is a bio-electrochemical system whichconverts the chemical energy present in the organiccompounds to electrical energy by microorganisms in theanaerobic conditions through catalytic reactions. The firstidea of using Microbial fuel cell in an attempt to produceelectricity was conceived in 1911. A real breakthrough wasmade when some microbes were found to transfer electronsdirectly to the anode Geobacteraceae metalloreducens (Min,et al., 2005) are all bioelectrochemically active and can form abiofilm on the anode surface and transfer electrons directlyby conductance through the membrane the anode will act asthe final electron acceptor in the dissimilatory (Table 1).
A MFC uses bacteria to catalyze the conversion oforganic matter into electricity by transferring electrons to a
developed circuit. When microorganisms consume a substratesuch as sugar in aerobic conditions they produce carbondioxide and water
Microbial cultures used in MFC:
Earlier it was thought only few microorganisms can beused to produce electricity. But recently it was observed thatmost of the microorganisms can be utilized in MFCs. MFCconcept was demonstrated as early in 1910 where Escherechiacoli and Saccharomyces sp. were used to generate electricityusing Platinum electrodes. Microorganisms do not use theenergy produced by the flow of electrons in a direct way, theflow of electrons is used to create a proton gradient acrossthe cell membrane.
There are three categories of microbes that can be usedin MFCs:
(a) Those that can directly transfer electrons to anode usinganode as terminal electron acceptor;
(b) Those that can’t directly but use mediators to transferelectrons to anode;
(c) Those who can accept electron from cathode.Presently several microorganisms have been tested for
the generation of electricity using microbial fuel cell systems.We have used Enterobacter cloacae and Enterobacteraerogene with 0.5, 1.0 optical density (O.D.) and two differentsubstrate i.e. sucrose and sodium acetate in same amount(0.4%) to check the electricity generation using dualchambered MFC and showed that 0.5 O.D. of Enterobactercloacae produced maximum power density of 440 mW/cm2
(Fig. 1) using 0.4% sodium acetate as compare to same opticaldensity of Enterobacter aerogene and E.coli that produced356.40 mW/cm2 and 222.60 mW/cm2 respectively (Fig.1 ) usingequal amount of same substrate (Masih et al., 2012a, Masihet al., 2012b). In another study we have compared electricitygeneration using different water samples (pond, canal,untreated and primary treated sewage water samples) at twodifferent pH values i.e. 4.5 and 5.5 with 0.4% sucrose assubstrate. Our results showed that 5.5 pH showed best resultsfor all the samples and among them pond gave highest voltagevalue of 724 mV as compare to other samples i.e. canal (538mV), untreated sewage water (492 mV) and primary treatedsewage water that showed 705 mV (Masih et al., 2011, Masih

702 Trends in Biosciences 6 (6), 2013
Table 1. Details of different bacteria, substrates and mediators used for MFC operation. Microorganisms Substrates Mediators Actinobacillus succinogenes Escherichia coli Geobacter metallireducens Geobacter sulfurreducens Shewanella putrefaciens Shewanella oneidensis Lactobacillus plantarum Desulfovibrio desulfuricans
Glucose Glucose sucrose Acetate Acetate Lactate, pyruvate, acetate, glucose Lactate Glucose Sucrose
Neutral red or thionin as electron mediator (Park and Zeikus 1999; Park and Zeikus , 2000) Mediators such as methylene blue needed. (Schroder et al .,2003; Ieropoulos et al., 2005., Grzebyk and Pozniak, 2005) Mediator-less MFC (Min et al., 2005) Mediator-less MFC (Bond et al., 2002 ; Bond and Lovely ., 2003 ) Mediator-less MFC (Kim et al., 1999) but incorporating an electron mediator like Mn (IV) or NR into the anode enhanced the electricity production(Park and Zeikus , 2002) Anthraquinone-2,6-disulfonate (AQDS) as mediator (Ringeisen et al., 2006) Ferric chelate complex as mediators (Vega and Fernandez, 1987) Sulphate/sulphideas mediator (Park et al., 1997 ; Ieropoulos et al., 2005)
et al., 2013). There are several other pure microbial culturesand mixed cultures as well that have been examined to produceelectricity using microbial fuel cell system (Table 2)
Role of electrode in MFC
Electrode materials, Proton exchange membranes andoperation conditions of anode and cathode have importanteffect on MFCs. If the electrodes are more porous it allowsdiffusion of oxygen to anode which reduces the efficiency offuel cells. Electrode modification is actively investigated byseveral research groups to improve MFC performance.Different anode materials results in different activationpolarization losses. The surface area of the electrode is alsoimportant. In the MFC operated by Venkata Mohan, et al.,2008, the surface area of the plain graphite electrode wereincreased from 70cm2 to 83.56cm2 by drilling nine uniform holesof 0.1 cm diameter to increase .
Experiments have shown that current increases onincreasing the surface area in the order-
Carbon felt®carbon foam ® graphite
Role of Proton Exchange membrane in MFC:
For improving the performance of MFC, the mainchallenges are to increase the electrons recovery from thesubstrate, i.e., the Columbic Efficiency (CE), and henceincreasing the power. It has been found that decrease in powerwas due to increased ohmic resistance from hot-pressing themembrane (Kim, et al., 2007). The use of Cation (CEMs) andAnion (AEMs) has been found to increase the CE (Kim et al.,2007, 2009; Zuo et al., 2008), it also increased the internalresistance, creates pH gradients, and reduces the powerdensities compared to systems that lack membranes (Kim, et
al., 2007; Rozendal, et al., 2007, Masih and Devasahaym, 2013).
Role of substrate for electricity generation:
In MFCs, substrate is regarded as one of the mostimportant biological factors affecting electricity generation(Liu, et al., 2009). A great variety of substrates can be used inMFCs for electricity production ranging from pure compoundsto complex mixtures of organic matter (Table 1). In anotherstudy, the energy conversion efficiency (ECE) of acetate andglucose as substrates in MFC was compared (Lee, et al., 2008).
Sucrose was used as a fuel in a thionine-mediatedmicrobial fuel cell containing Proteus vulgaris serving as thebiocatalyst in the anode compartment There are othersubstrates like cellulose, most abundant polymer, fructose,dextrose can be used as substrate for electricity generation inMFC. Ren, et al., 2007 reported a power density of 153 mW/m2
using carboxymethyl cellulose as substrate. Very recently,Rezaei, et al., 2009 tested the effect of particle size on maximumpower, power longevity and CE using different sized chitinparticles. In order to benchmark new MFC components, reactordesigns or operational conditions, acetate is commonly usedas a substrate because of its inertness towards alternativemicrobial conversions (fermentations and methanogenesis)at room temperature. Further, acetate is the end product ofseveral metabolic pathways for higher order carbon sources.Chae, et al., 2009 compared the performance of four differentsubstrates in terms of CE and power output.
The benefits of using microbial fuel cells for wastewatertreatment include clean, safe, quiet performance, lowemissions, high efficiency, and direct electricity recovery. Withsimilar designs of MFC, 506 mW/m2 was produced with acetate(Liu, et al., 2005, Masih and Devasahaym, 2013).The maximum
Table 2. Details of different microbial cultures producing current and power density.
S. No. Source Current (mA) Power Density (mW/cm2)
Coulombic Effeciency (%)
References
1 Chemical waste water 6.08 22.11 62.90 Venkatamohan et al., 2008 2 Enterobacter aerogene 9.9 356.4 83.43 Masih et al. , 2012a 3 Enterobacer cloacae 11 440 92.00 Masih et al. , 2012a 4 E.coli 7.79 220.66 69.49 Devasahayam and Masih , 2012 5 Geobacter sulfurreducens 0.24 43.63 --- Trinh et al., 2009 6 Klebsella spp. 1.47 0.1209 --- Xia et al., 2010 7 Shewanella oneidensis 0.40 0.50 --- Tront et al., 2008

MASIH AND DEVASAHAYAM, Developments in Microbial Fuel Cell System for Electricity Generation 703
power density produced appears to be related to the complexityof the substrate (i.e. single compound versus severalcompounds). Heilmann and Logan, 2006 reported that withsubstrates like peptone and meat processing wastewatercontaining many different amino acids and proteins, lowerpower was produced than achieved using single compoundlike bovine serum albumin (BSA). Recently, while evaluatingthe potential of various eco-systems in harnessingbioelectricity through benthic fuel cells, Venkata Mohan, etal., 2009 reported that the substrate concentration of the waterbody showed significant influence on the power generationas they act as carbon source (electron donor) for the benthicmetabolic activity. Water bodies containing higher organicmatter were able to generate higher power output.
Effect of resistance in MFC
There are several different methods to evaluate theinternal resistance of an MFC. These include polarization slope,power density peak, electrochemical impedance spectroscopy(EIS) using a Nyquist plot, and current interrupt methods.The microorganism oxidizing the substrate release electronsonto the anode surface and should thus be considered acurrent. However, this current source is not constant, butaffected the amount of resistance in the system. There is nota linear relationship between voltage and current in this case.It is plausible that under the conditions of limited electrondisposal through the circuit with a high resistance, theelectrons are consumed in the anode to reduce other electronacceptors such as sulfate and nitrate. There are some electricalparameters on which electrical conductance of MFC depend.An extremely high Columbic efficiency of 97% was reported
during the oxidation of formate with the catalysis of Pt black(Rosenbaum, et al., 2006.
Electrical parameters:
Open circuit voltage is the voltage measured in theabsence of any resistor. By definition it is the difference ofelectrical potential between the two electrodes i.e. anode andcathode of a cell in the absence of any resistor. Theoreticallyopen circuit voltage should be almost close to the electromotiveforce of a cell but in practice it does not happen generally. Theprobable reason for this disparity between the two is the largeenergy losses at the cathode, which is called the overpotential.Overpotential is directly related to current density andgenerally include:
Activation losses- To carry out the oxidation-reductionreaction at the electrode bacteria need to cross an energybarrier that results in large activation losses. Butincreasing the electrode surface area can minimize thisloss. Other measures taken to overcome this loss areincreasing temperature and by enrichment of biofilm onthe anode surface (Logan, et al., 2006).
Metabolic losses- This is because of the large differenceof redox potential between the substrate and anode(Logan, et al., 2006).
Concentration losses -These occurs at the high currentdensity and are due to rate of mass transport of a speciesto or from the electrode. And these losses limit the currentproduction.
Ohmic losses- Impedence to the flow of electrons at theelectrodes and interconnections and to the protons atthe membrane and electrolytes is the cause of theselosses. Keeping the electrodes in close proximity to eachother i.e. at the closest distance and using the electrolytesof higher conductivity can overcome these losses.
Power and power density-Power can be calculated asP =E2
cell/ Rex
where Ecell / Rext is calculated by Ohm’law. Thus powerdensity is calculated as amount of power per unit surface areaof the electrode. To enhance power density it is preferred touse anode with the projected surface area. Surface area ofanode can be enhanced greatly by using porous electrodes.Other measures are using electrodes in sieve or brush formbut in these cases it is difficult to measure surface area ofeach and every unit of the anode. Therefore using porousanode with defined surface area of the plate and of each poreas well is advantageous over others.
In many instances, however, the cathode reaction isthought to limit overall power generation or the anode consistsof a material which can be difficult to express in terms of surfacearea (i.e., granular material. Work by several researchers haveshown that MFC can be used for power generation but still
Fig. 1 Comparison of Power Density and CurrentDensity: Polarization curve of Power Density andCurrent Density has been plotted in between purecultures of E.aerogens(dark line), E.cloacae(dotted line)and E.coli(dashed line)

704 Trends in Biosciences 6 (6), 2013
ways has to be find to make the system economical. Powerdensity still needs to be increased under realistic conditions.Materials and different methods have to be examined in termsof power generation and cost. More information is needed onthe flow of nutrients and methods to control these in MFCbased system. Overall there is much exciting work has to bedone on better understanding the response of bacterial culturewith substrate and the conductivity of different electrodematerials that helps to harvest electrical conductance fromMFC.
ACKNOWLEDGEMENT
The authors wish to acknowledge with gratitude thesupport of Prof Dr Rajendra B Lal, Vice Chancellor, SamHigginbottom Institute of Agriculture, Technology andSciences for his encouragement. The authors wish to expresstheir gratitude to the Director (Research), SHIATS for financialsupport.
LITERATURE CITED
Chae , K.J., Choi, M.J., Kim, K.Y., Ajayi, F.F., Park, W., Kim, C.W. andKim ,S. 2009. Methanogenesis controlled by employing variousenvironmental stress conditions in two chambered Microbial FuelCell. Bioresource Technology. 101 (14): 5350-5357.
Heilmann, J. and Logan, B.E. 2006. Production of electricity fromproteins using a single chamber microbial fuel cell. EnvironmentalResearch. 78(5): 531-537.
Kim, J.R., Oh, S.E., Cheng, S. and Logan, B.E. 2007. Power generationusing different cation, anion and utrafiltration membranes inmicrobial fuel cells. Environmental Science Technology .41(3):1004-1009.
Kim, J.R., Premier, G.C., Hawkes, F.R., Dinsdale, R.M. and Guwy, A. J.2009. Development of a tubular microbial fuel cell (MFC) employinga membrane electrode assembly cathode. Journal of Power Sources,187(2): 393-399 .
Lee, H. S., Parameswaran, P., Kato-Marcus, A., Torres, C. I. andRittmann, B. E. 2008. Evaluation of energy-conversion efficienciesin microbial fuel cells (MFCs) utilizing fermentable and non-fermentable substrates. Water Research. 42: 1501-1510.
Liu, H., Cheng, S. and Logan, B.E. 2005. Power generation in fed-batchmicrobialfuel cells as a function of ionic strength, temperature, andreactor configuration. Environmental Science and Technology .39:5488–5493.
Liu, Z., Liu, J., Zhang, S. and Su, Z. 2009. Study of operationalperformance and electrical response on mediator-less microbialfuel cells fed with carbon- and protein-rich substrates. Journal ofBiochemical Engineering. 45:185–191.
Logan, B.E., Hamelers, B., Rozendal, R., Schrorder, U., Keller, J.,Freguia, S., Alterman, P., Verstraete, W. and Rabaey, K. 2006.Microbial fuel cells: Methodology and Technology. EnvironmentalScience and Technology. 40: 5181-5192.
Masih, S., Devasahayam, Haider, J. and Mishra, S. 2011. Remediationof Inland Water and Waste Water Samples Using Microbial FuelCell Technology. Trends in Biosciences. 4: 175-179.
Masih, S., Devasahayam, M., Srivastava, R. and Gupta, S. 2012a.Enterobacter Species Specific Microbial Fuel Cells Show IncreasedPower Generation With High Coulombic Efficiency. Trends inBiosciences 5: 114-118.
Masih, S., Devasahaym, M. and Zimik, M. 2012b. Optimization ofpower generation in dual chambered aerated membrane microbialfuel cell with E. coli as biocatalyst. Journal of Scientific andIndustrial Research, 71: 621-626.
Masih, S. and Devesahaym, M. 2013. Optimisation and the efficientdesign of an Enterobacter cloacae dual chambered aerated membranemicrobial fuel cell for enhanced power generation. InternationJournal of Ambient Energy. (accepted)
Masih, M., Devasahaym, M. and Dwivedi, C. 2013. Remediation ofInland water using Microbial Fuel Cell Technology. Journal ofScientific and Industrial Research. 72: (accepted)
Min, B., Cheng, S. and Logan, B. E. 2005. Electricity generation usingmembrane and salt bridge microbial fuel cells. Water Research.39:1675-1686.
Rabaey, K., Clauwaert, P., Aelterman, P. and Verstraete, W. 2005.Tubular microbial fuel cells for effcient electricity generation.Environmental Science and Technology. 39: 8077-8082.
Ren, Z., Ward, T.E. and Regan, J.M. 2007. Electricity production fromcellulose in a microbialfuel cell using a defined binary culture and anundefined mixed culture. Environmental Science and Technology.41(13): 4781-4786.
Rezaei, F., Richard, T.L. and Logan, B.E. 2009. Analysis of chitinparticle size on maximum power generation, power longevity, andCoulombic efficiency in solid-substrate microbial fuel cells. Journalof Power Sources. 192: 304–309.
Rosenbaum, M., Schreder , U. and Scholz, F. 2006. Investigation of theelectrolytic oxidation of formate and ethanol at platinum blackunder microbial fuel cell conditions. Journal of Solid StateElectrochemistry.10: 872-878.
Rozendal, R. A., Hamelers, H. V. M., Molenkamp, R. J. and Buisman, C.J. N. 2007. Performance of single chamber biocatalyzed electrolysiswith different types of ion exchange membranes. Water Research.41 (9): 1984-1994.
Venkata Mohan, S., Mohanakrishna, G., Purshotham Reddy, B.,Saravanan, R., and Sarma, P.N. 2008. Bioelectricity generationfrom chemical waste water treatment in mediatorless (anode)microbial fuel cell (MFC) using selectively enriched hydrogenproducing mixed culture under acidophilic microenvironment.Biochemical Engineering. 39:121-130.
Venkata Mohan, S., Srikanth, S., Veer Raghuvulu, S., Mohanakrishna,G., Kumar, A.K. and Sarma, P.N. 2009. Evaluation of the potentialof various aquatic eco-systems in harnessing bioelectricity throughbenthic fuel cell: effect of electrode assembly and watercharacteristics. Bioresource Technology. 100: 2240–2246.
Zuo, Y., S. Cheng and B.E. Logan. 2008. Ion exchange membranecathodes for scalable microbial fuel cells. Environmental Scienceand Technology. 42:6967-6972.
Recieved on 05-09-2013 Accepted on 15-10-2013

Trends in Biosciences 6 (6): 705-709, 2013
MINI REVIEW
Peanut Allergy in Need of ReviewDEEPIKA BARANWAL AND PREETI BAJPAI
*, **Deptt. of Food and Nutrition,College of Home science, MPUAT, Udaipur, Rajasthan, Indiaemail: [email protected]
ABSTRACT
Food allergy is the consequence of maladaptive immuneresponses to common and otherwise innocuous food antigens.Although much is known today about the prevalence of foodallergy in the developed world, there are serious knowledgegaps about the prevalence rates of food allergy in developingcountries. Food allergy affects up to 6% of children and 4% ofadults. Symptoms include urticaria, gastrointestinal distress,failure to thrive, anaphylaxis and even death. There are over170 foods known to provoke allergic reactions. Of these, themost common foods responsible for inducing 90% of reportedallergic reactions are peanuts, milk, eggs, wheat, nuts (e.g.,walnuts, almonds, cashews, etc.), soybeans, fish, crustaceansand shellfish. In the present article peanut allergy is coveredonly.
Key words Peanut, Allergy, Review
Although we often think of allergy as a western disease,in reality it’s fast becoming a global problem. In many westernnations, allergy rates stand at around 40% of the populationor sometimes higher. It may surprise you, but India is not farbehind, with an estimated 25% of the population now havingat least one allergic condition. Indeed most developing nationsin Asia and Africa, increasingly adopting a western lifestyle,are noticing burgeoning rates of allergic disease across agegroups, especially the young.
Equally, we view food allergy as being a westernproblem, and as being caused largely by peanuts, nuts, fish,shellfish, eggs and dairy. While this is largely true of the UKand the US, at least, globally the picture is more varied. Witha population of well over a billion, food allergy could becomean enormous problem also in India. Some estimates suggestup to 3% of Indians may already have food allergies, themajority under 40 years of age. Food allergies cause roughly30,000 emergency treatments and 100 to 200 deaths per yearin the nation. Up to 3 million Indians may have peanut allergyalone. In the present article peanut allergy is covered only (1).
Peanut is one of the eight most common food allergens.The increased prevalence of peanut food allergy in recentyears has led food processors to be more conscientious intheir good manufacturing practices (GMPs) and allergencontrol programs to prevent peanut contamination. Further,
safety of peanuts and peanut-derived products must beconsidered throughout production for foodborne disease risk.While they have not been associated with many foodbornedisease outbreaks, peanuts can be a source of aflatoxin,produced by the mold, Aspergillus spp., which can causeliver defects and cancer, especially in developing countries(CDCP, 2009). More recently, peanut butter has been in thespotlight as the source of foodborne disease outbreakscaused by Salmonella (USFOA, 2009, Woodroof, 1983). Inlight of the 2009 multistate outbreak involving numerouspeanut products from a Georgia peanut manufacturer, corporateresponsibility and GMPs are being increasingly recognizedand important (USDA 2010). Federal regulations to preventsuch outbreaks have also been developed. This review articlewill provide an overview of major safety concerns in peanutand peanut products production.
Areas of concern:
Consumption of peanuts and peanut products caninduce potential life threatening anaphylactic reactions toindividuals who are allergic to peanuts. Currently, since thereare no effective curative treatments available, the mosteffective way to deal with peanut allergies is to strictly avoidpeanut and peanut products. However, accidental exposuresare frequent due to the possibility of cross contamination ofother foods. Hence, it is imperative that the food processingindustries follow strict guidelines to ensure that the foodprepared is safe for allergic consumers, by following goodmanufacturing practices to reduce cross contamination, andby including proper advisory labeling on packages. Peanutsdo not pose a large risk for foodborne disease largely due tothe roasting step where peanuts are reduced to the 1.25%moisture content and <0.75 water activity (aw). Moisture isrequired for most microorganisms to survive. The low awinhibits growth of most bacteria and many molds. Sincepeanuts are rarely eaten raw, roasting not only improvespeanut aroma, flavor, and texture, but also destroyscontaminating microorganisms (USDA, 2011a). Very fewoutbreaks of foodborne diseases have been attributed towhole peanuts and any outbreaks that have occurred werelikely due to poor handling practices after a thermal treatmentstep, particularly roasting. Proper peanut processing andhandling postharvest should ensure a safe product for

706 Trends in Biosciences 6 (6), 2013
consumers. Instead, from the foodborne diseases perspective,areas of concern for peanuts revolve primarily aroundcontamination from aflatoxin, a mycotoxin produced by themold Aspergillus, and cross contamination from sources thatintroduce pathogens to peanuts after processing.
Allergens in food processing and product formulation:
Peanut is one of eight major food allergens of humans,which also include milk, egg, soy, wheat, tree nuts, fish, andshellfish. Estimated prevalence of food allergies among adultsin North America is 3-4% (Branum and Lukacs, 2008). In 2009,the Centers for Disease Control and Prevention (CDC)reported approximately 3.9% (3 million) children in the US hadfood allergies (Gupta, et al., 2011, Katz, et al., 2011). From1997 to 2007, prevalence of food allergy increased 18% amongchildren. Additionally, hospitalizations related to food allergieshave increased, and children with food allergy were more likelyto report having asthma. A more recent study reported a higherprevalence of food allergies, at 8.0% of children in the US,25.2% of which were allergic to peanut (Bischoff and Sellge,2003). Investigators (Taylor, et al., 2009) reported prevalenceof peanut allergy in children in the US to be 0.4-1.9%. A foodallergy is generally described as an adverse reaction to food.Immunoglobulin E (IgE) mediated food allergy, also known astype I hypersensitivity, and is considered a true food allergyas it elicits an immune response after multiple exposures to anallergen. Food allergens are antigens or proteins with whichantibodies in the human body bind. The initial exposure to anantigen is known as the sensitization phase in which nosymptoms occur but specific IgE antibodies that can bind tothe antigen are produced in larger quantities (Beyer et al.,2001). Subsequent exposure to the antigen causes mast cells,basophils, and eosinophils to degranulate, releasingprostaglandins, leukotrienes and other immune mediators.Inflammatory reactions caused by immune mediators vary inseverity, but can include a tingling sensation around themouth, urticaria, rhinitis, asthma, anaphylactic shock, anddeath within an hour of exposure (Kotz, et al., 2011).
Food allergens are chemical hazards. The increasingprevalence of food allergies, whether or not due to an actualincrease or simply an increase in awareness, inspiresconsumers to be more assertive in demanding safe food. Itwas reported that in their examination of food recalls in 1999,consumers were responsible for identifying the presence ofan allergen in 56% of food products recalled due to undeclaredallergens (Lansden and Davidson, 1983). Food producers arethus becoming more vigilant in GMPs and control methods toprevent cross contamination (Plenge, et al., 1997). Controlmeasures include labeling all raw materials and ingredients,separation of allergenic materials, dedication of equipment,scheduling, proper sanitation, sanitation validation, andeffective packaging. Effective allergen control programs canreduce number of allergen-related recalls and incidencesleading to hospitalization or death.
Mycotoxins:
Mycotoxins are produced by various fungi and areconsidered poisonous contaminants in susceptible foods andfeeds. Aflatoxin has been identified as the most toxicmycotoxin associated with peanuts, and hence the toxicityand measures to manage and prevent contamination byaflatoxin has been discussed in detail in this review. In additionto aflatoxins, another commonly occurring natural contaminantof peanut is the mycotoxin cyclopiazonic acid, produced byseveral species of Penicillium and Aspergillus (Antony, et al.,2003). Cyclopiazonic acid is a potent inhibitor of the reticularform of the Ca2þ ATPase pump (Nishie, et al., 1987). Thecompound is not considered to be a potent toxin in humansdue to low oral LD50 values, in the range of 30e70 mg/kg inrodents. On peanuts, the natural level of contamination bythis toxin is only 6.5 ppm (Antony, et al., 2003), thus, thecompound is toxic to humans only when it is consumed atlevels that exceed the natural level of intake of the toxin (Uranoet al., 1992) Further, in most cases, both cyclopiazonic acidand aflatoxin, both produced by Aspergillus flavus, are presentconcurrently (Kishore, et al., 2002), and this effectivelydisguises the presence of cyclopiazonic acid. Although to amuch lesser extent, there are also reports of natural occurrenceof other mycotoxins associated with peanuts, includingzearalenone (Mehan and McDonald, 1982, Bhavanishankarand Shantha, 2006), and trichothecene-toxins (Mehan andMcDonald, 1982), both produced by Fusarium sp.; citrinin(Mehan and McDonald, 1982), produced by Penicillium sp.,Aspergillus sp. and Monascus sp.; and ochratoxin A (Kamikaand Takoy, 2011) produced by Aspergillus sp. Aflatoxin isidentified as a known human carcinogen by the InternationalAgency for Research on Cancer, 2002. A. flavus andAspergillus parasiticus (commonly found in the soil) are theprimary species of mold that produce aflatoxin as a secondarymetabolite. Originally discovered in the 1960s, aflatoxin is oneof several mycotoxins that persist in peanuts, tree nuts,oilseeds, and cereal grains, especially in developing countrieswhere these commodities are grown and consumed (IARC,2002). Optimal conditions for A. flavus growth are 12-35%moisture at 27-380C (80-1000F). Once infected, the mold canproliferate in improperly stored peanuts, particularly in tropicalregions.
The types of aflatoxin are B1, B2, G1, and G2 (CFR, 2010a).Aflatoxin B1 is the most ubiquitous form and the most toxic(Bhat, et al., 2010 and CFR, 2010a). Major effects of aflatoxinare hepatocarcinoma, immunosuppresion leading to increasedsusceptibility to infections, and growth impairment in childrendue to the ability of aflatoxin to cross the human placenta(CFR, 2010a). Incidentally, chronic hepatitis B and hepatitis Cinfection are risk factors for hepatocarcinoma caused byaflatoxin. It is hypothesized that the viral infections interferewith the ability of hepatocytes to metabolize aflatoxin. Thetoxin resides in the liver for a longer period, causing damage

BARANWAL AND BAJPAI, Peanut Allergy in Need of Review 707
to tumor suppressor genes. An immediate consequence ofaflatoxin exposure can be aflatoxicosis, or aflatoxin poisoning.Signs and symptoms include gastrointestinal problems andliver lesions (USFDA, 2000). Exposure to amounts less than1000 ppb have been linked to aflatoxicosis. Consumingapproximately 5000 ppb of aflatoxin can cause acuteaflatoxicosis leading to death. The LD50 value of aflatoxinranges from 0.3 to 10 mg/kg for most animal species, and from0.54 to 1.62 mg/kg for human beings (IARC, 2002).
Aflatoxin content in peanuts is controlled. In the US,aflatoxin content in peanuts must be < 15 ppb to be certifiededible quality grade (Doughtie, 1947). The Food and DrugAdministration (FDA) will pursue legal action if peanut andpeanut products are found to contain at least 20 ppb aflatoxin(Van Egmond, 1989). It is a common difficulty to obtain arepresentative sample from a truckload of peanuts for testing,however. Representative sampling of peanuts is importantbecause of non-uniform distribution of aflatoxin in a batch ofpeanuts. The level of contamination can also vary. Specificguidelines for acceptable levels of aflatoxin in food and feed,and sampling plans for sample acceptance or rejection havebeen established by different countries. In the US, the peanutmarketing agreement established by the USDA, is administeredby the Peanut Administrative Committee (PAC). According tothe current aflatoxin sampling plan followed in the US, rawshelled peanuts are accepted or rejected based on a modifiedsequential plan where up to three 21.8 kg each representativetest samples are drawn from a single lot (Scott, 1998 andOgbadu, 1980). Peanuts are finely ground into a compositesince aflatoxin can exist on the order of parts per billion.Prevention of Aspergillus growth by effectively drying andstoring peanuts at low relative humidity and temperature isthe best way to prevent aflatoxin production. Geneticallymodified seeds resistant to Aspergillus have been developedbut are expensive (IARC, 2002). If peanuts are contaminated,various treatments exist such as applying ammonia, hydrogenperoxide, and ozone, although the side effects of thesetreatments are not currently reported in detail (USFDA, 2000and Staron et al., 1980). Irradiation and high temperatureroasting can also eliminate aflatoxin contamination (USFDA,2000, Eglezos, 2010 and Ogbadu, 1980). With ongoingresearch, many of these options may become more costeffective in the future.
Cross contamination and pathogen survival:
Implementation and adherence to good agriculturalpractices (GAPs) and GMPs should prevent contaminationand foodborne diseases caused by peanuts. What becomes aconcern is the survival of pathogens should crosscontamination occur, post-harvest and/ or post-processing.Cross contamination can occur anytime during peanutproduction and turn low moisture, safe food into one that cancause foodborne disease. Pathogens can be transferred inseveral ways to food, such as through contaminated water
and equipment, poor worker hygiene, and pests. If peanutsare contaminated, survival of pathogens becomes a majorissue.
It is generally understood that low water activity of afood prevents growth of many microorganisms. To verify thelow association of pathogens and peanuts, scientist (Kirk, etal., 2004) tested 343 samples of ready-to-eat peanuts andsamples of other nuts produced at Australian facility overthree years for Salmonella, other pathogens, and aerobic platecount (APC). No pathogens were found in any sample. In thisstudy, APC tests revealed that 48% of the peanut samplesshow counts above the detection limit of 100 CFU/g. Thesepositive samples had average plate counts of 2.7 log CFU/g.High APC counts do not necessarily indicate the presencesof a foodborne pathogen, but instead, are a general indicatorof sanitation and can assist peanut processors in identifyingwhere sanitation can be improved.
Dry foods like peanuts do not often support microbialgrowth, but they may still be able to allow survival ofpathogens. It was found that inoculated Salmonella couldsurvive for 3-4 weeks on dry, raw materials including crushedcocoa and hazelnut shells, cocoa beans, and almond kernelsat both room temperature and 5oC. Salmonella is typicallyinhibited by aw < 0.91, but the aw of these substances werelikely much lower. It can be concluded that any heat treatmentof food must be sufficiently high to destroy Salmonella whilestill providing a quality product. This is especially importantfor dry foods with long shelf life because if pathogens were tosurvive during processing, they would more likely reach theconsumer and increase risk of disease (Christian, 2007).
Peanut outbreaks:
Foodborne disease outbreaks are not typicallyassociated with peanuts and very few peanut outbreaks havebeen documented. In one international outbreak, SalmonellaStanley, S. Newport and other strains were found in packagesof a brand of roasted, in-shell peanuts imported from Asiafrom May to October 2001. There were 109 cases total inAustralia, Canada, England, Wales, and Scotland. Positivesamples were found to contain <0.03e2 CFU/g Salmonella.The peanuts were manufactured in one unidentified Asiancountry and distributed by several other countries. Theoriginal source of contamination was undetermined (57).
Prevention of contamination is the best way to preventfoodborne disease outbreaks and should be a goal of everyfood processor and handler. Peanuts pose a large risk forindividuals with peanut allergy and hence, preventingpeanut contamination of other foods by following GMPsand implementing allergen control programs is ofutmost importance. While peanuts are not typically associatedwith foodborne illness as they have caused very fewdocumented outbreaks, peanuts are at risk for aflatoxincontamination.

708 Trends in Biosciences 6 (6), 2013
LITERATURE CITED
Antony, M., Shukla, Y., and Janardhanan, K. K. 2003. Potential risk ofacute hepatotoxicity of kodo poisoning due to exposure tocyclopiazonic acid. Journal of Ethnopharmacology, 87:211-214.
Beyer, K., Morrow, E., Li, X. M., Bardina, L., Bannon, G. A., Burks, A.W., et al. 2001. Effects of cooking methods on peanutallergenicity. Journal of Allergy and Clinical Immunology, 107:1077-1081.
Bhat, R., Rai, R. V., and Karim, A. A. 2010. Mycotoxins in food andfeed: present status and future concerns. Comprehensive Reviewsin Food Science and Food Safety, 9: 57-81.
Bhavanishankar, T. N., and Shantha, T. 2006. Natural Occurrence ofFusarium toxins in peanut, sorghum and maize from Mysore (India).Journal of the Science and Food and Agriculture, 40 : 327-332.
Bischoff, S. C., and Sellge, G. 2003. Immune mechanisms in food-induced disease. In (Eds. D. D. Metcalfe, H. A. Sampson, & R. A.Simon (Eds.), Food Allergy: Adverse reactions to foods and foodadditives (3rd ed.). Malden, MA: Blackwell Publishing, Inc. pp. 14-37.
Branum, A. M., & Lukacs, S. L. 2008. Food allergy among US children:trends in prevalence and hospitalizations. NCHS Data Brief, 10, 1-8 .
Centers for Disease Control and Prevention. 2009. Multistate outbreakof Salmonella infections associated with peanut butter and peanutbutter-containing productsdUnited States, 2008-2009. Morbidityand Mortality Weekly Report, 58, 85-90.
Christian, K. A., Schlegal, J., Ard, L., Mays, E., Curry, P., & Davis, M.2007. Outbreak of Salmonella serotype Thompsonassociated with boiled peanutsdSouth Carolina, 2006. In Centersfor disease control and prevention, 56th annual epidemicintelligence service conference (pp. 62), Atlanta, GA: Retrieved08.07.11, from. http://www.cdc.gov/eis/downloads/2007.EIS.Conference.pdf.
Code of Federal Regulations. 2010a. Title 7, Part 996.11. Minimumquality and handling standards for domestic and imported peanutsmarketed in the United States: Negative aflatoxin content.Washington, D.C: US Food and Drug Administration, Office of theFederal Register.
Doughtie, R. T. 1947. Sampling of cottonseed, soybeans and peanuts:methods used and problems encountered. Journal of the AmericanOil Chemists’ Society, 24 : 335-340.
Eglezos, S. 2010. The bacteriological quality of retail-level peanut,almond, cashew, hazelnut, Brazil, and mixed nut kernels producedin two Australian nut processing facilities over a period of 3 years.Foodborne Pathogens and Disease, 7 : 863-866.
El-Maghraby, O. M. O., and El-Maraghy, M. S. S. 1987. Mycoflora andmycotoxins of peanut (Arachis hypogaea L.) seeds in Egypt. 1-sugar fungi and natural occurrence of mycotoxins. Mycopathologia,98, 165-170.
Gupta, R. S., Springston, E. E., Warrier, M. R., Smith, B., Kumar, R.,Pongracic, J., et al. 2011. The prevalence, severity, and distribution
and childhood food allergy in the United States. Pediatrics, 128:9-17.
International Agency for Research on Cancer. 2002. Some traditionalherbal medicines, some mycotoxins, naphthalene and styreneInIARC monographs on the evaluation of carcinogenic risks tohumans, Vol. 82. Lyon, France: IARC pp. 301-366.
Kamika, I., and Takoy, L. L. 2011. Natural occurrence of Aflatoxin B1in peanut collected from Kinshasa, Democratic Republic of Congo.Food Control, 22: 1760-1764.
Kirk, M. D., Little, C. L., Lem, M., Fyfe, M., Genobile, D., Tan, A.,2004. An outbreak due to peanuts in their shell caused by Salmonellaenterica serotypes Stanley and Newportdsharing molecularinformation to solve international outbreaks. Epidemiology andInfection, 132: 571-577.
Kishore, K. G., Pande, S., Manjula, K., Rao, N. J., and Thomas, D.2002. Occurrence of mycotoxins and toxigenic fungi in groundnut(Arachis hypogaea L.) seeds in Andhra Pradesh, India. PlantPathology Journal, 18 : 204-209.
Komitopoulou, E., & Penaloza, W. (2009). Fate of Salmonella in dryconfectionery raw materials. Journal of Applied Microbiology,106 : 1892-1900.
Kotz, D., Simpson, C. R. and Sheikh, A. 2011. Incidence, prevalence,and trends of general practitioner-recorded diagnosis of peanutallergy in England, 2001 to 2005. Journal of Allergy and ClinicalImmunology, 127: 623e630.
Lansden, J. A., and Davidson, J. I. 1983. Occurrence of cyclopiazonicacid in peanuts. Applied and Environmental Microbiology, 45 :766-769.
Mehan, V. K., and McDonald, D. 1982. Mycotoxin producing fungi ingroundnutspotential for mycotoxin contamination. In Proceedingsof the international symposium on mycotoxins and phycotoxins(pp. 98-101), 1-3 September 1982. Vienna, Austria.
Nishie, K., Cole, R. J., and Dorner, J. W. 1987. Toxic effects ofcyclopiazonic acid in the early phase of pregnancy in mice. ResearchCommunications in Chemical Pathology and Pharmacology, 55:303-315.
Ogbadu, G. 1980. Influence of gamma-irradiation of aflatoxin B1production by Aspergillus flavus growing on some Nigerianfoodstuffs. Microbios, 27: 19-26.
Plenge-Tellechea, F., Soler, F., and Fernandez-Belda, F. 1997. On theinhibition mechanism of sarcoplasmic or endoplasmic reticulumCa2þ-ATPases by cyclopiazonic acid. Journal of BiologicalChemistry, 272 : 2794-2800.
Scott, P. M. 1998. Industrial and farm detoxification process formycotoxins. Revue Med Vet., 149 : 543-548.
Staron, T., Thirouin, D., Perrin, L., and Frere, G. 1980. Microwavetreatment of biological food production. Industrie AlimentariAgricole, 12 : 1305-1312.
Taylor, S. L., & Hefle, S. L. 2005. Allergen control. Food Technology,59, 40-43, 75.
Taylor, S. L., Crevel, R. W. R., Sheffield, D., Kabourek, J., and Baumert,J. 2009. Threshold dose for peanut: risk characterization based
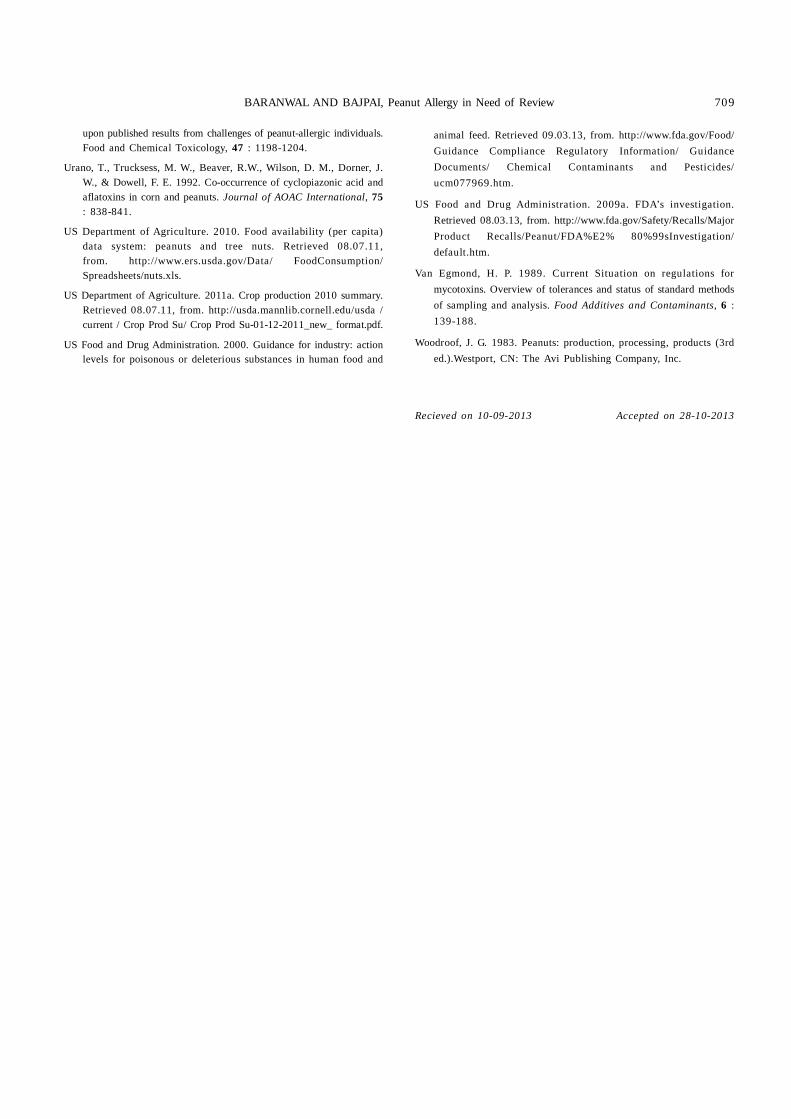
BARANWAL AND BAJPAI, Peanut Allergy in Need of Review 709
upon published results from challenges of peanut-allergic individuals.Food and Chemical Toxicology, 47 : 1198-1204.
Urano, T., Trucksess, M. W., Beaver, R.W., Wilson, D. M., Dorner, J.W., & Dowell, F. E. 1992. Co-occurrence of cyclopiazonic acid andaflatoxins in corn and peanuts. Journal of AOAC International, 75: 838-841.
US Department of Agriculture. 2010. Food availability (per capita)data system: peanuts and tree nuts. Retrieved 08.07.11,from. http://www.ers.usda.gov/Data/ FoodConsumption/Spreadsheets/nuts.xls.
US Department of Agriculture. 2011a. Crop production 2010 summary.Retrieved 08.07.11, from. http://usda.mannlib.cornell.edu/usda /current / Crop Prod Su/ Crop Prod Su-01-12-2011_new_ format.pdf.
US Food and Drug Administration. 2000. Guidance for industry: actionlevels for poisonous or deleterious substances in human food and
animal feed. Retrieved 09.03.13, from. http://www.fda.gov/Food/Guidance Compliance Regulatory Information/ GuidanceDocuments/ Chemical Contaminants and Pesticides/ucm077969.htm.
US Food and Drug Administration. 2009a. FDA’s investigation.Retrieved 08.03.13, from. http://www.fda.gov/Safety/Recalls/MajorProduct Recalls/Peanut/FDA%E2% 80%99sInvestigation/default.htm.
Van Egmond, H. P. 1989. Current Situation on regulations formycotoxins. Overview of tolerances and status of standard methodsof sampling and analysis. Food Additives and Contaminants, 6 :139-188.
Woodroof, J. G. 1983. Peanuts: production, processing, products (3rded.).Westport, CN: The Avi Publishing Company, Inc.
Recieved on 10-09-2013 Accepted on 28-10-2013

710 Trends in Biosciences 6 (6), 2013Trends in Biosciences 6 (6): 710-718, 2013
Assessment of Genetic Diversity in Sesame (Sesamum indicum L.) usingMorphological and Molecular ApproachesS.L KIRANMAYI1*, V ROJA 1, K PADMALATHA1, N SIVARAJ2 AND S SIVARAMAKRISHNAN1
1 Institute of Biotechnology, Acharya N.G Ranga Agricultural University, Rajendranagar,Andhra Pradesh - 500 030, India.2National Bureau of Plant Genetic Resources, Rajendranagar, Hyderabad, A P – 500030email: [email protected]
ABSTRACT
Morphological and molecular diversity of 23 accessions ofSesamum indicum germplasm collected from local areas ofAndhra Pradesh, India were analyzed. Correlation analysiswas carried out for morphological parameters. Euclidiansimilarity matrix for morphological data was computed betweenobservable distances and dendrogram (r = 0.79). Cluster analysisrevealed two major clusters. 4 polymorphic primers wererevealed using SSR markers. 14 alleles were detected at fourloci with an average of 3.5 alleles per locus. The pair wisesimilarity based on Dice coefficient ranged from 0 to 1. Thecorrelation coefficient (r) computed between observed distancesand dendrogram was 0.77 which indicates a good fit. Theirgenetic distance (0.1-0.9) is wider than their phenotypic distance(0.2-0.7). Matrix comparison between phenotypic and genotypicdata gave the correlation coefficient value (r) = 0.12. Thusevaluation of genetic variability is necessary in selecting eliteparents in breeding and Marker assisted selection studies.
Key words: Sesamum indicum; Dendrogram; Diversity;Polymorphism, SSR markers
Sesame (Sesamum indicum), one of the oldest oilseedcrops in the world known to humans and is valued for its highquality seed oil (Ashri, 1998). It belongs to the familyPedaliaceae with approximately 38 species in the genusSesamum and most of them are wild (Kobayashi, 1991). Thechromosome number of the cultivated sesame was reportedas 2n = 26 (Toan et al., 2009). Sesame is found in tropical,subtropical, and southern temperate areas of the world,particularly in India, China, South America and Africa(Chakraborthy, et al., 2008). It is grown in tropical andsubtropical areas on 164.1 million hectares (mha) worldwide,producing more than 18 million tons of seed.
Among the recent methods developed apart frommorphological markers for the study of genetic variability arethe biochemical and molecular markers. Molecular markersdominate over the biochemical and phenotypic markers asthey are not influenced by environmental or developmentalchanges. Genetic diversity in crop species can be determinedby using the agro-morphological as well as biochemical andmolecular markers (Geleta, et al., 2008).
A number of DNA based techniques have been
developed to identify genetic variability within species. Oneof the most recent advances in molecular genetics is theintroduction of Microsatellite markers to investigate the geneticdiversity of natural and hybrid population of crops. Thesemarkers are used today to address many questions related togenetic conservation. Thus present investigation was takenup to comprehensively explicit the characteristics of geneticdiversity using phenotypic and molecular approaches insesame germplasm.
MATERIAL AND METHODS
Germplasm of Sesamum indicum L. (23 accessions)collected from different districts of Andhra Pradesh (A.P),were selected for the study (Table 1). Among the accessions,20 were provided by National Bureau of Plant GeneticResource, (NBPGR) Regional station, Rajendranagar,Hyderabad and 5 accessions were sesame varieties releasedby Acharya N. G. Ranga Agricultural University (ANGRAU)which are indicated with an asterisk in the table. Seed materialsof the accessions were sown in simple random block designin the field at NBPGR field experimental site in 2007.
Total genomic DNA was extracted from leaf samples. 10SSR primers reported by Dixit and Swain, 2005 were used forthis study (Table 2). PCR reactions were performed with thereaction mixture of 50ng template DNA, 10pmol of both forwardand reverse primers, 2.5 µl of 10X PCR buffer (10mM Tris-HCl(pH-8.0); 50mM KCl, 1.5mM MgCl2), 1.0U of Taq DNApolymerase, 0.2mM dNTPs. The thermal profile used for PCRamplification comprised an initial denaturation step at 94ºCfor 2 minutes; denaturation step at 94ºC for 45 secondsfollowed by primer annealing at 55ºC for 45 seconds andelongation at 72ºC for 45 seconds. After29 cycles, the profileis terminated with final extension step at 72 ºC for 1 minute.The temperature profile is same for all primers used under thisstudy including primer annealing temperatures.3% Agarosegel is used and once the amplification is ensured on agarosegel the samples were then loaded on 10% Native PAGE gelsand 6% sequencing PAGE gels for better separation of thedifferent alleles. Native PAGE gels were stained with ethidiumbromide whereas sequencing PAGE gels were silver stainedto get the results.

KIRANMAYI et al., Assessment of Genetic Diversity in Sesame (Sesamum indicum L.) 711
Morphological variations : Among the accessions of S.indicum was accounted for 13 quantitative characters;capsules (per leaf axil, per plant and length), leaf length andwidth, plant height, branches per plant, internode length,nodes per main stem, leaves per plant, flowers per plant, seedweight, seed yield and 2 qualitative characters (seed colorand flower color). Diversity study has been conducted usingEuclidian similarity matrix and matrix comparison plot. Theaccessions were assessed using the above mentioned 13quantitative traits. Data on these traits was noted at the levelof mean values of field observations from NBPGR fieldexperimental site. Phenotypic relationships were assessedusing Euclidean distance for continuous quantitative traits. Aphenotypic distance matrix P = {Puv}was computed for theaccessions and subjected to Sequential AgglomerativeHierarchial Non overlapping (SAHN) cluster analysis usingthe average linkage (UPGMA) clustering algorithym and matrixcomparision plot (MXCOMP). Cophenetic correlationcoefficients were estimated to assess the degree of agreement
between the observed proximity matrices and the resultantdendrograms.Molecular variations : The amplified products were scoredfor the presence or absence of alleles. The presence of allelewas scored as 1 and the absence of allele was scored as 0 fromhigher to lower molecular size products. Approximate molecularsize of the DNA fragments was determined based on themolecular size marker. Average number of alleles per primerwas calculated based on the total number of bands scoredamong the accessions.
Estimates of the similarity for the SSRs were based onthe Nei and Li’s, 1979; definition of the similarity :
Sij = 2a/ (2a+b+c)where, Sij is the similarity between two individuals, i
and j, a is the number of bands present in both i and j, b is thenumber of bands present in i and absent in j, c is the numberof bands present in j and absent in i. This is also called Dicesimilarity co-efficient (Dice, 1945). Using NTSYS PC softwareversion 2.1 (rolf, 2002) SAHN clustering was performed bythe UPGMA (Unweighted Pair-Group Average) method. Thedendrogram was created with the TREE option of NTSYS.The goodness of fit of clustering to the data was calculatedusing COPH and MXCOMP options. The phenotypic andgenotypic data was compared by using MXCOMP throughNTSYS software.
RESULTS AND DISCUSSION
In the present study, 23 germplasm accessions ofSesamum indicum L. representing diverse origins usingmorphological and molecular techniques were analyzed. Thedetails of germplasm collected for the study are listed in Table1. Variations were observed for the 13 quantitative and 2qualitative characters. Among the qualitative charactersflower color and seed color showed variations and among thequantitative characters capsule bearing capacity exhibited alot of variation. Generally in the Indian sesame collection theflower color is white with purple shading but variations incolor were observed in Swetha variety, Swetha til, Rajeshwari,YLM 17 and Chandana (white with a yellow tinge at corollatip).
Seed colour is usually white or black, but variationswere observed in few accessions. Brown seed color was seenin NSKMS 92, 73,221 and Chandana. Mixed seed color ie.,reddish brown color was seen in NSKMS-260, 246, and 97.This result is in agreement with the findings of Spandana, etal., 2011. The mean values of individual morphologicalcharacters among the accessions under 5 replications areshown in Table 3. The morphological variations depictingflower colour and nature of branching among the accessionsare given in figures 1 and 2.
The phenotypic character of capsules per plant was
Table 1. Accessions of Sesamum indicum collected fromdifferent locations of Andhra Pradesh used fordiversity analysis
S.No. Accession No. Location / District
1 SKN 37 Sitampet, Srikakulam
2 SKN 64 Srikakulam
3 NSKMS 73 Peyalaram, Medak
4 NSKMS 20 Zaheerabad, Medak
5 NSKMS 221 Tandur
6 IC 426465 Badhrachalam
7 NSKMS 246 Molakmamidi, Mahaboobnagar
8 NSKMS 267 Srisailam
9 NSKMS 123 Upperpally Thanda, Medak
10 NSJB 6704 Chintoor, Khammam
11 NSKMS 92 Kashimpur
12 YLM 17* Yellamanchali. Visakhapatnam
13 Swetha Jagityal, Khammam
14 YLM 11* Yellamanchali. Visakhapatnam
15 IC 426466 Badhrachalam, Khammam
16 SKN 56 Srikakulam
17 NSKMS 260 Vottuvarlapally
18 NSKMS 55 Chilemamidi
19 Swetha Til* Jagityal, Khammam
20 NSKMS 142 Upperpally Thanda, Medak
21 NSKMS 97 Ippapally, Medak
22 Rajeswari* Jagityal, Khammam
23 Chandana* Jagityal, Khammam
24 NSKMS 261 Vottuvarlapally, Mahaboobnagar
25 SKN 49 Sitampet, Srikakulam

712 Trends in Biosciences 6 (6), 2013
Fig 1: Field observations of Sesamum indicum L. in naturalconditions. a) Plant grown in the field in NBPGR,Hyderabad. b) Natural stand of S. indicum crop in thefield of NBPGR c) Pod d) Flower
Fig 2. Morphological variations among different accessions ofS. indicum. a) Bushy (white arrow) and linear type(black arrow) of plants of S. indicum.b) White flowercolor with yellow tinge c) Purple flower color d) Whiteflower color with purple tinge seen at the tip
found to be highest for YLM 17 (53.0) and the lowest for YLM11 (1) and the other accessions were in the range between thetwo values. NSKMS-55 had the highest capsule length of3.26 cm and YLM 11 the least value of 0.5 cm. Plant height wasmore in Chandana (93.6cm) and least in NSKMS 92 (56.6 cm).Leaf length was highest in NSKMS-260 (14.02 cm) and lowestin SKN-64 (8.56 cm). Leaf width was highest in the accession
NSKMS 260 (8.84 cm) and lowest in NSKMS 123 (2.4 cm).Largest number of branches were observed in NSKMS 267(16.0) and smallest in accession
NSKMS 97 (4.0). Internodal length was highest inNSKMS 246 (9.18 cm) and least in IC 426466 (4.5cm). Thehighest number of nodes per main stem was observed in theaccession NSKMS 221 (22.0) and least in NSKMS 246 (7.0).The largest number of leaves per plant was observed inNSKMS 267 (135) and smallest in
NSJB 6704 (64.0). The number of flowers per plant waslargest in NSKMS 73 (28) and smallest in NSKMS 92 (4.0).The maximum seed weight was observed in the accessionSwetha (0.346 g) and the minimum in NSKMS 97 (0.20g). Seedyield was maximum in Swetha with 11.16g and minimum wasseen in 3 accessions i.e., IC426465, YLM 11 and NSKMS 246(0.15gm).
The accessions showed large differences in case ofquantitative characters like capsule per plant, leaf width,branches per plant, internode length, nodes per main stem,leaves per plant, flowers per plant, seed yield and qualitativecharacters like flower and seed colours. Much variation is notseen in other quantitative characters like capsules per leafaxil, capsule length, plant height, leaf length and seed weight.The phenotypic differences may be due to genetic diversitywhich may in turn be due to allelic diversity.
Cluster analysis was carried out for the variousmorphological characters among the accessions based onEuclidian genetic identity (Fig 3). Two major clusters wereobserved with only one accession (NSKMS 97) in Cluster I
Fig 3. Cluster diagram of 23 accessions of S. indicummorphological data based on Euclidean genetic identity.
Coefficient 0.73 2.22 3.70 5.19 6.67
10CH
NSKMS-142 NSKMS-92 NSKMS-55 NSKMS-73 NSKMS-20 Nsjb-6704 IC-426466
NSKMS123 YLM-17
SWETHA SWETHA TIL CHANDANA NSKMS-221
RAJESWARI IC-426465
SKN-64 NSKMS-267 NSKMS-260
SKN-56 YLM-11
NSKMS-246 SKN-37
NSKMS-97

KIRANMAYI et al., Assessment of Genetic Diversity in Sesame (Sesamum indicum L.) 713
and all the remaining accessions in Cluster II at 30 % similaritylevel. Cluster II was again divided into two sub-clusters inwhich five accessions (NSKMS 260, SKN 56, YLM-11, NSKMS246, and SKN 37) were placed in sub-cluster I and remainingin sub-cluster II at 50 % similarity level. Sub-cluster I wasagain subdivided into two groups. and sub-cluster II was
also sub-divided into two groups with a similarity of 60 %.The similarity coefficient value ranged from 0.2-0.7. Matrixcomparison of the dendrogram gave a correlation coefficientvalue of r = 0.79 (Fig 4 and Table 4). Morphological dataindicated considerable phenotypic variations of S. indicumas the second cluster depicts lot of sub clusters which are incongruence with the visual observations too (Table 3; Fig. 3).
It was observed that the cluster analysis placed theaccession NSKMS 97 into a group by itself separated fromthe other accessions. It could be mostly due to differencescaused by environmental, geographical and edaphic factors.Some of them may be climatic conditions like rainfall, moisturelevels and soil conditions. Except for the morphologicaldifference of NSKMS 97 accession which was influencedwith the geographical location rest all accessions were placedin one cluster as NSKMS 97 is collected from Ippapally (MedakDistrict) which is distant from collection areas of remainingaccessions. The cluster analysis based on agro-morphologicalcharacters partially separated the germplasm based on theirgeographical origins. This result is in partial agreement withthe findings of Dixit and Swain, 2000, Gupta, et al., 2001 andSpandana, et al., 2011.
Correlation study has been done among themorphological (quantitative) parameters among all theaccessions of S. indicum. The results of correlation analysisare given in Table 5. In correlation analysis degrees of freedomis (n-2), hence the table value at 5% level and 1% level ofsignificance was 0.468 and 0.590 respectively.
When correlation analysis was carried out for seedyield and other morphological characters of the plant, it wasnoted that seed yield was significantly correlated with capsule/
Locus Gen Bank Accession No.
Primer sequence Repeat motif Ta (o C)
Size range of alleles (bp)
GBssr-sa-05 AY838904 F:5’-TCATATATAAAAGGAGCCCAAC-3’ R:5’-GTCATCGCTTCTCTCTCTTCTTC-3’
(CT)13 55 158-172
GBssr-sa-08 AY838905 F:5’-GGAGAAATTTTCAGAGAGAAAAA-3’ R:5’-ATTGCTCTGCCTACACAAATAAAA-3’
(AG)17 58 150-164
Sesame-09 AY838907 F:5’-CCCAACTCTTCGTCTATCTC-3’ R:5’-TAGAGGTAATTGTGGGGGA-3’
(CT)18 58 217-231
GBssr-sa-33 AY838909 F:5’-TTTTCCTGAATGGCATAGTT-3’ R:5’-GCCCAATTTGTCTATCTCCT-3’
(AG)24 54 263-275
GBssr-sa-72 AY838913 F:5’-GCAGCAGTTCCGTTCTTG-3’ R:5’-AGTGCTGAATTTAGTCTGCATAG-3’
(CT)9 61 289-307
GBssr-sa-108 AY838915 F:5’-CCACTCAAAATTTTCACTAAGAA-3’ R:5’-TCGTCTTCCTCTCTCTCC-3’
(GA)7, (GA)15
61 204-218
GBssr-sa-123 AY838916 F:5’-GCAAACACACATGCATCCCT-3’ R:5’-GCCCTGATGATAAAGCCA-3’
(TC)21, (TC)15
61 272-282
GBssr-sa-173 AY838919 F:5’-TTTCTTCCTCGTTGCTCG-3’ R:5’-CCTAACCAACCACCCTCC-3’
[(G)5CTAGT(G)3 (A)2]2
55 218-245
GBssr-sa-182 AY838921 F:5’-CCATTGAAAACTGCACACAA-3’ R:5’-TCCACACACAGAGAGAGCCC-3’
(AT)11,(TC)18,(TG)12 55 221-259
GBssr-sa-184 AY838922 F:5’-TCTTGCAATGGGGATCAG-3’ R:5’-CGAACTATAGATAATCACTTGGAA-3’
(TC)20 55 179-193
Table 2. Characteristics of 10 SSR markers used for analyzing the Sesame germplasm
Ta - Annealing temperature
Fig 4. Matrix comparison plot of 23 accessions exhibitingmorphological variations (Cophenetic correlation r =0.79)
L111.NTS-0.16 -0.07 0.01 0.09 0.18
LV.NTS
-0.20
-0.12
-0.04
0.04
0.12

714 Trends in Biosciences 6 (6), 2013
Accession no. No. C/L
No. C/P
C L PH LL LW No. B/P
I L N/MS No. L/P
No. F/P
S W SY Flower color Seed color
NSKMS 142 1 14.8 2.96 75.2 12.14 4 6 5.06 18.4 108.2 7.6 0.238 2.2 White+purple white NSKMS 260 1 1.8 2.06 63.3 14.02 8 .84 11.4 5.76 12.8 112 5 0.238 0.25 White+purple mixed IC 426465 1 1.4 2.08 69.8 10.3 4 .62 14 5.48 11.6 110.8 17.4 0.205 0.15 White+purple black YLM 11 1 1 0.5 60.1 10.6 5 .92 7.6 4.6 12.2 102.8 10.2 0.245 0.15 White+purple black NSKMS 92 1 6.4 3.22 56.6 10.54 4 .3 4.6 4.9 16.6 81.6 3.6 0.283 1.02 White+purple brown NSKMS 55 1 8.8 3.26 67.6 12.82 2 .44 11.2 5.82 13.8 117.8 11.6 0.22 1.32 White+purple white NSKMS 267 1 11.6 2.2 71.22 10.4 7 .74 15.6 5.6 19 135.4 28 0.257 1.62 White+purple black SKN 56 1 12 2.28 65.84 11.84 8 .1 5.6 5.4 11.4 79.6 14.6 0.255 1.44 White+purple black NSKMS 246 1 1.4 2.06 63 14 7 .18 11.8 9.18 6.8 45.8 4.6 0.205 0.15 White+purple mixed SKN 37 1 1.4 2.04 57.2 10.38 5 .1 15.12 6.44 9 55.8 9 0.3 0.299 White+purple black NSKMS 73 1 23 2.6 75.2 10.42 3 .68 9.8 4.6 16.4 74.2 28.2 0.227 2.99 White+purple brown NSKMS 20 1 25.8 2.68 76 11.44 2 .98 8.4 4.6 17.8 70.2 23.8 0.263 5.16 White+purple white SKN 64 1 17.82 2.54 68.6 8.56 2 .96 12.2 4.64 15.2 128 27.4 0.275 3.38 White+purple black
YLM 17 1 52.4 2.9 76.6 11.34 3 .88 8.2 4.92 17.2 103.2 20 0.248 10.48 White+purple+ yellow tinge black
Chandana 1 40.6 3.1 93.6 13.4 3 .26 8.4 5.14 24 129 27.8 0.318 10.96 White+light purple brown
NSKMS 221 1 28.6 2.72 88.2 12.92 3 .76 11.2 5.82 22.4 120.8 21.2 0.245 4.86 White+yellow tinge brown
IC 426466 1 38.2 2.6 63.4 9.56 2 .7 7.6 4.56 16.6 79 10 0.234 5.35 White+light purple black
NSKMS 97 1.2 28 3.16 87.4 13.6 3 .68 3.6 6.18 22.8 72.8 19.6 0.202 3.92 White+light purple mixed
NSJB 6704 1 13.8 2.68 61.4 11.22 3 .14 8 4.96 16.8 64.4 14.2 0.225 2.35 White+purple white Rajeswari 1 23.2 2.88 84.4 12.8 3 .24 7 6.82 22.4 118.6 14 0.314 5.1 White+yellow white NSKMS 123 1 32.6 2.9 80.2 10.34 2 .4 5.4 5.48 19 81.8 12.6 0.247 4.56 White+purple white Swetha 1 36 2.52 84.1 12.5 3 .3 9.2 5.1 15.6 111.2 10.4 0.346 11.16 White white Swetha til 1 31.6 2.64 86.2 12.7 3 .8 10.6 5 14.6 114.2 11.4 0.341 9.16 White white
Table 3. Mean of 5 replications of Phenotypic data for 23 accessions of Sesame
C/L: Capsules per leaf axil, C/P: Capsules per plant, CL: Capsule lengthPH: Plant height, LL: Leaf length, LW: Leaf width, B/P: Branches per plantIL: Internode length, N/MS: Nodes per main stem, L/P: Leaves per plantF/P: Flowers per plant, SW: Seed weight, SY: Seed yield.
Table 4. Morphological Similarity matrix of 23 accessions of S. indicum
1 2 3 4 5 6 7 8 9 10 11 12 13 14 15 16 17 18 19 20 21 22 23 1 0.00 2 0.421 0 3 0.388 0.39 0 4 0.5 0.43 0.37 0 5 0.251 0.48 0.44 0.5 0 6 0.253 0.42 0.31 0.56 0.35 0 7 0.489 0.45 0.3 0.52 0.58 0.46 0 8 0.34 0.31 0.36 0.37 0.34 0.42 0.46 0 9 0.644 0.45 0.56 0.64 0.64 0.58 0.7 0.49 0 10 0.511 0.42 0.29 0.44 0.46 0.43 0.5 0.4 0.4 0 11 0.352 0.56 0.33 0.51 0.42 0.38 0.4 0.38 0.7 0.46 0 12 0.292 0.55 0.37 0.52 0.38 0.35 0.46 0.38 0.7 0.49 0.11 0 13 0.425 0.59 0.28 0.51 0.48 0.39 0.33 0.49 0.8 0.50 0.26 0.33 0 14 0.314 0.56 0.44 0.59 0.44 0.38 0.47 0.43 0.74 0.58 0.27 0.23 0.36 0 15 0.403 0.65 0.57 0.74 0.61 0.46 0.51 0.59 0.86 0.76 0.41 0.36 0.49 0.31 0 16 0.315 0.51 0.42 0.62 0.52 0.34 0.39 0.49 0.71 0.6 0.34 0.31 0.41 0.29 0.19 0 17 0.30 0.57 0.41 0.49 0.29 0.39 0.54 0.41 0.71 0.46 0.29 0.26 0.36 0.26 0.52 0.44 0 18 0.57 0.76 0.75 0.84 0.67 0.65 0.77 0.67 0.84 0.82 0.62 0.57 0.75 0.59 0.57 0.57 0.66 0 19 0.26 0.47 0.34 0.45 0.22 0.3 0.49 0.32 0.59 0.37 0.24 0.2 0.38 0.34 0.51 0.41 0.21 0.62 0 20 0.25 0.51 0.47 0.62 0.45 0.32 0.49 0.47 0.65 0.60 0.41 0.35 0.48 0.33 0.29 0.19 0.43 0.53 0.39 0 21 0.23 0.59 0.44 0.57 0.33 0.37 0.55 0.42 0.7 0.54 0.28 0.22 0.4 0.24 0.39 0.34 0.21 0.59 0.26 0.28 0 22 0.22 0.46 0.37 0.52 0.42 0.29 0.47 0.4 0.65 0.52 0.33 0.27 0.4 0.21 0.33 0.24 0.31 0.59 0.33 0.26 0.25 0 23 0.24 0.44 0.35 0.53 0.44 0.27 0.44 0.4 0.64 0.51 0.33 0.29 0.4 0.24 0.33 0.23 0.35 0.61 0.35 0.28 0.29 0.72 0

KIRANMAYI et al., Assessment of Genetic Diversity in Sesame (Sesamum indicum L.) 715
Table 6. SSR markers showing polymorphism amongsesame germplasm accessions and their allelicdistribution
S.No. Primer No. of alleles PIC values
1.
2.
3.
4.
GBssr-sa-08
GBssr-sa-33
GBssr-sa-72
GBssr-sa-173
4
4
3
3
0.28
0.39
0.82
0.78
plant which in turn is correlated with capsule length, plantheight, nodes per main stem. Capsules per plant is the mostcontributing character for seed yield of sesame (Ibrahim, etal., 1983). Seed yield is also significantly correlated with plantheight which in turn is correlated with nodes per main stemand flowers per plant. Seed yield is also directly correlatedwith nodes/main stem which in turn were correlated withflowers per plant. It is also directly correlated with seed weight.All these characters appear to contribute directly or indirectlyto crop yield.
Survey of SSR markers for polymorphism:
PCR using SSR markers was checked for amplificationusing a random selection of 8 accessions. Of the 10 SSRmarkers screened for polymorphism 4 markers (Table 6) werefound to be polymorphic among the 23 germplasm accessions.The four polymorphic primers used for analysis revealed 14
alleles with an average of 3.5 alleles per locus. The maximumnumber of alleles detected was 4, with 2 primer pairs GBssr-sa-08 (Fig 6), GBssr-sa-33 and the minimum number of alleleswas 3 with the primer pairs GBssr-sa-173 and GBssr-sa-72.
Table 5. Correlation values among the morphological parameters of S. indicum 23 accessions
Table value at 5% level and 1% level of significance is 0.468 and 0.590 respectively.*Indicates 5% level of significance** Indicates 1% level of significance
No. C/L No. C/P C L PH LL LW No. B/P I L N/MS No. L/P No. F/P S W SY No. C/L 1.00 No. C/P 0.12 1.00 No. CL 0.23 0.51* 1.00 PH 0.29 0.70** 0.46 1.00
LL 0.28 0.05 0.20 0.42 1.00
LW -0.08 -0.57 -0.57 -0.41 0.22 1.00
No. B/P -0.38 -0.35 -0.35 -0.20 -0.14 0.30 1.00
IL 0.15 -0.34 -0.06 -0.05 0.53* 0.36 0.23 1.00 N/MS 0.33 0.63** 0.58* 0.72** 0.14 -0.49 0.42 -0.29 1.00 No. L/P -0.20 0.19 0.07 0.43 0.05 -0.05 0.25 -0.30 0.40 1.00 No. F/P 0.12 0.39 0.17 0.48* -0.25 -0.23 0.20 -0.33 0.50* 0.34 1.00
SW -0.29 0.33 0.10 0.35 0.04 -0.18 0.03 -0.19 0.18 0.34 0.01 1.00
SY 0.00 0.91** 0.39 0.72** 0.15 -0.49 0.14 -0.26 0.48* 0.26 0.29 0.68** 1.0
Fig. 5. PCR amplification of 23 accessions of S. indicum usingSSR primer GBssr-sa-08 on sequencing gel 1-23accessions are represented according to the Table 1
Fig. 6. Cluster diagram of 23 accessions of S. indicum basedon Dice similarity identity.
Coefficient0.67 0.75 0.84 0 .92 1.00
10MW
NSKMS-142
YLM-11
NSKMS-92
NSKMS-246
YLM-17
SWETHA
NSKMS-260
NSKMS-55
NSKMS-267
SKN-56 CHNDANA
NSKMS-73
NSKMS-20
NSKMS-221
RAJESWARI IC-426465
NSKMS-97
NSKMS-123
NSJB-6704
SKN-64 SKN-37 IC-426466
SWETHA TIL

716 Trends in Biosciences 6 (6), 2013
Polymorphic information content (PIC) value of each of theprimers is given in Table 6. The high level of polymorphismassociated with SSRs is to be expected because of the uniquemechanism responsible for generating SSR allelic diversityby replication slippage (Tautz and Renz, et al., 1984; Tautz, etal., 1986) rather than only by single nucleotide mutations orinsertions or deletions.
In general, the grouping of accessions was observed tobe based on geographical origin, with few exceptions. However,the absence of significant geographical association with someaccessions suggests, the movement of accessions from oneregion to the other. This leads to the historical derivations ofthe gene bank accessions inaccurate.
Inter Accession genotypic Variation
Pair wise similarity matrix based on DICE coefficient wascarried out for 23 accessions and it ranged from 0.1-1.0 (Table7). The dendrogram derived from UPGMA cluster analysisrevealed two major clusters, cluster I and cluster II with adissimilarity of 30 % and with several sub-clusters (Fig. 6).Cluster I consisted of two accessions (IC 426466 and Swethatil) which were genetically found to be very similar. Cluster IIconsisted of two sub clusters with a dissimilarity of 25% with
one accession (SKN 37) in separate sub-cluster and theremaining accessions were present in other sub-cluster. Thesecond sub-cluster was again divided into two groups with16 % dissimilarity with IC 426465, NSKMS 97, NSKMS 123,NSJB 6704 and SKN 64 accessions in one cluster and amongthese NSKMS-97 and 123 were genetically found to be verysimilar.
The second group was further divided into two subgroups with NSKMS 221 and Rajeswari in one cluster andremaining accessions in other cluster. The matrix comparisongave the correlation coefficient r = 0.77 (Fig. 7)
The 23 accessions were genetically and phenotypicallyfound to be highly diverse, their phenotypic distance rangedfrom 0.2-0.7 and the genetic distance ranged from 0.1-0.9. WhenMXCOMP was carried out between phenotypic and genotypicdata the correlation coefficient value (r) = 0.12 which wasshowing little congruency (Fig 8).
Genotypic diversity is very important in selecting theparents for hybridization programmes for identifying heteroticcrosses and obtaining desirable recombinants in thesegregating generations. Diversity estimates in cultivatedplants provide a ration-ale for conservation strategies andsupport the careful selec-tion of starting material for breeding
Table 7. Molecular Similarity matrix of 23 accessions of S. indicum
1 2 3 4 5 6 7 8 9 10 11 12 13 14 15 16 17 18 19 20 21 22 23 1 1 2 0.9 1 3 0.8 0.78 1 4 0.96 0.94 0.84 1 5 0.96 0.94 0.84 0.1 1 6 0.86 0.97 0.74 0.9 0.9 1 7 0.86 0.97 0.81 0.9 0.9 0.93 1 8 0.89 0.93 0.76 0.86 0.86 0.9 0.96 1 9 0.96 0.86 0.83 0.92 0.92 0.82 0.89 0.92 1 10 0.76 0.82 0.6 0.74 0.74 0.85 0.85 0.88 0.8 1 11 0.81 0.86 0.75 0.78 0.78 0.89 0.89 0.92 0.84 0.88 1 12 0.88 0.86 0.83 0.85 0.85 0.82 0.89 0.92 0.92 0.8 0.92 1 13 0.8 0.78 0.81 0.84 0.84 0.81 0.81 0.76 0.83 0.69 0.83 0.83 1 14 0.96 0.86 0.83 0.92 0.92 0.82 0.89 0.92 0.1 0.8 0.84 0.92 0.8 1 15 0.89 0.93 0.84 0.93 0.93 0.9 0.96 0.93 0.92 0.81 0.85 0.92 0.84 0.92 1 16 0.92 0.9 0.8 0.89 0.89 0.86 0.86 0.89 0.88 0.76 0.81 0.88 0.72 0.88 0.89 1 17 0.69 0.61 0.7 0.66 0.66 0.64 0.64 0.66 0.72 0.57 0.63 0.63 0.7 0.72 0.66 0.69 1 18 0.84 0.82 0.86 0.88 0.88 0.85 0.85 0.81 0.88 0.75 0.8 0.8 0.86 0.88 0.88 0.84 0.76 1 19 0.84 0.82 0.86 0.88 0.88 0.78 0.85 0.81 0.88 0.66 0.72 0.8 0.86 0.88 0.88 0.84 0.76 0.91 1 20 0.84 0.82 0.69 0.81 0.81 0.85 0.78 0.81 0.8 0.75 0.8 0.8 0.78 0.8 0.81 0.92 0.76 0.83 0.83 1 21 0.8 0.78 0.9 0.84 0.84 0.81 0.81 0.76 0.83 0.69 0.83 0.83 0.9 0.83 0.84 0.8 0.7 0.95 0.86 0.78 1 22 0.92 0.82 0.78 0.88 0.88 0.85 0.85 0.88 0.96 0.83 0.88 0.88 0.86 0.96 0.88 0.84 0.76 0.91 0.83 0.83 0.86 1 23 0.83 0.74 0.76 0.8 0.8 0.76 0.76 0.8 0.86 0.72 0.78 0.78 0.85 0.86 0.8 0.75 0.84 0.81 0.81 0.81 0.76 0.9 1

KIRANMAYI et al., Assessment of Genetic Diversity in Sesame (Sesamum indicum L.) 717
Table 9. Molecular Similarity matrix of 23 accessions of S. indicum
1 2 3 4 5 6 7 8 9 10 11 12 13 14 15 16 17 18 19 20 21 22 23 1 1 2 0.9 1 3 0.8 0.78 1 4 0.96 0.94 0.84 1 5 0.96 0.94 0.84 0.1 1 6 0.86 0.97 0.74 0.9 0.9 1 7 0.86 0.97 0.81 0.9 0.9 0.93 1 8 0.89 0.93 0.76 0.86 0.86 0.9 0.96 1 9 0.96 0.86 0.83 0.92 0.92 0.82 0.89 0.92 1 10 0.76 0.82 0.6 0.74 0.74 0.85 0.85 0.88 0.8 1 11 0.81 0.86 0.75 0.78 0.78 0.89 0.89 0.92 0.84 0.88 1 12 0.88 0.86 0.83 0.85 0.85 0.82 0.89 0.92 0.92 0.8 0.92 1 13 0.8 0.78 0.81 0.84 0.84 0.81 0.81 0.76 0.83 0.69 0.83 0.83 1 14 0.96 0.86 0.83 0.92 0.92 0.82 0.89 0.92 0.1 0.8 0.84 0.92 0.8 1 15 0.89 0.93 0.84 0.93 0.93 0.9 0.96 0.93 0.92 0.81 0.85 0.92 0.84 0.92 1 16 0.92 0.9 0.8 0.89 0.89 0.86 0.86 0.89 0.88 0.76 0.81 0.88 0.72 0.88 0.89 1 17 0.69 0.61 0.7 0.66 0.66 0.64 0.64 0.66 0.72 0.57 0.63 0.63 0.7 0.72 0.66 0.69 1 18 0.84 0.82 0.86 0.88 0.88 0.85 0.85 0.81 0.88 0.75 0.8 0.8 0.86 0.88 0.88 0.84 0.76 1 19 0.84 0.82 0.86 0.88 0.88 0.78 0.85 0.81 0.88 0.66 0.72 0.8 0.86 0.88 0.88 0.84 0.76 0.91 1 20 0.84 0.82 0.69 0.81 0.81 0.85 0.78 0.81 0.8 0.75 0.8 0.8 0.78 0.8 0.81 0.92 0.76 0.83 0.83 1 21 0.8 0.78 0.9 0.84 0.84 0.81 0.81 0.76 0.83 0.69 0.83 0.83 0.9 0.83 0.84 0.8 0.7 0.95 0.86 0.78 1 22 0.92 0.82 0.78 0.88 0.88 0.85 0.85 0.88 0.96 0.83 0.88 0.88 0.86 0.96 0.88 0.84 0.76 0.91 0.83 0.83 0.86 1 23 0.83 0.74 0.76 0.8 0.8 0.76 0.76 0.8 0.86 0.72 0.78 0.78 0.85 0.86 0.8 0.75 0.84 0.81 0.81 0.81 0.76 0.9 1
programs. The genetic diversity results from evolutionaryprocesses including mutation, recombination, naturalselection, genetic drift, and migration in the many eco-geographic niches. Human intervention has increased thediversity, but seed exchange during trade and migration tendsto reduce diversity among eco-geographic niches. Theassessment of genetic diversity is not only significant forcrop improvement but also for efficient management andprotection of germplasm resources. The immense geneticdiversity of traditional varieties of crops is the most directlyuseful and economically valuable part of global biodiversity.DNA fingerprinting approaches which are capable of analyzinglarge number of loci with extensive variability are theinformative source of genetic diversity. The interest is mostlydue to the genetic heterogeneity which limits the vulnerabilityto pests and diseases and secondly it provides an ample
Table 8: SSR markers showing polymorphism amongsesame germplasm accessions and their allelicdistribution
S.No. Primer No. of alleles PIC values
1.
2.
3.
4.
GBssr-sa-08
GBssr-sa-33
GBssr-sa-72
GBssr-sa-173
4
4
3
3
0.28
0.39
0.82
0.78
pol y I.NT S-0.22 -0.13 -0.04 0.04 0.13
p oly III .NT S
-0.10
-0.03
0.04
0.10
0.17
Fig. 7. Matrix comparision of molecular data of 23 accessionsof S. indicum
supply of allelic variation that can be used to create newfavorable gene combinations.
ACKNOWLEDGEMENT
I would like to thank for the provision of conductingbiochemical work with NMR (Oxford NMR, 6500) and GC(Thermo FOCUSS-6500) in Directorate of Oilseed Research(DOR). Also would like to acknowledge NBPGR, RajendranagarHyderabad for collaborating.

718 Trends in Biosciences 6 (6), 2013
L111.NTS-0.16 -0.07 0.01 0.09 0.18
poly I.NTS
-0.22
-0.13
-0.04
0.04
0.13
Fig 8. Matrix comparision of phenotypic and genotypic dataamong 23 different accessions of S. indicum
LITERATURE CITED
Ashri, A. 1998. Sesame breeding. Plant Breeding Reviews., 16: 179–228.
Bedigian, D., Smyth C. and Harlan J. 1986. Patterns of morphologicalvariation in sesame. Economic Botany., 40: 353-365.
Chakraborthy, G.S., Sharma, G. and Kaushik, K. N. 2008. SESAMUMINDICUM: A REVIEW. Journal of Herbal Medicine and Toxicology.,2 (2): 15-19.
Dice, L. R. 1945. Measures of the amount of ecological associationbetween species. Ecology; 26: 297-302.
Dixit, U.N. and Swain, D. 2000. Genetic divergence and heterosis in
sesame. Indian Journal of Genetics., 60: 213-219.
Geleta, M., Bryngelsson, T., Bekel E. 2008. Assessment of geneticdiversity of Guizotia abyssinica (L.f.) Cass. (Asteraceae) fromEthiopia using amplified fragment length polymorphism. PlantGenetic Resources Characterization Utilization., 6: 41 – 51.
Gupta, R. R., Parihar, B.M.S. and Gupta, P.K. 2001. Genetic diversityfor some metric characters in sesame(Sesamum indicum L.). CropResearch., 21: 350-354.
Ibrahim, A. F., Ahmed, D. A. E. and Sharief, S. A. 1983. Interrelationshipsand path-coefficient analysis for some characters in sesame(Sesamum indicum L.). Journal of Agronomy Crop Science., 152:454-459.
Kobayashi, T. 1991. Cytogenetics of sesame (Sesamum indicum). In:Chromosome engineering in plants: Genetics, breeding, evolution.(eds. Tsuchiya, T., Gupta, R.K.). Elsevier Science PublishingCompany Inc. Amesterdam. pp. 581-592.
Nei, M. and Li, W. H. 1979. Mathematical model for studying geneticvariation in terms of restriction endonucleases. Proceedings ofNational Academy of Science, USA; 76: 5269-5273.
Rholf, F. J. 2002. Numerical taxonomy and multivariate analysis system.Applied Biostatistics Inc; New York.
Spandana, B., Anuradha, G., Sivaraj, N., Sivaramakrishnan S. andSubramoniam, 2011. Determination of Genetic Variation in IndianSesame (Sesamum indicum) Genotypes for Agro-MorphologicalTraits. Journal of Research in Agricultural Science., 7 (2): 88-99.
Tautz, D. and Renz, M. 1984. Simple sequences are ubiquitous repetitivecomponents of eukaryotic genomes. Nucleic Acids Research., 12:4127–4137.
Tautz, D., Trick, M. and Dover, G. A. 1986. Cryptic simplicity in DNAis a major source of genetic variation. Nature., 322: 652-656.
Toan, D.P., Tri, M.B., Gun, W., Tuyen, C.B., Arnulf, M. and Anders,S.C. 2009. A study of genetic diversity of sesame (Sesamum indicumL.) in Vietnam and Cambodia estimated by RAPD makers. GeneticResources and Crop Evolution., 56: 679-690.
Recieved on 17-09-2013 Accepted on 13-10-2013

Trends in Biosciences 6 (6): 719-722, 2013
Estimation of Heterosis for Yield and Yield attributing traits in Diallel Crosses ofMaizeDHAIRYASHIL M. LANGADE* J. P. SHAHI, PRABHAT KUMAR AND AMITA SHARMA
Department of Genetics and Plant Breeding, Institute of Agricultural Sciences,Banaras Hindu University, Varanasi-221005, (U.P.)*email: [email protected]
ABSTRACT
The present investigation was undertaken to estimateheterobeltiosis and standard heterosis in maize during Rabi2011-12 and Kharif 2012 at the Agricultural Research Farm,Institute of Agricultural Sciences, Banaras Hindu University,Varanasi, with a view to identify combinations expressing highhybrid vigour. Ten parents were crossed in a diallel fashionand were planted in a RCBD along with parents, reciprocalsand their ninety F1 combinations. Observations were recordedfor 8 yield and yield attributing traits. The analysis of variancerevealed that mean squares due to progenies and parents werehighly significant for all the traits. Heterosis over BP for PYvaried from +30.79% to +242.73% in Rabi and from -14.84% to+300.00% in Kharif. Eighty nine hybrids in Rabi and 80 hybridsin Kharif showed significant positive heterosis. P4 x P2, P10 x P7,P10 x P8 and P5 x P1 were the top performers for plant grainyield. Parental lines P1, P2, P3, P7, P8 and P10 would be desirablelines as donor to get high yield.
Key words Diallel cross; Heterobeltiosis; Maize (Zea mays L.);Standard heterosis
Maize (Zea mays L.) is a versatile and most widelydistributed crop, grown in varied climatic conditions; beingthe highest productive crop among cereals hence called as‘cereal queen’. Major growing countries are USA, China,Mexico, Brazil, Argentina and India etc. (FAO, 2007). Being apotential crop in India, maize occupies an important place as asource of human food (25%), animal feed (12%), poultry feed(49%), industrial products mainly as starch (12%) and 1%each in brewery and as seed .
Heterosis is a basic tool for improved production ofcrops in the form of F1 hybrids. Yield of many crops have beenboosted through widely using and exploiting heterosis byplant breeders. Therefore, the heterotic studies can providethe basis for the exploitation of valuable hybrid combinationsin future breeding programmes and their commercial utilization.Hybrid maize production has been successfully used bygrowers in each area. An important prerequisite for thesuccessful production of hybrid varieties is the presence ofsufficient hybrid vigour. Occurrence of heterosis inconsiderable quantities for grain yield and its variouscomponents in F1 maize populations has been reported by
several workers (Roy, et al., 1998; Paul and Debnath, 1999;Tollenaar, et al., 2004; Rokadia and Kaushik, 2005; Muraya, etal., 2006). Heterotic effects of varying degrees in differentcrosses of grain yield and other traits viz., plant height, earheight, kernels ear-1, 1000-grain weight and grain yield kg ha-
1 have also been reported by Soengas, et al., 2006 and Ojo,2007. The hybrid must be superior both quantitatively as wellas qualitatively.
Heterosis is the amount by which a hybrid exceeds itsmid parent value or its better parent (heterobeltiosis). Theterm heterobeltiosis was also estimated in terms of per centincrease or decrease of the F1 hybrid over its better parent.Both heterobeltiosis and standard heterosis were determinedas percent increase (+) or decrease (-) of F1 over better parent(F1-BP/BP x 100) parent as well as over standard checks (F1-SH/SH x100) respectively. Therefore, the present studies wereundertaken to estimate the standard heterosis andheterobeltiosis effects in maize.
MATERIALS AND METHODS
The present investigation was carried out during Rabi2011-12 and Kharif 2012 season at Agricultural Research Farmof the Institute of Agricultural Sciences, Banaras HinduUniversity, Varanasi. The experimental material consisted often inbreds of maize obtained from the All India Co-ordinatedMaize Improvement Project, Varanasi. A detail of ten inbredsis presented in Table 1.
Ten inbreds were sown in a randomized complete blockdesign with three replications. Each entry was sown as singlerow of 4 meter length with row-to-row and plant-to-plantdistance of 60 cm and 20 cm respectively. Initially two seedsper hill were sown and later on one plant was thinned tomaintain single plant per hill. Two border rows were alsoplanted to avoid the border effect. The crop was raised as perthe recommended package of practices. Observations viz.,plant height (PH) (cm), ear height (EH) (cm), ear length (EL)(cm), ear diameter (ED) (cm), number of kernels row-1 (KR),number of kernel rows ear-1 (KRE), plant grain yield (PY) (g)and plot yield (PtY) (kg) were recorded on ten plants selectedrandomly from each inbred in each replication. Later on it was

720 Trends in Biosciences 6 (6), 2013
adjusted at 15% moisture and 80% shelling. Moisturepercentage was measured by taking kernel samples from thebulk and recorded by electronic moisture meter. The model foranalyses of variance included seasons, replications, genotypeand genotype by season interaction. An analysis using meansover replications allowed the generation of entry least squaremeans. For each trait, inbred means were the average valuescalculated from all the replications in both seasons. Thestatistical analysis was done by using Statistical software‘Indostat’ Version 8.5, developed by Windostat Services,Hyderabad.
RESULTS AND DISCUSSION
Exploitation of heterosis or hybrid vigour is one of theimportant methods of crop improvement, adopted particularlyin the case of cross pollinated crops. This aspect of heterosisattracted the attention of plant breeders due to its conspicuouseffect on economic characters including grain yield as well asmaturity and quality traits. This concept of heterosis has beensuccessfully utilized in many cross pollinated crops amongwhich maize is a major one. The analysis of variance revealedthat mean squares due to progenies and parents were highlysignificant for all the traits. The per cent heterobeltiosis andstandard heterosis expressed by the F1 hybrids over thecommercial hybrid two check varieties, Bio-9681 and HQPM-1 for yield and different yield contributing characters arepresented. The degree of heterosis in F1 hybrids varied fromcharacter to character or from cross to cross.
Negative heterosis is desirable for PH and EH whichhelps for developing short statured plant leading to lesslodging. A perusal of data showed that heterobeltiosis rangedfrom +7.06% (P10 x P3) to +53.48% (P3 x P6) in Rabi and from+4.52% (P5 x P7) to +49.93% (P5 x P1) in Kharif. Eighty eight inRabi and 87 hybrids in Kharif out of 90 cross combinationsexhibited significant positive heterosis for PH in both theseasons over BP are in conformity with the findings of Devi,et al., 2007 who reported varying magnitudes of heterosis forPH in maize. None of the cross combinations showed significantnegative heterosis for PH over BP in both the seasons. Themagnitude of heterosis ranged from -22.37% (P8 x P10) to+12.16% (P3 x P6) in Rabi and from -17.84% (P10 x P1) to +13.03%(P3 x P7) in Kharif for SH1. Twenty four hybrids in Rabi and 49hybrids in Kharif exhibited significant negative heterosis. Themagnitude of heterosis ranged from -14.58% (P8 x P10) to+23.41% (P3 x P6) in Rabi and from -7.57% (P10 x P2) to +27.16%(P3 x P7) in Kharif for SH2. Four and 2 hybrids were observedto show significant negative heterosis for PH in Rabi andKharif respectively.
The magnitude of heterosis ranged from -5.46% (P10 xP3) to +103.25% (P8 x P4) in Rabi and from -11.09% (P10 x P4) to
+69.53% (P5 x P4) in Kharif for BP. Eighty seven hybrids inRabi and 71 hybrids in Kharif recorded significant positiveheterosis over BP is in conformity with the findings of Katna,et al., 2005. None of the cross combinations showed significantnegative heterosis for EH over BP in both the seasons.Magnitude of heterosis ranged from -26.87% (P10 x P3) to+24.83% (P3 x P5) in Rabi and from -11.09% (P10 x P4) to 69.53%(P5 x P4) in Kharif over SH1. Similarly, it varied from -18.84%(P10 x P3) to +38.53% (P3 x P5) in Rabi and from -10.66% (P10 xP4) to +42.38% (P3 x P8) in Kharif for SH2. Sixteen in Rabi and17 hybrids in Kharif demonstrated significant negativeheterosis for EH over SH1 and 4 in Rabi and none of thehybrids in Kharif recorded negative heterosis over SH2. Aliet al. (2011) and Yao et al. (2011) concluded that selection forplant height and its components would be effective in earlygeneration and improvement in these traits will be promisingto develop new varieties with desirable traits, most importantlylodging resistance.
The magnitude of heterobeltiosis for EL varied from+11.06% (P4 x P9) to +58.55% (P3 x P7) in Rabi and from -40.88% (P10 x P8) to +79.63% (P6 x P2) in Kharif. All crosscombinations in Rabi and 77 hybrids in Kharif exhibitedsignificant positive heterosis for EL over BP which is desirable.The magnitude of heterosis over SH1 varied from -24.19% (P8x P10) to 2.79% (P3 x P7) in Rabi and from -46.39% (P10 x P8) to+12.93% (P3 x P1) in Kharif. Similarly, heterosis over SH2 variedfrom -15.30% (P8 x P10) to +14.84% (P3 x P7) in Rabi and from -37.12% (P10 x P8) to +32.47% (P3 x P1) in Kharif. Fifty three inRabi and 67 hybrids out of 90 crosses in Kharif exhibitedsignificant negative heterosis over SH1, whereas, 6 in Rabiand 14 hybrids in Kharif showed significant positive heterosisover SH2.
The magnitude of heterosis over BP for ED varied from+3.80% (P2 x P6) to +34.86% (P10 x P6) in Rabi and from +4.59%(P7 x P10) to +62.88% (P5 x P4) in Kharif. Eighty six in Rabi and78 hybrids in Kharif exhibited significant positive heterosisfor ED. The magnitude of heterosis varied from -14.94% (P2 xP9) to +5.19% (P1 x P5) in Rabi and from -29.18% (P10 x P8) to+14.27% (P3 x P1) in Kharif over SH1. A total of 37 and only 2hybrids in Rabi and Kharif respectively demonstratedsignificant negative heterosis over SH1. Magnitude ofheterosis ranged from -1.61% (P2 x P9) to +21.67% (ISO-2 x P5)in Rabi and from -19.91% (P10 x P8) to +29.22% (P3 x P1) inKharif over SH2. Sixty four hybrids in Rabi and 51 hybrids inKharif, out of 90 crosses exhibited significant positiveheterosis for ED.
The magnitude of heterobeltiosis for K/R varied from+5.50% (P8 x P10) to +120.31% (P7 x P3) in Rabi and from -32.24% (P8 x P10) to +107.22% (P2 x P3) in Kharif. Eighty nine inRabi and 62 hybrids in Kharif exhibited significant positive

LANGADE et al., Estimation of Heterosis for Yield and Yield attributing traits in Diallel Crosses of Maize 721
heterosis over BP. It varied from -26.20% (P5 x P4) to +20.77%(P7 x P3) in Rabi and from -40.00% (P9 x P1) to +24.65% (P2 x P3)in Kharif for SH1. Seventeen in Rabi and 33 hybrids in Kharifshowed significant positive heterosis over SH1. It varied from-25.29% (P5 x P4) to +22.25% (P7 x P3) in Rabi and from -36.40%(P9 x P1) to +32.12% (P2 x P3) in Kharif for SH2. Six and 20hybrids in Rabi and Kharif respectively demonstratedsignificant positive heterosis over SH2.
The magnitude of heterobeltiosis for KR/E varied from -18.40% (P8 x P1) to +24.44% (P6 x P3) in Rabi and from -10.16%(P8 x P6) to +70.44% (P1 x P5) in Kharif. Thirteen in Rabi and 59hybrids in Kharif showed significant positive heterosis. Itvaried from -17.12% (P3 x P9) to +18.02% (P5 x P1) in Rabi andfrom -12.62% (P8 x P6) to +33.50% (P1 x P5) in Kharif over SH1.Seven in Rabi and 38 hybrids in Kharif recorded significantpositive heterosis over SH1. The magnitude of heterosis overSH2 varied from -13.21% (P3 x P9) to +23.58% (P5 x P8) in Rabiand from -8.16% (P8 x P6) to +40.31% (P1 x P5) in Kharif. Nineteenin Rabi and 62 hybrids in Kharif showed significant positiveheterosis over SH2.
The magnitude of heterobeltiosis for PY varied from+30.79% (P4 x P2) to +242.73% (P10 x P7) in Rabi andfrom -14.84% (P10 x P8) to +300.00% (P5 x P1) in Kharif. Eightynine hybrids in Rabi and 80 hybrids in Kharif showedsignificant positive heterosis over BP for PY which is inconformity with the findings of Alam, et al., 2008 who estimatedpositive heterosis for grain yield and its contributingcharacters in diallel crosses of maize. The magnitude ofstandard heterosis over SH1 varied from -36.76% (P2 x P9) to+24.88% (P10 x P7) in Rabi and from -50.00% (P8 x P9) to +16.39%(P1 x P2) in Kharif respectively. Only two hybrids inRabi and one hybrid in Kharif exhibited significant positiveheterosis over SH1. The magnitude of heterosis over SH2varied from -20.08% (P2 x P9) to +57.81% (P10 x P7) in Rabi andfrom -39.00% (P8 x P9) to +42.00% (P1 x P2) in Kharif. A total of22 hybrids in Rabi and 48 hybrids in Kharif demonstratedsignificant positive heterosis for PY is in consonancewith the findings of Langade, et al., 2012 and Singh, et al.,2012.
The magnitude of BPH for PtY ranged from +48.28% (P8x P10) to 233.65% (P5 x P7) in Rabi and from +2.22% (P10 x P8) to+673.26% (P4 x P8) in Kharif. All cross combinations in Rabiand 82 hybrids in Kharif exhibited significant positiveheterosis for PtY. Magnitude of standard heterosis over SH1ranged from -32.86% (P8 x P10) to +19.35% (P10 x P9) in Rabi andfrom -55.37% (P6 x P8) to +17.18% (P1 x P3) in Kharif. Two andfive hybrids in Rabi and Kharif respectively showedsignificant positive heterosis over SH1. The magnitude ofstandard heterosis over SH2 varied from -10.82% (P8 x P10) to+58.51% (P10 x P9) in Rabi and from -54.46% (P6 x P8) to +19.56%
(P1 x P3) in Kharif. Thirty eight hybrids in Rabi and only 5hybrids in Kharif demonstrated significant positive heterosisfor PtY over SH2. These results were in consonance with thefindings of several workers viz., Singh, et al., 2004, Sandhu, etal., 2006, Ali, et al., 2007, Renuka, et al., 2008 and Mandal, etal., 2009 who in their experiments came to the same conclusionas cited above.
Thus, it can be concluded from the present results thatparental lines P1, P2, P3, P7, P8 and P10 would be desirable linesas donor to get high yield as they were involved in maximumnumber of heterotic crosses of F1 hybrids either as male orfemale, thus indicating that these may be used in futurebreeding programmes.
LITERATURE CITED
Alam, A.K.M.M., S. Ahmed, M. Begum and M.K. Sultan, 2008. Heterosisand combining ability for yield and its contributing characters inmaize. Bangladesh J. Agric. Res., 33(3):375-379.
Ali, F., H. Rahman, N.F., Durrishahwar, M. Munir and U. Hidayat,2011. Genetic analysis of maturity and morphological traits underMaydis leaf blight (MLB) epiphytotics in maize (Zea mays L.).ARPN J Agric Biol Sci., 6:13-19.
Ali, G., A. Ishfaq, A.G. Rather, S.A. Wani, Zaffar, Gul and M.I.Makhdoomi, 2007 Heterosis and combining ability for grain yieldand its components in high altitude maize inbreds (Zea mays L.).Indian J. of Genetics and Plant Breeding, 67(1):81-82.
Devi, B., N.S. Barua, P.K., Barua and P. Talukar, 2007. Analysis of midparent heterosis in a variety diallel in rainfed maize. Indian J.Genet. and Plant Breed., 67(2):67-70.
Katana, G., H.B. Singh, J.K., Sharma and S.K., Guleria, 2005. Heterosisand combining ability studies for yield and its related traits in maize(Zea mays L.). Crop Res., 30(2):221-226.
Langade, D.M., J.P. Shahi and Ajay, Singh, 2013. Appraisal of heterosisfor yield and yield attributing components in maize (Zea mays L.),Biolife, 1(3):123-129.
Mandal, R.K., A, Kumar, P. Parmhansh and S.A., Akhtar, 2009.Heterosis for yield and yield components in maize (Zea mays L.).Environment and Ecology, 27(3A):1395-1400.
Muraya, M.M., C.M., Ndirangu and E.O., Omolo, 2006. Heterosis andcombining ability in diallel crosses involving maize (Zea mays) S1lines. Aust. J. Exp. Agric., 46(3):387–394.
Ojo, G.O.S., D.K., Adedzwa and L.L., Bello, 2007. Combiningability estimates and heterosis for grain yield and yieldcomponents in maize (Zea mays L.). J. Sust. Dev. Agric. & Envir.,3:49-57.
Paul, K.K. and S.C. Debnath, 1999. Heterosis and combining ability forgrain yield and its components in maize (Zea mays L.). BangladeshJ. Agri., 24:61-68.
Renuka, T., M. Kumar, H.S. Prodhan and N.B., Singh, 2008. Assessmentof heterosis for yield and its components along with oil contentunder two different environments in maize. Indian Agriculturist,52(3/4):191-196.
Rokadia, P. and S.K., Kaushik, 2005. Exploitation of combining abilityfor heterosis in maize (Zea mays L.). In: Pixley, K. and S.H. Zhang

722 Trends in Biosciences 6 (6), 2013
(ed). Proc. 9th Asian Reg.Maize Workshop. Beijing, China,September 5-9, pp. 89-91.
Roy, N.C., S.U., Ahmed, S.A., Hussain, and M.M., Hoque, 1998. Heterosisand combining ability analysis in maize (Zea mays L.). BangladeshJ. Pl. Breed. Genet., 11:35-41.
Sandhu, S.S., H., Singh and V.K., Saxena, 2006. Detection of promisinginbred lines of maize from new germplasm for heterotic breeding indifferent seasons. Crop Improvement, 33(1):25-30.
Singh, A.K., J.P., Shahi and J.K., Singh, 2004. Heterosis in maize. J. ofAppl. Biology, 14(1):1-5.
Singh, P.K., A.K., Singh, J.P., Shahi and R., Ranjan, 2012. Combining
ability and heterosis in Quality Protein Maize. The Bioscan, 7(2) :337-340.
Soengas, P., B. Ordas, R.A. Malvar, P. Revilla and A. Ordas, 2006.Combining abilities and heterosis for adaptation in flint maizepopulations. Crop Sci., 46(6):2666-2669.
Tollenaar, M. and E.A., Lee, 2002. Yield potential, yield stability andstress tolerance in maize. Field Crop Res., 75(2-3):161-169.
Yao, J.B., H.X., Ma, L.J., Ren, P.P., Zhang, X.M., Yang, G.C., Yao, P.Zhang and M.P., Zhou, 2011. Genetic analysis of plant height andits components in diallel crosses of bread wheat (Triticum aestivumL.). Aust J Crop Sci., 5:1408-1418.
Recieved on 24.09.2013 Accepted on 17.10.2013

Trends in Biosciences 6 (6): 723-731, 2013
Study of Variability, Diversity and Association Analysis of Chickpea (Cicer arietinumL.) Germplasm under Normal and Late Sown Condition of Chhattisgarh State.M. K. PURI, P.L. JOHNSON* AND R.N. SHARMA
Department of Genetics & Plant Breeding, Indira Gandhi Krishi Vishwavidyalaya, Raipur 492 012,Chhattisgarh, India.*email: [email protected]
ABSTRACT
The experimental material comprised of 42 genotypes ofchickpea grown under two different dates of sowing viz. 15th
November, 2005 and 1st December, 2005. Results of variabilityanalysis revealed sufficient variability for most of the charactersstudied viz. days to first flowering, days to 50 per cent flowering,days to maturity, 100 seed weight, biological yield, harvest indexand seed yield per plant. High heritability coupled with highgenetic advance as percentage over mean were observed fordays to first flowering, days to maturity, pods per plant, seedsper pod, 100 seed weight and seed yield per plant under firstdate of sowing whereas, for days to first flowering, days tomaturity and 100 seed weight under second date of sowing.Correlation coefficient analysis revealed that seed yield perplant was positively correlated with harvest index and biologicalyield under both dates of sowing. Path coefficient analysis ofvarious characters towards seed yield revealed that themaximum positive direct effect on seed yield was exhibited bybiological yield and harvest index under first and second dateof sowing, respectively. Whereas, path coefficient analysis ofvarious characters towards 100 seed weight revealed that themaximum positive direct effect on 100 seed weight was exhibitedby biological yield and days to 50 per cent flowering under firstand second date of sowing, respectively. Cluster analysis wascarried out for both the environments separately and thegenotypes were grouped into 6 and 3 clusters under first andsecond date of sowing, respectively. The intra and inter clusterdistances were computed for all the clusters. The resultsindicated that the genotypes belonging to clusters possessinghigh inter cluster distance between them may be used in thefuture hybridization programmes for the development of highyielding chickpea genotypes.
Key words Correlation, Genetic diversity, Path analysis,Variability.
Chickpea is the prime pulse crop of India, grown in anarea of 8.75 million hectares with the annual production of8.25 million tonnes, reflecting very low productivity (943 kg/ha). In Chhattisgarh, it is cultivated in around 0.324 millionhectare, with an average productivity of 1020 kg/ ha, due toits cultivation under rainfed ecosystem and particularly inrice and soybean fallows. Hence, there is urgent need ofselection of varieties suitable for this situation. Geneticvariability is the most essential requirement for any successfulcrop improvement programme. Genetic diversity for selection
of suitable and diverse genotypes should be based on soundstatistical procedure, such as D2 statistic and non hierarchicalEuclidean clusters analysis. The procedure characterizesgenetic divergence using the criterion of similarity ordissimilarity based on the aggregate effects of a number ofagronomical important characters. Correlation coefficientanalysis measures the mutual relationship between variousplant characters and determines the component characterson which selection can be based for genetic improvement inyield. The path analysis helps in partitioning the correlationcoefficient of yield components with seed yield into its directand indirect effects to ensure the actual contribution of anattribute as well as its influence through other traits
MATERIALS AND METHODS
Present investigation was carried out at Research Farm,Department of Plant Breeding and Genetics, Indira GandhiAgricultural University, Raipur (Chhattisgarh). Theexperimental material comprised of 42 genotypes of chickpeagrown under two different dates of sowing. The experimentalmaterial consisted of 42 genotypes of chickpea out of which40 genotypes were received from NBPGR, New Delhi and twogenotypes viz. JG 11 and JG 315 were obtained from IGKV,Raipur (Table 1). A randomized complete block design withtwo replications for each sowing date was used to conductthe experiment. Each entry was sown in one row of 4 m length.Entries were sown continuously with row-to-row spacing of30 cm. N, P and K were applied in the ratio of 20:50:20 kg ha-1
as basal, in the furrows. Two environments, viz., normal andlate sown were created by sowing the crop on different datesas follows: viz., 15th November, 2005 and 1st December, 2005.The soil type of experiment field was clayey loam andrecommended package of practices were adopted to raise thecrop. The various genetic parameter viz., genotypic andphenotypic coefficients of variation, heritability estimate inbroad sense and expected genetic advance were estimatedand selection indices were formulated as suggested by Burton,1952. Genetics diversity analysis was done by the formulaproposed by Mahalanobis, 1936. Mahalanobis D2 andclustering of genotypes was done according to Tocher’smethod as described by Rao, 1952. The correlation coefficientanalysis was done by the formula proposed by Miller, et al.,1958. The path analysis helps in partitioning the correlation

724 Trends in Biosciences 6 (6), 2013
Table 1. List of chickpea accessions
Table 2 a. Estimates of genetic parameters of variation under first date of sowing (E1)
S. No. Accession number Source S. No. Accession number Source
1 2 3 4 5 6 7
8 9 10 11 12 13 14 15 16 17
18 19 20 21
JG 11 IC 268996 IC 269009 IC 269011 IC 269015 IC 269017 IC 269018
IC 269025 IC 269028 IC 269032 IC 269034 IC 269041 IC 269043 IC 269045 IC 269047 IC 269049 IC 269053
IC 269055 IC 269061 IC 269081 IC 269086
IGKV, Raipur NBPGR, New Delhi NBPGR, New Delhi NBPGR, New Delhi NBPGR, New Delhi NBPGR, New Delhi NBPGR, New Delhi
NBPGR, New Delhi NBPGR, New Delhi NBPGR, New Delhi NBPGR, New Delhi NBPGR, New Delhi NBPGR, New Delhi NBPGR, New Delhi NBPGR, New Delhi NBPGR, New Delhi NBPGR, New Delhi
NBPGR, New Delhi NBPGR, New Delhi NBPGR, New Delhi NBPGR, New Delhi
22 23 24 25 26 27 28
29 30 31 32 33 34 35 36 37 38
39 40 41 42
IC 269099 IC 269104 IC 269120 IC 269121 IC 269129 IC 269132 IC 269145
IC 269160 IC 269186 IC 269187 IC 269216 IC 269375 IC 327061 IC 327074 IC 327689 IC 327692 IC 327698
IC 327708 IC 327751 IC 327776
JG 315
NBPGR, New Delhi NBPGR, New Delhi NBPGR, New Delhi NBPGR, New Delhi NBPGR, New Delhi NBPGR, New Delhi NBPGR, New Delhi
NBPGR, New Delhi NBPGR, New Delhi NBPGR, New Delhi NBPGR, New Delhi NBPGR, New Delhi NBPGR, New Delhi NBPGR, New Delhi NBPGR, New Delhi NBPGR, New Delhi NBPGR, New Delhi
NBPGR, New Delhi NBPGR, New Delhi NBPGR, New Delhi
IGKV, Raipur
Characters Mean Range GCV (%)
PCV (%)
Heritability ‘h2
BS’(%) Genetic Advance
(GA)
Genetic Advance as percentage of
mean Minimum Maximum
First flower ing (d) 62.43 44.5 73.5 12.26 12.44 97.2 15.55 24.91 50 percent flowering (d) 75.88 64.0 82.5 4.74 5.02 89.1 6.99 9.21 Days to maturity (d) 111.26 100.0 130.5 5.74 5.88 95.3 12.84 11.54 Plant height (cm) 54.28 50.4 59.8 4.42 4.97 79.2 4.4 8.11 Branches plant -1 5.01 3.5 6.0 5.52 13.71 16.2 0.23 4.59 Pods plant -1 30.68 19.5 43.5 19.12 22.18 74.3 10.42 33.96 Seeds pod -1 1.57 1.0 2.0 27.0 31.73 72.4 0.74 47.13 100 Seed weight (g) 12.84 10.88 21.78 14.19 15.58 83.0 3.42 26.64 Biological yield (g) 9.55 6.8 13.8 14.21 21.04 45.6 1.89 19.79 Harvest Index (%) 31.92 15.47 49.67 22.02 29.01 57.6 10.99 34.43 Seed yield plant -1 3.06 1.43 5.94 33.02 37.76 76.5 1.82 59.48
coefficient of yield components with seed yield into its directand indirect effects to ensure the actual contribution of anattribute as well as its influence through other traits. Pathcoefficient analysis suggested by Dewey and Lu, 1959 proveshelpful, in partitioning the correlation coefficient into measuresof direct and indirect effects of a set of independent variableson the dependent variable.
RESULTS AND DISCUSSION
Results of genetic variability (Table 2 a) revealed thatunder first date of sowing (E1), high genotypic coefficient ofvariation (GCV) was recorded for seed yield per plant, seedsper pod and harvest index. Moderate GCV was recorded forpods per plant, biological yield, 100 seed weight and days to
first flowering. Whereas, low GCV was observed for days tomaturity, number of branches per plant, days to 50 per centflowering and plant height. Similarly, (E2) under second dateof sowing (Table 2 b), high coefficient of variation (GCV) wasrecorded for seeds per pod. Moderate GCV was recorded forseed yield per plant, harvest index, 100 seed weight and daysto first flowering. Whereas, low GCV was recorded for days to50 per cent flowering, days to maturity, biological yield, podsper plant and plant height. Hence, the traits exhibiting highGCV indicated the existence of considerable variability for thetraits among the genotypes. These findings are in generalagreement with the findings of several research workers whohave reported high to low GCV for various yield attributes inchickpea viz., Durga, et al., 2005 and Jeena and Arora, 2005.

PURI et al., Study of Variability, Diversity and Association Analysis of Chickpea (Cicer arietinum L.) 725
Table 2b. Estimates of genetic parameters of variation under second date of sowing (E2)
Characters Mean Range GCV (%)
PCV (%)
Heritability ‘h2
BS’(%) Genetic Advance
(GA)
Genetic Advance as
percentage of mean
Minimum Maximum
First flowering (d) 59.29 46.5 68.0 10.5 10.72 96.0 12.56 21.18 50 percent flowering (d) 70.18 59.0 78.5 7.1 7.31 94.1 9.95 14.18 Days to maturity (d) 90.9 83.5 104.0 5.97 6.18 93.1 10.78 11.86 Plant height (cm) 49.66 45.4 52.4 1.8 3.62 24.7 0.92 1.85 Branches plant -1 4.87 4.0 5.5 3.21 11.14 8 .3 0.09 1.85 Pods plant -1 23.88 19.5 28.5 2.7 11.11 5 .9 0.32 1.34 Seeds pod -1 1.42 1.0 2.0 26.68 34.96 58.2 0.59 41.55 100 Seed weight (g) 12.07 9.98 14.76 11.5 12.54 84.1 2.62 21.71 Biological yield (g) 10.63 9.2 13.1 3.53 10.21 11.9 0.27 2.54 Harvest Index (%) 31.95 20.16 42.11 13.48 17.92 56.6 6.68 20.91 Seed yield plant -1 3.38 2.07 4.67 16.11 20.27 63.1 0.89 26.33
Under first date of sowing (E1), the highest heritability
estimate was observed for days to first flowering followed bydays to maturity, days to 50 per cent flowering, 100 seed weight,plant height, seed yield per plant, pods per plant and seedsper pod. Moderate heritability was recorded for harvest index,whereas low heritability estimates were recorded for biologicalyield and number of branches per plant. Under second date ofsowing (E2), the highest estimate of heritability was observedfor days to first flowering followed by days to 50 per centflowering, days to maturity and 100 seed weight. Moderateheritability were recorded for seed yield per plant, seeds perpod and harvest index whereas, low estimates of heritabilitywere recorded for plant height, biological yield, number ofbranches per plant and number of pods per plant .
In E1, the highest genetic advance as percentage of meanwas observed for seed yield per plant followed by number ofseeds per pod, harvest index, number of pods per plant, 100seed weight, days to first flowering and biological yield.Whereas, in E2 the highest genetic advance as percentage ofmean was observed for number of seeds per pod followed byseed yield per plant, 100 seed weight, days to first floweringand harvest index. High heritability estimates coupled withhigh genetic advance as percentage of mean were observedfor days to first flowering, number of pods per plant and seedsper pod, 100 seed weight and seed yield per plant in E1.Similarly, in E2 high heritability estimates coupled with highgenetic advance as percentage of mean were observed fordays to first flowering, days to 50 per cent flowering, days to
Table 3 a. Genotypic (G), Phenotypic (P) and Environmental (E) correlation coefficients for seed yield and its components inchickpea under first date of sowing (E1)
Characters 50 %
flowering (d)
Days to maturity
(d)
Plant height (cm)
Branches plant-1
Pods plant -1
Seeds pod-1
100 seed weight
(g)
Biological yield (g)
Harvest Index (%)
Seed yield plant-1 (g)
First flowering (d) P G
0.839** 0.872*v
0.514** 0.547**
-0.122 -0.195
-0.044 -0.055
-0.126 -0.464
0.065 0.078
-0.457** -0.498**
0.048 0.215
0.155 0.191
-0 .131 -0 .132
50 % flowering (d) P G
0.730** 0.788**
-0.030 -0.141
0.098 0.305*
0.012 -0.044
0.132 0.181
-0.343* -0.394**
-0 .003 0.083
0.352* 0.525**
-0 .315* -0 .428**
Days to maturity (d) P G
-0.005 -0.037
0.044 0.215
0.072 0.482**
0.111 0.133
-0.255 -0.276
-0 .072 -0 .227
0.520** 0.669**
-0 .484** -0 .598**
Plant height (cm) P G
0.023 0.524**
0.061 -0.585**
-0.173 -0.026
0.003 -0.065
-0 .227 -1 .483**
0.066 0.023
-0 .014 -0 .335*
Branches plant -1 P G
0.596** 0.606
-0.018 -0.295
0.071 0.352
0.024 0.746
0.114 0.764**
-0 .104 -0 .350*
Pods plant -1 P G
0.018 0.823**
0.078 0.240
0.078 1.580**
0.170 1.142**
-0 .118 -0 .555**
Seeds pod -1 P G
-0.158 -0.157
-0 .020 0.220
0.054 0.023
-0 .080 0.027
100 seed weight (g) P G
0.038 0.213
0.181 0.232
0.190 0.275
Biological yield (g) P G
0.029 0.778**
0.472** 0.856**
Harvest Index (%) P G
0.857** 0.993**
*, ** Significant at 5 and 1 per cent level of probability, respectively

726 Trends in Biosciences 6 (6), 2013
*, ** Significant at 5 and 1 per cent level of probability, respectively
Table 3 b. Genotypic (G), Phenotypic (P) and Environmental (E) correlation coefficients for seed yield and its components inchickpea under second date of sowing (E2)
Characters 50 %
flowering (d)
Days to maturity
(d)
Plant height (cm)
Branches plant-1
Pods plant -1
Seeds pod-1
100 seed weight (g)
Biological yield (g)
Harvest Index (%)
Seed yield plant-1 (g)
First flowering (d) P G
0.806** 0.857**
0.402** 0.406**
-0.041 -0.015
0.350* 0.882**
-0.164 -0.196
0.198 0.222
-0.233 -0.267
0.095 0.092
0.033 0.048
0.069 0.063
50 % flowering (d) P G
0.416** 0.440**
-0.003 -0.006
0.371* 1.027
-0.284 -0.371
0.019 0.051
-0.471** -0.530**
-0.029 -0.129
0.061 0.004
-0.095 -0.091
Days to maturity (d) P G
-0.021 -0.005
0.109 0.319
-0.148 -0.174
0.020 0.020
-0.102 -0.107
0.048 0.009
0.239 0.341*
0.208 0.224
Plant height (cm) P G
0.022 0.254
0.250 0.375*
-0.050 -0.055
0.046 0.029
-0.140 -0.270
0.018 0.037
-0.034 -0.057
Branches plant -1 P G
0.260 0.413**
0.161 0.035
-0.298 -0.579**
-0.063 0.039
0.203 0.527**
-0.180 -0.388*
Pods plant -1 P G
0.048 0.031
0.114 0.117
-0.095 -0.157
0.282 0.339*
-0.244 -0.261
Seeds pod -1 P G
-0.038 -0.075
-0.061 0.101
0.237 0.241
-0.203 -0.120
100 seed weight (g) P G
0.409** 0.669**
0.054 0.082
0.310* 0.378*
Biological yield (g) P G
0.081 0.528**
0.638** 0.838**
Harvest Index (%) P G
0 .807** 0.900**
maturity and 100 seed weight. The results indicated the roleof additive genetic variance towards expression of thesecharacters. Other traits had low to high heritability coupledwith medium to low genetic advance as percentage of meanwhich is mainly due to the role of non-additive geneticcomponent in their expression.
Overall observations of genetic variability analysisrevealed that direct selection for days to first flowering, daysto maturity and 100 seed weight under both the environmentsand for number of pods per plant, number of seeds per pod
and seed yield per plant in E1 may be advantageous indeveloping desirable chickpea genotypes. Similar findingswere also reported earlier by Jeena and Aarora, 2005,Kashiwagi, et al., 2006, Pandey, et al., 2007, Sidramappa, etal., 2008, Sharma and Saini, 2010, Yucel and Anlarsal, 2010.
Correlation analysis clearly revealed that in general, thephenotypic and genotypic correlations are similar in directionbut the magnitudes of genotypic correlations were higher thanthe phenotypic correlations. Under E1 (Table 3 a) the highestpositive correlation of seed yield per plant was observed with
#Diagonal values indicate direct effects
Table 4 a. Genotypic path coefficients of various characters for seed yield per plant in chickpea under first date of sowing (E1)
Characters
First flowering
(d)
50 % flowering
(d)
Days to maturity
(d)
Plant height (cm)
Branches plant -1
Pods plant -1
Seeds pod -1
100 seed weight
(g)
Biological yield (g)
Harvest index (%)
Genotype ‘r’ with
seed yield plant-1
First flowering (d) 0.597 -1.137 0.106 -0.005 0.198 0.099 -0.055 0 .164 0.085 0.011 0.063
50 % flowering (d) 0.512 -1.327 0.115 -0.002 0.230 0.186 -0.013 0 .326 -0.120 0.001 -0.091
Days to maturity (d)
0.242 -0.583 0.262 -0.002 0.072 0.087 -0.005 0 .066 0.009 0.077 0.224
Plant height (cm) -0.009 0.008 -0.001 0.322 0.057 -0.188 0.014 -0.018 -0.250 0.008 -0.057 Branches plant -1 0.526 -1.362 0.083 0.082 0.224 -0.208 -0.009 0.357 0.036 -0.119 -0.388* Pods plant -1 -0.117 0.492 -0.046 0.121 0.093 -0.502 -0.008 -0.072 -0.145 -0.076 -0.261 Seeds pod -1 0.132 -0.068 0.005 -0.018 0.008 -0.016 -0.249 0.046 0.093 -0.054 -0.120 100 seed weight (g)
-0.159 0.703 -0.028 0.009 -0.130 -0.059 0.019 -0.616 0.620 0 .018 0.378*
Biological yield (g) 0.055 0.171 0.002 -0.087 0.009 0.079 -0.025 -0.412 0.926 0.119 0.838**
Harvest index (%) 0.029 -0.006 0.089 0.012 -0.118 0.170 0.060 -0.050 0.489 0.225 0.900**

PURI et al., Study of Variability, Diversity and Association Analysis of Chickpea (Cicer arietinum L.) 727
Table 4b. Genotypic path coefficients of various characters for seed yield per plant in chickpea under second date of sowing (E2)
#Diagonal values indicate direct effects
Characters First flowering
(d)
50 % flowering
(d)
Days to maturity
(d)
Plant height (cm)
Branches plant -1
Pods plant -1
Seeds pod -1
100 seed weight
(g)
Biological yield (g)
Harvest index (%)
Genotype ‘r’ with
seed yield plant-1
First flowering (d) 0.041 -0.077 0.037 -0.014 -0.002 -0.009 -0.004 -0.002 0.058 -0.161 -0.132 50 % flowering (d) 0.036 -0.089 0.054 -0.010 0.013 -0.001 -0.009 -0.001 0.023 -0.443 -0.428**
Days to maturity (d) 0.022 -0.070 0.068 -0.003 0.009 0 .009 -0.006 -0.001 -0.062 -0.565 -0.598**
Plant height (cm) -0.008 0.012 -0.003 0.073 0.022 -0.011 0.001 0.000 -0.402 -0.020 -0.335* Branches plant -1 -0.002 -0.027 0.015 0.038 0.042 0.011 0.014 0.001 0.202 -0.645 -0.350* Pods plant -1 -0.019 0.004 0.033 -0.042 0.025 0.018 -0.040 0.001 0.429 -0.964 -0.555** Seeds pod -1 0.003 -0.016 0.009 -0.002 -0.012 0 .015 -0.049 -0.001 0.060 0.019 0.027 100 seed weight (g) -0.020 0.035 -0.019 -0.005 0.015 0 .004 0.008 0.003 0.058 0.196 0.275
Biological yield (g) 0.009 -0.007 -0.016 -0.108 0.031 0 .029 -0.011 0.001 0.271 0.657 0.856**
Harvest index (%) -0.008 0.047 -0.046 -0.002 -0.032 -0.021 -0.001 0.001 0.211 0.844 0.993**
harvest index, followed by biological yield and 100 -seedweight . Under E2 (Table 3 b) the positive correlation of seedyield per plant was observed with harvest index and biologicalyield. Whereas, negative correlation of seed yield per plantwas observed with days to maturity and days to 50 per centflowering. Overall observation of correlation coefficientanalysis revealed that biological yield and harvest index underboth the environments and 100 seed weight under E1 exhibitedthe positive correlation with seed yield per plant. Hence, directselection for these traits can lead to the development of highyielding chickpea genotypes. Similarly, selection for earlyflowering may be advantageous for developing chickpeavarieties with bold seed size. The experimental findings ofcorrelation coefficient analysis are in general agreement withthe results reported earlier by Jeena and Arora, 2005. Similarrelation was also reported by Obaidullah, et al., 2006, Singh,et al., 2007, Malik, et al., 2009, Johnson, et al., 2010. Kobraee,et al., 2010, Sharma and Saini, 2010 for pods plant-1 ; byShirivastava and Babbar, 2007, Vaghela, et al., 2009 for seedspod-1; by Thakur and Sirohi, 2009, Meena, et al., 2010 forharvest index.
In the present investigation path coefficient analysiswas carried out by taking seed yield per plant and 100 seedweight as dependent variables and rest of the quantitativetraits as independent variables. Under E1 the path coefficientsfor seed yield per plant under first date of sowing (Table 4 a)recorded the highest positive direct effect contributing to seedyield per plant is biological yield, followed by days to firstflowering, plant height, days to maturity, harvest index andnumber of branches per plant. Whereas, negative direct effectson seed yield per plant were observed due to 50 percentflowering, 100 seed weight, number of pods per plant andseeds per pod. The character 100 seed weight exhibited thepositive correlation with seed yield per plant. Similar resultwere reported by Farshadfar and Farshadfar, 2008, Vaghela, etal., 2009, Borate and Dalvi, 2010.
Under E2 second date of sowing, highest positive directeffect contributing to seed yield per plant was observed forharvest index, followed by biological yield , plant height, daysto maturity, number of branches per plant, days to firstflowering, number of pods per plant and 100 seed weight (Table
# Diagonal values indicate about direct effects
Table 5 a. Genotypic path coefficients of various characters for 100-seed weight in chickpea under first date of sowing (E1)
Characters
First flowering
(d)
50 % flowering
(d)
Days to maturity
(d)
Plant height (cm)
Branches plant -1
Pods plant -
1
Biological yield
(g)
Seed yield
plant -1
(g)
Genotype ‘r’ with 100 seed
weight
First flowering(d) 0.595 -1.464 0.152 -0.007 0.273 0.136 0.105 -0.056 -0.267 50 % flowering (d) 0.510 -1.709 0.165 -0.003 0.318 0.256 -0.147 0.081 -0.530** Days to maturity (d) 0.241 -0.751 0.374 -0.002 0.099 0.120 0.011 -0.198 -0.107 Plant height (cm) -0.009 0.011 -0.002 0.465 0.079 -0.259 -0.307 0.051 0.029 Branches plant -1 0.525 -1.754 0.119 0.118 0.310 -0.285 0.045 0.343 -0.579** Pods plant -1 -0.117 0.633 -0.065 0.175 0.128 -0.690 -0.178 0.231 0.117 Biological yield (g) 0.055 0.221 0.004 -0.126 0.012 0.108 1.137 -0.742 0.669** Seed yield plant -1 (g) 0.038 0.156 0.084 -0.027 -0.120 0.180 0.952 -0.885 0.378*

728 Trends in Biosciences 6 (6), 2013
4 b). Whereas, negative direct effect on seed yield per plantwas observed for days to 50 per cent flowering and seeds perpod. Overall, in contributing to seed yield direct selection forbiological yield and harvest index could be practiced todevelop high yielding chickpea genotypes in both E1 and E2as these traits possessed positive direct effect and significantcorrelation with seed yield. The above findings are in supportwith the findings given by Patel and Babbar, 2005, Renukadeviand Subbalakshmi, 2006, Borate and Dalvi, 2010 revealing highdirect effect of days to maturity on seed yield. Ali, et al., 2009and Kobraee, et al., 2010 also suggested high direct effect ofseeds plant-1 on seed yield. Muhammad, et al., 2008, Vaghela,et al., 2009 and Yucel and Anlarsal, 2010 reported high directeffect of harvest index on seed yield.
Genotypic correlation coefficients of various yieldattributing characters and yield with 100-seed weight werefurther partitioned into direct and indirect effects for eachenvironment separately.under first date of sowing E1 (Table 5a) The highest positive direct effect contributing to 100 seedweight was observed for biological yield followed by days tofirst flowering, plant height, days to maturity and number of
Table 5 b. Genotypic path coefficients of various characters for 100-seed weight in chickpea under second date of sowing (E2)
# Diagonal values indicate about direct effects
Characters First flowering (d)
50 % flowering (d)
Attaining maturity
(d)
Plant height (cm)
Branches plant -1
Pods plant -1
Biological yield (g)
Seed yield
plant -1 (g)
Genotype ‘r’ with 100 seed
weight
First flowering (d) -0.967 0.656 -0.042 -0.046 0.001 -0.058 0.021 -0.063 -0.498** 50 % flowering (d) -0.843 0.752 -0.060 -0.033 -0.006 -0.005 0.008 -0.206 -0.394** Days to maturity (d) -0.529 0.593 -0.077 -0.009 -0.004 0.060 -0.022 -0.288 -0.276 Plant height (cm) 0.188 -0.106 0.003 0.237 -0.010 -0.072 -0.144 -0.161 -0.065 Branches plant -1 0.053 0.230 -0.017 0.124 -0.018 0.075 0.073 -0.169 0.352* Pods plant -1 0.449 -0.033 -0.037 -0.139 -0.011 0.124 0.154 -0.267 0.240 Biological yield (g) -0.208 0.063 0.017 -0.351 -0.014 0.196 0.097 0.412 0.213 Seed yield plant -1 0.127 -0.322 0.046 -0.079 0.006 -0.069 0.083 0.482 0.275
Table 6 a. Composition of clusters under first date of sowing(E1)
Cluster Number of accessions
Accessions
I 7 IC 269034, IC 269041, IC 269043, IC 269045, IC 269053, IC 269055, IC 269145,
II 9 IC 269017, IC 269018, IC 269049, IC 269061, IC 269081, IC 269086, IC 269099, IC 269104, IC 269186
III 8 IC 269009, IC 269011, IC 269015, IC 269025, IC 269028, IC 269032, IC 269047, IC 269129
IV 7 IC 269216, IC 327074, IC 327689, IC 327698, IC 327708, IC 327751, IC 327776
V 2 JG 11, IC 269132 VI 9 IC 268996, IC 269120, IC 269121, IC
269160, IC 269187, IC 269375, IC 327061, IC 327692, JG 315
Table 6 b. Inter and intra cluster distances of genotypes inchickpea gene pool under first date of sowing (E1)
Clusters I II III IV V VI I 1.750 II 2.908 1.977 III 3.259 2.383 1.505 IV 4.062 2.598 3.570 1.760 V 5.335 6.156 6.734 6.702 2.727 VI 3.509 2.350 3.345 2.659 5.444 2.241
branches per plant. Whereas, negative direct effects on 100seed weight were observed due to days to 50 per centflowering followed by seed yield per plant and number ofpods per plant. Although, seed yield per plant was positivelycorrelated with 100-seed weight but its direct effect wasnegative which is mainly due to the nullifying effects via.biological yield. As biological yield exhibited high positivedirect effect towards 100-seed weight hence, direct selectionfor this trait could be effective in developing bold seededchickpea genotypes under normal sowing condition (E1).Under second date of sowing E2 (Table 5 b) the highest positivedirect effect contributing to 100 seed weight was observeddue to days to 50 per cent flowering followed by seed yieldper plant, plant height, number of pods per plant and biologicalyield. Whereas, negative direct effect on 100-seed weight wasobserved for days to first flowering followed by days tomaturity and number of branches per plant. In contributing toseed size, days to 50 per cent flowering exhibited the negativecorrelation with positive direct effect in E2. Hence, directselection for early 50 per cent flowering could be advantageousfor the development of bold seeded chickpea genotypes.Similar result was also reported by Sikarwar, 2004.
Under (E1) first date of sowing, the 42 accessions weregrouped into 6 clusters (Table 6 a) showing significantvariability for selecting the genotypes for future breedingprogrammes. Clusters II and VI were the biggest clusters with9 accessions each. Whereas, clusters I, III, IV and V comprisedof 7, 8, 7 and 2 accessions respectively. The intra- and inter

PURI et al., Study of Variability, Diversity and Association Analysis of Chickpea (Cicer arietinum L.) 729
Table 6 c. Mean performance of genotypes in individual clusters for different yield traits under first date of sowing (E1)
Clusters Characters First
flowering (d)
50% flowering
(d)
Days to maturity
(d)
Plant height (cm)
Branches plant -1
Pods plant -1
100 seed weight
(g)
Biological yield
(g)
Seed yield plant-1 (g)
I 52.07 72.36 103.43 53.61 4.50 29.00 12.68 9.03 2.65 II 63.56 76.06 114.94 52.30 5.11 32.89 12.25 8.98 2.54 III 62.81 76.19 110.75 57.54 5.19 36.31 12.24 7.68 2.11 IV 71.07 80.29 115.07 54.19 4.93 21.50 12.42 9.74 3.23 V 56.75 68.25 106.75 53.48 4.25 34.25 20.62 12.95 4.61 VI 63.56 76.44 112.17 54.11 5.39 31.11 12.68 11.30 4.28
cluster distances were computed for all the traits and arepresented in the Table 6 b. Results of cluster analysisrevealed that the highest intra- cluster distance was observedfor cluster V (2.727) followed by cluster VI (2.241), II (1.977),IV (1.760), I (1.750) and cluster III (1.505). The highest intercluster distance was measured between the clusters III and V(6.734) followed by IV and V (6.702), II and V (6.156), V and VI(5.444). Minimum inter cluster distance was observed betweenII and VI (2.350).
Mean performance of individual clusters for differentcharacters under E1is seen in Table 6 c. The maximum numberof pods per plant was exhibited by cluster III (36.31), followedby cluster V (34.25), cluster II (32.89), cluster VI (31.11) andcluster I (29.00). Whereas, the lowest number of pods perplant was observed for cluster IV (21.50). For 100 seed weight,cluster V exhibited the highest 100 seed weight of 20.62 gwhich was far ahead of all other clusters. The minimum 100seed weight was observed for cluster III (12.24 g). The maximumbiological yield was observed for cluster V (12.95 g) followedby cluster VI (11.30 g), cluster IV (9.74 g), cluster I (9.03 g) andcluster II (8.98 g) Cluster V was found to be the best withrespect to seed yield per plant as it possessed the highestseed yield per plant (4.61 g), followed by cluster VI (4.28 g),cluster IV (3.23 g), cluster I (2.65 g) and cluster II (2.54 g).Whereas, the lowest seed yield per plant was noted for clusterIII (2.11 g).
Under second date of sowing E2, the genotypes weregrouped into 3 clusters (Table 7 a) showing considerablevariability for selections to be made for future breedingprogrammes. Cluster II was the biggest cluster with 16genotypes, whereas clusters I and III comprised of 12 and 14genotypes respectively. Results of cluster analysis asdepended in Table 7 b revealed that the highest intra- clusterdistance was observed for cluster I (2.746) followed by clusterII (2.343). Cluster III possessed the minimum intra- clusterdistance (2.079). The highest inter cluster distance wasmeasured between the clusters I and III (3.743) followed byclusters II and III (2.860). Minimum inter cluster distance wasobserved between clusters I and II (2.582). Mean performanceof individual clusters for different characters as shown in table7 c. to reveals that The maximum number of pods per plantwas exhibited by cluster I (24.50) followed by cluster III (23.71).For 100 seed weight cluster I exhibited the maximum meanvalue of 13.56 g among all clusters. The smallest seed size wasobserved for cluster II (11.43 g per 100 seeds). The maximumbiological yield per plant was observed for cluster II (11.10 g),followed by cluster I (10.54 g). Cluster II was found to be thebest with respect to seed yield per plant as it possessed highestseed yield per plant of 3.83 g, followed by cluster I (3.41 g).Whereas, lowest yielding cluster was cluster III (2.84 g seedyield per plant).
The pattern of distribution of 42 genotypes in variousclusters under both the sowing dates revealed existence ofconsiderable genetic diversity in the material. Under first dateof sowing, the genotypes were grouped into 6 clusters. Thehighest intra-cluster distance was observed for cluster V.Hence, genotypes belonging to this cluster viz., JG-11 and IC-269132 can be utilized as parents in future breedingprogrammes with the desirable genotypes belonging toclusters III and IV. Under second date of sowing, the
Table 7 a. Composition of clusters under second date of sowing(E2)
Cluster Number of accessions
Accessions
I
12
IC 269028, IC 269032, IC 269034, IC 269041, IC 269043, IC 269045, IC 269047, IC 269049, IC 269055, IC 269132, IC 269375, IC 327692
II
16
JG 11, IC 268996, IC 269009, IC 269011, IC 269015, IC 269017,IC 269018, IC 269025, IC 269053, IC 269061, IC 269120, IC 269160,IC 269186, IC 269187, IC 327698, JG 315
III
14
IC 269081, IC 269086, IC 269099, IC 269104, IC 269121, IC 269129, IC 269145, IC 269216, IC 327061, IC 327074, IC 327689, IC 327708, IC 327751, IC 327776
Table 7 b. Inter and intra cluster distances of genotypes inchickpea gene pool under second date of sowing(E2)
Clusters I II III I 2.746 II 2.582 2.343 III 3.743 2.860 2.079

730 Trends in Biosciences 6 (6), 2013
Table 7c. Mean performance of genotypes in individual clusters for different yield traits under second date of sowing (E2)
Clusters
Characters First
flowering (d)
50% flowering
(d)
Days to maturity
(d)
Plant height (cm)
Branches plant -1
Pods plant -1
100 seed weight
(g)
Biological yield (g)
Seed yield plant-1 (g)
I 52.21 65.08 86.83 49.76 5.00 24.50 13.56 10.54 3.41 II 60.62 69.62 88.66 49.26 4.72 23.56 11.43 11.10 3.83 III 63.82 75.18 96.96 50.03 4.93 23.71 11.53 10.18 2.84
genotypes were grouped into 3 clusters. The highest intra-cluster distance was observed for cluster I. Hence, genotypesbelonging to this cluster viz. IC-269028, IC-269032, IC-269034,IC-269041, IC-269043, IC-269045, IC-269047, IC-269049, IC-269055, IC-269132, IC-269375 and IC-327692 can be utilized asparents in future breeding programmes with the desirablegenotypes belonging to cluster III. These results are in generalagreement with the findings of Sikarwar, 2004. On comparingthe genotypes on the basis of cluster wise mean yieldperformances under both the dates of sowing, it was noticedthat accessions viz., IC 269132, IC 268996, IC 269120, IC 269160,IC 269187, IC 269375, IC 327692, JG 11 and JG 315 performedbetter under both the environments. This finding are inaccordance with that of Dwevedi and Lal, 2009, Wadikar, etal., 2010, Akthar, et al., 2011, Parameshwarappa, et al., 2011,Jayalakshmi, et al., 2012, Singh, et al. 2012.
LITERATURE CITED
Akhtar, L. H., Muhammad, A. and Muhammad N. 2011. Geneticdivergence and inter-relationship studies in Chickpea (Cicerarietinum L.). Pakistan Journal of Agriculture Sciences 48: 35-39.
Ali, M. A., Nausherwan, A., Zulkiffal, M. and Sajjad, M. 2009. Evaluationof selection criteria in Chickpea (Cicer arietinum L.) usingcorrelation coefficients and path analysis. Journal AgricultureSociety Science 4: 177-179.
Borate, V. V. and Dalvi, V. 2010. Correlation and path analysis inChickpea. Journal of Maharashtra Agriculture University 35: 43-46.
Burton, G.W. 1952. Quantitative inheritance in grass. In: Proc. 6 th
Inter. Grassland Cong., 1: 277- 283.
Dewey, D. R. and Lu, K. H. 1959. A correlation and path coefficientanalysis of components of crested wheat grass seed population.Journal of Agriculture Sciences. 515-518.
Durga, K. K., Rao, Y. K. and Reddy, M.V. 2005. Genetic divergence inChickpea (Cicer arietinum L.). Legume Research, 28 : 250-255.
Dwevedi, K. K. and Lal, M. L. 2009. Assessment of genetic diversity ofcultivated Chickpea (Cicer arietinum L.) Asian Journal ofAgriculture Sciences 1: 7-8.
Farshadfar, M and Farshadfar,E. 2008. Genetic variability and pathanalysis of Chickpea (Cicer arietinum L.) land races and lines.Journal of Applied Sciences 8: 3951-3956.
Jayalakshmi, V., Reddy, C.K.K. and Jyothirmayi, G. 2012. Genetic studyon drought tolerance attributes in Chickpea (Cicer arietinum L.).Journal Food Legumes, 25: 94-96.
Jeena, A. S. and Arora, P. P. 2005. Variability and path coefficientstudies for yield and its components in Chickpea. Progressive
Research, 4 : 1-7.
Johnson, P. L., Sharma, R. N., Nair, S. K. and Pandey, R. L. 2010.Contribution of important traits of rainfed Chickpea (Cicerarietinum L.) for improving seed yield. Current Advances inAgriulture Sciences, 2: 104-106.
Kashiwagi, J., Krishnamurthy, L., Serraj, R., Uppadhyaya, H.D. Krishna,H., Chandra, S. and Vadez, V. 2006. Genetic variability among traitsin the minicore germplasm collection of Chickpea. Euphytica,146: 213-222
Kobraee, S., Shamsi, K. and Behrooz R. 2010. Investigation ofcorrelation analysis and relationships between grain yield and otherquantitative traits in Chickpea (Cicer arietinum L.) African JournalBiology, 9: 2342-2348.
Mahalanobis, P. C. 1936. On the generalized distance in statistics.Proceedings of the National Institute of Sciences of India, 2: 49–55.
Malik, S. R., Bakhsh, A., Asif, M. A, Iqbal U. and Iqbal S. M. 2009.Assessment of genetic variability and interrelationship among someagronomic traits in Chickpea. International Journal of AgricultureBiology. 12: 81–85.
Meena, H. P., Kumar, J., Upadhyaya H. D., Bharadwaj, C., Chauhan S.K., Verma, A. K. and Rizvi A. H. 2010. Chickpea mini coregermplasm collection as rich sources of diversity for cropimprovement. Journal of Statics Agriculture Research, 8.
Miller, D. A., Williams, J. C., Robinson, H. F. and Comstock, K. B.1958. Estimations of genotype and environmental variance andcovariance in upland cotton and their implication in selection.Agronomy Journal, 50: 126-131.
Muhammad, A., Bakhsh, A. and Abdul, G. 2008. Path coefficient analysisin Chickpea (Cicer arietinum L.) under rainfed conditions. PakistanJournal of Botany, 36: 75-81.
Obaidullah, S., Khan, M. and Khan, H. 2006. Genotypic and phenotypiccorrelation analysis of some important characters in gram. IndianJournal of Plant Sciences, 5: 701-704.
Pandey, R. L., Rastogi, N. K. and Geda, A. K. 2007. Genetic analysis ofquality traits in Chickpea. Journal of Food Legumes, 20: 25-28.
Parameshwarappa, S.G., Salimath, P.M., Upadhyaya, U.D., Patil, S.S.and Kajjidoni, S.T. 2011. Genetic divergence under threeenvironments in a minicore collection of Chickpea (Cicer arietinumL). Indian Journal of Plant Genetic Resources, 24: 177-185.
Patel, S. K. and Babbar, A. 2005. Genetic variation of desi, gulabi andkabuli Chickpea types in Madhya Pradesh. JNKVV Research Journal,38: 86-90.
Rao, C.R. 1952. Advance statistical methods in biometrics research.Hafaer Pub. Co., Darion, pp. 371-378.
Renukadevi, P. and Subbalakshmi, B. 2006. Correlations and pathcoefficient analysis in Chickpea. Legume Research 29: 201–204.
Sharma L. K. and Saini D. P. 2010. Variability and association studies

PURI et al., Study of Variability, Diversity and Association Analysis of Chickpea (Cicer arietinum L.) 731
for seed yield and yield components in Chickpea (Cicer arietinumL.). Research Journal of Agriculture Sciences, 1 : 209-211.
Shirivastava, A. and Babbar, A. 2007. Association studies and theirimplication in Chickpea selections. National Journal of PlantImprovement, 9: 23-28.
Sidramappa, B., Patil, S. A. and Salimath, P. M. 2010. Association ofphenotypical traits with productivity and its components inChickpea (Cicer arietinum L.). Legume Research, 33: 201-205.
Sidramappa, B., Patil, S. A., Salimath, P. M. and Kajjidoni, S.T. 2008.Genetic variation for productivity and its related traits in recombinantinbred lines population of Chickpea. Karnataka Journal ofAgriculture Sciences, 21: 488- 490.
Sikarwar, V.S. 2004. Evaluation of Chickpea (Cicer arietinum L.)germplasm in relation to different growth habits to develop selectioncriteria for high seed yield. M.Sc. (Ag) Thesis, IGKV, Raipur, India:pp. 90.
Singh, D. P., Sharma C. and Kumar, R. 2007. Correlation and path
coefficient analysis in Chickpea. Crop Res., 13: 625-629.
Singh, R .P., Singh, I., Singh S. and Sandhu, J.S. 2012. Assesment ofgenetics diversity among interspesfic derivatives in chickpea.Journal of Food Legumes, 25: 150-152.
Thakur, S. K. and Sirohi, A. 2009. Correlation and path analysiscoefficient in Chickpea (Cicer arietinum L.) under different season.Legume Research, 32: 1-6.
Vaghela, M. D., Poshiya, V. K., Savaliya, J. J. and Mungra, K. D. 2009.Studies on character association and path analysis for seed yield andits components in Chickpea (Cicer arietinum L.). Legume Research,32: 245-249.
Wadikar, P.B., Ghodke, M.K. and Pole, S.P.2010. Genetics divergencefor productivity traits in chickpea(Cicer arietinum L.). Journal ofFood Legumes, 23: 245-246.
Yucel, D. O. and. Anlarsal, A. E. 2010. Determination of selectioncriteria with path coefficient analysis in Chickpea (Cicer arietinumL.). Journal of Agriculture Sciences 16: 42-48.
Recieved on 17-07-2013 Accepted on 11-08-2013

732 Trends in Biosciences 6 (6), 2013Trends in Biosciences 6 (6): 732-734, 2013
Effect of Elevated Temperature on Quality Parameters of RiceARTHI RANI B. AND N.MARAGATHAM
Agro Climate Research Centre,Tamil Nadu Agricultural University,Coimbatore-3.email: [email protected]
ABSTRACT
Rice is very sensitive to temperature. Starch is widely used asa key material for processed foods. Increasing the starch contentin food crops is one of the important targets for crop breeding.Climate change is being recognized as a major threat toagricultural productivity. Increased temperature cause majorimpact on starch and chalkiness grain percentage in rice. Thepresent investigation on starch and chalkiness grain percentage(brown rice) was studied under temperature control chamberwith 2oC and 4oC elevated temperature from the ambientthroughout the crop season. The result indicated that starchpercentage varied from 37.6 (4oC elevated temperature) to 57.9(ambient temperature) per cent during rabi 2011 - ‘12, while itis from 34.3 (4oC elevated temperature) to 54 (ambienttemperature) per cent during kharif 2012 and from 31.3 (4oCelevated temperature) to 53.1 (ambient temperature) per centduring rabi 2012 - ’13 and significantly higher chalkiness grainpercent was noted under 4oC elevated temperature. Thereduction was 56 per cent during rabi 2011- 12 over the treatmentambient temperature, while it was 67 per cent during kharif2012 and 62 per cent during rabi 2012-’13.
Key word Rice, elevated temperature, seasons, starchpercentage, chalkiness grain percentage
Rice is very sensitive to temperature. In India, rice (Oryzasativa L.) is grown under widely varying conditions of altitudeand climate, extends from 8 to 35 degrees north latitude and ashigh as 3000 meters from sea level. Starch is widely used as akey material for processed foods such as bread, pancakes,cereals, noodles, pasta, porridge and tortilla. Increasing thestarch content in food crops is one of the important targetsfor crop breeding. Climate change is being recognized as amajor threat to present day society because of its adverseimpact on ecosystems, agricultural productivity, waterresources, socio-economy and sustainability globally, as wellas on a regional basis. The updated 100 year linear trend from1906 to 2005 was 0.74°C [0.56°C to 0.92°C] larger than thecorresponding trend from 1901 to 2000 as given in the ThirdAssessment Report of 0.6°C [0.4°C to 0.8°C]. The linearwarming trend over the last 50 years was 0.13°C [0.10°C to0.16°C] per decade and was nearly twice than the last 100years. The total temperature increased from 1850 –1899 to2001–2005 was 0.76°C [0.57°C to 0.95°C] (IPCC, 2007). Futureprojections of climate using regional climate models PRECISand RegCM3 under A1B scenario have projected an increasein maximum and minimum temperature by 3.1 to 3.7°C and 3.7to 4.2°C, respectively at the end of the 21 century for Tamil
Nadu. The range of reduction in duration of rice ranged from9 to 14 days at the end of the century. Ramaraj, et al., 2013observed that the high temperature at the grain filling stagedid increase protein content, and decreased amylose contentand taste meter value of rice; inferior grain quality varietiesshowed a greater magnitude of the increase or decrease thanthe superior ones. Tian, et al., 2006 reported that hightemperature showed a significant increase in grain sucrosecontent without any increase in fructose and glucose contents,which enhanced sucrose accumulation, while diminishingsucrose degradation in rice grains was observed. The decreasein activities of sucrose synthase, vacuolar invertase, and cellwall bound invertase with high temperature treated plantsindicated that the deceleration of sucrose-degradation wasrelated to the decrease in activities of sucrose synthase andinvertase. Yamakawa, et al., 2007 reported that expose of hightemperature on ripened grains consists decreased amylosecontent and increased long chain amylopectin. Severely chalkygrain contained amylopectin enriched particularly with longchains compared to slightly chalky grains, suggesting thatsuch alterations of amylopectin structure might be involvedin grain chalkiness. She, et al., 2010 observed that seedsdeveloped under high-temperature condition, had chalky orwhite core endosperm. According to Lanning et al., 2011 theelevated night time air temperature had contributed to higherchalk formation and reduced milling quality in rice.
MATERIALS AND METHODS
The experiment was conducted under temperaturecontrol chamber created at the Agro Climate Research Centre;Tamil Nadu Agricultural University located at 11oN latitude,77oE longitude and at altitude of 426.7m above sea level duringkharif 2012, rabi 2011 -‘12 and rabi 2012-‘13with short duration(105-110days) hybrid (CORH3) during kharif and mediumduration (130-135 days) hybrid (CORH4) during rabi season.For this experiment purpose temperature control chamber wascreated and adjusted for 2oC and 4oC elevated from the ambienttemperature (open) throughout the crop period/season (bothday and night). Each control chamber has a total area of 16m2
(8m x 2m) with a height of 3.6m attached with weather sensorsto record air temperature (oC), relative humidity (%) and soiltemperature (oC) were placed inside the chamber and also inthe open field. The weather sensor was monitored andrecorded by the VR18 PAPERLESS recorder by increasing thetemperature inside the control chamber from the ambient. Thedata logger records the weather data at three minute interval

RANI AND .MARAGATHAM, Effect of Elevated Temperature on Quality Parameters of Rice 733
of the ambient and control chamber and the data can bedownloaded through Solid Compact Flash Memory Card (CFcard) for analysis purpose. Estimation of starch per cent(statistical analysis was not done) was carried using anthronereagent procedure described by Thayumanavan andSadasivam, 1984 and to assess the chalkiness (arcsinetransformation was done before statistical analysis), a visualrating of the chalky proportion of the grain was used tomeasure chalkiness based on the standard Evaluation System(SES) and the scale is presented below:
Scale % area of chalkiness1 less than 105 10-209 more than 20Selected, segregated and weighed the chalky grains (SES
Scale 9). Determined the per cent chalky grain by using theequation:
Wt of chalky grainPer cent Chalky grain =———————————- X 100 Wt of milled rice
RESULTS AND DISCUSSION
The computed data on starch percentage for brown ricein respect of rabi, 2011 – 12, kharif, 2012 and rabi, 2012 – 13and chalkiness grain percentage are presented in figure 1 and2.
Starch percentage
The normal starch percentage of brown rice would bearound 68 – 70 per cent while it is 80 per cent for white rice(polished rice). In rice, Asaoka, et al., 1985 and Inouchi, et al.,2000 found that starch from cultivars grown at low temperature(25°C) had significantly higher amylose content than cultivarsgrown at high temperature (30°C).
In the present investigation, starch percentage variedfrom 37.6 (4oC elevated temperature) to 57.9 (ambienttemperature) per cent during rabi, 2011 - ‘12, while it is from34.3(4oC elevated temperature) to 54 (ambient temperature)per cent during kharif, 2012 and from 31.3(4oC elevatedtemperature) to 53.1(ambient temperature) per cent during rabi,2012 - ‘13.
Chalkiness grain percentage
The mean chalkiness grain percentage computed fromthe experiment conducted during rabi, 2011-‘12 was 20.7, whileit was 21.8 per cent during kharif, 2012 and 22.0 duirng rabi,2012-’13. In respect of temperature effect among three levelsstudied across seasons, significantly higher grain per centwas noted under T2 treatment (4oC elevated temperature). Thereduction was 56 per cent during rabi, 2011- 12 over thetreatment T0 (ambient temperature) while it was 67 per cent
during kharif, 2012 and 62 per cent during rabi, 2012-’13.These results support the hypothesis of Yonemaru and Morita,2012 found that high temperature during ripening of rice causedthe conditions namely “immature thin grain” and “chalkygrain” and in turn reduced the yield and did lower millingquality.
Rice is the staple food which greatly affected by elevatedtemperature. The grain quality parameters such as starch andchalkiness percentage get affected by elevated temperature.These impacts in turn affect the cooking and nutritive qualityof rice grain.
Fig. 1. Effect of elevated temperature on starch per centduring rabi, 2011-‘12, kharif, 2012 and rabi, 2012-’13.
Fig. 2. Effect of elevated temperature on chalkiness grain percent during rabi, 2011-‘12, kharif, 2012 and rabi,2012-13.
LITERATURE CITED
Asaoka M., Okuno K., Fuwa H. 1985. Effect of environmentaltemperature at the milky stage on amylose content and fine structureof amylopectin of waxy and nonwaxy endosperm starches of rice(Oryza sativa L.). Agric. Biol. Chem.49 : 373–379.

734 Trends in Biosciences 6 (6), 2013
Inouchi N., Ando H., Asaoka M., Okuno K., Fuwa H. 2000. The effectof environmental temperature on distribution of unit chains of riceamylopectin. Starch, 52: 8–12.
IPCC (INTERGOVERNMENTAL PANEL ON CLIMATE CHANGE)2007. Climate change and its impacts in the near and long termunder different scenarios. In Climate Change 2007: Synthesis Report(eds, R. K. Pachauri & A. Reisinger), pp. 43–54. Geneva, Switzerland:IPCC.
Khush, G.S. 1997. Origin, dispersal, cultivation and variation of rice.Plant Molecular Biology 35: 25-34.
Ramaraj, A.P., R. Jagannathan, V. Geethalakshmi and Rajalakshmi.D.(2013). Climate change and rice crop duration. Journal ofAgrometeorology 15 (Special Issue-I): 189-191.
Sarah B. Lanning, , Terry J. Siebenmorgen, Paul A. Counce, , Amogh A.Ambardekar and Andy Mauromoustakos. 2011. Extreme nighttimeair temperatures in 2010 impact rice chalkiness and milling Quality.Field Crops Research, 124:132–136
She K. -C ., Kusano H. , Yaeshima M., Sasak i T. , Sa toh H. , andShimada H. 2010. Reduced rice grain production under high-temperature stress closely correlates with ATP shortage during seeddevelopment. Plant Biotechnol. 27: 67–73.
Thayumanavan, B. and Sadasivam, S. 1984. Qual. Plant Foods Hum.Nutr., 34, pp. 253.
Tian, LI, LIU Qi-hua, Ryu OHSUGI, Tohru YAMAGISHI and HarutoSASAKI. 2006. Effect of High Temperature on Sucrose Contentand Sucrose Cleaving Enzyme Activity in Rice Grain during thefilling Stage. Rice Science, 13(3): 205-210
Yamakawa, H., T. Hirose, M. Kuroda, and T. Yamaguchi. 2007.Comprehensive expression proûling of rice grain ûlling-related genesunder high temperature using DNA microarray. Plant Physiol.,144:258-277.
Yonemaru J, Morita S 2012 Image analysis of grain shape to evaluatethe effects of high temperatures on grain filling of rice, Oryzasativa L. Field Crops Research, 137 (20) : 268–271.
Recieved on 26-08-2013 Accepted on 15-09-2013

Trends in Biosciences 6 (6): 735-741, 2013
Genotypic Variability for Intrinsic and Acquired Thermotolerance in Rice GenotypesScreened by TIR TechniqueK. RENUKA DEVI, A. SIVA SANKAR, P. SUDHAKAR1
Department of Crop Physiology, College of Agriculture, Rajendranagar, ANGRAU, Hyderabad.1Institute of Frontier Technology, RARS, Tirupati.email : [email protected]
ABSTRACT
Climate change needs us to look at various alternatives formore drought tolerant and tougher strains and to develop atechnique to screen a large number of genotypes for hightemperature tolerance. Adapting temperature inductionresponse (TIR) technique 100 rice genotypes were screened forthermotolerance. Significant variation for acquiredthermotolerance was observed in 100 rice lines. From the 100genotypes 30 were exhibits themotolerance to induced hightemperature. Among 30 genotypes 12 (NLR33358, NLR145,NLR33671-6, NLR 40024, NLR3042, MTU 1010, NLR33636,NLR3010, NLR33359, NLR40062, NLR40064, NLR 40065)genotypes showed highest thermo tolerance in terms of 100per cent seedlings survival and no reduction in root and shootgrowth and four genotypes (NLR 34242, NLR 40066, NLR 40059,NLR40050) showed higher thermo tolerance with no reductionin root and shoot growth, and also seedling survival was reducedonly by 10 per cent.
Key words rice genotypes, TIR technique
Rice (Oryza sativa and Oryza glaberrima) is one of theimportant cereals grown across the world. Although it hasbeen used as a model plant for many years, the growthresponses of rice to high temperature are still poorlyunderstood (Nagai and Makino 2009). Most rice is currentlygrown in regions where current temperatures are already closeto optimum for rice production. Therefore, any further increasesin mean temperatures or of short episodes of high temperaturesduring sensitive stages may be supra-optimal and reduce grainyield. Plants adapt to high temperature stress by inherentbasal level tolerance as well as acquired tolerance to severetemperature stress. (Hikosaka, et al., 2006; Larkindale, et al.,2005).
The ability to withstand and to acclimate to supra-optimaltemperatures results from both prevention of heat damageand repair of heat-sensitive components (Sung et al 2003;Senthil Kumar, et al., 2006). Many earlier studies havedemonstrated that genetic variability for high temperaturetolerance is noticed only upon induction treatment prior tosevere stress (Burke, 2001; Jayaprakash, et al., 1998;Srikanthbabu, et al., 2002).
The global rise in temperature will also increase theseverity of other environmental stresses such as floods and
drought. The variation in rainfall will lead to more frequentfloods and droughts (Yildiz and Terzi, 2008.) which are themost important constraints for deep water and aerobic croppingsystems, respectively. Both these extreme conditions (droughtand flood), will have substantial consequences on rice andmay lead to complete failure of the rice crop when occur atsensitive stages. And thus, the changing climate may enforcea shift in the cropping pattern in most parts of the world mostprobably making rice the most suitable choice for areas withincreased water availability but becoming less appropriate forfarmers in areas with decreased wetness. So there is a need toadopt a multi-faceted approach while studying the impact ofhigh-temperature stress, also focusing on other environmentalstresses, which may be equally detrimental for riceproductivity. Acquired tolerance for a specific abiotic stresshas been shown to give cross protection for other stressessuch as salinity, chilling temperatures, and drought.
MATERIALS AND METHODS
The experiment was conducted at Phenotypinglaboratory, Institute of Frontier Technology, RegionalAgricultural Research Station, Tirupati. Using the standardizedTIR(Temperature Induction Response) protocol. Highlythermo tolerant rice genotypes were screened from 100 ricegermplasm obtained from Agricultural Research Station,Nellore, Andhra Pradesh. This is a lead center for aerobic riceresearch. This approach of TIR involves first the identificationof challenging temperature and induction temperature andlater standardizing them before being used for screeninggermplasm for intrinsic tolerance. Phenotyping of ricegenotypes for thermo tolerance using TIR technique wasestablished in this laboratory (Sudhakar, et al., 2012) and sameprotocol is used in this study.
Rice seeds were surface sterilized by treating with 0.1per cent carbendizim for 30 minutes and washed with distilledwater for 4 to 5 times followed by 1 per cent sodiumhypochlorite for 1 to 2 minutes. Then the seeds were washedwith distilled water for 4 to 5 times and kept for germination at30°C and 60 per cent relative humidity in the incubator. After42 hours, uniform seedlings were selected in each genotypeand sown in aluminium trays (50 mm) filled with soil. Thesetrays with seedlings were subjected to sub-lethal temperatures(gradual temperature increasing from 36°C to 52°C for 5 hours

736 Trends in Biosciences 6 (6), 2013
Table 1. Screening of thermo tolerant rice genotypes through Thermo Induced Response (TIR) treatment
S.No. Entries % survival of seedlings
Root growth (cm) Actual growth
in control Actual growth in treatment
% reduction in root growth
1 ADT 37 70 2.20 1.63 26.01 2 NLR 40054 90 2.97 2.85 4.02 3 NLR 33358 100 0.00 0.00 0.00 4 NLR 145 100 0.00 0.00 0.00 5 NLR 3058 30 1.40 0.97 31.01 6 NLR 3060 50 1.80 1.22 32.01 7 NLR 3062 50 0.00 0.00 0.00 8 NLR 3064 40 4.73 1.28 73.03 9 MTU 1001 90 1.80 1.42 21.01
10 NLR3160 60 0.00 0.00 0.00 11 NLR3159 80 3.03 1.42 53.02 12 NLR3161 70 3.33 1.73 48.02 13 NLR 40078 30 2.33 1.86 20.01 14 IR 64 90 2.37 1.49 37.02 15 NLR33671-6 100 0.00 0.00 0.00 16 NLR40055 90 0.00 0.00 0.00 17 NLR40058 100 0.00 0.00 0.00 18 NLR40024 100 0.00 0.00 0.00 19 NLR3042 100 3.13 3.04 3.00 20 NLR34242 80 0.00 0.00 0.00 21 MTU1010 100 0.00 0.00 0.00 22 NLR33636 90 0.00 0.00 0.00 23 NLR3059 80 3.56 3.49 2.10 24 NLR3157 0 0.00 0.00 0.00 25 NLR34449 90 2.70 1.76 34.82 26 NLR3041 90 0.00 0.00 0.00 27 NLR3010 100 0.00 0.00 0.00 28 NLR33359 100 4.10 3.94 4.00 29 NLR34452 80 2.40 1.76 26.61 30 NLR40062 100 0.00 0.00 0.00 31 NLR3061 80 2.53 2.40 5.13 32 NLR30491 80 3.26 3.16 3.00 33 MLR34303 20 1.93 1.20 37.82 34 NLR40064 100 2.73 2.60 4.76 35 NLR40065 100 0.00 0.00 0.00 36 NLR40066 90 0.00 0.00 0.00 37 NLR40067 60 0.00 0.00 0.00 38 NLR40068 70 0.00 0.00 0.00 39 NLR40070 90 1.13 1.12 1.02 40 NLR40072 50 1.77 1.73 2.00 41 NLR40073 70 1.46 0.74 49.54 42 NLR40074 70 0.00 0.00 0.00 43 NLR40045 90 1.45 1.42 2.00

DEVI et al., Genotypic Variability for Intrinsic and Acquired Thermotolerance in Rice Genotypes Screened by TIR Technique 737
S.No. Entries % survival of seedlings
Root growth (cm) Actual growth
in control Actual growth in treatment
% reduction in root growth
44 NLR40050 90 0.00 0.00 0.00 45 NLR40049 80 0.00 0.00 0.00 46 NLR40059 80 0.00 0.00 0.00 47 NLR20131 70 2.05 1.68 17.88 48 NLR20106-1 60 1.87 1.50 19.91 49 NLR3093 100 1.66 0.77 53.70 50 NLR3094 90 2.15 1.62 24.55 51 NLR3095 90 1.88 0.64 66.13 52 NLR3096 100 1.69 0.90 46.54 53 NLR3097 100 1.43 0.48 66.33 54 NLR3098 90 0.00 0.00 0.00 55 NLR3099 80 2.08 1.22 41.12 56 NLR3100 80 2.11 0.98 53.78 57 NLR3101 100 3.09 1.45 53.14 58 NLR3102 100 3.54 1.50 57.72 59 NLR3103 70 0.00 0.00 0.00 60 NLR3104 80 1.44 0.60 58.44 61 NLR3105 70 1.52 0.80 47.17 62 NLR3106 70 1.58 1.16 26.81 63 NLR3107 80 1.66 0.68 58.81 64 NLR3108 70 1.48 1.12 24.28 65 NLR3109 80 0.00 0.00 0.00 66 NLR3110 70 0.00 0.00 0.00 67 NLR34450 60 1.59 1.34 15.67 68 NLR34452 100 2.06 1.56 24.45 69 MDT 1 80 0.00 0.00 0.00 70 MDT 2 90 0.00 0.00 0.00 72 MDT 4 70 2.30 2.25 2.01 74 MDT 6 70 2.60 2.30 11.54 75 BPT5204 100 1.22 1.19 2.76 76 MDT 8 90 0.00 0.00 0.00 77 TELLAHAMSA 90 2.03 1.99 2.00 78 MDT 10 100 2.90 2.84 2.02 79 AL 1 80 3.50 2.40 31.43 80 AL 2 100 4.30 2.60 39.55 81 AL 3 70 3.40 3.00 11.77 82 AL 4 90 4.30 2.10 51.18 83 AL 5 100 4.10 2.20 46.36 84 AL 6 80 4.70 1.80 61.73 85 AL 7 90 4.70 1.80 61.73 86 AL 8 80 4.60 1.80 60.89 87 AL 9 100 4.10 1.80 56.11 88 RNR2458 90 0.00 0.00 0.00 89 PL 3 60 3.90 3.20 17.95

738 Trends in Biosciences 6 (6), 2013
S.No. Entries % survival of seedlings
Root growth (cm) Actual growth
in control Actual growth in treatment
% reduction in root growth
90 PL 10 100 3.00 2.60 13.31 91 PL 13 90 2.90 1.57 45.85 92 PL 15 90 2.90 1.35 53.35 93 PL 16 80 4.50 1.84 59.12 94 JGL1798 70 0.00 0.00 0.00 95 PL 18 80 0.00 0.00 0.00 96 PL 19 90 4.00 3.72 6.89 97 PL 21 60 2.10 1.26 40.02 98 PL 22 50 3.50 2.12 39.49 99 JGL 17 70 2.80 2.40 14.29 100 JGL 385 80 2.60 1.60 38.48
SEm± 0.03 0.16 0.18 0.47 CD (P=0.05%) 1.02 0.48 0.53 1.49
in the environmental chamber (WGC 450 Programmable PlantGrowth Chamber). Later these seedlings were exposed to lethaltemperatures (55oC) (induced) for 2 hours. Another sub set ofseedlings were directly exposed to lethal temperatures (noninduced). Induced and non induced rice seedlings wereallowed to recover at 30oC and 60 per cent relative humidityfor 48 hours. A control tray was maintained at 30°C, withoutexposing to sub-lethal and lethal temperatures.
RESULTS AND DISCUSSION
Genetic Variability in Rice for Thermotolerance :
Using this technique it was proved that sufficient geneticvariability was present among rice genotypes for hightemperature tolerance. The genotypes showed significantgenetic variability for per cent survival of seedlings, per centreduction in root and shoot growth respectively. The per centsurvival of seedlings varied from 0 to 100 per cent with a meanof 80.33 per cent. The per cent reduction in root growth variedfrom 0 to 73 per cent with a mean of 20.89 per cent (4.10) (Table1) and the per cent reduction in shoot growth varied from 0 to65.8 per cent with a mean of 21.74 per cent (4.10). (Table 1a).Among the 100 rice genotypes 12 (NLR33358, NLR145,NLR33671-6, NLR40024, NLR3042, MTU 1010, NLR33636,NLR3010, NLR33359, NLR40062, NLR40064, NLR40065)genotypes showed highest thermo tolerance in terms of 100per cent seedlings survival and no reduction in root and shootgrowth. Four genotypes (NLR 34242, NLR 40066, NLR40059,NLR 40050 also showed higher thermo tolerance with noreduction in root and shoot growth, but seedling survivalwas reduced only by 10 per cent. These varieties are able tosurvive even they expose to lethal temperatures. These resultsare in conformity with several studies, which showed thatacclimated plants survive upon exposure to a severe stress,which otherwise could be lethal and is considered to be as
thermo tolerance (Senthil Kumar et al., 2002).
Thirty rice genotypes which showed 70 to 100 per centsurvival of seedlings:
0 to 5.0 per cent reduction in root growth and 0 to 5.0 percent reduction in shoot growth were selected for further potculture evaluation of genotypes under imposed moisture stressconditions. The effect of TIR on other genotypes revealedvariable results. Such acquired tolerance was variably recordedin other rice genotypes, where either survival of seedlingswas affected or root growth alone was affected or only shootgrowth was affected. In the genotype NLR 3157 seedlingsurvival, shoot and root growth were completely affecteddespite of recovery conditions maintained after exposing tosub-lethal and lethal temperature. This technique of exposingyoung seedlings to sub-lethal and lethal temperature has beenvalidated in many crop species (Senthil Kumar, et al., 2007).This novel temperature induction response technique has beendemonstrated to reveal genetic variability in intrinsic stresstolerance at cellular level. (Sudhakar, et al., 2012)
The present study also revealed that the ThermoInduced Response (TIR) technique can very well be used inrice crop. The identified 30 genotypes are showed increasedcell viability and protein synthesis capacity during alleviationfrom high temperature stress to possess high level of thermotolerance.
This study has shown that the seedlings exposed to asub-lethal temperature prior to challenge with severetemperature have better growth recovery than those seedlingschallenged directly to severe temperature stress and the resultssuggest that the TIR technique was a powerful andconstructive technique to identify genetic variability in hightemperature tolerance in rice within a short period of time andit is suitable for screening a large number of genotypes. The

DEVI et al., Genotypic Variability for Intrinsic and Acquired Thermotolerance in Rice Genotypes Screened by TIR Technique 739
Table 1a. Screening of thermo tolerant rice genotypes through Thermo Induced Response (TIR) treatment
S. No. Entries
Shoot growth(cm)
Actual growth in control
Actual growth in treatment
% reduction in shoot growth
1 ADT 37 8.00 6.80 15.01 2 NLR 40054 6.13 5.95 3.00 3 NLR 33358 7.90 7.51 5.00 4 NLR 145 0.00 0.00 0.00 5 NLR 3058 6.37 3.57 44.02 6 NLR 3060 7.03 4.50 36.02 7 NLR 3062 6.90 3.93 43.02 8 NLR 3064 8.57 6.17 28.01 9 MTU 1001 8.77 4.03 54.02
10 NLR3160 7.73 5.33 31.01 11 NLR3159 7.33 6.60 10.00 12 NLR3161 6.17 5.12 17.01 13 NlR40078 7.53 4.89 35.02 14 IR 64 7.63 6.10 20.01 15 NLR33671-6 0.00 0.00 0.00 16 NLR40055 6.46 6.33 2.01 17 NLR40058 5.80 5.54 4.41 18 NLR40024 0.00 0.00 0.00 19 NLR3042 6.96 6.77 2.73 20 NLR34242 0.00 0.00 0.00 21 MTU1010 6.56 6.23 5.00 22 NLR33636 0.00 0.00 0.00 23 NLR3059 8.60 8.19 4.81 24 NLR3157 0.00 0.00 0.00 25 NLR34449 7.13 5.16 27.61 26 NLR3041 6.76 5.10 24.51 27 NLR3010 0.00 0.00 0.00 28 NLR33359 8.10 7.93 2.10 29 NLR34452 6.83 3.53 48.32 30 NLR40062 9.66 9.55 1.14 31 NLR3061 9.26 5.20 43.82 32 NLR30491 9.40 9.20 2.12 33 MLR34303 6.80 3.90 42.62 34 NLR40064 0.00 0.00 0.00 35 NLR40065 0.00 0.00 0.00 36 NLR40066 0.00 0.00 0.00 37 NLR40067 4.03 3.63 10.00 38 NLR40068 0.00 0.00 0.00 39 NLR40070 10.55 10.12 4.12 40 NLR40072 7.05 6.61 6.31 41 NLR40073 8.12 4.76 41.33 42 NLR40074 9.98 7.13 28.58

740 Trends in Biosciences 6 (6), 2013
S. No. Entries
Shoot growth(cm)
Actual growth in control
Actual growth in treatment
% reduction in shoot growth
44 NLR40050 0.00 0.00 0.00 45 NLR40049 7.22 6.97 3.40 46 NLR40059 0.00 0.00 0.00 47 NLR20131 0.00 0.00 0.00 48 NLR20106-1 0.00 0.00 0.00 49 NLR3093 8.35 4.57 45.25 50 NLR3094 7.49 4.06 45.82 51 NLR3095 6.22 5.51 11.39 52 NLR3096 8.22 7.60 7.60 53 NLR3097 11.09 7.47 32.68 54 NLR3098 9.67 9.57 1.05 55 NLR3099 10.47 5.08 51.44 56 NLR3100 9.64 7.84 18.68 57 NLR3101 7.88 6.20 21.38 58 NLR3102 8.63 5.80 32.84 59 NLR3103 9.87 4.56 53.85 60 NLR3104 10.22 4.04 60.51 61 NLR3105 12.56 5.20 58.57 62 NLR3106 8.31 2.84 65.84 63 NLR3107 7.21 2.86 60.37 64 NLR3108 8.54 3.55 58.40 65 NLR3109 9.61 3.75 60.98 66 NLR3110 11.05 4.29 61.15 67 NLR34450 13.08 6.89 47.33 68 NLR34452 12.04 7.29 39.46 69 MDT 1 6.80 5.40 20.59 70 MDT 2 11.00 7.70 10.01 72 MDT 4 10.30 8.50 17.48 74 MDT 6 9.60 6.70 30.22 75 BPT5204 0.00 0.00 0.00 76 MDT 8 8.40 5.80 30.96 77 TELLAHAMSA 12.03 11.80 1.90 78 MDT 10 8.26 6.90 16.47 79 AL 1 13.30 8.50 36.12 80 AL 2 9.10 7.91 13.11 81 AL 3 14.10 7.60 46.12 82 AL 4 13.50 5.76 57.33 83 AL 5 15.10 7.80 48.32 84 AL 6 12.20 7.50 38.52 85 AL 7 10.90 7.40 32.12 86 AL 8 10.40 6.30 39.42 87 AL 9 12.30 5.30 56.93 88 RNR2458 8.59 8.28 3.64

DEVI et al., Genotypic Variability for Intrinsic and Acquired Thermotolerance in Rice Genotypes Screened by TIR Technique 741
S. No. Entries
Shoot growth(cm)
Actual growth in control
Actual growth in treatment
% reduction in shoot growth
89 PL 3 8.80 7.60 13.64 90 PL 10 9.80 9.41 4.00 91 PL 13 2.90 2.73 6.01 92 PL 15 13.20 10.60 19.70 93 PL 16 9.70 9.20 5.15 94 JGL1798 7.66 7.45 2.68 95 PL 18 14.30 9.78 31.58 96 PL 19 13.30 11.42 14.16 97 PL 21 10.60 9.45 10.88 98 PL 22 8.50 8.08 5.00 99 JGL 17 2.40 2.25 6.07 100 JGL 385 1.60 1.47 8.20
SEm± 0.10 0.21 0.41 CD (P=0.05%) 0.17 0.72 1.23
identified rice varieties can be used as donor source fordeveloping high temperature tolerant rice genotypes to resistglobal rise temperature.
LITERATURE CITED
Burke, J.J., 2001. Identification of genetic diversity and mutations inhigher plant acquired thermotolerance. Physiol. Plant. 112:167–170.
Hikosaka, K., Ishikawa, K., Borjigidai, A., Muller, O. and Onoda, Y.2006. Temperature acclimation of photosynthesis: mechanismsinvolved in the changes in temperature dependence ofphotosynthetic rate. J. Exp. Bot., 57 : 291–302.
Jayaprakash, T.L., G. Ramamohan, B.T. Krishna Prasad, G.Kumar,T.G. Prasad, M.K. Mathew, and M. Udayakumar.1998. Genotypicvariability in differential expression ofLea2 and Lea3 genes andproteins in response to salinity stress in finger millet (Eleusinecoracana Gaertn) and rice (Oryza sativa L.) seedlings. Annals ofBotony. 82:513–522.
Larkindale, J., Hall, J.D., Knight, M.R. and Vierling, E. 2005. Heatstress phenotypes of Arabidopsis mutants implicate multiplesignaling pathways in the acquisition of thermo tolerance. PlantPhysiology. 138: 882–897.
Nagai, T. and Makino, A. 2009. Differences between rice and wheat intemperature responses of photosynthesis and plant growth. Plantand Cell Physiology, 50:744–755.
SenthilKumar, M., Kumar, G., Srikanthbabu, V. and Udayakumar. M.2006. Assessment of variability in acquired thermotolerance:Potential option to study genotypic response and the relevance ofstress genes. J. Plant Physiol. 164:111–125.
Senthil Kumar, M., Ganesh Kumar1., Srikanthbabu, V and Udaykumar,M., 2007.Assessment of variability in acquired thermotolerance:Potential option to study genotypic response and the relevance ofstress genes. Journal of plant physiology. 164(23): 115-125.
Senthil Kumar, M., Srikanth babu, V., Mohan Raju, B., Ganesh Kumar,V., Savith, M and Udaykumar, M. 2002. Identification of peagenotypes with enhanced thermotolerance using TIR technique.Journal of Plant Physiology. 159: 535-545.
Srikanthbabu, V., Kumar, G., Krishnaprasad, B.T., Gopalakrishna, R.,Savitha, M. and Udayakumar, M. 2002. Identification of peagenotypes with enhanced thermotolerance using temperatureinduction response (TIR) technique. J. Plant Physiol. 159 : 535–545.
Sudhakar, P., Latha, P., Rameshbabu, Sujatha, K and Raja Reddy. 2012.Screening of paddy genotypes for thermotolerance to using TIRtechnique in pursuit of global warming. Indian journal of PlantPhysiology. (In Press).
Sung, D.Y., F. Kaplan, K.J. Lee, and C.L. Guy. 2003. Acquired toleranceto temperature extremes. Trends Plant Science. 8: 179–187.
Yildiz, M. and Terzi, H. 2008. Evaluation of acquired thermotolerancein wheat (Triticum aestivum and T. durum) cultivars grown in Turkey.Pak. J. Bot. 40(1): 317–327.
Recieved on 17-09-2013 Accepted on 27-10-2013

742 Trends in Biosciences 6 (6), 2013Trends in Biosciences 6 (6): 742-743, 2013
Genetic Variability and Character Association in Chickpea Germplasm (Cicerarietinum L.).NEELU KUMARI, SURESH BABU, G. ROOPA LAVANYA
Department of Genetics and Plant Breeding,Allahabad School of AgricultureSam Higginbottom Institute of Agriculture Technology and Sciences (Deemed to be University), Allahabad-211007, Uttar Pradesh.email : [email protected]
ABSTRACT
Genetic variability assessed among 32 advanced breeding linesof chickpea for grain yield and early duration suited inrandomized block design with three replications. Highestgenotypic coefficient of variance (GCV) was studied in seedyield per plant. Heritability is a measure of the extent ofphenotypic variation caused by the action of genes. Heritabilityin broad sense ranged from 55 % for total yield (t/ha) followedby 53 % for days of 50% flowering, High expected geneticadvance coupled with high heritability estimate was obtainedfor plant height, number of secondary branches per plant,number of pods per plant, and seed yield per plant suggestingthe dominant role of additive gene effects in expression ofthese traits. Grain yield per plant has positive and significantassociation with biological yield, harvest index, test weightwas also estimated.
Key words Genetic variability, chickpea, germplasm
Chickpea (cicer arietinum L) is an important rabi seasonlegume having extensive geographical distribution. Chickpeais a diploid species with the chromosome number 2n = 14, 16.It is a self pollinated crop and it belongs to sub familypapilionaceae of the family leguminaceae. Gram is a goodsource of protein (19-29%), carbohydrate (52-70%), fat (4-10%).In Asia, India is the largest producer of chickpea contributingover 70 per cent of the world production occupying an area of7.49 million hectares with a production of 6.33 million tonnesand with productivity of 780 kg per ha. Information on certaingenetic parameters for grain yield and associated charactersis essential for the success of breeding programme of anycrop. The knowledge of interrelationship of characters playsa vital role in developing appropriate selection criteria for theimprovement of complex character like grain yield. So, geneticvariability assessed among advance breeding lines is veryimportant character for grain yield.
MATERIALS AND METHODS
Thirty two advance genotypes of chickpea were seededin randomized block design with three replications during rabi2011. The experiment was conducted at the FieldExperimentation Center, Department of Genetics and PlantBreeding, Sam Higginbottom Institute of Agriculture,Technology and Science, Deemed to be University, Allahabad.
Each entry was sown in 5 rows plot of 6 m2 with 40 × 10 cmspacing. Five plants of from each replication were selected atrandom and observation were recorded on 11 characters viz.,days to 50% flowering, number of primary branches per plant,number of secondary branches per plant, number of pods perplants (g), days to maturity, plant height (cm), seed index,seed yield per plant (g), seed yield per hectare (tonnes), harvestindex and biological yield. Days of 50% flowering and days tomaturity were computed on plot basis. The mean data of eachcharacter was subjected to analysis of variance. Thephenotypic coefficient of variability (PCV) and Genotypiccoefficient of variability (GCV), broad sense heritability,expected genetic advance (GA) and genetic advance as % ofmean at 5% selection intensity where computed by usingformulae.
RESULTS AND DISCUSSION
The grain yield is a highly variable and complex characterand is a result of cumulative effects of its componentcharacteristics. The analysis of variance showed highlysignificant differences among the genotypes for all thecharacters suggesting the presence of considerable range ofvariation expressed for the traits, plant height varied from52.66 (AICP101) to 29.66 cm (AAICP135). Range varies fordays of 50% flowering (81.33-89.00), Days to maturity (121.0-128.5), and total yield per hac (3.99-7.33 t/hac). Meanperformance for days of 50% flowering (84.03), days to maturity(125.01), and total yield per hac (5.51 t/hac). A wide range ofphenotypic coefficient of variance (PCV) was observed fordifferent genotypes. Ranged from (24.52) seed yield per plantto (2.26) days of 50 % flowering. Higher magnitude ofphenotypic coefficient of variance (PCV) were recorded forseed yield per plant (24.52) and days to 50% flowering showedlow phenotypic coefficient of variance (PCV) value (2.26). Awide range genotypic of coefficient of variance (GCV) wasobserved for different genotypes. Ranged from (52.33-78.33)number of pods per plant to (3.33-5.33) number of primarybranches. Higher magnitude genotypic of coefficient ofvariance (GCV) were recorded for seed yield per plant (17.29)and days to 50% flowering showed low genotypic ofcoefficient of variance (GCV) value (1.64). High heritability(55.00 percent) was observed for seed yield per hectare,followed by days to 50% flowering (53.00 percent), 100 seed
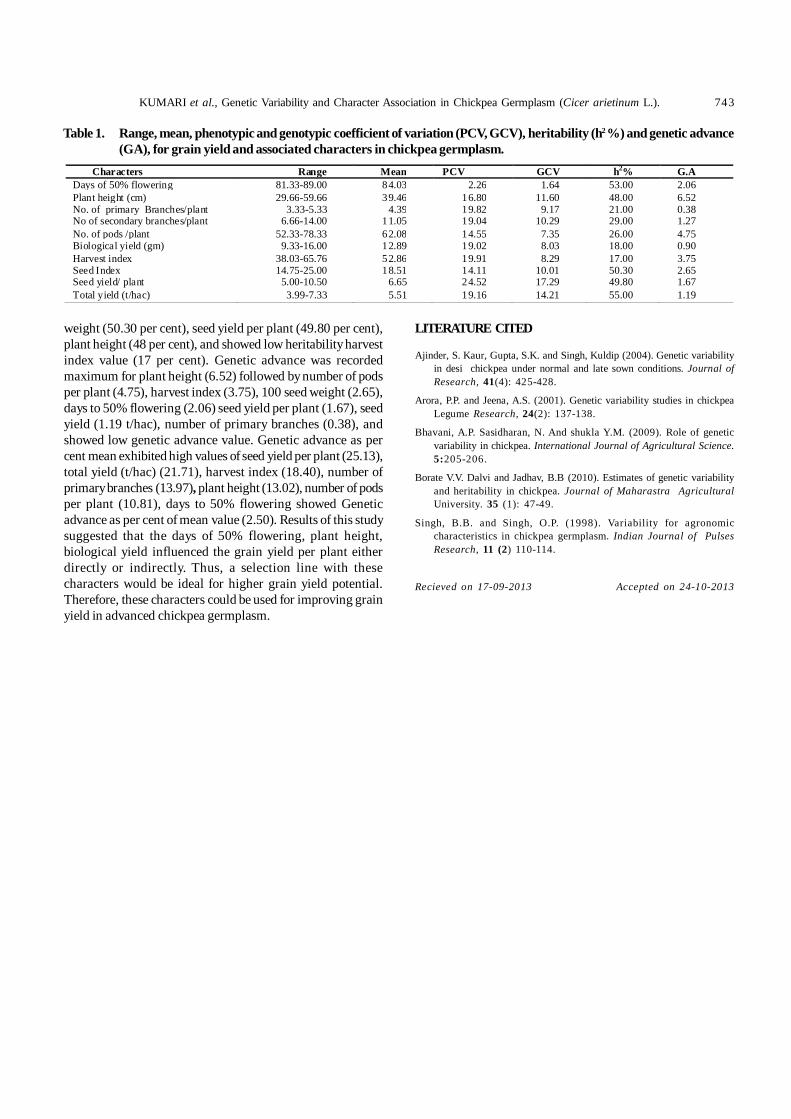
KUMARI et al., Genetic Variability and Character Association in Chickpea Germplasm (Cicer arietinum L.). 743
weight (50.30 per cent), seed yield per plant (49.80 per cent),plant height (48 per cent), and showed low heritability harvestindex value (17 per cent). Genetic advance was recordedmaximum for plant height (6.52) followed by number of podsper plant (4.75), harvest index (3.75), 100 seed weight (2.65),days to 50% flowering (2.06) seed yield per plant (1.67), seedyield (1.19 t/hac), number of primary branches (0.38), andshowed low genetic advance value. Genetic advance as percent mean exhibited high values of seed yield per plant (25.13),total yield (t/hac) (21.71), harvest index (18.40), number ofprimary branches (13.97), plant height (13.02), number of podsper plant (10.81), days to 50% flowering showed Geneticadvance as per cent of mean value (2.50). Results of this studysuggested that the days of 50% flowering, plant height,biological yield influenced the grain yield per plant eitherdirectly or indirectly. Thus, a selection line with thesecharacters would be ideal for higher grain yield potential.Therefore, these characters could be used for improving grainyield in advanced chickpea germplasm.
Table 1. Range, mean, phenotypic and genotypic coefficient of variation (PCV, GCV), heritability (h2 %) and genetic advance(GA), for grain yield and associated characters in chickpea germplasm.
Characters Range Mean PCV GCV h2% G.A Days of 50% flowering 81.33-89.00 84.03 2.26 1.64 53.00 2.06 Plant height (cm) 29.66-59.66 39.46 16.80 11.60 48.00 6.52 No. of primary Branches/plant 3.33-5.33 4.39 19.82 9.17 21.00 0.38 No of secondary branches/plant 6.66-14.00 11.05 19.04 10.29 29.00 1.27 No. of pods /plant 52.33-78.33 62.08 14.55 7.35 26.00 4.75 Biological yield (gm) 9.33-16.00 12.89 19.02 8.03 18.00 0.90 Harvest index 38.03-65.76 52.86 19.91 8.29 17.00 3.75 Seed Index 14.75-25.00 18.51 14.11 10.01 50.30 2.65 Seed yield/ plant 5.00-10.50 6.65 24.52 17.29 49.80 1.67 Total yield (t/hac) 3.99-7.33 5.51 19.16 14.21 55.00 1.19
LITERATURE CITED
Ajinder, S. Kaur, Gupta, S.K. and Singh, Kuldip (2004). Genetic variabilityin desi chickpea under normal and late sown conditions. Journal ofResearch, 41(4): 425-428.
Arora, P.P. and Jeena, A.S. (2001). Genetic variability studies in chickpeaLegume Research, 24(2): 137-138.
Bhavani, A.P. Sasidharan, N. And shukla Y.M. (2009). Role of geneticvariability in chickpea. International Journal of Agricultural Science.5:205-206.
Borate V.V. Dalvi and Jadhav, B.B (2010). Estimates of genetic variabilityand heritability in chickpea. Journal of Maharastra AgriculturalUniversity. 35 (1): 47-49.
Singh, B.B. and Singh, O.P. (1998). Variability for agronomiccharacteristics in chickpea germplasm. Indian Journal of PulsesResearch, 11 (2) 110-114.
Recieved on 17-09-2013 Accepted on 24-10-2013

744 Trends in Biosciences 6 (6), 2013Trends in Biosciences 6 (6): 744-746, 2013
Evaluation of Tomato Hybrid (Lycopersicon esculentum Mill.) in Allahabad AgroClimatic ConditionsASHUTOSH SINGH, CHANDAN SINGH AHIRWAR AND V. M. PRASAD
Department Horticulture, Sam Higginbottom Institute of Agriculture, Technology & Sciences, Allahabad,211007 U.P., Indiaemail: [email protected]
ABSTRACT
The investigation entitled evaluation of tomato hybrid(Lycopersicon esculentum Mill.) in Allahabad agro climaticconditions was carried out at the vegetable research farm,Department Horticulture, Sam Higginbottom Institute ofAgriculture, Technology & Sciences, Allahabad, U.P. duringthe winter (rabi) season of 2011. The experiment was laid outin randomized block design (R.B.D.) with nine treatments andthree replication. JK Nanadini, 2 to 848, Monica, Abhishek,Lakshami (NP 5005), Tanuja, ICS 141, Abhinav, and Rajshree.The treatment (v2) TO 848 was significantly best On the basisof plant height (83.67 cm), number of branches (13), number ofleaves (44), number of fruits (22), fruit diameter (6.47-6.65 polarand radial ) fruit weight (72.27g) this treatment also showedlowest intensity of leaf curl virus with higher benefit cost ratio(1:2.20).
Key words Tomato hybrid, To 848, agroclimatic, Allahabad
Tomato (Lycopersicon esculentum Mill.), common nameTamatar, one of most popular and nutritious fruit vegetable;widely grown around the world and having second rank afterpotato.
Tomato belongs to the family solanaceae is one of themost popular and widely grown vegetables in the world.Tomato is a self pollinated crop. The annual world wideproduction is 108.5mt. Out of which one-third is used asprocessed products and two-third of tomato fruit is consumedfresh. Total area under tomato crop in the country is assessedto be 0.52 m. ha with the productivity of (19.6 t/ha) andproduction of 8.6 mt.
Tomato is a warm season crop and requires relativelylong season to produce a profitable crop. It is highlysusceptible to frost showed that light intensity is a veryimportant factor for ascorbic acid content in tomato fruits.Under low light intensity, vitamin C is much lower than inhigher intensity. Environment factors such as light intensity,temperature, moisture markedly influence the process of fruitset of tomato and subsequent fruit development and yield(Calvert, 1959).
MATERIALS AND METHODS
The present investigation Evaluation trial of Tomatohybrids [Lycopersicon esculentum Mill] in Allahabad climaticcondition during the Rabi season of the year 2011. The detailsof material used and methodology adopted during the courseof study are mentioned as follows.
Experimental site:
The experiment was carried out at the Vegetable ResearchFarm, Department of Horticulture, Allahabad School ofAgriculture, Sam Higginbottom Institute of Agriculture,Science and Technology, Allahabad (U.P.)
The design of experiment:
The experiment was laid out in randomized block design(RBD) with 9 treatment was replicated three times. Treatmentwas randomly arranged in each replication, divided in to 9plots. The experimental details are as follows:
Treatment details:
V1 : JK Nanadini, V2 : TO- 848, V3 : Monica, V4 :Abhishek, V5 : Lakshmi (NP 5005) and V6 : TanujaGrowth parameters: Plant height (cm), Number of branchesper plant, Number of Leaves per plant and Days to firstflowering / plant
Yield and yield attributing parameters:
Number of fruit / plant, Number of fruit diameter (cm),Average of fruit weight (g) and Fruit yield / plant (kg)
Qualitative characters:
T.S.S. (Total soluble solids) 0Brix, Acidity (%), Ascorbicacid and Intensity of leaf curl virus.
RESULTS AND DISCUSSION
The maximum plant height was recorded in V2 TO 848(83.67) the minimum was found (53.73) with Rajshree. TO 848recorded maximum number of branches (13.73) and theminimum was found (10.73) with Rajshree. TO 848 recordedmaximum number of leaves (44.47) and the minimum was found

SINGH et al., Evaluation of Tomato Hybrid (Lycopersicon esculentum Mill.) in Allahabad Agro Climatic Conditions 745
(41.67) with Rajshree. TO 848 recorded early flowering (49.88days) and late flowering (53.92) was found Rajshree. TO 848recorded Maximum polar diameter (6.47 cm) and the minimumwere recorded (3.36 cm) with Rajshree. TO 848recorded maximum radial diameter (6.65 cm) and theminimum were recorded (4.57 cm) with Rajshree.TO 848 recorded maximum number of fruits (22.50)per plant while the minimum was recorded (20.89)with Rajshree. Maximum fresh weight of fruit wasrecorded with TO 848 (72.27 g) and the minimumwas recorded (65.00 g) with Rajshree. TO 848recorded maximum fruit yield per plant (1.63kg), andfruit yield (60.23q/ha) while the minimum wasrecorded (1.36 kg) and (50.29 q/ha) with Rajshree.Maximum T.S.S.(0 brix) of recorded with Rajshree(7.53)and minimum was recorded with JK Nanadini(5.60). Maximum acidity (%) of fruit was recordedTO 848 (0.84 %) and minimum was recorded (0.70%) with Rajshre. Maximum ascorbic acid (mg/100gpulp) of TO 848 (35.09 mg/100g pulp) and minimumwas recorded (25.81 mg/100g) with Rajshree.Maximum intensity of leaf curl virus (%) of plant
Table. Evaluation Trial of Tomato Hybrids (Lycopersicon esculentum Mill.) in Allahabad Agro Climatic Conditions.
Treatment Plant height (cm) 120
DAT
Number of
branches per plant 120 DAT
Number of leaves
per plant 120 DAT
Days to first
flowering
Polar diameter of fruit
(cm)
Radial diameter of fruit
(cm)
Number of fruits
per plant
Weight of fruit
(g)
Fruit yield per
plant (kg)
Fruit yield (t ha-
1)
Total soluble solids (T. S.
S.) (°Brix)
Acidity (%)
Ascorbic acid
(mg/100 g fruit pulp)
Intensity of leaf curl
virus (%)
V1JK Nanadini F1 Hybrid
69.80 11.67 44.27 52.44 4.98 5.35 21.21 68.01 1.44 53.43 5.60 0.76 28.16 68.82
V2 TO 848 F1 Hybrid 83.67 13.73 48.47 49.88 6.47 6.65 22.50 72.27 1.63 60.23 5.89 0.84 35.09 1.88
V3 Monica F1 Hybrid
70.53 12.00 44.33 51.89 5.19 6.23 21.43 70.13 1.50 55.67 6.27 0.79 30.67 47.33
V4
Abhishek F1 Hybrid
70.20 12.00 44.33 52.07 5.12 5.45 21.32 69.13 1.47 54.59 6.54 0.78 29.69 59.82
V5 Lakshmi (NP 5005 F1 Hybrid
74.00 12.93 45.73 50.27 6.15 6.52 21.73 71.39 1.55 57.45 6.84 0.82 33.30 18.13
V6 Tanuja F1 Hybrid 73.40 12.87 44.53 50.77 5.20 6.38 21.53 71.22 1.53 56.78 7.00 0.81 31.53 30.26
V7ICS 141 F1 Hybrid 68.60 11.60 44.07 52.88 4.71 5.04 21.11 66.77 1.41 52.20 7.20 0.74 27.57 78.82
V8 Abhinav F1 Hybrid 65.20 11.47 43.07 53.17 3.81 4.69 21.00 65.36 1.37 50.84 7.33 0.73 26.86 84.12
V9 Rajshree F1 Hybrid 53.73 10.73 41.67 53.92 3.36 4.57 20.89 65.00 1.36 50.29 7.53 0.70 25.81 90.42
F- test S S S S S S S S S S S S S S
S. Ed. (±) 0.12 0.03 0.03 0.09 0.03 0.03 0.04 0.07 0.01 0.26 0.04 0.01 0.10 2.40
C. D. at 5% 0.26 0.06 0.06 0.18 0.07 0.07 0.08 0.15 0.01 0.55 0.09 0.01 0.22 5.08
Fig. 1. Evaluation Trial of Tomato Hybrids (Lycopersicon esculentum Mill.) inAllahabad Agro Climatic Conditions.
was recorded to (90.42 %) Rajshree followed by (84.12 %)Abhinav and minimum recorded (1.88 %) was TO 848. Maximumcost benefit ratio recorded by TO 848 (1:4.20) followed by

746 Trends in Biosciences 6 (6), 2013
Lakshmi (5005) (1:4.01) and the minimum was found (1:3.51)with Rajshree. To - 848 was found superior over all othertreatment for growth, yield and yield attributes quality andeconomic returns for cultivation of Tomato.
On the basis of results obtained it is concluded that outof 9 cultivars than treatment (V2) (hybrid TO 848) was foundto be the best in respect of growth, yield and quality of Tomatoin Allahabad agro- climatic condition. This treatment alsoshowed lowest intensity of leaf curl virus with higher benefitcost ratio.
LITERATURE CITED
Calvert, T. 1959. Effect of the early environment on development offlowering in tomato.II. Light and temperature interaction. J. J.Hort.Sci., 34:154-62.
Hamner, K.C., Berntein, L. and Maynarrd. (1945) L.A. J.Nutr.,27:85-87.
Recieved on 10-10-2013 Accepted on 15-10-2013

Trends in Biosciences 6 (6): 747-750, 2013
Genetic Studies for Yield and Component Traits in Wheat (T. aestivum L.) Linesunder Sodic SoilsP N VERMA1, R K YADAV2, B N SINGH3, S R VISHWAKARMA4
1,2Department of Genetics and Plant Breeding, CSA University of Agriculture and Technology, Kanpur208002 (UP) India3,4Department of Genetics and Plant Breeding, ND University of Agriculture and Technology, Kumarganj,Faizabad 224229 (UP) Indiaemail: [email protected]
ABSTRACT
An experiment was carried out during rabi 2010-11 with 108exotic and indigenous wheat lines at research farm of NDUniversity of Agriculture and Technology, Kumarganj, Faizabad(UP), India to assess the genetic variability for yield and yieldrelated traits under sodic soils condition. All the genotypeswere evaluated for the eleven traits. All the data recorded wereaveraged and analyzed following the Federer, 1956 method.Genetic variability was statistically found for all the eleventraits. Maximum variations were observed among the entriesfor plant height with coefficient of variation 10.68% whileminimum variability was found for productive tillers per plant.The entry HD 3027 required minimum days for 50% floweringwhile entries PBW 621 and NW 1014 showed early maturity.Minimum plant height was observed for entry NW 4082 whilemaximum number of productive tillers possess by entry KRL229. One entry AMERY characterized by longest spike andentry KRL 99 had maximum spike weight per plant. The entriesNW 1014 and NW(S) 6-5 provided maximum number of grainper spike while entry K 0808 possess highest 1000-grain weight.Maximum biological yield per plant and harvest index wasexhibited by entries RAJ 4201 and NW 4091 respectively. Theentry KHARCHIA 65 is mainly characterized by havingmaximum grain yield per plant. High genetic variability presentin investigated wheat genotypes indicated scope forimprovement in yield and yield components.
Key words Wheat, Genetic variability, sodic soils
Globally, wheat is being grown in 122 countries andoccupies an area of 222.21 million ha producing nearly 645.41million tonnes of wheat (Anonymous; FAO. STAT 2010-11).Nearly 55 per cent of the world population depends on wheatfor intake of about 20 per cent of food calories. At nationallevel area under wheat is 29.25 million ha with the productionof 85.93 million tonnes with a productivity of 2.9 tonnes perha (Anonymous; AICWBIP Progress Report 2010-11). Indiastands second rank both in area and production next to Chinain the world. The India’s share in world wheat area andproduction is about 13%.
Possibility of achieving improvement in any crop plantsdepends heavily on the magnitude of genetic variability. Thephenotypic variability expressed by a genotype or a group of
genotypes in any species can be partitioned into genotypicand phenotypic components. The variability for variouscharacters are subjected to selection for changing the geneticarchitecture of plant characters and consequently of the plantas a whole to develop improved genotypes having highereconomic yield. So in this background, the objective of thepresent investigation was to estimate the genetic variabilityin wheat lines to identify the genotypes with best potentialityfor upgrading yield and its components characters undersodic soils condition.
MATERIALS AND METHODS
The present investigation was carried out during rabi2010-11 at Main Experimental Station Farm of ND Universityof Agriculture and Technology, Narendra Nagar Kumarganj,Faizabad (U.P.), India. Narendra Nagar is situated between26.47o N latitude, 81.12o E longitude and at an altitude of 113 mabove the mean sea level. The climate of district Faizabad issemi-arid with hot summer and cold winter. The soil type ofexperimental site was reclaimed salt affected soil [EC =0.41;pH = >8.8; ESP= >15], rich in potash and low in organic carbon,nitrogen and phosphorus. The experimental material consistedof 108 diverse genotypes including 4-checks (DBW 14, DBW17, HD2009 and KRL3-4) of wheat collected from Australiaand India. These genotypes were grown under sodic soilscondition in an augmented design comprising of 4 blocks,where each block contains 26 test entries and 4 checks(randomly allocated). Each genotype was grown in 4 rows of2.5 m long plot with 23 cm distance between rows. Therecommended cultural practices were adopted to raise goodcrop. Five random plants per plot were selected to recordobservations on yield and yield contributing characters. Allthe data recorded were averaged and analyzed following theFederer, 1956 method.
RESULTS AND DISCUSSION
The results of the present study showed moderate tohigh variability for all the eleven characters under study. Thissuggested that adequate scope is available for use in aprogrammed aimed at enhancing genetic yield potential ofwheat. The data presented in table- 1 showed wide range of

748 Trends in Biosciences 6 (6), 2013
Table 1. Descriptive statistics of the 11 quantitative traitsof 108 wheat lines under sodic soil.
Where, CV= Coefficient of variation in %, SE= Standard error, SD=Standard deviation
Characters Minimum Maximum Mean CV SE SD Days to 50% flowering 73 94 80 4.00 0.31 3.23
Days to maturity 114 126 120 1.96 0.22 2.37 Plant height (cm) 61 100 77 10.68 0.79 8.26 Productive tillers/plant
2 7 4 22.54 0.10 1.11
Spike length (cm) 6 13 9 11.16 0.10 1.10 Spike weight/plant (g) 3 12 7 27.55 0.20 2.15
Grains/spike 26 49 39 13.52 0.51 5.30 1000-grain weight (g) 24 45 36 12.51 0.43 4.50 Biological yield/plant (g) 9 24 16 25.00 0.40 4.18
Harvest index (%) 26 44 36 10.98 0.38 4.00 Grain yield/plant (g) 3 10 6 30.19 0.17 1.85
Days to 50% flowering
Fig. 1. X-axis: Days to 50% flowering & Y- axis: Genotypefrequency
genetic variability for all the eleven traits.The magnitude of genetic variability for days to heading
was ranged from 73- 94 days with the mean value of 80 daysand coefficient of variation 4.00 % (Table1). The frequencydistribution varied from 70 – 95 days (Fig 1). Two entries HD3027 and NWL 9-25 have minimum number of days to headingand only one entry CAMM had longest days of heading. Themagnitude of genetic variability for days to maturity trait wasranged from114-126 days with the mean value of 120 days andcoefficient of variation 1.96% (Table 1). The frequencydistribution varied from 114-128 days (Fig 2). Two entries PBW
Productive tillers per plant
Fig. 2. X-axis: Productive tillers/plant & Y- axis: Genotypefrequency
Spike length (cm)
Fig. 3. X-axis: Spike length & Y- axis: Genotype frequency
621 and NW- 014 have minimum days to maturity and twoentries CAMM and KRL 213 took maximum days of maturity.Significant variability was depicted for plant height parameter,which range from 61-100 cm with the mean value of 77 cm andcoefficient of correlation 10.68% (Table 1). The frequencydistribution varied from 60-100 cm (Fig 3). Minimum plantheight was observed in entries NW 4082 and NWL 9-22 whileKharchiya 65 exhibited maximum plant height. A frequentvariability was noted for productive tillers per plant trait whichranged from 2-7 with the mean value of 4 and coefficient ofvariation was 22.54% (Table 1). The frequency distributionvaried from 2-8 (Fig 4). Two entries KRL 229 and GAMENYAexhibited maxim number of productive tillers per plant while

VERMA et al., Genetic Studies for Yield and Component Traits in Wheat (T. aestivum L.) Lines under Sodic Soils 749
entries AMERY and NW 4081 showed minimum productivetillers per plant.
For spike length magnitude of genetic variability wasranged from 6-13 cm with the mean value of 9 cm and coefficientof variation 11.16% (Table 1). The frequency distribution wasvaried from 6-14 cm (Fig 5). Two entries AMERY and K 0808have maximum spike length and entry NW 3087 had minimumspike length. A significant result was observed for spike weightper plant trait. It varied from 3-12 g with the mean value of 7 gand coefficient of variation 27.55% (Table 1). The frequencydistribution was varied from 2-14 g (Fig 6). The entry KRL 99
and NW 4098 have highest spike weight per plant. Themagnitude of genetic variability for grains per spike trait wasranged from 26-49 with the mean value of 39 and coefficient ofvariation 13.52% (Table 1). The frequency distribution variedfrom 25-50 (Fig 7). Maximum number of grains per spike wasobserved for the entries NW 1014, NW(S) 6-5 and DBW 46while UP-262 and GUTHA showed minimum grains per spike.Significant variability was observed for 1000-grain weightcharacter, which ranged from 24-45 g with the mean value of36 g and coefficient of variation 12.51% (Table 1). Thefrequency distribution varied from 20-50 g (Fig 8). The entryK 0808 having maximum 1000-grain weight. Genetic variabilityranged from 9-24 g for biological yield per plant with the meanvalue of 16 g and coefficient of variation 25.00% (Table 1).The frequency distribution varied from 5-25 g (Fig 9). Maximumbiological yield per plant was observed in case of RAJ-4201and KHARCHIYA 65 while minimum value showed byWESTONIA.
Significant variability was depicted for harvest indexparameter, which ranged from 26-44%with mean value of 36%and coefficient of variation 10.98% (Table 1). The frequencydistribution ranged from 25-45 (Fig 10). The entry NW 4091has maximum harvest index value. A significant result wasobserved for grain yield per plant trait. It varied from 3-10 gwith the mean value of 6 g and coefficient of variation 30.19(Table 1). The frequency distribution ranged from 3-11 g (Fig11). The entry KHARCHIYA-65 was found highest grain yielderfollowed by KRL 104 and PBW 550. Genetic variability hasbeen calculated for different yield attributing characters inwheat by several workers (Sachan and Singh, 2003; Kumar, etal., 2003; Paul et al., 2006; Chaitali and Bini, 2007) whichrevealed that selection was effective for a population withbroad genetic variability.
Biological yield per plant (g)
Fig. 4. X-axis: Biological yield/plant & Y- axis: Genotypefrequency
Harvest index (%)
Fig. 5. X-axis: Harvest index & Y- axis: Genotype frequency
Grain yield per plant (g)
Fig. 6. X-axis: Grain yield/plant & Y- axis: Genotypefrequency

750 Trends in Biosciences 6 (6), 2013
Highly significant differences were obtained among thegenotypes for all the eleven selected characters; this indicatedadequate variability among the genotypes considered in thisstudy. The entry AMERY had maximum spike length and NW1014 had maximum number of grains per spike while Kharchiya65 had maximum grain yield per plant. Hence these entrieshave the required characteristics for obtaining maximum andrecommended for general cultivation under sodic soilscondition.
ACKNOWLEDGEMENT
The authors gratefully acknowledge Directorate ofWheat Research (DWR) and Australian Centre forInternational Agriculture Research (ACIAR) for providingexperimental materials for this investigation.
LITERATURE CITED
Anonymous, 2010-11. AICWBIP Progress Report 2010-11 (DWR).
Anonymous., 2010-11. Statistical database FAO.
Chaitali, S. and Bini, T., 2007. Variability, character association andcomponent analysis in wheat (T. aestivum L.) Crop Research, (Hisar).34 (1-3): 166-170.
Federer, W. T., 1956. Augmented Designs. Hawain Planters Record,40: 191-207.
Kumar, S., Dwivedi, V.K. and Tyagi, N.K., 2003. Genetic variability insome metric traits and its contribution to yield in wheat (Triticumaestivum L.) Progressive Agriculture. 3 (1-2): 152-153.
Paul, A.K., Islam, M.A., Hasan, M.J., Choudhary, M. M. H. andChoudhary, A.Z.M.K.A., 2006. Genetic variation of some morpho-physiological characters in triticum durum wheat. International J.of Sustainable Agricultural Technology. 2 (8): 11-14.
Sachan, M.S. and Singh, S.P., 2003. Genetics of yield and its componentsin durum wheat (T. durum Desf.). Journal of Inter Academicia. 7(2): 140-143.
Recieved on 13-09-2013 Accepted on 23-10-2013

Trends in Biosciences 6 (6): 751-754, 2013
Fertility Restoration Pattern of New Interspecific Derived Restorer Lines inSunflowerVENKATA R PRAKASH REDDY1 AND H. L. NADAF2
Department of Genetics and Plant breeding, S. V. Agricultural College, Tirupati, ANGRAUDepartment of Genetics and Plant Breeding, College of Agriculture, Dharwademail: [email protected])
ABSTRACT
Fertility restoration in four CMS sources of sunflower wasstudied using 12 diverse restorer lines, while fertility wascompletely restored in only 27 hybrids, 15 of them were partiallyrestored and rest six were found to be completely sterile. Thetester lines SCG 29, SCG 73, RES 834-1, HRHA 10, RHA 298and ID 25 were found to be common restorers of three CMSlines viz., CMS 234A, CMS 17A and CMS 1030A and it wasfound that there is no line that was completely sterile on CMS234A and CMS 1030A sterile lines. The differential behaviourof these pollen parents on different CMS lines could be due totheir wide genetic diversity as these restorer lines areinterspecific derived lines.
Key words Restorer lines, sunflower
Hybrid breeding has developed successfully insunflower over the last 30 years since the identification ofcytoplasmic male sterility among progenies of the interspecificcross Helianthus petiolaris ´ Helianthus annuus by Leclercq,1969 and the subsequent discovery of pollen fertilityrestoration genes (Kinman, 1970; Leclercq, 1971; Vranceanuand Stoenescu, 1971). This source (PET 1 cytoplasm), ofcytoplasmic male steility has proved to be very stable and isused almost exclusively in breeding programmes throughoutthe world since late 1970s, when it replaced the NMS systemfor producing hybrid seeds that was being used in severalEuropean countries till the early 1970s. Inspite of the fact thatnew CMS sources continue to be discovered (Serieys, 2002),there are hardly any reports of their utilization for commercialhybrid production. The reluctance is presumably due to alack of superior CMS restorer combinations, as well as thetiome consuming conversion programmes of CMS andrestoration genes into inbred lines (Sjan, et al., 2006).
Success in heterosis breeding is largely dependent onthe development of inbreds having broader genetic base. Ingeneral, inbreds with high combining ability and per seperformance are either converted into CMS lines or fertilityrestorer lines for their future use in hybrid breedingprogrammes. Keeping this in view superior inbreds wereevaluated for their maintainer and restorer behaviour, with theobjectives of identifying diverse sources of CMS maintainersand restorers. We herein make use of the easy methodproposed by Chaudhary, et al., 1981, for ascertaining the
pollen fertility of crosses; leading to the identification ofselected superior inbreds as maintainers and restorers of fourdiverse CMS sources, for the practical use of these inbreds infuture sunflower breeding programme to augment the geneticdiversity of sunflower hybrids.
MATERIALS AND METHODS
Twelve restorer lines comprising of accessions from coregermplasm viz., SCG 29 (PI 431542), SCG 37 (PI 505839), SCG73 (PI 650362), interspecific derivatives viz., RES 834-1 (CMSHA 89*2 x H. resinosus), PS 1070 (H. argophyllus x cultivatedsunflower), ID 25 (CMS HA 89*2 x H. resinosus) and restorerlines NDR 4, R 45, HRHA 10-3, RHA 298, RHA 334, RHA 43-5)obtained from Directorate of Oilseeds Research, Hyderabadwere crossed with four cytoplasmic male sterile (CMS) lines(CMS 234A, CMS 17A, CMS 607A and CMS 1030A) duringrabi 2010 in Line x Tester mating design to obtain 48 hybrids.The F1 s were sown during the kharif (8th August) season of2011-2012 at Main Agricultural Research Station, Dharwadfor evaluation. All the F1 s sown were studied maintainer/restorer behaviour of the inbreds. The plants were classifiedas male fertile or sterile based on anther exertion and pollenproduction during flowering. In case of no pollen production,conspicuous stigma projection coupled with pale yellow discflorets, the lines were classified as restorer or maintainers forthe different CMS sources. Identification of effective fertilityrestorers to these cytoplasmic male sterile lines helps inutilizing them for developing hybrids with diverse cytoplasmand the identified maintainers with good combining abilityalong with suitable genetic background can be converted intonew CMS lines for further exploitation in developing newhybrids.
RESULTS AND DISCUSSION
Out of the 48 hybrids obtained by crossing 12 malelines with four CMS lines, fertility was completely restored inonly 27 hybrids (Table 1 and 2), 15 of them were partiallyrestored and rest six were found to be completely sterile (Table1). The range of fertility restoration in different crosscombinations was between 8.33 (CMS 607A ́ RHA 435) and100 per cent (Table 1).
The results revealed that fertility restoration on CMS234A was found to be completely restored by most of the

752 Trends in Biosciences 6 (6), 2013
Table 1. List of hybrids with their fertility status
Sl. No. Crosses F1 plants scored
No. of plants fertile
No. of plants sterile
% fertility
Status of hybrid Status of male plant
1 CMS 234A × SCG 29 20 20 0 100 F Restorer 2 CMS 234A × SCG 37 20 20 0 100 F Restorer 3 CMS 234A × SCG 73 20 20 0 100 F Restorer 4 CMS 234A × RES 834-1 20 20 0 100 F Restorer 5 CMS 234A × NDR 4 20 12 8 58.01 F/S Partial Restorer 6 CMS 234A × R 45 20 17 3 84.52 F/S Partial Restorer 7 CMS 234A × HRHA 10-3 20 20 0 100 F Restorer 8 CMS 234A × RHA 298 20 20 0 100 F Restorer 9 CMS 234A × RHA 334 20 17 3 84.86 F/S Partial Restorer
10 CMS 234A × RHA 43-5 20 3 17 14.29 S/F Partial Restorer
11 CMS 234A × PS 1070 20 9 11 45 S/F Partial Restorer 12 CMS 234A × ID 25 20 20 0 100 F Restorer 13 CMS 17A × SCG 29 20 20 0 100 F Restorer 14 CMS 17A × SCG 37 20 5 15 22.5 S/F Partial Restorer
15 CMS 17A × SCG 73 20 20 0 100 F Restorer 16 CMS 17A × RES 834-1 20 20 0 100 F Restorer 17 CMS 17A × NDR 4 20 20 0 100 F Restorer 18 CMS 17A × R 45 20 20 0 100 F Restorer 19 CMS 17A × HRHA 10-3 20 20 0 100 F Restorer 20 CMS 17A × RHA 298 20 20 0 100 F Restorer 21 CMS 17A × RHA 334 20 0 20 0 S Maintainer 22 CMS 17A × RHA 43-5 20 10 10 50 F/S Partial Restorer 23 CMS 17A × PS 1070 20 20 0 100 F Restorer 24 CMS 17A × ID 25 20 20 0 100 F Restorer 25 CMS 607A × SCG 29 20 20 0 100 F Restorer 26 CMS 607A × SCG 37 20 20 0 100 F Restorer 27 CMS 607A × SCG 73 20 14 6 67.86 F/S Partial Restorer 28 CMS 607A × RES 834-1 20 0 20 0 S Maintainer 29 CMS 607A × NDR 4 20 0 20 0 S Maintainer 30 CMS 607A × R 45 20 0 20 0 S Maintainer 31 CMS 607A × HRHA 10-3 20 0 20 0 S Maintainer 32 CMS 607A × RHA 298 20 20 0 100 F Restorer 33 CMS 607A × RHA 334 20 20 0 100 F Restorer 34 CMS 607A × RHA 43-5 20 2 18 8.33 S/F Partial Restorer 35 CMS 607A × PS 1070 20 18 2 0 S Maintainer 36 CMS 607A × ID 25 20 20 0 100 F Restorer 37 CMS 1030A × SCG 29 20 20 0 100 F Restorer 38 CMS 1030A × SCG 37 20 16 4 81.8 F/S Partial Restorer 39 CMS 1030A × SCG 73 20 20 0 100 F Restorer 40 CMS 1030A × RES 834-1 20 20 0 100 F Restorer 41 CMS 1030A × NDR 4 20 17 3 83.33 F/S Partial Restorer 42 CMS 1030A × R 45 20 16 4 82.29 F/S Partial Restorer 43 CMS 1030A × HRHA 10-3 20 20 0 100 F Restorer 44 CMS 1030A × RHA 298 20 20 0 100 F Restorer 45 CMS 1030A × RHA 334 20 15 5 75 F/S Partial Restorer 46 CMS 1030A × RHA 43-5 20 16 4 80.13 F/S Partial Restorer 47 CMS 1030A × PS 1070 20 16 4 78.57 F/S Partial Restorer 48 CMS 1030A × ID 25 20 20 0 100 F Restorer

REDDY1 AND NADAF, Fertility Restoration Pattern of New Interspecific Derived Restorer Lines in Sunflower 753
whereas RHA 334 was completely a maintainer.The only restorer line RHA 334 behaved as maintainer
line on CMS 17A background but it restores the completefertility on CMS 607A background and partial fertility CMS234A and CMS 1030A with regards to CMS 607A background,most of the lines behaved as a maintainers except SCG 29,SCG 37, RHA 298, RHA 334 and ID 25, which restores fertilitycompletely. The differential behaviour of pollen parents ondifferent CMS sources indicate significant diversity amongcytoplasmic source and lines for fertility restoration as reportedby earlier study Divya Ambati, 2010.
The testers SCG 29, SCG 73, RES 834-1, HRHA 10-3,RHA 298 and ID 25 were found to be common restorers ofthree CMS lines viz., CMA 234A, CMS 17A and CMS 1030A,three restorers common four CMS sources (Table 3). And itwas found that there is no line that was completely sterile onCMS 234A and CMS 1030A more sterile lines and the restorerlines restore fertility either completely or partially on thesetwo backgrounds. Such kind of behaviour of male linessuggests the diverse origin of these lines, which is more usefulin locating R genes for restoration.
The one restorer line RHA 43-5 acted as a common partialrestorer line on all four CMS 234A, CMS 17A, CMS 10304Aand CMS 607A backgrounds. It was also evident that SCG 37partially restored fertility on CMS 17A and CMS 1030A, whileNDR 4, R 45, RHA 334 and PS 1070 were also acted as a commonpartial restorer lines on two CMS 234A and CMS 1030Abackgrounds. Thus, these lines have to be improved furtherfor fertility restoration. The differential behaviour of thesepollen parents on different CMS lines could be due to theirwide genetic diversity as these restorer lines are inter-specificderived lines.
All the four CMS sources utilized in the experimentshowed diversity among themselves, thus broadening thegenetic base of the CMS lines, which could be safely includedin breeding programmes thereby mitigating the vulnerabilityof the lines to various insect pests and diseases.
The restorers identified for the different CMS lines willhelp in developing hybrids with broad cytoplasmic base,enhanced heterosis and strengthen the future hybridsunflower-breeding programme. The identified maintainersalso will have greator application in developing new andsuperior agronomic background coupled with good generalcombining ability. With the help of effective restorers identifiedin the present study for the alternate sources of cytoplasm, asignificant improvement towards diversifying the parentalbase, especially with respect to the cytoplasm can beachieved, which may further lead to enhanced productionand productivity of sunflower by breaking the yieldstagnation.
Table 2. List of completely fertile hybridsSl. No. Crosses
1 CMS 234A × SCG 29 2 CMS 234A × SCG 37 3 CMS 234A × SCG 73 4 CMS 234A × RES 834-1 5 CMS 234A × HRHA 10-3 6 CMS 234A × RHA 298 7 CMS 234A × ID 25 8 CMS 17A × SCG 29 9 CMS 17A × SCG 73 10 CMS 17A × RES 834-1 11 CMS 17A × NDR 4 12 CMS 17A × R 45 13 CMS 17A × HRHA 10-3 14 CMS 17A × RHA 298 15 CMS 17A × PS 1070 16 CMS 17A × ID 25 17 CMS 607A × SCG 29 18 CMS 607A × SCG 37 19 CMS 607A × RHA 298 20 CMS 607A × RHA 334 21 CMS 607A × ID 25 22 CMS 1030A × SCG 29 23 CMS 1030A × SCG 73 24 CMS 1030A × RES 834-1 25 CMS 1030A × HRHA 10-3 26 CMS 1030A × RHA 298 27 CMS 1030A × ID 25
Table 3. Pattern of fertility restoration by different inbredlines on the CMS- sources
lines except NDR 4, R 45, RHA 43-5 and PS 1070 that restoredthe fertility partially. The fertility restoration on CMS 17A wasfound to be complete by most (nine) of the lines tested. But,lines SCG 37 and RHA 43-5 restored the fertility partially
Sl. No.
CMS- sources Maintainers Partial
restorers Restorers
1 CMS 234 4 None
NDR 4, R 45, RHA 334, RHA
43-5, PS 1070
SCG 29, SCG 37, SCG 73, RES 834-1, HRHA 10-3, RHA 298, ID 25
2 CMS 17 A RHA 334 SCG 37,
RHA 43-5
SCG 29, SCG 73, ES 834-1, NDR 4, R 45,
HRHA 10-3, RHA 298, PS 1070, ID 25
3 CMS 607 A
RES 834-1, NDR 4, R 45, HRHA
10-3, PS 1070
SCG 73, RHA 43-5
SCG 29, SCG 37, RHA 298, RHA 334,
ID 25
4 CMS 1030 A
None
SCG 37, NDR 4, R 45, RHA 334, RHA 43-5, PS
1070
SCG 29, SCG 73, RES 834-1, HRHA 10-3,
RHA 298, ID 25

754 Trends in Biosciences 6 (6), 2013
LITERATURE CITED
Chaudhary, R. C., Virmani, S. S. and Khush, G. S., 1981, Pattern ofpollen abortion in some cytoplasmic genetic male sterile lines ofrice. Oryza, 18 : 140-142.
Divya Ambati., 2010, Genetic analysis of diverse sources of cms onfertility restoration, heterosis and combining ability in sunflower(Helianthus annuus L.) M. Sc. (Agri.) Thesis, Univ. Agric. Sci.Dharwad, Karnataka (India).
SJan, C. C., Miller, J. F., Vick, B. A. and Seiler, G. J., 2006, Performanceof seven new cytoplasmic male-sterile sunflower lines from inducedmutation and a native American variety. Helia, 29 : 47-54.
Kinman, M. L., 1970, New developments in the USDA and stateexperiment station sunflower breeding programmes. Proc. Of 4 th
Intl. Sunflower Conf., June-23-25, Memphis, TN, USA, pp. 181-183.
Leclercq, P., 1969, Une sterile male cytoplasmique chez le tournesol.An. Amelior. Plant, 19 : 99-106.
Leclercq, P., 1971, La sterile male cytopmasmique de tournesol I.Premieres etudes sur la restoration de la fertile. Ann. Amerilior.Plant, 21 : 45-54.
Serieys, H., 2002, Identification study and utilization in breedingprogrammes of new CMS sources, in FAO Subnetwork. Proc.Sunflower Subnetwork Prog. Rep., FAO Rome, Italy, 7-9 October.
Vranceanu, A. V. and Stoenescu, F. M., 1971, Pollen fertility restorergene from cultivated sunflower (Helianthus annuus L.). Euphytica,20 : 536-541.
Recieved on 10-08-2013 Accepted on 13-09-2013

Trends in Biosciences 6 (6): 755-757, 2013
Assessment of Food Consumption Pattern and Nutritional Status of School GoingChildren of Faizabad DistrictSHAKTI, RITU PRAKASH DUBEY AND SARITA SHEIKH
Department of Foods and Nutrition,SHIATS, Allahabademail : [email protected]
ABSTRACT
The investigation was conducted to study the socio-economicprofile and food consumption pattern of school going childrenof 7-9 years of age from Mawai Block, Faizabad District ofUttar Pradesh State (India). Four hundred school going childrenwere selected purposely. Information was collected on socio-economic profile, food frequency, mean daily food intake andnutrient intake of school going children. The data revealedthat cereal and pulses, a staple food was consumed daily. Themean daily food and nutrient intake of school going childrenwere lower than RDA. Intake of cereals, pulses and milk andmilk products was found higher in boys than girls. Intake ofenergy, iron, calcium and thiamin was marginally inadequatein majority of school going children.
Key words Food intake, Nutrient intake
Adequate food is the most important requisite for growth,while it is important throughout childhood, it is more crucialduring first five years of life when rapid growth is occurring(Rana and Hussain, 2001). . Nutritional status is a majorcomponent of school health services (Izharual, et al., 2011).Over 1/5th of our population comprises of children aged 5-14years i.e. the group covering primary and secondary education(Raghava 2005). As today’s children are the citizen oftomorrow’s world, their survival, protection and developmentare the prerequisite for the future development of humanity(WHO 1996). Growth during childhood is widely used to assessadequate health, nutrition and development of children andto estimate overall nutritional status as well as health statusof the population. It is well documented that chronic undernutrition is associated with slower cognitive development andserious health impairment later in life which reduce the qualityof life. Health of children is of great importance as rapid growthoccurs during this period. Good nutrition is a basicrequirement for good health and a living organism is a productof nutrition.
MATERIALS AND METHODS
For the present investigation, Faizabad District of UttarPradesh State was selected purposively.
Selection of Schools:
Six primary schools namely primary school of Ranimau,primary school of Khushari, primary school of Amirpur, primaryschool of Dhanoli, primary school of Lalpur and primaryschool of Manapur were selected randomly from mawai block.
Selection of respondents:
For present study, 400 school going children (208 girlsand 192 boys) in the age group 7-9 years were drawn from theselected schools of mawai block.
A well structured detailed interview schedule wasdeveloped in accordance with the methodological procedurekeeping in view the objectives of the investigation. The datawere collected with the help of interview schedule. Initially,friendly situation was built up so as to develop efficient rapportwith respondents. The information was collected about socio-economic profile of respondents.
Dietary assessment :
Information regarding the intake of food was collectedfrom the respondents using 24 hour recall method as used byNational Nutrition Monitoring Bureau (NNMB, 1980). Averageintake of respondents was compared with RecommendedDietary Allowance (RDA) of Indian Council of MedicalResearch (ICMR, 1980). Nutrients namely energy, protein,calcium, iron and thiamin were calculated using foodcomposition table of ICMR 1980.
Statistical analysis of data :
The data were analyzed with the help of percentage andmean.
RESULTS AND DISCUSSION
The result obtained from the present investigation arepresented as follows :

756 Trends in Biosciences 6 (6), 2013
Table 1. Socio personal and economic profile of schoolgoing children
lact-protein. Green leafy vegetables are consumed by a fairlylarge number of school going children on a daily basis (8.75%),17.75% consume these 2-4d/week, 32.0% consume green leafyvegetables 3-4d/week and 23.0% consume it occasionally. 9.5%of respondents consume meat & poultry on 2-4d/week, 12.0%consumed these 3-6d/week, 37.5% consumed it onoccasionally and the balance 41.0% respondents didn’trespond to this query, implying they could be vegetarians. Allthe school going children consume sugar and jiggery on dailybasis. Consumption of fats and oils was high amongst therespondents. In addition to cooking oil/s they consume fatsin the form of butter or ghee with chapatti and junk foods.
Mean nutrient intake of school going children ofFaizabad District is given Table 3. The daily mean intake ofenergy by girls was found 1899.87 kcal which was 97.42% ofRDA and lower than RDA where as energy intake by boyswas found 1965.99kcal which was 100.82% that is higher thanRDA. The daily mean intake of protein by girls and boys was32.90g/d and 33.87g/d respectively was lower than the RDA.It was observed that boys were consuming higher amount ofprotein than girls. The daily mean intake of calcium was foundto be 327.84mg and 333.60mg among girls and boys,respectively. The boys were consuming higher amount ofcalcium than girls, which might be because consumption ofmore amount of milk and milk products than girls. The higherintake of calcium is also been reported by Vijayaraghavan andRao, 1998. On the contrary, lower intake of calcium was reportedby Dannhauser, 2000. The mean daily intake of iron was foundto be 18.90mg. (girls) and 18.36mg. (boys) which was lowerthan the RDA. Less intake of iron may be due to lessconsumption of green leafy vegetables. The mean daily thiaminintake of girls (72.69% of RDA) was quite close to RDA values.It was found that boys were consuming slighter higher amountof thiamin than girls. The higher intake of thiamine might bedue to consumption of whole cereals and pulses.
It can be concluded that diets of the school going childrenwere deficient in almost all the nutrients. The intake of foodand nutrients was higher in boys than girls. There is an urgentneed to impart nutrition education to mothers of school goingchildren so that they can provide balanced diet to their childrenand improve their nutritional status.
N=400 Percentage Sex Male 192 48.00
Female 208 52.00 Study Class IInd 159 39.75
IIIrd 120 30.00 IVth 121 30.25
School Performance Excellent 61 15.25 Very good 75 18.75 Good 101 25.25 Average 91 22.75 Poor 72 18.00
Pocket Money Yes 78 19.50 No 322 80.50
Socio personal and economic profile of school going
children is presented in Table 1. Out of total 400 subjectsurveyed, 208 were girls and 192 were male. Table shows thatthe majority of subjects (39.75%) belong to IInd class andremaining 30.00% and 30.25% belonged to IIIrd and IVth class,respectively. Data from school performance majority of thesubjects (25.25%) were good in their school performance,minimum 15.25% subjects were excellent in their schoolperformance and remaining 18.25%, 22.75% and 18.00% werevery good, average and poor in their school performance,respectively. As per data collected maximum respondents,80.50 percent who did not get monthly pocket money whileminimum respondents, 19.50 percent who get their pocketmoney.
Table 2 details the frequency at which school goingchildren consume various food groups constituents, 99.5%of respondents consume cereal daily and the balance 0.5%respondents consumed cereal 2-4d/week. 94.0% ofrespondents consume pulses at daily basis, 3.75% consumeit 2-4 d/week, 1.75% of respondents consume pulses at 3-6d/week and 0.5% respondents consume pulses occasionally.8.75% of total respondents consume milk and milk productson a daily basis, about 7.00% of them consume milk and milkproducts at 2-4d/week, 4% respondents consume it 3-6d/weekand the rest 1.5% consume it occasionally. Though many ofthe respondents consume milk as a constituent of teaeveryday, however, that is not considered as a source of rich
Food Group Daily % 2-4d/week % 3-6d/week % Occasionally % Never % Cereals 398 99.5 2 0.5 - - - - - - Pulses 376 94.0 15 3.75 7 1.75 2 0.5 - - Milk & milk products 350 87.5 28 7.0 16 4.0 6 1.5 - - Green leafy vegetables 35 8.75 71 17.75 128 32.0 92 23.0 74 18.5 Meat & Poultry - - 38 9.5 48 12 150 37.5 164 41.0 Sugar & Jaggery 400 100.0 - - - - - - - - Fats & Oils 400 100.0 - - - - - - - -
Table 2. Mean food intake of school going children

SHAKTI et al., Assessment of Food Consumption Pattern and Nutritional Status of School Going Children of Faizabad District 757
Girls Boys Nutrients RDA Mean daily nutrient
intake Overall intake (% of RDA)
Mean daily nutrient intake
Overall intake (% of RDA)
Energy (kcal) 1950 1899.87 97.42 1965.99 100.82 Protein (gm.) 41 32.90 80.24 33.87 82.60 Fat (gm.) 25 32.32 129.28 32.89 131.56 Calcium (mg.) 400 327.84 81.96 333.60 83.40 Iron (mg.) 26 18.90 72.69 18.36 70.61 Thiamin(mg.) 1 0.58 58.00 0.59 59.00
Table 3. Mean daily nutrient intake of school going children
LITERATURE CITED
Dannhauser, A., Bester, C.J., Joubert, G., Badenhorst, P.N., Slabber, M.,Badenhorst, A.M., Toit, E. Du, Barnard, H.C., Botha, P. and Nogabe,L. 2000. Nutritional status of pre-school children in informalsettlement areas near Bloemfontein, South Africa. Pub. HealthNutr., 3:303-312.
ICMR 1980. Nutrient requirement and recommended dietary allowancesfor Indians. Indian Council of Medical Research, New Delhi.
Izharual Hasan, Mohd Zulkifle and Abdul Haseeb Ansari 2011. Anassessment of nutritional status of the children of government urduhigher primary schools of Azad Nagar and its surrounding areas of
Bangalore. Archives of Applied Research 3(3): 167-176.
Raghava P.K. 2005. School Health. Indian Journal of CommunityMedicine 30: 1-3.
Rana, K. and Hussain, M. 2001. Body weight status of pre-schoolchildren belonging to high income group in relation to nutrientintake. Indian J. Nutr. Pediatr., 38: 236-241.
Vijayaraghavan, K. and Rao, D.H. 1998. Diet and nutrition situation inrural India. Indian J. Med. Res., 108: 243-253.
WHO 1996. Research to improve implementation and effectivenessof school health programmes. Geneva: 1,9,10-15.
Recieved on 08-09-2013 Accepted on 11-10-2013

758 Trends in Biosciences 6 (6), 2013Trends in Biosciences 6 (6): 758-761, 2013
Variability Patern in Agromorphological Characters in Tomato Genotypes(Lycopersicon esculentum Mill.).CHANDAN SINGH AHIRWAR AND V. M. PRASHAD
Department of Horticulture, Sam Higginbottom Institute of Agriculture, Technology and Sciences,(Formerly Allahabad Agriculture Institute), Allahabad (UP) 211007, Indiaemail : [email protected]
ABSTRACT
The present investigation on genetic variability, heritabilityand correlation study including mean, genotypic and phenotypicvariances, coefficient of variation, heritability, and geneticadvance was conducted on genetically diverse nineteengenotypes of Tomato. IIVR T0-17 genotypes was found superiorin terms of fruit yield per ha. Large amount of variabilityexhibited in the genotypes for selection. Significant differenceswere observed among the genotypes for all the traits. Thephenotypic coefficient of variation (PCV) was higher thangenotypic coefficient of variation (GCV) for all the traits. Traitslike plant height 120 DAT, number of branches 120 DAT, daysto flower an thesis, number of fruits per plant, average fruitweight, number of cluster per plant, fruit set (%), radialdiameter and polar diameter (mm), ascorbic acid (vita’C’), TSS(Brix), showed positive correlation with fruit yield per ha., plantheight after 120 DAT, days to 50% flowering, leaf curl incidenceand intensity showed negative correlation at both phenotypicand genotypic level.
Key words Tomato, (Lycopersicon esculentum mill.), GCV, PCV,heritability, correlation, path analysis.
Tomato (Lycopersicon esculentum mill., 2n=24) is oneof the members of family Solanaceae and the genusLycopersicon it is a herbaceous, annual to perennial, prostrateand sexual the propagated plant with bisexual flower. Thegrowth habit of the plant is determinate or indeterminate.Scientific information indicates that cultivated tomato wasoriginated in South Western (tropical) American. There areseveral species of tomato but the fruits are edible only of twospecies namely (L. esculantum and L. pimpinellifolium). It isgrown for its edible fruit which can be consumed either freshor cooked and also in the form of various processed productslike, juice, ketchup, sauce, puree, powder, essence, cocktailetc. Tomato is a good source of vitamins and minerals,compared to cereals, the pulp and juice are digestible mild apromoter of gastric secretion and blood purifier. It is alsoconsidered as intestinal antiseptic and said to be usefultreatment of in cancer of the mouth etc. Conventional breedingmethods such as pedigree, bulk and back cross breeding withsome modifications have been principal procedures usefulfor improvement of Tomato crop. Such procedures thoughsignificant and productive in their own right impose restrictionon the chance of better recombination because of larger
linkage blocks associated with the weakness of causing rapidhomozygosis and low genetic variability. Further negativecorrelation among yield components and high genotype xenvironmental interaction prevent full exploitation of geneticvariability for characters like yield. If these propositions areto be accepted, we must reevaluate our breeding procedures.
MATERIALS AND METHODS
The experiment was conducted in the VegetableResearch Farm, Department of Horticulture, Allahabad Schoolof Agriculture, Sam Higginbottom Institute of Agriculture,Technology and Sciences, Allahabad (Uttar Pradesh) during2011-2012. All the facilities necessary for cultivation, includinglabor were made available in the department. The details ofthe materials used and the methods adopted for this study arepresented in this chapter. the experimental comprised by 19genotypes of tomato randomized block design with threereplication having spacing 60 cm and 50 cm between and withinrow at plant. Five plant are tagged randomly for eachgenotypes in every replication to recorded observations onplant height, days to flowering, fruit set percentage, numberof branches/ plant, number of flowers / cluster , fruits/ plant,weight of fruit/plant, TSS , vitamin “C” , fruit yield (t/ha.).Various genotypes parameter were computed as per formulaesuggested by Johnson, et al., 1955
RESULTS AND DISUCSSION
Presented in at 120 DAT after planting the maximumheight in terminate plant height is IIVRT0-17 (134-81) followedby ArkaVikash (126.20) and the minimum plant height wasrecorded an IIVRT0 13 (108-69) and followed IIVRT0 14 (11.05)and IIVRT0 15 (114.27). At 120 DAT after planting maximumheight determinant plant height was in IIVRT0 10 (113.77)followed by IIVRT0 06 (101.76) and the minimum plant heightwas recorded in IIVRT0 5 (91-51) followed by (IIVR0 01 (93-14)and IIVRT0 4 (94.308). At 120 DAT alter planting the leavesmaximum number of leaves was IIVRT0 17(88.96) followed byIIVRT0 14 (85.95) and minimum number leaves was noticed ingenotype IIVRT0-6 (71-72) and IIVRT0 8 (71.74). At 120DATafter planning maximum number of branches wasobserved in genotypes IIVRT0 8 (13-07) followed by IIVRT0 3(12.61) and IIVRT0 7 (12.50) where as minimum number ofbranches was found genotypes ArkaVikash (7.68) followed

SINGH AND PRASHAD, Variability Patern in Agromorphological Characters in Tomato Genotypes (Lycopersicon esculentum Mill.). 759
Table 1. Mean performance of different genotypes various character in Tomato genotypes.
Character Plant height 120 DAT(Cm.)
Leaves at 120 DAT
Branches at 120 DAT
Days to 50 % Flowering
Clusters/ Plant
Flowers/ Plant
Fruits set (%)
Fruits/ Plant
Leaf curl incidence (%)
IIVRTO 01 93.15 75.93 12.31 46.53 15.96 65.03 50.70 32.03 21.64 IIVRTO 02 96.22 72.41 11.24 59.16 15.96 74.46 43.13 31.43 29.68 IIVRTO 03 94.02 78.65 12.61 60.10 12.63 63.76 43.03 29.40 39.43 IIVRTO 04 94.09 79.28 12.49 60.76 13.53 70.73 48.00 30.97 49.67 IIVRTO 05 91.52 82.36 8.85 71.43 16.63 104.10 32.20 22.63 17.10 IIVRTO 06 101.77 71.73 12.18 75.96 15.46 80.60 32.63 31.00 18.41 IIVRTO 07 97.38 75.52 12.50 75.50 12.66 88.73 48.66 35.23 14.20 IIVRTO 08 101.43 71.75 13.07 66.10 16.96 85.93 47.86 41.43 33.92 IIVRTO 09 96.85 76.62 11.94 64.03 17.40 80.76 50.16 38.67 35.52 IIVRTO 10 113.78 71.97 12.09 75.96 12.66 92.80 28.93 27.06 30.60 IIVRTO 11 98.15 72.22 11.03 75.56 8.63 86.60 27.46 23.96 20.44 IIVRTO 12 98.47 75.38 11.47 64.30 15.43 89.36 20.83 21.96 54.77 IIVRTO 13 108.70 74.73 12.21 63.80 17.90 84.00 53.03 42.93 40.20 IIVRTO 14 111.06 85.96 8.44 55.93 14.46 77.46 47.60 37.00 28.04 IIVRTO 15 114.28 73.99 10.05 69.13 9.86 98.86 30.53 30.50 18.91 IIVRTO 16 123.78 76.69 9.18 69.53 15.03 77.33 51.03 39.56 14.20 IIVRTO 17 134.82 88.97 8.58 59.36 20.36 110.50 62.63 45.03 11.28 ArkaVikas 126.21 77.91 7.68 58.38 11.83 99.20 40.03 39.06 14.48
H-86 97.13 74.58 11.44 62.03 16.13 85.16 48.56 38.33 50.48 GM 104.88 76.67 11.02 64.92 14.71 85.02 42.47 33.59 28.58
F.test. S S S S S S S S S SE 2.79 3.10 0.78 2.65 1.39 5.75 3.43 2.57 3.22
C.D. At 5% 8.00 8.89 2.24 7.62 4.01 16.51 9.83 7.38 9.24
by IIVRT0 14 (8-44) and IIVRT0 17 (8.58).The minimum days to50% flowering was showed in genotypes IIVRT0 1 (46.5)followed by IIVRT0-14 (55.93) and ArkaVikash (58.38) whereas maximum days to 50% flowering were found in IIVRT0 6(75.96) followed by IIVRT0 10 (75-960 and IIVRT0 7 (75.50).The maximum Number of cluster was showed in genotypesIIVRT0 17 (20.36) followed by IIVR0 13 (17.90) and IIVRT0 9(17.40) whereas minimum number cluster plant was found ingenotype IIVRT0-11 (68.63) followed by IIVRT0 15 (9.86) andArkaVikash (11.83). The maximum flower plant was showedin genotype IIVRT0 17 (110.50) followed by IIVRT0 5 (104.10)and Arka vikash (99.20) and the minimum number flower perplant was noticed in genotype IIVRT03 (63.76) followed byIIVRT0 1 (65.03) and IIVRT0 4 (70-73).The maximum fruit set(%) was \ observed in genotypes IIVRT0 17 (62.63) followedby IIVRT0 13(53.33) and IIVRT0 16 (51.03) and the minimumfruits set (%) was observed in genotypes IIVRT0 12 (20.83)followed by IIVRT0 11 (27.46) and IIVRT0 10 (28.93). Themaximum leaf curl incidence was noticed in genotypes IIVRT0-17 (11.28%) followed by IIVRT0-16 (14.20%) and IIVRT0 7 (40-20) whereas leaf curl incidence was observed in maximumIIVRT0 12 (54.77) genotypes followed by H 86 (50.48) andIIVRT0 4 (49.67). The minimum leaf curd intensity was showedin genotypes IIVRT0 17 (6.86) followed ArkaVikas (9.43) whereas maximum leaf curd intensity was found in genotype IIVRT012(54.47) followed by H 86 (46.86) and IIVRT0 4 (43.87). Themaximum no of leaf fruits per plant, was noted in genotypesIIVRT0 17 (45.03) followed by IIVRT0 13 (42.93) and IIVRT0 8
(41.43) and the minimum no. of fruit per plants was showed ingenotypes IIVRT0 12 (21.96) followed by IIVRT0 5 (22.63) andIIVRT0 (23.46). The maximum radial diameter (mm) was notedin genotypes IIVRT0 12 (75.04) followed by IIVRT0 17 (66.14)and IIVRT0 11 (66.00 mm) and minimum radial diameter wasshowed in genotypes IIVRT0 02 (26.17) followed by IIVRT0 3(33.44mm) and IIVRT0 01 (36.14 mm). The maximum polardiameter was found in genotypes IIVRT0 12 (60.91 mm)followed by IIVRT0 09 (53.01) and IIVRT0 11 (50.53) and theminimum polar diameter was showed in genotypes IIVRT0074 (26.48) followed by IIVRT0 04 (27.04 mm) and IIVRT0 02(31.15). The maximum TSS (0Brix) was observe in genotypesIIVRT0 17 (6.46) followed by IIVRT0 16 (6.06) and IIVRT0 09(5.20) and the minimum TSS (0Brix) was showed in genotypesIIVRT0 11 (3.13) followed by IIVRT0 12 (3.13) and IIVRT0 2(3.26). The maximum vitamin C was observed in genotypesIIVRT0-17 (41.51) followed by Arka Vikas (36.73) and IIVRT016 (36.27) and the minimum vitamin ‘C’ was showed ingenotype IIVRT0 13 (26.09) followed by IIVRT0 8 (28.03) andIIVRT0 6 (28.29) mg/100g). The maximum fruit weight wasobserve in genotypes IIVRT0 5 (61.35) followed by IIVRT0 11(58.48) and IIVRT0 10 (56.21) whereas minimum fruit weightwas found in genotype IIVRT0 02 (30.24) followed by IIVRT013 (31.21) and Arka Vikas (32.29). The maximum yield per plantwas noticed in genotypes IIVRT0 17 (2298.93) followed byIIVRT0 8 (1991.53) and IIVRT0 7 (1783.73) and IIVRT0 7(1783.73) and whereas minimum yield / plant was observed ingenotypes IIVRT0 12 (782.66) followed by IIVRT0 2 (1033.00(g)

760 Trends in Biosciences 6 (6), 2013
and IIVRT0 15 (1147.23). The maximum yield per hectare wasobserved in genotype IIVRT0 17 (76.70) tones followed byIIVRT0 8 (66.40t/ha) and IIVRT0 4 (61.36) and the minimumyield per hectare was observed in genotypes IIVRT0 12 (26.10)followed by IIVRT0 02 (34-43t/ha) and IIVRT0 15 (28.23t/ha).
Table 2. Mean performance of different genotypes various character in Tomato genotypes.
Character Leaf curl Intensity (%)
Radial diameter (mm)
Polar diameter (mm)
TSS (0Brix)
Vitamin 'C' (Mg.)/100g
Fruits Weight (g)
Yield/ Plant(g)
Yield/ ha. (Tonnes)
IIVRTO 01 16.92 36.14 35.46 4.23 32.66 42.61 1361.47 45.33 IIVRTO 02 21.00 26.17 31.15 3.26 35.30 30.24 1033.00 34.43 IIVRTO 03 31.01 33.44 34.80 4.16 34.40 49.66 1469.13 53.60 IIVRTO 04 43.87 37.48 27.04 5.10 31.95 50.81 1568.73 61.36 IIVRTO 05 12.35 52.14 33.10 4.66 28.85 61.35 1389.80 54.86 IIVRTO 06 12.18 52.90 31.87 3.96 28.29 46.95 1473.66 49.46 IIVRTO 07 30.92 45.80 26.48 6.30 37.38 51.88 1783.73 59.46 IIVRTO 08 28.69 59.83 40.26 4.50 28.03 48.18 1991.53 66.40 IIVRTO 09 31.52 57.54 53.01 5.20 34.61 35.53 1389.13 46.33 IIVRTO 10 30.83 50.18 46.49 5.00 33.23 56.21 1514.23 50.46 IIVRTO 11 13.60 66.00 50.53 3.13 32.93 58.48 1391.36 46.36 IIVRTO 12 54.47 75.04 60.91 3.13 35.52 36.01 782.66 26.10 IIVRTO 13 41.80 49.43 32.95 3.83 26.09 31.21 1398.86 46.66 IIVRTO 14 32.96 48.11 43.46 4.30 31.36 39.13 1450.10 48.30 IIVRTO 15 17.65 59.87 41.95 4.66 30.16 37.72 1147.23 38.23 IIVRTO 16 14.10 51.50 44.37 6.06 36.27 34.80 1380.43 46.03 IIVRTO 17 6.87 66.14 47.21 6.46 41.51 53.35 2298.93 76.70 ArkaVikas 9.43 61.48 34.40 4.33 36.73 32.29 1268.80 42.30
H-86 46.86 44.05 31.96 3.40 30.87 38.20 1466.50 48.86 GM 26.16 51.22 39.34 4.51 32.95 43.93 1450.49 49.54
F.test. S S S S S S S S SE 1.22 3.20 2.70 0.48 2.05 2.72 127.00 4.45
C.D. At 5% 3.50 9.19 7.75 1.38 5.88 7.82 364.28 12.78
In the direct and indirect contributions of component
traits towards fruit yield, selection on the basis of horticulturaltraits viz., number of fruits per plant, and average fruit weightwould be paying preposition in the genotypes included in thestudy.
Fig. 1. Mean performance of different genotypes various character in Tomato genotypes.

SINGH AND PRASHAD, Variability Patern in Agromorphological Characters in Tomato Genotypes (Lycopersicon esculentum Mill.). 761
LITERATURE CITED
Chand, B.; Jaiswal, R.C. and Gautam, N.C. 1987. Genetic variability andcorrelation studies in colocasia. Haryana J. Hort. Science 16(1-2):134-139.
Cheema, D.S., Singh, H.; A.S.; Sidhu, A.S. and and Naveen, Garg 2007.Studies of on genetic variability and correlation, colocasia, ISHS,Acta Hort. 752: 255-260.
Clegg, M.T., Allard, R.W. and Kahlar, A.L., 1972. Is the gene unit ofselection? Evidence from two experimental plant populations.Proceedings of National Academy of Science, United States ofAmerica, 19: 2474-2478.
Frageria, M.S. and U.K. Kokli, 1997. Correlation studies in tomato.Haryana J. Hortic. Sci., 25: 158-160.
Johnson, H. W., Robinson, H.F. and Comstock, R.F., 1955. Estimation
of genetic and environment variability in soyabean. Agron. J.,47:477-483.
Kamruzzahan, M.M. Hossain, R. Islam and M.F. Alam, 2000. Variabilityand correlation studies in tomato (Lycopersicon esculentum Mill.).Bangladesh J. Genet. Biotech.,1 (1): 21-26.
Mohanty, B. K. 2002. Studies on variability, heritability,interrelationship and path analysis in tomato. Ann. Agric. Res., 2(1) : 65-69.
Prema, G.; Indiresh, K. M. and Santhosha, H. M. 2011. Studies ongeneticvariability in cherry tomato (Solanumlycopersicum var.cerasiforme). Asian J. Horti. 6: 1, 207-209.
Tasisa, J. Belew, D. Bantte, K. and Gebreselassie, W. 2011. Variability,heritability and genetic advance in tomato (LycopersiconesculentumMill.) genotypes in West Shoa, Ethiopia. American-Eurasian J.Agri.&Env. Sci.. 11: 1, 87-94.
Recieved on 05-09-2013 Accepted on 15-10-2013
Fig. 2. Mean performance of different genotypes various character in Tomato genotypes.

762 Trends in Biosciences 6 (6), 2013Trends in Biosciences 6 (6): 762-769, 2013
Exploitation of Heterosis in Sunflower (Helianthus annuus L)VENKATA R PRAKASH REDDY1 AND H. L. NADAF2
Department of Genetics and Plant Breeding, S.V. Agricultural college, Tirupati and corresponding authorDepartment of Genetics and Plant Breeding, College of Agriculture, Dharwademail: [email protected] , [email protected]
Forty eight hybrids were tested using line × tester designinvolving four cytoplasmic male sterile and 12 fertility restorerlines study the magnitude and direction of heterosis over betterparent and stand check at main agriculture research station,dharwad during kharif 2011-12. The study revealed that differenthybrids exhibited varied magnitude and direction of heterosisfor different characters. Majority of hybrids involving CMS17A and CMS-1030A as the female parent recorded highestheterotic effects for days to 50% flowering, days to maturity,head diameter, test weight and seed yield . The crosses CMS1030A×PS 1070, CMS 1030A×ID 25 and CMS 17A×ID 25 wereidentified as potential hybrids with respect to all traits basedon their performance and heterosis estimates.
Key words Heterosis, suflower
Sunflower (Helianthus annuus L) is one of the importantoil seed crops of major economic importance. Due to its crosspollinated nature, it offers considerable scope for commercialexploitation of heterosis utilizing cyto-restorer system(Gangappa, et al., 1997). The superiority of hybrids over openpollinated cultivars for productivity, yield stability, oil contentand tolerance to disease and pest has experimentally beenwell established. Thus in recent past, the breeding emphasishas shifted from population breeding to heterosis breeding ina bid to meet the challenges and tremendous demand ofsunflower oil in the market. The present attempt has beentaken to study heterosis for seed yield, oil content and yieldcomponents in sunflower.
MATERIALS AND METHODS
Four cytoplasmic genetic male sterile (CMS) lines viz.,CMS 234A, CMS 17A, CMS 607A and CMS 1030A werecrossed with 12 restorer lines viz., SCG 29, SCG 37, SCG 73,RES 834-1, NDR 4, R 45, HRHA 10-3, RHA 298, RHA 334, RHA43-5, PS 1070 and ID 25. Crosses were made in line × testerfashion to synthesize 48 hybrids. The parents and hybridsalong with the checks viz., KBSH 53, KBSH 44, and SB-275were grown in a randomized block design with two replications.The experiment was conducted at Main Agricultural ResearchStation, Dharwad. Crossing was carried out during summer,2011 and the evaluation of crosses and their parents was doneduring Kharif 2011-12. Each entry was grown in two rows of 6meters length with a spacing of 60 cm and 30 cm betweenrows and plants. Data for morphological characters was
recorded on five randomly selected plants. Oil content wasestimated wide line NMR. Heterosis was calculated over betterparent and standard checks for seed yield, yield componentsand oil content.
RESULTS AND DISCUSSION
The estimates of heterosis values over better parentand standard check for nine characters are presented in Table1. For days to 50 per cent flowering, better parent heterosisranged from -8.96(CMS 17A×SCG 73) to 6.40 per cent (CMS1030A×ID 25). A total of 31 hybrids recorded significant bethe heterosis. However, the hybrid CMS 234A × RHA 298registered the highest and negative standard heterosis. Theexistence of both significant positive and negative heteroticeffects over parents and checks suggests the presence ofnon-additive gene action for this trait. The present findingsare in agreement with earlier investigations by Kandhola, etal, 1995. For days to maturity, the range of heterosis was from-10.5(CMS 1030A× PS 1070) to 11.52 (CMS 607A × SCG 29).The hybrid CMS1030A × RHA 298 recorded highest andnegative standard heterosis over all hybrids except CMS 1030A× ID 25. The above results are in agreement with Alone, et al.,2003 and Bajaj, et al., 2003 who have reported early maturityin hybrids.
Heterosis in negative direction was considered desirablefor plant height. The hybrids, CMS-1030A×RHA-334 recordedsignificant negative heterosis over better parent and standardchecks indicated that these hybrids were dwarf compared tobetter parent and checks. Longanathan and Gopalan, 2006reported both positive and negative heterosis for thischaracter, while only negative heterosis has been reported byPhad, et al., 2002. As many as 42 hybrids recorded significantpositive heterobeltosis for head diameter. The heterosis overbetter parent ranged from 7.86 (CMS 1030A × SCG 73) to 121.35per cent (CMS 607A × SCG 37) and hybrids CMS 1030A × PS1070 and CMS 1030A × RHA 298 recorded significant positivestandard heterosis.
Test weight (gm) is an important yield attributed trait insunflower. The heterosis ranged from -4.05 (CMS 1030A ×RHA 334) to 136.61 per cent (CMS 17A× SCG 37). Among 48hybrids, 38 hybrids recorded significant positive heterosis.The hybrid CMS 17A× SCG 37 recorded highest heterosisover better parent and commercial checks. These observations
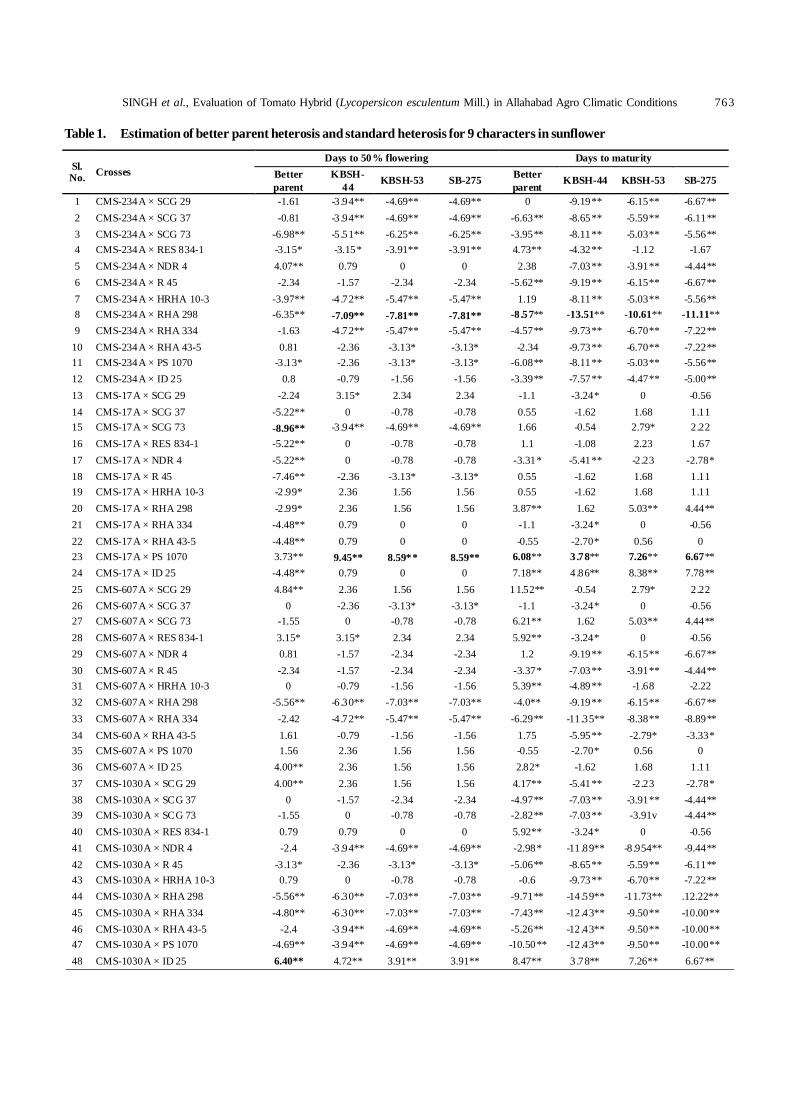
SINGH et al., Evaluation of Tomato Hybrid (Lycopersicon esculentum Mill.) in Allahabad Agro Climatic Conditions 763
Table 1. Estimation of better parent heterosis and standard heterosis for 9 characters in sunflower
Sl. No. Crosses
Days to 50% flowering Days to maturity Better parent
KBSH-44 KBSH-53 SB-275 Better
parent KBSH-44 KBSH-53 SB-275
1 CMS-234A × SCG 29 -1.61 -3 .94** -4.69** -4.69** 0 -9.19** -6.15** -6.67** 2 CMS-234A × SCG 37 -0.81 -3 .94** -4.69** -4.69** -6.63** -8.65** -5.59** -6.11** 3 CMS-234A × SCG 73 -6.98** -5 .51** -6.25** -6.25** -3.95** -8.11** -5.03** -5.56** 4 CMS-234A × RES 834-1 -3.15* -3.15* -3.91** -3.91** 4.73** -4.32** -1.12 -1.67 5 CMS-234A × NDR 4 4.07** 0.79 0 0 2.38 -7.03** -3.91** -4.44** 6 CMS-234A × R 45 -2.34 -1.57 -2.34 -2.34 -5.62** -9.19** -6.15** -6.67** 7 CMS-234A × HRHA 10-3 -3.97** -4 .72** -5.47** -5.47** 1.19 -8.11** -5.03** -5.56** 8 CMS-234A × RHA 298 -6.35** -7.09** -7.81** -7.81** -8 .57** -13.51** -10.61** -11.11** 9 CMS-234A × RHA 334 -1.63 -4 .72** -5.47** -5.47** -4.57** -9.73** -6.70** -7.22**
10 CMS-234A × RHA 43-5 0.81 -2.36 -3.13* -3.13* -2.34 -9.73** -6.70** -7.22** 11 CMS-234A × PS 1070 -3.13* -2.36 -3.13* -3.13* -6.08** -8.11** -5.03** -5.56** 12 CMS-234A × ID 25 0.8 -0.79 -1.56 -1.56 -3.39** -7.57** -4.47** -5.00** 13 CMS-17A × SCG 29 -2.24 3.15* 2.34 2.34 -1.1 -3.24* 0 -0.56 14 CMS-17A × SCG 37 -5.22** 0 -0.78 -0.78 0.55 -1.62 1.68 1.11 15 CMS-17A × SCG 73 -8.96** -3 .94** -4.69** -4.69** 1.66 -0.54 2.79* 2.22 16 CMS-17A × RES 834-1 -5.22** 0 -0.78 -0.78 1.1 -1.08 2.23 1.67 17 CMS-17A × NDR 4 -5.22** 0 -0.78 -0.78 -3.31* -5.41** -2.23 -2.78* 18 CMS-17A × R 45 -7.46** -2.36 -3.13* -3.13* 0.55 -1.62 1.68 1.11 19 CMS-17A × HRHA 10-3 -2.99* 2.36 1.56 1.56 0.55 -1.62 1.68 1.11 20 CMS-17A × RHA 298 -2.99* 2.36 1.56 1.56 3.87** 1.62 5.03** 4.44** 21 CMS-17A × RHA 334 -4.48** 0.79 0 0 -1.1 -3.24* 0 -0.56 22 CMS-17A × RHA 43-5 -4.48** 0.79 0 0 -0.55 -2.70* 0.56 0 23 CMS-17A × PS 1070 3.73** 9.45** 8.59** 8.59** 6.08** 3 .78** 7.26** 6.67** 24 CMS-17A × ID 25 -4.48** 0.79 0 0 7.18** 4 .86** 8.38** 7.78** 25 CMS-607A × SCG 29 4.84** 2.36 1.56 1.56 11.52** -0.54 2.79* 2.22 26 CMS-607A × SCG 37 0 -2.36 -3.13* -3.13* -1.1 -3.24* 0 -0.56 27 CMS-607A × SCG 73 -1.55 0 -0.78 -0.78 6.21** 1.62 5.03** 4.44** 28 CMS-607A × RES 834-1 3.15* 3.15* 2.34 2.34 5.92** -3.24* 0 -0.56 29 CMS-607A × NDR 4 0.81 -1.57 -2.34 -2.34 1.2 -9.19** -6.15** -6.67** 30 CMS-607A × R 45 -2.34 -1.57 -2.34 -2.34 -3.37* -7.03** -3.91** -4.44** 31 CMS-607A × HRHA 10-3 0 -0.79 -1.56 -1.56 5.39** -4.89** -1.68 -2.22 32 CMS-607A × RHA 298 -5.56** -6 .30** -7.03** -7.03** -4.0** -9.19** -6.15** -6.67** 33 CMS-607A × RHA 334 -2.42 -4 .72** -5.47** -5.47** -6.29** -11.35** -8.38** -8.89** 34 CMS-60A × RHA 43-5 1.61 -0.79 -1.56 -1.56 1.75 -5.95** -2.79* -3.33* 35 CMS-607A × PS 1070 1.56 2.36 1.56 1.56 -0.55 -2.70* 0.56 0 36 CMS-607A × ID 25 4.00** 2.36 1.56 1.56 2.82* -1.62 1.68 1.11 37 CMS-1030A × SCG 29 4.00** 2.36 1.56 1.56 4.17** -5.41** -2.23 -2.78* 38 CMS-1030A × SCG 37 0 -1.57 -2.34 -2.34 -4.97** -7.03** -3.91** -4.44** 39 CMS-1030A × SCG 73 -1.55 0 -0.78 -0.78 -2.82** -7.03** -3.91v -4.44** 40 CMS-1030A × RES 834-1 0.79 0.79 0 0 5.92** -3.24* 0 -0.56 41 CMS-1030A × NDR 4 -2.4 -3 .94** -4.69** -4.69** -2.98* -11.89** -8.954** -9.44** 42 CMS-1030A × R 45 -3.13* -2.36 -3.13* -3.13* -5.06** -8.65** -5.59** -6.11** 43 CMS-1030A × HRHA 10-3 0.79 0 -0.78 -0.78 -0.6 -9.73** -6.70** -7.22** 44 CMS-1030A × RHA 298 -5.56** -6 .30** -7.03** -7.03** -9.71** -14.59** -11.73** .12.22** 45 CMS-1030A × RHA 334 -4.80** -6 .30** -7.03** -7.03** -7.43** -12.43** -9.50** -10.00** 46 CMS-1030A × RHA 43-5 -2.4 -3 .94** -4.69** -4.69** -5.26** -12.43** -9.50** -10.00** 47 CMS-1030A × PS 1070 -4.69** -3 .94** -4.69** -4.69** -10.50** -12.43** -9.50** -10.00** 48 CMS-1030A × ID 25 6.40** 4.72** 3.91** 3.91** 8.47** 3 .78** 7.26** 6.67**

764 Trends in Biosciences 6 (6), 2013
Sl. No.
Crosses Head diameter Plant height (cm)
Better parent KBSH-44 KBSH-53 SB-275 Better
parent KBSH-44 KBSH-53 SB-275
1 CMS-234A × SCG 29 23.65* -10.73 -8.5 -3.68 50.94** -16.67** -15.34** -1.23 2 CMS-234A × SCG 37 63.16** -9.27 -7 -2.11 46.16** -19.69** -18.41** -4.81* 3 CMS-234A × SCG 73 60.16** -3.9 -1.5 3.68 37.56** -20.83** -19.58** -6.17** 4 CMS-234A × RES 834-1 68.70** -5.37 -3 2.11 50.24** -17.45** -16.14** -2.16 5 CMS-234A × NDR 4 47.57** -3.9 -1.5 3.68 55.92** -14.32** -12.96** 1.54 6 CMS-234A × R 45 51.75** -15.61* -13.5 -8.95 35.48** -16.15** -14.81** -0.62 7 CMS-234A × HRHA 10-3 16.85 -23.90** -22.00** -17.89* 37.87** -15.63** -14.29** 0 8 CMS-234A × RHA 298 15.92 -30.73** -29.00** -25.26** 58.29** -13.02** -11.64** 3.09 9 CMS-234A × RHA 334 31.90** -10.24 -8 -3.16 31.69** -16.67** -15.34** -1.23
10 CMS-234A × RHA 43-5 69.30** -5.85 -3.5 1.58 55.92** -14.32** -12.96** 1.54 11 CMS-234A × PS 1070 64.23** 9.76 12.5 18.42* 25.10** -16.93** -15.61** -1.54 12 CMS-234A × ID 25 59.32** -8.29 -6 -1.05 30.49** -16.41** -15.08** -0.93 13 CMS-17A × SCG 29 42.57** 2.93 5.5 11.05 45.69** -11.98** -10.58** 4.32 14 CMS-17A × SCG 37 37.70** -18.05** -16.00* -11.58 16.81** -29.83** -28.31** -16.36** 15 CMS-17A × SCG 73 40.65** -15.61* -13.5 -8.95 16.81** -29.83** -28.31** -16.36** 16 CMS-17A × RES 834-1 64.14** -2.32 0.13 5.39 21.98** -26.30** -25.13** -12.65** 17 CMS-17A × NDR 4 53.56** 0 2.5 7.89 24.14** -25.00** -23.81** -11.11** 18 CMS-17A × R 45 29.75** -22.78** -20.85** -16.68** 17.39** -27.34** -26.19** -13.89** 19 CMS-17A × HRHA 10-3 36.33** -11.22 -9 -4.21 20.85** -26.04** -24.87** -12.35** 20 CMS-17A × RHA 298 52.65** -8.78 -6.5 -1.58 26.72** -23.44** -22.22** -9.26** 21 CMS-17A × RHA 334 27.84** -13.01 -10.83 -6.14 10.29** -30.21** -29.10** -17.28** 22 CMS-17A × RHA 43-5 66.39** -0.98 1.5 6.84 31.03** -20.83** -19.58** -6.17** 23 CMS-17A × PS 1070 34.31** -10.24 -8 -3.16 25.49** -16.67** -15.34** -1.23 24 CMS-17A × ID 25 92.62** 14.63* 17.50* 23.68** 41.46** -9.38** -7.94** 7.41** 25 CMS-607A × SCG 29 24.32* -10.24 -8 -3.16 14.34** -27.34** -26.19** -13.89** 26 CMS-607A × SCG 37 121.35** -3.9 -1.5 3.68 25.00** -20.57** -19.31** -5.86** 27 CMS-607A × SCG 73 48.78** -10.73 -8.5 -3.68 16.39** -26.04** -24.87** -12.35** 28 CMS-607A × RES 834-1 18.26 -33.66** -32.00** -28.42** 0.41 -36.20** -35.19** -24.38** 29 CMS-607A × NDR 4 37.83** -10.24 -8 -3.16 17.62** -25.26** -24.07** -11.42** 30 CMS-607A × R 45 52.79** -15.78* -13.68 -9.13 7.79** -31.51** -30.42** -18.83** 31 CMS-607A × HRHA 10-3 37.08** -10.73 -8.5 -3.68 9.59** -30.36** -29.26** -17.47** 32 CMS-607A × RHA 298 20 -28.29** -26.50** -22.63** 14.75** -27.08** -25.93** -13.58** 33 CMS-607A × RHA 334 18.28 -19.51** -17.50** -13.16 7.38** -31.77** -30.69** -19.14** 34 CMS-60A × RHA 43-5 120.51** -4.27 -1.88 3.29 24.59** -20.83** -19.58** -6.17** 35 CMS-607A × PS 1070 42.34** -4.88 -2.5 2.63 19.61** -20.57** -19.31** -5.86** 36 CMS-607A × ID 25 69.49** -2.44 0 5.26 21.54** -22.14** -20.90** -7.72** 37 CMS-1030A × SCG 29 29.73** -6.34 -4 1.05 6.62** -16.15** -14.81** -0.62 38 CMS-1030A × SCG 37 61.43** 10.24 13 18.95* 14.57** -9.90** -8.47** 6.79** 39 CMS-1030A × SCG 73 7.86 -26.34** -24.50** -20.53** -22.85** -39.32** -38.36** -28.09** 40 CMS-1030A × RES 834-1 32.86** -9.27 -7 -2.11 -16.56** -34.38** -33.33** -22.22** 41 CMS-1030A × NDR 4 44.29** -1.46 1 6.32 -4.3 -24.74** -23.54** -10.80** 42 CMS-1030A × R 45 52.14** 3.9 6.5 12.11 -4.64 -25.00** -23.81** -11.11** 43 CMS-1030A × HRHA 10-3 49.29** 1.95 4.5 10 1.99 -19.79** -18.52** -4.94* 44 CMS-1030A × RHA 298 67.14** 14.15* 17.00 23.16** 0.66 -20.83** -19.58** -6.17** 45 CMS-1030A × RHA 334 58.57** 8.29 11 16.84** -12.58** -31.25** -30.16** -18.52** 46 CMS-1030A × RHA 43-5 45.71** -0.49 2 7.37 4.97* -17.45** -16.14** -2.16 47 CMS-1030A × PS 1070 70.71** 16.59* 19.50** 25.79** 6.29** -16.41** -15.08** -0.93 48 CMS-1030A × ID 25 52.14** 3.9 6.5 12.11 18.21** -7.03** -5.56** 10.19**

SINGH et al., Evaluation of Tomato Hybrid (Lycopersicon esculentum Mill.) in Allahabad Agro Climatic Conditions 765
Sl. No. Crosses
Tes t weight (gm) Seed yield per plant Better parent KB SH-44 KB SH -53 SB-275 Better
paren t KBSH-44 KB SH -53 SB-275
1 CM S-234A × SCG 29 9.95 -21.52** -6.61 20.52** 123.98** -36.19** -10.95 -17.79** 2 CM S-234A × SCG 37 35.45** -17.51** -1.84 26.67** 286.67** -32.56** -5.88 -13.11* 3 CM S-234A × SCG 73 29.06** -17.86** -2.26 26.13** 316.39** -26.16** 3.04 -4.87 4 CM S-234A × RES 834-1 35.70** -35.58** -23.35** -1.08 772.73** -30.23** -2.64 -10.11 5 CM S-234A × NDR 4 52.00** -27.85** -14.14** 10.8 193.75** -31.69** -4.67 -11.99** 6 CM S-234A × R 45 42.71v -31.15** -18.08** 5.72 391.80** -41.86** -18.86** -25.09** 7 CM S-234A × HRHA 10-3 43.75** -28.83** -15.31** 9.29 158.27** -52.33** -33.47** -38.58** 8 CM S-234A × RHA 298 25.80** -28.34** -14.73* 10.04 216.00** -54.07** -35.90** -40.82** 9 CM S-234A × RHA 334 4.59 -18.21** -2.68 25.59** 364.29** -33.87** -7.71 -14.79**
10 CM S-234A × RHA 43-5 51.70** -27.99** -14.31** 10.58 694.55** -36.48** -11.36 -18.16** 11 CM S-234A × PS 1070 52.74** -27.50** -13.72** 11.34 750.91** -31.98** -5.07 -12.36** 12 CM S-234A × ID 25 90.07** -9.77* 7.36 38.55** 172.26** -38.66** -14.40** -20.97** 13 CM S-17A × S CG 29 4.63 -25.32** -11.13** 14.69** 93.37** -44.91** -23.12** -29.03** 14 CM S-17A × S CG 37 136.61** 44.09** 71.46** 121.27** 99.39** -64.35** -50.25** -54.07** 15 CM S-17A × S CG 73 23.20** -21.59** -6.69 20.41** 259.35** -35.76** -10.34 -17.23** 16 CM S-17A × RES 834-1 76.13** -17.51** -1.84 26.67** 251.02** -37.25** -12.42* -19.15** 17 CM S-17A × NDR 4 88.14** .11.88* 4.85 35.31** 255.00** -17.44** 15.21* 6.37 18 CM S-17A × R 45 90.67** -8.02 9.46 41.25** 121.14** -60.47** -44.83** -49.06** 19 CM S-17A × HRHA 10-3 46.59** -27.43 -13.64* 11.45 336.22** -19.48** 12.37* 3.75 20 CM S-17A × RHA 298 74.57** -0.56 18.33** 52.70** 265.85** -34.59** -8.72 -15.73** 21 CM S-17A × RHA 334 20.32** -5.91 11.97* 44.49** 314.63** -25.87** 3.45 -4.49 22 CM S-17A × RHA 43-5 58.26** -25.88** -11.80* 13.82 281.30** -31.83** -4.87 -12.17* 23 CM S-17A × P S 1070 87.39** -12.24** 4.44 34.77** 295.12** -29.36** -1.42 -8.99 24 CM S-17A × ID 25 47.15** -31.08** -17.99** 5.83 154.84** -42.59** -19.88** -26.03** 25 CM S-607A × SCG 29 34.48** -4.01 14.23* 47.41** 27.55 -63.66** -49.29** -53.18** 26 CM S-607A × SCG 37 22.98** -25.11** -10.88** 15.01* 208.33** -46.22** -24.95** -30.71** 27 CM S-607A × SCG 73 19.45** -23.98** -9.54 16.74* 267.21** -34.88** -9.13 -16.10** 28 CM S-607A × RES 834-1 35.69** -29.68** -16.32** 7.99 95.58** -67.88** -55.17** -58.61** 29 CM S-607A × NDR 4 14.38 -40.72** -29.46** -8.96 102.50** -52.91** -34.28** -39.33** 30 CM S-607A × R 45 42.33** -26.23** -12.22* 13.28 189.38** -52.47** -33.67** -38.76** 31 CM S-607A × HRHA 10-3 25.78** -34.81** -22.43** 0.11 140.94** -55.52** -37.93** -42.70** 32 CM S-607A × RHA 298 17.41* -33.12** -20.42** 2.7 123.89** -63.23** -48.68** -52.62** 33 CM S-607A × RHA 334 -2.97 -24.12** -9.71 16.52* 150.44** -58.87** -42.60** -47.00** 34 CM S-60A × RHA 43-5 29.04** -33.12** -20.42** 2.7 242.48** -43.75** -21.50** -27.53** 35 CM S-607A × PS 1070 46.95** -23.84** -9.37 16.95* 261.95** -40.95** -17.04** -23.41** 36 CM S-607A × ID 25 48.44** -23.07** -8.45 18.14* 225.32** -26.71** 2.28 -5.57 37 CM S-1030A × SCG 29 -1.28 -29.54** -16.15** 8.21 42.86** -59.30** -43.20** -47.57** 38 CM S-1030A × SCG 37 20.37** -23.14** -8.54 18.03* 43.64** -61.77** -46.65** -50.75** 39 CM S-1030A × SCG 73 37.22** -12.38** 4.27 34.56** 16.33 -69.04** -56.80** -60.11** 40 CM S-1030A × RES 834-1 22.47** -21.80** -6.95 20.09** 71.49** -54.36** -36.31** -41.20** 41 CM S-1030A × NDR 4 34.25** -14.28** 2.01 31.64** 155.60** -31.98** -5.07 -12.36* 42 CM S-1030A × R 45 41.85 -9.42* 7.78 39.09** 156.69** -31.69** -4.67 -11.99* 43 CM S-1030A × HRHA 10-3 10.57 -29.40** -15.98** 8.42 135.39** -37.35** -12.58* -19.29** 44 CM S-1030A × RHA 298 35.13** -13.71** 2.68 32.51** 187.27** -23.55** 6.69 -1.5 45 CM S-1030A × RHA 334 -4.05 -24.96** -10.71 15.23* 104.81** -45.49** -23.94** -29.78** 46 CM S-1030A × RHA 43-5 6.06 -32.28** -19.41** 4 181.27** -25.15** 4.46 -3.56 47 CM S-1030A × PS 1070 34.36** -14.21** 2.09 31.75** 229.87** -12.21** 22.52** 13.11 48 CM S-1030A × ID 25 13.88 -27.29** -13.47* 11.66 137.58** -36.77** -11.76 -18.54**

766 Trends in Biosciences 6 (6), 2013
Sl. No. Crosses
Seed yield per hectare Oil content Better parent KBSH-44 KBSH-53 SB-275 Better
parent KBSH-44 KBSH-53 SB-275
1 CMS-234A × SCG 29 81.35** 6.33 -0.25 50.08** 5.49 -24.14 -23.69 -35.24 2 CMS-234A × SCG 37 322.21** 12.86 5.87 59.29** 5.49 -2.68 -2.1 -16.92 3 CMS-234A × SCG 73 200.44** 7.07 0.44 51.12** 0.97 -6.86 -6.3 -20.48 4 CMS-234A × RES 834-1 253.69** -32.61** -36.78** -4.88 7.75 -0.6 0 -15.14 5 CMS-234A × NDR 4 71.73** -9.89 -15.47 27.19* 1.13 -6.71 -6.15 -20.36 6 CMS-234A × R 45 273.87** 19.06 11.69 68.04** 6.46 -1.79 -1.2 -16.16 7 CMS-234A × HRHA 10-3 82.51** -14.52 -19.81* 20.65 3.07 -4.92 -4.35 -18.83 8 CMS-234A × RHA 298 162.82** -12.76 -18.16* 23.14 5.01 -3.13 -2.55 -17.3 9 CMS-234A × RHA 334 312.40** -12.87 -18.26* 22.98 18.58 9.39 10.04 -6.62
10 CMS-234A × RHA 43-5 330.00** -18.07 -23.14* 15.64 35.7 25.19 25.94 6.87 11 CMS-234A × PS 1070 138.54** -3.92 -9.87 35.61** 30.69 20.57 21.29 2.93 12 CMS-234A × ID 25 183.33** -4.6 -10.51 34.65** 26.66 16.84 17.54 -0.25 13 CMS-17A × SCG 29 53.89** -9.77 -15.36 27.35* 11.34 5.37 6 -10.05 14 CMS-17A × SCG 37 166.34** -15.42 -20.65* 19.38 -7.24 -12.22 -11.69 -25.06 15 CMS-17A × SCG 73 185.39** 1.7 -4.59 43.55** -0.79 -6.11 -5.55 -19.85 16 CMS-17A × RES 834-1 283.27** 21.72* 14.18 71.80** 5.51 -0.15 0.45 -14.76 17 CMS-17A × NDR 4 149.04** 30.67** 22.59* 84.44** -2.52 -7.75 -7.2 -21.25 18 CMS-17A × R 45 167.33** -14.87 -20.14* 20.16 -2.52 -7.75 -7.2 -21.25 19 CMS-17A × HRHA 10-3 150.83** 17.48 10.21 65.81** -3.15 -8.35 -7.8 -21.76 20 CMS-17A × RHA 298 242.83** 13.68 6.65 60.46** -7.24 -12.22 -11.69 -25.06 21 CMS-17A × RHA 334 345.26** 41.40** 32.65** 99.58** -7.72 -12.67 -12.14 -25.45 22 CMS-17A × RHA 43-5 286.89** 22.87* 15.26 73.42** 4.25 -1.34 -0.75 -15.78 23 CMS-17A × PS 1070 177.44** 11.74 4.83 57.72** 9.76 3.87 4.5 -11.32 24 CMS-17A × ID 25 307.54** 37.22** 28.72** 93.67** 9.13 3.28 3.9 -11.83 25 CMS-607A × SCG 29 8.95 -36.22** -40.08** -9.84 2.4 1.64 2.25 -13.23 26 CMS-607A × SCG 37 293.67** 5.23 -1.28 48.53** -3.6 -4.32 -3.75 -18.32 27 CMS-607A × SCG-73 247.02** 23.67* 16.01 74.55** 13.36 12.52 13.19 -3.94 28 CMS-607A × RES 834-1 317.48** -43.08** -46.60** -19.66 5.86 5.07 5.7 -10.31 29 CMS-607A × NDR 4 46.91** -22.92** -27.69** 8.8 7.36 6.56 7.2 -9.03 30 CMS-607A × R 45 358.67** 46.06** 37.02** 106.16** -6.46 -7.15 -6.6 -20.74 31 CMS-607A × HRHA 10-3 59.45** -25.32** -29.94** 5.41 4.35 3.58 4.2 -11.58 32 CMS-607A × RHA 298 84.20** -38.86** -42.64** -13.7 0.45 -0.3 0.3 -14.89 33 CMS-607A × RHA 334 172.75** -42.38** -45.94** -18.67 -6.31 -7 -6.456 -20.61 34 CMS-60A × RHA 43-5 678.17** 6.1 -0.47 49.76** -6.31 -7 -6.45 -20.61 35 CMS-607A × PS 1070 2000.58** 21.07* 13.57 70.88** 12.46 11.62 12.29 -4.71 36 CMS-607A × ID 25 174.09** -7.72 -13.43 30.25* 10.36 9.54 10.19 -6.49 37 CMS-1030A × SCG 29 23.11 -27.82** -32.28** 1.88 19.83 25.19 25.94 6.87 38 CMS-1030A × SCG 37 116.72** -13.41 -18.77** 22.21 6.56 11.33 11.99 -4.96 39 CMS-1030A × SCG 73 115.53** -13.89 -19.22** 21.54 2 6.56 7.2 -9.03 40 CMS-1030A × RES 834-1 113.62** -14.65 -19.93** 20.47 3.71 8.35 9 -7.51 41 CMS-1030A × NDR 4 111.06** 10.75 3.89 56.31** 1.43 5.96 6.6 -9.54 42 CMS-1030A × R 45 74.94** -30.10** -34.43** -1.34 5.42 10.13 10.79 -5.98 43 CMS-1030A × HRHA 10-3 95.03** -8.66 -14.31 28.93* -5.42 -1.19 -0.6 -15.65 44 CMS-1030A × RHA 298 151.77** 0.59 -5.63 41.98** -12.98 -9.09 -8.55 -22.39 45 CMS-1030A × RHA 334 165.03** 5.89 -0.66 49.46** 9.99 14.9 15.59 -1.91 46 CMS-1030A × RHA 43-5 74.32** -30.35** -34.66** -1.7 7.85 12.67 13.34 -3.82 47 CMS-1030A × PS 1070 255.36** 43.13** 34.27** 102.02** 6.99 11.77 12.44 -4.58 48 CMS-1030A × ID 25 220.95** 27.95** 20.03* 80.59** 11.41 16.39 17.09 -0.64

SINGH et al., Evaluation of Tomato Hybrid (Lycopersicon esculentum Mill.) in Allahabad Agro Climatic Conditions 767
Sl. No. Crosses Oil yield (kg/ha)
Better parent KBSH-44 KBSH-53 SB-275 1 CMS-234A × SCG 29 36.62 -19.29 -23.71 -2.72 2 CMS-234A × SCG 37 313.53 10.05 4.02 32.64 3 CMS-234A × SCG 73 178.73 -0.21 -5.68 20.28 4 CMS-234A × RES 834-1 280.41 -33.12 -36.78 -19.39 5 CMS-234A × NDR 4 68.70 -15.83 -20.43 1.46 6 CMS-234A × R 45 347.98 * 16.95 10.54 40.96 7 CMS-234A × HRHA 10-3 74.37 -18.7 -23.15 -2 8 CMS-234A × RHA 298 -67.40 ** -15.49 -20.12 1.86 9 CMS-234A × RHA 334 320.93 -4.84 -10.05 14.69 10 CMS-234A × RHA 43-5 483.55 * 2.6 -3.02 23.66 11 CMS-234A × PS 1070 216.07 15.74 9.4 39.51 12 CMS-234A × ID 25 203.47 11.47 5.37 34.36 13 CMS-17A × SCG 29 61.13 -4.81 -10.03 14.73 14 CMS-17A × SCG 37 146.65 -25.88 -29.93 -10.66 15 CMS-17A × SCG 73 167.43 -4.26 -9.5 15.4 16 CMS-17A × RES 834-1 304.47 * 21.55 14.89 46.51 17 CMS-17A × NDR 4 141.64 20.57 13.96 45.32 18 CMS-17A × R 45 161.54 -21.4 -25.71 -5.26 19 CMS-17A × HRHA 10-3 130.93 7.68 1.78 29.79 20 CMS-17A × RHA 298 -61.54 ** -0.3 -5.76 20.17 21 CMS-17A × RHA 334 310.72 * 23.43 16.67 48.77 22 CMS-17A × RHA 43-5 303.48 * 21.26 14.62 46.15 23 CMS-17A × PS 1070 217.34 16.21 9.84 40.07 24 CMS-17A × ID 25 285.86 * 41.74 33.98 70.84 25 CMS-607A × SCG 29 9.99 -35.03 -38.59 -21.69 26 CMS-607A × SCG 37 277.80 0.54 -4.97 21.18 27 CMS-607A × SCG 73 288.74 * 39.17 31.55 67.75 28 CMS-607A × RES 834-1 341.14 -40.2 -43.48 -27.93 29 CMS-607A × NDR 4 64.67 -17.84 -22.34 -0.97 30 CMS-607A × R 45 419.23 * 35.55 28.12 63.38 31 CMS-607A × HRHA 10-3 65.82 -22.68 -26.91 -6.8 32 CMS-607A × RHA 298 -76.50 ** -39.09 -42.43 -26.59 33 CMS-607A × RHA 334 137.64 -46.28 -49.22 -35.25 34 CMS-60A × RHA 43-5 631.02 * -0.91 -6.34 19.43 35 CMS-607A × PS 1070 269.01 * 35.13 27.73 62.87 36 CMS-607A × ID 25 175.31 1.13 -4.41 21.9 37 CMS-1030A × SCG 29 52.98 -9.63 -14.58 8.92 38 CMS-1030A × SCG 37 131.13 -3.43 -8.72 16.4 39 CMS-1030A × SCG 73 120.05 -8.06 -13.09 10.82 40 CMS-1030A × RES 834-1 121.25 -7.56 -12.62 11.42 41 CMS-1030A × NDR 4 135.71 17.61 11.17 41.75 42 CMS-1030A × R 45 84.36 -22.97 -27.19 -7.15 43 CMS-1030A × HRHA 10-3 93.55 -9.75 -14.69 8.78 44 CMS-1030A × RHA 298 -64.75 ** -8.63 -13.64 10.13 45 CMS-1030A × RHA 334 191.50 21.79 15.12 46.8 46 CMS-1030A × RHA 43-5 88.02 -21.44 -25.74 -5.31 47 CMS-1030A × PS 1070 282.94 ** 60 51.24 92.85 48 CMS-1030A × ID 25 256.44 * 48.93 40.77 79.51

768 Trends in Biosciences 6 (6), 2013
Character Desirable crosses Per cent heterosis
BP KBSH-44 KBSH-53 SB275 Days to 50% flowering CMS 234A × RHA 298 -6.35 -7.09 -7.81 -7.81 CMS 1030A × RHA 298 -5.56 -6.30 -7.03 -7.03 CMS 1030A × RHA 334 -4.80 -6.30 -7.03 -7.03 Days to maturity CMS 1030A × RHA 298 -9.71 -14.59 -11.73 -12.22 CMS 1030A × RHA 334 -7.43 -12.43 -9.50 -10.00 CMS 1030A × RHA 43-5 -5.26 -12.43 -9.50 -10.00 Plant height (cm) CMS 1030A × SCG 73 -22.85 -39.32 -38.36 -28.09 CMS 607A × RES 834-1 0.41 -36.20 -35.19 -24.38 CMS 1030A × RES 834-1 -16.56 -34.38 -33.33 -22.22 Head diameter (cm) CMS 1030 × PS 1070 70.71 16.59 19.50 25.79 CMS 17A × ID 25 92.62 14.63 17.50 23.68 CMS 1030 × RHA 298 67.14 14.15 17.00 23.16 Test weight (g) CMS 17A × SCG 37 136.61 44.09 71.46 121.27 CMS 17A × RHA 298 74.57 -0.56 18.33 52.70 CMS 607A × SCG 29 34.48 -4.01 14.23 47.41 Seed yield (kg/ha) CMS 607A × R 45 358.67 46.06 37.02 106.16 CMS 1030A × PS 1070 255.36 43.13 34.27 102.02 CMS 17A × RHA 334 345.26 41.40 32.65 99.58 Seed yield (g/plant) CMS 1030 × PS 1070 229.87 -12.21 22.52 13.11 CMS 17A × HRHA 10-3 336.22 -19.48 12.37 3.75 CMS 1030A × RHA 298 187.27 -23.55 6.69 -1.50 Oil content (%) CMS 1030 × SCG 29 19.83 25.19 25.94 6.87 CMS 234A × RHA 43-5 35.70 25.19 25.94 6.87 CMS 234A × PS 1070 30.69 20.57 21.29 2.93 Oil yield (kg/ha) CMS 1030A PS 1070 282.94 60.00 51.24 92.85
CMS 1030A ID 25 256.44 48.93 40.77 79.51 CMS 17A ID 25 285.86 41.74 33.98 70.84
are in line with those of Goksoy, et al., 1977.
For seed yield per plant (g|plant), the heterosis overbetter parent was ranged from 16.33 (CMS 1030A × SCG 73) to772.73 per cent (CMS 234A× RES 834-1). Among all hybrids,46 hybrids recorded significant positive heterosis. Nonehybrids recorded significant positive heterosis over checkKBSH 44, while three hybrids (CMS 17A× NDR 4, CMS 17A×HRHA 10-3 and CMS 1030A× PS 1070) over KBSH 53 andone hybrid (CMS 1030A× PS 1070) over SB 275 recordedsignificant positive heterosis. For seed yield (kg/ha), the rangeof heterobeltosis varied from -12.98 (CMS 1030A×RHA 298)to 35.70 per cent (CMS 234A×RHA 43-5). The hybrids CMS1030A× PS 1070, CMS 1030A× ID 25, CMS 17A × ID 25, CMS607A×R 45 and CMS 17A×RHA 334 were superior hybrids interms of the heterosis over better parent and standard checks.The results are in agreement with Gangappa et al., 1997,Madrap and Makne, 1993, Kandhola, et al., 1995, Radhika, etal., 2001 and Loganathan and Gopalan, 2006.
The magnitude of heterosis over mid parent for oilcontent ranged from 17.42 (CMS 234A× SCG 29) TO 97.65 per
cent (CMS 234A×RHA 43-5). Among all hybrids only onehybrid CMS 234A×RHA 43-5 recorded significant positiveheterosis over mid parent, where as none of the hybridssuperior compared to the best commercial checks. Similarresults were reported by several workers viz., Naresh, et al.,1996, Gill and Punia, 1996 and Alone, et al., 2003. Most of thehybrids recorded positive heterosis over mid parent indicatingnon-additive gene action for oil yield. None of the hybridsrecorded significant positive standard heterosis.
Heterosis for top three hybrids for yield and itscomponent traits were given in Table 2. Among all hybrids,CMS 1030A×PS 1070, CMS 1030A×ID 25 and CMS 17A×ID25 performed better with respect to seed yield, oil content andhead diameter and other yield component traits. Among the48 hybrids, some are fertile, some are partial fertile and someare sterle. So the partially fertile lines like CMS 1030A×PS1070 are promising for yield and component traits need to beimproved by employing them in biparental mating andselection schemes. Thus, these potential hybrids could betested on large scale over environments to assess their realpotential and adaptability.
Table 2. Heterosis for top three hybrids for different characters in sunflower

SINGH et al., Evaluation of Tomato Hybrid (Lycopersicon esculentum Mill.) in Allahabad Agro Climatic Conditions 769
LITERATURE CITED
Alone, P. K., Mate, S. N., Gagure, K. C. and Manjare, H. P., 2003,Heterosis in sunflower. Indian J. Agric. Res., 27(1) : 56-59.
Bajaj, R. K., Ahuja, K., Kaur, N. and Sharma, S. R., 2003, Estimation ofheterosis and inbreeding depression in sunflower (Helianthus annuusL.). J. Res., Punjab Agric. Univ., 40(2) : 146-150.
Gangappa, E., Channakrishniah, K. M., Ramesh, S. and Harini, A. S.,1997, Exploitation of heterosis in sunflower (Helianthus annuusL.). Crop Res., 13 : 339-348.
Gill, H. S. and Punia, M. S., 1996, Expression of heterosis in single,double and three way cross hybrids of sunflower (Helianthus annuusL.). Helia, 19 : 111-118.
Goksoy, A. T., Turkec, A. and Turan, Z. M., 2000, Heterosis andcombining ability in sunflower (Helianthus annuus L.). Indian J.Agric. Sci., 70(8) : 525-529.
Kandhola, S. S., Behl, R. K. and Punia, M. S., 1995, Combining abilityin sunflower. Ann. Biol., 11 : 103-106.
Loganathan, P. and Gopalan, A., 2006, Heterosis for yield and yieldcomponents in sunflower (Helianthus annuus L.). Res. On Crops,7(1) : 206-212.
Madrap, I. A. and Makne, V. G., 1993, Heterosis in relation to combiningability effect and phenotypic stability in sunflower. Indian J. Agric.Sci., 63(8) : 484-488.
Naresh, R., Channakrishnaiah, K. M. and Gangappa, E., 1996, Heterosisin single cross and three way cross hybrids of sunflower. Mysore J.Agric. Sci., 30 : 197-203.
Phad, D. S., Joshi, B. M., Ghodke, M. K., Kamble, K. R. and Gole, J. P.,2002, Heterosis and combining ability analysis of sunflower(Helianthus annuus L.). J. Maharashtra Agric. Univ., 27(1) : 115-117.
Radhika, P., Jagadeshwar, K. and Khan, K. A., 2001, Heterosis andcombining ability through line ´ tester analysis in sunflower(Helianthus annuus L.). J. Res., Acharya N. G. Ranga Agric. Univ.,29(2-3) : 35-43.
Recieved on 10-08-2013 Accepted on 11-09-2013
770 Trends in Biosciences 6 (6), 2013Trends in Biosciences 6 (6): 770-772, 2013
Effect of Grafting Time and Environment on the Graft Success of Guava (Psidiumguajava L.) under Wedge GraftingKARMA BEER1, A. L. YADAV2 AND AKHILENDRA VERMA1
1Department of Horticulture, Institute of Agricultural Sciences, Banaras Hindu University, Varanasi221005, (U.P.), India,2Department of Horticulture, Narendra Deva University of Agriculture and Technology, Kumarganj,Faizabad-224229 (U.P.) India.email: [email protected]
ABSTRACT
The experiment was carried out to appraise the effect of graftingtime and environment on the graft success of guava (Psidiumguajava Linn.) under wedge grafting in 2009-2010. It was foundthat controlled environment (when scion shoot covered withpoly tube) was best in all the attributes. The observation wererecorded on days taken to graft sprouting, per cent graftsprouting, per cent graft survival and per cent graft mortality.It was found that maximum per cent graft sprouting and percent graft survival was in15th February grafting under controlledenvironment and minimum days taken to graft sprouting in15th
April under open field condition and mortality percentage wasminimum in treatment seventh.
Key words Psidium guajava, grafting time, environment, wedgegrafting, poly tube.
Wedge grafting is a method of vegetative propagationwhich is standardized in guava (Psidium guajava Linn.)propagation gave maximum number of success than otherstandard methods of propagation in guava. Present studyrevealed that wedge method of grafting was tried in guava(Psidium guajava) cultivars Allahabad Safeda, Lucknow 49and Lalit under greenhouse (GH) as well as in open fieldconditions with and without Polycap. The grafting operationperformed in greenhouse with Polycap gave significantlyhigher success of grafts compared with other conditions ofwedge grafting in all taken cultivars. However, maximumsuccess of grafts was obtained in greenhouse (81.71%) andminimum in open field conditions (when grafting was carriedout during September to December in all three cultivars.Grafting under greenhouse significantly reduced the timetaken (12-13 days) for sprouting than those grafted in openfield conditions. The temperature range of 24 to 26°C and 70to 80 per cent RH were found most conductive for achievingmaximum success reported by Visen, et al., 2010.
MATERIALS AND METHODS
The experiment was laid out at main experimental stationNDUAT Kumarganj Faizabad during the year 2009-2010 withten treatments and replication thrice in randomized blockdesign. The grafting was performed in the 15th December to
15th April on monthly interval. There were two environmentalset in first two different environment i.e. open field (scionshoot not covered with poly tube) and controlled environment(scion shoot covered with poly tube) and in second one havingten treatments T1 (Grafting on 15th December in Open field), T2(Grafting on 15th December in controlled environment), T3(Grafting on 15th January in Open field), T4 (Grafting on 15th
January in Controlled environment), T5 (Grafting on 15th
February in Open field), T6 (Grafting on 15th February inControlled environment), T7 (Grafting on 15th March in Openfield), T8 (Grafting on 15th March in Controlled environment),T9 (Grafting on 15th April in Open field), T10 (Grafting on 15th
April in controlled environment).Percentage success of wedge grafting is higher than
that of patch method of budding. Also wedge grafted plantsgrow vigorously at initial stage of grafting therefore that wasimportant theme to conducted experiment on that aspect.
Poly tube was transparent white in color 15th cm in lengthhaving one end closed and one open of 200 gauges. In wedgegrafting, the seedling stocks were selected with proper ageabove thickness and terminal part of shoot were decapitatedat 10 to 15 cm above from the base of root stock. The uppercut end of decapitated shoots were incised longitudinal to alength of 2.5 to 3.0 cm in V-shaped cut with the help of sharpgrafting knife. The scion shoot having 6 to 8 cm length andequal thickness of diameter containing at least 4 to 5 bud werecollected from scion variety. The lower end of scion wood aremade with to slant cut on both side having 2.5 to 3.0 cm inlength equal to V- notch cut of root stock. The scion shootwere inserted in to V- shape cut of stock plant for the properplacement then after wrapped with 200 gauge transparentpolythene strip.
RESULTS AND DISCUSSION
A scrutinized data of the result presented in Table 1indicates that the maximum days (46.90) taken to graftsprouting was in treatment one (T1) and minimum (13.62) intreatment ten (T10). The similar findings have also beenreported by Ghafoor, et al., 2001, that maximum number ofdays to sprouting (107.25) was observed when grafting wasdone on 15th January, compared to 93.17 days when grafting

BEER, et al., Effect of Grafting Time and Environment on the Graft Success of Guava (Psidium guajava L.) under Wedge Grafting 771
was done on 15th February. Sanjay and Singh, 2007 conductedan experiment to standardize method and time of propagationin tamarind. Patch budding and soft-wood grafting (cleftmethod) were carried out at monthly interval. Patch buddedplants sprouted earliest during August (22 days) followed byJuly (23 Days) and June (24.25 days). The maximum time wastaken in the February (32 days). Higher percentage of graftsuccess was noted in August in patch budded plants, whereasit was recorded to be highest in soft wood grafted plants inMay, closely followed by April.
The maximum (51.78 per cent) graft sprouting wasrecorded in treatment six (T6) and minimum (20.88 per cent) intreatment one (T1). The results were closed conformity by thefindings of Ram and Kumar, 2005 reported success undercontrol environment (82.5%) as compared to naturalenvironment (65.00 %). Selvi, et al., 2008 studies the effects ofthe period of grafting (July, August, September, October,November and December 2004, and January 2005) andenvironment (mist, 50% agro-shade or tree shade) on thesuccess of softwood grafting in jackfruit were studied. Graftingsuccess was highest when seedlings were grafted in October.Among the environments, 50% agro-shade resulted in thelowest number of days to graft union (20.89), and highestpercentage of graft-take (17.96%) and sprouting (23.3%) onthe 60th day. Similar finding also reported by Shashi et al.,2012 when scions of guava cv. Sardar were cured for 3, 6, 9 or12 days by cutting the leaves and retaining the leaf petiole onthe mother tree. The scions were then wrapped in moist cloth,and softwood grafting was conducted. Grafting success,survival percentage, and growth parameters of the grafts wereevaluated at monthly interval. The greatest graft success andgraft survival were recorded for scions cured for 9 days (84.00and 88.09% respectively).
The graft survival was noticed maximum (46.82 per cent)in treatment six (T6) and minimum (14.33 per cent) in treatmentthree (T3). The similar findings were also reported by Singhand Singh, 2006, when the propagation is done in March gave40% success. Singh and Singh, 2006 standardize the methodand time of propagation in Jamun (Syzygium cuminii) under asemi-arid environment. Patch budding and soft wood graftingwas conducted at monthly intervals commencing fromSeptember 2002 to August 2004. Patch budded plants sproutedearliest in July (16 days). A higher percentage of graft successwas noted in March (40%) in patch budded plants, whereas itwas highest in soft wood-grafted plants in August (36%).
The maximum (30.52 per cent) mortality was found intreatment four (T4) and minimum (1.65 per cent) in treatmentseven (T7). That result was supported by Ram, et al., 2005studied in Aonla (Emblica officinalis cv. Chakaiya during2002-03 in Uttar Pradesh, India, to find out the effects ofenvironments and scion-stick on the performance of softwoodgrafting during the off season (March). Grafting was doneunder natural (E1) and controlled environments (E2) with two
types of scion-stick, i.e. with four buds (S1) and six buds (S2).Success percentage was maximum (82.50%) under thecontrolled environment compared to the natural environment(65.00%), whereas scion-stick with six buds recorded themaximum success percentage (72.50%) compared to scion-stick with four buds (70.00%). Interaction E2S2 recorded themaximum success percentage (85.00%), whereas E1S1 recordedminimum (60.00%).Chandra, et al., 2011 conducted anexperiment on two grafting methods (wedge and tonguegrafting) and five dates (15 December, 30 December, 15 January,30 January and 15 February). One-year-old seedlings of ‘PhuleArakta’ were used as a rootstock for the present study.Significantly higher scion sprouting was recorded with wedgegrafting done in the last week of January after 15 (90.00%) and21 (96.67%) days of grafting. Consequently maximum graftsuccess (85.00%) was recorded after 90 days of grafting withwedge grafting done on 30 January.
Table1. Effect of grafting time and environment on thegraft success of Guava (Psidium guajava) underwedge grafting
Treatments Days taken to
graft sprouting
Per cent graft
sprouting
Percent graft
survival
Percent graft
mortality
T1 46.90 20.88 16.79 19.58 T2 45.75 23.66 19.66 16.90 T3 42.44 19.97 14.33 28.24 T4 38.97 23.88 16.59 30.52 T5 22.99 44.68 38.96 12.80 T6 20.79 51.78 46.82 9.57 T7 18.89 34.49 33.92 1.65 T8 16.77 43.88 40.91 6.76 T9 16.89 32.69 31.87 2.50 T10 13.62 36.92 35.81 3.00
SEm± 0.57 0.93 0.91 0.83 CD at 5% 0.79 1.08 1.01 0.95
The minimum days was taken to graft sprouting in 15th
April under controlled environment, where as the maximumper cent graft sprouting was recorded 15th February graftingunder controlled environment and minimum per cent graftsprouting was recorded in 15th January under naturalenvironment. The maximum per cent graft survival wasrecorded 15th February grafting under controlled environmentwhile minimum per cent graft survival was noted in 15th Januarygrafting under natural environment. Percent graft mortalitywas minimum in 15th March under open field.
ACKNOWLEDGEMENT
With immense pleasure and profound sense of gratitude,indeed, I take this opportunity to express my heartfelt andsincere thanks to my esteemed supervisor, Dr. A. L. Yadav,Assistant Professor, Department of Horticulture, NarendraDeva University of Agriculture and Technology, Kumarganj,Faizabad, India.

772 Trends in Biosciences 6 (6), 2013
LITERATURE CITED
Chandra, R. Jadhav, V. T., Sharma, J. and Marathe, R. A. 2011. Effectof grafting methods and time on scion sprouting, graft success andsubsequent growth of grafted plants of pomegranate (Punicagranatum L.) ‘Bhagawa’. Acta Hortic., 35(1): 107-108.
Ghafoor, N., Muhammad, I. and Noor, R. 2001. Effect of differenttime of grafting on graft take success of different cultivars of pecannut. Sarhad J. of Agriculture, 17 (3): 333-338.
Ram, R. B. and Akhilesh Kumar 2005. Effect of environments andscion-stick on the performance of softwood grafting in Aonla(Emblica officinalis Gaertn.) during off season. Bioved, 16(1): 51-56.
Sanjay Singh and Singh, A. K. 2006. Standardization of method andtime of propagation in jamun (Syzygium cuminii) under semi-arid
environment of western India.Indian Journal of Agril. Sci.,76(4):242-245.
Sanjay Singh and Singh, A. K. 2007. Standardization of method andtime of vegetative propagation in tamarind under semi-aridenvironment of western India. Indian J. of Hort., 64(1):45-49.
Selvi, R., Kumar, N., Selvarajan, M. and Anbu, S. 2008. Effect ofenvironment on grafting success in jackfruit. Indian J. of Horti.,65(3): 341-343.
Shashi Kumar, Swamy, G. S. K., Kanamadi, V. C., Gangadharappa, P. M.,Prasad Kumar, Jagadeesha, R. C. and Jagadeesh, S. L. 2012. Effectof pre-curing of scion on softwood grafting success in guava.Karnataka J. of Agril. Sci., 25(2):289-290.
Visen Amit, Singh, J.N. and Singh, S. P. 2010. Standardization of wedgegrafting in guava under North Indian plains. Indian J. of Hort., 67:111-114.
Recieved on 08-09-2013 Accepted on 13-10-2013

Trends in Biosciences 6 (6): 773-775, 2013
Effect of Planting Geometry on the Yield, Nutrient Availability and Economics ofPigeonpea GenotypesRAVIKUMAR BHAVI, B. K. DESAI AND VINODAKUMAR, S. N.
Dept. of Agronomy, College of Agriculture, UAS, Raichur, Karnataka- 584 104, Indiaemail: [email protected] & [email protected]
ABSTRACT
A field experiment was conducted at Agriculture College Farm,Raichur, Karnataka (India) with three pigeonpea genotypesand five planting geometries during kharif, season of 2007.The seed yield and husk yield differs significantly among thethree pigeonpea genotypes. The seed yield and husk yieldproduced by genotypes BSMR 736 (1447 kg ha-1 and 1052 kg ha-
1, respectively) and ICPL 87119 (1368 kg ha-1 and 992 kg ha-1,respectively) were found to be significantly higher than theseed yield (1259 kg ha-1 and 901 kg ha-1, respectively) obtainedby ICPL 8863. The extent of reduction in seed yield by ICPL8863 was 15 and 9 per cent when compared to BSMR 736 andICPL 87119, respectively. Among different genotypes nitrogenavailability was significantly superior with ICPL 8863 (217.93kg/ha). The available nitrogen content in soil after harvest ofpigeonpea decreased with decrease in row spacing from 150 x90 cm (218.75 kg/ha) to 90 x 10 cm (202.04 kg/ha). The netreturn (19,491 ha-1) and benefit cost (B:C) ratio (2.02) werefound to be significantly higher in BSMR 736. Among differentPlanting geometry 90 x 20 cm recorded significantly higherseed yield and net returns (1637 kg ha-1 and Rs. 23,085 ha-1) wason par with 150 x 30 cm spacing (1621 kg ha-1 and Rs. 23,018 ha-
1, respectively). Significantly higher B:C ratio was observedwith 150 x 30 cm spacing (2.41).
Key words Pigeonpea Genotypes, Planting Geometry, Yield,Nutrient availability and Economics
The productivity of pulses in India has remainedvirtually stagnant for the last 45 years between 539 kg perhectare in 1961 to 585 kg per hectare in 2005-06, reflecting thepaucity of new high-yielding strains (Punnathara, 2007). Thepulses production in country has shown wild fluctuationsand stagnated at a level of about 13-14 m tones over a decade.After 60 years of planned agricultural development, thecountry is nowhere close to attaining self-sufficiency in pulsesproduction. And it continues to pay a heavy price as pulseimports burn a hole in our import bill. It has led to the severeshortage of pulses in India, which has aggravated the problemof malnutrition in large section of vegetarian population, sincemainly low protein cereals are consumed. Thus, there is anurgent need to increase the production of pulses to meet theincreasing demand by manipulating the productiontechnologies appropriately. Pigeonpea is the second mostimportant pulse crop of India after chickpea. The yield ofpigeonpea is limited by a number of factors such as agronomic,pathogenic, entomological, genetic and their interaction with
environment. Among the different agronomic practices limitingthe yield, choice of a suitable geometry (row spacing) andpopulation for a particular genotype is one of the importantfactors. Adaptation of proper planting geometry to a particulargenotype will go a long way in making efficient use of limitedgrowth resources and thus to stabilize yield.
MATERIALS AND METHODS
A field experiment was conducted at Agriculture CollegeFarm, Raichur, Karnataka (India) during kharif, season of 2007to evaluate the performance of three pigeonpea genotypesand five planting geometries. The experiment was laid out insplit plot design with three replications. The treatmentconsisted of three genotypes and five planting geometriesassigned to main and sub plots, respectively. The crop wassown in the second fortnight of July. The soil of theexperimental field was medium black soil. The soil was mediumin organic carbon (0.62), low in available N (223.70 kg ha-1),medium in available P (33.41 kg ha-1) and high in available K(342.50 kg ha-1) and alkaline in nature (pH 8.26). The entirequantity of recommended dose of fertilizer for pigeonpea(25:50 N: P2O5 kg/ha) was applied as basal dose at the time offieldpea portion. Three plants were tagged at random in netplot area for recording various plant growth and yieldcomponents. Net return (Rs. ha-1) was calculated by deductingcost of cultivation (Rs. ha-1) from gross return B:C ratio wasworked out as a ratio of net return (Rs. ha-1) to cost ofcultivation (Rs. ha-1).
RESULTS AND DISCUSSION
The data on yield, availability of N and economics arepresented in table 1, 2. The seed yield differs significantlyamong the three pigeonpea genotypes. The seed yield (1447kg ha-1) produced by genotype BSMR 736 was found to besignificantly higher than the seed yield (1259 kg ha-1) obtainedby ICPL 8863 and it was found to be on par with ICPL 87119(1368 kg ha-1). The extent of reduction in seed yield by ICPL8863 was 15 and 9 per cent when compared to BSMR 736 andICPL 87119, respectively. The differences in seed yield by thegenotypes was reported by Thakur, et al., 1998. The factorsmainly responsible for seed yield variation among genotypesis due to the variation in yield components viz., number ofpods per plant, number of seeds per pod, seed yield per plant,100-seed weight and harvest index. But, significant variations

774 Trends in Biosciences 6 (6), 2013
Treatments Seed yield (kg/ha)
Husk yield (kg/ha)
Available N (kg ha-1)
Genotypes (G) ICPL 87119 (Asha) 1368 992 210.3 ICPL 8863 (Maruti) 1259 901 217.9 BSMR 736 1447 1052 208.4 Mean 1358 982 212.20 S.Em.+ 26 21 0.68 C.D. at 5% 103 84 2.36 Spacing (S) 150 cm x 30 cm 1621 952 213.45 150 cm x 60 cm 1147 848 217.76 150 cm x 90 cm 1027 756 218.75 90 cm x 20 cm 1637 1133 209.03 90 cm x 10 cm 1359 1220 202.04 Mean 1358 982 212.20 S.Em.+ 11 14 0.50 C. D. at 5% 34 41 1.47 Interaction S at the same G levels S.Em.+ 20.6 24.9 0.9 C. D. at 5% NS NS NS G at the same or different S levels S.Em.+ 32.14 31.04 0.98 C. D. at 5% NS NS NS
Table 1. Seed yield, Husk yield and Availability of Nitrogenin pigeonpea genotypes as influenced by plantinggeometry
NS – Non significant
in the yield characters were noticed with variation in theplanting geometry. The spacing of 90 x 20 cm recordedsignificantly higher seed yield (1637 kg ha-1) when comparedto other spacings tested namely 90 x 10 cm (1359 kg ha-1), 150x 60 cm (1147 kg ha-1) and 150 x 90 cm (1027 kg ha-1). However,the seed yield (1621 kg ha-1) recorded by 150 x 30 cm rowspacing was found at par with the spacing of 90 x 20 cm.Significant differences in the seed yield of pigeonpea withspacing of 90 x 20 cm over 90 x 10 cm was because of improvedgrowth and yield components viz., number of pods per plant,number of seeds per pod, seed yield per plant, 100 seed weightand harvest index. Significantly higher seed yield (1637 kg ha-
1) obtained with 90 x 20 cm over wider spacing of 150 x 60 cm(1147 kg ha-1) and 150 x 90 cm (1027 kg ha-1) was mainly due toan higher plant population per unit area even though the yieldattributes are significantly lower when compared to the yieldattributes recorded under wider row spacing. On the contrary,the seed yield obtained with 150 x 30 (1621 kg ha-1) row spacingwas on par with 90 x 20 cm row spacing.
Genotypes differed significantly with respect to availablenitrogen in soil. ICPL 8863 recorded significantly higheravailable nitrogen in soil (217.93 kg ha-1) than BSMR 736(208.38 kg ha-1) and ICPL 87119 (210.29 kg ha-1). However,available nitrogen in soil recorded by later two genotypeswere on par with each other. Significantly lower availablenitrogen in soil was recorded by BSMR 736 (208.38 kg ha-1).Narrow row spacing of 90 x 10 cm recorded significantly lower
available nitrogen (202.04 kg ha-1) followed by 90 x 20 cm(209.0 kg ha-1), 150 x 30 cm (213.45 kg ha-1), 150 x 60 cm (217.76kg ha-1) and 150 x 90 cm (218.7 kg ha-1) and available nitrogencontent of soil recorded by latter two row spacings were onpar with each other. These results are in accordance with thefindings of Patel, et. al., 1984.
BSMR 736 recorded higher net returns (Rs. 19,491 ha-1)and B:C ratio (2.02) than ICPL 8863 by virtue of its higher seedyield per ha. Similarly, ICPL 87119 was also superior over ICPL8863 and on par with BSMR 736 genotype. Among differentrow spacings, the row spacing of 90 x 20 cm recordedsignificantly higher net returns (Rs. 23,085 ha-1) than otherspacings due to its higher seed yield and it was on par with arow spacing of 150 x 30 cm which recorded net returns (Rs.23,018 ha-1) respectively. B:C ratio was found significantlyhigher in a row spacing of 150 x 30 cm (2.41) when comparedto other spacings except 90 x 20 cm (2.35) spacing. Closelyhigher benefit cost ratio was noticed in 150 x 30 cm spacingcompared to 90 x 20 cm was due to its lower cost of cultivation(Rs. 9,402 ha-1) when compared to 90 x 20 cm (Rs. 9,663 ha-1)and the yield levels in both these spacings are numericallysimilar. These results are in accordance with the findings ofNedunzhiyan and Sambasiva Reddy, 1993 and Antaravalli, et.al., 2002.
Interaction effects of different genotypes towards varied
Treatments Gross returns (Rs. ha-1)
Cost of cultivation (Rs. ha-1)
Net returns (Rs. ha-1)
B:C ratio
Genotypes (G) G1 : ICPL 87119 (Asha) 27,361 9,424 17,936 1.86 G2 : ICPL 8863 (Maruti) 25,189 9,381 15,808 1.64 G3 : BSMR 736 28,948 9,456 19,491 2.02 Mean 27,166 9,420 17,745 1.84 S.Em.+ - - 517 0.054 C.D. at 5% - - 2,031 0.211 Spacing (S) S1 : 150 cm x 30 cm 32,420 9,402 23,018 2.41 S2 : 150 cm x 60 cm 22,937 9,138 13,799 1.47 S3 : 150 cm x 90 cm 20,537 9,054 11,483 1.23 S4 : 90 cm x 20 cm 32,748 9,663 23,085 2.35 S5 : 90 cm x 10 cm 27,186 9,844 17,342 1.7 Mean 27,166 9,420 17,745 1.84 S.Em.+ - - 232 0.025 C. D. at 5% - - 678 0.072 Interaction S at the same G levels S.Em.+ - - 402 0.043 C. D. at 5% - - NS NS G at the same or different S levels S.Em.+ - - 630 0.066 C. D. at 5% - - NS NS
NS – Non significant
Table 2. Economic analysis of pigeonpea genotypes asinfluenced by planting geometry

BHAVI et al., Effect of Planting Geometry on the Yield, Nutrient Availability and Economics of Pigeonpea Genotypes 775
spacing were not found to differ significantly for yield,availability of nitrogen and economics of pigeonpea.
From this study it can be stated that, pigeonpeagenotypes BSMR 736 and ICPL 87119 were found to be suitablein North Eastern Dry Zone of Karnataka (Zone 2) for kharifseason as both these genotypes recorded higher seed as wellas husk yield with higher net returns and B:C ratio. Amongthe different row spacing, the spacing of 90 x 20 cm was foundto give higher yields, net returns, but the B:C ratio was foundto be higher in 150 x 30 cm spacing.
LITERATURE CITED
Antaravalli, M. B., Halikatti, S. I., Kajjidoni, S. T. and Hiremath, S. M.,2002, Effect of planting geometry on the yield, yield componentsand economics of pigeonpea genotypes in vertisols of Dharwad.Karnataka Journal of Agriculture Sciences. 15 (3): 466-471.
Nedunzhiyan, Y. and Sambasiva Reddy, 1993, Performance of pigeonpeagenotypes at different plant densities under late sown rainfedconditions of Royalseema. Indian Journal of Pulses Research.6(2):210-211.
Patel, R. G., Patel, M. P., Patel, H. C. and Patel, R. B., 1984, Responseof arhar varieties to varying row spacings and levels of fertilizerunder clayey soils of South Gujarat. Indian Journal of Agronomy,29(1):135-136.
Punnathara, C. J., 2007, Why is the nations “pulse” weak. BusinessDaily from THE HINDU group pf publications, Wednesday, May23.
Tej Lal Kashyap, Shrivastava, G. K., Lakpale, R. and Choubey, N. K.,2003, Productive potential of pigeonpea (Cajanus cajan L. Millsp)genotypes in response to growth regulator under vertisols ofChattisgarh plains. Annals of Agricultural Research New Series24(2):449-452.
Thakur, H. S., Sinha, N. K. and Sharma, S. N., 1998, Response ofpigeonpea to plant population and fertility levels under Malwaconditions. Indian Journal of Agronomy, 43(3): 444-447.
Recieved on 04-09-2013 Accepted on 15-10-2013

776 Trends in Biosciences 6 (6), 2013Trends in Biosciences 6 (6): 776-780, 2013
Combining Ability Analysis for Salt Tolerance in Rice (Oryza sativa L.) under CostalSalt Affected SoilYASHLOK SINGH1, P. B. PATEL, P.K. SINGH AND VINOD SINGH
Department of Genetics and Plant Breeding, Narendra Deva University of Agriculture and Technology,Kumarganj, Faizabad 224229 (U.P.)email: [email protected]
ABSTRACT
Combining ability analysis in rice carried out during kharif,2011-12 under coastal salt affected soil at Costal Soil SalinityResearch Station, Danti, Navsari Agricultural University,Navsari, Gujarat. The experiment including 4 x 12 (line x tester)crossing programme was conducted for investigate the generalcombining ability (GCA) and specific combining abilityanalysis (SCA) for the various traits. The general combiningability effect enables to the identification of desirable maleand female parents. Parent, IET-18710 as found to be goodgeneral combiner for most of the traits viz., grain per panicle,productive tillers per hill, grain yield per plant, straw yield perplant, days to maturity and harvest index. Specific combiningability, hybrids viz., Jaya x IET 18710, NAUR 1 x IR 71829, IET15429 x IET 18710 and NAUR 1 x IET 18710 were found to bethe most promising for grain yield, its component traits undercostal salinity. Those crosses were found to involve at least oneparent with high GCA effect and other parents having eitherhigh or low GCA effect indicating the involvement of additiveas well as non-additive gene action operating in these crosses.The preponderance of non additive gene action, presence ofsubstantial degree of sca effects for grain yield and othercomponent characters favoured a hybrid breeding programmein rice.
Key word Combining ability, Gene action, Coastal salinity,Hybrid breeding.
The salinity and sodicity are the important factorsadversely affecting the soil health and crop production. Thetotal salt affected area in India approximately 8.1 m ha. Out ofwhich, 3.2 m ha in coastal saline (Anon., 2009). In coastalareas of south and middle Gujarat, paddy is a major crop duringkharif season. In coastal salt affected soil, the gap betweenachievable and existing productivity in paddy indicates thatthere is a good scope to raise the production and productivitythrough crop improvement (Roy, et al., 2009). India has salinityproblems on 11% of its land. This is not a static situation andapproximately 1.5 million hectares of irrigated land is salinizedeach year (Gregorio, et al., 2003).
As rice being a major food crop, development of thenew cultivars with enhanced salt stress–tolerance willundoubtedly have an important effect on global foodproduction. Hence, development of high yielding rice varieties,suitable for a salinity stress area is imperative in rice breeding
(Singh, et al., 2008). The Line × Tester analysis helps in identifythe better parents and heterotic crosses for general and specificcombining ability. The concept of combining ability is alandmark in the hybridization program. Knowledge on thenicking ability of genotypes in hybrid combination isparamount importance, since the combining ability of parentsand hybrids does not always depend on the per seperformance.
Line x Tester analysis was suggested by Kempthrone,1957 to elucidate the combining ability of parents for differentcharacters. Line x Tester analysis is a useful technique forscreening large number of lines for identifying the bestcombiners. This analysis provides a systematic approach foridentification of superior parents and crosses which is thebasic material on which the success of breeding programmerests. Furthermore, the breeding procedure to be adopteddepends upon the type and magnitude of genetic variance. Itprovides overall genetic picture of the material underevaluation of single generation. But under salt affected soilthe study is very complex. In coastal salt stress environment,the heterosis is flexible for plant attributes and in crosscombinations also. Magnitude of gene action controlling yieldand yield components are very useful for development of thebreeding procedures to be followed for crop improvement.
MATERIALS AND METHODS
The experiment was conducted at Coastal Soil salinityResearch Station, Danti- Umbharat, N.A.U., Navsari, Gujaratduring the kharif 2011-12. Three complete sets of 66 entriescomprising of 48 F1’s, 4 females, 12 males and 2 checks wereevaluated during kharif 2011-12. The experiment was laid outin a randomized block design replicated three times at researchstation of the university.. The parents and F1’s wererepresented by a single row plot of 10 plants placed at 20 cmx 15 cm spacing. All the agronomical practices and plantprotection measures were followed and when required to raisea good crop of rice. Geographically, Danti- Umbharat issituated at 20°83’ N latitude and 72o 50’E longitude with anelevation of 2.5 meter above sea level on the western coastalbelt of India. The soil of site was reserved as coastal salinetype. The EC(1:2.5)(dS/m) of soil experimental plot was 4.25(0-15cm depth) and 3.89(15-30cm depth), pH of the soil was 8.16(0-15 cm depth) and 8-11 at 15-30 cm depth. The experiment was

SINGH et al., Combining Ability Analysis for Salt Tolerance in Rice (Oryza sativa L.) under Costal Salt Affected Soil 777
Source of variation
d.f. Days to 50% flowering
Plant height (cm)
Panicle length (cm)
Grains per panicle
Productive tillers per hill
Grain yield per plant
(g)
1000 grain weight
(g)
Days to maturity
Replication 2 24.194 8.131 1.929 1077.583 1.195 4.724 15.768 1.798 Female 3 82.407 4306.136
** 14.487 146.167 5.692 262.863 15.721 166.895
Male 11 48.217 201.446 35.183** 1913.379 9.153 614.094** 20.159 78.188 Female x male 33 80.079** 136.363*
* 7.949 1590.848** 5.102** 204.844** 20.419** 95.653**
Error 94 16.180 57.997 5.392 618.427 2.173 19.466 6.447 20.919 Estimates
2 f 0.0647 115.827*
* 0.182 -40.130 0.016 1.612 -0.131 1.979
2 m -2.655 5.424 2.269** 26.878 0.338 34.104** -0.022 -1.455 2 g ca -0.615 88.226** 0.704** -23.378 0.0967** 9.735** -0.103 1.120* 2 s c a 20.573** 26.919** 0.722 356.198** 0.962** 61.870** 4.547** 25.364** 2 g ca / 2 s ca -0.030 3.277 0.975 0.066 0.101 0.157 0.023 0.044
Table 1. Analysis of variance for combining ability for different characters in rice.
*, ** significant at 5% and 1% levels of probability, respectively
laid out in a randomized block design with three replicated.During the investigation various morphological traits viz., Daysto 50% flowering, plant height, panicle length, grains perpanicle, productive tillers per hill, grain yield per plant, 1000grain weight and days to maturity were studied. Analysis ofVariance technique was followed to test the difference betweenthe genotype of all characters and combining abilitycomponent in accordance with the procedure suggested byKempthorne, 1957.
RESULTS AND DISCUSSION
The nature and magnitude of estimates of geneticvariance provide an idea about the relative role of fixable andnon-fixable gene effects in the inheritance of character. Thisin turn helps identifying suitable parents for hybridization aswell as breeding method to be employed. The geneticvariances were estimated from the analysis of variances forcombining ability for eight characters as suggested byKempthorne, 1957. The results are presented in Table 1. Thevariation present in the hybrids was partitioned into portionsattributable to females, males and female x male sources.Analysis of variance for combining ability revealed that meansquares due to females were significant or non-significant forvarious characters in rice.
The estimation of general combining ability (gca)variances for females (s2f) were non- significant for all thecharacters except plant height. General combining ability (gca)variances for males (s2 m) significant only for panicle lengthand grain yield per plant. On the other hand, specificcombining ability (sca) variances for f x m interaction werehighly significant for all characters except panicle length. Themagnitude of gca variances was lower than sca variances forvarious characters except plant height, which indicated thepredominance of non-additive gene action. This was furthersupported by low magnitude of s2gca/s2sca ratios. General
combining ability effects of females (Gj) and of males (Gi) aswell as specific combining ability effects of crosses (Sij) for allthe characters were also estimated.
The concept of combining ability analysis has significantpractical importance in plant breeding as it allows theprediction of the relative efficiency of parents based on earlygeneration performance besides enabling to study thecomparative performance of lines in hybrid combinations.Without genetic direction, plant breeders lack the rational basisto guide him in the choice of parents, in the manipulation ofprogenies and selection of superior parents.
In any breeding programme selection of parents isprimarily depends on their phenotypic divergence. Inquantitatively inherited characters, prediction of ability of theparents to combine well, generate more variability and transmitdesired gene combination to the progeny is rather difficultthrough parental phenotypes. Recent developments inbiometrical genetics have made it possible to make suchpredictions with ease. Various biometrical methods used toselect the right parents, combining ability analysis (Spragueand Tatum, 1942;) are some of the widely used ones.The natureof gene action has a bearing on development of efficientbreeding programme. General combining ability effects andadditive x additive gene action are theoretically fixable. Onthe other hand, specific combining ability attributed to nonadditive gene action may be due to dominance or epistasis orboth and is not fixable. The presence of non additive geneticvariance is primary justification for initiating the hybridprogramme (Cockerham, 1961). The success of hybridprogramme based on the results of combining ability dependson the extent of genetic parameters remaining stable overenvironments. The perusal of data for combining abilityanalysis indicated that general combining ability variancesfor females were non- significant for all the characters exceptplant height and general combining ability variances for males

778 Trends in Biosciences 6 (6), 2013
Table 2. Estimation of general combining ability effects of parents for different characters in rice.
*, ** significant at 5% and 1% levels of probability, respectively
Parents Days to 50% flowering (g)
Plant height (cm)
Panicle length (cm)
Grains per panicle
Productive tillers per hill
Grain yield per plant (g)
1000 grain weight (g)
Days to maturity
Lines
Ja ya 1.47* -15.92** 0.70 1.36 0.04 -1.05 -0.79 0.62
I R-7 1 90 7 -1.63* 7.46** -0.59 -2.38 0.52* -1.35 0.73 1.78*
NAU R-1 -0.91 1.60 0.36 -0.91 -0.42 -1.63* -0.23 -3.13**
I ET -15 42 9 1.08 6.85** -0.48 1.94 -0.14 4.03** 0.28 0.72
S Em. + (g j ) 0.71 1.24 0.40 3.81 0.25 0.73 0.43 0.74
S Em. + (g i -gj ) 1.01 1.76 0.57 5.39 0.35 0.19 1.10 1.04
Testers
I R-7 2 04 6 0.61 -4.11 1.55* -8.75 -0.72 -3.94** 1.25 -1.38
I R-7 2 04 9 -2.55* 1.46 -0.55 -5.00 -0.47 4.31** 1.31 0.535
NVS R- 60 30 -2.80* 1.13 -2.21** 2.41 0.27 3.33** 1.61* -1.54
C SR- 27 2.77* 1.54 -2.21** -5.91 1.43** -3.05* 0.64 -2.63*
I ET -18 85 0 2.02 0.04 -0.99 -19.83** 0.02 -9.79** 0.80 -0.04
I ET -20 03 6 1.61 -0.11 -0.11 1.00 0.77 1.12 1.17 1.70
I ET -18 71 0 -2.30 1.96 1.10 25.33** 1.60** 14.96** -1.85* -4.21**
I ET -17 70 4 1.77 -9.53** 2.87** -4.58 -1.14** -6.34** -0.52 0.78
I R-7 7 66 4 -0.30 -3.53 2.10** 0.25 -0.81 -10.22** -0.898 -2.38
NVS R- 60 79 1.36 1.38 -1.44* 22.83** -0.32 3.68** -1.53* 2.45*
I R-7 1 82 9 -2.13 3.29 -1.22 -5.08 -0.47 5.33** -0.18 4.86**
I R-6 8 65 2 -0.05 6.46** 1.10 -2.66 -0.14 0.61 -1.79* 1.86
S Em. + (g j ) 1.24 2.15 0.69 6.60 0.43 1.27 0.75 1.28
S Em. + (g i -gj ) 1.79 1.90 0.19 0.61 9.33 0.98 3.04 1.06
significant only for panicle length and grain yield per plant.Specific combining ability (sca) was significant for all thecharacters except panicle length. The ratio of s2gca/s2sca,however, indicated the preponderance of non-additive geneaction for all the characters while additive gene action waspredominant for plant height (Mirarab, et al.,2011) The generalcombining ability effect enables the identification of desirablemale and female parents presented in Table 2. Parent, IET18710 as found to be good general combiner for most of thetraits viz., grain per panicle, productive tillers per hill, grainyield per plant, days to maturity and harvest index. Parentsviz., IET 18710, IR 71829, IR 72049, IET 15429 and NVSR 6079were good general combiners for grain yield per plant as wellas one or more of its yield contributing traits viz., days to 50%flowering, grains per panicle, productive tillers per hill anddays to maturity. The estimates of sca effects revealed thatnone of the crosses was superior for all the characters.Estimation of specific combining ability presented in Table 3.However, best three hybrids on the basis of significant positivesca effects for grains yield per plant were NAUR 1 x IR 71829,IR 71907 x IET 17704 and Jaya x IET 18710. These crosses alsoregistered high and positive sca effects for most of its yieldattributes. The highest significant sca effects in desired
direction for various characters was exhibited by differenthybrids viz., IET 15429 x IET 20036, IR 71907 x CSR 27 andJaya x IET 17704 for days to 50% flowering, NAUR 1 x IET17704, NAUR 1 x CSR 27 and Jaya x IR 72049 for plant height,IR 71907 x IR 72046, NAUR 1 x IET 20036 and IET 15429 x IR77664 for panicle length, Jaya x IET 18710, IR 71907 x IR 72046and NAUR 1 x IET 18850 for grains per panicle, IET 15429 x IR72049, NAUR 1 x IR 68652 and Jaya x IET 71829 for productivetillers per hill, NAUR 1 x NVSR 6079, Jaya x IR 72046 and IET15429 x IR 77664 for 1000 grain weight, IET 15429 x IR 72049,IET 15429 x NVSR 6079 and NAUR 1 x IET 18850 for days tomaturity.
The comparison of sca effects with per se performanceof crosses indicated that along with high sca effects at leastone good general combiner was necessary for the hybrids. Inview of the per se performance of parents and their gca effectfor grain yield per plant, its components and salt tolerancestudied, IET 18710, IR 71829, IR 72049, IET 15429, NVSR 6079and NVSR 6030 among parents were identified as the mostpromising parents and hence they could be used extensivelyin breeding programme for improving grain yield in rice undercoastal salt affected soil. General combining ability and specific

SINGH et al., Combining Ability Analysis for Salt Tolerance in Rice (Oryza sativa L.) under Costal Salt Affected Soil 779
Table 3. Estimation of SCA effects for various characters in rice under coastal saline soil.
*, ** significant at 5% and 1% levels of probability, respectively
Crosses
Days to 50% flowering( g)
Plant height(cm)
Panicle length(cm)
Grains per
panicle
Productive tillers per hill
Grain yield per
plant(g)
1000 grain
weight(g)
Days to maturity
JAYA x IR 72046 7.53** -2.08 -2.14 -24.36 -0.55 1.32 3.77* -4.95 JAYA x IR 72049 -3.30 -7.66 -0.92 -4.44 0.20 2.22 3.22* 4.46 JAYA x NVSR 6030 1.61 -4.99 0.74 -21.23 -1.22 0.04 2.38 -6.45* JAYA x CSR 27 4.02 -3.41 -1.03 -23.86 0.62 -4.88 1.55 -5.03 JAYA x IET 18850 1.77 0.09 0.41 -6.94 0.37 1.50 -0.55 -0.95 JAYA x IET 20036 8.19** -2.74 -0.04 -12.44 -0.38 5.27* -3.26* 2.29 JAYA x IET 18710 -2.22 2.84 0.52 77.55** 0.78 13.58** -2.67 5.54* JAYA x IET 17704 -6.64* 11.34** -0.81 4.14 -1.13 -5 .29* -1.33 5.88* JAYA x IR 77664 2.11 -4.32 1.29 12.64 -0.47 -5.01 -1.02 -0.29 JAYA x NVSR 6079 -5.56* -4.24 0.85 1.38 0.70 -0.94 -0.78 -0.12 JAYA x IR 71829 -5.05* 6.84 1.07 8.64 1.87* -14.47** -1.57 -2.53 JAYA x IR 68652 -2.47 8.34 0.07 -10.79 -0.79 6.65* 0.28 2.13 IR 71907 x IR 72046 3.97 -0.46 2.69 27.06* 0.65 7.59** 0.75 9.54** IR 71907 x IR 72049 -1.19 5.95 -0.52 9.97 -2.60** -3.54 0.62 2.63 IR 71907 x NVSR 6030 -3.94 6.28 -1.52 -0.78 -0.02 -5 .16* -1.35 7.04** IR 71907 x CSR 27 -7.19** 13.86** -0.18 -5.11 -0.52 7.33** 0.57 -3.20 IR 71907 x IET 18850 -0.77 -4.96 -0.52 -32.86* 0.23 -0.89 3.28* 4.21 IR 71907 x IET 20036 -2.36 -6.13 0.37 10.30 0.48 1.57 3.25* -0.20 IR 71907 x IET 18710 5.22* -7.21 -2.18 -19.36 1.31 -9.71** 0.33 -6.62* IR 71907 x IET 17704 -1.86 -6.71 0.04 11.56 0.73 15.46** -3.75* -1.62 IR 71907 x IR 77664 0.22 7.28 -1.85 -12.94 -0.27 0.63 -3.90* -6.45* IR 71907 x NVSR 6079 5.22* 3.03 1.69 3.47 -0.10 -6 .54* -1.63 2.04 IR 71907 x IR 71829 2.72 -4.55 1.92 -2.94 0.39 -0.05 2.44 -3.70 IR 71907 x IR 68652 -0.03 -6.38 0.04 11.64 -0.27 -6.69** -0.61 -3.70 NAUR 1 x IR 72046 -6.42* 4.06 -0.04 3.25 -0.41 -6.63** -4.30* 0.79 NAUR 1 x IR72049 5.75* 2.81 0.29 -8.17 -0.66 3.64 -3.26* 2.88 NAUR 1 x NVSR 6030 2.66 -1.85 0.63 16.42 -0.08 2.36 0.27 -3.03 NAUR 1 x CSR 27 6.08* -8.60* 1.51 22.42 -0.24 -10.96** 0.01 -1.28 NAUR 1 x IET 18850 -0.50 -2.10 0.74 22.47 -0.49 2.09 -2.31 -7.87** NAUR 1x IET 20036 3.92 6.73 2.51 -4.83 -0.57 -2.53 -1.77 -3.28 NAUR 1 x IET 18710 -4.17 5.65 1.73 -20.50 -0.41 -0.84 2.62 3.29 NAUR 1 x IET 17704 5.42* -10.85* -0.04 -17.92 1.34 -9.86** 2.46 -4.04 NAUR 1 x IR 77664 -3.17 -0.18 -1.48 -19.42 -0.99 -1.33 1.58 -0.87 NAUR 1 x NVSR 6079 -2.50 7.23 -3.69** 21.00 1.17 7.33** 4.09* 5.96* NAUR 1 x IR 71829 -5.00* 1.98 -1.25 1.25 0.99 22.28** 0.82 5.21* NAUR 1 x IR 68652 -2.08 -4.85 -0.92 -15.50 2.34 -5 .56* -0.21 2.21 IET 15429 x IR 72046 -5.08* -1.52 -0.52 -5.94 0.31 -2.28 -0.23 -5.39* IET 15429 x IR 72049 -1.25 -1.10 1.14 2.63 3.06** -2.32 -0.58 -9.97** IET 15429 x NVSR 6030 -0.33 0.56 0.15 5.88 1.31 2.75 -1.29 2.43 IET 15429 x CSR 27 -2.92 -1.85 -0.29 6.56 0.15 8.50** -2.14 9.52** IET 15429 x IET 18850 -0.50 6.97 -0.63 17.81 -0.10 -2.70 -0.42 4.60 IET 15429x IET 20036 -9.75** 2.14 -2.84* 6.97 0.48 -4.32 1.79 1.18 IET 15429 x IET 18710 1.16 -1.27 -0.07 -37.69** -1.68 -3.03 -0.27 -2.30 IET 15429 x IET 17704 3.08 6.23 0.81 2.22 -0.93 -0.31 2.62 -0.23 IET 15429 x IR 77664 0.83 -2.77 2.03 19.72 1.72* 5.71* 3.35* 7.60** IET 15429 x NVSR 6079 2.83 -6.02 1.14 -25.86 -1.77* 0.16 -1.67 -7.89** IET 15429 x IR 71829 7.33** -4.27 -1.73 -6.94 -1.27 -7.77** -1.68 1.02 IET 15429 x IR 68652 4.58 2.89 0.81 14.64 -1.27 5.61* 0.55 -0.65 S Em.+ (Sij-Skl) 3.498 6.088 1. 964 18.659 1.215 3.580 2.126 3.611 S Em.+ (Sij-Sik) 2.258 3.930 1.268 12.044 0.784 2.311 1.372 2.331

780 Trends in Biosciences 6 (6), 2013
combining ability provides clues to the usefulness ofindividuals to be employed as the parents in the hybridizationprogramme as well as simultaneously to screen the hybridsfor coastal saline areas.
LITERATURE CITED
Anonymous 2009. Annual Progress Report (Rice). AICRP on Rice,Directorate of Rice Research, Hyderabad.
Cockerham, C. C. 1961. Implication of genetic variances in a hybridbreeding programme. Crop sci., 1 : 47-52.
Gregorio, G. B.; Senadhira, D.; Mendoza, R. D.; Manigbas, N. L.; Roxas,J. P. and Querta, C. Q. 2003. Progress in breeding for salinitytolerance and associated abiotic stress in rice. Field Crops Res., 76:91-101
Kempthorne, O. 1957. An introduction to genetic statistics. John Wileyand Sons., Inc., New York.
Mirarab, M., Asadollah, A. and Mohamad H.P. 2011 Stydy on conbiningability, heterosis and genetic parameter of yield traits in rice. AfricanJ. Biotech. 10(59): 12512-12519.
Roy, S. K.; Senapati, B. K.; Sinhamahapatra, S. P. and Sarkar, K. K.2009. Heterosis for yield and quality traits in rice. Oryza, 46 (2) :87-93.
Singh, R. K.; Gregorio, G. B. and Ismail, A. M. 2008. Breeding of ricevarieties with tolerance to salt stresses. J. Ind. Soc. Coastal Agri.Res.,26 (1):16-21.
Sprague, G. F. and Tatum, L. A. 1942. General versus specific combiningability in single crosses in corn. Agron. J., 34 : 923-932.
Recieved on 05-09-2013 Accepted on 21-10-2013

Trends in Biosciences 6 (6): 781-783, 2013
Chemical Control of Wilt of Brinjal (Solanum melongena L.) Caused by Fusariumoxysporium F.Sp. melongenae (Schlecht) Mutuo and IshigamiNARENDRA KUMAR JATAV, K. S. SHEKHAWAT AND LAXMAN PRASAD BALAI
Department of Plant Pathology, S.K.N. Collage of Agriculture, Jobner, Swami Keshwanand RajasthanAgricultural University, Bikaner.email: [email protected]
ABSTRACT
Wilt induced by Fusarium oxysporium f.sp. melongenae has beenobserved as an important disease on brinjal (Solanum melongenaL.) around Jobner vicinity. The seed borne inoculum was foundto use more disease incidence than soil borne inoculum. Sixfungicides viz., Bavistin, Captan, Dithane M-45, Kavach,Ridomil and Thiram, tested in vitro by poisoned food technique,inhibited the growth of F. oxysporium. Bavistin gave almostcomplete inhibition of mycelial growth at all concentrationused. Thiram and Captan were found to be second and third ineffectiveness in the control of fungus. When tested as seeddressing fungicides under pot condition, Bavistin was observedto be most effective seed dresser in reducing the incidence ofthe disease.
Key words Fusarium oxysporium, Brinjal, wilt, Bavistin, Thiram,Captan
Brinjal or eggplant is one of the most common andprincipal vegetable crops grown in India and other part ofworld. It can be grown in all seasons and almost in all part ofIndia except high altitude. This crop is extensively grown inwarm areas of India, Bangladesh, Pakistan, China andPhilippines. In Rajasthan state, it is grown in all districts whereirrigation facilities are available. It is cultivated over an area of512,800 hectares with an annual production of 8.450,200 metrictonnes in 2007 (Anonymous, 2006-07). The wilt disease ofbrinjal is very common in eastern Rajasthan and U.P. andcauses heavy losses. Disease is more severe in soils of lowpH below 6.4 and above 7pH, other condition which predispose the plant to wilt are short day length, low lightintensity, low nitrogen and phosphorous and high potassiumnutrition to crop (Singh1998). Initial symptoms of disease startsas of clearing of the vein lets, but main veins remaining green.This followed by a unilateral yellowing of the younger leaves,subsequent wilting and death, which beginnings in the olderleaves and progresses up to the main stem and ultimatelywhole plant. Xylem vessels of infected plant show browndiscoloration. The root system is very much reduced and theircolor also changes to light black. The root becomes spongy.The root covers of affected roots are easily removal. Fusariumoxysporum f. sp. melongenae is a highly destructive pathogen
of brinjals (Singh and Shukla, 1980) reported the appearanceof wilt the disease in Kanpur in the first fortnight of July,which gradually increase up to November and then decline.Crop loss varied from 5-60% Mathur and Prasad, 1964 reportedan average loss 20% in Rajasthan where diseases infectionranged from 70-80% in vegetable fields. Effective and efficientmanagement of crop disease is generally achieved by the useof synthetic pesticides (Kiran, et al., 2006). The main objectiveof present investigation was to evaluate the possibility ofcontrolling Fusarium wilt of brinjal with the use of fungicidesin vitro and under the glass house conditions.
MATERIALS AND METHODS
In vitro test:
Efficacies of six fungicides were tested Bavistin, Captan,Dithane M-45, Kavach, Ridomil and Thiram against mycelialgrowth of pathogen. Three different concentrations viz., 500,1000 and 2000 ppm each fungicides were used. They weretested by using food poisoned technique. Need quantity ofeach fungicides were mixed in 250 ml PDA separately tosterilized PDA was poured in 9 cm diameter petridish andallowed to solidify. Three replications were maintained foreach treatment. After 24 h these petridish were inoculatedwith 5 mm disc with the help of sterilized cork borer from theedge of the in center with Fusarium oxysporium isolated frombrinjal roots. Petri dish was incubated at 25±1c° for ten dayand the growth of the fungus was recorded, PDA withoutfungicides was used as control. The measuring of redial growthof the fungus was recorded. Per cent growth inhibition wascalculated. The experiment was set up using CRD design.
In vivo test (under pot condition):
This experiment was conducted in S.K.N. College ofAgriculture, Jobner, green house pot condition. Apparentlyhealthy surface sterilized seeds of brinjal were artificiallyinoculated with 7 day old culture of pathogen. After inoculationwith pathogen, the inoculated seed were treated withfungicides viz, Bavistin, Captan, Dithane M-45, Kavach,Ridomil and Thiram fungicides at their recommended dose(Table 1).

782 Trends in Biosciences 6 (6), 2013
Table1. Fungicides used to test their efficacy againstFusarium oxysporium in vitro and pot conditions
ppm) of fungicides significantly inhibit the mycelial growthover low concentrations (500 and 1000 ppm) and the maximuminhibition was observed at 2000 ppm and minimum at 500 ppmconcentration in all the fungicides. Thiram, Captan and DithaneM-45 were not so effective at lower concentration althoughthere were increase in growth inhibition in these fungicideswith increase in concentration. Our observations are inconformity to Jayashekhar, 1995 who observed Bavistin andVitavax seed treatment resulted in eradication of Fusariumoxysporium from brinjal seed and induced higher growth andBavistin gave 90 % germination and 10% pre emergencemortality and 5% post emergence mortality and higher yield
Under pot condition:
Our result of pot experiment indicated that all fungicidesimproved seed germination significantly over untreated control(Table 3). Bavistin was found superior when used as seeddresser @ 2g/kg of seed than other fungicide used. It reducedpre emergence rot to 10% as compared to 50% in control andonly 5 % seedling post emergence mortality as compared to60% in control. Other fungicides Thiram (80%), Captan (75%),Dithan M-45 (73%) germination gave and (20%, 25% and 27%)pre emergence mortality and Kavach and Ridomil gave at parresults 71.25% germination and 28.36 % pre emergencemortality and 23.95% post emergence mortality alsosignificantly.
In relative efficacy of fungicides in -vitro and potcondition Bavistin to be most effective followed by Thiram,Captan and Dithane m- 45 were also found to be effective
Chemical name Trade name Doses ppm/liter
Methyl-12,benzimidazole carbamets
Bavistin Used 500, 1000 and 2000 ppm concentration
N trichloromethyl, 1-thio-4 cyclohexene- 1,2 dicarboximide
Captan ,, ,,
Tetramethyl thion disulphide
Thiram ,, ,,
Megnese ethylene bis ti thio carbamate
Dithane M-45 ,, ,,
Metalaxyl Ridomil ,, ,, Chlorothalanil Kavach ,, ,,
The treated seeds were planted in pots sterilized soil.
Untreated inoculated seeds served as control. Each treatmentwas replicated thrice. After seven day and twenty days ofincubation in green house the observation was recorded forseed germination. Pre and post emergence mortality and percentdisease control calculated.
RESULTS AND DISCUSSION
In vitro test:
All fungicides namely Bavistin, Captan, Dithane M-45, Kavach, Ridomil and Thiram tested at 500, 1000 and 2000ppm concentration inhibited the fungal growth of Fusariumoxysporium in petridish. Maximum inhibition was observedin Bavistin (90.00%) growth inhibition occurred at lowestconcentration used i.e. 500 ppm. Higher concentrations (2000
Table 2. Growth inhibition of Fusarium oxysporium byafter 7 day of incubation at 25±1°c
*Average of the three replications.**Figures in parenthesis are angular values.
Concentration o f fungicides in (ppm) Fungicides 500 1000 2000 Bavistin 90.00
(71.58) 90.00
(71.58) 90.00
(71.58) Ridomil 44.26
(41.89) 47.18
(43.37) 79.12
(62.81) Captan 47.98
(43.83) 51.41
(45.82) 82.19
(64.99) Diathen M -45 45.76
(42.55) 49.07
(44.46) 80.48
(63.77) Kavach 44.26
(41.89) 47.18
(43.37) 79.12
(62.81) Thiram 51.77
(46.01) 61.41
(51.58) 85.00
(67.21) Control 0.00 0.00 0.00 CD at 5% 1.19 0.99 1.29 SEm± 0 .394 0.327 0.427 C.V. 1.66 1.32 1.31
Table 3. Effect of different systemic and non-systemicfungicides on the incidence of wilt of brinjal
*Average of the three replications.**Figures in parenthesis are angular values
Fungi-cides
Dose g/kg seed
Seed germin-
ates (%)
Pre emerg-
ence mortality
(%)
Disease control
%
Post emerg-
ence mortality
(%)
Disease control
%
Bavistin 2g/kg seed
90.00 (71.58)
10.00 (18.43)
80.00 5.00 (12.92)
91.66
Ridomil ,, 71.25 (55.23)
28.36 (33.17)
43.28 23.95 (29.51)
60.08
Captan ,, 75.00 (61.00)
25.00 (29.97)
50.00 20.00 (27.97)
66.66
Diathen M -45
,, 73.00 (58.50)
27.00 (31.28)
46.00 22.00 (25.56)
63.33
Kavach ,, 71.25 (55.23)
28.36 (33.17)
43.28 23.95 (29.91)
60.08
Thiram ,, 80.00 (64.44)
20.00 (26.53)
60.00 15.00 (22.78)
75.00
Control 50.00 (45.00)
50.00 (45.00)
60.00 (50.77)
CD at 5% 2.45 1.070 1.23 SEm± 0.810 0.353 0.406 C.V. 2.38 1.98 2.45

JATAV et al., Chemical Control of Wilt of Brinjal (Solanum melongena L.) Caused by Fusarium oxysporium 783
over control in reducing disease incidence and decrease thewilt symptoms and increasing per cent germination.
ACKNOWLEDGEMENT
Authors are grateful to Head, Department of PlantPathology S. K. N. College of Agriculture Jobner, RajasthanAgricultural University, Bikaner for providing necessaryfacilities during the course of investigation
LITERATURE CITED
Anonymous, 2006-07 . Vital Agriculture Statistics. Directorate ofAgriculture Rajasthan, Jaipur, pp. 1-2.
Jaya shekhar, M. Alagia,O .A. 1995. Management of brinjal wilt disease.Madras Ag. Journal, 82 (6-7):495-496.
Kiran, K., Linguraju, S. and Adiver, S. 2006. Effect agents of plantextract on Sclerotium
Mathur, B. L. and Prasad, N. 1964. Studies on wilt disease of brinjalcaused by Fusarium oxysporium f.sp. melongenae. Indian JournalScience, 34 (2) : 131-157.
Singh, M. and Shukla, T. N. 1980. Epidemiology of wilt and fruit rot ofbrinjal. Ind. Journal Mycology and Plant Pathology, 7: 51-57.
Singh, R. S. 1998. Disease of vegetable crops . Oxford IBH PublishingCo., New Delhi, pp. 118-131.
Recieved on 08-07-2013 Accepted on 10-08-2013

784 Trends in Biosciences 6 (6), 2013Trends in Biosciences 6 (6): 784-788, 2013
Status of Chilli Murda Disease in Northern Karnataka and Its ManagementPRADEEP MANYAM* AND A. S. BYADGI**Department of Plant Pathology, University of Agricultural Sciences (UAS), Dharwad, Karnataka,Indiaemail: [email protected]
ABSTRACT
Chilli murda complex associated with thrips, mites and a virusis one of the most serious diseases of chilli (Capsicum annuumL.) where the role of virus is poorly understood. The surveyundertaken in four northern districts of Karnataka revealedin Haveri district maximum average disease incidence (45.86%)followed by Dharwad (39.36%), Belgaum (31.68%) and Gadag(30.81%). Symptomatically murda complex was noticed withsevere leaf curling in both upward and downward directionswith puckering, crinkling, elongated petiole and completesterility. Dark green mottling with vein banding symptomswas also observed. Among management practices taken up,Imidacloprid 17.8 SL@ 0.3 ml/L was found effective againstchilli thrips and aphids and its simultaneous application withFenazaquin @ 2 ml/L for 3-4 sprays proved best in controllingthrips and aphids including mites together.
Key words Chilli, murda, survey, management, vectors, pests
Chilli leaf curl is one of the most destructive syndromesreferred to as ‘Murda’ locally affecting chilli in India (Kulkarni,1962). Puttarudraiah, 1959 reported the involvement of thripsand mites in most cases and viruses in rare cases, as thecause of the murda complex in Karnataka. Venkatesh, et al.1998 reported that chilli leaf curl complex was caused by chillileaf curl Gemini virus (ChLCV) transmitted by Bemisia tabaciand also due to feeding injuries by thrips and mites. Aphid(Myzus persicae), whitefly (B. tabaci) and thrips (Scirtothripsdorsalis), apart from sucking the sap of the plant parts, alsoact as vector of virus diseases like mosaic and leaf curl due towhich the crop suffers heavy losses (Singh et al., 1998).
Thrips, mites and aphids desap chilli crop resulting leafcurling, petiole elongation (murda) in presence of viraldiseases, most of the time. The yield losses due to these pestsestimated to be 50 per cent by Kandasamy, et al., 1990. Rao, etal., 1984 evaluated 18 insecticides for the control of pestcomplex of chilli and found Acephate as the most effectivecompound against the chilli pest complex as a whole. Raju,2010 showed that the chilli crop could be protected fromdisease incidence by spraying of insecticides viz., Imidaclopridand vertimac at 15 and 45 days after transplanting whichreduced vector population. Hence, the following investigationwas taken to study the disease incidence of chilli murdacomplex and to know the efficacy of different insecticides incontrolling the sucking pest cmplex and insect vectors of thevirus.
MATERIALS AND METHODS
Survey of disease incidence
A roving survey was carried out to record the incidenceof chilli murda disease in major chilli growing districts likeBelgaum, Dharwad, Haveri and Gadag of Northern Karnatakaduring kharif season 2010, corresponding to a crop stage oftwo to three months old. In each field, five plots of 10 m2 wereselected and the percentage incidence of disease wascalculated after counting the diseased and healthy plants usingthe following formula Number of plants infectedPercent Disease incidence =——————————— × 100 Total number of plants observed
Management:
An experiment was conducted in the field nearby Hebbalifarm, Dharwad during kharif, season, 2010 using ByadgiDabbi, a chilli cultivar reported to be highly susceptible tomurda disease. The experiment was conducted in randomizedblock design with a plot size of 6x2.5 m, spacing of 60x60 cmand four replication.
Healthy seedlings obtained from nursery were carriedto main field by dipping in Imidacloprid solution (0.01%). Thetreatment were – T1 : Spray with Imidacloprid 17.8SL (Confidor)@0.3 ml/L, T2 : Spray with Fenazaquin 10% EC (Magister) @2ml/ L, T3 : T1 + T2 , T4 : Spray with Boron (Borax) @ 2g / L, T5: T1 + T2 + T4 and T6 : Control
First spray was given at 20 days after transplanting(DAT) and remaining 3 sprays were given at 20 days intervalbetween two successive sprays. Observations on per centdisease incidence, leaf curl index thrips and mites andpopulation were taken 10 days after each spray. Scoring Leafcurling for individual plants of each treatment were rated usingthe following scale (Niles, 1980).
Scoring Symptoms 0 No symptom 1 1-25% leaves per plant show curling 2 26-50% leaves per plant show curling-moderately curling 3 51-75% leaves per plant show curling, heavily damaged,
malformation of growing points and reduction in plant height
4 leaves/plant show curling severe and complete destruction of growing points, drastic reduction in plant height, defoliation and severe malformation.
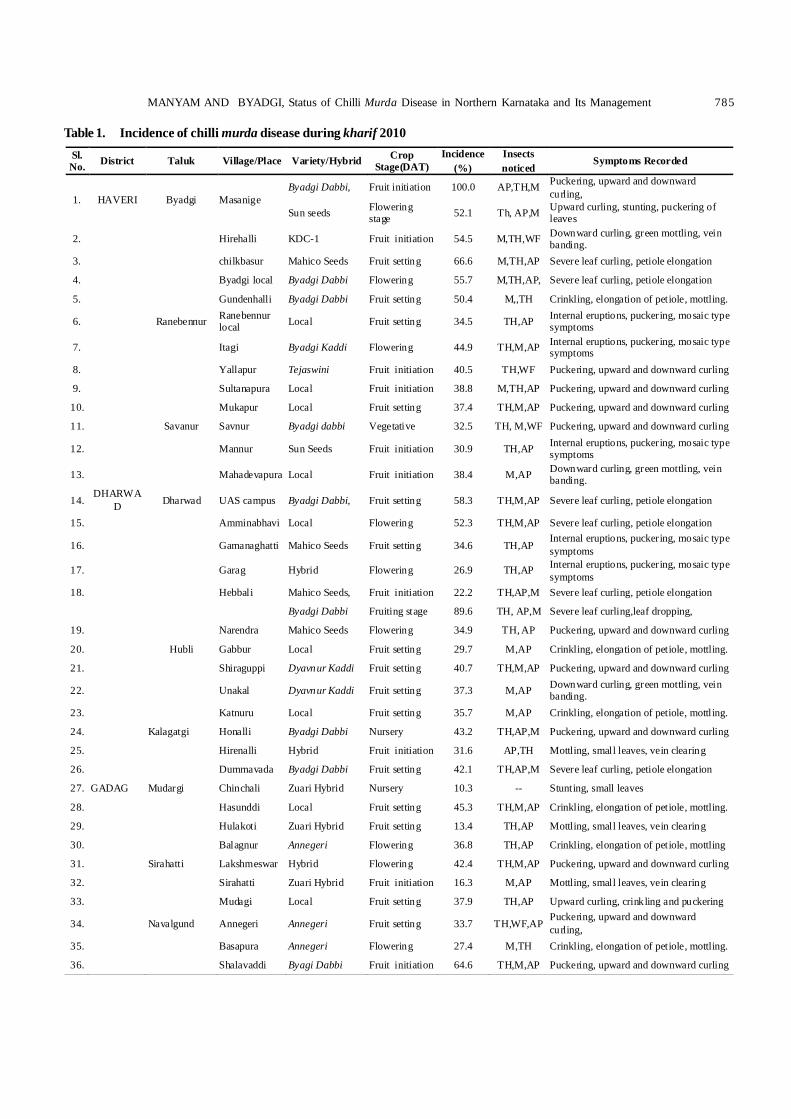
MANYAM AND BYADGI, Status of Chilli Murda Disease in Northern Karnataka and Its Management 785
Table 1. Incidence of chilli murda disease during kharif 2010Sl. No. District Taluk Village/Place Variety/Hybrid Crop
Stage(DAT) Incidence
(%) Insects noticed
Symptoms Recorded
1. HAVERI Byadgi Masanige Byadgi Dabbi, Fruit initiation 100.0 AP,TH,M Puckering, upward and downward
curling,
Sun seeds Flowering stage 52.1 Th, AP,M Upward curling, stunting, puckering of
leaves
2. Hirehalli KDC-1 Fruit initiation 54.5 M,TH,WF Downward curling, green mottling, vein banding.
3. chilkbasur Mahico Seeds Fruit setting 66.6 M,TH,AP Severe leaf curling, petiole elongation
4. Byadgi local Byadgi Dabbi Flowering 55.7 M,TH,AP, Severe leaf curling, petiole elongation
5. Gundenhalli Byadgi Dabbi Fruit setting 50.4 M,,TH Crinkling, elongation of petiole, mottling.
6. Ranebennur Ranebennur local Local Fruit setting 34.5 TH,AP Internal eruptions, puckering, mosaic type
symptoms
7. Itagi Byadgi Kaddi Flowering 44.9 TH,M,AP Internal eruptions, puckering, mosaic type symptoms
8. Yallapur Tejaswini Fruit initiation 40.5 TH,WF Puckering, upward and downward curling
9. Sultanapura Local Fruit initiation 38.8 M,TH,AP Puckering, upward and downward curling
10. Mukapur Local Fruit setting 37.4 TH,M,AP Puckering, upward and downward curling
11. Savanur Savnur Byadgi dabbi Vegetative 32.5 TH, M,WF Puckering, upward and downward curling
12. Mannur Sun Seeds Fruit initiation 30.9 TH,AP Internal eruptions, puckering, mosaic type symptoms
13. Mahadevapura Local Fruit initiation 38.4 M,AP Downward curling, green mottling, vein banding.
14. DHARWA
D Dharwad UAS campus Byadgi Dabbi, Fruit setting 58.3 TH,M,AP Severe leaf curling, petiole elongation
15. Amminabhavi Local Flowering 52.3 TH,M,AP Severe leaf curling, petiole elongation
16. Gamanaghatti Mahico Seeds Fruit setting 34.6 TH,AP Internal eruptions, puckering, mosaic type symptoms
17. Garag Hybrid Flowering 26.9 TH,AP Internal eruptions, puckering, mosaic type symptoms
18. Hebbali Mahico Seeds, Fruit initiation 22.2 TH,AP,M Severe leaf curling, petiole elongation
Byadgi Dabbi Fruiting stage 89.6 TH, AP,M Severe leaf curling,leaf dropping,
19. Narendra Mahico Seeds Flowering 34.9 TH, AP Puckering, upward and downward curling
20. Hubli Gabbur Local Fruit setting 29.7 M,AP Crinkling, elongation of petiole, mottling.
21. Shiraguppi Dyavnur Kaddi Fruit setting 40.7 TH,M,AP Puckering, upward and downward curling
22. Unakal Dyavnur Kaddi Fruit setting 37.3 M,AP Downward curling, green mottling, vein banding.
23. Katnuru Local Fruit setting 35.7 M,AP Crinkling, elongation of petiole, mottling.
24. Kalagatgi Honalli Byadgi Dabbi Nursery 43.2 TH,AP,M Puckering, upward and downward curling
25. Hirenalli Hybrid Fruit initiation 31.6 AP,TH Mottling, small leaves, vein clearing
26. Dummavada Byadgi Dabbi Fruit setting 42.1 TH,AP,M Severe leaf curling, petiole elongation
27. GADAG Mudargi Chinchali Zuari Hybrid Nursery 10.3 -- Stunting, small leaves
28. Hasunddi Local Fruit setting 45.3 TH,M,AP Crinkling, elongation of petiole, mottling.
29. Hulakoti Zuari Hybrid Fruit setting 13.4 TH,AP Mottling, small leaves, vein clearing
30. Balagnur Annegeri Flowering 36.8 TH,AP Crinkling, elongation of petiole, mottling
31. Sirahatti Lakshmeswar Hybrid Flowering 42.4 TH,M,AP Puckering, upward and downward curling
32. Sirahatti Zuari Hybrid Fruit initiation 16.3 M,AP Mottling, small leaves, vein clearing
33. Mudagi Local Fruit setting 37.9 TH,AP Upward curling, crinkling and puckering
34. Navalgund Annegeri Annegeri Fruit setting 33.7 TH,WF,AP Puckering, upward and downward curling,
35. Basapura Annegeri Flowering 27.4 M,TH Crinkling, elongation of petiole, mottling.
36. Shalavaddi Byagi Dabbi Fruit initiation 64.6 TH,M,AP Puckering, upward and downward curling

786 Trends in Biosciences 6 (6), 2013
Sl. No. District Taluk Village/Place Variety/Hybrid Crop
Stage(DAT) Incidence
(%) Insects noticed
Symptoms Recorded
37. BELGAUM Belgaum Kamanhatti Tejaswini Vegetative 20.6 M,TH,WF Crinkling, elongation of petiole, mottling.
38. Devagiri Mahico Seeds Vegetative 15.4 AP, M Mottling, small leaves, vein clearing
39. Hirebagewadi Local Fruit initiation 32.5 TH,M,AP Crinkling, elongation of petiole, mottling.
40. Hukkeri Sankeshwar Sankeshwar Local, Fruit setting 54.6 TH,WF,AP Severe leaf curling, petiole elongation
Tejaswini Fruit iniation 85.8 TH,M,AP Upward curling, crinkling and stunting
41. Manjiri Sankeshwar Local Fruit setting 52.3 TH,AP,M, Puckering, upward and downward curling
42. Gokak Kangaro Local Fruit setting 23.5 TH,M Puckering, upward and downward curling,
43. Nesargi Local Fruit initiation 19.8 TH,AP Internal eruptions, puckering, mosaic type symptoms.
Note : AP- Aphids, TH-Thrips, M-Mites, WF- Whitefly
For counting thrips and mites, five plants were selectedin each plot and six leaves from the top canopy of each plant.
RESULTS AND DISCUSSION
Survey:
The results of the survey conducted during kharif 2010revealed that the disease incidence was alarming anddistributed in almost all regions surveyed. Disease incidencevaried from 10.3 to 100 per cent with an average of 36.90 percent. The maximum average disease incidence (45.86%) wasin Haveri district followed by Dharwad (39.36%), Belgaum(31.68%) and Gadag (30.81%). Earlier similar levels ofincidences were recorded by several workers. Notable amongthem was upto 96.3 per cent yield loss due to chilli mite byBorah, 1987 and complete failure of crop itself some times.During survey, major symptoms observed were severe leafcurling, stunting and complete sterility of the plants (Table 1).
Upward curling, puckering and internaleruptions of leaves produced by thrips asreported by Reddy and Puttaswamy, 1983 wasnoticed along with mite infestation symptomson chilli viz., downward curling, crinkling ofleaves and elongation of leaf petiole (Fig 1)as referred by Karupachamy, et al., 1993. Darkgreen mottle, vein banding and necroticringspots, the symptoms incited by virusesin chillies were also observed during thecourse of investigation with above suckingpest symptoms. Ong and Ting, 1977 reportedsimilar type symptoms on chilli produced byChilli veinal mottle virus.
Management:
Imidacloprid 17.8SL (0.03%) againstthrips and aphids, Fenazaquin 10% EC (0.2%)against mites and Boron sprays which induce
Table 2. Effect of chemicals against the incidence of chilimurda disease in the field
Treatments
Concentration Per cent disease incidence
30 DAT 50 DAT
70 DAT
90 DAT
T1 : Imidacloprid 17.8 SL
0.3 ml/L 6.67 (14.85)
15.46 (23.04)
25.93 (30.56)
43.05 (39.54)
T2 : Fenazaquin 10% EC
2ml/ L 9.7 (18.01)
12.48 (20.65)
28.96 (32.51)
63.47 (52.86)
T3 : T1 + T2 0.3 ml/L + 2ml/ L
11.49 (19.79)
7.69 (15.81)
22.08 (27.98)
44.49 (41.79)
T4 : Boron 2 g/L 15.54 (23.058)
19.65 (26.11)
31.05 (33.82)
69.77 (56.68)
T5 : T1 + T2 + T4
0.3 ml/L + 2ml/ L + 2 g/L
15.47 (23.00)
9.45 (17.73)
23.47 (28.95)
41.42 (39.96)
T6 : Control
-- 25.00 (29.89)
18.75 (25.64)
40.5 (39.50)
80.75 (63.98)
SEm ± 1.50 1.52 0.98 3.59 CD@ 5% 4.53 4.58 2.98 11.92
Values in parenthesis are angular transformed valuesDAT- Days after transplanting
Fig 1. Typical chilli murda complex disease symptoms observed during survey, A)Crinkling of leaves and petiole elongation, B) Upward curling andcrinckling, C) Downward curling and petiole elongation, D) Defoliation andsterlity
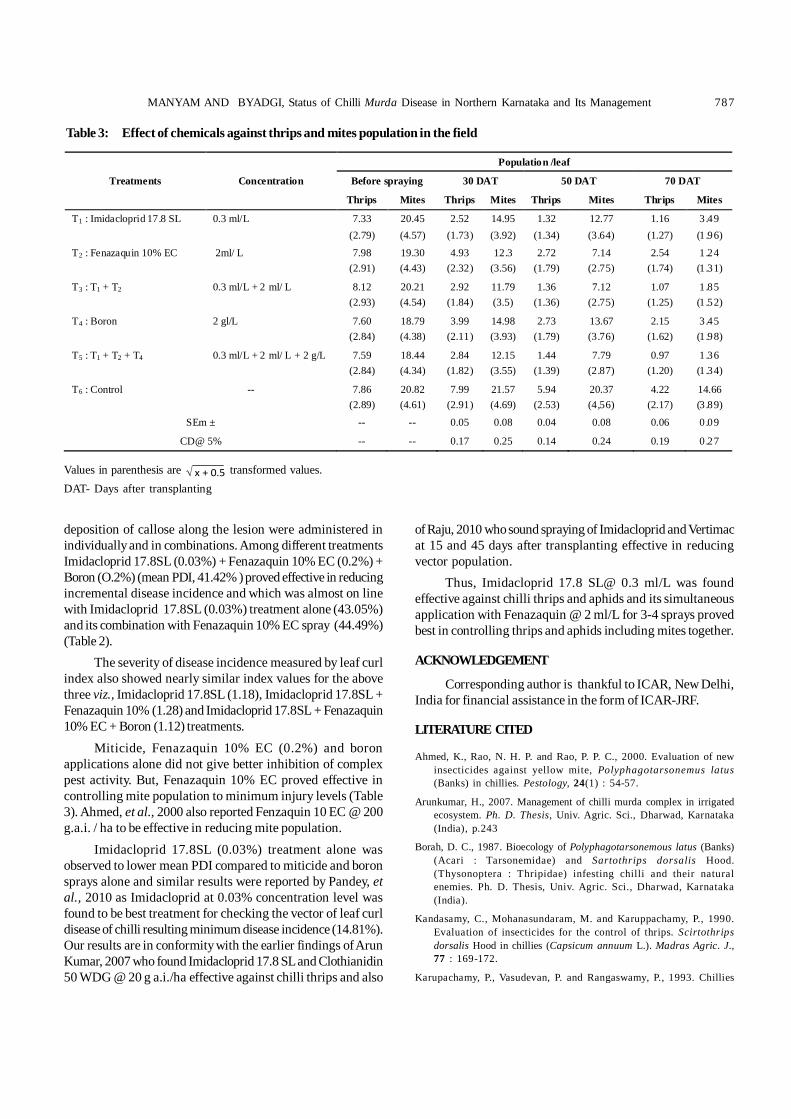
MANYAM AND BYADGI, Status of Chilli Murda Disease in Northern Karnataka and Its Management 787
Table 3: Effect of chemicals against thrips and mites population in the field
Values in parenthesis are x + 0.5 transformed values.DAT- Days after transplanting
Treatments Concentration
Population /leaf
Before spraying 30 DAT 50 DAT 70 DAT
Thrips Mites Thrips Mites Thrips Mites Thrips Mites
T1 : Imidacloprid 17.8 SL 0.3 ml/L 7.33 (2.79)
20.45 (4.57)
2.52 (1.73)
14.95 (3.92)
1.32 (1.34)
12.77 (3.64)
1.16 (1.27)
3 .49 (1 .96)
T2 : Fenazaquin 10% EC 2ml/ L 7.98 (2.91)
19.30 (4.43)
4.93 (2.32)
12.3 (3.56)
2.72 (1.79)
7.14 (2.75)
2.54 (1.74)
1 .24 (1 .31)
T3 : T1 + T2 0.3 ml/L + 2 ml/ L 8.12 (2.93)
20.21 (4.54)
2.92 (1.84)
11.79 (3.5)
1.36 (1.36)
7.12 (2.75)
1.07 (1.25)
1 .85 (1 .52)
T4 : Boron 2 gl/L 7.60 (2.84)
18.79 (4.38)
3.99 (2.11)
14.98 (3.93)
2.73 (1.79)
13.67 (3.76)
2.15 (1.62)
3 .45 (1 .98)
T5 : T1 + T2 + T4 0.3 ml/L + 2 ml/ L + 2 g/L 7.59 (2.84)
18.44 (4.34)
2.84 (1.82)
12.15 (3.55)
1.44 (1.39)
7.79 (2.87)
0.97 (1.20)
1 .36 (1 .34)
T6 : Control -- 7.86 (2.89)
20.82 (4.61)
7.99 (2.91)
21.57 (4.69)
5.94 (2.53)
20.37 (4,56)
4.22 (2.17)
14.66 (3 .89)
SEm ± -- -- 0.05 0.08 0.04 0.08 0.06 0 .09
CD@ 5% -- -- 0.17 0.25 0.14 0.24 0.19 0 .27
deposition of callose along the lesion were administered inindividually and in combinations. Among different treatmentsImidacloprid 17.8SL (0.03%) + Fenazaquin 10% EC (0.2%) +Boron (O.2%) (mean PDI, 41.42% ) proved effective in reducingincremental disease incidence and which was almost on linewith Imidacloprid 17.8SL (0.03%) treatment alone (43.05%)and its combination with Fenazaquin 10% EC spray (44.49%)(Table 2).
The severity of disease incidence measured by leaf curlindex also showed nearly similar index values for the abovethree viz., Imidacloprid 17.8SL (1.18), Imidacloprid 17.8SL +Fenazaquin 10% (1.28) and Imidacloprid 17.8SL + Fenazaquin10% EC + Boron (1.12) treatments.
Miticide, Fenazaquin 10% EC (0.2%) and boronapplications alone did not give better inhibition of complexpest activity. But, Fenazaquin 10% EC proved effective incontrolling mite population to minimum injury levels (Table3). Ahmed, et al., 2000 also reported Fenzaquin 10 EC @ 200g.a.i. / ha to be effective in reducing mite population.
Imidacloprid 17.8SL (0.03%) treatment alone wasobserved to lower mean PDI compared to miticide and boronsprays alone and similar results were reported by Pandey, etal., 2010 as Imidacloprid at 0.03% concentration level wasfound to be best treatment for checking the vector of leaf curldisease of chilli resulting minimum disease incidence (14.81%).Our results are in conformity with the earlier findings of ArunKumar, 2007 who found Imidacloprid 17.8 SL and Clothianidin50 WDG @ 20 g a.i./ha effective against chilli thrips and also
of Raju, 2010 who sound spraying of Imidacloprid and Vertimacat 15 and 45 days after transplanting effective in reducingvector population.
Thus, Imidacloprid 17.8 SL@ 0.3 ml/L was foundeffective against chilli thrips and aphids and its simultaneousapplication with Fenazaquin @ 2 ml/L for 3-4 sprays provedbest in controlling thrips and aphids including mites together.
ACKNOWLEDGEMENT
Corresponding author is thankful to ICAR, New Delhi,India for financial assistance in the form of ICAR-JRF.
LITERATURE CITED
Ahmed, K., Rao, N. H. P. and Rao, P. P. C., 2000. Evaluation of newinsecticides against yellow mite, Polyphagotarsonemus latus(Banks) in chillies. Pestology, 24(1) : 54-57.
Arunkumar, H., 2007. Management of chilli murda complex in irrigatedecosystem. Ph. D. Thesis, Univ. Agric. Sci., Dharwad, Karnataka(India), p.243
Borah, D. C., 1987. Bioecology of Polyphagotarsonemous latus (Banks)(Acari : Tarsonemidae) and Sartothrips dorsalis Hood.(Thysonoptera : Thripidae) infesting chilli and their naturalenemies. Ph. D. Thesis, Univ. Agric. Sci., Dharwad, Karnataka(India).
Kandasamy, C., Mohanasundaram, M. and Karuppachamy, P., 1990.Evaluation of insecticides for the control of thrips. Scirtothripsdorsalis Hood in chillies (Capsicum annuum L.). Madras Agric. J.,77 : 169-172.
Karupachamy, P., Vasudevan, P. and Rangaswamy, P., 1993. Chillies

788 Trends in Biosciences 6 (6), 2013
yellow mite – A serious pests. Spice India, 6(10) : 14.
Kulkarni, G. S., 1962. The murda disease of chilli (Capsicum). Agric. J.of India, 22 : 51-54.
Niles, G. A., 1980. Breeding cotton for resistance to insects pests. In :Breeding Plant Resistance to Insects (eds. Maxwell, P. G. andJennings, P. R.), John Wiley and Sons, New York, pp. 337-369.
Ong, C. A. and Ting, W. P., 1977. A review of plant virus disease inPeninsular Malaysia. Symp. of Virus Disease of Tropical Crops.Proc. Symp. Trop. Agric. Res., September 1976, TARC Trop. Agric.Ser., Tsukubu, Japan, 10 : 155-164.
Pandey, S. K., Mathur, A. C. and Srivastava, M., 2010. Management ofleaf curl disease of Chilli (Capsicum annuum L.). Int. J. Virol., 6 :246-250.
Puttarudraiah, M., 1959. Short review on the leaf curl complex and
spray programme for its control. Mysore Agric. J., 34 : 93-95.
Raju, S. G., 2010. Studies on chilli leaf curl complex disease. Ph. D.Thesis, Univ. Agric. Sci., Dharwad, Karnataka (India).
Rao, D. M., K. Ahmed and N. S. Murthy, 1984. Chilli varieties and theirreaction towards pests. Indian Cocoa Arecanut Species J., 7 : 118-119.
Reddy, D. N. R. and Puttaswamy, 1983. Pest infesting chilli (Capsicumannuum L.) – In the nursery. Mysore J. Agric. Sci., 17 : 246-251.
Singh, U. C., Reeti Singh and Nagaich, K. N., 1998. Reaction of somepromising chilli varieties against major insect pests and leaf curldisease. Indian J. Entomol., 60(2) : 181-183.
Venkatesh, H. M., Muniyappa, V., Ravi, K. S. and Krishnaprasad, P. R.,1998. Management of chilli leaf curl complex. Proc. of First Nation.Symp. on Pest Management of Horticultural Crops, Bangalore, pp.48.
Recieved on 20-08-2013 Accepted on 18-09-2013

Trends in Biosciences 6 (6): 789-791, 2013
Field Evaluation of Fungicides for Management of Maydis Leaf Blight of MaizeCaused by Dreschslera maydis (Nisikado) Subram. and Jain.HULAGAPPA1, S.I.HARLAPUR1, R.S.ROOPA1 AND VENKATESH M.DORE2
1Department of Plant Pathology University of Agricultural Sciences Dharwad,Karnataka (India)2Department of Crop Physiology University of Agricultural Sciences Dharwad,Karnataka (India)email: [email protected]
ABSTRACT
Foliar application of fungicides was found to be highly effectiveagainst MLB and resulted in increased grain and fodder yieldand reducing PDI. Two sprays of Propiconazole 25 EC @ 0.1%at 35 to 50 DAS found to be highly effective against MLB,followed by Tebuconazole 250 EC @ 0.1% and Difenconazole25 EC @ 0.1%. Propiconazole 25 EC @ 0.1% has highestavoidable loss in grain yield and fodder yield. This treatmentalso increased the grain yield and fodder yield with highestdisease control efficacy.
Key words Maize, Maydis leaf blight, Management, Chemicals,Drechslera maydis
Maize (Zea mays L) is the most versatile crop, adaptedto different agro-ecological and climatic condition. In India,maize is an important cereal crop next to rice, wheat andsorghum. It is mainly grown in Karnataka, Andhra Pradesh,Maharashtra, Uttar Pradesh, Bihar, Rajasthan, MadhyaPradesh and Punjab. It is gaining significant importance onaccount of its growing demand for diversified uses, especiallyfeed and industrial uses. Maize ranks third in the world afterwheat and rice in area and production. However, as far asproductivity is considered it ranks first. In India, about 50 to60 per cent of maize production is consumed directly as food,30 to 35 per cent goes for poultry, piggery and fish meal, 10 to12 per cent in wet milling industry e.g., starch and oil andabout 3 per cent in dry milling for traditional requirements likeDalia and Sattu and other food industry such as corn breadand corn chips, brewery one per cent and as seed, one percent (Anon., 2011).Karnataka, Andra Pradesh, Uttar Pradesh,Bihar, Rajasthan, Madhya Pradesh and Punjab are the leadingstates growing maize on large scale, though the maximumacreage and production of the maize is in Uttar Pradesh,Andhra Pradesh has highest average yield (3,730 kg) followedby Punjab (3,692 kg/ha) (Anon., 2012).
Karnataka has six per cent of the total maize area with15.35 per cent production share in the country. Nearly 90 percent of the total production of maize comes from Kharif whichis the main growing season covering an area to the extent of86 per cent. The irrigated ecosystem accounts for 60 per centarea and constitutes more than 90 per cent area under hybrids.Maydis leaf blight (MLB) a fungal disease caused byDrechslera maydis (Nisikado) Subram. and Jain is an important
foliar disease in almost all the maize growing regions of India.The maize growing regions in Karnataka, Andhra Pradesh,Bihar, Maharashtra, Uttaranchal and Tamil Nadu have beenidentified as endemic areas for the disease. Losses up to 40per cent or more have been demonstrated in inoculated yieldtrails (Byrnes, et al., 1989). Vaibhav, et al., 2011 noticedthat,Propiconazole was found highly effective and it ensuredminimum disease intensity (21.40%) and highest yield (29.37q/ha) followed by Chlorothalonil (27.93% disease intensityand 27.60 q/ha yield).
MATERIALS AND METHODS
The field trial was conducted during Kharif, 2011at MainAgricultural Research Station, Dharwad and laid out in arandomized block design with three replications. The trial wasconducted under irrigated black soil conditions. Hybrid 900M was sown in a plot size of 5 x 5 m with spacing of 75 x 20 cmin 6 rows. Recommended dose of fertilizers and insect controlmeasures were followed. The most effective fungicidesevaluated in vitro were further evaluated under fieldconditions against maydis leaf blight. The various fungicidesviz., Hexaconazole 5% EC, Propiconazole 25% EC,Difenconazole 25% EC, Tebuconazole 250% EC, Mancozeb75% WP, Chlorothalonil 75% WP, Carbendazim 25% + Iprodion25%, Hexaconazole 4% + Zineb 68% one treatment includinguntreated control was imposed. Two sprays were given at 35and 50 days after sowing. The observation on disease severitywas recorded at silk drying stage. The grain yield and fodderyield data was recorded on maturity at 120 days.

790 Trends in Biosciences 6 (6), 2013
RESULTS AND DISCUSSION
The result revealed that, statistically significantdifferences among the treatments for PDI, grain yield andfodder yield. Foliar spray of fungicides were found more
effective against MLB and resulted in increased grain andfodder yield and decreased PDI. The treatment, viz., T5 : Twosprays of Propiconazole 25 EC @ 0.1% at 35 and 50 DaysAfter Sowing (DAS) T3: Two sprays of Tebuconazole 250 EC@ 0.1% at 35 and 50 DAS and T4: two sprays of Difenconazole25 EC @ 0.1% at 40 to 50 DAS were found to be most effectivein reducing the maydis leaf blight (PDI of 20.68%, 25.82% and28.75 % respectively), as compared to control (74.75 PDI).
Foliar spray of fungicides were found more effectiveagainst MLB and resulted in increased grain and fodder yieldand reducing disease severity. Propiconazole 25 EC @ 0.1% ,Tebuconazole 250 EC @ 0.1% and Difenconazole 25 EC @0.1% at 35 and 50 DAS were found significantly most effectivein reducing the maydis leaf blight severity (PDI of 20.68%,25.82% and 28.75 % respectively), as compared to 74.75 percent in untreated check.
Significantly lowest PDI (20.68%),maximum grain yield(73.46 q/ha) and fodder yield (10.96 t/ha) was recorded intreatment T5, i.e., Two sprays of Propiconazole 25 EC @ 0.1%which was on par with two sprays of 0.1% Tebuconazole 250EC @ 0.1% at 35 and 50 DAS and two sprays of 0.1%Difenconazole 25 EC @ 0.1% at 35 to 50 DAS followed twosprays Hexaconazole 4%WP + Zineb 68%WP @ 0.25% ascompared untreated control wherein it recorded the highestPDI (74.75%) lowest grain yield (54.37/ha) lowest fodder yield
Sl. No. Fungicide Dosage
(%)
Per cent disease index
Grain yield
(q/ha)
Fodder yield (t/ha)
1 Mancozeb 75WP 0.20 45.58 (42.42)*
59.25 6.73
2 Hexaconazole 5 EC 0.10 45.56 (42.40)
60.97 7.25
3 Tebuconazole 250 EC 0.10 25.82 (30.55)
70.68 9.84
4 Difenconazole 25EC 0.10 28.75 (32.46)
65.74 7.66
5 Propiconazole 25EC 0.10 20.68 (26.99)
73.46 10.96
6 Chlorothalonil 70 WP 0.20 43.66 (41.38)
62.35 7.55
7 Hexaconazole 4%WP + Zineb 68%WP
0.20 29.16 (32.65)
66.30 7.96
8 Carbendazim 25%WP + Iprodione 25%WP
0.20 48.50 (44.41)
59.44 6.86
9 Untreated Control - 74.75 (60.38)
54.37 6.14
S.Em± C.D. at 5 %
2.85 1.16 0.56 8.66 3.48 1.64
Table 1. Field efficacy of fungicides for the management ofmaydis leaf blight
* Figures in the parentheses indicate arc sine transformed values
Table 1a. Field efficacy of fungicides on avoidable loss, yieldand disease control
Fungicide Dosage (%)
Per cent avoidable loss
Per cent increased in yield over untreated
Per cent disease control
over untreated Grain
yield Fodder
yield Grain yield
Fodder yield
Mancozeb 75WP
0.20 8.24 8.77 8.98 9.61 39.02
Hexaconazole 5 EC
0.10 10.82 15.31 12.14 18.08 39.05
Tebuconazole 250 EC
0.10 23.08 37.60 30.00 60.26 65.46
Difenconazole 25EC
0.10 17.30 19.84 20.91 24.76 61.54
Propiconazole 25EC
0.10 25.99 43.98 35.11 78.50 72.33
Chlorothalonil 70 WP
0.20 12.80 18.68 14.68 22.96 41.59
Hexaconazole 4% +WP Zineb 68% WP
0.20 17.99 22.86 21.94 29.64 60.99
Carbendazim 25%WP + Iprodione 25%WP
0.20 8.53 10.50 9.32 11.73 35.12
Table 2. Influence of fungicides on plant height, 100 grainweight and shelling percentage
* Figures in the parentheses indicate arc sine transformed values
Sl. No. Fungicide Dosage
(%)
Plant height (cm)
100 grain
weight (g)
Shelling percentage
1 Mancozeb 75WP 0.20 186.51 32.17
80.28 (63.68)*
2 Hexaconazole 5 EC 0.10 188.53 32.33
81.66 (64.68)
3 Tebuconazole 250 EC
0.10 188.87 38.91 82.30 (65.16)
4 Difenconazole 25EC
0.10 189.63 34.53 81.65 (64.67)
5 Propiconazole 25EC 0.10 191.27 39.66 84.83
(67.12) 6 Chlorothalonil
70 WP 0.20 186.80 30.37 80.19 (63.60)
7 Hexaconazole 4% WP + Zineb 68% WP
0.20 184.93 34.03 81.71 (64.74)
8 Carbendazim 25% + Iprodione 25%
0.20 186.00 31.33 80.68 (63.97)
9 Untreated Control - 174.77 27.83 78.17
(62.20) S.Em± 2.83 1.49 0.80 C.D. at 5 % 8.42 4.43 2.39

HULAGAPPA et al., Field Evaluation of Fungicides for Management of Maydis Leaf Blight of Maize 791
(6.14 t/ha). Propiconazole 25 EC @ 0.1% highest avoidableloss in grain yield (25.99%) and fodder yield (43.98%) thistreatment also increased the grain yield and fodder yield tothe tune of 35.11 % and 78.50 % respectively with highestdisease control efficacy (72.33 %).These results are inagreement with Kumar, et al., 1977 who evaluated eightfungicides and found that Dithane M-45, Unizeb and Dithane-Z-78 significantly reduced the maize leaf blight severity by 55,47.4 and 44.43 per cent, respectively, and increased grain yieldby 8.54, 10.12 and 9.90 per cent. Vaibhav, et al., 2011 alsoreported that, Propiconazole 25 EC was found highly effectiveand it ensured minimum disease intensity (21.40%) and highestyield (29.37 q/ha) followed by Chlorothalonil (27.93% diseaseintensity and 27.60 q/ha yield).
LITERATURE CITED
Anonymous, 2011, Maize monthly report. Indian agribusiness systemsPvt. Ltd, pp. 1-8.
Anonymous, 2012, Directorate of Economics and Statistics, Departmentof Agriculture and Cooperation.
Byrnes, K. J., Pataky, J. K., and White, D. G., 1989, Relationshipsbetween yield of three maize hybrid and severity of southern leafblight caused by race of Bipolaris maydis Pl. Dis, 73 : 834-840.
Kumar, S. U., Gupta, K. and Mahammad, M., 1977, Studies on leafblight of maize caused by Helminthosporium turcicum and H.maydis. Sci. and Cul., 42 : 533-535.
Vaibhav K, Singh, Abdul Nasir and Akhilesh Singh., 2011, Effect of seedtreatment and one foliar spray on maydis leaf blight severity andyield of maize. Pestol., 35 (3) : 32-35.
Recieved on 23-08-2013 Accepted on 25-09-2013

792 Trends in Biosciences 6 (6), 2013Trends in Biosciences 6 (6): 792-796, 2013
Enhancement of Chitinase Enzyme Producing Ability of Trichoderma viride Mutantsand Dual Culture Studies against Soil Borne Plant Pathogen Sclerotium rolfsii.*K. K. SURYAWANSHI, S. P. PATOLE AND A. A. AWALE
Department of Plant Pathology, PGI, Dr. PanjabraoDeshmukhKrishiVidyapeeth, Akola 444 104.email : [email protected]
ABSTRACT
In an attempt to construct superior Trichodermaviride isolatesfor improvement of chitinase enzyme productivity,induction ofmutants was applied.After application of different concentrationof Ethyl methane sulfonate (EMS) and Hydroxyl amine (HA)treatments on T. viride, TVME1 a, TVME 1b, TVME 1c, TVME2a, TVME 2b, TVME 2c, TVME 3a, TVME 3b, TVME 3c, TVME4a, TVME 4b,TVME 4c, TVMH 1a, TVMH 1b, TVMH 1c, TVMH2a, TVMH2b, TVMH 2c, TVMH 3a, TVMH 3b, TVMH 3c,TVMH 4a, TVMH 4b and TVMH 4cmutants were obtained.These mutants were tested for their chitinase productivity.TVME 4c,TVME 4b, TVME 3c, TVMH 4a, TVMH 4c, TVMH 4bmutants proved to be the highest producer of chitinase enzyme,since it produced 0.63, 0.62, 0.62, 0.61, 0.58 and 0.57 enzymeunits respectively, greater thanthe mother culture.Statisticallysignificant differences were obtained among the mutants overcontrol (mother culture). The effective treatment was T 20(TVMH 3b) i.e. 63.78% which was at par with T22 (TVMH 4a),T24 (TVMH 4c), T16 (TVMH 2a), T13 (TVMH 1a) and T9 (TVME3c) i.e. 63.32%, 63.27%, 62.32%, 62.06% and 60.78%respectively. The lowest per cent growth inhibition of Fusariumsolaniwas exerted in T3 (TVME 1c) i.e. 49.95%.With thisbackground in the present investigation an attempt was madeto mutate Trichodermaviride with interest to enhance theirbiocontrol efficacy.
Key words Chitinase, Trichoderma viride, Dual culture,Sclerotium
Advances in molecular biology have laid the foundationforisolation of valuable genes and their transfer to target plantsthrough noveltransgenic approach. Chitinases, ß-1, 3-glucanases and proteases are the best studied antifungalproteins. Chitinase encoding genes are being used to improveplant defence against fungal pathogens. These enzymesarecapable of degrading 4-N-acetyl- Dglucosamine,the maincell wall component of most phytopathogenic fungi,showingstrong inhibitory activity in vitro on spore germination and
hyphalgrowth (Lorito et al., 1994)from biocontrol microbessuch as Trichoderma is very important.In accordance withthe importance of Trichoderma as potential biocontrol agentthe present investigation was carried out to study chitinaseproducing ability of Trichoderma by mutation.
MATERIALS AND METHODS
Trichoderma viride, mother culture received fromDepartment of Plant Pathology, PGI, Dr. P.D.K.V Akola ,wasused in the present study.
Spore count
Spore suspension (0.1ml) of the test bioagent was placedat the centre of haemocytometer and allowed to stand for 2min. Five squares of Haemocytometer were chosen randomlyand the spores inside the square were counted.
Chemical mutagenesis
Induction of Chemical mutagenesis was carriedaccording to procedure suggested by Chandra, et al., 2010and Durand, et al., 1988.
Conidiospores of 8 days old culture of T. viride wereused for mutagenesis. Spore suspension of T. viride wastreated with Ethyl methyl sulphonate (EMS) andHydroxylamine (HA) @ 50 ìl/ml, 100 ìl/ml, 150 ìl/ml, 200 ìl/mlincubate at 28oC in orbital shaker for 30 minutes.Then kept incentrifuge machine at 5000 rpm to remove the chemicaltraces,centrifuge it for three times and then washed withdistilled water.Suspension was spread on to the surface PDAmedium and incubated at 28 0C for 72 hrs.Same procedure wasdone for 45 minutes and 60 minutes. In each treatmentmaintained three replications. After incubation colonies weretransferred on fresh PDA medium and grown up to sixgenerations to check the stability of Tichoderma viridemutants.
Treatments Code name Code no Description T1 TVME1 a 1 Spore suspension of T. viride treated with Ethyl methyl sulphonate (EMS) @ 50 µl/ml for 30 minutes. T2 TVME 1b 2 Spore suspension of T. viride treated with Ethyl methyl sulphonate (EMS) @ 50 µl/ml for 45 minutes. T3 TVME 1c 3 Spore suspension of T. viride treated with Ethyl methyl sulphonate (EMS) @ 50 µl/ml for 60 minutes. T4 TVME 2a 4 Spore suspension of T. viride treated with Ethyl methyl sulphonate (EMS) @ 100 µl/ml for 30 minutes. T5 TVME 2b 5 Spore suspension of T. viride treated with Ethyl methyl sulphonate (EMS) @ 100 µl/ml for 45 minutes. T6 TVME 2c 6 Spore suspension of T. viride treated with Ethyl methyl sulphonate (EMS) @ 100 µl/ml for 60 minutes. T7 TVME 3a 7 Spore suspension of T. viride treated with Ethyl methyl sulphonate (EMS) @ 150 µl/ml for 30 minutes.

SURYAWANSHI et al., Enhancement of Chitinase Enzyme Producing Ability of Trichoderma viride 793
Sample preparation:
Trichoderma viride mutants obtained after chemicalmutagenesis were grown on synthetic media(Czapek’s broth)along with crab shell chitin (50 ml in 250 ml flask). Afterinoculating with 5 x 206 / ml conidia these flasks were kept onrotary shakerat 140 rpm at 250 C for 4-5 days. Culture filtratewas collected after separating the biomass filtered with nyloncloth and dialyzed with 50 mm potassium phosphate bufferPH 6.7 (6: 1) at 400 C overnight. Sodium azide was added tokeep it for further usage.
Measurement of chitinase activity (turbidity method):
Endochitinase activity was measured by the reductionof turbidity of a suspension of colloidal chitin. A suspensioncontaining 1%(w/v) or moist colloidal chitin was prepared in50 mm potassium phosphate buffer, pH 6.7. A mixtureconsisting of 0.5 ml each of chitin suspension and the enzymesolution to be tested was prepared and incubated for 24 hat300 C. Subsequently the mixture was diluted with 5 ml andthe optical density was read at 510 nm. Enzyme activity wascalculated as the percentage of reduction of a chitin suspensionby 5 per cent. One min of enzyme activity (CU) is defined asrelease of 1 mmol n-glucose acetyl amine/ml culture filtrate /min / mg protein. 1 cu=release of 1 m mol N-acetyl glucosamine/ ml of culture filtrate/mm/mg/protein.
Preparation of colloidal chitin
Colloidal chitin was prepared as per the method ofRobertsand Selintrenikoff, 1988. 5 g of chitin powder was addedslowly into 60 ml of concentrated HCl and left for vigorousshaking overnight at 4oC. The mixture was added to two liters
of ice-cold 95 per cent ethanol with rapid stirring and keptovernight at room temperature (25oC).The precipitate wascollected by centrifugation at 5,000g for 20 minutes at 4oC andthen washed with sterile distilled water until the pH of thecolloidal chitin turned neutral (pH 7.0).Later, colloidal chitinsolution (5 per cent) was prepared and stored at 40C for furtheruse.
Preparation of phosphate buffer (pH 6.7) :
1M of PottasiumDihydrogen Phosphate (KH2 PO4) andPottasium hypophosphate (K2 HPO4) were preparedseparately. Both were mixed together and dilute up to requiredconcentration (50mm) and 6.7 pH was maintained.
Preparation of standard graph :
The standard graph was constructed by using dextrose(‘AR’ grade) as glucose source. Standard solutions of glucose(0.1, 0.2, 0.3, 0.4, 0.5, 0.6, 0.7, 0.8, 0.9 and 1.0 %) were prepared.0.5 ml of each standard solution and chitin suspension weremixed in test tubes and incubated for 24 hr at 300C. Theabsorbance at 510 nm was recorded using spectrophotometerafter dilution with 5 ml distilled water.
RESULTS AND DISCUSSION
Chitinase enzyme units in Trichoderma viride motherculture and mutants:
Culture filtrates Trichoderma viride mutants variedamong themselves with respect to production of chitinaseenzyme.
Treatments Code name Code no Description T7 TVME 3a 7 Spore suspension of T. viride treated with Ethyl methyl sulphonate (EMS) @ 150 µl/ml for 30 minutes. T8 TVME 3b 8 Spore suspension of T. viride treated with Ethyl methyl sulphonate (EMS) @ 150 µl/ml for 45 minutes. T9 TVME 3c 9 Spore suspension of T. viride treated with Ethyl methyl sulphonate (EMS) @ 150 µl/ml for 60 minutes. T10 TVME 4a 10 Spore suspension of T. viride treated with Ethyl methyl sulphonate (EMS) @ 200 µl/ml for 30 minutes. T11 TVME 4b 11 Spore suspension of T. viride treated with Ethyl methyl sulphonate (EMS) @ 200 µl/ml for 45 minutes. T12 TVME 4c 12 Spore suspension of T. viride treated with Ethyl methyl sulphonate (EMS) @ 200 µl/ml for 60 minutes. T13 TVMH 1a 14 Spore suspension of T. viride treated with Hydroxyl amine (HA) @ 50 µl/ml for 30 minutes. T14 TVMH 1b 15 Spore suspension of T. viride treated with Hydroxyl amine (HA) @ 50 µl/ml for 45 minutes. T15 TVMH 1c 16 Spore suspension of T. viride treated with Hydroxyl amine (HA) @ 50 µl/ml for 60 minutes. T16 TVMH 2a 17 Spore suspension of T. viride treated with Hydroxyl amine (HA) @ 100 µl/ml for 30 minutes. T17 TVMH 2b 18 Spore suspension of T. viride treated with Hydroxyl amine (HA) @ 100 µl/ml for 45 minutes. T18 TVMH 2c 19 Spore suspension of T. viride treated with Hydroxyl amine (HA) @ 100 µl/ml for 60 minutes. T19 TVMH 3a 20 Spore suspension of T. viride treated with Hydroxyl amine (HA) @ 150 µl/ml for 30 minutes. T20 TVMH 3b 21 Spore suspension of T. viride treated with Hydroxyl amine (HA) @ 150 µl/ml for 45 minutes. T21 TVMH 3c 22 Spore suspension of T. viride treated with Hydroxyl amine (HA) @ 150 µl/ml for 60 minutes. T22 TVMH 4a 23 Spore suspension of T. viride treated with Hydroxyl amine (HA) @ 200 µl/ml for 30 minutes. T23 TVMH 4b 24 Spore suspension of T. viride treated with Hydroxyl amine (HA) @ 200 µl/ml for 45 minutes. T24 TVMH 4c 25 Spore suspension of T. viride treated with Hydroxyl amine (HA) @ 200 µl/ml for 60 minutes. T25 control 13 Untreated control i.e. T. viride mother culture

794 Trends in Biosciences 6 (6), 2013
* Figures in parentheses are square root transformed values
The data presented in Table 1 showed that TVME 4ccontent maximum i.e. 0.63 chitinase enzyme units/ mg of proteinwas at par with TVME 4b, TVME 3c and TVMH 4a i.e. 0.62,0.62 and 0.61 chitinase enzyme units/mg of protein respectively.The next best mutants were TVME 3a and TVMH 4c thatcontains 0.59 and 0.58 chitinase enzyme units/ mg of protein.TVMH 4b, TVME 3b TVME 4a were also at par with eachother. Trichoderma viride mother culture contain 0.38 chitinaseenzyme units/ mg of protein whereas the lowest chitinaseenzyme units was found in T3 (TVME 1c) i.e. 0.29 enzymeunits.
Chitinase enzyme units in Trichoderma viride mutants.
Table 1a Chitinase enzyme units in Trichoderma viridemutantsas follow:
Table 1. Chitinase enzyme units in Trichoderma viridemother culture and mutants.
Factors Time (30 m)
Time (45 m)
Time (60 m)
Chemical(EMS) X Conc(50µl)
0.32
(0.91)*
0.35
(0.92)
0.29
(0.89)
Chemical(EMS) X Conc(100µl)
0.46
(0.98)
0.45
(0.97)
0.35
(0.92)
Chemical(EMS) X Conc(150µl)
0.59
(1.04)
0.57
(1.03)
0.62
(1.06)
Chemical(EMS) X Conc(200µl)
0.57
(1.03)
0.62
(1.06)
0.63
(1.06)
Chemical (HA) X Conc (50µl)
0.34
(0.92)
0.36
(0.93)
0.32
(0.91)
Chemical (HA) X Conc (100µl)
0.39
(0.95)
0.41
(0.96)
0.39
(0.94)
Chemical (HA) X Conc (150µl)
0.34
(0.92)
0.48
(0.99)
0.56
(1.03)
Chemical (HA) X Conc (200µl)
0.61
(1.05)
0.57
(1.03)
0.58
(1.04)
* Figures in parenthesis are square root transformed values
Factor Level Means Chemical(A) EMS 0.99
HA 0.97 Conc.(B) 50 µl/ml 0.91
100 µl/ml 0.95 150 µl/ml 1.011 200 µl/ml 1.047
Time(C) 30 m 0.974 45 m 0.985 60 m 0.982
Chitinase assay of Trichoderma viride mutants revealed
statistically significance in respect to enzyme units (Table1a). All the Trichoderma viride mutants possesses chitinaseenzyme units while highest has existed in TVME 4c i.e. 0.63units which was at par with TVME 4b, TVME 3c and TVMH4a i.e. 0.62, 0.62 and 0.61 enzyme units respectively, followedby TVME 3a, TVMH 4c, TVMH 4b i.e. 0.59, 0.58, 0.57. Thelowest chitinase enzyme units were estimated in TVME 1c i.e.0.29 enzyme units/mg of protein.
1 chitinase unit=Release of 1 mmo 1Nacetyl 1glucosamine / m 1 of culture filtrate / min / mg/ protein.
Chemical factor EMS was found significantly superiorover HA in enhancing the enzymic activities which arepositively related to inhibit the growth of pathogen causingdisease in plants
Treatments Chitinase enzyme units/ mg of protein
(T1) TVME1a 0.32 (0.91)*
(T2) TVME1b 0.35 (0.92)
(T3)TVME1c 0.29 (0.89)
(T4)TVME2a 0.46 (0.98)
(T5)TVME2b 0.45 (0.97)
(T6)TVME2c 0.35 (0.92)
(T7)TVME3a 0.59 (1.04)
(T8)TVME3b 0.57 (1.03)
(T9)TVME3c 0.62 (1.06)
(T10)TVME4a 0.57 (1.03)
(T11)TVME4b 0.62 (1.06)
(T12)TVME4c 0.63 (1.06)
(T13)TVMH1a 0.34 (0.92)
(T14)TVMH1b 0.36 (0.93)
(T15)TVMH1c 0.32 (0.91)
(T16)TVMH2a 0.39 (0.95)
(T17)TVMH2b 0.41 (0.96)
(T18)TVMH2c 0.39 (0.94)
(T19)TVMH3a 0.34 (0.92)
(T20)TVMH3b 0.48 (0.99)
(T21)TVMH3c 0.56 (1.03)
(T22)TVMH4a 0.61 (1.05)
(T23)TVMH4b 0.57 (1.03)
(T24) TVMH4c 0.58 (1.04)
(T25) Mother culture 0.38 (0.94)
‘F’ test Sig
SE(m)± 0.0084
CD(P=0.01) 0.031

SURYAWANSHI et al., Enhancement of Chitinase Enzyme Producing Ability of Trichoderma viride 795
Among concentrations 200 µl/ml was exhibitedsuperiority over all followed by 150, 100 and 50 µl/ml ininducing higher activities. Time exposure studies showed that45 m l was found superior and was at par with 60 and 45 m forincreasing the potential for inhibitory ability. Over allinteractions viz., chemical X concentration, chemical X timeand concentration X time were statistically significant.
Efficacy of Trichoderma viride mother culture andmutants against Fusarium solani (per cent growthinhibition) at 7 DAI :
Table 2. Efficacy of Trichoderma viride mother culture andmutants againstFusarium solani (per cent growthinhibition) at 7 DAI
Efficacy of Trichoderma viride mutants against Fusariumsolani (per cent growth inhibition) at 7 DAI
The data presented in Table 2a. showed that maximumper cent growth inhibition of Fusarium solani was observedin T20 (TVMH 3b) i.e. 63.78% which was at par with T22 (TVMH4a), T24 (TVMH 4c), T16 (TVMH 2a), T14 (TVMH 1a), T21(TVMH3c), T23(TVMH 4b), T9 (TVME 3c) and T12 (TVME 4c) i.e.,63.32, 63.27, 62.32, 62.06, 61.82, 61.27, 60.78 and 59.8 per centgrowth inhibition respectively, The minimum per cent growthinhibition of Fusarium solani was noticed by TVME 1c(49.95%).
For increasing the ability of T.viride through mutationchemical factor HA was found significantly superior over EMS
Concentration i.e. 200 µl/ml was found superior and atpar with 150 µl/ml, followed by 100 and 50 µl/ml in developingthe ability of the mutants in inhibiting the pathogen.
Time exposure studies revealed that 60 m was foundsuperior and was at par with 30 m and 45 m.
About interactions chemical X concentration andchemical X time was found statistically non significant whereas concentration X time was statistically significant.
Sereih, et al., 2007 treated Trichoderma harzianum andFusarium oxysporum f. sp. sesami by five concentration ofchitosan. Increased dose found efficient in inhibiting thegrowth of Fusarium. While, Trichoderma was affectedgenetically and enhanced the antagonistic properties ofTrichoderma against Fusarium spp.
Table 2a. Efficacy of Trichoderma viride mutants againstFusarium solani (per cent growth inhibition) at 7DAI
Treatments PGI (T1) TVME1a 53.52 (47.02)* (T2) TVME1b 51.72 (45.99) (T3)TVME1c 49.95 (44.97) (T4)TVME2a 51.51 (45.86) (T5)TVME2b 51.90 (46.09) (T6)TVME2c 53.49 (47.00) (T7)TVME3a 50.69 (45.40) (T8)TVME3b 48.47 (44.12) (T9)TVME3c 60.78 (51.24) (T10)TVME4a 55.24 (48.01) (T11)TVME4b 50.96 (45.55) (T12)TVME4c 59.80 (50.66) (T13)TVMH1a 62.06 (51.98) (T14)TVMH1b 57.84 (49.52) (T15)TVMH1c 55.99 (48.45) (T16)TVMH2a 62.32 (52.14) (T17)TVMH2b 56.75 (48.88) (T18)TVMH2c 57.87 (49.54) (T19)TVMH3a 58.82 (50.09) (T20)TVMH3b 63.78 (53.14) (T21)TVMH3c 61.82 (51.84) (T22)TVMH4a 63.32 (52.74) (T23)TVMH4b 61.28 (51.52) (T24) TVMH4c 63.27 (52.70)
(T25) Mother culture 51.99 (46.14) ‘F’ test Sig SE(m)± 1.31
CD(P=0.01) 3.75
Per cent growth inhibition of Fusarium solani by T.viride mother culture and mutants is given as follow:* Figures in parentheses are arc sin transformed values
Statistically significant differences were obtained amongthe mutants over control (mother culture). The effectivetreatment was T20 (TVMH 3b) i.e. 63.78% which was at parwith T22 (TVMH 4a), T24 (TVMH 4c), T16 (TVMH 2a), T13 (TVMH1a) and T9 (TVME 3c) i.e. 63.32%, 63.27%, 62.32%, 62.06% and60.78% respectively. The lowest per cent growth inhibition ofFusarium solani was exerted in T3 (TVME 1c) i.e. 49.95%.Data presented in Table 2.
Factors Time (30 m)
Time (45 m)
Time (60 m)
Chemical(EMS) X Conc(50µl)
53.52 (47.02)*
51.72 (45.99)
49.95 (44.97)
Chemical(EMS) X Conc(100µl)
51.51 (45.86)
51.90 (46.09)
53.49 (47.00)
Chemical(EMS) X Conc(150µl)
50.69 (45.40)
48.47 (44.12)
60.78 (51.24)
Chemical(EMS) X Conc(200µl)
55.24 (48.01)
50.96 (45.55)
59.80 (50.66)
Chemical (HA) X Conc (50µl)
62.06 (51.98)
57.84 (49.52)
55.99 (48.45)
Chemical (HA) X Conc (100µl)
62.32 (52.14)
56.75 (48.88)
57.87 (49.54)
Chemical (HA) X Conc (150µl)
58.82 (50.09)
63.78 (53.14)
61.82 (51.84)
Chemical (HA) X Conc (200µl)
63.32 (52.74)
61.28 (51.52)
63.27 (52.70)
* Figures in parentheses are arc sin transformed values

796 Trends in Biosciences 6 (6), 2013
Chang et al. (2009) also evaluated eighteen strains ofTrichoderma spp for antagonism against isolates of Fusariumspp. The Trichoderma strains exhibited various degrees ofovergrowth of Fusarium spp in paired culture on PDA. Therestriction of pathogen was occurred due to various types ofmechanisms i.e. competition, mycoparasitism, antibiosis andlysis and the same might have worked in reducing the growthof pathogen. Hence, the present observations correlate theresults published by various workers.
LITERATURE CITED
Roberts, W. K. and C. P. Selitrennikoff. 1988. Plant and BacterialChitinases Differ in Antifungal Activity. Journal of GeneralMicrobiology, 134: 169 – 176
Chang, L., S. Hwang, B. D.Gosson, R. Bowness, G. D. Turnbull,S. E.Strelkov.2009.Biological control of Fusarium root rot of Lupinwith Trichoderma species. 2009. APS Annual Meeting Abstracts ofpresentations.vol.99 (6): S21.
Recieved on 31-08-2013 Accepted on 25-09-2013

Trends in Biosciences 6 (6): 797-799, 2013
Evaluation of the Bio-efficacy of Fungicides as Potato Tuber Treatment againstBlack Scurf Disease Caused by Rhizoctonia solaniS. P. SINGH, L. P. AWASTHI AND A. N. CHUABEY
Department of Plant Pathology, N.D. University of Agriculture & Technology, Kumarganj, Faizabad, U.P.,India.email: [email protected]
ABSTRACT
Cultivation of potato (Solanum tuberosum L.) is influenced bythe several biotic and abiotic stresses. Numbers of fungaldiseases have been reported on this crop by several workers inthe world, which produced various types of typical symptoms.Black scurf is the major disease of this crop which cause hugelosses in yield as well as quality of tubers. The management ofR. solani is difficult due to soil borne nature. It is known tocause a large number of distinct diseases on a wide variety ofplants and under more diverse environmental conditions thanany other fungal pathogen. This diverse characteristic providesthis pathogen with great potential for adaptability and survival.They usually limit the production of this crop hence the use ofvarious practices is needed for successful management of thisdisease. The experiments conducted, have revealed that tubertreatment, before sowing with, Thiophanate Methyl 45 % +Pyraclostrobin 5 % FS @ 20 ml /100 kg seeds tubers andThiophanate Methyl 45 % + Pyraclostrobin 5 % FS @ 16 ml /100 kg seeds tubers may be recommended to control BlackScurf disease caused by Rhizoctonia solani as well as to obtainhigher yields.
Key words Potato, Fungicides, Tuber treatments, Rhizoctoniasolani
Potato has been identified as staple food and richestsource of carbohydrate. It is used as vegetable alone andmixed with other vegetables. It is used in preparation of briefproducts (chips and frozen French fries), dehydrated products(dices, waries, flakes granules, starch, gravy thickener, potatocustard powder etc.) and canned potato (Marwaha andSandhu, 1999).
Potato produces 3 kg of edible protein/ha/day ascompared to 2.5 kg and 1.0 kg in wheat and rice, respectively.Potato also produces more carbohydrate, fibre and vitaminsper unit area and per unit time than other major food crops(Shekhawat and Dahiya, 2000).
Despite the introduction of high yielding varieties andimproved cultural practices, the per unit area production ofpotato is low due to different biotic and abiotic (mesobiotic)stresses including fungi. Numbers of fungal diseases havebeen reported on this crop by several workers in the world,which produces various types of typical symptoms. Blackscurf is the major diseases of this crop which cause huge
losses in yield as well as quality of tubers. They usually limitthe production of this crop and the use of various practices isneeded for successful management of the diseases. Black scurfis the major disease of this crop which cause huge losses inyield as well as quality of tubers. The management of R. solaniis difficult due to soil borne nature. It is known to cause alarge number of distinct diseases on a wide variety of plantsand under more diverse environmental conditions than anyother fungal pathogen. This diverse characteristic providesthis pathogen with great potential for adaptability and survival(Baker, 1970). The fungus (R. solani Kuhn.), causing blackscurf of potato, survives in soil on dead tissues and on seedsurfaces as masses of fungus cell. Controlling such diseasemainly depend on fungicides treatments (Rauf, 2000).
MATERIALS AND METHODS
The present research work entitled “Evaluation of theBio-efficacy of fungicides as potato tuber treatment againstBlack Scurf disease caused by Rhizoctonia solani” was carriedout at Department of Plant Pathology, Student’s InstructionalFarm of N.D. University of Agriculture and Technology,Kumarganj, Faizabad (Uttar Pradesh) during “Rabi” 2012-13with seven treatments including untreated control underrandomized block design. Experimental layout was made asper treatment combinations and three replications. Tubers ofpotato (Kufri Ashoka) were collected from the Department ofVegetable Science of this University. Sixty plots were laid outfor this experiment. The plot size was 3 x 3 m (9 m2) with row torow and plant to plant spacing of 60 x 10 cm. The main irrigationchannel was provided in southern side of the experimentalfield and the sub irrigation channels were provided betweentwo replications of the crop.
Method of application:
Required quantity of fungicide was diluted with water(2.5 lts) to treat 100 kg of potato tubers. The contents weresprayed uniformly on the tubers by using knapsack sprayer.Complete coverage on the tubers was ensured. The tubersthus treated were allowed to dry under shade for 2 hrs andthen planted in the field. Observations were recorded onemergence percent, plant height, disease incidence and fruityield. The details of treatments are given in Table 1.

798 Trends in Biosciences 6 (6), 2013
Table 1. Treatments details treatment T3- Thiophanate Methyl 45 % + Pyraclostrobin 5 %FS @ 16 ml /100 kg seeds tubers (97.63 %), T2- ThiophanateMethyl 45 % + Pyraclostrobin 5 % FS @ 12 ml /100 kg seedstubers (97.56 %), T1- Thiophanate Methyl 45 % +Pyraclostrobin 5 % FS @ 10 ml /100 kg seeds tubers (95.63 %),T7- M.E.M.C 3% WS @ 41.5 gm/ 100 kg seeds tubers (94.15%), T6- Pyraclostrobin 20 % FS @ 5 gm / 100 kg seeds tubers(93.54 %) and T5- Thiophanate Methyl 70 % @ 30 gm / 100 kgseeds tubers (92.35 %) as compared to control plot (Table 2).
Plant height:
A gradual increase in plant height was recorded inall the treatments with increase in doses. Result presented inTable 2 revealed that all the treatments were superior overcontrol. Maximum increase in plant height (36.68 cm) wasrecorded in treatments T4. Next in order to superiority withrespect to plant height (cm) was recorded in the treatment T3(33.65 cm) followed by T2 (30.78 cm), T1 (27.64 cm), T7 (26.26cm), T6 (25.56 cm) and T5 (24.87 cm) as compared to controlplot (19.45 cm).
Black Scurf disease incidence:
Results presented in Table 2 indicated that all thetreatments were superior over control. However, minimumdisease incidence (7.37 %) was recorded in treatment of T4which was found most effective treatment against black scurfdisease of Potato. The treatment T3 (12.42 %) was next inorder of efficacy followed by T2, T1, T7, T6 and T5 with thedisease incidence of 15.65, 19.76, 22.72, 24.86 and 26.54 percent, respectively, against black scurf of potato (Table 2).
Per cent disease control:
Maximum per cent disease control was recorded intreatment of Thiophanate Methyl 45 % + Pyraclostrobin 5 %FS @ 20 ml /100 kg seeds tubers (88.35 %). Next in order ofsuperiority was recorded in tuber treatment with ThiophanateMethyl 45 % + Pyraclostrobin 5 % FS @ 16 ml /100 kg seedstubers (80.37 %) followed by Thiophanate Methyl 45 % +Pyraclostrobin 5 % FS @ 12 ml /100 kg seeds tubers (75.26 %),Thiophanate Methyl 45 % + Pyraclostrobin 5 % FS @ 10 ml /100 kg seeds tubers (68.77 %), M.E.M.C 3% WS @ 41.5 gm/100 kg seeds tubers (64.09 %), Pyraclostrobin 20 % FS @ 5 gm/ 100 kg seeds tubers (60.71 %) and Thiophanate Methyl 70 %@ 30 gm / 100 kg seeds tubers (58.05 %) as compared tocontrol plot (Table 2).
Yield:
Data on tuber yield (t/ha) presented in Table 2, revealedthat the maximum tuber yield (20.19 t/ha) was recorded fromthe plot treated with Thiophanate Methyl 45 % +Pyraclostrobin 5 % FS @ 20 ml /100 kg seeds tubers ascompared to rest of the treatments. All the treatmentsincreased the tuber yield per hectare as compared with control(10.58 t/ha).
S. No. Treatment Dose (per 100 kg seed tubers)
1. Thiophanate Methyl 45 % + Pyraclostrobin 5 % FS
10 ml
2. Thiophanate Methyl 45 % + Pyraclostrobin 5 % FS
12 ml
3. Thiophanate Methyl 45 % + Pyraclostrobin 5 % FS
16 ml
4. Thiophanate Methyl 45 % + Pyraclostrobin 5 % FS
20 ml
5. Thiophanate Methyl 70 % 30 gm 6. Pyraclostrobin 20 % FS 5 gm 7. M.E.M.C 3% WS 41.5 gm 8. Control -
Emergence percentage: Number of emerged tubers/ Numberof seeds planted/ Crop stand. Assessment on plant populationwas done 20 DAS and 40 DAS.Plant height (cm): Plant height was measured from the ridgelevel to the apical tip of the plant with the help of meter scaleat maturity of crop. Ten plants were selected randomly in eachplot.Yield (t/ha): Observation on tuber yield of potato was recordedtreatment wise and reported as t/ha.
Data statistically analyzed and conclusions were drawnon the basis of critical differences among the treatments. Thetransformed angular values of percent germination, percentdisease incidence and percent disease control were statisticallyanalyzed and results interpreted for Black Scurf diseasecaused by Rhizoctonia solani.
RESULTS AND DISCUSSION
Statistically analyzed data for the Black Scurf disease(Rhizoctonia solani) on emergence, incidence, Plant heightand yield are presented in Table 2.
Emergence percentage:
Emergence percentage at 20 DAS:
A gradual increase in emergence percent was recordedin all the treatments with the increase in doses. However,maximum emergence percent (97.36 %) was recorded intreatment of Thiophanate Methyl 45 % + Pyraclostrobin 5 %FS @ 20 ml /100 kg seeds tubers which was found most effectivetreatment against black scurf disease of Potato. ThiophanateMethyl 45 % + Pyraclostrobin 5 % FS @ 16 ml /100 kg seedstubers was next in order of efficacy as compared to controlplots (83.67 %) against black scurf of potato (Table 2).
Emergence percentage at 40 DAS:
Maximum emergence percentage was recorded intreatment of T4- Thiophanate Methyl 45 % + Pyraclostrobin 5% FS @ 20 ml /100 kg seeds tubers (98.45 %) followed by

SINGH et al., Evaluation of the Bio-efficacy of Fungicides as Potato Tuber Treatment against Black Scurf Disease 799
Previous studies indicate that use of disease free seedcombined with seed treatment with the systemic fungicidessuch as, benomyl, thiabendazole, corboxin, or soil treatmentof benomyl or PCNB can effectively reduce the diseaseinoculum (Hooker, 1986; singh, 1995).
Errampalli, et at., 2006 evaluated chlorine dioxide andthiophanate-methyl fungicides against black scurf disease ofpotato caused by Rhizoctonia solani. The combinationtreatment of chlorine dioxide (200ìgg”1) and thiophanate-methyl (50g active ingredient100kg”1 of tubers) significantly(P=0.05) reduced black scurf on tubers at harvest. Acomparison among control, chlorine dioxide, thiophanate-methyl, and the combination treatment indicates that pre-planting chlorine dioxide treatment may have killed the majorityof the black scurf sclerotia on the tuber surface and that thecombination of thiophanate-methyl fungicide treatmentfollowing chlorine dioxide treatment gave protection toprogeny tuber by suppressing the growth of the R. solani.
Jan, et al., 2003 concluded that use of Dithane M-45 @3 % when applied to either cut or whole seed and boric acid @3 % when applied to only cut seed potatoes, can effectivelyminimize the disease levels on the surfaces of tubers.
Treatments Fungicides Emergence percentage
Plant height (cm)
Disease Incidence
(%)
Percent Disease
Control (%)
Yield (t/ha)
20 DAS 40 DAS T1 Thiophanate Methyl 45 % + Pyraclostrobin 5 % FS@
10 ml /100 kg seeds tubers 94.45
(76.93) 95.63 (78.77)
27.64 19.76 (26.39)
68.77 (56.10)
18.67
T2 Thiophanate Methyl 45 % + Pyraclostrobin 5 % FS@ 12 ml /100 kg seeds tubers
95.24 (78.60)
97.56 (88.86) 30.78
15.65 (23.30)
75.26 (60.31)
19.15
T3 Thiophanate Methyl 45 % + Pyraclostrobin 5 % FS@ 16 ml /100 kg seeds tubers
95.79 (79.74)
97.63 (82.04)
33.65 12.42
(20.63) 80.37
(63.88) 19.6
7 T4 Thiophanate Methyl 45 % + Pyraclostrobin 5 % FS @
20 ml /100 kg seeds tubers 97.36
(80.88) 98.45 (83.43) 36.68
7.37 (15.75)
88.35 (70.79)
20.19
T5 Thiophanate Methyl 70 % @ 30 gm / 100 kg seeds tubers
89.65 (72.25)
92.35 (76.16) 24.87
26.54 (31.01)
58.05 (49.64)
17.26
T6 Pyraclostrobin 20 % FS @ 5 gm / 100 kg seeds tubers 90.87 (73.30)
93.54 (77.54)
25.56 24.86 (29.88)
60.71 (51.13)
17.67
T7 M.E.M.C 3% WS @ 41.5 gm/ 100 kg seeds tubers 92.23 (74.78)
94.15 (78.39) 26.26
22.72 (28.46)
64.09 (53.22)
17.87
T8 Control (No tuber treatment) 83.67 (66.54)
86.76 (69.21)
19.45 63.27 (52.85)
0.00 (0.0)
10.58
SEm ± 3.756 4 .278 1.297 0.824 2.400 0.818 CD at 5 % 11.399 12.976 3.933 2.498 7.278 2.483
Table 2. Evaluation of the Bio-efficacy of fungicides as potato tuber treatment against Black Scurf disease caused by Rhizoctoniasolani.
Figure in parenthesis () are angular transformed value
LITERATURE CITED
Baker, K. F. 1970. Types of Rhizoctonia diseases and their occurrencein potato, Biology and pathology. J. K. Parmeter Jr. (ed.) Universityof California Press. Berkeley, USA. pp. 255.
Errampalli, D., Peters, R. D., MacIsaac, K., Darrach, D. and Boswall P.2006. Effect of a combination of chlorine dioxide and thiophanate-methyl pre-planting seed tuber treatment on the control of blackscurf of potatoes. Crop Protection, 25 (12): 1231-1237.
Hooker, W. J. 1986. Compendium of potato diseases. The Am.Phytopathol. Society, USA, pp: 52-54.
Jan, H., Muhammad, A., 1 Hidalgo, O. A. and Iqbal, N. 2003. Effect ofseed or soil treatment with fungicides on the control of black scurfof potato. Pakistan Journal of Plant Pathology, 2 (3): 136-140.
Marwaha, R. S. and Sandhu, S. K. 1999. Processed products from potato.Indian Farming, 49 (3): 31-38.
Rauf, B.A. 2000. Seed- borne disease problem of legume crops inPakistan. Pakistan J. Sce. and Indust. Res., 43: 249-254.
Shekawat, G.S. and Dhaiya, P. S. 2000. A neglected major food crop.The Hindu Survey of Indian Agriculture, (Annual), Chenni. pp-73-76.
Singh, R. S. 1995. Diseases of vegetable crops (3rd Ed.). Oxford and IBHPublishing Co. Pvt. LTD., New Delhi, India, pp. 46-52.
Recieved on 13-09-2013 Accepted on 29-10-2013

800 Trends in Biosciences 6 (6), 2013Trends in Biosciences 6 (6): 800-801, 2013
Antagonistic Effect of Rhizospheric Mycoflora against Fusarium solani CausingCoriander (Coriandrum sativum L.) Root RotC. M. BHALIYA* AND K. B. JADEJA
*Kharawad Plot, Ravi Pan Street, Dhoraji- 360 410, Dist:- Rajkot, Gujarat, India.Department of Plant Pathology, Junagadh Agricultural University, Junagadh 362 001, Gujarat, India.*email: [email protected]
ABSTRACT
The root rot disease of coriander (Coriandrum sativum L.) incitedby Fusarium solani cause considerable crop loss in Saurashtraregion of Gujarat. The fungal isolates of coriander rhizospherewere evaluated for their antagonistic effect against F. solaniunder in vitro study. Five fungal isolates were obtained fromrhizosphere soils of coriander plants. Based on morphologicaland cultural characteristics, these antagonistic isolates wereidentified as Trichoderma viride- I, Trichoderma viride- II,Trichoderma harzianum- I, Trichoderma harzianum- II andAspergillus niger. By means of dual culture method, they wereexamined for antagonism against F. solani, which causescoriander root rot. Two isolates were found to be evidentlyantagonistic to the pathogens. Among these isolates, maximuminhibition of pathogen (96.21 %) was observed in the presencesof Trichoderma viride- II followed by T. harzianum- II (90.58 %)while Aspergillus niger was less effective with 60.44 % inhibition.
Key words Trichoderma, coriander, root rot, Fusarium solani,Aspergillus niger
Coriander (Coriander sativum L.) is one of the mostimportant spice crops grown in India. It is well known forits uses as medicine, oil, perfumery and culinary purposes.Coriander plants are subjected to attack by several fungalpathogens. Among these root rot caused by Fusariumsolani is very common in occurrence in Saurashtra regionof Gujarat and caused considerable crop losses.
In spite of their effectiveness, chemicals are notadvocated for controlling the soil borne plant pathogensin view of their prohibitive cost and threat to beneficialsoil microfloras, hence the interest is shifting towardsbiological control. The rhizosphere microfloras are ideal asbiological agents because the rhizosphere provides thefirst line of defence to root surface against invadingpathogen (Weller, 1988). The rhizosphere provides the mostabundant and most desirable source for isolatingantagonists against soil pathogens. The main objectivesof the current study were to obtain fungal isolates fromrhizosphere soil of coriander plants and screen them inrelation with the control of F. solani which cause corianderroot rot.
MATERIALS AND METHODS
Collection of Soil Sample and Isolation ofRhizosphere Mycoflora:
The rhizosphere soils were collected from healthyand root rot affected coriander plants from the fields.Three centimeter of the top soil was removed and fivesubsamples were taken randomly at a depth of 15 cm formeach site. The soil samples were then transferred intosterile polyethylene bags and transported to the laboratory.All subsamples from one site were combined to yield onecomposite sample representing the location and exposed itto room temperature and sieved through a mesh of 2 mm2.The serial dilutions (10-3) were prepared from one gram ofeach rhizosphere soil and 1 ml of each dilution waspoured in to petriplates containing solidified potato dextroseagar. These plates were kept in incubator for 7 days at30Ú C. Each fungal colony was picked up and transferredit to PDA slants separately and purified by hyphal tipmethods. The fungi which appeared frequently wereidentified based on morphological and cultural characters.
Isolation and Pathogenicity of the Pathogen:
The fungus Fusarium solani was frequently isolatedfrom the root rot affected coriander plant and pathogenicitywas proved by the method described by Sagar and Sugha,1997.
Screening of rhizosphere mycoflora for antagonisticactivity against the pathogen
The mycoflora isolated from coriander rhizosphere,were screened for their antagonistic activity towards thetarget pathogen by dual culture. All the rhizosphere fungalisolates and the Pathogen were multiplied in PDA.
A 5 mm disc of the each rhizosphere fungus wasinoculated at one side of PDA plate aseptically and a 5mm disc of the pathogen was also inoculated at theopposite side of the same plate in such a way both theinoculate were 4 cm apart. The plates were, then incubatedat 30º C for 7 days and the inhibition of the growth of thepathogen was recorded. After incubation the growth ofantagonist and test fungus was measured by linearmeasurement.

BHALIYA AND JADEJA, Antagonistic Effect of Rhizospheric Mycoflora against Fusarium solani 801
RESULTS AND DISCUSSION
Five fungal isolates were collected from rhizospheresoils around coriander plants which was collected fromdifferent agricultural fields of saurashtra region of Gujarat.Different fungal antagonists and their respective collectionplaces are 0 given in Table 1. Based on morphological andcultural characteristics these fungal isolates were identifiedas Trichoderma viride- I, Trichoderma viride- II,Trichoderma harzianum - I, Trichoderma harzianum – IIand Aspergillus niger. The antagonistic actions of thesefive fungal isolate were evaluated against the test fungusby dual culture technique. Based on observations of radialgrowth of antagonist and test fungus, per cent inhibitionwas calculated. The results are expressed in Table 2.
T. viride showed strongest antagonistic activity followedby Aspergillus niger, A. sydowi, A. flavus and Spicariasylvatica. Bora, 1977 tested antagonistic activity ofrhizosphere mycoflora against F. solani causing root rot ofcotton. Among these rhizosphere mycoflora T. viride foundmost effective in reducing the mycellial growth of pathogen.
LITERATURE CITED
Bora, T. 1977. In vitro and in vivo investigations on the effectof some antagonistic fungi against the damping off disease ofeggplant. Journal of Turkish Phytopathology, 6 (1): 17-25.
Dayaram, M., Sharma, S. and Chaturvedi, O. P. 2004. Management ofshisham wilt Fusarium solani f. sp. dalbergiae. Indian Journalof Agroforestry, 6(2): 67-69.
Hukma, R. 2010. Comparative efficacy of the bioagents and fungicidesin the management of wilt of pigeon pea, black root rot ofchickpea and root rot of black gram. In. Ph. D Thesis, AnandAgricultural University, Anand, Gujarat. pp. 1-84.
Jha, P. K. and Jalali, B. L. 2006. Biocontrol of pea root rot incitedby Fusarium solani f. sp. pisi with rhizosphere mycoflora.Indian phytopathology, 59 (1): 41-43.
Mallesh, S. B., Narendrappa, T. and Kumari. 2009. Management ofroot rot of sage (Salvia officinallis) caused by Fusarium solaniand Rhizoctonia solani. International Journal of Plant Protection,2 (2): 261-264.
Sagar, V. and Sugha, S. K. 1997. Role of individual and combineinoculation on the development of pea root rot. IndianPhytopathlogy, 50:499-503.
Singh, G. and Verma, R. K. 2005. Compatibility of fungicides andneem products and Trichoderma spp. against Fusarium solani f. sp. Glycines causing root rot of soybean. Journalof Mycopathlogy Research, 43 (2): 211-214
Weller, D. M. 1988. Biological control of soil borne plant pathogensin the rhizosphere with bacteria. Annual Review ofPhytopathology, 26: 379-407.
Recieved on 28-11-2013 Accepted on 30-11-2013
Table 1. Different fungal antagonists and their respectivecollection places
Sr. No. Isolate Place District 1 Trichoderma viride- I Vansajaliya Rajkot 2 Trichoderma viride- II Gundala Rajkot 3 Trichoderma harzianum- I Plasava Junagadh 4 Trichoderma harzianum- II Choki Junagadh 5 Aspergillus niger Naredi Junagadh
Perusal of data revealed that all the isolates showed
impressive results. All the isolates inhibited above 60 %growth of the test fungus. Among all antagonistsTrichoderma viride- II (96.21 %) gave highest inhibitionwith typical clear zone. This was followed by T. harzianum-II (90.58 %). The T. harzianum- I was also found betterwith 85.00 per cent inhibition of pathogen followed by T.viride- I with 72.84 per cent inhibition. Minimum inhibitionof test fungus was observed in presence of Aspergillusniger (60.44 %). Aspergillus niger elicited moderateantagonism. The results obtained in present investigationconfirmed the findings of Dayaram, et al., 2004, Singh andVerma, 2005 and Hukama, 2010. They reported that T. virideshowed strong antagonistic activity toward F. solani underin vitro study.
Similarlly, Mallesh, et al., 2009 reported that T. virideand T. virens were found most effective and exhibitedmaximum inhibition of F. solani, which was followed by T.harzianum and T. hamatum. The result of the presentfindings are also comparative with that of Jha and Jalali,2006 who isolated seven fungal isolates from rhizosphereof healthy and root rot affected pea plants and testedagainst Fusarium solani f. sp. pisi. Out of these isolates
Table 2. Growth inhibition of F. solani by different fungal antagonists after seven days of incubation at30º C
Fungal antagonist Mean per cent growth inhibition*
Trichoderma viride- II 96.21 Trichoderma harzianum- II 90.58 Trichoderma harzianum- I 85.00 Trichoderma viride- I 72.84 Aspergillus niger 60.44 Control 0.00 S.Em. + 0.91 C.D.at 5% 2.73
*Mean of four replications

802 Trends in Biosciences 6 (6), 2013Trends in Biosciences 6 (6): 802-804, 2013
Bacterial Surveillance Associated with Water from River GangaVINAY KUMAR SINGH, ANIL CHATURVEDI, SANGEETA SHUKLA, AND ANKITA GAUTAM
Department of Dairy Microbiology, Sam Higginbottom Institute of Agriculture Technology and Sciences,Allahabad, India 211 007email: [email protected]
ABSTRACT
In the study water samples were studied for different bacterialload in Ganga River, from Kanpur, Allahabad and Varanasi atthe site of upstream and downstream. Out of total 24 watersamples 96 isolates were found. 18 & 20 isolates were found inupstream and downstream Kanpur Ganga water 14 and 19isolates were found in upstream and downstream AllahabadGanga water and 11 & 15 isolates were found in upstream anddownstream Varanasi Ganga water. Highest bacterial load wasfound in Ganga water of downstream of Kanpur. The isolateswere identified on the basis of morphological and biochemicalcharacteristics and found belonging to different generaincluding Bacillus sp., Escherichia coli, Staphylococcus aureusand Pseudomonas aeruginosa and Salmonella typhi.
Key words River Ganga, pollution load, upstream, downstream
The impact of the River Ganga (The Ganges) is widelyfelt in Indian community life. The Ganga has shaped the cultural,spiritual and economic life of the Indian people. The river issubjected to uses and misuses, such as use as domestic andindustrial water supplies, and the disposal of sewage andindustrial wastes, leading to severe river pollution. Naturally,the pollution levels of the River Ganga have caused seriousconcern and attracted wide attention (NEERI, 1976).
The microbiological quality of river Ganga, a life-sustaining surface water resource for large population ofnorthern India, is adversely affected by several point andnon-point sources of pollution. Further, untreated surfacewaters are consumed for drinking and various household tasksin India making the public vulnerable to water-borne diseasesand outbreaks. Enterococci, the ‘indicator’ of water quality,correlates best with the incidence of gastrointestinal diseasesas well as prevalence of other pathogenic microorganisms.
The contamination of processed or unprocesseddrinking water by fecal coliform bacteria has been reportedworldwide. Despite a high incidence of waterborne diseases,enterohemorrhagic Escherichia coli (EHEC) is an underacknowledged pathogen of concern to public health in India.Although the presence of EHEC is recorded in surface waterresources of India, drinking water sources are yet to beinvestigated. (Siya et al., 2008).
Among the bacteria better adapted to life in soil or waterare strains belonging to Bacillus and Pseudomonas (e.g., P.aeruginosa). However, other groups have been referred to
be present on several occasions in freshwater, includingEnterobacteriaceae, Flavobacterium, Acinetobacter,Moraxella, Aeromonas, Micrococcus, Staphylococcus,Streptococcus and anaerobic bacteria (e.g., Clostridium)(Toranzo, et al.,1989; Sousa, 1996).
The purpose of the present investigation to assesswater quality in more detail within a narrow stretch of theriver and as to have better idea of the pollution load inthis region. (Kanpur, Allahabad, Varanasi). And investigatesome quantitative and qualitative aspects of the bacterial floraand to determine the microbial population of water.
MATERIALS AND METHODS
Collection and processing of sample:Water samples were collected from upstream and
downstream of river Ganga in Kanpur, Allahabad and Varanasi.samples were transported to the laboratory by using sterilizedsample bottles
Isolation and Identification of isolates:The initial isolation of pathogenic strains from different
water samples were done on Nutrient Agar medium and thenit was incubated at 37°C for 48 hrs. Gram staining of isolatedbacteria was done and observed under 100X objective ofmicroscope. In addition an array of biochemical tests likemotility, catalase, indole production, voges proskaur, H2Sproduction, methyl red, simmon citrate utilization and sugarfermentation test was performed to determine the ability ofthe microorganism to degrade various carbohydrates Glucose,Sucrose, Mannitol, Xylose and Arabinose was used . Theisolates were identified on the basis of characters as given inBergey’s Manual of Systematic Bacteriology (Holt, et al.,1984). And Antibiotic susceptibility test were done usingmodified Kirby-Bauer disc diffusion method.
Enumeration of each isolatesEnumeration of bacteria was done by serial dilution agar
plate technique and plate count. Serial dilution was preparedby transferring a known volume of dilution to second dilutionblank and so on. Once diluted, the specified volume of dilutionsample (0.1ml) from each dilution was added to sterile Petriplates (in triplicate of each dilution) to which molten and cooled(45-50°C) suitable agar medium is added. The plates wereincubated at 37°C for 48 hrs. The colonies were counted on aQuebec colony counter.

SINGH et al., Bacterial Surveillance Associated with Water from River Ganga 803
RESULTS AND DISCUSSION
Microbial load in water sample:
In the study the population of bacteria in Ganga riverfrom three different city viz, Kanpur, Allahabad and Varanasi.Highest Bacterial population was found in water sample fromKanpur (Downstream 5.3 × 10⁶ cfu/ml) while least bacterialpopulation was found in Varanasi (Upstream 3.62 × 10⁶ cfu/ml) However the results when analyzed statistically werefound to be non significant [P>0.05].(see Table no.1 and Figno.1) Baghel, et al. 2005, collect water samples from 21 differentsites moving downstream from the glacier, which is the sourceof river Ganges, during winter, summer and monsoon seasonstaken for the analysis of total viable count, Total viable countswere found in the range of 2 × 10² to 40 × 102 ml-1 in winter, 7 ×10² to 40 × 102 ml-1 in summer and 2 × 10² to 40 × 102 ml-1 inmonsoon. Sousa and Souza, 2001, conducted a bacteriologicalstudy of water from Congonhas River, Sertaneja (22º58’ S;50º58’ W), Parana State, Brazil. The numbers of cfu/ml of watervaried from 3.1 x 10² to 1.0 x 10³.
12(12.50%). Total incidence of E.coli 18(18.75%) (Table 2 andFig. no. 2&3). Sousa and Souza, 2001, conducted abacteriological study on water from Congonhas River,Sertaneja (22º58’ S; 50º58’ W), Parana State, Brazil. In the water,the bacterial groups detected were Pseudomonas,Acinetobacter, Aeromonas, Enterobacteriaceae, Bacillus andFlavobacterium, from which Flavobacterium andAcinetobacter were the most abundant. Vagarali, et. al., 2011,also studied on total of 30 drinking water samples. Out of 30samples 10(33.33%) were contaminated with either one or morethan one type of organisms, results of most probable no test(MPN) showed 4(13.33%) were unsatisfactory. Pseudomonaswas the common cause of contamination about 6(20%) while
Table 1. Microbial load in water sample
S.N. Name of the city
Upstream cfu/ml × (106)
Downstream cfu/ml × (106)
1 Kanpur 4.62 5.3 2 Allahabad 3.72 4.27 3 Varanasi 3.87 3.62
Fig. 1. Microbial load in water sample
Incidence of bacteria from Ganga water:
Among the 24 samples screened for growth in Nutrientagar, 96 isolates showed positive result. Five different isolateswere identified that showed positive result namely,Pseudomonas aeruoginosa, Bacillus subtilis, E.coli,Salmonella typhi and Staphylococcus aureus. Out of 96isolates incidence of Pseudomonas aeruginosa was17(17.70%).Total incidence of Bacillus subtilis was18(18.75%).Total incidence of Salmonella typhi was14(14.58).Total incidence of Staphylococcus aureus was
Table 2. Incidence of bacteria from Ganga water
S.N. City
name Total
isolates Sample site
(n=4) Positive isolates
Percentage of positive isolates
1 Kanpur 38 Upstream 18 47.36%
Downstream 20 52.63%
2 Allahabad 32 Upstream 14 43.75%
Downstream 18 56.25%
3 Varanasi 26 Upstream 11 42.30%
Downstream 15 57.69%
Fig. 2. Incidence of bacteria from Ganga water
Fig. 3. Individual incidence of Microorganisms in Ganga water

804 Trends in Biosciences 6 (6), 2013
Escherichia coli and Klebsiella pneumoniae were 3(10%),Proteus vulgaris 1(3.33%).
In these study water samples were studied for differentbacterial load in ganga river, from kanpur, allahabad andvaranasi at the site of upstream and downstream. Out of total24 water sample 96 isolates were found. Highest bacterial loadfound in water in kanpur (Downstream Incidence of B. subtilisand E. coli was higher than other bacteria in water sample ofGanga river. The purpose of the present study was assesswater quality in more detail within a narrow stretch of theriver, so as to have better idea of the pollution load in thisregion (Kanpur, Allahabad, Varanasi).
LITERATURE CITED
Baghel, V. S., Gopal, K., Dwivedi, S., Tripathi, R. D. 2005. Bacterialindicators of faecal contamination of the Gangetic river systemright at its source. Ecological Indicators, 5: 49–56.
Holt, J. G., Bergey, D. H., Krieg, N. R. 1984. Bergey’s Manual ofSystematic Bacteriology,Vol 2, Williams and Wilkins, Baltimore,USA.
NEERI (National Environmental Engineering Research Institute) 1976.Baseline Water Quality Studies in the Hooghly Estuary. NationalEnvironmental Engineering Research Institute Nagpur, India.
SiyaRam, Vajpayee, P., and Shanker, R. 2008. Contamination of PotableWater Distribution Systems by Multiantimicrobial-ResistantEnterohemorrhagic Escherichia coli. 4:116.
Sousa, J. A. D., and Souza, A. T. S. 2001. Bacterial Community Associatedwith Fish and Water from Congonhas River, Sertaneja, Parana,Brazil. International Journal of Brazilian Archives of Biology andTechnology. 44 (4): 373 – 381.
Toranzo, A. E., Baya, A. M., Romalde, J. L. and Hetrick, F. M. 1989.Association of Aeromonas sobria with mortalities of adult gizzardshad, Dorosoma cepedianum Lesueur. Journal of Fish Diseases,12: 439-448.
Vagarali, M. A., Karadesai, S. G., Preeti., Metgaud, S. 2011.Bacteriological Analysis Of Drinking Water Samples. Journal ofBioscience and Technology; 2 (1): 220-222.
Recieved on 20-08-2013 Accepted on 15-09-2013

Trends in Biosciences 6 (6): 805-807, 2013
Bacterial Activity of Scent Components of Certain Heteropteran BugsCH. SRINIVASULU1, C. JANAIAH2
1Department of Zoology, SR&BGNR Govt Degree College Khammam, A. P,2Department of zoology, Kakatiya University, Warangal, A. Pemail : chsri39@gmail. com
ABSTRACT
Heteropteran bugs have abdominal scent glands in nymphalstage and metathoracic scent glands in adult stage. These glandssecreted scent compounds, these volatile scent compoundscollected from some heteropteran bugs and their antibacterialactivity was assayed by employing by paper disc method onRhodococcus sp. And Bacillus mycoids. Undecane a scentcomponent exhibited the mild bactericidal activity against boththe bacteria. n-dodecane exhibited bactericidal activity againstRhodococcus while mild against B. mycoids. n-Tridecanestimulated for Rhodococcus sp. While B. mycoids was inhibitedto some extent. n-tetradecane, which had no effect onRhodococcus sp. Inhibited the growth of B. mycoids to a limitedextent. Pentadecane stimulated the growth of Rhodococcus,while B. mycoids was affected only marginally. n-Hexanol,propanol-1-ol and 1-butanol, these three alcoholic scentcomponents exhibited almost same response against bothbacteria under study. They showed a marginal bactericidalactivity. Benzyl alcohol was active against B. mycoid andRhodococcus sp. 2-Butanone(methyl ethyl ketone) exhibitedmild bactericidal activity against both bacteria. Benzaldehydea scent component showed mild toxicity against Rhodococcus,while had no activity on B. mycoids.
Key words Heteropteran bugs, scent components, anti bacterialactivity, Rhodococcus sp. , Bacillus mycoids
Certain insects are reported to be free from bacterialinfection. Such a condition has been attributed either due tosurface texture or their secretions. Heteropteran bugs arereported to secrete variety of volatile chemicalcompounds(Janaiah, et al. , 1988). Anti microbial action hadbeen suggested for the secretion of the metathoracic glandsof Notonecta glauca (Pattenden and Staddon, 1968).
n-hexenol and hexenal were natural compounds fromthe metathoracic scent glands of coreoid bugs, whichdemonstrated to protect itself from predators including ants,amphibians, birds and mice (Waterhouse, et al. , 1961; Aldrichand Yonke, 1975). The metathoracic gland secretions of bothsexes of Plea leachi Mc Grey at Kirch are toxic against bacterialand fungi (Maschwitch, 1971). In certain insects, aliphaticaldehyde act as defensive against which suggest that thephenolic of Llycoris and queens of tenebroids show antibioticactivities (Chapman, 1982). The phenolics and hydrogenperoxide of aquatic bugs are secondarily evolved Metathoracicglands secretions and probably important as antiseptics(Staddon, 1979). Myrmecia gulosa and Nasutitermes exitosus
showed a strong anti microbial activity against gram positive(+)and gram negative (-) bacteria (Beatti, et al. , 1994). Certainhydrocarbons, Alcohols, Ketones and Aldehydes identifiedfrom scent secretions of some heteropteran bugs showedantibacterial activity against the Eschericidal coli, Klebsiellasps. , Bacillus subtillis and Bacilluspoly myxa (Vidyasagar,1995). Akpat and Olagbemiro, 1982 identified the secretion ofAspari brunna as alkanes, alkyle acetates, alcohols andunsaturated aldehydes. These compounds employed from aschemical agent against microbes, Vertebrates andinvertebrates. The scent components from the scent glandsof pentatomid bugs acted as defensive agents against thebacteria.
MATERIALS AND METHODS
The heteropteran bugs (H. dentatus, C. janus, T.javanica, C. purpureus , C. lactularius, Amblypelta nitida ,Gelasto corisis, N. viridula and C. siccifolia) were fieldcollected and extracted the scent from the abdominal andmetathoracic scent glands of insects and subjected to chemicalanalysis by GC-MS and identified the scent components withthe help of authentic samples(obtained from ICN Laboratories,New York). Some of the compounds from different heteropteranbugs (Waterhouse and Gilby, 1964; and Aldrich, 1988)werealso assayed.
For assaying antibacterial activity growing cultures of(Rhodococcus sp. and Bacillusmycoids) were exposed tovapours of test compounds. 20ml of nutrient broth wassuspended in 100ml Erlenmeryer flask containing 5ml glassvial. Flask along with medium were steam sterilized for 30minutes for three consecutive days and inoculated withrespective bacterium and incubated at 37+1 for72hours. Oneml of the test compound as listed in table was placed in glassvial and flasks were sealed with the help of aluminium foil.Water in place of compound served as control. At the end ofthe incubation period, the growth of bacteria was determinedby turbidity determination at 625nm. uninoculated mediumand inoculated flasks at zero hour served as blanks.
RESULTS AND DISCUSSION
In the present investigations, different scent componentsof some heteropteran bugs were collected and their antibacterialactivity was assayed by employing Rhodococcus sps. (-)andBacillus mycoids (+) by paper disc method(Vincent andVincent, 1944)and the results are presented in Table 1.

806 Trends in Biosciences 6 (6), 2013
Hydrocarbons:Undecane, the hydrocarbon compound fromthe metathoracic scent glands of Coridius janus (Srinivasuluand Janaiah, 2012) was in effective against Bacillus mycoids,while it was mild toxicity on Rhodococcus sps. n-dodecanefrom the abdominal scent glands of C. purpureus (Janaiah,1978) was mild toxicity on both Rhodococcus sps. and B.mycoids. n-tridecane reported from the abdominal scent glandsof C. purpureus(janaiah, et al. , 1988) and Halysdentatus(Srinivasulu et al., 1996) had mild bactericidal effecton Bacillus mycoids and while it was high toxic onRhodococcus sps. n-tetradecane, the scent secretions of theheteropteran bug Caura rufiventris (Prestwitch, 1976) showedno effect on Rhodococcus sps. while B. mycoids was inhibitedonly to a limited extent. Pentadecane present in the scentsecretion of metathoracic glands of female Chlorochroa bug(Hsao-Young Ho and Jocelyn, 2001) caused the growthinhibition of both the bacteria understudy. n-hexane a scentcomponent from the metathoracic scent glands of coreoidbugs, stimulate the growth of both bacteria of Rhodococcussps. and B. mycoids.Alcohols : 1-hexanol, found from the metathoracic scent glandsof adult coreoid bugs of Gelastocoris occulatus (Staddon,1973) and from Amblypelta nitida (Baker, et al., 1971) exhibitedmarginal bactericidal activity against both, of Rhodococcussps. and B. mycoids and 1-butanol, reported from the coreoidbugs, exhibited intermediate degree of inhibition of growth ofB. mycoid, while it strong by inhibited growth of Rhodococcussps. to a significant level. Benzyl alcohol, the alcoholiccompound found in the scent secretions of the abdominalscent glands of heteropteran bugs(Aldrich, 1988)and Coreoidbugs, Leptoglossus australis (Gough, et al., 1985 ) was potentbactericide for B. mycoids and it was mild bactericide for
Rhodococcus sps. Propan-1-ol a alcoholic scent componentfound in Heteropteran bugs, showed marginal bactericidalactivity against both the Rhodococcus sps. and B. mycoids.Ketone:2-Butanone(Methyl ethyl ketone)found in the scentsecretion of C. stolli (Choudhari and Dass, 1968) exihibitedmild bactericidal activity against Rhodococcus sps. and B.mycoids.Aldehydes:Benzaldehyde, found in the scent secretion ofPodisus maculiventris (Aldrich, et al., 1975) was highly toxicand inhibited the growth of Rhodococcus sps. and B. mycoids.
From the present investigations, it is clear that the scentcomponents n-dodecane, Pentadecane and n-hexane werefound to be potent bactericide. Similarly 1-hexanol, 1-butanoland propan-1-ol were marginal antibacterial activity againstRhodococcus sps. while benzyl alcohol was mild bactericideand inhibited the growth on B. mycoids. Benzaldehyde showeda strong antibacterial effect on Rhodococcus sps. whilemarginal bactericidal activity on B. mycoids.
Undecane exihibited the mild bactericidal activity againstthe both bacteria Rhodococcus sps. and Bacillus mycoids. n-dodecane was effected to some extent and on the otherhandVidyasagar, 1995 reported a differential response of bacterialstudied by him. n-tridecane was similar to Rhodococcus sps.while B. mycoids was inhibited to some extent . Inhibition ofB. subtilis, B. polymyxa and Klebsiella sp. Vidyasagar, 1995also observed varying response of inhibition both the bacteriaunderstudy. n-tetradecane, which has no effect onRhodococcus sp. in its bactericidal activity against bacteriastudied by Vidyasagar, 1995, was also observed pentadecanestimulated the growth of Rhodococcus sp. While B. mycoidswas effected only marginally. Pentadecane stimulatedthegrowth of Rhodococcus sps. While B. mycoids was effectedonlymarginally. Pentadecane stimulated the grouth ofRhodococcus sp. while B. mycoids was effected onlymarginally. Pentadecane stimulated the growth ofRhodococcus sp. While B. mycoids was affected onlymarginally. n-Hexane stimulated the growth of both the bacteriaunderstudy. Surender, et al. , 1988 reported that it has mildbactericidal activity against E. coli.
1-Hexanol, propan-1-ol and 1-butanol, exhibited almostsame response against the both the bacteria understudy, theyshowed a marginal bactericidal activity. Similarly, Vidyasagar,1995 have reported mild bactericidal activity of the compoundsagainst E. coli, Klebsiella sp. , B. substilis and B. polymyxa.Benzyl alcohol was active against B. mycoids and Rhodococcussp. Similarly Vidyasagar, 1995 also observed bactericidalactivity of these compounds against Klebsiella sp. B.polymyxa, E, coli and B. substilis. 2-Butanone exhibited mildbactericidal activity against Rhodococcus sp. and B. mycoids.E. coli, Klebsiells sp. B. substilis, B. polymyxa also reportedto be sensitive towards this compound. Benzaldehyde highlytoxic and also mild in its toxicity against both the bacteriaunderstudy.
Table. Effect of Scent Components on bacterial growth:
* Growth difference between control and treatment expressed inoptical density (O. D. ) Indicates Bacterial Activity.
Chemical Compounds
Rhodococcus sp (-) Bacillus mycoids (+) O. D Percentage of
inhibition O. D Percentage of
inhibition I. Hydrocarbons 1. Undecane 2. n-Dodecane 3. n-tridecane 4. n-tetradecane 5. Pentadecane 6. n- hexane II. Alcohols 7. 1- Hexanol 8. 1- butanol 9. Benzyl Alcohol 10. Propan -1-ol III Ketone 11. 2-Butanone (methyl ethyl ketone) IV Aldehyde 12. Benzyldehyde
0. 39 0. 69 0. 67 0. 52 1. 23 0. 92
0. 42 0. 45 0. 32 0. 45
0. 34
0. 58
27. 7 (-) 27. 7 (+) 24. 0 (+) 3. 7 (-) 127 (+) 70. 3 (+)
22. 2 (-) 16. 6 (-) 40. 7 (-) 16. 6 (-)
37. 0 (-)
7. 4 (+)
0. 34 0. 52 0. 24 0. 35 0. 38 0. 89
0. 32 0. 31 0. 50 0. 31
0. 41
0. 47
45. 1 (-) 16. 1 (-) 61. 2 (-) 43. 5 (-) 38. 7 (-) 43. 5 (+)
48. 4 (+) 50. 0 (-) 19. 3 (-) 50. 0 (-)
33. 8 (-)
24. 2 (-)
Control 0. 54 0. 62
SRINIVASULU AND JANAIAH., Bacterial Activity of Scent Components of Certain Heteropteran Bugs 807
In the present observations, it is confirmed that the scentcomponents of heteropteran larvae and adults are useful toprotect themselves from ants, birds, lizards, predators andfrom infenctions caused by the various fungi and bacteria.Further, position of these defensive chemicals also help thecrop plants in keeping away the pathogenic fungi and bacteria.However, more detailed studies are required before reachingany concrete conclusion.
n-tridecane from C. purpureus was stimulated forRhodococcus sp. while B. mycoids was inhibited to someextent. n-tetradecane from heteropteran bugs which had noeffect on Rhodococcus sp. Inhibited the growth of B. mycoidsto a limited extent. Pentadecane from heteropteran bugsstimulated the growth of Rhodococcus sp. while B. mycoidswas effected only marginally. n-Hexane from the coreoid bugs,stimulated the growth of both the bacteria understudy.Undecane from C. janus exihibited the mild bactericidal activityagainst both the bacteria Rhodococcus sp. and B. mycoids. n-dodecane from the H. dentatus exhibited bactericidal activityagainst Rhodococcus sp. while mild against B. mycoids.
1-hexanol, propan-1-ol and 1-butanol from Gelastocorisoculatus, Libypis angolensis and coreoid bugs, exhibitedalmost the same response against both bacteria understudy,they showed a marginal bactericidal activity. Benzyle alcoholfrom heteropteran bugs was active against B. mycoids andRhodococcus sp. 2-Butanone (methyl ethyl ketone) from C.stolli exhibited mild bactericidal activity against both bacteria.Benzaldehyde from the P. maculiventris exhibited mild toxicityagainst Rhodococcus sp. while had no activity on B. mycoids.
ACKNOWLEDGEMENT
The author are grateful to the ICN Laboratories, NewYork for supplied the authentic samples. I also thank to prof.S. M. Reddy, Department of Botany, Kakatiya university fortechnical assistance, guidance and advice
LITERATURE CITED
Akpat, M.I. and Olagbemiro, T.O. 1982. The defensive secretion ofAspavia
Brunna (heteroptera: pentatomidae) Z. Nature for Sch Teil BanorgChem. Or Chem
37(7) : 935-936
Aldrich, J.R. 1988. Chemical ecology of the Heteroptera. Ann. Rev.Entomol., 33 : 211-238
Aldrich, J.R. and Yonke, T.R. 1975. Natural products of the abdominaland metathoracic scent glands of coreoid bugs. Ann. Entomol. Soc.Ame. 68 (6) : 955-960
Baker, J.T. Blake, J.D. Mc leoid, J.K. Irouside, D.A. and Johnson, I.C.1971. The Volatile constituents of the scent gland reservoir of thefruity spotting bug Amblypelta nitida. Aust J Chem 25 : 393-400
Beattie, A.J. Mackintosh, T.A., Cruse, A. and Veal, D.A. 1994. Defense
against micro organisms in the ant Myrmedia gulosa and termiteNasutitermes exitiosus. 12th congress of the international union forthe study of social insects IUSSI Paris Sorbonne 21-27 August pp.108
Chapman, R.F. 1982. The insect structure and function E L B S of IIIDen. Hodder one Stoughton educational advn, of Hodder &Stoughton Ltd. Color craft,
Choudhuri, D.K. and Das, K.K. 1968. On the odour components of thestink of two Heteropteran bugs of India. Indian J Ent 30 (3) : 203-208
Gough, A.J.E. Hamilton, J.G.C. Games, D.E. and Staddon, B.W. 1985.Multichemical defense of plant bug Hotea gambiae (West wood).(heteroptera: Scutelleridea) sequiterpenoids from abdominal glandsin larvae. J Chem Ecol. 11(3) : 343-352
Hsao – Yungo, Ho and Jocelyn, G. Millar, 2001. compounds inmetathoracic scent glands of adults and dorsal abdominal glands ofnymphs of stink bugs, Chlorochrora uhleri c. sayi and C. ligate(Hemiptera; Pentatomidae) department of Entomology, universityof California, Riverside CA 92521, USA.
Janaiah, C. 1978. Studies on the scent glands of two pentatomid bugs.Ph. D Thesis Kakatiya University, Warangal
Janaiah, C. Leela, Kumari, S.J. Rao, P.S. and Surender, P. 1988. Chemicalanalysis of secretion from the abdominal scent glands of Chrysocorispurpureus (Heteroptera: pentatomidae). Proc Indian Acad. Sci.(Ani. Sci. ) 97(1) : 111-115
Maschwitz, U. 1971. Nature wissenschaften 57(11): 572
Pattenden, G. and Staddon, B.W. 1968. Secretion of the metathoracicglands of the water bug Notonecta glauca L. (Heteroptera:Notonectidae). Experientia. 24 : 1092
Prestwich, G.D. 1976. Composition of the scent of eight East AfricanHemipterous. Nymph adult chemical polymorphism in coreids.Ann Entamol Soc Am 69 (5) : 812-814
Srinivasulu, Ch. Surender, P. and Janaiah, C. 1996. Chemical compositionof scent from the abdominal scent glands of Halys dentatus. BoiScience Research Bulletin 2(1) : 15-22
Srinivasulu, Ch. and Janaiah, C. 2012. Morphology and Chemicalcomposition of metathoracic scent glands in coridius janus(Heteroptera) J. Exp. Zool. India. 15 (1) : 45-48
Staddon, B.W. 1973. A note on the composition of the scent from themetathoracic scent glands of Gelastocoris oculatus (Fabricius)(Heteroptera: Gelastocoridae). Entomol. 106 : 253-255
Staddon, B.W. 1979. The scent glands of heteroptera Adv Insect Physiol,14 : 315-418
Surender, P. Janaiah, C. Krishna Reddy, V. and Reddy, S.M. 1988.Bactericidal activity of certain Volatile scent components ofheteropteran bugs Proc. Indian Natn. Sci. Acad. 54 : 315-316
Vidyasagar, C.H. 1995. Identification and functions of scent secretionfrom the scent glands of pentatomid bugs Ph. D Thesis KakatiyaUniversity Warangal.
Vincent, J.G. and Vincent, H.W. 1944. Proc Exptl Biol Med 55 : 162.
Waterhouse, D.F. and Gilby, A.R. 1964. The adult scent glands andscent of nine bugs of the super family coreoidae. J. Insect. Physiol.10 : 977-987
Waterhouse, D.F. Forss, D.A. and Hackman, R.H. 1961. Characteristicodour components in the secretion of stink bugs. J Insect Physiol.6 : 113-121.
Recieved on 15-09-2013 Accepted on 13-10-2013

808 Trends in Biosciences 6 (6), 2013Trends in Biosciences 6 (6): 808-810, 2013
Effect of Different Farming Methods on Maize (Zea mays. L) Productivity and SoilMicrobial StatusVIJAYA. N1, VINAYAK HOSAMANI2, VINODAKUMAR, S. N3 AND RAGHAVENDRA, S4
1 Dept. of Soil Science and Agriculture Chemistry, College of Agriculture, Navile Shivamogga UAS,Bangalore, Karnataka- 577 201 India 2, 3 Dept. of Agronomy, College of Agriculture, UAS, Raichur, Karnataka- 584 104, India4 Dept. of Soil Science and Agriculture Chemistry, College of Agriculture, UAS, Raichur,Karnataka- 584 104, Indiaemail: [email protected] & [email protected]
ABSTRACT
A field experiment was conducted during kharif, 2007 at ZARS,Navile campus Shivamogga, Karnataka (India) to study theimpact of different farming methods on productivity of maizeand microbial activity in soil. The farming methods viz., zerobudget farming (Subash Palekar’s method), organic farming,inorganic farming, package of practices, zero budget plusinorganic farming methods. Results, of the study revealed thatamong the methods followed the package of practicessignificantly increased the growth and yield attributes of maize.Highest grain yield of 12.24 t ha-1 and stover yield of 8.90 t ha-
1 was recorded in package of practices compared to other farmingmethods. Whereas, the highest bacterial, fungal, andactinomycetes population of 11.46 x 10⁴, 25x 103 and 19.62x10³
CFU g-1 soil respectively was recorded under package of practicesat harvest stage of the crop, but at 30 days after sowing (DAS)the highest bacterial and fungal population of 21.77x10⁴ CFUg-1 soil and 43 x103 CFU g-1 soil was recorded under organicfarming method however the lowest microbial population wasrecorded under inorganic farming method.
Key words Farming methods, Zero budget farming, Organicfarming, Inorganic farming, Package of practices andCFU (Cellular farming units)
Green revolution brought a great change in Indianagriculture, which is rightly termed as transformation from“begging bowl to bread basket” and this was achieved withhigh yielding varieties and increased fertilizer use. However,despite commendable progress made earlier deceleration ofgrowth and crop yield from green revolution caused seriousconcern and chain of several problems to tackle. Moreover,continuous use of only chemical fertilizers in intensivecropping system is leading to imbalance of nutrients in soil,which has an adverse effect on soil health and also on cropyields. It is therefore necessary to develop a sustainableproduction system with maximum productivity and minimumenvironmental pollution. Use of cow urine in crop productionmight act as stimulator for accumulation of nutrients in theplant biomass, proliferation of plant growth promoting,phosphate solubalizing, abiotic stress tolerant andantagonism towards plant pathogenic fungi in the rhizosphere
of plants, and enhance the total phenolic contents of the plantsand controlling plant pathogenic fungi, and also it’s effectivein the enhancement of plant growth and soil health (Nautiyal,et al., 2004). In this context the use of organics, inorganicsand their combined use as a source of nutrients assumesgreater importance.
MATERIALS AND METHODS
A Field experiment was conducted during Kharif, 2007at Zonal Agricultural Research Station Navile, Shivamogga,Karnataka (India) comes under University of AgriculturalSciences, Bangalore and belongs to Southern TransitionAgro-climatic Zone of Karnataka. The research station issituated at 140 01 to 140 11 North latitude and 750 401 to 750 421
East longitude with an altitude of 650 meters above the meansea level. The mean rainfall of the zone is 817 mm with 56 rainydays. The soil of the experimental site belongs to taxonomicclass of Typic haplustalf with sandy loam texture. The soil pHof 5.53, Electrical conductivity (0.31d S m-1- at 250 C), OC 0.24per cent, available N (162.50 kg ha-1), available P2O5 (54.70 kgha-1) and available K2O (141.70 kg ha-1). Six treatments weretried in a completely randomized block design (RCBD) withfour replications using maize (Zea mays L.) as test crop underrainfed condition. The treatment comprising, T1- absolutecontrol without any fertilizers and manures. T2- zero budgetfarming method or Subash Palekar’s method involving bothBeejamrutha and Jeevamrutha,T3- organic farming method inwhich the FYM was applied on the basis of the recommendednitrogen, T4- inorganic method which involves recommendeddose of fertilizer (RDF) @ 100 kg N, 50 kg P2O5, 25 kg K2O ha-
1 plus Zinc sulphate @ 10 kg ha-1, T5 - package of practicesinvolving RDF (@ 100 kg N, 50 kg P2O5 and 25 kg K2O ha-1),zinc sulphate @ 10 kg ha-1 plus recommended dose of FYM @7.5 t ha-1 and T6 - combined treatment of both T2 (SubashPalekar) plus T4 (inorganic farming method). During the fieldexperimentation growth and yield attributes were recordedafter the harvest of the crop and a composite surface 10-15 cmdepth soil sample was collected from each plot at 30, 60 DASand also at harvest of the maize. Dilution and plate counttechnique was used for enumerating the living micro

VIJAYA et al., Effect of Different Farming Methods on Maize (Zea mays. L) Productivity and Soil Microbial Status 809
organisms in soil Finally, the number of colonies (CFU) in 1gof soil was calculated by using the following formula.No. of colonies per No. of microbial count X dilution factorgram of soil (CFUg-1 soil) = —————————————————
ml. taken for dilution X weight of soil
RESULTS AND DISCUSSION
Among the different methods studied, except for thelength of cob and number of grains per row, the package ofpractices method recorded significantly higher girth of cob(18.33 cm), number of rows per cob (18.73) and test weight(37.19 g) followed by the inorganic method and the methodconsisting of both Subash Palekar and inorganic farmingmethods. However, Subash Palekar method had a least coblength (9.55 cm), cob girth (14.48 cm), less number of rows percob (15.28), grains per row (28.30) and less test weight (24.62g) compared to other methods of cultivation. Higher grain(12.24 t ha-1) and stover (8.90 t ha-1) yield of maize were recordedin the package of practices (Table. 1), followed by the treatmentthat received both Subash Palekar and inorganic farmingmethods which recorded the grain yield (9.76 t ha-1) and stoveryield (8.82 t ha-1) and was on par with the inorganic farmingmethod which recorded the 9.63 and 8.76 t ha-1 of grain andstover yield respectively. Minimum grain (2.07 t ha-1) and stover(3.73 t ha-1) yields were recorded by Subash Palekar method.
These results indicated that the variation and magnitude ofincrease in yield was related to the availability of microorganisms in soil.The present results are conformity withfindings of Kamalakumari and Singaram, 1996; Kholy, et al.,20075 and Dhaliwal, et al., 2007.
From the result given in Table 2, it was noticed thatorganic farming method and the package of practice methodrecorded significantly higher number of bacterial counts atdifferent stages of crop growth compared to other methods.This might be due to the addition of FYM to the soil whichmight have served as a source of carbon and energy for thesemicroorganisms. Whereas, inorganic farming method (withoutFYM) recorded significantly less number of bacterial counts.This suggests that addition of organic matter is must formaintaining biological activity in soil. However, organicfarming method recorded the highest number of 21.77 x 10⁴
CFUg-1 soil at 30 DAS and reduced to 10.40 x 10⁴ CFUg-1 soilat harvest of crop. Whereas, in case of package of practicemethod it decreased from 20.10 x 10⁴ CFUg-1 soil to 11.46 x 10⁴
CFUg-1 soil, indicating the more stable activity compared toorganic farming method during the period of crop growthbecause of higher availability of nutrients in soil under packageof practice method. This may be due to the addition of FYMcoupled with the NPK fertilizers exerted a stimulating influenceon the activities of microbes in soil as a result of root exudates
Table 1. Effect of different farming methods on yield attributes, grain and stover yield of maize.
S P: Subash Palekar Absolute control: without NPK fertilizer and FYM
Treatments
Length of cob (cm)
Girth of cob (cm)
No. of rows Cob-1
No. of grains row-1
Test weight (g)
Grain Yield (t ha-1)
Stover yield (t ha-1)
T1- Absolute control 8.15 13.45 11.18 21.23 21.89 1.84 2.34 T2- Zero budget farming (S P method) 9.55 14.48 15.28 28.30 24.62 2.07 3.73 T3- Organic farming method 12.63 15.03 15.52 34.65 29.39 5.08 5.90 T4- Inorganic farming method 20.03 17.13 16.05 42.45 32.12 9.63 8.76 T5- Package of practices 18.45 18.33 18.73 38.37 37.19 12.24 8.90 T6- S P method + Inorganic farming method 20.33 17.43 16.08 42.50 32.73 9.76 8.82 S.E m 0.29 0.22 0.20 0.23 0.50 0.24 0.25 CD at 5% 0.87 0.67 0.61 0.68 1.51 0.73 0.75
Table 2. Effect of different farming methods on soil bacteria, fungi and actinomycetes at different growth stages of maize
S P: Subash Palekar DAS: Days after sowing Absolute control: without NPK fertilizers and FYM
Treatments Bacteria
(No. x 104 CFU g -1 soil) Fungi
(No. x 103CFU g-1 soil) Actinomycetes
(No. x 103CFU g-1 soil) 30DAS 60DAS Harvest 30DAS 60DAS Harvest 30DAS 60DAS Harvest
T1- Absolute control 8.82 6.76 2.83 18.22 17.58 10.26 2.18 5.18 8.14 T2- Zero budget farming (S P method)
13.29 9.15 5.17 32.80 25.16 14.17 9.20 11.27 15.18
T3- Organic farming method 21.77 12.82 10.40 43.87 36.18 18.65 9.87 12.88 16.22 T4- Inorganic farming method 8.62 3.50 1.64 24.21 19.24 12.20 8.85 10.17 12.19 T5- Package of practices 20.10 14.80 11.46 41.82 32.85 25.34 9.20 13.81 19.62 T6- S P method + Inorganic farming method 14.27 9.78 9.17 39.46 28.53 16.21 9.12 10.86 15.84
S.E m 0.31 0.12 0.09 0.737 0.282 0.171 0.244 0.230 0.325 CD at 5% 0.92 0.36 0.28 2.220 0.849 0.515 0.734 0.693 0.978

810 Trends in Biosciences 6 (6), 2013
and addition of crop residue helped in providing the increasedcarbon substrate for microbial activity. Similarly, the countsof fungi also followed the same trend as that of bacteria dueto the imposed farming methods. Here also, the organic farmingmethod and the package of practice method recordedsignificantly higher number of counts compared to othermethods. Further, the counts of fungi decreased in soil withcrop growth i.e. from 43.87 x 10³ CFUg-1 soil to 18.65 x 10³
CFUg-1 soil and 41.82 x 10³ CFUg-1 soil to 25.34 x 10³ CFUg-1
soil in organic farming and package of practice methods,respectively. However, the inorganic farming method recordedsignificantly less number of fungi counts in soil (24.21 x 10³
CFUg-1 soil to 12.2 x 10³ CFUg-1 soil) due to the addition of noFYM. On the contrary to bacteria and fungi the actinomycetescounts in soil increased from 30 days after sowing to harveststage of the crop in all the treatments because, as the bacterialand fungal population come down, the actinomycetes takeupper hand, since they act on somewhat complex organicsubstances than other two. However, maximum number ofcounts of actinomycetes were recorded (9.2 x 10³ to 19.62 x10³ CFUg-1 soil) by package of practice method followed by
organic farming method (9.87 x 10³ to 16.22 x 10³ CFUg-1 soil)and the minimum numbers of counts were recorded in thetreatment which received only NPK fertilizer (8.85 x 10³ to12.19 x 103 CFUg-1 soil). Hence, addition of FYM or organicmatter is must for sustain biological activity in soil. Similarresults were reported by Aviva Hadas, et al., 1996; Balakrishna,et al., 2000; Balakrishna, et al., 2002; Nautiyal, et al., 2004 andKrishna Kumar, et al., 2005 and Selvi, et al., 2005.
LITERATURE CITED
Aviva Hadas, Larissa Kautsky and Ritaportony., 1996, Mineralizationof composted manure and microbial dynamics in soil as affected bylong term nitrogen management. Soil Biol. Biochem., 28(6): 733-738.
Balakrishna, A. N., Lakshmipathy, R., Sudhir, K. and Bagyaraj, D. J.,2000, Influence of organic amendments in conjunction withinorganic fertilizers on soil microbial biomass and native VAMfungal propagules in the root zone soil of finger millet. J. Soil Biol.Ecol., 20(1&2): 36-46.
Balakrishna, A. N., Lakshmipathy, R., Sudhir, K. and Bagyaraj, D. J.,2002, Effect of long term application of inorganic fertilizers onnative am fungi and soil microbial biomass in a finger millet- maize-fallow. J. Soil Biol. Ecol., 22(1&2): 1-7.
Dhaliwal, B. S., M. S. Virk and B. S. Brar. 2007, Effect of long termfertilizer use on yield and yield sustainability in maize (Zea mays)-wheat (Triticum aestivum) rotation. Indian J. Agric. Sci., 77(22):79-83.
Kamalakumari, K and Singaram, P. 1996, Effect of continuousapplication of FYM and NPK on fertility status of soil, yield andnutrient uptake in maize. Madras Agric. J., 83: 181-184.
Kholy M. A., Ashry, and Gomaa, A. M. 2005, Biofertilization of maizecrop and its impact on yield and grains nutrient content under lowrates of mineral fertilizers. J. Apl Sci. Res., 1(2): 117-121.
Krishna Kumar, S., Saravanan, A., Natarajan, S. K., Veerabadran, V. andMani, S., 2005, Microbial population and enzymatic activity asinfluenced by organic farming. Res. J. Agric. Biol. Sci., 1(1): 85-88.
Nautiyal, C. S., Metha, S., Singh, H. B., Mansinghka, S. B., Dawle, S. H.,Rajhans, N. E. and Pushpangadhan, P., 2004, A synergistic fermentedplant growth promoting bio-control composition, NationalBotanical Research Institute Rana Pratap Marg Lucknow, UttarPradesh. International Application Published Under the PatentCooperation Treaty (PCT), Pub. No.: US 2004/0248738A1. Dec.9 .
Selvi, D., D. Santhy, M. Dhakshinamoorthy and Maheshwari, M. 2005,Effect of inorganics alone and in combination with farm yard manureon physical properties and productivity of vertic Haplustepts underlong-term fertilization. J. Indian Soc. Soil Sci., 53(3): 302-307.
Recieved on 07-09-2013 Accepted on 19-10-2013
Fig. 1. Effect of different farming methods on grain and stoveryield of maizeT1- Absolute control (without NPK fertilizer and FYM)T2- Zerobudget farming (Subash Palekar method)T3- Organic farmingmethod T4- Inorganic farming methodT5- Package of practicesT6- Subash Palekar method + Inorganic farming method

Trends in Biosciences 6 (6): 811-814, 2013
Effect of Nitrogen Level and Cutting Interval on Fodder Yield of Oat GenotypesSMITHA PATEL P. A.1 AND ALAGUNDAGI S.C.2
1Dept. of Agronomy, UAS-Dharwad, 2College of Agriculture-Bijapur, UAS-Dharwademail: [email protected]
ABSTRACT
A field experiment was conducted to study the effect of oatgenotypes to nitrogen level and cutting interval on forage yieldunder irrigation during rabi, 2011-12 and 2012-13. The genotypeJHO 99-2 recorded significantly higher green forage (37.71 tha-1) and dry matter yield (7.45 t ha-1) compared to JHO 822 andKent. The nitrogen level of 150 kg N ha -1 produced significantlyhigher green forage (39.41 t ha-1) and dry matter yield (7.79 tha-1) compared to 120 and 90 kg N ha-1. Harvesting of fodder at65 DAS recorded significantly higher green forage (35.39 t ha-
1) and dry matter yield (7.19 t ha-1) compared to 55 DAS. Ininteraction significantly higher green forage (46.92 t ha1) anddry matter yield (8.64 t ha-1) was obtained with genotype JHO99-2 with 150 kg N ha-1 with cutting interval of 65 DAS.
Key words Oat, Nitrogen level, Cutting interval, Green forageyield, Dry matter yield
Oat (Avena sativa L.) is the important cereal(Graminaceous) forage crop grown during rabi season and isnext to berseem in nutritive value, it is rich in energy, protein,vitamin B, phosphorous and iron (Tiwana, et al., 2008). Oathas wider adaptability because of its excellent growing habits,quick regrowth, better yield potentials and provides palatable,succulent and nutritious green fodder. Apart from genotypes,balanced fertilization and cutting intervals are critical for higherfodder yields (Chakraborty, et al., 1999). Oat, being a cerealcrop it responds well to nitrogen levels and positive responseof increased levels of nitrogen has been reported by severalworkers. However, reports on the effect of oat genotypes todifferent levels of nitrogen and cutting intervals on fodderyield in northern transition zone of Karnataka (India) wasmeager, where winter temperatures are low and appearcongenial for its growth keeping these points in view presentinvestigation was carried out.
MATERIALS AND METHODS
The field experiment was conducted under irrigatedsituation during rabi, seasons of 2011-12 and 2012-2013 atMain Agricultural Research Station, University of AgriculturalSciences, Dharwad in Northern Transition Zone of Karnatakaon clay soil with medium available nitrogen and phosphorusand high available potassium with normal pH. The treatmentscomprised of three genotypes (G1: Kent, G2: JHO 822 and G3:JHO 99-2), three levels of nitrogen (N1:90, N2:120 and N3: 150kg N/ha) and two cutting intervals (55 and 65 DAS). Theexperiment was laid out in randomized complete block design
(RCBD) with Factorial concept and replicated thrice. Sowingwas done on 13 th and 9 th November during 2011 and 2012,respectively, with a seed rate of 100 kg/ha in rows at 30 cmapart. The farm yard manure (FYM) was applied before threeweeks of sowing and the inorganic fertilizer was applied @ 60kg P2O5 and 40 kg K2O in the form of DAP and MOP alongwith 50 per cent of nitrogen as per the treatments in the formof urea as a basal dose. The remaining half dose of nitrogen ofeach treatment was applied in two equal splits at 30 DAS andat harvest for fodder. The irrigation was given at 15 daysinterval. The yield of green fodder was recorded immediatelyafter harvest of oat and dry matter yield was recorded basedon dry matter content obtained by drying known quantity ofgreen fodder from each plot in hot air oven at 70°C for 72hours. The treatment wise green forage yield was multipliedby respective dry matter percentage to get the dry matteryield.
RESULTS AND DISCUSSION
Effect of genotype:
The pooled results revealed that, green forage and drymatter yield varied significantly among the genotypes (Table2). The genotype JHO 99-2 recorded significantly higher greenforage yield and dry matter yield (G3, 37.71 and 7.45 t ha-1,respectively) compared to the genotype JHO 822 (G2, 33.68and 7.12 t ha-1, respectively) and Kent (G1, 30.24 and 6.46 t ha-
1, respectively). Similar trend of green forage and dry matteryield followed during individual years of 2011-12 and 2012-13.This was mainly due to significantly higher fresh weight(1173.29 g per m row length) and higher total dry matteraccumulation (0.574 g plant-1) (Table 1) and these results werein conformity with the findings of Habib, 2003, MuhammadAyub, et al., 2011, Nazakat, et al., 2004 and Rana, et al., 2009.
Effect of Nitrogen levels:
There was linear and significant increase in the greenforage and dry matter yield with increased level of nitrogen.Application of 150 kg N ha-1 recorded significantly highergreen forage and dry matter yield (N3, 39.41 and 7.79 t ha-1,respectively) compared to lower levels i.e., 120 kg N ha-1 (N2,34.34 and 7.19 t ha-1, respectively) and 90 kg N ha-1 (N1, 27.88and 6.04 t ha-1, respectively). The same trend of increment ingreen forage and dry matter yield was also observed duringindividual years of 2011-12 and 2012-13. This was mainly dueto significantly higher fresh weight (1169.66 g per row length)

812 Trends in Biosciences 6 (6), 2013
and higher total dry matter accumulation (0.574 g plant-1) andsimilar observations were recorded by Barik, and Roy, 2002,Iqbal, et al., 2009, Patel, et al., 2010, Rana, et al., 2009, Sharma,2009 and Shekara, et al., 2008.
Effect of cutting interval:The cutting interval also influenced the green forage
and dry matter yield significantly. Harvesting at 65 DASrecorded significantly higher green forage and dry matter yield
(C2, 35.39 and 7.19 t ha-1,respectively) compared to harvesting55 DAS (C1, 32.37 and 6.82 t ha-1, respectively). Similar trendfollowed during individual years of 2011-12 and 2012-13. Thiswas mainly due to higher fresh weight (1156.69 g per m rowlength) and total dry matter (0.568 g plant-1)was recorded in 65DAS harvesting for fodder and these findings are inconformity with the Virendra Singh, et al., 1985, Pradhan, andMishra, 1994.
Table 1. Fresh weight and total dry matter accumulation in oat genotypes as influenced by nitrogen level and cutting interval
Means followed by the same lower case letter/s in a column do not differ significantly by DMRT (P= 0.05), DAS-Days after sowing
Treatment Fresh weight (g m-1 row length) Total dry matter accumulation (g plant-1)
2011-12 2012-13 Pooled 2011-12 2012-13 Pooled Genotype (G) G1:Kent 1138.54 c 1121.48 c 1130.01 c 0.623 a 0.507 a 0.565 a G2:JHO-822 1175.42 b 1149.48 b 1162.45 b 0.626 a 0.498 a 0.562 a
G3:JHO-99-2 1185.68 a 1160.90 a 1173.29 a 0.621 a 0.526 a 0.574 a S.Em. ± 1.42 2.43 1.65 0.007 0.011 0.007 Nitrogen level (N, kg ha-1) N1:90 1153.97 c 1127.53 c 1140.75 c 0.623 a 0.511 a 0.567 a N2:120 1166.20 b 1144.47 b 1155.34 b 0.623 a 0.498 a 0.560 a N3:150 1179.47 a 1159.85 a 1169.66 a 0.625 a 0.523 a 0.574 a S.Em. ± 1.42 2.43 1.65 0.007 0.011 0.007 Cutting interval (C) C1: 55 DAS 1165.51 a 1142.10 a 1153.80 a 0.623 a 0.509 a 0.566 a
C2: 65 DAS 1167.58 a 1145.81 a 1156.69 a 0.624 a 0.512 a 0.568 a
S.Em. ± 1.16 1.98 1.34 0.006 0.001 0.006 Interaction (G×N×C) G1N1C1 1121.44 j 1101.44 g 1111.44 g 0.623 a 0.513 a 0.568 a
G1N1C2 1123.70 ij 1107.04 fg 1115.37 fg 0.621 a 0.505 a 0.563 a G1N2C1 1132.40 i 1118.40 e-g 1125.40 ef 0.619 a 0.502 a 0.560 a G1N2C2 1146.19 h 1123.19 d-f 1134.69 de 0.626 a 0.496 a 0.561 a G1N3C1 1155.41f-h 1137.41 cd 1146.41 cd 0.623 a 0.516 a 0.570 a G1N3C2 1152.10 gh 1141.44 cd 1146.77 cd 0.625 a 0.515 a 0.570 a G2N1C1 1162.03 e-g 1134.03 c-e 1148.03 d 0.630 a 0.520 a 0.575 a G2N1C2 1164.59 d-f 1138.26 cd 1151.42 bc 0.626 a 0.503 a 0.565 a G2N2C1 1171.62 c-e 1143.29 c 1157.45 bc 0.625 a 0.471 a 0.548 a G2N2C2 1174.00 cd 1149.00 bc 1161.50 b 0.626 a 0.472 a 0.549 a G2N3C1 1189.58 a 1164.25 ab 1176.91a 0.626 a 0.486 a 0.556 a G2N3C2 1190.70 a 1168.03 a 1179.37 a 0.624 a 0.537 a 0.581 a G3N1C1 1177.59 bc 1141.25 cd 1159.42 bc 0.619 a 0.519 a 0.569 a G3N1C2 1174.49 cd 1143.16 c 1158.82 bc 0.619 a 0.509 a 0.564 a G3N2C1 1185.99 ab 1167.33 ab 1176.66 a 0.620 a 0.517 a 0.568 a G3N2C2 1186.98ab 1165.64 ab 1176.31 a 0.621 a 0.531 a 0.576 a G3N3C1 1193.51a 1171.51 a 1182.51a 0.622 a 0.539 a 0.580 a G3N3C2 1195.50 a 1176.50 a 1186.00 a 0.627 a 0.544 a 0.586 a S.Em. ± 3.47 5.49 4.04 0.018 0.026 0.018

PATEL AND ALAGUNDAGI, Effect of Nitrogen Level and Cutting Interval on Fodder Yield of Oat Genotypes 813
Table 2. Green forage and dry matter yield of oat genotypes as influenced by nitrogen level and cutting interval.
Means followed by the same lower case letter/s in a column do not differ significantly by DMRT (P= 0.05), DAS-Days after sowing.
Treatment
Green forage yield (t ha-1) Dry matter yield (t ha-1) 2011-12 2012-13 Pooled 2011-12 2012-13 Pooled
Genotype (G) G1:Kent 31.34 c 29.14 c 30.24 c 6 .83 c 6.08 c 6.46 c
G2:JHO 822 34.68 b 32.67 b 33.68 b 7 .26 b 6.95 b 7.12 b
G3:JHO 99-2 39.22 a 36.20 a 37.71 a 7 .54 a 7.35 a 7.45 a
S.Em. ± 0.31 0.27 0.23 0 .087 0.10 0.064
Nitrogen level (N, kg ha-1) N1:90 28.89 c 26.87 c 27.88 c 6 .28 c 5.79 c 6.04 c
N2:120 35.74 b 32.94 b 34.34 b 7 .44 b 6.94 b 7.19 b
N3:150 40.61 a 38.20 a 39.41 a 7 .92 a 7.66 a 7.79 a
S.Em. ± 0.31 0.27 0.23 0 .087 0.10 0.064 Cutting interval (C)
C1: 55 DAS 33.55 b 31.18 b 32.37 b 7 .02 b 6.62 b 6.82 b
C2: 65 DAS 36.61 a 34.16 a 35.39 a 7 .41 a 6.98 a 7.19 a
S.Em. ± 0.25 0.22 0.21 0 .071 0.08 0.052
Interaction (G×N×C) G1N1C1 25.30 k 21.99 j 23.65 h 5 .34 h 4.28 g 4.81 i
G1N1C2 26.70 jk 24.98 i 25.84 g 6 .39 g 5.00 f 5.69 h
G1N2C1 31.33 i 28.48 h 29.91 f 7 .15 d-f 6.48 c-e 6.81 ef
G1N2C2 34.30 g 31.36 g 32.83 e 7 .32 d-f 6.52 c-e 6.92 d-f
G1N3C1 34.43 g 32.80 fg 33.62 e 7 .34 c-f 6.94 cd 7.14 c-e
G1N3C2 35.97 fg 35.22 de 35.59 d 7 .47 b-d 7.27 bc 7.37 cd
G2N1C1 26.42 jk 25.16 i 25.79 g 6 .12 g 5.89 e 6.00 gh
G2N1C2 28.67 j 28.71 h 28.69 f 6 .69 fg 6.18 de 6.44 fg
G2N2C1 33.75 gh 31.40 g 32.57 e 7 .41 b-e 7.12 c 7.26 c-e
G2N2C2 38.30 de 34.56 ef 36.43 d 7 .57 b-d 7.24 bc 7.41 cd
G2N3C1 39.17 de 37.11 cd 38.14 c 7 .74 b-d 7.30 bc 7.52 c
G2N3C2 41.80 bc 39.11 bc 40.45 b 8 .03 bc 7.99 ab 8.01 b
G3N1C1 31.67 hi 28.59 h 30.13 f 6 .43 g 6.53 c-e 6.48 fg
G3N1C2 34.60 g 31.81 g 33.21 e 6 .75 e-g 6.87 cd 6.81 ef
G3N2C1 37.14 ef 34.47 ef 35.81 d 7 .52 b-d 6.99 c 7.25 c-e
G3N2C2 39.63 cd 37.36 c 38.50 c 7 .64 b-d 7.26 bc 7.45 c
G3N3C1 42.75 b 40.66 b 41.70 b 8 .10 b 8.02 ab 8.06 b
G3N3C2 49.53 a 44.31 a 46.92 a 8 .83 a 8.45 a 8.64 a
S.Em. ± 0.76 0.67 0.57 0 .21 0.24 0.16
Interaction effect:
The interaction of genotypes, nitrogen level and cuttinginterval were significant with respect to green forage and drymatter yield. The combination of G3N3C2 i.e., genotype JHO99-2 with 150 kg nitrogen per ha with cutting interval for fodderof 65 DAS (46.92 and 8.64 t ha-1, respectively) recordedsignificantly higher green forage and dry matter yield comparedto rest of the interactions, this was mainly due to significantlyhigher fresh weight (1186.00 g per m row length) and highertotal dry matter accumulation (0.586 g plant-1). It was followed
by G3N3C1 i.e., genotype JHO 99-2 with 150 kg nitrogen per hawith cutting interval for fodder of 55 DAS (41.70 and 8.06 t ha-
1, respectively) and G2N3C2 i.e., genotype JHO 822 with 150 kgNitrogen per ha with cutting interval for fodder of 65 DAS(40.45 and 7.52 t ha-1, respectively) which were on par. Thesame trend of green forage and dry matter yield was followedduring individual years of 2011-12 and 2012-13. Finally it canbe concluded that the genotype JHO 99-2 with 150 kg N ha-1
with cutting interval of 65 days after sowing recordedsignificantly higher green forage and dry matter yield.

814 Trends in Biosciences 6 (6), 2013
LITERATURE CITED
Barik, A.S. and Roy, D. 2002. Effect of mulching and nitrogen onforage yield of rainfed oats in rice fallow. Journal of Inter-academicia, 6(1):55-58.
Chakraborty, T., Subrata Mandal, and Saswat Haldar 1994. Effect ofdifferent levels of nitrogen and cutting on growth, forage and grainyield of oat. Crop Research, 18 (1):39-45.
Habib, G., Ahmed, T., Saba, I. and Akhtar, N. 2003. Genotype variationin the yield and nutritive quality of oat fodder. Sarhad JournalAgriculture 12(1):59-66.
Iqbal, M.F., Sufyan, M.A., Aziz, M. M., Zahid, I. A. Qamir-ul-Ghani,and Aslam, S. 2009. Efficacy of nitrogen on green fodder yield andquality of oat (Avena sativa L.). The Journal of Animal & PlantSciences 19(2): 82-84.
Muhammad Ayub, Muhammad Shehzad, Muhammad Ather Nadeem,Muhammad Pervez, Muhammad Naeem and Naeem Sarwar 2011.Comparative study on forage yield and quality of different oat(Avena sativa L.) varieties under agroecological conditions ofFaisalabad, Pakistan. African Journal of Agricultural Research6(14): 3388-3391.
Nazakat Nawaz, Abdul Razzaq, Zulifaqar Ali, Sarwar, G. and Yousaf, M.,2004. Performance of different oat (Avena sativa L.) varieties
under the agro-climatic Conditions of Bahawalpur–Pakistan.International Journal of Agriculture & Biology, 6(4):624-626.
Patel, M.R., Meisheri, T.G. and Sadhu, A.C. 2010. Effect of irrigation,nitrogen and bio-fertilizer on forage yield and quality of oat (Avenasativa L.). Forage Research, 35 (4): 231-235.
Pradhan, L. and Mishra, S.N. 1999. Effect of cutting management, rowspacing and levels of nitrogen on fodder yield and quality of oat.Indian Journal of Agronomy, 39 (2): 233-236.
Rana, D.S., Bhagat Singh and Joshi, U.N. 2009. Response of oatgenotypes to nitrogen levels. Forage Research, 35 (3): 184-185.
Sharma K.C. 2009. Integrated nitrogen management in fodder oats(Avena sativa) in hot arid ecosystem of Rajasthan. Indian Journalof Agronomy 54(4): 459-464.
Shekara, B.G., Lohithaswa, H.C., Sreedhara,D. and Saritha, K.S. 2008.Response of single cut oat genotypes to nitrogen levels. ForageResearch, 34(3):199-200.
Tiwana, U S., Puri, K. P. and Chaudhary, D.P., 2008. Fodder productivity,quality of multicut oat grown pure and in mixture with differentseed rates of sarson. Forage Research, 33(4): 224-226.
Virendra Singh, Khoker,J.S., Joshi, Y.P. and Verma, S.S. 1985. Responseof forage oat to sowing dates and cutting management on seedproduction. Forage Research, 11 (1): 45-49.
Recieved on 21-08-2013 Accepted on 19-09-2013

Trends in Biosciences 6 (6): 815-817, 2013
Effect of Organic Fertilizers on the Growth and Yield of Garlic (Allium sativum)under Teak (Tectona grandis) Based Agroforestry SystemRAJIV UMRAO, SETSO MEYASE, NEELAM KHARE AND R. K. ANAND
School of Forestry & Environment, Sam Higginbottom Institute of Agriculture, Technology and Sciences,Allahabad-211007 (U.P.)email: [email protected].
ABSTRACT
The present study was conducted at the experimental field ofSchool of Forestry and Environment , Sam HigginbottomInstitute of Agriculture, Technology and Sciences Allahabad(U.P) during the period of November 2011- April 2012.Theexperiment was carried out in the randomized block designwith seven treatments each in open and shade conditions. Thetreatment combinations used were control, FYM, vermicompost, neem cake, 50% FYM + 50% vermi compost, 50%FYM + 50% neem cake, 50% vermi compost + 50% neem cake.The groth and yield parameters were observed. The resultsshowed that different treatment of organic fertilizers had apositive effect on the growth and yield of plants under bothopen and shaded conditions but plants grown under shadedconditions performed better in comparison to the ones grownin the open. Among all the treatment combination theapplication of FYM have better influence on growth and yieldof garlic under open and shade conditions but more yield wasobtained with the application of FYM under light shade oftrees.
The world’s land resources are finite and presently only22 per cent of the earth’s resources are suitable for agriculturalpurposes, of these, 13 per cent area has low productioncapacity, 6 per cent medium and only 3 percent is characterizedwith high capacity for intensive crop production (Buringh,1989). With the ever increasing population there is a need toincrease output from the same unit of land. As a result thereis a need to sustainably manage the available land in such away that it gives a desirable high net output with minimumsoil degradation. Under such circumstances agroforestry canbe advantageous over conventional agricultural and forestproduction methods in the aspect of production, economicbenefits, social outcomes and the ecological balance.Agricultural crops such as garlic are therefore popularly grownin various agroforestry systems.
Garlic is an annual herbaceous plant belonging to thefamily Amaryllidaceae (Alliaceae). It can be grown year-roundin mild climates. While sexual propagation of garlic is indeedpossible, nearly all of the garlic in cultivation is propagatedasexually by planting individual cloves in the ground. It cangive maximum economic benefit from the minimum out put.Garlic is being used in the Indian culinary since hundreds ofyears as a condiment.
It is extensively grown throughout the country. It holdsa premier position in production of these commodities in theworld and occupies second important place (Srivastava andGupta, 2006). It is among the most ancient cultivatedvegetables giving pungency of the genus Allium. Originalabode of garlic is said to be central Asia and Southern Europe,specially Mediterranean. It has long been grown in India andChina. It is a herbaceous annual bulb producing crop. Theedible underground stem is the composite bulb made ofnumerous smaller bulbs called cloves. In India MadhyaPradesh is the leading state growing garlic, followed by Gujaratand Rajasthan (Srivastava and Gupta, 2006).
MATERIALS AND METHODS
Study Area:
The experiment was conducted in the experimental fieldof School of Forestry and Environment, Sam HigginbottomInstitute of Agriculture Technology and Sciences, Allahabadduring November 2011 to April 2012. The experimental site isat an elevation of 98m above mean sea level at 28.87oN latitudeand 81.15oE longitude. The climate of the area is sub tropicalwith extremes of summer and winter. During the winter monthsespecially December and January, temperature drops down toas low as 3-5-0C, while in the summer temperature reachesabove 45-480C. Hot scorching winds are a regular featureduring the summer where as, there may be an occasional spellof frost during the winter. The annual rainfall is 1100mm, mostlyduring the monsoon period.
Experiment details:
The tip of the garlic cloves were cut and soaked in waterfor about 5 minutes and left in a cool room for 48 hours prior tosowing to obtain a good germination. Seed (clove) were sownleaving just the tip of the cloves exposed during November2011. The experiment was carried out under randomized blockdesign with seven treatments and three replications each inopen and shade conditions. The plot size was 2X2 m .Thetreatment combinations were same for both open and shadeconditions. The details of treatments are presented in Table 1.Growth data were recorded few days before harvesting. Yielddata were recorded at the time of harvesting during April 2012.

816 Trends in Biosciences 6 (6), 2013
Table 1. Details of treatment combinations: The maximum number of leaves(8) under open conditionwas observed in FYM( T1) followed by combination of 50%FYM+ 50% vermi compost (T4 -7.2), on the other hand the T0(control) had the minimum number of leaves with 6.5 followedby T3 (Neem cake) with 6.7. Under shaded conditions, themaximum number of leaves (8.1) were found in T1 (FYM)followed by T4 (7.7), the minimum number of leaves was foundin T0 (Control) with 6.8 followed byT3 (neem cake) with 7.0.
The average weight of garlic bulb in open conditionafter 150 DAS was found maximum in T1 (10.2 gm.) followedby T4 (10.1 gm.), however minimum was recorded in T0 (8.2gm.) Whereas in shaded conditions maximum weight of bulbwas also recorded in T1 (12.8 gm.) followed by T4 (12.3 gm.),however minimum was recorded in T0 (l0.3gm).The number ofcloves per bulb in open conditions and shaded conditionwere also showed similar pattern with maximum in T1 (29.90cloves under open and 30.10 cloves under shade) and minimumin T0 (28.65 cloves under open and 28.70 cloves) these findingswere similar to that of Shashidhar, et al., 2009. The plantsgrown under open conditions gave maximum yield in T1 (FYM)with 4.0 ton/ha followed by T4 (50% FYM + 50% vermi compost)with 3.5 ton/ha. On the other hand, the minimum yield wasobtained from T0 (control) with 2.8 ton/ha followed by T3 (neemcake) with 3.0 ton/ha. In contrast to this, plants grown inshaded conditions gave more yield with maximum in T1 (6.3ton/ha) and minimum in T4 (5.7 ton/ha).
Table 2 and 3 explicated that different treatment of
RESULTS AND DISCUSSION
The effect of different organic manures on growth andyield of Garlic (Allium sativum) under open and shadedconditions is presented in the Table 2 and Table 3 respectively,which revealed that after 150 Days of sowing (DAS) maximumplant growth in open conditions, was observed with theapplication of FYM (T 1- 66.08 cm) followed by combinationof 50% FYM + 50% vermi compost (T4 -66.0 cm). Whereas,minimum plant growth was observed in control (T0-59.63 cm)followed by application of neem cake (T3 -64.08 cm.).Similartrend of effect of organic manure was also observed undershaded conditions. But plant growth was more in compressionto open condition. Maximum plant growth under opencondition was recorded in case of application of FYM (T1-69cm.) whereas T0 (control) show minimum plant growth (60.22cm).
Treatments Particulars Dose (gm/plot) T0 Control (with out organic
manure) -
T1 FYM 2900 T2 Vermi compost 2700 T3 Neem Cake 350 T4 50% FYM +
50% Vermi compost 1800
T5 50% FYM + 50% Neem cake 1600 T6 50% Vermi compost + 50%
Neem cake 1500
Table 3. Effect of different organic manures on growth andyield of Garlic (Allium sativum) under teak basedagroforestry
S.No. Treatments Plant Height (cm)
Number of leaves
Average weight of bulb (gm)
Number of cloves per bulb
Bulb yield
(ton/ha)
T0 Control (with out organic manure)
60.22 6.8 10.3 28.70 4.5
T1 FYM 69.0 8.1 12.8 30.10 6.3 T2 Vermicompost 65.40 7.4 11.7 29.53 5.1 T3 Neem Cake 64.41 7.0 11.4 28.90 4.7 T4 50% FYM +
50% Vermicompost
67.12 7.7 12.3 29.86 5.7
T5 50% FYM + 50% Neem cake
66.72 7.5 12.1 29.71 5.5
T6 50% Vermicompost + 50% Neem cake
64.46 7.2 11.5 29.50 4.9
F- Test S S S S S S.E.(±) 0.654 0.094 0.274 0.401 0.448 C.D.(P=0.05) 1.350 0.194 0.566 0.828 0.925
Table 2. Effect of different organic manures on growth andyield of Garlic (Allium sativum) under openconditions
S.No. Treatments Plant Height (cm)
Number of leaves
Average weight of bulb (gm)
Number of cloves per bulb
Bulb yield
(ton/ha)
T0 Control (with out organic manure)
59.63 6.5 8.2 28.65 2.8
T1 FYM 69.00 8.0 10.2 29.90 4.0 T2 Vermicompost 65.40 7.0 9.9 29.45 3.1 T3 Neem Cake 64.41 6.7 8.91 28.66 3.0 T4 50% FYM +
50% Vermicompost
67.12 7.2 10.1 29.80 3.5
T5 50% FYM + 50% Neem cake
66.72 7.1 10.0 29.60 3.4
T6 50% Vermicompost + 50% Neem cake
64.46 6.9 109.6 28.9 3.2
F- Test S S S S S S.E.(±) 0.654 0.243 0.244 0.409 0.244 C.D.(P=0.05) 1.350 0.502 0.504 0.845 0.504

UMRAO et al., Effect of Organic Fertilizers on the Growth and Yield of Garlic (Allium sativum) under Teak (Tectona grandis) 817
organic fertilizers had an influence on the growth and yield ofplants under both open and shaded conditions but plantsgrown under shaded conditions performed better incomparison to the ones grown in the open. Similar resultswere also observed by Islah, 2010, who reported enhancedplant growth and yield with the application of organic manure.
Therefore it can be concluded from the present studythat the application of FYM have better influence on growthand yield of garlic under open and shade conditions but moreyield can be obtained with the application of FYM (7.25 ton /ha) under light shade of trees.
LITERATURE CITED
Buringh, P. 1989. Availability of agricultural land for crop and livestockproduction. In: Food and Natural Resources (Eds. D.Pimental andC.W,Hall) Academic Press. San Diego, C.A. pp. 70-80.
Islah, M. E. 2010. Response of garlic (Allium sativum L.) to somesources of organic fertilizers under North Sinai conditions. ResearchJournal of Agriculture and Biological Sciences. 6( 6): 928-936.
Shashidhar, T. R., Mannikeri, I. M. and Chavan, M. L. 2009. Influenceof different organic manures on growth and yield of garlic (Alliumsativum). Journal of Ecobiology. 25( 3): 235-239.
Srivastava, K. J. and Gupta, R.P. 2006. Diseases of onion and garlic.National Horticultural Research and Development Foundation,Nashik.
Recieved on 30-08-2013 Accepted on 15-09-2013

818 Trends in Biosciences 6 (6), 2013Trends in Biosciences 6 (6): 818-819, 2013
Effect of Planting Dates on Incidence of Insect-pests and Their Predators in RiceFieldA.P. SINGH, R.B. SINGH, M.N. LAL AND R.C. SHARMA
Department of Entomology, N.D. University of Agriculture & Technology, Kumarganj, Faizabad- 224 229,U.P.*email: [email protected]
ABSTRACT
Field experiments were carried out at NDUA&T crop researchstation of Masodha and farmers fields of Faizabad district duringKharif 2011 and 2012, rice was transplanted normal, late andvery late conditions the maximum damaged of SB and LF andpopulation per five sweeps of LF, GLH and GH were observed invery late transplanting and least in normal planting in bothexperimental years. The natural enemies’ populations per fivesweeps were highest in normal followed by very late plantingrice.
Key word Rice, Insect pests, Date of transplanting
Rice (Oryza sativa L.), the most important single foodcrop of the global importance and is the staple food for nearlyhalf for the world population. It is the most important crop ofIndia and it occupies 23.3 per cent of gross cropped area ofcountry. Rice contributes 43 per cent of total food grainproduction and 46 per cent per cent of total cereal productionin India. It continues to play vital role in national food grainsupply.
Various biotic and abiotic constraints encountered therice production and productivity, among them insects are majorharmful biotic factor that caused 21-40 per cent losses in riceyield (Pathak and Dhaliwal, 1995). Paddy crop suffers maximumlosses due to wide range of insects and non-insect-pests underdifferent ecological condition. Insects alone cause about 30%yield losses in rice every year by attacking almost all the aerialparts of the crop plants as well as root system in soil (Prakashand Rao, 2003).
Among the various insect-pests damaging the rice cropstem borer, gall midge, brown plant hopper and leaf folder aremajor in India.
In recent decades the environment, mainly owing toglobal warming has highly influenced the insect-pests andtheir natural enemies population in rice ecosystem .Thereforein view an experiment was carried out to studies the effect ofplanting dates in incidence of rice insect- pests and theirpredatory population.
MATERIALS AND METHODS
To achived the above objective the rice was transplantednormal, late and very late conditions (treatments) in the area
of 1500 sq. m. each with ten replications in RBD. Thus thetotal aera of experiment was 4500sqm. The scented varietyPusa Basmati-1 was sown for this experiment. All agronomicalpractices will be adopted to raise the good crop.
The 5 hills were tagged randomly in each replication ofeach treatment to record the observations. Insect pestsincidence and their predatory population were started torecord on tagged hills from their first appearance andcontinued up to maturity of crop season at 15 days interval.Besides, the population of insect-pests and their predatorswere also observed with hand collecting nets by 5 sweepingat 3 places in each replication from their first appearance inthe field at 15 days intervals.
RESULTS AND DISCUSSION
Influence of the three dates of planting on insect-pestand its natural enemies were observed Kharif season 2011and12 and presented as below:
The results showed that the insect-pests incidence werelow at initial of crop established, which attained its highestpeak at reproductive stage of crop except in case of RH ineach transplanting dates during both experimental years. Themaximum borer incidence recorded with 3.51 and 3.37 per centdead heart upto vegetative stage and 3.44 and 3.54 per centwhite ear head at reproductive stage in very late planting inboth the experimental year, respectively.
Leaf folder damage was recorded maximum in very lateplanting with 1.43 and 1.71 per cent up to vegetative stageand 5.92 and 6.81 per cent leaves damage in reproductivestage in both year of Kharif, 2011 and 2012, respectively.
The highest population of GLH, GH and LF recorded invery late transplanting rice with 205.00 and 179.00, 13.00 and9.75 and 96.25 and 58.75 in per five sweeps in both experimentalyears, respectively followed by late and normal planting riceupto vegetative stage during both Kharif season. Rice hispapopulation was observed only normal planting up to 40 DATin both the years.
At reproductive stage of crop maximum population ofGLH, GH and LF were recorded at highest in very late plantingwith 201.00 and 195.00, 15.66 and 11.66 and 55.00 and 48.33during Kharif, 2011 and 2012, respectively late and normalplanting.

SINGH et al., Effect of Planting Dates on Incidence of Insect-pests and Their Predators in Rice Field 819
The results showed that the natural enemies populationwere highest recorded in normal and late planting incomparison to very late planting.
Spiders, damselflies, dragonflies and ground beetle weremaximum population observed in normal planting with 4.00and 3.50, 1.50 and 1.25, 0.75 and 1.00, 1.75 and 1.50 in per fivesweeps, respectively, both experimental years at vegetativestage followed by late planting.
At reproductive stage of crop maximum population ofspiders, damselflies, dragonflies and ground beetles wereobserved at highest in late planting with 5.33 and 6.00, 2.33and 1.00, 2.33 and 0.66, 1.33 and 1.33 during Kharif, 2011 and2012, respectively followed by normal and very late planting.
The findings of present studies are in conformity resultof Gangwar and Ahmadi, 1990; Safique and Anwar, 1986 andFlario et al., 2001.
LITERATURE CITED
Faleiro, J.R.; Patil, K.D. and Viraktamath, B.C. 2001. Incidence of leafhopper, Cnaphalecrocis medinalis and gall midge Orselia oryza onmedium duration rice varieties. Indian J. Entomology, 63 (2): 201-203.
Gangwar, B. and Ahamedi, R. 1990. Effect of planting time on growth,yield and incidence of insect-pests and disease in rice. Oryza, 27(4): 497-500.
Prakash, A. and Rao, J. 2003. Insect-pests of cereals and theirmanagement. Pub. by AZRA, CRRI, Cuttack, Orrisa, pp. 167.8
Pathak, M.D. and Dhaliwal, G.S. 1995. Insect Control Global aspect offood production. In: (eds. M.S. Swaminathan and S.K. Sinha).Tycooly international, Oxford, U.K., pp. 357-386.
Shafique, M. and Anwar, M. 1986. Effect of transplanting time onborer attack and yield of rice cultivars. Proceeding of PakistanCongress of Zoology. 6: pp. 86-92.
Recieved on 03-09-2013 Accepted on 24-10-2013
Table 1. Status of insect-pests of rice and its natural enemies under different date of transplanting during Kharif, 2011 and2012
Crop stage Av. damage (%)/Av. Population per five sweep
Insect pests its natural enemies
Normal planting Late planting Very late planting
Av. Damage (%) and population (Av. No./five sweeps)
2011 2012 2011 2012 2011 2012
Vegetative
SB (DH %) 2.73 2.83 3.18 3.17 3.51 3.37
LF (DL %) 0.91 0.03 1.19 0.08 1.43 1.71
LF (Adult) 2.75 2.00 43.50 66.25 58.75 96.25
RH (adult) 1.00 1.00 0.00 0.00 0.00 0.00
GH (Nymph and adult) 3.25 3.00 9.00 8.75 9.75 13.00
GLH (Nymph and adult) 12.25 10.00 154.00 178.00 179.00 205.00
Spider (Nymph and adult) 4.00 3.50 3.75 3.00 1.50 2.00
Damselfly (Adult) 1.50 1.25 0.50 1.00 1.00 0.00
Dragonfly(Adult) 0.75 1.00 1.50 0.75 0.50 0.00
Ophinia (Adult) 1.75 1.50 1.00 0.75 1.00 1.00
Reproductive
SB (WE %) 3.10 2.52 3.41 2.79 3.44 3.54
LF (DL %) 2.49 1.72 2.50 4.06 5.92 6.81
RH (adult) 0.00 0.00 0.00 0.00 0.00 0.00
GH (Nymph and adult) 3.66 6.33 10.00 11.66 11.66 15.66
LF (Adult) 2.57 19.66 5.33 41.00 48.33 55.00
GLH (Nymph and adult) 91.66 28.33 97.0 178.00 195.00 201.00
Spider (Nymph and adult) 3.66 3.33 5.33 6.00 1.00 1.00
Damselfly (Adult) 2.33 1.00 2.33 1.00 0.00 0.00
Dragonfly(Adult) 1.00 2.00 2.33 0.66 0.00 0.00
Ophinia (Adult) 1.33 1.00 1.33 1.33 0.33 0.66
820 Trends in Biosciences 6 (6), 2013Trends in Biosciences 6 (6): 820-822, 2013
Effect of Salinity on Germination and Early Seedling Growth Stages of Urdbean(Vigna mungo L. Hepper)BHUPENDRA KUMAR1, DR. ARVIND SHUKLA2, AND YASHLOK SINGH3
1. K.V.K., SVBPUAT, Meerut, 2. GBUAT, Pantnagar,3. NDUAT,Faizabad,email : [email protected]
ABSTRACT
The present investigation, which was carried out to find outscreening criteria against salt stress under incubator conditionsin urdbean during 1999 comprised 18 improved land racescollected from diversity rich zones of Uttar Pradesh and fromNBPGR, New Delhi along with four check varieties were used.The study revealed the possible selection criteria for salttolerance to be a combination of high germination and radiclelength. A significant reduction in germination was found atsalinity levels of 11.25 dS/m, but genotypes ShU 9503, ShU9508, ShU 9518, ShU 9511, ShU-9532, Type 9 and PU 19 showedgood capacity to germinate at this level. Most of these genotypeswas also reduced at high salinity levels, ShU 9536, ShU 9511and ShU 9519 gave better radicle length. Type 9, PLU 289 andShU 9601 had high plumule radicle length ratio at various saltconcentrations, indicating better salt tolerance over othergenotype. Dry matter production was also reduced at highsalinity levels and other genotype. Dry matter production wasalso reduced at high salinity levels and significant differenceswere found among the genotypes for dry matter production.However, dry matter obtained under salt stress was not foundto match with good germination. Judicious use of selection onthe basis of good germination (above 70%) along with highplumule radicle length ratio (more than 1) under salt stresscondition can give a base for standardization of techniques.
Key words Salinity, germination, urdbean
Blackgram or Urdbean (Vigna mungo L. Hepper. 2n =22) is an important crop in India, Having high protein contentand its wide culinary uses.
It is estimated that the country’s population will touchnearly 1350 million by 2020 AD. The country would then needa minimum of 30.3 million tonnes of pulses. The total areaunder pulses remained virtually stagnant ( 22-24) millionhectares) with almost stable production ( 12-14 million tonnes) over the last four decades. In urd bean, India has shownmarginal increase in area from 3.10 to 3.15 m ha and inproductivity from 377 kg per ha 473 kg per ha during 1986-87to 1996-97 respectively. (Asthana and Chaturedi, 1999).
A large global land area is affected by saline, alkali (sodic)and acid soil conditions. In India, the salt affected soil covers9.38 m ha, a out of which 5.5 m ha area has been affected bysalinity and 3.3m ha due to alkalinity, of this area 1.58 m ha hasbeen reported to be in the State of Uttar Pradesh only(Annoymous, 1990).
Ten percent of total worlds croplands are affected bysalinity. 20 to 27 per cent of irrigated land is salt affected and37 per cent area is either saline, alkali (sodic) or water logged.Irrigation water contains 0.1-4kg salt/m3. Thus 1-60 metrictonnes of salts/ha are applied to croplands annually. Therefore,for sustainable agriculture this salt has to be removed fromthe crop root zone by leaching or drainage. *The extent ofgenetic diversity for salinity tolerance in urdbean germplasmhas been little explored and scope of utilization of this crop insalt affected area is existing in India.
MATERIALS AND METHODS
The present investigation was carried out on 22genotypes as given in Table for preliminary observation, onsalt tolerance behavior.
Screening of selected genotypes was carried out atdifferent levels of salt concentrations at germination and earlyseedling stage up to ten days growth period under controlledincubator conditions (260 C temperature and 80% relativehumidity).
The twenty two genotypes were screened underincubator conditions (260 C temperature and 80 per cent relativehumidity) using sodium chloride (NaCl) salt solution. Aqueoussolution of 2 electrical conductivities (EC) viz., 0.00 and 11.25ds/m (decisemiens/meter or millimhos/cm) were used forscreening purpose.
Preparation of solutions of different electrical conductivity(EC):
The solution of different EC were prepared in deionisedwater using reagent grade salts in 0.00EC solution no saltwas added in deonised water. For the preparation on 11.25 ds/m solution 0.920 g of NaCl was dissolved per 100ml ofdeionised water.
The electrical conductivity (EC) of these solutions weremeasured at conductivity bridge (Systronic ConductivityBridge 305).
First the display was adjusted equal to the all constantvalue(0.68) with the half of cell constant knobs. Then theconductivity cell was dipped into the solution whoseconductance was to be measured. The function switch wasbrought to MHOS position. The display indicated theconductance directly. On the same basis 20 liter of solution

KUMAR, et al., Effect of Salinity on Germination and Early Seedling Growth Stages of Urdbean (Vigna mungo L. Hepper) 821
S.No. Genotype Name
Mean germinability %
Mean plumule lenght(cm)*
Mean radicle length (cm)*
Mean plumule radicle length ratio*
Mean dry matter weight (gm)*
Electrical Conductivity
(EC)ds/m
Electrical Conductivity
(EC)ds/m
Electrical Conductivity (Ec)
ds/m
Electrical Conductivity (Ec)
ds/m
Electrical Conductivity (Ec)
ds/m 0.00 11.25 0.00 11.25 0.00 11.25 0.00 11.25 0.00 11.25
1 ShU 9503 91.33 85.20 31.89 12.68 8.87 8.54 3.57 1.49 1.53 0.31 2 ShU 9505 80.67 76.00 32.56 12.96 90.87 7.28 3.31 1.79 1.52 0.29 3 ShU 9508 86.00 82.00 21.22 13.68 10.10 8.74 2.10 1.77 1.43 0.20 4 ShU 9518 82.00 84.80 20.22 12.92 10.43 10.70 1.93 1.20 0.88 0.33 5 ShU 9511 89.33 85.00 22.45 12.08 11.50 10.52 1.94 1.14 1.41 0.17 6 ShU 9519 85.33 77.60 29.33 12.52 10.70 8.96 2.75 1.39 1.56 0.15 7 ShU 9525 76.00 46.40 23.11 11.64 8.27 7.32 2.52 1.59 1.42 0.11 8 ShU 9532 89.33 79.60 28.22 8.72 8.53 6.20 2.66 1.35 0.64 0.28 9 ShU 9536 82.67 84.0 21.78 12.88 15.40 10.74 1.42 1.20 0.84 0.31 10 ShU 9601 77.33 64.80 21.33 11.2 8.33 6.66 2.40 1.69 1.34 0.27 11 ShU 9611 90.67 66.80 25.67 11.92 8.33 10.28 1.97 1.16 1.06 0.17 12 ShU 9622 80.67 74.40 20.22 12.2 13.03 7.56 1.96 1.56 1.16 0.28 13 ShU 9626 84.00 76.40 27.22 12.4 13.80 7.84 2.24 1.58 1.57 0.46 14 ShU 9632 87.33 77.60 23.78 12.76 12.13 7.56 2.94 1.70 1.58 0.13 15 ShU 9642 86.00 78.80 26.22 11.32 9.20 8.08 2.84 1.59 1.56 0.27 16 ShU 96133 88.00 76.00 32.22 12.56 9.20 7.08 2.45 1.56 0.86 0.31 17 PLU 289 72.00 64.40 21.89 12.28 13.13 6.52 2.33 1.88 1.19 0.22 18 PLU 433 86.00 80.80 30.67 9.76 9.33 6.80 2.97 1.42 1.63 0.29 19 T 9 87.33 80.80 21.45 13.64 10.73 6.88 2.19 1.99 0.88 0.27 20 PU 19 87.33 80.00 20.33 11.52 8.70 7.04 2.33 1.66 1.55 0.17 21 PU 35 80.67 76.00 19.45 8.48 8.66 6.72 2.62 1.26 1.61 0.11 22 NU 1 82.67 76.00 23.78 10.08 8.73 6.40 2.64 1.57 1.53 0.20 Grand Mean 84.21 75.38 24.77 11.83 10.45 7.88 2.43 1.52 1.31 0.24 SEM 2.77 2.40 1.80 0.56 0.45 0.33 0.14 0.78 0.035 0.009
was prepared for carrying out germination and early seedlinggrowth experiment.
Germination and early seedling evaluation:
The seeds of the twenty two genotypes were surfacetreated with fungicide, thiram at the rate of 2.5 gm per kg seedweight and 100 seed of each genotypes were kept on towelpaper soaked in the salt solution of different electricalconductivity. The seeds were then covered with another sheetof moist germination paper, rolled up along with butter paperand fastened with rubber band and kept in the trays verticallyand placed in temperature controlled incubator at 260 C withrelative humidity of 80 percent following the International rulesfor seed testing. Each genotypes were replicated five times inboth 0.00 and 11.25 EC Conditions.
The observation for germination trends and earlyseedling behavior were taken in all the genotypes after tendays of incubation and found that the germination percentage(Out of 100-seeds the total seeds with appearance of plumuleand radical were counted in all the replications after 10 daysof incubation), Plumule length(The length of plumule wasmeasured in cm with the help of scale on randomly selectedfive seedlings, 10 days after incubation), Radicle length (Thelength of radicle was recorded on the same randomly selected
five seedling with the help of a scale in cm after 10 days ofincubation), Plumule radicle length ratio (The ratio wasobtained by dividing the length of plumule by length of radiclefrom each marked seedling on which earlier plumule and radiclelengths were taken on 10th day) and Dry matter weight (All thetagged seedling of each genotypes were pooled acrossreplication in a butter paper bag and dried in the hot air plantdryer at 70 + 50 C for 24-27 hours and then weight was recordedin grams).
RESULTS AND DISCUSSION
Grand mean of germination of various salt concentrationTable indicated that application of saline water significantlyreduced the percentage of germination when compared withthat of deionised water of control treatment.
These finding have been reported by several scientistsviz. Singh and Lal, 1972 in black gram, Paliwal and Maliwal,1973 in pea, Sekhar, 1994 in green gram and Sarkar and Shukla,1997 in lentil crop. This may be due to osmotic inhibition ofwater absorption by seeds or due to accumulation of ions intoxic concentrations in the plant tissue or by altering theabsorption of mineral nutrient has as been reported by Haywardand Wadleigh, 1949.
Table 1. Germinability(%), plumule length(cm)*, radicle length(cm)* plumule radicle length ratio* and dry matter weight(gm)* of various genotypes of urdbean at different salt concentrations.

822 Trends in Biosciences 6 (6), 2013
AT 11.25 dS/m salt concentration six genotypes ShU9503, ShU 9508, ShU 9518, ShU 9536 and ShU 9642 had morethan 80 per cent germination and also higher radicle length.Kuhad and Sheoran, 1987 and Chugh, et al., 1988 in pigeonpea also reported that radicle length decreased at increasinglevel of salt stress. They suggested that radicle length may bemost useful parameters in evaluating salt tolerant cultivars ofcrop plants. Increasing levels of salinity decreased germinationand seedling growth in cowpea crop. In the present study itwas found that association between germination percent andplumule redicle length ration at 11.25 EC salt concentrationwas significantly positive indicating a possible selectioncriteria for salt tolerance in urdbean.
Study on twenty-two genotypes to find out selectioncriteria for screening of genotypes against salt stress,indicated that germination and early seedling growth wereadversely affected with increasing level of salinity. Thepossible criteria for salt tolerance can be a combination ofhigh germination and radicle length. Germination of urdbeangenotypes were significantly reduced as salinity levelsincreased from 0.00 dS/x to 11.25 dS/m. A significant reductionin germination was found at salinity levels of 11.25 dS/m. Thegenotypes, ShU 9503, ShU 9508, ShU 9518, ShU 9511, ShU9532, Type 9 and PU 19 showed good capacity to germinate at11,25 dS/m saline condition under germinator. Plumule lengthand seedlings growth were adversely affected with increasinglevels of salinity. At 11.25 dS/m, there is drastic reduction inplumule length under germinator was found. Among thegenotypes, ShU 9503, ShU 9505, ShU 9508, ShU 9511, ShU9519, ShU 9536, ShU 9632, ShU 96133 and Type 9 attainedgood plumule length at high salinity levels (11.25 dS/m). Radiclelength was also reduced with increasing levels of salinity.The genotypes namely, ShU 9536, ShU 9511 and ShU 9519gave better performance at salinity level of 11.25 dS/m. Thehighest redicle length was attained by ShU 9536. Thegenotypes, Type 9, PLU 289 and ShU 9601 had high plumuleradicle length ratio at various salt concentration in germinator.Thus, indicating better salt tolerance over other genotypes.The dry matter production was reduced at high salinity levels(11.25 dS/m ) as compared to control (0.00 dS/m). There wassignificant difference in dry matter production among the
genotypes. The maximum dry matter production was recordedin ShU 9503, ShU 9518, ShU 9536, ShU 9626 and ShU 96133.While, dry matter production was less found in ShU 9525,ShU 9519 and ShU 9511, as compared to control treatment.The dry matter obtained under salt stress was not found tomatch with good germination. The preliminary studiesindicated that only germination percentage can not be thecriteria of selection for salt tolerance. While, other characterslike plumule, radicle length, plumule radicle length ratio canalso be the good indicator for salt tolerance in urdbean. Thiscan highlighted by genotypes ShU 9503, ShU 9505, ShU 9519,ShU 9626 and ShU 96133 having high plumule and radilcelength. Judicious use of selection as the basis of goodgermination (above 70%) along with the high plumule radiclelength ration (more than 1) under salt stress conditions cangive a base for standardization of techniques.
LITERATURE CITED
Anonymous, 1990. Annual report, 1989, IBPGR, Rome.
Asthana, A.N. and Chaturvedi, S.K. 1999. A little impetus needed. TheHindu Survey of Indian Agriculture. pp. 61-65.
Hayward, H.E. and Wadleigh, C.H. 1949. Advances in Agronomy, 1, 1-38.
Chugh, L.K., Kuhad, M.S. and Sheoran, I.S. 1988. Response of pigeonpeagenotypes to simulated salt and water stress at iso osmotic levelduring germination and early growth. Annals of Biology, 4(1-2) :20-24.
Kuhad, M.S. and Sheoran, I.S. 1987. Influence of simulated drought andsalt stress at iso osmotic level on seedling growth on pigeonpeagenotype. international Pigeonpea Newsletter, 6: 4850.
Paliwal, K.V. and Maliwal G.L. 1973. Salt tolerance of some arhar(Cajanus indicus) cowpea (vigna cinensis) varieties at germinationand seedling stages. Ann. Arid Zone, 12(3/4): 135/144.
Sarkar, Basudev and Shukla, Arvind, 1997. Selection criteria for salttolerance in lentil germplasm I, Germination and seedling traits.Indian J. Pl. Genet Resources. 10(1): 35-40.
Sekhar, M.R. 1994. Salt tolerance of mungbean (Vigna radiata L. Wilezek)at germination stage. Annals of Agricultural Research, 15(1): 90-91.
Singh, Megh and Lal, P. 1972. Salt tolerance of seeds of blackgram(Phaseolus mungo Roxb.) during germination stage. Indian J. Agric.Sci. 42(2): 135-139.
Recieved on 10-09-2013 Accepted on 25-10-2013

Trends in Biosciences 6 (6): 823-826, 2013
Efficacy and Economics of Some Modern Insecticides against Aphid, Aphis gossypiiL. in CottonYOGESH PATEL
Jawahalal Nehru Krishi Vishwa Vidhyalaya, College of Agriculture Ganjbasoda Distt. Vidisha M.P.email: [email protected]
ABSTRACT
A Field trial were conducted in two crop seasons (kharif) during2005-06 & 2006-07 to study the comparative bioefficacy of sixinsecticides, against Cotton Aphid, Aphis gossypii L., using foliarapplication. A insecticide of Thio-ureas class Difenthiuron 50SC @ 400 gai/ha was found most effective and its recordedmaximum reduction in population of cotton aphid, withmaximum increase in yield over control, net profit and wasrelatively safer for potent predators. However Thiomethoxam25 WG 75 gai/ha and Imidacloprid 200 SL @ 100 gai /ha werenext effective chemicals. In the initial stage of infestationapplication of Thiomethoxam 25 WG was found to be moreeconomical because of its higher cost: benefit ratio andrelatively less toxic to potent natural enemies. Our resultssuggest that Difenthiuron, Thiomethoxam and Imidaclopridare good substitutes for conventional insecticides in vogue,which could be used in formulating a successful managementfor A. gossypii in cotton.
Key words Cotton, Bioefficacy, insecticides, Aphid, Ladybirdbeetle, Green lacewing
Cotton (Gossypiuam hirsuttum L.) commercially grownin about 60 to 65 countries (Sundaram, 1972). In India theproductibity is very low when compared to other countriesand this is due to heavy damaged caused by insect pest.(Rathore and Bapodra, 2006). It has been estimated that about20 to 25 per cent yield losses were encountered due to thedamage caused by insect pest (Sohi, 1964).Among 162different species of insect and mites that are reported to attackcotton, Aphid (Aphis gossypii) is a major factor limitingprofitable cultivation of cotton. In the early stage of crop,aphid causes heavey economic loss by sucking cell sap fromthe the tender leaves and secreted honey dew like substances,resulted in development of black sooty mold fungus whichhinder photosynthesis , the get wrinkled and curledbadly.Recently , highly efficacious new insecticides with novelmode of action are introduced in the Indian market . Theseinsecticides are required only in a few gram in camparision toolder class of compounds which are required in few hundredgrams and are perceived to carry higher safety/ environmentalrisks (Wing, et al.,1998, 2000). But the studies on identifyingnew molecules for the control of aphid on cotton not initiatedin a systematic manner. Hence the present study was initiatedto identify the newer insecticides to tackle this problem.
MATERIALS AND METHODS
The present investigation was carried out at the J.N.Krishi Vishwa Vidhyalaya, Cotton Research Station, KhandwaM.P. during 2005-06 & 2006-07 kharif season on Americancotton variety JK 4. The experiment was laid out in randomizedblock design (RBD) with eleven treatment including untreatedcontrol (Table 1). The crop was shown on 27th June and 28th
June during 2005 and 2006 respectively at a spacing of 60X60cm. Normal agronomic practices recommended for the regionwere followed for raising the crop. The insecticides wereevaluated as foliar treatment is given in Table 1. In all, threeneeds based sprays were given during the seasons. A highvolume hand compression Knapsack sprayer was used forapplication of insecticides at their respective doses. Thesprayer was calibrated to deliver the required quantity of spraysolution per plot. Pre and post treatment observations willrecord from each plot from five randomly selected taggedplants. Post treatment observations were recorded two, fiveand seven days after treatment. The regular observations ofpopulation of Aphid recorded on five leaves, two each fromlower, middle and one from upper canopy of the plants. Toevaluate the economics of treatment, current market rate ofinsecticides were obtained and the expenditure on treatmentper plot was calculated based on the doses / concentrationdissolved in the required quantity of water for the treatment.The data were transformed as suggested by Gomez and Gomez,1984 and analyzed by using the analysis of variancetechniques as suggested by Lalchand, 1981.
RESULTS AND DISCUSSION
The pooled average data of Aphid population of twoyear presented in Table 1. revealed that, all the insecticidestested against cotton aphid Aphis gossipii were found to beeffective over control. Insecticides of Thio-ureas groupDifenthiuron 50 SC @ 400 gai/ha were found to be mosteffective and significantly superior over the other insecticidaltreatment. It was give maximum reduction in aphid populationup to 14 days after spray and also recorded maximumpercentage increase in seed cotton yield over control. It alsogives maximum net profit and was also found to be less toxicto potent natural enemies. Review of literature revealed thatno work has been reported so far on use of Difenthiuronagainst cotton aphid. The new group of insecticidesNeonicotinoids, Thiomethoxam 25 WG @ 75 gai/ha

824 Trends in Biosciences 6 (6), 2013
Table: 1 Effect of insecticides treatment on population of Cotton Aphid, Aphis gossypii Glover
()=Figures in parentheses are square root transformed value, DAS= Days after spraying, NS=Non significant *Mean based of 2 observations,** Mean based of 3 observations, *** Mean based of 6 observations, # Mean based of 18 observations
Treatment Population of Aphids par three leaves
PT First year Second year Pooled of two year Pool of
pooled #
2 DAS**
5 DAS**
7 DAS**
2 DAS**
5 DAS**
7 DAS**
2 DAS***
5 DAS***
7 DAS***
Diafenthiuron 50 SC @ 300 gai/ha.
37.91 (6.20)
14.35 (3.85)
16.47 (4.11)
23.45 (4.89)
13.43 (3.73
15.55 (4.00)
22.53 (4.80)
13.89 (3.79)
16.01 (4.06)
22.99 (4.84)
17.63 (4.26)
Diafenthiuron 50 SC @ 400 gai/ha.
38.87 (6.27)
12.71 (3.63)
15.47 (3.99)
22.52 (4.79)
11.79 (3.50)
14.55 (3.87)
21.60 (4.70)
12.25 (3.56)
15.01 (3.93)
22.06 (4.75)
16.44 (4.12)
Imidacloprid 200 SL @ 50 gai/ha.
38.02 (6.20)
21.66 (4.70)
24.46 (4.99)
31.38 (5.65)
20.74 (4.60)
23.54 (4.90)
30.46 (5.56)
21.20 (4.65)
24.00 (4.95)
30.92 (5.60)
25.37 (5.09)
\Imidacloprid 200 SL @ 100 gai/ha.
36.05 (6.05)
14.69 (3.90)
17.45 (4.24)
24.43 (4.99)
13.77 (3.78)
16.53 (4.12)
23.51 (4.90)
14.23 (3.84)
16.99 (4.18)
23.97 (4.94)
18.40 (4.35)
Thiomethoxam 25 WG @ 50 gai/ha.
38.83 (6.27)
18.33 (4.34)
20.37 (4.57)
27.61 (5.30)
17.41 (4.23)
19.45 (4.47)
26.69 (5.21)
17.87 (4.28)
19.91 (4.52)
27.15 (5.26)
21.64 (4.70)
Thiomethoxam 25 WG @ 75 gai/ha.
38.89 (6.28)
13.56 (3.75)
16.37 (4.11)
23.40 (4.89)
12.64 (3.62)
15.45 (3.99)
22.48 (4.79)
13.10 (3.69)
15.91 (4.05)
22.94 (4.84)
17.32 (4.22)
Acetamiprid 20 SP @ 15 gai/ha.
38.67 (6.26)
25.62 (5.11)
28.44 (5.38)
35.42 (5.99)
24.70 (5.02)
27.52 (5.29)
34.50 (5.92)
25.16 (5.06)
27.98 (5.34)
34.96 (5.95)
29.37 (5.46)
Acetamiprid 20 SP @ 20 gai/ha.
37.94 (6.20)
19.59 (4.48)
22.35 (4.78)
29.26 (5.45)
18.67 (4.38)
21.43 (4.68)
28.34 (5.37)
19.13 (4.43)
21.89 (4.73)
28.80 (5.41)
23.27 (4.87)
Trizophos 40 EC @ 500 gai/ha.
37.89 (6.19)
31.49 (5.65)
33.60 (5.84)
41.38 (6.47)
30.57 (5.57)
32.68 (5.76)
40.46 (6.40)
31.03 (5.61)
33.14 (5.80)
40.92 (6.43)
35.03 (5.96)
Oxy-demeton Methyal 25 EC@ 500 gai/ha.
37.34 (6.15)
33.45 (5.83)
35.63 (6.01)
43.19 (6.61)
32.53 (5.75)
34.71 (5.93)
42.27 (6.54)
32.99 (5.79)
35.17 (5.97)
42.73 (6.57)
36.97 (6.12)
Untreated 34.84 (5.94)
39.42 (6.32)
44.40 (6.70)
44.25 (6.69)
38.50 (6.24)
43.48 (6.63)
43.33 (6.62)
38.96 (6.28)
43.94 (6.67)
43.79 (6.65)
42.23 (6.54)
Mean 37.75 (6.18)
22.26 (4.69)
25.00 (4.97)
31.48 (5.61)
21.34 (4.58)
24.08 (4.88)
30.56 (5.53)
21.80 (4.63)
24.54 (4.93)
31.02 (5.57)
25.79 (5.06)
S.Em. ± 0.09 0.10 0.10 0.10 0.10 0.10 0.10 0.10 0.10 0.10 0.06 S.Ed. ± 0.13 0.14 0.14 0.14 0.14 0.14 0.15 0.14 0.14 0.14 0.08 CD (P=0.05) NS 0.29 0.28 0.29 0.30 0.29 0.30 0.29 0.28 0.30 0.17
,Imidacloprid 200 SL @ 100 gai /ha and Acetamiprid 20SP @20gai/ha were also found effective in controlling the aphidpopulation. However lower dose of these insecticides wereless effective in restricting the pest population. Maximum cost:benefit ratio was obtained the application of Thiomethoxam25 WG @ 75 gai / ha which might be probably due to it’s lowcost. These findings are in accordance with those ofMaienfisch, et al., 2001 they also reported that Thiamethoxamis the first commercial neonicotinoid insecticide from thethianicotinyl subclass. It provides excellent control against
Aphis gossypii. Some other workers like Kharboutli and Allen,2000, Mathirajan and Regupathy, 2001a,b and Mathirajan andRegupathy, 2005, also recorded similar findings. Mathirajanand Regupathy, 2005 observed that foliar application ofthiamethoxam 25 WG at 100 g/ha resulted in more than 90%reduction of Aphis gossypii. Mathirajan and Regupathy, 2001revealed that Thiamethoxam and imidacloprid were equallyeffective in reducing Aphis gossypii population.
The pooled average data of natural enemies population

PATEL, Efficacy and Economics of Some Modern Insecticides against Aphid, Aphis gossypii L. in Cotton 825
Table:2 Effect of insecticides treatment on population of natural enemies of cotton Aphid (Pooled of two year )
()=Figures in parentheses are Arcsine-transformed value, DAS= Days after spraying, NS=Non significant , *Mean based of 2 observations, **Mean based of 6 observations
Treatment Population of lady bird beetle par five plant Population of green lacewing par five plant PT* 2DAS** 5DAS** 7DAS** PT* 2DAS** 5DAS** 7DAS**
T1 31.41 (5.65)
27.07 (5.24)
27.99 (5.33)
28.98 (5.43)
12.01 (3.53)
8.48 (2.99)
9.42 (3.15)
9.65 (3.18)
T2 30.93 (5.60)
26.11 (5.15)
27.14 (5.25)
27.71 (5.30)
10.91 (3.34)
8.44 (2.96)
8.68 (3.02)
9.54 (3.16)
T3 32.53 (5.75)
22.00 (4.74)
23.10 (4.86)
23.78 (4.93)
11.08 (3.39)
6.27 (2.58)
6.55 (2.64)
7.40 (2.81)
T4 31.65 (5.67)
19.90 (4.51)
21.39 (4.67)
21.87 (4.73)
12.04 (3.53)
5.32 (2.41)
5.74 (2.47)
6.42 (2.62)
T5 32.54 (5.74)
24.95 (5.03)
26.02 (5.15)
26.99 (5.24)
11.95 (3.52)
7.64 (2.85)
8.43 (2.97)
8.65 (3.02)
T6 29.80 (5.50)
24.32 (4.98)
25.99 (5.15)
26.68 (5.21)
11.32 (3.43)
7.51 (2.82)
8.36 (2.97)
8.52 (3.00)
T7 30.74 (5.59)
25.07 (5.06)
26.04 (5.14)
26.80 (5.22)
10.97 (3.38)
7.47 (2.82)
8.32 (2.97)
8.56 (3.01)
T8 31.53 (5.66)
23.97 (4.94)
25.07 (5.05)
25.79 (5.12)
12.03 (3.53)
7.34 (2.80)
7.61 (2.84)
8.44 (2.99)
T9 30.67 (5.58)
18.85 (4.40)
19.66 (4.49)
20.25 (4.55)
10.50 (3.31)
4.75 (2.29)
5.02 (2.35)
5.26 (2.40)
T10 30.69 (5.58)
17.95 (4.29)
18.91 (4.41)
19.50 (4.47)
11.46 (3.45)
4.14 (2.15)
4.38 (2.21)
4.62 (2.26)
T11 31.80 (5.68)
32.09 (5.71)
33.15 (5.79)
30.79 (5.59)
11.00 (3.39)
11.34 (3.43)
11.54 (3.46)
10.69 (3.34)
Mean 31.30 (5.64)
23.84 (4.91)
24.95 (5.03)
25.37 (5.07)
11.39 (3.44)
7.16 (2.74)
7.64 (2.82)
7.97 (2.89)
S.Em. ± 0.11 0.13 0.16 0.12 0.17 0.16 0.15 0.11 S.Ed. ± 0.15 0.19 0.22 0.17 0.24 0.23 0.22 0.15 CD (P=0.05) NS 0.39 0.45 0.36 NS 0.46 0.45 0.30
i.e. Coccinelids, Lady Bird Beetle and Chrysopids, Greenlacewing of two year presented in Table 2 revealed that themean population of both predators was lowest in all theinsecticides treated plots in comparison to untreated controlplots. The maximum population of predators i.e. LBB and GLWwere found in plot treated with Difenthiuron 50 SC @ 300 g ai/ha 28.98 and 9.42 / 5 plants respectively. Study also revealedthat newer insecticides of thio-ureas and neonictinoids class,i.e. Difenthiuron, Thiomethoxam and Acetamiprid were foundreletivelly less toxic to natural enemies that older, organo-phosphsates groups insecticides i.e. oxy demeton methyl andtriazophos. However among the insecticides thio-urea class,Difenthiuron was found to be safest for the natural enemies.This is probably due to their high selective mode of action.These findings are in accordance with Varghese, and Beevi,2004. Among the neonictinoids, popular insecticide,Imidacloprid was more toxic to predators, that newerThiomethoxam and Acetamiprid, but relatively less toxic thanTriazophos and Oxy demeton methyl. These finding are inaccordance with those of Rathod and Bapodra, 2002, Vargheseand Beevi, 2004.
The data presented in Table 3 clearly indicated thatmaximum seed cotton yield was obtained from plots treatedwith Difenthiuron 50 SC @ 400 gai/ha (998.94 kg/ha) followedby Thiomethoxam 25 WG 75 gai/ha and Imidacloprid 200 SL@ 100 gai /ha. Highest per cent increase in yield over control(88.09%) and net profit (7581.49 Rs/ha ) were also recorded inplot treated with Difenthiuron 50 SC @ 400 gai/ha, whereashighest cost benefit ratio Rs 1:8.08 was recorded in plotstreated with Thiomethoxam 25 WG 75 gai/ha this is probablydue to its cost.
In the present experiment it can be inferred that all theinsecticides tested against sucking pests were found to besignificantly superior over control, however newer insecticidesof Thio-ureas group, Difenthiuron 50 SC @ 400 gai/ha wasfound most effective its spray give maximum reduction inpopulation of all three sucking pests and registered maximumincreased in yield over control, net profit and relatively saferagainst potent predator of cotton. Thiomethoxam 25 WG 75gai/ha and Imidacloprid 200 SL @ 100 gai /ha were next effectivechemicals.

826 Trends in Biosciences 6 (6), 2013
Table: 3 Seed cotton yield and economics of different insecticides treatment (Pooled of two year )Treatment Marketable Yield
of seed cotton (Kg/ha.)
Increased in yield over
control (%)
Cost of Increased Yield
(Rs /ha)
Cost of Inputs
(Rs /ha)
Cost: Benefit Ratio
(Rs)
Net Profit (Rs)
T1 963.11 81.35 8476.30 1200.00 1: 7.06 7278.46 T2 998.94 88.09 9179.15 1600.00 1: 5.74 7581.49 T3 672.72 26.67 2778.73 375.00 1: 7.41 2404.44 T4 692.37 30.37 3164.25 500.00 1: 6.33 2665.05 T5 674.47 27.00 2813.18 620.00 1: 4.54 2193.90 T6 914.15 72.13 7515.57 930.00 1: 8.08 6587.49 T7 738.23 39.00 4064.09 750.00 1: 5.42 3315.12 T8 835.83 57.38 5979.00 1000.00 1: 5.98 4980.52 T9 635.23 19.61 2043.16 525.00 1: 3.89 1518.68 T10 595.25 12.08 1258.79 760.00 1: 1.66 499.11 T11 531.09 -
Mean 750.13 S.Em. ± 23.40 S.Ed. ± 33.00 CD (P=0.05) 67.58
LITERATURE CITED
Gomez, K.A. and Gomez, A.A. 1984. Statistical Procedures forAgricultural Research (IInd edition), An International Rice ResearchInstitute, A wiba –International publication, John willey and sons,New york . pp 680
Kharboutli, M.S.; Allen, C.T. 2000. Special Report Arkansas AgriculturalExperiment Station. (198) pp: 128-131
Lalchand (1981). Correlation and regression statistics for beginners.Manoranjan Publication, Allahabad UP India. pp: 130-153
Maienfisch,P.; Angst,M.;Brandl, F.; Fischer,W.; Hofer,D.; Kayser,H.;Kobel,W.; Rindlisbacher,A.; Senn,R.; Steinemann,A.; Widmer,H.2001. Chemistry and biology of thiamethoxam: a second generationneonicotinoid. Pest Management Science 57(10): 906-913
Mathirajan, V.G. and Regupathy, A. 2001. Seed treatment withthiamethoxam (CruiserReg.): an ecologically selective method forthe management of sucking pests of cotton. Pest Management andeconomic Zoology 9(2): 177-186
Mathirajan, V.G.; Regupathy, A. 2005. Thiamethoxam 25 WG (Actara):
a novel nicotinyl insecticide for the management of sucking pestsof cotton. Journal of Ecobiology 17(3): 223-228
Rathod, R.R. and Bapodra, J.G. 2002. Relative toxicity of variousinsecticides to coccinellid predators in cotton. Indian Journal ofPlant Protection 30(1): 29-31
Sohi 1964. Pest of cotton “Entomology in India” a silver jublii number(1964). : 112-148
Sundaram . V. 1972. Rapid strides in cotton quality improvement.Indian Farming 22(7)
Varghese,B. and Beevi, S.N. 2004. Safety of insecticides to the greenlace-wing, Chrysoperla carnea (Stephens). Insect Environment10(1): 45-47
Wing,K.D.,Schnee, M.E. and Connair,M. 1998. A novel oxadiazineinsecticide is bioactivated in lepidopteran larvae . Arch.insectBiochemestry Physiology 37: 91-103
Wing, K.D., Sacher,M.,Kagaya, Y., Tsurubuchi,Y.,Mulderig L.,Connair,M. Schnee 2000. Bioactivation and mode of action of theoxadiazine indoxacarb in insect. Crop protection. 19; 537-545.
Recieved on 26.08.2013 Accepted on 22.09.2013

Trends in Biosciences 6 (6): 827-830, 2013
Biology of Mallada boninensis (Okamoto) [Chrysopidae: Neuroptera] on Aphidsand Neonate NoctuidsM. NAGAMALLIKADEVI1, DR. D.B. UNDIRWADE2, B. NAGENDRA REDDY3, A. RAMADEVI4 ANDSRASVANKUMAR.G5
1Department of Entomology, Dr. PDKV, Nagpur, Maharashtra, India, 2 Department of Entomology, Collegeof Agriculture, Nagpur, Maharashtra, India, 3 Department of Entomology, Dr. PDKV, Nagpur,Maharashtra, India, 4Department of Entomology, Dr. PDKV, Nagpur, Maharashtra, India and 5Departmentof Entomology, Dr. PDKV, Nagpur, Maharashtra, India.email : [email protected]
ABSTRACT
The chrysopids have emerged as strong and potent bio-controlagents and the result oriented researches are further neededto conclusively ascertain their efficiency in the integrated pestmanagement program. Hence, the investigations were madeon Mallada boninensis (Okamoto) [Chrysopidae: Neuroptera]to know their efficiency on neonates of lepidopteran pests andaphids for better management. Laboratory experiments wereconducted to know the biology of Mallada boninensis on nymphsof aphids like Aphis craccivora , Aphis gossypii andRhopalosiphum maidis from different crops viz., cowpea, cottonand sorghum respectively and neonates of lepidopteran pestslike Helicoverpa armigera, Spodoptera litura and Earias vitellaunder controlled room temperature (24 ± 2p C) and relativehumidity (60 ± 5%) during 2011-2012. Overall points showedthat eggs of Corcyra cephalonica was superior over all treatmentsfollowed by sucking pests for all biological parameters. It wasfound that total larval (16.95, 15.60, 16.39), pupal (12.32, 13.57,14.91), pre oviposition (16.33, 14.85, 15.60) and incubation period(5.90, 5.20, 5.97) days when larvae reared on neonates ofHelicoverpa armigera, Spodoptera litura and Earias vitella,respectively. Male and female longevity of predator was foundsuperior for neonates of Spodoptera litura (21.16, 35.58) followedby H. armigera (18.11, 34.41) and Earias vitella (19.61, 33.35)days. Reproductive potential was recorded as 84.66, 94.50, 91.16eggs/female of M. boninensis when its larvae fed with neonatesof H. armigera, S. litura and E. vitella, respectively. The studyrevealed that neonates of lepidopteran pests were used assubstitute for rearing of M. boninensis in the laboratory.
Key words Biology, Mallada boninensis, neonate noctuids, biocontrol, chrysopids, sucking pests.
The wide use of chemicals has led to several problemslike development of resistance to insecticides in insect pests,resurgence and distribution of pests, destruction of naturalenemies (Jayraj,1991) and environmental pollution. Due to illeffects of insecticides as well the serious concerned aboutenvironmental and health hazards there has been change fromconcept of chemical pest control to ‘Integrated pestmanagement’ as well as non-pesticidal pest management. IPMstrategies provide the environmental safety. In Integrated pestmanagement program greater reliance has been given on
biological control and non chemical approach. Hazard ofinsecticides have developed the trends to use need basedapplication of safer insecticides to natural enemies andpromote the use of bio agent for controlling the insect pestsof different crops. Therefore bio agents occupy the primeposition in IPM system. During the last two decades or so,the role of chrysopids as a predator of pest of different cropshas been appreciated all over the world. Several Chrysopidspecies are included among the most importantaphidophagous predators. The most of adult chrysopids arenon predatory, but their larval instars are predatory in nature.They attack and consume a wide variety of pests includingaphids, chinch bugs, mealy bugs, scales, whiteflies, leafhoppers, lepidopterous eggs and larvae and mites (Sujathaand Singh, 2003; Syed et al., 2008; Alasady et al., 2010).Among these, chrysopids have been recorded as importantnatural enemies in suppressing especially soft bodied insectsand lepidopterous pests. Narindah and Indrayani, 1989recorded M. boninensis on H. armigera infesting cotton inIndonesia for the first time. The natural population of this bioagent in the field is not adequate to suppress the pestpopulation of their own. It was concluded that biologicalcontrol would be best achieved by mass rearing and seasonalcolonization of the aphid lion, M. boninensis. The influenceof prey on the development of insect predator has beenevaluated for several predatory species (Tauber and Tauber,1987).
The chrysopids have emerged as strong and potent bio-control agents and the result oriented researches are furtherneeded to conclusively ascertain their efficiency in theintegrated pest management program. Hence, theinvestigations were made on Mallada boninensis to knowtheir efficiency on neonates of lepidopteran pests and aphidsfor better management.
MATERIALS AND METHODS
Mass multiplication of M. boninensis was done in thelaboratory to obtain healthy culture of the test predator. Theinitial culture was obtained from National Research Centre onCitrus (NRCC), Nagpur and it was further multiplied on the

828 Trends in Biosciences 6 (6), 2013
Table 1. Influence of different hosts on biological parameters of M. boninensis (in days) Treatments Total
larval Pupa Adult longevity Preoviposition Incubation
Male Female Nymphs of A. craccivora 14.45 10.63 19.65 42.26 12.99 3.82 Nymphs of Aphis gossypii 12.22 10.62 26.16 41.10 12.73 3.35 Nymphs of Rhopalosiphum maidis 14.51 11.90 23.46 37.13 13.93 4.20 Neonate of H. armigera 16.95 12.32 18.11 34.41 16.33 5.90 Neonate of S. litura 15.60 13.57 21.16 35.58 14.85 5.20 Neonate of Earias vitella 16.39 14.91 19.61 33.35 15.60 5.97 Eggs of C. cephalonica 10.05 9.16 42.33 50.40 7.44 2.87 C.D values (p=0.05) 1.16 1.01 1.94 2.81 0.75 0.56
standard laboratory host, the eggs of rice moth. The aphidswere collected from the field of Department of Entomology,College of Agriculture, Nagpur, Maharashtra, India fromdifferent crops viz; cowpea, cotton, sorghum. The crops sownplots were maintained untreated and the aphids were collecteddaily from those plots with the help of camel hair brush inplastic vials which were further utilized for feeding. The larvaeand pupae of Helicoverpa armigera, Spodoptera litura andEarias vitella were collected from bio control laboratory ofCentral Institute of Cotton Research (CICR), Nagpur. Theselarvae and pupae were reared in the laboratory to obtain F1progeny, neonates thus obtained were utilized for feeding.
The clean and well sterilized plastic vials (3.0x3.5 cm)were utilized for rearing the larvae of Mallada boninensis onthe host. A set of ten plastic vials wereused for a treatment which wasreplicated three times. In each plasticvial a single egg of M. boninensis withknown age were transferred. Afterhatching, the individual larva wasprovided with known number of freshhost every day, hosts were providedtwice, once during morning andevening. The data on all biologicalparameters viz; larval period, pupalperiod, pre oviposition period,incubation period, adult longevity andfecundity has been recorded daily upto the death of adults. The data wassubjected to one way analysis ofvariance (ANOVA) under completelyrandomized design with threereplications for determining the 5%LOS (Gomez and Gomez, 1984).
RESULTS AND DISCUSSION
Influence of different prey hosts onbiological parameters of M.boninensis:
In the present study, the datapresented in Table 1 and Fig. 1 revealedthat for all biological parameters of M.
boninensis was significant when fed with various hosts andeggs of C. cephalonica was found to be superior overall thetreatments. The total larval period, pupal period when larvaefed with neonate of S. litura was 15.60, 13.57 days, neonate ofE. vitella, 16.39, 14.91 days and neonate of H. armigera, 16.95,12.32 days respectively. Mani and Krishnamoorthy, 1989 andRamkumar, et al., 2005 who reported 9 to 10, 9.25 and 10.79days of larval period, 8.5 to 9.5, 8.35 ± 0.68, 5.63 days of pupalperiod, respectively. Kabissa, et al., 1995 reported that thetotal larval and pupal period of M. desjardinsi on nymphs ofAphis gossypii was 14.98, 14.75 days). Elsidding, et al., 2006reported that the total larval, pupal period of M. boninensis tothe extent of 8.0 ± 0.09; 9.0 ± 0.16 days when reared on eggs ofC. cephalonica. Nehare, et al., 2004 reported that the total
Fig 1: Influence of different hosts on biological parameters of M.boninensis (in days)
T1: Nymphs of A. craccivora T2 : Nymphs of Aphis gossypii T3 : Nymphs ofRhopalosiphum maidis T4: Neonate of H. armigera T5 : Neonate of S. litura T6: Neonate of Earias vitella T7 : Eggs of C. cephalonica

NAGAMALLIKADEVI et al., Biology of Mallada boninensis (Okamoto) [Chrysopidae: Neuroptera] 829
larval, pupal period of M. boninensis was 11.13, 12.00 and8.55; 10.46, 10.63 and 10.73 days on Aphis gossypii and A.craccivora and inactivated eggs of C. cephalonica,respectively at 26 ± 2p C temperature and 65 ± 5 per centrelative humidity. Sirimachan, et al., 2005 reported the pupalperiod of M. boninensis was observed to be 9.12 ± 1.13 dayswhen fed on A. craccivora at 25 ± 2p C temperature and 75 ±5 percent relative humidity.
The longevity for male and female was recorded as 21.16,35.58 days with neonate of S. litura, with neonate of E. vitella,19.61, 33.35 days and for neonate of H. armigera 18.11, 34.41days. In present studies the male and female longevity of M.boninensis with eggs of C. cephalonica was recorded as 42.33and 50.40 days. Ramkumar, et al., 2005 reported that the maleand female longevity of M. boninensis to the extent of 43.05and 47.60 days, respectively when reared on eggs of C.cephalonica. Nehare, et al., 2004 reported that the male andfemale longevity of M. boninensis was 18.83, 18.33 and 30.00;49.41, 45.72 and 53.22 days on Aphis gossypii infesting mustardand A. craccivora infesting beans and inactivated eggs of C.cephalonica respectively at 26 ± 2p C temperature and 65 ± 5per cent relative humidity. The male and female longevity ofM. boninensis when fed with nymphs of A. craccivora wasrecorded as 19.65 and 42.26days. Sirimachan, et al., 2005reported the male and femalelongevity of M. boninensiswas found to be 29.67 ± 12.86and 52.67 ± 13.59 daysrespectively when fed on Aphiscraccivora.
From the experimentaldata the pre oviposition andincubation period of predatorwas found to be 14.85, 5.20;15.60, 5.97 and16.33, 5.90 dayswhen treated with neonates ofS. litura, E. vitella and H.armigera, respectively. Inpresent studies the preoviposition and incubation
period of M. boninensis with eggs of C. cephalonica wasrecorded as 7.44 and 2.87 days. Elsidding, et al., 2006 reportedthat pre oviposition and incubation period of M. boninensisto the extent of 5.3 ± 0.28 and 3 days when reared on eggs ofC. cephalonica. Nehare et al., 2004 reported that the preoviposition and incubation period of M. boninensis was 12.01,9.95 and 6.97; 3, 4.21 and 3.98 days on Aphis gossypii, A.craccivora and inactivated eggs of C. cephalonica at 26 ± 2poC temperature and 65 ± 5 per cent relative humidityrespectively. The incubation period with nymphs of A. gossypiiwere recorded as 3.35 days which were nearer to findings ofBrettell, 1979 who reported 3.7 days of incubation period.Kabissa, et al., 1995 reported that the incubation period of M.desjardinsi on nymphs of Aphis gossypii was 3.09 days. Theincubation period with nymphs of Aphis craccivora wasrecorded as 3.82 days. Sirimachan, et al., 2005 reported theincubation period of M. boninensis was found to be 2.3 ± 0.48days when fed on Aphis craccivora at 25 ± 2p C temperatureand 75 ± 5 percent relative humidity.
Influence of different prey hosts on fecundity of M.boninensis:
The data on fecundity of M. boninensis presented inTable 2 and Fig. 2 was found statistically significant. Thelarvae fed with eggs of C. cephalonica have expressedsignificantly superior position overall the treatments recorded178.73 eggs/female. Female of M. boninensis laid 94.50, 91.16and 84.66 eggs when its larvae reared on neonates of S. litura,E. vitella and H. armigera respectively. In present studiesthe fecundity of M. boninensis with eggs of C. cephalonicawas recorded as 178.30 eggs/female. Elsidding, et al., 2006reported that fecundity of M. boninensis to the extent of 63.08eggs when reared on eggs of C. cephalonica. Ramkumar, etal., 2005 reported that the fecundity of M. boninensis to theextent of 345.77 eggs/female when reared on eggs of C.
Table 2. Influence of different prey hosts on fecundity ofM. boninensis (eggs/female)
Treatments Fecundity Nymphs of A. craccivora 122.58 Nymphs of Aphis gossypii 107.58 Nymphs of Rhopalosiphum maidis 112.00 Neonate of H. armigera 84.66 Neonate of S. litura 94.50 Neonate of Earias vitella 91.16 Eggs of C. cephalonica 178.73 C.D. Values (p=0.05) 7.14
Fig 2: Influence of different prey hosts on fecundity of M.boninensis
T1: Nymphs of A. craccivora T2 : Nymphs of Aphis gossypii T3 : Nymphs ofRhopalosiphum maidis T4: Neonate of H. armigera T5 : Neonate of S. litura T6 : Neonateof Earias vitella T7 : Eggs of C. cephalonica

830 Trends in Biosciences 6 (6), 2013
cephalonica. Nehare, et al., 2004 reported that the fecundityof M. boninensis was 121.60, 114.60 and 315.33 eggs/femaleon A. gossypii, A. craccivora and inactivated eggs of C.cephalonica at 26 ± 2p C temperature and 65 ± 5 per centrelative humidity.
The study results concluded that on the basis of allbiological parameters of M. boninensis it could be inferredthat undoubtedly the factitious host, eggs of Corcyracephalonica was found most suitable for rearing M.boninensis. However, the field hosts viz; nymphs of Aphisgossypii, Aphis craccivora and Rhopalosiphum maidis alsohave good effect on its development and its multiplication. Itwas concluded that among noctuids S. litura was betterpreferred than that of H. armigera and E. vitella and wasfollowed by E. vitella and then H. armigera which were usedas substitute for rearing of M. boninensis in the laboratory.
LITERATURE CITED
Alasady, M.A.A., Omar, D.B., Ibrahim, Y.B. and Ibrahim, R.B. 2010.Life table of green Lacewing Apertochrysa sp. reared on rice moth,Corcyra cephalonica. International Journal of Agricultural Biology.12:266-270.
Brettell J. H. 1979. Green lacewing (Neuroptera: Chrysopidae) of cottonfields in central Rhodesia I. Biology of Chrysopa boninensis andtoxicity of certain insecticides to larvae. Rhodesian J. Agric. Res.,17: 141-150.
Elsidding S. I. Y., R. D. Gautam and S. Chander, 2006. Life tables ofpredator, Mallada boninensis (Okamoto) (Chrysopidae: Neuroptera)on the eggs of Corcyra cephalonica (Stainton) and larvae ofTribolium castaneum Herbst. Journal of Entomological Research.30 (4): 301-307.
Gomez K.A. and A.A.Gomez 1984. Statistical procedure for AgriculturalResearch. New York, A Wiley Inter Science Publication, Netherland.pp: vii +68
Jayraj S. 1991. An overview of botanical pest control research at
Tamilnadu, India. Paper presented in Midterm Project, ReviewMeeting of the Botanical Pest- Control Project, Phase II of AsianDevelopment Bank, IARI, held on July 28-31, at Dhaka, Bangladeshpp. 36-38.
Kabissa J. C. B., H. Y. Kayumbo and J. G. Yarro, 1995. Comparativebiology of Mallada desjardinsi (Navas) and Chrysoperla congrau(Walkar) (Neuroptera: Chrysopidae), predators of Helicoverpaarmigera (Hubner) (Lepidoptera: Noctuidae). International Journalof Pest Management, 41(4): 214-218.
Mani M. and A. Krishnamoorthy, 1989. Feeding potential anddevelopment of green lace wing, M. boninensis (Okamoto) ongrape mealy bug Maconelicoccus hirsutus (green). Entomon, 14(1): 19-20.
Narindah A. A. A. G. and I. G. A. A. Indrayani, 1989. New records ofnatural enemies of Heliothis armigera on cotton in Indonesia.Industrial Crop Res. J., 2(1) :1-5.
Nehare, S. K., V. Y. Deotale, R. O. Deotale and P. N. Dawane, 2004.Biology and predatory potential of Mallada boninensis (Okamoto)against sucking pests. Journals of soils and crops, 14(2): 427- 432.
Ramkumar J., G. D. More, M. B. Rajkumar and S. Thiruvarason, 2005.Biology of Mallada boninensis (Okamoto) on different stages ofAleurocanthus woglumi Ashby. J. Appl. Zool. Res., 16(1): 17-18.
Sirimachan N., O. Kern-asa, W. Amornsak and W. Suasa-ard, 2005.Biological study and efficiency of the green lacewing, Malladabasalis (Walker) (Neuroptera: Chrysopidae) as biological controlagent of Aphis craccivora Koch (Homoptera: Aphididae).Proceedings of 43rd Kasetsart University Annual Conference,Thailand, 1-4 February, 2005. Subject: Plants. pp. 124-131.
Sujatha, A. and Singh, S.P. 2003. Predatory efficiency of Malladaastur, a Chrysopid predator of coconut leaf eating caterpillar,Opisina arenosella. Journal of Biological Control, 17: 23-24.
Syed, A.N., Ashfaq, M. and Ahmas, S. 2008. Comparative effect ofvarious diets on development of Chrysoperla carnea. InternationalJournal of Agriculture and Biology. 10: 728-730.
Tauber, C. N. and M. J. Tauber, 1987. Food specificity in predaceousinsects, a comparative eco-physiological and genetic study.Environmental Ecology, 1: 175-186.
Recieved on 02-09-2013 Accepted on 12-10-2013

Trends in Biosciences 6 (6): 831-837, 2013
Studies on Antimicrobial Compounds of Extract of Bark of Sonneratia albaSAVANTA V.RAUT, P.D.ANTHAPPAN
Department of Microbiology, Bhavan’s college, Munshi nagar, Andheri [W], Mumbai 400 058email : [email protected]
ABSTRACT
This study was aimed at evaluating antibacterial potential ofthe Sonneratia alba in attempt to identify potential naturalsources for synthesis of new drug to avoid the growingantibacterial resistance. The peals of bark were extracted bycold and hot methanolic extract by Alade and Irobi’s and Soxhletextraction method. Antibacterial activity of crude extract showedpromising activity against tested organisms. The MIC of crudehot methanolic extracts was >2.5 mg/ml and cold methanolicextract were 1.25 mg/ml. The methanolic crude extract wassubjected for HPTLC analysis shows 11 peaks indicates approx.11 different phyto-compounds such as glycosides, tannins,saponins and alkaloids. The hot methanolic crude extract wasfurther subjected to activity guided fractionation with differentpolarity solvents, showed varying levels of bactericidal activity.Fraction E[acetone] and fraction F[methanol] shows maximumactivity than other fractions. HPTLC and bioautography wasperformed for both fractions and phytochemical analysis showsmainly presence of flavonoids and saponin. Preparative HPTLCwas performed to obtained semi purified bioactive compoundand separated band were subjected to AST, UV spectroscopy,GCMS, FTIR,CHNS(O) analysis and NMR spectroscopy. Bycomparing with GCMS library matches most of theseprobabilities and may be the compound of interest viz; N-â-Chloropropinoyltryptamine in fraction E and Myo-Inositol, 4Cmethyl in fraction F. Both of the compounds were confirmed byperforming NMR spectroscopy and matching its dell values.
Key words Sonneratia alba, bark extract, AST, FractionE[acetone] , Fraction F (methanol), Phytochemicalanalysis, HPTLC, N-â-Chloropropinoyltryptamineand Myo-Inositol, 4C methyl.
Plants have an almost infinite ability to produce aromaticsubstances, most of which are phenols or their oxygensubstituted derivatives. Some of the compounds like,terpenoids- give plants their odors and, quinones and tanninsare responsible for its pigmentations. Many compounds areresponsible for plant flavor (e.g., the terpenoid capsaicin fromchili peppers) and some of the same herbs and spices used byhumans to season food yield useful medicinal compounds. Inthe treatment of drug resistant infections, combinations ofantibiotics have often been used as this takes advantage ofdifferent mechanisms of action. The use of antimicrobialagents displaying synergy is one of the well establishedindications for combination antimicrobial therapy. Thescreening of crude plant extracts for synergistic interactionwith antibiotics is expected to provide ways for the isolation
of MDR inhibitors. The ability of crude extracts of plants topotentiate the activity of antibiotics has been observed bysome researchers (Aiyegoro and Okoh, 2009)
Sonneratia occur throughout the Indo-West Pacificregion from East Africa to China, through Asia and Indonesia,to New Guinea, the western Pacific and northern Australia. InAustralia, there are three species and two hybrids. A thirdhybrid, S. alba X S. gulngai, is known only as a single tree inthe McIvor River, north-eastern Australia Three Sonneratiaspecies and two widely-occurring hybrids are recognized inAustralia’s mangroves across the northern coast from WesternAustralia, Northern Territory and Queensland. They aredistinguished by colour of petals and stamens, calyx surface,shape of the calyx on mature fruit, plus the shape of leavesand leaf apices. Sonneratia grow mostly along banks of tidalrivers, creeks and within sheltered bays of offshore islandsand reef cays.
MATERIALS AND METHODS
Bark pieces of plant Sonneratia alba, collected in May,from Kokan region -Ratnagiri mangroves Maharashtra. Thebark pieces were cut in to very small parts and then crushedand powdered to fine powder using motor and pestle. Theobtained powdered then sieve and stored under refrigerationat 40C for further analysis.
10gm powder of bark packed in Whatman’s filter paperno. 1 and place in the thimble and extracted using methanolfor 6 – 8 hrs at 450 – 500C. The dark brown coloured barkextract obtained. Solvent was separated at same temperatureand crude concentrated extract stored at refrigerator 40C forfurther use
The methanolic extract of bark was subjected toantimicrobial assay using Paper disc method and Agar cupmethod.. The loaded plates were incubated at 40c for pre-diffusion for 15min and incubated at 370c for 24 hrs. Zone ofinhibition were measured in mm.
The MIC is defined as the lowest concentration of theextract that dose not show any growth of the tested organismafter macroscopic evaluation. For determination of Minimuminhibitory Concentration (MIC), the Microdilution methodusing 96 wells microtitre plates described by the NationalCommittee for Clinical Laboratory Standards (NCCLS) wasused.
The separation of compounds in pure form from mixture

832 Trends in Biosciences 6 (6), 2013
and their quantification very important in research.Chromatographic separation of mixture of various compoundare based on their distribution in stationary phase and mobilephase; which are present in chromatographic column.
Method / Procedure :
I. Take 20 × 10 aluminum plates percolates with silica 60F254 gel Merck.
II. Make a program in CAMAG wincat software for sampleloading.
III. Fill the syringe with the sample and fix in to sampleloader; which helps to apply sample on TLC plate withproper concentration. Dry the plate and run the plate in
suitable mobile phase approximately th of the plate.
Allow it to dry Visualize the plate in TLC scanner-3 andtake a photograph in white light(visible) , at 366nm(fluorescence) and at 254nm (ultraviolet).Merge a platein derivitizing agent, dry and again take photograph atsame wavelength.
Instrument : CAMAG linomats TLC sample applicatorand visualizer (LINOMAT, CAMAG ISO 9001,Switzerland)
Mobile phase : Silica F254 TLC plate. Stationary phase : Saturated chamber of (a) Ethyl
acetate: Methanol: Water (20:2.8:2) (b) Toluene : Ethylacetate (18.6:1.4).
Treatment after development : dried in hot air.For Successful isolation of the active compounds from
the plants, the crude extracts are sequentially fractionatedwith various organic solvents differing in their polarity, fromhighly polar, and each obtained fraction is subjected tobioassay.[5]
Antibacterial activity of each fraction was performedagainst Escherichia coli , Staphyloccocus aureus withcontrol on St. Muller Hinton Agar plates. With solvent controlon plates and zone of inhibition were measured.
The developed chromatographic plates were thenoverlaid with Muller Hinton agar, inoculated with 0.5 ml(O.D530nm = 0.1) of bacterial test culture Staphylococcus aureusMTCC 1144 and E coli NCIM 2641. Results were noted afterincubation at 370c for 16-18 hrs as zone of inhibition in thearea which biologically active compounds diffused. The Rfvalue of zones showing inhibitory activity on developed plateswere compared with that of Rf value of compounds onderivitized plate to identify the location and molecular weightdetermination of the separated compounds.
Phytochemical analysis was performed with differenttest to find the phyto constituents present in the fractions.Acetone fraction and methanol fractions were tested for thepresence of certain set of phytochemicals present in them.
Table 1. Phytochemical analysis of crude extract by HPTLCmethod:
Ultraviolet–visible spectroscopy or ultraviolet-visiblespectrophotometry (UV-Vis or UV/Vis) refers to absorptionspectroscopy or reflectance spectroscopy in the ultraviolet-visible spectral region. This means it uses light in the visibleand adjacent (near-UV and near-infrared (NIR)) ranges. Theabsorption or reflectance in the visible range directly affectsthe perceived color of the chemicals involved. In this regionof the electromagnetic spectrum, molecules undergo electronictransitions.
GCMS analysis was performed on GCD-1800Ainstrument present at SAIF, IIT Powai. The column used wasDB-5, 30 m in length with 0.25 internal diameter and 0.25µmfilm thickness. Initial temperature -80ÚC with 3’ hold andincreased to 250ÚC/min and 5.33’ hold. Total run time 65 min.helium gas was used with 50ml split.
Fourier transform infrared spectroscopy (FTIR) is atechnique which is used to obtain an infrared spectrum ofabsorption, emission, photoconductivity or Raman scatteringof a solid, liquid or gas. An FTIR spectrometer simultaneouslycollects spectral data in a wide spectral range. This confers asignificant advantage over a dispersive spectrometer whichmeasures intensity over a narrow range of wavelengths at atime. FTIR has made dispersive infrared spectrometers all butobsolete (except sometimes in the near infrared), opening upnew applications of infrared spectroscopy.
For identification of active antibacterial fractions presentin the purified extract, CHNS(O) analysis was performed onFLASH EA 1112 instrument present at SAIF, IIT Powai. Thebuilt in chromatographic column converts the compound andelutes it in the form of NO2,CO2, SO2,H2O which are thendetected with the help of Thermal Conductivity Detector.
This method finds greatest utility in finding outpercentages of C, H, N, S, (O) in organic compounds whichare generally combustible at 1800Ú C.
Nuclear magnetic resonance spectroscopy, mostcommonly known as NMR spectroscopy, is a researchtechnique that exploits the magnetic properties of certain
Sr.no Phyto-chemical
constituents
Mobile phase Derivitizing agent
1 Alkaloids Toluene:ethylacetate:diethylether (7:2:1)
Dragendroff’s reagent
2 Flavonoids Ethylacetate: formic acid: Glacial acetic acid: water (10:0.5:0.5:1.3)
Anisaldehyde sulfur
3 Tannins Toluene: ethylacetate : formic acid (6:4:0.3)
Fecl3
4 Glycosides Toluene: chloroform: ethanol (4:4:1)
5 General fingerprints
1. Ethylacetate: methnol: water (20:2.8:2)
2. Toluene : ethylacetate (18.6:1.4)
Alcoholic KOH

RAUT AND ANTHAPPAN, Studies on Antimicrobial Compounds of Extract of Bark of Sonneratia alba 833
atomic nuclei. It determines the physical and chemicalproperties of atoms or the molecules in which they arecontained. It relies on the phenomenon of nuclear magneticresonance and can provide detailed information about thestructure, dynamics, reaction state, and chemical environmentof molecules.NMR spectra were determined by Mercury Plus300MHz NMR SPECTROMETER
RESULTS AND DISCUSSION
An antibacterial susceptibility test was performed onthe extracts obtained from both the cold and hot methods ofextraction to determine their antimicrobial efficacy against arange of human pathogens and phytopathogens.
Table 2. AST by agar cup method on MHA plate of bark hotand cold crude extract
Fig. 1. Fingerprint analysis of the crude extract of bark
In order to determine the exact concentration of theextracts that inhibits the growth of the test cultures, a 96 wellMicrotitre plate assay was performed using serial two-folddilutions of extracts. The results are as follows.
Table 3. (MIC) and (MBC) of the crude extracts byMicrodilution method
Sr. no
Culture Methanol hot Solvent extract
Methanol cold solvent
extract 1 Proteus vulgaris NCIM 2813 16 19.6 2 Salmonella paratyphi B
MTCC 3220 18.1 17.33
3 Escherichia coli NCIM 2641 16 15.33 4 Vibrio cholera MTCC 3906 22. 19.8 5 Salmonella typhimurium
NCIM 2501 22 21.3
6 Shigella flexneri MTCC 1457
22. 23.
7 Klebsiella pneumonia MTCC 4032
11. 15
8 Staphylococcus aureus MTCC 1144
23. 22.4
9 Bacillus subtilis MTCC 441 -- -- 10 Erwinia carotovara MTCC
1428 21.6 18.3
11 Agrobacter tumefaciens MTCC 431
19.6 16.
12 Candida albicans MTCC 183
20 19.4
Sr. No
Extract E. coli (mg/ml)
Agrobacterium tumefaciens
( mg/ml)
Candida albicans (mg/ml)
MIC MBC MIC MBC MIC MBC 1 Bark methanol
(Soxhlet’s mtd)
>2.5 >2.5 >2.5 >2.5 >2.5 >2.5
2 Bark methanol (Alade and Irobi’s mtd)
0.62 1.25 1.25 1.25 1.25 >2.5
Fig. 2. plate observed at 366nm
Fractionation
Activity guided fractionation was performed withorganic solvents in increasing order of polarity from Petroleumether (fraction A)<chloroform(fraction B)<benzene(fractionC)<ethyl acetate(fraction D)<acetone(fraction E)<methanol(fraction f)<water (fraction G) of crude bark extract so that theactive components soluble in that particular solvent can beextracted and further assayed for their antimicrobial activity.
Fig.2. Fractionation of bark extract with different solventsvarying in polarity
AST of fractions
An AST of each fraction with a set of 6 pathogenicorganisms was carried out to determine the potency of eachfraction on MHA agar plate by Agar cup method , with 8mmcork borer and incubated at 37ÚC for 24hrs after a 15 minprediffusion in the refrigerator at 4ÚC. On the basis of theAST results, it was seen that the Fraction E (Acetone) andFraction F (Methanol) of the bark showed maximum activity

834 Trends in Biosciences 6 (6), 2013
as compared to the fractions with other solvents. Thus thesetwo fractions were selected for further characterization of theactive components.
Table 4. Results of AST of bark after fractionation
Characterization of the Fractions :
HPTLC and Bioautography :
To further characterize the compounds from the twoselected fractions , Fraction E and Fraction F of both bark.HPTLC was carried out. Since the active compound of choiceis unknown, two different solvent systems were used to findout which can yield better separation; they are as follows:
1) Ethyl acetate : Methanol : water (20 :2.8:2)
2) Toluene : Ethyl acetate ( 18.6:1.4).It was seen that solvent system 1, gave better separation
as compared to solvent system 2, in case of both,bark.Bioautography was also carried out with the same two solventsystems, using Staphyloccocus aureus MTCC 1144 sinceit’s an opportunistic pathogen and is also a pigment producer,thus can show the inhibitory zones visibly. However for betterobservation, the plate was sprayed with 0.2% TTC solutionwhich turns pink where there is growth of the culture whilethe zones of inhibition remain colourless. The Rf valuesobtained from HPTLC and Bioautography were compared,thus showing the possibility of the bands which can have theantimicrobial activity.
Sr. No
Solvent fraction
E. coli
S. aureus
V. cholerae
C. albicans
Agro-bacter
Erwinia
1 Ether - - - - - - 2 Chloroform 9.33 10.5 11.33 12.33 7 11.33 3 Benzene 9.5 9.33 10 10 9.33 8.66 4 Ethyl
acetate 7.33 10.33 8 11.33 8.66 14.33
5 Acetone 16.33 17.33 11 11.66 13.33 14 6 Methanol 20 21.66 12 15.33 16.33 13.66 7 Water 8.66 10.33 14.66 10 11.33
Table 5. Results of photochemical tests of bark acetoneand methanolic fraction obtained on fractionation,by tube method.
Sr. No
Phytochemicals Acetone extract
Methanol extract
1 Glycosides - + 2 Tannins - + 3 Saponins + - 4 Phytosterols - - 5 Flavonoids - + 6 Alkaloids + + 7 Anthraquinone - - 8 Coumarins - - 9 Terpenoids - -
Table 6. Results of HPTLC and bioautography of acetone and methanol fraction of bark extracts obtained on fractionation
Solvent fraction
HPTLC BIOAUTOGRAPHY Solvent system I Solvent system II Solvent system I Solvent system II
No.of peaks End Rf value
No. of peaks
End Rf value No.of peaks End Rf value
No. of peaks End Rf value
Acetone fraction
9 0.07 8 0.02 3 0.3 2 0.36 0.11 0.02 0.6 0.32 0.22 0.05 0.74 0.24 0.13 0.31 0.19 0.36 0.45 0.46 0.68 0.76 0.85 0.91
Methanol fraction
11 0.08 4 0.00 1 0.64 4 0.96 0.12 0.02 0..26 0.20 0.07 0.3 0.25 0.82 0.2 0.28 0.35 0.40 0.52 0.64 0.81 0.93

RAUT AND ANTHAPPAN, Studies on Antimicrobial Compounds of Extract of Bark of Sonneratia alba 835
Key : Band 1 bark acetone, Band 2 bark methanol
Fig 3 : Test for tannins,Fig 13.2 : test for flavonoids, Fig 13.3:test for saponins
Table 7. Consolidated results of Phytochemical analysison basis of HPTLC and Bioautography
dissolved in their respective solvents and then centrifuged.The supernatant was further used to identify the components.
AST of the supernatents
SAn antibacterial susceptibility test was done of thepurified extract, i.e the supernatant obtained by preparativeHPTLC. This contains the active component and hence itsaction on a normal flora and an opportunistic pathogen wascarried out by the Agar cup method with 8mm cork borer andwas incubated at 37ÚC for 24hrs. A very small zone ofinhibition was observed since the component is present isvery less quantity.
Identification of the component
Visible and Ultraviolet spectrometer : Since the compoundto be identified is of unknown origin, its maximum absorbancewas found by UV spectroscopy analysis, where theabsorbance was observed in both visible range and UV range.
Table 8. Fraction E (acetone)
Isolation of the Bioactive component
Preparative HPTLC
On the basis of all the results obtained until now, fractionE (acetone) and fraction F (methanol) were selected forisolation of the active components since they showed betterseparation and activity as compared to other fractions.
Preparative HPTLC was carried out on the Merck SilicaF254 plates with 30µL of the sample with the help of CAMAGlinomat TLC applicator and was allowed to run in the saturatedchamber with solvent system, toluene: ethyl acetate: formicacid (6.4:4:0.3). from Fraction E and F, 2 bands were obtained,out of which one band was further subjected for GCMS,FTIR,CHNSO and LCMS analysis while the other band wassubjected just for GCMS analysis. The bands were cut and
Sample HPTLC (Rf
Value)
Bioautography(Rf value)
Phytochemicals with their
respective Rf Bark fraction E
0.36 o.36 0.36- Flavonoid
Bark fraction F
0.36 0.30 0.30 Flavonoid
Fig. 4. Absorbance spectra of methanol fraction under visibleand UV light.
CHNS(O) Analysis :
For identification of the compound, it is important toknow the percentage of carbon, hydrogen, nitrogen, sulfurand oxygen to elucidate structure of the active components.Thus, CHNS(O) analysis were carried out on CHNS(O) analyzerFLASH EA 1112 present in SAIF, IIT Bombay. From the results,it can be seen that, sulfur was absent in both the sample.
Peak at wavelength Visible range 280 nm
270 nm Ultraviolet region 360 nm
400 nm

836 Trends in Biosciences 6 (6), 2013
FTIR Analysis: To know the possible functional group presentin the compound, FTIR analysis was carried out in SAIF, IITBombay with the help of FTIR analyzer MANGA 550. Theresult revealed that the unknown compound may be ‘aromatic’in nature, probably contained ‘amino’ and ‘chloro’ group.GCMS analysis : The Gas chromatography MassSpectroscopy analysis was carried out with the help of GCD1800 A instrument in SAIF, IIT Bombay to identify thecompound presents in the sample. From the result obtained, 2probable structures were identified N–â –Chloropropionyltryptamine (60.2%) and Myo-inositol-4Cmethyl.
NMR analysis :
To know the structure of probable compound present inthe sample can be detected in the NMR spectroscopy.Obtained structure correlate with standard dell values and itmay be N–â –Chloropropionyltryptamine andMyo-inositol 4Cmethyl.
These peaks were matched with standard as well asGCMS results.Plant Extraction aspect : The basic parameter influencing thequality of an extract are a) plant part used as starting material,b) choice of solvent for extraction, c) extraction technology.(4)
In this study, bark of the plant were selected for assayingtheir therapeutic potential as claimed by traditional healers.Dried plant material was used due to time delay betweencollection of the material and processing. Successfuldetermination of the bioactive compound is largely dependenton the type of solvent used in extracting procedure. Duringextraction, solvents diffuse into the solid plant material andsolubilize compounds with similar polarity. In this study,Methanol, Acetone, Ethyl acetate, Ethanol, water andhydroalcohol were used to find which solvent can yield betterextraction of the phytocompounds. Water was selected sinceit was the medium of decoction used by the traditional healers.Antimicrobial aspect : The antimicrobial activity of the extractand its potency was quantitatively assessed by the presenceor absence of inhibition zone and zone diameter. From the twodifferent extraction methods used, it was found, among thesolvents used in Hot extraction, Methanol gave the highestactivity, followed by Acetone, then Ethyl acetate while in coldextraction Alcohol gave the highest followed by Hydroalcohol.
In this case, Staphyloccocus aureus MTCC 1144 (23mm)and Salmonella typhi and Shigella flexneri MTCC1457(22mm), showed maximum activity .The sensitivity of thestrains in decreasing order : Shigella flexneri >Staphyloccocus aureus > Vibrio cholera > Salmonella typhi> Erwinia carotovora > Candida albicans > Salmonellapara B > Proteus vulgaris while Bacillus subtilis , gave nozone of inhibition.
Antibacterial activity thus served to be broad spectrumas its activity was independent of the organism being Grampositive or Gram negative.Minimum Inhibitory Concentration (MIC) : MIC of crudeextract hot is >2.5 mg/ml. while cold methanol is > 1.5 mg/ml.while MBC is > 2.5 mg/ml.Fractionation : Since the extract showed promising activity inthe bioassay, it was further subjected to Activity- guidedfractionation wherein the crude extract was sequentiallyfractionated with solvents of increasing polarity fromPetroleum ether ( least polar) to water (most polar), to ensurethat a wide polarity range of compounds could be extractedand an AST was performed for each fraction. Methanol andAcetone fractions gave the maximum activity ., in methanol13-21.66 mm inhibition zone and in acetone 11-17.33mminhibition zone was observed The sensitivity of test strains inboth fractions E.coli and Staphylococcus aureus gavemaximum as compared to other test cultures.However, sincedrug resistant strains of bacteria like Staphylococcus aureusand Candida albicans were found to be sensitive to the testedplant extracts fraction, it clearly indicates that antibioticresistance does not interfere with the antimicrobial action ofplant extracts and these extracts might have different modesof action on test organisms (Aliero et al. 2008).
In acetone fraction using solvent system 1, 9 peaks wereobtained while in bioautography 3 peaks from which 1 hadsimilarity. In solvent system 2, 8 peak was seen in HPTLC and2 peaks in bioautography out of which none was similar. Inmethanol fraction, 9 peaks were obtained in HPTLC methodwhile in bioautography one peaks were obtained which hadsimilarity.In solvent system 2, 4 peak was obtained by HPTLCand 4 in bioautography with 1 Rf value coinciding.Phytochemical analysis: It was carried out by the tube methodand those showing positive results were further confirmed byHPTLC method.
The acetone fraction showed the presence of tannins,saponins and alkaloids while the methanol fraction showedthe presence of glycosides, tannins, saponins and alkaloids.By the HPTLC method the acetone fraction showed presenceof tannins, saponins and flavonoids and the methanolicfraction showed only the presence of tannins.
Tannins were present in all the fraction in more quantityas compared to others which justifies the fact thatSonneratiaceae family is known to contain high amount of
Table 9. Presenting percentage of C, H, N, S and O.
Percent of Fractions tested Ethyl acetate Methanol
Carbon 51.038 % 50.163 % Hydrogen 5.35 % 5.815 % Nitrogen 3.057 % 2.757 % Oxygen 22.722 % 24.044 %

RAUT AND ANTHAPPAN, Studies on Antimicrobial Compounds of Extract of Bark of Sonneratia alba 837
tannins.(Kanchuree et al., 2004)However, when the phytochemical results were
consolidated with bioautography and HPTLC results bycomparing the Rf values, it was seen that in fruit and leaffraction E and F, flavonoids are dominating which thussuggests that the antimicrobial component may be from theclass of flavonoids.Preparative HPTLC : To isolate semi purified bioactivecompound preparative HPTLC was carried out and separatedband were tested against test organism. AST result showedinhibitory action to test strain.UV-Visible spectrometry : The semi purified fractionssubjected to spectrophotometry showed peaks at 280nm and270nm, visible and 360 and 400nm in U,V. range of acetonefraction E, while for fraction F methanol 360,380nm in visibleand 270,280, 300nm in U.V. range. This two peaks indicatessemi purified compound contains two different compoundsin both fractions.
CHNS(O) analysis :
For identification of compound, the percentage ofCarbon, hydrogen, nitrogen, sulfur and oxygen was carriedout. It was found that sulfur group was absent in both thefractions that is Fraction E and Fraction F. Fraction E (Acetone)contained 51.038 % of carbon, 5.350% of hydrogen, 3.057% ofnitrogen and 22.722% of oxygen were detected. Fraction F(methanol) contained 50.163% of carbon, 5.815% of hydrogen,2.757% of nitrogen and 24.044% of oxygen were detected.Thus it can interpret that bioactive compound may not containsulfur group.
GCMS analysis :
Fraction E (Acetone) and fraction F [methanol] was sendfor GCMS analysis which was prepared in DMSO. One peakwas detected of DMSO. 3 other peak was observed and 6probable structures were detected through GCMS libraryresearch having molecular weights of 795, 794, 717, 694, 774,748 of pyridine (probability 30.4%), Indole (probability 29.2%),Myo- Inositol, 4-C-methyl (probability 32.6%), Myo-Inositol,2-C-methyl (probability 11.9%), N-â-Chloropropionyltryptamine(probability 60.2%) and3-(2-N-Acetyl- N- Methylaminoethyl)indol (probability 18.1%) respectively.
Therefore, probable compound may be N-â-Chloropropionyltryptamine and Myo- Inositol, 4-C-methyl.
FTIR analysis :
To know its functional group, FTIR analysis was carriedout. By standards given in literature it estimated that, since,
two sets of bands in region around 1600 to 1500 cm-1; itindicated that compound may be aromatic in nature. Whencompared to GCMS analysis, similar results were matchedindicating probable compound may be ‘aromatic’ in nature.Also, since absorption is seen above 3000cm-1, the compoundmay be aromatic. Within 1500- 1400cm-1, indicated that theremay be presence of ‘amino’ group. There were other peaks ofcarboxylic acid, aldehydes, esters, amino salts also observed.To confirm the bioactive compound, sample send for NMRspectroscopic analysis.
NMR spectroscopy :
NMR was carried out to know the exact compoundisolated by using prior steps. Fraction E (Acetone) and fractionF( methanol) were subjected for NMR spectroscopy.
On comparing with standard dell values, Fraction Eshowed probable compound may be N-â-chloropro-pionyltryptamine [3-N-ethyl(1-Chloropropionamide)Benzoate] with probability 60.2% and Fraction F showedprobable compound Myo-inositol 4C methyl with probability36.7% as detected in GCMS analysis and its dell value matcheswith standard dell value. The probable bioactive compoundas follows:
LITERATURE CITED
Aseer Manilal, S.Sujith, G.Seghal Kiran, Joseph Sehin, Chippu Shakir2009. Biopotentials of mangroves collected from southwest coastof India. Global Journal of Biotech and Biochem, Vol 4(1), 59-65
Aliero A., Aliero Bl., Buhari 2008. Preliminary phytochemical andantibacterial screening of Scadaxus muliflorus. Int. J. Pure Appl.Sci., 2;13-17
Kanchuree Chaiyadej, Hathaichanok Wongthap, Surasi Vadhanavi andKan Chantrapromma 2004. Bioactive constituents from twigs ofSonneratia alba.Walalak J. Sci & Tech,vol 1(1):15-22
O. A. Aiyegoro and A. I. Okoh (2009). Use of bioactive plant productsin combination with standard antibiotics: Implications inantimicrobial chemotherapy. Journal of Medicinal Plants Research3(13) : 1147-1152,
Recieved on 29-06-2013 Accepted on 24-07-2013
Fig. 5. N--Chloropropionyltryptamine
Fig. 6. Myo-inositol 4Cmethyl

838 Trends in Biosciences 6 (6), 2013Trends in Biosciences 6 (6): 838-841, 2013
Seed Cotton Yield, Uptake of NPK and Economics of Bt Cotton (Gossypium hirsutumL.) as Influenced by Different Bio-fertilizers and In-situ Green Manuring underIrrigationTHIMMAREDDY, K1., B. K. DESAI2 AND VINODAKUMAR, S. N.3*
1, 2, 3Dept. of Agronomy, College of Agriculture, UAS, Raichur, Karnataka 584 104, Indiaemail: [email protected] , [email protected]
ABSTRACT
A field experiment was carried out during kharif season of2009-2010 at the Agriculture College Farm, Raichur, Karnataka(India) to study the response of Bt cotton to different fertilizerlevels, bio-fertilizers and in-situ green manuring underirrigation. The results revealed that among green manuressunnhemp in-situ green manuring registered significantlyhigher seed cotton yield, gross returns, net returns and benefitcost ratio (B: C ratio) (2231 kg ha-1, Rs. 60,246/ha, Rs. 35,189/haand 2.40, respectively). With respect to uptake of NPKapplication of sunnhemp in-situ green manuring foundsignificantly Higher N (128.27 kg ha-1), P (30.63 kg ha-1) and K(142.33 kg ha-1) over no green manuring. Among differentFertilizer levels and Bio-fertilizers, 150 % recommended doseof fertilizers (RDF) recorded significantly higher seed cottonyield per hectare, gross returns, net returns and B: C ratio(2295.78 kg ha -1, Rs. 61,986/ha, Rs. 36,473/ha and 2.42,respectively). With respect to uptake of NPK application of 150% RDF found significantly higher N (132.46 kg ha-1), P (32.44kg ha-1) and K (147.21 kg ha-1)
Key words Bt cotton, in-situ green manuring, Bio-fertilizers,fertilizer levels and irrigation.
Bt cotton was first planted in India in 2002, following itssuccess, the area under this crop and the number of farmerswho adopted this technology increased significantly from yearto year. The projection made in India for 2020 AD is around47.5 million bales of lint to meet the anticipated domestic andexport requirement. To fulfil this projected requirement, thecotton production has to be increased by 15 % and it has tocome mainly from increased productivity. Current stock ofcotton in the country is estimated at 54 lakh bales as against43 lakh bales during the year 2007-08. There is an encouragingresponse of farmers towards Bt cotton cultivation whilereplacing traditional varieties and hybrids at stroke, just toescape bollworm menace and to achieve potential yield. Butunfortunately there is no specific blue print regardingagronomic package for Bt cotton which has a tremendousyield potentiality by virtue of its resistance to bollworm onone hand and having an excellent canopy architecture, whichsupports huge number of bolls on the other. Fertilizerrequirement is the most critical inputs as far as cottoncultivation is concerned as it is a long duration crop in blackcotton soils under rainfed and irrigated conditions. Production
and productivity increases of Bt cotton can be achievedthrough enhanced soil fertility. Soil fertility can only besustained if the nutrients removed from soil are replenishedby way of additions. By 2020, the projected requirement ofcotton would be around 23 million bales. To produce thisquantity, anticipated requirement of N, P and K are 1.2, 1.1 and1.8 million tonnes, respectively (Kairon and Venugopalan,2000). Supplying the entire quantity of nutrients requiredthrough fertilizers may not be possible, because other cropswould compete for application, and shortfall in supplies. Atpresent, there is a wide gap between the supply and removalby crops (Tandon and Narayan, 1990). Therefore, anintegration of sources has to be done. Nutrient requirementof cotton, for that matter any crop would have to be metthrough organic sources in combination with mineral fertilizers.This led to the development of Integrated NutrientManagement System (INMS). Hence, a field study wasconducted to find out a suitable fertilizer levels for Bt cottonhybrids which are being well accepted by farmers across thecountry and more so in black cotton soils of TBP & UKPareas in Karnataka.
MATERIAL AND METHODS
Field experiment was carried out during kharif, seasonof 2009-2010 at the Agriculture College Farm, Raichur,Karnataka (India) on deep black soil having 218.00, 35.0 and345.00 kg ha-1 available N, P2O5 and K2O respectively with pHof 8.20 and organic matter content of 0.70 %. There were 18treatment combinations consisting of three in-situ greenmanures in main plot were as follows: M1: Control (No greenmanuring), M2: Sunnhemp in-situ green manuring (Cotton +Sunnhemp in 1:2 row proportion) and M3: Dhaincha in-situgreen manuring (Cotton + Dhaincha in 1:2 row proportion).Whereas in subplot six different fertilizer levels and bio-fertilizers are taken for study as follows: S1: RDF (150:75:75),S2: 125 % RDF, S3: 150 % RDF, S4: RDF + Seed treatment withAzotobacter @ 600 g ha-1 followed by soil application @ 2 kgha-1, S5: RDF + Seed treatment with Azospirillum @ 600 g ha-
1 followed by soil application @ 2 kg ha-1 and S6: RDF + Seedtreatment with Phosphobacteria @ 600g ha-1 followed by soilapplication @ 2 kg ha-1. The experiment was laid out in Splitplot design and the treatments were replicated thrice. Thecrop was sown on 19th August 2009 with a plot size of 7.2 m ×

THIMMAREDDY, et al., Seed Cotton Yield, Uptake of NPK and Economics of Bt Cotton (Gossypium hirsutum L.) 839
6.0 m. All the growth, yield parameters, seed cotton yield andsoil nutrient parameters were recorded and statisticallyanalyzed.
RESULTS AND DISCUSSION
Seed Cotton Yield:
In the present study among different in-situ greenmanures sunnhemp in-situ green manuring (2231.33 kg ha-1)recorded significantly higher seed cotton yield per hectareand was on par with dhaincha in-situ green manuring (2225.72kg ha-1). Significantly lower seed cotton yield per hectare wasrecorded in no green manuring (1867.28 kg ha-1) (Table. 1 and
Fig. 1). Among sub-plot treatments, significantly higher seedcotton yield per hectare was recorded in 150 % RDF (2295.78kg ha-1) which was followed by RDF + seed treatment withAzospirillum @ 600 g per ha followed by soil application @ 2kg per ha (2152.42 kg ha-1). RDF + seed treatment withAzospirillum @ 600 g per ha followed by soil application @ 2kg per ha was on par with RDF + seed treatment withAzotobacter @ 600 g per ha followed by soil application @ 2kg per ha (2117.33 kg ha-1), RDF + seed treatment withPhosphobacteria @ 600 g per ha followed by soil application@ 2 kg per ha (2116.90 kg ha-1) and 125 % RDF (2087.22 kg ha-
1). Significantly lower seed cotton yield per hectare wasrecorded in 100 % RDF (1879.00 kg ha-1). The present resultsare conformity with findings of Gidnavar, et. al.,1992; Biradar,
Table 1. Seed cotton yield (kg ha-1) and Uptake of NPK (kgha-1) of Bt cotton as influenced by nutrientmanagement practice
Treatments Seed
cotton yield
Nitrogen uptake
Phosphorus uptake
Potassium uptake
Main plot M1 1867.28 115.26 24.45 134.62 M2 2231.33 128.27 30.63 142.33 M3 2225.72 125.98 30.60 141.97 S. Em.± 27.5 1.48 0.45 1.64 C.D. at 5% 108.3 5.8 1.79 6.4 Sub plot S1 1879.00 113.50 23.73 131.31 S2 2087.22 121.80 28.21 139.73 S3 2295.78 132.46 32.44 147.21 S4 2117.33 124.04 28.36 139.80 S5 2152.42 123.39 29.18 140.20 S6 2116.90 123.82 29.46 139.59 S. Em.± 38.2 2.5 0.73 2.20 C.D. at 5% 110.4 7.4 2.11 6.3 Interactions MXS S. Em.± 66.2 4.4 1.26 3.8 C.D. at 5% NS NS NS NS SXM S. Em.± 66.4 4.3 1.24 3.8 C.D. at 5% NS NS NS NS
DAS - Days after sowingNS - Non significant
Main plot treatments
Sub plot treatments M1: M2: M3:
Control (No green manuring) Sunnhemp in-situ green manuring (Cotton + Sunnhemp in 1:2 row proportion) Dhaincha in-situ green manuring (Cotton + Dhaincha in 1:2 row proportion)
S1: S2: S3: S4: S5: S6:
RDF (150:75:75) 125% RDF 150% RDF RDF + Seed treatment with Azotobacter @ 600 g ha-1 followed by soil application @ 2 kg ha-1 RDF + Seed treatment with Azospirillum @ 600 g ha-1 followed by soil application @ 2 kg ha-1 RDF + Seed treatment with Phosphobacteria @ 600 g ha -1 followed by soil application @ 2 kg ha-1
Table 2. Economics (Rs. ha-1) of Bt cotton as influenced bynutrient management practices
Note: Prevailing price of Bt cotton in the market Rs. 2,700 perquintalDAS - Days after sowing NS - Non significant
Treatments Cost of cultivation
Gross returns Net returns Benefit cost
ratio Main plot M1 22435.58 50416.50 27980.92 2.25 M2 25056.67 60246.00 35189.33 2.40 M3 25173.24 60094.37 34921.12 2.38 S. Em.± - 745.1 703.7 0.02 C.D. at 5% - 2925.6 2763.1 0.10 Sub plot S1 23307.50 50733.00 27425.50 2.18 S2 24407.83 56355.00 31947.17 2.30 S3 25512.67 61986.00 36473.33 2.42 S4 24017.00 57168.00 33151.00 2.38 S5 24069.63 58115.40 34045.77 2.41 S6 24016.35 57156.33 33139.98 2.37 S. Em.± - 1032.1 974.7 0.03 C.D. at 5% - 2980.9 2815.3 0.10 Interactions MXS S. Em.± - 1787.6 1688.3 0.06 C.D. at 5% - NS NS NS SXM S. Em.± - 1793.9 1694.3 0.06 C.D. at 5% - NS NS NS
Main plot treatments Sub plot treatments M1: M2: M3:
Control (No green manuring) Sunnhemp in-situ green manuring (Cotton + Sunnhemp in 1:2 row proportion) Dhaincha in-situ green manuring (Cotton + Dhaincha in 1:2 row proportion)
S1: S2: S3: S4: S5: S6:
RDF (150:75:75) 125% RDF 150% RDF RDF + Seed treatment with Azotobacter @ 600 g ha-1 followed by soil application @ 2 kg ha-1 RDF + Seed treatment with Azospirillum @ 600 g ha-1 followed by soil application @ 2 kg ha-1 RDF + Seed treatment with Phosphobacteria @ 600 g ha-1 followed by soil application @ 2 kg ha-1

840 Trends in Biosciences 6 (6), 2013
2000, Subramanian, et. al., 1995; Tarhalkar and Venugopalan,1995; Kamble, 2003 and Amit Kumar et. al., 2013.
Uptake of NPK:
NPK uptake was significantly higher with sunnhempand dhaincha in-situ green manuring over no manuringpractice (Table. 1 and Fig. 2). This increased uptake may beattributed to the increased availability of nutrients in soil.Increased nutrient uptake with green manure treatments inturnresulted in higher dry matter production. Similar results werereported by Badole and More, 2000 and also by Katkar, et. al.,2002 who reported higher NPK uptake by cotton withsunnhemp and dhaincha with green leaf and green manuringpractices. Among main plot treatments sunnhemp in-situ greenmanuring recorded significantly higher NPK uptake (128.27,30.63 and 142.33 kg ha-1, respectively) as compared to no greenmanuring (115.26, 24.45 and 134.62 kg ha-1, respectively).Sunnhemp in-situ green manuring was on par with dhainchain-situ green manuring (125.98, 30.60 and 141.97 kg ha-1,respectively). In the present investigation, green manuringwith sunnhemp and dhaincha increased the N, P and Kavailability. This might be due to direct addition of nutrientsthrough organics to the available pool of soil and greatermultiplication of soil microbes for the conversion of organicallybound form to inorganic form particularly for nitrogen. Further,in calcareous soils added organic material through green
manures might have formed a protective cover on sesqueoxide,thus resulting in reduction of phosphate fixation and increasein phosphorus availability (Bellakki and Badanur, 1994). Theseresults are in agreement with the findings of Tarahalkar, et. al.,1997, Basavanagouda, 1998 and Katkar, et al., 2002. Amongsub-plot treatments, uptake of NPK by Bt cotton at harvestwas significantly higher with 150 % RDF (132.46, 32.44 and147.21 kg ha-1, respectively) compared to rest of the treatments.This increase in uptake of nutrients may be attributed to highertotal dry matter production. These results are in accordancewith the findings of Pagaria, et. al., 1995, Krishnan andLourduraj, 1997 and Hulihalli, 2003.
Economics:
Gross returns, net returns and B:C ratio of Bt cotton wassignificantly affected by use of in-situ green manuring as wellas combined use inorganic nutrients and bio-fertilizers.However, their interaction effect was found to be non-significant. Among main plot treatments sunnhemp in-situgreen manuring recorded significantly higher gross returns,net returns and benefit cost ratio (60246.00 Rs. ha-1, 35189.33Rs. ha-1 and 2.40, respectively) as compared to no greenmanuring (50416.50 Rs. ha-1, 27980.92 Rs. ha-1 and 2.25,respectively). Sunnhemp in-situ green manuring was on parwith dhaincha in-situ green manuring (60094.37 Rs. ha-1,34921.12 Rs. ha-1 and 2.38, respectively) (Table 2 and Fig. 3)..These results are in accordance with the findings of Hongal,2001, Katkar, et. al., 2002 and Chandrashekara, et al., 2004.Among sub-plot treatments, 150 % RDF recorded asignificantly higher gross returns, net returns and benefit costratio (61986.00 Rs. ha-1, 36473.33 Rs. ha-1 and 2.42, respectively)which was followed by RDF + seed treatment withAzospirillum @ 600 g per ha followed by soil application @ 2kg per ha (58115.40 Rs. ha-1, 34045.77 Rs. ha-1and 2.41,respectively). Significantly lower gross return was noticed in100 % RDF (50733.00 Rs. ha-1, 27425.50 Rs. ha-1 and 2.18,respectively). Similar results were reported by Marimuthu, et.al., 2004 and Srinivasan, 2008.
Fig. 1. Seed cotton yield (kg ha-1) of Bt cotton as influencedby nutrient management practice
Fig. 2. Uptake of NPK (kg ha-1) by Bt cotton as influencedby nutrient management practices
Fig. 3. Economics (Rs. ha-1) of Bt cotton as influenced bynutrient management practices

THIMMAREDDY, et al., Seed Cotton Yield, Uptake of NPK and Economics of Bt Cotton (Gossypium hirsutum L.) 841
Interaction effects between in-situ green manuring,combined use of inorganic nutrients and bio-fertilizers wasnot found to differ significantly for seed cotton yield, Uptakeof NPK and economics of Bt cotton.
Application of organics (green manures and bio-fertilizers) was found beneficial in improving the soil fertilitywhen compared to application of RDF alone to obtain higherseed cotton yield it is advisable to go in for in-situ greenmanuring with sunnhemp + 125 % RDF + seed treatmentfollowed by soil application of Azospirillum as this reduces50 per cent chemical fertilizer without significant reduction inseed cotton yield and net returns compared to sunnhemp +150 % RDF + seed treatment followed by soil application ofAzospirillum.
LITERATURE CITED
Amit Kumar, Dipak Kumar Gupta and Mukesh Kumar, 2013, GreenManure Crops: A Boon for Agricultural Soil. Inter. J. Agri. Env.Biotech., 6: 193.
Badole, S. B. and More, S. D., 2000, Yield and nutrient uptake asinfluenced by integrated nutrient supply system in cotton. J. IndianSoc. Cotton Improv., 25(3): 161-165.
Basavanagouda, K. H., 1998, Evaluation of perennial green manuringcrops for their suitability as year long field covers in chilli (Capsicumannum L.). M.Sc. (Agri.) Thesis, Univ. Agric. Sci., Dharwad.
Bellakki, M. A. and Badanur, V. P., 1994, Effect of crop residueincorporation on physical and chemical properties of a vertisol andyield of sorghum. J. Indian Soc. Soil Sci., 7(4): 533-535.
Biradar, I. B., 2000, Studies on cover cropping in hybrid cotton undertransitional tract of Dharwad. Ph.D. Thesis, Univ. Agric. Sci.,Dharwad.
Chandrashekara, C. P., Girijesh, G. K. and Halemani, H. L., 2004,Integrated nutrient management in cotton-maize sequence croppingsystem at Ghataprabha irrigated command area. Int. Symp. Strat.Sust. Cotton Prod. –A G Vis. UAS, Dharwad, 23-25 November pp.252.
Gidnavar, V. S., Shashidhara, G. B. and Manjunathaiah, 1992, Soil fertilitymanagement in monocrop cotton through legume incorporation.Farming Syst., 8(1&2): 53-55.
Hongal, M. M., 2001, Effect of green manuring and levels of nitrogen
on the performance of chilli + cotton intercropping system. M. Sc.(Agri.) Thesis, Univ. Agric. Sci., Dharwad.
Hulihalli, U. K., 2003, Effect of in-situ moisture conservation andintegrated nutrient management practices in rainfed herbaceumcotton. Ph.D Thesis, Univ. Agric. Sci., Dharwad.
Kairon, M. S. and Venugopalan, M. V., 2000, Nutrient management incotton and cotton- based cropping systems. Ferti. News., 45(4):51-56.
Kamble, A. S., 2003, Effect of in-situ green manuring and nitrogenlevels on hybrid cotton (DHH- 11) under transitional tract ofDharwad. M. Sc. (Agri.) Thesis, Univ. Agric. Sci., Dharwad.
Katkar, R. N., Turkhede, A. B. Solanke, V. M., Wankhade, S. T. andSakhare, B. A., 2002, Effect of integrated nutrient management oforganic manures and fertilizers on soil properties and yield of cotton.J. Cotton Res. Dev., 16(1): 89-92.
Krishnan, P. K. and Cristopher Lourduraj, A., 1997, Different levels,time and method of application of nitrogen and potash on theuptake of nutrients and soil nutrient status in cotton. Madras Agric.J., 84(6): 330-334.
Marimuthu, S., Subbian, P. and Samiyappan, R., 2004, Integrated nutrientmanagement studies on yield and economics of cotton. MadrasAgric. J., 91(4-6): 317-320.
Pagaria, T. M., Ravankar, H. N., Khonde, H. W., Gawande, R. P. andLaharia, G. S., 1995, Effect of FYM with and without fertilizer onthe yield and chemical composition of cotton under rainfedcondition. PKV Res. J., 19(1): 87-88.
Srinivasan, G., 2008, Response of summer irrigated cotton (Gossypiumhirsutum) to biofertilizer application. J. Cotton Res. Dev., 22(1):66-68.
Subramanian, V., Jaganathan, N. T., Venkitaswamy, R., Premsekhar, P.and Purushothaman, S., 1995, Effect of fast growing leguminousintercrops and nitrogen levels on cotton. Madras Agric. J., 82: 40-41.
Tandon, H. L. S. and Narayan, P., 1990, Fertilizers in Indian agriculture:Past, present and future (1950-2000), FDCO, New Delhi, India,pp. 160.
Tarhalkar, P. P and Venugopalan, M. V., 1995, Effect of organic recyclingof fodder legumes in stabilizing productivity of rainfed cotton(Gossypium hirsutum L.) on marginal lands. Tropical Agric., 72:73-75.
Tarhalkar, P. P., Venugopalan, M. V., Rajendran, T. P., Bambawale, O.M. and Kairon, M. S., 1997, Generation and evaluation ofappropriate technology for organic cotton cultivation in rainfedvertisols. J. Indian Soc. Cotton Improv., 21: 123-130.
Recieved on 30-08-2013 Accepted on 25-09-2013

842 Trends in Biosciences 6 (6), 2013Trends in Biosciences 6 (6): 842-843, 2013
To studies on Efficacy of Newer Insecticides against Yellow Stem Borer (Scerpophagaincertulus) in Faizabad DistrictA.P. SINGH*, R.B. SINGH, M.N. LAL AND R.C. SHARMA
Department of Entomology, N.D. University of Agriculture & Technology, Kumarganj, Faizabad - 224 229,U.P.*email: [email protected]
ABSTRACT
Field experiments were carried out at NDUA&T crop researchstation of Masodha and farmers fields of Faizabad district duringKharif 2011 and 2012, to evaluated seven insecticides viz: cartaphydrochloride 4 G@(750gm a.i/ha) cartap hydrochloride 75SG(@ 375 gm a.i/ha), fipronil 5 SC(@75 a.i./ha), methomyl 40SP(@ 500 gm a.i/ha), monochrotophos 36 EC(@500 a.i./ha)imidacloprid 17.8 SL (@ 25 a.i./ha), and spinosad 45 SP(@100gm.a.i./ha). insecticides against yellow stem borer.The resultrevealed that the cartap hydrochloride 4G @750 gm a.i./hatreated plots showed lowest infestation and gave higher grainyield(28.20q/ha) fallowed by cartap hydrochloride 75SG (25.43q/ha) and fipronil 5SC(24.61q/ha).
Key words Efficacy, newer insecticides, yellow stem borer
Rice (Oryza sativa L.), is the most important single foodcrop of the global importance and is the staple food for nearlyhalf for the world population. It is the most important crop ofIndia and it occupies 23.3 per cent of gross cropped area ofcountry. Rice contributes 43 per cent of total food grainproduction and 46 per cent per cent of total cereal productionin India. It continues to play vital role in national food grainsupply.
More than hundred insect species have been reported
to attack rice crop at different stages of growth. Out of which,20 are of major importance.
The increased adaptation of new high yielding varietiesand management practices, the use of insecticides alsointensified. For a long, the opinion of majority of farmers wereshed in favors of the use of pesticides in the battle against thepests for getting desirable harvest from the paddy fields, butmost of the conventional insecticides are broad spectrum andtheir indiscriminate use for controlling the insect pests arenot only expensive but also creates lots of problem related toenvironmental problem as well as health hazards. However,the use of newer insecticides viz., Cartap hydrochloride 4G,Cartap hydrochloride 75 SG, Fipronil 5SC, Spinosad 45 SP andMethomyl 40SP etc. have been found more effective inovercoming the pest problems in integrated pestmanagement(IPM) system (Dani,2007).
MATERIALS AND METHODS
To assess the field efficiency of newer insecticidesagainst yellow stem borer, Scerpophaga incertulus anexperiments was executed under randomized block design(RBD) with three replication and eight treatment with eachplot size measuring 5 x 3.9 sqm. during Kharif, 2011 and 2012at Crop Research Station, Masodha of N.D.U.A.T., Faizabad.
Table 1. Efficacy of various insecticides against rice stem borer during kharif, 2011.T. No. Treatments Dose
(a.i./ha) Mean percent damage
Pre treatment First application Second application 3 DAS 10 DAS 15 DAS 3 DAS 10 DAS 15 DAS
T1 Mortor 4 G 750 5.32 (2.39)
3.40 (2.04)
2.47 (1.71)
1.87 (1.56)
1.65 (1.46)
2.56 (1.75)
2 .87 (1.96)
T2 Imidachloprid 25 5.52 (2.45)
4.90 (2.32)
4.26 (2.13)
3.98 (1.89)
3.44 (1.86)
4.06 (2.12)
4 .24 (2.09)
T3 Spinosad 100 5.01 (2.32)
4.38 (2.21)
4.20 (2.25)
4.11 (2.15)
4.15 (2.28)
4.34 (2.17)
4 .56 (2.29)
T4 Mortor 75 SG 375 5.68 (2.47)
3.54 (2.06)
2.89 (1.83)
1.98 (1.44)
2.15 (1.82)
3.37 (1.97)
3 .56 (1.83)
T5 Methomyl 500 4.90 (2.32)
3.85 (1.96)
3.81 (2.03)
3.77 (2.06)
3.08 (1.65)
3.78 (2.03)
3 .86 (2.13)
T6 Fipronil 75 4.17 (2.16)
3.75 (2.10)
3.53 (2.07)
2.40 (2.02)
2.24 (1.88)
3.56 (1.75)
3 .78 (1.86)
T7 Monocrotophos 500 4.87 (2.31)
4.40 (2.21)
3.90 (1.88)
3.74 (1.59)
3.80 (2.00)
3.99 (1.94)
4 .11 (2.13)
T8 Control - 5.19 (2.37)
7.92 (2.90)
8.56 (3.01)
9.36 (3.13)
10.14 (3.26)
9.83 (3.20)
9 .40 (2.14)
SEm± 0.15 0.11 0.10 0.25 0.11 0.094 0.093 CD at 5 % NS 0.34 0.31 0.76 0.34 0.28 0.28

SINGH et al., To studies on Efficacy of Newer Insecticides against Yellow Stem Borer (Scerpophaga incertulus) in Faizabad district 843
The 25 days old seedling of improved Pb 1 rice variety wastransplanted on IInd fortnight of July in both experimental years.All the agronomical practices were adopted to raised a goodcrop.
The data on damaged caused by yellow stem borer (DH/WE) were recorded at one day before and 3, 10 and 15 daysafter treatment. The total number of tillers/panicles and totaldamaged tiller (DH /WE) were counted on 10 randomlyselected hills in each plot. The insecticides were applied asand when the pest population reached at their ETL (Economicthreshold level) with their respective doses.
RESULTS AND DISCUSSION
Field efficacy of different treatments against incidenceof S. incertulus showed that treatments differed significantlyduring both the experimental years. Based on damage symptom(dead heart and white ear heads), it was observed that someof the treatments viz., Cartap hydrochloride 4 G, Cartaphydrochloride 75 SG, Fipronil and Methomyl were mosteffective all these tested treatments registered comparativelylow incidence of S. incertulus. Cartap hydrochloride 4 G (750g a.i./ ha) proved best to the stem borer incidence followed by
Table 2. Efficacy of various insecticides against rice stem borer during kharif, 2012.
T. No. Treatments Dose (a.i./ha)
Mean percent damage Pre treatment First application Second application
3 DAS 10 DAS 15 DAS 3 DAS 10 DAS 15 DAS T1 Mortor 4 G 750 4.56
(2.24) 2.56 (1.75)
1.54 (1.42)
1.25 (1.32)
1.32 (1.35)
2.00 (1.58)
3.12 (1.90)
T2 Imidachloprid 25 4.61 (2.26)
4.45 (2.29)
4.14 (2.15)
3.74 (1.82)
3.64 (2.03)
4.11 (2.15)
4.25 (2.18)
T3 Spinosad 100 5.44 (2.43)
4.15 (2.10)
3.97 (1.91)
3.85 (2.15)
4.01 (2.11)
4.09 (2.14)
4.42 (2.22)
T4 Mortor 75 SG 375 4.22 (2.17)
3.02 (2.13)
1.89 (1.89)
1.91 (1.54)
2.24 (1.71)
2.45 (1.71)
3.31 (1.94)
T5 Methomyl 500 5.80 (2.50)
3.69 (2.12)
3.08 (1.80)
2.56 (1.74)
3.38 (1.97)
3.25 (2.11)
3.76 (2.12)
T6 Fipronil 5SC 5.86 (2.50)
3.26 (1.88)
2.31 (1.64)
2.02 (1.57)
2.45 (1.63)
2.48 (1.72)
3.14 (1.91)
T7 Monocrotophos 500 5.41 (2.43)
3.99 (2.12)
3.61 (2.02)
3.49 (2.00)
3.29 (1.95)
3.41 (1.98)
4.01 (2.12)
Cartap hydrochloride 75 SG (375 g a.i./ ha) and Fipronil 5 SC(75 g a.i./ ha). Sahithi and Mishra, 2006; Lal, 2006 and Singh, etal., 2010 have also reported that Cartap hydrochloride 4G wasmost effective insecticide to check the stem borer infestation.Panda, et al., 2004 also reported Fipronil 5 SC @ 750 g a.i./ haas effective insecticide to check the stem borer incidence.
LITERATURE CITED
Dani, K.C. 2007. Use of sex pheromone in rice pest management.National symposium on Research priorities and strategies in riceproduction system for second Green Revolution held on 20-22Nov, 2007 at CRRI, Cuttak, pp. 95-96.
Lal, Roshan 2006. Annual use of cartap hydrochloride 4G formanagement of stem borer in aromatic rice in Haryana, India, J. ofEnt. 68 (3) : 230-234.
Panda, B.M.; Rath, L.K. and Dash, D. 2004. Effect of fipronil onyellow stem borer S. incertulus Walker and certain plant growthparameters in rice. Indian J. Ent., 66 (1) : 17-19.
Sahithi, S. and Mishra, H.P. 2006. Field evaluation of newer insecticidesagainst YSB S. incertulus, Indian J. Pl. Prot., 84 (1) : 116-117.
Singh, Dilbag; Bhatnagar, Praduman; Om, Hari and Sheokhand, R.S.2010. Efficacy of insecticides against stem borer and leaf hopper.Environment and Ecology, 20 (2) : 884-886.
Recieved on 03-09-2013 Accepted on 15-10-2013

844 Trends in Biosciences 6 (6), 2013Trends in Biosciences 6 (6): 844-849, 2013
Bioremediation and Decolorization of Distillery Effluent by Aspergillus niger and ANovel Fungal Strain Curvularia andropogonis.SHUBHNAGINI SHARMA1, PALLAVI MITTAL2 AND MANJU RAI3
Mewar University, Rajisthan, India, 2ITS Paramedical college, Ghaziabad, India, 3Raizo Biotech Lab,Ludhiana, Indiaemail: [email protected]
ABSTRACT
Distillery effluent leads to an environmental pollution due toits high BOD, COD, TSS, TDS, heavy metals (Iron, Zinc,Copper, Lead and Manganese), low pH along with melanoidin,a color compound generally produced by “Millard reaction”and when discharged in a river or ground results in impairmentof ecological balance. These discharge into water bodies, sombrethe aquatic life in consonance with decrease in the quality ofwater and irrigation land. Discharge of effluent (spent wash)into the environment is hazardous and has high pollutionpotential. In the present study efforts has been made tobioremediate the distillery waste with two fungi namelyAspergillus niger and Curvularia andropogonis and check thebioremedial efficiency (decolorize and reduce COD) of theselected strains and therefore provide a environment friendlyand less expensive method which involves the natural processesresulting in the efficient conversion of hazardous compoundsinto innocuous products. Among these two fungal strainsAspergillus niger showed the highest decolorization i.e. 67.7%when cultivated at 30°C on 8th day in 5% spent wash with 1%glucose and the pH found to be is approximately 4.0. In additionthis strain reduced COD upto 86.5%. However, without carbonsupplement, the decolorization and reduction in COD were49.13% and 74.36%, respectively which shows that the presenceof extra carbon source increase the efficiency of fungal strains.Similar results for color are observed with another strain(Curvularia andropogonis) maximum reduction was 46.98% onday 3 when additional carbon source provided. But in contrastto A. niger this strain show 88.35% reduction in COD on 11th
day in absence of additional carbon source. During the presentstudy first time we are reporting and promoteing Curvulariaandropogonis for its bioremedial efficiency.
Key words Distillery industry, Bioremediation, Aspergillus niger,Curvularia andropogonis
Distillery industry is one of the major agro-basedindustries, which utilize molasses as raw material for theproduction of alcohol. Distillery industries have importantrole in the economic development of the country, but theeffluents released produce a high degree of organic pollutionin both aquatic and terrestrial ecosystems. Distilleries generatespentwash as waste water @ 8–15 L for every liter of alcoholproduced and the spentwash released from distilleries andfermentation industries are the major source of soil and aquaticpollution due to presence of water-soluble recalcitrant coloring
compounds (Guruswami, 1988; Evershed, etal., 1997).Spentwash has dark brown color and an objectionable odor.Its dark brown color is due to the presence of brown polymerscalled melanoidins (Wedzicha and Kaputo, 1992). Melanoidinis dark brown coloured natural condensation product of sugarand amino acids produced by nonenzymatic browningreactions called maillard reactions (Plavsic, et al., 2006).Spentwash is believed to resemble humic acids in its properties(Ivarson and Benzing-purdie, 1987). These compounds arehighly recalcitrant and have antioxidant properties, whichrender them toxic to many microorganisms, typically presentin wastewater treatment processes (Kitts, etal., 1993). LowpH value, high organic load, depletion of oxygen content andbad smell etc. are some of the major pollution problem. Thesewastewaters released from industries require pretreatmentbefore its disposal into the environment (Mohana, etal., 2007;Kumar and Chandra 2006). The conventional aerobicwastewater treatment method would not be appropriatebecause of the large land space requirement, as well as highcapital costs (mechanical or diffused aeration systems) andoperational costs.
Distillery takes several initiatives to minimize their waterconsumption and recycle the treated water but they are notmuch effective hence there is a need for such technique whichfills the gaps and also provide comprehensive and costeffective solution to unable industrries to become lower waterconsuming and zero discharge unit. Flocculation treatmentand physicochemical treatment such as ozonation andactivated carbon adsorption have been accomplished, butthese methods are not economically feasible on large scaledue to cost limitation where as biological decolourization byusing fungi such as Coriolus, Aspergillus, Phanerochaeteand certain bacterial species such as Bacillus, Alkaligenesand Lactobacillus (Kumar and Chandra, 2006; Kumar etal.,1997; Ohmomo, et al., 1985, 1987; Aoshima, et al., 1985) havebeen successfully achieved and thus can be applied as abioremediation technique. Recently microbial bioremediationhas emerged as an alternative technique to traditional chemicaltreatments. Bioremediation has been recognized as aenvironment friendly and less expensive method whichinvolves the natural processes resulting in the efficientconversion of hazardous compounds into innocuousproducts. This technique involves suitable microbes

SHARMA et al., Bioremediation and Decolorization of Distillery Effluent by Aspergillus niger and A Novel Fungal Strain 845
undergoing various physical and chemical reactions in thepolluted water system and during the microbial metabolism,the pollutants are degraded and removed.
In recent years, several basidiomycetes andascomycetes type fungi have been used in the decolourizationof natural and synthetic melanoidin in connection with colourreduction of wastewaters from distilleries. In comparison tobacteria filamentous fungi have lower sensitivity to variationsin temperature, pH, nutrients and aeration and have lowernucleic acid content in the biomass. One of the most studiedfungus having ability to treat distillery effluent is Aspergillussps. such as Aspergillus fumigatus G-2-6, A. niger, A. niveus,A. fumigates Ub²60 brought about an average of 69-75%decolourization along with 70-90% COD reduction (Ohmomoetal. 1987; Miranda, et al., 1996; Jimnez, et al., 2003, Agarwal,et al. 2010).
Fungi have tremendous capacity for treating industrialhazardous waste in support of an environment. Removal ofmelanoidin present in distillery effluent by fungi was reportedby Agarwal, et al., 2010. Pant and Adholeya, 2010 havedeveloped a novel fungal consortium for the treatment ofmolasses distillery wastewater. Similarly, we report a novelfungal strain of Curvularia for its bioremedial efficiency andit is reveal from the literature survey that no researcher hasincorporated Curvularia andropogonis for their degradationcapacity as far as distillery industries is concerned.
MATERIALS AND METHODS
Collection of sample:
The effluent (spent wash) to be bioremediated wascollected from the Shamli Sugar Industry, Uttar Pradesh, India.Immediately after the effluent sampling, the effluent samplewas taken to the laboratory and stored at 4°C in the laboratoryfor further analysis using standard methods. Characterizationof the effluent was done for pH, colour and COD.
Maintenance of Aspergillus niger and Curvulariaandropogonis:
A culture of Aspergillus niger and Curvulariaandropogonis (MTCC) collected from the IMTEC Chandigarh.A. niger was revived on the czapek yeast extract agar-CYAand C. andropogonis on PDA (Potato Dextrose Agar) underaseptic conditions as described by MTCC, IMTECHChandigarh India. The plates were incubated for 4-5 days tillsporulation became distinct. Multiple plates were preparedfrom spores taken from exposed plates. Aspergillus niger andCurvularia andropogonis were grown on subscribed media.Composition of CYA (Czapek concentrate 10 ml (NaNO3- 30g,KCl- 5g, MgSO4.7H2O- 5g, FeSO4.7H2O-0.1 g, Distilled Water-100 ml), K2HPO4- 1g, Yeast Extract 5g, Sucrose 30g, Agar 15g)and PDA containing potato (200gm), dextrose (20gm), agar(15gm), distilled water (1000ml) at pH 5-6 was used.
Extra metabolite source:
From the literature enough evidence is available toindicate that the fungus requires additional extra metabolitessource, if the material is to be graded as recalcitrant (Ravikumar,etal., 2010). In the present study 1% glucose was used as anextra metabolite. It is also based on previous study and theirresults (Akthar and Mohan, 1995).
Experiment design:
In this study we check the effect of two fungal strainsand simultaneously we also want to ensure the effect ofadditional carbon source on our work. To achieve our goal wedesign 5 set of experiments. Details of experiments are shownin Table 1.
Table 1. Experimental designs for the study.
Measurement of working parameters
A volume of 30 ml was drawn on 0, 3, 5, 8 and 11 day insterilized conditions. These samples were divided into 2 parts15 ml, used for measurement of color and to calculate pH andCOD. Remaining sample is kept at 4°C for further analysis.
Decolourisation Studies:
Two discs of A. niger and C. andropogonis wastransferred in 5% spent wash in 500 ml flask and incubated at300C to study the decolourisation ability of the selected fungalstrains. Dilution of spentwash was necessary to reduce thelevel of toxic ingredients in spent wash which otherwise inhibitthe growth of micro-organisms. After two days of interval 10ml aliquot was withdrawn for assaying decolourisation. Aftercentrifugation, the supernatant was analyzed for colourintensity at 475 nm with a UV-Visible spectrophotometer. Thedecolourisation was measured as decrease in optical densityof supernatant of treated effluent. Decolorization activity wasexpressed as the difference between initial and finalabsorbance divided by initial absorbance. The concentrationsof melanoidins and caramels were measuredspectrophotometrically (at 282 and 300 nm) and then calculated(Sapronov, 1963).
pH
pH measurement were made through the study usingdigital pH meter having separate calomel and grass electrodes.The pH meter was calibrated at 25°C by using standard buffer
S.No Name of Experiment Details 1 Control 5% Effluent uninoculated 2 AWG Aspergillus niger with 1% Glucose 3 AWOG Aspergillus niger without Glucose 4 CWG Curvularia andropogonis with 1%
Glucose 5 CWOG Curvularia andropogonis without
Glucose

846 Trends in Biosciences 6 (6), 2013
of pH 4.2 and 9.0. Once the calibration was done the pH of thesample were taken at the room temperature.
COD (Chemical Oxygen Demand)
COD as measured by using closed reflux method ofFerrous Ammonium Sulphate (FAS - 0.25 N) published byAPHA standard method edition 1995. All organic compoundswith a few exceptions are oxidized to CO2 and H2O by theaction of strong oxidizing agent regardless of biologicalassimilability of substances.
Data were tabulated and results were derived based onthe values obtained. The treatment efficiency was validatedby calculating the % reduction of physico-chemical parameter.
RESULTS AND DISCUSSION
Characterization of wastes: (5%)
The results of characterization of spent wash wasteswater after anaerobic and aerobic treatment taken from ShamliSugar Industry work as given in Table No. 2
Table 2. Characterstics of wastes at different stages of in-vivo treatment.
treatment efficiency was validated by calculating thepercentage reduction of all the parameters measured. Phenoliccompounds present in the wine distilleries imparts highinhibitory and anti-bacterial activity which slows down theanaerobic digestion process that’s why we design fiveexperiment for our studies with 2 fungal starins and also checkthe effect of carbon source on effluent. During the study itwas observed when effluent is not having glucose, pHincrease from 4.13 to 8.23 in CWOG where as in AWOG pHreach upto 6.03. On the other hand there is no much change inpH when additional carbon source is provided to effluent asclearly shown in table 3.
Decolorization study and effect of pH
Experiments design for this study shows enormousreduction in color on 8th day at 30°C. Maximum reduction wasobserved in AWG i.e. 67.67%, whereas best reduction inAWOG and CWG was 49.13%, 46.98% on day 3rd, respectivelyin comparison to control (OD=1.877). It was suggested thatdecolourization by fungi takes place due to the destruction ofcoloured molecules by enzymes (Ligninolytic enzyme or byendoglucanase and â-glucosidase enzyme of A. niger) andpartially because of sorption phenomena. In this work ODwas chossen as the measure of colorant degradation. As perthe results shown in table 3 and plate 1, maximum reduction incolor is observed on 8th day and after that color startincreasing, longer aeration period causes the adsorbed colourmolecules to be released as a result of endogenous respirationand cell death, hence reducing decolourization efficiency. Theresults of A. niger was supported by Miranda, et al., 1996 andPatel, et al., 2001. But, reduction in color is not less in CWOGi.e. 16.02% on day 3rd and after that color become dark asshown in fig 1 and 2.
A reduction of colour in the experiment having glucosemay be production of extracellular hydrogen peroxide andperoxidases. Peroxidase activity requires hydrogen peroxide,which is produced during glucose oxidation, and thusnecessitates addition of glucose as an extra carbon source. Inthis study reported here, supplementation of a readily availablecarbon source (glucose) seems to aid the degradation ofcolorants at 30°C. The result were supported by Adikane etal.,2006 and Bharagava etal., 2009. Another reason for decreasein colour removal in this study might be due to the fact thatthe melanoidin responsible for colour were more soluble inthe alkaline pH. In the acidic pH, the melanoidin might beprecipitated and removed easily. Thats why result were betterin AWG and CWG where pH is approx 4 (Table 3) and theseare supported by Angayarkanni, etal., 2003.
The present study shows that the liquor effluent samplewas acidic in nature and the pH was found to be 4.5. Table 2reveals that effluent sample shows high amount of COD value(100,000 mg/L) and very dark color. This specifies that amountof organic matter present in effluent is towards higher side ofits limits which may create stress upon biological system ifreleased in water body as it is. From the data, it is clear thateffective treatment is required to reduce the level of pollution.So that if it is release in the water body the natural degradationsystem will not suffer from stress and the aquatic life will alsoget least affected.
In the present study, physico- chemical parameters ofthe bioremediated effluent was estimated for 12 days and theresults were furnished in Table 3. After treatment withAspergillus niger and Curvularia andropogonis (in presenceand absence of additional carbon source as per table 1), theeffluent shows huge ruduction in color and COD. The
Characteristics Control (Spent Wash)
Waste Water After
Anaerobic Treatment
Aerobic Treatment
Color Brown (1.877) Dark Brown Brown
Temperature 70-80°C 28°C 26°C
pH 5.3 7.2 8.3
COD (mg/l) 1,06,666.68 78,875.43 45,326.82

SHARMA et al., Bioremediation and Decolorization of Distillery Effluent by Aspergillus niger and A Novel Fungal Strain 847
3.3. Effect on COD (Chemical oxygen demand)
The process of bioremediation is generally understoodwith higher percentage of reduction accompanied with COD.These values were noted in control as well as for samples ofdistillery effluent inoculated with two different fungus speciesnamely Aspergillus niger, and Curvularia andropogonis.Significant reduction in COD values were noted i.e. 86.54,74.36, 44.38 and 88.25% in AWG, AWOG, CWG and CWOGrespectively. So accordiang to the data shown in table 3
maximum reduction in COD was observed in CWOG(Curvularia andropogonis without glucose) where as A. nigershow very good reduction with and without glucose (seen inAWG and AWOG) shown in fig. 3. Similar results was observedby Pant, and Adholeya, 2010 they observe 65% reduction anovel fungal consortium and the results were also supportedby the studies performed by Ohmomo, et al., 1987; Miranda,et al., 1996; Jimnez, et al., 2003) which shows 70-90% reductionin COD by using different fungul strains.
Table 3. Physiochemical properties of bioremediated distillery effluent using fungal strains of Aspergillus niger and Curvulariaandropogonis (and effect of carbon source).
Days
AWG AWOG OD %
Reduction pH COD %
Reduction OD %
Reduction pH COD %
Reduction 0 1.877 0 4.13 1,06,666.67 0 1.877 0 4.13 1,06,666.67 0 3 0.711 62.13 4.13 1,60,000.01 -50 0.955 49.13 5.1 74,666.67 30 5 0.627 66.58 4.13 66,688.00 37.48 1.007 46.38 5.97 52,320.00 50.95 8 0.607 67.67 4.13 38,058.70 64.32 1.251 33.38 6.17 41,120.00 61.45 11 0.694 63.03 4.13 14,357.30 86.54 1.480 21.18 6.03 27,349.33 74.36
Days
CWG CWOG
OD % Reduction
pH COD % Reduction
OD % Reduction
pH COD % Reduction
0 1.877 0 4.13 1,06,666.67 0 1.877 0 4.13 1,06,666.67 0 3 0.995 46.98 3.07 1,40,000.01 -31.25 1.577 16.02 6.37 58,400.01 45.25 5 1.002 46.63 4.03 1,26,666.67 -18.75 1.905 -1.47 6.93 47,200.00 55.75 8 1.225 34.73 4.33 1,01,333.34 5 1.892 -0.76 7.87 21,066.67 80.25 11 1.310 30.24 4.07 59,333.34 44.38 1.984 -5.7 8.23 12,533.34 88.25
Plate 1. Showing results with different sets of experiment and decolorization in color at 0, 3, 5, 8 and 11th day.(a) AWG (A. niger with Glucose), (b) AWOG (A. niger without Glucose), (c) CWG (C. andropogonis with Glucose),
(d) CWOG (C. andropogonis without Glucose)

848 Trends in Biosciences 6 (6), 2013
Physicochemical analysis of liquor effluent revealed thelevel of pollutants. This study concluded that physico-chemical parameters such as pH, color and COD were relativelyhigh in the distillery effluent and severely affected theenvironment and water bodies. It was observed that all thevalues of pollutants were complying with the limits as perstated by CPCB (Central Pollution Control Board). The effluentdischage from the industry is highly toxic to plants and it isnot permissible for irrigation. In the present study, the
biodegradation ability of fungi such as Aspergillus niger andCurvularia andropogonis was evaluated under variousexperimental conditions. Initially fungal inoculum in the formof discs was added to the effluent sample to assess whetherthese fungi are able to degrade the effluent or not, and also toascertain whether quantity of fungal inoculum plays anaccountable role or not. Hence from this study it could beconcluded that both the fungi namely Aspergillus niger andCurvularia andropogonis do possess the biodegradationability, both fungi are able to reduce the pollutants of effluentsample at 0, 3, 5, 8 and 11. Although maximum reduction incolor and COD was observed by Aspergillus niger withglucose but in present study we support Curvulariaandropogonis because there in no report in literature regadingits toxicity for humans.
AKNOWLEGEMENT
We wish to express our thanks to Mewar Universityand ITS Paramedical College to help in carry out our researchwork.
LITERATURE CITED
Adikane, H.V.; Dange, M.N.; Selvakumari, K. 2006. Optimization ofanaerobically digested distillery molasses spent wash decolorizationusing soil as inoculum in the absence of additional carbon and nitrogensource. Bioresour. Technol. 97: 2131-2135.
Agarwal, R.; Lata, S.; Gupta, M; Singh, P. 2010. Removal of melanoidinpresent in distillery effluent as a major colorant. J Environ Biol.31(4):521-8.
Akthar M.N.; Mohan, P.M. 1995. Bioremediation of toxic metal ionsfrom polluted lake waters and industrial effluents by fungalbiosorbent. Curr Sci, 69:1028 – 30.
Angayarkanni, J., M. Palaniswamy and K. Swaminathan 2003.Biotreatment of distillery effluent using Aspergillus niveus. Bull.Environ. Contam. Toxicol., 70, 268-277.
Aoshima, I., Y. Tozawa, S. Ohmomo and K. Udea, 1985; “Productionof decolourizing activity for molasses pigment by Coriolusversicolour Ps4a. Agric”. Biol. Chem., 49: 2041-2045.
Bharagava R.N., Chandra R, Rai V. 2009. Isolation and characterizationof aerobic bacteria capable of the degradation of synthetic andnatural melanoidins from distillery effluent. World J. Microbiol.Biotechnol. 25(5): 737-744.
Evershed, R. P., H.A. Bland, P.F.Van Bergen, J.F. Carter, M.C.Hortonand Rowley conwy, P.A. 1997. Volatile compounds in archaeologicalplant remains and the Maillard reaction during decay of organicmatter. Sci. 278(5337): 432-433.
Guruswami R. 1988. Pollution control in distillery industry. NationalSeminar on Pollution Control in Sugar and Allied Industries, Bombay
Ivarson, K.C. and Benzing-purdie, L.M. 1987. Degradation ofmelanoidins by soil microorganisms under laboratory conditions.Can. J. Soil Sci. 67:409–414
Jimnez, A.M., R. Borja and A. Martin 2005. Aerobic-anaerobicbiodegradation of beet molasses alcoholic fermentation wastewater.Process Biochem., 38, 1275-1284 (2003).
Kitts, D.D., Wu, CH, Stich, H.F. and Powerte, W.D. (1993) Effect of
Fig. 3. Reduction in COD during the studies.
Fig. 2. Effect on pH during the studies.
Fig. 1. Reduction in color during the studies.

SHARMA et al., Bioremediation and Decolorization of Distillery Effluent by Aspergillus niger and A Novel Fungal Strain 849
glucose-glycine maillard reaction products on bacterial andmammalian cells mutagenesis. J. Agric. Food Chem. 41: 2353–2358
Kumar, V., L. Wati, P. Nigam, I.M. Banat, G. MacMullan, D. Singh andR. Marchant, 1997. Microbial decolourization and bioremediat ionof anaerobically digested molasses spent wash effluent by aerobicbacterial culture”. Microbios., 89, 81-90.
Kumar, P. and R. Chandra. 2006. Decolourisation and detoxification ofsynthetic molasses melanoidin by individual and mixed cultures ofBacillus spp. Biores. Technol., 7, 2096-2102.
Miranda, P.M., G.G. Benito, N.S. Cristobal and C.H Nieto 1996. Colourelimination from molasses wastewater by Aspergillus niger. Biores.Technol., 57, 229-235.
Mohana, S., C.Desai, and Madamwar, D. 2007. Biodegradationdecolorisation of an aerobically treated distillery spent wash by anovel bacterial consortium. Biores. Technol. 98:333-339.
Ohmomo, S., I. Aoshima, Y. Tozawa, N. Sakurada and K. Ueda 1985.Purification and some properties of melanoidin decolourizingenzymes, P-3 and P-4, from mycelia of Coriolus vericolour Ps4a.Agric. Biol. Chem., 49 : 2047-2053
Ohmomo, S., Y. Kaneko, S. Sirianuntapiboon, P. Somchai, P.Atthasumpunna and I. Nakamura, 1987. Decolourization of molasses
wastewater by a thermophilic strain Aspergillus fumigatus G-2-6.Agric. Biol. Chem., 51: 3339-3346.
Pant, D. and Adholeya, A. 2010. Development of a novel fungalconsortium for the treatment of molasses distillery wastewater.Environmentalist, 30(2): 178-182.
Patel A, Pawar P, Mishra S, Tewari A 2001. Exploitation of marinecyanobacteria for removal of colour from distillery effluent. Ind JEnviron Prot; 21:1118-1121.
Plavsic, M., B. Cosovic and C. Lee, 2006; Copper complexing propertiesof melanoidin and marine humic material. Sci. Total Environ. 366: 310-319.
Ravikumar, R; Vasanthi, S; Saravanan, K; 2010. Single factorialexperimental design for decolorizing anaerobically treated distilleryspent wash using cladosporium cladosporioides, Int. J. Environ. Sci.Tech., 8 (1), 97-106, Winter 2011.
Sapronov A.R. 1963. Kolichectvennoe opredelenie krasyashchikhveshchestv v produktakh saharnogo proizvodstva (Quantitativedetermination of colourants in the sugar industry products).Sacharnaja Promyslennost’ SSSR (in Russian), 37: 32-35.
Wedzicha, B.L. and Kaputo, M.T. 1992 Melanoidins from glucose andglycine: Composition, characteristics and reactivity towards sulphiteion. Food Chem 43:359–367.
Recieved on 03-09-2013 Accepted on 12-10-2013

850 Trends in Biosciences 6 (6), 2013Trends in Biosciences 6 (6): 850-853, 2013
Diversity and Abundance of Bacterivore and Fungivore nematodes in MangoOrchards of Dehradun (Uttarakhand), IndiaANJUM NASREEN RIZVI AND SHREYANSH SRIVASTAVA
Zoological Survey of India, Northern Regional Centre, 218 Kaulagarh Road, Dehradun-248195(Uttarakhand), India.email: [email protected]
ABSTRACT
Soil analysis of mango orchards of Dehradun yielded 26 generaof bacterivore and fungivore nematodes. Bacterivore nematodeswere dominant group comprising 80.76% while, fungivorecomprised 19.23 %. In terms of taxonomic diversity among the26 genera identified, 51% belonged to order Rhabditidacomprising 13 genera, followed by Araeolaimida( 19.2%) with5 genera, Tylenchida ( 11.5%) with 3 genera, Aphelenchida (7.6%) with 2 genera and the orders Chromadorida,Monhysterida and Alaimida comprising 3.8% each with onegenus each. The diversity indices such as the Shannon-Weaverand Inverse Simpson showed that this site has a high nematodediversity of 2.78 and 12.7 respectively. Nematode ChannelRation (NCR) showed 0.862 which shows that bacterialdecomposition pathway is dominant in the area.
Key words Diversity, abundance, nematode, Mango orchard,Dehradun
Nematodes occupy a central position in the soil foodweb (Neher, 2001). Bacterial and fungal feeding nematodes, inparticular, play vital roles in soil ecosystem processes (Inghamet al., 1985; Neher, 2001). Bacterivore nematodes affect organicmatter decomposition in several ways. They include: feedingon microbes and regulating the rate at which organiccompounds are degraded into inorganic ions; dispersal ofmicrobes throughout the soil and water; feeding onsaprophytic and plant pathogenic bacteria and influencingthe composition of the microbial community; act as prey anda source of nutrients for fauna and microflora such as soilnematophagous fungi; affecting the distribution and functionof plant symbionts. (Freckman, 1988).
Decomposition processes in soil, although ultimatelydependent on the plant resource base, are often allocated toeither the bacterial based energy channel (or pathway) or theslower fungal- based channel (Moore, et al., 1988). The ratiobetween these two functional groups gives an account of therelative contribution of the two channels, it is helpful to expressthis ratio as a Nematode Channel Ratio (NCR=B/B+F), where= abundance of Bacterivores nematodes, F= abundance ofFungivores nematodes.
Nematode community analyses have been conductedfor biological assessments for agricultural soil environmentsin Europe, the United States, Australia and Japan (Neher et
al., 1998; Neher, 200; Ficus and Neher, 2002; Neher, et al.,2005; Liang et al., 2005; Okada and Harada, 2007).
Dehradun or Doon valley is a distinct unique ecosystemin the foothills of Himalayas in Uttarakhand state. The valleyis bounded on the North-East by Lesser Himalayan belt, onthe South-West by the Siwalik. Dehradun extends from thelatitude 30 o 19’N to longitude 78o 04’E. The mean averagealtitude is approximately 650 m. The Ganga and the Yamuna,demarcate South-Eastern and North-Eastern boundaries.
Some of the studies on the community analysis ofnematodes from state Uttarakhand include Rathaur, et al.,2006; 2007, Rizvi, 2008, and Rizvi and Mehta, 2009.
The important fruits grown in the district are the mango,guava and litchi. Though many studies are available on thediversity of higher animals as well as insects from the fuirtorchards of district Dehradun, no study is yet available onthe diversity of nematodes from mango orchards and hencethe present study was undertaken to find the diversity andabundance of soil inhabiting nematodes occurring in themango orchards of district Dehradun. Nematodes were isolatedusing standard techniques; identification of genera andcounting were performed in the lab. Statistical analysis anddiversity indices were calculated on MS Excel to analyze thenematode community in the mango orchards of Dehradun.
MATERIALS AND METHODS
Site description, soil sampling and processing:
Mango orchards in District Dehradun: The important fruitsgrown in the district are the mango, guava and litchi, however,during the recent years, litchi and guava have been found tobe restricted to certain areas only. Mango orchards are locatedat Purani Kalsi, Langha, Badhwala, Asanpul, Ranipokhri etc.Twenty-five soil samples each consisting of 10-15 coresdepending upon the area of the orchards were randomlycollected around the root zones. Five sub-samples werecollected from a depth of about 10-15 cm. These sub-sampleswere mixed to make a composite sample from which 100 cm 3 ofsoil was taken for processing of nematodes. Nematodes wereisolated by modified Baermann funnel techniques. Soilanalysis was performed at Central Soil & Water ConservationInstitute (CSWC), Dehradun (Table1).

RIZVI AND SRIVASTAVA, Diversity and Abundance of Bacterivore and Fungivore nematodes in Mango Orchards of Dehradun 851
Table 1. Soil Parameters of Mango orchards in district Dehradun
Sample details
Moisture %
PH 1:2.5
Ec Dsm-1
Oc% Total nitrogen
(%)
Mechanical
Clay %
Silt %
C.Sand %
F.Sand %
Badhwala 28.7 6.1 0.032 0.735 0.083 20.8 32.8 5 41.4
Langha 24.4 6.8 0.07 0 1.512 0.182 19.2 17.6 24 39.2
Asanpul 19.9 6.6 0.048 0.720 0.091 24.0 22.4 25 28.6
Rani pokhri 12.8 6.4 0.065 0.691 0.080 6.4 41.6 12.2 39.8
Purani Kalsi 6.56 5.49 0.102 0.757 0.098 13.6 26.4 25.4 34.6
Table 2. Population structure of Bacterivore and Fungivore nematodes in mango orchards of district Dehradun
Identification of Nematode genera:
Permanent glass slide were prepared for identification.Identification up to generic level was done mainly byconsulting Goodey (1963), Andrassy (1983) and websites.Trophic groups were assigned and cp groupings after Bongers(1990).
Abundance and Diversity:
The following parameters were calculated to determinecommunity analysis of nematodes
Frequency (N) is frequency of nematode genus (i.e. thenumber of samples in which the genus was present), AbsoluteFrequency (AF %) is (Frequency of the genus) X 100/ totalnumber of samples counted. Density (D) is the number ofnematode specimens of the genus counted in all samples /
total number of the samples collected. Relative density (RD%) is the Mean density of the genus X 100/sum of meandensity of all nematode genera.
The following indices were calculated (Table3).Shannon-Weaver Index (H’) = -”Pi.lnPiSimpson Index (ë) = -”Pi2 (Simpson, 1949)Hill’s reciprocal N2 = 1/ ë (Hill, 1973)Nematode Channel Ratio (NCR) =B/B+FWhere Pi= proportion of individual of taxon i in the
total population; Vi & PPi = c-p values assigned to taxon i,according to Bongers, 1990; fi = frequency of the genera; Xi =abundance of taxon i in the sample; B= abundance ofBacterivores nematodes; F= abundance of Fungivoresnematodes.
Nematode Genera Cp Value N AF MD RD Protorhabditis 3 5 20 1 4.970 Mesorhabditis 3 11 44 2.2 10.93 Rhabditis 3 3 12 0.6 2.980 Diploscapter 3 1 4 0.2 0.994 Eucephalobus 3 1 4 0.2 0.994 Cephalobus 3 3 12 0.6 2.982 Teratolobus 3 1 4 0.2 0.994 Acrobeloides 3 19 76 3.8 18.88 Chiloplacus 3 6 24 1 5.964 Acrobeles 3 2 8 0.4 1.988 Pseudoacobeles 3 5 20 1 4.970 Htereocephalobus 3 2 8 0.4 1.988 Macrolaimellus 3 2 8 0.4 1.988 Achromadora 3 6 24 1.2 5.964 Plectus 3 1 4 0.2 0.994 Chiloplectus 3 2 8 0.4 1.988 Wilsonema 3 11 44 2.2 10.93 Rhabdolaimus 3 1 4 0.2 0.994 Paraphanolaimus 3 1 4 0.2 0.994 Prismatolaimus 3 2 8 0.4 1.988 Alaimus 3 2 8 0.4 1.988 Fungivorous Aphelenchus 2 3 12 0.6 2.982 Aphelenchoides 2 2 8 0.4 1.988 Filenchus 2 6 24 0.72 3.578 Tylenchus 2 2 8 0.4 1.988 Aglenchus 2 3 12 0.6 2.982

852 Trends in Biosciences 6 (6), 2013
RESULTS AND DISCUSSION
Soil analysis of mango orchards of Dehradun yielded 26genera of bacterivore and fungivore nematodes. Bacterivorenematodes were dominant group comprising 80.76% while,19.23 % fungivore. In terms of taxonomic diversity (Table 2)among the 26 genera identified, 51% belonged to orderRhabditida comprising 13 genera, followed by Araeolaimida(19.2%) with 5 genera, Tylenchida ( 11.5%) with 3 genera,Aphelenchida (7.6%) with 2 genera and the ordersChromadorida, Monhysterida and Alaimida comprising 3.8%each with one genus each.
In terms of abundance, Rhabditida were again the mostabundant group representing 60.6% followed by Araeolaimidawith 15.9%; Tylenchida (8.5%); Chromadorida (5.9%);Aphelenchida (4.9%) and least abundant were Monhysteridaand Alaimida with just 1.9% each.
Acrobeloides was most dominant genus with the highestfrequency (73%) of occurrence and relative density (18.8%)per 100 cm3 of soil, Chiloplectus and Mesorhabditis were alsoquite frequent (42%) and relative density (10.9%). Six generanamely ,Diploscapter, Eucephalobus, Teratolobus, Plectus,Rhabdolaimus and Paraphanolaimus represented leastabundance (3.8%) and relative density (0.99%) per 100 cm3 ofsoil.Frequency: Among bacterivore, genus Acrobeloides was themost prevalent with absolute frequency (AF) of 76% , followedby Mesorhabditis and Chiloplectus ( AF =40%) and leastfrequent genera were Diploscapter, Eucephalobus,Teratolobus, Plectus, Rhabdolaimus and Paraphanolaimuswith 4% AF. Among fungivore, Filenchus was most prevalentwith absolute frequency (AF) of 24% , and least frequent
genera were Tylenchus and Aphelenchoides with 8% AF .
Trophic relationship among soil-inhabiting nematodes
Frequency: Among the bacterivore and Fungivorenematode community analyzed in Mango orchards,bacterivore were found to be the most prevalent group withN=4 and Coefficient of Variation (CV) =109.2%,AF =16.5(CV=109.5%). Fungivores with N= 3.2(CV=51.3%) andAF=12.8 (CV=51.2%) .
A thorough knowledge of nematode population indifferent habitats is prerequisite to assess the importance ofsoil nematodes in the ecosystem. The abundance of eachspecies in the community can be transformed into ecologicalindices and parameters to measure changes in diversity andtrophic structure and also to assess soil disturbance levelsand decomposition pathways (Gomes, et al., 2003). Bothbacterivores and fungivores play vital roles in decompositionof organic matter in a soil food web with two main energychannels, a faster bacterial channel and a slower fungal-basedchannel. Though, bacteria and fungi are the primarydecomposers in the soil food web, they can also immobilizeinorganic nutrients in the soil. However, when the bacterivoreand fungivore nematodes graze on these microbes , they giveoff CO2 and NH4 and other nitrogenous compounds, affectingC and N mineralization directly (Ingham, et al., 1985). Indirectly,nematodes can disseminate microbial propagules throughoutthe soil (Freckman, 1988) .Nematodes , thus , play significantroles in soil nutrient cycling.
Of the five mango orchards surveyed for soil sampling ,the maximum nematodes were recovered from the Langhaorchards with highest total Nitrogen percentage 0.182 andleast acidic PH 6.8 ( Table 1) and is in agreement with earlierstudies that less acidic PH favours bacterial decompositionpathways (Alexander, 1977) with dominant bacterivorenematode community .Further, the diversity indices (Table3.),such as the Shannon-Weaver and Inverse Simpson showedthat this site has a high nematode diversity of 2.78 and 12.7respectively. Nematode Channel Ration (NCR) showed 0.862which shows that bacterial decomposition pathway isdominant in the area. However, distribution and diversity ofdifferent nematode taxa are influenced by different factors(Freckman and Virginia, 1997).
Thus, it may be concluded that the soils of mangoorchards of district Dehradun favours bacterial decompositionpathways and shows high abundance and diversity ofbacterivore nematodes which is in agreement with the earlierstudies that bacterial decomposition pathway is dominant inagro-ecosystems ( Kothals et al. ,1996).
ACKNOWLEDGEMENT
We are grateful to Dr. K. Venkataraman, the Director,Zoological Survey of India, Kolkata for providing necessaryfacilities and to the Officer-in Charge, Zoological Survey of
Table 3. Summary of Bacterivore and Fungivore Nematodediversity indices in Mango orchards of Dehradundistrict
Index Values Shannon-Weaver index(H’) 2 .87 Simpson diversity index(D) 0.078 Inverse Simpson diversity index (Hills reciprocal)
12.7
Nematode Channel Ratio (NCR) 0.862
Table 4. Community relationship between Bacterivore andnematodes [Mean ± SD (range).]
Value Bacterivores CV %
Fungivores CV %
N 4.1 ± 4.54 (1-19)
109.2 3.2 ± 1.64 (2-6)
51.3
AF % 16.5 ± 18.1 (4-76)
109.5
12.8 ± 6.5 (8-24)
51.2
MD 0.82 ± 0.9 (0.2-3.8)
109.3
0.54 ± 0.14 (0.4-0.7)
25.8
RD % 4.1 ± 4.5 (0.9-18.8)
109.6
2.7 ± 0.69 (1.9-3.5)
25.6

RIZVI AND SRIVASTAVA, Diversity and Abundance of Bacterivore and Fungivore nematodes in Mango Orchards of Dehradun 853
India, Northern Regional Station, Dehradun, forencouragements. Financial assistance provided by theDepartment of Science & Technology (DST-SERB), New Delhiis gratefully acknowledged.
LITERATURE CITED
Alexander, M. 1977. Introduction to soil microbiology. 2nd ed. Wiley,New York,USA, pp. 467.
Bongers, T. 1990.The maturity index: an ecological measure ofenvironmental disturbance based on nematode species composition.Oecologia, 83: 14-19.
Freckman, D.W. 1988. Bacterivorous nematodes and organic matterdecomposition. Agriculture, Ecosystems & Environment, 24: 195-217.
Freckman, D. W. and R. A. Virginia. 1997. Low diversity Antarctic soilnematode communities: Distribution and response to disturbance,Ecology, 78: 363-369.
Gomes, G.S., Huang, S.P. and Cares, J .E. 2003. Nematode community,trophic structure and population fluctuation in soybean fields.Fitopatologia Brasileira, 28: 258-266.
Ingham, R.E., Trofymow, J.A., Ingham, E.R. and Coleman, D.C. 1985.Interactions of bacteria, fungi and their nematode grazers: Effectson nutrient cycling and plant growth. Ecological Management,55: 119-140.
Kothals, G. W., Bongers, T. Kammenga, J.E., Alexiev, A.D. and Lexmond,T.M. 1996. Long term effects of copper and ph on the nematodecommunity in an agroecosystem. Environmental Toxicology andChemistry, 15: 979-985.
Liang, W., Zhang,X., Yong,Q.L., Jhiang,W.O. and Neher, D.A. 2005.Vertical distribution of bacterivorous nematodes under differentland uses. Journal of Nematology, 37: 254-258.
Moore, J.C., Walter, D.E. and Hunt, H.W 1988. Arthrpod regulation ofmicro-and mesobiota in below ground detrital food webs. AnnualReview of Entomology, 33: 419-439.
Neher, D.A.2001. Role of Nematodes in soil health and their use asindicators. Journal of Nematology, 33:161-168.
Neher, D.A., Easterling, K.N., Fiscus,D. and Campbell, C.L. 1998.Comparison of nematode communities in agricultural soils of NorthCarolina and Nebraska. Ecological Applications, 8: 213-223.
Neher, D.A.,Wu,J., Barbercheck, M.E.nas Anas, O. 2005. Ecosystemtypes affects interpretation of soil nematode community measures.Applied Soil Ecology, 30: 47-64.
Okada, H. and Harada, H. 2007. Effects of tillage and fertilizer onnematode communities in a Japanese soybean field. Applied SoilEcology, 35: 582-598.
Rahtour, K.S., Pandey, J. and Ganguly, S. 2006. Community structureof Plant Parasitic Nematodes in Champawat distrct of Uttaranchal,India. Indian Journal of Nematology, 36: 89-93.
Rahtour, K.S., Sharma, S., Ganguly, S., and Pandey, R.K. 2007.Community analysis of plant nematode associated with someornamental, medicinal and aromatic plants in Bareilly district,India. International Journal of Nematology, 17: 9-12.
Rizvi, A.N. 2008. Community analysis of soil inhabiting nematodes innatural sal forest of Dehradun, India . International Journal ofNematology, 18: 181-190.
Rizvi, A.N. and Mehta, H.S. 2009. Significance of trophic diversity ofsoil nematodes. Annals of Forestry, 17: 311-318.
Recieved on 09-06-2013 Accepted on 15-07-2013

854 Trends in Biosciences 6 (6), 2013Trends in Biosciences 6 (6): 854-857, 2013
Studies on the Effect of Butter Milk Solids and Vegetable Oil on Preparation of“Filled Chhana”UPENDRA SINGH1, RAJNI KANT2 SAURABH PRAKASH3 AND SONIA KUMARI4
Department of Dairy Technology,S. G. Institute of Dairy Technology, B.A.U. Campus, P.O- B.V.C, Patna-800014 (Bihar)1Department of Dairy Technology, S. G. Institute of Dairy Technology, Patna- 800014 (Bihar)2Department of Food Science & Technology, Warner School of Food and Dairy Technology, SamHigginbottom Institute of Agriculture, Technology and Science, (Deemed-To-Be- University) Allahabad-211007 (UP)3Division of Dairy Technology, National Dairy Research Institute, Karnal- 132001 (Haryana).4Department of Dairy Microbiology, S.G. Institute of Dairy Technology, Patna 800014(Bihar)email: [email protected]
ABSTRACT
The production of Chhana is confined to the eastern region ofthe country. It contains less than 70 percent moisture andapproximate 50 per cent fat on dry matter basis. Chhana is anacid coagulated indigenous milk product which is very widelyused in India as a base material for the preparation of varioussweetmeats like sandesh, rasogolla, cham-cham, rasmalai,balsahi, Khurma, pantooa etc. Butter milk containing about10% milk solids, after modifying the composition withvegetable oil and skim milk powder (3.0% fat and 8.5% SNF),can be converted into chhana like product to be utilized inmaking various sweetmeats, viz Rasogolla, Sandesh, Cham-cham, Rasmalai, Pantua, and Rajbhog etc. Vegetable oil, beingcheaper than milk fat, can be mixed with butter milk to obtaina filled chhana which would definitely be cheaper than thenormal chhana. It will be helpful for people suffering fromprotein energy malnutrition because this product is rich inprotein and energy and it will be also helpful for people sufferingfrom lactose intolerance where diet should contain restrictedamounts or no lactose because in the absence of enzyme lactase,lactose is not hydrolyzed to glucose and galactose. Almost 90per cent of lactose content of initial milk is lost in whey duringchhana preparation. On other hand it will be helpful fromeconomic point of view for those people who come undereconomically weaker section because by replacing milk fatwith edible vegetable oil the cost of the product can considerablybe reduced.
Key word Cream; Butter Milk; Vegetable Oil; SMP; Chhana;Citric Acid; Temperature.
Chhana is a traditional Indian milk product, obtainedby acid coagulation of hot milk. When dilute acid is added tohot milk, it destabilizes the milk proteins by disturbing thecharges carried by the casein micelles and by releasing calciumions from colloidal calcium caseinate phosphate complex.Consequently, large structural aggregates (coagulum) ofcasein micelles are formed. From the normal colloidaldispersion of casein, this coagulum is known as chhana. It is
used as an intermediate base for a wide variety of milk basedBengali sweets. Its preparation is mainly continued to thecottage sector, largely in eastern parts of India and morerecently in Bikaner district of Rajasthan. It is claimed thatmore rasogullas are made in Bikaner than in Kolkata wherecow milk in large quantity is available. India’s total productionof chhana is estimated at 2, 00, 000 tones and the value ofChhana based sweets, around Rs 70,000 million.
Butter milk containing about 10% milk solids, aftermodifying the composition, can be converted into chhanalike product to be utilized in making various sweetmeats, viz,Rasogolla, Sandesh, Cham-cham, Rasmalai, Pantua, andRajbhog etc.Vegitable oil, being cheaper than milk fat, can bemixed with butter milk to obtain a filled chhana which woulddefinitely be cheaper than the normal chhana.
MATERIALS AND METHODS
Sweet cream butter milk, skim milk and cow milk werecollected from students Training Dairy. Allahabad AgricultureInstitute, Allahabad. Skim milk powder and hydrogenatedvegetable oil were obtained form market (M\S Hindustan LeverLtd, Bombay).
Preparation of Filled Chhana
Butter milk
Standardization (4 % Fat & 8.5 % SNF
Filtration
Pasteurization (630 C for 30 min)
Homogenization ((150/35kg\cms) at 60-62.50C.)

SINGH et al., Studies on the Effect of Butter Milk Solids and Vegetable Oil on Preparation of “Filled Chhana” 855
Heating (900 C for 5 min)
Cooling (700 C)
Addition of coagulant (2 % Citric acid solution at 700 C)
Continuous slow Stirring till clear whey separates out
Filtration of coagulum
Draining of whey (30 min)
Field chhana
Fig. 1. The process chart for preparation of Field Chhana
Testing:
Fat:Fat content sweet cream buttermilk, cow milk, skim milkand chhana whey were determined as per BIS (2006).Solids Not Fat: The solids not fat content was calculatedaccording to the method prescribe in as per BIS (2006).Moisture: Moisture content of chhana was determined as perthe procedure of as per BIS (2006).
Standardization- Standardization of Sweet cream buttermilkwas standardized to 4.0 % fat and 8.5% solid not fat levelusing hydrogenated oil and skim milk powder and followedby two stage homogenization (150/35kg\cms) at 60-62.50C.The procedure of De, 1976 was followed for preparation ofchhana.
Standardization of Cow milk- Cow milk was standardized tocontain 4.0% milk fat and 8.5% milk solids not fat by usingskim milk for the manufacturing of chhana.
Yield- The yield of Chhana was noted by weighing the producton a physical balance.
Statistical Analysis- The data were analyzed statistically byusing the paired “t” test technique.
RESULTS AND DISCUSSION
Moisture content of Chhana:
The moisture content filled chhana was 52.44% were asthat of control was 52.97% (Table -1). The observed “t” value(1.03) was found to be lower than the tabulated one (2.262) at5% level indicating no significant difference between contentsof control and the experimental chhana. Similar results werealso reported by De, 1976.
Table 1. The moisture percentage in Control andExperimental Chhana
Number of Replication
Control (Moisture %)
Experimental (Moisture %)
1. 54.25 52.93 2. 52.28 52.58 3. 51.50 53.25 4. 53.00 53.50 5. 54.24 50.94 6. 52.16 52.44 7. 52.74 53.16 8. 51.85 52.27 9. 53.50 51.57
10. 54.18 51.84 Average 52.18 52.44 Range 51.50
to 54.25
50.94 to
53.50
't' value Calculated-1.0339Tabulated- 2.262
(At 5 % level of significances)
Fat content of Chhana:
It is evident from Table 2. That the average fat contentof control chhana was 23.63% where as filled chhana had anaverage of 23.56%. On the basis of paired "t" test it was foundthat percent fat of filled chhana did not vary significantlyfrom that of the chhana made from cow milk.
Table 2. The fat percentage in Control and ExperimentalChhana
Number of Replication
Control (Fat %) Experimental (Fat %)
1. 23.80 23.50 2. 23.50 22.10 3. 23.50 23.50 4. 24.20 23.80 5. 22.50 23.50 6. 24.50 23.50 7. 23.50 23.40 8. 22.40 23.80 9. 23.90 24.00 10. 24.50 24.50
Average 23.63 23.56 Range 23.63
to 24.50
22.10 to
24.50
't' value Calculated-0.79
Tabulated- 2.262(At 5 % level of significances)
Yield of Chhana:
The average yield of filled chhana and control chhanawere 19.2% and 18.88% respectively (Table 3) on the basis of

856 Trends in Biosciences 6 (6), 2013
paired "t" test it was founded that the yield of filled chhanadid not differ significantly from that of the chhana made fromcow milk.
Table 3. Show the yield in percentage of Control andExperimental Chhana:
Overall average of filled chhana:
It was evident from (Table 5) that the average sensoryscore of filled chhana for appearance body and texture andflavor were obtained as 14.05, 11.08, 11.07and 41.36 respectivelyagainst the value of 14.90, 11.72, 11.77 and 42.37 for the controlsample. On the basis of paired "t" test, it found that appearancebody and texture, flavor and over all sensory score filled chhanadid not vary significantly from that of the chhana made fromcow milk taken as control.
Table 5. Per cent moisture, fat and yield and fat loss inwhey during filled chhana preparation:
Number of Replication
Control (Yield %) Experimental (Yield %)
1. 19.50 19.84 2. 18.87 19.12 3. 18.87 18.00 4. 17.76 18.25 5. 18.50 18.87 6. 19.76 20.45 7. 18.87 18.25 8. 19.25 18.12 9. 19.25 20.12 10. 18.36 20.75
Average 18.88 19.207 Range 17.76
to 19.76
18.12 to
20.75
''t' value Calculated-0.98Tabulated- 2.262
(At 5 % level of significances)
Fat losses in chhana whey:
The average fat losses (Table -4) in filled chhana wheywas 0.17% against the value of 0.16% in the whey of controlchhana. Lower calculate "t" value (1.176), compared totabulated value (2.262) at 5% level of significance, showedthat fat losses in control and filled chhana whey did not differsignificantly.
Table 4. Show the fat losses of Control and ExperimentalChhana whey
't' value Calculated-1.176Tabulated- 2.262
(At 5 % level of significances)
Number of Replication
Control (fat %) Experimental (fat %)
1. 0.20 0.22 2. 0.15 0.18 3. 0.10 0.15 4. 0.13 0.16 5. 0.15 0.14 6. 0.15 0.20 7. 0.18 0.12 8. 0.17 0.14 9. 0.19 0.22
10. 0.16 0.17 Average 0.158 0.17 Range 0.10
to 0.20
0.12 to
0.22
*Table "t" value at 5% level 2.262.
Sensory score of chhana:
The panel of four judges gave their opinion inorganoleptic score on both control and experimental chhanaand judged the products for overall score, flavours, body,texture and general appearance.
Table 6: Sensory score of chhana
Praticular (%)
Average value
Range “t” value* Significance at 5% level
1. 2. 3. 4. 5. Moisture 52.44
(52.97) 50.94 – 53.50
(51.50- 54.25)
1.0339 NS
Fat 23.56 (23.63)
22.10 – 24.50
(24.40- 24.50)
0.79 NS
Yield 19.207 (18.88)
18.12 – 20.75
(17.75 – 19.76)
0.98 NS
Fat loss in chhana whey
0.17 (0.158) 0.12- 0.22 (0.10 – 0.20)
1.176 NS
*Average of 10 replications. t- Value (table) at 5% level is 2.262.
Sl. No.
Particular Score Full Average Value
obtained
Score range t- Value at 5% level
1. Appearance 20 14.05(14.90)
12.75- 15.00 (14.00-
15.75)
0.9477
2. Body 15 11.08(11.72)
9.50-12.25 (10.50-12.50)
1.725
3. Texture 15 11.07(11.77)
10.00-12.75 (10.25-13.00)
1.32
4. Flavour 50 41.30(42.37)
39.25-43.25 (39.0-43.75)
1.43
5. Over all 100 77.50(80.76)
71.5-83.75 (73.75-83.75)
1.276

SINGH et al., Studies on the Effect of Butter Milk Solids and Vegetable Oil on Preparation of “Filled Chhana” 857
The chhana (control) preparation from cow milk hadaverage moisture 52.97 %, fat 23.63 %, yield of chhana 18.88%, and fat losses in chhana whey 0. 158 %, whereas the filledchhana (experimental) prepared from sweet cream buttermilkgave an average moisture 52.44 %, fat 23.56 %, and yield 19.207%, and fat losses in chhana whey 0.17 %.
A filled chhana at cheaper cost from sweet creambuttermilk, skim milk powder and vanaspati of comparablecomposition with conventional one in moisture and fatcontents can be prepared the butter milk solids which are noteconomically utilized otherwise can be of good use in themanufacture of filled chhana and it preparation filled rasogollaand sandesh.
ACKNOWLEDGEMENT
First of all we are thankful to our respected elderly whopatiently contributed to our knowledge. We are also thankfulto Department of Dairy Technology, Allahabad AgricultureInstitute to provide facilities and opportunities to do this work.
LITERATURE CITED
De, S. 1976. Chhana and chhana - based sweets. Indian Dairyman 28(3): 105.
Recieved on 10.09.2003 Accepted on 15.10.2013

858 Trends in Biosciences 6 (6), 2013Trends in Biosciences 6 (6): 858-860, 2013
Evaluation and Characterization of Germplasm Accessions of Urdbean (Vigna mungoL. Hepper)BHUPENDRA KUMAR1, ARVIND SHUKLA2, AND YASHLOK SINGH3
1. K.V.K., SVBPUAT, Meerut, 2. GBUAT, Pantnagar, 3. NDUAT, Faizabad,email : [email protected]
ABSTRACT
A field experiment was conducted to evaluate and characterizethe available improved land races in Urdbean at CRC of theGBPUA & T, Pantnagar during Zaid – 99 and Kharif – 99comprised of 18 improved land races collected from diversityrich zones of Uttar Pradesh and from NBPGR, New Delhi. Thestudy highlighted wide range of variability for variousquantitative and visual characters. A strong positive correlationwas observed with braches per plant, pods per plant and seedsper pod. The genotypes Sh. U- 9503, Sh U- 9518, PLU – 289, PU-19, PU-35 and NU-1 were found immune to both yellow mosaicand leaf crinkle diseases.
Key words Evaluation, germplasm, urdbean
Blackgram or Urdbean (Vigna mungo L. Hepper. 2n= 22) is an important crop in India, Having high protein contentand its wide culinary uses. It also maintain soil fertility throughbiological nitrogen fixation by bacteria prevalent in their rootnodules and thus play a vital role in sustainable agriculture.Since time immemorial, pulses have been cultivated in rainfedconditions which are characterized by poor soil fertility andmoisture stress ( poor water retentive soils )
It is estimated that the country’s population will touchnearly 1350 million by 2020 AD. The country would then needa minimum of 30.3 million tonnes of pulses. The total areaunder pulses remained virtually stagnant (22-24) millionhectares) with almost stable production (12-14 million tonnes)over the last four decades. In urdbean, India has shownmarginal increase in area from 3.10 to 3.15 m ha and inproductivity from 377 kg per ha 473 kg per ha during 1986-87to 1996-97 respectively. (Asthana and Chaturvedi, 1999).
The available germplasm in this crop can serve asthe most valuable natural resources in providing donorparents having desirable attributes for developing successfulvarieties. Therefore, collection and conservation of germplasmis essential at persent, as well as for future crop improvementneeds. Since India is one of the important centre of diversityfor urd bean, a thrust for germplasm collection and evalutionis of utmost significance to have a dynamic breedingprogramme. The superior donor parents are urgently requiredfor incorpating disease, insect pest and abiotic stressresistance ( Paroda, 1990). Evalution of germplasm indicatedtheir potential value as breeding material.
MATERIALS AND METHODS
The evaluation trials were conducted to evaluate 22improved land races of urdbean at Crop Research Centre ofthe G.B. Pant University of Agriculture and TechnologyPantnagar during Zaid – 99 and Kharif – 99. The land racesincluded having those acquired from NBPGR, New Delhi aswell as those collected from districts of Garhwal and Kumaunhills, Hardui, Sitapur, Barabanki and Bareilly in state of UttarPradesh, as sample from farmers field, local markets etcpresented in Table 1). The location were reported to be rich indiversity for urdbean ( Paroda and Arora, 1991 )
The field evaluation trial was sown on the 11th March,1999 (Zaid-99) and 4th August 1999 (Kharif-99) at the CropResearch Centre. Twenty two genotypes were put in arandomize block design (RBD) with three replications. Eachplot comprised of 4 rows of 4 m length. The rows were spaced30 cm apart i.e. , The plot size was 4.8m2 and plant to plantdistances was kept at 10 cm.
RESULTS AND DISCUSSION
The experiment data recorded on the urdbean genotypeshave been presented in Table 2 and 3 for quantitativecharacters and in Table 4 for visual traits.
The variability present for agronomic and economic traitsand abiotic and biotic resistance in urdbean has been reportedby various scientists (Singh, et al., 1980; Chhabra and Kooner,1980; Singh and Sharma, 1981).
The present genotype collection had various improvedland races derived from the collected germplasm whichexceeded the limits of mean values of checks which were fourhigh yielding currently cultivated varieties. Genotypes ShU9536 and ShU 9626, flowered in 45.67 and 46.67 days,respectively and were earlier than checks during Kharif-99.Similarly for days to maturity where the minimum days (79.00)were observed in ShU 9519 and ShU 9622, which wassignificantly earlier than the earliest check PU 19 (80.67).
These were the collection from village Khajuraha,Arva in Hardoi and Bareilly districts of Uttar Pradesh,respectively.For the characters pods per plants, pods percluster, pod clusters per plant and seeds per pod, the upperlimit of the range was 73.33, 6.00, 24.67 and 7.67, respectively.These value were significantly higher than those from the

KUMAR et al., Evaluation and Characterization of Germplasm Accessions of Urdbean (Vigno mungo L. Hepper) 859
S.No. PGR NO. Accession No. (entry name) Village/Town District State Country 1 PGRU 95003 Shukla U 9503 Mishrikh Sitapur Uttar Pradesh India 2 PGRU 95005 Shukla U 9505 Sidhauli Sitapur Uttar Pradesh India 3 PGRU 95008 Shukla U 9508 Sakaran Sitapur Uttar Pradesh India 4 PGRU 95011 Shukla U 9511 Haargaon Sitapur Uttar Pradesh India 5 PGRU 95018 Shukla U 9518 Hariyawan Hardoi Uttar Pradesh India 6 PGRU 95019 Shukla U 9519 Khajuraha Hardoi Uttar Pradesh India 7 PGRU 95025 Shukla U 9525 Sandi Hardoi Uttar Pradesh India 8 PGRU 95032 Shukla U 9532 Beniganj Hardoi Uttar Pradesh India 9 PGRU 95036 Shukla U 9536 Berua Hardoi Uttar Pradesh India 10 PGRU 96001 Shukla U 9601 Markara Bareilly Uttar Pradesh India 11 PGRU 96011 Shukla U 9611 Manpur Bareilly Uttar Pradesh India 12 PGRU 96022 Shukla U 9622 Arva Bareilly Uttar Pradesh India 13 PGRU 96026 Shukla U 9626 Baragaon Bareilly Uttar Pradesh India 14 PGRU 96032 Shukla U 9632 Shivpuri Bareilly Uttar Pradesh India 15 PGRU 96042 Shukla U 9642 Manpur Bareilly Uttar Pradesh India 16 PGRU 96133 Shukla U 96133 Kaladhungi Nainital Uttar Pradesh India 17 - PLU 289 Acquired from NBPGR New Delhi India 18 - PLU 433 Acquired from NBPGR New Delhi India 19 - Type 9 Acquired from NBPGR New Delhi India 20 - PU 19 Acquired from Pantnagar Uttar Pradesh India 21 - PU 35 Acquired from Pantnagar Uttar Pradesh India 22 - NU 1 Acquired from Pantnagar Uttar Pradesh India
check varieties during Kharif 99 . Whereas, during Zaid 99,the character days to maturity where the minimum days (77.00)was observed in ShU 9622 which was significantly earlier thanthe earliest check (Type 9 (80.67 days)). This was a collectionfrom village Arva in Bareilly district of Uttar Pradesh. For thecharacters pods per plant and the seeds per pod, the upperlimit of the range was 68.0 and 7.33, respectively. In Zaid 99,for seed yield per hectare, the high yielding genotypes likeShU 9511, ShU 9632, ShU 9532 and ShU 9503 with yields, 2375kg, 2250 kg, 2200 kg and 2115.20 kg, respectively wereindicative of the facts that higher yielding germplasm are stillavailable and there is ample scope of land race improvement.Similarly, in Kharif 99, for the character seed yield per hectares,the high yielding genotypes were ShU 9511, ShU 9536, ShU9525 and ShU 9503 with yields 1756.94 kg, 1580.55kg, 1395.82kgand 1309.02 kg respectively. Further testing of such genotypesin wide areas will be needed. The evaluation data for
quantitative traits clearly suggests the richness of variabilityin existing collection and scope of improvement over existingchecks.
The studies on characters association are abundant butthe present investigation which includes substantial diversitywill be a good indicator of correlated response amongcharacters in urdbean crop as such.
Table 2 revealed the result that seed yield per kg waspositively and significantly associated with pods per plant,seeds per pod and branches per plant during Zaid 99. Similarly,Table 3 exhibited the result that yield per hectare was positivelyand significantly correlated with pods per plant, pods percluster, seeds per pod and yield per plot. Thus, it showed astrong linear and true relationship, therefore, seed yieldimprovement through selection needs consideration for thesetraits.
Table 1. Passport data of collected/acquired urdbean accessions
*,** Significant at 5% and 1% level, respectively.
Table 2. Phenotypic correlation between seed yield and its components in urdbean germplasm in preliminary yield trial Zaid99.
Character Plant height (cm)
Branch per plant
Pods per plant
Seeds per pod
100 Seed weight (g)
Yield per plant(g)
Yield per plot(kg)
Yield per hectare (kg)
Days to maturity 0.534** -0.299** -0.406** -0.342** 0.064 -0.636** -0.430** -0.444** Plant height -0.446** -0.598** -0.178 -0.663** -0.633** -0.668** Branches per plant 0.619** 0.040 0.475** 0.451** 0.488** Pods per plant -0.043 0.765** 0.507** 0.557** Seeds per pod 0.015 0.560** 0.480** 0.520** 100–seed weight(g) -0.283* -0.207* -0.263* Yield per plant(g) 0.662* 0.681** Yield per plot(kg) 0.291 Yield per hectare(kg)

860 Trends in Biosciences 6 (6), 2013
Similar relationship between these yield contributingcharacter in urdbean have been reported by several scientistsviz. Das and Dasgupta (1985), Renganayki andScreerengasamy (1992), Kasundra, et al., 1995, Rao andSuryawanshi, 1998.
The seed yield has shown a negative association withflowering and maturity indicating that early maturity typesare better yielders. The similar results were reported by Singhet al. (1986) in urdbean. Although Wanjari, 1988 in urdbean,reported positive correlation with maturity and negativecorrelation with flowering.
LITERATURE CITED
Asthana, A.N. and Chaturvedi, S.K. 1999. A little impetus needed. TheHindu Survey of Indian Agriculture. 61-65.
Chhabra, K.S. and Kooner, B.S. 1990. Screening of breeding materialfor insect-pest resistance in pulse crops. In : Breeding methods forthe improvement of pulse crop. pp. 161-170.
Das P.K and Das Gupta T. 1985. Character association, physiologicalfunction and nodulation in blackgram and their implication onimproved seed yield. Paper presented in fifth SABRAO, Cong., 25-29 Nov., Bangkok, Thailand (Abstr,\.) pp. 66.
Kasundra, J.K.; Pethani, K.V. and Kathiria, K.B. 1995. Studies ongenetic variability, correlation and path analysis in urdbean. IndianJournal of Pulses Research, 8(2): 113-118.
Paroda, R.S. 1990. Production and improvement of pulse. Crops. In:Indian Genetic Improvement of pulse crops (eds. Jafar Nizam andIrfan A. Khan and S.A. Farook).
Paroda, R.S. and Arora, R.K. 1991. Plant Genetic Resources.Conservation and Management. IBPGE, Rome pp. 387.
Rao, S. S.: Suryawanshi, R.K. 1998. Analysis of yield factors in urdbean(Vigna mungo L). Legume Research. 11 (3): 134-138.
Renganayaki, K and Sreerengasamy, S. R. 1992. Path coefficient analysisin blackgram. Madras Agric. J. 79 (11): 634-639.
Singh, D.P. and Sharma, B.L, 1981. Evalution of mungbean germplasm.Mad.Agric. J 68: 285-289.
Singh, D.P. Singh, HpP. And Sharm, B.L. 1980. Evaluation of blackgram(vigan mungo (L.)Hepper) Germplasm. Pantnagar J. Res. 5(2):110-115.
Singh, J.N.; Mishra, M.K.; Chauhan, G.S. and Himayat Khan. 1986.Genetic association among yield and its components characters inwinter season urd (Vigna mungo L). Gram Sciencem Journal. 1 (1-2): 95-96.
Wanjari, K.B. 1988. Variability and character association in blackgram(Vigng mungo). Indian Journal of Agricultural Science. 58(1): 48-51.
Recieved on 10-09-2013 Accepted on 18-10-2013
Table 3. Phenotypic correlation between seed yield and its components in urdbean germplasm in preliminary yield trialKharif 99.
Characters Days to maturity
Plant height (cm)
Branch per plant
Pods per plant
Pod length (cm)
Pods per cluster
Pod cluster
per plant
Seeds per pod
100 seed weight
(g)
Yield per plot (kg)
Yield per hec. (kg)
Days to 50% flowering 0.514** 0.551** 0.402** -0.298* -0.287* -0.168 -0.220 -0.182 0.245* -0.653** -0.688** Days to maturity 0.455** 0.125 -0.198 -0.123 -0.237 0.056 -0.075 -0.342** -0.455** -0.480** Plant height (cm) 0.088 -0.516** -0.114 -0.208 -0.099 0.006 0.131 0.439** -0.449** Branch/plant 0.191 -0.338** 0.065 0.170 -0.108 0.050 -0.189 -0.194 Pods/plant 0.038 0.330** 0.504** 0.035 0.010 0.390** 0.422** Pod length (cm) 0.169 -0.066 0.029 -0.033 0.092 0.070 Pods/cluster 0.093 0.134 0.170 0.167 0.252** Pod cluster/plant 0.080 0.296** 0.125 0.130 Seeds per pod 0.150 0.274* 0.243* 100 seed weight -0.103 -0.050 Yield/plot (kg) 0.956** Yield/ha (kg)

Trends in Biosciences 6 (6): 861-863, 2013
Fungicidal Management of Cercospora Leaf Spot of Mungbean (Vigna radiata)S. P. SINGH, S.K. SINGH AND V. SHUKLA
Department of Plant Pathology, N.D. University of Agriculture & Technology, Kumarganj, Faizabad- U.P.,India.email: [email protected] and [email protected]
ABSTRACT
Mungbean [Vigna radiata (L.) Wilczek] is an important pulsecrop grown widely in entire Indian Sub-continent during rainyand summer season. The average productivity of mungbean inIndia is very low due to several abiotic and biotic stresses. Thepresent investigation was carried out to evaluate theeffectiveness 6 fungicides at 250, 500, 750, 1000 and 1500 ppmconcentration in vitro and green house condition against C.canescens Ellis & Martin. The results showed that all fungicideswere inhibitory to mycelial growth and the effectiveness offungicides increased with an increase in concentration andtime. The Carbendazim and Propiconazole completelyinhibited the mycelial growth at 250 ppm concentration while,Copper oxychloride, Thiophenate methyl and Mancozeb wasfound most effective at 1500 ppm in inhibiting mycelial growthof the fungus. Thiram was found ineffective against C.canescens. In green house condition, the similar patterns werealso observed for reduction in diseases intensity.
Key words Cercospora leaf spot, Mungbean, Management andFungicides.
Mungbean (Vigna radiate L. Wilczek) also known asgreen gram or golden gram is an important pulse crop of Indiaand grown in Kharif, spring and summer seasons. Severalfactors viz., insect pests and diseases are mostly responsiblefor its low production. Among diseases, cercospora leaf spotcaused by Cercospora canescens Ellis and Martin is one ofthe most important diseases (Mew, et al., 1975) and appearevery year in varying intensity causing heavy losses in yield.An yield loss up to 47% has been reported due to this diseaseduring the warm-wet season (AVRDC, 1976). Gupta and Gupta2000 reported losses in grain yield up to 29.60% an earlyinfected crop. The number of pods/plant and number of grain/pod were also reduced.
Hence, for minimizing the losses caused by disease needto search an effective fungicide with effective dose for diseasemanagement. Several fungicides have been found effectivefor the management of disease caused by Cercospora spp. indifferent crops including cercospora leaf spot of mungbeanin vitro and in vivd.
MATERIALS AND METHODS
Efficacy of fungicides against Cercospora canescens invitro:
Efficacy of 6 fungicides viz., Carbendazim, Propiconazole,
Thiram, Copper oxychloride, Topsin-M and Mancozeb wereevaluated at 250, 500, 1000 and 1500 ppm for their inhibitoryeffect on the mycelial growth of Cercospora canescens usingpoisoned food technique. For preparation of differentconcentration of fungicides were weighted with the help ofelectronic balance. The weighted fungicides were added insterilized PDA.
This poisoned PDA poured into sterilized petridishes.Three replications were maintained for each concentration.After solidification of medium in petridishes each plates wascentrally inoculated with 5 mm disc cut from the edge of cultureof C. canescens using sterilized cork borer. All the inoculatedplates were incubated at 28 ± 2 0C. Colony diameter wasmeasured after 21 days of inoculation.
Effect of fungicides on disease intensity under greenhouse condition:
The effect of two foliar spray with six fungicides(Carbendazim @ 0.1 %, Propiconazole @ 0.1 %, Thiram @ 0.2%, Copper oxychloride @ 0.2 %, Topsin-M @ 0.1 % andMancozeb @ 0.2 %) at 15 days interval against cercosporaleaf spot of mungbean were evaluated in green house. Percent disease intensity (PDI) and per cent disease control (PDC)were calculated by using the following formula:
100 x x maximum
grade Total number of
leaves examined
Sum of all
numerical value Per cent disease
intensity (PDI)
100 x checkin PDI
ntin treatme PDI -check in PDI Per cent disease control (PDC)
RESULTS AND DISCUSSION
Efficacy of fungicides against C. canescens in vitro:
Radial growth:
Six fungicides were evaluated in vitro against C.canescens by poison food technique at 250, 500, 1000 and1500 ppm concentration after 21 days of incubation. Nomycelial growth was recorded in Carbendazim andPropiconazole followed by Copper oxychloride (12.00 mm),Topsin-M (12.83 mm), Mancozeb (16.50 mm) and Thiram (38.83mm) at 250 ppm concentration as compared to control (66.00mm). All treatments were significantly superior to control.Carbendazim and Propiconazole were statistically similar to

862 Trends in Biosciences 6 (6), 2013
each other, however Copper oxychloride, Topsin-M,Mancozeb and Thiram were statistically differed to each other(Table 1).
The similar results were recorded in 500 ppm and 1000ppm concentration as 250 ppm concentration and the radialgrowth in both concentrations ranged from 0.0 to 66.00 mm.Each treatment was significantly superior to control.Carbendazim and Propiconazole were statistically similar toeach others, however Copper oxychloride, Topsin-M,Mancozeb and Thiram were statistically differed to each other(Table 1).
In 1500 ppm concentration zero radial growth wasrecorded in Carbendazim, Propiconazole, Copper oxychloride,Topisin-M and Mancozeb followed by Thiram (17.17 mm) ascompared to control (66.00 mm). Each treatment wassignificantly superior to control. Carbendazim, Propiconazole,Copper oxychloride, Topsin-M and Mancozeb werestatistically similar to each other, however Thiram wassignificantly differed to each treatments.
Per cent inhibition on radial growth:
Carbendazim and Propiconazole completely (100.00 %)inhibited the mycelial growth at 250 ppm concentrationfollowed by Copper oxychloride (81.82 %), Topsin-M (80.81%), Mancozeb (75.00 %) and Thiram (41.41 %). All treatmentswere significantly superior to control. Carbendazim andPropiconazole, Copper oxychloride and Topsin-M were at parto each other; however Mancozeb and Thiram werestatistically differed to each other (Table 2).
The similar patterns were recorded in 500 and 1000 ppmconcentration as 250 ppm concentration and the per centinhibition in radial growth were ranged from 51.01 to 100.00per cent and 58.33 to 100.00 per cent, respectively. Eachtreatment was significantly superior to control. Carbendazimand Propiconazole in both concentrations and Copperoxychloride and Topsin-M in 500 ppm concentrationstatistically similar to each other, however rest of thetreatments were significantly differ to each other (Table 2).
In 1500 ppm concentration Carbendazim, Propiconazole,Copper oxychloride, Topsin-M and Mancozeb were completely(100.00 per cent) inhibited the radial growth followed by Thiram(73.99 %). All treatments were significantly superior to control.Carbendazim, Propiconazole, Copper oxychloride, Topsin-Mand Mancozeb were statistically similar to each othesr,however Thiram was differed significantly (Table-2).
Singh and Singh, 1976 found that Carbendazim mosteffective in controlling the disease followed by CopperOxychloride and Mancozeb. The same results were also found,Jamadar and Padagnur, 1995, Main et al., 2000 and Khalil andJalaluddin, 2004 also found Carbendazim was inhibitory tomycelial growth of this fungus, however, Copper Oxychloride
Table 1. Effect of fungicides against C. canescens onmycelial growth in vitro at 21 days after incubation
Fungicides Mycelial growth (mm) Concentration (ppm)
250 500 1000 1500 Carbendazim 0.00 0.00 0.00 0.00 Mancozeb 16.50 13.00 10.33 0.00 Thiram 38.67 32.33 27.50 17.17 Propiconazole 0.00 0.00 0.00 0.00 Topsin-M 12.67 10.83 9.50 0.00 Copper oxychloride 12.00 10.33 8.50 0.00 Control 66.00 66.00 66.00 66.00 CD at 5% 0.54 0.47 0.60 0.54 SEm± 0.18 0.15 0.20 0.18 CV 1.48 1.41 1.98 2.23
Table 3. Effect of fungicides on disease intensity ofcercospora leaf spot of mungbean under greenhouse condition
Fungicides Per cent inhibition
Concentration (ppm) 250 500 1000 1500
Carbendazim 100.00 (90.00)
100.00 (90.00)
100.00 (90.00)
100.00 (90.00)
Mancozeb 75.00 (60.00)
80.30 (63.66)
84.34 (66.69)
100.00 (90.00)
Thiram 41.41 (40.06)
51.01 (45.58)
58.33 (49.80)
73.99 (59.34)
Propiconazole 100.00 (90.00)
100.00 (90.00)
100.00 (90.00)
100.00 (90.00)
Topsin-M 80.81 (64.02)
83.58 (66.10)
85.61 (67.71)
100.00 (90.00)
Copper oxychloride
81.82 (64.76)
84.34 (66.69)
87.12 (68.97)
100.00 (90.00)
Control 0.00 0.00 0.00 0.00 CD at 5% 0.82 0.71 0.91 0.83 SEm± 0.27 0.23 0.30 0.27 CV 0.69 0.57 0.71 0.60
Figure given in parenthesis are transformed value
S. No. Treatment Percent Disease Intensity (%)
Percent Disease Control (%)
1. Carbendazim 14.45 (22.30)
76.50 (61.00)
2. Mancozeb 21.67 (27.70)
64.82 (53.60)
3. Thiram 28.59 (32.30)
53.57 (47.00)
4. Propiconazole 17.85 (25.00)
71.03 (57.40)
5. Topsin-M 15.49 (23.20)
74.85 (59.90)
6. Copper oxychloride
23.40 (28.90)
62.00 (51.70)
7. Control 61.57 (51.70)
0.00
SEm± 0.437 0.443 CD at 5% 1.326 1.342
Table 2. Effect of fungicides against C. canescens on percent mycelial inhibition in vitro at 21 days afterincubation
Figure given in parenthesis are transformed value

SINGH et al., Fungicidal management of cercospora leaf spot of mungbean (Vigna radiata) 863
and Carbendazim were inhibited the spore germination. Thisis the confirmation to present finding.
Effect of fungicides on disease intensity under greenhouse condition:
The effect of foliar spray with six fungicides ondisease intensity of mungbean against Cercospora canescenswere evaluated in green house. Two foliar sprays ofCarbendazim (0.1%) was found most effective with minimumdisease intensity(14.45 %) followed by Topsin- M (15.49 %),Propiconazole (17.85 %), Mancozeb (21.67 %), Copperoxychloride (23.40 %) and Thiram (28.59 %) as compared tocontrol plot (61.57 %). The data (Table 3) clearly indicatedthat the Carbendazim and Topsin- M and Mancozeb andCopper oxychloride significantly at par to each other.
Effect on per cent disease control (PDC):
The maximum disease control (76.50 %) was observedin two foliar sprays of Carbendazim followed by Topsin- M(74.85 %), Propiconazole (71.03 %), Mancozeb (64.82 %),Copper oxychloride (62.00 %) and Thiram (53.57 %). Therewas no significantly difference in the treatment Carbendazimand Topsin- M. However, rest of the treatments differsignificantly to each other. Saxena and Tripathi (2006) alsofound that Mancozeb, Bavistin, Topsin-M, Kavach andPropiconazole were significantly reduces the disease severity.The same results were also reported by Singh, et al., 2007,Rathore, 2006 and Dubey and Singh, 2006. However, underfield condition Topsin-M and Carbendazim were foundeffective in reducing disease incidence and increase grainyield (Elazagus and Mew, 1987 and Kaur, et al., 2004).
Rathore, 2009 managed the disease by application ofthe Carbendazim and plant extract and found that Carbendazimwas best with minimum disease intensity and maximum grainyield followed by Garlic and Neem were another bettertreatment for minimize the disease intensity and increasedyield.
LITERATURE CITED
AVRDC. 1976. (Asian Vegetable Research and Development Centre).Mungbean Report for 1975, Shanhua, Tianan, Taiwan Republic ofChina, pp. 18.
Dubey, S.C. and Singh, B. 2006. Integrated management of cercosporaleaf spot and yellow mosaic of urdbean (Vigna mungo L.). Indian J.Agri. Sci., 76 (8): 485-489.
Elazegus, F.A. and Mew, T.W. 1987. Efficiency of chemical control oftwo leaf diseases of mungbean grown after rice. J. Pl. Protec. in theTrop. 4 : 85-94.
Gupta R P and Gupta A B. 2000. Effect of environment factors inCercospora leaf spot and its relationship with yield in mungbean.Indian Phytopath. 54 (4): 506-507.
Jamadar, M.M. and Padganur, G.M. 1995. Bioassay of different fungicidesagainst greengram leaf spot incitant (Cercospora canescens Ellis &Martin.). Karnataka J. Agric. Sci., 5: 241-243.
Kaur, A.; Gupta, V.P. and Singh, R.B. 2004. Chemotheraphy an efficienttool to control cercospora leaf spot in mungbean. J. Mycol. Pl.Pathol., 34 (2): 515-516.
Khalil, M.I. and Jalaluddin, M. 2004. Fungicidal management ofcercospora leaf spot and powdery midew of black gram. BangladeshJ. Pl. Pathol., 20 (1): 63-66.
Main, M.S.; Hossainn, M.D. and Jalaluddin, M. 2000. Effect of fungicidesand urea on cercospora leaf spot of mungbean. Bangladesh J. Pl.Path., 16 : 23-26.
Mew I.P., Wang T.C. and Mew, T.C. 1975. Inoculum production andevaluation of mungbean varieties for resistance to Cercosporacanescens. Plant Dis. Report. 59: 397-611.
Rathore, B.S. 2006. Management of diseases of greengram withfungicides. J. Mycol. Pl. Pathol., 36 (2): 138-141.
Rathore, B.S. 2009. Effect of plant extracts on foliar disease incidenceand yield of greengram. J. Mycol. Pl. Pathol., 39 (2) : 235-237.
Saxena, P. and Tripathi, H.S. 2006. Fungicidal management of cercosporaleaf spot of mungbean (Vigna radiata). J. Mycol. Pl. Pathol., 36(2): 336-337.
Singh, D.V. and Singh, R.R. 1976. Chemical control of cercospora leafspot of greengram. Indian Phytopath., 29: 332-339.
Singh, R.K.; Gupta, R.P.; Singh, R.V. and Shukla, N. 2007. Efficacy offungicides against major fungal diseases of mungbean. IndianPhytopath., 60 (3): 392.
Recieved on 13-09-2013 Accepted on 27-10-2013

864 Trends in Biosciences 6 (6), 2013Trends in Biosciences 6 (6): 864-865, 2013
Indian Plants in Medicine- Green EconomicsKRISHNA MURARI1, BINOD KUMAR BHARTI2, SUDHANSHU KUMAR BHARTI3
1Department of Dairy Engineering, Sanjay Gandhi Institute of Dairy Technology, Bihar AgricultureUniversity, Sabour, Patna 800014, Bihar, India; Email- [email protected] of Dairy Chemistry, Sanjay Gandhi Institute of Dairy Technology, Bihar AgricultureUniversity, Sabour, Patna 800014, Bihar, India; Email- [email protected] of Biochemistry, Patna University, Patna, 800005, Bihar, Indiaemail : [email protected]
ABSTRACT
From ancient to modern history, many traditional plant basedmedicines are playing an important role in health care.Phytochemicals are natural bioactive compounds found invegetables, fruits, medicinal plants, aromatic plants, leaves,flowers and roots which act as a defense system to combat againstdiseases. The phytochemicals from medicinal aromatic plants(MAP) cover a diverse range of chemical entities such aspolyphenols, flavonoids, steroidal saponins and vitamins. Anumber of bioactive compounds generally obtained fromterrestrial plants such as isoflavones, diosgenin, resveratrol,quercetin, catechin, sulforaphane, tocotrienols and carotenoidsare proven to reduce the risk of many diseases perhaps due totheir antioxidative, antihypercholesteroemic, antiangiogenic,anti-ischemic, inhibition of platelet aggregation and antiinflammatory activities. The multi-faceted role of thephytochemicals is mediated by its structure-functionrelationship and can be considered as leads for perfumery,pharmaceuticals, nutraceuticals, cosmaceuticals andagrochemical industries in future.
Key words Medicinal aromatic plants, perfumery,pharmaceuticals, nutraceuticals, cosmaceuticals,agrochemical industries
Indian medicinal system, among them the ancient scienceof Ayurveda, have always been aware of the medicinal valueof plants. For at least 2500 years before the west recognizedthe medicinal properties of Rauwolfia (Sarpgandha) root thatIndian medicine men and been using it to calm violentlydisturbed patients. It was called snake root and used it totreat apart from ‘moon madness’ or lunacy a whole range ofaffections from snakebite to cholera. Later in 20th century Indianscientists isolated an active substance from Rauwolfia provingto be significant remedy for high blood pressure (Nadkarni,1976; Grover and Vats, 2001).
Indian has an impressive list of medicinal plants, almostall of them native to the soil. Towering above the rest is theNeem (Margosa). All parts of this ubiquitous tree are bitterand ara used in medicine. A decoction of Neem leaves helpsfevers, particularly malarial fever, and liver problems such ashepatitis, boils and all kinds of skin disease. Extract of Neemis a powerful insecticide, poisonous to insects and parasites(Nadkarni, 1976; Grover and Vats, 2001).
The Amla (Emblica officinalis) has been regarded asrichest source of Vitamin ‘C’ in heat stable form. It is invaluablein the treatment of respiratory complaints and rejuvenation ofboth body and hair. According to ‘Charaka’, the father ofAyurveda, a regular intake of amla or amla based preparationsis a sure method of delaying the ageing process (Nadkarni,1976; Grover and Vats, 2001).
Amla with two other plants ‘haritaki’ abd ‘bibhitaki’makes the super combination known as ‘triphala’ (three fruit-combine). Whether used externally or internally, the benefitsof ‘triphala’ are legion. The most significant being therejuvenation of the membrane of intestinal of intestinal tract(Nadkarni, 1976).
The tree of ‘Bael’ (Aegle marmelos) yields a fruit that ispanacea for majority of digestive disorders. The bamboo’shollow stem has a white powdery deposit known as ‘tavashir’which has marked decongestant properties particularly usefulas a local application in tonsillitis. The evergreen ‘Camphor’tree is the traditional source of camphor used extensively inritual worship is also an important ingredient of ointmentsand medicinal oils. Guggul (Cominiphora mukul), a small treeof arid regions, produce a resin with marked anti-inflamatoryproperties, making it one of the best for arthritis (Nadkarni,1976; Grover and Vats, 2001).
Asafoetida, is a resin collected from living rhizome androot of ‘Ferula asfoetida’ an efficacious medicine for colicand abdominal distension. The fragrant wood of ‘chandan’ isobtained from a small tree ‘Santallum album’, used a pastefor powder, it calms skin eruptions. Taken orally, it cools thebody and mind. ‘Tagara’ (Valiriana wallichi) has sedativeand anti-spansmodic properties. Being a natural tranquillizer,it is particularly useful in the treatment of hysteria and epilepsy(Bakkali, et al., 2008).
Berberis (Berberis aristala) is used to control jaundiceand inflammations ranging from gastroenteritis toconjunctivitis. It is a difficult to list all the uses of Tulsi(Ocimum) plant. It protects the thorat, skin, digestive andrespiratory tracts, combined with ginger juice, black pepperand honey. It cures catarrh. It is tonic for the heart and veryeffective in the first stages of many cancers. ‘Tulsi’ purifiesthe air and it is also an insect repellent. Along with Tulsi we
MURARI et al., Indian Plants in Medicine- Green Economics 865
can not forget fenugreek or ‘Methi’ (Trigonella), a powerfultonic for the digestive, respiratory and nervous system. Highlyeffective in the treatment of both diabetes and high bloodpressure. In addition, a hair cleaner made from soaked andground seeds of ‘Methli’, prevents premature hair loss(Nadkarni, 1976; Grover and Vats, 2001).
‘Saffron’ is effective in respiratory congestion while mintand coriander are digestives. ‘Drumstick’ leaves help highblood pressure, the fruit tones up the heart and circulatorysystem. The ripe fruit of the tamarind stimulates the appetiteand digestion. Garlic lowers both blood cholesterol andpressure. Ginger is definitely anti-catarrh, besides being a safeand sure digestive. ‘Aloe’, a succulent herb contains‘allantoin’ an efficacious healing substance. Thus, ‘aloe’ isapplied externally to burns, rashes, inflammations and otherpainful conditions, with excellent results. It has become a partof many cosmetic preparations due to its properties (Bakkali,et al., 2008; Kunwar and Bussmann, 2008).
Chemically, the curative properties of these plants aredue to the presence of complex chemical substances ofdifferent composition (secondary plant metabolites). Thesemetabolites according to their composition are grouped asalkaloids, glycosides, corticosteroids, essential oils etc(Vasanthi, et al., 2012).
The alkaloid forms the largest group which includesmorphine and codein (poppy), strychnine (Nux vomica),guanine (Cinchona), hypocyamine (Belladona), eructine(Ipecac), cocaine (Coca), ephedrine (Ephedra), reserpine(Rauwolfia), caffeine (Tea dust), aconitine (Aconite), vaccine(Vasaca), santonina (Artemisia) and large number of others.Glycosides form another important group represented bydigoxine (foxglove), stropnathire (Strophanthus), glycyrrhizin(liquorice), barbolin (Aloe) etc. Corticosteroids have come intoprominence only recently and diosgenin (Dioscorea),solasodin (Solanum species) etc, now command a large worlddemand. Some essential oils such as ‘Kulch’ and peppermintalso possess medicating properties and are used in pharmaindustries (Bakkali, et al., 2008; Kunwar and Bussmann, 2008).
Medicinal aromatic plants (MAP) related businessopportunities are enormous and are visibly on the rise due todiversified uses that plant derived compounds are finding inperfumery, pharmaceuticals, nutraceuticals, cosmaceuticalsand agrochemical industries. If proper values can be added tothe traditional medical knowledge-based health practices andsubsistence oriented MAP applications, a large number ofjobs can be created in the rural areas. Even at the current levelof conversion of traditional medical knowledge into economicopportunities, enterprised-based initiatives can account forthousand of jobs in rural areas. Thus, MAP have high potentialin creating jobs and stimulating economic growth in resource
constrained areas suffering from lack of educationalopportunities and infrastructure. The conversion of socio-cultural traditions and indigenous knowledge into livelihoodmeans (specially for marginalized rural population includingwomen) and economic opportunities also has the advantageof preserving the rapidly eroding cultural knowledge andpractices which are increasingly threatened due toglobalization and urban oriented movement of people andcommunities (Vasanthi, et al., 2012).
India is regarded as one of the twelve mega biodiversitycenters of the world bestowed with treasure trove of biologicaland cultural diversity, the product of millions of years ofevolution. There is an urgent need to protect indigenousknowledge and cultural diversity (Nadkarni, 1976).
Another significance of MAP is its environmentalperspective. The increasing apathy towards products madefrom chemicals as well as unsustainably harvested forestproducts are becoming ethically unacceptable consumergoods and have created new markets for quality, certified andorganic herbal products. MAPs have potential to fill theseneeds as they provide green health alternatives and a numbersof other eco-friendly products of domestic and industrial usage.Plants species abundantly growing in our country and theirentry into indigenous and world food and drug market as theeco-friendly herbal products are looked upon as a new andemerging opportunity that can help save tropical andsubtropical forests by promoting community-basedconservation. Our government has launched a number of MAPbased economic initiatives for promoting greater participationof people in conservation of forest eco-systems. At thedomestic front, adoption of MAPs cultivation/ agriculture maybe an ideal method for achieving economic security for ourBPL (below poverty line) rural population. A pragmaticapproach and policy for the protection and cultivation ofMAPs is the need of the hour.
LITERATURE CITED
Bakkali, F. Averbeck, S. Averbeck, D. Idaomar, M. 2008. Biologicaleffects of essential oils-a review. Food and Chemical Toxicology,46(2):446-75.
Grover, J.K. and Vats. V. 2001. Shifting paradigm: From conventionalto alternative medicines — an introduction on traditional Indianmedicines. Asia Pacific Biotech News, 5: 28-32.
Kunwar, R.M. and Bussmann, R.W. 2008. Ethnobotany in the NepalHimalaya. Journal of Ethnobiology and Ethnomedicine, 4:24.
Nadkarni, K.M. 1976. Indian Materia Medica (Bombay PopularPrakashan), 1(3): 1241-1243 & 1291.
Vasanthi, R.H., ShriShriMal, N., Das, K. D. 2012. Phytochemicals fromPlants to Combat Cardiovascular Disease. Current MedicinalChemistry, 19(14): 2242-2251.
Recieved on 14-09-2013 Accepted on 28-10-2013

866 Trends in Biosciences 6 (6), 2013Trends in Biosciences 6 (6): 866-869, 2013
Genotypic Variability for Spikelet Sterility under Moisture Stress and AerobicConditions in RiceK. RENUKA DEVI, A. SIVA SANKAR, AND P. SUDHAKAR1
Department of Crop Physiology, College of Agriculture, Rajendranagar, ANGRAU, Hyderabad.Institute of Frontier Technology, RARS, Tirupati.email: [email protected]
ABSTRACT
One of the main problems of rice cultivation and production isthe lack of water resources, especially during reproductive stage.The present study was conducted to determine how droughtaffects grain yield and the process of grain filling and theobservations were recorded on the number of spikelet’s perhill, number of filled and unfilled spikelets per hill, 1000 grainweight and yield characters in thirty rice cultivars undermoisture stress conditions and eleven cultivars under aerobicconditions. Simultaneously, the genotypic variation in spikeletsterility and yield and yield attributes was also determined.The data indicated that NLR 3010, NLR 40059, NLR 34242,NLR 33671cultivars showed the lowest spikelet sterility undermoisture stress conditions. Furthermore, these cultivars alsoshows highest grain yield and harvest index than the othercultivars.
Key words Spikelet sterility, moisture stress, aerobic condition
Drought is the most important limiting factor for cropproduction and it is becoming an increasingly severe problemin many regions of the world. Drought is a world-spreadproblem seriously influencing grain production and qualityand with increasing population and global climate changemaking the situation more serious. Rice (Oryza sativa L.) as apaddy field crop is particularly susceptible to water stress. Itis estimated that 50% of the world rice production is affectedmore or less by drought.
Aerobic rice is a way of growing rice in aerobic soilswith intermittent irrigation. It is a system of growing highyielding rice in non puddle and non-flooded aerobic soil(Bouman and Toung, 2001). Under such conditions, wherethe soil is partially or fully aerobic, the rice plants oftenexperience water limited conditions which invariably affecttissue water status and plant metabolism. Because of theseeffects yield reduction in the range of 15 to 40 per cent hasbeen reported in aerobically cultivated rice (Bouman, et al.,2005). Major constraint that affect productivity under aerobicconditions is the stress induced spikelet sterility. Moistureand temperature stress mostly responsible for such lowspikelet sterility.
MATERIALS AND METHODS
The experiments were carried out at the green house
and college farm, Department of Plant Physiology, College ofAgriculture, Hyderabad. During Rabi, 2010-2011Moisturestress was imposed for a period of 15days before and afterpanicle initiation (reproductive) stage starting on 90 days aftersowing in specialized plastic pots with 30 rice genotypes. Thedesign used in this study was FRBD with 3 replications(Experiment 1) and during Kharif, 2011 in a randomized blockdesign (RBD) with contrast eleven rice genotypes screenedbased on performance in pot culture experiment and replicatedthrice (Experiment 2). A total rainfall of 376 mm was received in25 rainy days during the entire crop growth period.Recommended dose of fertilizers were applied. Need basedlife irrigation was given. Prophylactic measures were takenfor protecting the crop from pest and diseases. Spikelet sterilitypercentage was calculated with the help of following formula
Spikelet Sterility % = 100 x grains ofnumber Total
grains unfilled ofNumber
The yield the yield components viz., grain yield, strawyield, total dry matter production, test weight and harvestindex were recorded after harvest.
RESULTS AND DISCUSSION
Spikelet Sterility:
Water deficits at the anthesis stage in rice induce a highpercentage of spikelet sterility and reduce grain yield. Panicledesiccation can occur when drought coincides with flowering.The results pertaining spikelet sterility of different ricegenotypes to moisture stress tolerance was reported in theTable.1 and 2. In general there was significant differencebetween the rice genotypes in pot culture experiment andalso field study under aerobic conditions
The results pertaining spikelet sterility of different ricegenotypes to moisture stress tolerance was reported in the(Table 1, 2). There was significant difference between the ricegenotypes, treatments. Maximum filled spikelets percentageof 76.50 was recorded in genotype NLR 3010 whereas minimumpercentage of 40.10 was observed in genotype NLR 30491.The present study showed that number of filled spikelets hadsignificant positive effect on rice grain yield in both pot andfield study. Among cultivars NLR 30491 and NLR 40065, BPT5204, NLR 40058, NLR 40062, NLR 40068 and NLR 40070

DEVI et al., Genotypic Variability for Spikelet Sterility under Moisture Stress and Aerobic Conditions in Rice 867
Table 1. Total spikelets and unfilled spikelets (panicle-1) in rice genotypes as influenced by moisture stress at harvest
S.No. Genotypes Total spikelets Un filled spikelets Control Stress Mean Control Stress Mean
1 NLR33358 139 131 135 39 44 42 2 NLR33359 132 124 128 37 42 40 3 NLR33636 132 125 129 36 40 38 4 NLR33671 143 137 140 31 36 34 5 NLR34242 138 137 138 29 34 32 6 MTU1010 138 135 137 32 46 39 7 NLR3059 132 125 129 42 46 44 8 NLR3098 133 126 130 39 44 42 9 NLR40024 135 126 131 42 46 44
10 NLR40045 131 125 128 42 47 45 11 NLR40049 136 128 132 45 49 47 12 NLR40050 132 123 128 38 45 42 13 NLR40054 135 129 132 39 43 41 14 NLR40055 130 123 127 40 44 42 15 NLR40058 130 125 128 53 58 56 16 NLR40059 144 138 141 29 34 32 17 NLR40062 133 125 129 48 54 51 18 NLR40064 139 131 135 32 39 36 19 NLR40065 140 133 137 43 49 46 20 NLR40066 132 124 128 39 43 41 21 NLR40068 133 124 128 33 37 35 22 NLR40070 132 124 129 44 48 46 23 TELLAHAMSA 130 128 129 37 41 39 24 JGL1798 136 127 132 39 42 41 25 NLR145 141 135 138 30 35 33 26 NLR3010 145 140 143 29 34 32 27 NLR3042 133 126 130 42 46 44 28 RNR2458 134 127 131 40 44 42 29 NLR30491 127 118 123 60 65 63 30 BPT5204 128 122 125 48 53 51
Mean 135 128 131 39 44 41 T G TxG T G TxG SEm± 0.10 0.20 0.34 0.11 0.22 0.39 CD (P=0.05) 0.17 0.67 0.96 1.19 0.76 0.55
exhibited greater spikelet sterility due to moisture stress atflowering. Total number of grains per panicle was drasticallyreduced when drought stress occurred at flowering thisreflected the reduced crop growth. Limitations of assimilatesupply particularly during reproductive stage affected spikeletnumber per panicle and filled spikelets percentage. Reductionin leaf water potential at anthesis caused poor panicle exertionand this might be the reason for less number of grains due topollination abnormalities.
This results are agreement with Kumar, et al., 2004showed that percentage of unfilled grains were significantlyhigher in drought at flowering. Similar rates of lower reductionin spikelet fertility were reported by (Matsui, et al., 2001 andMatsui, 2009). Similar results were reported by Islam, et al.,1994 showed that the number of filled grains per panicledecreased significantly compared with control.
Yield and yield attributes:
Grain yield was significantly varied among thegenotypes when evaluated under moisture stress aerobiccondition. Good genotypic variability was recorded between
the genotypes i.e. 0.120 to 0.241 g m-2 (Table3). Such genotypicdifferences for grain yield under aerobic condition werereported by (Nieuwenhuis, et al., 2002 and Bouman, et al.,2002). NLR 3010 recorded highest grain yield of 240.9 g m-2
compared to other genotypes followed by NLR 40059 (0.234 gm-2) NLR 33671 (0.232 g m-2) NLR 34242 (0.232 g m-2), MTU1010 and NLR 145 recorded moderate seed yields of 0.185 and0.183 g m-2 respectively. Lowest seed yield recorded in NLR30491 (0.120 g m-2), NLR 40058 (0.121g m-2), and NLR 40054(0.165 kg.m-2) NLR 40070 (0.160 g m-2), NLR 40064 (0.183 g m-2)shows moderately (Fig. 4.15).The genotype NLR 3010 recordedhighest straw yield (0.314 g m-1) followed by NLR 40059 (0.320g m-1), NLR 34242 and NLR 33671 on par. The genotype MTU1010 recorded (0.295 g m-1) fallowed by NLR 145 (0.310 g m-1).Under aerobic system of rice production most of the genotypesevaluated have produced straw yield to a range of (0.300 to0.380 g m-2) only which denotes the straw yield was not muchaffected compared to other yield parameters yield in both potand field study (Table 3).
Spikelet weight in rice generally expressed in terms of1000 grain weight (test weight) in grams (Table 3). The test

868 Trends in Biosciences 6 (6), 2013
Table 1a. Spikelet sterility (%) in rice genotypes asinfluenced by moisture stress at harvest
Sl. No. Genotypes Spikelet sterility
Control Stress Mean 1 NLR33358 34 28 31 2 NLR33359 34 28 31 3 NLR33636 32 27 30 4 NLR33671 26 22 24 5 NLR34242 25 21 23 6 MTU1010 34 23 29 7 NLR3059 37 32 34 8 NLR3098 35 29 32 9 NLR40024 37 31 34 10 NLR40045 38 32 35 11 NLR40049 38 33 36 12 NLR40050 37 29 33 13 NLR40054 33 29 31 14 NLR40055 36 31 33 15 NLR40058 46 41 44 16 NLR40059 25 20 22 17 NLR40062 43 36 40 18 NLR40064 30 23 26 19 NLR40065 37 31 34 20 NLR40066 35 29 32 21 NLR40068 39 33 36 22 NLR40070 30 25 27 23 TELLAHAMSA 32 28 30 24 JGL1798 33 29 31 25 NLR145 26 22 24 26 NLR3010 24 20 22 27 NLR3042 37 32 34 28 RNR2458 35 30 32 29 NLR30491 55 47 51 30 BPT5204 43 38 40
Mean 29 35 32 T G TxG SEm± 0.11 0 .22 0.38 CD (P=0.05) 0.19 0 .75 1.07
Sl. No.
Genotypes Total spikelets Unfilled spikelets S.S
1 NLR 34242 126 18 14 2 NLR 3010 135 15 11 3 NLR 40059 125 14 11 4 NLR 33671 121 16 13 5 MTU 1010 110 19 17 6 NLR 40054 106 20 18 7 NLR 145 110 19 17 8 NLR 40058 98 25 25 9 NLR 40070 95 21 22
10 NLR 40064 105 24 22 11 NLR 30491 102 30 29
SEm± 1.46 0.25 0.21 CD (P=0 .05) 4.31 0.74 0.62
Table 2. Spikelet sterility (%) in rice genotypes underaerobic condition
Sl. No. Genotypes
Grain yield
Straw yield
Harvest index
Test weight
1 NLR 34242 232 320 42.02 18.3 2 NLR 3010 241 314 43.40 19.4 3 NLR 40059 234 320 42.26 18.9 4 NLR 33671 232 320 42.02 20.2 5 MTU 1010 185 280 39.78 17.1 6 NLR 40054 165 278 37.25 14.3 7 NLR 145 183 295 38.28 16.0 8 NLR 40058 121 283 29.95 13.2 9 NLR 40070 160 300 34.78 15.6 10 NLR 40064 183 325 36.02 14.3 11 NLR 30491 120 305 28.24 14.0 SEm± 2.44 3.59 0.60 0.20 CD (P=0.05) 7.22 10.61 1.79 0.59
Table 3. Grain yield (g m-2), straw yield (g m-2), harvestindex (%) and test weight (g) in rice genotypesunder aerobic condition
weight is significantly varied between the cultivars and agenotypic variability of 13.2 g to 20.2 g recorded. Among therice cultivars evaluated under aerobic system of cultivation.Such variability among rice cultivars under aerobic conditionalso reported by (Vanitha, 2008). Among the cultivarsNLR33671 recorded significantly higher test weight of grains(20.2 g) followed by NLR 3010 (19.4 g), NLR 40059 (18.4 g) andNLR 34242 (18.3 g). In contrast, lower test weight was recordedwith the cultivars NLR 40058 (13.2 g), NLR 40054 (14.3 g), NLR40070 (15.6 g), NLR 40064 (14.3 g) and NLR30491 (14.0). Whichfurther establish the fact that the varieties have low thermotolerance and low WUE capabilities would not fit into aerobicsystem of cultivation.
Harvest index reflects the physiological capacity of acrop to mobilize and translocate to organs having economicvalue. There was a significant difference between cultivarsfor harvest index and NLR 3010 reported highest H.I (43%)followed by NLR 40059 (42.3 %), NLR 33671 (42.0%) and NLR34242 (42.0 %) compared to other entries. NLR 145 and MTU
1010 recorded moderate HI of 39.7 and 38.5 and othergenotypes have recorded less HI values (Table 3). Suchgenotypic variability of Harvest index among rice genotypesunder flooded condition is reported by (Surek and Beser,2003).
The relative reduction in mean of all these yield traitswas mainly due to the limitations of assimilate supplyparticularly during reproductive stage affected spikeletnumber per panicle and filled spikelets percentage. Reductionin leaf water potential at anthesis caused poor panicle exertionand this might be the reason for less number of grains due topollination abnormalities. Spikelet fertility was greatlyinfluenced the grain yield both directly and indirectly henceshould be given priority during selection for enhancing grainyield under drought stress situation.
The genotypes, NLR 30491 and NLR 40058 showedlesser spikelet sterility and higher grain yield compared toremaining of twenty eight genotypes respectively. Thereforethese genotypes are considered as susceptible cultivars underaerobic cultivation.

DEVI et al., Genotypic Variability for Spikelet Sterility under Moisture Stress and Aerobic Conditions in Rice 869
LITERATURE CITED
Bouman, B.A.M., and Tuong, T.P. 2001. Field water management tosave water and increase its productivity in irrigated lowland rice.Agricultural Water Management. 49: 11–30.
Bouman, B.A.M., Yang Xiaegwang, Wang Hwaqi, Wqng Zhiming,Zhaojunfang, Wang Changgui and Cheug Bin. 2002. Aerobic rice(Han Do): A new way of growing rice in water short areas. 12th ISCOconference, pp. 175-181.
Islam, M. T., Salam, M.A and Kauser, M. 1994. Effect of soil waterstress at different growth stages of rice of yield components andyield. Progress Agriculture, 5(20): 151-156.
Kumar, R., Atlin, G. and Lafitte, R. 2004. Evalution of rapid droughtstress protocol to predic field performance of rice under droughtstress condition. In: Proceeding Workshop on Resilint Crops forwater limited environments. CIMMYT, Mexico, pp. 167-168.
Matsui T, Omasa K and Horie T 2001. Comparison between anthers oftwo rice (Oryza sativa L.) cultivars with tolerance to hightemperatures at flowering or susceptibility. Plant ProductionScience. 4(1): 36-40.
Matsui, T. 2009. Floret sterility induced by high temperatures at theflowering stage in rice (Oryza sativa L.) Japanese Journal of CropScience. 78(3): 303-311.
Nieuwenhius, J., Bouman, B.A. M. and A. Castaned, A. 2002. Crop –water responses of aerobically grown rice: preliminary results ofpot culture experiments. In: Water wise Rice production. (eds.Bouman, B.A.M. Hendijik, H,Hardy, P.S. Bindrabad, S.T.P. Tuongand J.K. Ladha). IRRI. pp. 177-185.
Surek, H. and Beser, N. 2003. Correlation and path analysis for someyield related traits under rainfed condition. Turkish Journal ofAgricultural Forestry. 27(2):77-83.
Vanitha, K. 2008. Drip fertigation and its Physiological impact inaerobic rice. M.Sc. (Ag.) Thesis, TNAU, Combatore. Unpubl.
Recieved on 17-09-2013 Accepted on 21-10-2013

870 Trends in Biosciences 6 (6), 2013Trends in Biosciences 6 (6): 870-875, 2013
Enrinchment of Iron and Zinc Concentration in Introgression Lines of Brown RiceROJA V1, KIRANMAYI S. L1 AND SARLA N2
1Acharya NG Ranga Agricultural University, Rajendranagar, Hyderabad2 Directorate of Rice Research, Rajendranagar, Hyderabad-500030, India;email: [email protected]
ABSTRACT
In the present study, 128 lines of BC4F4 population derivedfrom the backcross between an indica cultivar, Samba Mahsuriand wild rice, O.rufipogon were measured for high iron andzinc concentration with the help of Atomic AbsorptionSpectophotometry (AAS). The iron and zinc concentration of128 rice lines ranged from 6.4 to 106.6 ìg g-1 and 15.5 to 52.05 ìgg-1 respectively. The top ten lines had high iron concentrationranging from 24 to 106.6 ìg g-1 and that of zinc concentrationranged from 31.5 to 52.05 ìg g-1. The lines that had high ironconcentration also had the high zinc concentration but thelines with high zinc concentration did not have high iron levels.In case of iron concentration the maximum number of linesi.e. 81 % were falling in between the range 13 to 24 ìg g-1. Incase of zinc concentration majority (53 %) of lines were fallingin between the range 26 to 30 ìg g-1 and 30 % were falling inbetween the range 21 to 25 ìg g-1. All the top ten lines with highiron concentration (24 to 106.6 ìg g-1) had iron concentrationmore than O.rufipogon (21.2 ìg g-1). The top ten lines with highzinc concentration (31.5 to 52.05) exhibited either slightly loweror slightly higher zinc concentration than O.rufipogon (45.3 ìgg-1). These results clearly indicated the favourable effect of theintrogressed genetic variability from the wild rice (O.rufipogon).
Key words Wild rice, Atomic Absorption Spectophotometry,Backcross, O. rufipogon
Rice is the primary or secondary staple food for 50% ofthe world’s population. In countries where rice is used asstaple food, the per capita consumption is very high rangingfrom 62 to 190 kg/year. However, rice is a poor source ofessential micronutrients such as Iron and Zinc. Just as greenrevolution helped in overcoming the problem of food securityworldwide, biofortification is a strategy that helps in subsidingmicronutrient malnutrition in staple food crops, especially indeveloping and under-developed countries. Improving thehealth of poor people by breeding staple food crops that arerich in micronutrients is one of the approaches ofbiofortification apart from agronomic practices. Breeding forhigher concentrations of essential micronutrients in the grainsis possible as there is ample genotypic variation in thegermplasm of major cereal crops like rice, wheat. Attemptshave been made to increase iron and zinc concentrations inrice grains with the aid of conventional breeding program.biofortification offers a cost-effective process of increasingmicronutrients in the edible portions of staple crops whencompared to costly application of fertilizers and other
agronomic practices. Also addition of molecular approachesto traditional breeding will still alleviates the problem ofmicronutrient malnutrition.
The present investigation was carried out with the primeobjective of screening 128 lines of BC4F4 population derivedfrom the backcross between an indica cultivar, Samba Mahsuriand wild rice, O.rufipogon for high iron and zinc concentrationwith the help of Atomic Absorption Spectophotometry (AAS).
MATERIALS AND METHODS
Plant material
The population used in the present study was derivedfrom four consecutive backcrosses between a recipient parentSamba Mahsuri (BPT5204), an elite indica cultivar andaccession WR119 of common wild rice Oryza rufipogon(2n=24,AA). All the lines were grown in the fields of Directorateof Rice Research (DRR), Rajendranagar. The experiment waslaid out in augmented block design with two replications. Thefield was managed following standard agronomic procedures.Grains were harvested from each line and bulked separatelyfor each line then used for iron and zinc analysis.
Sample preparation
A representative sample from each line was manuallydehulled (dehusked) using palm husker and one gram ricesample was weighed and digested using microwave digestionmethod. This method provides for the acid digestion of thefood sample in a closed vessel device using temperaturecontrol microwave heating for metal determination byspectroscopic methods. Milestone ETHOS lab station witheasy WAVE or easy CONTROL software and HPR1000/10Shigh pressure segmented rotor was used for digestion. 7 ml ofconcentrated Nitric Acid (HNO3 – 65 %) and 1 ml of H2O2 wereadded on the inner wall of the TFM vessel drop by drop andthen the solution was swirled gently to homogenize the samplewith the acids, then the vessel was closed and introducedinto the rotor segment, then tightened by using the torquewrench. The segment was inserted into the microwave cavityand connected to the temperature sensor. The microwaveprogram was run for 40 minutes at 200ºC up to 1000 Watt.Then the rotor was cooled by air or by water until the solutionreached room temperature. Finally the vessel was opened andthe solution was transferred to a 25-ml volumetric flask andfinal volume was made up to 25ml with MilliQ water. Each

ROJA et al., Enrinchment of Iron and Zinc Concentration in Introgression Lines of Brown Rice 871
Table 1. Details of the top ten lines with high Iron and Zinc concentration
S.No Line No Seed Image Iron conc.
( µg g -1) Line No
Zinc conc.
( µg g-1) Seed Image
1 28
106.6 51 52.05
2 117
102.5 54 43.25
3 50
69.7 91 43.05
4 108
38.22 34 40.65
5 49
30.9 83 38.45
6 20
25.6 116 38.25
7 145
25.25 23 36.6
8 37
25.12 81 32.85
9 46
24.6 90&9 31.72
10 77
24 50 31.5

872 Trends in Biosciences 6 (6), 2013
Fig. 2. Frequency distribution for Zinc concentration.
Red arrow indicates Samba Mahsuri value for traitBlue arrow indicates O.rufipogon value for trait
Fig. 1. Frequency distribution for Iron concentration.
S.No. Trait Range Mean ± SD 1 100 seed weight (g) 1.2 - 2.7 1.53 ± 0.18 2 100 kernel weight (g) 1. 0 - 2.2 1.25 ± 0.21 3 Area (mm) 13.6 - 28.4 18.6 ± 1.80 4 Length (mm) 7.4 - 10.4 8.04 ± 0.38 5 Width (mm) 2.5 – 4.0 3.17 ± 0.21 6 Aspect 2.1 - 6.5 2.58 ± 0.38 7 Perimeter (mm) 17.8 - 26.3 20.3 ± 1.11 8 Compactness 19.6 – 27.0 22.4 ± 1.20 9 Elongation 2.1 - 2.9 2.55 ± 0.14 10 Iron (µg g-1) 64-106.6 18.5 ± 12.5 11 Zinc (µg g-1) 15.5-36.5 32.22 ± 4.6
Table 2. Phenotypic values of the grain traits in mappingpopulation
sample was stored in polypropylene flasks to avoid possiblecontamination.
Micronutrient (iron and zinc) measurement:
Brown rice samples of 128 ILs were evaluated at QualityControl Laboratory, ANGRAU, Rajendranagar for iron andzinc concentration in two replications using atomic absorptionspectrophotometer, model A Analyst 700, Perkin Elmer, USA.
Phenotyping of the Grain quality traits:
A representative seed sample from each line washarvested separately and 100 seed counted and 100 kernelweights recorded. Grain dimensions such as area, length andwidth, aspect, perimeter, compactness and elongation wererecorded for fully filled twenty seeds using the image analyzersoftware (Biovis image plus) at DRR. The average value ofthe twenty seeds data was taken as the value for that particulartrait of that representative line.
Statistical analysis for Grain quality traits:
Average, mean and range for the phenotypic values werecalculated using Standard Excel program of Microsoft Office.Correlation between character pairs were computed at p <0.05 and p < 0.01 in Microsoft Excel using trait averages.Correlation coefficients were determined for iron and zincconcentration and grain weight and dimensions for each BC4F3line. Significance of correlation coefficients (r) at P =0.05 or0.01 is indicated by * or **, respectively.
RESULTS AND DISCUSSION
Evaluation of micronutrient (iron and zinc) concentration:
The iron and zinc concentration in the grains of ricecultivar Samba Mashuri were 14.95 ìg g-1 and 32.22 ìg g-1
respectively, while the grains of O.rufipogon had iron andzinc concentration of 21.2 ìg g-1 and 45.3 ìg g-1 respectively.The iron and zinc concentration of 128 rice lines ranged from6.4 to 106.6 ìg g-1 and 15.5 to 52.05 ìg g-1 respectively. The topten lines (Table 1) had high iron concentration ranging from24 to 106.6 ìg g-1 and that of zinc concentration ranged from31.5 to 52.05 ìg g-1. It was interesting to note that the lines thathad high iron concentration also had high zinc concentrationbut the lines with high zinc concentration did not have highiron levels. In case of iron concentration the maximum numberof lines i.e. 81 % fell in between the range 13 to 24 ìg g-1(Fig.1&2). In case of zinc concentration majority (53 %) of lines fellin between the range 26 to 30 ìg g-1 and 30 % in the range 21 to25 ìg g-1. All the top ten lines with high iron concentration (24to 106.6 ìg g-1) had iron concentration more than that ofO.rufipogon (21.2 ìg g-1). However the top ten lines with highzinc concentration (31.5 to 52.05) exhibited either slightly loweror slightly higher zinc concentration than O.rufipogon (45.3ìg g-1). These results clearly indicate the favourable effect ofthe introgressed genetic variability from the wild rice(O.rufipogon) and the transgressive segregants that couldbe obtained. From the above results it can be concluded thatZn concentration was probably governed by a QTL and fewgenes might be involved in controlling iron concentration.

ROJA et al., Enrinchment of Iron and Zinc Concentration in Introgression Lines of Brown Rice 873
Traits Fe Zn Klwt S wt Ar Len Wid Asp Peri Com El Fe 1.000 0.041 0.035 -0.025 -0.106 -0.092 -0.004 -0.048 -0.033 0.046 -0.075 Zn 1.000 -0.119 -0.122 -0.043 -0.064 0.058 -0.068 0.031 0.056 -0.128
Klwt 1.000 0.901** 0.608** 0.525** 0.538** -0.091 0.530** -0.102 -0.172 S wt 1.000 0.671** 0.595** 0.552** -0.111 0.563** -0.119 -0.154 Ar 1.000 0.792** 0.786** -0.166 0.853** 0.051 -0.300 Len 1.000 0.538** 0.048 0.936** 0.455** 0.188* Wid 1.000 -0.330 0.711** -0.151 -0.683 Asp 1.000 -0.021 0.316** 0.370** Peri 1.000 0.447** -0.068 Com 1.000 0.588**
El 1.000
** = Significant at 1 % level * = Significant at 5 % level (P>0.05, 0.195) (P>0.01, 0.254)Fe: Iron concentration, Zn: Zinc concentration, Klwt: Kernel weight, S.wt: Seed weight, Ar: Seed area, Len: length, Wid: WidthAsp: Aspect, Peri: Perimeter, Com: Compactness, El: Elongation ratio.
Table 3. Pair wise correlation among grain traits, iron and zinc concentration in BC4F4 population derived from a crossbetween an indica rice cultivar Samba Mahsuri and the wild relative Oryza rufipogon
Earlier Banerjee and Chandel, 2011 tested the range of ironand zinc concentration (ìg g-1) in brown rice in 11 ricegenotypes and found 8.5 to 18.6 ìg g-1 of iron and 13.9 to 39.3ìg g-1 zinc. Fe and Zn contents were measured by Garcia-Oliveira, et al., 2009 using 85 introgression lines (ILs) derivedfrom a cross between an elite indica cultivar, Teqing and wildrice (Oryza rufipogon) by inductively coupled argon plasma(ICAP) spectrometry. Among micro-elements, Zn wasobserved in highest quantities with combined mean value of27.1 ìg g-1, whereas Fe was found in the lowest quantities witha mean value of 9.6 ìg g-1. The back cross lines used in thepresent investigation showed mean iron concentration of 18.5ìg g-1 and mean zinc concentration of 26.9 ìg g-1. Thus thepopulation used in the present study exhibited high ironconcentration and slightly lower zinc concentration than thelines developed by Garcia-Oliveira, et al., 2009.
Evaluation of grain quality traits:
The BC4F4 seed of 128 lines were analyzed for 100 seedweight, 100 kernel weight and seven grain dimensionparameters - grain area, length, width, aspect, perimeter,compactness and elongation using image analyzer (Biovisimage plus) software. The range and mean of all the graintraits are given in (Table 2 and Fig 3). Data collected on graintraits of all BC4F4 lines were compared with those of the betterparent i.e Samba Mahsuri, which is a fine grain variety widelycultivated and highly accepted by the consumers. In ourbackcross population the values of the grain parametersranged from 1.2 to 2.7 g for 100 seed weight, 1.0 to 2.2 g forkernel weight, 13.6 to 28.4 mm for area, 7.4 to 10.4 mm forlength, 2.5 to 4.0 mm for width, 2.1 to 6.5 for aspect, 17.8 to 26.3mm for perimeter, 19.6 to 27.0 for compactness and 2.1 to 2.9for elongation. The grain characteristics of the backcrosspopulation showed bias towards Samba Mashuri since fourbackcrosses were made with Samba Mahsuri.
The appearance of transgressive segregants is a common
phenomenon in wide crosses; a lot of new and unknownvariations are unleashed in the interspecific crosses. Thesenew variations are created because of many genetic andepigenetic factors (Wang et al., 2005, Kovach and Mc Couch,2008). One of the main advantages of wide crosses is thepossibility to introgress useful genetic variability into elitecultivars. Wide variability was observed for all the traits. Thisprovides the breeders more opportunities to select plants withdifferent combination of desirable traits including yield.Transgressive segregation was observed for 100 seed weight,100 kernel weight, area, length, width, aspect, perimeter,compactness and elongation. Transgressive segregation forall traits was towards the positive side (within the SambaMahsuri range) except for 100 kernel weight, seed width andcompactness.
These transgressive segregants might have resulted dueto either accumulation of favourable genes controlling graincharacters or development of new combinations of genescontrolling grain traits derived from the parent. Transgressivesegregation is commonly observed in segregating populationsfor quantitative traits (De Vicente and Tanksley, 1993 and Xiaoet al., 1996). Earlier the cause most often proposed fortransgressive segregants was complementary alleles at multipleloci inherited from the two parents (Rick and Smith, 1953).
With the advent of molecular markers and genomesequence information, it is now recognized that there areseveral potential causes of transgression including unmaskingof recessive deleterious alleles due to inbreeding band denovo variations arising due to activity of transposons andretrotransposons as shown in Zizania (Wang, et al, 2005)
Correlation analysis:
Correlation coefficients among 11 grain traits in BC4F4population indicated that iron and zinc concentration did notexhibit significant correlation with the other grain traits i.e.100 seed weight, 100 kernel weight and seven grain dimension

874 Trends in Biosciences 6 (6), 2013
Fig. 3. Frequency distribution for nine grain traits 100 seed wt (g), 100 kernel wt (g), seed area (mm), seed length (mm), seed width(mm), aspect, perimeter (mm), compactness and elongation.
Arrow indicates the Samba Mahsuri value for grain traits

ROJA et al., Enrinchment of Iron and Zinc Concentration in Introgression Lines of Brown Rice 875
Figure 3 (cont.). Arrow indicates the Samba Mahsuri value for grain traits
parameters such as grain area, length, width, aspect, perimeter,compactness and elongation (Table 3). Earlier Tiwari, et al.,2009 also reported that there was no correlation between 100grain weight and iron and zinc concentration in RIL populationof wheat derived from cross between Triticum boeoticum(pau5088) and Triticum monococcum (pau14087). They alsofound that there was no significant correlation between Feand Zn concentrations in the grains indicating that grain Feand Zn accumulation may be controlled by different loci.
ACKNOWLEDGEMENT
The work was financially supported by Indian Councilfor Agricultural Research, Govt. of India, Network project onTransgenics and functional genomics of crops -project 3019(NPTC/FG/05/2672/33).
LITERATURE CITED
Banerjee, S. and Chandel, G. 2011. Understanding the role of metalhomeostasis related candidate genes in Fe/Zn uptake, transportand redistribution in rice using semi-quantitative RT-PCR. Journalof Plant Molecular Biology and Biotechnology. 2 (1): 33-46.
De Vicente, M.C and Tansksky, S.D. 1993. QTL analysis of transgressivesegregation in an interspecific tomato cross. Genetics 134: 585-596.
Garcia-Oliveira, A.L. Lubin, T. Yongcai, F and Chuanqing, S. 2009.Genetic identification of Quantitative Trait Loci for contents ofmineral nutrients in rice grain. Journal of Integrative Plant Biology.51 (1): 84–92.
Kovach, M.J and McCouch, S.R. 2008. Leveraging natural diversity:back through the bottleneck. Current Opinion in Plant Biology.11:193-200.
Rick, C.M and Smith P.G. 1953. Novel variation in tomato specieshybrids. American national. 88: 359-373.
Tiwari, V.K. Rawat, N. Parveen, C., Neelam, K. Renuka, A. Gursharn,S.Randhwa. Harcharan,S. Dhaliwal. Keller, B and Singh, K. 2009.Mapping of quantitative trait loci for grain iron and zincconcentration in diploid A genome wheat. Journal of Heredity .100(6) :771–776.
Wang, Y.M. Dong, Z.Y. Zhang, Z.J. Lin, X.Y. Shen, Y. Zhou, D and Liu,B. 2005. Extensive denovo variation in rice induced by introgressionfrom wild rice (Zizania latifolia ). Genetics. 170:1945-1956.
Xiao, J. Hi, J. Yuan, L and Tansky S.D. 1996. Identification of QTLsaffecting traits of agronomic importance in recombinant inbredpopulation derived from a sub species cross. Theoretical and AppliedGenetics. 92: 230-244.
Recieved on 18-09-2013 Accepted on 26-10-2013

876 Trends in Biosciences 6 (6), 2013Trends in Biosciences 6 (6): 876-878, 2013
Assessment of Yield Loss due to Finger Millet Blast Caused by Pyricularia grisea(Cooke) Sacc.V. P. PRAJAPATI1, A. N. SABALPARA2 AND D. M. PAWAR1Department of Plant Pathology, College of Agriculture, Navsari Agricultural University, Waghai (Dangs)(Gujarat)-3964502Navsari Agricultural University, Navsari (Gujarat)-396450email: [email protected]
ABSTRACT
Loss in Finger millet [Eleusine coracana (L) Gaertn.] caused byblast disease Pyricularia greisea (Cooke) Sacc., is a majorconcern of finger millet growers worldwide. Blast is consideredas the most injurious disease of finger millet in south Gujarat,resulting in severe loss especially to susceptible finger milletcutivars. The avoidable loss of grain yield and fodder yield wasestimated to be 35.78 and 43.72 per cent due to the blast disease,respectively. With the proper protection measures, 70.45, 67.72and 62.97 per cent disease of leaf blast, neck blast and fingerblast can be controlled, respectively. The blast can be protectedby giving the seed treatment with bavistin (3g/kg of seed) + twospray of tricyclazole (0.6g/lit. of water).
Key words Blast, Eleusine coracana, Pyricularia grisea, Yield,Loss
Finger millet [Eleusine coracana (L) Gaertn.] is one ofthe most important millet crop belongs to family Poaceae andsubfamily Chloridoidae (Dida, et al., 2008). It is a staple foodfor millions of poor people and widely grown in the semi-aridareas of Eastern and Southern Africa and South Asia. Theglobal annual planting area of finger millet is estimated ataround 4.0-4.5 million hectares, with a total production of 5million tons of grains, of which India alone produces 3.0 milliontons (2.6 million hectares) and Africa about 2 million tons. InGujarat, finger millet is the staple food of the tribals inAgroclimatic Zone – I, II and III. It is grown as kharif rainfedcrop in the least fertile hilly soils. Finger millet grains are richsource of protein, dietary fiber, minerals and amino acids(Malleshi and Klopfenstein 1998).
The major finger millet growing area in Gujarat isconfined in hilly tract of Dang, Valsad, Navsari, Surat, Bharuch,Vadodara, Panchmahal, Sabarkantha and Banaskanthadistricts having over an area of 21,700 hectares with totalproduction of 23,200 metric tonnes (Anon., 2010). Blast causedby Pyricularia grisea (Cooke) Sacc. [teleomorph:Magnaporthe grisea (Hebert) Barr.] have been reported asthe major disease, causing serious losses in finger millet. Theaverage loss due to blast has been reported to be around 28to 36 per cent (Nagaraja, et al. 2007), and in certain areas, yieldlosses could be as high as 80 to 90 percent (Vishwanath, et al.
1986; Rao, 1990). Blast affects the crop at all growth stages,and neck and panicle blast are the most destructive form ofthe disease (Takan, et al., 2012).
In kharif, due to continuous, heavy rainfall, highhumidity and warm temperature, the crop is heavily infestedby blast is a major constraint to the production of finger millet,resulting in direct crop losses in the districts of Dang, Valsadand Navsari of south Gujarat region. The low productivity ofthis area (1,200 kg/ha) is mainly due to the blast disease. Itwas found very severe in the area where neck blast and fingerblast phase were occurring. As finger millet is very importantcrop of tribal area and blast reported as very serious constraint,further study to create more detail informations on the diseaseand control measures, the present investigation wasundertaken.
MATERIALS AND METHODS
The trial for loss assessment due to blast disease offinger millet was carried out at Hill Millet Research Station,N.A.U., Waghai (Dang) during 2012. Susceptible (GN 4) varietyof finger millet was transplanted in two separate plots each of20 m x 20 m for the study. The crop was transplanted on 14th
July, 2012 and harvested on 12 th November, 2012.Recommended management measures were taken in one plottreated as protected plot while the plot in which no any controlmeasure was applied was treated as unprotected plot. Therecommended agronomical practices were adopted area forboth the plots.
Protected Plot : Seed treatment with carbendazim (Bavistin@ 3g/kg) was given and three spraying of tricyclazole (Beam@ 0.6g/l. of water) were done at an interval of 15 days startingfirst at the time of initiation of disease.
Unprotected Plot : In unprotected plot, seed treatment andspraying of fungicides was not done. This plot was keptunsprayed and served as control.
The observations on leaf blast intensity, neck blastincidence, finger blast incidence were recorded. Forrecording the observation of blast, 10 sites of 1×1mt wererandomly selected and labeled. Ten plants from each of the

PRAJAPATI et al., Assessment of Yield Loss due to Finger Millet Blast Caused by Pyricularia grisea (Cooke) sacc. 877
Table 1. Loss due to blast (Pyricularia grisea) in finger millet
site were selected for the observations on leaf blast. Thedisease rating was recorded by adopting 0-5 grade scale,where 0 = no infection on leaf, 1 = less than 1 per centleaf area affected, 2 = 1-5 per cent leaf area affected, 3 = 5-25per cent leaf area affected, 4 = 25-30 per cent leaf area affectedand 5 = above 50 per cent leaf area affected (Nagaraja, et al,2007).
For recording neck blast and finger blast incidence, totalnumber of healthy necks/fingers and blast infected necks andfingers at the dough stage were counted.
The grain and fodder yield per plot was alsorecorded.
RESULTS AND DISCUSSION
The loss in finger millet yield due to blast caused byPyricularia grisea was assessed during the year 2012 at HillMillet Research Station, N.A.U., Waghai (Dang). The resultspresented in Table 1 indicated that average mean grain yieldof finger millet in protected plot was 135.28 kg/plot (33.82 q/ha), while in unprotected plot, it was 86.88 kg/plot (21.72 q/ha). Thus, the loss of grain yield occurred due to the blastdisease was 35.78 per cent. Average mean fodder yield offinger millet in protected plot was 324.80 kg/plot (81.20q/ha),while in unprotected plot, it was 182.80 kg/plot (45.70q/ha).Thus, the loss of fodder yield occurred due to the blast diseasewas 43.72 per cent.
In protected plot, 09.67 per cent blast intensity wasrecorded as against 32.73 per cent in unprotected plot. Thus,70.45 per cent disease was controlled by protecting the plot
with giving the seed treatment with carbendazim (Bavistin,3g/kg seed) + two spray of tricyclazole (Beam, 0.6g/l). In caseof per cent neck blast in protected plot was 11.47 as against35.53 per cent in unprotected plot. Thus, 67.72 per cent neckblast was controlled. Similarly, per cent finger blast in protectedplot was 13.81 per cent as against 37.29 per cent in unprotectedplot. Thus, 62.97 per cent finger blast was controlled byrecommended control measures.
The present findings suggest that the grain and fodderyields are drastically reduced by finger millet blast in southGujarat region which can be avoided by adopting effective,economical and eco friendly control measures. Saksena, etal., 1982 and Gupta and Jain, 2010 also estimated losses dueto finger millet blast from 10 to 50 per cent depending uponincidence and favourable weather condition.
LITERATURE CITED
Anonymous, 2010. Annual Report, Hillmillet Research Station Waghai.(Dang), pp: 1-61.
Dida, M. M., Srinivasachary, S., Ramakrishnan, J. L., Bennetzen, M.D., and Devos, K. 2008. Population structure and diversity in fingermillet (Eleusine coracana) germplasm. Tropical Plant Biol., 1:131-141.
Gupta, A. K and Jain, A. K. 2010. Performance of promising fingermillet entries against blast disease and yield potential under rainfedconditions. In. National Symposium on perspective in the planthealth management, held in Anand Agricultural University duringDecember 2010., pp. 109.
Malleshi, N. G and Klopfenstein, C. F. 1998. Nutrient composition,amino acid and vitamin contents of malted sorghum, pearl millet,finger millet and their rootlets. Intern. J. Food Sci. & Nutrition,49: 415–422.
Treatment Grain Yield (%)
Loss
(Grain
yield)
Fodder yield (%)
Loss
(Fodder
yield)
(%)
Leaf
blas t
Intensity
(%)
Disease
control
(%)
Neck
blast
(%)
Disease
control
(%)
Finger
blast
(%)
Disease
control
Protected Plot
[seed treated with
carbendazim (Bavistin
@ 3g/kg) + 2 spray of
tricyclazole (0.6g/lit. of
water)]
135.28kg/plot
(33.82q/ha) -
324.80kg/plot
(81.20q/ha) - 09.67 70.45 11.47 67.72 13.81 62.97
Unprotected
plot (Check)
86.88kg/plot
(21.72q/ha) 35.78
182.80kg/plot
(45.70q/ha) 43.72 32.73 - 35.53 - 37.29 -

878 Trends in Biosciences 6 (6), 2013
Nagaraja, A., Kumar, J., Jain, A. K., Narasimhudu, Y., Raghuchander,T., Kumar, B. and Gowda, B. H. 2007. Compendium of small milletsdiseases. Published by Project coordinator, All India CoordinatorSmall Millets Improvement Project. pp: 1-75.
Rao, A. N. S. 1990. Estimates of losses in finger millet (Eleusinecoracana) due to blast disease (Pyricularia grisea). J. Agril. Sci.,24: 57–60.
Saksena, H. K., Singh, M., Singh, R. P., Tripathi, R. C. and Shukla, T. N.1982. Chemical control of blast disease of Mandua (Ragi). Indian.
J. Mycol. Pl. Pathol., 12(2): 230-231.
Takan, J. P., Chipili, J., Muthumeenakshi, S., Talbot, N. J., Manyasa,E. O., Bandyopadhyay, R., Sere, Y., Nutsugah, S. K., Talhinhas, P.,Hossain, M., Brown, A. E. and Sreenivasaprasad, S. 2012.Magnaporthe oryzae populations adapted to finger millet and riceexhibit distinctive patterns of genetic diversity, sexuality and hostinteraction. Molecular Biotechnol., 50 (2): 145–158.
Vishwanath, S., Gowda, S. S., Seetharam, A. and Gowda, S. B. T. 1986.Reaction to blast disease of released and pre-released varieties offinger millet from different states. Millet Newsletter., 5: 31.
Recieved on 25-10-2013 Accepted on 22-11-2013

Trends in Biosciences 6 (6): 879-885, 2013
A Comparative Study on Final Quality of Smoked Product Prepared using IcedMackerel (Rastrelliger kanagurta) and Pink Perch (Nemipterus japonicus) duringSummer SeasonJAYA NAIK, C.V. RAJU, B. HANUMANTHAPPA, MANJUNATHA A.R., MOHAN KUMAR K.C.
Dept. of Fish Processing Technology, Karnataka Veterinary, Animal and Fisheries Sciences University,College of Fisheries, Mangaloreemail: [email protected]
ABSTRACT
The study was conducted on the keeping quality and shelf lifeof smoked product prepared using iced fish of 8 days old Pinkperch and Mackerel. The fishes were subject to smoking fordifferent concentration of brine like 5.0%, 6.0%, 7.0% and8.0% for standardization of the quantity of brine. Among allthe four concentrations the panelist had chosen 6.0% forMackerel and 5.0% for Pink Perch. Temperature on sensoryattributes of the smoke product was 80oC for 90 minutes toMackerel and 70oC for 90 minutes in case for Pink perch wereadopted by the panel standardized product in the present studythe moisture content was found to be decrease in protein, Fatin ash was found to be increase in both Pink perch and mackerel.The smoke product store at cooler temperature 6±20C for bothvarieties of fishes. Free fatty acid (FFA), Thiobarbuteric acid(TBA), Total volatile base nitrogen (TVB-N), Non- ProteinNitrogen (NPN), Hypoxanthine (Hx) phenol content and totalplate count (TPC) was studied. Based on these studies theproduct store at refrigeration temperature was found good upto 30 days in Mackerel, whereas, in Pink perch it was foundgood up to 45 days. This study reveals that the raw material,which was used for the study have been good until 30 days forMackerel and 45 days for Pink Perch. As per the consumerpreference are concern it can be store for 30 days and 45 days incooler temperature for both Mackerel and Pink perchrespectively. The decrease in Moisture content was due todehydration in cooler temperature in increase in protein, fatand lipid content was due to attributed to the reduction inmoisture content of samples on smoking and the fat content isbecause of the dehydration in the cold storage and ash contentincrease possibly due to the decrease in moisture content. TheF.F.A. storage the slight increase in F.F.A. is due to the enzymaticdegradation of triglyceride and phospholipids. This TBA contentis the index of Malanaldehyde formation due to the oxidativerancidity in fatty fishes is very complex process, in Pink PerchTBA values were well within the limit even at the end of storagesdays .TVB-N indicates the production of ammonia, mono, diand trimethylamine nitrogen and are found in the commonpattern of spoilage. The increase in NPN is due to proteolysisof tissue protein. This leads to the formation of smallermolecular weight nitrogenous compound like free amino acids,volatile base nitrogen particularly ammonia, TMAO (Trimethyl ammine oxidase) and urea. Decrease in phenol contentis presumably due to the lost of moisture along with whichtake phenol compounds during storage. However, TPC in the
storage studies showed a steady increase and thereafter spoilingproduct within 30 days in case of Mackerel in 45 days in case ofPink Perch have been observed.
Key words Shelf life, Storage stability, Brine, Quality, Smoking
Smoked Mackerel in pink perch is highly appreciatedfish product by the consumer. Shelf life of smoked fish dependson many factors, namely the species , the initial quality of rawmaterial, the concentration of salt and corresponding wateractivity, the temperature regime during smoking, the contentof smoke component, the type of packaging, the hygienicstandard of the premises , the storage temperature and alsothe bacterial load. Smoking is described as a method toenhance the shelf life by improving the organoleptic qualitiesand reducing the bacterial level (Kazimerz, et al., 1999). Theantioxidative action and bacteriostatics properties of smokeare critical in determining the shelf life of smoked productspoor quality control of smoked seafood items is a major factorholding back the rapid market expansion of smoked productand development of innovative items in this area (Piogott andTucker, 1990).
In the context, the determinations of microbial qualityas well as quality changes during storage are very important.The major quality changes during storage of smoked fish arefat oxidation, lipolysis, microbial spoilage due to high moisturecontent etc. which limit its shelf life (Lakshmanan, 2002) leanvarieties are expected to show better storage life due to lowfat oxidation. In addition lower levels of water activity,temperature of storage and bacterial load are quite critical(Thomas and balachandran, 1989). Lipid hydrolysis leads tothe accumulation of free fatty acids and undesirable off-odors.Smoking, drying and heating, due to an exothermic fatoxidation initially, may catalysis further oxidative change inMarine lipids (Lilabati, et. al., 1997). Total plate count increasewith increase in the humidity of the environment and themoisture content of the fish as reported by the Lilabati, et al.,1999. Here the major cause of the spoilage at RH levels above70%. Smoked fish product deteriorated showing growth ofspoilages changes include colour and flavor changes,lypolysis, proteolysis and production of mycotoxins (Verma,2002).

880 Trends in Biosciences 6 (6), 2013
Table 1. Changes in the proximate composition of smoked mackerel and pink perch
Stored at refrigerated temperature (6 ± 20C) during summer season Parameters
Storage days
Mackerel
Pink perch
0 15 30 45 0 15 30 45
Moisture (%) 67.30
(± 0.40)
66.90
(± 1.10)
66.05
(± 0.10)
* 72.41
(± 0.57)
71.46
(± 0.49)
70.92
(± 0.60)
70.38
(± 0.92)
Crude Protein (%) 24.38
(± 0.62)
24.80
(± 0.40)
24.89
(± 0.39)
* 20.65
(± 0.35)
21.19
(± 0.81)
21.43
(± 0.57)
21.87
(± 0.37)
Crude Fat (%) 4.89
(± 0.01)
4.90
(± 0.05)
5.04
(± 0.06)
* 3.54
(± 0.04) 3.81
(± 0.04) 4.08
(± 0.04)
4.15
(± 0.15)
Ash (%) 3.31
(± 0.11)
3.38
(± 0.02)
3.83
(± 0.11)
* 3.23
(± 0.22)
3.47
(± 0.27)
3.51
(± 0.01)
3.60
(± 0.40)
Values on wet weight basis; Note: * spoiled product; Parenthesis values indicates standard deviation, n=3.
Table 2. Changes in the Chemical composition of smoked mackerel and pink perch
Stored at refrigerated temperature (6 ± 20C) during summer season
Values on wet weight basis; Note: * spoiled product; Parenthesis values indicates standard deviation, n=3.
Parameters Storage days
Mackerel
Pink perch
0 15 30 45 0 15 30 45
PV(millimoles of O2
/ kg fat) 9.54
(± 0.88) 16.72
(± 0.32) 19.98
(± 0.62) * 7.28
(± 0.04) 9.73
(± 0.50) 15.45
(± 0.10) 19.70
(± 0.11)
FFA (% of Oleic acid)
3.75 (± 0.21)
6.11 (± 0.22)
10.31 (± 0.24)
* 3.33 (± 0.05)
4.87 (± 0.30)
6.72 (± 0.10)
9.75 (± 0.01)
TBA (mg malonaldehyde / kg meat)
0.345 (± 0.25)
0.942 (± 0.78)
2.045 (± 0.45)
* 0.312 (± 0.60)
0.893 (± 0.22)
1.540 (± 0.22)
1.970 (± 0.10)
TMA-N(mg%) 5.23 (± 0.24)
7.45 (± 0.84)
10.54 (± 0.12)
* 3.40 (± 0.30)
5.10 (± 0.30)
8.40 (± 0.20)
10.10 (± 0.12)
TVB-N (mg%) 10.30 (± 0.28)
38.50 (± 0.55)
50.90 (± 0.32)
* 8.89 (± 0.50)
30.41 (± 0.20)
41.56 (± 0.20)
49.80 (± 0.02)
Hot smoking process is more efficient as it becomesmore associated with food approximately seven times fasterthan cold smoke (Joseph, 1988). Time of smoking is anotherimportant difference in two processes, for example coldsmoking of food can take up to several weeks so that theproper amount of colour and flavor are generated in food.Whereas, hot smoking may take only several hours (Toth,1982). Quality changes during storages and smoke “cubes”and “fillet steaks”
MATERIALS AND METHODS
Raw material:
After eight days of iced pink perch and mackerel were
used for the preparation of the smoked products. The recipewas standardized by trained /expert panel and the recipe hasbeen adopted and same as shown in Figure 1 and 2.
Ingredients:
Salt:
Commercially available common salt (crystal) of goodquality was used in the brining of both pink perch and mackerel
Saw dust and wood Shaving:
Sawdust from hard wood and wood shaving wereobtained from a local saw mill for the used in smokingoperation.

NAIK et al., A Comparative Study on Final Quality of Smoked Product Prepared using Iced Mackerel 881
Table 3. Changes in the Nitrogenous, Hx and Phenol content of smoked mackerel and pink perch
Stored at refrigerated temperature (6 ± 20C) during summer season
Values on wet weight basis; Note: * spoiled product; Parenthesis values indicates standard deviation, n=3.
Parameters Storage days
Mackerel
Pink perch
0 15 30 45 0 15 30 45
NPN (mg %) 151.15 (± 0.20)
160.26 (± 0.75)
170.26 (± 0.96)
* 110.22 (± 0.78)
130.05 (± 0.20)
122.70 (± 0.05)
180.00 (± 5.50)
SSN (% of total nitrogen)
63.44 (± 0.46)
67.59 (± 0.11)
66.79 (± 0.31)
* 53.59 (± 1.01)
54.47 (± 0.23)
59.83 (± 0.50)
60.49 (± 0.74)
Total nitrogen (g / 100g meat)
3.90 (± 0.10)
3.96 (± 0.05)
3.98 (± 0.02)
* 3.30 (± 0.10)
3.39 (± 0.23)
3.42 (± 0.94)
4.49 (± 0.09)
Hx (µg / 100g meat) 0.349 (0)
0.784 (0)
0.989 (± 0.13)
* 0.248 (± 0.01)
0.442 (± 0.01)
0.562 (± 0.14)
1.022 (± 0.03)
Phenol (mg%) 10.4 (±0.10)
8.24 (±0.04)
5.10 (0)
* 9.48 (± 0.02)
9.51 (± 0.03)
9.13 (± 0.02)
8.79 (± 0.12)
pH 8.25 (±0.20)
6.10 (± 0.20)
5.65 (±0.30)
*
9.13 (± 0.07)
8.73 (± 0.06)
7.77 (± 0.03)
7.63 (± 0.25)
Equipment:
Smoking was carried out using an AFOS torry mini kiln.The quality of smoke entering the smoking chamber wasregulated by lighting one or two smokes saw dust burner. Thekiln is essentially a wide tunnel into which smoke is drawn bycentrifugal fans from the sawdust burning. The fan blows thesmoke over the trolly where fish products are kept on a meshscreen and a controllable proportion of moisture laden smokeis then vented up to a chimney. Fresh air and smoke arecontinuously introduced into the kiln and appropriate
temperature is maintained by thermostatically control electricheater. Uniforminity of smoke flow is obtained by fixing baffles(Torry Advisory note No. 82).
Packaging material:
Low density polyethylene (LDPE) bags were used forthe finished smoked by heat sealing. These were then store atdifferent temperature in master cartons for storages study.
Methods:
Phenol:
Total phenol content was estimated by the method ofFoster and Simpson (1961). Phenol was estimated in all smokedsample. 20 gms of meat sample macerated and steam distilled.1 ml of distillate was pipettes for estimation of phenols withthe addition of reagent like sodium carbonate (3ml), 4-amino-anti pyrene (1ml), 25ml of distilled water and potassiumferricynanide (1ml) for colour development. The colour wasmeasured at 550 nm.
Table 4. Effects of varying brine concentration on sensoryattributes of the Smoked
Table 5. Effects of varying brine concentration on sensoryattributes of the Smoked
Table 6. Effects of varying temperature on sensoryattributes of the smoked Mackerel
* Highest score
Brine Concent-
ration (%)
Appea-rance
Colour Taste Text-ure
Flavor Overall Accept-ability
5.0 8.30 8.60 8.00 8.1 8.16 8.16
6.0 8.50 8.22 8.40 8.6 8.42 8.42*
7.0 8.50 8.21 7.00 7.5 7.70 7.70
8.0 8.12 8.30 6.62 7.08 7.56 7.56
Brine Concen-
tration (%)
Appear-ance
Colour Taste Text-ure
Flavor Overall Acceptab-
ility 5.0 8.20 8.70 7.90 8.16 7.75 8.14*
6.0 8.50 8.22 7.00 7.58 7.33 7.73
7.0 8.10 8.31 6.66 7.08 7.33 7.49
8.0 7.49 7.20 7.20 7.60 7.40 7.37
Tempe-rature
(oC)
Appear-ance
Colour Taste Texture Flavor Overall Accept-ability
50 6.80 6.30 7.10 7.20 7.30 6.94
60 6.75 6.50 7.43 7.35 7.58 7.12
70 6.50 6.75 7.25 7.55 7.36 7.45*
80 6.50 8.22 6.75 7.25 7.55 7.25

882 Trends in Biosciences 6 (6), 2013
Table 9. Effects of varying time on sensory attributes ofthe smoked Pink perch
* Highest score
Table 10. Estimation of varying salt up take in saturatedbrine with different time (min) of dip treatment ata reference temperature of 70oC along withdifferent smoking hours for mackerel
RESULTS AND DISCUSSION
The proximate composition showed moisture contentof 67.30% in mackerel and 66.41% in pink perch. Protein 24.38%in mackerel and 26.65% in pink perch, fat with 4.89% in mackereland 3.54% in pink perch was observed. Free fatty acids 3.75 %of oleic acid in mackerel and 3.33% of oleic acid in pink perch,TBA value to 0.345mg of malanaldehyde/ kg sample inmackerel and 0.312mg of malanaldehyde/kg of sample wereobserved in pink perch. The TVB-N amounted to 10.30mg%and 8.89mg% was observed in both mackerel and pink perchrespectively. The value for non protein nitrogen was 91.95mg%and 110.22mg% was observed in both mackerel and pink perchrespectively. The smoked fish product had a hypoxanthinecontent of 0.349µg/100g of meat in mackerel and 0.248µg/100gm meat in pink perch was observed. The phenol contentof smoked product was 10.43mg% in mackerel and 9.48mg%in case of pink perch was observed at the beginning of thesmoked products. The total plate count (TPC) was 1.5X10⁵
cfu /g and 3.6X10⁵cfu/gm was observed in both mackerel andpink perch respectively.
Chemical characteristic of mackerel and pink perchstored at refrigerated temperature:
The proximate composition showed a moisture contentof 66.05% in mackerel and 64.38% in case of pink perch wereobserved at the end of 30days and 45 days respectively.Protein 24.89% in mackerel and 27.87% in case of pink perchwere observed at the end of 30 days and 45 days respectively.
Table 7. Effects of varying temperature on sensoryattributes of the smoked Pink perch
Table 8. Effects of varying time on sensory attributes ofthe smoked Mackerel
Fat contents were 5.04% in mackerel at 30 days of storage,whereas 4.15% in pink perch at the end of 45 days were found.The ash content for mackerel was 3.83% and 3.60% for pinkperch observed at the end of 30 days and 45 days respectively.Free fatty acids 10.31% of oleic acid in mackerel and 9.75% ofoleic acid in case of pink perch was observed in the presentinvestigation at the end of 30 days and 45 days respectively.Thioburbuteric acid value to 2.045mg of malanaldehyde/kg ofsample in mackerel and 1.970mg of malanaldehyde/kg of samplein pink perch were found at the end of 30 days and 45 daysrespectively. The TVB-N amounted to 50.90mg% in mackereland 49.80mg% in case of pink perch were found at the end of30 days and 45 days at refrigerated stored temperaturerespectively. The value for non protein nitrogen was120.62mg% in mackerel and180.00mg% in case of pink perchwas observed at the end of 30 days and 45 days respectively.The smoked product had a hypoxanthine content of 0.349µg/100g meat in mackerel and 1.022µg/100gm meat in pink perchwere observed at the end of 30 days and 45 days respectively.The phenol content of the smoked product was 5.10mg% inmackerel and 8.79mg% in pink perch were observed at the endof 30 days and 45 days respectively. The total plate count(TPC) was 3.5X10⁶cfu/gm in mackerel and 4.2 X10⁶ cfu/gmwas observed in pink perch at the end of 30 days and 45 daysrespectively.
Tempera-ture (oC)
Appea-rance
Colour Taste Texture Flavor Overall Accept-ability
50 6.80 6.30 7.10 7.20 7.30 7.09
60 6 .50 7.32 6.30 7.00 7.25 6.87
70 8 .00 7.55 7.00 7.60 8.20 7.67*
80 7 .30 6.60 7.90 8.10 8.25 7.17
Time (hrs.)
Appea-rance
Colour Taste Texture Flavor Overall Accept-ability
1 6.45 5.95 7.40 7.10 7.66 6.91
2 7 .55 7.80 7.60 7.55 8.30 7.76
3 7 .75 7.56 7.01 7.25 7.11 7.33
4 6 .15 7.50 7.15 7.16 7.13 7.01
5 7 .60 7.85 7.90 8.85 7.85 8.01*
6 6 .58 6.66 7.01 7.25 7.22 6.94
Time (hrs.)
Appea-rance
Colour Taste Texture Flavor Overall Accept-ability
1 6.75 6.25 7.80 8.06 7.50 7.27
2 7.35 7.60 7.40 7.10 7.35 7.36
3 6.55 8.10 7.55 7.53 7.66 7.47
4 8.00 8.25 8.00 8.25 7.75 8.05*
5 6.98 6.55 6.90 7.02 7.10 6.91
6 7.22 6.85 6.52 6.82 6.56 6.79
Fish dip time (Min) in saturated
brine
Smoking Time (hrs) for mackerel / Salt up take (%) for respective time
1 2 3 4 5
5.0 1.28 1.35 2.08 2.55 3.00
6.0 1.82 1.38 2.00 2.50 3.02
7.0 1.99 1.90 2.12 2.58 3.42
8.0 2.00 2.10 2.22 2.62 3.66*

NAIK et al., A Comparative Study on Final Quality of Smoked Product Prepared using Iced Mackerel 883
Table 11. Estimation of varying salt up take in saturatedbrine with different time (min) of dip treatment ata reference temperature of 70oC along withdifferent Smoking hours for pink perch
Moisture:
From the Table 1. It was observed that the initial moisturecontent just before storage and immediately after smokingwas 67.30 to 66.05% in mackerel and 66.41% to 64.38% in caseof pink perch was found to decrease in both the variety offishes at the end of 30 days and 45 days of storage. Thedecrease in moisture content was mainly due to thedehydration in the refrigerated storage. The decrease inmoisture content during storage was also reported byHanumanthappa, 1983 and Kumara, 1996.
Protein:
From the Table1, it can be seen that the initial proteincontent of smoked product was 24.38% to 24.89% in mackereland 26.65% to 27.87% in pink perch found to be increasing atthe end of 30 days and 45 days respectively. This increase inprotein value may be attributed to the reduction in the moisturecontent of sample on smoking and because of the reductionin moisture content of the sample, the protein get concentratedand hence the higher protein contents in the sample wasobserved. This has also been supported by the increase inprotein value in case of smoked breaded and battered pinkperch meat and even in hot smoked and stored mackerel(Kumara, 1996 and Hanumanthappa, 1983).
Lipid:
From the Table1 it can be seen that the total lipid contentof the smoked samples, increased gradually from an initialvalue of 4.89% to 5.04% in mackerel and 3.54% to 4.15% inpink perch were observed at the end of 30 days and 45 daysrespectively. The increase in fat content may be attributed tothe dehydration in the storage. Similar result was obtained forHanumanthappa, 1983 and Kumara, 1986.
Ash:
From the Table 1 it can be seen that there was increase
in ash content in the sample after smoking at the end of storage.This increase in concentration of ash content is possibly dueto the decrease in moisture content, consequence to theconcentration of solute due to smoking and storage. Similarobservations were made by Hanumanthappa 1983 and Kumara1986. Table1.
Changes in Free Fatty Acid:
From the Table 2, it can be seen that there was increasein FFA values observed in the entire product stored atrefrigerated temperature. Similar observations were made onthe increase of FFA content by Hanumanthappa, 1983 andKumara, 1996. During storage the slight increase FFA wasdue to the enzymatic degradation of triglyceride andphospholipids (Bilinski, et al., 1981).
Changes in Thiobarbituric acid value:
From the Table 3, it can be seen that an increasing trendin the entire product during refrigerated storage. Similarobservations were made on the increasing trend of TBA valuesby Hanumanthappa, 1983 and Pandian 1994. This TBA contentis the index of malanaaldehyde formation due to the oxidativerancidity in fatty fishes which is very complex process. Herethe oxygen initially reacts with the unsaturated lipids andform hydro peroxide which further break down to objectionablerancid flavoring compounds. Though in present study thefish used was both lean and fatty fish and in the lean fish TBAvalue were well within the limit even at the end of storage of45 days. A limit of 2 mg of malanaldehyde/kg of materials hasbeen suggested for fresh fish (Connell, 1980). The spoilage ofrefrigerated stored product was probably not because of rancidflavor but because of the petrifaction which was remarkedduring the panel, which gave a putrid offensive smell duringopening of the pack.
Changes in the Total volatile base nitrogen (TVB-N):
From the Table 4, it has been reported that the totalvolatile base nitrogen gives better index of the spoilage of thecured fish product than trimethylamine nitrogen (TMA-N)(Rao, et al., 1958). The TVB-N indicates the production ofammonia, mono, di and trimethylamine nitrogen and is foundin the common pattern of spoilage. The TVB-N content showsa steady change in both the product during smoking andstorage at different temperature. Similar results were observedby Hanumanthappa, 1983, Anthony, 1993 and Kumara, 1996).The spoilage of products in refrigerated temperature storagecan be attributed to the production of total volatile basenitrogen with an offensive putrid smell in conglomeration withmicrobial growth. The growth of microbes on the productmay be because of the formation of degraded product due tothe above reaction.
Fish dip time (Min) in saturated
brine
Smoking Time (hrs) for pink perch/ Salt up take (%) for respective time
1 2 3 4 5
5.0 1.33 1.38 2.11 2.50 3.03
6.0 1.87 1.41 2.03 2.45 3.06
7.0 2.04 1.94 2.15 2.53 3.36
8.0 2.05 2.14 2.25 2.59* 3.60
* Acceptable score

884 Trends in Biosciences 6 (6), 2013
Changes in non-protein nitrogenous compound in theproducts stored at refrigerated temperature:
From Table 5, it can be seen that the non protein nitrogenincrease after smoking and also during storage. There arenumerous reports on changes in NPN during storage. Indianmackerel had showed no definite changes (Nair, et al., 1987).A steady increase in the values of NPN was noticed uptoThirty days of storage and later Pink perch was also observedto decreasing upto the end of 45 days of storage. Similarobservations were made by (Verma, 1992). Increase in NPNupto 11weeks of storage was noticed by Joseph, et al., 1980.
Changes in the Hypoxanthine content during refrigeratedstorages:
From the Table 6, it can be seen that the hypoxanthinecontent after smoking and also during storage. There are fewreports on the changes in Hx during storage. A steady increasein Hx content was due to the changes in ATPase breakdownduring postmortem changes. It was accepted upto the end of30 days in case of mackerel and 45 days in case of pink perch.It has been suggested that the Hx content less than 1µg/100gm meat is well accepted. (Gopakumar, 2002).
Changes in the phenol content:
From the Table 7, it has been notice that the phenolpresence in the smoke gives a direct relation to the typicalflavor of the smoked products (Eyo, 1982). Apparently certainphenolic compounds such as guiacols, syrengols andeugenols play a predominant role in this flavoring effect ofthe smoked (Toth, 1980). A total phenol content of 10.4mg%gave a good taste and flavor to the product (Hanumanthappa,1983). Similar results were obtained in this present study whichwas found to decrease in refrigerated storage condition. Thisstudy is also supported by the result obtained by Anthony1993 and Kumara 1996.
Microbial characteristics:
The microbial characteristic included total plate count,from the Table 8, it can be seen that the total plate countincrease during smoking from an initial of 1.5X10⁵cfu/gm ofsamples to a decrease load of 3.5X10⁶cfu/gm in mackerel and3.6X105 to 4.2X10⁶cfu/gm in pink perch was observed. Thisincrease in trend in refrigerated temperature stored productmay be attributed to the presence of mesophillic organismand in particular of refrigerated storage the initial slow downin increase number may be attributed to the sudden exposedto lower temperature and thereafter developing resistance atthat temperature (Borgstrom, 1965).
From this study it was concluded that, the fishes whichused for the study can withstand upto 30 days in case ofmackerel and 45 days in case of pink perch. It shows that theproduct prepared by the iced fish like mackerel will loose its
cell components when stored in chilled water in 8 days, butpink perch can withstand for further more storage. The studyreveals that the lean fish has got better storage stability thanthe fatty fish which was smoked and stored under refrigeratedcondition.
ACKNOWLEDGEMENT
The First author (Naik) are grateful to the UniversityGrants Commission (UGC), New Delhi for providing Fund underRajiv Gandhi National Fellowship to carry out the Ph.D. worksuccessfully and also thankful to the Dean (Fisheries), Collegeof Fisheries, Mangalore for giving an opportunity to publishthis work.
LITERATURE CITED
Anthony, A.S. 1993.Studies on freezing and cold storage of smoked seafish (Scombermorus commersoni). Master Thesis submitted toUniversity of Agricultural Sciences, Bangalore
Bilinski, E., Jhons, R.E.E and Peter, M.D. 1981. Treatment effectingthe degradation of lipids in frozen pacific herringing clupeaharrengus pallasi. Journal of Canadian Institute of Food Scienceand Technology, 14(2):123-127.
Borgnstrom, G. 1965. In fish as food (iii) method of smoking, pp. 55-100.
Connell, J.J. 1980. Control of fish quality. Fishing news books, Ltd,Survey, England pp. 17
EYO, A. A. 1982. Comparative evaluations of the colour and theflavour of southerodon galilees smoked with different acid typical,Annual Report Kini. Lake Institute, 74-81.
Foster, W. M., Simpson, T.H and Campbell, D. 1961. Studies of smokingprocess for foods . The role of smoked particles, Journal of Scienceand Food Agriculture, 12:63
Gopakumar, K. A. 2002. Text book of Processing Technology Press atNew Delhi, pp 1-23.
Hanumanthappa, B. 1983.Preparation and keeping quality of hot smokedmackerel Master thesis submitted to University of AgriculturalSciences, Bangalore
Joseph, P., Perigreen, P.A., George, C and Govindan T.K. 1987. Icedand frozen characteristics of cultured Chanos chanos(Forsakel).Fishery Technology, 17(1):21-25.
Kazimerz, B. M., Miler and Sikorski, Z.E. 1999. Smoking In : Seafoodresources, Nutritional composition and preservation (Sikorski ZEEd.)CRC Press Florida, 164-178.
Kumar, L. 1996. Studies on development of value added fish productsby smoking Process. Master thesis submitted to University ofAgricultural Sciences, Bangalore
Lakshmannan, P.T . 2002. Fish spoilage quality and assessment, qualityassurance in sea food processing (Iyer TSG, kandoran MK, Mary Tand Mathew PT Eds.) CIFT Cochin.
Lilabati, H., Vishwanathan, W and Shyamkesosingh, M. 1999. Changesin bacterial and fungal Quality during storage of smoked (Esomusdandricus) of Manipur,fishery technology, 36(1):36-39.
Lilabati, H., Bijaayanti, N and Vishwanathan, W. 1997. Bio chemicaland microbiological quantity of smoked Channa puntitus availablein Manipur fishery technology, 21-25

NAIK et al., A Comparative Study on Final Quality of Smoked Product Prepared using Iced Mackerel 885
Nair, P. R., George, C., Thompson, N., Perigreen and Gopakumar, K.1987. Studies on frozen mackerel .Fishery Technology, 24:103-108.
Pandian, K.M. 1994. Preparation of value added products from shrimpsand their quality changes during frozen storage. Master Thesissubmitted to University of Agricultural Sciences, Bangalore.
Piggot, A. M and Tucker, B. W. 1990. Sea food effect of technology onnutrition, Marcel, Dekker, INC, New York; pp. 362.
Rao, S.V.S., Valsan, A. P and Nair, M.R. 1958. Studies on the preservationof fish by pickling. Indian Journal of Fisheries; 5(2) :326.
Sindhu, S., Krishnakumar, S., Nambudiri, D.D. and Alphikorat. 2008.Keeping quality and storage life of cubes and fillet steaks from amarine perch king emperor, Lethrinus Lentjan, (Lacepede ); 45(2):189-196.
Thomas, F and Balachandran, K. K. 1989. Fish curing in India, In :recent trend in processing low cost fish (Balachandran KK, PerigreenPP, Madhavan P and Surendran PK Eds.) Society of fisheriesTechnology India, Cochin. pp 15-36.
Toth, L. 1980. Influence of smoked house technology on phenols inthe smoke .Fleischirtschalt; 60(8):1472.
Verma, J. K. 1992. Effects of cryoprotectants on biochemical andfunctioning properties if fish mince during frozen storage MasterThesis submitted to University of Agricultural Sciences, Bangalore.
Verma. 2002. Preservative quality problems in sea food industry. In :quality assurance in sea food processing 2nd edition, (eds. Iyer,T.S.G.Kandoran, M.K., Mary, T. and Mathew, P.T., Eds) CIFT, Cochin,pp. 13-18.
Recieved on 11-12-2013 Accepted on 15-12-2013

Subscription Order Form
Name : …………………………………………………………………………..............................................................
Designation : …………………………………………………………………………..............................................................
Organization : …………………………………………………………………………..............................................................
Mailing Address : …………………………………………………………………………..............................................................
City ............................................................................ State .........................................................................................
Pin .............................................................................. Country ...................................................................................
Phone ........................................................................ Mobile .....................................................................................
E-mail ........................................................................ Fax ............................................................................................
Subscription period January- December (Year)
Annual Subscription Rates for 2013 :
Author’s Contribution : Rs. 1000/paper (for single author) and Rs. 600/paper for additional authors.** Same for SAARC,countries only soft copy
Terms and Conditions:
1. Online subscription includes online access
2. Print subscription is volume based where as online subscription is Calendar year based
3. Online subscription includes current subscription + Back Files (for last two years)
4. Please add Rs. 50 for non-Delhi cheque and for non-Kanpur cheque Rs. 50
5. The online subscription should be send to : Print subscription and manuscript should be sent toindianjournals.com Dr. S. S. AliB-9, Local Shopping Complex, ‘A’ Block Editor in Chief, H- 1312, VIP lane,Naraina Vihar, Ring Road Satyam Vihar, Avas Vikas No.1New Delhi 110 028, India Kalyanpur, Kanpur- 208 018, U.P. IndiaPhone: +91-11-45055555, 45055500 Mob. 09919388690, 09696499966Fax: + 91-11-25778876 E-mail: [email protected]: [email protected] DD should be in favour of “Trends in Biosciences” for print version
(State Bank of India, Kalyanpur, Kanpur, U.P. Branch Code 01962,A/c No. 31575871348)
Kindly Note :All queries and complaints regarding online access of the journal should be addressed to Indianjournals.com while for printversion to Editor in chief.For prompt delivery and communication please provide e-mail ID, mobile no. and complete contact details with pincode.
Individual Institutional Single article Version INDIAN
in Rs./issue FOREIGN
in US$/issue INDIAN
in Rs. FOREIGN
in US$ INDIAN
in Rs. FOREIGN
in US$ *Print /Number 1000* 50 2500 200 50 10 **Online 1000 50 2500 200 150 25

Instruction to the Authorswww.trendsinbiosciencesjournal.com
The journal of Trends in Biosciences is essentially devoted to the publication of original research papers on all aspects ofbiosciences. All papers and short communication submitted to Trends in Biosciences must be unpublished original works. Themanuscripts in English should be in a finished form and typed on one side of A4 size paper and double spaced throughout withample margins. Pages should be numbered consecutively beginning from the title page. Text in any format (tables and figureincluded or separately) on CD in MS word with two hard copies or sent through email to [email protected],[email protected] as attached file (s) is preferred since it saves retyping.
Research Papers: Each full length of research papers should be covered within 1500 words including tables and illustrations.Short communication should be within 175 words including tables, figures and references, in case of exceeding the limit, paymenthas to be made for extra materials by the authors. Correct language is the responsibility of the author. No editing or materialschanges at the proof stage will be permitted. While short communication will have only title, authors name, address and e-mailfollowed by text and references. In case of full length paper authors should have the following headings.
Title : The title to be typed in capital and small letters, author names (all capital) and affiliation (capital and small letters withitalics fonts). Give e-mail address in italic fonts also. Manuscript must confirm to the journal style (see latest issue)
ABSTRACT : The abstract should indicate the main findings of the papers and typed in bold, single space. It should be notmore than 150 words. The abstract should be typed before the main text and intended ca. 2cm to the right of it.
Key words 5-6 key words in italics should be given.Tables and figures : Table should be descriptive without and references to the text with heading in bold letters. Each table
should be typed on a separate sheet. Figures whether line drawing or graph should be of good quality. Legends to figures shouldbe given on a separate sheet. Tables and figures should be numbered consequently in Arabic numerals (Table 1., Table 2., Fig.1.,Fig.2.- 3) can be identified on the back by name (s) of the author(s).
Introduction : This should be brief and related to aim of the study. The review of the literature should be pertinent to thetheme of the paper. Extensive review and unnecessary details of earlier work should be avoided. Heading “introduction” shouldnot be written.
MATERIALS AND METHODS : When methods are well known, citation of the standard work is sufficient. All measurementshould be in metric units.
RESULTS AND DISCUSSION : The result should be supported by brief and adequate tables, graphs and charts, whereverneeded.
LITERATURE CITED : In the text, references should be cited as follows: two authors (Ali, and Pervez, 2005), three or moreauthors (Gaugler, et al., 2001). All references made in the text must be listed under LITERATURE CITED at the end of the text.References should be listed alphabetically by the authors, followed by the year of the publication. Journal titles should be citedin full and in italics, while for books the place of the publication should precede the name of the publisher, Example Strong,D.R. 2002. Population of entomopathogenic nematodes in food webs. In: Entomopathogenic Nematology, (ed.Randy Gaugler)CAB International, ix + 387. pp. 225-240.
Fox, P.C. and Atkinson, H.J. 1984. Glucose phosphate isomerase polymorphism in field population of the potato cystnematode, Globedera rostochiensis and G. pallida. Annals of Applied Biology, 104(1):503-506.
Submission of manuscript : Duplicate copy of manuscript along with soft copy (CD) should be submitted to the Editor inChief, Dr. S.S. Ali, H-1312, VIP Lane, Satyam Vihar, Avas Vikas No. 1, Kalyanpur, Kanpur 208 018, India. The text may sent throughe-mail to [email protected]. Payment must be made through Demand Draft/e-banking payable to State Bank of India,Kalyanpur Branch, (Branch code 01962, IFSC : SBIN0001962) Kanpur, U.P. India, in favour of account of “Trends in Bioscience”(Account number 31575871348) along with manuscript and send to Dr. S. S. Ali, Editor in Chief. For online subscription ofjournal contact [email protected]
Copyright : copyright © of all papers published in Trends in Biosciences, acceptance of manuscript for Trends in Biosciences,automatically transfers the copyright to Trends in Biosciences The use of trade name or a propriety product does not constitutea guarantee of the product by the author (s) or the society and does not simply its approval to the exclusion of the products thatmay be suitable.