
Transport trajectories of “smart” pebbles on an artificial coarse-grained beach at Marina di...
10
This article appeared in a journal published by Elsevier. The attached copy is furnished to the author for internal non-commercial research and education use, including for instruction at the authors institution and sharing with colleagues. Other uses, including reproduction and distribution, or selling or licensing copies, or posting to personal, institutional or third party websites are prohibited. In most cases authors are permitted to post their version of the article (e.g. in Word or Tex form) to their personal website or institutional repository. Authors requiring further information regarding Elsevier’s archiving and manuscript policies are encouraged to visit: http://www.elsevier.com/copyright
Transcript of Transport trajectories of “smart” pebbles on an artificial coarse-grained beach at Marina di...

This article appeared in a journal published by Elsevier. The attachedcopy is furnished to the author for internal non-commercial researchand education use, including for instruction at the authors institution
and sharing with colleagues.
Other uses, including reproduction and distribution, or selling orlicensing copies, or posting to personal, institutional or third party
websites are prohibited.
In most cases authors are permitted to post their version of thearticle (e.g. in Word or Tex form) to their personal website orinstitutional repository. Authors requiring further information
regarding Elsevier’s archiving and manuscript policies areencouraged to visit:
http://www.elsevier.com/copyright

Author's personal copy
Transport trajectories of “smart” pebbles on an artificial coarse-grained beach atMarina di Pisa (Italy): Implications for beach morphodynamics
D. Bertoni a, G. Sarti a,⁎, G. Benelli b, A. Pozzebon b, G. Raguseo b
a Department of Earth Sciences, University of Pisa, Pisa, Italyb Department of Information Engineering, University of Siena, Siena, Italy
a b s t r a c ta r t i c l e i n f o
Article history:Received 3 February 2011Received in revised form 28 July 2011Accepted 16 August 2011Available online 6 September 2011
Keywords:pebble transportcoarse beachtracing techniqueRFIDreplenishment
In this paper, transport pathways for coarse sediments were studied on an artificial pebble beach located atMarina di Pisa (Tuscany, Italy). Radio frequency identification (RFID) technology was used to trace the peb-bles. The RFID technique is an inexpensive and reliable methodology that is used to address sediment dis-placement along the coastline. The use of low-frequency radio signals (125 kHz) enabled the detection ofthe marked pebbles within a range of 40 cm on the underwater and subaerial portions of the beach. Aboutone hundred pebbles were sampled on the beach and paired with passive transponders. The tracers were re-leased along a series of cross-shore transects (March 2009). The pebbles were injected on the fair-weatherberm, on the swash zone, and on the step crest along each transect. The recovery campaign was carriedout in May 2009. Fifty-three pebbles were detected; this number is rather high given the intensity of thethree storms that hit the coast during the period of the experiment and the significant reworking that thisbeach is subjected to even under fair-weather conditions. The analysis of the tracer pathways highlightedtwofold convergent longshore movement on the beach. The trajectories indicated that the longshore move-ment dominated the cross-shore movement, but there was no prevailing transport direction. To explore themorphology of the sea bottom fronting the beach, a topographic survey was carried out using an echo sounder.The survey showed the presence of two distinct shoals 20 m off the coastline that are responsible for the resultingcoarse sediment transport. These results confirm that even mild sea bottom irregularities may significantly affectsediment transport dynamics along a beach, suggesting that accurate planning for defense schemes such as artifi-cial coarse replenishment must begin with an in-depth knowledge of the morphology of the sea floor. Such infor-mation may increase the durability and/or the efficiency of the intervention.
© 2011 Elsevier B.V. All rights reserved.
1. Introduction
Coarse-grained coastal environments have attracted increasing scien-tific attention lately,mostly because coarse beaches are considered a suit-able tool for protecting eroding shores (Allan and Komar, 2004; Horn andLi, 2006). Even though gravel beaches are common around the world,particularly at high latitudes and where mountain slopes are close tothe coastline, they have not experienced the extensive investigationthat sandy beaches have because of the logistical difficulties involved inproperly reproducing the environment for laboratory tests or in settingup field experiments (Buscombe andMasselink, 2006). However, severalaspects of gravel beach morphodynamics have been assessed in recentyears, encouraging increasing scientific production centered on thistopic (Jennings and Shulmeister, 2002; Cammelli et al., 2004; Austinand Masselink, 2006b; Horn and Li, 2006; Pedrozo-Acuña et al., 2006;Austin and Buscombe, 2008). Many works dealt with the hydrodynamic
processes of coarse-grained beaches, highlighting the differences in com-parison to sandy beaches. Firstly, the higher permeability of coarse sedi-ments induces a reduction in backwash water volume, which isnegligible on sandy beaches (Ivamy and Kench, 2006; Pedrozo-Acuña etal., 2007). Secondly, the steepness of coarse-grained beaches usually im-plies narrow surf zones because waves break close to the nearshore, pro-ducing the increasing importance of swash zone processes in terms ofcoarse sediment transport (Mason and Coates, 2001). In contrast tosandy beaches, where spilling breakers are predominant, plunging orsurging breakers also characterize steep beaches: the influence ofplunging breakers on nearshore processes has recently been empha-sized (Pedrozo-Acuña et al., 2008, 2010). One particular issue that isstressed in these studies is the phenomenon of coarse sediment trans-port, which has a significant impact on virtually every shore process:as amatter of fact, anywork dealingwith coastalmorphodynamics can-not forgo assessments on sediment transport. Coarse sediment trans-port has been studied from a conceptual standpoint (Van Wellen etal., 2000; Lee et al., 2007) and inmore practical terms, both in the labo-ratory (Voropayev et al., 1998) and in the field (Osborne, 2005; Austinand Masselink, 2006a). Recently, the development of new tracing
Marine Geology 291-294 (2012) 227–235
⁎ Corresponding author. Tel.: +39 050 2215734; fax: +39 050 2215800.E-mail address: [email protected] (G. Sarti).
0025-3227/$ – see front matter © 2011 Elsevier B.V. All rights reserved.doi:10.1016/j.margeo.2011.08.004
Contents lists available at SciVerse ScienceDirect
Marine Geology
j ourna l homepage: www.e lsev ie r .com/ locate /margeo

Author's personal copy
techniques has encouraged additional interest on this subject, andmajor results related to sediment movement have been presented.The use of RFID (radio frequency identification) technology (Nichols,2004), which involves coupling a small transponder with a pebble, pro-vided broader datasets on coarse particle pathways than ever before(Allan et al., 2006; Curtiss et al., 2009). The RFID techniquewas later re-fined by Bertoni et al. (2010) to enable the underwater detection of themarked pebbles, resulting in the collection of data involving the subaer-ial and the underwater portion of the beach. The aim of this paper is tostress the implications of the interaction between sea floormorphologyand incoming waves for nearshore sediment transport, analyzing thedisplacement pathways of marked pebbles along an artificial pebblebeach at Marina di Pisa (Tuscany, Italy). The results that this researchhas yielded further confirm the efficiency of the RFID techniquewith re-gard to pebble tracing. The resultsmight also beuseful in better definingthemorphodynamic processes acting on this kind of beach,which is fre-quently used as a form of protection from coastal erosion, andmay helpto optimize future interventions like the one set up at Marina di Pisa interms of both cost and durability. In addition, the transport patterns iso-lated here might facilitate the in-depth comprehension of depositionalprocesses for coarse sediment, which in turn should stimulate researchon ancient, gravelly shorelines (Pascucci et al., 2009).
2. Regional setting
Marina di Pisa is a small seaside village located slightly less than11 km west of Pisa. It is one of the most frequented sites of summertourist activities along the coast of Pisa, even though the area hasbeen subjected to recurrent episodes of erosion-related processesthat threatened the existence of the village itself. The Pisa coast
extends for about 25 km on both sides of the River Arno and fallswithin the River Magra–Livornesi Mounts physiographic unit, whichencompasses a 65-km stretch of coast along the southern sector ofthe Ligurian Sea (Fig. 1).
The evolution of the Pisa coast is strictly linked to the dynamics ofthe River Arno, which is the main source of sediment naturally feed-ing the entire area. The River Arno's delta experienced significant,
Fig. 1. Satellite image of the study area. The picture on the left shows the asymmetry of the River Arno's mouth. The thin black arrows show the direction of the longshore driftthroughout this sector of the Tuscany coast.
Fig. 2. This picture, taken in the aftermath of a powerful storm in 2003, shows the lit-toral promenade of Marina di Pisa covered with gravel thrown over the sea wall by theviolent waves.
228 D. Bertoni et al. / Marine Geology 291-294 (2012) 227–235

Author's personal copy
rapid growth between the sixteenth and eighteenth centuries, mostlybecause of the expansion of farming land and deforestation, which ul-timately created high rates of progradation (Pranzini, 2001). Since themid-eighteenth century, however, the entire area has faced seriousmodifications caused by different human activities that have led toa major turnabout in the evolution of the coastline. Changes in landuse in the hinterland, dam and armored bank construction along thecourse of the rivers, wetland reclamation, the readjustment and refor-estation of mountain slopes to reduce hydrological hazard, and riverbed quarrying have all combined to produce a severe decrease inthe River Arno's sediment load, and early erosion processes havebegun as a result (Aminti et al., 2000; Pranzini, 2001; Sarti et al.,2010). At first, the entire area was struck. Then, in the early twentiethcentury, as the erosion wiped out the sandy beaches fronting Marinadi Pisa (Fig. 1) and wave processes menaced the waterfront duringstorms, a series of protection structures began to be erected alongthe littoral promenade of Marina di Pisa. These include sea walls, de-tached breakwaters, and groins. At that time, the retreat of the left sideof the delta was contained at the expense of any chance of natural feed-ing for the shore. Conversely, the right side of the delta, which fallswithin the boundaries of the Migliarino–San Rossore–MassaciuccoliNatural Park (Fig. 1), was not as protected as the left side, resulting ina larger loss of land (an estimated retreat of about 1300 m over lessthan 150 years as opposed to less than 300 m on the left side) (Amintiet al., 2000). This differential erosion led to the present asymmetric con-figuration of the River Arno's delta.
The hard defenses built to prevent further shoreline retreat at Marinadi Pisa fixed the coastline but blocked any land/sea interaction from
taking place. The beaches could not be preserved, and the need for ar-tificial replenishment arose. The first beach fill attempts were per-formed in the mid-1980s, but the sediments used (sand of grainsize comparable to that typical in this sector of the coast) provednot to be suitable because of the high losses reported after storms.Therefore, a subsequent project in 2001 used coarser particles(8-to-16 mm), but the outcome was not satisfactory due to an unex-pected process that occurred in the autumn of 2003 during a fewpowerful storms: gravel was literally hurled onto the littoral prome-nade, causing significant damage and risk to the population (Fig. 2).After these unfortunate events, local authorities did not relinquishtheir quest for artificial beach fills; rather, in 2006, they elected anew replenishment plan involving two separate sites about 1 kmapart using 30-to-90 mm marble pebbles. The protection schemewas rounded out with modifications to the groins, which were con-siderably enlarged. The southern site, which is characterized by asingle artificial beach named Barbarossa, represents the study areafor the present research (Fig. 3). The beach is 110 m long and isbound by two groins, but there are no offshore protection structures.The backshore is separated from the littoral promenade by a massivesea wall. The width of the beach is uneven due to the presence ofbuildings that limit the extension of the beach at the back (it isabout 35 m wide in the central sector but less than 20 m widewhere man-made construction interrupts the regularity of the seawall). Barbarossa Beach is characterized by a steep beach face and apronounced step that sometimes exceeds 60 cm in height. The
Fig. 3. Southern view of Barbarossa Beach. The picture shows the height of the storm berm. The dashed lines point out the area that was investigated during the experiment.
Fig. 4. A pebble used as a tracer and, on the bottom right corner, examples of transpon-ders that were inserted into the pebbles.
Fig. 5. The pebbles were released along closely spaced cross-shore transects; more spe-cifically, they were injected into the fair-weather berm (a), the swash zone (b), and thestep crest (c). The dashed lines point out the area where pebbles moved during thetime frame of the research.
229D. Bertoni et al. / Marine Geology 291-294 (2012) 227–235
Author's personal copy
transition to the finer sediments typical of the Pisa coast (medium-to-fine sand) occurs at the step base. The sea bottom is relativelyflat; its slope is average for this sector of the Tuscany coast (1%;Cipriani et al., 2001). Barbarossa Beach can be classified as reflectivein accordance with the classification presented by Wright and Short(1984). Likewise, it can be defined as a composite gravel beachaccording to the classification by Jennings and Shulmeister (2002).The littoral drift is directed southward throughout the study area(Aiello et al., 1975; Pranzini, 2004). The waves most frequently ap-proach the coastline from the southwest, and the major storms arecommonly driven by southwesterly winds (Cipriani et al., 2001).Tides are not a major controlling factor, the tidal range being hardlyhigher than 30 cm.
3. Materials and methods
3.1. Tracing technology
Recently, radio frequency identification proved a dependablemethod of tracing coarse sediments (Allan et al., 2006; Curtiss et al.,2009; Bertoni et al., 2010). It consists of coupling passive tags (ortransponders) to pebbles and tracking their movement, recordingthe release and recovery positions of the tracers using highly accuratepositioning instruments. Each tag includes an antenna, a small micro-processor, and a sufficient quantity of memory to store an unambigu-ous identification code. It is detected and identified by a readingdevice that retrieves the identification code via a radio connection.Specific technical innovations were used to enable underwater iden-tification (refer to Bertoni et al., 2010, for an in-depth explanationof the technique). A low-frequency (125 kHz) RFID system was used.Ad hoc studies were performed to obtain the best performance, withthe most suitable devices chosen for every part of the technology. ABStransponders of 30 mm in diameter (manufactured by PartItalia srl)were used as tags. A CORE-125 by CoreRFID ltd. was employed as areading device; it provides an IP67 protection level, which enables im-mersion up to 1 m of depth for short spans of time. To allow deeperand more prolonged immersion, the reader was further waterproofedby filling any possible holes with silicone.
Once the technology had been prepared, 102 pebbles were sampledrandomly on the beach. The only limitation was the mean diameter,which could not be lower than 40 mm, to avoid the unintentionalbreakage of the pebbles during the preparation procedure. A hole
32 mm in diameter and 27 mm deep was carved into each pebbleusing a core drill, and a tag was pasted onto the bottom with a strongtwo-component epoxy adhesive. The hole was plugged with a smallmarble core, at which point everything was sealed with syntheticresin (Fig. 4). In thatway, the preparation procedurewould only slightlyaffect the physical properties of the pebbles.
Once ready, the pebbles were released at Barbarossa on March18th, 2009. A series of cross-shore transects was traced out on thebeach; a pebble was placed on the fair-weather berm, on the swashzone (more precisely, at the upper limit of the swash), and on thestep crest of each transect (Fig. 5). The release and recovery positionsof the pebbles were recorded with a Sokkia SET-610 total station. Therecovery campaign, which was performed just prior to the beginningof the summer tourist activities (May 2009), located 52% of themarked pebbles. The device enabled the detection of the tracers
Fig. 6. The sea-weather during the experiment was characterized by significant wave height (black line) and wind speed (red line) as recorded by the wavemeter and the anemom-eter (the wave and wind data were provided by the Tuscany Hydrological Service). The three major storms that occurred are visible on the plot.
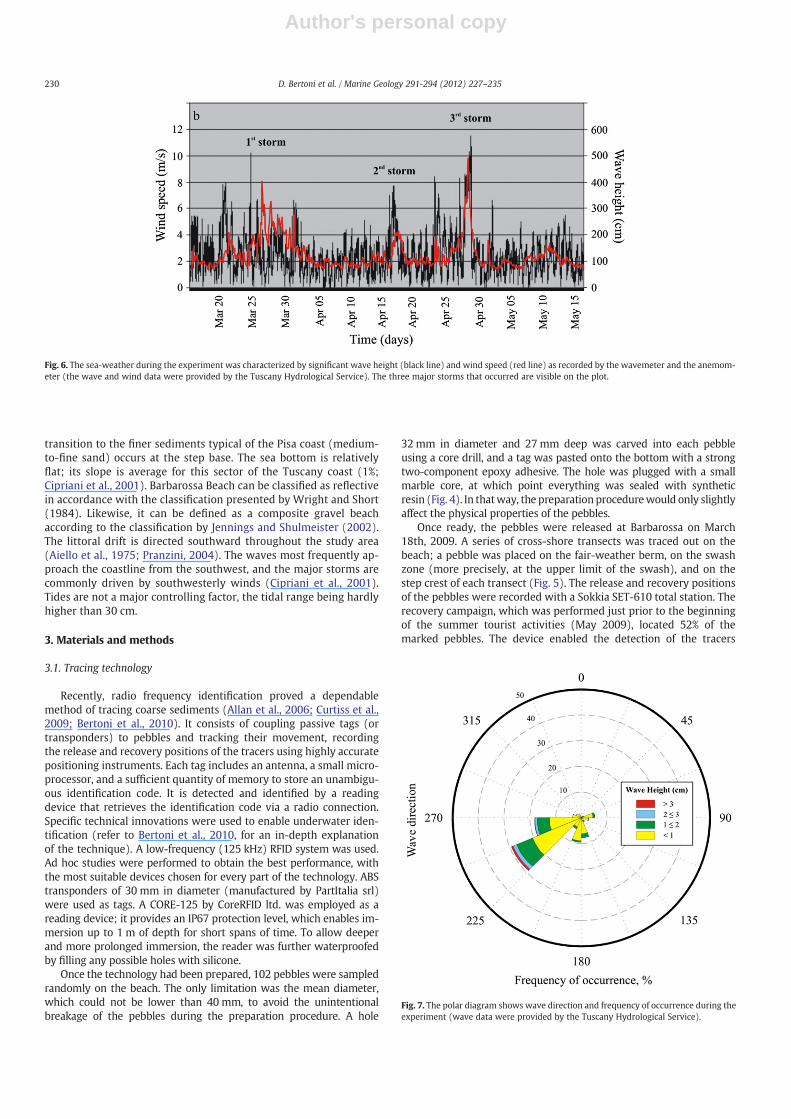
Fig. 7. The polar diagram shows wave direction and frequency of occurrence during theexperiment (wave data were provided by the Tuscany Hydrological Service).
230 D. Bertoni et al. / Marine Geology 291-294 (2012) 227–235

Author's personal copy
within a 40 cm range in the subaerial environment; the detectionrange decreased to 35 cm for the underwater stage of the fieldwork.
3.2. Topographic survey
Topographic monitoring was conducted on the sea bottom front-ing Barbarossa Beach to determine its morphology and to underlineany existing features that might possibly affect the transport path-ways of the pebbles. This monitoring process took place in April2009, just prior to the strong late April 2009 storm. The survey was
conducted using an echo sounder, the Actisense DST-2-C SingleBeam (supplied with an AIRMAR SS510 transducer). The device,properly set up on a small rubber dinghy, recorded one point per sec-ond. During the survey, the boat speed never exceeded 3 m/s(5.83 knots), leaving little distance between consecutive points. Thesea bottom was surveyed up to 300 m off the coastline and thereforeat a depth of 10 m, which is well over the closure depth of the area(about 7 m according to Cipriani et al., 2001). A closely spaced gridwas identified on an electronic map before the survey, and theroute was followed during the fieldwork. Because the echo sounder
Table 1The results of the recovery campaign at Barbarossa: the table shows the volume ofpebbles located, their release locations and their percentage.
Release location
Fair-weather berm Swash zone Step crest Total % REC. % A/U W % OL
Recovery location Storm berm Subaerial 11 12 6 29 54.6 58.5 19.4Fair-weather berm 1 0 0 1 1.9Swash zone 0 1 0 1 1.9Step crest Underwater 4 6 1 11 20.8 41.5 72.7Step base 4 2 5 11 20.8Total 20 21 12 53 52
Note: % REC. is the percentage of pebbles recovered sorted according to their recovery locations; % A/UW signifies the percentage of pebbles detected on the subaerial portion of thebeach as opposed to the percentage of pebbles retrieved under the water; % OL stands for the percentage of pebbles recovered on the subaerial portion of the beach but releasedunderwater and vice versa.
Fig. 8. The transport pathways of the marked pebbles at Barbarossa. The red arrowsrepresent the northward displacement of the pebbles; the black arrows indicate thesouthward displacement of the pebbles.
Fig. 9. Sea bottom and subaerial morphology of Barbarossa as of April 2009. The greendots represent the release position of each pebble; the red dots indicate the locationwhere pebbles were recovered.
231D. Bertoni et al. / Marine Geology 291-294 (2012) 227–235

Author's personal copy
was not perfectly accurate (allowing about 50 cm of instrumenterror), it was also wired to an RTK-GPS (Leica RTK 1200) to increaseits precision. Therefore, the level of instrument error was reduced to2 cm for the positioning and 10 cm for the elevation. The resultingdata were subsequently processed using ArcGIS software (ArcGIS9.2) to create accurate electronic maps of the sea bottom fronting Bar-barossa Beach. The RTK-GPS was also used to conduct topographicsurveys of the backshore and foreshore of the beach. The prominentfeatures of the backshore were tracked (the landward toe of thestorm berm, the crest of the storm berm, the coastline), along withthe crest of the step. Five cross-shore transects were traced to in-crease the precision of the survey. Along these transects, any existingslope variation from the sea wall to the lower limit of the foreshorewas recorded.
3.3. Wind and wave measurements
A buoyant wavemeter and an anemometer were used to collectwind andwave data during the research (Fig. 6). The wavemeter is lo-cated about 40 km southwest of the Pisa coast, offshore from GorgonaIsland (Fig. 1). The device measured the period, direction, and signif-icant height of the waves twice per hour. The fixed anemometer sta-tion is located 1 km north of the study area, close to the mouth of the
River Arno. The instrument recorded wind direction and wind speed4 times per hour (about 6240 measurements). No system break-downs were reported during the experiment. Fig. 6 shows the occur-rence of three major high-energy events, all of which came from thesector between 225° and 270° (WSW). These events were consistentwith historical sea-weather data, which confirm that most intensestorms usually come from the WSW sector along the Pisa coast(Cipriani et al., 2001). The polar diagram displays that almost 60% ofthe incident waves came from the west and southwest (Fig. 7); thisis also in accordance with historical sea-weather data from the Pisacoast (Cipriani et al., 2001). Wind and wave data are consistent,showing peaks in wind speed and wave height during these events.The first storm (March 24th, 240°) was the longest one, lasting for6 days. During this time-span, the significant wave height never fellbelow 1 m. The storm was characterized by two distinct peaks: thefirst peak presented a higher wave height (3.5 m) than the secondpeak (2.5 m), which occurred about 36 h after the former. The secondstorm (April 16th, 230°) was defined by mild wave height and windspeed and lasted for less than 2 days. Its effects were thoroughlyobliterated by the third storm (April 29th, 240°), which was thestrongest one in terms of both wave height and wind speed. The high-est recorded wave heights during the period of the research were4.5 m.
4. Results
The recovery campaign was carried out in May 2009 and was 52%successful (53 of 102 pebbles were retrieved during the fieldwork).The bulk of the recovered pebbles was found on the storm berm,where 29 tracers were found back. Conversely, only one pebble wasrecovered on the fair-weather berm and one on the swash zone(Table 1). These data imply that 58.5% of the tracers were detectedon the subaerial portion of the beach, nowhere near the swash zonegiven that the storm berm is about 10 m landward of the coastlineat Barbarossa. The results of the underwater detection process wereconsistent as well; 11 pebbles were retrieved on the step crest, aswere just as many as on the step base. Whereas a similar amount oftracers released on the berm and on the swash zone were found (20and 21 respectively), more of the pebbles initially placed on thestep crest were lost. Only 12 pebbles released on the step crestwere detected. Of the 29 pebbles found back on the storm berm, sixcame from the step crest; this number is not negligible consideringthe distance between the step and the storm berm at Barbarossa(about 15 m, and more than 3 m in height). Additionally, 16 out ofthe 22 pebbles (72.7%) that were detected underwater were initially
Fig. 10. Detail of the beach face of Barbarossa. The swash action often clears away thecoarse sediments, leaving the underlying sand visible on the surface.
Fig. 11. The plot does not show any trends between the weight of the pebbles (sorted by increasing weight) and the length of their displacement.
232 D. Bertoni et al. / Marine Geology 291-294 (2012) 227–235

Author's personal copy
released on the subaerial portion of the beach, indicating that a signif-icant amount of tracers moved seaward.
The analysis of the resulting tracer pathways highlights the ten-dency of the coarse sediments to move from both sides of the beachtowards the central portion. In fact, the pebbles released in the north-ern sector displayed distinct southward movement with very few ex-ceptions (Fig. 8). In contrast, the southern part of the beach showedexactly the opposite trend, with the pebbles largely moving north-wards. However, two distinct convergence areas were detected; thetracers initially placed in the central sector of the beach exhibited aslight tendency to move towards both sides of the beach, highlightingthe occurrence of twofold convergence at Barbarossa. Virtually everypebble detected moved along the shore, in some cases traveling a re-markable distance (the average displacement is over 30 m). Cross-shore transport was weak, and the pebbles that experienced thiskind of movement traveled just short distances (hardly over 8 m).
However, the pebbles showed no clear prevailing tendency to moveto any direction; 28 pebbles presented northward displacement and25 southward displacement. The movement of the pebbles releasedon the step crest did not display any trend at all (50% moved south-ward and 50% northward), whereas the tracers placed on the swashzone and on the berm showed a slight trend toward southward andnorthward movement. The topographic survey indicated that thesea bottom fronting Barbarossa was never less than two metersdeep, although two definite shoals reduced the depth by up to 1 m(Fig. 9). These shoals were located very close to the coastline, just op-posite the two convergence areas underlined by the movement of thepebbles. At the time of the recovery campaign, the backshore wascharacterized by a major storm berm 3 m high, formed during thelate April 2009 storm, and by a lower-order storm berm formed dur-ing the waning of that storm. Extensive cusp presence was notreported.
5. Discussion
The recovery campaign indicates the importance of the underwa-ter detection of pebbles for the purpose of sediment tracing; about42% of the marked pebbles were found back on the step. The 52% re-covery rate was not as high as that reported in previous studies(about 75%; Allan et al., 2006; Curtiss et al., 2009; Bertoni et al.,2010), but it is not negligible considering the configuration of Barbarossabeach, which is subjected to severe reworking even during mildstorms (Bertoni, 2010). The intense reworking of the beach systemgenerated huge pebble displacement rates and higher chances thatthe tracers would be buried. Because Barbarossa behaves as a closedsedimentary system, at least with regard to its coarse sediments(pebble loss either over the groins or offshore was never reported),the major factors affecting whether the tracers could be locatedwere wave energy and the sediment burial rate. The high wave ener-gy level at Barbarossa is further highlighted by the limited recoveryrate for pebbles on the swash zone and the fair-weather berm. Theswash basically sweeps the swash zone both during the strongeststorms and at other times, moving the pebbles either landward orseaward. At times, the swash zone is devoid of gravel and pebbles,often showing the underlying sand (Fig. 10). In addition, the preva-lent landward movement of marked pebbles, which resulted in thefrequent recovery of the tracers on top of the storm berm, impliesthe high intensity of incident wavemotion at Barbarossa. No peculiartransport tendencies were revealed with regard to the release loca-tions; thus, whatever the initial position, the chances of retrievinga given pebble were not biased by any factors. However, the signifi-cant loss of pebbles originally released on the step crest is relatedto the seaward displacement of coarse sediments, which causedhigher burial rates on that portion of the beach. This transport pat-tern is more remarkable when reflection-related processes increaseonce the beach profile attains a reflective configuration (Bertoni,2010). Another factor that does not exert any control over the trans-port trends is the weight of the pebbles because light (less than 1 kg)and heavy (more than 1 kg) pebbles do not display particular dis-placement tendencies (Fig. 11). Table 2 makes clear that there areno relations between both weight and size of the pebbles and theirdisplacement. This implies that the pebbles are moved regardlessof their weight and size: most of the displacement must have oc-curred under high-energy conditions well above the threshold ofmovement of the heavier pebbles, supporting the notion that mostof the transport is generated during storms. The different length ofdisplacement between pebbles of similar weight and size is likelyto be associated to rapid burial episodes (Fig. 11).
To understand the resulting tendency toward longshore move-ment among the marked pebbles, we must remember that the seabottom at Barbarossa affects the incoming waves so much that thewave crest is refracted and approaches the coast head-on. Thus, the
Table 2Length of displacement (m), weight (g) and grain size (mm) of the pebbles that weredetected at Barbarossa beach during the recovery campaign. The grain size is expressedin form of the length of the major, medium and minor axes (a, b and c) of the pebbles.
# Pebble Displ. Weight a axis b axis c axis
3 56.0 915.6 12.5 10.1 6.811 1.1 1530.8 16.6 11.9 7.713 69.5 992.3 11.4 9.2 4.717 76.8 650.9 11.3 8.4 7.035 25.2 681.2 11.4 9.1 7.440 21.7 1338.5 15.5 10.2 5.741 58.4 1000.6 10.8 9.2 5.747 7.5 643.2 10.3 9.7 7.150 12.4 716 12.6 7.8 7.351 42.7 670.7 10.5 9 5.952 29.5 789.4 10.0 9.0 4.753 13.9 743.1 9.2 6.4 5.856 42.9 766.5 13.4 11.9 662 61.4 1482.4 16.2 12 8.467 82.4 987.4 15.0 7.0 5.173 53.5 1394.7 17.1 11.5 7.282 29.7 991.4 11.7 9.0 5.693 79.9 990 14.4 8.8 4.394 2.1 1300.6 15.7 12 7.3103 54.0 1088.6 12.6 9.6 5.9105 18.1 772.6 10.5 8.1 4.6106 23.3 660.2 8.4 8.0 6.6108 8.7 941.3 12.6 11.8 5.1110 4.2 1693 14.7 14 8.8115 59.9 931.3 11.2 9.3 5.3124 77.3 881.9 11.3 8.6 5.3126 40.5 1152.7 14.7 10.5 6.9127 23.8 1094.8 13.6 9.2 4.8136 25.7 997.9 13.8 10.4 7.1138 48.4 1132.8 10.9 8.6 6.4141 14.4 1080.7 12.3 11.6 7.2142 7.1 1010 12.6 7.6 7.2144 29.9 750 13.9 8.9 6.8146 27.6 1881.6 16.0 11.5 6.2150 22.1 1341.9 13.6 10.2 5.2151 14.7 1213.2 17.1 12.2 6.7155 41.8 792.3 11.8 9.1 4.5161 27.3 1343.6 13.8 8.3 5.6165 21.5 1347.1 14.2 10.3 9.9170 12.9 811.4 13.1 10.2 6.6171 23.4 1018 15.7 8.1 4.5174 18.4 1599.5 13.7 10.9 6.5176 27.2 1230.3 17.1 9.7 6.9177 24.6 1113.1 14.6 10.7 7.5178 27.0 1135.2 14.3 10.1 7.1180 9.5 933.5 11.7 9.3 7.1182 8.2 954.6 12.1 6.9 5.5184 24.6 1299.2 12.5 9.2 5.6188 29.4 1205.3 13.9 8.8 6.7190 36.0 874.8 11.3 8.4 7.2194 67.4 687.3 12.3 7.9 6200 60.2 1447.1 13.9 11.5 6.4
233D. Bertoni et al. / Marine Geology 291-294 (2012) 227–235

Author's personal copy
slightly different direction of the three storms that occurred duringthe experiment did not create a particular transport pattern. The typ-ical littoral drift, which is directed to the south throughout this sectorof the Pisa coast, cannot create any major movement because its in-tensity is not capable of entraining coarse sediments like those usedas tracers. In addition, the huge groins that bound the beach hinderthe course of the drift, yet again reducing its effect on the nearshore,which is why the resulting transport vectors are not consistent withthose reported by Cammelli et al. (2004) in a previous study carriedout on this beach. The authors pointed out south-trending sedimentdisplacement that eventually led to the realignment of the shoreline,resulting in differential backshore width from the north (narrower)to the south (wider). At the time, the beach was longer (330 m) be-cause the present northern groin was not yet built. The increasedprox-imity of the present groins, which are even larger than before – and,consequently, the more limited extension of the beach – has preventedthe littoral drift from moving the coarse sediments extensively.
Assuming that incidentwave angle and littoral drift did not generatea transport trend along the beach, another controlling factor that mustbe considered if we are to understand the origins of the resulting path-ways is the morphology of the sea bottom. The topographic survey ofthe sea bottom at Barbarossa, which was carried out a few days priorto the third storm (late April 2009), shows two distinct shoals in thecentral sector of the beach so close to the coastline that they are almostconnected to the shore (Fig. 9). The presence of these shoals on the seafloor about 20 m off the coast modifies incident wave propagation andtriggers processes similar to wave convergence. Wave crest velocity isreduced only where the wave encounters shallower water, whereason both sides, wave crests still propagate in deeper water and, conse-quently, at a faster rate (Masselink and Hughes, 2003). This process re-sults in the activation of convergent nearshore fluxes (possibly attainedwhen the uprush approaches the beach face at a small angle and thebackwash moves back to a nearly normal position at the shoreline),which in turn cause the pebbles to move towards the central sector ofthe beach. Therefore, as the northernmost and southernmost pebblesare displaced towards the center of the beach, the tracers initially re-leased on the central sector exhibit an opposing trend, displaying a
slight tendency to move towards both sides of the beach. This processleads to the individuation of two convergence areas located oppositethe shoals on the backshore, both of which present high rates of recov-ered pebbles. Considering that the storm that occurred in late April of2009 was the strongest one during the time frame for the experimentand that no other high-energy event has hit the Pisa coast since, the re-covery positions of the pebbles reflect the fluxes established during thislast storm. To confirm the presence of these two shoals, an additionalunderwater surveywas carried out. A scuba diver patrolled the sea bot-tom fronting Barbarossa up to a depth of 3 m, pointing out the existenceof both sea floor irregularities. The northern shoal (Fig. 12a)was consti-tuted by the remnants of a previous protection structure (a groin madeof large boulders) that was dismantled during the operational stage ofthe 2001 beach-fill intervention. The shoal was connected to thebeach face by a narrow neck made of sand and coarser sediments;sand accumulated on the seaward side of the shoal, creating a distinctrise in the sea floor. Conversely, the southern shoal (Fig. 12b) wasmuch smaller than the northern shoal. It was composed of a mixtureof gravel and pebbles, and therewas no indication that it was generatedby beach-fill intervention-related activities.
6. Conclusions
Radio frequency identification technology proved yet again to bean efficient and inexpensive means of tracing coarse sediments. Inparticular, this research confirmed the reliability of the RFID techniqueeven in underwater environments, due to the use of low-frequencyradio signals. Just under 50% of the recovered pebbles were foundback underwater, and this result highlights the importance of under-water tracer detection as a means of defining the transport pathwaysof a beach as a whole. The results obtained by tracking one hundredpebbles on a coarse-grained artificial beach show that the primaryfactor controlling their displacement was the modification of inci-dent waves induced by irregularities in the morphology of the seabottom, which in this case are two separate shoals a few meters offthe coastline. Depending on the direction of approach of the swashafter the incident waves were affected by the sea floor's irregular
Fig. 12. Pictures of the shoals that were pointed out on the sea bottom fronting Barbarossa beach: a) the massive boulders constituting the northern shoal; b) the northern shoal,which is connected to the beachface by a narrow neck made of coarse sediments; c) the southern shoal, mainly composed of gravel and pebbles; and d) the southern shoal, which isdefinitely smaller than the northern one.
234 D. Bertoni et al. / Marine Geology 291-294 (2012) 227–235

Author's personal copy
morphology, different transport patterns would have been triggeredon the beach face that would eventually drive the evolution of thebeach in terms of sediment movement. Longshore transport provedmore continuous and widespread than cross-shore movement, indi-cating that the longshore component generally prevails on thisbeach. In any event, high cross-shore transport rates are attainedwhen reflection-related processes begin to push the pebbles towardsthe step, which in turn creates the increased chance of burial that inthis case led to the reported high losses of marked pebbles initiallyreleased on the step. All of these indications may help improve ourunderstanding of coarse-grained beach morphodynamics and to op-timize artificial beach fill, in terms of both efficiency and durability.
Acknowledgments
The Provincia di Pisa supported this research through technicaland logistical support: we thank Drs. Andrea Carli, Luca Sardi andNicola Casarosa, and Alessio Pannocchia. We cannot forget to mentionDrs. Alessandro Cannata and Federico Creatini, along with manyfriends who helped us during the recovery campaign. We are alsothankful to scuba divers Dr. Domenico Veneziano and FrancescoGambacciani, who were instrumental in the underwater recovery ofthe pebbles. Comments by Prof. Vincenzo Pascucci and an anonymousreviewer led to improvements of the final manuscript. Thanks arealso due to Prof. Paolo Ciavola for his helpful remarks. The TuscanyHydrological Service provided us with wind and wave measurements.
References
Aiello, E., Bartolini, C., Caputo, C., D'Alessandro, L., Fanucci, F., Fierro, G., Gnaccolini, M.,La Monica, G.B., Lupia Palmieri, E., Piccazzo, M., Pranzini, E., 1975. Il trasporto litor-aneo lungo la costa toscana tra la foce del fiume Magra ed i Monti dell'Uccellina.Bollettino della Societa Geologica Italiana 94, 1519–1571.
Allan, J.C., Komar, P.D., 2004. Environmentally compatible cobble berm and artificialdune for shore protection. Shore Beach 72 (1), 9–18.
Allan, J.C., Hart, R., Tranquilli, J.V., 2006. The use of Passive Integrated Transponder(PIT) tags to trace cobble transport in a mixed sand-and-gravel beach on thehigh-energy Oregon coast, USA. Marine Geology 232, 63–86.
Aminti, P., Cipriani, L.E., Pranzini, E., 2000. Back to the beach: converting seawalls intogravel beaches. Proceedings of the First International Soft Shore Protection Confer-ence, Patras, Greek, pp. 187–196.
Austin, M.J., Buscombe, D., 2008. Morphological change and sediment dynamics of thebeach step on a macrotidal gravel beach. Marine Geology 249, 167–183.
Austin, M.J., Masselink, G., 2006a. Observations of morphological change and sedimenttransport on a steep gravel beach. Marine Geology 229, 59–77.
Austin, M.J., Masselink, G., 2006b. Swash–groundwater interaction on a steep gravelbeach. Continental Shelf Research 26, 2503–2519.
Bertoni, D., 2010. The morphodynamics of three artificial pebble beaches at Marina diPisa (Italy): coarse sediment transport and beach profile evolution. Ph.D. Thesis,Department of Earth Sciences, University of Pisa, Italy.
Bertoni, D., Sarti, G., Benelli, G., Pozzebon, A., Raguseo, G., 2010. Radio Frequency Iden-tification (RFID) technology applied to the definition of underwater and subaerialcoarse sediment movement. Sedimentary Geology 228, 140–150.
Buscombe, D., Masselink, G., 2006. Concepts in gravel beach dynamics. Earth-ScienceReviews 79, 33–52.
Cammelli, C., Jackson, N.L., Nordstrom, K.F., Pranzini, E., 2004. Assessment of a gravelnourishment project fronting a seawall at Marina di Pisa, Italy. Journal of CoastalResearch SI 39, 770–775.
Cipriani, L.E., Ferri, S., Iannotta, P., Paolieri, F., Pranzini, E., 2001. Morfologia e dinamicadei sedimenti del litorale della Toscana settentrionale. Studi Costieri 4, 119–156.
Curtiss, G.M., Osborne, P.D., Horner-Devine, A.R., 2009. Seasonal patterns of coarse sed-iment transport on a mixed sand and gravel beach due to vessel wakes, windwaves, and tidal currents. Marine Geology 259, 73–85.
Horn, D., Li, L., 2006. Measurement and modelling of gravel beach groundwater re-sponse to wave run-up: effects on beach profile changes. Journal of Coastal Re-search 22 (5), 1241–1249.
Ivamy, M.C., Kench, P.S., 2006. Hydrodynamics and morphological adjustment of amixed sand and gravel beach, Torere, Bay of Plenty, New Zealand. Marine Geology228, 137–152.
Jennings, R., Shulmeister, J., 2002. A field based classification scheme for gravel bea-ches. Marine Geology 186, 211–228.
Lee, M.W.E., Sear, D.A., Atkinson, P.M., Collins, M.B., Oakey, R.J., 2007. Number of tracersrequired for the measurement of longshore transport distance on a shingle beach.Marine Geology 240, 57–63.
Mason, T., Coates, T.T., 2001. Sediment transport processes on mixed beaches: a reviewfor shoreline management. Journal of Coastal Research 17, 645–657.
Masselink, G., Hughes, M.G., 2003. Introduction to Coastal Processes & Geomorphology.Arnold, London.
Nichols, M.H., 2004. A radio frequency identification system for monitoring coarse sed-iment particle displacement. Applied Engineering in Agriculture 20 (6), 783–787.
Osborne, P.D., 2005. Transport of gravel and cobble on a mixed-sediment inner bankshoreline of a large inlet, Grays Harbor, Washington. Marine Geology 224,145–156.
Pascucci, V., Martini, I.P., Endres, A.L., 2009. Facies and ground-penetrating radar char-acteristics of coarse-grained beach deposits of the uppermost Pleistocene glacialLake Algonquin, Ontario, Canada. Sedimentology 56, 529–545.
Pedrozo-Acuña, A., Simmonds, D.J., Otta, A.K., Chadwick, A.J., 2006. On the cross-shoreprofile change of gravel beaches. Coastal Engineering 53, 335–347.
Pedrozo-Acuña, A., Simmonds, D.J., Chadwick, A.J., Silva, R., 2007. A numerical-empirical approach for evaluating morphodynamic processes on gravel andmixed sand–gravel beaches. Marine Geology 241, 1–18.
Pedrozo-Acuña, A., Simmonds, D.J., Reeve, D.E., 2008. Wave impact characteristics ofplunging breakers acting on gravel beaches. Marine Geology 253, 26–35.
Pedrozo-Acuña, A., Torres-Freyermuth, A., Zou, Q., Hsu, T.-J., Reeve, D.E., 2010. Diagnos-tic investigation of impulsive pressures induced by plunging breakers impingingon gravel beaches. Coastal Engineering 57, 252–266.
Pranzini, E., 2001. Updrift river mouth migration on cuspate deltas: two examples fromthe coast of Tuscany (Italy). Geomorphology 38, 125–132.
Pranzini, E., 2004. Caratteristiche morfologiche e sedimentologiche di una zona di con-vergenza del trasporto litoraneo (Versilia, Toscana). Studi Costieri 8, 135–149.
Sarti, G., Bini, M., Giacomelli, S., 2010. The growth and the decline of Pisa (Tuscany,Italy) up to the Middle Ages: correlations with landscape and geology. Il Quater-nario 23, 311–322.
Van Wellen, E., Chadwick, A.J., Mason, T., 2000. A review and assessment of longshoresediment transport equations for coarse-grained beaches. Coastal Engineering 40,243–275.
Voropayev, S.I., Roney, J., Boyer, D.L., Fernando, H.J.S., Houston, W.N., 1998. The motionof large bottom particles (cobbles) in a wave-induced oscillatory flow. Coastal En-gineering 34, 197–219.
235D. Bertoni et al. / Marine Geology 291-294 (2012) 227–235