Poverty reduction and growth interactions: what can be learned from the Syrian experience
Upload
khangminh22Category
view
3download
0
Transport Development and Poverty
Reduction in Northeast Brazil
Rodolfo Gomes Benevenuto
Dissertation submitted to the Department of Civil, Structural & Environmental
Engineering at Trinity College Dublin for the partial fulfilment of the requirements for
the Degree of:
Doctor of Philosophy
May, 2020
Declaration I declare that this thesis has not been submitted as an exercise for a degree at
this or any other university and it is entirely my own work.
I agree to deposit this thesis in the University’s open access institutional
repository or allow the library to do so on my behalf, subject to Irish Copyright
Legislation and Trinity College Library conditions of use and acknowledgement.
________________________
Rodolfo Gomes Benevenuto

i
"Like slavery and apartheid, poverty is not natural. It is man-made and it can be
overcome and eradicated by the actions of human beings. Overcoming poverty
is not a gesture of charity. It is an act of justice.”
Nelson Mandela

ii
Summary
The recent shift in focus from the income-based to the multidimensional
understanding of poverty has revealed that the global goal of ending poverty
requires more than isolated and remedial actions. Integrated efforts from scholars
and practitioners across the range of human knowledge are rather necessary to
meet the agenda of ‘leaving no one behind’ and uplift over 700 million people out
of extreme poverty. This thesis examines the key contributions that transportation
development can promote to alleviate several dimensions of exclusion and the
structures underpinning the intergenerational poverty transfer. The particular
challenges and research gaps on this theme in the context of Northeast Brazil
are addressed throughout this research. While the transport-poverty nexus has
long been explored in the academic literature of wealthier and more urbanised
regions, this thesis sets out theoretical frameworks and practical tools that are
applicable to regions where poverty is widely and severely spread. The research
developed in this thesis delves into the transportation and poverty literature from
three distinct perspectives: theoretical (i.e. links between transport and poverty in
the Global South), ex-post (i.e. social outcomes of transport experiences) and ex-
ante (socially inclusive transport planning).
A transport policy analysis framework showing the various dimensions of
transport-related exclusion present in the Global South is initially proposed with
reference to the literature. To illustrate the links between transport and poverty,
the accessibility to healthcare and urban centres of nearly half-million low-income
families from rural Northeast Brazil is statistically and spatially evaluated. This
first set of findings show that 53.5% of them are living farther than 5 km from the
nearest primary care centre and over 49% are at a distance greater than 10km
from the closest urban centre, where majority of the essential services are
located. Meanwhile, from the ex-post perspective, a quasi-experimental analysis
is developed particularly tailored to the Northeast Brazil, drawing on open access
data only. Whilst the results suggest a wide range of positive social effects that
are associated with recent transport infrastructure investments in Northeast
Brazil, they also point out to negative outcomes of these interventions upon the

iii
average income of people living in extreme poverty. This fact emphasises the
necessity for ex-ante assessments of the social dimension and the distributional
impacts of transport interventions.
Finally, extensive work was subsequently conducted to develop a spatial
accessibility poverty index that could be fed into a comprehensive screening
framework of transport needs. This final ex-ante approach draws upon the
theoretical framework initially proposed to shed light on how inclusive
transportation can be objectively planned to tackle the poverty cycles more
effectively. The results point out to priority lines of actions derived from a
hierarchisation of the transport-related exclusion dimensions that can help guide
targeted transport initiatives at the local and regional level. Findings call attention
to several sub-regions in Northeast Brazil that are affected by multiple hotspots
of transport-related exclusion and, thus, should be prioritised by future transport
interventions. In summary, the exploratory nature of this thesis raises evidence
that can be a valuable input to highlight the essential role that transport
academics and practitioners ought to play in order to stand up to poverty when
developing new transport policies.

iv
Acknowledgements
The first person who believed that this project was worthy to be pursued was Prof
Brian Caulfield. His mentorship, encouragement, and support throughout all the
research challenges over the past three years have made this academic
endeavour an enjoyable and productive experience. To him, I express my
profound admiration, respect, and gratitude.
This project could not have been completed without the support of inspiring
people from Fundação Estudar who have not only funded me but also
encouraged me to dream big and strive for socially-inclusive progress in Brazil.
In the same way, I am grateful for the Trinity College Dublin for awarding me the
Postgraduate Research Studentship and for making this project a real
transformative student experience.
I would like to also thank my research fellows from the Centre for Transport
Research Páraic Carroll, Shreya Dey, and Mohammadamin Rezaei for their
lifesaver pieces of advice and support in the day-to-day challenges. Special
thanks to my two tireless interns, Fernando Fernandez and André Mançaneira
who were of crucial help during the busiest time of this PhD. Also, deep gratitude
to my amazing colleagues from the Civil Engineering department Alex, Hoa, Unni,
Charu, Himanshu, Saps, John, Matthew, Sheila, Saheba, and Radison who have
made my days brighter with their friendship and have helped me in the numerous
demonstrations undertaken during these years.
My gratitude goes also the researchers and practitioners who have directly
contributed to this project. Thank you to Prof. Niamh Harty for her thoughtful
feedback on my transfer report and final thesis, as well as for the GIS classes
and so many TA opportunities extended to me. Thank you to Prof. Steven Jones
for so many valuable suggestions given to me on his careful review of my thesis
and for being such a kind and thoughtful examiner during the viva. Thank you to
Robson Brandão, José Farias, Lautemyr Canel, Joyce Silva and Renato Arruda
from SUDENE for all their instrumental contributions especially during my time in
Recife. Thank you to Thiago Guimarães for the most productive visit in Dublin
v
and all the transport equity works for the NECTAR workshop. Thank you to Dra.
Guiga and Paulinho for your support since my application process and then later
in Chapter 3 (even being in the middle a fantastic backpacking trip around the
globe).
My sincere gratitude also to our loved hosts who have generously received my
wife and I in our yearly Brazilian expeditions, Nati Maeda, Daniel Almeida, Érico
e Ingrid Melo, Mateus e Mira Menes, Sandra and Sofia Loiola, Tio Silvio e Tia
Rose. Thanks also to the brothers and sisters from the Brazilian community in
Dublin, Bruno, Dani, Higor, Lou, Cadu, Fafá, Gustavo, Catarina, Lucy, Gui, Zuka,
Fernando, Naiara, Leandro, Bruna, Telminha, Renatinho, Marquinhos, and so
many others who have wholeheartedly supported me emotionally and spiritually.
At last, I would like to thank some people whom I owe more than I can ever repay.
My parents Bárbara and Aparecido Benevenuto, for teaching me everything
valuable I know and for supporting me with absolute and unconditional love in
every decision I made since I gave up my job in Brazil to start this PhD. My sister
Carol, for being my academic role model since my day one in school, and for
always giving me reasons to smile with Paulo and baby Rafa Moreira. My wife
Sarah Benevenuto, for being the best companion I could ever wonder to have in
the ups and downs of this journey, for being my counsellor and supporter after
every fall, for keeping me sane during long days and nights of work, for being
always by my side. To all of you, my deepest gratitude and eternal love.

vi
Table of Contents 1. CHAPTER 1: INTRODUCTION ............................................................................. 1
1.1. Background and rationale .............................................................................. 1
1.2. The case study choice: Northeast Brazil ......................................................... 3
1.2.1. Socioeconomic context ........................................................................... 3
1.2.2. Transportation context ............................................................................. 8
1.3. Research objectives ..................................................................................... 12
1.4. Thesis layout ................................................................................................ 14
1.5. Research design .......................................................................................... 18
2. CHAPTER 2: LITERATURE REVIEW ................................................................. 20
2.1. Introduction .................................................................................................. 20
2.2. Methodology ................................................................................................ 22
2.3. A conceptual framework for poverty and transport ....................................... 24
2.4. Empirical insights ......................................................................................... 35
2.4.1. Intersectionality and travel behaviour .................................................... 35
2.4.2. Prioritisation by accessibility analysis .................................................... 37
2.4.3. Private agendas of policymakers ........................................................... 38
2.4.4. Transport and intergenerational poverty transfer ................................... 40
2.5. Gaps in the literature and research agenda .................................................. 42
2.6. Policy Implications ........................................................................................ 44
2.6.1. Transport policy analysis framework ..................................................... 44
2.6.2. The Sustainable Development Goals .................................................... 44
2.7. Conclusions ................................................................................................. 46
3. CHAPTER 3: ACCESSIBILITY EVALUATION AT THE HOUSEHOLD LEVEL .... 48
3.1. Introduction .................................................................................................. 48
3.2. Public health challenges in Rural Northeast Brazil ....................................... 50
3.3. Data and Methods ........................................................................................ 55
3.3.1. Households in Extreme Poverty ............................................................ 56
3.3.2. Public services and Basic amenities ...................................................... 60
3.3.3. Accessibility estimate ............................................................................ 63
3.4. Results and Discussion ................................................................................ 65
3.4.1. Cisterns as a proxy for low-income households..................................... 65
3.4.2. Access to urban amenities .................................................................... 66
3.4.3. Access to healthcare ............................................................................. 70
4. CHAPTER 4: SOCIOECONOMIC OUTCOMES OF TRANSPORT
INTERVENTIONS ...................................................................................................... 77
4.1. Introduction .................................................................................................. 77
4.2. Context of the case study ............................................................................. 81
vii
4.3. Data and Methods .........................................................................................83
4.3.1. Data collation .........................................................................................83
4.3.2. Difference in Difference Matching technique ..........................................88
4.3.3. Propensity Score Matching ....................................................................91
4.4. Ex-post evaluation Results ............................................................................94
4.4.1. Propensity Score Matching ....................................................................94
4.4.2. Sensitivity analysis of the propensity scores ...........................................96
4.4.3. Social outcomes .....................................................................................99
4.5. Policy implications ....................................................................................... 106
4.6. Conclusion .................................................................................................. 107
5. CHAPTER 5: ACCESSIBILITY EVALUATION AT THE MUNICIPALITY LEVEL 109
5.1. Introduction ................................................................................................. 109
5.2. Data and Methods ....................................................................................... 111
5.2.1. Mapping opportunities .......................................................................... 111
5.2.2. The spatial accessibility poverty indices ............................................... 113
5.2.3. Municipalities profile analysis ............................................................... 125
5.3. Results and Discussion ............................................................................... 127
5.3.1. Sensitivity analysis of the travel impedance models ............................. 127
5.3.2. Factor analysis ..................................................................................... 135
5.4. Conclusion .................................................................................................. 142
6. CHAPTER 6: A SCREENING FRAMEWORK OF TRANSPORT NEEDS ........... 145
6.1. Introduction ................................................................................................. 145
6.2. Social impacts of transport interventions ..................................................... 147
6.3. Methodology ............................................................................................... 150
6.3.1. Selection and normalisation of proxies ................................................. 150
6.3.2. Weighting the transport-related exclusion dimensions .......................... 154
6.3.3. Prioritisation scores calculation ............................................................ 158
6.3.4. Cluster analysis and evaluation of priority regions ................................ 159
6.4. Results and Discussion ............................................................................... 160
6.4.1. Weighting factors ................................................................................. 160
6.4.2. Incremental spatial autocorrelation ....................................................... 165
6.4.3. Local spatial cluster analysis ................................................................ 168
6.5. Conclusion .................................................................................................. 172
7. CHAPTER 7: DISCUSSION ............................................................................... 174
7.1. Key findings and implications ...................................................................... 174
7.2. Policy recommendations ............................................................................. 182
7.2.1. Federal level ........................................................................................ 183
7.2.2. State level ............................................................................................ 185
7.2.3. Municipality level .................................................................................. 186
8. CHAPTER 8: CONCLUSIONS ........................................................................... 188

viii
8.1. Thesis summary ......................................................................................... 188
8.2. Main contributions ...................................................................................... 191
8.3. Critical assessment .................................................................................... 192
8.4. Future research .......................................................................................... 193
PUBLICATIONS ....................................................................................................... 195
REFERENCES ......................................................................................................... 196
APPENDIX A: Performance indicators for MCDAs ................................................... 238
List of Figures
Figure 1.1: Wealth inequality measured by GINI coefficient. Adapted from WB (2019c) 4
Figure 1.2: Human Development Index across municipalities in Brazil ......................... 5
Figure 1.3: Federal transportation network in SUDENE area (Extended Northeast), Brazil
..................................................................................................................................... 9
Figure 1.4: Four guiding principles of the SUMPs. Adapted from Ministério das Cidades
(2007) ......................................................................................................................... 10
Figure 1.5: Urban transport policy milestones in Brazil ............................................... 10
Figure 1.6: Transport modes used by low-income population in Northeast Brazil
(retrieved from Googlestreet view® in 2019) .............................................................. 12
Figure 1.7: Overall research design ............................................................................ 19
Figure 2.1 : Frequency distribution of the transport-related exclusions dimensions
addressed in the reviewed papers .............................................................................. 33
Figure 2.2: Spatial distribution of publications addressing Transport and Poverty in the
Global South .............................................................................................................. 34
Figure 2.3: Diagram to illustrate the potential contributions of transport development to
the structures, processes, and livelihood strategies that can affect inter-generational
poverty transfer .......................................................................................................... 41
Figure 3.1: Vital statistics in Brazilian states. i) Life Expectancy [years] in the colour scale
and ii) Under 5 mortality [per 1000 live births] in the symbol scale .............................. 51
Figure 3.2: Life expectancy [years] of states in Northeast Brazil comparing urban and
rural rates ................................................................................................................... 53
Figure 3.3: Under 5 mortality [per 1000 live births] of states in Northeast Brazil states
comparing urban and rural rates ................................................................................. 53
Figure 3.4: Life expectancy [in years] stratified by quintiles of average income and
clustered by share of the rural population ................................................................... 54
Figure 3.5: Under 5 mortality [per 1000 livebirths] stratified by quintiles of average income
and clustered by share of the rural population ............................................................ 55
Figure 3.6: Typical cistern and low-income household in Rural Northeast Brazil ........ 56
Figure 3.7: Beneficiary from Programme 1 Million of Cisterns (ASA, 2018) ................ 57

ix
Figure 3.8: Spatial distribution of cisterns in extended Northeast Brazil (SUDENE Area)
....................................................................................................................................58
Figure 3.9: Sample of accuracy checking of cisterns location (screenshot taken from
ArcMap 10.6.1) ............................................................................................................60
Figure 3.10: Low-income households under the urban influence area - Municipalities of
Brejo de Madre de Deus and Poção (Source: ArcGIS online) .....................................64
Figure 3.11: Descriptive statistics of the cistern plotting accuracy ...............................66
Figure 3.12: Frequency distribution of households by geodesic distance to Local Centre
....................................................................................................................................67
Figure 3.13: Frequency distribution of households by geodesic distance to Zone Centre
....................................................................................................................................67
Figure 3.14: Frequency distribution of households by geodesic distance to Sub-regional
centre ..........................................................................................................................68
Figure 3.15: Frequency distribution of households by geodesic distance to Regional
centre ..........................................................................................................................68
Figure 3.16: Frequency distribution of households by geodesic distance to Metropolis
....................................................................................................................................69
Figure 3.17: Frequency distribution of households by geodesic distance to Primary care
unit ..............................................................................................................................71
Figure 3.18: Frequency distribution of households by geodesic distance to Hospitals or
Emergency care unit ...................................................................................................71
Figure 3.19: Distribution of distances by remoteness from health services thresholds .72
Figure 3.20: Concentration of low-income households (proxied by cisterns) located
farther than 10 km from any healthcare centre ............................................................74
Figure 4.1: Road BR-232 - The original motorway on the left with just two lanes, and the
widened stretch with four lanes on the right (Source: Googlemaps Streetview) ...........80
Figure 4.2: Location of motorway BR-232 in Pernambuco state ..................................80
Figure 4.3: Transport infrastructure priority in Pernambuco state according to National
Logistic Plan (EPL, 2018) ............................................................................................82
Figure 4.4: Catchment area of the motorway BR-232 with poverty rates (%) before the
completion of the project (year 2000). .........................................................................88
Figure 4.5: Schematic summary of methodological alternatives ..................................89
Figure 4.6: Methodology summary using DIDM technique ...........................................94
Figure 4.7: Frequency distribution of Propensity Scores by group ...............................95
Figure 4.8: Sensitivity analysis of the propensity scores across municipalities. A) Original
PS B) PS calculated without the Healthcare centres variable C) PS calculated without
the Schools variable D) PS calculated without the RAI variable E) PS calculated without
the GDP variable F) PS calculated without the Share of Urban population variable....98
Figure 4.9: Variables with opposing conclusions depending on the method of analysis
.................................................................................................................................. 104
Figure 5.1: Urban centres in extended Northeast Brazil (SUDENE area) .................. 112
Figure 5.2: Calculation of Local Accessibility using Kernel Density method ............... 119

x
Figure 5.3: Calculation of Local Accessibility using Friction Surface method ............ 122
Figure 5.4: Spatial Accessibility Poverty by three different thresholds of Urban Influence
................................................................................................................................. 129
Figure 5.5: Spatial comparison of SAP indices by travel impedance model, with the
colour scales classified by quintiles. ......................................................................... 131
Figure 5.6: Spatial comparison of SAP indices by travel impedance model, with the
colour scales classified by equal intervals ................................................................ 132
Figure 5.7: Graphical comparison of SAP index by different travel impedance models
with coincident quintiles highlighted .......................................................................... 133
Figure 5.8: Income poverty rates by SAP quintile ..................................................... 139
Figure 5.9: Basic Housing facilities by SAP quintile .................................................. 139
Figure 6.1: Overall methodology of the screening framework of transport needs ...... 150
Figure 6.2: Steps of AHP method applied to calculate the TRE dimensions’ weights 154
Figure 6.3: Distribution of weights estimated by AHP to each transport-related exclusion
dimension ................................................................................................................. 162
Figure 6.4: Distribution of weights derived from AHP by each indicator .................... 164
Figure 6.5: Incremental global spatial autocorrelation analysis (Moran’s I) of the
prioritisation scores of the transport-related exclusion proxies .................................. 167
Figure 6.6: Local spatial cluster (Getis-Ord Gi*) analysis of the prioritisation scores of the
eight transport-related exclusion dimensions ............................................................ 170
Figure 6.7: Priority areas at 99% of confidence based on the transport-related exclusion
screening framework applied to Northeast Brazil ...................................................... 171
List of Tables
Table 1.1: Population with restricted access to basic services and jobs. Adapted from
IBGE (2018a) ............................................................................................................... 6
Table 1.2: Poverty lines commonly applied in Brazil and respective figures from 2017.
Adapted from IBGE (2018b) ......................................................................................... 8
Table 2.1 : Summary of the reviewed papers ............................................................. 29
Table 3.1: Description of elements analysed in the Geospatial object-based-image
analysis ...................................................................................................................... 59
Table 3.2: Urban centre hierarchy .............................................................................. 62
Table 3.3: Healthcare centres classification in Brazil .................................................. 63
Table 4.1: National and regional figures of the socioeconomic indicators included in the
model ......................................................................................................................... 86
Table 4.2: Propensity score strata descriptions .......................................................... 96
Table 4.3: Standard deviation of the variables considered in the PS estimate ............ 97
Table 4.4: Comparison of estimated outcomes by DID and DIDM ............................ 102
Table 4.5: Outcome variable means ......................................................................... 103
xi
Table 5.1: Catchment areas by each urban centrality level. ....................................... 117
Table 5.2: Statistical difference among quintiles - Kruskal Wallis test ........................ 138
Table 5.3: Factor analysis of the municipalities by SAP quintiles ............................... 140
Table 6.1: Summary of transport impacts on poverty ................................................. 149
Table 6.2: Judgment rules applied to each pair of transport-related exclusion dimensions
.................................................................................................................................. 155
Table 6.3: Matrix showing a sample of the computed weights - Ipupiara, Bahia state 156
Table 6.4: Matrix showing a sample of the computed weights – Bom Jesus das Selvas,
Piaui state ................................................................................................................. 157
List of Equations
Equation 3.1 ................................................................................................................59
Equation 4.1 ................................................................................................................90
Equation 4.2 ................................................................................................................90
Equation 4.3 ................................................................................................................93
Equation 4.4 ................................................................................................................93
Equation 5.1 .............................................................................................................. 114
Equation 5.2 .............................................................................................................. 116
Equation 5.3 .............................................................................................................. 116
Equation 5.4 .............................................................................................................. 124
Equation 6.1 .............................................................................................................. 158
Equation 6.2 .............................................................................................................. 158
Abbreviations
2SFCA 2 Step Floating Catchment Area
AHP Analytical Hierarchy Process
BRT Bus Rapid Transit
CBA Cost Benefit Analysis
DID Difference-In-Difference
DIDM Difference-In-Difference Matching
FCA Floating Catchment Area
xii
GDP Gross Domestic Product
GIS Geographic Information System
GTFS General Transit Feed Information
HDI Human Development Index
IBGE Brazilian Institute of Geography and Statistics (Instituto
Brasileiro de Geografia e Estatística)
INDE National Infrastructure of Spatial Data (Infraestrutura
Nacional de Dados Espaciais)
ISA Incremental Spatial Autocorrelation
KD Kernel Density
MAUP Modifiable Area Unit Problem
MDCA Multi-Dimensional Criteria Analysis
MDG Millennium Development Goal
NASF Family health support nucleus (Núcleo de Apoio a Saúde
da Família)
P1MC Programme of 1 Million Cisterns (Programa 1 Milhão de
Cisternas)
PCI Per Capita Income
POI Point of Interest
PS Propensity Score
PSM Propensity Score Matching
SAP Spatial Accessibility Poverty
SDG Sustainable Development Goal

xiii
SUDENE Superintendency for the Development of the Northeast
(Superintendência de Desenvolvimento do Nordeste)
SUMP Sustainable Urban Mobility Plan
SUS Brazilian Public Health (Sistema Único de Saúde)
TRE Transport-related exclusion
UNDP United Nations Development Programme
UPA Emergency Care Unit (Unidade de Pronto Atendimento)
UBS Primary Healthcare Centre (Unidade Básica de Saúde)


CHAPTER 1: INTRODUCTION
1
1. CHAPTER 1: INTRODUCTION
1.1. Background and rationale
One of the boldest goals ever set by the United Nations is to eradicate extreme
poverty everywhere in all its forms by 2030 (UN, 2019a). In fact, huge strides
have been achieved over the past 30 years, especially looking at the reduction
of global poverty, decreasing from 43 percent in 1990 to 21 percent in 20101
(Inchauste et al, 2014). Yet, the pace of this decline is decelerating, and recent
data has shown that if this trend continues, poverty will not end by 2030 (UN,
2019b). From a practical standpoint, the absolute number of people still
struggling in these conditions remains over a staggering figure of 736 million in
20192 (UN, 2019a), which is approximately the total population in Europe. This
fact does not only show how far we are, as a global community, from achieving
this goal, but also how many more researchers and practitioners from across the
range of human knowledge are still needed to deepen efforts towards this
direction.
In the realm of transportation research, studies devoted to evaluating the links
between poverty and transport have long been published in the literature. Despite
being often overlooked in mainstream transport planning (Vasconcellos, 2003;
World Bank, 2006; Geurs et al, 2009; Jones and Lucas, 2012b; Van Wee and
Geurs, 2011), the potential contributions of the transportation sector to poverty
reduction have been investigated in several countries since the late 1960s (Ornati
1 Considering the lower-bound poverty line in 1990 of 1 USD a day (at 1993 purchasing parity
power) and then updated to 1.25 USD in 2010, at 2005 prices (Economist, 2013).
2 This figure considers the extreme poverty line as 1.9 USD a day (at 2011 purchasing parity
power).
CHAPTER 1: INTRODUCTION
2
et al, 1969; Wachs and Kumagai, 1973; Hanson and Hanson, 1980; Armstrong-
Wrigh, 1986; Booth et al, 2000; Setboonsarng et al, 2006; Porter et al, 2014;
Benevenuto and Caulfield, 2019).
In recent years, the conceptualisation and measurement of transport
disadvantages have garnered the attention particularly from academics and
decision-makers of the Global North, for being considered as a key driver of
social exclusion and inequality (Cass, 2005; Lucas, 2012; ITF, 2017a). This
phenomenon has been illustrated by a number of studies pointing out that
accessibility constraints tend to deepen socio-spatial inequalities leading to
multidimensional deprivations and, eventually, poverty traps (Lucas et al., 2016a,
Porter, 2007; Cervero et al., 2002). In this sense, accessibility, as the ultimate
goal of most transportation (Litman et al., 2003), has been also proposed to be
understood and planned as a fundamental human capability3 since it plays a
central role in enabling people to meet their needs and promote a healthy human
flourishing (Pereira et al., 2017).
Nevertheless, despite some parallels that can be drawn, the theoretical
frameworks, planning tools, and policy recommendations derived from
economically developed countries where research is mostly developed to, as a
rule, cannot fully address the challenges and particularities of the Global South4
(Rynning et al, 2018; Lucas et al., 2016a). For instance, while the academic
dialogue on accessibility constraints in highly deprived rural areas of the global
North has increasingly focused on issues such as forced car ownership (Walks,
2018; Currie and Senbergs, 2007; Banister, 1994), symmetrical conditions in the
developing countries require solutions to people who are forced to live in a
walking world (Porter, 2002; Benevenuto and Caulfield, 2019).
There are also substantial disparities in terms of data between these two
contexts. The replicability of ground-breaking research tailored to wealthier
3 According to Nussbaum (2011) human capabilities are “sets of freedoms and opportunities
available for individuals to choose and to act, resulting from […] a combination of personal abilities
and the political, social and economic environment”.
4 Since the 1970’s the term ‘Global South’ has been ever more used to refer to low- and middle-
income countries located in Asia, Africa, Latin America and the Caribbean (UN, 2004).
CHAPTER 1: INTRODUCTION
3
countries usually depends on timely and disaggregated data relating social
exclusion and transport, which often times is not available in less urbanised and
low-income contexts (Dimitriou, 2013). This research conundrum, added to other
factors that are further explored in the following chapters, have continuously
evolved in a debilitating transfer of knowledge to public policies and a
perpetuation of the paternalistic and arbitrary fashion that prioritisation of
investments and policies are done in the transportation realm (Di Ciommo, 2016).
Beyond the necessity of identifying these transport-poverty interactions and
understanding the social outcomes of transport policy malfunctions which
happened in the past, ultimately the most critical question to be answered is how
to enhance the planning of future transportation. While the economic and
environmental aspects of transport appraisals have been widely recognised and
well researched, there have been relatively few attempts to include poverty and
other social dimensions into these frameworks (Geurs et al, 2009).
In this sense, this thesis focuses on addressing the potential contributions of
transport development to poverty reduction from the following three different
perspectives: theoretical, ex-post, and ex-ante. This research dedicates
particularly more attention to the Northeast Brazil region, where this topic has
been consistently neglected in both academic and public policy realms. Hence,
a further rationale for this case study choice and its current socioeconomic and
transport contexts are provided in the following Section.
1.2. The case study choice: Northeast Brazil
1.2.1. Socioeconomic context
Brazil is classified as an upper middle-income country (World Bank, 2019a), with
the eighth largest economy in the world (World bank, 2019b). Yet, this bulky
Gross Domestic Product (GDP) is distributed in a sharply uneven fashion across
regions and income groups. Figure 1.1 presents a comparison of income

CHAPTER 1: INTRODUCTION
4
inequality measured by the GINI5 coefficient, highlighting Brazil as one of the
most unequal countries among its peers from BRICS6 and Latin America.
Figure 1.1: Wealth inequality measured by GINI coefficient. Adapted from WB (2019c)
The same pattern of wealth concentration is also found when comparing regions
within Brazil. For instance, while the GDP per capita in the Southeast region was
equivalent to €9,991.55 in 2016, the Northeast region presented a figure 60%
smaller (IBGE, 2016). Likewise, these spatial inequalities can be portrayed by
the Human Development Index7 (HDI) across municipalities. As shown in Figure
1.2, higher levels of HDI’s are as a rule concentrated in the Southern regions.
5 The Gini coefficient is an indicator that measures income or wealth inequality, being zero for
perfect equality, and 1 (or 100%) for maximal inequality. 6 BRICS is the acronym for Brazil, Russia, India, China and South Africa - the five major emerging
national economies. 7 The Human Development Index (HDI) is widely used to measure wellbeing, in which higher
values of the HDI indicator represent higher levels of life expectancy, education, and per capita
income.

CHAPTER 1: INTRODUCTION
5
Figure 1.2: Human Development Index across municipalities in Brazil
The Northeast region is one of the five macro-regions in Brazil, which is
composed of nine member states and has total population of 56.8 million people
(IBGE, 2019a), which is equivalent to the population of countries like South Africa
or Italy. In total area it is comparable to countries such as Mongolia or Iran, and
it has an HDI comparable to countries like Guatemala or Namibia (UNDP, 2019;
UNDP, 2016). As shown in Table 1.1, this is the Brazilian region that as a rule
presents the most worrying figures of access restriction to basic services
(education8, sanitation9) and job10 opportunities.
8 Access restriction to education is measured by the relative number of people aged between 6-
14 who were not attending school, plus population aged 15 or older who were illiterate, plus
population aged 16 or over who have not completed elementary school (deducting double
counting) (IBGE, 2018a) 9 Access restriction to sanitation is measured by the percentage of people residing in households
that did not have access to three sanitation services simultaneously (i.e. garbage collection, water
supply, and sewage system) (IBGE, 2018a). 10 Access restriction to jobs is measured by the unemployment rate among population aged 14
years and older (IBGE, 2018a).

CHAPTER 1: INTRODUCTION
6
Table 1.1: Population with restricted access to basic services and jobs. Adapted from
IBGE (2018a)
Region Jobs Education Sanitation
Northeast 15.3% 34.7% 58.8%
North 13.1% 28.4% 82.3%
Centre-west 10.8% 26.9% 49.3%
Southeast 13.2% 24.1% 13.0%
South 8.1% 28.5% 35.9%
Brazil 12.7% 28.2% 37.6%
Since the extent of this underdevelopment pattern also covers the north part of
the region immediately below (Southeast), the Brazilian Federal Government has
also incorporated these municipalities within the scope of the Superintendency
for the Development of the Northeast (SUDENE). Consequently, Chapter 5 and
6 also reflect the same extended Northeast area, which is composed of a total of
1,990 municipalities from 11 different states.
In the early 1970’s the Northeast Brazil was considered the least developed
region of the entire western hemisphere (Galeano, 1972) and in recent years it
was still considered to have the largest pocket of rural poverty in Latin America
(Coirolo and Lammert, 2008). In fact, according to the latest Brazilian Census
(UNDP et al, 2010), this region accounts alone for more than half (63%) of the
population living in extreme poverty in Brazil. Considering that the total population
in extreme poverty in Brazil is approximately 12.6 million people, this means that
7.9 million of them are in the Northeast region.
Nonetheless, the amount of people living in these circumstances may vary
depending on which definition of poverty is being considered. In fact, several
bodies of scholarships have been dedicated to conceptualising poverty over the
past years (Sen, 1982; Ravallion, 1988; Spicker, 1999; Alkire and Foster, 2008;
Santos, 2009). Whilst the World Bank definition for extreme poverty11 is
internationally more accepted, other definitions have been also disseminated
within subnational public policy and academic dialogues.
11 Per capita income of less than 1.9 USD a day (at 2011 purchasing parity power).
CHAPTER 1: INTRODUCTION
7
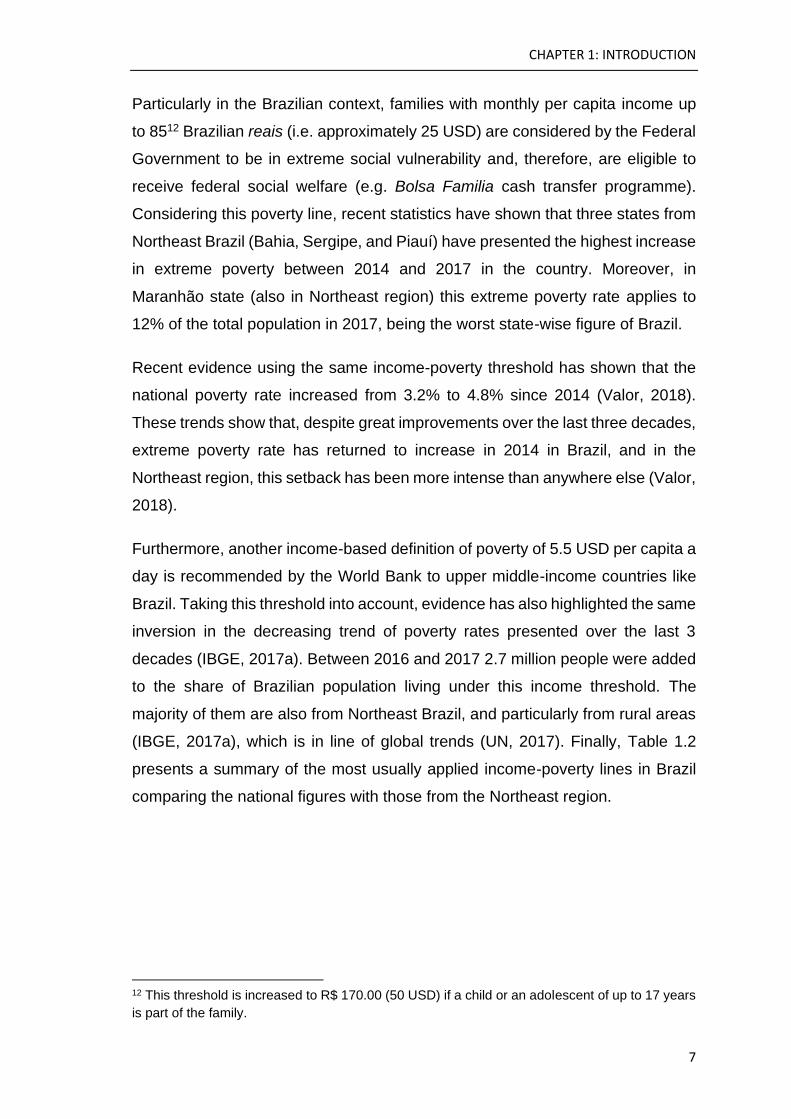
Particularly in the Brazilian context, families with monthly per capita income up
to 8512 Brazilian reais (i.e. approximately 25 USD) are considered by the Federal
Government to be in extreme social vulnerability and, therefore, are eligible to
receive federal social welfare (e.g. Bolsa Familia cash transfer programme).
Considering this poverty line, recent statistics have shown that three states from
Northeast Brazil (Bahia, Sergipe, and Piauí) have presented the highest increase
in extreme poverty between 2014 and 2017 in the country. Moreover, in
Maranhão state (also in Northeast region) this extreme poverty rate applies to
12% of the total population in 2017, being the worst state-wise figure of Brazil.
Recent evidence using the same income-poverty threshold has shown that the
national poverty rate increased from 3.2% to 4.8% since 2014 (Valor, 2018).
These trends show that, despite great improvements over the last three decades,
extreme poverty rate has returned to increase in 2014 in Brazil, and in the
Northeast region, this setback has been more intense than anywhere else (Valor,
2018).
Furthermore, another income-based definition of poverty of 5.5 USD per capita a
day is recommended by the World Bank to upper middle-income countries like
Brazil. Taking this threshold into account, evidence has also highlighted the same
inversion in the decreasing trend of poverty rates presented over the last 3
decades (IBGE, 2017a). Between 2016 and 2017 2.7 million people were added
to the share of Brazilian population living under this income threshold. The
majority of them are also from Northeast Brazil, and particularly from rural areas
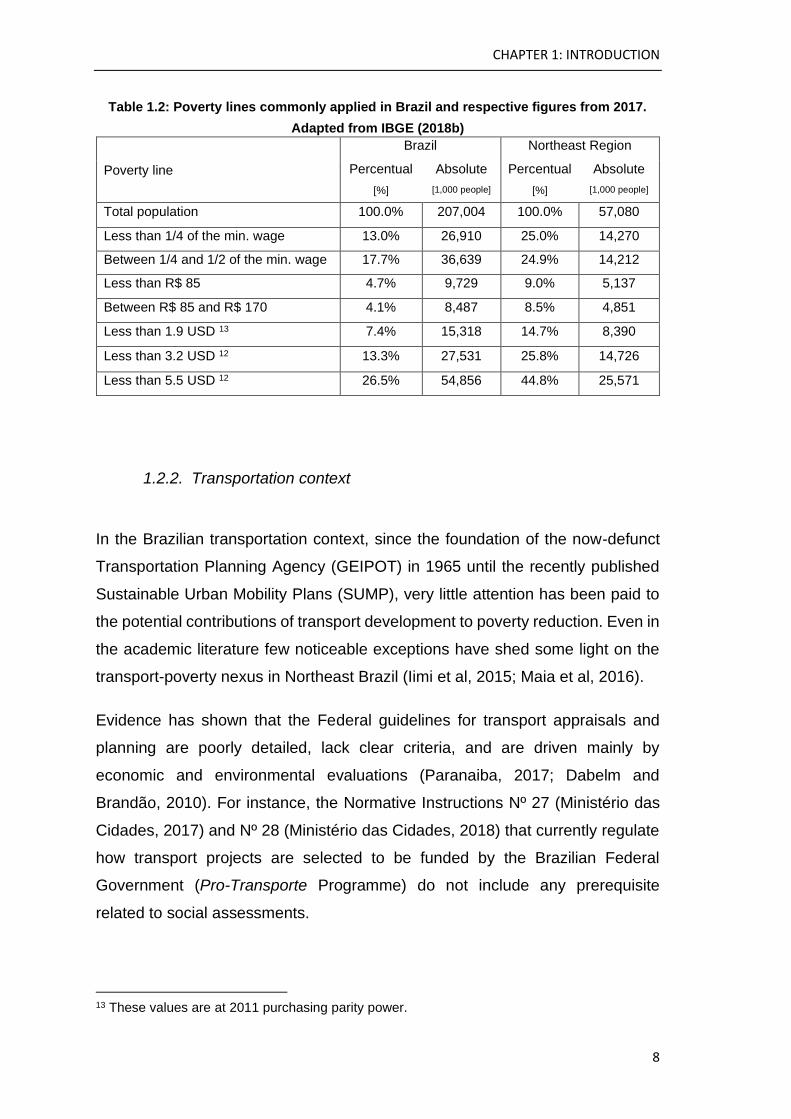
(IBGE, 2017a), which is in line of global trends (UN, 2017). Finally, Table 1.2
presents a summary of the most usually applied income-poverty lines in Brazil
comparing the national figures with those from the Northeast region.
12 This threshold is increased to R$ 170.00 (50 USD) if a child or an adolescent of up to 17 years
is part of the family.
CHAPTER 1: INTRODUCTION
8
Table 1.2: Poverty lines commonly applied in Brazil and respective figures from 2017.
Adapted from IBGE (2018b)
Poverty line
Brazil Northeast Region
Percentual
[%]
Absolute
[1,000 people]
Percentual
[%]
Absolute
[1,000 people]
Total population 100.0% 207,004 100.0% 57,080
Less than 1/4 of the min. wage 13.0% 26,910 25.0% 14,270
Between 1/4 and 1/2 of the min. wage 17.7% 36,639 24.9% 14,212
Less than R$ 85 4.7% 9,729 9.0% 5,137
Between R$ 85 and R$ 170 4.1% 8,487 8.5% 4,851
Less than 1.9 USD 13 7.4% 15,318 14.7% 8,390
Less than 3.2 USD 12 13.3% 27,531 25.8% 14,726
Less than 5.5 USD 12 26.5% 54,856 44.8% 25,571
1.2.2. Transportation context
In the Brazilian transportation context, since the foundation of the now-defunct
Transportation Planning Agency (GEIPOT) in 1965 until the recently published
Sustainable Urban Mobility Plans (SUMP), very little attention has been paid to
the potential contributions of transport development to poverty reduction. Even in
the academic literature few noticeable exceptions have shed some light on the
transport-poverty nexus in Northeast Brazil (Iimi et al, 2015; Maia et al, 2016).
Evidence has shown that the Federal guidelines for transport appraisals and
planning are poorly detailed, lack clear criteria, and are driven mainly by
economic and environmental evaluations (Paranaiba, 2017; Dabelm and
Brandão, 2010). For instance, the Normative Instructions Nº 27 (Ministério das
Cidades, 2017) and Nº 28 (Ministério das Cidades, 2018) that currently regulate
how transport projects are selected to be funded by the Brazilian Federal
Government (Pro-Transporte Programme) do not include any prerequisite
related to social assessments.
13 These values are at 2011 purchasing parity power.

CHAPTER 1: INTRODUCTION
9
In terms of the transportation infrastructure, the Northeast network is composed
of approximately 416.7 thousand kilometres of roads (of which only 16.8% is
paved), 7.3 thousand kilometres of railways and 0.5 thousand kilometres of
waterways (excluding the shore) (MTPA, 2018). Only 10% of the road network is
managed by the Federal Government (motorways depicted in Figure 1.3), leaving
the rest to the states’ and municipalities’ administration. Perhaps due to this high
level of governance decentralisation and a large number of unpaved roads,
several concerning gaps still remain in the spatial datasets14 that map this road
network, especially in rural areas. The spatial distribution of this transportation
network is presented in Figure 1.3.
Figure 1.3: Federal transportation network in SUDENE area (Extended Northeast), Brazil
In terms of urban mobility, an emerging policy dialogue around this issue started
in 2001, when the City Statute established that municipalities of over 500
thousand inhabitants were then obliged to deliver a Director Plan, addressing
transport and mobility plans for the urban areas. However, only after 2007 the
14 Either in Governmental datasets or in open platforms such as HERE maps®, Google maps®, and
OpenStreetMap®.

CHAPTER 1: INTRODUCTION
10
first Federal guidelines were released, stablishing four principles to guide the
elaboration of SUMPs, one of them being “Social Inclusion”, as further illustrated
in Figure 1.4.
Figure 1.4: Four guiding principles of the SUMPs. Adapted from Ministério das Cidades
(2007)
Another important transport policy milestone in Brazil was the sanctioning of the
federal law Nº 12.587 in 2012, also known as the Urban Mobility law (Brasil,
2012). Among other regulations, this legislation has defined that municipalities of
over 20,000 inhabitants became obliged to deliver a SUMP in order to receive
Federal funding for urban mobility projects. Three years later a second SUMP
guidelines book was released in 2015 and a new deadline was defined for the
submission of the municipalities SUMPs (Ministerio das Cidades, 2015). The
summary of these urban transport policy milestones is presented in Figure 1.5.
Figure 1.5: Urban transport policy milestones in Brazil
According to the foregoing legislation, 1,762 municipalities (31.6% of the total)
are required to prepare their SUMP in Brazil since their population are greater

CHAPTER 1: INTRODUCTION
11
than 20,000 inhabitants. However recent data provided by the Ministry of
Regional Development (former Ministry of Cities) to this study have shown that
only 181 municipalities have delivered their SUMPs. Moreover, 75% of those
municipalities which are obliged and have not delivered it yet have declared that
their SUMPs are not even being prepared. On top of that, a report from IBGE
(2017) has shown that 1,418 municipalities (25.5%) have declared that there is
no competent body currently in charge of local transport policies.
Unsurprisingly, 33.6 million people in Brazil live in municipalities where there is
no public transport by bus (IBGE, 2017b). Even being a region predominantly
based on road transport, the Northeast region accounts alone for over half of this
population (18 million). IBGE (2017b) points out that there is no bus (as a mode
of public transport) in 60.9% of the municipalities in Northeast Brazil. This number
is nearly twice higher than the Southeast region’s statistics, where only 31.4% of
the municipalities do not provide bus services as a public transport mode.
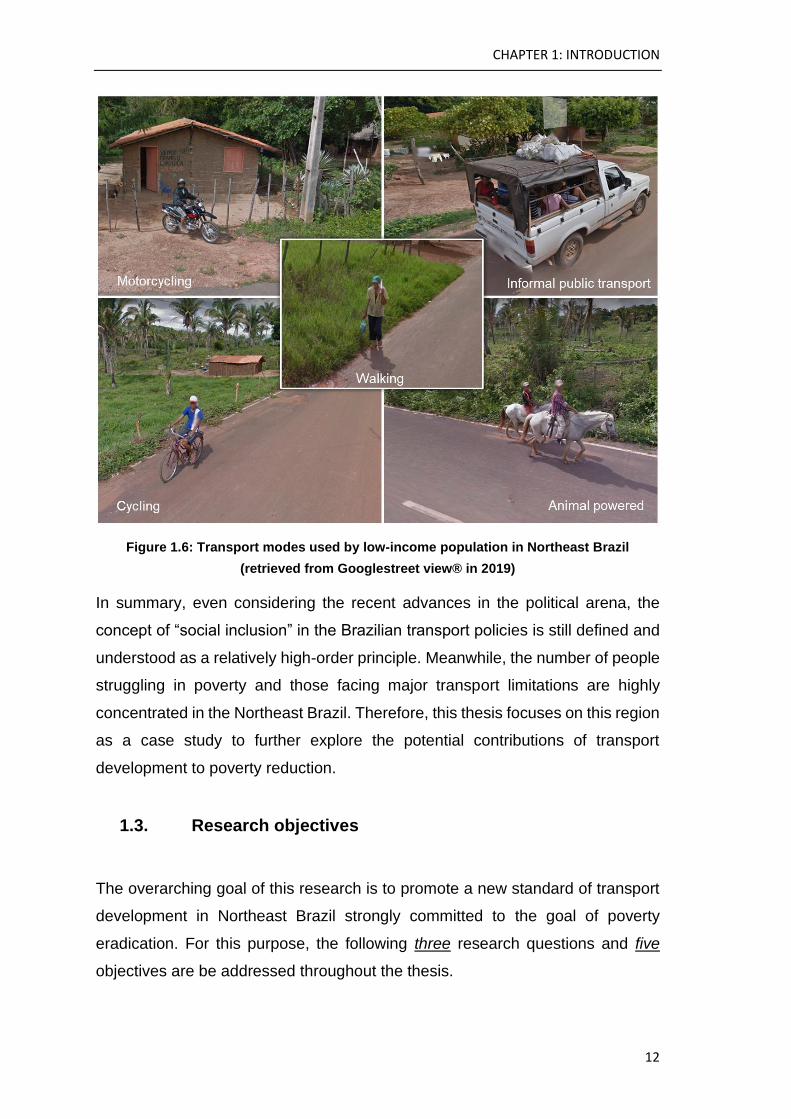
To fill this gap of formal public transport, other modes such as vans, taxis, and
moto-taxis assume a central role in the local transportation. For instance, IBGE
(2017b) reveals that moto-taxi is a public transport mode present in nearly 70%
of the secondary cities in Brazil (i.e. between 20 and 100 thousand inhabitants).
Based on a case study in Campina Grande (Paraiba state), Junior and Filho
(2002) concludes that 48% of the moto-taxi users live with less or equal than the
minimum national wage (i.e. around U$ 368.00 per month, in 2010 purchasing
power parity according to the conversion rate provided by OECD (2018)).
Likewise, informal vans and adapted trucks are also other highly disseminated
modes of public transport available in smaller municipalities of Northeast Brazil.
Their operation usually starts from a fixed terminal and the route is defined based
on the passengers’ demand. Based on a mixed methods study in Recife
(Pernambuco state), Oliveira and Andrade (2016) concludes that there has been
a substantial growth in informal transportation in low-income areas especially due
to poor quality or lack of public transport. Figure 1.6 illustrates some of the most
popular modes of transport utilised by the low-income population in small
municipalities of Northeast Brazil.
CHAPTER 1: INTRODUCTION
12
Figure 1.6: Transport modes used by low-income population in Northeast Brazil
(retrieved from Googlestreet view® in 2019)
In summary, even considering the recent advances in the political arena, the
concept of “social inclusion” in the Brazilian transport policies is still defined and
understood as a relatively high-order principle. Meanwhile, the number of people
struggling in poverty and those facing major transport limitations are highly
concentrated in the Northeast Brazil. Therefore, this thesis focuses on this region
as a case study to further explore the potential contributions of transport
development to poverty reduction.
1.3. Research objectives
The overarching goal of this research is to promote a new standard of transport
development in Northeast Brazil strongly committed to the goal of poverty
eradication. For this purpose, the following three research questions and five
objectives are be addressed throughout the thesis.

CHAPTER 1: INTRODUCTION
13
i) How is transport development linked to poverty reduction in the Global South
context?
Objective 1: The first research objective is to develop a theoretical framework
adapted to the Global South context that can help guide transport policies to
tackle more effectively the poverty trap. The core idea is to explore by which
channels transport development can be instrumental in breaking cycles of
intergenerational poverty transfer.
Objective 2: The second objective that also addresses this research question
is to evaluate, by means of spatial accessibility indicators, how critical is the
current situation of people living in extreme poverty in Northeast Brazil, in
terms of access to basic services.
ii) How can we measure the social outcomes of transport interventions?
Objective 3: The third objective of this research is to develop a framework that
uses only publicly available data for ex-post assessments of how people living
in different levels of poverty have been affected by transport interventions in
the Northeast Brazil context.
iii) How can transport be planned to tackle poverty?
Objective 4: The fourth objective of this thesis is to develop an accessibility
indicator capable of measuring at the municipality level for the whole
Northeast Brazil region the transport-related exclusion caused by the lack of
access to basic services and opportunities (e.g. health, education, shopping,
etc).
Objective 5: Finally, the fifth objective of this research is to apply the proposed
theoretical concept (objective 1) and the spatial accessibility indicator
(objective 4) into a screening framework to assess the transport issues in
Northeast Brazil that are more likely to be reinforcing poverty traps both at the
municipality and regional level.

CHAPTER 1: INTRODUCTION
14
1.4. Thesis layout
This thesis is structured to deliver the chapters in the same sequence of the three
research questions earlier stated. Chapters 2 and 3 are focused on exploring the
question of how transport development is linked to poverty reduction. Chapter 4
is presented as a standalone section dedicated to address the question of how
the social outcomes of transport investments can be measure. Finally, building
on the debate set out by the first chapters, Chapter 5 and 6 provide an answer to
the third research question on how transport can be planned to tackle poverty.
To conclude, the last two chapters (7 and 8) finish the thesis with a broader
discussion about the findings, policy recommendations, and a conclusion. Thus,
this thesis is organised into eight chapters, the first being this introduction, and
the remaining ones outlined as follows.
Chapter 2
Chapter 2 addresses the first objective of this research and it is done by means
of a comprehensive literature review on the topic of transport and poverty focused
on the Global South. This review included the state-of-the-art publications not
only in academic journals but also produced by multilateral organisations (e.g.
World Bank, United Nations, Organisation for Economic Co-operation and
Development, etc). Drawing on the seminal framework proposed by Church et al
(2000), this Chapter puts forward the transport-poverty nexus adapting this
framework to the Global South context and setting out a theoretical foundation
for the thesis. Relevant findings and methodologies are assessed and
categorised by this updated theoretical framework. The main research gaps
found in the literature are also summarised, pointing out to limitations in terms of
data (spatial-, socioeconomic-, and transport-related data), and methods to
measure the transport needs of people living in extreme poverty and to assess
(ex-post) the social outcomes of transport interventions. The convergence of the
studies, as well as the insights and gaps of research are also presented at the
end of this Chapter, shedding light on the essential role of transport policy in
reducing poverty.

CHAPTER 1: INTRODUCTION
15
Chapter 3
To address the data limitation found in the literature, an innovative dataset is
proposed to proxy a representative sample of low-income households in the case
study region and assess their spatial accessibility to basic services (e.g.
healthcare, education, etc) at a household level. This analysis uses the dataset
containing the location of water tanks (i.e. cisterns) provided by the Brazilian
Federal Government to low-income families in Northeast Brazil. Nearly half a
million rural low-income households from this region are spatially tracked by
means of this novel and highly accurate proxy. Combining the location of these
households with other spatial datasets, this Chapter applies Geographic
Information System (GIS) techniques to assess how the low levels of spatial
access to basic services and opportunities (e.g. healthcare, education, jobs, etc)
can offer an insurmountable barrier for people living in extreme poverty. This step
of the research is essential to show how indirect datasets can be harnessed to
provide accessibility evaluations in data-poor regions. Moreover, it demonstrates
how low-income families are virtually prevented from accessing basic public
services and better life-chances due to this spatial hurdle. Taken together with
the previous Chapter, these two steps of the research provide both a theoretical
and a practical answer to the question of how transport development is linked to
poverty reduction.
Chapter 4
To tackle the methodological challenges in ex-post assessments of transport
projects’ impacts on poverty, identified in the literature review, a quasi-
experimental study using publicly available data is then proposed in Chapter 4.
This Chapter aims to answer the second research question by providing a
standalone method for measuring the social outcomes of transport interventions
particularly tailored to cope with the data challenges in the Global South context.
In this sense, Chapter 4 builds on the difference-in-difference matching technique
and open access data to evaluate the ex-post social impacts of a large transport
project performed in Northeast Brazil, namely, the project to widen the BR-232
motorway. This quasi-experimental study sets out debate as to what extent large
transport infrastructure interventions like this have also resulted in socio-
CHAPTER 1: INTRODUCTION
16
economic progress for the least advantaged population living nearby. This part
of the research is essential to evaluate the hypothesis of whether the population
in extreme poverty benefit from large transport infrastructure investments. The
findings highlight the importance of considering the interactions between
transport and poverty at an early stage of the transport planning process in order
to develop a fair transport system capable of not only providing regional
economic growth but also of breaking cycles of poverty.
Chapter 5
In response to the last research question and aiming at the fourth objective of
this thesis, Chapter 5 presents an index for measuring spatial accessibility
poverty at a municipality level tailored to rural Northeast Brazil, but potentially
replicable globally. Despite providing an unprecedented statistical evaluation of
the accessibility patterns of low-income people in Rural Northeast Brazil, the
measurements developed in Chapter 3 are still limited to the municipalities which
presented the proxy. Thus, this Chapter extends the accessibility measurement
performed in Chapter 3 to a broader context, unlocking accessibility audits for all
municipalities within the case study region. The core of its methodology relies on
a gravity-based model composed of floating catchment area techniques coupled
with two travel impedance models (Kernel Density and Friction Surface). The
index conjugates one factor of intensity (i.e. how spatially excluded is the
population from the basic services?) and one factor of extent (i.e. how many
people are being affected by this spatial accessibility poverty?). Beyond being
highlighted in choropleth maps, the areas mostly affected by this spatial
accessibility poverty are also assessed in terms of socio-economic indicators.
Once again, this method harnesses a fairly basic amount of spatial data into a
simple and well-grounded index that can be used in local and regional transport
planning. This step of the research is particularly valuable for identifying the
subregions that should be prioritised when tackling transport-related exclusion
from facilities in the region. From a methodological standpoint, even though
specifically tailored to the Northeast Brazil region, the SAP index puts forward
the state-of-the-art transportation planning since it presents a solid method for

CHAPTER 1: INTRODUCTION
17
estimating spatial accessibility using data that is as a rule publicly available
globally.
Chapter 6
Drawing on the theoretical framework proposed in Chapter 2 and the spatial
accessibility poverty index designed in Chapter 5, this Chapter develops a
socially-driven tool to screen the transport needs that are most likely to be
reinforcing cycles of poverty in Northeast Brazil. This framework uses the Analytic
Hierarchy Process (AHP) to explore the relative importance of each transport-
related exclusion dimension within all municipalities in Northeast Brazil.
Moreover, the spatial patterns of each dimension are identified by means of
cluster analysis of the municipalities to highlight subregions that are affected by
similar issues, as well as priority areas that are affected by multiple transport-
exclusion dimensions simultaneously. Despite focusing on the Northeast Brazil
region, the screening framework that is proposed can be also replicated in other
regions worldwide since it requires only fairly basic level of data that is typically
collected by Census surveys globally. As a complement to the previous step, this
socially-driven screening framework and the resulting evidence base provide an
objective answer to the third research question. As the final contribution of this
research, the evidence that is raised in this Chapter can potentially replace the
arbitrary, paternalistic or even utilitarian transport planning standards that are
currently leading to the perpetuation of the intergenerational poverty transfer.
Chapter 7
Chapter 7 presents a macro discussion in order to clearly answer the three
research questions presented earlier. This discussion connects the debates set
out by the previous chapters and proposing policy recommendations derived
from the thesis’ findings targeting each level of governance in Brazil (municipality,
state and federal level).
CHAPTER 1: INTRODUCTION
18
Chapter 8
To conclude, a summary of the main contributions articulated throughout the
thesis, the limitations of this research, as well as an outlook for future research
are presented in this last Chapter. This Chapter clarifies how the five objectives
of this research were achieved throughout the thesis and concludes by calling
attention to the crucial role that transport academics and practitioners ought to
play in order to stand up to poverty.
1.5. Research design
This Section describes how the present research project is designed, explaining
graphically the line of reasoning adopted throughout the thesis to address the
research questions and the specific objectives set out in Section 1.3. Ultimately,
the function of this research design is to ensure that the obtained evidence fully
answer the research questions.
As the three research questions approach the poverty-transport nexus from three
different perspectives, a few different methods are appropriately selected to
answer each question. Therefore, a separate methodology chapter is not
included in this thesis. Rather, for the sake of clarity, the research methods that
were mentioned earlier in Section 1.4, as well as their advantages and limitations,
are discussed in further detail in the Chapters 2, 3, 4, 5 and 6.
On the whole, the design that is proposed narrows down from a comprehensive
literature review on the theme to a specific screening tool of transport needs that
builds on the insights, evidence and theoretical frameworks generated
throughout this research. Figure 1.7 presents a flow chart diagram that illustrates
the train of thought developed in this thesis, pointing out the steps of research,
the interconnections of chapters and the guiding questions covering each step.

CHAPTER 1: INTRODUCTION
19
Figure 1.7: Overall research design

CHAPTER 2: LITERATURE REVIEW
20
2. CHAPTER 2: LITERATURE REVIEW
2.1. Introduction
The most widely used index to measure poverty is based only on individual
income. According to the World Bank (2017), this index is defined by an
international poverty line, which considers a person who lives with less than 1.90
USD a day in 2015 purchasing parity power (PPP15) as extremely poor. Based
on this poverty indicator, the primary objective of the United Nations Development
Programme (UNDP) is to lift 736 million people out of extreme poverty by 2030
(UN, 2019a). However, evidence has shown that poverty is neither related nor
perceived as just lack of income (Narayan et al., 2000; Alkire and Santos, 2014;
UN, 1995).
One of the largest and most comprehensive surveys about poverty published to
date, to the best of the authors’ knowledge, is “The Voices of the Poor” (Narayan
et al., 2000), which summarises 40,000 experiences of poor people from 50
different countries around the world. The findings of this report assert that poverty
is perceived as consisting of many interlocking dimensions, in which lack of
access to basic infrastructure, rural roads, transportation are frequently pointed
out as remarkable factors (Narayan et al., 2000). In that sense, new models, such
as the one proposed by Alkire-Foster (2011), have suggested a non-monetary
approach to measure poverty. These models consist of multidimensional analysis
at a household level composed of a variety of indicators mostly related to health,
education, employment, living standards, and empowerment (Alkire-Foster,
15 PPPs are the rates of currency conversion that try to equalise the purchasing power of different
currencies (available at: https://data.oecd.org/conversion/purchasing-power-parities-ppp.htm)

CHAPTER 2: LITERATURE REVIEW
21
2011). When considering the multidimensional concept, it is estimated that some
1.3 billion people are still living in poverty globally (UN, 2019a).
Indeed, not all cases of low scores on these indicators are necessarily due to lack
of mobility or transport disadvantage. Hence, it is essential in the realm of
transport planning and policy to identify, track and map where exactly poverty is
mainly linked to transport issues in order to provide more effective strategies that
may accelerate the extreme poverty eradication process. This transport-related
exclusion is also often referred to as ‘transport poverty’ (Lucas, 2012; Lucas et
al., 2016a), which is caused by direct and indirect interactions of transport
disadvantage and social disadvantage.
The studies dedicated to evaluating the connections between poverty and
mobility were initially developed during the late 1960s (Ornati et al., 1969). In the
following decades, this theme was also researched by several other authors from
different institutions (Wachs and Kumagai, 1973; Hanson and Hanson, 1980;
Armstrong-Wrigh, 1986; Gannon and Liu, 1997; Hammer et al., 2000; De Luca,
2007; Titheridge et al., 2014).
Nevertheless, the extent of studies on this subject is not comprehensive enough
in geographical terms and has not included most of the regions where poverty is
widely spread (Porter, 2014), especially in rural areas (IFAD, 2011). Additionally,
many of the existing methodologies applied to wealthier and more urbanised
countries are not applicable to emerging-market and low-income countries due
to the disparity of data availability and the level of aggregation of the data
(Dimitriou, 2013). Rynning et al. (2018) also recognise that, despite some
parallels which can be drawn, there are fundamental differences in the premises,
requirements, and constraints of mobility and accessibility between developing
post-colonial cities and those from the Global North. Furthermore, Lucas et al.
(2016a) highlight that there is a need for a specific transport poverty evidence-
base tailored to the Global South, given the more extreme intensity and extent of
the problem within the developing world. To the best knowledge of the author,
except for the publication derived from this Chapter (Benevenuto and Caulfield,
2019) no other literature overview addressing the transport-poverty nexus in the
entire Global South has been published in an academic journal to date.
CHAPTER 2: LITERATURE REVIEW
22
Under these circumstances, this Chapter aims to present an overview that
highlights some underexposed insights about the central role that transport
policies can play in the poverty reduction process of the Global South. This
Chapter, therefore, contributes to the literature by (i) extending and adapting
Church et al.’s (2000) framework of transport-related exclusion to the
particularities of the Global South; (ii) summarising and categorising relevant
findings and methodologies applied to date in this geographical context; and (iii)
pointing out important insights and gaps of research that require attention to shed
light on the importance of transport policy for tackling poverty. Finally, this
Chapter concludes by connecting these insights and gaps to propose a
convergence of the reviewed studies emphasising the importance and urgency
of a new standard of transport policies strongly committed to the goal of
eradicating poverty.
2.2. Methodology
Due to the complex nature of the problem, this Chapter follows the model of
research synthesis proposed by Pawson (2005) for a literature review. Besides
being an effective method for providing theoretical understanding and empirical
evidence of complex interventions targeted to policy making, this realist approach
has also been extensively cited16, including in studies addressing similar topics
(Ormerod et al., 2015; Titheridge et al., 2014). Based on this model, the following
four steps were utilised to develop this literature overview: conceptualisation of
the theme and scope; search for relevant evidence; appraisal of the studies and
data extraction; and synthesis of the evidence.
The scope of this overview, which was already briefly introduced in Section 2.1,
is also further detailed in Section 2.3 when the conceptual framework of poverty
and transport is presented. The search for relevant evidence (step 2) was initially
carried out in two large databases of Transport research, namely, Science Direct
and Web of Science. The keywords and Booleans applied to these search
engines were: “transport” OR “mobility” AND “poverty”. Moreover, only papers
16 To date this method has been cited by over 1,700 other papers according to www.scholar.google.com
CHAPTER 2: LITERATURE REVIEW
23
published after 200317 were considered in this overview, and the inclusion criteria
were:
• Publications based on Global South countries’ datasets; and
• Publications reporting evidence-based interactions between poverty and
transport.
Furthermore, following guidelines proposed by Wee and Banister (2016), after
selecting the first 31 papers from the systematic search, other relevant
publications were gathered by snowballing backward (reviewing the references
of the articles previously identified) and forward (reviewing publications citing the
papers initially collected). After full textual analysis, 9 articles were then included
following the same inclusion criteria. Thus, 40 papers were deemed fit for the
purpose of this overview. It is worth noting that even though only English-
language literature has been considered in this review, 10 out the 20 countries
addressed in the selected papers do not have English as their official
languages18.
Given the different backgrounds, data restrictions related to a comparable
poverty measure, and the wide range of methodologies applied in the assessed
studies, instead of deploying a meta-analysis based on statistical correlations (or
even causations) between transport development and poverty reduction, this
Chapter concentrates on appraising the studies and extracting the evidence (step
3) through a qualitative framework to offer a panoramic overview of these themes
in the Global South to date. The final step, synthesis of the evidence, is drawn in
terms of empirical insights (Section 2.4) including policy recommendations for
breaking chronic poverty through transport development (Section 2.4.4), as well
as gaps in the literature and research agenda (Section 2.5). The findings in the
next sections of this Chapter are also published in Benevenuto and Caulfield
(2019).
17 This timely cut line was applied taking into account the publication of the study Making the Connections (Social Exclusion
Unit, 2003), widely recognised as a milestone for identifying the inter-relationship between transport disadvantage and
social exclusion (Lucas, 2012).
18 Non-English-speaking countries addressed in this Literature Review include: Brazil, Chile, China, Colombia, Ecuador,
Ethiopia, Laos, Nepal, Uruguay, and Venezuela.
CHAPTER 2: LITERATURE REVIEW
24
2.3. A conceptual framework for poverty and transport
Few relationships in the dynamics of expansion and transformation of the urban
space are as evident as the one established between land use and transport
development (Nigriello, 1992). Early reflections under the Marxist framing have
pointed out that the transport network is intertwined in the urban fabric with other
layers to compose the ‘social space’ (Lefebvre, 1974). Likewise, Harvey (1980)
also recognises the mechanism how transport and spatial patterns can play on
the urban development, creating a socially unjust city, where the worse-off are
pushed to live in crowded and very small places with poor access to opportunities.
Hansen (1959) also argues that accessibility shapes land use, linking, therefore,
social outcomes such as urban poverty to urban and transport planning.
However, recent authors have suggested that the relationship between transport
and poverty is still marginal in the traditional approaches of mainstream transport
planning, which have inevitably entailed in the perpetuation of socio-economic,
environmental and spatial inequalities in cities (Levy and Davila, 2017, Levy,
2013; Lucas, 2012; Vasconcellos, 2001).
Particularly in the academic literature, several frameworks have been published
to date describing how transport relates to social exclusion (Currie and Delbosc,
2010; Cass et al. 2005; Wixey et al., 2005; Hine and Mitchell, 2017; Church et
al., 2000). Despite being two different social constructs, poverty and social
exclusion have still an undeniable intersection, since people who are socially
excluded are as a rule also poor, particularly if poverty is defined in a
multidimensional way (Khan et al., 2015).
Generally, the arguments to make a firm distinction of these concepts are based
on the idea of a unidimensional concept of poverty (i.e. income-poverty) (Kenyon
et al. 2002). However, a substantial body of literature has been dedicated to
addressing the multidimensional concept of poverty over the past few decades.
This update in the understanding of poverty is clearly seen in the definition of
absolute poverty established by the United Nations at the Copenhagen summit
in 1995,

CHAPTER 2: LITERATURE REVIEW
25
“[Absolute poverty is] a condition characterised by severe deprivation of
basic human needs, including food, safe drinking water, sanitation
facilities, health, shelter, education and information. It depends not only on
income but also on access to services” (UN, 1995).
This literature review builds on Church et al.’s (2000) seven categories, not only
because it is one of the most recognised frameworks on this topic, but also
because it is compatible to the concept of multidimensional poverty previously
described. Each one of the seven transport-related exclusion dimensions
proposed by Church et al. (2000) is revisited and illustrated by real examples
from the Global South in the following items. As already pointed out by Hernandez
and Titheridge (2016), while some of Church et al.’s (2000) dimensions can
overlap, especially in the context of severe deprivation, they provide initial criteria
to distil the mechanisms by which transport policies can effectively contribute to
breaking cycles of poverty. Alongside the seven dimensions established by
Church, the present Chapter proposes the introduction of an eighth dimension
that refers to the transport-related exclusion based on one’s social position (i.e.
gender, race, ethnicity, religion, etc). Further clarifications and examples of this
new dimension are provided below.
I. Physical exclusion: This refers to physical barriers at a micro-level that
affect the mobility of certain groups of people (e.g. people with visual,
hearing or mobility disabilities). Kabia et al. (2018) report that women with
mobility and visual disabilities in Kenya were either denied transport or
charged a higher fee because their boarding process requires greater
assistance, and this was viewed to be more time-consuming for the
transport providers.
II. Geographical exclusion: Authors have shown that the location where
one lives has a great influence on his/her accessibility to transport
services. Vasconcellos (2005) explains that although people in extreme
poverty of São Paulo’s (Brazil) urban fringe spend proportionally a greater
share of their income on transport than any other social strata, they have
less than half of the mobility level than the richest on average and have
almost no contribution to transport externalities.
CHAPTER 2: LITERATURE REVIEW
26
III. Exclusion from facilities: Beyond the exclusion from the transport
network there is the exclusion from key facilities such as hospitals,
schools, shops which is often argued to be one of the reasons behind the
poverty trap. Farrow et al. (2005), for example, confirm that greater access
to markets is highly associated with lower levels of food poverty in
Ecuador.
IV. Economic exclusion: Affordability is frequently pointed out as the biggest
barrier to access the transport system for low-income people
(Vasconcellos, 2005; Lau, 2010; Lucas, 2011; and Adeel, 2016). Guzman
et al. (2017b) state that if appropriate subsidies are applied on bus and
Transmilenio (Bogotá's BRT) fares, the job-accessibility for low-income
workers may increase up to 28.3%.
V. Time-based exclusion: This feature explains how lengthy journey times
may exclude even more vulnerable groups that are time poor mostly due
to other time-consuming responsibilities (e.g. household and child-care
duties). Motte-Baumvol and Nassi (2012) report that women from Rio de
Janeiro (Brazil) have lower mobility than men due to a heavier burden on
women in family care, even having the same transport opportunities for
both genders.
VI. Fear-based exclusion: Exclusion can be even more exacerbated due to
unsafe public space and services. Anand and Tiwari (2006) maintain that
due to the absence of footpaths, poor location of bus shelters, high steps
of public buses, and risk of sexual harassment while traveling, women’s
mobility is very reduced in Delhi (India), which is inextricably linked to
poverty.
VII. Space exclusion: This dimension refers to restrictions on access for
certain groups of people in particular areas or routes (e.g gated
communities, or areas under control of militias). Hernandez and Titheridge
(2016) explain that local criminal groups are responsible for physically
restricting neighbourhood’s mobility by even imposing tolls to the right to
circulate in certain areas of Soacha (Colombia). Despite these restrictions

CHAPTER 2: LITERATURE REVIEW
27
being sometimes enforced by non-official authorities, it is still a different
case than the fear-based exclusion since it prevents the accessibility of
people not only by the feeling of insecurity but literally by spatial selective
barriers just as in a gated community.
VIII. Social position-based exclusion: This transport-related exclusion
dimension, that is proposed, refers to the prevention from moving in public
space due to censure, social control or any other restriction based on one’s
social position (i.e. gender, race, ethnicity, cast, religion, etc). Remarkable
and not so old examples of this range from the ‘white-only’ carriages that
operated until the early ’90s in South Africa (Seekings, 2008) to the ban
on women’s driving (Rajkhan, 2014) that occurred until the year 2018 in
Saudi Arabia. The inevitable legacy of historic cases like these is still
currently perceived in the form of discrimination of public and private
transport users (Cano, 2010; Seiler, 2007). For instance, Adeel et al.
(2016) reports that women face additional mobility constraints in Pakistan
such as lack of walking, permission from home and need for veiling and
escort during travel due to social and cultural patterns. Similarly, Özkazanç
and Sönmez (2017) report that in Turkey women have been excluded from
public transport because they face pressure from society to be home
before dark, as well as harassment in traffic simply due to the very fact
that they are women. The outcomes of such gendered segregation in
mobility have been also revealed by several other authors from Ghana,
Malawi, South Africa, Colombia, Lesotho, India, Kenya and China in
statistical, spatial and qualitative findings (Kabia et al., 2018; Rodriguez et
al., 2016; Hernandez and Titheridge, 2016; Lau, 2013; Porter et al., 2012;
Vajjhala and Walker, 2010; Anand and Tiwari, 2006). Evidence of
transport-related exclusion based on the social position has been also
raised by the survey and interviews performed by Lau (2013) in China. The
author reports that one of the limiting factors on low-income migrant
workers’ travel patterns is that they cannot receive social welfare (and thus
cannot afford longer and more expensive trips) due to the very fact that
they are not recognised as local citizens. Another facet of this dimension
is reported by Ramos & Musumeci (2005) revealing that in Brazil the

CHAPTER 2: LITERATURE REVIEW
28
proportion of people with black and brown skin colour among those who
declared to have been stopped by the police while walking or using public
transport was higher than the corresponding share of these racial groups
in the population. Thus, considering the lack of coverage of these aspects
in the original seven categories proposed by Church et al. (2000), it is
argued that the Social Position-based dimension should be also
recognised into future studies using such a framework in order to ensure
clear evaluations of the intersectionality of these social features and its
outcomes upon the travel patterns of the most vulnerable population.
The summary of the main insights from the 40 evaluated papers on the transport-
poverty nexus, as well as further information on their methodology and the type
of transport-related exclusion that they have addressed are provided in Table 3.1.
The evaluated papers are presented in chronological order.
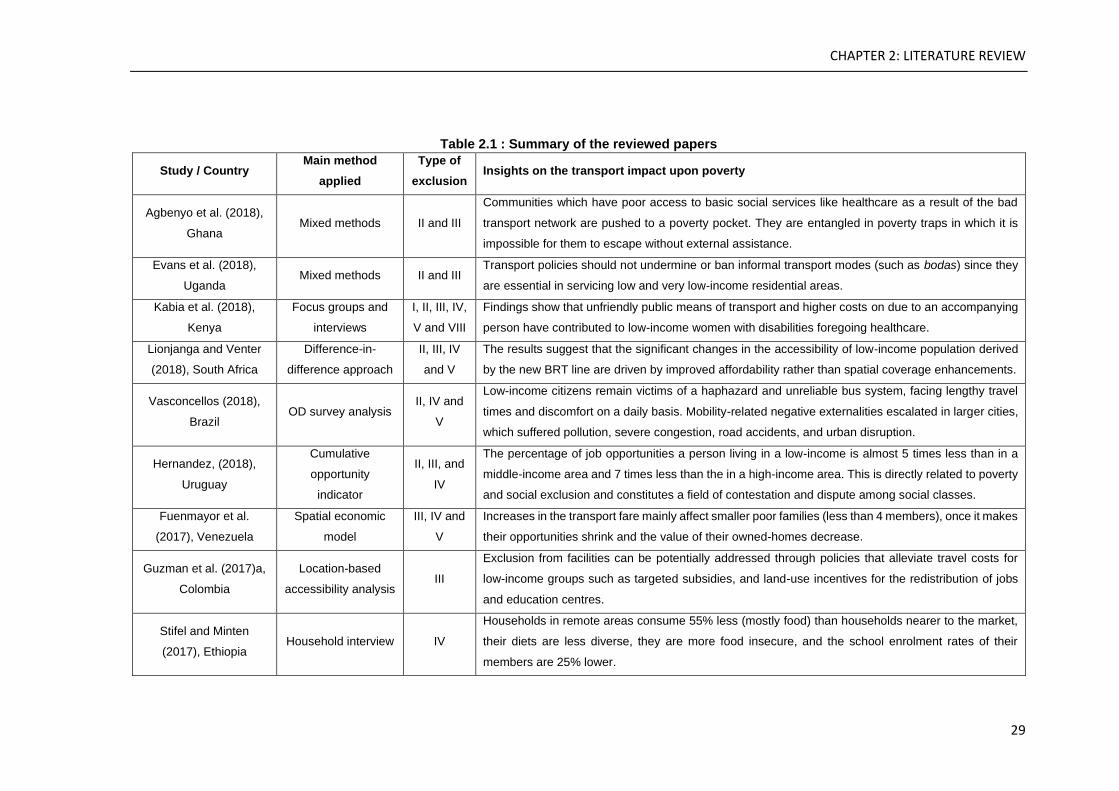
CHAPTER 2: LITERATURE REVIEW
29
Table 2.1 : Summary of the reviewed papers
Study / Country Main method
applied
Type of
exclusion Insights on the transport impact upon poverty
Agbenyo et al. (2018),
Ghana Mixed methods II and III
Communities which have poor access to basic social services like healthcare as a result of the bad
transport network are pushed to a poverty pocket. They are entangled in poverty traps in which it is
impossible for them to escape without external assistance.
Evans et al. (2018),
Uganda Mixed methods II and III
Transport policies should not undermine or ban informal transport modes (such as bodas) since they
are essential in servicing low and very low-income residential areas.
Kabia et al. (2018),
Kenya
Focus groups and
interviews
I, II, III, IV,
V and VIII
Findings show that unfriendly public means of transport and higher costs on due to an accompanying
person have contributed to low-income women with disabilities foregoing healthcare.
Lionjanga and Venter
(2018), South Africa
Difference-in-
difference approach
II, III, IV
and V
The results suggest that the significant changes in the accessibility of low-income population derived
by the new BRT line are driven by improved affordability rather than spatial coverage enhancements.
Vasconcellos (2018),
Brazil OD survey analysis
II, IV and
V
Low-income citizens remain victims of a haphazard and unreliable bus system, facing lengthy travel
times and discomfort on a daily basis. Mobility-related negative externalities escalated in larger cities,
which suffered pollution, severe congestion, road accidents, and urban disruption.
Hernandez, (2018),
Uruguay
Cumulative
opportunity
indicator
II, III, and
IV
The percentage of job opportunities a person living in a low-income is almost 5 times less than in a
middle-income area and 7 times less than the in a high-income area. This is directly related to poverty
and social exclusion and constitutes a field of contestation and dispute among social classes.
Fuenmayor et al.
(2017), Venezuela
Spatial economic
model
III, IV and
V
Increases in the transport fare mainly affect smaller poor families (less than 4 members), once it makes
their opportunities shrink and the value of their owned-homes decrease.
Guzman et al. (2017)a,
Colombia
Location-based
accessibility analysis III
Exclusion from facilities can be potentially addressed through policies that alleviate travel costs for
low-income groups such as targeted subsidies, and land-use incentives for the redistribution of jobs
and education centres.
Stifel and Minten
(2017), Ethiopia Household interview IV
Households in remote areas consume 55% less (mostly food) than households nearer to the market,
their diets are less diverse, they are more food insecure, and the school enrolment rates of their
members are 25% lower.

CHAPTER 2: LITERATURE REVIEW
30
Guzman et al. (2017)b,
Colombia Gravity model IV, V, III
If appropriate subsidies are applied on bus fares and Transmilenio (Bogotá's BRT) fares, the job-
accessibility for low-income workers may increase up to 28.3%.
Sadhu and Tiwari
(2016), India
Discrete choice
model
II, III, IV
and V
The traditional transport planning does very little for the mobility of the urban poor, who depend
predominantly on short pedestrian travels.
Rodriguez et al. (2016),
Colombia
Difference-in-
difference approach IV and VIII
Fare's subsidy appears to be increasing productivity by allowing informal workers to have better
mobility and accessibility to economic opportunities and thus higher earnings.
Naimanye and Whiteing
(2016) Ghana/Uganda
Expert weighting
survey III
In order to mitigate existing road sector inequities, enhance sustainability and offer equality of transport
opportunities, a goal programming model that highly prioritises multidimensional poverty is
recommended for rural road scheme selection in sub-Saharan Africa.
Qin and Zhang (2016),
China
Difference-in-
difference approach II
Findings indicate that road connections improve household agricultural income and reduce poverty.
Evidence has shown that road access enhances agricultural income by 27.1% in rural areas of China.
Stifel et al. (2016),
Ethiopia
Willingness-to-pay
approach
II, III and
IV
A hypothetical feeder rural road project that reduces the transport costs for the most remote
households by 50 US Dollars per metric ton, has the potential to result in benefits worth roughly 35%
of household consumption for these households.
Hernandez and
Titheridge (2016),
Colombia
Qualitative Content
Analysis All types
Informal transport is pointed as an essential factor in helping vulnerable people to overcome social
exclusion, once it allows flexibility in the geographical, economic and social aspects.
Deng et al. (2016),
China
Primary Component
Regression II and III
In order to promote socially inclusive public transport, the needs of socially disadvantaged groups
should be taken into account when distributing public transport funding.
Adeel et at (2016),
Pakistan Binary Logit model
IV, VI, and
VIII
The study found that affordability of transportation is the toughest mobility challenge for urban residents
of low and middle-income groups of Rawalpindi Islamabad.
Vermeiren et al. (2015),
Uganda Household survey
I, II, IV and
V
BRT could be leverage for socio-economic development of deprived neighbourhoods if two crucial
criteria are met: (1) the BRT is physically accessible from these neighbourhoods, (2) the BRT-fares
are made affordable for the lowest social classes.
Asomani-Boateng et al.
(2015), Ghana
Ex-post average
comparison
II, III, IV
and V
The analysis revealed that road improvements led to a dramatic growth (390.4%) in the household
income during the initial phase of the program of improvements and maintenance of rural feeder roads.

CHAPTER 2: LITERATURE REVIEW
31
Fang and Zou (2014),
China
Multilevel
econometric model II, IV
Results show that transportation infrastructure is also a determining factor in leading to rural poverty
traps. Improvements in transport infrastructure can increase the living standards of young generations
and break the intergenerational transmission of poverty.
Bocarejo, et al. (2014),
Colombia
Difference-in-
difference approach II and IV
Metrocable of Medellín has had a positive and measurable impact on access to activities by the low-
income population, although this outcome is also attributed to localised ease of access to specific
centres of activity.
Porter et al. (2013),
Tanzania Household survey
All types
except VII
Transport is clearly a major hurdle for many older people in the study settlements – particularly for their
daily domestic water and fuel needs, but also for accessing healthcare.
Li and Da Costa, M. N.
(2013), China
OLS Linear
regression IV
Highways, railways and waterways development were found to be negatively associated with income
inequality in urban areas. Higher mobility may further alleviate income inequality.
Lau (2013), China Questionnaire
survey
I, II, IV,
VIII
The lower the respondents’ incomes, the more likely they were to use slower transport modes to reach
their workplaces, thus, excluding them from seeking distant employment opportunities.
Motte-Baumvol and
Nassi (2012), Brazil Logistic model II and IV
Income is not the only dimension of poverty which is correlated to immobility. Employment status and
education level were found with a very strong effect on the mobility level of the poorer areas’ population
of Rio de Janeiro city.
Venter (2011), South
Africa
Binomial probit
model
I, II, IV and
VII
People living in displaced urban settlements or in isolated rural locations face long commute distances,
poor road conditions and few travel alternatives, which combine to raise the cost of motorised travel
and perceptions of the severity of transport affordability problems.
Dillon et al. (2011),
Nepal
Hedonic and panel
data analysis IV and V
Increasing access to rural roads also has distributional consequences. The likelihood of escaping
poverty increases by 0.51% for a 10% reduction in travel time in the area studied.
Vajjhala and Walker
(2010), Lesotho
Participatory
mapping II, III, VIII
The maps generated through this study reveal significant differences in mobility of vulnerable people,
with implications for access to and use of diverse services, such as healthcare, education, banking,
the postal system, and pension distribution.
Salon and Gulyani
(2010), Kenya Logit model IV and V
Poorest residents of Nairobi who are forced to walk long distances because they cannot afford other
modes, they are highly impacted by a physical and time burden on their basic travel needs.
Lau (2010), China Questionnaire
survey
I, II, III, IV
and V
The survey shows that low-income residents experience geographical exclusion from employment
because of accessibility problems arising from the spatial mismatch and jobs-housing imbalance.
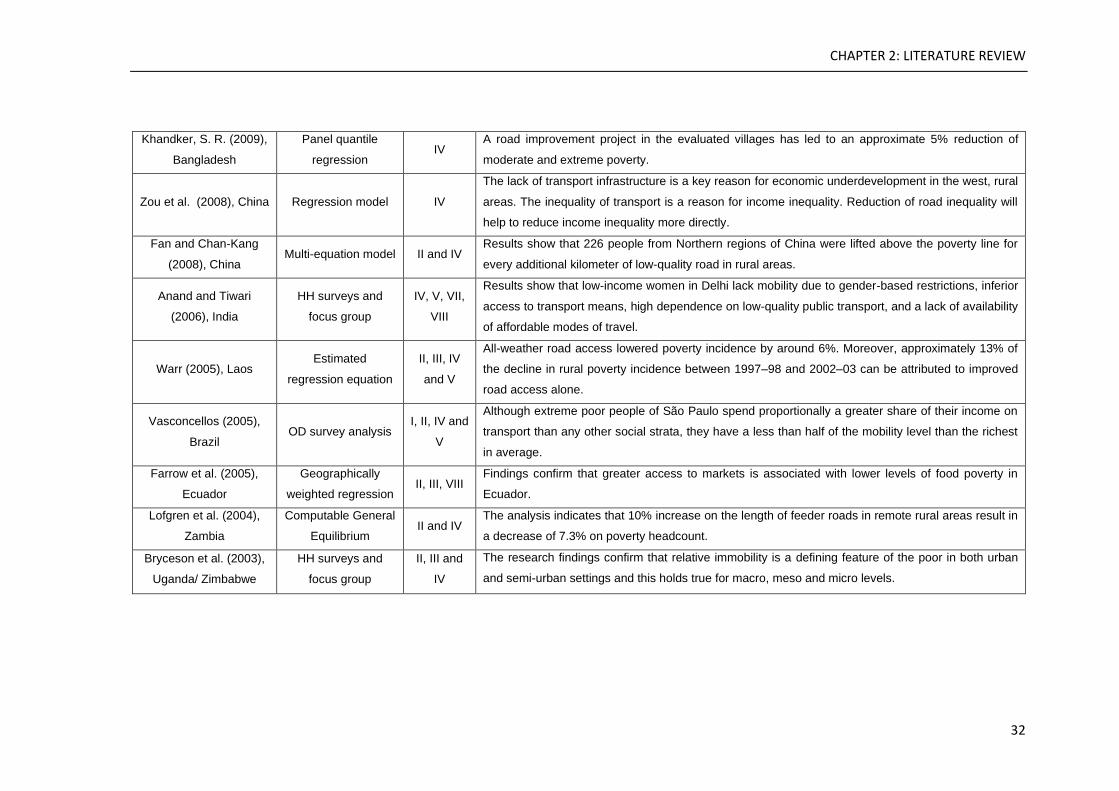
CHAPTER 2: LITERATURE REVIEW
32
Khandker, S. R. (2009),
Bangladesh
Panel quantile
regression IV
A road improvement project in the evaluated villages has led to an approximate 5% reduction of
moderate and extreme poverty.
Zou et al. (2008), China Regression model IV
The lack of transport infrastructure is a key reason for economic underdevelopment in the west, rural
areas. The inequality of transport is a reason for income inequality. Reduction of road inequality will
help to reduce income inequality more directly.
Fan and Chan-Kang
(2008), China Multi-equation model II and IV
Results show that 226 people from Northern regions of China were lifted above the poverty line for
every additional kilometer of low-quality road in rural areas.
Anand and Tiwari
(2006), India
HH surveys and
focus group
IV, V, VII,
VIII
Results show that low-income women in Delhi lack mobility due to gender-based restrictions, inferior
access to transport means, high dependence on low-quality public transport, and a lack of availability
of affordable modes of travel.
Warr (2005), Laos Estimated
regression equation
II, III, IV
and V
All-weather road access lowered poverty incidence by around 6%. Moreover, approximately 13% of
the decline in rural poverty incidence between 1997–98 and 2002–03 can be attributed to improved
road access alone.
Vasconcellos (2005),
Brazil OD survey analysis
I, II, IV and
V
Although extreme poor people of São Paulo spend proportionally a greater share of their income on
transport than any other social strata, they have a less than half of the mobility level than the richest
in average.
Farrow et al. (2005),
Ecuador
Geographically
weighted regression II, III, VIII
Findings confirm that greater access to markets is associated with lower levels of food poverty in
Ecuador.
Lofgren et al. (2004),
Zambia
Computable General
Equilibrium II and IV
The analysis indicates that 10% increase on the length of feeder roads in remote rural areas result in
a decrease of 7.3% on poverty headcount.
Bryceson et al. (2003),
Uganda/ Zimbabwe
HH surveys and
focus group
II, III and
IV
The research findings confirm that relative immobility is a defining feature of the poor in both urban
and semi-urban settings and this holds true for macro, meso and micro levels.
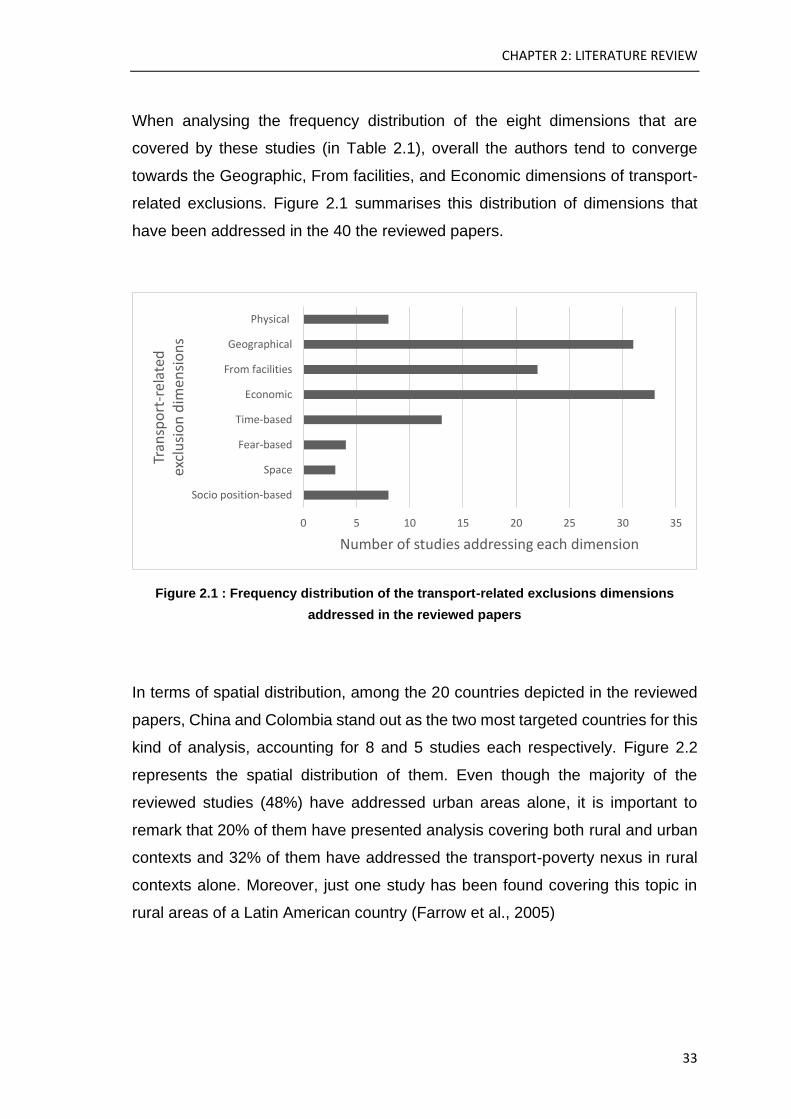
CHAPTER 2: LITERATURE REVIEW
33
When analysing the frequency distribution of the eight dimensions that are
covered by these studies (in Table 2.1), overall the authors tend to converge
towards the Geographic, From facilities, and Economic dimensions of transport-
related exclusions. Figure 2.1 summarises this distribution of dimensions that
have been addressed in the 40 the reviewed papers.
Figure 2.1 : Frequency distribution of the transport-related exclusions dimensions
addressed in the reviewed papers
In terms of spatial distribution, among the 20 countries depicted in the reviewed
papers, China and Colombia stand out as the two most targeted countries for this
kind of analysis, accounting for 8 and 5 studies each respectively. Figure 2.2
represents the spatial distribution of them. Even though the majority of the
reviewed studies (48%) have addressed urban areas alone, it is important to
remark that 20% of them have presented analysis covering both rural and urban
contexts and 32% of them have addressed the transport-poverty nexus in rural
contexts alone. Moreover, just one study has been found covering this topic in
rural areas of a Latin American country (Farrow et al., 2005)
0 5 10 15 20 25 30 35
Socio position-based
Space
Fear-based
Time-based
Economic
From facilities
Geographical
Physical
Number of studies addressing each dimension
Tran
spo
rt-r
elat
ed
excl
usi
on
dim
ensi
on
s

CHAPTER 2: LITERATURE REVIEW
34
Figure 2.2: Spatial distribution of publications addressing Transport and Poverty in the Global South

CHAPTER 2: LITERATURE REVIEW
35
2.4. Empirical insights
The reviewed papers converge around the extent and severity of the multi-
dimensional poverty and social inequalities present in the Global South that
arises from transport-related exclusion in its various forms. However, the
traditional links and mechanisms illustrating this relationship have been already
reported in similar reviews of literature from urban Latin America (Blanco et al.,
2018), rural Sub-Saharan Africa (Porter, 2014, Jones and Walsh, 2013), as well
as from more general contexts (Booth, 2000; Setboonsarng, 2006). Hence, this
Section aims at summarising some underexplored empirical insights on how to
better tackle poverty through transport development.
2.4.1. Intersectionality and travel behaviour
Over the past few years, authors have increasingly evaluated the relationship
between transport and poverty through the lens of an intersectional view of
exclusion (Kabia et al., 2018; Oviedo et al., 2017; Levy, 2013). The concept of
intersectionality was originally coined by Crenshaw (1989) when proposing that
the intersectional exclusion experienced by black women is even greater than the
sum of racism or sexism experienced separately. After its inception, other
interlocking and mutually reinforcing vectors of exclusion have been also
considered to expand this concept to class, ethnicity, disabilities, age, religion,
etc (Nash, 2008). Two out of all these vectors appear to have received particularly
more attention in recent studies addressing the impact of intersectionality on
travel behaviour.
Firstly, gender has been widely considered as a crucial factor that affects how
low-income people benefit from the development of transport services and
infrastructure. Authors have argued that transport policies must be gender-
sensitive to be effective in tackling poverty since women face different challenges
than men in accessing, using and paying for transport services (Babinard et al.,
2010; Salon and Gulyani, 2010; Anand and Tiwar, 2006). Cook et al. (2005)

CHAPTER 2: LITERATURE REVIEW
36
illustrate this, pointing out that the better the quality, reliability and security of the
transport services, the more parents from India, Thailand, and China are prone
to allow girls to carry on with their education and to participate in social and
economic activities outside the villages, which is an essential step to enabling
low-income girls to improve their future livelihood and well-being. A more extreme
example reported by Babinard et al. (2010) underlines that, if not well planned,
the opening of new transport corridors in localities where poverty is most spread
may result in trafficking of girls and women, especially in remote localities. Kabia
et al. (2018) report that the intersections of gender, poverty, and disability in
Kenya have resulted not only in limited mobility for them but also in less
awareness about health services since they are usually excluded from public
participation forums due to negative stereotypes attributed to them.
The second major aspect found was that transport policies targeting these people
should first consider the impact of income poverty on travel patterns
(Vasconcellos, 2018; Sadhu and Tiwari, 2016; Motte-Baumvol and Nassi, 2012;
Lau, 2010). Some authors have demonstrated empirically that in many regions
the concept of travel choice cannot be applied to people living in extreme income
poverty, because mostly there is no choice but walking (Sadhu and Tiwari, 2016;
Salon and Gulyani, 2010; and Cook et al., 2005). In fact, low-income people may
continue to use non-motorised transport even on a brand-new road since they do
not have automobiles nor enough resources to afford a new one (Porter, 2002;
Setboonsarng, 2006; and Raballand et al., 2011). Similarly, authors have also
stressed how vital informal transport19 is for helping vulnerable people to
overcome social exclusion since it is usually the only type of public transport
flexible enough to overcome geographical, economic and social barriers (Evans
et al., 2018; Hernandez and Titheridge, 2016). In that sense, it is argued that
large investments in transport infrastructure construction that disregard informal
and non-motorised transports are not enough to guarantee poverty alleviation.
19 Informal transport, also referred as paratransit, are usually provided in form of unregulated
minibuses, passenger-adapted trucks, vans, microvans, station wagons, three-wheelers,
motorcycles taxis and pedicabs.
CHAPTER 2: LITERATURE REVIEW
37
These examples attempt to illustrate the travel pattern outcomes of intersecting
social features and transport-related exclusions. These insights shed light on the
importance of not only evaluating the outputs of transport development (such as
road length, or quantity of buses delivered), but also of evaluating the outcomes
of it, such as accessibility improvement and social development.
2.4.2. Prioritisation by accessibility analysis
A nearly ubiquitous policy recommendation of the reviewed studies is that
accessibility analysis (including the spatial, social and economic distributional
effects) should be an essential driver of transport appraisals utilised in the
prioritisation process of transport investments. This would be conducted with
traditional travel demand, cost-benefit and wider economic benefit analysis. This
type of assessment is paramount in identifying the differences in access to life-
enhancing opportunities (education, healthcare, employment, etc) among
different locations (rural/urban, centre/peripheral areas), socio-economic
features (e.g. income groups, age, gender, ethnicity, etc), and transport modes
resulting in more transparent and equitable transport planning.
Vasconcellos (2011) argues that equity audits are needed to overcome the ‘more
common, limited pseudo-scientific technical approach to urban transport
appraisal’. Reinforcing previous studies (Bryceson et al., 2003; Lau, 2010)
Guzman et al. (2017) also conclude that the redistribution of current levels of
accessibility should be guided by assessments of access to employment and
education between income groups. Particular attention to the most vulnerable
income groups has been also consistently suggested as a high priority for
achieving a fair transport system (Vermeiren et al., 2015; Li and Da Costa, 2013).
Drawing on expert opinion surveys and empirical evidence from Ghana and
Uganda, Naimanye and Whiteing (2016) hold that the allocation of funds for rural
roads should be poverty-centred20 to provide equality of transport opportunities.
In a systematic reflection on the key theories of justice (utilitarianism,
20 Naimanye and Whiteing (2016) argues that multi-dimensional poverty index should be a guiding
factor in the allocation of funds for rural roads in Sub-Saharan Africa

CHAPTER 2: LITERATURE REVIEW
38
libertarianism, intuitionism, Rawl’s egalitarianism, and capability approach)
Pereira et al. (2017) propose a framework for evaluating transport policies by
detailed analysis of their distributional effects. According to the authors, such a
framework should consider accessibility to key destinations, preservation of
individuals’ rights, prioritisation of disadvantaged groups, reduction of inequalities
of opportunities, and finally, mitigation of transport negative externalities.
2.4.3. Private agendas of policymakers
When considering transport projects led by the public sector, some political
dimensions that are often overlooked in academic studies, also need to be
explored to shed light on the reasons why transport policies have not been more
effective in tackling poverty. As highlighted by Benitez et al. (2010), there are at
least four power- and money-seeking private agendas in the realm of
infrastructure policymakers which negatively affect transport development. These
are described below.
• Populism/re-election: Excessively strong focus on fitting infrastructure
projects to the electoral calendar (short‐term), instead of following an
appropriate long-term development agenda. Remarkable preference for
what is visible rather than necessary investments;
• Patronage: Support and bolster power for an elite control over a sector. It
is a mechanism of long‐term power‐hunt that focuses on prioritisation of
certain people to control strategic departments (e.g. regulatory institutions,
state agencies) to facilitate for party allies controlling the country;
• Industry‐friendliness: Agreements made among politicians and private
sector representatives in order to achieve revenues for the party or new
business for party allies in exchange of assuring future concession
contracts or more profitable projects for specific private companies;
• Corruption: Increase personal incomes by illegal appropriation of fractions
of projects’ budgets usually in exchange for manipulating the bidding
process to assure that specific contractors will be hired.

CHAPTER 2: LITERATURE REVIEW
39
It is argued that infrastructure development is often hampered and misdirected
by these private agendas of decision-makers, especially in countries from the
Global South where there is weak accountability and low-performance evaluation
of this sector (Benitez et al., 2010). The likely consequences of these setbacks in
the political arena can be illustrated in the following situations:
• Prioritisation of transport projects based on bribes, rather than appropriate
planning (Benitez et al, 2010)
• Subsidies to enhance accessibility and affordability frequently get lost in
corruption (Benitez et al, 2010)
• Limited access to information (data) of transport sector performance to
ensure less accountability (Benitez et al, 2010)
• Weaken of regulatory agencies and technical departments (Benitez et al,
2010)
• Great expenses with many pre‐feasibility studies with no continuity
because of low credibility of political decisions (Benitez et al, 2010)
• Allocation of resources driven by industry-friendliness and patronage,
rather than by social return (Asomani-Boateng et al., 2015)
• High appetite for transport infrastructure investments particularly during
periods leading to elections, rather than following a consistent long-term
investment plan (Asomani-Boateng et al., 2015)
• Transport investments focused on what is visible rather than what is
needed (Benitez et al, 2010)
• Favourability of specific suppliers, reducing market competition and
worsening the transport service quality
• Distribution of public resources based on clientelism, such as the case of
the cisterns addressed in next Chapter (Sergio et al., 2010)
• Frequent unclear renegotiation of concession contracts resulting in money
evasion to corruption schemes (Guasch, 2004)
• Selection of projects focusing on flagship construction (media-attractors),
rather than maintenance of remote rural roads (Setboonsarng, 2006)
• Expansion of transport contracts without concern on affordability for the
poorest (Fuenmayor et al., 2017)
CHAPTER 2: LITERATURE REVIEW
40
2.4.4. Transport and intergenerational poverty transfer
Sachs (2008) suggested that poverty will not be ended by sheer will power nor
by ethical commitment alone. Rather, it will be ended only by bringing the best of
our thinking and science together with the ethical commitment of scholars and
practitioners from across the range of human knowledge (Sachs, 2008).
Therefore, this Section by no means aims to offer a panacea for such a complex
problem. Conversely, what is proposed is how transport planners and
practitioners could more effectively contribute to a multi-dimensional solution.
Vakis et al. (2016) define as ‘chronic poor’ people who are born into poverty and
may never escape from it. Based on surveys and the analysis of Censuses in
Latin America and the Caribbean, these authors have concluded that the main
difference between the chronic poor and those who escaped poverty is
essentially the access to services, subscribing to the view that accessibility is not
only inextricably linked with, but it can also reinforce cycles of poverty. Porter et
al. (2007) observe that poor health and education, as well as poor job
opportunities, are likely to be transferred to the next generation if the same
circumstances of lack of social networks and poor access to health and education
services are maintained. Fang and Zou (2014) also emphasise that
improvements in transport infrastructure can increase the living standards of
young generations and break the intergenerational poverty transfer.
In that sense, drawing upon the eight transport-related exclusion categories
(described in Section 2.3) and the relationship of transport disadvantage and
social exclusion proposed by Lucas (2012), Figure 2.3 summarises the key
strategies of transport development and their potential accessibility outcomes.
These could tackle the structures, processes, and livelihood strategies that can
affect inter-generational poverty transfer, according to Hulme et al. (2001).

CHAPTER 2: LITERATURE REVIEW
41
Figure 2.3: Diagram to illustrate the potential contributions of transport development to the structures, processes, and livelihood strategies
that can affect inter-generational poverty transfer
CHAPTER 2: LITERATURE REVIEW
42
2.5. Gaps in the literature and research agenda
Although there is an increasing body of knowledge underpinning links between
Transport and Poverty in the Global South, several omissions and limitations
have been persistently reported. Many authors attribute the gaps of research
inter-relating transport improvements and poverty alleviation to the lack of reliable
data (Sanchez, 2008; Salon and Gulyani, 2010; Porter, 2014). In fact, the
Millennium Development Goals (MDG) Report (2015) considers the following
dimensions as the major challenges in terms of data collection: (1) Poor data
quality; (2) lack of timely data and; (3) unavailability of disaggregated data. The
same report also points out that almost half of 155 assessed countries lack
adequate data to monitor poverty.
In terms of transport-related data, even larger limitations have been consistently
reported on the availability and accuracy of maps of the transport network (i.e.
roads, footpaths, cycle lanes, railways, etc), General Transit Feed Specification
(GTFS) data (including routes, timetables and location of stops of public
transport), travel surveys, level of infrastructure quality/maintenance, location of
opportunities and services (i.e. schools, healthcare, jobs, parks, etc) (Pritchard
et al., 2019; Pereira, 2019; Oloo, 2018; Evans et al., 2018).
As a result, this lack of accurate, timely and disaggregated poverty and transport-
related data warps the perception about the transport metabolism21
(Vasconcellos, 2005) and misleads planners and decision-makers to a less
socially-driven transport development. Dimitriou (2013) suggests that this
scenario of data deprivation results in a trade-off between model sophistication
and data availability, which usually result in the creation of simplistic and
sometimes unrealistic transport planning models.
21 The term ‘‘transport metabolism’’ has been proposed by Vasconcellos (2005) to illustrate the
process of transport-related consumption of resources (e.g. public space, fuel) and production of
externalities (e.g. pollution, accidents, congestion).
CHAPTER 2: LITERATURE REVIEW
43
In terms ex-post studies, the reviewed papers’ methodologies tend to converge
around quasi-experimental methods (also called nonexperimental evaluation or
observational study) when assessing the impacts of transport investments (e.g.
construction of rural roads, BRT’s, metro cables, pro-poor subsidies on fares, etc)
on poverty reduction (Qin and Zhang, 2016; Rodriguez et al., 2016; Bocarejo et
al., 2014; Khandker, 2009). However, Ravallion (2007) asserts that this
methodology is quite data demanding and, therefore, limitations in the spatial and
timely disaggregation of this data might give rise to endogeneity (i.e. invalidation
of causal claims due to non-observed variables) and heterogeneity (i.e.
differences between groups not due to chance) issues when assessing the
treatment effect (i.e. the outcomes) of transport investments on poverty
reduction.
In complement to the current level of evidence addressing transport-related
exclusions, authors have emphasised that further investigations are needed
disaggregating analysis by:
• Services: Education (primary/secondary) and Healthcare
(emergency/basic care) should be also disaggregated by public/private
provider (Fuenmayor, et al. (2017);
• Socio-economic features: including income groups (Guzman et al.,
2017b), gender (Anand and Tiwari, 2006) and age-specific analysis
(Porter, 2013);
• Transport modes: including informal (Evans et al., 2018) and non-
motorised modes (Motte-Baumvol and Nassi, 2012);
• Location: rural/urban (Fan and Chan-Kang, 2008) and central/peripheral
areas (Rodriguez et al., 2016);
• Job opportunities: separating by job requirements (Pereira, 2019) and
including informal jobs (Pritchard, 2019).
Thus, the research chapters (3 to 6) of this thesis seek to address these research
gaps, presenting innovative datasets and methodologies to cope with the
limitations mentioned above.
CHAPTER 2: LITERATURE REVIEW
44
2.6. Policy Implications
2.6.1. Transport policy analysis framework
In the literature on transport policy, much has been written on implications and
approaches in the developed world, whereas the developing world has garnered
comparably much less attention, as discussed in Lucas et al. (2016a). This
Chapter builds upon the seminal transport policy analysis framework published
by Church et al. (2000) and adapts it into the Global South context. The study in
this Chapter describes how issues in transport policy analysis in the Global South
are different from the rest of the world and how new analysis tools are required.
The adaptation of the Church et al. (2000) framework comes in the addition of an
eighth stage to the seven-stage framework that examines transport-related
exclusion. This additional stage is demonstrated, with reference to the literature,
to be appropriate for the Global South and its addition adapts a framework
developed for London to this region. One of the main contributions of this
Chapter is to demonstrate that the issues in the Global South for transport policy
appraisal may not be fully addressed using tools from developed countries. The
approach documented provides policymakers and practitioners with an
alternative framework to address transport policies in cities and regions in the
Global South.
2.6.2. The Sustainable Development Goals
The 2030 agenda for Sustainable Development defined by the UN in 2015 sets
out an ambitious strategy to shift the world on to a sustainable and resilient path.
This strategy comprises of 17 Sustainable Development Goals (SDGs) with 169
targets in total. The Partnership on Sustainable, Low Carbon Transport22
highlights 12 targets of the SDG’s that directly (Targets 3.6, 7.3, 9.1, 11.2, 12.c)
22 The SLoCaT Partnership on Sustainable Transport is a multi-stakeholder partnership of over 90
organizations representing UN organizations, Multilateral and Bilateral development organizations, NGOs
and Foundations, Academe and the Business Sector (SLoCaT, 2019).

CHAPTER 2: LITERATURE REVIEW
45
or indirectly (Targets 2.3, 3.9, 6.1, 11.6, 12.3, 13.1, and 13.2) related to transport.
However, these targets are limited to topics related to road safety, air pollution,
access to transport systems, and productivity improvements.
During the negotiation window of the SDG’s agenda, Njenga and Odero (2014)
have highlighted that the transport sector, despite acting as a key enabler to the
achievement of various goals, has only been marginally recognised in the
proposed specific targets. Drawing upon this critique, this Chapter has
demonstrated how transportation development is also intrinsically connected to
targets related to poverty reduction and the universalisation of access to basic
services and life opportunities. This association is explicitly illustrated in Figure
2.3 (page 40) in which the inter-generational poverty transfer is shown as a result
of several accessibility restrictions. Thus, beyond the 12 targets identified by the
SLoCaT, it is argued that transport strategies addressing the 8 transport-related
exclusion dimensions may also offer an effective path in the achievement of the
specific seven targets described below:
Target 1.4: By 2030, ensure that all men and women, in particular the poor
and the vulnerable, have equal rights to economic resources, as well as
access to basic services, ownership and control over land and other forms
of property, inheritance, natural resources, appropriate new technology
and financial services, including microfinance.
Target 2.1: By 2030, end hunger and ensure access by all people, in
particular the poor and people in vulnerable situations, including infants,
to safe, nutritious and sufficient food all year round
Target 2.3: By 2030, double the agricultural productivity and incomes of
small-scale food producers, in particular women, indigenous peoples,
family farmers, pastoralists and fishers, including through secure and
equal access to land, other productive resources and inputs, knowledge,
financial services, markets and opportunities for value addition and non-
farm employment
Target 3.7: By 2030, ensure universal access to sexual and reproductive
health-care services, including for family planning, information and
CHAPTER 2: LITERATURE REVIEW
46
education, and the integration of reproductive health into national
strategies and programme
Target 3.8: Achieve universal health coverage, including financial risk
protection, access to quality essential health-care services and access to
safe, effective, quality and affordable essential medicines and vaccines for
all
Target 4.2: By 2030, ensure that all girls and boys have access to quality
early childhood development, care and pre-primary education so that they
are ready for primary education
Target 4.5: By 2030, eliminate gender disparities in education and ensure
equal access to all levels of education and vocational training for the
vulnerable, including persons with disabilities, indigenous peoples and
children in vulnerable situations
2.7. Conclusions
Overall, this literature overview suggests that the scarcity of poverty and
transport-related data about the most disadvantaged regions (UN, 2015b) limits
the development of solid and effective research about transport-related exclusion
in the Global South (Porter, 2002; Salon and Gulyani, 2010). Under this low level
of research, and many misperceptions about the impacts of intersectionality on
travel patterns (Levy, 2013), transport policy recommendations that should be
guided by disaggregated accessibility and equity analysis (Vasconcellos, 2011)
are frequently inaccurate and socially unjust (Pereira et al., 2017). In a political
context of low transparency and low accountability that also lacks this evidence-
based policy recommendations, policy-makers are likely to mislead transport
investments towards their own private agendas (Benitez, 2010). As a result,
debilitating and unconstrained transport and urban development are
perpetuated, reinforcing cycles of chronic poverty (UN, 2016; Hulme et al., 2001).
By pointing out and connecting these underexplored insights on the transport-
poverty nexus in the Global South, this Chapter has argued that new transport
CHAPTER 2: LITERATURE REVIEW
47
policies should comprehend strategies to address the eight transport-related
dimensions of exclusion, if the goal is to end poverty in all its manifestations by
2030. The gravity and urgency of lifting 1.3 billion people out of poverty are
translated by Narayan et al.’s (2000) definition of poverty:
“Poverty is pain. Poor people suffer physical pain that comes with too little
food and long hours of work; emotional pain stemming from the daily
humiliations of dependency and lack of power; and the moral pain from
being forced to make choices such as whether to pay to save the life of an
ill family member or to use the money to feed their children. “
Undeniably, while many political leaders insist on claiming that we are finally the
generation that can end extreme poverty, this will not come true until
professionals from across the range of human knowledge start working strongly
committed towards this direction. This Chapter has raised evidence that can be
a valuable input to call particular attention to the essential role that transport
academics and practitioners ought to play in order to stand up to poverty when
developing new transport policies.
CHAPTER 3: ACCESSIBILITY EVALUATION AT THE HOUSEHOLD LEVEL
48
3. CHAPTER 3: ACCESSIBILITY EVALUATION AT THE
HOUSEHOLD LEVEL
3.1. Introduction
There is a growing body of literature dedicated to evaluating spatial access to
public services including methods based on minimum travel-distance (Apparicio
et al., 2008), gravity models (Haynes et al., 2003), kernel-density estimation
(Spencer and Angeles, 2007), and floating catchment areas (Luo and Wang,
2003). However, mostly due to a lack of accurate data, especially spatial data,
quantitative research on this topic still falls short in the context of low-income and
remote rural areas globally (Serajuddin, 2015).
As already discussed in Chapters 1 and 2, poverty is a multidimensional
phenomenon directly related to the lack of access essential services (such as
healthcare, education) (Narayan et al., 2000; Alkire and Santos, 2014).
Nonetheless, while accessibility has been long recognised as central in the social
inclusion agenda of rural areas (Farrignton and Farrignton, 2005), this transport-
related dimension of poverty has remained understudied in quantitative studies
in several low-income regions from the rural Global South (Benevenuto and
Caulfield, 2019; IFAD, 2011). In the context of Northeast Brazil, which contains
the largest percentage of people in extreme poverty of the Country and where
the majority of these people still live in rural areas (IBGE, 2010a), very few
quantitative studies exist examining access to these basic services (Garcia-
Subirats et al., 2014).
Yet, a few notable exceptions dedicated to specific health outcomes have pointed
to the same direction of the international studies on this agenda. De Souza et al.
(2000), for instance, have shown that healthcare accessibility was reported by
CHAPTER 3: ACCESSIBILITY EVALUATION AT THE HOUSEHOLD LEVEL
49
mothers as a determinant factor leading to delays in seeking professional care
when their infants had potentially life-threatening symptoms. Likewise, other
authors have also reported that the greatest impediments in the utilisation of
healthcare for the Brazilian rural population are related to difficulties of
geographical access, either perceived by long journey times, lengthy distances
or low availability of transport (Osorio et al., 2011; Travassos, 2006). In fact,
lengthy distances to healthcare centres have long been recognised as a major
determinant of the utilisation of public services such as healthcare (Shannon et
al., 1969; Stock, 1983; Thaddeus and Maine, 1994; Adedini et al., 2014; Fluegge
et al., 2018). Gabrysch and Campbell, 2009 explains that low spatial accessibility
of healthcare exerts a twofold burden, firstly by discouraging from seeking care,
and secondly by being an actual impedance to reaching medical care once the
decision to seek it has been made.
Healthcare accessibility has gained a lot of recent attention in Brazil due to the
structural changes in the program “Mais Médicos” (More Doctors), which since
2013 has added 4917 physicians to work in remote and deprived areas of Brazil
(Santos et al., 2017). However, there is still no evidence published to date (to the
best of the author’s knowledge) showing either the health outcomes associated
with this initiative or the current level of spatial accessibility of health services in
rural and deprived areas.
This Chapter proposes a novel strategy to measure the spatial burden that is
potentially preventing the low-income population in rural Northeast Brazil from
accessing basic services. Whilst much has been written on the transport and
social exclusion dialogue of more economically vibrant and data-rich contexts,
the present Chapter contributes to the literature by i) assessing accessibility to
basic services in an often-overlooked region; ii) proposing an innovative proxy for
a quantitative accessibility evaluation of the rural Northeast Brazil; iii) shedding
light on the transport issues that undermine public health in rural low-income
contexts; iv) devising practical policy recommendations to address the
concerning health and social outcomes of the case study region.
Since this Chapter provides further analysis on healthcare accessibility, beyond
the overall accessibility measurements, a brief overview of the health challenges
CHAPTER 3: ACCESSIBILITY EVALUATION AT THE HOUSEHOLD LEVEL
50
in rural Northeast Brazil is initially provided to set the background for this analysis.
Then, combining the urban and healthcare centres’ locations with a proxy for the
low-income households’ location, this Chapter proposes a quantitative
accessibility evaluation at the household level in the Northeast Brazil context.
The distances between households facing income poverty and healthcare
centres are calculated by means of GIS tools and then described spatially and
statistically. Finally, some policy recommendations are drawn upon these
findings, and the gaps that still need to be further studied in this field are
identified. The results in the next sections of this Chapter are also published in
Benevenuto et al. (2019).
3.2. Public health challenges in Rural Northeast Brazil
Despite the investment in public policies and the creation of Brazil's publicly
funded healthcare system (SUS) in 1988, which follows a guiding principle of
equity, regional and socio-economic disparities are still prevalent in the overall
health outcomes in Brazil (Szwarcwald et al., 2016; Rasella et al., 2013; Barros
et al., 2011). Evidence shows that the North and Northeast regions, which have
the lowest average income (IBGE, 2010a), have historically presented the most
unsatisfactory rates of several health indicators that are usually associated with
limited accessibility of health services (Albuquerque, 2017; Szwarcwald et al.,
2016; Victoria et al., 2011). These concerning trends are hereafter represented
and further considered by two specific indicators, namely, life expectancy at birth,
and mortality in children younger than 5 years (i.e. under-5 mortality).
Life expectancy is a particularly suitable indicator to measure the impact of
healthcare accessibility since it summarises the social, health, and general well-
being conditions of a population by considering mortality rates in their different
age groups. All causes of death are contemplated when estimating this indicator,
including diseases and external causes, such as violence and accidents (UNDP
et al., 2010). Likewise, Under-5 Mortality is an internationally applied indicator
also widely used to evaluate coverage and adequate access to healthcare
(Walker, 2013; Gabrysch and Campbell, 2009). This is due to the fact that some
of the main strategies to reduce its occurrence (i.e. timely treatment,
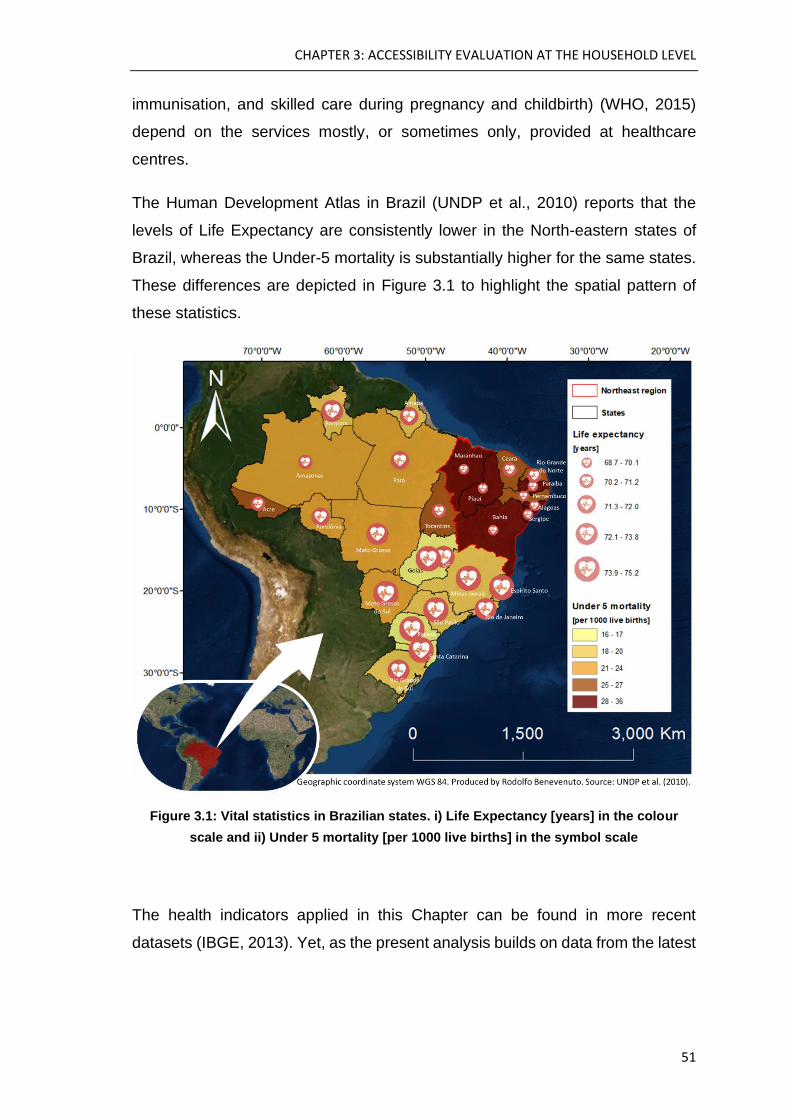
CHAPTER 3: ACCESSIBILITY EVALUATION AT THE HOUSEHOLD LEVEL
51
immunisation, and skilled care during pregnancy and childbirth) (WHO, 2015)
depend on the services mostly, or sometimes only, provided at healthcare
centres.
The Human Development Atlas in Brazil (UNDP et al., 2010) reports that the
levels of Life Expectancy are consistently lower in the North-eastern states of
Brazil, whereas the Under-5 mortality is substantially higher for the same states.
These differences are depicted in Figure 3.1 to highlight the spatial pattern of
these statistics.
Figure 3.1: Vital statistics in Brazilian states. i) Life Expectancy [years] in the colour
scale and ii) Under 5 mortality [per 1000 live births] in the symbol scale
The health indicators applied in this Chapter can be found in more recent
datasets (IBGE, 2013). Yet, as the present analysis builds on data from the latest
CHAPTER 3: ACCESSIBILITY EVALUATION AT THE HOUSEHOLD LEVEL
52
Census23 (IBGE, 2010a) to keep the consistency among variables, older health
indicators are used. Perhaps the most concerning limitation of the Brazilian
Health Database (i.e. DATASUS) is that despite the thorough disaggregation
levels in terms of socio-economic, demographic and health variables, this
database falls short in disaggregation of spatial details.
Currently, there is no disaggregation publicly available of these datasets for
urban/rural areas at a municipality level, or by areas smaller than a municipality
(i.e. electoral division, census sector, etc). In that sense, location-based
comparisons and correlations of health indicators become limited to the few
health indicators included in the Brazilian Census, which is also timewise limited
(once every 10 years) and only disaggregated by location (urban/rural) at the
state level.
Nevertheless, when comparing these state-wise health indicators by location it is
possible to spot major disparities between urban and rural areas in the
Northeastern states. Figure 3.2 and Figure 3.3 point out that the difference in Life
Expectancy can be up to 3.4 years lower in rural areas compared to urban areas
in the same state (e.g. Sergipe state). Similarly, the rate of Under 5 mortality (per
1000 live births) is up to 44% higher in rural areas compared to the urban figure
of the same state (also Sergipe).
23 The Brazilian Census is updated every 10 years. Therefore, the next one is planned to be
released in 2020.
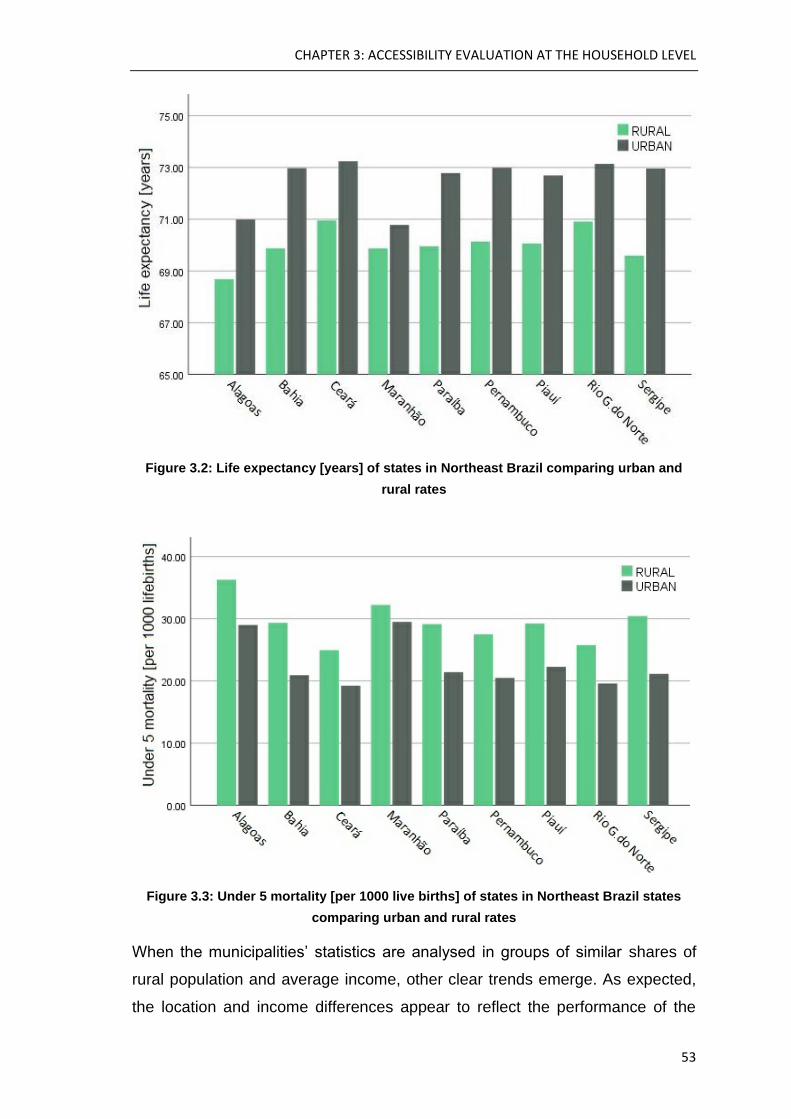
CHAPTER 3: ACCESSIBILITY EVALUATION AT THE HOUSEHOLD LEVEL
53
Figure 3.2: Life expectancy [years] of states in Northeast Brazil comparing urban and
rural rates
Figure 3.3: Under 5 mortality [per 1000 live births] of states in Northeast Brazil states
comparing urban and rural rates
When the municipalities’ statistics are analysed in groups of similar shares of
rural population and average income, other clear trends emerge. As expected,
the location and income differences appear to reflect the performance of the
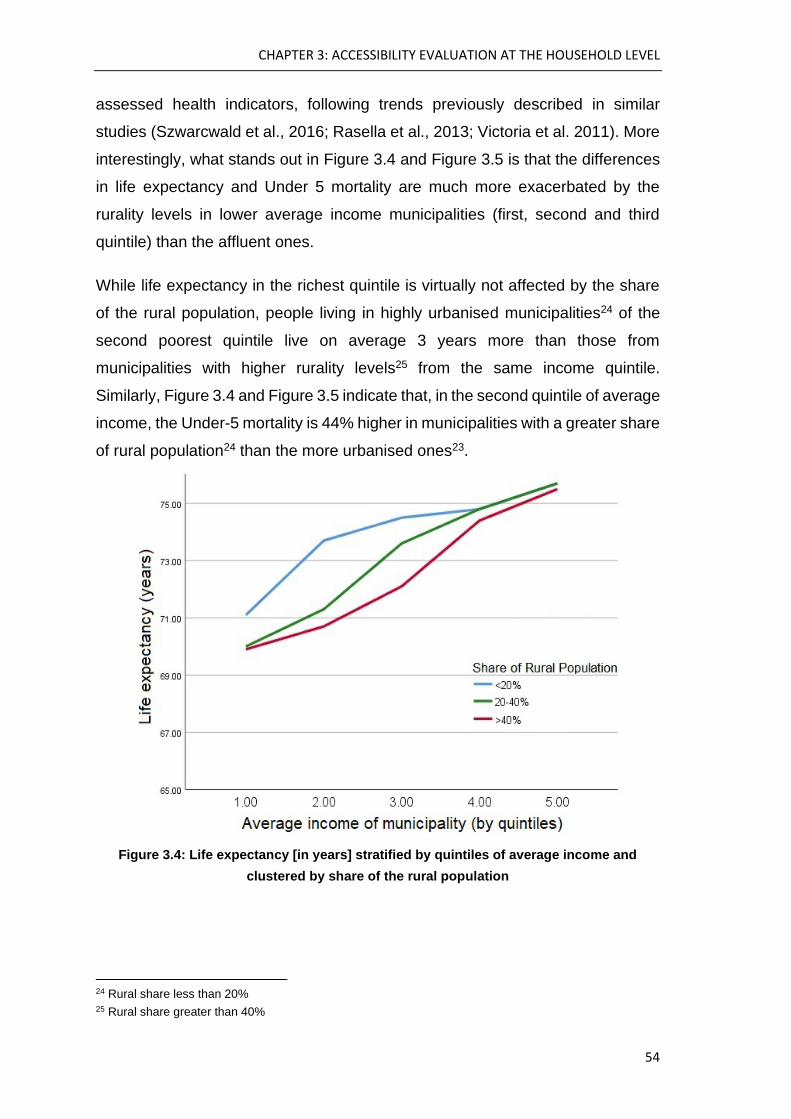
CHAPTER 3: ACCESSIBILITY EVALUATION AT THE HOUSEHOLD LEVEL
54
assessed health indicators, following trends previously described in similar
studies (Szwarcwald et al., 2016; Rasella et al., 2013; Victoria et al. 2011). More
interestingly, what stands out in Figure 3.4 and Figure 3.5 is that the differences
in life expectancy and Under 5 mortality are much more exacerbated by the
rurality levels in lower average income municipalities (first, second and third
quintile) than the affluent ones.
While life expectancy in the richest quintile is virtually not affected by the share
of the rural population, people living in highly urbanised municipalities24 of the
second poorest quintile live on average 3 years more than those from
municipalities with higher rurality levels25 from the same income quintile.
Similarly, Figure 3.4 and Figure 3.5 indicate that, in the second quintile of average
income, the Under-5 mortality is 44% higher in municipalities with a greater share
of rural population24 than the more urbanised ones23.
Figure 3.4: Life expectancy [in years] stratified by quintiles of average income and
clustered by share of the rural population
24 Rural share less than 20% 25 Rural share greater than 40%

CHAPTER 3: ACCESSIBILITY EVALUATION AT THE HOUSEHOLD LEVEL
55
Figure 3.5: Under 5 mortality [per 1000 livebirths] stratified by quintiles of average
income and clustered by share of the rural population
Thus far, this Section has attempted to provide a brief summary of the health
challenges particularly affecting rural low-income families of Northeast Brazil.
The next Section describes the data and methods utilised in this Chapter for
evaluating a spatial barrier that is potentially preventing these families from
accessing healthcare and other essential services.
3.3. Data and Methods
This section provides a further description of the data and the methods applied
to this accessibility analysis. Section 3.3.1 and 3.3.2 provide a rationale for the
proxies that are proposed in this Chapter, showing how existing open access
datasets can be harnessed to track the location of the households in extreme
poverty and basic services in Northeast Brazil. Section 3.3.3 propose a method
that is suitable for estimating spatial accessibility in the case study context.
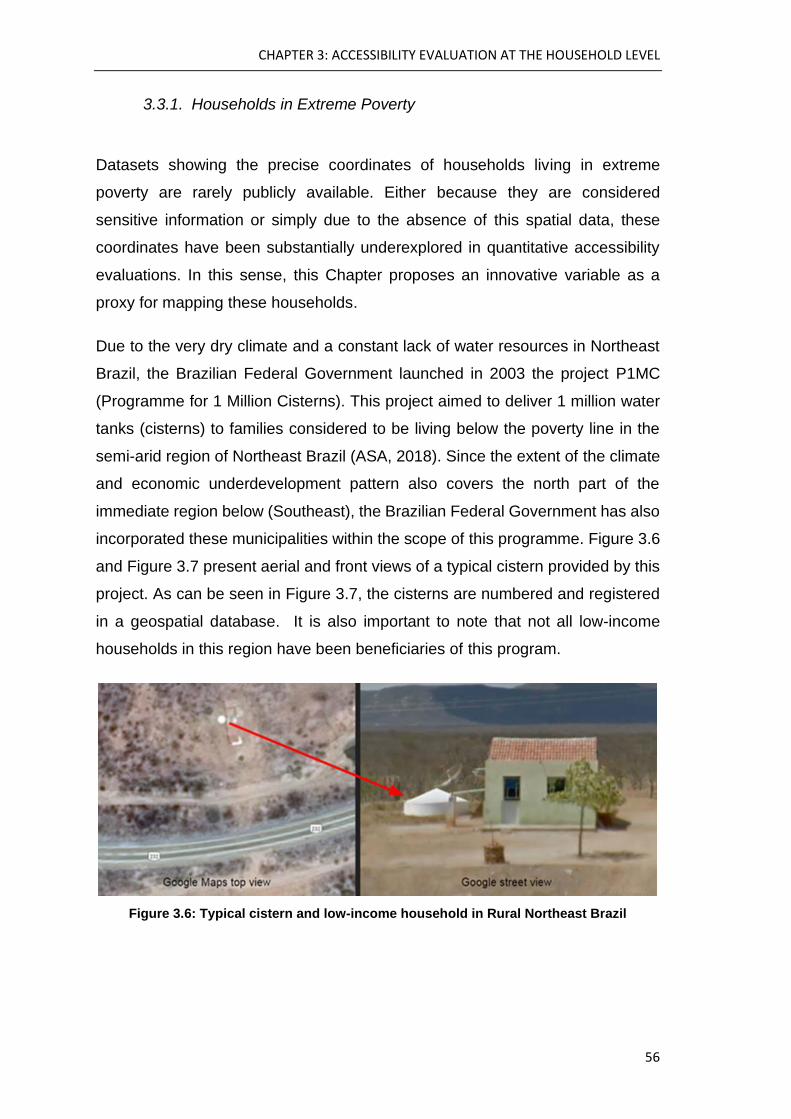
CHAPTER 3: ACCESSIBILITY EVALUATION AT THE HOUSEHOLD LEVEL
56
3.3.1. Households in Extreme Poverty
Datasets showing the precise coordinates of households living in extreme
poverty are rarely publicly available. Either because they are considered
sensitive information or simply due to the absence of this spatial data, these
coordinates have been substantially underexplored in quantitative accessibility
evaluations. In this sense, this Chapter proposes an innovative variable as a
proxy for mapping these households.
Due to the very dry climate and a constant lack of water resources in Northeast
Brazil, the Brazilian Federal Government launched in 2003 the project P1MC
(Programme for 1 Million Cisterns). This project aimed to deliver 1 million water
tanks (cisterns) to families considered to be living below the poverty line in the
semi-arid region of Northeast Brazil (ASA, 2018). Since the extent of the climate
and economic underdevelopment pattern also covers the north part of the
immediate region below (Southeast), the Brazilian Federal Government has also
incorporated these municipalities within the scope of this programme. Figure 3.6
and Figure 3.7 present aerial and front views of a typical cistern provided by this
project. As can be seen in Figure 3.7, the cisterns are numbered and registered
in a geospatial database. It is also important to note that not all low-income
households in this region have been beneficiaries of this program.
Figure 3.6: Typical cistern and low-income household in Rural Northeast Brazil

CHAPTER 3: ACCESSIBILITY EVALUATION AT THE HOUSEHOLD LEVEL
57
A dataset composed of 493,659 locations (Latitude and Longitude) of these
cisterns has been provided by the Articulação do Semi-Árido Brasileiro (ASA26)
in cooperation with the Superintendency for the Development of Northeast Brazil
(SUDENE27) for the present academic purpose. Each cistern is usually located a
few meters from at least one low-income household registered in the social
programmes of the Federal Government. While other proxies such as night-time
lights, often used to measure poverty in Sub-Saharan Africa (Noor et al., 2008),
would inevitably fall short in spatial and socioeconomic accuracy, these cisterns
are only given to families considered in extreme poverty after a thorough analysis
by the social workers from the local government. Therefore, it is argued that this
dataset represents one of the most accurate and representative proxy to track
the location of rural low-income households in rural Northeast Brazil. Figure 3.8
presents these points plotted over Northeast Brazil, showing its wide coverage in
the region. Further evidence of the accuracy of this dataset is provided in the
following sections.
Figure 3.7: Beneficiary from Programme 1 Million of Cisterns (ASA, 2018)
26 ASA is a network composed of more than 3.000 civil society organizations of different purposes including
NGOs, rural unions, farmers associations, cooperatives, and other entities that act in defence of the rights
of people living in the Semi-arid region of Northeast Brazil. 27 SUDENE is a Brazilian governmental agency in charge of planning and stimulating the social and
economic development of the Northeastern region of Brazil.

CHAPTER 3: ACCESSIBILITY EVALUATION AT THE HOUSEHOLD LEVEL
58
Figure 3.8: Spatial distribution of cisterns in extended Northeast Brazil (SUDENE Area)
This cistern location dataset is the result of an effort of ASA of compiling a number
of smaller datasets containing the cisterns’ locations in different sub-regions in
Northeast Brazil. Since the cisterns of each of these sub-regions have been
mapped by different governmental agencies for different purposes using a few
different coordinate systems, the complete location dataset compiled by ASA has
never been used before. In that sense, an accuracy checking of such complete
dataset was carried out.
Considering that these cisterns present a very regular pattern of elements for
image interpretation, a geospatial object-based-image analysis as described by
Blaschke (2010) was conducted to perform a systematic scanning of the plotting
accuracy. According to Lillesand et al. (2014), the fundamental elements of this
image interpretation can be described by five key elements, as shown in Table
3.1. The features verified for each of these elements in the present analysis are
also described in the third column of Table 3.1.

CHAPTER 3: ACCESSIBILITY EVALUATION AT THE HOUSEHOLD LEVEL
59
Table 3.1: Description of elements analysed in the Geospatial object-based-image
analysis
Element Description Features verified
Shape General form, configuration or outline of the
object Regular circle
Size Must be considered in the context of the image
scale.
4 meters in diameter
at a 1:1000 scale
Pattern Relates to the spatial arrangement of the object Surrounded by at
least one house
Tone Refers to the relative brightness or colour of
the object Opaque whitish
Texture It is the frequency of tonal change on an image Regular smooth
Since the satellite imagery datasets that are publicly available for this region
present a spatial resolution of 10 meters or higher28, and the cistern diameter is
around 4 meters, the object-based-image analysis had to be done manually using
the world imagery basemap layer available in ArcMap 10.6.129, as shown in
Figure 3.9. In this sense, to determine the accuracy of this plotting (i.e. the
cisterns dataset), the distances between the plotted coordinates and the closest
visible cistern (that met all the image interpretation criteria) were individually
measured for a sample of 384 points (randomly selected). The traditional
sampling formula (Equation 3.1) proposed by Krejcie and Morgan (1970) has
been used to calculate a representative sample size for this dataset:
𝑛 =𝑁 ∙ 𝑝 ∙ (1 − 𝑝) ∙ (𝑍𝛼
2)
𝑝 ∙ (1 − 𝑝) ∙ (𝑍𝛼2
) + (𝑁 − 1) ∙ 𝐸2
Where:
o 𝑛 is the sample size to be estimated (384 points)
o 𝑁 is the population size (493,659 for this case)
28 For example Sentinel-2 (available at https://sentinel.esa.int/) or Landsat-8 (available
https://landsat.gsfc.nasa.gov/)
29 The resolution of this basemap offered by ArcMap 10.6.1 is less than 1 meter per pixel.
Equation 3.1

CHAPTER 3: ACCESSIBILITY EVALUATION AT THE HOUSEHOLD LEVEL
60
o 𝑍𝛼
2 is the critical value that corresponds to the desirable confidence
degree (in this case 1.96 for a confidence degree of 95%, assuming
a normal distribution)
o 𝑝 is the likelihood of the expected event (assumed as 50% when
unknown)
o 𝐸 is the adopted error margin (± 5% for this case)
Figure 3.9: Sample of accuracy checking of cisterns location (screenshot taken from
ArcMap 10.6.1)
3.3.2. Public services and Basic amenities
This Section describes the datasets that were utilised to proxy the location of
public services and basic amenities in this analysis. In the Brazilian context,
substantial progress has been achieved on the compilation of spatial data since
2008 when the National Spatial Data Infrastructure (INDE30) was created.
However, the clear majority of public services’ and basic amenities’ locations
(latitude/longitude) remain still unknown at a national level, especially in the rural
and suburban contexts. For example, regarding the education centres, recent
efforts are being made by the Federal Government to deliver the full mapping of
30 INDE portal: http://www.inde.gov.br/

CHAPTER 3: ACCESSIBILITY EVALUATION AT THE HOUSEHOLD LEVEL
61
these services by the next educational census (i.e. by 2020). However, at the
time that this thesis was written (i.e. 2019), only the list of addresses of the
schools and centres of education (including private and public ones) was
available on-demand via the National Institute of Educational Studies and
Research (INEP). While the geo-codification31 of this list can achieve a fair level
of accuracy for urban addresses, the rural ones are mostly too vague to be
geocoded (rural roads with no name, or no number, or broken zip code). Similarly,
the location (Latitude/Longitude) of essential services such as public transport,
social assistance centres, police stations, and other basic amenities (e.g.
supermarkets, grocery shops, pharmacies) are as a rule not consistently
available for Northeast Brazil. In fact, among these points of interests, the only
country-wide and accurate spatial dataset currently available is the location of
healthcare centres. These are made available by the Ministry of Health that will
be further discussed later in this Section.
Nonetheless, since these public services and basic amenities are primarily
concentrated within the urban centres (IBGE, 2008; Church et al., 2000), it is
reasonable to assume the geolocation of each urban centre (i.e. city hall
coordinates) as an aggregated proxy for public services and basic amenities’
locations at a larger scale. For instance, from the list of addresses of education
centres mentioned above, it is possible to conclude that 87% of the education
centres that offer high school are located in the urban areas. Moreover, this
premise has been also used by recent studies (Weiss et al., 2018; Headey et al.
2018), to demonstrate how access to urban centres stratifies the educational,
economic and health status across different communities. The variety and
complexity of services and amenities offered in each centre are dependent on
the urban hierarchy of each centre. Following the traditional hierarchisation
method proposed by IBGE (2008) this Chapter considers the five different levels
of centrality in Brazil, as described in Table 3.2.
31 Computational process of transforming an address into a pair of coordinates (latitude and longitude).

CHAPTER 3: ACCESSIBILITY EVALUATION AT THE HOUSEHOLD LEVEL
62
Table 3.2: Urban centre hierarchy
Hierarchy Quantity of urban
centres considered
Population range
[thousand inhabitants each]
Metropolis 6 From 1,393 to 2,675
Regional centre 27 From 134 to 1,014
Sub-regional centre 66 From 23 to 334
Zone centre 220 From 8 to 126
Local centre 1,765 From 1 to 87
Beyond population size, different services are taken into consideration when
composing these centrality levels, for example, higher education provision,
banking services, number of business offices, hospitals, coverage areas of
television stations and internet, etc (IBGE, 2008). Overall, this hierarchy is mainly
based on i) the number and complexity of services available in each urban centre,
and ii) by the influence that each centre exerts on the surrounding municipalities
(IBGE, 2008).
Even though other studies have been published since 2008 updating the regional
divisions of the Country (IBGE, 2016; IBGE, 2017), they do not propose any
different hierarchisation method for urban centrality. Rather, they based their
population arrangements and regional divisions on the same seminal paper
(IBGE, 2008), confirming, thus, that this urban hierarchisation method is still valid
nowadays. Moreover, no municipalities have been created in this region since
2008.
Another accessibility measurement is also proposed using one of the few public
services location datasets that is consistently available for all regions in Brazil,
that is, the location of healthcare centres. As described in Table 3.3, this dataset
contains the location of four different types of healthcare centres (Ministério da
Saúde, 2018):

CHAPTER 3: ACCESSIBILITY EVALUATION AT THE HOUSEHOLD LEVEL
63
Table 3.3: Healthcare centres classification in Brazil
Type of
healthcare
centre
Quantity
in Brazil Description
Basic care
unit 40,612
These units are known in Brazil as the UBS (i.e. acronym for
Unidade Básica de Saúde). They are the main place where
interdisciplinary primary care professionals operate for a specific
population in each geographic area. It is preferably the first
contact of the patient in the healthcare network.
Family
health
support
nucleus
4,417
These centres are known in Brazil as NASF (i.e. acronym for
Núcleo de Apoio a Saúde da Família) was created in 2008 by the
Brazilian Ministry of Health, with the intention to expand the scope
and spectrum of care actions on the primary care and to increase
its effectiveness. The medical specialities available in each NASF
depend on the local health needs.
Emergency
care unit 425
Also known as UPA (i.e. acronym for Unidade de Pronto
Atendimento), they are part of the Emergency Care Network. Its
objective is to concentrate the healthcare of intermediate
complexity, forming a network organized in conjunction with Basic
Attention and Hospital Attention, decreasing queuing in hospital
emergency rooms, as well as increasing the service capacity of
the Brazilian Healthcare system (i.e. SUS). As they are also a
recent government initiative, there are only 425 of this kind of
units.
Hospital 3,406 Centres of a wide range of medium and high complexity
healthcare services.
3.3.3. Accessibility estimate
Accessibility-related studies commonly use GIS tools32 to estimate service areas
based on driving/cycling/walking distances or time from an origin, for example, a
household, or neighbourhood, to the closest point of interest, such as schools,
hospitals, or even job opportunities (Pereira, 2018; Guagliardo, 2004). The
accuracy level of this estimates deeply relies on the quality of the transport
network datasets33.
32 Mostly by means of OpenTripPlanner, QGIS, ArcGIS®, or Sugaraccess® 33 For example: General Transit Feed Specification (GTFS) datasets

CHAPTER 3: ACCESSIBILITY EVALUATION AT THE HOUSEHOLD LEVEL
64
In contrast, Rural Northeast Brazil is predominantly covered by non-paved
secondary and tertiary roads and footpaths that are in many cases not mapped
either by the Government authority34 or by large mapping platforms (HERE
maps®, Google maps®, and OpenStreetMap®). Figure 3.10 depicts the
discrepancies between the catchment areas using Driving distance (estimated
by ArcGIS online) and linear radius methods (buffers) from small towns in
Pernambuco state in Northeast Brazil. The location of the mapped roads can be
seen along the reddish areas and lines depicted in Figure 3.10. As can be noted
in this Figure, if this method of travel impedance was used, several households
(white dots) would wrongly appear to be not connected to the road network.
Figure 3.10: Low-income households under the urban influence area - Municipalities of
Brejo de Madre de Deus and Poção (Source: ArcGIS online)
As shown in Figure 3.10, many roads that connect low-income households to
urban centres and healthcare centres are not mapped, creating serious gaps in
the service areas estimated by driving distance (reddish scale). Moreover, if only
the areas where transport-related data is available were selected to be assessed,
a significant caveat would be introduced in the analysis as these areas are as a
rule more urbanised and economically vibrant. Therefore, in order to include also
areas that have been persistently overlooked in the academic literature (perhaps,
precisely for not having accurate and timely transport-related data), a simpler
travel impedance method had to be adopted.
34 Brazilian National Transport Infrastructure Department (DNIT)

CHAPTER 3: ACCESSIBILITY EVALUATION AT THE HOUSEHOLD LEVEL
65
Tanser et al. (2006) argue that conventional models using network analysis are
not appropriate for areas where people mostly walk to the nearest service, and
public transport is unregulated, and its coverage is temporal and spatially
sporadic. Therefore, following other studies of healthcare accessibility in similar
contexts of the Global South (Francis et al., 2009; Tanser et al., 2006; Noor et
al., 2003; Tanser et al., 2001), the present methodology applies the Geodesic35
method to provide a comprehensive and consistent spatial distance evaluation.
Even though this method does not include extra distances caused by natural
barriers (rivers, cliffs, etc) and road curvature, it enables consistency to be
maintained among all regions despite the gaps of the mapped transport network.
As demonstrated earlier in this Section (Figure 3.10), any estimate of travel
impedance based on this road network dataset would be result a rather
inconsistent output. Thus, despite its limitations, the linear distance method
provides a much more conservative estimate of the travel distances.
3.4. Results and Discussion
3.4.1. Cisterns as a proxy for low-income households
The geospatial object-based-image analysis performed with the 384 cisterns’
locations has shown that these points are on average 104.83 meters away from
the real cistern observed on the satellite view. Figure 3.11 shows the descriptive
statistics and a frequency distribution graph of these plotting imprecisions,
highlighting that 81.4% of the cases have an inaccuracy of less than 200 meters.
Only for 0.8% of the cases (8 points), no cistern was identified in a search radius
of 3,000 meters - which is still in accordance to the error margin of 5% expected
from this sample size.
35 The Geodesic method consist of the measurement of distance along the shortest route between
two points on the Earth’s surface.

CHAPTER 3: ACCESSIBILITY EVALUATION AT THE HOUSEHOLD LEVEL
66
Figure 3.11: Descriptive statistics of the cistern plotting accuracy
Given the relatively low inaccuracy of the plotted points evaluated in the sample,
the cisterns’ locations dataset can be considered as a good proxy for the rural
low-income households in Northeast Brazil. This dataset represents an accurate
and representative collection of information that can be utilised for better
understanding of the spatial burden faced by low-income families in this region.
Nevertheless, spatial analysis (e.g. prioritisation areas) using this dataset should
be done with more caution. Once again it is important to note that the absence
of cisterns in a given municipality does not mean absence of households in
extreme poverty. Therefore, the following analysis primarily focuses on
describing statistically the limited accessibility patterns of these households,
rather than creating a regional index of accessibility based on this proxy. In the
following sections, the accessibility patterns of these households are spatially
and statistically described.
3.4.2. Access to urban amenities
The statistical description of the spatial burden separating low-income
households and to the closest urban centre of each centrality level defined in
Table 3.2 are presented in Figure 3.12-Figure 3.16.

CHAPTER 3: ACCESSIBILITY EVALUATION AT THE HOUSEHOLD LEVEL
67
Figure 3.12: Frequency distribution of households by geodesic distance to Local Centre
Figure 3.13: Frequency distribution of households by geodesic distance to Zone Centre
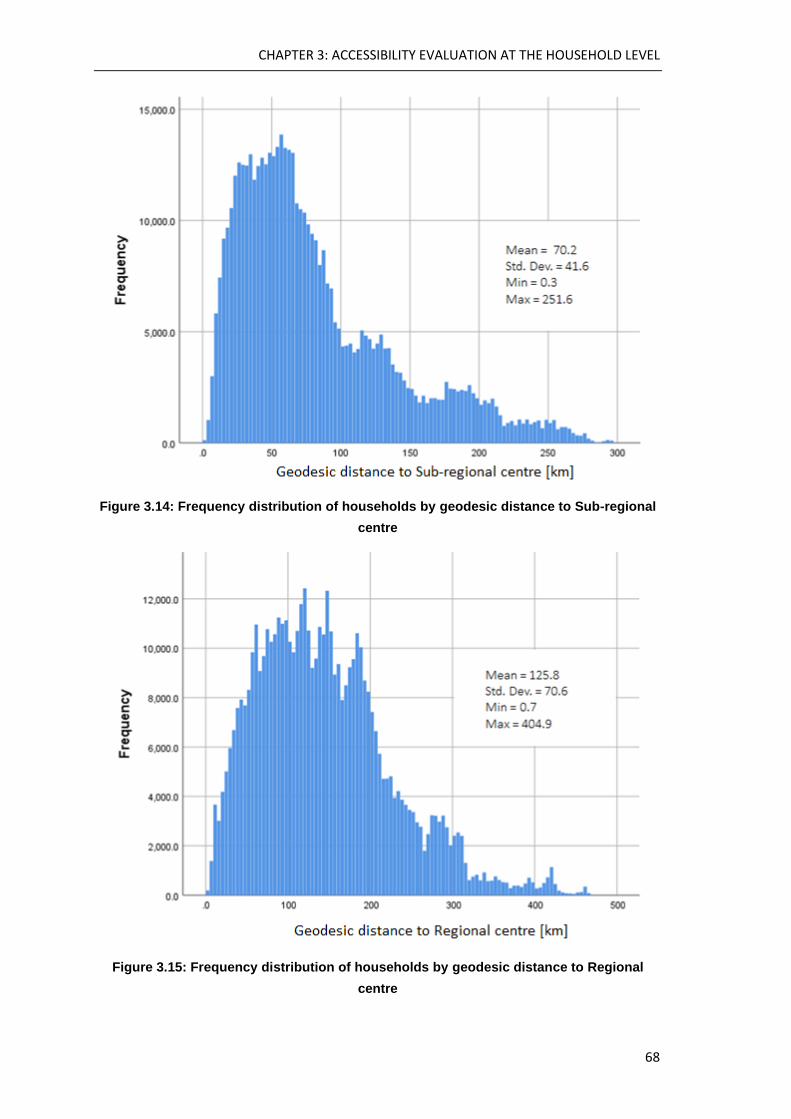
CHAPTER 3: ACCESSIBILITY EVALUATION AT THE HOUSEHOLD LEVEL
68
Figure 3.14: Frequency distribution of households by geodesic distance to Sub-regional
centre
Figure 3.15: Frequency distribution of households by geodesic distance to Regional
centre

CHAPTER 3: ACCESSIBILITY EVALUATION AT THE HOUSEHOLD LEVEL
69
Figure 3.16: Frequency distribution of households by geodesic distance to Metropolis
The distances presented in Figure 3.12 to Figure 3.16 illustrate the lack of access
to basic services and amenities that almost half-million households face in this
case study region. In addition, these graphs also depict the vast accessibility
inequalities in Northeast Brazil, especially when looking at the urban centres of
higher hierarchy. Even though the services and amenities assessed in this
analysis are aggregated by a proxy (urban centres), these findings present an
unprecedented quantitative assessment of the overall accessibility of the low-
income families in Rural Northeast Brazil.
Beyond the high averages, the findings also show that nearly half of the assessed
households (242,300) are currently living farther away than 10 km from any urban
centre. These results once again subscribe to the view that many basic services
remain mostly inaccessible for a substantial portion of the rural families living in
poverty in Northeast Brazil. This fact not only represents a major hurdle faced by
these families nowadays but also points out a potential explanation as to why
poverty reduction has not been sustained and effectively addressed in this region
over the past decades.

CHAPTER 3: ACCESSIBILITY EVALUATION AT THE HOUSEHOLD LEVEL
70
As the centrality levels are mainly defined by the number and complexity of
services36 available in each urban centre, it can be also argued that the reachable
services and amenities from rural low-income households are mostly basic, such
as primary schools and primary healthcare.
Beyond providing a representative measurement on the broad level of
accessibility to urban centres, these findings also point out to land use and
population distribution issues. These concerning spatial burden on rural low-
income households suggest that a polycentric fashion of urban development
could also support the promotion of universal access to essential services.
Likewise, Weiss et al. (2018) hold that transport infrastructure development might
also play an important role in this process by reducing the travel time to reach
these services. Further elaboration on this topic is provided in Chapter 4 by
illustrating the social outcomes of a transport infrastructure intervention with a
case study in Northeast Brazil.
3.4.3. Access to healthcare
The distances from the 493,659 low-income households to the nearest
healthcare centre were calculated for both types of healthcare units using
Geodesic distance. A summary of the findings related to access to health
services are presented in Figure 3.17 and Figure 3.18. When the closest
healthcare facility is evaluated, considering both hospitals, emergency, and
primary care units, 96,508 rural low-income households (approximately 20% of
the sample) are found farther than 10 km the closest health centre as measured
by geodesic distance. Considering that people in extreme poverty mostly live in
a walking world and that Geodesic measurements are often underestimated, it is
argued that people living under such a spatial burden are virtually excluded from
the public healthcare system and require urgent action from policymakers.
36 Such as higher education provision, banking services, number of business offices, coverage areas of
television stations and internet, etc (IBGE, 2008).
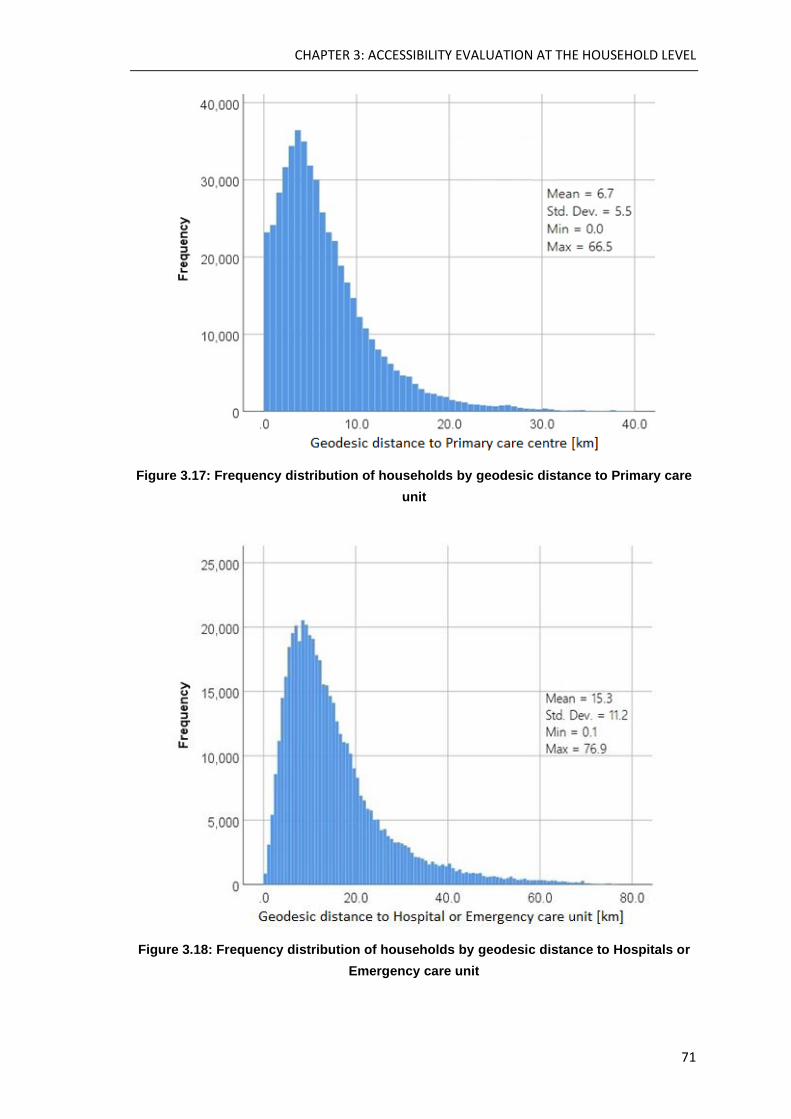
CHAPTER 3: ACCESSIBILITY EVALUATION AT THE HOUSEHOLD LEVEL
71
Figure 3.17: Frequency distribution of households by geodesic distance to Primary care
unit
Figure 3.18: Frequency distribution of households by geodesic distance to Hospitals or
Emergency care unit

CHAPTER 3: ACCESSIBILITY EVALUATION AT THE HOUSEHOLD LEVEL
72
Previous studies assessing the spatial accessibility of health services by linear
distances have applied threshold distances of up to 5 km for Primary care and
25 km for Hospitals and emergency care to define remoteness from health
services (Bell et al., 2012; Jordan et al. 2004). Figure 3.19 summarises the
distribution of the assessed households in 5 different strata of remoteness from
health services.
Figure 3.19: Distribution of distances by remoteness from health services thresholds
Since the proxy used here is not evenly distributed among the Northeastern
municipalities, any quantitative correlation between the average spatial burden
of the municipalities and their respective health indicators could lead to biased
interpretations of the data. That said, on the other hand, it is undeniable that at a
macro level such a lengthy distances separating low-income families from health
services contribute directly to the poor health indicators described in Section 3.2.

CHAPTER 3: ACCESSIBILITY EVALUATION AT THE HOUSEHOLD LEVEL
73
Neutens et al. (2014) argue that there is convincing evidence showing that spatial
barriers between patients and health services providers contribute to lower
healthcare utilisation, which entails a limited uptake of preventive services and
eventually gives rise to poorer health outcomes. Particularly in the Northeast
Brazil context, Macinko et al. (2007) have reported evidence supporting the
hypothesis that higher physician supply is associated with lower infant mortality.
Macinko et al. (2007) also state that the real vital statistics from deprived rural
areas (for instance the ones shown in Section 3.2) are likely to be even worse
than what it is measured since there is evidence of undercounting of child
mortality in these places37.
The implemented public policies and investments in primary healthcare, including
the Mais Médicos program, that were carried out in recent years, have
contributed to improving the living conditions of the population located at remote
and deprived regions of Northeast Brazil (Silva et al., 2018). However, in the
Semi-arid region, which is at the heart of Northeast Brazil, and where rurality and
poverty levels are higher, doctors and healthcare infrastructure remain still scarce
(Nogueira et al., 2016). This lack of biomedical professionals in these areas is
also evident in the study Demografia Médica no Brasil, conducted in 2018
(Scheffer et al., 2018), which shows that there are 8.4 times more doctors per
1,000 people in the Northeastern capitals than in the secondary and tertiary
municipalities.
It is argued that the simple location (latitude/longitude) collection of the low-
income households registered in Social Programs (like P1MC) would enable a
significant step forward in the Brazilian Transport and Public health planning.
While this spatial data remains unavailable, the presented dataset stands as an
accurate and statistically significant (nearly half a million households) proxy for
representing the quantitative accessibility patterns of families living under these
conditions.
Although the proxied dataset is still of limited use for ranking priority areas, Figure
3.20 is an attempt to highlight areas with a higher concentration of rural low-
37 It is estimated that only 78.1% of the infant deaths in Northeast region were registered in 2010 (Datasus,
2010).

CHAPTER 3: ACCESSIBILITY EVALUATION AT THE HOUSEHOLD LEVEL
74
income households (mapped by the cisterns) located farther than 10 km from any
healthcare centre. Figure 3.20 exemplifies the type of spatial prioritisation
analysis that could be done in future (when most of low-income households
become mapped) to evaluate healthcare accessibility of people in poverty. This
map calls attention to the potential benefits for action prioritisation that could be
achieved by enhancing the collection of spatial data.
Figure 3.20: Concentration of low-income households (proxied by cisterns) located
farther than 10 km from any healthcare centre
4.3. Conclusion
This Chapter explored the accessibility to urban and healthcare centres at a
household level of low-income families in rural Northeast Brazil by means of an
innovative proxy, namely, the cisterns’ locations. There is enough evidence to
support the use of this dataset as a proxy for the rural low-income households’
location of this region since its inaccuracy is less than 105 meters and the sample
size is substantially representative (493,659 households). Considering that each
cistern supplies water for an average of 5 people (Assis, 2012), it is estimated

CHAPTER 3: ACCESSIBILITY EVALUATION AT THE HOUSEHOLD LEVEL
75
that this location dataset may represent the location of nearly 2.5 million people
living in extreme poverty in Northeast Brazil.
However, it is important to remark that some municipalities do not have any
mapped cistern within their perimeter. In that sense, we maintain that this dataset
should be mainly used for drawing statistical analysis, rather than geospatial
rankings and density evaluations. In other words, the absence of mapped
cisterns in some municipalities should not be taken as an indicator of the absence
of low-income households.
Thus, although it is possible to spot some priority areas that are at most risk of
being denied access to health services due to the spatial burden (as shown in
Figure 3.20), further research is required to develop indicators applicable to all
municipalities of this region. More accurate and disaggregated results will also
require a comprehensive mapping of the transport network, as well as the full
geocodification of addresses of the families registered in the Federal Social
Programs, like P1MC.
The findings show that 53.5% of the rural low-income population in Northeast
Brazil are living farther than 5km (i.e. approximately an hour of walking) from the
nearest Primary care centre and over 49% are at a distance greater than 10km
(i.e. approximately two hours of walking) from the closest urban centre. These
results emphasise that the majority of this rural low-income population, who
mostly live in a walking world, experience an insurmountable spatial burden
preventing them from accessing basic public services and urban amenities.
Overall, this Chapter strengthens the idea that it is necessary to create
multidisciplinary teams to devise strategies as well as creative and lasting
solutions to address the barriers of transportation, social disparities and access
to health. As shown in the previous sections, transport also has a direct impact
on health indicators. Therefore, it is essential to bring together transport and
health professionals to promote more effective solutions to the current public
health challenges that affect specially the least advantaged segments of
population. Future research is needed to further investigate the impacts of
transport infrastructure investments and accessibility improvements on health

CHAPTER 3: ACCESSIBILITY EVALUATION AT THE HOUSEHOLD LEVEL
76
outcomes of remote and deprived areas such as rural Northeast Brazil. The
limitation of both spatial data and health data at a municipality and rural/urban
level, are likely to be additional challenges in this work. Thus, it is recommended
the use of innovative proxies (like cisterns’ locations) as auxiliary tools for public
policy planning and decision making.
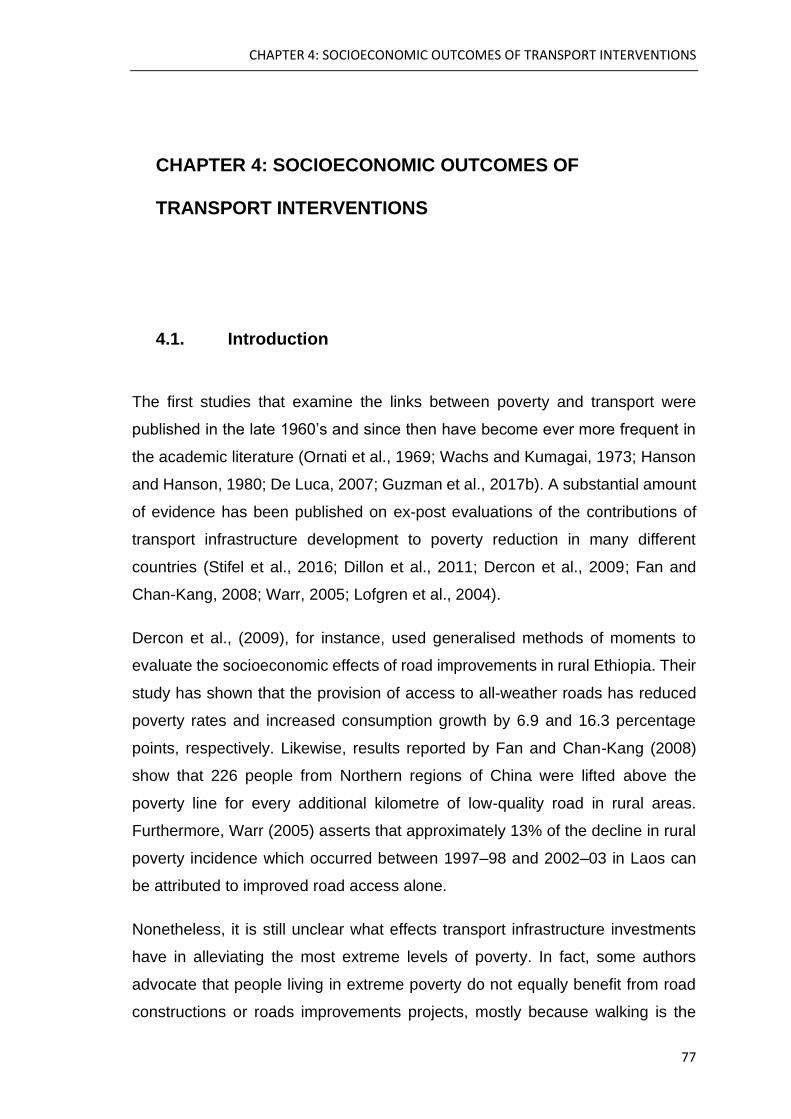
CHAPTER 4: SOCIOECONOMIC OUTCOMES OF TRANSPORT INTERVENTIONS
77
4. CHAPTER 4: SOCIOECONOMIC OUTCOMES OF
TRANSPORT INTERVENTIONS
4.1. Introduction
The first studies that examine the links between poverty and transport were
published in the late 1960’s and since then have become ever more frequent in
the academic literature (Ornati et al., 1969; Wachs and Kumagai, 1973; Hanson
and Hanson, 1980; De Luca, 2007; Guzman et al., 2017b). A substantial amount
of evidence has been published on ex-post evaluations of the contributions of
transport infrastructure development to poverty reduction in many different
countries (Stifel et al., 2016; Dillon et al., 2011; Dercon et al., 2009; Fan and
Chan-Kang, 2008; Warr, 2005; Lofgren et al., 2004).
Dercon et al., (2009), for instance, used generalised methods of moments to
evaluate the socioeconomic effects of road improvements in rural Ethiopia. Their
study has shown that the provision of access to all-weather roads has reduced
poverty rates and increased consumption growth by 6.9 and 16.3 percentage
points, respectively. Likewise, results reported by Fan and Chan-Kang (2008)
show that 226 people from Northern regions of China were lifted above the
poverty line for every additional kilometre of low-quality road in rural areas.
Furthermore, Warr (2005) asserts that approximately 13% of the decline in rural
poverty incidence which occurred between 1997–98 and 2002–03 in Laos can
be attributed to improved road access alone.
Nonetheless, it is still unclear what effects transport infrastructure investments
have in alleviating the most extreme levels of poverty. In fact, some authors
advocate that people living in extreme poverty do not equally benefit from road
constructions or roads improvements projects, mostly because walking is the

CHAPTER 4: SOCIOECONOMIC OUTCOMES OF TRANSPORT INTERVENTIONS
78
only travel mode available/affordable for them (Salon and Gulyani, 2010;
Setboonsarng 2006; Cook et al., 2005; Porter, 2002). Similarly, Hansen et al.
(2011) also argue that transport infrastructure interventions only impact people’s
well-being after a long chain of intermediate outcomes that interact with other
investments, private as well as public, and geographical conditions.
Khandker and Koolwal (2011), for example, report that the benefits of rural road
investments to households in rural Bangladesh have varied substantially over
time. In a dynamic panel data study, these authors have concluded that while
non-agricultural wage employment has risen in the long term, other positive
effects initially observed on school enrolment, transport costs and per capita
expenditure have attenuated over time.
Whilst policy recommendations derived from this literature suggest more public
spending in transport infrastructure to foster economic development in remote
and disadvantaged areas, a central question that requires attention is to what
extent this development results real improvements in the well-being of the
neediest population living nearby these projects.
From a political philosophy perspective, Pereira et al. (2017) reinforced this
question by applying the difference principle of the Rawl’s Egalitarianism theory38
(Rawls, 1999) to transport justice. They conclude that, through the lens of this
principle of justice, transport infrastructure and other transport related
investments can only be considered fair if they improve the accessibility levels of
the least advantaged groups.
Therefore, this Chapter addresses this recurrent issue of transport planning and
aims to develop a framework of an ex-post social impact assessment of transport
projects particularly tailored to the Brazilian context. The methodology draws
upon the literature to employ a quasi-experimental approach performed by
38 Rawls (1999) defines the difference principle as a key concept of his theory of Justice, which
governs the distribution of primary goods (e.g. wealth, positions of responsibility and power,
government services). This principle maintains that inequalities in the distribution of primary
goods are only permissible if it maximises the minimum level of them among the least advantaged
population (similar to the maximin criterion, commonly referred to in the Economics literature).

CHAPTER 4: SOCIOECONOMIC OUTCOMES OF TRANSPORT INTERVENTIONS
79
means of a difference in difference matching (DIDM) technique since it has been
considered an effective and robust method for this type of analysis by various
authors in similar contexts (Chein and Pinto, 2017; Iimi et al., 2015; Rand, 2011;
Rauniyar et al., 2011; Hansen et al., 2011).
This framework is then applied to a case study in Northeast Brazil, in which the
social impacts of a large transport project are analysed. The selected project for
this case study is the widening of the BR-232 motorway. There are at least three
main reasons to believe that this particular transport infrastructure intervention is
an appropriate and paradigmatic example to be investigated by this framework.
Firstly, the project was carried out during the latest intercensal period, between
the years 2000 and 2010, which enables the Census’ Demographic Database to
be used for longitudinal comparisons. Whilst traditional panel data studies rely
on expensive household surveys that require a lot of manpower to be performed
and are often limited to a few social indicators and few communities, this study
proposes the use of census data that are publicly available and provide a
comprehensive range of socioeconomic indicators of all municipalities before and
after the infrastructure investment.
Secondly, this motorway (BR-232) has been only partially widened, leaving
another considerable stretch with very similar socioeconomic, environmental and
spatial characteristics rather suitable to be used as a control group. Figure 4.1
presents pictures of this motorway showing the two different stretches, the
original and the widened one.
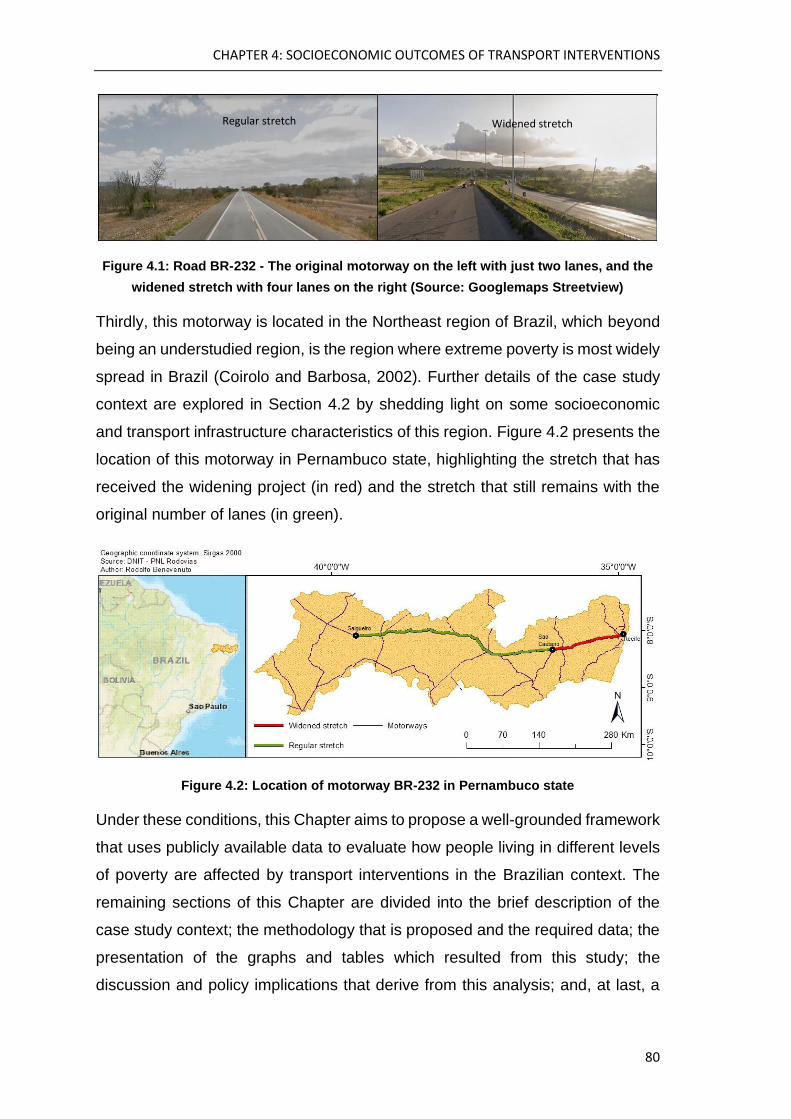
CHAPTER 4: SOCIOECONOMIC OUTCOMES OF TRANSPORT INTERVENTIONS
80
Figure 4.1: Road BR-232 - The original motorway on the left with just two lanes, and the
widened stretch with four lanes on the right (Source: Googlemaps Streetview)
Thirdly, this motorway is located in the Northeast region of Brazil, which beyond
being an understudied region, is the region where extreme poverty is most widely
spread in Brazil (Coirolo and Barbosa, 2002). Further details of the case study
context are explored in Section 4.2 by shedding light on some socioeconomic
and transport infrastructure characteristics of this region. Figure 4.2 presents the
location of this motorway in Pernambuco state, highlighting the stretch that has
received the widening project (in red) and the stretch that still remains with the
original number of lanes (in green).
Figure 4.2: Location of motorway BR-232 in Pernambuco state
Under these conditions, this Chapter aims to propose a well-grounded framework
that uses publicly available data to evaluate how people living in different levels
of poverty are affected by transport interventions in the Brazilian context. The
remaining sections of this Chapter are divided into the brief description of the
case study context; the methodology that is proposed and the required data; the
presentation of the graphs and tables which resulted from this study; the
discussion and policy implications that derive from this analysis; and, at last, a
Regular stretch Widened stretch
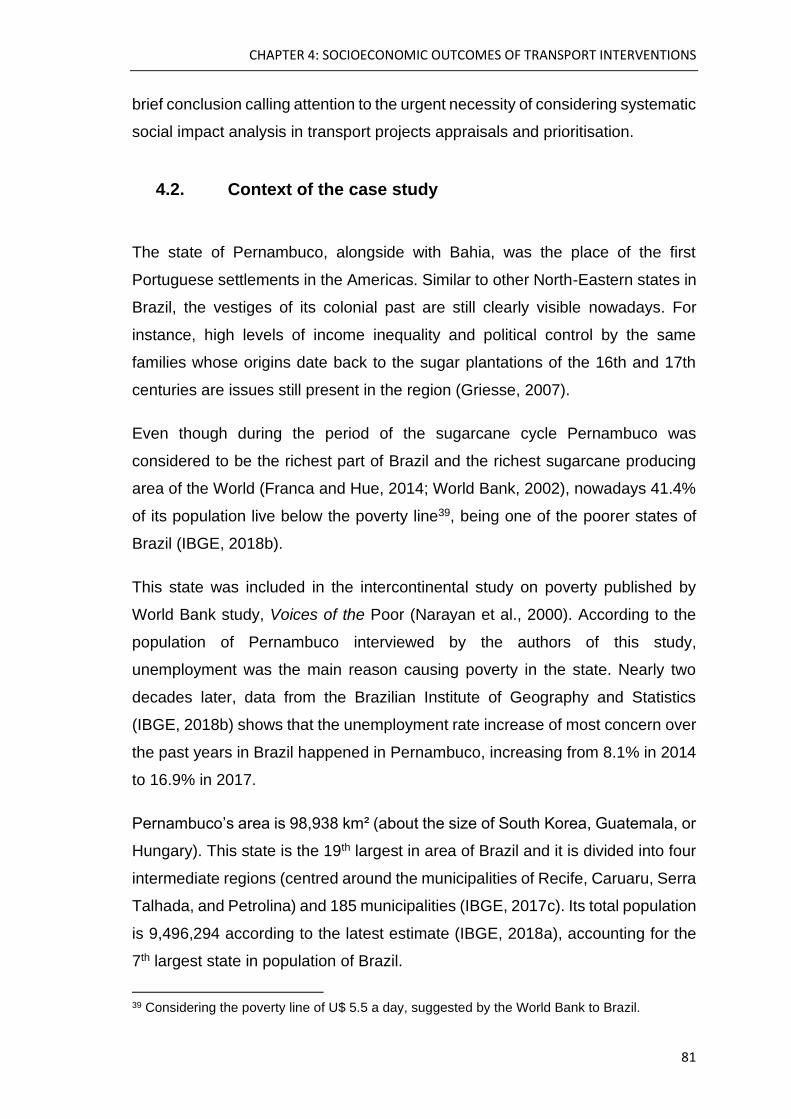
CHAPTER 4: SOCIOECONOMIC OUTCOMES OF TRANSPORT INTERVENTIONS
81
brief conclusion calling attention to the urgent necessity of considering systematic
social impact analysis in transport projects appraisals and prioritisation.
4.2. Context of the case study
The state of Pernambuco, alongside with Bahia, was the place of the first
Portuguese settlements in the Americas. Similar to other North-Eastern states in
Brazil, the vestiges of its colonial past are still clearly visible nowadays. For
instance, high levels of income inequality and political control by the same
families whose origins date back to the sugar plantations of the 16th and 17th
centuries are issues still present in the region (Griesse, 2007).
Even though during the period of the sugarcane cycle Pernambuco was
considered to be the richest part of Brazil and the richest sugarcane producing
area of the World (Franca and Hue, 2014; World Bank, 2002), nowadays 41.4%
of its population live below the poverty line39, being one of the poorer states of
Brazil (IBGE, 2018b).
This state was included in the intercontinental study on poverty published by
World Bank study, Voices of the Poor (Narayan et al., 2000). According to the
population of Pernambuco interviewed by the authors of this study,
unemployment was the main reason causing poverty in the state. Nearly two
decades later, data from the Brazilian Institute of Geography and Statistics
(IBGE, 2018b) shows that the unemployment rate increase of most concern over
the past years in Brazil happened in Pernambuco, increasing from 8.1% in 2014
to 16.9% in 2017.
Pernambuco’s area is 98,938 km² (about the size of South Korea, Guatemala, or
Hungary). This state is the 19th largest in area of Brazil and it is divided into four
intermediate regions (centred around the municipalities of Recife, Caruaru, Serra
Talhada, and Petrolina) and 185 municipalities (IBGE, 2017c). Its total population
is 9,496,294 according to the latest estimate (IBGE, 2018a), accounting for the
7th largest state in population of Brazil.
39 Considering the poverty line of U$ 5.5 a day, suggested by the World Bank to Brazil.

CHAPTER 4: SOCIOECONOMIC OUTCOMES OF TRANSPORT INTERVENTIONS
82
In terms of transport infrastructure, all main cities in Pernambuco are connected
to the capital, Recife, through 41,657 km of roads, of which only 5,548 km are
paved (GEIPOT, 200040). In a recent survey published by the Brazilian National
Confederation of Transport (CNT, 2018), 94,9% of the state road network was
considered in either regular, bad or extremely bad condition. Moreover, Railway
transport is still very limited in areas close to the Recife metropolitan region, and
waterway transport is restricted to the São Francisco basin (southwest border
with Bahia state).
Four transport infrastructure projects have been recently announced as the future
priority for this state by the National Logistic Plan (EPL, 2018). These projects
refer to improvements in the roads BR-232 (between Salgueiro and Parnamirim),
BR-316 (between the municipality of Parnamirim and Piauí state), BR-116
(between the municipality of Salgueiro and Bahia state), BR-101 (between the
municipality of Palmares and Alagoas state). Figure 4.3 highlights the stretches
of these roads in Pernambuco state that are planned to be improved until 2025.
Figure 4.3: Transport infrastructure priority in Pernambuco state according to National
Logistic Plan (EPL, 2018)
It is important to emphasise that this plan, as well as the previous investments
plans for transport infrastructure in Brazil have been solely driven by economic
40 No more up to date figure has been found in official sources by the authors.

CHAPTER 4: SOCIOECONOMIC OUTCOMES OF TRANSPORT INTERVENTIONS
83
and environmental analysis, disregarding, therefore, the social dimension and
distributive effects at the planning stage. In the following sections of this Chapter,
a case study will be provided, analysing whether the investment in the BR-232
has promoted, even if unintentionally, any improvement in any of the main
poverty dimensions in the municipalities more closely affected by this
intervention.
4.3. Data and Methods
4.3.1. Data collation
Traditionally, ex-post studies assessing the social impacts of transport
infrastructure require a substantial amount of data to be collected, usually by
questionnaires in two or more periods of time, before and after the intervention –
ruling out the possibility of doing this kind of studies on projects that occurred in
the past. Moreover, ex-post evaluation methods normally require data collection
in several different locations, for example communities, villages, or households
that received the intervention (i.e. treatment) as well as the control ones. Mu and
Van de Walle (2007), for instance, reports that 3,000 households from 200
different communes were surveyed in four different years to collect the needed
database for their study.
Besides being very costly and time-consuming, these methods can also give rise
to politically difficult situations, as reported by Iimi et al. (2015). Before even
starting the surveys, the authors report that the State Government of Tocantins
(Brazil) decided not to interview people in the control group (which would not
receive the intervention), because this could trigger frustration and dissatisfaction
with the government, once they would know in advance that other communities
would receive more transport investments than theirs. In this case, Iimi et al.
(2015) had to use as a control group the population who was located around one
transport intervention that due to a long delay in the project happened to not
receive the treatment on time.

CHAPTER 4: SOCIOECONOMIC OUTCOMES OF TRANSPORT INTERVENTIONS
84
Under these circumstances, the study presented in this thesis proposes an
innovative methodology that requires publicly available census data alone for
evaluating the social impacts of transport interventions. The advantages of using
this kind of data are that i) it can be applied to projects that happened in the past;
ii) it has one of the most comprehensive ranges of socioeconomic indicators at a
municipal level; iii) census data are commonly available by all over the Global
South; iv) it is reliable, official and free of cost information; and finally v) it is
available in a time frame that usually is long enough for capturing all the direct
and indirect benefits of a large transport intervention.
4.3.1.1. Social indicators
The main datasets utilised for this study were the Demographic Censuses of year
2000 and 2010, collected by the Brazilian Institute of Geography and Statistics
(IBGE) and made available by the Atlas of Human Development in Brazil (UNDP,
2010). From the original datasets, 26 socioeconomic indicators at a municipality
level have been collated to compose a multi-dimensional evaluation of poverty
for the referred region. The selection of such a range of indicators builds on the
concept of multi-dimensional poverty, widely explored in public economics and
welfare literature (Narayan et al., 2000; Alkire and Santos, 2014). The following
dimensions are included in the present analysis:
• Health: This dimension includes two basic health indicators that are
included in the Brazilian census, namely, the life expectancy (in years) and
the child mortality (in child deaths/1,000 live births);
• Education: This set of indicators is related to illiteracy and school
enrolment (including creche, primary and secondary school, and higher
education);
• Income: This dimension includes income indicators that measure intensity
(average income) and extent (share of population) of three different
poverty levels (i) extreme poverty (monthly per capita income up to R$
70.0041); (ii) poverty (monthly per capita income up to R$ 140.00) and; (iii)
41 The minimum wage in 2010 was R$ 510.00 a month – around U$ 368.00 in 2010 purchasing
power parity according to the conversion rate provided by OECD (2018)

CHAPTER 4: SOCIOECONOMIC OUTCOMES OF TRANSPORT INTERVENTIONS
85
vulnerable to poverty (monthly per capita income up to R$ 255.00), also
disaggregated by overall and child poverty;
• Wellbeing: This block comprises the Human Development Index (HDI) and
its disaggregation by income, education, and longevity;
• Housing conditions: This set includes indicators related to the housing
characteristics such as the percentage of households with piped water,
waste collection, electricity, or sewage facilities;
• Inequality: This dimension is evaluated by means of the GINI index42,
which measures the degree of income inequality experienced by a
municipality;
• Unemployment: Finally, this is presented as the unemployment rates for
each municipality, considering the share of the population of 18 years of
age or more who were unemployed at the same month when the census
data was collected.
Table 4.1 presents the indicators described above showing a comparison
between the national figures and the values for the municipalities assessed in
this Chapter. Further explanations for selecting criteria of this sample of
municipalities are given in the Section 4.3.1.2.
42 The Gini Index is a measure of income inequality, varying from 0 (perfect equality) to 1
(maximum inequality) (UNDP, 2010).
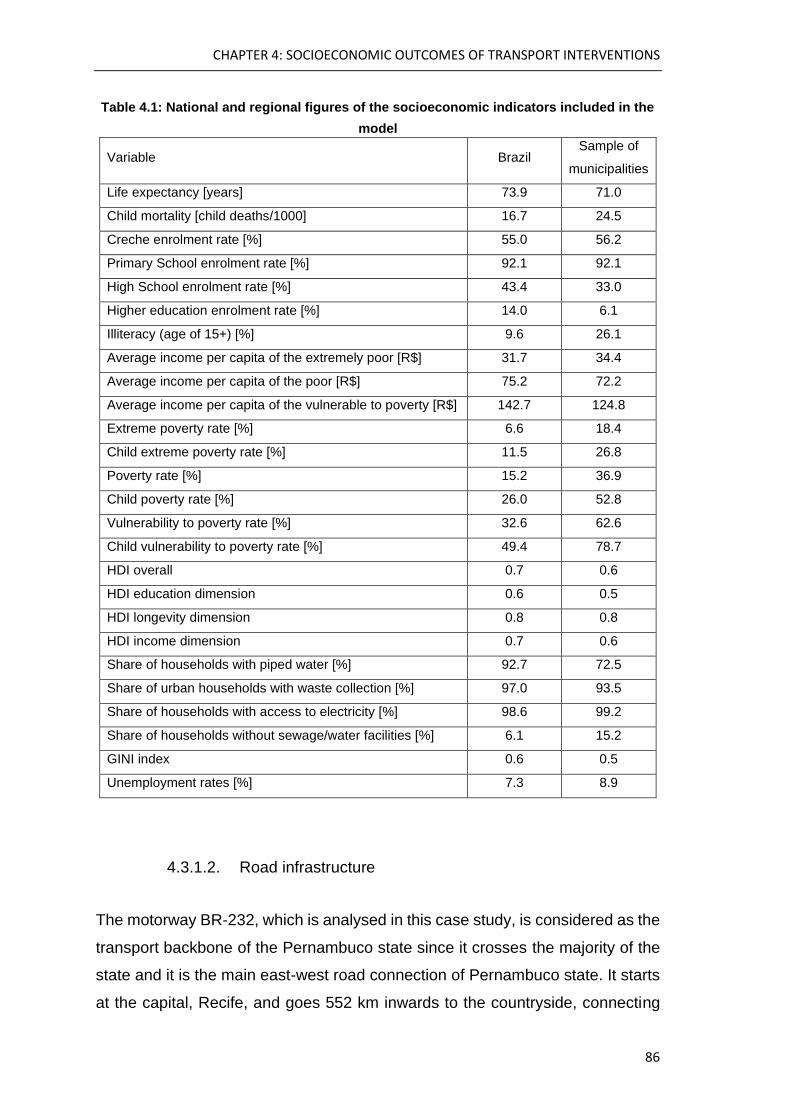
CHAPTER 4: SOCIOECONOMIC OUTCOMES OF TRANSPORT INTERVENTIONS
86
Table 4.1: National and regional figures of the socioeconomic indicators included in the
model
Variable Brazil Sample of
municipalities
Life expectancy [years] 73.9 71.0
Child mortality [child deaths/1000] 16.7 24.5
Creche enrolment rate [%] 55.0 56.2
Primary School enrolment rate [%] 92.1 92.1
High School enrolment rate [%] 43.4 33.0
Higher education enrolment rate [%] 14.0 6.1
Illiteracy (age of 15+) [%] 9.6 26.1
Average income per capita of the extremely poor [R$] 31.7 34.4
Average income per capita of the poor [R$] 75.2 72.2
Average income per capita of the vulnerable to poverty [R$] 142.7 124.8
Extreme poverty rate [%] 6.6 18.4
Child extreme poverty rate [%] 11.5 26.8
Poverty rate [%] 15.2 36.9
Child poverty rate [%] 26.0 52.8
Vulnerability to poverty rate [%] 32.6 62.6
Child vulnerability to poverty rate [%] 49.4 78.7
HDI overall 0.7 0.6
HDI education dimension 0.6 0.5
HDI longevity dimension 0.8 0.8
HDI income dimension 0.7 0.6
Share of households with piped water [%] 92.7 72.5
Share of urban households with waste collection [%] 97.0 93.5
Share of households with access to electricity [%] 98.6 99.2
Share of households without sewage/water facilities [%] 6.1 15.2
GINI index 0.6 0.5
Unemployment rates [%] 7.3 8.9
4.3.1.2. Road infrastructure
The motorway BR-232, which is analysed in this case study, is considered as the
transport backbone of the Pernambuco state since it crosses the majority of the
state and it is the main east-west road connection of Pernambuco state. It starts
at the capital, Recife, and goes 552 km inwards to the countryside, connecting

CHAPTER 4: SOCIOECONOMIC OUTCOMES OF TRANSPORT INTERVENTIONS
87
main cities like Caruaru, Salgueiro, Sao Caetano, and Serra Talhada. The
widening project was performed between 2001 and 2005 only in the stretch
between Recife and Sao Caetano (142 km).
According to the responsible authorities, only two other transport infrastructure
projects of construction and widening of motorways were performed during this
intercensal period in the Pernambuco state. Both projects (at the BR-101 and
BR-104) were carried out on the east part of Pernambuco state, that is, at the
same side of the widened stretch of BR-232. The information about the road
network including dates, dimensions and its spatial distribution have been
provided by the Brazilian National Transport Infrastructure Department (DNIT,
2018).
Two groups of municipalities were then identified: those within the influence area
of the widened stretch of the motorway (treatment group) and those along the
original stretch of the motorway (control group). Several authors have applied the
concept of buffer zones (from 5 to 300 km) to estimate the influence area of a
road over the surrounding communities (Chein et al., 2017; Asomani-Boateng et
al., 2015; Ortega et al., 2014, Danida, 2010). The rationale for the size definition
of these buffers, however, is not clear in any of these studies.
It is undeniable that large transport infrastructure interventions would cause a
long sequence of direct and indirect socioeconomic effects that may reverberate
and affect communities much farther than any predefined buffer. Nevertheless,
following Tobler’s first law of Geography43, it is reasonable to assume that a
higher impact would, as a rule, affect communities that are closer to the
intervention. In this sense, a few characteristics can be broadly considered to
define the influence area around a given transport intervention.
In the present study, the average size of municipalities, presence of spatial
barriers (e.g. rivers, mountains, shore, etc), type of infrastructure intervention,
population distribution and density, as well as the aggregation level of the
43 When discussing urban growth in Detroit region, Tobler (1960) states what he calls as the first
law of Geography: “everything is related to everything else, but near things are more related than
distant things”.
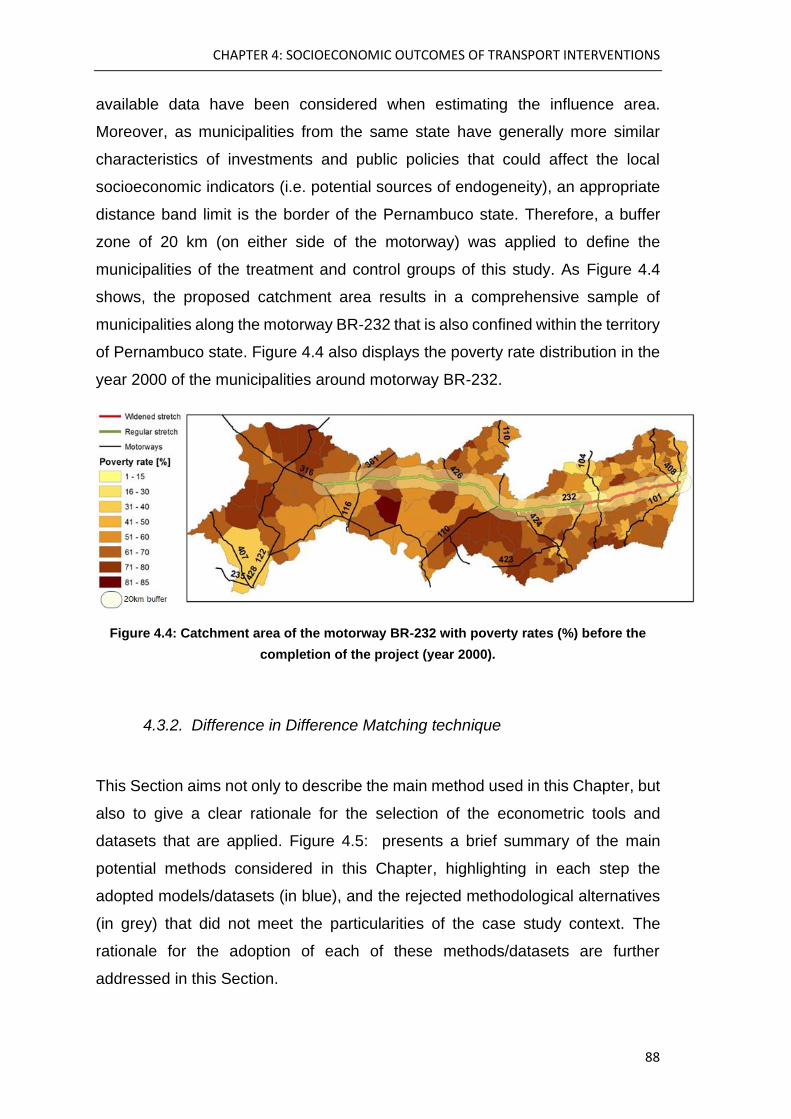
CHAPTER 4: SOCIOECONOMIC OUTCOMES OF TRANSPORT INTERVENTIONS
88
available data have been considered when estimating the influence area.
Moreover, as municipalities from the same state have generally more similar
characteristics of investments and public policies that could affect the local
socioeconomic indicators (i.e. potential sources of endogeneity), an appropriate
distance band limit is the border of the Pernambuco state. Therefore, a buffer
zone of 20 km (on either side of the motorway) was applied to define the
municipalities of the treatment and control groups of this study. As Figure 4.4
shows, the proposed catchment area results in a comprehensive sample of
municipalities along the motorway BR-232 that is also confined within the territory
of Pernambuco state. Figure 4.4 also displays the poverty rate distribution in the
year 2000 of the municipalities around motorway BR-232.
Figure 4.4: Catchment area of the motorway BR-232 with poverty rates (%) before the
completion of the project (year 2000).
4.3.2. Difference in Difference Matching technique
This Section aims not only to describe the main method used in this Chapter, but
also to give a clear rationale for the selection of the econometric tools and
datasets that are applied. Figure 4.5: presents a brief summary of the main
potential methods considered in this Chapter, highlighting in each step the
adopted models/datasets (in blue), and the rejected methodological alternatives
(in grey) that did not meet the particularities of the case study context. The
rationale for the adoption of each of these methods/datasets are further
addressed in this Section.

CHAPTER 4: SOCIOECONOMIC OUTCOMES OF TRANSPORT INTERVENTIONS
89
Figure 4.5: Schematic summary of methodological alternatives
Assessing social outcomes of transport investments means understanding the
context in which an intervention happens and the channels through which the
impacts are expected to occur (Hansen et al., 2011). In the context of large
infrastructure interventions, one of the most suitable and referenced approaches
used for capturing these outcomes is the quasi-experimental design (Hansen et
al., 2011; Ravallion, 2007). This approach, also known as a nonexperimental, or
observational, study (Ravallion, 2007), draws comparisons between groups to
test for the effect of an intervention. Differently from the ‘experimental method’ in
which samples are randomly assigned to treatment and control groups before the
treatment, this empirical study estimates the effect of a treatment that have
already occurred in the past. Thus, the target population is selected without
random assignment.
Among the methods that are suitable to this type of studies, the DID technique
stands out as a particularly interesting model. The core principle of this method
is to draw causal relationships between an intervention and its outcomes based
on a longitudinal comparison between a treatment and a control group (Cook et
al., 2002). One of its main advantages is that the pre- and post-test observations
can be done using datasets such as the censuses, which are globally available
and periodically updated. Allied to this, the DID model also compares the effects
of an intervention between control and treatment groups, thus reducing the bias
of single difference comparisons. Furthermore, it has been extensively adopted
for analysing different effects of transport interventions in similar contexts of the
Global South (Lionjanga and Venter, 2018; Chein and Pinto, 2017; Qin and
Zhang, 2016; Rodriguez et al., 2016; Iimi et al., 2015; Bocarejo et al., 2014).
Local context: Data limitations,
Socioeconomic and spatial
characteristics
Experimental Method
Quasi-Experimental
method
Regression Discontinuity
Difference in Difference
Instrumentalvariable
Propensity Score
matching
Availablevariables
Selected covariate variables
Rejected alternative
Adopted approach
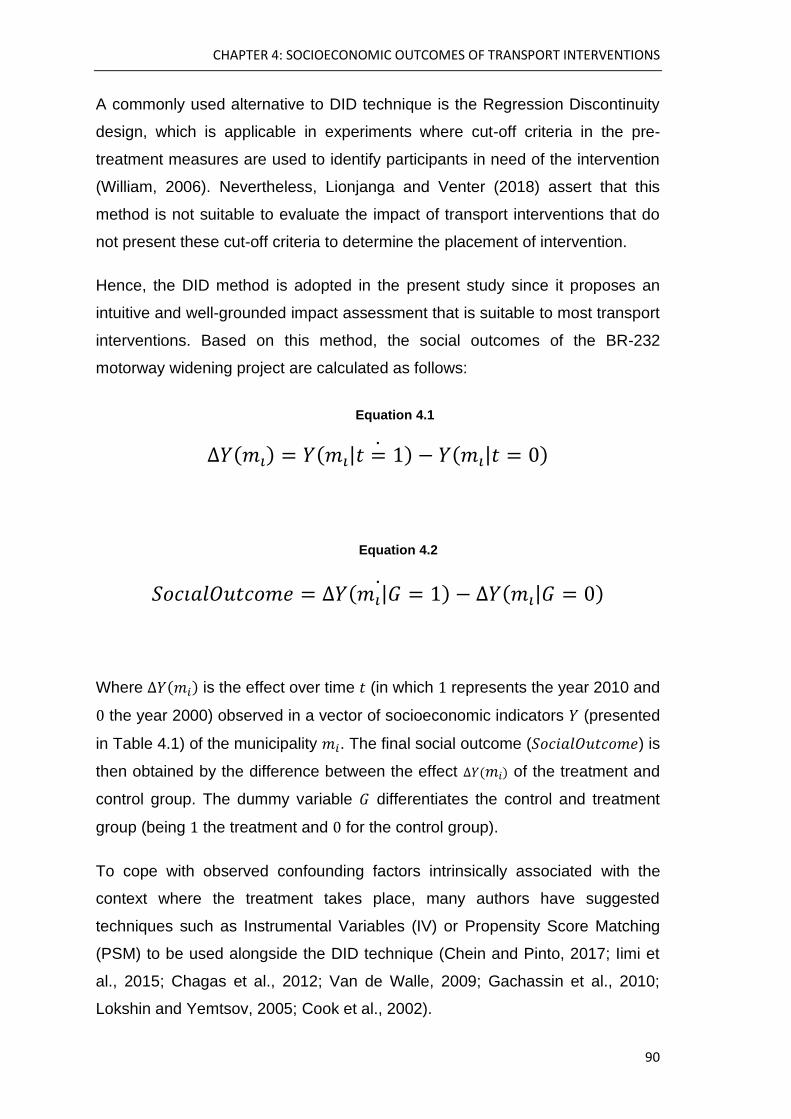
CHAPTER 4: SOCIOECONOMIC OUTCOMES OF TRANSPORT INTERVENTIONS
90
A commonly used alternative to DID technique is the Regression Discontinuity
design, which is applicable in experiments where cut-off criteria in the pre-
treatment measures are used to identify participants in need of the intervention
(William, 2006). Nevertheless, Lionjanga and Venter (2018) assert that this
method is not suitable to evaluate the impact of transport interventions that do
not present these cut-off criteria to determine the placement of intervention.
Hence, the DID method is adopted in the present study since it proposes an
intuitive and well-grounded impact assessment that is suitable to most transport
interventions. Based on this method, the social outcomes of the BR-232
motorway widening project are calculated as follows:
∆𝑌(𝑚𝑖) = 𝑌(𝑚𝑖|𝑡 = 1) − 𝑌(𝑚𝑖|𝑡 = 0)̇
𝑆𝑜𝑐𝑖𝑎𝑙𝑂𝑢𝑡𝑐𝑜𝑚𝑒 = ∆𝑌(𝑚𝑖|𝐺 = 1) − ∆𝑌(𝑚𝑖|𝐺 = 0)̇
Where ∆𝑌(𝑚𝑖) is the effect over time 𝑡 (in which 1 represents the year 2010 and
0 the year 2000) observed in a vector of socioeconomic indicators 𝑌 (presented
in Table 4.1) of the municipality 𝑚𝑖. The final social outcome (𝑆𝑜𝑐𝑖𝑎𝑙𝑂𝑢𝑡𝑐𝑜𝑚𝑒) is
then obtained by the difference between the effect ∆𝑌(𝑚𝑖) of the treatment and
control group. The dummy variable 𝐺 differentiates the control and treatment
group (being 1 the treatment and 0 for the control group).
To cope with observed confounding factors intrinsically associated with the
context where the treatment takes place, many authors have suggested
techniques such as Instrumental Variables (IV) or Propensity Score Matching
(PSM) to be used alongside the DID technique (Chein and Pinto, 2017; Iimi et
al., 2015; Chagas et al., 2012; Van de Walle, 2009; Gachassin et al., 2010;
Lokshin and Yemtsov, 2005; Cook et al., 2002).
Equation 4.2
Equation 4.1

CHAPTER 4: SOCIOECONOMIC OUTCOMES OF TRANSPORT INTERVENTIONS
91
Instrumental variables are often applied in quasi-experimental studies to control
for endogeneity between the assignment into control/treatment group and the
outcome. However, since the present case study considers only municipalities
along the same motorway (i.e. the group assignment is spatially restricted) in the
samples, the use of Instrumental Variables is not applicable. In this sense, PSM
emerges as the most appropriate method to reduce the bias when estimating the
treatment effects caused by potential confounding factors of the samples.
So far, this Section has explored the reasons behind the selection of this
methodological approach, which is also known as the Difference-in-Difference-
Matching (DIDM) technique. The next Section will provide a further rationale for
the selection of covariates applied in the calculation of the propensity scores.
4.3.3. Propensity Score Matching
Rosenbaum and Rubin (1983) define a propensity score (PS) as the conditional
probability of assignment to a particular group (control or treatment) considering
a number of observed covariates. Several confounding variables have been
applied throughout the literature for the formulation of propensity scores in similar
studies (Chein and Pinto, 2017; Iimi et al., 2015; Mu and Van de Walle, 2011;
Lokshin and Yemtsov, 2005; Escobal and Ponce, 2002; Cook et al., 2002).
Ravallion (2007) states that these scores must be calculated based on a range
of pre-exposure control variables, which can also include pre-treatment values of
the outcome indicator.
Therefore, the PS offers a single numeric description of the initial context of the
samples (municipalities/villages/neighbourhoods) in the analysis. In the context
of transport studies, these confounding variables addressed in the literature
mentioned above can be summarised in the following three levels in this study:
• Demographics: total population, GINI index, economic dependency per
household, ethnicity rates, GDP per capita, poverty rates, etc;
• Number of facilities/services available: such as schools, enterprises,
industries, police stations, banks (with credit availability) post offices,

CHAPTER 4: SOCIOECONOMIC OUTCOMES OF TRANSPORT INTERVENTIONS
92
restaurants, markets, hospitals and motorways, as well as coverage of
sewage, water piped, electricity, phone and internet resources;
• Land use: urbanisation rates, population density, size of arable areas,
rural accessibility index (RAI), the presence of other infrastructure
construction projects, etc.
Despite the lack of consensus on which variables should be included in PS
calculation, according to Austin (2011) several studies in the literature have
applied either i) all the baseline covariates, ii) just those that affect the outcome,
iii) just those that are associated with the treatment assignment, or iv) both (i.e.
true confounders). Brookhart et al. (2013) assert that these variables can be also
selected based on expert knowledge, as well as more empirical data-driven
analysis relating the variables, the outcome and the treatment being analysed.
Nonetheless, as explained by Rosenbaum and Rubin (1983), as the number of
confounding variables increase, the number of subclasses defined by the
propensity scores also grows. This issue often results in several subclasses (also
called strata) that do not contain both treated and control samples within the
same PS range, reducing, therefore, the number of matchings (Rosenbaum and
Rubin, 1983). Hence, it is essential to balance the number of confounding
variables that compose the PS and the number of matchings resulted by them.
In the absence of a clear method defined in the literature, a number of trials with
different combinations of the confounding variables mentioned above were
carried out to determine the baseline covariates that would be considered in the
composition of the PS for this case study. It was found that variables with extreme
levels of variations - either too much (e.g. total population), or too little (e.g. GINI
index) – have not resulted in a good balance between the number of confounding
variables and number of matchings. Therefore, after this pre-assessment of the
baseline variables the following five have been selected:
1. Gross Domestic Product (GDP)
2. Urban population rate (%)
3. Rural Accessibility Index (RAI)
4. Number of schools
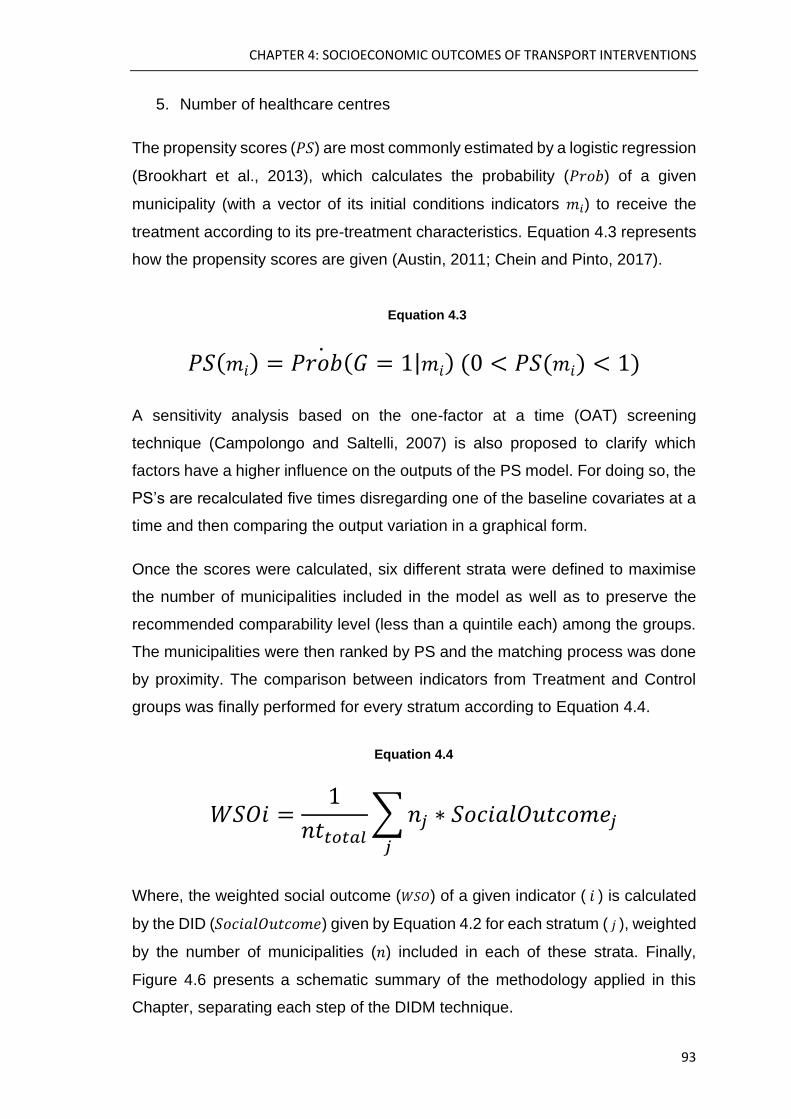
CHAPTER 4: SOCIOECONOMIC OUTCOMES OF TRANSPORT INTERVENTIONS
93
5. Number of healthcare centres
The propensity scores (𝑃𝑆) are most commonly estimated by a logistic regression
(Brookhart et al., 2013), which calculates the probability (𝑃𝑟𝑜𝑏) of a given
municipality (with a vector of its initial conditions indicators 𝑚𝑖) to receive the
treatment according to its pre-treatment characteristics. Equation 4.3 represents
how the propensity scores are given (Austin, 2011; Chein and Pinto, 2017).
𝑃𝑆(𝑚𝑖) = 𝑃𝑟𝑜𝑏(𝐺 = 1|𝑚𝑖)̇ (0 < 𝑃𝑆(𝑚𝑖) < 1)
A sensitivity analysis based on the one-factor at a time (OAT) screening
technique (Campolongo and Saltelli, 2007) is also proposed to clarify which
factors have a higher influence on the outputs of the PS model. For doing so, the
PS’s are recalculated five times disregarding one of the baseline covariates at a
time and then comparing the output variation in a graphical form.
Once the scores were calculated, six different strata were defined to maximise
the number of municipalities included in the model as well as to preserve the
recommended comparability level (less than a quintile each) among the groups.
The municipalities were then ranked by PS and the matching process was done
by proximity. The comparison between indicators from Treatment and Control
groups was finally performed for every stratum according to Equation 4.4.
𝑊𝑆𝑂𝑖 =1
𝑛𝑡𝑡𝑜𝑡𝑎𝑙∑ 𝑛𝑗 ∗ 𝑆𝑜𝑐𝑖𝑎𝑙𝑂𝑢𝑡𝑐𝑜𝑚𝑒𝑗
𝑗
Where, the weighted social outcome (𝑊𝑆𝑂) of a given indicator ( 𝑖 ) is calculated
by the DID (𝑆𝑜𝑐𝑖𝑎𝑙𝑂𝑢𝑡𝑐𝑜𝑚𝑒) given by Equation 4.2 for each stratum ( 𝑗 ), weighted
by the number of municipalities (𝑛) included in each of these strata. Finally,
Figure 4.6 presents a schematic summary of the methodology applied in this
Chapter, separating each step of the DIDM technique.
Equation 4.3
Equation 4.4
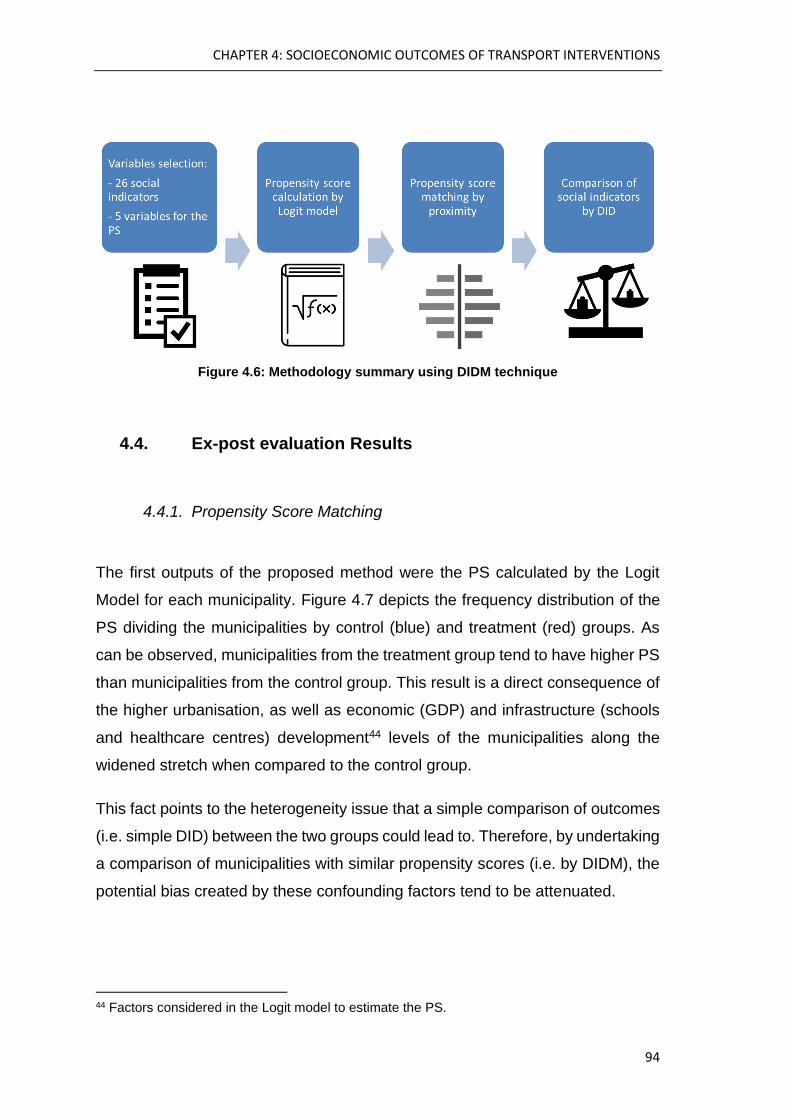
CHAPTER 4: SOCIOECONOMIC OUTCOMES OF TRANSPORT INTERVENTIONS
94
Figure 4.6: Methodology summary using DIDM technique
4.4. Ex-post evaluation Results
4.4.1. Propensity Score Matching
The first outputs of the proposed method were the PS calculated by the Logit
Model for each municipality. Figure 4.7 depicts the frequency distribution of the
PS dividing the municipalities by control (blue) and treatment (red) groups. As
can be observed, municipalities from the treatment group tend to have higher PS
than municipalities from the control group. This result is a direct consequence of
the higher urbanisation, as well as economic (GDP) and infrastructure (schools
and healthcare centres) development44 levels of the municipalities along the
widened stretch when compared to the control group.
This fact points to the heterogeneity issue that a simple comparison of outcomes
(i.e. simple DID) between the two groups could lead to. Therefore, by undertaking
a comparison of municipalities with similar propensity scores (i.e. by DIDM), the
potential bias created by these confounding factors tend to be attenuated.
44 Factors considered in the Logit model to estimate the PS.

CHAPTER 4: SOCIOECONOMIC OUTCOMES OF TRANSPORT INTERVENTIONS
95
Figure 4.7: Frequency distribution of Propensity Scores by group
As previously described, the only two transport infrastructure projects delivered
to this region in this intercensal period (other than the BR-232 widening project),
were performed both along the widened stretch. Hence, any potential
endogeneity which originated from these two projects would only exacerbate the
differences between treatment and control group and would not diminish potential
social impacts assessed by the model. Moreover, it is also assumed that
investments in any sector (including new public transport services) other than
transport infrastructure, are expected to be either very local (therefore dissolved
in the averages or mitigated by PSM technique) or with similar effects throughout
all considered municipalities since they are spatially concentrated in the same
state. In other words, as large infrastructure investments are predominantly done
at the state level in Brazil, and only municipalities from the same state
(Pernambuco) have been selected in this study45, further endogeneity factors
tend to be evenly distributed throughout the municipalities, not affecting any of
the groups specifically.
Once the PS’s are calculated, the definition of the matching strata could then be
carried out. Based on the distribution of PS’s across municipalities, six different
strata were proposed to maximise the number of matchings, while also keeping
a comparable range of PS between the groups. In this sense, the municipalities
45 As described above in Section 4.3.1.2, only municipalities within 20km from either side of the
road have been included in the samples.

CHAPTER 4: SOCIOECONOMIC OUTCOMES OF TRANSPORT INTERVENTIONS
96
with too high or too low PS (i.e. outliers) were not included in the DIDM analysis
since no comparable municipalities were found within the considered samples.
As a result, from the original sample of 76 municipalities (35 from the control and
41 from treatment group), only 51 municipalities (23 from control and 28 from
treatment group) were deemed fit for comparison within the six different PS
strata. Simply put, 25 municipalities of the original sample had to be disregarded
for not having a comparable pair in their opposing group.
Table 4.2 describes the PS strata showing the number of municipalities and the
PS range of each stratum. It is worth mentioning that the PS range of each
stratum varies from 0.07 (stratum 2) up to 0.12 (stratum 6), which demonstrates
that all the comparable municipalities present a relatively small variation of
baseline characteristics (proxied by the PS). Table 4.2 shows, while the total
number of control and treatment municipalities considered in this study are
similar, the number of municipalities from the Control group is higher in the lower
strata.
Table 4.2: Propensity score strata descriptions
Strata PS range Group
Number of
municipalities
1 0.19 < PS < 0.30
Control 5
Treatment 4
2 0.31 < PS < 0.38
Control 8
Treatment 3
3 0.45 < PS < 0.54
Control 4
Treatment 4
4 0.55 < PS < 0.63
Control 2
Treatment 5
5 0.67 < PS < 0.76
Control 2
Treatment 6
6 0.80 < PS < 0.92
Control 2
Treatment 6
Total 0.19 < PS < 0.92
Control 23
Treatment 28
Total 51
4.4.2. Sensitivity analysis of the propensity scores
Figure 4.8 illustrates the sensitivity analysis showing how the PS’s values
respond to variations of the input baseline covariates. The PS’s of the
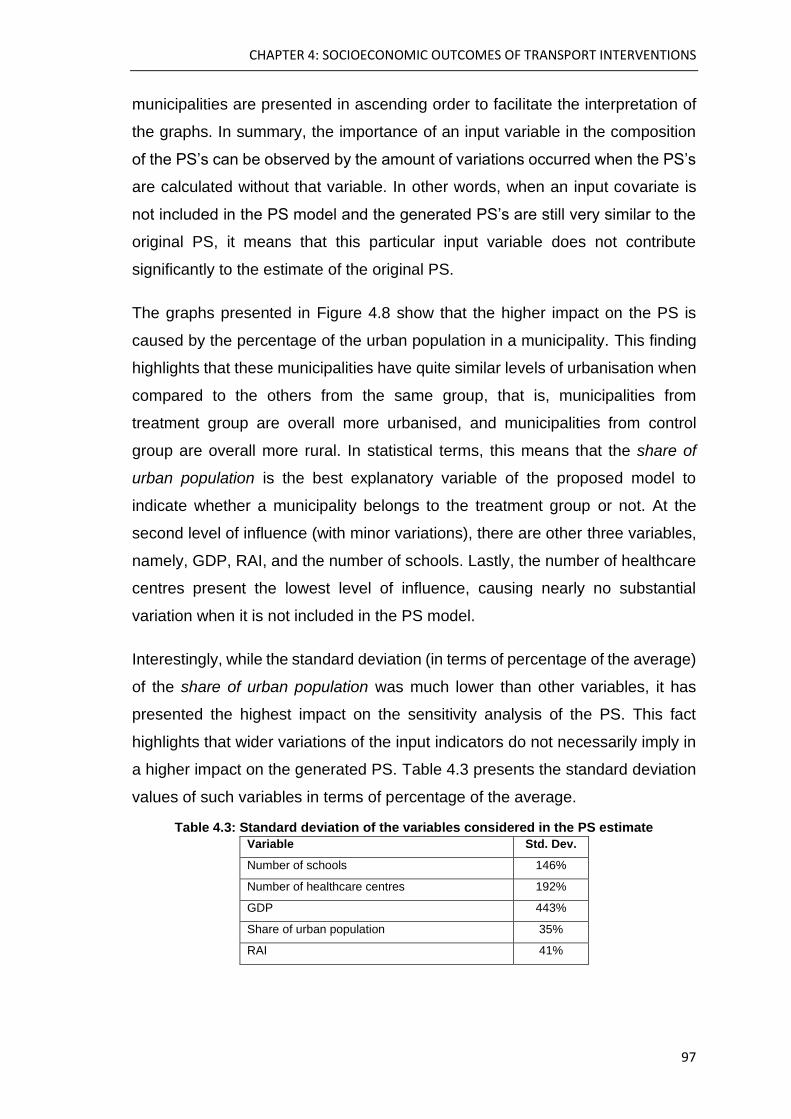
CHAPTER 4: SOCIOECONOMIC OUTCOMES OF TRANSPORT INTERVENTIONS
97
municipalities are presented in ascending order to facilitate the interpretation of
the graphs. In summary, the importance of an input variable in the composition
of the PS’s can be observed by the amount of variations occurred when the PS’s
are calculated without that variable. In other words, when an input covariate is
not included in the PS model and the generated PS’s are still very similar to the
original PS, it means that this particular input variable does not contribute
significantly to the estimate of the original PS.
The graphs presented in Figure 4.8 show that the higher impact on the PS is
caused by the percentage of the urban population in a municipality. This finding
highlights that these municipalities have quite similar levels of urbanisation when
compared to the others from the same group, that is, municipalities from
treatment group are overall more urbanised, and municipalities from control
group are overall more rural. In statistical terms, this means that the share of
urban population is the best explanatory variable of the proposed model to
indicate whether a municipality belongs to the treatment group or not. At the
second level of influence (with minor variations), there are other three variables,
namely, GDP, RAI, and the number of schools. Lastly, the number of healthcare
centres present the lowest level of influence, causing nearly no substantial
variation when it is not included in the PS model.
Interestingly, while the standard deviation (in terms of percentage of the average)
of the share of urban population was much lower than other variables, it has
presented the highest impact on the sensitivity analysis of the PS. This fact
highlights that wider variations of the input indicators do not necessarily imply in
a higher impact on the generated PS. Table 4.3 presents the standard deviation
values of such variables in terms of percentage of the average.
Table 4.3: Standard deviation of the variables considered in the PS estimate
Variable Std. Dev.
Number of schools 146%
Number of healthcare centres 192%
GDP 443%
Share of urban population 35%
RAI 41%
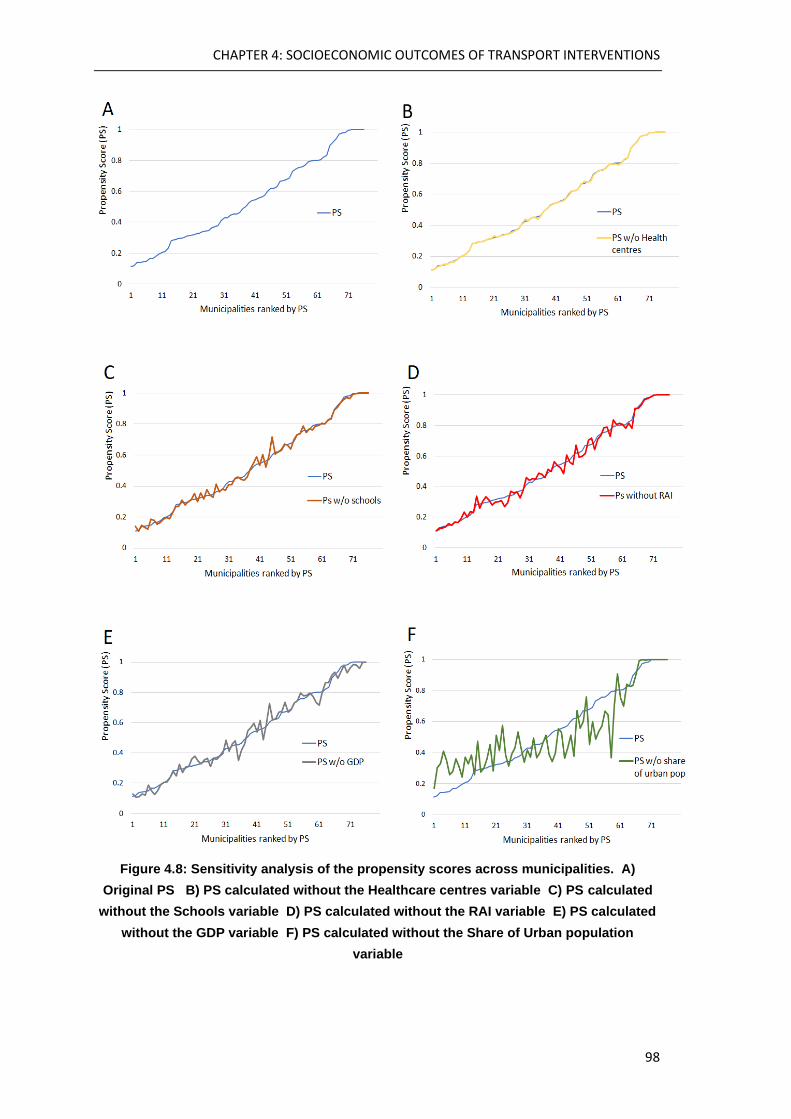
CHAPTER 4: SOCIOECONOMIC OUTCOMES OF TRANSPORT INTERVENTIONS
98
Figure 4.8: Sensitivity analysis of the propensity scores across municipalities. A)
Original PS B) PS calculated without the Healthcare centres variable C) PS calculated
without the Schools variable D) PS calculated without the RAI variable E) PS calculated
without the GDP variable F) PS calculated without the Share of Urban population
variable
CHAPTER 4: SOCIOECONOMIC OUTCOMES OF TRANSPORT INTERVENTIONS
99
4.4.3. Social outcomes
4.4.3.1. Broad socioeconomic results
A summary of the social outcomes of the BR-232 motorway widening project is
presented in Table 4.4. This table shows a comparison between outputs obtained
by two different methods previously described in Section 4.3.2, the DID technique
(Equation 4.2) and the DIDM technique (Equation 4.4). For a better
understanding of the social effects depicted in Table 4.4, the means of the 26
evaluated indicators are presented in Table 4.5 separating by time (before and
after the project) and by group (treatment and control municipalities).
The purpose of this set of indicators presented in Table 4.4 and Table 4.5 is to
assess how people living in different poverty levels have benefited from the BR-
232 transport investment. In general, the evaluated socioeconomic indicators
have improved over time in both groups of municipalities (treatment and control).
The only two exceptions among the twenty-six assessed outcomes were (i) the
average income per capita of the extremely poor population, which has
decreased (i.e. worsened) in the treatment group and increased (i.e. improved)
in the control group, and (ii) the share of households without sewage/water
facilities which has decreased (i.e. improved) in the treatment group and
increased (i.e. worsened) in the control group.
Eleven out of the twenty-six assessed indicators (i.e. 42%) have presented in
both methodologies (DIDM and DID) greater positive effects in the municipalities
which have received the treatment. This shows that, in general, there was an
overall social benefit of the project to widen the BR-232 motorway. Six out of
these eleven, have presented substantial differences in the treatment group
when compared to the control group46. It is worth noting that the results reveal
that creche enrolment rate was the indicator most affected by the widening
project. The findings show that municipalities along the widened stretch of BR-
46 For example, child mortality (9.03 pp more reduction), average income per capita of the
population vulnerable to poverty (R$ 4.71 more), child poverty rate (3.78 pp more reduction),
poverty rate (3.32 pp more reduction), and the primary school enrolment rate (3.26 pp more).

CHAPTER 4: SOCIOECONOMIC OUTCOMES OF TRANSPORT INTERVENTIONS
100
232 had over 9.9% percentage points (pp) more creche enrolment after the
completion of the project than the other ones. The indicators related primary and
high school enrolment also present the same trend of positive effects on
education. These results are in line with findings from similar research published
by Lebo and Schelling (2001), who have reported that primary school enrolment
of girls in well-connected villages in Bhutan is three times higher than the
unconnected ones.
Perhaps contrary to what was expected, the average income per capita of the
poor, the share of urban households with waste collection, and the share of
households with access to electricity have improved less in the treatment group
than in the control group. By analysing Table 4.5, it is possible to conclude that
the access to electricity has improved more in the control group because the
original share of households with access to electricity in the treatment group was
already very high in the year 2000 (i.e. 96.7%). Leaving, thus, less room for
improvement when compared to the original figure of the control group (i.e.
88.5%). The same argument can be made to explain lower improvements in the
treatment municipalities in waste collection when compared to the control ones.
Finally, the findings also reveal that wellbeing and inequality indicators (i.e. HDI’s
and GINI index) have not presented significant differences between the groups.
According to the data provided in Table 4.5, it is possible to conclude that both
dimensions have improved nearly at the same rate within the analysed time
frame. Section 4.5 presents a discussion on how the reported findings relate to
each other and how they can be interpreted to derive evidence-based policy
recommendations for future transport interventions.
In summary, all these findings (Table 4.4) are broadly consistent with earlier
studies (Asher and Novosad, 2018; Gibson and Olivia, 2009; McMulloch et al.,
2007, Cook et al., 2005) showing that transport infrastructure investments have
fostered social development in various ways. In a context where transport
infrastructure has been substantially underinvested over the recent years
(Amann et al., 2016), these findings support the increasing evidence base,
particularly in Northeast Brazil, that shows how transport development could
tackle multi-dimensional poverty in this region.

CHAPTER 4: SOCIOECONOMIC OUTCOMES OF TRANSPORT INTERVENTIONS
101
The results showing a reduction on the less severe levels of poverty reported in
Table 4.4 further support the idea stressed by Calderón and Serven (2004), that
infrastructure investments should be at the top of the poverty reduction agenda.
After evaluating a large panel data encompassing over 100 countries, Calderón
and Serven (2004) found that transport infrastructure investments (among other
infrastructure investments) were positively associated with economic growth and
negatively associated with inequality.
Similar to the results presented here for unemployment reduction, Gibson and
Olivia (2009), also assert that improvements in access to transport and electricity
infrastructure have unleashed non-farm enterprise development in rural
Indonesia, which has been considered as the most promising path out of rural
poverty in the region (McMulloch et al., 2007). Likewise, Asher and Novosad
(2018) conclude that 4 years after the completion of new feeder roads in India,
the main observed benefit in the assessed villages was the connection of rural
workers to new employment opportunities out of agriculture.
In this sense, the findings from the Northeast Brazil reported in this Section
provide some support to these earlier studies. As described above, several
socioeconomic indicators have shown higher improvements in the region where
the road widening project was performed, compared to the control areas.
Nevertheless, despite the positive impact on the broad socioeconomic outcomes
of the case study region, a further analysis is still needed to compare how the
least advantaged population have benefitted from the same transport investment.
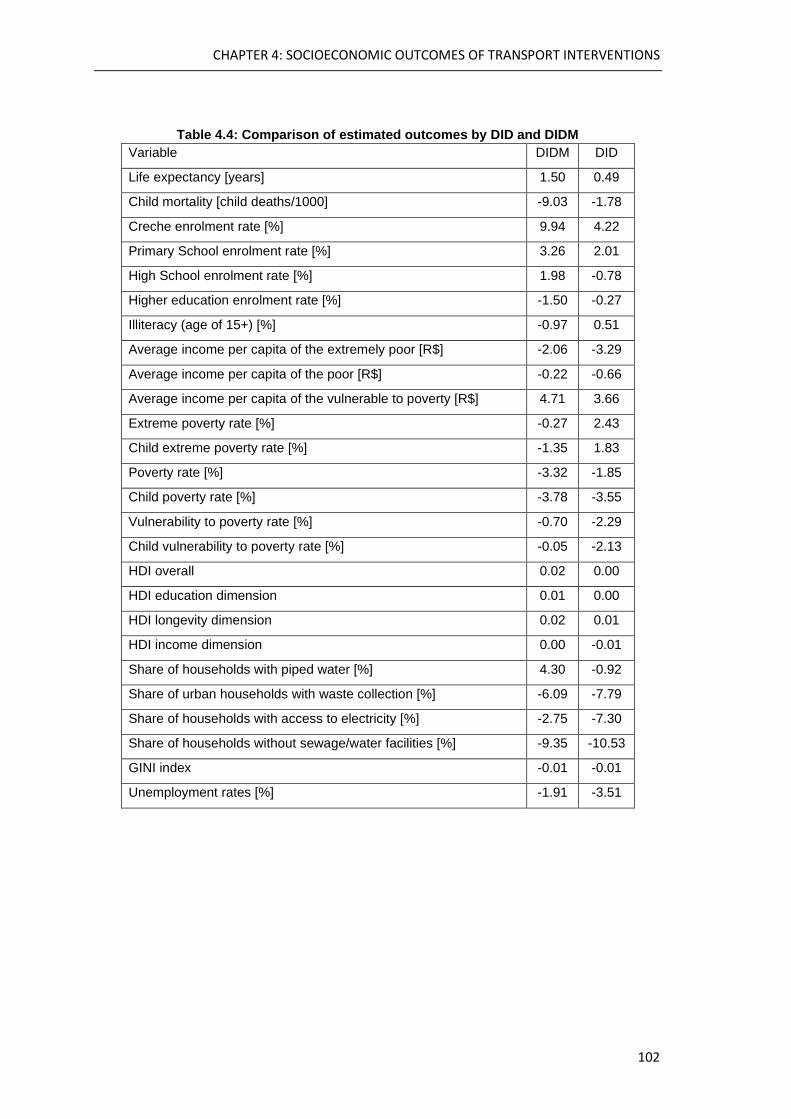
CHAPTER 4: SOCIOECONOMIC OUTCOMES OF TRANSPORT INTERVENTIONS
102
Table 4.4: Comparison of estimated outcomes by DID and DIDM
Variable DIDM DID
Life expectancy [years] 1.50 0.49
Child mortality [child deaths/1000] -9.03 -1.78
Creche enrolment rate [%] 9.94 4.22
Primary School enrolment rate [%] 3.26 2.01
High School enrolment rate [%] 1.98 -0.78
Higher education enrolment rate [%] -1.50 -0.27
Illiteracy (age of 15+) [%] -0.97 0.51
Average income per capita of the extremely poor [R$] -2.06 -3.29
Average income per capita of the poor [R$] -0.22 -0.66
Average income per capita of the vulnerable to poverty [R$] 4.71 3.66
Extreme poverty rate [%] -0.27 2.43
Child extreme poverty rate [%] -1.35 1.83
Poverty rate [%] -3.32 -1.85
Child poverty rate [%] -3.78 -3.55
Vulnerability to poverty rate [%] -0.70 -2.29
Child vulnerability to poverty rate [%] -0.05 -2.13
HDI overall 0.02 0.00
HDI education dimension 0.01 0.00
HDI longevity dimension 0.02 0.01
HDI income dimension 0.00 -0.01
Share of households with piped water [%] 4.30 -0.92
Share of urban households with waste collection [%] -6.09 -7.79
Share of households with access to electricity [%] -2.75 -7.30
Share of households without sewage/water facilities [%] -9.35 -10.53
GINI index -0.01 -0.01
Unemployment rates [%] -1.91 -3.51
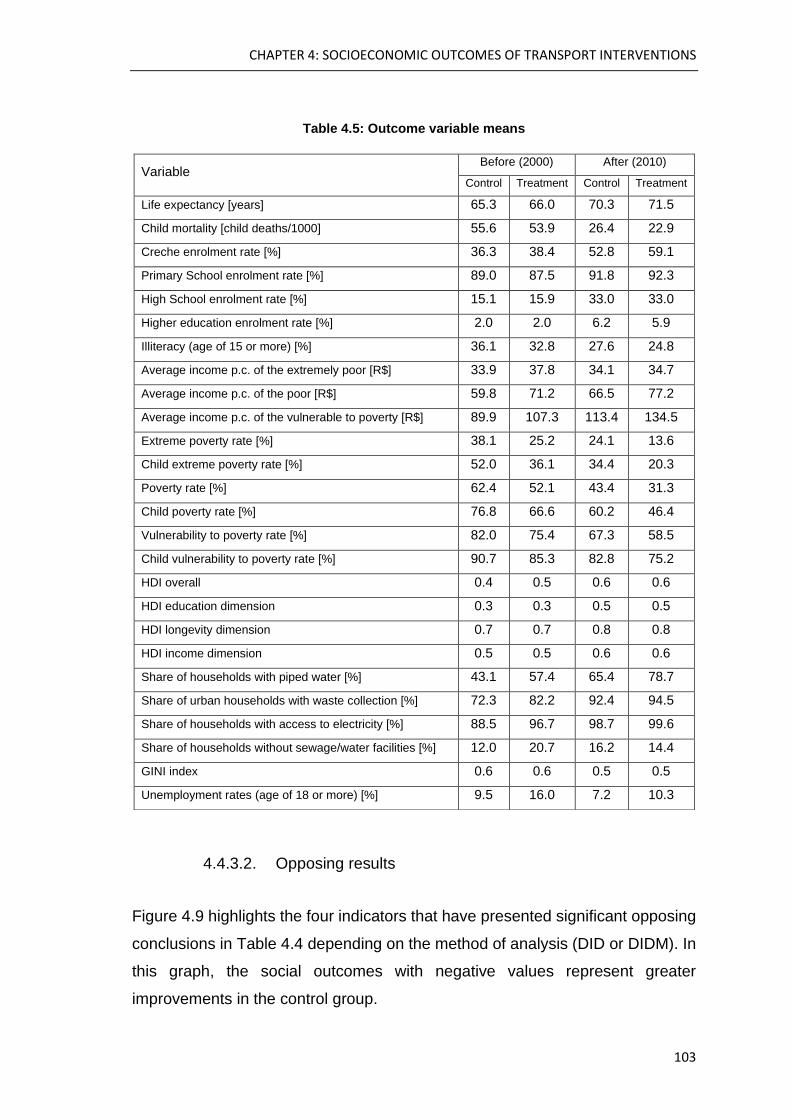
CHAPTER 4: SOCIOECONOMIC OUTCOMES OF TRANSPORT INTERVENTIONS
103
Table 4.5: Outcome variable means
4.4.3.2. Opposing results
Figure 4.9 highlights the four indicators that have presented significant opposing
conclusions in Table 4.4 depending on the method of analysis (DID or DIDM). In
this graph, the social outcomes with negative values represent greater
improvements in the control group.
Variable Before (2000) After (2010)
Control Treatment Control Treatment
Life expectancy [years] 65.3 66.0 70.3 71.5
Child mortality [child deaths/1000] 55.6 53.9 26.4 22.9
Creche enrolment rate [%] 36.3 38.4 52.8 59.1
Primary School enrolment rate [%] 89.0 87.5 91.8 92.3
High School enrolment rate [%] 15.1 15.9 33.0 33.0
Higher education enrolment rate [%] 2.0 2.0 6.2 5.9
Illiteracy (age of 15 or more) [%] 36.1 32.8 27.6 24.8
Average income p.c. of the extremely poor [R$] 33.9 37.8 34.1 34.7
Average income p.c. of the poor [R$] 59.8 71.2 66.5 77.2
Average income p.c. of the vulnerable to poverty [R$] 89.9 107.3 113.4 134.5
Extreme poverty rate [%] 38.1 25.2 24.1 13.6
Child extreme poverty rate [%] 52.0 36.1 34.4 20.3
Poverty rate [%] 62.4 52.1 43.4 31.3
Child poverty rate [%] 76.8 66.6 60.2 46.4
Vulnerability to poverty rate [%] 82.0 75.4 67.3 58.5
Child vulnerability to poverty rate [%] 90.7 85.3 82.8 75.2
HDI overall 0.4 0.5 0.6 0.6
HDI education dimension 0.3 0.3 0.5 0.5
HDI longevity dimension 0.7 0.7 0.8 0.8
HDI income dimension 0.5 0.5 0.6 0.6
Share of households with piped water [%] 43.1 57.4 65.4 78.7
Share of urban households with waste collection [%] 72.3 82.2 92.4 94.5
Share of households with access to electricity [%] 88.5 96.7 98.7 99.6
Share of households without sewage/water facilities [%] 12.0 20.7 16.2 14.4
GINI index 0.6 0.6 0.5 0.5
Unemployment rates (age of 18 or more) [%] 9.5 16.0 7.2 10.3
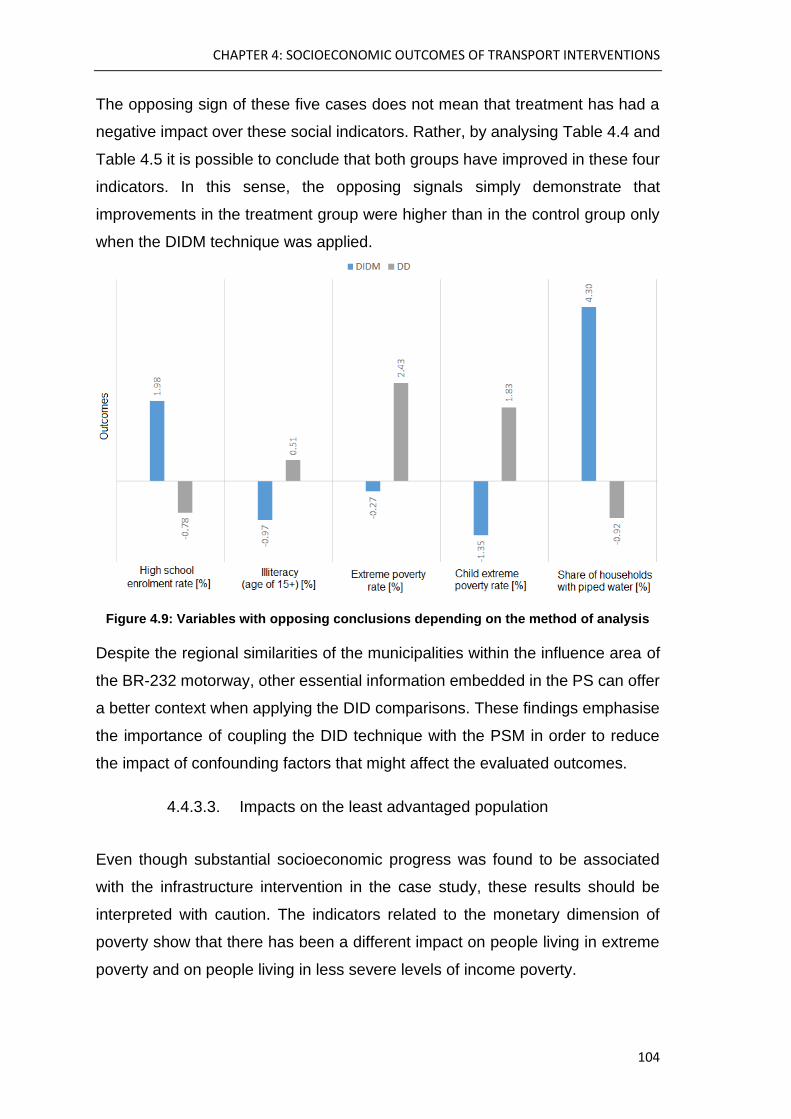
CHAPTER 4: SOCIOECONOMIC OUTCOMES OF TRANSPORT INTERVENTIONS
104
The opposing sign of these five cases does not mean that treatment has had a
negative impact over these social indicators. Rather, by analysing Table 4.4 and
Table 4.5 it is possible to conclude that both groups have improved in these four
indicators. In this sense, the opposing signals simply demonstrate that
improvements in the treatment group were higher than in the control group only
when the DIDM technique was applied.
Figure 4.9: Variables with opposing conclusions depending on the method of analysis
Despite the regional similarities of the municipalities within the influence area of
the BR-232 motorway, other essential information embedded in the PS can offer
a better context when applying the DID comparisons. These findings emphasise
the importance of coupling the DID technique with the PSM in order to reduce
the impact of confounding factors that might affect the evaluated outcomes.
4.4.3.3. Impacts on the least advantaged population
Even though substantial socioeconomic progress was found to be associated
with the infrastructure intervention in the case study, these results should be
interpreted with caution. The indicators related to the monetary dimension of
poverty show that there has been a different impact on people living in extreme
poverty and on people living in less severe levels of income poverty.
CHAPTER 4: SOCIOECONOMIC OUTCOMES OF TRANSPORT INTERVENTIONS
105
Whilst the average income per capita of people in poverty and people who are
vulnerable to poverty have improved more in the treatment group over time, the
same indicator for people in extreme poverty has actually decreased after the
intervention. In other words, people surviving in extreme poverty in municipalities
that received the transport project saw their average income decreasing over
time.
Additionally, the improvement in the treatment group was only modestly higher
than the control one (0.23 percentage points) in terms of extreme poverty
reduction. These differences point to a trend suggested by other studies (Salon
and Gulyani, 2010; Setboonsarng, 2006; Cook et al., 2005; Porter, 2002) that
extreme poverty is not necessarily alleviated by large transport infrastructure
investments.
Similar to these findings, Khandker and Koolwal (2011) in a dynamic panel data
study performed in rural Bangladesh also point out that households in extreme
poverty may not be as able as the better off population to capture the productivity
and cost reductions benefits of a road project. Likewise, Setboonsarng (2006)
argue that despite evidence that transport infrastructure can indeed promote
poverty reduction, this process is not automatic, and often the non-poor and less
poor population benefit more from these investments then the neediest. Without
complementary assistance to the poorest, Setboonsarng (2006) explains, these
benefits are typically captured by the local elite.
Thus, the findings reported in this case study from Northeast Brazil support
earlier evidence, showing that the benefits of a new transport infrastructure might
vary significantly even among groups of lower income levels. This has important
implications for planning new transport interventions, especially where extreme
poverty is most spread, like in rural Northeast Brazil. The results of this ex-post
assessment ultimately highlight the need to assess the distributional impacts and
screening the transport-related needs at a local level prior to massive transport
infrastructure investments. In the next Chapter, this topic is further addressed in
order to present tools for preventing this unequal socioeconomic progress and
tackle poverty more effectively.
CHAPTER 4: SOCIOECONOMIC OUTCOMES OF TRANSPORT INTERVENTIONS
106
4.5. Policy implications
This study set out with the aim of structuring a framework capable of evaluating
the social outcomes of transport interventions in Northeast Brazil using publicly
available datasets only. Regarding the framework, the comparisons between the
results obtained by DID and DIDM have highlighted potential misperceptions of
a ‘context-less’ analysis. As displayed in Figure 4.9, a set of five indicators have
resulted in opposing conclusions when the outputs of these two methods were
compared. This contrast emphasises the importance of using the PSM technique
when estimating causal treatment effects in panel data studies like this. The
findings strongly support the idea that if the context of the quasi-experiment study
is not considered, the results may lead to biased conclusions being made on the
relationships between a transport investment and its outcomes.
Whilst the results point to a wide range of positive socioeconomic effects that can
emerge from the road widening project, they also call attention to the necessity
of evaluating the distributive impacts of transport investments. As shown by
indicators of average income per capita, it is not guaranteed that improvements
on the transport infrastructure will result in welfare gains for the population in
most need. This particular case study demonstrates that people in extreme
poverty living in municipalities along the widened stretch had actually a decrease
in their average income per capita after the completion of the project.
In that sense, it is argued that transport infrastructure projects should be
complemented by further public policies targeting specifically these low-income
groups that cannot directly benefit from these investments. These policies should
be able to address the dimensions of transport-related exclusion that are most
likely to be reinforcing cycles of poverty in each municipality. Particularly in the
case of Northeast Brazil, these complementary measures should not disregard
informal public transport and active modes since they are the main mobility
alternatives used by people under the most severe levels of poverty.
The findings reported in this Chapter highlight the need for distributional impact
appraisals across different social groups and the need for screening the specific

CHAPTER 4: SOCIOECONOMIC OUTCOMES OF TRANSPORT INTERVENTIONS
107
transport needs at a local level, especially prior to large-scale transport
infrastructure investments. In the next chapters, additional tools and reflections
are provided on how to identify in ex-ante assessments the priority regions and
transport-related needs of each region that demand primary action in this sense.
4.6. Conclusion
This Chapter has sought to evaluate the social outcomes of a transport
infrastructure intervention in Northeast Brazil by developing and applying a well-
grounded ex-post assessment framework. Whilst many transport infrastructure
projects have been advertised as key investments to promote regional economic
growth, this Chapter sheds light on to the extent to which this development has
also resulted in socioeconomic benefits to the least advantaged population.
Overall, the reported findings subscribe to the view that transport infrastructure
investments broadly contribute to the reduction of multidimensional poverty. This
conclusion is particularly illustrated in this case study by the greater positive
impacts in eleven socioeconomic indicators of the municipalities on the region of
this transport project.
Nonetheless, this Chapter has also demonstrated that people living in the most
severe levels of poverty do not equally benefit from large transport infrastructure
investments. This is mostly supported by the decrease of the average income
per capita of the extremely poor and by the modest decline of the extreme poverty
rate in the municipalities along the widened stretch of BR2-232 when compared
to the municipalities of the control group.
Thus, the proposed framework draws attention to a recurrent misperception that
occurs when the distributional impacts of transport infrastructure interventions
are disregarded at the planning stage. Despite overall socioeconomic progress,
the findings have shown that complementary actions are still needed to ensure
that these investments will result in a fair distribution of their benefits to society.
It is argued that these additional interventions should be guided by ex-ante social
impact analysis performed when appraising and prioritising transport
CHAPTER 4: SOCIOECONOMIC OUTCOMES OF TRANSPORT INTERVENTIONS
108
interventions. This topic receives further attention in Chapter 6 when a socially
driven framework is proposed to screen the transport needs at a local level.
In terms of the methodology, it is possible to conclude that the framework
proposed in this Chapter is particularly suitable for the case study region,
considering its data limitations. Perhaps the main advantage of this framework is
that it does not require expensive surveys and highly disaggregated data to be
performed since it is based on publicly available data only. Thus, it unlocks a
myriad of possibilities of case studies to assess other transport interventions
which occurred in the past during intercensal periods, and to explore their social
effects over time.
Future research, however, is still needed to address limitations related to the
endogeneity and aggregation of spatial data highlighted throughout this Chapter.
For regions where data is more spatially disaggregated, the same framework can
be refined into areas smaller than a municipality to further explore spatial
distributional effects. Moreover, the inclusion of other types of investments (other
than transport infrastructure) as a means to reduce the bias potentially caused
by endogeneity factors is highly recommended in further studies exploring this
research line.
Finally, this Chapter also makes a strong case for the debate about the large
transport infrastructure investments that are currently in the pipeline of
Pernambuco state (e.g. BR-316, BR-116, BR-101), as well as throughout the
whole Country (EPL, 2018). The evidence reported by this study emphasises that
these transport infrastructure interventions must not be disconnected from the
local needs, and the distributional impacts must be considered at the planning
stage if poverty eradication is a goal to be achieved within this generation.
CHAPTER 5: ACCESSIBILITY EVALUATION AT THE MUNICIPALITY LEVEL
109
5. CHAPTER 5: ACCESSIBILITY EVALUATION AT THE
MUNICIPALITY LEVEL
5.1. Introduction
Studies addressing the multidimensional concept of poverty have shown that
monetary indicators, although important, do not capture many essential factors
of deprivation experienced by the poor (Alkire and Seth, 2015; Narayan et al.,
2000). Thus, other dimensions of poverty like access to education, health, and
living standards have been increasingly incorporated in social studies to promote
more comprehensive assessments and better policy recommendations for
tackling poverty (Alkire and Foster, 2011). Evidence recently published by the
World Bank has shown that the primary difference between those who have
escaped chronic poverty and those still trapped in it is not income, but access to
essential services (Vakis et al., 2016).
From a transport planning standpoint, as already mentioned in previous chapters,
the links between poverty and accessibility have been clarified in the literature
(Benevenuto and Caulfield, 2019). Nevertheless, while the conceptualisation and
measurement of accessibility disadvantages in the Global North already plays a
central role in the social inclusion research and policy debate (Church et al.,
2000; Farrington and Farrington, 2005; Velaga et al., 2012; ITF, 2017b), the
same agenda has garnered comparatively much less attention in the Global
South, where poverty is more wide-spread. Moreover, in spite of the increasing
body of research dedicated to evaluating access to house facilities (e.g.
electricity, sanitation) and healthcare services in rural Global South (e.g. Luo et
al., 2017; Nesbitt et al., 2014), only few notable exceptions have been dedicated
to evaluating quantitatively the overall accessibility poverty in these contexts

CHAPTER 5: ACCESSIBILITY EVALUATION AT THE MUNICIPALITY LEVEL
110
(Weiss et al., 2018; Iimi et al., 2016; Roberts et al., 2006; Sarkar and Ghosh,
2008).
The Rural Access Index (RAI) proposed by Roberts et al. (2006) and restructured
by Iimi et al. (2016) has delivered a substantial contribution by establishing a
quantitative indicator of rural accessibility for more than 170 countries. However,
such an index presents only the ease of access to the rural transport network47,
which generally does not mean access to basic services. In a context where
travel distances are predominantly high (Porter, 2014) and where the population
in poverty mostly live in a walking world, access to the transport network might
not be a sufficient indicator to assess real accessibility in rural areas.
Another significant contribution to the modelling of rural accessibility globally is
the map of travel time to cities proposed by Weiss et al. (2018). This study builds
on a method developed by Nelson (2008) that estimates the speed at which
humans move through the landscape based on a Global Surface Friction map48.
Whilst such a study provides a comprehensive and rational overview to assess
the global inequalities in terms of access to the nearest city49, it neglects the
overlapping influences of other smaller urban centres not characterised as cities.
In the absence of GTFS50 data covering rural areas, Starkey et al. (2013) propose
the use of local surveys to estimate indicators such as fare price per passenger
kilometre, and transport frequency on normal days in rural areas of several Sub-
Saharan Countries. Despite reporting an unprecedented amount of data of rural
transport services in these regions, the results cannot be generalised to farther
afield as they only reflect the local supply of rural transport. Moreover, the
replication of this method in larger areas would necessarily require costly and
time-consuming surveys.
47 The RAI index estimates the share of people living farther than 2km from any all-season road. 48 This Global map shows at a resolution of 1x1km the travel impedance (minutes per meter) based on
several spatial datasets such as spatial distribution of roads, railroads, rivers, bodies of water, topographical
conditions, land use, and national borders. 49 Which is defined as a contiguous area with population density of at least 1,500 inhabitants/km2, or a built-
up land cover coincident with a population of at least 50,000 inhabitants (Weiss et al., 2018). 50 GTFS or General Transit Feed Specification is a common format for public transport data that combines
spatial and tabular datasets including routes, stops and timetables.

CHAPTER 5: ACCESSIBILITY EVALUATION AT THE MUNICIPALITY LEVEL
111
In this context, where no quantitative indicator of accessibility is available or
accurate enough to foster equitable and inclusive transparent planning, the
prioritisation of transport interventions inevitably assumes a biased, arbitrary and
paternalistic fashion (Di Ciommo, 2018). The research presented in this Chapter
attempts to fill this research gap and support an evidence-based transport
planning that may mitigate the current status of subjectivity in social appraisals
of transport interventions. Drawing upon the literature, this Chapter constructs
two Spatial Accessibility Poverty (SAP) indices to offer innovative and well-
grounded tools for transport planning in remote areas of the Global South. As a
result, while addressing the limitations of previous studies, the indices that are
proposed also aim to catalyse actions to reduce the transport-related exclusion
in rural areas caused by the lack of access to basic facilities (e.g. health,
education, financial facilities). Even though this research is particularly tailored to
the Brazilian context, it is potentially replicable in other countries with similar
characteristics of poor spatial data.
5.2. Data and Methods
5.2.1. Mapping opportunities
As already explained in Chapter 3, several basic facilities’ coordinates51 and job
opportunities locations remain still unknown at a national level in Brazil,
especially in the rural and suburban areas (Benevenuto et al., 2018).
Nonetheless, since these points of interest are primarily concentrated within the
urban centres (IBGE, 2008; Church et al., 2000), it is reasonable to assume the
geolocation of each urban centre (i.e. city hall coordinates) as an aggregated
proxy for public services and basic amenities’ locations at a larger scale. This
premise has been also used by recent studies (Weiss et al., 2018; Headey et al.
51 Location of schools, police stations, social service centres, healthcare centres, supermarkets, financial
facilities, etc.

CHAPTER 5: ACCESSIBILITY EVALUATION AT THE MUNICIPALITY LEVEL
112
2018), to demonstrate how access to urban centres stratifies the educational,
economic and health status across different communities.
The variety and complexity of services and amenities offered in each centre are
dependent on the urban hierarchy (i.e. the centrality level) of each centre.
Following the same approach described in Chapter 3, the present Chapter
considers the traditional centrality hierarchisation method proposed for Brazil by
IBGE (2008), which stratifies the Municipalities of this case study region in five
different levels of centrality (weights) as described in Table 3.2 (Chapter 3), and
further illustrated in Figure 5.1.
Figure 5.1: Urban centres in extended Northeast Brazil (SUDENE area)
CHAPTER 5: ACCESSIBILITY EVALUATION AT THE MUNICIPALITY LEVEL
113
5.2.2. The spatial accessibility poverty indices
Over the past two decades, there has been an increasing body of research
assessing spatial accessibility by estimating floating catchment areas (FCA) of
opportunities, their distance decay effects, and the population attended by the
given Point Of Interest (POI) (Luo and Wang, 2003; Geurs and van Wee, 2004;
Schuurman et al, 2010; Dai, 2010; Polzin et al., 2014; Shaw and Sahoo, 2019).
Radke and Wu (2000) have introduced a simple and effective gravity-based
measure aiming to achieve a fair and equal distribution of social programs. This
model, later named as Two Step Floating Catchment Area (2SFCA) by Luo and
Wang (2003), defines the service area of a given POI by a threshold travel
time/distance while also accounting for the availability of this POI over its
surrounded demands (Luo and Wang, 2003). Later studies have also introduced
three ways of conceptualising the distance decay effect in this model, calling it
Enhanced Two Step Floating Catchment Area (E2SFCA): the continuous
functions, the discrete variables, or a hybrid of these two (Luo et al., 2017; Wang,
2012; Guagliardo, 2004).
One of the main advantages of using this FCA techniques to measure
accessibility is to be able to incorporate the overlapping influences of different
POI’s around the same location. This is particularly important since bypassing
the nearest service is a phenomenon frequently observed in places where
populations have more than one option of the same service to choose from
(McGrail and Humphreys, 2009). Additionally, in the context of the present
Chapter, by considering the different levels of influence from all urban centres in
this case study, it becomes possible to account for the availability of POIs of
different levels of complexity. For example, while the availability of primary
schools can be accounted by the FCA of local centres, the range of specialised
hospitals (or any other service of higher complexity) can be accounted by the
FCA of centres of higher position in the hierarchy (i.e. Regional Centres and
Metropolis). In this sense, by using FCA of urban centres the issue of measuring
accessibility based only on the nearest urban centre (Weiss, 2018) can be
avoided.
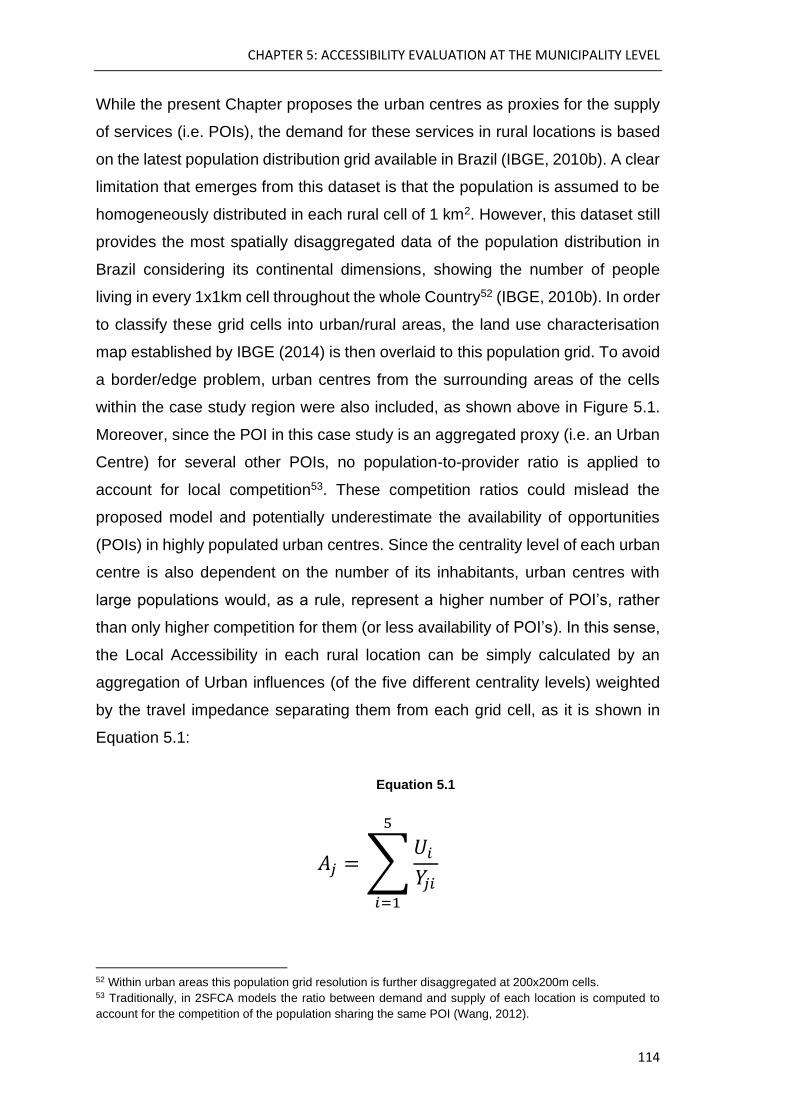
CHAPTER 5: ACCESSIBILITY EVALUATION AT THE MUNICIPALITY LEVEL
114
While the present Chapter proposes the urban centres as proxies for the supply
of services (i.e. POIs), the demand for these services in rural locations is based
on the latest population distribution grid available in Brazil (IBGE, 2010b). A clear
limitation that emerges from this dataset is that the population is assumed to be
homogeneously distributed in each rural cell of 1 km2. However, this dataset still
provides the most spatially disaggregated data of the population distribution in
Brazil considering its continental dimensions, showing the number of people
living in every 1x1km cell throughout the whole Country52 (IBGE, 2010b). In order
to classify these grid cells into urban/rural areas, the land use characterisation
map established by IBGE (2014) is then overlaid to this population grid. To avoid
a border/edge problem, urban centres from the surrounding areas of the cells
within the case study region were also included, as shown above in Figure 5.1.
Moreover, since the POI in this case study is an aggregated proxy (i.e. an Urban
Centre) for several other POIs, no population-to-provider ratio is applied to
account for local competition53. These competition ratios could mislead the
proposed model and potentially underestimate the availability of opportunities
(POIs) in highly populated urban centres. Since the centrality level of each urban
centre is also dependent on the number of its inhabitants, urban centres with
large populations would, as a rule, represent a higher number of POI’s, rather
than only higher competition for them (or less availability of POI’s). In this sense,
the Local Accessibility in each rural location can be simply calculated by an
aggregation of Urban influences (of the five different centrality levels) weighted
by the travel impedance separating them from each grid cell, as it is shown in
Equation 5.1:
𝐴𝑗 = ∑𝑈𝑖
𝑌𝑗𝑖
5
𝑖=1
52 Within urban areas this population grid resolution is further disaggregated at 200x200m cells. 53 Traditionally, in 2SFCA models the ratio between demand and supply of each location is computed to
account for the competition of the population sharing the same POI (Wang, 2012).
Equation 5.1
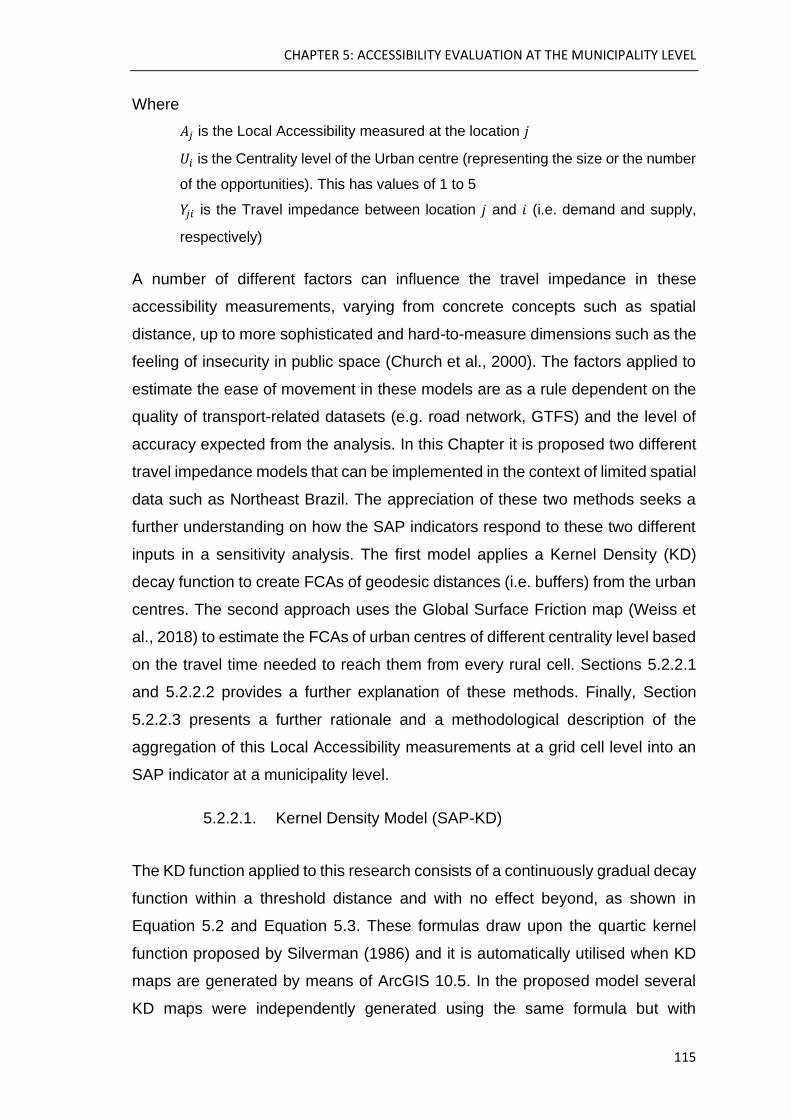
CHAPTER 5: ACCESSIBILITY EVALUATION AT THE MUNICIPALITY LEVEL
115
Where
𝐴𝑗 is the Local Accessibility measured at the location 𝑗
𝑈𝑖 is the Centrality level of the Urban centre (representing the size or the number
of the opportunities). This has values of 1 to 5
𝑌𝑗𝑖 is the Travel impedance between location 𝑗 and 𝑖 (i.e. demand and supply,
respectively)
A number of different factors can influence the travel impedance in these
accessibility measurements, varying from concrete concepts such as spatial
distance, up to more sophisticated and hard-to-measure dimensions such as the
feeling of insecurity in public space (Church et al., 2000). The factors applied to
estimate the ease of movement in these models are as a rule dependent on the
quality of transport-related datasets (e.g. road network, GTFS) and the level of
accuracy expected from the analysis. In this Chapter it is proposed two different
travel impedance models that can be implemented in the context of limited spatial
data such as Northeast Brazil. The appreciation of these two methods seeks a
further understanding on how the SAP indicators respond to these two different
inputs in a sensitivity analysis. The first model applies a Kernel Density (KD)
decay function to create FCAs of geodesic distances (i.e. buffers) from the urban
centres. The second approach uses the Global Surface Friction map (Weiss et
al., 2018) to estimate the FCAs of urban centres of different centrality level based
on the travel time needed to reach them from every rural cell. Sections 5.2.2.1
and 5.2.2.2 provides a further explanation of these methods. Finally, Section
5.2.2.3 presents a further rationale and a methodological description of the
aggregation of this Local Accessibility measurements at a grid cell level into an
SAP indicator at a municipality level.
5.2.2.1. Kernel Density Model (SAP-KD)
The KD function applied to this research consists of a continuously gradual decay
function within a threshold distance and with no effect beyond, as shown in
Equation 5.2 and Equation 5.3. These formulas draw upon the quartic kernel
function proposed by Silverman (1986) and it is automatically utilised when KD
maps are generated by means of ArcGIS 10.5. In the proposed model several
KD maps were independently generated using the same formula but with
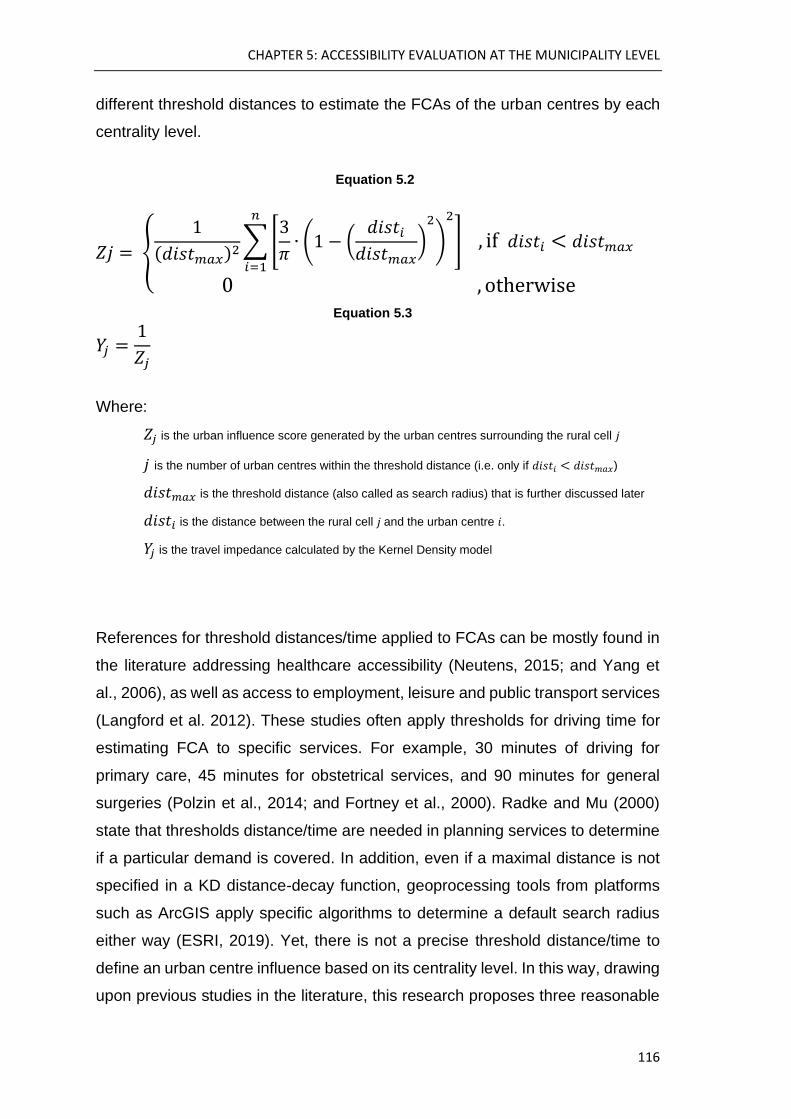
CHAPTER 5: ACCESSIBILITY EVALUATION AT THE MUNICIPALITY LEVEL
116
different threshold distances to estimate the FCAs of the urban centres by each
centrality level.
𝑍𝑗 = {
1
(𝑑𝑖𝑠𝑡𝑚𝑎𝑥)2∑ [
3
𝜋∙ (1 − (
𝑑𝑖𝑠𝑡𝑖
𝑑𝑖𝑠𝑡𝑚𝑎𝑥)
2
)
2
]
𝑛
𝑖=1
, if 𝑑𝑖𝑠𝑡𝑖 < 𝑑𝑖𝑠𝑡𝑚𝑎𝑥
0 , otherwise
𝑌𝑗 =1
𝑍𝑗
Where:
𝑍𝑗 is the urban influence score generated by the urban centres surrounding the rural cell 𝑗
𝑗 is the number of urban centres within the threshold distance (i.e. only if 𝑑𝑖𝑠𝑡𝑖 < 𝑑𝑖𝑠𝑡𝑚𝑎𝑥)
𝑑𝑖𝑠𝑡𝑚𝑎𝑥 is the threshold distance (also called as search radius) that is further discussed later
𝑑𝑖𝑠𝑡𝑖 is the distance between the rural cell 𝑗 and the urban centre 𝑖.
𝑌𝑗 is the travel impedance calculated by the Kernel Density model
References for threshold distances/time applied to FCAs can be mostly found in
the literature addressing healthcare accessibility (Neutens, 2015; and Yang et
al., 2006), as well as access to employment, leisure and public transport services
(Langford et al. 2012). These studies often apply thresholds for driving time for
estimating FCA to specific services. For example, 30 minutes of driving for
primary care, 45 minutes for obstetrical services, and 90 minutes for general
surgeries (Polzin et al., 2014; and Fortney et al., 2000). Radke and Mu (2000)
state that thresholds distance/time are needed in planning services to determine
if a particular demand is covered. In addition, even if a maximal distance is not
specified in a KD distance-decay function, geoprocessing tools from platforms
such as ArcGIS apply specific algorithms to determine a default search radius
either way (ESRI, 2019). Yet, there is not a precise threshold distance/time to
define an urban centre influence based on its centrality level. In this way, drawing
upon previous studies in the literature, this research proposes three reasonable
Equation 5.3
Equation 5.2
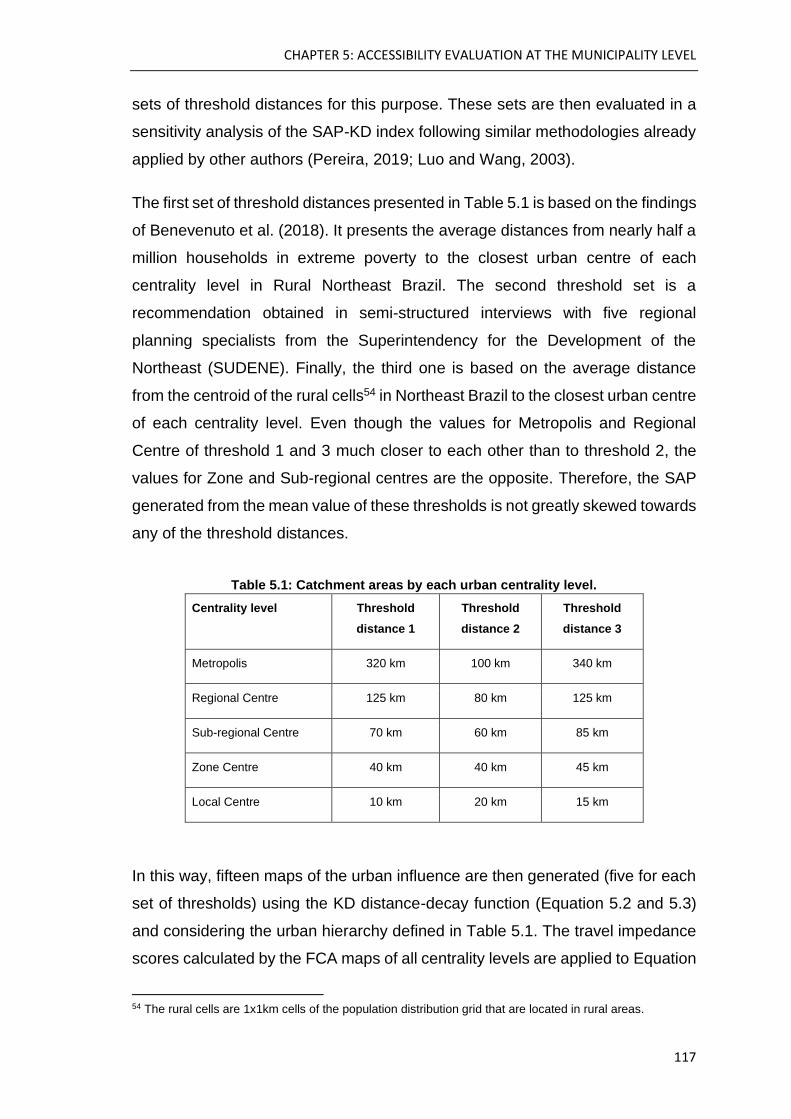
CHAPTER 5: ACCESSIBILITY EVALUATION AT THE MUNICIPALITY LEVEL
117
sets of threshold distances for this purpose. These sets are then evaluated in a
sensitivity analysis of the SAP-KD index following similar methodologies already
applied by other authors (Pereira, 2019; Luo and Wang, 2003).
The first set of threshold distances presented in Table 5.1 is based on the findings
of Benevenuto et al. (2018). It presents the average distances from nearly half a
million households in extreme poverty to the closest urban centre of each
centrality level in Rural Northeast Brazil. The second threshold set is a
recommendation obtained in semi-structured interviews with five regional
planning specialists from the Superintendency for the Development of the
Northeast (SUDENE). Finally, the third one is based on the average distance
from the centroid of the rural cells54 in Northeast Brazil to the closest urban centre
of each centrality level. Even though the values for Metropolis and Regional
Centre of threshold 1 and 3 much closer to each other than to threshold 2, the
values for Zone and Sub-regional centres are the opposite. Therefore, the SAP
generated from the mean value of these thresholds is not greatly skewed towards
any of the threshold distances.
Table 5.1: Catchment areas by each urban centrality level.
Centrality level Threshold
distance 1
Threshold
distance 2
Threshold
distance 3
Metropolis 320 km 100 km 340 km
Regional Centre 125 km 80 km 125 km
Sub-regional Centre 70 km 60 km 85 km
Zone Centre 40 km 40 km 45 km
Local Centre 10 km 20 km 15 km
In this way, fifteen maps of the urban influence are then generated (five for each
set of thresholds) using the KD distance-decay function (Equation 5.2 and 5.3)
and considering the urban hierarchy defined in Table 5.1. The travel impedance
scores calculated by the FCA maps of all centrality levels are applied to Equation
54 The rural cells are 1x1km cells of the population distribution grid that are located in rural areas.
CHAPTER 5: ACCESSIBILITY EVALUATION AT THE MUNICIPALITY LEVEL
118
5.1, and then assigned as a single attribute of Local Accessibility in each rural
cell of the case study region. Figure 5.2 presents a graphical description of this
process for one set of threshold distances. The creation sequence of the urban
FCAs for each centrality level is presented at the upper part of the figure. At the
lower part, a zoomed snapshot of the overlapping FCA’s over the rural cells is
presented to indicate how the urban influence scores are accounted and
assigned to each cell.

CHAPTER 5: ACCESSIBILITY EVALUATION AT THE MUNICIPALITY LEVEL
119
Figure 5.2: Calculation of Local Accessibility using Kernel Density method

CHAPTER 5: ACCESSIBILITY EVALUATION AT THE MUNICIPALITY LEVEL
120
5.2.2.2. Friction Surface Model (SAP-FS)
The second travel impedance model that is proposed is based on the Global
Friction Surface method published by Weiss et al. (2018). As already mentioned,
this database estimates the speed at which humans move on average through
the landscape based on several proprietary and open-source spatial datasets,
that include information about the transport network (roads, railways, navigable
rivers), the terrain (land use, national borders) and other geographic features
(elevation55, slope56). The combination of these inputs results in a Friction
Surface map at a resolution of 1x1km that represents the estimated time in
minutes required to cross each grid cell.
This method was originally proposed with data from two decades ago by Nelson
(2008), and then it had a significant update with inputs from 2015 by Weiss et al.
(2018). In this new version, a substantial improvement in the input data quantity
and quality has been achieved by incorporating two major roads datasets from
Open Street Map57, and from the Google roads58 database. In this sense, even
though this database does not represent a perfect representation of the current
transport infrastructure in Northeast Brazil, it offers a solid and well-grounded
model of travel impedances. The following examples present some of the
relevant travel speed assumptions that are considered in this model (JRC, 2019)
to illustrate how these travel impedances are estimated in each grid cell:
• 0.5 min per km (i.e. 120km/h) if there is a Motorway
• 1 min per km (i.e. 60km/h) if there is a Major road
• 2 mins per km (i.e. 30km/h) if the terrain is covered by artificial/urban areas
• 24 mins per km (i.e. 2.5km/h) if the terrain is covered by sparse
herbaceous or shrub
• 36 mins per km (i.e. 1.67km/h) if the terrain is covered by cultivated or
managed areas
55 There is an attenuation factor in the ease of movement for altitudes higher than 2000 meters.
56 Uphill and downhill travels present slower travel speeds.
57 www.openstreetmaps.org
58 www.maps.google.com

CHAPTER 5: ACCESSIBILITY EVALUATION AT THE MUNICIPALITY LEVEL
121
Based on this Friction Surface (FS) raster data and the urban centre locations,
the travel time from anywhere in Northeast Brazil to the closest urban centre of
each centrality level could be calculated. This measurement was performed using
a cost-distance algorithm available in ArcMap 10.6.1, which calculates the least
accumulative cost distance for each cell to the nearest source (i.e. urban centre)
over the friction surface. Even though this travel impedance model does not
require the definition of threshold times in the calculation of the FCA of each
centrality level, travel times that are too long tend to be neglectable in the final
account of the Local Accessibility since they are inversely proportional. Finally,
Figure 5.3 summarises the process of how the five travel impedance maps are
generated and subsequently aggregated following into another Local
Accessibility measurement at each rural cell.
It is also worth mentioning, that whilst 1x1km of resolution is an extremely
accurate grid size at a global level of analysis, it can mask a significant variation
of travel impedance within a single grid cell, especially since this travel
impedance is directionless. As already discussed by Benevenuto et al. (2019),
several gaps in the mapped road network are still present in the available
databases from the government (DNIT59), private (Google maps, Here maps60),
and opensource (Openstreetmaps). In this sense, even though the FS method
offers a far more accurate method for representing travel impedances between
two points than a Geodesic distance-based model, the FS model may
occasionally fall short in consistency, especially in remote regions where the
quality of the mapped transport network is more limited.
59 National Department of Transport Infrastructure - www.dnit.gov.br
60 https://wego.here.com/

CHAPTER 5: ACCESSIBILITY EVALUATION AT THE MUNICIPALITY LEVEL
122
Figure 5.3: Calculation of Local Accessibility using Friction Surface method
CHAPTER 5: ACCESSIBILITY EVALUATION AT THE MUNICIPALITY LEVEL
123
5.2.2.3. Spatial Accessibility Poverty (SAP) indices at a municipality
level
The SAP indices (KD and FS) are intended to provide a quantitative tool for
transport planning that could support evidenced-based decisions (e.g. resources
allocation) at the municipality level or at a higher scale. This is particularly
important in the Brazilian context where very little attention has been paid to
accessibility audits in transport appraisals (Pereira, 2019; Vasconcellos, 2003).
Hence, this Section proposes a weighted aggregation of the Local Accessibility
indicators calculated above for each rural cell into an SAP index at a municipality
level. This aggregated indicator will facilitate the applicability of such an index in
regional transport appraisals and in the resource allocation process. As the
municipality is the smallest political-administrative division in Brazil, the majority
of the socio-economic and demographic indicators utilised in the country are also
calculated at this level.
In order to implement this aggregation of the SAP index, a model is proposed
that conjugates two factors: severity (how spatially excluded is the population
from the basic facilities?) and the extent factor (how many people are being
affected by this spatial accessibility poverty?). This approach was first applied to
assess the size and scope of accessibility poverty by Martens and Bastiaanssen
(2014). However, this study has its methodology based on the sufficientarianism
principle, which stresses that transport policies should give absolute priority to
address the accessibility needs of people who fall below a minimum level of
accessibility (Martens et al., 2014). In this sense, the very objective propositions
and insightful discussions on this topic, also presented by Martens (2016), still
leave the question on how to define an absolute accessibility poverty line
(similarly to an income poverty line) open to debate. From a theoretical
standpoint, the definition of such a line is most controversial because, among
other reasons, it would be morally hard to defend absolute priority to those just
below the threshold over those just above it (Martens et al., 2014).
Hence, the present Chapter proposes a novel accessibility poverty index also
based on the same two factors (severity and extent) but grounded on a
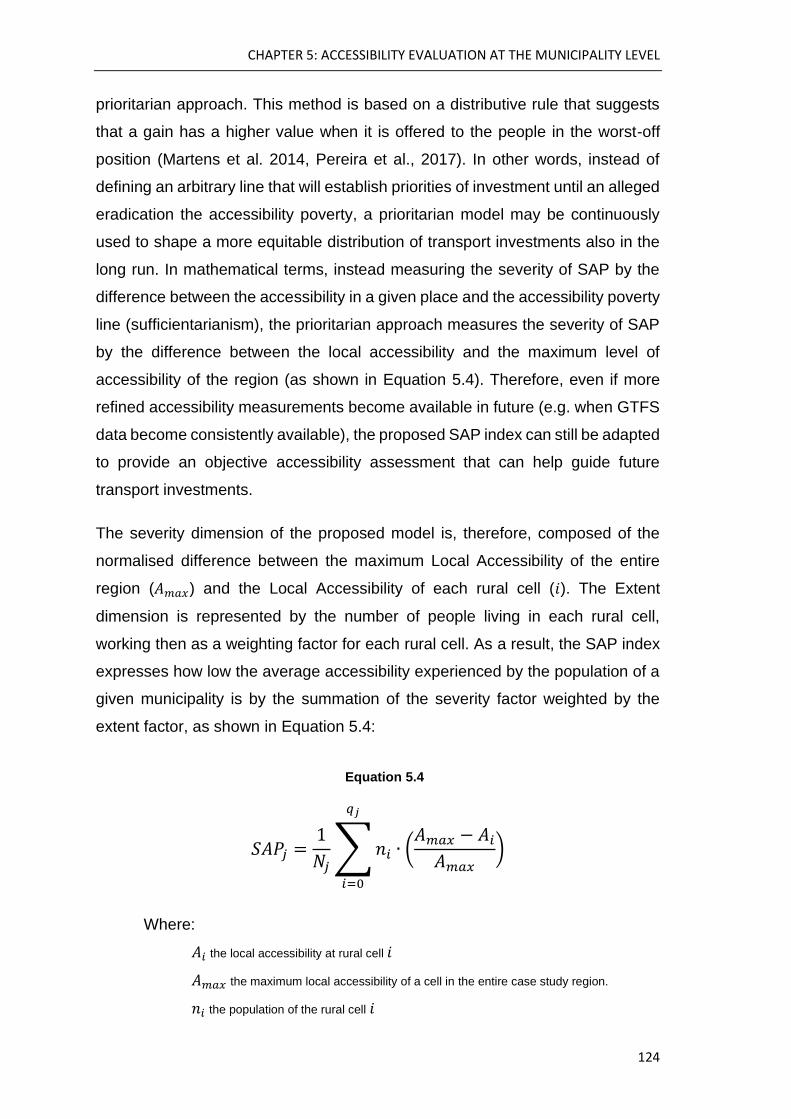
CHAPTER 5: ACCESSIBILITY EVALUATION AT THE MUNICIPALITY LEVEL
124
prioritarian approach. This method is based on a distributive rule that suggests
that a gain has a higher value when it is offered to the people in the worst-off
position (Martens et al. 2014, Pereira et al., 2017). In other words, instead of
defining an arbitrary line that will establish priorities of investment until an alleged
eradication the accessibility poverty, a prioritarian model may be continuously
used to shape a more equitable distribution of transport investments also in the
long run. In mathematical terms, instead measuring the severity of SAP by the
difference between the accessibility in a given place and the accessibility poverty
line (sufficientarianism), the prioritarian approach measures the severity of SAP
by the difference between the local accessibility and the maximum level of
accessibility of the region (as shown in Equation 5.4). Therefore, even if more
refined accessibility measurements become available in future (e.g. when GTFS
data become consistently available), the proposed SAP index can still be adapted
to provide an objective accessibility assessment that can help guide future
transport investments.
The severity dimension of the proposed model is, therefore, composed of the
normalised difference between the maximum Local Accessibility of the entire
region (𝐴𝑚𝑎𝑥) and the Local Accessibility of each rural cell (𝑖). The Extent
dimension is represented by the number of people living in each rural cell,
working then as a weighting factor for each rural cell. As a result, the SAP index
expresses how low the average accessibility experienced by the population of a
given municipality is by the summation of the severity factor weighted by the
extent factor, as shown in Equation 5.4:
𝑆𝐴𝑃𝑗 =1
𝑁𝑗∑ 𝑛𝑖 ∙ (
𝐴𝑚𝑎𝑥 − 𝐴𝑖
𝐴𝑚𝑎𝑥)
𝑞𝑗
𝑖=0
Where:
𝐴𝑖 the local accessibility at rural cell 𝑖
𝐴𝑚𝑎𝑥 the maximum local accessibility of a cell in the entire case study region.
𝑛𝑖 the population of the rural cell 𝑖
Equation 5.4

CHAPTER 5: ACCESSIBILITY EVALUATION AT THE MUNICIPALITY LEVEL
125
𝑞𝑗 the number of rural cells in the municipality 𝑗
𝑁𝑗 the total population of the municipality 𝑗
𝑆𝐴𝑃𝑗 the Spatial Accessibility Poverty index of the municipality 𝑗
It is worth mentioning that the well-known modifiable areal unit problem (MAUP)61
(Openshaw, 1984) could arise in the model when aggregating the influence
scores to create the SAP index to each municipality. Still, according to previous
studies in the literature (Dark and Bram, 2007; Hay et al., 2001), a weighting
function (e.g. the cell population) might reduce the effect of the MAUP when
aggregating spatial data by incorporating object-specific measures throughout
the analysis of the upscaled data. Therefore, since the SAP index is based on an
aggregation of several62 small cells (1x1km) per municipality, which are weighted
by the ratio of the population located on each cell, the MAUP caveat tends to be
reduced. Nevertheless, further applications of the SAP index should be done
carefully.
5.2.3. Municipalities profile analysis
Additional factor analysis is proposed to further investigate the interactions of the
SAP index with potential socio-economic patterns of the municipalities
experiencing higher levels of accessibility poverty. Drawing upon studies
addressing income poverty (Gwatkin et al., 2000; Vyas and Kumaranayake,
2006), the comparisons among municipalities are made by quintiles of
accessibility poverty. As two SAP indicators are being proposed, only the
municipalities that were classified in the same quintile of both SAP indicators
(SAP-FS and SAP-KD) are taken into consideration (i.e. 45% of the total). The
descriptive statistics summary of nineteen socio-economic and demographic
indicators is then evaluated at this step. These indicators are taken from the latest
Brazilian Census (IBGE, 2010a) and the list, although not exhaustive, can
61 MAUP is a source of statistical bias that refers to the fact that the observed values may vary depending
on how the data is aggregated into spatial boundaries (Openshaw, 1984).
62 On average there are nearly 600 rural cells in each municipality in this case study region.

CHAPTER 5: ACCESSIBILITY EVALUATION AT THE MUNICIPALITY LEVEL
126
provide a fair overview of basic dimensions required for the human flourishing in
a rural environment.
It is possible to further classify the vector of selected indicators from the
perspective of five general domains of capabilities deprivations63. The
dimensions listed below have been selected for convenience mainly based on
the existing census data (IBGE, 2010a) that are available for all municipalities
and are disaggregated by location (rural/urban):
• Freedom of Movement (SAP indicators, road density64, car, and motorbike
ownership)65
• Housing Facilities (toilet, electricity, sewage disposal66)
• Education (illiteracy rates67 and density of rural schools)
• Health (density of rural healthcare centres and hospitals68)
• Income (income-poverty levels)
The descriptive statistics of other municipality-wise characteristics are also
included, such as GDP, population size and density, and share of the rural
population. Moreover, since there is no data available of the income-poverty
levels by municipality that are also disaggregated by location (rural/urban) for the
entire region, for the Income domain it was considered three poverty lines
dependent on the per capita income (PCI) of rural families:
• Extreme Poverty when PCI < ¼ of the minimum national wage69
63 For further reflections on this, see Sabina Alkire (2007) ‘Choosing Dimensions: The Capability Approach
and Multidimensional Poverty’.
64 This indicator was calculated by of GIS tools based on the federal motorways only (EPL, 2019).
65 No public transport mode has been considered into this study due to the scarcity of GTFS data and the
presence of several informal operators providing intermittent transport services in this region.
66 An adequate sewage disposal has been considered when the household has access to either the general
sewage network or a septic tank.
67 The rates for illiteracy consider the percentage of people of 10 years of age or more who are illiterate.
68 The only information health-related that is available from the census (IBGE, 2010a) for all municipalities
that is also disaggregated by location (urban/rural) are the numbers of population with any mental, visual,
motor or hearing impairment. Therefore, only the number of health care centres has been considered in the
Health domain. This dataset has been provided on demand by the Ministry of Health via
https://esic.cgu.gov.br/
69 The minimum wage in 2010 was R$ 510.00 a month – around U$ 368.00 in 2010 purchasing power parity
according to the conversion rate provided by OECD (2018)

CHAPTER 5: ACCESSIBILITY EVALUATION AT THE MUNICIPALITY LEVEL
127
• Poverty when PCI is between ¼ and ½ of the minimum national wage
• Vulnerable to poverty when PCI is between ½ and 1 of the minimum
national wage
Finally, in order to compare the distribution of these variables, their values are
presented in reference to the quintiles of the SAP index. The statistical difference
between the quintile means is tested by the nonparametric test of Kruskal-Wallis,
coupled with a pairwise post-hoc analysis to evaluate which pairs of quintiles did
not present significant difference.
5.3. Results and Discussion
5.3.1. Sensitivity analysis of the travel impedance models
The sensitivity analysis varying the threshold distances of the SAP index based
on the KD model has shown that at the state-wise level the different threshold
distances have not presented an intense impact upon the estimated accessibility
poverty. This is a rather interesting outcome, showing the consistency and
potential applicability of this index as an aid to support transport project
prioritisations at a higher level. This result could perhaps be attributed to the fact
that the maximum difference of threshold distances presented in Table 5.1 was
only 240 km (between the Metropolis cut-offs of set 2 and 3), added to the rapid
decay of influence within the thresholds caused by the KD function. Figure 5.4
presents the three different SAP indices plotted at the same colour scale to allow
a visual comparison of the regional patterns.
As it can be expected, mostly regions along the shore (right and upper parts of
the map), which have a higher concentration of urban centres (see Figure 5.1 in
page 112), have presented lower levels of spatial accessibility poverty in the
three trials. The two larger spots in blue colour that are common in the three maps
represent the metropolitan area of Salvador (Bahia’s state capital) and the
conurbation of the metropolitan regions of Recife (Pernambuco’s state capital)
and João Pessoa (Paraiba’s state capital). In contrast, the inner mainland areas
are clearly the most affected by accessibility poverty in both cases, with an overall

CHAPTER 5: ACCESSIBILITY EVALUATION AT THE MUNICIPALITY LEVEL
128
remarkable low accessibility presented in Maranhão and Piauí states (the two
states at the top left side).

CHAPTER 5: ACCESSIBILITY EVALUATION AT THE MUNICIPALITY LEVEL
129
Figure 5.4: Spatial Accessibility Poverty by three different thresholds of Urban Influence
A relatively greater variation has been found when comparing the SAP indices
computed with the two different travel impedance models (KD and FS). Figure
5.5 and Figure 5.6 presents a spatial comparison of these indices in a colour
scale classified by quintiles and equal intervals, respectively. The SAP-KD used
in this comparison (on the right in Figure 5.5) is based on the average of the three
indices calculated above (shown in Figure 5.4). These results show that, even
though the coastal area where there is higher concentration of urban areas
present lower levels of SAP in both maps, a substantial variation can be observed
depending on which travel impedance model is applied. Still, higher SAP rates
are prevalent throughout the inner areas of the region in both maps, especially in
Maranhão, Piauí, West of Bahia, West of Pernambuco, and North of Minas
Gerais.
To further clarify the impacts of the travel impedance methods on the SAP
indicator, Figure 5.7 presents a dispersion graph between the SAP indicators
calculated with the FS and KD models. In this graph, each point represents a
municipality from the case study area. The points highlighted in colours represent
municipalities that were classified in the same quintile of both SAP indicators (FS
and KD). For example, points highlighted in red are classified in the first quintile
(accessibility richest) of the SAP-KD index as well as in the first quintile of the
SAP-FS index. In total, 45% of the municipalities were found in coincident
quintiles in both models. However, while the intermediate quintiles (second,
middle and fourth) present higher variations in the municipality classification, the
first and fifth quintiles present 66% and 51% of coincidence in quintile
classification respectively.
These results show that municipalities in the extreme levels of SAP are less
sensitive to variations on the travel impedance model than the other ones.
Particularly in the fifth quintile (accessibility poorest), besides a greater
coincidence in terms of quintile comparison, less variability can be also observed
in Figure 5.5 to Figure 5.7 in terms of the absolute values. While in statistical
terms this could be explained by a relatively smaller range of variation of the

CHAPTER 5: ACCESSIBILITY EVALUATION AT THE MUNICIPALITY LEVEL
130
accessibility poorest quintile (for both indices), in practical terms, this relates
simply to the higher levels of remoteness experienced by the populations in these
municipalities. In other words, regardless how these distances are measured, the
travel impedance between these populations and the opportunities is still
significantly above the average experienced by other municipalities.
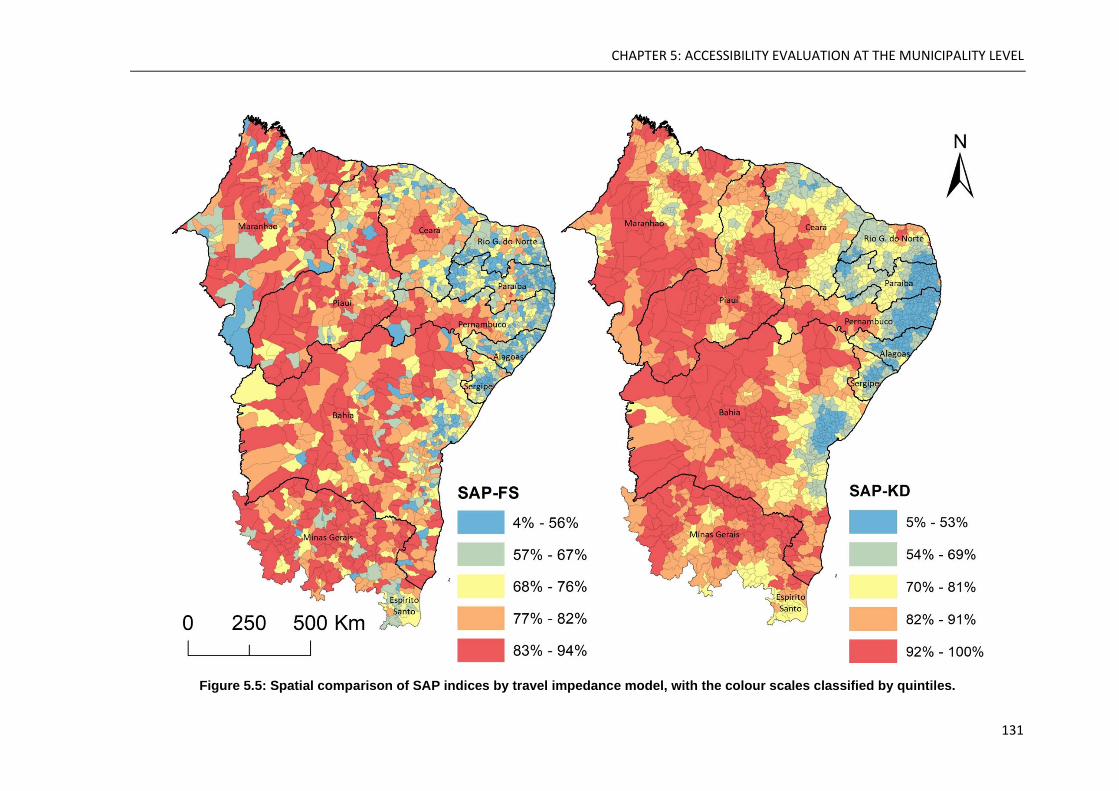
CHAPTER 5: ACCESSIBILITY EVALUATION AT THE MUNICIPALITY LEVEL
131
Figure 5.5: Spatial comparison of SAP indices by travel impedance model, with the colour scales classified by quintiles.

CHAPTER 5: ACCESSIBILITY EVALUATION AT THE MUNICIPALITY LEVEL
132
Figure 5.6: Spatial comparison of SAP indices by travel impedance model, with the colour scales classified by equal intervals
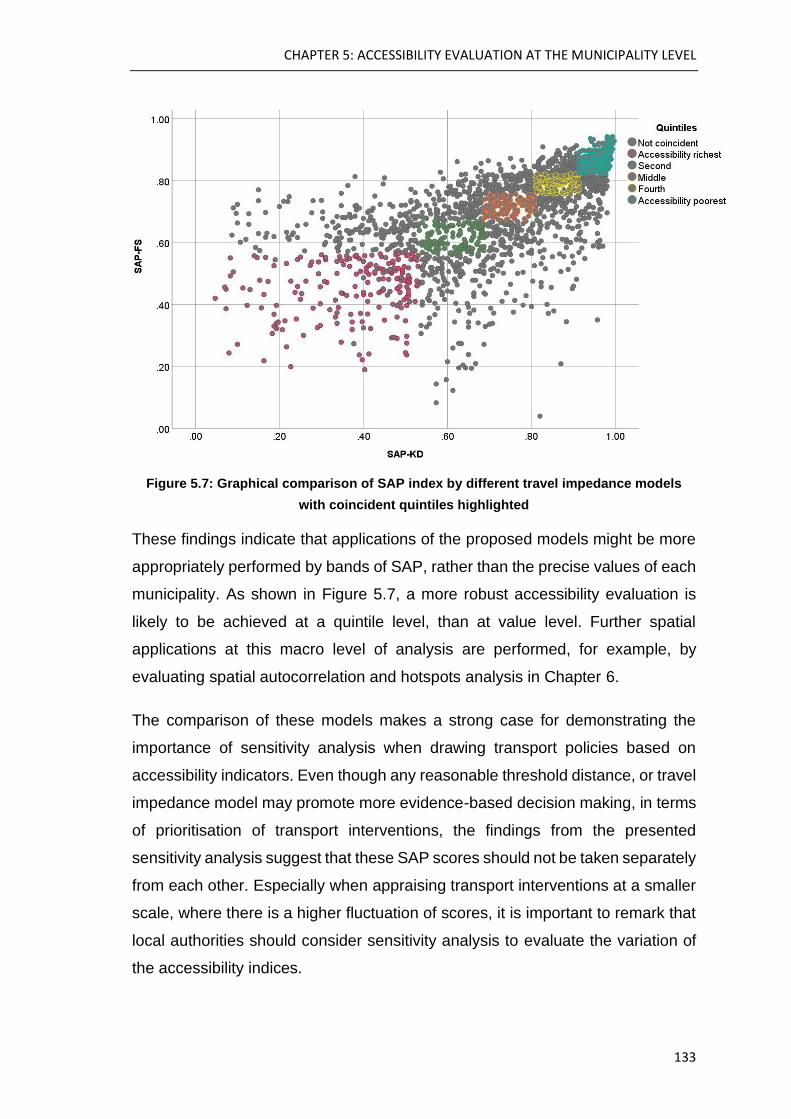
CHAPTER 5: ACCESSIBILITY EVALUATION AT THE MUNICIPALITY LEVEL
133
Figure 5.7: Graphical comparison of SAP index by different travel impedance models
with coincident quintiles highlighted
These findings indicate that applications of the proposed models might be more
appropriately performed by bands of SAP, rather than the precise values of each
municipality. As shown in Figure 5.7, a more robust accessibility evaluation is
likely to be achieved at a quintile level, than at value level. Further spatial
applications at this macro level of analysis are performed, for example, by
evaluating spatial autocorrelation and hotspots analysis in Chapter 6.
The comparison of these models makes a strong case for demonstrating the
importance of sensitivity analysis when drawing transport policies based on
accessibility indicators. Even though any reasonable threshold distance, or travel
impedance model may promote more evidence-based decision making, in terms
of prioritisation of transport interventions, the findings from the presented
sensitivity analysis suggest that these SAP scores should not be taken separately
from each other. Especially when appraising transport interventions at a smaller
scale, where there is a higher fluctuation of scores, it is important to remark that
local authorities should consider sensitivity analysis to evaluate the variation of
the accessibility indices.
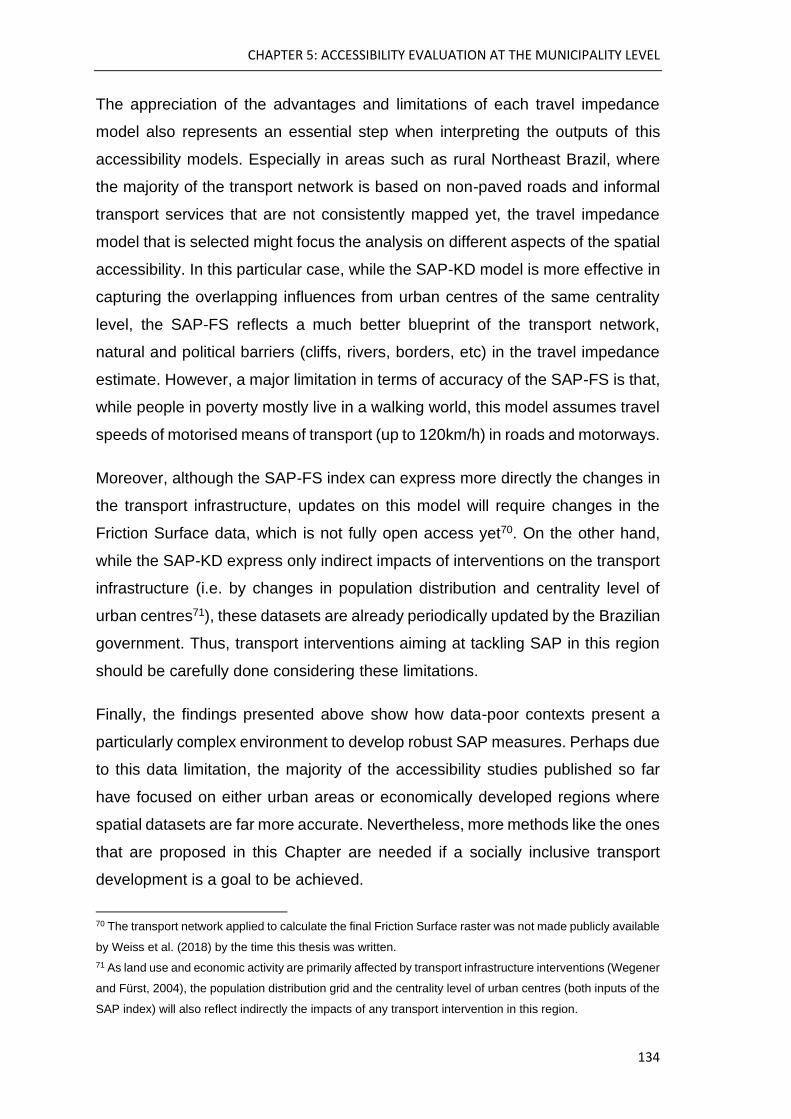
CHAPTER 5: ACCESSIBILITY EVALUATION AT THE MUNICIPALITY LEVEL
134
The appreciation of the advantages and limitations of each travel impedance
model also represents an essential step when interpreting the outputs of this
accessibility models. Especially in areas such as rural Northeast Brazil, where
the majority of the transport network is based on non-paved roads and informal
transport services that are not consistently mapped yet, the travel impedance
model that is selected might focus the analysis on different aspects of the spatial
accessibility. In this particular case, while the SAP-KD model is more effective in
capturing the overlapping influences from urban centres of the same centrality
level, the SAP-FS reflects a much better blueprint of the transport network,
natural and political barriers (cliffs, rivers, borders, etc) in the travel impedance
estimate. However, a major limitation in terms of accuracy of the SAP-FS is that,
while people in poverty mostly live in a walking world, this model assumes travel
speeds of motorised means of transport (up to 120km/h) in roads and motorways.
Moreover, although the SAP-FS index can express more directly the changes in
the transport infrastructure, updates on this model will require changes in the
Friction Surface data, which is not fully open access yet70. On the other hand,
while the SAP-KD express only indirect impacts of interventions on the transport
infrastructure (i.e. by changes in population distribution and centrality level of
urban centres71), these datasets are already periodically updated by the Brazilian
government. Thus, transport interventions aiming at tackling SAP in this region
should be carefully done considering these limitations.
Finally, the findings presented above show how data-poor contexts present a
particularly complex environment to develop robust SAP measures. Perhaps due
to this data limitation, the majority of the accessibility studies published so far
have focused on either urban areas or economically developed regions where
spatial datasets are far more accurate. Nevertheless, more methods like the ones
that are proposed in this Chapter are needed if a socially inclusive transport
development is a goal to be achieved.
70 The transport network applied to calculate the final Friction Surface raster was not made publicly available
by Weiss et al. (2018) by the time this thesis was written.
71 As land use and economic activity are primarily affected by transport infrastructure interventions (Wegener
and Fürst, 2004), the population distribution grid and the centrality level of urban centres (both inputs of the
SAP index) will also reflect indirectly the impacts of any transport intervention in this region.

CHAPTER 5: ACCESSIBILITY EVALUATION AT THE MUNICIPALITY LEVEL
135
5.3.2. Factor analysis
Instead of drawing causal relationships between the factors, the results of this
factor analysis are intended to shed some light on the differences between
municipalities with higher and lower accessibility levels, and to evaluate whether
the newly defined SAP indicators generate reasonable results. Even though
some patterns can be identified from this analysis, prescriptions of transport
interventions based on it should be done carefully. As already highlighted in the
previous sections of this Chapter, the lack of accurate, timely and spatialised data
about some capabilities’ domains, and the local transport patterns (including
services and infrastructure) could lead to biased interpretations of the findings.
A summary of this factor analysis is presented in Table 5.3. In order to provide a
statistic estimator of central tendency more robust to outliers than the mean, the
median and mode of the variables have also been provided in the results.
Moreover, as can be seen from coefficient of variability in Table 5.3, the quintiles
of population, population density, GDP, percentage of rural households without
electricity, road density, density of high schools, hospitals and basic care units
present a high level of variability from the mean. However, only four out of the
nineteen variables analysed (i.e. Density of Hospitals, Rural illiteracy, Total
Population and Road density) did not present any statistical difference of means
among the accessibility richest and poorest quintiles, as shown in Table 5.2.
Moreover, the findings from the pairwise post-hoc analysis presented in Table 5.2
show that the variables of Population density, Municipality Area, Density of rural
primary schools, and Rural households with no toilet present significant
differences of means (sig<0.000) between all quintiles.
It is clear from the findings presented in Table 5.3 that municipalities with higher
spatial accessibility, despite not being statistically different in total population,
they are more than ten times smaller in area. This fact clearly demonstrates an
intense concentration of rural settlements, which is also indicated by the
population density significantly (6.86 times) higher in municipalities better-off in
spatial accessibility. In addition, the accessibility-richest municipalities present a
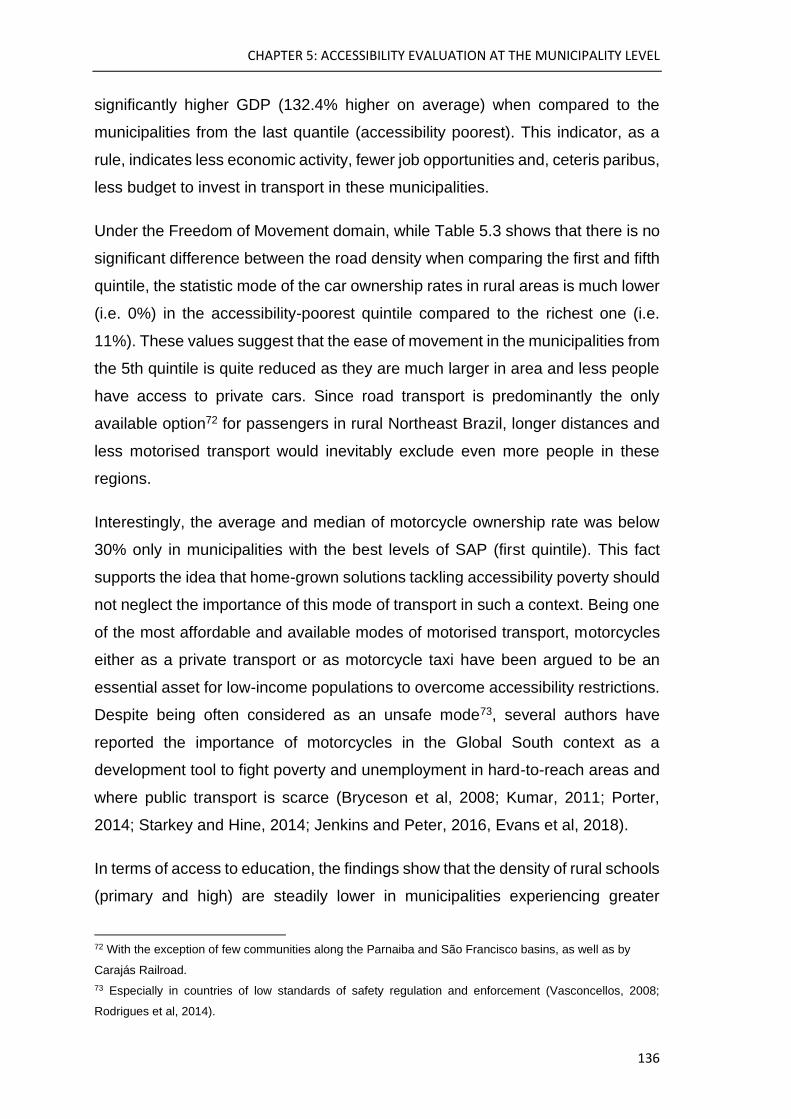
CHAPTER 5: ACCESSIBILITY EVALUATION AT THE MUNICIPALITY LEVEL
136
significantly higher GDP (132.4% higher on average) when compared to the
municipalities from the last quantile (accessibility poorest). This indicator, as a
rule, indicates less economic activity, fewer job opportunities and, ceteris paribus,
less budget to invest in transport in these municipalities.
Under the Freedom of Movement domain, while Table 5.3 shows that there is no
significant difference between the road density when comparing the first and fifth
quintile, the statistic mode of the car ownership rates in rural areas is much lower
(i.e. 0%) in the accessibility-poorest quintile compared to the richest one (i.e.
11%). These values suggest that the ease of movement in the municipalities from
the 5th quintile is quite reduced as they are much larger in area and less people
have access to private cars. Since road transport is predominantly the only
available option72 for passengers in rural Northeast Brazil, longer distances and
less motorised transport would inevitably exclude even more people in these
regions.
Interestingly, the average and median of motorcycle ownership rate was below
30% only in municipalities with the best levels of SAP (first quintile). This fact
supports the idea that home-grown solutions tackling accessibility poverty should
not neglect the importance of this mode of transport in such a context. Being one
of the most affordable and available modes of motorised transport, motorcycles
either as a private transport or as motorcycle taxi have been argued to be an
essential asset for low-income populations to overcome accessibility restrictions.
Despite being often considered as an unsafe mode73, several authors have
reported the importance of motorcycles in the Global South context as a
development tool to fight poverty and unemployment in hard-to-reach areas and
where public transport is scarce (Bryceson et al, 2008; Kumar, 2011; Porter,
2014; Starkey and Hine, 2014; Jenkins and Peter, 2016, Evans et al, 2018).
In terms of access to education, the findings show that the density of rural schools
(primary and high) are steadily lower in municipalities experiencing greater
72 With the exception of few communities along the Parnaiba and São Francisco basins, as well as by
Carajás Railroad.
73 Especially in countries of low standards of safety regulation and enforcement (Vasconcellos, 2008;
Rodrigues et al, 2014).

CHAPTER 5: ACCESSIBILITY EVALUATION AT THE MUNICIPALITY LEVEL
137
accessibility poverty. Since the rural illiteracy rates are about the same
(approximately 30%), these findings suggest that a less centralised allocation of
schools may have compensated for the accessibility poverty impacts on
education. Further investigations considering the number of rural school buses
per municipality could bring more insights to the agenda of transport interventions
that are more likely to be effective in tackling the deprivations of this domain.
In the Health dimension, the density of hospitals and primary healthcare units is
also consistently lower as the SAP increases. This fact highlights the need for
longer trips to reach medical services, especially of higher complexity, in rural
settlements affected by SAP. These findings are in accordance with those
presented in Chapter 3, showing that the SAP index can also capture low
accessibility to healthcare.
The findings on the housing facilities domain show that municipalities which are
accessibility deprived also experience less access to electricity and sanitation
facilities (i.e. toilet and appropriate sewerage system). This outcome contrasts
with the variations of income poverty by SAP quintiles. Whilst there is a clear
increasing trend showing that housing conditions get worse as the SAP index
increases, no straightforward pattern could be identified for the income poverty
rates variations throughout the municipality groups. For a better visualisation of
these outputs, Figure 5.8 and Figure 5.9 are presented showing the income
poverty, and the housing conditions variations by SAP quintile, respectively.
These findings reveal the underlying dynamic of multidimensional poverty that
cannot be entirely captured by assessing income indicators alone. Figure 5.8
clearly shows that the lack of access to out-of-home basic services (e.g.
education and healthcare) is often experienced in tandem with the lack of access
to at-home services (e.g. sanitation and electricity).
Figure 5.9 shows that, perhaps contrary to what was expected, only minor
differences when comparing the highest and lowest SAP quintiles in terms of
income-poverty rates. Even though extreme income-poverty rates are 15.6%
higher in the accessibility poorest municipalities, less severe levels of income-
poverty do not present the same expected trend. This fact does not completely
square with the intuition that higher access to essential services would lead to

CHAPTER 5: ACCESSIBILITY EVALUATION AT THE MUNICIPALITY LEVEL
138
less income poverty, but it calls attention once again to the multidimensional
concept of poverty. As already discussed earlier in Chapters 1 and 2, various
deprivations experienced by a person in poverty cannot be fully captured by
income indicators alone. In that sense, more dimensions of poverty (such as
housing conditions) should be taken into account before drawing any causal
inference between accessibility levels and actual poverty reduction.
The lack of access to essential services and job opportunities is a transport-
related exclusion dimension (Church et al., 2010) that plays a central role in the
perpetuation of chronic poverty (Vakis et al., 2016). Benevenuto and Caulfield
(2019) argue that improvements in accessibility to services and opportunities are
instrumental in tackling the structures, processes and livelihood strategies that
affect the inter-generational poverty transfer. Thus, the SAP indicators that are
proposed can be used in complement to other poverty-related indicators to devise
socially oriented transport interventions.
Table 5.2: Statistical difference among quintiles - Kruskal Wallis test
Variable Sig. Quintiles not significantly different in pairwise post-hoc comparison (Sig.>0.05)
SAP KD (average) 0.000 -
SAP FS 0.000 -
Area 0.000 -
Gross Domestic Product (GDP) 0.001 1-2 , 2-3 , 3-1 , 4-3 , 4-2 , 4-1 , 5-3 , 5-4
Total Population 0.067 All
Population density 0.000 -
Share of population in rural areas 0.000 1-2 , 2-3 , 3-4, 4-5
Road density 0.073 All
Car ownership in rural areas 0.002 2-1 , 2-3 , 3-1 , 3-4 , 4-2 , 5-2 , 5-3 , 5-4
Motorbike ownership in rural areas 0.000 2-5 , 2-4 , 2-3 , 4-3 , 5-4 , 5-3
Illiteracy in Rural population +10 of age 0.037 All
Rural households with no electricity 0.000 1-2
Rural households with no toilet 0.000 -
Rural households with no adequate sewage 0.000 1-2 , 2-3 , 3-4 , 4-5
%Rural families in extreme poverty 0.003 1-2 , 1-3 , 2-3 , 2-4 , 2-5 , 3-4 , 3-5 , 5-4
%Rural families in poverty 0.000 3-2 , 4-3 , 4-2 , 5-4 , 5-3 , 5-2
%Rural families vulnerable to Poverty 0.001 1-2 , 1-3 , 1-4, 2-3 , 2-4 , 3-4 , 5-4
Density of rural primary schools 0.000 -
Density of rural high schools 0.000 1-2 , 1-4 , 1-3 , 2-3 , 2-4 , 3-4 , 3-5 , 4-5
Density of rural Primary healthcare centres 0.001 2-1 , 3-2 , 3-1 , 4-5 , 4-3 , 4-2, 5-3 , 5-2
Density of rural Hospitals 0.299 All
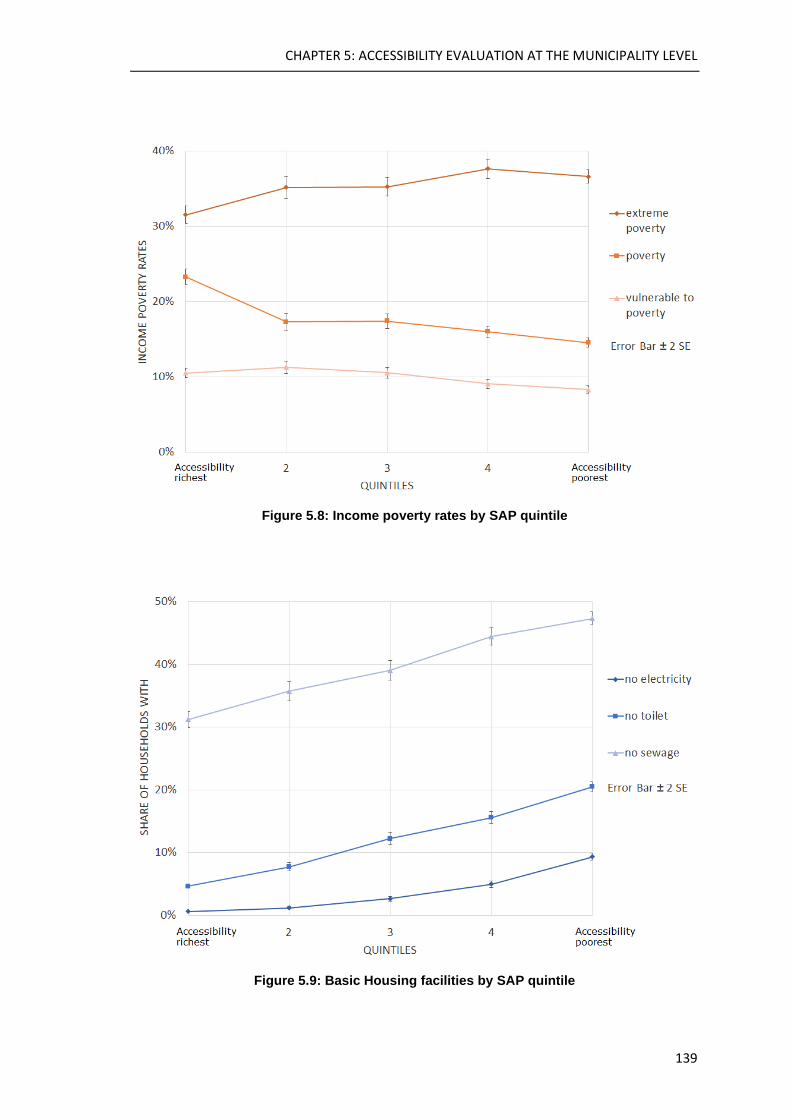
CHAPTER 5: ACCESSIBILITY EVALUATION AT THE MUNICIPALITY LEVEL
139
Figure 5.8: Income poverty rates by SAP quintile
Figure 5.9: Basic Housing facilities by SAP quintile

CHAPTER 5: ACCESSIBILITY EVALUATION AT THE MUNICIPALITY LEVEL
140
Table 5.3: Factor analysis of the municipalities by SAP quintiles
Quintile Statistics
SAP KD
(average) SAP FS Area
Total
Population
Population
density
Share of
population in
rural areas
Road density Density of
rural Hospitals
Density of
rural Basic
healthcare
units
Density of
rural Prim.
Schools
% % km2 Inhab. Inhab./km2 % km/100km2 100/km2 100/km2 100/km2
Accessibility
Richest
Mean 37% 45% 189.7 26801 138.7 37% 3.46 0.05 1.50 7.93
Median 41% 47% 125.7 12508 98.6 36% 0.00 0.00 0.44 6.76
Mode 50% 51% 26.0 a 1526 a 17.1 a 36% 0.00 0.00 0.00 0.00
Std. Dev. 13% 9% 183.3 62798 254.5 19% 5.41 0.28 3.32 5.56
Coef. of Var. 34% 20% 97% 234% 183% 52% 157% 600% 221% 70%
Second
Mean 62% 62% 380.5 22935 80.7 41% 2.93 0.05 0.71 4.11
Median 63% 62% 277.4 12598 44.9 41% 0.98 0.00 0.31 3.64
Mode 68% 59% a 39.7 a 1944 a 9.9 a 35% a 0.00 0.00 0.00 0.65 a
Std. Dev. 5% 3% 329.0 31540 169.0 18% 3.50 0.26 1.05 2.83
Coef. of Var. 7% 5% 86% 138% 210% 44% 120% 520% 148% 69%
Middle
Mean 74% 72% 716.8 25211 35.1 45% 2.44 0.01 0.40 2.69
Median 74% 72% 499.3 12546 25.7 44% 1.97 0.00 0.16 2.15
Mode 71% 72% 66.3 a 10454 3.3 a 40% a 0.00 0.00 0.00 1.19
Std. Dev. 4% 2% 853.1 41012 42.7 19% 2.83 0.05 0.68 2.03
Coef. of Var. 5% 3% 119% 163% 122% 42% 116% 407% 171% 75%
Fourth
Mean 86% 79% 1116.1 18831 18.8 50% 1.97 0.02 0.28 1.93
Median 86% 79% 834.5 13418 15.5 52% 1.38 0.00 0.15 1.47
Mode 86% 79%a 131.3 a 2368 a 1.6 a 52% 0.00 0.00 0.00 1.35 a
Std. Dev. 3% 2% 875.1 20324 13.4 18% 2.20 0.12 0.40 1.58
Coef. of Var. 4% 2% 78% 108% 72% 35% 112% 515% 147% 82%
Accessibility
Poorest
Mean 96% 87% 1946.4 16452 20.2 52% 1.55 0.01 0.24 1.38
Median 96% 87% 1369.7 10614 8.2 54% 1.03 0.00 0.13 0.92
Mode 97% 84% 181.9 a 3532 a 1.0 a 69% 0.00 0.00 0.00 0.28 a
Std. Dev. 2% 3% 1751.6 32818 171.0 18% 1.95 0.03 0.31 1.34
Coef. of Var. 2% 3% 90% 199% 847% 34% 125% 380% 132% 97%
* Multiple modes exist. The smallest value is shown.

CHAPTER 5: ACCESSIBILITY EVALUATION AT THE MUNICIPALITY LEVEL
141
Table 5.3 (continued)
Quintile Statistics
Car ownership
in rural areas
Motorbike ownership in rural areas
Gross Domestic Product (GDP)
Rural households
with no electricity
Rural households with no toilet
Rural households
with no adequate sewage
Illiteracy in Rural
population +10 of age
%Rural families in extreme poverty
%Rural families in
poverty
%Rural families vulnerable to
Poverty
% % R$ 1000 % % % % % % %
Accessibility Richest
Mean 10% 26% 470731 1% 5% 31% 30% 32% 23% 11%
Median 10% 24% 134917 1% 3% 31% 31% 32% 22% 10%
Mode 11% a 19% a 14837 a 0% 1% 18% 32% 0% 0% 0%
Std. Dev. 4% 13% 1459622 1% 5% 18% 6% 16% 15% 9%
Coef. of Var. 44% 49% 310% 117% 101% 58% 20% 51% 64% 85%
Second
Mean 9% 32% 418468 1% 8% 36% 30% 35% 17% 11%
Median 8% 30% 131511 1% 5% 36% 30% 35% 16% 11%
Mode 0% a 2% a 20246 a 1% 1% 50% 28% a 27% 0% 0%
Std. Dev. 4% 15% 1036494 2% 7% 18% 6% 16% 13% 9%
Coef. of Var. 48% 47% 248% 168% 95% 49% 20% 46% 73% 84%
Middle
Mean 10% 37% 406532 3% 12% 39% 29% 35% 17% 11%
Median 9% 36% 105659 1% 9% 37% 30% 37% 16% 10%
Mode 6% 6% a 16222 a 1% 2% 36% 29% a 37% 13% a 0%
Std. Dev. 6% 15% 1004401 4% 12% 19% 6% 15% 11% 8%
Coef. of Var. 62% 42% 247% 167% 98% 48% 20% 42% 65% 78%
Fourth
Mean 9% 34% 196439 5% 16% 44% 30% 38% 16% 9%
Median 8% 34% 109996 3% 14% 44% 31% 36% 16% 8%
Mode 1% a 9% a 23153 a 1% 3% a 56% 33% 39% 0% 0%
Std. Dev. 5% 12% 329646 6% 12% 17% 6% 16% 9% 8%
Coef. of Var. 60% 36% 168% 129% 77% 39% 19% 43% 58% 86%
Accessibility Poorest
Mean 9% 33% 202517 9% 20% 47% 29% 37% 15% 8%
Median 8% 32% 83493 6% 18% 48% 29% 36% 14% 7%
Mode 0% a 3% a 35703 2% 11% 55% 24% 31% a 0% 0%
Std. Dev. 5% 13% 972725 10% 14% 17% 6% 15% 10% 8%
Coef. of Var. 62% 38% 480% 103% 67% 35% 22% 40% 67% 95%
* Multiple modes exist. The smallest value is shown.
CHAPTER 5: ACCESSIBILITY EVALUATION AT THE MUNICIPALITY LEVEL
142
5.4. Conclusion
Throughout this Chapter, two methods have been developed to estimate the
overall access to basic services and opportunities in rural areas. The presented
findings shed light particularly on municipalities of an understudied region of
Brazil which is intensely affected by various social and accessibility issues. The
proposed indicators are potentially replicable globally since they require a fairly
basic spatial database to be processed, filling a significant research gap in the
transport literature of the Global South.
In summary, the present Chapter has sought to contribute to the literature by
covering four major limitations of previous works addressing this research gap.
First, as an alternative to indices measuring rural accessibility only to the
transport network (Roberts et al., 2006; Iimi et al., 2016), the SAP index evaluates
the level of access from rural areas to key destinations proxied by the urban
centres. Second, since the proposed indicators measure accessibility based on
land use and geographic spatial data, they do not require sophisticated spatial
databases (e.g. GTFS data) that are, as a rule, not consistently available yet in
many rural areas of the global South. Third, instead of measuring the accessibility
only to the nearest city (Weiss et al., 2018), it considers also the overlapping
influences of the surrounding urban centres of different sizes and distances.
Finally, since the SAP index is built on a prioritarian principle, it does not require
the definition of an arbitrary accessibility poverty line for defining priority areas.
In this sense, this Chapter provides ready-to-use tools for assessing access to
services and opportunities in rural and underdeveloped areas, where the majority
of people in poverty still live (Iimi et al., 2016). The appreciation of this index is
also intended to open the debate in the transport planning realm on where and
for whom transport interventions ought to be mostly targeted. Arguably, including
indicators such as the SAP indices in transport appraisal frameworks should
provide a means to consider the social impact and equity in a much less biased
and paternalistic fashion.

CHAPTER 5: ACCESSIBILITY EVALUATION AT THE MUNICIPALITY LEVEL
143
If taken together with other indicators, a comprehensive framework can be
developed to screen the local needs and the transport-related exclusion
dimensions (Church et al., 2000) in an objective way at a municipality level. The
SAP indicators can be particularly useful as indicators for the transport-related
exclusion dimension called ‘exclusion from facilities’ by Church et al. (2000). In
this sense, it is suggested that SAP indicators can be applied, for example, as a
weighting factor for criteria related to this dimension in multi-criteria decision
analysis of transport projects, giving, thus, priority for projects that deliver greater
improvements to regions in higher accessibility poverty.
When assessing the SAP index in the sensitivity analysis, the presented results
have shown that the travel impedance models can significantly affect the outputs
of accessibility indicators. Therefore, the interpretations and further applications
of these indices in transport policies should be done also considering the
limitations of each method. This fact once again suggests the importance of
considering sensitivity analysis and complementary factor analysis when
applying the SAP index for action prioritisation purposes.
Additionally, the factor analysis has presented five domains of capabilities
deprivations that can be drawn from census indicators to investigate potential
patterns of the municipalities most affected by accessibility poverty. Perhaps
counter-intuitively, the findings point out that the high rates of income poverty are
not always associated with spatial accessibility poverty. Instead, other factors like
deprivation of housing facilities and low population density appear to be more
associated with critical SAP levels.
For future studies, the disaggregation of the SAP index for each service and
opportunity (education, health, jobs, etc) should be carried out as soon as the
location of the services become available. More accurate results will be also
possible when the transport network become consistently mapped and census
data for the rural areas become disaggregated in smaller areas (i.e. by census
tract, or neighbourhood). Meanwhile, the proposition of new transport
interventions targeting poverty reduction should consider accessibility poverty
indicators in addition to other socio-economic and transport-related indicators
that could depict the specific needs and particularities of each region.

CHAPTER 5: ACCESSIBILITY EVALUATION AT THE MUNICIPALITY LEVEL
144
Finally, it is argued that poverty reduction policies are more likely to be effective
in the long run if they also address the accessibility dimension of poverty in a
systematic way as discussed throughout this Chapter. Since access to services
and opportunities is a key difference between those who have escaped chronic
poverty and those still trapped in it (Vakis et al., 2016), the SAP index and other
indicators of transport-related exclusion are crucial to promoting a new standard
of transport development strongly committed to eradicating poverty.
CHAPTER 6: A SCREENING FRAMEWORK OF TRANSPORT NEEDS
145
6. CHAPTER 6: A SCREENING FRAMEWORK OF TRANSPORT
NEEDS
6.1. Introduction
Despite the increasing emphasis on the social aspects of transport externalities
in the global agenda of public policies (UN, 2016), transport appraisals (ex-ante)
are still strongly driven by economic and environmental analysis only (Geurs et
al, 2009; Jones and Lucas, 2012b). In this context, the goals targeting poverty
reduction and social well-being promotion become fundamentally undermined
when the social impacts are overlooked in the decision-making process of
transport development (Vasconcellos, 2003; World Bank, 2006; Jones and
Lucas, 2012b, Jones et al, 2013).
Geurs et al. (2009) argue that traditional transport appraisal frameworks like Cost-
Benefit Analysis (CBA) often underexpose the social dimension claiming an
alleged lack of objectivity and a difficulty to precisely estimate the social effects
of transport projects and policies. In terms of transport modelling, Vasconcellos
(2003) argues that traditional models, such as the four-stage model74, should not
be enhanced, but rather fully replaced by novel social and political approaches
that are able to carefully address issues relating transport, equity and poverty
reduction. Furthermore, policy recommendations reported in the academic
literature and by numerous international guidelines75 have consistently
74 The four-stage model is a classical transportation demand forecasting model that combines trip
generation, trip distribution, mode choice and trip assignment into computational iterations that
attempt to predict the equilibrium of a transportation system (Ortuzar and Willumsen, 2011).
75 Especially from countries with a tradition in transport project evaluation like the Netherlands,
Japan, Australia, Germany, UK, and Ireland.
CHAPTER 6: A SCREENING FRAMEWORK OF TRANSPORT NEEDS
146
emphasised the essential role of accessibility audits when appraising transport
interventions in terms of distributional effects, equity and social exclusion
(Thomopoulos et al, 2009; Mackie and Worsley, 2013; Manaugh et al, 2015,
DTTAs, 2016, DfT, 2017; Pereira, 2019).
Nonetheless, since accessibility alone does not account for all the aspects in
which transport impacts poverty and well-being, a more comprehensive socially
driven framework is still needed. As concluded in Chapter 2, tackling the cycles
of poverty through transport development requires strategies to address all the
eight Transport-Related Exclusion (TRE) dimensions. Despite the importance of
performing accessibility assessments (Chapters 3 and 5) in theses contexts,
other TRE dimensions also need to be evaluated. Thus, by clarifying what and
where the priority transport-related needs are, the decision-making process can
have the right inputs to be more objective and effective in reducing poverty.
As described in Chapter 1, the methodologies applied to screen regional transport
needs and prioritise transport interventions in Brazil have persistently neglected
fundamental aspects of poverty reduction and the social dimension of transport.
Dabelm and Brandão (2010) report that the Brazilian federal guidelines for road
transport appraisal are poorly detailed and are restricted to economic and
environmental evaluations. Moreover, Paranaiba (2017) states that even for
screening urban mobility needs, the Federal Guidelines fall short in defining clear
criteria for the selection of potential transport projects.
Beyond the Brazilian case, several authors have asserted that poverty reduction
and social issues are, in general, still superficially addressed in transport
appraisals, and more interdisciplinary research is needed to develop tools and
call attention to the social dimension in the decision-making process (Geurs et al
2009; Van Wee and Geurs, 2011; Jones and Lucas, 2012a). Overall, these
studies also reinforce the latent need for an objective method of screening the
transport needs at a municipal and regional that can objectively guide transport
interventions to where and for whom they are most needed.
Allied to this, the spillover effects on economic growth and productivity often
attributed to transport infrastructure investments (Cantos et al., 2005; Yu et al.,

CHAPTER 6: A SCREENING FRAMEWORK OF TRANSPORT NEEDS
147
2013) do not necessarily result in poverty alleviation and wellbeing improvements
for the least advantaged population. As illustrated in Chapter 4, the population in
extreme poverty have not benefitted in terms of per capita income improvements
from the flagship project on the BR-232 motorway performed in Northeast Brazil.
This evidence shows once again that socio-economic progress for the neediest
is not an automatic outcome from large transport infrastructure investments.
Hence, in a context where the transport-related needs have been either
disregarded, not fully captured, or addressed by subjective approaches, the
proposition of an objective and well-grounded screening framework of transport
needs can play a pivotal role in making transport planning more socially inclusive.
This Chapter is dedicated to respond to this challenge answering the last
research question of this thesis and building on theoretical frameworks and
evidence raised in the first five chapters. The framework that is proposed applies
the Analytic Hierarchy Process (AHP) and spatial autocorrelation techniques to
provide tools and evidence-based guidelines that can guide transport
interventions in Northeast Brazil to become more effective in reducing poverty.
While the socially driven framework that is outlined here focuses on the transport
needs of Northeast Brazil, it can also be replicated in other developing countries
facing similar socio-economic and transport challenges.
This Chapter is divided into a brief review of the social impacts of transport
interventions; the methodology describing the reasons for the selected data and
techniques; the resulting maps and graphs along with a discussion and
interpretation of the findings; and, finally, the conclusion reflecting on policy
implications and guidelines devised from this study.
6.2. Social impacts of transport interventions
The definition by Geurs et al. (2009) for the social impact of transport is used in
this Chapter as the positive/negative influence that transport-related interventions
have on well-being, preferences, behaviour or perception of individuals, groups,
social categories and society in general. It is worth mentioning that in order to

CHAPTER 6: A SCREENING FRAMEWORK OF TRANSPORT NEEDS
148
avoid the risk of neglecting important issues related to poverty reduction, this
definition might occasionally overlap with economic and environmental impacts.
Table 6.1 summarises a substantial amount of research reported in academic
literature (Vasconcellos, 2003; Geurs et al, 2009; Jones and Lucas, 2012b; Jones
et al, 2013; Mackie and Worsley, 2013; Manaugh et al, 2015) as well as
international guidelines (DNIT, 2006; World Bank, 2006; Eliasson, 2013; DfT,
2015; DTTAs, 2016, TaIC, 2016; DfT, 2017; Marcelo and House, 2018) applied
in several countries to measure transport impacts on social exclusion, multi-
dimensional poverty and equity. The table presents theoretical concepts that
underpin the social effects of transport interventions.
For the sake of clarity, five categories and twenty-three subcategories are used
based on the literature to classify all these dimensions of measurable social
effects. Table 6.1 also presents some specific examples that have been applied
in the literature to disaggregate and measure these subcategories. Additionally,
a corresponding TRE dimension (Church et al, 2000; Benevenuto and Caulfield,
2019) is linked to each sub-category in order to exemplify how these dimensions
can be measured by usual proxies. As discussed in Chapter 2, these eight TRE
dimensions compose a comprehensive theoretical framework that can be used
to distil the relationships of social exclusion, poverty, and transport in the Global
South. Moreover, Chapter 2 has shown that the factors that promote the inter-
generational poverty transfer can be reduced by developing strategies to tackle
these eight dimensions when planning transport.
However, Lucas (2012) states that while these TRE dimensions provide an
overall description of the nexus between social exclusion and transport, they fail
in identifying where transport policy attention should be focused. The present
Chapter covers this research gap by developing a framework that can evaluate
where and which transport-related needs should receive higher attention in social
appraisals of transport interventions. In the next Section, the methodological
steps applied in this Chapter to develop such a socially driven framework for
screening transport needs are further clarified.

CHAPTER 6: A SCREENING FRAMEWORK OF TRANSPORT NEEDS
149
Table 6.1: Summary of transport impacts on poverty
Category Sub-category Example of Disaggregation
Transport-related
exclusion
dimensions
Accessibility
To Education Public/Private and
Primary/Secondary/Training/Higher From facilities
To Healthcare Public/Private and
GP's/Clinics/Hospitals From facilities
To Employment,
and social activities
Rural (to urban centres),
Urban (jobs, gatherings, supermarkets) From facilities
To Transport
network
Rural (all-season roads),
Urban (public transport nodes) Geographic
At a meso-level Between neighbourhoods
(mostly for social trips) Geographic
At a micro-level Facilities adapted to special needs
(people with disabilities, elders, etc) Physical
Economic
Land Land use, land and rent price,
densification, agglomeration Economic
Productivity Employments changes estimates,
increase in production Economic
Affordability
Public transport (fares) and
Private transport (vehicle operating
costs)
Economic
Social
environment
Severance By physical barriers or intense traffic
during the construction of operation Spatial
Discrimination Prevention of movement based
on gender, race, ethnicity, etc
Social position-
based
Security Crime prevention measures (CCTV,
lighting, emergency call, etc) Fear-based
Forced Relocation Uncertainty of being relocated
and relocation itself
Fear-based,
Geographic
Transit-
related
Travel time Time savings in all types of trips
(business, leisure, educational, etc) Time-based
Reliability Frequency, timetables, opening and
closing times of public transport. Time-based
Comfort Levels of crowdedness and
stress during the trips Physical
Resilience Disruption of service/infrastructure due
to floods, landslide, accidents, etc
Indirectly related
to all dimensions
Health-
related
Water pollution During operation (waterways) and
construction (groundwater, rivers) Idem
Air quality
Increased risk of death/diseases due to
high exposure to CO2, NOx, SO2,
particles
Idem
Noise
During construction and operation
(noise nuisance, sleep disturbance,
etc)
Idem
Vibration Due to vehicles (operation)
and machines (construction) Idem
Accidents Fatal, serious, slight, damage only,
or including dangerous cargo Idem
Physical fitness
Change in premature death by
increasing the use of NMT Idem
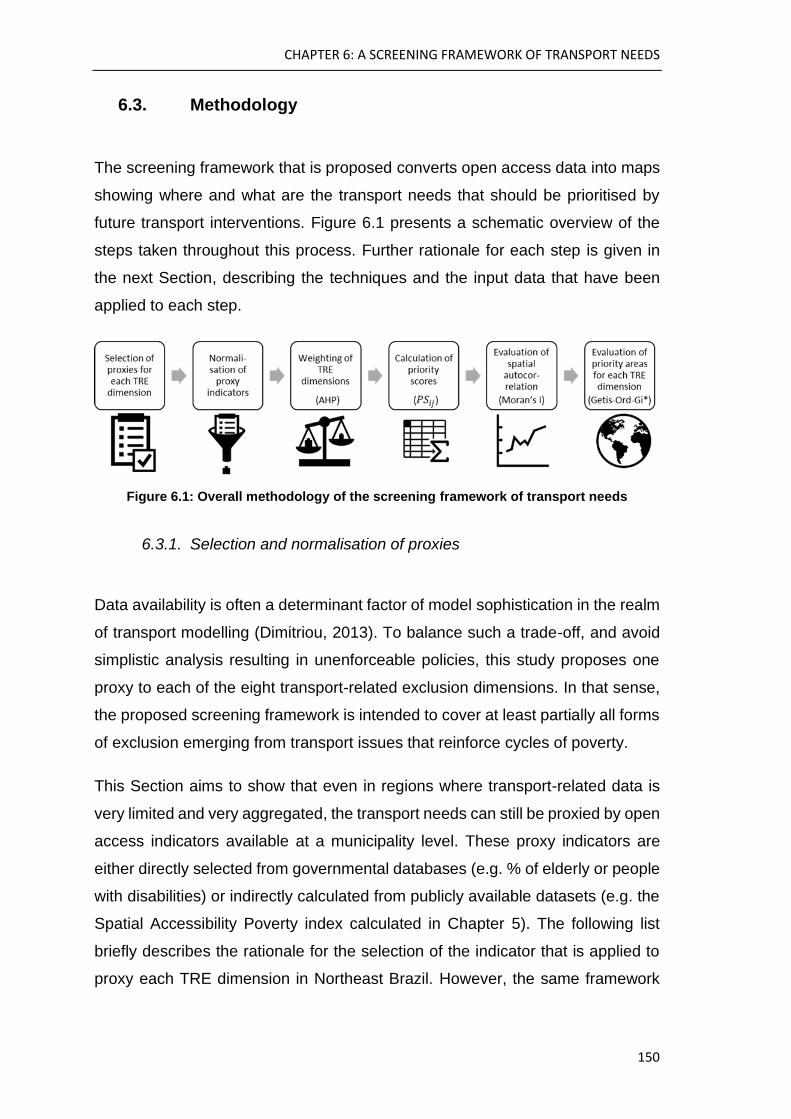
CHAPTER 6: A SCREENING FRAMEWORK OF TRANSPORT NEEDS
150
6.3. Methodology
The screening framework that is proposed converts open access data into maps
showing where and what are the transport needs that should be prioritised by
future transport interventions. Figure 6.1 presents a schematic overview of the
steps taken throughout this process. Further rationale for each step is given in
the next Section, describing the techniques and the input data that have been
applied to each step.
Figure 6.1: Overall methodology of the screening framework of transport needs
6.3.1. Selection and normalisation of proxies
Data availability is often a determinant factor of model sophistication in the realm
of transport modelling (Dimitriou, 2013). To balance such a trade-off, and avoid
simplistic analysis resulting in unenforceable policies, this study proposes one
proxy to each of the eight transport-related exclusion dimensions. In that sense,
the proposed screening framework is intended to cover at least partially all forms
of exclusion emerging from transport issues that reinforce cycles of poverty.
This Section aims to show that even in regions where transport-related data is
very limited and very aggregated, the transport needs can still be proxied by open
access indicators available at a municipality level. These proxy indicators are
either directly selected from governmental databases (e.g. % of elderly or people
with disabilities) or indirectly calculated from publicly available datasets (e.g. the
Spatial Accessibility Poverty index calculated in Chapter 5). The following list
briefly describes the rationale for the selection of the indicator that is applied to
proxy each TRE dimension in Northeast Brazil. However, the same framework

CHAPTER 6: A SCREENING FRAMEWORK OF TRANSPORT NEEDS
151
can still be replicated to other contexts using similar proxies that can capture the
severity of each TRE dimension.
1. Physical: The demand for special transport facilities described by this
dimension is measured by the share of the population of each municipality
of over 65 years of age or with any disability76 (including mental, mobility,
visual or hearing disabilities). For visual and hearing disability, only people
with severe and total levels of impairment were taken into account. The
dataset was retrieved from the latest Brazilian demographic census (IBGE,
2010a).
2. Geographical: Since GTFS data is still very limited in the Global South
(Pritchard et al, 2019; Pereira, 2019; Oloo, 2018; Evans et al, 2018) and
informal mobilities are vital to billions living with poor road access (O’Brian
and Evans, 2017), any attempt to measure the geographic exclusion
dimension at a state or regional level built on the formal public transport
network datasets would inevitably include too many areas with a coarse
misrepresentation. Therefore, a simpler but rather consistent index is then
applied to proxy this dimension. The Rural Accessibility Index (RAI)
proposed by the World Bank studies (Roberts et al, 2006; Iimi et al, 2016)
measures the share of people living farther than 2km from an all-season
road.
3. From facilities: In a context where the facilities are not consistently
mapped, and the majority of them are as a rule concentrated in the urban
centres (Weiss et al., 2018; IBGE, 2008; Church et al, 2000), the Spatial
Accessibility Poverty index (Chapter 5) offers a reasonable proxy for
measuring the exclusion from facilities of a given municipality. This SAP
index conjugates a factor of severity (how spatially excluded a person from
the basic opportunities77 is) and an extent factor (how many people are
being affected by this accessibility poverty).
76 This proxy can also be used to measure the need for healthcare, in cases where there is enough data to
disaggregate the dimension from facilities by healthcare and other essential services.
77 The SAP index, that has been further explained in Chapter 5, considers the urban centres as an
aggregated proxy for basic opportunities such as schools, healthcare centres, and job opportunities.
CHAPTER 6: A SCREENING FRAMEWORK OF TRANSPORT NEEDS
152
4. Economic: To assess the severity of the economic needs preventing
people from accessing desired destinations, this study applies a
household per capita income indicator that measures the share of the
population living with less than half of a minimum wage - which means
R$255.00 a month78 in the purchasing power parity of 2010. The
individuals below this income line are considered to be at least vulnerable
to poverty by the UNDP (2010).
5. Time-based: The only travel-time indicator consistently available for all the
municipalities in the Brazilian census (IBGE, 2010a) is the share of
employed individuals who i) are vulnerable to poverty (same income strata
mentioned above) and ii) spend more than two hours commuting every
day.
6. Fear-based: The indicator utilised to proxy the fear-based dimension in the
proposed framework is the ratio between the number of deaths per year
per municipality caused by transport-related accidents (reported by the
Brazilian Health Database – DATASUS, 2016a) and the number of
vehicles registered in each municipality (reported by the National Transit
Authority - DENATRAN, 2016) multiplied by 100,000. The number of
deaths considered in this study was an average of the latest years of data
available (from 2009 to 2016).
7. Spatial: This dimension evaluates the exclusion caused by spatial barriers
(e.g. gated communities, traffic intense roads, etc) that mostly affect low-
income people who live in a walking world. To create a spatial indicator
that measures these barriers, an unpractical and currently non-existent
amount of spatial data would be needed at a regional level. In that sense,
alternatively, this study applies the concept of motorcycle ownership as a
proxy for this dimension. It is argued that municipalities with high
motorcycle ownership would be less vulnerable to exclusion caused by
spatial barriers since low-income population would have higher access to
78 Or 139 EUR, or 184 USD applying the appropriate exchange rates according to OECD (2018).
CHAPTER 6: A SCREENING FRAMEWORK OF TRANSPORT NEEDS
153
low-cost motorised vehicles, either as their own private motorised
transport or in the form of motorcycle taxis79.
8. Social-position based: Since ethnicity-, race- and religion-based crimes in
public space are as a rule not consistently measured across municipalities
and over time, the selected proxy for this dimension had to be restricted to
gender-based violence. Cases of verbal, physical and sexual violence
against women perpetrated by strangers in public space (reported by the
Brazilian Health Database - DATASUS, 2016b) were considered into this
dimension as an average of the latest years of available data (from 2009
to 2016). The ratio between the number of these cases and the female
population multiplied by 10,000 is then taken as the final proxy for this
transport-related exclusion dimension.
Since the selected indicators do not have comparable scales, normalisation and
outlier removal are required before the hierarchisation process that is described
in the next Section. The extreme outliers have been identified80 by means of
SPSS software81 and converted to the closest neighbour value in order to have a
smoother range of values, while also keeping the shape of the original frequency
distribution. After this, the normalisation of all the eight selected indicators was
carried out leaving the data prepared for the pairwise comparison presented in
next step.
79 Despite being considered as an unsafe mode of transport especially in countries of low
standards of safety regulation and enforcement (Vasconcellos, 2008, Rodrigues et al, 2014),
several studies have reported the importance of motorcycle taxis and motorcycle ownership in
the Global South context as a development tool to fight poverty and unemployment in hard-to-
reach areas and where public transport is scarce (Bryceson et al, 2008; Kumar, 2011; Porter,
2014; Starkey and Hine, 2014; Jenkins and Peter, 2016, Evans et al, 2018).
80 Even for the most dispersed variable analysed only less than 1% of the sample (i.e. 19
municipalities) have been identified as extreme outliers.
81 IBM Corp. Released 2017. IBM SPSS Statistics for Windows, Version 25.0. Armonk, NY: IBM
Corp.

CHAPTER 6: A SCREENING FRAMEWORK OF TRANSPORT NEEDS
154
6.3.2. Weighting the transport-related exclusion dimensions
Once the proxies were selected as described in the previous Section, a weighting
system is then proposed to evaluate the relevance of each dimension in
comparison to the others within each municipality. This system is based on the
Analytical Hierarchy Process establish by Saaty (1980), which is still nowadays
one of the most commonly used methods for multi-criteria decision analysis in
transport projects (Macharis and Bernardini, 2015; Jones et al., 2013;
Thomopoulos et al, 2009). For the purpose of this study, the Analytic Hierarchy
Process (AHP) has only been applied to calculate the weights (also called the
eigenvector) of the TRE dimensions. The following flow chart presents the steps
taken based on the AHP method to estimate the relative importance (i.e. weights)
of the TRE dimensions proxied by the indicators specified in Section 6.3.1.
Figure 6.2: Steps of AHP method applied to calculate the TRE dimensions’ weights
An important aspect of this research is that while traditional weight calculations
using AHP rely on surveys or personal opinion judgment at the pair-wise
comparison step, the approach that is proposed applies objective judgment rules
based on numerical comparison of indicators. Therefore, the weights derived

CHAPTER 6: A SCREENING FRAMEWORK OF TRANSPORT NEEDS
155
from this process are less susceptible to manipulation or strong interference of
private agendas of decision-makers.
The judgment rules applied to the pairwise comparisons of the normalised proxy
indicators are presented in Table 6.2. In summary, when two given dimensions
are compared by their normalised proxies, the higher is the first proxy is in
comparison to the second, the higher is the score assigned to this pairwise
comparison. For instance, if the normalised proxy indicators for the “time-based”
and the “fear-based” exclusion dimensions are 0.60 and 0.20 respectively, the
pairwise comparison following the judgment rules proposed in Table 6.2 result in
a score of 9 (since the first dimension (i.e. Di) is more than 100% greater than
the second dimension (i.e Dj)). Scores like this one are then used to populate the
AHP matrix (exemplified by Table 6.3 and Table 6.4) in which the final
dimensions’ weights are finally calculated. Since the indicators are compared
only after the normalisation and outlier removal, differences of over 100%
between a pair of indicators would represent a significant variation in absolute
terms. Therefore, the maximum and minimum scores (i.e. 9 and 1/9) are given to
variations of over 100% between the dimensions. The other seven intermediate
scores are defined considering an even distribution of variation among these
intermediate bands, as shown in Table 6.2 below.
Table 6.2: Judgment rules applied to each pair of transport-related exclusion dimensions
Pairwise comparison Score
Di is more than 100% greater than Dj 9
Di is between 75% and 100% greater than Dj 7
Di is between 50% and 75% greater than Dj 5
Di is between 25% and 50% greater than Dj 3
Di is between 25% lower and 25% greater than Dj 1
Di is between 50% and 25% less than Dj 1/3
Di is between 75% and 50% less than Dj 1/5
Di is between 100% and 75% less than Dj 1/7
Di is more than 100% lower than Dj 1/9

CHAPTER 6: A SCREENING FRAMEWORK OF TRANSPORT NEEDS
156
The matrices displayed in Table 6.3 and Table 6.4 show samples of the pairwise
comparison of dimensions done by the AHP method. These are two cases out of
the 1,990 municipalities analysed by the same framework. The weights shown at
the last column of this matrix have been computed by the technique proposed by
Kostlan (1991). This approximation method was selected since it is one of the
most commonly used techniques that simplify the original calculation process
proposed by Saaty (1980), reducing dramatically the computational power
needed to solve 1,900 matrices simultaneously82, while also keeping only less
than 10% of variation from the exact eigenvector (Vargas, 2010).
Table 6.3: Matrix showing a sample of the computed weights - Ipupiara, Bahia state
Dimensions From
facilities Economic Spatial Geographic
Time-
based Physical
Fear-
based
Social
position-
based
Weights
From
facilities 1 7 9 9 9 5 9 9 39%
Economic 1/7 1 1 9 9 1/3 9 9 13%
Spatial 1/9 1 1 9 7 1/5 9 9 12%
Geographic 1/9 1/9 1/9 1 1/9 1/9 1/9 9 3%
Time-based 1/9 1/9 1/7 9 1 1/9 9 9 8%
Physical 1/5 3 5 9 9 1 9 9 19%
Fear-based 1/9 1/9 1/9 9 1/9 1/9 1 9 5%
Social
position-
based 1/9 1/9 1/9 1/9 1/9 1/9 1/9 1 1%
82 One for each municipality.
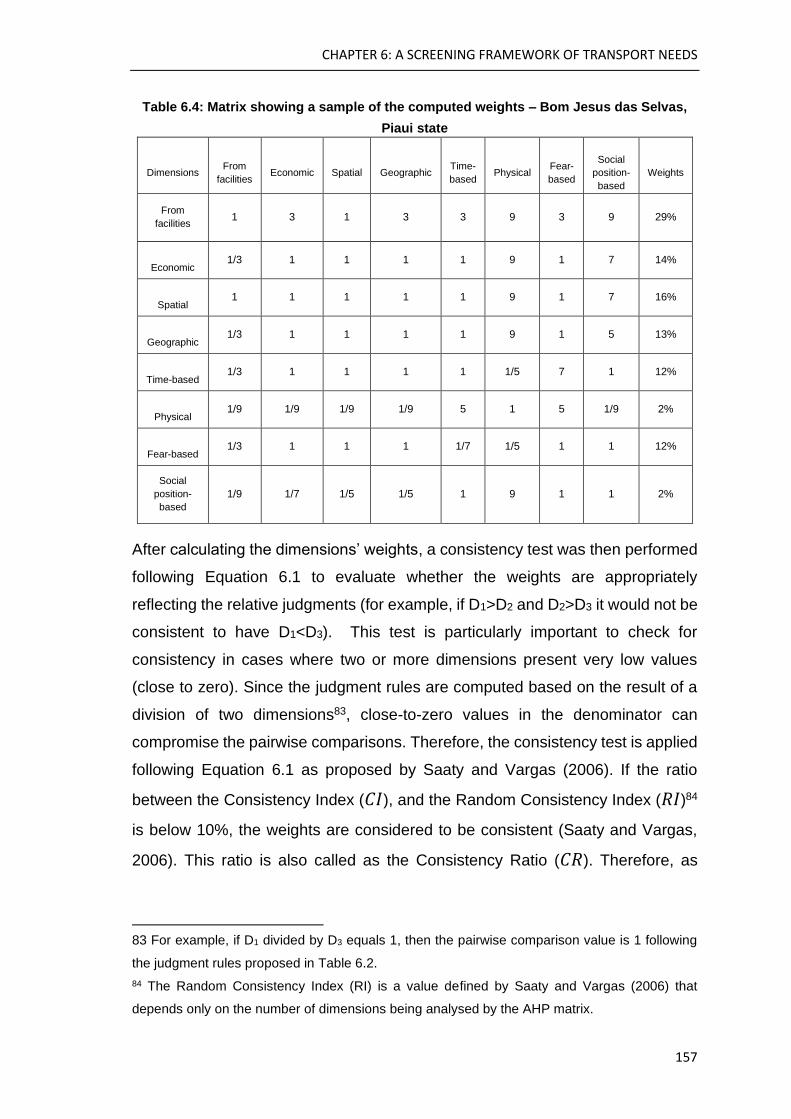
CHAPTER 6: A SCREENING FRAMEWORK OF TRANSPORT NEEDS
157
Table 6.4: Matrix showing a sample of the computed weights – Bom Jesus das Selvas,
Piaui state
Dimensions From
facilities Economic Spatial Geographic
Time-
based Physical
Fear-
based
Social
position-
based
Weights
From
facilities 1 3 1 3 3 9 3 9 29%
Economic 1/3 1 1 1 1 9 1 7 14%
Spatial 1 1 1 1 1 9 1 7 16%
Geographic 1/3 1 1 1 1 9 1 5 13%
Time-based 1/3 1 1 1 1 1/5 7 1 12%
Physical 1/9 1/9 1/9 1/9 5 1 5 1/9 2%
Fear-based 1/3 1 1 1 1/7 1/5 1 1 12%
Social
position-
based
1/9 1/7 1/5 1/5 1 9 1 1 2%
After calculating the dimensions’ weights, a consistency test was then performed
following Equation 6.1 to evaluate whether the weights are appropriately
reflecting the relative judgments (for example, if D1>D2 and D2>D3 it would not be
consistent to have D1<D3). This test is particularly important to check for
consistency in cases where two or more dimensions present very low values
(close to zero). Since the judgment rules are computed based on the result of a
division of two dimensions83, close-to-zero values in the denominator can
compromise the pairwise comparisons. Therefore, the consistency test is applied
following Equation 6.1 as proposed by Saaty and Vargas (2006). If the ratio
between the Consistency Index (𝐶𝐼), and the Random Consistency Index (𝑅𝐼)84
is below 10%, the weights are considered to be consistent (Saaty and Vargas,
2006). This ratio is also called as the Consistency Ratio (𝐶𝑅). Therefore, as
83 For example, if D1 divided by D3 equals 1, then the pairwise comparison value is 1 following
the judgment rules proposed in Table 6.2.
84 The Random Consistency Index (RI) is a value defined by Saaty and Vargas (2006) that
depends only on the number of dimensions being analysed by the AHP matrix.

CHAPTER 6: A SCREENING FRAMEWORK OF TRANSPORT NEEDS
158
described in the flowchart of Figure 6.2, if 𝐶𝑅 < 10% the calculated weights are
accepted.
𝐶𝐼 =𝜆𝑚𝑎𝑥 − 𝑛
𝑛 − 1
Where:
𝐶𝐼 is the consistency index
𝜆𝑚𝑎𝑥 is the maximum eigenvalue
𝑛 is the number of dimensions
6.3.3. Prioritisation scores calculation
Finally, a prioritisation score is proposed taking the weights and the normalised
proxies as inputs. This step is crucial to combine the priorities at a local and
regional level into the same indicator. While the normalised proxies (𝑁𝑝𝑖𝑗)
indicate the severity of a TRE dimension in a given municipality in comparison to
the region (regional priority), the weights (𝑤𝑖𝑗) shows the respective severity of
this dimension when compared to the other dimensions of the same municipality
(local priority). Hence, the prioritisation score (𝑃𝑆𝑖𝑗) at a municipality level is
proposed by Equation 6.2, combining these two factors - how important a given
dimension is at a local level, and how severe the same dimension is in a
municipality comparing with the regional figures.
𝑃𝑆𝑖𝑗 = 𝑤𝑖𝑗 ∗ 𝑁𝑝𝑖𝑗
Equation 6.1
Equation 6.2
CHAPTER 6: A SCREENING FRAMEWORK OF TRANSPORT NEEDS
159
Where:
𝑃𝑆𝑖𝑗 is the priority score of the dimension i in municipality j
𝑤𝑖𝑗 is the weight of the dimension i in municipality j
𝑁𝑝𝑖𝑗 is the normalised proxy of the dimension i in municipality j
6.3.4. Cluster analysis and evaluation of priority regions
Whilst the priority indicators proposed above in Section 6.3.3 can be applied for
example to funding prioritisation of local transport investments (at the municipality
level), a final step is still needed to identify where interventions at a regional level
are most needed. Thus, a spatial cluster analysis is proposed for each of the eight
transport-related exclusion dimensions measured by the prioritisation scores. By
doing so, it becomes possible to spot patterns of transport-related exclusions at
a regional level, showing priority areas where a given dimension is severe in both,
absolute (𝑁𝑝𝑖𝑗) and relative (𝑤𝑖𝑗) terms. The outputs of this analysis offer an
objective answer at a regional level to the third research question, providing
evidence-based guidance for transport policies aiming at poverty reduction. In
summary this is possible by i) defining regions (clusters of municipalities) sharing
a higher need for specific transport interventions, ii) evaluating the level of
governance85 at which these interventions are needed, and iii) identifying top-
priority areas that accrue more overlapping clusters of transport-related exclusion
dimensions.
Firstly, an incremental analysis was performed to check for global spatial
autocorrelation of the prioritisation score at different distance bands. This
analysis is an essential step to identify the size in which the clusters reach
maximum spatial autocorrelation. That is, the number of neighbour municipalities
that results in fewer chances of a given transport-related exclusion dimension
being randomly distributed across the entire region. As this study has been
developed using the ArcGIS platform, the recommended method for this in the
literature is the Moran’s I test of global spatial autocorrelation (Mitchell, 2005).
85 For example: municipal, sub-regional, state, regional, or national.

CHAPTER 6: A SCREENING FRAMEWORK OF TRANSPORT NEEDS
160
In this analysis, the z-scores are plotted versus a series of increasing distances
varying from 5 km up to 1,200 km in some cases. According to Mitchell (2005),
z-scores reflect the intensity of spatial clustering (or randomness). Therefore,
statistically significant peaks of z-scores are considered to be appropriate
distance bands (distance radius parameters) for measuring also spatial clusters
(hot spots). In other words, the distance bands that represent the maximal
clustering pattern of each Priority Score can then serve as inputs to the final
evaluation of regional hotspots that will show the areas that should be prioritised
in future transport interventions for each TRE dimension.
Thus, after identifying the distance bands of each TRE dimension, a local cluster
analysis could be then performed using the technique proposed by Getis and Ord
(1992) by means of ArcGIS. In a more recent study, Getis and Ord (2010) argue
that when Moran’s I tests are used in conjunction with their Gi*-statistics methods
(Ord and Getis, 1995), local “pockets” of dependence may be identified giving
rise to spatial associations. Finally, the location of these pockets of priority scores
that proxy transport-related exclusion dimensions are suggested to be priority
areas that are in most need for specific transport interventions at a municipal and
regional level.
6.4. Results and Discussion
6.4.1. Weighting factors
The first test performed after calculating the weights of each dimension was the
consistency test described by Equation 6.1. The maximum consistency ratio
found among all the 1,990 cases was less than 6%. As this value is below the
consistency ratio limit (10%), all the calculated weights can, therefore, be
considered consistent. In other words, all the generated weights reflect
appropriately the relative scale of priorities determined by the comparison
judgments rules (presented in Table 6.2 on page 155).
The boxplots in Figure 6.3 describe statistically the weights of the transport-
related exclusion dimensions obtained by the AHP matrices of the 1,990

CHAPTER 6: A SCREENING FRAMEWORK OF TRANSPORT NEEDS
161
municipalities included in this case study86. Based on the averages presented on
this graph, it is possible to observe that exclusion from facilities stands out as the
highest priority in the region overall. This fact demonstrates that the most
recurrent transport issue in Northeast Brazil is related to the lack of access to
basic services and opportunities.
As described in Chapter 5, the SAP index (the proxy for this dimension) measures
the remoteness from urban centres experienced by the rural population. By
comparing this issue with the other seven dimensions through the AHP model, it
is possible to conclude that this is the most pressing transport issue for the
majority of municipalities in Northeast Brazil. Yet, the specific areas which
demand particular transport interventions targeting this issue are further explored
later by the results of the cluster analysis.
In addition, Figure 6.3 also points out to other two groups of dimensions with an
overall second and third level of importance among the municipalities of this
region. The first group is composed of the Spatial, Geographic, Economic and
Physical dimensions. This group presents similar levels of relative priority,
showing that, as a rule, there are only minor variations of the weights of these
dimensions among the municipalities.
As can also be noted in Figure 6.3, the third level of relative priority is composed
of the fear-based, time-based and social position-based dimensions. Since the
distribution of the proxies of these dimensions is highly skewed (not normally
distributed), a substantial number of outliers are displayed when evaluating their
overall average. This fact denotes that, while most of municipalities are not much
affected by these three transport-related exclusion dimensions, in a few specific
municipalities (outliers) these dimensions do represent critical transport issues
that require high priority. The variations of these indicators throughout the
municipalities contrast particularly with the Geographic and From Facilities
dimensions, which present a much more parametric distribution (i.e. less skewed
and with fewer outliers). It is worth noting that these two dimensions are related
86 The complete spreadsheet showing these weights is available at the following link
https://drive.google.com/file/d/19WZR9ZlpmtfZAyalp5oj3pjXK7YK373N/view?usp=sharing

CHAPTER 6: A SCREENING FRAMEWORK OF TRANSPORT NEEDS
162
to the level of remoteness (from all-season-roads and town centres) in which the
inhabitants of each municipality live. This fact highlights once again that the
spatial burden separating people from opportunities in Northeast Brazil is a key
priority to be addressed even when compared to the other TRE dimensions.
Figure 6.3: Distribution of weights estimated by AHP to each transport-related exclusion
dimension
As can be expected, by following the objective judgment rules proposed in Table
6.2, the average weights and their frequency distribution tend to follow the same
patterns of the original indicators (proxies) on which they are based. Therefore, it
is worth mentioning that, even after the normalisation and the outlier removal, it
is likely that the indicators with a negatively skewed frequency distribution would
tend to have higher weights on the overall average. That is, the higher the
normalized average of a proxy indicator, the higher its respective average weight.
Nevertheless, the skewness of the overall input data, in this case, should not be
taken as a caveat in the model since it also represents the regional trends in
terms of transport needs. Moreover, the distribution of the overall data does not
affect the hierarchisation process at a local level since it is done considering only
the relative importance of the local indicators.
Figure 6.4 shows that, despite having a clear relationship between the proxy
indicator and its respective weight, a substantial variability can be also observed
in the dispersion graphs. This fact reveals the relevance of the hierarchisation
model. By assessing the relative importance of specific transport-related

CHAPTER 6: A SCREENING FRAMEWORK OF TRANSPORT NEEDS
163
exclusion dimensions in comparison to the others, it is possible to understand the
nature of transport interventions that are primarily needed. In a context with
several transport needs and limited budget, these results may help guide the
prioritisation of transport investments to tackle poverty more effectively.
Even though this Chapter applies these weights mainly to screen the transport
needs at a local and regional level, they can also serve as a valuable input for
MCDA-based appraisals of potential transport projects targeting this region. This
is a potential secondary application of the outputs of this Chapter. Since these
weights represent an evidence-based ranking of social priorities, they can
mitigate the risk of corruption and manipulation when defining the social criteria
and their respective weights in MCDA frameworks. This contribution represents
a significant step forward in the methods for prioritising transport projects that are
crucially needed for planning a socially inclusive transport. Building upon these
weights, performance indicators can then assess how a potential transport
project will impact the most relevant local needs. In this way potential transport
projects that deliver solutions of greater social impact to problems of greater
importance (translated by the higher weights) will, therefore, receive greater
prominence in the MCDA appraisal. To further illustrate this, some performance
indicators are suggested in Appendix A showing how the social impact promoted
by a potential project can be estimated in each transport-related exclusion
dimension and, subsequently combined with other economic and environmental
impact indicators.
Finally, this variability also shows that the same value of a proxy indicator may
represent different priority levels depending on the municipality. For instance, if
the exclusion from facilities was compared only based on the plain SAP indicators
of the municipalities of Santo Amaro do Maranhão (Maranhão State) and Mucugê
(Bahia state), the conclusion would be that this dimension should be equally
prioritised in both municipalities since their SAP index is 98% for both. However,
as they have different local weights, the final priority score (𝑃𝑆𝑖𝑗) obtained for the
same dimension (from facilities) is 2.35 times higher for the latter municipality
when compared to the former. This example emphasises the importance of

CHAPTER 6: A SCREENING FRAMEWORK OF TRANSPORT NEEDS
164
having an evidence-based comparison of the local needs when establishing
priority areas and priority lines of action for transport interventions.
Figure 6.4: Distribution of weights derived from AHP by each indicator
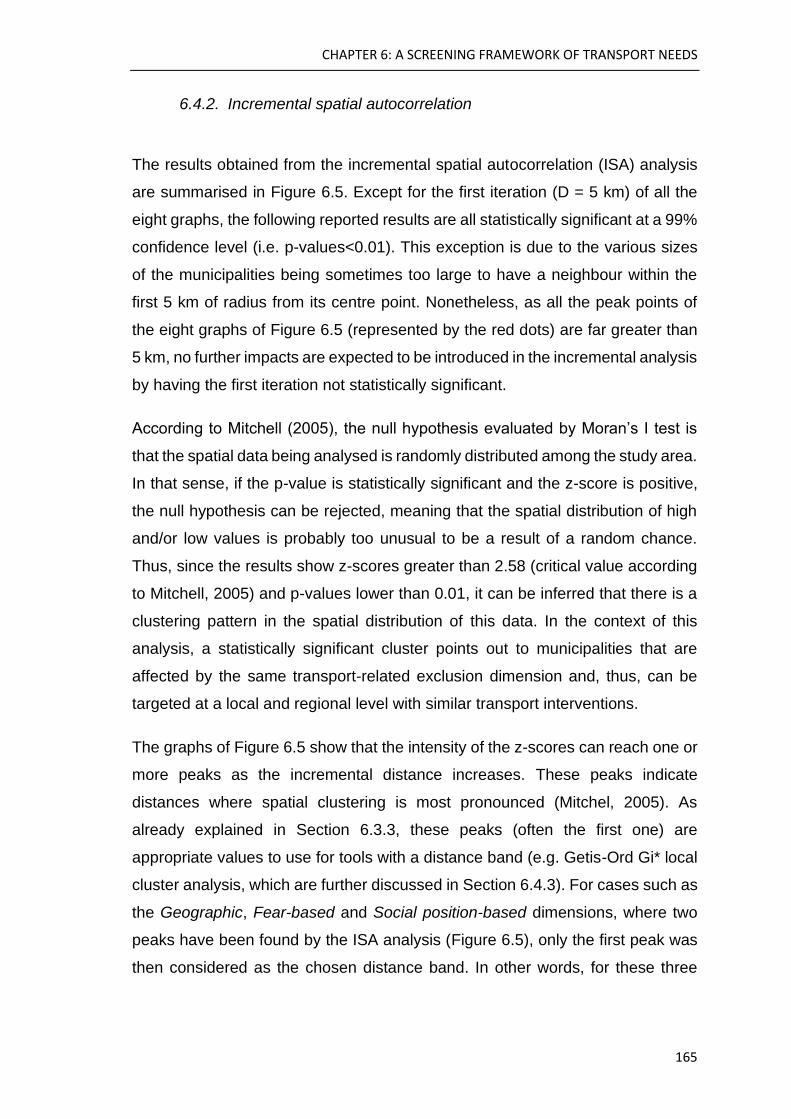
CHAPTER 6: A SCREENING FRAMEWORK OF TRANSPORT NEEDS
165
6.4.2. Incremental spatial autocorrelation
The results obtained from the incremental spatial autocorrelation (ISA) analysis
are summarised in Figure 6.5. Except for the first iteration (D = 5 km) of all the
eight graphs, the following reported results are all statistically significant at a 99%
confidence level (i.e. p-values<0.01). This exception is due to the various sizes
of the municipalities being sometimes too large to have a neighbour within the
first 5 km of radius from its centre point. Nonetheless, as all the peak points of
the eight graphs of Figure 6.5 (represented by the red dots) are far greater than
5 km, no further impacts are expected to be introduced in the incremental analysis
by having the first iteration not statistically significant.
According to Mitchell (2005), the null hypothesis evaluated by Moran’s I test is
that the spatial data being analysed is randomly distributed among the study area.
In that sense, if the p-value is statistically significant and the z-score is positive,
the null hypothesis can be rejected, meaning that the spatial distribution of high
and/or low values is probably too unusual to be a result of a random chance.
Thus, since the results show z-scores greater than 2.58 (critical value according
to Mitchell, 2005) and p-values lower than 0.01, it can be inferred that there is a
clustering pattern in the spatial distribution of this data. In the context of this
analysis, a statistically significant cluster points out to municipalities that are
affected by the same transport-related exclusion dimension and, thus, can be
targeted at a local and regional level with similar transport interventions.
The graphs of Figure 6.5 show that the intensity of the z-scores can reach one or
more peaks as the incremental distance increases. These peaks indicate
distances where spatial clustering is most pronounced (Mitchel, 2005). As
already explained in Section 6.3.3, these peaks (often the first one) are
appropriate values to use for tools with a distance band (e.g. Getis-Ord Gi* local
cluster analysis, which are further discussed in Section 6.4.3). For cases such as
the Geographic, Fear-based and Social position-based dimensions, where two
peaks have been found by the ISA analysis (Figure 6.5), only the first peak was
then considered as the chosen distance band. In other words, for these three
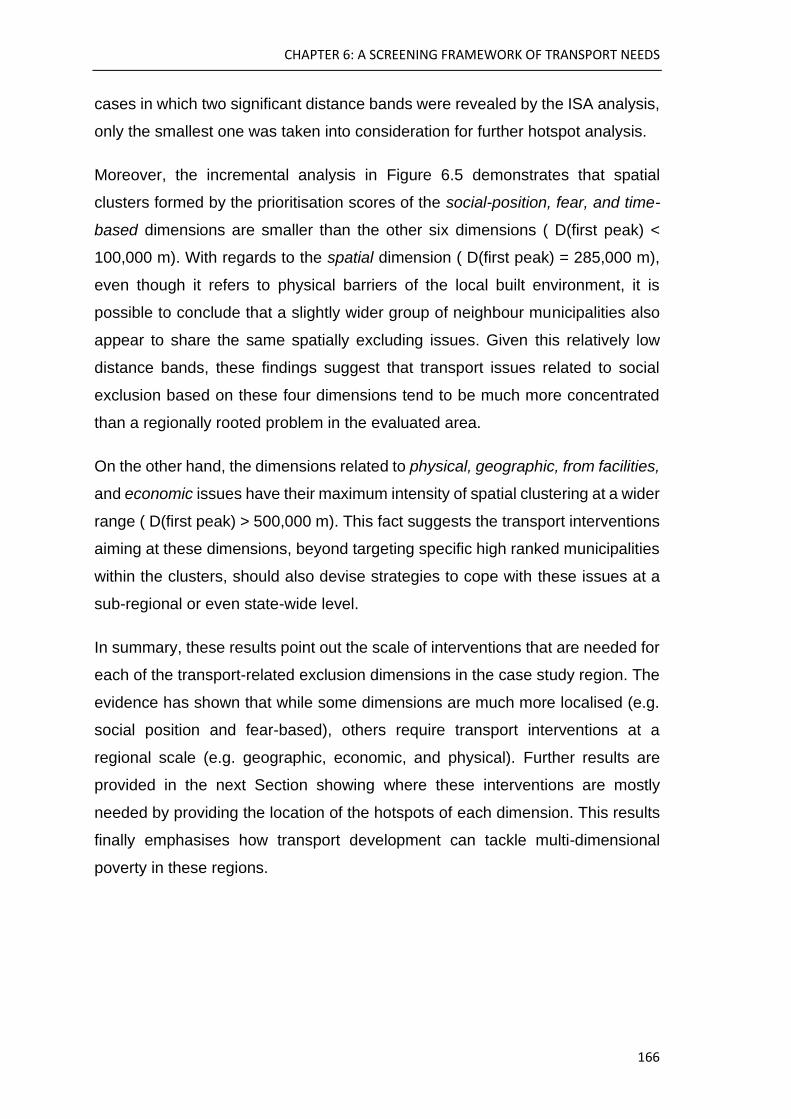
CHAPTER 6: A SCREENING FRAMEWORK OF TRANSPORT NEEDS
166
cases in which two significant distance bands were revealed by the ISA analysis,
only the smallest one was taken into consideration for further hotspot analysis.
Moreover, the incremental analysis in Figure 6.5 demonstrates that spatial
clusters formed by the prioritisation scores of the social-position, fear, and time-
based dimensions are smaller than the other six dimensions ( D(first peak) <
100,000 m). With regards to the spatial dimension ( D(first peak) = 285,000 m),
even though it refers to physical barriers of the local built environment, it is
possible to conclude that a slightly wider group of neighbour municipalities also
appear to share the same spatially excluding issues. Given this relatively low
distance bands, these findings suggest that transport issues related to social
exclusion based on these four dimensions tend to be much more concentrated
than a regionally rooted problem in the evaluated area.
On the other hand, the dimensions related to physical, geographic, from facilities,
and economic issues have their maximum intensity of spatial clustering at a wider
range ( D(first peak) > 500,000 m). This fact suggests the transport interventions
aiming at these dimensions, beyond targeting specific high ranked municipalities
within the clusters, should also devise strategies to cope with these issues at a
sub-regional or even state-wide level.
In summary, these results point out the scale of interventions that are needed for
each of the transport-related exclusion dimensions in the case study region. The
evidence has shown that while some dimensions are much more localised (e.g.
social position and fear-based), others require transport interventions at a
regional scale (e.g. geographic, economic, and physical). Further results are
provided in the next Section showing where these interventions are mostly
needed by providing the location of the hotspots of each dimension. This results
finally emphasises how transport development can tackle multi-dimensional
poverty in these regions.

CHAPTER 6: A SCREENING FRAMEWORK OF TRANSPORT NEEDS
167
Figure 6.5: Incremental global spatial autocorrelation analysis (Moran’s I) of the
prioritisation scores of the transport-related exclusion proxies
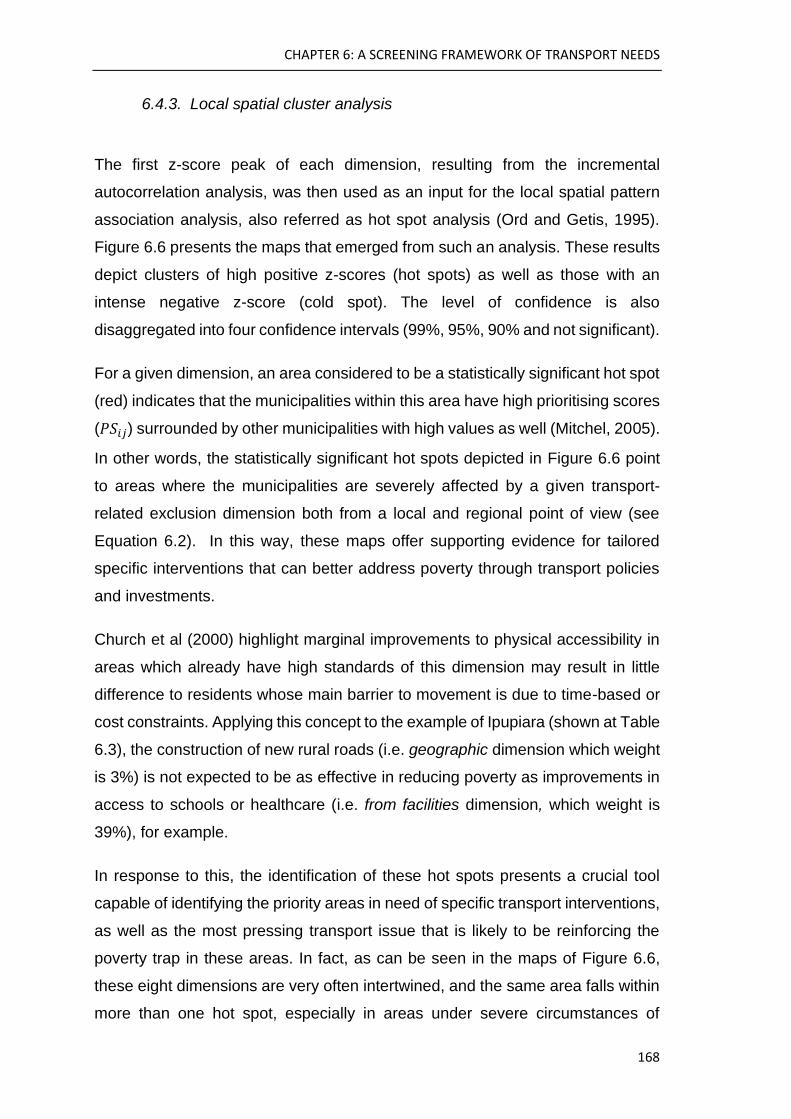
CHAPTER 6: A SCREENING FRAMEWORK OF TRANSPORT NEEDS
168
6.4.3. Local spatial cluster analysis
The first z-score peak of each dimension, resulting from the incremental
autocorrelation analysis, was then used as an input for the local spatial pattern
association analysis, also referred as hot spot analysis (Ord and Getis, 1995).
Figure 6.6 presents the maps that emerged from such an analysis. These results
depict clusters of high positive z-scores (hot spots) as well as those with an
intense negative z-score (cold spot). The level of confidence is also
disaggregated into four confidence intervals (99%, 95%, 90% and not significant).
For a given dimension, an area considered to be a statistically significant hot spot
(red) indicates that the municipalities within this area have high prioritising scores
(𝑃𝑆𝑖𝑗) surrounded by other municipalities with high values as well (Mitchel, 2005).
In other words, the statistically significant hot spots depicted in Figure 6.6 point
to areas where the municipalities are severely affected by a given transport-
related exclusion dimension both from a local and regional point of view (see
Equation 6.2). In this way, these maps offer supporting evidence for tailored
specific interventions that can better address poverty through transport policies
and investments.
Church et al (2000) highlight marginal improvements to physical accessibility in
areas which already have high standards of this dimension may result in little
difference to residents whose main barrier to movement is due to time-based or
cost constraints. Applying this concept to the example of Ipupiara (shown at Table
6.3), the construction of new rural roads (i.e. geographic dimension which weight
is 3%) is not expected to be as effective in reducing poverty as improvements in
access to schools or healthcare (i.e. from facilities dimension, which weight is
39%), for example.
In response to this, the identification of these hot spots presents a crucial tool
capable of identifying the priority areas in need of specific transport interventions,
as well as the most pressing transport issue that is likely to be reinforcing the
poverty trap in these areas. In fact, as can be seen in the maps of Figure 6.6,
these eight dimensions are very often intertwined, and the same area falls within
more than one hot spot, especially in areas under severe circumstances of
CHAPTER 6: A SCREENING FRAMEWORK OF TRANSPORT NEEDS
169
deprivation. Nevertheless, by separating out these maps it is possible not only to
evaluate the interactions of these transport-related exclusion dimensions but also
to draw regional strategies for a socially driven transport planning.
Finally, Figure 6.7 combines all the statistically significant hot spots at 99%
confidence into the same map. This map depicts regions where there is
overlapping of four transport-exclusion dimensions, bringing particular attention
to the states of Maranhão (MA) and Piauí (PI), which are vastly covered by priority
areas of 3 and 4 dimensions. Minor, yet still significant, spots of fourfold
overlapping can be also spotted in Southeast of Bahia (BA), centre of Paraíba
(PB) and Pernambuco (PE).
It can thus be concluded that, since these areas are affected by severe levels of
multidimensional transport-related exclusion, that they might require higher
priority than the others. Particularly the state of Maranhão (MA), which is entirely
immersed in issues related to income poverty (economic), long commuting times
(time-based), and low access to opportunities (from facilities), is an obvious
concern clearly in need of urgent socially driven transport interventions. Taken
together, these results suggest that transport planning in Northeast Brazil can
and should be sensitive to social issues by including quantitative analysis, as is
proposed in this study, into screening frameworks and appraisals of transport
projects.
Overall, these findings elucidate a crucial step in the process of planning transport
for poverty alleviation. By knowing the nature of the most critical transportation
needs and the areas where they are most severe, targeted transport initiatives
can be more effectively planned to break the factors that perpetuate the poverty
cycle. In the next Chapter a further discussion is provided on successful cases
that can be used as references for addressing these needs in Northeast Brazil
and how these results can be input into the decision-making of transport policies.
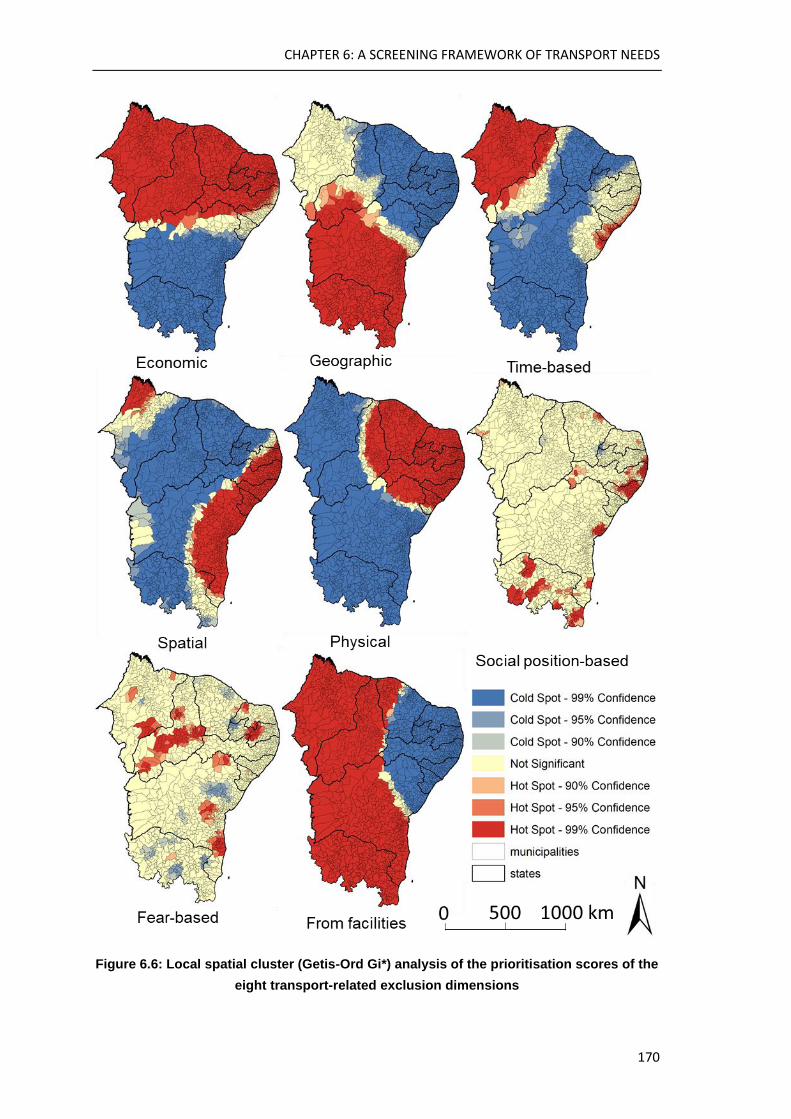
CHAPTER 6: A SCREENING FRAMEWORK OF TRANSPORT NEEDS
170
Figure 6.6: Local spatial cluster (Getis-Ord Gi*) analysis of the prioritisation scores of the
eight transport-related exclusion dimensions

CHAPTER 6: A SCREENING FRAMEWORK OF TRANSPORT NEEDS
171
Figure 6.7: Priority areas at 99% of confidence based on the transport-related exclusion
screening framework applied to Northeast Brazil
CHAPTER 6: A SCREENING FRAMEWORK OF TRANSPORT NEEDS
172
6.5. Conclusion
The framework proposed in this case study has sought to offer a screening
framework that can support transport planning in Northeast Brazil by identifying
transport issues that are likely to be reinforcing poverty traps both at the
municipality and regional level. By applying publicly available data to well-
established MCDA and spatial cluster analysis, the proposed methodology has
been able to identify priority areas and priority lines of action to tackle poverty
more effectively through transport development.
Previous research has documented the lack of tools for appraising social issues
in transport planning (Geurs et al 2009; Van Wee and Geurs, 2011; Jones and
Lucas, 2012a). On the other hand, the links between transport development,
social exclusion, and poverty have been increasingly recognised in the literature
(Church et al 2000; Lucas, 2012). In that sense, this Chapter contributes to the
literature by proposing a framework capable of performing a transparent and
objective analysis of the social dimension that can complement mainstream
transport planning techniques. This framework is particularly tailored to the
context of Northeast Brazil, where the poverty level is most severe in the Country
and where the social dimension of transport has been continuously neglected at
the planning stage.
As discussed in previous chapters, transport and accessibility are directly related
to the structures, processes and livelihood strategies that affect the inter-
generational transfer of poverty. The findings reported throughout this study
reflect an effort to clarify which transport-related exclusion dimension should be
mainly targeted at in each municipality and sub-regions in order to break the
cycles of poverty.
The results have shown that municipalities within the Northeast region present
different transport needs and suffer from a range of transport externalities.
Therefore, the methodology of screening priorities at a sub-regional level (by
clusters) and at a local level (by priority scores) can provide a systematic and
evidence-based social analysis to guide transport policies.

CHAPTER 6: A SCREENING FRAMEWORK OF TRANSPORT NEEDS
173
Furthermore, the findings also highlight that whilst some areas are particularly
affected by a single dimension (e.g. west of Bahia and east of Ceará states),
others are overlapped by four dimensions (e.g. North of Maranhão and Center of
Pernambuco states). This fact sheds light on specific sub-regions and
municipalities that deserve higher priority and targeted transport interventions.
Overall, it is also worth mentioning that only two out of 1990 municipalities of the
entire case study region were not found in any statistically significant hot spot
(considering 99% confidence). Revealing, thus, the relevance and the need for
socially driven transport interventions in Northeast Brazil.
Future research is needed to integrate the weights generated by the presented
framework into MCDA-based social appraisals of potential transport projects.
Likewise, more detailed and comprehensive proxies should be further explored
in future as soon as disaggregated poverty- and transport-related data becomes
available for these municipalities. Nonetheless, for any region or municipality
where this data is already available, this methodology can still be adapted to
harness more transport-related exclusion indicators through this screening
framework and reorient transport planning towards more effective poverty
reduction strategies.

CHAPTER 7: DISCUSSION
174
7. CHAPTER 7: DISCUSSION
This Chapter provides an overall discussion of the key findings presented
throughout this thesis in order to clearly link them to the three research questions
stated in Chapter 1.
7.1. Key findings and implications
The first research question investigated in this thesis was how transport
development is linked to poverty reduction in the Global South context. As shown
in the literature review (Chapter 2), the existing approaches that describe the
transport-poverty nexus tend to focus on urbanised and economically developed
countries and do not fully address the challenges experienced in less developed
countries. This issue, occasionally suggested by previous studies (Rynning et al.,
2017; Lucas et al. 2016a), has also emerged after the systematic analysis of 40
studies from developing countries through the lenses of the theoretical framework
proposed by Church et al. (2000). As demonstrated with reference to the
literature, the seven transport-related exclusion dimensions proposed by this
seminal study in the British context must be adapted and complemented by an
eighth dimension (related to the social position type of exclusion) in order to better
explain the links between poverty and transport in the Global South. This
theoretical update articulates a transport policy analysis framework that is
compatible with the multidimensional concept of poverty against which to judge
the channels that transport development can contribute to poverty reduction.
The findings from Chapter 2 also show that several factors can affect the
intergeneration poverty transfer (Hulme et al., 2001). These are related to
accessibility to jobs, education, social network, social capital, healthcare, and
public transport. More recently, researchers have also shown that such a
CHAPTER 7: DISCUSSION
175
phenomenon can be influenced even by the DNA since poverty leaves wide
epigenetic marks in the genome87 (McDade et al., 2019). Nonetheless, while
genetic legacy and many other factors cannot be directly addressed by public
policies, indirect solutions can be fostered by a more equitable and socially
inclusive transport development. In this context, Chapter 2 brings to light a more
nuanced understanding of how cycles of poverty can be broken by promoting
specific strategies targeting the eight transport-related exclusion dimensions.
In the particular case of Northeast Brazil, Chapter 3 has shown that spatial
accessibility limitations can present a major hurdle for rural low-income families
when in need of basic services, such as healthcare. The results have shown that
one every five people in extreme poverty is forced to travel 10 km at least, mostly
by non-motorised transport, in the hottest and driest part of Brazil to reach the
nearest healthcare centre. The findings also show that 53% of the rural low-
income population travel over 5 km to the closest basic healthcare centre, and
60% of them are farther than 10 km from the nearest hospital. In other words, the
intersectionality between income poverty and lack of access to basic services
have clearly jeopardised the well-being and health outcomes of these rural low-
income families. This fact has been also demonstrated by combining health-
related data with the rurality and per-capita income levels from municipalities of
Northeast Brazil. Whilst among more affluent municipalities the rurality level
virtually does not affect the Life expectancy, among municipalities with the lowest
per-capita income, the population from more urbanised municipalities are
expected to live 3 years more than those living in more ruralised municipalities.
Global trends show that 90% of maternal deaths are concentrated in low- and
middle-income countries, and the majority of them could have been prevented by
appropriate access to healthcare (UN, 2019b). The global statistics presented in
the latest Sustainable Development Goals report indicate that extreme poverty is
concentrated in, and overwhelmingly affects, rural populations (UN, 2019b). This
strongly supports the case that transport policies aiming at tackling extreme
poverty should be concentrated on less urbanised municipalities where extreme
87 Evidence has shown that people living in poverty have presented a particular DNA methylation process
that leads to more susceptibility to developing health problems later in life.
CHAPTER 7: DISCUSSION
176
poverty is most severe and is experienced in a number of different deprivations.
Nevertheless, the proposition of public policies addressing rural transportation
should be done carefully. Otherwise, even more negative externalities related to
road crashes and air pollution can result as a consequence of rapid and
debilitating development of motorised mobility (Jones et al., 2016; Jones et al.,
2019).
From this, the next research question that has driven this thesis was how the
social outcomes of transport interventions in Northeast Brazil can be measured,
in order to learn from the past what has been successful in reducing poverty. The
case study presented in Chapter 4 has shown two main findings on this matter
that emerge by applying different-in-different matching (DIDM) techniques to
publicly available socioeconomic datasets, such as those from the national
census (IBGE, 2010a). First, the estimated social outcomes were shown to be
substantially dependent on which method is used to analyse the data. The
analysis of nearly 20% of the indicators (5 out 26) resulted in opposing
conclusions depending on whether the DIDM method was used, instead of a
simple DID. This fact emphasises the potential misperceptions of a ‘context-less’
analysis that can lead to equivocate transport policies.
Secondly, the results demonstrated that while this large transport infrastructure
investment (a crossing-state road widening project) improved the overall levels
of poverty-related indicators, the impact on the average per-capita income of the
population in extreme poverty was actually negative. In other words, the findings
show that the population surviving in extreme poverty had their average per-
capita income reduced by 8.2% after the completion of the project, while the
equivalent control group presented opposite trends for the same indicator. This
empirical case study serves as a cautionary tale about how large transport
infrastructure investments are not enough to guarantee extreme poverty
alleviation. Likewise, this fact underscores the necessity to evaluate the local
needs and transport issues that mostly affect the least advantaged population
when prioritising transport interventions.
Possibly, the persistent neglect of these needs assessment is not by lack of
awareness nor by chance, but it has been driven by the efficient-equity trade-off
CHAPTER 7: DISCUSSION
177
that is often mentioned in the academic literature (Gannon and Liu, 1997;
Vasconcellos, 2003; Macharis et al, 2009; Haddad et al, 2011; Annema et al,
2015; Marcelo et al, 2016). In other words, decision-makers may tend to focus on
transport investments that can produce higher impacts on productivity and gross
domestic product growth (Haddad et al, 2011) rather than on improvements in
the welfare of vulnerable people (Gannon and Liu, 1997). Mackie et al. (2014)
also claim that with the global financial crisis, even decision-makers and
politicians from countries88 that usually include some social impact dimensions in
traditional CBAs for transport projects are often more prone to focus on the
economic impacts, rather than less tangible social benefits.
In this context, many researchers have consistently argued that CBAs or any
other utilitarian approach are not enough for evaluating equity and social
exclusion issues in transport appraisals since they tend to neglect specific
transport needs of each region and of particular ‘at risk’ groups (Van Wee and
Geurs, 2011; Lucas et al, 2016a; Di Ciommo and Shiftan, 2017; ITF, 2017b;
Hickman and Dean, 2018). Martens and Di Ciommo (2017) conclude that even if
accessibility gains are used instead of travel time savings in the traditional CBA,
questions of justice and equity would still remain about the model. These authors
argue that the real problem is that the utilitarian bias of a CBA framework would
still prioritise the ‘greatest good for the greatest population’, regardless the
distribution among different social categories and regions. Hickman and Dean
(2018) also sustain that the nature of CBA is consequential, so it will favour
projects that affect larger groups of populations in, as a rule, denser and
economically more vibrant regions, rather than in socially deprived and more
dispersed areas. Reinforcing, thus, the existing inequalities and poverty traps in
the long run.
In response to that, over the past 15 years, researchers and planners have
increasingly adopted and suggested the introduction of a second social appraisal
method based on multi-criteria decision analysis (MCDA), as a complement or
even a full substitute of the CBAs (Thomopoulos et al, 2009, Manaugh et al,
2015). Authors have argued that MCDA enhances the likelihood of policy success
88 Such as New Zealand, Sweden, England, USA and Germany.
CHAPTER 7: DISCUSSION
178
in the long run since it can be done even when data is scarce, and it is capable
of reconciling conflicts among several interested and affected groups (Manaugh
et al, 2015; Marcelo et al, 2016). For instance, Jones et al. (2013) have
demonstrated that is possible to integrate indigenous and scientific knowledge in
transport appraisals by using a MCDA framework. Likewise, Van Wee (2012)
asserts that MCDA offers an alternative framework in order to include in social
appraisals effects that are difficult to monetise (e.g. social and distributional
effects) in traditional CBAs.
On the other hand, Lucas et al (2016b) maintain that MCDAs do not inherently
clarify the distributional effects of a given project, and this needs to be carefully
evaluated and embedded into the framework to ensure that priority is given to
vulnerable groups. Eijgenraam et al. (2000) and Thomopoulos et al. (2009) also
criticise MCDA for its subjectivity and for being susceptible to manipulation
specially when assigning the weights to each criterion. In this sense, the expected
benefit of a comprehensive social analysis given by MCDA frameworks could be
substantially undermined by the risk of corruption and manipulation of this
analysis. As a result, while MCDA frameworks have been proposed to address
the limitations of traditional CBAs, they have also amplified a major flaw of
subjectivity in the definition of their parameters.
This brief panorama on the limitations of the most commonly used social
appraisals frameworks sheds light on the challenges that lie in the third research
question of this thesis. In a context where the resources and data are scarce (UN,
2015b), and the decision-making process is dominated by politicised power
(Benitez et al., 2010), the question of how to plan transport to tackle poverty
requires better analytical methods that can help guide transport interventions to
where and for whom they are mostly needed. Thus, the last two research
Chapters (5 and 6) have sought to offer a two-fold answer to this research
question: firstly, by proposing a key indicator compatible with the municipality
governance level that could perform a comprehensive evaluation of the lack of
access to basic services in Northeast Brazil; and, secondly, by developing a
screening framework that not only addresses the current limitations of the
abovementioned frameworks (CBA and MCDA), but also brings a clear
CHAPTER 7: DISCUSSION
179
understanding on where each transport-related exclusion dimension requires
higher priority of action.
By triangulating the Spatial Accessibility Poverty index against other
socioeconomic indicators, Chapter 5 has shown that municipalities considered as
the accessibility-poorest of Northeast Brazil have also other spatial and transport-
related similarities when compared to the accessibility richest ones. The results
have shown that municipalities facing higher accessibility-poverty are 6.8 times
more sparsely populated (i.e. with lower population density), with 55.2% less
motorways (i.e. with a lower motorway density) and have the motorcycle
ownership rate 27% higher. These trends show that transport interventions
targeting this municipalities are more likely to be successful in reducing poverty
if they consider this decentralised demand for transport. Since investments in
large infrastructure projects, such as the paradigmatic case of the widening of the
BR-232 motorway assessed in Chapter 4, might not result in real improvements
for the least advantaged population, it is argued that more decentralised transport
interventions are needed in these municipalities in order to tackle poverty more
effectively. The discussion on whether private or public transport solutions should
take the lead in responding to these needs involves economic and operational
issues that are out of the scope of this thesis. Yet, a few references to both
scenarios can be found in the international literature.
Lessons from some European countries show that Demand Responsive
Transport (DRT) can offer a high level of flexible and feasible public transport
services for deprived and sparsely populated communities (Saroli, 2015; Leiren
and Skollerud, 2015; Velaga et al., 2012; McDonagh, 2006). For instance, data
from the Rural Transport Programme (RTP) launched in 2007 in Ireland shows
an increasing popularity and effectiveness by connecting over 2 million
passengers to essential services (i.e. hospitals, banks, post offices, retail centres)
in 2018 (NTA, 2019). Nevertheless, concerns related to funding and affordability
of these schemes in contexts of severe and multidimensional poverty might
represent a significant issue to be addressed in further studies. Alternatively,
when formal public transport services fail to meet the local demands for mobility,
CHAPTER 7: DISCUSSION
180
small-scale operators of paratransit-type of services89 come into play to fill these
gaps. These informal services are often-times the only available transport
alternative to carless, disadvantaged individuals to reach jobs, market, and
access healthcare in areas devoid of formal public transport (Cervero and Golub,
2007). For these reasons, despite having concerns on safety, noise and air
pollution, most researchers have advocated towards a middle ground between
the extremes of acceptance and outright prohibition of informal flexible transport
systems especially in peri-urban and rural contexts (Silcock, 1981; Cervero 2000,
Kumar, 2011; Phun, 2016; Jenkins and Peters, 2016; Evans et al., 2018).
Although the latest official data (IBGE, 2019b) indicates that the current Brazilian
population is mostly urban (84.7% of the total), it is important to highlight how the
limitations of these definitions of ‘urban’ and ‘rural’ also result in unfavourable
consequences in transport policy making. The current definition of rurality based
essentially on the non-urban classification, which ignores intermediate rurality
situations in thousands of small municipalities, results in a distorted picture for
the transport policies aimed at this target area within the Brazilian territory. For
example, using rural typification methodologies based on OECD international
experiences, Bitoun et al. (2015) argue that the share of population residing in
essentially and relatively rural municipalities actually corresponds to 37% of the
Brazil’s total population (2.5 times higher than the current official data). This fact
illustrates how transport policies aiming only at urban mobility90 could result in
unfeasible transport service standards by defining the same level of service for
these different so-called ‘urban’ contexts. Likewise, overestimating urban
population can also lead to transport planning and policies to be incorrectly
restrictively focused on urban mobility alone, which would result in the complete
neglect of majority of people in extreme poverty who live in rural areas and are
severely affected by transport-related exclusions.
The results of Chapter 5 have also shed some light on this topic, showing that
income poverty is not necessarily associated with lack of accessibility. Rather,
89 Such as minibuses, passenger-adapted trucks, vans, microvans, station wagons, three-
wheelers, motorcycles taxis and pedicabs.
90 Such as the Federal Law 12.587/2012 (Brasil, 2012) that are further discussed later.
CHAPTER 7: DISCUSSION
181
other dimensions of poverty that are mostly present in less urbanised
communities were found to be associated with high SAP levels. For example, the
rural households of municipalities facing higher accessibility poverty have
proportionally 9 times more households without electricity, 5 times less access to
proper toilet facilities, and 1.5 times less access to adequate sewerage system
than the accessibility richer ones. These findings show also how poverty cannot
be fully captured by income indicators and that the local transport needs
preventing social development might change even among income-poor regions.
Also, this emphasises the fact that to overcome poverty, coordinated transport
interventions in multiple sectors are needed (Gomide, 2004), rather than
fragmented social policies. In this sense, Chapter 6 recalls the theoretical concept
of the eight transport-related exclusion dimensions (Church et al., 2000) to
promote a comprehensive understanding of the nature of the transport
interventions that should be prioritised in each municipality and sub-region of
Northeast Brazil.
As explained in Chapter 2, the factors that promote the inter-generational poverty
transfer can be reduced by developing specific strategies to tackle these eight
dimensions individually when planning transport. While the proposed priority
scores proposed in Chapter 6 have revealed specific priorities within each
municipality, the overall results of this Chapter have presented a high clustering
pattern of these dimensions with a particularly high prevalence of the exclusion
from facilities. The states of Piauí and Maranhão have shown the largest number
of municipalities overlapped by 3 and 4 hotspots of transport exclusion
simultaneously. These results make a strong evidence base to help guide future
targeted transport interventions aiming at reducing the mechanisms that prevent
people to escape poverty.
Additionally, the weights which resulted from the analysis in Chapter 6 can serve
as a valuable input for social appraisals of transport projects using MCDA
frameworks. Since these weights represent an evidence-based ranking of social
priorities, they can mitigate the risk of corruption and manipulation when defining
the social criteria and their respective weights in MCDA frameworks. This
contribution represents a significant step forward in the methods for prioritising

CHAPTER 7: DISCUSSION
182
transport projects that are crucially needed for planning a socially inclusive
transport. Building upon these weights, performance indicators can then assess
how a potential transport project will impact the most relevant local needs. In this
way projects that deliver solutions of greater social impact to problems of greater
importance (translated by the higher weights) will, therefore, receive greater
prominence in the MCDA appraisal.
7.2. Policy recommendations
A number of theoretical insights, appraisal methods, and policy guidance have
been proposed throughout this thesis based on the evidence raised in each
chapter. Likewise, the recommendations consolidated in this Section are
intended to support policy-makers, researchers and practitioners involved in
transport planning and poverty reduction programmes in the Global South,
particularly those from Northeast Brazil. The list of policy recommendations
presented in this Section gives broad guidance in order to make public spending
on transport development more effective in reducing poverty. To avoid the
recurrent issue of seeing the government as a singular entity (Veeneman and
Mulley, 2018), the recommendations provided in this Section are divided into the
three levels of governance that are practiced in Brazil. In the absence of broader
guiding legislation (for both rural and urban contexts) defining the roles of each
government layer in this matter, the present Section draws policy
recommendations based on the duties defined by the Federal Law 12.587/2012,
also called Law of Urban Mobility (Brasil, 2012).
As shown in Chapter 3 and 5, the greatest challenges of transport that prevent
people in extreme poverty to access essential services occur predominantly in
remote and sparsely populated communities, where the nearest urban or
healthcare centre are still very far for a non-motorised trip. Therefore, in order to
improve accountability and effectiveness of public transport policies targeting
these communities, it is firstly suggested a more objective definition of duties of
each level of governance in the planning and provision of transport services and
infrastructure for remote and sparsely populated regions. In other words, future
federal transport policies should consider a transversal update on the concept of
CHAPTER 7: DISCUSSION
183
passenger transportation, as being far greater than just urban mobility. In the
same way, while the specific strategies that are devised below support the main
assignments of each government level according to the Law of Urban Mobility (n.
12.587/2012), they also consider this broader concept of transport, including peri-
urban, rural and remote rural mobility.
7.2.1. Federal level
Developing an urban mobility data system
Perhaps the most common issue consistently raised throughout this thesis was
the lack of transport- and poverty-related data. Opensource, timely and spatially
disaggregated data is a sine qua non condition for tackling poverty more
effectively. For example, the location of low-income residents could be easily
collected when they are registered in public social programmes such as P1MC,
Bolsa Familia91, etc. Likewise, simple spatial databases containing the locations
(latitude/longitude) of public schools, public transport stops, social security
centres, police stations, and other basic public services could unchain a myriad
of accessibility analysis that would result in a huge stride for an equitable
development of transport, as well as other sectors. Despite rapid advances in
technologies using artificial intelligence, for example, to map roads automatically
from satellite images (e.g. Mapwith.ai), manual mapping efforts are likely to
remain needed to generate and update GTFS databases at a national level.
Therefore, it is vital to deepen this agenda within this Information System,
mapping and gathering data not only in urban but also in rural areas. This is also
a crucial step in informing independent researchers, advocacy groups (e.g.
INFRA2038) and grassroots movements (e.g. ASA) that can increase the
accountability on the social dimension of transport development and collaborate
in developing new tools and studies to support decision-makers.
91 It is a well-established cash transfer programme that currently benefits over 14.1 million families
living in poverty or extreme poverty Brazil (Brasil, 2019).
CHAPTER 7: DISCUSSION
184
Giving technical and financial assistance to states and municipalities
As shown in Chapter 5, the municipalities facing better spatial accessibility also
present a GDP 132.4% higher than those with worst accessibility levels. This fact
indicates limitations that might occur not only related to the lack of qualified
human resources to perform appropriate transport planning, but also to properly
invest in essential transport projects at the local level. In that sense, considering
the limited budget available to this end, Federal Agencies could benefit from the
municipality rankings and hotspot maps developed in this thesis (Chapter 5 and
6) to support the prioritisation of municipalities where there is a higher need for
financial and technical support from the Federal government.
Fostering medium and large-scale transport projects in urban agglomerations
and metropolitan regions
Based on the findings of Chapter 4 on how the large-scale transport investment
has impacted upon extreme poverty, it is recommended to complement technical,
economic and environmental appraisals with social impact evaluations (ex-ante)
to foster more socially inclusive transport projects. To do so, the framework
proposed in Chapter 6 combined with the MCDA techniques further addressed in
Appendix A are likely to bring transparency and objectivity to the planning stage
of the transport infrastructure life cycle. Moreover, ex-post analysis, as developed
in Chapter 4, of previous transport projects of this magnitude can also promote
an important learning process to feedback future planning. In this way, a new
standard of transport planning is expected to be achieved, reconciling the supply
requirements (economic efficiency and technical feasibility) and the needs of
people who have been mostly prevented from accessing essential services and
life opportunities.
Supporting coordinated actions among municipalities and states in conurbations.
As pointed out in Chapter 6, there is a high clustering pattern on the distribution
of all the eight transport-related exclusion dimensions, in which the clustering size
varies from 42km (for the time-based dimension) to 710 km (for the economic
dimension). These clusters of municipalities reveal where and which kind of
targeted actions should be primarily coordinated by the Federal Government
CHAPTER 7: DISCUSSION
185
among municipalities and states in policy instruments such as Regional
Development Plans (SUDENE, 2019). The results from this thesis have shown
that the states of Maranhão and Piauí should be given the top priority of these
coordinated actions since their municipalities have the higher number of hotspots
of transport-related exclusions.
7.2.2. State level
Providing public intercity public transport services
Studies measuring spatial accessibility, as presented in Chapter 5, are capable
of revealing where the most profitable demands for intercity public transport
services are (cold spots of this dimension), and conversely, the sub-regions
presenting the most remote areas with very limited access to urban centres. By
harnessing this kind of information, state governments might be able to design
bidding contracts serving accessibility poor regions as a counterpart for winning
profitable routes, combining economic efficiency with social sustainability. For the
specific case of Northeast Brazil, while the higher demand for intercity services
is likely to remain along the shore at the eastern side92, Chapter 5 also highlights
that large areas in Piauí, Maranhão and West Bahia require further attention
when planning intercity public transport to reduce the impacts of spatial
accessibility poverty in these municipalities.
Proposing specific tax policy and incentives for the implementation of PNMU (i.e.
National Plan of Urban Mobility)
Following the guiding principles of equity, social inclusion and universal access
present in the PNMU (Brasil, 2013), evidence from Chapter 2 has shown some
specific groups of people that should be given priority when designing equitable
tax policies and specific incentives of transport. Therefore, it is essential to
evaluate the distributional effects of any proposal of this nature, disaggregating
the impacts by gender, age, ability, race, and income strata. As shown in Chapter
2, these social groups generally present specific travel behaviours, especially
92 In states such as Sergipe, Alagoas, Paraíba, Rio Grande do Norte, and East of Pernambuco

CHAPTER 7: DISCUSSION
186
when there is intersectionality of more than one layer of social exclusion.
Therefore, targeted incentives should consider these patterns, including social
characteristics of the beneficiaries and their preferred mode of transport and
routes, in order to better serve these critical groups.
7.2.3. Municipality level
Planning, executing and evaluating the Urban Mobility Policy;
A transport recommendation that can be drawn from this thesis is that Urban
Mobility Plans and other transport policy instruments at municipality level
(Barone, 2003) should be tailored according to the relative importance of the local
transport needs. This is particularly illustrated in Chapter 6 by many examples of
municipalities with similar figures of a given transport-related exclusion indicator
that represent different levels of local priority. In this sense, it is argued that the
local hierarchisation of transport-related exclusion dimensions might point out to
transport interventions that will have a higher impact on improving the conditions
of the most vulnerable population. As shown in Chapter 2, the intergenerational
cycle of poverty is woven in a tangle of exclusions that can be mitigated by
appropriate transport interventions. In this sense, instead of isolated and remedial
poverty-reduction actions, a socially-inclusive transport planning is suggested to
foster long-term and effective solutions to break these cycles.
Promoting regulation of urban transport services;
The main reason for the increase of informal transport services in Brazil is the
lack of an appropriate regulatory framework, that usually causes shortcomings
on the regular public transport such as inadequate itineraries, low frequencies,
few service options, high tariffs, poor comfort, among others (Gomide, 2004).
Moreover, as already discussed in the previous Section, the disruption of informal
transport services can jeopardize even more the accessibility of the least
advantaged population since this is often the only option available for them.
Therefore, the results presented in this thesis, especially in Chapter 6, call on
decision-makers to reflect on how regulation of transport services should be

CHAPTER 7: DISCUSSION
187
structured taking into account the travel behaviour of the low-income population
to promote a more inclusive and equitable transport system.
Providing directly, indirectly or by associated management, the essential urban
collective public transport services;
Since the predominant transport-related exclusion dimension in the Northeast is
lack of access to essential services and opportunities, it is argued that the
heatmaps provided in Chapter 5 showing the spatial accessibility poverty can
offer a transparent and less paternalistic evaluation of which areas deserve
priority investments in this matter. But that is not enough. To plan an effective
provision of essential transport services for people facing multidimensional
poverty, it is important also to understand their accessibility restrictions as people
and not only as inhabitants of a certain place. As low-income people in Northeast
Brazil mostly travel by NMT (Cortez and Vaz, 2013; ANTP, 2018) and are
primarily affected by land price variations, it is also essential to integrate any
future transport investment with an ample strategy to improve NMT infrastructure
(e.g. cycle lanes and footpaths) as well as land use and housing measures to
avoid unexpected gentrification processes. Especially in Northeast Brazil where
local governments face constant scarcity of resources and fiscal crisis, it is crucial
to make transport investments more effective in addressing these needs.

CHAPTER 8: CONCLUSIONS
188
8. CHAPTER 8: CONCLUSIONS
This Chapter outlines the main conclusions that can be drawn from this research,
explaining how the five objectives proposed in Chapter 1 have been met
throughout the thesis. This final Section also summarises the main contributions
to the knowledge in the field of transport planning and policy, while also
acknowledging its methodological and data limitations in a critical assessment.
Finally, future directions for research relating poverty reduction and transport
development are suggested, based on the topics that have not been fully
captured by this project as well as on emerging issues that are likely to influence
future academic research around this theme.
8.1. Thesis summary
The overarching goal of this research was to promote a new standard of transport
development in Northeast Brazil strongly committed to poverty eradication. To
this end, the first specific research objective was to develop a theoretical
framework that could help guide transport policies to tackle the poverty trap more
effectively in the Global South context. This objective has been achieved by
adapting the seminal transport policy analysis framework published by Church et
al. (2000) to meet the challenges reported by 40 recently published papers
addressing the transport-poverty nexus in the Global South. It was concluded that
targeted transport initiatives should take into account all the eight transport-
related exclusion dimensions described in Chapter 2 in order to foster social
development and mitigate the intergenerational poverty transfer.
The second objective was to evaluate the current level of access to basic services
of people in extreme poverty in Northeast Brazil. By evaluating the location of
nearly half-million cisterns given by the Federal Government to low-income

CHAPTER 8: CONCLUSIONS
189
families, the spatial accessibility to healthcare and urban centres of remote low-
income households in Northeast Brazil has been investigated. From the analysis
in Chapter 3, it was possible to conclude that more than half of the low-income
rural families in this region live more than 5 km from the nearest basic healthcare
centre and over 10 km from the nearest urban centre, where most of the basic
public services and job opportunities are located. These results emphasise that
the majority of this rural low-income population, who mostly live in a walking
world, experience a severe transport-related burden preventing them from
accessing essential public services, which often translates into significant
worsening in living and health conditions.
The third objective of this research was to develop an ex-post evaluation
framework to assess the impacts of transport interventions upon low-income
residents of Northeast Brazil, using publicly available data only. Chapter 4 has
sought to meet this goal by structuring and testing such a framework in a case
study involving a road-widening project in Pernambuco state. In the development
process of this framework, it was possible to conclude that the estimated social
outcomes are highly sensitive to the assessment method that is applied to
interrogate the data (comparing DID and DIDM techniques). This shows how
crucial it is to consider the context of these transport interventions to purge
eventual confounding factors from the ex-post impact analysis. Moreover, the
case study assessed by this framework has also shown that despite the overall
socioeconomic progress brought about by this large transport investment, the
least advantaged groups within the project catchment area have not benefitted
from this project. This fact calls attention to the need for complementary actions
targeting these groups to ensure an equitable and inclusive distribution of public
investments.
The fourth objective of this thesis was to develop a spatial indicator that could
measure the lack of access to basic services and opportunities at the municipality
level for the entire region of Northeast Brazil. While the findings in Chapter 3 give
an unprecedented statistical panorama on this issue, Chapter 5 was set out to
explore this question from a spatial standpoint enabling, thus, more accurate and
socially inclusive transport interventions. Although the results of these two

CHAPTER 8: CONCLUSIONS
190
chapters are not directly comparable (i.e. statistical vs spatial), they complement
each other to provide a comprehensive assessment of the exclusion from
facilities in the Northeast Brazil.
Due to the scarcity of spatial data in this context, the indicator had to be
developed with a fairly basic amount of spatial inputs, summarising for each
municipality the overlapping influence of the surrounding urban centres on its
rural localities. On the other hand, the relative simplicity of this model allows its
replicability in other regions with similar widespread poverty and lack of spatial
data, where few similar indicators have been applied. The analysis of the SAP
index in Northeast Brazil has shown that high rates of income-poverty or rurality
in a given municipality do not necessarily imply high levels of spatial accessibility
poverty. Rather, low access to basic services was found to be much more
associated with deprivations of housing facilities (such as sanitation and
electricity), and low population density. Beyond showing that not all cases of
income poverty are necessarily associated with accessibility poverty, this fact
also highlights the concept of multi-dimensional poverty, reinforcing that income
measurements should be complemented by other exclusion dimensions (such as
accessibility) when planning for more socially sustainable transport development.
Finally, the fifth objective of this research was to combine the proposed
theoretical concept (Chapter 2), the spatial accessibility indicator (Chapter 5), and
other publicly available datasets into a screening framework of transport needs.
In Chapter 6, this tool was developed to point out the lines of actions that should
receive higher priority from the transport authorities at a local and regional level.
Besides calculating the hierarchy of dimensions to be addressed for each
municipality, this last research Chapter also called attention to the precise
location of a number of different hotspots of high concentration of multiple
transport-related deprivations. Hence, the final recommendations for future
transport planning and policy discussed in Chapter 7 were founded upon the
theoretical, quantitative and spatial evidence raised throughout this thesis.

CHAPTER 8: CONCLUSIONS
191
8.2. Main contributions
Several gaps in the existing literature were identified in the literature review
(Chapter 2), as well as in the introduction of each research chapter (Chapters 3-
6). This thesis has sought to provide innovative methodologies and raise
evidence to address these gaps and contributes to the state of the knowledge on
transport planning and poverty reduction by:
• Conceiving a theoretical framework showing the nexus between transport
planning and intergenerational poverty transfer in the context of the Global
South
• Updating the traditional transport-related exclusions dimensions model
proposed by Church et al. (2000) with an eighth dimension (based on the
social position) that is particularly suitable for countries of the Global South
• Applying a cisterns location dataset to proxy for the low-income
households in Northeast Brazil, which have allowed quantitative
evaluations of the current level of access to basic services and
opportunities of the least advantaged population in this understudied area,
and have highlighted how transport issues can undermine public health
and wellbeing in these contexts
• Structuring an ex-post analysis framework capable of evaluating the social
outcomes of transport interventions in Northeast Brazil using publicly
available datasets only, thus, unlocking a myriad of possibilities of case
studies to assess from a social impact perspective, the transport
interventions which occurred between previous censuses
• Assessing the project of widening the motorway BR-232 in Pernambuco
state in terms of social impacts and distributional effects on different low-
income groups in the municipalities along the project
• Developing an index to measure spatial accessibility to key destinations
based on simple land-use patterns, as an alternative to data-intensive
accessibility indicators that are not applicable where the transport network
is not consistently mapped in the Global South. The SAP index is also built
based on the prioritarian principle which does not require the definition of
an arbitrary accessibility poverty line for defining priority areas

CHAPTER 8: CONCLUSIONS
192
• Proposing a tailored transport screening framework capable of performing
a transparent and objective analysis of the social dimension that can
complement mainstream transport planning techniques in Northeast
Brazil, and pointing out the lines of actions that are most needed at a local
and regional level to target poverty through transport development more
effectively
8.3. Critical assessment
While this research endeavour has sought to address as much as possible the
central questions about the transport-poverty nexus in underexplored and data-
scarce areas, some limitations of scope and methodology should be
acknowledged to offer a clear understanding about which ways this work can be
improved in future. Overall, the methods applied in this thesis are limited by the
trade-off between model sophistication and data availability. For instance, while
accessibility models of high accuracy are currently inapplicable in these areas as
they require unavailable sets of spatial data to be processed, Chapters 3 and 5
had to use simpler models based on Geodesic distance and Friction Surface to
cope with these data limitations. Similarly, the SAP index that applies the
locations of urban centres to proxy essential services and opportunities, could be
enhanced in an updated version considering the exact location of these points of
interest, as soon as their locations become consistently available in Northeast
Brazil.
With regards to the scope of the ex-post analysis, as already mentioned in
Chapter 4, this research has not investigated the direct impacts of transport
infrastructure investments on health outcomes. Moreover, despite being
reasonable to assume that neighbour municipalities with similar characteristics
(translated by a similar propensity score) tend to be homogeneous in terms of
socioeconomic conditions, other sources of endogeneity that could affect social
development such as private investments, and targeted public initiatives in
healthcare, education, and welfare have not been considered in this study. Also,
the distributional impacts within the municipalities could not be considered
CHAPTER 8: CONCLUSIONS
193
beyond the rural/urban differences in this analysis since there was no further
disaggregation of the publicly available datasets for these municipalities.
Finally, even though the social impact and accessibility evaluations of this study
were mainly focused on rural areas where poverty is most severe, the negative
effects of transport-related exclusions on urban residents did not go unnoticed.
Although global trends show that the majority of people in extreme poverty still
live in rural areas (UN, 2019b), a substantial number of poverty-stricken groups
living in the fringes of post-colonial cities also face concerning transport issues.
While this issue has garnered some attention in large cities from Southeast Brazil,
like Sao Paulo (Pritchard et al., 2019) and Rio de Janeiro (Pereira, 2018), this
thesis has not been able to cover the metropolis in the Northeast at the same
level of detail.
8.4. Future research
The United Nations projects that, if trends are kept and no significant change in
the current policies are made, extreme poverty will remain around 6% of the
global population by 2030 (UN, 2019b), which in absolute terms will represent
over a half billion people. In the realm of transportation, this projection shows the
clear need to increase research on methods for a socially driven transport
planning that can be translated into the universalisation of access to basic
services and life opportunities, primarily for those trapped in chronic and
multidimensional poverty.
A natural progression of this research field is to address the data limitations often
referred to throughout this thesis. For example, as GTFS data, and transport-
related data become consistently available and more disaggregated in the Global
South, more accurate accessibility measurements will become also possible.
Moreover, as artificial intelligence enables an increasingly accurate satellite
imagery interpretation (e.g. mapwith.ai), spatially disaggregated data on the
transport infrastructure will shortly not be a problem for accessibility measures
even in remote areas anymore. Rather, the innovative methods to map
socioeconomic and travel behaviour indicators in low-income regions might offer

CHAPTER 8: CONCLUSIONS
194
a promising research avenue to move forward the debate on transport planning,
poverty reduction, and social exclusion. Moreover, as the literature review
chapter has shown, with more disaggregated data at hand, essential accessibility
analysis will become possible, disaggregating evaluations by services
(education, healthcare, public transport), by socio-economic features (e.g.
income groups, gender, age), by transport modes (including informal and
nonmotorized modes), by location (rural/urban, central/peripheral areas), and job
opportunities (separating by job requirements and including informal jobs).
On the other hand, with the majority of people moving towards urban areas, and
serious transport issues emerging from a debilitating and unconstrained
urbanisation process (UN Environment, 2016), deprived and sparsely populated
regions are less likely to attract as much transport research and investments as
urban mobility issues. In this sense, if decision-makers and researchers are
willing to deepen the agenda of ‘leaving no one behind’ (UN, 2018), the trade-off
between equity and efficiency might come to the fore in the academic and public
debate. Thus, further research showing how to integrate the weights of the
transport-related exclusion dimensions (presented in Chapter 6) into MCDA-
based transport appraisals might be another interesting line for future research in
this context. These are a few possible directions to extend the research on how
transport development can be instrumental in achieving the first Sustainable
Development Goal of eradicating poverty everywhere and in all its forms by 2030.
PUBLICATIONS
195
PUBLICATIONS
Journal Papers:
Benevenuto, R., Caulfield, B., Poverty and transport in the Global South: An Overview,
Transport Policy, 79, 2019, p115 – 124. DOI: 10.1016/j.tranpol.2019.04.018
Benevenuto, R., Azevedo, I.C.C. and Caulfield, B., 2019. Assessing the spatial burden
in health care accessibility of low-income families in rural Northeast Brazil. Journal of
Transport & Health, 14, p.100595. DOI: 10.1016/j.jth.2019.100595
Benevenuto, R. and Caulfield, B., 2020. Measuring access to urban centres in rural
Northeast Brazil: A spatial accessibility poverty index. Journal of Transport Geography,
82, p.102553. DOI: 10.1016/j.jtrangeo.2019.102553
Conference Proceedings:
Benevenuto, R., Fernandez, F., Caulfield, B., From rural poverty to urban amenities -
Assessing the risk of accessibility poverty in Northeast Brazil. 46th European Transport
Conference, Dublin Castle, 2018. Available at: https://bit.ly/30R9ylp
Benevenuto, R., Fernandez, F., Caulfield, B., Assessing social outcomes of transport
investments – A quasi-experimental study of Pernambuco, Brazil. Civil Engineering
Research Ireland (CERI) Conference, Dublin, Ireland, 2018.
Benevenuto, R., Fernandez, F., Caulfield, B., Accessibility and extreme poverty in Rural
Northeast Brazil. The International Network for Transport and Accessibility in Low-
Income Communities (INTALInC) Workshop, University of Oxford 2018. Available at
http://doi.org/10.13140/RG.2.2.15585.15204
Guimarães, T., Benevenuto, R. Assessing Urban Mobility Plans through the lenses of
transport equity. Case study of four Brazilian cities. NECTAR Cluster 7 Social and Health
Issues international workshop. University of Utrecht, 2018.
Benevenuto, R., Caulfield, B., Addressing poverty through transport development in the
developing World, Irish Transport Research Network Conference, Dublin, Ireland, 2017.
Available at: https://bit.ly/31vixJv

REFERENCES
196
REFERENCES
Adedini, S.A., Odimegwu, C., Bamiwuye, O., Fadeyibi, O. and Wet, N.D., 2014.
Barriers to accessing health care in Nigeria: implications for child survival. Global
health action, 7(1), p.23499.
Adeel, M., Yeh, A.G.O. and Zhang, F., 2016. Transportation disadvantage and
activity participation in the cities of Rawalpindi and Islamabad, Pakistan.
Transport Policy, 47, pp.1-12. DOI:10.1016/j.tranpol.2015.12.001
Agbenyo, F., Nunbogu, A.M. and Dongzagla, A., 2017. Accessibility mapping of
health facilities in rural Ghana. Journal of Transport & Health, 6, pp.73-83.
DOI:10.1016/j.jth.2017.04.010
Albuquerque, M.V.D., Viana, A.L.D.Á., Lima, L.D.D., Ferreira, M.P., Fusaro, E.R.
and Iozzi, F.L., 2017. Desigualdades regionais na saúde: mudanças observadas
no Brasil de 2000 a 2016. Ciência & Saúde Coletiva, 22, pp.1055-1064.
Alkire, S. and Foster, J. 2008. Counting and multidimensional poverty
measurement. Oxford: Oxford Poverty & Human Development Initiative - OPHI,
33 p. (OPHI working papers, n. 7). Retrieved at 15/02/2019 from
<http://www.ophi.org.uk/wp-content/uploads/ophi-wp7.pdf>. Acesso em: nov.
2017.
Alkire, S. and Foster, J., 2011. Counting and multidimensional poverty
measurement, Journal of Public Economics 95, 476-487.
DOI:10.1016/j.jpubeco.2010.11.006
Alkire, S. and Santos M. E., 2014. Measuring Accurate Poverty in the Developing
World: Robustness and Scope of the Multidimensional Poverty Index. World
Development Vol. 59, 251-274. DOI: 10.1016/j.worlddev. 2014.01.026
Alkire, S. and Seth, S., 2015. Multidimensional poverty reduction in India between
1999 and 2006: Where and how? World Development, 72, pp.93-108. DOI:
10.1016/j.worlddev.2015.02.009

REFERENCES
197
Alkire, S., 2007. Choosing dimensions: The capability approach and
multidimensional poverty. In The many dimensions of poverty (pp. 89-119).
Palgrave Macmillan, London. DOI:10.1057/9780230592407_6
Alkire, S., Chatterjee, M., Conconi, A., Seth, S., Vaz, A., 2014. Poverty in Rural
and Urban Areas: Direct comparisons using the global MPI, The Oxford Poverty
and Human Development Initiative (OPHI), Briefing 24.
Amann, E., Baer, W., Trebat, T. and Lora, J.V., 2016. Infrastructure and its role
in Brazil's development process. The Quarterly Review of Economics and
Finance, 62, pp.66-73.
Anand, A. and Tiwari, G., 2006. A gendered perspective of the shelter–transport–
livelihood link: the case of poor women in Delhi. Transport Reviews, 26(1), pp.63-
80. DOI:10.1080/01441640500175615
Annema, J.A., Mouter, N. and Razaei, J., 2015. Cost-benefit analysis (CBA), or
multi-criteria decision-making (MCDM) or both: politicians’ perspective in
transport policy appraisal. Transportation Research Procedia, 10, pp.788-797.
ANTP (Associação Nacional de Transportes Público), 2018. Sistema de
Informações da Mobilidade Urbana - Simob/ANTP. Relatório geral 2016.
Available at http://files.antp.org.br/simob/simob-2016-v6.pdf
Apparicio, P., Abdelmajid, M., Riva, M. and Shearmur, R., 2008. Comparing
alternative approaches to measuring the geographical accessibility of urban
health services: Distance types and aggregation-error issues. International
journal of health geographics, 7(1), p.7.
Armstrong-Wrigh, A., 1986. Urban Transit Systems, World Bank Technical paper
number 52.
Articulação do Semiárido Brasileiro (ASA), 2018. Programa 1 milhão de cisterna,
retrieved from http://www.asabrasil.org.br/acoes/p1mc
Asher, S. E.; Novosad, P. M., 2018. Rural roads and local economic development
(English). Policy Research working paper; no. WPS 8466. Washington, D.C.:
REFERENCES
198
World Bank Group. http://documents.worldbank.org/curated/en/2043015282462
25577/Rural-roads-and-local-economic-development
Asomani-Boateng, R., Fricano, R.J. and Adarkwa, F., 2015. Assessing the socio-
economic impacts of rural road improvements in Ghana: a case study of
Transport Sector Program Support (II). Case studies on transport policy, 3(4),
pp.355-366. DOI:10.1016/j.cstp.2015.04.006
Assis, T. R. P., 2012. Sociedade civil e a construção de políticas públicas na
região semiárida brasileira: o caso do programa um milhão de cisternas rurais
(P1MC). Revista de Políticas Públicas, 16(1).
Austin, P.C., 2011. An introduction to propensity score methods for reducing the
effects of confounding in observational studies. Multivariate behavioral research,
46(3), pp.399-424.
Babinard, J.; Hine, J.; Ellis, S.; Ishihara, S.. 2010. Mainstreaming gender in road
transport : operational guidance for World Bank staff. Transport paper series ; no.
TP-28. Washington, DC: World Bank.
Banister, D., 1994. Equity and acceptability in internalising the social costs of
transport. EMCT, Internalising the social costs of transport, pp.153-175.
Barone, M. Pobreza, 2003. Pobreza, Transporte e Inclusão Social. 14º
Congresso de Transportes e Trânsito em Vitória/ES ANTP. Available at
http://files-server.antp.org.br/_5dotSystem/download/dcmDocument/2013/01/
21/E16178C3-9D55-4F45-ABDE-02DD83888054.pdf
Barros, M.B.D.A., Francisco, P.M.S.B., Zanchetta, L.M. and César, C.L.G., 2011.
Trends in social and demographic inequalities in the prevalence of chronic
diseases in Brazil. PNAD: 2003-2008. Ciencia & saude coletiva, 16(9), pp.3755-
3768.
Bell, S., Wilson, K., Shah, T.I., Gersher, S. and Elliott, T., 2012. Investigating
impacts of positional error on potential health care accessibility. Spatial and
spatio-temporal epidemiology, 3(1), pp.17-29.

REFERENCES
199
Benevenuto, R. and Caulfield, B., 2019. Poverty and transport in the global south:
An overview. Transport Policy, 79, pp.115-124. DOI:
10.1016/j.tranpol.2019.04.018
Benevenuto, R., Fernandez Jr., F. Caulfield, B., 2018. From rural poverty to urban
amenities - Assessing the risk of accessibility poverty in rural Northeast Brazil. In
European Transport Conference papers 2018, Dublin, Ireland. Association for
European Transport (AET). Available at https://aetransport.org/en-gb/past-etc-
papers/conference-papers-2018?abstractId=5895& state=b
Benitez, D., Estache, A. and Søreide, T., 2010. Dealing with politics for money
and power in infrastructure. The World Bank. DOI:10.1596/1813-9450-5455
Beuran, M., Gachassin, M. and Raballand, G., 2015. Are There Myths on Road
Impact and Transport in Sub‐Saharan Africa?. Development Policy Review,
33(5), pp.673-700. DOI:10.1111/dpr.12125
Bitoun, J., Miranda, L.I.B.D. and De Araújo, T.B., 2015. As ruralidades brasileiras
e os desafios para o planejamento urbano e regional. XVI ENANPUR “Espaço,
Planejamento e Insurgências.
Blanco, J., Lucas, K., Schafran, A., Apaolaza, R. (2018). Contested mobilities in
the Latin American context. Journal of Transport Geography, 67, 73–75.
DOI:10.1016/j.jtrangeo.2018.01.006
Blaschke, T., 2010. Object based image analysis for remote sensing. ISPRS
journal of photogrammetry and remote sensing, 65(1), pp.2-16.
Bocarejo, J.P., Portilla, I.J., Velásquez, J.M., Cruz, M.N., Peña, A. and Oviedo,
D.R., 2014. An innovative transit system and its impact on low income users: the
case of the Metrocable in Medellín. Journal of Transport Geography, 39, pp.49-
61. DOI:10.1016/j.jtrangeo.2014.06.018
Booth, D., L. Hanmer, and E. Lovell. 2000. Poverty and transport: a report
prepared for the World Bank in collaboration with DFID Overseas Development
Institute: London. Available at https://www.odi.org/resources/docs/3554.pdf
REFERENCES
200
Brasil, 2012. Lei nº 12.587, de 3 de janeiro de 2012, que institui as diretrizes da
Política nacional de mobilidade Urbana. Diário oficial da União, 4.
Brasil, 2013. Política Nacional de Mobilidade Urbana. Ministério das Cidades.
Available at http://www.portalfederativo.gov.br/noticias/destaques/municipios-
devem-implantar-planos-locais-de-mobilidade-urbana/CartilhaLei12587site.pdf
Brasil, 2019. Bolsa Família repassa R$ 2,6 bilhões a beneficiários em abril.
Secretaria Especial do Desenvolvimento Social – Ministério da Cidadania.
Available at http://mds.gov.br/area-de-imprensa/noticias/2019/abril/bolsa-
familia-repassa-r-2-6-bilhoes-a-beneficiarios-em-abril
Brookhart, M.A., Wyss, R., Layton, J.B. and Stürmer, T., 2013. Propensity score
methods for confounding control in nonexperimental research. Circulation:
Cardiovascular Quality and Outcomes, 6(5), pp.604-611.
Bryceson, D.F., Bradbury, A. and Bradbury, T., 2008. Roads to poverty
reduction? Exploring rural roads' impact on mobility in Africa and Asia.
Development Policy Review, 26(4), pp.459-482. DOI: 10.1111/j.1467-
7679.2008.00418.x
Bryceson, D.F., Mbara, T.C. and Maunder, D., 2003. Livelihoods, daily mobility
and poverty in sub-Saharan Africa. Transport reviews, 23(2), pp.177-196.
DOI:10.1080/01441640309891
Calderón, C., Servén, L., 2004. The Effects of Infrastructure Development on
Growth and Income Distribution. Policy Research Working Paper;No.3400. World
Bank, Washington, D.C.. © World Bank. https://openknowledge.worldbank.org/
handle/10986/14136 License: CC BY 3.0 IGO.
Campolongo, F., Cariboni, J. and Saltelli, A., 2007. An effective screening design
for sensitivity analysis of large models. Environmental modelling & software,
22(10), pp.1509-1518.
Cano, I., 2010. Racial bias in police use of lethal force in Brazil. Police Practice
and Research: An International Journal, 11(1), pp.31-43.

REFERENCES
201
Cantos, P., Gumbau-Albert M., Maudos, J., 2005. Transport infrastructures,
spillover effects and regional growth: evidence of the Spanish case, Transport
Reviews, 25:1, 25-50, DOI: 10.1080/014416410001676852
Cass, N., Shove, E. and Urry, J., 2005. Social exclusion, mobility and access 1.
The sociological review, 53(3), pp.539-555. DOI:10.1111/j.1467-
954X.2005.00565.x
Cervero, R. and Golub, A., 2007. Informal transport: A global perspective.
Transport policy, 14(6), pp.445-457.
Cervero, R., 2000. Informal transport in the developing world. UN-HABITAT.
Chagas, A.L.S., Toneto, R. and Azzoni, C.R., 2012. A spatial propensity score
matching evaluation of the social impacts of sugarcane growing on municipalities
in Brazil. International Regional Science Review, 35(1), pp.48-69.
Chein, F., Pinto, C. C. de X., 2017. Roads, Urbanization and Development: some
empirical evidences from Brazilian experience. Seminário 52 IPEA.
Church, A., Frost, M. and Sullivan, K., 2000. Transport and social exclusion in
London. Transport Policy, 7(3), pp.195-205. DOI: 10.1016/S0967-
070X(00)00024-X
Coirolo, L., Barbosa, T., 2002. Rural Development and Poverty Alleviation in
Northeast Brazil. en breve; No. 11. World Bank, Washington, DC. © World Bank.
https://openknowledge.worldbank.org/ handle/10986/10402 License: CC BY 3.0
IGO.
Coirolo, L.; Lammert, J., 2008. Rural Poverty Reduction in Northeast Brazil:
Achieving Results through Community-Driven Development. en breve; No. 125.
World Bank, Washington, DC. © World Bank. https://openknowledge.
worldbank.org/handle/10986/10279 License: CC BY 3.0 IGO.
Confederação Nacional dos Transportes (CNT)., 2018. Classificação do Estado
Geral - Extensão Total Avaliada. Pesquisa CNT de Rodovias 2018. Available at:
http://pesquisarodovias.cnt.org.br/Pagina/relatorio_por_unidade_federativa

REFERENCES
202
Conselho Federal de Medicina (CFM), 2018. Considerações sobre o programa
mais médicos. Available at https://portal.cfm.org.br/images/PDF/
2018_pesquisa_maismedicos.pdf
Cook, C. C., Duncan, T., J., S., Sharma, A., Guobao, W., 2005. Assessing the
Impact of Transport and Energy Infrastructure on Poverty Reduction. © Asian
Development Bank. <http://hdl.handle.net/11540/240>.
Cook, T.D., Campbell, D.T. and Shadish, W., 2002. Experimental and quasi-
experimental designs for generalized causal inference. Boston: Houghton Mifflin.
Cortez, F., Vaz, N. P., 2013. A bicicleta como alternativa de transporte e a
possibilidade de inserção social em Maceió/AL. 19º Congresso Brasileiro de
Transporte Trânsito. ANTP
Crenshaw, K., 1989. Demarginalizing the intersection of race and sex: A black
feminist critique of antidiscrimination doctrine, feminist theory and antiracist
politics. U. Chi. Legal F., p.139.
Currie, G. and Delbosc, A., 2010. Modelling the social and psychological impacts
of transport disadvantage. Transportation, 37(6), pp.953-966.
DOI:10.1007/s11116-010-9280-2
Currie, G. and Senbergs, Z., 2007, September. Exploring forced car ownership
in metropolitan Melbourne. In Australasian Transport Research Forum (Vol. 200).
Dai, D. and Wang, F., 2011. Geographic disparities in accessibility to food stores
in southwest Mississippi. Environment and Planning B: Planning and Design,
38(4), pp.659-677. DOI: 10.1068/b36149
Dai, D., 2010. Black residential segregation, disparities in spatial access to health
care facilities, and late-stage breast cancer diagnosis in metropolitan Detroit.
Health & place, 16(5), pp.1038-1052. DOI: 10.1016/j.healthplace.2010.06.012
Dalbem, M.C. and Brandão, L., 2010. Avaliação econômica de projetos de
transporte: melhores práticas e recomendações para o Brasil. Revista de
Administração Pública, 44(1), pp.87-117.
REFERENCES
203
Danish International Development Agency (Danida), 2010. Impact evaluation of
Danida support to rural transport infrastructure in Nicaragua. Prepared jointly by
Orbicon A/S and Goss Gilroy. Copenhagen: Danish Ministry of Foreign Affairs,
Denmark.
Datasus, 2010. Razao entre óbitos informados e estimados. Available at
http://tabnet.datasus.gov.br/cgi/idb2011/a1802b.htm. Retrieved in 11/Dec/18.
Datasus, 2016a. Mortalidade causada por acidentes de transportes terrestres por
municípios. Retrieved at 25/Mar/2019 from http://tabnet.datasus.gov.br/cgi/
tabcgi.exe?sim/cnv/obt10br.def.
Datasus, 2016b. Violência doméstica, sexual e outras violências - Brasil.
Retrieved at 25/Mar/2019 from http://tabnet.datasus.gov.br/cgi/
tabcgi.exe?sinannet/cnv/violebr.def
De Luca, G.D., 2007. Roads, Development and Deforestation: a review.
Development Research Group Paper. The World Bank. Available at
http://siteresources.worldbank.org/INTKNOWLEDGEFORCHANGE/Resources/
491519-1199818447826/roads_development_and_desorestation_a_review.pdf
de Souza, A.T., Peterson, K.E., Andrade, F.M.O., Gardner, J. and Ascherio, A.,
2000. Circumstances of post-neonatal deaths in Ceara, Northeast Brazil:
mothers’ health care-seeking behaviors during their infants’ fatal illness. Social
science & medicine, 51(11), pp.1675-1693.
DENATRAN (Departamento Nacional de Trânsito (DENATRAN),. 2016. Frota
nacional de veículos - Dezembro de 2016. Retrieved at 25/Mar/2019 from
http://www.denatran.gov.br/estatistica/261-frota-2016
Deng, H., Li, Y., Li, W. and Yu, Y., 2016. Urban transport social needs in China:
Quantification with central government transit grant. Transport Policy, 51, pp.126-
139. DOI:10.1016/j.tranpol.2016.07.005
Dercon, S., Gilligan, D.O., Hoddinott, J. and Woldehanna, T., 2009. The impact
of agricultural extension and roads on poverty and consumption growth in fifteen

REFERENCES
204
Ethiopian villages. American Journal of Agricultural Economics, 91(4), pp.1007-
1021.
DER-SP (Departamento de Estradas de Rodagem do Estado de São Paulo
(DER-SP)., 2014. Avaliação de impacto social e ambiental (AISA) -
Complementar. Programa de Transporte, Logistica e Meio Ambiente pp 233-235.
DfT (Department for Transport (DfT)., 2015. TAG UNIT A4.2 - Distributional
Impact Appraisal. Transport Analysis Guidance. Available at
https://www.gov.uk/transport-analysis-guidance-webtag
DfT (Department for Transport (DfT)., 2017. TAG UNIT A4.1 - Social Impact
Appraisal. Transport Analysis Guidance. Available at
https://www.gov.uk/transport-analysis-guidance-webtag
Di Ciommo, F. and Shiftan, Y., 2017. Transport equity analysis Transport Rev.,
37 (2) (2017), pp. 139-151
Di Ciommo, F., 2018. How the Inaccessibility Index Can Improve Transport
Planning and Investment. International Transport Forum - OECD, Paris, France.
Discussion Paper. Available at https://www.itf-
oecd.org/sites/default/files/docs/inaccessibility-index-transport-planning-
investment_0.pdf
Dillon, A., Sharma, M. and Zhang, X., 2011. Estimating the impact of rural
investments in Nepal. Food Policy, 36(2), pp.250-258. DOI:
10.1016/j.foodpol.2010.11.022
Dimitriou, H.T. ed., 2013. Transport Planning for Third World Cities (Routledge
Revivals). Routledge. pp 280-292.
DNIT (Departamento Nacional de Infraestrutura de Transportes (DNIT), 2006.
Diretrizes básicas para elaboração de estudos e projetos rodoviários. Escopos
básicos/Instruções de serviço. Ministério dos Transportes. Publicação IPR-726
pp 40-41.

REFERENCES
205
DNIT (Departamento Nacional de Infraestrutura de Transportes), 2018. Road
shapefiles. Retrieved from http://www.dnit.gov.br/mapas-multimodais /shapefiles
Dourado, A. de F., 1915. Transporte “informal” x “formal” verdadeira ou falsa
questão? Revista dos Transportes Públicos – ANTP. Ano 17 1º trimestre. p81-
92.
DTTAS (Department of Transport, Tourism and Sport (DTTAS), 2016. Guidelines
on a Common Appraisal Framework for Transport Projects and Programmes.
Strategic Research and Analysis Division (SRAD) pp 45-54 available at
http://www.dttas.ie/corporate/english/appraisal
Economist. 2013. “Not Always with Us.” June 1–7. Retrieved at 22/05/2019 from
https://www.economist.com/briefing/2013/06/01/not-always-with-us
Eijgenraam, C.J.J., Koopmans, C.C., Tang, P.J.G., Verster, A.C.P., 2000.
Evaluation of Infrastructural Projects; Guide for cost-benefit analysis, Sections I
and II, CPB, The Hague, NEI (Changed Name to ECORYS), Rotterdam.
Eliasson, J. 2013. International comparisons of transport appraisal practice:
Annex 4 Sweden Country Report. Institute for Transport Studies, University of
Leeds, Leeds.
Empresa Brasileira de Planejamento de Transportes (GEIPOT), 2000.
Transportes em Pernambuco – Maio de 2000. O sistema de transportes.
Available at http://www.geipot.gov.br/cadernos/2000/pe-2000.htm# sub1
Empresa de Planejamento e Logística S.A. (EPL), 2018. Plano Nacional de
Logística – Relatório Executivo. Available at: https://www.epl.gov.br/plano-
nacional-de-logistica-pnl
EPL (Empresa de Planejamento Logístico S.A.), 2019. Rede Georreferenciada –
Cenário Rede Básica. Retrieved at 12/06/2019 from https://www.epl.gov.br/rede-
georeferenciada-pnl-2025
Escobal, J. and Ponce, C., 2002. The benefits of rural roads: enhancing income
opportunities for the rural poor.

REFERENCES
206
ESRI. 2019. How Kernel Density Works - Default search radius (bandwidth)
algorithm. ArcMap 10.3. Available at
http://desktop.arcgis.com/en/arcmap/10.3/tools/spatial-analyst-toolbox/how-
kernel-density-works.htm
Evans, J., O., Brien, J. and Ch Ng, B., 2018. Towards a geography of informal
transport: Mobility, infrastructure and urban sustainability from the back of a
motorbike. Transactions of the Institute of British Geographers.
DOI:10.1111/tran.12239
Fan, S. and Chan-Kang, C., 2008. Regional road development, rural and urban
poverty: Evidence from China. Transport Policy, 15(5), pp.305-314. DOI:
10.1016/j.tranpol.2008.12.012
Fang, Y. and Zou, W., 2014. Neighborhood effects and regional poverty traps in
rural China. China & world economy, 22(1), pp.83-102. DOI:10.1111/j.1749-
124X.2014.12054.x
Farrington, J. H., & Farrington, C., 2005. Rural accessibility, social inclusion and
social justice: towards conceptualisation. Journal of Transport Geography, 13(1),
1–12. DOI: 10.1016/j.jtrangeo.2004.10.002
Farrow, A., Larrea, C., Hyman, G. and Lema, G., 2005. Exploring the spatial
variation of food poverty in Ecuador. Food policy, 30(5), pp.510-531.
DOI:10.1016/j.foodpol.2005.09.005
Fluegge, K., Malone, L.L., Nsereko, M., Okware, B., Wejse, C., Kisingo, H.,
Mupere, E., Boom, W.H. and Stein, C.M., 2018. Impact of geographic distance
on appraisal delay for active TB treatment seeking in Uganda: a network analysis
of the Kawempe Community Health Cohort Study. BMC public health, 18(1),
p.798.
Fontes, L.F.C., Conceição, O.C. and Jacinto, P.D.A., 2018. Evaluating the impact
of physicians' provision on primary healthcare: Evidence from Brazil's More
Doctors Program. Health economics.

REFERENCES
207
Fortney, J., Rost, K. and Warren, J., 2000. Comparing alternative methods of
measuring geographic access to health services. Health Services and Outcomes
Research Methodology, 1(2), pp.173-184.
França, J.M.C. and Hue, S., 2014. Piratas no Brasil: As incríveis histórias dos
ladrões dos mares que pilharam nosso litoral. Globo Livros.
Francis, R.L., Lowe, T.J., Rayco, M.B. and Tamir, A., 2009. Aggregation error for
location models: survey and analysis. Annals of Operations Research, 167(1),
pp.171-208.
Fuenmayor, G.J., Hunt, J.D. and Abraham, J.E., 2017. Impact of Transit Fare
Increase in Caracas, Venezuela: Analysis Using PECAS Model (No. 17-01764).
Gabrysch, S. and Campbell, O.M., 2009. Still too far to walk: literature review of
the determinants of delivery service use. BMC pregnancy and childbirth, 9(1),
p.34.
Gachassin, M., Najman, B. and Raballand, G., 2010. The Impact of Roads on
Poverty Reduction: a case study of Cameroon.
Galeano, E.H., 1972. Las venas abiertas de América Latina. Departamento de
Publicaciones, Universidad de la República. No. 338(8) p.91.
Gannon, C.A. and Liu, Z., 1997. Poverty and transport (No. TWU-30).
Washington, DC: World Bank. Available at:
http://siteresources.worldbank.org/INTURBANTRANSPORT/Resources/twu-
30.pdf
Garcia-Subirats, I., Vargas, I., Mogollón-Pérez, A.S., De Paepe, P., da Silva,
M.R.F., Unger, J.P. and Vázquez, M.L., 2014. Barriers in access to health care
in countries with different health systems. A cross-sectional study in
municipalities of central Colombia and north-eastern Brazil. Social Science &
Medicine, 106, pp.204-213.
Getis, A. and Ord, J.K. 1992. "The Analysis of Spatial Association by Use of
Distance Statistics" in Geographical Analysis 24(3).
REFERENCES
208
Getis, A. and Ord, J.K., 2010. The analysis of spatial association by use of
distance statistics. In Perspectives on Spatial Data Analysis (pp. 127-145).
Springer, Berlin, Heidelberg.
Geurs, K.T. and Van Wee, B., 2004. Accessibility evaluation of land-use and
transport strategies: review and research directions. Journal of Transport
geography, 12(2), pp.127-140. DOI: 10.1016/j.jtrangeo.2003.10.005
Geurs, K.T., Boon, W. and Van Wee, B., 2009. Social impacts of transport:
literature review and the state of the practice of transport appraisal in the
Netherlands and the United Kingdom. Transport reviews, 29(1), pp.69-90. DOI:
10.1080/01441640802130490
Gibson, J. and Olivia, S., 2010. The effect of infrastructure access and quality on
non-farm enterprises in rural Indonesia. World Development, 38(5), pp.717-726.
Gomide, A.D.Á., 2004. Transporte urbano e inclusão social: elementos para
políticas públicas. Revista dos Transportes Públicos - ANTP - Ano 26, 3º
trimestre
Griesse, M.A., 2007. The geographic, political, and economic context for
corporate social responsibility in Brazil. Journal of Business Ethics, 73(1), pp.21-
37.
Guagliardo, M.F., 2004. Spatial accessibility of primary care: concepts, methods
and challenges. International journal of health geographics, 3(1), p.3. DOI:
10.1186/1476-072X-3-3
Guasch, J.L., 2004. Granting and renegotiating infrastructure concessions: doing
it right. World Bank Publications.
Guzman, L.A., Oviedo, D. and Rivera, C., 2017a. Assessing equity in transport
accessibility to work and study: The Bogotá region. Journal of Transport
Geography, 58, pp.236-246. DOI:10.1016/j.jtrangeo.2016.12.016
REFERENCES
209
Guzman, L.A., Oviedo, D., Rivera, C., Rodriguez, C. and Peralta-Quiros, T.,
2017b. Accessibility and Poverty: Assessing Public Transport Subsidies in
Bogotá. TRB Conference No. 17-01180.
Gwatkin, D. R., Rustein, S., Johnson, K., Pande, R. P., Wagstaff, A. 2000. Socio-
economic differences in health, nutrition, and population in Brazil (English). World
Bank publication. Country reports on HNP and poverty. Washington, DC. Report
number 30553. Available at
http://documents.worldbank.org/curated/en/455461468015634905/Socio-
economic-differences-in-health-nutrition-and-population-in-Brazil
Haddad, E.A., Perobelli, F.S., Domingues, E.P. and Aguiar, M., 2011. Assessing
the ex ante economic impacts of transportation infrastructure policies in Brazil.
Journal of development effectiveness, 3(1), pp.44-61.
Hanmer, L., Booth, D. and Lovell, E., 2000. Poverty and Transport. A Report
prepared for the World Bank in collaboration with DFID, Overseas Development
Institute. DOI:10.2139/ssrn.1754546
Hansen, H., Andersen, O.W. and White, H., 2011. Impact evaluation of
infrastructure interventions. Journal of Development Effectiveness, 3(1), pp.1-8.
Hansen, W.G., 1959. How accessibility shapes land use. Journal of the American
Institute of planners, 25(2), pp.73-76. DOI:10.1080/01944365908978307
Hanson, S., Hanson, P., 1980. Gender and urban activity patterns in Uppsala,
Sweden. Geogr. Rev. 70, 291–299. DOI:10.2307/214257
Harvey, D., 1980. A justiça social ea cidade. Hucitec. p. 116
Haynes, R., Lovett, A. and Sünnenberg, G., 2003. Potential accessibility, travel
time, and consumer choice: geographical variations in general medical practice
registrations in Eastern England. Environment and Planning A, 35(10), pp.1733-
1750.

REFERENCES
210
Headey, D., Stifel, D., You, L. and Guo, Z., 2018. Remoteness, urbanization, and
child nutrition in sub‐Saharan Africa. Agricultural Economics, 49(6), pp.765-775.
DOI: 10.1111/agec.12458
Hernandez, D., 2018. Uneven mobilities, uneven opportunities: Social distribution
of public transport accessibility to jobs and education in Montevideo. Journal of
Transport Geography, 67, pp.119-125. DOI:10.1016/j.jtrangeo.2017.08.017
Hernandez, D.O. and Titheridge, H., 2016. Mobilities of the periphery: informality,
access and social exclusion in the urban fringe in Colombia. Journal of transport
geography, 55, pp.152-164. DOI:10.1016/j.jtrangeo.2015.12.004
Hickman, R. and Dean, M., 2018. Incomplete cost–incomplete benefit analysis in
transport appraisal. Transport Reviews, 38(6), pp.689-709.
Hine, J. and Mitchell, F., 2017. Transport disadvantage and social exclusion:
exclusionary mechanisms in transport in urban Scotland. Routledge.
DOI:10.4324/9781315235677
Hulme, D., Moore, K. and Shepherd, A., 2001. Chronic poverty: meanings and
analytical frameworks. Chronic Poverty Research Centre Working Paper, (2).
IBGE (Instituto Brasileiro de Geografia e Estatística), 2008. Regiões de influência
das cidades (REGIC). Retrieved at 06/06/2019 from
http://www.ibge.gov.br/home/geociencias/geografia/regic.shtm.
IBGE (Instituto Brasileiro de Geografia e Estatística), 2010a. Censo Demográfico
2010 - Resultados da Amostra - Famílias e Domicílios. Retrieved at 06/06/2019
from https://sidra.ibge.gov.br/
IBGE (Instituto Brasileiro de Geografia e Estatística), 2010b. Grade Estatística
2010. Retrieved at 13/6/2019 from
http://mapasinterativos.ibge.gov.br/grade/default.html
IBGE (Instituto Brasileiro de Geografia e Estatística), 2013. Projeção da
população do Brasil por sexo e idade para o período 2000-2060; Projeção da
população das Unidades da Federação por sexo e idade 2000-2030. Rio de
REFERENCES
211
Janeiro Disponível em: <http://www.ibge.gov.br/home/estatistica/populacao/
projecao_da_populacao/2013/default.shtm>.
IBGE (Instituto Brasileiro de Geografia e Estatística), 2014. Uso da terra do Brasil
1:5.000.000. Shape file retrieved at 06/06/2019 from
http://www.geoservicos.ibge.gov.br/geoserver/wms?service=
WFS&version=1.0.0&request=GetFeature&typeName=CREN:UsoTerraBrasil_5
000&outputFormat=SHAPE-ZIP
IBGE (Instituto Brasileiro de Geografia e Estatística), 2016. Arranjos
populacionais e concentrações urbanas no Brasil. Retrieved at 06/06/2019 from
https://www.ibge.gov.br/apps/arranjos_populacionais/2015/pdf/publicacao.pdf
IBGE (Instituto Brasileiro de Geografia e Estatística), 2016. Produto Interno Bruto
dos Municípios. Tabela 5938 – PIB a preços correntes. Retrieved at 22/05/2019
from https://sidra.ibge.gov.br/tabela/5938
IBGE (Instituto Brasileiro de Geografia e Estatística), 2017a. Síntese de
indicadores sociais: uma análise das condições de vida da população brasileira.
Coordenação de População e Indicadores Sociais. - Rio de Janeiro. ISSN 1516-
3296; n. 37
IBGE (Instituto Brasileiro de Geografia e Estatística), 2017b. Perfil dos
municípios Brasileiros. Available at
https://biblioteca.ibge.gov.br/visualizacao/livros/liv101595.pdf
IBGE (Instituto Brasileiro de Geografia e Estatística), 2017c. Divisão regional do
Brasil em regiões geográficas imediatas e regiões geográficas intermediárias:
2017. Available at https://biblioteca.ibge.gov.br/index.php/biblioteca-catalogo?
view= detalhes&id=2100600
IBGE (Instituto Brasileiro de Geografia e Estatística), 2018a. Pesquisa Nacional
por Amostra de Domicílios Contínua Primeiro Trimestre de 2018. Retrieved at
22/05/2019 from: https://biblioteca.ibge.gov.br/ visualizacao/
periodicos/2421/pnact_2018_1tri.pdf.
REFERENCES
212
IBGE (Instituto Brasileiro de Geografia e Estatística), 2018b. Síntese de
indicadores sociais: uma análise das condições de vida da população brasileira:
2018. Coordenação de População e Indicadores Sociais. - Rio de Janeiro. 151
p. ISSN 1516-3296. Retrieved at 22/05/2019 from
https://biblioteca.ibge.gov.br/visualizacao/livros/liv101629.pdf
IBGE (Instituto Brasileiro de Geografia e Estatística), 2019a. Pesquisa Nacional
por Amostra de Domicílios Contínua - Divulgação Trimestral - 1º trimestre 2019.
Retrieved at 22/05/2019 from https://sidra.ibge.gov.br/home/pnadct/nordeste
IBGE (Instituto Brasileiro de Geografia e Estatística), 2019b. População Rural e
Urbana. Available at https://educa.ibge.gov.br/jovens/conheca-o-
brasil/populacao/18313-populacao-rural-e-urbana.html
Iimi, A., Ahmed, A.K.F., Anderson, E. C., Diehl, A. S., Maiyo, L.; Peralta-Quiros,
T., Rao, K. S., 2016. New rural access index: main determinants and correlation
to poverty (English). Policy Research working paper; no. WPS 7876. Washington,
D.C.: World Bank Group. http://documents.worldbank.org/curated/en/
821621478094511356/New-rural-access-index-main-determinants-and-
correlation-to-poverty
Iimi, A., Lancelot, E. R., Manelici, I., Ogita, S., 2015. Evaluating the social and
economic impacts of rural road improvements in the state of Tocantins, Brazil
(English). Washington, D.C.: World Bank Group. http://documents.worldbank.org
/curated/en/109021467992478157/Evaluating-the-social-and-economic-
impacts-of-rural-road-improvements-in-the-state-of-Tocantins-Brazil
Inchauste, G., Azevedo, J. P, Essama-Nssah, B., Olivieri, S., Nguyen, T. V.,
Saavedra-Chanduvi, J. and Winkler, R. 2014. Understanding changes in poverty
(English). Directions in development; poverty. Washington, DC: World Bank
Group. http://documents.worldbank.org/curated/en/275271468336660502/
Understanding-changes-in-poverty
International Fund for Agricultural Development, 2011. Rural poverty report
(2011), IFAD, Rome. Available at:

REFERENCES
213
http://www.fao.org/fileadmin/user_upload/rome2007/docs/IFAD%20Rural%20P
overty%20Report%202011.pdf
ITF (International Transport Forum), 2017a. Income inequality, social inclusion
and mobility. Roundtable report 164, 200p. Retrieved at 22/05/2019 from
https://www.itf-oecd.org/sites/default/files/docs/income-inequality-social-
inclusion-mobility.pdf
ITF (International Transport Forum), 2017b, Quantifying the Socio-economic
Benefits of Transport, ITF Roundtable Reports, OECD. Publishing, Paris. DOI:
10.1787/9789282108093-en
Jenkins, J.T. and Peters, K., 2016. Rural connectivity in Africa: motorcycle track
construction. In Proceedings of the Institution of Civil Engineers-Transport (Vol.
169, No. 6, pp. 378-386). Thomas Telford Ltd. DOI: 10.1680/jtran.15.00080
Jones, P. and Lucas, K., 2012a. Social impacts and equity issues in transport: an
introduction. Journal of Transport Geography, 21.
Jones, P. and Lucas, K., 2012b. The social consequences of transport decision-
making: clarifying concepts, synthesising knowledge and assessing implications.
Journal of transport geography, 21, pp.4-16.
Jones, S. and Walsh, J., 2013. Defining a post-conflict role for rural transport in
sub-Saharan Africa: A crosscutting literature review. AFCAP GEN B, 127.
Jones, S., Tefe, M. and Appiah-Opoku, S., 2013. Proposed framework for
sustainability screening of urban transport projects in developing countries: A
case study of Accra, Ghana. Transportation Research Part A: Policy and
Practice, 49, pp.21-34.
Jones, S., Tefe, M., Zephaniah, S., Tedla, E., Appiah-Opoku, S. and Walsh, J.,
2016. Public transport and health outcomes in rural sub-Saharan Africa–A
synthesis of professional opinion. Journal of Transport & Health, 3(2), pp.211-
219.

REFERENCES
214
Jones, S., Lidbe, A. and Hainen, A., 2019. What can open access data from India
tell us about road safety and sustainable development?. Journal of Transport
Geography, 80, p.102503.
Jordan, H., Roderick, P., Martin, D. and Barnett, S., 2004. Distance, rurality and
the need for care: access to health services in South West England. International
journal of health geographics, 3(1), p.21.
Júnior, J.A.O. and Filho, M.A.A., 2002. The Brazilian Motorcycle Taxi
Phenomenon. In Traffic And Transportation Studies (2002) (pp. 1566-1572).
Kabia, E., Mbau, R., Muraya, K.W., Morgan, R., Molyneux, S. and Barasa, E.,
2018. How do gender and disability influence the ability of the poor to benefit from
pro-poor health financing policies in Kenya? An intersectional analysis.
International journal for equity in health, 17(1), p.149. DOI:10.1186/s12939-018-
0853-6
Kenyon, S., Lyons, G. and Rafferty, J., 2002. Transport and social exclusion:
investigating the possibility of promoting inclusion through virtual mobility. Journal
of Transport Geography, 10(3), pp.207-219. DOI:10.1016/S0966-
6923(02)00012-1
Khan, S., Combaz, E. & McAslan Fraser, E. (2015). Social exclusion: topic guide.
Revised edition. Birmingham, UK: GSDRC, University of Birmingham.
Khandker, S. R.; Koolwal, G. B., 2011. Estimating the Long-term Impacts of Rural
Roads: A Dynamic Panel Approach. Policy Research working paper; no. WPS
5867. World Bank. © World Bank. https://openknowledge.worldbank.org/
handle/10986/3633 License: CC BY 3.0 IGO.”
Khandker, S.R., Bakht, Z. and Koolwal, G.B., 2009. The poverty impact of rural
roads: evidence from Bangladesh. Economic Development and Cultural Change,
57(4),pp.685-722. DOI:10.1086/598765
Kostlan, E. (1991). Statistical Complexity of Dominant Eigenvector Calculation.
Hawaii: Journal of Complexity Volume 7, Issue 4, December 1991, Pages 371-
379.

REFERENCES
215
Krejcie, R.V. and Morgan, D.W., 1970. Determining sample size for research
activities. Educational and psychological measurement, 30(3), pp.607-610.
Kumar, A. 2011. Understanding the Emerging Role of Motorcycles in African
Cities: A Political Economy Perspective. Sub-Saharan Africa Transport Policy
Program (SSATP) discussion paper; no. 13. World Bank publication,
Washington, DC. Available at http://hdl.handle.net/10986/17804 License: CC BY
3.0 IGO.”
Langford, M. and Higgs, G., 2006. Measuring potential access to primary
healthcare services: the influence of alternative spatial representations of
population. The Professional Geographer, 58(3), pp.294-306. DOI:
10.1111/j.1467-9272.2006.00569.x
Langford, M., Fry, R. and Higgs, G., 2012. Measuring transit system accessibility
using a modified two-step floating catchment technique. International Journal of
Geographical Information Science, 26(2), pp.193-214. DOI:
10.1080/13658816.2011.574140
Lau, J.C.Y., 2010. The influence of suburbanization on the access to employment
of workers in the new towns: A case study of Tin Shui Wai, Hong Kong. Habitat
international, 34(1), pp.38-45. DOI:10.1016/j.habitatint.2009.05.002
Lau, J.C.Y., 2013. Sustainable urban transport planning and the commuting
patterns of poor workers in a historic inner city in Guangzhou, China. Habitat
International, 39, pp.119-127. DOI: 10.1016/j.habitatint.2012.11.006
Lebo, J. and Schelling, D., 2001. Design and appraisal of rural transport
infrastructure: ensuring basic access for rural communities (Vol. 23). World Bank
Publications.
Lefebvre, H., 1974. La production de l'espace. L'Homme et la société, 31(1),
pp.15-32.
Leiren, M. D. and Skollerud, K., 2015. Passenger transport in rural and sparsely
populated areas in Norway. International Transport Forum Discussion Paper
2015-08. OCDE.

REFERENCES
216
Levy, C. and Dávila, J.D., 2017. Planning for Mobility and Socio-Environmental
Justice: The Case of Medellín, Colombia. In Environmental Justice and Urban
Resilience in the Global South (pp. 37-55). Palgrave Macmillan, New York.
Levy, C., 2013. Travel choice reframed: “deep distribution” and gender in urban
transport. Environment and Urbanization, 25(1), pp.47-63.
DOI:10.1177/0956247813477810
Li, Y. and DaCosta, M.N., 2013. Transportation and income inequality in China:
1978–2007. Transportation Research Part A: Policy and Practice, 55, pp.56-71.
DOI:10.1016/j.tra.2013.08.006
Lillesand, T., Kiefer, R.W. and Chipman, J., 2014. Remote sensing and image
interpretation. John Wiley & Sons.
Lionjanga, N. and Venter, C., 2018. Does public transport accessibility enhance
subjective well-being? A study of the City of Johannesburg. Research in
Transportation Economics, 69, pp.523-535. DOI:10.1016/j.retrec.2018.07.011
Litman, T., 2003. Measuring transportation: Traffic, mobility and accessibility.
Institute of Transportation Engineers. ITE Journal, 73(10), p.28.
Lofgren, H., Robinson, S. and Thurlow, J., 2004. Prospects for growth and
poverty reduction in Zambia, 2001-2015.
Lokshin, M. and Yemtsov, R., 2005. Has rural infrastructure rehabilitation in
Georgia helped the poor?. The World Bank Economic Review, 19(2), pp.311-333.
Lucas, K., 2011. Making the connections between transport disadvantage and
the social exclusion of low income populations in the Tshwane Region of South
Africa. Journal of Transport Geography, 19, 1320-1334.
DOI:10.1016/j.jtrangeo.2011.02.007
Lucas, K., 2012. Transport and social exclusion: Where are we now?. Transport
policy, 20, pp.105-113.
Lucas, K., Mattioli, G., Verlinghieri, E. and Guzman, A., 2016a. Transport poverty
and its adverse social consequences. In Proceedings of the institution of civil
REFERENCES
217
engineers-transport (Vol. 169, No. 6, pp. 353-365). Thomas Telford (ICE
Publishing). DOI:10.1680/jtran.15.00073
Lucas, K., Tyler, S. and Christodoulou, G., 2009. Assessing the ‘value’ of new
transport initiatives in deprived neighbourhoods in the UK. Transport Policy,
16(3), pp.115-122.
Lucas, K., Van Wee, B. and Maat, K., 2016b. A method to evaluate equitable
accessibility: combining ethical theories and accessibility-based approaches.
Transportation, 43(3), pp.473-490.
Luo, J., Tian, L., Luo, L., Yi, H. and Wang, F., 2017. Two-step optimization for
spatial accessibility improvement: a case study of health care planning in rural
China. BioMed research international, Volume 2017 (p.12). DOI:
10.1155/2017/2094654
Luo, W. and Wang, F., 2003. Measures of spatial accessibility to health care in a
GIS environment: synthesis and a case study in the Chicago region. Environment
and Planning B: Planning and Design, 30(6), pp.865-884.
Luo, W. and Wang, F., 2003. Measures of spatial accessibility to health care in a
GIS environment: synthesis and a case study in the Chicago region. Environment
and Planning B: Planning and Design, 30(6), pp.865-884. DOI: 10.1068/b29120
Macharis, C. and Bernardini, A., 2015. Reviewing the use of Multi-Criteria
Decision Analysis for the evaluation of transport projects: Time for a multi-actor
approach. Transport policy, 37, pp.177-186.
Macharis, C., De Witte, A. and Ampe, J., 2009. The multi‐actor, multi‐criteria
analysis methodology (MAMCA) for the evaluation of transport projects: Theory
and practice. Journal of Advanced transportation, 43(2), pp.183-202.
Macinko, J., de Souza, M.D.F.M., Guanais, F.C. and da Silva Simoes, C.C., 2007.
Going to scale with community-based primary care: an analysis of the family
health program and infant mortality in Brazil, 1999–2004. Social science &
medicine, 65(10), pp.2070-2080.

REFERENCES
218
Mackie, P. and Worsley, T., 2013. International comparisons of transport
appraisal practice: overview report. Institute for Transport Studies, University of
Leeds, Leeds.
Mackie, P., Worsley, T. and Eliasson, J., 2014. Transport appraisal revisited.
Research in Transportation Economics, 47, pp.3-18.
Maia, M.L., Lucas, K., Marinho, G., Santos, E. and de Lima, J.H., 2016. Access
to the Brazilian City—From the perspectives of low-income residents in Recife.
Journal of Transport Geography, 55, pp.132-141. DOI:
10.1016/j.jtrangeo.2016.01.001
Manaugh, K., Badami, M.G. and El-Geneidy, A.M., 2015. Integrating social equity
into urban transportation planning: A critical evaluation of equity objectives and
measures in transportation plans in North America. Transport policy, 37, pp.167-
176.
Marcelo, D. G.; House, A. S. R. 2018. Prioritizing Infrastructure Investments: A
Comparative Review of Applications in Chile (English). Policy Research working
paper; no. WPS 8602. Washington, D.C.: World Bank Group.
http://documents.worldbank.org/curated/en/959221538 675961651/Prioritizing-
Infrastructure-Investments-A-Comparative-Review-of-Applications-in-Chile
Marcelo, D., Mandri-Perrott, C., House, S., Schwartz, J. 2016. Prioritizing
Infrastructure Investment : A Framework for Government Decision Making. Policy
Research Working Paper;No. 7674. World Bank, Washington, DC. © World Bank.
https://openknowledge.worldbank.org/handle/10986/24511 License: CC BY 3.0
IGO.
Martens, K. and Bastiaanssen, J., 2014. An index to measure accessibility
poverty risk. In Paper presented at Colloquium Vervoersplanologisch Speurwerk.
Eidhoven, the Netherlands (Vol. 32, p. 33). Available at:
https://www.academia.edu/7908819/An_index_to_measure_accessibility
_poverty_risk
Martens, K. and Di Ciommo, F., 2017. Travel time savings, accessibility gains
and equity effects in cost–benefit analysis. Transport reviews, 37(2), pp.152-169.

REFERENCES
219
Martens, K., 2016. Transport justice: Designing fair transportation systems.
Routledge. p. 158. DOI: 10.4324/9781315746852
Martens, K., Di Ciommo, F. and Papanikolaou, A., 2014. Incorporating equity into
transport planning: utility, priority and sufficiency approaches. In: "XVIII Congreso
Panamericano de Ingeniería de Tránsito, Transporte y Logística. PANAM 2014",
11/06/2014 – 13/06/2014, Santander, España. pp. 1-16. Available at
http://oa.upm.es/36984/
McCulloch, N., Weisbrod, J., Timmer, C. P., 2007. Pathways Out of Poverty
During an Economic Crisis: An Empirical Assessment of Rural Indonesia. Policy
Research Working Paper; No. 4173. World Bank, Washington, DC. © World
Bank. https://openknowledge.worldbank.org/handle/10986/7217 License: CC BY
3.0 IGO.”
McDade, T.W., Ryan, C.P., Jones, M.J., Hoke, M.K., Borja, J., Miller, G.E.,
Kuzawa, C.W. and Kobor, M.S., 2019. Genome‐wide analysis of DNA
methylation in relation to socioeconomic status during development and early
adulthood. American journal of physical anthropology, 169(1), pp.3-11.
McDonagh, J., 2006. Transport policy instruments and transport-related social
exclusion in rural Republic of Ireland, Journal of Transport Geography, Vol. 14,
pp. 355-366.
McGrail, M.R. and Humphreys, J.S., 2009. Measuring spatial accessibility to
primary care in rural areas: improving the effectiveness of the two-step floating
catchment area method. Applied Geography, 29(4), pp.533-541. DOI:
10.1016/j.apgeog.2008.12.003
Ministério da Saúde, 2018. UPA e UBS. Sabe o que significam essas siglas?
Retrieved from http://www.blog.saude.gov.br/servicos/33620-upa-e-ubs-sabe- o-
que-significam-essas-siglas.html
Ministério das Cidades, 2017. Instrução Normativa nº 17, de 11 de Julho de 2017.
Regulamenta a reformulação do Programa de Infraestrtura de Transporte e da
Mobilidade Urbana - Pró-Transporte. Available at http://www.cidades.gov.br/

REFERENCES
220
images/stories/ArquivosCidades/ArquivosPDF/IN27-80140.000 291.2017-
27eegulamentaareformulacaodoprotransporte-CONSOLIDADA.pdf
Ministério das Cidades, 2017. Instrução Normativa nº 27, de 11 de Julho de 2017.
Regulamenta a reformulação do Programa de Infraestrtura de Transporte e da
Mobilidade Urbana - Pró-Transporte. Retrieved at 22/05/2019 from
http://www.in.gov.br/materia/-/asset_publisher/Kujrw0TZC2Mb/content/id/
19170407/do1-2017-07-12-instrucao-normativa-n-27-de-11-de-julho-de-2017-
19170212
Ministério das Cidades, 2018. Instrução Normativa nº 28, de 20 de Novembro de
2018. Regulamenta o Programa de Desenvolvimento Urbano (Pró-Transporte).
Retrieved at 22/05/2019 from http://www.in.gov.br/materia/-/asset_publisher/
Kujrw0TZC2Mb/content/id/51058894Cidades)
Ministério das Cidades, 2018. Instrução Normativa nº 28, de 20 de Novembro de
2018. Regulamenta o Programa de Desenvolvimento Urbano (Pró-Transporte).
Retrieved at 22/05/2019 from http://www.in.gov.br/materia/-
/asset_publisher/Kujrw0TZC2Mb/content/id/ 51058894Cidades
Ministério das Cidades. 2015. Caderno de Referência para Elaboração de plano
de mobilidade urbana. Secretaria nacional de transporte e da mobilidade urbana
– SeMob. Retrieved at 22/05/2019 from http://www.cidades.gov.br/images/
stories/ArquivosSE/planmob.pdf
Mitchell, A., 2005. The ESRI Guide to GIS Analysis: Volume 2: Spatial
Measurements & Statistics (Vol. 2). Redlands, CA: ESRI press.
Motte-Baumvol, B. and Nassi, C.D., 2012. Immobility in Rio de Janeiro, beyond
poverty. Journal of Transport geography, 24, pp.67-76.
DOI:10.1016/j.jtrangeo.2012.06.012
MTPA (Ministério dos Transportes, Portos e Aviação Civil). 2018. Anuário
Estatístico de Transportes 2010-2017. Brasília, Brasil. Segunda edição.
Available at https://www.infraestrutura.gov.br/ anu%C3%A1rio_estatistico.html

REFERENCES
221
Mu, R. and Van de Walle,D., 2007. Rural Roads and Local Market Development
in Vietnam. Policy Research Working Paper; No. 4340. World Bank, Washington,
DC. © World Bank. https://openknowledge.worldbank.org/handle/10986/6878
License: CC BY 3.0 IGO.”
Naimanye, A.G. and Whiteing, T., 2016, October. Poverty-centred rural road
funds sharing in sub-Saharan Africa. In Proceedings of the Institution of Civil
Engineers-Transport (Vol. 169, No. 6, pp. 387-396). Thomas Telford Ltd.
DOI:10.1680/jtran.15.00071
Narayan, D., Patel, R., Schafft, K., Rademacher, A., Koch-Schulte, S., 2000.
Voices of the poor Can anyone hear us? New York. Oxford University Press for
the World Bank. Available at:
http://documents.worldbank.org/curated/en/131441468779067441/Voices-of-
the-poor-can-anyone-hear-us
Nash, J.C., 2008. Re-thinking intersectionality. Feminist review, 89(1), pp.1-15.
DOI:10.1057/fr.2008.4
Nelson, A., 2008. Travel time to major cities: a global map of accessibility. Global
Environment Monitoring Unit, Joint Research Centre of the European
Commission. Available at: http://forobs.jrc.ec.europa.eu/products/gam/
Nesbitt, R.C., Gabrysch, S., Laub, A., Soremekun, S., Manu, A., Kirkwood, B.R.,
Amenga-Etego, S., Wiru, K., Höfle, B. and Grundy, C., 2014. Methods to measure
potential spatial access to delivery care in low-and middle-income countries: a
case study in rural Ghana. International journal of health geographics, 13(1),
p.25. DOI: 10.1186/1476-072X-13-25
Neutens, T., 2015. Accessibility, equity and health care: review and research
directions for transport geographers. Journal of Transport Geography, 43, pp.14-
27. DOI: 10.1016/j.jtrangeo.2014.12.006
Nigriello, A., 1992. O Impacto do Sistema de Transporte sobre o Espaço Urbano
e seu Controle. Pós. Revista do Programa de Pós-Graduação em Arquitetura e
Urbanismo da FAUUSP, 1(2), pp.47-54.
REFERENCES
222
Nogueira, P.T.A., Bezerra, A.F.B., Leite, A.F.B., Carvalho, I.M.D.S., Gonçalves,
R.F. and Brito-Silva, K.S.D., 2016. Características da distribuição de
profissionais do Programa Mais Médicos nos estados do Nordeste, Brasil.
Ciência & Saúde Coletiva, 21, pp.2889-2898.
Noor, A. M., Zurovac, D., Hay, S. I., Ochola, S. A., & Snow, R. W., 2003. Defining
equity in physical access to clinical services using geographical information
systems as part of malaria planning and monitoring in Kenya. Tropical Medicine
and International Health, 8(10), 917–926. doi:10.1046/j.1365-3156.2003.01112.x
Noor, A.M., Alegana, V.A., Gething, P.W., Tatem, A.J. and Snow, R.W., 2008.
Using remotely sensed night-time light as a proxy for poverty in Africa. Population
Health Metrics, 6(1), p.5.
NTA (National Transport Authority), 2019. Rural Transport Programme: Growth
in Passenger Journeys. Retrieved from https://www.nationaltransport.ie/public-
transport-services/rural-transport-programme/
O’Brian, J.E., Evans J., 2017. Informal mobilities and elusive subjects:
researching urban transport in the global South. Urban Mobilities in the Global
South. Routledge, pp. 98-114. DOI: 10.4324/9781315265094
OECD (Organisation for Economic Co-operation and Development), 2018.
Purchasing power parities (PPP), Retrieved at 12/06/2019 from
https://data.oecd.org/conversion/purchasing-power-parities-ppp.htm#indicator-
chart
Oliveira, F.C. and Andrade, M.O., 2016. Mobility difficulties to low income people
living in peripheral hill areas in Recife Brazil. The 14th World Conference in
Transport Research, Shanghai. Transport Research Proceedings
Oloo, F., 2018. Mapping Rural Road Networks from Global Positioning System
(GPS) Trajectories of Motorcycle Taxis in Sigomre Area, Siaya County, Kenya.
ISPRS International Journal of Geo-Information, 7(8), p.309.
DOI:10.3390/ijgi7080309

REFERENCES
223
Ord, J.K. and Getis, A., 1995. Local spatial autocorrelation statistics: distributional
issues and an application. Geographical analysis, 27(4), pp.286-306.
Ormerod, M., Newton, R., Phillips, J., Musselwhite, C., McGee, S. and Russell,
R., 2015. How can transport provision and associated built environment
infrastructure be enhanced and developed to support the mobility needs of
individuals as they age. Future of an ageing population: evidence review
Foresight, Government Office for Science, London, UK.
Ornati, O.A., Whittaker, J.W. and Solomon, R., 1969. Transportation needs of the
poor: A case study of New York City. Praeger.
Ortega E, Otero I, Mancebo S., 2014. TITIM GIS-tool: A GIS-based decision
support system for measuring the territorial impact of transport infrastructures.
Expert Systems with Applications. Nov 15;41(16):7641-52.
Ortuzar, J., Willumsen, L.G., 2011. Modelling Transport, 4th edition John Wiley &
Son Ltd., Chichester, United Kingdom.
Osorio, R.G., Servo, L.M.S. and Piola, S.F., 2011. Necessidade de saúde
insatisfeita no Brasil: uma investigação sobre a não procura de atendimento.
Ciência & Saúde Coletiva, 16, pp.3741-3754.
Oviedo, D., Levy, C. and D’avila, J, 2017. Constructing wellbeing, deconstructing
urban (im)mobilities in Abuja, Nigeria. In Urban Mobilities in the Global South (pp.
193-214). Routledge)
Özkazanç, S. and Sönmez, F.N.Ö., 2017. Spatial analysis of social exclusion
from a transportation perspective: A case study of Ankara metropolitan area.
Cities, 67, pp.74-84. DOI:10.1016/j.cities.2017.04.013
Paranaiba, A. C., 2017. Metodologia Para Priorização de Projetos de
Infraestrutura em Mobilidade Urbana com Base na Configuração Urbana e no
Escalonamento Multidimensional. Dissertação de Mestrado, Departamento de
Engenharia Civil e Ambiental, Universidade de Brasília, Brasília, DF, 135p.
REFERENCES
224
Partnership on Sustainable, Low Carbon Transport (SLoCaT), 2019. Transport
Targets of Sustainable Development Goals. Available at
http://www.slocat.net/sdg-targets
Pawson, R., Greenhalgh, T., Harvey, G. and Walshe, K., 2005. Realist review-a
new method of systematic review designed for complex policy interventions.
Journal of health services research & policy, 10(1_suppl), pp.21-34.
DOI:10.1258/1355819054308530
Pereira, R. H. M., 2018. Ex-Ante Evaluation of the Accessibility Impacts of
Transport Policy Scenarios: Equity and Sensitivity to Travel Time Thresholds for
Bus Rapid Transit Expansion in Rio De Janeiro. Available at SSRN:
https://ssrn.com/abstract=3147748 or http://dx.doi.org/10.2139/ ssrn.3147748
Pereira, R.H., 2019. Future accessibility impacts of transport policy scenarios:
equity and sensitivity to travel time thresholds for Bus Rapid Transit expansion in
Rio de Janeiro. Journal of Transport Geography, 74, pp.321-332.
DOI:10.1016/j.jtrangeo.2018.12.005
Pereira, R.H., Schwanen, T. and Banister, D., 2017. Distributive justice and equity
in transportation. Transport Reviews, 37(2), pp.170-191. DOI:
10.1080/01441647.2016.1257660
Phun, V.K. and Yai, T., 2016. State of the art of paratransit literatures in Asian
developing countries. Asian Transport Studies, 4(1), pp.57-77.
Polzin, P., Borges, J. and Coelho, A., 2014. An extended kernel density two-step
floating catchment area method to analyze access to health care. Environment
and Planning B: Planning and Design, 41(4), pp.717-735. DOI:
10.1068/b120050p
Porter, G., 2014. Transport services and their impact on poverty and growth in
rural Sub-Saharan Africa: A review of recent research and future research needs.
Transport Reviews, 34, 25–45.

REFERENCES
225
Porter, G., 2002. Living in a walking world: rural mobility and social equity issues
in sub-Saharan Africa. World development, 30(2), 285-300. DOI:10.1016/S0305-
750X(01)00106-1
Porter, G., 2007, March. Transport, (Im)Mobility, and Spatial Poverty Traps:
Issues for Rural Women and Girl Children in Sub-Saharan Africa. In
Understanding and addressing spatial poverty traps: An international workshop,
Spier Estate, Stellenbosch, South Africa. http://www. odi. org. uk/sites/odi. org.
uk/files/odi-assets/publications-opinion-files/3536. pdf
Porter, G., Blaufuss, K. and Acheampong, F.O., 2007. Youth, mobility and rural
livelihoods in sub-Saharan Africa: Perspectives from Ghana and Nigeria: Poverty,
development and livelihoods. Africa insight, 37(3), pp.420-431.
DOI:10.4314/ai.v37i3.22500
Porter, G., Hampshire, K., Abane, A., Munthali, A., Robson, E., Mashiri, M. and
Tanle, A., 2012. Youth, mobility and mobile phones in Africa: findings from a
three-country study. Information Technology for Development, 18(2), pp.145-162
DOI:10.1080/02681102.2011.643210
Porter, G., Tewodros, A., Bifandimu, F., Gorman, M., Heslop, A., Sibale, E.,
Awadh, A. and Kiswaga, L., 2013. Transport and mobility constraints in an aging
population: health and livelihood implications in rural Tanzania. Journal of
Transport Geography, 30, pp.161-169. DOI:10.1016/j.jtrangeo.2013.05.001
Pritchard, J.P., Tomasiello, D.B., Giannotti, M. and Geurs, K., 2019. Potential
impacts of bike-and-ride on job accessibility and spatial equity in São Paulo,
Brazil. Transportation Research Part A: Policy and Practice, 121, pp.386-400.
DOI:10.1016/j.tra.2019.01.022
Qin, Y. and Zhang, X., 2016. The road to specialization in agricultural production:
Evidence from rural China. World Development, 77, pp.1-16.
DOI:10.1016/j.worlddev.2015.08.007
Raballand, G., Thornton, R.L., Yang, D., Goldberg, J., Keleher, N.C. and Müller,
A., 2011. Are rural road investments alone sufficient to generate transport flows?
Lessons from a randomized experiment in rural Malawi and policy implications.

REFERENCES
226
Radke, J. and Mu, L., 2000. Spatial decompositions, modeling and mapping
service regions to predict access to social programs. Geographic Information
Sciences, 6(2), pp.105-112. DOI: 10.1080/10824000009480538
Rajkhan, S., 2014. Women in Saudi Arabia: Status, rights, and limitations. A
paper submitted to the faculty of the University of Washington Bothell in
candidacy for the degree of Master of Arts in Policy Studies.
Ramos, S., & Musumeci, L., 2005. Elemento suspeito: Abordagem policial e
discriminação na cidade do Rio de Janeiro. Rio de Janeiro: Civilização Brasileira.
Rand, J., 2011. Evaluating the employment-generating impact of rural roads in
Nicaragua. Journal of development effectiveness, 3(1), pp.28-43.
Rasella, D., Aquino, R. and Barreto, M.L., 2013. Impact of income inequality on
life expectancy in a highly unequal developing country: the case of Brazil. J
Epidemiol Community Health, pp.jech-2012.
Rauniyar, G., Orbeta, A. and Sugiyarto, G., 2011. Impact of water supply and
sanitation assistance on human welfare in rural Pakistan. Journal of development
effectiveness, 3 (1), 62–102.
Ravallion, M., 1998. Poverty lines in theory and practice. The World Bank. DOI:
10.1596/0-8213-4226-6
Ravallion, M., 2007. Evaluating anti-poverty programs. Handbook of
development economics, 4, pp.3787-3846. DOI:10.1016/S1573-4471(07)04059-
4
Roberts, P., KC, S., Rastogi, C., 2006. Rural Access Index: A Key Development
Indicator. Transport paper series; no. TP-10. World Bank, Washington, DC. ©
World Bank. https://openknowledge.worldbank.org/handle/10986/17414
License: CC BY 3.0 IGO.
Rodrigues, E.M., Villaveces, A., Sanhueza, A. and Escamilla-Cejudo, J.A., 2014.
Trends in fatal motorcycle injuries in the Americas, 1998–2010. International
REFERENCES
227
journal of injury control and safety promotion, 21(2), pp.170-180. DOI:
10.1080/17457300.2013.792289
Rodríguez, C., Gallego, J.M., Martinez, D., Montoya, S. and Peralta-Quiros, T.,
2016. Examining Implementation and Labor Market Outcomes of Targeted
Transit Subsidies: Subsidy by Sistema Nacional de Selección de Beneficiarios
for Urban Poor in Bogotá, Colombia. Transportation Research Record: Journal
of the Transportation Research Board, (2581), pp.9-17. DOI:10.3141/2581-02
Rosenbaum, P.R. and Rubin, D.B., 1983. The central role of the propensity score
in observational studies for causal effects. Biometrika, 70(1), pp.41-55.
Rynning, M. K., Uteng, T.P. and Lucas, K., 2017. Epilogue: Creating planning
knowledge through dialogues between research and practice. Urban mobilities in
the global south. Routledge.
Saaty, T.L. and Vargas, L.G., 2006. Decision making with the analytic network
process (Vol. 282). Springer Science+ Business Media, LLC.
Saaty, T.L., 1980. The analytic hierarchy process, McGrawHill, New York
Sachs, J., 2008. The end of poverty: economic possibilities for our time. European
Journal of Dental Education, 12, pp.17-21. DOI:10.1111/j.1600-
0579.2007.00476.x
Sadhu, S.S. and Tiwari, G., 2016. An activity pattern–destination land use choice
model of low income households of informal settlements–Case study of Delhi.
Transportation Research Part A: Policy and Practice, 85, pp.265-275.
DOI:10.1016/j.tra.2016.01.017
Salon, D. and Gulyani, S., 2010. Mobility, poverty, and gender: travel ‘choices’ of
slum residents in Nairobi, Kenya. Transport Reviews, 30(5), 641-657.
DOI:10.1080/01441640903298998
Sanchez, T.W., 2008. Poverty, policy, and public transportation. Transportation
Research Part A: Policy and Practice, 42(5), 833-841.
DOI:10.1016/j.tra.2008.01.011

REFERENCES
228
Silva, J.B., Guerra, L.D., Ioris, A.A. and Gomes, R.A., 2015. Conflitos
sociopolíticos, recursos hídricos e programa um milhão de cisternas na região
semiárida da Paraíba. Novos Cadernos NAEA, 18(2).
Santos, L. M. P., Oliveira, A., Trindade, J.S., Barreto, I.C., Palmeira, P.A., Comes,
Y., Santos, F.O., Santos, W., Oliveira, J.P.A., Pessoa, V.M. and Shimizu, H.E.,
2017. Implementation research: towards universal health coverage with more
doctors in Brazil. Bulletin of the World Health Organization, 95(2), p.103.
Santos, M., 2009. Pobreza urbana. São Paulo. Editora EDUSP.
Sarkar, A.K. and Ghosh, D., 2008. Integrated Rural AccessiIbility Planning (IRAP)
an application in three panchayats in Rajasthan, India. Progress in Development
Studies, 8(3), pp.241-259. DOI: 10.1177/146499340800800303
Saroli, C, 2015. Passenger transport in rural and sparsely populated areas in
France. International Transport Forum Discussion Paper 2015-09. OCDE.
Scheffer, M., Cassenote, A., Guilloux, A. G. A., Biancarelli, A., Miotto, B. A., &
Mainardi, G. M., 2018. Demografia médica no Brasil 2018. Demografia Médica
no Brasil 2018. São Paulo, SP: FMUSP, CFM, Cremesp, 2018. 286 p. ISBN: 978-
85-87077-55-4.
Schuurman, N., Berube, M. and Crooks, V.A., 2010. Measuring potential spatial
access to primary health care physicians using a modified gravity model. The
Canadian Geographer/Le Geographe Canadien, 54(1), pp.29-45. DOI:
10.1111/j.1541-0064.2009.00301.x
Seekings, J., 2008. The continuing salience of race: Discrimination and diversity
in South Africa. Journal of contemporary African studies, 26(1), pp.1-25.
Seiler, C., 2007. The significance of race to transport history. The Journal of
Transport History, 28(2), pp.307-311.
Sen, A., 1982. Poverty and famines: an essay on entitlement and deprivation.
Oxford university press.

REFERENCES
229
Serajuddin, U., Uematsu, H., Wieser, C., Yoshida, N. and Dabalen, A., 2015.
Data deprivation: another deprivation to end. The World Bank. Policy Research
working paper; no. WPS 7252. Washington, D.C.: World Bank Group.
http://documents.worldbank.org/curated/en/700611468172787967/Data-
deprivation-another-deprivation-to-end
Setboonsarng, S. 2006. Transport Infrastructure and Poverty Reduction. Asian
Development Bank. Research Policy Brief No. 21. Available at
http://hdl.handle.net/11540/4064
Shannon, G.W., Bashshur, R.L. and Metzner, C.A., 1969. The concept of
distance as a factor in accessibility and utilization of health care. Medical Care
Review, 26(2), pp.143-161.
Shaw, S. and Sahoo, H., 2019. Accessibility to Primary Health Centre in a Tribal
District of Gujarat, India: application of two step floating catchment area model.
GeoJournal, pp.1-10. DOI: 10.1007/s10708-019-09977-1
Silcock, D.T., 1981. Urban paratransit in the developing world. Transport
Reviews, 1(2), pp.151-168.
Silva, E.N.D., Ramos, M.C., Santos, W., Rasella, D., Oliveira, A. and Santos,
L.M.P., 2018. Cost of providing doctors in remote and vulnerable areas:
Programa Mais Médicos in Brazil. Revista Panamericana de Salud Pública, 42,
p.e11.
Silverman, B. W., 1986. Density Estimation for Statistics and Data Analysis. New
York: Chapman and Hall. 175pp. DOI: 10.1002/bimj.4710300745
Social Exclusion Unit, 2003. Making the Connections: Final report on Transport
and Social Exclusion. Office of the Deputy Prime Minister, London.
Spencer, J. and Angeles, G., 2007. Kernel density estimation as a technique for
assessing availability of health services in Nicaragua. Health Services and
Outcomes Research Methodology, 7(3-4), pp.145-157.

REFERENCES
230
Spicker, P., 2007. Definitions of poverty: twelve clusters of meaning. Poverty: An
international glossary, pp.229-243.
Starkey, P.; Hine, J. Poverty and sustainable transport: how transport affects poor
people with policy implications for poverty reduction. ODI, London, UK (2014) pp.
72 .
Starkey, P., Njenga, P., Kemtsop, G., Willilo, S., Opiyo, R. and Hine, J., 2013,
September. Rural transport service indicators. In Final Report. International
Forum for Rural Transport and Development (IFRTD), for African Community
Access Programme.
Stifel, D. and Minten, B., 2017. Market access, well-being, and nutrition: evidence
from Ethiopia. World Development, 90, pp.229-241.
DOI:10.1016/j.worlddev.2016.09.009
Stifel, D., Minten, B. and Koru, B., 2016. Economic Benefits of Rural Feeder
Roads: Evidence from Ethiopia. The Journal of Development Studies, 52(9),
pp.1335-1356. DOI: 10.1080/00220388.2016.1175555
Stock, R., 1983. Distance and the utilization of health facilities in rural Nigeria.
Social science & medicine, 17(9), pp.563-570.
SUDENE (Superintendencia de Desenvolvimento do Nordeste), 2019. Plano
Regional de Desenvolvimento do Nordeste – PRDNE. Recife. Available at
http://www.sudene.gov.br/images/arquivos/planejamento/PRDNE/PRDNE-
27052019.pdf
Szwarcwald, C.L., de Souza Júnior, P.R.B., Marques, A.P., de Almeida, W.D.S.
and Montilla, D.E.R., 2016. Inequalities in healthy life expectancy by Brazilian
geographic regions: findings from the National Health Survey, 2013. International
journal for equity in health, 15(1), p.141.
TaIC, 2016. ATAP Guidelines: T5 Distributional (Equity) Effects. Retrieved from
https://atap.gov.au/tools-techniques/distributional-effects/files/t5_distributional_
equity_effects.pdf
REFERENCES
231
Tanser, F., Gijsbertsen, B., & Herbst, K., 2006. Modelling and understanding
primary health care accessibility and utilization in rural South Africa: An
exploration using a geographical information system. Social Science & Medicine,
63(3), 691–705. doi:10.1016/j.socscimed.2006.01.015
Tanser, F., Hosegood, V., Benzler, J., & Solarsh, G., 2001. New approaches to
spatially analyse primary health care usage patterns in rural South Africa.
Tropical Medicine and International Health, 6(10), 826–838. doi:10.1046/j.1365-
3156.2001.00794.x
Thaddeus, S. and Maine, D., 1994. Too far to walk: maternal mortality in context.
Social science & medicine, 38(8), pp.1091-1110.
Thomopoulos, N., Grant-Muller, S. and Tight, M.R., 2009. Incorporating equity
considerations in transport infrastructure evaluation: Current practice and a
proposed methodology. Evaluation and program planning, 32(4), pp.351-359.
Titheridge, H., Mackett, R.L., Christie, N., Oviedo Hernández, D. and Ye, R.,
2014. Transport and poverty: a review of the evidence.
Travassos, C., de Oliveira, E.X. and Viacava, F., 2006. Desigualdades
geográficas e sociais no acesso aos serviços de saúde no Brasil: 1998 e 2003.
Ciência & Saúde Coletiva, 11, pp.975-986.
UN Environment, 2016. Global Outlook on Walking and Cycling. UN
Environment, Nairobi.
UN (United Nations), 1995. The Copenhagen declaration and programme of
action: World summit for social development 6-12 March 1995, New York: United
Nations Department of Publications
UN (United Nations), 2004. Forging a Global South – United Nations
Development Programme. Available at: https://www.undp.org/content/dam/
china/docs/Publications/UNDP-CH-PR-Publications-UNDay-for-South-South-
Cooperation.pdf

REFERENCES
232
UN (United Nations), 2015a. Resolution adopted by the General Assembly on
25 September 2015 - Transforming our world: the 2030 Agenda for Sustainable
Development. Available at
https://www.un.org/ga/search/view_doc.asp?symbol=A/RES/70/1&Lang=E
UN (United Nations), 2015b. The Millennium Development Goals Report.
UN (United Nations), 2016, Global Sustainable Development Report 2016,
Department of Economic and Social Affairs, New York, July.
UN (United Nations), 2017. The Sustainable Development Goals (SDG). New
York: United Nations, 2017. 60 p. Retrieved at 22/05/2019 from
https://unstats.un.org/sdgs/files/report/2017/TheSustainableDevelopmentGoals
Report2017.pdf
UN (United Nations), 2018. Leaving no one behind - Committee for Development
Policy. Available at: https://sustainabledevelopment.un.org/content/documents
/2754713_July_PM_2._Leaving_no_one_behind_Summary_from_UN_Committ
ee_for_Development_Policy.pdf
UN (United Nations), 2019a. Sustainable Development Goals. Goal 1: No
poverty. Facts and figures. Retrieved at 15/02/2019 from
https://www.undp.org/content/undp/en/ home/sustainable-development-
goals/goal-1-no-poverty.html
UN (United Nations), 2019b. The Sustainable Development Goals Report 2019.
Available at https://unstats.un.org/sdgs/report/2019/The-Sustainable-
Development-Goals-Report-2019.pdf
UN (United Nations), 2019c. Sustainable Development Goals - Knowledge
platform. Sustainable Transport. Available at https://sustainabledevelopment.
un.org/topics/sustainabletransport
UNDP (United Nations Development Programme), Fundação João Pinheiro e
Instituto de Pesquisas Econômica Aplicada. 2010 Atlas do desenvolvimento
humano no Brasil. Available at http://www.atlasbrasil.org.br/2013/pt/consulta/

REFERENCES
233
UNDP (United Nations Development Programme), 2016. Desenvolvimento
humano nas macrorregiões brasileiras: 2016. – Brasília. PNUD, IPEA, 55 p.
Retrieved at 22/05/2019 from
https://www.undp.org/content/dam/brazil/docs/IDH/undp-br-macrorregioes
brasileiras-2016.pdf
UNDP (United Nations Development Programme), 2019. Table 1. Human
Development Index and its components. Retrieved at 22/05/2019 from
http://hdr.undp.org/en/composite/HDI
Vajjhala, S.P. and Walker, W.M., 2010. Roads to participatory planning:
Integrating cognitive Mapping and GIS for transport prioritization in rural Lesotho.
Journal of Maps, 6(1), pp.488-504. DOI:10.4113/jom.2010.1086
Vakis, R., Rigolini, J., Lucchetti, L., 2016. Left Behind: Chronic Poverty in Latin
America and the Caribbean. World Bank publication. Washington, DC. Available
at: http://hdl.handle.net/10986/21552
Valor. 2018. Extrema pobreza avança e é recorde em 9 estados. Retrieved at
22/05/2019 from https://www.valor.com.br/brasil/5912587/extrema-pobreza-
avanca-e-e-recorde-em-9-estados
Van de Walle, D., 2009. Impact evaluation of rural road projects. Journal of
development effectiveness, 1(1), pp.15-36.
Van Wee, B. and Geurs, K., 2011. Discussing equity and social exclusion in
accessibility evaluations. European journal of transport and infrastructure
research, 11(4).
Van Wee, B., 2012. How suitable is CBA for the ex-ante evaluation of transport
projects and policies? A discussion from the perspective of ethics. Transport
Policy, 19(1), pp.1-7.
Vargas, R. V., 2010. Using the analytic hierarchy process (AHP) to select and
prioritize projects in a portfolio. In PMI global congress (pp. 1-22). Available at:
https://ricardo-vargas.com/downloads/download-file/6888/12430
REFERENCES
234
Vasconcellos, E., 2001. Urban Transport: Environment and Equity: The Case for
Developing Countries, Earthscan, London and Sterling VA, 333 pages.
Vasconcellos, E.A., 2003. Inclusion of social benefits in road transport planning.
Think piece paper for the Framework for the Inclusion of Social Benefits in
Transport Planning, United Kingdom Department for International Development.
Available at: https://www.gov.uk/dfid-research-outputs/inclusion-of-social-
benefits-in-road-transport-planning-a-think-piece-paper
Vasconcellos, E.A., 2005. Urban change, mobility and transport in São Paulo:
three decades, three cities. Transport Policy, 12(2), pp.91-104.
DOI:10.1016/j.tranpol.2004.12.001
Vasconcellos, E.A., 2008. O custo social da motocicleta no Brasil. Revista dos
Transportes Públicos–ANTP, ano, 30, p.31. Available at
http://www.emdec.com.br/moto2012/downloads/artigo.pdf
Vasconcellos, E.A., 2008. O custo social da motocicleta no Brasil. Revista dos
Transportes Públicos–ANTP, ano, 30, p.31.
Vasconcellos, E.A., 2011. 12 Equity evaluation of urban transport. Urban
transport in the developing world: a handbook of policy and practice, p.332.
Vasconcellos, E.A., 2018. Urban transport policies in Brazil: The creation of a
discriminatory mobility system. Journal of transport geography, 67.
DOI:10.1016/j.jtrangeo.2017.08.014
Veeneman, W. and Mulley, C., 2018. Multi-level governance in public transport:
Governmental layering and its influence on public transport service solutions.
Research in Transportation Economics, 69, pp.430-437.
Velaga, N. R., Beecroft, M., Nelson, J. D., Corsar, D., & Edwards, P. (2012).
Transport poverty meets the digital divide: accessibility and connectivity in rural
communities. Journal of Transport Geography, 21, 102-112. DOI:
10.1016/j.jtrangeo.2011.12.005
REFERENCES
235
Venter, C., 2011. Transport expenditure and affordability: The cost of being
mobile. Development Southern Africa, 28(1), pp.121-140.
DOI:10.1080/0376835X.2011.545174
Vermeiren, K., Verachtert, E., Kasaija, P., Loopmans, M., Poesen, J. and Van
Rompaey, A., 2015. Who could benefit from a bus rapid transit system in cities
from developing countries? A case study from Kampala, Uganda. Journal of
Transport Geography, 47, pp.13-22. DOI:10.1016/j.jtrangeo.2015.07.006
Victora, C.G., Aquino, E.M., do Carmo Leal, M., Monteiro, C.A., Barros, F.C. and
Szwarcwald, C.L., 2011. Maternal and child health in Brazil: progress and
challenges. The Lancet, 377(9780), pp.1863-1876.
Vyas, S. and Kumaranayake, L., 2006. Constructing socio-economic status
indices: how to use principal components analysis. Health policy and planning,
21(6), pp.459-468. DOI: 10.1093/heapol/czl029
Wachs, M. and Kumagai, T.G., 1973. Physical accessibility as a social indicator.
Socio-Economic Planning Sciences, 7(5), 437-456. DOI: 10.1016/0038-
0121(73)90041-4
Walker, N., Yenokyan, G., Friberg, I.K. and Bryce, J., 2013. Patterns in coverage
of maternal, newborn, and child health interventions: projections of neonatal and
under-5 mortality to 2035. The Lancet, 382(9897), pp.1029-1038.
Walks, A., 2018. Driving the poor into debt? Automobile loans, transport
disadvantage, and automobile dependence. Transport policy, 65, pp.137-149.
Wang, F., 2012. Measurement, optimization, and impact of health care
accessibility: a methodological review. Annals of the Association of American
Geographers, 102(5), pp.1104-1112. DOI: 10.1080/00045608.2012.657146
Warr, P., 2005. Road development and poverty reduction: The case of Lao PDR
(No. 64). ADBI Research Paper Series.
Wee, B.V. and Banister, D., 2016. How to write a literature review paper?.
Transport Reviews, 36(2), pp.278-288. DOI:10.1080/01441647.2015.1065456

REFERENCES
236
Weiss, D.J., Nelson, A., Gibson, H.S., Temperley, W., Peedell, S., Lieber, A.,
Hancher, M., Poyart, E., Belchior, S., Fullman, N. and Mappin, B., 2018. A global
map of travel time to cities to assess inequalities in accessibility in 2015. Nature,
553(7688), p.333. DOI: 10.1038/nature25181
Wegener, M. and Fürst, F., 2004. Land-use transport interaction: state of the art.
Available at SSRN 1434678.
William, M. K., 2006. The regression-discontinuity design.
http://socialresearchmethods.net/kb/quasird.htm.
Wixey, S., Jones, P., Lucas, K. and Aldridge, M., 2005. Measuring accessibility
as experienced by different socially disadvantaged groups. London, Transit
Studies Group, University of Westminster.
World Bank, 2002. Brazil: Growth and Poverty Reduction in Pernambuco.
Washington, DC. © World Bank. https://openknowledge.worldbank.org
/handle/10986/15444 License: CC BY 3.0 IGO.
World Bank, 2006. Social analysis in transport projects: guidelines for
incorporating social dimensions into Bank-supported projects (English). Social
Analysis Sector Guidance Note Series. Washington, DC: World Bank.
http://documents.worldbank.org/curated/en/688971468136802153/Social-
analysis-in-transport-projects-guidelines-for-incorporating-social-dimensions-
into-Bank-supported-projects
World Bank, 2017. Monitoring Global Poverty: Report of the Commission on
Global Poverty. Washington, DC: World Bank.
<https://openknowledge.worldbank.org/handle/10986/25141>.
World Bank, 2019a. Country and Lending Groups. Retrieved at 22/05/2019 from
https://datahelpdesk.worldbank.org/knowledgebase/articles/906519-world-bank-
country-and-lending-groups
World Bank, 2019b. GDP (current US$). Retrieved at 22/05/2019 from
https://data.worldbank.org/indicator/NY.GDP.MKTP.CD?most_recent_value_de
sc=true&year_high_desc=true
REFERENCES
237
World Bank, 2019c. GINI index (World Bank estimate). Retrieved at 22/05/2019
from https://data.worldbank.org/indicator/si.pov.gini
WHO (World Health Organization), 2015. MDG 4: Reduce child mortality.
Available at
https://www.who.int/topics/millennium_development_goals/child_mortality/en/
Yang, D.H., Goerge, R. and Mullner, R., 2006. Comparing GIS-based methods
of measuring spatial accessibility to health services. Journal of medical systems,
30(1), pp.23-32. DOI: 10.1007/s10916-006-7400-5
Yu, N., De Jong, M., Storm, S., & Mi, J., 2013. Spatial spillover effects of transport
infrastructure: evidence from Chinese regions. Journal of Transport Geography,
28, 56-66.
Zou, W., Zhang, F., Zhuang, Z. and Song, H., 2008. Transport Infrastructure,
Growth, and Poverty Alleviation: Empirical Analysis of China. Annals of
Economics & Finance, 9(2).

APPENDIX A: Performance indicators for MCDAs
238
APPENDIX A: Performance indicators for MCDAs
The following list of indicators describes how the theoretical framework of
transport-related exclusion dimension could be further applied to MCDAs. As it
can be noted, all the following indicators that are suggested are presented as a
relative value, that is, expected change for every euro invested, or also, affected
population over the total population. This type of indicator is mainly suggested
since it allows the total social impact to be accounted for the sum of these values
multiplied by the weights calculated in Chapter 6. It is also worth mentioning that
these indicators can be further simplified into discrete values (e.g. zero for 'no
impact', -1 for 'worsening' or +1 for 'improvement') if the planning agency cannot
afford more detailed performance estimates.
• From facilities: Increase or decrease of the overall level of accessible
public services (e.g. education, health) in a given threshold time for every
euro invested. Whenever possible, also disaggregating the analysis by
social groups (e.g. income strata, gender, race, etc.), sub-region (e.g.
neighbourhoods, census tracts) and mode of transport (e.g. walking,
cycling, public transport, private car, cycle & ride, etc)
• Geographic: Increase or decrease of the of socially vulnerable population
covered by transport network (e.g. public transport terminals, shared
bicycle stations, on-demand rural transport lines, all-season roads) and
displaced after project completion for every euro invested
• Economic: Percentage of population in income poverty positively or
negatively affected by changes in direct or indirect costs caused by the
new intervention (e.g. changes in fares, inclusion of tolls, changes in land
use costs around new stations, increase in productivity and job creation
around the project, etc)
• Fear-based: Increase or decrease in the expected number of accidents for
every euro invested, or also, from a fear of crime standpoint, the
percentage of the population benefited by improvements in the public
space security (e.g. CCTV installation, security guards, lighting on public
roads, etc)
APPENDIX A: Performance indicators for MCDAs
239
• Physical: Number of the elderly or disabled population benefiting from
micro accessibility enhancements (e.g. sidewalk accessibility ramps,
sound, visual and tactile signalling at intersections, etc.) for every euro
invested
• Time-based: Increase or decrease on the average travel time between
neighbourhoods / municipalities for every euro invested. Whenever
possible, also disaggregating analysis by social group (e.g. income
bracket, gender, race), subregion (e.g. census tracts) and mode by
transport (e.g. public transport, car, cycle & ride, etc)
• Spatial: Number of people benefiting from the reduction of spatial barriers
(e.g. pedestrian crosswalks, inclusion of cycle lanes and crosswalks in
tunnels and bridges, etc) for every euro invested
• Based on social position: Percentage of the population of a particularly
excluded social groups (evidenced by prior analysis) that will be impacted
(positively or negatively) by a project, or also, the total number of this
population that will be impacted for every euro invested. Thus, urban
infrastructure projects that aim, for example, at improving security in these
high-crime regions should be given priority in this regard
At last, based on models similarly applied by the World Bank (Marcelo et al.,
2018; and Marcelo et al., 2016), the social impact calculated these MCDAs can
be plotted against other environmental and economic assessments (e.g. Net
Present Value, or Internal Rate of Return) to provide a comprehensive appraisal
of potential transport interventions. By doing so, a more socially inclusive
transport planning can be achieved, delivering feasible and objective transport
contributions to the poverty eradication process.
Copyright © 2022 FDOKUMEN