Transport d'eau généré par le cotransport Na/glucose - Papyrus
119
// J Ô Université de Montréal Transport d’eau généré par le cotransport Na/glucose: nouvelle interprétation basée sur les effets distincts des flux entrants de cations et de glucose. par Marilène Gagnon Département de Physique Faculté des Arts et Sciences Mémoire présenté à la Faculté des études supérieures en vue de l’obtention du grade de maîtrise (M. Sc.) en Physique option biophysique et physiologie moléculaires êtU des Juin 2003 , Grade conféré G 20030CT,02 de © Marilène Gagnon, 2003
-
Upload
khangminh22 -
Category
Documents
-
view
0 -
download
0
Transcript of Transport d'eau généré par le cotransport Na/glucose - Papyrus

// J Ô
Université de Montréal
Transport d’eau généré par le cotransport Na/glucose:
nouvelle interprétation basée sur les effets distincts des
flux entrants de cations et de glucose.
par
Marilène Gagnon
Département de Physique
Faculté des Arts et Sciences
Mémoire présenté à la Faculté des études supérieures
en vue de l’obtention du grade de maîtrise (M. Sc.)
en Physique
option biophysique et physiologie moléculaires
êtU des
Juin 2003 , Grade conféré G
20030CT,02
de© Marilène Gagnon, 2003
3
.:; I

Université dIde Montréal
Direction des bibliothèques
AVIS
L’auteur a autorisé l’Université de Montréal à reproduire et diffuser, en totalitéou en partie, par quelque moyen que ce soit et sur quelque support que cesoit, et exclusivement à des fins non lucratives d’enseignement et derecherche, des copies de ce mémoire ou de cette thèse.
L’auteur et les coauteurs le cas échéant conservent la ptopriété du droitd’auteur et des droits moraux qui protègent ce document. Ni la thèse ou lemémoire, ni des extraits substantiels de ce document, ne doivent êtreimprimés ou autrement reproduits sans l’autorisation de l’auteur.
Afin de se conformer à la Loi canadienne sur la protection desrenseignements personnels, quelques formulaires secondaires, coordonnéesou signatures intégrées au texte ont pu être enlevés de ce document. Bienque cela ait pu affecter la pagination, il n’y a aucun contenu manquant.
NOTICE
The author of this thesis or dissertation has granted a nonexciusive licenseallowing Université de Montréal to reproduce and publish the document, inpart or in whole, and in any format, solely for noncommercial educational andresearch purposes.
The author and co-authors if applicable retain copyright ownership and moralrights in this document. Neither the whole thesis or dissertation, norsubstantial extracts from it, may be printed or otherwise reproduced withoutthe author’s permission.
In compliance with the Canadian Privacy Act some supporting forms, contact
information or signatures may have been removed from the document. Whilethis may affect the document page count, it does not represent any Ioss ofcontent from the document.
Université de Montréal
Faculté des études supérieures
Ce mémoire intitulé
Transport d’eau généré par le cotransport Na/g1ucose : nouvelle interprétation basée sur les
effets distincts des flux entrants de cations et de glucose.
présenté par
Iviarilène Gagnon
a été évalué par un jury composé des personnes suivantes
Raynald Laprade, président-rapporteur
Jean-Yves Lapointe, directeur de recherche
Rémy Sauvé, membre du jury
111
Résumé
Le transport d’eau à travers les membranes, depuis ses premières descriptions et
jusqu’à récemment, avait toujours été considéré comme un phénomène passif Cependant,
depuis une dizaine d’années, cette doctrine des flux d’eau passifs a été remise en question
par plusieurs études suggérant l’existence d’un transport d’eau secondairement actif. Cette
interprétation découlait en grande partie de l’observation qu’un influx de Na ne peut
reproduire le gonflement rapide et important induit par le cotransport Na7glucose. Dans ce
projet, le phénomène est analysé plus avant en comparant le flux d’eau généré par le
cotransport Na/glucose (hSGLT1) à ceux induits par un courant entrant cationique (avec
ROMX2, un canal potassique) ou par un influx de glucose (avec GLUT2, un transporteur
facilité de glucose). Ces protéines sont surexprimées dans les ovocytes de Xenopus Iaevis,
puis testées avec des mesures volumétriques combinées à des mesures
électrophysiologiques (double-électrode) ou à des mesures de transport radioactif Les
gradients osmotiques nécessaires pour engendrer les gonflements observés sont déduits par
comparaison avec le gonflement provoqué par un choc osmotique d’amplitude connue. On
trouve que, pour des influx équivalents de cations ou de glucose, l’addition des
accumulations de substrats observées avec ROMK2 et GLUT2 est suffisante pour fournir le
gradient osmotique nécessaire à un flux d’eau entièrement passif à travers SGLT1. On peut
en conclure que des processus d’accumulation différents ont lieu pour les solutés neutres et
les ions, les solutés neutres s’accumulant sous la membrane plus rapidement que les
cations. Comme le flux d’eau rapide associé au cotransport Na/glucose peut être
quantitativement reproduit avec des flux de glucose et de cations, la doctrine du transport
passif d’eau demeure valide et le recours au cotransport d’eau n’est pas strictement
nécessaire.
Mots-clés biophysique, transport membranaire, SGLT1, ovocytes de Xenopus Ïaevis,
mesures de volume, transport d’eau, cotransport d’eau, perméabilité osmotique, diffusion
intracellulaire
iv
AbstractOver the last decade, several cotransport studies have led to the proposai of
secondary active transport of water, challenging the dogma that ail water transport is
passive. The major observation leading to this interpretation was that a Na influx failed to+
reproduce the large and rapid ceil swelling induced by Na /solute cotransport. We have
investigated this phenomenon by comparing a Na’7glucose (hSGLTI) induced water flux to
water fluxes triggered either by a cationic inward current (using ROMK2 K channeis) or by
a glucose influx (using GLUT2, a passive glucose transporter). These proteins were
overexpressed in Xenopus oocytes and assayed through volumetric measurements
combined with double-electrode electrophysiology or radioactive uptake measurements.
The osmotic gradients driving the observed water fluxes were estimated by comparison
with the swelling induced by osmotic shocks of known amplitude. We found that, for
equivalent cation or glucose uptakes, the combination of substrate accumulations observed
with ROMK2 and GLUT2 are sufficient to provide the osmotic gradient necessary to
account for a passive water flux through SGLT1. Despite the fact that the Na/glucose
stoichiometry of SGLT1 is 2:1, glucose accumulation accounts for 2/3 of the osmotic
gradient responsible for the water flux observed at t=30s. It is conciuded that the different
accumulation processes for neutral vs charged solutes can quantitatively account for the fast
water flux associated with Nat’glucose cotransport activation without having to propose the
presence of secondary active water transport.
Keywords : SGLT1, Xenopus Ïaevis oocytes, volume measurement, water transport, water
cotransport, osmotic permeability.
V
Table des matières
Résumé iii
Abstract iv
Table des matières y
Liste des figures vii
Liste des abbréviations et symboles viii
Remerciements x
Chapitre I Introduction 1
I Évolution de l’interprétation du transport de l’eau 2
1.1 Observations macroscopiques et osmose 2
1.2 Digression sur les unités 3
1.3 Prédiction de pores perméables à l’eau dans les membranes plasmiques 5
1.4 Observations moléculaires et canaux à eau 7
1.5 L’épineuse question des flux d’eau dans les épithélia 11
2 L’hypothèse du cotransport d’eau 12
3 Contexte du projet de recherche 16
3. 1 Travaux précédents 16
3.2 But du présent travail 19
3.3 Protéines à l’étude 20
Chapitre II L’accumulation de glucose peut expliquer les flux d’eau initiaux générés par
le cotransport Na/glucose 32
Chapitre III Discussion 63
1 Limites de notre approche 63
2 Réponse aux arguments appuyant le cotransport d’eau 66
3 GLUT2, une autre pompe à eau9 68
4 Exigences structurelles pour faire une pompe à eau 70
Conclusion et perspectives 76
Bibliographie 79
vi
Annexe 1 Article complémentaire: L’hypothèse controversée du transport d’eau
secondairement actif 97
vii
Liste des figures
Figure 1.1 Topologie de 1’ aquaporine 1: modèle du sablier 9
Figure 1.2 Structure du pore aqueux de l’aquaporine 1 10
Figure 1.3 Comparaison des flux de volumes provoqués par l’activation de SGLT1 ou
d’influx de cations 14
Figure 1.4 Effet sur le volume d’une réduction rapide du courant de cotransport 16
Figure 1.5 Modèle de diffusion intracellulaire 18
Figure 1.6 La famille SLC5 21
Figure 1.7 Topologie prédite de hSGLT1 22
Figure 1.8 Classification des transporteurs de glucose GLUT 26
Figure 1.9 Topologie des GLUT de la classe 1, dont GLUT2 fait partie 27
Figure 1.10 Modèle proposé pour l’empaquetage des hélices transmembranaires de GLUT1.
2$
Figure 1.11 Modèle tri-dimensionnel proposé par Zuniga et al 29
Figure 111.1 Calcul d’une pseudo stoechiométrie de cotransport d’eau pour GLUT2 6$
Figure 111.2 Les modes de transport d’eau envisagés pour SGLT1 71
Figure 111.3 États ouvert et fermé du canal potassique 73
Figure 111.4 Ca2 ATPase : changement de conformation relié à la liaison du Ca2 74
viii
Liste des abbréviations et symboles
C Concentration de solutés imperméables
C Concentration de l’eau
D Coefficient de diffusion
J Flux d’eau (J flux de volume, J flux de molécules d’eau)
L Conductivité hydraulique
osm Osmolarité
P Pression hydrostatique
Pf Perméabilité osmotique
“‘ À noter: le symbole L est toutefois utilisé pour désigner la perméabilité
osmotique dans l’article (Chap. II), pour assurer la continuité avec les publications
précédentes sur ce sujet. ‘“
Pd Perméabilité de l’eau par diffusion
Volume spécifique de l’eau
H Pression osmotique
z\lt Gradient osmotique en mOsm
SGLT Cotransporteur Na/glucose
GLUT Transporteur facilité de glucose
ROIVIX Canal potassique (renal outer medullary K channel)
ix
AQP Aquaporine
ŒMG Œ-Methylglucose
2DG 2-deoxyglucose
n
X
Remerciements
Merci tout d’abord à Jean-Yves Lapointe, mon directeur de recherche. Toujours
très généreux de son temps et de ses conseils, il m’a impeccablement guidée dans ce
cheminement scientifique. Et par-dessus tout, son optimisme inébranlable et sa sagace vue
d’ensemble m’ont apporté le support nécessaire dans les moments d’incertitude.
L’équipe du laboratoire a créé avec les années une atmosphère complice et détendue
où je me suis sentie bien accueillie. Je remercie particulièrement Bernadette et Pierre pour
leur sens de l’humour et leur aide technique. Je suis extrêmement reconnaissante à Louis
Martin Deslandes pour l’été passé à m’aider dans mon projet. La présence de mes
collègues étudiants, Dominique et Francis, a aussi été très enrichissante pour toutes les
conversations qu’elle a occasionnées, scientifiques ou pas!
Thérèse et Normand, votre soutien moral et financier m’aide depuis 24 ans à réaliser
tous mes rêves. Sachez que la bienveillance que vous démontrez envers tous vos proches
sera toujours pour moi une source d’inspiration et un modèle à suivre.
Merci à tous les amis qui m’ont apporté plein d’encouragements comme de
divertissements!
Finalement, Martin, mon compagnon de toutes les joies et de toutes les épreuves
durant cette maîtrise, je te remercie d’être à mes côtés. Je chéris le souvenir des
merveilleux moments passés avec toi, et j’anticipe toutes les aventures qui nous attendent.
Chapitre I Introduction
L’eau est la molécule majoritaire des milieux intracellulaire comme extracellulaire,
ce qui fait de l’homéostasie de l’eau un élément essentiel au bon fonctionnement de tout
organisme. À chaque seconde, d’innombrables échanges de substrats ont lieu à travers la
membrane plasmique d’une seule cellule, entraînant des flux d’eau tout aussi abondants.
L’hydrophobicité de la membrane plasmique empêche une équilibration instantanée de
l’eau suivant des flux importants de solutés. C’est pourquoi un certain nombre de
mécanismes se sont développés avec l’évolution pour faciliter les flux d’eau d’une façon
appropriée et spécifique à la fonction de chaque organe. La compréhension de ces flux
d’eau microscopiques intéresse donc les scientifiques depuis très longtemps.
Un parcours historique portant sur les étapes déterminantes de l’évolution du
concept de transport d’eau est d’abord présenté dans cette introduction. Suivront un retour
sur les arguments majeurs en faveur d’un transport d’eau secondairement actif, une
exposition du raisonnement à la base de la présente étude, ainsi qu’un résumé des
caractéristiques importantes des protéines à l’étude.
2
1 Évolution de l’interprétation du transport de l’eau
1.1 Observations macroscopiques et osmose
L’osmose est un phénomène connu depuis des lustres. La déshydratation des
aliments en les couvrant de sel ou de sucre est un exemple d’exploitation instinctive de
l’osmose qui avait cours dès l’Antiquité. Une approche plus scientifique du processus
d’osmose vit le jour par la suite avec, entre autres, les expériences de J. A. Nollet au
siècle (Andreoli et Schafer 1980). À l’aide d’une vessie animale séparant deux enceintes
contenant de l’eau pour l’une et du vin pour l’autre, il put observer que le volume du côté
contenant le vin augmentait. Il baptisa ainsi ce phénomène d’osmose (du grec ôsinés,
impulsion). Pfeffer apporta aussi une contribution plus quantitative en étudiant les flux
d’eau à travers une membrane semi-perméable séparant des solutions à différentes
concentrations de sucrose (Pfeffer 1877). La description mathématique de l’osmose fit par
la suite un bond en avant vers la fin du 19e siecle grâce à Jacobus H. van’t Hoff (van’t Hoif
1887). Ce dernier établit la loi suivante qui relie la différence de pression osmotique L\fl
(équivalente au gradient de pression hydrostatique qui serait nécessaire pour freiner le flux
d’eau osmotique) à la différence de concentration de solutés imperméables C
z\ll=RTAC, (1)
où R est la constante des gaz, de 8.31 J•mol’K’ et T la température en K. Dans le
cas où C serait exprimé en molfL, l’équation (1) permet d’obtenir la pression osmotique
tH enkPa.
Le flux d’eau à travers une membrane semi-perméable est ainsi la résultante de la
différence entre les gradients de deux pressions distinctes : la pression hydrostatique P et la
pression osmotique H:
J = L (AP-
AH), (2)
3
où J, est le flux de volume et L la conductivité hydraulique de la membrane. Pour
des pressions en kPa et un flux d’eau J, en cm3cm2-s’, les unités de la conductivité
hydraulique L seraient des cms’•kPa’.
1.2 Digression sur les unités
Dès le début de cette présentation, il serait utile de clarifier les unités qui seront
utilisées. Tout d’abord, les flux d’eau sont donnés soit en tant que flux de volume
(cm3.cm2.s’, comme J, dans l’équation 2), soit en tant que flux de molécules d’eau (J, en
mo[cm2.s’). Ces deux formes du flux d’eau sont reliées par le volume spécifique de
l’eau (18.2 cm3•mol’).
On définit ensuite une perméabilité osmotique P telle que, pour un flux d’eau
traversant une membrane du côté I vers le côté 2
J P(C —C2) t3)
où C1 et C2 sont les «concentrations d’eau» de chaque côté. Pour des solutions
assez diluées, on peut ensuite faire l’approximation suivante
(Ci —C2) - (C —C2) - (4)
Et donc:
Jtv’PfL\Cs (5)
La perméabilité osmotique Pf prendra alors des unités de cms1.
Dans le cadre du présent projet, il est peu probable que les conditions
expérimentales mènent à la formation d’un gradient de pression hydraulique significatif de
part et d’autre de la membrane des oocytes. C’est pourquoi on peut considérer dans notre
4
cas que AP = O dans l’équation 2. Sachant que J x J, on peut utiliser les expressions
pour ces flux données par les équations 2 et 5 pour établir que:
- L A.H-
X PAC5 (6)
et en remplaçant tXH par son expression donnée dans l’équation 1, on relie la
conductivité hydraulique L à la perméabilité osmotique Pf de la façon suivante
L = Pf x x (RT)1, (7)
Pour les calculs de flux osmotiques qui suivront, une relation équivalente à
l’équation 5 sera utilisée. Les solutions utilisées ne contiennent pas de protéines et ont une
faible osmolalité (—2OO mosmlkg H20), ce qui nous permet de considérer que le volume des
solutés est très petit par rapport au volume occupé par l’eau. Par conséquent, nous
utiliserons le terme osmolarité et décrirons nos solutions en terme de leur osmolarité au lieu
de leur osmolalité, ce qui nous permettra d’utiliser Ait en mOsm au lieu de AC en mosmlkg
H20. Tout ceci résulte en une équation de la forme suivante:
dV_ - Q P A
oU IfXL2C,
où S est la surface standard d’un ovocyte, évaluée à 0.4 cm2 pour un facteur de
repliement de la membrane de 8.5 à 9.5. Il faut préciser cependant que la perméabilité à
l’eau Pf (en cm.s’) est désignée dans le chapitre II par la variable L, afin assurer la
cohérence avec les publications précédentes (Duquette et al. 2001; Zeuthen et al. 2001).
C’est pourquoi on y retrouvera L en cm-s’ plutôt qu’en cm•s’kPa’ comme dans
l’équation 2.
5
1.3 Prédiction de pores perméables à l’eau dans les membranes
plasmiques
La maîtrise approfondie des concepts de diffusion et d’osmose permettait la mesuredes perméabilités à l’eau de diverses membranes. Néanmoins, ce n’est que lorsque desformes isotopiques (eau lourde t D20 et eau tritiée : THO) de la molécule d’eau devinrentdisponibles que la perméation de l’eau à travers une membrane a pu être observée d’unefaçon différente. L’eau marquée prenait alors un rôle de soluté ou de traceur plutôt que desolvant. Sa diffusion à travers une membrane, comme pour tout traceur, suit alors la loi defick:
dC(9)
où est le flux d’eau marquée en mol.st.cm2, D le coefficient de diffusion de
2-1 dC1 eau a travers la membrane en cm •s et le gradient de concentration U eau marquee
à travers la membrane. L’intégration de la loi de fick à travers l’épaisseur de la membranepermet d’obtenir une autre expression pour le flux
Jw+=PdZXCW*, (10)
où P est la perméabilité par diffusion de l’eau. Deux formes de perméabilités àl’eau pouvaient désormais être mesurées une perméabilité osmotique (Pf ou L, équation6), et une perméabilité par diffusion Pd ; la différence entre ces deux mesures étant laprésence d’une force motrice et d’un flux net d’eau pour la situation d’osmose.
Cependant, dès les premières expériences répertoriées (Hevesy et al. 1935; Visscheret aÏ. 1944), les comparaisons entre les flux d’eau osmotiquement induits et les flux d’eaulourde présentaient des contradictions. La perméabilité à l’eau de la membrane qu’on

6
déduisait de la diffusion d’eau lourde était trop petite pour prédire correctement le flux
osmotique mesuré (Koefoed-Johnsen et Ussing 1953). Cet écart laissait supposer qu’une
interaction entre les molécules d’eau avait lieu, plutôt que seulement leur diffusion
individuelle à travers la membrane lipidique. La présence de pores aqueux traversant la
membrane fut donc proposée (Pappenheimer et al. 1951; Koefoed-Johnsen et Ussing 1953)
pour expliquer la divergence entre ces mesures et la théorie décrivant la diffusion des
molécules d’eau dans les lipides. Avec l’hypothèse des pores perméables à l’eau, le rapport
Pf/Pd permet de déduire le rayon du pore en question s’il est large (Pappenheimer et al.
1951; Koefoed-Johnsen et Ussing 1953; Solomon 1968), ou encore le nombre de molécules
d’eau qu’il contient si celles-ci y circulent à la file indienne (Levitt 1974; Rosenberg et
finkelstein 1978).
Les nombreuses études utilisant des globules rouges permirent par la suite de
raffiner l’interprétation des flux d’eau à travers de vraies membranes plasmiques (au lieu
d’un épithélium au complet comme la peau de grenouille), et de bien les distinguer de la
diffusion de l’eau à travers une couche de lipides. C’est ainsi qu’un certain nombre
d’observations (bien résumées dans la revue suivante : Macey 1984) furent établies en
faveur de l’existence d’un canal à eau hautement spécifique
1) L’énergie d’activation Ea de la perméabilité à l’eau des globules rouges (4-6
kcal!mol (Vieira et al. 1970), est similaire à celle de la diffusion de l’eau en milieu aqueux
(— 5 kcallmol, Agre et al. 2002)), et nettement inférieure à l’énergie d’activation pour la
diffijsion des molécules d’eau à travers une bicouche lipidique (11-15 kcal/mol, fettiplace
et Haydon 1980)).
2) La perméabilité à l’eau des globules rouges est plus élevée que celle des
bicouches lipidiques. Aussi, tel que mentionné plus haut, la perméabilité osmotique des
membranes de globules rouges est plus élevée que la perméabilité par diffusion de l’eau
(Pf/Pd - 5 à 9 (Macey 1984)). Ces deux types de perméabilités sont identiques dans les
bicouches lipidiques. Toutefois, la présence de couches non-mélangées auraient pu
7
augmenter le rapport Pp”Pd, les obstacles à la diffusion de l’eau diminuant
préférentiellement la valeur obtenue pour Pd (Finkelstein 1987). L’épaisseur estimée de la
couche non mélangée externe aux érythrocytes semblait cependant pouvoir être suffisament
réduite (1 à 4 im pour des expériences de mélange rapide (Rice 1980)) pour écarter
l’éventualité d’un rapport PIJPd> I artéfactuel.
3) Les composés mercurés ramènent la perméabilité à l’eau des globules rouges à
des valeurs similaires à celles des bicouches lipidiques (Macey et Farmer 1970). Cet effet
spécifique suggère la présence d’un groupement —SH critique au passage des molécules
d’eau à travers ces canaux.
4) Pour des molécules d’eau circulant à la file indienne dans le pore, le rapport
PPPd permet de déduire que 5 à 9 molécules d’eau doivent y être contenues (Macey 1984),
ce qui paraissait assez raisonnable.
1.4 Observations moléculaires et canaux a eau
Bien que plusieurs observations semblaient suggérer la présence dans les
membranes plasmiques de pores spécifiquement perméables à l’eau, la véritable
confirmation de cette hypothèse survint quand une de ces protéines fut enfin identifiée.
La première protéine membranaire dont les propriétés de perméabilité à l’eau ont
été démontrées est le transporteur de glucose GLUT (Fischbarg et al. 1990). La diminution
de la perméabilité à l’eau causée par des inhibiteurs spécifiques des transporteurs de
glucose fournit un premier indice à ce sujet (Fischbarg et al. 1987; Fischbarg et al. 1989).
La surexpression de GLUT1, GLUT2 et GLUT4 dans les ovocytes de Xenopus Ïaevis
(Fischbarg et al. 1990) a ensuite pu apporter une preuve solide de la perméation de l’eau via
ces protéines.
$
L’année suivante fut déterminante le canal à eau cloné à partir des érythrocytes par
Preston et Agre (Preston et Agre 1991) put apporter une brillante confirmation de certaines
des hypothèses faites précédemment. La protéine CHW28, baptisée depuis aquaporine 1,
s’exprime en 120 000-160 000 copies par érythrocyte humain (Denker et al. 1988), et peut
reproduire dans les ovocytes les caractéristiques spécifiques à la perméabilité à l’eau des
érythrocytes telles que l’augmentation de la perméabilité osmotique, la sensibilité au
chlorure de mercure (Preston et al. 1992) et la faible énergie d’activation (Preston et al.
1992).
Les aquaporines se regroupent en tétramères (Smith et Agre 1991; Jap et Li 1995;
Murata et al. 2000), où chacun des monomère contient un pore aqueux fonctionnel.
Chaque monomère (Figure 1.1) possède 6 segments transmembranaires et deux boucles
repliées se faisant face à l’intérieur de la membrane la boucle B entre les segments 2 et 3
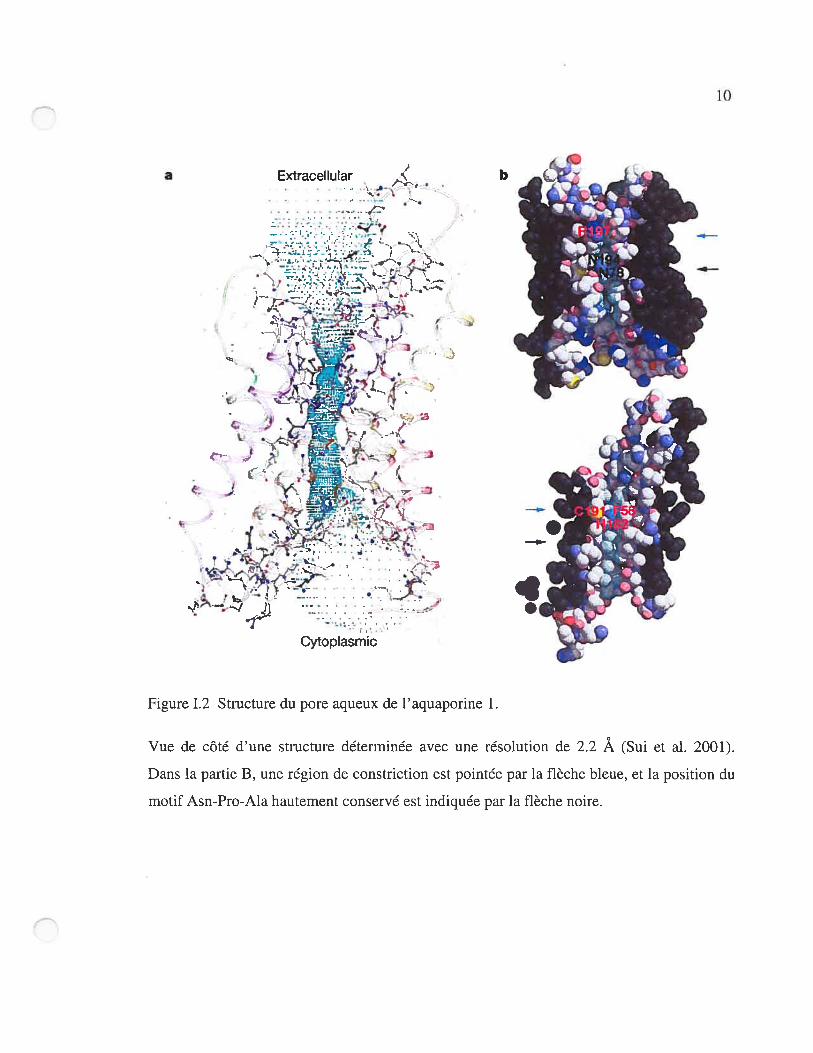
et la boucle E entre les segments 5 et 6. Le pore aqueux (figure 1.2) est bordé par les
hélices 2 et 5, les portions C-terminales des hélices 1 et 4 ainsi que les boucles B et E qui
contiennent les séquences Asn-Pro-Ala hautement conservées (Murata et al. 2000). La
structure cristallographique la plus précise obtenue jusqu’à maintenant pour Ï’aquaporine 1
atteint une résolution de 2.2 Â (Sui et al. 2001). L’aquaporine existe sous plusieurs
isoformes, dont 10 ont été identifiées jusqu’à maintenant (AQPO à AQP9). Elles sont
exprimées dans une large variété d’organes, et dans pratiquement tous les organismes, du
plus simple (organismes unicellulaires) au plus complexe (mammifères). Pour une revue
récente sur les aquaporines, consulter Agre et al.(Agre et al. 2002).

9
HOOC
hemporG-1 hempore2
figure 1.1 Topologie de l’aquaporine 1: modèle du sablier.
Tiré de (Borgnia et al. 1999), d’après la proposition originale de (Jung et al. 1994).
extraceflular
llpidbilayer
ntracelluar
A
D
hourglass
10
n
Figure 1.2 Structure du pore aqueux de l’aquaporine 1.
Vue de côté d’une structure déterminée avec une résolution de 2.2 Â (Sui et al. 2001).
Dans la partie B, une région de constriction est pointée par la flèche bleue, et la position du
motif Asn-Pro-Ala hautement conservé est indiquée par la flèche noire.
a bI
ç
Cytoplasmic
11
1.5 L’épineuse question des flux d’eau dans les épithélia
Parmi les mécanismes biologiques impliquant le transport d’eau à travers des
interfaces, l’absorption de fluide par les épithélia a suscité et continue de susciter beaucoup
de recherches et de questionnement. En effet, bien que —l2O litres de fluide traversent
l’épithélium du tubule proximal chaque jour et que 8 litres par jour soient absorbés par le
petit intestin, ces flux importants ont lieu en l’absence de tout gradient osmotique
détectable entre les 2 côtés de l’épithélium. Il a plutôt été observé que le flux d’eau
transépithélial dépendait de l’absorption des solutés. Pour expliquer ce phénomène, un
modèle à 3 compartiments fut d’abord proposé (Curran et MacIntosh 1962), impliquant un
compartiment central où l’accumulation active des solutés attirerait de l’eau par osmose en
provenance du côté apical, le tout étant évacué par la suite vers le côté basolatéral suivant le
gradient de pression généré. Par la suite, les espaces latéraux intercellulaires ont été
suggérés (Whitlock et Wheeler 1964) pour tenir le rôle de cet espace particulier où
l’accumulation active des solutés provenant des cellules adjacentes attirerait de l’eau par
osmose. La pression hydrostatique engendrée par cet excès de fluide dans les espaces
latéraux entrainerait ensuite l’eau comme les solutés dans l’interstitium basal. Basé sur ce
principe, le modèle plus raffiné du flux osmotique à gradient stable (standing-gradient
osmolic ftow) vit le jour (Diamond et Bossert 1967). Cependant, aucune des vérifications
expérimentales des caractéristiques nécessaires à l’occurence d’un gradient stable
(expression des pompes à solutés localisée près de la partie fermée des espaces latéraux
intercellulaires, bonne étanchéité des jonctions serrées, diffusion restreinte des solutés dans
les espaces latéraux) n’a donné le résultat escompté (Xia et al. 1998; Spring 1999). Des
modèles alternatifs ont donc été présentés, revenant parfois (Spring 1999) au modèle à 3
compartiments qui avait précédé celui du gradient stable, suggérant des proportions variées
entre les flux d’eau transcellulaires et paracellulaires, ou permettant une certaine
recirculation des solutés pompés vers les espaces intercellulaires (Larsen et al. 2002; Spring
12
2002). Ces modèles restent toutefois basés sur le principe qu’un flux de solutés à travers
une membrane génère un gradient osmotique local pour entraîner de l’eau.
Le mécanisme par lequel d’aussi grandes quantités d’eau peuvent traverser des
épithélia sans altérer l’intégrité des cellules est donc encore loin d’être bien élucidé. Dans
cette optique, l’éventualité de la présence de pompes à eau à la membrane apicale a généré
beaucoup d’intérêt.
2 L’hypothèse du cotransport d’eau
La perméabilité osmotique de sa membrane plasmique permet à la cellule
d’équilibrer l’osmolarité du cytosol avec celle du milieu environnant. Lorsqu’une certaine
quantité de substrat est absorbée par une cellule, son osmolarité augmente graduellement,
ce qui génère un flux d’eau proportionnel au gradient osmotique (équation 8). Le flux d’eau
passif doit toujours survenir suite à la création d’un gradient d’osmolarité : c’est
essentiellement ce principe qui a amené T. Zeuthen (Zeuthen 1991 a) à suggérer la première
fois un nouveau mécanisme de transport de l’eau. Ces premières études (Zeuthen 1991a;
Zeuthen 199 lb; Zeuthen 1994) portaient sur la membrane ventriculaire de l’épithélium du
plexus choroïde de Nectunts rnacuÏosus, et suggéraient la présence de cotransport K-Cl
accompagné d’un transport secondairement actif d’eau. Le plexus choroïde est responsable
de la sécrétion du liquide céphalo-rachidien, et son épithélium est de type « lâche» (Wright
197$). Les mesures de volume dans ce cas étaient relativement indirectes, puisque c’est
avec des électrodes sélectives au K, qui sont, en fait, encore plus sélectives à la choline
(Ch), que les changements de concentrations intracellulaires de Ch étaient enregistrés.
C’est par l’intermédiaire de ces changement de concentration iCh que des zWol étaient
déduits. Quoi qu’il en soit, les flux de K, de Cl et d’eau trouvés semblaient s’induire
13
mutuellement de manière rapide, et les effets attendus de l’accumuLation de solutés dans les
couches non-mélangées ont été écartés par des considérations théoriques. Un cotransport
avec stoechiométrie de 1 K : 1 C1: 500 H20 fut donc proposé. Une conclusion semblable
a été tirée de mesures similaires pour les flux de H, de lactate et d’eau à travers la
membrane rétinienne de l’épithélium pigmenté de la grenouille (Zeuthen et al. 1996).
En 1996, Loike et al. observaient (Loike et al. 1996) une perméabilité à l’eau
sensible à la phlorizine chez les ovocytes exprimant le cotransporteur Na7glucose de lapin
(rSGLT1). Quelques mois plus tard, Loo et al. publiaient leurs premières mesures de
volume avec des ovocytes exprimant rSGLT1 (Loo et al. 1996). Ces résultats obtenus avec
un montage qui permettait des mesures de volume en temps réel ont amené Loo et al. à
suggérer un couplage direct des flux d’eau avec ceux du sodium, impliquant le transfert de
260 molécules d’eau à chaque cycle du cotransporteur. Toujours pour le cotransporteur de
lapin, ce nombre a par la suite été révisé à 390 (Zeuthen et al. 1997), puis 424 (Zeuthen et
al. 2001). Cette première suggestion de transport secondairement actif d’eau par un
cotransporteur cloné marquait le début d’une longue série de publications. Des activités deS +«pompe a eau» ont ete suggerees pour le cotransporteur Na /glucose d humain (hSGLT1,
Meinild et al. 1998)), le cotransporteur Na7dicarboxylate (NaDC-1, Meinild et al. 2000), le
cotransporteur Na/glutamate (EAAT1, MacAulay et al. 2001), et les cotransporteurs
Naiiode et H/acide aminé (mentionnés dans Loo et al. 1996; Meinild et al. 2000). Le
mécanisme de cotransport d’eau aurait pour chaque cotransporteur une stoechiométrie
spécifique, allant de 50 à 400 molécules d’eau par cycle.
Les observations et arguments appuyant l’existence d’un transport d’eau
secondairement actif sont à peu près les mêmes pour tous ces cotransporteurs. Ces
arguments sont expliqués dans plusieurs revues ((Wright et Loo 2000; Loo et al. 2002;
Zeuthen et al. 2002)). En voici un résumé:
1 - Quand le cotransporteur est activé, le gonflement suit rapidement et semble
avoir initialement une pente constante. Les flux de cations n’ont pas cet effet rapide ; ils
14
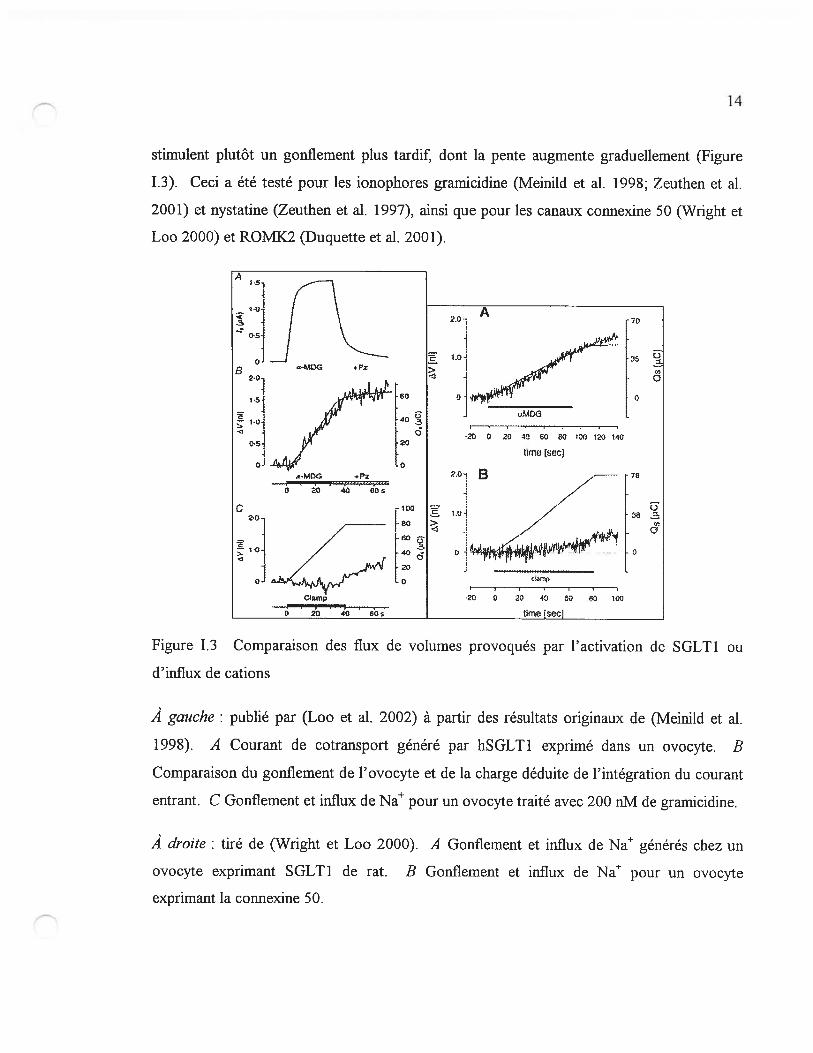
stimulent plutôt un gonflement plus tardif dont la pente augmente graduellement (figure
1.3). Ceci a été testé pour les ionophores gramicidine (Meinild et al. 1998; Zeuthen et al.
2001) et nystatine (Zeuthen et al. 1997), ainsi que pour les canaux connexine 50 (Wright et
Loo 2000) et ROMX2 (Duquette et al. 2001).
À gauche: publié par (Loo et al. 2002) à partir des résultats originaux de (Meinild et al.
1998). A Courant de cotransport généré par hSGLT1 exprimé dans un ovocyte. B
Comparaison du gonflement de l’ovocyte et de la charge déduite de l’intégration du courant
entrant. C Gonflement et influx de Na pour un ovocyte traité avec 200 nM de gramicidine.
À droite: tiré de (Wright et Loo 2000). A Gonflement et influx de Na générés chez un
ovocyte exprimant SGLT1 de rat. B Gonflement et influx de Na pour un ovocyte
exprimant la connexine 50.
Figure 1.3 Comparaison des flux de volumes provoqués par l’activation de SGLT1 ou
d’influx de cations
15
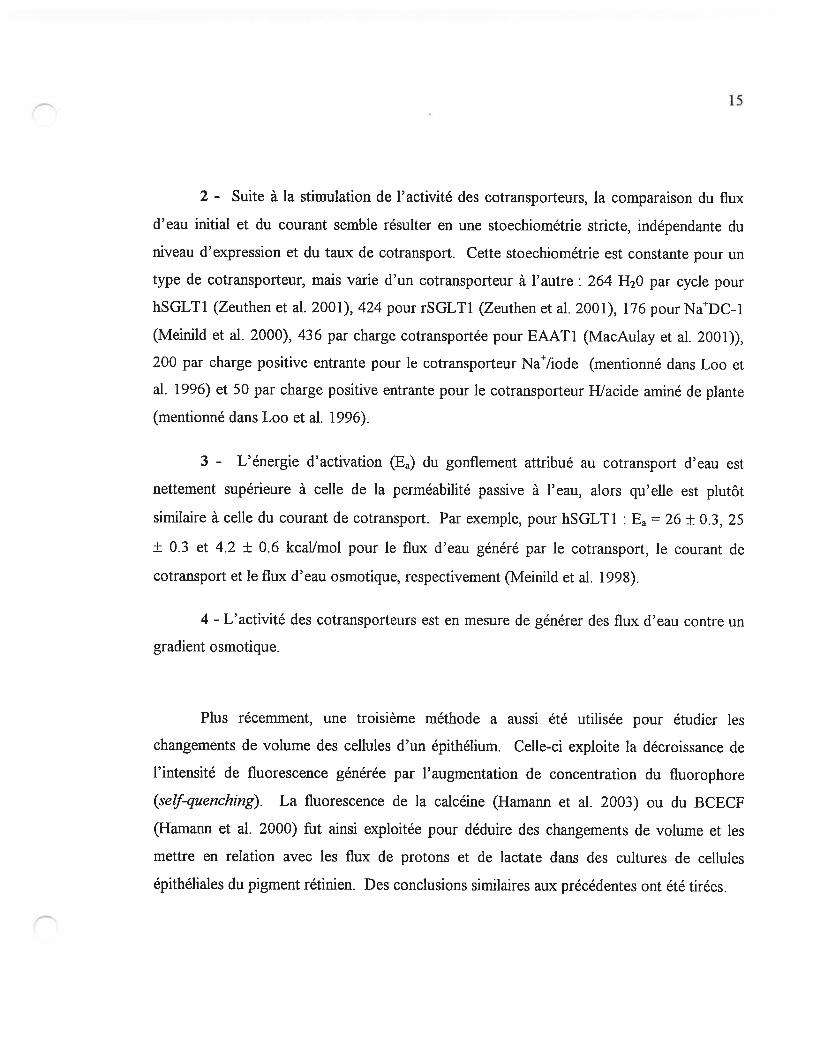
2 - Suite à la stimulation de l’activité des cotransporteurs, la comparaison du flux
d’eau initial et du courant semble résulter en une stoechiométrie stricte, indépendante du
niveau d’expression et du taux de cotransport. Cette stoechiométrie est constante pour un
type de cotransporteur, mais varie d’un cotransporteur à l’autre : 264 H20 par cycle pour
hSGLT1 (Zeuthen et al. 2001), 424 pour rSGLT1 (Zeuthen et al. 2001), 176 pour NaDC-l
(Meinild et al. 2000), 436 par charge cotransportée pour EAAT1 (MacAulay et al. 2001)),
200 par charge positive entrante pour le cotransporteur Na7iode (mentionné dans Loo et
al. 1996) et 50 par charge positive entrante pour le cotransporteur Wacide aminé de plante
(mentionné dans Loo et al. 1996).
3 - L’énergie d’activation (Ea) du gonflement attribué au cotransport d’eau est
nettement supérieure à celle de la perméabilité passive à l’eau, alors qu’elle est plutôt
similaire à celle du courant de cotransport. Par exemple, pour hSGLT1 Ea = 26 ± 0.3, 25
± 0.3 et 4.2 ± 0.6 kcallmol pour le flux d’eau généré par le cotransport, le courant de
cotransport et le flux d’eau osmotique, respectivement (Meinild et al. 1998).
4 - L’ activité des cotransporteurs est en mesure de générer des flux d’eau contre un
gradient osmotique.
Plus récemment, une troisième méthode a aussi été utilisée pour étudier les
changements de volume des cellules d’un épithélium. Celle-ci exploite la décroissance de
l’intensité de fluorescence générée par l’augmentation de concentration du fluorophore
(s4f-quenching). La fluorescence de la calcéine (Hamann et al. 2003) ou du BCECf
(Hamann et al. 2000) fut ainsi exploitée pour déduire des changements de volume et les
mettre en relation avec les flux de protons et de lactate dans des cultures de cellules
épithéliales du pigment rétinien. Des conclusions similaires aux précédentes ont été tirées.
16
3 Contexte du projet de recherche
3.1 Travaux précédents
Les flux d’eau associés au cotransport Nat’glucose dans les ovocytes ont déjà fait
l’objet d’une série de travaux dans ce laboratoire. Les premières expériences de volumétrie
combinée à des mesures électrophysiologiques, effectuées par Pierre-Pascal Duquette dans
le cadre de sa maîtrise supervisée par le professeur Jean-Yves Lapointe (Duquette 2000;
Duquette et al. 2001), avaient ainsi pour but d’identifier la force motrice à la source des
flux d’eau reliés à l’activité de SGLT1. Tout d’abord, l’inhibition du cotransport
Na/gIucose après une longue période d’activité stationnaire a permis de quantifier le
gradient osmotique généré par l’accumulation des substrats sous la membrane (16 ± 2
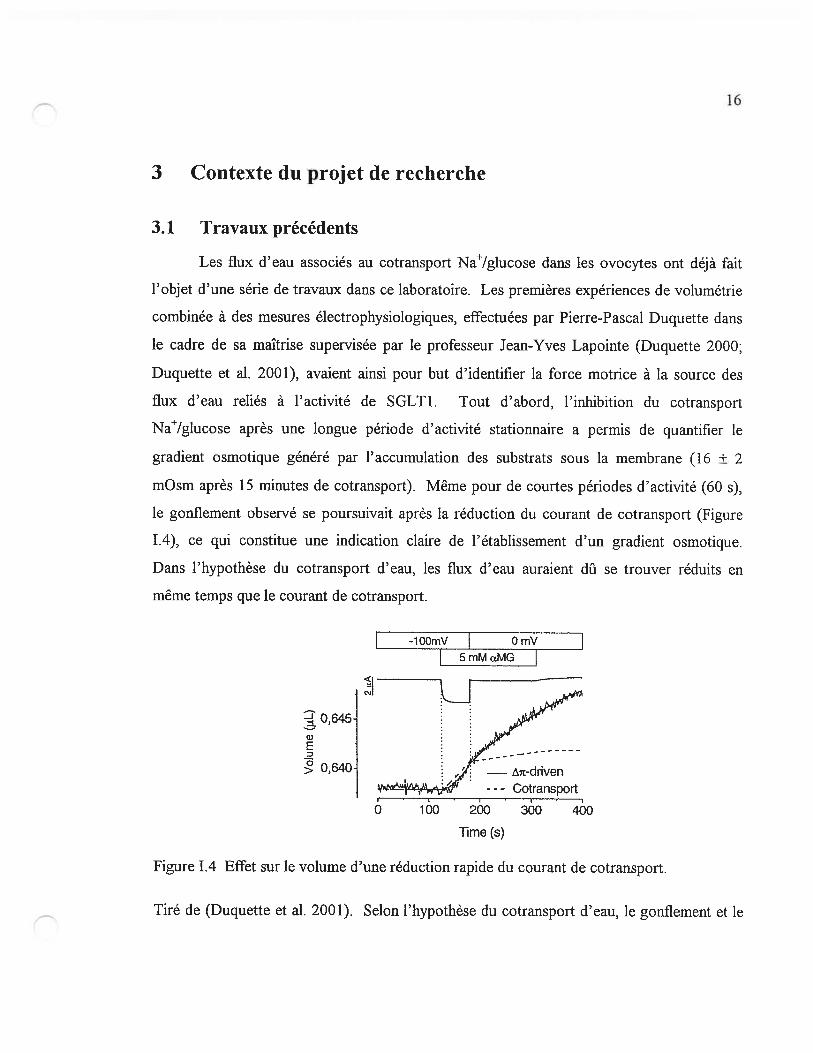
mOsm après 15 minutes de cotransport). Même pour de courtes périodes d’activité (60 s),
le gonflement observé se poursuivait après la réduction du courant de cotransport (Figure
1.4), ce qui constitue une indication claire de l’établissement d’un gradient osmotique.
Dans l’hypothèse du cotransport d’eau, les flux d’eau auraient dfi se trouver réduits en
même temps que le courant de cotransport.
-lOOmV j OmV
mMaMG
0 100 200 30 40
0,645-
E
0,640
lime (s)
Figure 1.4 Effet sur le volume d’une réduction rapide du courant de cotransport.
Tiré de (Duquette et al. 2001). Selon l’hypothèse du cotransport d’eau, le gonflement et le
17
courant observés suite à l’application de 5 mM ŒMG correspondraient à une stoechiométrie
de 240 molécules d’eau par molécule d’ŒMG (trait pointillé). Avec la dépolarisation, le
gonflement aurait alors dû s’interrompre en même temps que le courant, ce qui n’est
clairement pas le cas. Le modèle de diffusion intracellulaire (courbe continue), quant à lui,
reproduit très bien la mesure de volume.
Des mesures de potentiel d’inversion avec des ovocytes exprimant le canal
potassique ROMX2 ont aussi indiqué que, malgré le fait que les flux d’eau suivant
l’application du courant ne paraissent pas aussi immédiats qu’avec SGLT1, une
accumulation de K pouvait être détectée dès 30 secondes après le déclenchement du
courant (Duquette et al. 2001).
Ces résultats ont permis de conclure que des gradients osmotiques considérables
s’établissaient rapidement suite au déclenchement du cotransport Nat’glucose. Un modèle
numérique de diffision intracellulaire a été élaboré. Dans ce modèle simple, l’ovocyte est
subdivisé en 50 coquilles concentriques. La perméabilité à l’eau de la membrane est
directement déduite du choc hypotonique imposé à l’ovocyte à la fin de l’expérience
(équation 8). Le courant mesuré fournit la quantité d’osmolytes qui arrivent à chaque
incrément de temps à la couche externe et en changent la concentration. De plus,
l’électrode de courant, pour maintenir un potentiel intracellulaire fixe, peut en théorie
absorber des cations ou injecter des anions en réaction à l’entrée de Na dans la cellule.
C’est pourquoi un certain nombre d’osmolytes par ŒMG transporté est aussi présent
comme paramètre ajustable. Ce nombre peut prendre une valeur entre 1 (si 2 K sont
absorbés par l’électrode quand 2 Na arrivent) et 5 (si l’électrode émet 2 C1 quand 2 Na
arrivent). Par la suite, la diffusion des osmolytes entre chaque couche est calculée avec un
coefficient de diffusion unique pour l’osmolyte intracellulaire «moyen ». Après cette
phase de diffusion intracellulaire, l’osmolarité de la première couche et la perméabilité à
l’eau de la membrane permettent de déduire l’entrée d’eau et le changement de volume
18
subséquent. Ainsi, 2 paramètres étaient ajustés (le coefficient de diffiasion intracellulaire et
le nombre d’osmolytes par charge) afin de reproduire une expérience donnée. Les
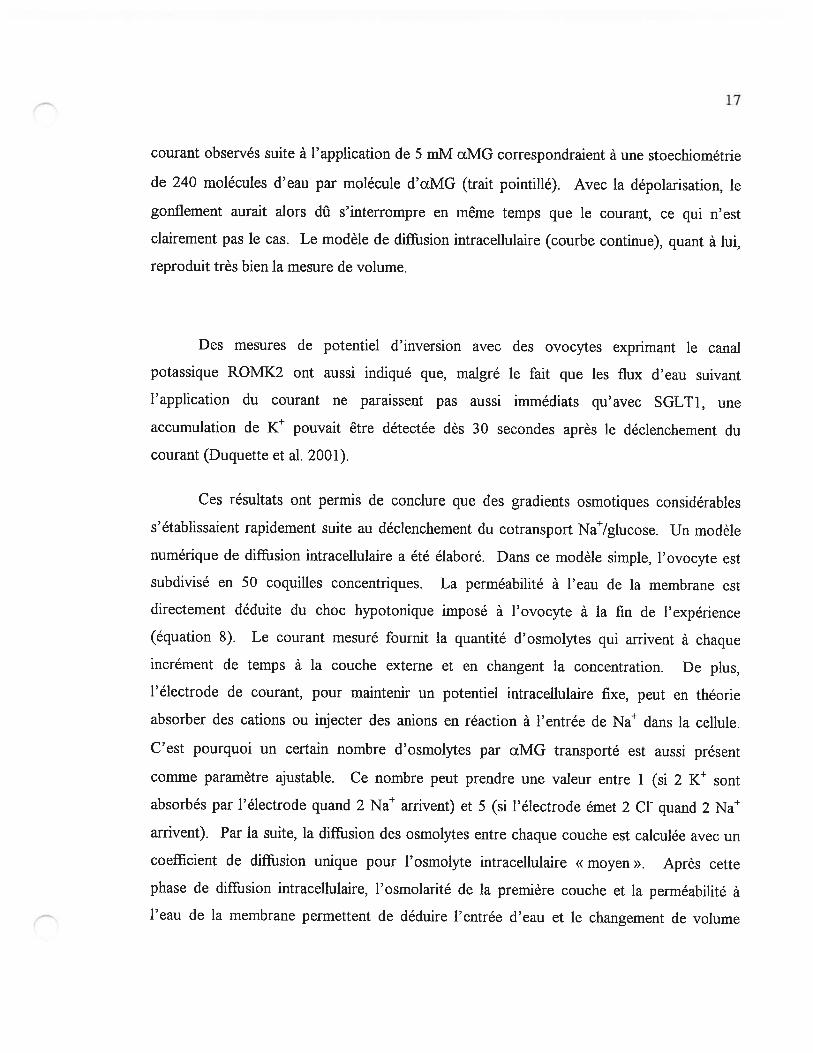
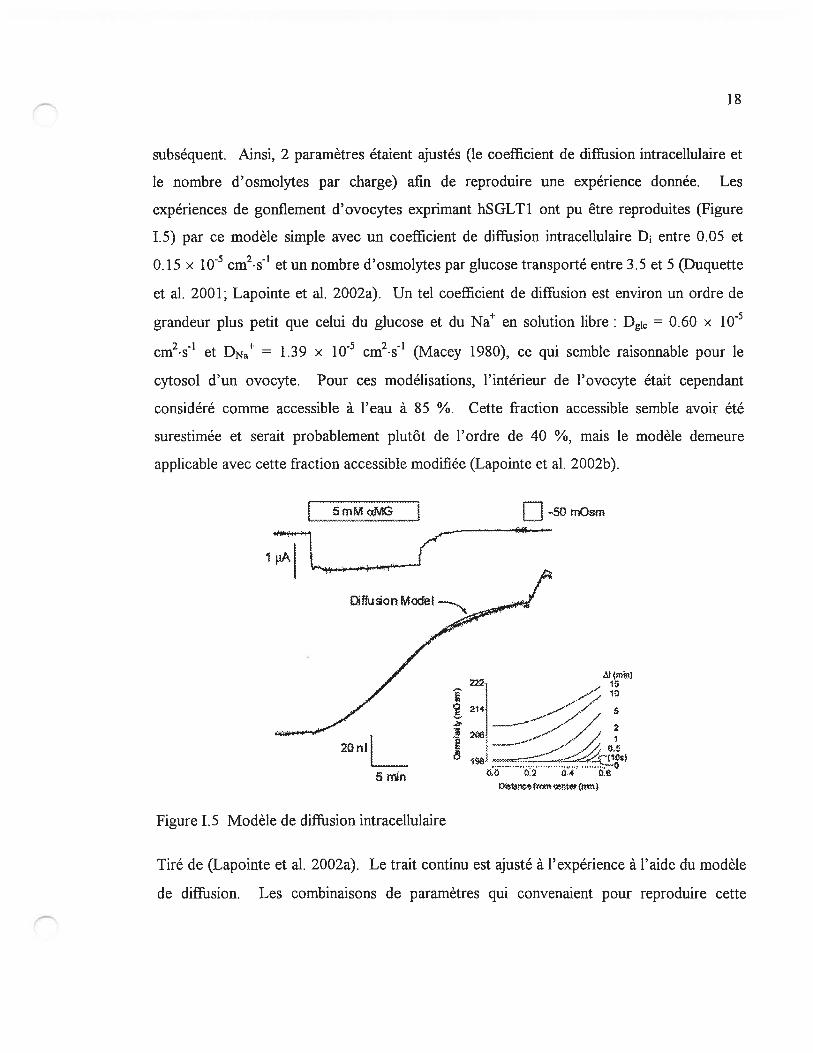
expériences de gonflement d’ovocytes exprimant hSGLT1 ont pu être reproduites (Figure
1.5) par ce modèle simple avec un coefficient de diffusion intracellulaire D entre 0.05 et
0.15 x 1 0 cm2• &1 et un nombre d’ osmolytes par glucose transporté entre 3.5 et 5 (Duquette
et al. 2001; Lapointe et al. 2002a). Un tel coefficient de diffusion est environ un ordre de
grandeur plus petit que celui du glucose et du Na en solution libre: Dgic = 0.60 X i0
cm2•s et DNa = 1.39 x 1OE5 cm2•s’ (Macey 1980), ce qui semble raisonnable pour le
cytosol d’un ovocyte. Pour ces modélisations, l’intérieur de l’ovocyte était cependant
considéré comme accessible à l’eau à 85 ¾. Cette fraction accessible semble avoir été
surestimée et serait probablement plutôt de l’ordre de 40 ¾, mais le modèle demeure
applicable avec cette fraction accessible modifiée (Lapointe et al. 2002b).
Tiré de (Lapointe et al. 2002a). Le trait continu est ajusté à l’expérience à l’aide du modèle
de diffusion. Les combinaisons de paramètres qui convenaient pour reproduire cette
[1
1
222-
214 z.z / 2
----..-, ,//
o l%O. :2
Figure 1.5 Modèle de diffiasion intracellulaire
19
expérience au complet incluant le choc hypotonique utilisaient en moyenne D1 = 0.11 ±
0.03 x i0 cm2•s4 et 4.1 ± 0.3 osmolytes par ŒMG transporté. Les profils d’osmolarité
calculés du centre de l’ovocyte jusqu’à la membrane sont présentés à droite.
3.2 But du présent travail
À la lumière des résultats récoltés par Pierre-Pascal Duquette, des osmolytes
accumulés sous la membrane peuvent expliquer entièrement le gonflement fort et rapide+associe a 1 activite du cotransporteur Na !glucose. La plupart des observations utihsees
pour soutenir l’occurrence d’un cotransport d’eau peuvent alors être expliquées si la
diffusion intracellulaire est assez faible pour permettre une accumulation rapide des
osmolytes sous la membrane.
Cependant, une observation incontestable demeure: c’est la rapidité et la force avec
laquelle le gonflement de l’ovocyte est déclenché après la stimulation du courant de
cotransport lorsqu’on le compare au cas où un flux purement ionique est activé (figure 1.3).
Si le transport secondairement actif d’eau n’existe pas, il faut conclure qu’un flux combiné
d’ions et de solutés neutres ne peut être comparé à un flux ionique équivalent, i.e. l’effet
osmotique du transport du soluté neutre (par exemple, le glucose) est majeur. La
quantification de cet effet osmotique du glucose dans les ovocytes et sa comparaison avec
les effets osmotiques d’un flux cationique ou de cotransport constituent les buts du présent
projet de recherche. Cette investigation se veut une suite logique de l’étude menée par
Pierre-Pascal Duquette, car une fois la conclusion atteinte que les flux d’eau précédemment
attribués à un transport actif d’eau peuvent être expliqués par une accumulation
d’osmolytes, il est primordial de comprendre de quelle façon la nature des osmolytes
transportés influence le processus d’accumulation. Si on peut reproduire les gradients
osmotiques nécessaires pour expliquer les flux d’eau générés par SGLT1, et ce en utilisant
des protéines qui ne sont pas apparentées à ce cotransporteur, il peut être conclu que la
20
force de ces flux d’eau n’est pas attribuable à la protéine en tant que telle mais plutôt aux
substrats transportés par celle-ci.
3.3 Protéines à l’étude
Les deux protéines membranaires sélectionnées pour expliquer séparément l’effet
des flux de cations et de glucose du cotransporteur Naiglucose (h$GLTI) sont le canal
potassique ROMK2 et le transporteur facilité de glucose GLUT2.
3.3.1 SGLT1 : le cotransporteur Na/glucose
Le phénomène de transport de solutés neutres couplé au flux de sodium est connu
depuis les travaux de Crane dans les années 60 (Crane 1962; Crane 1965). Le cotransport
Na/glucose constitue un exemple typique de cette exploitation des gradients de Na par la
cellule pour importer et accumuler différents solutés. De nombreuses études cinétiques du
cotransporteur Na/glucose ont été faites avant son clonage, notamment par l’exploitation
de cellules du tubules proximal, ou de vésicules de membrane à bordure en brosse de
l’intestin (BBMV) (articles de revue : Freel et Goldner 1981; Semenza et al. 1984). Le
cotransporteur Na7glucose SGLT1 du lapin a été cloné en 1987 en utilisant, pour la
première fois, la technique du clonage par expression (Hediger et al. 1987). L’isoforme
SGLT1 est la plus étudiée des cotransporteurs SGLT. Chez l’humain, ses sites
d’expression les mieux connus sont les membranes apicales des cellules du tubule proximal
du rein et du petit intestin. D’autres types de cotransporteurs Na/glucose ont aussi été
identifiés. Les deux principaux sont SGLT2 (Wells et al. 1992) et SGLT3 (Kong et al.
1993; Mackenzie et al. 1994), deux candidats potentiels pour le transport de glucose rénal à
faible affinité (pour une revue récente : Wright 2001). On définit aujourd’hui une famille
de cotransporteurs homologues à SGLT (la famille SLC5) qui compte plus de 220
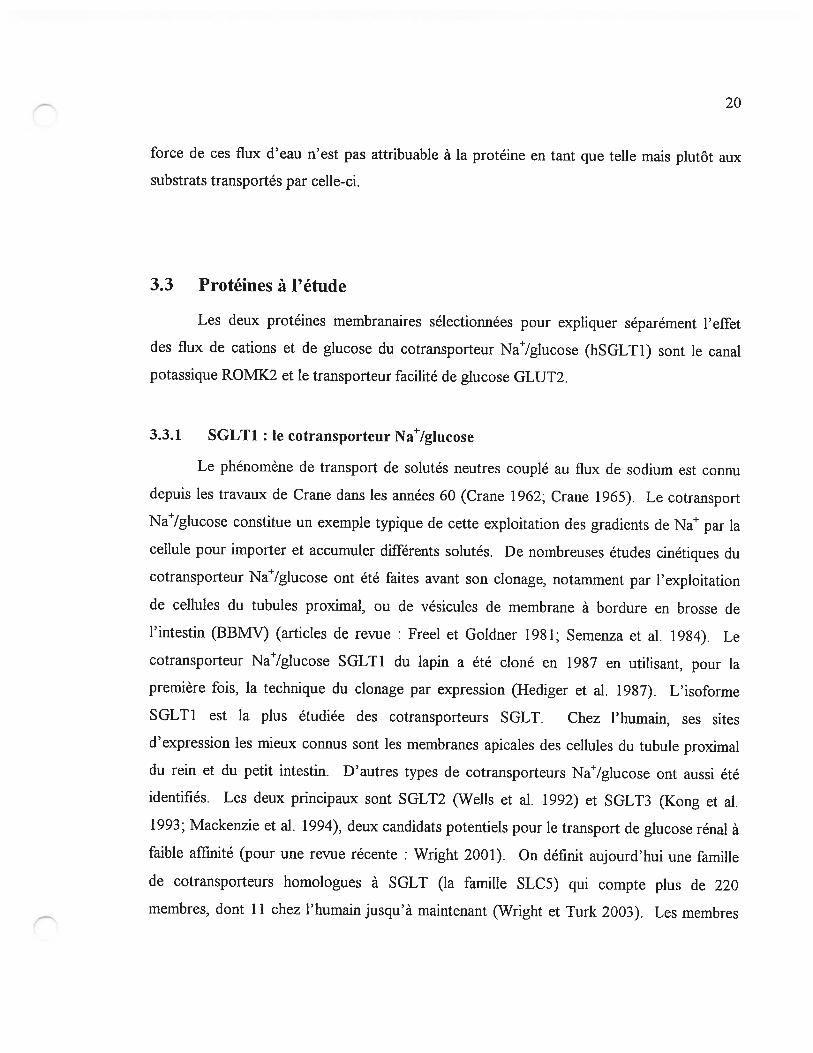
membres, dont 11 chez l’humain jusqu’à maintenant (Wright et Turk 2003). Les membres
21
humains de la famille SLC5 (figure 1.6) sont de 21 à 59 % identiques à SGLT1 et sont
impliqués dans le cotransport (couplé au Na) de glucose, de myo-inositol, de choline, de
vitamine ou d’iode (Wright et Turk 2003).
Figure 1.6 La famille SLC5
Arbre phylogénétique des membres humains de la famille SLC5, et deux membres d’autres
vertébrés (d’après Wright et Turk 2003). (SGLT cotransporteur Na/glucose, SMIT
cotransporteur Na1 /myo-inositol, SIvfVT cotransporteur Na/multivitamines, CHT
transporteur de choline, AIT transporteur d’iode apical, NIS cotransporteur Na17iode)
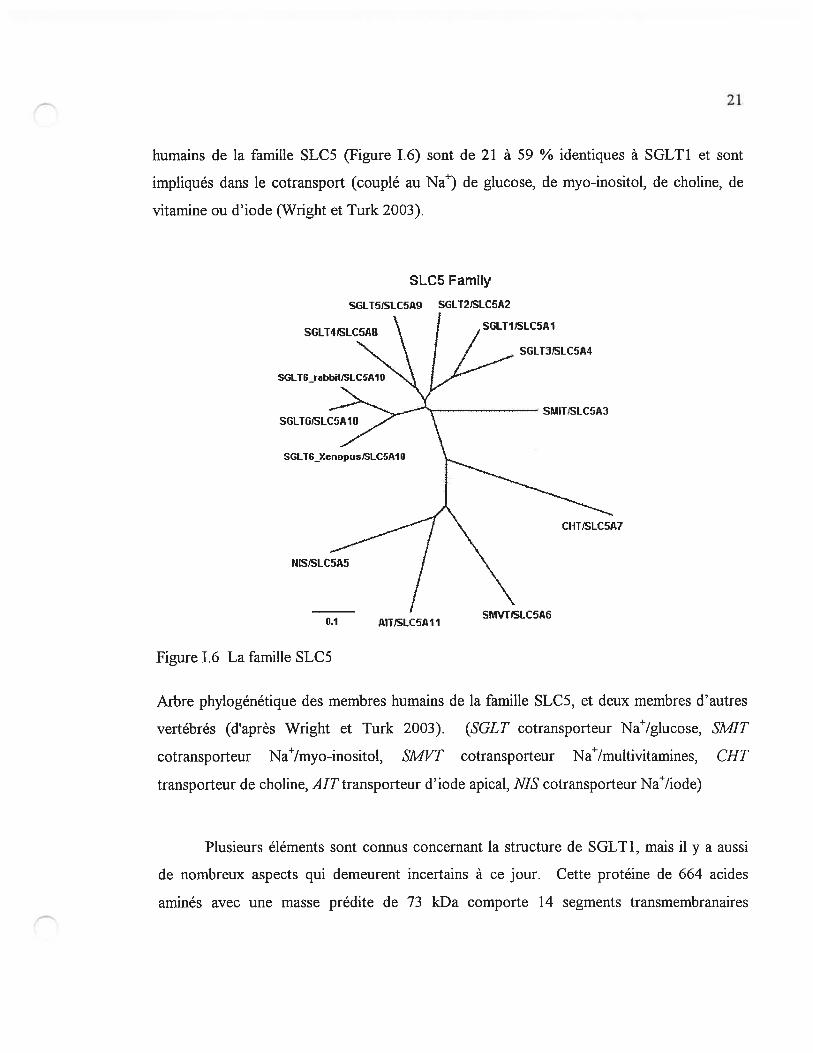
Plusieurs éléments sont connus concernant la structure de SGLT1, mais il y a aussi
de nombreux aspects qui demeurent incertains à ce jour. Cette protéine de 664 acides
aminés avec une masse prédite de 73 kDa comporte 14 segments transmembranaires
SLC5 Family
SGLT5ISLC5I9 SGLT2ISLC5A2
SGLI4ISLC5IW
SGLT3ISLC5M
SMITISLC5A3
NISSIC5A5
CHTSLC5M
0.1 AIIISLC5AIISMVTîSLC56
22
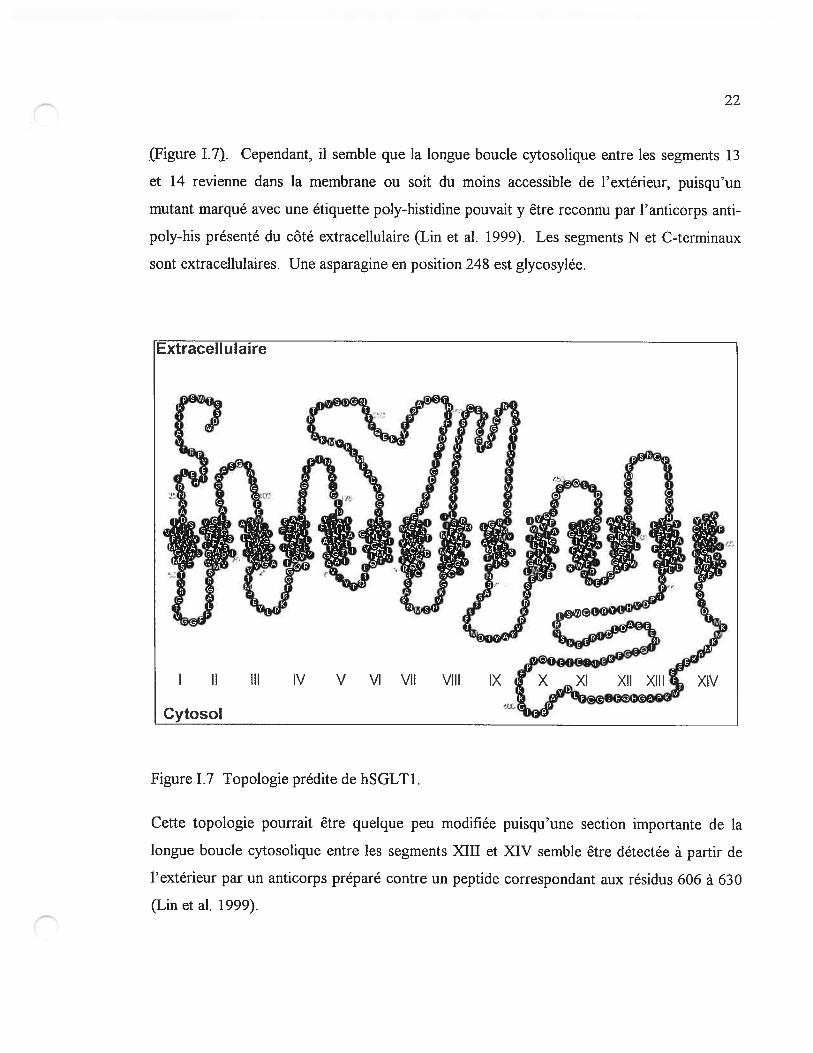
Figure 1.7). Cependant, il semble que la longue boucle cytosolique entre les segments 13
et 14 revienne dans la membrane ou soit du moins accessible de l’extérieur, puisqu’un
mutant marqué avec une étiquette poly-histidine pouvait y être reconnu par l’anticorps anti
poly-his présenté du côté extracellulaire (Lin et al. 1999). Les segments N et C-terminaux
sont extracellulaires. Une asparagine en position 248 est glycosylée.
Cette topologie pouffait être quelque peu modifiée puisqu’une section importante de la
longue boucle cytosolique entre les segments XIII et XIV semble être détectée à partir de
l’extérieur par un anticorps préparé contre un peptide correspondant aux résidus 606 à 630
(Lin et al. 1999).
Extracéllùlaire
figure 1.7 Topologie prédite de hSGLT1.
23
Les opinions sont partagées concernant l’oligomérisation possible de SGLT1. Des
études d’inactivation par radiation sur la membrane à bordure en brosse du rein de rat (Jette
et al. 1997) ou de l’intestin de lapin (Stevens et al. 1990) suggèrent un cotransport
Nat’glucose médié par un tétramère. Une autre analyse des flux de glucose dans les
vésicules de membrane à bordure en brosse de l’intestin s’est montrée compatible avec une
structure dimérique ou tétramérique de SGLT1 (Chenu et Berteloot 1993). Par contre, des
observations par cryodécapage semblent indiquer que rSGLT1 formerait un monomère
asymétrique à la membrane des ovocytes (Eskandari et al. 199$). Un consensus n’est donc
pas encore atteint à ce sujet. Cependant, il est aussi possible que l’oligomérisation de
SGLT1 varie selon la membrane où il est exprimé (tissu natif ou système hétérogène
d’expression).
Les résultats disponibles présentement semblent montrer que le site de liaison au
glucose est du côté C-terminal, et les sites de liaison aux ions Na du côté N-terminal. En
effet, une protéine tronquée possédant seulement les 5 derniers segments
transmembranaires se comportait comme un transporteur facilité de glucose (Panayotova
Heiermann et al. 1997). Aussi, le remplacement de divers résidus par des cystéines
(SCAM, substituted cysteine accessibiÏity methoci) propose une rôle important de la boucle
extracellulaire entre les segments 4 et 5 pour la liaison du Na et la sensibilité au voltage
(Lo et Silverman 199$). De plus, des mutations et des mesures de spectroscopie à
résonance paramagnétique des électrons (EPR) dans le domaine N-terminal du
cotransporteur Na/proline (PutP), suggèrent une implication de ce domaine pour la liaison
du Na et le couplage des flux de Na et de substrat (Quick et al. 1999; Wegener et al.
2000; Pirch et al. 2002).
Les propriétés cinétiques à l’état stationnaire des ovocytes exprimant SGLT1 sont
bien connues (Parent et al. 1992a; Wright et al. 1998; Wright 2001). L’Œ-méthyl-D
glucoside (ŒMG) est transporté de façon dépendante du Na, avec une constante d’affinité
KM = 0.4 mM pour la forme humaine de SGLT1 (Wright 2001). Le transport du sodium est
24
dépendant du voltage, avec KM = 3 mlvi à —150 mV. La fréquence d’activité intrinsèque est
de 60 cycles•s’ pour hSGLT1. Le cotransport Na/glucose par SGLT1 est inhibé par la
phiorizine, avec un K1 entre une dizaine de nM et quelques 1M, selon l’espèce. En absence
de glucose, un courant de fuite de Na sensible à la phiorizine est détecté, mais son
amplitude est de beaucoup inférieure (2 à 10 %) à celle du cotransport (Umbach et al. 1990;
Parent et al. 1992a; Chen et al. 1995).
Bien que des travaux initiaux sur le cotransport Na7glucose aient proposé une
stoechiométrie de 1 Na pour 1 glucose à la fois pour des vésicules intestinales (Hopfer et
Groseclose 1980) et pour des vésicules du cortex rénal (Beck et Sacktor 1978), on reconnait
aujourd’hui que la stoechiométrie dans l’intestin est de 2 Na: 1 glucose et que celle au
niveau du rein est une combinaison de cotransports 1:1 et 2:1 (Turner et Moran 1982).
Dans le cas du cotransporteur SGLTI isolé, la stoechiométrie de 2 Na : 1 glucose est
maintenant bien acceptée. Des études variées ont amené différentes équipes à cette
conclusion ; notamment par des mesures de potentiels d’inversion avec la méthode du eut-
open oocyte (Chen et al. 1995), et par la mesure directes des flux de Na ou d’ŒMG
isotopiques en parallèle avec la mesure de courant dans les ovocytes exprimant SGLT1
(Mackenzie et al. 1998).
La cinétique précise du mode de fonctionnement de SGLT1 est l’objet de multiples
recherches impliquant les modes stationnaire et pré-stationnaire (Loo et al. 1993; Chen et
al. 1996; Chen et al. 1997; Falk et al. 199$). Néanmoins, l’ordre de liaison des substrats
présentement privilégié est lNa1 :1Na :lglucose (Parent et al. 1992b; Berteloot 2003).
3.3.2 ROMK2: un canal potassique
Les canaux Kir 1.1 ou ROMK (renal outer medullary K channel) sont des canaux
potassiques à rectification entrante, activés par l’ATP. ROMK1, le premier membre de
cette famille, a été découvert en 1993 (Ho et al. 1993). Les diverses isoformes des canaux
ROMK semblent provenir de l’épissage alternatif d’un même gène (Boim et al. 1995).
25
L’isoforme ROMK2 (Kiri. lb) a été clonée par expression dans les ovocytes de Xenopus
Ïaevis, à partir de reins de rats (Zhou et al. 1994). ROMX2 est exprimée à divers endroits
le long du tubule rénal: on en retrouve à la portion épaisse de l’anse ascendante de Henlé,
au tubule contourné distal, au tubule connecteur et à la portion corticale du tubule
collecteur (Boim et al. 1995). Ce canal possède deux segments transmembranaires qui
jouxtent une région «H5 » contenant les résidus G-Y-G essentiels au filtre de sélectivité
spécifique aux canaux potassiques (Wang et al. 1997). Le canal fonctionnel serait composé
de 4 sous-unités de Kir et 4 sous-unités de SUR.
Le clone de ROMK2 fut offert à notre laboratoire par J. Xu et S. C. Hebert.
L’injection de son ARN messager dans les ovocytes génère une expression forte et rapide,
des expériences étant possibles dès le lendemain de l’injection. Ainsi, la membrane des
ovocytes exprimant ROMX2 devient presque complètement sélective au potassium.
3.3.3 GLUT2: un transporteur de glucose
Le premier transporteur de glucose GLUT1 fut cloné en 1985 (Mueckler et al.
1985). La famille des GLUT regroupe maintenant 13 transporteurs facilités de
sucre/polyols (GLUT1-12 et HIVIIT), regroupés en trois classes (figure 1.8). Plusieurs
nouveaux membres de cette famille ont récemment été découverts, par homologie de
séquence entre les GLUTs déjà connus et les bases de données disponibles sur le génome
(pour une revue récente sur la classification : Joost et Thorens 2001). Leur classification et
nomenclature ont été réétablies suite à un consensus entre les équipes les plus impliquées
(Joost et al. 2002).
26
GLUT6
Css III
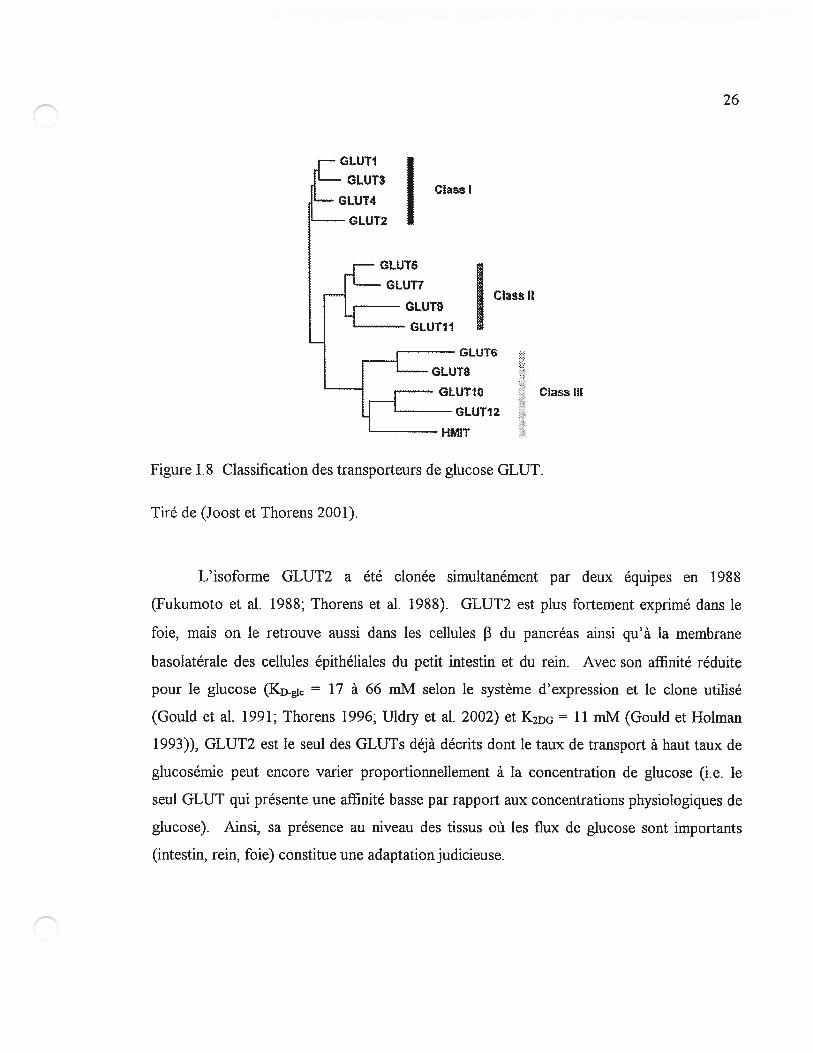
figure 1.8 Classification des transporteurs de glucose GLUT.
Tiré de (Joost et Thorens 2001).
L’isoforme GLUT2 a été clonée simultanément par deux équipes en 1988
(fukurnoto et al. 198$; Thorens et al. 1988). GLUT2 est plus fortement exprimé dans le
foie, mais on le retrouve aussi dans les cellules f3 du pancréas ainsi qu’à la membrane
basolatérale des cellules épithéliales du petit intestin et du rein. Avec son affinité réduite
pour le glucose (Kgic = 17 à 66 mM selon le système d’expression et le clone utilisé
(GoulU et al. 1991; Thorens 1996; Uldry et al. 2002) et K2DG = 11 mM (Gould et Holman
1993)), GLUT2 est le seul des GLUTs déjà décrits dont le taux de transport à haut taux de
glucosémie peut encore varier proportionnellement à la concentration de glucose (i.e. le
seul GLUT qui présente une affinité basse par rapport aux concentrations physiologiques de
glucose). Ainsi, sa présence au niveau des tissus où les flux de glucose sont importants
(intestin, rein, foie) constitue une adaptation judicieuse.
Cass I
GLUTI 2
HMIT
27
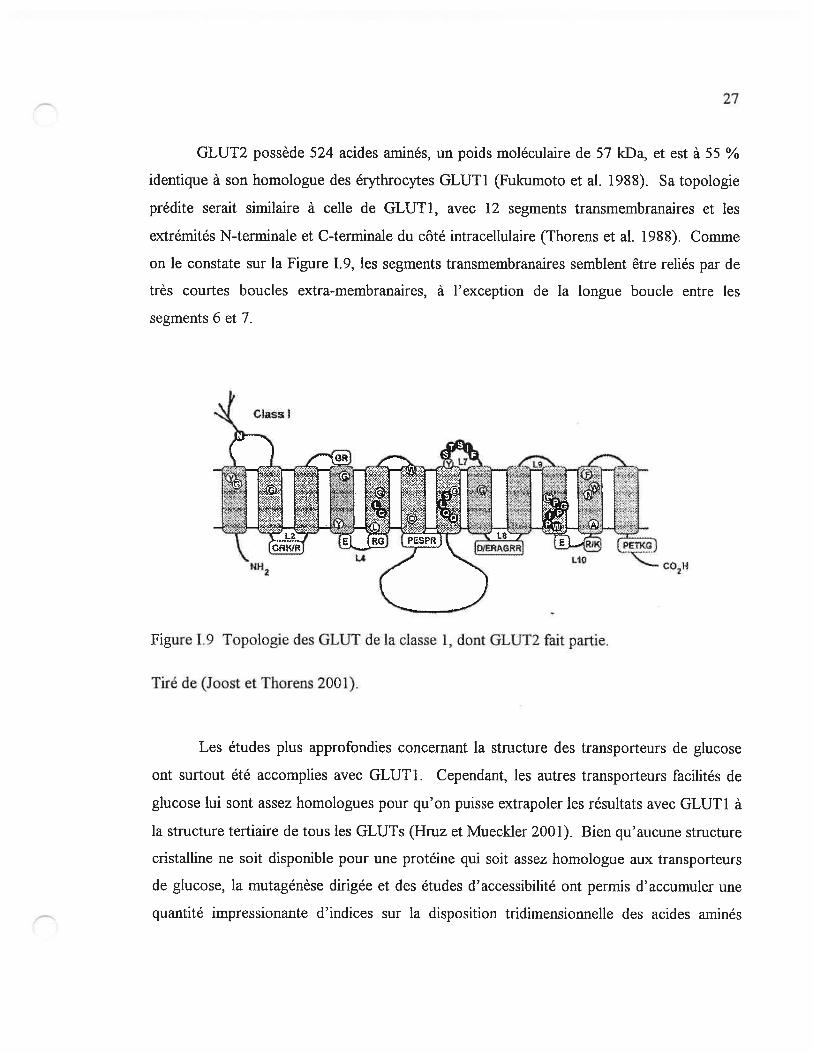
GLUT2 possède 524 acides aminés, un poids moléculaire de 57 kDa, et est à 55 %
identique à son homologue des érythrocytes GLUT1 (Fukumoto et al. 1988). Sa topologie
prédite serait similaire à celle de GLUT1, avec 12 segments transmembranaires et les
extrémités N-terminale et C-terminale du côté intracellulaire (Thorens et al. 198$). Comme
on le constate sur la figure 1.9, les segments transmembranaires semblent être reliés par de
très courtes boucles extra-membranaires, à l’exception de la longue boucle entre les
segments 6 et 7.
Tiré de (Joost et Thorens 2001).
Les études plus approfondies concernant la structure des transporteurs de glucose
ont surtout été accomplies avec GLUT1. Cependant, les autres transporteurs facilités de
glucose lui sont assez homologues pour qu’on puisse extrapoler les résultats avec GLUT1 à
la structure tertiaire de tous les GLUTs (Hruz et Mueckier 2001). Bien qu’aucune structure
cristalline ne soit disponible pour une protéine qui soit assez homologue aux transporteurs
de glucose, la mutagénèse dirigée et des études d’accessibilité ont permis d’accumuler une
quantité impressionante d’indices sur la disposition tridimensionnelle des acides aminés
Cbss I
L10
Figure 1.9 Topologie des GLUT de la classe 1, dont GLUT2 fait partie.

28
(pour une revue récente sur la stmcture de GLUT1 : Hmz et Mueckier 2001). De plus, des
expériences d’échange du deutérium indiquent que $0 % des acides aminés de GLUT1 sont
accessibles à l’eau (Alvarez et al. 1987). Ceci est cohérent avec l’existence d’une
importante cavité aqueuse dans la protéine qui pourrait éventuellement être reliée à la
perméabilité osmotique considérable des GLUT (Fischbarg et al. 1990; Iserovich et al.
2002). La présence de deux pores aqueux dans la protéine a même été récemment
suggérée, suite aux résultats obtenus avec le mutant simple T3 101 de GLUT 1, qui a pour
effet de réduire le transport de glucose tout en augmentant la perméabilité osmotique
(Iserovich et al. 2002). La figure 1.10 et la figure 1.11 présentent deux modèles récemment
proposés pour l’organisation tridimensionnelle de GLUT 1.
figure 1.10 Modèle proposé pour l’empaquetage des hélices transmembranaires de GLUT1.
Tiré de (Hruz et Mueckler 2001).
29
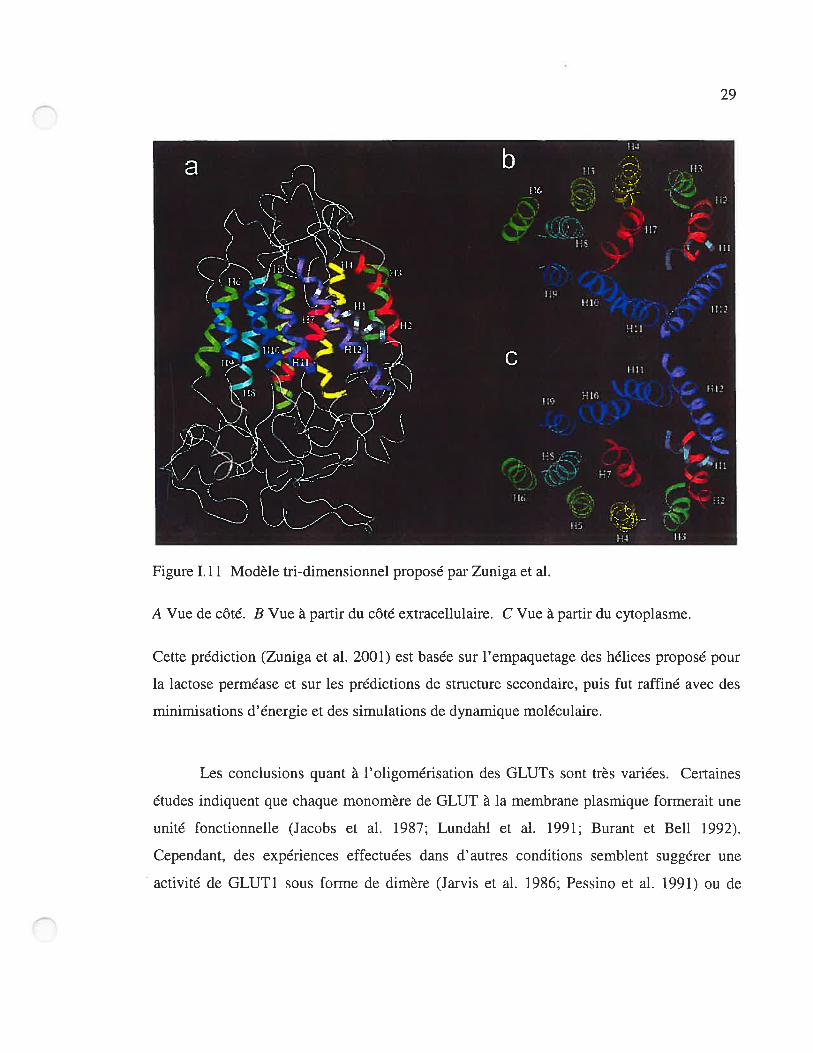
o
A Vue de côté. B Vue à partir du côté extracellulaire. C Vue à partir du cytoplasme.
Cette prédiction (Zuniga et al. 2001) est basée sur l’empaquetage des hélices proposé pour
la lactose perméase et sur les prédictions de structure secondaire, puis fut raffiné avec des
minimisations d’énergie et des simulations de dynamique moléculaire.
Les conclusions quant à l’oligomérisation des GLUTs sont très variées. Certaines
études indiquent que chaque monomère de GLUT à la membrane plasmique formerait une
unité fonctionnelle (Jacobs et al. 1987; Lundahi et al. 1991; Burant et Bell 1992).
Cependant, des expériences effectuées dans d’autres conditions semblent suggérer une
activité de GLUT1 sous forme de dimère (Jarvis et al. 1986; Pessino et al. 1991) ou de
o
Figure Lii Modèle tri-dimensionnel proposé par Zuniga et al.
30
tétramère. Il a même été suggéré par le groupe de Carruthers que GLUT1 puisse
fonctionner en tétramère avec une certaine coopération entre les sous-unités, ce qui
donnerait à l’état d’oligomérisation un certain rôle dans la modulation du transport de
glucose (Hebert et Carruthers 1992; Zottola et al. 1995; Hamili et al. 1999). 11 semble donc
qu’il n’y ait pas encore de consensus quant à l’état oligomérique des transporteurs de
glucose. Cependant, la cinétique d’ovocytes coexprimant GLUT2 et GLUT3 n’offrait pas
la possibilité d’hétérotétramères, et la coexpression de GLUT3 et d’un mutant non
fonctionnel de GLUT3 n’altérait pas la cinétique non plus (Burant et Bel! 1992). Ainsi, si
l’unité fonctionnelle de GLUT3 à la membrane des ovocytes est le monomère, il est bien
possible que ce soit aussi le cas pour GLUT2.
Le transport de substrat par les GLUTs semble à priori obéir à une cinétique
michaelienne simple. Cependant, une asymétrie entre les flux de glucose entrants et
sortants des érythrocytes ou des adipocytes a pu être observée (Cloherty et al. 1995;
Cloherty et al. 1996). Pour expliquer cette asymétrie, l’équipe de Carruthers propose un
influx biphasique provenant d’une occlusion, modulée par l’ATP, du glucose dans une sorte
de cage à l’intérieur de la protéine (Heard et al. 2000; Cloherty et al. 2002). Les opinions
quant à la liaison du glucose sont aussi quelques peu divisées. Suite à des études de liaison
d’inhibiteurs spécifiques, il a pu être déduit que deux sites de liaison du glucose
spatialement distincts étaient présents dans la protéine. En effet, des inhibiteurs compétitifs
semblent se lier spécifiquement du côté cytosolique ou extracellulaire (Bell et al. 1993). Le
modèle le plus simple actuellement proposé implique un mouvement de la protéine entre
deux conformations exposant alternativement les sites de liaison extracellulaire ou
intracellulaire (voir les revues Carmthers 1990; BeIl et al. 1993). Cependant, des
modifications à ce modèle ont été suggérées. Par exemple, le fonctionnement de GLUT1
en tétramère avec une coopération entre les sous-unités pourrait apporter une explication à
l’accessibilité simultanée des deux sites de liaison qui a pu être observée (Hebert et
Carruthers 1992; Sultzman et Carruthers 1999). De cette façon, deux sites de liaison
31
intracellulaire et deux sites de liaison extracellulaire seraient exposés en tout temps pour
chaque tétramère.
Chapitre II L’accumulation de glucose peut expliquer
les flux d’eau initiaux générés par le cotransport
Na/glucose
Le présent chapitre, contenant l’article Glucose accunmlatio,i can account for the
initial water flux triggered by Na/glticose cotransport, constitue le coeur de mon mémoire
de maîtrise. Cet article a été soumis au Biophysical Journal le 12 juin 2003, accepté
moyennant des corrections mineures et resoumis le 22 août 2003.
En tant que première auteure, je fut responsable de sa rédaction en entier. J’ai
effectué toute l’analyse qui s’y retrouve, ainsi que la majorité des expériences. Les
résultats qui ont été recueillis par d’autres chercheurs du laboratoire soit relèvent
d’expériences qui ont été effectuées avant mon arrivée à la maîtrise (Bernadette
Wallendorf, technicienne), soit sont complémentaires à des expériences que j’ai faites
(Pierre Bissonnette, biologiste cellulaire et moléculaire), soit sont issus de la répétition
d’expériences que j’avais déjà effectuées, mais que nous souhaitions refaire dans des
conditions légèrement différentes (ceci a permis à un étudiant d’été, Louis-Martin
Deslandes, d’appréhender la technique utilisée).
Un second article de revue auquel j’ai participé est aussi joint en annexe.
33Glucose accumulation can account for the initial water flux
triggcred by Na7g1ucose cotransport
Marilène P. Gagnon, Pierre Bissonnette, Louis-Martin Deslandes, Bernadette
Wallendorf Jean-Yves Lapointe.
Groupe d’étude des protéines membranaires (GÉPROM) & Département de
Physique, Université de Montréal, Canada
Corresponding address: Jean-Yves Lapointe
Groupe d’étude des protéines membranaires
(GÉPROM)
Université de Montréal
CP.6128, succ. centre-ville
Montréal, Québec
H3C 3J7
CANADA
email:
Running titie:
Glucose accumulation and water flux
SGLT 1, Xenopus laevis oocytes, volume measurement, water transport,
water cotransport, osmotic permeability.
34Abstract
Over the last decade, several cotransport studies have led to the proposai of
secondary active transport of water, challenging the dogma that ail water transport ispassive. The major observation leading to this interpretation was that a Na iniTux failed to
reproduce the large and rapid celi sweiling induced by Na/solute cotransport. We have
investigated this phenomenon by comparing a Na/glucose (hSGLT1) induced water flux to
water fluxes triggered either by a cationic inward current (using ROMK2 K channels) or by
a glucose influx (using GLUT2, a passive glucose transporter). These proteins wereoverexpressed in Xenopus oocytes and assayed through volumetric measurementscombined with double-electrode electrophysiology or radioactive uptake measurements.The osmotic gradients driving the observed water fluxes were estimated by comparisonwith the swelling induced by osmotic shocks of known amplitude. We found that, forequivalent cation or glucose uptakes, the combination of substrate accumulations observed
with ROMK2 and GLUT2 are sufficient to provide the osmotic gradient necessary to
account for a passive water flux through SGLT1. Despite the fact that the Na/glucose
stoichiometry of SGLT1 is 2:1, glucose accumulation accounts for 2/3 of the osmoticgradient responsible for the water flux observed at t30s. It is concluded that the differentaccumulation processes for neutral vs charged solutes can quantitatively account for the fast
water flux associated with Na/giucose cotransport activation without having to propose the
presence of secondary active water transport.
35
Introduction
Understanding water transport through biological membranes has been a subject of
continuous interest for the past fifiy years. Measurements of activation energies, water
permeabilities and sensitivity to mercurial inhibitors have leU to the conclusion that certain
proteins are responsible for mediating a sigmficant portion of measured water flux. The
first membrane proteins clearly identified to be water permeable were the facilitated
glucose transporters (GLUTs) ; inhibitors of glucose transport significantly reduced the
osmotic water permeability of J774 macrophages (Fischbarg et al. 1989), and
overexpression of GLUT1, GLUT2 and GLUT4 isoforms in Xenopus oocytes increased
their water permeability by 5-fold (Fischbarg et al. 1990). Soon afier, a first member of
the family of water channels was discovered (Preston et Agre 1991; Zhang et al. 1993),
providing a satisfying molecular basis to the contention that water was passing through a
specific pathway characterized by a single file of 5 to 9 water molecules (Macey 1984).
The dogma that transmembrane water transport is aiways passive was first
chalÏenged in the early nineties by two studies which suggested that secondary active water
transport is mediated by a K/Cl cotransporter in the choroid plexus epithelium ofNecturus
macutosus (Zeuthen 1991; Zeuthen 1994). Later, using overexpression in Xenopus oocytes,
the rabbit Na+/glucose cotransporter rSGLT1 was proposed to operate as a water pump
with a stoichiometry of 260 water molecules per glucose molecule transported (Loo et al.
1996), which was later re-evaluated to 390-424 water molecules per glucose . A series of
publications then reported observations ofwater cotransport for several other cotransporters
expressed in Xenopus oocytes: the human Na/g1ucose cotransporter hSGLT1 (Meinild et
al. 1998), the Na/glutamate cotransporter EAAT1 (MacAulay et al. 2001), the
Na/dicarboxylate cotransporter (Meinild et al. 2000), the Na/iodide cotransporter
(mentioned in Loo et al. 1996; Meinild et al. 2000) and the H/amino acid cotransporter
(mentioned in Loo et al. 1996; Meinild et al. 2000), with stoichiometries ranging from 50 to
400 water molecules per transport cycle.

36
The most direct evidence supporting water cotransport is the observation that the
initial water flux generated by a pure ionic inward current is much smaller than the water
flux induced by a Na/solute cotransport current of similar amplitude. This has been
observed for cation pores including gramicidin (Meinild et al. 199$; Zeuthen et al. 2001)
and nystatin (Zeuthen et al. 1997), as well as for cation chaimels such as connexin 50
(Wright et Loo 2000) and ROMK2 (Duquette et al. 2001). The delay (-1 mm) observed
between current stimulation and measurable volume increase has been interpreted as an
experimental measurement of the time required to build a significant osmotic gradient.
Consequentty, it was assumed that the early swelling of an oocyte following the start of
Na’7glucose cotransport was too fast to be osmotically-driven.
While it is acknowÏedged that a pure cation influx fails to reproduce the early water
flux observed with Nat’glucose cotransport, it is flot known whether a pure glucose influx
would do the same. In fact, the osmotic consequences of an accumulation of ions may flot
be the same as the effects of cytosolic accumulation of a neutral solute like glucose. The
present study is aimed at evaluating the osmotic effect of a glucose influx vs the effect of a
cation influx by separately expressing a facilitated glucose transporter and a cation channel
in oocytes. Volumetric measurements during transport allow osmolyte local accumulations
to be deduced. The accumulations corresponding to K, 2-deoxyglucose (2DG) and
Na/glucose are calculated for ROMX2, GLUT2 and SGLT1-expressing oocytes,
respectively. A comparative analysis of these accumulations demonstrates that glucose
accumulates much faster than do ions, which can quantitatively explain the early water flux
that accompanies stimulation ofNa/glucose cotransport.

37Materials ami Methoils
Oocyte injections and incubation
Preparation of the Xenopus Ïaevis oocytes and cRNA injection with human SGLT1
or rat ROMK2 mRNA were done as previously described (Duquette et al. 2001; Coady et
al. 2002). for GLUT2 expression, oocytes were injected with 46 ni of solution containing 1
p.g!c1 of human GLUT2 cRNA. They were then incubated for 4-7 days at 18°C in Barth’s
solution (in mM 90 NaC1, 3 KCI, 0.82 MgSO4, 0.41 CaC12, 0.33 Ca(N03)2, 5 Hepes, pH
7.6) supplemented witli 5 % horse serum, 2.5 mM Na-pyruvate, 100 U/rnl penicillin and
0.1 mg/mÏ streptomycin.
With hSGLT1-expressing oocytes, the bathing medium (control solution) used for
volumetric measurements had the following composition (in mM) : 50 NaCI, 3 KC1, 0.82
MgC12, 0.74 CaCI2, 5 Hepes and 85 mannitol, resulting in a measured osmolality of 197
mosmlkg of water. Solutions containing Œ-Methylglucose (ŒMG) were obtained by
replacing 5 mM mannitol with 5 mlvi uMG. The bathing medium for ROMK2-expressing
oocytes was the same as for SGLT1 experiments, except that 20 mlvi KCI was present
rather than 3 mM and 50 mM mannitol was used rather than $5 mlvi. In experiments with
GLUT2-expressing oocytes, 5 m]\4 2-deoxyglucose (2DG) was used as a non-metabolizable
substrate in replacement of 5 mM mannitol.
for ail experiments, hypotonic solutions were obtained by omitting 20 mlvi
mannitol from the control solutions. Osmolalities were verified within ± 2 mosm!kg H20
using a freezing point osmometer (Advanced DigiMatic Osmometer, model 3D2, Advanced
Instruments, Needham Heights, MA).
38
Electrophysiology
The two-electrode voltage clamp technique was used as previously described
(Bissonnette et al. 1999; Duquette et al. 2001). Electrode tips were fihled with a cushion
layer of 1 % agarose in 1 M KC1 in order to reduce ceil swelling associated with KC1
leakage into the cytosol ($chreibmayer et al. 1994).
SGLT1-injected oocytes were clamped at —50 mV before stimulating a cotransport
current by superfusing the ŒMG-containing solution. ROMK2-expressing oocytes were
unclamped and a K current between 0.8 and 1.5 jiA was then generated by rapidly
clamping to a pre-set potential which was 1 to 3 mV more negative than the resting
potential. GLUT2-injected oocytes were flot clamped, but simply held in place by
microelectrodes or suction pipettes of150 im tip diameter.
Optical measurements
The apparatus used for volumetric measurement was a new version of one
previously described (Duquette et al. 2001). The perfusion rate was about 2 ml/min, and
solution changes were controlled by an electrical valve and characterized by a total dead
space of 50 iil between the solution selector and the experimentat chamber. The bath had a
volume of P—120 pi, and 80 % of the solution change was achieved within 3 s, as judged by
the time required for the cotransport current to reach 80 % of its final value afler applying a
5 mM concentration of ŒMG.
The oocyte was illuminated from above, and its cross section was continuously
measured from below using a CCD camera (model CCD72, Dage-MTI, Michigan, IN),
through the 3x objective of an inverted microscope. Custom-made sofiware counted the
pixels corresponding to the oocyt&s cross section every 0.2 s and the data points were later
averaged to obtain 1 point per s. Assuming the oocyte is spherical, and calibrating the
system with a steel ball of known diameter, we could then translate the cross sectional
39recordings into volume measurements. A noise level of 0.05 % of the volume
measurement could usually be reached. Before starting the experiments, oocytes were
equilibrated for at least 20 minutes in substrate-free bathing medium to obtain a stable
volume measurement. However, a certain endogenous volume change could stili be
occasionally observed before starting the experiment. This volume change rate averaged
0.14 ± 0.26, 0.17 ± 0.25 and —0.7 ± 0.5 pLs’ for SGLT1-, ROMX2- and GLUT2-
expressing oocytes, respectively, and was subtracted from the raw measurements before
ftwther analysis.
Isotopic uptakes in oocytes
GLUT2-expressing oocytes were rinsed twice with substrate-free Barth’s solution
and transport was initiated by exposing a group of 4 to 6 oocytes to the transport solution
containing 5mM 2-DG (ljiCiJml [1,2J3H 2DG, PerkinElmer - New England Nuclear,
Boston, MA). The non-specific fraction of uptake was determined by similar incubation of
oocytes in media containing 200 jiM phloretin. The oocytes were incubated at room
temperature for the required incubation time in 1 ml of transport media. The incubation was
stopped by rapid removal of transport media followed by addition of 2 ml ice-cold
substrate-free media. The oocytes were rinsed a further three times and individually
transferred to scintillation vials. Digestion of the oocytes were performed by addition of 0.2
ml 10% SDS for two hours prior to addition of scintillation cocktail (Beta Blend (ICN,
Irvine, CA)). The vials were counted for tritium activity using an LS6000 SC scintillation
counter (B eckman, fullerton, CA).
Analysis
In order to determine the osmotic pressure necessary to account for the water fluxes
observed during transport, we exposed each oocyte to an osmotic shock of —20 mOsm at
the end of each exp eriment. From the ratio of the siope of swelling during transport to the
40change in swelling rate induced by the hypotonic shock, we could deduce the osmoticgradient corresponding to any observed swelling rate for that particular oocyte. Thehypotonic shock also provided us with the apparent water permeability (Lu, in cm.s’) oftheoocyte being tested using the following equation:
L- (dVdV1xiJxSdt dt0
where dV!dt is the initial siope of swelling foïlowing the osmotic shock in cm3•s1,dV/dt0 is the baseline swelling observed immediately before the osmotic shock, Ait is theamplitude of the osmotic shock triggered (20 mOsm in ail cases here), î3 is the waterspecific molar volume (18.2 cm3.mof’) and S is a standard oocyte surface of 0.4 cm2considering a membrane infolding factor of 8.5 to 9. 5-fold (Zampighi et al. 1995).
Spontaneous volume changes ofthe order of 0.3 to 0.4 nI are present throughout ourvolume measurements. As these volume changes occur with characteristic time courses of-1 O s, they can significantly affect our time to time estimation of celi sweiÏing rate.Consequently, in order to get an accurate estimation of water flux at any time, a continuousftmction was fitted to the volume data. For SGLT1 and ROMK2, a function was usedwhere the swelling rate starts from an initial value (mo) and exponentially reaches a secondf evel (mo+dm), as follows
siope m0 + dm(l - exp(-t/t)) (2)
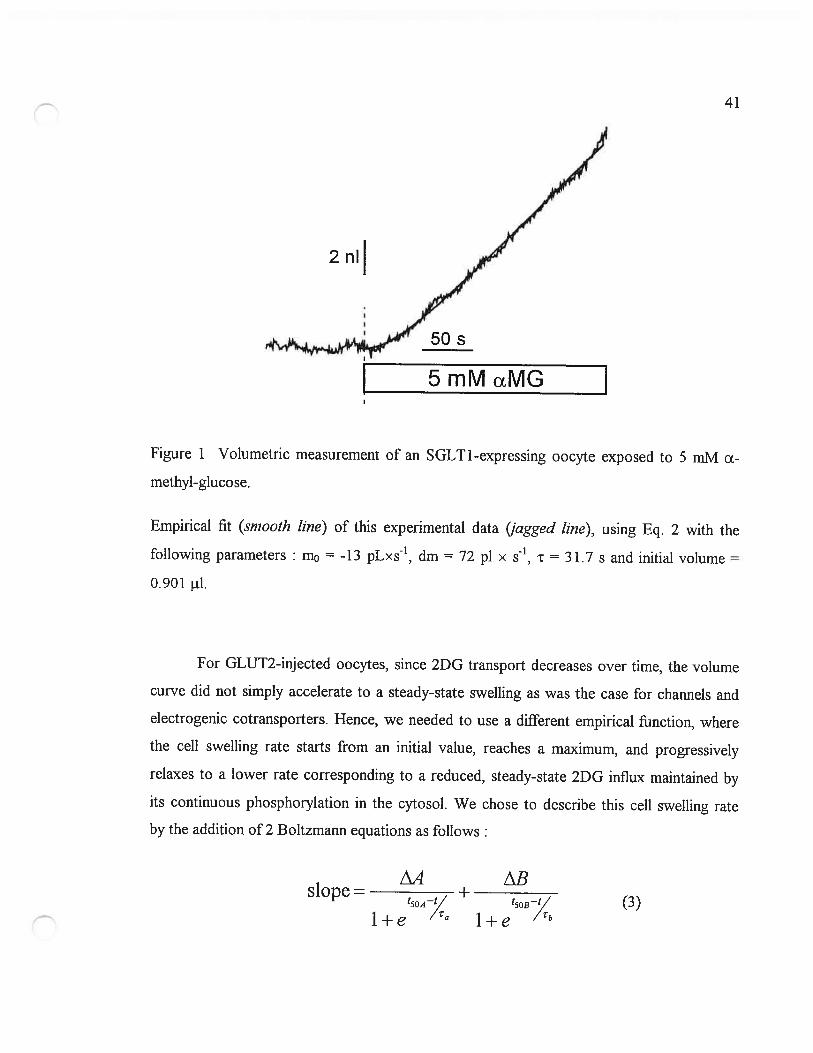
This function was integrated to give a volume-time empirical relation, and the fourparameters (mo, dm, t and an initial volume) were numerically adjusted to minimize thechi-squared value. The parameters m0 and dm were aflowed to take any positive or negativevalue and no restriction was set on t. Figure 1 shows an example of the empirical fit for anSGLT1-expressing oocyte exposed to 5 mM ŒMG. These fitted curves provide a goodmatch to the slightly noisy volume curves, without being influenced by brief (<10 s),spontaneous volume changes.
41
2 nu
4%44ZS
I 5mMŒMG
exposed to 5 m]\4 cL-Figure I Volumetric measurement of an SGLT I -expressing oocyte
methyl-glucose.
Empirical fit (srnooth une) of this experimental data (jagged hue), using Eq. 2 with the
following parameters m0 -13 pLxs’, dm = 72 pi x s, t = 31.7 s and initial volume =
0.901 i1.
For GLUT2-injected oocytes, since 2DG transport decreases over time, the volume
curve did flot sïmply accelerate to a steady-state swelling as was the case for channels and
electrogenic cotransporters. Hence, we needed to use a different empirical function, where
the ceil swelling rate starts from an initial value, reaches a maximum, and progressively
relaxes to a lower rate corresponding to a reduced, steady-state 2DG influx maintained by
its continuous phosphorylation in the cytosol. We chose to describe this ceil sweÏling rate
by the addition of 2 Boltzmann equations as follows:
____
z\Bslope= / + /
t5OAt/ t5oBt/
1+e /a 1+e /Vb
(3)
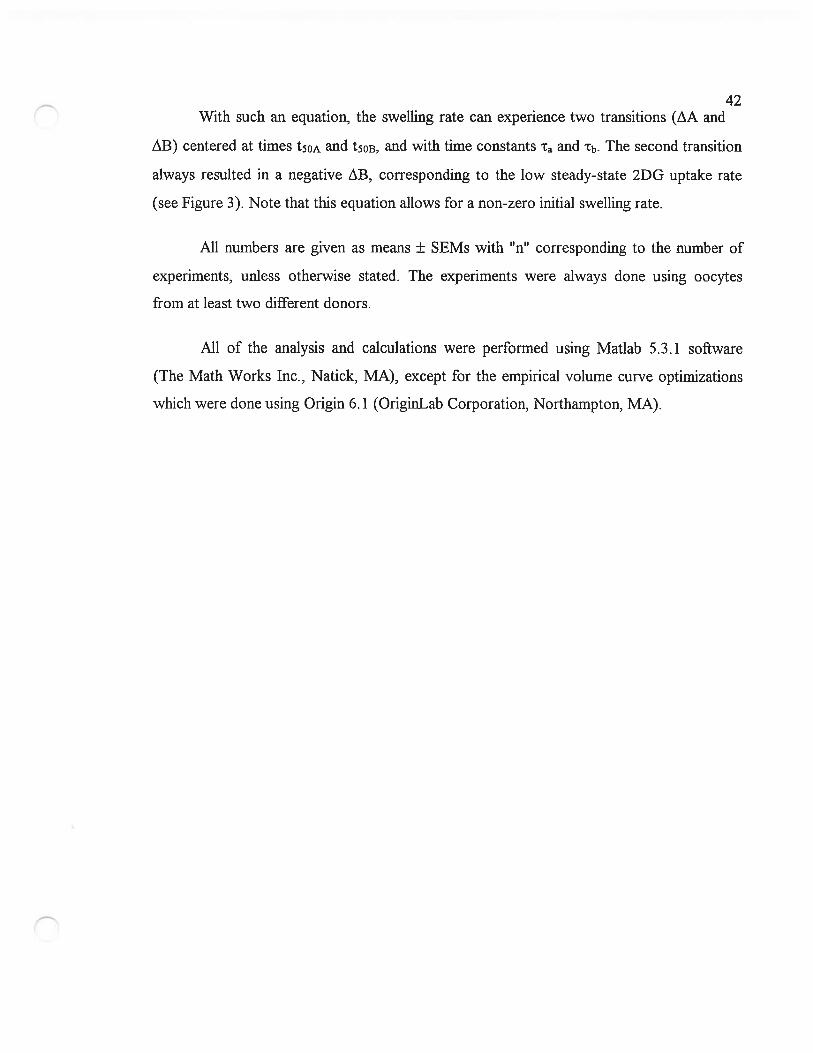
42With such an equation, the swelling rate can experience two transitions (AA and
zXB) centered at times t5OA and t5OB, and with time constants ta and tb. The second transition
aiways resulted in a negative AB, corresponding to the low steady-state 2DG uptake rate
(see figure 3). Note that this equation allows for a non-zero initial swelling rate.
Ml numbers are given as means ± SEMs with “n” corresponding to the number of
experiments, unless otherwise stated. The experiments were aiways done using oocytes
from at least two different donors.
Ml of the analysis and calculations were performed using Matlab 5.3.1 software
(The Math Works Inc., Natick, MA), except for the empirical volume curve optimizations
which were done using Origin 6.1 (OriginLab Corporation, Northampton, MA).
43Resuits
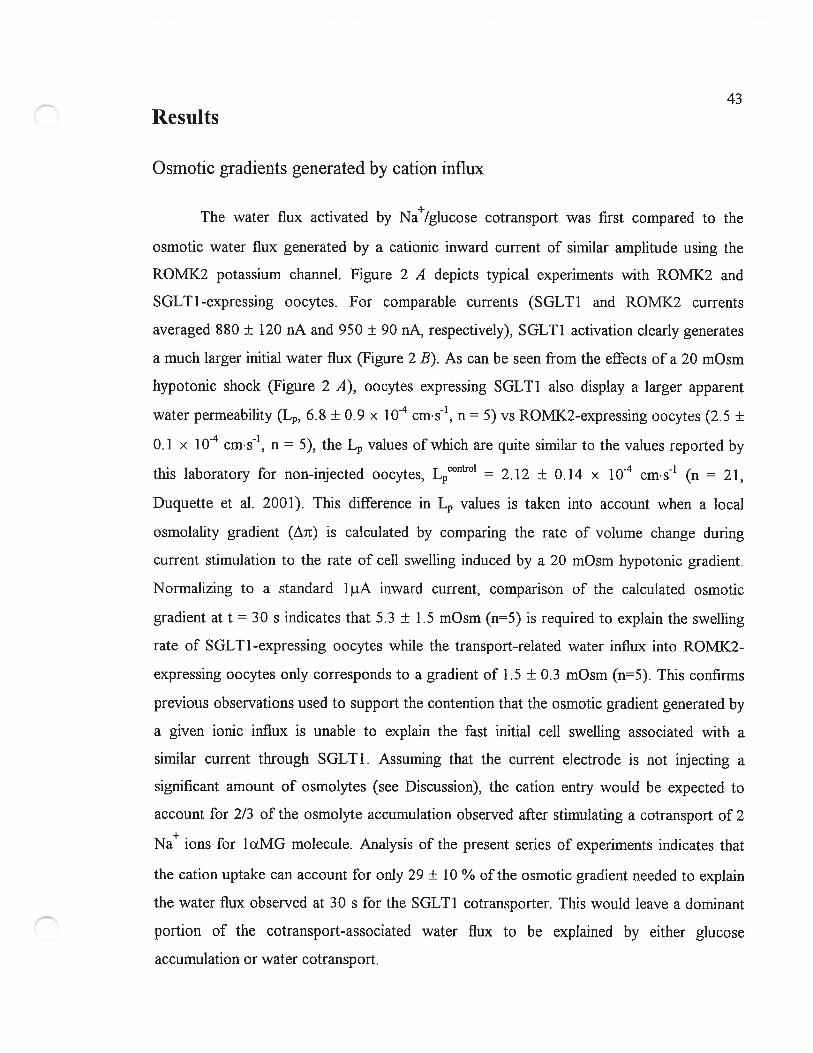
Osmotic gradients generated by cation influx
The water flux activated by Na/g1ucose cotransport was first compared to the
osmotic water flux generated by a cationic inward current of similar amplitude using the
ROMK2 potassium channel. Figure 2 A depicts typical experiments with ROMK2 and
SGLT1-expressing oocytes. For comparable currents (SGLT1 and ROMK2 currents
averaged 880 ± 120 nA and 950 ± 90 nA, respectively), SGLT1 activation clearly generates
a much larger initial water flux (Figure 2 B). As can be seen from the effects of a 20 mOsm
hypotonie shock (Figure 2 A), oocytes expressing SGLT1 also display a larger apparent
water permeabulity (Le, 6.8 ± 0.9 x i0 cm•s1, n = 5) vs ROMK2-expressing oocytes (2.5 ±
0.1 x i0” cm•s’, n = 5), the L values ofwhich are quite sirnilar to the values reported by
this laboratory for non-injected oocytes, L°’ = 2.12 ± 0.14 x i0 cms’ (n 21,
Duquette et al. 2001). This difference in L values is taken into account when a local
osmolality gradient (z1t) is calculated by comparing the rate of volume change during
current stimulation to the rate of celt swelling induced by a 20 rnOsm hypotonie gradient.
Normalizing to a standard 1 j.iA inward current, comparison of the calculated osmotic
gradient at t 30 s indicates that 5.3 ± 1.5 mOsm (n=5) is required to explain the swelling
rate of SGLT1-expressing oocytes while the transport-related water influx into ROMK2-
expressing oocytes only corresponds to a gradient of 1.5 ± 0.3 mOsm (n=5). This confirms
previous observations used to support the contention that the osmotic gradient generated by
a given jouie influx is unable to explain the fast initial ceil swelling associated with a
similar current through SGLT 1. Assuming that the current electrode is not injecting a
significant amount of osmolytes (see Discussion), the cation entry would be expected to
account for 2/3 of the osmolyte accumulation observed afler stimulating a cotransport of 2
Na ions for 1ŒMG molecule. Analysis of the present series of experiments indicates that
the cation uptake can account for only 29 ± 10 % ofthe osmotic gradient needed to explain
the water flux observed at 30 s for the $GLT1 cotransporter. This would leave a dominant
portion of the cotransport-associated water flux to be explained by either glucose
accumulation or water cotransport.
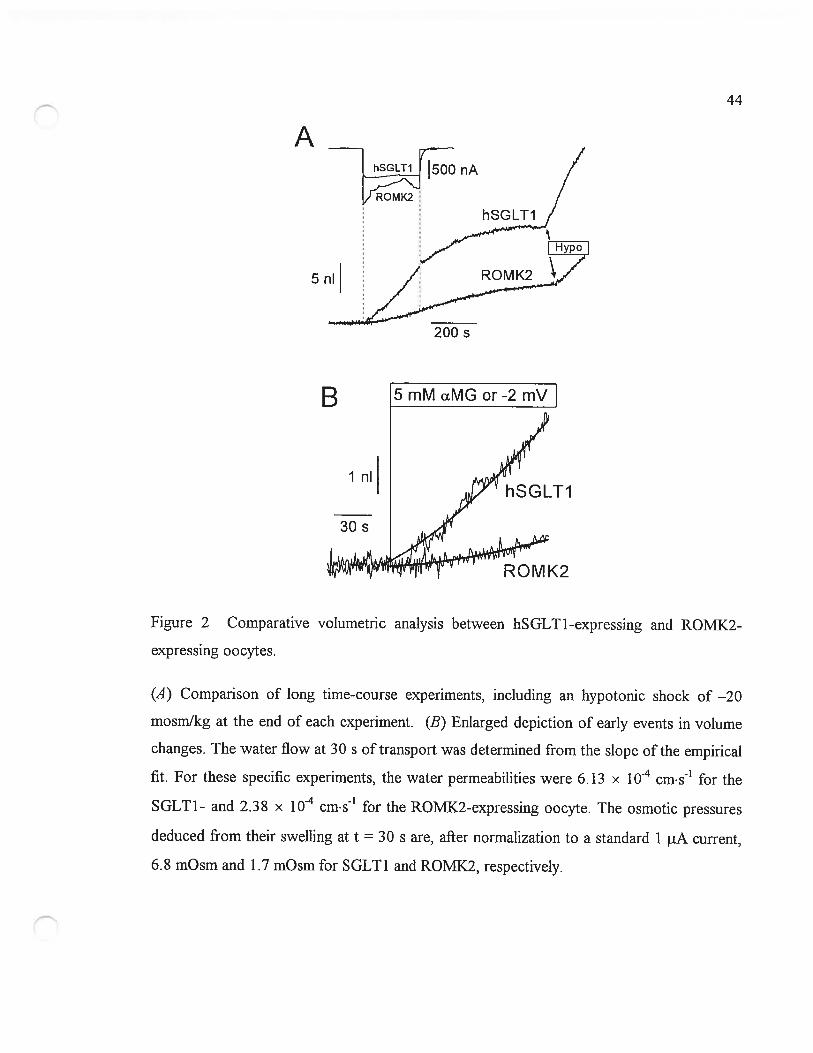
44
A
Figure 2 Comparative volumetric analysis between liSGLT1-expressing and ROMX2-
expressing oocytes.
(A) Comparison of long time-course experiments, including an hypotonic shock of —20
mosm!kg at the end of each experiment. (B) Enlarged depiction of early events in volume
changes. The water flow at 30 s of transport was determined from the siope ofthe empirical
fit. for these specific experiments, the water permeabilities were 6.13 x iOE cm•s’ for the
SGLT1- and 2.38 x i0 cm•s’ for the ROMK2-expressing oocyte. The osmotic pressures
deduced from their swelling at t = 30 s are, afler normalization to a standard 1 tA current,
6.8 mOsm and 1.7 mOsm for SGLT1 and ROMK2, respectively.
nA
5 nI
200 s
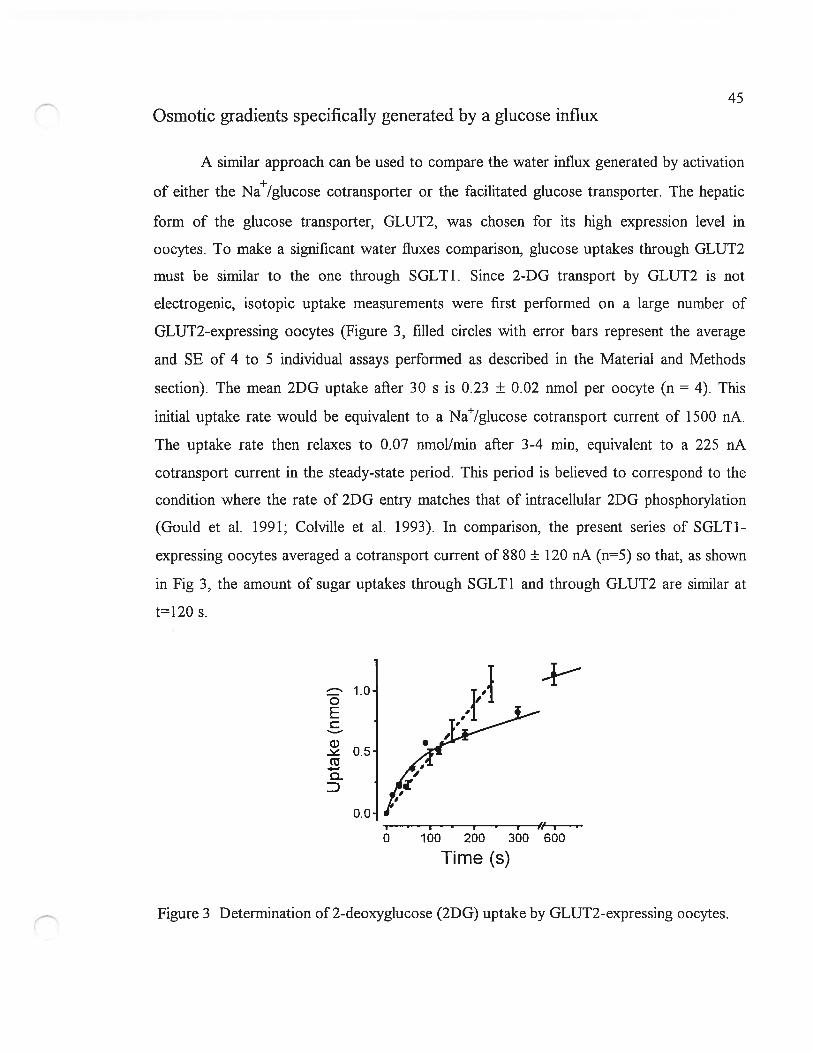
45Osmotic gradients specifically generated by a glucose influx
A similar approach can be used to compare the water influx generated by activation
of either the Na+/glucose cotransporter or the facilitated glucose transporter. The hepatic
form of the glucose transporter, GLUT2, was chosen for its high expression level in
oocytes. To make a significant water fluxes comparison, glucose uptakes through GLUT2
must be similar to the one through SGLT1. Since 2-DG transport by GLUT2 is not
electrogenic, isotopic uptake measurements were first performed on a large number of
GLUT2-expressing oocytes (figure 3, filled circles with error bars represent the average
and SE of 4 to 5 individual assays performed as described in the Material and Methods
section). The mean 2DG uptake afier 30 s is 0.23 ± 0.02 nmol per oocyte (n = 4). This
initial uptake rate would be equivalent to a Na/glucose cotransport current of 1500 nA.
The uptake rate then relaxes to 0.07 nmol/min after 3-4 mm, equivalent to a 225 nA
cotransport current in the steady-state period. This period is believed to correspond to the
condition where the rate of 2DG entry matches that of intracellular 2DG phosphorylation
(Gould et al. 1991; Colville et aï. 1993). In comparison, the present series of SGLTÏ
expressing oocytes averaged a cotransport current of $80 ± 120 nA (n=5) so that, as shown
in Fig 3, the amount of sugar uptakes through SGLT1 and through GLUT2 are similar at
t=120 s.
‘ 1.0oEC
G)- 0.5—Q-D
0.0 -
0 100 200 300 600
Time (s)
figure 3 Determination of2-deoxyglucose (2DG) uptake by GLUT2-expressing oocytes.
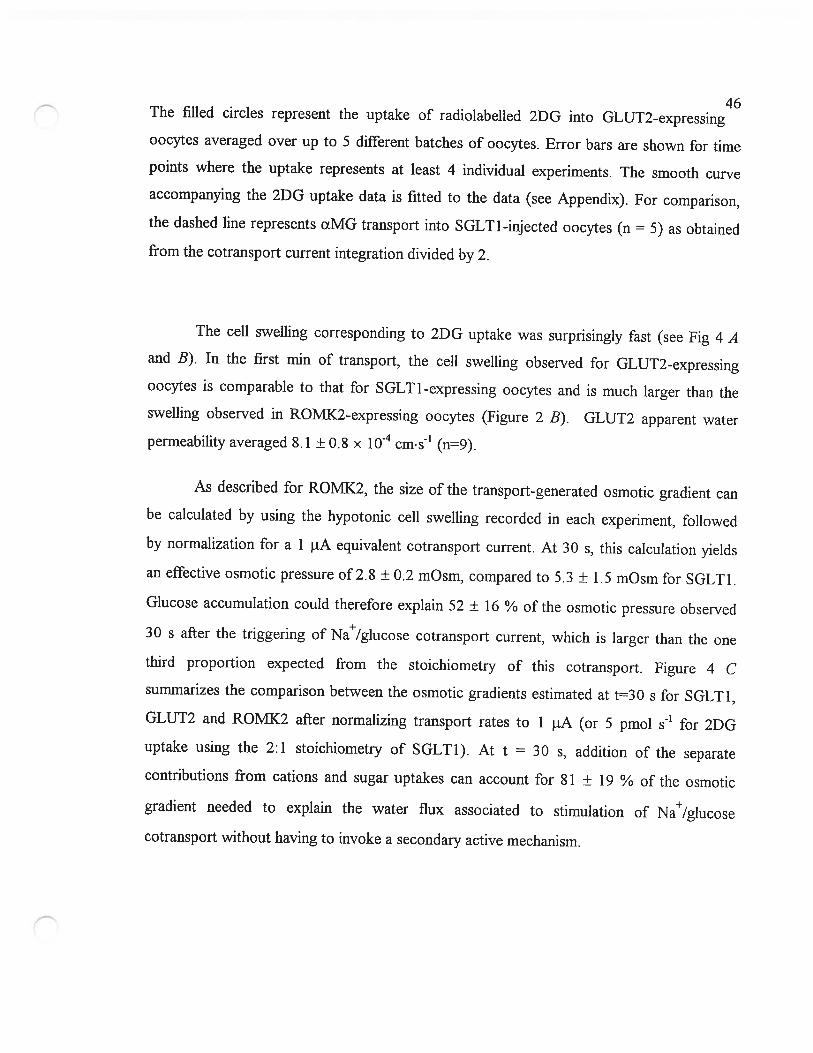
46The flhled circles represent the uptake of radiolabelled 2DG into GLUT2-expressingoocytes averaged over up to 5 different batches of oocytes. Error bars are shown for timepoints where the uptake represents at least 4 individual experiments. The smooth curveaccompanying the 2DG uptake data is fitted to the data (see Appendix). For comparison,the dashed une represents ŒMG transport into SGLT1-injected oocytes (n 5) as obtainedfrom the cotransport current integration divided by 2.
The celi swelling corresponding to 2DG uptake was surprisingly fast (see Fig 4 Aand B). In the first min of transport, the celi swelÏing observed for GLUT2-expressingoocytes is comparable to that for SGLT1-expressing oocytes and is much larger than theswelling observed in ROMK2-expressing oocytes (Figure 2 B). GLUT2 apparent waterpermeability averaged 8.1 ± 0.8 x i0 cms’ (n=9).
As described for ROMK2, the size of the transport-generated osmotic gradient canbe calculated by using the hypotonic ceil swelling recorded in each experiment, followedby normalization for a 1 1iA equivalent cotransport current. At 30 s, this calculation yields
an effective osmotic pressure of 2.8 ± 0.2 mOsm, compared to 5.3 ± 1.5 mOsm for SGLT1.
Glucose accumulation could therefore explain 52 ± 16 % of the osmotic pressure observed
30 s after the triggering of Na+/glucose cotransport current, which is larger than the onethird proportion expected from the stoichiometry of this cotransport. Figure 4 Csummarizes the comparison between the osmotic gradients estimated at t=30 s for SGLT1,GLUT2 and ROMK2 after normalizing transport rates to 1 .tA (or 5 pmol s for 2DGuptake using the 2:1 stoichiometry of SGLT1). At t 30 s, addition of the separatecontributions from cations and sugar uptakes can account for 81 ± 19 ¾ of the osmotic
gradient needed to explain the water flux associated to stimulation of Na/glucose
cotransport without having to invoke a secondary active mechanism.
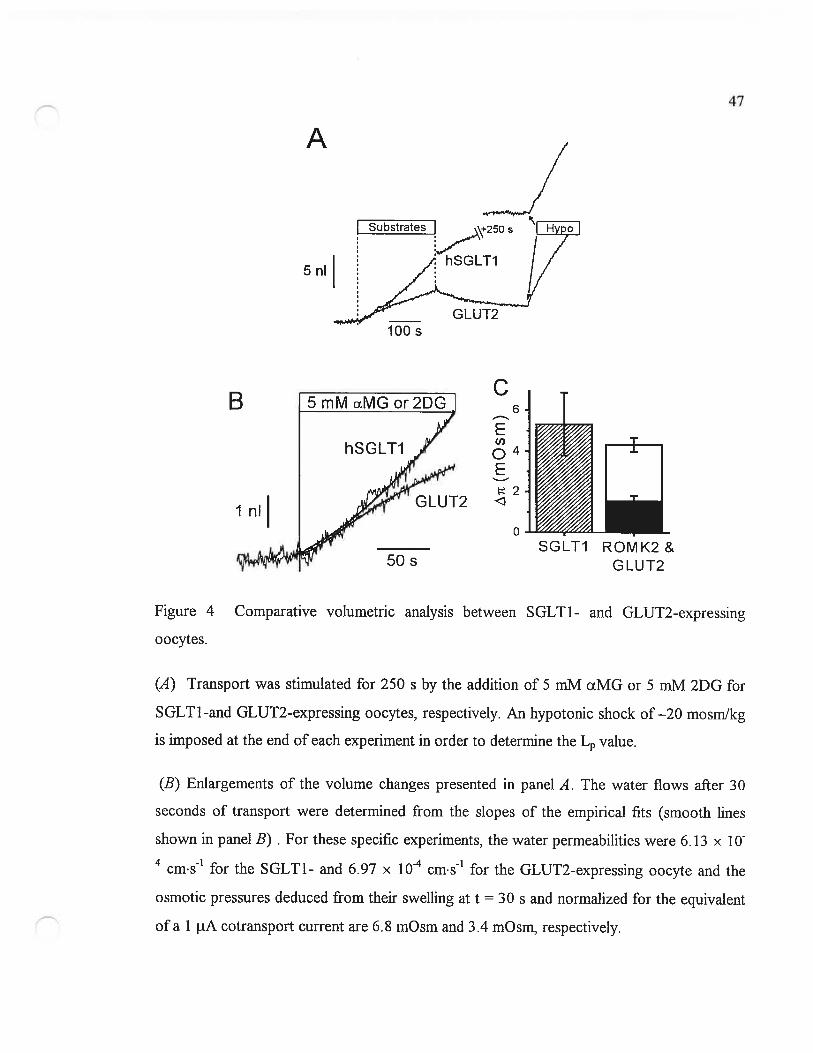
47
A
5 nI
o
Figure 4 Comparative volumetric analysis between
oocytes.
SGLT1- and GLUT2-expressing
(A) Transport was stimulated for 250 s by the addition of 5 mM ŒMG or 5 mlvi 2DG for
SGLT1-and GLUT2-expressing oocytes, respectively. An hypotonic shock of—20 mosmlkg
is imposed at the end of each experiment in order to determine the L value.
(B) Enlargements of the volume changes presented in panel A. The water flows afier 30
seconds of transport were determined from the slopes of the empirical fits (smooth unes
shown in panel B) . For these specific experiments, the water permeabilities were 6.13 x 10
cm•s for the SGLT1- and 6.97 x 10 cm•s1 for the GLUT2-expressing oocyte and the
osmotic pressures deduced from their swelling at t = 30 s and normalized for the equivalent
ofa 1 1iA cotransport current are 6.8 mOsm and 3.4 mOsm, respectively.
B
1 nI
C6
GLUT2 <
50 sSGLT1 ROMK2&
GLUT2
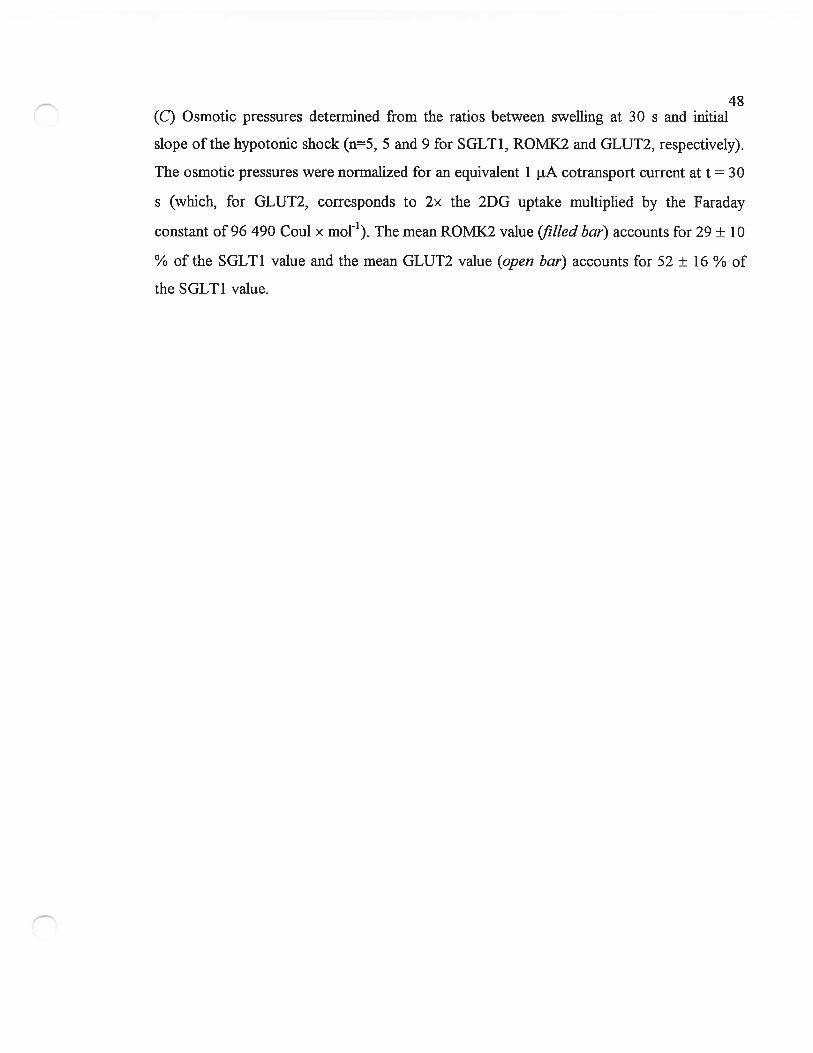
48(C) Osmotic pressures determined from the ratios between swelling at 30 s and initial
siope ofthe hypotonic shock (n=5, 5 and 9 for SGLT1, R01V1K2 and GLUT2, respectively).
The osmotic pressures were normalized for an equivalent 1 iA cotransport current at t = 30
s (which, for GLUT2, corresponds to 2x the 2DG uptake multiplied by the Faraday
constant of 96 490 Cou! x mol’). The mean ROMK2 value (flhïed bar) accounts for 29 ± 10
% of the SGLT1 value and the mean GLUT2 value (open bar) accounts for 52 ± 16 % of
the SGLT1 value.
49
Data analysis
The analysis presented so far for a single time point of 30 s takes advantage of the
fact that the initial uptake rates for oocytes expressing SGLT1, ROMK2 or GLUT2 were of
similar amplitudes. Ibis analysis cannot be carried over time as the time course of 2DG+uptake differs somewhat from the rather stable Na /glucose cotransport rate and the slowly
declining ROMK2-mediated K current. An interesting alternative analysis is to compute the
effective local concentration reached not as a function of time but as a ftinction of the
amount of solute transported for each type of expressing oocyte.
The actual local concentration of a transported solute (i.e. the concentration that is
feit by the membrane) is distinct from the effective An as the latter also includes a global
intracellular dilution due to the measured amount of water uptake. As water fluxes are flot
identicai for ROMX2, GLUT2 or SGLT1-expressing oocytes, the diluting effect of each
water influx must be separately taken into account in order to estimate the taie amounts of
Na, glucose or K accumulated. As water enters the oocyte (generating a volume increase
of AV), it has a predictable diluting effect (Aosm) which is given by Eq. 4 as a function of
the initial accessible volume Vacc and the initial internai osmolarity osm (assumed to be
197 mOsm). Once this volume is increased to Vacc+t\V, simple conservation calcuiations
lead to the following decrease in osmolarity:
Aosm = osm x AV/V, (4)
given that AV « Vacc. The accessible fraction of the volume was chosen as 0.4, in
accordance with the data of Zeuthen et al. (Zeuthen et al. 2002) and with data from tritiated
water experiments from our own laboratory (data flot shown). The volume-time curve from
the fitted equations described previously was used to obtain AV at any time. For example,
at t30s, the correction Aosm is minimal and amounts to 0.27 ± 0.1 mM, 0.05 ± 0.03 mM
and 0.34 ± 0.07 mM for SGLT1, ROMX2 and GLUT2 respectively. At t = 60 s, the
correction is more substantial and amounts to 0.75 ± 0.20 mM, 0.14 ± 0.05 mM, and 0.80 ±
0.15 mM for SGLTI, ROMX2 and GLUT2 respectively. When these corrections are
(oQDo(o-oQ
oQu)C
H
50incorporated into the resuits, the real accumulation oftransported substrates as a ffinctionof time can be calculated (accumulation (t) z\rc (t) + Aosm (t)) for oocytes expressing thethree proteins studied (Figure 5). It is interesting to see that, in the case of GLUT2, theconcentration of transported osmolytes reaches 4 mlvi within the first 30 s beforeexperiencing a much siower steady state rate for the remaining of the experiment duration.This is what one wouïd expect from a faciÏitated transporter exposed to 5 mM external 2DGand presenting an uptake rate that rapidly declines to 15 ¾ of its initial rate as seen inFigure 3. This provides a good support to the assumptions made and to the accuracy oftheintracellular concentration calculations based on volume measurements.
15SGTL1
gCo
DEDoo
ROMK2
- — -I— — — —
0 50 100 150 200 250lime (s)
Figure 5 Corrected sofute accumulation as a function oftime
Corrected solute accumulation as a function of time for SGLT1 (full une, n=5), ROMK2(dashed une, n=5), and GLUT2 (dash-dotted une, w=9). The corrections compensate for theglobal dilution due to water entry and are applied to each individual experiment beforeaveraging.
51
Integration of the inward current observed in each experiment yields the uptake
time curves of K for ROMK2 and of Na (or ŒMG) for SGLT 1. To compare the
accumulations at any time, a continuous estimation of 2DG uptake in GLUT2 oocytes was
also needed. The time course of 2DG uptake by GLUT2-expressing oocytes is relatively
simple. The initial uptake rate is fast and progressively relaxes to a slower, linear uptake,
the siope of which reflects the steady-state phosphorylation rate of intracellular 2DG. The
experimental data could be fitted (Figure 3, smooth curve) to a theoretical equation
obtained from the analysis of such an uptake mechanism (see Appendix 1). This fit is then
used as the uptake/time curve for the volume experiments with GLUT2.
Using the uptake-time curves obtained for SGLT1, ROMK2 and GLUT2 expressing
oocytes, the time axis of Figure 5 can be transformed into an uptake axis as shown in
Figure 6 A. Since ail oocytes did flot express at the same level, this relation was calculated
for each experiment and averaged afterwards using pre-determined uptake points. It is
apparent that 2DG accumulation is about 2 to 3 times larger than K accumulation in the
initial phase (K uptake < 0.6 nmol), but becomes progressively similar as uptake continues
to increase. Addition of the separate contributions from K and 2DG (Figure 6 3) gives rise
to a complete reconstruction of the total Na and ŒMG accumulation needed to explain the
swelling of SGLT1-injected oocytes. It is clear that, throughout the uptake fange studied,
the effective concentration ofthe solutes transported by SGLT1 can be accounted for by the
ion accumulation predicted by ROMK2-expressing oocytes and the sugar accumulation
predicted by GLUT2-expressing oocytes.

52
A120e
2 E 9o’—U)
D O
CD
3.
o.
B12
2Eo’-
c° ° 6-—
O D
3-
o-
0.0 0.3 0.6
0.00 0:15
figure 6 Effective transported osmolyte concentrations as a function of the quantity of
sub strate transported
(A) Effective transported osmolyte concentrations as a function of the quantity of substrate
transported, for SGLT1 (n=5, fitit une), ROMK2 (n=5, dashed une) and GLUT2 (n=9,
dotted une and hotÏow circÏes). The values at zero uptake are obtained with linear
regressions over the minute preceding the onset of transport. (B) Addition of the substrate
accumulations from GLUT2 and ROMK2 (dashed une, hoÏÏow circle at t = O) reproduces
the substrate accumulation calculated from SGLT1 experiments (continuous une, hoÏlow
square at t = O).
SGLT1
GLUT2
- - - - - - ROM K2— —I—
00 03 06
0)0 0.5 0.30
09 12Cations uptake (nmol)
• 0.5 0.0Sugar uptake fnmol)
SGLTJ
GLUT2 +
0.9 12Cations uptake fnmol)
O.O - 045 - 0.60
Sugar uptake (nmol)
53
Discussion
In 1996, SGLT1 was proposed to generate a secondary active water flux (Loo et al.
1996) as was previously proposed for the KCI cotransporter of the choroid plexus (Zeuthen
1991; Zeuthen 1994). Water flux through SGLT1 was particularly interesting as the high
level of expression in Xenopus oocytes allowed for the simultaneous measurement of
cotransport cunent and of oocyte volume with high sensitivity. The oocyte expression
system first revealed that the Na/glucose cotransporter has a significant water
permeability. For example, in precedent series of experiments, L = 2 x i0 cm•s’ was
obtained for native oocytes while L = 4 x i0 cm•s1 was obtained for hSGLTI
expressing oocytes (Duquette et al. 2001). This water permeabiÏity however stays much
smaller than that of aquaporine-expressing oocytes which averages 43 ± 2 x l0 cms1
(Zeuthen et al. 2001). Although the L of a single AQP molecule is estimated to be 10 to
40 times larger than the L of SGLTI (Wright et Loo 2000; Duquette et al. 2001), the
passive water permeability of SGLT 1 may serve an important role if the lower water
permeability of SGLT1 can be compensated by a higher density of this cotransporter vs the
AQP1 channel. The small intestine is a good example of a tissue presenting a high density
of SGLT1 in the virtual absence of aquaporin (Ma et Verkman 1999). In the original and
subsequent publications proposing a water pump activity for SGLT1, (Loo et al. 1996;
Zeuthen et al. 1997; Meinild et al. 1998; MacAulay et al. 2001; Zeuthen et al. 2001), the
most significant observation supporting the presence of a water cotransport in addition to
the osmotically-driven passive water flow was the fact that a pure ionic current of
amplitude similar to the cotransport current was completely ineffective in generating any
significant water transport within the first minute of transport.
In the present study, we confirm that the celi swelling induced by SGLT1 is
much faster than the celI swelling induced by the stimulation of an inward cationic current.
By measuring L in each experiment, it was possible to show that the difference in swelling
rates was flot simply due to the larger L value of SGLT1 over that of ROMX2. Our
analysis hasalso shown that the accumulation of an osmotic gradient was tmly slower for
ROMK2- than for $GLT1-expressïng oocytes. In the case of ROMK2, a period of at least

5430 s is needed to detect a significant osmotic gradient, which is flot the case for SGLT1
(see Figure 2 3). This confirms the original observation that a cationic flux is significantly
less efficient than a cotransport current in generating an early water flux. We aimed at
completing this observation by comparing the volume increase induced by the transport of
a neutral osmolyte to that induced by SGLT 1. If water is cotransported through S GLT 1,
then the onset of SGLT 1 -dependent water transport should occur sooner than the water flux
related to the combined neutral solute and ionic fluxes. Experimental observations showed
that the water flux triggered by GLUT2 was fast and comparable in amplitude to the water
flux associated with SGLT1 (Figure 4 B). Further analysis shows that, when added to the
water flux expected from a cationic current, the water flux associated with glucose transport
through a facilitated transporter can quantitatively explain the entire water flux associated
with SGLT1 (Figure 6).
How could glucose accurnulate faster than accompanying cations?
The comparison of the water flux induced by glucose accumulation in GLUT2-
expressing oocytes to the flux associated with cation transport in ROMK2-expressing
oocytes suggests that, for similar transport rates, glucose can locally accumulate much
faster than K. This can be explained by at least two processes. First, in aqueous solutions,
glucose has a diffusion coefficient (D = 0.60 x i0 cm2.s’) 2.3 fold smaller than that for
NaC1 (D = 1.39 x 10 cm2•s’) and -2.$ fold smaller than for KC1 (D = 1.6$ x i0 cm2•s’)+(Macey 1980). This implies that, for a given transport rate, Na should accumulate at the
muer face of the plasma membrane much siower than would glucose. Second, during ion
influx through the plasma membrane, electroneutrality must be respected at all times. If it is
assumed that the steady-state cell swelling achieved by an SGLT1-expressing oocyte
exposed to ŒMG for several minutes reflects isotonic water transport, it can be estimated
that the cotransport of 1 glucose molecule corresponds to the net uptake of 2.6 to 3.3
osmolytes (Table 2 of Zeuthen et al. 2002). This indicates that, for 2 Na ions entering
through the plasma membrane, the current electrode will absorb 1 cation from the cytosol
and inject one anion from the electrode resulting in the net uptake of I glucose and 2 other
55osmolytes. As cunent is injected at the plasma membrane and at the tip of the electrode,
it is flot straightforward to predict where the osmolality should accumulate. Locally, when a
Na ion (or a K ion) is transported through the plasma membrane of an oocyte, it will haveto either repel another cation or attract an anion. Measurements with ion-selective microelectrodes in Xenopus oocytes yield the following intracellular ionic activities : 9 mlvi Na,
76 mM K and 24 mM C1 (Cougnon et al. 1996). Hence, as the cytosolic ion pooi isgenerally composed of K and negatively charged proteins, it can be expected thatintracellular anions will be less mobile than intracellular cations. The preferentialdispiacement of positive charges (mostly K) away from the plasma membrane should
reduce the capacity of cation influx in generating local osmotic gradients. In other words,when a cation influx is generated at the plasma membrane, an equivalent current is injected
at the current electrode and “sait’ will accumulate either at the plasma membrane or at the
current electrode site, depending on the relative mobilities of cytosolic cations and anions.
As time progresses during a stimulated cation influx, the osmolyte accumulation generatedaround the current electrode will reach the plasma membrane and will add its contributionto the local osmotic gradient, which would explain the water flux that can be detected only
afler 30 to 60 s. Interestingly, assuming an intracellular diffusion coefficient of 0.2 x l0
cm2s’ (see below), haif of the osmolytes will have diffused by more than 150 .im in 60 s
(Macey 1980). If the distance between the electrode tip and the membrane was 150 11m, this
simple diffusion process would explain the delay observed between the onset of an ioniccurrent and the detection of its associated water flux.
Why couldn’t GLUT2 be considered as a water cotransporter?
GLUT2-activated 2DG transport can reproduce the early celi swelÏing triggered by
Na/glucose cotransport (Figure 4 A and B). It could be argued that this passive glucose
transporter may also function as a molecular water pump. Activation energies of 14.1 ± 1.2
kcaf•mof’ and 13-16 kcal•mol’ were reported for glucose transport into human
erythrocytes (Hu et al. 2000) and for the passive water permeability through GLUT 1,
respectively (Zeidel et al. 1992; Iserovich et al. 2002). This would be consistent with

56important conformational changes associated with these activities. If GLUT2 could act as
a water pump, a fixed stoichiometry between sugar uptake and the amount of water
accompanying it would be expected. With time, as osmotic gradients are building up, the
apparent stoichiometry tends to increase toward isotonicity which is 280 water molecules
per osmolyte. If one compares volume flow to 2DG uptake rate (Figure 3 and 4), the
apparent stoichiometry would go from 35 to 310 in the first min of transport and would
reach 700 water molecule per 2DG at t=200 s before sÏowly relaxing to 280 for a few long
experiments lasting up to 900 s (data flot shown). As discussed above, this is flot consistent
with a 2DG/water cotransporter with a fixed stoichiometry. This is, however, expected
from a facilitated 2DG transporter which generates a significant osmotic gradient in the
first 3 0-60 s and then continues to stimulate a passive water uptake even after the 2DG
transport rate has decreased to a low steady-state level.
Is this consistent with an mtracellular diffusion model?
Our lab has recently challenged the water cotransport hypothesis (Duquette et al.
2001; Lapointe et al. 2002a; Lapointe et al. 2002b), using a simple model where the
required osmotic gradient could be generated with a low diffusion coefficient averaging
0.11 ± 0.03 x i0 cm2•s’ (Duquette et al. 2001) and an oocyte accessible space of 85 ¾.
More recently, new experimental data has indicated that only 40 ¾ of the oocyte volume is
accessible (Zeuthen et al. 2002). Given that, in our mode!, a reduced accessible space has
the same global effect as a low diffusion coefficient, this new estimate of the accessible
space would permit the required diffusion coefficient to be as high as 0.23 x i0 cm2s’,
which is 40 % of the diffusion coefficient of glucose in free solution. This number can be
considered as a rough estimate of the intracellular diffusion coefficient for an “averag&
intracellular osmolyte. Given that water entering the cell will dilute flot only the transported
osmolytes but also ail intracellular osmolytes present, concentration gradients will be
established for different solutes. The goal of the proposed mode! was to explain the
transport-dependent ceil swelling with a minimal number of adjustable parameters. As the
accessible space was set and the osmotic permeability of each oocyte was measured, the
57model was able to explain the glucose-dependent celi swelling for a 600 s experimental
period followed by a 600 s recovery using only 2 adjustable parameters (intracellular
diffusion coefficient and number of osmolytes per transported charge). Given the
observations in this study, it is clear that a diffusion model should minimally include
distinct diffusion coefficients for glucose and for a representative sait composed of Na or
K and the most abundant and mobile intracellular anion. In addition, the osmolality
associated with the cation influx should be distributed between the plasma membrane and
the tip of the current electrode located at a certain distance from the membrane. If a
diffusion model with 2 parameters was able to reproduce the ceil swelling associated with
Na+/glucose cotransport, it is clear that a more realistic model involving 4 or 5 adjustable
parameters should perform even better. But this increased number of parameters would also
decrease the relevance and simplicity ofthe model without changing our conclusions.
Conclusion
The observation that activation of Na+/glucose cotransport produced an initial rate
of celi swelling much larger than did an equivalent cationic influx was one of the strongest
pieces of experimental evidence supporting the hypothesis of water cotransport by SGLT 1.
In the present study, a complete comparison is presented between the celi swelling
observed for a cationic flux, a glucose influx and a Na+/glucose cotransport. When
analysed in terms of the capacity of each transport pathway to generate an osmotic gradient
at the plasma membrane, it was found that the osmotic gradient required to expiain the
water flux associated with Na+/glucose cotransport can be quantitatively accounted for by
adding the effects of a cationic flux to the effect of neutral solute transport. The initial
water influx (t<45s afier induction of Na+/glucose cotransport) can be largely explained by
glucose accumulation while the contribution of Na (and its associated intracellular anion)
would become dominant only afler 100s ofcotransport.
58Acknowledgments
We thank Drs. Jason Xu and Steve C. Hebert ftom Vanderbiit University for the giif
of the ROMK2 clone. This work was supported by CliP. Grant No. MI-10580. M.P.G.
received a scholarsbip from NSERC.

59
Appendix : Uptake of 2DG by GLUT2-expressing oocytes
The mechanism of 2DG uptake into Xenopus oocytes can be separated into two
distinct steps : entry of 2DG molecules through GLUT2 uniporters (rate constant k1), and
their phosphorylation by hexokinase (fate constant k2). The change in cytosolic,
unphosphorylated 2DG is described by the following equation:
—‘-=k1(G0—G)—k2G, , (Ai)
where G and G0 are respectively the cytosolic and external unphosphorylated 2DG
concentrations. The rate of change in phosphorylated 2DG (concentration P) is simply:
(A2)
Assuming that P = O initially, solving this pair of equations yields the following
result for total 2DG uptake:
k+k2 [k1k2(1_e12)th-k2t] (A3)
It is this total quantity of 2DG that is detected in uptake measurements and which is
osmotically active in volumetric experiments. Since this type of analysis describes
concentration changes foïlowing enzymatic reactions without spatial considerations, il
cannot be strictly applied to the uptake of the 2DG molecules into a certain intracellular
accessible volume which might change with time. Therefore, 2DG uptake (Upt) was fitted
using Eq. A4 which contains three parameters (A, t and P2) instead oftwo:
UPt(i_e+?2t. (A4)
60
References
Bissonnette P, Noel J, Coady MJ, Lapointe JY. 1999. Functional expression oftagged
human Na+-glucose cotransporter in Xenopus laevis oocytes. JFhysiol 520 Pt
2:359-71.
Coady Ml, Wallendorff B, Gagnon DG, Lapointe W. 2002. Identification ofa novel
Na+/myo-inositol cotransporter. J Biol Chem 277(38) :35219-24
Colville CA, Seatter MJ, Jess TJ, GoulU GW, Thomas 1-1M. 1993. Kinetic analysis of the
liver-type (GLUT2) and brain-type (GLUT3) glucose transporters in Xenopus
oocytes: substrate specificities and effects of transport inhibitors. Biochem J 290 (Pt 3):701-6.
Cougnon M, Bouyer P, Hulin P, Anagnostopoulos T, Planelles G. 1996. Further
investigation ofionic diffusive properties and ofNfT4+ pathways in Xenopus laevis
oocyte ceil membrane. FflugersArch 43 1(4):65$-67.
Duquette PP, Bissonnette P, Lapointe JY. 2001. Local osmotic gradients drive the water
flux associated with Na(+)/glucose cotransport. Froc NatÏ Acad Sel U S A
98(7):3 796-$01.
Fischbarg J, Kuang KY, Hirsch J, Lecuona S, Rogozinski L, Silverstein SC, Loike J. 1989.
Evidence that the glucose transporter serves as a water channel in 1774
macrophages. Froc NatÏ Acad Sci U S A 86(21): 8397-401.
Fischbarg J, Kuang KY, Vera JC, Axant S, Silverstein SC, Loike J, Rosen 0M. 1990.
Glucose transporters serve as water channels. Froc NatïAcad Sel USA $7(8):3244-
7.
Gould GW, Thomas HM, Jess TJ, Beil GI. 1991. Expression ofhuman glucose transporters
in Xenopus oocytes: kinetic characterization and substrate specificities ofthe
erythrocyte, liver, and brain isoforms. Biochernistty 30(21):5139-45.
Hu XJ, Peng F, Zhou HQ, Zhang ZH, Cheng WY, Feng 11F. 2000. The abnormality of
glucose transporter in the erythrocyte membrane of Chinese type 2 diabetic patients.
Biochim Biophys Acta 1466(1-2):306-14.

61Iserovich P, Wang D, Ma L, Yang H, Zuniga FA, Pascual JM, Kuang K, De Vivo DC,
fischbarg J. 2002. Changes in glucose transport and water permeability resulting
from the T3 101 pathogenic mutation in GlutI are consistent with two transport
channels per monomer. JBiot Chem 277(34):30991-7.
Lapointe IY, Gagnon M, Poirier S, Bissonnette P. 2002a. The presence of local osmotic
gradients can account for the water flux driven by the Na+-glucose cotransporter. J
Physiot 542(Pt 1):61-2.
Lapointe IY, Gagnon MP, Gagnon DG, Bissonnette P. 2002b. Controversy regarding the
secondary active water transport hypothesis. Biochem Cet! Biot 80(5):525-33.
Loo DD, Zeuthen T, Chandy G, Wright EM. 1996. Cotransport ofwater by the
Na+/glucose cotransporter. Froc Natt Acad Sel U S A 93(23): 13367-70.
Ma T, Verkman AS. 1999. Aquaporin water channels in gastrointestinal physiology. J
Physiot 517 (Pt 2):317-26.
MacAulay N, Gether U, Klaerke DA, Zeuthen T. 2001. Water transport by the human Na+
coupled glutamate cotransporter expressed in Xenopus oocytes. JFhysiol 530(Pt
3):367-78.
Macey RI. 1980. Mathematical Models of Membrane Transport Processes. In: Fanestil DD,
editor. Membrane Fhysiotogy. New York: Plenum Medical. p 125-146.
Macey RI. 1984. Transport ofwater and urea in red blood ceils. Am JFhysiol 246(3 Pt
l):C195-203.
Meinild A, Klaerke DA, Loo DD, Wright EM, Zeuthen T. 1998. The human Na+-glucose
cotransporter is a molecular water pump. JFhysioÏ 50$ (Pt 1):15-21.
Meinild AK, Loo DD, Pajor AM, Zeuthen T, Wright EM. 2000. Water transport by the
renal Na(+)-dicarboxylate cotransporter. Anz JPhysioÏ ReiiaÏ Fhysiot 278(5):F777-
83.
Preston GM, Agre P. 1991. Isolation ofthe cDNA for erythrocyte integral membrane
protein of 28 kilodaltons: member of an ancient channel family. Froc NatÏAcad Sel
USA 8$(24):11110-4.
Schreibmayer W, Lester HA, Dascal N. 1994. Voltage clamping ofXenopus laevis oocytes
utilizing agarose-cushion electrodes. Pjhtgers Arch 426(5) :453-8.

62Wright EM, Loo DD. 2000. Coupling between Na+, sugar, and water transport across the
intestine. Ann N YAcad Sel 915:54-66.
Zampighi GA, Kreman M, Boorer U, Loo DD, Bezanilla F, Chandy G, Hall JE, Wright
EM. 1995. A method for determining the unitary ftinctional capacity of cloned
channels and transporters expressed in Xenopus laevis oocytes. JMembr Bio!
148(1): 65-78.
Zeidel ML, Albalak A, Grossman E, Carruthers A. 1992. Role of glucose carrier in human
erytbrocyte water permeability. Biochernistiy 3 1(2):5 $9-96.
Zeuthen T. 1991. $econdary active transport ofwater across ventricular ceil membrane of
choroid plexus epithelium ofNecturus maculosus. JPhysio! 444:153-73.
Zeuthen T. 1994. Cotransport ofK+, Cl- and H20 by membrane proteins from choroid
plexus epithelium ofNecturus maculosus. JPhysioÏ 478 (Pt 2):203-19.
Zeuthen T, Meinild AK, Klaerke DA, Loo DD, Wright EM, Belhage B, Litman T. 1997.
Water transport by the Na+/glucose cotransporter under isotonic conditions. Bio!
Ce!! 89(5-6):307-12.
Zeuthen T, Meinild AK, Loo DD, Wright EM, Klaerke DA. 2001. Isotonic transport by the
Na+-glucose cotransporter SGLT1 from humans and rabbit. JFhysiol 53 1(Pt
3):631-44.
Zeuthen T, Zeuthen E, Klaerke DA. 2002. Mobility of ions, sugar, and water in the
cytoplasm ofXenopus oocytes expressing Na(+)-coupled sugar transporters
(SGLT1). JFhysio! 542(Pt 1):71-87.
Zhang R, Skach W, Hasegawa H, van Hoek AN, Verkrnan AS. 1993. Cloning, functional
analysis and celi localization of a kidney proximal tubule water transporter
homologous to CHIP28. J Ce!! Bio! 120(2):359-69.
Chapitre III Discussion
1 Limites de notre approche
Les expériences présentées au chapitre précédent ont été planifiées de façon à
rapprocher entre elles les conditions expérimentales mettant en scène chacune des 3
protéines utilisées. Pour comparer les accumulations locales générées par le transport
d’une même quantité de solutés, il était important que la vitesse à laquelle ces substrats ont
été transportés dans l’ovocyte soit du même ordre de grandeur. En effet, il est parfaitement
envisageable qu’une grande quantité de molécules se retrouvant rapidement sous la
membrane cellulaire y crée un gradient osmotique plus fort que si la même quantité y était
amenée progressivement et avait alors amplement le temps de diffuser dans le cytosol. De
ce point de vue, les ovocytes hSGLTI exposés à 5 mM ŒMG et les ovocytes GLUT2
exposés à 5 mM 2DG transportaient par chance des quantités comparables de sucre durant
les 250 premières secondes, comme le montre la figure 3 du Chapitre II. Pour le canal
ROMK2, qui jouit d’une forte expression dans les ovocytes, les expériences étaient
effectuées très tôt après la micro-injection d’ARNm (souvent le lendemain ou le
surlendemain) et la valeur du potentiel imposé lors de la période de transport était
spécifiquement sélectionnée pour chaque expérience de façon à produire un courant
potassique d’environ 1 p.A, c’est-à-dire similaire aux courants moyens de cotransport
Na/glucose.
Avant de faire la comparaison des accumulations générées par l’activité de nos
différentes protéines, il a aussi fallu prendre en considération le fait que la perméabilité à
l’eau de la membrane était différente selon la protéine exprimée et même d’un ovocyte à
l’autre. C’est pourquoi les gradients osmotiques déduits des gonflements mesurés ont été
comparés plutôt que les changements de volume eux-mêmes. En outre, l’eau traversant la
membrane diluait les osmolytes intracellulaires. Il fallait aussi en tenir compte puisque
l’information importante à recueillir était l’accumulation de substrats sous la membrane
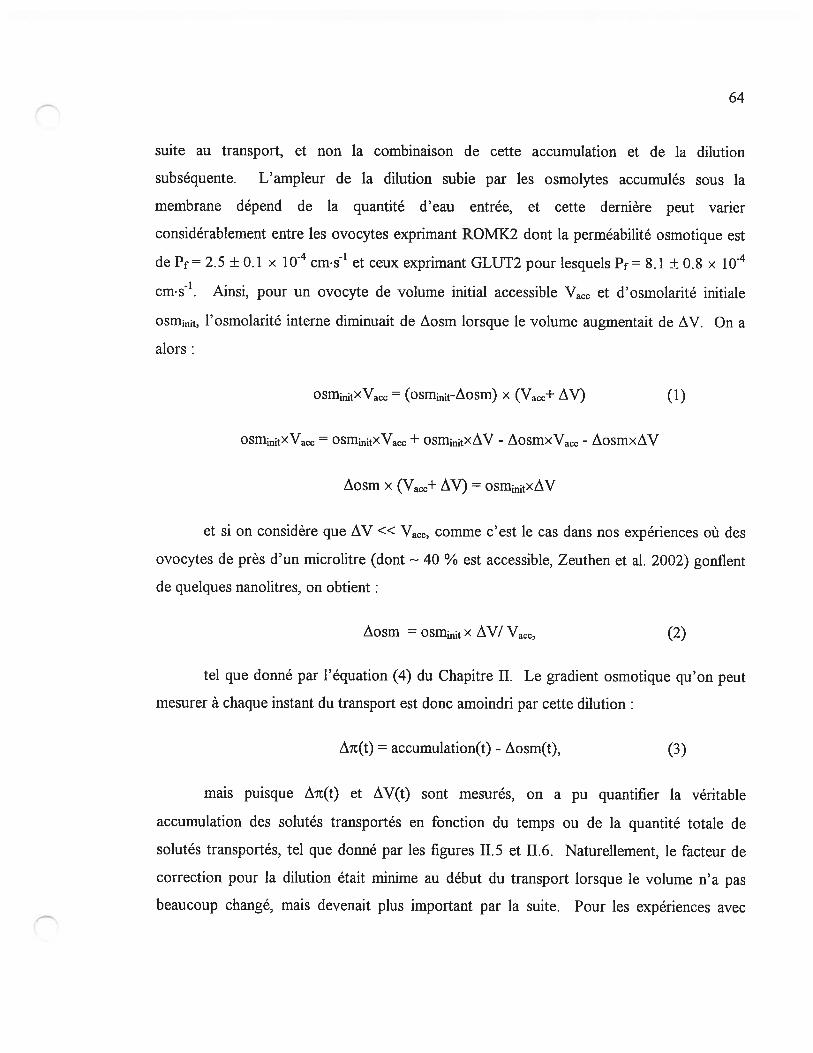
64
suite au transport, et non la combinaison de cette accumulation et de la dilution
subséquente. L’ampleur de la dilution subie par les osmolytes accumulés sous la
membrane dépend de la quantité d’eau entrée, et cette dernière peut varier
considérablement entre les ovocytes exprimant ROMX2 dont la perméabilité osmotique est
de Pf= 2.5 ± 0.1 x i0 cms’ et ceux exprimant GLUT2 pour lesquels Pf= 8.1 ± 0.8 x i0
cms’. Ainsi, pour un ovocyte de volume initial accessible Vace et d’osmolarité initiale
l’osmolarité interne diminuait de Aosm lorsque le volume augmentait de AV. On a
alors
osmjnjtxVacc = (osmt—Aosm) X (Vacc+ AV) (1)
O5ffljnjtXVacc = osminjtxVacc + osm11txAV - AosmxVacc - AosmxAV
Aosm X (Vacc+ /W) = osmjxAV
et si on considère que AV « Vacc, comme c’est le cas dans nos expériences où des
ovocytes de près d’un microlitre (dont 40 % est accessible, Zeuthen et al. 2002) gonflent
de quelques nanolitres, on obtient:
Aosm = osm11 X AV/ Vacc, (2)
tel que donné par l’équation (4) du Chapitre II. Le gradient osmotique qu’on peut
mesurer à chaque instant du transport est donc amoindri par cette dilution
A’t(t) = accumulation(t) - Aosm(t), (3)
mais puisque Ait(t) et AV(t) sont mesurés, on a pu quantifier la véritable
accumulation des solutés transportés en fonction du temps ou de la quantité totale de
solutés transportés, tel que donné par les figures 11.5 et 11.6. Naturellement, le facteur de
correction pour la dilution était minime au début du transport lorsque le volume n’a pas
beaucoup changé, mais devenait plus important par la suite. Pour les expériences avec
65
GLUT2 en particulier, la correction atteignait 3 mM après 250 sec, alors que le gradient
osmotique mesuré était lui-même de 2.7 mOsm.
Cette correction prenant de l’ampleur avec le temps imposait une première limite à
la durée possible des expériences. D’autres contraintes se sont aussi ajoutées à cette
dernière pour nous inciter à effectuer des expériences d’assez courte durée. En effet, après
un certain temps, le transport d’eau et de solutés devient inévitablement isotonique et peut
difficilement fournir un indice fiable des gradients osmotiques en présence. Finalement, il
faut aussi garder en mémoire la cinétique du transport de 2DG par GLUT2 : puisque non
électrogénique, ce transport ne peut être forcé. Il perd donc progressivement son intensité
initiale pour se poursuivre à un taux assez réduit correspondant à la phosphorylation interne
des molécules de 2DG, comme on peut le voir sur la figure 3 du chapitre II. Pour des
transports de plus de 300 sec, l’entrée de 2DG dans les ovocytes exprimant GLUT2 ne
pouvait donc être comparée à celle d’ŒMG dans les ovocytes exprimant SGLT1.
Finalement, il est important de garder à l’esprit que, malgré la grande efficacité de
la technique de volumétrie avec les ovocytes de Xenopus Ïae vis pour des mesures de flux
d’eau très sensibles en temps réel, on ne peut pas nécessairement se fier aux changements à
très court terme (moins de 30 s) qui sont observés. C’est pourquoi des équations
empiriques ont été numériquement ajustées sur les mesures de volume. Cette approche
fournit une estimation continue de la pente du volume qui est moins bruyante que ne le
seraient des régressions linéaires sur une petite fenêtre temporelle, et plus objective qu’une
évaluation « visuelle» de la pente basée sur une portion choisie.
66
2 Réponse aux arguments appuyant le cotransport d’eau
Les résultats récoltés ici semblent indiquer que les flux d’eau reliés au cotransportNa/glucose sont passifs et générés par une accumulation particulièrement rapide duglucose. Nous pouvons réévaluer sous cet angle les observations appuyant initialementl’existence d’un transport d’eau secondairement actif (Chapitre I 2).
1 - Gonflement relié au cotransport plus rapide et important que le gonflement associé à uncourant ionique.
Ce projet de recherche a permis de réaliser que les molécules de glucoses’accumulent sous la membrane plus efficacement que ne le font les ions, d’où les flux d’eauosmotiques qui paraissent plus “immédiats” quand on observe un transport de solutésneutres.
2 - Un nombre fixe de molécules d’eau semble accompagner chaque cycle de cotransport.Cette stoechiométrie, qui serait de 264 F120 par cycle pour h$GLT1, ne varie pas avec leniveau d’expression ni le taux de transport, et est spécifique à chaque type decotransporteur.
Puisque ce sont les substrats transportés par SGLI1 qui s’accumulent et stimulentl’entrée passive d’eau, il est naturel que le taux d’entrée d’eau mesuré à l’état stationnaire soit
proportionnel au taux de transport. Cependant, plusieurs expériences de courte durée où lecourant de cotransport était brusquement réduit (Duquette et al.; Lapointe et al. 2002a;Lapointe et al. 2002b) ont montré que le changement de volume se poursuivait alors pourun certain temps en raison du gradient osmotique accumulé, puis ralentissait graduellement.
67
De plus, la stoechiométrie calculée pour le cotransport d’eau, qui semble être
spécifique à chaque espèce de cotransporteur, est plus élevée lorsque la perméabilité
osmotique des ovocytes est plus grande (figure 4 de l’article en annexe Lapointe et al.
2002b). Cette proportionnalité serait fortuite dans l’hypothèse du transport actif d’eau, mais
on ne s’attend pas à autre chose si on considère que les flux d’eau sont passifs une
perméabilité osmotique plus grande permet un taux d’entrée d’eau plus important pour la
même accumulation de solutés.
3 - L’énergie d’activation du gonflement durant le cotransport ressemble à celle du courant
plutôt qu’à celle de la perméabilité passive.
L’accumulation d’osmolytes sous la membrane est une conséquence de l’activité de
cotransport. Si cette activité augmente, l’accumulation sera plus importante et les flux d’eau
passifs aussi. Il est donc tout-à-fait prévisible que la dépendance en température soit la
même pour le taux de cotransport et pour le flux d’eau causé indirectement par le
cotransport.
4 - L’activité de cotransport NaJgIucose peut générer des flux d’eau contre un gradient
osmotique.
Un flux d’eau osmotique dépend de la perméabilité à l’eau et du gradient osmotique
de part et d’autre de la membrane (Chapitre I, équation 8). Si on augmente l’osmolarité de
la solution externe en même temps qu’on génère une accumulation d’osmolytes sous la
membrane par l’activité de cotransport, le gradient osmotique effectif à la membrane sera
simplement la résultante de ces deux effets. Un accumulation dûe au cotransport qui serait
plus importante que le gradient hypertonique imposé serait donc en mesure de générer un
gonflement, tel que précédemment simulé par le modèle de diffusion intracellulaire (figure
6 de Duquette et al. 2001).
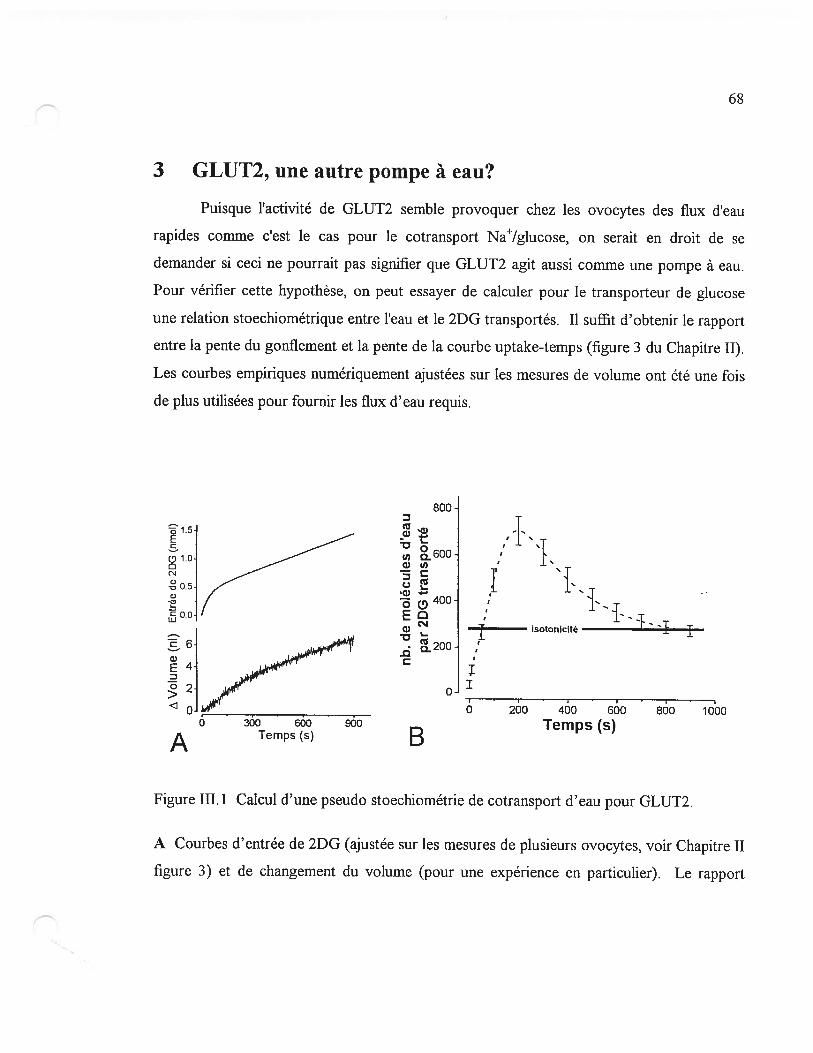
6$
3 GLUT2, une autre pompe à eau?
Puisque l’activité de GLUT2 semble provoquer chez les ovocytes des flux d’eau
rapides comme c’est le cas pour le cotransport Na4/glucose, on serait en droit de se
demander si ceci ne pourrait pas signifier que GLUT2 agit aussi comme une pompe à eau.
Pour vérifier cette hypothèse, on peut essayer de calculer pour le transporteur de glucose
une relation stoechiométrique entre l’eau et le 2DG transportés. Il suffit d’obtenir le rapport
entre la pente du gonflement et la pente de la courbe uptake-temps (figure 3 du Chapitre II).
Les courbes empiriques numériquement ajustées sur les mesures de volume ont été une fois
de plus utilisées pour fournir les flux d’eau requis.
800
I I j: /
W isotonicité — I I
I
2O0
0
___________________________
0 260 400 660 s6o ioooÔ 3D0 600 9D Temps (s)
Temps (s) B
Figure 111.1 Calcul d’une pseudo stoechiométrie de cotransport d’eau pour GLUT2.
A Courbes d’entrée de 2DG (ajustée sur les mesures de plusieurs ovocytes, voir Chapitre Il
figure 3) et de changement du volume (pouf une expérience en particulier). Le rapport
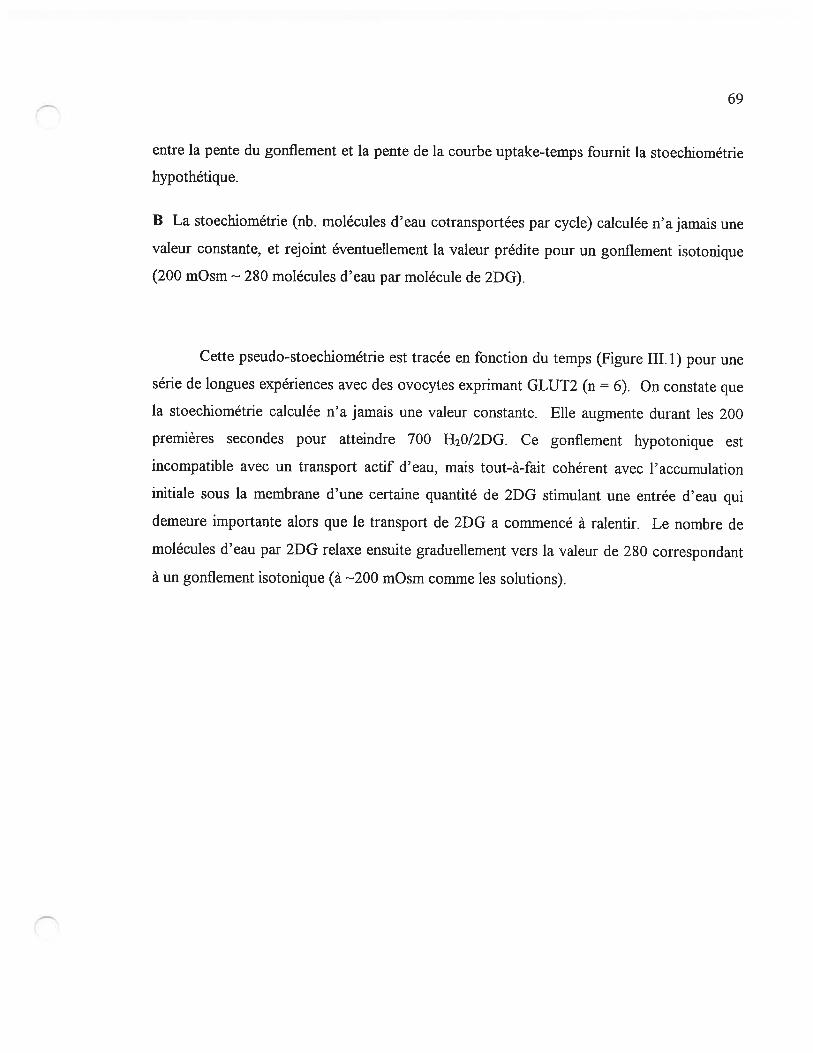
69
entre la pente du gonflement et la pente de la courbe uptake-temps fournit la stoechiométrie
hypothétique.
B La stoechiométrie (nb. molécules d’eau cotransportées par cycle) calculée n’a jamais une
valeur constante, et rejoint éventuellement la valeur prédite pour un gonflement isotonique
(200 mOsm 280 molécules d’eau par molécule de 2DG).
Cette pseudo-stoechiométrie est tracée en fonction du temps (Figure 111.1) pour une
série de longues expériences avec des ovocytes exprimant GLUT2 (n = 6). On constate que
la stoechiométrie calculée n’a jamais une valeur constante. Elle augmente durant les 200
premières secondes pour atteindre 700 H20/2DG. Ce gonflement hypotonique est
incompatible avec un transport actif d’eau, mais tout-à-fait cohérent avec l’accumulation
initiale sous la membrane d’une certaine quantité de 2DG stimulant une entrée d’eau qui
demeure importante alors que le transport de 2DG a commencé à ralentir. Le nombre de
molécules d’eau par 2DG relaxe ensuite graduellement vers la valeur de 280 correspondant
à un gonflement isotonique (à 200 mOsm comme les solutions).
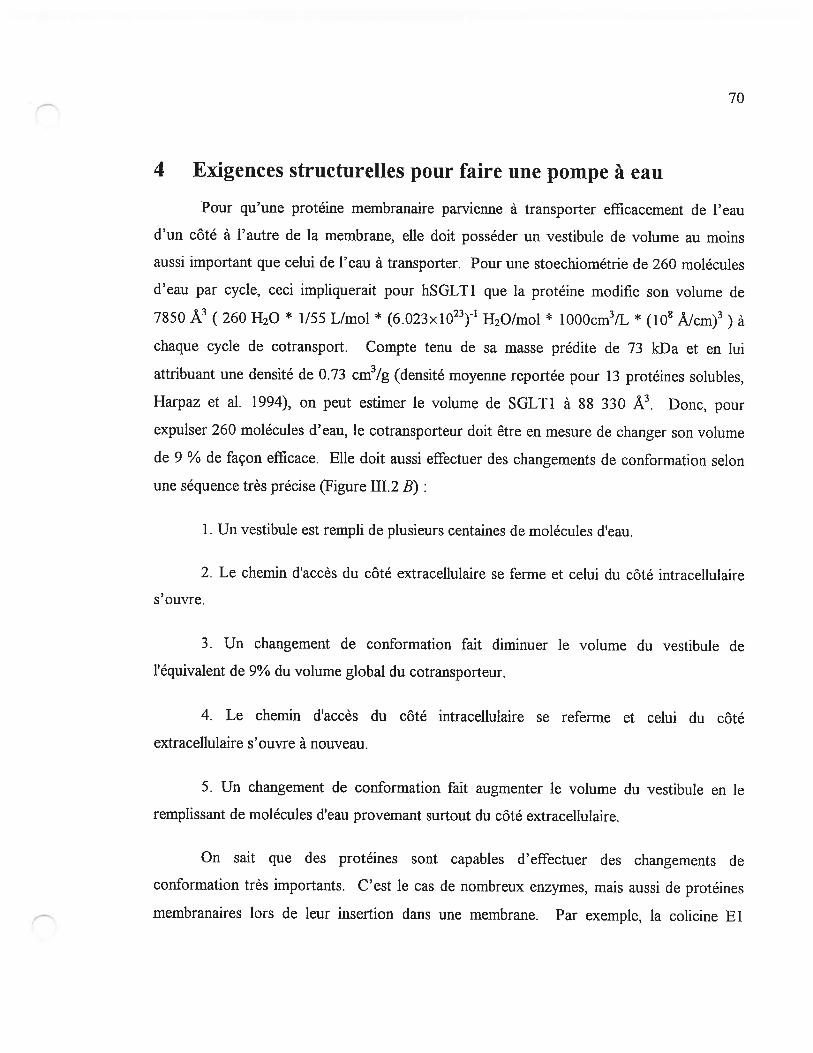
70
4 Exigences structurelles pour faire une pompe à eau
Pour qu’une protéine membranaire parvienne à transporter efficacement de l’eau
d’un côté à l’autre de la membrane, elle doit posséder un vestibule de volume au moins
aussi important que celui de l’eau à transporter. Pour une stoechiométrie de 260 molécules
d’eau par cycle, ceci impliquerait pour hSGLTI que la protéine modifie son volume de
7850 À3 (260 H20 * 1/55 L/mol * (6.023x10²³)’ H20/mol * l000cm3/L * (10$ À/cm)3 ) à
chaque cycle de cotransport. Compte tenu de sa masse prédite de 73 kDa et en lui
attribuant une densité de 0.73 cm3/g (densité moyenne reportée pour 13 protéines solubles,
Harpaz et al. 1994), on peut estimer le volume de SGLT1 à 8$ 330 À3. Donc, pour
expulser 260 molécules d’eau, le cotransporteur doit être en mesure de changer son volume
de 9 % de façon efficace. Elle doit aussi effectuer des changements de conformation selon
une séquence très précise (Figure 111.2 3)
1. Un vestibule est rempli de plusieurs centaines de molécules d’eau.
2. Le chemin d’accès du côté extracellulaire se ferme et celui du côté intracellulaire
s’ouvre.
3. Un changement de conformation fait diminuer le volume du vestibule de
l’équivalent de 9% du volume global du cotransporteur.
4. Le chemin d’accès du côté intracellulaire se referme et celui du côté
extracellulaire s’ ouvre à nouveau.
5. Un changement de conformation fait augmenter le volume du vestibule en le
remplissant de molécules d’eau provemant surtout du côté extracellulaire.
On sait que des protéines sont capables d’effectuer des changements de
conformation très importants. C’est le cas de nombreux enzymes, mais aussi de protéines
membranaires lors de leur insertion dans une membrane. Par exemple, la colicine El
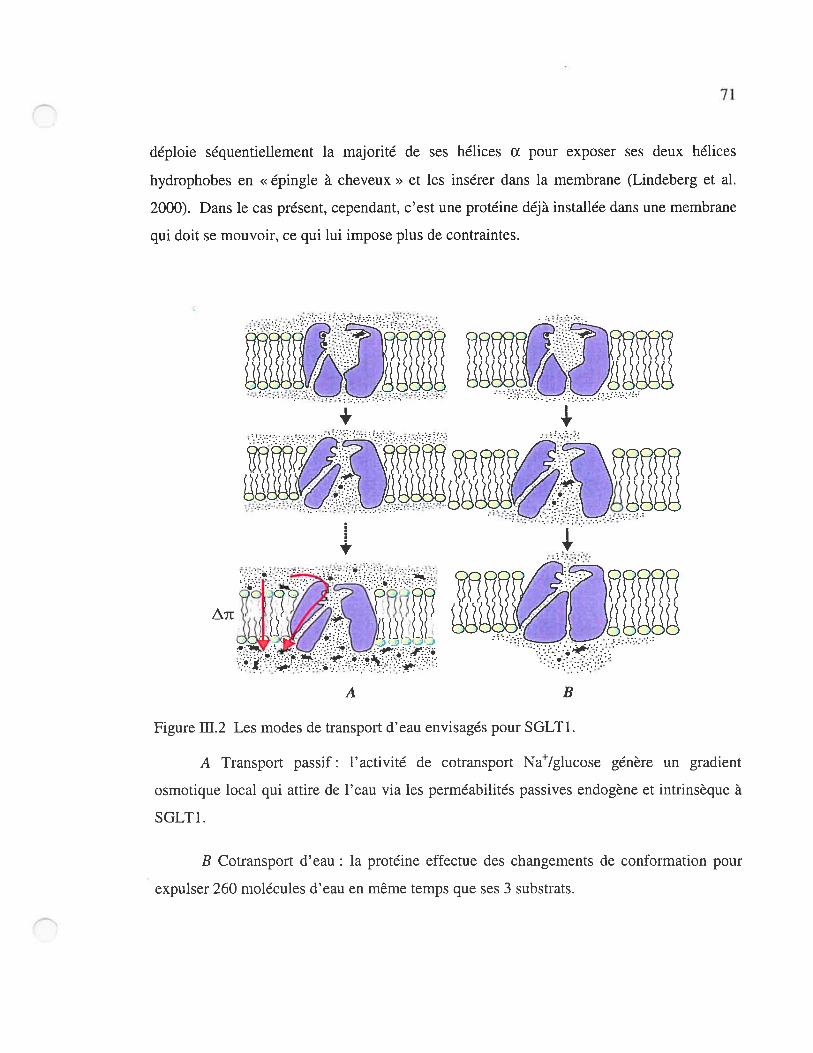
71
Cdéploie séquentiellement la majorité de ses hélices ci. pour exposer ses deux hélices
hydrophobes en «épingle à cheveux» et les insérer dans la membrane (Lindeberg et al.
2000). Dans le cas présent, cependant, c’est une protéine déjà installée dans une membrane
qui doit se mouvoir, ce qui lui impose plus de contraintes.
1121i ii!+
‘4
+
....
-K •
A
Figure ffl.2 Les modes de transport d’eau envisagés pour SGLTÏ.
A Transport passif: l’activité de cotransport Na/glucose génère un gradient
osmotique local qui attire de l’eau via les perméabilités passives endogène et intrinsèque à
SGLTY.
B Cotransport d’eau: la protéine effectue des changements de conformation pour
expulser 260 molécules d’eau en même temps que ses 3 substrats.
B
72
Depuis quelques années, un certain nombre de structures tri-dimensionnelles ont pu
être élucidées pour des protéines membranaires dans des conditions qui devraient
reproduire assez bien celles de la membrane plasmique. Les structures par diffraction des
rayons X dans différentes conditions (ex. : avec ou sans inhibiteur) fournissent de précieux
indices sur la nature des changements de conformation. Les canaux potassiques sont les
protéines membranaires qu’on connaît le mieux actuellement au niveau de la structure. Le
vestibule central formé par le tétramère du canal KcsA dans l’état fermé (Figure 111.33)
contiendrait 27 molécules d’eau, selon les plus récentes estimations (Kuo et al. 2003).
Dernièrement, la structure d’un canal potassique dans l’état ouvert a été élucidée pour la
première fois (Jiang et al. 2002b; Jiang et al. 2002a). Il s’agit du canal K bactérien régulé
par le calcium, MthK. Les domaines formant le pore de KcsA et de MthK sont considérés
comme assez homologues pour être comparés. La figure 111.3 confronte donc les structures
du canal potassique dans l’état ouvert et fermé. La cavité (moitié inférieure des canaux sur
la Figure 111.3) qui contient 30 molécules d’eau à l’état fermé semble à peu près doubler
de volume lorsque le canal est à l’état ouvert, ce qui permettrait à 30 molécules d’eau
supplémentaires de s’y insérer. La fermeture du canal potassique est donc un changement
de conformation qui modifierait considérablement l’hydratation de la protéine, mais on
demeure tout de même loin des 260 molécules d’eau prédites pour le cotransport d’eau par
hSGLT1. L’activité de transport de K à travers le filtre de sélectivité du canal ouvert,
quant à elle, impliquerait une seule molécule d’eau transportée par ion K (Berneche et
Roux 2000; Zhou et al. 2001)).
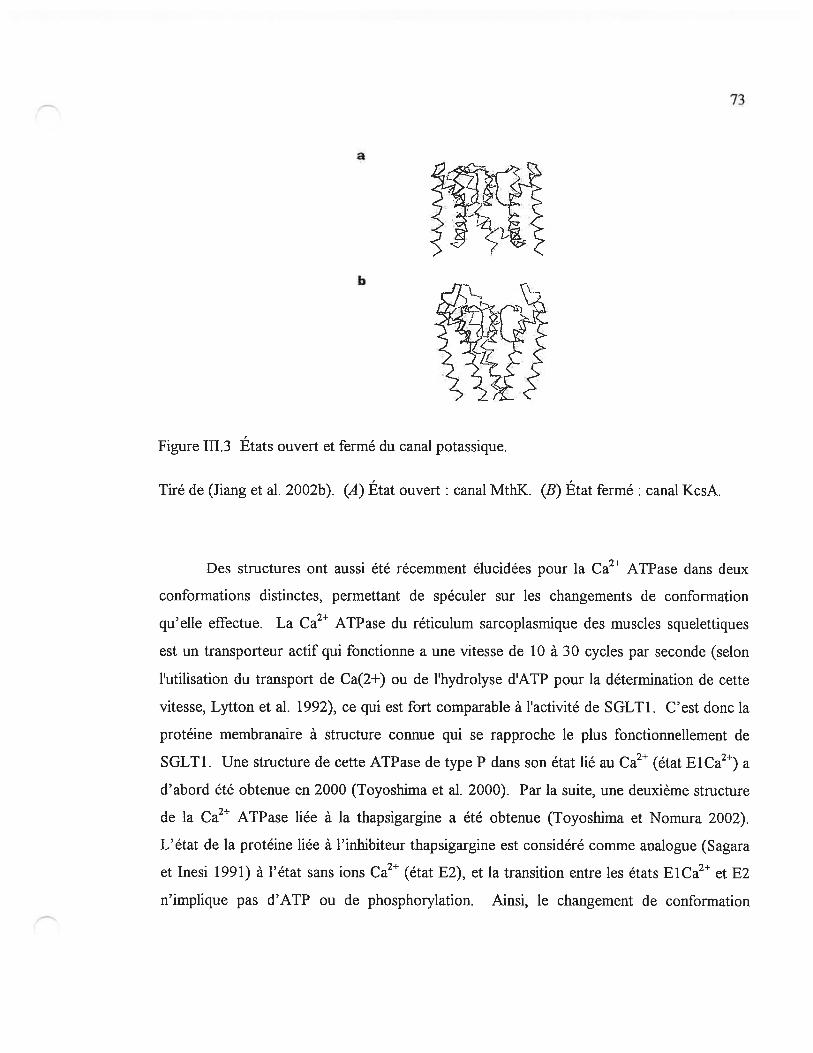
73
a
b
figure 111.3 États ouvert et fermé du canal potassique.
Tiré de (Jiang et al. 2002b). (A) État ouvert: canal MtbK. (B) État fermé: canal KcsA.
Des structures ont aussi été récemment élucidées pour la Ca2 ATPase dans deux
conformations distinctes, permettant de spéculer sur les changements de conformation
qu’elle effectue. La Ca2 ATPase du réticulum sarcoplasmique des muscles squelettiques
est un transporteur actif qui fonctionne a une vitesse de 10 à 30 cycles par seconde (selon
l’utilisation du transport de Ca(2+) ou de l’hydrolyse d’ATP pour la détermination de cette
vitesse, Lytton et al. 1992), ce qui est fort comparable à l’activité de SGLT1. C’est donc la
protéine membranaire à structure connue qui se rapproche le plus fonctionnellement de
SGLT1. Une structure de cette ATPase de type P dans son état lié au Ca2 (état ElCa2) a
d’abord été obtenue en 2000 (Toyoshima et al. 2000). Par la suite, une deuxième structure
de la Ca2 ATPase liée à la thapsigargine a été obtenue (Toyoshima et Nomura 2002).
L’état de la protéine liée à l’inhibiteur thapsigargine est considéré comme analogue (Sagara
et Inesi 1991) à l’état sans ions Ca2 (état E2), et la transition entre les états E1Ca2 et E2
n’implique pas d’ATP ou de phosphorylation. Ainsi, le changement de conformation
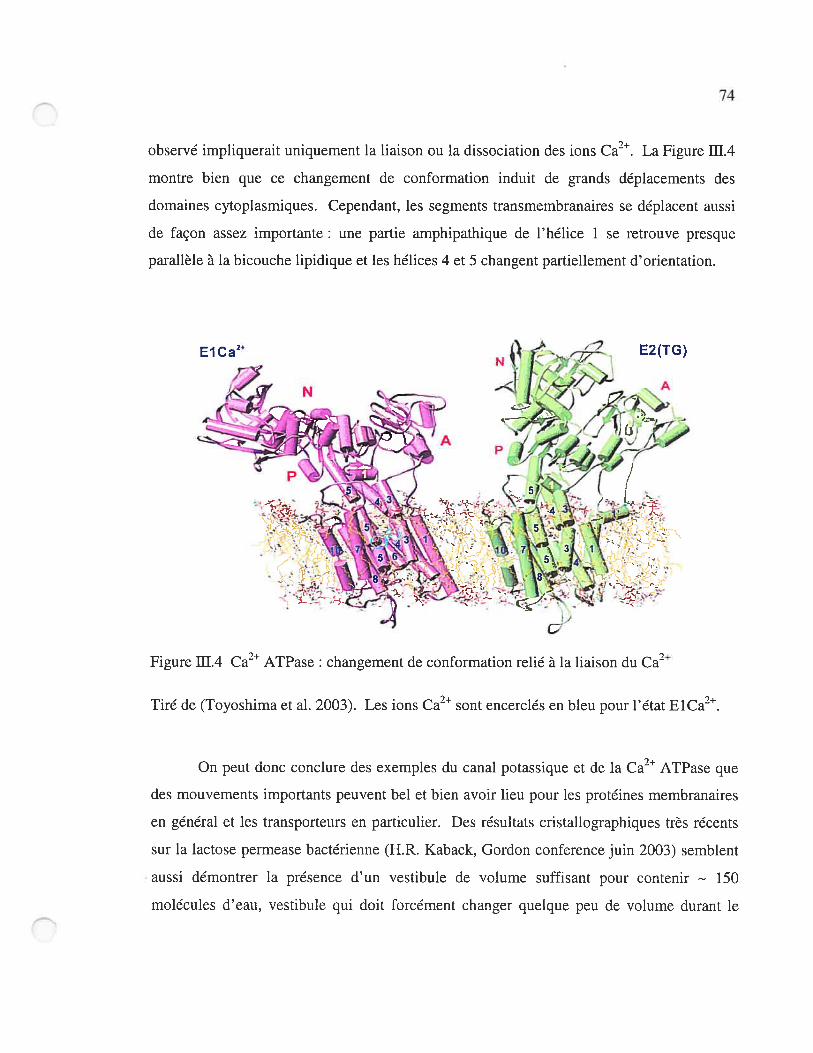
C74
observé impliquerait uniquement la liaison ou la dissociation des ions Ca2. La Figure ffl.4
montre bien que ce changement de conformation induit de grands déplacements des
domaines cytoplasmiques. Cependant, les segments transmembranaires se déplacent aussi
de façon assez importante une partie amphipathique de l’hélice Ï se retrouve presque
parallèle à la bicouche lipidique et les hélices 4 et 5 changent partiellement d’orientation.
Tiré de (Toyoshima et al. 2003). Les ions Ca2 sont encerclés en bleu pour l’état ElCa2t
On peut donc conclure des exemples du canal potassique et de la Ca2 ATPase que
des mouvements importants peuvent bel et bien avoir lieu pour les protéines membranaires
en général et les transporteurs en particulier. Des résultats cristallographiques très récents
sur la lactose permease bactérienne (TIR. Kaback, Gordon conference juin 2003) semblent
aussi démontrer la présence d’un vestibule de volume suffisant pour contenir - 150
molécules d’eau, vestibule qui doit forcément changer quelque peu de volume durant le
Figure ffl.4 Ca2 ATPase : changement de conformation relié à la liaison du Ca2

75
cycle de la protéine. Les cotransporteurs Na/so1uté subissent donc probablement aussi des
changements de conformations considérables, comme les courants transitoires et des
résultats de fluorescence (Meinild et al. 2002) semblent l’indiquer. Cependant, tel que
mentionné plus haut, des mouvements très précis dans un ordre strict sont requis pour
l’activité d’une pompe à eau moléculaire forçant le transfert d’une quantité fixe de
molécules d’eau à chaque cycle. Jusqu’à ce jour, on n’a jamais présenté une structure de
protéine membranaire qui supporterait les changements de conformation nécessaires pour
effectuer ce genre de travail. Ce type de pompage d’eau, si jamais il a vraiment lieu, serait
sans précédent.
Conclusion et perspectives
L’hypothèse d’un transport d’eau secondairement actif présente des perspectives
très intéressantes dans plusieurs domaines. Au niveau moléculaire, d’abord, l’occurence de
protéines formant des pompes à eau serait captivante, mais assez surprenante (voir
Discussion).
Au niveau physiologique ensuite, le cotransport d’eau par SGLT1 a été suggéré
comme un acteur important de l’absorption d’eau par l’intestin (Loo et al. 1999; Loo et al.
2002). En effet, puisque des gradients osmotiques n’ont pu être observés jusqu’à présent à
travers cet épithélium et que l’absorption d’eau semble y être reliée à l’absorption de
glucose (voir Chapitre I 1.5), la présence de pompes à eau dépendantes du glucose
arriverait à point pour combler une lacune dans la compréhension de l’absorption des
fluides par l’épithélium intestinal. Considérant qu’environ une mole de glucose est
absorbée chaque jour par l’intestin humain, le cotransport de 260 molécules d’eau par
molécule de glucose expliquerait le transport de 5 des $ litres d’eau absorbés
quotidiennement par l’intestin. Cependant, même si ce cotransport d’eau par l’épithélium
intestinal est physiologiquement attrayant, ce n’est pas la seule option qui subsiste pour
expliquer l’absorption de fluides par l’intestin. Ce projet a permis de constater que les
solutés neutres comme le glucose peuvent s’accumuler d’une façon particulière à leur
arrivée dans les cellules. Le transport de solutés pourrait donc générer des gradients
osmotiques locaux n’ayant pu être détectés jusqu’à maintenant. Si c’est le cas, diverses
voies de perméabilité à l’eau dans les enthérocytes pourraient ensuite médier les flux d’eau
osmotiques : SGLT1 possède une perméabilité passive à l’eau, des aquaporines ont
récemment été détectées à divers sites le long de l’intestin (Ma et Verkman 1999; Gallardo
et al. 2001), et une série d’études récentes (Helliweil et al. 2000b; Helliweil et al. 2000a;
Kellett et HelliweIl 2000; Kellett 2001; Helliweli et Kellett 2002; Helliweil et al. 2003)
suggèrent un recrutement de GLUT2 à la membrane apicale dépendant de la concentration
de glucose luminale. Ce dernier mécanisme expliquerait la portion passive de l’absorption
de glucose, mais apporterait aussi une perméabilité à l’eau supplémentaire via GLUT2
lorsque la quantité de glucose ingérée devient importante.
77
Bien que le cotransport d’eau soit une hypothèse intéressante, le principe de ladiffusion passive de l’eau est toujours en mesure d’expliquer les résultats avec les ovocytes
qui ont mené à cette nouvelle hypothèse (pour une revue des arguments pour et contrel’hypothèse du cotransport d’eau, consulter l’article en annexe). En outre, la perméabilitépassive du cotransporteur Na/glucose est à elle seule une propriété très intéressante. Lesétudes futures pourraient s’orienter vers une meilleure description de cette perméabilité, en
s’inspirant par exemple de ce qui a déjà été fait pour les aquaporines et les GLUTs. Ainsi,
on pourrait d’abord mesurer le rapport des perméabilités osmotiques et de diffusion,
comme il a déjà été fait pour les érythrocytes (voir Chapitre I 1.3). Si la perméabilité àl’eau de SGLT1 prend la forme d’un canal bien déterminé, peut-être ce rapport PtfPd
permettrait-il de déduire un nombre de molécules d’eau en file indienne. Aussi,l’observation qu’un mutant du transporteur facilité GLUT1 altérait différement ses activitésde transport de glucose et d’eau a mené à la suggestion de 2 pores aqueux par monomère deGLUT1 (Iserovich et al. 2002). Les mutants cystéine de hSGLT1 déjà élaborés dans celaboratoire pourraient être exploités de façon similaire la comparaison des effets demutations simples sur la fonction de cotransport et de perméabilité à l’eau permettrait devoir si l’eau et les substrats suivent des voies distinctes ou communes dans la protéine. Deplus, des mesures de perméabilité à la suite de l’application de réactifs sulfhydrylsméthane-thio-sulfonate (MTS) pourrait faire découvrir des résidus situés aux abords du
pore aqueux du cotransporteur.
Ainsi, l’hypothèse du transport d’eau secondairement actif n’est toujours pasnécessaire à l’interprétation des flux d’eau générés par le cotransporteur Na/glucose.L’accumulation locale combinée du glucose et des ions est suffisante pour générer desgradients osmotiques importants, lesquels peuvent ensuite déclencher les flux d’eau
observés. Le fait que des transporteurs de solutés neutres comme GLUT2 et SGLTIcomportent une perméabilité osmotique considérable est particulièrement intéressant dupoint de vue évolutif. En effet, cette association d’une perméabilité osmotique à desprotéines susceptibles de générer d’importants gradients osmotiques locaux semble bien à
78
propos. Est-ce que ce type de transporteurs perméables pourrait avoir été favorisé à un
certain moment par rapport à des transporteurs plus étanches? Peut-être le nombre
croissant de structures et de fonctions connues pour des protéines membranaires permettra-
t-il un jour de répondre à cette question...
79
Bibliographie
Agre P, King LS, Yasui M, Guggino WB, Ottersen OP, Fujiyoshi Y, Engel A, Nielsen S.
2002. Aquaporin water channels--from atomic structure to clinical medicine. J
Physiol 542(Pt 1):3-16.
Alvarez J, Lee DC, Baldwin SA, Chapman D. 1987. Fourier transform inftared
spectroscopic study ofthe structure and conformational changes ofthe human
erythrocyte glucose transporter. JBiol Chem 262(8):3502-9.
Andreoli TE, Schafer JA. 1980. Principles ofwater and nonelectrolyte transport across
membranes. In: Fanestil DD, editor. Membrane PhysioÏogy. New York: Plenum
Medical. p 165-184.
Beck JC, Sacktor B. 1978. The sodium electrochemical potential-mediated uphili transport
of D-glucose in renal brush border membrane vesicles. JBiol Chem 253(15):5531-
5.
Bel! GI, Burant CF, Takeda J, Gould GW. 1993. Structure and ftinction ofmammalian
facilitative sugar transporters. JBioÏ Chem 268(26): 19161-4.
Berneche S, Roux B. 2000. Molecular dynamics ofthe KcsA K(+) channe! in a bilayer
membrane. Biophys J 78(6):2900-17.
Berte!oot A. 2003. Kinetic Mechanism ofNa(+)-Glucose Cotransport through the Rabbit
Intestinal SGLT1 Protein. Jliembr Biot 192(2):89-100.
80Boim MA, Ho K, Shuck ME, Bienkowski MJ, Block JH, Slightom IL, Yang Y, Brenner
BM, Hebert SC. 1995. ROMX inwardly rectifying ATP-sensitive K+ channel. II.
Cloning and distribution of alternative forms. Am J Physiol 262(6 Pt 2):F 1132-40.
Borgnia M, Nielsen S, Engel A, Agre P. 1999. Cellular and molecular biology ofthe
aquaporin water channels. Annu Rev Biochem 68:425-58.
Burant Cf, Bel! GI. 1992. Mammalian facilitative glucose transporters: evidence for similar
substrate recognition sites in ftmnctionally monomeric proteins. Biochemistiy
31(42): 10414-20.
Carruthers A. 1990. facilitated diffusion of glucose. PhysiotRev 70(4):1135-76.
Chen XZ, Coady MJ, Jackson f, Berteloot A, Lapointe JY. 1995. Thermodynamic
determination ofthe Na+: glucose coupling ratio for the human SGLTI
cotransporter. Biophys J 69(6): 2405-14.
Chen XZ, Coady MJ, Jalal f, Wal!endorff B, Lapointe JY. 1997. Sodium leak pathway and
substrate binding order in the Na+-glucose cotransporter. BiophysJ73(5):2503-10.
Chen XZ, Coady MJ, Lapointe JY. 1996. fast voltage c!amp discloses a new component of
presteady-state currents from the Na(+)-glucose cotransporter. Biophys J
71(5):2544-52.
Chenu C, Berteloot A. 1993. Mlosterism and Na(+)-D-glucose cotransport kinetics in
rabbit jejunal vesicles: compatibility with mixed positive and negative
cooperativities in a homo- dimeric or tetrameric structure and experimenta!
evidence for only one transport protein involved. JMembr Biot 132(2):95-113.
81Cloherty EK, Heard KS, Carmthers A. 1996. Human erythrocyte sugar transport is
incompatible with available carrier models. Biochemistiy 35(32): 10411-21.
Cloherty EK, Levine KB, Graybili C, Carruthers A. 2002. Cooperative nucleotide binding
to the human erytbrocyte sugar transporter. Biochemistry 41(42): 12639-51.
Cloherty EK, Sultzman LA, Zottola RI, Carmthers A. 1995. Net sugar transport is a
multistep process. Evidence for cytosolic sugar binding sites in erythrocytes.
Biochemistry 34(47): 15395-406.
Crane RK. 1962. Hypothesis ofmechanism of intestinal transport of sugars. fed Froc
21:891-$95.
Crane RK. 1965. Na+ -dependent transport in the intestine and other animal tissues. Fed
Froc 24(5): 1000-6.
Curran PF, MacIntosh JR. 1962. A model system for biological water transport. Nature
193:347-348.
Denker BM, Smith BL, Kuhajda fP, Agre P. 1988. Identification, purification, and partial
characterization of a novel Mr 28,000 integral membrane protein from erythrocytes
and renal tubules. J Bio! Chem 263(30): 15634-42.
Diamond JM, Bossert WH. 1967. Standing-gradient osmotic flow. A mechanism for
coupling ofwater and solute transport in epithelia. J Gen FhysioÏ 50(8):2061-83.
Duquette PP. 2000. Étude de taforce motrice impliquée dans le flux d’eau associé au
cotransport Na/glucose [mémoire de Maîtrise]. Montréal: Université de Montréal.
85 p.
82Duquette PP, Bissonnette P, Lapointe W. 2001. Local osmotic gradients drive the water
flux associated with Na(+)/glucose cotransport. Froc Nati Acad Sci U S A
9$(7):3796-801.
Eskandari S, Wright EM, Kreman M, Starace DM, Zampighi GA. 1998. Structural analysis
of cloned plasma membrane proteins by freeze-fracture electron microscopy. Froc
NatlAcad Sel USA 95(19):11235-40.
Falk S, Guay A, Chenu C, Patil SD, Berteloot A. 1998. Reduction of an eight-state
mechanism of cotransport to a six-state model using a new computer program.
BiophysJ74(2 Pt 1):$16-30.
fettiplace R, Haydon DA. 1980. Water permeability of Ïipid membranes. FhysioÏ Rev
60(2):5 10-50.
finkelstein A. 1987. Water moveinent through hpid bitayers, pores, andplasma
membranes. New York: Wiley-Interscience. 228 p.
fischbarg J, Kuang KY, Hirsch J, Lecuona S, Rogozinski L, Silverstein SC, Loike J. 1989.
Evidence that the glucose transporter serves as a water channel in J774
macrophages. Froc Nati Acad Sel USA 86(21):8397-40 1.
Fischbarg J, Kuang KY, Vera JC, Axant S, Silverstein SC, Loike J, Rosen 0M. 1990.
Glucose transporters serve as water channels. Froc NatÏAcad Sci USA 87($):3244-
7.
Fischbarg J, Liebovitch LS, Koniarek W. 1987. Inhibition oftransepitheÏial osmotic water
flow by blockers ofthe glucose transporter. Biochim Biophys Acta 898(3):266-74.
83freel RW, Goldner AIvI. 1981. Sodium-coupled nonelectrolyte transport across epithelia:
emerging concepts and directions. Am JFhysiol 241(6):G451-60.
fukumoto H, Seino S, Imura H, Seino Y, Eddy RL, Fukushima Y, Byers MG, Shows TB,
Beli GI. 1988. Sequence, tissue distribution, and chromosomal Ïocalization of
mRNA encoding a human glucose transporter-like protein. Froc NattAcadSci US
A 85(15):5434-8.
Gallardo P, Cid LP, Vio CP, Sepulveda fV. 200L Aquaporin-2, a regulated water channel,
is expressed in apical membranes of rat distal colon epithelium. Am J FhysioÏ
Gastrointesi Liver Physiol 281 (3):G856-63.
Gould GW, Holman GD. 1993. The glucose transporter family: structure, function and
tissue-specific expression. Biochem J295 (Pt 2):329-41.
Gould GW, Thomas HM, Jess TJ, Bell GI. 1991. Expression ofhuman glucose transporters
in Xenopus oocytes: kinetic characterization and substrate specificities ofthe
erythrocyte, liver, and brain isoforms. Biochemistiy 30(21): 5139-45.
HamaIm S, Kiilgaard JF, Cour M, Prause TU, Zeuthen T. 2003. Cotransport ofH(+),
lactate, and H(2)O in porcine retinal pigment epithelial ceils. Exp Eye Res
76(4):493-504.
Hamann S, la Cour M, Lui GM, Bundgaard M, Zeuthen T. 2000. Transport of protons and
lactate in cultured human fetal retinal pigment epithelial celis. Fflugers Arch
440(1):84-92.
Hamili S, Cloherty EK, Carmthers A. 1999. The human erythrocyte sugar transporter
presents two sugar import sites. Biochernistiy 38(51): 16974-83.
84Harpaz Y, Gerstein M, Chothia C. 1994. Volume changes on protein folding. Structure
2(7):641-9.
Heard KS, Fidyk N, Carruthers A. 2000. ATP-dependent substrate occlusion by the human
erythrocyte sugar transporter. Biocheinistry 39(1 l):3005-14.
Hebert DN, Carruthers A. 1992. Glucose transporter oligomeric structure determines
transporter function. Reversible redox-dependent interconversions oftetrameric and
dimeric GLUT 1. JBio! Chem 267(33 ):23 $29-3$.
Hediger MA, Coady MJ, Ikeda TS, Wright EM. 1987. Expression cloning and cDNA
sequencing ofthe Na+/glucose co-transporter. Nature 330(6146):379-$1.
Helliweli PA, Kellett GL. 2002. The active and passive components of glucose absorption
in rat jejunum under low and high perfusion stress. JFhysioÏ 544(Pt 2):579-$9.
Helliweil PA, Richardson M, Affleck J, Kellett GL. 2000a. Regulation of GLUT5, GLUT2
and intestinal brush-border fructose absorption by the extracelÏular signal-regulated
kinase, p38 mitogen-activated kinase and phosphatidylinositol 3-kinase intracellular
signalling pathways: implications for adaptation to diabetes. Biochem J 350 Pt
1:163-9.
Helliweli PA, Richardson M, Afileck J, KelÏett GL. 2000b. Stimulation of fructose
transport across the intestinal bmsh-border membrane by PMA is mediated by
GLUT2 and dynamically regulated by protein kinase C. Biochem J 350 Pt 1:149-54.
Helliweil PA, Rumsby MG, Kellett GL. 2003. Intestinal sugar absorption is regulated by
phosphorylation and turnover ofPKC bu mediated by PI 3-kinase- and mTOR
dependent pathways. J Bio! Chem.
85Hevesy G, Hofer E, Krogh A. 1935. je lai pas ... et la revue pas à la bibli... SkancL Archiv
Physiot. 72:199.
Ho K, Nichols CG, Lederer WJ, Lytton J, Vassilev PM, Kanazirska MV, Hebert SC. 1993.
Cloning and expression of an inwardly rectifying ATP-regulated potassium channel.
Nature 362(6415):31-8.
Hopfer U, Groseclose R. 1980. The mechanism ofNa+-dependent D-glucose transport. J
Biol Chem 255(10):4453-62.
Hruz PW, Mueckier MM. 2001. Structural analysis ofthe GLUT1 facilitative glucose
transporter (review). Mot Mernbr Biol 18(3): 183-93.
Iserovich P, Wang D, Ma L, Yang H, Zuniga FA, Pascual JM, Kuang K, De Vivo DC,
Fischbarg J. 2002. Changes in glucose transport and water permeability resulting
from the T3 lOI pathogenic mutation in Gluti are consistent with two transport
channels per monomer. JBioÏ Chem 277(34):30991-7.
Jacobs DB, Berenski CJ, Spangler RA, Jung CY. 1987. Radiation inactivation target size of
rat adipocyte glucose transporters in the plasma membrane and intracellular pools. J
BioÏ Chem 262(17):8084-7.
Jap BK, Li H. 1995. Structure ofthe osmo-regulated H20-channel, AQP-CRTP, in
projection at 3.5 A resolution. JMoÏ Bio! 251 (3):41 3-20.
Jarvis SM, Ellory JC, Young JD. 1986. Radiation inactivation ofthe human erythrocyte
nucleoside and glucose transporters. Biochim Biophys Acta 855(2):3 12-5.

86Jette M, Vachon V, Potier M, Beliveau R 1997. Radiation-inactivation analysis ofthe
oligomeric structure ofthe renal sodiumfD-glucose symporter. Biochim Biophys
Acta 1327(2):242-8.
Jiang Y, Lee A, Chen J, Cadene M, Chait BI, MacKinnon R. 2002a. Crystal structure and
mechanism of a calcium-gated potassium channel. Nature 417(6888): 515-22.
Jiang Y, Lee A, Chen J, Cadene M, Chait BT, MacKinnon R. 2002b. The open pore
conformation of potassium channels. Nature 417(6888): 523-6.
Joost HG, Beil GI, Best JD, Birnbaum MJ, Charron MJ, Chen YT, Doege H, James DE,
Lodish HF, Moley KH and others. 2002. Nomenclature ofthe GLUT/SLC2A
family of sugar/polyol transport facilitators. Ani JFhysioÏ Eiîdocrinol Metab
282(4):E974-6.
Joost HG, Thorens B. 2001. The extended GLUT-family of sugar/polyol transport
facilitators: nomenclature, sequence characteristics, and potential fùnction ofits
novel members (review). Mol Mernbr Biol 1 $(4):247-56.
Jung JS, Preston GM, Smith BL, Guggino WB, Agre P. 1994. Molecular structure of the
water channel through aquaporin CHIP. The hourglass model. JBIoÏ Cheni
269(20): 14648-54.
Kellett GL. 2001. The facilitated component of intestinal glucose absorption. J Physiol
531(Pt 3):5$5-95.
Kellett GL, Helliweli PA. 2000. The diffusive component of intestinal glucose absorption is
mediated by the glucose-induced recmitment of GLUT2 to the brush-border
membrane. Biochem J 350 Pt 1:155-62.
87Koefoed-Johnsen V, Ussing Ffl{ 1953. The contribution of diffusion and flow to the
passage ofD2O through living membranes : Effect ofneurohypophysical hormone
on isolated anuran skin. Acta Physiot. Scand 28:60-76.
Kong CT, Yet 5F, Lever JE. 1993. Cloning and expression of a mammalian Na+/amino
acid cotransporter with sequence similarity to Na+/glucose cotransporters. JBioÏ
Chein 268(3):1509-12.
Kuo A, Gulbis JM, Antcliff IF, Rahman T, Lowe ED, Zimmer J, Cuthbertson J, Ashcroft
FM, Ezaki T, Doyle DA. 2003. Crystal Structure of the Potassium Channel
KirBacLi in the Closed State. Science 300(5627):1922-6.
Lapointe JY, Gagnon M, Poirier S, Bissonnette P. 2002a. The presence of local osmotic
gradients can account for the water flux driven by the Na+-glucose cotransporter. J
Fhysiot 542(Pt 1):61-2.
Lapointe JY, Gagnon MP, Gagnon DG, Bissonnette P. 2002b. Controversy regarding the
secondary active water transport hypothesis. Biochem CeÏÏBioÏ $0(5):525-33.
Larsen EH, Sorensen JE, Sorensen IN. 2002. Analysis ofthe sodium recirculation theory of
solute-coupled water transport in small intestine. JFhysioÏ 542(Pt l):33-50.
Levitt DG. 1974. A new theoiy of transport for celi membrane pores. I. General theory and
application to red celi. Biochim Biophys Acta 373(1): 115-31.
Lin J, Kormanec J, Homerova D, Kinne RK. 1999. Probing transmembrane topology ofthe
high-affinity Sodium!Glucose cotransporter (SGLT1) with histidine-tagged mutants.
Jliernbr Biot 170(3):243-52.

8$Lindeberg M, Zakharov SD, Cramer WA. 2000. Unfolding pathway ofthe colicin El
channel protein on a membrane surface. JMo1 Biol 295(3):679-92.
Lo B, Silverman M. 199$. Cysteine scanning mutagenesis ofthe segment between putative
transmembrane helices IV and V ofthe high affinity Na+fGlucose cotransporter
SGLT1. Evidence that this region participates in the Na+ and voltage dependence of
the transporter. J Biol Chem 273(45) :29341-51.
Loike JD, Hickman S, Kuang K, Xu M, Cao L, Vera JC, Silverstein SC, Fischbarg J. 1996.
Sodium-glucose cotransporters display sodium- and phiorizin-dependent water
permeability. Am JFhysiot 27 1(5 Pt 1):C1774-9.
Loo DD, Hazama A, Supplisson S, Turk E, Wright EM. 1993. Relaxation kinetics ofthe
Na+/glucose cotransporter. Froc Nati Acad Sci U S A 90(12): 5767-71.
Loo DD, Wright EM, Meinild AK, Klaerke DA, Zeuthen T. 1999. Commentary on
“Epithelial Fluid Transport--A Century of Investigation”. News Physiol Sel 14:98-
100.
Loo DD, Wright EM, Zeuthen T. 2002. Water pumps. JFhysioÏ 542(Pt 1):53-60.
Loo DD, Zeuthen T, Chandy G, Wright EM. 1996. Cotransport ofwater by the
Na+/glucose cotransporter. Froc NatÏAcadSci USA 93(23):13367-70.
Lundahi P, Mascher E, Andersson L, Englund AK, Greijer E, Kameyama K, Takagi T.
1991. Active and monomeric human red celi glucose transporter after high
performance molecular-sieve chromatography in the presence ofoctyl glucoside
and phosphatidylserine or phosphatidylcholine. Biochim Biophys Acta 1067(2): 177-
86.

89Lytton J, Westlin M, Burk SE, Shuli GE, MacLennan DH. 1992. Functional comparisons
between isoforms ofthe sarcoplasmic or endoplasmic reticulum family of calcium
pumps. JBioÏ Chem 267(20): 14483-9.
Ma T, Verkman AS. 1999. Aquaporin water channels in gastrointestinal physiology. J
Physiol 517 (Pt 2):317-26.
MacAulay N, Gether U, Klaerke DA, Zeuthen T. 2001. Water transport by the human Na+
coupled glutamate cotransporter expressed in Xenopus oocytes. JPhysioÏ 530(Pt
3): 367-78.
Macey RI. 1980. Mathematical Models of Membrane Transport Processes. In: Fanestil DD,
editor. Membrane PhysioÏogy. New York: Plenum Medical. p 125-146.
Macey M. 1984. Transport ofwater and urea in red blood celis. Am JFhysiot 246(3 Pt
1): Cl 95-203.
Macey RI, Farmer RE. 1970. Inhibition ofwater and solute permeability in human red
ceils. Biochiin Biophys Acta 211(1): 104-6.
Mackenzie B, Loo DD, Wright EM. 1998. Relationships between Na+/glucose
cotransporter (SGLTI) currents and fluxes. JliembrBiol 162(2):101-6.
Mackenzie B, Panayotova-Heiermann M, Loo DD, Lever JE, Wright EM. 1994. SAAT1 is
a low affinity Na+/glucose cotransporter and flot an amino acid transporter. A
reinterpretation. J Biot Chem 269(36) :22488-91.
Meinild A, Klaerke DA, Loo DD, Wright EM, Zeuthen T. 1998. The human Na+-glucose
cotransporter is a molecular water pump. JPhysiol 508 (Pt 1):15-21.
90Meinild AK, Hirayama BA, Wright EM, Loo DD. 2002. Fluorescence studies ofligand
induced conformational changes of the Na(+)/glucose cotransporter. Biochernistîy
41(4): 1250-8.
Meinild AK, Loo DD, Pajor AM, Zeuthen T, Wright EM. 2000. Water transport by the
renal Na(+)-dicarboxylate cotransporter. Am JFhysiol Renat Physiol 278(5):F777-
83.
Mueckier M, Caruso C, Baldwin SA, Panico M, Blench I, Morris TIR, Mlard WJ, Lienhard
GE, Lodish 1-IF. 1985. Sequence and structure ofa human glucose transporter.
Science 229(4717):941-5.
Murata K, Mitsuoka K, Rirai T, Walz T, Agre P, Heymann JE, Engel A, Fujiyoshi Y. 2000.
Structural determinants of water permeation through aquaporin- 1. Nature
407(6804): 599-605.
Panayotova-Heiermann M, Eskandari S, Turk E, Zampighi GA, Wright EM. 1997. Five
transmembrane helices form the sugar pathway through the Na+/glucose
cotransporter. J Biol Chem 272(33) :20324-7.
Pappenheimer JR, Renkin EM, Borero LM. 1951. Filtration, diffusion and molecular
sieving through peripheral capillary membranes. Am JFhysioÏ 167:13-46.
Parent L, Supplisson S, Loo DD, Wright EM. 1 992a. Electrogenic properties of the cloned
Na+!glucose cotransporter: I. Vo!tage-clamp studies. JliembrBiot 125(1):49-62.
Parent L, Supplisson S, Loo DD, Wright EM. 1992b. Electrogenic properties ofthe cloned
Na+/glucose cotransporter: II. A transport mode! under nonrapid equilibrium
conditions. JMernbr Biot 125(1): 63-79.
91Pessino A, Hebert DN, Woon CW, Harrison SA, Clancy BM, Buxton JM, Carruthers A,
Czech MP. 1991. Evidence that functional erytbrocyte-type glucose transporters are
oligomers. JBiot Chenz 266(30):20213-7.
Pfeffer W. 1877. Osmotische Untersuchzrngen. Engelman, editor. Leipzig. 236 p.
Pirch T, Quick M, Nietschke M, Langkamp M, Jung H. 2002. Sites important for Na+ and
substrate binding in the Na+/proline transporter ofEscherichia cou, a member ofthe
Na+/solute symporter family. JBiot Chem 277(1 1):$790-6.
Preston GM, Agre P. 1991. Isolation ofthe cDNA for erythrocyte integral membrane
protein of 2$ kilodaltons: member of an ancient cliannel family. Froc Natt Acad Sci
USA 8$(24):1 1110-4.
Preston GM, Carroli TP, Guggino WB, Agre P. 1992. Appearance ofwater channels in
Xenopus oocytes expressing red cell CHIP28 protein. Science 256(5055):3 $5-7.
Quick M, Stolting S, Jung H. 1999. Role ofconserved Arg4O and Argl 17 in the
Na+/proline transporter of Escherichia cou. Biochemistry 38(41): 13523-9.
Rice SA. 1980. Hydrodynamic and diffusion considerations ofrapid-mix experiments with
red blood ceils. BiophysJ29(1):65-77.
Rosenberg PA, Finkelstein A. 1978. Water permeability of gramicidin A-treated lipid
bilayer membranes. J Gen Physiot 72(3):341-50.
Sagara Y, Inesi G. 1991. Inhibition of the sarcoplasmic reticulum Ca2+ transport ATPase
by thapsigargin at subnanomolar concentrations. JBioÏ Chem 266(21): 13503-6.
92Semenza G, Kessier M, Hosang M, Weber J, Schmidt U. 1984. Biochemistry ofthe Na+,
D-glucose cotransporter ofthe small-intestinal brush-border membrane. The state of
the art in 1984. Biochim Biophys Acta 779(3):343-79.
Smith BL, Agre P. 1991. Erythrocyte lvii 28,000 transmembrane protein exists as a
multisubunit oligomer similar to channel proteins. JBiot Chem 266(10):6407-15.
Solomon AK. 1968. Characterization ofbiological membranes by equivalent pores. J Gen
Physiol 51:335s-364s.
Spring KR. 1999. Epithelial Fluid Transport--A Century of Investigation. News FhysioÏ Sel
14:92-9$.
Spring KR. 2002. Solute recirculation. JFhysioÏ 542(Pt 1):51.
Stevens BR, fernandez A, Hirayama B, Wright EM, Kempner ES. 1990. Intestinal brush
border membrane Na+/glucose cotransporter functions in situ as a homotetramer.
Froc NatlAcad Sel USA 87(4):1456-60.
Sui H, Han BG, Lee JK, Walian P, Jap BK. 2001. Structural basis ofwater-specific
transport through the AQP1 water channel. Nature 414(6866):872-8.
Sultzman LA, Carruthers A. 1999. Stop-flow analysis ofcooperative interactions between
GLUT1 sugar import and export sites. Biochemistiy 38(20):6640-50.
Thorens B. 1996. Glucose transporters in the regulation of intestinal, renal, and liver
glucose fluxes. Am JFhysiol 270(4 Pt 1):G54 l-53.
Thorens B, Sarkar HK, Kaback HR, Lodish HP. 1988. Cloning and ftmctional expression in
bacteria of a nove! glucose transporter present in liver, intestine, kidney, and beta
pancreatic islet celis. CeÏÏ 55(2):281-90.

93Toyoshima C, Nakasako M, Nomura H, Ogawa H. 2000. Crystal structure ofthe calcium
pump ofsarcoplasmic reticulum at 2.6 A resolution. Nature 405(6787):647-55.
Toyoshima C, Nomura H. 2002. Structural changes in the calcium pump accompanying the
dissociation of calcium. Nature 41 8(6898) :605-11.
Toyoshima C, Nomura H, Sugita Y. 2003. Crystal structures of Ca2+-ATPase in various
physiological states. Ann N YAcadSci 986:1-8.
Turner U, Moran A. 1982. Further studies of proximal tubular bmsh border membrane D-
glucose transport heterogeneity. JMernbr Biol 70(l):37-45.
Uldry M, Ibberson M, Hosokawa M, Thorens B. 2002. GLUT2 is a high afflnity
glucosamine transporter. FEBSLett 524(1-3):199-203.
Umbach JA, Coady MJ, Wright EM. 1990. Intestinal Na+/glucose cotransporter expressed
in Xenopus oocytes is electrogenic. Biophys J 57(6): 12 17-24.
van’t Hoif 1H. 1887. Die roue des osmotischen druckes in der analogie zwischen lôsungen
und gasen. Zeitschrflfitr Physikalische Chernie 1:481-493.
Vieira FL, Sha’afi RI, Solomon AK. 1970. The state ofwater in hurnan and dog red celi
membranes. J Gen FhysioÏ 5 5(4):45 1-66.
Visscher MB, Fetcher ES, Carr CW, Gregor HP, Bushey MS, Barker DE. 1944. Isotopic
tracer studies on the movement ofwater and ions between intestinal lumen and
blood. Am JFhysiol 142:550.
Wang W, Hebert SC, Giebisch G. 1997. Renal K+ channels: structure and function. Annu
RevFhysiot 59:413-36.
94Wegener C, Tebbe S, SteinhoffHJ, Jung H. 2000. Spin labeling analysis of structure and
dynamics of the Na(+)/proline transporter of Escherichia cou. Biochernistiy
39(16):483 1-7.
Wells RG, Pajor AM, Kanai Y, Turk E, Wright EM, Hediger MA. 1992. Cloning of a
human kidney cDNA with similarity to the sodium-glucose cotransporter. Am J
Physiol 263(3 Pt 2):f459-65.
Whitlock RT, Wheeler HO. 1964. Coupled transport ofsolute and water across rabbit
gallbladder epithelium. I Clin. Invest. 43:2249-2265.
Wright EM. 1978. Transport processes in the formation ofthe cerebrospinal fluid. Rev
Physiol Biochem Pharmacol 83:3-34.
Wright EM. 2001. Renal Na(+)-glucose cotransporters. Am JPhysioÏ RenaÏFhysioÏ
280(1):f 10-8.
Wright EM, Loo DD. 2000. Coupling between Na+, sugar, and water transport across the
intestine. Ann N YAcad Sci 915:54-66.
Wright EM, Loo DD, Panayotova-Heiermann M, Hirayama BA, Turk E, Eskandari S, Lam
JT. 1998. Structure and function ofthe Na+/glucose cotransporter. Acta Physiol
Scand Suppi 643 :25 7-64.
Wright EM, Turk E. 2003. The sodiumlglucose cotransport family SLC5. PflugersArch.
Xia P, Bungay PM, Gibson CC, Kovbasnjuk ON, Spring KR. 1998. Diffusion coefficients
in the lateral intercellular spaces of Madin-Darby canine kidney celi epithelium
determined with caged compounds. Biophys J 74(6):3302-12.
95Zeuthen T. 199 la. Secondaiy active transport ofwater across ventricular ceil membrane
ofchoroid plexus epithelium ofNecturus maculosus. JFhysiot 444:153-73.
Zeuthen T. 199 lb. Water permeability ofventricular celi membrane in choroid plexus
epithelium from Necturus maculosus. JFhysiol 444:133-51.
Zeuthen T. 1994. Cotransport ofK+, Cl- and H20 by membrane proteins from choroid
plexus epithelium ofNecturus maculosus. JFhysioÏ 478 (Pt 2):203-19.
Zeuthen T, Hamann S, la Cour M. 1996. Cotransport ofH+, lactate and H20 by membrane
proteins in retinal pigment epithelium ofbullfrog. JFhysioÏ 497 (Pt 1):3-17.
Zeuthen T, Meinild AK, Klaerke DA, Loo DD, Wright EM, Beihage B, Litman T. 1997.
Water transport by the Na+/glucose cotransporter under isotonic conditions. BioÏ
CeÏl 89(5-6):307-12.
Zeuthen T, Meïnild AK, Loo DD, Wright EM, Klaerke DA. 2001. Isotonic transport by the
Na+-glucose cotransporter SGLT1 ftom humans and rabbit. JPhysiot 53 1(Pt
3):63 l-44.
Zeuthen T, Zeuthen E, Klaerke DA. 2002. Mobility of ions, sugar, and water in the
cytoplasm ofXenopus oocytes expressing Na(+)-coupled sugar transporters
(SGLT1). JPhysiol 542(Pt 1):71-87.
Zhou H, Tate 55, Palmer LG. 1994. Primary structure and ifinctional properties of an
epithelial K channel. Am JPhysiot 266(3 Pt 1):C809-24.
Zhou Y, Morais-Cabral 111, Kaufman A, MacKinnon R. 2001. Chemistry of ion
coordination and hydration revealed by a K+ channel-fab complex at 2.0 A
resolution. Nature 414(6859) :43-8.
96Zottola RJ, Cloherty EK, Coderre PE, Hansen A, Hebert DN, Carmthers A. 1995.
Glucose transporter function is controlled by transporter oligomeric structure. A
single, intramolecular disulfide promotes GLUTI tetramerization. Biochernistty
34(30):9734-47.
Zuniga FA, Shi G, Haller W, Rubashkin A, Flynn DR, Iserovich P, Fischbarg J. 2001. A
three-dimensional modeÏ ofthe human facilitative glucose transporter Gluti. JBiot
Chem 276(48):44970-5.
97
Annexe 1 Article complémentaire: L’hypothèse
controversée du transport d’eau secondairement actif
Étant donné sa grande pertinence avec les sujets discutés ici, l’article suivant est
présenté en complément du mémoire : Controversy regarding the secondaiy active water
transport hypothesis. Les différents arguments ayant mené à la suggestion d’un cotransport
d’eau y sont discutés en détail.
Faisant suite à la participation du professeur Jean-Yves Lapointe au 12e Symposium
international annuel d’hiver de la SCBBMC (Société canadienne de biochimie et de
biologie moléculaire et cellulaire), il a été soumis pour révision le 29 mai 2002 et accepté le
22 juillet 2002 pour publication dans le journal canadien Biochemistiy and CeÏÏ BioÏogy:
Biochimie et Biologie Cellulaire.
Ma contribution se situe au niveau des calculs et de l’élaboration de 3 figures sur 4.
J’ai aussi participé à la réflexion menant à l’élaboration du contenu de l’article.
525
MINIREVIEW I MINISYNTHSE
Controversy regarding the secondary active watertransport hypothesis
]ean-Yves Lapointe, Marilène P. Gagnon, Dominique G. Gagnon, andPierre Bissonnette
Abstract: Historically, water transport across biological membranes has aiways been considered a passive process, i.e.,the net water transport is proportional te the gradients of hydrostatic and osmotic pressure. More recently, this dogmawas challenged by the suggestion that secondary active transporters such as the Na/glucose cotransporter (SGLTI)could perform secondary active water transport with a fixed stoichiometry. In the case of SGLTI, the stoichiometiywould consist of one glucose molecule to ttvo Na ions to 220—400 water molecules. In the present minireview, wesummarize and criticize the evidence supporting and opposing this water cotransport hypothesis. Published and unpublished observations from our own laboratory are also presented in support of the idea that transport-dependent osmoticgradients begin to buiid up immediately afler cotransport commences and are fully responsible for the ccli swelling ohserved.
Key words: Xenopus oocyte, intraceilu]ar diffusion, water cotransport, SGLTI.
Résumé : Le transport de l’eau è travers les membranes biologiques a toujours été décrit comme un phénomène passifnécessitant la présence d’un gradient de pression hydrostatique ou osmotique pour expliquer la présence de tout fluxnet mesuré. Récemment, ce dogme a été remis en question par une série d’articles mi l’on prétendait que certainscotransporteurs, dont le cotransporteur Na/glucose (SGLT1), avaient la capacité de faire du transport d’eausecondairement actif. Dans le cas de SGITI, la stoechiomètrie du cotransport serait d’une molécule de glucose, deuxions Na* et 220—400 molécules d’eau. Dans cette minisynthèse. nous allons faire la synthèse des arguments en faveuret contre l’hypothèse du transport secondairement actif d’eau. Nous allons notamment présenter des données de notrelaboratoire (publiées ou inédites) afin de défendre l’idée que des faibles coefficients de diffusion pour les solutésintracellulaires peuvent expliquer quantitativement tout gonflement cellulaire associé à l’activation du cotransport parl’établissement rapide de gradients osmotiques locaux.
Mots clés : ovocyte de Xénope. diffusion intracellulaire, cotransport d’eau, SGLT1.
Introduction
One of the earliest reports suggesting the existence of aplasma membrane was published in 1877 by WiffielmPfeffer and described the behaviour of plant celis exposed toa hypertonie shock (Pfeffer 1877). It is interesting to notethat this initial observation of a plasma membrane involves amost flmdamental property: its water permeability. A considerable body of literature, drawing mainly on experiments
Received 29 May 2002. Accepted 22 July 2002. Published onthe NRC Research Press Web site at http://bcb.nrc.ca on 13September 2002.
J.-Y. Lapointe,’ 1W.?. Gagnon, D.G. Gagnon, and P.Bissonnette. Groupe de recherche en transport membranairemd département de Physique. Université de Montréal, C.P.6128, suce. « centre-ville », Montreal, QC H3C 3J7, Canada.
‘Coffesponding author (e-mail: ).
with red blood ceils (Sidel and Solomon 1957; Paganelli andSolomon 1957; Brabn 1982; Finkelstein 1987), lins clearlyestablished that the water permeation process utilises at leastrtvo different pathways: a diffusion permeabiity through thelipid bilayer and a much larger permeabiity associated wiffia mercurial-sensitive pathway. This latter pathway presentsresults characteristic of a single file of ‘l5 water moleculesdifflising through a narrow pore md triggered the search fora membrane protein that could mediate this type of waterpermeability. Interestingly, the first membrane protein foundto mediate water permeabiity was not a water channel but aglucose carrier. fischbarg et al. (1989) first reported aphioretin-sensitive water permeability in a macrophage-likeccli lime, suggesfing that water could bu carried across theplasma membrane by a mechanism intimately related to theglucose-facilitated transporter. Ibis suggestion was rapidlyconfirmed by expressing GLUT1 fransporters in oocytes(fischbarg et al. 1990). A year later, the cloning of CFIIP2$(Preston md Agre 1991) revolutionised the field of water
Biochem. Ceil Biol. 80: 525—533 (2002) DOl: 10i139/002-150 © 2002 NRC Canada
526 Biochem. Ceil Biol. Vol. 80, 2002
transport. This protein, which was later named aquaporin1 (AQP1), was found to function as a true water channel(Zhang et al. 1993) capable of transporting io watermoieculess’. At this tirne, 10 aquaporin isoforms havebeen identified in human tissues and hundreds of relatedproteins have been found in animais ceils, plant celis, anddifferent microorganisms (Borgnia et al. 1999; Verkman andMitra 2000).
Ciassically, the transmembrane water flux (J) has aiwaysbeen described as a passive mechanism, i.e., being driven bya hydrostatic (zF) and an osmotic (&t) pressure gradient according to the Kedem—Katchalsky equation:
[1]
where L is the hydraulic permeability (centimefres per second) and is the water specific volume (-4 8.07 mLmol’). Ina series of two papers pubhshed in 1991, it was proposedthat a KC1 cotransporter in the choroid plexus could mediatewater transport in a secondary active manner (Zeuthen1991a, 1991b). Soon after. a paper describing the fast waterflux that accompanies Na/glucose cotransport in Xenopusoocytes more firmiy established the foundation for the watercotransport hypothesis (Loo et al. 1996). In the followingyears, several publications reported the occurrence of watercotransport associated witb the human Na/glucosecotransporter (hSGLT1, Meinild et al. 1998), the Na!glutamate cotransporter (EAATI, MacAulay et al. 2001), theNa/dicarboxylate cotransporter (Meinild et al. 2000), theNa/iodide cotransporter (mentioned in Loo et al. 1996 andMeinild et al. 2000), anti a H/amino acid cotransporter (mentioned in Loo et al. 1996) with calculated stochiometriesvarying from 50 to 400 water molecuies per turnover of thecarrier.
The existence of secondary active water transport wouldprofoundly change die physiological concepts of water transport and isotonic absorption (Reuss 1996; Spring 1999; Diamond 1996; Schiiltz 2001). The present minireviewsummarises the evidence gathered during the last 6 years,both for and against the possibility of water cotransport withSGLT1.
Experimental approach
The examination of water cotransport relies on the combination of measuring a celi volume with great sensitivity andobtaining an electrophysiological recording of the solutetransport rate. The large size and low surface to volume ratioprovided by Xenopus Ïaevis oocytes permit the accuratemeasurement of water fluxes over a time frame of seconds tohours. A low-magnification inverted microscope equippedwith an imaging system is used to record the cross section ofan oocyte while continuously recording transmembrane currents with a two-microelectrode voltage-clamp system(Zeuthen et al. 1997). With this approach, the signal to noiseratio is of the order of 2000 to 1, allowing for the detectionof volume changes as small as 0.3 nL. Solutions can bechanged within 15—20 s on a routine basis (Zeuthen et al.2001; Duquette et al. 2001) and solution exchange times asfast as 5 s were occasionally reported (Zeuthen et al. 1997;Meinild et al. 1998).
lnïtial observations suggesting watercotransport
“Instantaneous” celi swelÏïngThe main observation supporting the water cotransport
hypothesis is the surprisingly fast onset of ceil swellingupon addition of sugar to an SGLT1-expressing oocyte(Zeuthen et al. 1997, 2001; Meinild et al. 1998). in these experiments, ceil swelling was found to closely match the timecourse of the cotransport cunent. More speciflcally, the cdlswelling induced by activation of Na/glucose cotransportwas significantiy faster than the cell swelling induced by activation of a Na current of similar size through gramicidin(Zeuthen et al. 1997; Meinild et al. 1998) or a K cunentthrough ROIVIK2 channels (Duquette et al. 2001). The fastcell swelling was best observed when the cotransport currentwas rapidly modulated by sudden hyperpolarisation or de-polarisation in the presence of cotransported sugar (Loo etal. 1396; Zeuffien et al. 2001). As membrane potential canbe confrolled within 5—10 ms, tins is the fastest way to increase or decrease the cotransport current.
Each cotransporter studïed is characterised by adistinct water to solute transport stoichiometry
The celi swelling observed during die first minute afterglucose addition vas reporteti to be somewhat linear antiwas suggested to have been directly mediated by a secondary active transport mechanism. In the case of hSGLT1,comparing the initial water uptake with the initialcotransport cunent indicates that 210 water molecules accompany each glucose molecule transported (Meinild et al.1998). This apparent stoichiometry was shown to vary from50 for die Wamino acid cofransporter (mentioned in Loo etal. 1996, 2002) to 424 for rabbit SGLT1 (Zeuthen et al.2001). It was argued that if the water flux were dependenton osmolyte accumulation, similar rates of water flux shouldaccompany similar transport rates (Loo et al. 2002).
It should be recognised, however, that in ail cases studiedthe amount of water cotransported with a given number ofsubsfrate molecuies resuits in hypertonie solute transport.for example, if the cunent electrode is osmotically inactivewhen compensating for the inward Na/glucose cunent (i.e.,if as much C1 travels from die electrode to the cytosol as Kfrom the cytosol to die electrode), then 210 water moiecuiesaccompany the influx of two Na ions anti one glucose molecule. With an extemal solution osmoÏarity of 200 mosmol,each solute is surrounded by an average of 275 water molecules, indicating that the three fransported osmolytes shouldbe accompanied by —825 water molecules in order to generate isotonic absorption. As a result, the osmolyte cofransportdescribed must generate a fransmembrane osmotic gradientthat increases with time producing a progressive increase inthe water influx.
Similar acfivatiou energies for water cotransport andNa/glucose cotransport
Another piece of evidence presented in favour of the water cofransport hypothesis is the temperature dependence ofthe different water transport mechanisms (Loo et al. 1996).In die absence of glucose, SGLT1-expressing oocytes pres
© 2002 NRC Canada
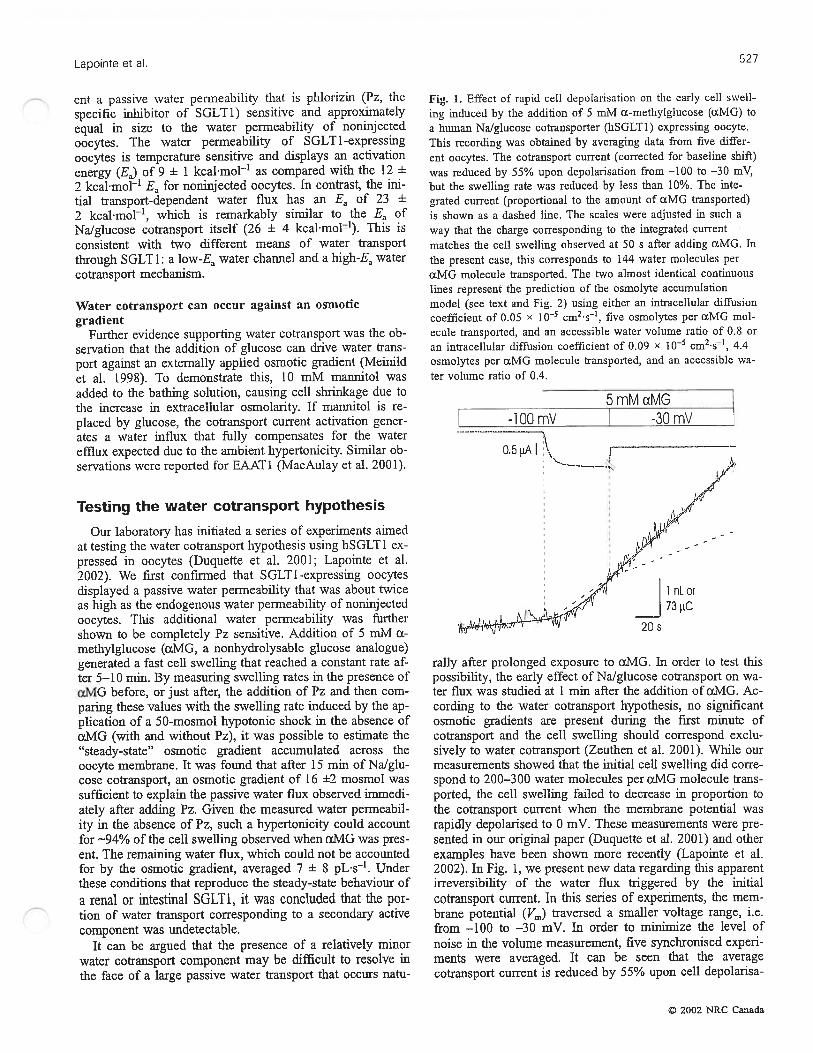
Lapointe et al. 527
eut a passive water permeability that is phiorizin (Pz, thcspecific inliibitor of SGLI1) sensitive and approximatelyequal in size to the water permeability of noninjectedoocytes. The water permeabiity of SGLT1-expressingoocytes is temperature sensitive and displays an activationenergy (Ea) of 9 ± I kcalmo1’ as compared with the 12 *
2 kca1mol Fa for noninjected oocytes. In confrast, the initial fransport-dependent water flux has an La of 23 *
2 kcalmor’, which is remarkably similar to the Fa ofNalglucose cotransport itself (26 ± 4 kcaFmol’). This isconsistent with two different means of water transportthrough SGLT 1: a lOWfa water chaimel and a high-E watercotransport mechanism.
Water cotransport cnn occur against an osmoticgradient
Further evidence supporting water cotransport was the observation diat the addition of glucose can drive water transport against an extemally applied osmotic gradient (Meinildet al. 199$). To demonstrate this, 10 mM mannitol wasadded to the bathing solution, causing ccli shrinkage due tothc increase in extracellular osmolarity. If mannitol is replaced by glucose, the cotransport current activation generates a water influx that fiully compensates for the waterefflux expected due to the ambient hypertonicity. Similar observations wcre reported for EAAT1 (MacAulay et al. 2001).
Testing the water cotransport hypothesïs
Our laboratory has initiated a series of experiments aimedat testing thc water cofransport hypothesis using hSGLTÏ cxprcssed in oocytes (Duquefte et al. 2001; Lapointe et aï.2002). We flrst confinned that SGLT1-expressing oocytesdisplayed a passive water penneability that was about twiceas high as the endogenous water penneability of noninjectedoocytes. Tius additional water permeability vas flirthershown to be completely Pz sensitive. Addition of 5 mM OL
methylgiucose (ci.MG, a nonhydrolysable glucose analogue)generated a fast ccli swelling that reached a constant rate after 5—10 min. By measuring swelling rates in the presence offtMG before, or just after, the addition of Pz and then comparing these values with the swelling rate induced by the application of a 50-mosmol hypotonic shock in the absence ofŒMG (with and without Pz), it was possible to estimate the“steady-state” osmotic gradient accumulated across theoocyte membrane. It was found that after 15 min of Na!glucose cotransport, an osmotic gradient of 16 ±2 mosmol wassufficient to explain the passive water flux observed immediately afler adding Pz. Given die measured water permeability in the absence of Pz, such a hypertonicity could accountfor —94% of the cdl swelling observed when c.TvIG was preseut. The remaining water flux, which could not be accountedfor by die osmotic gradient, averaged 7 ± $ pLs’. Underthese conditions ifiat reproduce the steady-state behaviour of
a renal or intestinal SGLT1. it was concluded that the portion of water transport corresponding to a secondary activecomponent was undetectable.
It can be argued that the presence of a relatively minorwater cotransport compouent may be difficult to resolve indie face of a large passive water transport that occurs natu
fig. 1. Effect of rapid ceil depolarisation on the early ccli swelling induced by the addition of 5 mM -methylglucose (o.MG) to
a human Nalglucose cotransporter (hSGLT1) expressing oocyte.
This recording was obtained by averaging data from five differ
ent oocytes. The cotransport cunent (corrected for baseline shift)
vas reduced by 55% upon depolarisation from —100 to —30 mV,but the swelling rate was reduced by less than 10%. The mte
grated current (proportional to the amount of ŒivlG transported)
is shown as a dashed une. The scales were adjusted in such a
way that the charge corresponding to the intcgrated current
matches die ccli swelling observed at 50 s after adding aMG. In
the present case, this corresponds to 144 water molecules per
uMG molecule transported. The two almost identical contmuous
lines represent the prediction of the osmolyte accumulation
model (sec text and fig. 2) using either an intracellular diffusioncoefficient of 0.05 x l0 cm2s’, five osmolytes per ŒMG mol
ecule transportcd, and an accessible water volume ratio of 0.8 or
an intracellular diffusion coefficient of 0.09 x l0 cm2s, 4.4osmolytes per cLMG moiccuic transported, and an accessible wa
ter volume ratio of 0.4.
E -lOOmV
rally afier prolonged exposure to alvIG. In order to test thispossibility, the early effect of Na/glucose cofransport on water flux was studied at 1 min afler the addition of XMG. According to the water cotransport hypothesis, no significantosmotic gradients are present during the first minute ofcotransport and the ccli swelling should correspond exclusively to water cotransport (Zeuthen et al. 2001). While ourmeasurements showed that the initial cdl swelling did correspond to 200—3 00 water molecules per xMG molecule tiansported, the ccli swelling failed to decrease in proportion to
the cotransport current wlien the membrane potential wasrapidly depolarised to O mV. These measurements were presented in our original paper (Duquette et al. 2001) and otherexamples have been shown more recently (Lapointe et al.2002). In fig. 1, we present ncw data regarding this apparentirreversibility of the water flux friggered by die initialcotransport current. In tIns series of experiments, die membrane potential (J7m) traversed a smaller voltage range, i.e.from —100 to —30 mV. In order to minimize the level ofnoise in the volume measurement, five synchronised experiments were averaged. It can be seen diat the averagecotransport current is reduced by 55% upon cdl depolarisa
5mMaMG-ROmV
—
T
1 nI or73 tiC
20 s
© 2002 NRC Canada
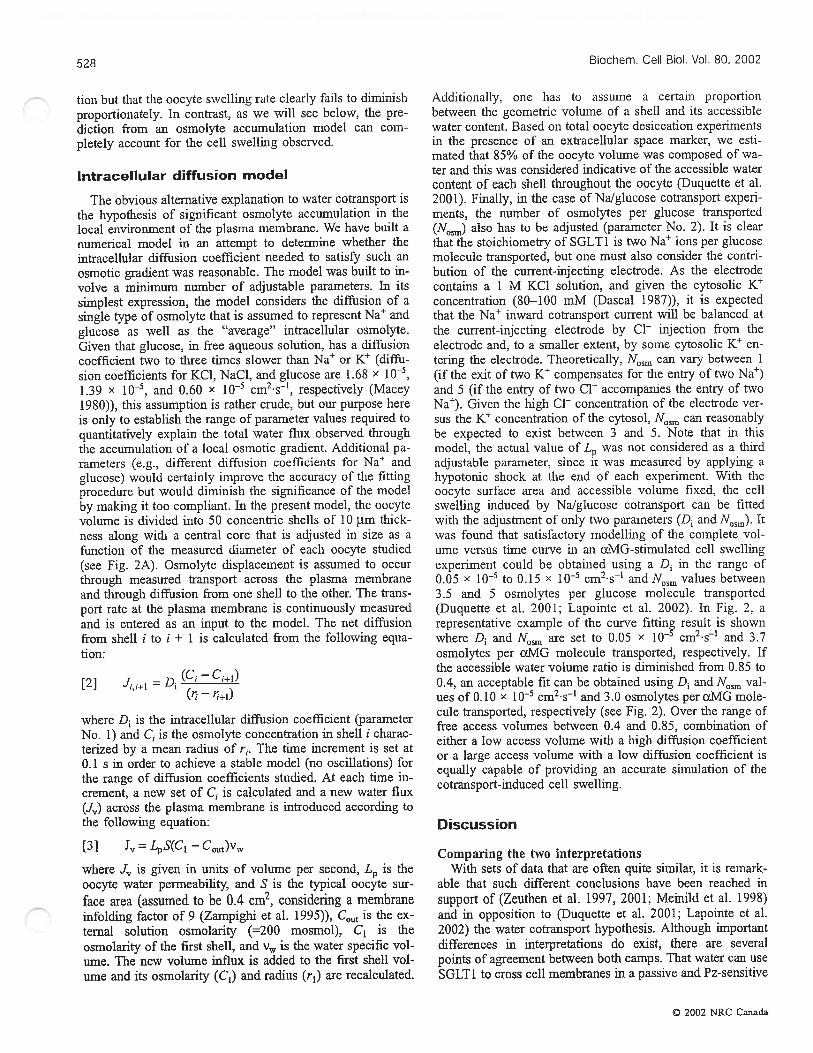
528 Biochem. Cou Biol. Vol. 80, 2002
tion but that the oocyte swelling rate cÏearly fafis to dirninisliproportionately. In contrast, as we will sce below, the prediction from an osmolyte accumulation mode! can completely account for the ccli swelling observed.
IntraceHular diffusion model
The obvions alternative explanation to water cotrarisport isthe hypothesis of significant osmolyte accumulation in thelocal environment of the plasma membrane. Wc have built anumerical model in an aftempt to determine whether theintracellular diffusion coefficient needed to satisf’ such anosmotic gradient was reasonable. The model was built to in-volve a minimum number of adjustable parameters. In itssimpiest expression, the model considers the diffusion of asingle type of osmolyte that is assumed to represent Na antiglucose as well as the “average” iritraceliular osmolyte.Given that glucose, in frec aqucous solution, has a diffusioncoefficient two to tinec times siower than Na or K (diffusion coefficients for KC1, NaC1, and glucose are 1.6$ x i0,1.39 x ko—5, and 0.60 x cm2s, respectively (Macey1 980)), this assumption is rather crudc, but our purpose hereis only to establish the range of parameter values required toqnantitatively explain the total water flux observcd throughthe accumulation of a local osmotic gradient. .dditional parameters (e.g.. different diffusion coefficients for Na antiglucose) would ccrtainly improve the accuracy of the fittingprocedure but would diminish the significance of the modelby malting it too compliant. In the present model, the oocytevolume is divided into 50 concenfric shelis of 10 p.m thickness along with a central coTe that is adjusted in size as afiinction of the measured diameter of each oocyte studied(sec Fig. 2A). Osmolyte displacement is assumed to occurthrough measured transport across the plasma membraneand through diffusion from one sheil to the other. The transport rate at the plasma membrane is continuously measuredand is entercd as an input to the model. The net diffusionfrom sheli i to i + 1 is calculated from the following equation:
PI J.. =(C—C1+)
(‘i — ‘1÷1)
wherc D is the intracellular diffusion coefficient (JarameterNo. 1) and C, is the osmolyte concentration in sheli j characterized by a mean radius of r,. The tinie increment is set at0.1 s in order to achieve a stable model (no oscillations) forthe range of diffusion coefficients studied. At each tinte increment, a new set of C1 is calculated and a new water flux(J,) across the plasma membrane is introduced according tothe following equation:
[3J J = L0S(C1— C0)v
where J.., is given in units of volume per second, L is theoocyte water permeability, and $ is the typical oocyte surface area (assumed to be 0.4 cm2, considering a membraneinfolding factor of 9 (Zampighi et al. 1995)), C0ffl is the cxtemal solution osmolarity (200 mosmol), C1 is theosmoiarity of the flrst sheil. and v, is the water specific volume. The new volume influx is added to the flrst sheli volume and its osmoiarity (C1) anti radius (r1) are recalculated.
Additionafly, one bas to assume a certain proportionbertveen the geometric volume of a sheli anti its accessiblewater content. Based on total oocyte desiccation experimentsin the presence of an extraceflular space marker, we estimated that 85% of the oocyte volume was composed of water and this was considered indicative of the accessible watercontent of each sheil throughout the oocyte (Duquette et ai.2001). Finaliy, in the case ofNa/glucose cotransport experiments, the number of osmolytes per glucose transported(Nosm) also lias to be adjusted (parameter No. 2). It is clearthat the stoichiomefrv of SGLT 1 is two Na ions per glucosemolecule transported, but one must also consider the contribution of the current-injecting electrode. As the electrodecontains a 1 M KC1 solution, and given the cytosolic Kconcentration (80—100 mlvi (Dascal 1987)), it is cxpectedthat the Na inward cotransport current will be balanced atthe current-injecting electrotie by Cl injection from theclectrode and, to a smaller cxtent, by some cytosolic K entering the electrode. Theoretically, Nosm can vary bertveen 1(if the exit of two K compensates for the entry of two Najanti 5 (if the entry of two Cl- accompanies the entry of twoNaj. Given the high Cl— concentration of the elecirode versus the K concentration of the cytosol, Nosm can reasonablybe expected to exist between 3 and 5. Note that in thismodcl, the actual value of vas not considered as a thurdatijustable pararneter. since it was measnred by applying ahypotonie shock at the end of cadi experiment. With ticoocyte surface area and accessible volume fixcd, the ccliswelling iitduceti by Na!glucose cotransport eau be fittedwith flac adjustment of only two parameters (D anti Itwas found that satisfactory modelling of the complete vo!-urne versus time curve in an ŒIviG-stimulatcd ccl! swellingexperiment could be obtained using a D in the range of0.05 x io— to 0.15 x cm2s1 and No,m values between3.5 and 5 osmolytes per glucose molecule fransported(Duquette et al. 2001; Lapointe et al. 2002). In Fig. 2. arepresentative example of the curve fitting result is shownwhere D anti Nosm are set to 0.05 X i0 cm2s anti 3.7osmolytes per ŒIvIG molecule transporteti, respectively. Ifthe accessible water volume ratio is duminished from 0.65 to0.4, an acceptable fit can be obtained using D and N, values of 0.10 X iO cm2s’ and 3.0 osmolytes per cdvlG mole-cule transported, respectively (sec Fig. 2). Over the range offree access volumes bettveen 0.4 anti 0.85, combination ofeither a low access volume with a high diffusion coefficientor a large access volume with a low diffusion coefficient isequally capable of provitiing an accurate simulation of thecotransport-induced ccli swelling.
Discussion
Comparing the hvo hiterpretafionsWith sets of data that are often quite situer. it is remark
able that such different conclusions have been reached insupport of (Zeuthen et al. 1997, 2001; Meinilti et al. 199$)anti in opposition to (Duquette et al. 2001; Lapointe et al.2002) the water cotransport hypothesis. Aithough importantdifferences iii interpretations do exist, there are severalpoints of agreement between both camps. That water can useSGLTÏ to cross ccli membranes in a passive anti Pz-sensitive
© 2002 NRC Canada
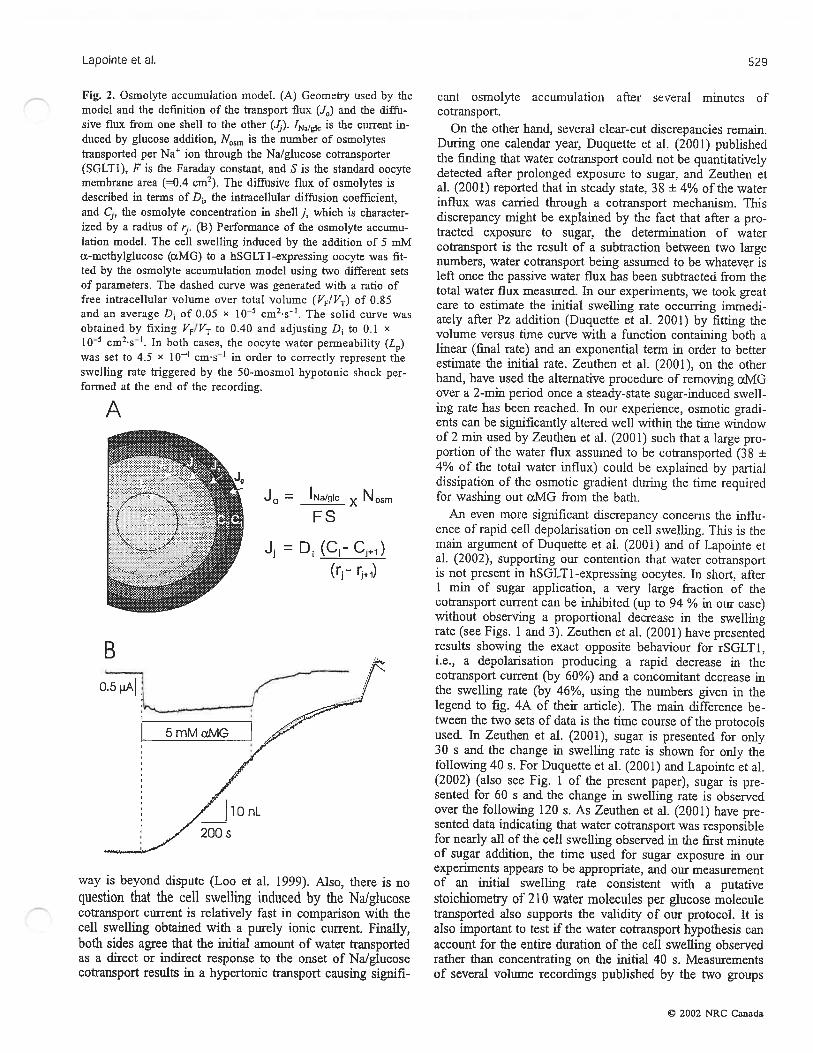
Lapointe et ai, 529
f ig. 2. Osmolyte accumulation model. (A) Geometry used by thcmodel and the definition of thc transport flux (J0) and the diffusive flux from one sheil to the other (J). ‘Na/glc is ifie cunent induced by glucose addition, N01,1 is the number of osmolytestransported per Na ion through the Na/glucose cotransporter(SGIT1), F is the Faraday constant, and S is die standard oocytemembrane area (=0.4 cm2). The diffusive flux of osmolytes isdescribed in terms of D1, the intracellular diffusion coefficient,and Ç. die osmolyte concentration in sheli j. which is characterized by a radius of r. (B) Performance of the osmolyte accumulation model. The celi swelling induced by the addition of 5 mlviŒ-methylglucose OEMG) to a hSGLTI-expressing oocyte was fitted by the osmolyte accumulation model using rtvo different setsof parameters. Ilie dashed curve was generated with a ratio offree intracellular volume over total volume (V/V1) ni’ 0.85and an average D1 of 0.05 X i05 cm2s1. The solid curve wasobtained by fixing Vf/VT to 0.40 and adjusting D1 to 0.1l0- cm2’s* In both cases, the oocyte water permeability (Lu)was set to 4.5 x l0 cm’s in order to conectly represent theswelling rate triggered by the 50-mosmol hypotonie shock performed at die end of the recording.
J0 = ‘Na/glc x NosmFS
J = D. (C1- C11)(ri— r+1)
way is beyond dispute (Loo et al. 1999). Also, there is noquestion that the celi swelling iiiduced by the Nalglucosecotransport current is relatively fast iTt comparison with theceil swelling obtained with a purely jouie current. finally,both sides agree that the initial amount of water transportedas a direct or indirect response to the onset of Nalglucosecotransport resuits in a hypertonie transport causing signifi
cant osmolyte accumulation after several minutes ofcotransport.
On the other hand, several clear-cut discrepancies remain.During one calendar year, Duquette et al. (2001) publisheddie finding diat water cotransport could not be quantitativelydetected after prolonged exposure to sugar, and Zeuthen etal. (2001) reported that in steady state, 38 + 4% ofthe waterinflux was carried tbough n cotransport mechanism. Thisdiscrepancy might be explained by the fact that after n pro
tracted exposure to sugar, the determination of watercotransport is the resuit of a subtraction between two largenumbers, water cotransport being assumed to be whatever isleft once the passive water flux has been subtracted ftom thetotal water flux measured. In our experiments, we took greatcare to estimate the initial swelling rate occurring immediately afler Pz addition (Duquette et al. 2001) by fitting thevolume versus time curve with n function containing both alinear (final rate) and an exponential term in order to betterestimate the initial rate. Zeuthen et al. (2001), on the otherhand, have used the alternative procedure of removing ŒMGover a 2-min period once a steady-state sugar-induced swelling rate lias been reacbed. In ouï experience, osmotic gradients cnn be sigmficantly altered well within the turne windowof 2 min used by Zeuthen et al. (2001) such flint a large proportion of the water flux assumed to be cotransported (38 ±
4% of the total water influx) could be explained by partialdissipation of the osmotic gradient during the time requiredfor washing out ciivlG from the bath.
An even more significant discrepnncy conccrns the influence of rapid cdl depolarisation on cdl swelling. This is themain argument of Duquette et al. (2001) and of Lapointe etal. (2002). supportrng our contention that water cotransportis flot present in hSGLT1-expressing oocytes. In short, afier1 min of sugar application, a very large fraction of thecotranspon current can be inhibited (up to 94 in oui case)without observing a proportional decrease in the swelhngrate (see figs. 1 and 3). Zeuthen et al. (2001) have presentedresuits showing the exact opposite behaviour for rSGLT1,i.e., a depolarisation producing a rapid decrease in thecotransport cunent (by 60%) and n concomitant decrease inthe swelling rate (by 46%, using the numbers given in thelegend to fig. 4A of their article). 11e main difference between die two sets of data is the time course of the protocolsused. In Zeuthen et aÏ. (2001), sugar is presented for only30 s and the change in sweiling rate is shown for only thefollowing 40 s. For Duquette et al. (2001) and Lapointe et ai.(2002) (also sec fig. 1 of the present paper), sugar is presented for 60 s and the change in swelling rate is observedover die following 120 s. As Zeuthen et al. (2001) have presented data indicating that water cofransport was responsiblefor nearly ail of the ccli sweliing observed in die first minuteof sugar addition, the turne used for sugar exposure in ourexperiments appears to be appropriate, and oui measurementof an initial swelling rate consistent witli a putativestoichiometry of 210 water molecules per glucose moleculetransported aiso supports the validity of our protocol. It isalso important to test if the water cotransport hypothesis eauaccount for die entire duration of the ccli swefling observedrather dian concentrating on die initiai 40 s. Measurementsof severai volume recordings published by the two groups
A
B
5mMaMG
10 nL
200 s
© 2002 NRC Canada
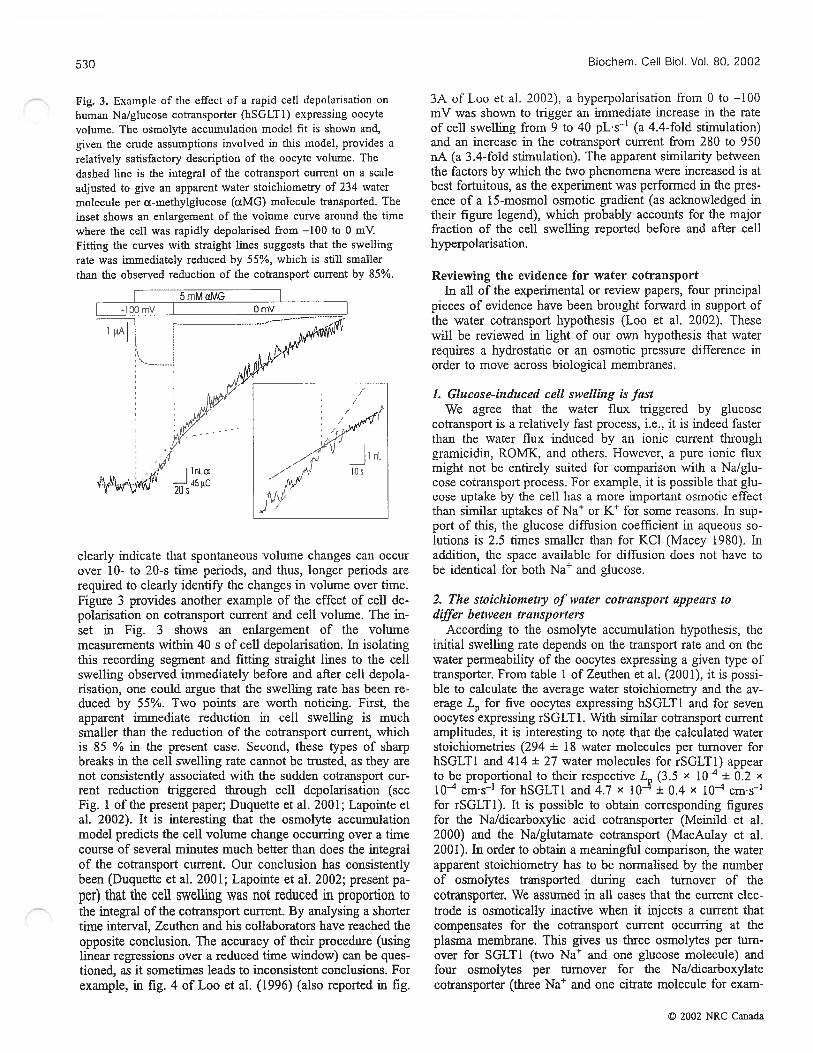
530 Biochem. Celi Biol. Vol. 80, 2002
fig. 3. Example of the effect of a rapid ceil depolansation on
human Na/glucose cotransporter (hSGLT1) expressing oocyte
volume. The osmolyte accumulation mode] fit is shown and.
given the cnide assumptions involved in this model, provides arelatively satisfactory description of the oocyte volume. The
dashed une is the integral of the cotransport current on a scaleadjusted to give an apparent water stoichiometry of 234 watermolecule per Œ-methylglucose (ŒMG) molecule transported. Theinset shows an enlargement of the volume curve around the timewhere the ccli was rapidiy depolarised from —100 to O mV.Fitting the curves wiffi straight Unes suggests that the swellingrate was immediately reduced by 55%, which is stiil smaller
than the observed reduction of the cofransport current by 85%.
cleariy indicate that spontaneous volume changes can occurover 10- to 20-s time pcriods, and thus, longer periods arerequfred to ciearly identify the changes in volume over tirne.Figure 3 provides another example of the effect of ccli de-polarisation on cotransport cunent and ccli volume. The in-set in fig. 3 shows an enlargement of the volumemeasurements within 40 s of ccli depolarisation, In isolatingtitis recording segment and fitting straight unes to the cciisweliing observed immediately before and after celi depolarisation, one could argue that the sweliing rate bas been reduccd by 55%. Two points arc worth noticing. first, theapparent iinmediate reduction in ccii swelling is muchsmalicr than the reduction of the cotransport current, winchis 85 % in the present case. Second, these types of sharpbreaks in the ccii swelling rate cannot be trusted, as they aretint consistently associated with the sudden cotransport currdnt reduction friggered tbrough ceil depolarisation (secFig. 1 ofthe prescnt paper; Duquette et ai. 2001; Lapointe etal. 2002). It is interesting that the osmolyte accumulationmodel predicts the ccli volume change occurring over a timecourse of severai minutes much better than does the integralof the cotransport durrent. Our conclusion bas consistentiybeen (Duquette et al. 2001; Lapointe et ai. 2002; present paper) that the celi swelling was not reduced in proportion to
the integral ofthe cotransport current. By anaiysing a shortertime interval, Zeuthen and bis collaborators have reached theopposite conclusion. The accuracy of their procedure (usinglinear regressions over a reduced time window) can be questioned, as it sometimcs leads to inconsistent conclusions. Forexampie, in fig. 4 0f Loo et al. (1996) (also reported in fig.
3A of Loo et al. 2002), a hyperpolarisation from O to —100mV was shown to trigger an immediate increase in the rateof ccii swelling from 9 to 40 pL’s’ (a 4.4-foid stimulation)arid an increase in the cotransport cunent from 280 to 950nA ta 3.4-foid stimulation). The apparent similarity betweenthe factors by winch the two phenomena were increased is atbest fortuitous, as the experimcnt was performed in ifie presence of a 15-mosmoi osmotic gradient (as acimowledgcd inthcir figure iegend), which probably accounts for the majorfraction of the ccli swclling reported before and affer cclihyperpolarisation.
Reviewing the evidence for water cotransportIn ail of the experimental or revicw papers, four principal
picces of evidence have been brought forward in support ofthe watcr cotransport hypothesis (Loo et ai. 2002). Thesewili bc reviewed in hght of our own hypothesis that waterrequires a hydrostatic or an osmotic pressure difference inorder to move across biological membranes.
1. Gtucose-induced cett sweltiizg is fastWe agrcc that the water flux triggercd by giucose
cofransport is a reiatively fast proccss, i.e., it is indecd fastcrthan the watcr flux induced by an ionic cunent throughgramicidin, ROMX, and others. Howcvcr, a pure ionic fluxmight not be entireiy suited for comparison with a Na/glucosc cotransport process. For exampie, it is possible that glucose uptake by the ccli bas a more important osmotic effectthan similar uptakes of Na or K for sorne reasons. In support of this, the giucosc diffusion coefficient in aqueous solutions is 2.5 times smaiier than for KCi (Macey i980). Inaddition, thc space avaiiabic for diffusion does not have tobe identicai for both Na and glucose.
2. The stoiehiomety cf water cotralisport appears tedijfrr between trausporters
Accordhig to the osmolyte accumulation hypothcsis, theinitial swclling rate dcpcnds on thc transport rate and on thewater permcability of the oocytes cxprcssing a given type oftransporter. From table 1 of Zcuthcn et al. (2001), it is possible to caiculatc the avcragc water stoichiometry and thc average L for five oocytes cxprcssing hSGLTi and for sevcnoocytes cxpressing rSGLT1. With simiiar cotransport cunentamplitudes, it is interesting to note that the calcuïated waterstoichiomctries (294 + 18 water moiccules per turnover forhSGLT1 and 414 ± 27 water molecules for rSGLT1) appearto bc proportionai to their respective L (3.5 X ± 0.2l0 cm’s1 for hSGLTi and 4.7 x i0 ± 0.4 x cm’s’for rSGLT1). It is possible to obtain conesponding figuresfor the Na/dicarboxyhc acid cotransporter (Mefrdld et al.2000) and thc Na/giutamate cotransport (MacAulay et al.200 i). In order to obtain a meaningful comparison, the waterapparent stoichiometry bas to be nonnalised by the numberof osmoiytes transportcd during each turnover of thecotransporter. We assumed in ail cases that the current dcctrode is osmoticaliy inactive when it injects a cuncnt thatcompensates for die cotransport cunent occurring at theplasma membrane. Tins gives us tbree osmolytes per turnover for SGLT1 (two Na and onc glucose moiccuie) andfour osmoiytes per turnover for the Naldicarboxyiatccotransporter (threc Na and one citrate molecule for exam
1 nLOs
i.
© 2002 NRC Canada
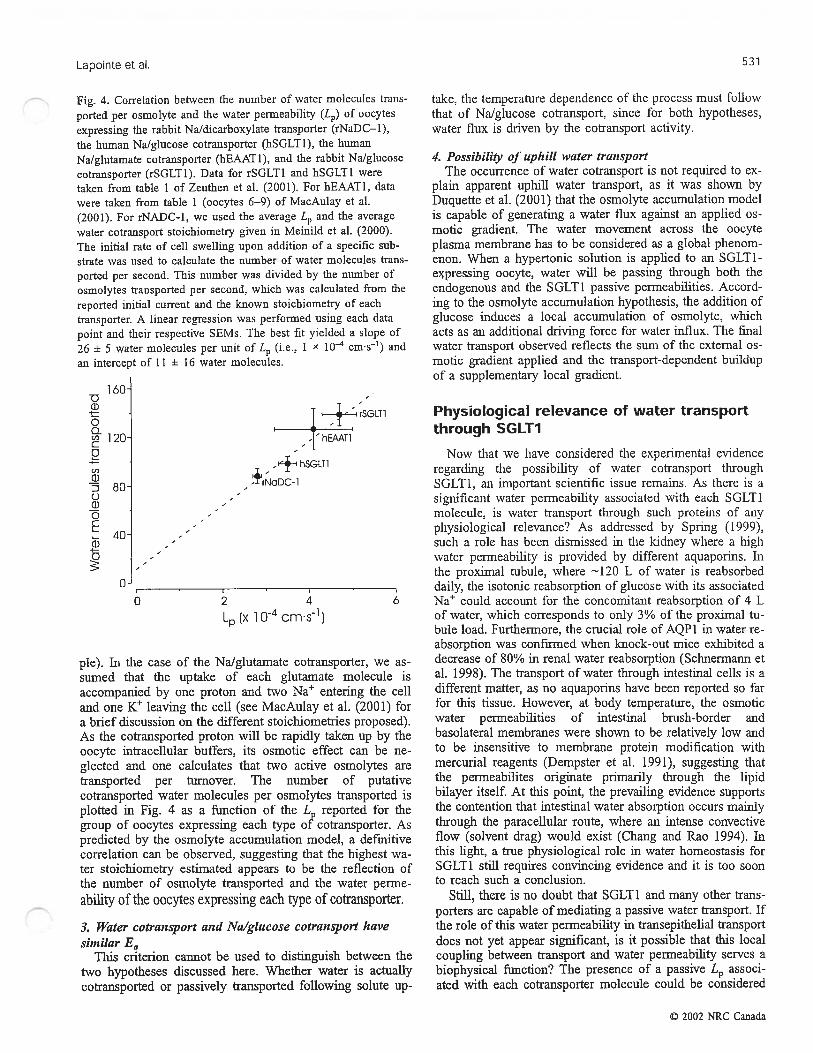
Lapointe et al. 531
Fig. 4. Coffelation between the number of water molecules trans
ported per osmolyte and die water penneability (Lu) of oocytes
expressing die rabbit Na/dicarboxylate transporter (rNaDC—l),
the human Na/glucose cotransporter (hSGLTI), the human
Na/glutamate cotransporter (hEAATI). and the rabbit Na/glucose
cotransporter (rSGLT1). Data for rSGLT1 and hSGLI1 tveretaken from table I of Zeuthen et al. (2001). For hEAATI, data
were taken from table I (oocytes 6—9) of MacAulay et al.
(2001). For rNADC-1, we used the average L and the average
xvater cotransport stoichiomctry given in Meinild et al. (2000).
The initial rate of ceil swelling upon addition of a specific substrate was used to calculate the number of water molecules transportcd per second. This number was divided by the number of
osmolytes fransported per second, which was calculated from the
reported initial current and the known stoichiometiy of eachtransporter. A linear regression was performed using each data
point and their respective SEMs. The best fit yielded a siope of
26 ± 5 water molecules per unit 0f L (i.e., 1 x cm’s1) and
an intercept of 11 ± 16 water molecules.
l60
pie). In the case of the Na/glutamatc cotransporter, we assumed that the uptake of each glutamate moiecule isaccompanicd by one proton and twa Na entering the ceiland one Kt leaving the celi (see MacAulay et al. (2001) fora brief discussion on the different stoichiometries proposed).As the cotransported proton will be rapidly taken up by theoocyte intracellular buffers, its osmotic effect can be rieglected and one calculates that two active osmolytes arctransported per turnover. 11e number of putativecotransported water molecules per osmolytes transported isplotted in Fig. 4 as a functiosi of the L reported for diegroup of oocytes expressing each type of cofransporter. Aspredicted by the osmolyte accumulation model, a defmitivecorrelation cari be observed, suggesting that the highest water stoichiometry estimated appears ta be die reflection ofthe number of osmolyte transponed and the water penneability of the oocytes expressing each type of cotransporter.
3. Water cotransport and Na/gtucose cotransport havesimitar Ea
Tins criterion cannot be used to distinguish between dietwa hypoffieses discussed here. Wheffier water is actuallycotransported or passively transported following solute up
take, the temperature depcndence of thc proccss must followthat of Na/glucose cotransport, since for bath hypotheses,watcr flux is driven by die cotransport activity.
4. Possibitity of uphiil water transportThe occurrence of water cotransport is not required to cx-
plain apparent uphiil water transport, as it was shown byDuquette et ai. (2001) that the osmolyte accumulation modelis capable of generating a water flux against an appÏied osmotic gradient. The water movement across the oocyteplasma membrane has ta be considered as a global phenomenon. When a hypertonic solution is applied ta an SGLT1-expressing oocyte, water will be passing through bath theendogenous and die SGLT1 passive penneabiities. Accord
ing to flic osmolyte accumulation hypothesis. the addition ofglucose induces a local accumulation of osmolyte. whichacts as an additionai driving force for water influx. The fmalwater transport observed refiects the sum of the external osmotic gradient applied and the transport-dependent buildupof a suppiementary local gradient.
Physiological relevance of water transportthrough SGLTI
Now that we have considered the experimental evidenceregarding the possibility of water cotransport throughSGLTI. an important scientific issue remains. As there is asignificant water permeability associated with each SGLT1molecule, is water transport through such proteins of anyphysiological relevance? As addrcssed by Spring (1999).such a raie bas been dismissed in the kidney where a highwater permeabiity is provided by different aquaporins. Iiithe proximal tubule. where —120 L of water is reabsorbeddaily. the isotonic reabsorption of glucose with its associated
6 Na couid account for the concomitant reabsorption of 4 Lofwatcr, winch corresponds ta only 3% ofthe proximal tubule load. Furthermore, the crucial role of AQP 1 in water reabsorption was confwmed when knock-out mice exinbited adecrease of 80% in renal water reabsorption (Schnermann etal. 1938). 11e transport ofwater through intestinal cells is adifferent matter, as no aquaporins have been reported sa farfor tins tissue. However, at body temperature. the osmoticwater permeabilities of intestinal bnish-border antibasolateral membranes were showri ta be relatively low andta be inscnsitive ta membrane protein modification withmercurial reagents (Dempster et aÏ, 1991), suggesting thatthe permeabilites originate primarily through die lipidbilayer itseif. At dis point, the prevailing evidence supportsthe contention that intestinal water absorption occurs mainiythrough the paracellular route, where an intense convectiveflow (solvent drag) would exist (Chang and Rao 1994). Intins light, a truc physiological role in water homeostasis forSGLT1 stii requises convincing evidence and il is too soonta reach such a conclusion.
Stiil. there is no doubt that SGLI 1 and many other transporters are capable of mediating a passive water transport. Ifthe role of tins water permeability in transepitheliai transportdoes not yet appear significant, is it possible that this localcoupling between transport and water pemieability serves abiophysical function? The presence of a passive L associated with each cotransporter molecule could be considered
130)lEociu,Cou,G)DoG)oEg)
rSGCT1
- .‘hEMT1’
T
rNaDC- 1
120-
80-
40-
0-
0 2 4
L (X J -4 cms1]
© 2002 NRC Canada
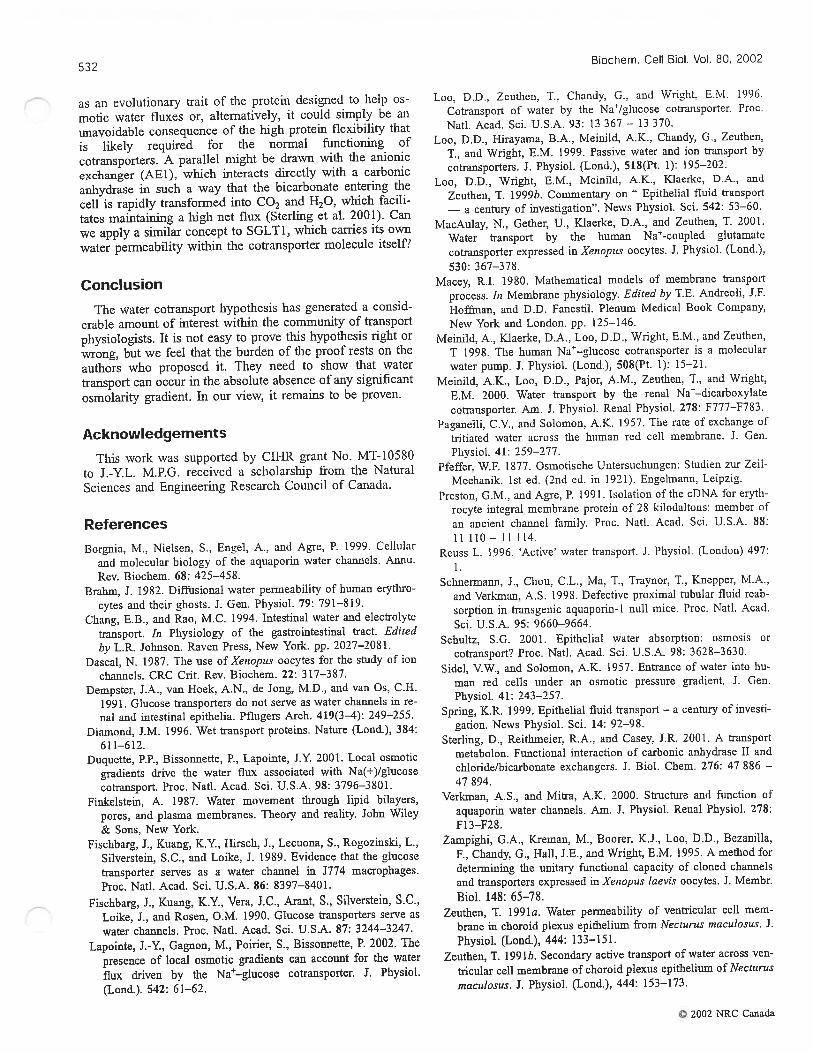
532Biochem. Celi Bio!. Vol. 80, 2002
as an evolutionary trait cf the protcin designed to hclp os
mofic water fluxes or, altematively, it could simply be an
unavoidable consequence of the higli protein flexibility that
is likely requfred for the normal ftinctioning cf
cotransporters. A paraliel miglit be drawn with the anionic
exchanger (AE1), winch interacts directly with a carbonic
anhydrase in such a way that the bicarbonate entering the
ccli is rapidly transformed into C02 and H20, which facii
tates maintaining a high net flux (Sterling et ai. 2001). Cari
we apply a similar concept to SGLT1, which carnes its own
water permeabiity within the cofransporter molecule itself?
Conclusion
The water cotransport hypothesis has generated a consid
erable amount cf interest within the community cf transport
physiologists. It is net easy te prove tins hypothesis night or
wrong, but we feel that the burden of the proof rests on the
authors who proposed it. They need to show that water
transport can occur in the absolute absence of any significant
osmolarity gradient. In our view, it remains te be proven.
Acknowledgements
This work was supported by CIFfR grant No. MI-10580
te I.-YL. M.P.G. received a scholarship from the NaturalSciences and Engineering Research Council of Canada.
References
Borania, M., Nielscn. S., Engel, A., and Agre, P. 1999. Cellular
and molecular biology of the aquaporin water channels. Annu.
Rev. Biochem. 68: 425—458.
Brahm, J. 1982. Diffiisional water pemeabi1ity of human ervthro
cytes and their ghosts. J. Gen. Physiol. 79: 791—8 19.
Chang, E.B., and Rao, MC. 1994. Intestinal water and electrolyte
transport. In Physiology cf the gastrointestina] tract. fdited
by L.R. Johnson. Raven Press. New Ycrk. p?. 2027—2081.
Dascal, N. 1987. The use cf Xenopus oocytes for the smdy cf ioncliannels. CRC Cnt. Rev. Biochem. 22: 3 17—387.
Dempster, J.A., van Hoek, A.N., de Jong, MD.. and van Os, C.H.1991. Glucose transporters do oct serve as water channels in re
nal and intestinal epithelia. Pflugers Arch. 419(3—4): 249—255.
Diamond, J.M. 1996. Wet transport proteins. Nature (Lond.), 384:611—612.
Duquette. P.P.. Bissonnette, P., Lapointe, J.Y. 2001. Local osmoticgradients drive the water flux associated with Na(+)/glucose
cotransport. Proc. Nati. Acad. Sci. U.S.A. 9$: 3796—3801.
Finkelstein, A. 1987. Water movement through lipid bilayers.pores, and plasma membranes. Theory and reality. John Wiley
& Sons, New York.Fischbarg, J., Kuang, K.Y, Hirsch, J., Lecuona, S., Rogozinski, L.,
Silverstein, S.C., and Loike, 1. 1989. Evidence that the glucosetransporter serves as a water channel in 1774 macrophages.Proc. Nati. Acad. Sci. U.S.A. 86: 8397—8401.
fischbarg, J., Kuang, K.Y, Vera. J.C., Arant, S., Sllverstein, S.C.,
Loike, J., and Rosen, 0M. 1990. Glucose transporters serve as
water channels. Froc. Nati. Acad. Sci. U.S.A. 87: 3244—3247.
Lapointe, 1.-Y., Gagncn, M., Poirier, S., Bissonnette, P. 2002. The
presence cf local osmotic gradients can account for the water
flux driven by the Na—glucose cotransporter. J. Physiol.
(Lond.). 542: 6 1—62.
LOOr D.D.. Zetithen, T.. Chandy, G.. and Wright. E.Iv1. 1996.
Cotransport cf water by the Na/glucose cotransponer. Prcc.
Nati. Acad. Sci. U.S.A. 93: 13 367 — 13 370.
Loc, D.D., Hirayama, B.A., Meinild, A.K., Cbandy, G., Zeuthen,
T., and Wright, E.M. 1999. Passive water and ion transport by
cotransporters. J. Physiol. (Lond.), 518(Pt. 1): 195—202.
Loo, DU., Wright, E.M., Meinild, A.K., fUaerke, D.A., and
Zcuthen, T. 1999b. Commentary on Epithelia] fluid transport
— a century of investigation”. News Phvsicl. Sci. 542: 53—60.
MacAulay, N., Gether, U., Klaerke, D.A., and Zeuthen, T. 200f.
Water transport by the human Na-coupled glutamate
cotransporter expressed in Xenopus oocytes. J. Physiol. (Lond.).
530: 367—378.
Macey, RI. 1980. Mathematicai models cf membrane transport
process. In Membrane physiology. Edited bv I.E. Andreoli, 1F.
Hoffman, and DU. Fanestil. Plenum Medical Bock Companv,
New York and London. p?. 125—146.
Meinild. A., Klaerke, D.A., Loo, D.D., Wdght, 1M., and Zeuthen,
T 1998. The human Na—glucose cotransporter is a molecular
water pump. J. Physiol. (Lond.), 50$(Pt. 1): 15—21.
Meinild, A.K., Loo, D.D., Pajor, A.M., Zeuthen, T., and Wiight.
E.M. 2000. Water transport by the renal Na—dicarboxy1ate
cotransporter. Ara. J. Physiol. Renal Physici. 278: F777—f7$3.
Paganelli, CV.. and Solomon. A.K. 1957. The rate of exchange of
tritiated water across the humao red ccl] membrane. J. Gen.
Physiol. 41: 259—277.
Pfeffer. W.F. 1877. Osmotische Untersuehungen: Studien zur Zeil
Mechanik. lst cd. (2nd cd. in 1921). Enge!mann, Leipzig.
Preston, G.M., andAgre, P. 199f. Isolation ofthe cDNA for eryth
rocyte integrai membrane protein of 28 kilodaltons: member of
an ancient channel fami]y. Froc. Nat]. Acad. Sci. U.S.A. 88:
11110— 11114.Reuss C. 1996. ‘Active’ water transport. J. Physiol. (London) 497:
Schnermann, J.. Chou, CL.. Ma. T., Traynor. T., Knepper. MA.,
and Verkman. AS. 1998. Defective proximal tubular fluid reab
sorption in transgenic aquaporin-l nuil mice. Proc. Nati. Acad.
Sci. U.S.A. 95: 9660—9664.Schultz. S.G. 2001. Epithelial water absorption: osmosis or
cotransport? Proc. NatI. Acad. Sci. U.S.A. 98: 3628—3630.
Sidel, V.W., and Solomon, A.K. 1957. Entrance of water into hu
man red ceils under an osmotic pressure gradient. J. Gen.
Physiol. 41: 243—257.
Spring, K.R. 1999. Epithelial ibid transport — a century cf investi
gation. News Physiol. Sci. 14: 92—98.
Sterling, D., Reithmeier, RA.. and Casey, J.R. 2001. A transport
metabolon. functional interaction cf carbonic anhydrase II and
chloride/bicarbonate exchangers. J. BioÏ. Chem. 276: 47 886 —
47 894.Verkman, AS., and Mitra, A.K. 2000. Structure ami function cf
aquaporin water channels. Arc. J. Physiol. Renal Physiol. 278:
F1 3—F28.Zampighi, G.A., Kreman, M., Boorer, K.J., Loo, DU., Bezanilla,
F., Chandy, G., Hall, I.E., and Wright, E.M. 1995. A method for
determining die unitarv functional capacity cf cloned channels
and transporters expressed in Xenopus laevis oocytes. J. Membr.
Biol. 148: 65—78.Zeuthen, T. 199 la. Water permeability of ventricular ccli mem
brane in choroid plexus epiffielium from Necturus rnaculosus. J.
Physiol. (Lond.), 444: 133—151.
Zeuthen, T. 199 1h. Secondary active transport cf water across yen
tricular ccli membrane cf choroid plexus epithelium ofNecturus
macutosus. J. Physiol. (Lond.), 444: 153—173.
© 2002 NRC Canada
Lapointe et ai, 533
Zeuthen, T., Meinild, A.K., Klaerke, D.A., Loo, D.D., Wright,E.M., Beihage, B., and Liffian, T. 1997. Water transport by theNaJglucose cotransporter under isotonic conditions. Biol. Ceil.89(5—6): 307—3 12.
Zeuthen, T., Meinild, A.K., Loo, D.D., Wright, E.M., and Klaerke,D.A. 2001. Isotonic transport by the Na—g1ucose cotransporter
SGLTÎ from hunim and rabbit. J. Physiol. (London), 531: 631—644.
Zhang, R., Skach, W., Hasegawa, H.. van Hoek, AN.. andVerkman, A.S. 1993. Cloning, functional analysis and ceil localization of a kidney proximal tubule water transporter homologous to Cff1P28. J. Ceil Biol. 120: 359—369.
© 2002 NRC Canada

-s