Transition Points for the Gender Gap In Computer Enjoyment
15
Journal of Research on Technology in Education 23 Copyright © 2005, ISTE (International Society for Technology in Education), 800.336.5191 (U.S. & Canada) or 541.302.3777 (Int’l), [email protected], www.iste.org. All rights reserved. Transition Points for the Gender Gap In Computer Enjoyment Rhonda Christensen Gerald Knezek eresa Overall University of North Texas Abstract Data gathered from 10,000 Texas public school students in Grades 3–12 over the years 2000, 2001, 2002, and 2005 were analyzed to replicate findings first discovered as a byproduct of evaluation of a large scale U.S. Department of Education Technology Innovation Challenge Grant 1 . Initial findings were that girls in Grades 4 and 5 reported enjoying computers more than boys. Detailed trend analyses determined that although boys and girls begin first grade with few or no differences in attitudes toward computers (Collis, Knezek, Lai, Miyashita, Pelgrum, Plomp, & Sakamoto, 1996), by Grades 4 and 5, girls are more positive in their enjoyment. Starting about Grade 6, girls’ self-reported perception of computers begins to be- come less positive than boys, and by Grade 8 becomes significantly lower than boys. Attitudes may become similar again by the end of secondary school. e authors suggest further study is needed to determine if this phenomenon exists in many locations, and if it does, why it takes place. (Keywords: gender, attitudes, technology, computers, World Wide Web.) INTRODUCTION Many past studies have reported that boys have more positive attitudes to- ward computers than girls, but most were carried out at the secondary school level (Collis, 1985a; Collis & Williams, 1987; Kay, 1992; Kirk, 1992; Siann, McCleod, Glissov, & Durndell, 1990; Wilder, Mackie, & Cooper, 1985). An international study spanning 1990–1993 found no significant differences in attitudes toward computers among first grade boys and girls in Japan, Mexico, or the United States—and no consistent differences in boys and girls through Grade 3 (Collis et al., 1996; Knezek, Miyashita, & Sakamoto, 1995). e ques- tion that has intrigued many researchers since the latter findings were reported is: “At what grade level does gender differentiation take place, if it in fact ex- ists?” is question is the focus of this paper. REVIEW OF LITERATURE In the mid-eighties, a large-scale study reported that significant gender dif- ferences in attitudes toward computers existed, and that these differences were clearly established by the eighth grade (Collis, 1985b). Many research- ers attribute the differences in part to parent influences. For example, Chen (1986) found that more parents purchased a computer with a son in mind than a daughter. In the early nineties, a research study was conducted that re- ported finding the ratio of girls to boys using computers was 1:4 among fourth through sixth grade computer users (Sakamoto, 1994). 1 U.S. Dept. of Ed. Technology Innovation Challenge Fund Grant #R303A990301.
Transcript of Transition Points for the Gender Gap In Computer Enjoyment
Journal of Research on Technology in Education 23Copyright © 2005, ISTE (International Society for Technology in Education), 800.336.5191(U.S. & Canada) or 541.302.3777 (Int’l), [email protected], www.iste.org. All rights reserved.
Transition Points for the Gender Gap In Computer Enjoyment
Rhonda ChristensenGerald KnezekTheresa Overall
University of North Texas
AbstractData gathered from 10,000 Texas public school students in Grades 3–12 over the years 2000, 2001, 2002, and 2005 were analyzed to replicate findings first discovered as a byproduct of evaluation of a large scale U.S. Department of Education Technology Innovation Challenge Grant
1. Initial findings were that girls in Grades 4 and 5 reported enjoying computers more
than boys. Detailed trend analyses determined that although boys and girls begin first grade with few or no differences in attitudes toward computers (Collis, Knezek, Lai, Miyashita, Pelgrum, Plomp, & Sakamoto, 1996), by Grades 4 and 5, girls are more positive in their enjoyment. Starting about Grade 6, girls’ self-reported perception of computers begins to be-come less positive than boys, and by Grade 8 becomes significantly lower than boys. Attitudes may become similar again by the end of secondary school. The authors suggest further study is needed to determine if this phenomenon exists in many locations, and if it does, why it takes place. (Keywords: gender, attitudes, technology, computers, World Wide Web.)
INTRODUCTIONMany past studies have reported that boys have more positive attitudes to-
ward computers than girls, but most were carried out at the secondary school level (Collis, 1985a; Collis & Williams, 1987; Kay, 1992; Kirk, 1992; Siann, McCleod, Glissov, & Durndell, 1990; Wilder, Mackie, & Cooper, 1985). An international study spanning 1990–1993 found no significant differences in attitudes toward computers among first grade boys and girls in Japan, Mexico, or the United States—and no consistent differences in boys and girls through Grade 3 (Collis et al., 1996; Knezek, Miyashita, & Sakamoto, 1995). The ques-tion that has intrigued many researchers since the latter findings were reported is: “At what grade level does gender differentiation take place, if it in fact ex-ists?” This question is the focus of this paper.
REVIEW OF LITERATUREIn the mid-eighties, a large-scale study reported that significant gender dif-
ferences in attitudes toward computers existed, and that these differences were clearly established by the eighth grade (Collis, 1985b). Many research-ers attribute the differences in part to parent influences. For example, Chen (1986) found that more parents purchased a computer with a son in mind than a daughter. In the early nineties, a research study was conducted that re-ported finding the ratio of girls to boys using computers was 1:4 among fourth through sixth grade computer users (Sakamoto, 1994).
1 U.S. Dept. of Ed. Technology Innovation Challenge Fund Grant #R303A990301.

24 Fall 2005: Volume 38 Number 1Copyright © 2005, ISTE (International Society for Technology in Education), 800.336.5191
(U.S. & Canada) or 541.302.3777 (Int’l), [email protected], www.iste.org. All rights reserved.
Several scholars have hypothesized reasons for reported male-female differences in computer attitudes. Cooper and Weaver (2003) developed a model for technology interest that listed reluctance of parents to purchase home computers for girls, and hence less home use for girls, as one of the reasons. Other scholars have made the case that many popular explanations are likely non-issues. For example, Sherry Turkle, co-chair of the AAUW’s Commission on Technology, Gender, and Teacher Education, insists that girls are not “computer-phobic.” Instead, because of this pervasive think-ing about what is important in a technology culture, they are actually just “computer-reticent.” Girls tend to see computers as tools, whereas they believe boys use them as toys, substituting computer skills for social skills. According to Turkle, girls’ reluc-tance stems from an unwillingness to make that trade (AAUW, 2000, p. 7–9).
The first step in identifying causal relationships in gender-based distinctions regarding computer attitudes is the establishment of which differences still per-sist in the third millennium. Careful identification of gender differences regard-ing computer enjoyment is a primary goal of this paper.
METHODResearch Design
This study is primarily descriptive in nature, employing a longitudinal design based on unbiased sampling techniques and well-validated instruments. It relies on self-re-port data from individual students. The research design is modeled after an approach established by the International Association for the Evaluation of Educational Achieve-ment (IEA) and now used in many nations. It was successfully employed in the IEA Computers in Education study involving more than 20 nations during 1985–1993 (Pelgrum, Janssen Reinen, & Plomp, 1993) and produced most of the Likert-type items used in the current research. The IEA classifications of levels of study of informa-tion technology in education continue to be prominent in many research arenas (Kne-zek, Christensen, Miyashita, & Ropp, 2000). These levels include the:
• Macro level: the educational system policy making level• Meso level: the campus or local unit level• Micro level: the classroom level (Pelgrum & Anderson, 1999).
According to Pelgrum and Anderson, consideration for effective technol-ogy integration must take place at all levels. The macro and meso levels have a facilitating role in integrating technology at the classroom level. The research reported in this study took place at the meso and micro levels, with a focus on information gathered directly from students in classrooms at the micro level.
INSTRUMENTATIONFindings reported in this paper are based primarily on data gathered through
the Young Children’s Computer Inventory questionnaire (Knezek et al., 2000). Items used for the computer enjoyment index had their original source in the IEA Computers in Education Project (Pelgrum et al., 1993) and were used in the Japan-Mexico-USA study of the psychological impact of computers on young children (Collis et al., 1996).

Journal of Research on Technology in Education 25Copyright © 2005, ISTE (International Society for Technology in Education), 800.336.5191(U.S. & Canada) or 541.302.3777 (Int’l), [email protected], www.iste.org. All rights reserved.
The Young Children’s Computer Inventory (YCCI-v5.14) is a 52-item Likert instrument for measuring elementary school children’s attitudes on seven major indices:
• Computer Importance: perceived value or significance of knowing how to use computers; relevance to school work
• Computer Enjoyment: amount of pleasure derived from using com-puters
• Motivation/Persistence: unceasing effort; perseverance; never giving up• Study Habits: mode of pursuing academic exercises within and outside
class• Empathy: a caring identification with the thoughts or feelings of others• Creative Tendencies: inclinations toward exploring the unknown, tak-
ing individual initiative, finding unique solutions• Attitudes Toward School: perceived value or significance of school.
Computer Importance and Computer Enjoyment can be combined into the scale Attitudes Toward Computers. Similarly, Study Habits and Motivation can be combined to form the scale Motivation to Study. Acceptable construct validity and internal consistency reliability has been established through analy-ses spanning 1991–2001 (Christensen & Knezek, 2002), with individual scale internal consistency reliabilities (Cronbach’s Alpha) typically ranging from .66 to .85 for elementary/middle school students similar to those providing data for this study (Knezek et al., 2000). These can be classified as “minimally accept-able” to “very good” according to guidelines provided by DeVellis (1991).
The Computer Attitude Questionnaire (CAQ) (Knezek et al., 2000), which is a superset of the YCCI, was used to gather data from secondary school students in this study. The CAQ contains the same scales as the YCCI but includes additional items in most areas to achieve higher reliability. Individual scale internal consistency reliabilities (Cronbach’s Alpha) typically range from .72 to .89 for secondary school students similar to those providing data for this study. These can be classified as “re-spectable” to “very good” according to guidelines provided by DeVellis (1991).
Focus on Enjoyment of ComputersOnly computer enjoyment findings are reported in detail in this study. The
computer enjoyment scale on the YCCI and the CAQ is composed of the fol-lowing five items:
• I enjoy doing jobs which use a computer• I am tired of using the computer• I enjoy lessons on the computer• I enjoy computer games very much• I concentrate on a computer when I use one.
Data from Grades 3 through 5 were gathered using a 4-point rating scale of 1 = strongly disagree to 4 = strongly agree. For the CAQ at the secondary level,

26 Fall 2005: Volume 38 Number 1Copyright © 2005, ISTE (International Society for Technology in Education), 800.336.5191
(U.S. & Canada) or 541.302.3777 (Int’l), [email protected], www.iste.org. All rights reserved.
and for sixth grade 2005 data included in this study, a 1–5 Likert rating scale was used in which 3 = undecided. The second item listed above is negatively worded and therefore must be reversed before being combined with the other four to form a scale (1 becomes 4, 2 becomes 3, and vice-versa on the YCCI; 1 becomes 5, 2 becomes 4 and so on on the CAQ).
Sources of DataThe majority of the data for this research were gathered as part of the evalua-
tion component of the Key Instructional Design Strategies (KIDS) Project, which spanned 1999–2004 (Christensen & Knezek, 2001; Knezek & Christensen, 2000; Knezek & Christensen, 2002; Knezek & Christensen, 2003). The KIDS Project was one of the last U.S. Department of Education Technology Innovation Challenge Grants funded to span five years. It involved 50 Texas public school districts and focused on educator technology professional development as well as technology-enhanced reading achievement at the K–3 grade levels. Most of these districts were in small, rural communities with the majority of the student body on free or reduced lunches, and scattered throughout the state of Texas. However, one of the lead districts was in a large, suburban metropolitan community in the high-technology corridor of Dallas-Ft. Worth, and another was a large suburban public school district in far west Texas, bordering Mexico. All schools that par-ticipated in the project were required to have their students provide data, so the analyses reported in this paper for 2000, 2001, and 2002 are believed to represent a reasonable cross-section of students in the state of Texas during those years.
Data for 2005 were gathered from a large public school district in the Dallas-Ft. Worth metropolitan area that was geographically near to the high-technolo-gy district contributing KIDS data for 2000–2002. The primary distinctions in the school district contributing 2005 data were that it had a more diverse stu-dent clientele with larger minority representations of Hispanic and Asian stu-dents. Although the district providing data in 2005 is also a suburb of Dallas, it is a consolidated district of 25,000 students made up of two communities. Data were gathered from students as part of a district-wide technology needs as-sessment initiative that had been ongoing for three years. Approximately 3,600 students representing all targeted schools provided data.
All data for 2005 were gathered from students in a computer lab environment through online survey administration. Most student data for 2000–2002 were gathered using online survey administration as well. However, as was estab-lished prior to the research reported in this paper, very young school children (Grades K–3) were found to be able to more easily respond using paper ver-sions. Analyses conducted during the first year of the KIDS Project found no significant differences in the reliability of student data gathered online versus data gathered using paper survey administration (Christensen & Knezek, 2001; Knezek & Christensen, 2000).
Subjects2001 vs. 2000 Comparative Study
Data were gathered from ten public elementary schools (K–6), two middle schools (7–8), and two secondary schools (one Grade 9 and one Grades 10–12)

Journal of Research on Technology in Education 27Copyright © 2005, ISTE (International Society for Technology in Education), 800.336.5191(U.S. & Canada) or 541.302.3777 (Int’l), [email protected], www.iste.org. All rights reserved.
in a suburb of a large north Texas metropolitan area during April/May 2001. Data had also been gathered from the school system’s eight elementary schools, two middle schools, and two secondary schools one year earlier, in April/May 2000. All schools in the district contributed data each year.
One thousand one hundred forty-four (1,144) students in Grades 4 through 6 completed the Young Children’s Computer Inventory (YCCI) questionnaire through online Web administration during April/May 2001. Students were typically taken to a computer laboratory and completed the survey under the supervision of their teachers and lab attendants. Data were automatically col-lected in a server environment when an individual student pressed “submit” after completing all questions. Instructions for administration procedures were distributed by the researchers in advance. Data were gathered over a time period spanning approximately three weeks. In addition, 398 seventh through twelfth grade students from the same school system completed the longer Computer Attitude Questionnaire (CAQ) during the spring of 2001 that incorporated all YCCI items.
During the previous year (2000), approximately 1600 K–6 students from the same school system had completed the YCCI survey instrument. In addition, during the year 2000, more than 1,300 students in Grades 7 through 12 com-pleted the CAQ survey. Thus, initial findings were focused on data from Grades 4–6 within the context of data from K–3 and 7–12. Conclusions were based on findings from two large-scale data administrations approximately one year apart.
2002 Replication StudyDuring the spring of 2002, data were gathered from 17 school districts
consisting of: (a) the suburban north Texas public school district used in the previously reported findings for 2000 and 2001, (b) a suburban public school district in far west Texas bordering Mexico, and (c) 15 rural school districts with wide geographic distribution throughout the state. Detailed findings are reported in the third year evaluation report of the Technology Innovation Chal-lenge Grant that provided the avenue for gathering the additional data (Knezek & Christensen, 2002).
2005 Replication StudyComputer Enjoyment data were gathered from a large suburban school
district in the Dallas-Ft. Worth metropolitan area similar to the large subur-ban public school district providing data for 2000–2002. Self-report surveys were completed by 2,223 boys and 2,409 girls in Grades 3 through 8 from 26 schools.
FINDINGS2001 vs. 2000 Comparative Study
From Grade 1 through Grade 3, there appeared to be no consistent differences between males and females on attitudes toward computers. At Grades 4 and 5, girls were significantly (p < .01) higher than boys in computer enjoyment for both years studied (2000 and 2001). From Grade 6 through Grade 12, males appeared

28 Fall 2005: Volume 38 Number 1Copyright © 2005, ISTE (International Society for Technology in Education), 800.336.5191
(U.S. & Canada) or 541.302.3777 (Int’l), [email protected], www.iste.org. All rights reserved.
to be consistently more positive in their attitudes toward computers than females, and especially higher in computer enjoyment. This was judged to be convincing evidence that females at Grades 4 and 5 in these Texas schools enjoyed using com-puters more than males (Christensen & Knezek, 2003). As shown in Figure 1, the divergence by gender in Computer Enjoyment for 2001 was best described as a decline on the part of girls rather than an increase on the part of boys.
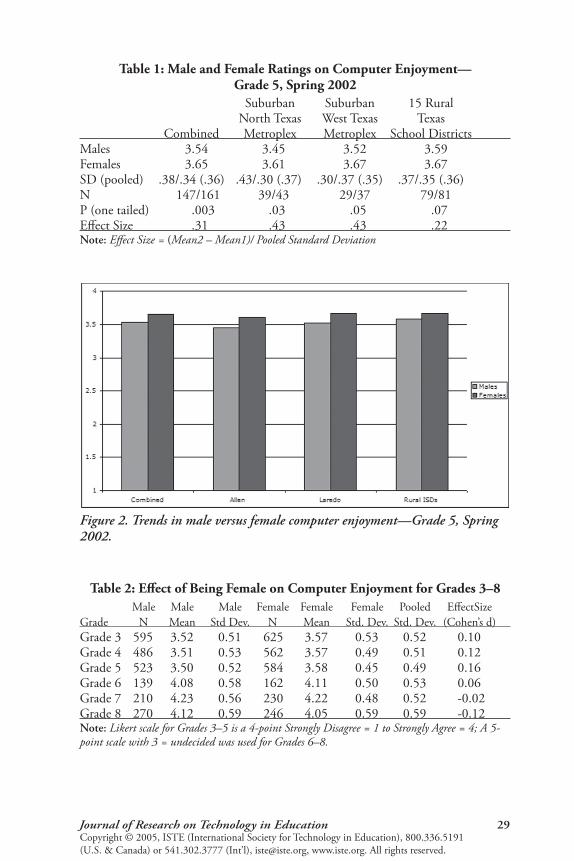
2002 Replication StudyThe anticipated areas of significant differences for females versus males emerged
in Spring 2002 data. Specifically, fifth grade girls were found to be significantly (p = .003) more positive than boys on computer enjoyment. As listed in Table 1 and shown in Figure 2, the average effect size of .31 in favor of fifth grade females is in the range of “educational importance” (Bialo & Sivin-Kachala, 1996). This reconfirms the findings from the 2000 versus 2001 study that females at Grade 5 in these Texas schools enjoyed using computers more than males.
2005 Replication StudyAs shown in Table 2, standardized measures of the magnitude of differences
between boys and girls (effect size as indicated by Cohen’s d) indicate that the trend for girls’ enjoyment of computers across grade levels changes from: (a) be-ing higher than boys for Grades 3–5, to (b) reversing direction at Grade 6, and to (c) becoming lower than boys by Grade 8. The difference between girls and boys at Grade 5 is highly significant (f = 7.28, 1 x 1108 df., p = .007) according to commonly accepted standards. This reconfirms the 2000–2002 findings that at earlier ages/grade levels, girls have more positive attitudes toward computers. By Grade 8 the more positive attitude is found in boys. This trend is graphically illustrated in Figure 3.
Figure 1. Trends in computer enjoyment across 1,144 students in Grades 4–6, 2001.
Journal of Research on Technology in Education 29Copyright © 2005, ISTE (International Society for Technology in Education), 800.336.5191(U.S. & Canada) or 541.302.3777 (Int’l), [email protected], www.iste.org. All rights reserved.
Table 1: Male and Female Ratings on Computer Enjoyment— Grade 5, Spring 2002
Suburban Suburban 15 Rural North Texas West Texas Texas Combined Metroplex Metroplex School Districts Males 3.54 3.45 3.52 3.59Females 3.65 3.61 3.67 3.67SD (pooled) .38/.34 (.36) .43/.30 (.37) .30/.37 (.35) .37/.35 (.36)N 147/161 39/43 29/37 79/81P (one tailed) .003 .03 .05 .07Effect Size .31 .43 .43 .22 Note: Effect Size = (Mean2 – Mean1)/ Pooled Standard Deviation
Table 2: Effect of Being Female on Computer Enjoyment for Grades 3–8 Male Male Male Female Female Female Pooled EffectSize Grade N Mean Std Dev. N Mean Std. Dev. Std. Dev. (Cohen’s d) Grade 3 595 3.52 0.51 625 3.57 0.53 0.52 0.10Grade 4 486 3.51 0.53 562 3.57 0.49 0.51 0.12Grade 5 523 3.50 0.52 584 3.58 0.45 0.49 0.16Grade 6 139 4.08 0.58 162 4.11 0.50 0.53 0.06Grade 7 210 4.23 0.56 230 4.22 0.48 0.52 -0.02Grade 8 270 4.12 0.59 246 4.05 0.59 0.59 -0.12 Note: Likert scale for Grades 3–5 is a 4-point Strongly Disagree = 1 to Strongly Agree = 4; A 5-point scale with 3 = undecided was used for Grades 6–8.
Figure 2. Trends in male versus female computer enjoyment—Grade 5, Spring 2002.

30 Fall 2005: Volume 38 Number 1Copyright © 2005, ISTE (International Society for Technology in Education), 800.336.5191
(U.S. & Canada) or 541.302.3777 (Int’l), [email protected], www.iste.org. All rights reserved.
DISCUSSIONSimilarity of Transitions for Computer Enjoyment and Use of the Web
Although this study focused on computer enjoyment, other demographic and self-reported data were examined to shed light on possible reasons for computer enjoyment trends. Analysis of variance procedures were used to identify strong discriminators within and across grade levels. This analysis was conducted for both the elementary level data set and the secondary level data set (Grades 6–10). One interesting finding from the 2005 data was that at the seventh grade level, girls reported spending a greater number of hours on the World Wide Web than boys (p = .028), before the trend began to swing in favor of the boys generally reporting more hours per week across Grades 8–12. These tendencies are summarized in Table 3 and graphically shown in Figure 4. Both boys and girls increased their hours per week on the Web extensively from Grade 6 to Grade 7. In Grades 6 and 7, girls appear to have more hours of use than boys. At the eighth grade level the reported use is roughly equal for boys and girls, reflecting a decline from Grade 7 on the part of the girls. The girls continue to decline into the ninth grade and then appear to level out at a usage rate somewhat lower than boys for Grades 9 through 11. At Grade 12, the boys’ reported hours of use per week decline near to the level reported at Grade 12 by girls. The use of the Web appears to have a male-female transition point similar to computer enjoyment, but with crossover at a different grade level. Further research is needed to determine if computer enjoyment and use of the Web pat-terns are strongly related.
Figure 3. Effect size trends for female versus male levels of computer enjoyment across Grades 3–8 in 2005.

Journal of Research on Technology in Education 31Copyright © 2005, ISTE (International Society for Technology in Education), 800.336.5191(U.S. & Canada) or 541.302.3777 (Int’l), [email protected], www.iste.org. All rights reserved.
Female Skills Higher in E-mail and the World Wide WebAnalysis of several indices other than computer enjoyment from the 2005
data set indicated male-female separation may not persist through Grade 12. Among other indicators were the Technology Proficiency (TP) Self Assessment survey that included e-mail and Web indicators, each of which is a five-item scale. As is shown in Table 4, and as is graphically illustrated in Figures 5 and 6, female self-reported skill in e-mail and the Web appear to be higher than males at the eleventh and twelfth grade levels. Additional research is needed to deter-mine whether attitudes also swing once again in favor of females being more positive at this level.
Table 3: Trend in Hour per Week using Web Grade Male Mean Female Mean Grade 6 1.78 1.90 Grade 7 2.16 2.33 Grade 8 2.10 2.08 Grade 9 2.26 1.81 Grade 10 2.23 2.07 Grade 11 2.44 2.07 Grade 12 1.99 1.88 Note: category rating 1 = 0–1 hrs/week, 2 = 2–4 hrs, 3 = 5–10 hrs, and 4 = >10.
Figure 4. Trends in boys’ vs. girls’ hours per week using Web, Grades 6–12.

32 Fall 2005: Volume 38 Number 1Copyright © 2005, ISTE (International Society for Technology in Education), 800.336.5191
(U.S. & Canada) or 541.302.3777 (Int’l), [email protected], www.iste.org. All rights reserved.
Figure 5. Technology proficiency in female vs. male e-mail skills, Grades 6–12.
Table 4: Mean Scores for Male and Female Learning Dispositions, 2005Grade 6 7 8 9 10 11 12 Attitude toward School-Male 3.19 2.93 2.97 3.14 3.04 3.06 3.12 Attitude toward School-Female 3.37 3.14 3.11 3.32 3.32 3.24 3.45TPemail-Male 3.49 3.84 3.68 3.81 4.07 4.14 3.86TPemail-Female 3.91 4.12 4.06 3.85 4.18 4.42 4.32TPWWW-Male 3.67 3.91 3.85 3.84 4.09 4.13 3.87TPWWW-Female 3.88 4.10 3.94 3.84 3.96 4.21 4.09TP Integrated Applications-Male 3.42 3.67 3.59 3.71 3.89 3.79 3.63TP Integrated Applications-Female 3.58 3.76 3.63 3.70 3.68 3.91 3.84

Journal of Research on Technology in Education 33Copyright © 2005, ISTE (International Society for Technology in Education), 800.336.5191(U.S. & Canada) or 541.302.3777 (Int’l), [email protected], www.iste.org. All rights reserved.
SIGNIFICANCE OF FINDINGSFemale Views of Technology Differ from Male Views
According to Eck, Hale, Ruff, & Tjelmeland (2002), during middle school years, most girls are very social, preferring people to things; achievement-ori-ented—wanting a machine only to help them attain their goals. Boys are still happy with competition and winning (conquering the machine). In other words, females tend to view technology as a tool while males tend to view tech-nology as a toy.
Findings in this study are consistent with the interpretation of Eck et al. Dur-ing the middle school years, enjoyment and use of technology by girls becomes smaller compared to male counterparts. By Grade 11, however, females are higher in e-mail skills and in using the Web. It’s possible that girls have found a useful tool for promoting their social skills by the end of their high school career.
Why Is the Grade 6 Transition Point Important?The 2002 average effect size of .31 in favor of fifth grade females enjoying
computers more than males is above the threshold for “educational impor-tance,” but more realistically serves to illustrate that no objective observer should seriously contend that for this grade level, boys enjoy computers more than girls. Trends are consistent from four years of study and multiple data sets.
The sixth grade appears to be the point at which male computer enjoyment begins to become more positive than that of females. Based on the trends re-ported in this paper, the divergence by gender in computer enjoyment may in fact reflect a decline on the part of girls rather than an increase on the part of
Figure 6. Technology proficiency in female vs. male Web skills, Grades 6–12.

34 Fall 2005: Volume 38 Number 1Copyright © 2005, ISTE (International Society for Technology in Education), 800.336.5191
(U.S. & Canada) or 541.302.3777 (Int’l), [email protected], www.iste.org. All rights reserved.
boys. The decline appears to continue until it becomes educationally meaning-ful in favor of boys. This may negatively influence, and in the process limit, future studies and career choices at a critical juncture in a young girl’s life.
Well documented in previous research studies are traditionally more positive attitudes toward computers on the part of males at the junior high and high school level. This is an important issue in the educational environment of No Child Left Behind, which as part of its mission “… seeks to improve achieve-ment in elementary and secondary schools through the use of technology, to assist students to become technically literate by the eighth grade” (Rathbun & West, 2003, p. 1). Mayfield (2001) reported that factors that influence technol-ogy use by girls are typically in place by eighth grade. Kimmel (2000) reported that the drop in adolescent girls’ self esteem inhibits their use of technology. Because international research in the early 1990s demonstrated that higher computer enjoyment leads to higher computer importance (relevance to school work), and that more positive perceptions of computer relevance to schooling lead to higher motivation and achievement (Collis et al., 1996; Knezek et al., 1995), gender equity regarding attitudes toward computers in general and com-puter enjoyment in particular is an important issue in the educational environ-ment of No Child Left Behind. It is also an important issue from the broader perspective of helping each individual child become a productive citizen with a sense of self-worth and happiness in an information society (Collis & Saka-moto, 1996).
IMPLICATIONS FOR EDUCATOR PROFESSIONAL DEVELOPMENTRegardless of cause for gender differences in attitudes toward technology, it
appears that teachers are in a position to closely monitor equity in the edu-cational setting, and the relative newness of technology’s integration into the curriculum affords a unique opportunity to start from the beginning. Unfor-tunately, however, most current professional development programs (both pre-service and inservice) give minimal attention to equity issues (AAUW, 2000). In fact, many programs give limited attention to the integration of technology itself—what Darling-Hammond refers to as a “drive-by” approach to teacher preparation (AAUW, 2000, p. 14).
In order to reverse this trend, the AAUW suggests advocating technology as a learning partner across the curriculum, designing for equity that involves: (1) choosing engaging, relevant subjects and activities to attract girls and other “nontraditional” users, (2) developing a deeper content-technology link that broadens relevance for all students, (3) incorporating customizable learning environments using technology that can be personalized, updated, and recon-structed, and (4) developing appropriate assessment tools to continually moni-tor equity (AAUW, 2000, pp. 20–21).
Implications for Classroom Activities to Encourage Digital EquityIn the conclusions of their study, Linn and Hsi (2000) recommended that
teachers incorporate “multiple activity structures” into the instructional model. Based on the findings of this study, their recommendations would appear to ac-
Journal of Research on Technology in Education 35Copyright © 2005, ISTE (International Society for Technology in Education), 800.336.5191(U.S. & Canada) or 541.302.3777 (Int’l), [email protected], www.iste.org. All rights reserved.
commodate many types of female preferences. Alternatives to standard practice may include (among others):
• Assigning, then frequently reassigning, roles in group projects.• Integrating both oral and written communication skills into technol-
ogy assignments.• Doing projects and conducting online discussions using both anony-
mous and attributed roles (Linn & Hsi, 2000, pp. 174–175).
However, although teachers can play an active role in ensuring gender equity in the Digital Age, all stakeholders must be knowledgeable about inequities and how to remedy them. Parents, administrators, community partners, and software manufacturers all have important parts to play in ensuring that girls emerge from their educational experiences ready and willing to use technology to the fullest.
SUMMARY/CONCLUSIONSAnalysis of data gathered through the Young Children’s Computer Inventory
and the Computer Attitude Questionnaire in Texas indicates fifth grade girls are more positive (p < .01) than boys on computer enjoyment across the four years studied: 2000, 2001, 2002 and 2005. Data gathered in 2005 also reconfirmed that by Grade 8, boys are more positive on the subscale of computer enjoyment than girls. Further research is needed to determine if this trend exists in other geographic locations, and if so, why the change from girls-more-positive to boys-more-positive occurs around the sixth grade (age 12) in school. Analysis of related indices such as e-mail and Web skills indicate that some technology-related areas exist in which girls are measurably higher than boys, even after the transition to lower computer enjoyment. Therefore, it appears that full un-derstanding of gender preferences for attitudes toward and skill in technology is a complex issue. This study is a first step in determining what modifications might need to be made in classroom technology integration practices to ensure digital equity with regard to gender.
ContributorsRhonda Christensen earned a PhD in Information Science with a focus on
Computer Education. She is an Associate Director of the Institute for the Inte-gration of Technology into Teaching and Learning and is a Research Scientist at the University of North Texas in Denton. Gerald Knezek earned his PhD at the University of Hawaii in Educational Psychology. He is a professor of Technol-ogy & Cognition at the University of North Texas and Director of the Institute for the Integration of Technology into Teaching and Learning. Theresa Overall is a doctoral candidate in Educational Computing at the University of North Texas. The authors have worked together on multiple research projects involv-ing technology integration in education. (Address: Rhonda Christensen, Uni-versity of North Texas, Denton, TX 76203; [email protected].)
36 Fall 2005: Volume 38 Number 1Copyright © 2005, ISTE (International Society for Technology in Education), 800.336.5191
(U.S. & Canada) or 541.302.3777 (Int’l), [email protected], www.iste.org. All rights reserved.
ReferencesAmerican Association of University Women (AAUW) Educational Founda-
tion, Commission on Technology, Gender, and Teacher Education. (2000). Tech-savvy: Educating girls in the new computer age. Washington, DC: Author. Available: http://www.aauw.org/member_center/publications/TechSavvy/Tech-Savvy.pdf
Bialo, E. R., & Sivin-Kachala, J. (1996). The effectiveness of technology in schools: A summary of recent research. SLMQ, 25(1), 51–57. Available: http://www.ala.org/ala/aasl/aaslpubsandjournals/slmrb/editorschoiceb/infopower/se-lectbialohtml.htm
Chen, M. (1986). Gender and computers: The beneficial effects of experience on attitudes. Journal of Educational Computing, 2(3), 265–281.
Christensen, R., & Knezek, G. (2001). Equity and diversity in K–12 applica-tions of information technology. Key instructional design strategies: KIDS project findings for 2000–2001. Denton, TX: Institute for the Integration of Technol-ogy into Teaching and Learning.
Christensen, R., & Knezek, G. (2002). Instruments for assessing the impact of technology in education. In assessment/evaluation in educational informa-tion technology. Computers in the Schools, 18(2/3/4), 5–25.
Christensen, R., & Knezek, G. (2003). Girls and computers: Who says boys en-joy them more? Paper presented at the National Educational Computing Confer-ence, June 29-July 2, 2003, Seattle, WA.
Collis, B. (1985a). Psychosocial implications of sex differences in attitudes toward computers: Results of a survey. International Journal of Women’s Studies, 8(3), 207–213.
Collis, B. (1985b). Sex differences in secondary school students’ attitudes to-wards computers. The Computing Teacher, 12(7), 33–36.
Collis, B., Knezek, G., Lai, K., Miyashita, K., Pelgrum, W., Plomp, T., & Sakamoto, T. (1996). Children and computers in school. Mahwah, NJ: Lawrence Erlbaum.
Collis, B. & Sakamoto, T. (1996). Children in the Information Age. In B. Collis, G. Knezek, K. Lai, K. Miyashita, W. Pelgrum, T. Plomp, & T. Sakamoto (Eds.), Children and computers in school (pp. 1–8). Mahwah, NJ: Lawrence Erlbaum.
Collis, B., & Williams, R. L. (1987). Cross-cultural comparison of gender differences in adolescents’ attitudes toward computers and selected school sub-jects. The Journal of Educational Research, 81(1), 17–27.
Cooper, J., & Weaver, K. (2003). Gender and computers: Understanding the digital divide. Mahwah, NJ: Lawrence Erlbaum.
DeVellis, R. F. (1991). Scale development. Newbury Park, NJ: Sage Publications.Eck, J., Hale, M., Ruff, S., & Tjelmeland, M. (2002). An educator’s guide to
access issues [Online document]. Available: http://lrs.ed.uiuc.edu/wp/access/in-dex.html.
Kay, R. H. (1992). Understanding gender differences in computer attitudes, aptitudes, and use: An invitation to build theory. Journal of Research on Comput-ing in Education, 25(2), 159–171.

Journal of Research on Technology in Education 37Copyright © 2005, ISTE (International Society for Technology in Education), 800.336.5191(U.S. & Canada) or 541.302.3777 (Int’l), [email protected], www.iste.org. All rights reserved.
Kimmel, M. (2000). The gendered society. New York: Oxford University Press.Kirk, D. (1992). Gender issues in information technology as found in
schools: Authentic/Synthetic/Fantastic? Educational Technology, 32, 28–31.Knezek, G., & Christensen, R. (2000). Refining best teaching practices for tech-
nology integration: KIDS project findings for 1999–2000. Denton, TX: Institute for the Integration of Technology into Teaching and Learning.
Knezek, G., & Christensen, R. (2002). Technology, pedagogy, professional development and reading achievement: (KIDS) project findings for 2001–2002, Year Three Report. Denton, TX: Institute for the Integration of Technology into Teaching and Learning.
Knezek, G., & Christensen, R. (2003). Results of scientifically based research on reading achievement. Unpublished evaluation report submitted to the U.S. Dept. of Education September 15, 2003. Available: http://www.iittl.unt.edu.
Knezek, G., Christensen, R., Miyashita, K., & Ropp, M. (2000). Instruments for assessing educator progress in technology integration. Denton, TX: Institute for the Integration of Technology into Teaching and Learning.
Knezek, G. A., Miyashita, K. T., & Sakamoto, T. (1995). Findings from the Young Children’s Computer Inventory Project. In J. D. Tinsley & T. J. van Weert (Eds.), World Conference on Computers in Education VI (pp. 909–920). London: Chapman & Hall.
Linn, M., & Hsi, S. (2000). Computers, teachers, peers: Science learning part-ners. San Francisco: Lawrence Erlbaum Associates.
Mayfield, K. (2001). Girls into science, not computers. Wired News, March 9, 2001.
Pelgrum, W. J., Janssen Reinen, I. A. M., & Plomp, T. J. (1993). Schools, teachers, students, and computers: A cross-national perspective. Twente, Nether-lands: I.E.A.
Pelgrum, W. J. & Anderson R. E. (1999). ICT and the emerging paradigm for life long learning: A worldwide assessment of infrastructure, goals and prac-tices. Amsterdam: International Association for the Evaluation of Educational Achievement.
Rathbun, A. H., & West, J. (2003). Young children’s access to computers in the home and at school in 1999 and 2000. Education Statistics Quarterly, 5(1), 1–6. Accessed July 5, 2005, at http://nces.ed.gov/programs/quarterly/vol_5/5_1/q3_1.asp.
Sakamoto, A. (1994). Video game use and the development of sociocognitive abilities in children: Three surveys of elementary school students. Journal of Ap-plied Social Psychology, 24(1), 21–42.
Siann, G., McCleod, H., Glissov, P. & Durndell, A. (1990). The effect of computer use on gender differences in attitudes toward computers. Computers in Education, 14(2), 14–17.
Wilder, G., Mackie, D. & Cooper, J. (1985). Gender and computers: Two surveys of computer-related attitudes. Sex Roles, 13(3/4), 215–228.