
transformational infrastructure for development of a wellbeing ...
Upload
khangminh22Category
view
4download
0
Pepperdine University Pepperdine University
Pepperdine Digital Commons Pepperdine Digital Commons
Theses and Dissertations
2011
Transformational leadership styles of organizational social Transformational leadership styles of organizational social
network leaders as observed by fully employed Pepperdine network leaders as observed by fully employed Pepperdine
business and leadership students business and leadership students
Eric Hilary Furlong
Follow this and additional works at: https://digitalcommons.pepperdine.edu/etd
Recommended Citation Recommended Citation Furlong, Eric Hilary, "Transformational leadership styles of organizational social network leaders as observed by fully employed Pepperdine business and leadership students" (2011). Theses and Dissertations. 204. https://digitalcommons.pepperdine.edu/etd/204
This Dissertation is brought to you for free and open access by Pepperdine Digital Commons. It has been accepted for inclusion in Theses and Dissertations by an authorized administrator of Pepperdine Digital Commons. For more information, please contact [email protected] , [email protected].
brought to you by COREView metadata, citation and similar papers at core.ac.uk
provided by Pepperdine Digital Commons

Pepperdine University
Graduate School of Education and Psychology
TRANSFORMATIONAL LEADERSHIP STYLES OF ORGANIZATIONAL SOCIAL
NETWORK LEADERS AS OBSERVED BY FULLY EMPLOYED PEPPERDINE
BUSINESS AND LEADERSHIP STUDENTS
A dissertation submitted in partial satisfaction
of the requirements for the degree of
Doctor of Education in Organizational Leadership
by
Eric Hilary Furlong
October, 2011
Mark Allen, Ph.D. — Dissertation Chairperson

This dissertation, written by
Eric Hilary Furlong
under the guidance of a Faculty Committee and approved by its members, has been submitted to and accepted by the Graduate Faculty in partial fulfillment of the requirements for the degree of
DOCTOR OF EDUCATION
Doctoral Committee:
Mark Allen, Ph.D., Chairperson
Kent Rhodes, Ed.D.
Doug Leigh, Ph.D.

© Copyright by Eric Hilary Furlong (2011)
All Rights Reserved

TABLE OF CONTENTS
Page
LIST OF TABLES ........................................................................................................... viii
LIST OF FIGURES ........................................................................................................... ix
DEDICATION .................................................................................................................... x
ACKNOWLEDGEMENTS ............................................................................................... xi
VITA ................................................................................................................................. xii
ABSTRACT ...................................................................................................................... xx
Chapter 1: Introduction ....................................................................................................... 1
The Organizational Social Network ........................................................................ 1 The Problem ............................................................................................................ 3 Purpose of Study ..................................................................................................... 4 Research Questions ................................................................................................. 5 Research Subjects ................................................................................................... 6 Relevance of This Study ......................................................................................... 6 Definitions of Terms ............................................................................................... 7
Terms that will be used in this study .......................................................... 7 Limitations .............................................................................................................. 9
Chapter 2: Literature Review ............................................................................................ 12
Literature Review Section 1: Leadership Theories ............................................... 12 Skills approach .......................................................................................... 12 Style approach ........................................................................................... 13 Situational leadership ................................................................................ 14 Trait theory................................................................................................ 17 Path goal theory ........................................................................................ 18 Leader-member exchange ......................................................................... 20 Contingency theory ................................................................................... 22 Transactional and transformational leadership ......................................... 23 Transactional and transformational leadership and the
multifactor leadership questionnaire (MLQ). ..................................... 27 Literature Review Section 2: Organizational Social Networks ............................ 28
Basic structures and roles of organizational social networks according to Cross............................................................................... 28
Organizational social networks within the larger organization ................ 30 Traditional network structure function and efficacy ................................. 34

v
Page
Looking at leadership in organizational social networks within organizations ............................................................................ 35
Organizational social network performance, knowledge overlap, and knowledge variety .......................................................... 36
Organizational social networks, open innovation communities, and communities of practice ............................................................... 37
Leadership within communities of practice .............................................. 42 Beyond organizational social networks and communities of
practice within formal bureaucracies .................................................. 43 Organizational social networks, order from chaos ................................... 44 Organizational social networks as a behavioral phenomenon .................. 45 Conclusion to literature review ................................................................. 46
Chapter 3: Methodology ................................................................................................... 48
Restatement of the Problem .................................................................................. 48 Restatement of Purpose of Study .......................................................................... 49 Restatement of the Research Questions ................................................................ 49 Hypotheses to Test ................................................................................................ 50
Testing the results. .................................................................................... 50 Research variables .................................................................................... 51 The research instruments .......................................................................... 51 Questions related to possible future study ................................................ 53 Why two parts to the research instrument? ............................................... 53 Collecting data from part two of the research—the MLQ ratings ............ 53 Making comparisons ................................................................................. 54 Research subjects ...................................................................................... 54 Reaching and recruiting a desired range of research participants ............. 55 Research execution ................................................................................... 57 The second questionnaire .......................................................................... 59 Opportunities for future studies ................................................................ 59
Conclusion to Research Methodology .................................................................. 60 Chapter 4: Research Results ............................................................................................. 62
Introduction ........................................................................................................... 62 Restatement of research questions and hypotheses. ................................. 62
Changes to Research Instrument ........................................................................... 64 Research Test Results ........................................................................................... 65
Selecting the most appropriate t test. ........................................................ 65 Understanding the results tables ............................................................... 65
MLQ Research Results of Test Subjects .............................................................. 66 Idealized influence (attributed) ................................................................. 66 Idealized influence—Behaviors ................................................................ 67

vi
Page
Inspirational motivation ............................................................................ 68 Intellectual stimulation .............................................................................. 69 Individual consideration............................................................................ 70 Contingent reward ..................................................................................... 71 Management-by-exception (active) .......................................................... 71 Management-by-exception (passive) ........................................................ 72 Laissez-faire leadership ............................................................................ 73 Extra effort ................................................................................................ 74 Effectiveness ............................................................................................. 74 Satisfaction ................................................................................................ 75
Summary of Research Findings ............................................................................ 76 Chapter 5: Discussion and Conclusion ............................................................................. 78
Discussion of Results ............................................................................................ 79 Discussion of results for idealized influence (attributed). ........................ 79 Discussion of results for idealized influence (behavior) ........................... 80 Discussion of results for inspirational motivation. ................................... 81 Discussion of results for intellectual stimulation. ..................................... 82 Discussion of results for individual consideration. ................................... 83 Discussion of results for contingent reward.............................................. 84 Discussion of results for management-by-exception (active). .................. 85 Discussion of results for management-by-exception (passive). ............... 86 Discussion of laissez-faire leadership ....................................................... 87 Discussion of results for satisfaction, efficacy, and extra effort. .............. 87 Satisfaction ................................................................................................ 88 Effectiveness ............................................................................................. 88 Extra effort. ............................................................................................... 88
Summary of Research Results .............................................................................. 89 Key findings .............................................................................................. 89 Findings of ranked and grouped subject-leader pairs. .............................. 91
Organizational Social Network Members’ Motivations— Revisiting Selections From the Literature Review ......................................... 94
Balkundi and Kilduff’s consideration of nonleader forces on social networks............................................................................... 94
Reconsideration of leader-member exchange theory. ............................... 95 Behavior science tradition of self-preservation. ....................................... 95
Opportunities for Future Research ........................................................................ 96 Consideration of environmental and situational factors. .......................... 96 Taking a closer look at motivation............................................................ 97 Outcomes versus perceived efficacy. ........................................................ 98
Conclusion ............................................................................................................ 98 Significance of findings. ......................................................................... 100

vii
Page
The transformation of the nontransformational organizational social network leader. ....................................................................... 101
Organizational social network member empowerment. ......................... 102 REFERENCES ............................................................................................................... 103
APPENDIX A: Research Instrument Part One, Prior to Revision ................................. 108
APPENDIX B: Research Instrument Part Two, the MLQ ............................................. 110
APPENDIX C: E-mail Request to School Deans Asking for Permission to Contact Respective Professors and Ask for Assistance in Conducting My Research During a Scheduled Class ................................................................... 111
APPENDIX D: E-mail Request to Course Instructors Asking for Assistance
in Conducting My Research During a Scheduled Class ........................................... 112 APPENDIX E: E-mail Invitation and Link to Part Two of the Research Instrument .... 113
APPENDIX F: Research Instrument Part One, Revised ................................................ 114
APPENDIX G: Permission to Use Avolio and Bass’ Multifactor Leadership Questionnaire Instrument and Rater Form ................................................................ 116
APPENDIX H: Ranking of Subject-Leader Pairs of the Mean of the Five
Transformational Leadership Behaviors ................................................................... 117 APPENDIX I: Quartile Analysis, Individual Consideration .......................................... 118
APPENDIX J: Quartile Analysis, Idealized Influence, Attributed ................................. 120
APPENDIX K: Quartile Analysis, Idealized Influence, Behavior ................................. 122
APPENDIX L: Quartile Analysis, Inspirational Motivation .......................................... 124
APPENDIX M: Quartile Analysis, Intellectual Stimulation .......................................... 126
APPENDIX N: Figures N.1-N.12 ................................................................................... 128
APPENDIX O: Figures O.1-O.5 ..................................................................................... 140

viii
LIST OF TABLES
Page
Table 1. Research and Welch t Test Comparison Results, Idealized Influence (Attributed) ................................................................................................................. 66
Table 2. Research and Welch t Test Comparison Results, Idealized Influence
(Behavior) .................................................................................................................. 67
Table 3. Research and Welch t Test Comparison Results, Inspirational Motivation ....... 68
Table 4. Research and Welch t Test Comparison Results, Intellectual Stimulation ......... 69
Table 5. Research and Welch t Test Comparison Results, Individual Consideration ...... 70
Table 6. Research and Welch t Test Comparison Results, Contingent Reward ............... 71
Table 7. Research and Welch t Test Comparison Results, Management-by-Exception (Active) ....................................................................................................................... 72
Table 8. Research and Welch t Test Comparison Results, Management-by-Exception
(Passive) ...................................................................................................................... 72
Table 9. Research and Welch t Test Comparison Results, Laissez-Faire Leadership Behavior ...................................................................................................................... 73
Table 10. Research and Welch t Test Comparison Results, Extra Effort ......................... 74
Table 11. Research and Welch t Test Comparison Results, Effectiveness ....................... 75
Table 12. Research and Welch t Test Comparison Results, Satisfaction ......................... 75
Table 13. Mean Transformational Scores of Organizational Social Network Leader Sample......................................................................................................................... 76
Table 14. Mean Transformational Scores and Overall Laissez-Faire Score of
Organizational Social Network Leader Sample .......................................................... 77
Table 15. Comparing the Five Transformational Leadership Behaviors of the Top Quartile of Subjects to the General Population of Leaders ......................................... 92

ix
LIST OF FIGURES
Page
Figure N.1. Welch t Test Results: Idealized Influence (Attributed) ............................... 128
Figure N.2. Welch t Test Results: Idealized Influence (Behavior) ................................. 129
Figure N.3. Welch t Test Results: Inspirational Motivation ........................................... 130
Figure N.4. Welch t Test Results: Intellectual Stimulation ............................................ 131
Figure N.5. Welsh t Test Results: Individual Consideration .......................................... 132
Figure N.6. Welch t Test Results: Contingent Reward ................................................... 133
Figure N.7. Welch t Test Results: Management-by-Exception (Active) ........................ 134
Figure N.8. Welch t Test Results: Management-by-Exception (Passive) ...................... 135
Figure N.9. Welch t Test Results: Laissez-Faire ............................................................ 136
Figure N.10. Welch t Test Results: Extra Effort ............................................................. 137
Figure N.11. Welch t Test Results: Efficiency ............................................................... 138
Figure N.12. Welch t Test Results: Satisfaction ............................................................. 139
Figure O.1. Welch t Test Results, Top Quartile Analysis: Idealized Influence (Attributed) ............................................................................................................... 140
Figure O.2. Welch t Test Results, Top Quartile Analysis: Idealized Influence
(Behavior) ................................................................................................................. 141
Figure O.3. Welch t Test Results, Top Quartile Analysis: Inspirational Motivation ................................................................................................................. 142
Figure O.4. Welch t Test Results, Top Quartile Analysis: Intellectual
Stimulation ................................................................................................................ 143 Figure O.5. Welch t Test Results, Top Quartile Analysis: Individual
Consideration ............................................................................................................ 144

x
DEDICATION
This is dedicated to my parents and my wife Betsy.

xi
ACKNOWLEDGEMENTS
I would like to thank my dissertation chair, Dr. Mark Allen. Without his guidance
and insights, this journey would not have come to a satisfying conclusion. I would also
like to thank my other committee members, Dr. Kent Rhodes and Dr. Doug Leigh, for
their contributions in keeping my research focused and manageable.
I would also like to express special thanks to Dr. Rhodes. If it were not for a
handful of kind and inclusive words that came from him during my first few weeks in the
doctoral program, I would have left it. Thanks to him I continued on with what became a
wonderful journey.
Finally I would like to thank all my instructors and cohort members. What a great
time it was! My life is so much better for knowing all of you.

xii
VITA
ER I C H. FU R L O N G
E D U C A T I O N A L B A C K G R O U N D
ED.D. (ABD), ORGANIZATIONAL LEADERSHIP
Pepperdine University—Graduate School of Education & Psychology, Malibu, CA
Academic concentration: Postbureaucratic social network emergence, problem solving,
and leadership dynamics
2005-present (dissertation in progress); GPA: 3.985 (4.0)
MASTER OF BUSINESS ADMINISTRATION (MBA)
Pepperdine University—Graziadio School of Business, Malibu, CA
1993; GPA 3.650 (4.0)
BACHELOR OF ARTS—LIBERAL STUDIES, ENGLISH LITERATURE CONCENTRATION
California State University, Long Beach, CA
President’s Honor List; Dean’s Honor List
T E A C H I N G A N D T R A I N I N G E X P E R I E N C E
CORINTHIAN COLLEGES, COSTA MESA, CA JANUARY 2010-PRESENT
Curriculum Manager, Business and Accounting Programs
Provide management of various business and accounting programs currently being run at
over 50 campuses nationwide. Responsibilities include providing extensive curriculum
and programmatic training to campus faculty and staff, consulting with curriculum
designers on development of syllabi, lesson plans, and other course documents, assisting

xiii
in textbook selections, contributing to local PAC meetings, and working daily with
program chairs, career services, admissions, registrars, deans, and other key campus
stakeholders in the delivery of business and accounting educational programs.
VANGUARD UNIVERSITY, COSTA MESA, CA JANUARY 2010-MAY 2010
Adjunct Instructor, School of Business
Taught upper-division course in consumer behavior. Developed course syllabus, outlined
learning objectives, and heavily modified provided instruction materials to better cover
current business issues and to better fit student backgrounds.
IRVINE UNIVERSITY, CERRITOS, CA OCTOBER 2009-JANUARY 2010
Instructor (Part Time), School of Business
Taught course in business finance. Developed course syllabus, outlined learning
objectives, and heavily modified provided instruction materials to better cover current
business issues and to better fit student backgrounds. Assisted in the adoption of a new
Internet-based, online instructional software application.
HANOI SCHOOL OF BUSINESS (HSB), HANOI, VIETNAM NOVEMBER 2009
Guest lecturer
Conducted a seminar on negotiation and business communications for graduate students
in HSB’s International Executive MBA program. Participated in commencement
ceremony for 120 graduating MBA students.
STAR TRAC FITNESS, IRVINE, CA 2007-FEBRUARY 2009
Provided training on next-generation, Internet-based, and social networking-centric
fitness products to fitness facility managers, trainers, and end-users. Provided technical

xiv
training to facility staff on setup and usage of related software applications and hardware.
Developed related training materials.
Specific seminars taught included:
Installation and use of software Use of next-generation fitness equipment hardware Sales and marketing strategies for business development Financial modeling methods and revenue streams analysis for maximizing
profitability
EPSON AMERICA, LONG BEACH, CA 1999-2007
Developed curriculum and executed on-going training on custom-developed business
productivity software applications for a user base of over 200 people spread across
several departments and from several different levels of the organization ranging from
administrative assistants to senior management. Conducted ‘train the trainers’ education,
and developed all related education materials.
Specific seminars taught included:
General introduction to software platform and fundamentals of its logic and structure
Budget planning and monitoring Measuring and predicting the impacts of promotional activities on consumer
demand and purchasing patterns Alternative approaches to measuring marketing programs’ ROI Marketing programs planning Predicting and monitoring cash flows
TORRANCE UNIFIED SCHOOL DISTRICT, TORRANCE, CA 1998-1999
Performed as a substitute teacher for various schools in the Torrance Unified School
District. Earned passing and ‘above average’ scores on CBEST, SSAT (English), and
Praxis (English) teaching exams in preparation for a career teaching high school English.

xv
MAGNAVOX, TORRANCE, CA 1992-1995
Wrote several owners manuals for consumer and commercial GPS navigation products,
and provided product training to dealer representatives within Magnavox’s authorized
dealer network.
Specific seminars taught included:
Basics of the Global Positioning System (GPS) Using GPS navigation products Fundamentals of Differential GPS
DIVE MASTER/SSDI ONGOING
Assisted in the education and certification of over 250 scuba divers. Provided field
education and classroom control for students ranging in age from 14 through 65.
Conducted tours and acted as field naturalist for groups of certified scuba divers.
Provided one-on-one feedback to students regarding scuba diving equipment setup and
usage and scuba diving techniques.
xvi
S U B J E C T A R E A S O F E X P E R T I S E
Business Administration
Leadership Theory and Practice
Marketing Management
Economics Quantitative and Qualitative Methods
Statistics and Research Methods
Communications Business Software/MS Office Products
Organizational Behavior
Direct Marketing Database Marketing Creative Direction Message Development Branding and Brand
Development Finance and Financial
Analysis Advertising Product Life Cycle
Management Public Relations
S C H O L A R L Y A C T I V I T I E S
Furlong, Kaltenbach, Taylor (2006). Cultural DNA: The Six Strands for Successful
Practice of the New Leadership Models. Proceedings of the 29th Annual Conference of
the Society of Educators and Scholars. Heritage Press, Long Beach, CA.
P R O F E S S I O N A L E X P E R I E N C E
CORINTHIAN COLLEGES, COSTA MESA, CA JANUARY 2010–PRESENT
CURRICULUM MANAGER, BUSINESS AND ACCOUNTING PROGRAMS
Provide management of various business and accounting programs currently being run at
over 50 campuses nationwide. Responsibilities include providing extensive curriculum
and programmatic training to campus faculty and staff, consulting with curriculum
designers on development of syllabi, lesson plans, and other course documents, assisting
in textbook selections, contributing to local PAC meetings, and working daily with
program chairs, career services, admissions, registrars, deans, and other key campus
stakeholders in the delivery of business and accounting educational programs.

xvii
STAR TRAC FITNESS, IRVINE, CA 2007-FEB. 2009
ADVANCED DEVELOPMENT PRODUCTS AND VERTICAL MARKETING MANAGER
Developed and executed go-to-market and launch campaigns for next-generation
products for fitness facilities and end-users. Launch efforts included strategic
demographic targeting, product training, collateral development and production, demand
generation, retail signage and in-store promotions, technical consulting on product
requirements, and product installation advisement.
Directed all internal departments and cross-functional teams in the quoting, sales, delivery, installation, and user-training of all products from the Advanced Development products division.
Provided revenue streams and pricing consultation, what-if scenario analysis, and final recommendations to gym and fitness facility owners and managers.
Provided product training to fitness facility owners, managers, personal trainers, and end users on products in the advanced development product line.
Directed Marketing Communications department in the production of various communications pieces, including email and animated XML campaigns, advertising, brochures, and direct mail.
Initiated, tracked, and analyzed results of direct marketing campaigns.
EPSON AMERICA, LONG BEACH, CA 1999-2007
MANAGER—MARKET DEVELOPMENT FUNDS ADMINISTRATION, SALES OPERATIONS
Responsible for ensuring integrity, measuring effectiveness, and predicting impact of the
Company’s second largest budget—exceeding $100,000,000 annually—through setting
policies and directing all inter and intra-departmental operations. Operational
responsibilities spanned several areas of the organization and included developing tactical
procedures and deliverables for personnel in finance, product management, retail
operations, field sales, and other departments. Reviewed and approved all Epson-funded
channel partner marketing program requests, including MDF, co-op advertising, and
incremental demand generation funding to ensure compliance with policies and

xviii
alignment with Epson’s marketing strategies. Collaborated extensively with other
departments to monitor and predict marketing programs’ impact on relevant dimensions
of the business. Supervised staff of four analysts and senior analysts, providing coaching,
professional development, promotion advocacy, and annual performance reviews.
Directed development of custom, Web-based software applications key to improving operational effectiveness. Hailed by one Sales Director as the greatest productivity tool implemented in over a decade, and securing the Kaizen award for continuous improvement, this tool is now in use by over 200 people on a daily basis, and saves literally thousands of labor-hours a year.
Collaborated with product management, finance, senior management, sales, and other stakeholders in the rollout, administration, reporting, and analysis of myriad marketing programs and related budgets.
Managed multimillion dollar consumer and reseller marketing programs for the professional graphics printer division.
Managed various vendors and consultants supporting marketing programs, program fulfillment, website design, and custom developed software applications.
Improved MDF/co-op advertising annual accrual and expense predictions to within 2% of forecast from previous 10% achieved by predecessor.
STARBASE/SELECT SOFTWARE, IRVINE, CA 1996-1998
MANAGER, MARKETING COMMUNICATIONS
Working directly with executive management, built entire marketing communications
function from ground up, handling all media selection, trade shows, collateral
development, product data sheets, print advertising, direct mail campaigns, and co-op
advertising. Led forums with executive management, engineering, product management,
sales, and creative agencies in the development of marketing messages, strategies, and
campaigns. Developed and independently controlled marketing budget, and directed all
tactical implementation of marketing communications strategies. Directed extensive
qualitative and quantitative market research efforts, including descriptive statistics and
hypotheses tests.

xix
Directed development of closed-loop lead tracking and inquiry fulfillment systems and their integration with the sales forces’ contact management system.
Implemented marketing performance measurement tools to analyze message and campaign success.
Established and maintained all relationships with creative agencies and vendors. Served as liaison to agencies, senior management, and other company stakeholders.
Led corporate image and branding campaigns, contributing significantly to successful listing of company on the NASDAQ.
MAGNAVOX ADVANCED PRODUCTS AND SYSTEMS, TORRANCE, CA 1988-1995
ASSISTANT PRODUCT MANAGER, GPS NAVIGATION AND SURVEY
Responsible for the P&L of selected OEM GPS navigation and time recovery products,
which once became the most profitable product line in the division. As a true matrix
organization, was responsible for all activities, and associated costs and charges, of all
internal contributors supporting the product line including marketing communications,
engineering, software development, production, technical support, sales, customer
service, and purchasing. Improved product line profitability through identifying needs for
product hardware and software modifications, and creating associated ROI models for
evaluation.
Directed advertising agencies, public relations agencies, and creative vendors in the development, production, and coordination of marketing communications campaigns.
Developed pricing strategies to maximize revenues, profits, and market share; established short and long term demand and sales forecasts for product line, established production schedules and target inventory levels. Assisted in price point analysis and development of pricing strategies.
Developed authorized dealer network and associated support programs, including lead referral and synergistic public relations efforts. Performed all associated training.

xx
ABSTRACT
Of the mechanisms that organizations embrace to find a competitive advantage in
postbureaucratic environments, one of the more common is to allow the emergence of
informal networks in which individuals work together regardless of the formal scope of
their responsibilities. As these networks emerge, so do leaders within them.
To date, there has been almost no research on the leadership behaviors of
emergent network leaders. However, that has not stopped many thinkers on the topics of
leadership and organizational theory from assigning behaviors to them. Avolio, Bass, and
others have assigned transformational leadership to these leaders; and such assignments
seem defendable given the nature of transformational leadership and the dynamics of
emergent networks.
This exploratory study set out to address this void. Specifically, it explores the
transformational, transactional, and Laissez-faire leadership behaviors displayed by a
select sample of leaders, and then compares them to the general population of formally
established leaders. The results of this study show that in general, the emergent network
leaders sampled are judged to be essentially no different than the general population of
leaders. But in taking a closer look at the results, very high degrees of variation between
subjects’ scores reveal some interesting patterns; one of these being that a subset of the
subject sample proved to be significantly more transformational than formal leaders in a
few important categories. Further research is needed to find the commonalities of these
exceptionally transformational leaders, and what separates them from their peers and
formal leaders alike.

xxi
In the meantime, this research points to other important conclusions, one of the
more significant being that the assumption that leaders of emergent networks will be, by
default, highly transformational might be an overgeneralization. The sample used in this
study turned out not to be. Organizations seeking to leverage the competitive advantage
emergent networks can deliver should not take the emergence of transformational
leadership of these networks as a given. Instead, the formal leaders of organizations
might want to walk the fine line of allowing these networks to emerge organically while
ensuring the materialization of transformational behaviors of these networks’ leaders.

1
Chapter 1: Introduction
The notion that the organizational structures are continuing to flatten has been
around so long it is basically a modern day cliché. Reductions in layers of middle
management, employee empowerment, decentralization, local decision making,
decreasing bureaucracy, and numerous other common themes, as well as the findings and
statements of countless researchers and authors on organizational structure, are common
topics of business literature that attest to the phenomenon of organizational flattening.
For the purposes of this study, I will use the term postbureaucracy or
postbureaucratic to describe situations in which the traditional structure and/or function
of bureaucracy is absent, or at least secondary to a prevailing force that is not a formal
construct of the organization. This is not to say that all organizations can be classified as
either bureaucratic or not. But rather this study embraces the notion that organizations
exist in which postbureaucratic operations have successfully emerged, whether that
particular organization would typically be described as highly bureaucratic or not.
The Organizational Social Network
There are, of course, many dimensions to postbureaucratic forms and functions.
For my purposes here, it is the specific dimensions of how certain forms of work get done
in a postbureaucratic way that is primary. Largely, that work gets done through the
organic emergence of organizational social networks (Cross & Parker, 2004) composed
of individuals who work together without any directive from superiors and without direct
reward. These are situations in which individuals within an organization resource, and
become resources to one another, through social rather than formal ties. While personal
relationships undoubtedly come into play in the structure and function of these

2
organizational social networks as they do in formally established workgroups, it is their
efforts to get a job done that is of primary importance.
Oftentimes when problems or challenges are encountered in postbureaucratic
environments, they are not escalated to management for solving. Instead, employees take
it upon themselves to solve their own problems. They network with each other,
borrowing each others’ expertise to solve short-term problems or to cope with or manage
long-term problems. They often do this without being asked. They do this without formal
supervision.
It should be noted that from here on in the term organizational social network will
be used to refer to these social networks, and both questionnaires used in the research will
use the term informal workplace networks. This departure from the generally accepted
academic term embraced by Cross and others will be done to avoid any possible
confusion with Facebook, MySpace, Twitter, and other Internet-based social media
products. At the time of the writing of this study, the term social network is commonly,
and often instantly, interpreted by many people as a reference to social media. Therefore,
in order to avoid lengthy efforts to clarify the term for research subjects, and to avoid
possibly confusing readers of this study, the term social network will be avoided and
replaced as illustrated above.
Cross and others have built a large body of research behind these organizational
social networks, creating methods to make sense of them, and outlining processes to
better enable organizational social network emergence. But there is a near vacuum
regarding research into specific leadership behaviors or methods found in those who
become leaders within these organizational social networks.

3
This is not to say that leadership that emerges organically has been ignored.
Indeed, many researchers have looked at varying aspects of emergent leaders. The
emergence of leadership from, and the functioning of, emergent networks ranging from
organizational social networks to communities of practice to open innovation teams and
other forms has been studied and documented by several authors, including Eagly and
Karau (1991), Hoffman (2004), Hollingsworth, Meglino, and Shaner (1977), Sorrentino
(1986), Yoo and Alvi (2004), and others. However, these studies either do not consider
leadership styles and behaviors specifically, or do not concern themselves with
organizational social networks specifically.
Hinging off the chapter opening quote from Avolio and Bass (2004) regarding the
ineffectual nature of transactional leadership behaviors in postbureaucratic scenarios, this
study will explore the transformational, transactional, and laissez-faire leadership
behaviors that are observed by a selected sample to be employed by leaders of
organizational social networks, which by definition are postbureaucratic.
The Problem
The absence of research on organizational social network leadership has left a
void in what might be an important area of leadership studies given the increasing
importance of organizational social networks. As noted, their ability to enable the
organization to remain competitive and even gain a competitive advantage through
transcending bureaucracy to deal with an ever more increasingly complex world is
increasingly important (Jamali et al., 2006).
There is also the problem in that the primary focus of leadership studies have
focused on leaders that were formally established as either managers, supervisors, leads,

4
and so on (Gronn, 2002). That is to say that the study of leadership has primarily focused
on the behaviors of leaders as they go about being an appointed leader.
Given these considerations, the neglect of organizational social network leader
behaviors is in need of remedy. Due to the informal nature of organizational social
networks, these leaders can come in any form and from anywhere. We embrace the
notion that “leadership is available to everyone” (Northouse, 2004, p. 3), and we accept
as the norm that leadership can be found from any chair (Zander & Zander, 2002). And it
is upon the leaders that emerge from the second strings in the orchestra to lead
organizational social networks to success is where this study will focus its explorations.
Purpose of Study
The purpose of this exploratory study is to reveal to what degrees
transformational, transactional, and laissez-faire leadership behaviors are observed to be
in use by leaders of organizational social networks as observed by a select sample of
organizational social network members, and to compare those measurements to those of
formally established leaders.
Without defining the role or nature of organizational social networks, Bass and
Avolio (1990) state that “As organizations themselves move from being hierarchically
structured entities… with compressed hierarchies and blurred lines of authority, the need
to explore a broader range of leadership styles suited for these new environments is
apparent”(p. 1). Bass and Avolio (2004) proceed to state that the leadership styles
suitable for these new environments are those they define as transformational. These
behaviors include Idealized Influence (Attributed), Idealized Influence (Behavior),
Inspirational Motivation, Intellectual Stimulation, and Individualized Consideration (Bass

5
& Avolio, 2004). Putting these behaviors in context and on a continuum, Avolio and Bass
(2004) also address transactional leadership behaviors of Contingent Reward,
Management-by-Exception (Active), Management-by-Exception (Passive), and the non-
leadership behavior of laissez-faire leadership in their research and papers on the subject.
All of these behaviors will be defined and discussed in detail shortly.
These authors’ theories and research findings on behaviors has been thoroughly
explored, refined, and defended. However, neither they nor other researchers appear to
have specifically looked at these behaviors within distinctly identified organizational
social networks.
This exploratory study builds upon the existing body of leadership research in
general, and adds to the body of research on the behaviors listed above by employing
Bass and Avolio’s (2004) Multifactor Leadership Questionnaire Form 5x-Short (MLQ)
and a profiling questionnaire created for this study that will capture key contact
information but primarily act as a tool to qualify whether or not any given subject
participated as a non-leading member of an organizational social network.
Avolio and Bass’ (2004) MLQ questionnaire provides the mechanism by which
the behaviors of organizational social network leaders are explored, and the MLQ
research results for the general population of leaders provides the population against
which the sample of organizational social network leaders is compared. More precise
details follow in Chapter 3.
Research Questions
As implied in the purpose of this study, two research questions are addressed
here:

6
1. What types of transformational, transactional, and laissez-faire leadership
behaviors do a select sample of organizational social network members
perceive to be in use by leaders of the organizational social networks in which
the subjects participated?
2. How does the sample of organizational social network leaders compare to
formally established leaders as measured by Bass and Avolio’s (2004) MLQ
study?
These research questions are stated as hypotheses in Chapter 3.
Research Subjects
The subjects to be used in this research will be fully-employed students from
Pepperdine’s Graziadio Graduate School of Business and Pepperdine’s School of
Education and Psychology. These students will be used in order to assure a broad cross
section of industries, organizational rank, cultural backgrounds, and other considerations
where diversity serves to enhance this study. Since this study will focus on
transformational behaviors found in organizational social network leaders in general,
such diversity helps assure trends that might be found in certain industries or other
dimensions of segments of the research subjects will less likely to be a factor. More
details on the research subjects follows in Chapter 3.
Relevance of This Study
Aside from contributing to the body of research in the field of leadership, the
findings of this study might be important to leaders, managers, and other stakeholders in
organizations which might rely, or someday rely, on organizational social networks in
order to function effectively. According to many of the authors explored in this study,

7
they should be numerous (Avolio & Bass, 2004; Cross & Parker, 2004; Jamali et al.,
2006; Kira & Forslin, 2008). And resting on the assumption that transformational
leadership can be learned, actions can be taken to help foster and nurture the development
of transformational leadership abilities in employees so that as these employees emerge
as organizational social network leaders they can be better prepared to assume these
leadership positions and perform in them effectively.
Definitions of Terms
Because this study relies on a unique vocabulary in order to economically convey
some rather lengthy concepts, an exploration of a few of the terms used frequently in this
study is in order. Most of these terms are fairly common, but have slightly different
meanings in this study.
Terms that will be used in this study. For this study, I will use the definition of
leadership as Northouse (2004) states it, which is “Leadership is a process whereby an
individual influences a group of individuals to achieve a common goal” (p. 3). This
definition of leadership suits this study remarkably well given that it pays no homage to
formal authority, supervision, or management.
For this study, the term organizational social network leader is used to describe
individuals who are identified by organizational social network members as a leader of a
network of people that is engaged in solving a new problem, confronting a new
challenge, or changing the way an existing process or procedure is done without having
formal authority or power over the members of the network of individuals engaged in
these endeavors.

8
The term organizational social network leader is not found in the literature, but is
rather a term invented for this study; and is used to avoid confusion with the term
emergent leaders, which are often found in the canon of literature on organizational social
networks and other emergent networks. The term emergent leader has been used to refer
to individuals who, through their actions, are identified by others above them in the
organizational hierarchy that then bestow a leadership position to said emergent leader
(Sorrentino, 1986). Emergent leader has also been used to describe individuals who
emerge as leaders from a group with basically static or formally formed networks (Eagly
& Karau, 1991; Hoffman, 2004; Hollingsworth et al., 1977; Yoo & Alavi, 2004). The
distinction between these definitions and the one used in this study is that the groups in
this study are dynamic and informal, and that the leaders of these networks are not
handed any formal leadership, power, or authority over network members.
The term organizational social network is used to describe a network of
individuals that emerges organically and not as a formal construct of management. In this
study, the organizational social networks in question are those that emerge to confront a
new challenge or problem or put new processes or procedures into place. The
organizational social network can include individuals who are not necessarily employees
of the same company. Their qualification as part of the organizational social network is
that they in some way contributed to the solution towards which the network was
working. While Cross and Parker (2004) do not provide a concise definition of
organizational social networks as they use the term, the exploration of it here is very
similar to how they treat the term.

9
Limitations
The nature of this exploratory study makes no attempt to garner multiple MLQ
ratings for any one given leader. Indeed, it is highly likely that no one individual leader
will have more than one person’s rating given the nature of how the research was
conducted. However, this is not a problem as this study is limited to finding aggregate
patterns of specific behaviors within organizational social networks in general.
Considerations of industry type, size of the organization, and other environmental and
situational factors that might be contributing to the existence of the leadership behaviors
explored here are not part of this study. However, these factors may make for interesting
further study, so some environmental factors are included in part one of this research for
such a purpose.
Another limitation of this study lays in the fact that organizational social network
members do not necessarily work with one another all the time. The MLQ Rater Form
poses questions regarding the frequency certain leadership behaviors were observed to be
in use. Therefore, the questions could be misconstrued to mean frequency relative to a
timeframe and not relative to the number of occurrences. In other words, if the subject is
asked to rate their leader on a scale of 0 to 4, 4 being always or almost always, in terms
of how frequently that leader was pleasant to be around, the subject might score the
leader lower than a 4 even if the leader was always pleasant to be around when the leader
and the subject were together based on the fact that there may have been little contact
over a course of several weeks or even months. Instructions regarding this issue will be
added as an introduction to the MLQ in part two in order to hopefully avoid such errors.
10
Further, the very nature and structure of organizational social networks must be
considered. It is possible that different members of these networks move in and out of
leadership roles depending on the nature of the work these networks perform at any given
time. In turn, it is quite possible that there may be more than one person who could be
considered as a leader within the network. Given these two considerations, the population
size of leaders of organizational social networks for this study is not only unknown at this
time, but it is also unknowable without extensive research dedicated to answering this
question alone.
Given this limitation, the sample size needed to accurately portray the population
of organizational social networks in the statistical tests to be used cannot be determined.
Therefore, the sample size used was one of convenience. The results thus represent an
exploration into a previously unexplored area rather than concrete conclusions. Given
these considerations, the term significance will be avoided except when speaking
specifically about the sample used in this study as it cannot be applied to the general
population of organizational social network leaders.
A related limitation to this study is the fact that the only guidance subjects were
given regarding their selection of a leader to rate was to choose the person who they felt
played the most important leadership role. Subjects were not asked to identify the
strongest leader, nor the one who had longest leadership role tenure. Nor were subjects
asked to explain the reasons why the leaders they chose to rate were considered the most
important. Regarding these limitations, this study seeks to explore leadership behaviors
of organizational social network leaders in general, not focusing on any given type of
organizational social network leader. Therefore, these limitations do not detract from this

11
study, but do make for a potentially broad range of identified leaders, which is the intent
given this study’s exploratory nature.

12
Chapter 2: Literature Review
This literature review is broken into two primary sections. The first section is a
review of dominant leadership theories. The second section of this literature review
explores various texts on organizational social networks from different disciplines.
Selections were made due to their relevance, sometimes narrowly but always importantly,
to the research to be conducted in the field and explored in the following chapters.
Literature Review Section 1: Leadership Theories
Skills approach. The skills approach to leadership focuses on the skills necessary
for successful leadership. It embraces the idea that these skills can be learned. One of the
better examples of this approach is outlined by Katz (1955) when he says, “Performance
depends on fundamental skills rather than personality traits” (p. 33). Further, Katz
establishes a three-skill approach to effective leadership in three different roles. The skills
he outlines are technical, human, and conceptual. Technical skill is the “understanding of,
and proficiency in, a specific kind of activity, particularly one involving methods,
processes, procedures, or techniques” (Katz, 1955, p. 34). Human skill is the “ability to
work effectively as a group member and build cooperative effort with the team (one)
leads” (Katz, 1955, p. 34). Conceptual skill, as Katz puts it:
involves the ability to see the enterprise as a whole; it includes recognizing how
the various functions of the organization depend on one another, and how changes
in any one part affect all the others; and it extends to visualizing the relationship
of the individual business to the industry, the community, and the political, social,
and economic forces of the nation as a whole. (pp. 35–36)

13
The effective leader is one who has the proper combination of these three skills
for the leader’s respective level. Those in higher levels of the organization require high
degrees of human and conceptual skills. Those in the lower levels require higher degrees
of human and technical skills but less conceptual skills. Those falling in between require
a lower degree of technical skill, but a moderate degree of conceptual skills (Katz, 1955).
It is interesting to note that Katz (1955) identifies human skills as the one constant for
successful leaders regardless of their level in the organization.
The skills approach was later expanded upon by Mumford, Zaccaro, Harding,
Jacobs, and Fleishman (2000) to incorporate aspects of individual attributes such as
general cognitive ability, motivation, and personality; competencies, such as problem-
solving skills, social judgment, and knowledge; and leadership outcomes, such as
effective problem solving and performance. They look at the development of leaders
through their own career experiences and environmental influences, which makes leaders
more effective as they are exposed to more and different experiences and influences over
time, through direct experience and formal training (Marta, Leritz, & Mumford, 2005).
Style approach. The style approach to leadership focuses on what leaders do,
how they act, and how they interact with their subordinates (Northouse, 2004). The style
approach has most notably been expanded upon by Blake and his associates. Of particular
note is Blake and Mouton’s (1982) adaptation and expansion of the managerial grid,
which is the contemporary cornerstone of style theory.
The grid is composed of an X axis which is numbered from 1 to 9 to show the
degree of concern the leader has for production. The Y axis, which is also numbered 1 to
9, shows the degree of concern the leader has for people. The result is a two-dimensional
14
playing field where five dominant combinations emerge—one combination in each
corner and one in the center. By name, the quadrants, beginning in the lower left and
moving clockwise, are called impoverished leadership, country club leadership, team
management, authority-compliance management, and, in the center, middle-of-the-road
management. While many explorations of the style approach do not overtly state the
virtues of any one style over the others, it is apparent that the top right quadrant—team
management—emerges as the style of true leadership.
Blake and Mouton (1982) are less diplomatic in their approach. They not only
identified team management as the most effective, but they also take a direct aim at a
competing theory of leadership, Blanchard’s situational leadership model (Blanchard,
Zigarmi, & Zigarmi, 1985), which will be explored shortly.
Concentrating for now strictly on the virtues of team management, Blake and
Mouton (1982) stress that the team management approach is best regardless of the
maturity level or competence of the subordinate. They also provide a healthy degree of
research to support their findings, and offer more than a few hypothetical scenarios to
illustrate their points and support their conclusions. The authors also spend considerable
time and space dedicated to paternalism/maternalism, which, in their view, is a corrupted
and often confused construct of the team management style. Paternalism/maternalism is
neither preferred nor found to be effective; however, it is often embraced through
corrupted intentions of the leader to provide rewards to the subordinate as well as support
conforming behavior, as a parent might (Blake & Mouton, 1982).
Situational leadership. Situational leadership is recognized as one of the most
popular approaches to leadership. It is firmly based on the premise that there is no one

15
best leadership style, and that leadership style should be based on the situation.
Specifically, leaders need to choose one of four styles depending on the development
level of the subordinate relative to their responsibilities. Blanchard et al. (1985) identified
four development levels, which are listed below:
D1: Low Competence/High Commitment
D2: Low to Some Competence/Low Commitment
D3: Moderate to High Competence/Variable Commitment
D4: High Competence/High Commitment (p. 56)
Blanchard et al. (1985) then identifies two independent behaviors to be employed
by the leader to varying degrees. These are supportive behavior and directive behavior.
As simple as they sound, supportive behavior:
Involves listening to people, providing support and encouragement for their
efforts, and then facilitating their involvement in problem-solving and decision
making.…Directive behavior involves clearly telling people what to do, how to
do it, and then closely monitoring their performance. (p. 46)
The combinations of these two elements provide the leader with the following
style options:
Style 1—High Directive behavior/Low Supportive Behavior—Directing.
In the directing style, the leader provides specific instructions about what and how
goals or tasks will be accomplished. The leader also closely supervises the
individual’s performance. Most decisions in S1 are made by the leader.

16
Style 2—High Directive Behavior/High Supportive Behavior—Coaching
The leader explains decisions, solicits suggestions from the individual, praises
progress, and continues to direct task accomplishment. Input from the individual
is considered, although final decisions are made by the leader.
Style 3—Low Directive Behavior/High Supportive Behavior—Supporting
A leader using Style 3 listens, encourages, and facilitates self-reliant decision
making and problem solving.
Style 4—Low Directive Behavior/Low Supportive Behavior—Delegating
The leader empowers the individual to act independently and provides the
appropriate resources to get the job done. (Blanchard, 2001, p. 5)
Situational leadership now involves marrying each of the four development
categories to the styles categories to arrive at a best fit. The leader identifies the level of
development of an employee, relative to that employee’s duties, and then adopts either
the S1, S2, S3, or S4 leadership style accordingly. Using the behaviors outlined for each,
the leader now has a practical guide for how to behave with said employee to achieve the
best results.
In situational leadership, the subordinate is expected to move forward, and
sometimes backward, along the development continuum. Logically, as the subordinate
gains confidence and ability and moves from low levels of development to higher levels
of development, the leader adjusts his or her style accordingly. And in those situations
where there is a backward slide in performance, or regression, the leader reverts back to
the lower style accordingly (2001).

17
Other notable authors contributing to the body of literature on situational
leadership include Graeff (1997), who provides a critical review of the theory in finding,
among other things, that the evolution of the theory only adds to its overall ambiguity and
confusion when it comes to putting it into practice, and that the D1 to D4 continuum does
not take into account a myriad of other dispositions that subordinates may adopt. Vecchio
(1987) also adds to the discussion by adding some formal research techniques to test the
validity of situational leadership. However, his findings are far from conclusive. The one
area where situational leadership showed to have its strongest correlations to success
were in situations where subordinates were in the lower levels of development. Support
for the theory diminished at higher levels of subordinate development (Vecchio, 1987).
Trait theory. Trait theory is one of the oldest theories behind how people become
leaders. Simply put, and in its simplest form, trait theory holds that some people are born
with specific traits that enable them to become strong, even great, leaders.
Researchers have identified different sets of traits that make for strong leaders. In
fact, the list is so long that it is seen as a weakness of the theory in general (Northouse,
2004). However, the common major traits between trait theorists, as identified by
Northouse (2004), include: intelligence, self-confidence, determination, integrity, and
sociability (p. 19). The theorists from which this list was derived include Stogdill; Mann;
Lord, DeVader, and Alliger; and Kirkpatrick and Locke.
Kirkpatrick and Locke (1991) explore various leaders including Sam Walton, Ray
Kroc, a Navy captain, and various other strong but less publicly known leaders from
well-known companies. Their core set of traits include drive, leadership motivation,
honesty and integrity, self-confidence, cognitive ability, knowledge of the business, and a

18
handful of secondary traits that include charisma, creativity, and flexibility (p. 49). And
while Kirkpatrick and Locke make a solid argument based on these individuals and their
peers in favor of trait theory, it must be noted that the authors offer no statistical research
to support their assertions. And while trait theory may seem something of a relic when
looking at more contemporary theories, Kirkpatrick and Locke do offer us a bridge to the
future in offering up that at least two of their core traits can be developed by the
individual, which are knowledge of the industry and its associated technologies, and self-
confidence.
More recently, Youngjohn (1999) built on Kirkpatrick and Locke’s foundation in
her doctoral dissertation by applying different meta-analysis tools to the topic. She found
that the “correlations between many… characteristics and leader effectiveness were
impressive” (Youngjohn, 1999, p. 115). However, she also qualifies these results saying
that situational factors for which metrics could not practically be constructed had a
significant influence on the results.
Path goal theory. To introduce it with a direct quote, House (1996) says:
(The) essential notion underlying the path-goal theory is that individuals in
positions of authority will be effective to the extent that they complement the
environment in which their subordinates work by providing the necessary
cognitive clarifications to ensure that subordinates expect that they can attain
work goals and that they will experience intrinsic satisfaction and receive valent
rewards as a result of work goal attainment. (p. 326)

19
A bit more simply put, path-goal theory asserts that the better a leader’s style
matches the characteristics of the subordinate and the work setting, the more effective the
leader will be.
But it really is not that simple. House (1996) goes on to develop a number of
propositions related to the effectiveness of leader behaviors, group members, and task
characterizations. Laying the foundation for his study, he says:
Clarifying path-goal relationships…will have positive motivational effects to the
extent that it reduces role ambiguity. Where a leader attempts to clarify path-goal
relationships are redundant with existing conditions…that is where it is (already
obvious)…will be seen by the subordinates as redundant…(and) will result in
decreased satisfaction. (House, 1971, pp. 324-325)
From these propositions, House (1971) creates a series of hypotheses relative to
subordinate roles and task ambiguity, the different levels of task satisfaction relative to
clear or ambiguous task demands, and so on. The eventual conclusion is that optimal
effectiveness is reached when the leader adopts either directive, supportive, participative,
or achievement-oriented behaviors relative to dimensions of the group members
autonomy and job scope or task characteristics (p. 334).
Adding to the literature on path-goal, Jermier (1996) points out that:
Path-goal theory laid the groundwork for considering situations where behaviors
of leaders were of little or no consequence. It stated that leader behavior will be
motivational for subordinates to the extent that it complements the work
environment and supplements it with what is otherwise lacking. (p. 313)

20
This provides an interesting premise to ponder—the high performing individual or
group in which leadership is not a requirement.
To use this point as a segue to a summary of the path-goal leadership theory, from
a leader’s perspective, when considering a leadership behavior to adopt, behaviors that do
not fill a void are inconsequential. Therefore, the core leadership behaviors must be
selected based on what is lacking with the subordinate and/or their work environment
(House, 1971). Otherwise the leader behavior adds no value to productivity nor increases
degrees of motivation. For instance, subordinates who display high degrees of
competence in an environment that provided its own high levels of support in an
unambiguous setting and unambiguous tasks would not benefit from supportive behavior.
This notion, while more extreme, is not entirely inconsistent with situational leadership
theory, also discussed in this section.
Leader-member exchange. To quote Grean and Uhl-Bien (1995) directly,
leader-member exchange theory “(Is) a multi-facetted construct involving aspects of the
leader, the follower, and the dyadic relationship between the two” (p. 224). It is important
to note that this theory of leadership, as obviated by a careful read of the quote above, is
not about a relationship between the leader and a group. Leader-member exchange is all
about the unique relationship between the leader and each individual member. The heart
of the leader-member exchange theory focuses on two opposite types of followers
defined as falling into either the in-group or the out-group.
One of the more interesting points, and one that is central to the support and
construction of the theory, are the findings that different subordinates often provide very
different descriptions of the same leader. For example, a leader would be described as

21
having high degrees of mutual trust, respect, and obligation by one subordinate while the
same leader would be described as not trustworthy, disrespectful, and possessing a low
sense of obligation by another subordinate (Graen & Uhl-Bien, 1995).
Leader member exchange provides a logical explanation for this inconsistency.
And that explanation is that it is the subordinates’ views of, or rather relationships with,
the leader that causes the inconsistency. In this case, the former subordinate would be
considered as part of the in-group, and the latter subordinate as part of the out-group.
Leaders reward in-group members by bestowing them personal affirmation, or “support
for self-worth,” (Francis & Fred, 2002, p. 92) and negotiating latitude in making
decisions and changing either job. Out-group members are simply rewarded with a
paycheck.
As one would expect, members of the in-groups and out-groups differ in their
performance. Out-group members are “analogous to the Transactional Leadership model
as defined by Bass (1985) in that the exchange (service) is based upon subordination to
the leader” (Graen & Uhl-Bien, 1995, p. 232). Those who are part of the out-group do
their work and go home. Those who become part of the in-group “move beyond their
own self-interests to focus more on larger mutual interests” (Graen & Uhl-Bien, 1995, p.
233). In short, “in-groups are lead… out-groups are supervised” (Keller & Dansereau,
1995, p. 128).
According to Grean and Uhl-Bien (1995), there are distinct stages through which
subordinates pass along their way to reaching the in-group. In fact, it is presented as a
natural progression over time, and coined as a “life cycle of leadership relationship
22
maturity” (Graen & Uhl-Bien, 1995, p. 230). However, there is some literature that
refutes this assertion.
Research conducted by Liden, Wayne, and Stillwell (1993) found that in-group
and out-group designations developed within two weeks of hiring and subsequently
remain relatively stable over time. Whether this is a good thing or bad thing will depend
on whether an employee is in the in-group or out-group. If we accept the premise that
employee performance deviates over time, then an extension of this finding suggests that
actual performance and improved or diminished performance over time are relatively
inconsequential to in-group and out-group status. This conclusion is noted by Keller and
Dansereau (1995) when they observed in their study that “interestingly, performance
appraisal data (provided by superiors) does not consistently correlate with subordinate
reports… Thus it appears that performance which is satisfying to superiors is somewhat
distinct from performance which is assessed annually by the organization” (pp. 138-139).
Anecdotally, we have all heard of such things as the “good old boy” network and other
real-life examples where such a conclusion seems intuitively valid. Here we once again
hear one of Northouse’s (2004) criticisms of the leader member exchange theory as
potentially unfair.
Contingency theory. Northouse (2004) notes that contingency theory could be
used to describe several approaches to leadership, but that the most widely accepted as
core to the theory are the works done by Fiedler and a few key associates. Contingency
theory asserts that leadership style becomes more or less effective depending on two key
factors. Ayman, Chemers, and Fiedler (1995) state “the model predicts that a leader’s

23
effectiveness is based on two main factors: a leader’s attributes, referred to as task or
relationship motivational orientation…and a leader’s situational control” (p. 148).
In order to determine which motivation is dominant, Ayman et al. (1995)
constructed a measurement instrument known as the “least preferred coworker” scale.
The scale does not look for patterns or trends, but only measures the degree to which the
respondent found certain character traits objectionable. High scores indicate relationship
motivation. Low scores indicate task motivation as dominant. The theory goes on to
explain that situations requiring both high and low degrees of control gives leaders who
are more task motivated an edge over those who are relationship motivated. And
conversely, leaders who are relationship motivated should outperform leaders who are
task motivated in situations where control is neither high nor low, but moderate. As for
the situations themselves, Ayman et al. provides three elements for consideration: the
Group Atmosphere/Leader-Member Relation Sociometric Method, Task Structure Scale
or Type of Job task Structure, and Position Power Scale (Ayman et al., 1995).
Transactional and transformational leadership. Transformational leadership
has become a key area of focus in the field of leadership. There are several dimensions to
transformational leadership, and what it looks like has been described in many different,
but very similar, ways. Over the past 15 years or so, the definitions and scope of
transformational leadership itself has undergone some transformation, with the theory
logically unfolding in depth and direction.
In the mid 1980s, Tichy and Devanna (1986) published The Transformational
Leader, a book that outlined transformational leadership as a drama that leveraged off

24
three themes, which included recognizing the need for revitalization, creating a new
vision, and institutionalizing change.
One of the more recent definitions put forth by Bass (1990) summarizes and
expands transformational leadership in ways that have become more familiar today. He
says:
(Transformational leadership) occurs when leaders broaden and elevate the
interests of their employees, when they generate awareness and acceptance of the
purposes and mission of the group, and when they stir their employees to look
beyond their own self-interest for the good of the group. (p. 21)
Bennis and Nanus (1997) expand the total impact transformational leadership can
have when they say “(Transformational) leadership can move followers to higher degrees
of consciousness, such as liberty, freedom, justice and self-actualization” (p. 202).
As for transformational leaders themselves, the commonly accepted set of
characteristics they possess were defined in a few different articles on the subject by Bass
and Avolio (1994, 2004) as the “4 I’s.” These include:
1. Individualized Influence or Charisma: Provides vision and sense of mission,
instills pride, gains respect, and trust. An important distinction is made by the
authors in that vision and mission shared by the leader is one that advances the
organization, and not a personal agenda.
2. Inspiration: Communicates high expectations, uses symbols to focus efforts,
expresses important purposes in simple ways. Particularly relevant to this
study is the notion that, according to Bass and Avolio (2004), this “inspiration
can occur without the need for identification of associates with the leader” (p.
25
28) enabling people with disparate backgrounds to find a common
inspirational catalyst.
3. Intellectual Stimulation: Promotes intelligence, rationality, and careful
problem solving. Associates of these leaders question the world around them,
and often the leaders themselves, objectively, challenging prevailing wisdom,
assumptions, values, and so on. Particularly relevant to this study is the notion
that “transformational leaders help others to think about old problems in new
ways.” (Bass, 1990, p. 29)
4. Individualized Consideration: Gives personal attention, treats each employee
individually, coaches, advises. (Bass, 1990; Bass & Avolio, 2004)
Transformational leadership is considered the ultimate level of effectiveness of
leadership involvement in the transactional-to-transformational leadership continuum.
This continuum has distinct levels. In order, they are laissez-faire, passive management
by exception, active management by exception, contingency reward, and finally,
transformational (Bass & Avolio, 1994, 2004).
The laissez-faire leader essentially “abdicates responsibilities (and) avoids making
decisions” (Bass, 1990, p.7). This is essentially a leadership vacuum.
Up the continuum from there, one finds transactional leadership. Transactional
leadership, which at its higher levels is often quite effective depending on the situation, is
where “the leader gets things done by making, and fulfilling, promises of recognition, pay
increases, and advancement for employees who perform well. By contrast, employees
who do not do good work are penalized” (Bass, 1990, p. 20).

26
The first, and least effective, levels of transactional leadership include those who
are characterized by either mode of managing by exception (MBE). These folks only get
involved when problems exist. The passive MBE is one who waits until something breaks
or standards are not met before they get involved. The active MBE, on the other hand,
searches for fault and gets involved upon its discovery. The next level of transactional
leadership is Contingent-Reward. At this level the leader does not just penalize, they
provide “rewards for effort, promises (of) rewards for good performance, (and
recognition) of accomplishments” (Bass, 1990, p. 22).
Adding to the body of literature on transformational leadership, Kuhnert and
Lewis (1987) explore the development of a leader through stages that mirror the
effectiveness progression of the other leadership styles mentioned in the continuum.
Kuhnert and Lewis illustrate and emphasize that there are some degrees of
transformational leadership being employed by leaders in the lower level styles. For
instance, a transactional leader may strive to develop a group atmosphere that is more
akin to transformational leadership, such as team spirit and mutual respect. However, the
leader in question may still lack the requisite elements for attaining true transformational
leadership until he or she develops the ability to transcend the individual experiences and
attain a true understanding of, and focus upon, the higher level group experience. In the
example chosen here—team spirit and mutual respect—the higher consciousness required
for transformational leadership would be mutual experiences and shared perceptions
(Kuhnert & Lewis, 1987). This point is important in that it asserts transformational
leadership as something that can be learned, which answers some criticisms of the theory
that say it is difficult to teach and is almost a trait (Northouse, 2004). Bass (1995) goes

27
further in defense of transformational leadership in his article “Transformational Theory
Redux”. In it he answers, admittedly only partially at times, several criticisms of the
theory ranging from its difficulty to measure to its teach-ability and concerns that
somehow transformational leadership is potentially unethical and manipulative (Bass,
1995).
Transactional and transformational leadership and the multifactor
leadership questionnaire (MLQ). Due to the fact that Bass and Avolio’s (2004)
Multifactor Leadership Questionnaire (MLQ) and its associated text will be used as an
important part of this study, it is explored here in particular. The MLQ documents the
development of the identification, testing, and defense of factors that comprise
transformational and transactional leadership, and whose presence indicate where on the
transformational, transactional, management by exception (MBE), laissez-faire
continuum mentioned above one would find any given leader in the transformational-
transactional continuum. The current iteration of their research now in wide use, the
MLQ, identifies six factors. They include some of the elements of the 4I’s mentioned
above, but include some important distinctions and expansions to encompass
transactional behaviors, which are important to this study as they are behaviors under
test. To quote Bass and Avolio (2004) directly on these six, they include:
Charismatic/Inspirational—Provides followers with a clear sense of purpose that
is energizing; a role model for ethical conduct which builds identification with the
leader and his/her articulated vision.

28
Intellectual Stimulation—Gets followers to question the tried and true ways of
solving problems; encourages them to question the methods they use to improve
upon them.
Individualized Consideration—Focuses on understanding the needs of each
follower and works continuously to get them to develop to their full potential.
Contingent Reward—Clarifies what is expected from followers and what they
will receive if they meet expected levels of performance.
Active Management-by-Exception—Focuses on monitoring task execution for
any problems that might arise and correcting those problems to maintain current
performance levels.
Passive Avoidant—Tends to react only after problems have become serious to
take corrective action and may avoid making any decisions at all. (p. 50)
Detailed in the MLQ are the results of several iterations of their research in
development and defense of the six factors listed above, the most recent being the MLQ
5X which includes measurements from 27,285 subjects in the United States.
Literature Review Section 2: Organizational Social Networks
Basic structures and roles of organizational social networks according to
Cross. Cross and Parker (2004) identify four positions in organizational social networks,
each playing a specific role in the network’s function. These include central connectors,
boundary spanners, information brokers, and peripheral people.
Central connectors are those individuals who have a relatively large number of
arrows pointing at them. They possess important information needed by others to do their
jobs. Cross and Parker (2004) note that when explaining the network diagram, the quality

29
and influence of these connections is not revealed in the diagram. As Cross and Parker
describe them, these individuals can be “heroes” (p. 71) or “bottlenecks” (p. 73) or
something in-between.
As heroes, central connectors enable the success of others and the organization;
they come in the form of politicians who use their resources as a means to power.
However, they can also be the well-intentioned but overworked to the point where they
become bottlenecks preventing others from achieving optimal efficiency. Cross and
Parker (2004) note that oftentimes these individuals’ contributions, or detractions, to the
health of the organization can be invisible to management.
Boundary spanners have connections to two or more central connectors, and are
those individuals in the network who Cross and Parker (2004) say link to “two groups of
people that are defined by functional affiliation, physical location, or hierarchical level”
(p. 74). These individuals can be critical to organizational social network effectiveness as
they enable the cross-pollination of capabilities and sensibilities between the different
groups. Often boundary spanners are strategically placed by management as an attempt to
achieve such cross-pollination (Cross & Parker, 2004).
Information brokers are those individuals who two or more groups access for
information. These individuals also represent an indirect connection between these
groups that would otherwise be disconnected. They are different from boundary spanners
in that they don’t just establish a connection, but provide an important and significant
amount of expertise that can be shared with the different groups with whom they connect
(Cross & Parker, 2004).

30
Peripheral people are those who have only one connection to the network (Cross
& Parker, 2004). Cross and Parker (2004) note that such isolation can result from several
factors ranging from natural and intentional isolation that benefits specialists and
researchers, to those that desire closer integration into the network but remain at arm’s
length due to interpersonal or cultural issues. In these cases, Cross and Parker note that
such peripheral people might represent an underutilized resource.
Organizational social networks within the larger organization. As explored in
Chapter 1, the notion that organizational social networks as defined here are the things
that enable an organization not just to function in an increasingly complex environment
in a postbureaucratic way, but to also maintain viability and sustainability is an aphorism
amongst those who write about it (Cross & Parker, 2004; Cross & Prusak, 2002; Jamali et
al., 2006; Kira & Forslin, 2008). However, in terms of leadership behaviors displayed by
leaders of these networks, there is scant attention paid. Therefore, the literature review of
organizational social networks that follows does not focus on leadership dimensions of
these networks, but rather on aspects of organizational social networks that are relevant to
their emergence and other elements that contribute to dimensions of organizational social
network where leadership is enabled or required for network success in whatever
endeavor undertaken.
The realm of organizational social networks and their functions requires that
leadership be viewed through a somewhat different lens (Pearce & Manz, 2005). This is
of course due to the fact that leaders in organizational social networks emerge
organically, and in the context of the organization as it is referred to here, they become

31
leaders of people who report to others who are in supervisory and leadership positions as
well.
One may look at the modern advent of the organizational social network as a
phenomenon enabling, or perhaps is a result of, the natural evolution of business
organizations. Outlining the evolving nature of the dominant forms of organization and
leadership, Pearce and Manz (2005) provide a short map that starts in early European
farming, travels through the industrial revolution in the USA, creates a milestone through
establishing bureaucracy as the dominant organizational form, finally arriving at a
destination requiring a new approach for the survival and prosperity of its inhabitants—
the postbureaucratic organization. As has been established, Pearce and Manz join an
increasingly widening chorus of voices that say this is a better form that allows better
innovation. Therefore, if the organization does not enable organizational social networks,
it ceases to evolve into an organism that can compete with a form that has better adapted
to a new environment, one in which keeping up with rapid change, competition, and
technologies enables ever more effective networking.
However, the role of organizational social networks in the general discipline of
organizational science has a somewhat shorter history, albeit a rich one that continues to
grow rapidly. Borrowing themes from other disciplines, organizational scientists have
made great contributions toward making sense of organizational social networks as they
operate within organizations. In exploring dimensions of organizational social networks
in organizations, Dal Fiore (2007) makes an important distinction between, and adds a
dimension to the definition of, concepts of community and networks.

32
Dal Fiore (2007) asserts that traditional notions of how innovation arises and
becomes part of an organization’s culture is more likely to come from enabling
organizational social networks rather than from the traditional notion of innovation as an
intentional and designed undertaking that is then developed and adopted mandated from
above. Emphasizing this notion as pivotal to organization innovation, Dal Fiore goes on
to explain how organizational social networks promote “tension towards differentiation
[and] evolution” (2007, p. 860) while communities promote “tension towards
homogenization [and] conservation” (2007, p. 860). He then poses, almost rhetorically,
the question of which construct—network or community—should be designed, or
perhaps enabled, when embarking on creating such constructs (Dal Fiore, 2007).
Important to my study is the notion that organizational social networks are indeed distinct
from community. As connoted in the term, and as Dal Fiore points out, community has
implications of very different sorts of interpersonal relationships than exist in
organizational social networks. Organizational social networks in the context of this
study defy most of the dimensions that typically define communities, such as geographic
proximity, common faith traditions, similar political orientations, and so on. And, more
importantly, is the implication that an attempt to create communities—to add dimensions
typical of a community to a organizational social network—might actually corrupt or
inhibit the performance of innovation that Dal Fiore says prevails when they are instead
absent.
Arguing that change indeed comes too quickly to rely upon management as the
purveyors of what is new, Teare (1997) espouses that “individuals need to learn and
develop at least as quickly as the pace of external change” (p. 315). Reading into his

33
work a bit, this would suggest that formalizing the required learning into training
sessions, or waiting for learning-leaders to legitimize the new reality to enable an
embrace of it by staff simply keeps the organization a few steps behind external change
and, quite possibly, their competitors. Indeed, Teare sees the traditionally embraced
organizational learning process as something that is in reverse of what really happens.
The “organizations learn from individuals or groups or teams as they share insights and
experiences and, in so doing, capture new knowledge and understanding” (Teare, 1997,
p. 315). Therefore, the key things to enable learning in the organization are constructs
that facilitate learning at these levels. Teare concentrates on three themes that he believes
will provide this. These include a solid organizational vision, leadership and motivation,
and organizational change as a performance imperative.
To elaborate on each, Teare (1997) shares the opinion that vision is the primary
facilitating agent of organizational learning; and that a vision statement, and presumably
actions consistent with it, that emphasize themes of organizational flexibility and
adaptation married to individual empowerment and legitimacy, will lay the foundation of
a learning organization. Outside of leadership and motivation providing the tangible
lashing points for vision to take hold and materialize into actions, Teare (1997)
specifically sees the challenge to leadership in the facilitation of knowledge propagation
between individuals and departments to create “learning communities within the
organization” (p. 318).
One might argue that organizational change is the penultimate artifact of
intelligent and deliberate employment of organizational learning. Teare (1997) explores
organizational change in a similar manner saying that change, driven by experiential

34
learning and made possible through advanced coping strategies enable the organization
continued and perpetual learning. Teare goes on to explore the implications of these
elements; however, they will not be labored here. And as for the ultimate, following the
penultimate, artifact of effective organizational learning? That would be an increase in
organizational performance due to the changes that followed that learning.
Traditional network structure function and efficacy. Continuing to look at
work that has been done around performance and effectiveness of organizational social
networks within organizations, Guetzkow and Simon (1955) researched the effectiveness
of certain network forms in terms of simple problem solving.
They set up experiments testing the familiar all-channel, circle, and wheel
networks. Interestingly, they found that all-channel networks have “almost too many
[communication] opportunities” (Guetzkow & Simon, 1955, p. 239) and did not perform
as well as other network forms. Also of interest was the finding that information
exchange in all-channel networks was less consistent than in more restrictive networks.
The general implication is that since there are no formal restrictions resulting in a form of
interdependence for information exchange between members, there is less
communication actually happening within the network as a whole (Guetzkow & Simon,
1955). Important for those interested in organizational social network efficacy is their
finding that certain communication restrictions improved performance, and that
communication can actually be inhibited by all-channel networks, a seemly
counterintuitive notion. As obviated in the network diagrams detailed in Cross and
Parker’s (2004) research, as organizational social networks emerge, they usually take on

35
very complicated network forms that include all-channel, circle, wheel, and other forms
all within the same macro-network.
Looking at leadership in organizational social networks within organizations.
Approaching the idea of analyzing leadership that arises in organizational social
networks, Gronn (2002) argues that traditional approaches to the study of leadership have
primarily used a lens that focuses directly on formally recognized leaders. While Gronn
does not specifically confront organizational social networks, his work has important
implications toward them. While acknowledging the importance of traditional approaches
to leadership, Gronn advocates that “students and practitioners of leadership would be
better served by a more expanded unit of analysis... [one that] encompasses patterns or
varieties of distributed leadership” (p. 424). Distributed leadership, as Gronn defines the
term, is the phenomenon of a few different leadership role types emerging as the
organization embraces, or at least allows the emergence of, many of the same elements
that are typically used to describe postbureaucratic structures. Gronn explains these as
instances where one finds the fluid division of labor as something negotiated and agreed
upon between organization members—these divisions being based upon individuals’
unique spheres of knowledge, access to tools, and range of competencies relative to those
of others. Gronn acknowledges that division of labor dynamics is also influenced by
social considerations of shared “values and interests, the preferred arrangement or
configuration of tasks (e.g., their scheduling, physical alignment, available technology)”
(p. 428).
As for the types of distributed leadership that emerges within these
postbureaucratic forms, Gronn (2002) says they are numerous and are ascribed to the

36
leadership forms voluntarily from associates rather than prescribed by management. As
for these leadership forms, they come in a few different sizes and shapes ranging from
“one individual [to] an aggregate of separate individuals [to] sets of small numbers of
individuals acting in concert or larger plural-member organizational units” (Gronn, 2002,
p. 428). He also points out that the ascription of leadership is available to all
organizational members and not to just those in management positions. Indeed, Gronn
makes it a point to draw a clear distinction between management and leadership, the
former founded on authority and the latter founded in influence. Gronn (2002) goes on to
explain that the primary function of leadership is evidenced by “collaborative modes of
engagement which arise spontaneously… intuitive understanding that develops as part of
close working relations among colleagues… [and] structural relations and…
agreements…” (p. 429).
Regardless of the sizes and shapes of leadership, or the motivations individuals
have for voluntarily participating in said organizational social networks, involvement in
these networks usually takes individuals out of their official sphere of responsibility,
expanding and blurring their roles to provide the proper connections between interrelated
tasks required for dealing with the challenge at hand.
Organizational social network performance, knowledge overlap, and
knowledge variety. As is intuitively obvious and consistent with Gronn’s (2002)
reasoning, is the notion that as organizational social networks form, there will be varying
degrees of instances where network members share some of the same knowledge. Also
seemingly intuitive is the notion that degrees of shared knowledge, referred to by Wong
(2007) as knowledge overlap, would work to the advantage of the network’s function.

37
However, of particular interest here is the fact that Wong’s (2007) study, which
involved rather intensive field research, found that such overlaps do not work to make the
group more effective. What Wong did find that made some of the groups more effective
was knowledge variety—the breadth of different knowledge held between members of
the group. The implication here is that groups drawing upon broader ranges of knowledge
variety will be more effective than those with less variety. When framed by the findings
of Guetzkow and Simon (1955), which once again suggests that all-channel networks can
be less effective than other forms, this indeed poses an interesting dilemma in terms of
how to best leverage the power of knowledge variety.
Organizational social networks, open innovation communities, and
communities of practice. Somewhere between communities of practice and
organizational social networks as they are narrowly defined here lays another emergent
network form called open innovation communities.
Like organizational social networks, open innovation communities are not
formally constructed. They are constructed of people who voluntarily opt in to make a
contribution and are free to leave. Open innovation communities have been made a
household term due to the Internet and the success of open source and open innovation
software development efforts.
Fleming and Waguespack (2007) look at how leadership arises inside these
communities. Their study specifically looks at dimensions of brokerage and boundary
spanning, and how these dimensions play in the emergence of individuals as leaders in
open innovation communities. Fleming and Waguespack (2007) define brokerage as the
practice to “…connect otherwise disconnected actors” (p. 165), and boundary spanning

38
as the practice to “…identify, translate, and relay information within and across… firms”
(2007, p. 165). As Fleming and Waguespack outlined and tested four hypotheses, their
findings can be generalized for our purposes here. They find that the members of these
communities who engage primarily in brokerage are less likely to emerge as leaders than
those who engage in boundary spanning. Indeed, they find that boundary spanners can be
up to 658% more likely to ascend to leadership positions than those that are not (Fleming
& Waguespack, 2007). They also find that physical presence plays a role in ascension to
leadership as well. Simply put, those who show up are more likely to become leaders
(Fleming & Waguespack, 2007).
While not tested, Fleming and Waguespack (2007) theorize that boundary
spanners are more trusted by those in the community since their value-add to the
community includes contributions to its knowledge base. They also theorize that brokers
are often perceived as “calculating and politically savvy operators” (Fleming &
Waguespack, 2007, p. 166).
Differing from the approach taken in this study, Fleming and Waguespack (2007)
define leaders as those who actually end up in formal leadership roles in the organization.
But the relevance to this study remains since these actors emerge as leaders in their
communities informally. And indeed, since these communities remain as informal
networks, ascension to a formal leadership role does not catalyze the open innovation
community into a formal structure. Hence the informal leadership function within the
community remains informal while the role of a formal leader is taken in another
dimension within the organization. While they do address behaviors that lead to an
39
ascension to leadership, Fleming and Waguespack do not approach leadership theories,
methods, or styles of these leaders before or after taking on the formal role.
The notion that stronger organizational social networks are better performers than
weaker organizational social networks is an aphorism often stated, but not often tested
empirically. Balkundi and Harrison (2006) formally studied 37 teams, and proved the
aphorism as true. In their research, they identify a significant relationship between team
structure and the teams’ efficacy. Specifically, Balkundi and Harrison tell us “…teams
with denser…networks tend to perform better and remain more viable” (p. 63).
The same year, Balkundi teamed up with Kilduff in another study concentrating
on organizational social networks and leadership (Balkundi & Kilduff, 2006). In their
study, they identify four elements that they say are central to making sense of existing
organizational social networks. These elements are embedded-ness, social utility of
network connections, structural patterns of social life, and the relationships themselves.
They then theorize how leaders’ own perceptions shape some of the leaders’ own
networks. These include “…the direct ties surrounding leaders, the pattern of direct and
indirect ties within which leaders are embedded…and the inter-organizational linkages
formed by leaders as representatives of organizations” (Balkundi & Kilduff, 2006, p.
941).
To explain briefly, Balkundi and Kilduff (2006) use the term embedded-ness to
describe the degree to which members of the organizational social network prefer to
interact with other members of the network as opposed to those outside the network.
They make it a point early on to stipulate that leaders within the network need to be part
of the other members’ embedded set of players. Social utility, as the name implies, is

40
used to describe degrees and dimensions of how becoming part of the network benefits
the individual, hence making membership attractive and sustainable. Balkundi and
Kilduff also stress that leadership emergence involves “building and using social capital”
(p. 421); social capital being the perceived ability of leaders, now elevated in stature, to
use their role as a leader to benefit those that bestow upon them said role.
Structural patterns of social life refer to the interconnectivity of members within
and across networks. These patterns are mapped in organizational social network
diagrams as illustrated by Cross and Parker (2004).
Finally, and most importantly according to the authors, are the relationships
between the immediate network members. Summarizing their findings regarding
networks and leadership, Balkundi and Kilduff (2006) state, “Our network approach
locates leadership not in the attributes of individuals but in the relationships connecting
individuals” (p. 420).
Looking back at the leaders’ perceptions, they outline the direct ties and the
indirect ties surrounding the leader as “ego networks” (Balkundi & Kilduff, 2006, p.
422), which are comprised of relationship density, range, and cohesion; and postulate that
the leaders’ own acuity to their networks and their roles as leaders is directly related to
the leaders’ own potency. They say the dimension of inter-organizational linkages are
comprised of boundary spanning, alliances, and centrality, and hypothesize that dynamics
of all of these drive leader effectiveness (Balkundi & Kilduff, 2006).
As Balkundi and Kilduff (2006) explore these aforementioned dimensions in
detail, and hypothesize on their effects on organizational social networks and their
leaders, a few elements come forth that are notably important for this study. This includes

41
the notion that someone who is perceived as influential and perhaps a leader in one
network might not be perceived the same way by those in other networks despite the
intersection of the two. Also, they note that some networks’ members erroneously
perceive members of other networks as powerless when in fact they are closely tied to
those in power in their core network (Balkundi & Kilduff, 2006). Also, while not used by
name, they explore dimensions of social intelligence as illustrated by Goleman (2006),
and hypothesize that heightened degrees of social intelligence are important in being an
effective leader within an organizational social network (Balkundi & Kilduff, 2006).
Also of note, Balkundi and Kilduff (2006) point out in their conclusion that the
role of Leader-Member Exchange (LMX) leadership theory is something that can
enhance the study of leadership within organizational social networks. However they do
not explore LMX in any detail relative to the dimensions they explore.
Prior to Balkundi and Kilduff (2006), and Hoffman (2004), Sparrowe and Liden
(2005) also found that organizational social networks with central leaders in denser
networks performed better than those that were less dense. One of the interesting things
in Sparrowe and Liden’s (2005) work is that they focused on degrees of LMX
behaviors—the strength of the interpersonal relationships between leaders and
subordinates—as key variables in their research, but they did not specifically look at any
other leadership theories or styles for analysis. Also in their research, they looked at the
degrees of trust that other members of organizational social networks have with leaders
and with the leaders’ subordinates. The findings indicate that mutual trust combined with
presence enhances team performance (Sparrowe & Liden, 2005). But in situations in
which other members of organizational social networks distrust the formal leader, or

42
when the leader is distant rather than central, then the opposite phenomenon prevails—
the team is less effective and subordinates are less satisfied in their roles (Sparrowe &
Liden, 2005).
Leadership within communities of practice. Pemberton, Mavin, and Stalker
(2007) address the dynamics of leadership within communities of practice, noting that
leadership is essential for a community of practice to function. They also note that
oftentimes communities of practice emerge organically from a group of individuals
whose interconnectedness “…lie outside of the formal organization…and are not a result
of management awareness, or for that matter the awareness of other employees who are
not part of this community” (Pemberton et al., 2007, p. 67). Even so, the authors do note
that leadership within communities of practice, even those that emerge organically,
require leadership in order to function (Pemberton et al., 2007), a finding particularly
relevant to this study. However, they dedicate most of their study to looking at how
communities of practice, and in particular their leadership, encounter problems. Degrees
of power within the communities and individual agendas that might not run parallel to
those of others or to the communities in general were noted as dominant forces that could
lead to the community either not functioning well, or even dissolving altogether
(Pemberton et al., 2007). All the more tragic, the authors lament, is the fact that many
members join communities of practice in order to share and expand their expertise in
environments that appear to be bastions of freedom where “tensions toward
homogenization [and] conservation” (Dal Fiore, 2007, p. 861) do not operate And here
perhaps we find an important distinction in the literature. Recall that Dal Fiore (2007) is
very intentional with his use of the term community. However, Pemberton et al. (2007)

43
see communities of practice as organically emerging forms with the potential to turn into
the stifling environment it strives to reach above through what we would agree is poor
leadership. Pemberton et al. never approach leadership behaviors within communities of
practice, except to point out how they dysfunction, and to note that research specifically
in this area is lacking.
Beyond organizational social networks and communities of practice within
formal bureaucracies. There are, of course, other ways organizations can respond to
forces that seem to favor the postbureaucratic form. One of these options, the “cleaned-up
bureaucracy” is explored by Jones and Kriflik (2006, p. 154).
The cleaned-up bureaucracy reads somewhat like generic descriptors of
organizations that have been “streamlined,” “optimized,” or “right-sized.” The authors
make the important distinction that the streamlined bureaucracy is in no way something
less bureaucratic than its pre-morphological self (Jones & Kriflik, 2006). It is just as
bureaucratic, but with “…hierarchical controls, centrally imposed rules, and individual
managerial responsibility and accountability [still in place]” (Hales, 2002, p. 64 as cited
in Jones & Kriflik, 2006).
Of particular note here are the findings in Jones and Kriflik’s (2006) research that
reveal that subordinates in such organizations feel less empowered, less able to expand
their contributions to the organization, and less in touch with their leaders. The authors’
main point is that managers in cleaned-up organizations are not allowed the bandwidth to
establish relationships, regardless of their form, with their subordinates. This, of course,
renders most dimensions of leadership ineffective. The authors go on to solve the

44
problem with such remedies as making managers aware of the pitfalls of the cleaned-up
organization and ameliorating it by taking the time to establish some form of relationship.
Of particular interest are the authors’ specific identification of situational
leadership (Blanchard, 1991) and path-goal leadership as being particularly befitting the
cleaned-up organization due to their emphasis on the leaders’ objective evaluation of both
the environment and the follower in deciding on a course of action (Jones & Kriflik,
2006). However, these, nor other leadership styles that might be effective in the cleaned-
up bureaucracy, are explored in any depth. Indeed, these leadership styles are mentioned
in the antepenultimate paragraph of the article’s conclusion.
Organizational social networks, order from chaos. Central to the primary
themes found in organizational social networks that are of relevance to this study—the
natural, organic emergence of teams and leaders within them—one finds a heavy
intersection with themes also found complexity theory. Complexity theory, among other
things, studies the organic emergence of outwardly simple outcomes that are generated
from a complex set of inputs (MacGill, 2007).
Taking complexity theory and merging it with organizational science, Brodbeck
(2002) espouses that in many cases organizational procedures that emerge organically
will outperform those that were dictated by management. Before going further, it should
be noted that Brodbeck does focus his study on procedures as opposed to people.
However, his work does explore individual behaviors, motivations, and ad hoc, informal
social relationships that are relevant to organizational social networks (Brodbeck, 2002).
Also, while not a primary area of focus, his work also touches on themes of job-
expansion and redefinition as it occurs in organizational social networks. Finally, the idea

45
that self-organization can be fostered through particular, intentional actions by
management to foster self-organization is of interest here (Brodbeck, 2002).
Also merging complexity theory with organizational science, Smith and Graetz
(2006) embrace the idea that organizational social networks, more specifically framed as
“emergent, self-organized behavior in organizations” (p. 851) are better equipped for
unsolicited creativity and innovation, and can be fostered through constructing opposing
forces within the greater organization. Specifically, Smith and Graetz outline several
opposing elements that management can put into place within the organization to create
opposing dualities that, theoretically, will catalyze self-organization.
Smith and Graetz (2006) propose that the creation of such a dualistic environment
will be more effective than more clear-cut, managerial efforts to foster organizational
social networks since the introduction of management into the equation corrupts organic
formation before it can even start. Overt efforts by management, by default, negate the
possibility of true self-emergence, and hence the result is something less optimal than that
which would emerge organically. Smith and Graetz say that the a successful construct of
the proposed dualism will result in an organization that operates on the “edge of chaos”
(p. 851).
Organizational social networks as a behavioral phenomenon. The forces that
drive the development and sustainability of various networks so far have focused on more
overt elements such as solving problems, creating innovation, and checking chaos in
favor of establishing order. However, some consideration needs to be made to the
subconscious forces that pull networks together. Therefore, some attention will be paid to

46
the realms of sociology and social psychology. Only a cursory exploration will be offered
here.
Gherardi and Nicolini (2001) summarize the sociological tradition that underlies
all group formation when they espouse that individuals come to understand
subconsciously that their well-being is best served by behaving in a fashion that ensures
their acceptance by the group. These individuals also come to understand that their well-
being is also tied inextricably to the overall health and strength of the group; therefore,
the organization remains cohesive as long as the members of the organization continue to
benefit from their mutual associations (Gherardi & Nicolini, 2001). Through these and
other forces, cultural norms and systems for reward and punishment arise—or rather are
learned—by the group through its desire for self-perpetuation (Gherardi & Nicolini,
2001). Simply put, organizational social networks emerge when people think they will
benefit from their involvement in them, and will behave in these networks according to
an adopted set of norms (Gherardi & Nicolini, 2001).
Conclusion to literature review. Of the many things that paint a picture of
transformational leadership, the image of leaders inspiring others to transcend the self
and move beyond selfish interests is an important part of the landscape. At first blush
such a notion applied to organizational social networks might seem to be inconsistent
with the behavioral science traditions as illustrated by Gherardi and Nicolini (2001).
Organizational social networks as defined here exist outside of formal boundaries, and
are likely not even visible to management (Cross & Parker, 2004). Therefore,
participation in organizational social networks is likely to not be rewarded.

47
But if indeed several of the authors explored in this section and in Chapter 1 are
correct, an unwillingness to participate in these organizational social networks puts not
just the organizational social network at a disadvantage, but puts the entire organization
at risk as it bends under the weight of bureaucracy and contorts with the tension of
complexity. Therefore, the emergence of organizational social networks and their
functions indeed is consistent with Gherardi and Nicolini (2001), as individuals,
organizational social networks, and the organization all benefit from the mutual
association. However, these associations might not guarantee optimal effectiveness.
Another important element might be a proper form of leadership, including the leadership
of organizational social networks.

48
Chapter 3: Methodology
Restatement of the Problem
The primary focus of leadership studies has been placed on the leaders that are
formally established and formally recognized as either managers, supervisors, leads, or
other roles that grant authority over the supervision of others by the bureaucracy within
the organization (Gronn, 2002). That is to say that the study of leadership has primarily
focused on the behaviors of leaders as they go about performing a role in which their
leadership role has been formally established. But the notion that leadership only exists in
cases where it is formally prescribed has been replaced by a broader understanding and
acceptance of what leadership is. Today, we embrace the notion that “leadership is
available to everyone” (Northouse, 2004, p. 3), and we accept as the norm that
“leadership can be found from any chair” (Zander & Zander, 2002, p. 7).
Concurrently, there is an ever-growing body of literature that embraces the notion
that traditional bureaucratic structures and functions are diminishing in effectiveness as
the nature of business becomes ever more complex and time-sensitive, requiring degrees
of agility that bureaucracy cannot provide (Avolio & Bass, 2004; Balkundi & Kilduff,
2006; Bass & Avolio, 1994; Conger, 1999; Cross & Parker, 2004; Jamali et al., 2006;
Levi Martin, 1998; Tichy & Devanna, 1986). Stepping in to fill these voids are—among
other things—organizational social networks: groups of people that work together and act
as resources for one another informally in order to solve problems or change the way
things are accomplished in an organization (Cross & Parker, 2004).
Despite their emerging importance to the success of organizations, very little
attention has been paid to the leadership dynamics of organizational social networks. The

49
nature of these networks, where individuals are called to rise above their standard roles
and their missions, to transform what and how organizations produce—appear to provide
a fertile environment where transformational leadership behaviors will be found and will
flourish.
Restatement of Purpose of Study
The purpose of this exploratory study is to reveal to what degrees
transformational, transactional, and laissez-faire leadership behaviors are observed to be
in use by leaders of organizational social networks as observed by a select sample of
organizational social network members, and to compare those measurements to those of
formally established leaders.
These findings might have important implications regarding organizational
development. If transformational leadership behaviors are found to be employed
significantly more frequently in organizational social networks, and if the canon of
literature espousing the importance of organizations to embrace postbureaucratic
practices is accurate, then it behooves organizations to nurture not only organizational
social networks, but to develop transformational leadership behaviors of individuals
(Avolio & Bass, 2004; Cross & Parker, 2004; Jamali et al., 2006; Kira & Forslin, 2008).
Restatement of the Research Questions
Again as implied in the purpose of this study, two research questions are
addressed here: (a) What types of transformational, transactional, and laissez-faire
leadership behaviors does a select sample of organizational social network members
perceive to be in use by leaders of the organizational social networks in which the
subjects participated? (b) How does the sample of organizational social network leaders
50
compare to formally established leaders as measured by Bass and Avolio’s (2004) MLQ
study?
Hypotheses to Test
To state these two questions as a pair of hypotheses:
H(0) 1: As perceived by a selected sample of organizational social network
members, those identified as leaders of their networks employ transformational,
transactional, and laissez-faire leadership behaviors.
H(0) 2: As perceived by a selected sample of organizational social network
members, there are no significant differences between the degrees of the different
transformational, transactional, and laissez-faire leadership behaviors in use by those
identified as leaders of their networks and those found in the general population of
leaders as represented by Avolio and Bass’ (2004) MLQ research.
Testing the results. In order to test for a difference between the means of the
leaders of organizational social networks and those found in the general population of
leaders, a t test was employed. The t test calculations were run using GraphPad
Software’s online QuickCalcs tool. Given the non-volatile, exploratory nature of this
study, the alpha level was set at .05. Since this study considered the possibilities of
organizational social network leaders’ measurement means as diverging from the general
population of leaders in both negative and positive directions, the t test was run two-
tailed. And given the sample of organizational social network leaders represent a separate
group than do the formal leaders from Avolio and Bass’ (2004) MLQ study, the t test was
calculated as unpaired. As noted, this is an exploratory study given limitations outlined
above. To avoid confusion, definitive statements about significance will not be employed

51
when discussing statistical test results except in those cases where statements are clearly
limited to describing the sample used in this study and where there can be no reasonable
chance they might be interpreted as descriptions of the general population of
organizational social network leaders.
Research variables. The variables studied are the leadership behaviors explored
by Avolio and Bass (2004) in their MLQ study. Also included in the discussion are three
dimensions of employees’ feelings regarding their leaders and their teams which are also
included in the MLQ study and associated questionnaire. These are listed below:
1. Degree of transformational leadership style of Idealized Influence (Attributed)
2. Degree of transformational leadership style: Idealized Influence (Behavior)
3. Degree of transformational leadership style: Inspirational Motivation
4. Degree of transformational leadership style: Intellectual Stimulation
5. Degree of transformational leadership style: Individualize Consideration
6. Degree of transactional leadership style: Contingent Reward
7. Degree of transactional leadership style: Management by Exception (Active)
8. Degree of transactional leadership style: Management by Exception (Passive)
9. Degree of non-leadership style: Laissez-Faire Leadership
The research instruments. To gather the outlined data, the research was broken
into two parts using two different questionnaires. The first questionnaire—primarily a
qualification tool—was one created for this study. The second questionnaire was Avolio
and Bass’ Multifactor Leadership Questionnaire Rater Form, Short-Form version 5X
(2004), simply referred to from here on in as the MLQ.

52
The first questionnaire (Appendix A) began with a narrative statement to lead the
subject to consider organizational social networks, and to then identify one in which he or
she has participated, if possible. This question acts as a qualifying question for inclusion
into the study. Subjects who could not think of an organizational social network were
asked to indicate so, and were then omitted from the second part of the study.
The first questionnaire also created a short profile for each subject, established a
name for the organizational social network if they identified one, and identified an
individual who the research subject felt played an important leadership role within that
network. Also used for qualification purposes was a question that asked the research
subject to identify whether he or she considered himself or herself to be the most
important leader of the network. This question was subsequently changed to be an
instruction as will be detailed shortly.
Also captured were the names and email addresses of the subjects, which were
used for sending those who were deemed to have passed the qualifying questions
mentioned above a link for participating in part two of this study. Also asked were a few
other questions that might be relevant for future research, but were not explored in this
study.
The name of the organizational social network and the first name or initials of the
leader that the subject provided were used in the email invitations for part two of this
study in order to aid the subject in recalling the organizational social network situation
and leader they identified in part one. Subjects were also asked to estimate the number of
people that comprised the network.

53
Questions related to possible future study. Another question asked if the
subjects in the organizational social network were solving a problem, confronting a
challenge, implementing a change to the way things were typically done, or if it was a
combination of both. This question, along with questions regarding the type of industry
and size of the organizational social network were asked for use in possible future
studies, but were not explored here. The second questionnaire (Appendix B) is Avolio
and Bass’ (2004) MLQ rater form.
Why two parts to the research instrument? The research is broken down into
two pieces to ensure a reasonable sample size, to minimize classroom disruption, and to
control the number of actual subjects completing the MLQ questionnaire online. As will
be detailed shortly, the first part of this research study took place in classrooms before or
during scheduled instruction. Also, copyright considerations limit the number of
completed MLQ questionnaires to be 100. By executing the MLQ online, access to the
MLQ by subjects was simply turned off once the minimum number of respondents
completed the questionnaire, and well before the 100 respondent limit was reached.
Another advantage to putting the MLQ questionnaire online was the fact that
results were downloaded in an electronic format so that no manual coding by the
researcher was required. Aside from the obvious convenience of this practice, it also
eliminated the possibility of data entry errors occurring.
Collecting data from part two of the research—the MLQ ratings. The online
MLQ survey was conducted using Survey Monkey, which provided electronic downloads
of collected data as noted previously. Due to copyright restrictions, the actual questions
associated with the MLQ have been omitted.

54
As Mindgarden charges for the use of the MLQ, a package for the right to 100
uses of the MLQ was purchased. This is the minimum quantity that can be purchased.
The final step before developing descriptions regarding the degrees of employment of
transformational, transactional, and laissez-faire leadership behaviors and applying a t
test to compare the sample of organizational social network leaders to the general
population of leaders was to simply derive sample size, means, and standard deviations of
the MLQ question-ratings for each of the organizational social network leaders given by
the sample of organizational social network members.
Making comparisons. The second hypothesis, calling for a comparison of the
sample of organizational social network leaders to the general population of leaders was
tested using a t test to compare the means of the two different populations.
Since the MLQ database already details the mean, standard deviation, and sample
size, the t test was simply executed using the online statistics calculation and reporting
tool from GraphPad in which the user need only enter mean, standard deviation, and
sample size once the appropriate t test is selected. Since the nature of this study is
nonvolatile and exploratory in nature, an alpha level of 0.05 was established.
Research subjects. The subjects for this research were fully-employed students
in Pepperdine University’s Graziadio School of Business Management’s fully employed
BSM (Bachelor of Science in Management), MBA, EMBA (Executive MBA) programs,
and Pepperdine University’s School of Education and Psychology’s doctoral program in
organizational leadership. These students were chosen to simplify the research, gather
data from divergent organizations and industries, gather data from a wide range of
professional backgrounds, and to ensure a reasonable sample size albeit too small to be
55
representative of the general population of organizational social network leaders as
explain under the limitations section in Chapter 1.
Such diversity is important to this study as it is the leadership behavior within
organizational social networks in general, and not leadership behavior within
organizational social networks of any particular industry or business function that is
being explored here.
Reaching and recruiting a desired range of research participants. In order to
reach these subjects, once the research instruments passed institutional review, I asked
permission from the deans of Pepperdine’s Graziadio School of Business and
Pepperdine’s Graduate School of Education and Psychology programs for permission to
conduct my study in the classrooms of those professors who agreed to allow me to do so
(Appendix C). Once permission was secured, I consulted relevant course schedules and
identified individual professors teaching courses in these programs. The venues for this
research included all Pepperdine campuses which hosted programs for fully employed
students. These included campuses in Irvine, West Los Angeles, Encino, Westlake
Village, and Pasadena.
Once the course instructors were identified, I emailed them and asked them for
assistance in conducting my research (Appendix D). Specifically, I asked for permission
to enter their classrooms, to invite their students to participate in part one of the research,
and to immediately commence researching with those students who volunteered to
participate. When asking for permission from the professors, I was sure to explain that
this part of the research would take less than 10 minutes of time in totality.

56
I also asked these instructors to provide me a specific day and time that was
convenient for them to facilitate this part of my research. Once an instructor provided me
a specific date and time, I confirmed my visit via email and also thanked the instructor
for his or her assistance. If a course instructor was willing to assist but did not provide a
specific day and time, I would respond via email thanking him or her for the assistance
and then suggest a day and time based on their course schedule and any commitments I
might have already made. Given my employment status at the time, I could accommodate
any schedule provided there was not a conflict between two or more instructors’
classroom visits. In order to manage this process, I used a calendar to keep track of
commitments. If a course instructor identified a day and time that conflicted with a
commitment I already made, I would have replied via email stating that there was a
conflict. I provided the course instructor details, based on the calendar I was keeping, as
to when I would be available to visit his or her class; and then asked if any of the days
and times I identified might be acceptable. I was sure to mention that I was available
anytime, including after or during scheduled breaks. If a mutually agreed upon day and
time could not be established, then that instructor’s class would be excluded from my
research.
If a course instructor did not reply to my email request for a class visit, I waited
one week and then sent a second request. If that request was also ignored, I omitted that
instructor’s class from my research. This, of course, was done to avoid creating an
annoyance to that instructor. This process of contacting instructors and scheduling class
visits was continued until I had scheduled a classroom visit or had abandoned the attempt
to visit the class as outlined above.

57
Classroom visits were then commence as scheduled, and part one of the research
was conducted as detailed. This was continued until all scheduled visits were executed
and until a minimum of 30 or a maximum of 100 subjects completed part two of the
research online.
The maximum number of completed surveys was capped at 100 due to copyright
restrictions associated with the MLQ. If the 100th survey would have been completed, the
survey would have been taken down from Survey Monkey and replaced with a message
thanking the participant for their assistance, but stating that the research had already been
completed. Also, any remaining scheduled classroom visits would have been cancelled
by contacting the course instructors via email, thanking them for their offer of assistance,
but informing them that the research was already completed.
As detailed in Chapter 1, the population size of organizational social network
leaders is not established; therefore, the sample size used in this study for employing t
test is one of convenience rather one driven by population size. Given that when using a z
distribution to test hypothesis, “if the size of the sample is at least thirty, the results are
deemed satisfactory” (Mason & Lind, 1990, p. 418), for the research to be complete, a
minimum threshold of 30 completed part two surveys was established. If all classroom
visits during the course of one trimester would not have rendered at least 30 completed
part two surveys, the research would have been continued into the next trimester.
Research execution. The first questionnaire was to be administered and collected
in classrooms, preferably prior to the beginning of the day or evening’s instruction, in
person, by me. The medium for the questionnaires was printed hard copies (Appendix A).

58
Once in the classroom, and before instruction was started, I introduced myself as
a graduate student completing his dissertation on the topic of leadership and informal
networks found at work and other organizations. I then asked the class members if they
would please participate as subjects in my research. I explained that the first part of the
research included a short questionnaire that would take between 5 and 7 minutes to
complete in class while I was there, and that I would collect the responses once they were
finished. I also explained there would be a second part to the research to be conducted
online, and that I would send the participants a link to the online questionnaire via email.
I then explained that the second questionnaire would take approximately 20 minutes; and
that they would be able to complete it at their leisure within a week from when I sent the
link.
I then asked for a show of hands of those who agreed to participate, and then
handed out the first questionnaire to them. Once all questionnaires were given to the
volunteering participants, I read aloud the IRB disclaimer and a short introduction to the
concept and function of organizational social network. The same text appeared on their
questionnaires, and I asked them to read along with me. Once the reading was finished, I
asked them to proceed with filling out the questionnaire.
As the subjects finished the questionnaires, I collected the completed forms.
When the final questionnaire was finished, I thanked them for their participation; and let
them know once again that I would email them a link to the second questionnaire
(Appendix E).
Part one of the research was then coded into an Access database the day
immediately following the collection of the completed part one surveys for use in a mail

59
merge document that became the body of the email inviting the participants to take part
in part two of the study.
The second questionnaire. The second questionnaire, the MLQ, was completed
online by those who agreed to participate in the research and of course followed through
with completing the MLQ.
Mindgarden, the publisher of the MLQ, provides an option for administering the
MLQ online via the researcher’s own collection method. Embracing this option, it was
employed through the use of Survey Monkey.
Emails (Appendix E) notifying the subjects of how to log in and complete the
MLQ Rater Form were sent to the subjects within 48 hours of their completion of part
one of the research. Subjects were asked to complete the online MLQ rater form within
one week. As noted, to help ensure consistency with the first questionnaire and to aid the
subjects in their recollection of the organizational social network experience under study,
the name of the organizational social network and the name of the organizational social
network leader identified in part one of the research were included in the email invitation
and linked to the Survey Monkey-hosted MLQ.
Opportunities for future studies. While this study limited its scope to an
exploration of transformational leadership, transactional leadership, and laissez-faire
leadership behaviors of organizational social network leaders, additional data was
captured for possible future studies. Information regarding industry type, the size of
organizational social network in terms of membership numbers, and the type of work in
which the organizational social network was engaged was captured. There was, of course,
the possibility that relationships between these variables and the rated behaviors from the

60
MLQ exist. Patterns that emerged in the data analysis suggesting such will be considered
for further analysis and continued research that might be conducted to refine the findings,
and make them particularly relevant to more specific scenarios.
Also of potential relevance but not subject to consideration here are the patterns
of the organizational social networks in play. Organizational social networks typically
have mutated patterns of connectivity networks where common network configurations
such as star and circle networks intertwine, but also have the added dimensions of
information flow and even knowledge or skill specializations of network members (Cross
& Parker, 2004). Further study might include layering in network pattern dynamics in
order to see if any particular patterns relate to dimensions of transformational leadership.
Conclusion to Research Methodology
As outlined in Chapter 1 and detailed in Chapter 2, the notion of postbureaucratic
organizations operating in ever increasingly complex environments benefiting from
informal and organizational social networks has been thoroughly advocated and even
tested. But specific dimensions of leadership behaviors found in organizational social
networks have only been given a cursory treatment. Most studies in this area look at how
leaders formally emerge, not how informal leaders actually act.
This study will add to the existing body of leadership literature by exploring
transformational, transactional, and laissez-faire leadership found in organizational social
networks. Given the increasing reliance that organizations have on organizational social
networks, and given that transformational leadership behaviors can be identified or taught
and/or nurtured, the implications of this study may prove to be important to formal
leaders seeking to optimize the performance of their organizations. Highly effective

61
organizational social network with effective leaders can allow organizations to operate at
“the edge of chaos” (Smith & Graetz, 2006, p. 851) without falling into its abyss.

62
Chapter 4: Research Results
Introduction
This study sought to explore and, to some degree, measure what so many of the
authors explored in the earlier chapters of this paper left to assumption. And it was upon
these assumptions that yet another one was formed by this researcher in the course of
creating this study, but one not overtly stated in either the research questions or the
hypotheses. This assumption was that after applying the MLQ test to the sample of
leaders of organizational social networks, one of two scenarios would be found. The first
scenario was that the sample organizational social network leaders used in this study
would be no different than their formal leader counterparts; the second being that indeed
the mythos of the aforementioned authors would be reinforced, and the sample of
organizational social network leaders used in this study would indeed appear, and
perhaps even test, to be more transformational and less transactional than formal ones.
However, the results of this exploration sometimes seem to run contrary to every
assumption detailed in the paragraph above—regardless of author. Here forward is a
discussion of what was actually found.
Restatement of research questions and hypotheses. The purpose of this
exploratory study is to reveal to what degrees transformational, transactional, and laissez-
faire leadership behaviors are observed to be in use by leaders of organizational social
networks as observed by a select sample of organizational social network members, and
to compare those measurements to those of formally established leaders.
As implied in the purpose of this study, two research questions are addressed
here:

63
1. What types of transformational, transactional, and laissez-faire leadership
behaviors do a select sample of organizational social network members
perceive to be in use by leaders of the organizational social networks in which
the subjects participated?
2. How does the sample of organizational social network leaders compare to
formally established leaders as measured by Bass and Avolio’s MLQ study?
To consider these questions as a pair of hypotheses:
H(0) 1: As perceived by a selected sample of organizational social network
members, those identified as leaders of their networks employ transformational,
transactional, and laissez-faire leadership behaviors.
H(0) 2: As perceived by a selected sample of organizational social network
members, there are no significant differences between the degrees of the different
transformational, transactional, and laissez-faire leadership behaviors in use by those
identified as leaders of their networks and those found in the general population of
leaders as represented by Avolio and Bass’ (2004) MLQ research.
As noted throughout, there is no attempt to establish a statistical significance
difference between the general population of organizational social network leaders and
the general population of leaders given unknown population parameters of organizational
social networks; therefore, this exploratory study seeks to establish areas where
differences are found for future research. As also noted, this is the first study of its kind,
so a broad approach was in order.
The MLQ addresses several behaviors in the transformational leadership—
transactional leadership—laissez-faire leadership spectrum, and also includes the

64
followers’ feelings of satisfaction, extra effort, and perceived efficiency of the group to
which they belong.
Changes to Research Instrument
Upon beginning execution of the research, it was found that 25 of the first 31
subjects to complete part one identified themselves as the leaders of the organizational
social network they identified. Since the research was specifically designed to measure
the perceptions of those who were members, but not leaders, of social organizational
networks, the vast majority of the subjects were ineligible to be part of the research in
part two. The problem was compounded by the fact that similar results likely would have
been found in future class visits with other potential subjects.
To remedy this problem, a minor change was made to the research instrument,
which was then submitted for IRB review and approval. The net effect of the change was
to eliminate the original question that asked if the subject was a leader of the
organizational social network identified. Instead, the questionnaire was changed to
instruct the subject to think of an organizational social network in which they
participated, but in which they were not the leader. The revised instrument is shown in
Appendix F. Given the limited scope of the change, IRB approval was secured and the
revised instrument put into use.
The adoption of this change seemed to not adversely affect the success of getting
subjects to agree to participate and to complete part one of the research. A total of 55
subjects who completed part-one were evaluated as eligible for continuation to part two.
A total of 31 of these 55 subjects completed part two of the research, enough to satisfy
the minimum number established in Chapter 3.

65
Research Test Results
Selecting the most appropriate t test. Upon calculating the descriptive statistics
needed to run t tests to compare the sample of organizational social network leaders to
the general population of leaders as represented by Avolio and Bass’ (2004) MLQ
research, it was noted that the standard deviations of the ratings of the sample of
organizational social network leaders were substantially greater than those associated
with the general population of leaders, sometimes exceeding them two-fold. Given this
disparity in variances, it was decided that the use of a Welch t test for unequal variances
be employed rather than a student t test as “student's t-test is unreliable when variances
differ…” (Ruxton, 2006, p. 688).
As mentioned in Chapter 3, since this study considered the possibilities of the
sample of organizational social network leaders’ measurement means as diverging from
the general population of leaders in both negative and positive directions, the test was run
two-tailed. And given that the sample of organizational social network leaders represent a
separate group than do the formal leaders from Avolio and Bass’ (2004) MLQ study, they
were calculated as unpaired.
Understanding the results tables. In order to comply with copyright restrictions
placed on the use of the MLQ instrument, neither the actual text of the questions used in
the research nor the descriptive statistics associated with the MLQ results are reproduced
here. Instead, each of the following tables shows the descriptive statistics for the sample
of organizational social network leaders that were needed to run the Welch t test. Also
shown are the two-tailed p-values derived from the comparisons of the sample of
organizational social network leaders and the general population of leaders from the

66
MLQ. Again, the descriptive statistics from the general population of leaders is not
reproduced in the tables due to copyright restrictions. There are tables included on the
following pages for each of the MLQ leadership behavior categories. The specific
leadership style in question is identified in the table name and also in the table itself. At
the bottom of each table, the mean standard deviation of subjects’ scores per question
within that MLQ category is shown. These standard deviation measurements are not
related to the Welch t test, but are instead included for discussion purposes later.
Numerical scores indicate the following frequency ratings:
0: Not at all
1: Once in a while
2: Sometimes
3: Fairly often
4: Frequently, if not always
MLQ Research Results of Test Subjects
Idealized influence (attributed). Four of the MLQ questions measured the
frequency of the employment of the transformational leadership behavior of Idealized
Influence (Attributed). The results of these four questions are summarized in Table 1.
Table 1
Research and Welch t Test Comparison Results, Idealized Influence (Attributed)
MLQ Category: Idealized Influence (Attributed) Welch t Test
n Range Mean SD Mode Two-tailed
P value
31 0 to 4 2.6 1.27 3 0.1466 (continued)

67
MLQ Category: Idealized Influence (Attributed) Welch t Test
Number of MLQ questions associated with this category: 4
Mean standard deviation per question, per subject: 0.7
As observed by organizational social network members, organizational social
network leaders in this sample employ the transformational behavior of Idealized
Influence (Attributed), more often than sometimes, but less than fairly often given their
mean score of 2.6. The most common score for this behavior for this sample was a 3, or
fairly often. As noted in the table, the standard deviation of scores was 1.27. While not
reproduced here, this standard deviation is substantially higher than that of the population
of formal leaders established in Avolio and Bass’ (2004) MLQ study. Again, this
disparity in variance is the reason the Welch t test was chosen over the more commonly
used student t test.
As for the results of the Welch t test, the difference between this sample of
organizational social network leaders and their formal leader peers is not significant at
the .05 level (p = 0.1466).
Idealized influence—Behaviors. Four of the MLQ questions measured Idealized
Influence (Behavior). The results of these four questions are summarized in Table 2.
Table 2
Research and Welch t Test Comparison Results, Idealized Influence (Behavior)
MLQ Category: Idealized Influence (Behavior) Welch t Test
n Range Mean SD Mode Two-tailed P Value
31 0 to 4 2.26 1.42 4 0.0547 (continued)

68
MLQ Category: Idealized Influence (Behavior) Welch t Test
Number of MLQ questions associated with this category: 4
Mean standard deviation per question, per subject: 0.89
For the transformational leadership behavior of Idealized Influence (Behavior),
the sample of organizational social network leaders used in this study had a mean score
of 2.26, as a group scoring just over sometimes. Of interest in these scores is the mode of
4, which is associated with frequently, if not always. Given these scores, a standard
deviation of 1.42 is not surprising. It seems that organizational social network leaders are
observed to employ Idealized Influence, Behavior less often on average than Idealized
Influence, Attributed, but inconsistently so given the higher standard deviation and the
seemingly contradictory mode score of 4.
Regarding differences of Idealized Influence behaviors between this sample of
leaders of organizational social network leaders and formal leaders, they are just short of
being significant at the 0.05 level (p =.0547).
Inspirational motivation. Four of the MLQ questions measured Inspirational
Motivation. The results of these four questions are summarized in Table 3.
Table 3
Research and Welch t Test Comparison Results, Inspirational Motivation
MLQ Category: Inspirational Motivation Welch t Test
n Range Mean SD Mode Two-tailed P Value
31 0 to 4 2.65 1.21 3 0.2238 (continued)

69
MLQ Category: Inspirational Motivation Welch t Test
Number of MLQ questions associated with this category: 4
Mean standard deviation per question, per subject: 0.71
For the transformational behavior category of Inspirational Motivation, the
sample of organizational social network leaders used in this study had a mean score of
2.65, which puts them between sometimes and fairly often. These scores vary less widely
than Idealized Influence (Behavior) with a mode of 3 and a standard deviation of 1.21.
As for the results of the Welch t test, the difference between this sample of
organizational social network leaders and their formal leader peers is not significant at
the .05 level (p = 0.2238).
Intellectual stimulation. Four of the MLQ questions measured Intellectual
Stimulation. The results of these four questions are summarized in Table 4.
Table 4
Research and Welch t Test Comparison Results, Intellectual Stimulation
MLQ Category: Intellectual Stimulation Welch t Test
n Range Mean SD Mode Two-tailed P Value
31 0 to 4 2.33 1.24 3 0.0524 Number of MLQ questions associated with this category: 4
Mean standard deviation per question, per subject: 0.76
For the transformational leadership behavior category of Intellectual Stimulation,
the sample of organizational social network leaders used in this study had a mean score
of 2.33, again putting them between sometimes and fairly often. Of the five scores, they
were observed to use Intellectual Stimulation fairly often—a score of 3—most often.

70
With a standard deviation of 1.24, organizational social network leaders scored more
consistently in this behavior than the previous ones, but only slightly.
As for the results of the Welch t test, the difference between this sample of
organizational social network leaders and their formal leader peers falls just short of
significance at the .05 level (p = 0.0524).
Individual consideration. Four of the MLQ questions measured Individual
Consideration. The results of these four questions are summarized below in Table 5.
Table 5
Research and Welch t Test Comparison Results, Individual Consideration
MLQ Category: Individual Consideration Welch t Test
n Range Mean SD Mode Two-tailed P Value
31 0 to 4 2.31 1.42 4 0.0427 Number of MLQ questions associated with this category: 4
Mean standard deviation per question, per subject: 1.04
For the transformational leadership behavior category of Individual
Consideration, this sample of organizational social network leaders had a mean score of
2.31. Again, it is interesting to note the mode score of 4, showing that the most common
score for these leaders was frequently, if not always. And again it is no surprise to see
another high standard deviation score relative to the other categories explored thus far of
1.42.
As for the results of the Welch t test, the difference between this sample of
organizational social network leaders and their formal leader peers is significant at the .05

71
level (p = 0.0427). However, the mean score of the organizational social network leaders
in this sample was lower than that of the formal leaders.
Contingent reward. Four of the MLQ questions measured the transactional
Contingent Reward behaviors. The results of these four questions are summarized in
Table 6.
Table 6
Research and Welch t Test Comparison Results, Contingent Reward
MLQ Category: Contingent Reward Welch t Test
n Range Mean SD Mode Two-tailed P Value
31 0 to 4 2.36 1.28 3 0.1877 Number of MLQ questions associated with this category: 4
Mean standard deviation per question, per subject: 0.82
For the transactional leadership behavior of Contingent Reward, the sample of
organizational social network leaders used in this study had a mean score of 2.36, again
putting them between sometimes and fairly often. Also recurring is the mode score of 3,
showing they were observed to employ Contingent Reward behaviors fairly often most
often.
As for the results of the Welch t test, the difference between this sample of
organizational social network leaders and their formal leader peers is not significant at
the .05 level (p = 0.1877).
Management-by-exception (active). Four of the MLQ questions measured the
transactional Management-by-Exception (Active) behaviors. The results of these four
questions are summarized in Table 7.

72
Table 7
Research and Welch t Test Comparison Results, Management-by-Exception (Active).
MLQ Category: Management-by-Exception (Active) Welch t Test
n Range Mean SD Mode Two-tailed P Value
31 0 to 4 1.85 1.26 2 0.4328 Number of MLQ questions associated with this category: 4
Mean standard deviation per question, per subject: 0.98
For the transactional leadership behavior of Management-by-exception (active),
the sample of organizational social network leaders used in this study had a mean score
of 1.85, putting them well above the score once in a while and close to the next level of
sometimes. With a mode score of 2, these leaders were most often using this behavior
sometimes, but somewhat inconsistently with a standard deviation of 1.26. As for the
Welch t test, the difference between this sample of organizational social network leaders
and their formal leader peers is not significant at the .05 level (p = 0.4328).
Management-by-exception (passive). Four of the MLQ questions measured the
transactional Management-by-Exception (Passive) behavior. The results of these four
questions are summarized in Table 8.
Table 8
Research and Welch t Test Comparison Results, Management-by-Exception (Passive)
MLQ Category: Management-by-Exception (Passive) Welch t Test
n Range Mean SD Mode Two-tailed P Value
31 0 to 4 1.28 1.31 0 0.2966 (continued)

73
MLQ Category: Management-by-Exception (Passive) Welch t Test
Number of MLQ questions associated with this category: 4
Mean standard deviation per question, per subject: 0.69
For the transactional leadership behavior of Management-by-Exception (Passive),
the sample of organizational social network leaders used in this study had a mean score
of 1.28. Therefore, on average they were observed to employ this behavior only slightly
more often than once in a while. Most commonly, these leaders were observed employing
Management-by-Exception (Passive) not at all. However, as the mean and mode suggest,
again observed is a seemingly high standard deviation, this time being 1.31. These
leaders again covered the full range of possible scores from 0 to 4.
As for the results of the Welch t test, the difference between this sample of
organizational social network leaders and their formal leader peers is not significant at
the .05 level (p = 0.2966).
Laissez-faire leadership. Four of the MLQ questions measured what is
essentially an abdication of leadership, the laissez-faire leadership behavior. The results
of these four questions are summarized in Table 9.
Table 9
Research and Welch t Test Comparison Results, Laissez-Faire Leadership Behavior
MLQ Category: Laissez-Faire Leadership Welch t Test
n Range Mean SD Mode Two-tailed P Value
31 0 to 4 1.06 1.19 0 0.0647 Number of MLQ questions associated with this category: 4
Mean standard deviation per question, per subject: 0.59

74
For the abdication of leadership category laissez-faire leadership, the sample of
organizational social network leaders used in this study averaged a score of 1.6, falling
between once in a while and sometimes. Again, the most common score was not at all.
With a refreshingly low standard deviation of 1.19, these leaders scored most consistently
in this behavior than any of the other. It still should be noted that this standard deviation
is higher than that of the general population of leaders.
As for the results of the Welch t test, the difference between this sample of
organizational social network leaders and their formal leader peers is not significant at
the .05 level (p = 0.0647).
Extra effort. Three of the MLQ questions measured Extra Effort. The results of
these three questions are summarized in Table 10.
Table 10
Research and Welch t Test Comparison Results, Extra Effort
MLQ Category: Extra Effort Welch t Test
n Range Mean SD Mode Two-tailed P Value
31 0 to 4 2.47 1.36 4 0.2779 Number of MLQ questions associated with this category: 3
Mean standard deviation per question, per subject: 1.28
As for the results of the Welch t test, the difference between this sample of
organizational social network leaders and their formal leader peers is not significant at
the .05 level (p = 0.2779).
Effectiveness. Four of the MLQ questions were dedicated to Effectiveness. The
results of these four questions are summarized in Table 11.

75
Table 11
Research and Welch t Test Comparison Results, Effectiveness
MLQ Category: Effectiveness Welch t Test
n Range Mean SD Mode Two-tailed P Value
31 0 to 4 2.6 1.32 3 0.0567 Number of MLQ questions associated with this category: 4
Mean standard deviation per question, per subject: 0.63
As for the results of the Welch t test, the difference between this sample of
organizational social network leaders and their formal leader peers falls just short of
significant at the .05 level (p = 0.0567).
Satisfaction. Two of the MLQ questions measured the degree of subject
satisfaction. The results are summarized in Table 12.
Table 12
Research and Welch t Test Comparison Results, Satisfaction
MLQ Category: Satisfaction Welch t Test
n Range Mean SD Mode Two-tailed P Value
31 0 to 4 2.69 1.46 4 0.1474 Number of MLQ questions associated with this category: 2
Mean standard deviation per question, per subject: 0.52
As for the results of the Welch t test, the difference between this sample of
organizational social network leaders and their formal leader peers is significant at the .05
level (p = 0.1474). However, the mean score of the organizational social network leaders
in this sample was lower than that of the formal leaders.

76
Summary of Research Findings
Regarding observations of transformational leadership behaviors in this sample of
organizational social network leaders, it is found that these behaviors are indeed
employed to varying degrees, and are employed in ways that can only be interpreted as
inconsistent given a casual comparison to the general population of leaders. However, as
will be explored in more depth in Chapter 5, one notices that the mean standard deviation
per question, per subject is fairly low. Expanding the observation to consider
transactional and laissez-faire behaviors, it is interesting to note that on average the
sample of leaders of organizational social networks in this study were rated as employing
transformational behaviors more often than transactional and laissez-faire behaviors as
shown in Table 13 and Table 14.
Table 13
Mean Transformational Scores of Organizational Social Network Leader Sample
Mean Transformational Behavior Scores
Idealized Influence
(Attributed)
Idealized Influence
(Behavior)
Inspirational Motivation
Intellectual Stimulation
Individual Consideration
2.6 2.26 2.65 2.33 2.31 Average overall transformational score: 2.43

77
Table 14
Mean Transformational Scores and Overall Laissez-Faire Score of Organizational Social Network Leader Sample
Mean Transactional Behaviors Mean Laissez-Faire Score
Contingent Reward
Management-by-Exception (Active)
Management-by-Exception (Passive)
Laissez-Faire
2.36 1.85 1.28 1.06 Average overall transactional score: 1.83
After running a t test for significance using an alpha level of 0.05, it was found
that in all but two cases there is not a significant difference between the sample of leaders
of organizational social networks used in this study and formal leaders from the general
population. And in those two cases where a significant difference was found, it was the
sample of organizational social network leaders who were less transformational in their
behavior than the general population of leaders as represented in Avolio and Bass’ (2004)
MLQ research.
Given the direction of this study, and given the contents of the literature found on
this topic and explored throughout this paper, this finding proved somewhat surprising.
While it was not hypothesized on which direction the difference between these groups
would be, it was expected to find either no difference between them, or to find the sample
of leaders of organizational social networks as acting more transformational than the
general population of leaders. The former finding would be consistent with much of what
is found generalized in the literature review. The implications of this rather surprising
find will be discussed in the following chapter.

78
Chapter 5: Discussion and Conclusion
As recalled from prior chapters, one of the foundations of this study rests on a
body of literature that asserts that rapid rates of change confronting organizations render
traditional bureaucracies less efficient than groups of individuals that form organically to
address said changes. Forming within the organization, but operating outside of its
traditional bureaucratic structure, these networks of people are believed to react faster
and implement change quicker than otherwise possible (Avolio & Bass, 2004; Balkundi
& Kilduff, 2006; Bass & Avolio, 1994; Conger, 1999; Cross & Parker, 2004; Jamali et
al., 2006; Levi Martin, 1998; Tichy & Devanna, 1986).
Generally speaking, these groups, and the environments that allow their
emergence, are generally considered as somewhat postbureaucratic in nature. These
groups can take different forms. But for this study, I have focused on those groups that
are comprised strictly of volunteers who have no formal ties to the group, who would
suffer no direct detriments due to leaving the group, and who are not directly rewarded
for participating in these groups. Borrowing from Cross and Parker (2004), I have used
the term organizational social network to describe these teams.
As also recalled from prior chapters, there is a large canon of literature that
supports the idea that organizations and groups who operate in a postbureaucratic fashion
benefit from leadership styles that are transformational as opposed to transactional.
Avolio and Bass (2004) summarize much of this sentiment when they say
“Transactional leadership styles will clearly fall short of the leadership challenges
confronting most organizations…[as a result of] compressed hierarchies and blurred lines
of authority” (p. 1).

79
Given these considerations, this research project set out to explore what
transformational leadership behaviors organizational social network leaders employed,
and how they measure up against formal leaders. Transactional and laissez-faire
leadership behaviors and other sentiments included in the MLQ were also explored.
Each of these MLQ dimensions is discussed in the following section.
The discussion here, as well as for the other MLQ categories in this section of this
study are not drawing a distinction between the sample of organizational social network
leaders and the general population of leaders. Moreover, these discussions contribute to
the part of the research in which I am curious about the observations of organizational
social network leaders rather than measuring them against formal leaders.
Discussion of Results
Discussion of results for idealized influence (attributed).
These leaders are admired, respected, and trusted. Followers identify with
and want to emulate their leaders. Among the things the leader does to
earn credit with followers is to consider followers’ needs over his or her
needs. The leader shares risks with followers and is consistent in conduct
with underlying ethics, principals, and values. (Avolio & Bass, 2004, p.
96)
As detailed in the results in Table 1, we find that the sample of leaders of
organizational social networks display degrees of this behavior somewhere between
sometimes and fairly often having a mean score of 2.6, with a standard deviation between
subjects of 1.27. Grounding this to Avolio and Bass’s (2004) MLQ population of leaders,
we observe that the mean score of the leaders of organizational social networks lower

80
than that of the general population of leaders. Additionally, the standard deviation found
between leaders of organizational social networks of 1.27 is substantially higher than
what we find from the general population of leaders. Scores for the leaders of
organizational social networks are quite a bit more erratic than what is found in the
general population of leaders.
But these observations might simply be meaningless. Recall that in applying the
Welch t test on the numbers, we found that there is not a significant difference between
the sample leaders of organizational social networks and the general population of
leaders.
If this one behavior and its associated test result was the only one under
consideration, then discussing the results would seem somewhat meaningless given there
is little confidence that the difference here was not due to chance. However, the results
here, and elsewhere, when looked at in context of all the other MLQ dimensions, we find
an interesting pattern worthy of exploration, which is aligned with the mission of the first
research question posed.
Discussion of results for idealized influence (behavior). Not surprisingly,
following the results of the Idealized Influence (Attributed), the research finds that
Idealized Influence (Behavior) practices of organizational social network leaders are
lower than those found in the general population of leaders.
Regarding some of the descriptive statistics, the difference in MLQ scores
between the sample of organizational social network leaders and those from the general
population is greater than that found in Idealized Influence (Attributed). The standard
deviation between test subject scores of 1.42 is also higher that that found in Idealized

81
Influence (Attributed), and is about twice as high as that found in the general population
of formal leaders. For the general population of leaders taken from Avolio and Bass’
(2004) research, Idealized Influence (Behavior) is also lower than Idealized Influence
(Attributed), but by a much narrower margin than found with the sample of
organizational social network leaders.
Interestingly, the mode for the test group is actually 4, the highest score available,
representing frequently, if not always. This ranking was found in 32 of the 132 responses,
or 26% of the time.
The findings here regarding Individualized Influence (Attributed and Behavior)
beg two obvious questions. Do organizational social networks need a shared sense of
values and beliefs in order to do their work? And if so, from where—or from whom—do
these values emerge?
Discussion of results for inspirational motivation.
These leaders behave in ways that motivate those around them by
providing meaning and challenge to their followers’ work. Individual team
spirit is aroused. Enthusiasm and optimism are displayed. The leader
encourages followers to envision attractive future states which they can
ultimately envision for themselves. (Avolio & Bass, 2004, p. 96)
The scores for this sample of organizational social network leaders improve a bit
in this category, with a mean score of 2.65. The standard deviation also comes down a bit
to 1.21. And once again, the opinions this sample of social network members have
regarding their leaders vary more greatly than opinions found of formal leaders in the
MLQ.

82
Employing the Welch t test, we find again that there is not a significant difference
between the sample of organizational social network member and the general population
of leaders; but consistent with the previous behavior, we find the general population of
leaders’ mean score for Inspirational Motivation as being higher than the sample leaders
of organizational social networks. And again the prospect that this finding is due to
chance takes precedent in this individual case, but the means of the two scores do add to
an emerging pattern that might be worth further exploration.
Wondering about the meaning of these results, it would seem that Inspirational
Motivation behaviors are some of the behaviors that are most readily available and
employable by organizational social network leaders. “Encourage[ing] followers to
envision attractive future states” (Avolio & Bass, 2004, p. 96) would seem a core impetus
for individuals to join an organizational social network; for achieving—and working
within—these visionary end-states is the one material reward that organizational social
network members have coming their way for their efforts.
Again, interesting questions comes to light as they did with the first two behaviors
discussed: Do organizational social networks need Inspirational Motivation to function?
And if so, from where or whom do they get it?
Discussion of results for intellectual stimulation.
These leaders stimulate their followers’ effort to be innovative and
creative by questioning assumptions, reframing problems, and
approaching old situations in new ways. There is no ridicule or public
criticism of individual members’ mistakes. New ideas and creative
solutions to problems are solicited from followers, who are included in the

83
process of addressing problems and finding solutions. (Avolio & Bass,
2004, p. 97)
As with Inspirational Motivation, this transformational behavior would seem to
lend itself well to the leaders of organizational social networks as it is the work of
organizational social networks to “be innovative…creative…and [to] approach old
situations in new ways” (Avolio & Bass, 2004, p. 97). Indeed, the core part of part one of
this research project intentionally borrowed from this description when it asked subjects
to “think of a time when they were solving problems, confronting challenges, or changing
the way things get done” (Avolio & Bass, 2004, p. 97).
However, when we compare results to the general population of leaders, we find
this sample of organizational social network leaders trail their formal leader counterparts.
And their opinions differ in variance. The mode of the scores of test subjects is nearly
split between selections 2 and 3. The ranking of sometimes (a 2) was chosen 32 times.
The ranking of fairly often (a 3) was chosen 33 times.
When going up against their formal leader counterpart in the Welch t test, we find
that this sample of organizational social network leaders are almost, but not quite,
significantly less intellectually stimulating than their formal leader counterparts. Recall
the p value for the Welch t test here was 0.0542 and the alpha value was set at 0.05.
Discussion of results for individual consideration.
These leaders pay attention to each individual’s need for achievement and
growth by acting as a coach or mentor. Followers are developed to
successively higher levels of potential. New learning opportunities are
created along with a supportive climate in which to grow. Individual

84
differences in terms of needs and desires are recognized. (Avolio & Bass,
2004, p. 97)
While the general population of leaders scored slightly higher in Individual
Consideration than they do for Intellectual Stimulation, the inverse is true of this sample
of organizational social network leaders. They score .02 points lower for Individual
Consideration than they do for Intellectual Stimulation, and of course score lower on
average than formal leaders And once again, opinions about social network leaders vary
more widely than they do for the general population, having nearly twice the degree of
standard deviation.
Due to the informal nature of organizational social networks, one may
hypothesize that leaders of these networks have limited abilities to develop followers into
“successively higher levels of potential” (Avolio & Bass, 2004, p. 97), and therefore
would naturally score lower than formal leaders in this particular area. However, one
would expect that the informal nature of the organizational social network would not
preclude the leader of such a social network from acting as, or being perceived as, a
mentor or coach.
Discussion of results for contingent reward.
Transactional contingent reward leadership clarifies expectations and
offers recognition when goals are achieved. The clarification of goals and
objectives and providing of recognition once goals are achieved should
result in individuals and groups achieving expected levels of performance.
(Avolio & Bass, 2004, p. 97)
As noted in the results section, Contingent Reward scores for this sample of

85
organizational social network leaders trail formal leaders in this transactional behavior,
but again opinions vary as illustrated by a standard deviation that is higher than that
found with formal leaders.
Given the Welch t test P value of 0.1877 and the alpha level of 0.05, there is, of
course, no significant difference between the sample of organizational social networks
and the population of formal leaders, but it is interesting to note that this behavior
category is the first, and only, instance in which the organizational social network leaders
outscored their formal leader counterparts. What so far have been, and will continue to be
after this, results that run counter to the intuition that organizational social network
leaders would score better in the MLQ categories than formal leaders, finally there is
found an example where leaders of organizational social networks outperform their
formal leader peers.
But perhaps this is not all that surprising. Given the informal nature of
organizational social networks, and the limited ability for their leaders to provide
materially significant forms of recognition, the organizational social networks leader
might have limited means of providing materially significant forms of recognition.
Bonuses, raises, and other formal perks that formal leaders have within their means to
provide as a bargaining chip for performance are not available to organizational social
network leaders.
Discussion of results for management-by-exception (active).
The leader specifies the standards for compliance, as well as what
constitutes ineffective performance, and may punish followers for being
out of compliance with those standards. This style of leadership implies

86
that closely monitoring for deviances, mistakes, and errors and taking
corrective action as quickly as possible when they occur. (Avolio & Bass,
2004, p. 97)
Given the results so far, it is not surprising to see that the transactional
Management-by-Exception (Active) leadership behavior is the first leadership behavior
category in which organizational social network leaders score higher than the general
population of leaders. Not that it is of any significance to this particular study, it is
interesting to note that this turns out to be the behavior category in which the scores of
organizational social network leaders come closest to that of their formal leader
counterparts. However, once again the standard deviation between scores of 1.26 is
relatively high compared to the general population.
Discussion of results for management-by-exception (passive). Consistent with
Management-by-Exception (Active), leaders of organizational social networks also score
higher than the general population of leaders in the transactional Management-by-
Exception (Passive) leadership behavior category. And once again the standard deviation
of scores for organizational social network leaders is much higher than that found in the
general population of leaders.
Similar to Management-by-Exception (Active), Management-by-Exception
(Passive) is the practice of waiting for something to go wrong before taking corrective
actions (Avolio & Bass, 2004). What one must be curious about regarding this and
Management-by-Exception (Active) is that both behaviors rely on the leader having
access to ways to coerce network members into taking action or changing their behavior,

87
which of course should not be in the tool kit of an organizational social network leader by
definition.
Again, these observations are for general discussion and exploration as the Welch
t test P value is 0.2966 well away from the alpha level of 0.05. This discussion is not
about comparison, but rather observations made by the subjects.
Discussion of laissez-faire leadership. The final behavior included in the MLQ,
which is basically off the transactional—transformational scale as it represents an
abdication of leadership, is laissez-faire leadership. And true to form so far, this sample
of organizational social network leaders outscore their formal leader counterparts. And it
is rather interesting to note that the standard deviation of scores for the organizational
social network leaders, while still higher than the general population, is lower in this
category of behaviors than in any of the other behaviors.
This finding is interesting as again by definition one would expect that an
organizational social network would simply cease to function, and therefore cease to
exist, without a functioning leader.
That is unless some other force was holding that network together and acting as
an impetus for continued contributions by network members, an intriguing prospect that
will be discussed shortly.
Discussion of results for satisfaction, efficacy, and extra effort. As noted
above, the MLQ includes measurements of subjects’ feelings of satisfaction, judgments
of group efficiency, and contributions of extra effort. These dimensions of course are not
aspects of transformational leadership, but offer interesting dimensions to both Avolio
and Bass’ (2004) MLQ findings and to this research as well.

88
Satisfaction. Leaders who are given high scores with satisfaction are those who
“…use methods of leadership that are satisfying [and] work with others in a satisfactory
way” (Avolio & Bass, 2004, p. 98).
Two of the MLQ questions measured how satisfied subjects were with their
leadership. The results of these four questions are detailed in Table 12. On average, this
sample of organizational social network team members seem to be somewhat satisfied,
given a mean score of 2.69, which puts them in between being satisfied sometimes and
fairly often, but gravitating toward fairly often. But like all the other categories, they do
not always agree on how satisfied they are given a standard deviation of 1.46.
And like some of the other categories, we see an encouraging mode score of 4—
most of the team members of this sample are satisfied frequently if not always. The range
of scores varied from this high mark of 4 down to 0, indicating some members of this
sample—actually three of the 31, or roughly 10%—were not at all satisfied.
Effectiveness. Another part of the MLQ includes measurements on how effective
leaders are in “meeting other’s job-related needs… representing the group… [and]
lead[ing] a group that is effective” (Avolio & Bass, 2004, p. 98). However, it is
interesting to note the mean score of 2.6, which leans toward the ‘fairly often’ category,
which is also the mode—a score of 3. And once again, we find a degree of standard
deviation. This sample of organizational social network leaders seem to be perceived to
be fairly effective, but inconsistently so.
Extra effort. Part of the MLQ includes measurements on how leaders get others
to “do more than they expected to… heighten others’ desire to succeed… [and] increase
others’ willingness to try harder” (Avolio & Bass, 2004, p. 98). The findings regarding
89
extra effort are indeed interesting. By definition, the work that organizational social
networks produce is built upon extra effort—effort asserted that is not part of the
organizational social network member’s regular job. However, on average, the frequency
that this sample of organizational social network members exert extra effort somewhere
between sometimes and fairly often given their average score of 2.47. So once again an
obvious question arises: If the motivation of organizational social network members to
put forth extra effort does not come from the leader of the organizational social network,
from where does it come?
Summary of Research Results
Key findings. As noted throughout, in the vast majority of cases, this sample of
organizational social network leaders is not significantly different in the MLQ categories
as the general population of leaders.
However, standing back from the individual results, it cannot helped but be
noticed that in all cases but one, this sample of organizational social network leaders
scores on average less than formal leaders. Again, individually in all but one case this
difference cannot be ascribed to anything other than chance given the P value
calculations and the alpha level of 0.05. But again, of the 13 categories, this sample of
organizational social network leaders scored lower than formal leaders 12 times. That
does not seem entirely something that should be ascribed to chance. It looks like
something is going on, and more research is needed.
Key to this study was the finding that, in general, this sample of organizational
social network leaders are no more transformational, less transactional, more inspiring,
more satisfying, more effective than the general population of leaders, a finding that

90
contradicts much of what is put forth in the literature as aphorisms, but never actually
tested.
This study, which explored these aphorisms as broadly as they are often used in
the literature casts a shadow of suspicion on their accuracy. This sample of
postbureaucratic organizational social networks was not always led by leaders that one
would consider more transformational than the general population of leaders. However,
the leaders of this sample were not dismal failures either.
Firstly, it should be noted that while leaders of organizational social networks
were observed to score lower than formal leaders, their scores would likely not be
considered poor as was noted several times previously. And when comparing the MLQ
scores of this sample of organizational social network leaders with those of the general
population of leaders, there is not a statistical difference between them in 12 of the 13
MLQ categories. Recalling that these leaders emerged organically, and were not formally
promoted into positions of leadership, the fact that they were mostly on par with their
formal leaders seems encouraging.
Also, one does notice general similarities. The scores for both this sample of
organizational social network leaders and those of formal leaders follow the same general
pattern of tending to be higher in the transformational leadership behaviors, and lower in
the transactional leadership behaviors.
Of particular note, and as mentioned repeatedly in the previous discussion
sections, haunting the results of this study are persistently high degrees of standard
deviations of the ratings between subjects rating different leaders. And as noted in some
of the previous discussions, many of the mode scores for this sample of social

91
organizational network leaders are rather strong, but they are not consistent enough to
bring the general measurements up to their formal leader counterparts.
Looking beyond the confines of comparing the two groups with the Welch t test,
and instead exploring the implications within the research related to these findings, we
see some interesting patterns.
Findings of ranked and grouped subject-leader pairs. Given that this study
asks individual subjects to rank a single leader, and given that the nature of the research
methodology makes the probability that any two subjects are scoring the same leader
essentially nil, results in the data reflecting 31 independent subject-leader pair
measurements. Such pairing of stand-alone measurements lends itself to reorganization
that can obviate some key patterns.
One of the patterns noticed is the consistency of the subjects’ ratings of their
organizational social network leaders.
If subjects’ scores for the five transformational leadership behaviors of Individual
Consideration, Idealized Influence (Attributed and Behavior), Inspirational Motivation,
and Intellectual Stimulation are averaged and then ranked into quartiles as independent
subject-leader pairs, a clear and consistent pattern emerges. Table 13 details the results of
this reorganization and ranking into quartiles. Appendices I through M detail complete
and ranked results for all subjects.
Exploring these results, one finds that the organizational social network members
in this study who found their leaders acting with high degrees of transformational
leadership in one transformational leadership behavior found them to be consistently
transformational in the other behaviors as well. In descending order of the top quartile,

92
subjects 27, 19, 28, 17, 24, 18, 20, and 30 found their leaders to be the most
transformational on average. Their high mean scores for Individual Consideration,
Idealized Influence (Attributed and Behavior), Inspirational Motivation, and Intellectual
Stimulation (3.34, 3.56, 3.50, 3.50, and 3.4 respectively) coincide with relatively low
degrees of standard deviation (0.90, 0.50, 0.95, 0.62, and 0.68 respectively).
As illustrated in Table 15, if we take the top quartile of this ranking of the five
transformational leadership behaviors and compare them to the general population
represented by the MLQ, we indeed find that the top quartile of this sample of
organizational social network leaders are observed to use transformational leadership
behaviors significantly more often than the general population of leaders in four of the
five of the identified behavior categories. These findings are detailed in Table 15.
Table 15
Comparing the Five Transformational Leadership Behaviors of the Top Quartile of Subjects to the General Population of Leaders
Welch t Test Results
n Range Mean SD Two-tailed P Value
Top Quartile, Individual Consideration
31 0 to 4 3.45 0.68 0.027 Top Quartile, Inspirational Motivation
31 0 to 4 3.5 0.62 0.0332 Top Quartile, Idealized Influence (Behavior)
31 0 to 4 3.5 0.95 0.0663 Top Quartile, Idealized Influence (Attributed)
31 0 to 4 3.56 0.5 0.0099 Top Quartile, Intellectual Stimulation
31 0 to 4 3.45 .68 0.0270
Conversely, but consistently, scores at the bottom end are also of interest. Using
the same ranking system, these same five transformational behaviors come in at 0.94,

93
1.13, 1.10, 1.56, and 1.03, respectively. However, the standard deviation for these five
(1.11, 1.18, 1.08, 1.13, and 0.91, respectively) and a range of 0 to 4 for all but one
behavior shows organizational social network members are less consistent in giving
lower scores. Transformational behavior, while rare in this quartile, can still be found on
occasion.
Regarding low scores—at least for those scores where a low score is bad—the
worst score is Satisfaction with a score of 0.78. This also coincides with the lowest
standard deviation between scores. These organizational social network members who
have leaders who score dismally on the five transformational leadership behaviors are
indeed very unsatisfied, and consistently so.
But, of course, neither random chance nor legitimate differences can be ascribed
to the differences found between the quartiles examined here, and the findings based on
the data ranking cannot be described as statistically significant. But in the spirit of
exploration and in the quest to address the observation of behaviors consistent with the
first research question posed in this study, this ranking highlights the observation that the
high degrees of variance found in this study are introduced by inconsistencies between
different leader-subject pairs, and not by this sample of organizational social network
members perceiving their individual leaders as lacking or being inconsistent in any
specific areas of transformational leadership behaviors.
Also adding to the insignificance of the findings based on this ranking
procedure—but adding quite a bit to its curiosity quotient—is the fact that, by design, no
attempt was made to categorize any of the subjects into logical segments based on

94
individual, industry, or organizational considerations. The ranking cannot be done in any
other way as no environmental or background data is associated with the subjects.
This brings us to an obvious question: What might have been found if background
and environmental dimensions were included in the research?
Organizational Social Network Members’ Motivations—Revisiting Selections From
the Literature Review
As recalled, this study focused on individuals and leaders of groups of volunteers
operating informally. Given the results of this study, an obvious question arises: Why do
individuals participate in these groups when often they provide little satisfaction and
never provide formal rewards?
As mentioned early on, there is little in the body of literature on the topic of
leadership of organizational social networks or other organically formed, voluntary
organizations that go by other names. However, we do find a few selections from the
literature review that are worthy of looking at through a somewhat different lens now as
they might cast some light as to why some organizational social network members persist
in contributing to an effort they seemingly would abandon given how they ranked their
satisfaction.
Balkundi and Kilduff’s consideration of nonleader forces on social networks.
Of particular note are the findings of Balkundi and Kilduff (2006). Their research finds
evidence that denser social networks outperform weaker networks, and that the strength
of social utility and the embedded-ness of social network leaders also contribute to the
performance of organizational social networks. Balkundi and Kilduff (2006) summarize
their research on leaders of these networks by saying, “Our network approach locates

95
leadership not in the attributes of individuals but in the relationships connecting
individuals” (p. 420).
Given the disparity of the findings of this study, and especially given the
divergent scores seen in Satisfaction and Effectiveness, perhaps looking at
transformational leadership alone, or even along with the environmental considerations as
was deliberately avoided here, is not enough to reach a conclusion that supports anything
other than a null hypothesis. Perhaps this study indirectly supports Balkundi and
Kilduff’s (2006) findings through finding that the attributes of the individual leaders are
indeed secondary to other forces enabling the organizational social network.
Reconsideration of leader-member exchange theory. Another journal article
from Chapter 2 comes to mind in light of the research findings, and that is the work of
Sparrowe and Linden (2005) who belong to a rare set of researchers who actually
addressed leadership in their study of networks, albeit briefly. Like Balkundi and Kilduff
(2006), they too found strong correlation of network density to performance, but their
research also pointed toward Leader-Member Exchange (LMX) as a leadership behavior
that factored strongly into higher performing groups. Given the results of this study,
perhaps LMX should be given consideration as a leadership method that competes, or
perhaps cohabitates, with transformational leadership given it can be extracted through
research.
Behavior science tradition of self-preservation. As explored to a minor degree
in the literature review, psychological and sociological motivations for contributing to the
positive outcomes of organizational social networks may not lay in any inspirational
behaviors of the organizational social network leaders to go above and beyond their

96
regularly assigned duties. Instead, they might stem from innate drives for self-survival.
Perhaps organizational social network members at some level believe that the
organization’s survival, and hence their own wellbeing, is ensured by their contribution to
the organizational social network’s endeavors regardless of its leadership.
Opportunities for Future Research
Consideration of environmental and situational factors. As noted repeatedly,
several patterns emerge from the research findings that have potential implications in this
study. First of all are the high degrees of standard deviations found in the MLQ test
measurements, often approaching twice the levels found with the general population of
leaders. Secondly, we find some relatively high mode scores that in several cases exceed
those of the mean found in the general population of leaders. And finally, we find that the
variance between scores made by individual test subjects in each of the behavior
categories for their individual leader was very consistent.
The variations found indicate that the high degrees of standard deviation were not
caused by individual test subjects scoring organizational social network leaders
inconsistently, but rather the variations were caused by high degrees of difference
between test subjects who individually scored their leaders very consistently. This
consistency allowed for the subject-leader pair ranking and quartile analysis outlined
earlier.
Recall that this study was intentionally very wide in terms of selecting test
subjects. Their only qualification was that they, at some point, had worked full time. No
information regarding gender, age, industry, job level, career history, length of time in
position, length of time as part of the organizational social network, et cetera were used

97
to create distinctions for hypothesis testing. There is, of course, the possibility that there
are some individual environmental, situational, demographic, et cetera factors that would
correlate with those test subjects who scored their leaders as highly transformational
versus those who found their leaders less transformational.
A course of research would be to include these and other background factors into
a similar study so as to surface any correlations, isolate them, and test the different
segments individually for degrees of transformational leadership. It is entirely possible
that the top quartiles found in the subject-leader pair rankings all had something in
common. If isolated, such a finding would indeed be important from both a research and
an organizational development perspective.
Taking a closer look at motivation. As noted earlier, leaders of organizational
social networks scored significantly lower than their formal leader counterparts in areas
of Inspirational Motivation and Satisfaction. In short, the members of many
organizational social networks found neither much motivation nor satisfaction through
their participation in the network. A few explanations as to why members continue to be
members is broached in the literature and have been previously reiterated.
In terms of future research, an obvious direction to take would be to include
dimensions of motivations found in organizational social network members, taking into
account the possibilities illustrated by the few stated examples, but also opened up to
other possibilities. The implication toward organizational social networks and
transformational leadership is that perhaps the motivations afforded by other forces, such
as a desire for self-preservation or for sustaining a relationship or something entirely
different, are primary.

98
Outcomes versus perceived efficacy. While the MLQ included questions that
rendered a measurement of perceived effectiveness, it did not include any research
regarding actual outcomes. It is possible that the actual outcomes of the groups’ efforts
were effective even if perceived to be otherwise by group members. Such a disconnection
might seem to be unlikely in most work teams, but the nature of organizational social
networks seem likely to make such a disconnect less likely. Organizational social
network members contribute to the group effort as needed, and may often contain several
members who do not see the end result of the group’s effort, and therefore are less
equipped to judge group efficacy.
It is aso interesting to note that this research project shows that in general
organizational social network members do not share a conception of the attractive future-
state associated with the Inspirational Motivation behavior category (Bass, 1990). They
contribute, or at least participate, seemingly without knowing what the outcome will be.
Given these considerations, a topic for future research would be to look at actual
outcomes of organizational social networks. These findings could then be correlated to
transformational leadership findings.
Conclusion
Much of literature uses broad brush strokes to paint a truism of statements about
postbureaucratic groups as being highly efficient and motivated, staffed by people who
exert extra effort and are deeply satisfied, and who are led by transformational figures.
The results of this research study suggest these positions may be somewhat ideological,
and that things might not be that simple, or at least not that universal.

99
As noted throughout the literature, transformational leadership is often viewed as
the leadership style that will empower organically formed networks of individuals to
provide an organization the ability to operate in a postbureaucratic fashion, adapting to
changes and challenges faster and more elegantly than would be possible under
traditional methods, thereby giving the organization a competitive advantage or the
ability to remain competitive in a rapidly changing environment (Avolio & Bass, 2004;
Balkundi & Kilduff, 2006; Bass & Avolio, 1994; Conger, 1999; Cross & Parker, 2004;
Jamali et al., 2006; Levi Martin, 1998; Senge, 1994; Tichy & Devanna, 1986; Zander &
Zander, 2002). Accepting such a premise has important implications to the organization
as it strives to enhance and leverage these abilities in pursuit of the fabled results.
However, the territory explored in this study suggests that the leadership
landscape described in much of the literature might not be all that level. The leaders upon
which this study focused behaved in vastly divergent ways when it comes to dimensions
of transformational, transactional, and laissez-faire leadership. What we know now is that
organizational social networks are sometimes, as in the case of this study, led by highly
transformational individuals who appear more transformational than their formal leader
counterparts. Most of the others leaders appear less stellar. And some could even be fairly
described as dismal. Hence formal leaders of organizations simply should not expect
transformational leaders to emerge organically along with organizational social networks.
Regarding those leaders that this study found to be more transformational in their
behavior than the general population of formal leaders, it is important to note that at this
time we do not know what environmental, situational, or other factors separate, or
separated, these two sets of leaders. But if we embrace the notion that transformational

100
leaders and the groups and individuals they inspire actually do outperform others, then
finding and developing those differentiating factors, and ensuring they are present in
those individuals who emerge as organizational social network leaders, might give that
organization a competitive advantage over those that make no similar investment. As this
exploratory study suggests, those organizations might likely have non-transformational
leaders leading their organically formed networks. And as pointed out repeatedly, they
likely do not even know it as no one seems to have asked it before.
But indeed that is the past. Hopefully this exploratory study will advance the idea
that there is a need to approach organizational social network leadership with less
confidence, or at least with fewer assumptions, than much of the literature would lead
many formal leaders to embrace.
Significance of findings. Aside from the continued research that should be done
in this area, the implications of this study should cause a moment of pause for those
organizations that embrace organizational social networks and expect them to do the
important work at which so many authors have insisted they excel: improving
organizational competitiveness in a fashion that is faster and more effective than could be
accomplished through traditional, formal, or bureaucratic methods. Until further research
can be conducted that provides definitive results, this exploratory study suggests that
leaders of these networks might be highly divergent in terms of transformational
leadership behaviors. Therefore, formal leaders of organizations who hope to leverage the
prophesized power of postbureaucratic, emergent networks should not leave the
organizational social network leaders’ effectiveness to chance. Simply because the
organizational social network emerged organically does not preclude the organization

101
from providing leadership training to those individuals who emerge as their leaders. As
noted earlier, the identification of leaders of organizational social networks proved to be
one of the easiest dimensions of this study to achieve. Leaders of organizations should
also identify these leaders, but rather than studying them, they should nurture them,
training them in transformational leadership behaviors.
This exploratory study suggests that many of the organizational social network
leaders may not need this training as we have evidence that some of these leaders are
already more transformational than the general population of leaders, and significantly
so. However, for most organizational social networks and their leaders, their true
potential is untapped, and awaits what could be a transformational metamorphosis, a
metamorphosis that will transcend the leader and raise the organizational social network
to heightened levels of effectiveness.
The transformation of the nontransformational organizational social
network leader. As stated very early on in this study, leaders of organizational social
networks are artifacts that support Zander and Zander’s (2002) assertions that one can
find leadership from any chair. And the astute organizational social network member who
finds him or herself emerging as the leader of the network will be well-served to
understand his or her effectiveness is by no means guaranteed. Indeed, given the results
of this study, one wonders if many of the organizational social network leaders would
want to continue in such a role if they were aware of the dim view so many of their
constituents have of them. Therefore, the astute organizational social network leader will
be well-served to study transformational leadership, and put effort toward practicing it.
102
Organizational social network member empowerment. Formal leaders of the
organization and the informal leaders of the organizational social network are not the
only ones who should heed the implications of this study. Members of organizational
social networks who find themselves in a group suffering from highly transactional,
unsatisfying leadership—as we have seen many do—need to understand that things can
likely be much better.
Instead of envying those who belong to networks in which members share a
vision of the future, find inspiration, and bask in levels of satisfaction superior to those
they find in their formal roles as employees, they should understand that a change in
leadership, or a least a change in the current leaders’ behaviors, can bring them to
satisfaction and performance parity. Recalling that part of being an organizational social
network member means that one can quit without repercussion, these members are in a
position few of them can enjoy with their formal leaders. And that is the freedom to
suggest without fear of retribution that the leader of the network does something to
improve their leadership skills. As volunteers contributing to the goals of organizational
social network with no formal rewards to look forward to, they deserve nothing less.
And if indeed the authors who preach the efficiency gospel of the post
bureaucratic networks are right, then organizations owe it to themselves, and to their
various stakeholders, to ensure their emergent saviors are prepared to deliver on the
promise of organizational social networks.
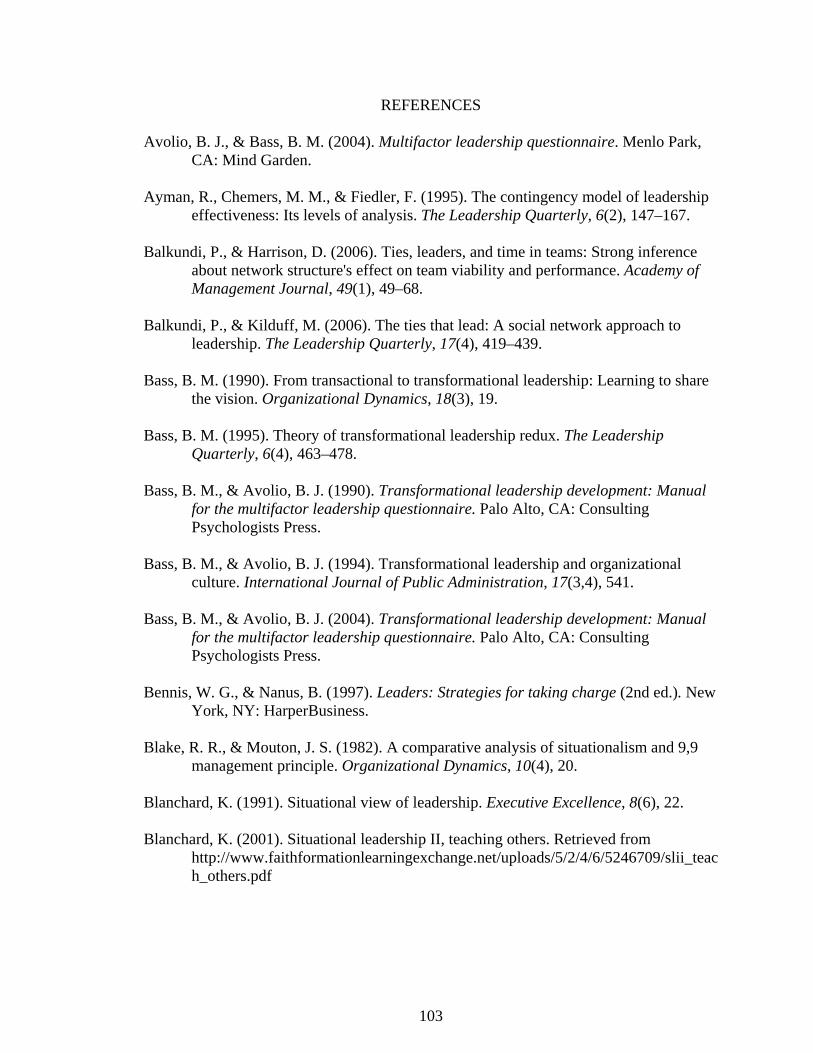
103
REFERENCES
Avolio, B. J., & Bass, B. M. (2004). Multifactor leadership questionnaire. Menlo Park, CA: Mind Garden.
Ayman, R., Chemers, M. M., & Fiedler, F. (1995). The contingency model of leadership
effectiveness: Its levels of analysis. The Leadership Quarterly, 6(2), 147–167. Balkundi, P., & Harrison, D. (2006). Ties, leaders, and time in teams: Strong inference
about network structure's effect on team viability and performance. Academy of Management Journal, 49(1), 49–68.
Balkundi, P., & Kilduff, M. (2006). The ties that lead: A social network approach to
leadership. The Leadership Quarterly, 17(4), 419–439. Bass, B. M. (1990). From transactional to transformational leadership: Learning to share
the vision. Organizational Dynamics, 18(3), 19. Bass, B. M. (1995). Theory of transformational leadership redux. The Leadership
Quarterly, 6(4), 463–478. Bass, B. M., & Avolio, B. J. (1990). Transformational leadership development: Manual
for the multifactor leadership questionnaire. Palo Alto, CA: Consulting Psychologists Press.
Bass, B. M., & Avolio, B. J. (1994). Transformational leadership and organizational
culture. International Journal of Public Administration, 17(3,4), 541. Bass, B. M., & Avolio, B. J. (2004). Transformational leadership development: Manual
for the multifactor leadership questionnaire. Palo Alto, CA: Consulting Psychologists Press.
Bennis, W. G., & Nanus, B. (1997). Leaders: Strategies for taking charge (2nd ed.). New
York, NY: HarperBusiness. Blake, R. R., & Mouton, J. S. (1982). A comparative analysis of situationalism and 9,9
management principle. Organizational Dynamics, 10(4), 20. Blanchard, K. (1991). Situational view of leadership. Executive Excellence, 8(6), 22. Blanchard, K. (2001). Situational leadership II, teaching others. Retrieved from
http://www.faithformationlearningexchange.net/uploads/5/2/4/6/5246709/slii_teach_others.pdf

104
Blanchard, K. H., Zigarmi, P., & Zigarmi, D. (1985). Leadership and the one minute manager: Increasing effectiveness through situational leadership (1st ed.). New York, NY: Morrow.
Brodbeck, P. (2002). Complexity theory and organization procedure design. Business
Process Management, 8(4), 377–402. Conger, J. A. (1999). Charismatic and transformational leadership in organizations: An
insider's perspective on these developing streams of research. The Leadership Quarterly, 10(2), 145–179.
Cross, R. L., & Parker, A. (2004). The hidden power of social networks: Understanding
how work really gets done in organizations. Boston, MA: Harvard Business School Press.
Cross, R. L., & Prusak, L. (2002). The people who make organizations go—or stop.
Harvard Business Review, 80(6), 105–112. Dal Fiore, F. (2007). Communities versus networks, the implications on innovation and
social change. American Behavioral Scientists, 50(7), 857–866. Eagly, A., & Karau, S. (1991). Gender and the emergence of leaders: A meta-analysis.
Journal of Personality and Social Psychology, 60(5), 710–736. Fleming, L., & Waguespack, D. M. (2007). Brokerage, boundary spanning, and
leadership in open innovation communities. Organization Science, 18(2), 165–180.
Francis, J. Y., & Fred, D. (2002). Individualized leadership. Journal of Leadership &
Organizational Studies, 9(1), 90. Gherardi, S., & Nicolini, D. (2001). The sociological foundations of organizational
learning. In M. Dierkes, A. B. Antal, J. Child, & I. Nonaka (Eds.), Handbook of organizational learning & knowledge (pp. 35–60). New York, NY: Oxford University Press.
Goleman, D. (2006). Social intelligence: The new science of human relationships. New
York, NY: Bantam Books. Graeff, C. L. (1997). Evolution of situational leadership theory: A critical review. The
Leadership Quarterly, 8(2), 153–170. Graen, G. B., & Uhl-Bien, M. (1995). Relationship-based approach to leadership:
Development of leader-member exchange (LMX) theory of leadership over 25 years: Applying a multi-level multi-domain perspective. The Leadership Quarterly, 6(2), 219–247.

105
GraphPad Software [Computer Software]. La Jolla, CA: GraphPad Software.
Gronn, P. (2002). Distributed leadership as a unit of analysis. The Leadership Quarterly, 13, 423–451.
Guetzkow, H., & Simon, H. A. (1955). The impact of certain communication nets upon
organization and performance in task-oriented groups. Management Science, 1(3/4), 233–250.
Hoffman, R. (2004). The role of task-related behavior in the emergence of leaders. Group
and Organization Management, 29(6), 659–685. Hollingsworth, T., Meglino, B., & Shaner, M. (1977). Predicting the effectiveness of
emergent leaders: An extension of the contingency model. Journal of Economics and Business, 30(1), 68–73.
House, R. J. (1971). A path goal theory of leadership effectiveness. Administrative
Science Quarterly, 16(3), 321. House, R. J. (1996). Path-goal theory of leadership: Lessons, legacy, and a reformulated
theory. The Leadership Quarterly, 7(3), 323–352. Jamali, D., Khoury, G., & Sahyoun, H. (2006). From bureaucratic organizations to
learning organizations: An evolutionary roadmap. Learning Organization, 13(4), 337–352.
Jermier, J. M. (1996). The path-goal theory of leadership: A subtextual analysis. The
Leadership Quarterly, 7(3), 311–316. Jones, R., & Kriflik, G. (2006). Subordinate expectations of leadership within a cleaned-
up bureaucracy. Journal of Organizational Change Management, 19(2), 154–172. Katz, R. L. (1955). Skills of an effective administrator. Harvard Business Review, 33(1),
53–65. Keller, T., & Dansereau, F. (1995). Leadership and empowerment: A social exchange
perspective. Human Relations, 48(2), 127. Kira, M., & Forslin, J. (2008). Seeking regenerative work in the post-bureaucratic
transition. Journal of Organizational Change Management, 21(1), 76–91. Kirkpatrick, S. A., & Locke, E. A. (1991). Leadership: Do traits matter? The Executive,
5(2), 48.

106
Kuhnert, K. W., & Lewis, P. (1987). Transactional and transformational leadership: A constructive/developmental analysis. Academy of Management Review, 12(4), 648–657.
Levi Martin, J. (1998). Structures of power in naturally occurring communities. Social
Networks, 20(3), 197–225. Liden, R. C., Wayne, S. J., & Stilwell, D. (1993). A longitudinal study on the early
development of leader-member exchanges. Journal of Applied Psychology, 78(4), 662–674.
MacGill, V. (2007). Complexity pages, a non-technical introduction to the new science of
chaos and complexity. Retrieved from http://complexity.orconhosting.net.nz/intro .html
Marta, S., Leritz, L. E., & Mumford, M. D. (2005). Leadership skills and the group
performance: Situational demands, behavioral requirements, and planning. The Leadership Quarterly, 16(1), 97–120.
Mason, R., & Lind, D. (1990). Statistical techniques in business and economics. Boston,
MA: Irwin. Mumford, M. D., Zaccaro, S. J., Harding, F. D., Jacobs, T. O., & Fleishman, E. A.
(2000). Leadership skills for a changing world: Solving complex social problems. Leadership Quarterly, 11(1), 11.
Northouse, P. G. (2004). Leadership: Theory and practice (3rd ed.). Thousand Oaks, CA:
Sage. Pearce, C. L., & Manz, C. C. (2005). The importance of self and shared leadership in
knowledge work. Organizational Dynamics, 34(2), 130–140. Pemberton, J., Mavin, S., & Stalker, B. (2007). Scratching beneath the surface of
communities of (mal)practice. Learning Organization, 14(1), 62–73. Ruxton, G. (2006). The unequal variance t-test is an underused alternative to Student's t-
test and the Mann-Whitney U test. Bahavioral Ecology, 17(4), 688–690. Senge, P. M. (1994). The fifth discipline (1st ed.). New York, NY: Currency Doubleday. Smith, A., & Graetz, F. (2006). Complexity theory and organizing form dualities.
Management Decision, 44(7), 851–870. Sorrentino, R. (1986). Emergent leadership over time: The functional value of positive
motivation. Journal of Personality and Social Psychology, 50(6), 1091–1099.

107
Sparrowe, R. T., & Liden, R. C. (2005). Two routes to influence: Integrating leader-member exchange and social network perspectives. Administrative Science Quarterly, 50(4), 505–535.
Teare, R. (1997). Enabling organizational learning. International Journal of
Contemporary Hospitality Management, 9(7), 304. Tichy, N. M., & Devanna, M. A. (1986). The transformational leader. Training and
Development Journal, 40(7), 27. Vecchio, R. P. (1987). Situational leadership theory: An examination of a prescriptive
theory. Journal of Applied Psychology, 72(3), 444–451. Wong, S. S. (2007). Task knowledge overlap and knowledge variety: The roles of advice
network structures and impact on group effectiveness. Journal of Organizational Behavior, 29, 591–614.
Yoo, Y., & Alavi, M. (2004). Emergent leadership in virtual teams: What do emergent
leaders do? Information and Organization, 14(1), 27–59. Youngjohn, R. M. (1999). Is leadership trait theory fact or fiction? A meta-analytic
investigation of the relationship between individual differences and leader effectiveness. Unpublished manuscript, Texas A&M University, College Station, TX.
Zander, R. S., & Zander, B. (2002). The art of possibility (Rev. ed.). New York, NY:
Penguin Books.

108
APPENDIX A
Research Instrument Part One, Prior to Revision
Informal Networking in Organizations and Leadership
Research Instrument Part 1 of 2.
1. Whether it is called postbureaucracy, organizational flattening, decentralized control, or even employee-empowerment, in today’s organizations, it is increasingly common to find situations in which the traditional organizational bureaucracy does not formally address every issue that arises or formally implement changes to the way work gets done. Instead it is increasingly common to find groups of people that network with each other informally to solve problems, confront challenges, and even implement changes to the way things get done without the formal involvement of their superiors. Some researchers call these groups ‘informal workplace networks’.
2. Now please take a few minutes to think of a situation at work in which you became, or in which you currently are, part of a group that solved a new problem, confronted a new challenge, or changed the way an existing process or procedure was done without being asked to do so by your supervisor (i.e. you were a part of an informal workplace network). Once you have identified such a situation, please give it name below. The name does not need to be anything descriptive or detailed. Giving it a name just provides an easy way to refer to the event for the second part of this study. If you cannot think of any situation as outlined above, please write “N/A” and disregard the remainder of this questionnaire.
Name of network: __________________________________________________
3. When thinking about the network you named above, what would you say best describes what the network was doing (choose one):
a. Solving a problem or confronting a challenge
b. Implementing a change in the way something gets done
c. Both #1 and #2
d. Other (please describe): ________________________________

109
4. In his book “Leadership”, Peter Northouse defines leadership as “…a process whereby an individual influences a group of individuals to achieve a common goal” (2004, p. 3).
In thinking about the network you named above, enter the first name or the
initials of the individual you felt played the most important leadership role in
that network.
First name or initials: _________
Was/is that individual you? Yes No
5. About how many people do you think were, or currently are, involved in that network?
Number of People: __________
6. What industry would you say describes the industry you are in (i.e. consumer packaged goods, electronics, defense, software, education, etc)
Type of industry: ____________________________________________
7. What is your name and email address? Note that this information will be kept strictly confidential, and will not be used for any purpose other than sending you a link via email to the second questionnaire that will be online.
Your name: _______________________________________________________
Your email address: _______________________________________________

110
APPENDIX B
Research Instrument Part Two, the MLQ
Questionnaire #2, the MLQ
Multifactor Leadership Questionnaire
MLQ Manual, Copyright 1995, 2000, 2004 by Bernard Bass and Bruce Avolio. All rights reserved.
Published by Mind Garden, Inc., www.mindgarden.com
Multifactor Leadership Questionnaire
Rater Form
This questionnaire is used to describe the leadership style of the individual you
identified as playing an important leadership role in the workplace social network you
identified. Answer all items on this answer sheet. If an item is irrelevant, or if you are
unsure or do not know the answer, leave the answer blank.
Forty-five descriptive statements are listed on the following pages. Judge how
often each statement applies (or applied) to the person you are describing when he or
she interacts (or interacted) with you and/or other members of the network you identified.
Use the following rating scale:
Not at all: 0
Once in a while: 1
Sometimes: 2
Fairly often: 3
Frequently, if not always: 4
Reproduction of actual MLQ questions has been omitted from publication of this study due to copyright restrictions.

111
APPENDIX C
E-mail Request to School Deans Asking for Permission to Contact Respective Professors
and Ask for Assistance in Conducting My Research During a Scheduled Class
<insert current date> Email subject line: Research for Doctoral Dissertation. Dear <insert Dean’s name here>, My name is Eric Furlong, and I am a student working on a doctorate in Organizational Leadership in Pepperdine’s Graduate School of Education and Psychology. I am currently working on my dissertation, which is focused on the leadership behaviors found in naturally emerging social networks in the workplace. And I am hoping to use fully-employed students in the business and leadership programs at Pepperdine as subjects for this study. Therefore, I’d like to get your permission to contact individual professors within your school so as to secure their permission to conduct this research in their classrooms on days and times of their choosing. Please note that my research instrument has already passed IRB, and the total time I will be in the classroom will be less than 10 minutes. I hope you will give my request consideration. Please let me know if you have any questions, or would like to see a copy of my research instrument. Sincerely, Eric Furlong

112
APPENDIX D
E-mail Request to Course Instructors Asking for Assistance in Conducting My Research
During a Scheduled Class
Email subject line: Research for Doctoral Dissertation. Dear <insert instructor name here>, My name is Eric Furlong, and I am a student working on a doctorate in Organizational Leadership in Pepperdine’s Graduate School of Education and Psychology. I am currently working on my dissertation, which is focused on the leadership behaviors found in naturally emerging organizational social networks in the workplace. My subjects for this research will include fully-employed students in business and leadership programs at Pepperdine. I am hoping that you will agree to assist me in reaching these students. Specifically, I’d like to ask you to please let me have a total of less than 10 minutes of time to conduct a preliminary research questionnaire in your classroom to students who agree to participate. The questionnaire contains some short background information, and 10 short questions regarding organizational social networks. There is a second part of the research, but it will be completed online (outside of the classroom and at the leisure of the participants). I have attached a copy of the questionnaire I’d like to conduct in your class in case you would like to review it. My schedule is currently wide open, and I can visit your class either just as a class starts, before or after or during a scheduled break, or at the end of a class. I hope you will give my request consideration. If you agree to help me out, please reply with a day and time that works for you. And please do not hesitate to contact me by phone or email if you have any questions. Sincerely, Eric Furlong

113
APPENDIX E
E-mail Invitation and Link to Part Two of the Research Instrument
Email subject line: Pepperdine Research Project, Part Two for <mail merge code 1>, informal network leader <mail merge code 3>. Dear <mail merge code 1>, Thank you for your continued participation in my research study. Your participation is important in adding to the body of knowledge in the field of leadership. In part one of this research study, you identified a situation or a group that you called <mail merge code 2>, and you identified <mail merge code 3> as playing an important leadership role in that network. The second part of this research study will ask some specific questions about the leadership styles of <mail merge code 3>. The total time it usually takes to complete this questionnaire is less than 10 minutes. Link to “Leadership Dynamics within Informal Organizational Networks”: <hyper link to Survey Monkey MLQ Rater From> Thank you once again for your participation. Eric Furlong, MBA, Ed.D. (ABD)

114
APPENDIX F
Research Instrument Part One, Revised
Informal Networking in Organizations and Leadership
Research Instrument Part 1 of 2.
1. Whether it is called postbureaucracy, organizational flattening, decentralized control, or even employee-empowerment, in today’s organizations, it is increasingly common to find situations in which the traditional organizational bureaucracy does not formally address every issue that arises or formally implement changes to the way work gets done. Instead it is increasingly common to find groups of people that network with each other informally to solve problems, confront challenges, and even implement changes to the way things get done without the formal involvement of their superiors. Some researchers call these groups ‘informal workplace networks’.
2. Now please take a few minutes to think of a situation at work in which you became, or in which you currently are, part of a group (but one in which you were not its leader) that solved a new problem, confronted a new challenge, or changed the way an existing process or procedure was done without being asked to do so by your supervisor (i.e. you were a part of an informal workplace network). Once you have identified such a situation, please give it name below. The name does not need to be anything descriptive or detailed. Giving it a name just provides an easy way to refer to the event for the second part of this study. If you cannot think of any situation as outlined above, please write “N/A” and disregard the remainder of this questionnaire.
Name of network: __________________________________________________
3. When thinking about the network you named above, what would you say best describes what the network was doing (choose one):
e. Solving a problem or confronting a challenge
f. Implementing a change in the way something gets done
g. Both #1 and #2
h. Other (please describe): ________________________________

115
4. In his book “Leadership”, Peter Northouse defines leadership as “…a process whereby an individual influences a group of individuals to achieve a common goal” (2004, p. 3). In thinking about the network you named above, enter the first name or the initials of the individual you felt played the most important leadership role in that network.
First name or initials: _________
5. About how many people do you think were, or currently are, involved in that network?
Number of People: __________
6. What industry would you say describes the industry you are in (i.e. consumer packaged goods, electronics, defense, software, education, etc)
Type of industry: ____________________________________________
7. What is your name and email address? Note that this information will be kept strictly confidential, and will not be used for any purpose other than sending you a link via email to the second questionnaire that will be online.
Your name: _______________________________________________________
Your email address: _______________________________________________

116
APPENDIX G
Permission to Use Avolio and Bass’ Multifactor Leadership Questionnaire Instrument
and Rater Form

117
APPENDIX H
Ranking of Subject-Leader Pairs of the Mean of the Five Transformational Leadership
Behaviors
Note. IC: Individual Consideration (four questions) IIA: Idealized Influence, Attributed (four questions) IIB: Idealized Influence, Behavior (four questions) IM: Inspirational Motivation (four questions) IS: Intellectual Stimulation (four questions)
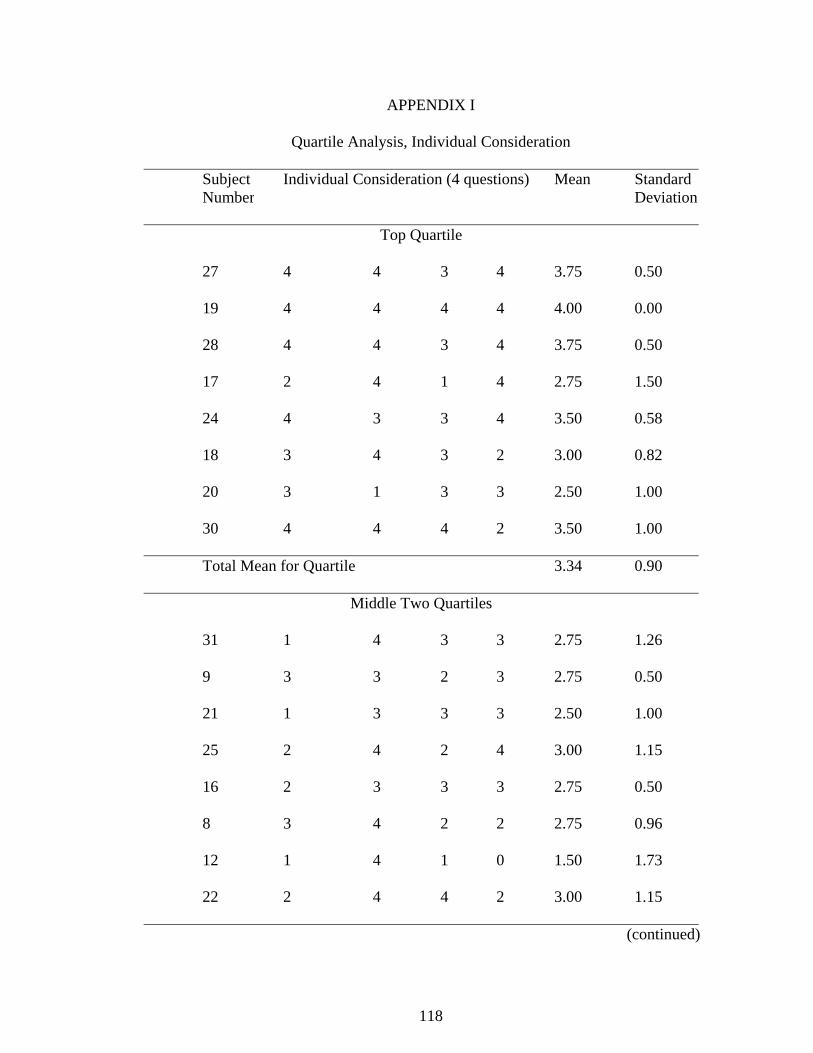
118
APPENDIX I
Quartile Analysis, Individual Consideration
Subject Number
Individual Consideration (4 questions) Mean Standard Deviation
Top Quartile
27 4 4 3 4 3.75 0.50
19 4 4 4 4 4.00 0.00
28 4 4 3 4 3.75 0.50
17 2 4 1 4 2.75 1.50
24 4 3 3 4 3.50 0.58
18 3 4 3 2 3.00 0.82
20 3 1 3 3 2.50 1.00
30 4 4 4 2 3.50 1.00
Total Mean for Quartile
3.34 0.90
Middle Two Quartiles
31 1 4 3 3 2.75 1.26
9 3 3 2 3 2.75 0.50
21 1 3 3 3 2.50 1.00
25 2 4 2 4 3.00 1.15
16 2 3 3 3 2.75 0.50
8 3 4 2 2 2.75 0.96
12 1 4 1 0 1.50 1.73
22 2 4 4 2 3.00 1.15
(continued)

119
Subject Number
Individual Consideration (4 questions) Mean Standard Deviation
23 1 4 2 4 2.75 1.50
29 3 3 3 2 2.75 0.50
14 0 4 2 2 2.00 1.63
26 1 4 4 2 2.75 1.50
15 1 3 3 1 2.00 1.15
6 0 4 4 1 2.25 2.06
3 1 4 0 3 2.00 1.83
Bottom Quartile
10 2 3 0 2 1.75 1.26
11 0 2 3 0 1.25 1.50
7 0 1 1 0 0.50 0.58
4 1 1 2 2 1.50 0.58
2 0 1 4 0 1.25 1.89
13 0 0 1 0 0.25 0.50
1 0 1 1 0 0.50 0.58
5 0 0 2 0 0.50 1.00
Total Mean for Quartile
0.94 1.11

120
APPENDIX J
Quartile Analysis, Idealized Influence, Attributed
Subject Number
Idealized Influence Attributed (4 questions)
Mean Standard Deviation
Top Quartile
27 4 4 4 3 3.75 0.50
19 4 4 4 4 4.00 0.00
28 4 4 4 4 4.00 0.00
17 3 4 4 4 3.75 0.50
24 4 4 3 4 3.75 0.50
18 3 3 3 3 3.00 0.00
20 3 3 4 3 3.25 0.50
30 3 3 3 3 3.00 0.00
Total Mean for Quartile
3.56 0.50
Middle Two Quartiles
31 4 3 4 3 3.50 0.58
9 3 2 3 3 2.75 0.50
21 3 2 3 3 2.75 0.50
25 3 3 3 3 3.00 0.00
16 3 3 3 3 3.00 0.00
8 4 4 4 2 3.50 1.00
12 3 4 4 3 3.50 0.58
22 2 2 3 2 2.25 0.50
(continued)

121
Subject Number Idealized Influence Attributed
(4 questions) Mean Standard
Deviation
23 2 3 4 4 3.25 0.96
29 3 2 3 3 2.75 0.50
14 3 1 2 3 2.25 0.96
26 3 4 4 2 3.25 0.96
15 3 3 3 1 2.50 1.00
6 3 3 2 1 2.25 0.96
3 0 3 4 4 2.75 1.89
Bottom Quartile
10 1 1 3 2 1.75 0.96
11 1 1 1 3 1.50 1.00
7 2 0 0 4 1.50 1.91
4 2 1 2 1 1.50 0.58
2 0 0 0 4 1.00 2.00
13 1 0 0 2 0.75 0.96
1 0 1 0 2 0.75 0.96
5 0 0 0 1 0.25 0.50
Total Mean for Quartile
1.13 1.18

122
APPENDIX K
Quartile Analysis, Idealized Influence, Behavior
Subject Number
Idealized Influence, Behavior (4 questions)
Mean Standard Deviation
Top Quartile
27 4 4 4 4 4.00 0.00
19 4 3 4 4 3.75 0.50
28 0 4 4 4 3.00
2.00
17 4 4 4 4
4.00 0.00
24 1 4 3
4 3.00 1.41
18 4 4 4
4 4.00 0.00
20 3 4 4
3 3.50 0.58
30 3 3 3
2 2.75 0.50
Total Mean for Quartile
3.50 0.95
Middle Two Quartiles
31 1 2
4 2 2.25 1.26
9 2 3
3 3 2.75 0.50
21 4 4
3 3 3.50 0.58
25
3 3 3 3 3.00 0.00
16
2 3 2 2 2.25 0.50
8 2 3 3 3 2.75 0.50
12 0 0 1 3 1.00
1.41
22 1 1 4 4
2.50 1.73
(continued)

123
Subject Number
Idealized Influence, Behavior (4 questions)
Mean Standard Deviation
23 2 2 4 2
2.50 1.00
29 2 2 4 1
2.25 1.26
14 2 2 3 2
2.25 0.50
26 2 0 4 0 1.50
1.91
15 3 1 3 1
2.00 1.15
6 2 0 3 0
1.25 1.50
3 0 0 4
1 1.25 1.89
Bottom Quartile
10 1 1
0 2 1.00 0.82
11 3 1
2 1 1.75 0.96
7 4 0
0 3 1.75 2.06
4 2 2
1 1 1.50 0.58
2 2 1
0 0 0.75 0.96
13 2 1
0 0 0.75 0.96
1 1
2 1 1.33 0.58
5 0 0
0 0 0.00 0.00
Total Mean for Quartile
1.10 1.08
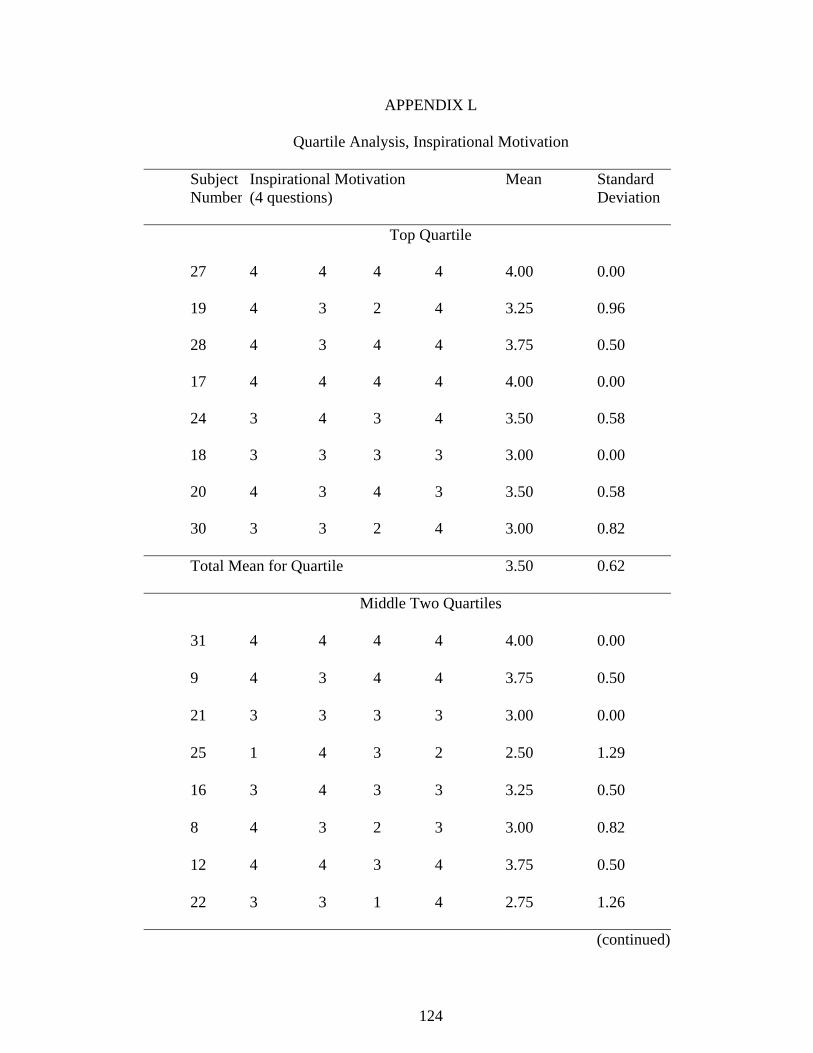
124
APPENDIX L
Quartile Analysis, Inspirational Motivation
Subject Number
Inspirational Motivation (4 questions)
Mean Standard Deviation
Top Quartile
27 4 4 4 4 4.00 0.00
19 4 3 2 4 3.25 0.96
28 4 3 4 4 3.75 0.50
17 4 4 4 4 4.00 0.00
24 3 4 3 4 3.50 0.58
18 3 3 3 3 3.00 0.00
20 4 3 4 3 3.50 0.58
30 3 3 2 4 3.00 0.82
Total Mean for Quartile
3.50 0.62
Middle Two Quartiles
31 4 4 4 4 4.00 0.00
9 4 3 4 4 3.75 0.50
21 3 3 3 3 3.00 0.00
25 1 4 3 2 2.50 1.29
16 3 4 3 3 3.25 0.50
8 4 3 2 3 3.00 0.82
12 4 4 3 4 3.75 0.50
22 3 3 1 4 2.75 1.26 (continued)

125
Subject Number
Inspirational Motivation (4 questions)
Mean Standard Deviation
23 2 2 2 4 2.50 1.00
29 3 1 1 3 2.00 1.15
14 2 3 3 3 2.75 0.50
26 2 1 0 4 1.75 1.71
15 3 2 1 2 2.00 0.82
6 3 3 1 3 2.50 1.00
3 2 1 2 4 2.25 1.26
Bottom Quartile
10 2 3 1 2 2.00 0.82
11 1 2 2 3 2.00 0.82
7 3 3 3 3 3.00 0.00
4 1 2 2 1 1.50 0.58
2 1 4 1 1 1.75 1.50
13 3 2 0 0 1.25 1.50
1 1 0 1 0 0.50 0.58
5 1 1 0 0 0.50 0.58
Total Mean for Quartile
1.56 1.13

126
APPENDIX M
Quartile Analysis, Intellectual Stimulation
Subject Number
Intellectual Stimulation (4 questions)
Mean Standard Deviation
Top Quartile
27 4 4 4 4.00 0.00
19 4 4 4 4 4.00 0.00
28 4 3 4 4 3.75 0.50
17 3 4 3 2 3.00 0.82
24 3 4 3 4 3.50 0.58
18 4 3 3 2 3.00 0.82
20 3 4 3 3 3.25 0.50
30 4 4 2 3 3.25 0.96
Total Mean for Quartile
3.45 0.68
Middle Two Quartiles 31 4 3 2 3 3.00 0.82
9 1 2 4 3 2.50 1.29
21 1 3 3 3 2.50 1.00
25 2 2 3 4 2.75 0.96
16 3 2 3 3 2.75 0.50
8 1 3 2 1 1.75 0.96
12 3 4 4 3 3.50 0.58
22 2 2 3 2 2.25 0.50
(continued)

127
Subject Number
Intellectual Stimulation (4 questions)
Mean Standard Deviation
23 1 2 2 2 1.75 0.50
29 3 2 4 2 2.75 0.96
14 4 3 3 1 2.75 1.26
26 3 3 2 1 2.25 0.96
15 1 4 1 3 2.25 1.50
6 2 2 2 2 2.00 0.00
3 1 1 1 3 1.50 1.00
Bottom Quartile
10 2 1 2 3 2.00 0.82
11 2 1 1 2 1.50 0.58
7 0 2 0 1 0.75 0.96
4 1 1 1 2 1.25 0.50
2 2 0 1 0 0.75 0.96
13 2 2 0 0 1.00 1.15
1 2 0 0 0.67 1.15
5 1 0 0 0 0.25 0.50
Total Mean for Quartile
1.03 0.91

128
APPENDIX N
Figures N.1-N.12
Figure N.1. Welch t Test Results: Idealized Influence (Attributed)

129
Figure N.2. Welch t Test Results: Idealized Influence (Behavior)

130
Figure N.3. Welch t Test Results: Inspirational Motivation

131
Figure N.4. Welch t Test Results: Intellectual Stimulation

132
Figure N.5. Welsh t Test Results: Individual Consideration

133
Figure N.6. Welch t Test Results: Contingent Reward

134
Figure N.7. Welch t Test Results: Management-by-Exception (Active)

135
Figure N.8. Welch t Test Results: Management-by-Exception (Passive)

136
Figure N.9. Welch t Test Results: Laissez-Faire

137
Figure N.10. Welch t Test Results: Extra Effort

138
Figure N.11. Welch t Test Results: Efficiency

139
Figure N.12. Welch t Test Results: Satisfaction

140
APPENDIX O
Figures O.1-O.5
Figure O.1. Welch t Test Results, Top Quartile Analysis: Idealized Influence (Attributed)

141
Figure O.2. Welch t Test Results, Top Quartile Analysis: Idealized Influence (Behavior)

142
Figure O.3. Welch t Test Results, Top Quartile Analysis: Inspirational Motivation

143
Figure O.4. Welch t Test Results, Top Quartile Analysis: Intellectual Stimulation

144
Figure O.5. Welch t Test Results, Top Quartile Analysis: Individual Consideration
Copyright © 2022 FDOKUMEN