Towards precision monitoring of elders for providing assistive services
8
Towards Precision Monitoring of Elders for Providing Assistive Services Athanasios Bamis, Dimitrios Lymberopoulos, Thiago Teixeira and Andreas Savvides Embedded Networks and Applications Lab, ENALAB New Haven, CT 06520, USA {firstname.lastname}@yale.edu ABSTRACT The in-house monitoring of elders using intelligent sensors is a very desirable service that has the potential of increasing autonomy and independence while minimizing the risks of living alone. Because of this promise, the efforts of building such systems have been spanning for decades, but there is still a lot of room for improvement. Driven by the recent technology advances in many of the required components, in this paper we present a scalable framework for detailed behavior interpretation of elders. We report on our early deployment experiences and present our current progress in three main components: sensors, middleware and behavior interpretation mechanisms that aim to make effective mon- itoring and assistive services a reality. Categories and Subject Descriptors J.3 [Life and Medical Sciences]: Health General Terms Design, Experimentation Keywords human activity monitoring, assisted living, sensor networks 1. INTRODUCTION Monitoring people activities and providing automated ser- vices that improve safety and quality of life is a very attrac- tive proposition for elders living alone. Although the prob- lem was considered for many years, it has recently begun to become more relevant for two main reasons. First, many studies together with the rising costs of healthcare point out that the caring of elders that live alone at home is about to become a challenge in the next few years [4, 11]. The second, and more positive development is that communication, sens- ing and processing technologies are rapidly maturing to the point that make automated services for elders living alone possible both in terms of cost and technology. From a technology perspective, the majority of compo- nents required to build such systems are becoming read- Permission to make digital or hard copies of all or part of this work for personal or classroom use is granted without fee provided that copies are not made or distributed for profit or commercial advantage and that copies bear this notice and the full citation on the first page. To copy otherwise, to republish, to post on servers or to redistribute to lists, requires prior specific permission and/or a fee. PETRA 2008 July 15-19, 2008, Athens, Greece Copyright 2008 ACM X-XXXXX-XX-X/XX/XX ...$5.00. ily available. Many systems under development both in academia [5, 10, 12, 16] and industry [1], as well as some commercial systems [3] are already capable to provide es- sential monitoring services (for a survey of current state-of- the-art see [2, 4]). What is mostly missing is experience and systematic knowledge to intelligently assemble the compo- nents in to robust architectures and practical, deployable systems. In addition, most of these systems focus on col- lecting and presenting simple statistics, often using intrusive sensors (e.g., wearable devices), requiring, thus, the involve- ment of healthcare providers and stakeholders in the system loop. The BehaviorScope project at Yale [15] is investigating these challenges by trying to build a functional system that can autonomously understand behaviors with enough de- tail to provide meaningful services. The goal of the project is to design an extensible architecture that can use a wide variety of sensors to interpret human activity, dynamically generate activity models and use them to generate alarms, reports, triggers and to answer queries. In this paper we provide an overview of the architecture of the system under development, and report on the main components that our research is trying to address. Section 2 provides an overview of our system requirements, section 3 outlines our system ar- chitecture and section 4 explores various methods we have considered for interpreting the data. 2. OVERVIEW The provision of services requires a set of sensors to be deployed inside a home to observe the inhabitants, inter- pret the observations and provide meaningful responses. De- pending on their condition, one can anticipate that the home inhabitants would be willing to subject themselves to a cer- tain level of observation (i.e., give up some of their privacy) in exchange for services. The goal of our architecture is to provide a versatile system that can accommodate this at dif- ferent levels, from very simple to very detailed observation, according to individual needs. The initial form of the system is intended for elders that live alone, and are fairly indepen- dent. In this case, the role of the system would be to elimi- nate certain risk factors that could otherwise be avoided by resorting to institutionalization. In its simplest form, such a system would offer a wide variety of services: • Queries - the system should be able to answer queries such as: where is the person, is that person getting enough sleep, is the person out of the house beyond the expected time? • Alarms and triggers - notify stakeholder when the per- son returns/leaves the house, notify when the person Permission to make digital or hard copies of part or all of this work or personal or classroom use is granted without fee provided that copies are not made or distributed for profit or commercial advantage and that copies bear this notice and the full citation on the first page. To copy otherwise, to republish, to post on servers, or to redistribute to lists, requires prior specific permission and/or a fee. PETRA'08, July 15-19, 2008, Athens, Greece. Copyright 2008 ACM 978-1-60558-067-8... $5.00
-
Upload
independent -
Category
Documents
-
view
1 -
download
0
Transcript of Towards precision monitoring of elders for providing assistive services

Towards Precision Monitoring of Elders for ProvidingAssistive Services
Athanasios Bamis, Dimitrios Lymberopoulos, Thiago Teixeira and Andreas SavvidesEmbedded Networks and Applications Lab, ENALAB
New Haven, CT 06520, USA{firstname.lastname}@yale.edu
ABSTRACTThe in-house monitoring of elders using intelligent sensors isa very desirable service that has the potential of increasingautonomy and independence while minimizing the risks ofliving alone. Because of this promise, the efforts of buildingsuch systems have been spanning for decades, but there isstill a lot of room for improvement. Driven by the recenttechnology advances in many of the required components,in this paper we present a scalable framework for detailedbehavior interpretation of elders. We report on our earlydeployment experiences and present our current progress inthree main components: sensors, middleware and behaviorinterpretation mechanisms that aim to make effective mon-itoring and assistive services a reality.
Categories and Subject DescriptorsJ.3 [Life and Medical Sciences]: Health
General TermsDesign, Experimentation
Keywordshuman activity monitoring, assisted living, sensor networks
1. INTRODUCTIONMonitoring people activities and providing automated ser-
vices that improve safety and quality of life is a very attrac-tive proposition for elders living alone. Although the prob-lem was considered for many years, it has recently begunto become more relevant for two main reasons. First, manystudies together with the rising costs of healthcare point outthat the caring of elders that live alone at home is about tobecome a challenge in the next few years [4, 11]. The second,and more positive development is that communication, sens-ing and processing technologies are rapidly maturing to thepoint that make automated services for elders living alonepossible both in terms of cost and technology.
From a technology perspective, the majority of compo-nents required to build such systems are becoming read-
Permission to make digital or hard copies of all or part of this work forpersonal or classroom use is granted without fee provided that copies arenot made or distributed for profit or commercial advantage and that copiesbear this notice and the full citation on the first page. To copy otherwise, torepublish, to post on servers or to redistribute to lists, requires prior specificpermission and/or a fee.PETRA 2008 July 15-19, 2008, Athens, GreeceCopyright 2008 ACM X-XXXXX-XX-X/XX/XX ...$5.00.
ily available. Many systems under development both inacademia [5, 10, 12, 16] and industry [1], as well as somecommercial systems [3] are already capable to provide es-sential monitoring services (for a survey of current state-of-the-art see [2, 4]). What is mostly missing is experience andsystematic knowledge to intelligently assemble the compo-nents in to robust architectures and practical, deployablesystems. In addition, most of these systems focus on col-lecting and presenting simple statistics, often using intrusivesensors (e.g., wearable devices), requiring, thus, the involve-ment of healthcare providers and stakeholders in the systemloop.
The BehaviorScope project at Yale [15] is investigatingthese challenges by trying to build a functional system thatcan autonomously understand behaviors with enough de-tail to provide meaningful services. The goal of the projectis to design an extensible architecture that can use a widevariety of sensors to interpret human activity, dynamicallygenerate activity models and use them to generate alarms,reports, triggers and to answer queries. In this paper weprovide an overview of the architecture of the system underdevelopment, and report on the main components that ourresearch is trying to address. Section 2 provides an overviewof our system requirements, section 3 outlines our system ar-chitecture and section 4 explores various methods we haveconsidered for interpreting the data.
2. OVERVIEWThe provision of services requires a set of sensors to be
deployed inside a home to observe the inhabitants, inter-pret the observations and provide meaningful responses. De-pending on their condition, one can anticipate that the homeinhabitants would be willing to subject themselves to a cer-tain level of observation (i.e., give up some of their privacy)in exchange for services. The goal of our architecture is toprovide a versatile system that can accommodate this at dif-ferent levels, from very simple to very detailed observation,according to individual needs. The initial form of the systemis intended for elders that live alone, and are fairly indepen-dent. In this case, the role of the system would be to elimi-nate certain risk factors that could otherwise be avoided byresorting to institutionalization. In its simplest form, sucha system would offer a wide variety of services:
• Queries - the system should be able to answer queriessuch as: where is the person, is that person gettingenough sleep, is the person out of the house beyondthe expected time?
• Alarms and triggers - notify stakeholder when the per-son returns/leaves the house, notify when the person
Permission to make digital or hard copies of part or all of this work or personal or classroom use is granted without fee provided that copies are not made or distributed for profit or commercial advantage and that copies bear this notice and the full citation on the first page. To copy otherwise, to republish, to post on servers, or to redistribute to lists, requires prior specific permission and/or a fee. PETRA'08, July 15-19, 2008, Athens, Greece. Copyright 2008 ACM 978-1-60558-067-8... $5.00
PIRDriver
Deployment #2
Deployment #1
Data Synchronization
Manager
Door/WindowDriver
CameraDriver
CameraData
PIRData
Door/Window
Data
Deployment #n
...
...
Deployment #2
Deployment #n
Table
Door/Window
Table
Camera
Table
PIR
...
...
Deployment #1
......
...
Behavior Recognition
Engine
Deviation DetectionEngine
Daily Routine
Extraction Engine
...
User #1
User #2
User #m
Central Server
Gateway
Application Modules
Door/Window Sensor Specific Filtering
PIR Sensor Specific Filtering
...
View
User #2
View
User #m
View
User #1
User #1
Config
User #2
Config
User #m
Config
......
Camera Sensor Specific Filtering
DatabaseUpdater
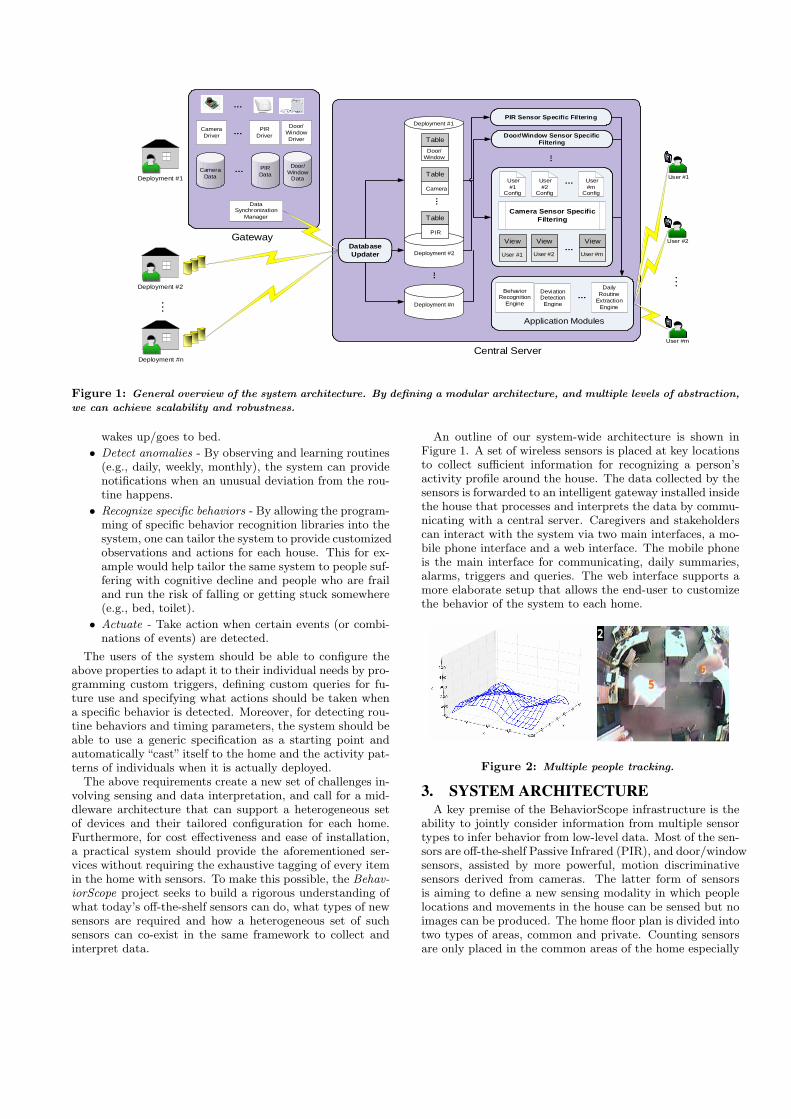
Figure 1: General overview of the system architecture. By defining a modular architecture, and multiple levels of abstraction,
we can achieve scalability and robustness.
wakes up/goes to bed.
• Detect anomalies - By observing and learning routines(e.g., daily, weekly, monthly), the system can providenotifications when an unusual deviation from the rou-tine happens.
• Recognize specific behaviors - By allowing the program-ming of specific behavior recognition libraries into thesystem, one can tailor the system to provide customizedobservations and actions for each house. This for ex-ample would help tailor the same system to people suf-fering with cognitive decline and people who are frailand run the risk of falling or getting stuck somewhere(e.g., bed, toilet).
• Actuate - Take action when certain events (or combi-nations of events) are detected.
The users of the system should be able to configure theabove properties to adapt it to their individual needs by pro-gramming custom triggers, defining custom queries for fu-ture use and specifying what actions should be taken whena specific behavior is detected. Moreover, for detecting rou-tine behaviors and timing parameters, the system should beable to use a generic specification as a starting point andautomatically “cast” itself to the home and the activity pat-terns of individuals when it is actually deployed.
The above requirements create a new set of challenges in-volving sensing and data interpretation, and call for a mid-dleware architecture that can support a heterogeneous setof devices and their tailored configuration for each home.Furthermore, for cost effectiveness and ease of installation,a practical system should provide the aforementioned ser-vices without requiring the exhaustive tagging of every itemin the home with sensors. To make this possible, the Behav-iorScope project seeks to build a rigorous understanding ofwhat today’s off-the-shelf sensors can do, what types of newsensors are required and how a heterogeneous set of suchsensors can co-exist in the same framework to collect andinterpret data.
An outline of our system-wide architecture is shown inFigure 1. A set of wireless sensors is placed at key locationsto collect sufficient information for recognizing a person’sactivity profile around the house. The data collected by thesensors is forwarded to an intelligent gateway installed insidethe house that processes and interprets the data by commu-nicating with a central server. Caregivers and stakeholderscan interact with the system via two main interfaces, a mo-bile phone interface and a web interface. The mobile phoneis the main interface for communicating, daily summaries,alarms, triggers and queries. The web interface supports amore elaborate setup that allows the end-user to customizethe behavior of the system to each home.
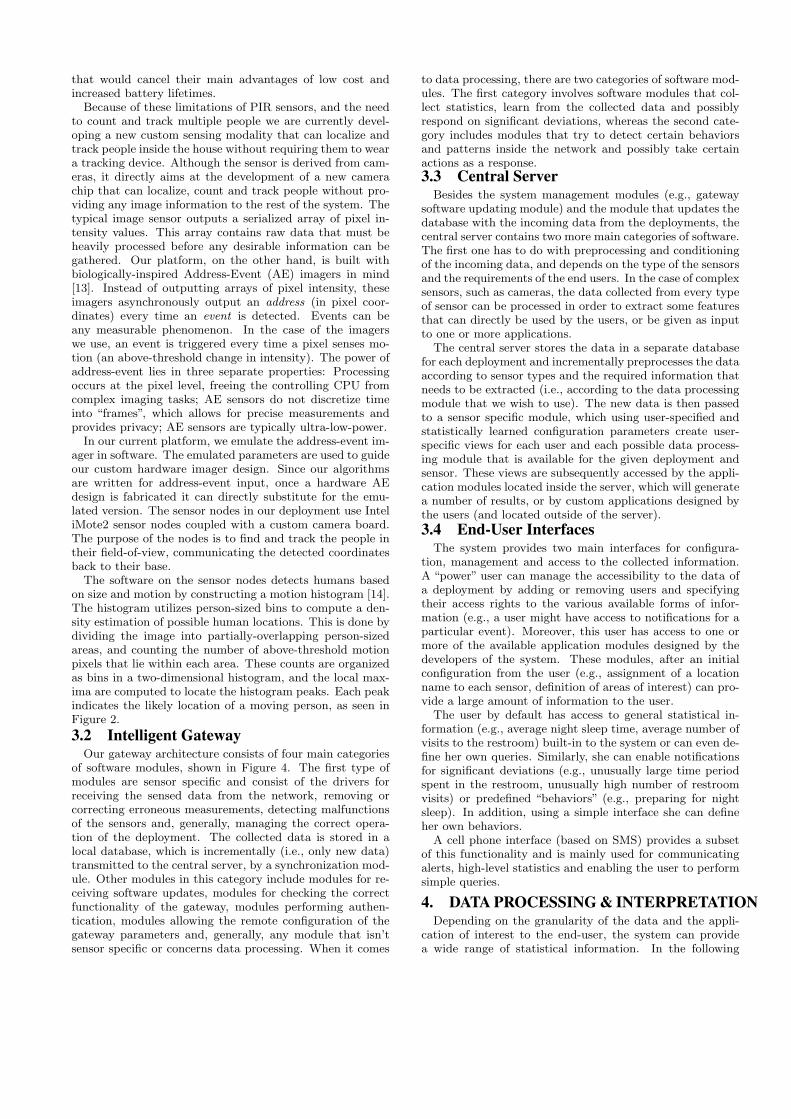
Figure 2: Multiple people tracking.
3. SYSTEM ARCHITECTUREA key premise of the BehaviorScope infrastructure is the
ability to jointly consider information from multiple sensortypes to infer behavior from low-level data. Most of the sen-sors are off-the-shelf Passive Infrared (PIR), and door/windowsensors, assisted by more powerful, motion discriminativesensors derived from cameras. The latter form of sensorsis aiming to define a new sensing modality in which peoplelocations and movements in the house can be sensed but noimages can be produced. The home floor plan is divided intotwo types of areas, common and private. Counting sensorsare only placed in the common areas of the home especially

Figure 3: Room transitions and detection of sleeping activity and bathroom usage (using rule based triggers) of the monitored
person of Deployment A (person living alone) for a period of one week.
near the exits. PIR sensors and door/windows sensors canbe placed anywhere in the house according to the specificmonitoring needs. Although it would be possible to exhaus-tively cover the house with a large number of sensors, inthis paper we consider the possibility of achieving similar orbetter activity inference with a smaller kit of sensors.
The main components of the system include an intelli-gent gateway (see Figure 4) able to collect data from a largenumber of sensors, process them and transmit them back toa central server. In the central server data can be stored,preprocessed in a number of different formats depending onthe types of sensors and the information that needs to beextracted before it is passed to the application modules. Incases of increased privacy concerns, data processing can bedone locally inside the gateway, and the results can be di-rectly transmitted to the authorized end-users, with the cen-tral server responsible for only the authentication of the end-users, the configuration of the deployment and the systemmaintenance.
Thanks to modular design, the addition of new applica-tions or sensors to the system does not interfere with itsnormal operation. In particular, to add a new type of sen-sors, cameras for example, the developers have to providea “driver application” for the gateway, that will be able tocollect data from the particular type of sensor network, anddump it into the gateway’s database. The system will auto-matically take care of the data synchronization process withthe central server. In addition, the developer can add anumber of preprocessing modules, depending on the type of“fundamental” information that needs to be extracted fromthe data. For example, in the case of a camera node we candefine areas of interest and generate an event, whenever mo-tion is detected inside that given area. The outputs of thepreprocessing modules are added back to the database, andcan be used by applications running either on the centralserver or locally by the end-users. Similarly, in order to adda new application on the central server, all we need to do isadd a preprocessing module, that given possibly some con-figuration parameters from the users, will convert raw (or
previously preprocessed) data into the proper format and itwill then pass them to the application module.
Figure 4: Home sensor network kit.
3.1 SensorsThe PIR and door sensors used in our system are off-the-
shelf sensors readily available form different vendors. Al-though PIR sensors detect motion, they don’t necessarilydetect occupancy of an area inside the house. For instanceif two people enter a room, and one person leaves, mea-surements from PIR sensors alone cannot easily determinethat a person is still in the room if the person does notmove. Moreover, most commercial sensors have very prim-itive MAC layers, primarily geared towards security alarmtrigger applications. This does not always favor assisted liv-ing setups where readings from multiple sensors, and theirrelative timing have a meaning. A straightforward solutionis to attach PIR sensors to off-the-shelf sensor nodes, but
that would cancel their main advantages of low cost andincreased battery lifetimes.
Because of these limitations of PIR sensors, and the needto count and track multiple people we are currently devel-oping a new custom sensing modality that can localize andtrack people inside the house without requiring them to weara tracking device. Although the sensor is derived from cam-eras, it directly aims at the development of a new camerachip that can localize, count and track people without pro-viding any image information to the rest of the system. Thetypical image sensor outputs a serialized array of pixel in-tensity values. This array contains raw data that must beheavily processed before any desirable information can begathered. Our platform, on the other hand, is built withbiologically-inspired Address-Event (AE) imagers in mind[13]. Instead of outputting arrays of pixel intensity, theseimagers asynchronously output an address (in pixel coor-dinates) every time an event is detected. Events can beany measurable phenomenon. In the case of the imagerswe use, an event is triggered every time a pixel senses mo-tion (an above-threshold change in intensity). The power ofaddress-event lies in three separate properties: Processingoccurs at the pixel level, freeing the controlling CPU fromcomplex imaging tasks; AE sensors do not discretize timeinto “frames”, which allows for precise measurements andprovides privacy; AE sensors are typically ultra-low-power.
In our current platform, we emulate the address-event im-ager in software. The emulated parameters are used to guideour custom hardware imager design. Since our algorithmsare written for address-event input, once a hardware AEdesign is fabricated it can directly substitute for the emu-lated version. The sensor nodes in our deployment use InteliMote2 sensor nodes coupled with a custom camera board.The purpose of the nodes is to find and track the people intheir field-of-view, communicating the detected coordinatesback to their base.
The software on the sensor nodes detects humans basedon size and motion by constructing a motion histogram [14].The histogram utilizes person-sized bins to compute a den-sity estimation of possible human locations. This is done bydividing the image into partially-overlapping person-sizedareas, and counting the number of above-threshold motionpixels that lie within each area. These counts are organizedas bins in a two-dimensional histogram, and the local max-ima are computed to locate the histogram peaks. Each peakindicates the likely location of a moving person, as seen inFigure 2.
3.2 Intelligent GatewayOur gateway architecture consists of four main categories
of software modules, shown in Figure 4. The first type ofmodules are sensor specific and consist of the drivers forreceiving the sensed data from the network, removing orcorrecting erroneous measurements, detecting malfunctionsof the sensors and, generally, managing the correct opera-tion of the deployment. The collected data is stored in alocal database, which is incrementally (i.e., only new data)transmitted to the central server, by a synchronization mod-ule. Other modules in this category include modules for re-ceiving software updates, modules for checking the correctfunctionality of the gateway, modules performing authen-tication, modules allowing the remote configuration of thegateway parameters and, generally, any module that isn’tsensor specific or concerns data processing. When it comes
to data processing, there are two categories of software mod-ules. The first category involves software modules that col-lect statistics, learn from the collected data and possiblyrespond on significant deviations, whereas the second cate-gory includes modules that try to detect certain behaviorsand patterns inside the network and possibly take certainactions as a response.3.3 Central Server
Besides the system management modules (e.g., gatewaysoftware updating module) and the module that updates thedatabase with the incoming data from the deployments, thecentral server contains two more main categories of software.The first one has to do with preprocessing and conditioningof the incoming data, and depends on the type of the sensorsand the requirements of the end users. In the case of complexsensors, such as cameras, the data collected from every typeof sensor can be processed in order to extract some featuresthat can directly be used by the users, or be given as inputto one or more applications.
The central server stores the data in a separate databasefor each deployment and incrementally preprocesses the dataaccording to sensor types and the required information thatneeds to be extracted (i.e., according to the data processingmodule that we wish to use). The new data is then passedto a sensor specific module, which using user-specified andstatistically learned configuration parameters create user-specific views for each user and each possible data process-ing module that is available for the given deployment andsensor. These views are subsequently accessed by the appli-cation modules located inside the server, which will generatea number of results, or by custom applications designed bythe users (and located outside of the server).
3.4 End-User InterfacesThe system provides two main interfaces for configura-
tion, management and access to the collected information.A “power” user can manage the accessibility to the data ofa deployment by adding or removing users and specifyingtheir access rights to the various available forms of infor-mation (e.g., a user might have access to notifications for aparticular event). Moreover, this user has access to one ormore of the available application modules designed by thedevelopers of the system. These modules, after an initialconfiguration from the user (e.g., assignment of a locationname to each sensor, definition of areas of interest) can pro-vide a large amount of information to the user.
The user by default has access to general statistical in-formation (e.g., average night sleep time, average number ofvisits to the restroom) built-in to the system or can even de-fine her own queries. Similarly, she can enable notificationsfor significant deviations (e.g., unusually large time periodspent in the restroom, unusually high number of restroomvisits) or predefined “behaviors” (e.g., preparing for nightsleep). In addition, using a simple interface she can defineher own behaviors.
A cell phone interface (based on SMS) provides a subsetof this functionality and is mainly used for communicatingalerts, high-level statistics and enabling the user to performsimple queries.
4. DATA PROCESSING & INTERPRETATIONDepending on the granularity of the data and the appli-
cation of interest to the end-user, the system can providea wide range of statistical information. In the following

Figure 5: Occupancy of the living room inferred from motion information for (a) Deployment A (single person living alone)
and (b) Deployment B (multiple people).
subsections, we will use data collected from online deploy-ments in two different homes, consisting mainly from PIRand door/windows sensors. Deployment A has been contin-uously monitoring an elder person living alone in the USAfor more than 7 months, whereas Deployment B monitorsan elder couple and their adult son in Cyprus for the past4 months. In both deployments camera sensors are locatednear the exits of the house and are used only for countingthe number of persons present in it.The following subsections first discuss the statistics we can
extract from motion-only information generated from PIRsensors in the BehaviorScope deployments. The discussionis separated into two cases, the case where we have a singleperson living in the house and the case where we have morethan one persons living in the house. Afterwards, we aregoing to shortly discuss a method for detecting significantdeviations from the “normal” living pattern of a person ora house, and in the following two sections we are going todiscuss how our system can automatically generate a highlevel model of the daily living pattern of a person, as wellas how it can be programmed to detect specific behaviors.
4.1 Motion StatisticsThe lowest level of information we can extract from a mo-
tion sensor is a time-stamped notification of when motionwas detected. Although PIR motion measurements are notsufficient to determine occupancy (i.e., wether a person is ina certain room or not), they can provide information aboutpeople movement inside the house. This information pro-vides an indication of the room occupancy patterns insidethe house.
4.1.1 Single Person CaseIn the case where only a single person is in the house, time-
stamped motion sensor measurements capture the room-to-room transitions of the person. This information on its owncan reveal the activity profile of a person and the level ofperiodicity of a person’s daily routine. Figure 3 shows theroom transition profile of the elder in Deployment A over theperiod of one week (September 19-25, 2007). The sequencesreveal that the person has a very consistent daily pattern,and with a few basic rules and statistics we can extract basicactivities and sleep patterns [6].Moreover, using simple rules and collected statistics (e.g.,
average sleep duration) we can detect very simple activities,as for example night sleep. Night sleep in the deployment ofFigure 3 can be inferred when we detect motion in the thirdbedroom of the house (BR3), after 11pm, and followed by
lack of motion for at least approximately 30 minutes.Assuming that a person is not moving between two con-
secutive motion notifications, we can, additionally, provideoccupancy statistics for a given location. Figure 5.(a) showsthe occupancy of the living room of Deployment A (personliving alone) for the duration of a week (August 9-15, 2007).From this figure it is easy to observe that the person spendssignificant amounts of time in the living room, and usuallyaround the same time of the day. In particular, we can seethat the person will always spend time in the living room(watching TV), late in the evening (before going to bed),as well as during most of the morning and noon, until shegoes to work around 3:30pm. It is easy to observe, thatduring the weekend this pattern changes significantly, sincefor example the person will spend more time in the livingroom and will, also, spend time in the living room between3:30-6pm, something which can’t happen during a normalweekday when the person is at work.
4.1.2 Multiple People CaseIn the case of multiple people living in a house, motion
sensor data loses its sequence properties and cannot revealthe daily patterns of one person in specific. Since, the se-quence property is essential for inferring occupancy informa-tion, we can see in Figure 5.(b) that there is no clear occu-pancy pattern for the living room of Deployment B (multiplepeople in the house). The data however still provides someuseful information on the usage profile of each room in thehouse.To provide meaningful statistics comparing the utilization
of the rooms of the house, we first need to define a commonrepresentation of the “quantity of motion” for a given areaand time window, that we are interested. Hence, we definea new metric for the mobility of a person at a given locationand time window, called relative mobility level. The relativemobility level is essentially the normalized amount of motionin a specific area and time window with respect to a giventime period and a given area of interest.More formally, given the minimum time duration tmin
(e.g., 15 minutes) for which we are interested we can de-fine a set of time bins tbi over a given time period T (e.g.,a day) as tbi = [ T
i·tmin, T(i+1)tmin
). Similarly, for a given
set of sensors S we can define a set of space bins sj as theunion of space covered by one or more members of S (e.g.,the area covered by sensors with ids 5 and 11, which is theliving room area for Deployment A). If we take all the pairsof space and time bins, we define as relative mobility level of

Figure 6: Relative mobility levels for the entire house and (a) Deployment A for time bins equal to 15 minutes, (b)
Deployment A for time bins equal to 1 hour, (c) Deployment B for time bins equal to 1 hour.
each such pair the total number of motion notifications thatwe received in the particular space bin and the particulartime bin over the total number of motion notifications wereceived for all the period T and all the sensors in S.For example, Figure 6.(a) shows the average relative mo-
bility level of an elder person living alone in 15-minute in-tervals. In this case S is defined to be the entire house (i.e.,all sensors) and the time bins are selected to be 15-minutedurations during the course of the day. Consequently, everybar in the graph indicates the average “quantity of motion”at the given 15-minute window during the day for the entirehouse. Apparently, depending on the information that theend-users or specific applications require, we can have differ-ent types of resolution. For instance, in Figure 6(b) showsthe average relative mobility level for the same deployment,but with hour-long time bins.From Figures 6.(a) and 6.(b) it is easy to extract useful
information for the daily living pattern of the monitoredperson. From the plots it is easy to infer when the person issleeping or is out of the house by combining measurementswith other context information such as the time of the dayor the last known location of the person inside the house.In deployment A, it is easy to observe that the person isgoing to bed some time between 11:30pm and 12:30am, andwakes up some time between 8:30am and 9:30am, since thedetected “amount” of motion suddenly increases. Moreover,it is easy to observe that the person consistently goes outof the house some time after 3:30pm and returns some timeafter 5:00pm and before 6:00pm. Spikes that appear whilethe person is absent or during the night (when the personis sleeping), are mainly attributed to sensing errors. Forinstance, you can see a spike at around 5:30am in the morn-ing, which is caused by a misconfigured motion sensor thattriggers whenever it detects light changes (in the particularcase, sun rising). The statistical information provided bythe relative mobility level can be used in order to providetime windows, where interesting events occur or specify therequired timeouts for detecting certain events, based on user-defined rules. Apparently, selecting different time or spaceresolutions can be useful for the detection of different typesof events.Figure 6.(c) shows a similar plot for the house of Deploy-
ment B, where the motion pattern is significantly differentfrom that of Deployment A, and doesn’t provide as muchinformation as that of Figure 6.(b). Figure 7 plots the aver-age relative mobility level of the rooms of the house of De-
ployment B, which is an indication of their utilization. Weseparate weekdays from weekends, in order to make someinteresting observations obvious. In particular we can seethat for most of the basic rooms the motion pattern re-mains approximately the same. However, we can see thatthe utilization of Bedroom 1 (“BD1” in the figure) decreasesduring the weekend. This happens due to the fact that Bed-room 1 is used by a young adult, who on a Saturday nightwill spend most of his night out of the house. On the con-trary, the utilization of Bedroom 2 (“BD2”), which is usedby two elders (who don’t work) remains the same. Similarly,we can see that during the weekend the family spends sig-nificantly more time hanging out in the Sun Room (“SR”) ofthe house and, also, more time in the Dining Room (“DR”)having lunch and dinner.
Figure 7: Average daily relative mobility level for every
room of Deployment B. Weekdays are separated from week-
end days in order to demonstrate that they follow different
occupancy patterns.
4.2 Detecting DeviationsTo detect deviations in the living pattern of a person or
the house, we have first to model the motion activity pat-tern in a way that will enable us to find regularities, thusdefining a notion of “normal”. Apparently, every person orhouse (in the case of multiple people) has its own pattern,which changes over time. and is also dependent on manymacroscopic parameters, as for example the time of the yearor, in the case of the house, the current set of people living

inside it. Of course, we can try to detect deviations in manydifferent time windows, but for the following discussion wewill limit ourselves to detecting “deviating days”. Besides adaily pattern, a person or a house can have patterns in manydifferent time resolutions both larger and smaller. For ex-ample, most people have a certain wake-up routine and ahouse has a yearly usage pattern, that is, the utilization ofthe rooms changes depending on the season of the year. Thisbecomes apparent even by simple observation of Figures 5,and 7, where it can be seen that the normal pattern of aweekday presents several differences from the pattern of aweekend day, both when we focus on the pattern of a personand when we focus on the pattern of a house.
To learn the daily pattern of a person, ideally, we need todiscover what remains invariant, possibly adapting over timeto the new parameters. Our intuition is that a person willspend approximately similar amounts of time in a place overthe course of a“normal”day and will produce proportionallyequal amounts of motion information. By modeling the dailymotion pattern of a person using a vector, with each fieldof the vector indicating the relative mobility level at a givenplace of the house during a given time window, we can usethe distance of the vectors as an indication of how differenttwo days are. We expect that the distance between“normal”days will be relatively small in comparison to “deviating”days. Thus, we can define as “deviating days” any vectorswho are outliers. In order to detect outliers a clusteringalgorithm, such as k-means, can be used.
4.3 Extracting Activity ModelsWhile the statistical representation of the raw sensing
data and its variation over time can provide valuable in-formation about the monitored person, it fails to provide anin-depth analysis about the person’s daily living habits. Asthe person moves inside the house, a sequence of detectedsensing features is produced over time. These features mightencode spatial information, such as the rooms /areas the per-son visits or the objects with which she interacts, as well astemporal information, such as the exact time and durationof these features. The sequence of these recorded sensingfeatures over the course of a day represent the monitoredperson’s daily activity signature. Using this stream of sym-bols, we formulate the problem of human activity modelingas a spatiotemporal pattern-matching problem on top of thesequence of recorded sensing features and solve it using anexhaustive search algorithm [6].
The sensor network is modeled as a spatiotemporal featuregenerator that is triggered by the monitored person as shemoves over space and time. Every day can be represented asa sequence of spatiotemporal features. Given a large numberof such daily activity sequences, we formulate the problem offinding the daily activity model of a person as the problemof finding the most frequent sequences of sensing features,namely location, time and duration [6]. In general, everysequence of sensing features corresponds to one or more ac-tivities. However, the most frequent sequences of features,the ones that appear in a large number of daily signatures,represent the daily living model of the person.
To automatically discover the sequence of sensing featuresthat frequently appear in a collection of daily signatures weuse an exhaustive search algorithm that is based on the a-priori principle: any subsequence of a frequent sequence hasto also be frequent [6]. Given this, we have employed anexhaustive, yet very efficient, search algorithm that auto-
matically discovers the most frequent sequences of sensingfeatures. Initially all the frequent sequences of size 1 arediscovered. Then, using the set of frequent sequences ofsize 1 as our starting point we identify the most frequentsequences of size 2 and the algorithm continues iterativelyuntil no frequent pattern is finally discovered.
At the end, the most frequent sequences of features ofdifferent sizes have been identified. Since these sequencesrepresent the monitored person’s frequent activities, whencombined, they can be used to build the daily living model ofthe monitored person. For instance, Figure 8 shows the dailyliving activity model that was extracted out of 30 days ofrecorded data of an elder person living alone in DeploymentA. In this case, the basic sensing features recorded were veryprimitive activities such as sleeping, having breakfast etc.
1.0
1.0
1.0
0.93 0.07
1.0
0.76 0.24
0.34
0.1
0.28
0.17
0.1
1.0
1.0
0.25
0.75
1.0
0.74
0.26
1.0
1.0
1.0
1.0
1.0
Breakfast_M_Long
Breakfast_M_Short
Sleep_M_Long
Hangout_E_Long
GetReady_A
GetReady_M
Bath_M
Bath_N
Sleep_N_Long
Hangout_M_Long
Hangout_A_Short
Bath_E
Sleep_E_Long
Sleep_M_Short
Bath_A
Out_A_Long
Hangout_A_Long
Figure 8: Simplified daily living model of the monitored
person of Deployment A.
4.4 Rule-Based Activity InferenceIn addition to the automatically extracted activity mod-
els, our project has also developed a behavior interpretationsystem with which users are able to describe activities asa collection of probabilistic rules with spatial and tempo-ral characteristics expressed in high level script form. Eachactivity description has well-defined inputs and outputs en-abling the creation of a library of activity components thatcan be connected together into hierarchies to provide evenmore complex interpretations. The power of such a frame-work comes from the hierarchical organization of reasoning.This allows the use of simple timestamped, localized sensormeasurements to reason about more macroscopic behaviorstaking place in space and time.
The main idea is that human behaviors are sequences ofvery primitive actions that take place over space and time.Different activities can be described by simply combiningthese primitive actions over time in different ways. A mul-timodal wireless sensor network monitoring a person’s loca-tion and interaction with different objects over space andtime provides a stream of basic sensing features for identi-fying these primitive human actions. The proposed methodsuggests to parse the sequence of detected sensing features

into higher level human behaviors in a hierarchical bottom-up processing model that is similar to natural language pro-cessing. The set of recorded features becomes the humanactivity alphabet. In the same sense that we combine lettersto form words, we combine these features to define primi-tive actions; similarly, as words are combined to form sen-tences, sequences of primitive actions are combined to de-scribe basic human activities; and so on from sentences toparagraphs, paragraphs to stories, we combine human ac-tivities over space and time to define macroscale human be-haviors.
The basic interpretation blocks in this hierarchy are Prob-abilistic Context-Free Grammars (PCFGs) [7, 8] that can beeither specified by the user or even automatically extractedfrom the collected data as shown in [6]. Through a simplehigh-level interface, users provide a collection of probabilis-tic rules that form a PCFG. This set of rules specifies one ormore activities by enforcing a syntax on the recorded inputstream of sensing features. This syntax takes into accountspatial characteristics (detected sensing features and theirsequences over time) as well as temporal characteristics. Aflexible time abstraction layer we have designed and imple-mented [9], enables users to associate time information tothe recorded sensing features on a per-grammar and on aper-feature basis allowing the definition of grammar specificspatiotemporal features. By parsing these sequences of spa-tiotemporal features, activity recognition at different levelsof spatial and temporal granularity is achieved.
The grammar hierarchy interpretation framework has al-ready been used in several home network deployments toautomatically interpret the recorded stream of data and pro-vide meaningful activity summaries [8, 9]. Its interpretationpower has also been demonstrated by the successful detec-tion of complex activities, such as the cooking activity [8].
5. CONCLUSIONS & FUTURE WORKThis paper described our up-to-date progress on a scal-
able system for monitoring elder activities in assisted liv-ing. Our problem consideration and deployment experienceshave shown encouraging signs that fine-grained monitoringfor providing services will be possible in the near future.To achieve that one needs high precision sensors for localiz-ing people, preferably without requiring them to wear sen-sors. Furthermore, we have discovered that there is a lack ofsynergy between learned and predefined models. Our workup-to-date has demonstrated that the two model types arecomplementary, and in order to deploy an effective systemthe two models should work together in close coordination.This and the development of intelligent motion discrimina-tive sensors will become the focus of our future work.
AcknowledgmentsThis work was partially funded by the National ScienceFoundation under projects CNS 0626802 and CNS 0751513.Any opinions, findings and conclusions or recommendationexpressed in this material are those of the author(s) anddo not necessarily reflect the views of the National ScienceFoundation (NSF).
6. REFERENCES[1] S. Consolvo, P. Roessler, and B. Shelton. The CareNet
Display: Lessons Learned from an In Home Evaluationof an Ambient Display. UbiComp 2004: UbiquitousComputing: 6th International Conference,
Nottingham, UK, September 7-10, 2004: Proceedings,2004.
[2] D. Cook and S. Das. How smart are our environments?An updated look at the state of the art. Pervasive andMobile Computing, 3(2):53–73, 2007.
[3] EATON’s Home Heartbeat.http://www.homeheartbeat.com.
[4] European Commission’s 6th Framework Programme:Service-oriented Programmable Smart Environmentsfor Older Europeans (SOPRANO).
[5] N. M. Gil, N. A. Hine, J. L. Arnott, J. Hanson, R. G.Curry, T. Amaral, and D. Osipovic. Data visualisationand data mining technology for supporting care forolder people. In Assets ’07: Proceedings of the 9thinternational ACM SIGACCESS conference onComputers and accessibility, pages 139–146, NewYork, NY, USA, 2007. ACM.
[6] D. Lymberopoulos, A. Bamis, and A. Savvides.Extracting spatiotemporal human activity patterns inassisted living using a home sensor network (underreview). Sensor, Mesh and Ad Hoc Communicationsand Networks, 2008. SECON ’08. 5th Annual IEEECommunications Society Conference on, 2008.
[7] D. Lymberopoulos, A. S. Ogale, A. Savvides, andY. Aloimonos. A sensory grammar for inferringbehaviors in sensor networks. In IPSN ’06:Proceedings of the fifth international conference onInformation processing in sensor networks, pages251–259, New York, NY, USA, 2006. ACM.
[8] D. Lymberopoulos, T. Teixeira, and A. Savvides.Detecting patterns for assisted living using sensornetworks: A case study. Sensor Technologies andApplications, 2007. SensorComm 2007. InternationalConference on, pages 590–596, 14-20 Oct. 2007.
[9] D. Lymberopoulos, T. Teixeira, and A. Savvides.Macroscopic human behavior interpretation usingdistributed sensor networks. To appear in Proceedingsof IEEE, 2008.
[10] D. Malan, T. Fulford-Jones, M. Welsh, andS. Moulton. CodeBlue: An Ad Hoc Sensor NetworkInfrastructure for Emergency Medical Care.International Workshop on Wearable and ImplantableBody Sensor Networks, 2004.
[11] M. Pollack. Intelligent Technology for the AgingPopulation. AI Magazine, 26(2):9–24, 2005.
[12] E. Tapia, S. Intille, and K. Larson. ActivityRecognition in the Home Using Simple and UbiquitousSensors. Pervasive Computing: Second InternationalConference, Pervasive 2004, Linz/Vienna, Austria,April 18-23, 2004: Proceedings, 2004.
[13] T. Teixeira, E. Culurciello, J. H. Park,D. Lymberopoulos, A. Barton-Sweeney, andA. Savvides. Address-event imagers for sensornetworks: evaluation and modeling. In IPSN ’06:Proceedings of the fifth international conference onInformation processing in sensor networks, pages458–466, New York, NY, USA, 2006. ACM.
[14] T. Teixeira and A. Savvides. Lightweight peoplecounting and localizing in indoor spaces using camerasensor nodes. Distributed Smart Cameras, 2007.ICDSC ’07. First ACM/IEEE InternationalConference on, pages 36–43, 25-28 Sept. 2007.
[15] The BehaviorScope project.http://www.eng.yale.edu/enalab/behaviorscope.htm.
[16] A. Wood, G. Virone, T. Doan, Q. Cao, L. Selavo,Y. Wu, L. Fang, Z. He, S. Lin, and J. Stankovic.ALARM-NET: Wireless Sensor Networks forAssisted-Living and Residential Monitoring.University of Virginia Computer Science DepartmentTechnical Report, 2006.