
Towards an Organisational Readness Framework for Emerging Technologie
30
EJISDC (2012) 53, 5, 1-30 The Electronic Journal on Information Systems in Developing Countries http://www.ejisdc.org 1 TOWARDS AN ORGANISATIONAL READINESS FRAMEWORK FOR EMERGING TECHNOLOGIES: AN INVESTIGATION OF ANTECEDENTS FOR SOUTH AFRICAN ORGANISATIONS’ READINESS FOR SERVER VIRTUALISATION Abiodun A. Ogunyemi University of Cape Town South Africa [email protected] Kevin A. Johnston University of Cape Town South Africa [email protected] ABSTRACT The lack of unifying frameworks to investigate emerging technologies and changing practices in organisations remains a major challenge to the Information Systems body of knowledge. This study developed and validated a new conceptual readiness framework NOIIE (an acronym for National e-readiness, Organisational preparedness, Industrial relationships, Internal resistance and External influence), for investigating organisational readiness for emerging technologies and applications. Server virtualisation was used as a pilot technology to investigate the antecedents for the readiness of 83 South African organisations for emerging technologies through a quantitative approach and an online survey. The readiness of South African organisations for server virtualisation was impressive, as 73% of organisations surveyed had implemented server virtualisation to one extent or another. The NOIIE framework was validated, as national e-readiness, organisational preparedness and industrial relationships were found to be highly significant and positive contributors to organisational readiness for adopting server virtualisation in South African organisations. The NOIIE framework could be further developed and used to investigate other emerging technologies in organisations in developing countries. KEYWORDS: emerging technologies, adoption, server virtualisation, organisation readiness 1. INTRODUCTION Global economic recession became a reality from 2008 (El Sawy & Pavlou, 2008; Latham, 2009). Organisations embarked on mass staff retrenchment (Raghuram, 2009) and IT budgets were drastically reduced (Luftman & Ben-Zvi, 2010). Information technology (IT) departments were mandated to provide cost efficient solutions that enhanced productivity (El Sawy & Pavlou, 2008; Luftman & Ben-Zvi, 2010). In 2009, a Society for Information Management survey of 243 IT executives in the United States of America (USA) considered server virtualisation (a technology that allows a physical server computer to host two or more virtual servers) the second most important technology in this recession (Luftman & Ben-Zvi, 2010). However, rapid releases of new and emerging technologies and economic recession have made the adoption of emerging technologies and applications a challenge (El Sawy & Pavlou, 2008; Luftman & Ben-Zvi, 2010). The environments in which organisations operate in developing countries are most times not enabling due to poor e-readiness of the country (Dada, 2006; Ifinedo, 2005). This suggests an evaluation of countries’ e-readiness. This study adopted the definition of e- readiness offered by the Economist Intelligence Unit (EIU), as it provides a holistic view of national e-readiness assessment areas. EIU defines e-readiness as “a measure of the quality of a country’s information and communications technology (ICT) infrastructure and the ability of its consumers, businesses and governments to use ICT to their benefit” (EIU, 2008, p. 2).
Transcript of Towards an Organisational Readness Framework for Emerging Technologie

EJISDC (2012) 53, 5, 1-30
The Electronic Journal on Information Systems in Developing Countries http://www.ejisdc.org
1
TOWARDS AN ORGANISATIONAL READINESS FRAMEWORK FOR EMERGING
TECHNOLOGIES: AN INVESTIGATION OF ANTECEDENTS FOR SOUTH AFRICAN
ORGANISATIONS’ READINESS FOR SERVER VIRTUALISATION
Abiodun A. Ogunyemi University of Cape Town
South Africa [email protected]
Kevin A. Johnston University of Cape Town
South Africa [email protected]
ABSTRACT
The lack of unifying frameworks to investigate emerging technologies and changing practices in organisations remains a major challenge to the Information Systems body of knowledge. This study developed and validated a new conceptual readiness framework NOIIE (an acronym for National e-readiness, Organisational preparedness, Industrial relationships, Internal resistance and External influence), for investigating organisational readiness for emerging technologies and applications. Server virtualisation was used as a pilot technology to investigate the antecedents for the readiness of 83 South African organisations for emerging technologies through a quantitative approach and an online survey. The readiness of South African organisations for server virtualisation was impressive, as 73% of organisations surveyed had implemented server virtualisation to one extent or another. The NOIIE framework was validated, as national e-readiness, organisational preparedness and industrial relationships were found to be highly significant and positive contributors to organisational readiness for adopting server virtualisation in South African organisations. The NOIIE framework could be further developed and used to investigate other emerging technologies in organisations in developing countries.
KEYWORDS: emerging technologies, adoption, server virtualisation, organisation readiness
1. INTRODUCTION
Global economic recession became a reality from 2008 (El Sawy & Pavlou, 2008; Latham, 2009). Organisations embarked on mass staff retrenchment (Raghuram, 2009) and IT budgets were drastically reduced (Luftman & Ben-Zvi, 2010). Information technology (IT) departments were mandated to provide cost efficient solutions that enhanced productivity (El Sawy & Pavlou, 2008; Luftman & Ben-Zvi, 2010).
In 2009, a Society for Information Management survey of 243 IT executives in the United States of America (USA) considered server virtualisation (a technology that allows a physical server computer to host two or more virtual servers) the second most important technology in this recession (Luftman & Ben-Zvi, 2010). However, rapid releases of new and emerging technologies and economic recession have made the adoption of emerging technologies and applications a challenge (El Sawy & Pavlou, 2008; Luftman & Ben-Zvi, 2010).
The environments in which organisations operate in developing countries are most times not enabling due to poor e-readiness of the country (Dada, 2006; Ifinedo, 2005). This suggests an evaluation of countries’ e-readiness. This study adopted the definition of e-readiness offered by the Economist Intelligence Unit (EIU), as it provides a holistic view of national e-readiness assessment areas. EIU defines e-readiness as “a measure of the quality of a country’s information and communications technology (ICT) infrastructure and the ability of its consumers, businesses and governments to use ICT to their benefit” (EIU, 2008, p. 2).

EJISDC (2012) 53, 5, 1-30
The Electronic Journal on Information Systems in Developing Countries http://www.ejisdc.org
2
Organisations are often unaware of emerging technologies or applications and their potential benefits (Jensen, 2007). For instance, emerging technologies such as server virtualisation have potential economic and environmental benefits (Luftman & Ben-Zvi, 2010). Organisations in a difficult economic situation can evaluate emerging technologies in order to take adoption and implementation decisions. However, when organisations are adequately prepared, adoption and implementation decisions are easier to take.
The Information Technology (IT) industry appears not to be providing the required support such as product awareness, software cost affordability and flexible licensing to organisations (Molla & Licker, 2005). This suggests an evaluation of the relationship that exists between organisations and the IT industry.
Meanwhile, organisational preparedness for adopting an emerging technology may be influenced by internal resistance to technological change within an organisation and influences to accept or reject the technology from external bodies such as peer organisations and business associates. For example, the decision to adopt server virtualisation has the potential to be resisted by IT staff when they lack appropriate skills to support the technology (Info-Tech, 2008). Secondly, application owners and users in the organisation may resist the adoption decision due to a perceived security risk associated with server virtualisation (Uddin & Rahman, 2011). Lastly, internal resistance may be due to the perceived risk associated with virtualising mission-critical servers (Ray & Schultz, 2009). External bodies however, often influence organisations to accept an innovation, because other organisations may be using such an innovation (Kurnia et al., 2009). The two research questions formulated were:
1. What factors contribute to organisational readiness for server virtualisation in developing countries?
2. What factors influence organisational preparedness for server virtualisation in developing countries?
The rest of the paper is organised as follows: The next Section provides a review of the literature and theoretical development, while section three describes the research methodology used. Section four analyses the research results and section five provides discussions of the results and implications for researchers and practitioners.
2. LITERATURE REVIEW
Many theories and models including Diffusion of Innovations (Rogers, 2003), Technology Acceptance (TAM) (Davis et al., 1989), Unified Theory of Acceptance and Use of Technology (UTUAT) (Venkatesh et al., 2003), Theory of Reasoned Action (TRA) (Ajzen & Fishbein, 1975), Theory of Planned Behaviour (TPB) (Ajzen, 1991), Technological, Organisational and Environmental (TOE) Framework (Tornatzky & Fleischer, 1990) and Emerging IT Framework (Cegielski et al., 2005) were considered. The contributions of Rogers (2003), Tornatzky and Fleischer (1990), Kwon and Zmud (1987), EIU (2009), Kurnia et al. (2009) and Molla and Licker (2005), were considered more appropriate for the purpose of this study. This Section discusses innovations adoption, e-readiness and readiness models and theoretical development of the antecedents for organisational readiness.
2.1 Diffusion of Innovation
Rogers’ (2003) theory of diffusion of innovations provides a holistic insight into organisational adoption of innovations (new ideas, concepts, or objects) and is appropriate to understand issues around the adoption of emerging technologies such as server virtualisation.
Innovation diffusion has five processes: (i) knowledge is the first process where there is awareness of the innovation and intended users undergo learning of the innovation and

EJISDC (2012) 53, 5, 1-30
The Electronic Journal on Information Systems in Developing Countries http://www.ejisdc.org
3
eventually understand how to use it; (ii) persuasion follows, where users consider the consequences of using the innovation and then form attitudes towards such innovation. Attitudes may be favourable or otherwise. After persuasion, (iii) a decision is made whether to adopt or reject the innovation. Adoption of innovations leads to implementation (iv) where innovations are put into use. Finally, adopters seek to reinforce their earlier decisions. This is the confirmation stage (v).
Server virtualisation like other technologies is likely to have adoption challenges. According to Rogers (2003)innovators are often venturesome and risk takers (Ashley, 2009). The perceived ‘single point of failure’ risk associated with server virtualisation is capable of making adopters sceptical (Enfield et al., 2011, Uddin and Rahman 2011). In this regard, adopters may form the late majority who adopt only when the innovation has been tried and can now be trusted.
Server virtualisation may offer adopting organisations better value than current practice; however, server virtualisations learning curve suggests that the technology is used in a test environment before actual deployment in a production environment. Thus, Rogers’ (2003) Theory of Diffusion of Innovation may be relevant to understanding the adoption of server virtualisation in South African (a developing country) organisations.
2.2 E-readiness and Readiness Models
The terms readiness and e-readiness have been used interchangeably by some scholars. For example, Ram and Pattinson (2009), adopted an e-readiness definition offered by Fathian et al. (2008), to define organisational readiness as “the ability of a firm to successfully adopt, use and benefit from information technologies” (p. 8). Ram and Pattinson’s (2009), definition is also similar to the contribution of Maugris et al. (2003) which defined e-readiness as the “ability to pursue value creation opportunities facilitated by the use of internet” (p. 4). In other words, readiness and e-readiness strive to achieve a common purpose. This study adopted this stance in understanding the factors (antecedents) that contribute to organisational readiness for emerging technologies and other influencing factors.
2.2.1 POER and PEER
Molla and Licker (2005) proposed a model on perceived organisational e-readiness (POER) and perceived environmental e-readiness (PEER) and carried out a quantitative study of 150 organisations in South Africa to determine the factors that affect e-commerce adoption in a developing country. Molla and Licker (2005) discovered that POER (organisational e-readiness) explains innovation adoptions better than PEER. Molla and Licker (2005) suggested that organisations in developing countries should take cognisance of organisational factors such as awareness, human resources, business resources, technology resources, commitment, governance and environmental factors such as government e-readiness, market forces e-readiness and support industries e-readiness, when making adoption decisions.
2.2.2 Electronic Commerce Readiness
Kurnia et al. (2009) carried out a quantitative study of 180 Malaysian SMEs and discovered that readiness variables such as organisational readiness, industrial readiness, national readiness and external influence, have different correlations with different e-commerce technologies such as e-mail, internet, intranet, barcode and so on. This suggests that an investigation of organisational readiness for individual technologies (such as server virtualisation) is better, in order to establish the significance of readiness variables (Mutula & van Brakel, 2006).

EJISDC (2012) 53, 5, 1-30
The Electronic Journal on Information Systems in Developing Countries http://www.ejisdc.org
4
Kurnia et al. (2009) hypothesised five factors to support adoption decisions for e-commerce technologies. Organisational Readiness was measured by determining how top managers perceived e-commerce technologies to provide benefits to their business and human and technological resources within the organisation and organisational governance. Industrial Readiness entailed “industry structure and standards and readiness of trading partners that promotes adoption of EC technologies” (Kurnia et al., 2009, p. 4). National Readiness referred to support (enabling environment through economic and socio-political stablities, ICT infrastructures, research and development and foreign investments) from governmental and non-governmental bodies. Perceived Environmental Pressure was added to the E-Commerce Readiness Model and refered to influences exerted by peer organisations and business associates on organisations to adopt a technology. The need to remain competitive was another reason for perceived environmental pressure on organisations.
2.3 Theoretical Development
The world is in an information age, where ICTs have become the “major driving forces for productivity, competitiveness, collaboration and superposition of resources on both national and international level” (Hanafizadeh et al., 2009, p. 189). However, the advent of ICT has also brought a digital separation between the developed and developing countries (Al-Solbi & Mayhew, 2005; Javadi & Gharakani, 2008). What this implies is that a nation or organisation that is not making extensive use of ICTs for competitive advantage is left behind (Mutula & van Brakel, 2006).
The adoption of technologies by organisations is premised on their status of readiness (Fathian et al., 2008; Uzoka et al., 2007). Assessment of the current status of ICT adoption in organisations helps to understand if ICT policies and implementations are working and how to address failing issues (Uzoka et al., 2007).
There has yet to be a unifying framework to investigate organisations’ readiness for emerging technologies such as server virtualisation. It has been argued that it is challenging to provide a unifying theory to fit adoption of innovations and that frameworks should be built to fit the context of the innovation being investigated (Molla & Licker, 2005).
This research develops a new conceptual readiness framework (NOIIE), which will be beneficial to undertake studies on emerging technologies in the context of organisations in developing countries (Lucas et al., 2007). The proposed conceptual organisational readiness framework (NOIIE) is shown in Figure 1.
Organisational Readiness
Figure 1: Conceptual NOIIE Readiness Framework
National E-Readiness
External Influence
Industrial Relationships
Internal Resistance
Emerging Technology Adoption Organisational
Preparedness

EJISDC (2012) 53, 5, 1-30
The Electronic Journal on Information Systems in Developing Countries http://www.ejisdc.org
5
Grounded in the Theory of Diffusion of Innovation and partly the TOE framework, NOIIE was developed from the contributions offered by EIU (2009), Kurnia et al. (2009), Lapointe and Rivard (2005) and Molla and Licker (2005). As shown in Figure 1, the overall organisational readiness for adoption of an emerging technology such as server virtualisation is dependent on three variables namely: national e-readiness, industrial relationships and organisational preparedness. Moreover, two extraneous factors; i.e. internal resistance and external influence, may influence organisational preparedness and affect the overall organisational readiness for emerging technologies indirectly. Thus, internal resistance to emerging technologies within an organisation and, or external influence from peer organisations and business associates may influence organisational preparedness. The dependent variable server virtualisation is assessed based on the potentials the technology offers (relative advantage or perceived usefulness) and the challenges (complexity or perceived ease of use) associated with the technology. The NOIIE framework was developed based on a positivistic stance that reality is governed by objectives, measurable and independent of the researcher (Myers, 2010; Orlikowski & Baroudi, 1991). Table 1 shows the details of the NOIIE readiness variables.
NOIIE is a reflective model as it assesses reflective latent variables and posits that the overall readiness of an organisation for an emerging technology (such as server virtualisation) depends on such an organisation’s preparedness, which is measured by people, governance and technology in such an organisation. Organisational readiness also depends on the e-readiness of the environment in which the organisation operates, i.e. national e-readiness and the relationships between the organisation and its technology supplier, i.e. industrial relationships. As depicted in Figure 1, two extraneous factors identified as internal resistance and external influence may influence organisational preparedness. A reflective latent variable is the formation of reflective indicators (effects). Reflective indicators change as the latent variable changes thereby establishing internal consistency (Urbach & Ahlemann, 2010). This implies that NOIIE variables will change as a change is introduced to the reflective indicators measuring such variable.
2.3.1 NOIIE Readiness Areas
This section discusses the NOIIE e-readiness assessment areas. The purpose is to provide a holistic guide to assessing organisations’ e-readiness for emerging technologies such as server virtualisation.
2.3.1.1 National E-Readiness
Considering the significance of e-readiness assessment and the role ICTs play in narrowing the digital divide between developed and developing countries, national e-readiness is important in order to provide an enabling environment for organisations to operate (Ifinedo, 2005; Mutula & van Brakel, 2006).
Most e-readiness studies focus on countries in order to determine if ICTs are being used extensively and to enhance drives for effective participation of countries and its members (citizens and organisations) in the global economy (Molla & Licker, 2005; Mutula & van Brakel, 2006). National e-readiness was found to be insignificant to organisations’ readiness for e-commerce adoption in studies by Kurnia et al. (2009) and Molla and Licker (2005).
The EIU provides a five-category assessment of e-readiness of countries: internet connectivity, business environment, legal environment, government policy and vision and consumer and business adoption (EIU, 2009). The EIU e-readiness assessment tool also takes
EJISDC (2012) 53, 5, 1-30
The Electronic Journal on Information Systems in Developing Countries http://www.ejisdc.org
6
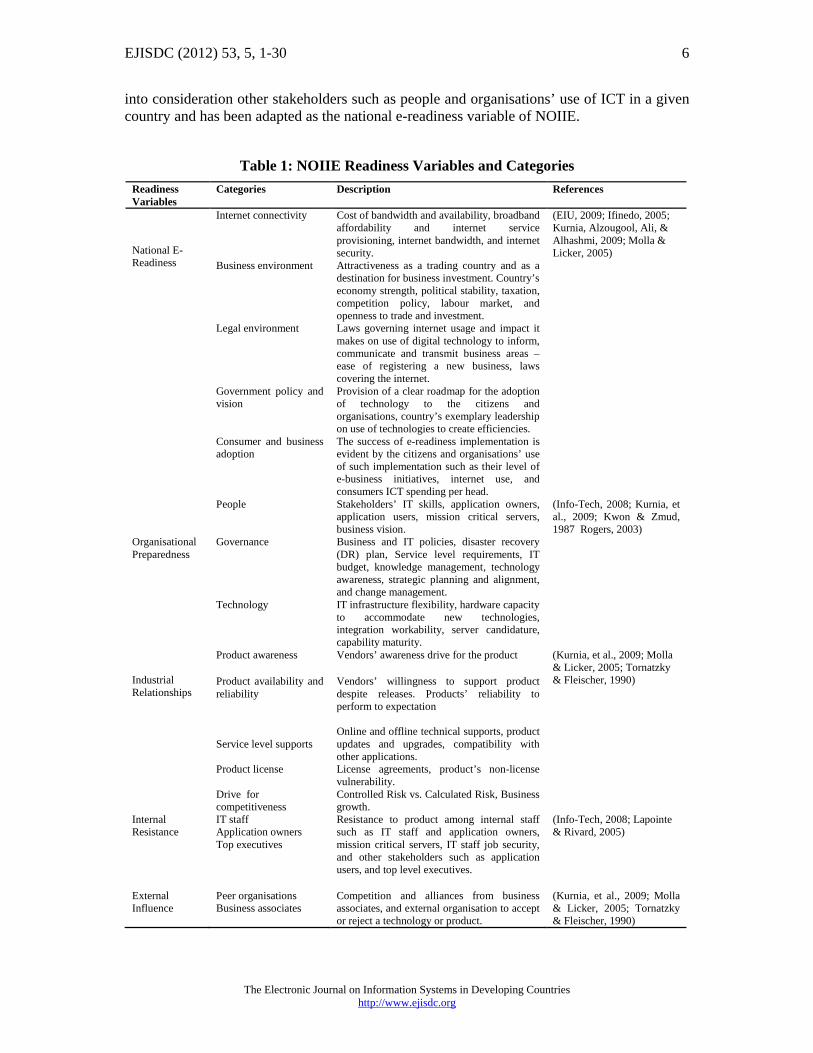
into consideration other stakeholders such as people and organisations’ use of ICT in a given country and has been adapted as the national e-readiness variable of NOIIE.
Table 1: NOIIE Readiness Variables and Categories
Readiness Variables
Categories Description References
National E-Readiness
Internet connectivity Cost of bandwidth and availability, broadband affordability and internet service provisioning, internet bandwidth, and internet security.
(EIU, 2009; Ifinedo, 2005; Kurnia, Alzougool, Ali, & Alhashmi, 2009; Molla & Licker, 2005)
Business environment Attractiveness as a trading country and as a destination for business investment. Country’s economy strength, political stability, taxation, competition policy, labour market, and openness to trade and investment.
Legal environment Laws governing internet usage and impact it makes on use of digital technology to inform, communicate and transmit business areas – ease of registering a new business, laws covering the internet.
Government policy and vision
Provision of a clear roadmap for the adoption of technology to the citizens and organisations, country’s exemplary leadership on use of technologies to create efficiencies.
Consumer and business adoption
The success of e-readiness implementation is evident by the citizens and organisations’ use of such implementation such as their level of e-business initiatives, internet use, and consumers ICT spending per head.
Organisational Preparedness
People Stakeholders’ IT skills, application owners, application users, mission critical servers, business vision.
(Info-Tech, 2008; Kurnia, et al., 2009; Kwon & Zmud, 1987 Rogers, 2003)
Governance Business and IT policies, disaster recovery (DR) plan, Service level requirements, IT budget, knowledge management, technology awareness, strategic planning and alignment, and change management.
Technology IT infrastructure flexibility, hardware capacity to accommodate new technologies, integration workability, server candidature, capability maturity.
Industrial Relationships
Product awareness Vendors’ awareness drive for the product (Kurnia, et al., 2009; Molla & Licker, 2005; Tornatzky & Fleischer, 1990) Product availability and
reliability
Vendors’ willingness to support product despite releases. Products’ reliability to perform to expectation
Service level supports
Online and offline technical supports, product updates and upgrades, compatibility with other applications.
Product license License agreements, product’s non-license vulnerability.
Drive for competitiveness
Controlled Risk vs. Calculated Risk, Business growth.
Internal Resistance
IT staff Application owners Top executives
Resistance to product among internal staff such as IT staff and application owners, mission critical servers, IT staff job security, and other stakeholders such as application users, and top level executives.
(Info-Tech, 2008; Lapointe & Rivard, 2005)
External Influence
Peer organisations Business associates
Competition and alliances from business associates, and external organisation to accept or reject a technology or product.
(Kurnia, et al., 2009; Molla & Licker, 2005; Tornatzky & Fleischer, 1990)
EJISDC (2012) 53, 5, 1-30
The Electronic Journal on Information Systems in Developing Countries http://www.ejisdc.org
7
Grounded in the contributions of EIU (2009) and Kurnia et al. (2009), National E-Readiness is defined as the enabling environment in terms of ICT infrastructures, policies, market, business attractiveness, consumers ICT spending and use, e-business and e-government initiatives, political and economic stabilities and provision of a clear roadmap for technological adoption by the citizens and organisations, provided by the country in which an organisation operates. The hypotheses developed were:
H11: National E-Readiness contributes significantly and positively to organisational readiness for emerging technology adoption (server virtualisation).
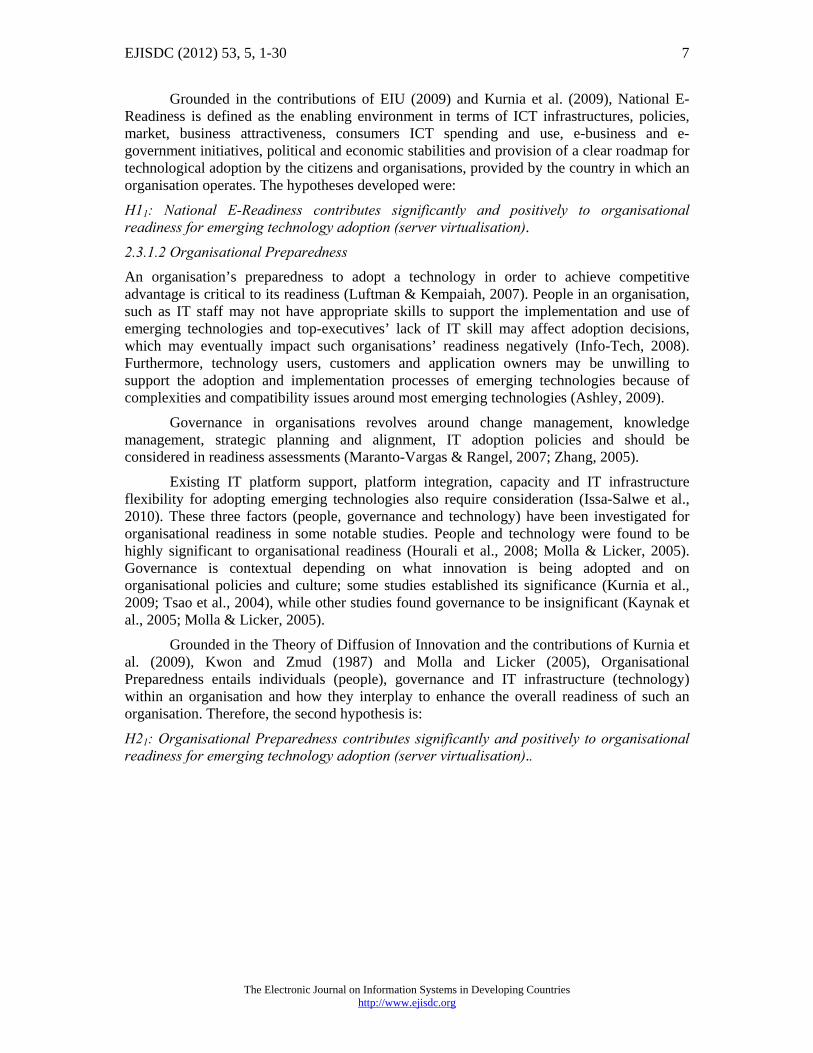
2.3.1.2 Organisational Preparedness
An organisation’s preparedness to adopt a technology in order to achieve competitive advantage is critical to its readiness (Luftman & Kempaiah, 2007). People in an organisation, such as IT staff may not have appropriate skills to support the implementation and use of emerging technologies and top-executives’ lack of IT skill may affect adoption decisions, which may eventually impact such organisations’ readiness negatively (Info-Tech, 2008). Furthermore, technology users, customers and application owners may be unwilling to support the adoption and implementation processes of emerging technologies because of complexities and compatibility issues around most emerging technologies (Ashley, 2009).
Governance in organisations revolves around change management, knowledge management, strategic planning and alignment, IT adoption policies and should be considered in readiness assessments (Maranto-Vargas & Rangel, 2007; Zhang, 2005).
Existing IT platform support, platform integration, capacity and IT infrastructure flexibility for adopting emerging technologies also require consideration (Issa-Salwe et al., 2010). These three factors (people, governance and technology) have been investigated for organisational readiness in some notable studies. People and technology were found to be highly significant to organisational readiness (Hourali et al., 2008; Molla & Licker, 2005). Governance is contextual depending on what innovation is being adopted and on organisational policies and culture; some studies established its significance (Kurnia et al., 2009; Tsao et al., 2004), while other studies found governance to be insignificant (Kaynak et al., 2005; Molla & Licker, 2005).
Grounded in the Theory of Diffusion of Innovation and the contributions of Kurnia et al. (2009), Kwon and Zmud (1987) and Molla and Licker (2005), Organisational Preparedness entails individuals (people), governance and IT infrastructure (technology) within an organisation and how they interplay to enhance the overall readiness of such an organisation. Therefore, the second hypothesis is:
H21: Organisational Preparedness contributes significantly and positively to organisational readiness for emerging technology adoption (server virtualisation)..

EJISDC (2012) 53, 5, 1-30
The Electronic Journal on Information Systems in Developing Countries http://www.ejisdc.org
8
Organisational Readiness
Figure 2: Conceptual NOIIE Readiness Framework Showing Hypotheses
2.3.1.3 Industrial Relationships
The role of the technology provider to influence organisations’ decision to use such technology cannot be over-emphasised (Molla & Licker, 2005). For instance, awareness is observed to be significant in organisations’ readiness to use technologies (Kurnia et al., 2009; Mutula & van Brakel, 2006). Availability of technologies and reliability to fulfil intended use are other imperatives (Bajgoric, 2006). Technical support from the technology provider should also be considered (Bajgoric, 2006). Industrial relationships were found as insignificant to organisational readiness due to a number of factors such as lack of awareness of technology and enabling environment (national e-readiness) (Kurnia et al., 2009; Molla & Licker, 2005). Based partly on the TOE Framework of Tornatzky and Fleischer (1990) and contributions of Kurnia et al. (2009) and Molla and Licker (2005), Industrial Relationship is defined as the mutual and continuous business relationships between a technology provider (vendor) and the user (organisation) in such a way that mutual benefits and cost effectiveness are achieved. Thus, the third hypothesis:
H31: Industrial Relationships contribute significantly and positively to organisational readiness for emerging technology adoption (server virtualisation).Figure 2 highlights the hypotheses in the NOIIE model.
2.3.1.4 Internal Resistance
It has been observed that the success of adoption of a technology by organisations depends among other things, on the people within such organisations (Kurnia et al., 2009). People within an organisation may resist the adoption of a technology due to several reasons such as perceived security risk in using such technology and perceived job loss, or loss of control as a result of adoption of such technology (Hourali et al., 2008; Kwahk & Lee, 2008). Thus, internal resistance is an extraneous factor that may influence an organisation’s preparedness to adopt a new or emerging technology.
National E-Readiness
External Influence
Industrial Relationships
Internal Resistance
Emerging Technology Adoption
(Server Virtualisation)
Organisational
Preparedness H3
H2 H4
H5
H1

EJISDC (2012) 53, 5, 1-30
The Electronic Journal on Information Systems in Developing Countries http://www.ejisdc.org
9
Based on the contribution of Lapointe and Rivard (2005), Internal Resistance is defined as the opposition to adoption of a technology due to perceived negative impact of the technology on existing IT infrastructure (incompatibility), lack of skill to manage the technology and lack of IT skill to support adoption decisions within an organisation. Therefore the fourth hypothesis is:
H41: Internal Resistance influences organisational preparedness for emerging technology adoption (server virtualization) negatively.
2.3.1.5 External Influence
The influence to accept or reject a technology may come from external organisations or other business associates (Kurnia et al., 2009; Molla & Licker, 2005). An organisation may be influenced to adopt a technology if peer organisations are adopting the technology and such an organisation is moved by the need to remain competitive (Kuan & Chau, 2001). Similarly, business associates can exert influence on organisations by recommending or requesting such organisations to adopt certain technologies (Gibbs & Kraemer, 2004). Thus, external influence is another extraneous factor that should be examined for its influence on organisational readiness.
Grounded partly on the TOE framework and the contribution of Kurnia et al. (2009), External Influence is defined in this context as the pressure exerted on an organisation by peer organisations and business associates to adopt a technology. Therefore, the fifth hypothesis is:
H51: External Influence influences organisational preparedness for emerging technology adoption (server virtualisation) positively.
3. RESEARCH METHODOLOGY
This study was largely quantitative by method and adopted a positivist stance (Orlikowski and Baroudi, 1991). The study was both explanatory and predictive as it attempted to test a conceptual framework (NOIIE) in a bid to widen “the predictive understanding of” organisational readiness for emerging technologies (Myers, 2010, p. 2).
Data was gathered through an online survey and a questionnaire. Questions were based on the readiness areas of the NOIIE conceptual framework. A 7-point Likert scale was chosen after a considerable factor analysis for grouping of questions (Bell, 2005). A 7-point Likert scale unlike 5-point, allows respondents to have a broad range of options to choose from, ensures responses are not unnecessarily skewed and allows for rigorous analysis (Hussey & Hussey, 1997).
Respondents were selected because they understand the phenomena being investigated (Hussey & Hussey, 1997). A total of 1500 invites were sent out to IT executives in South African organisations, in order to provision for an adequate response rate. Respondents were selected based on their relevant knowledge of the phenomena being investigated (Hussey & Hussey, 1997). Poor response rates have been a major limitation to quantitative survey studies (Cycyota & Harrison, 2006).
A total of 124 organisations responded, accounting for an 8% response rate. Eighty three responses were useful and 41 questionnaires were rejected. The questionnaires rejected contained blank responses, or were completed by an unqualified person, for example the executive had passed the survey on to a subordinate. Several emails were received from organisations that did not participate.

EJISDC (2012) 53, 5, 1-30
The Electronic Journal on Information Systems in Developing Countries http://www.ejisdc.org
10
To answer the two research questions, the magnitude and algebraic signs of the beta coefficients and the p values were examined. A factor was accepted to contribute significantly if the resultant p value was less than or equal to 0.05.
Questions on national e-readiness were drawn based on the EIU’s (2009) e-readiness assessment framework, while questions on all other sections were drawn form the literature. The questions were drawn on a 7-point Likert scale and were chosen after a considerable factor analysis for grouping of questions (Bell, 2005; Hussey & Hussey, 1997). A copy of the research questionnaire is provided in Appendix A. Table 2 shows a summary of the sources of the measures and how these correspond to hypotheses and research questions.
Table 2: Sources of the NOIIE measures
Readiness areas (NOIIE)
Data requirement Research hypotheses being addressed
Section of the questionnaire and question numbers
Internet Connectivity H1 Section C, Items 1-3 Business Environment H1 Section C, Items 4, 6-8 Legal Environment H1 Section C, Item 10 Government Policy & Vision
H1 Section C, Items 5, 9, 11
National E-Readiness (N)
Consumer & Business Adoption
H1 Section C, Items 12-16
People H2 Section B, Questions 22-23, 28
Governance H2 Section B, Questions 11, 24-27, 29
Organisational Preparedness (O)
Technology H2 Section B, Questions 18-21
Product Awareness H3 Section B, Questions 30
Availability & Reliability H3 Section B, Questions 31-32
Service Level Support H3 Section B, Questions 33-34
Product License H3 Section B, Questions 35
Industrial Relationships (I)
Drive for Competitiveness
H3 Section B, Questions 36-37
Internal Resistance (I)
Internal Resistance H4 Section B, Questions 38-41
External Influence (E)
External Influence H5 Section B, Questions 42-43
Others Server virtualisation implementation overview, Demographic Data analysis, enablers and inhibitors and benefits and drawbacks of server virtualisation
Section A, Section, Section D Questions 1-7, Questions 8-9

EJISDC (2012) 53, 5, 1-30
The Electronic Journal on Information Systems in Developing Countries http://www.ejisdc.org
11
4. ANALYSIS AND FINDINGS
4.1 Demographic Information
One hundred and twenty organisations participated in the survey and 83 organisations cutting across sectors banking and finance, IT, telecommunications, government, retail, education and research and manufacturing have adopted and implemented server virtualisation. Sixty one percent of the organisations that have adopted server virtualisation were large organisations, 22% were medium and 17% were small organisation and cut across major provinces in South Africa such as Western Cape (84%) and Gauteng (10%). The remaining organisations were from other provinces including KwaZulu-Natal. IT executives such as IT Managers (33%), Senior IT Officers (17%) and Chief Information Officers (11%) formed the larger proportion of the respondents.
4.2 Research Framework Test
The descriptive statistics are shown in Table 3. Forty two out of the 59 indicators of the research instrument met the convergent validity criteria and were chosen for analysis of the NOIIE framework and for testing the hypotheses. Furthermore, the 83 responses from the organisations using server virtualisation formed the sample size.
Table 3: Descriptive Statistics
LATENT VARIABLES INDICATORS Mean Std. Deviation
SERVER VIRTUALISATION
SV 1 5.94 .874 SV 2 5.82 1.084 SV 3 5.64 1.143 SV 4 5.46 1.451 SV 5 5.81 1.184 SV 6 5.93 .947 SV 7 5.90 1.165 SV 8 5.73 1.344 SV 9 5.65 1.029 SV 10 5.58 1.037SV 11 5.14 1.106 SV 12 5.22 1.148
NATIONAL E-READINESS
NER 1 2.78 1.631 NER 2 2.14 1.415 NER 3 2.94 1.484 NER 4 3.58 1.531NER 5 3.60 1.388 NER 6 2.95 1.545 NER 7 3.12 1.477 NER 8 3.29 1.502 NER 9 3.75 1.395 NER 10 3.52 1.434 NER 11 3.63 1.479 NER 12 3.48 1.603 NER 13 3.12 1.477 NER 14 3.80 1.512 NER 15 3.36 1.330NER 16 3.05 1.489
ORGANISATIONAL PREPAREDNESS
OR 2 5.14 1.515 OR 3 5.28 1.417 OR 6 5.49 1.417 OR 11 4.63 1.737
INDUSTRIAL RELATIONSHIPS
IRL 1 5.57 1.026IRL 2 5.83 .881 IRL 3 5.53 .888 IRL 4 5.39 .935 IRL 5 5.61 .908
INTERNAL RESISTANCE
IRS 1 4.31 1.667 IRS 2 3.88 1.580 IRS 3 4.10 1.605
EXTERNAL INFLUENCE EIF 1 3.81 1.410 EIF 2 4.72 1.564

EJISDC (2012) 53, 5, 1-30
The Electronic Journal on Information Systems in Developing Countries http://www.ejisdc.org
12
Table 3 reveals that the indicators were close to the mean and suggests that the indicators were not widely spread from the latent variables they were measuring.
Similarly, an assessment in the WarpPLS software, of the variance inflation factor was made in order to check for multicollinearity or redundancy among the latent variables that were postulated to influence another latent variable and the results are as shown in Table 4.
Table 4: Variance Inflation Factors
Dependent variables Independent variables
National E-Readiness
Organisational Preparedness
Industrial Relationships
Internal Resistance
External influence
Server Virtualisation
1.125 1.118 1.089
Organisational Preparedness
1.125 1.125
Multicollinearity is a measure of the correlation between the predictors of a variable (Kock, 2011). In other words, the latent variables (at least two) that predict another latent variable are highly correlated (close to being the same). The results presented in Table 4 indicate that the indicators on each independent variable were not multicollinear as they were not measuring the same thing on the different constructs against their respective dependent variable. A value that is lower than 5 is generally acceptable to determine multicollinearity among latent variables (Hair et al., 1987).
4.3 Measurement Model Assessment
The research instrument was tested for reliability, convergent validity and discriminant validity. The three tests have been widely used in major IS research in order to ensure that a research instrument is dependable and consistent (Henseler et al., 2009; Urbach & Ahlemann, 2010).
4.3.1 Reliability Test
Table 5 shows the results of the NOIIE construct reliability test. WarpPLS 2.0 was used to test the reliability of the research instrument in order to ensure that measures are free from error and therefore yield consistent results (Fornell & Larcker, 1981). Two measures, namely; Cronbach’s alpha and composite reliability are widely used to determine item reliability. Cronbach’s alpha is weak for its underestimation of internal consistency reliability of latent variables in PLS-based SEM, as it assumes that all indicators have equal reliability (Urbach & Ahlemann, 2010). Composite reliability on the other hand, takes the Cronbach’s alpha deficiency into consideration by treating indicators as having different loadings and is recommended (Henseler et al., 2009). A measurement instrument has good reliability if either the composite reliability or Cronbach’s alpha coefficient is equal to or greater than 0.7 (Fornell & Larcker, 1981; Urbach & Ahlemann, 2010).

EJISDC (2012) 53, 5, 1-30
The Electronic Journal on Information Systems in Developing Countries http://www.ejisdc.org
13
Table 5: Results of Construct Reliability Assessment
R-squared coefficients Server virtualisation
National E-Readiness
Organisational Preparedness
Industrial Relationships
Internal Resistance
External Influence
0.45 0.12 Composite reliability coefficients Server virtualisation
National E-Readiness
Organisational Preparedness
Industrial Relationships
Internal Resistance
External Influence
0.915 0.932 0.860 0.875 0.888 0.843 Cronbach alpha coefficients Server virtualisation
National E-Readiness
Organisational Preparedness
Industrial Relationships
Internal Resistance
External Influence
0.897 0.921 0.799 0.821 0.808 0.627 Average variances extracted Server virtualisation
National E-Readiness
Organisational Preparedness
Industrial Relationships
Internal Resistance
External Influence
0.475 0.465 0.612 0.585 0.727 0.728
The results in Table 5 demonstrate that the research instrument passed the reliability assessment as the latent variables all loaded above 0.7. The External Influence variable has a Cronbach’s alpha coefficient score of 0.627 and composite reliability coefficient score of 0.843. From the analysis provided in Table 3, the mean and standard deviation scores of the two items measuring External Influence were adequate. However, External Influence is the only latent variable in the NOIIE framework with least items and this may account for the low Cronbach’s alpha of 0.627. Since the composite reliability is more suitable to PLS-based SEM and the External Influence composite score was 0.843, the survey instrument was considered to be consistent with the results obtained (Henseler et al., 2009).
4.3.2 Discriminant Validity Test
Discriminant validity is the extent to which items in a measurement instrument differentiate among measures or measure distinct concepts (Fornell & Larcker, 1981). The square roots of the average variances extracted of each variable displayed at the bottom of Table 5 were taken and the resulting values are displayed in bold along the diagonal of Table 6. If the items associated with a measure correlate more highly with other items of the same measure in the model, then the measure is said to have adequate discriminant validity (Fornell & Larcker, 1981). The values on the diagonal exceed values below them in the same column and in the same row in Table 6 and the associated p values indicate that the inter-correlations of most of the latent variables are significant at p<0.05 and highly significant at p<0.001. Thus, the research instrument was determined to have adequate discriminant validity.

EJISDC (2012) 53, 5, 1-30
The Electronic Journal on Information Systems in Developing Countries http://www.ejisdc.org
14
Table 6: Latent Variable Correlations
Server National Organisational Industrial Internal External Virtualisation E-Readiness Preparedness Relationships Resistance Influence Server Virtualisation
0.689 p=1.000
National E-Readiness
0.361 p<0.001***
0.682 p=1.000
Organisational Preparedness
0.496 p<0.001***
0.236 P=0.031*
0.782 p=1.000
Industrial Relationships
0.414 P<0.001***
0.332 P=0.002**
0.189 p=0.087
0.765 p=1.000
Internal Resistance
0.183 P=0.098
-0.087 P=0.435
0.172 P=0.120
0.051 p=0.646
0.853 p=1.000
External Influence
0.229 P=0.037*
-0.126 P=0.258
0.253 p=0.021*
-0.017 p=0.880
0.507 p<0.001***
0.853 p=1.000
Note: Significance at: p<0.05*, p<0.01**, p<0.001***
4.3.3 Convergent Validity Test
Convergent validity is the extent to which items forming a construct combine together when compared to “items measuring different constructs” (Urbach & Ahlemann, 2010, p 19). Table 7 provides the results of the convergent validity test. An instrument has good convergent validity if the respondents answered the research questionnaire in the same way and in the way intended by the researcher (Hair et al., 1987).
The research instrument for our study comprised a total of 59 indicators. Seventeen items measure Server Virtualisation, 16 items measure National E-Readiness, 14 items measure Organisational Preparedness, 6 items measure Industrial Relationships, 4 items measure Internal Resistance and 2 items measure External Influence. The loadings in each latent variable were examined and loadings that were equal to or greater than 0.5 were determined to have good convergent validity and selected (Hair et al., 1987). All indicators that were not 0.5 and above were rejected and removed. All indicators in the National E-Readiness variable loaded adequately at initial and final readings. Indicator ‘OR 10’ met the convergent threshold of 0.5 at the initial reading, but in Table 7, after the final loadings were made and indicators were further examined for convergent validity, ‘OR 10’ in the Organisational Preparedness latent variable was dropped because it failed to meet the convergent validity threshold value of 0.5 or greater. One indicator each was dropped in Industrial Relationships and Internal Resistance variables. The 2 indicators in External Influence variable were adequate for convergent validity. Thus, 42 indicators were selected for framework analysis as shown in Table 7. The results demonstrated that since most of the items loaded, the constructs were to a reasonable extent valid.

EJISDC (2012) 53, 5, 1-30
The Electronic Journal on Information Systems in Developing Countries http://www.ejisdc.org
15
Table 7: Combined Loadings at the Final Reading
Latent Variables
Indicators Server Virtualisation
National E-Readiness
Organisational Preparedness
Industrial Relationships
Internal Resistance
External Influence
SER
VE
R V
IRT
UA
LIS
AT
ION
SV 1 0.798 SV 2 0.775 SV 3 0.736 SV 4 0.697 SV 5 0.745 SV 6 0.653 SV 7 0.684 SV 8 0.657 SV 9 0.707 SV 10 0.503 SV 11 0.596 SV 12 0.665
NA
TIO
NA
L E
-RE
AD
INE
SS
NER 1 0.531 NER 2 0.574 NER 3 0.577 NER 4 0.590 NER 5 0.761 NER 6 0.662 NER 7 0.620 NER 8 0.543 NER 9 0.732 NER 10 0.720 NER 11 0.790 NER 12 0.731 NER 13 0.731 NER 14 0.713 NER 15 0.776 NER 16 0.772
OR
GA
NIS
AT
ION
AL
P
RE
PA
RE
DN
ES
S
OR 2 0.879
OR 3 0.918
OR 6 0.666
OR 11 0.624
IND
UST
RIA
L
RE
LA
TIO
NSH
IPS IRL 1 0.696
IRL 2 0.747
IRL 3 0.821
IRL 4 0.705
IRL 5 0.844
INT
ER
NA
L
RE
SIST
AN
CE
IRS 1
0.744
IRS 2 0.919
IRS 3 0.884
EX
TE
RN
AL
IN
FL
UE
NC
E EIF 1 0.853
EIF 2 0.853
4.4 Structural Model Assessment
SEM is predominantly a testing and confirmatory analysis technique, which helps to determine causal relationships among latent and formative constructs and establish the validity of a model (Haenlein & Kaplan, 2004). SEM focuses on latent (non-measurable, unobservable and hypothetical) variables and helps to ensure that there is no bias in

EJISDC (2012) 53, 5, 1-30
The Electronic Journal on Information Systems in Developing Countries http://www.ejisdc.org
16
estimating relationships between latent variables (Eikebrokk & Olsen, 2007). Finally, SEM allows for multiple estimations on a single latent variable.
SEM was chosen for our study based on its positivist epistemological stance to investigate causal effects in linear relationships and assess and validate the NOIIE (a reflective model), which is being developed (Urbach & Ahlemann, 2010). Unlike other analysis techniques such as multiple regression, discriminant and factor analysis, SEM allows for developing and analysing complex models, is suitable for reflective and formative latent constructs, allows for predictions and embodies two sets of equations: structural model and measurement model to produce an entire structural equation model (Urbach & Ahlemann, 2010).
PLS (variance-based SEM) is ideal for investigating a relatively new phenomenon and use of newly-developed models to assess a phenomenon and for prediction, with a small sample of between thirty and one hundred (Urbach & Ahlemann, 2010). This study developed a new conceptual model (NOIIE) and used PLS to assess the antecedents for the readiness of 83 South African organisations for server virtualisation with a view to predicting the readiness of organisations in developing countries for emerging technologies. PLS makes lower demands on measurement scales and sample size (Urbach & Ahlemann, 2010). WarpPLS 2.0 estimates the strength and direction of the relationships in the NOIIE model by determining the path (beta) coefficients and p values between latent variables and by providing the associated R2 values (coefficient of determination) which are shown in Table 5.
4.4.1 Coefficient of Determination
WarpPLS 2.0 was used to model the NOIIE framework using the Warp3 PLS regression algorithm. The bootstrapping resampling method was used in the analysis. However, the jackknifing resampling method was also used to check the level of consistency with the data sample of 83 organisations. Both bootstrapping and jackknifing resampling methods produced similar results and this confirmed the appropriateness of the resampling method used.
The R2 is the measure of “the explained variance of a latent variable relative to its total variance” (Urbach & Ahlemann, 2010, p. 21). The R2 measure is important for determining the extent to which a dependent (endogenous) variable can be predicted by one or more independent (exogenous) variables. Server virtualisation and organisational preparedness are two dependent variables in the NOIIE model as shown in Figure 3. The R2 value associated with server virtualisation is 0.45 (Figure 3). This implies that the independent variables (national e-readiness, organisational preparedness and industrial relationships), pointing at server virtualisation (the dependent variable), are explaining the dependent variable (server virtualisation) by 45% and is an acceptable moderate threshold for an endogenous variable with few exogenous variables (Henseler et al., 2009). This result however, suggests that other independent variables or additional indicators to the existing independent variables might still explain in more details the dependent variable (server virtualisation) in addition to the three variables, already identified (Cameron & Windmeijer, 1996). Similarly, organisational preparedness is predicted to be influenced by internal resistance and external influence. The R2 value of 12% (Figure 3) is also acceptable (Falk & Miller, 1992) and suggests that there may be other factors which explain influence on organisational preparedness, in addition to the two factors (internal resistance and external influence) already identified (Henseler et al., 2009).
PLS is suitable when a model is being developed and interestingly, the results suggest that the model (NOIIE) demonstrates good predictive validity (Sosik et al., 2009) and may

EJISDC (2012) 53, 5, 1-30
The Electronic Journal on Information Systems in Developing Countries http://www.ejisdc.org
17
also be expanded to accommodate more factors that contribute to, or influence the overall readiness for emerging technologies of organisations in developing countries (Urbach & Ahlemann, 2010).
4.4.2 Model Fit
The NOIIE model was also evaluated for goodness of fit in order to determine how well the NOIIE model will explain specific situations (Narsky, 2003). PLS-based SEM is known for its limitation in providing established global goodness of fit indices (Henseler et al., 2009). However, the WarpPLS 2.0 provides three basic model fit indices which are: average path coefficient (APC), average R2 (ARS) and average variance inflation factor (AVIF) (Kock, 2011). APC is the average of all the path coefficients in the inner model. WarpPLS takes all the path coefficients and averages them. WarpPLS then calculates a p value with the significance cut-off as the classic .05. ARS is the same; the average of the R2 of the inner model. AVIF is different. AVIF is the average of the variance inflation factors of the paths of the inner model. AVIF is a measure of multicollinearity. The results obtained, using the three indices were: APC=0.273, p=<0.001, ARS=0.288, p=<0.001, AVIF=1.117. If the p values associated with both the APC and ARS are lower than 0.05 and the AVIF is lower than 5, then a model is determined to have a good fit with the sample data (Kock, 2011). The outcome of these results suggests that the NOIIE model has good fit with its theoretical assumptions and the sample data.
Organisational readiness
Figure 3: NOIIE organisational readiness framework validation Note: Significance at: p<0.05*, p<0.01**, p<0.001***
External Influence
Industrial Relationships
Organisational Preparedness R2=0.12
Emerging Technology Adoption (Server
Virtualisation) R2=0.45
National E-Readiness
Internal Resistance
β =0.19 P=0.007**
β=-0.22, p = 0.030*
β =0.41, P<0.001***
β =0.21, P=0.010*
β = 0.34, P<0.001***

EJISDC (2012) 53, 5, 1-30
The Electronic Journal on Information Systems in Developing Countries http://www.ejisdc.org
18
4.4.3 Path Coefficients
Path coefficients help to determine whether the structural path from an exogenous variable to the endogenous variable is empirically supporting the theoretical assumptions between the exogenous and endogenous variables and are indicated by algebraic signs (Henseler et al., 2009). If a path coefficient has an algebraic sign that is contrary to the hypothesis formulated, then such path is determined not to support such hypothesis (Urbach & Ahlemann, 2010).
The path between national e-readiness and server virtualisation has a beta coefficient of 0.19 and a p value of 0.007. The rest of the results are shown in In Figure 3. These results suggest that all the NOIIE variables are supported by their hypotheses and were significant (Urbach & Ahlemann, 2010). Furthermore, all the path coefficients range from 0.19 through to 0.41 and met the threshold of 0.2 and this suggests that the NOIIE framework has a good fit (Chin, 1998).
4.4.4 Effect Size
An effect size is the measure of the extent to which an exogenous (independent) latent variable has a significant influence on an endogenous (dependent) latent variable (Urbach & Ahlemann, 2010). The standard measure is Cohen’s ‘f2’, which put the thresholds at 0.02 for small, 0.15 for medium and 0.35 and above, for large effects (Henseler et al., 2009). Mathematically effect size can be determined using the following notation:
f2 = R21 – R
2* / 1 - R2
1, where f2 = effect size, R21 = coefficient of determination of the full
model and R2* = coefficient of determination when a dependent variable is removed (Cohen,
1988). Table 8 shows the effect sizes of the independent variables against their respective dependent variables.
Table 8: Effect Sizes of Independent Variables
Dependent variables R2 Independent variables and effect sizes (f2) National E-Readiness
Organisational Preparedness
Industrial Relationships
Internal Resistance
External Influence
Server Virtualisation 0.45 0.05 0.25 0.18 Organisational Preparedness
0.12 0.05 0.03
In order to determine the effect size of each independent variable, the initial R21 of the
model was taken, the independent variable was removed from the model and a new value (R2
*) was determined and used in the mathematical notation to arrive at the f2 values shown in Table 8.
In Figure 3 and as shown in Table 8, the R2 values are 0.45 for Server Virtualisation and 0.12 for Organisational Preparedness. Using the f2 values in Table 8, we interpret the effect size of each independent variable. The effect size of national e-readiness (0.05) suggests that national e-readiness has a small effect on server virtualisation. In other words national e-readiness has a weak influence on server virtualisation in the overall readiness assessment of an organisation. Both the Organisational Preparedness and Industrial Relationships have a moderate effect on Server Virtualisation. The results suggest that in the overall readiness assessment of an organisation for emerging technologies, Organisational Preparedness and Industrial Relationships play moderate roles. Similarly, both Internal Resistance and External Influence have weak influences on Organisational Preparedness.

EJISDC (2012) 53, 5, 1-30
The Electronic Journal on Information Systems in Developing Countries http://www.ejisdc.org
19
4.5 Hypotheses Testing
All five hypotheses as shown in Figure 3 were accepted. National e-readiness (H1) showed a highly significant and positive relationship with the dependent variable (server virtualisation). This result in conjunction with Table 8 however, reveals that national e-readiness has a small influence on the readiness of organisations for emerging technologies. This is surprising as existing knowledge suggests that national e-readiness does not contribute to organisational readiness to adopt an innovation (Kurnia et al., 2009).
Organisational preparedness (H2) significantly and positively contributes to the overall organisational readiness and has a moderate effect on the overall readiness of organisations for emerging technologies. This is consistent with the existing knowledge on IT adoption in organisations in developing countries (Hourali et al., 2008; Molla & Licker, 2005).
Industrial relationships (H3) have a highly significant positive relationship with the dependent variable (server virtualisation) and contribute significantly and positively to organisational readiness and has a moderate influence on the readiness of organisations for emerging technologies. This result is surprising as existing knowledge suggests that industrial relationships are insignificant to the overall organisational readiness (Kurnia et al., 2009; Molla & Licker, 2005).
Internal resistance (H4) negatively influences organisational preparedness. The implication of this result is that adoption of an innovation may be problematic in organisations in developing countries if the stakeholders do not buy into the adoption of such an innovation. Internal resistance however has a small effect on organisational preparedness, this confirms existing knowledge on readiness of organisations that resistance occurs if an innovation has certain potentials to change users’ behaviours and the existing systems (Kwahk & Lee, 2008; Lapointe & Rivard, 2005).
External influence (H5) has a strong positive influence on organisational preparedness. The implication is that organisations in developing countries appear to adopt innovations due to pressure from peer organisations and business associates. This is consistent with existing knowledge on readiness of organisations in developing countries (Kurnia et al., 2009; Molla & Licker, 2005).
So to sum up, the NOIIE readiness model was found to have both the measurement and structural validities. All the relationships hypothesised were found to be very significant and ranged from small through to moderate effects between the independent variables and the dependent variables.
5. DISCUSSIONS AND IMPLICATIONS
The results provided by the analysis of this study validated the proposed NOIIE readiness framework. All the null hypotheses were rejected. National e-readiness, organisational preparedness and industrial relationships were highly significant and positive contributors to organisational readiness for server virtualisation. Furthermore, the extraneous factors (internal resistance and external influence) were found to have significant influence on organisational preparedness. Thus, these extraneous factors (internal resistance and external influence) should not be ignored by organisations in assessing their readiness for emerging technologies.
The outcome of this research shows that the e-readiness of South Africa is highly significant to the readiness of its organisations, which suggests that national e-readiness is a significant and positive contributor to the organisational readiness for emerging technologies.
EJISDC (2012) 53, 5, 1-30
The Electronic Journal on Information Systems in Developing Countries http://www.ejisdc.org
20
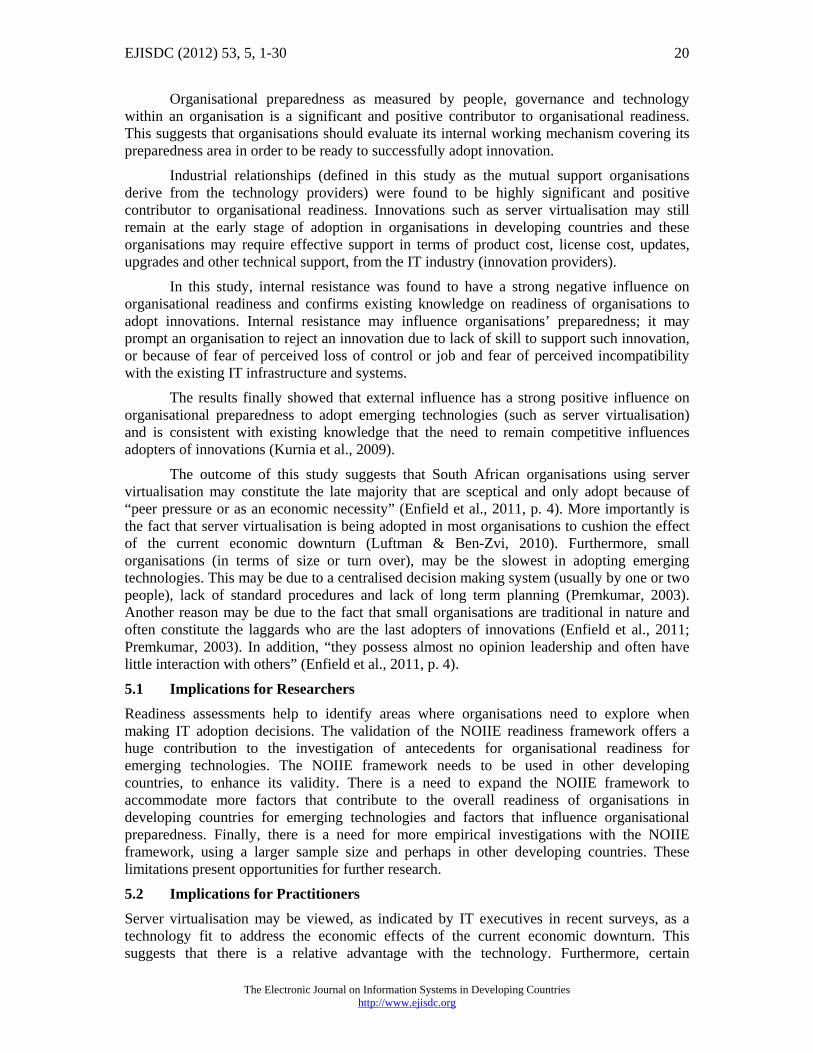
Organisational preparedness as measured by people, governance and technology within an organisation is a significant and positive contributor to organisational readiness. This suggests that organisations should evaluate its internal working mechanism covering its preparedness area in order to be ready to successfully adopt innovation.
Industrial relationships (defined in this study as the mutual support organisations derive from the technology providers) were found to be highly significant and positive contributor to organisational readiness. Innovations such as server virtualisation may still remain at the early stage of adoption in organisations in developing countries and these organisations may require effective support in terms of product cost, license cost, updates, upgrades and other technical support, from the IT industry (innovation providers).
In this study, internal resistance was found to have a strong negative influence on organisational readiness and confirms existing knowledge on readiness of organisations to adopt innovations. Internal resistance may influence organisations’ preparedness; it may prompt an organisation to reject an innovation due to lack of skill to support such innovation, or because of fear of perceived loss of control or job and fear of perceived incompatibility with the existing IT infrastructure and systems.
The results finally showed that external influence has a strong positive influence on organisational preparedness to adopt emerging technologies (such as server virtualisation) and is consistent with existing knowledge that the need to remain competitive influences adopters of innovations (Kurnia et al., 2009).
The outcome of this study suggests that South African organisations using server virtualisation may constitute the late majority that are sceptical and only adopt because of “peer pressure or as an economic necessity” (Enfield et al., 2011, p. 4). More importantly is the fact that server virtualisation is being adopted in most organisations to cushion the effect of the current economic downturn (Luftman & Ben-Zvi, 2010). Furthermore, small organisations (in terms of size or turn over), may be the slowest in adopting emerging technologies. This may be due to a centralised decision making system (usually by one or two people), lack of standard procedures and lack of long term planning (Premkumar, 2003). Another reason may be due to the fact that small organisations are traditional in nature and often constitute the laggards who are the last adopters of innovations (Enfield et al., 2011; Premkumar, 2003). In addition, “they possess almost no opinion leadership and often have little interaction with others” (Enfield et al., 2011, p. 4).
5.1 Implications for Researchers
Readiness assessments help to identify areas where organisations need to explore when making IT adoption decisions. The validation of the NOIIE readiness framework offers a huge contribution to the investigation of antecedents for organisational readiness for emerging technologies. The NOIIE framework needs to be used in other developing countries, to enhance its validity. There is a need to expand the NOIIE framework to accommodate more factors that contribute to the overall readiness of organisations in developing countries for emerging technologies and factors that influence organisational preparedness. Finally, there is a need for more empirical investigations with the NOIIE framework, using a larger sample size and perhaps in other developing countries. These limitations present opportunities for further research.
5.2 Implications for Practitioners
Server virtualisation may be viewed, as indicated by IT executives in recent surveys, as a technology fit to address the economic effects of the current economic downturn. This suggests that there is a relative advantage with the technology. Furthermore, certain

EJISDC (2012) 53, 5, 1-30
The Electronic Journal on Information Systems in Developing Countries http://www.ejisdc.org
21
drawbacks such as network and storage and disaster recovery complexities, associated with server virtualisation implementation, suggest that adopting organisations should endeavour to establish at an early stage the compatibility of the emerging technologies with their own standard IT/IS systems. The learning curve associated with every innovation tells how quickly and easily the innovation can be understood and implemented (Ashley, 2009). Thus, there is a need to determine the complexity associated with server virtualisation before adoption takes place.
It is however, pertinent to note that adopters may seek to try innovations before the full adoption decision is made, or the implementation is conducted (Enfield et al., 2011). Thus, supporting industries (vendors) should make virtualisation software available to organisations for test implementations. In addition, the trial ability characteristic of innovations suggests that it is advantageous to implement server virtualisation in a test environment before actual deployment in a production environment (Uddin & Rahman, 2011). Finally, adopting organisations need to determine whether they are fully achieving all the advertised benefits of server virtualisation and if the drawbacks are being addressed.
ACKNOWLEDGEMENTS
The authors would like to thank Professor Michael Kyobe and Dr Brewster Jonathan for their assistance.
6. REFERENCES
Ajzen, I. (1991) The Theory of Planned Behaviour, Organisational Behaviour and Human Decision Processes, 50, 179-211.
Ajzen, I. & Fishbein, M. (1975) Belief, Attitude, Intention and Behaviour: An Introduction to Theory and Research. Reading: Addison-Wesley.
Al-Solbi, A. & Mayhew, P.J. (2005) Measuring E-readiness Assessment in Saudi Organisations: Preliminary Results from a Survey Study. Proceedings of the1st European Conference on Computer Network Defence, 467-475, Wales: Springer.
Ashley, S.R. (2009) Innovation Diffusion: Implications for Evaluation. New Directions for Evaluation, 124, 35-45.
Bajgoric, N. (2006) Information Technologies for Business Continuity: An Implementation Framework, Journal of Information Management and Computer Security, 14(5), 450-466.
Bell, J. (2005) Doing your Research Project: A Guide for First-Time Researchers in Education, Health and Social Science (4th ed.) Berkshire: Open University.
Cameron, A.C. & Windmeijer, F. A. (1996) R-Squared Measures for Count Data Regression Models with Applications to Health-Care Utilization. Journal of Business & Economic Statistics, 14(2), 209-220.
Cegielski, C.G., Reithel, B.J. & Rebman, C.M. (2005) Emerging Information Technologies: Developing a Timely IT Strategy. Communications of the ACM, 48(8), 113-117.
Chin, W.W. (Ed.) (1998) Issues and Opinion on Structural Equation Modeling, MIS Quarterly, 22(1), vii-xvi.
Cohen, J. (1988) Statistical Power Analysis for the Behavioural Sciences (2nd ed.) Hillsdale, NJ: Lawrence Earlbaum Associates.
Cooper, R.B. & Zmud, R. W. (1990) Information Technology Implementation Research: A Technological Diffusion Approach, Management Science, 36(2), 123-139.
Cotteleer, M.J. & Bendoly, E. (2006) Order Lead-Time Improvement Following Enterprises Information Technology Implementation: An Empirical Study. MIS Quarterly, 30(3), 643-660.

EJISDC (2012) 53, 5, 1-30
The Electronic Journal on Information Systems in Developing Countries http://www.ejisdc.org
22
Cycyota, C.S. & Harrison, D.A. (2006) What (Not) to Expect when Surveying Executives: A Meta-Analysis of Top Manager Response Rates and Techniques over Time. Organizational Research Methods, 9(2), 133-160.
Dada, D. (2006) E-readiness for Developing Countries: Moving the Focus from the Environment to the Users. The Electronic Journal on Information Systems in Developing Countries, 27(6), 1-14.
Davis, F.D., Bagozzi, R.P. & Warshaw, P.R. (1989) User Acceptance of Technology: A Comparison of Two Theoretical Models. Management Science, 35(8), 982-1003.
Dube, L. & Pare, G. (2003) Rigor in Information Systems Positivist Case Research: Current Practices, Trends and Recommendations, MIS Quarterly, 27(4), 597-635.
Eikebrokk, T.R. & Olsen, D.H. (2007) An Empirical Investigation of Competency Factors Affecting E-business Success in European SMEs, Information and Management, 44, 364-383.
EIU (2008) E-readiness Rankings 2008: Maintaining the Momentum. New York: The Economist.
EIU (2009) E-readiness Rankings 2009: The Usage Imperative. New York: The Economist. El Sawy, O.E. & Pavlou, P.A. (2008) IT-enabled Business Capabilities for Turbulent
Environments. MIS Quarterly Executive, 7(3), 139-150. Enfield, J., Myers, R.D., Lara, M. & Frick, T.W. (2011) Innovations Diffusion: Assessment
of Strategies within the Diffusion and Simulation Game,. Simulation and Gaming, 20(10), 1-27.
Falk, R.F. & Miller, N.B. (1992) A Primer for Soft Modeling. Akron, OH: University of Akron Press.
Fathian, M., Akhavan, P. & Hoorali, M. (2008) E-readiness Assessment of Non-profit ICT SMEs in a Developing Country: The Case of Iran. Technovation, 28, 578-590.
Fornell, C. & Larcker, D.F. (1981) Evaluating Structural Equation Models with Unobservable variables and measurement error. Journal of Marketing Research, 18(1), 39-50.
Gibbs, J.L. & Kraemer, K.L. (2004) A Cross-Country Investigation of the Determinants of Scope of E-commerce Use: An Institutional Approach. Electronic Markets, 12(2), 124-137.
Haenlein, M. & Kaplan, A.M. (2004) A Beginner's Guide to Partial Least Squares Analysis. Understanding Statistics, 3(4), 283-297.
Hair, J.F. anderson, R.E. & Tatham, R.L. (1987) Multivariate Data Analysis. New York, NY: Macmillan.
Hanafizadeh, P., Hanafizadeh, M.R. & Khodabakhshi, M. (2009) Taxonomy of E-readiness Assessment Measures, International Journal of Information Management, 29, 189-195.
Henseler, J., Ringle, C.M. & Sinkovics, R.R. (2009) The Use of Partial Least Squares Path Modeling in International Marketing, Advances in International Marketing, 20, 277-320.
Hourali, M., Fathian, M., Montazeri, A. & Hourali, M. (2008) A Model for E-readiness Assessment of Iranian Small and Medium Enterprises, Journal of Faculty of Engineering (of Teheran University), 41(7), 969-985: http://journals.ut.ac.ir/page/download-avWev2-zH1U.artdl
Hussey, J. & Hussey, R. (1997) Business Research: A Practical Guide for Undergraduate and Postgraduate Students. London: Macmillan.
Ifinedo, P. (2005) Measuring Africa's E-readiness in the Global Networked Economy: A Nine-Country Data Analysis, International Journal of Education and Development Using ICT, 1(1), 1-19.

EJISDC (2012) 53, 5, 1-30
The Electronic Journal on Information Systems in Developing Countries http://www.ejisdc.org
23
Info-Tech. (2008) Business and Operational Assessment for Virtual Server Implementation. Canada: Info-Tech Research.
Issa-Salwe, A., Ahmed, M., Aloufi, K. & Kabir, M. (2010) Strategic Information Systems Alignment: Alignment of IS/IT with Business Strategy, Journal of Information Processing Systems, 6(1), 121-128.
Javadi, M.M. & Gharakani, A. (2008) Evaluating Iran's Progress in ICT Sector Using E-readiness Index, A System Dynamic Approach. Proceedings of the 26th International Conference of the System Dynamics Society, 1-23, Athens: Curran Associates.
Jensen, R. (2007) The Digital Provide: Information (Technology), Market Performance and Welfare in the South Indian Fisheries Sector, The Quarterly Journal of Economics, 122(3), 879-924.
Kaplan, B. & Duchon, D. (1988) Combining Qualitative and Quantitative Methods in Information Systems Research: A Case Study. MIS Quarterly, 12(4), 571-586.
Kaynak, E., Tatoglu, E. & Kula, V. (2005) An Analysis of the Factors Affecting the Adoption of Electronic Commerce by SMEs: Evidence from an Emerging Market. International Marketing Review, 22(6), 623-640.
Klein, H.K. & Myers, M.D. (1999) A Set of Principles for Conducting and Evaluating Interpretive Field Studies in Information Systems, MIS Quarterly, 23(1), 67-94.
Kock, N. (2011) Using WarpPLS in E-collaboration Studies: Descriptive Statistics, Settings and Key Analysis Results. International Journal of e-Collaboration, 7(2), 1-18.
Kuan, K.K. & Chau, P.Y. (2001) A Perception-Based Model for EDI Adoption in Small Businesses Using a Technology-Organization-Environment Framework. Information and Management, 38, 507-521.
Kurnia, S., Alzougool, B., Ali, M. & Alhashmi, S. M. (2009) Adoption of Electronic Commerce Technologies by SMEs in Malaysia. Proceedings of the 42nd Hawaii International Conference on System Sciences, 1-10, California: IEEE Computer Society.
Kwahk, K.-Y. & Lee, J.N. (2008) The Role of Readiness for Change in ERP Implementation: Theoretical Bases and Empirical Validation. Information and Management, 45, 474-481.
Kwon, T.H. & Zmud, R.W. (1987) Unifying the Fragmented Models of Information Systems Implementation, in Boland, R. & Hirschheim, R. (Eds.), Critical Issues in Information Systems Research. New York: Wiley.
Lapointe, L. & Rivard, S. (2005) A Multilevel Model of Resistance to Information Technology Implementation, MIS Quarterly, 29(3), 461-491.
Latham, S. (2009) Contrasting Strategic Response to Economic Recession in Start-up Versus Established Software Firms. Journal of Small Business Management, 47(2), 180-201.
Lucas, H.C., Swanson, E.B. & Zmud, R.W. (2007) Implementation, Innovation and Related Themes over the Years in Information Systems Research, Journal of the Association for Information Systems, 8(4), 206-210.
Luftman, J. & Ben-Zvi, T. (2010) Key issues for IT Executives 2009: Difficult Economy's Impact on IT. MIS Quarterly Executive, 9(1), 49-59.
Luftman, J. & Kempaiah, R. (2007) An Update on Business-IT Alignment: "A Line" has been Drawn. MIS Quarterly Executive, 6(3), 165-177.
Maranto-Vargas, D. & Rangel, R.G.-T. (2007) Development of Internal Resources and Capabilities as Sources of Differentiation of SME under Increased Global Competition: A Field Study in Mexico. Technological Forecasting and Social Change, 74, 90-99.
Maugis, V., Choucri, N., Madnick, S.E., Siegel, M.D., Gillet, S.E., Haghseta, F., Zhu, H.W. & Best, M.L. (2003) Global e-readiness - for what? Cambridge: Massachusetts
EJISDC (2012) 53, 5, 1-30
The Electronic Journal on Information Systems in Developing Countries http://www.ejisdc.org
24
Institute of Technology: http://web.mit.edu/polisci/nchoucri/publications/articles/G-7_Choucri_Global_eReadiness_for_What.pdf
Molla, A. & Licker, P. (2005) Perceived E-readiness Factors in E-commerce Adoption: An Empirical Investigation in a Developing Country. International Journal of Electronic Commerce, 10(1), 83-110.
Mustonen-Ollila, E. & Lyytinen, K. (2003) Why Organizations Adopt Information System Process Innovation: A Longitudinal Study Using Diffusion of Innovation Theory. Information Systems Journal, 13, 275-297.
Mutula, S.M. & van Brakel, P. (2006) An Evaluation of E-readiness Assessment Tools with Respect to Information Access: Towards an Integrated Information Rich Tool. International Journal of Information Management, 26, 212-223.
Myers, M.D. (2010) Qualitative Research in Information Systems. http://www.qual.auckland.ac.nz
Narsky, I. (2003) Goodness of Fit: What do we Really Want to Know? Proceedings of the PHYSTAT 2003, 70-74, Stanford: SLAC.
Orlikowski, W.J. & Baroudi, J.J. (1991) Studying Information Technology in Organizations: Research Approaches and Assumptions. Information Systems Research, 2(1), 1-28.
Premkumar, G. (2003) A Meta-Analysis of Research on Information Technology Implementation in Small Business, Journal of Organizational Computing and Electronic Commerce, 13(2), 91-121.
Raghuram, S. (2009) Pro-Poor Development in Crisis: Combating Economic Recession and Market Fundamentalism. Development, 52(3), 349-355.
Ram, J. & Pattinson, M. (2009) Exploring Antecedents of Organisational Adoption of ERP and their Effect on Performance of Firms, 17th European Conference on Information Systems, Verona.
Ray, E. & Schultz, E. (2009) Virtualization Security. 5th Annual Workshop on Cyber Security and Information Intelligence Research: Cyber Security and Information Intelligence Challenges and Strategies, Knoxville.
Rogers, E. (2003) Diffusion of Innovations (5th ed.) New York: Free Press. Sosik, J.J., Kahai, S.S. & Piovoso, M.J. (2009) Silver Bullet or Voodoo Statistics?: A Primer
for Using the Partial Least Squares Data Analytic Techniques in Group and Organization Research. Group and Management, 34(1), 5-36.
Tornatzky, L.G. & Fleischer, M. (1990) The Processes of Technological Innovation. Massachusetts: Lexington Books.
Tsao, H., Lin, K. & Lin, C. (2004) An Investigation of Critical Success Factors in the Adoption of B2B EC by Taiwanese Companies. Journal of American Academy of Business, 5(1), 198-202.
Uddin, M. & Rahman, A.A. (2011) Virtualization Implementation Model for Cost Effective and Efficient Data Centers. International Journal of Advanced Computer Science and Applications, 2(1), 69-74.
Urbach, N. & Ahlemann, F. (2010) Structural Equation Modeling in Information Systems Research Using Partial Least Squares. Journal of Information Technology Theory and Application, 11(2), 5-40.
Uzoka, F.-M.E., Shemi, A.P. & Seleka, G.G. (2007) Behavioral Influence on E-commerce Adoption in a Developing Country, Electronic Journal on Information Systems in Developing Countries, 31(4), 1-15.
Venkatesh, V., Morris, M.G., Davis, G.B. & Davis, F.D. (2003) User Acceptance of Information Technology: Towards a Unified View. MIS Quarterly, 27(3), 425-478.

EJISDC (2012) 53, 5, 1-30
The Electronic Journal on Information Systems in Developing Countries http://www.ejisdc.org
25
Zhang, M.J. (2005) Information Systems, Strategic Flexibilities and Firm Performance: An Empirical Investigation, Journal of Engineering and Technology Management, 22, 163-184.

EJISDC (2012) 53, 5, 1-30
The Electronic Journal on Information Systems in Developing Countries http://www.ejisdc.org
26
Appendix A: Research Questionnaire
Section A
Server Virtualisation Implementation
(Type (x) in the appropriate box)
Has your organisation implemented server virtualisation? Have implemented extensively
Pilot implementation
Plans to implement in the next 12 months
Have not investigated
Limited implementation
Plans to implement in the next 6 months
Have investigated but no firms plans
Section B
Please indicate your level of agreement with each of the following server virtualisation factors:
(Type (x) in the appropriate box)
Str
ongl
y D
isag
ree
Dis
agre
e
Dis
agre
e so
mew
h
Neu
tral
Agr
ee
som
ewh
Agr
ee
Str
ongl
y A
gree
1 Server virtualisation reduces our organisation's Total Cost of Ownership (TCO) and improves its Return on Investment (ROI)
2 Our organisation reduces costs on power and cooling as result of server virtualisation implementation
3 Our organisation cuts its carbon footprint as a result of server virtualisation implementation
4 Our organisation achieves less down times as a result of server virtualisation implementation
5 Server virtualisation improves our organisation's disaster recovery capability
6 Our organisation achieves more efficiency in CPU utilisation as a result of server virtualisation implementation
7 Virtual machines are quicker to re-configure and deploy
8 Our organisation gained more floor space in its data centre as a result of

EJISDC (2012) 53, 5, 1-30
The Electronic Journal on Information Systems in Developing Countries http://www.ejisdc.org
27
server virtualisation implementation 9 Server virtualisation provides for a
better management through central environment control
10 Server virtualisation is the backbone technology in cloud computing services
11 It is better to implement and manage server virtualisation through outsourcing services than in-sourcing
12 Server virtualisation implementation helps organisations to reduce the effects of economic downturn such as cut in IT budgets
13 Virtual servers are more vulnerable to malicious attack than stand-alone servers
14 Virtual sprawl could arise from uncontrolled deployments of virtual servers
15 Skill set scarcity affects successful management of virtual server environments
16 Cost of virtualisation software is critical to server virtualisation implementation
17 Server virtualisation deployments create licensing legal risks
18 Our organisation's current server computers do not have good hardware support for virtualisation
19 Our IT infrastructures do not have good platform support for virtualisation
20 Virtualisation software has limited multi-monitor support within virtual machines
21 Our organisation must purchase new server hardware in order to implement server virtualisation
22 Our organisation's IT department has the expertise to support server virtualisation
23 Our organisation's top-executives have relevant IT skills to support IT decisions
24 Our organisation is very critical about Business and IT alignment
25 Disaster Recovery and High

EJISDC (2012) 53, 5, 1-30
The Electronic Journal on Information Systems in Developing Countries http://www.ejisdc.org
28
Availability are critical to our organisation
26 Change management is crucial to our organisation
27 Our organisation's IT policy does not support early adoption of new technologies such as server virtualisation
28 Personnel training and development programmes are crucial to our organisation
29 Clients' service level requirements are critical to our organisation
30 Virtualisation software vendors such as VMware, Microsoft, Citrix, Sun and Oracle offer product awareness
31 Virtualisation software products such as VMware, Microsoft Virtual Server, Citrix Xen, Sun xVM and Oracle VM are readily available in markets
32 Virtualisation products such as VMware, Microsoft Virtual Server, Citrix Xen, Sun xVM and Oracle VM perform to expectation
33 Virtualisation software vendors such as VMware, Microsoft, Citrix, Sun and Oracle provide products online and offline supports
34 Virtualisation software vendors such as VMware, Microsoft, Citrix, Sun and Oracle provide products update and upgrade supports
35 Our organisation virtualisation software product does not have licensing complexity
36 Our organisation moved from controlled risk to calculated risk as a result of server virtualisation implementation
37 Our organisation's business growth enhances as a result of server virtualisation implementation
38 There are IT staff in our organisation that are not interested in server virtualisation
39 There are Application Owners and Users in our organisation that are not interested in server virtualisation
40 There are certain top-executives in our

EJISDC (2012) 53, 5, 1-30
The Electronic Journal on Information Systems in Developing Countries http://www.ejisdc.org
29
organisation that are not interested in server virtualisation
41 Our organisation has mission-critical servers that are unsuitable for server virtualisation
42 Our organisation has business associates that are not interested in server virtualisation
43 Certain external organisation(s) influenced our organisation's decision to reject server virtualisation
Section C
Please rate the following e-readiness indicators for South Africa
(Type (x) in the appropriate box)
Question: How will you assess the e-readiness of South Africa in terms of the following criteria?
Poo
r
Fai
r
Ave
rage
Neu
tral
Goo
d
Ver
y G
ood
Exc
elle
nt
High broadband connectivity Low costs of broadband and bandwidth Internet Service Providers (competitiveness, secure connectivity and affordability)
Attractiveness to business investments Business laws and government policies Labour market Socio-economic stability Political stability ICT policies Business registration process Internet regulations and policies ICT use by the citizens and organisations E-Government services E-Commerce ICT investments by the citizens and organisations
E-Government participation by the citizens and organisations

EJISDC (2012) 53, 5, 1-30
The Electronic Journal on Information Systems in Developing Countries http://www.ejisdc.org
30
Section D 1. What virtualisation software has your organisation implemented?
VMware Citrix Xen Oracle VM Microsoft Virtual Server
Sun xVM Other Please specify here:
2. What sector does your organisation belong to?
Automobile Construction Internet Services
Oil & Gas/Energy
Banking & Finance Information Technology
Manufacturing Software Development/Services
Telecommunications Textile Other Please specify here:
3. Where is your organisation located in South Africa?
Eastern Cape Gauteng Limpopo Northern Cape Free State KwaZulu-Natal Mpumalanga North West Western cape
4. How many server computers do you have in your organisation? 1-10 21-30 41-50 101 - 200 11-20 31-40 51-100 More than 200
5. How many employees do you have in your organisation? 1-10 21-50 101-200 More than 250 11-20 51-100 201 - 250
6. What percentage of your organisation's annual budget goes to IT? 1-5% 11-20% 31-40% More than 50% 6-10% 21-30% 41-50%
7. What is your role in your organisation? Chief Executive Officer
IT Manager Network Administrator
IT Analyst
Chief Information Officer
Senior IT Officer Systems Manager Chief Technical Officer
Other Please specify here: 8. Please identify at least three factors that would enhance or hinder adoption of server virtualisation in developing countries' organisations ...................................................................................................................................................................................................................................................................................................... 9. What have you found to be the benefits and drawbacks of server virtualisation? ...................................................................................................................................................................................................................................................................................................... Thank you for your time and participation