
Towards a predictive cache replacement strategy for multimedia content
20
Towards a predictive cache replacement strategy for multimedia content Jeroen Famaey * , Fr´ ed´ eric Iterbeke, Tim Wauters, Filip De Turck Ghent University – IBBT, Department of Information Technology, Gaston Crommenlaan 8 bus 201, B-9050 Gent, Belgium Abstract In recent years, telecom operators have been moving away from traditional broadcast-driven television, towards IP-based interactive and on-demand mul- timedia services. Consequently, multicast is no longer sufficient to limit the amount of generated traffic in the network. In order to prevent an explosive growth in traffic, caches can be strategically placed throughout the content de- livery infrastructure. As the size of caches is usually limited to only a small fraction of the total size of all content items, it is important to accurately pre- dict future content popularity. Traditional caching strategies only take into account the past when deciding what content to cache. Recently, a trend to- wards novel strategies that actually try to predict future content popularity has arisen. In this article, we ascertain the viability of using popularity pre- diction in realistic multimedia content caching scenarios. The proposed generic popularity prediction algorithm is capable of predicting future content popular- ity, independent of specific content and service characteristics. Additionally, a novel cache replacement strategy, which employs the popularity prediction algo- rithm when making its decisions, is introduced. A detailed evaluation, based on simulation results using trace files from an actual deployed Video on Demand service, was performed. The evaluation results are used to determine the merits of popularity-based caching compared to traditional strategies. Additionally, the synergy between several parameters, such as cache size and prediction win- dow, is investigated. Results show that the proposed prediction-based caching strategy has the potential to significantly outperform state-of-the-art traditional strategies. Specifically, the evaluated Video on Demand scenario showed a per- formance increase of up to 20% in terms of cache hit rate. Keywords: multimedia content delivery, caching strategies, popularity prediction * Corresponding author, tel: +3293314938, fax: +3293314899 Email addresses: [email protected] (Jeroen Famaey), [email protected] (Tim Wauters), [email protected] (Filip De Turck) Preprint submitted to Elsevier July 14, 2012
Transcript of Towards a predictive cache replacement strategy for multimedia content

Towards a predictive cache replacement strategy formultimedia content
Jeroen Famaey∗, Frederic Iterbeke, Tim Wauters, Filip De Turck
Ghent University – IBBT, Department of Information Technology,Gaston Crommenlaan 8 bus 201, B-9050 Gent, Belgium
Abstract
In recent years, telecom operators have been moving away from traditionalbroadcast-driven television, towards IP-based interactive and on-demand mul-timedia services. Consequently, multicast is no longer sufficient to limit theamount of generated traffic in the network. In order to prevent an explosivegrowth in traffic, caches can be strategically placed throughout the content de-livery infrastructure. As the size of caches is usually limited to only a smallfraction of the total size of all content items, it is important to accurately pre-dict future content popularity. Traditional caching strategies only take intoaccount the past when deciding what content to cache. Recently, a trend to-wards novel strategies that actually try to predict future content popularityhas arisen. In this article, we ascertain the viability of using popularity pre-diction in realistic multimedia content caching scenarios. The proposed genericpopularity prediction algorithm is capable of predicting future content popular-ity, independent of specific content and service characteristics. Additionally, anovel cache replacement strategy, which employs the popularity prediction algo-rithm when making its decisions, is introduced. A detailed evaluation, based onsimulation results using trace files from an actual deployed Video on Demandservice, was performed. The evaluation results are used to determine the meritsof popularity-based caching compared to traditional strategies. Additionally,the synergy between several parameters, such as cache size and prediction win-dow, is investigated. Results show that the proposed prediction-based cachingstrategy has the potential to significantly outperform state-of-the-art traditionalstrategies. Specifically, the evaluated Video on Demand scenario showed a per-formance increase of up to 20% in terms of cache hit rate.
Keywords: multimedia content delivery, caching strategies, popularityprediction
∗Corresponding author, tel: +3293314938, fax: +3293314899Email addresses: [email protected] (Jeroen Famaey),
[email protected] (Tim Wauters), [email protected](Filip De Turck)
Preprint submitted to Elsevier July 14, 2012

1. Introduction
The proliferation of interactive, personalized and on-demand television ser-vices is causing an increasing need for bandwidth in telecom operator networks.Obviously, broadcasting or multicasting cannot sufficiently reduce bandwidthconsumption of on-demand multimedia services. Proxy caching, which had al-ready been widely employed in the delivery of web content, has been proposedas a way of offloading bottleneck links [1] in on-demand scenarios. Caches arestrategically placed throughout the network and store a subset of the availablecontent. However, the size of such caches is usually limited, so they are onlycapable of storing a fraction of available content. Therefore, it is very importantto accurately predict the future popularity of content, so that the most popularitems, or item segments, can be offered closer to the end-users.
Over the years, many caching strategies have been proposed. Traditionalstrategies, such as Least Recently Used (LRU) and Least Frequently Used(LFU), assume that what was most popular in the past, will also be most popu-lar in the future. However, the popularity of multimedia content is known to behighly dynamic [2]. Consequently, caching efficiency can be further increased bytaking these dynamics into account and actually try to predict future popularityinstead of directly applying historical information.
Predicting the future popularity of individual multimedia content items canbe reduced to a time series prediction problem [3]. Several efforts have beenmade to apply this theory to the prediction of multimedia content popularity [4,5]. However, to our knowledge, these predictions have never been integratedinto an actual cache replacement strategy. Additionally, the effect of importantparameters, such as the prediction window size, has not yet been thoroughlyevaluated.
This article presents a generic popularity prediction algorithm. In contrastto existing algorithms, it is not tailored to a specific service. The predictionalgorithm fits a set of functions to the cumulative request pattern of contentitems. These fitted curves are then used as an approximated model of therequest pattern. Through extrapolation the future of the request pattern canthen be estimated. Subsequently, we present a novel prediction-based cachereplacement strategy. It uses the predicted request patterns to determine thesubset of all available content to store in the cache. Additionally, to assessthe theoretical maximal gain in caching efficiency that can be achieved usingpredictions, a theoretical variant is also presented. It assumes the future can beperfectly predicted.
The proposed cache replacement strategies are thoroughly evaluated andcompared to traditional strategies that directly employ historical information.The goal of this evaluation is to determine both the theoretical and practical gainin caching efficiency that can be achieved using popularity prediction. More-over, the effect of the prediction window parameter is assessed. This parameteris defined as the future time-frame that is predicted (i.e., the counterpart of thehistory window parameter of LFU). The effect of this parameter is influenced bythe cache size. Therefore, the synergy between these parameters is thoroughly
2

evaluated. In order to increase the applicability and validity of the presented re-sults, all evaluations are performed using a trace of an actual deployed Video onDemand (VoD) service of a leading European telecom operator. This gives ourevaluations more leverage and credibility than those performed on syntheticallygenerated datasets. The ultimate goal of this study is to show that popular-ity prediction indeed improves caching efficiency and to determine under whatcircumstances it achieves the most optimal result.
The remainder of this article is structured as follows. Section 2 gives a morein depth description of existing work on popularity prediction of multimediacontent. Section 3 presents our proposed generic popularity prediction algorithmand cache replacement strategy that uses it. Subsequently, Section 4 evaluatesthe proposed cache replacement strategy using simulation results. Finally, thepaper is concluded in Section 5.
2. Related work
The large size and stringent sequential delivery demands of multimedia con-tent have caused a push towards novel caching strategies. Traditional cachingstrategies have been adapted to operate on individual content segments insteadof entire items [6, 7]. This allows the caches to better utilize the sequentialnature of multimedia content demand patterns. Additionally, such techniquesbetter map to the skewed internal popularity of multimedia content. Yu etal. [8] argue that selecting a suitable segment size is a complex problem andtherefore propose an alternative solution that models the internal popularity ofmultimedia streams independent of segment size. Kim and Das [9] further ex-tended the work on segment-based caching, by way of an analytical model thatexploits the temporal locality and popularity of content. Guo et al. [10] studieda prefix caching method that exploits the fact that the beginning of a movie ismore popular than the ending. Their algorithm automatically determines theoptimal number of segments from the beginning of each movie that should becached, based on the internal popularity distribution of the movie. Certain IP-TV services have specific properties that can be exploited by caching strategies.For example, the use of sliding-window caches has been proposed in the contextof time-shifted TV services [11]. In line with our work, these techniques aim toimprove caching efficiency. Nevertheless, they focus on a different aspect, whichfalls outside the scope of this article.
In the field of time series prediction, a wide range of techniques have beendeveloped for forecasting all sorts of time series. Recently, machine learningtechniques, such as support vector machines and artificial neural networks havebeen applied to this problem [12, 13]. Recently, wyffels et al. [14] have usedreservoir computing, a form of recurrent neural networks, for time series pre-diction. Additionally, time series often exhibit repeating trends and periodicaleffects. For example, multimedia content request patterns often show repeat-ing effects on a daily and weekly basis. The use of wavelet decomposition hasbeen proposed to decompose time series into signals with dynamics in differentscales. This has been shown to simplify prediction with neural network based
3

techniques [15]. This approach was also successfully combined with reservoircomputing [16].
Recently, several studies have been conducted on modelling the popularityof multimedia content. These studies can be split into two types. A first typefocuses on characterizing the popularity distribution among different multimediaobjects, while the second type focuses on modelling the popularity evolution ofindividual multimedia files.
A popularity distribution among multiple multimedia objects models thestatic popularity relationship between the content items offered by a multime-dia service. It can be used to derive the probability that the content item witha specific popularity index (e.g., the Xth most popular item) will be requested.Many models have been proposed for modelling the popularity distribution ofa multimedia service, including Zipf [17], Zipf-Mandelbrot [18], stretched expo-nential [19], Zipf with exponential cut-off tail [20], power-law with exponentialcut-off tail [21], log-logistic [22] and Weibull [22].
Other research has focused on modelling the dynamic popularity evolutionof individual content items. It thus allows the request evolution of content tobe estimated, based on historical request information. This latter type of re-search is also the focus of our work. Most work on this topic was performedin the context of video-sharing services such as YouTube. Cha et al. [20, 23]found that there is a strong correlation between the popularity of a video aftertwo days and after ninety days. These observations were supported by a studyperformed by Szabo et al. [5]. More recently, Chatzopoulou et al. [24] studiedthe correlation between popularity and a wider range of metrics. They foundthat the popularity of a video is highly correlated with the amount of postedcomments, ratings and favourites. Figueiredo et al. [25] characterised the popu-larity evolution of YouTube videos. They found that several different categoriesexist that exhibit distinct popularity evolutions. For example, copyright pro-tected videos got most of their views early in their lifetime. Additionally, theyidentified and quantified the main referrers that lead users to videos, as theyare key mechanisms in attracting users and thus highly influence popularityevolutions. An alternative approach was proposed by Avramova et al. [4]. Theyfound that YouTube video popularity traces follow several different distribu-tions, such as power-law or exponential. An analytical model is devised thatpredicts the distribution associated with specific popularity traces. Jamali andRangwala [26] studied the evolution of popularity on the social news websiteDigg. Based on comment data and the co-participation network, they are ableto accurately predict the future popularity of any news item shortly after it hasbeen posted. In the context of VoD services, De Vleeschauwer & Laevens [2]propose a prediction method based on a generic user-demand model derivedfrom traces of VoD and catch-up TV services. Wu et al. [27] adapted the pre-viously mentioned reservoir computing approach to the popularity predictionof multimedia content. Niu et al. [28] employ time-series analysis techniquesto predict future content popularity, online population, peer upload and serverbandwidth consumption in peer-to-peer VoD streaming systems. Specifically,they use an algorithm based on the Box-Jenkins approach [29] to predict fu-
4

ture popularity and regression methods to infer initial popularity evolutions offlash-crowds. In summary, some work has been done on the modelling and pre-diction of content popularity evolution. However, these previous studies havenot applied this work to content caching. This application is the focus of ourwork.
This article extends previous work by ourselves [30], where the theoreticalvariant of the predictive cache replacement strategy was presented. Here, apractical prediction algorithm is proposed and combined with the previouslyintroduced strategy. This additionally allows us to characterise the influence onperformance of prediction errors.
3. Prediction-based caching
This section describes the proposed generic prediction-based caching strat-egy. The strategy consists of two parts; an algorithm to predict content popu-larity (cf. Section 3.1) and a caching strategy that determines what content tocache based on these predictions (cf. Section 3.2). The remainder of this sectiongives an in-depth overview of these two parts.
3.1. Predicting content popularity
This section presents a generic algorithm to predict the content popularityevolution of multimedia content. Concretely, the prediction algorithm estimatesthe evolution of the content’s cumulative request pattern, based on historicalinformation. It uses non-linear optimization techniques to fit a given set ofmodels to the historical input data. These fitted models can subsequently beused to extrapolate the request pattern’s future evolution. The remainder ofthis section provides a more in depth and formal overview of the algorithm.
Given is a cumulative request pattern Rc (t), which is a function of time rep-resenting the total number of perceived requests of content object c up to timet. The goal of the popularity prediction algorithm is to estimate the value ofRc (t1) at some future point in time t1 > t, given the value of Rc (t2) for (a rep-resentative sample of) all moments in time t2 ≤ t. The algorithm approximatesthe request history up to time t2 with a set of popularity distribution modelsD. A popularity distribution D (t) ∈ D is a function of time that mathemat-ically models request patterns. It is characterized by a set of parameters PD.The presented algorithm supports an arbitrary set of popularity distributions.However, we have identified four that cover a wide range of request patterns:
• Constant: This distribution is capable of modelling unpopular contentthat receives no or very few requests over long periods of time. Addition-ally, it supports the modelling of a constant request rate. Its parameterset PD consists of two parameters a and b, which respectively representthe slope and intercept. The associated cumulative distribution representsthe linear function and is expressed as follows:
D (t, a, b) = a× t+ b (1)
5
• Power-law: Allows the modelling of steep changes in popularity. It hasbeen previously proposed in literature as a model for cumulative requestpatterns of multimedia content [4]. It is characterized by two parameters,C and α, which respectively represent the normalization constant andscaling factor. The cumulative distribution function is defined as follows:
D (t, C, α) = C × tα (2)
• Exponential: In contrast to power-law, this distribution is used to modelmore rounded and slow changes in popularity. Its parameter set consistsof the scale parameter α and rate parameter λ. The scale parameter αspecifies the value that the distribution asymptotically approaches, whilethe rate parameter λ influences the steepness of the slope (and thus pop-ularity increase). The cumulative distribution function is expressed asfollows:
D (t, α, λ) = α(1− e−λt
)(3)
• Gaussian: This distribution represents an S-shaped pattern: a steepincrease in popularity pre- and succeeded by a constant request rate. It ischaracterized by the mean µ and standard deviation σ. The cumulativedistribution function is expressed as follows:
D (t, µ, σ) =1√2πσ2
∫ t
−∞e−
(x−µ)2
2σ2 dx (4)
Subsequently, every distribution D (t) is fitted to Rc (t) using an uncon-strained non-linear optimization algorithm [31, 32, 33], which is capable of find-ing the parameter values that minimize the error between D (t) and Rc (t).Throughout the rest of this article the Levenberg-Marquardt algorithm [31] isused, as it has been shown to be faster and more robust than other existingapproaches [34]. The optimization algorithm is used to find the optimal valuesP optD,c for the parameters PD that allow D (t) to best approximate Rc (t) accord-
ing to some metric. We call this metric the fitting metric. In this article, weuse the mean squared error (MSE) as a fitting metric. It measures the averageof the squares of the errors. Using this metric, the fitting algorithm minimizesthe following function when finding the optimal parameter values P opt
D,c:
f (PD) =
∑tt2=0 (Rc (t2)−D (t2, PD))
2
t(5)
Based on the optimal parameter values P optD,c of every distribution D (t) ∈ D,
a distribution Doptc (t) needs to be selected for predicting the future request
evolution of object c. This selection is made based on the quality of the fit tothe historical trace. The metric used to assess this quality is called the selectionmetric. The MSE metric could for example be used. However, as our goal isto determine the theoretical performance gain that can be achieved, we define
6

the optimal (OPT) selection metric. It selects the distribution that results inthe best absolute prediction within the prediction interval. This is obviously atheoretical metric as it uses information only available in the future. As such,it provides the theoretical upper performance limit of the presented predictionalgorithm (i.e. it assumes the best candidate distribution is always chosen). Itis calculated using the following formula:∣∣∣Rc (t1)−Rc (t)−
(D
(t1, P
optD,c
)−D
(t, P opt
D,c
))∣∣∣ (6)
Finally, the selected distribution Doptc (t) and its optimal parameters P opt
D,c areused to predict the future. More specifically, the estimated value of Rc (t1) is
defined as Doptc
(t1, P
optD,c
).
Note that time is a continuous variable. To reduce the total number ofdata points in the historical request pattern, we introduce the concept timegranularity. The time granularity θ defines the interval of the sampled datapoints in the request pattern. Concretely, the historical request pattern Rc (t)contains a sampled value for time instants {0, θ, 2θ, ..., t}. On one hand, reducingthe granularity will allow the algorithm to make more fine-grained predictions.On the other hand, this will also increase its execution time. Throughout therest of this article, a value of 1 hour is used for θ.
The algorithm is graphically illustrated by way of an example in Figure 1.It shows the request trace of an actual video in a deployed VoD system overthe course of 448 hours. The prediction algorithm was applied to the first 400hours of the trace (the known history) using the exponential and gaussian dis-tributions. The parts of the curves before the vertical line represent the fitsto known history, while the parts after the line represent the predictions. Theactual number of requests that occur in the interval [400, 448[ is 15. The expo-nential distribution predicts 14.55 requests within that interval, which is veryclose to the real value. On the other hand, the gaussian distribution predictsonly 1.25. This is also reflected in the figure, which show that the gaussian dis-tribution poorly approximates the start and end of the request pattern. Notethat when using the prediction algorithm in combination with a cache replace-ment strategy (cf. Section 3.2), the absolute prediction errors are not alwaysa good indicator for the caching performance. Instead, the relative ordering ofcontent items implied by the prediction algorithm’s output will determine theeventual caching efficiency.
3.2. Predictive cache replacement strategy
The predicted future popularity of content can be used as input for a pre-dictive cache replacement strategy. This section describes a cache replacementstrategy that uses predicted popularity to make more efficient replacement deci-sions. In contrast to traditional strategies, it uses the expected future popularityof content as a measure instead of the known historical popularity.
The proposed strategy is called Predictive Least Frequently Used (P-LFU).It is a predictive version of the LFU caching strategy. LFU keeps track of the
7

0
100
200
300
400
500
600
0 100 200 300 400cu
mul
ativ
e re
ques
t cou
nt
time (hours)
history future
request patterngaussian
exponential
Figure 1: Optimal fit of the exponential and gaussian distributions to an example cumulativerequest pattern; the vertical line represents the current point in time t, on its left is the400-hour known history, on its right the 48-hour predicted future
number of times that every object is requested. The objects that receive thehighest number of requests within a specified time frame (i.e., the history win-dow) are kept in cache [35]. In contrast, the P-LFU strategy uses the predictednumber of requests for each object, instead of the known number of requestsin the past. The objects with the most predicted number of requests in theprediction window W , are kept in cache. The prediction window is a config-urable parameter. A larger value will allow the algorithm to take into accountlonger term popularity variations, but is also more prone to prediction errors.We introduce two variants of the strategy. The first assumes the future canbe perfectly predicted. The other uses the prediction algorithm presented inSection 3.1. Throughout the rest of this article they are referred to as PerfectPredictive Least Frequently Used (PP-LFU) and Optimal-Selection PredictiveLeast Frequently Used (OP-LFU) respectively. Using the notations introducedin Section 3.1, we can define the number of estimated requests for object c attime t up to time t+W as follows for PP-LFU:
r (t,W, c) = Rc (t+W )−Rc (t) (7)
The PP-LFU strategy thus uses the actual request pattern Rc to achieve aperfect estimation. On the other hand, OP-LFU uses the optimal estimatorDopt
c :
r (t,W, c) = Doptc
(t+W,P opt
D,c
)−Dopt
c
(t, P opt
D,c
)(8)
Whenever a request arrives for object ci that is not currently cached, itreplaces the cached object cj if and only if r(W, cj) < r(W, ci) and ∀c ∈ C :r(W, cj) ≤ r(W, c), with C the set of all cached objects. Or in other words, atevery time t, the cache contains the subset of objects with the highest estimatedrequest count within the interval [t, t+W ].
8

1
10
100
1000
1 10 100 1000
requ
est c
ount
movie
(a) popularity distribution
0
1000
2000
3000
4000
0 6 12 18 24 30
requ
est c
ount
day
(b) requests per day
Figure 2: A graphical representation of the Video on Demand dataset
4. Results & discussion
This section evaluates the presented popularity prediction algorithm (cf.Section 3.1) and predictive caching strategies (cf. Section 3.2). More specifi-cally, the prediction algorithm is evaluated in terms of accuracy and executiontime. Additionally, the effect of the prediction window parameter W on cachingefficiency is studied in more detail. Finally, the predictive cache replacementstrategies are compared to the traditional LFU caching strategy [35], as well asthe theoretical optimal caching strategy MIN [36]. The MIN strategy replacesthe object in the cache whose next request occurs furthest in the future. Ithas been proven to be optimal in terms of cache hit rate [37]. It thus givesa theoretical upper bound on performance. However, it has no practical use,as the time of the next request cannot be known in advance. Throughout thisevaluation a history window of 12 hours is used for LFU. We have previouslyshown this to be a near optimal value for small cache sizes in combination withthe dataset used in this article [30]. The cache hit rate is used as an evaluationmetric. It is defined as the percentage of requests that can be served from acache, as opposed to from the origin content server.
4.1. Evaluation scenario
The dataset employed in the evaluation consists of a request trace of theVoD service of a leading European telecom operator, measured over a period of32 days between Friday February 5 2010 and Monday March 8 2010. Withinthis period, a total of 75013 requests were sent by 8392 unique users for 4971different movies. Figure 2 graphically depicts the properties of the dataset. Thepopularity distribution over the movies is shown in Figure 2a. The popularitydistribution is highly skewed. A total of 691 requests were measured for themost popular movie, while 10 or less requests were received for over 72% of allmovies. Figure 2b depicts the request count per day. The figure clearly showsthe weekly trend in the dataset. The five peaks represent the five weekends
9

part of the trace, with increased activity on Friday, Saturday and Sunday. Inaddition to the weekly pattern, there is a daily pattern (not depicted in thefigure). On weekdays, two peaks are observed. A first, smaller, peak starts asearly as 1 pm and lasts until about 5 pm. The second peak occurs during theevening from approximately 8 pm until midnight. On Saturday and Sunday,high request rates persist from 9 am until midnight.
The evaluation scenario considers a single content server and proxy cache.The topology thus consists of a content server directly connected to the proxycache. This cache is then directly connected to all end-users. The content serveris assumed to have enough disk space to host all content. The available diskspace of the proxy varies throughout the experiments and is expressed in termsof number of cached content items. The depicted cache hit rate results weremeasured in the intermediary proxy cache.
4.2. Prediction algorithm evaluation
This section evaluates the accuracy and performance of the prediction al-gorithm presented in Section 3.1. All results are depicted as a function of thehistory length. This is the length (i.e., number of data points) of the historicalrequest trace used for the curve fitting step of the algorithm.
4.2.1. Prediction accuracy
The prediction accuracy represents the error of the predicted future requestfrequency compared to the actual future request frequency. As a metric foraccuracy, the absolute prediction error is used. For a popularity distributionD ∈ D, prediction window W and distribution parameters P , it is calculated asfollows:
|Rc (t+W )−Rc (t)− (D (t+W,P )−D (t, P ))| (9)
In other words, the absolute prediction error is defined as the difference betweenthe actual number of requests and the predicted number of requests in theinterval [t, t+W ]. The goal of this section is to assess the effect of the historylength and prediction window W parameters on the prediction error. Figure 3depicts the absolute prediction error as a function of the history length forthe four different popularity distributions. Figure 4 depicts the same for theexponential distribution only, but for multiple values of the prediction windowW .
Figure 3a plots the prediction error as a function of the number of historicaldatapoints used in the curve fitting step of the prediction algorithm, averagedover all movies in the trace. On the other hand, Figure 3b depicts the predictionerror, averaged over the 250 most popular movies only. As expected, the predic-tion error decreases significantly as the number of historical datapoints grows.For a small history size (i.e., a few hours), the prediction error is very large.However, it quickly converges to the optimum. More specifically, there is nosignificant difference between the prediction after 20 hours and after 100 hours.This is obviously expected to influence performance of a predictive cache re-placement strategy, as its predictions will be less accurate for newly introduced
10

0
0.1
0.2
0.3
0.4
0.5
0 20 40 60 80 100
abso
lute
pre
dict
ion
erro
r
history length (hours)
linearpowerlawgaussian
exponential
(a) Averaged over all objects
0
0.5
1
1.5
2
0 20 40 60 80 100
abso
lute
pre
dict
ion
erro
r
history length (hours)
linearpowerlawgaussian
exponential
(b) Averaged over the 250 most popular objects
Figure 3: The absolute prediction error averaged over all objects as a function of the historyrequest pattern length for W = 1 hour
content. Additionally, comparing the two figures shows a significant differentin prediction error averaged over all movies as compared to averaged over themost popular movies. This proves that it is more difficult to predict the futureof popular content than that of unpopular content. Finally, the linear and powerlaw distributions result in the worst overall predictions. Although the differencebetween the four distributions is insignificant when averaged over all movies, itis much clearer when looking at the 250 most popular movies only. In the lattercase, the exponential and gaussian distributions clearly outperform the othertwo, resulting in much more accurate predictions (for a large enough history).
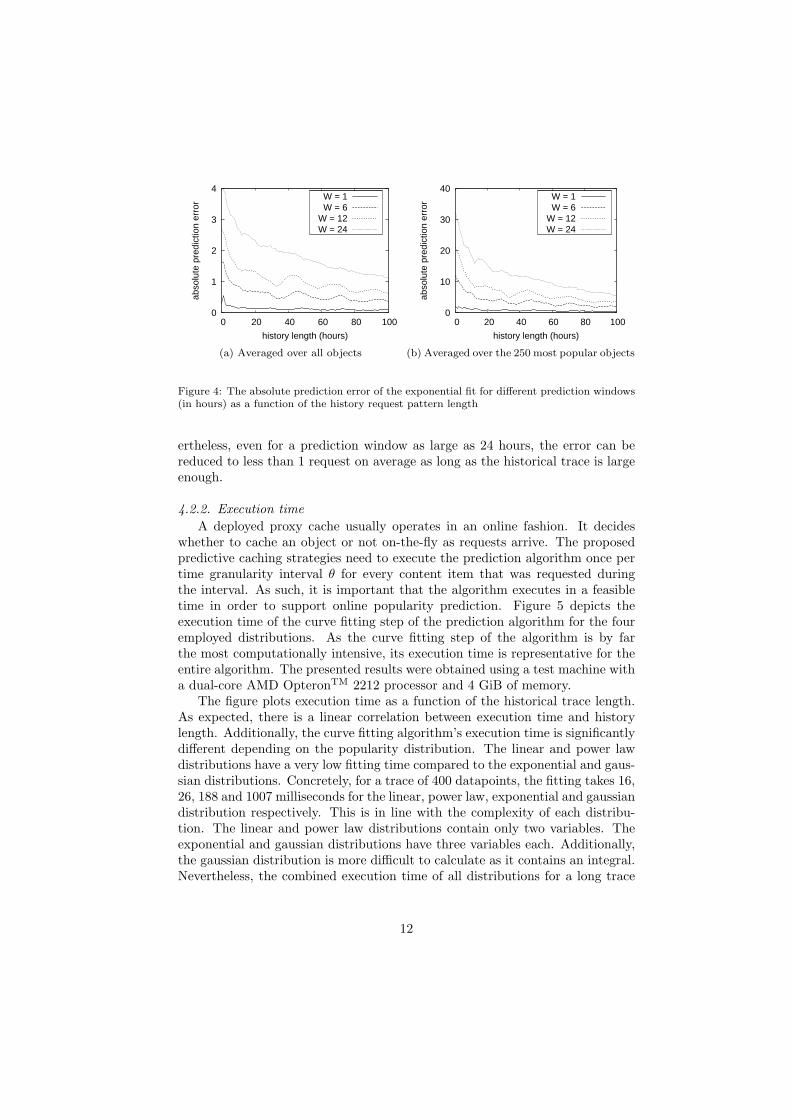
In addition to the history length, the prediction window is also expected toinfluence prediction accuracy. More specifically, a bigger prediction window isassumed to lead to larger errors, as it is easier to predict the nearby future.Figure 4a depicts the prediction error of the exponential fit as a function ofthe history length for different prediction window sizes W , averaged over allmovies. Figure 4b depicts the same, but averaged over the 250 most popularmovies only. The figures confirm our assumptions and clearly shows the directlinear connection between the prediction error and window W . However, for arequest history of more than 100 datapoints, the prediction error averaged overall movies is less than 1 request even for a prediction window of 24 hours. Forpopular content the error increases and a prediction window of 24 hours resultsin an average error of less than 6 requests for a history window of 100 datapointsor more.
In summary, the above results lead to several pertinent conclusions. First,predicting the future is very difficult if the size of the known history is small.This makes popularity prediction of newly introduced content highly error prone.However, results showed that a short history trace (e.g., 20 hours) already re-duces the error to a near optimal value. Additionally, there is a direct linearrelationship between the prediction error and the prediction window W . Nev-
11
0
1
2
3
4
0 20 40 60 80 100
abso
lute
pre
dict
ion
erro
r
history length (hours)
W = 1W = 6
W = 12 W = 24
(a) Averaged over all objects
0
10
20
30
40
0 20 40 60 80 100
abso
lute
pre
dict
ion
erro
r
history length (hours)
W = 1W = 6
W = 12 W = 24
(b) Averaged over the 250 most popular objects
Figure 4: The absolute prediction error of the exponential fit for different prediction windows(in hours) as a function of the history request pattern length
ertheless, even for a prediction window as large as 24 hours, the error can bereduced to less than 1 request on average as long as the historical trace is largeenough.
4.2.2. Execution time
A deployed proxy cache usually operates in an online fashion. It decideswhether to cache an object or not on-the-fly as requests arrive. The proposedpredictive caching strategies need to execute the prediction algorithm once pertime granularity interval θ for every content item that was requested duringthe interval. As such, it is important that the algorithm executes in a feasibletime in order to support online popularity prediction. Figure 5 depicts theexecution time of the curve fitting step of the prediction algorithm for the fouremployed distributions. As the curve fitting step of the algorithm is by farthe most computationally intensive, its execution time is representative for theentire algorithm. The presented results were obtained using a test machine witha dual-core AMD OpteronTM 2212 processor and 4 GiB of memory.
The figure plots execution time as a function of the historical trace length.As expected, there is a linear correlation between execution time and historylength. Additionally, the curve fitting algorithm’s execution time is significantlydifferent depending on the popularity distribution. The linear and power lawdistributions have a very low fitting time compared to the exponential and gaus-sian distributions. Concretely, for a trace of 400 datapoints, the fitting takes 16,26, 188 and 1007 milliseconds for the linear, power law, exponential and gaussiandistribution respectively. This is in line with the complexity of each distribu-tion. The linear and power law distributions contain only two variables. Theexponential and gaussian distributions have three variables each. Additionally,the gaussian distribution is more difficult to calculate as it contains an integral.Nevertheless, the combined execution time of all distributions for a long trace
12

0
0.2
0.4
0.6
0.8
1
0 100 200 300 400ex
ecut
ion
time
(sec
)
history length (hours)
linearpowerlawgaussian
exponential
Figure 5: The processing time required to fit a single distribution to a request pattern as afunction of the history request pattern length
of up to 400 hours long, is only about 1.2 seconds. This allows up to 3000 pop-ularity distribution updates in a one hour interval. Under more stringent timeconstraints, this time can be further reduced by either limiting the historicaldata that is taken into account, or limiting the maximum amount of iterationsthe fitting algorithm may perform. Additionally, the algorithm’s execution timeis significantly impacted by the number of variables in the popularity distribu-tions. Limiting the amount of variables in the employed distributions wouldtherefore greatly increase efficiency.
4.3. Predictive cache replacement strategy evaluation
This section evaluates the caching performance of the proposed predictivecache replacement strategies. The MIN, PP-LFU and OP-LFU cache replace-ment strategies all give an upper bound on performance. The MIN strategyachieves the optimal cache hit rate and represents the absolute upper boundon caching efficiency. The PP-LFU strategy provides the upper bound forfrequency-based prediction strategies, as it assumes the future is perfectly pre-dicted. Finally, OP-LFU uses a real prediction algorithm (and thus introducesprediction errors), but assumes the best popularity distribution is always cho-sen. It thus represents the upper bound on performance that can be achievedusing the prediction algorithm presented in Section 3.1. This section consistsof two parts. First, the optimal value of the prediction window parameter W isdetermined. Second, PP-LFU and OP-LFU are compared to to the traditionalLFU and optimal MIN strategies.
4.3.1. Prediction window parameter
The prediction window parameter allows the predictive cache replacementstrategy to adapt the future time frame that is taken into account. If this timeframe is too short the strategy runs the risk of ignoring important future pop-ularity fluctuations. However, if it becomes too long the prediction accuracysignificantly decreases and the strategy might take into account expected popu-
13

0
20
40
60
80
0 12 24 36 48
cach
e hi
trat
e (%
)
prediction window (hours)
C = 25C = 50
C = 100C = 200
(a) PP-LFU
0
20
40
60
80
0 12 24 36 48
cach
e hi
trat
e (%
)
prediction window (hours)
C = 25C = 50
C = 100C = 200
(b) OP-LFU
Figure 6: The cache hit rate as a function of the prediction window W for different cache sizesC
larity changes that are not yet relevant. The results in Figure 6 depict the cachehit rate as a function of the prediction window W for different cache sizes C.
The figure shows that there is indeed a peak in cache hitrate. Additionally,the location of this peak is directly proportional to the cache size. Compar-ing Figures 6a and 6b also proves that this is the case for both PP-LFU andOP-LFU. More specifically, for a very small cache of 25 objects, the optimalprediction window is 1 hour. As the cache size increases to 100 objects, the op-timum increases to 6 hours. Finally, for a larger cache of 200 objects, the optimalprediction window is 12 hours. The results additionally show that estimatingthe prediction window parameter value both too large or too small results indecreased performance. In the depicted results, the optimal prediction windowvalue performs up to 33% better than the worst. As such, a practical implemen-tation should intelligently adapt its prediction window parameter to the size ofthe cache, in order to prevent significant drops in performance. Throughoutthe remainder of this section, a prediction window of 12 hours is chosen, as itachieves good performance for caches of 50 or more objects.
4.3.2. Comparison with traditional strategies
This section compares the cache hit rate of the PP-LFU and OP-LFU withthat of LFU and MIN. This provides us with insights of how well predictivecaching can perform compared to a good traditional strategy (i.e., LFU) andthe theoretical optimum (i.e., MIN). Figure 7 depicts these results. As expected,MIN performs best, closely followed by PP-LFU, OP-LFU and finally LFU.
The results for PP-LFU represent the theoretical upper bound that can beachieved using a frequency-based predictive cache replacement strategy. Asthe cache size increases, its results approach the optimum more closely. Fora cache size of 50 objects, PP-LFU performs 17% worse (i.e., a cache hit ratedifference of 8.5%) than MIN, while for a cache size of 200 objects it onlyperforms 3% worse (i.e., a cache hit rate difference of 2.5%). Additionally, PP-
14

0
20
40
60
80
0 50 100 150 200ca
che
hitr
ate
(%)
cache size
LFUOP-LFUPP-LFU
MIN
Figure 7: Comparison of the different cache replacement strategies in terms of cache hit rate,as a function of cache size for W = 12 hours
LFU’s caching efficiency is considerably better than that of the traditional LFUstrategy, performing around 20% better for all depicted cache sizes.
The OP-LFU strategy gives a theoretical upper bound on cache efficiencywhen using the prediction algorithm presented in Section 3.1. In contrast toPP-LFU, it is thus subject to prediction errors, which explain the reduced per-formance of OP-LFU. For all depicted cache sizes, its caching efficiency is about10% worse than that of PP-LFU. Compared to MIN, its efficiency increases asthe cache size grows. For a small cache of 50 objects, it is up to 25% worse, whilefor a larger cache of 200 objects it is only 11% worse. Additionally, OP-LFUperforms considerably better than LFU. Its gain in efficiency even increases asthe cache size grows, with a 5% improvement for small caches up to 50 objectsand over 10% for a larger cache of 200 objects.
In summary, the presented results show that applying popularity predictionto cache replacement has the potential of significantly improving the cache hitratio compared to traditional strategies such as LFU. Theoretically, employingthe perfect prediction allowed the algorithm to improve up to 20% compared toLFU. The prediction errors introduced by an actual prediction algorithm basedon curve fitting reduced the maximum performance gain to 10%.
5. Conclusion
The goal of this article was to investigate the merits of using popularity pre-diction techniques in cache replacement strategies. To this end, we proposed anovel generic popularity prediction algorithm. It estimates the future popularityof multimedia content by fitting a set of popularity distributions to the knownrequest history. The set of popularity distributions can be adapted to fit thecharacteristics of the multimedia service to which it is applied. Additionally,a predictive variant of the Least Frequently Used cache replacement strategy,called P-LFU, is proposed. It uses the predicted future request frequency todetermine what content to cache. Two theoretical versions of P-LFU are con-sidered. PP-LFU assumes the future can be perfectly predicted. It thus gives
15

an upper bound on performance that can be achieved using P-LFU. OP-LFUinstead employs the presented popularity prediction algorithm, but assumes thepopularity distribution that best predicts the future is selected. It thus givesan upper bound on performance that can be achieved using P-LFU, when usedin combination with the presented prediction algorithm.
A detailed simulation study, using an actual Video on Demand trace file, wasperformed in order to evaluate the merits of prediction-based cache replacement.The evaluation consists of two main components. First, the popularity predic-tion algorithm was validated. Second, PP-LFU and OP-LFU were compared, interms to cache hit rate, to LFU and the theoretical optimum. This evaluationlead to several pertinent conclusions. First, the prediction accuracy is severelyimpacted by the number of available historical datapoints. This is especially truefor very short history lengths of less than 10 datapoints. This makes predictingthe popularity of newly introduced content highly error prone. Additionally,there is a direct linear relationship between the prediction window parameterand the prediction error. Nevertheless, even for a prediction window as large as1 day, the error can be reduced to on average less than 1 request as long as theknown history is large enough. For the predictive cache replacement strategiesit was shown that the optimal value of the prediction window parameter is di-rectly proportional to the cache size. Choosing a suboptimal prediction windowwas shown to lead to performance drops of up to 33%. A practical predictivecache replacement strategy could thus automatically adapt its prediction win-dow according to changes in cache size in order to further optimize performance.Moreover, applying popularity prediction to cache replacement has the potentialof significantly improving the cache hit rate compared to traditional strategies,such as LFU. Under the assumption that the future can be perfectly predicted(i.e., PP-LFU) an improvement of up to 20% can be achieved. However, wheninstead using the actual prediction algorithm, this improvement is reduced toat most 10%.
The presented OP-LFU strategy uses information about the future popu-larity of content to select the best popularity distribution for prediction. Asthis approach is infeasible in a practical deployment, our future work consists offinding a good estimator for the selection of the optimal popularity distributionbased on historical information.
Acknowledgement
Jeroen Famaey is partly funded by the Institute for the Promotion of Inno-vation by Science and Technology in Flanders (IWT). Tim Wauters is funded bythe Fund for Scientific Research Flanders (FWO). The research leading to theseresults has received funding from the European Union’s Seventh FrameworkProgramme ([FP7/2007-2013]) under grant agreement number 248775.
16

References
[1] K. J. Ma, R. Bartos, S. Bhatia, A survey of schemes for internet-based videodelivery, Journal of Network and Computer Applications 34 (5) (2011)1572–1586. doi:10.1016/j.jnca.2011.02.00.
[2] D. De Vleeschauwer, K. Laevens, Performance of caching algorithms forIPTV on-demand services, IEEE Transactions on Broadcasting 55 (2)(2009) 491–501. doi:10.1109/TBC.2009.2015983.
[3] S. Makridakis, Time series prediction: Forecasting the future and under-standing the past, International Journal of Forecasting 10 (3) (1994) 463–466.
[4] Z. Avramova, S. Wittevrongel, H. Bruneel, D. De Vleeschauwer, Anal-ysis and modeling of video popularity evolution in various online videocontent systems: Power-law versus exponential decay, in: First Interna-tional Conference on Evolving Internet (INTERNET), 2009, pp. 95–100.doi:10.1109/INTERNET.2009.22.
[5] G. Szabo, B. A. Huberman, Predicting the popularity of on-line content, Communications of the ACM 53 (8) (2010) 80–88.doi:10.1145/1787234.1787254.
[6] K.-L. Wu, P. Yu, J. Wolf, Segmentation of multimedia streams forproxy caching, IEEE Transactions on Multimedia 6 (5) (2004) 770–780.doi:10.1109/TMM.2004.834870.
[7] S. Chen, H. Wang, X. Zhang, B. Shen, S. Wee, Segment-based proxycaching for internet streaming media delivery, IEEE Multimedia 12 (3)(2005) 59–67. doi:10.1109/MMUL.2005.56.
[8] J. Yu, C. Chou, Z. Yang, X. Du, T. Wang, A dynamic caching algorithmbased on internal popularity distribution of streaming media, MultimediaSystems 12 (2) (2006) 135–149. doi:10.1007/s00530-006-0045-x.
[9] S. Kim, C. R. Das, An analytical model for interval caching in interactivevideo servers, Journal of Network and Computer Applications 30 (1) (2007)384–413. doi:10.1016/j.jnca.2005.06.005.
[10] H. Guo, G. Shen, Z. Wang, S. Li, Optimized streaming media proxy and itsapplications, Journal of Network and Computer Applications 30 (1) (2007)265–281. doi:10.1016/j.jnca.2005.08.008.
[11] T. Wauters, W. Van de Meerssche, P. Backx, F. De Turck, B. Dhoedt,P. Demeester, T. Van Caenegem, E. Six, Proxy caching algorithms andimplementation for time-shifted TV services, European Transactions onTelecommunications 19 (2) (2008) 111–122. doi:10.1002/ett.1181.
17

[12] D. Verstraeten, B. Schrauwen, M. D’Haene, D. Stroobandt, An experimen-tal unification of reservoir computing methods, Neural Networks 20 (3)(2007) 391–403. doi:10.1016/j.neunet.2007.04.003.
[13] R. Samsundin, A. Shabri, P. Saad, A comparison of time series forecastingusing support vector machine and artificial neural network model, Journalof Applied Sciences 10 (11) (2010) 950–958. doi:10.3923/jas.2010.950.958.
[14] F. wyffels, B. Schrauwen, A comparative study of reservoir computingstrategies for monthly time series prediction, Neurocomputing 73 (2010)1958–1964. doi:10.1016/j.neucom.2010.01.016.
[15] S. Soltani, On the use of the wavelet decomposition for time se-ries prediction, Neurocomputing 48 (2002) 267–277. doi:10.1016/S0925-2312(01)00648-8.
[16] F. wyffels, B. Schrauwen, D. Stroobandt, Using reservoir computing in adecomposition approach for time series prediction, in: European Sympo-sium on Time Series Prediction, 2007, pp. 149–158.
[17] M. Breslau, L. Baum, G. Molter, S. Rothkugel, S. P., The implicationsof Zipf’s law for web caching, in: Third International Conference on WebCaching, 1998.
[18] W. Tang, Y. Fu, L. Cherkasova, A. Vahdat, Modeling and generating real-istic streaming media server workloads, Computer Networks 51 (1) (2007)336–356. doi:10.1016/j.comnet.2006.05.003.
[19] L. Guo, E. Tan, S. Chen, Z. Xiao, X. Zhang, The stretched exponentialdistribution of Internet media access patterns, in: Twenty-Seventh ACMSymposium on Principles of Distributed Computing, 2008, pp. 283–294.doi:10.1145/1400751.1400789.
[20] M. Cha, H. Kwak, P. Rodriguez, Y.-Y. Ahn, S. Moon, I tube, you tube, ev-erybody tubes: Analyzing the world’s largest user generated content videosystem, in: 7th ACM SIGCOMM conference on Internet measurement(IMC), ACM, 2007. doi:10.1145/1298306.1298309.
[21] X. Cheng, C. Dale, L. J., Understanding the characteristics of Internetshort video sharing: YouTube as a case study, in: 7th ACM SIGCOMMConference on Internet Measurements, 2007, pp. 28–36.
[22] A. Abhari, M. Soraya, Workload generation for youtube, Multimedia ToolsApplications 46 (1) (2010) 91–118. doi:10.1007/s11042-009-0309-5.
[23] M. Cha, H. Kwak, P. Rodriguez, Y.-Y. Ahn, S. Moon, Analyzing thevideo popularity characteristics of large-scale user generated content sys-tems, IEEE/ACM Transactions on Networking 17 (5) (2009) 1357–1370.doi:10.1109/TNET.2008.2011358.
18

[24] G. Chatzopoulou, C. Sheng, M. Faloutsos, A first step to-wards understanding popularity in YouTube, in: IEEE Confer-ence on Computer Communications Workshops (INFOCOM), 2010.doi:10.1109/INFCOMW.2010.5466701.
[25] F. Figueiredo, F. Benevenuto, J. M. Almeida, The tube over time: char-acterizing popularity growth of YouTube videos, in: Fourth ACM Inter-national Conference on Web Search and Data Mining, 2011, pp. 745–754.doi:10.1145/1935826.1935925.
[26] S. Jamali, H. Rangwala, Digging digg: Comment mining, popular-ity prediction, and social network analysis, in: International Con-ference on Web Information Systems and Mining, 2009, pp. 32–38.doi:10.1109/WISM.2009.15.
[27] T. Wu, M. Timmers, D. De Vleeschauwer, W. Van Leekwijck, On the useof reservoir computing in popularity prediction, in: The Second Interna-tional Conference on Evolving Internet (INTERNET), 2010, pp. 19–24.doi:10.1109/INTERNET.2010.13.
[28] D. Niu, Z. Liu, B. Li, S. Zhao, Demand forecast and performance pre-diction in peer-assisted on-demand streaming systems, in: IEEE Con-ference on Computer Communications (INFOCOM), 2011, pp. 421–425.doi:10.1109/INFCOM.2011.5935196.
[29] G. E. P. Box, G. M. Jenkins, G. C. Reinsel, Time Series Analysis: Fore-casting and Control, Wiley, 2008.
[30] J. Famaey, T. Wauters, F. De Turck, On the merits of popularityprediction in multimedia content caching, in: IFIP/IEEE InternationalSymposium on Integrated Network Management (IM), 2011, pp. 17–24.doi:10.1109/INM.2011.5990669.
[31] K. Levenberg, A method for the solution of certain non-linear problemsin least squares, Quarterly Journal of Applied Mathmatics 2 (2) (1944)164–168.
[32] J. A. Nelder, R. Mead, A simplex method for function minimization, TheComputer Journal 7 (4) (1965) 308–313. doi:10.1093/comjnl/7.4.308.
[33] M. J. D. Powell, An efficient method for finding the minimum of a functionof several variables without calculating derivatives, The Computer Journal7 (2) (1964) 155–162. doi:10.1093/comjnl/7.2.155.
[34] S. Katare, A. Bhan, J. M. Caruthers, W. N. Delgass, V. Venkatasubra-manian, A hybrid genetic algorithm for efficient parameter estimation oflarge kinetic models, Computers & Chemical Engineering 28 (12) (2004)2569–2581. doi:10.1016/j.compchemeng.2004.07.002.
19

[35] N. Megiddo, D. S. Modha, Outperforming LRU with an adap-tive replacement cache algorithm, Computer 37 (4) (2004) 58–65.doi:10.1109/MC.2004.1297303.
[36] J. Gecsei, D. R. Slutz, I. L. Traiger, Evaluation techniques for storage hier-archies, IBM Systems Journal 9 (2) (1970) 78–117. doi:10.1147/sj.92.0078.
[37] B. Van Roy, A short proof of optimality for the MIN cache replace-ment algorithm, Information Processing Letters 102 (2-3) (2007) 72–73.doi:10.1016/j.ipl.2006.11.009.
20