How Mars and the Earth’s atmosphere react differently to light and objects

Tone Sequences With Conflicting Fundamental Pitch and TimbreChanges Are Heard Differently by Musicians and Nonmusicians
Annemarie Seither-Preisler,Department of Experimental Audiology, ENT Clinic, Münster University Hospital, Münster,Germany, and Department of Psychology, Cognitive Science Section, University of Graz, Graz,Austria
Katrin Krumbholz,MRC Institute of Hearing Research, Nottingham, England
Roy Patterson,Centre for the Neural Basis of Hearing, Department of Physiology, University of Cambridge
Linda Johnson, andDepartment of Experimental Audiology, ENT Clinic, Münster University Hospital, Münster,Germany
Andrea NobbeMED-EL GmbH, Innsbruck, Austria
Stefan Seither and Bernd LütkenhönerDepartment of Experimental Audiology, ENT Clinic, Münster University Hospital, Münster,Germany
AbstractAn Auditory Ambiguity Test (AAT) was taken twice by nonmusicians, musical amateurs, andprofessional musicians. The AAT comprised different tone pairs, presented in both within-pairorders, in which overtone spectra rising in pitch were associated with missing fundamentalfrequencies (F0) falling in pitch, and vice versa. The F0 interval ranged from 2 to 9 semitones.The participants were instructed to decide whether the perceived pitch went up or down; noinformation was provided on the ambiguity of the stimuli. The majority of professionals classifiedthe pitch changes according to F0, even at the smallest interval. By contrast, most nonmusiciansclassified according to the overtone spectra, except in the case of the largest interval. Amateursranged in between. A plausible explanation for the systematic group differences is that musicalpractice systematically shifted the perceptual focus from spectral toward missing-F0 pitch,although alternative explanations such as different genetic dispositions of musicians andnonmusicians cannot be ruled out.
Keywordspitch perception; missing fundamental frequency; auditory learning; musical practice; AuditoryAmbiguity Test
Copyright 2007 by the American Psychological Association
Correspondence concerning this article should be addressed to Annemarie Seither-Preisler, Department of Psychology, CognitiveScience Section, University of Graz, Universtätsplatz 2, Graz A-8010, Austria. [email protected].
Europe PMC Funders GroupAuthor ManuscriptJ Exp Psychol Hum Percept Perform. Author manuscript; available in PMC 2010 February15.
Published in final edited form as:J Exp Psychol Hum Percept Perform. 2007 June ; 33(3): 743–751. doi:10.1037/0096-1523.33.3.743.
Europe PM
C Funders A
uthor Manuscripts
Europe PM
C Funders A
uthor Manuscripts

The sounds of voiced speech and of many musical instruments are composed of a series ofharmonics that are multiples of a low fundamental frequency (F0). Perceptually, suchsounds may be classified along two major dimensions: (a) the fundamental pitch, whichcorresponds to F0 and reflects the temporal periodicity of the sound and (b) the spectrum,which may be perceived holistically as a specific timbre (brightness, sharpness) oranalytically in terms of prominent frequency components (spectral pitch). Under naturalconditions, fundamental and spectral pitch typically change in parallel. For example, thesharpness of a voice or an instrument becomes more intense for higher notes.
Fundamental pitch sensations occur even when the F0 is missing from the spectrum. Thisphenomenon has fascinated both auditory scientists and musicians since its initialdescription in 1841 (Seebeck). The perception of the missing F0 plays an important role inthe reconstruction of animate and artificial signals and their segregation from the acousticbackground. It enables the tracking of melodic contours in music and prosodic contours inspeech, even when parts of the spectra are masked by environmental noise or are simply nottransmitted, as in the case of the telephone, in which the F0 of the voice is commonly notconveyed. In early theories, researchers argued that the sensation had a mechanical origin inthe auditory periphery (Fletcher, 1940; Schouten, 1940). However, recent neuroimagingstudies from different groups, including our lab, suggest that pitch processing involves boththe subcortical level (Griffiths, Uppenkamp, Johnsrude, Josephs, & Patterson, 2001) and thecortical level (Bendor & Wang, 2005; Griffiths, Buchel, Frackowiak, & Patterson, 1998;Krumbholz, Patterson, Seither-Preisler, Lammertmann, & Lütkenhöner, 2003; Patterson,Uppenkamp, Johnsrude, & Griffiths, 2002; Penagos, Melcher, & Oxenham, 2004; Seither-Preisler, Krumbholz, Patterson, Seither, & Lütkenhöner, 2004, 2006a, 2006b; Warren,Uppenkamp, Patterson, & Griffiths, 2003). The strong contribution of auditory cortexsuggests that fundamental pitch sensations might be subject to learning-induced neuralplasticity. Indirect evidence for this assumption comes from psychoacoustic studies, whichshow that the perceived salience of the F0 does not depend only on the stimulus spectrumbut also on the individual listener (Houtsma & Fleuren, 1991; Renken, Wiersinga-Post,Tomaskovic, & Duifhuis, 2004; Singh & Hirsh, 1992; Smoorenburg, 1970). Surprisingly,the authors of these studies did not address the reasons for the observed interindividualvariations. In the present investigation, we took up this interesting aspect and focused on therole of musical competence. It might be expected that musical training has an influence inthat it involves the analysis of harmonic relations at different levels of complexity, such assingle-tone spectra, chords, and musical keys. Moreover, it involves the simultaneoustracking of different melodies played by the instruments of an orchestra.
The findings presented here confirm the above hypothesis and demonstrate, for the firsttime, that the ability to hear the missing F0 increases considerably with musical competence.This finding suggests that even elementary auditory skills undergo plastic changesthroughout life. However, differences in musical aptitude, constituting a genetic factor,might have had an influence on the present observations, as well.
ExperimentMethod
Participants—Participants who had not played a musical instrument after the age of 10years were considered nonmusicians. Participants with limited musical education whoregularly (minimum of 1 hr per week during the past year) practiced one or moreinstruments were classified as musical amateurs. Participants with a classical musicaleducation at a music conservatory and regular practice were considered professionalmusicians. All in all, we tested 30 nonmusicians (M = 30.9 years of age; 23 women, 7 men);31 amateurs (M = 28.6 years of age, M = 12 years of musical practice; 24 women, 7 men);
Seither-Preisler et al. Page 2
J Exp Psychol Hum Percept Perform. Author manuscript; available in PMC 2010 February 15.
Europe PM
C Funders A
uthor Manuscripts
Europe PM
C Funders A
uthor Manuscripts

and 18 professionals (M = 31.2 years of age; M = 23.8 years of musical practice; 11 women,7 men). The inhomogeneous group sizes reflect the fact that we had to exclude aconsiderable proportion of nonmusicians and amateurs from our final statistical analysis, inwhich only those participants with low guessing probability were accounted for (seeSimulation-Based Correction for Guessing and Data Reanalysis section). Table 1 lists theinstruments (voice included) played by the amateurs and professionals at the onset ofmusical activity (first instrument) and at the time of the investigation (actual majorinstrument).
Auditory Ambiguity Test (AAT)—The AAT consisted of 100 ambiguous tone sequences(50 different tone pairs presented in both within-pair orders) in which a rise in the spectrumwas associated with a missing F0 falling in pitch and vice versa (see Figure 1). Each tonehad a linearly ascending and descending ramp of 10 ms and a plateau of 480 ms. The timeinterval between two tones of a pair was 500 ms, and the time interval between twosuccessive tone pairs was 4,000 ms. The sequences were presented in a prerandomized orderin 10 blocks, each of which comprised 10 trials. The participants had to assess, in a two-alternative forced-choice paradigm, whether the pitch of a tone sequence went up or down.The score that could be achieved in the AAT varied from 0 (100 spectrally based responses)to 100 (100 F0-based responses). The stimuli were generated by additive synthesis throughuse of a freeware programming language (C-sound, Cambridge, MA). They werenormalized so that they had the same root-mean-square amplitude value.
The tones of a pair had one of the following spectral profiles: (a) low-spectrum tone: 2nd–4th harmonic, high-spectrum tone: 5th–10th harmonic, N = 17 tone pairs; (b) low-spectrumtone: 3rd–6th harmonic, high-spectrum tone: 7th–14th harmonic, N = 17 tone pairs; and (c)low-spectrum tone: 4th–8th harmonic, high-spectrum tone: 9th–18th harmonic, N = 16 tonepairs. Note that the frequency ratio between the lowest and highest frequency component ofa tone was always 1:2, corresponding to one octave. To achieve a smooth, natural timbre, wedecreased the amplitudes of the harmonics by 6 dB per octave relative to F0. The frequencyof the missing F0 was restricted to a range of 100–400 Hz. Five different frequencyseparations of the missing F0s of a tone pair were considered: (a) ±204 cents (musicalinterval of a major second; two semitones; frequency ratio of 9:8); (b) ±386 cents (musicalinterval of a major third; four semitones; frequency ratio of 5:4); (c) ±498 cents (musicalinterval of a fourth; five semitones; frequency ratio of 4:3); (d) ±702 cents (musical intervalof a fifth; seven semitones; frequency ratio of 3:2); (e) ±884 cents (musical interval of amajor sixth; nine semitones; frequency ratio of 5:3). For each of these five intervalconditions, the type of spectral profile was matched as far as possible (each type occurringeither six or seven times). Because of the ambiguity of the stimuli (cf. Figure 1), anincreasing F0 interval was associated with a decreasing frequency separation of the overtonespectra. As the spectrum of each tone comprised exactly one octave, corresponding to aconstant range on a logarithmic scale, the spectral shift between the two tones of a pair canbe expressed in terms of a specific frequency ratio, and it does not matter whether the lowestor the highest frequency is considered. The magnitudes of spectral- and F0-based pitch shiftswere roughly balanced at the F0 interval of the fifth (frequency ratio for missing F0: 1.5;frequency ratio for spectral profile type a: 1.666; frequency ratio for spectral profile type b:1.555; frequency ratio for spectral profile type c: 1.5). For smaller F0 intervals, the shift wasrelatively larger for the spectral components, whereas for wider F0 intervals, the shift wasrelatively larger for the missing F0.
Procedure—A computer monitor informed the participants that they were about to hear100 tone sequences (50 tone pairs presented in both within-pair orders). Participants wereinstructed to decide, for each pair, whether they had heard a rising or falling pitch sequenceand to note their decision on an answer sheet. No information was provided on the
Seither-Preisler et al. Page 3
J Exp Psychol Hum Percept Perform. Author manuscript; available in PMC 2010 February 15.
Europe PM
C Funders A
uthor Manuscripts
Europe PM
C Funders A
uthor Manuscripts

ambiguous nature of the stimuli, and the participants were kept in the belief that there wasalways a correct and an incorrect response alternative. We encouraged the participants torely on their first intuitive impression before making a decision, but we allowed them toimagine singing the tone sequences or to hum them. In the case of indecision, the test blockwith the respective trial could be presented again (10 trials, each with a duration of 40.5 s).But, to keep the testing time short, the participants rarely used this option.
The test was presented via headphones (AKG K240) in a silent room at a sound pressurelevel of 60 dB. To familiarize the participants with the AAT, we presented the first testblock twice but considered only the categorizations for the second presentation. The test wasrun without feedback. The AAT was performed twice, with a short pause in between, so thatfour responses were obtained for each tone pair.
Data Analysis—The AAT scores (proportion of trials categorized in terms of the missingF0s) from the two test presentations were averaged. As the average scores were not normallydistributed, nonparametric statistics, which were based on the ranking of test values(Friedman test, Mann-Whitney U test, Kruskal-Wallis test, Spearman rank correlation,Wilcoxon signed-rank test), were used.
ResultsEffect of Musical Competence—The mean AAT scores were 45.9 in nonmusicians,61.6 in amateurs, and 81.6 in professional musicians. A Mann–Whitney U test on theranking of the achieved scores indicated that all differences between groups were highlysignificant (nonmusicians vs. amateurs, U = 275, Z = −2.7, p = .0061; nonmusicians vs.professionals, U = 76, Z = −4.1, p < .0001; amateurs vs. professionals, U = 137, Z = −2.9, p= .0032). When all participants were dichotomously categorized as either “spectral” or“missing-F0 classifiers,” the proportion of missing-F0 classifiers increased significantlywith growing musical competence: A liberal categorization criterion (AAT score either up toor above 50) resulted in χ2(2, N = 79) = 11.6, p = .0031 (see more details in Figure 2a); astricter categorization criterion (AAT score either below 25 or above 75) resulted in χ2(2, N= 61) = 12.9, p = .0016 (see more details in Figure 2b).
Effect of Interval Width—The likelihood of F0-based judgments systematically increasedwith interval width, χ2(4, N = 79) = 197.4, p < .0001; Friedman ranks: 1.3 (major second),2.3 (major third), 3.0 (fourth), 3.9 (fifth), 4.5 (major sixth). The mean proportions of F0-based decisions were 43% for the major second, 55% for the major third, 60% for the fourth,68% for the fifth, and 75% for the major sixth. The effect was significant for all threemusical competence groups: nonmusicians, χ2(4, N = 30) = 100.5, p < .0001; amateurs,χ2(4, N = 31) = 85.4, p < .0001; professionals, χ2(4, N = 18) = 20.8, p < .0003. Moredetailed results are shown in Figure 3. We again categorized participants as “spectralclassifiers” (up to 50% of F0-based classifications) and “missing-F0 classifiers” (otherwise),but now this categorization was done separately for each interval condition so that a subjectcould belong to different categories, depending on the interval. Figure 4 shows the resultsfor the three musical competence groups. For nonmusicians and amateurs, the proportion ofmissing-F0 classifiers increased gradually with F0-interval width. The equilibrium point, atwhich spectral and missing-F0 classifiers were equally frequent, was around the fifth in thesample of nonmusicians and around the major third in the sample of amateurs. For theprofessionals, there was a clear preponderance of F0 classifiers at all intervals, although lesspronounced at the major second. An equilibrium point would possibly be reached at aninterval smaller than two semitones.
Seither-Preisler et al. Page 4
J Exp Psychol Hum Percept Perform. Author manuscript; available in PMC 2010 February 15.
Europe PM
C Funders A
uthor Manuscripts
Europe PM
C Funders A
uthor Manuscripts

Spectral Profile Type—The type of spectral profile had a significant effect on theclassifications, Friedman test: χ2(2, N = 79) = 21.3, p < .0001. The mean proportion of F0-based responses was 60.8% for tone pairs of type a, 63.8% for tone pairs of type b, and55.7% for tone pairs of type c. As each trial of the AAT consisted of two tones withdifferent spectral characteristics, the effects cannot be tied down to specific parameters.Therefore, we refrain from interpreting the effect in the Discussion.
Ordering of Tone Sequences—It did not matter whether the missing F0s of the tonepairs were falling and the spectra were rising (60.1% F0-based responses) or whether themissing F0s of the tone pairs were rising and the spectra were falling (60.3% F0-basedresponses; Wilcoxon signed rank test: Z = −0.2, p = .84).
Simulation-Based Correction for Guessing and Data ReanalysisBefore drawing definite conclusions, we had to take into account that only a minority ofparticipants responded in a perfectly consistent way. Thus, the assumption is that, with acertain probability, our participants made a random decision or, in other words, they wereguessing. To check for inconsistencies in the responses, we derived two additionalparameters. By relating these parameters to the results of extensive model simulations, weestimated not only a probability of guessing but also a parameter that may be considered aguessing-corrected AAT score. After applying this correction, we will present a statisticalreanalysis.
MethodReanalysis of the Participants’ Responses—To assess the probability of guessing,we exploited the fact that tone pairs had to be judged four times (50 tone pairs presented inboth orders; AAT test performed twice). The four judgments should be identical for aperfectly performing subject, but inconsistencies are expected for an occasionally guessingsubject (one deviating judgment or two judgments of either type). To characterize a subjecton that score, we determined the percentage of inconsistently categorized tone pairs,pinconsistent. It can be expected that this parameter will monotonically increase with theprobability of guessing. The second parameter, called the percentage of inhomogeneousjudgments, pinhomogeneous, seeks to characterize a subject’s commitment to one of the twoperceptual modes. This parameter is defined as the percentage of judgments deviating fromthe subject’s typical response behavior (indicated by the AAT score). For spectralclassifiers, this is the percentage of F0-based judgments, whereas for missing-F0 classifiers,it is the percentage of spectral judgments. For reduction of the effect of guessing, thecalculation of this parameter ignored equivocally categorized tone pairs (two judgments ofeither type) and, in the case of only three identical judgments, the deviating judgment. Whilepinconsistent ranges between 0% and 100%, pinhomogeneous is evidently limited to 50%, whichis the expected value for a subject guessing all of the time or for a perfectly performingsubject without a preferred perceptual mode.
Model—Although the associations of the above parameters with the probability of guessingand the determination for one or the other perceptual mode, respectively, is evident, themethod for interpreting them in a more quantitative sense is not obvious. To solve thisproblem, we performed extensive Monte Carlo simulations. We assumed that participantsmade a random choice with probability pguess and a deliberate decision with probability 1 –pguess. The proportion of deliberate decisions in favor of F0 was specified by the parameterpF0, called the missing-F0 prevalence value. For the sake of simplicity, we assumed that pF0was the same for all tone pairs. For given parameter combinations (pguess, pF0), theinvestigation of 100,000 participants was simulated, and each virtual subject was evaluated
Seither-Preisler et al. Page 5
J Exp Psychol Hum Percept Perform. Author manuscript; available in PMC 2010 February 15.
Europe PM
C Funders A
uthor Manuscripts
Europe PM
C Funders A
uthor Manuscripts

in exactly the same way as a real subject. This means that for each virtual subject, we finallyobtained a parameter pair (pinconsistent, pinhomogeneous). Note that the prevalence values pF0and 100%-pF0 yield identical results in this model so that simulations can be restricted tovalues 0 ≤ pF0 ≤ 50%. An example of the simulated results (four specific groups ofparticipants; AAT with 50 tone pairs) is shown in Figure 5. The two axes represent thepercentages of inconsistent and inhomogeneous categorizations, respectively. Each symbolcorresponds to 1 virtual subject. Four clusters of symbols, each representing a specific groupof participants, can be recognized. The center of a cluster is marked by a cross; it representsthe two-dimensional (2D) median derived by convex hull peeling (Barnett, 1976). Becausethe percentage of inconsistent classifications is between 0 and 100, corresponding to twicethe number of tone pairs in the test, the clusters are organized in columns at regular intervalsof 2%. The cluster at the upper right corresponds to participants guessing all of the time(pguess of 100%), whereas the cluster at the lower left corresponds to a population of almostperfectly performing participants (pguess of 10%) with a missing-F0 prevalence pF0 of 0%(or 100%). As long as pguess is relatively small, the value derived for pinhomogeneous istypically distributed around pF0 or 100% – pF0. The other two clusters in Figure 5 wereobtained for a missing-F0 prevalence of 20% (or 80%) and 5% (or 95%), respectively; theprobability pguess was 20% and 40%, respectively. Note that a perfectly performing subject(pguess of 0%) would be characterized by pinconsistent = 0; moreover, pinhomogeneous wouldcorrespond to either pF0 or 100% pF0, with pF0 being the AAT score.
Maximum Likelihood Estimation of the Unknown Model Parameters—Themodel parameters considered in Figure 5 were chosen such that the resulting clusters werelargely separated. It is clear that a higher similarity of the parameters would have resulted ina considerable overlap. Thus, in practice, unequivocally assigning a subject characterized by(pinconsistent, pinhomogeneous) to a certain group of virtual participants characterized by pguess,pF0 is impossible. Nevertheless, supposing that pinconsistent, pinhomogeneous corresponds to apoint close to the center of a specific cluster (e.g., one of those in Figure 5), the conclusioncan be made that the subject’s performance is more likely described by the modelparameters associated with that cluster than by other parameter constellations. Thus, modelparameters (pguess, pF0) could be determined so that the center of the resulting clustercorresponds to the observed data point (pinconsistent, pinhomogeneous). This idea basicallycorresponds to maximum-likelihood parameter estimation. Simulations also provide a basisfor discarding participants with high guessing probability. The contour line in the upperright cluster in Figure 5 represents the 99.9% percentile for participants with pguess = 100%;it is based on the simulation of 100,000 virtual participants. Supposing that an observed datapoint (pinconsistent, pinhomogeneous) is located outside the area enclosed by that curve, it ishighly unlikely that the respective subject was guessing all the time.
ResultsFigure 6a shows the same parameter space as that of Figure 5, which means that the abscissais the percentage of inconsistent classifications, pinconsistent, and the ordinate is thepercentage of inhomogeneous classifications, pinhomogeneous. Each of the 79 participants isrepresented by exactly one data point. The 99.9% percentile for participants guessing all ofthe time (displayed in Figure 5 as a contour line) now corresponds to the boundary of thegray area. Participants with data points inside this area (“forbidden region”) were excludedfrom further analysis because they could not be sufficiently distinguished from participantsguessing all the time. All in all, 56 participants met the inclusion criterion (16 nonmusicians,22 amateurs, 18 professionals). This meant that we had to exclude almost half of thenonmusicians and about one third of the amateurs but none of the professionals. Thedependence of the exclusion rate on musical competence was statistically significant, χ2(2,N = 79) = 11.9, p = .0026.
Seither-Preisler et al. Page 6
J Exp Psychol Hum Percept Perform. Author manuscript; available in PMC 2010 February 15.
Europe PM
C Funders A
uthor Manuscripts
Europe PM
C Funders A
uthor Manuscripts

The inner grid in Figure 6a is based on extensive model simulations. The model parameterspguess and pF0 were systematically varied in steps of 5%, and simulations as exemplified inFigure 5 were performed. In this way, we obtained 100,000 estimates of pinconsistent,pinhomogeneous for each combination of pguess, pF0, which provided the basis for theestimation of a 2D median,1 which corresponds to a grid point in Figure 6a. The smallnumbers on the vertical grid lines indicate the associated model parameter pguess, whereasthe model parameter pF0 may be read on the scale for pinhomogeneous (remember that forpguess = 0 and pF0 < 50%, pinhomogeneous and pF0 are identical).2
By associating each data point with the closest grid point, mapping the experimentalparameters (pinconsistent, pinhomogeneous) onto the model parameters (pguess, pF0) is nowpossible, thereby characterizing each subject in terms of a model. Because our grid isrelatively coarse, we refined this mapping by interpolation and extrapolation techniques.Figure 6b shows the result. The abscissa is the subject’s guessing probability, pguess, and theordinate is the prevalence of F0-based categorizations, pF0. The gray area represents thecounterpart of the forbidden region in Figure 6a. In contrast to the simulations, in which itwas sufficient to consider pF0 values between 0% and 50%, we now consider the full range,that is, 0%–100% (by accounting for the AAT score, distinguishing between pF0 and 100%– pF0 is easy). The prevalence value pF0, that is, the estimated predominance of missing-F0hearing, may be interpreted as a guessing-corrected AAT score. The distribution of theprevalence value pF0 was clearly bimodal: Except for one amateur musician, the value waseither below 25% or above 75% (indicated by thick horizontal lines in Figure 6b). For themajority of participants (73.2%), the value was even below 10% or was above 90%(indicated by thin horizontal lines in Figure 6b).
Musical Competence—A comparison of the three musical competence groups confirmedthe conclusions derived from the original data. Only 37.5% of the nonmusicians but 73% ofthe amateur musicians and 89% of the professional musicians based their judgmentspredominantly on F0-pitch cues. A nonparametric Mann–Whitney U test on the ranking ofthe individual missing-F0 prevalence values indicated that the effect was due mainly to thedifference between nonmusicians and musically experienced participants (nonmusicians vs.amateurs: U = 84.5, Z = −2.7, p = .0068; nonmusicians vs. professionals, U = 43, Z = −3.5, p= .0005; amateurs vs. professionals, U = 161.5, Z = −1.0, p = .32). When the participantswere categorized as either “spectral” or “missing-F0 classifiers,” a significant increase againwas observed in the proportion of missing-F0 classifiers with growing musical competence:With a liberal criterion for group assignment (missing-F0 prevalence value either up to orabove 50%), the p value was .0049, χ2(2, N = 56) = 10.6; with a stricter criterion for groupassignment (missing-F0 prevalence value either below 25% or above 75%), the p valuewas .0036, χ2(2, N = 55) = 11.3. A comparison between the original analysis (see Figure 2,Panels a and b) and the simulation-based reanalysis (see Figure 2, Panels c and d) shows noobvious difference.
Figure 7 shows the relative proportions of spectral and missing-F0 classifiers (up to or morethan 50% of missing-F0 categorizations; N = the number of participants accounted for). Thedistribution pattern is very similar to the one obtained for the original data (see Figure 4).The apparent irregularity around the fourth in nonmusicians most likely results from the
1The actual simulations were a bit different. A 2D median was calculated on the basis of 1,000 trials, and the procedure was repeated100 times. We obtained the final result by calculating conventional (one-dimensional) medians. By this means, the computation timecould be reduced by orders of magnitude.2Minor irregularities of the inner grid in Figure 6a are due to the fact that pinconsistent and pinhomogeneous are discrete numbersrather than random variables defined on a continuous scale.
Seither-Preisler et al. Page 7
J Exp Psychol Hum Percept Perform. Author manuscript; available in PMC 2010 February 15.
Europe PM
C Funders A
uthor Manuscripts
Europe PM
C Funders A
uthor Manuscripts

reduced sample size. In summary, the reanalyses corroborated our hypothesis that the effectsseen in the original data were, first and foremost, due to true perceptual differences.
Specific Factors Associated With Musical Competence—In the following section,we address the question of whether the two factors of (a) age when musical training startedand (b) instrument that was initially and actually played were related to the observedperceptual group differences. As the categorization of participants according to specificcriteria led to relatively small subgroups, all participants were included in the followinganalyses, irrespective of their guessing probabilities. Comparisons were made betweenamateur and professional musicians only. The parameter was the guessing-corrected AATprevalence value.
Onset of musical activity: We calculated a Spearman rank order correlation for allmusically experienced participants (amateurs and professionals) to test whether the agewhen training started critically affected the AAT prevalence value. This was not the case(ρ= −0.079, p = .5). In addition, two parallel samples of amateurs and professionals werebuilt, which were matched for the onset of musical practice. Each of these samplescontained 15 participants, all of whom had started to practice at the following ages: 3 years(n = 2), 4 years (n = 3), 5 years (n = 2), 6 years (n = 2), 7 years (n = 1), 8 years (n = 2), 9years (n = 1), 10 years (n = 1), and 15 years (n = 1). The AAT prevalence values were stillsignificantly different for the two groups (mean value for amateurs: 69.7; mean value forprofessionals: 89.1; U = 51, Z = −2.5, p = .01). These results indicate that the onset ofmusical practice is not critical for the prevalent hearing mode, as measured by the AAT.
First instrument: As evident from Table 1, the probability of having played a certaininstrument at the onset of musical activity (first instrument) and in advanced musicalpractice (actual major instrument) differed between amateurs and professionals. Althoughabout half of the amateurs had started with the recorder (48.4%), this was the case for only aminority of professionals (11.1%). Most professionals (55.5%) but relatively few amateurs(19.3%) indicated that their first instrument had been the piano. The recorder producesalmost no overtones, whereas the spectra of piano tones are richer, with a prominent F0 andlower harmonics that decrease in amplitude with harmonic order (Roederer, 1975). It may,therefore, be speculated that playing the piano as the first instrument sensitizes participantsto harmonic sounds and facilitates the extraction of F0, whereas playing the recorder mighthave no effect or a different effect. To test this hypothesis, we performed two selectivestatistical comparisons in which we excluded all participants who had started with one ofthese instruments. The significant difference in the AAT prevalence values of amateur andprofessional musicians was changed neither by the exclusion of the recorder players (U =74, Z = −2, p = .04) nor by the exclusion of the piano players (U = 43.5, Z = −2.4, p = .018).Consistently, when all of the indicated first instruments were considered, it was found thatthey had no systematic influence on the AAT prevalence values (Kruskal–Wallis test: H =11, df = 8, p = .2). It may be argued that it makes a difference whether the first musicalexercises were done with string, keyboard, or wind instruments or with the vocal cords andwhether this action required active intonation (bow instruments, trombone, singing) or not(plucked instruments, keyboard, percussion, most wind instruments). Separate analyses, inwhich we considered these aspects, were insignificant, as well (category of instrument: H =3.4, df = 4, p = .49; intonated vs. nonintonated playing: U = 144, Z= −0.9, p = .35). Theseresults allow rejection of the hypothesis that the first instrument determines the prevalenthearing mode.
Actual major instrument: The spectrum of actually played instruments was slightlybroader and more balanced between the two musical competence groups than for the first
Seither-Preisler et al. Page 8
J Exp Psychol Hum Percept Perform. Author manuscript; available in PMC 2010 February 15.
Europe PM
C Funders A
uthor Manuscripts
Europe PM
C Funders A
uthor Manuscripts

instrument (see Table 1). A comparison considering all indicated major instruments revealedno systematic influence on the AAT prevalence values (Kruskal–Wallis test: H = 12.4, df =13, p = .5). Neither the instrument category (H = 2, df = 4, p = .73), nor the necessity ofcontrolling pitch during playing (U = 266, Z = −0.1, p = .9) had an effect, thus arguingagainst the hypothesis that the major instrument determines the prevalent hearing mode.
DiscussionThe reanalyzed data support the hypothesis that the observed differences in the AATprevalence values of nonmusicians, musical amateurs, and professional musicians are due totrue perceptual differences. In the following, three different hypotheses are formulated toexplain this effect.
Hypothesis 1: The observed interindividual differences are due to learning-inducedchanges in the neural representation of the pitch of complex tones.
According to our initial hypothesis, the most plausible explanation would be that playing aninstrument enhances the neural representation of the fundamental pitch of complex tones.Support for this interpretation comes from the previous finding that musicians are superiorto nonmusicians when the task involves tuning a sinusoid to the missing F0 of a singlecomplex tone (Preisler, 1993). A high learning-induced plasticity would be consistent withrecent neuroimaging studies, underlining the importance of cortical pitch processing(Bendor & Wang, 2005; Griffiths, Buchel, Frackowiak, & Patterson, 1998; Krumbholz,Patterson, Seither-Preisler, Lammertmann, & Lütkenhöner, 2003; Patterson, Uppenkamp,Johnsrude, & Griffiths, 2002; Penagos, Melcher, & Oxenham, 2004; Seither-Preisler,Krumbholz, Patterson, Seither, & Lütkenhöner, 2004, 2006a, 2006b; Warren, Uppenkamp,Patterson, & Griffiths, 2003). Moreover, the plasticity hypothesis would be in line with twoinfluential auditory models on pitch processing.
Terhardt, Stoll, and Seewann (1982) formulated a pattern-recognition model, which startsfrom the assumption that individuals acquire harmonic templates in early infancy bylistening to voiced speech sounds. According to the model, in the case of the missing F0, theindividual would use the learned templates to complete the missing information. From thispoint of view, a higher prevalence of F0-pitch classifications in musicians could indicatethat extensive exposure to instrumental sounds further consolidates the internalrepresentation of the harmonic series based on F0.
The auditory image model of Patterson et al. (1992) postulates a hierarchical analysis, whichends in a stage that combines the spectral profile (spectral pitches and timbre) and thetemporal profile (fundamental pitch) of the auditory image—a physiologically motivatedrepresentation of sound (Bleeck & Patterson, 2002). A change in the relative weight of thetwo profiles in favor of the temporal profile could account for learning-induced shifts fromspectral sensations toward missing-F0 sensations.
Hypothesis 2: The observed interindividual differences are due to genetic factorsand/or early formative influences.
It may also be the case that the observed perceptual differences reflect congenital differencesin musical aptitude and that highly gifted participants are more sensitive to the fundamentalpitch of complex tones. In its extreme form, this assumption is not tenable because musicalaptitude is not necessarily related to the social facilities required for learning an instrumentand eventually becoming a musician. The present data do not allow us to exclude congenitalinfluences. To quantify the relative contributions of learning-related and genetic factors, wewould need to perform a time-consuming longitudinal study from early childhood to
Seither-Preisler et al. Page 9
J Exp Psychol Hum Percept Perform. Author manuscript; available in PMC 2010 February 15.
Europe PM
C Funders A
uthor Manuscripts
Europe PM
C Funders A
uthor Manuscripts

adulthood that investigates how musical practice influences the individual AAT score overtime.
The situation is more clear-cut with regard to the hypothesis that our observations are afunction of early formative influences. To this end, the onset of musical activity and the typeof the first instrument played could be critical in establishing the prevalent hearing mode.Our results clearly argue against this view because none of these aspects had a systematiceffect on the AAT prevalence value.
Hypothesis 3: The observed interindividual differences are due to variations infocused attention on melodic pitch contours.
In Western tonal music, melodic intervals are normally drawn from the chromatic scale,dividing the octave into 12 semitones. In our study, all F0-intervals were drawn from thisscale, whereas the spectral intervals were irregular. It may be speculated that theprofessionals focused their attention on the musically relevant F0-intervals, even if theseintervals were small relative to the concomitant spectral changes. Amateurs andnonmusicians may have been less influenced by this criterion so that their perceptual focuswas more strongly directed toward the changes of the immediate physical sound attributes. Itis unlikely, however, that melodic processing was the only influential factor becausemusicians are already superior when they have to tune a sinusoid to the missing F0 of asingle complex tone (Preisler, 1993).
AcknowledgmentsThis study was supported by the University of Graz (Austria), the Austrian Academy of Sciences (APART), theAlexander von Humboldt Foundation (Institutspartnerschaft), and the UK Medical Research Council. We thank theMünster Music Conservatory for the constructive collaboration.
ReferencesBarnett V. The ordering of multivariate data. Journal of the American Statistical Association. 1976;
A139:318–339.
Bendor D, Wang X. The neuronal representation of pitch in primate auditory cortex. Nature. Aug25.2005 436:1161–1165. [PubMed: 16121182]
Bleeck, S.; Patterson, RD. A comprehensive model of sinusoidal and residue pitch; Poster presented atthe Pitch: Neural Coding and Perception international workshop; Hanse-Wissenschaftskolleg,Delmenhorst, Germany. 2002, August;
Fletcher H. Auditory patterns. Review of Modern Physics. 1940; 12:47–65.
Griffiths TD, Buchel C, Frackowiak RS, Patterson RD. Analysis of temporal structure in sound by thehuman brain. Nature Neuroscience. 1998; 1:422–427.
Griffiths TD, Uppenkamp S, Johnsrude I, Josephs O, Patterson RD. Encoding of the temporalregularity of sound in the human brainstem. Nature Neuroscience. 2001; 4:633–637.
Houtsma AJM, Fleuren JFM. Analytic and synthetic pitch of two-tone complexes. Journal of theAcoustical Society of America. 1991; 90:1674–1676. [PubMed: 1939912]
Krumbholz K, Patterson RD, Seither-Preisler A, Lammertmann C, Lütkenhöner B. Neuromagneticevidence for a pitch processing center in Heschl’s gyrus. Cerebral Cortex. 2003; 13:765–772.[PubMed: 12816892]
Patterson, RD.; Robinson, K.; Holdsworth, J.; McKeown, D.; Zhang, C.; Allerhand, M. Complexsounds and auditory images. In: Cazals, Y.; Demany, L.; Horner, K., editors. Auditory physiologyand perception. Pergamon Press; Oxford, England: 1992. p. 429-446.
Patterson RD, Uppenkamp S, Johnsrude IS, Griffiths TD. The processing of temporal pitch andmelody information in auditory cortex. Neuron. 2002; 36:767–776. [PubMed: 12441063]
Seither-Preisler et al. Page 10
J Exp Psychol Hum Percept Perform. Author manuscript; available in PMC 2010 February 15.
Europe PM
C Funders A
uthor Manuscripts
Europe PM
C Funders A
uthor Manuscripts

Penagos H, Melcher JR, Oxenham AJ. A neural representation of pitch salience in nonprimary humanauditory cortex revealed with functional magnetic resonance imaging. Journal of Neuroscience.2004; 24:6810–6815. [PubMed: 15282286]
Preisler A. The influence of spectral composition of complex tones and of musical experience on theperceptibility of virtual pitch. Perception & Psychophysics. 1993; 54:589–603. [PubMed:8290328]
Renken R, Wiersinga-Post JEC, Tomaskovic S, Duifhuis H. Dominance of missing fundamentalversus spectrally cued pitch: Individual differences for complex tones with unresolved harmonics.Journal of the Acoustical Society of America. 2004; 115:2257–2263. [PubMed: 15139636]
Roederer, JG. Introduction to the physics and psychophysics of music. 2nd ed.. Springer-Verlag; NewYork: 1975.
Schouten JF. The residue and the mechanism of hearing. Proceedings of the Koninklijke NederlandseAkademie van Wetenschappen [Royal Dutch Academy of Sciences]. 1940; 43:991–999.
Seebeck A. Beobachtungen über einige Bedingungen der Entstehung von Tönen [Observations oversome conditions of the emergence of tones]. Annals of Physics and Chemistry. 1841; 53:417–436.
Seither-Preisler A, Krumbholz K, Patterson R, Seither S, Lütkenhöner B. Interaction between theneuromagnetic responses to sound energy onset and pitch onset suggests common generators.European Journal of Neuroscience. 2004; 19:3073–3080. [PubMed: 15182315]
Seither-Preisler A, Krumbholz K, Patterson R, Seither S, Lütkenhöner B. Evidence of pitch processingin the N100m component of the auditory evoked field. Hearing Research. 2006a; 213:88–98.[PubMed: 16464550]
Seither-Preisler A, Krumbholz K, Patterson R, Seither S, Lütkenhöner B. From noise to pitch:Transient and sustained responses of the auditory evoked field. Hearing Research. 2006b; 218:50–63. [PubMed: 16814971]
Singh PG, Hirsh IJ. Influence of spectral locus and F0 changes on the pitch and timbre of complextones. Journal of the Acoustical Society of America. 1992; 92:2650–2661. [PubMed: 1479128]
Smoorenburg GF. Pitch perception of two-frequency stimuli. Journal of the Acoustical Society ofAmerica. 1970; 48:924–942. [PubMed: 5480388]
Terhardt E, Stoll G, Seewann M. Pitch of complex signals according to virtual pitch theory: Tests,examples and predictions. Journal of the Acoustical Society of America. 1982; 71:671–678.
Warren JD, Uppenkamp S, Patterson RD, Griffiths TD. Analyzing pitch chroma and pitch height in thehuman brain. Proceedings of the National Academy of Sciences of the United States of America.2003; 999:212–214.
Seither-Preisler et al. Page 11
J Exp Psychol Hum Percept Perform. Author manuscript; available in PMC 2010 February 15.
Europe PM
C Funders A
uthor Manuscripts
Europe PM
C Funders A
uthor Manuscripts

Figure 1.Example of an ambiguous tone sequence. The spectral components of the first tone representlow-ranked harmonics (2nd to 4th) of a high missing F0, whereas for the second tone, theyrepresent high-ranked harmonics (5th to 10th) of a low missing F0. In the case of spectrallistening, a sequence rising in pitch would be heard, whereas pitch would fall in the case ofF0-based listening.
Seither-Preisler et al. Page 12
J Exp Psychol Hum Percept Perform. Author manuscript; available in PMC 2010 February 15.
Europe PM
C Funders A
uthor Manuscripts
Europe PM
C Funders A
uthor Manuscripts

Figure 2.Percentage of spectral classifiers and missing-F0 classifiers among the three musicalcompetence groups. In Panels a and b, assignment is based on the Auditory Ambiguity Test(AAT) score. In Panels c and d, assignment is based on the guessing-corrected F0-prevalence value. The criteria for group assignment were, for Panels a and c, AAT score orF0-prevalence value either up to or above 50 (liberal criterion) and, for Panels b and d, AATscore or F0-prevalence value either below 25 or above 75 (stricter criterion). non-mus. =nonmusicians.
Seither-Preisler et al. Page 13
J Exp Psychol Hum Percept Perform. Author manuscript; available in PMC 2010 February 15.
Europe PM
C Funders A
uthor Manuscripts
Europe PM
C Funders A
uthor Manuscripts

Figure 3.Interval-specific response patterns for the three musical competence groups (error barsrepresent standard deviations).
Seither-Preisler et al. Page 14
J Exp Psychol Hum Percept Perform. Author manuscript; available in PMC 2010 February 15.
Europe PM
C Funders A
uthor Manuscripts
Europe PM
C Funders A
uthor Manuscripts

Figure 4.Percentage of participants who predominantly classified the tasks of a respective intervalcondition in terms of spectral or missing-F0 cues (spectral classifier: Auditory AmbiguityTest [AAT] score ≤ 50%, missing-F0 classifier: AAT score > 50%).
Seither-Preisler et al. Page 15
J Exp Psychol Hum Percept Perform. Author manuscript; available in PMC 2010 February 15.
Europe PM
C Funders A
uthor Manuscripts
Europe PM
C Funders A
uthor Manuscripts
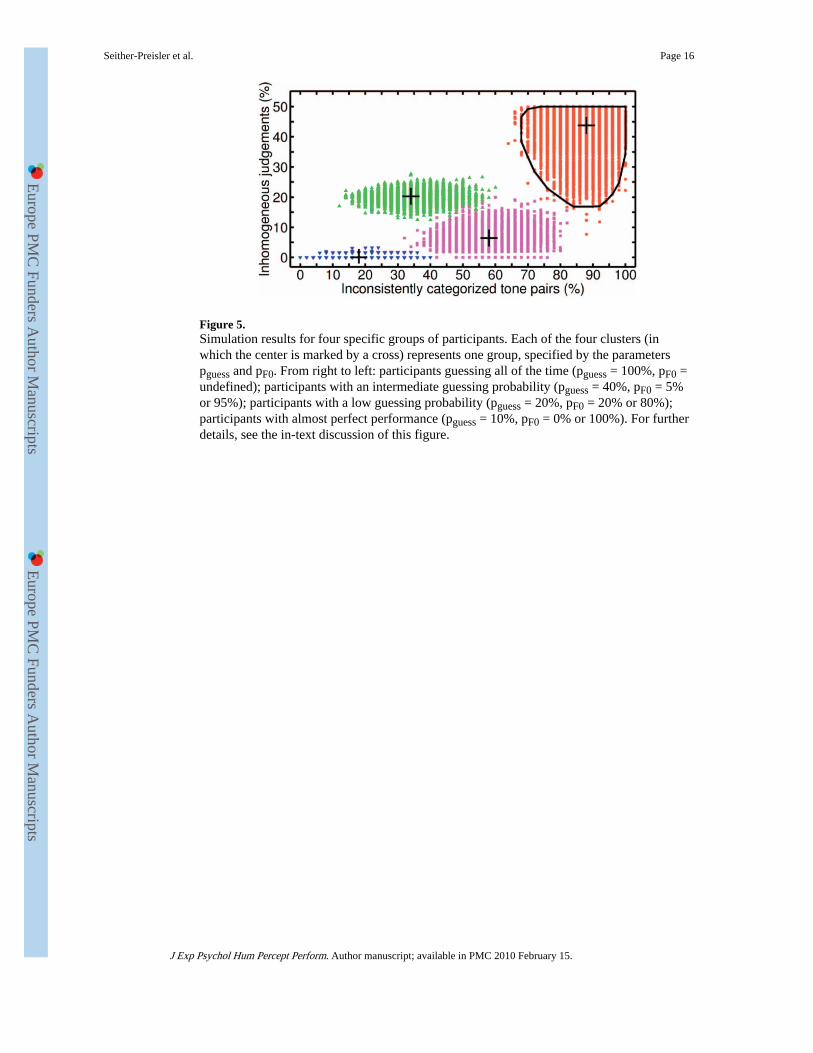
Figure 5.Simulation results for four specific groups of participants. Each of the four clusters (inwhich the center is marked by a cross) represents one group, specified by the parameterspguess and pF0. From right to left: participants guessing all of the time (pguess = 100%, pF0 =undefined); participants with an intermediate guessing probability (pguess = 40%, pF0 = 5%or 95%); participants with a low guessing probability (pguess = 20%, pF0 = 20% or 80%);participants with almost perfect performance (pguess = 10%, pF0 = 0% or 100%). For furtherdetails, see the in-text discussion of this figure.
Seither-Preisler et al. Page 16
J Exp Psychol Hum Percept Perform. Author manuscript; available in PMC 2010 February 15.
Europe PM
C Funders A
uthor Manuscripts
Europe PM
C Funders A
uthor Manuscripts

Figure 6.Simulation-based correction for guessing. (a) Outer axes represent experimental parametersand inner grid represents model parameters; for further details, see in-text discussion of thisfigure. (b) Mapping of experimental parameters onto the model parameters. Responsecharacteristics of individual participants are visualized in a two-dimensional parameterspace, with the probability of guess as the abscissa and the prevalence of missing F0judgments as the ordinate. Participants guessing all the time would be mapped, withprobability 99.9%, into the gray area, signifying the “forbidden region.” Data points fallinginto this region were excluded from further statistical analysis. The prevalence ofnonmusicians (×) above the 75% line and of amateurs (open circles) and professionals (filledcircles) below the 25% line shows that musical expertise is associated with a significant shiftfrom spectral hearing toward F0-based hearing.
Seither-Preisler et al. Page 17
J Exp Psychol Hum Percept Perform. Author manuscript; available in PMC 2010 February 15.
Europe PM
C Funders A
uthor Manuscripts
Europe PM
C Funders A
uthor Manuscripts

Figure 7.Percentage of spectral classifiers and missing-F0 classifiers (up to or more than 50% ofinterval-specific tasks categorized in terms of the missing F0) among the participantsmeeting the inclusion criterion. N = number of participants included in the respectivecomparison. The distribution pattern is similar to the one obtained for the original data (seeFigure 4).
Seither-Preisler et al. Page 18
J Exp Psychol Hum Percept Perform. Author manuscript; available in PMC 2010 February 15.
Europe PM
C Funders A
uthor Manuscripts
Europe PM
C Funders A
uthor Manuscripts

Europe PM
C Funders A
uthor Manuscripts
Europe PM
C Funders A
uthor Manuscripts
Seither-Preisler et al. Page 19
Table 1Number of Participants Who Played the Indicated Instruments at Onset of MusicalActivity (First Instrument) and Who Play the Indicated Instruments Presently (ActualMajor Instrument)
First instrument Actual major instrument
Instrument Amateurs Professionals Amateurs Professionals
Piano 6 10 6 6
Keyboard — — 1 —
Guitar 4 — 6 —
Violin 2 2 3 2
Viola — — 1 —
Cello 1 1 1 1
Recorder 15 2 1 1
Transverse flute — — 3 —
Clarinet — — 1 —
Bassoon — — — 1
Oboe — 1 — 3
Trumpet — 1 1 1
Percussion — — 1 —
Xylophone 1 — — —
Voice 2 1 6 3
J Exp Psychol Hum Percept Perform. Author manuscript; available in PMC 2010 February 15.
Copyright © 2022 FDOKUMEN