TNF-hemmere ved revmatiske sykdommer (del 3) - NCBI
63
Hovedfunn: Gjennomgangen av økonomiske evalueringer av TNF-hemmere vis- te betydelig variasjon i modeller som i sin tur førte til stor variasjon i resultater. Dette begrenset potensialet for å sammenligne data på tvers av modeller, samt overføre resultatene til norske forhold. Med utgangspunkt i dette, har vi kom- met frem til følgende konklusjoner:•Bruk av TNF-hemmere i førstebehandling synes ikke å være kostnadseffektivt. Ingen relevante studier ble funnet for an- drebehandling. Som tredjebehandling kan TNF-hemmere være kostnadseffek- tive sammenlignet med behandling med DMARDs. Dette gjelder særlig i tilfel- ler hvor sykdommen har en varighet på tre år eller kortere, og i tilfeller med god respons.•Om rapporten: Analyser av kostnadseffektivitet kan være et nyttig økonomisk hjelpemiddel når man skal prioriterere i helsevesenet. I denne sam- menheng betyr kostnadseffektivitet en vurdering av hvorvidt legemidlene re- presenterer verdi for pengene sammenlignet med annen type behandling. Ver- dien, eller gevinsten, ligger i den potensielle effekten som legemidlene kan ha på helserelatert livskvalitet og overlevelse. Med ”pengene” forstår TNF-hemmere ved revmatiske syk- dommer (del 3): Helseøkonomi Rapport fra Kunnskapssenteret Nr 16–2007 Kunnskapsoppsummering (fortsetter på baksiden)
-
Upload
khangminh22 -
Category
Documents
-
view
0 -
download
0
Transcript of TNF-hemmere ved revmatiske sykdommer (del 3) - NCBI

Hovedfunn: Gjennomgangen av økonomiske evalueringer av TNF-hemmere vis-
te betydelig variasjon i modeller som i sin tur førte til stor variasjon i resultater.
Dette begrenset potensialet for å sammenligne data på tvers av modeller, samt
overføre resultatene til norske forhold. Med utgangspunkt i dette, har vi kom-
met frem til følgende konklusjoner:•Bruk av TNF-hemmere i førstebehandling
synes ikke å være kostnadseffektivt. Ingen relevante studier ble funnet for an-
drebehandling. Som tredjebehandling kan TNF-hemmere være kostnadseffek-
tive sammenlignet med behandling med DMARDs. Dette gjelder særlig i tilfel-
ler hvor sykdommen har en varighet på tre år eller kortere, og i tilfeller med
god respons.•Om rapporten: Analyser av kostnadseffektivitet kan være et nyttig
økonomisk hjelpemiddel når man skal prioriterere i helsevesenet. I denne sam-
menheng betyr kostnadseffektivitet en vurdering av hvorvidt legemidlene re-
presenterer verdi for pengene sammenlignet med annen type behandling. Ver-
dien, eller gevinsten, ligger i den potensielle effekten som legemidlene kan ha
på helserelatert livskvalitet og overlevelse. Med ”pengene” forstår
TNF-hemmere ved revmatiske syk-dommer (del 3): Helseøkonomi Rapport fra Kunnskapssenteret Nr 16–2007
Kunnskapsoppsummering
(fortsetter på baksiden)

vi effekten på kostnader, ressursbruk, både innenfor og uten-
for helsevesenet.•Målet med rapporten er å undersøke hvorvidt den økte res-
sursbruken ved å benytte TNF-hemmere i stedet for DMARDs står i et rimelig
forhold til den forventede ekstra gevinsten. Et annet mål var å utrede hvorvidt
det er signifikante forskjeller på kostnadseffektivitet som første-, andre- eller
tredjebehandling.•Metode: Systematisk gjenomgang av publiserte studier.
(forts fra forsiden)
Nasjonalt kunnskapssenter for helsetjenesten
Postboks 7004, St. Olavs plass
N-0130 Oslo
(+47) 23 25 50 00
www.kunnskapssenteret.no
ISBN 978-82-8121-165-0 ISSN 1890-1298
nr 16–2007

Title/Tittel TNF-inhibitors for rheumatic diseases (part 3):
Health economics / TNF-hemmere ved revmatiske sykdommer (del 3) / Helseøkonomi
Institution/
Institusjon
Norwegian Knowledge Centre for the Health Services
/Nasjonalt kunnskapssenter for helsetjenesten
Responsible/
Ansvarlig
John-Arne Røttingen, director/direktør
Authors/
Forfattere
Movik, Espen
Neilson, Aileen Rae
Aaserud, Morten
ISBN / ISSN ISBN 978-82-8121-165-0/ ISSN 1890-1298
Report/Rapport 16-2007
Project number/
Prosjektnummer
292
Number of pages/
Antall sider
61 (120 with appendices/med vedlegg)
Commissioner/
Oppdragsgiver
Ministry of Health and Care Services / Northern
Norway Regional Health Authority/Helse- og
omsorgsdepartementet og Helse Nord RHF
The Norwegian Knowledge Centre for the Health Services summarizes and disseminates evidence concerning the effect of treatments, methods, and interventions in health services, in addition to monitoring health service quality. Our goal is to support good decision making in order to provide patients in Norway with the best possible care. The Centre is organized under The Directorate for Health and Social Affairs, but is scientifically and professionally independent. The Centre has no authority to develop health policy or responsibility to implement policies. Nasjonalt kunnskapssenter for helsetjenesten fremskaffer og formidler kunnskap om effekt, nytte og kvalitet av metoder, virkemidler og tiltak innen alle deler av helsetjenesten.
1

Kunnskapssenteret er formelt et forvaltningsorgan under Sosial- og helsedirektoratet. Det har ingen myndighetsfunksjoner og kan ikke instrueres i faglige spørsmål.
The Norwegian Knowledge Centre for the Health Services Nasjonalt kunnskapssenter for helsetjenesten
Oslo, june/juni 2007
2

Contents Contents...................................................................................................................................... 3 List of tables ............................................................................................................................... 5 Forord ......................................................................................................................................... 6 Preface........................................................................................................................................ 8 Abbreviations ........................................................................................................................... 10 Oppsummering ......................................................................................................................... 11 Key messages ........................................................................................................................... 12 Sammendrag............................................................................................................................. 13 Executive summary .................................................................................................................. 16 1 Introduction ...................................................................................................................... 19
1.1 The Norwegian Knowledge Centre for the Health Services’ review of TNF-inhibitors for RA........................................................................................................................... 19
1.2 Objectives................................................................................................................. 19 1.3 Structure of the report .............................................................................................. 20
2 Background ...................................................................................................................... 22 2.1 The economic burden of rheumatoid arthritis .......................................................... 22
2.1.1 Costs associated with RA................................................................................. 22 2.1.2 Cost of illness studies....................................................................................... 22
2.2 TNF-inhibitors in Norway........................................................................................ 24 2.2.1 Consumption .................................................................................................... 24 2.2.2 Financing.......................................................................................................... 25
3 Review of economic evaluations of TNF inhibitors ........................................................ 26 3.1 About economic evaluations in RA ......................................................................... 26
3.1.1 The concept of cost-effectiveness .................................................................... 26 3.1.1.1 Cost effectiveness and economic evaluation................................................ 26 3.1.1.2 Components of an economic evaluation ...................................................... 26 3.1.1.3 The ICER...................................................................................................... 28 3.1.1.4 Cost-effectiveness thresholds....................................................................... 28 3.1.1.5 The need for appropriate health economic models ...................................... 29
3.2 Methods.................................................................................................................... 30 3.3 Results ...................................................................................................................... 31
3.3.1 Adalimumab ..................................................................................................... 31 3.3.1.1 Chen 2006 .................................................................................................... 31 3.3.1.2 Bansback 2005 ............................................................................................. 33 3.3.1.3 Summary points adalimumab....................................................................... 34
3.3.2 Etanercept......................................................................................................... 34 3.3.2.1 Chen 2006 .................................................................................................... 35 3.3.2.2 Bansback 2005 ............................................................................................. 36 3.3.2.3 Coyle 2006 ................................................................................................... 36 3.3.2.4 Kobelt 2005 .................................................................................................. 37 3.3.2.5 Brennan 2004 ............................................................................................... 38 3.3.2.6 Tanno 2006................................................................................................... 39 3.3.2.7 Welsing 2004................................................................................................ 40 3.3.2.8 Jobanputra 2002 and Barton 2004................................................................ 41 3.3.2.9 Summary points etanercept .......................................................................... 42
3.3.3 Infliximab ......................................................................................................... 42 3.3.3.1 Chen 2006 .................................................................................................... 42 3.3.3.2 Bansback 2005 ............................................................................................. 43
3

3.3.3.3 Coyle 2006 ................................................................................................... 44 3.3.3.4 Kobelt 2003 .................................................................................................. 45 3.3.3.5 Barbieri 2005................................................................................................ 46 3.3.3.6 Wong 2002 ................................................................................................... 46 3.3.3.7 Jobanputra 2002 and Barton 2004................................................................ 47 3.3.3.8 Summary points infliximab.......................................................................... 48
3.4 Summarising results ................................................................................................. 48 3.5 Discussion ................................................................................................................ 50
4 Analysis of data from the NOR-DMARD study.............................................................. 53 5 Conclusions ...................................................................................................................... 55 References ................................................................................................................................ 57
4

List of tables Table 1 The costs of RA (inflammatory joint disease)2 in Sweden, 2001 ........................ 23 Table 2 Distribution of different treatment regimens in RA, as recorded in the NOR-
DMARD observational study............................................................................... 24 Table 3 ICERs: Adalimumab (+MTX) compared to a standard DMARD sequence in the
UK. Base-case results from the BRAM model, Chen 2006................................. 32 Table 4 ICERs: Adalimumab (+MTX) compared to a standard DMARD sequence in
Sweden. Base-case results, Bansback 2005 ......................................................... 34 Table 5 ICERs: Etanercept (+MTX) compared to a standard DMARD sequence in the
UK. Base-case results from the BRAM model, Chen 2006................................. 35 Table 6 ICERs: Etanercept (+MTX) compared to a standard DMARD sequence in
Sweden. Base-case results, Bansback 2005 ........................................................ 36 Table 7 ICERs: Etanercept before and after gold in a Canadian DMARD sequence,
compared to a similar sequence without TNF-inhibitors. Base-case results, Coyle 2006...................................................................................................................... 37
Table 8 ICER: Etanercept + MTX compared to MTX in Sweden. Base-case results (10 year model), Kobelt 2005..................................................................................... 38
Table 9 ICERs: Etanercept compared to MTX in the UK. Base-case results, Brennan 2004...................................................................................................................... 39
Table 10 ICERs: Etanercept as second line therapy in a DMARD sequence, compared to a standard DMARD sequence in Japan Base-case results, Tanno 2006 ............ 40
Table 11 ICERs: Etanercept in mono- or combination therapy as third line therapy in a DMARD sequence, compared to “usual treatment” sequence in the Netherlands. Base-case results, Welsing 2004. ......................................................................... 41
Table 12 ICERs: Etanercept compared to a standard DMARD sequence in the UK. Base-case results from the BPM and BRAM models, .................................................. 41
Table 13 ICERs: Infliximab + MTX compared to a standard DMARD sequence in the UK. Base-case results from the BRAM model, Chen 2006................................. 43
Table 14 ICERs: Infliximab + MTX compared to a standard DMARD sequence in Sweden. Base-case results, Bansback 2005 ........................................................ 44
Table 15 ICERs: Infliximab + MTX before and after gold in a Canadian DMARD sequence, compared to the same sequence without TNF-inhibitors. Base-case results, Coyle 2006............................................................................................... 45
Table 16 ICER: Infliximab + MTX compared to MTX in Sweden and the UK. Base-case results, Kobelt 2003.............................................................................................. 46
Table 17 ICERs: Infliximab+ MTX compared to MTX in the UK. Base-case results, Barbieri 2005........................................................................................................ 46
Table 18 ICERs: Infliximab + MTX compared to MTX in the US. Base-case results, Wong 2002 ........................................................................................................... 47
Table 19 ICERs: Infliximab +MTX compared to a standard DMARD sequence in the UK. Base-case results from the BPM and BRAM models, ......................................... 48
Table 20 QALYs gained: Third line treatment with TNF-inhibitors .................................. 49 Table 21 ICERs: Third line treatment with TNF-inhibitors, figures in NOK 2005 ............ 49 Table 22 Baseline characteristics and six-monthly changes in SF-6D across different drug
regimens in the NOR-DMARD observational study ........................................... 53 Table 23 Comparison of six-monthly changes in SF-6D, adjusted for beeline value and
propensity score.................................................................................................... 54
5

Forord Denne rapporten utgjør tredje del av et oppdrag fra Helse- og omsorgsdepartementet og Helse Nord RHF, med fokus på effekt og bivirkninger ved bruk av TNF-hemmere i behandlingen av revmatiske sykdommer. Denne rapporten omhandler kostnadseffektivitet forbundet med slik behandling, da det i mandatet for prosjektet står at dette også skal vurderes. Forfattere har vært: Helseøkonom Espen Movik, som har søkt litteratur, oppsummert studier for alle tre TNF-hemmere og ført rapporten i pennen. Senior helseøkonom Aileen Rae Neilson, som har konsultert eksperter med hensyn til mulig modellarbeid, vært med på valg av studier, oppsummert studier for infliximab og vurdert utkast til rapport. Seniorrådgiver Morten Aaserud som har vurdert og kommentert valg av metodetilnærming, innsamling og vurdering av data, og utkast til rapport. En ekstern utredningsgruppe har vært sentral i prosjektet. Gruppen deltok i selve rapportskrivingen i prosjektets to første deler. I denne tredjedelen har ikke gruppen vært aktiv i selve skriveprosessen, men har kommentert rapporten underveis. Gruppen besto av:
• Seniorrådgiver Lars Granum, Statens legemiddelverk, Oslo • Avd. overlege Hans Christian Gulseth, Betanien Hospital, Revmatologisk avdeling,
Skien • Njål Idsø, forbundsleder Norsk Revmatikerforbund, Stavanger • Revmatolog Ole Gard Knudsrød, privatpraktiserende spesialist, Tønsberg • Avd. overlege dr. med. Wenche Koldingsnes, Universitetssykehuset Nord-Norge HF,
Revmatologisk avdeling, Tromsø • Jan A. Monsbakken, (nå tidligere) generalsekretær Norsk Psoriasisforbund, Gjøvik • Overlege dr. med. Bjørn-Yngvar Nordvåg, Revmatismesykehuset AS, Lillehammer • Overlege dr. med. Øyvind Palm, Rikshospitalet, Revmatologisk avdeling, Oslo • Overlege Marianne Wallenius, St. Olavs Hospital, revmatologisk avdeling,
Trondheim Overlege dr. med. Bjørn-Yngvar Nordvåg har ledet arbeidet i utredningsgruppen. Forsker dr. philos. Helene Arentz-Hansen fra Kunnskapssenteret har vært prosjektleder. for hovedprosjektet (første og andre rapport i serien). Forskningsleder dr. philos. Inger Natvig Norderhaug og Forskningsleder dr. med Marianne Klemp Gjertsen har vært prosjektansvarlige på forskjellige stadier av prosjektet. Alle medlemmene i gruppen har avgitt habilitetserklæring om at de ikke har kommersielle interesser eller bindinger som kan påvirke på en objektiv vurdering av kunnskapsgrunnlaget. Det er redegjort for økonomiske og faglige forhold, samt oppgaver eller verv som er av relevans for prosjektet.
6

Som underlagsmateriale i del 3 av prosjektet er det blant annet brukt en analyse basert på NOR-DMARD studien, utført av stipendiat Marte Schrumpf Heiberg og Professor dr. med. Tore K. Kvien ved Diakonhjemmet Sykehus, revmatologisk avdeling. En tidligere versjon av del 3 er gjennomgått og kommentert av Professor dr. med. Ivar Sønbø Kristiansen ved Institutt for helseledelse og helseøkonomi ved Universitet i Oslo. Kristiansen oppgir at han tidligere har mottatt honorar fra alle tre firma involvert med TNF-hemmere, samt fra offentlige myndigheter. En tidligere versjon av rapporten har også blitt gjennomgått og kommentert av referansegruppens leder, ovverlege dr. med. Bjørn Yngavar Nordvåg. Endelig utkast til rapport ble fagfellevurdert internt, av helseøkonom Kristin K. Linnestad. Ansvaret for innholdet i sluttrapporten ligger hos forfatterne. Espen Movik Ansvarlig for prosjektets helseøkonomidel
7

Preface This report constitutes the third part of a project commissioned by the Ministry of Health and Care Services and the Regional Health Authority for Northern Norway, focusing on the efficacy and safety of TNF-inhibitors in the treatment of rheumatic diseases. This report aims to assess the cost-effectiveness of such treatment, as this was one of the requirements outlined in the project’s mandate. The authors have been: Health economist Espen Movik, who has conducted the literature search, participated in article selection, summarised studies for all three TNF-inhibitors and written the report. Senior health economist Aileen Rae Neilson, who has consulted experts regarding potential modelling work, participated in the selection of articles, summarised infliximab studies and commented on draft versions of the report. Senior adviser Morten Aaserud who has advised and commented on the choice of methods as well as the collection and appraisal of data, and also commented on draft versions of the report. An external advisory group has been instrumental in the project. The group contributed to the actual writing of the reports in the first two reports of the TNF for RA project, though not in the health economics part. They have however, commented on various drafts of the report in the course of the project period. The group comprised the following
• Senior adviser Lars Granum, Norwegian Medicines Agency, Oslo • Consultant Hans Christian Gulseth, Betanien Hospital, Department of
Rheumatology, Skien • Njål Idsø, leader of the Norwegian Rheumatism Association, Stavanger • Rheumatologist Ole Gard Knudsrød, spesialist in private practice, Tønsberg • Consultant dr. med. Wenche Koldingsnes, University hospital of Northern Norway,
Department of Rheumatology, Tromsø • Jan A. Monsbakken, (now former) secretary general, Norwegian Psoriasis
Association Gjøvik • Consultant dr. med. Bjørn-Yngvar Nordvåg, Revmatismesykehuset AS,
Lillehammer • Consultant dr. med. Øyvind Palm, Rikshospitalet University Hospital, Departement
of rheumatology, Oslo • Consultant Marianne Wallenius, St. Olavs Hospital, revmatologisk avdeling,
Trondheim Consultant dr. med Bjørn-Yngvar Nordvåg has led the work in the advisory group. Researcher dr. philos. Helene Arentz-Hansen front he Norwegian Knowledge Centre for the Health Services has been the project manager for the main project. (First and second reports in the series). .
8

Research director dr. philos. Inger Natvig Norderhaug and Research director dr. med Marianne Klemp Gjertsen have been project supervisors at different stages of the project. All the members of the group have signed a declaration o interest stating that they do not have interests or ties that could influence an objective assessment of the evidence base. Economic and professional issues, as well as elected positions held and assignments undertaken which are of relevance to the project have been accounted for, The supporting documentation in part 3 of the project includes an analysis based on the NOR-DMARD observational study, conducted by research fellow Marte Schrumpf Heiberg and Professor dr. med. Tore K. Kvien, both rheumatologists at the Diakonhjemmet hospital in Oslo. . An earlier draft has been reviewed by Professor Dr. med. Ivar Sønbø Kristiansen at the Institute of Health Management and Health Economics at the University of Oslo. Kristiansen declares that he has previously received fees from all the three TNF-inhibitor manufacturers, as well as from public authorities. An earlier draft has also been reviewed by Consultant Dr. med. Bjørn Yngvar Nordvåg, head of the project advisory group. The final draft of the report was subject to internal peer review, carried out by Health economist Kristin K. Linnestad. The contents of the final report remain the responsibility of the authors. Espen Movik Responsible for the project’s health economics component
9

Abbreviations ACR20, 50, 70 American College of Rheumatology, response measure registering
20%, 50% and 70% improvement respectively BPM Birmingham Preliminary Model BRAM Birmingham Rheumatoid Arthritis Model CAD Canadian dollars CCOHTA Candian Coordinating Office for Health Technology Assessment DAS28 Disease Activity Score, 28 joints DMARD Disease modifying anti-rheumatic drug EQ-5D EuroQol 5 dimensions (generic health assessment questionnaire) EULAR European League Against Rheumatism GBP Pounds sterling HAQ Health assessment questionnaire HRQoL Health-related quality of life HCQ Hydrochloroquine HUI3 Health Utility Index, mark 3 (generic health assessment questionnaire) ICER Incremental cost-effectiveness Ratio JPY Japanese yen MTX Methotrexate NICE National Institute for Health and Clinical Excellence NHS National Health Service (UK) NOK Norwegian kroner NOKC Norwegian Knowledge Centre for the Health Services NOR-DMARD Norwegian observational study of rheumatoid arthritis patients OMERACT Outcome measures in rheumatoid arthritis (expert working group) QALY Quality adjusted life year RA Rheumatoid arthritis RCT Randomised controlled trial SEK Swedish kroner SF-6D Short Form 6 dimensions (generic health assessment questionnaire) SSZ Sulphasalazine TNF Tumour necrosis factor USD US dollars VAS Visual Analogue Scale WMHTAC West Midlands Health Technology Assessment Collaboration
10

Oppsummering Bakgrunn: Behandling med tumor nekrose faktor alfa (TNF-α eller bare TNF)-hemmere blir ansett som et alternativ til behandling med tradisjonelle sykdomsmodifiserende antirevmatiske medikamenter (såkalte DMARDs) for pasienter med revmatiske lidelser som revmatoid artritt (RA). Det finnes for tiden tre TNF-hemmere på det norske markedet (merkenavn i parentes): Adalimumab (Humira), etanercept (Enbrel) og infliximab (Remicade). Kunnskapssenteret har i tidligere rapporter foretatt en oppsummering av effekt og bivirkninger av preparatene (i randomiserte kliniske studier og registerstudier), mens vi i denne rapporten vurderer preparatenes kostnadseffektivitet for pasienter med revmatoid artritt. Etter kraftig vekst i forbruket over flere år, utgjorde det samlede salget av de tre preparatene 860 miilioner kroner i Norge i 2006. RA er en alvorlig sykdom, ikke minst i økonomisk forstand. Det finnes ingen oversikter over sykdomsmens kostnader for Norge, men studier fra Sverige antyder at de kan være betydelige med en stor andel av kostnadene knyttet til tapt arbeidsevne. Metoder: Vi utførte en systematisk oversikt over publiserte økonomiske evalueringer av TNF-hemmere mot RA. I tillegg bestilte vi en analyse av livskvalitetsdata forbundet med bruk av TNF-hemmere og DMARDs hentet fra en norsk registerstudie. Resultater: Vi inkluderte tolv studier i litteraturoversikten. Studiene var basert på helseøkonomiske beregningsmodeller. Siden det var stor variasjon i modellenes type og forutsetninger ble det stor spredning i anslagene på kostnadseffektivitet. Konklusjoner: I vår gjennomgang av økonomiske evalueringer av TNF-hemmere fant vi betydelig variasjon i modeller som i sin tur førte til stor variasjon i resultater. Potensialet for sammenligning av data på tvers av modeller samt overførbarhet til norske forhold er derfor begrenset. Med dette i bakhodet, har vi kommet fram til følgende konklusjoner: Førstelinjebehandling: På bagkrunn av den eneste studien som tar for seg førstelinjebehandling med TNF hemmere, synes ikke preparatene å være kostnadseffektive som førstelinjebehandling. Andrelinjebehandling: Her kan vi ikke konkludere da ingen relevante studier ble funnet. Tredjelinjebehandling: TNF-hemmere kan være kostnadseffektive, i forhold til behandling med DMARDs. Særlig gjelder dette i tilfeller ved sykdomsvarighet på tre år eller kortere, og i tilfeller med god respons. Indirekte kostnader: Forebygging av produktivitetstap kan stå for betydelige potensielle besparelser for samfunnet, men dette blir diskutert kun i et fåtall av de økonomiske evalueringene. Analyse av seks-måneders forbedringer i livskvalitet: Data fra Norge antyder at RA-pasienter på kombinasjonsbehandling med TNF + metotreksat (MTX) i gjennomsnitt oppnår en større forbedring i livskvalitet enn pasienter på MTX alene, som i sin tur er medfører en større forbedring for pasienter enn TNF monoterapi. Forkskjeller mellom pasientgrupper hva gjelder sykdommens alvorlighetsgrad samt toleranse overfor MTX må imidlertid tas med i betraktningen.
11

Key messages Background: Treatment with tumour necrosis factor alpha (TNF-α, or simply TNF) inhibitors is considered to be an alternative to the use of traditional disease-modifying anti-rheumatic drugs (DMARDs) in patients with different rheumatic diseases, i.e. rheumatoid arthritis (RA). There are three TNF-inhibitor drugs currently available on the market (brand names in brackets): adalimumab (Humira), etanercept (Enbrel) and infliximab (Remicade). The Norwegian Knowledge Centre for the Health Services has previously summarised the evidence on the drugs’ efficacy and safety (in randomised clinical trials and observational studies) while the present report considers cost-effectiveness of the drugs for rheumatoid arthritis. After considerable growth over several years, the aggregate sales of the three drugs amounted to 860 million NOK in 2006. RA is a serious disease, not least from an economic perspective. No cost-of-illness studies have been found for Norway, but studies from Sweden suggest that the costs of the disease are substantial with a large proportion related to loss of work capacity. Methods: We undertook a review of economic evaluations of TNF-inhibitors against RA, and considered an analysis of health-related quality of life data for patients on TNF-inhibitors and DMARD users from a Norwegian observational study. Results: A total of twelve studies from six countries was included in the literature review. The studies were based on health economic models, which were diverse in their characteristics, and therefore the estimates of cost-effectiveness varied significantly. Conclusions: In our review of economic evaluations of TNF-inhibitors, we found significant variation in the type and features of the models used, which led to a wide range of estimates. The potential for direct comparisons of results between the studies, and thus transferability of results into Norwegian setting, is limited. With this in mind, our main conclusions are as follows: First line therapy: TNF inhibitors seem not to be cost-effective as first line therapy, based on the one study in which this was considered. Second line therapy: We cannot draw any conclusions, since no relevant studies were found. Third line therapy: TNF-inhibitors may be cost-effective, particularly in the case of patients in early disease. The drugs are also likely to be more cost-effective for patients who experience a good rather than a moderate response. Indirect costs: Prevention of productivity loss may account for considerable savings, but has only been accounted for in a few of the economic evaluations. Analysis of six month quality of life data: Data from Norway indicate that RA patients on TNF + methotrexate (MTX) on average experience a larger improvement in health-related quality of life than patients on MTX monotherapy who in turn had a larger improvement than those on TNF monotherapy. Differences in patient groups concerning severity of disease and MTX tolerance should however, be taken into consideration.
12

Sammendrag
Innledning Behandling med tumor nekrose faktor alfa (TNF-α eller bare TNF)-hemmere blir ansett som et alternativ til behandling med tradisjonelle sykdomsmodifiserende antirevmatiske medikamenter (såkalte DMARDs) for pasienter med revmatiske lidelser som revmatoid artritt (RA). Det finnes for tiden tre TNF-hemmere på det norske markedet (merkenavn i parentes): Adalimumab (Humira), etanercept (Enbrel) og infliximab (Remicade). Medikamentene blir gjerne omtalt som biologiske legemidler, sammen med andre legemidler som er framstilt ved hjelp av levende organsimer, og som er innrettet mot spesifikke reseptorer i immunsystemet.
Kunnskapssenterets oversikter over TNF-hemmere Nasjonalt kunnskapssenter for helsetjenesten har tidligere utarbeidet en systematisk oversikt over tilgjengelig dokumentasjon om effekt og sikkerhet knyttet til bruken av TNF-hemmere for revmatoid artritt, psoriasis artritt og bechterew. Arbeidet er publisert i to rapporter.
Formål I mandatet til denne tredje rapporten i serien heter det at kostnadseffektivitet ved bruk av TNF-hemmere skal vurderes. Når man skal prioritere i helsevesenet, kan analyser av kostnadseffektivitet være et nyttig økonomisk hjelpemiddel. I denne sammenheng betyr det å vurdere hvorvidt legemidlene representerer verdi for pengene i forhold til alternativ behandling. Verdien – eller gevinsten - ligger i den potensielle effekten legemidlene kan ha på helserelatert livskvalitet og overlevelse. Med ”pengene” mener vi effekten på kostnader - eller ressursbruk - både innenfor og utenfor helsevesenet. Gitt de betydelige høye prisene til TNF-hemmere sammenlignet med alternative legemidler, er vårt primære formål å undersøke hvorvidt den økte ressursbruken står i et rimelig forhold til den forventede ekstra gevinsten. Det sekundære formålet er å utrede hvorvidt TNF-hemmerne er kostnadseffektive tidligere snarere enn senere i behandlingssekvensen. Med andre ord, er det noen signifikante forskjeller i preparatenes kostnadseffektivitet som første-, andre- eller tredjelinjebehandling?
Rapportens inndeling Rapportens sentrale del består av en systematisk oversikt over publiserte økonomiske evalueringer av TNf-hemmere for revmatoid artritt (ikke psoriasisartritt eller bechterew). I tillegg omfatter rapporten kapitler om den samfunnsøkonomiske byrde av RA for å kaste lys over tapet av ressurser som følge av sykdommen, samt forbruket og sammensetningen av TNF-hemmere og DMARDs i Norge. Kapitlet om økonomiske evalueringer blir fulgt av en analyse av forskjeller i helserelatert livskvalitet knyttet til bruk av TNF-hemmere og DMARDs over seks måneder i norsk klinisk praksis, med NOR-DMARD registerstudien som kilde.
Den samfunnsøkonomiske byrden av RA Anslag over den totale kostnaden RA påfører samfunnet varierer fra land til land, men ingen studier finnes foreløpig for Norge. Vi har imidlertid funnet en omfattende kostnadsstudie fra Sverige der man ved Universitetet i Linköping anslo den totale kostnad forbundet med inflammatorisk leddsykdom til 8,5 milliarder svenske kroner, som tilsvarte 7,8 milliarder norske kroner i 2005. Størstedelen av kostnadene var knyttet til sykepenger og førtidspensjon.
13

TNF-hemmere i Norge Det har vært en sterk vekst i bruken av TNF-hemmere mot RA og relaterte sykdommer i det siste tiåret. I 2005 ble legemidlene anvendt av ca. 23 % av RA-pasienter i Norge. En rapport anslo antallet potensielle pasienter innen alle diagnosegrupper til totalt 11 500. Et grovt overslag basert på salgsstatistikk over TNF-hemmere og som forutsetter kontinuerlig forbruk av en definert døgndose per pasient per døgn, gir 7 2000 pasienter (alle diagnoser) i 2006. Målt på apotek utsalgspris utgjorde det totale salget av TNF-hemmere 860 millioner kroner i 2006, noe som representerte 5 % av totalsalget av reseptpliktige legemidler det året.
Litteraturgjennomgang
Kostnadseffektivitet Kostnadseffektivitet er synonymt med tanken om verdi for pengene. Hvorvidt et tiltak er kostnadseffektivt, kan imidlertid bare vurderes ved å sammenligne kostnader og gevinster forbundet med tiltaket med kostnader og gevinster forbundet med en alternativ handlemåte, eller rett og slett med status quo: ”det å gjøre ingenting”. Når man vil vurdere om et tiltak eller en strategi er kostnadseffektivt etler ei, benytter man seg av helseøkonomisk evaluering, som er betegnelsen på prosessen med å identifisere, måle samt verdsette kostnader og helseeffekter forbundet med de foreliggende alternativene. Kostnadene omfatter ikke bare prisen på legemidler, men også de vidtgående konservene for helsetjenesten (for eksempel bivirkninger, legekonsultasjoner og sykehusinnleggelse) eller for samfunnet for øvrig (evne til å gå på jobb eller skole, behov for assistanse fra pårørende). Helseeffektene kan uttrykkes på flere måter, men den mest relevante i denne sammenheng er et kombinasjonsmål på overlevelse og helserelatert livskvalitet kalt kvalitetsjusterte leveår. (QALY). Livskvalitetskomponenten i QALYs innebærer verdsetting av helsetilstander i området mellom 0 (død) og 1 (helt frisk). Resultatene fra økonomiske evalueringer blir ofte uttrykt som kostnader per vunne leveår (ICER). Merkostnaden et tiltak innebærer i forhold til et annet fordeles over dem forventede ekstra gevinsten.
Resultater Vi gjennomgikk tolv publiserte studier, der et par av studiene omfattet resultater fra mer enn en TNF-hemmer. Studiene var fra Storbritannia, Sverige, Canada, Nederland, Japan og USA. Det primære formålet var å vurdere hvorvidt TNF-hemmere generelt kan anses som kostnadseffektivt i forhold til behandling med DMARDs for pasienter med RA. Median kostnad per vunne leveår basert på de inkluderte studiene var NOK 443 000, og var innenfor grensen for det som for mange oppfattes som kostnadseffektivt. Det er imidlertid stor variasjon i resultantene med anslag på kostnad per vunne leveår i området fra NOK 145 000 til over NOK 8,1 million. Følgelig er de biologiske legemidlene ikke nødvendigvis kostnadseffektive i alle stadier av behandlingssekvensen eller for alle undergrupper av pasienter. De sekundære formålet var å undersøke hvorvidt det var noen betydelige forskjeller i forhold til kostnadseffektivitet mellom første-, andre og tredjelinjebehandling med TNF-hemmerne, noe som ser ut til å være tilfelle: Førstelinjebehandling: På bakgrunn av den eneste studien som tar for seg dette, synes ikke TNF-hemmere å være kostnadseffektive som førstelinjebehandling.
14

Andrelinjebehandling: Vi har ikke funnet litteratur som tar for seg de økonomiske konsekvensene av andrelinjebehandling med TNF-hemmere. Tredjelinjebehandling: Resultatene varierer også her, men det er sannsynlig at TNF-hemmere kan være kostnadseffektive i forhold til tradisjonelle DMARDs særlig dersom de brukes av pasienter med sykdomsvarighet på 3 år eller mindre, eller av pasienter med god snarere enn moderat respons.
Analyse fra NOR-DMARD registerstudien For å supplere resultatene fra litteraturgjennomgangen med gevinstmål fra norsk klinisk praksis bestilte vi en analyse av data fra registerstudien NOR-DMARD. Vi ønsket å finne ut om det var noen betydelige forskjeller i helserelatert livskvalitet samt deltagelse i arbeidslivet mellom pasienter som behandles med TNF monoterapi, TNF + MTX, MTX alene eller i kombinasjon med andre DMARDs. Analyse av seks-måneders oppfølgingsdata avslørte at pasienter på TNF + MTX erfarte en klinisk relevant forbedring i livskvalitet. Det samme gjorde pasienter på MTX alene, mens pasienter på TNF monoterapi og MTX + DMARDs ikke gjorde det. Pasienter på TNF + MTX hadde i gjennomsnitt en høyere livskvalitetsforbedring enn pasienter på kun MTX, som igjen hadde en større forbedring enn pasienter på TNF monoterapi. TNF monoterapi er imidlertid mest aktuell for bestemte pasientgrupper (med alvorlig sykdomsgrad og intolerante mot MTX). Arbeidsdeltagelse ble også målt, men ingen betydelige endringer kunne observeres over halvårsperioden.
Konklusjoner I vår gjennomgang av økonomiske evalueringer av TNF-hemmere fant vi betydelig variasjon i modeller som i sin tur forte til stor variasjon i resultater. Potensialet for sammenligning av data på tvers av modeller samt overførbarhet til norske forhold er derfor begrenset. Med dette i bakhodet, har vi kommet fram til følgende konklusjoner: Førstelinjebehandling: TNF hemmere er sannsynligvis ikke kostnadseffektive som førstelinjebehandling. Tredjelinjebehandling: TNF-hemmere kan være kostnadseffektive, i forhold til behandling med DMARDs særlig i tilfeller ved sykdomsvarighet på 3 år eller under, og i tilfeller med god snarere enn moderat respons. Indirekte kostnader: Forebygging av produktivitetstap kan stå for betydelige potensielle besparelser, men dette blir diskutert kun i et fåtall av de økonomiske evalueringene. Analyse av seks-månederes forbedringer i livskvalitet: Data fra Norge antyder at RA-pasienter på TNF + MTX i gjennomsnitt oppnår en større forbedring i livskvalitet enn pasienter på MTX alene, som i sin tur er medfører en større forbedring enn TNF monoterapi. Forkskjeller mellom pasientgrupper hva gjelder sykdommens alvorlighetsgrad samt toleranse overfor MTX må imidlertid tas med i betraktningen.
15

Executive summary
Introduction Treatment with tumour necrosis factor alpha (TNF-α, or simply TNF) inhibitors is considered to be an alternative to the use of traditional disease-modifying anti-rheumatic drugs (DMARDs) in patients with different rheumatic diseases, i.e. rheumatoid arthritis (RA). There are three TNF-inhibitor drugs currently available on the market (brand names in brackets): adalimumab (Humira), etanercept (Enbrel) and infliximab (Remicade). The drugs are often referred to as biologics, along with other medicines derived from living organisms that target specific receptors in the immune system.
The Norwegian Knowledge Centre for the Health Services’ review of TNF-inhibitors for rheumatoid arthritis The Norwegian Knowledge Centre for the Health Services (NOKC) has conducted a systematic review of the available evidence on effectiveness and safety connected to the use of TNF inhibitors for the treatment of rheumatoid arthritis, psoriasis arthritis and Bechterew’s Disease (ankylosing spondylitis). The review has been published in two reports. These were concerned with data on effectiveness and adverse events from randomised clinical trials and observational studies respectively.
Objectives The third and present report’s mandate states that “the cost-effectiveness of TNF-inhibitors shall also be considered”. Cost-effectiveness analysis is an economic tool that can be used to guide priority-setting in the health care sector. In this context it is taken to mean the assessment of whether the drugs represent value for money compared to alternative treatment. The value or benefit refers to the potential impact the drugs have on health-related quality of life and survival. Money refers to the effect on costs, or resource use, both inside and outside the health sector. Given the significantly higher prices of TNF-antagonists compared to those of traditional DMARDs, the primary objective is therefore to examine whether the additional resources spent following the use of the TNF-inhibitors are in reasonable proportion to the expected added benefits. The secondary objective is to investigate whether the TNF-inhibitors are cost-effective earlier rather than later in the treatment sequence. In other words, are there any significant differences between first, second and third line therapy?
Structure of the report The main focus of the analysis is a literature review of economic evaluations of TNF-inhibitors for RA (not psoriasis arthritis or Bechterew’s). In addition, the report comprises sections on the economic burden of RA. The purpose is to illustrate the extent of resources lost to society due to the disease, and the magnitude and composition of TNF-inhibitor and DMARD consumption in Norway. The section on economic evaluation is followed by an analysis of the 6-month difference in health related quality of life associated with TNF and DMARD use in Norwegian clinical practice, as recorded in the NOR-DMARD observational study.
Economic burden of RA Estimates of the total cost to society due to RA vary from country to country but no published studies are as yet available for Norway. Moreover, few specific statistics are readily available with regard to the costs associated with the disease in this country. We thus have to look to
16

our neighbouring country Sweden for more comprehensive cost-of-illness reviews. A study carried out at the University of Linköping for the Swedish RA patient association, found that the total cost associated with RA (broadly defined as inflammatory joint disease)1 amounted to SEK 8,5 billion (NOK 7,4 billion) in 2001, or NOK 7.8 billion in 2005 money terms. The bulk of the costs was indirect in kind and related to sick leave and early retirement
TNF inhibitors in Norway The use of TNF-inhibitors in RA and related diseases has grown rapidly over the last decade. They were used by approximately 23% of RA patients in Norway in 2005. A report estimated the number of potential recipients of TNF inhibitors across all diagnoses in Norway to be 11 500. A crude estimate based on TNF-inhibitor sales statistics, assuming continuous consumption of doses at a given level (defined daily dose), estimated some 7 200 patients (all diagnoses) to be actively treated in 2006. In retail prices, the sales of the three biologics added up to approx. NOK 860 million in 2006, which represents approximately 5 % of total prescription drug sales that year.
Literature review
Cost-effectiveness Cost-effectiveness is synonymous with the notion of “value for money”. Whether an intervention is cost-effective can only be judged by comparing costs and outcomes of that intervention with those associated with an alternative course of action, or simply the status quo, “doing nothing”. To determine whether something is cost-effective or not, one may employ economic evaluation. This is the process of identifying, measuring, valuing and comparing costs and outcomes of alternative interventions or strategies, The costs do not only encompass the price of the drugs, but also the wider consequences for the health services (e.g. adverse events, consultations and hospitalisation) or for society at large (ability to go to school or work, need for assistance from friends and family). The outcomes may be expressed in several ways, but the most relevant in this context is a combined measure of expected survival time and health-related quality of life (HRQoL) indicators known as a quality-adjusted life year (QALY). The HRQoL, or utility, component of a QALY involves assigning values to a health states in the range between 0 (corresponding to death) to 1 (corresponding to perfect health).
Results The results of an economic evaluation are often expressed as the incremental cost-effectiveness ratio (ICER), the change in costs per additional unit of benefit brought about by moving from one strategy (the comparison strategy) to another (the intervention strategy). In a cost-utility analysis, the ICERs are the extra costs incurred for an additional QALY gained compared to those resulting from the standard strategy. We have reviewed twelve studies, some of which included results for more than one TNF-inhibitor-. The studies were from the UK, Sweden, Canada, the Netherlands, Japan and the US. The primary objective was to assess whether TNF-inhibitors in general are likely to be cost-effective compared to DMARDs in patients with RA. The median ICERs from all the studies included was NOK 443 000, which means that half of the results were within the range of what is by many considered cost-effective. There is a great deal of variation in the 1 defined as “Inflammatory joint and joint-related diseases, ICD-10 codes M00-M11, M13, M45-46, M65, M68, M70-71 2 Source: Farmastat, www.farmastat.no
17

results, as the ICERs ranged from NOK145 000 to above 8.1 million. The biologics may hence not be cost-effective at all stages of treatment and for all patient subpopulations. The secondary objective was to investigate if there were any significant differences in cost-effectiveness between first, second and third line therapy with TNF-inhibitors. Our results suggest the following: First line therapy: Based on the one study that covered this question, TNF-inhibitors do not appear to be cost-effective as first line therapy, compared to MTX. Second line therapy: We have not found evidence in the literature with regard to the health economic consequences of second line treatment with TNF-inhibitors. Third line therapy: The results vary significantly, but it seems that TNF-inhibitors may be cost-effective compared to traditional DMARDs particularly if used by patients in the early stages of disease (3 years or less), or by patients with a good response.
Analysis from the NOR-DMARD observational study To supplement the results with summary measures of benefit relating to Norwegian clinical practice, we commissioned an analysis of data from the NOR-DMARD observational study. We sought to find out whether there were any significant differences in the HRQoL and work capacity of patients on TNF-monotherapy, TNF + MTX and MTX alone or in combination with other DMARDs. Analysis of six-month follow up data based on the propensity score method revealed that, on average, patients on TNF + MTX and on MTX monotherapy experiences a clinically relevant improvement in quality of life, whereas patients on TNF monotherapy and MTX + DMARDs did not. TNF + MTX was associated with a slightly larger improvement than MTX alone, which in turn involved a larger improvement than TNF monotherapy. The latter is however, given to selected patient groups, who may be MTX intolerant. Employment status after 6 months was investigated, and presented as the share of patients above and below a 50 % employment threshold, using the last observation carried forward method. No significant changes could be observed.
Conclusion In our review of economic evaluations of TNF-inhibitors, we found significant variation in the type and features of the models used, which led to a wide range of estimates. The potential for direct comparisons of results between the studies, and thus transferability of results into Norwegian setting, is limited. With this in mind, our main conclusions are as follows: First line therapy: Based on the results of a signle study, TNF inhibitors do not appear to be cost-effective as first line therapy Second line therapy: We cannot conclude, since no relevant studies were found. Third line therapy: TNF-inhibitors may be cost-effective, particularly in the case of patients in early disease. The drugs are also likely to be more cost-effective for patients who experience a good rather than a moderate response. Indirect costs: Prevention of productivity loss may account for considerable savings, but has only been accounted for in a few of the economic evaluations. Analysis of six-monthly change in quality of life: Data from Norway indicate that RA patients on TNF + MTX on average experience a larger HRQoL improvement than patients on MTX monotherapy, who in turn had a larger improvement than those on TNF monotherapy. Differences in patient groups concerning severity of disease and MTX tolerance should however, be taken into consideration.
18

1 Introduction
1.1 The Norwegian Knowledge Centre for the Health Services’ review of TNF-inhibitors for RA
Treatment with tumour necrosis factor alpha (TNF-α, or simply TNF) inhibitors is considered to be an alternative to the use of traditional disease-modifying anti-rheumatic drugs (DMARDs) in patients with different rheumatic diseases, i.e. rheumatoid arthritis (RA). There are three TNF-inhibitor drugs currently available on the market (brand names in brackets): adalimumab (Humira), etanercept (Enbrel) and infliximab (Remicade). The drugs are often referred to as biologics, along with other medicines derived from living organisms that target specific receptors in the immune system. The Norwegian Knowledge Centre for the Health Services (NOKC) has conducted a systematic review of the available evidence on effect and safety connected to the use of TNF inhibitors for the treatment of rheumatoid arthritis, psoriasis arthritis and Bechterew’s Disease (ankylosing spondylitis). The review has been published in two separate reports: The first (1) concerned itself with randomised clinical trials (RCTs) and found that the three TNF-inhibitors in the studies included were significantly more effective with respect to reducing disease activity in rheumatoid arthritis, Bechterew’s disease and psoriasis arthritis than the comparator (placebo or other active treatment). However, the studies included in this report were of a short duration and were therefore not suitable as a basis for judging the long-term effects of TNF-inhibitors. Short periods of observation and few patients also make it impossible to discover rare, but potentially serious, adverse events. These include cancer, which may appear only after several years. The second report (2) covered observational studies and concluded that TNF-inhibitors were also effective in clinical practice. Compared to the RCTs, the patient populations in the observational studies were larger and more similar to that found in clinical practice. Infections seem to occur at a higher rate than expected. Even in the observational studies, the follow-up time for individual patients was too short to support any conclusions regarding risks of serious adverse events beyond what has been revealed in the clinical trials. Combination therapy with a TNF-inhibitor and methotrexate (MTX) was found to be more effective than TNF monotherapy. Also, drug survival time on a TNF-inhibitor was generally longer than on a traditional DMARD. The third and present report considers cost-effectiveness and other health economic implications of TNF-inhibitors for RA. All three reports have been commissioned by the Norwegian Government’s Department of Health and Care Services and the Regional Health Authority for Northern Norway. Together, they are likely to form the basis for Norwegian prescribing guidelines to be developed by the Directorate for Health and Social Affairs in 2007.
1.2 Objectives The project mandate states that “the cost-effectiveness of TNF-inhibitors shall also be considered”. Cost-effectiveness analysis is an economic tool that can be used to guide priority-setting in the health care sector. In this context, it is taken to mean to assess whether the drugs represent “value for money” compared to alternative treatment. The “value” or benefit refers to the potential impact the drugs have on health-related quality of life and
19

survival. “Money” refers to the effect on costs, or resource use, both inside and outside the health sector. Given the significantly higher prices of TNF-antagonists compared to those of traditional DMARDs, the primary objective is therefore to examine whether the additional resources spent following the use of the TNF-inhibitors are in reasonable proportion to the expected added benefits- The secondary objective was to investigate whether the TNF-inhibitors are cost-effective earlier rather than later in the treatment sequence. In other words, are there any significant differences between first, second and third line therapy?
1.3 Structure of the report To establish whether an intervention is cost-effective or not one needs to perform an economic evaluation, and compare the costs and benefits of the intervention to those associated with an alternative strategy: which should cover what would have happened in place of the intervention. RA is a chronic disease, and one would therefore be particularly interested in costs and outcomes incurred over a longer period of time. Estimates of such figures may be extrapolated from short term data using a health economic model. The optimal approach with regard to determining whether TNF-inhibitors are cost-effective for RA in Norway would have been to devise a specific health economic model. This could have utilised data on Norwegian clinical practice, patient outcomes, unit costs and probabilities of different events. Alternatively, a ready-made model from another country could have been employed, validated and adapted to fit Norwegian conditions. Both alternatives were explored but had to be abandoned due to time limitations. External experts in health economics were consulted in this process. Time limitations also led to the present report being restricted to rheumatoid arthritis (RA). Hence, economic studies related to ankylosing spondylitis, juvenile arthritis and psoriasis arthritis will not be reviewed here. Even though a comprehensive analysis in the form of a “new” economic model cannot be presented, we have sought to compile information that, viewed as a whole, may be of some relevance in the Norwegian context. The phrase “some relevance” is chosen since it should be borne in mind that no strong conclusions can be drawn in the absence of a specific and sophisticated model that reflects the complexity of real life decision making by rheumatologists and that is geared to Norwegian conditions. The main focus of the analysis is a literature review of economic evaluations of TNF-inhibitors for RA. In addition, the report comprises background sections on the economic burden of RA to illustrate the extent of resources lost to society due to the disease, and the magnitude and composition of TNF-inhibitor and DMARD prescribing in Norway. The section on economic evaluation is followed by an analysis of the health related quality of life associated with TNF and DMARD use in Norwegian clinical practice, as recorded in the NOR-DMARD observational study. The structure of the report, in chronological order, is thus as follows:
• The economic burden of RA The brunt of the cost of treating a disease is borne by the health care services. However, the costs of the disease itself will affect society at large in the form of lost productivity and non-medical assistance. Cost of illness studies serve the purpose of estimating the potential savings to society from a reduction in disease, and also the extent to which this occurs inside or outside the health sector (3). Since many
20

economic evaluations of RA interventions are restricted to costs and effects within the health sector, we have deemed it useful to provide a brief discussion of the economic burden of RA.
• TNF-inhibitors in Norway
An intervention may involve added benefits to society as a whole which do not show up in the health budget. The fact remains however, that the TNF-inhibitors are significantly more expensive than the drugs they are intended to replace, and may pose a financial burden on the budget. This is not the prime concern of this report, but it justifies the need for economic evaluation in this field. The distribution of consumption of TNF-antagonists and DMARDs in Norway is provided, an estimate of the number of patients eligible for TNF-antagonist treatment.
• A literature review of economic evaluations of TNF-alpha inhibitors.
The costs and benefits of TNF-inhibitors compared to traditional DMARDs have been evaluated in a number of health economic studies. Although transferability to the Norwegian setting may be limited, we have listed the results, grouped by drug name and study, in terms of cost per extra benefit (quality-adjusted life year) in both contemporary local currency values and in Norwegian kroner (2005 money terms).
• An analysis of results from the NOR-DMARD observational study
As noted in the NOKC report on observational studies (2), data on how the drugs are actually used in clinical practice are useful in ascertaining their effect. This is also true with regard to health economic results. Data on work capacity and health-related quality of life (HRQoL) outcomes in Norwegian RA patients are registered in the Norwegian observational study NOR-DMARD. We commissioned an analysis of these variables drawn from the study. Unfortunately, data on work capacity was too limited to be analysed, but HRQoL associated with the use of TNF-alpha (as a group) compared to MTX and other DMARDs over a six-month period was reported. Although the analysis is not an economic evaluation, as costs are not included, it does give some information on the relative HRQoL gains in clinical practice. The analysis was conducted by Dr. Marte S. Heiberg and Prof. Tore K. Kvien of Diakonhjemmet Hospital in Oslo and the NOR-DMARD observational study. A summary of the report is given in the main section, whilst the entire report is supplied in appendix F (in Norwegian).
21

2 Background
2.1 The economic burden of rheumatoid arthritis
2.1.1 Costs associated with RA Rheumatoid arthritis is a chronic, inflammatory disease, principally affecting synovial tissue in the joints, and most often resulting in progressive destruction of articular structures (cartilage and bone). The disease causes pain, fatigue and loss of function and mobility (4). This may in turn lead to depression among RA patients. Age-specific mortality is believed to be higher among people with RA than in the general population, but estimates tend to vary. Standardised mortality rates for RA have been reported to be 1.57 in Sweden and 2.0 in Norway (7). Furthermore a reduced life expectancy of 5 - 10 years was reported compared to the general population. Survival in the RA patient group has not changed much over the last 40 years (4). RA is also seen to affect work capacity: A UK study concluded that 29 % of the patients studied had stopped working because of RA within five years of disease initiation (5). A similar Finnish 5-year follow up study (6) tried to asses the associated costs and found that the mean lost productivity per patient-year was euro 7 217 (NOK 56 000, 2005). The costs associated with RA and its treatment may be split into direct and indirect portions:
• Direct costs include: physician visits, medication, monitoring (laboratory services), management of drug-related adverse events, hospitalisations, surgery (such as joint replacement) and assistance required due to disability.
• Indirect costs comprise loss of employment and reductions in productivity of patients,
their families and caregivers that can be ascribed to the disease.
• A third cost category known as “intangibles” refers to the burden of suffering and grief borne by patients and families, but is most often unaccounted for in economic evaluations, as it is hard, if not impossible, to quantify.
2.1.2 Cost of illness studies Estimates of the total cost to society due to RA vary from country to country but no published studies are as yet available for Norway. Moreover, few specific statistics are readily available with regard to the costs associated with the disease in this country. We thus have to look to our neighbouring country Sweden for more comprehensive cost-of-illness reviews. A study carried out at the University of Linköping for the Swedish RA patient association, found that the total cost associated with RA (broadly defined as inflammatory joint disease)2 amounted to SEK 8.5 billion (NOK 7.4 billion) in 2001, or NOK 7.8 billion in 2005 money terms. The number of patients within each diagnostic group was not supplied, so a cost figure per patient could not be calculated. As shown in table 1, the bulk of the costs was indirect in kind and
2 (defined as “Inflammatory joint and joint-related diseases, ICD-10 codes M00-M11, M13, M45-46, M65, M68, M70-71) 2 Source: Farmastat, www.farmastat.no
22

related to sick leave and early retirement. The drug costs included expenditure on etanercept and infliximab, but not on adalimumab, as it was not marketed in Sweden at the time. Table 1 The costs of RA (inflammatory joint disease)
in Sweden, 2001 Costs Cost component SEK million Percent
Direct costs Inpatients 190 2 %Outpatients / Primary care 981 12 %Drugs 343 4 %Subtotal 1 514 18 %Indirect costs Sick leave 2 124 25 %Early retirement 4 854 57 %Subtotal 6 978 82 %Total 8 492 100 %Source: Schmidt 2003 (7), table 19 Another Swedish study (8) found a similar cost pattern with respect to patients with early RA, with indirect costs two to three times the magnitude of the direct cost estimate. As will become evident in the review later in this chapter, many studies have demonstrated a relationship between costs and severity of disease. For example, a third Swedish study (9) found costs per year to vary between SEK 5 000 (NOK 4 600, 1997) for patients with health assessment questionnaire (HAQ) scores under 0.5 (i.e. less serious disease), to SEK 60 0003 (NOK 46 400, 1997), for patients with HAQ scores above 2.6 (severe disease). Even though the cost structure seems to be dominated by indirect costs, the direct cost component has probably increased in recent years, judging from the literature (10). Following the introduction of biologic drugs, a US study (11) estimated direct costs per RA patient per year to be USD 9 519 (NOK 86 000, 2001 values) where 66 % was due to drugs, 16 % to hospitalisation and 17 % to outpatient services. A quarter of the patient sample was using biologic drugs, and this group’s mean direct costs (USD 19 016, NOK 170 000, 201) were more than three times larger than those of the group who was not on biologics (USD 6 164, NOK 55 000, 2001). However, as pointed out in the NOKC clinical trial review (1), both the magnitude and composition of costs are bound to vary across countries, and the lack of clear guidelines for standardising in costing studies makes generalisation difficult.
3 total costs, SEK 15 500 if only direct costs are counted
23

2.2 TNF-inhibitors in Norway
2.2.1 Consumption The use of TNF-inhibitors in RA and related diseases has grown rapidly over the last decade. They were in 2005 used by approximately 23% of RA patients in Norway. At the same time, the use of other DMARDs, with the exception of methotrexate (MTX), has generally been much reduced. Sulphasalazine (SSZ) is also still used, but to a lesser extent than before, whilst drugs such as gold salts, penicillamine and cyclosporine now only play a marginal role in the RA drug therapy in Norway. A report has estimated the number of potential recipients of TNF-α inhibitors across all diagnoses in Norway to be 11 500 (12). A crude estimate based on TNF-inhibitor sales statistics, assuming continuous consumption of doses at a given level (defined daily dose), estimated some 7 200 patients (all diagnoses) to be actively treated in 2006 (see appendix A). Given the assumptions, however, this estimate should be viewed with great caution. The Norwegian Medicines Agency’s (NoMA) estimate involved slightly less than 4 000 treated patients. (12) Consultants Drs Tore K. Kvien and Bjørn-Yngvar Nordvåg expect the number of patients to rise, but assume that improved identification methods might mean that the number on TNF inhibitors will level out at around 8 000 patients. (12) According to Nordvåg, approx. 35 % of those initiating treatment with a new DMARD in 2004 used TNF inhibitors. Of these, 80 % commenced treatment with combination therapy (TNF + MTX). The distribution of RA drug treatment regimes as found in the multicentre NOR-DMARD longitudinal study across some 3 000 cases is given in table 2 below. The consumption of TNF inhibitors has risen significantly over the last couple of years (see appendix A), with the 2005- 2006 growth rate at approximately 22 %4. All three drugs were among the top ten drugs sold in Norway in terms of value in 20065. In retail prices, the sales of the three biologics added up to approximately. NOK 860 million in 20064, which represents approximately 5 % of total prescription drug sales that year. The medicines cost per patient per year is in the area of NOK 150 000 for etanercept and adalimumab, and NOK 80 000 for infliximab. This excludes the cost of drug administration and monitoring. Table 2 Distribution of different treatment
regimens in RA, as recorded in the NOR-DMARD observational study
Drug regimen Cases Per centTNF mono 256 8.4 TNF + MTX 428 14.1 MTX 1 072 35.3 MTX + DMARD 325 10.7 Leflunomide 335 11.0 Sulphasalazine 300 9.9 Other DMARD regimens 323 10.6 Total 3 039 100.0 Source: Kvien 2005 (13), table II
4 Source: Drug consumption in Norway 2006, Norwegian Institute of Public Health, http://www.legemiddelfrobruk.no 5 Drugs and Health Care: Facts and figues 2007, Norwegian Association of Pharmaceutical Manufacturers (LMI)
24

2.2.2 Financing As noted earlier, the drugs are relatively expensive compared to traditional DMARDs. Budget impact questions have therefore been addressed in published articles (14-16), but a discussion of spending and implementation, subject to detailed discussion in the latter paper, is beyond the scope of this report. We shall only note that the three TNF drugs have been financed in different ways depending on their mode of administration. Infliximab, which until recently required 2 hours of intravenous infusion (reduced to only one hour infusion time, except for the two first infusions) followed by 2 hours of monitoring (at least initially), is given in hospital and therefore paid for over the hospital budget. The two others may be administered by the patient at home and the bills have therefore been footed by the social insurance system, Folketrygden. This, however, did not entail them being granted unconditional reimbursement. They were subject to a more restricted (individual) form of reimbursement involving certain patient-related conditions, requiring an individual application to the social insurance system Folketrygden from the treating doctor on behalf of the patient. Nevertheless, as from June first 2006, the Ministry of Health and Care Services, represented by the five Regional Health Authorities, has assumed responsibility for financing all three TNF inhibitors (17) in a similar way.
25

3 Review of economic evaluations of TNF inhibitors
3.1 About economic evaluations in RA
3.1.1 The concept of cost-effectiveness
3.1.1.1 Cost effectiveness and economic evaluation Cost-effectiveness is synonymous with the notion of “value for money”. Whether an intervention is cost-effective can only be judged by comparing costs and outcomes of that intervention with an alternative course of action, or simply with the status quo, “doing nothing”. In the case of drugs, it is not only the price of the drugs themselves that should be taken into account in cost calculations, but also the wider consequences for the health services (e.g. adverse events, treatment procedures and hospitalisations) or for society at large (such as the ability to go to school or work ant the need for assistance from friends and family) (18). The process of identifying, measuring, valuing and comparing costs and outcomes of alternative interventions, or strategies, is known as economic evaluation (18). There are three6 main types of economic evaluation which differ in terms of how outcomes are measured. In cost-effectiveness analyses, the outcomes are expressed in terms of clinical endpoints such as deaths avoided, unit changes on a medical scale (blood pressure, say), life years gained, symptom-free time and so on. In cost-utility analyses, they are expressed in terms of survival time weighted by health-related quality of life (HRQoL), or sometimes only the latter. Finally, in cost-benefit analyses, the outcomes are measured in money terms. Cost-effectiveness and cost-utility studies are the most prevalent forms of health economic evaluation. The strength of the former type of analysis is that it is relatively straightforward to carry out, but it is not capable of combining anticipated gains in health-related quality of life with gains in survival, which is possible in the latter. HRQoL (sometimes referred to as utility) values ranging from 0 (death) to 1 (perfect health) are multiplied by expected survival time to produce quality adjusted life years (QALYs). A QALY is thus the equivalent of a year in a state of perfect health. The utility data may be elicited through different methods, in which people are asked to weigh a certain condition as compared to perfect health. The utility value of a particular health state may be determined by societal preferences such as in the EurQuol 5 Dimensions (EQ-5D), the Health Utility Index mark 3 (HUI3) or the Short Form 6 Dimensions (SF-6D) questionnaires, or directly by the patient in the Visual Analogue Scale (VAS).
3.1.1.2 Components of an economic evaluation We have already referred to various ways in which costs and outcomes can be measured in economic evaluation, as well as characteristics of the type of evaluation itself. In addition, there are several components of an economic evaluation that will influence its results. Some of these are discussed below:
Perspective: The perspective is the viewpoint of the evaluation and determines the extent to which cost and health consequences are taken into account. If the perspective is that of the health services,
6 There are actually four, if one includes cost-minimisation studies, which assume that the effect of the compared interventions are identical.
26

effects on patients’ work capacity and required assistance from other institutions need not be incorporated. If the perspective is societal, however, then such effects should be included.
Time horizon Since RA is a chronic disease, lifetime models are generally preferred over shorter-term models. However, the longer the time horizon, the larger the chance of capturing all costs and benefits accruing from an intervention. At the same time, the uncertainty attached to the underlying assumptions will also be larger in long-term models.
Type of model: There are two main types of models which tend to predominate in economic evaluations of TNF-inhibitors; Markov models and discrete event simulations. In Markov models a hypothetical cohort of patients move through different states (Markov states) depending on disease progression. Each state is associated with a level of HRQoL (utility) and costs. The patients spend a given time (cycle length) in each state and then move on to another state (or remain in the same state) following their reaction to the intervention. At the end of the model’s time horizon, the accumulated costs and benefits are calculated for the entire cohort (19). In discrete event simulation, on the other hand, the idea is to simulate patient histories with individual variation (20). Costs and outcomes are accumulated when patients encounter an event, which can occur at any discrete time as opposed to Markov states, which occur at set intervals (21). Discrete event simulations are more complex and therefore also more difficult to compare than Markov models- but have been argued to constitute a more efficient way of representing clinical practice (20) .
Underlying data Trial-based economic evaluations are short-term in nature, as they only incorporate costs and outcomes that arise during the course of the trial. Model-based studies are able to assess costs and outcomes in the longer run as they synthesise and extrapolate data from short-term trials with long-term observational studies. Short-term trials may entail high internal validity, but may not necessarily represent effects experienced in clinical practice. The challenge is thus to combine these data sources in a meaningful way.
Benefits The health-related quality of life component in QALYs is based on utilities derived from generic questionnaires such as the EQ-5D. Sometimes generic HRQoL trial data are not available for particular interventions, and one has to calculate them on the basis of other outcomes. An important outcome measure in RA is the health assessment questionnaire (HAQ), a disease-specific questionnaire which records RA patients’ functions on 20 items in 8 categories. The HAQ score plays a pivotal role in many models as it is linked to health related quality of life, mortality and costs. The HAQ scale ranges between 0 (best condition) and 3 (worst condition). The smallest recognised change in disability is 0.125 (22), and it is commonly held that a change of twice that magnitude, 0.25, has clinical significance. The estimated relationship between HAQ and HRQoL will influence the results, as will any projection regarding HAQ and relative morality risk.
Costs The extent to which cost items, both direct and indirect, are included and the manner in which they are valued, will affect the result of an economic evaluation. There is a potential for cost offsets when increased expenditure on one item leads to reductions in expenditure on others, both inside and outside the health sector Costs are often categorised as direct or indirect (see
27

section 2.1.1). The former refers to the costs of tearing a disease, while the latter refers to costs caused by the disease with regard to sick leave and early retirement-
Discount rate: Because of the uncertainty attached to future costs and outcomes, and because of social time preferences for resources, the stream of such values over time should be discounted. The discounted value represents the present value of the future stream. Hence, the higher the discount rate, the lower the present value. It is common practice to discount both costs and benefits at the same rate, and this also applies to projects within health care (23). However, some have argued that social time preferences for health resources are different from those for financial resources, and that the former should be discounted at a lower rate than the latter (24). This has been practised in economic evaluations carried out for the National Institute of Health and Clinical Excellence (NICE) in the UK7. .
3.1.1.3 The ICER The results of an economic evaluation are often expressed as the incremental cost-effectiveness ratio (ICER), the change in costs per additional unit of benefit brought about by moving from one strategy (the comparison strategy) to another (the intervention strategy). In a cost-utility analysis, the ICERs are the extra costs incurred for an additional QALY gained compared to those resulting from the standard strategy.
comparisononinterventi
comparisononinterventi
essEffectivenessEffectivenCostCost
ICER−
−=
The results may be described in terms of four scenarios: i) Less costs, more benefits (the intervention is cost saving) ii) More costs, more benefits iii) Less costs, less benefits iv) More costs, less benefits (the intervention is dominated) Scenarios i) and iv) offer clear-cut answers, albeit with opposite conclusions: Scenario i) is extremely desirable, whereas scenario iv) is best avoided from an economic standpoint. . Strategies ii) and iii) deserve a closer examination, but scenario iii) is not particularly relevant here, since most new strategies involve a higher cost than the one already in place. The most prevalent scenario in economic evaluations therefore tends to be scenario ii).
3.1.1.4 Cost-effectiveness thresholds Because health budgets are not infinite, it is often argued that some sort of threshold denoting the upper limit of what society is willing to pay for an additional health benefit – for example a QALY – should be determined, if not as a definite cut-off point then at least as a 7The recommended discount rates were changed to 3,5 % for both costs and benefits by the UK Treasury in 2003: http://www.info.doh.gov.uk/doh/finman.nsf/526655e250fd75150025673e0036b174/8f946e5f6cebb8d380256da90039a6a3?OpenDocument
28

contributing guideline for decision-makers (25). In England and Wales, for example, research has suggested that the unofficial watershed lies at GBP 30 000 (26). In Norway, the idea that health care costs are to be in “reasonable proportion” with respect to the increase in benefits is founded in law (25). Norway does at present not have any official cost-effectiveness threshold. However, Kristiansen & Gyrd-Hansen (25) have suggested figures of NOK 412 000, based on the World Bank’s recommended principle of GDP per capita forming the upper limit, or NOK 425 000 based on the value of a statistical life-year set by the Ministry of Finance.
3.1.1.5 The need for appropriate health economic models Models are essential in the economic evaluation of TNF-inhibitors for rheumatoid arthritis. As Prof. Ivar S Kristiansen has pointed out (27):
“One full year of TNF treatment costs is in the order of NOK150 000. If such a treatment should be cost-effective in a one-year perspective, it would need to generate 0.3 QALYs even if the cost-effectiveness threshold were as high as NOK 500 000. Even with the most”optimistic” QALY-weights, TNF-inhibitors are not cost-effective in the short run.”
TNF inhibitors may prevent or delay radiographic progression in RA patients, and although benefits may appear immediately, it is claimed that the improvement will be maintained over time (28). Moreover, RA is a chronic disease with fluctuating disease activity, and it is necessary that costs and outcomes be modelled over the long-term, preferably the remaining lifetime of the patient (28;29). Since the question of when TNF-inhibitors are to be used is important, the appropriate intervention and comparison in an economic evaluation of TNF-inhibitors ought to be a sequence of DMARDs with a TNF-inhibitor compared to one without (20;30;31). TNF-inhibitors will constitute an additional therapy for some patients, but an alternative therapy for others (29). RA is a disease where treatment regimens are changed relatively frequently, due to adverse events or lack of response. Survival on TNF-inhibitors is nevertheless higher than on traditional DMARDs, as stated in the second NOKC TNF-inhibitor report (2), and is also evident from the NOR-DMARD analysis in appendix F in the present report. A Swedish observational study (32) found no significant differences in survival time between etanercept and infliximab in terms of survival time (79 % and 75 % respectively, at 20 months). This was supported by a Dutch study (33) which also included adalimumab, where median survival time on TNF-inhibitors was 37 months (approx 3 years). Most of the extra costs and benefits related to TNF treatment will accrue when on active treatment. Even if a patient reverts to her baseline quality of life, or even slightly lower, upon quitting a treatment, disease progression is likely to have been slower than if the treatment had not been undertaken. Therefore, the economic – if not the clinical – benefit will last beyond the time of active treatment. As has been noted, there are many components in the design of economic evaluations that will have a bearing on the results. In response to what was seen as an unacceptably large variation in study design in economic evaluations within rheumatology, rendering some studies incomparable, the OMERACT (Outcome Measures in Rheumatology) Economics Working Group was convened in 1997 (34). This informal international group of experts sought to develop a reference case of minimum standards that would address the most important methodological controversies in the field, such as data sources, assumptions and use of models. The recommended criteria regarding such factors are listed in appendix B.
29

3.2 Methods Searches were made on Medline (PubMed) and the UK Centre for Reviews and Disseminations’ NHS Economic Evaluations database (NHS EED). The search strategies are supplied in appendix C. Moreover, the reference lists of included references were examined. Two authors reviewed all the search results, abstracts and reference lists of included studies. The full text of potentially relevant reports was retrieved. Cost-effectiveness and cost-utility analyses including one or several TNF-inhibitors administered to rheumatoid arthritis patients, as well as reviews of such studies, were included. Studies were excluded if they were unpublished, the time horizon was shorter than 5 years, if the focus was on ankylosing spondylitis, juvenile arthritis or psoriasis arthritis, or if they were of the cost-cost type. Pharmaceutical company submissions were invited for all three NOKC reports. We received a report from Abbott on adalimumab related to Finland by Brennan et al. from 2003 (28). This was excluded however, because it had not been published, but was in any event seen to be very similar to a later published report by Bansback et al. from Sweden in 2005 (35). Reviews were referred to in the discussion section, and only to the extent that they highlight elements in the primary studies. A detailed summary of the primary studies has been provided in tables in appendix D.
• Inclusion criteria: o Population: RA patients o Intervention: TNF inhibitor as therapy o Comparison: DMARDs o Outcomes: All o Study type: cost-effectiveness and cost-utility analyses, reviews
• Exclusion criteria:
o Unpublished study o Population: patients with ankylosing spondylitis, juvenile idiopathic arthritis or
psoriasis arthritis o Modelling time horizon shorter than five years
One author reviewed the included studies, the quality of which was assessed using the checklist for economic evaluations developed by Drunnond,(36) (scores supplied in appendix E). The study quality was rated as high if the score was above 50 %, otherwise it would have been rated low. All the studies were rated high quality. Costs have been converted into Norwegian kroner (NOK) at contemporary average exchange rates, using historical data from the Central Bank of Norway.8. These figures have then been adjusted to 2005 values based on the Consumer Price Index from Statistics Norway9 and rounded to the nearest thousand. Obviously, such a method is associated with caveats, and results may not be readily transferable over space and time due to differences in clinical practice and cost structure. With this in mind however, it seems useful to present some form of common cost denominator. Purchasing power parities should ideally have been used in conversion, but these were not available for euro.
8 Source: Average annual exchange rates from the Central Bank of Norway: http//www.noregesbank.no 9 http://www.ssb.no/kpi/
30

3.3 Results We included 12 economic evaluations. The results of these are reviewed in the subsequent sections. Following the format of the NOKC clinical trial review (1), we have grouped the results by drug. This means that details from studies which included two or more of the TNF-inhibitors, will be repeated.
3.3.1 Adalimumab Adalimumab (Humira) is the most recent addition to the TNF-inhibitor group, and relatively few economic evaluations have therefore been carried out to date. Two studies were included: Chen 2006 (22), was a recent UK health technology assessment report commissioned by NICE. The study included a systematic review of effectiveness and an economic evaluation of TNF-inhibitors for rheumatoid arthritis in the UK, based on the Birmingham Rheumatoid Arthritis Model (BRAM). The other study, Bansback 2005, adapted a model originally developed in Sheffield, to Swedish conditions.
3.3.1.1 Chen 2006
Study background Chen 2006 (22) was a cost-utility study conducted by the West Midlands Health Technology Assessment Collaboration (WMHTAC) for the UK National Institute for Health and Clinical Excellence (NICE) as part of the institute’s current reappraisal of the use of TNF-inhibitors for RA patients in England and Wales. An extended version of this study summary is supplied in appendix D.1.
Patients Two patient populations were modelled: i) Patients with early RA, which was defined as a disease duration of 3 years or less, who were either MTX-naïve or who had not failed MTX. ii) Patients with late RA, i.e. disease duration of longer than 3 years, who had failed MTX.
Intervention and comparison The study included all three TNF-inhibitors, and the results pertaining to etanercept and infliximab are reported in the subsequent sections covering these drugs. The effects of placing TNF-inhibitors at different positions; first, third and last, in a standard UK DMARD sequence were investigated and compared to a sequence without TNF-inhibitors. The use of several TNF-inhibitors in the same sequence was also modelled, but is not reviewed here. The standard sequence was derived from a survey of British rheumatologists. In the case of adalimumab, this gives the following relevant intervention and comparator strategies: Intervention: Adalimumab, with or without MTX in the first, third or final position in a standard UK DMARD sequence (see appendix D.1 for full details). Comparison: Standard UK DMARD sequence based on a survey of rheumatologists
31

Study perspective, time horizon and model type The study perspective was that of the health services in England and Wales, the modelling time horizon was the patients’ expected remaining lifetime and the model, known as the Birmingham Rheumatoid Arthritis Model (BRAM), was a discrete event simulation. Further information about the model and its input data are given in appendix D.1.
Results The incremental costs and QALYs, and the resulting ICERs for the various intervention strategies are given in table 5 below: Effects of placing adalimumab at different points in the sequence were investigated, as were the effects of using “early” and “late” RA data. The latter distinction was one of the refinements made to previous versions of the Birmingham model (20;30), Chen et al. argued that the late group was more representative of clinical practice in the UK as most patients would have failed MTX before starting TNF-inhibitor therapy, as third line treatment, as recommended by NICE/BSR guidelines. Third line treatment for “early RA” patients resulted in relatively low ICERs (around NOK 400 000). Adding MTX to adalimumab in this case led to a significant QALY improvement, as well as limited cost increases. The ICER of third line combination therapy wast at the watershed between what may and may not be accepted as cost-effective by NICE (26). The highest ICER was associated with first line treatment with adalimumab + MTX, which was probably due to the QALY effect of replacing MTX monotherapy being negligible. First line monotherapy with adalimumab also led to a relatively high ICER, most likely for the same reason. For “late RA” patients, the combination therapy QALY gain was approximately twice that of monotherapy, and the corresponding ICER approximately half as low. Nevertheless, the “late RA” ICERs were significantly higher than their “early RA” equivalents. Table 3 ICERs: Adalimumab (+MTX) compared to a standard DMARD sequence
in the UK. Base-case results from the BRAM model, Chen 2006 Incremental ICER Strategy Cost QALYs GBP 2004 NOK 2005
adalimumab mono third line early RA 31 770 0.92 35 000 441 000 adalimumab + MTX third line early RA 32 042 1.06 30 000 378 000 adalimumab mono first line early RA 34 207 0.65 53 000 667 000 adalimumab + MTX first line early RA 34 319 0.20 170 000 2 141 000 adalimumab mono third line late RA 30 934 0.22 140 000 1 763 000 adalimumab + MTX third line late RA 31 454 0.49 64 000 806 000 Source: Chen 2006 (22), table 50
32

3.3.1.2 Bansback 2005
Study background Bansback 2005 (35) was a cost-utility study of adalimumab (+ MTX) in Sweden, but the other two TNF-inhibitors were included in comparison strategies. The study was carried out by a group associated with the University of Sheffield’s School of Health and Related Research (ScHARR), who have been involved in economic evaluations of TNF-inhibitors in several countries, particularly in the UK. For an extended study summary, please refer to appendix D.2.
Patients Moderate to severe RA patients failing two DMARD treatments were included in the study.
Intervention and comparison Intervention: adalimumab mono or with MTX as third line treatment in a Swedish DMARD sequence. The position of individual DMARDs in the sequence was not described in the study, except for the beginning which is given as MTX, SSZ or HCQ or combinations of these drugs, which were followed by three unidentified DMARDs and palliative treatment. However, it was claimed that the model’s patient pathway followed Swedish clinical practice. Comparisons: DMARD sequence without TNF-inhibitors, DMARD sequence with etanercept (mono or with MTX) as third line therapy, and DMARD sequence with infliximab + MTX as third line therapy.
Study perspective, time horizon and model type The study perspective was that of the Swedish health services, the time horizon lifetime and the model type a patient based transition state based on work by Jobanputra 2002 (30) and Brennan 2004 (37). Further model details are provided in appendix D.2.
Results The results are shown in table 4 below. Two different scenarios are modelled: The “ACR50/DAS28 Good” means that only ACR50 or EULAR DAS28 “Good responders” received TNF-inhibitors beyond 6 months. the “good response” data yielded lower costs compared to traditional DMARD since fewer patients were deemed responders at 6 months and hence received TNF inhibitors beyond this period. In the adalimumab + MTX version, the result proved less costly but also less effective. Adalimumab was in general more cost-effective in combination with MTX than in monotherapy. Comparisons were made with other TNF-antagonists, and the result indicated that that all three biologics were more or less equally cost-effective in Sweden, subject to a cost-effectiveness threshold (the willingness to pay for an extra QALY) at euro 44 000/GBP 30 000 (approx. NOK 375 000, 2005). The ICERs were on average lower than in the Chen 2006 study which did not include hospitalisation cost offsets.
33

Table 4 ICERs: Adalimumab (+MTX) compared to a standard DMARD sequence in Sweden. Base-case results, Bansback 2005
Incremental ICER Strategy Costs, euro QALYs euro 2001 NOK 2005ACR50/DAS28 Good response adalimumab + MTX 38 595 1.3 34 167 291 000adalimumab + MTX pooled 32 222 0.9 34 922 298 000adalimumab mono 19 671 0.5 41 561 354 000ACR20/DAS28 Moderate response % adalimumab + MTX 49 221 1.2 40 875 348 000adalimumab + MTX pooled 45 705 1.0 44 018 375 000adalimumab mono 47 684 0.7 65 499 558 000Source: Bansback 2005 (35), table 4
3.3.1.3 Summary points adalimumab
• Adalimumab does not seem to be cost-effective as first line therapy for RA patients. In the UK based on the results of Chen 2006.
• Adalimumab seems to be cost-effective as third line therapy for RA patients in the UK with a disease duration of 3 years or less, particularly in combination with MTX, based on the results of Chen 2006.
• Adalimumab does not seem to be cost-effective as third line therapy for RA patients in the UK with a disease duration of more than 3 years, based on the results of Chen 2006.
• Adalimumab seems to be cost-effective as third line therapy for RA patients in Sweden, particularly in the case of ACR50/DAS28 Good responders. Based on the results of Bansback 2005.
• Adalimumab is according to the studies generally more cost-effective in combination with MTX than in monotherapy, which is supported by evidence from the NOR-DMARD study in Norway (49).
• None of the costs reported included indirect costs, which if incoporated would probably have led to lower ICERs.
3.3.2 Etanercept We included 9 studies of etanercept (Enbrel). The recent cost-utility model known as the BRAM, Chen 2006 (22) has already been mentioned. In addition, two studies presenting etanercept results from previous versions of the BRAM were found, Jobanputra 2002 (30) and Barton 2004 (20). To avoid excessive repetition, these two studies have been reviewed together. They were conducted as part of the previous NICE appraisal of TNF-inhibitor for RA, as was the study Brennan 2004 (37). The Bansback 2005 study has also been discussed previously, but since it included etanercept in monotherapy and combination therapy (+MTX) as separate strategies, these results are reported here. A relatively recent study from Canada, Coyle 2006 (38). and a further study from Sweden, Kobelt 2005 (39) were also reviewed. Finnaly, reviews of the Tanno 2005 (40) preliminary model from Japan and the Welsing 2004 (19) 5-year model from the Netherlands have been provided.
34

3.3.2.1 Chen 2006
Study background Chen 2006 (22) was a cost-utility study conducted by the West Midlands Health Technology Assessment Collaboration (WMHTAC) for the UK National Institute for Health and Clinical Excellence (NICE) as part of the institute’s current reappraisal of the use of TNF-inhibitors for RA patients in England and Wales. Again, we refer to appendix D.1 for an extended summary of this study.
Patients Two patient populations were modelled: i) Patients with early RA, meaning a disease duration of 3 years or less, who were either MTX-naïve or who had not failed MTX. ii) Patients with late RA, i.e. disease duration of longer than 3 years, who had failed MTX.
Intervention and comparison Intervention: Etanercept with or without MTX in the first, third or final position in a standard UK DMARD sequence (see below). Comparison: Standard UK DMARD sequence based on survey of rheumatologists (See appendix D.1 for further details)
Study perspective, time horizon and model type The study was conducted from the perspective of the health services in England and Wales. The discrete event model had a lifetime time horizon. Further model details are provided in appendix D.1.
Results The incremental costs and QALYs, and the resulting ICERs for the various intervention strategies are given in table 5 below: The results for third line treatment for “early RA” patients were in the region of 350-380 000 NOK, which is comparable to similar results for adalimumab. Here too, combination therapy is more cost-effective than monotherapy. Relatively high ICERs were produced in the first line strategy scenario, especially in the case of combination therapy, reflecting the marginal gains in QALYs compared to MTX. The QALY gain was also relatively low in the “late RA” scenarios, which led to ICERs in the region of NOK 600 000. Again, it should be pointed out that the ICERs would be slightly higher if discounting of costs and benefits had been identical. Table 5 ICERs: Etanercept (+MTX) compared to a standard DMARD sequence
in the UK. Base-case results from the BRAM model, Chen 2006 Incremental ICER Therapy Cost QALYs GBP 2004 NOK 2005
etanercept monothird line early RA 44 454 1.46 30 000 378 000 etanercept + MTX third line early RA 44 761 1.57 28 000 353 000 etanercept mono first line early RA 48 561 0.98 49 000 617 000 etanercept + MTX first line early RA 48 748 0.62 78 000 982 000 etanercept mono 3r d line late RA 43 832 0.92 47 000 592 000 etanercept + MTX third line late RA 43 821 0.88 50 000 630 000 Source: Chen et al. (2006), table 50
35

3.3.2.2 Bansback 2005
Study background Bansback 2005 (35) was primarily a cost-utility study of adalimumab?????? (+MTX) in Sweden, but the other two TNF-inhibitors were included in other intervention strategies. Please see appendix D.2 for the extended study summary.
Patients Moderate to severe RA patients failing 2 DMARD treatments were included in the study.
Intervention and comparison Intervention: adalimumab mono or with MTX as third line treatment in a Swedish DMARD sequence. Comparisons: DMARD sequence without TNF-inhibitors.
Study perspective, time horizon and model type The study perspective was that of the Swedish health services, the time horizon lifetime and the model type a patient based transition state based on work by Jobanputra 2002 (30) and Brennan 2004 (37). Other model details are given in appendix, D.2.
Results The results are shown in the table below. As in the case of the adalimumab results from the same study, the ACR50 scenario was less costly than the ACR20 version. This was due to the proportion of patients receiving biologics being higher in the latter scenario. The ICERs are low compared to the Chen 2006 results, which could be attributed to the more extensive inclusion of hospitalisation costs. Table 6 ICERs: Etanercept (+MTX) compared to a standard DMARD sequence in
Sweden. Base-case results, Bansback 2005 Incremental ICER Strategy Costs, euro QALYs euro 2001 NOK 2005
ACR50/DAS28 Good response etanercept + MTX 32 742 0.9 35 760 305 000 etanercept mono 32 034 0.9 36 927 315 000 ACR20/DAS28 Moderate response etanercept + MTX 64 832 1.2 51 976 443 000 etanercept mono 43 593 1.0 42 480 362 000 Source: Bansback 2005 (35), table 4
3.3.2.3 Coyle 2006
Study background Coyle 2006 (38) was a systematic review and economic evaluation (cost-utility and cost-effectiveness analyses) of etanercept and infliximab published by the Canadian Co-ordinating Office for Health Technology Assessment (CCOHTA). The extended study summary is found in appendix D.3.
36

Patients Patients with long-standing RA
Intervention and comparison Intervention Etanercept monotherapy before or after intramuscular gold in a typical Canadian DMARD sequence (see appendix D.3) Comparison: intramuscular gold as fourth line therapy following MTX / (MTX + SSZ)/ (MTX + SSZ + hydrochloroquine (HCQ))
Study perspective, time horizon and model type The study was carried out from the health services’ point of view and had a five year time-horizon. The model, of the Markov type, involved cycle lengths of six months.
Results As seen in table 7, placing etanercept before and after gold in the sequence produced ICERs of CAD 144 700 (NOK 770 000) and CAD 125 700 (NOK 670 000) respectively. It turned out that placing etanercept after, rather than before, gold in the sequence, was less costly as well as less effective (0.36 vs. 0.34 QALYs gained). However, both strategies cost more than CAD 120 000 per QALY which is more than double the Canadian threshold value of CAD 50 000 per QALY gained (NOK 266 000, 2005), and they were therefore not considered cost-effective when only direct costs were taken into account. Table 7 ICERs: Etanercept before and after gold in a Canadian DMARD
sequence, compared to a similar sequence without TNF-inhibitors. Base-case results, Coyle 2006
Incremental ICER Costs, CAD QALYs CAD 2005 NOK 2005
etanercept before gold 39 200 0.27 144 700 770 000 etanercept after gold 32 000 0.22 125 700 670 000 Source: Coyle 2006 (38), table 8
3.3.2.4 Kobelt 2005
Study background Kobelt 2005 (39) was a cost-utility study from Sweden sponsored by Wyeth. A more detailed summary of this study is supplied in appendix D.4.
Patients The modelled patients had active RA and had failed DMARDs other than MTX
Intervention and comparison Intervention: etanercept + MTX Comparison: MTX monotherapy. No treatment sequences were described
37

Study perspective, time horizon and model type The study had a societal study perspective, which meant that indirect costs were included. The Markov model had a 10-year time horizon, and was developed with five states determined by functional status as measured by the HAQ10. These were in turn separated into high and low disease activity (determined by the DAS28 score). The cycle length was one year, which may seem somewhat long compared to other models where response is usually measured over 6 months.
Results The ten-year extrapolation, shown in the table below, produced an ICER of euro 46 494 (NOK 396000, 2005) per QALY gained. The probability of the ICERs being below a threshold of euro 50 000 (NOK 427 000, 2005) was reported as being 88 %. Sensitivity analysis showed that the results were sensitive both to utility/effectiveness changes and costs. The ten-year extrapolation results should thus be considered with a great degree of caution. No sensitivity analysis was reported with regard to different cost calculations of direct and indirect cost components. Table 8 ICER: Etanercept + MTX compared to MTX in Sweden.
Base-case results (10 year model), Kobelt 2005 Incremental ICER Strategy Costs, euro QALYs euro 2004 NOK 2005
etanercept + MTX 42 148 0.91 46 494 395 000Source: Kobelt 2005 (39), table 6
3.3.2.5 Brennan 2004
Study background Brennan 2004 (37) was a cost-utility study from the UK. The model described in the study was submitted by Wyeth to NICE as part of the institute’s 2002 assessment of the use of TNF inhibitors for RA in England and Wales, and the subsequent development of guidelines. The extended study summary is provided in appendix D.5.
Patients The population modelled comprised adult RA patients who had failed 2 six-month treatments with DMARDs, one of which had to be MTX, in line with contemporary British Society for Rheumatology (BSR) guidelines. Other baseline characteristics were consistent with the Moreland 1999 clinical trial (41).
Intervention and comparison Intervention: A DMARD sequence which included etanercept as third line treatment after MTX and SSZ and before intramuscular gold (see appendix D.5 for further details). Comparison: A similar sequence without the biologic The choice of sequences compared was intended to reflect the most popular DMARDs in the UK.
10 Cur-off points HAQ 0.6, 1.1, 1.6, 2.1
38

Study perspective, time horizon and model type In accordance with NICE recommendations, the study perspective was that of the health services. The discrete event simulation model had a lifetime perspective.
Results The strategy including etanercept was estimated to cost GBP 27 014 more than the one without, whilst producing 1.6 QALYs (all figures per patient). This rendered an incremental cost per QALY gained of GBP 16 330 (NOK 224 000, 2005). Productivity costs were included in the sensitivity analysis by combining UK wage rates with Swedish HAQ-related employment data. This reduced the incremental cost per QALY to under GBP 10 000 (NOK 137 000, 2005). Table 9 ICERs: Etanercept compared to MTX in the UK.
Base-case results, Brennan 2004 Incremental ICER
Costs, GBP QALYs GBP 2001 NOK 2005 etanercept monotherapy 27 014 1.6 16 330 224 000 Source: Brennan 2004 (37), table 3
3.3.2.6 Tanno 2006
Study background Tanno 2006 (40) was a cost-utility study from Japan sponsored by the Japanese government. An extended study summary is given in appendix D.6.
Patients The study focused on Japanese adult RA patients who had failed first line treatment with bucillamine.
Intervention and comparison Intervention: Bucillamine → etanercept mono → MTX → SSZ → MTX + SSZ → no DMARD Comparison: As above but without etanercept monotherapy
Study perspective, time horizon and model type The study had a societal perspective, a lifetime time horizon and utilised a Markov model with 6-month cycles.
Results The ICERs are shown in table 10 underneath. The ICER included indirect costs and were therefore relatively low, even though the HRQoL gain per unit change in HAQ was lower than in other studies.
39

Table 10 ICERs: Etanercept as second line therapy in a DMARD sequence, compared to a standard DMARD sequence in Japan Base-case results, Tanno 2006
Incremental ICER Strategy Costs,
JPY million QALYs JPY million2005 NOK 2005
etanercept 6,39 2.56 2.5 145 000Source: Tanno 2006 (40), table 4
3.3.2.7 Welsing 2004
Study background Welsing 2004 (19) was a cost-utility study from the Netherlands. An extended summary of this study is supplied in appendix D.7.
Patients Dutch patients with active RA (DAS 28>3.2,) who had failed two DMARDS, one of which had to be MTX.
Intervention and comparison 1) usual treatment; 2) leflunomide, if non-response after 3 months: usual treatment; 3) TNF-blockers, if non-response after 3 months, usual treatment; 4) leflunomide, if non-response, TNF-blocker, if non-response to this; usual treatment; 5) TNF-blocker, if non-response, leflunomide, if non-response to this; usual treatment. In the interests of comparison with other studies, only one intervention will be focused upon here: Intervention: Strategy 3) TNF-blockers, if non.response after 3 months, usual treatment. Comparison: Strategy 1) usual treatment “Usual treatment” is not very well defined. The initial drugs are given as SSZ and MTX, followed by “a range of DMARDs”.
Study perspective, time horizon and model type The study had a third party payer perspective, a 5 year time horizon and employed a Markov model.
Results The ICER, shown in table 11, was notably high. However, the lack of clarity with regard to the comparator and the short time horizon mean that comparisons with the results of other studies is not feasible.
40

Table 11 ICERs: Etanercept in mono- or combination therapy
as third line therapy in a DMARD sequence, compared to “usual treatment” sequence in the Netherlands. Base-case results, Welsing 2004.
Incremental ICER Strategy Costs,
euro 2003 QALYs Costs, euro2003 NOK 2005
etanercept 45 763 0.14 326 879 2 667 000*price year is not stated, so 2003 is assumed Source: Welsing 2004 (19), table 2
3.3.2.8 Jobanputra 2002 and Barton 2004
Study background Jobanputra 2002 (30) and Barton 2004 (20) were cost-utility studies performed in the first round of appraisal of TNF-inhibitors for RA by NICE in the UK. An extended study summary is to be found in appendix D.8.
Patients Patients with RA
Intervention and comparison Intervention: Etanercept with or without MTX in the third position in a UK DMARD sequence (see appendix D.8). Comparison: UK DMARD sequence:
Study perspective, time horizon and model type Both studies had a health service perspective, the time horizon was lifetime and the model was of the discrete event simulation type.
Results The ICERs for etanercept in both studies were significantly higher than in the later version of the BRAM (Chen 2006). The later version differentiated between “early RA” and “late RA” patients, and found the ICERs for the former to be much lower than those of the latter in third line therapy. Table 12 ICERs: Etanercept compared to a standard DMARD sequence
in the UK. Base-case results from the BPM and BRAM models, Incremental ICER
Strategy Cost, GBP QALYs GBP 2000 NOK 2005
etanercept, Jobanputra 2002 (30) 19 573 0,24 83 095 1 207 000 etanercept, Barton 2004 (20) 25 257 0,43 59 289 861 000 Source: Jobanputra 2002 (30), table 30 and Barton 2004 (20), table 13
41

3.3.2.9 Summary points etanercept • Etanercept does not seem to be cost-effective as first line therapy for RA patients. In
the UK based on the results of Chen 2006. • Etanerceptb seems to be cost-effective as third line therapy for RA patients in the UK
with a disease duration of 3 years or less, particularly in combination with MTX, based on the results of Chen 2006.
• Etanercept does not seem to be cost-effective as third line therapy for RA patients in the UK with a disease duration of more than 3 years, based on the results of Chen 2006.
• Bansback 2005 maintained that etanercept is likely to be cost-effective as third line therapy for RA patients in Sweden, particularly in the case of ACR50/DAS28 Good responders.
• The Coyle 2006 and Welsing 2004 studies are of limited relevance to the Norwegian setting because of their comparison strategies (“before and after gold" and “usual treatment” respectively).
• The Kobelt 2005 study which included indirect costs indicates considerable offsets in this area, however, there is a great deal of uncertainty surrounding the specification of such costs.
3.3.3 Infliximab Eight infliximab studies were included: Chen 2006 (22), Jobanputra 2002 (30), Barton 2004 (20).Bansback 2005 (35) and Coyle 2006 (38) have all been reviewed earlier. Kobelt 2003 (42) presented data for both Sweden and the UK, while Barbieri 2005 (43) reported from the UK and Wong 2002 (44) from the US.
3.3.3.1 Chen 2006
Study background Chen 2006 (22) was a cost-utility study conducted by the West Midlands Health Technology Assessment Collaboration (WMHTAC) for the UK National Institute for Health and Clinical Excellence (NICE) as part of the institute’s current reappraisal of the use of TNF-inhibitors for RA patients in England and Wales.
Patients Two patient populations were modelled: i) Patients with early RA, meaning a disease duration of 3 years or less, who were either MTX-naïve or who had not failed MTX. ii) Patients with late RA, i.e. disease duration of longer than 3 years, who had failed MTX.
Intervention and comparison Intervention: Infliximab with MTX in the first, third or final position in a standard UK DMARD sequence. Comparison: Standard UK DMARD sequence based on survey of rheumatologists (See appendix D.1 for further details)
42
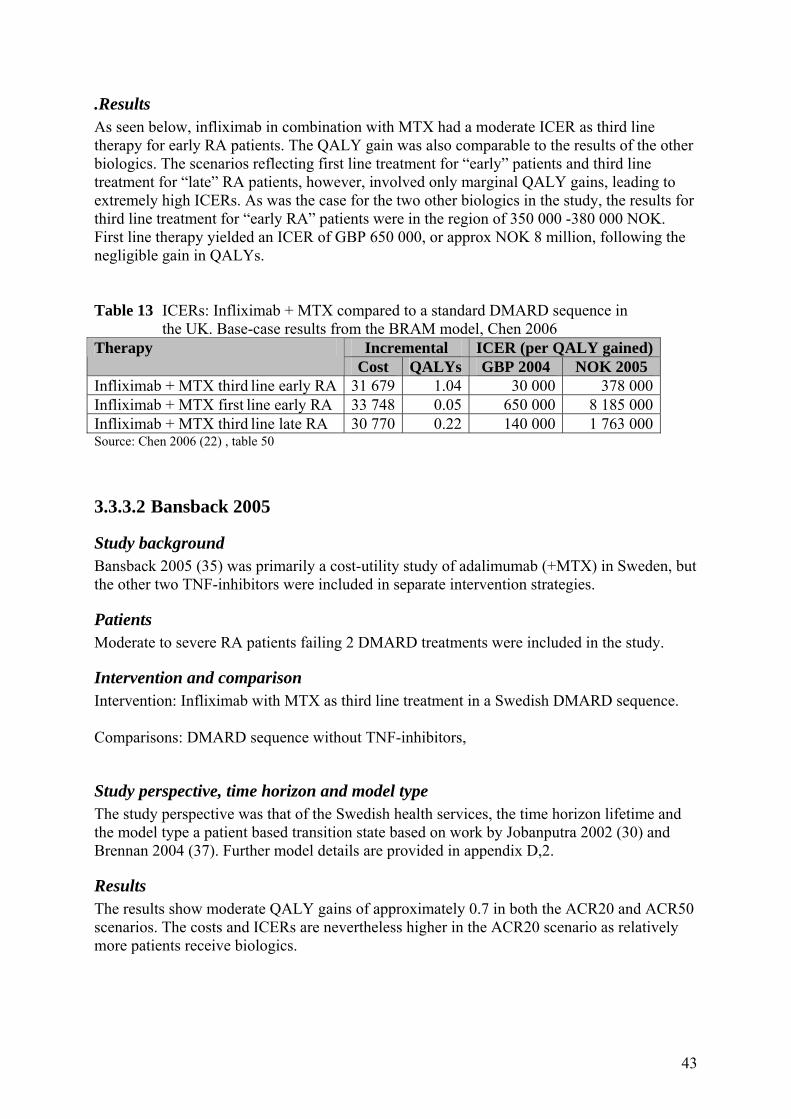
.Results As seen below, infliximab in combination with MTX had a moderate ICER as third line therapy for early RA patients. The QALY gain was also comparable to the results of the other biologics. The scenarios reflecting first line treatment for “early” patients and third line treatment for “late” RA patients, however, involved only marginal QALY gains, leading to extremely high ICERs. As was the case for the two other biologics in the study, the results for third line treatment for “early RA” patients were in the region of 350 000 -380 000 NOK. First line therapy yielded an ICER of GBP 650 000, or approx NOK 8 million, following the negligible gain in QALYs. Table 13 ICERs: Infliximab + MTX compared to a standard DMARD sequence in
the UK. Base-case results from the BRAM model, Chen 2006 Incremental ICER (per QALY gained) Therapy
Cost QALYs GBP 2004 NOK 2005 Infliximab + MTX third line early RA 31 679 1.04 30 000 378 000 Infliximab + MTX first line early RA 33 748 0.05 650 000 8 185 000 Infliximab + MTX third line late RA 30 770 0.22 140 000 1 763 000 Source: Chen 2006 (22) , table 50
3.3.3.2 Bansback 2005
Study background Bansback 2005 (35) was primarily a cost-utility study of adalimumab (+MTX) in Sweden, but the other two TNF-inhibitors were included in separate intervention strategies.
Patients Moderate to severe RA patients failing 2 DMARD treatments were included in the study.
Intervention and comparison Intervention: Infliximab with MTX as third line treatment in a Swedish DMARD sequence. Comparisons: DMARD sequence without TNF-inhibitors,
Study perspective, time horizon and model type The study perspective was that of the Swedish health services, the time horizon lifetime and the model type a patient based transition state based on work by Jobanputra 2002 (30) and Brennan 2004 (37). Further model details are provided in appendix D,2.
Results The results show moderate QALY gains of approximately 0.7 in both the ACR20 and ACR50 scenarios. The costs and ICERs are nevertheless higher in the ACR20 scenario as relatively more patients receive biologics. 43

Table 14 ICERs: Infliximab + MTX compared to a standard DMARD sequence in Sweden. Base-case results, Bansback 2005
Incremental ICER Strategy Costs, euro QALYs euro 2001 NOK 2005 ACR50/DAS28 Good response Infliximab + MTX 31 711 0.7 48 333 412 000 ACR20/DAS28 Moderate response Infliximab + MTX 45 974 0.7 64 935 553 000 Source: Bansback 2005 (35), table 4
3.3.3.3 Coyle 2006
Study background Coyle 2006 (38) was a systematic review and economic evaluation (cost-utility and cost-effectiveness analyses) of etanercept and infliximab published by the Canadian Co-ordinating Office for Health Technology Assessment (CCOHTA).
Patients Patients with long-standing RA
Intervention and comparison Intervention Infliximab with MTX before or after intramuscular gold in a typical Canadian DMARD sequence (see below) Comparison: intramuscular gold as fourth line therapy following MTX /(MTX + SSZ)/(MTX + SSZ + hydrochloroquine (HCQ))
Study perspective, time horizon and model type The study was carried out from the health services’ point of view and had a five year time-horizon. The model, of the Markov type, involved cycle lengths of six months-
Results The results show that the QALY gains were relatively low and the ICERs correspondingly high. It should be borne in mind that Coyle 2006 was a 5-year model, which makes comparison of results difficult, and in any case, the “before and after gold” scenarios were not particularly relevant to the Norwegian setting.
44

Table 15 ICERs: Infliximab + MTX before and after gold in a Canadian DMARD sequence, compared to the same sequence without TNF-inhibitors. Base-case results, Coyle 2006
Incremental ICER Costs, CAD QALYs CAD 2005 NOK 2005
Infliximab + MTX before gold 28 700 0.25 113 000 600 000 Infliximab + MTX after gold 21 700 0.22 97 800 522 000 Source: Coyle 2006 (38), table 7
3.3.3.4 Kobelt 2003
Study background Kobelt 2003 (42) was a cost-utility study sponsored by Schering-Plough that modelled results for both Sweden and the UK,
Patients The study included RA patients with advanced disease, not adequately controlled on DMARDs (including MTX). The ATTRACT trial that was used for efficacy data input involved patients who had active RA despite MTX therapy.
Intervention and comparison Intervention: infliximab + MTX Comparison: MTX alone
Study perspective, time horizon and model type The study perspective was societal. The Markov model had 1-year cycle lengths and extrapolated data for 10 years.
Results ICER results based on 1 year of treatment (2 year results were also presented in the study) are shown in table 16 below. The ICERs were SEK 266 000 (NOK 231 000) and GBP 25 700 (NOK 333 0000) for the UK and Sweden, respectively. When indirect cost offsets were incorporated , the ICERs were reduced to SEK 32 000 (NOK 29 000) for Sweden and GBP 21 600 (NOK 296 000) for the UK. Significant cost offsets were modelled for both countries. It is not necessarily surprising that incremental costs differ in the two countries given varying unit costs. Variations on the benefit side may be more interesting: Both infliximab + MTX as well as MTX monotherapy produced more QALYs in Sweden than in the UK, but the increment was lower in the former. This exemplifies the potential caveats in translating results from one clinical practice context to another. 45

Table 16 ICER: Infliximab + MTX compared to MTX in Sweden and the UK. Base-case results, Kobelt 2003.
Incremental ICER (based on direct costs)Costs, SEK/GBP 2001Strategy
Direct Total QALYs SEK/GBP 2001 NOK 2005
infliximab + MTX, Sweden 65 969 8 031 0,25 266 000 231 000Infliximab + MTX, UK 7 651 6 440 0,29 25 700 333 000Source: Kobelt 2003 (42), table 4
3.3.3.5 Barbieri 2005
Study background Barbieri 2005 (43) was a cost-utility study from the UK, partly funded by Schering-Plough through a research fellowship.
Patients The study incorporated severe RA patients, inadequately controlled on DMARD treatments and resistant to MTX.
Intervention and comparison Intervention: Infliximab + MTX Comparison: MTX alone
Study perspective, time horizon and model type The study perspective was that of the health services, the time horizon lifetime and the model was of the Markov type with 6-month cycle lengths.
Results The ICER in table 17 was within the bounds of the NICE cost-effectiveness threshold (GBP 30 000), and infliximab + MTX is deemed as a cost-effective intervention for MTX-resistant patients. However, the sensitivity analysis showed that if the discount rate for benefits had been set identical to that of the costs, the ICER would have been GBP 34 680 .(NOK 503 000). Table 17 ICERs: Infliximab+ MTX compared to MTX in the UK.
Base-case results, Barbieri 2005 Incremental ICER 2000
Strategy Cost, GBP 2000 QALYs GBP 2000 NOK 2005
infliximab + MTX 30 147 1.26 23 936 347 000Source: Barbieri 2005 (43), table IX
3.3.3.6 Wong 2002
Study background
46

Wong 2002 (44) was a cost-utility study from the United States.
Patients The study included patients with active, refractory RA. The authors defined active RA as a combination of synovitis (minimum 6 swollen or tender joints) and certain other symptoms
Intervention and comparison Intervention: infliximab + MTX Comparison: MTX alone
Study perspective, time horizon and model type The study perspective was societal, the time horizon lifetime and the model was of the Markov kind.
Results The ICER was 30 000 dollars when only direct costs were incorporated. When indirect offsets were included, the ICER was USD 8 966 (NOK 76 000, 2005). This rests on the assumption of indirect costs being three times the size of direct costs, and is therefore subject to a great deal of uncertainty. (see appendix D.11). Table 18 ICERs: Infliximab + MTX compared to MTX in the US.
Base-case results, Wong 2002 Incremental ICER 2000
Strategy Cost, USD 1998 QALYs USD 1998 NOK 2005
infliximab + MTX 8 900 0.29 30 690 295 000Sources: Wong 2002 (44), based on table 4
3.3.3.7 Jobanputra 2002 and Barton 2004
Study background Jobanputra 2002 (30) and Barton 2004 (20) were cost-utility studies performed in the first round of appraisal of TNF-inhibitors for RA by NICE in the UK.
Patients Patients with RA
Intervention and comparison Intervention: Etanercept/Infliximab with or without MTX in the third position in a UK DMARD sequence. Comparison: UK sequence of traditional DMARDs,
Study perspective, time horizon and model type
47

Both studies had a health service perspective, the time horizon was lifetime and the model was of the discrete event simulation type.
Results The table below shows that the ICERs were above 1 million NOK per QALY gained, which could mask differences between patient groups: The later version of the Birmingham model (Chen 2006), for example, produced ICERs below NOK 400 000 for patients with “early RA” and above 1 million NOK for those with “late RA”, respectively. Table 19 ICERs: Infliximab +MTX compared to a standard DMARD sequence
in the UK. Base-case results from the BPM and BRAM models, Incremental ICER
Strategy Cost, GBP QALYs GBP 2000 NOK 2005 infliximab, Jobanputra 2002 (30) 14 725 0,13 115 937 1 684 000 infliximab, Barton 2004 (20) 18 957 0,23 81 583 1 185 000 Source: Jobanputra 2002 (30), table 30 and Barton 2004 (20), table 13
3.3.3.8 Summary points infliximab • Infliximab + MTX do not seem to be cost-effective as first line therapy for RA
patients. In the UK based on the results of Chen 2006. • Infliximab + MTX seems to be cost-effective as third line therapy for RA patients in
the UK with a disease duration of 3 years or less, based on the results of Chen 2006.. • Infliximab + MTX do not seem to be cost-effective as third line therapy for RA
patients in the UK with a disease duration of more than 3 years, based on the results of Chen 2006.
• Infliximab + MTX is according to Bansback 2005 likely to be cost-effective as third line therapy for RA patients wit a good response (ACR50) in Sweden, Kobelt’s 2004 study from Sweden had a particularly low ICER, but methodological issues pertaining to the estimation of indirect costs render the results questionable.
3.4 Summarising results Our primary objective was to determine whether the extra costs incurred by using the TNF-inhibitors are in reasonable proportion to the expected added benefits. Based on the median ICERs from all the 12 studies included, NOK 443 000, it appears that they can be. However, there is a great deal of variation in the results, as the ICERs ranged from NOK 145 000 to above 8.1 million. The secondary objective was to investigate if there were any differences with regard to cost-effectiveness between first, second and third line therapy with TNF-inhibitors:
First line therapy Only one study, Chen 2006, modelled first line therapy with TNF-inhibitors. The QALY gain varied from 0.05 to 0.98, and the ICERs from NOK 617 000 to NOK 8.1 million. The study concluded that first line therapy with TNF-inhibitors instead of MTX involved very high ICERs, and does therefore not seem to be cost-effective.
48

Second line therapy Only one study explicitly considered second line therapy with TNF-inhibitors: Tanno 2006. The first line therapy in this study was bucillamine, which is found in any of the other studies and which is not used in Norway. We can therefore not draw any conclusions about the effects of using TNF-inhibitors as second line rather than first or third line treatment.
Third line therapy In order to facilitate comparison, we only considered the ten studies with a lifetime time horizon. Further, we removed four studies from the analysis: Jobanputra 2002, Barton 2004 and Welsing 2004 were not considered in the following analysis because the results do not distinguish between mono and combination therapy, though based on trials of both. The Tanno 2006 study was also removed as it examines second line treatment, but the first line drug bucillamine is not used in Norway. We were then left with five studies: Chen 2006, Bansback 2005, Brennan 2004, Barbieri 2005 and Wong 2002. The results of these studies can be summarised as follows: Third-line treatment with TNF-inhibitors rather than DMARDs generate QALYs gained over the remaining lifetime of the patients, expressed as mrdian present values of the different therapies in the range of 0.5 to 1. Table 20 QALYs gained: Third line treatment with TNF-inhibitors Therapy Studies Cases Lowest Highest Median adalimumab mono 2 6 0,2 (4) 0,9 (5) 0,6 adalimumab + MTX 2 6 0,5 (4) 1,3 (1) 1 etanercept mono 3 5 0,9 (1) 1,6 (2) 1 etanercept + MTX 3 4 0,9 (4) 1,6 (1) 1 infliximab + MTX 4 6 0,2 (4) 1,3 (7) 0,5 (1) ACR50/DAS28 Good response, Bansback 2005, (2) Brennan 2004, (3) active RA despite MTX treatment, Wong 2002, (4) late RA, Chen 2006 5) early RA, Chen 2006 (7) severe RA, Barbieri 2005 The median present values of the different therapies of the cost per QALY gained are in the range of 362 000 to 500 000 Norwegian kroner (2005 money terms). Table 21 ICERs: Third line treatment with TNF-inhibitors, figures in NOK 2005 Therapy Studies Cases Lowest Highest Median adalimumab mono 2 6 354 000 (1) 1 763 000 (4) 500 000 adalimumab + MTX 2 6 291 000 (1) 806 000 (4) 362 000 etanercept mono 3 5 224 000 (2) 592 000 (4) 362 000 etanercept + MTX 3 4 305 000 (1) 630 000 (4) 398 000 infliximab + MTX 4 6 295 000 (3) 1 763 000 (4) 395 000 (1) ACR50/DAS28 Good response, Bansback 2005, (2) Brennan 2004, (3) active RA despite MTX treatment, Wong 2002, (4) late RA, Chen 2006 The results vary significantly, but it seems that TNF-inhibitors may be cost-effective compared to traditional DMARDs. The results of the Chen 2006 and Bansback 2005 studies suggest that this may particularly be the case if they are used by patients in the early stages of disease (3 years or less), or by patients with a good response.
49

3.5 Discussion We have reviewed twelve studies, some of which included results for more than one TNF-inhibitor, and one, Kobelt 2003, which even covered more than one country. The results showed variations in QALYs gained from 0.2-1.3 for adalimumab, 0.14 to 2.56 for etanercept and 0.05 to 1.26 for infliximab. The corresponding ranges in ICERs were (in Norwegian kroner, 2005 values, no indirect costs included) 291 000 to 2.1 million, 145 000 to 2.6 million and 221 000 to 8.2 million. The large variation in results reflects the fact that economic evaluations of TNF inhibitors are characterised by significant heterogeneity, even when geographic differences are accounted for. This seems to be the case despite the efforts to promote standardisation through an OMERACT economic reference case (none of the evaluated studies complied with all recommended items). Since we cannot simply subject the results to meta-analysis (45), we have tried to analyse how some of the model components discussed previously vary among the studies reviewed.
Perspective All but three of the analyses reviewed were undertaken from the perspective of the health services. Kobelt 2003, Kobelt 2005, and Wong 2002 all had a societal perspective. These three studies reported productivity losses in the main analysis while the others did not (although Brennan 2004 included indirect costs in the sensitivity analysis). To enable comparison, however, all ICERs reported here are based on direct costs only. The ICERs would most likely have been significantly lower if indirect cost offsets were incorporated.
Time horizon All but three studies featured a lifetime tine horizon. The exceptions were the two Kobelt studies and Coyle 2006. Intuitively, one would expect the ICERs to be lower in a longer-term model in RA, but this cannot be verified.
Type of model In our review, four of the models were of the discrete event simulation type; Chen 2006, Barton 2004, Jobanputra 2002, and Brennan 2003. One was an apparent hybrid between this type of model and a Markov simulation, known as a “patent based transition state”; Bansback 2005. The remaining seven were Markov models. We have unfortunately been unable to determine to which extent the type of model has affected the results.
Underlying data: Clinical trials and observational studies As noted in the NOKC report on TNF-inhibitors and observational studies (2) , because of the “washout” period prior to a RCT, the effects of treatment in randomised clinical trials may be greater than in clinical practice. The Brennan 2004 etanercept study was for example, criticised for not representing clinical practice (46) since the underlying efficacy data were not adjusted with data from observational studies. The OMERACT reference case recommends that results be based on a “synthesis of evidence from observational studies, trials, and other sources”. Many of the sensitivity analyses showed that the results were sensitive to assumptions about HAQ-progression on active treatment over the longer term. This demonstrates the need for data from clinical practice. Half of the reviewed studies seem to incorporate data from observational studies: Chen 2006, Bansback 2005, Kobelt 2005, Kobelt 2003, Barbieri 2005 and Wong 2002. Nevertheless, the “right” kind of observational data may not always be available: Kobelt 2003 and Wong 2002 were criticised by Bansback for combining RCT data from patients with “late RA” with observational data from patients with “early RA” (47). Bansback was in turn
50
criticised by Geborek & Saxne for basing adalimumab results in the 2005 Swedish study on an observational study that did not involve the drug (48). The latest Birmingham model described in Chen 2006 also came under attack from Brennan and Bansback (49) who criticised the failure to identify appropriate clinical practice data. They noted that the withdrawal rates reported in the BSR Biologic Registry (19 %) were more than double those found in the Chen model and argued that this would lead to an overestimation of costs in Chen’s ICERs.
Benefits: HAQ, HRQoL and mortality In RA, the HAQ is a key variable with regard to measuring patients’ health states, although according to Barton (20), it may be “extremely labile”, particularly in the early stages of RA. In order to calculate QALYs however, one also needs to value these states, which requires transformation form HAQ to generic HRQoL measures such as the EQ-5D. This process involves a potential for variation in results. The transformation in some of the studies reviewed above has been carried out through linear regression, and the resulting formulae have involved different payoffs in HRQoL for each unit change in HAQ, as seen below: Chen 2006; 0.327, Bansback 2005; 0.28, Brennan 2004, Barton 2004 and Jobanputra 2002: 0.2 and Tanno 2006; 0.17. The impact of HAQ changes on mortality is subject to a great deal of uncertainty and requires further investigation (50). Six of the studies incorporated HAQ-adjusted relative mortality risks11, while the remainder did not. This means that part of the QALY gain in the former is explained by increased life expectancy, whereas the QALY gain in the latter only refers to improvements in quality of life. However, as Drummond found in another review, the morality rates do not seem to have any major effect with regard to the cost-effectiveness results (50).
Costs Some of the variation in costs may be explained by differences in costs in healthcare systems across countries. There is nevertheless a variation in the extent to which direct costs are incorporated. Chen 2006 and Coyle 2006 for example, only included costs of drugs and monitoring, whereas Bansback 2005 included hospitalisation and surgery costs based on a regression analysis of HAQ and hospital costs. Kobelt 2005 involved the most extensive inclusion of direct costs encompassing investments, devices, informal care and transportation. According to Chen 2006 (51), there is not enough evidence to conclude whether the need for orthopaedic surgery is reduced in the long term as a consequence of the use of TNF-inhibitors. Only direct costs are reported in this review, but four studies also included indirect costs: Brennan 2004, Kobelt 2003, Kobelt 2005, and Wong 2002. The results of these studies show that the costs per QALY were far lower when indirect costs are accounted for. However, there is a great deal of uncertainty attached to the underlying assumptions in these studies.
Discount rate Discounting costs and benefits differently (6 % and 1.5% respectively) as recommended by NICE occurred in 8 of the 13 studies (Kobelt 2003 discounted the UK results, but not the Swedish results, in this way). If all other variables were equal, this would lead to somewhat lower ICERs compared to the studies in which costs and benefits were discounted by the same rate.
11 Chen 2006, Barbieri 2005, Kobelt 2005, Tanno 2006, Barbieri 2004 and Wong 2002
51

Implications for Norway One should act with caution when interpreting the results with regard to Norwegian conditions due to different underlying input data (patient populations, costs, efficacy data, dosage regimens etc). Due to lack of head-to-head and inter-model variation studies we cannot rank the results in terms of costs per QALY. In the concluding sections, we therefore refer to the TNF-inhibitors as a group.
52

4 Analysis of data from the NOR-DMARD study The literature review above provided estimates of the gain in HRQoL and increase in costs associated with the use of TNF-inhibitors from model-based economic evaluations. It would be useful to supplement these results with economic indicators from Norwegian clinical practice. As previously noted, we cannot present a full cost assessment, but data on HRQoL, work capacity and TNF/DMARD use has been collected in a Norwegian observational study known as NOR-DMARD. This is a cohort study, incepted in December 200012 which follows patients with RA in clinical practice at 5 centres in Norway. We commissioned an analysis from the NOR-DMARD study to investigate whether there were any significant differences in the HRQoL and work capacity of patients on TNF-monotherapy, TNF + MTX combination therapy and on MTX alone or in combination with other DMARDs. Analysis of data from the NOR-DMARD study was carried out by rheumatologists research fellow Marte S Heiberg and Prof. Tore K Kvien at Diakonnhjemmet hospital in Oslo. The analysis was based on aggregate data, that is, no separate results were presented for each TNF-inhibitor. Heiberg and Kvien analysed data for patients with RA who were included in the NOR-DMARD study before April first 2005, which allows for at least 6 months of follow-up. The following drug regimens were analysed: TNF-antagonists as monotherapy (n=246) and in combination with MTX (n=439) were compared to MTX as monotherapy (n=1063) and MTX in combination with other DMARDs (n=331). Primary outcome measures were six-month changes in SF-6D and M-HAQ. The former parameter is a utility score based on the SF-36 scale measuring health-related quality of life (0=dead, 1=perfect health), while the latter represents a modified version of the HAQ (1=good function, 4=poor function). Secondary outcomes included disease-specific outcomes such as DAS28, VAS, “drug survival” as well as variables related to employment and resource consumption. The Heiberg and Kvien analysis is enclosed in extenso in appendix F (in Norwegian). Our main concern with regard to their results is the change in quality of life associated with different drug regimens, measured on the SF-6D. The table below shows the basline characteristics; distribution of patients across drug regimens, their average number of previous DMARDs and the average disease duration. SF-6D baseline and incremental values are also given. From the table, it seems clear that the patients on TNF monotherapy have longer disease duration (almost 13 years) and have on average tried more DMARDs than the other groups. Members of the MTX group on the other hand, have suffered from RA in approximately 6 years and have tried, on average, slightly more than one DMARD. The unadjusted 6-month change in SF-6D shows a 0.06 improvement in the TNF + MTX group, closely followed by MTX monotherapy with 0.05. TNF monotherapy was associated with a relatively small improvement of 0.02. Table 22 Baseline characteristics and six-monthly changes in SF-6D across different drug
regimens in the NOR-DMARD observational study SF-6D Drug regimen N No, of previous
DMARDS Disease duration Baseline Change
TNF + MTX 319 3.53 10.4 0.56 0.06 MTX 730 1.12 5.88 0.56 0.05
12 For a more detailed introduction to the study, please consult Kvien 2005 (13)
53

MTX + DMARDs 241 1.83 7.21 0.57 0.04 TNF mono 174 4.47 12.54 0.55 0.02 The likelihood of a patient being in a treatment group was determined by a propensity scoring method, a statistical procedure often used in analysing observational studies. A pairwise comparison of treatment groups after 6 months was conducted, based on 2-year data from the NOR-DMARD register. According to Walters & Brezier (52), a clinically relevant change in the SF-6D, should be 0.05 or above. On average, this was achieved over 6 months by patients on TNF + MTX therapy and by those on MTX alone. The average change for patients on TNF monotherapy and on MTX + DMARDs was below this level. Adjustments were made for propensity score and baseline value of the SF-6D, and group comparison was performed. The results in the table below, show that although none of the differences was large enough to be considered clinically relevant over the 6 month period (52), some clear trends could be observed: TNF + MTX therapy involved slightly higher scores than MTX alone and MTX + DMARDS. On the other hand, TNF monotherapy scores lower than MTX alone, and only marginally higher than MTX + DMARDs. Heiberg and Kvien commented that this might be due to TNF monotherapy only being administered to selected patient groups who are MTX-intolerant, and that this option does not constitute a “real alternative” in clinical practice. The measure is known to have “floor and ceiling effects” in RA and may therefore render more conservative results than the EQ-5D. Table 23 Comparison of six-monthly changes in SF-6D,
adjusted for beeline value and propensity score Drug regimen N SF-6D changeTNF+ MTX vs MTX TNF + MTX 298 0.07 MTX 679 0.05 Difference 0.02 TNF + MTX vs MTX + DMARDs TNF + MTX 301 0.07 MTX + DMARDs 228 0.04 Difference 0.03 TNF mono vs MTX MTX 710 0.05 TNF mono 161 0.03 Difference 0.01 TNF mono vs MTX + DMARDs TNF mono 236 0.04 MTX + DMARDs 169 0.03 Difference 0.02 Employment status after six months was investigated, and presented as the share of patients above and below a 50 % employment threshold, using the last observation carried forward method. No significant changes could be observed. Resource consumption data could not be analysed due to lack of data.
54

5 Conclusions In terms of retail prices, the sales value of TNF inhibitors in Norway added up to approximately NOK 860 million in 2006. Our review of economic evaluations of TNF inhibitors identified 12 studies, distributed across countries as follows: UK 6 studies (1 study shared with Sweden), Sweden 3 (1 study shared with the UK), Canada 1, the Netherlands 1, Japan, 1 and the US 1. All were cost-utility studies, based on economic models. The potential for direct comparisons of results between the studies, and thus for transferability of results to the Norwegian setting, is limited. This is due to important differences in the study approaches – related to model types, time horizons, underlying effectiveness data, measurement of costs and benefits and discount rates. By removing some of the studies and grouping others, we may conclude that:
First line therapy Based on results of one study, TNF-inhibitors do not appear to be cost-effective compared to MTX.
Second line therapy We have not found evidence in the literature with regard to the health economic consequences of second line treatment with TNF-inhibitors (following MTX).
Third line therapy TNF-inhibitors may be cost-effective compared to traditional DMARDs if used by patients in the early stages of disease (3 years or less), or by patients with a good ACR or DAS28 response. The results were more uncertain with regard to other patient groups, as many of the ICERs were high. The results suggest that, if feasible, it could be worthwhile to identify responders to TNF inhibitors. Good responders are likely to experience higher HAQ improvement, which in turn leads to higher QALY gains and improved cost-effectiveness.
Indirect costs The costs per QALY gained reported here relate to direct costs, as only four studies reported indirect cost offsets. We do not contest the notion that deterioration of RA involves negative effects on work capacity. One would therefore expect the costs per QALY gained from using TNF-inhibitors to be lower if indirect cost offsets were incorporated. There is however, as yet not enough evidence to demonstrate that the use of TNF-inhibitors actually prevents productivity loss.
Other biologic alternatives The drug regimens reviewed here do not necessarily encompass all the options available in clinical practice. For example, likely alternatives to TNF treatment such as anakinra,
55

abatacept and rituximab have not been considered. Nor have the included studies explored the possibility of TNF-blockers used in succession in a sequence (though this issue is addressed in the latest BRAM (51)).
Ranking Due to lack of head to head comparisons and differences in data sources for treatment, we can not rank the three TNF inhibitors in terms of their cost-effectiveness.
NOR-DMARD results Results from the NOR-DMARD analysis suggest that TNF + MTX yield slightly higher improvements in quality of life over 6 months compared to MTX alone. However, MTX alone, or in combination with other DMARDs in turn involves larger quality of life improvements compared to TNF monotherapy. TNF monotherapy is however, only given to select patient groups.
Recommendations for further research: In the course of a few years, when more data has been collected, it may be worthwhile to combine HRQoL and work capacity data from the NOR-DMARD study to estimate the longer term effects and costs associated with the use of TNF-inhibitors. This will require modelling work, which ideally should be performed in compliance with the standards laid down in the OMERACT reference case (see appendix B).
56

References (1) Arentz-Hansen H, Granum L, Gulseth H, Idsø N, Knudsrød O, Koldingsnes W, et al.
TNF-hemmere ved revmatiske sykdommer. Nasjonalt Kunnskapssenter for Helsetjenesten; 2006. Report No.: 12.
(2) Arentz-Hansen H, Granum L, Gulseth H, Idsø N, Knudsrød O, Koldingsnes W, et al. TNF-hemmere ved revmatiske sykdommer: Effekt og bivirkninger over tid (del 2). Nasjonalt Kunnskapssenter for Helsetjenesten; 2007. Report No.: 12.
(3) Byford S, Torgerson DJ, Raftery J. Economic Note: Cost of illness studies. BMJ 2000 May 13;320(7245):1335.
(4) Kvien TK. Epidemiology and burden of illness of rheumatoid arthritis. Pharmacoeconomics 2004;22(2 Suppl):1-12.
(5) Young A, Dixey J, Kulinskaya E, Cox N, Davies P, Devlin J, et al. Which patients stop working because of rheumatoid arthritis? Results of five years' follow up in 732 patients from the Early RA Study (ERAS). Ann Rheum Dis 2002 Apr 1;61(4):335-40.
(6) Puolakka K, Kautiainen H, Pekurinen M, Mottonen T, Hannonen P, Korpela M, et al. Monetary value of lost productivity over a five year follow up in early rheumatoid arthritis estimated on the basis of official register data on patients' sickness absence and gross income: experience from the FIN-RACo trial. Ann Rheum Dis 2006 Jul 1;65(7):899-904.
(7) Schmidt A, Husberg M, Bernfort L. Samhällsekonomiska kostnader för reumatiska sjukdomar. Linköping: CMT; 2003. Report No.: 5.
(8) Hallert E, Husberg M, Jonsson D, Skogh T. Rheumatoid arthritis is already expensive during the first year of the disease (the Swedish TIRA project). Rheumatology (Oxford) 2004 Nov;43(11):1374-82.
(9) Kobelt G, Eberhardt K, Jonsson L, Jonsson B. Economic consequences of the progression of rheumatoid arthritis in Sweden. Arthritis Rheum 1999 Feb;42(2):347-56.
(10) Kavanaugh A. Health economics: implications for novel antirheumatic therapies. Ann Rheum Dis 2005 Nov;64 Suppl 4:iv65-iv69.
(11) Michaud K, Messer J, Choi HK, Wolfe F. Direct medical costs and their predictors in patients with rheumatoid arthritis: a three-year study of 7,527 patients. Arthritis Rheum 2003 Oct;48(10):2750-62.
(12) Statens legemiddelverk. Rapport og anbefaling fra Statens legemiddelverk vedrørende søknad om opptak av Enbrel på listen over refusjonsberettigede legemidler jf. § 14-4 i legemiddelforskriften. 2005.
(13) Kvien TK, Heiberg M, Lie E, Kaufmann C, Mikkelsen K, Nordvag BY, et al. A Norwegian DMARD register: prescriptions of DMARDs and biological agents to
57

patients with inflammatory rheumatic diseases. Clin Exp Rheumatol 2005 Sep;23(5 Suppl 39):S188-S194.
(14) Nuijten MJ, Engelfriet P, Duijn K, Bruijn G, Wierz D, Koopmanschap M. A cost-cost study comparing etanercept with infliximab in rheumatoid arthritis. Pharmacoeconomics 2001;19(10):1051-64.
(15) Sorensen J, Andersen LS. The case of tumour necrosis factor-alpha inhibitors in the treatment of rheumatoid arthritis: a budget impact analysis. Pharmacoeconomics 2005;23(3):289-98.
(16) Kvien TK, Uhlig T, Kristiansen IS. Criteria for TNF-targeted therapy in rheumatoid arthritis: estimates of the number of patients potentially eligible. Drugs 2001;61(12):1711-20.
(17) Stortingsporposisjon Nr. 1. Regjeringen; 2006.
(18) Drummond M. Pharmacoeconomics: friend or foe? Ann Rheum Dis 2006 Nov 1;65(suppl_3):iii44-iii47.
(19) Welsing PM, Severens JL, Hartman M, van Riel PL, Laan RF. Modeling the 5-year cost effectiveness of treatment strategies including tumor necrosis factor-blocking agents and leflunomide for treating rheumatoid arthritis in the Netherlands. Arthritis Rheum 2004 Dec 15;51(6):964-73.
(20) Barton P, Jobanputra P, Wilson J, Bryan S, Burls A. The use of modelling to evaluate new drugs for patients with a chronic condition: the case of antibodies against tumour necrosis factor in rheumatoid arthritis. Health Technol Assess 2004 Mar;8(11):iii, 1-iii,91.
(21) Karnon J. Alternative decision modelling techniques for the evaluation of health care technologies: Markov processes versus discrete event simulation. Health Econ 2003 Oct;12(10):837-48.
(22) Chen Y, Jobanputra P, Barton P, Jowett S, Bryan S, Clark W, et al. A systematic review of the effectiveness of adalimumab, etanercept and infliximab for the treatment of rheumatoid arthritis in adults and an economic evaluation of their cost-effectiveness. West Midlands HTA Collaboration, University of Birmingham / National Institute for Health and Clinical Excellence ; 2006.
(23) Olsen JA. On what basis should health be discounted? J Health Econ 1993 Apr;12(1):39-53.
(24) West RR, McNabb R, Thompson AG, Sheldon TA, Grimley EJ. Estimating implied rates of discount in healthcare decision-making. Health Technol Assess 2003;7(38):1-60.
(25) Kristiansen IS, Gyrd-Hansen D. [Prioritization and health--should maximum-price life years be introduced?]. Tidsskr Nor Laegeforen 2007 Jan 4;127(1):54-7.
(26) Devlin N, Parkin D. Does NICE have a cost-effectiveness threshold and what other factors influence its decisions? A binary choice analysis. Health Econ 2004 May;13(5):437-52.
58

(27) Professor of Health Economics at the University of Oslo, Ivar Sønbø Kristiansen. 2006.
Ref Type: Personal Communication
(28) Brennan A, Bansback NJ, Akerhurrst R, Saxton.C. Report on the health economic modelling of Humira in rheumatoid arthritis: Finland. School of Health and Related Research, University of Sheffield; 2003.
(29) Emery P. Review of health economics modelling in rheumatoid arthritis. Pharmacoeconomics 2004;22(2 Suppl):55-69.
(30) Jobanputra P, Barton P, Bryan S, Burls A. The effectiveness of infliximab and etanercept for the treatment of rheumatoid arthritis: a systematic review and economic evaluation. Health Technol Assess 2002;6(21):1-110.
(31) Gabriel S, Drummond M, Maetzel A, Boers M, Coyle D, Welch V, et al. OMERACT 6 Economics Working Group report: a proposal for a reference case for economic evaluation in rheumatoid arthritis. J Rheumatol 2003 Apr;30(4):886-90.
(32) Geborek P, Crnkic M, Petersson IF, Saxne T. Etanercept, infliximab, and leflunomide in established rheumatoid arthritis: clinical experience using a structured follow up programme in southern Sweden. Ann Rheum Dis 2002 Sep 1;61(9):793-8.
(33) Flendrie M, Creemers MCW, Welsing PMJ, den Broeder AA, van Riel PLCM. Survival during treatment with tumour necrosis factor blocking agents in rheumatoid arthritis. Ann Rheum Dis 2003 Nov 1;62(90002):30ii-33.
(34) Gabriel SE, Tugwell P, Drummond M. Progress towards an OMERACT-ILAR guideline for economic evaluations in rheumatology. Ann Rheum Dis 2002 Apr;61(4):370-3.
(35) Bansback NJ, Brennan A, Ghatnekar O. Cost effectiveness of adalimumab in the treatment of patients with moderate to severe rheumatoid arthritis in Sweden. Ann Rheum Dis 2005 Jul;64(7):995-1002.
(36) Drummond M, O'Brien B, Stoddart G, Torrance G. Methods for the Economic Evaluation of Health Care Programmes. second ed. Oxford: Oxford University Press;
1997.
(37) Brennan A, Bansback N, Reynolds A, Conway P. Modelling the cost-effectiveness of etanercept in adults with rheumatoid arthritis in the UK. Rheumatology (Oxford) 2004 Jan;43(1):62-72.
(38) Coyle D, Judd M, Blumenauer B, Cranney A, Maetzel A, Tugwell P, et al. Infliximab and Etanercept in Patients with Rheumatoid
Arthritis: A Systematic Review and Economic Evaluation. Canadian Coordinating Office for Health Technology Assessment; 2006. Report No.: 64.
(39) Kobelt G, Lindgren P, Singh A, Klareskog L. Cost effectiveness of etanercept (Enbrel) in combination with methotrexate in the treatment of active rheumatoid arthritis based on the TEMPO trial. Ann Rheum Dis 2005 Aug;64(8):1174-9.
59

(40) Tanno M, Nakamura I, Ito K, Tanaka H, Ohta H, Kobayashi M, et al. Modeling and cost-effectiveness analysis of etanercept in adults with rheumatoid arthritis in Japan: a preliminary analysis. Mod Rheumatol 2006;16(2):77-84.
(41) Moreland LW, Schiff MH, Baumgartner SW, Tindall EA, Fleischmann RM, Bulpitt KJ, et al. Etanercept therapy in rheumatoid arthritis. A randomized, controlled trial. Ann Intern Med 1999 Mar 16;130(6):478-86.
(42) Kobelt G, Jonsson L, Young A, Eberhardt K. The cost-effectiveness of infliximab (Remicade) in the treatment of rheumatoid arthritis in Sweden and the United Kingdom based on the ATTRACT study. Rheumatology (Oxford) 2003 Feb;42(2):326-35.
(43) Barbieri M, Wong JB, Drummond M. The cost effectiveness of infliximab for severe treatment-resistant rheumatoid arthritis in the UK. Pharmacoeconomics 2005;23(6):607-18.
(44) Wong JB, Singh G, Kavanaugh A. Estimating the cost-effectiveness of 54 weeks of infliximab for rheumatoid arthritis. Am J Med 2002 Oct 1;113(5):400-8.
(45) Sculpher MJ, Claxton K, Drummond M, McCabe C. Whither trial-based economic evaluation for health care decision making? Health Econ 2006 Jul;15(7):677-87.
(46) Wolfe F, Michaud K, Pincus T. Do rheumatology cost-effectiveness analyses make sense? Rheumatology (Oxford) 2004 Jan;43(1):4-6.
(47) Bansback NJ, Regier DA, Ara R, Brennan A, Shojania K, Esdaile JM, et al. An overview of economic evaluations for drugs used in rheumatoid arthritis : focus on tumour necrosis factor-alpha antagonists. Drugs 2005;65(4):473-96.
(48) Geborek PST. Expensive antirheumatic drugs",e-letter. Ann Rheum Dis 2005 September 2164
(49) Bansback NJ, Young A, Brennan A. The NICE reappraisal of biologics in 2005: what rheumatologists need to know. Rheumatology 2005 Jan 1;44(1):3-4.
(50) Drummond MF, Barbieri M, Wong JB. Analytic choices in economic models of treatments for rheumatoid arthritis: What makes a difference? Med Decis Making 2005 Sep;25(5):520-33.
(51) Chen Y, Jobanputra P, Barton P, Jowett S, Bryan S, Clark W, et al. A systematic review of the effectiveness of adalimumab, etanercept and infliximab for the treatment of rheumatoid arthritis in adults and an economic evaluation of their cost-effectiveness. West Midlands HTA Collaboration, University of Birmingham / National Institute for Health and Clinical Excellence ; 2005.
(52) Walgers S, Brazier J. Sample sizes for the SF-6D preference based measure of health from the SF-36: a practical guide. Health Economics Group, The University of
Sheffield ScHARR, School of Health and Related Research; 2002. Report No.: 02/3.
60

61