Title of the Poster: 'Does land use Patterns M atter for Bt-Maize: The case of Maize Farming System...
16
Title of the Poster: ‘Does land use Patterns Matter for Bt-Maize: The case of Maize Farming System in Kenya’ Authors: Lutta Muhammad, 1 George Owuor 2 , Hugo De Groote 3 Simon Kimenju 3 1. Kenya Agricultural Research Institute, Nairobi Kenya,, E-mail: [email protected]. 2. Presenter and Correspondence Author: Lecturer, Agricultural Economics & Agribusiness Department, Egerton Universit y, Box 536, Njoro, Kenya. E-mail: [email protected]: 3. Internat ional Wheat and Maize Improvement Centre, Nairobi, E-mail: [email protected]. Contributed Poster prepared for presentation at the International Association of Agricultural Economists Conference, Gold Coast, Australia, August 12-18, 2006 Copyright 2006 by Lutta Muhammad, George Owuor, Hugo De Groote and Simon Kimenju. All rights reserved. Readers may make verbatim copies of this document for non-commercial purposes by any means, provided that this copyright notice appears on all such copies.
-
Upload
independent -
Category
Documents
-
view
5 -
download
0
Transcript of Title of the Poster: 'Does land use Patterns M atter for Bt-Maize: The case of Maize Farming System...

Title of the Poster:
‘Does land use Patterns Matter for Bt-Maize: The case of Maize Farming System in
Kenya’
Authors:
Lutta Muhammad, 1 George Owuor 2, Hugo De Groote 3 Simon Kimenju3
1. Kenya Agricultural Research Inst itute, Nairobi Kenya,,
E-mail: [email protected].
2. Presenter and Correspondence Author: Lecturer, Agricultural Economics &
Agribusiness Department, Egerton Universit y, Box 536, Njoro, Kenya.
E-mail: [email protected]:
3. Internat ional Wheat and Maize Improvement Centre, Nairobi,
E-mail: [email protected].
Contributed Poster prepared for presentation at the International Association of Agricultural Economists Conference, Gold Coast , Australia, August 12-18, 2006
Copyright 2006 by Lutta Muhammad, George Owuor, Hugo De Groote and
Simon Kimenju. All rights reserved. Readers may make verbatim copies of this document for non-commercial purposes by any means, provided that this copyright notice appears on all such copies.
Abstract Population pressures and the need to optimize the use of limited available land has led to
increasing cropping affluence levels within the maize agro-ecologies in Kenya, and a
shift from large to smallholder intensification and multiple cropping patterns. Using a
geographic information system, this study relates cropping patterns, by area share, maize
productivity and household incomes across maize agro-ecologies, with the purpose to
establish a decision support system for optimizing land allocation and in priority setting
for introduction of new technologies such as Bt maize varieties. Results show that land
use patterns and maize productivity in maize farming systems differ between agro-
ecological zones. The high potential areas experience high maize yields, with maize
grown alongside major cash crops such as tea and coffee. In contrast, lowland coastal
strip and lake Victoria region tend to grow drought tolerant tuber crops (such as cassava
and sweet potatoes) alongside maize in appreciable land sizes. Similarly the dry areas
grow drought tolerant legumes such as pigeon pea alongside maize. These low potential
areas thus concentrate on meeting their subsistence food self-sufficiency needs, pointing
at risk management strategies against drought and pests such as stem borer, unlike high
potential areas with high value cash crops. Maize breeders should therefore consider
insertion of Bt- genes in maize varieties that would achieve high production and which
are also capable of safely growing side by side with crops that meet different food
security conditions in different agro-ecological zones in Kenya.
Key Words: Land use, Smallholders , Maize production, Food security, Kenya
1. Introduction
1.1 Land Scarcity, population growth and Land Use Distribution
Land use according to Lundgren, (1975) is defined as the application of human controls,
in a relatively systematic manner, to key elements within any ecosystem, in order to
derive benefit from it. The use may be permanent or cyclic intervention. Land scarcity in
Kenya has emerged due to increases in rural population as well as due to improved
market access; both of which have subsequently resulted in increased value of output. As
a result, land has become a marketable commodity, attracting both old and young
families, and leading to increased intensification with multiple crop enterprises.
Population growth has led to increasing clearing of woodlands and wetlands for extra
arable land, consequently affecting types o f farm enterprises, mainly the type of crops
grown and the adoption of new technologies.
A study on land use in Europe by (Grigg, 1980) shows that a rise in population has a
strong influence hitherto on cultivation of inferior crops such as potatoes and maize,
which were earlier grown only as livestock feed. The study further points at the influence
of market demand for the crops in developing nations as key to more distribution of land
to crops. Similarly, Omosa, (1994) found that root crops are neglected in Kenya, in spite
of being highly ecologically adaptive, mainly because of poor market demand;
strengthening the influence of market demand on the allocation of land and patterns of
land use.
By focusing on the interdependence between land use and technology, Boserup, (1965)
usurped that in the Pre-industrial peasant societies increased output was possible only
through expansion of cultivated area or increased frequency of crop ping per year. Later
on, however, increased output has been mainly realized through a shift towards high
yielding crop varieties. These changing patterns influence productivity substantially. In
this respect, population pressure though poses a challenge to agricultural growth, it may
however, also lead to innovation and higher technological advancement through
intensification. Under such conditions, the introduction of the plough can be regarded as
a means to prevent a fall in output per man-hour rather than as a means to raise it.
Intensification of agriculture then becomes a gradual change towards patterns of land use,
which makes it possible to crop a given area of land more frequently than before, in order
for productivity to be enhanced.
However, in Western Europe, change to annual cropping is described as a result of the
discovery of the possibility of cropping the land without fallow by the use of crop
rotations with fodder p lants, of which some are leguminous. Rapid growth in population
is then considered to be the result rather than the cause of this change. Other evidence
however suggests that some o f the intensive practices introduced in the fields during the
agricultural revolution in Europe had been used in gardens, and were extended to fields,
only after the rapid increase in numbers and the need for more ou tput. This suggests that
the transition in Europe from short fallow to annual cropping was not the result of
contemporary inventions. Instead, it was the spread of various methods of intensive
cultivation.

1.2 Land use in Kenya
In Kenya and many parts of Africa, lowland areas and the semi-arid farmers have become
specialists in mixed farming and crop-livestock integration. In areas with variable
rainfall, income diversification, in the sense of combining farming and non-farm
activities within one household, has advantages, particularly by spreading risk. For
instance, out of a total land area of 581,679 km2 only about 17 percent is arable of high to
medium potential for agriculture and intensive livestock production. The rest of the land
is classified as arid or semi-arid lands and mainly used for extensive livestock rearing and
wildlife (Gok, 2001b). This justifies the significance of analyzing arable land use
patterns, particularly for basic food crops relative to other crops as food self-sufficiency
and security depend on the patterns in question. With the increasing demand of land for
various uses, evaluation of land use patterns is crucial for livelihood sustainability
(Lovemore, 1999). Studies on land use patterns in Kenya have however not captured its
influence on productivity of key food crops. A study undertaken in 1988 in the densely
populated Nyeri and Kakamega districts (Migot-Athola and Shem, 1994b), although
focused at the relationship between land tenure, agricultural investment and farm
productivity, never established the nature of cropp ing patterns on the productivity.
Besides, Kenya’s agricultural sector has registered poor growth over the last decade,
with growth falling to negative 2.4 percent in the year 2000 (GoK, 2001a) and percentage
value addition to the sector gradually declining from 26.3 % of GDP in 1998 to 16.4% in
2002 (World-Bank, 2004). All these have been blamed on, among other factors,
increasing frequency of drought and falling agricultural productivity due to poor land use
systems.
In view of the above, this study had the objectives to compare land use patterns and
cropping practices in maize farming systems across all the maize agro-ecological zones in
Kenya, to establish (through mapping) the influence of land use patterns on maize
productivity, household size and income and, to establish factors that influence area
shares in different group of crops across the zones, with final derivation of
recommendations targeted at breeders’ priority setting for Bt-insertion on available maize
varieties in different maize agro-ecologies in Kenya.
2. Methods and Data
2.1 Area of the Study
The areas of study was based on an earlier survey by CIMMYT and KARI (Kenya
Agricultural Research Institute) that defined six major maize agro-ecological zones in
Kenya in 1992 (Hassan, 1998). Figure 1. is a representation of the zones. The zonation is
based on variations in parameters such as elevation, temperature, precipitation,
evaporation, radiation, and humidity data [Mwasi, 2001].
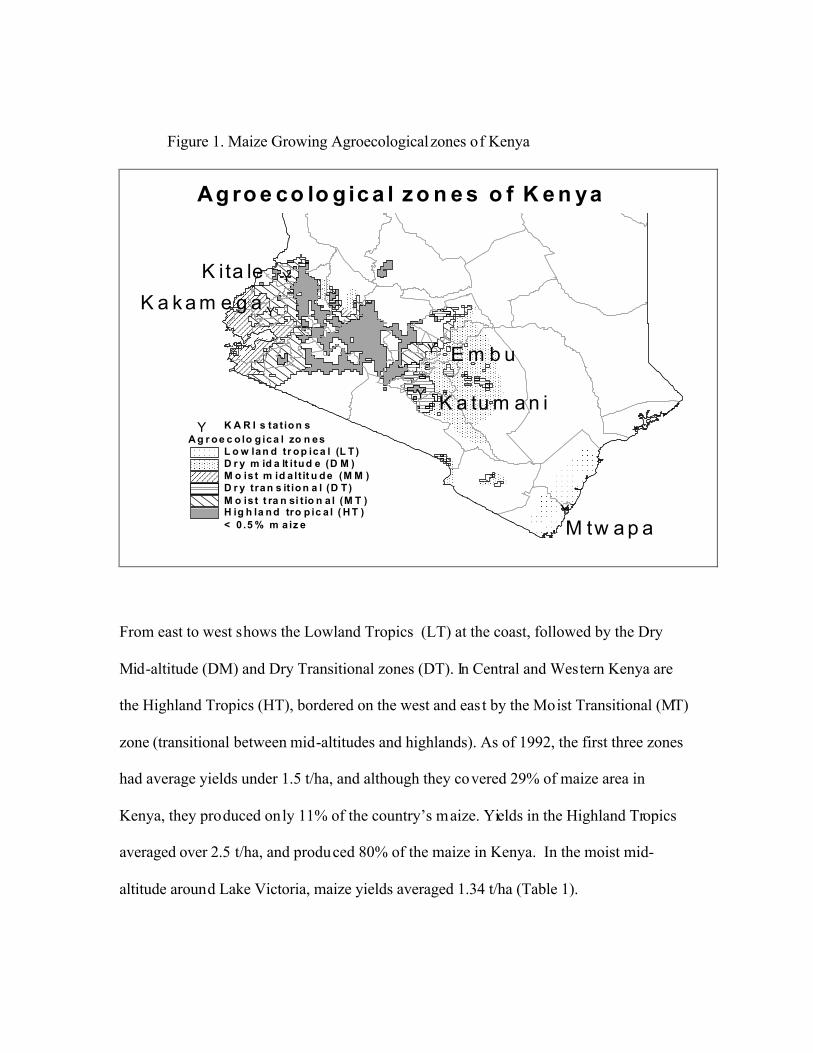
Figure 1. Maize Growing Agroecological zones of Kenya
#Y
#Y
#Y
#Y
#Y
E m b u
K ita le
M tw a p a
K a k a m e g a
K a tu m a n iA g r oe c o lo g ica l zo n es
L o w lan d tr op ica l (L T )D r y m id a lt itud e (D M )M o is t m id a lt it u d e (M M )D r y tran s it ion a l (D T )M o is t t ra n si t io n a l (M T )H ig h la nd tro p ic a l ( H T )< 0 .5 % m aiz e
#Y K A R I s ta t io n s
Ag ro e co lo gic a l z o n e s o f K e n ya
From east to west shows the Lowland Tropics (LT) at the coast, followed by the Dry
Mid-altitude (DM) and Dry Transitional zones (DT). In Central and Western Kenya are
the Highland Tropics (HT), bordered on the west and east by the Moist Transitional (MT)
zone (transitional between mid-altitudes and highlands). As of 1992, the first three zones
had average yields under 1.5 t/ha, and although they covered 29% of maize area in
Kenya, they produced only 11% of the country’s maize. Yields in the Highland Tropics
averaged over 2.5 t/ha, and produced 80% of the maize in Kenya. In the moist mid-
altitude around Lake Victoria, maize yields averaged 1.34 t/ha (Table 1).
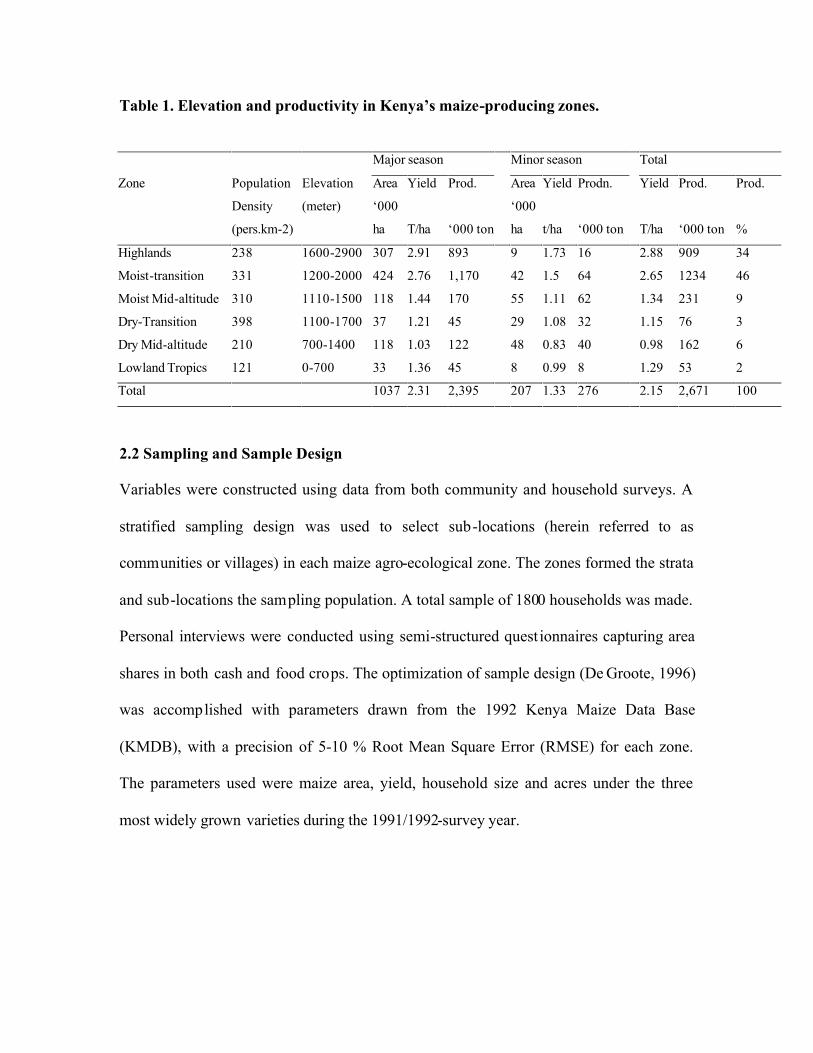
Table 1. Elevation and productivity in Kenya’s maize-producing zones.
2.2 Sampling and Sample Design
Variables were constructed using data from both community and household surveys. A
stratified sampling design was used to select sub-locations (herein referred to as
communities or villages) in each maize agro-ecological zone. The zones formed the strata
and sub-locations the sampling population. A total sample of 1800 households was made.
Personal interviews were conducted using semi-structured questionnaires capturing area
shares in both cash and food crops. The optimization of sample design (De Groote, 1996)
was accomplished with parameters drawn from the 1992 Kenya Maize Data Base
(KMDB), with a precision of 5-10 % Root Mean Square Error (RMSE) for each zone.
The parameters used were maize area, yield, household size and acres under the three
most widely grown varieties during the 1991/1992-survey year.
Major season Minor season Total
Zone Population Elevation Area Yield Prod. Area Yield Prodn. Yield Prod. Prod.
Density
(pers.km-2)
(meter) ‘000
ha T/ha ‘000 ton
‘000
ha t/ha ‘000 ton T/ha ‘000 ton %
Highlands 238 1600-2900 307 2.91 893 9 1.73 16 2.88 909 34
Moist-transition 331 1200-2000 424 2.76 1,170 42 1.5 64 2.65 1234 46
Moist Mid-altitude 310 1110-1500 118 1.44 170 55 1.11 62 1.34 231 9
Dry-Transition 398 1100-1700 37 1.21 45 29 1.08 32 1.15 76 3
Dry Mid-altitude 210 700-1400 118 1.03 122 48 0.83 40 0.98 162 6
Lowland Tropics 121 0-700 33 1.36 45 8 0.99 8 1.29 53 2
Total 1037 2.31 2,395 207 1.33 276 2.15 2,671 100
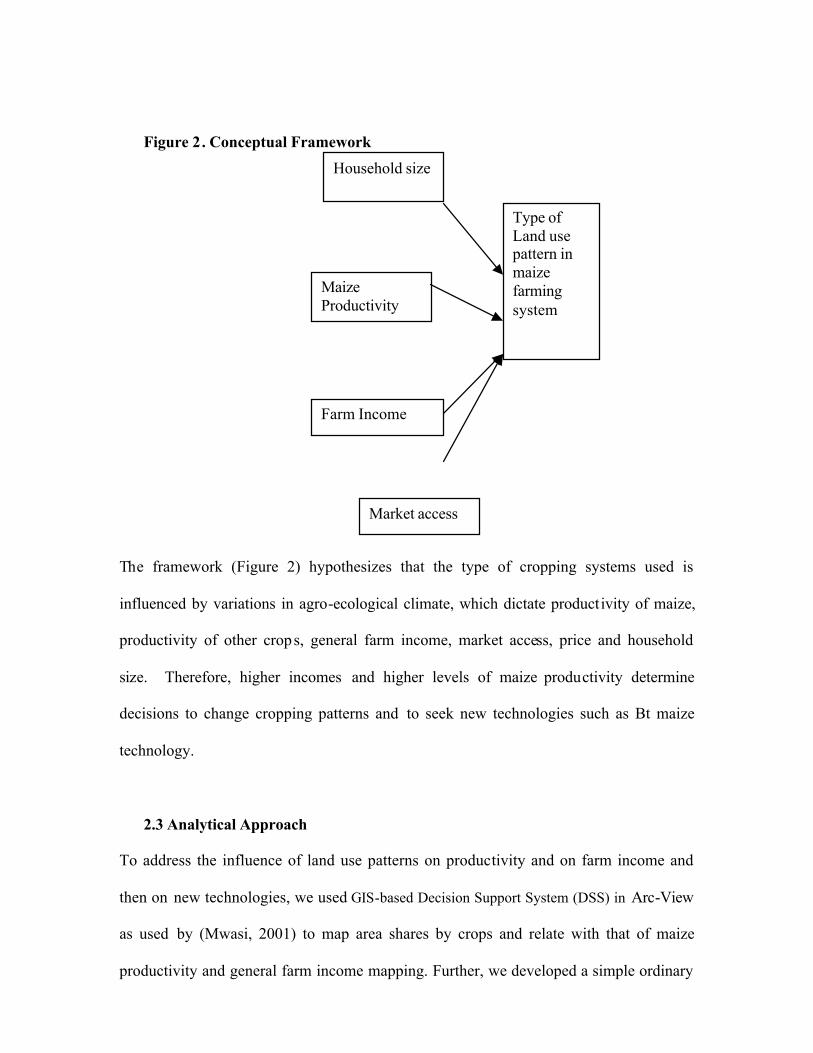
Figure 2. Conceptual Framework
The framework (Figure 2) hypothesizes that the type of cropping systems used is
influenced by variations in agro-ecological climate, which dictate productivity of maize,
productivity of other crops, general farm income, market access, price and household
size. Therefore, higher incomes and higher levels of maize productivity determine
decisions to change cropping patterns and to seek new technologies such as Bt maize
technology.
2.3 Analytical Approach
To address the influence of land use patterns on productivity and on farm income and
then on new technologies, we used GIS-based Decision Support System (DSS) in Arc-View
as used by (Mwasi, 2001) to map area shares by crops and relate with that of maize
productivity and general farm income mapping. Further, we developed a simple ordinary
Type of Land use pattern in maize farming system
Farm Income
Maize Productivity
Market access
Household size
least squares model to measure factors that influence area shares in each group of crops,
with dependent variable being the area share in a given crop or group of crops as follows:
),,Pr,,,(% typroductiviMaizeIncomeicessMarketacceizehouseholdsAEZfcroparea =
3. Results
3.1 Importance of Land holdings
In the areas surveyed, land remains the main source of production and reproduction, and
for this, its ownership is economically, socially, politically, and emotionally driven. In
general, land holdings range from as low as a quarter of an acre to over 50. But, some
households in the medium-large scale areas around Kitale in the High tropics and
marginal areas in the Dry-mid-altitude zones have as much as 100 acres of land.
In addition, househo lds augment their holdings by hiring in land, particularly in the high
potential areas, where land is quite scarce due to high productivity and high population
densities. Renting land is, however, a recent phenomenon among small holders; few
households (less than 10 per cent per region) hire land.
3.2 Area Shares by Crops and cropping patterns
Most of the agricultural land is under crops, with maize taking precedence in land
allocation against all other crops (Figures 2 and 3). In the low tropics, where food deficits
are more prevalent, maize is grown in larger areas than all other zones, followed by the
dry areas and then the transitional zone in Kisii. In most zones, beans are the second in
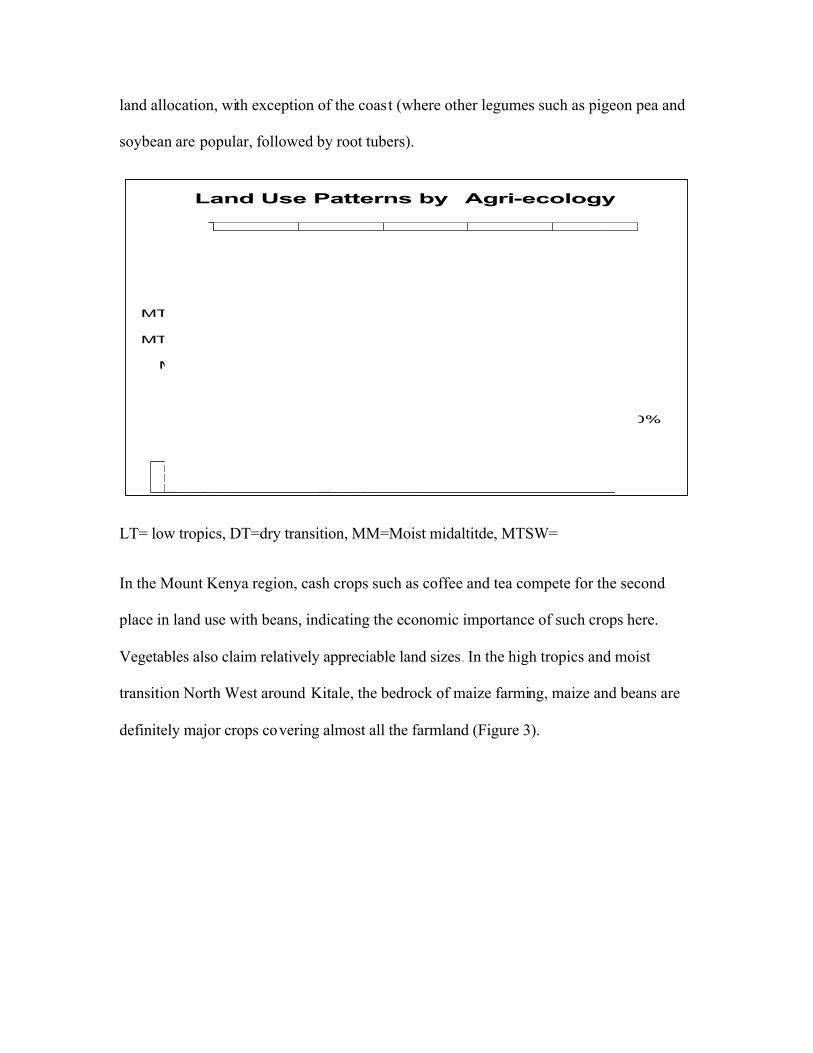
land allocation, with exception of the coast (where other legumes such as pigeon pea and
soybean are popular, followed by root tubers).
Land Use Patterns by Agri-ecology
0% 20% 40% 60% 80% 100%
HT
MTE
MTNW
MTSW
MM
DT
LT
Area share
maize other cereal beansotherlegumes root crops tree cropsnapier vegetables
LT= low tropics, DT=dry transition, MM=Moist midaltitde, MTSW=
In the Mount Kenya region, cash crops such as coffee and tea compete for the second
place in land use with beans, indicating the economic importance of such crops here.
Vegetables also claim relatively appreciable land sizes . In the high tropics and moist
transition North West around Kitale, the bedrock of maize farming, maize and beans are
definitely major crops covering almost all the farmland (Figure 3).
D R Y M ID A L T IT U D E
H IG H T R O P I C S
L O W T R O P IC S
D R Y T R A N S IT I O N A L
O IS T M ID -A L T I T U D E M O IS T T R A N S IT IO N A L
7 2 %1 4 %
1 1 %
6 8 %
3 0 %6 1 %
3 2 %
1 0 0 0 1 0 0 2 0 0 M i le s
P e r c e n t a g e a r e a s h a r e .s h pM a i z eO th e r c e r e aB e a n sL e g u m e sT u b e r sN a p i e rC o f fe eT e aS u g a r c a n eV e g e ta b l e
P e r c e n t a g e a r e a s h a r e
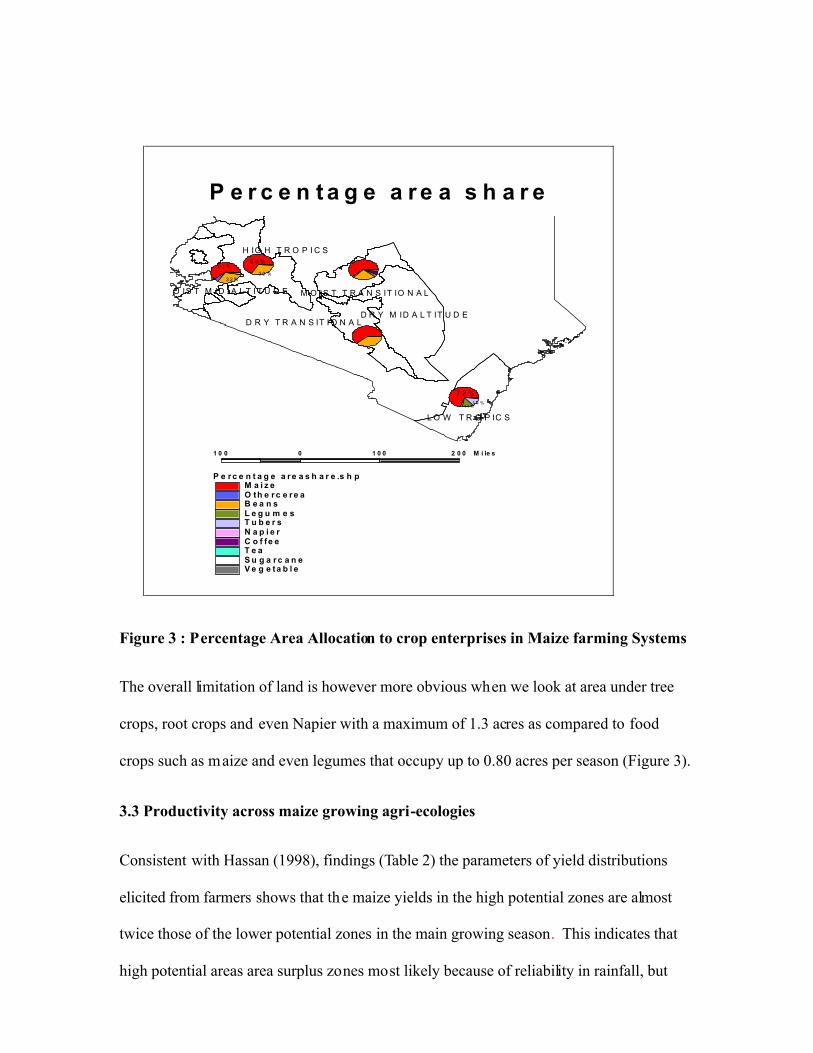
Figure 3 : Percentage Area Allocation to crop enterprises in Maize farming Systems
The overall limitation of land is however more obvious when we look at area under tree
crops, root crops and even Napier with a maximum of 1.3 acres as compared to food
crops such as maize and even legumes that occupy up to 0.80 acres per season (Figure 3).
3.3 Productivity across maize growing agri-ecologies
Consistent with Hassan (1998), findings (Table 2) the parameters of yield distributions
elicited from farmers shows that the maize yields in the high potential zones are almost
twice those of the lower potential zones in the main growing season. This indicates that
high potential areas area surplus zones most likely because of reliability in rainfall, but
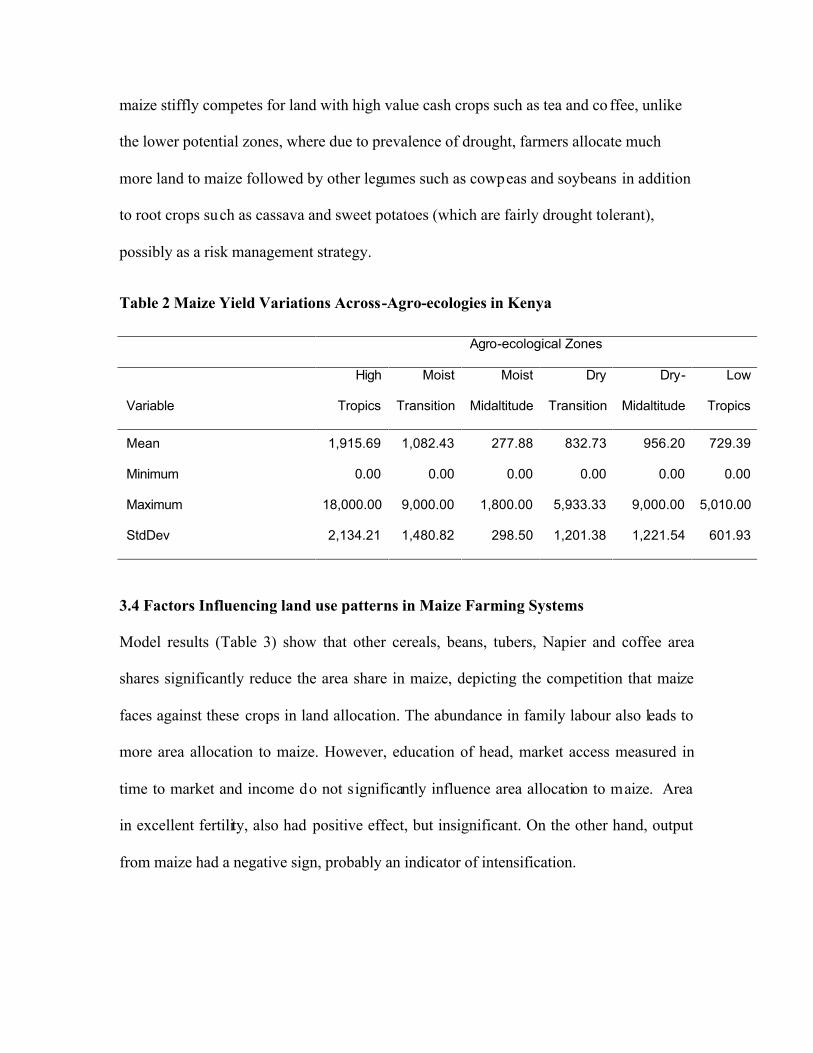
maize stiffly competes for land with high value cash crops such as tea and co ffee, unlike
the lower potential zones, where due to prevalence of drought, farmers allocate much
more land to maize followed by other legumes such as cowpeas and soybeans in addition
to root crops such as cassava and sweet potatoes (which are fairly drought tolerant),
possibly as a risk management strategy.
Table 2 Maize Yield Variations Across-Agro-ecologies in Kenya
Agro-ecological Zones
Variable
High
Tropics
Moist
Transition
Moist
Midaltitude
Dry
Transition
Dry-
Midaltitude
Low
Tropics
Mean 1,915.69 1,082.43 277.88 832.73 956.20 729.39
Minimum 0.00 0.00 0.00 0.00 0.00 0.00
Maximum 18,000.00 9,000.00 1,800.00 5,933.33 9,000.00 5,010.00
StdDev 2,134.21 1,480.82 298.50 1,201.38 1,221.54 601.93
3.4 Factors Influencing land use patterns in Maize Farming Systems
Model results (Table 3) show that other cereals, beans, tubers, Napier and coffee area
shares significantly reduce the area share in maize, depicting the competition that maize
faces against these crops in land allocation. The abundance in family labour also leads to
more area allocation to maize. However, education of head, market access measured in
time to market and income do not significantly influence area allocation to maize. Area
in excellent fertility, also had positive effect, but insignificant. On the other hand, output
from maize had a negative sign, probably an indicator of intensification.
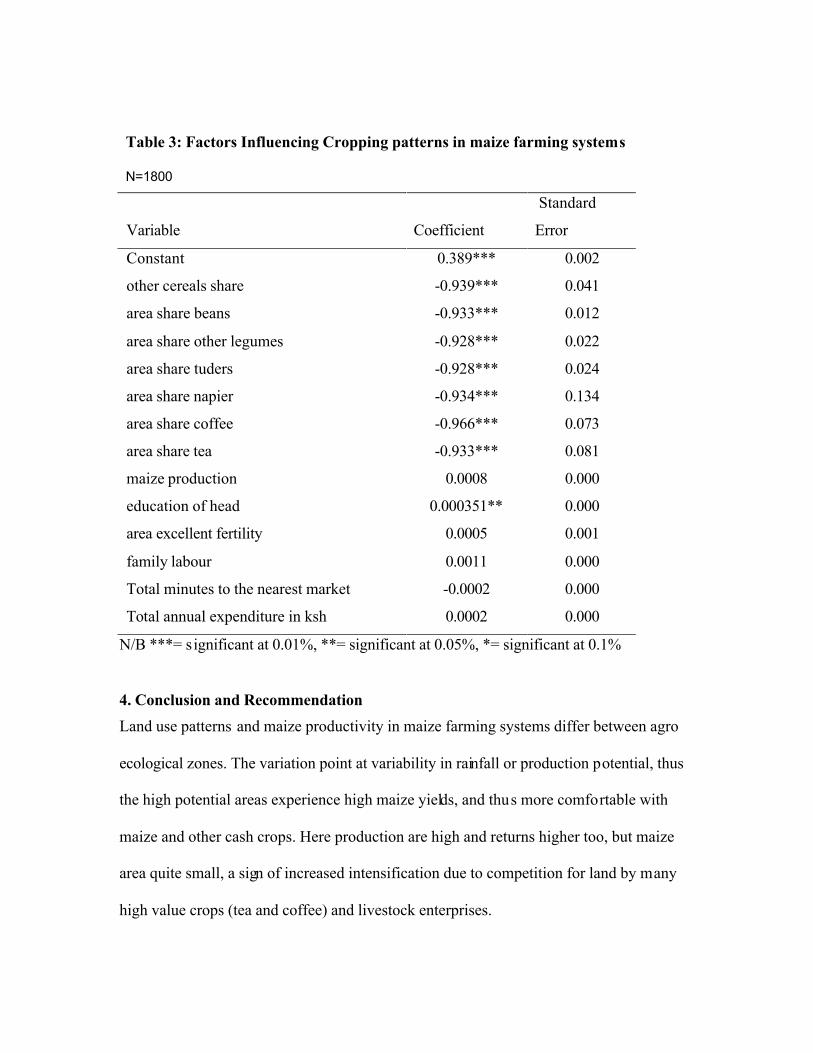
Table 3: Factors Influencing Cropping patterns in maize farming systems
N=1800
Variable Coefficient
Standard
Error
Constant 0.389*** 0.002
other cereals share -0.939*** 0.041
area share beans -0.933*** 0.012
area share other legumes -0.928*** 0.022
area share tuders -0.928*** 0.024
area share napier -0.934*** 0.134
area share coffee -0.966*** 0.073
area share tea -0.933*** 0.081
maize production 0.0008 0.000
education of head 0.000351** 0.000
area excellent fertility 0.0005 0.001
family labour 0.0011 0.000
Total minutes to the nearest market -0.0002 0.000
Total annual expenditure in ksh 0.0002 0.000
N/B ***= significant at 0.01%, **= significant at 0.05%, *= significant at 0.1%
4. Conclusion and Recommendation Land use patterns and maize productivity in maize farming systems differ between agro
ecological zones. The variation point at variability in rainfall or production potential, thus
the high potential areas experience high maize yields, and thus more comfortable with
maize and other cash crops. Here production are high and returns higher too, but maize
area quite small, a sign of increased intensification due to competition for land by many
high value crops (tea and coffee) and livestock enterprises.
In contrast, the lowland areas around the coastal strip and areas around Lake Victoria
tend to grow drought tolerant tuber crops (such as cassava and sweet potatoes) besides
maize in appreciable land sizes. Similar practices apply to the dry areas for other legumes
such as pigeon pea. These latter regions peg much of their cropping systems to m eet their
food subsistence needs, because they are characterized by rampant food deficiency. Food
self-sufficiency reasons are thus their main priority and land use patterns here hinge
around risk management strategies against drought and pests such as stem borer. On the
contrary, high potential areas exhibit surplus productions, with land use patterns pegged
on high value cash crops (with commercial orientation) as opposed to subsistence maize
production.
In view of the above, breeders should consider insertion of Bt-genes in maize varieties
that would achieve high production and which are also capable of safely growing side by
side with crops that meet different food security conditions in different agro-ecological
zones in Kenya.
References
Boserup, E. 1965. The Conditions of Agricultural Growth. London: George Allen &
Unwin Limited.
De Groote, H. 1996. "Optimal survey design in rural data collection in developing
countries." Quarterly Journal of International Agriculture 35, 2:163-175.
GoK. 2001a. " Economic Survey." Nairobi: Central Bureau of Statistics.
Gok. 2001b. "Statistical Abstract." Nairobi: Central Bureau of Statistics.
Grigg ., D. 1980. Population Growth and Agrarian Chan ge. A Historical Perspective.
Cambridge: Cambridge University Press.
Hassan, R. M., K. Njoroge, M. Njore, R. Otsyula, and A. Laboso. 1998. "Adoption
patterns and performance of improved maize in Kenya."
Lovemore, Zinyama (Ed.). 1999. Land Reform and Land Use in Africa. Harare:
University of Guelph, Canada. Weaver Press.
Lundgren, B. 1975. Land Use in Kenya and Tanzani a. The Physical Background and
Present Situation and an Analysis of the Needs for Its Rational Planning .
Stockholm: Royal College of Forestry.
Migot-Athola Shem E., Frank Place and Oluoch -Kosura. W. (Ed.). 1994b. Security of
Tenure and Land Productivity i n Kenya. In Searching for land Tenure Security in
Africa. World Bank: Kendal/Hunt Publishing Company.
Mwasi, B, . 2001. "Land Use Conflicts Resolution in a Fragile Ecosystem Using Multi-
Criteria Evaluation (MCE) and a GIS-based Decision Support System (DSS)." in
International Conference on Spatial Informatio n for Sustainable Development.
Omosa, M. 1994. "Current and Potential demand for Fresh and Processed Sweet potato
Products in Nairobi and Kisumu, kenya." NAIROBI: International Potato Centre
World-Bank. 2004. " www.devdata.worldbank.org." World Bank.