TIA-INAOE's Participation at ImageCLEF 2009
10
TIA-INAOE’s Participation at ImageCLEF 2009 Hugo Jair Escalante, Jes´ us A. Gonz´alez, Carlos A. Hern´andez, Aurelio L´opez, Manuel Montes, Eduardo Morales, Elias Ruiz, Luis E. Sucar, Luis Villase˜ nor Research Group on Machine Learning for Image Processing and Information Retrieval Department of Computational Sciences National Institute of Astrophysics, Optics and Electronics Luis Enrique Erro No. 1, 72840, Puebla, M´ exico [email protected] Abstract This working note describes the participation of TIA-INAOE in the Photographic Retrieval and the Large Scale Image Annotation tracks at ImageCLEF2009. We de- veloped specific methods for each track with the goal of exploiting the information available while maximizing annotation and retrieval performance. On the one hand, for the retrieval track, we proposed a post processing technique for re-ranking docu- ments according to different diversity categories. With this formulation we considered both visual and textual features and we incorporated information of the different cat- egories by which topics are clustered. Results obtained with this technique suggest it is a promising method for result diversification. However, we still need to deal with is- sues that affect the retrieval performance. On the other hand, for the annotation task, we adopted a simple annotation technique based on KNN classification. Only global features were considered under this formulation. The output of the KNN method was then refined by means of an energy-based model that attempts to maximize the seman- tic cohesion among labels assigned to each image. We considered information of the annotation hierarchy to constraint certain labeling configurations. Results obtained with this technique give evidence that the KNN approach is an effective annotation technique despite being rather simple. The refinement strategy resulted useful for im- proving the labeling performance of an ineffective annotation method; although we could not improve the labeling performance of a strong baseline. Summarizing, the results obtained at ImageCLEF2009 are encouraging and motivate further research in several directions that we are currently exploring. Categories and Subject Descriptors H.3 [Information Storage and Retrieval]: H.3.1 Content Analysis and Indexing; H.3.3 [Information Systems and Applications]: Information Search and Retrieval—Retrieval models; Selection process; Information Filtering General Terms Performance, Experimentation Keywords Multimedia image retrieval; Image annotation; Result diversification; Semantic cohesion modeling; Document re-ranking.
-
Upload
independent -
Category
Documents
-
view
0 -
download
0
Transcript of TIA-INAOE's Participation at ImageCLEF 2009
TIA-INAOE’s Participation at ImageCLEF 2009
Hugo Jair Escalante, Jesus A. Gonzalez, Carlos A. Hernandez, Aurelio Lopez,Manuel Montes, Eduardo Morales, Elias Ruiz, Luis E. Sucar, Luis Villasenor
Research Group on Machine Learning forImage Processing and Information Retrieval
Department of Computational SciencesNational Institute of Astrophysics, Optics and Electronics
Luis Enrique Erro No. 1, 72840, Puebla, [email protected]
Abstract
This working note describes the participation of TIA-INAOE in the PhotographicRetrieval and the Large Scale Image Annotation tracks at ImageCLEF2009. We de-veloped specific methods for each track with the goal of exploiting the informationavailable while maximizing annotation and retrieval performance. On the one hand,for the retrieval track, we proposed a post processing technique for re-ranking docu-ments according to different diversity categories. With this formulation we consideredboth visual and textual features and we incorporated information of the different cat-egories by which topics are clustered. Results obtained with this technique suggest itis a promising method for result diversification. However, we still need to deal with is-sues that affect the retrieval performance. On the other hand, for the annotation task,we adopted a simple annotation technique based on KNN classification. Only globalfeatures were considered under this formulation. The output of the KNN method wasthen refined by means of an energy-based model that attempts to maximize the seman-tic cohesion among labels assigned to each image. We considered information of theannotation hierarchy to constraint certain labeling configurations. Results obtainedwith this technique give evidence that the KNN approach is an effective annotationtechnique despite being rather simple. The refinement strategy resulted useful for im-proving the labeling performance of an ineffective annotation method; although wecould not improve the labeling performance of a strong baseline. Summarizing, theresults obtained at ImageCLEF2009 are encouraging and motivate further research inseveral directions that we are currently exploring.
Categories and Subject Descriptors
H.3 [Information Storage and Retrieval]: H.3.1 Content Analysis and Indexing; H.3.3 [InformationSystems and Applications]: Information Search and Retrieval—Retrieval models; Selectionprocess; Information Filtering
General Terms
Performance, Experimentation
Keywords
Multimedia image retrieval; Image annotation; Result diversification; Semantic cohesion modeling;Document re-ranking.
1 Introduction
This working note describes the participation of TIA-INAOE in the Photographic Retrieval andthe Large Scale Image Annotation tracks at ImageCLEF2009. A total of 10 runs were submittedthat comprise different settings of our proposed methods for image annotation and retrieval.The proposed methods aim exploiting the information available while maximizing annotation andretrieval performance.
On the one hand, for the retrieval task, we adopted a two stages retrieval process. In the firststage, an initial image search is performed by using only textual information to obtain potentiallyrelevant documents. In a second stage the candidate documents are re-ranked by considering thedifferent diversity categories (clusters) as provided by the organizers. For re-ranking we consideredboth visual and textual information. Results with this approach are mixed: whereas the re-ranking technique resulted helpful for diversifying retrieval results, the best retrieval performance(MAP) was obtained with the baseline retrieval method. This result suggests that textual retrievalmethods are better suited for this collection.
On the other hand, for the annotation task, we adopted a three stages methodology. In afirst stage, candidate labels for test images are selected with a KNN approach, which consists ofobtaining the labels assigned to the K-nearest neighbors (in the training set) of the test image. Inthe second stage, an energy-based model is used to select, among the candidate labels, the disjointlabels for the image, see [4]; this model uses the output of the KNN method and label co-occurrencestatistics. In a third stage, we consider the labels selected in the second stage to obtain the optionallabels for the test image. Applying this method took about 0.25 seconds per image, which makes itattractive for large scale annotation. Annotation results are contradictory: we obtained acceptableperformance when considering the evaluation measure based on the annotation hierarchy [5, 4];however, the performance of our methods is rather limited in terms of EER and area under theROC curve, we analyze these results below.
The rest of this document is organized as follows. In the next section we describe the approachwe adopted for the photographic retrieval task and the results obtained with this technique. Next,in Section 3, we present the annotation method we proposed as well as official results of thismethod. Finally, in Section 4, we describe the conclusions derived from this work and we outlinefuture work directions.
2 Photographic retrieval
We proposed a two stage approach for the photographic retrieval task at ImageCLEF2009; ourmethodology is depicted in Figure 1. In the first stage a set of m potentially relevant documentsis retrieved by using a text-based image retrieval technique. In the second stage the m documentsare re-ranked by taking into account the initial score assigned to documents and the similarityof candidate documents to the diversity clusters provided by the organizers. We proposed thisformulation for two main reasons: 1) we wanted to take advantage of the topic clusters for diversi-fying retrieval results and 2) we wanted to make more efficient the search process. The latter wasaccomplished because the initial search can be performed efficiently (over the 500, 000 documents)and once the set of potentially relevant documents is reduced to a subset of documents we cancompare images in acceptable time and we can apply more complex strategies over this reducedset of documents. The rest of this section describes in detail our method. Further details on thetask and on the collection are described by Lestari et al. [6].
2.1 Feature extraction
The proposed method considers both textual and visual information for representing documents.As textual features we consider a tf-idf weighting scheme over words for representing documents,see the next section. As visual features we use color histograms on both RGB (256 bins) andHSI (128 bins per channel), for a total of 640 visual attributes. We also performed preliminary

Figure 1: Diagram of the proposed approach to image retrieval.
experiments with other visual features, including: edge histograms, color histograms in CIE-Lab,texture features and local descriptors; however, the RGB and HSI color histograms resulted moreeffective (according to an empirical evaluation we conducted) for retrieving images under theEuclidean distance.
2.2 Initial retrieval
For the initial retrieval we considered the vector space model (VSM) under tf-idf weighting forrepresenting documents [1]; we used the cosine similarity for comparing documents. In particular,we used the TMG MatlabR toolbox for indexing and retrieval [9]. Because of the size of thecollection we indexed the collection by batches of 20, 000 documents.
We considered textual information only, because computing the Euclidean distance, betweenquery images and the 500, 000 images that compose the collection, would be very computationallyexpensive. Thus, the re-ranking approach was also used for efficiency reasons (query images anda reduced set of m−images can be compared in acceptable time).
For querying we used all of the textual information available in topics (i.e. title, cluster titlesand cluster descriptions); this is motivated because at this stage we wanted to retrieve documentsthat were related to the query as a whole, so that in the next stage the search can be refined. Weranked the documents by their similarity to the query and we keep the m = 1, 000 top rankeddocuments for the second stage; our baseline run consists of returning these 1, 000 documents.
2.3 Re-ranking based on multimedia features
In the second stage we re-ranked the m−documents obtained by the initial retrieval method. Foreach topic category (cluster), j, we assigned a score to each of the m−documents, di∈{1,...,m}, asfollows:
scXfinal(d
Xi , qX
j ) = λ× scinitial(di) +×SX(dXi , qX
j ) (1)
where scinitial is the similarity score obtained from the initial retrieval stage and SX(dXi , qX) is
an estimate of the similarity between the ith−document and the jth−sub-query under modalityX. λ is a scalar weighting the contribution of the first term. A sub-query qX
j is the part ofthe topic corresponding to the jth diversity cluster, where j ∈ {1, . . . , C} and C the number ofcategories associated with the topic. The superscript X indicates which information modality isused: X = T means that textual information was considered (e.g. cluster title), X = V indicates

that visual information was used (i.e. cluster image) and X = M means that both textual andvisual information wee considered. When X = T , we used the cosine similarity as ST ; whenX = V we used the (normalized) inverse of the Euclidean distance as SV ; when X = M we usedSM = wm1 × ST + wm2 × SV , where the scalars wm1 and wm2 weight the contribution of eachmodality.
For each category j, the score assigned to the m documents was sorted in descending order;thus for each category we had a different ranking for the m−documents. The C−rankings werecombined (by means of round robin) to generate a final ranking for the m−documents. The top1, 000 documents according to the final ranking were submitted for evaluation. For the topics thatdo not have textual information (i.e. topics 25 to 50) we used the provided query images.
2.4 Submitted runs and results
Table 1 summarizes the five runs we submitted for the photographic retrieval task; while Table 2shows the results obtained by these runs. We report the (average across topics of) mean averageprecision (MAP), cluster recall at 20 documents (C20), R-precision (RP), precision at 20 docu-ments and the ratio of relevant retrieved / relevant documents (RR/R). The parameters involvedin our method were set empirically, analyzing the results of each configuration, Table 2 shows theparameter settings used for each run.
ID Par. DescriptionR-1 - Textual retrieval method, see Section 2.2.R-2 wm1 = 4;
wm2 = 1The m−documents obtained by the initial retrieval method are re-ranked according to the score in Equation (1); although the topic wasnot separated into categories under this formulation.
R-3 λ = 0.25 Re-ranking technique with X = V , see Section 2.3.R-4 λ = 0.25 Re-ranking technique with X = T , see Section 2.3.R-5 λ = 0.25;
wm1 = 4;wm2 = 1
Re-ranking technique with X = M , see Section 2.3.
Table 1: Runs submitted by our team to the photographic retrieval track.
ID MAP C-20 RP P20 RR/RR-1 0.2901 0.4299 0.3411 0.5550 263.20/697.74R-2 0.2723 0.4737 0.3300 0.5540 262.92/697.74R-3 0.2710 0.5787 0.3298 0.5580 262.92/697.74R-4 0.2706 0.4855 0.3274 0.5340 262.92/697.74R-5 0.2645 0.5534 0.3242 0.5690 262.92/697.74
Table 2: Official retrieval results obtained with the submitted runs.
The obtained results are mixed. The best retrieval performance, in terms of MAP and RP,was obtained with the baseline (i.e. a textual retrieval technique); P20 was higher with the R-5configuration. Nevertheless, the difference in retrieval performance between the baseline and theother runs was of less than 0.03.
In terms of results diversification (i.e. C20), it is observed an improvement over the baselinefor all of the runs (rows 3-6 in Table 2). The largest improvement in C20 was obtained with themethods that considered visual information (i.e. R-3 and R-5). The run R-3, which used onlyvisual information for re-ranking documents, resulted particularly helpful for diversifying retrievalresults (this run was ranked 67 out of 84). These results suggest that the re-ranking technique

can be helpful for diversifying results and that using different modalities for the initial searchand the re-ranking technique results in better performance. Note that the performance of the re-ranking technique depends on the initial retrieval, thus we expect better diversification of resultswhen better retrieval methods are considered for the initial search. We are studying this researchdirection. Retrieval performance is slightly affected by applying the re-ranking method. However,the performance of the initial search method was rather limited: this method was ranked 47 outof the 85 submitted runs.
2.5 Discussion
The results obtained by the TIA-INAOE team in the photographic retrieval task at Image-CLEF2009 may seem discouraging in a first instance. However, interesting findings can be drawnfrom our participation: the proposed re-ranking technique resulted helpful for result diversifica-tion, although it slightly affects the retrieval performance; better diversification performance wasobtained when the re-ranking was based on visual information only; better diversification perfor-mance is expected if a better search engine is used for the initial retrieval; as whole, the proposedformulation can be helpful for efficient multimedia retrieval in large scale image collections.
3 Large scale image annotation
We proposed a three steps methodology for facing the annotation task at ImageCLEF2009. Foreach test image, we identified a subset of candidate labels by comparing the test image to thetraining ones. Then, we selected the disjoint labels for the image by means of an energy-basedmodel. Next, optional labels were assigned by taking into account co-occurrence statistics.
The method described in this section is based in the assumption that similar images have asso-ciated similar labels. Thus, for each test image we considered the labels assigned to the K−mostsimilar training images; then, we applied different strategies for selecting disjoint and optionallabels for a test image. The benefits of adopting this methodology are annotation efficiency, im-plementation simplicity and the competitive performance that can be obtained with the proposedformulation. The rest of this section describes our methodology and the obtained results. Furtherdetails on the task and on the collection are described by Nowak et al. [4].
3.1 Feature extraction
We used global features to represent images. In particular, we considered an RGB color histogram(256 bins), texture features extracted from the co-occurrence matrix (88 values), an edge histogram(360 bins) and an HSI color histogram with 128 bins per channel for a total of 1, 088 attributes.Each image was represented by its vector of features; thus, hereafter, we will refer as images toboth the images themselves and the vectors of features representing the images. For comparingimages we used a weighted Euclidean distance, where a different weight is used for each subset offeatures (i.e. RGB, texture, edge, HSI). The weights were set empirically by trial and error.
3.2 KNN for image annotation
The first step in our methodology (depicted in Figure 2) is to obtain the k−most similar training-images to each test image IT , we denote this set of images by IT
NN . We are interested in the labelsassociated with the images in IT
NN , we denote the corresponding set of labels by LTNN and we call
it the set of candidate labels for IT . We call the positions of label lTi to the set of positions, inthe sorted set IT
NN , occupied by images that have lTi as annotation. Then, we assigned a score toeach label lTi ∈ LT
NN as follows:
Ψ(lTi ) = αr × wr(lTi , LTNN ) + αa × wa(lTi , LT
NN ) + αr × ws(lTi , LTNN ) (2)

where wr(li, LTNN ) is the normalized frequency of occurrence of label lTi in LT
NN ; wa(li, LTNN ) is
the average of positions of label lTi ; ws(li, LTNN ) is the standard deviation of the positions of label
lTi ; αr, αa and αs are scalars that weight the contribution of each term into the final score.
0
0.2
0.4
0.6
0.8
1
1.2
1.4
Ne
utr
al−
Illu
min
atio
nP
lan
tsD
ay
No
−P
ers
on
sO
utd
oo
rN
o−
Blu
rS
till−
Life
Pa
rtly
−B
lurr
ed
Su
mm
er
Flo
we
rsL
an
dsca
pe
−N
atu
reO
ve
rall−
Qu
ality
;S
prin
gN
o−
Vis
ua
l−S
ea
so
nT
ree
sS
un
ny
Ma
cro
Ae
sth
etic−
Imp
ressio
n;
An
ima
lsA
utu
mn
Sm
all−
Gro
up
Ind
oo
rB
uild
ing
−S
igh
tsC
itylife
No
−V
isu
al−
Pla
ce
No
−V
isu
al−
Tim
eF
an
cy;
Fa
miliy
−F
rie
nd
sO
ut−
of−
focu
sS
ky
Wa
ter
Nig
ht
Sin
gle
−P
ers
on
Sn
ow
Win
ter
Clo
ud
sS
po
rts
Ψ
Figure 2: The KNN approach to image annotation. The k-most similar images (middle) to the testimage (left) were obtained; then, a weight was assigned to each label according to its repetitionin the set of images and to the position of the images in which the label appeared. The top−t canlabels be used to annotate the image.
The scores assigned to the candidate labels were used by the model to be described below.Alternatively, a rather simple labeling approach consists in sorting the candidate labels, in de-scending order of Ψ(li) (Figure 2, right), and using the top t−labels for annotating the test imageIT . We call this setting our baseline1 run. This annotation approach is based in the work of Maka-dia et al., where the labeling problem is faced as one of retrieval [3]. Nevertheless, in this workwe are using a different scheme for weighting labels, and we introduce a novel labeling refinementmethod.
3.2.1 Alternative re-ranking
We also considered an alternative re-ranking approach that aims refining the ranking of the can-didate images (as obtained with global attributes) by considering local features. Under this tech-nique, we obtained the k0−most similar images (k0 > k) to each test image, using the featuresdescribed above and the Euclidean distance. Next, we re-ranked this k0−images by using a naıveBayesian classifier (NBC). The NBC evaluates the pixel similitude between a patch of the imagein the test set, with several patches of the k0 images, using the Euclidean distance as well. Patcheswere obtained from little regions in the image that were passed through Gabor and max filters.This is according to a simplified Bayesian approximation of a bio inspired model of the visual cor-tex [7]. As above, the top−k images (in the new ranking) were considered the nearest neighborsITNN of the test image IT . Despite a different approach was used for ranking images, we used the
score from Equation (2) to rank the labels.
3.3 Labeling refinement
Once we identified a set of candidate labels for a test image, as described in Section 3.2, weapplied a labeling refinement method for selecting the disjoint labels for the image. Intuitively, wewanted to select, from the set of candidate labels, the best combination of disjoint labels, usingco-occurrence statistics calculated from the training set.
1Note that we have applied the same postprocessing described below for selecting labels under this formulation.

We defined an energy-based model for the disjoint categories (i.e. Seasons, Place, TimeOfDay,Illumination, Blurring and Persons) using a variable aj per category, with j ∈ {1, . . . , 6}. Eachrandom variable can take values from its corresponding set of possible labels (e.g. the variablecorresponding to the category TimeOfDay, can take the values: Day, Night or No-Visual-Time);we denote the assignment of label lx to variable aj with ax
j , thus axj can be considered a label
itself. Additionally, we restricted the values that each variable can take, by considering as possiblevalues only to those labels that appear in the set of candidate labels (i.e. LT
NN ). Figure 3 depictsthe modeling process for a particular test image.
Figure 3: Illustration of the proposed energy-based model. Each variable (node) represents adisjoint category. A variable can take values labels from the corresponding category only (shadedbox). The estimate from Equation (2) is normalized and used as input for the model. Weconsidered a fully connected model.
The goal of the model is to select the configuration of labels A (i.e. a label assignment percategory) that maximizes the cohesion among the labels assigned to the image. Accordingly, weassigned an energy value to each configuration of labels as follows:
E(A) = −( ∑
aj∈A
δ ×Ψ(axj ) +×
∑
aj∈A
∑ah∈ηaj
ρ(axj , ay
h))
(3)
Where Ψ(axj ) as in Equation (2) and ρ(ax
j , ayh) is a factor that weights the association between
labels lx and ly, assigned to categories aj and ah, respectively; ηaj is the set of neighbors2, underthe model, of category aj , as we are using a fully complete graph the set of neighbors for aj
is ηaj = ap ∈ A : p 6= j. δ weights the contribution of the initial ranking to the energy ofthe configuration. We used co-occurrence statistics to estimate the association between labels.Specifically, we estimate ρ(ax
j , ayh) as follows:
ρ(axj , ay
h) =#(lx, ly)
#(lx)#(ly)(4)
where #(lx) is the number of images in the training set in which label lx occurs and #(lx, ly) isthe number of images in which both lx and ly co-occur. For specific labels lx and ly, the higherρ(ax
j , ayh) the more both labels are associated. Note that ρ(ax
j , ayh) can be calculated for any pair
of labels (disjoint and optional); thus we use this association information in the next section for
2Note that these neighbors are different from the neighbors considered in Section 3.2.

selecting optional labels as well. Equation (3) assigns low energy values to correct configurationsand large values to incorrect ones. Therefore, the problem of selecting disjoint labels for a testimage is reduced to that of finding the configuration of labels that minimizes Equation (3); forthis work we used iterated conditioned modes (ICM) for this task [8].
The energy-based model returns labels for each disjoint category. Intuitively, the model selectsthe combination of labels that maximizes their semantic cohesion. This method is based on themethod proposed in [2] for region-labeling; in this paper we extend such a model to work forimage-level annotation.
3.4 Annotating images
Once we selected the disjoint labels we assigned optional labels to each test image as follows.We assigned a score to each candidate label lTi (that does not belong to any disjoint category),identified in Section 3.2, as follows:
ζ(lTi ) = Ψ(lTj )×6∏
j=1
ρ(lTi , ldj) (5)
where Ψ(lTj ) and ρ(lTi , ldj ) are defined as above and ldj is the label assigned to the jth disjointcategory. We ranked labels according to ζ(lTi ) and used the top−n labels for labeling the testimage.
3.5 Postprocessing
For generating the final annotation for a test image we applied the following postprocessing. First,regarding the number of labels, we assigned the top 4 optional labels to each test image, as 4 isthe average number of optional labels that were used for annotating the training images. Second,when a leaf-label was chosen as optional label for an image, we also included its parent label, asappear in the annotation hierarchy defined by the organizers. Thus, for example, if the label Lakewas considered as optional label for the image, we also included the label Water. Of course, thisis only applicable to optional labels that appear in the hierarchy as leafs.
3.6 Submitted runs and results
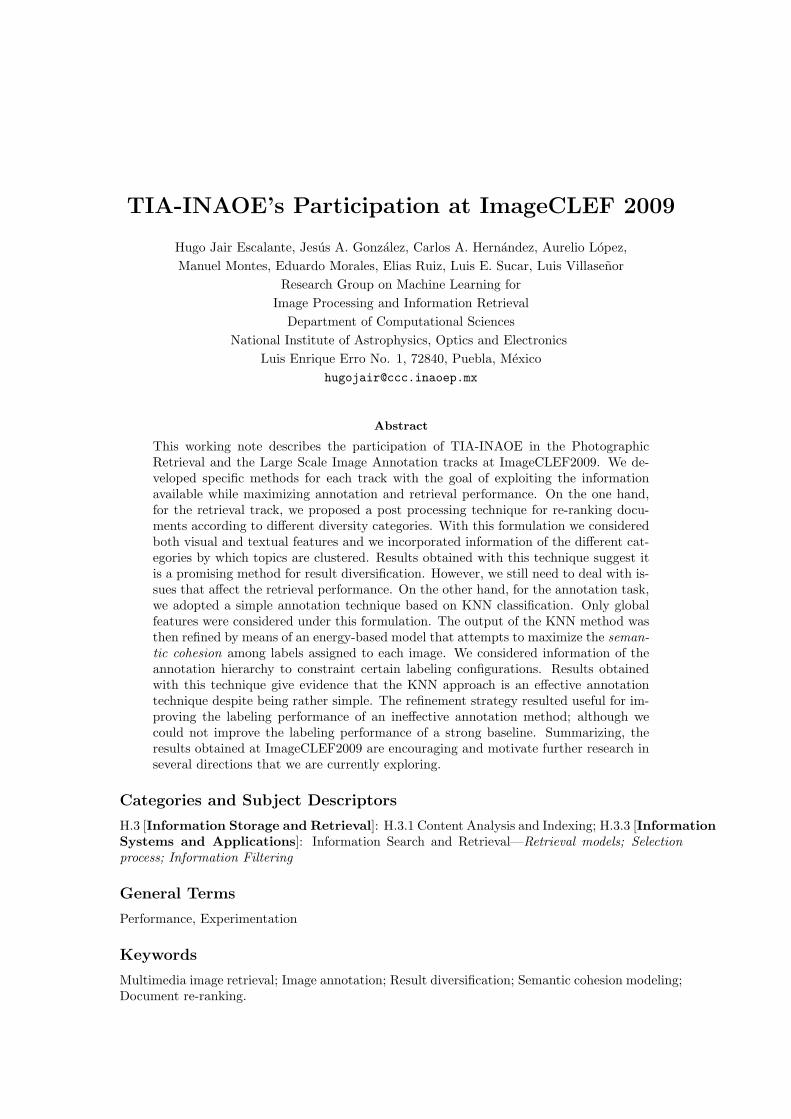
Table 3 summarizes the five runs we submitted for the large scale annotation task; whereas Table 4shows the results obtained by such runs. We show the following performance measures: the hier-archical measure described in [5], two variants are available: H-A is the hierarchical performancewith annotator agreement, whereas H-WA is the performance without annotator agreement, thehigher the values of H-A and H-WA the better the annotation performance, see [4, 5] for furtherdetails. Also, the average of equal error rate (EER) and the area under the ROC curve (AUC)were considered for evaluation. The parameters involved in our method were set by using crossvalidation using the training set of images.
From Table 4 we can see that the baseline method is a rather strong baseline, confirming theresults reported by Makadia et al. [3]. The performance of the baseline was not improved byapplying the energy-based model. This can be due to the fact that we did not use a good setof parameters for the model. In cross validation experiments we obtained better performance inboth EER and AUC, thus it seems we overfitted the data.
The worst performance, in terms of H-A and H-WA, was obtained when local informationwas used for ranking labels according to the KNN approach. Hence these local features were nothelpful for re-ranking. An interesting result, however, is that when the energy-based model wasapplied with the labels ranked according to local features, the energy-based model was able toimprove the performance of the former significantly (compare the performances of runs A-2 andA-4). This result suggest the energy-based model can be helpful when the initial labeling is notgood.

ID DescriptionA-1 KNN; the score in Equation (2) is used for assigning labels.A-2 KNN-RR; we use the alternative re-ranking with local features (see Section 3.2.1)
and the score in Equation (2) for assigning labels.A-3 KNN + EBM; candidate labels selected as in A-1, the energy-based model is
used to select the disjoint labels and optional labels are selected as described inSections 3.3, 3.4 and 3.5
A-4 KNN-RR + EBM; candidate labels selected as in A-2, the energy-based modelis used to select the disjoint labels and optional labels are selected as describedin Sections 3.3, 3.4 and 3.5
A-5 KNN-RRW + EBM; same as A-4, but we use a larger δ value.
Table 3: Runs submitted by our team to the large scale annotation track.
ID H-A H-WA EER AUC Time (s)A-1 0.7592 0.7317 0.4862 0.1008 0.15A-2 0.5329 0.5125 0.4847 0.0993 0.24A-3 0.7281 0.6966 0.4929 0.0442 0.25A-4 0.7323 0.7018 0.4924 0.0622 0.26A-5 0.7418 0.7127 0.4872 0.0947 0.23
Table 4: Official annotation results obtained with the submitted runs.
It is interesting to note that whereas the performance of our runs in H-A and H-WA was, tosome extent, satisfactory, the performance in terms of EER and AUC was rather limited. Ourbest run (A-1) was ranked 26 out of 74 submitted runs in terms of H-A and H-WA. However,the same run was ranked 59 and 66 out 74 in terms of EER and AUC, respectively. Thisresult suggest that the method can label images as whole satisfactorily, although its per-labelperformance is limited; which is not surprising as we have not developed visual concept detectorsper class. Note that the main goal of assigning labels to images is to support annotation basedimage retrieval methods, which use labels assigned to the images as a whole. Thus, it seems thatour method could support effectively this form of image retrieval, we will study this aspect asfuture work, currently we are conducting an more in-deep analysis of the results.
Finally, the processing time3 of our methods is quite acceptable, this time could be furtherreduced if we use software that is less computationally expensive (we used MatlabR for all of ourexperiments) and if we optimize our code.
3.7 Discussion
The results obtained by the TIA-INAOE team are encouraging. The KNN approach to imagelabeling proved to be a very effective method for image annotation, regardless of its simplicityand generality. Despite the proposed energy-based model did not improve the performance of theKNN method, it was able to improve significantly the performance of the KNN-RR method. Thussuggesting the energy-based model can be helpful when the initial method is not very effective; thisis a desired behavior of the model. Note that the energy-based model is still under developmentand that we have fixed the number of labels that are assigned to an image, also the parameterselection process can be improved. In general terms, our annotation methodology offers a goodtradeoff in terms of annotation performance (in H-A and H-WA) and processing time. We wouldlike to emphasize that the proposed approach for labeling refinement is not restricted to our KNNannotation method. It can be applied as a postprocessing step with any annotation method,
3The reported time does not include feature extraction from images.

provided that the labels can be ranked, hence, showing the generality of the method and thepotential impact it can have. Summarizing, the energy-based model is intuitively sound and is apromising method in which we are still working on.
4 Conclusions
We have described the participation of TIA-INAOE at ImageCLEF2009. Our team submittedruns for the Photographic Retrieval and for the Large Scale Annotation tracks. We proposedspecific methods for each track. On the one hand, we described a re-ranking approach that aimsat maximizing the diversity of retrieved documents at the first positions. Our results show thatwhereas the proposed technique can improve the diversity of results, the base retrieval system stillneeds to be improved. On the other hand, we adopted a simple method for image annotation, andintroduced a labeling refinement technique with the goal of improving the annotations as obtainedwith the former method. Our results suggest the KNN approach is effective for annotation andvery efficient. However, there are still several issues with our refinement method that we arecurrently working on.
Acknowledgements. The authors thank the organizers of ImageCLEF2009 because of their support.This work was partially supported by CONACyT under project grant 61335 and scholarship 205834.
References
[1] R. Baeza-Yates and B. Ribeiro-Neto. Modern Information Retrieval. Pearson E. L., 1999.
[2] H. J. Escalante, M. Montes, and E. Sucar. Maximizing the semantic cohesion for region labeling.Submitted to International Journal of Computer Vision, 2009.
[3] A. Makadia, V. Pavlovi, and S. Kumar. A new baseline for image annotation. In ECCV’08: Proceedingsof the 10th European Conference on Computer Vision, volume 5304 of LNCS, pages 316–329, Marseille,France, 2008. Springer.
[4] S. Nowak and P. Dunker. Overview of the clef 2009 large scale - visual concept detection and annotationtask. In F. Borri, A. Nardi, and C. Peters, editors, CLEF working notes, Corfu, Greece, October 2009.
[5] S. Nowak and H. Lukashevich. Multilabel classification evaluation using ontology information. In Pro-ceedings of the First ESWC Workshop on Inductive Reasoning and Machine Learning on the SemanticWeb, volume 474 of CEUR Workshop Proceedings, Heraklion, Greece, 2009.
[6] M. Paramita, M. Sanderson, and P. Clough. Diversity in photo retrieval: Overview of the imageclef-photo task 2009. In F. Borri, A. Nardi, and C. Peters, editors, CLEF working notes, Corfu, Greece,October 2009.
[7] T. Serre, M. Kouh, C. Cadieu, U. Knoblich, G. Kreiman, and T. Poggio. A theory of object recognition:computations and circuits in the feedforward path of the ventral stream in primate visual cortex.Technical report, AI Memo #2005-036, Massachusetts Institute of Technology, Cambridge, MA, USA,Dec 2005.
[8] G. Winkler. Image Analysis, Random Fields and Markov Chain Monte Carlo Methods. Number 27 inApplications of Mathematics. Springer, 2006.
[9] D. Zeimpekis and E. Gallopoulos. Tmg: A matlab toolbox for generating term-document matricesfrom text collections. In C. Nicholas J. Kogan and M. Teboulle, editors, Grouping MultidimensionalData: Recent Advances in Clustering, pages 187–210. Springer, 2005.