Three-Phase-Lag Bio-Heat Transfer Model of Cardiac Ablation
15
Citation: Singh, S.; Saccomandi, P.; Melnik, R. Three-Phase-Lag Bio-Heat Transfer Model of Cardiac Ablation. Fluids 2022, 7, 180. https://doi.org/ 10.3390/fluids7050180 Academic Editors: Eduardo Divo, Alain Kassab, Ray Prather and Arka Das Received: 15 April 2022 Accepted: 19 May 2022 Published: 21 May 2022 Publisher’s Note: MDPI stays neutral with regard to jurisdictional claims in published maps and institutional affil- iations. Copyright: © 2022 by the authors. Licensee MDPI, Basel, Switzerland. This article is an open access article distributed under the terms and conditions of the Creative Commons Attribution (CC BY) license (https:// creativecommons.org/licenses/by/ 4.0/). fluids Article Three-Phase-Lag Bio-Heat Transfer Model of Cardiac Ablation Sundeep Singh 1,2, * , Paola Saccomandi 3 and Roderick Melnik 2,4 1 Schulich School of Engineering, University of Calgary, 2500 University Drive NW, Calgary, AB T2N 1N4, Canada 2 MS2Discovery Interdisciplinary Research Institute, Wilfrid Laurier University, 75 University Avenue West, Waterloo, ON N2L 3C5, Canada; [email protected] 3 Department of Mechanical Engineering, Politecnico di Milano, 20156 Milan, Italy; [email protected] 4 BCAM—Basque Center for Applied Mathematics, Alameda de Mazarredo 14, E-48009 Bilbao, Spain * Correspondence: [email protected] Abstract: Significant research efforts have been devoted in the past decades to accurately modelling the complex heat transfer phenomena within biological tissues. These modeling efforts and analysis have assisted in a better understanding of the intricacies of associated biological phenomena and factors that affect the treatment outcomes of hyperthermic therapeutic procedures. In this contribution, we report a three-dimensional non-Fourier bio-heat transfer model of cardiac ablation that accounts for the three-phase-lags (TPL) in the heat propagation, viz., lags due to heat flux, temperature gradient, and thermal displacement gradient. Finite element-based COMSOL Multiphysics software has been utilized to predict the temperature distributions and ablation volumes. A comparative analysis has been conducted to report the variation in the treatment outcomes of cardiac ablation considering different bio-heat transfer models. The effect of variations in the magnitude of different phase lags has been systematically investigated. The fidelity and integrity of the developed model have been evaluated by comparing the results of the developed model with the analytical results of the recent studies available in the literature. This study demonstrates the importance of considering non-Fourier lags within biological tissue for predicting more accurately the characteristics important for the efficient application of thermal therapies. Keywords: hyperthermia; cardiac ablation; bio-heat transfer; non-Fourier heat transfer; TPL model; numerical simulations 1. Introduction Minimally invasive thermal therapies (viz., radiofrequency, laser, microwave, and cryo- and ultrasound ablations) are well-established as a promising localized treatment option for treating different types of cancers, cardiovascular diseases, neurodegenerative disorders, as well as chronic pain [1–5]. The goal of thermal ablation is to attain direct cellular injury by the application of extreme temperatures, either too high (hyperthermic ablation) or too low (cryoablation). During thermal therapies, the applicator/catheter is introduced percutaneously into the target tissue with the aid of image-guided modalities, such as computed tomography (CT), magnetic resonance imaging (MRI), or ultrasound [1,6]. The energy deposited within the biological tissue from the applicator in high-temperature thermal therapies leads to localized heating at the target site resulting in protein denatura- tion, mitochondrial dysfunction, halt in enzyme function, and cell membrane collapse [2]. Importantly, minimally invasive thermal therapies result in a potential reduction in the physical, emotional, and financial stress on patients as compared to surgery and are quite useful for treating patients on whom conventional surgery cannot be performed due to associated comorbidities. Computational modeling and simulations have played an important role in better understanding the underlying physics of various thermal ablative procedures among Fluids 2022, 7, 180. https://doi.org/10.3390/fluids7050180 https://www.mdpi.com/journal/fluids
-
Upload
khangminh22 -
Category
Documents
-
view
0 -
download
0
Transcript of Three-Phase-Lag Bio-Heat Transfer Model of Cardiac Ablation

Citation: Singh, S.; Saccomandi, P.;
Melnik, R. Three-Phase-Lag Bio-Heat
Transfer Model of Cardiac Ablation.
Fluids 2022, 7, 180. https://doi.org/
10.3390/fluids7050180
Academic Editors: Eduardo Divo,
Alain Kassab, Ray Prather and
Arka Das
Received: 15 April 2022
Accepted: 19 May 2022
Published: 21 May 2022
Publisher’s Note: MDPI stays neutral
with regard to jurisdictional claims in
published maps and institutional affil-
iations.
Copyright: © 2022 by the authors.
Licensee MDPI, Basel, Switzerland.
This article is an open access article
distributed under the terms and
conditions of the Creative Commons
Attribution (CC BY) license (https://
creativecommons.org/licenses/by/
4.0/).
fluids
Article
Three-Phase-Lag Bio-Heat Transfer Model of Cardiac AblationSundeep Singh 1,2,* , Paola Saccomandi 3 and Roderick Melnik 2,4
1 Schulich School of Engineering, University of Calgary, 2500 University Drive NW,Calgary, AB T2N 1N4, Canada
2 MS2Discovery Interdisciplinary Research Institute, Wilfrid Laurier University, 75 University Avenue West,Waterloo, ON N2L 3C5, Canada; [email protected]
3 Department of Mechanical Engineering, Politecnico di Milano, 20156 Milan, Italy; [email protected] BCAM—Basque Center for Applied Mathematics, Alameda de Mazarredo 14, E-48009 Bilbao, Spain* Correspondence: [email protected]
Abstract: Significant research efforts have been devoted in the past decades to accurately modellingthe complex heat transfer phenomena within biological tissues. These modeling efforts and analysishave assisted in a better understanding of the intricacies of associated biological phenomena andfactors that affect the treatment outcomes of hyperthermic therapeutic procedures. In this contribution,we report a three-dimensional non-Fourier bio-heat transfer model of cardiac ablation that accountsfor the three-phase-lags (TPL) in the heat propagation, viz., lags due to heat flux, temperaturegradient, and thermal displacement gradient. Finite element-based COMSOL Multiphysics softwarehas been utilized to predict the temperature distributions and ablation volumes. A comparativeanalysis has been conducted to report the variation in the treatment outcomes of cardiac ablationconsidering different bio-heat transfer models. The effect of variations in the magnitude of differentphase lags has been systematically investigated. The fidelity and integrity of the developed modelhave been evaluated by comparing the results of the developed model with the analytical results ofthe recent studies available in the literature. This study demonstrates the importance of consideringnon-Fourier lags within biological tissue for predicting more accurately the characteristics importantfor the efficient application of thermal therapies.
Keywords: hyperthermia; cardiac ablation; bio-heat transfer; non-Fourier heat transfer; TPL model;numerical simulations
1. Introduction
Minimally invasive thermal therapies (viz., radiofrequency, laser, microwave, andcryo- and ultrasound ablations) are well-established as a promising localized treatmentoption for treating different types of cancers, cardiovascular diseases, neurodegenerativedisorders, as well as chronic pain [1–5]. The goal of thermal ablation is to attain directcellular injury by the application of extreme temperatures, either too high (hyperthermicablation) or too low (cryoablation). During thermal therapies, the applicator/catheter isintroduced percutaneously into the target tissue with the aid of image-guided modalities,such as computed tomography (CT), magnetic resonance imaging (MRI), or ultrasound [1,6].The energy deposited within the biological tissue from the applicator in high-temperaturethermal therapies leads to localized heating at the target site resulting in protein denatura-tion, mitochondrial dysfunction, halt in enzyme function, and cell membrane collapse [2].Importantly, minimally invasive thermal therapies result in a potential reduction in thephysical, emotional, and financial stress on patients as compared to surgery and are quiteuseful for treating patients on whom conventional surgery cannot be performed due toassociated comorbidities.
Computational modeling and simulations have played an important role in betterunderstanding the underlying physics of various thermal ablative procedures among
Fluids 2022, 7, 180. https://doi.org/10.3390/fluids7050180 https://www.mdpi.com/journal/fluids

Fluids 2022, 7, 180 2 of 15
different organs/tissues. These models also assist in providing a reasonable a priori estimateof the treatment outcomes of therapy that is beneficial in optimizing the thermal dosageand better planning of the procedure, thus minimizing the risk of unnecessary damage tothe surrounding healthy tissue and critical structures. Several advancements have beenreported in the computational modeling of thermal ablation in the past decades to reach astage where the discrepancy between the model outcome and experimental/clinical resultsis minimal [7–11]. So that the patient-specific models can be readily integrated within thehospital workflow to provide accurate predictions during the treatment planning stage,thereby enhancing the efficacy of such thermal therapies.
The Fourier’s law-based Pennes model [12] is a widely used bio-heat transfer modelfor analyzing the heat transport within the biological tissue during thermal therapies.However, the assumption of the infinitely fast speed of heat transport in the Pennes model isheavily criticized, particularly in the biological tissues which have highly non-homogenousinner structures. Thus, the heat always propagates at a finite speed within biologicaltissues, suggesting the existence of thermal delay and non-Fourier behavior [9,13,14].Several numerical studies have incorporated the single-phase lag (accounting for thelag associated with the heat flux vector as proposed by Cattaneo [15] and Vernotte [16])and dual-phase-lag (accounting for the lag associated with the heat flux vector and thetemperature gradient as proposed by Tzou [17]) [18–29]. More recently, a three-phase-lag (TPL) heat transfer model was applied in biological tissue, accounting for the phaselags associated with the heat flux vector, temperature gradient, and thermal displacementgradient, as proposed by Choudhuri [30], based on the thermoelasticity model developed byGreen and Naghdi [31,32]. Zhang et al. [33] have reported the first study utilizing the TPLmodel in biological tissue to quantify the heat response of the skin, adopting the method ofseparation of variables to obtain the analytical solution of temperature distributions. Later,the TPL bio-heat transfer model was successfully applied and reported in other recentstudies [34–36]. However, all of these previous studies related to the application of the TPLmodel in biological tissue consider a one-dimensional analysis. Hereby, we provide the firstthree-dimensional study of the TPL bio-heat transfer model applied to cardiac ablation. Inthis study, we report a comparative analysis of treatment outcomes obtained with differentbio-heat transfer models during cardiac ablation. In particular, the heat-sink effect causedby both microvasculature blood perfusion and the blood flow within the cardiac chamberwas considered in our analysis. The finite element method (FEM) has been utilized tosolve the governing equations, and the results have been presented in terms of both thetemperature distribution and ablation volume. Parametric studies have been conductedto evaluate the influence of the magnitude of three lags on the treatment outcome of thecardiac ablation. Next, the governing equations, material properties, boundary conditions,and numerical setup for the proposed model are presented in Section 2.
2. Materials and Methods
The three-dimensional computational domain of cardiac ablation considered in thepresent study comprising the cardiac tissue, blood chamber, and the applicator, is presentedin Figure 1 [37]. Further, the heat transport utilizing Pennes’ bio-heat transfer model isbased on the classical Fourier’s law, which assumes that heat propagation occurs at aninfinite speed and relates to the heat flux (q) as [12]:
q(→r , t) = −k∇T(
→r , t). (1)

Fluids 2022, 7, 180 3 of 15
Fluids 2022, 7, x FOR PEER REVIEW 3 of 16
2 ( ,) ωρ ρ∂ = ∇ − − +∂
+b b mb b pTc k c Qt
TT QT (2)
where ρ is the density (kg/m3), c is the specific heat capacity (J/kg/K), T is the tissue tem-perature (K), k is the thermal conductivity (W/m/K), ρb is the density of blood (kg/m3), cb is the specific heat capacity of blood (J/kg/K), ωb is the blood perfusion rate (1/s), Tb is the temperature of blood entering the tissue, the term [ρbcbωb(T − Tb)] represents the heat sink effect caused by the small capillary vasculature, Qm is the metabolic heat generation (W/m3), which is normally ignored due to its minimal impact compared to other heat source terms during thermal ablation, and Qp (W/m3) represents the volumetric heat gen-eration during thermal ablative procedures (e.g., radiofrequency or laser heat sources).
Figure 1. (a) Reduction in the computational domain from the full thorax model to a limited domain model (Adapted from Irastorza et al. [37] under the terms of the Creative Commons CC BY license for an open access article). (b) Schematic of the three-dimensional model of cardiac ablation that comprises of myocardium tissue, blood chamber, and the applicator.
The thermal lag associated with the time delay between the heat flux and tempera-ture gradient was independently introduced by Cattaneo [15] and Vernotte [16] in the Fourier’s conduction law as:
Figure 1. (a) Reduction in the computational domain from the full thorax model to a limited domainmodel (Adapted from Irastorza et al. [37] under the terms of the Creative Commons CC BY licensefor an open access article). (b) Schematic of the three-dimensional model of cardiac ablation thatcomprises of myocardium tissue, blood chamber, and the applicator.
The generalized Fourier conduction of Pennes’ bio-heat transfer equation based onenergy conservation in the Cartesian coordinate system is represented as:
ρc∂T∂t
= k∇2T −ωbρb cb(T − Tb) + Qm + Qp, (2)
where ρ is the density (kg/m3), c is the specific heat capacity (J/kg/K), T is the tissuetemperature (K), k is the thermal conductivity (W/m/K), ρb is the density of blood (kg/m3),cb is the specific heat capacity of blood (J/kg/K), ωb is the blood perfusion rate (1/s), Tb isthe temperature of blood entering the tissue, the term [ρbcbωb(T − Tb)] represents the heatsink effect caused by the small capillary vasculature, Qm is the metabolic heat generation(W/m3), which is normally ignored due to its minimal impact compared to other heatsource terms during thermal ablation, and Qp (W/m3) represents the volumetric heatgeneration during thermal ablative procedures (e.g., radiofrequency or laser heat sources).

Fluids 2022, 7, 180 4 of 15
The thermal lag associated with the time delay between the heat flux and temperaturegradient was independently introduced by Cattaneo [15] and Vernotte [16] in the Fourier’sconduction law as:
q(→r , t + τq) = −k∇T(
→r , t), (3)
where τq is the thermal relaxation time that represents the time delay between the heat fluxvector and the temperature gradient. The constitutive relation obtained by incorporatingthe thermal relaxation time phase lag as the linear extension of Fourier law is known as thesingle-phase-lag (SPL) non-Fourier heat transfer model (or Cattaneo-Vernotte (C-V) heattransfer model). In this case, the resulting hyperbolic-type SPL heat equation is given by:
τqρc ∂2T∂t2 +
(ρc + τqωbρbcb
)∂T∂t =
k∇2T −ωbρb cb(T − Tb) + Qm + Qp + τq
(∂Qm
∂t +∂Qp∂t
).
(4)
Tzou [17] proposed another relaxation time to account for the effects of micro-structuralinteraction along with fast transient effects of thermal inertia, and accordingly, the conduc-tion relation between heat flux and temperature gradient was modified as:
q(→r , t + τq) = −k∇T(
→r , t + τt), (5)
where, as before, τq is the phase lag for the heat flux, and τt is the phase lag for thetemperature gradient. For τq < τt, heat flux precedes the temperature gradient, and forτq > τt, the temperature gradient precedes the heat flux. It is noteworthy to mention thatin order to obey the causality principle τq ≥ τt, as highlighted in [13]. By substitutingEquation (2) in Equation (5), and after some mathematical manipulations, the dual-phase-lag (DPL) non-Fourier heat transfer model can be obtained as:
τqρc ∂2T∂t2 +
(ρc + τqωbρbcb − τtk∇2) ∂T
∂t =
k∇2T −ωbρb cb(T − Tb) + Qm + Qp + τq
(∂Qm
∂t +∂Qp∂t
).
(6)
For τt = 0, Equation (6) reduces to the SPL bio-heat transfer model (Equation (4)), andfurther reduces to Fourier’s heat transfer model (Equation (2)) for τq = 0.
Later, Choudhuri [30] proposed a three-phase-lag model by incorporating an addi-tional phase lag of thermal displacement gradient in the DPL model based, in its turn, onthe thermoelastic model developed by Green and Naghdi [31,32] and as given by:
q(→r , t + τq) = −
[k∇T(
→r , t + τt) + k∗∇v(
→r , t + τv)
], (7)
where τq, τt, and τv are phase lags associated with heat flux, temperature gradient, andthermal displacement gradient, respectively, v is thermal displacement satisfying
.v = T,
and k∗ is the rate of thermal conductivity. After some mathematical manipulations ofEquation (7) combined with Equation (2), the following constitutive equation for TPL canbe obtained [33]:
τqρc ∂3T∂t3 +
(ρc + τqρc k∗
k + τqωbρbcb − kτt∇2)
∂2T∂t2 +(
ρc k∗k + ωbρbcb + ωbρbcb
k∗k + τqωbρbcb
k∗k − k∇2 − k∗τv∇2
)∂T∂t =
k∗∇2T −ωbρb cbk∗k (T − Tb) +
∂Qm∂t +
∂Qp∂t + τq
(∂2Qm
∂t2 +∂2Qp∂t2
).
(8)
Importantly, the phase lags should obey the following inequality to obtain a stablesolution, 0 ≤ τv < τt < τq [38]. For k* = 0 and integrating w.r.t time, Equation (8) will reduceto the DPL bio-heat transfer model. Further with τt = 0, this equation will reduce to theSPL model, and additionally, with τq = 0, the equation will reduce to the Pennes’ bio-heattransfer model.

Fluids 2022, 7, 180 5 of 15
In the present study, we have simulated a cardiac ablative procedure at a constantpower. As such, for a constant power source, the time-derivative of the volumetric heatgeneration (i.e., Qp) would be zero in the TPL model (Equation (8)). To avoid this paradox,we have considered a constant temperature at the tip of the applicator, which is maintainedat 95 C. It is noteworthy to mention that the constant temperature can be easily maintainedduring the thermal ablative procedures utilizing a closed-loop feedback proportional-integral-derivative (PID) controller, as demonstrated in previous studies [39–43]. A compar-ative analysis has been conducted by comparing the temperature distributions predictedwithin the myocardium tissue incorporating Pennes’ (Equation (2)), SPL (Equation (4)),DPL (Equation (6)), and TPL (Equation (8)) bio-heat transfer models.
The blood flow within the cardiac chamber was modeled utilizing the laminar andincompressible flow as given by the coupled momentum and continuity, Navier–Stokesequations:
ρb∂u∂t + ρb(u · ∇)u = ∇ ·
[−pI + µ(∇2u)
]+ F,
∇ · u = 0,(9)
where u is the velocity vector (m/s), ρb is the density of blood (kg/m3), p is the bloodpressure (Pa), µ is the dynamic viscosity of blood (=2.1 × 10⁻³ Pa.s), and F is the bodyforce neglected in this study [43–45]. It is noteworthy to mention that Newtonian behaviorhas been used to model the blood, which is adequate for shear rates >100 s−1 [46,47]. Thefluid–structure interaction (FSI) has received significant attention in research related tocardiovascular modeling [48–55]. In this study, FSI only pertains to the convective heat-sink(cooling) effect induced by the blood flow during cardiac ablation, as the cardiac tissue hasbeen modeled as a rigid body. However, future studies are warranted to incorporate themechanical deformation of the cardiac tissue caused by the pulsatile blood flow within thecardiac chamber, as has been recently reported in [56,57].
Further, the blood perfusion rate has been modeled utilizing a temperature-dependentpiecewise model, whereby a constant value of blood perfusion rate prevails below thetemperature of 50 C and ceases beyond it [40,58], as given by:
ωb =
0.017 s−1 for T < 50
C
0 for T ≥ 50C
(10)
The ablation volume (V) attained during the cardiac ablation was obtained utilizingthe isotherm of 50 C, i.e., the volume of myocardium tissue having a temperature of≥50 C after the selected treatment time, as given by [37,40,59]:
V =y
Ω
dV (mm3) (where Ω ≥ 50C) (11)
A finite-element method (FEM)-based COMSOL Multiphysics software [60] was usedto solve different bio-heat transfer models for predicting the temperature distributionsand ablation volumes during 60 s of cardiac ablation. The initial temperature of the entirecomputational domain presented in Figure 1b was 37 C, and the tip of the applicator wasmaintained at a temperature of 95 C throughout the simulation. Further, the blood flowinside the cardiac chamber was modeled by considering two values for the blood velocityat the inlet, viz., 8.5 cm/s and 3 cm/s representing the high and low blood flow rates,respectively [19,43–45,58]. The outlet of the cardiac chamber was subjected to zero pressureconditions. No-slip boundary conditions were imposed on the wall of the applicator inthe cardiac chamber as well as the tissue-fluid interface. The thermophysical propertiesof cardiac tissue considered in the present study were: ρ = 1060 kg/m3, c = 3111 J/kg/K,ρb = 1000 kg/m3, cb = 4180 J/kg/K,ωb = 0.017 s−1, k = 0.54 W/m/K, k* = 0.1 W/m/K/s,τq = 16 s, τT = 6 s and τv = 2 s [19,33,43–45,58]. The computational domain presentedin Figure 1b was discretized using the heterogeneous tetrahedral mesh elements withadditional refinements close to the applicator where higher thermal gradients were ex-
Fluids 2022, 7, 180 6 of 15
pected. Furthermore, a grid independence study was performed to determine the optimalnumber of mesh elements that would result in a mesh-independent solution. The meshrefinements were carried out using the ablation volume convergence criterion, i.e., the meshwas progressively refined until the absolute error for ablation volume was less than 0.5 %compared to the previous mesh size. The final mesh comprises of 551,690 domain elements,26,674 boundary elements, and 1288 edge elements. The constitutive equations for heattransfer and fluid flow, presented earlier, were solved using the multifrontal massivelyparallel sparse direct solver (MUMPS) [61], employing a segregated solution approach. Allof the simulations were conducted on a Dell Precision 7920 Tower workstation with 96 GBRAM and 2.20 GHz Intel® Xeon® processors with a computational time of less than 4 h foreach simulation.
3. Results and Discussion
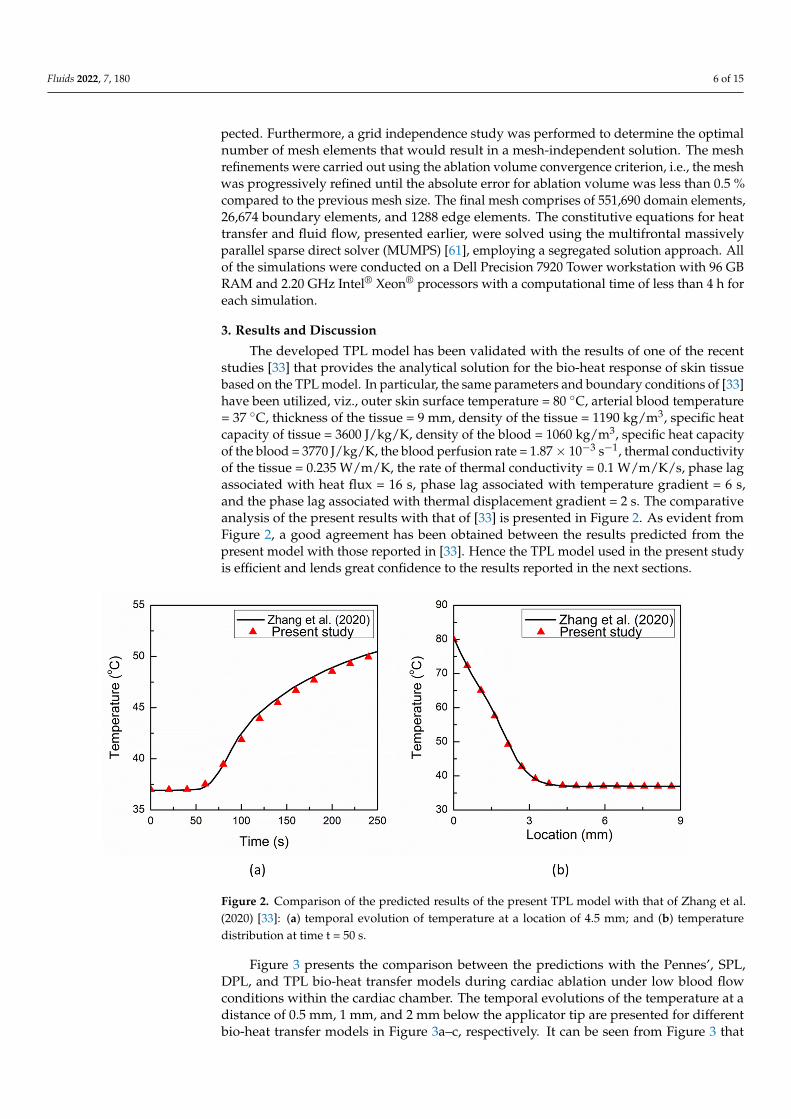
The developed TPL model has been validated with the results of one of the recentstudies [33] that provides the analytical solution for the bio-heat response of skin tissuebased on the TPL model. In particular, the same parameters and boundary conditions of [33]have been utilized, viz., outer skin surface temperature = 80 C, arterial blood temperature= 37 C, thickness of the tissue = 9 mm, density of the tissue = 1190 kg/m3, specific heatcapacity of tissue = 3600 J/kg/K, density of the blood = 1060 kg/m3, specific heat capacityof the blood = 3770 J/kg/K, the blood perfusion rate = 1.87× 10⁻³ s−1, thermal conductivityof the tissue = 0.235 W/m/K, the rate of thermal conductivity = 0.1 W/m/K/s, phase lagassociated with heat flux = 16 s, phase lag associated with temperature gradient = 6 s,and the phase lag associated with thermal displacement gradient = 2 s. The comparativeanalysis of the present results with that of [33] is presented in Figure 2. As evident fromFigure 2, a good agreement has been obtained between the results predicted from thepresent model with those reported in [33]. Hence the TPL model used in the present studyis efficient and lends great confidence to the results reported in the next sections.
Fluids 2022, 7, x FOR PEER REVIEW 7 of 16
Figure 2. Comparison of the predicted results of the present TPL model with that of Zhang et al. (2020) [33]: (a) temporal evolution of temperature at a location of 4.5 mm; and (b) temperature dis-tribution at time t = 50 s.
Figure 3 presents the comparison between the predictions with the Pennes’, SPL, DPL, and TPL bio-heat transfer models during cardiac ablation under low blood flow con-ditions within the cardiac chamber. The temporal evolutions of the temperature at a dis-tance of 0.5 mm, 1 mm, and 2 mm below the applicator tip are presented for different bio-heat transfer models in Figure 3a–c, respectively. It can be seen from Figure 3 that for all locations, the thermal propagation speed is fastest in the Pennes’ model, which is based on the Fourier law of heat conduction that presumes an infinitely fast propagation of ther-mal signals within the medium. Furthermore, the thermal propagation speed is lowest in the SPL model, owing to the delayed response between the heat flux and temperature gradient that leads to the propagation of thermal disturbance at a finite speed. The thermal propagation speed in the DPL and TPL models lies between those of the Pennes’ and SPL, with the TPL model thermal response being lower than that of DPL. It is noteworthy to mention that the TPL model exhibits both the diffusion and wave characteristics of heat propagation, similar to the DPL model. Furthermore, as evident from Figure 3, the tem-perature prediction with the SPL model is always on the higher side for all three points. The deviations in the temperature prediction between the Pennes’ and TPL models are significantly higher for the first 30 s or so and eventually diminish with the passage of time.
Figure 2. Comparison of the predicted results of the present TPL model with that of Zhang et al.(2020) [33]: (a) temporal evolution of temperature at a location of 4.5 mm; and (b) temperaturedistribution at time t = 50 s.
Figure 3 presents the comparison between the predictions with the Pennes’, SPL,DPL, and TPL bio-heat transfer models during cardiac ablation under low blood flowconditions within the cardiac chamber. The temporal evolutions of the temperature at adistance of 0.5 mm, 1 mm, and 2 mm below the applicator tip are presented for differentbio-heat transfer models in Figure 3a–c, respectively. It can be seen from Figure 3 that

Fluids 2022, 7, 180 7 of 15
for all locations, the thermal propagation speed is fastest in the Pennes’ model, which isbased on the Fourier law of heat conduction that presumes an infinitely fast propagation ofthermal signals within the medium. Furthermore, the thermal propagation speed is lowestin the SPL model, owing to the delayed response between the heat flux and temperaturegradient that leads to the propagation of thermal disturbance at a finite speed. The thermalpropagation speed in the DPL and TPL models lies between those of the Pennes’ andSPL, with the TPL model thermal response being lower than that of DPL. It is noteworthyto mention that the TPL model exhibits both the diffusion and wave characteristics ofheat propagation, similar to the DPL model. Furthermore, as evident from Figure 3, thetemperature prediction with the SPL model is always on the higher side for all three points.The deviations in the temperature prediction between the Pennes’ and TPL models aresignificantly higher for the first 30 s or so and eventually diminish with the passage of time.
Fluids 2022, 7, x FOR PEER REVIEW 8 of 16
Figure 3. Temporal evolution of temperature predicted with different bio-heat transfer models at a location of: (a) 0.5 mm, (b) 1 mm, and (c) 2 mm below the tip of the applicator.
Figures 4a,b present the temperature distribution predicted with different bio-heat transfer models along the line below the tip of the applicator at 30 s and 60 s, respectively. The distance of 0 mm reflects the tip of the applicator that is maintained at the temperature of 95 °C. As evident from Figure 4a, among all the bio-heat transfer models, the tempera-ture predicted by the SPL model is on the slightly higher side until it is close to 1.5 mm. After this location, the Pennes’ model predicts a higher temperature compared to the other three models’ predictions. This can be attributed to the fact that the location where the Pennes’ model temperature prediction becomes higher than that of the SPL model shows the position where the thermal wave arrives in the SPL model. So, before this position, more heat was concentrated and confined due to the finite thermal propagation speed in the SPL model as compared to the infinite thermal propagation speed in the Pennes’ bio-heat transfer model, which leads to more thermal energy transfer to the unaffected zone away from the applicator. These findings are consistent with those recently reported in [33]. Furthermore, the deviations between the temperature predictions of different bio-heat transfer models are more pronounced at 30 s and eventually diminish with the pas-sage of treatment time of cardiac ablation, as can be seen from Figure 4a,b.
Figure 3. Temporal evolution of temperature predicted with different bio-heat transfer models at alocation of: (a) 0.5 mm, (b) 1 mm, and (c) 2 mm below the tip of the applicator.
Figure 4a,b present the temperature distribution predicted with different bio-heattransfer models along the line below the tip of the applicator at 30 s and 60 s, respectively.The distance of 0 mm reflects the tip of the applicator that is maintained at the temperatureof 95 C. As evident from Figure 4a, among all the bio-heat transfer models, the temperaturepredicted by the SPL model is on the slightly higher side until it is close to 1.5 mm. Afterthis location, the Pennes’ model predicts a higher temperature compared to the otherthree models’ predictions. This can be attributed to the fact that the location where thePennes’ model temperature prediction becomes higher than that of the SPL model showsthe position where the thermal wave arrives in the SPL model. So, before this position,

Fluids 2022, 7, 180 8 of 15
more heat was concentrated and confined due to the finite thermal propagation speedin the SPL model as compared to the infinite thermal propagation speed in the Pennes’bio-heat transfer model, which leads to more thermal energy transfer to the unaffected zoneaway from the applicator. These findings are consistent with those recently reported in [33].Furthermore, the deviations between the temperature predictions of different bio-heattransfer models are more pronounced at 30 s and eventually diminish with the passage oftreatment time of cardiac ablation, as can be seen from Figure 4a,b.
Fluids 2022, 7, x FOR PEER REVIEW 9 of 16
Figure 4. Temperature distribution predicted with different bio-heat transfer models along the line below the tip of the applicator at: (a) 30 s, and (b) 60 s.
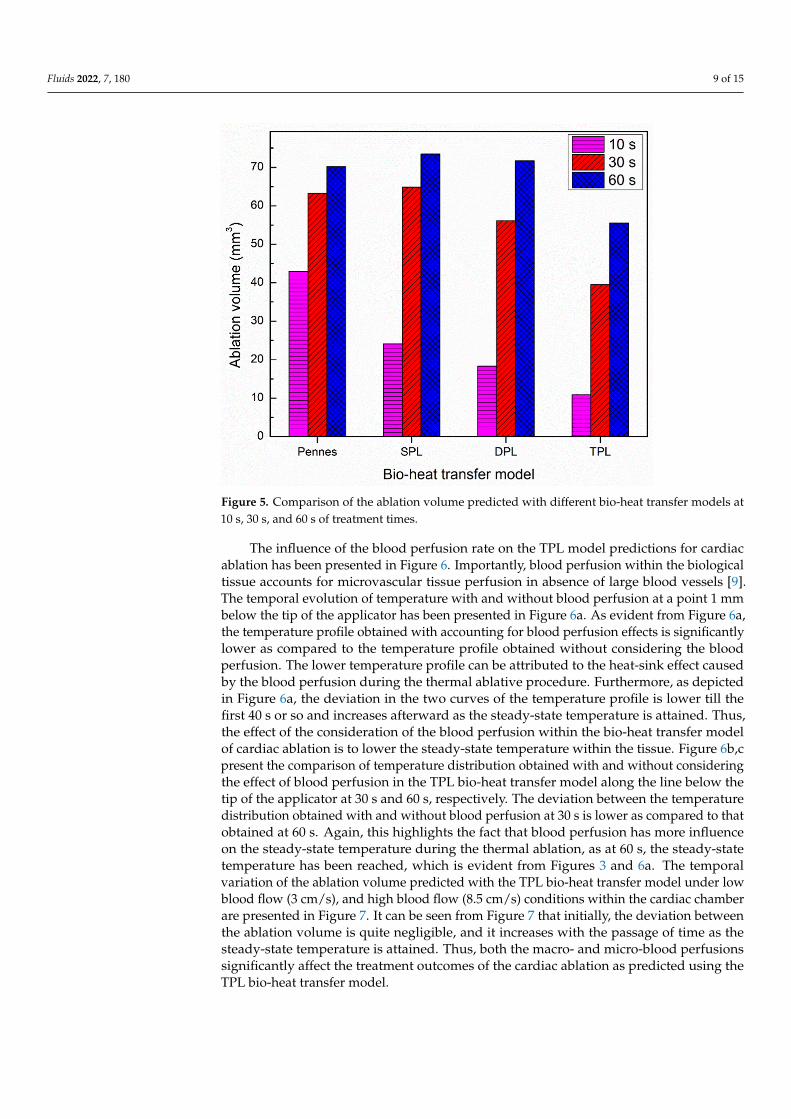
Figure 5 presents the comparison of predicted ablation volume with different bio-heat transfer models after 10 s, 30 s, and 60 s of the cardiac ablative procedure. As depicted in Figure 5, there prevail significant deviations in the ablation volume predicted by Pennes’, SPL, DPL, and TPL bio-heat transfer models post 10 s of cardiac ablation. In par-ticular, the ablation volumes predicted by SPL, DPL, and TPL models are 44%, 57%, and 75%, respectively, lesser as compared to the Pennes’ model predictions. This deviation decreases with an increase in the treatment time of cardiac ablation. For instance, at the end of 30 s and 60 s ablations, the differences between Pennes’ and TPL model predictions are 37% and 21%, respectively. Similarly, at the end of 30 s and 60 s ablation, the differ-ences between Pennes’ and DPL model predictions are 11% and 2%, respectively. Thus, the importance of considering the non-Fourier heat transfer phenomena in the computa-tional models of thermal ablations becomes quite essential in therapies for which treat-ment time ≤ 60 s. It is noteworthy to mention that the treatment time for cardiac ablation varies between 30–60 s, so it becomes extremely important to consider the various lags introduced due to the non-Fourier phenomena in the bio-heat transfer models to obtain accurate predictions. Similarly, for the thermal ablative procedures that utilize pulsed la-ser ablation (On–Off cycles), the non-Fourier phenomena will play a more pronounced role in the accurate treatment outcome predictions from computational studies.
Figure 4. Temperature distribution predicted with different bio-heat transfer models along the linebelow the tip of the applicator at: (a) 30 s, and (b) 60 s.
Figure 5 presents the comparison of predicted ablation volume with different bio-heattransfer models after 10 s, 30 s, and 60 s of the cardiac ablative procedure. As depicted inFigure 5, there prevail significant deviations in the ablation volume predicted by Pennes’,SPL, DPL, and TPL bio-heat transfer models post 10 s of cardiac ablation. In particular,the ablation volumes predicted by SPL, DPL, and TPL models are 44%, 57%, and 75%,respectively, lesser as compared to the Pennes’ model predictions. This deviation decreaseswith an increase in the treatment time of cardiac ablation. For instance, at the end of 30 sand 60 s ablations, the differences between Pennes’ and TPL model predictions are 37% and21%, respectively. Similarly, at the end of 30 s and 60 s ablation, the differences betweenPennes’ and DPL model predictions are 11% and 2%, respectively. Thus, the importanceof considering the non-Fourier heat transfer phenomena in the computational models ofthermal ablations becomes quite essential in therapies for which treatment time ≤60 s.It is noteworthy to mention that the treatment time for cardiac ablation varies between30–60 s, so it becomes extremely important to consider the various lags introduced due tothe non-Fourier phenomena in the bio-heat transfer models to obtain accurate predictions.Similarly, for the thermal ablative procedures that utilize pulsed laser ablation (On–Offcycles), the non-Fourier phenomena will play a more pronounced role in the accuratetreatment outcome predictions from computational studies.
Fluids 2022, 7, 180 9 of 15Fluids 2022, 7, x FOR PEER REVIEW 10 of 16
Figure 5. Comparison of the ablation volume predicted with different bio-heat transfer models at 10 s, 30 s, and 60 s of treatment times.
The influence of the blood perfusion rate on the TPL model predictions for cardiac ablation has been presented in Figure 6. Importantly, blood perfusion within the biologi-cal tissue accounts for microvascular tissue perfusion in absence of large blood vessels [9]. The temporal evolution of temperature with and without blood perfusion at a point 1 mm below the tip of the applicator has been presented in Figure 6a. As evident from Figure 6a, the temperature profile obtained with accounting for blood perfusion effects is signif-icantly lower as compared to the temperature profile obtained without considering the blood perfusion. The lower temperature profile can be attributed to the heat-sink effect caused by the blood perfusion during the thermal ablative procedure. Furthermore, as depicted in Figure 6a, the deviation in the two curves of the temperature profile is lower till the first 40 s or so and increases afterward as the steady-state temperature is attained. Thus, the effect of the consideration of the blood perfusion within the bio-heat transfer model of cardiac ablation is to lower the steady-state temperature within the tissue. Figure 6b,c present the comparison of temperature distribution obtained with and without con-sidering the effect of blood perfusion in the TPL bio-heat transfer model along the line below the tip of the applicator at 30 s and 60 s, respectively. The deviation between the temperature distribution obtained with and without blood perfusion at 30 s is lower as compared to that obtained at 60 s. Again, this highlights the fact that blood perfusion has more influence on the steady-state temperature during the thermal ablation, as at 60 s, the steady-state temperature has been reached, which is evident from Figures 3 and 6a. The temporal variation of the ablation volume predicted with the TPL bio-heat transfer model under low blood flow (3 cm/s), and high blood flow (8.5 cm/s) conditions within the car-diac chamber are presented in Figure 7. It can be seen from Figure 7 that initially, the deviation between the ablation volume is quite negligible, and it increases with the pas-sage of time as the steady-state temperature is attained. Thus, both the macro- and micro-blood perfusions significantly affect the treatment outcomes of the cardiac ablation as pre-dicted using the TPL bio-heat transfer model.
Figure 5. Comparison of the ablation volume predicted with different bio-heat transfer models at10 s, 30 s, and 60 s of treatment times.
The influence of the blood perfusion rate on the TPL model predictions for cardiacablation has been presented in Figure 6. Importantly, blood perfusion within the biologicaltissue accounts for microvascular tissue perfusion in absence of large blood vessels [9].The temporal evolution of temperature with and without blood perfusion at a point 1 mmbelow the tip of the applicator has been presented in Figure 6a. As evident from Figure 6a,the temperature profile obtained with accounting for blood perfusion effects is significantlylower as compared to the temperature profile obtained without considering the bloodperfusion. The lower temperature profile can be attributed to the heat-sink effect causedby the blood perfusion during the thermal ablative procedure. Furthermore, as depictedin Figure 6a, the deviation in the two curves of the temperature profile is lower till thefirst 40 s or so and increases afterward as the steady-state temperature is attained. Thus,the effect of the consideration of the blood perfusion within the bio-heat transfer modelof cardiac ablation is to lower the steady-state temperature within the tissue. Figure 6b,cpresent the comparison of temperature distribution obtained with and without consideringthe effect of blood perfusion in the TPL bio-heat transfer model along the line below thetip of the applicator at 30 s and 60 s, respectively. The deviation between the temperaturedistribution obtained with and without blood perfusion at 30 s is lower as compared to thatobtained at 60 s. Again, this highlights the fact that blood perfusion has more influenceon the steady-state temperature during the thermal ablation, as at 60 s, the steady-statetemperature has been reached, which is evident from Figures 3 and 6a. The temporalvariation of the ablation volume predicted with the TPL bio-heat transfer model under lowblood flow (3 cm/s), and high blood flow (8.5 cm/s) conditions within the cardiac chamberare presented in Figure 7. It can be seen from Figure 7 that initially, the deviation betweenthe ablation volume is quite negligible, and it increases with the passage of time as thesteady-state temperature is attained. Thus, both the macro- and micro-blood perfusionssignificantly affect the treatment outcomes of the cardiac ablation as predicted using theTPL bio-heat transfer model.

Fluids 2022, 7, 180 10 of 15Fluids 2022, 7, x FOR PEER REVIEW 11 of 16
Figure 6. (a) Temporal evolution of temperature predicted with and without considering the blood perfusion effects at a location of 1 mm below the applicator’s tip. Temperature distribution pre-dicted with and without considering the blood perfusion effects along the line below the tip of the applicator at: (b) 30 s and (c) 60 s.
Figure 7. Temporal variation of ablation volume attained within the myocardium tissue with low and high blood flow conditions within the cardiac chamber.
Figure 6. (a) Temporal evolution of temperature predicted with and without considering the bloodperfusion effects at a location of 1 mm below the applicator’s tip. Temperature distribution predictedwith and without considering the blood perfusion effects along the line below the tip of the applicatorat: (b) 30 s and (c) 60 s.
Fluids 2022, 7, x FOR PEER REVIEW 11 of 16
Figure 6. (a) Temporal evolution of temperature predicted with and without considering the blood perfusion effects at a location of 1 mm below the applicator’s tip. Temperature distribution pre-dicted with and without considering the blood perfusion effects along the line below the tip of the applicator at: (b) 30 s and (c) 60 s.
Figure 7. Temporal variation of ablation volume attained within the myocardium tissue with low and high blood flow conditions within the cardiac chamber. Figure 7. Temporal variation of ablation volume attained within the myocardium tissue with lowand high blood flow conditions within the cardiac chamber.

Fluids 2022, 7, 180 11 of 15
The result of parametric studies of the influence of single-phase-lag (τq), dual-phase-lag (τt), and three-phase-lag (τv) on the thermal behavior obtained with the TPL model ispresented in Figures 8 and 9. The effect of τq on temperature response at a point 1 mmbelow the tip of the applicator is presented in Figure 8a. As evident from this figure, thehigher the value of τq, the higher would be the lagging characteristic of thermal behaviorthat would lead to a steeper rise in temperature. Thus, the heat propagation within thetissue decreases with an increase in the value of τq.
Fluids 2022, 7, x FOR PEER REVIEW 12 of 16
The result of parametric studies of the influence of single-phase-lag (τq), dual-phase-lag (τt), and three-phase-lag (τv) on the thermal behavior obtained with the TPL model is presented in Figures 8 and 9. The effect of τq on temperature response at a point 1 mm below the tip of the applicator is presented in Figure 8a. As evident from this figure, the higher the value of τq, the higher would be the lagging characteristic of thermal behavior that would lead to a steeper rise in temperature. Thus, the heat propagation within the tissue decreases with an increase in the value of τq.
Figure 8. Effect of magnitude of (a) τq, (b) τt, and (c) τv on the time-history of temperature at a loca-tion of 1 mm below the tip of the applicator.
The effect of τt on the temperature response at a point 1 mm below the tip of the applicator is presented in Figure 8b. As evident from Figure 8b, the influence of variation in τt is smaller on the thermal propagation and lag characteristics as compared to τq. Fig-ure 8c presents the influence of variation in the thermal displacement gradient τv on the temperature response at a point 1 mm below the tip of the applicator. As evident from Figure 8c, the increase in the value of τv results in a decrease in the predicted temperature during cardiac ablation. The effect of the influence of variation in τq, τt, and τv on the abla-tion volumes predicted after 10 s, 30 s, and 60 s of cardiac ablation are presented in Figure 9. As evident from this figure, the maximum variation in the ablation volume for different values of lags occurs at 10 s and then decreases with the increase in treatment time.
Figure 8. Effect of magnitude of (a) τq, (b) τt, and (c) τv on the time-history of temperature at alocation of 1 mm below the tip of the applicator.
The effect of τt on the temperature response at a point 1 mm below the tip of theapplicator is presented in Figure 8b. As evident from Figure 8b, the influence of variationin τt is smaller on the thermal propagation and lag characteristics as compared to τq.Figure 8c presents the influence of variation in the thermal displacement gradient τv onthe temperature response at a point 1 mm below the tip of the applicator. As evident fromFigure 8c, the increase in the value of τv results in a decrease in the predicted temperatureduring cardiac ablation. The effect of the influence of variation in τq, τt, and τv on theablation volumes predicted after 10 s, 30 s, and 60 s of cardiac ablation are presented inFigure 9. As evident from this figure, the maximum variation in the ablation volume fordifferent values of lags occurs at 10 s and then decreases with the increase in treatment time.

Fluids 2022, 7, 180 12 of 15Fluids 2022, 7, x FOR PEER REVIEW 13 of 16
Figure 9. Comparison of the ablation volume attained after 10 s, 30 s, and 60 s of cardiac ablation for different values of (a) τq, (b) τt and (c) τv.
The limitations of this numerical study are mainly related to the considerations of unidirectional and constant blood flow, which is highly complex and variable in the actual patient scenarios. Moreover, the flow rate and flow direction of blood in the cardiac cham-ber are highly dependent on the cardiac cycle. Further, we have considered the homoge-neous and isotropic properties of cardiac tissue with a sharp insertion of the applicator without considering any mechanical deformation. In addition, the material properties of the cardiac tissue are considered to be constant, and in actuality, they vary with tempera-ture. Albeit, this has been done purposely to quantify the variations only induced due to the phase lags and to suppress the variations induced due to other properties. Another limitation is associated with the validation of the numerical model with the results re-ported in the previous numerical study due to the lack of experimental in vivo data/find-ings available in the literature. Future studies are required to address these limitations to provide further improve the predicted temperature distribution and ablation volume dur-ing cardiac ablation. The extension of these models in terms of multiscale coupling at the tissue-cellular scale can be found in [62–65]. Despite these limitations, we were able to highlight the importance of considering the phase lags in the computational modeling of cardiac ablation for predicting accurate treatment outcomes.
Figure 9. Comparison of the ablation volume attained after 10 s, 30 s, and 60 s of cardiac ablation fordifferent values of (a) τq, (b) τt and (c) τv.
The limitations of this numerical study are mainly related to the considerations ofunidirectional and constant blood flow, which is highly complex and variable in the actualpatient scenarios. Moreover, the flow rate and flow direction of blood in the cardiacchamber are highly dependent on the cardiac cycle. Further, we have considered thehomogeneous and isotropic properties of cardiac tissue with a sharp insertion of theapplicator without considering any mechanical deformation. In addition, the materialproperties of the cardiac tissue are considered to be constant, and in actuality, they vary withtemperature. Albeit, this has been done purposely to quantify the variations only induceddue to the phase lags and to suppress the variations induced due to other properties.Another limitation is associated with the validation of the numerical model with theresults reported in the previous numerical study due to the lack of experimental in vivodata/findings available in the literature. Future studies are required to address theselimitations to provide further improve the predicted temperature distribution and ablationvolume during cardiac ablation. The extension of these models in terms of multiscalecoupling at the tissue-cellular scale can be found in [62–65]. Despite these limitations, wewere able to highlight the importance of considering the phase lags in the computationalmodeling of cardiac ablation for predicting accurate treatment outcomes.

Fluids 2022, 7, 180 13 of 15
4. Conclusions
In the present study, we have reported a three-dimensional TPL non-Fourier bio-heattransfer model for cardiac ablation, considering the phase lags of heat flux, temperature gra-dient, and thermal displacement gradient. The model has also accounted for fluid-structureinteractions. A comparative analysis has been conducted to highlight the deviations be-tween the temperature distribution and ablation volume obtained with Pennes’, SPL, DPL,and TPL bio-heat transfer models. Our findings suggest that there are significant prevailingvariations in the predicted temperature distribution and ablation volumes among differentbio-heat transfer models during cardiac ablation. These variations are very pronounced upto the first 30 s or so and decrease thereof, justifying the need for the consideration of thesephase lags in the bio-heat transfer models for predicting more realistic estimates of ablationvolume and temperature distribution, thus minimizing the deviations between the experi-mentally obtained and numerically predicted results. Importantly, these considerationswould play a more pronounced role in thermal ablative modalities where the treatmenttime is 60 s or less (as in the case of cardiac ablation) or thermal ablative procedures thatutilize pulsed laser ablation (On–Off cycles). Furthermore, parametric studies have alsobeen conducted to quantify the effect of variations in the magnitude of different phaselags, blood perfusion rate, and blood flow on the treatment outcomes of cardiac ablation aspredicted by the TPL bio-heat transfer model.
Author Contributions: S.S.: conceptualization, methodology, simulations, formal analysis, investiga-tion, data curation, writing—original draft preparation, and writing—review and editing. P.S. andR.M. contributed to the conceptualization of the research idea, supervision of the study, and reviewand editing of the final manuscript. All authors have read and agreed to the published version of themanuscript.
Funding: This research was funded by the Natural Sciences and Engineering Research Council(NSERC) of Canada and Canada Research Chairs (CRC) Program.
Institutional Review Board Statement: Not applicable.
Informed Consent Statement: Not applicable.
Data Availability Statement: All data generated or analyzed during this study are included inthis article.
Acknowledgments: RM is also acknowledging support of the BERC 2018-2021 program and SpanishMinistry of Science, Innovation and Universities through the Agencia Estatal de Investigacion (AEI)BCAM Severo Ochoa excellence accreditation SEV-2017-0718 and the Basque Government fund AI inBCAM EXP. 2019/00432.
Conflicts of Interest: The authors declare no conflict of interest.
References1. Almekkawy, M.; Chen, J.; Ellis, M.D.; Haemmerich, D.; Holmes, D.R.; Linte, C.A.; Panescu, D.; Pearce, J.; Prakash, P.; Zderic, V.
Therapeutic systems and technologies: State-of-the-art applications, opportunities, and challenges. IEEE Rev. Biomed. Eng. 2019,13, 325–339. [CrossRef]
2. Chu, K.F.; Dupuy, D.E. Thermal ablation of tumours: Biological mechanisms and advances in therapy. Nat. Rev. Cancer 2014, 14,199–208. [CrossRef]
3. Kok, H.P.; Cressman, E.N.; Ceelen, W.; Brace, C.L.; Ivkov, R.; Grüll, H.; Ter Haar, G.; Wust, P.; Crezee, J. Heating technology formalignant tumors: A review. Int. J. Hyperth. 2020, 37, 711–741. [CrossRef]
4. Huang, S.K.S.; Miller, J.M. Catheter Ablation of Cardiac Arrhythmias; Elsevier: Philadelphia, PA, USA, 2020.5. Prakash, P.; Srimathveeravalli, G. Principles and Technologies for Electromagnetic Energy Based Therapies; Academic Press: Cambridge,
MA, USA, 2021.6. Haemmerich, D.; Laeseke, P. Thermal tumour ablation: Devices, clinical applications and future directions. Int. J. Hyperth. 2005,
21, 755–760. [CrossRef]7. Andreozzi, A.; Brunese, L.; Iasiello, M.; Tucci, C.; Vanoli, G.P. Modeling heat transfer in tumors: A review of thermal therapies.
Ann. Biomed. Eng. 2019, 47, 676–693. [CrossRef]8. Bianchi, L.; Cavarzan, F.; Ciampitti, L.; Cremonesi, M.; Grilli, F.; Saccomandi, P. Thermophysical and mechanical properties of
biological tissues as a function of temperature: A systematic literature review. Int. J. Hyperth. 2022, 39, 297–340. [CrossRef]

Fluids 2022, 7, 180 14 of 15
9. Singh, S.; Melnik, R. Thermal ablation of biological tissues in disease treatment: A review of computational models and futuredirections. Electromagn. Biol. Med. 2020, 39, 49–88. [CrossRef]
10. González-Suárez, A.; Pérez, J.J.; Irastorza, R.M.; D’Avila, A.; Berjano, E. Computer modeling of radiofrequency cardiac ablation:30 years of bioengineering research. Comput. Methods Programs Biomed. 2021, 214, 106546. [CrossRef]
11. Mohammadi, A.; Bianchi, L.; Korganbayev, S.; De Landro, M.; Saccomandi, P. Thermomechanical Modeling of Laser AblationTherapy of Tumors: Sensitivity Analysis and Optimization of Influential Variables. IEEE Trans. Biomed. Eng. 2021, 69, 302–313.[CrossRef]
12. Pennes, H.H. Analysis of tissue and arterial blood temperatures in the resting human forearm. J. Appl. Physiol. 1948, 1, 93–122.[CrossRef]
13. Maillet, D. A review of the models using the Cattaneo and Vernotte hyperbolic heat equation and their experimental validation.Int. J. Therm. Sci. 2019, 139, 424–432. [CrossRef]
14. Mitra, K.; Kumar, S.; Vedevarz, A.; Moallemi, M. Experimental evidence of hyperbolic heat conduction in processed meat. J. HeatTransf. 1995, 117, 568–573. [CrossRef]
15. Cattaneo, C. A form of heat-conduction equations which eliminates the paradox of instantaneous propagation. Comptes Rendus1958, 247, 431.
16. Vernotte, P. Les paradoxes de la theorie continue de l’equation de la chaleur. Comptes Rendus 1958, 246, 3154–3155.17. Tzou, D.Y. The generalized lagging response in small-scale and high-rate heating. Int. J. Heat Mass Transf. 1995, 38, 3231–3240.
[CrossRef]18. Singh, S.; Melnik, R. Coupled thermo-electro-mechanical models for thermal ablation of biological tissues and heat relaxation
time effects. Phys. Med. Biol. 2019, 64, 245008. [CrossRef]19. Singh, S.; Melnik, R. Fluid–structure interaction and non-fourier effects in coupled electro-thermo-mechanical models for cardiac
ablation. Fluids 2021, 6, 294. [CrossRef]20. Singh, S.; Repaka, R. Thermal characterization using fourier and non-fourier conduction during radiofrequency ablation of breast
tumor. Multiph. Sci. Technol. 2018, 30, 207–219. [CrossRef]21. Youssef, H.M.; Alghamdi, N.A. The exact analytical solution of the dual-phase-lag two-temperature bioheat transfer of a skin
tissue subjected to constant heat flux. Sci. Rep. 2020, 10, 15946. [CrossRef]22. Askarizadeh, H.; Ahmadikia, H. Analytical analysis of the dual-phase-lag model of bioheat transfer equation during transient
heating of skin tissue. Heat Mass Transf. 2014, 50, 1673–1684. [CrossRef]23. Askarizadeh, H.; Ahmadikia, H. Analytical study on the transient heating of a two-dimensional skin tissue using parabolic and
hyperbolic bioheat transfer equations. Appl. Math. Model. 2015, 39, 3704–3720. [CrossRef]24. Kabiri, A.; Talaee, M.R. Theoretical investigation of thermal wave model of microwave ablation applied in prostate Cancer
therapy. Heat Mass Transf. 2019, 55, 2199–2208. [CrossRef]25. Kumar, D.; Singh, S.; Rai, K. Analysis of classical Fourier, SPL and DPL heat transfer model in biological tissues in presence of
metabolic and external heat source. Heat Mass Transf. 2016, 52, 1089–1107. [CrossRef]26. Li, X.; Li, Y.; Luo, P.; Tian, X. Relationship between the nonlocal effect and lagging behavior in bioheat transfer. J. Heat Transf.
2021, 143, 051201. [CrossRef]27. Sahoo, N.; Ghosh, S.; Narasimhan, A.; Das, S.K. Investigation of non-Fourier effects in bio-tissues during laser assisted photother-
mal therapy. Int. J. Therm. Sci. 2014, 76, 208–220. [CrossRef]28. Shih, T.-C.; Horng, T.-L.; Huang, H.-W.; Ju, K.-C.; Huang, T.-C.; Chen, P.-Y.; Ho, Y.-J.; Lin, W.-L. Numerical analysis of coupled
effects of pulsatile blood flow and thermal relaxation time during thermal therapy. Int. J. Heat Mass Transf. 2012, 55, 3763–3773.[CrossRef]
29. Zhang, Y. Generalized dual-phase lag bioheat equations based on nonequilibrium heat transfer in living biological tissues. Int. J.Heat Mass Transf. 2009, 52, 4829–4834. [CrossRef]
30. Choudhuri, S.R. On a thermoelastic three-phase-lag model. J. Therm. Stresses 2007, 30, 231–238. [CrossRef]31. Green, A.; Naghdi, P. On undamped heat waves in an elastic solid. J. Therm. Stresses 1992, 15, 253–264. [CrossRef]32. Green, A.; Naghdi, P. Thermoelasticity without energy dissipation. J. Elast. 1993, 31, 189–208. [CrossRef]33. Zhang, Q.; Sun, Y.; Yang, J. Bio-heat response of skin tissue based on three-phase-lag model. Sci. Rep. 2020, 10, 16421. [CrossRef]
[PubMed]34. Hobiny, A.; Alzahrani, F.; Abbas, I. Analytical estimation of temperature in living tissues using the TPL bioheat model with
experimental verification. Mathematics 2020, 8, 1188. [CrossRef]35. Kumar, D.; Rai, K. Three-phase-lag bioheat transfer model and its validation with experimental data. Mech. Based Des. Struct.
Mach. 2020, 1–15. [CrossRef]36. Verma, R.; Kumar, S. Computational Study on Skin Tissue Freezing Using Three-Phase Lag Bioheat Model. J. Heat Transf. 2021,
143, 111201. [CrossRef]37. Irastorza, R.M.; Gonzalez-Suarez, A.; Pérez, J.J.; Berjano, E. Differences in applied electrical power between full thorax models
and limited-domain models for RF cardiac ablation. Int. J. Hyperth. 2020, 37, 677–687. [CrossRef] [PubMed]38. Quintanilla, R.; Racke, R. A note on stability in three-phase-lag heat conduction. Int. J. Heat Mass Transf. 2008, 51, 24–29. [CrossRef]39. Korganbayev, S.; Orrico, A.; Bianchi, L.; Paloschi, D.; Wolf, A.; Dostovalov, A.; Saccomandi, P. PID controlling approach based on
FBG array measurements for laser ablation of pancreatic tissues. IEEE Trans. Instrum. Meas. 2021, 70, 1–9. [CrossRef]

Fluids 2022, 7, 180 15 of 15
40. Singh, S.; Melnik, R. Domain heterogeneity in radiofrequency therapies for pain relief: A computational study with coupledmodels. Bioengineering 2020, 7, 35. [CrossRef]
41. Singh, S.; Repaka, R. Temperature-controlled radiofrequency ablation of different tissues using two-compartment models. Int. J.Hyperth. 2017, 33, 122–134. [CrossRef]
42. Singh, S.; Repaka, R. Numerical study to establish relationship between coagulation volume and target tip temperature duringtemperature-controlled radiofrequency ablation. Electromagn. Biol. Med. 2018, 37, 13–22. [CrossRef]
43. González-Suárez, A.; Pérez, J.J.; Berjano, E. Should fluid dynamics be included in computer models of RF cardiac ablation byirrigated-tip electrodes? Biomed. Eng. Online 2018, 17, 1–14. [CrossRef] [PubMed]
44. González-Suárez, A.; Berjano, E. Comparative analysis of different methods of modeling the thermal effect of circulating bloodflow during RF cardiac ablation. IEEE Trans. Biomed. Eng. 2015, 63, 250–259. [CrossRef] [PubMed]
45. González-Suárez, A.; Berjano, E.; Guerra, J.M.; Gerardo-Giorda, L. Computational modeling of open-irrigated electrodes forradiofrequency cardiac ablation including blood motion-saline flow interaction. PLoS ONE 2016, 11, e0150356. [CrossRef][PubMed]
46. Johnston, B.M.; Johnston, P.R.; Corney, S.; Kilpatrick, D. Non-Newtonian blood flow in human right coronary arteries: Steadystate simulations. J. Biomech. 2004, 37, 709–720. [CrossRef] [PubMed]
47. Rossmann, C.; Motamarry, A.; Panescu, D.; Haemmerich, D. Computer simulations of an irrigated radiofrequency cardiacablation catheter and experimental validation by infrared imaging. Int. J. Hyperth. 2021, 38, 1149–1163. [CrossRef] [PubMed]
48. Formaggia, L.; Quarteroni, A.; Veneziani, A. Cardiovascular Mathematics: Modeling and Simulation of the Circulatory System; SpringerScience & Business Media: Berlin, Germany, 2010; Volume 1.
49. Quarteroni, A.; Manzoni, A.; Vergara, C. Mathematical Modelling of the Human Cardiovascular System: Data, Numerical Approximation,Clinical Applications; Cambridge University Press: Cambridge, UK, 2019; Volume 33.
50. Quarteroni, A.; Veneziani, A.; Vergara, C. Geometric multiscale modeling of the cardiovascular system, between theory andpractice. Comput. Methods Appl. Mech. Eng. 2016, 302, 193–252. [CrossRef]
51. Hessenthaler, A.; Falgout, R.D.; Schroder, J.B.; de Vecchi, A.; Nordsletten, D.; Röhrle, O. Time-periodic steady-state solution offluid-structure interaction and cardiac flow problems through multigrid-reduction-in-time. Comput. Methods Appl. Mech. Eng.2022, 389, 114368. [CrossRef]
52. Kadem, M.; Garber, L.; Abdelkhalek, M.; Al-Khazraji, B.K.; Keshavarz-Motamed, Z. Hemodynamic modeling, medical imaging,and machine learning and their applications to cardiovascular interventions. IEEE Rev. Biomed. Eng. 2022. [CrossRef]
53. Le, T.B.; Usta, M.; Aidun, C.; Yoganathan, A.; Sotiropoulos, F. Computational Methods for Fluid-Structure Interaction Simulationof Heart Valves in Patient-Specific Left Heart Anatomies. Fluids 2022, 7, 94. [CrossRef]
54. Mittal, R.; Seo, J.H.; Vedula, V.; Choi, Y.J.; Liu, H.; Huang, H.H.; Jain, S.; Younes, L.; Abraham, T.; George, R.T. Computationalmodeling of cardiac hemodynamics: Current status and future outlook. J. Comput. Phys. 2016, 305, 1065–1082. [CrossRef]
55. Viola, F.; Spandan, V.; Meschini, V.; Romero, J.; Fatica, M.; de Tullio, M.D.; Verzicco, R. FSEI-GPU: GPU accelerated simulations ofthe fluid–structure–electrophysiology interaction in the left heart. Comput. Phys. Commun. 2022, 273, 108248. [CrossRef]
56. Parés, C.; Berjano, E.; González-Suárez, A. Effect of intracardiac blood flow pulsatility during radiofrequency cardiac ablation:Computer modeling study. Int. J. Hyperth. 2021, 38, 316–325. [CrossRef] [PubMed]
57. Pérez, J.J.; Nadal, E.; Berjano, E.; González-Suárez, A. Computer modeling of radiofrequency cardiac ablation including heartbeat-induced electrode displacement. Comput. Biol. Med. 2022, 144, 105346. [CrossRef] [PubMed]
58. Singh, S.; Melnik, R. Computational modeling of cardiac ablation incorporating electrothermomechanical interactions. J. Eng. Sci.Med. Diagn. Ther. 2020, 3, 041004. [CrossRef]
59. Pérez, J.J.; González-Suárez, A.; Berjano, E. Numerical analysis of thermal impact of intramyocardial capillary blood flow duringradiofrequency cardiac ablation. Int. J. Hyperth. 2018, 34, 243–249. [CrossRef]
60. COMSOL Multiphysics v. 6; COMSOL AB: Stockholm, Sweden, 2022.61. Amestoy, P.R.; Duff, I.S.; L’excellent, J.-Y. Multifrontal parallel distributed symmetric and unsymmetric solvers. Comput. Methods
Appl. Mech. Eng. 2000, 184, 501–520. [CrossRef]62. Singh, S.; Krishnaswamy, J.A.; Melnik, R. Biological cells and coupled electro-mechanical effects: The role of organelles,
microtubules, and nonlocal contributions. J. Mech. Behav. Biomed. Mater. 2020, 110, 103859. [CrossRef]63. Singh, S.; Melnik, R. Microtubule biomechanics and the effect of degradation of elastic moduli. In Proceedings of the 20th
International Conference on Computational Science, Lecture Notes in Computer Science, Amsterdam, The Netherlands, 3–5 June2020; Springer: Cham, Switzerland, 2020; Volume 12142. [CrossRef]
64. Singh, S.; Melnik, R. Coupled Electro-mechanical Behavior of Microtubules. In Proceedings of the 8th International Work-Conference on Bioinformatics and Biomedical Engineering, Lecture Notes in Computer Science, Granada, Spain, 6–8 May 2020;Springer: Cham, Switzerland, 2020; Volume 12108. [CrossRef]
65. Singh, S.; Melnik, R. Coupled thermo-electro-mechanical models of cardiac ablation at tissue-cellular scales and a role ofmicrotubules. In Proceedings of the 14th WCCM-ECCOMAS Congress 2020, Web, 11–15 January 2021; p. 400. [CrossRef]