Thompson, J.R., Wehmeyer, M.L., Hughes, C., Shogren, K.A., Palmer, S.B., & Seo, H. (2014). The...
27
SIS-C Preliminary Reliability and Validity 1 Running Head: SIS-C PRELIMINARY RELIABILITY AND VALIDITY The Supports Intensity Scale – Children’s Version: Preliminary Reliability and Validity James R. Thompson Illinois State University Michael L. Wehmeyer University of Kansas Carolyn Hughes Queens College, City University of New York Karrie A. Shogren, Susan B. Palmer, Hyojeong Seo University of Kansas Final Submitted Manuscript Version Thompson, J.R., Wehmeyer, M.L., hughes, C., Shogren, K.A., Palmer, S.B., & Seo, H. (in press). The Supports Intensity Scale-Children’s Version: Preliminary Reliability and Validity. Inclusion.
Transcript of Thompson, J.R., Wehmeyer, M.L., Hughes, C., Shogren, K.A., Palmer, S.B., & Seo, H. (2014). The...

SIS-C Preliminary Reliability and Validity 1
Running Head: SIS-C PRELIMINARY RELIABILITY AND VALIDITY
The Supports Intensity Scale – Children’s Version: Preliminary Reliability and Validity
James R. Thompson
Illinois State University
Michael L. Wehmeyer
University of Kansas
Carolyn Hughes
Queens College, City University of New York
Karrie A. Shogren, Susan B. Palmer, Hyojeong Seo
University of Kansas
Final Submitted Manuscript Version
Thompson, J.R., Wehmeyer, M.L., hughes, C., Shogren, K.A., Palmer, S.B., & Seo, H. (in
press). The Supports Intensity Scale-Children’s Version: Preliminary Reliability and Validity.
Inclusion.

SIS-C Preliminary Reliability and Validity 2
Abstract
This paper introduces the Supports Intensity Scale – Children’s Version (SIS-C) designed and
normed to be used with children across multiple contexts, including home, school, and
community life. Steps taken to develop the scale are described, and findings from data collected
on a field test version of the SIS-C are shared. Preliminary findings in regard to reliability and
validity suggest that the SIS-C has strong psychometric properties.

SIS-C Preliminary Reliability and Validity 3
The Supports Intensity Scale – Children’s Version: Preliminary Reliability and Validity
The measurement of support needs has received increased attention in the intellectual
disability field. The social-ecological model of disability adopted by the World Health
Organizations’ International Classification of Functioning, Disability, and Health (ICF; WHO,
2001) and the American Association on Intellectual and Developmental Disabilities’ (AAIDD)
Terminology and Classification committee (Luckasson et al., 1992; 2002; Schalock, 2010)
defines disability as a function of the fit between a person’s capacities and the demands of the
environment. Conceptualizing intellectual disability in this manner prompts a focus on the
supports needed to address discrepancies between an individual’s personal capacities and the
demands or requirements of different environments and contexts.
Supports are resources and strategies that enhance human functioning (Luckasson et al.,
2002). Although everyone uses supports, the types and intensity of supports needed by people
with intellectual disability are different from those needed by most people in terms of intensity,
duration, and type. Support needs is a psychological construct referring to the pattern and
intensity of support a person requires to participate in activities associated with typical human
functioning (Thompson et al., 2009). The support needs construct is based on the premise that
human functioning is influenced by the extent of congruence between individual capacity and the
environments in which that person is expected to function.
Recognizing the need for standardized, reliable, and valid measures of support needs, the
Supports Intensity Scale - Adult Version (SIS-A; Thompson et al., 2004) was developed to
measure supports needs of adults with intellectual disability ages 16 to 64. The reliability and
validity of the SIS-A (in the original English version as well as translated versions) have been
well established (see Buntinx, Van Unen, Speth, & Grooth, 2006; Morin & Cobigo, 2008;

SIS-C Preliminary Reliability and Validity 4
Thompson et al., 2004; Thompson, Tassé, & McLaughlin, 2008; Verdugo, Arias, Ibanez, &
Schalock, 2010). Within the U.S., it has been adopted on a widespread basis by state intellectual
disability / developmental disabilities systems in 23 U.S. states and Canadian provinces to more
equitably distribute resources, and to assist in the planning of individualized supports (AAIDD,
2014). The SIS-A has been shown to more reliably predict the need for extraordinary supports
than other instruments that were traditionally used for such purposes, and it therefore provides a
more equitable means to make resource allocation decisions (Wehmeyer, Chapman, Little,
Thompson, Schalock, & Tasse, 2009). In addition, provider organization planning teams use the
SIS to identify a Support Needs Profile to provide information about supports a person would
need to be successful in key life domains (see Bailey & Nixon this issue).
Supports needs, however, do not begin in adulthood. There is also a need for a
standardized, reliable, and valid tool to measure the intensity of supports needed by children with
intellectual and related developmental disabilities. Such a tool would be helpful to state disability
service systems to inform policy decisions such as resource allocation, well as school systems for
educational planning. For these reasons, the Supports Intensity Scale – Children’s Version (SIS-
C) was developed. In the following sections, we describe the SIS-C in greater detail, and present
preliminary findings on its reliability and validity from the sample generated to standardize the
scale.
Supports Intensity Scale – Children’s Version (SIS-C)
The SIS-A was used as a starting point in developing the SIS-C, although a systematic
process was followed so that the SIS-C would be congruent with the unique support needs of
students with intellectual disability ages 5 to 16. The measurement structure of the SIS-A was
maintained; items are rated on type, frequency, and amount of time of support needed. The

SIS-C Preliminary Reliability and Validity 5
subscale structure, however, was changed to better reflect the areas of support need for children
and youth. In total, there are seven subscales: Home Living Activities, Community and
Neighborhood Activities, School Participation Activities, Health and Safety Activities, Social
Activities, Advocacy Activities. Although the Advocacy Activities section (called Protection
and Advocacy on the SIS-A) had been removed from the standardized portion of the scale in the
SIS-A because of initial concerns with reliability (which further research has suggested are not a
concern [see Shogren et al., this issue]), it was always intended to be part of the standardized
portion of the SIS-C. The SIS-C also includes an Exceptional Medical and Behavioral Support
Needs section as found in the SIS-A, therefore recognizing that certain medical conditions and
challenging behaviors result in a child requiring increased levels of support, regardless of his or
her relative intensity of support needs in other life domains.
Item Selection
The item selection process for the SIS-C began with identifying items from the SIS-A,
which might, with modifications if necessary, be appropriate for use to determine the support
needs of children ages 5 to 16. This step was conducted by a Task Force appointed by AAIDD
that included professionals in special education and individuals familiar with state ID/DD service
systems. Once a candidate pool of items from the SIS-A version was identified, the Task Force
conducted a review of the extant literature to determine support areas that might be included in a
SIS-C that were not reflected in the SIS-A, and generated an item pool for those support areas.
This review was completed by searching: (a) major electronic databases (e.g., ERIC, Psychlit,
Educational Abstracts); (b) published assessments of adaptive behavior and curriculum guides
developed for children with disabilities; (c) relevant texts and recent review articles; (d)
published articles in which the SIS-A was used as instrumentation; and (e) unpublished

SIS-C Preliminary Reliability and Validity 6
governmental reports related to service provision. A candidate item pool of additional, new items
was generated, and when combined with items from the SIS-A, a pool of 75 potential indicators
(candidate items) of support need (e.g., eating, participating in co-curricular activities,
socializing within and outside the family) resulted.
Q-Sort
The task force then developed detailed descriptions of each candidate item in the item
pool. Using procedures described by McKeown and Thomas (1988), the task force conducted a
Q-Sort to determine the content validity of the items. Items that did not show consistent loading
in an area of support were eliminated. Respondents had the opportunity to place a candidate item
in one of seven support areas (Home Living Activities, Community and Neighborhood
Activities, School Participation Activities, Health and Safety Activities, Social Activities,
Advocacy Activities), or indicate that an item was not relevant to any of the support areas. Fifty-
one respondents replied, and 61 candidate items that a simple majority of respondents placed into
a specific area were retained. These items were used to develop an initial pilot test version of the
scale, which also included instructions to interviewers for data collection as well as demographic
items. The initial pilot test version was shared with a focus group of experts that provided
training on the SIS-A who were asked to pay particular attention to consistency of
implementation of the SIS-C with the SIS-A. A pilot test version of the SIS-C was finalized
based on feedback from the focus group.
Pilot Test
Once a pilot version of the SIS-C was finalized, it was piloted with participants from
three states (Illinois, North Carolina, & Tennessee). Twenty-five interviewers in North Carolina,
23 interviewers in Illinois, and four interviewers in Tennessee were trained on the administration

SIS-C Preliminary Reliability and Validity 7
and scoring of the Children’s SIS by one of the authors. Interviewers were asked to interview at
least two respondents who were very familiar with a child with intellectual disability who was
between the ages of 5 and 16. These interviewers were also asked for their perspectives on
administering and scoring the scale, with a particular focus on any items that were unclear or
confusing. Descriptive statistics were calculated and showed a wide range of raw scores for each
subscale as well as the entire scale. Minor edits were made to the instrument (including item
descriptions) as a result of this pilot test and a new field test version was developed.
Field Test Version
The field test version of the SIS-C was the tool that was used to collect the data from the
normative sample described subsequently. As mentioned previously, the Support Needs Index
score (the portion of the SIS-C that will be standardized) includes items grouped into seven
subscales or domains:
• Home Living Activities (9 items) - Activities completed as a function of living in a household.
• Community & Neighborhood Activities (8 items) - Activities completed as a function of
being a member of a community or neighborhood.
• School Participation Activities (9 items) - Activities associated with participating in the
school community.
• School Learning Activities (9 items) - Activities associated with acquiring knowledge and/or
skills while attending school.
• Health & Safety Activities (8 items) - Activities that assure safety and health across home,
school, and community environments.
• Social Activities (9 items) - Activities that pertain to social integration with others, both
children and adults.

SIS-C Preliminary Reliability and Validity 8
• Advocacy Activities (9 items) - Activities that are related to acting as a causal agent in one’s
life, making choices and decisions, and availing oneself of leadership opportunities.
Each domain included eight or nine unique items that are rated across three support dimensions:
Type (the nature of support that is needed); Frequency (how often is support needed); and Time
(how much total daily time is needed to provide support). Because the domains have different
numbers of items and to maintain the metric of the original scale, responses on these three areas
will be averaged for the SIS-C to generate a score for each item.
Once the standardization process is completed, the intent is for the administration of SIS-
C to provide a standard score for each subscale and a standard composite score (referred to as the
Support Needs Index score). The Support Needs Index score will not only provide an overall
measure of the intensity of a child’s support needs, it will also allow a meaningful comparison of
a child or adolescent’s support needs with the larger population of children or adolescents with
ID/DD. Importantly for educators and disability support providers, the completion of the SIS-C
will also result in the development of a Support Needs Profile. Percentile scores will be
calculated and can be graphed for each child/adolescent in each life domain (subscale).
Educators and disability support providers will be able to chart out a support needs profile across
domains and to look at individual items to determine the relative intensity, duration, and types of
supports needed. This will provide critical information for the development of support plans and
(within schools) IEPs.
As mentioned previously, the SIS-C also has an Exceptional Medical and Behavioral
Support Needs section that lists common medical conditions and problem behaviors, and
provides the opportunity for raters to identify other types of medical and behavioral concerns. As
with the SIS-A, the underlying assumption is that certain medical conditions and challenging

SIS-C Preliminary Reliability and Validity 9
behaviors predict that a child/adolescent will require increased levels of support, regardless of his
or her relative intensity of support needs in other life domains. For example, children with high
needs in respiratory care require maximum support in their daily life regardless of their level of
support needs in specific activities across all domains. Likewise, a child who acts in a physically
aggressive manner will require additional support, regardless of his or her level of relative
independence in other areas of life. A scale ranging from 0 to 2 is used to rate the relative
significance of supports needed to manage medical conditions and challenging behaviors: 0 = no
support needed, 1 = some support needed, and 2 = extensive support needed.
Administration of the SIS-C
Like the SIS-A, the SIS-C is completed by a qualified interviewer. Interviewers need to
have completed at least a bachelor-level degree in a field such as education, social work, or
psychology, and need to have been trained in the administration of the scale. The scale is
completed via a semi-structured interview with two or more respondents who know the child
well. The interviewer focuses on gathering information about the support that the assessed
child/adolescent with a disability needs in order to function successfully (i.e., fully participate) in
typical settings. A respondent can be a parent, relative, guardian, educational assistant, direct
support professional, work supervisor, teacher, or any other individual who works or lives with
the child being evaluated and understands his or her specific support needs. Detailed
information about the administration of the instrument will be provided in a Standardization and
Users Manual to be published by AAIDD along with the SIS-C.
Technical Properties of the Supports Intensity Scale – Children’s Version

SIS-C Preliminary Reliability and Validity 10
This section describes the procedures that are being undertaken to standardize the SIS-C,
including (a) normative information and sample selection, (b) demographic characteristics of the
norming sample, and (c) preliminary reliability and validity information.
Normative Information and Sample Selection
The Task Force, based on literature and knowledge of the field, assumed that the support
needs would be confounded with age. Typically functioning younger children require more
support that typically functioning older children (i.e., a 5-year old needs more assistance than a
15-year old). Not only do children change dramatically from the age of 5 to 16, they, in fact,
often have significant changes change within the span of a year or two. As such, the SIS-C Task
Force decided that the sample generated to standardize the scale would be stratified by age
cohorts that varied by two years: 5-6 year olds, 7-8 year olds, 9-10 year olds, 11-12 year olds,
13-14 year olds, and 15-16 year olds. Power analysis indicated that a sample size of
approximately 420 children per age cohort was needed. The SIS-C task force also decided—
because of the range of intellectual functioning/adaptive behavior of students with intellectual
disability—to further stratify the age cohorts by commonly used classifications of students with
intellectual disability, based on IQ scores (i.e., mild, IQ > 55; moderate, IQ 40-55;
severe/profound, IQ < 40). The decision was made to use IQ estimations for classification as
these scores are generally more readily available and known by respondents. When, however,
IQ estimation information was missing, information on adaptive behavior estimations was used
to classify students into one of the age/intellectual functioning groups. This occurred in 129
cases (3.2% of cases). For the remaining cases (2.2% of cases), to be able to retain these
students in the normative sample, multiple imputation was used to capture unbiased parameter
estimates. The statistical program, R (R Development Core Team, 2008), was used to impute

SIS-C Preliminary Reliability and Validity 11
missing data by feeding the data to Amelia Package with 100 iterations (Honaker, King, &
Blackwell, 2011).
To summarize, we structured our sample to collect data in 18 cells (see Table 1)
generated by crossing six age bands with three levels of intellectual functioning. It is important
to note that we did not independently test intellectual functioning or collect data on adaptive
behavior. We instead relied on information recorded on the demographic form by interviews
based on information provided by respondents.
Additionally, because the SIS-A is normed from ages 16 and upward, and the SIS-C was
normed for students ages 5 to 16, we collected data for 17-18 year olds with both the SIS-C and
the SIS-A to provide a linking sample to calibrate scores across the two measures. In the present
description of the SIS-C normative sample, only data from the 5 to 16 year old sample will be
described, as this is the sample that will be used to norm the SIS-C.
Sampling Method
To generate the normative sample, data were collected through multiple sources. To
obtain data for children and adolescents receiving supports through state Developmental
Disabilities (DD) services systems, a request for participation was sent to state DD systems
currently using the SIS-A. Once appropriate consent was obtained, data from willing states were
collected and redacted versions sent to task force participants involved in data entry and analysis.
Second, so as to ensure that a representative number of protocols in the norming sample were
obtained from school districts (rather than state DD systems), members of the task force were
funded by a federal education agency to collect data with children and youth in schools. In all,
data from either a DD system or school district in 23 states were obtained, representing all
geographic regions of the United States.

SIS-C Preliminary Reliability and Validity 12
There were 694 interviewers that participated in collecting data on the 4,015 students that
were part of the normative sample. The majority of interviewers were female (81%) and most
had a graduate degree and more than 10 years of experience in the field. Most interviewers knew
the student that was the focus of the completed SIS-C (average years interviewers had known
students: 1.1 years, SD = 1.79). Table 2 provides information on the demographic characteristics
of the interviewers.
As mentioned previously, respondents for a SIS-C can be anyone who knows the target
child/adolescent well. Interviewers solicited at least two respondents for each interview. In all
interviews at least two respondents participated and in 14% of interviews more than two
respondents participated. In total, 12,050 respondents participated across all interviews. As
shown in Table 3, family members were the most frequent respondent (28%), followed by
teachers (13%). There was variability in how long the respondents had known the participants,
with the largest groups of respondents knowing the participants for one to two years or for more
than 10 years. The average length of time respondents had known the participants was six years
(SD = 4.99). Further information on the characteristics of respondents is provided in Table 3.
Characteristics of the Supports Intensity Scale – Children’s Version Normative Sample
The normative sample consisted of 4,015 children and youth with intellectual disability
aged 5-16. As mentioned previously, a stratified sampling plan was developed with 18 cells to
fill, representing our age/intellectual functioning cohorts. Table 1 provides the number of
children or youth in each of our 18 cells (age cohorts crossed by level of intellectual
functioning). On average, there were 223 children/youth in each cell.
In the overall student sample, females comprised 30% (n = 1,202) of the total participants
while males were 68 % (n = 2,710). Gender information was not available for the rest of the

SIS-C Preliminary Reliability and Validity 13
sample. The majority of participants were White (n = 2,244, 56%) or Black (n = 820, 20%);
although children/youth from other ethnic groups were also represented in the sample. Table 4
provides information on other demographic characteristics of children/youth being rated,
including home residence, primary language, and state of residence.
Preliminary Reliability and Validity Information
Data collection for the normative sample for the SIS-C was recently completed, and
analysis of the reliability and validity of the SIS-C is underway. It is important to note that these
analyses are ongoing, and the information presented here involves the initial findings, but
provides similar reliability and validity properties of the SIS-C in comparison to the SIS-A.
Reliability. To examine the reliability of the items on the SIS-C, we calculated internal
consistency indices to determine the extent to which measured scores are precise or consistent
across groups (Widaman, Little, Preacher, & Sawalani, 2011). Specifically, coefficient alpha
(Cronbach, 1951) and coefficient omega (McDonald, 1970, 1999, 2013) were computed for the
entire sample. Cronbach’s alpha is the most often used internal consistency index; however, it
assumes that items of the scale are equally good indicators of the latent variable (Schmitt, 1996).
Coefficient omega can be reported when the factor loadings are not identical for all items, which
is the case for the SIS-C. To obtain necessary values to compute Cronbach’s alpha and
coefficient omega, the equations provide by Widaman et al. (2011) were used.
Table 5 provides Cronbach’s alpha and coefficient omega values for the total sample.
Both Cronbach’s Alpha and coefficient omega valued exceeded .90 for all subscales in the total
sample, which is considered excellent internal consistency values ( .9; Kline, 2000; >.9;
McDonald, 2013).

SIS-C Preliminary Reliability and Validity 14
Validity. Instruments are said to yield valid results if they measure the underlying
construct they intend to measure. An instrument’s validity must be examined over time, and in
multiple ways. In previous sections, we documented our attempts to establish the content
validity of the SIS-C by describing the systematic process through which items were elected and
piloted, leading to the field test version. We have also begun preliminary analyses of construct
validity, specifically the “extent to which a test measures some type of theoretical characteristic
or concept” (Taylor, 2002, p. 66). First, because we hypothesized that support needs would vary
based on age cohorts for students age 5 to 16 years old, we report the raw score means and
standard deviations in Table 6. Analyses are undergoing to inform the standardization process,
but these preliminary values suggest that there may, in fact, be differences in average scores of
SIS-C domains across age/intellectual functioning cohorts, confirming the importance of
developing norms for differing age cohorts. Such data will be reported in the Standardization and
Users Manual.
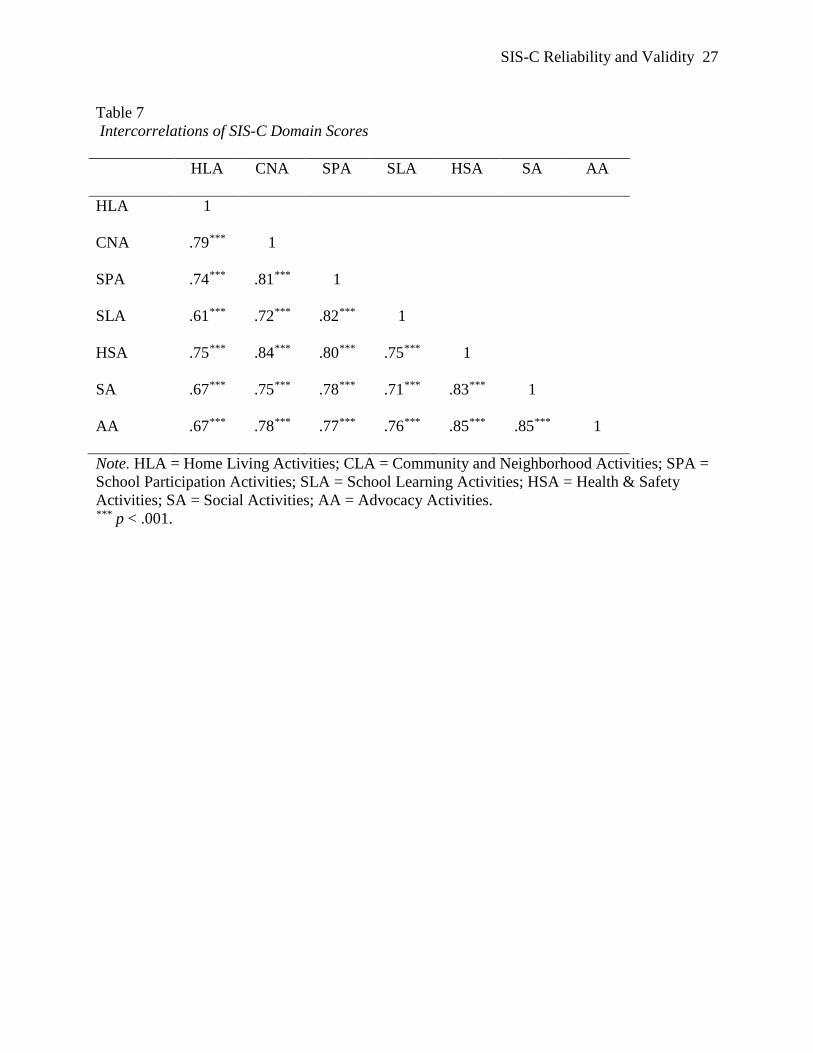
We also examined the pattern of relationships among the SIS-C subscales. The
assumption is that because all domains measure aspects of support needs, they should be
significantly intercorrelated. As shown in Table 7, there were significant intercorrelations
among the subscale scores, with all intercorrelations significant at the .001 level, and ranging
from .67 to .85.
Next Steps
A systematic process was followed to develop the SIS-C, building on work that has
already been conducted establishing the reliability and validity of the SIS-A, but addressing
unique issues identified in the literature and by experts in the field related to measurement of the
support needs of children/youth with intellectual disability ages 5 to 16. We are actively

SIS-C Preliminary Reliability and Validity 15
engaged in further examining the reliability and validity of the SIS-C, and will undertake the
process of developing standardized scores (referred to as the Support Needs Index score) and
percentile scores for each of the SIS-C domains based on age cohorts. Within the next year, the
SIS-C will be available to enable resource planning and allocation as a function of relative
student need as well as the development of a support needs profile across domains that will
provide critical information for the development of support plans and, ultimately, IEPs.

SIS-C Preliminary Reliability and Validity 16
Author Note
Funding for this research was provided by Grant PR Award# R324A110177 from the U.S.
Department of Education, Institute of Education Sciences, National Center for Special Education
Research. The contents of this report do not necessarily represent the policy of the Department
of Education and endorsement by the Federal Government should not be assumed.

SIS-C Preliminary Reliability and Validity 17
References
Buntinx, W., Van Unen, F., Speth, W., & Groot, W. (2006). The Supports Intensity Scale in the
Netherlands: Psychometric properties and applications in practice. Journal of Applied
Research in Intellectual Disabilities, 19, 245-246.
Cronbach, L. J. (1951). Coefficient alpha and the internal structure of tests. Psychometrika, 16,
297-334.
Honaker, J., King, G., & Blackwell, M. (2011). Amelia II: A program for missing data. Journal of
Statistical Software, 45(7), 1-47.
Kline, P. (2000). The handbook of psychological testing (2nd ed.). London: Routledge.
Luckasson, R., Coulter, D. L., Polloway, E. A., Reiss, S., Schalock, R. L., Snell, M. E., . . . Stark,
J. A. (1992). Mental retardation: Definition, classification, and systems of supports (9th
ed.). Washington, DC: American Association on Mental Retardation.
Luckasson, R., Borthwick-Duffy, S., Buntinx, W. H. E., Coulter, D. L., Craig, E. P. M., Reeve,
A., . . . Tasse, M. J. (2002). Mental retardation: Definition, classification, and systems of
support (10th ed.). Washington, DC: American Association on Mental Retardation.
McDonald, R. P. (1970). The theoretical foundations of principal factor analysis, canonical factor
analysis, and alpha factor analysis. British Journal of Mathematical and Statistical
Psychology, 23, 1-21.
McDonald, R. P. (1999). Test theory. Mahwah, NJ: Erlbaum.
McDonald, R. P. (2013). Test theory: A unified treatment. New York: Psychology Press.
McKeown, B., & Thomas, D. (1988). Q methodology. Newbury Park, CA: Sage.

SIS-C Preliminary Reliability and Validity 18
Morin, D., & Cobigo , V. (2008). Reliability of the Supports Intensity Scale (French Version).
American Journal on Intellectual and Developmental Disabilities, 47, 24-30.
R Development Core Team (2008). R: A language and environment for statistical computing. R
Foundation for Statistical Computing, Vienna, Austria. ISBN 3-900051-07-0, URL
http://www.R-project.org.
Schalock, R. L., Borthwick-Duffy, S., Bradley, V., Buntix, W. H. E., Coulter, D. L., Craig, E. P.
M., . . . Yeager, M. H. (2010). Intellectual disability: Definition, classification, and
systems of support (11th ed.). Washington, DC: American Association on Intellectual and
Developmental Disabilities.
Schmitt, N. (1996). Uses and abuses of coefficient alpha. Psychological Assessment, 8, 350-353.
Taylor, R. L. (2002). Assessment of exceptional students (6th ed.). Boston: Allyn & Bacon.
Thompson, J. R., Bradley, V., Buntinx, W. H. E., Schalock, R. L., Shogren, K. A., Snell, M. E., . .
. Yeager, M. H. (2009). Conceptualizing supports and the support needs of people with
intellectual disability. Intellectual and Developmental Disabilities, 47, 135-146.
Thompson, J. R., Bryant, B. R., Campbell, E. M., Craig, E. P. M., Hughes, C. M., Rotholz, D.
A., . . . Wehmeyer, M. L. (2004). Supports Intensity Scale. Washington, DC: American
Association on Intellectual and Developmental Disabilities.
Thompson, J. R., Tassé , M. J., & McLaughlin, C. A. (2008). Interrater reliability of the Supports
Intensity Scale (SIS). American Journal on Mental Retardation, 113, 231-237.
Verdugo, M., Arias, B., Ibanez, A., & Schalock, R. L. (2010). Adaptation and psychometric
properties of the Spanish version of the Supports Intensity Scale (SIS). American Journal
on Intellectual and Developmental Disabilities, 115, 496-503. doi:10.135/1944-7558-
115.6.496

SIS-C Preliminary Reliability and Validity 19
Wehmeyer, M. L., Chapman, T., Little, T. D., Thompson, J. R., Schalock, R. L., & Tassé, M. J.
(2009). Efficacy of the Supports Intensity Scale (SIS) to predict extraordinary support
needs. American Journal of Intellectual and Developmental Disabilities, 114, 3-14.
Widaman, K. F., Little, T. D., Preacher, K. J., & Sawalani, G. (2011). On creating and using short
forms of scales in secondary research. In K. Trzesniewski & B. Roberts (Eds.), Archival
research methods (pp. 39-61). Washington, DC: APA (doi: 10.1037/12350-003).
World Health Organization. (2001). International classification of functioning, disability, and
health. Geneva, Switzerland: Author.

SIS-C Preliminary Reliability and Validity 20
Table 1
Sample Size for Age Cohorts and Intellectual Functioning
Age
Cohort
Mild
Moderate
Severe / Profound
Total
5 – 6 151 168 194 513
7 – 8 197 176 189 562
9 – 10 227 280 280 787
11 – 12 226 320 298 844
13 – 14 241 295 286 822
15 – 16 166 172 149 487
Total 1,208 1,411 1,396 4,015
Note. Mild ID Group is IQ > 55 or AB in mild range for the assessment; Moderate ID Group is
IQ 40-55 or AB at moderate range for assessment; Severe/Profound Group is IQ < 40 or ABL at
severe/profound.

SIS-C Preliminary Reliability and Validity 21
Table 2
Demographic Characteristics of Interviewers
N %
Gender
Female 564 81.3
Male 93 13.4
Missing 37 5.3
Ethnicity
White 500 72.0
Black 95 13.7
Asian/Pacific Islander 21 3.0
Native American 2 0.3
Hispanic 29 4.2
Multiple ethnic backgrounds 10 1.4
Other 1 0.1
Missing 36 5.2

SIS-C Preliminary Reliability and Validity 22
Table 3
Demographic Characteristics of Respondents
n %
Relationship to participant
Family 3,315 27.5
Teachers 1,556 12.9
Direct service providers/care givers/social workers 609 5.1
Paraprofessionals 606 5.0
Case managers 375 3.1
Other (friends/mentor/advocate) 309 2.6
Program coordinators/service coordinators 301 2.5
Residential service managers/group home associates 138 1.1
Therapists 118 1.0
Qualified developmental professionals/ education service providers 115 1.0
Foster Parents/Guardians 104 0.9
Self 99 0.8
Behavioral specialists 55 0.5
Not specified/unclear 4,350 36.1
Number of years respondent has known the participant*
Less than 1 year 583 7.3
1-2 years 2075 25.8
3-5 years 990 12.3
6-10 years 1365 17.0
More than 10 years 1785 22.2
Missing 1232 15.3
* Data were only collected for the first two respondents, sample size = 8,030.

SIS-C Preliminary Reliability and Validity 23
Table 4
Demographic Characteristics of Normative Sample
n % of Sample
Gender
Female 1,202 29.9
Male 2,710 67.5
Missing 103 2.6
Age
5-6 513 12.8
7-8 562 14.0
9-10 762 19.0
11-12 804 20.0
13-14 818 20.4
15-16 487 12.1
Missing 69 1.7
Ethnicity
White 2,244 55.9
Black 820 20.4
Asian/Pacific Islander 159 4.0
Native American 26 0.6
Hispanic 384 9.6
Multiple ethnic backgrounds 237 5.9
Other 73 1.8
Missing 72 1.8
Primary language
English 2,299 57.3
Spanish 88 2.2
English and Spanish 52 1.3
Nonverbal & sign language 12 0.3
Others (Nepalese, Farsi, Russian, Urdu, etc.) 26 0.6
Missing 1,538 38.3
Student’s intelligence level
< 25 or profound 459 11.4
25-39 or severe 862 21.5
40-55 or moderate 1,321 32.9
55-70 or mild 1,157 28.8
Missing 216 5.4
Student’s adaptive behavior level
Profound 563 14.0
Severe 1,052 26.2
Moderate 1,335 33.3
Mild 948 23.6
Missing 117 2.9
(table continues)

SIS-C Preliminary Reliability and Validity 24
Table 4 (cont.)
Additional Diagnoses/Classifications
Low Vision/Blindness 545 13.6
Deafness/Hearing Impairment 191 4.8
Psychiatric Disability 248 6.2
Developmental Delay 1,588 39.6
Physical Disability (Arm & Hand limitations) 742 18.5
Physical Disability (Mobility limitations) 950 23.7
Chronic Health Condition 673 16.8
Autism Spectrum Disorder 2,124 52.9
Brain/Neurological Damage 763 19.0
Speech Disorder 1,527 38.0
Language Disorder 1,174 29.2
Learning Disability 1,028 25.6
ADD or Attention Deficit Hyperactivity Disorder 696 17.3
Other 578 14.4
Student’s Home Residence
Family Home 3,789 94.4
Foster Family Home 59 1.5
Small Group Home (less than 7 residents) 37 0.9
Midsize Group Home (7-15 residents) 46 1.1
Large residential school/facility (>15 residents) 17 0.4
Other residential facility 18 0.4
Missing 49 1.2

SIS-C Preliminary Reliability and Validity 25
Table 5
Reliability Indices for Total Sample
Cronbach's Alpha Omega
Home Living Activities 0.927 0.970
Community and Neighborhood Activities 0.936 0.978
School Participation Activities 0.928 0.966
School Learning Activities 0.948 0.982
Health and Safety Activities 0.930 0.973
Social Activities 0.948 0.982
Advocacy Activities 0.928 0.972

SIS-C Reliability and Validity
26
Table 6
Means and Standard Deviations for SIS-C subscales
5-6 7-8 9-10 11-12 13-14 15-16
Subscale M SD M SD M SD M SD M SD M SD
HLA 2.64 .89 2.47 .84 2.44 .86 2.31 .89 2.24 .95 2.03 1.04
CNA 2.98 .78 2.89 .76 2.87 .72 2.79 .72 2.77 .73 2.60 .82
SPA 3.10 .78 3.07 .76 3.03 .76 2.98 .78 2.94 .82 2.74 .92
SLA 3.26 .73 3.31 .67 3.30 .60 3.29 .64 3.27 .65 3.15 .77
HSA 3.10 .84 3.05 .78 3.01 .73 2.95 .77 2.89 .82 2.69 .93
SA 3.08 .88 3.05 .83 3.00 .83 2.88 .90 2.79 .92 2.59 1.02
AA 3.03 .85 2.99 .79 2.98 .73 2.94 .77 2.91 .82 2.76 .89
Note. HLA = Home Living Activities; CLA = Community and Neighborhood Activities; SPA =
School Participation Activities; SLA = School Learning Activities; HSA = Health & Safety
Activities; SA = Social Activities; AA = Advocacy Activities.
SIS-C Reliability and Validity
27
Table 7
Intercorrelations of SIS-C Domain Scores
HLA CNA SPA SLA HSA SA AA
HLA 1
CNA .79*** 1
SPA .74*** .81*** 1
SLA .61*** .72*** .82*** 1
HSA .75*** .84*** .80*** .75*** 1
SA .67*** .75*** .78*** .71*** .83*** 1
AA .67*** .78*** .77*** .76*** .85*** .85*** 1
Note. HLA = Home Living Activities; CLA = Community and Neighborhood Activities; SPA =
School Participation Activities; SLA = School Learning Activities; HSA = Health & Safety
Activities; SA = Social Activities; AA = Advocacy Activities. *** p < .001.