Thesis Submitted to the Padmashree Dr. D. Y .Patil University ...
289
1 AN EMPIRICAL STUDY OF FACTORS AFFECTING SALES OF MUTUAL FUNDS COMPANIES IN INDIA Thesis Submitted to the Padmashree Dr. D. Y .Patil University, Department of Business Management in partial fulfillment of the requirements for the award of the Degree of DOCTOR OF PHILOSOPHY in BUSINESS MANAGEMENT Submitted by Mr.SUYASH BHATT (Enrollment No. DYP-PhD-066100006) Research Guide Dr. PRADIP MANJREKAR PROFESSOR PADMASHREE DR. D.Y. PATIL UNIVERSITY, DEPARTMENT OF BUSINESS MANAGEMENT, Sector 4, Plot No. 10, CBD Belapur, Navi Mumbai – 400 614 June 2010
-
Upload
khangminh22 -
Category
Documents
-
view
0 -
download
0
Transcript of Thesis Submitted to the Padmashree Dr. D. Y .Patil University ...

1
AN EMPIRICAL STUDY OF FACTORS
AFFECTING SALES OF MUTUAL FUNDS COMPANIES IN INDIA Thesis Submitted to the Padmashree Dr. D. Y .Patil University,
Department of Business Management
in partial fulfillment of the requirements for the award of the Degree
of
DOCTOR OF PHILOSOPHY
in
BUSINESS MANAGEMENT
Submitted by
Mr.SUYASH BHATT
(Enrollment No. DYP-PhD-066100006)
Research Guide
Dr. PRADIP MANJREKAR
PROFESSOR
PADMASHREE DR. D.Y. PATIL UNIVERSITY,
DEPARTMENT OF BUSINESS MANAGEMENT,
Sector 4, Plot No. 10,
CBD Belapur, Navi Mumbai – 400 614
June 2010

2
AN EMPIRICAL STUDY OF FACTORS
AFFECTING SALES OF MUTUAL FUNDS
COMPANIES IN INDIA

3
DECLARATION
I hereby declare that the thesis entitled “ AN EMPIRICAL STUDY OF
FACTORS
AFFECTING SALES OF MUTUAL FUNDS COMPANIES IN INDIA”
submitted for the
Award of Doctor of Philosophy in Business Management at the
Padmashree Dr.D.Y.
Patil University Department of Business Management is my original work and
the thesis
has not formed the basis for the award of any degree, associate ship,
fellowship or any
other similar titles.
Place:
Date:
Signature of the Guide Signature of the Head of the dept. Signature of
the student

4
CERTIFICATE
This is to certify that the thesis entitled AN EMPIRICAL STUDY OF FACTORS
AFFECTING
SALES OF MUTUAL FUNDS COMPANIES IN INDIA and submitted by Mr.
SUYASH N
BHATT is a bonafide research work for the award of the Doctor of Philosophy in
Business
Management at the Padmashree Dr. D. Y. Patil University Department of Business
Management
in partial fulfillment of the requirements for the award of the Degree of Doctor of
Philosophy in
Business Management and that the thesis has not formed the basis for the award
previously of
any degree, diploma, associate ship, fellowship or any other similar title of any
University or
Institution. Also certified that the thesis represents an independent work on the
part of the
candidate.
Place:
Date:
Signature of the Head of the department Signature of the Guide

5
ACKNOWLEDGEMENT
In the first place, I am indebted to the Padmashree Dr. D.Y. Patil University’s Department of Business Management, which has accepted me for Doctorate program and provided me with an excellent opportunity to carry out the present research project. I would like to sincerely thank to Dr. Pradip Manjrekar Professor & Head Research, Consultancy & Extension Centre, Padmashree Dr. D.Y. Patil University’s Department of Business Management, my guide my mentor, without whose cooperation and guidance it would not have been possible for me to pursue such goal oriented research. Also for his time, advice and especially for constantly encouraging me in my efforts. I thank Dr. R Gopal, Director – Department of Business Management at Padmashree Dr. D.Y. Patil University’s Department of Business Management without whose cooperation it would not have been possible for me to complete this research.
I am immensely thankful to Prof.(Dr) James Thomas, Vice Chancellor and Dr. F.A. Fernandes, Registrar at Padmashree Dr. D.Y. Patil University for providing me this opportunity to persue the PhD at Department of Business Management. I also express my gratitude to the administrative staff of Padmashree Dr. D.Y. Patil University Department of Business Studies whose secretarial assistance helped me in summiting the various evaluation documents in time.
I am grateful to Shri. Amarjit Singh Manhas [University of Mumbai Senate Member and MHADA Chairman], who has immensely contributed in whatever I am today. I would like to mention few individuals who have been a source of inspiration for me throughtout, they are; § Shri . Y.K.Bhushan – Advisor – IBS
§ Prof.P.V.Narasimham – Director General – K.J.Somaiya Institute of
Management Studies and Research.
§ Dr.Suresh Ghai – Director – K.J.Somaiya Institute of Management Studies
and Research.
§ Dr. R. Gopal – Director – Dr. D.Y.Patil Institute of Management Studies and
Research.
I would like to thank and acknowledge the support of Kotak Securities Limited making this project possible. Most of all my gratitude is extended to my family, without whose support, I could not have undertaken this endeavour.

6
Place: Date: Signature of the student

7
SR.No PARTICULARS PAGE
NO.
§ LIST OF TABLES iv
§ LIST OF FIGURES viii
§ LIST OF ABBREVATIONS xiii
§ EXECUTIVE SUMMARY xv
1 CHAPTER 1 : INTRODUCTION 1
1.1 THE HISTORY OF MUTUAL FUNDS 1
1.2 BACKGROUND OF MUTUAL FUND 2
1.3 DEFINATION OF MUTUAL FUND 9
1.4 PURPOSE OF STUDY 11
1.5 ORGANISATION OF THESIS 12
2 CHAPTER 2 : LITERATURE REVIEW 14
2.1 Introduction and Structure
2.1.1 Effects of Management Tenure (Past Record)
2.1.2 Effects of Size (Asset Under Management)
2.1.3 Effects of Turnover (NAV)
14
16
19
22
2.2 MUTUAL FUND INDUSTRY MANAGEMENT OF
CUSTOMER.
24
2.3 IMPACT OF IT AND IT ENABLED SERVICES IN
MUTUAL FUND INDUSTRY
26
2.4 ROLE OF INFORMATION TECHNOLOGY &
CUSTOMER RELATIONSHIP MANAGEMENT IN
MUTUAL FUND INDUSTRY
40
2.5 HOW TO MEASURE CUSTOMER RELATIONSHIP
MANAGEMENT – IN MUTUAL FUND INDUSTRY
45
2.6 OVERALL CUSTOMER SATISFACTION IN MUTUAL
FUND INDUSTRY
48

8
2.7 CUSTOMER SATISFACTION W.R.T IT ENABLED
SERVICES [ONLINE] IN MUTUAL FUND INDUSTRY
52
2.8 IT ENABLED SERVICES [ONLINE] IN MUTUAL
FUND INDUSTRY
55
2.9 CUSTOMER LOYALTY IN MUTUAL FUND
INDUSTRY
58
3 CHAPTER 3 : RESEARCH FRAMEWORK FOR MUTUAL
FUND CUSTOMER
62
3.1 RESEARCH OBJECTIVE 68
3.2 FORMULATE AN ANALYSIS PLAN 69
3.3 NULL HYPOTHESIS FORMATION 71
4 CHAPTER 4 : RESEARCH METHODOLOGY 73
4.1 SURVEY SAMPLING METHODS 74
4.2 SAMPLE DESIGN
4.2.1 SAMPLE SIZE
78
79
4.3 DATA COLLECTION METHOD
4.4 THE RESEARCH INSTRUMENT
81
82
4.5 THE SAMPLE 83
4.6 DEMOGRAPHIC PROFILE 85
4.7 PILOT STUDY 91
4.8 SCALE RELIABILITY 91
4.9 BIAS IN SURVEY SAMPLING 92
4.10 STATISTICAL ANALYSIS 94
5 CHAPTER 5 : DATA ANALYSIS & FINDINGS 98
5.1 FINDINGS IN DETAIL 99
5.2 MULTIPLE REGRESSION MODEL FOR SALES
OF MUTUAL FUNDS
179
7 CHAPTER 6 : CONCULSION 181

9
8
CHAPTER 7 : LIMITATION AND FUTURE SCOPE OF
RESEARCH
187
8.1 FUTURE SCOPE OF RESEARCH 190
v SAMPLE QUESTIONAIRE 192
v ANNEXURE I
v ANNEXURE II
v ANNEXURE III
v ANNEXURE IV
v ANNEXURE V
v ANNEXURE VI
v BIBLIOGRAPHY AND REFERENCE
197
198
203
210
216
219
240

10
LIST OF TABLES
Table 1.1 Phase II of Mutual Fund Industry. 6
Table 1.2 Growth of Fund Mobilisation 8
Table 4.6.2 Descriptive Statistics for Gender [Mean[ 85
Table 4.6.3 Descriptive Frequency for Gender 85
Table 4.6.4 Descriptive Statistics for Martial status 86
Table 4.6.5 Descriptive Frequency for Martial Status 86
Table 4.6.6 Descriptive Statistics for Occupation 87
Table 4.6.7 Descriptive Frequency for Occupation 87
Table 4.6.8 Descriptive Statistics for Age Group 88
Table 4.6.9 Descriptive Frequency for Age Group 88
Table 4.6.10 Descriptive Statistics for Annual Income 89
Table 4.6.11 Descriptive Frequency for Annual Income 89
Table 4.6.12 Descriptive Statistics for Amount of Purchase 90
Table 4.6.13 Descriptive Frequency for Amount of Purchase 90
Table 4.8.1 Case Processing Summary 91
Table 4.8.2 Reliability Statistics 91
Table 5 Descriptive Statistics 98
Table 5.1.1. Cross tabulation between Mode of Investment
and Sales
103
Table 5.1.2. Cross tabulation between Brandname and Sales 105
Table 5.1.3. Cross tabulation between AUM and Sales 108

11
Table 5.1.4. Cross tabulation between NAV and Sales 111
Table 5.1.5. Cross tabulation between PR and Sales 114
Table 5.1.6.
Table 5.1.7. Cross tabulation between Quality of Service and
Sales
117
Table 5.1.8. Cross tabulation between SAFE_IT and Sales 122
Table 5.1.9. Cross tabulation between Service Time_IT and
Sales
125
Table 5.1.10. Cross tabulation between ease of use of IT and
Sales
127
Table 5.1.11. Cross tabulation between catering to all need
using IT and Sales
131
Table 5.1.12. Cross tabulation between excellent IT QoS and
Sales
134
Table 5.1.13. Cross tabulation between current investment
and Sales
138
Table 5.1.14. Cross tabulation between repeat purchase and
Sales
141
Table 5.1.15. Cross tabulation between satisfaction with IT
and Sales
144
Table 5.1.16. Cross tabulation between referral for IT and
Sales
147

12
Table 5.1.17. Cross tabulation between safety in agent /
brokerage firm and Sales
150
Table 5.1.18. Cross tabulation between service time in agent /
brokerage firm and Sales
153
Table 5.1.19. Cross tabulation between current mode of
investment using agent / brokerage firm and Sales
156
Table 5.1.20. Cross tabulation between additional investment
using agent / brokerage firm and Sales
159
Table 5.1.21. Cross tabulation between satisfaction with
services of agent / brokerage firm and Sales
162
Table 5.1.22. Cross tabulation between agent / brokerage
firm for cash incentive and Sales
165
Table 5.1.23. Cross tabulation between services provided by
agent / brokerage firm and Sales
168
Table 5.1.24. Cross tabulation between recommendation of
company and Sales
172
Table 5.1.25. Cross tabulation between satisfaction services
provided by company and Sales
176
Table 5.2.1. Multiple Regression Model Summary for Sales 179
Table 5.2.2. Multiple Regression Model Coefficients for
Sales
180

13
Table 6.1Summary of Hypothesis Testing 185

14
LIST OF FIGURE
Figure 1.1 Growth in Asset Under Management. 7
Figure 2.3.1 The Relationships Among IT, E-Commerce, and E-
Finance
28
Figure 4.6.1 Pie Chart for Gender 85
Figure 4.6.2 Pie Chart for Martial Status
86
Figure 4.6.3 Pie Chart for Occupation
87
Figure 4.6.4 Pie Chart for Age Group
88
Figure 4.6.5 Pie Chart for Annual Income
89
Figure 4.6.6 Pie Chart for Amount of Purchase
90
Figure 5.1.1Pie chart for Investment Company 100
Figure 5.1.2Bar chart for Investment Company 101
Figure 5.1.3Pie chart for Mode of Investment 102
Figure 5.1.4Pie chart for Investment Based on Brandname 104
Figure 5.1.5Bar chart for Investment Based on Brandname 106
Figure 5.1.6Pie chart for Investment Based on AUM 107
Figure 5.1.7Bar chart for Investment Based on AUM 109
Figure 5.1.8Pie chart for Investment Based on NAV 110
Figure 5.1.9Bar chart for Investment Based on NAV 112
Figure 5.1.10Pie chart for Investment Based on PR 113
Figure 5.1.11Bar chart for Investment Based on PR 115
Figure 5.1.12Pie chart for Investment Based on Quality of 116

15
Services
Figure 5.1.13Bar chart for Investment Based on Quality of
Services
118
Figure 5.1.14Pie chart for source of Information for Mutual
Fund
119
Figure 5.1.15Pie chart for source of more information for
Mutual Fund
120
Figure 5.1.16Pie chart for Perception of safety in IT & IT Enabled
Services.
121
Figure 5.1.17Bar chart for Perception of safety in IT & IT
Enabled Services.
123
Figure 5.1.18Pie chart for Perception of service time in IT & IT
Enabled Services.
124
Figure 5.1.19Bar chart for Perception of service time in IT & IT
Enabled Services.
126
Figure 5.1.20Pie chart for Perception of ease of use in IT & IT
Enabled Services.
127
Figure 5.1.21Bar chart for Perception of ease of use in IT & IT
Enabled Services.
129
Figure 5.1.22Bar chart for Perception of ease of use in IT & IT
Enabled Services.
129
Figure 5.1.23Pie chart for catering to all need for using IT & IT 130

16
Enabled Services.
Figure 5.1.24Pie chart for catering to all need for using IT & IT
Enabled Services.
132
Figure 5.1.25Pie chart for Perception of quality of service in IT
& IT Enabled Services.
133
Figure 5.1.26 Bar chart for Perception of quality of service in IT
& IT Enabled Services.
135
Figure 5.1.27Bar chart for Perception of quality of service in IT
& IT Enabled Services.
136
Figure 5.1.28Pie chart for investment using IT & IT Enabled
Services.
137
Figure 5.1.29Bar chart for investment using IT & IT Enabled
Services.
139
Figure 5.1.30Pie chart for additional investment using IT & IT
Enabled Services
140
Figure 5.1.31Bar chart for additional investment using IT & IT
Enabled Services
142
Figure 5.1.32Pie chart for satisfaction with IT & IT Enabled
Services.
143
Figure 5.1.33Bar chart for satisfaction with IT & IT Enabled
Services.
145
Figure 5.1.34Pie chart for recommendation of IT & IT Enabled 146

17
Services.
Figure 5.1.35 Bar chart for recommendation of IT & IT
Enabled Services
148
Figure 5.1.36Pie chart for Perception of safety in agent /
brokerage firm
149
Figure 5.1.37Bar chart for Perception of safety in agent /
brokerage firm
151
Figure 5.1.38Pie chart for Perception of service time in agent /
brokerage firm.
152
Figure 5.1.39Bar chart for Perception of service time in agent /
brokerage firm.
154
Figure 5.1.40Pie chart for current mode of investment using
agent / brokerage firm.
155
Figure 5.1.41Bar chart for current mode of investment using
agent / brokerage firm.
157
Figure 5.1.42Pie chart for additional investment using agent /
brokerage firm.
158
Figure 5.1.43Bar chart for additional investment using agent /
brokerage firm.
160
Figure 5.1.44Pie chart for satisfaction with services of agent /
brokerage firm.
161
Figure 5.1.45Bar chart for satisfaction with services of agent / 163
18
brokerage firm.
Figure 5.1.46Pie chart for using agent / brokerage firm for cash
incentive.
164
Figure 5.1.47Pie chart for using agent / brokerage firm for cash
incentive.
166
Figure 5.1.48Pie chart for recommendation of services provided
by agent / brokerage firm.
167
Figure 5.1.49Bar chart for recommendation of services provided
by agent / brokerage firm.
169
Figure 5.1.50Histogram for recommendation of services
provided by agent / brokerage firm.
170
Figure 5.1.51Pie chart for recommendation of company. 171
Figure 5.1.52Bar chart for recommendation of company. 173
Figure 5.1.53Bar chart for recommendation of company. 174
Figure 5.1.54Pie chart for satisfaction services provided by
company.
175
Figure 5.1.55Pie chart for satisfaction services provided by
company.
177
Figure 5.1.56Bar chart for satisfaction services provided by
company.
178

19
LIST OF ABBREVATIONS
§ MF_TAX = Tax Saving Mutual Fund.
§ MFNAME = Mutual Fund Name
§ MODEOFINV = Mode of Investment
§ AUM = Asset Under Management
§ NAV = Net asset Value
§ PR = Past Record
§ QOS = Quality of Service
§ IT = Information Technology & IT Enabled Services
§ SAFE_IT = Safety w.r.t Inofrmation Tachnology
§ ST_IT = Service Time w.r.t. IT
§ EU_IT = Easy of Use of IT
§ N_IT = All Needs catered to with IT
§ ES_IT = Excellent Service w.r.t IT
§ CURRENTINV = Current Investment.
§ REPEATPURCHASE = Repeat Purchase
§ S_IT = Satisfaction w.r.t. IT
§ REFERRAL_IT = Referral of IT
§ SAFE = Safety of Agent / Brokerage Firm,
§ ST = Service Time via Agent / Brokerage Firm
§ EU = Ease of Use via Agent / Brokerage Firm
§ N = All needs catered to with Agent / Brokerage Firm
§ ES = Excellent Service w.r.t Agent / Brokerage Firm
§ CURRENT = Current Investment via Agent / Brokerage Firm
§ REPEAT = Repeat Purchase via Agent / Brokerage Firm
§ S = Satisfaction w.r.t. Agent / Brokerage Firm
§ CASHINV = Cash Incentive Agent / Brokerage Firm

20
§ REFERRAL = Referral of Agent / Brokerage Firm
§ CS_REFFERAL = Company Referral
§ CS_COMP = Satisfied with Company

21
EXECUTIVE SUMMARY
The purpose of the study is to determine whether mutual fund attributes affect mutual
fund performance. Attributes such as management tenure, expenses, NAV , and size
are examined and the different positions are quoted from the literature. Lastly, this
section summarizes why further research is warranted in this field.
As the amount of assets invested in mutual funds has ballooned, mutual funds have
become more abundant and more attractive to study. The common thread connecting
the overwhelming majority of studies in this field is an explanation of mutual fund
performance. The initial goal of mutual funds was to make saving and diversification
more seamless for the lay investor, but as more and more mutual funds were developed
and as more investment companies marketed their mutual funds, it became increasingly
difficult and confusing for investors to select mutual funds. Moreover, as the popularity
of these mutual funds increased, evidenced by the sheer amount and growth of invested
assets from 1999 to 2010, finance scholars and practitioners began to examine the
attributes of mutual funds that affected sales of mutual funds. Also to investigate the
relative effects of IT Enabled Services on the Customer Satisfaction and Loyalty
concepts to determine if the extra effort and cost of introducing IT Enabled Services
protocols to highly valued customers really does positively affect customer
satisfaction rates and the intention to remain loyal. Another objective of this study is
to look at whether these concepts are further affected if other variables are introduced,
specifically in a financial service industry context. The performance persistence, where
past performance could possibly predict immediate future returns. This is known as the

22
“hot hands” phenomenon. The topic of persistence is a subject for debate because there
are many conflicting views among researchers (Cahart, 1997; Grinblatt et al., 1992;
Hendricks et al., 1993). Also literature review deals with the predictive attributes of
mutual funds, excluding past performance. According to Peterson et al. (2001), this
segment of the literature is much more sparse than that which examine the persistence and
market. An increase in customer satisfaction rates generally translates into an increase
in loyalty rates (Jones and Sasser 1995; Reichheld, Markey and Hopton 2000; Bolton,
Kaniian and Bramlett 2000; Anderson and Sullivan 1993; Gwinner, Gremler and
Bitner 1998). And, an increase in loyalty can decrease administrative costs by 10-40%
(Vincent 2000). There is little published empirical research on the subject of IT and
IT Enabled Services aside from industry surveys evaluating company results after
Information Technology programs are installed. As important, little research exists on
differentiating between highly vs. moderately satisfied customers and what effect this
has on customer satisfaction and loyalty rates.

23
CHAPTER I
INTRODUCTION
This study examines the role that information technology plays in supporting
relationships between customers and suppliers in the financial service industry. It
traces the interrelationships among the different sectors of this industry -brokerage
houses, mutual funds, insurance companies, and others - and identifies roles that
information technology and electronic service delivery can play in creating and
supporting inter-organizational integration across sector boundaries. It further
identifies the opportunities for and threats to these relationships caused, in large part,
by the continuing evolution of information technology.
1.6 THE HISTORY OF MUTUAL FUNDS
The origin of the concept of mutual fund dates back to the very dawn of commercial
history. It is said that Egyptians and Phoenicians sold their shares in vessels and
caravans with a view to spreading the risk attached with these risky ventures.
However, the real credit of introducing the modern concept of mutual fund goes to the
foreign and colonial Government Trust of London established in 1868, thereafter, a
large number of close-ended mutual funds were formed in the U.S.A. in 1930’s
followed by many countries in Europe, the Far East and Latin America. In most of
the countries, both open and close-ended types were popular. In India, it gained
momentum only in 1980, though it began in the year 1964 with the Unit Trust of India
launching its first fund, the Unit scheme 1964. While the mutual funds had its origin
in Belgium, it did not take firm root in continental soil but flourished when

24
transplanted in UK and USA surroundings.
1.7 BACKGROUND OF MUTUAL FUND
Although historians may differ on the exact genesis of mutual funds, the origin of
mutual funds can be traced back to a little more than one & half century ago. In 1822,
king William of the Netherlands formed “societe generale de belique”, at Brussells,
which appears to be the first mutual fund. It was intended to facilitate small
investments in foreign government loans, which, then, offered more security and
returns than the home industry. Later, another similar company was started with an
objective to make cooperative investments, to protect investors against loss by wide
undertakings, and to secure larger returns through investing in industries.
The genesis of the mutual fund industry in India can be traced back to 1964 with the
setting up of the Unit Trust of India (UTI) by the Government of India. Since then
UTI has grown to be a dominant player in the industry. UTI is governed by a special
legislation, the Unit Trust of India Act, 1963.
The industry was opened up for wider participation in 1987 when public sector banks
and insurance companies were permitted to set up mutual funds. Since then, 6 public
sector banks have set up mutual funds. Also the two Insurance companies LIC and
GIC have established mutual funds. Securities Exchange Board of India (SEBI)
formulated the Mutual Fund (Regulation) 1993, which for the first time established a
comprehensive regulatory framework for the mutual fund industry. Since then several
mutual funds have been set up by the private and joint sectors.

25
Indian Financial Services Sector (Mutual Fund) have been a significant source of
investment in both government and corporate securities. Decades it has been the
monopoly of the state with UTI being the key player, with invested funds exceeding
Rs.300 bn. The state-owned insurance companies also hold a portfolio of stocks.
Presently, numerous mutual funds exist, including private and foreign companies and
mainly state-owned Banks. Foreign participation in mutual funds and asset
management companies (AUM) is permitted on a case-by-case basis.
UTI, the government in 1964 set up the largest mutual fund in the country, to
encourage small investors in the equity market, presently having extensive marketing
network of over 35, 000 agents spread over the country. The UTI scrip’s have
performed relatively well in the market, as compared to the Sensex trend. However,
the same cannot be said of all mutual funds.
All MFs are allowed to apply for firm allotment in public issues. SEBI regulates the
functioning of mutual funds, and it requires that all MFs should be established as
trusts under the Indian Trusts Act. The actual fund management activity shall be
conducted from a separate asset management company (AMC). The minimum net
worth of an AMC or its affiliate must be Rs. 50 million to act as a manager in any
other fund. MFs can be penalized for defaults including non-registration and failure to
observe rules set by their AMCs. MFs dealing exclusively with money market
instruments have to be registered with RBI. All other schemes floated by MFs are
required to be registered with SEBI. In 1995, the RBI permitted private sector
institutions to set up Money Market Mutual Funds (MMMFs). They can invest in

26
treasury bills, call and notice money, commercial paper, commercial bills
accepted/co-accepted by banks, certificates of deposit and dated government
securities having unexpired maturity up to one year. UTI pioneered the mutual fund
industry in India ( 1963) with slow & staidly growth , but it accelerated from the year
1987 when non-UTI players entered the industry. In the past decade, Indian mutual
fund industry had seen a dramatic improvement, both qualities wise as well as
quantity wise. Before, the monopoly of the market had seen an ending phase; the
Assets Under Management (AUM) was Rs.67 bn. The private sector entry to the fund
family raised the AUM to Rs. 470 bn in March 1993 and till April 2004; it reached the
height of Rs. 1,540 billion. Putting the AUM of the Indian Financial Services Sector
(Mutual Fund Industry) into comparison, the total of it is less than the deposits of SBI
alone, constitute less than 11% of the total deposits held by the Indian banking
industry. The main reason of its poor growth is that the mutual fund industry in India
is new in the country. Large sections of Indian investors are yet to be intellectuated
with the concept. Hence, it is the prime responsibility of all mutual fund companies,
to market the product correctly abreast of selling.
The mutual fund industry can be broadly put into four phases according to the
development of the sector. Each phase is briefly described as under.
Phase 1. Establishment and Growth of Unit Trust of India - 1964-87
Unit Trust of India enjoyed complete monopoly when it was established in the year
1963 by an act of Parliament. UTI was set up by the Reserve Bank of India and it
continued to operate under the regulatory control of the RBI until the two were de-
linked in 1978 and the entire control was transferred in the hands of Industrial

27
Development Bank of India (IDBI). UTI launched its first scheme in 1964, named as
Unit Scheme 1964 (US-64), which attracted the largest number of investors in any
single investment scheme over the years.
UTI launched more innovative schemes in 1970s and 80s to suit the needs of different
investors. It launched ULIP in 1971, six more schemes between 1981-84, Children's
Gift Growth Fund and India Fund (India's first offshore fund) in 1986, Mastershare
(India’s first equity diversified scheme) in 1987 and Monthly Income Schemes
(offering assured returns) during 1990s. By the end of 1987, UTI's assets under
management grew ten times to Rs 6700 crores.
Phase II. Entry of Public Sector Funds - 1987-1993
The Indian mutual fund industry witnessed a number of public sector players entering
the market in the year 1987. In November 1987, SBI Mutual Fund from the State
Bank of India became the first non-UTI mutual fund in India. SBI Mutual Fund was
later followed by Canbank Mutual Fund, LIC Mutual Fund, Indian Bank Mutual
Fund, Bank of India Mutual Fund, GIC Mutual Fund and PNB Mutual Fund. By
1993, the assets under management of the industry increased seven times to Rs.
47,004 crores. However, UTI remained to be the leader with about 80% market share.

28
1992-93 Amount
Mobilised
Assets
Under Management
Mobilisation as % of
Gross Domestic Savings
UTI 11,057 38,247 5.2%
Public
Sector 1,964 8,757 0.9%
Total 13,021 47,004 6.1%
Table 1.3Phase II of Mutual Fund Industry.
Phase III. Emergence of Private Sector Funds - 1993-96
The permission given to private sector funds including foreign fund management
companies (most of them entering through joint ventures with Indian promoters) to
enter the mutual fund industry in 1993, provided a wide range of choice to investors
and more competition in the industry. Private funds introduced innovative products,
investment techniques and investor-servicing technology. By 1994-95, about 11
private sector funds had launched their schemes.
Phase IV. Growth and SEBI Regulation - 1996-2004
The mutual fund industry witnessed robust growth and stricter regulation from the
SEBI after the year 1996. The mobilisation of funds and the number of players
operating in the industry reached new heights as investors started showing more
interest in mutual funds.
Investors' interests were safeguarded by SEBI and the Government offered tax
benefits to the investors in order to encourage them. SEBI (Mutual Funds)

29
Regulations, 1996 was introduced by SEBI that set uniform standards for all mutual
funds in India. The Union Budget in 1999 exempted all dividend incomes in the
hands of investors from income tax. Various Investor Awareness Programmes were
launched during this phase, both by SEBI and AMFI, with an objective to educate
investors and make them informed about the mutual fund industry.
In February 2003, the UTI Act was repealed and UTI was stripped of its Special legal
status as a trust formed by an Act of Parliament. The primary objective behind this
was to bring all mutual fund players on the same level. UTI was re-organised into
two parts: 1. The Specified Undertaking, 2. The UTI Mutual Fund
GROWTH IN ASSETS UNDER MANAGEMENT
Figure 1.2 Growth in Asset Under Management.

30
Presently Unit Trust of India operates under the name of UTI Mutual Fund and its
past schemes (like US-64, Assured Return Schemes) are being gradually wound up.
However, UTI Mutual Fund is still the largest player in the industry. In 1999, there
was a significant growth in mobilisation of funds from investors and assets under
management which is supported by the following data:
GROSS FUND MOBILISATION (RS. CRORES)
FROM TO UTI PUBLIC
SECTOR
PRIVATE
SECTOR TOTAL
01-April-98 31-March-99 11,679 1,732 7,966 21,377
01-April-99 31-March-00 13,536 4,039 42,173 59,748
01-April-00 31-March-01 12,413 6,192 74,352 92,957
01-April-01 31-March-02 4,643 13,613 1,46,267 1,64,523
01-April-02 31-Jan-03 5,505 22,923 2,20,551 2,48,979
01-Feb-03 31-March-03 - 7,259 58,435 65,694
01-April-03 31-March-04 - 68,558 5,21,632 5,90,190
01-April-04 31-March-05 - 1,03,246 7,36,416 8,39,662
01-April-05 31-March-06 - 1,83,446 9,14,712 10,98,158
Table 1.4 Growth of Fund Mobilisation
Phase V. Growth and Consolidation - 2004 Onwards
The industry has also witnessed several mergers and acquisitions recently, examples
of which are acquisition of schemes of Alliance Mutual Fund by Birla Sun Life, Sun

31
F&C Mutual Fund and PNB Mutual Fund by Principal Mutual Fund. Simultaneously,
more international mutual fund players have entered India like Fidelity, Franklin
Templeton Mutual Fund etc. There were 29 funds as at the end of March 2006. This
is a continuing phase of growth of the industry through consolidation and entry of
new international and private sector players.
1.8 DEFINATION OF MUTUAL FUND
This section deals with the various concepts and terms used in this study that may
carry different meanings in another context. This section defines those terms with the
help of the literature. The following terms are defined operationally, as they are used
in this study.
Asset Under Management (AUM): The net assets under the management of a mutual
fund as of the close of the calendar year.
Net Asset Value (NAV): The amount of buying and selling that happens within a
mutual fund during the year as a percentage of the total value of the mutual fund at
the beginning of the year. The NAV ratio is reported in percentages that represent the
replacement of stocks in the portfolio divided by its net assets.
Past performance (PP): This study uses the one-year return of the mutual fund from
January to December of that year that has been adjusted for their respective category
Do mutual fund attributes affect mutual fund performance. For example, a small cap
mutual fund that produces a return of 15% may be relatively lower than a more value
oriented mutual fund with the same nominal unadjusted performance. To adjust for

32
different investment objectives and understanding that there are multiple categories,
the average category performance is subtracted from the unadjusted one-year return.
Persistence: The nature of mutual funds to exhibit lasting performance over multiple
time periods. This behavior is also called the “hot hands” phenomenon in the
literature. Mutual Fund is a fund, managed by an investment company with the
financial objective of generating high Rate of Returns. These asset management or
investment management companies collects money from the investors and invests
those money in different Stocks, Bonds and other financial securities in a diversified
manner. Before investing they carry out thorough research and detailed analysis on
the market conditions and market trends of stock and bond prices. These things help
the fund mangers to speculate properly in the right direction. The investors who invest
their money in the Mutual fund of any Investment Management Company, receive an
Equity Position in that particular mutual fund. When after certain period of time,
whether long term or short term, the investors sell the Shares of the Mutual Fund, they
receive the return according to the market conditions. The investment companies
receive profit by allocating people's money in different stocks and bonds according to
their Speculation about the Market Trend. Other than some specific mutual funds
which carry certain Maturity Term, Investors can generally sell the shares of their
mutual funds at any time they want. But, the return will vary according to market
value of the stocks and bonds in which that particular mutual fund made investment.
But, generally the share holders of mutual fund sell their share when the prices are up
and Capital Gain is sure to happen.

33
1.9 PURPOSE OF STUDY
The initial goal of mutual funds was to make saving and diversification more seamless for
the lay investor, but as more and more mutual funds were developed and as more
investment companies marketed their mutual funds, it became increasingly difficult and
confusing for investors to select mutual funds. Moreover, as the popularity of these
mutual funds increased, evidenced by the sheer amount and growth of invested assets
from 1999 to 2010, finance scholars and practitioners began to examine the attributes of
mutual funds that affected sales of mutual funds. Also to investigate the relative effects
of IT Enabled Services on the Customer Satisfaction and Loyalty concepts to
determine if the extra effort and cost of introducing IT Enabled Services protocols to
highly valued customers really does positively affect customer satisfaction rates and
the intention to remain loyal. Another objective of this study is to look at whether
these concepts are further affected if other variables are introduced, specifically in a
financial service industry context. This study is important for several reasons:
1) The performance persistence, where past performance could possibly predict
immediate future returns. This is known as the “hot hands” phenomenon. The topic of
persistence is a subject for debate because there are many conflicting views among
researchers (Cahart, 1997; Grinblatt et al., 1992; Hendricks et al., 1993). Also
literature review deals with the predictive attributes of mutual funds, excluding past
performance. According to Peterson et al. (2001), this segment of the literature is
much more sparse than that which examine the persistence and market.
2) An increase in customer satisfaction rates generally translates into an increase
in loyalty rates (Jones and Sasser 1995; Reichheld, Markey and Hopton 2000;

34
Bolton, Kaniian and Bramlett 2000; Anderson and Sullivan 1993; Gwinner,
Gremler and Bitner 1998). And, an increase in loyalty can decrease administrative
costs by 10-40% (Vincent 2000).
3) There is little published empirical research on the subject of IT and IT Enabled
Services aside from industry surveys evaluating company results after Information
Technology programs are installed. As important, little research exists on
differentiating between highly vs. moderately satisfied customers and what effect this
has on customer satisfaction and loyalty rates.
1.10 ORGANISATION OF THESIS
This thesis is organised in a structured format. Initially in Chapter 1 we introduced the
details about the Mutual Fund Industry in India and how it started. Then we moved on
to explaining the purpose of the study and why attributes like Financial Factors,
Brandname, Service Quality and Customer Satisfaction affects sales of a Mutual
Funds in India. In Chapter 2 we talk about the literature review and how past
researchers has tried to measure financial factors, customer satisfaction, service
quality, IT Enabled services and other area’s like CRM. In Chapter 3 we have
identified what are the research gaps and how do we bridge those gaps through the
current research. We also have discussed the research methodology in which we have
discussed what the sampling method used, why it is used, what are biases in sample
and how do we deal with it. In Chapter 4 we have discussed the how data needs to be
analysed and whether the finding are in sink with what we aim to achieve. We have
displayed what are the different statistical tools used by us and its respective output of

35
SPSS version16. In Chapter 5 we have discussed the conclusion and findings of our
study. In Chapter 6 we have added the limitation and future scope of research. Finally
we have questionnaire followed by annexure and bibliography.

36
CHAPTER II
LITERATURE REVIEW
2.1 Introduction and Structure
The purpose of the study is to determine whether mutual fund attributes affect mutual
fund performance. The previous chapter discussed the various dilemmas in this field
and stated the hypotheses to be tested in this study. This chapter presents the literature
review and shows that further research is needed. In the literature review, the
contradictory findings of various researchers are presented. Attributes such as
management tenure, expenses, NAV , and size are examined and the different
positions are quoted from the literature. Lastly, this section summarizes why further
research is warranted in this field.
As the amount of assets invested in mutual funds has ballooned, mutual funds have
become more abundant and more attractive to study. The common thread connecting
the overwhelming majority of studies in this field is an explanation of mutual fund
performance.
Since the inception and use of mutual funds, financial academics and practitioners
have sought to describe their behavior. With billions of dollars invested for a short
period of time, mutual funds have come to play an integral role in an investor’s
portfolio. Countless studies have been conducted attempting to describe the behavior
of these mutual funds. This section introduces the various mutual fund attributes and
their roles in influencing mutual fund performance.
Before examining the literature specific to the mutual fund attribute/performance
relationship, it is important to note the different topics within the mutual fund

37
literature. The literature can be split into three distinct categories. The first category
examines the characteristics of mutual fund managers themselves. This part of the
literature examines whether or not mutual fund managers have great skill in selecting
securities and timing markets successfully. Researchers such as Ferson and Schadt
(1996), Henricksson (1984), and Treynor and Mazuy (1966) have examined the
ability of mutual fund managers to select securities and time markets successfully, but
there is little evidence that supports the notion that they possess such skills. The
second segment of the literature deals with performance persistence, where past
performance could possibly predict immediate future returns. This phenomenon is
also known as the “hot hands” phenomenon. The topic of persistence is a subject for
debate because there are many conflicting views among researchers (Cahart, 1997;
Grinblatt et al., 1992; Hendricks et al., 1993). The third segment of the literature deals
with the predictive attributes of mutual funds, excluding past performance. According
to Peterson et al. (2001), this segment of the literature is much more sparse than its
other two segments, which examine the persistence and market timing/securities
selection skills of the mutual fund manager. The relatively small number of studies
that examine mutual fund attributes and their effects on performance demonstrate this.
Although the two segments of the literature not dealing with mutual fund attributes
are noteworthy, this study agrees with the researchers examining the
attribute/performance relationship who claim that a better understanding of these
relationships will give practical value to lay investors as well as contributing to the
literature and attracting more research into this field of study. This section presents a
summary of the literature dealing with mutual fund attributes.

38
2.1.1 Effects of Management Tenure (Past Record)
This section examines the varying perspectives on management tenure and its
influence over mutual fund performance. Management tenure is the number of years a
professional money manager has been working for a particular investment company.
In this study, management tenure stands as a proxy for experience. Although there is
an overwhelming consensus on the role of management tenure and its effect on
mutual fund performance, only a minority of the literature concludes that management
tenure is an attribute positively related to mutual fund performance. For example,
Adrangi et al. (2002) examine portfolio returns between professional money managers
versus randomly chosen stocks selected by a process called the “dartboard” method
(as the name suggests, a dart is thrown at a board listing all of the stocks on the New
York Stock Exchange (NYSE)). They found that professional money managers
outperformed the “dartboard” portfolio method, which in the study represented lay
investors managing their own portfolios without specialized financial knowledge.
Therefore, their research suggests that professional money managers are beneficial
(Adrangi et al., 2002). They also asserted that lay investors did not have the expertise
to filter relevant data to make a worthy investment decision. In this case, the relevant
data consists of financial and econometric information that could influence portfolio
returns. They further suggest that the move towards professional money management
and away from managing one’s own portfolio is due to professional money managers
specializing in this field and historically outperforming lay investors (Adrangi et al.,
2002).

39
Although one can be convinced by the conclusions presented by Adrangi et al. (2002),
Fortin and Michelson (1999) suggest that management tenure has no effect on mutual
fund performance. Furthermore, they suggest that all investors should look past
management tenure and examine other variables such as the risk characteristics of
mutual funds, the type of mutual fund, size, and NAV . They caution against the easy
conclusion that management tenure and mutual fund performance need be positively
related. Although professional money managers (mutual fund managers included)
have a specialized knowledge of markets, they do not possess any significant skills in
selecting stocks or timing markets. Although their study concludes that longer-term
fund managers have lower risk in their portfolios than shorter-term or inexperienced
fund managers, the relationship between management tenure and performance is
negative. Lemak and Satish (1996) side with Fortin and Michelson (1999) in their
study of 313 mutual funds; they also found that longer-term fund managers have more
stable returns than shorter-term fund managers because longer-term fund managers
construct less volatile portfolios.
Costa and Porter (2003) provide evidence that contradicts Adrangi et al. (2002). They
found that the experience or tenure of the mutual fund manager does not imply
expertise (Costa & Porter, 2003). The core argument between these articles concerns
whether professional money managers are needed. On the one hand, Adrangi et al.
(2002) suggest that they are needed because they are able to outperform the lay
investor. On the other hand, Costa and Porter (2003) suggest that professional money
managers are not needed because as experience or management tenure increases, it is
unclear whether experience contributes to mutual fund performance. According to

40
Adrangi et al. (2002), professional money managers should be able to perform better
because they have specialized knowledge and expertise in this field. Unfortunately,
Costa and Porter (2003) found that management tenure does not contribute to above
average returns, nor is it a cause of consistent returns. However, Costa and Porter’s
(2003) research does not suggest a negative relationship between performance and
management tenure, as in Fortin and Michelson’s study (1999).
Peterson, Pietranico, Riepe and Xu (2001) agree with Fortin and Michelson (1999)
and Lemak and Satish (1996) in not finding a statistically significant relationship
between management tenure and mutual fund performance in their cross-sectional
data over a nine-year span from 1992 to 2000. In fact, this study amplifies the
findings of Fortin and Michelson (1999), concluding that if their confidence level
were lowered from 95% to 90%, it would illustrate that mutual funds management
would be statistically significant, but the relationship between mutual fund
performance and management tenure would be negative. The negative relationship
could be explained by the conventional adage that as risk increases, the potential
return increases. Therefore, mutual fund managers who have longer tenures construct
less risky portfolios; this would explain why increases in management tenure translate
into lower, albeit consistent, performance.
However, a study from Goetzmann and Ibbotson (1994) suggests that mutual fund
managers with longer tenures who have had a two- to three-year span of abnormal
returns would experience similarly high rates of return in the two subsequent years.
This study reinforces Adrangi et al. (2002), that management tenure is needed because
of its attributable influence on mutual fund performance – the “hot hands”

41
phenomenon. Other researchers such as Costa and Porter (2003) state that this “hot
hands” phenomenon is not attributable to management tenure. They examined 112
mutual funds with managers having ten years or more of tenure versus 930 mutual
funds with managers having less than ten years tenure. They found that performance
persistence was not statistically different from one group of managers to the other. In
conclusion, Goetzmann and Ibbotson (1994), Adrangi et al. (2002), and other
researchers such as Grinblatt and Titman (1993) assert that mutual fund performance
is a function of longer management tenure. However, the literature presented by
Fortin and Michelson (1999), Lemak and Satish (1996), and Peterson et al. (2001)
suggest that management tenure is not a variable statistically significant enough to
explain mutual fund performance. Peterson et al. (2002) best stated the point that,
even though the literature on persistence is somewhat robust and conclusive, the
literature on management tenure exhibits mixed results.
The fact that there are many researchers in this field with different perspectives
regarding management tenure is evidence for the inconclusiveness identified by
Peterson et al. (2001).
2.1.2 Effects of Size (Asset Under Management)
The debate does not end with management tenure. This section examines the effects
of mutual fund size on mutual fund performance. This excerpt from Gregoriou and
Fabrice’s (2001) study encapsulates the rationale of size affecting performance:
“Studies investigating this relationship among mutual funds have yielded mixed
conclusions. Among academics, fund size is frequently quoted as a deterrent to
performance enhancement, especially when a substantial amount of cash is

42
continually injected into the fund” (Gregoriou & Fabrice, 2001). There are two points
to note from this statement: (1) The relationship between mutual fund size and
performance is mixed; and (2) One can infer from Gregoriou and Fabrice’s (2001)
statement above that larger mutual funds have a difficult time finding worthwhile
investment opportunities as the inflow of assets increases.
Although they do not examine the entire range of mutual funds (they specifically
examined only hedge funds in the study), they draw the conclusion that fund size has
no bearing on performance. However, Gregoriou and Fabrice (2001) believe that the
relationship between the two is not linear, and they introduce the concept of an
optimally sized portfolio. They suggest that small mutual funds cannot cover the costs
of acquiring and trading information, so the net returns to an investor on this small
mutual fund may only be minimal. On the other hand, extremely large mutual funds,
such as George Soros’ Quantum fund, also experience poor performance because of
management problems due to size. Furthermore, the argument for diseconomies of
scale, where management has a more difficult time organizing and implementing
investment strategy, is realized with larger funds (Gregoriou & Fabrice, 2001). The
results in their study state that mutual fund size does not influence performance.
However, they suggest that the relationship could be negative and statistically
significant if the confidence level were lowered (Gregoriou & Fabrice, 2001).
Moreover, if lowered, this would add to the literature suggesting that larger mutual
funds exhibit management problems such as not being able to sell out of or buy into
different positions quickly.
43
Likewise, Peterson et al. (2001) examined cross-sectional data through time and
found that mutual fund size measured by net assets has no effect on mutual fund
performance. Peterson et al. (2001), like Gregoriou and Fabrice (2001), admit that the
literature is sparse in regard to the size/performance relationship. Of course, there is
contradictory evidence presented by Indro, Jiang, Hu, and Lee (1999). They recount
that when the mutual fund Fidelity Magellan was getting too large, the fund manager,
Jeff Vinik, had to divest out of equities and into bonds because the management of
such a large fund was becoming too daunting. Saunders-Egodigwe and Franeki (1998)
also amplify the observation made by Indro et al. (1999). Their study reported that
many other mutual funds also closed off the inflow of investor money in the late
1990s because fund managers were suddenly burdened with moving large amounts of
money into and out of positions. Mutual fund managers found that the organization
and implementation of investment strategy was becoming more and more difficult.
However, Indro et al. (1999) do not suggest that as mutual funds gather more assets
performance declines. Their study pooled 683 domestic, actively managed mutual
funds from Morningstar’s Mutual Funds OnDisc database from the years 1993-1995
(Indro et al., 1999). The data used was cross-sectional. They found that mutual funds
must have a certain minimum amount of net assets before the costs of information
acquisition can be offset by gains from trading. They suggest that over a certain range
of mutual fund sizes, returns are poor for a small-sized fund, but as the fund becomes
larger, performance increases to exceed the cost of trading on information; however,
when the fund becomes too large, performance declines. The relationship between

44
size and performance is curvilinear. Hence, there is the suggestion of optimal size and
diminishing returns to scale as mutual funds become larger:
The incremental contribution to return from the cost of acquiring and trading on
information when the size of net assets is taken into account. An interesting pattern
emerges…A minimum size of net assets apparently exists below which the return is
insufficient to justify the cost of an active investment strategy.
In addition, beyond the breakeven size, the net gain to active management increases
with the size of net assets. But as the size of net assets increases…the magnitude of
the net gain is proportionally less with each successive group. (Indro et al., 1999)
This explains why the literature is ambiguous as to the true relationship between size
and performance. Many researchers concur with Wagner and Edwards (1993) that the
relationship is negative because when a fund becomes too large it necessarily incurs
certain cost disadvantages.
2.1.3 Effects of Turnover (NAV)
Mutual fund turnover is the complete cycle of replacing stocks within the portfolio.
Aside from the expense of commissions, there are other internal costs in owning a
mutual fund. This section examines NAV and their effect on performance.
Although the NAV changes then its effect on turnover ratio of a mutual fund adds to
the cost of investing in mutual funds, the literature exhibits mixed results in regard to
this variable’s relationship to performance; this is similar to the management tenure
and size/performance relationships discussed previously. Some researchers assert that
NAV is positively related to performance. They argue that as NAV increases

45
(implying active mutual fund management), the fund will perform better because fund
managers are able to see changes in financial market behavior. Also, when active
management is able to pull out of certain equity positions, high NAV could be a
signal of fund managers hedging to protect the growth of the mutual fund.
The study by Peterson et al. (2001) concluded that there was statistically significant
relationship between NAV and performance. They further mention that NAV was a
significant variable over the years tested (1992-2000); however, they claim that the
influence may be so subtle that the relationship cannot be detected due to the size of
the sample. Droms, William and Walker (1996) examined similar variables, but they
used 151 mutual funds over longer time intervals, spanning from 1971 to 1990. As
Droms, William and Walker (1996) regressed portfolio NAV against performance,
they further state that conventional finance literature suggests NAV is negatively
related to performance. However, they report that mutual fund managers are
performing efficiently, meaning as the mutual fund incurs costs for trading on
information such as turning over securities throughout the year, fund managers are
able to recoup those costs, even though performance stagnates. They conclude that
there is a positive and statistically significant relationship between performance and
NAV ; however, this contradicts the findings presented by Ippolito (1989), which
state there is no statistical relationship between NAV and performance, mainly
because turnover does not occur evenly throughout the year at equal rates. Amplifying
what Ippolito (1989) asserts, Droms and Walker (2001) reexamined their previous
study from 1996. Droms and Walker (2001) regressed mutual fund attributes such as
NAV and other operating variables with respect to performance and found that the
46
results were statistically significant and that NAV rates of mutual funds were
influential over performance. The literature has shown mixed results regarding its
relationship to mutual fund performance.
2.2 MUTUAL FUND INDUSTRY MANAGEMENT CUSTOMER
In recent years, there can be found as many definitions of CRM as there are clients.
Now, there is widespread acceptance that it is a philosophy or culture that should
penetrate the whole organization (Gofton 2001). It is a combination of business
process and technology that seeks to understand a firm's customers - who they are,
what they do, what they like - and convert them into returning customers. It is a
systematic approach to managing the relationship between a business and its
customers for mutual benefit (Couldwell 1999).
Defining customer relationship marketing is not an easy task. Relationship
marketing is perceived and defined in different ways both from an academic and a
practical perspective. CRM is defined by one financial service firm as: "an approach
to providing seamless coordination among process, people, information and
technology that creates positive experiences for a parry each time he or she interacts
with the bank. It is the capability for delivering each `valued experience' enabled by
the bank's knowledge about a party including their preferences, behaviours, goals, and
attitudes"
Parvartiyar and Sheth (1994) view relationship marketing as an orientation
that seeks to develop close interactions with selected customers, suppliers, and
competitors for value creation through cooperative and collaborative efforts. Several

47
other views of relationship marketing are noted: "Relationship marketing is database
marketing that emphasizes the promotional aspects of marketing linked to database
efforts" (Bickert 1992). Or, as Vavra (1995) suggests, it is customer retention in
which a variety of after-marketing tactics are used for customer bonding or staying in
touch after the sale is made. A more popular approach is to focus on "individual or
one-to-one relationships with customers that integrate database knowledge with a
long-term customer retention and growth strategy" (Peppers and Rogers 1999). And,
Shani and Chalasani (1992) define relationship marketing as `an integrated effort to
identify, maintain, and build a network with individual consumers and to continuously
strengthen the network for the mutual benefit of both sides through interactive,
individualized and value-added contacts over a long period of time.' Berry and
Parasuraman (1991) define relationship marketing more strategically as attracting,
maintaining, and in multi-service organizations, enhancing customer relationships.
And, Gronroos (1995) proposed relationship marketing is establishing relationships
with customers and other parties at a profit by mutual exchange and fulfillment of
promises. The primary goal of relationship marketing is to build and maintain a base
of committed customers who are profitable for the organization (Zeithaml and Bitner
2000) and, at the same time, minimize the time and effort spent on customers who are
not profitable. The benefits to the organization of building and maintaining this base
of committed customers are numerous and can be linked directly to an organization's
bottom line. Morgan and Hunt (1994) suggest that relationship marketing is all
marketing activities directed toward establishing, developing, and maintaining

48
successful relational exchanges. And, Gummesson notes that relationship marketing is
seen as relationships, networks and interaction (Gummesson 1999). This definition is
the only one that includes the concepts of networks and interaction. From a
practitioner's perspective, it is considered a strategy to enhance existing relationships
by expanding the depth of the relationship (by investing more money on more
products and services with the firm) and by concentrating on repeat business from the
firm's most valuable customers. It is marketing-oriented management, not limited to
marketing or sales departments but becoming part of the total management of the firm
(Gummesson 1999). And, most financial service firms use CRM systems as the basis
and driver of their relationship marketing and management strategy.
For the purpose of this study, the following definition is used: Customer
relationship marketing is the ongoing process of engaging in cooperative and
collaborative activities and programs with the purpose of enhancing mutual
economic value over the long-term using technology, programs and protocols that
intentionally aim to enhance the depth of the relationship. Without these aspects of
interaction between the firm and the customer, the relationship could easily unravel.
It is important to recognize the value of each customer segment and to concentrate
relationship marketing programs on those segments of customers who have a higher
potential to return profits to the company.
2.3 IMPACT OF IT AND IT ENABLED SERVICES IN MUTUAL FUND
INDUSTRY
The impacts of 1T and IT Enabled Services (e-finance technologies) on
financial institutions vary from one country to another. The financial institutions in

49
the developed countries are able to align new IT with financial management much
better than their counterparts do in both newly developed and other developing
countries. Therefore, the financial institutions in the developed countries may
outperform their counterparts in the newly and other developing countries in terms of
their operational performance as measured the cost and profit efficiencies and scope
economies. No legacy systems but the most updated IT systems are usually applied in
the newly developed countries; thus, the financial institutions in the newly developed
countries may leapfrog over their counterparts in the developed countries. Moreover,
the use of IT may spur the further integration of the international financial
institutional markets across nations; and this intrigues me to test the international
market integration hypothesis in the context of IT and IT Enabled Services.
During the past decade, information technology (IT) has profoundly changed the
landscape of international financial markets. For instance, in the U.S., financial
services have become the largest customer of IT in the economy. This phenomenon
also has taken place in many other countries. The use of IT has overwhelmingly and
fundamentally improved the quality of financial services and operations of financial
institutions. This dramatic development, known as e-finance, has become a focal point
of practice in multinational financial institutions.
What is e-finance? Hartmann (2002) defines e-finance as "transactions in which
funding for an economic activity is provided through an electronic communication
medium." Therefore, by definition, e-finance is a branch of e-commerce, while e
commerce forms a critical part of the management of IT. Allen et at. (2002) define it

50
as "the provision of financial services and markets using electronic communication
and computation." Hence, the term e-finance technology can be referred to as the
application of IT in the field of finance. The relationships among IT, e-commerce, and
e-finance are illustrated in Figure 1.
Figure 2.3.1 The Relationships Among IT, E-Commerce, and E-Finance
The impacts of e-finance may be categorized into two types. First, the use of
electronic communications, such as electronic bill paying, home banking, and internet
transaction; has been altering business-to-business (B2B) and business-to-customer
(B2C} in the financial markets. The marketing accessibility of financial institutions is
extended and increased to remote areas or countries via new telecommunications
technology. Second, the applications of electronic computation and databases shorten
the IT here refers to the information technology in a broad sense, which includes

51
telecommunications. Some others have called it ICT (informational and
communications technology). Reproduced with permission of the copyright
owner. Further reproduction prohibited without permission. The Management of
IT (including electronic computation and electronic telecommunications) E-
Commerce or E-Business (Distribution channels, promotions, and technical
execution of transactions of business) E-Finance (Internet banking, paperless
processing, stored-value cards, e-payment, on-line stock trading, etc.) processing
time of each financial transaction. Thus, via electronic communication and
computation, financial institutions can operate more efficiently than ever before.
Here, e-finance is defined as the application of 1T (including electronic computation
and electronic telecommunications) in financial management.
On the other hand, after many countries have joined the European Economic Union
(EEU) and the World Trade Organizations (WTQ), goods, labor, and services are
allowed to move easily across national boundaries. International harmonization of
regulation in financial markets is expected (White, 2000). The diffusion of e-finance
technology across nations further speeds up the transmission of information in
different countries. Hence, the global financial markets could become more unified
than before due to the progress of e-finance (Claessens et al., 2002). Therefore, an
investigation of the international market's integration of financial intermediaries along
with the development of IT is important.
In the finance literature, many previous studies (e.g., Timme, 1991, among others)
have explored the `technological change' of commercial banks in the U.S. Only a few,
such as Lin and Lin (2004) and Lin et al. (2004), have discussed technological

52
changes under the framework of international finance. Furthermore, the concept of
the `technological change' is too broad to capture the contribution of IT. Therefore, it
is critical to evaluate the impact of IT on the international financial industry.
Although IT investments are risky and costly in practice, they are seldom tied to
profit-making aspects (Lin and Shao, 2000; and Shao and Lin, 2002). In the
information systems literature, this problem is well-known and called the IT
productivity paradox (Hitt and Brynjolfsson, 1996; Brynjolfsson and Yang, 1996;
Dewan and Kraemer, 2000 and Lin and Shao, 2000; among others). While financial
institutions are the major customers of IT, justifying substantial IT investment has
become necessary and important. Alpar and Kim (1991) have found that IT is cost
saving, labor saving, and capital using, but Prassad and Harker (1997) have stated that
IT investments have little significance on the productivity of commercial banks.
Therefore, there is no conclusion on whether or not IT significantly contributes to the
profit or cost performance of financial institutions.
Moreover, most previous research on e-finance has been confined to the case of the
U.S. And, an international comparison in this field is rare except the work of
Claessens et al. (2002), who have discussed e-finance all over the world by using
conceptual reasoning rather than providing strong empirical evidence. Therefore, it is
important to investigate the impact of IT on financial services across nations, given
that the world economy is increasingly globalizing.
Although the literature essentially remains silent on the effect of e-finance on
international finance, the impact of IT across nations has been discussed extensively.
For instance, Dewan and Kraemer (2000) have investigated the international

53
productivity paradax of IT. They have found that IT investment is negatively related
to the productivity across nations. However, they have found strong evidence to
support the conten'ien that IT improves productivity for developed countries, but
reduces productivity for newly developed and other developing countries. In other
words, the negative relationship between IT and productivity is supported by the
observations from the developing countries subsample and there is no "productivity
paradox" in the developed countries at all.
The major businesses of commercial banks include loans (commercial and consumer
loans), deposits (term deposits and demand deposits) and financial investments (long-
term and short-term). The insurance industry consists of property/casualty insurance,
health care insurance, and life insurance, and can also be categorized into life and
non-life insurances. Although the sources and uses of funds are different across these
· The definition of globalization according to Czinkota et al. (2000) is that
the discrepancy among different will decrease and eventually disappear.
two types of insurances, they have some basic common features: they receive
premiums from customers, pay them for accidents, and invest their reserves in
financial markets. Due mainly to the limit of data available, I do not separate
them in this study. According to Rai (1996), most international insurance
companies (over 60%) are engaged in both life and non-life insurances, but
during this deregulation era, the boundary between these two insurances
becomes less important because in many countries an insurance company
issues both life and non-life policies. This trend justifies our focus in this study

54
on a global comparison rather than comparing different types of insurance
companies.
Regarding the methodological issues, note that efficiency analysis has become
dominant in research on financial institutions (Allen and Rai, 1996; and Rai,
1996). I follow this convention but adopt a more generalized stochastic frontier
approach to estimate cost and profit efficiencies. This approach is shown
empirically and theoretically to be superior to previous approaches.
This section discusses the relevant findings and problems of the earlier studies that lead
to the development of goals for this research. The debate on IT's contribution to
Corporate Performance(especially Sales) has contributed for at least three decades. So
far, apparently no study has found a significant relationship between lT investments and
the overall profitability of the firm, and only a few studies have found a significant
positive relationship between IT and some aspect of Corporate Performance(especially
Sales). The argument of Hitt and Brynjolfsson (1996) that IT contributes to
productivity but not profitability (as all the gains are passed on to the customers due to
heightened competition may be true in the case of few firms. However, it is not clear
why their argument should be true for all firms, cutting across different industrial
settings and competitive arenas. Also, if it is true that firms investing in IT see no
increase in profits due to heightened competition, then the firms not investing in IT
should probably see a decrease in profits and tend to go out of business in turn, the
presence of fewer firms should lessen competition and result in increased profits for the
surviving firms. Many problems associated with evaluating IT's contribution to

55
Corporate Performance(especially Sales) are methodological in nature. The evaluation
of IT's contribution to Corporate Performance(especially Sales) appears to be sensitive
to the research methodology adopted by a given researcher (Noyelle, 1990). Depending
on the methodology adopted, one may or may not be able to assess the contribution of
IT. For example, using the same data set, Loveman (1999) finds no contributions while
Barua (1995) do. Aside from a couple of novel approaches (e.g. Bresrtaha R, 1986;
Banker and Kauffman, 1988), two major methodologies have been utilized in
previous studies to evaluate 1T's contribution to Corporate Performance(especially
Sales). At least seven studies ( i.e., Cron and Sobol, 1983; Bender, 1986; Harris & Kat,
1988, 1989; Siege! and Griliches 1991; Baruu., 1995; Brynjolfsson 1996) employ a ratio
approach to evaluating IT's contribution to Corporate Performance(especially Sales).
These seven studies use either correlation or regression analysis to establish the
relationship between a particular CT ratio and a particular profitability ratio. Although
none of these seven studies found a significant relationship between FT investments and
the fern’s bottom line, each one (except for Hitt & Bryryol~'sson, 1996) did find a
significant positive relationship between 1T investments and some important aspects of
Corporate Performance(especially Sales). Thus, the findings of these seven studies are
generally consistent. On the other hand, studies by Mocrison & Berndt (1990),
Loveman (1999), and Hitt 8c Brynjolfsson (1996} employ a production function
(drawn from microeconomics theory} to evaluate IT's contribution to Corporate
Performance(especially Sales). The findings of these three studies are inconsistent.
Morrison & Bernd that the marginal contribution of IT to productivity is minus 20%;
Loveman finds it to be 0%; and Hitt & Brynjolfsson find it to be plus 95%. These three

56
widely different findings indicate that the researchers may not have selected an
appropriate production function to evaluate IT's contribution to Corporate
Performance(especially Sales). Hence, the present study uses the ratio approach to
evaluate IT's contribution to Corporate Performance(especially Sales). There are also
other reasons for using the ratio approach in the present study. Firsr, the ratio
approach appears to be most appropriate for this study's objectives and goals. Alpar
& Kim state that financial ratios "are excellent indicators of the state of a firm and an
industry" (1990: 67). IT-related ratios are used by industry associations, consulting
firms, and corporate management to compare one or more firms with competitors
(Snotty & Gruber, 1981). Similarly, Harris & Katz observe that "financial ratios have
been used extensively to predict firms performance" (1989). Studies by Beaver (1966),
Altman (1968), Pinches & Mingo (1973), McGowan (1985), and Buzzel & Gale (1987)
are all examples of studies using financial ratios to understand and predict Corporate
Performance(especially Sales). Second, the findings of the financial-ratio approach are
more meaningful and easier to interpret than the findings of the production-function
approach. For instance, in the production-function approach it is not clear as to what a
high- or low-gross marginal product means, or how an organization may apply this
knowledge. ln this regard, it is instructive to note that while Hitt & Brynjolfsson (1995)
found a surprising 95% gross marginal product for 1T (which implies that firms are
considerably under-invested in IT), they are quite ambivalent about recommending
more IT consumption by firms. On the other hand, Barua et al. (1995) use the financial-
ratio approach, and their results inform us about the degree of relationship as well as the
detection of association between a particular IT-spending ratio and a particular financial

57
ratio such as capacity utilization or inventory turnover. Similarly, Harris and Katz
(1989) use the financial-ratio approach to develop a model that discriminates, with high
reliability, between high-performing and low-performing insurance companies based on
their IT spending levels. Third, the production-function approach is based on the
assumption that firms are driven solely by the motive of obtaining higher profits or
lower costs. This assumption may not always be valid as organizations are run by
people, whose motivations are not necessarily aligned with those of the organization.
Sometimes, managers are less interested in increasing firm's profits or reducing firm's
costs but more interested in increasing their own job security or stability (Gordorr,
1961). These managers may engage in empire building or showing off{e.g. having
more secretaries, better parking spaces, bigger offices, fatter expense accounts ), and in
increasing their persona! status, power, or income (Williamson, 1966). Thus, managers
may make IT investments not for reasons of improving the firm's bottom line but for
other reasons, including possession of the latest technology to impress colleagues. The
evaluation of IT's contribution to Corporate Performance(especially Sales) is also
sensitive to the nature of the specific measure employed as the independent or the
dependent variable. The use by Barua (1995) of several lower level financial ratios
(capacity utilization or inventory turnover) rather than higher-level financial ratios
(return on assets or return or equity) is a case in point. Also, it is important to note that
return on equity or return on assets may not always be the most relevant ratios for
evaluating the financial heath of all industries. For instance, cash-flow ratios are often
better predictors of the financial health of real-estate firms or REIT, like passenger-load
factors may better explain the profitability of airlines. Thus, it makes sense to examine

58
the changes in the different financial ratios in different contexts and over time in order
to capture meaningfull the impact of IT investments on Corporate
Performance(especially Sales). Similarly, it seems that the ratio of IT spending to total
operating expense is a better predictor of Corporate Performance(especially Sales)
than the ratio of IT spending to the number of employees. Bender (1986) and Harris &
Katz (1988, 1989) use the ratio of IT spending to total operating expense as the
independent variable in their studies, and their findings are consistent. Each of these
three studies finds a significant positive association between IT investments and some
key aspect of Corporate Performance(especially Sales). On the other hand, Barua
(1995) and Hitt & Brynjolfsson (1996) use the ratio of IT spending to number of
employees as the independent variable and their findings are inconsistent. Further, it
appears that the proportion of the total operating expense that a firm spends on IT is a
better indicator of that firm's commitment to IT than an absolute dollar amount per
employee that the firm spends on IT. The absolute dollar amount per employee that a
Firm spends on IT is not merely a function of that firm's commitment to IT' but also a
function of that firm's resource richness. A resource-rich firm is more likely than a
resource-scarce firm to purchase IT without necessarily making sure that the IT being
purchased is really needed by the firm. Thus, a resource-rich firm with little
commitment to IT may spend on IT a higher dollar amount per employee than a
resource-scarce firm with a high commitment to IT. On the other hand, the proportion
of the total operating expense that a firm is ready to spend on IT is essentially a
function of that firm's commitment to IT. Thus, it seems that using the ratio of IT
spending to total operating expense as the independent variable may provide

59
meaningful insights into the relationship between lT' investments and corporate
performance. lt also seems that the identification of the relationship between IT
spending and Corporate Performance(especially Sales) is significantly dependent on
what specific IT spending ratio is used as the independent variable and what specific
financial ratio is used as the dependent variable. Hence, it makes sense to use different
1T spending ratios as independent variables, and examine the relationship between each
of them and the various financial ratios to capture IT's contributions to Corporate
Performance(especially Sales). Much research has been done to evaluate the average
contribution of IT to Corporate Performance(especially Sales) atoning forms using IT.
Earlier studies do not examine how IT's contributions to Corporate
Performance(especially Sales) vary across firms. Surely, some firms employ IT more
effectively and consequently obtain greater benefits from IT usage than other firms.
Also, much research seems to be based on the notion that as the amount of IT' used by a
firm increases, so do its profits. These studies tend to emphasize the quantity and tend
to ignore the quality of information that a firm processes or generates per unit time.
Clearly, if good information management is important for a firm's operations and
performance, then both the quantity and quality of information that a firm processes or
generates per unit time do matter. A firm's recent-past performance provides some
insight into the effectiveness of that firm's existing information-management system.
Thus, it would make sense to control for a firm's growth rate in the recent past while
exploring the relationship between IT investments and Corporate
Performance(especially Sales). Earlier studies exploring the relationship between IT
investments and Corporate Performance(especially Sales) have tended to neglect or

60
ignore the factor of risk. It is very important to incorporate risk in the model for
evaluation of IT impacts. Clearly, the management of risk is a key aspect of
performance. Also, a firm's risk-adjusted performance may be quite different from its
performance not adjusted for risk {this is most clearly evident in the case of mutual
fund companies or investment advisory firms). Thus, it is not unreasonable to expect
that the relationship between IT investments and risk-adjusted performance measures
may be quite different from the relationship between IT investments and performance
measures not adjusted for risks. Ironically, the employment of rapidly advancing IT'
not only facilitates risk management but also accentuates the kinds and levels of risks
faced by a firm. It is conventional wisdom that introduction of new technology in the
marketplace poses challenges for the existing market leader and provides opportunities
for the current market follower to overtake the market leader. However, in the
information era, the challenges faced by the market leader in any given industry are
more frequent and come not only from within the industry but from all parts of the
economy. The information ere is characterized by more and increasing levels of
knowledge, complexity, and turbulence (Huber, 1984). It is also characterized by
constantly shifting demographics, ruthlessly competitive global markets, severe
regulation, short product-life cycles, and scarce resources (Piore & Sabel. 1984; Miles
& Snow, 1986; Handy, 1989; Ohmae, 1989). To cope with these new environmental
realities, organizational adaptations appear to include the strategies of "buy not make" and
"collaborate to compete," both characteristics of the Virtual Corporation (VC).
Increasingly, organizations are adopting numerous strategies: outsourcing (Malone.,
1987; joint ventures (Harrigan, 1985); strategic alliances (Hamel., 1989); information

61
partnerships (Konsynski & McFarlan, 1990); inter-organizationaI collaboration (Astley
& Bruhm, 1989); new hybrid organizational structures or forms (Powell, I987; Borys
Jemison, 1989); and dynamic networks that form and reform with a lead firm acting as a
broker (Miles and Snow, 1988) or as a hub (Jarillo, 1988). Thus, the barriers and
boundaries between organizations and industries appear to be less distinct and more
diffuse. Accordingly, the challenge to a firm can come from any number of sources.
Hence, it is important to consider the factor of risk when exploring the relationship
between IT investments and Corporate Performance(especially Sales). Further, all
studies except Weill (1990) conceive of IT as one monolithic, homogeneous entity.
Clearly, there are different types of ITs: from telecommunications to mainframe
computers to networked client-servers to stand alone desktops, etc. Why, then, should
the impacts of different ITs be the same? Additionally, nearly all studies are plagued
with technological determinism: use IT and a definite profitability outcome will ensue.
Barring studies done by Barua (1995) and Hitt & Brynjolfsson (1996), much of the
relevant research has tended to ignore all contextual variables. Most studies seem to
be based on the notion that a single characterization of the effect of IT usage on the
firm's profitability is possible, and would be true for all firms, irrespective of their
size, industry setting, competitive arena, or IT-management practices and tactics. Why
should the information needs and IT requirements of a small semiconductor firm be
same as those of a large semiconductor firm or of a large airline? Again, why should
the impact of IT investments on profitability for a firm using 1T to control costs or
improve management control be the same as for a firm using IT to improve customer
service or operational flexibility? To conclude, there are clearly a large variety of

62
firms operating in widely different settings and competitive situations. Further, IT's
contributions are not limited to just one Corporate Performance(especially Sales)
variable or dimension. Should not then, our ability to understand, explain, and predict
IT's contribution to Corporate Performance(especially Sales) be dependent on how
well we simultaneously address sets of contingencies, performance criteria, and
tactical alternatives.
2.4 ROLE OF INFORMATION TECHNOLOGY & CUSTOMER
RELATIONSHIP MANAGEMENT IN MUTUAL FUND INDUSTRY
Most of what has been written about CRM is from the practitioner's point of
view (Plakoyiaunaki and Tzokas 2002) and relatively little is known about the CRM
process as there is no field-based empirical research to provide a clear picture of the
system's process complexity. Yet, Forrester Research reports that only 2% of
businesses have an integrated view of customer data (Calhoun 2001) and most firms
still seem to strategize in silos (i.e., each department or division concentrates on the
strategy that will help achieve their goal rather than overall company goals).
Customer databases in different departments of a firm are rarely linked together
especially Sales in financial service companies where investment in legacy systems
has hindered the use of database technology. One of the top barriers stowing CRM
deployments are integration with legacy systems (65%) and pulling together scattered
legacy data sources (62%) (Sweat 2000). (Legacy systems are large computer systems

63
and application programs that capture large stores of information specific to a
corporation's needs (customer or otherwise) and are usually very organization-specific
and very difficult and cost prohibitive to modify) (Gold 1998). Although things are
changing and more dollars are being invested to merge and enhance these systems,
financial institutions are still a long way from achieving this.
During the 1990s, technological advances bolstered the amount and quality
of customer data available to firms and firms began to spend millions of dollars on
CRM systems. Companies began to look at their customers more holistically in
order to better understand the reasons behind their loyalty (James 2002). CRM
systems may, justifiably, pose other concerns for marketers. Do consumers
understand what database technology is? Do consumers view database marketing
as an invasion of their privacy or do they, as marketers believe, see it as a method
of enhancing a marketer's knowledge in order to better understand the customer's
needs? Although most corporations have strict policies around customer
information and privacy, earlier studies have shown that consumers and marketers
do not necessarily perceive ethical issues in the same way. Even though
corporations distribute a `privacy policy' to their customers, it alone does not
necessarily provide the level of confidence that a customer has in the firm's privacy
practices. And, customers today are more aware of marketing databases and how
that information is used. Information technology equates to knowledge for the
company and for the consumer. It could be argued that this technology shift is
causing more and more anxiety on the part of consumers who resent the amount of
information firms have accumulated on them and, at the same time, sense a

64
departure from the one-to-one personal relationship they previously knew. Yet,
having a customer database is no longer a competitive advantage. Not having one,
however, is a competitive disadvantage (Newell 1997). Database marketing allows
the firm to combine the best of customization and personalization in varying
degrees. 1999-2000 was the year of exposing "privacy laws" to consumers in the
hope that their fears would be allayed. Customers, however, still tend to view
information technology as an invasion to their privacy. This reaction also tends to
erode the trust element in the relationship. In spite of all the confidence placed on
database marketing systems, emotionally satisfying relationships require periodic
human presence. Absent human involvement, authenticity is compromised in a
customer's perception (Sheth and Parvatiyar 2000). CRM does not necessarily
espouse elimination of personal contact, but it certainly is designed to minimize the
time human interaction is needed. Barefoot (2001) suggests that the best way to
avoid problems with customer privacy is to build a pervasive privacy culture
within the organization so that employees can recognize privacy issues when they
encounter them and know how to react. This, of course, requires leadership that
builds and then sustains sensitivity to privacy throughout the company. Installing a
privacy culture in a financial institution requires a supportive environment. The
critical factor becomes the surrounding culture in which employees operate -- that
set of shared understandings and informal rules that groups use to guide behaviour.
Generally speaking, financial service institutions today possess deeply rooted
cultures that guide employees toward building market share and earnings.
However, when privacy issues arise outside the scope of new rules (e.g., Gramm-

65
Leach-Bliley Act), they will struggle to compete for thoughtful attention with the
business values already entrenched there, including a drive to gather ever more
customer information and use it more creatively to improve performance. After all,
such use of customer information constitutes one of the major building blocks of
the customer relationship management strategy (Barefoot, 2001). Using database
marketing is considered by the firm as an innovative way to present new products
and services to consumers based on their buying patterns translated to their specific
needs - products and services intended to enhance the relationship. It helps to
build, strengthen and maintain relationships. This permits firms to segment in new
ways and retain customers via the design of products and services that meet the
needs of customer "clusters", communicate with them more effectively, and earn
their loyalty. It employs tools (neural networks, decision trees, rule induction, etc.)
that look for meaning, find patterns and infer rules that may be causal, predictive
or descriptive to make better management decisions (Gordon 1998). At the same
time, however, customers often perceive it as an invasion of their privacy. In the
final analysis, the financial institution must create a complete culture supporting
infrastructure with written policies and procedures, ongoing privacy training,
creating privacy `champions' who monitor customer interactions and the
institution's own products and practices. Employee `ownership' of the privacy issue
is a must if sensitivity to it is to permeate the corporation and if customers are
going to get the sense that they are in secure hands. Customer information
generally captured in databases includes things like: name, phone number,
customer value (to the firm), demographics (household size, age, income, gender),

66
consumption habits, psychographics, purchase and post-purchase behavior,
creditworthiness, etc. In the right hands, the company can learn about consumers
and add value to the relationship. In the wrong hands, this information can
compromise the customer (Gordon 1998). Database marketing can identify
customer differences and similarities and can help marketers know what customers
want. It is also important to characterize segments into identifiable and measurable
groups via demographic and psychographic variables (Zeithaml 2000). Database
marketing helps the firm do this. Clearly, then, for CRM to be successful several
elements must be in place: a database of the highest quality; a high level of
commitment at the top of the organization and alignment of activities around the
CRM strategy and goal; proper segmentation; appropriate protocols that add value
for the most highly-profitable customers; and a high level of training and
indoctrination of all employees. It also is important to created easily accessible
technology for customers' use so that information on them can be more easily
gathered. Managed appropriately and consistently, this should increase customer
satisfaction and, in turn, customer loyalty rates. Today's database technology is
powerful and, used appropriately, provides the firm the capability to manage
proper products and services to customer segments. However, if not appropriately
applied, it can also serve to put the customer outside the firm's walls (Gordon
1998). Caught up in our enthusiasm for our information-gathering capabilities and
for the potential opportunities that long-term engagements with customers hold, it
is possible that we have forgotten that relationships take two sides to succeed
(Fournier, Dobscha and Mick 1998). We may have lost sight of the needs of the

67
relationship. In other words, to get loyalty a firm must give loyalty. To get trust, a
firm must give trust. Database marketing supports the CRM effort, but may be
precisely the element that turns customers away.
2.5 HOW TO MEASURE CUSTOMER RELATIONSHIP MANAGEMENT –
IN MUTUAL FUND INDUSTRY
Increasingly, customer satisfaction and loyalty measurements are being integrated
with internal operational data that CRM systems provide. Firms also need to be able
to justify the enormous costs of their CRM systems and need to be able to measure the
effects of CRM on the bottom line. According to James (2002), the top three strategic
rationales for implementing CRM have been to increase customer retention/loyalty, to
respond effectively to competitive pressure, and to differentiate competitively based
on customer service superiority. Linking CRM data with customer satisfaction survey
data let firms show that CRM systems have a larger, indirect effect by influencing
customers' intentions. Total spending by U.S. banks on CRM was close to $9 billion
by the end of 1999 and was expected to grow to $46 billion by the end of 2003
(Patton 2001). In the industry, it is thought that the Pareto rule still holds where a
small portion of elite customers account for the bulk of profits (Masters 2000)-
approximately 80% of bank profits come from 20% of customers. But, this may be
over stated. Deloitte Consulting suggests that a mere 3% of customers provide up
to 44% of profits at Norwest, a Minneapolis-based regional bank now merged with
Wells Fargo (Kiesnoski 2000). Increased loyalty among high value customers, actual
or potential, has a major effect on profitability according to a Gale Group study

68
(Masters 2000). Generally, this is precisely the reason that financial service industry
firms install CRM protocols for their most highly-valued and profitable customers.
CRM, however, is not for the weak-spirited. Although the technology is designed to
help companies keep track of their customers and boost revenues by developing long-
term relationships and increasing customer loyalty, it is proving difficult to
accomplish. Companies are investing up to $70 million in a CRM launch and millions
more during multi-year rollouts. Yet some companies still jump into CRM projects
without clear strategies or support from top management (Patton 2001). B2B
Analysts' President, David Dobrin, in visits to six Fortune 500 companies during 1999
and 2000, described CRM projects as `moribund' or used in a way that didn't match
initial expectations (Patton 2001). The collective opinion about CRM
implementations and results suggest that part of the problem with CRM is that, once
installed, associates are not trained properly to use it efficiently nor does top
management continue to give it the support it needs to produce the expected results.
Companies are beginning to demand more practical and long-term support
from CRM consultants. Many firms have learned that CRM is more than a
technology or software solution. Other factors involving organizational changes,
executive (upper management) support and buy-in, user friendliness, and ongoing
CRM consultant support are important in the success of CRM implementations. In a
report sponsored by IBM and Royal Mail, it was suggested that the most advanced
companies were at best only two-thirds of the way to implementing CRM by the end
of 2000 (Goflon 2001). Insight Technology reported in 2000 that 31% of companies
implementing CRM solutions believed they received no return on the investment;

69
38% reported only minor gains; and 70% reported it was a failure or minor success
(Calhoun 2001). The Gartner Group reported that 45% of CRM projects fail to
improve customer interactions while 51% generate no positive returns within three
years and the Meta Group goes further to say that up to 75% of CRM initiatives fail
to meet their objectives (Anonymous 2001). Another study showed that 35% of
CRM users reported significant improvement in customer satisfaction; 46% showed
slight improvement; and 15% could not tell the difference (Sweat 2001). Although it
may be too early to tell, these numbers are discouraging at best. There are many
reasons why it is thought that CRM programs have failed. However, one study
suggests that to drive loyalty a firm must take an integrated approach that focuses on
improving the total customer experience (Calhoun 2001), a strategic and costly
approach that not all firms are willing to take. On the other hand, in an article
predicting future trends in CM Yorgey (2002) emphasizes that companies will
realize that customer satisfaction does not always translate to loyalty, She notes that
many customers may be dissatisfied with a service but remain loyal to a product and
continue to buy it. And, it is safe to say that the opposite is also true that as many
customers may be satisfied with a service but will switch if enticed with a better
offer. Most reported results of CRM implementations come from consulting firms or
from CRM firms themselves via in-house customer satisfaction surveys. If CRM
systems are so sophisticated, then, why is there so much dissatisfaction with them?
Why are measured results so poor compared with firm expectations? Why aren't
those companies that install such programs producing the expected increased
customer satisfaction and increased loyalty? And, why aren't there more studies

70
analyzing the roots and results of so important an investment? Many factors may
contribute but there is an obvious need for more empirical investigations into CRM
strategy.
2.6 OVERALL CUSTOMER SATISFACTION IN MUTUAL FUND
INDUSTRY
Why should a financial service firm, then, invest so much money, time and effort to
pursue a systemic customer relationship marketing strategy? One reason is that as
mentioned earlier, historically, those firms that concentrate their efforts on retaining
customers and establishing long-term relationships produce higher profits than those
who concentrate their efforts on acquiring new customers (Reichheld and Sasser
1990; Anderson and Sullivan 1993). In the credit card industry, especially, where
competition is at the highest it has ever been and where the customer base is saturated
with offers from every other financial institution, it is important to understand the
customer's needs in order to grow the depth of the relationship and to achieve higher
profits. In every economic quarter since the American Customer Satisfaction Index
began (in 1994), banks trail the national satisfaction statistics by a significant
percentage each year. While overall national satisfaction scores have modestly
increased over the past five years, bank customer satisfaction scores have declined 5.1
% (Feinberg, Hokama, Kadam, Kim 2002). Hence, it is important to concentrate
efforts on improving customer satisfaction rates. And, one way to do this is through
implementation of a CRM strategy. One of the major goals of CRM is to identify

71
what protocols not only satisfy customers but what protocols "delight" them so that
customers warn to maintain and grow a relationship with the firm. It is thought that
the more satisfied customers are, generally, the more loyal customers are. As was
mentioned earlier, several authors have identified a strong and positive link between
customer satisfaction and loyalty (Jones and Sasser 1995; Rust and Zahorik 1991);
Anderson and Sullivan 1993; Payne, Hoh and Frow 2000). Others have found a
distinct link between customer satisfaction, loyalty and customer retention (Reichheld
and Sasser 1990; Reichheld 1996). And, research suggests that customer loyalty
(rather than relative market share or any other factor) is the primary determinant of
profitability. Needless to say, concentrating efforts on customer satisfaction in order
to promote loyalty among customers is a major part of the CRM strategy of modern
financial service firms. One way to do this is to not only be customer-oriented, but to
be involved in educating, training and providing the most sophisticated technical
support to the staff to obtain buy-in and understanding of the importance of treating
customers with a `long-term relationship' in mind. To accomplish this, every
department that directly or indirectly touches a customer must be involved in
determining which protocols will result in higher customer satisfaction rates amongst
the most highly valued customers. Although some authors conclude that increased
customer satisfaction rates lead to increased loyalty, increased retention rates and
profitability, there is also discussion about what, exactly, customer satisfaction is.
Some authors suggest it is perceived quality (as opposed to expectations) directly
affecting satisfaction rates (Churchill and Suprenant 1982). Others show that
disconfirniation (the extent to which perceived quality fails to match pre-purchase

72
expectations) is an important antecedent of satisfaction (Anderson and Sullivan 1993)
along with perceive quality. Others contend that providing customers with
outstanding value may be the only reliable way to achieve sustained customer
satisfaction and loyalty (Jones and Sasser 1495; Heskett, Jones, Loveman and Sasser
1994). And, one way to establish value in the financial services industry is to provide
customers with choices in their method or channel of banking (e.g., , telephone/IVR
banking, internet, banking centers). Others have investigated the importance of the
overall physical setting and a customer's familiarity with the players (associates) of a
firm that can influence a customer's ultimate satisfaction (Garbarino and Johnson
1999). Although there are many different ways to measure customer satisfaction,
there is consensus that it should be viewed as a judgment based on a cumulative
experience rather than on a one-time transaction event (Homburg and Giering 2001).
A single transaction producing satisfaction is unlikely to produce loyalty and vice
verse. It is relatively clear that a lot depends on how you define customer satisfaction
and on whom you are trying to satisfy. Satisfaction is relative and because of the
relationship to various norms, it should not be taken in an absolute sense (Goode,
Moutinho, Chien 1996). As there are indeed many elements of customer satisfaction,
hence, many definitions of a satisfied customer exist. They can be thought of as those
customers who indicate anything above a "5" on a scale of 1-10 or it can be thought of
as only those who are "highly" satisfied by choosing anything above an "8" on the
same scale. Some studies reveal that there is a sizeable difference in retention rates
between those who say (in a questionnaire) that they are very satisfied and those who
are just satisfied (Gummesson 1999). Some organizations do not even distinguish

73
between the satisfaction rates of their most and least valued customers (Gofton 2001).
According to Heskett, et al. (1994), there is a distinct relationship between satisfaction
and loyalty (defined by them as retained relationships). The more highly satisfied the
customer, the more loyal they are and the more likely they are to remain a customer.
On the other hand, many customers say they are satisfied but are not loyal and switch
for a variety of reasons - persuasion by another firm, the influence of friends, a desire
to try something new, etc. And, many dissatisfied customers remain despite the fact
that a firm is charging more or offers lower quality than a competitor (Gummesson
1999). Perhaps this is due to their fear of switching or the difficulties involved in
establishing new relationships. And, it is important to understand which segments of
the customer base are more likely to stay or switch, whatever their reason may be. It is
important to note here the existence of the `service paradox' which states that the less
profitable customers are, the more satisfied they are; while the more profitable
customers are the less satisfied they are (e.g., the airline industry offers an off season
economy ticket for $250 and full business for $3000; the business traveller is
profitable but highly demanding and the economy traveller is less profitable but
gratefull for a low price and not as demanding. There is a likelihood that the business
traveller is less satisfied even though he/she is offered better service) (Gummesson
1999). This is important because CRM customers are the firm's `most profitable' and
possibly their least satisfied customers. For the purpose of this study, customer
satisfaction is defined as "those customers who are satisfied with the value of their
credit card". In this particular financial service firm, it is the installation and practice
of new CRM protocols that is expected to so enhance the customer experience and

74
provide increased value that those customers receiving these protocols will be more
highly satisfied than their non-CRM counterparts who receive only basic products and
services and no special treatment. It is thought that these protocols and special
treatment add value to the customer experience as they are intended to enhance the
interaction the customer has with the firm. The objective of CRM, generally, is to
enhance the customer experience so that the customer is delighted with the service
and is receiving the attributes that make this credit card service better for them than
the competition. In the case of this financial service firm, CRM customers receive
added protocols that include higher credit limits, waived fees (e.g., late payment fee,
check cashing fee, etc.), higher over-limit spending, more thoughtful scripting on the
part of employees who they may encounter, and other special treatments.
2.7 CUSTOMER SATISFACTION W.R.T IT ENABLED SERVICES
[ONLINE] IN MUTUAL FUND INDUSTRY
Intensifying competition among financial service providers has increased pressure on
profit margins and has emphasized the strategic role of technology as a potential
source of differentiation and cost reduction (Moutinho and Smith 2000). In order to
increase profits and decrease expenses over the long-term, financial institutions have
shifted some of their services from branches to the virtual banking arena (ATMs,
telephone banking, internet banking). Bank service automation is a critical factor in
the process of trying to attain cost-effectiveness - a strategic competitive weapon in
the financial service market (Goode, Moutinho, Chien 1996). The expectation of
banks is that more customers will take advantage of the convenience and speed of

75
being able to deposit and withdraw money without having to wait in line for personal
assistance. (The firm in this present study has customer satisfaction survey data from
several years past indicating that customers expect faster, more convenient methods of
banking). On the other hand, some segments of the population do find the shift away
from personal service disconcerting (Thornton and White 2000). It is vitally important
to provide the most valuable customers the level of personal interaction they expect
and it is difficult, at best, to arrive at that level for the millions of customers serviced
each day. Some authors suggest that a reduction in branch visits could have a
detrimental effect on the relationship between customers and service providers
(Thornton and White 2000). Although it is generally thought that service quality is
compromised by a reduction in the employee-customer interface (Reazha, et al, 2003),
Mols (1999) found that many users of electronic (internet) banking have become even
more satisfied overall with their bank possibly due to the fact that a new service
delivery option is available. On the other hand, many customers still feel vulnerable
when exposing their finances to electronic media and are inclined to perceive `branch
banking' as more reliable and trustworthy (Tee 2000). It was found that a low level of
satisfaction was attached by some bank customers to the fact associated with their
experience of having to queue when using an ATM, and that breakdowns in ATMs is
another source of service dissatisfaction. And, it is suggested that the reasons for
being loyal to a bank are changing as a result of increased competition and the
application of technology in the provision of bank services (Goode, Moutinho and
Chien 1996). Virtual banking exists in many forms. The most common uses of
technology for financial services are ATMs to deposit and extract cash, telephone

76
banking to make payments and transfer money from one account to another, and,
more recently, home or online banking to pay bills on accounts outside the financial
institution, move investment money, and view account balances and activity. The
financial services industry is information intensive and is rapidly changing the way it
designs and delivers personal services. For the purposes of this study, the definition of
virtual banking from Liao et al. (1999) will be used: Virtual banking is the provision
of banking services through electronic media. The technology referred to, specifically
in this study, is ATM usage and Telephone Banking with a interactive voice response
unit (IVR). Because most consumers say they require more channels to do their
banking, ATM access is one channel in which financial institutions are investing great
amounts of money in order to satisfy that customer need. Telephone banking and
interactive voice response units (IVR in have also become important channels
customers use to perform the same functions that required one-on-one involvement
only a decade ago. However, providing these channels to customers does not imply
that all customers will use them. Some segments of the population are more likely to
shy away from any type of technology no matter how simple it may be to use.
`Innovators' and `early adopter' segments may be more likely to try technology first
(Rogers 1983). According to Rogers (1483), `innovators' and `early adopters' of
innovations are usually young, well educated, and with higher incomes than `late
adopters' and `laggards'. Demographics, then, should be one means of differentiating
which segments are likely to be users of and satisfied with technology and which
segments simply are not. Another element that might differentiate the satisfied users
from the non-users or dissatisfied users might be whether they are CRM customers or

77
not. As CRM customers are more accustomed to special treatment and personal
interaction with their banker, they may not take advantage of technology as much as
non-CRM customers. Or, when they do, they may be less satisfied than their non-
CRM counterpart. And, as it is suggested that customers satisfied with technology are,
in turn, more satisfied with the overall Financial Service Product like mutual fund, it
is possible that these different segments would show different satisfaction rates, not
only with technology, but in their overall satisfaction of the service as well.
2.6 IT ENABLED SERVICES [ONLINE] IN MUTUAL FUND INDUSTRY
In the financial services arena, access over the phone is emerging as the access of
choice for customers who expect telephone access 24 hours a day, 7 days a week, 365
days a year (Feinberg, Hokama, Kadun, Kim 2002). As competition for life-long
customers is fiercer than ever, financial institutions are searching for ways to leverage
their call centers and interactive voice response units (IVRs) to their advantage. PSI
Global reports that the number of monthly transactions among telephone banking
users has risen 55% over the past five years, with consumers conducting an average of
13 financial transactions by phone each month (Floyd 2000). According to a 1997
report from the Tower Group, the number of transactions with retail call center agents
was 1.2 billion in 1996 and is expected to rise to 2.4 billion by the end of 2001
(Jacobson 1999). The most common transactions conducted through a call center are
account inquiries, loan servicing, funds transfers, new account openings and
investment transactions. Telephone banking is undergoing its own metamorphosis, It
is clear that customers satisfied with their telephone contact are more likely to

78
repurchase, purchase more, and promote positive word of mouth (Feinberg, et al,
2002). Call centers clearly play a role in achieving overall customer satisfaction
(Allirnadi 1999; Anton 1997), but determining exactly what elements of the
telephone/IVR call experience directly influence customer satisfaction is key to a
more accurate measurement. An important part of telephone banking is a firm's
capability to perform `intelligent routing' to serve the best customers better and to
help retain the most valued customers. By combining the advantages of customer
relationship management and call routing, firms can commit to providing tiered
service-with their most valuable customers receiving enhancements and less valuable
customers still receiving good service but no enhanced protocols. At the same time,
IVRs offer customers the advantage of receiving the information they need without
human interaction and, usually, with greater speed. Financial institutions favor virtual
response units because of the cost savings. According to a study by Booz, Allen and
Hamilton in 1999, the cost of a call center transaction involving an agent is $2 while
the same transaction using IVR technology costs only 35 cents (Floyd 2000).
Financial institutions typically encourage their customers to use telephone banking
IVR rather than opting out to speak with a human representative. And, to make this
happen more conveniently, a firm creates as many options on their IVR to
accommodate that which it seems customers consistently and frequently perform.
What financial institutions fail to deeply investigate, though, is how customers really
react to IVR options and whether the IVR is being embraced by customers, as the firm
suspects, or simply is being tolerated. If convenience for the customer is at the heart
of technology development (Van Zyl 1999) and if the primary benefit for firms is cost

79
savings, then the quality of service element also needs to be addressed. IVR servicing
is often time-consuming and even complicated to use for the customer. Many
customers opt out of a IVR out of frustration causing firms to lose customers or to
have them call back and opt out to a representative, a practice that is twice as costly.
Telephone banking also relies on the elements of trust and commitment. In order for a
customer to fully trust that their issue is being resolved appropriately, they need to
have confidence in the representative on the phone or in the fact that the IVR has
captured their information properly and is going to pass that information on to the
appropriate party for resolution. If there is an absence of direct contact, such as with
telephone banking, it is assumed that there is less control perceived by the customer
(Joseph, McClure and Joseph 1999). Unless other attributes of the technology are
considered of high quality (e.g., reliability, user-friendliness), customers may not trust
the service. Also, as was mentioned in relation to ATM technology, new product
diffusion theory suggests that not all products and services are accepted by consumers
at the time of introduction. Some products are much slower than others in being
accepted by potential adopters (Mahajan, Muller and Bass 1990). Possibly, those
segments of this firm's customer base who are older and less educated would likely
not be as accepting of telephone technology as their younger and more educated
counterparts. This implies that this technology might be more accepted by the early
adopter than later adopter or laggard segments. This also implies that CRM
customers, who are generally older customers, might not be as enthusiastic about
using IVR technology. Although a growing number of customers prefer to conduct
transactions on their own, many still want human interaction. And, demographics

80
(especially age, income level, gender and comfort level with the technology) may play
a part in how individuals respond to IVR technology. Some customers may give up if
the IVR instructions are not clear or are seemingly too lengthy. Firms who have
adopted this technology early, generally, see substantial cost reductions and increases
in revenue and profits. At the same time they, generally, see increases in the usage
volume. Clearly, customers are using the technology, especially when it comes to
seeking simple information like asking for "account balance" or "last payment"
information. The convenience of IVR/telephone banking services enhances the
customer experience, generally, and it is likely that some customers will be more
satisfied, overall, because they are satisfied with this technology service. And, it is
likely that these customers are the younger segment of this firm's customer base.
2.7 CUSTOMER LOYALTY IN MUTUAL FUND INDUSTRY
There are also different ways to perceive loyalty and many definitions of loyalty.
Customers define loyalty to an organization according to their total experience with it
across all touch points in the exchange process (Calhoun 2001). Loyalty can be
thought of as a percentage of retained customers, as those customers intending to
continue using the service or product or as those customers who intend to recommend
the product or service to others. Customers will declare themselves loyal through
feelings and perceptions of high satisfaction, through positive attitudes and
preferences (for the supplier) meaning that customers will be willing to repurchase
from this supplier (Hennig-Thurau and Hansen 2000; Peppers, Rogers and Dorf
1999). Most of the early literature conceptualizes loyalty as behavioral (Brown 1952;

81
Churchill 1942). This type of loyalty is characterized as a form of repeat passive
purchasing (Beckett, Hewer, Howcroft 2000). However, other studies indicate that it
is both behavioral and attitudinal. Attitudinal loyalty involves holding positive or
negative attitudes towards a service provider (Beckett, Hewer, Howcroft 2000) and is
characterized by a likelihood that a customer will recommend the product or service
to another (Day 2000; Dick and Basu 1994; Homburg and Giering 2001; Peppers,
Rogers and Dorf 1999). A dual perspective of loyalty is adopted for this study.
It is thought that CRM impacts loyalty through customer satisfaction. Some
authors suggest that unless customers are very "highly" satisfied (as opposed to
"moderately" satisfied), loyalty rates do not significantly increase (Jones and
Sasser 1995; Reichheld, Markey and Hopton 2000), especially in highly
competitive markets as is the case with credit cards. Jones and Sasser (1995)
studied the satisfaction-loyalty link to test Xerox' discovery that a high level of
satisfaction will lead to greatly increased customer loyalty. They looked at the
automobile, personal computer, hospital, airline, and telephone services
industries, and found that customers who are `completely satisfied' are more loyal
than `merely' satisfied customers. And, John Larson (VP, Opinion Research
Corporation), found that `completely satisfied customers' were nearly 42% more
likely to be loyal than `merely' satisfied customers. In the Jones and Sasser article
(1995), they found that individuals can be classified into four categories
(loyalists, defectors, mercenaries, hostages). Hostages had low to medium levels
of satisfaction but high loyalty rates; and mercenaries had high levels of
satisfaction but low/medium loyalty rates. Perhaps some customers remain loyal

82
because they cannot move due to switching costs or the fear of risking a move to
another firm? One issue unearthed in the Reichheld, Markey and Hopton article
(2000) on the relationship between loyalty and profits suggests that satisfaction
surveys alone don't yield the information companies need to have about
delivering value to customers. For example, at one Toyota dealership a salesman
pleaded with a customer to `fill out the satisfaction questionnaire with favorable
responses', explaining that `both my wife and I lost our jobs at a computer
company and I'll lose my job here if I don't get high satisfaction scores'. This kind
of pressure on customers to tweak their responses on customer satisfaction
surveys is not uncommon in today's market. This may be one factor in
determining why customer satisfaction rates are high but loyalty rates are not as
high as expected. Other authors intimate that there are other moderating factors
that determine customer satisfaction and loyalty. For example, Zeitharcil, Berry
and Parasuraman (1996), in a multi-company empirical study examining
relationships from the model concerning customers' behavioral intentions, show
strong evidence of their being influenced by service quality and suggest that
those customers not reporting service problems have the strongest levels of
loyalty. Reichheld (2001) suggests that customer loyalty cannot he achieved
unless corporate executives gain employee loyalty via `principled leadership' and
a set of surveys that measure more than customer satisfaction and loyalty by
forcing people to think of whether the organization really does deserve that
customer's loyalty. And, Homburg and Giering (2001), in a consumer-durables
context analyzing the moderating effect of selected personal characteristics on the

83
relationship between satisfaction and loyalty, found that age, income, and variety
seeking are important moderators of the satisfaction-loyalty link. Loyalty can be
elusive even if customer satisfaction exists. And, there may be other barriers to
higher loyalty rates that firms need to investigate and overcome. Loyalty, on the
other hand, may be involuntary. Possibly there is no alternative to the product or
service or maybe the bonus or reward for participating is so great (Hennig-
Thurau and Hansen 2000) that it makes sense to a customer to remain with the
firm. Yet, what a firm really strives for is loyalty with no strings attached. In
other words, if an error is made and the service is compromised, the firm hopes
that the customer will still be inclined to stay once the problem is fixed.
Generally, though, past evidence does suggest that the majority of highly satisfied
customers remain loyal. For the purpose of this study, then, loyalty is defined as
customers who indicate intent to repurchase this service by continuing to use
their credit card and by their intent to recommend this service to others. As
mentioned in the studies above, it is thought that the more highly satisfied a
customer is, the more likely they are to be loyal (Heskett et al 1994; Gummeson
1999)

84
CHAPTER III
RESEARCH FRAMEWORK FOR MUTUAL FUND CUSTOMER
Studies in this field limit themselves to topics such as investor behaviour, links
between mutual fund performance and stock price movements, and how money
moves from one mutual fund to another due to advertising expenditures made by the
investment company. This study examines sales mutual fund as a function of its own
attributes. There is contradictory evidence documented in the literature concerning the
variables affecting sales of mutual fund. For example, the variable of management
tenure(past record) has been shown in the literature to be an asset to the investment
company as well as to mutual fund asset under management; where the mutual fund
manager has more experience, the better the mutual fund performs (Adran et al.,
2002). Other researchers, however, have scrutinized management tenure as being an
attribute that precludes mutual fund net asset value (Costa & Porter, 2003). This study
contributes to the literature in two main respects. First, this is the first study to present
evidence on the attributes relationship using data on all actively managed equity
mutual funds for the entire period spanning 1999 to 2009. Previous studies have only
analyzed selected years in this period, using subsets of managed mutual funds in each
year. By examining larger samples for a greater number of consecutive years that
includes periods of recession and economic growth, the empirical results from this
study are more robust and shed light on the existing contradictions in the previous
literature. In addition, since investors have been facing new mutual funds choices in
recent years, estimating the relationship between sales of mutual fund and its
attributes with more recent data gives investors general guidelines that are relevant for

85
selecting mutual funds in today’s environment. Second, the empirical results from this
study are based on a model that includes mutual funds’ attributes as predictors of sales
of mutual fund. With the exception of one other study, which used a different data set,
previous conclusions have been based on models that focused only on selected
attributes. By examining these attributes from a more comprehensive data set, this
study provides a more general set of conclusions that encompass those found in the
past literature.
Many studies have been conducted to evaluate the relationship between IT
investments and corporate performance. However, the findings of these studies are
confusing or conflicting (Brynjolfsson, 1993). Most of these studies have employed
only two financial measures of corporate performance: productivity and profitability.
One of the most widely cited research efforts on IT's contribution to productivity is
probably the work done by Roach on white-collar productivity (1987, 1989, 1991).
Roach's research is primarily based on data obtained from the Bureau of Economic
Analysis (BEA) and the Bureau of Labor Statistics (BLS). Citing statistics from the
mid-seventies to mid-eighties, Roach (1987) compares the productivity of information
workers to that of production workers, and concludes that the productivity of on
workers has fallen in some economic sectors and not kept up with the productivity of
production workers in other sectors. Roach (1991) finds that IT's performance has been
most dismal in the service sector. Similarly, other studies done at the economy-wide
level find either no impact or a negative impact of IT on productivity. Baily and
Chakrabarti (1988) conclude that IT does not show any significant productivity gain,
possibly because of measurement problems and the failure of firms to value IT properly.

86
These difficulties, in turn, lead to wrong allocation of resources by organizations.
Also, Brooke (1991) finds that IT correlates negatively with productivity and
hypothesizes that the primary impact of IT is increased product variety rather than
profitability. At least seven studies have examined IT's contribution to corporate
performance in the manufacturing sector, but the findings of these studies are conflicting.
Morrison and Berndt (1990) obtain data from the BEA for 20 industry categories over the
period 1968 to 1990. They use structured production-function models and find that
the net marginal benefits from IT are a minus 20% (i.e., the marginal benefit accruing
from each dollar invested in IT is only 80 cents). However, using his structured models
though still drawing data from BEA and BLS, Berndt and Morrison (1991) find that IT is
not correlated with higher productivity in a majority of 20 industry categories that they
examine. Berndt and Morrison do, however, find that 1T is correlated with significantly
increased demand for skilled labor. On the other hand, Siegel and Gritiches (1991) use
industry-wide data and do find a positive correlation between IT usage and productivity
in most industry categories. They obtain their data from multiple government sources.
However, they do not perform highly structured analyses (like those done by Morrison &
Berndt, 1990) because of their concerns about the reliability of government data and
measurement techniques employed by government. Similarly, Dudley and Lassere
(1989) find that better information and communication capability reduce the need for
inventories. However, they do not relate IT usage to the firm's bottom-line performance.
Loveman (1994) examines about 60 business units, primarily in the manufacturing
sector, for the period 1979-1984 using the Management Productivity and IT (MPIT}
database. The MPIT database is a subset of the better known Profit impact of Marketing

87
Strategy (PIMS} database. Loveman uses a Douglas production function to evaluate
IT's contribution to productivity. He finds no evidence of a significant positive
productivity impact from IT. Indeed, he finds that the marginal dollar would be best
spent on non-IT inputs. On the other hand, Barua et al. (199.5} use exactly the same
MPIT data that Loveman used and find a significant positive relationship between IT
and corporate performance. Instead of examining the direct relationship between IT and
final output variables, Barua et al. introduce an intermediate stage and do two different
analysis. In both analyses, they also control for contextual variables. First, they examine
the relationship of the input variable (ratio of IT spending to the number o. f `
employees) to a set of intermediate variables (capacity utilization, inventory turnover,
relative inferior quality, relative price, and new products. Then, they examine the
relationship of these intermediate variables to final output variables (market share and
return on assets) They conclude that IT has a significant positive correlation with each
of the intermediate variables (except new products}, and that the intermediate variables
have significant positive correlations with the final output variables. Unlike Barua et al.,
Weiil (1990) obtains data by interviews and a survey conducted within valve-
manufacturing firms. in his study, Weill desegregates IT by use. He concludes that
contextual variables affect the relationship between IT and firm performance, and that
significant productivity gains exist with transactional type of IT (e.g., data processing}
but not with strategic IT (e.g., sales support) or informational IT (e.g., email).
One of the earliest studies on IT's contribution to corporate performance in the service
sector is by Cron and Soboi (1983). They separated medical wholesalers into four
groups depending on the number of computer applications, wholesaler had in use in

88
the year l979. Then, they segregate the same 138 wholesalers into another set of four
groups depending on each wholesaler's profitability for the year 1979. Thereafter,
they calculate and analyze the two-way frequencies for computer utilization and
profitability. Basically, Cron and Sobol find that low IT use is associated with either
poor (i.e., weak) or average performance, while heavy IT users are either very
strong or very weak performers. On the other hand, Strassman (1985, 1990) finds
no correlation between IT investments and a group of I38 profitability. Strassman
examines many different sets of firms, including a set of 38 service firms
identified in a Computerworld survey as the most effective users of IT'.
The most recent study on IT's contribution to corporate performance has been done by
Hitt and Brynoifsson (1991. They accumulate 370 firms (basically, the top half of
Fortune 500 manufacturing & service firms) over the period 1988 to t 992. They obtain
figures on IT spending by firms from International Data Group's Annual Surveys,
financial data on firms from Standard & Poor’s Compustat Database, and price indices
from a host of sources (primarily, BEA}. They perform three different analyses. Their
first analysis follows the approach taken by Loveman (199a) to evaluate IT's
contribution to organizational productivity. Using a Cobb-Douglas production function,
Hitt and Brynjolfsson find that the gross marginal product of CT is a whopping 94.9%,
while that of Capital is 7.8% and Labor is 1.2%. Their second analysis evaluates IT's
contribution to organizational profitability by separately regressing three profitability
ratios (return on assets, return on equity, & total shareholders' return) on the ratio of
IT spending to the number of employees while controlling for the following variables:
capital intensity, market share, debt to equity ratio, sales growth, R&D expense,

89
industry, and year. However, they find no significant impact of IT usage on firm's
profitability. Their third analysis evaluates consumer surplus resulting from IT
investments, following the method used by Bresnahan (1986). Hitt and Brynjolfsson
find a substantial increase in consumer surplus primarily because of declining prices of
IT. They attempt to reconcile their results by arguing as follows: Investments in IT
by a firm may result in gains in the firm’s productivity and yet there may be no increase
in the profitability of the firm if all the gains made in productivity are not retained by
the firm or are "competed away" and hence, passed on to the consumers.
In summary, most of these studies demonstrate little or no correlation between IT
investments and profitability. Thus we explores the reasons for this IT profitability
impasse and proposes a different perspective to identify and evaluate IT's contribution
to corporate sales which results in Profitability for Financial Services Firm.
Researchers such as Ferson and Schadt (1996), Henricksson (1984), and
Treynor and Mazuy (1966) have examined the ability of mutual fund managers to select
securities and time markets successfully, but there is little evidence that supports the
notion that they possess such skills. The performance persistence, where past
performance could possibly predict immediate future returns. This phenomenon is also
known as the “hot hands” phenomenon. The topic of persistence is a subject for debate
because there are many conflicting views among researchers (Cahart, 1997; Grinblatt et
al., 1992; Hendricks et al., 1993). The relatively small number of studies that examine
mutual fund attributes and their effects on sales demonstrate this. Although the two
segments of the literature not dealing with mutual fund attributes are noteworthy, this
study agrees with the researchers examining the attribute relationship who claim that a

90
better understanding of these relationships will give practical value to lay investors as
well as contributing to the literature and attracting.
3.1 RESEARCH OBJECTIVE
The purpose of the study is to determine whether mutual fund attributes affect
sales of mutual fund. Attributes such as past record, net asset value, asset under
management, brandname, customer satisfaction, service quality, service time are
examined. In the age of technology and the Internet, several new factors have begun to
play an important role in the type and quality of experience the customer has. In an
effort to respond to the proliferation of technology in the process through which
products and services are purchased and consumed, Parasuraman and Grewal (2000)
created the `pyramid model' by adding technology as a third dimension to Kotler's
two-dimensional triangle model suggested earlier (1994). The pyramid model
emphasizes the need for effectively managing three new linkages - company-
technolgy, employee-technology, and customer-technology to maximize marketing
effectiveness.
The primary question in this study is whether mutual fund attributes really affect sales of
mutual fund. Since there are many mutual fund attributes, it is difficult to make a general
statement that these mutual fund attributes unequivocally do or do not affect mutual fund
performance. In short we could summarize the objective of research as;
¡ To examine relation between customer satisfaction on sales of mutual fund.
¡ To study relation between Information Technology and customer satisfaction.
¡ To examine relation between quality of service on sales of mutual fund.
¡ To study relation between Information Technology on quality of service.

91
¡ To study relation between brand-name and sales of mutual fund.
¡ To examine relation between asset under management and sales of mutual
fund.
¡ To study relation between net asset value on sales of mutual fund.
¡ To examine relation between past record and sales of mutual fund.
¡ To examine relation between tax rebate and sales of mutual fund.
By answering these questions through the use of the appropriate statistical tests, this study
constitutes a practical value to both the mutual fund attribute literature and lay Mutual
Fund companies by establishing certain framework to follow. The rationale for selecting
these attributes and their predicted impact on mutual fund sales is afforded by past
researchers recommending to the finance community that more research is needed in this
field. It was best stated by Peterson et al. (2001), that the results from these studies must
be useful to the mutual fund companies. On these recommendations of past researchers,
this study chose independent variables that were not too obscure for the asset managers to
understand and use in decision-making. Although past research has focused on these
attributes because they are the most closely examined, the findings in regard to these
attributes are mixed.
3.2 Formulate an Analysis Plan
Every hypothesis test requires the analyst to state a null hypothesis and an alternative
hypothesis. The hypotheses are stated in such a way that they are mutually exclusive.
That is, if one is true, the other must be false; and vice versa.

92
The analysis plan describes how to use sample data to accept or reject the null
hypothesis. It should specify the following elements.
§ Significance level. Often, researchers choose significance levels equal to 0.01,
0.05, or 0.10; but any value between 0 and 1 can be used.
§ Test method. Use the one-sample z-test to determine whether the hypothesized
population proportion differs significantly from the observed sample
proportion.
Analyze Sample Data
Using sample data, find the test statistic and its associated P-Value.
§ Standard deviation. Compute the standard deviation (σ) of the sampling
distribution.
σ = sqrt[ P * ( 1 - P ) / n ]
where P is the hypothesized value of population proportion in the null
hypothesis, and n is the sample size.
§ Test statistic. The test statistic is a z-score (z) defined by the following
equation.
z = (p - P) / σ

93
where P is the hypothesized value of population proportion in the null
hypothesis, p is the sample proportion, and σ is the standard deviation of the
sampling distribution.
§ P-value. The P-value is the probability of observing a sample statistic as
extreme as the test statistic. Since the test statistic is a z-score, use the Normal
Distribution Calculator to assess the probability associated with the z-score.
3.3 HYPOTHESIS FORMATION
¡ Null Hypothesis (H01) : “Customer Satisfaction does not have an impact on
Sales of Mutual Fund”
¡ Null Hypothesis (H02) : “Information Technology does not have an impact
on Customer Satisfaction”
¡ Null Hypothesis (H03) : “Quality of Service does not have an impact on
Sales of Mutual Fund”
¡ Null Hypothesis (H04) : “Information Technology does not have an impact
on Quality of Service”
¡ Null Hypothesis (H05) : “Brand-name does not have an impact on Sales of
Mutual Fund”
¡ Null Hypothesis (H06) :“Asset Under Management does not have an impact
on Sales of Mutual Fund”
¡ Null Hypothesis (H07) : “Net Present Value does not have an impact on
Sales of Mutual Fund”

94
¡ Null Hypothesis (H08) : “Past Record does not have an impact on Sales of
Mutual Fund”

95
CHAPTER IV
RESEARCH METHODOLOGY
This research represents the first phase of a multi-phase effort to identify the
current and potential role of information technology in supporting relationships
among customers of the Indian Mutual Fund Companies. Our approach was to
interview people in a wide range of Indian Mutual Fund Companies, at both at small
retail and HNI retail customers.
Each respondent presented, from the perspective of their own sector, a view
of their supplier and customer relationships and the opportunities for and barriers to
expanding these relationships through electronic commerce. We then combined and
unified these views to create an industry-wide perspective. The data collected was
focused on establishing that, as a result of customer focus groups and other limited
survey results, it concluded its highly valued customers of the company and felt that
the company would improve customer satisfaction and loyalty rates.
Past studies from Peterson et al. (2001), Apap and Griffith (1998), Costa and
Porter (2003), Dellva and Olson (1998), Droms and Walker (1996) and Indro et al.
(1999) used ordinary least squares (OLS) regression analysis to examine the effects of
multiple mutual fund attributes to aid in explaining fund performance. With that in
mind, this study follows suit with past research by implementing a non-experimental
quantitative design to determine whether the attribute/performance relationship exists.
This study tests the hypotheses mentioned in Chapter 3 using Chi-square test. Mutual
fund attributes such as past record, NAV and AUM are regressed with respect to
mutual fund performance in their respective years. Through the results illustrate the

96
relationship between mutual fund performance and the independent variables.
Furthermore, the partial effects of one independent variable are easily examined with
respect to mutual fund performance.
4.1 SURVEY SAMPLING METHODS
Sampling method refers to the way that observations are selected from a population to
be in the sample for a sample survey.
Population Parameter vs. Sample Statistic
The reason for conducting a sample survey is to estimate the value of some attribute
of a population.
§ Population parameter. A population parameter is the true value of a population
attribute.
§ Sample statistic. A sample statistic is an estimate, based on sample data, of a
population parameter.
The quality of a sample statistic (i.e., accuracy, precision, representativeness) is
strongly affected by the way that sample observations are chosen; that is., by the
sampling method.

97
Probability vs. Non-Probability Samples
As a group, sampling methods fall into one of two categories.
§ Probability samples. With probability sampling methods, each population
element has a known (non-zero) chance of being chosen for the sample. We
have used this method for sampling in our research.
§ Non-probability samples. With non-probability sampling methods, we do not
know the probability that each population element will be chosen, and/or we
cannot be sure that each population element has a non-zero chance of being
chosen. We have used this method for sampling in our research.
Non-probability sampling methods offer two potential advantages - convenience and
cost. The main disadvantage is that non-probability sampling methods do not allow
you to estimate the extent to which sample statistics are likely to differ from
population parameters. Only probability sampling methods permit that kind of
analysis.
Non-Probability Sampling Methods
Two of the main types of non-probability sampling methods are voluntary samples
and convenience samples.

98
§ Voluntary sample. A voluntary sample is made up of people who self-select
into the survey. Often, these folks have a strong interest in the main topic of
the survey.
§ Convenience sample. A convenience sample is made up of people who are
easy to reach. We have used this method for sampling in our research.
Probability Sampling Methods
The main types of probability sampling methods are simple random sampling,
stratified sampling, cluster sampling, multistage sampling, and systematic random
sampling. The key benefit of probability sampling methods is that they guarantee that
the sample chosen is representative of the population. This ensures that the statistical
conclusions will be valid.
§ Simple random sampling. Simple random sampling refers to any sampling
method that has the following properties.
· The population consists of N objects.
· The sample consists of n objects.
· If all possible samples of n objects are equally likely to occur, the
sampling method is called simple random sampling.
There are many ways to obtain a simple random sample. One way would be
the lottery method. Each of the N population members is assigned a unique

99
number. The numbers are placed in a bowl and thoroughly mixed. Then, a
blind-folded researcher selects n numbers. Population members having the
selected numbers are included in the sample. We have used this method for
sampling in our research.
§ Stratified sampling. With stratified sampling, the population is divided into
groups, based on some characteristic. Then, within each group, a probability
sample (often a simple random sample) is selected. In stratified sampling, the
groups are called strata.
As a example, suppose we conduct a national survey. We might divide the
population into groups or strata, based on geography - north, east, south, and
west in our case with respect to city.. Then, within each stratum, we might
randomly select survey respondents.
§ Cluster sampling. With cluster sampling, every member of the population is
assigned to one, and only one, group. Each group is called a cluster. A sample
of clusters is chosen, using a probability method (often simple random
sampling). Only individuals within sampled clusters are surveyed.
Note the difference between cluster sampling and stratified sampling. With
stratified sampling, the sample includes elements from each stratum. With
cluster sampling, in contrast, the sample includes elements only from sampled
clusters.

100
§ Multistage sampling. With multistage sampling, we select a sample by using
combinations of different sampling methods.
For example, in Stage 1, we might use cluster sampling to choose clusters
from a population. Then, in Stage 2, we might use simple random sampling to
select a subset of elements from each chosen cluster for the final sample.
§ Systematic random sampling. With systematic random sampling, we create a
list of every member of the population. From the list, we randomly select the
first sample element from the first k elements on the population list.
Thereafter, we select every kth element on the list.
This method is different from simple random sampling since every possible
sample of n elements is not equally likely.
4.2 SAMPLE DESIGN
A sample design can be described by two factors.
§ Sampling method. Sampling method refers to the rules and procedures by
which some elements of the population are included in the sample.
§ Estimator. The estimation process for calculating sample statistics is called the
estimator. Different sampling methods may use different estimators. For
example, the formula for computing a mean score with a simple random

101
sample is different from the formula for computing a mean score with a
stratified sample. Similarly, the formula for the standard error may vary from
one sampling method to the next.
The "best" sample design depends on survey objectives and on survey resources. For
example, a researcher might select the most economical design that provides a desired
level of precision. Or, if the budget is limited, a researcher might choose the design
that provides the greatest precision without going over budget. Or other factors might
guide the choice of sample design. In our case we have selected simple random
sampling due to budgetary constraints.
4.2.1 SAMPLE SIZE
The larger your sample size, the more sure you can be that their answers truly reflect
the population. This indicates that for a given confidence level, the larger your sample
size, the smaller your confidence interval. However, the relationship is not linear (i.e.,
doubling the sample size does not halve the confidence interval). Our accuracy also
depends on the percentage of our sample that picks a particular answer. If 99% of our
sample said "Yes" and 1% said "No," the chances of error are remote, irrespective of
sample size. However, if the percentages are 51% and 49% the chances of error are
much greater. It is easier to be sure of extreme answers than of middle-of-the-road
ones. When determining the sample size needed for a given level of accuracy we must
use the worst case percentage (50%). We should also use this percentage if we want to
determine a general level of accuracy for a sample we already have. To determine the

102
confidence interval for a specific answer our sample has given, we can use the
percentage picking that answer and get a smaller interval. How many people are there
in the group our sample represents? This may be the number of people in a city we are
studying, the number of people who buy new cars, etc. Often we may not know the
exact population size. This is not a problem. The mathematics of probability proves
the size of the population is irrelevant unless the size of the sample exceeds a few
percent of the total population we are examining. This means that a sample of 500
people is equally useful in examining the opinions of a state of 1,50,00,000 as it
would a city of 1,00,000. For this reason, The Survey System ignores the population
size when it is "large" or unknown. Population size is only likely to be a factor when
we work with a relatively small and known group of people (e.g., the members of an
association). In this we have selected a sample of 700 across four tier 1 cities with
equal representation.
Sample Size
ss =
Z 2 * (p) * (1-p)
c 2
= 600.25 round it to 700
Where:
Z = Z value (e.g. 1.96 for 95% confidence level) p = percentage picking a choice, expressed as decimal (.5 used for sample size needed) c = confidence interval, expressed as decimal (e.g., .04 = ±4)

103
4.3 DATA COLLECTION METHODS
To derive conclusions from data, we need to know how the data were collected; that
is, we need to know the method(s) of data collection.
Methods of Data Collection
There are four main methods of data collection.
§ Census. A census is a study that obtains data from every member of a
population. In most studies, a census is not practical, because of the cost
and/or time required.
§ Sample survey. A sample survey is a study that obtains data from a subset of a
population, in order to estimate population attributes. We have used this
method for collection of data. It is an administered sample survey.
§ Experiment. An experiment is a controlled study in which the researcher
attempts to understand cause-and-effect relationships. The study is
"controlled" in the sense that the researcher controls (1) how subjects are
assigned to groups and (2) which treatments each group receives.
In the analysis phase, the researcher compares group scores on some
dependent variable. Based on the analysis, the researcher draws a conclusion
about whether the treatment ( independent variable) had a causal effect on the
dependent variable.

104
§ Observational study. Like experiments, observational studies attempt to
understand cause-and-effect relationships. However, unlike experiments, the
researcher is not able to control (1) how subjects are assigned to groups and/or
(2) which treatments each group receives.
In this research we have used sample survey technique. The data for this study was
collected from customers of Indian Mutual Fund Companies. A sample of 175 from
each of the four tier 1 city i.e. Mumbai, Kolkata, Chennai and Delhi was collected. A
total of 1,000 responses were captured representing a response rate of over 100%.
Almost 30% of these respondents, however, were missing demographic and other
important data pertinent to the study and these cases were eliminated. The collection
was done through personal interview and questionnaire method personally.
4.4 THE RESEARCH INSTRUMENT
The questionnaire is prepared in such a manner than it cam capture certain
parameters to measured upfront like demographic details [age, income etc],
Brandname, Asset under management, Net asset value etc. Customer satisfaction is
measured by asking number of questions asking customers to rate their overall
satisfaction on a 5-point Likert type scale. Then, they are asked to rate their overall
satisfaction for IT Enabled Services [online] usage and usage using a human
representative like Broker/Agent. They are also asked how often they use these

105
services and for what purposes. For the purpose of this study, customer satisfaction
ratings of 1 are considered `highly satisfied' ratings and those of 2 are considered
`moderately satisfied'. Any rating 4 or 5 is thought to represent a dissatisfied
customer. Any rating of 3 is considered neutral Appendix A documents the questions
used to measure each construct in the model. Loyalty is measured by two questions
asking customers to rate their intention to use the service in the future and their
intention to recommend the service to others. According to Zeithaml, Berry,
Parasuraman (1996) only one of these questions is used in a 1992 study by Cronin and
Taylor; and both questions are used in a 1993 study by Boulding. And, Sheth, Sisodia,
and Sharnia (2000) used a variation of these two questions in a 2000 study. Previous
research suggests that customer loyalty consists of a behavioral and an attitudinal
component (Homburg, Giering 2001; Peppers, Rogers and Dorf 1998) so that a
customer's willingness to recommend a product or service and intentions to
repurchase a product or service implies his/her intention to be loyal to the company.
The variables representing "likelihood to use" and "likelihood to recommend" were
highly correlated and were combined to form an "overall loyalty" variable to measure
the loyalty concept.
4.5 THE SAMPLE
The data for this study was collected from customers of Indian Mutual Fund
Companies. Out of the total of 33 Mutual Fund Companies 26 were observed
and taken as their market capitalisation is greater than Rs.50,000 crores.
Questionnaires to measure the customer satisfaction and loyalty constructs

106
were created for and used in a field survey setting where representatives
contacted 700 randomly selected customers. A total of 1,000 responses were
captured representing a response rate of over 100%. Almost 30% of these
respondents, however, were missing demographic and other important data
pertinent to the study and these cases were eliminated. Additionally, any
other cases missing the respondent's answers to other questions pertinent to
the study were also eliminated, bringing the final total sample of available
responses to 700. The participants were at least 18 years of age and were the
primary or joint financial decision makers regarding their accounts. They
were investors who had invested in the Mutual Fund Company through a
particular scheme six months preceding the interview. The investor belonged
to four major metro cities i.e. Mumbai, Delhi, Kolkatta and Chennai with
equal representation of 175 sample. A demographic analysis shows that less
than half of the respondents (40%) are female and the remaining Male
(60%). A demographic analysis shows less than half again (28%) have
higher incomes (Rs.3,00,000 or above), with 20% are small investor with
low income (below Rs.2,00,000) and the remaining 50% in middle income
group (between 2 lakh and 3 lakh). A profile of demographic information on
respondents can be found in Tables below;

107
4.6 DEMOGRAPHIC PROFILE
Table 4.6.14 Descriptive Statistics for Gender [Mean[ N Valid 700
Missing 0 Mean 1.31 Median 1.00 Std. Deviation .462
Table 4.6.15 Descriptive Frequency for Gender
Frequency Percent Valid Percent Cumulative
Percent Valid MALE 484 69.1 69.1 69.1
FEMALE 216 30.9 30.9 100.0
Total 700 100.0 100.0
Figure 4.6.1 Pie Chart for Gender
69.1
30.9
MALE
FEMALE
GENDER

108
Table 4.6.16 Descriptive Statistics for Martial status
N Valid 700 Missing 0
Mean 1.50 Median 1.50 Std. Deviation .500
Table 4.6.17 Descriptive Frequency for Martial Status
Frequency Percent Valid Percent Cumulative
Percent Valid MARRIED 350 50.0 50.0 50.0
UNMARRIED 350 50.0 50.0 100.0
Total 700 100.0 100.0
Figure 4.6.2 Pie Chart for Martial Status
5050
MARRIED
UNMARRIED
MARTIAL STATUS

109
Table 4.6.18 Descriptive Statistics for Occupation N Valid 700
Missing 0 Mean 1.38 Median 1.00 Std. Deviation .487
Table 4.6.19 Descriptive Frequency for Occupation
Frequency Percent Valid Percent Cumulative
Percent Valid SALARIED 431 61.6 61.6 61.6
SELF EMPLOYED 269 38.4 38.4 100.0
Total 700 100.0 100.0
Figure 4.6.3 Pie Chart for Occupation
61.6
38.4
SALARIED
SELF EMPLOYED
OCCUPATION

110
Table 4.6.20 Descriptive Statistics for Age Group N Valid 700
Missing 0 Mean 2.27 Median 2.00 Std. Deviation 1.095
Table 4.6.21 Descriptive Frequency for Age Group
Frequency Percent Valid Percent Cumulative
Percent Valid 20 TO 25 215 30.7 30.7 30.7 25 TO 30 215 30.7 30.7 61.4 30 TO 35 135 19.3 19.3 80.7 35 TO 40 135 19.3 19.3 100.0 Total 700 100.0 100.0
Figure 4.6.4 Pie Chart for Age Group
30.71
30.71
19.29
19.29
20 TO 25
25 TO 30
30 TO 35
35 TO 40
AGE GROUP

111
Table 4.6.22 Descriptive Statistics for Annual Income N Valid 700
Missing 0 Mean 2.96 Median 3.00 Std. Deviation 1.315
Table 4.6.23 Descriptive Frequency for Annual Income
Frequency Percent Valid Percent Cumulative
Percent Valid 1.5 TO 2 LAKH 135 19.3 19.3 19.3 2 TO 2.5 LAKH 135 19.3 19.3 38.6 2.5 TO 3 LAKH 135 19.3 19.3 57.9 3 TO 4 LAKH 215 30.7 30.7 88.6 4 LAKH &
ABOVE 80 11.4 11.4 100.0
Total 700 100.0 100.0
Figure 4.6.5 Pie Chart for Annual Income
19.29
19.29
19.29
30.71
11.43
1.5 TO 2 LAKH
2 TO 2.5 LAKH
2.5 TO 3 LAKH
3 TO 4 LAKH
4 LAKH & ABOVE
ANNUAL INCOME

112
Table 4.6.24 Descriptive Statistics for Amount of Purchase N Valid 700
Missing 0 Mean 2.73 Median 2.00 Std. Deviation 1.228
Table 4.6.25 Descriptive Frequency for Amount of Purchase
Frequency Percent Valid Percent Cumulative
Percent Valid <50000 54 7.7 7.7 7.7
<100000 404 57.7 57.7 65.4 <50000000 161 23.0 23.0 88.4
5 81 11.6 11.6 100.0 Total 700 100.0 100.0
Figure 4.6.6 Pie Chart for Amount of Purchase
7.7
57.7
23
11.6
<50000
<100000
<50000000
5
AMOUNT OF PURCHASE

113
4.7 PILOT STUDY
In phase I we conducted a pilot study in Mumbai and Delhi with a sample size of 100.
We got insight related to minor modifications related to questionnaire and modified
the same before starting the phase II of the study. In phase II of study which was a full
fledge study of sample of 1000 was collected both using personal interview and
administered interview.
4.8 SCALE RELIABILITY
Cronbach's α (alpha) is a statistic. It is commonly used as a measure of the internal
consistency or reliability of a psychometric test score for a sample of examinees. It
was first named alpha by Lee Cronbach in 1951, as he had intended to continue with
further coefficients. The measure can be viewed as an extension of the Kuder-
Richardson Formula 20 (KR-20), which is an equivalent measure for dichotomous
items. Alpha is not robust against missing data. Several other Greek letters have been
used by later researchers to designate other measures used in a similar context.
Table 4.8.1 Case Processing Summary
N % Cases Valid 700 100.0
Excluded(a)
0 .0
Total 700 100.0
a Listwise deletion based on all variables in the procedure. Table 4.8.2 Reliability Statistics
Cronbach's Alpha N of Items
.881 21

114
Alpha can take on any value less than or equal to 1, including negative values,
although only positive values make sense. Higher values of alpha are more desirable.
Some professionals, as a rule of thumb, require a reliability of 0.70 or higher
(obtained on a substantial sample) before they will use an instrument. Obviously, this
rule should be applied with caution when α has been computed from items that
systematically violate its assumptions. Furthermore, the appropriate degree of
reliability depends upon the use of the instrument.
4.9 BIAS IN SURVEY SAMPLING
In survey sampling, bias refers to the tendency of a sample statistic to systematically
over- or under-estimate a population parameter.
Bias Due to Unrepresentative Samples
A good sample is representative. This means that each sample point represents the
attributes of a known number of population elements.
Bias often occurs when the survey sample does not accurately represent the
population. The bias that results from an unrepresentative sample is called selection
bias. Some common examples of selection bias are described below.
§ Undercoverage occurs when some members of the population are
inadequately represented in the sample.

115
§ Nonresponse bias. Sometimes, individuals chosen for the sample are unwilling
or unable to participate in the survey. Nonresponse bias is the bias that results
when respondents differ in meaningful ways from nonrespondents.
§ Voluntary response bias. Voluntary response bias occurs when sample
members are self-selected volunteers, as in voluntary samples.
Random sampling is a procedure for sampling from a population in which (a) the
selection of a sample unit is based on chance and (b) every element of the population
has a known, non-zero probability of being selected. Random sampling helps produce
representative samples by eliminating voluntary response bias and guarding against
undercoverage bias. All probability sampling methods rely on random sampling.
In this research the only biases that could occur is from the administrator, since it was
an administered survey. This was removed by a repeat exercise conducted after a
fixed time interval with same respondents and the data was cross examined and it was
found that there was no bias from administrator’s end.
A survey produces a sample statistic, which is used to estimate a population
parameter. If you repeated a survey many times, using different samples each time,
you would get a different sample statistic with each replication. And each of the
different sample statistics would be an estimate for the same population parameter. If
the statistic is unbiased, the average of all the statistics from all possible samples will
equal the true population parameter; even though any individual statistic may differ
from the population parameter. The variability among statistics from different

116
samples is called sampling error. Increasing the sample size tends to reduce the
sampling error; that is, it makes the sample statistic less variable. However, increasing
sample size does not affect survey bias. A large sample size cannot correct for the
methodological problems (undercoverage, nonresponse bias, etc.) that produce survey
bias. However in our case this was not a major problem as nonresponse bias did not
exceed 1% of the total sample.
4.10 STATISTICAL ANALYSIS
Factor Analysis : Factor analysis is a statistical method used to describe variability
among observed variables in terms of a potentially lower number of unobserved
variables called factors. In other words, it is possible, for example, that variations in
three or four observed variables mainly reflect the variations in a single unobserved
variable, or in a reduced number of unobserved variables. Factor analysis searches for
such joint variations in response to unobserved latent variables. The observed
variables are modeled as linear combinations of the potential factors, plus "error"
terms. The information gained about the interdependencies between observed
variables can be used later to reduce the set of variables in a dataset. Factor analysis
originated in psychometrics, and is used in behavioral sciences, social sciences,
marketing, product management, operations research, and other applied sciences that
deal with large quantities of data. Factor analysis is related to principal component
analysis (PCA) but not identical. Because PCA performs a variance-maximizing
rotation of the variable space, it takes into account all variability in the variables. In
contrast, factor analysis estimates how much of the variability is due to common

117
factors ("communality"). The two methods become essentially equivalent if the error
terms in the factor analysis model (the variability not explained by common factors,
see below) can be assumed to all have the same variance.
Pearson's chi-square (χ2): Pearson's chi-square test is the best-known of several chi-
square tests – statistical procedures whose results are evaluated by reference to the
chi-square distribution. Its properties were first investigated by Karl Pearson. In
contexts where it is important to make a distinction between the test statistic and its
distribution, names similar to Pearson Χ-squared test or statistic are used. It tests a
null hypothesis stating that the frequency distribution of certain events observed in a
sample is consistent with a particular theoretical distribution. The events considered
must be mutually exclusive and have total probability 1. A common case for this is
where the events each cover an outcome of a categorical variable. A simple example
is the hypothesis that an ordinary six-sided dice is "fair", i.e., all six outcomes are
equally likely to occur. Pearson's chi-square is used to assess two types of
comparison: tests of goodness of fit and tests of independence. A test of goodness of
fit establishes whether or not an observed frequency distribution differs from a
theoretical distribution. The chi-square statistic is calculated by finding the difference
between each observed and theoretical frequency for each possible outcome, squaring
them, dividing each by the theoretical frequency, and taking the sum of the results. A
second important part of determining the test statistic is to define the degrees of
freedom of the test: this is essentially the number of observed frequencies adjusted for
the effect of using some of those observations to define the "theoretical frequencies".

118
Correlation : In statistics, correlation and dependence are any of a broad class of
statistical relationships between two or more random variables or observed data
values. Familiar examples of dependent phenomena include the correlation between
the physical statures of parents and their offspring, and the correlation between the
demand for a product and its price. Correlations are useful because they can indicate a
predictive relationship that can be exploited in practice. For example, an electrical
utility may produce less power on a mild day based on the correlation between
electricity demand and weather. Correlations can also suggest possible causal, or
mechanistic relationships; however, statistical dependence is not sufficient to
demonstrate the presence of such a relationship. Formally, dependence refers to any
situation in which random variables do not satisfy a mathematical condition of
probabilistic independence. In general statistical usage, correlation or co-relation can
refer to any departure of two or more random variables from independence, but most
commonly refers to a more specialized type of relationship between mean values.
There are several correlation coefficients, often denoted ρ or r, measuring the degree
of correlation. The most common of these is the Pearson correlation coefficient,
which is mainly sensitive to a linear relationship between two variables. Other
correlation coefficients have been developed to be more robust than the Pearson
correlation, or more sensitive to nonlinear relationships.
Regression Analysis : In statistics, regression analysis includes any techniques for
modeling and analyzing several variables, when the focus is on the relationship
between a dependent variable and one or more independent variables. More

119
specifically, regression analysis helps us understand how the typical value of the
dependent variable changes when any one of the independent variables is varied,
while the other independent variables are held fixed. Most commonly, regression
analysis estimates the conditional expectation of the dependent variable given the
independent variables — that is, the average value of the dependent variable when the
independent variables are held fixed. Less commonly, the focus is on a quantile, or
other location parameter of the conditional distribution of the dependent variable
given the independent variables. In all cases, the estimation target is a function of the
independent variables called the regression function. In regression analysis, it is also
of interest to characterize the variation of the dependent variable around the
regression function, which can be described by a probability distribution. Regression
analysis is widely used for prediction and forecasting, where its use has substantial
overlap with the field of machine learning. Regression analysis is also used to
understand which among the independent variables are related to the dependent
variable, and to explore the forms of these relationships. In restricted circumstances,
regression analysis can be used to infer causal relationships between the independent
and dependent variables. A large body of techniques for carrying out regression
analysis has been developed. Familiar methods such as linear regression and ordinary
least squares regression are parametric, in that the regression function is defined in
terms of a finite number of unknown parameters that are estimated from the data.
Nonparametric regression refers to techniques that allow the regression function to lie
in a specified set of functions, which may be infinite-dimensional.

120
CHAPTER V
DATA ANALYSIS AND FINDINGS
This study used a standard statistical software package, SPSS, to provide descriptive
statistics for all years under examination. Specifically, this study provides the mean and
standard deviations of the independent variables. A summary of the descriptive statistical
results is provided. Aside from the descriptive statistics, this study presents the specified
forms of the regression equations for all nine years. This study also performs chi-square
test necessary to conclude statistical significance in the parameters and examine the R-
squared and adjusted-R-squared in all of the regression equations. The data are presented
in a tabular format. Since the population of mutual funds is finite, this study elects to use
the population of mutual funds in the database. All attempts have been made to use the
entire population of mutual funds.
Table 5 Descriptive Statistics
N Range Sum Mean Std. Deviation GENDER 700 1 916 1.31 .462 LOCATION 700 3 1750 2.50 1.119 MARTIALSTATUS 700 1 1050 1.50 .500 OCCUPATION 700 1 969 1.38 .487 AGE 700 3 1590 2.27 1.095 INCOME 700 4 2070 2.96 1.315 MF_TAX 700 1 835 1.19 .395 MFNAME 700 25 9286 13.27 7.512 MODEOFINV 700 1 914 1.31 .461 BRANDNAME 700 4 2664 3.81 1.179 AUM 700 3 1534 2.19 .834 NAV 700 4 2070 2.96 1.315 PR 700 4 1909 2.73 1.403 QOS 700 4 1452 2.07 1.410 SAFE_IT 700 4 1482 2.12 1.189 ST_IT 700 3 1454 2.08 .617 EU_IT 700 4 1451 2.07 1.326 N_IT 700 4 1453 2.08 1.238 ES_IT 700 4 1695 2.42 1.212

121
CURRENTINV 700 4 1668 2.38 1.570 REPEATPURCHASE 700 4 1776 2.54 1.309 S_IT 700 4 1506 2.15 1.379 REFERRAL_IT 700 4 1830 2.61 1.305 SAFE 700 4 2664 3.81 1.179 ST 700 4 2987 4.27 1.164 EU 700 4 2613 3.73 1.285 N 700 3 2612 3.73 1.093 ES 700 4 2720 3.89 1.281 CURRENT 700 4 2693 3.85 1.292 REPEAT 700 4 2507 3.58 1.305 S 700 4 2181 3.12 1.087 CASHINV 700 4 2776 3.97 1.222 REFERRAL 700 4 2855 4.08 1.299 CS_REFFERAL 700 4 1530 2.19 1.356 CS_COMP 700 3 1238 1.77 .933 SALE 700 4 1911 2.73 1.228 Valid N (listwise) 700
5.1 FINDINGS IN DETAIL
We have sample of over 26 mutual funds out of the total mutual funds of 36 as on 31st
March 2010. However the selected mutual funds have a AUM of 89% of the total
market. Thus the findings of this research could be generalized for entire mutual fund
sector as a whole. Our study has captured data for mutual fund investors from all four
tier 1 cities. It is interesting to find that there is a very little significance of location
and a homogeneity is observed in the pattern, behavior and expectation of investors.
We have tried to all segments right from retail investor upto an HNI investor.
However institutional investors are not a part of this study.

122
Figure 5.1.57Pie chart for Investment Company
7
7
7
7
7
7
77
6
6
2
2
3
3
2
2
2
2
22
22 1 1 2 2
WHICH MUTUAL
FUND DO YOU INVEST IN
RELIANCE MF
HDFC MF
ICICI PRUMF
UTI MF
BIRLA SUNLIFE MF
SBI MF
LIC MF
KOTAK MF
FRANKLIN MF
TATA MF
IDFC MF
DSP BLACKROCK MF
DEUTCHE MF
SUNDARAM BNP MF
HSBC MF
TAURUS MF
BENCHMARK MF
RELIGARE F
FIDELITY MF
PRINCIPAL MF
CANARA ROBECO MF
JM FINANCIAL MF
JPMORGAN MF
BARODA PIONEER MF
DBS CHOLA MF
MORGAN STANLEY MF

123
As seen in the pie chart the distribution of respondents is shown above based on
Mutual Fund Company. All major mutual funds are covered under this which have
AUM of more than 98% of market. We have ensured the representation of sample is
homogeneous and there is no intentional inclination towards any fund house.
Figure 5.1.58 Bar chart for Investment Company
RE
LIA
NC
E M
FH
DF
C M
FIC
ICI P
RU
MF
UT
I MF
BIR
LA
SU
NL
IFE
MF
SB
I MF
LIC
MF
KO
TA
K M
FF
RA
NK
LIN
MF
TA
TA
MF
IDF
C M
FD
SP
BL
AC
KR
OC
K M
FD
EU
TC
HE
MF
SU
ND
AR
AM
BN
P M
FH
SB
C M
FT
AU
RU
S M
FB
EN
CH
MA
RK
RE
LIG
AR
E F
FID
EL
ITY
MF
PR
INC
IPA
L M
FC
AN
AR
A R
OB
EC
O M
FJ
M F
INA
NC
IAL
MF
JP
MO
RG
AN
MF
BA
RO
DA
PIO
NE
ER
MF
DB
S C
HO
LA
MF
MO
RG
AN
ST
AN
LE
Y M
F
MFNAME
0
5
10
15
20
25
30
Co
un
t
SALE
<50000
<100000
<50000000
5
Bar Chart

124
Figure 5.1.59 Pie chart for Mode of Investment
60
40
WHAT IS THE MODE OF
INVESTMENT
ONLINE
OFFLINE
As seen in the pie chart the distribution of respondents is shown above based on mode
of investment. There are 60% respondents belonging to online group. There are 40%
respondents belonging to offline group. We have ensured the representation of
sample is homogeneous and there is intentional inclination towards any age group.
Since random sampling is used for collecting data from different cities with the help
of administered sampling technique used.

125
Table 5.1.1. Cross tabulation between Mode of Investment and Sales
χ2=208.102; df=3; p=0.04;
λ=.252
SALE
Total <50000 <100000 <50000000 5 MODEOFINV ONLINE Count 0 324 81 81 486
% within MODEOFINV .0% 66.7% 16.7% 16.7% 100.0%
% within SALE .0% 80.2% 50.3% 100.0% 69.4% % of Total .0% 46.3% 11.6% 11.6% 69.4%
OFFLINE Count 54 80 80 0 214 % within MODEOFINV 25.2% 37.4% 37.4% .0% 100.0%
% within SALE 100.0% 19.8% 49.7% .0% 30.6% % of Total 7.7% 11.4% 11.4% .0% 30.6%
Total Count 54 404 161 81 700 % within MODEOFINV 7.7% 57.7% 23.0% 11.6% 100.0%
% within SALE 100.0% 100.0% 100.0% 100.0% 100.0% % of Total 7.7% 57.7% 23.0% 11.6% 100.0%
As seen from the cross-tabulation of respondents is shown above based on mode of
investment with respect to amount of purchase. There are 46.3% of investors with
investment in the range of 1 lakh prefer online medium along with other two
categories having 11.6% each, with investments in range of 1 lakh to 5crore and
above 5 crore respectively. However an insignificant percentage of investor with
investment less than 50 thousand, less than 1 lakh and less than 5 crore prefer offline
mode of investment with percentage of 7.7%, 11.4% and 11.4% respectively. This
clearly indicates than online medium is one of the most preferred medium for
investment.

126
Figure 5.1.60 Pie chart for Investment Based on Brandname
8
8
12
42
31
I INVEST IN MF BASED ON
BRANDNAME?
STRONGLY AGREE
AGREE
NEUTRAL
DISAGREE
STRONGLY DISAGREE
As seen in the pie chart the distribution of respondents is shown above based on
Brandname. There are 31% respondents strongly disagree that they invest on the basis
of brandname. There are 42% respondents disagree that they invest on the basis of
brandname. There are 12% respondents who are neutral on investing based on
brandname. However are 8% respondents strongly agree and the balance 8% also
agree that they invest on the basis of brandname. This is an interesting fact and we
found that this is because most of the Brandname oriented Mutual Funds like SBI,
LIC, UTI and CanaraRobecco were owned by PSU and probably there could be a

127
perception of non performance amongst investor. However it is a observed from past
return that PSU owned Mutual Funds have given lower return as compared to other.
We have ensured the representation of sample is homogeneous and there is intentional
inclination towards any age group.
Table 5.1.2. Cross tabulation between Brandname and Sales
χ2=279.18; df=12; p=0.044;
λ=.386 SALE Total
<50000 <100000 <50000000 >50000000 BRANDNAME STRONGLY
AGREE Count 0 54 0 0 54
% within BRANDNAME .0% 100.0% .0% .0% 100.0%
% within SALE .0% 13.4% .0% .0% 7.7% % of Total .0% 7.7% .0% .0% 7.7% AGREE Count 54 0 0 0 54 % within
BRANDNAME 100.0% .0% .0% .0% 100.0%
% within SALE 100.0% .0% .0% .0% 7.7% % of Total 7.7% .0% .0% .0% 7.7% NEUTRAL Count 0 0 81 0 81 % within
BRANDNAME .0% .0% 100.0% .0% 100.0%
% within SALE .0% .0% 50.3% .0% 11.6% % of Total .0% .0% 11.6% .0% 11.6% DISAGREE Count 0 135 80 81 296 % within
BRANDNAME .0% 45.6% 27.0% 27.4% 100.0%
% within SALE .0% 33.4% 49.7% 100.0% 42.3% % of Total .0% 19.3% 11.4% 11.6% 42.3% STRONGLY
DISAGREE Count 0 215 0 0 215
% within BRANDNAME .0% 100.0% .0% .0% 100.0%
% within SALE .0% 53.2% .0% .0% 30.7% % of Total .0% 30.7% .0% .0% 30.7% Total Count 54 404 161 81 700 % within
BRANDNAME 7.7% 57.7% 23.0% 11.6% 100.0%
% within SALE 100.0% 100.0% 100.0% 100.0% 100.0% % of Total 7.7% 57.7% 23.0% 11.6% 100.0%
As seen from the cross-tabulation of respondents shown above based on brandname
with respect to amount of purchase. There are 30.7% of investors with investment in

128
the range of 1 lakh strongly disagree with the fact that they consider brandname as a
parameter for investment along with other two categories having 19.3%, 11.4% and
11.6% with investments in range of 1 lakh, 1 lakh to 5crore and above 5 crore
respectively. However an insignificant percentage of investor with investment less
than 50 thousand and less than 1 lakh consider brandname as a parameter for
investment with percentage of 7.7%, respectively. This clearly indicates that
brandname is not considered as a parameter before making an investment. There by it
is inferred that fifth null hypothesis is accepted.
Figure 5.1.61 Bar chart for Investment Based on Brandname
STRONGLY AGREE
AGREE NEUTRAL DISAGREE STRONGLY DISAGREE
BRANDNAME
0
50
100
150
200
250
Co
un
t
SALE
<50000
<100000
<50000000
5
Bar Chart

129
Figure 5.1.62 Pie chart for Investment Based on AUM
15.4
61.6
11.4
11.6
STRONGLY AGREE
AGREE
NEUTRAL
DISAGREE
I CONSIDER ASSET UNDER MANAGEMENT OF MUTUAL FUND COMPANY BEFORE TAKING AND INVESTMENT CALL ?
As seen in the pie chart the distribution of respondents is shown above based on Asset
Under Management(AUM). There are 11.6% respondents strongly disagree that they
invest on the basis of AUM. There are 11.4% respondents disagree that they invest on
the basis of AUM. However are 61.4% respondents strongly agree and the balance
15.4% also agree that they invest on the basis of AUM. We have ensured the
representation of sample is homogeneous and there is intentional inclination towards
any age group.

130
Table 5.1.3. Cross tabulation between AUM and Sales
As seen from the cross-tabulation of respondents shown above based on AUM with
respect to amount of purchase. There are 15.4% of investors with investment in the
range of 1 lakh strongly agree with the fact that they consider AUM as a parameter for
investment along with other three categories having 7.7%, 42.3% and 11.6% with
investments in range of less than 50 thousand, less than 1 lakh and 1 lakh to 5crore
respectively. However an insignificant percentage of investor with investment more
than 5crore do not consider AUM as a parameter for investment with percentage of
χ2=468.64; df=9; p=0.047;
λ=.428
SALE
Total <50000 <100000 <50000000 5 AUM STRONGLY
AGREE Count 0 108 0 0 108 % within AUM
.0% 100.0% .0% .0% 100.0%
% within SALE .0% 26.7% .0% .0% 15.4%
% of Total .0% 15.4% .0% .0% 15.4% AGREE Count 54 296 81 0 431
% within AUM 12.5% 68.7% 18.8% .0% 100.0%
% within SALE 100.0% 73.3% 50.3% .0% 61.6%
% of Total 7.7% 42.3% 11.6% .0% 61.6% NEUTRAL Count 0 0 80 0 80
% within AUM .0% .0% 100.0% .0% 100.0%
% within SALE .0% .0% 49.7% .0% 11.4%
% of Total .0% .0% 11.4% .0% 11.4% DISAGREE Count 0 0 0 81 81
% within AUM .0% .0% .0% 100.0% 100.0%
% within SALE .0% .0% .0% 100.0% 11.6%
% of Total .0% .0% .0% 11.6% 11.6% Total Count 54 404 161 81 700
% within AUM 7.7% 57.7% 23.0% 11.6% 100.0%
% within SALE
100.0% 100.0% 100.0% 100.0% 100.0%
% of Total 7.7% 57.7% 23.0% 11.6% 100.0%

131
11.6%. This clearly indicates that AUM is considered as a parameter before making
an investment. There by it is inferred that sixth null hypothesis is rejected.
Figure 5.1.63 Bar chart for Investment Based on AUM
STRONGLY AGREE
AGREE NEUTRAL DISAGREE
AUM
0
50
100
150
200
250
300
Co
un
t
SALE
<50000
<100000
<50000000
5
Bar Chart

132
Figure 5.1.64 Pie chart for Investment Based on NAV
19
19
19
31
11
NAV
STRONGLY AGREE
AGREE
NEUTRAL
DISAGREE
STRONGLY DISAGREE
As seen in the pie chart the distribution of respondents is shown above based on
NAV. There are 11% respondents strongly disagree that they invest on the basis of
NAV. There are 31% respondents disagree that they invest on the basis of NAV.
There are 19% respondents who are neutral on investing based on NAV. However are
19% respondents strongly agree and the balance 19% also agree that they invest on
the basis of NAV. This is an interesting fact and we found that this is because most of

133
the investor who ignore NAV as a parameter for investments were salaried and high
investment amount indicating that the emphasise more on other parameter. When this
is probed further we identified that past performance was a parameter which
influenced them in taking a decision of investment. We have ensured the
representation of sample is homogeneous and there is intentional inclination towards
any age group.
Table 5.1.4. Cross tabulation between NAV and Sales
χ2=295.206; df=12; p=0.031;
λ=.512
SALE
Total <50000 <100000 <50000000 5 NAV
STRONGLY AGREE
Count 0 135 0 0 135 % within NAV .0% 100.0% .0% .0% 100.0% % within SALE .0% 33.4% .0% .0% 19.3% % of Total .0% 19.3% .0% .0% 19.3%
AGREE Count 0 135 0 0 135 % within NAV .0% 100.0% .0% .0% 100.0% % within SALE .0% 33.4% .0% .0% 19.3% % of Total .0% 19.3% .0% .0% 19.3%
NEUTRAL Count 0 54 0 81 135 % within NAV .0% 40.0% .0% 60.0% 100.0% % within SALE .0% 13.4% .0% 100.0% 19.3% % of Total .0% 7.7% .0% 11.6% 19.3%
DISAGREE Count 54 0 161 0 215 % within NAV 25.1% .0% 74.9% .0% 100.0% % within SALE 100.0% .0% 100.0% .0% 30.7% % of Total 7.7% .0% 23.0% .0% 30.7%
STRONGLY DISAGREE
Count 0 80 0 0 80 % within NAV .0% 100.0% .0% .0% 100.0% % within SALE .0% 19.8% .0% .0% 11.4% % of Total .0% 11.4% .0% .0% 11.4%
Total Count 54 404 161 81 700 % within NAV 7.7% 57.7% 23.0% 11.6% 100.0% % within SALE 100.0% 100.0% 100.0% 100.0% 100.0% % of Total 7.7% 57.7% 23.0% 11.6% 100.0%
As seen from the cross-tabulation of respondents shown above based on NAV with
respect to amount of purchase. There are 19.3% of investors with investment in the

134
range of 1 lakh strongly agree with the fact that they consider NAV as a parameter for
investment along with one other category having 19.3% with investments in range of
less than 1 lakh. A similar type of investor in various category are neutral on this with
total percentage of 19.3% However a significant percentage of investor with
investment less than 50 thousand and in the range of 1lakh to 5 crore do not consider
NAV as a parameter for investment with percentage of 7.7% and 23% respectively. In
addition investors with investment in the range of 1 lakh strongly disagree with the
fact that they consider NAV as a parameter for investment with percentage of 11.4%
This clearly indicates that NAV is not considered as a parameter before making an
investment. There by it is inferred that seventh null hypothesis is accepted.
Figure 5.1.65 Bar chart for Investment Based on NAV
STRONGLY AGREE
AGREE NEUTRAL DISAGREE STRONGLY DISAGREE
NAV
0
50
100
150
200
Cou
nt
SALE
<50000
<100000
<50000000
5
Bar Chart

135
Figure 5.1.66 Pie chart for Investment Based on PR
23
35
31
12
PR
STRONGLY AGREE
AGREE
DISAGREE
STRONGLY DISAGREE
As seen in the pie chart the distribution of respondents is shown above based on past
record. There are 12% respondents strongly disagree that they invest on the basis of
past record. There are 31% respondents disagree that they invest on the basis of past
record. However are 35% respondents strongly agree and the balance 23% also agree
that they invest on the basis of past record. We have ensured the representation of
sample is homogeneous and there is intentional inclination towards any age group.

136
Table 5.1.5. Cross tabulation between PR and Sales
χ2=368.54; df=9; p=0.027;
λ=.323
SALE
Total <50000 <100000 <50000000 5 PR STRONGLY
AGREE Count 0 81 81 0 162 % within PR .0% 50.0% 50.0% .0% 100.0% % within SALE .0% 20.0% 50.3% .0% 23.1%
% of Total .0% 11.6% 11.6% .0% 23.1% AGREE Count 54 189 0 0 243
% within PR 22.2% 77.8% .0% .0% 100.0% % within SALE 100.0% 46.8% .0% .0% 34.7%
% of Total 7.7% 27.0% .0% .0% 34.7% DISAGREE Count 0 134 80 0 214
% within PR .0% 62.6% 37.4% .0% 100.0% % within SALE .0% 33.2% 49.7% .0% 30.6%
% of Total .0% 19.1% 11.4% .0% 30.6% STRONGLY DISAGREE
Count 0 0 0 81 81 % within PR .0% .0% .0% 100.0% 100.0% % within SALE .0% .0% .0% 100.0% 11.6%
% of Total .0% .0% .0% 11.6% 11.6% Total Count 54 404 161 81 700
% within PR 7.7% 57.7% 23.0% 11.6% 100.0% % within SALE 100.0% 100.0% 100.0% 100.0% 100.0%
% of Total 7.7% 57.7% 23.0% 11.6% 100.0%
As seen from the cross-tabulation of respondents shown above based on past record
with respect to amount of purchase. There are 11.6% of investors each with
investment in the range of 1 lakh and 1lakh to 5crore who strongly agree with the fact
that they consider past record as a parameter for investment along with other two
categories having 7.7% and 27% with investments in range of less than 50 thousand
and less than 1 lakh respectively. However an insignificant percentage of investor
with investment more than 5crore do not consider past record as a parameter for
investment with percentage of 11.6%. This clearly indicates that past record is
considered as a parameter before making an investment. There by it is inferred that

137
eighth null hypothesis is rejected.
Figure 5.1.67Bar chart for Investment Based on PR
STRONGLY AGREE
AGREE DISAGREE STRONGLY DISAGREE
PR
0
50
100
150
200
Co
un
t
SALE
<50000
<100000
<50000000
5
Bar Chart

138
Figure 5.1.68 Pie chart for Investment Based on Quality of Services
50
27
11.6
11.4
STRONGLY AGREE
AGREE
DISAGREE
STRONGLY DISAGREE
I INVEST IN MUTUAL FUND BASED ON ITS QUALITY OF SERVICE
As seen in the pie chart the distribution of respondents is shown above based on
Quality of Service. There are 11.4% respondents strongly disagree that they invest on
the basis of past record. There are 11.6% respondents disagree that they invest on the
basis of past record. However are 27% respondents strongly agree and the balance
50% also agree that they invest on the basis of past record. We have ensured the
representation of sample is homogeneous and there is intentional inclination towards
any age group.

139
Table 5.1.6. Cross tabulation between Quality of Service and Sales
χ2=266; df=9; p=0.028;
λ=.375
SALE
Total <50000 <100000 <50000000 5 QOS STRONGLY
AGREE Count 54 215 81 0 350 % within QOS 15.4% 61.4% 23.1% .0% 100.0% % within SALE 100.0% 53.2% 50.3% .0% 50.0%
% of Total 7.7% 30.7% 11.6% .0% 50.0% AGREE Count 0 189 0 0 189
% within QOS .0% 100.0% .0% .0% 100.0% % within SALE .0% 46.8% .0% .0% 27.0%
% of Total .0% 27.0% .0% .0% 27.0% DISAGREE Count 0 0 0 81 81
% within QOS .0% .0% .0% 100.0% 100.0% % within SALE .0% .0% .0% 100.0% 11.6%
% of Total .0% .0% .0% 11.6% 11.6% STRONGLY DISAGREE
Count 0 0 80 0 80 % within QOS .0% .0% 100.0% .0% 100.0% % within SALE
.0% .0% 49.7% .0% 11.4%
% of Total .0% .0% 11.4% .0% 11.4% Total Count 54 404 161 81 700
% within QOS 7.7% 57.7% 23.0% 11.6% 100.0% % within SALE 100.0% 100.0% 100.0% 100.0% 100.0%
% of Total 7.7% 57.7% 23.0% 11.6% 100.0%
As seen from the cross-tabulation of respondents, is shown above based on quality of
service with respect to amount of purchase. There are 27% of investors with
investment in the range of 1 lakh agree with considering quality of service as a
parameter for investment along with other three categories which strongly agrees,
having 7.7%, 30.7% and 11.6% each, with investments less than 50 thousand, less
than 1 lakh and in range of 1 lakh to 5crore respectively. However an insignificant
percentage of investor with investment in the range of 1lakh to 5crore and less than
5crore disagree with the fact that quality of service is a parameter for investment
11.4% and 11.6% respectively. This clearly indicates that quality of service is

140
considered as a parameter for investment. There by it is inferred that third null
hypothesis is rejected.
Figure 5.1.69 Bar chart for Investment Based on Quality of Services
STRONGLY AGREE
AGREE DISAGREE STRONGLY DISAGREE
QOS
0
50
100
150
200
250
Co
unt
SALE
<50000
<100000
<50000000
5
Bar Chart

141
Figure 5.1.70 Pie chart for source of Information for Mutual Fund
20
10
20
10
20
20
HOW DO YOU KNOW ABOUT
MUTUAL FUND OR ITS
ONLINE
TELE CALL
SMS
THROUGH A FRIEND
PRINT MEDIA
AGENT
As seen in the pie chart the distribution of respondents is shown above based on
source of information for knowing about mutual fund. There are 20% respondents
belonging to group which gets to know about mutual fund through online medium.
There are 10% respondents belonging to group which gets to know about mutual fund
through Tele-Call. There are 20% respondents belonging to group which gets to know
about mutual fund through SMS. There are 10% respondents belonging to group
which gets to know about mutual fund through friend. There are 20% respondents
belonging to group which gets to know about mutual fund through print media. There
are 10% respondents belonging to group which gets to know about mutual fund
through agent. We have ensured the representation of sample is homogeneous and

142
there is intentional inclination towards any group. Since random sampling is used for
collecting data from different cities with the help of administered sampling technique
used.
Figure 5.1.71 Pie chart for source of more information for Mutual Fund
40
10
30
20
WHERE DO YOU FIND MORE
INFORMATION ON MUTUAL FUND
WEBSITE
BROUCHRE
CALL CENTER
AGENT
As seen in the pie chart the distribution of respondents is shown above based on
source of information for knowing about mutual fund. There are 40% respondents
belonging to group which gets to know about mutual fund through website. There are
10% respondents belonging to group which gets to know about mutual fund through
brochure. There are 30% respondents belonging to group which gets to know about
mutual fund through call-centre. There are 10% respondents belonging to group
which gets to know about mutual fund through agent. We have ensured the

143
representation of sample is homogeneous and there is intentional inclination towards
any group. Since random sampling is used for collecting data from different cities
with the help of administered sampling technique used.
Figure 5.1.72 Pie chart for Perception of safety in IT & IT Enabled Services.
50
10
40
I feel safe investing
through IT & IT Enabled Services
[online]?
STRONGLY AGREE
AGREE
STRONGLY DISAGREE
As seen in the pie chart the distribution of respondents is shown above based on
perception of safety in IT & IT Enabled Services. There are 50% respondents
belonging to group which strongly feels safe to use IT & IT Enabled services. There
are 10% respondents belonging to group which feels safe to use IT & IT Enabled
services. There are 40% respondents belonging to group which does not feels safe to
use IT & IT Enabled services. We have ensured the representation of sample is
homogeneous and there is intentional inclination towards any group. Since random

144
sampling is used for collecting data from different cities with the help of administered
sampling technique used.
Table 5.1.7. Cross tabulation between SAFE_IT and Sales
Χ2=883.048; df=12; p=0.000;
λ=.194
SALE
Total <50000 <100000 <50000000 5 SAFE_IT STRONGLY
AGREE Count 0 162 80 0 242 % within SAFE_IT .0% 66.9% 33.1% .0% 100.0%
% within SALE .0% 40.1% 49.7% .0% 34.6% % of Total .0% 23.1% 11.4% .0% 34.6%
AGREE Count 0 134 81 81 296 % within SAFE_IT .0% 45.3% 27.4% 27.4% 100.0%
% within SALE .0% 33.2% 50.3% 100.0% 42.3% % of Total .0% 19.1% 11.6% 11.6% 42.3%
NEUTRAL Count 0 54 0 0 54 % within SAFE_IT .0% 100.0% .0% .0% 100.0%
% within SALE .0% 13.4% .0% .0% 7.7% % of Total .0% 7.7% .0% .0% 7.7%
DISAGREE Count 54 0 0 0 54 % within SAFE_IT 100.0% .0% .0% .0% 100.0%
% within SALE 100.0% .0% .0% .0% 7.7% % of Total 7.7% .0% .0% .0% 7.7%
STRONGLY DISAGREE
Count 0 54 0 0 54 % within SAFE_IT .0% 100.0% .0% .0% 100.0%
% within SALE .0% 13.4% .0% .0% 7.7% % of Total .0% 7.7% .0% .0% 7.7%
Total Count 54 404 161 81 700 % within SAFE_IT
7.7% 57.7% 23.0% 11.6% 100.0%
% within SALE 100.0% 100.0% 100.0% 100.0% 100.0% % of Total 7.7% 57.7% 23.0% 11.6% 100.0%
As seen from the cross-tabulation of respondents, is shown above based on Perception
of safety in IT & IT Enabled Services with respect to amount of purchase. There are
23.1% of investors with investment in the range of 1 lakh strongly agree with
perception of safety in IT & IT Enabled Services along with other three categories

145
which strongly agrees, having 19.1%, 11.6% and 11.6% each, with investments less
than less than 1 lakh, in range of 1 lakh to 5crore and less than 5 crore respectively.
However an insignificant percentage of investor with investment in the range of less
than 50 thousand and less than 1 lakh disagree with the perception of safety in IT &
IT Enabled Services 7.7% and 7.7% respectively. This clearly indicates that
perception of safety in IT & IT Enabled Services is high.
Figure 5.1.73 Bar chart for Perception of safety in IT & IT Enabled Services.
STRONGLY AGREE
AGREE NEUTRAL DISAGREE STRONGLY DISAGREE
SAFE_IT
0
50
100
150
200
Co
un
t
SALE
<50000
<100000
<50000000
5
Bar Chart

146
Figure 5.1.74 Pie chart for Perception of service time in IT & IT Enabled
Services.
50
10
40
Service-time is comparitively low in services offered IT Enabled Services
[online]?
STRONGLY AGREE
AGREE
STRONGLY DISAGREE
As seen in the pie chart the distribution of respondents is shown above based on
perception of service time in using IT & IT Enabled Services. There are 50%
respondents belonging to group having perception of having low service time in using
IT & IT Enabled services. There are 10% respondents belonging to group having
perception of having low service time in using IT & IT Enabled services. There are
40% respondents belonging to group having perception of not having low service time
in using IT & IT Enabled services. We have ensured the representation of sample is
homogeneous and there is intentional inclination towards any group. Since random

147
sampling is used for collecting data from different cities with the help of administered
sampling technique used.
Table 5.1.8. Cross tabulation between Service Time_IT and Sales
χ2=738.248; df=6; p=0.000;
λ=.267
SALE
Total <50000 <100000 <50000000 5 ST_IT STRONGLY
AGREE Count 54 0 0 0 54 % within ST_IT 100.0% .0% .0% .0% 100.0%
% within SALE 100.0% .0% .0% .0% 7.7%
% of Total 7.7% .0% .0% .0% 7.7% AGREE Count 0 350 161 81 592
% within ST_IT .0% 59.1% 27.2% 13.7% 100.0%
% within SALE .0% 86.6% 100.0% 100.0% 84.6%
% of Total .0% 50.0% 23.0% 11.6% 84.6% DISAGREE Count 0 54 0 0 54
% within ST_IT .0% 100.0% .0% .0% 100.0%
% within SALE
.0% 13.4% .0% .0% 7.7%
% of Total .0% 7.7% .0% .0% 7.7% Total Count 54 404 161 81 700
% within ST_IT 7.7% 57.7% 23.0% 11.6% 100.0%
% within SALE
100.0% 100.0% 100.0% 100.0% 100.0%
% of Total 7.7% 57.7% 23.0% 11.6% 100.0%
As seen from the cross-tabulation of respondents, is shown above based on perception
of low service time in using IT & IT Enabled Services with respect to amount of
purchase. There are 80% of investors in various categories agree with perception of
low service time in using IT & IT Enabled Services. However an insignificant
percentage of investor with investment in the range of less than 1 lakh disagree with
the perception of low service time in using IT & IT Enabled Services with a
percentage of 7.7%. This clearly indicates that perception of low service time in using
IT & IT Enabled Services is high. This is an important inference as it is one of the

148
parameter which indicates influence of IT on service quality as per Parsuraman’s
SERVQUAL Model.
Figure 5.1.75 Bar chart for Perception of service time in IT & IT Enabled
Services.
STRONGLY AGREE AGREE DISAGREE
ST_IT
0
100
200
300
400
Co
un
t
SALE
<50000
<100000
<50000000
5
Bar Chart

149
Figure 5.1.76 Pie chart for Perception of ease of use in IT & IT Enabled
Services.
50
10
40
The IT & IT Enabled Services provided are easy to use ?
STRONGLY AGREE
AGREE
STRONGLY DISAGREE
As seen in the pie chart the distribution of respondents is shown above based on
perception ease of use with IT & IT Enabled Services. There are 50% respondents
belonging to group having perception of easy use of IT & IT Enabled services. There
are 10% respondents belonging to group having perception of easy use of IT & IT
Enabled services. There are 40% respondents belonging to group disagree with
perception of easy use of IT & IT Enabled services. We have ensured the
representation of sample is homogeneous and there is intentional inclination towards
any group. Since random sampling is used for collecting data from different cities
with the help of administered sampling technique used.

150
Table 5.1.9. Cross tabulation between ease of use of IT and Sales
χ2=896.202; df=9; p=0.001;
λ=.277
SALE
Total <50000 <100000 <50000000 5 EU_IT STRONGLY
AGREE Count 0 216 81 0 297 % within EU_IT .0% 72.7% 27.3% .0% 100.0%
% within SALE .0% 53.5% 50.3% .0% 42.4% % of Total .0% 30.9% 11.6% .0% 42.4%
AGREE Count 0 108 80 81 269 % within EU_IT .0% 40.1% 29.7% 30.1% 100.0%
% within SALE .0% 26.7% 49.7% 100.0% 38.4% % of Total .0% 15.4% 11.4% 11.6% 38.4%
DISAGREE Count 54 0 0 0 54 % within EU_IT 100.0% .0% .0% .0% 100.0%
% within SALE 100.0% .0% .0% .0% 7.7% % of Total 7.7% .0% .0% .0% 7.7%
STRONGLY DISAGREE
Count 0 80 0 0 80 % within EU_IT .0% 100.0% .0% .0% 100.0%
% within SALE .0% 19.8% .0% .0% 11.4% % of Total .0% 11.4% .0% .0% 11.4%
Total Count 54 404 161 81 700 % within EU_IT 7.7% 57.7% 23.0% 11.6% 100.0%
% within SALE 100.0% 100.0% 100.0% 100.0% 100.0% % of Total 7.7% 57.7% 23.0% 11.6% 100.0%
As seen from the cross-tabulation of respondents, is shown above based on perception
ease of use with IT & IT Enabled Services with respect to amount of purchase. There
are 42.4% and 38.4% of investors in various categories who strongly agree and agree
respectively with perception that IT & IT Enabled Services are ease to use. However
an insignificant percentage of investor with investment in the range of less than 50
thousand disagree with the perception that IT & IT Enabled Services are ease to use,
with a percentage of 7.7%. This clearly indicates that perception that IT & IT Enabled
Services are ease to use is high. This is an important inference as it is one of the
parameter which indicates influence of IT on service quality as per Parsuraman’s

151
SERVQUAL Model.
Figure 5.1.77 Bar chart for Perception of ease of use in IT & IT Enabled
Services.
STRONGLY AGREE
AGREE DISAGREE STRONGLY DISAGREE
EU_IT
0
50
100
150
200
250
Coun
t
SALE
<50000
<100000
<50000000
5
Bar Chart
Figure 5.1.78 Bar chart for Perception of ease of use in IT & IT Enabled
Services.
Overall
4
3
2
1
Clu
ster
0 20 40 60 80 100
Percent within Cluster
N
AGREE
NEUTRAL
DISAGREE
STRONGLY DISAGREE
Within Cluster Percentage of N

152
Figure 5.1.79 Pie chart for catering to all need for using IT & IT Enabled
Services.
50
10
40
The IT & IT Enabled Services are
catering to all my needs ?
STRONGLY AGREE
AGREE
STRONGLY DISAGREE
As seen in the pie chart the distribution of respondents is shown above based on
perception that IT & IT Enabled Services are catering to all needs. There are 50%
respondents belonging to group having perception that IT & IT Enabled services are
catering to all needs. There are 10% respondents belonging to group having
perception that IT & IT Enabled services are catering to all needs. There are 40%
respondents belonging to group disagree with perception that IT & IT Enabled
services are catering to all needs. We have ensured the representation of sample is
homogeneous and there is intentional inclination towards any group. Since random

153
sampling is used for collecting data from different cities with the help of administered
sampling technique used.
Table 5.1.10. Cross tabulation between catering to all need using IT and
Sales
χ2=896.202; df=9; p=0.000;
λ=.27
SALE
Total <50000 <100000 <50000000 5 N_IT STRONGLY
AGREE Count 0 108 80 81 269 % within N_IT .0% 40.1% 29.7% 30.1% 100.0% % within SALE .0% 26.7% 49.7% 100.0% 38.4%
% of Total .0% 15.4% 11.4% 11.6% 38.4% AGREE Count 0 216 81 0 297
% within N_IT .0% 72.7% 27.3% .0% 100.0% % within SALE .0% 53.5% 50.3% .0% 42.4%
% of Total .0% 30.9% 11.6% .0% 42.4% DISAGREE Count 0 80 0 0 80
% within N_IT .0% 100.0% .0% .0% 100.0% % within SALE .0% 19.8% .0% .0% 11.4%
% of Total .0% 11.4% .0% .0% 11.4% STRONGLY DISAGREE
Count 54 0 0 0 54 % within N_IT 100.0% .0% .0% .0% 100.0% % within SALE 100.0% .0% .0% .0% 7.7%
% of Total 7.7% .0% .0% .0% 7.7% Total Count 54 404 161 81 700
% within N_IT 7.7% 57.7% 23.0% 11.6% 100.0% % within SALE 100.0% 100.0% 100.0% 100.0% 100.0%
% of Total 7.7% 57.7% 23.0% 11.6% 100.0%
As seen from the cross-tabulation of respondents, is shown above based on perception
that IT & IT Enabled Services are catering to all needs with respect to amount of
purchase. There are 38.4% and 42.4% of investors in various categories who strongly
agree and agree respectively with perception that IT & IT Enabled Services are
catering to all needs. However an insignificant percentage of investor with investment
in the range of less than 50 thousand strongly disagree with the perception that IT &

154
IT Enabled Services are catering to all needs, with a percentage of 7.7%. This clearly
indicates that perception that IT & IT Enabled Services are catering to all needs is
high. This is an important inference as it is one of the parameter which indicates
influence of IT on service quality as per Parsuraman’s SERVQUAL Model.
Figure 5.1.80 Pie chart for catering to all need for using IT & IT Enabled
Services.
STRONGLY AGREE
AGREE DISAGREE STRONGLY DISAGREE
N_IT
0
50
100
150
200
250
Co
un
t
SALE
<50000
<100000
<50000000
5
Bar Chart
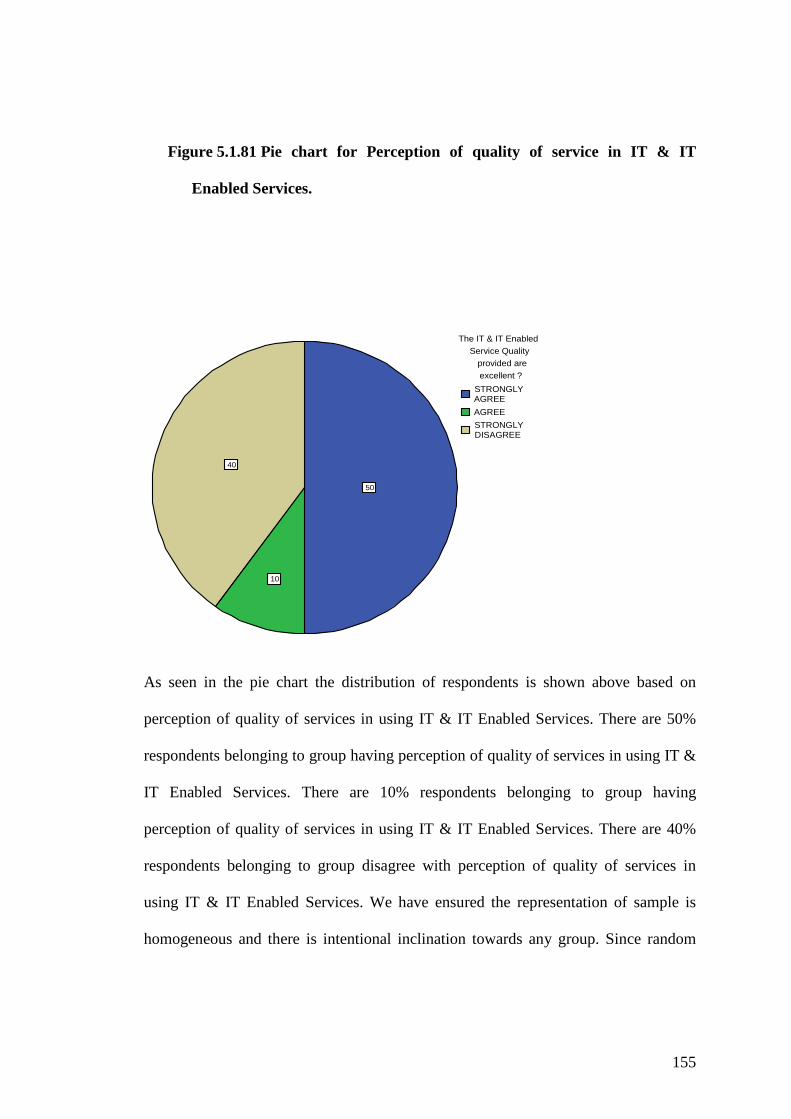
155
Figure 5.1.81 Pie chart for Perception of quality of service in IT & IT
Enabled Services.
50
10
40
The IT & IT Enabled Service Quality
provided are excellent ?
STRONGLY AGREE
AGREE
STRONGLY DISAGREE
As seen in the pie chart the distribution of respondents is shown above based on
perception of quality of services in using IT & IT Enabled Services. There are 50%
respondents belonging to group having perception of quality of services in using IT &
IT Enabled Services. There are 10% respondents belonging to group having
perception of quality of services in using IT & IT Enabled Services. There are 40%
respondents belonging to group disagree with perception of quality of services in
using IT & IT Enabled Services. We have ensured the representation of sample is
homogeneous and there is intentional inclination towards any group. Since random

156
sampling is used for collecting data from different cities with the help of administered
sampling technique used.
Table 5.1.11. Cross tabulation between excellent IT QoS and Sales
χ2= 304.12; df=12; p=0.029;
λ=.208
SALE
Total <50000 <100000 <50000000 5 ES_IT STRONGLY
AGREE Count 0 54 80 0 134 % within ES_IT .0% 40.3% 59.7% .0% 100.0%
% within SALE .0% 13.4% 49.7% .0% 19.1% % of Total .0% 7.7% 11.4% .0% 19.1%
AGREE Count 0 189 81 81 351 % within ES_IT .0% 53.8% 23.1% 23.1% 100.0%
% within SALE .0% 46.8% 50.3% 100.0% 50.1% % of Total .0% 27.0% 11.6% 11.6% 50.1%
NEUTRAL Count 0 81 0 0 81 % within ES_IT .0% 100.0% .0% .0% 100.0%
% within SALE .0% 20.0% .0% .0% 11.6% % of Total .0% 11.6% .0% .0% 11.6%
DISAGREE Count 54 0 0 0 54 % within ES_IT 100.0% .0% .0% .0% 100.0%
% within SALE 100.0% .0% .0% .0% 7.7% % of Total 7.7% .0% .0% .0% 7.7%
STRONGLY DISAGREE
Count 0 80 0 0 80 % within ES_IT .0% 100.0% .0% .0% 100.0%
% within SALE .0% 19.8% .0% .0% 11.4% % of Total .0% 11.4% .0% .0% 11.4%
Total Count 54 404 161 81 700 % within ES_IT
7.7% 57.7% 23.0% 11.6% 100.0%
% within SALE 100.0% 100.0% 100.0% 100.0% 100.0% % of Total 7.7% 57.7% 23.0% 11.6% 100.0%
As seen from the cross-tabulation of respondents, is shown above based on perception
of excellent quality of services in using IT & IT Enabled Services with respect to
amount of purchase. There are 19.1% and 50.1% of investors in various categories
who strongly agree and agree respectively with perception of excellent quality of
services in using IT & IT Enabled Services. However an insignificant percentage of

157
investor with investment in the range of less than 50 thousand strongly disagree with
the perception of excellent quality of services in using IT & IT Enabled Services, with
a percentage of 7.7%. This clearly indicates that the perception of excellent quality of
services in using IT & IT Enabled Services is high. This is an important inference as it
is one of the parameter which indicates influence of IT on service quality as per
Parsuraman’s SERVQUAL Model.
Figure 5.1.82 Bar chart for Perception of quality of service in IT & IT
Enabled Services.
STRONGLY AGREE
AGREE NEUTRAL DISAGREE STRONGLY DISAGREE
ES_IT
0
50
100
150
200
Co
un
t
SALE
<50000
<100000
<50000000
5
Bar Chart

158
Figure 5.1.83 Bar chart for Perception of quality of service in IT & IT
Enabled Services.
Overall
4
3
2
1
Clu
ste
r
0 20 40 60 80 100
Percent within Cluster
N
AGREE
NEUTRAL
DISAGREE
STRONGLY DISAGREE
Within Cluster Percentage of N

159
Figure 5.1.84 Pie chart for investment using IT & IT Enabled Services.
50
10
40
I invest in existing scheme through IT
& IT Enabled Services ?
STRONGLY AGREE
AGREE
STRONGLY DISAGREE
As seen in the pie chart the distribution of respondents is shown above based on
perception of investment using IT & IT Enabled Services. There are 50% respondents
belonging to group having perception investment using IT & IT Enabled Services.
There are 10% respondents belonging to group having perception investment using IT
& IT Enabled Services. There are 40% respondents belonging to group disagree with
perception investment using IT & IT Enabled Services. We have ensured the
representation of sample is homogeneous and there is intentional inclination towards
any group. Since random sampling is used for collecting data from different cities
with the help of administered sampling technique used.

160
Table 5.1.12. Cross tabulation between current investment and Sales
χ2=931.534; df=9; p=0.000; λ=.423
SALE
Total <50000 <10000
0 <500000
00 5 CURRENTINV STRONGLY
AGREE Count 0 215 0 81 296 % within CURRENTINV .0% 72.6% .0% 27.4% 100.0%
% within SALE .0% 53.2% .0% 100.0% 42.3% % of Total .0% 30.7% .0% 11.6% 42.3%
AGREE Count 0 189 0 0 189 % within CURRENTINV .0% 100.0% .0% .0% 100.0%
% within SALE .0% 46.8% .0% .0% 27.0% % of Total .0% 27.0% .0% .0% 27.0%
DISAGREE Count 0 0 81 0 81 % within CURRENTINV .0% .0% 100.0% .0% 100.0%
% within SALE .0% .0% 50.3% .0% 11.6% % of Total .0% .0% 11.6% .0% 11.6%
STRONGLY DISAGREE
Count 54 0 80 0 134 % within CURRENTINV 40.3% .0% 59.7% .0% 100.0%
% within SALE 100.0% .0% 49.7% .0% 19.1% % of Total 7.7% .0% 11.4% .0% 19.1%
Total Count 54 404 161 81 700 % within CURRENTINV 57.7% 23.0% 11.6% 100.0%
% within SALE 100.0% 100.0% 100.0% 100.0% 100.0% % of Total 7.7% 57.7% 23.0% 11.6% 100.0%
As seen from the cross-tabulation of respondents, is shown above based on perception
investment using IT & IT Enabled Services with respect to amount of purchase. There
are 42.3% and 27% of investors in various categories who strongly agree and agree
respectively indicating their current mode of investment is using IT & IT Enabled
Services. However an insignificant percentage of investor with 11.6 and 19.1%
investment from various categories disagree and strongly disagree with the using IT &
IT Enabled Services as a mode of investment. This clearly indicates that majority of
investors have made current investments using IT & IT Enabled Services. This is an
important inference as it is one of the parameter which indicates current mode of

161
investment and rechecks it with the earlier question asked to remove any error or bias.
Figure 5.1.85 Bar chart for investment using IT & IT Enabled Services.
STRONGLY AGREE
AGREE DISAGREE STRONGLY DISAGREE
CURRENTINV
0
50
100
150
200
250
Co
un
t
SALE
<50000
<100000
<50000000
5
Bar Chart

162
Figure 5.1.86 Pie chart for additional investment using IT & IT Enabled
Services
50
10
40
I would like to purchase similar products IT & IT
Enabled Services ?
STRONGLY AGREE
AGREE
STRONGLY DISAGREE
As seen in the pie chart the distribution of respondents is shown above based on
perception of additional investment using IT & IT Enabled Services. There are 50%
respondents belonging to group having perception additional investment using IT &
IT Enabled Services. There are 10% respondents belonging to group having
perception additional investment using IT & IT Enabled Services. There are 40%
respondents belonging to group disagree with perception additional investment using
IT & IT Enabled Services. We have ensured the representation of sample is
homogeneous and there is intentional inclination towards any group. Since random

163
sampling is used for collecting data from different cities with the help of administered
sampling technique used.
Table 5.1.13. Cross tabulation between repeat purchase and Sales
χ2=1163.384; df=9; p=0.000; λ=.458
SALE
Total <50000 <10000
0 <500000
00 5 REPEATPURCHASE
STRONGLY AGREE
Count 0 135 0 0 135 % within REPEATPURCHASE
.0% 100.0% .0% .0% 100.0%
% within SALE .0% 33.4% .0% .0% 19.3% % of Total .0% 19.3% .0% .0% 19.3%
AGREE Count 0 269 81 0 350 % within REPEATPURCHASE
.0% 76.9% 23.1% .0% 100.0%
% within SALE .0% 66.6% 50.3% .0% 50.0% % of Total .0% 38.4% 11.6% .0% 50.0%
DISAGREE Count 54 0 80 0 134 % within REPEATPURCHASE
40.3% .0% 59.7% .0% 100.0%
% within SALE 100.0% .0% 49.7% .0% 19.1% % of Total 7.7% .0% 11.4% .0% 19.1%
STRONGLY DISAGREE
Count 0 0 0 81 81 % within REPEATPURCHASE
.0% .0% .0% 100.0% 100.0%
% within SALE .0% .0% .0% 100.0% 11.6% % of Total .0% .0% .0% 11.6% 11.6%
Total Count 54 404 161 81 700 % within REPEATPURCHASE
7.7% 57.7% 23.0% 11.6% 100.0%
% within SALE 100.0% 100.0% 100.0% 100.0% 100.0% % of Total 7.7% 57.7% 23.0% 11.6% 100.0%
As seen from the cross-tabulation of respondents, is shown above based on perception
additional investment using IT & IT Enabled Services with respect to amount of
purchase. There are 19.3% and 50% of investors in various categories who strongly
agree and agree respectively indicating their additional investment would be done

164
using IT & IT Enabled Services. However an insignificant percentage of investor with
19.1% and 11.6% investment from various categories disagree and strongly disagree
with the using IT & IT Enabled Services as a mode of investment for additional
purchase. This clearly indicates that majority of investors would make additional
investments using IT & IT Enabled Services. This is an important inference as it is
one of the parameter which indicates additional investment mode. This also reaffirms
that satisfied customers are loyal and IT plays an important role in this.
Figure 5.1.87 Bar chart for additional investment using IT & IT Enabled
Services
STRONGLY AGREE
AGREE DISAGREE STRONGLY DISAGREE
REPEATPURCHASE
0
50
100
150
200
250
300
Co
un
t
SALE
<50000
<100000
<50000000
5
Bar Chart

165
Figure 5.1.88 Pie chart for satisfaction with IT & IT Enabled Services.
49
10
0
41
I am satisfied with the IT & IT Enabled
Services ?
STRONGLY AGREE
AGREE
DISAGREE
STRONGLY DISAGREE
As seen in the pie chart the distribution of respondents is shown above based on
satisfaction with IT & IT Enabled Services. There are 49% respondents belonging to
group having satisfaction with IT & IT Enabled Services. There are 10% respondents
belonging to group agree with perception satisfaction with IT & IT Enabled Services.
There are 41% respondents belonging to group strongly disagree with satisfaction
with IT & IT Enabled Services. We have ensured the representation of sample is
homogeneous and there is intentional inclination towards any group. Since random
sampling is used for collecting data from different cities with the help of administered
sampling technique used.

166
Table 5.1.14. Cross tabulation between satisfaction with IT and Sales
χ2=189; df=9; p=0.039;
λ=.423
SALE
Total <50000 <100000 <50000000 5 S_IT STRONGLY
AGREE Count 0 216 81 0 297 % within S_IT .0% 72.7% 27.3% .0% 100.0% % within SALE .0% 53.5% 50.3% .0% 42.4%
% of Total .0% 30.9% 11.6% .0% 42.4% AGREE Count 54 188 0 0 242
% within S_IT 22.3% 77.7% .0% .0% 100.0% % within SALE 100.0% 46.5% .0% .0% 34.6%
% of Total 7.7% 26.9% .0% .0% 34.6% DISAGREE Count 0 0 80 0 80
% within S_IT .0% .0% 100.0% .0% 100.0% % within SALE .0% .0% 49.7% .0% 11.4%
% of Total .0% .0% 11.4% .0% 11.4% STRONGLY DISAGREE
Count 0 0 0 81 81 % within S_IT .0% .0% .0% 100.0% 100.0% % within SALE
.0% .0% .0% 100.0% 11.6%
% of Total .0% .0% .0% 11.6% 11.6% Total Count 54 404 161 81 700
% within S_IT 7.7% 57.7% 23.0% 11.6% 100.0% % within SALE 100.0% 100.0% 100.0% 100.0% 100.0%
% of Total 7.7% 57.7% 23.0% 11.6% 100.0%
As seen from the cross-tabulation of respondents, is shown above based on
satisfaction with IT & IT Enabled Services with respect to amount of purchase. There
are 42.4% and 36.6% of investors in various categories who strongly agree and agree
respectively that they are satisfied with IT & IT Enabled Services. However 11.4 and
11.6% an insignificant percentage of investors in various categories disagree and
strongly disagree with the fact that IT & IT Enabled Services provided by mutual fund
company are satisfactory. This clearly indicates that majority of investors are satisfied
with IT & IT Enabled Services. This is an important inference as it is one of the

167
parameter which indicates influence of IT on customer satisfaction. There by it is
inferred that second null hypothesis is rejected.
Figure 5.1.89 Bar chart for satisfaction with IT & IT Enabled Services.
STRONGLY AGREE
AGREE DISAGREE STRONGLY DISAGREE
S_IT
0
50
100
150
200
250
Co
un
t
SALE
<50000
<100000
<50000000
5
Bar Chart

168
Figure 5.1.90 Pie chart for recommendation of IT & IT Enabled Services.
51
10
40
I recommend my friends to use IT &
IT Enabled Services ?
STRONGLY AGREE
AGREE
STRONGLY DISAGREE
As seen in the pie chart the distribution of respondents is shown above based on
recommendation of IT & IT Enabled Services. There are 50% respondents belonging
to group for recommendation of IT & IT Enabled Services. There are 10%
respondents belonging to group for recommendation of IT & IT Enabled Services.
There are 40% respondents belonging to group disagree with recommendation of IT
& IT Enabled Services. We have ensured the representation of sample is
homogeneous and there is intentional inclination towards any group. Since random
sampling is used for collecting data from different cities with the help of administered
sampling technique used.

169
Table 5.1.15. Cross tabulation between referral for IT and Sales
χ2=1546.229; df=12; p=0.000;
λ=.423
SALE
Total <50000 <10000
0 <500000
00 5 REFERRAL_IT STRONGLY
AGREE Count 0 135 0 0 135
% within REFERRAL_IT .0% 100.0% .0% .0% 100.0%
% within SALE .0% 33.4% .0% .0% 19.3%
% of Total .0% 19.3% .0% .0% 19.3%
AGREE Count 0 215 81 0 296
% within REFERRAL_IT
.0% 72.6% 27.4% .0% 100.0%
% within SALE .0% 53.2% 50.3% .0% 42.3% % of Total .0% 30.7% 11.6% .0% 42.3%
NEUTRAL Count 54 0 0 0 54
% within REFERRAL_IT 100.0% .0% .0% .0% 100.0%
% within SALE 100.0% .0% .0% .0% 7.7%
% of Total 7.7% .0% .0% .0% 7.7%
DISAGREE Count 0 54 80 0 134
% within REFERRAL_IT .0% 40.3% 59.7% .0% 100.0%
% within SALE .0% 13.4% 49.7% .0% 19.1%
% of Total .0% 7.7% 11.4% .0% 19.1% STRONGLY DISAGREE
Count 0 0 0 81 81
% within REFERRAL_IT .0% .0% .0% 100.0% 100.0%
% within SALE .0% .0% .0% 100.0% 11.6%
% of Total .0% .0% .0% 11.6% 11.6%
Total Count 54 404 161 81 700
% within REFERRAL_IT
7.7% 57.7% 23.0% 11.6% 100.0%
% within SALE 100.0% 100.0% 100.0% 100.0% 100.0%
% of Total 7.7% 57.7% 23.0% 11.6% 100.0%
As seen from the cross-tabulation of respondents, is shown above based on
recommendation of IT & IT Enabled Services with respect to amount of purchase.
There are 19.3% and 42.3% of investors in various categories who strongly agree and
agree respectively that they would recommend using IT & IT Enabled Services.
However 19.1 and 11.6% an insignificant percentage of investors in various
categories disagree and strongly disagree with the fact that IT & IT Enabled Services

170
provided by mutual fund company are recommendable. This clearly indicates that
majority of investors would like to recommend use of IT & IT Enabled Services. This
is an important inference as it is seen from literature only satisfied customer would
recommend. This is one of the parameter which indicates influence of IT on customer
satisfaction.
Figure 5.1.91 Bar chart for recommendation of IT & IT Enabled Services.
STRONGLY AGREE
AGREE NEUTRAL DISAGREE STRONGLY DISAGREE
REFERRAL_IT
0
50
100
150
200
250
Co
un
t
SALE
<50000
<100000
<50000000
5
Bar Chart

171
Figure 5.1.92 Pie chart for Perception of safety in agent / brokerage firm
10
30
60
I feel safe investing through agent / brokerage firm?
STRONGLY AGREE
DISAGREE
STRONGLY DISAGREE
As seen in the pie chart the distribution of respondents is shown above based on
perception of safety in agent / brokerage firm. There are 10% respondents belonging
to group for perception of safety in agent / brokerage firm. There are 30% respondents
belonging to group for perception of safety in agent / brokerage firm. There are 60%
respondents belonging to group disagree with perception of safety in agent /
brokerage firm. We have ensured the representation of sample is homogeneous and
there is intentional inclination towards any group. Since random sampling is used for
collecting data from different cities with the help of administered sampling technique
used.

172
Table 5.1.16. Cross tabulation between safety in agent / brokerage firm
and Sales
χ2=1210.506; df=12;
p=0.000; λ=.386
SALE
Total <50000 <100000 <50000000 5 SAFE STRONGLY
AGREE Count 0 54 0 0 54 % within SAFE .0% 100.0% .0% .0% 100.0%
% within SALE .0% 13.4% .0% .0% 7.7%
% of Total .0% 7.7% .0% .0% 7.7% AGREE Count 54 0 0 0 54
% within SAFE 100.0% .0% .0% .0% 100.0%
% within SALE 100.0% .0% .0% .0% 7.7%
% of Total 7.7% .0% .0% .0% 7.7% NEUTRAL Count 0 0 81 0 81
% within SAFE .0% .0% 100.0% .0% 100.0%
% within SALE .0% .0% 50.3% .0% 11.6%
% of Total .0% .0% 11.6% .0% 11.6% DISAGREE Count 0 135 80 81 296
% within SAFE .0% 45.6% 27.0% 27.4% 100.0%
% within SALE .0% 33.4% 49.7% 100.0% 42.3%
% of Total .0% 19.3% 11.4% 11.6% 42.3% STRONGLY DISAGREE
Count 0 215 0 0 215 % within SAFE .0% 100.0% .0% .0% 100.0%
% within SALE .0% 53.2% .0% .0% 30.7%
% of Total .0% 30.7% .0% .0% 30.7% Total Count 54 404 161 81 700
% within SAFE 7.7% 57.7% 23.0% 11.6% 100.0%
% within SALE 100.0% 100.0% 100.0% 100.0% 100.0%
% of Total 7.7% 57.7% 23.0% 11.6% 100.0%
As seen from the cross-tabulation of respondents, is shown above based on perception
of safety in agent / brokerage firm (Non-IT) with respect to amount of purchase.
There is a majority of investors 42.3% and 30.7% of investors in various categories
who strongly disagree and disagree respectively that services provided by agent /

173
brokerage firm (Non-IT) are safe. However 7.7 and 11.6% an insignificant percentage
of investors in various categories strongly agree and agree with the fact that services
provided by agent / brokerage firm (Non-IT) are safe. This clearly indicates that
majority of investors do not find safety in agent / brokerage firm (Non-IT). This is an
important inference as it supports the fact that non – IT services are not preferred by
investors.
Figure 5.1.93 Bar chart for Perception of safety in agent / brokerage firm
STRONGLY AGREE
AGREE NEUTRAL DISAGREE STRONGLY DISAGREE
SAFE
0
50
100
150
200
250
Co
un
t
SALE
<50000
<100000
<50000000
5
Bar Chart

174
Figure 5.1.94 Pie chart for Perception of service time in agent / brokerage
firm.
10
30
60
Service-time is comparitively is not
high in services offered on agent / brokerage firm ?
STRONGLY AGREE
DISAGREE
STRONGLY DISAGREE
As seen in the pie chart the distribution of respondents is shown above based on
perception of high service time in agent / brokerage firm. There are 10% respondents
belonging to group for perception of high service time in agent / brokerage firm.
There are 30% respondents belonging to group for perception of high service time in
agent / brokerage firm. There are 60% respondents belonging to group disagree with
perception of high service time in agent / brokerage firm. We have ensured the
representation of sample is homogeneous and there is intentional inclination towards
any group. Since random sampling is used for collecting data from different cities
with the help of administered sampling technique used.

175
Table 5.1.17. Cross tabulation between service time in agent / brokerage
firm and Sales
χ2=1011.442; df=9; p=0.000;
λ=.382
SALE
Total <50000 <100000 <5000000
0 5 ST STRONGLY
AGREE Count 0 54 0 0 54 % within ST .0% 100.0% .0% .0% 100.0% % within SALE .0% 13.4% .0% .0% 7.7%
% of Total .0% 7.7% .0% .0% 7.7% NEUTRAL Count 0 0 0 81 81
% within ST .0% .0% .0% 100.0% 100.0% % within SALE .0% .0% .0% 100.0% 11.6%
% of Total .0% .0% .0% 11.6% 11.6% DISAGREE Count 54 81 0 0 135
% within ST 40.0% 60.0% .0% .0% 100.0% % within SALE 100.0% 20.0% .0% .0% 19.3%
% of Total 7.7% 11.6% .0% .0% 19.3% STRONGLY DISAGREE
Count 0 269 161 0 430 % within ST .0% 62.6% 37.4% .0% 100.0% % within SALE .0% 66.6% 100.0% .0% 61.4%
% of Total .0% 38.4% 23.0% .0% 61.4% Total Count 54 404 161 81 700
% within ST 7.7% 57.7% 23.0% 11.6% 100.0% % within SALE 100.0% 100.0% 100.0% 100.0% 100.0%
% of Total 7.7% 57.7% 23.0% 11.6% 100.0%
As seen from the cross-tabulation of respondents, is shown above based on perception
of service time in agent / brokerage firm (Non-IT) with respect to amount of purchase.
There is a majority of investors 19.3% and 61.4% of investors in various categories
who strongly disagree and disagree respectively that service time in agent / brokerage
firm (Non-IT) is less. However 7.7 an insignificant percentage of investors in various
categories strongly agree with the fact that service time in agent / brokerage firm
(Non-IT) is less. This clearly indicates that majority of investors do not find service
time in agent / brokerage firm (Non-IT) is less. This is an important inference as it

176
supports the fact that non – IT services do not lead to better service quality.
Figure 5.1.95 Bar chart for Perception of service time in agent / brokerage
firm.
STRONGLY AGREE
NEUTRAL DISAGREE STRONGLY DISAGREE
ST
0
50
100
150
200
250
300
Co
un
t
SALE
<50000
<100000
<50000000
5
Bar Chart

177
Figure 5.1.96 Pie chart for current mode of investment using agent /
brokerage firm.
10
30
60
I invest in existing scheme through
agent / brokerage firm ?
STRONGLY AGREE
DISAGREE
STRONGLY DISAGREE
As seen in the pie chart the distribution of respondents is shown above based on
perception current mode of investment using agent / brokerage firm. There are 10%
respondents belonging to group for current mode of investment using agent /
brokerage firm. There are 30% respondents belonging to group for current mode of
investment using agent / brokerage firm. There are 60% respondents belonging to
group disagree with current mode of investment using agent / brokerage firm. We
have ensured the representation of sample is homogeneous and there is intentional

178
inclination towards any group. Since random sampling is used for collecting data
from different cities with the help of administered sampling technique used.
Table 5.1.18. Cross tabulation between current mode of investment using
agent / brokerage firm and Sales
χ2=1210.506; df=12; p=0.000;
λ=.386
SALE
Total <50000 <10000
0 <500000
00 5 CURRENT STRONGLY
AGREE Count 54 0 0 0 54 % within CURRENT 100.0% .0% .0% .0% 100.0%
% within SALE 100.0% .0% .0% .0% 7.7% % of Total 7.7% .0% .0% .0% 7.7%
AGREE Count 0 80 0 0 80 % within CURRENT .0% 100.0% .0% .0% 100.0%
% within SALE .0% 19.8% .0% .0% 11.4% % of Total .0% 11.4% .0% .0% 11.4%
NEUTRAL Count 0 0 81 0 81 % within CURRENT .0% .0% 100.0% .0% 100.0%
% within SALE .0% .0% 50.3% .0% 11.6% % of Total .0% .0% 11.6% .0% 11.6%
DISAGREE Count 0 189 0 0 189 % within CURRENT
.0% 100.0% .0% .0% 100.0%
% within SALE .0% 46.8% .0% .0% 27.0% % of Total .0% 27.0% .0% .0% 27.0%
STRONGLY DISAGREE
Count 0 135 80 81 296 % within CURRENT .0% 45.6% 27.0% 27.4% 100.0%
% within SALE .0% 33.4% 49.7% 100.0% 42.3% % of Total .0% 19.3% 11.4% 11.6% 42.3%
Total Count 54 404 161 81 700 % within CURRENT 7.7% 57.7% 23.0% 11.6% 100.0%
% within SALE 100.0% 100.0% 100.0% 100.0% 100.0% % of Total 7.7% 57.7% 23.0% 11.6% 100.0%
As seen from the cross-tabulation of respondents, is shown above based on current
mode of investment using agent / brokerage firm (Non-IT) with respect to amount of
purchase. There is a majority of investors 27% and 42.3% of investors in various

179
categories who strongly disagree and disagree respectively that their current mode of
investment is using agent / brokerage firm (Non-IT). However 7.7 and 11.6% an
insignificant percentage of investors in various categories strongly agree with the fact
that their current mode of investment is using agent / brokerage firm (Non-IT). This
clearly indicates that majority of investors do not invest currently using agent /
brokerage firm (Non-IT). This is an important inference as it supports the fact that
non – IT services are not preferred by investors.
Figure 5.1.97 Bar chart for current mode of investment using agent /
brokerage firm.
STRONGLY AGREE
AGREE NEUTRAL DISAGREE STRONGLY DISAGREE
CURRENT
0
50
100
150
200
Co
un
t
SALE
<50000
<100000
<50000000
5
Bar Chart

180
Figure 5.1.98 Pie chart for additional investment using agent / brokerage
firm.
10
30
60
I would like to purchase similar products agent / brokerage firm ?
STRONGLY AGREE
DISAGREE
STRONGLY DISAGREE
As seen in the pie chart the distribution of respondents is shown above based on
perception for additional investment using agent / brokerage firm. There are 10%
respondents belonging to group for additional investment using agent / brokerage
firm. There are 30% respondents belonging to group for additional investment using
agent / brokerage firm. There are 60% respondents belonging to group disagree with
additional investment using agent / brokerage firm. We have ensured the
representation of sample is homogeneous and there is intentional inclination towards
any group. Since random sampling is used for collecting data from different cities
with the help of administered sampling technique used.

181
Table 5.1.19. Cross tabulation between additional investment using agent
/ brokerage firm and Sales
Χ2=1619.802; df=12;
p=0.000; λ=.665
SALE
Total <50000 <10000
0 <500000
00 5 REPEAT STRONGLY
AGREE Count 0 80 0 0 80 % within REPEAT
.0% 100.0% .0% .0% 100.0%
% within SALE .0% 19.8% .0% .0% 11.4%
% of Total .0% 11.4% .0% .0% 11.4% AGREE Count 54 0 0 0 54
% within REPEAT 100.0% .0% .0% .0% 100.0%
% within SALE 100.0% .0% .0% .0% 7.7%
% of Total 7.7% .0% .0% .0% 7.7% NEUTRAL Count 0 0 161 0 161
% within REPEAT .0% .0% 100.0% .0% 100.0%
% within SALE
.0% .0% 100.0% .0% 23.0%
% of Total .0% .0% 23.0% .0% 23.0% DISAGREE Count 0 108 0 81 189
% within REPEAT .0% 57.1% .0% 42.9% 100.0%
% within SALE .0% 26.7% .0% 100.0% 27.0%
% of Total .0% 15.4% .0% 11.6% 27.0% STRONGLY DISAGREE
Count 0 216 0 0 216 % within REPEAT .0% 100.0% .0% .0% 100.0%
% within SALE .0% 53.5% .0% .0% 30.9%
% of Total .0% 30.9% .0% .0% 30.9% Total Count 54 404 161 81 700
% within REPEAT 7.7% 57.7% 23.0% 11.6% 100.0%
% within SALE
100.0% 100.0% 100.0% 100.0% 100.0%
% of Total 7.7% 57.7% 23.0% 11.6% 100.0%
As seen from the cross-tabulation of respondents, is shown above based on additional
investment using agent / brokerage firm (Non-IT) with respect to amount of purchase.
There is a majority of investors 27% and 30.9% of investors in various categories who
strongly disagree and disagree respectively that they would undergo additional

182
investment using agent / brokerage firm (Non-IT). However 11.4 and 7.7% an
insignificant percentage of investors in various categories strongly agree with the fact
they would undergo additional investment using agent / brokerage firm (Non-IT).
This clearly indicates that majority of investors do not want to make additional
investment using agent / brokerage firm (Non-IT). This is an important inference as it
supports the fact that non – IT services are not preferred by investors.
Figure 5.1.99 Bar chart for additional investment using agent / brokerage
firm.
STRONGLY AGREE
AGREE NEUTRAL DISAGREE STRONGLY DISAGREE
REPEAT
0
50
100
150
200
250
Co
un
t
SALE
<50000
<100000
<50000000
5
Bar Chart

183
Figure 5.1.100 Pie chart for satisfaction with services of agent / brokerage
firm.
10
30
60
I am satisfied with the agent /
brokerage firm ?
STRONGLY AGREE
DISAGREE
STRONGLY DISAGREE
As seen in the pie chart the distribution of respondents is shown above based on
perception for satisfaction with services of agent / brokerage firm. There are 10%
respondents belonging to group for satisfaction with services of agent / brokerage
firm. There are 30% respondents belonging to group for satisfaction with services of
agent / brokerage firm. There are 60% respondents belonging to group disagree with
satisfaction with services of agent / brokerage firm. We have ensured the
representation of sample is homogeneous and there is intentional inclination towards

184
any group. Since random sampling is used for collecting data from different cities
with the help of administered sampling technique used.
Table 5.1.20. Cross tabulation between satisfaction with services of agent
/ brokerage firm and Sales
χ2=787.936; df=12; p=0.000;
λ=.358
SALE
Total <50000 <100000 <5000000
0 5 S STRONGLY
AGREE Count 0 54 0 0 54 % within S .0% 100.0% .0% .0% 100.0% % within SALE .0% 13.4% .0% .0% 7.7%
% of Total .0% 7.7% .0% .0% 7.7% AGREE Count 0 80 0 81 161
% within S .0% 49.7% .0% 50.3% 100.0% % within SALE .0% 19.8% .0% 100.0% 23.0%
% of Total .0% 11.4% .0% 11.6% 23.0% NEUTRAL Count 54 135 0 0 189
% within S 28.6% 71.4% .0% .0% 100.0% % within SALE 100.0% 33.4% .0% .0% 27.0%
% of Total 7.7% 19.3% .0% .0% 27.0% DISAGREE Count 0 81 161 0 242
% within S .0% 33.5% 66.5% .0% 100.0% % within SALE
.0% 20.0% 100.0% .0% 34.6%
% of Total .0% 11.6% 23.0% .0% 34.6% STRONGLY DISAGREE
Count 0 54 0 0 54 % within S .0% 100.0% .0% .0% 100.0% % within SALE .0% 13.4% .0% .0% 7.7%
% of Total .0% 7.7% .0% .0% 7.7% Total Count 54 404 161 81 700
% within S 7.7% 57.7% 23.0% 11.6% 100.0% % within SALE 100.0% 100.0% 100.0% 100.0% 100.0%
% of Total 7.7% 57.7% 23.0% 11.6% 100.0%
As seen from the cross-tabulation of respondents, is shown above based on
satisfaction with services of agent / brokerage firm (Non-IT) with respect to amount
of purchase. There is a majority of investors 34.6% and 7.7% of investors in various

185
categories who strongly disagree and disagree respectively that they are satisfaction
with services of agent / brokerage firm (Non-IT). However 7.7% and 23% an
insignificant percentage of investors in various categories strongly agree with the fact
that they are satisfaction with services of agent / brokerage firm (Non-IT). This
clearly indicates that majority of investors are not satisfied with services of agent /
brokerage firm (Non-IT). This is an important inference as it supports the fact that
customers using non – IT services are not satisfied. Also it help us in indirectly in
rejecting second null hypothesis.
Figure 5.1.101 Bar chart for satisfaction with services of agent / brokerage
firm.
STRONGLY AGREE
AGREE NEUTRAL DISAGREE STRONGLY DISAGREE
S
0
50
100
150
200
Co
unt
SALE
<50000
<100000
<50000000
5
Bar Chart

186
Figure 5.1.102 Pie chart for using agent / brokerage firm for cash incentive.
10
30
60
I invest through agent / brokerage firm to get cash
incentives ?
STRONGLY AGREE
DISAGREE
STRONGLY DISAGREE
As seen in the pie chart the distribution of respondents is shown above based on
perception for using agent / brokerage firm for cash incentive. There are 10%
respondents belonging to group for using agent / brokerage firm for cash incentive.
There are 30% respondents belonging to group for using agent / brokerage firm for
cash incentive. There are 60% respondents belonging to group disagree with using
agent / brokerage firm for cash incentive. We have ensured the representation of
sample is homogeneous and there is intentional inclination towards any group. Since
random sampling is used for collecting data from different cities with the help of
administered sampling technique used.

187
Table 5.1.21. Cross tabulation between agent / brokerage firm for cash
incentive and Sales
χ2=865.742; df=9; p=0.000;
λ=.233
SALE
Total <50000 <100000 <5000000
0 5 CASHINV STRONGLY
AGREE Count 0 80 0 0 80 % within CASHINV .0% 100.0% .0% .0% 100.0%
% within SALE .0% 19.8% .0% .0% 11.4% % of Total .0% 11.4% .0% .0% 11.4%
NEUTRAL Count 54 0 0 0 54 % within CASHINV 100.0% .0% .0% .0% 100.0%
% within SALE 100.0% .0% .0% .0% 7.7% % of Total 7.7% .0% .0% .0% 7.7%
DISAGREE Count 0 135 80 81 296 % within CASHINV .0% 45.6% 27.0% 27.4% 100.0%
% within SALE .0% 33.4% 49.7% 100.0% 42.3% % of Total .0% 19.3% 11.4% 11.6% 42.3%
STRONGLY DISAGREE
Count 0 189 81 0 270 % within CASHINV .0% 70.0% 30.0% .0% 100.0%
% within SALE .0% 46.8% 50.3% .0% 38.6% % of Total .0% 27.0% 11.6% .0% 38.6%
Total Count 54 404 161 81 700 % within CASHINV 7.7% 57.7% 23.0% 11.6% 100.0%
% within SALE 100.0% 100.0% 100.0% 100.0% 100.0% % of Total 7.7% 57.7% 23.0% 11.6% 100.0%
As seen from the cross-tabulation of respondents, is shown above based on using
agent / brokerage firm (Non-IT) for cash incentive with respect to amount of
purchase. There is a majority of investors 42.3% and 38.6% of investors in various
categories who strongly disagree and disagree respectively that they use agent /
brokerage firm (Non-IT) for cash incentive. However 11.4% and 7.7% an
insignificant percentage of investors in various categories strongly agree with the fact
that they use agent / brokerage firm (Non-IT) for cash incentive. This proves that the
only motive for investors to invest using agent / brokerage firm (Non-IT) is to get

188
cash incentive. This is very interesting as we were not able to understand as to why do
some investors prefer using agent / brokerage firm (Non-IT) inspite of so many
adverse perception. This explain the gap that even dissatisfied investor with service of
agent / brokerage firm (Non-IT) use their service purely with intention of getting cash
incentive.
Figure 5.1.103 Pie chart for using agent / brokerage firm for cash incentive.
STRONGLY AGREE
NEUTRAL DISAGREE STRONGLY DISAGREE
CASHINV
0
50
100
150
200
Co
un
t
SALE
<50000
<100000
<50000000
5
Bar Chart

189
Figure 5.1.104 Pie chart for recommendation of services provided by agent /
brokerage firm.
10
30
60
I recommend my friends to use the agent / brokerage
firm ?
STRONGLY AGREE
DISAGREE
STRONGLY DISAGREE
As seen in the pie chart the distribution of respondents is shown above based on
perception for recommendation of services provided by agent / brokerage firm. There
are 10% respondents belonging to group for recommendation of services provided by
agent / brokerage firm. There are 30% respondents belonging to group for
recommendation of services provided by agent / brokerage firm. There are 60%
respondents belonging to group disagree with recommendation of services provided
by agent / brokerage firm. We have ensured the representation of sample is
homogeneous and there is intentional inclination towards any group. Since random

190
sampling is used for collecting data from different cities with the help of administered
sampling technique used.
Table 5.1.22. Cross tabulation between services provided by agent /
brokerage firm and Sales
χ2=1058.912; df=9; p=0.000;
λ=.305
SALE
Total <50000 <10000
0 <500000
00 5 REFERRAL STRONGLY
AGREE Count 54 0 0 0 54
% within REFERRAL 100.0% .0% .0% .0% 100.0%
% within SALE 100.0% .0% .0% .0% 7.7%
% of Total 7.7% .0% .0% .0% 7.7%
AGREE Count 0 80 0 0 80
% within REFERRAL .0% 100.0% .0% .0% 100.0%
% within SALE .0% 19.8% .0% .0% 11.4%
% of Total .0% 11.4% .0% .0% 11.4%
DISAGREE Count 0 108 0 81 189
% within REFERRAL .0% 57.1% .0% 42.9% 100.0%
% within SALE .0% 26.7% .0% 100.0% 27.0%
% of Total .0% 15.4% .0% 11.6% 27.0%
STRONGLY DISAGREE
Count 0 216 161 0 377
% within REFERRAL .0% 57.3% 42.7% .0% 100.0%
% within SALE .0% 53.5% 100.0% .0% 53.9%
% of Total .0% 30.9% 23.0% .0% 53.9%
Total Count 54 404 161 81 700
% within REFERRAL 7.7% 57.7% 23.0% 11.6% 100.0%
% within SALE 100.0% 100.0% 100.0% 100.0% 100.0%
% of Total 7.7% 57.7% 23.0% 11.6% 100.0%
As seen from the cross-tabulation of respondents, is shown above based on
recommendation of services provided by agent / brokerage firm (Non-IT) with respect
to amount of purchase. There is a majority of investors 27% and 53.9% of investors in
various categories who strongly disagree and disagree respectively that they would

191
recommend other to use services provided by agent / brokerage firm (Non-IT).
However 7.7% and 11.4% an insignificant percentage of investors in various
categories strongly agree with the fact that they would recommend other to use
services provided by agent / brokerage firm (Non-IT). This clearly indicates that
majority of investors are would not recommend other to use services provided by
agent / brokerage firm (Non-IT). This is an important inference as it supports the fact
that customers using non – IT services are not satisfied and a dissatisfied customer do
not recommend. Also it helps in indirectly in rejecting second null hypothesis.
Figure 5.1.105 Bar chart for recommendation of services provided by agent /
brokerage firm.
STRONGLY AGREE
AGREE DISAGREE STRONGLY DISAGREE
REFERRAL
0
50
100
150
200
250
Co
unt
SALE
<50000
<100000
<50000000
5
Bar Chart

192
Figure 5.1.106 Histogram for recommendation of services provided by agent /
brokerage firm.
1 2 3 4 5
I RECOMMEND MY FRIENDS TO USE THE AGENT / BROKERAGE FIRM ?
0
100
200
300
400
Fre
qu
en
cy
Mean = 4.08Std. Dev. = 1.299N = 700

193
Figure 5.1.107 Pie chart for recommendation of company.
700
10
20
I recommend this company to my
friends ?
STRONGLY AGREE
AGREE
DISAGREE
STRONGLY DISAGREE
As seen in the pie chart the distribution of respondents is shown above based on
perception for recommendation of company. There are 70% respondents belonging to
group for recommendation of company. There are 10% respondents belonging to
group disagree with recommendation of company. There are 20% respondents
belonging to group strongly disagree with recommendation of company. We have
ensured the representation of sample is homogeneous and there is intentional
inclination towards any group. Since random sampling is used for collecting data
from different cities with the help of administered sampling technique used.

194
Table 5.1.23. Cross tabulation between recommendation of company and
Sales
χ2=588.280; df=9; p=0.000;
λ=.296
SALE
Total <5000
0 <1000
00 <50000
000 5 CS_REFFERAL STRONGLY
AGREE Count 0 189 81 0 270
% within CS_REFFERAL .0% 70.0% 30.0% .0% 100.0
% % within SALE .0% 46.8% 50.3% .0% 38.6%
% of Total .0% 27.0% 11.6% .0% 38.6%
AGREE Count 54 135 0 81 270
% within CS_REFFERAL 20.0% 50.0% .0% 30.0% 100.0
% % within SALE 100.0
% 33.4% .0% 100.0% 38.6%
% of Total 7.7% 19.3% .0% 11.6% 38.6%
DISAGREE Count 0 80 0 0 80
% within CS_REFFERAL .0% 100.0
% .0% .0% 100.0%
% within SALE .0% 19.8% .0% .0% 11.4%
% of Total .0% 11.4% .0% .0% 11.4%
STRONGLY DISAGREE
Count 0 0 80 0 80
% within CS_REFFERAL .0% .0% 100.0% .0% 100.0
% % within SALE .0% .0% 49.7% .0% 11.4%
% of Total .0% .0% 11.4% .0% 11.4%
Total Count 54 404 161 81 700
% within CS_REFFERAL 7.7% 57.7% 23.0% 11.6% 100.0
% % within SALE 100.0
% 100.0
% 100.0% 100.0%
100.0%
% of Total 7.7% 57.7% 23.0% 11.6% 100.0%
As seen from the cross-tabulation of respondents, is shown above based on
recommendation of company to others with respect to amount of purchase. There are
38.6% and 38.6% of investors in various categories who strongly agree and agree
respectively that they would recommend company to others. However 11.4% and
11.4% an insignificant percentage of investors in various categories disagree and
strongly disagree with the fact that they would recommend company to others. This

195
clearly indicates that majority of investors would like to recommend the company to
others. This is an important inference as it is seen from literature only satisfied
customer would recommend to others. This is one of the parameter which indicates
influence of IT on customer satisfaction.
Figure 5.1.108 Bar chart for recommendation of company.
STRONGLY AGREE
AGREE DISAGREE STRONGLY DISAGREE
CS_REFFERAL
0
50
100
150
200
Co
un
t
SALE
<50000
<100000
<50000000
5
Bar Chart

196
Figure 5.1.109 Bar chart for recommendation of company.
Overall
4
3
2
1
Clu
ste
r
0 20 40 60 80 100
Percent within Cluster
CS_REFFERAL
STRONGLY AGREE
AGREE
DISAGREE
STRONGLY DISAGREE
Within Cluster Percentage of CS_REFFERAL

197
Figure 5.1.110 Pie chart for satisfaction services provided by company.
700
10
20
I am satisfied with the services provided by company ?
STRONGLY AGREE
AGREE
DISAGREE
STRONGLY DISAGREE
As seen in the pie chart the distribution of respondents is shown above based on
perception satisfaction services provided by company. There are 70% respondents
belonging to group for satisfaction services provided by company. There are 10%
respondents belonging to group disagree with satisfaction services provided by
company. There are 20% respondents belonging to group strongly disagree with
satisfaction services provided by company. We have ensured the representation of
sample is homogeneous and there is intentional inclination towards any group. Since
random sampling is used for collecting data from different cities with the help of
administered sampling technique used.

198
Table 5.1.24. Cross tabulation between satisfaction services provided by
company and Sales
Χ2=469.04; df=9; p=0.019;
λ=.002
SALE
Total <50000 <100000 <5000000
0 5 CS_COMP STRONGLY
AGREE Count 54 135 80 81 350 % within CS_COMP 15.4% 38.6% 22.9% 23.1% 100.0%
% within SALE 100.0% 33.4% 49.7% 100.0% 50.0% % of Total 7.7% 19.3% 11.4% 11.6% 50.0%
AGREE Count 0 135 81 0 216 % within CS_COMP .0% 62.5% 37.5% .0% 100.0%
% within SALE .0% 33.4% 50.3% .0% 30.9% % of Total .0% 19.3% 11.6% .0% 30.9%
NEUTRAL Count 0 80 0 0 80 % within CS_COMP .0% 100.0% .0% .0% 100.0%
% within SALE .0% 19.8% .0% .0% 11.4% % of Total .0% 11.4% .0% .0% 11.4%
DISAGREE Count 0 54 0 0 54 % within CS_COMP .0% 100.0% .0% .0% 100.0%
% within SALE .0% 13.4% .0% .0% 7.7% % of Total .0% 7.7% .0% .0% 7.7%
Total Count 54 404 161 81 700 % within CS_COMP 7.7% 57.7% 23.0% 11.6% 100.0%
% within SALE 100.0% 100.0% 100.0% 100.0% 100.0% % of Total 7.7% 57.7% 23.0% 11.6% 100.0%
As seen from the cross-tabulation of respondents, is shown above based on
satisfaction services provided by company with respect to amount of purchase. There
are 50% and 30.9% of investors in various categories who strongly agree and agree
respectively that they are satisfied with services provided by company. However 11.4
and 7.7% an insignificant percentage of investors in various categories disagree and
strongly disagree with the fact that services provided by company are satisfactory.
This clearly indicates that majority of investors are satisfied with services provided by

199
company. This is an important inference as it is one of the parameter which indicates
influence of customer satisfaction on sales. There by it is inferred that first null
hypothesis is rejected.
Figure 5.1.111 Pie chart for satisfaction services provided by company.
STRONGLY AGREE
AGREE NEUTRAL DISAGREE
CS_COMP
0
20
40
60
80
100
120
140
Co
un
t
SALE
<50000
<100000
<50000000
5
Bar Chart

200
Figure 5.1.112 Bar chart for satisfaction services provided by company.
Overall
4
3
2
1
Clu
ste
r
0 20 40 60 80 100
Percent within Cluster
CS_COMP
STRONGLY AGREE
AGREE
NEUTRAL
DISAGREE
Within Cluster Percentage of CS_COMP

201
5.2 Multiple Regression Model for Sales of Mutual Funds
Regression analysis is widely used for prediction and forecasting, where its use has
substantial overlap with the field of machine learning. Regression analysis is also
used to understand which among the independent variables Customer Satisfaction,
Service Quality, AUM, NAV, Past Record, Brandname and IT are related to the
dependent variable i.e. Sales, and to explore the forms of these relationships. In
restricted circumstances, regression analysis can be used to infer causal relationships
between the independent and dependent variables. A large body of techniques for
carrying out regression analysis has been developed. Familiar methods such as linear
regression and ordinary least squares regression are parametric, in that the regression
function is defined in terms of a finite number of unknown parameters that are
estimated from the data. Nonparametric regression refers to techniques that allow the
regression function to lie in a specified set of functions, which may be infinite-
dimensional.
Table 5.2.3. Multiple Regression Model Summary for Sales
Model R R Square Adjusted R
Square
Std. Error of
the Estimate
F
P Value
1 .887(a) .787 .785 .570 365.263 .001

202
Table 5.2.4. Multiple Regression Model Coefficients for Sales
Model Unstandardized
Coefficients Standardized Coefficients t Sig.
B Std. Error Beta
1 (Constant) 4.157
1.410 .53 .000
CS_REFFERAL 2.19 1.228 .320 12.49 .001
CS_COMP 1.77 1.315 .820 7.03 .003 S_IT 2.15 1.179 .596 15.59 .002 REFERRAL_IT 2.61 .834 .613 7.21 .002 BRANDNAME 0.81 1.315 .012 13.89 .003 AUM 2.19 1.403 .454 4.391 .000 NAV 2.96 .395 .011 3.803 .000 PR 0.73 1.10 .320 .439 .000 QOS 2.07 .233 .820 11.42 .001
The multiple regression analysis indicates that parameters like customer satisfaction,
quality of service, AUM, Past Record and others affect sales of a mutual fund.
Parameters like referral, repeat purchase indicate loyalty of customer and there by
indicating customer satisfaction.

203
CHAPTER 6 : CONCULSION
This study adds to the existing literature by bringing an awareness of the
importance of the impact of three basic factors namely Financial Factors, Brand name
and most importantly Information Technology and Information Technology Enabled
Services on customer satisfaction and service quality in the financial service industry
in India. It confirms previous studies that indicate that highly satisfied customers are,
indeed, more loyal customers and help in increased sales of mutual fund company, by
either in the form of additional purchase or by referring to a friend. And, it also
suggests that services provided by agents / brokerage firm may not have much
influence over customer satisfaction or loyalty levels.
It is observed statistically that there exist a significant relation between Customer
Satisfaction and sales of Mutual Fund company. The Goodness of Fit is 0.9 which
indicates that model fit was acceptable. The χ2-test has a value of 469.04 for sample
of 700. The p - value of 0.019 indicates that there exist relationship between Customer
Satisfaction and sales of Mutual Fund company as the significance level of 0.05 is
used. Customer Satisfaction shows a positive correlation with sales of Mutual Fund
company. Also based on statistical results the first null hypothesis is rejected. Thus it
is inferred that Customer Satisfaction does have an impact on sales of Mutual Fund
company.
It is observed statistically that there exist a significant relation between
Information Technology Enabled Services and customer satisfaction. The Goodness
of Fit is 0.89 which indicates that model fit was acceptable. The χ2-test has a value of

204
189 for sample of 700. The p - value of 0.039 indicates that there exist relationship
between Information Technology Enabled Services and customer satisfaction as the
significance level of 0.05 is used. IT Services shows a positive correlation with
customer satisfaction. Also based on statistical results the second null hypothesis is
rejected. Thus it is inferred that Information Technology Enabled Services does have
an impact on customer satisfaction
It is observed statistically that there exist a significant relation between Service
Quality and Sales of Mutual Funds. The Goodness of Fit is 0.88 which indicates that
model fit was acceptable. The χ2-test has a value of 266 for sample of 700. The p -
value of 0.028 indicates that there exist relationship between Service Quality and
Sales as the significance level of 0.05 is used. Service Quality shows a positive
correlation with Sales. Also based on statistical results the third null hypothesis is
rejected. Thus it is inferred that Service Quality does have an impact on Sales of
Mutual Funds.
It is observed statistically that there exist a significant relation between
Information Technology Enabled Services and Service Quality. The Goodness of Fit
is 0.89 which indicates that model fit was acceptable. The χ2-test has a value of
304.12 for sample of 700. The p - value of 0.029 indicates that there exist relationship
between IT Services and Service Quality as the significance level of 0.05 is used.
Service Quality shows a positive correlation with Sales. Also based on statistical
results the fourth null hypothesis is rejected. Thus it is inferred that Information
Technology Enabled Services does have an impact on Service Quality.

205
It is observed statistically that there exist a significant relation between
Brandname and Sales of Mutual Funds. The Goodness of Fit is 0.88 which indicates
that model fit was acceptable. The χ2-test has a value of 279.18 for sample of 700.
The p - value of 0.44 indicates that there is no relationship between Brandname and
Sales of Mutual Funds as the significance level of 0.05 is used. Brandname shows no
correlation with Sales of Mutual Funds. Also based on statistical results the fifth null
hypothesis is accepted. Thus it is inferred that Brandname does not have an impact
on Sales of Mutual Funds.
It is observed statistically that there exist a significant relation between Asset
Under Management and Sales of Mutual Funds. The Goodness of Fit is 0.88 which
indicates that model fit was acceptable. The χ2-test has a value of 468.64 for sample
of 700. The p - value of 0.047 indicates that there exist relationship between Asset
Under Management and Sales of Mutual Funds as the significance level of 0.05 is
used. Asset Under Management shows a positive correlation with Sales of Mutual
Funds. Also based on statistical results the sixth null hypothesis is rejected. Thus it is
inferred that Asset Under Management does have an impact on Sales of Mutual
Funds
It is observed statistically that there exist a significant relation between Net Asset
Value and Sales of Mutual Funds. The Goodness of Fit is 0.88 which indicates that
model fit was acceptable. The χ2-test has a value of 295.206 for sample of 700. The p
- value of 0.31 indicates that there no relationship between NAV and sales of mutual
fund company as the significance level of 0.05 is used. Net Asset Value shows a no
significant correlation with sales. Also based on statistical results the seventh null

206
hypothesis is accepted. Thus it is inferred that Net Asset Value does not have an
impact on sales of Mutual Funds company.
It is observed statistically that there exist a significant relation between Past
Return and Sales of Mutual Funds. The Goodness of Fit is 0.88 which indicates that
model fit was acceptable. The χ2-test has a value of 368.54 for sample of 700. The p
- value of 0.027 indicates that there exist relationship between Past Return and Sales
of Mutual Funds as the significance level of 0.05 is used. Past Return shows a positive
correlation with Sales of Mutual Funds. Also based on statistical results the eighth
null hypothesis is rejected. Thus it is inferred that Past Return does have an impact
on Sales of Mutual Funds.

207
Table 6.2 Summary of Hypothesis Testing
χ2 Df p-value
Null hypothesis
CUSTOMER SATISFACTION HAS IMPACT ON SALES OF MUTUAL FUNDS.
469.04
3
0.019
NA
INFORMATION TECHNOLOGY HAS AN IMPACT ON CUSTOMER SATISFACTION.
182 3 0.039 NA
SERVICE QUALITY HAS AN IMPACT ON SALES OF MUTUAL FUNDS.
266
2
0.028
NA
INFORMATION TECHNOLOGY ENABLED SERVICES HAS AN IMPACT ON SERVICE QUALITY.
304.12
3
0.029
NA
BRANDNAME HAS AN IMPACT ON SALES OF MUTUAL FUNDS.
279.18 2 0.44 A
ASSET UNDER MANAGEMENT HAS AN IMPACT ON SALES OF MUTUAL FUNDS.
478.64
3
0.047
NA
NET ASSET VALUE HAS AN IMPACT ON SALES OF MUTUAL FUNDS.
395.206 2 0.31 A
PAST RECORD HAS AN IMPACT ON SALES OF MUTUAL FUNDS.
368.54
3
0.027
NA
A - Null Hypothesis is accepted at significance level of 0.05
NA - Null Hypothesis is not accepted at significance level of 0.05
As a result of this study, managers have additional information to help them
evaluate where increased spending of the marketing effort should occur (or not occur)
to maximize profitability. It also suggests that more empirical study needs to be done
to understand the true relationship between customer satisfaction, service quality and
loyalty and what each segment of a customer base expects from its financial services

208
firms and its partners. Although many of the pitfalls of installing a IT strategy have
been identified, the route to effective IT and IT Enabled management needs more
marketing research And, because IT and IT Enabled is such an important and
expensive strategy to employ, this research needs to dig more deeply into what
consumers really want and why consumers think the way they do. Clarity around
consumer needs can only help managers to determine where they should spend their
limited resources.

209
CHAPTER 7 : LIMITATION AND FUTURE SCOPE OF RESEARCH
7.1 LIMITATION
Although this research project provided some interesting insights to
understanding IT & IT Enabled Services, its impact on satisfaction levels and the
impact that demographics and technology might have on customer satisfaction or
loyalty, it is important to recognize the limitations associated with this study.
First, the data used in this study was obtained from a 26 financial service firm
with an average of 30 customer from each company. It might be more beneficial to
obtain large sample data from various firms in the industry to test whether this model
can be generalized throughout the industry worldwide and to test whether it can be
useful for measuring customer satisfaction, service quality and loyalty levels and
show moderating effects in other industries.
This study concentrated on selected demographic characteristics of
individual customers. A number of other personality traits (e.g., uncertainty
orientation of a customer, purchase decision involvement) that were not considered
here could have impacts on customer satisfaction, on loyalty and on the relationship
between the two concepts. And, as women in our society become increasingly more
responsible for their family's financial status, it is possible that females will become
more objective in their evaluation of services than has traditionally been the case.
It is noted by Crosby, Johnson and Quinn (2002) that a key deficiency of
these IT systems is their inability to address the "why" question of buyer behavior
and that demographics predict behavior in reaction to marketing stimuli only
because of their association with the internal states and motives of customers. Until

210
it can incorporate insight into the minds of consumers into the information
technology, it is unlikely that it will be able to capture and measure the true
effectiveness of this strategy.
Possibly, the fact that this was a administered survey put a constraint on the
accuracy of the information captured. The time constraints of interviews
necessitate the use of relatively simple measurement scales (Urban and Pratt 2000).
Future studies might incorporate other survey methods that provide for more
complex measurement scales.
Although it is clear that more highly satisfied customers are, generally, more
loyal, there is no substantial support for the idea that customer relationship
marketing boosts customer satisfaction levels significantly for IT customers in this
financial service firm. There could be several reasons for this result. Often IT
programs are either not properly installed, people are not properly trained, or firms
are not appropriately measuring the needs of their customers. Some researchers
think that the things being measured in call centers, for example, are thought
important simply because they are automated and are simple to measure (rather than
being important enough to measure) (Feinberg, et al. 2002). Often, this leads to
installing protocols that are not addressing the needs of the customer but might be
addressing the needs of the firm.
In the marketing arena, it is not uncommon for changes to be made to
processes, products and services as a direct result of a company's need to boost
revenue and profitability. However, these changes do not necessarily respond
to consumer needs.

211
It is also possible that the database information from this firm is not of the
highest quality or that customer tiers are not appropriately segmented, which might
indicate that the wrong protocols are in place, customer were inaccurately coded, or
that, in the final analysis, these protocols simply do not matter to these customer
segments.
And, it is possible that this IT program does not receive the appropriate level
of executive management support. If this is true, the IT tools may be inappropriately
used by employees or not used at all, leaving IT a strategy in name only.
Managers can make some assumptions from this study regarding the impact of
demographics as they relate to technology usage and customer satisfaction and loyalty
levels. These results can help managers understand what protocols and channels of
service are more highly appreciated by which segments of their customer base and
tailor their services to better meet customer needs. And, it may be a fair warning to
managers that the adoption of technology without considering customer needs and
preferences is short-sighted and dangerous. More studies on customer preference by
segment and demographic are needed to help guide managers to the proper strategy.

212
7.2 FUTURE SCOPE OF RESEARCH
Financial Institutions and especially fund house could carry out more
studies related to IT & IT Enabled Services, focusing primarily on customer
expectations and which segments of the customer base are particularly fond of
using these technologies, while understanding which segments are truly committed
to the idea of more personal banking services and its impact on top line. Other
demographics of interest to study might include zip code or some other regional
delineator for tier 2, tier 3 cities. It is possible that individuals in different regions
have different expectations of financial services, in general, and technology usage,
in particular. However, as the number of females in the workplace and who are
heads of households increases and, as technology usage becomes an even more
important part of every day business acumen, it is important to continue to study
gender, income and age as they relate to technology usage in the financial service
arena.
Although the sample is reasonably large with 700 cases, it would be preferable
to obtain larger samples to provide a higher the level of reliability of the study. And,
larger samples of each tiered segment might support stronger comparisons between IT
& IT Enabled Services and agents / brokerage firm customers. Also, it is likely that
due to the newness of the protocols intended for IT & IT Enabled services customers,
a survey conducted in the second or third year after protocols have been in place will
possibly show different and more realistic and reliable results.

213
Clearly more research needs to be done in understanding the needs of
customers and whether differentiated protocols are something that customers desire.
Surveys that truly capture customer expectations will guide the firm to the proper
protocols rather than managers imposing protocols and technologies on customers
based on managerial assumptions -- all too often why certain products and services
are developed.
Institutions employing a IT strategy need further study to help companies
understand when to (or not to) use IT as it is such a costly and multi-dimensional
undertaking: With more empirical studies, managers can make more cost effective
decisions for the firm and for the customer base.

214
SAMPLE QUESTIONARE
QUESTIONARE CODE NO:
LOCATION : _______________________________
1. NAME :_____________________________________________________
2. GENDER : □ MALE □ FEMALE
3. MARTIAL STATUS : □ MARRIED □ UNMARRIED
4. OCCUPATION : □ SALARIED □ SELF-
EMPLOYED
5. AGE GROUP □ 20-25 □ 25-30 □ 30-35 □ 35-40 □ 40 & above
6. ANNUAL INCOME :□ 1.5 to □ 2 to □ 3 to □ 4 lakh and
2 lakh 2.5 lakh 4 lakh above.
7. DO YOU INVEST IN MUTUAL FUNDS ? YES / NO
8. DO YOU INVEST IN MUTUAL FUND FOR TAX-SAVINGS ?
YES / NO
9. WHICH MUTUAL FUND / ULIP DO YOU INVEST IN(in order of asset
allocation investment)
o COMPANY1:_____________________________________________
10. WHAT IS THE MODE OF INVESTMENT ?
OFFLINE ONLINE
□ - AGENT □-COMPANY WEBSITE
□ - CHEQUE/DROP BOX □-FINANCIAL PORTAL
□ - Other(please specify)________________ □-TELE-BANKING

215
11. HOW DO YOU KNOW ABOUT MUTUAL FUND / ULIP COMPANY ?
□ - THROUGH A FRIEND □-ONLINE MAIL / ADDS
□ - ADVERSTISEMENT IN PRINT □ - TELE-CALL
□ - AGENT □ - SMS
12. WHERE DO YOU FIND MORE INFORMATION ON MUTUAL
FUND/ULIP PRODUCT ?
□ WEBSITE □ BROUCHURE
□ CALL CENTER □ AGENT
13. AMOUNT OF INVESTMENT ANNUALLY IN MUTUAL FUND?
□ <50000 □ 50,000 TO 1LAKH
□ 1LAKH TO 5 CRORE □ > 5CRORE

216
APPENDIX - A
PLEASE TICK ONE OPTION OUT OF FIVE AS YOUR ANSWER PER
QUESTION AS THE LIKERT SCALE IS BEING USED WITH ;
1- Strongly Disagree, 2- Disagree, 3-Neutral
4- Agree, 5- Strongly Agree
No Questions LIKERT SCALE
1 I INVEST IN MUTUAL FUND BASED ON BRANDNAME 1 2 3 4 5
2
I CONSIDER ASSET UNDER MANAGEMENT OF
MUTUAL FUND COMPANY BEFORE TAKING AND
INVESTMENT CALL ? 1 2 3 4 5
3
I CONSIDER CURRENT NAV OF MF BEFORE
INVESTING 1 2 3 4 5
4
I CONSIDER PAST RECORD OF MUTUAL FUND
COMPANY BEFORE TAKING AND INVESTING CALL ? 1 2 3 4 5
5
I INVEST IN MUTUAL FUND BASED ON ITS QUALITY
OF SERVICE 1 2 3 4 5
6
I FEEL SAFE INVESTING IT ENABLED SERVICES
[ONLINE]? 1 2 3 4 5
7
SERVICE-TIME IS COMPARITIVELY LOW IN
SERVICES OFFERED IT ENABLED SERVICES
[ONLINE]? 1 2 3 4 5
8
THE IT ENABLED SERVICES [ONLINE] PROVIDED
ARE EASY TO USE ? 1 2 3 4 5
9
THE IT ENABLED SERVICES [ONLINE] ARE
CATERING TO ALL MY NEEDS ? 1 2 3 4 5
10
THE IT ENABLED SERVICES [ONLINE] PROVIDED
ARE EXCELLENT ? 1 2 3 4 5
11
I INVEST IN EXISTING SCHEME THROUGH IT
ENABLED SERVICES [ONLINE] ? 1 2 3 4 5

217
12
I WOULD LIKE TO PURCHASE SIMILAR PRODUCTS IT
ENABLED SERVICES [ONLINE] ? 1 2 3 4 5
13
I AM SATISFIED WITH THE IT ENABLED SERVICES
[ONLINE] ? 1 2 3 4 5
14
I RECOMMEND MY FRIENDS TO USE THE IT
ENABLED SERVICES [ONLINE] ? 1 2 3 4 5
15
I FEEL SAFE INVESTING THROUGH AGENT /
BROKERAGE FIRM? 1 2 3 4 5
16
SERVICE-TIME IS COMPARITIVELY HIGH IN
SERVICES OFFERED ON AGENT / BROKERAGE FIRM ? 1 2 3 4 5
17
THE AGENT / BROKERAGE FIRM PROVIDED ARE
EASY TO USE ? 1 2 3 4 5
18
THE AGENT / BROKERAGE FIRM ARE CATERING TO
ALL MY NEEDS ? 1 2 3 4 5
19
THE AGENT / BROKERAGE FIRM PROVIDED ARE
EXCELLENT ? 1 2 3 4 5
20
I INVEST IN EXISTING SCHEME THROUGH AGENT /
BROKERAGE FIRM ? 1 2 3 4 5
21
I WOULD LIKE TO PURCHASE SIMILAR PRODUCTS
AGENT / BROKERAGE FIRM ? 1 2 3 4 5
22
I AM SATISFIED WITH THE AGENT / BROKERAGE
FIRM ? 1 2 3 4 5
23
I INVEST THROUGH AGENT / BROKERAGE FIRM TO
GET CASH INCENTIVES ? 1 2 3 4 5
24
I RECOMMEND MY FRIENDS TO USE THE AGENT /
BROKERAGE FIRM ? 1 2 3 4 5
25 I RECOMMEND THIS COMPANY TO MY FRIENDS ? 1 2 3 4 5
26
I AM SATISFIED WITH THE SERVICES PROVIDED BY
COMPANY ? 1 2 3 4 5

218
27
I AM SATISFIED WITH THE IT ENABLED SERVICES
[ONLINE] ? 1 2 3 4 5
28
I INVEST IN MUTUAL FUND BASED ON ABOVE
PARAMETERS DISCUSSED ? 1 2 3 4 5

219
ANNEXURE 1
INCOME
Total 1.5 TO 2 LAKH
2 TO 2.5
LAKH 2.5 TO 3 LAKH
3 TO 4 LAKH
4 LAKH &
ABOVE LOCATION MUMBAI Count 26 42 69 38 0 175
% within LOCATION 14.9% 24.0% 39.4% 21.7% .0% 100.0%
% within INCOME 19.3% 31.1% 51.1% 17.7% .0% 25.0%
% of Total 3.7% 6.0% 9.9% 5.4% .0% 25.0% DELHI Count 42 26 0 69 38 175
% within LOCATION 24.0% 14.9% .0% 39.4% 21.7% 100.0%
% within INCOME 31.1% 19.3% .0% 32.1% 47.5% 25.0%
% of Total 6.0% 3.7% .0% 9.9% 5.4% 25.0% KOLKATTA Count 28 39 66 42 0 175
% within LOCATION 16.0% 22.3% 37.7% 24.0% .0% 100.0%
% within INCOME 20.7% 28.9% 48.9% 19.5% .0% 25.0%
% of Total 4.0% 5.6% 9.4% 6.0% .0% 25.0% CHENNAI Count 39 28 0 66 42 175
% within LOCATION 22.3% 16.0% .0% 37.7% 24.0% 100.0%
% within INCOME 28.9% 20.7% .0% 30.7% 52.5% 25.0%
% of Total 5.6% 4.0% .0% 9.4% 6.0% 25.0% Total Count 135 135 135 215 80 700
% within LOCATION 19.3% 19.3% 19.3% 30.7% 11.4% 100.0%
% within INCOME 100.0% 100.0% 100.0% 100.0% 100.0% 100.0%
% of Total 19.3% 19.3% 19.3% 30.7% 11.4% 100.0%

220
ANNEXURE 1I
N Mean
Std. Deviatio
n Std. Error
95% Confidence Interval for Mean
Minimum
Maximum
Lower Bound
Upper Bound
GENDER <50000 54 2.00 .000 .000 2.00 2.00 2 2 <100000 404 1.40 .491 .024 1.35 1.45 1 2 <50000000 161 1.00 .000 .000 1.00 1.00 1 1
5 81 1.00 .000 .000 1.00 1.00 1 1 Total 700 1.31 .462 .017 1.27 1.34 1 2
LOCATION
<50000 54 2.96 1.009 .137 2.69 3.24 2 4 <100000 404 2.53 1.126 .056 2.42 2.64 1 4 <50000000 161 2.52 1.107 .087 2.35 2.69 1 4
5 81 1.99 1.006 .112 1.77 2.21 1 3 Total 700 2.50 1.119 .042 2.42 2.58 1 4
MARTIALSTATUS
<50000 54 2.00 .000 .000 2.00 2.00 2 2 <100000 404 1.33 .471 .023 1.29 1.38 1 2 <50000000
161 1.50 .502 .040 1.43 1.58 1 2
5 81 2.00 .000 .000 2.00 2.00 2 2 Total 700 1.50 .500 .019 1.46 1.54 1 2
OCCUPATION
<50000 54 2.00 .000 .000 2.00 2.00 2 2 <100000 404 1.13 .341 .017 1.10 1.17 1 2 <50000000 161 1.50 .502 .040 1.42 1.57 1 2
5 81 2.00 .000 .000 2.00 2.00 2 2 Total 700 1.38 .487 .018 1.35 1.42 1 2
AGE <50000 54 2.00 .000 .000 2.00 2.00 2 2 <100000 404 2.07 1.000 .050 1.97 2.16 1 4 <50000000 161 2.51 1.505 .119 2.28 2.74 1 4
5 81 3.00 .000 .000 3.00 3.00 3 3 Total 700 2.27 1.095 .041 2.19 2.35 1 4
INCOME <50000 54 4.00 .000 .000 4.00 4.00 4 4 <100000 404 2.39 1.449 .072 2.25 2.54 1 5 <50000000 161 4.00 .000 .000 4.00 4.00 4 4
5 81 3.00 .000 .000 3.00 3.00 3 3 Total 700 2.96 1.315 .050 2.86 3.05 1 5
MF_TAX <50000 54 1.00 .000 .000 1.00 1.00 1 1 <100000 404 1.13 .341 .017 1.10 1.17 1 2 <50000000 161 1.50 .502 .040 1.43 1.58 1 2
5 81 1.00 .000 .000 1.00 1.00 1 1

221
Total 700 1.19 .395 .015 1.16 1.22 1 2 MFNAME <50000 54 14.81 5.043 .686 13.44 16.19 10 20
<100000 404 12.77 7.298 .363 12.06 13.48 1 26 <50000000 161 14.25 8.227 .648 12.97 15.53 4 25
5 81 12.75 8.212 .912 10.94 14.57 3 23 Total 700 13.27 7.512 .284 12.71 13.82 1 26
MODEOFINV
<50000 54 2.00 .000 .000 2.00 2.00 2 2 <100000 404 1.20 .399 .020 1.16 1.24 1 2 <50000000 161 1.50 .502 .040 1.42 1.57 1 2
5 81 1.00 .000 .000 1.00 1.00 1 1 Total 700 1.31 .461 .017 1.27 1.34 1 2
BRANDNAME
<50000 54 2.00 .000 .000 2.00 2.00 2 2 <100000 404 4.13 1.312 .065 4.00 4.26 1 5 <50000000 161 3.50 .502 .040 3.42 3.57 3 4
5 81 4.00 .000 .000 4.00 4.00 4 4 Total 700 3.81 1.179 .045 3.72 3.89 1 5
AUM <50000 54 2.00 .000 .000 2.00 2.00 2 2 <100000 404 1.73 .443 .022 1.69 1.78 1 2 <50000000 161 2.50 .502 .040 2.42 2.57 2 3
5 81 4.00 .000 .000 4.00 4.00 4 4 Total 700 2.19 .834 .032 2.13 2.25 1 4
NAV <50000 54 4.00 .000 .000 4.00 4.00 4 4 <100000 404 2.39 1.449 .072 2.25 2.54 1 5 <50000000 161 4.00 .000 .000 4.00 4.00 4 4
5 81 3.00 .000 .000 3.00 3.00 3 3 Total 700 2.96 1.315 .050 2.86 3.05 1 5
PR <50000 54 2.00 .000 .000 2.00 2.00 2 2 <100000 404 2.46 1.147 .057 2.35 2.58 1 4 <50000000 161 2.49 1.505 .119 2.26 2.72 1 4
5 81 5.00 .000 .000 5.00 5.00 5 5 Total 700 2.73 1.403 .053 2.62 2.83 1 5
QOS <50000 54 1.00 .000 .000 1.00 1.00 1 1 <100000 404 1.47 .500 .025 1.42 1.52 1 2 <50000000 161 2.99 2.006 .158 2.68 3.30 1 5
5 81 4.00 .000 .000 4.00 4.00 4 4 Total 700 2.07 1.410 .053 1.97 2.18 1 5
SAFE_IT <50000 54 4.00 .000 .000 4.00 4.00 4 4 <100000 404 2.13 1.313 .065 2.01 2.26 1 5 <5000000 161 1.50 .502 .040 1.43 1.58 1 2

222
0
5 81 2.00 .000 .000 2.00 2.00 2 2 Total 700 2.12 1.189 .045 2.03 2.21 1 5
ST_IT <50000 54 1.00 .000 .000 1.00 1.00 1 1 <100000 404 2.27 .681 .034 2.20 2.33 2 4 <50000000 161 2.00 .000 .000 2.00 2.00 2 2
5 81 2.00 .000 .000 2.00 2.00 2 2 Total 700 2.08 .617 .023 2.03 2.12 1 4
EU_IT <50000 54 4.00 .000 .000 4.00 4.00 4 4 <100000 404 2.06 1.523 .076 1.91 2.21 1 5 <50000000 161 1.50 .502 .040 1.42 1.57 1 2
5 81 2.00 .000 .000 2.00 2.00 2 2 Total 700 2.07 1.326 .050 1.97 2.17 1 5
N_IT <50000 54 5.00 .000 .000 5.00 5.00 5 5 <100000 404 2.13 1.022 .051 2.03 2.23 1 4 <50000000 161 1.50 .502 .040 1.43 1.58 1 2
5 81 1.00 .000 .000 1.00 1.00 1 1 Total 700 2.08 1.238 .047 1.98 2.17 1 5
ES_IT <50000 54 4.00 .000 .000 4.00 4.00 4 4 <100000 404 2.66 1.298 .065 2.53 2.79 1 5 <50000000
161 1.50 .502 .040 1.43 1.58 1 2
5 81 2.00 .000 .000 2.00 2.00 2 2 Total 700 2.42 1.212 .046 2.33 2.51 1 5
CURRENTINV
<50000 54 5.00 .000 .000 5.00 5.00 5 5 <100000 404 1.47 .500 .025 1.42 1.52 1 2 <50000000 161 4.50 .502 .040 4.42 4.57 4 5
5 81 1.00 .000 .000 1.00 1.00 1 1 Total 700 2.38 1.570 .059 2.27 2.50 1 5
REPEATPURCHASE
<50000 54 4.00 .000 .000 4.00 4.00 4 4 <100000 404 1.67 .472 .023 1.62 1.71 1 2 <50000000 161 2.99 1.003 .079 2.84 3.15 2 4
5 81 5.00 .000 .000 5.00 5.00 5 5 Total 700 2.54 1.309 .049 2.44 2.63 1 5
S_IT <50000 54 2.00 .000 .000 2.00 2.00 2 2 <100000 404 1.47 .499 .025 1.42 1.51 1 2 <50000000 161 2.49 1.505 .119 2.26 2.72 1 4
5 81 5.00 .000 .000 5.00 5.00 5 5 Total 700 2.15 1.379 .052 2.05 2.25 1 5
REFERRA <50000 54 3.00 .000 .000 3.00 3.00 3 3

223
L_IT <100000 404 1.93 .931 .046 1.84 2.02 1 4 <50000000 161 2.99 1.003 .079 2.84 3.15 2 4
5 81 5.00 .000 .000 5.00 5.00 5 5 Total 700 2.61 1.305 .049 2.52 2.71 1 5
SAFE <50000 54 2.00 .000 .000 2.00 2.00 2 2 <100000 404 4.13 1.312 .065 4.00 4.26 1 5 <50000000 161 3.50 .502 .040 3.42 3.57 3 4
5 81 4.00 .000 .000 4.00 4.00 4 4 Total 700 3.81 1.179 .045 3.72 3.89 1 5
ST <50000 54 4.00 .000 .000 4.00 4.00 4 4 <100000 404 4.26 1.343 .067 4.13 4.40 1 5 <50000000 161 5.00 .000 .000 5.00 5.00 5 5
5 81 3.00 .000 .000 3.00 3.00 3 3 Total 700 4.27 1.164 .044 4.18 4.35 1 5
EU <50000 54 2.00 .000 .000 2.00 2.00 2 2 <100000 404 3.61 1.449 .072 3.46 3.75 1 5 <50000000 161 4.50 .502 .040 4.42 4.57 4 5
5 81 4.00 .000 .000 4.00 4.00 4 4 Total 700 3.73 1.285 .049 3.64 3.83 1 5
N <50000 54 2.00 .000 .000 2.00 2.00 2 2 <100000 404 3.80 1.107 .055 3.70 3.91 2 5 <50000000 161 4.50 .502 .040 4.42 4.57 4 5
5 81 3.00 .000 .000 3.00 3.00 3 3 Total 700 3.73 1.093 .041 3.65 3.81 2 5
ES <50000 54 1.00 .000 .000 1.00 1.00 1 1 <100000 404 3.80 1.107 .055 3.70 3.91 2 5 <50000000 161 4.50 .502 .040 4.42 4.57 4 5
5 81 5.00 .000 .000 5.00 5.00 5 5 Total 700 3.89 1.281 .048 3.79 3.98 1 5
CURRENT <50000 54 1.00 .000 .000 1.00 1.00 1 1 <100000 404 3.94 1.061 .053 3.83 4.04 2 5 <50000000 161 3.99 1.003 .079 3.84 4.15 3 5
5 81 5.00 .000 .000 5.00 5.00 5 5 Total 700 3.85 1.292 .049 3.75 3.94 1 5
REPEAT <50000 54 2.00 .000 .000 2.00 2.00 2 2 <100000 404 3.94 1.523 .076 3.79 4.09 1 5 <50000000
161 3.00 .000 .000 3.00 3.00 3 3
5 81 4.00 .000 .000 4.00 4.00 4 4

224
Total 700 3.58 1.305 .049 3.48 3.68 1 5 S <50000 54 3.00 .000 .000 3.00 3.00 3 3
<100000 404 3.00 1.213 .060 2.88 3.12 1 5 <50000000 161 4.00 .000 .000 4.00 4.00 4 4
5 81 2.00 .000 .000 2.00 2.00 2 2 Total 700 3.12 1.087 .041 3.04 3.20 1 5
CASHINV <50000 54 3.00 .000 .000 3.00 3.00 3 3 <100000 404 3.87 1.497 .074 3.73 4.02 1 5 <50000000 161 4.50 .502 .040 4.43 4.58 4 5
5 81 4.00 .000 .000 4.00 4.00 4 4 Total 700 3.97 1.222 .046 3.88 4.06 1 5
REFERRAL
<50000 54 1.00 .000 .000 1.00 1.00 1 1 <100000 404 4.14 1.145 .057 4.03 4.25 2 5 <50000000 161 5.00 .000 .000 5.00 5.00 5 5
5 81 4.00 .000 .000 4.00 4.00 4 4 Total 700 4.08 1.299 .049 3.98 4.17 1 5
CS_REFFERAL
<50000 54 2.00 .000 .000 2.00 2.00 2 2 <100000 404 1.93 1.122 .056 1.82 2.04 1 4 <50000000 161 2.99 2.006 .158 2.68 3.30 1 5
5 81 2.00 .000 .000 2.00 2.00 2 2 Total 700 2.19 1.356 .051 2.09 2.29 1 5
CS_COMP
<50000 54 1.00 .000 .000 1.00 1.00 1 1 <100000 404 2.13 1.026 .051 2.03 2.23 1 4 <50000000 161 1.50 .502 .040 1.43 1.58 1 2
5 81 1.00 .000 .000 1.00 1.00 1 1 Total 700 1.77 .933 .035 1.70 1.84 1 4

225
ANNEXURE III
N Mean
Std. Deviatio
n Std. Error
95% Confidence Interval for Mean
Minimum
Maximum
Lower Bound
Upper Bound
GENDER 1.5 TO 2 LAKH 135 1.40 .492 .042 1.32 1.48 1 2
2 TO 2.5 LAKH 135 1.40 .492 .042 1.32 1.48 1 2
2.5 TO 3 LAKH 135 1.40 .492 .042 1.32 1.48 1 2
3 TO 4 LAKH 215 1.25 .435 .030 1.19 1.31 1 2
4 LAKH & ABOVE 80 1.00 .000 .000 1.00 1.00 1 1
Total 700 1.31 .462 .017 1.27 1.34 1 2 LOCATION 1.5 TO 2
LAKH 135 2.59 1.102 .095 2.41 2.78 1 4
2 TO 2.5 LAKH 135 2.39 1.134 .098 2.20 2.59 1 4
2.5 TO 3 LAKH 135 1.98 1.003 .086 1.81 2.15 1 3
3 TO 4 LAKH 215 2.63 1.098 .075 2.48 2.78 1 4
4 LAKH & ABOVE 80 3.05 1.005 .112 2.83 3.27 2 4
Total 700 2.50 1.119 .042 2.42 2.58 1 4 MARTIALSTATUS
1.5 TO 2 LAKH 135 1.00 .000 .000 1.00 1.00 1 1
2 TO 2.5 LAKH 135 1.40 .492 .042 1.32 1.48 1 2
2.5 TO 3 LAKH 135 1.60 .492 .042 1.52 1.68 1 2
3 TO 4 LAKH 215 1.63 .484 .033 1.56 1.69 1 2
4 LAKH & ABOVE 80 2.00 .000 .000 2.00 2.00 2 2
Total 700 1.50 .500 .019 1.46 1.54 1 2 OCCUPATION
1.5 TO 2 LAKH 135 1.00 .000 .000 1.00 1.00 1 1
2 TO 2.5 LAKH 135 1.40 .492 .042 1.32 1.48 1 2
2.5 TO 3 LAKH 135 1.60 .492 .042 1.52 1.68 1 2
3 TO 4 LAKH 215 1.62 .486 .033 1.56 1.69 1 2
4 LAKH & ABOVE 80 1.00 .000 .000 1.00 1.00 1 1
Total 700 1.38 .487 .018 1.35 1.42 1 2 AGE 1.5 TO 2
LAKH 135 1.60 .492 .042 1.52 1.68 1 2
2 TO 2.5 LAKH 135 1.80 .983 .085 1.63 1.97 1 3
2.5 TO 3 LAKH 135 3.40 .492 .042 3.32 3.48 3 4
3 TO 4 215 2.38 1.320 .090 2.20 2.56 1 4

226
LAKH
4 LAKH & ABOVE
80 2.00 .000 .000 2.00 2.00 2 2
Total 700 2.27 1.095 .041 2.19 2.35 1 4 MF_TAX 1.5 TO 2
LAKH 135 1.40 .492 .042 1.32 1.48 1 2
2 TO 2.5 LAKH 135 1.00 .000 .000 1.00 1.00 1 1
2.5 TO 3 LAKH 135 1.00 .000 .000 1.00 1.00 1 1
3 TO 4 LAKH 215 1.38 .486 .033 1.31 1.44 1 2
4 LAKH & ABOVE 80 1.00 .000 .000 1.00 1.00 1 1
Total 700 1.19 .395 .015 1.16 1.22 1 2 MFNAME 1.5 TO 2
LAKH 135 11.97 7.246 .624 10.74 13.20 2 22
2 TO 2.5 LAKH 135 11.39 7.001 .603 10.19 12.58 1 21
2.5 TO 3 LAKH 135 13.18 7.113 .612 11.97 14.39 3 23
3 TO 4 LAKH
215 14.39 7.548 .515 13.38 15.41 4 25
4 LAKH & ABOVE 80 15.75 8.264 .924 13.91 17.59 6 26
Total 700 13.27 7.512 .284 12.71 13.82 1 26 MODEOFINV
1.5 TO 2 LAKH 135 1.00 .000 .000 1.00 1.00 1 1
2 TO 2.5 LAKH 135 1.00 .000 .000 1.00 1.00 1 1
2.5 TO 3 LAKH 135 1.00 .000 .000 1.00 1.00 1 1
3 TO 4 LAKH 215 1.62 .486 .033 1.56 1.69 1 2
4 LAKH & ABOVE 80 2.00 .000 .000 2.00 2.00 2 2
Total 700 1.31 .461 .017 1.27 1.34 1 2 BRANDNAME
1.5 TO 2 LAKH 135 3.40 1.967 .169 3.07 3.73 1 5
2 TO 2.5 LAKH 135 4.00 .000 .000 4.00 4.00 4 4
2.5 TO 3 LAKH 135 4.40 .492 .042 4.32 4.48 4 5
3 TO 4 LAKH 215 3.12 .782 .053 3.02 3.23 2 4
4 LAKH & ABOVE
80 5.00 .000 .000 5.00 5.00 5 5
Total 700 3.81 1.179 .045 3.72 3.89 1 5 AUM 1.5 TO 2
LAKH 135 1.60 .492 .042 1.52 1.68 1 2
2 TO 2.5 LAKH 135 2.00 .000 .000 2.00 2.00 2 2
2.5 TO 3 LAKH 135 2.80 1.475 .127 2.55 3.05 1 4
3 TO 4 LAKH 215 2.37 .484 .033 2.31 2.44 2 3
4 LAKH & ABOVE 80 2.00 .000 .000 2.00 2.00 2 2

227
Total 700 2.19 .834 .032 2.13 2.25 1 4 NAV 1.5 TO 2
LAKH 135 1.00 .000 .000 1.00 1.00 1 1
2 TO 2.5 LAKH 135 2.00 .000 .000 2.00 2.00 2 2
2.5 TO 3 LAKH
135 3.00 .000 .000 3.00 3.00 3 3
3 TO 4 LAKH 215 4.00 .000 .000 4.00 4.00 4 4
4 LAKH & ABOVE
80 5.00 .000 .000 5.00 5.00 5 5
Total 700 2.96 1.315 .050 2.86 3.05 1 5 PR 1.5 TO 2
LAKH 135 2.00 .000 .000 2.00 2.00 2 2
2 TO 2.5 LAKH 135 2.20 1.475 .127 1.95 2.45 1 4
2.5 TO 3 LAKH 135 3.80 1.475 .127 3.55 4.05 2 5
3 TO 4 LAKH 215 2.37 1.318 .090 2.19 2.54 1 4
4 LAKH & ABOVE 80 4.00 .000 .000 4.00 4.00 4 4
Total 700 2.73 1.403 .053 2.62 2.83 1 5 QOS 1.5 TO 2
LAKH 135 1.40 .492 .042 1.32 1.48 1 2
2 TO 2.5 LAKH
135 1.60 .492 .042 1.52 1.68 1 2
2.5 TO 3 LAKH 135 3.20 .983 .085 3.03 3.37 2 4
3 TO 4 LAKH
215 2.49 1.938 .132 2.23 2.75 1 5
4 LAKH & ABOVE 80 1.00 .000 .000 1.00 1.00 1 1
Total 700 2.07 1.410 .053 1.97 2.18 1 5 SAFE_IT 1.5 TO 2
LAKH 135 2.60 1.967 .169 2.27 2.93 1 5
2 TO 2.5 LAKH 135 1.40 .492 .042 1.32 1.48 1 2
2.5 TO 3 LAKH 135 2.40 .492 .042 2.32 2.48 2 3
3 TO 4 LAKH 215 2.13 1.169 .080 1.97 2.29 1 4
4 LAKH & ABOVE 80 2.00 .000 .000 2.00 2.00 2 2
Total 700 2.12 1.189 .045 2.03 2.21 1 5 ST_IT 1.5 TO 2
LAKH 135 2.80 .983 .085 2.63 2.97 2 4
2 TO 2.5 LAKH 135 2.00 .000 .000 2.00 2.00 2 2
2.5 TO 3 LAKH
135 2.00 .000 .000 2.00 2.00 2 2
3 TO 4 LAKH 215 1.75 .435 .030 1.69 1.81 1 2
4 LAKH & ABOVE
80 2.00 .000 .000 2.00 2.00 2 2
Total 700 2.08 .617 .023 2.03 2.12 1 4 EU_IT 1.5 TO 2
LAKH 135 1.40 .492 .042 1.32 1.48 1 2

228
2 TO 2.5 LAKH 135 1.00 .000 .000 1.00 1.00 1 1
2.5 TO 3 LAKH 135 2.00 .000 .000 2.00 2.00 2 2
3 TO 4 LAKH 215 2.13 1.171 .080 1.97 2.28 1 4
4 LAKH & ABOVE 80 5.00 .000 .000 5.00 5.00 5 5
Total 700 2.07 1.326 .050 1.97 2.17 1 5 N_IT 1.5 TO 2
LAKH 135 1.60 .492 .042 1.52 1.68 1 2
2 TO 2.5 LAKH 135 2.00 .000 .000 2.00 2.00 2 2
2.5 TO 3 LAKH 135 1.00 .000 .000 1.00 1.00 1 1
3 TO 4 LAKH 215 2.38 1.581 .108 2.17 2.59 1 5
4 LAKH & ABOVE 80 4.00 .000 .000 4.00 4.00 4 4
Total 700 2.08 1.238 .047 1.98 2.17 1 5 ES_IT 1.5 TO 2
LAKH 135 2.60 .492 .042 2.52 2.68 2 3
2 TO 2.5 LAKH 135 1.60 .492 .042 1.52 1.68 1 2
2.5 TO 3 LAKH 135 2.00 .000 .000 2.00 2.00 2 2
3 TO 4 LAKH 215 2.13 1.169 .080 1.97 2.29 1 4
4 LAKH & ABOVE 80 5.00 .000 .000 5.00 5.00 5 5
Total 700 2.42 1.212 .046 2.33 2.51 1 5 CURRENTINV
1.5 TO 2 LAKH 135 2.00 .000 .000 2.00 2.00 2 2
2 TO 2.5 LAKH
135 1.00 .000 .000 1.00 1.00 1 1
2.5 TO 3 LAKH 135 1.40 .492 .042 1.32 1.48 1 2
3 TO 4 LAKH 215 4.62 .486 .033 4.56 4.69 4 5
4 LAKH & ABOVE 80 1.00 .000 .000 1.00 1.00 1 1
Total 700 2.38 1.570 .059 2.27 2.50 1 5 REPEATPURCHASE
1.5 TO 2 LAKH 135 1.60 .492 .042 1.52 1.68 1 2
2 TO 2.5 LAKH 135 1.40 .492 .042 1.32 1.48 1 2
2.5 TO 3 LAKH 135 3.80 1.475 .127 3.55 4.05 2 5
3 TO 4 LAKH 215 3.25 .971 .066 3.12 3.38 2 4
4 LAKH & ABOVE 80 2.00 .000 .000 2.00 2.00 2 2
Total 700 2.54 1.309 .049 2.44 2.63 1 5 S_IT 1.5 TO 2
LAKH 135 1.40 .492 .042 1.32 1.48 1 2
2 TO 2.5 LAKH 135 1.00 .000 .000 1.00 1.00 1 1
2.5 TO 3 135 3.80 1.475 .127 3.55 4.05 2 5

229
LAKH
3 TO 4 LAKH
215 2.37 1.318 .090 2.19 2.54 1 4
4 LAKH & ABOVE 80 2.00 .000 .000 2.00 2.00 2 2
Total 700 2.15 1.379 .052 2.05 2.25 1 5 REFERRAL_IT
1.5 TO 2 LAKH 135 1.60 .492 .042 1.52 1.68 1 2
2 TO 2.5 LAKH 135 2.20 1.475 .127 1.95 2.45 1 4
2.5 TO 3 LAKH 135 3.80 1.475 .127 3.55 4.05 2 5
3 TO 4 LAKH 215 3.00 .867 .059 2.88 3.11 2 4
4 LAKH & ABOVE 80 2.00 .000 .000 2.00 2.00 2 2
Total 700 2.61 1.305 .049 2.52 2.71 1 5 SAFE 1.5 TO 2
LAKH 135 3.40 1.967 .169 3.07 3.73 1 5
2 TO 2.5 LAKH 135 4.00 .000 .000 4.00 4.00 4 4
2.5 TO 3 LAKH
135 4.40 .492 .042 4.32 4.48 4 5
3 TO 4 LAKH 215 3.12 .782 .053 3.02 3.23 2 4
4 LAKH & ABOVE
80 5.00 .000 .000 5.00 5.00 5 5
Total 700 3.81 1.179 .045 3.72 3.89 1 5 ST 1.5 TO 2
LAKH 135 3.40 1.967 .169 3.07 3.73 1 5
2 TO 2.5 LAKH 135 4.40 .492 .042 4.32 4.48 4 5
2.5 TO 3 LAKH 135 3.80 .983 .085 3.63 3.97 3 5
3 TO 4 LAKH 215 4.75 .435 .030 4.69 4.81 4 5
4 LAKH & ABOVE 80 5.00 .000 .000 5.00 5.00 5 5
Total 700 4.27 1.164 .044 4.18 4.35 1 5 EU 1.5 TO 2
LAKH 135 4.60 .492 .042 4.52 4.68 4 5
2 TO 2.5 LAKH 135 4.40 .492 .042 4.32 4.48 4 5
2.5 TO 3 LAKH 135 3.60 .492 .042 3.52 3.68 3 4
3 TO 4 LAKH
215 3.87 1.169 .080 3.71 4.03 2 5
4 LAKH & ABOVE 80 1.00 .000 .000 1.00 1.00 1 1
Total 700 3.73 1.285 .049 3.64 3.83 1 5 N 1.5 TO 2
LAKH 135 4.00 .000 .000 4.00 4.00 4 4
2 TO 2.5 LAKH 135 5.00 .000 .000 5.00 5.00 5 5
2.5 TO 3 LAKH 135 3.00 .000 .000 3.00 3.00 3 3
3 TO 4 LAKH 215 3.87 1.169 .080 3.71 4.03 2 5

230
4 LAKH & ABOVE 80 2.00 .000 .000 2.00 2.00 2 2
Total 700 3.73 1.093 .041 3.65 3.81 2 5 ES 1.5 TO 2
LAKH 135 4.00 .000 .000 4.00 4.00 4 4
2 TO 2.5 LAKH
135 4.20 .983 .085 4.03 4.37 3 5
2.5 TO 3 LAKH 135 5.00 .000 .000 5.00 5.00 5 5
3 TO 4 LAKH
215 3.62 1.581 .108 3.41 3.83 1 5
4 LAKH & ABOVE 80 2.00 .000 .000 2.00 2.00 2 2
Total 700 3.89 1.281 .048 3.79 3.98 1 5 CURRENT 1.5 TO 2
LAKH 135 4.60 .492 .042 4.52 4.68 4 5
2 TO 2.5 LAKH 135 4.40 .492 .042 4.32 4.48 4 5
2.5 TO 3 LAKH 135 4.60 .492 .042 4.52 4.68 4 5
3 TO 4 LAKH 215 3.24 1.564 .107 3.03 3.45 1 5
4 LAKH & ABOVE 80 2.00 .000 .000 2.00 2.00 2 2
Total 700 3.85 1.292 .049 3.75 3.94 1 5 REPEAT 1.5 TO 2
LAKH 135 4.60 .492 .042 4.52 4.68 4 5
2 TO 2.5 LAKH 135 4.60 .492 .042 4.52 4.68 4 5
2.5 TO 3 LAKH
135 4.40 .492 .042 4.32 4.48 4 5
3 TO 4 LAKH 215 2.75 .435 .030 2.69 2.81 2 3
4 LAKH & ABOVE
80 1.00 .000 .000 1.00 1.00 1 1
Total 700 3.58 1.305 .049 3.48 3.68 1 5 S 1.5 TO 2
LAKH 135 2.80 1.475 .127 2.55 3.05 1 4
2 TO 2.5 LAKH 135 3.00 .000 .000 3.00 3.00 3 3
2.5 TO 3 LAKH 135 3.20 1.475 .127 2.95 3.45 2 5
3 TO 4 LAKH 215 3.75 .435 .030 3.69 3.81 3 4
4 LAKH & ABOVE 80 2.00 .000 .000 2.00 2.00 2 2
Total 700 3.12 1.087 .041 3.04 3.20 1 5 CASHINV 1.5 TO 2
LAKH 135 5.00 .000 .000 5.00 5.00 5 5
2 TO 2.5 LAKH
135 4.00 .000 .000 4.00 4.00 4 4
2.5 TO 3 LAKH 135 4.40 .492 .042 4.32 4.48 4 5
3 TO 4 LAKH
215 4.13 .784 .053 4.02 4.23 3 5
4 LAKH & ABOVE 80 1.00 .000 .000 1.00 1.00 1 1
Total 700 3.97 1.222 .046 3.88 4.06 1 5

231
REFERRAL 1.5 TO 2 LAKH 135 4.60 .492 .042 4.52 4.68 4 5
2 TO 2.5 LAKH 135 4.60 .492 .042 4.52 4.68 4 5
2.5 TO 3 LAKH 135 4.40 .492 .042 4.32 4.48 4 5
3 TO 4 LAKH 215 4.00 1.739 .119 3.76 4.23 1 5
4 LAKH & ABOVE 80 2.00 .000 .000 2.00 2.00 2 2
Total 700 4.08 1.299 .049 3.98 4.17 1 5 CS_REFFERAL
1.5 TO 2 LAKH 135 1.00 .000 .000 1.00 1.00 1 1
2 TO 2.5 LAKH 135 2.00 .000 .000 2.00 2.00 2 2
2.5 TO 3 LAKH 135 1.60 .492 .042 1.52 1.68 1 2
3 TO 4 LAKH 215 2.74 1.787 .122 2.50 2.98 1 5
4 LAKH & ABOVE 80 4.00 .000 .000 4.00 4.00 4 4
Total 700 2.19 1.356 .051 2.09 2.29 1 5 CS_COMP 1.5 TO 2
LAKH 135 2.80 .983 .085 2.63 2.97 2 4
2 TO 2.5 LAKH 135 1.40 .492 .042 1.32 1.48 1 2
2.5 TO 3 LAKH 135 1.00 .000 .000 1.00 1.00 1 1
3 TO 4 LAKH 215 1.38 .486 .033 1.31 1.44 1 2
4 LAKH & ABOVE 80 3.00 .000 .000 3.00 3.00 3 3
Total 700 1.77 .933 .035 1.70 1.84 1 4 SALE 1.5 TO 2
LAKH 135 2.00 .000 .000 2.00 2.00 2 2
2 TO 2.5 LAKH 135 2.00 .000 .000 2.00 2.00 2 2
2.5 TO 3 LAKH 135 3.80 1.475 .127 3.55 4.05 2 5
3 TO 4 LAKH 215 3.25 1.304 .089 3.07 3.42 1 4
4 LAKH & ABOVE 80 2.00 .000 .000 2.00 2.00 2 2
Total 700 2.73 1.228 .046 2.64 2.82 1 5

232
ANNEXURE 1V
KMO and Bartlett's Test Kaiser-Meyer-Olkin Measure of Sampling Adequacy. .338
Bartlett's Test of Sphericity
Approx. Chi-Square 11008.966 df 36 Sig. .000
Communalities
Initial Extraction GENDER 1.000 .981 MARTIAL STATUS 1.000 .875 OCCUPATION 1.000 .825 AGE GROUP 1.000 .629 I INVEST IN MUTUAL FUND BASED ON BRANDNAME
1.000 .882
I CONSIDER ASSET UNDER MANAGEMENT OF MUTUAL FUND COMPANY BEFORE TAKING AND INVESTMENT CALL ?
1.000 .929
I CONSIDER CURRENT NAV OF MF BEFORE INVESTING
1.000 .936
I CONSIDER PAST RECORD OF MUTUAL FUND COMPANY BEFORE TAKING AND INVESTING CALL ?
1.000 .757
I INVEST IN MUTUAL FUND BASED ON ITS QUALITY OF SERVICE
1.000 .909
Extraction Method: Principal Component Analysis.

233
Total Variance Explained
Component
Initial Eigenvalues Extraction Sums of Squared
Loadings Rotation Sums of Squared
Loadings
Total % of
Variance Cumulati
ve % Total % of
Variance Cumulati
ve % Total % of
Variance Cumulati
ve % 1 4.746 52.735 52.735 4.746 52.735 52.735 4.576 50.845 50.845 2 1.795 19.947 72.682 1.795 19.947 72.682 1.765 19.607 70.451 3 1.180 13.106 85.788 1.180 13.106 85.788 1.380 15.337 85.788 4 .697 7.747 93.535 5 .373 4.142 97.677 6 .143 1.584 99.261 7 .060 .668 99.928 8 .005 .060 99.988 9 .001 .012 100.000
Extraction Method: Principal Component Analysis.
1 2 3 4 5 6 7 8 9
Component Number
0
1
2
3
4
5
Eig
en
va
lue
Scree Plot
Component Matrix(a)

234
Component
1 2 3 GENDER -.331 .262 .896 MARTIAL STATUS .167 .903 -.179 OCCUPATION .759 .247 .434 AGE GROUP -.077 .774 -.156 I INVEST IN MUTUAL FUND BASED ON BRANDNAME
.925 -.130 .097
I CONSIDER ASSET UNDER MANAGEMENT OF MUTUAL FUND COMPANY BEFORE TAKING AND INVESTMENT CALL ?
.910 .100 -.301
I CONSIDER CURRENT NAV OF MF BEFORE INVESTING
.966 -.009 -.039
I CONSIDER PAST RECORD OF MUTUAL FUND COMPANY BEFORE TAKING AND INVESTING CALL ?
.827 .238 .130
I INVEST IN MUTUAL FUND BASED ON ITS QUALITY OF SERVICE
.852 -.411 .117
Extraction Method: Principal Component Analysis. a 3 components extracted.

235
Rotated Component Matrix(a)
Component
1 2 3 GENDER -.119 .052 .982 MARTIAL STATUS .161 .921 -.008 OCCUPATION .843 .151 .301 AGE GROUP -.078 .788 .039 I INVEST IN MUTUAL FUND BASED ON BRANDNAME
.918 -.140 -.139
I CONSIDER ASSET UNDER MANAGEMENT OF MUTUAL FUND COMPANY BEFORE TAKING AND INVESTMENT CALL ?
.827 .173 -.464
I CONSIDER CURRENT NAV OF MF BEFORE INVESTING
.934 .009 -.250
I CONSIDER PAST RECORD OF MUTUAL FUND COMPANY BEFORE TAKING AND INVESTING CALL ?
.844 .210 -.005
I INVEST IN MUTUAL FUND BASED ON ITS QUALITY OF SERVICE
.840 -.418 -.166
Extraction Method: Principal Component Analysis. Rotation Method: Varimax with Kaiser Normalization. a Rotation converged in 4 iterations. Component Transformation Matrix
Component 1 2 3 1 .976 .010 -.219 2 .040 .975 .221 3 .215 -.224 .951
Extraction Method: Principal Component Analysis. Rotation Method: Varimax with Kaiser Normalization.

236
Component Score Coefficient Matrix
Component
1 2 3 GENDER .101 -.028 .769 MARTIAL STATUS .022 .524 -.041 OCCUPATION .241 .053 .345 AGE GROUP -.027 .450 -.027 I INVEST IN MUTUAL FUND BASED ON BRANDNAME
.205 -.087 .019
I CONSIDER ASSET UNDER MANAGEMENT OF MUTUAL FUND COMPANY BEFORE TAKING AND INVESTMENT CALL ?
.134 .113 -.273
I CONSIDER CURRENT NAV OF MF BEFORE INVESTING
.191 .005 -.077
I CONSIDER PAST RECORD OF MUTUAL FUND COMPANY BEFORE TAKING AND INVESTING CALL ?
.199 .106 .096
I INVEST IN MUTUAL FUND BASED ON ITS QUALITY OF SERVICE
.187 -.243 .004
Extraction Method: Principal Component Analysis. Rotation Method: Varimax with Kaiser Normalization. Component Score Covariance Matrix
Component 1 2 3 1 1.000 .000 .000 2 .000 1.000 .000 3 .000 .000 1.000
Extraction Method: Principal Component Analysis. Rotation Method: Varimax with Kaiser Normalization.

237
-1.0 -0.5 0.0 0.5 1.0Component 1
-1.0
-0.5
0.0
0.5
1.0
Co
mp
on
en
t 2
-1.0-0.50.00.51.0
Component 3
VAR00001
VAR00002
VAR00003
VAR00005
IT_ResponsiveIT_CS1
IT_CL2
CL
CS
Component Plot in Rotated Space

238
ANNEXURE V
INCOME
Total 1.5 TO 2 LAKH
2 TO 2.5
LAKH 2.5 TO 3 LAKH
3 TO 4 LAKH
4 LAKH &
ABOVE SALE <50000 Count 0 0 0 54 0 54
% within SALE .0% .0% .0% 100.0% .0% 100.0%
% within INCOME .0% .0% .0% 25.1% .0% 7.7%
% of Total .0% .0% .0% 7.7% .0% 7.7%
<100000 Count 135 135 54 0 80 404 % within SALE 33.4% 33.4% 13.4% .0% 19.8% 100.0%
% within INCOME 100.0% 100.0% 40.0% .0% 100.0% 57.7%
% of Total 19.3% 19.3% 7.7% .0% 11.4% 57.7%
<50000000
Count 0 0 0 161 0 161 % within SALE .0% .0% .0% 100.0% .0% 100.0%
% within INCOME .0% .0% .0% 74.9% .0% 23.0%
% of Total .0% .0% .0% 23.0% .0% 23.0%
5 Count 0 0 81 0 0 81 % within SALE .0% .0% 100.0% .0% .0% 100.0%
% within INCOME .0% .0% 60.0% .0% .0% 11.6%
% of Total .0% .0% 11.6% .0% .0% 11.6%
Total Count 135 135 135 215 80 700 % within SALE
19.3% 19.3% 19.3% 30.7% 11.4% 100.0%
% within INCOME 100.0% 100.0% 100.0% 100.0% 100.0% 100.0%
% of Total 19.3% 19.3% 19.3% 30.7% 11.4% 100.0%

239
Cases
Valid Missing Total
N Percent N Percent N Percent GENDER * INCOME 700 97.9% 15 2.1% 715 100.0% LOCATION * INCOME 700 97.9% 15 2.1% 715 100.0% MARTIALSTATUS * INCOME 700 97.9% 15 2.1% 715 100.0%
OCCUPATION * INCOME 700 97.9% 15 2.1% 715 100.0% AGE * INCOME 700 97.9% 15 2.1% 715 100.0% MF_TAX * INCOME 700 97.9% 15 2.1% 715 100.0% MFNAME * INCOME 700 97.9% 15 2.1% 715 100.0% MODEOFINV * INCOME 700 97.9% 15 2.1% 715 100.0% BRANDNAME * INCOME 700 97.9% 15 2.1% 715 100.0% AUM * INCOME 700 97.9% 15 2.1% 715 100.0% NAV * INCOME 700 97.9% 15 2.1% 715 100.0% PR * INCOME 700 97.9% 15 2.1% 715 100.0% QOS * INCOME 700 97.9% 15 2.1% 715 100.0% SAFE_IT * INCOME 700 97.9% 15 2.1% 715 100.0% ST_IT * INCOME 700 97.9% 15 2.1% 715 100.0% EU_IT * INCOME 700 97.9% 15 2.1% 715 100.0% N_IT * INCOME 700 97.9% 15 2.1% 715 100.0% ES_IT * INCOME 700 97.9% 15 2.1% 715 100.0% CURRENTINV * INCOME 700 97.9% 15 2.1% 715 100.0% REPEATPURCHASE * INCOME 700 97.9% 15 2.1% 715 100.0%
S_IT * INCOME 700 97.9% 15 2.1% 715 100.0% REFERRAL_IT * INCOME 700 97.9% 15 2.1% 715 100.0% SAFE * INCOME 700 97.9% 15 2.1% 715 100.0% ST * INCOME 700 97.9% 15 2.1% 715 100.0% EU * INCOME 700 97.9% 15 2.1% 715 100.0% N * INCOME 700 97.9% 15 2.1% 715 100.0% ES * INCOME 700 97.9% 15 2.1% 715 100.0% CURRENT * INCOME 700 97.9% 15 2.1% 715 100.0% REPEAT * INCOME 700 97.9% 15 2.1% 715 100.0% S * INCOME 700 97.9% 15 2.1% 715 100.0% CASHINV * INCOME 700 97.9% 15 2.1% 715 100.0% REFERRAL * INCOME 700 97.9% 15 2.1% 715 100.0% CS_REFFERAL * INCOME
700 97.9% 15 2.1% 715 100.0%
CS_COMP * INCOME 700 97.9% 15 2.1% 715 100.0% SALE * INCOME 700 97.9% 15 2.1% 715 100.0%

240
Cases
Valid Missing Total
N Percent N Percent N Percent GENDER * SALE 700 97.9% 15 2.1% 715 100.0% LOCATION * SALE 700 97.9% 15 2.1% 715 100.0% MARTIALSTATUS * SALE 700 97.9% 15 2.1% 715 100.0% OCCUPATION * SALE 700 97.9% 15 2.1% 715 100.0% AGE * SALE 700 97.9% 15 2.1% 715 100.0% MF_TAX * SALE 700 97.9% 15 2.1% 715 100.0% MFNAME * SALE 700 97.9% 15 2.1% 715 100.0% MODEOFINV * SALE 700 97.9% 15 2.1% 715 100.0% BRANDNAME * SALE 700 97.9% 15 2.1% 715 100.0% AUM * SALE 700 97.9% 15 2.1% 715 100.0% NAV * SALE 700 97.9% 15 2.1% 715 100.0% PR * SALE 700 97.9% 15 2.1% 715 100.0% QOS * SALE 700 97.9% 15 2.1% 715 100.0% SAFE_IT * SALE 700 97.9% 15 2.1% 715 100.0% ST_IT * SALE 700 97.9% 15 2.1% 715 100.0% EU_IT * SALE 700 97.9% 15 2.1% 715 100.0% N_IT * SALE 700 97.9% 15 2.1% 715 100.0% ES_IT * SALE 700 97.9% 15 2.1% 715 100.0% CURRENTINV * SALE 700 97.9% 15 2.1% 715 100.0% REPEATPURCHASE * SALE 700 97.9% 15 2.1% 715 100.0%
S_IT * SALE 700 97.9% 15 2.1% 715 100.0% REFERRAL_IT * SALE 700 97.9% 15 2.1% 715 100.0% SAFE * SALE 700 97.9% 15 2.1% 715 100.0% ST * SALE 700 97.9% 15 2.1% 715 100.0% EU * SALE 700 97.9% 15 2.1% 715 100.0% N * SALE 700 97.9% 15 2.1% 715 100.0% ES * SALE 700 97.9% 15 2.1% 715 100.0% CURRENT * SALE 700 97.9% 15 2.1% 715 100.0% REPEAT * SALE 700 97.9% 15 2.1% 715 100.0% S * SALE 700 97.9% 15 2.1% 715 100.0% CASHINV * SALE 700 97.9% 15 2.1% 715 100.0% REFERRAL * SALE 700 97.9% 15 2.1% 715 100.0% CS_REFFERAL * SALE 700 97.9% 15 2.1% 715 100.0% CS_COMP * SALE 700 97.9% 15 2.1% 715 100.0% INCOME * SALE 700 97.9% 15 2.1% 715 100.0%

241
ANNEXURE VI
1. GENDER Statistics GENDER N Valid 700
Missing 15 Mean 1.31 Std. Deviation .462 Sum 916
GENDER
Frequency Percent Valid Percent Cumulative
Percent Valid MALE 484 67.7 69.1 69.1
FEMALE 216 30.2 30.9 100.0 Total 700 97.9 100.0
Missing System 15 2.1 Total 715 100.0
2. LOCATION Statistics LOCATION N Valid 700
Missing 15 Mean 2.50 Std. Deviation 1.119 Sum 1750
LOCATION
Frequency Percent Valid Percent Cumulative
Percent Valid MUMBAI 175 24.5 25.0 25.0
DELHI 175 24.5 25.0 50.0 KOLKATTA 175 24.5 25.0 75.0
CHENNAI 175 24.5 25.0 100.0 Total 700 97.9 100.0
Missing System 15 2.1

242
Total 715 100.0
3. MARTIALSTATUS Statistics MARTIALSTATUS N Valid 700
Missing 15 Mean 1.50 Std. Deviation .500 Sum 1050
MARTIALSTATUS
Frequency Percent Valid Percent Cumulative
Percent Valid MARRIED 350 49.0 50.0 50.0
UNMARRIED 350 49.0 50.0 100.0
Total 700 97.9 100.0 Missing System 15 2.1 Total 715 100.0
4. OCCUPATION Statistics OCCUPATION N Valid 700
Missing 15 Mean 1.38 Std. Deviation .487 Sum 969
OCCUPATION
Frequency Percent Valid Percent Cumulative
Percent Valid SALARIED 431 60.3 61.6 61.6
SELF EMPLOYED 269 37.6 38.4 100.0
Total 700 97.9 100.0 Missing System 15 2.1 Total 715 100.0

243
5. AGE Statistics AGE N Valid 700
Missing 15 Mean 2.27 Std. Deviation 1.095 Sum 1590
AGE
Frequency Percent Valid Percent Cumulative
Percent Valid 20 TO 25 215 30.1 30.7 30.7
25 TO 30 215 30.1 30.7 61.4 30 TO 35 135 18.9 19.3 80.7 35 TO 40 135 18.9 19.3 100.0 Total 700 97.9 100.0
Missing System 15 2.1 Total 715 100.0
6. INCOME Statistics INCOME N Valid 700
Missing 15 Mean 2.96 Std. Deviation 1.315 Sum 2070
INCOME
Frequency Percent Valid Percent Cumulative
Percent Valid 1.5 TO 2
LAKH 135 18.9 19.3 19.3
2 TO 2.5 LAKH 135 18.9 19.3 38.6
2.5 TO 3 LAKH 135 18.9 19.3 57.9
3 TO 4 LAKH 215 30.1 30.7 88.6

244
4 LAKH & ABOVE 80 11.2 11.4 100.0
Total 700 97.9 100.0 Missing System 15 2.1 Total 715 100.0
7. MF_TAX Statistics MF_TAX N Valid 700
Missing 15 Mean 1.19 Std. Deviation .395 Sum 835
MF_TAX
Frequency Percent Valid Percent Cumulative
Percent Valid STRONGLY
AGREE 565 79.0 80.7 80.7
AGREE 135 18.9 19.3 100.0 Total 700 97.9 100.0
Missing System 15 2.1 Total 715 100.0
8. MFNAME Statistics MFNAME N Valid 700
Missing 15 Mean 13.27 Std. Deviation 7.512 Sum 9286
MFNAME
Frequency Percent Valid Percent Cumulative
Percent Valid RELIANCE MF 28 3.9 4.0 4.0
HDFC MF 28 3.9 4.0 8.0

245
ICICI PRUMF 28 3.9 4.0 12.0 UTI MF 28 3.9 4.0 16.0 BIRLA SUNLIFE MF 28 3.9 4.0 20.0
SBI MF 28 3.9 4.0 24.0 LIC MF 28 3.9 4.0 28.0 KOTAK MF 28 3.9 4.0 32.0 FRANKLIN MF 28 3.9 4.0 36.0 TATA MF 28 3.9 4.0 40.0 IDFC MF 27 3.8 3.9 43.9 DSP BLACKROCK MF
27 3.8 3.9 47.7
DEUTCHE MF 27 3.8 3.9 51.6 SUNDARAM BNP MF 27 3.8 3.9 55.4
HSBC MF 26 3.6 3.7 59.1 TAURUS MF 26 3.6 3.7 62.9 BENCHMARK 26 3.6 3.7 66.6 RELIGARE F 26 3.6 3.7 70.3 FIDELITY MF 26 3.6 3.7 74.0 PRINCIPAL MF 26 3.6 3.7 77.7 CANARA ROBECO MF 26 3.6 3.7 81.4
JM FINANCIAL MF 26 3.6 3.7 85.1
JPMORGAN MF 26 3.6 3.7 88.9 BARODA PIONEER MF 26 3.6 3.7 92.6
DBS CHOLA MF 26 3.6 3.7 96.3 MORGAN STANLEY MF 26 3.6 3.7 100.0
Total 700 97.9 100.0 Missing System 15 2.1 Total 715 100.0
9. MODEOFINV Statistics MODEOFINV N Valid 700
Missing 15 Mean 1.31 Std. Deviation .461 Sum 914
MODEOFINV

246
Frequency Percent Valid Percent Cumulative
Percent Valid ONLINE 486 68.0 69.4 69.4
OFFLINE 214 29.9 30.6 100.0 Total 700 97.9 100.0
Missing System 15 2.1 Total 715 100.0
10. BRANDNAME Statistics BRANDNAME N Valid 700
Missing 15 Mean 3.81 Std. Deviation 1.179 Sum 2664
BRANDNAME
Frequency Percent Valid Percent Cumulative
Percent Valid STRONGLY
AGREE 54 7.6 7.7 7.7
AGREE 54 7.6 7.7 15.4 NEUTRAL 81 11.3 11.6 27.0 DISAGREE 296 41.4 42.3 69.3 STRONGLY DISAGREE 215 30.1 30.7 100.0
Total 700 97.9 100.0 Missing System 15 2.1 Total 715 100.0
11. AUM Statistics AUM N Valid 700
Missing 15 Mean 2.19 Std. Deviation .834 Sum 1534

247
AUM
Frequency Percent Valid Percent Cumulative
Percent Valid STRONGLY
AGREE 108 15.1 15.4 15.4
AGREE 431 60.3 61.6 77.0 NEUTRAL 80 11.2 11.4 88.4 DISAGREE 81 11.3 11.6 100.0 Total 700 97.9 100.0
Missing System 15 2.1 Total 715 100.0
12. NAV Statistics NAV N Valid 700
Missing 15 Mean 2.96 Std. Deviation 1.315 Sum 2070
NAV
Frequency Percent Valid Percent Cumulative
Percent Valid STRONGLY
AGREE 135 18.9 19.3 19.3
AGREE 135 18.9 19.3 38.6 NEUTRAL 135 18.9 19.3 57.9 DISAGREE 215 30.1 30.7 88.6 STRONGLY DISAGREE 80 11.2 11.4 100.0
Total 700 97.9 100.0 Missing System 15 2.1 Total 715 100.0

248
13. PR Statistics PR N Valid 700
Missing 15 Mean 2.73 Std. Deviation 1.403 Sum 1909
PR
Frequency Percent Valid Percent Cumulative
Percent Valid STRONGLY
AGREE 162 22.7 23.1 23.1
AGREE 243 34.0 34.7 57.9 DISAGREE 214 29.9 30.6 88.4 STRONGLY DISAGREE 81 11.3 11.6 100.0
Total 700 97.9 100.0 Missing System 15 2.1 Total 715 100.0
14. QOS Statistics QOS N Valid 700
Missing 15 Mean 2.07 Std. Deviation 1.410 Sum 1452
QOS
Frequency Percent Valid Percent Cumulative
Percent Valid STRONGLY
AGREE 350 49.0 50.0 50.0
AGREE 189 26.4 27.0 77.0 DISAGREE 81 11.3 11.6 88.6 STRONGLY DISAGREE 80 11.2 11.4 100.0
Total 700 97.9 100.0

249
Missing System 15 2.1 Total 715 100.0
15. SAFE_IT Statistics SAFE_IT N Valid 700
Missing 15 Mean 2.12 Std. Deviation 1.189 Sum 1482
SAFE_IT
Frequency Percent Valid Percent Cumulative
Percent Valid STRONGLY
AGREE 242 33.8 34.6 34.6
AGREE 296 41.4 42.3 76.9 NEUTRAL 54 7.6 7.7 84.6 DISAGREE 54 7.6 7.7 92.3 STRONGLY DISAGREE 54 7.6 7.7 100.0
Total 700 97.9 100.0 Missing System 15 2.1 Total 715 100.0
16. ST_IT Statistics ST_IT N Valid 700
Missing 15 Mean 2.08 Std. Deviation .617 Sum 1454
ST_IT
Frequency Percent Valid Percent Cumulative
Percent Valid STRONGLY
AGREE 54 7.6 7.7 7.7

250
AGREE 592 82.8 84.6 92.3 DISAGREE 54 7.6 7.7 100.0 Total 700 97.9 100.0
Missing System 15 2.1 Total 715 100.0
17. EU_IT Statistics EU_IT N Valid 700
Missing 15 Mean 2.07 Std. Deviation 1.326 Sum 1451
EU_IT
Frequency Percent Valid Percent Cumulative
Percent Valid STRONGLY
AGREE 297 41.5 42.4 42.4
AGREE 269 37.6 38.4 80.9 DISAGREE 54 7.6 7.7 88.6 STRONGLY DISAGREE 80 11.2 11.4 100.0
Total 700 97.9 100.0 Missing System 15 2.1 Total 715 100.0
18. N_IT Statistics N_IT N Valid 700
Missing 15 Mean 2.08 Std. Deviation 1.238 Sum 1453
N_IT

251
Frequency Percent Valid Percent Cumulative
Percent Valid STRONGLY
AGREE 269 37.6 38.4 38.4
AGREE 297 41.5 42.4 80.9 DISAGREE 80 11.2 11.4 92.3 STRONGLY DISAGREE 54 7.6 7.7 100.0
Total 700 97.9 100.0 Missing System 15 2.1 Total 715 100.0
19. ES_IT Statistics ES_IT N Valid 700
Missing 15 Mean 2.42 Std. Deviation 1.212 Sum 1695
ES_IT
Frequency Percent Valid Percent Cumulative
Percent Valid STRONGLY
AGREE 134 18.7 19.1 19.1
AGREE 351 49.1 50.1 69.3 NEUTRAL 81 11.3 11.6 80.9 DISAGREE 54 7.6 7.7 88.6 STRONGLY DISAGREE 80 11.2 11.4 100.0
Total 700 97.9 100.0 Missing System 15 2.1 Total 715 100.0
20. CURRENTINV Statistics CURRENTINV N Valid 700
Missing 15 Mean 2.38

252
Std. Deviation 1.570 Sum 1668
CURRENTINV
Frequency Percent Valid Percent Cumulative
Percent Valid STRONGLY
AGREE 296 41.4 42.3 42.3
AGREE 189 26.4 27.0 69.3 DISAGREE 81 11.3 11.6 80.9 STRONGLY DISAGREE 134 18.7 19.1 100.0
Total 700 97.9 100.0 Missing System 15 2.1 Total 715 100.0
21. REPEATPURCHASE Statistics REPEATPURCHASE N Valid 700
Missing 15 Mean 2.54 Std. Deviation 1.309 Sum 1776
REPEATPURCHASE
Frequency Percent Valid Percent Cumulative
Percent Valid STRONGLY
AGREE 135 18.9 19.3 19.3
AGREE 350 49.0 50.0 69.3 DISAGREE 134 18.7 19.1 88.4 STRONGLY DISAGREE 81 11.3 11.6 100.0
Total 700 97.9 100.0 Missing System 15 2.1 Total 715 100.0

253
22. S_IT Statistics S_IT N Valid 700
Missing 15 Mean 2.15 Std. Deviation 1.379 Sum 1506
S_IT
Frequency Percent Valid Percent Cumulative
Percent Valid STRONGLY
AGREE 297 41.5 42.4 42.4
AGREE 242 33.8 34.6 77.0 DISAGREE 80 11.2 11.4 88.4 STRONGLY DISAGREE 81 11.3 11.6 100.0
Total 700 97.9 100.0 Missing System 15 2.1 Total 715 100.0
23. REFERRAL_IT Statistics REFERRAL_IT N Valid 700
Missing 15 Mean 2.61 Std. Deviation 1.305 Sum 1830
REFERRAL_IT
Frequency Percent Valid Percent Cumulative
Percent Valid STRONGLY
AGREE 135 18.9 19.3 19.3
AGREE 296 41.4 42.3 61.6 NEUTRAL 54 7.6 7.7 69.3 DISAGREE 134 18.7 19.1 88.4 STRONGLY DISAGREE 81 11.3 11.6 100.0

254
Total 700 97.9 100.0 Missing System 15 2.1 Total 715 100.0
24. SAFE Statistics SAFE N Valid 700
Missing 15 Mean 3.81 Std. Deviation 1.179 Sum 2664
SAFE
Frequency Percent Valid Percent Cumulative
Percent Valid STRONGLY
AGREE 54 7.6 7.7 7.7
AGREE 54 7.6 7.7 15.4 NEUTRAL 81 11.3 11.6 27.0 DISAGREE 296 41.4 42.3 69.3 STRONGLY DISAGREE 215 30.1 30.7 100.0
Total 700 97.9 100.0 Missing System 15 2.1 Total 715 100.0
25. ST Statistics ST N Valid 700
Missing 15 Mean 4.27 Std. Deviation 1.164 Sum 2987

255
ST
Frequency Percent Valid Percent Cumulative
Percent Valid STRONGLY
AGREE 54 7.6 7.7 7.7
NEUTRAL 81 11.3 11.6 19.3 DISAGREE 135 18.9 19.3 38.6 STRONGLY DISAGREE 430 60.1 61.4 100.0
Total 700 97.9 100.0 Missing System 15 2.1 Total 715 100.0
26. EU Statistics EU N Valid 700
Missing 15 Mean 3.73 Std. Deviation 1.285 Sum 2613
EU
Frequency Percent Valid Percent Cumulative
Percent Valid STRONGLY
AGREE 80 11.2 11.4 11.4
AGREE 54 7.6 7.7 19.1 NEUTRAL 54 7.6 7.7 26.9 DISAGREE 297 41.5 42.4 69.3 STRONGLY DISAGREE 215 30.1 30.7 100.0
Total 700 97.9 100.0 Missing System 15 2.1 Total 715 100.0
27. N Statistics N N Valid 700
Missing 15

256
Mean 3.73 Std. Deviation 1.093 Sum 2612
N
Frequency Percent Valid Percent Cumulative
Percent Valid AGREE 134 18.7 19.1 19.1
NEUTRAL 135 18.9 19.3 38.4 DISAGREE 216 30.2 30.9 69.3 STRONGLY DISAGREE 215 30.1 30.7 100.0
Total 700 97.9 100.0 Missing System 15 2.1 Total 715 100.0
28. ES Statistics ES N Valid 700
Missing 15 Mean 3.89 Std. Deviation 1.281 Sum 2720
ES
Frequency Percent Valid Percent Cumulative
Percent Valid STRONGLY
AGREE 54 7.6 7.7 7.7
AGREE 80 11.2 11.4 19.1 NEUTRAL 54 7.6 7.7 26.9 DISAGREE 216 30.2 30.9 57.7 STRONGLY DISAGREE 296 41.4 42.3 100.0
Total 700 97.9 100.0 Missing System 15 2.1 Total 715 100.0

257
29. CURRENT Statistics CURRENT N Valid 700
Missing 15 Mean 3.85 Std. Deviation 1.292 Sum 2693
CURRENT
Frequency Percent Valid Percent Cumulative
Percent Valid STRONGLY
AGREE 54 7.6 7.7 7.7
AGREE 80 11.2 11.4 19.1 NEUTRAL 81 11.3 11.6 30.7 DISAGREE 189 26.4 27.0 57.7 STRONGLY DISAGREE 296 41.4 42.3 100.0
Total 700 97.9 100.0 Missing System 15 2.1 Total 715 100.0
30. REPEAT Statistics REPEAT N Valid 700
Missing 15 Mean 3.58 Std. Deviation 1.305 Sum 2507
REPEAT
Frequency Percent Valid Percent Cumulative
Percent Valid STRONGLY
AGREE 80 11.2 11.4 11.4
AGREE 54 7.6 7.7 19.1 NEUTRAL 161 22.5 23.0 42.1 DISAGREE 189 26.4 27.0 69.1

258
STRONGLY DISAGREE 216 30.2 30.9 100.0
Total 700 97.9 100.0 Missing System 15 2.1 Total 715 100.0
31. S Statistics S N Valid 700
Missing 15 Mean 3.12 Std. Deviation 1.087 Sum 2181
S
Frequency Percent Valid Percent Cumulative
Percent Valid STRONGLY
AGREE 54 7.6 7.7 7.7
AGREE 161 22.5 23.0 30.7 NEUTRAL 189 26.4 27.0 57.7 DISAGREE 242 33.8 34.6 92.3 STRONGLY DISAGREE 54 7.6 7.7 100.0
Total 700 97.9 100.0 Missing System 15 2.1 Total 715 100.0
32. CASHINV Statistics CASHINV N Valid 700
Missing 15 Mean 3.97 Std. Deviation 1.222 Sum 2776
CASHINV
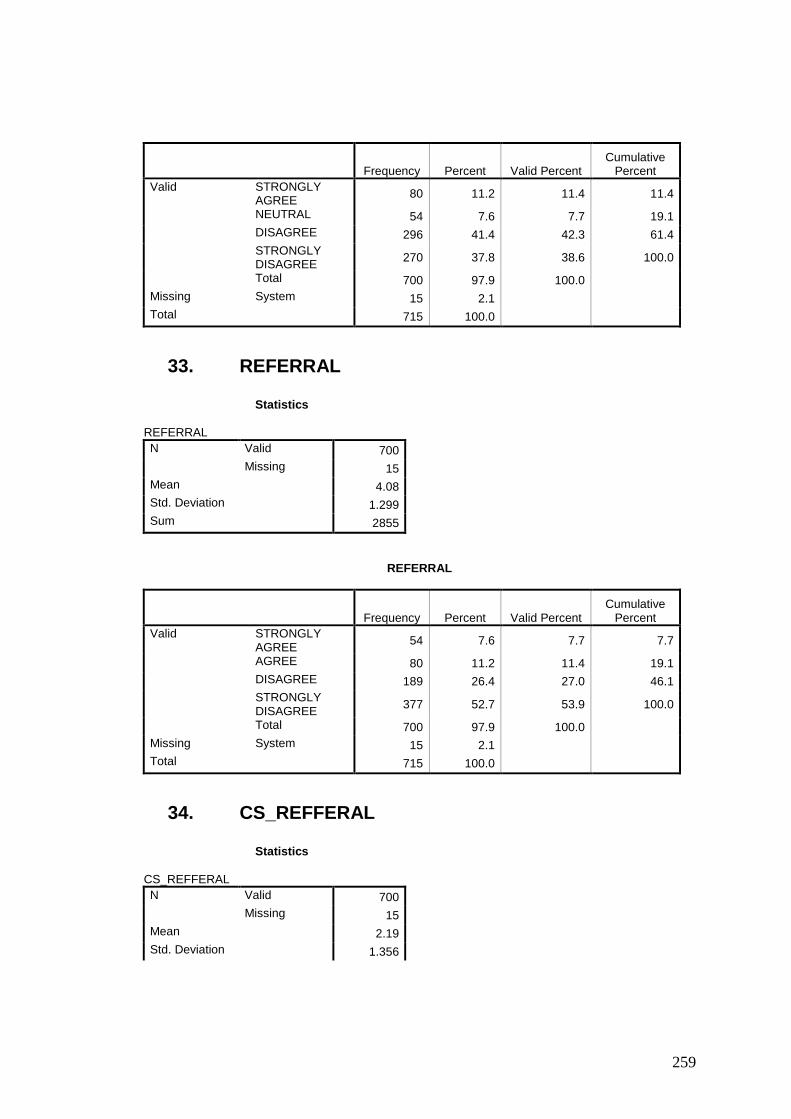
259
Frequency Percent Valid Percent Cumulative
Percent Valid STRONGLY
AGREE 80 11.2 11.4 11.4
NEUTRAL 54 7.6 7.7 19.1 DISAGREE 296 41.4 42.3 61.4 STRONGLY DISAGREE 270 37.8 38.6 100.0
Total 700 97.9 100.0 Missing System 15 2.1 Total 715 100.0
33. REFERRAL Statistics REFERRAL N Valid 700
Missing 15 Mean 4.08 Std. Deviation 1.299 Sum 2855
REFERRAL
Frequency Percent Valid Percent Cumulative
Percent Valid STRONGLY
AGREE 54 7.6 7.7 7.7
AGREE 80 11.2 11.4 19.1 DISAGREE 189 26.4 27.0 46.1 STRONGLY DISAGREE 377 52.7 53.9 100.0
Total 700 97.9 100.0 Missing System 15 2.1 Total 715 100.0
34. CS_REFFERAL Statistics CS_REFFERAL N Valid 700
Missing 15 Mean 2.19 Std. Deviation 1.356

260
Sum 1530
CS_REFFERAL
Frequency Percent Valid Percent Cumulative
Percent Valid STRONGLY
AGREE 270 37.8 38.6 38.6
AGREE 270 37.8 38.6 77.1 DISAGREE 80 11.2 11.4 88.6 STRONGLY DISAGREE 80 11.2 11.4 100.0
Total 700 97.9 100.0 Missing System 15 2.1 Total 715 100.0
35. CS_COMP Statistics CS_COMP N Valid 700
Missing 15 Mean 1.77 Std. Deviation .933 Sum 1238
CS_COMP
Frequency Percent Valid Percent Cumulative
Percent Valid STRONGLY
AGREE 350 49.0 50.0 50.0
AGREE 216 30.2 30.9 80.9 NEUTRAL 80 11.2 11.4 92.3 DISAGREE 54 7.6 7.7 100.0 Total 700 97.9 100.0
Missing System 15 2.1 Total 715 100.0

261
36. SALE Statistics SALE N Valid 700
Missing 15 Mean 2.73 Std. Deviation 1.228 Sum 1911
SALE
Frequency Percent Valid Percent Cumulative
Percent Valid <50000 54 7.6 7.7 7.7
<100000 404 56.5 57.7 65.4 <50000000 161 22.5 23.0 88.4 >50000000 81 11.3 11.6 100.0 Total 700 97.9 100.0
Missing System 15 2.1 Total 715 100.0

262
BIBLIOGRAPHY
§ Abdul-Muhiivn, Alhassan G. (1998), "Demographic Differences in Usage
and Attitudes Toward the Saudi Arabian EFTPOS System," International
Journal of Bank Marketing, Vol. 16 No. 3, 117-128.
§ Achrol, R. S. (1997), "Changes in the Theory of Interorganizational
Relations in Marketing: Toward a Network Paradigm," Journal of the
Academy of Marketing Science, Vol. 25, 56-71.
§ ADuvadi, Milton (02/Ol/99), "Banking and Financial Institutions' Call Centers
Eye Big Bucks," Call Center Magazine, 3-5.
§ Anderson, Eugene W., and Sullivan, Mary W. (1993), "The Antecedents
and Consequences of Customer Satisfaction for Firms," The Marketing
Journal of TIMS/ORS'A, Vol. 12 No. 2,125-144.
§ Anton, J. (1997), Call Center Management by the Numbers, Purdue University
Press, West Lafayette, IN (2000), "The Past, Present and Future of Customer
Access Centers," International Journal of Service Management, Vol. 11, 120-
130.
§ Angel, Bob (2002), "Relationship Results," CA Magazine, Vol. 135 No. 1,
28-30.
§ Anonymous (2001), "Does CRM Pay?" The Journal of Business Strategy,
Vol. 22 No.6, 3.

263
§ Anonymous (2001), "7-Eleven Tests New Financial Services and Kiosks in
Florida," National Petroleum News, Vol. 93 No. 9, 9-10.
§ Aronson, Elliot (1972), The Social Animal, W.H. Freeman and
Company, San Francisco, CA.
§ Ahituv, N., (1989). "Assessing the Value of Information: Problems and
Approaches". Proceedings of the Tenth International Conference on Information
Systems, Boston, MA, pp. 315-326.
§ Ahituv, N., and Giladi, R., (1994). "Business success and Information
Technolgy: Are They Really Related?" Proceedings of the Seventh Annual
Conference of Management IS, Tel Aviv University.
§ Ahituv, N., Lipovetsky, S., and Tishier, A., (1999). "The Relationship Between
Firm's Information Systems Policy and Business Performance: A Multivariate
Analysis". In Mo Adam Mahmood and Edwar J. Szewczak, Measuring
Information Technology Investment Payoff.- Contemporary Approaches.
Hershey, PA: Idea Group Publishing, pp. 62-82.
§ Alarcon Olmos, K. P., (199O). La Globalizacion Financiera Mundial y sus
Efectos en la Banca Mexicana: Estrafegia de Crecimiento de Un Banco
Mexicano. [The World Financial Globalization: Devepment Strategy of a
Mexican Bank]. Unpublished Thesis. Universidad lberoamericana. Mexico D.
F., Mexico.
264
§ Alpar, P., and Kim, M., (1990}. "A Microeconomic Approach to the
Measurements of Information Technology Value," Journal of Management
Information Systems, Vol. 7, No 3, pp. 55-69.
§ Alvarez. J. M., (1990). Desarrollo Inisfituciona! del Sistema Bancario
MWxicano. (Institutional Development of the Mexican Banking System].
Unpublished Thesis. Universidad iberoamericana, Mexico, D. F., Mexico.
§ Aaye, P., (1993). Economic Transformation the Mexican Way. Cambridge,
Massachussets: The MIT Press.
§ Adkisson, J. A., & Fraser, D. R. (2003). Reading the stars: Age bias in
Morningstar ratings. Financial Analysts Journal, 24-27.
§ Adrangi, B., Chatrath, A., & Shank, T. M. (2002). A comparison of the risk-
adjusted portfolio performance: The dartboard versus professionals and major
indices. American Business Review, 82-90.
§ Apap, A., & Griffith, J. M. (1998). The impact of expenses on equity mutual
fund performance. Journal of Financial Planning, 11, 76-82.
§ Atkinson, S. M., & Sturm, R. R. (2003). All-star mutual funds? Journal of
Investing, 12(2), 87- 95.
§ Bogle, J. (1994). Bogle on mutual funds. Burr Ridge, IL: Irwin Professional
Publishing.
§ Brown, K., Harlow, U., and Starks, L. (1996). Of tournaments and
temptations: An analysis of managerial incentives in the mutual fund industry.
Journal of Finance, 51, 85-110.

265
§ Brush, M. (1997). How fund costs drag down gains. Money, 26, 7A-9A.
§ Badgett, M.V. Lee, and Folbre, Nancy (1999), "Assigning Care: Gender
Norms and Economic Outcomes," International Labor Review, Vol. 138 No.
3, 311-326.
§ Bagozzi, Richard P. (1995), "Reflections on Relationship Marketing in
Consumer Markets: Rebuttal," Journal of the Academy of Marketing Science,
Vol. 23 No. 4, 272-277.
§ Barefoot, Jo Ann (2001), "Privacy's Human Shield." Banking Strategies,
July/August, 42-46. Barlow, Richard G. (1992), "Relationship Marketing: The
Ultimate in Customer Service," Retail Control, Vol. 60 No. 3, 29-38.
§ Bateson, JEG (1995), Managing Services Marketing. The Dryden Press, Fort
Worth, TX. Bawden, Tom (1999), "Cherry Pickers," Marketing Week, Vol.
22 No. 21, 38-40.
§ Berry, Leonard.L. (1995), "Relationship Marketing of Services - Growing
Interest, Emerging Perspectives," Journal of the Academy of Marketing
Science, Vol. 23 No. 4,236-245.
§ Bolton, Ruth N., Kannan, P.K. and Bramlett, Matthew D. (2000),
"Implications of Loyalty Program Membership and Service Experiences for
Customer Retention and Value." Journal of the Academy of Marketing
Science, Vol. 28 No. 1, 95-108.

266
§ Brown, G.N. (1952), "Brand Loyalty: Fact or Fiction?" AdvertisingAge, Vol.
23, 535.
§ Burton, Dawn (1995), "Women and Financial Services: Some Directions for
Future Research," International Journal of Bank Marketing, Vol. 13 No. 8,
21-31.
§ Butler, John E. (1988), "Theories of Technological Innovation as Useful
Tools for Corporate Strategy," Strategic Management Journal, Vol. 9 No 1,
15-30.
§ Bakos, J. Y., and Brynloifsson, E., (1993}. "lnformation Technology,
Incentives, and the Optimal Number of Suppliers," Journal of Management
Information Systems, Vol. 10, No. 2, Fall, pp. 37-42.
§ Brynjolfsson, E., (1993). "The Productivity Paradox of Information
Technology," Communications of the ACM, Vol 36, No. 12, Dec, pp. 67.
§ Brynjoifsson, E., and Hitt, L., (1995). "The Productive Keep Producing --
Successful Companies Support Good Business Plans with the Right
Information Technologies," Informationweek, Sep 18, pp, 38.
§ Brynjolfsson, E., and Hitt, L., (1996). "Paradox Lost? Firm-level Evidence on
the Returns to Information Systems Spending," Management Science, Vol. 42,
No. 4, Apr, pp. 54't-559.

267
§ Brynjolfsson, E., and Hitt L., (1996). "The Customer Counts - Investing in
Computers Pays Off. But to Get the Most Value for Your IT Dollar, Focus on
Customers, " lnfonnationweek, Sep 9, pp. 48.
§ Brynjolfsson, E., and Hitt, L., (1997). "MIT Analysis: Breaking Boundaries,"
lnformationweek, Sep 22, pp. 54-61.
§ Brynjolfsson, E., Malone, T. W., Gurbaxani, V., and Kambil, A., (1994).
"Does information Technology Lead to Smaller Firms?," Management Science
Vol. 40, No. 12, Dec, pp. 1628-1644.
§ Brynjolfsson, E., Renshaw, A. A., and Van Alstyne, M., (1997). "The Matrix
of Change," Sloan Management Review, Vol. 38, No. 2, Winter, pp. 37-54.
§ Canciola, C. (1999). "El Gerente de Sistemas como Promotor de lnversiones
Tecnoiogicas." [The Systems Manager as Technology Investments Promotor].
Empf+esa 400, No. 12, Abril-Mayo, pp. 20-26.
§ Capote, A., (1999). Interview with Alfredo Capote, President and CEO of IBM
de Mexico, Febrary 3, 1999. Mexico D.F. Mexico. {Appendix C]
§ Chong, R., (1999). Interview with Roberto Chong, CIO of Atlantico Bank,
March 13,1999, Mexico D.F. Mexico. [Appendix Cj
§ Ciemons, E. K., (1991). "Evaluation of Strategic Investments in Information
Technology," Communications of the ACM, Vol. 34, No. 1, Jan, pp. 22-36.
§ Clemons, E. K., Croson, D. C., and Weber, B. W., (1996). "Market
Dominance as a Precursor of a Firm's Failure: Emerging Technologies and the

268
Competitive Advantage of New Entrants," Journal of Management
Information Systems, Vol. 13, No. 2, Fall, pp. 59-75.
§ Clemons, E. K., Reddi, S. P., and Row, M. C., (1993). "The Impact of
Information Technology on the Organization of Economic Activity: The
"Move to the Middle" Hypothesis," Journal of Management Information
Systems, Vol. 10, No. 2, Fall, pp. 9.
§ Clemons, E. K., and Row M. C., (1989). "Information Technofogy and
Economic Reorganization." Proceedings of the Tenth International Conference
on Information Systems. December 1989. Boston, MA., pp. 341-351.
§ Clemons, E. K., and Row, M. C., (1991). "Sustaining IT Advantage: The
MUM of Structural Differences," MIS Quarterfy, Vol. 15, Iss. 3, Sep, pp. 275-
292.
§ Clemons, E. K., and Weber, B. W., (1994). "Segmentation, Differentiation,
and Flexible Pricing: Experiences with Information Technology and Segment-
Tailored Strategies," Journal of Management Information Systems, Fall, Vol.
11, No. 2, pp. 9.
§ Collofly, F., Adya, M., and Armstrong, J. S., (1994). "Principles for
Examining Predictive Validity: The Case of Information Systems Spending,"
Information Systems Research, Vol. 5, Iss. 2, June, pp. 170-179.
§ Calhoun, John (2001), "Driving Loyalty by Managing the Total
Customer Experience," Ivey Business Journal, Vol. 65 No. 6, 69-80.

269
§ Chase, Richard B. and Dasu, Sriram (2001), "Want to Perfect Your
Company's Service? Use Behavioral Science," Harvard Business Review, Vol.
79 No. 6, 79-84.
§ Churchill, G.A. Jr. (1987), Marketing Research Methodological
Foundations (6`'' Edition), Dryden Press, Ft. Worth, TX.
§ Churchill, Gilbert A. and Suprenant, Carol (1982), "An Investigation into the
Determinants of Customer Satisfaction," Journal of Marketing Research,
Vol. 19 November, 491-504.
§ Churchill, H.L. (1942), "How to Measure Brand Loyalty," Advertising and
Selling, Vol. 35, 24.
§ Cleland, Kim (2001), "CRM's Role in the New Consumer Climate,"
Advertising Age, Vol. 71 No. 44, S2.
§ Coffey, Jeanne O. (2001), "The Road to CRM Nirvana," Bank
Systems and Technology, Vol. 38 No. 7, 34-38.
§ Couldwell, Clive (1999), "Loyalty Bonuses," Marketing Week, Vol. 22 No.
3, 41-42.
§ Coyne, William (2000), "Lead User: A Conversation with William Coyne,"
Health Forum Journal, Vol. 43 No. 4, 28-24.
§ Crosby, Lawrence A., Johnson, Sheree L. and Quinn, Richard (2002), "Is
Survey Research Dead?" Marketing Management, Vol. 11 No. 3, 24-29.

270
§ Crutchfield Jr., Edward E. (1998), "The `High Touch' Solution: Use of
Sophisticated Technology to Provide Quality Service to Bank Customers,"
The Banker, Vol. 148 No. 14,14-16.
§ Darley, William K. and Smith, Robert E. (1995), "Gender Differences in
Information Processing Strategies: An Empirical Test of the Selectivity Model
in Advertising," Journal of Advertising, Vol. 24 No. l, 41-54.
§ Day, George S. (2000), "Managing Market Relationships" Journal of the
Academy of Marketing Science, Vol. 28 No. 1, 24-30.
§ Demarrais, Kevin (S112102), "Your Money's Worth: Over 50 Getting
Attention," The Record, Bergen County, NJ, B1.
§ Dhebar, Anirudh (2001), "Six Chasms in Need of Crossing," MIT Sloan
Management Review, Vol. 42 No.3, 95-99.
§ Dick, A.S., and Basu, K. (1994), "Customer Loyalty: Toward an Integrated
Conceptual Framework," Journal of the Academy of Marketing Science, VoL
22, 99113.
§ Dickson, Peter R. (2000), "Understanding the Trade Winds: The Global
Evolution of Production, Consumption, and the Internet, " Journal of
Consumer Research, Vol. 27 No. 1, 115-122.
§ Dienhart, John W. (Z000), "Just Caring, Caring Justice," Business and Society
Review, Vol. 105 No. 2, 247-267.

271
§ Doocey, Paul (2001), "Just thinking", Bank Systems and Technology, Vol. 38
No. 7, 6.
§ Dver, Alyssa (2001), "Real-Time Customer Data That's Useful for
Retention," Bank Marketing, Vol. 33 No. 2,32-35.
§ Eagly, Alice (1987), "Gender and Helping Behavior: A Meta-Analytic
Review of the Social Psychological Literature," Psychological Bulletin, Vol.
100 No. 3, 283-95.
§ Eagly, Alice and Johnson, Blair T. (1990), "Gender and Leadership Style:
A MetaAnalysis," Psychological Bulletin, Vol. 108 No. 2, 233-45.
§ Epstein, Chuck (1999), "Financial Services Firms Take Aim at
Customers," Wall Street and Technology, Vol. 17 No. 9, 32-36.
§ Feinberg, Richard A., Hokaina, Leigh, I{adani, Rajesh, and IkSuk, Kim
(2002), "Operational Determinants of Caller Satisfaction in the
Banking/Financial Services Call Center," The International Journal of Bank
Marketing, Vol. 20 No. 4, 174-180.
§ Gatignon, Hubert G., Tushman, Michael L., Smith, Wendy and Anderson,
Philip (2002), "A Structural Approach to Assessing Innovation: Construct
Development of Innovation, Locus, Type, and Characteristics, " Management
Science, Vol. 48 No. 9, 1103-23.

272
§ Gilbert, Faye W, and Warren, William E. (1995), "Psychographic
Constructs and Demographic Segments," Psychology and Marketing,
Vol. 12 No. 3, 223-38.
§ Gold, Nicolas (1998), "The Meaning of `Legacy Systems' ", SABA Project
Report, January, Lincoln School of Management, University of Lincolnshire
and Humberside, UK.
§ Goode, Mark, and Moutinho, Luiz (1995), "The Effects of Free Banking on
Overall Satisfaction: The Use of ATMs", International Journal of Bank
Marketing, Vol. 13 No. 4, 33-40., and Chien, Charles (1996), "Structural
Equation Modelling of Overall Satisfaction and Full Use of Services for
ATMs," International Journal of Bank Marketing, Vol. 14 No. 7, 4-11.
§ Gordon, Ian H. (1998) Relationship Marketing. John Wiley and Sons,
Canada, LTD.
§ Greco, A.J. and Fields, D.M. (1991), "Profiling Early Triers of Service
Innovations: A Look at Interactive Home Video Ordering Services," Journal
of Services Marketing, Vol. 5 Summer, 19-26.
§ Grisaffe, Doug (1121l02), "See About Linking CRM and MR Systems,"
Marketing News, 13.
§ Gronroos, Christian (1995), "Relationship Marketing: Strategy Continuum."
Journal of the Academy of Marketing Science, Vol. 23 No. 4, 252-254.

273
§ Gruen, Thomas W. (1995), "The Outcome Set of Relationship Marketing in
Consumer Markets," International Business Review, Vol. 4 No. 4, 447-469.
§ Gamniesson, Evert (1998), "Implementation Requires a Relationship
Marketing Paradigm," Journal of the Academy of Marketing Science, Vol.
26 No. 3, 242-249.
§ Garcia Vlacias, A., (1999). Interview with Alfonso Garcia Macias, CEO of
International and BCH Banks, Febrary 5,1999, Mexico D. F., Mexico.
[Appendix Cj
§ Garcia Noriega, G., (1999). Interview with Gerardo Garcia IVoriega, CIO of
International Bank, April 21, 2000, Mexico D. F., Mexico. [Appendix C]
§ Grover, V., Teng, J., Segars, A. H., and Fiedler, K., (1998). "The Influence of
Information Technology Diffusion and Business Process Change on Perceived
Productivity: The IS Executive's Perspective," Information & Management,
Vol. 34, No. 3, Oct, pp. 141-159.
§ Harris, S. E., and Katz, J. L., (1991). "Organizational Performance and
Information Technology Investments Intensity in the Insurance Industry,"
Organization Science, Vol. 2, No. 3, pp 263-295.
§ Harris, S. E., and Katz, J. L., (1988). "Profitability and Information Capital
Intensity in the Insurance Industry." Proceedings of the Twenty-First Annual
Hawaii Conference on Systems Sciences, Applications Track, 4, pp. 124-130.

274
§ Hulfbauer, G. C., and Schoh, J. J., (1992}. North American Free Trade: issues
and Recommendations. Institute of International Economics. Washington, D.
C., pp. 306.
§ Oxford.(1999), Total Relationship Marketing, Butterworth,
Heinemann,Gwinner Kevin P., Gremler, Dwayne D. and Bitner, Mary Jo
(1998), "Relational Benefits in Services Industries: Customer's
Perspective," Journal of the Academy of Marketing Science, Vol. 26 No. 2,
101-114.
§ Ha, Jung-Bok. (1998) "Conceptual and Empirical foundations for an
Integrated Model of Behavioral Factors Influencing Exporter-Importer
Relationships". PhD Dissertation, Old Dominion University.
§ Hair, Joseph E. Jr., Anderson, Rolph E., Tatham, Ronald L., and Black,
William C. (1998), Multivariate Data Analysis, Prentice Hall, New
Jersey.
§ Hayes, Mary (2001), "An `RM' Market Grows," Information
Week, Hayhoe Celia, Leach Lauren J., Turner Pamela R.,
Bruin Marilyn J. and Lawrence, Frances C. (2000),
"Differences in Spending Habits and Credit Use in College
Students," Journal of Consumer Affairs, VoL 34 No 1, 113-
133.

275
§ Hennig-Thurau, Thorsten and Hansen, Ursula (2000), Relationship
Marketing, Springer, Berlin. Heskett, James L., Jones, Thomas O.,
Loveman, Gary W. and Sasser, W. Earl Jr., "Putting the Service
Profit Chain to Work." Harvard Business Review, Vol. 72 No. 2,164-
175.
§ lacovou, C. L., Benbasat, I., and Dexter, A. S., (1995). "Electronic Data
Interchange and Small Organizations: Adoption and Impact of Technology,"
MlS Quarterly, Vol. 19, No. 4, pp. 465-485.
§ Ives, B., (1994). "Probing the Productivity Paradox," MIS Quarterly (editor's
comment), Vol. 18, No. 2, pp. xx-xxiii.
§ Jurison, J., (1995). Defining and Measuring Productivity. In Paul Gray and
Jaak Jurison, Productivity in the Office and the Factory. Danvers, MA: Boyd
& Fraser.
§ Kaplan, R. S., and Norton, D. P., (1992). "The Balanced Scorecard - Measures
That Drive Performance," Harvard Business Review, Vol. 70, No.1, JanlFeb,
pp. 71-80.
§ Kapian, R. S., and Norton, D. P., (1996). "Strategic Learning & the Balanced
Scorecard," Strategy & Leadership, Vol. 24, No. 5, SeplOct, pp. 18-24.
§ Kauffman, R. J., and W, ill, P., (1989). An Evaluative Framework for
Research on the Performance Effects of Information Technology

276
investmetns." Proceedings of the Tenth International Conference on
Information Systems, Boston, MA, 1989, pp. 377-388.
§ Keen, P. G. W., {1991}. Shaping the Future: Business Design Through
Information Technology. Boston, MA: Harvard Business School Press.
§ Keen, P. G. W., and Woddman, L. A., (1984). "What to Do With all Those
Micros," Harvard Business Review, Sep-Oct 1984, pp. 142-150.
§ King, W. R., (1998). "T-enhanced Productivity and Profitability," Information
Systems Management, Vol. 15, No. 1, Winter, pp. 64-66.
§ Kluckhon, F. R., (1962). "Dominant and Subtitute Profiles of Culture
Orientation: Their Significance for the Analysis of Social Stratification". In
Hofstede, G. (1980) Culture's Consequences: International Differences in
Work Related Values. London. England: Sage Publications.
§ Karimi, Jahangir, Somers, Toni M. and Gupta, Yash P. (2001), "Impact of
Information Technology Management Practices on Customer Service,"
Journal of Management Information Systems, Vol. 17 No. 4, 125-158.
§ Kelly, Michael (2000), "Insure Against Administrative Nightmares,"
The British Journal of Administrative Management, July/August, 16-18.
§ Kiesnoski, Kenneth (2000), "ATMs give AmEx, E*Trade a Banking
Footprint, " Bank Systems and Technology, Vol. 37 No. S, 16.(1999),

277
"Customer Relationship Management," Bank Systems and Technology, Vol.
36 No. 2, 30-34.
§ Leidner, D. E., (1995). "The Use of Information Technology to Enhance
Mangement School Education: A theoretical View," M!S Quarterly. Vol. 19,
No. 3, Sep, pp. 2fi5-292.
§ Loveman, G. W., (1994). "An Assessment of the Productivity Impact of
Information Technologies." In Allen T. J.; Scott Morton M. S. Information
Technologies and the Corporation of the 1990's. New York, N. Y.: Oxford
University Press.
§ Loveman, G. W., (1988). "An Assessment of the Productivity Impact of
Information Technologies". Sloan School of Management, Massachusetts
Institute of Technology, Management in the 1990's Working Paper No. 88154.
§ Lucas, H. C., (1999). Information Technology and the Productivity Paradox:
Assessing the Value of Investing in IT. New York, Oxford: Oxford University
Press 1999.
§ Lucas, H. C., Jr., (1993). "The Business Value of Information Technology: A
Historical Perspective and Thought for Future Research", In R. D. Banker, R. J.
Kauffman and M. A. Mahmood, Strategic Information Technology
Managemente: Perspectives on Organizational Growth and Competitive
Advantage, Harrisburg, PA:Idea Group Publishing.

278
§ Lucas, H. C., Jr., (1975). "The Use of an Accounting Information System,
Action and Organizational Performance," The Accounting Review. October, pp.
735-746.
§ Mafone, T. W., "Is Empowerrnent Just a Fad? Control, Decision Making, and
IT", Sloan Management Review, Vol. 38, No. 2, Winter 1997, pp. 23-35.
§ Markus, M. L., and Soh, C., (1993). Banking on Information Technology:
Converting IT Spending into Firm Performance, Chapter 19 in R. Banker, et al.
(Eds.). Strategic Information Technology Management: Perspectives on
Organizational Growth and Competitive Advantage, pp. 375-403. Harrisburg,
PA: Idea Group Publishing.
§ Marin, E., (20 00). Interview with Erasmo Marrn, C10 of International Bank.
December 21, 2000. Mexico, D. F., Mexico.
§ McKeen, J. E., Smith, H. A., and Parent, M., (1999). An Integrative Research
Approach to Assess the Business Value of Information Technology. In Mo
Adam Mahmood and Edwar J. Szewczak, Measuring Information
§ Technology Investment Payoff.- Contemporary Approaches, pp. 5-23.
Hershey, PA: Idea Group Publishing.
§ Malone, T. W., Yates, J., and Benjamin, R. I., (1994). Electronic Markets and
Electronic Hierarchies. In Allen and Scott Morton Information Technologies
and the Corporation of the 1990's, pp.61-83. New York, NY: University Press.

279
§ Mukhopadhyay, T., Kekre, S., Kalathur, S., {1995}. "Business Value of
Information Technology: A Study of Electronic Data Interchange," MIS
Quarterly, Vol. 19, No. 2, pp. 137-15fi.
§ Masters, Tony (2000), "The Loyal Few," Marketing Week; Vol. 23 No.
17, 75-78.
§ Mather, A., Sherman, E. and Schiffman, L.G. (1998), "Marketing Travel
Services to New-Age Elderly," Journal of Service Marketing, VoL 12 No. 4,
265-77.
§ Mazanet, Shirley (2000), "Online ATMs Enhance Member
Relationships," Credit Union Magazine, Vol. 66 No. 11, 66-68.
§ Mazur, Laura (8/16/O1) "Life Stages Hold Key to Improving Customer
Bonds," Marketing, 16.
§ Milberg, Sandra J, Burke, Sandra J., Smith, H. Jeff and Kallman, Ernest A.
(1995), "Values, Personal Information Privacy, and Regulatory Approaches,"
Association for Computing Machinery, Vol. 38 No. 12, 65-78.
§ Milligan, John W. (1997), "What Do Customers Want From You?
Everything!" US Banker, Vol. 107 No 12, 38-42.
§ Mols, Niels P. (1999), "The Internet and the Banks' Strategic Distribution
Channel Decisions," International Journal of Bank Marketing, Vol. 17 No.
6, 295-307.

280
§ Moreau, C. Page, Lehmann, Donald R. and Markman, Arthur B. (2001),
"Entrenched Knowledge Structures and Consumer Response to New
Products," Journal of Marketing Research, Vol. 38 No. 1, 14-29.
§ Morgan, Robert M. and Hunt, Shelby D. (1994) "The Commitment-Trust
Theory of Relationship Marketing. " Journal of Marketing, Vol. 58 No. 3,
20-38.
§ Morrow, Edwin P. (2001), "Client Relationship Marketing," Financial
Services Advisor, Vol. 144 No. 5, 14-18.
§ Murdock, Gene W. and Franz, Lori (1983), "Habit and Perceived Risk as
Factors in Resistance to Use of ATMs," Journal of Retail Banking, Vol. 5
No. 2, 20-30.
§ Nelson, Kristi (2001), "NYCE Banks Testing `Pinless' Person-to-Person
Transactions Via ATMs, Phone and Web," Bank Systems and Technology,
Vol. 38 No. 2, 12.(2/20/01), "Profitability Software Gives Account Officers
20/20 Vision,"
§ Newell, Frederick (1997). The New Rules of Marketing: How to Use One-
to-One Relationship Marketing to be the Leader in Your Industry.
McGraw-Hill.
§ Nevin, J.R (1995), "Relationship Marketing and Distribution Channels:

281
§ Parasuraman, A. and Grewal, Dhruv (2000), "The Impact of Technology
on the Quality-Value-Loyalty Chain: A Research Agenda," Journal of the
Academy of Marketing Science, Vol. 28 No. 1 168-174.
§ Patrickson, Margaret and Hartmann, Linda (1997), "Golden Oldies`1"
Management Development Review, Vol. 10 No. 3, 94-98.
§ Patton, Susannah (2001), "The Truth About CRM," CIO, Vol. 14 No. 14, 76-
85.
§ Payne, Adrian and Frow, Penelope (2000), "Services Relationship
Marketing: A Sector Case Study," in Relationship Marketing, 299-316.,
Holt, Sue and Frow, Penelope (2000), "Integrating Employee, Customer
and Shareholder Value through an Enterprise Performance Model," The
International Journal of Bank Marketing, Vol. 18 No. 6, 258-280.
§ Payne, Adrian, Christopher, Martin, Clark, Moira and Peck, Helen (1995),
Relationship Marketing for Competitive Advantage, Butterworth-Heinemann,
Ltd., Oxford.
§ Peppers, D and Rogers, M. (1999), The One-to-One Manager. Doubleday,
NY. and Dorf, Bob (1999), "Is Your Company Ready for Oneto-One
Marketing7" Harvard Business Review On Point, Product # 956X.
§ Prahalad, C.K. and Ramaswamy, Venkatram (2000), "Co-opting
Customer Competence," Harvard Business Review, 79-87.

282
§ Panko, R. R., (1991). "Is the Office Productivity Stagnant?," MIS Quarterly,
Vol. 15, no. 2., 191-203.
§ Parker, M. M., and Benson, R. J., (1988). Information Economics: Linking
Business Performance to Information Technology. Englewood Cliffs, NJ:
Prentice-Hail, Inc.
§ Regozinski, J., (1993). La privatizacion de Empresas Paraestatales. [
Government Owned Companies Privatization]. Mexico D_ F., Mexico: FCE.
§ Roach, S. S., (1991). "Services under siege- the restructuring imperative,"
Harvard Business Review. September/October, 82-92.
§ Roach, S. S., (1989). The Case of the Missing Technology Payback. Tenth
International Conference on Information Systems, Boston, MA.
§ Shani, D. and Chalasani, S. (1992), "Exploiting Niches Using
Relationship Marketing," Journal of Consumer Marketing, Vol. 9
No. 3, 33-42.
§ Sheth, Jagadish N. (2002), "The Future of Relationship Marketing,"
Journal of Services Marketing, Vol. 16 No. 7, 590-592.
§ Sievewright, Mark (2001), "Delivery Channels are Evolving,"
Credit Union Magazine, Vol. 67 No. S, 36-40.
§ Sin, Leo Y.M., Tse, Alan C.B., Yau, Oliver H.M., Lee, Jenny S.Y. and
Chow, Raymond (2002), "The Effect of Relationship Marketing Orientation

283
on Business Performance in a Service-oriented Economy, " Journal of
Services Marketing, Vol. 16 No. 7, 656-676.
§ Singh, Jagdip and Sirdeshmukh, Deepak (2000), "Agency and Trust
Mechanisms in Consumer Satisfaction and Loyalty Judgments," Journal of
the Academy of Marketing Services, Vol. 28 No. 1, 150-167.
§ Singhapakdi, Anusorn, Vitell, Scott J. and Franke, George R. (1999),
"Antecedents, Consequences, and Mediating Effects of Perceived Moral
Intensity and Personal Moral Philosophies," Journal of the Academy of
Marketing Science, Vol. 27 No. 1, 19-35.
§ Sanchez Montemayor, J., (1991). "El Proceso de Privatizacion de fa Banca
Mexicanna [The Mexican Banking Divestiture Process]. Revista de
Administracion Publica. Instituto de Administracion Publica: Mexico D.F.
Mexico.
§ Schrage, M., (1997). "The real problem with computers," Harvard Business
Review, Vol. 75, No. 5, Sep/Oct, pp. 178-188.
§ Scott Morton, M. S., (1991). The Corporations of the 1990s Information
Technology and Organizational Transformation. Oxford University Press. PP.
1-23.
§ Sichel, D. E., (1999). "Computers and aggregate economic growth: An
update," Business Economics, Vol. 34, No. 2, Apr 1999, pp. 18-24.

284
§ Skinner, IN., (198fi). "The Productivity Paradox," Management Review, Vol.
77, pp. 41-45.
§ Slavin, R. H., (1994). "Re-engineering: A productivity paradox," Quality, Vol.
33, No. 6, Jun, p. 18.
§ Snow, C. C., Miles, R. E., and Coleman, N. J., Jr., (1992). "Managing 21st
Century Network Organizations," Organizational Dynamics, Vol. 20, No. 3,
Winter 1992, pp. 5-20.
§ Spiegel, M. R. (1961). Theory and Problems of Statistics. McGrow-Hill, pp.
168.
§ Steiner, T. D., and Teixeira, D. g., (1990). Technology in Banking: Creating
Value and Destroying Profits. Homewood, Illinois: Dow Jones-Irwing.
§ Strassman, P. A., (1984). "Value-added Productivity Measurements: Concepts
and Results," EDP Analyzaer, June, pp. 13-14.
§ Strassman, P. A., (1990). The Business Value of Computers: An Executive's
Guide. New Canaan, CT: Information Economic Press.
§ Strassman, P. A., (1998}. Response of the Author, Communications of the
ACM, Vol. 41, No. 21, pp. 11.
§ Tello, C., {1984). La Nacionahzacion de la Banca en Mexico. (The Mexican
Banking Industry Nationalization]. Mexico, D. F., Mexico: Siglo XXI Editores,
S.A.

285
§ Thor, C. G., (1998). Designing Fedback Performance Measures for Continous
Improvement Crip Publications.
§ TrA. W., and Treacy, M. E., {198fi). "Utilization as a Dependent Variable in
MIS Research," Proceedings of the Seventh International Conference on
Information Systems, pp. 227-257.
§ Triplett, J. E., (1989). "Price and Technological Change in a Capital Good: A
Survey of Research on Computers". In Jorgenson, D.W. and Landau, R.
Technology and Capital Formation. Cambridge, MA: The MIT Press.
§ Venkatraman, N., (1991). "IT-Induced Business Reconfiguration". Chapter 5 in
M. Scott Morton (Ed.) The Corporation of the 1990s: Information Technology
and Organizational Transformation. New York: Oxford University Press, pp.
122-158.
§ Vitell, Scott J., Rao, C.P. and Kurtz, David L. (1949), "Ethics Gap: Comparing
Marketers with Consumers on Important Determinants of Ethical Decision-
Making," Journal of Business Ethics, Vol. 21 No. 4, 317-328.
§ Wehrs, W.E., (1999). A Road Map for IS/IT Evaluation. In Mo Adam
Mahmood and Edwar J. Szewczak, Measuring Information Technology
Investment Payoff Contemporary Approaches, pp. 5-23. Hershey, PA: Idea
Group Publishing.

286
§ Weill, P., (1988). The Relationship between Investments in Inotormation
Technology and Firm Performance in the Manufacturing Sector. Unpublished
Ph.D. Theses. Stem School of Business, New York University. In McKeen J. E.
! Smith, H. A.; and Parent, M. (1999). An Integrative Research Approach to
Assess the Business Value of Information Technology. In Mo Adam Mahmood
and Edwar J. Szewczak, Measuring Information Technology Investment
Payoff.* Contemporary Approaches. Hershey, PA: Idea Group Publishing,
pp.5-23.
§ Weill, P., (1992). "The Relationship Between investment in information
Technology and Firm Performance: A Study of the Value Manufacturing
Sector," Information Systems Research, Vol. 3, No. 4, Dec 1992, pp. 307332.
§ Willcocks, L. P., and Lest r, S., (1996). "Beyond the IT Productivity Paradox,"
European Management Joumal, Vol. 14, No. 3 Jun 1996, pp. 279-291.
§ Willcocks, L. P., and Lester, S., (1997}. in search of information technology
productivity: Assessment issues," Journal of the Operational Research Society,
Vol. 48, No. 11, Nov, 1082-1094.
§ Rao, C.P. and Vitell, Scott J. (1996), "Ethical Decision Making: An
Investigation of Services Marketing Professionals," Journal of Business
Ethics, Vol. 15 No. 6, 635-644.
287
§ Yates, J., and Benjamin, R. I., (1991 ). "The Past and Present as a Window On
the Future." !n Scott Morton, M. S. (1991) The Corporation of the 1990's.
Oxford University Press, pp. 61-93.
§ Zeithaml, Valarie A. (2000), "Service Quality, Profitability, and the Economic
Worth of Customers: What We Know and What We Need to Learn," Journal
of the Academy of Marketing Science, Vol. 28 No. 1, 67-85.and Bitner, Mary
Jo (2000), Services Marketing: Integrating Customer Focus Across the Firm
(2"° edition), Irwin McGraw-Hill
§ Asian Development Bank, “2005 Outlook and Key Indicators”, Banerjee, A.
(1992) “A Simple Model of Herd Behavior”, The Quarterly Journal of
Economics, Vol.10, No.3, pp.797-817
§ Bekaert, Geert; Campbell R. Harvey, and Christian Lundblad (2001).
“Emerging Equity Markets and Economic Development”, Journal of
Development Economics, Vol.66(2001), pp.465-504.
§ de Brouwer, Gordon (2003). “Financial Markets, Institutions, and Integration
in East Asia”, Asian Economic Papers, CSIS-MIT (The Center for Strategic
and International Studies), pp.53-65.

288
§ Chow, Peter (1989). “Monetary Coordination in a Tripartite Word, An
Empirical Test of the International Monetary Rule”, The Journal of
Economics, Vol. XV,1989, pp.55-
§ Feldman, RA, and Kumar, MS (1994). “Emerging equity markets: growth,
benefits and policy concerns”, IMF Working Paper on Policy Analysis and
Assessment, WP/92/85.
§ Fry, M.J. (1997). “In Defence of Financial Liberalisation”, Economic Journal,
Vol. 107 (May 1997) pp. 754-70.
§ Johnston, R. Barry (1998), “Sequencing Capital Account Liberalization”, IMF
Quarterly, Finance and Development, Vol.35, No.4.
§ Kaminsky, Graciela, Richard Lyons, Sergio Schmuckler (2001). “Mutual Fund
Investment in Emerging Markets: An Overview”, World Bank Economic
Review, 15:2, pp. 315-340.
§ Kennedy, Peter, “A Guide to Econometrics”, Cambridge MIT Press, 1998.
§ Levy-Yeyati, Eduardo and Angel Ubide (1998). “Crises, Contagion, and the
Closed-End Country Fund Puzzle”, IMF Working Paper, WP/98/143.

289
§ Masson, Paul R. (1999). “Multiple Equilibria, Contagion, and the Emerging
Market Crises”, IMF Working Paper, WP/99/164.
§ Montiel, Peter (1993). “Capital Mobility in Developing Countries”, PRE Paper
1103 1993, Policy Research Department, World Bank Morgan Stanley Capital
International (MSCI) Emerging Markets Data.
§ Park, Yung Chul (1996). “East Asian Liberalization, Bubbles, and the
Challenge from China”, Brookings Papers on Economic Activity, Vol. 1996,
No. 2 (1996) 357-371.
§ Pindyck and Rubinfeld (1998). “Econometric models and Economic
Forecast”, McGraw-Hill.
§ Sayuri Shirai (2002). “ Is Equity Market really developed in PRC?”, ADB
Institute Research Paper No. 41.
§ Scharfstein, D.(1990). “Herd Behavior and Investment”, The American
Economic Review, Vol.80, No.3 (Jun1990), pp.465-479.
§ Sharma, S. and Sushil B. (2000). “Herd Behavior in Financial Markets”, IMF
Working Paper, WP/00/48.