Thesis for the Master's degree in chemistry - UiO - DUO
78
Thesis for the Master’s degree in chemistry Lan Thi Thu Nguyen Approaches for characterizing unknown compounds by liquid chromatography in combination with mass spectrometry and nuclear magnetic resonance spectroscopy 60 study points DEPARTMENT OF CHEMISTRY Faculty of mathematics and natural sciences UNIVERSITY OF OSLO 12/2007
-
Upload
khangminh22 -
Category
Documents
-
view
2 -
download
0
Transcript of Thesis for the Master's degree in chemistry - UiO - DUO

Thesis for the Master’s degree in
chemistry
Lan Thi Thu Nguyen
Approaches for characterizing unknown
compounds by liquid chromatography in
combination with mass spectrometry and nuclear
magnetic resonance spectroscopy
60 study points
DEPARTMENT OF CHEMISTRY Faculty of mathematics and natural sciences UNIVERSITY OF OSLO 12/2007


…stop and consider God´s wonders.
Job 37.14
Ask and it will be given to you;
seek and you will find;
knock and the door will be opened to you.
for everyone who asks receives;
he who seeks finds;
and to him who knocks,
the door will be opened.
Matt.7.7-8

1
CONTENTS
CONTENTS....................................................................................................................................1
PREFACE......................................................................................................................................3
ABSTRACT................................................................................................................................4
ABBREVIATION .......................................................................................................................5
1. INTRODUCTION ................................................................................................................7
1.1 THE SCREAM PAINTING BY EDVARD MUNCH........................................................................7
1.2 PROTEINS...........................................................................................................................8
1.2.1 Peptides................................................................................................................. 10
1.2.2 Tryptic digestion.................................................................................................... 10
1.2.3 Reduction and alkylation ....................................................................................... 11
1.3 PROTEIN NMR ................................................................................................................. 13
1.4 CAPILLARY LIQUID CHROMATOGRAPHY ............................................................................ 14
1.5 MASS SPECTROMETRY....................................................................................................... 14
1.6 AIM OF STUDY.................................................................................................................. 15
2. EXPERIMENTAL.............................................................................................................. 17
2.1 MATERIALS AND REAGENTS.............................................................................................. 17
2.2 REFERENCE GLUE SAMPLES................................................................................................ 18
2.3 NMR ANALYSIS OF REFERENCE GLUE................................................................................. 18
2.3.1 NMR Sample preparation ...................................................................................... 18
2.3.2 NMR Experiments.................................................................................................. 19
2.4 TOTAL PROTEIN MEASUREMENT OF REFERENCE GLUE.......................................................... 20
2.4.1 Reference glue solutions........................................................................................ 20
2.4.2 Calibration solutions ............................................................................................. 20
2.4.3 Total protein measurement .................................................................................... 20
2.5 TRYPSINATION PROCEDURE............................................................................................... 21
2.5.1 Materials and reagents .......................................................................................... 21
2.5.2 Solutions and sample preparations ........................................................................ 21
2.5.3 Reduction, alkylation and tryptic digestion............................................................ 23
2.6 SAMPLE PREPARATION SCREAM PAINTING.......................................................................... 23
2.6.1 Scream painting sample......................................................................................... 23
2.6.2 Reduction, alkylation and tryptic digestion............................................................ 24
2.7 LC – MS ANALYSIS........................................................................................................... 24
2.7.1 The LC system ....................................................................................................... 24
2.7.2 The MS system....................................................................................................... 25

2
2.8 DATABASE SEARCH...........................................................................................................25
2.8.1 Data analysis.........................................................................................................25
3. RESULTS AND DISCUSSION ..........................................................................................27
3.1 IR ANALYSIS AND SOLUBILITY ...........................................................................................27
3.2 PROTEIN NMR .................................................................................................................28
3.3 TOTAL PROTEIN MEASUREMENT OF REFERENCE GLUE..........................................................32
3.4 TRYPTIC DIGESTION PROCEDURE.......................................................................................34
3.4.1 Tryptic digestion of standard proteins and reference glue......................................34
3.5 LC-MS ANALYSIS OF SREAM PAINTING .............................................................................41
3.5.1 LC separations.......................................................................................................41
3.5.2 Mass spectrometry .................................................................................................42
3.5.3 Data analysis and identification.............................................................................45
4. CONCLUDING REMARKS ..............................................................................................50
PART TWO..................................................................................................................................51
5. INTRODUCTION...............................................................................................................52
5.1 NMR SPECTROSCOPY........................................................................................................52
5.2 LC-NMR .........................................................................................................................53
5.2.1 Modes of operation for LC-NMR............................................................................54
5.3 AIM OF THE STUDY............................................................................................................58
6. EXPERIMENTAL..............................................................................................................59
6.1 DMSO UV ABSORBANCE MEASUREMENT...........................................................................59
6.2 PRESSURE MEASUREMENT WITH DMSO AS MOBILE PHASE..................................................59
6.3 HE DEGASSING OF DEUTERATED SOLVENTS AND ULTRASONIC TREATMENT...........................59
6.4 MGSO4 AS SPE COLUMN...................................................................................................60
6.4.1 Column packing process ........................................................................................60
6.4.2 Testing the MgSO4 column ....................................................................................60
7. RESULTS AND DISCUSSION ..........................................................................................61
7.1 DMSO UV ABSORBANCE..................................................................................................61
7.2 DMSO AS MOBILE PHASE..................................................................................................62
7.3 DEUTERATED SOLVENTS AND TREATMENTS........................................................................63
7.4 MGSO4 COLUMN ...............................................................................................................65
8. APPENDIX .........................................................................................................................67
8.1 MASCOT SEACHING PROCEDURE ION TRAP MS....................................................................67
8.2 MASCOT SEARCH RESULTS.................................................................................................68
Mascot search results standard protein beta-A .....................................................................68
REFERENCES .............................................................................................................................72

3
Preface
There are doors everywhere in many places. Most of them are closed unless someone
opens a door or two. I am grateful to God that doors kept on opening up for me and
would like to thank my supervisors, Prof. Elsa Lundanes, Prof. Frode Rise, Prof.
Tyge Greibrokk, and Steven Ray Wilson, Ph.D., for giving me the opportunity to be
part of their research projects and for tasks that challenged me to learn more
throughout my studies. Thanks to their wise counsel and guidance, support and trust,
this thesis of mine has now been completed. Special thanks further to Steven who
truly helped me whenever a problem was encountered.
I would like to thank Dirk Petersen for his help at the NMR lab and Hege Lynne and
her staff at the analytical course lab for their help and the use of the lab
equipment. Thanks to Inge Mikalsen who fixed almost everything needed from time to
time. Thanks to Leon Reubsaet and Håvard Loffheim for their help with the total
protein measurement. Thanks to fellow students for the time we spent together
including talks, sharing of ideas, and discussions.
Many thanks to my mother and family, Eva, Anna, Espen, and my friends, for their
support, love, and for remembering me in their prayers. You make my life much
easier.
Thank you, Long, for your love, support, and for believing that I managed to take
good care of our children, Viet and Isabel, though at times I was quite overwhelmed
with my studies. Studying is also part of the life and love that I always treasure
for my children. Thank you.
Oslo, Norway, December 2007
Lan Thi Thu Nguyen

4
ABSTRACT
The stolen Scream painting of Edvard Munch was restored and in the restoration work of the
damages on the painting, a glue of the materials which have to be somewhat identical to the
glue that Munch used in the Scream painting was needed. A reference glue which was
provided by the Munch museum and some origin materials from the Scream painting was
analyzed in this thesis. The work presented characterized the two samples. The reference glue
was analyzed by NMR with protein options. A tryptic digestion procedure with DTT
recduction and IAM alkylation was explored in the study and the trypsination procedure was
proved to function well in the method. The tryptic digested reference glue and the sample
from the Scream were analyzed by LC-ESI-MS (TOF-MS and IT-MS). The protein and
peptide identifications by Mascot search engine were also applied and discussed showing the
identification procedures’ pros and cons. The second part of this thesis, investigated some
aspects for LC-SPE-NMR, such as DMSO as LC mobile phase, degassing effect on D2O and
CD3CN and an MgSO4 column was packed and investigated to see whether it could absorb
water. Results from the testing showed that the water peak was retained, which is a seldom
trait in chromatography. Though not tested further, a MgSO4 column as a SPE column in the
LC-SPE-NMR system was an idea which should be further.

5
ABBREVIATION
ACN Acetonitrile
Beta-A β-lactoglobulin-A
BSA Bovine Serum Albumin
capLC capillary Liquid Chromatography
CD3CN deuterated ACN
Cyto-C Cytochrome C
DMSO dimetyl sulfoxide
DMSOd6 deuterated DMSO
D2O deuterium oxide
DTT DL-dithiothreitol
EIC Extracted Ion Chromatogram
ES electrospray
ESI electrospray ionization
F.a. formic acid
HPLC High Performance Liquid Chromatography
HSQC Heteronuclear Single-Quantum Correlation
IAM or IAA iodoacetamide
I.D. Internal Diameter
IR Infrared
IT Ion Trap
LC Liquid Chromatography
MP mobile phase
MS Mass Spectrometry
MS/MS tandem MS/MS
MSDB Mass Spectrometry protein sequence DataBase
m/z mass to charge ratio
NCBI National Center for Biotechnology Information
NMR Nuclear Magnetic Resonance
S/N Signal to Noise
SPE Solid Phase Extration
TOF Time-Of-Flight

6
Tris trishydroxymethylaminomethan
3D 3-dimensional
2D 2-dimensional
UV ultraviolet
Amino acids
A Ala alanine
C Cys cysteine
D Asp aspartic acid
E Glu glutamate
F Phe phenylalanine
G Gly glycine
H His histidine
I Ile isoleucine
K Lys lysine
L Leu leucine
M Met methionine
N Asn asparagine
P Pro proline
Q Gln glutamine
R Arg arginine
S Ser serine
T Thr threonine
V Val valine
W Trp tryptophan
Y Tyr tyrosine

7
1. INTRODUCTION
1.1 The Scream painting by Edvard Munch
On 22nd of August 2004 the Scream painting by Edvard Munch was stolen from the Munch
Museum, along with Madonna [1]. The Scream or Skrik, as it is named in Norwegian, is
painted with a special technique known as tempera. Munch had painted the image directly on
a cardboard which was again glued to a wooden board [2]. The Scream (1893) stolen from
Munch museum is one of the two painted version of the worldwide known Scream image
which is said to symbolize the mental image of the existential angst of civilised man [3]. The
Scream has also become the key conception in the series of expressionist artworks by Edvard
Munch. After two years of intense investigation, on 31st. August 2006 the Norwegian Police
announced the recovery of the two stolen paintings (Figure 1) [4].
Figure 1: picture of the restored Scream painting on the left and Madonna on the right [4]

8
After examinations of the two paintings, The Scream showed damp damages in addition to
rips on the paintings, and a comprehensive and time demanding restoration process including
testing of chemical aspect of similar materials was considered necessary [2].
In restoration of a artwork it is necessary to know the chemical composition of the original
materials and type of glue in use to define a proper program for the conservation in such a
way that the integrity of the original materials and the characteritics of the painting materials
is kept [5]. Tempera painting is often made by binding pigment in egg medium, sometimes
along with other materials such as honey, water and milk in form of casein. Conservation
treatments also make use of similar adhesives for fixing the flakes on painting surfaces.
The glue that Edvard Munch used in his artworks was suspected to be made from animal glue
[6]. Animal glue is an adhesive created by prolonged boiling of animal connective tissues -
animal skins, bones and tendons, and is formed through hydrolysis of the collagen from these
animal tissues and can be produced from a variety of different animals e.g. horse, fish, rabbit
[7]. These glues, and casein and egg based glues are all protein-based materials. When
restoration of a painting is necessary, knowledge of the type of glue used is important for
successful result. To reveal the type of glue used, analysis of the original glue is necessary.
The sample has to be taken from the original painting layer, and is hence usually available in
only a few micrograms in total, thus requiring sensitive analytic methods. Different
application and identification of proteinaceous materials in paintings have been studied earlier
with analytical methods such as High Performance Liquid Chromatography (HPLC) [8], Gas
Chromatography-Mass Spectrometry (GC-MS) [9], MS [6], Time-resolved Fluorescence
Spectroscopy [10] and Raman Spectroscopy [5].
Before representing the experimental work done in this study, the following give some basic
information on the subjects.
1.2 Proteins
Proteins are large organic compounds made of amino acids. In the protein chain the amino
acids are bond together by peptide bonds with a free carboxyl and amino group at the each
end of the chain, the C-terminus and the N- terminus, respectively. A protein is a complete

9
biological molecule in a stable conformation and is measured with the number of amino acids
and molecular mass (in Daltons (Da)). There are 20 amino acids which are directly encoded
for protein synthesis by the standard genetic code. Naturally folded 3-dimensional (3D)
protein is known as its native state shown in Figure 2, which shows three possible
representations of the three-dimensional structure of the protein triose phosphate isomerase
[11].
Figure 2: Three possible representations of the three-dimensional structure of the protein triose phosphate isomerase. Left: all-atom representation colored by atom type. Middle: simplified representation illustrating the backbone conformation, colored by secondary structure. Right: Solvent-accessible surface representation colored by residue type (acidic residues red, basic residues blue, polar residues green, nonpolar residues white).[11]
Other model structures of protein are also used such as primary structure - showing the amino
acid sequence; secondary structure - showing the alpha helix and beta sheet with regularly
repeating local structures stabilized by hydrogen bonds, (these contiguous segments of the
protein is defined by specific bond angels in the polypeptide backbone), and the quaternary
structure- showing the shape and structure resulting from interactions of other protein
molecules. Hydrophobic, van der Waals, ionic, dipole, and hydrogen bonding are many of the
forces that contribute to the formation of protein structures and influence how the proteins
fold and interact with other molecules. Common experimental methods of protein structure
determination are X-ray crystallography and NMR spectroscopy which can produce
information at atomic resolution, and other methods such as cryoelectron microscopy and
electron crystallography.

10
1.2.1 Peptides
A peptide consists of a relatively small and specific number of amino acids and often lacks
naturally folded 3D structure which the protein has. Figure 3 in the following shows a peptide
made of five amino acid residues linked together by the peptide bonds. The peptide bonds are
formed by dehydration, removal of the water elements from the α-carboxyl group of one
amino acid and the α-amino group of another. Peptides are named beginning with the amino-
terminal residue. Peptides contain only one free α-amino group and one free α-carboxyl
group, at the opposite ends of the chain. These groups ionize as they do in free amino acids.
Figure 3: The pentapeptide serylglycyltyrosylalanylleucine, or Ser-Gly-Tyr-Ala-Leu (or SGYAL) showing the N-terminus and C-terminus and the peptide bonds in blue-grey color.[12]
1.2.2 Tryptic digestion
Large proteins can often be cut into peptides by proteolytic enzymes in biological processes
and in the study of proteins. Protein identification is often based on the analysis of peptides
generated by proteolytic digest. Trypsin is a serine protease found in the digestive system,
where it breaks down proteins into smaller peptides or amino acids; it is widely used in
biotechnological processes and is commonly used, in proteomics, to digest proteins into
peptides for protein analysis [13].
11
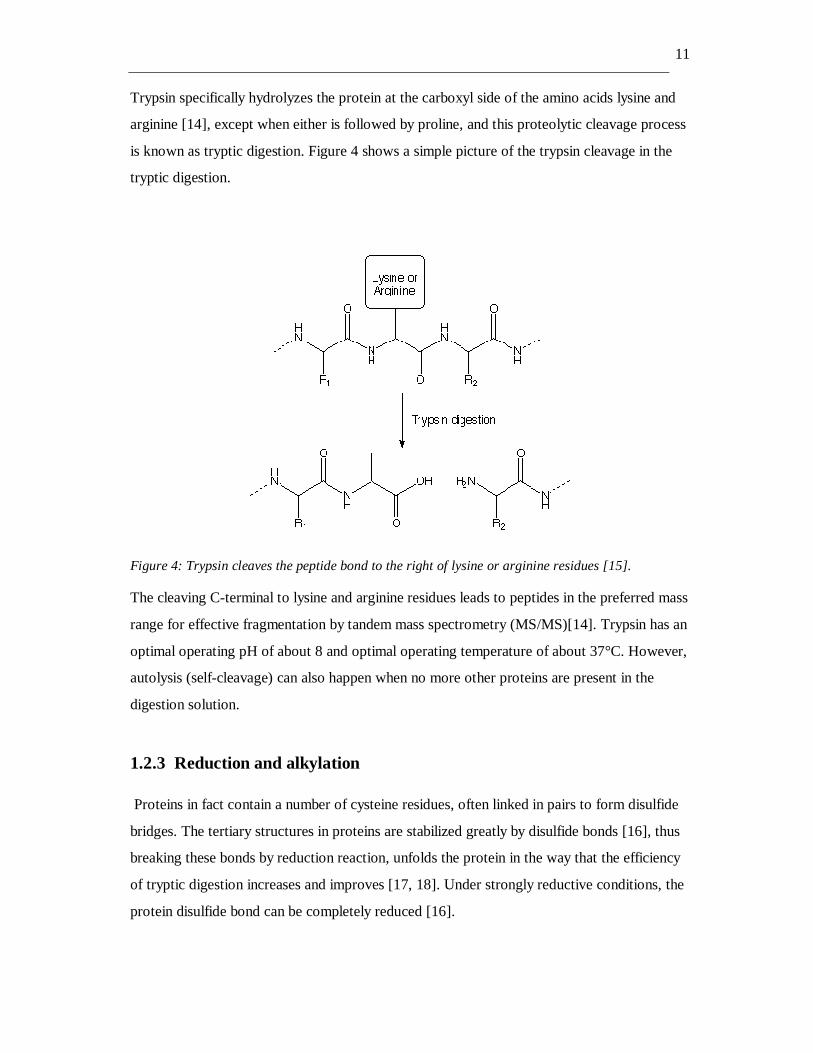
Trypsin specifically hydrolyzes the protein at the carboxyl side of the amino acids lysine and
arginine [14], except when either is followed by proline, and this proteolytic cleavage process
is known as tryptic digestion. Figure 4 shows a simple picture of the trypsin cleavage in the
tryptic digestion.
Figure 4: Trypsin cleaves the peptide bond to the right of lysine or arginine residues [15].
The cleaving C-terminal to lysine and arginine residues leads to peptides in the preferred mass
range for effective fragmentation by tandem mass spectrometry (MS/MS)[14]. Trypsin has an
optimal operating pH of about 8 and optimal operating temperature of about 37°C. However,
autolysis (self-cleavage) can also happen when no more other proteins are present in the
digestion solution.
1.2.3 Reduction and alkylation
Proteins in fact contain a number of cysteine residues, often linked in pairs to form disulfide
bridges. The tertiary structures in proteins are stabilized greatly by disulfide bonds [16], thus
breaking these bonds by reduction reaction, unfolds the protein in the way that the efficiency
of tryptic digestion increases and improves [17, 18]. Under strongly reductive conditions, the
protein disulfide bond can be completely reduced [16].

12
Figure 5: Reduction of the disulfide bond in the protein [15]
Figure 5 shows an example of the reduction reaction done with mercaptoethanol (HS-CH2-
CH2-OH). Other reduction agent such as DL-dithiothreitol (DTT) is also used quite often in
the reduction reaction before tryptic digestion of proteins.
Free sulfhydryl groups are highly reactive and will spontaneously oxidize with other
sulfhydryl groups, for this reason these free groups are blocked by alkylation to prevent
unwanted reactions from occurring [17]. Figure 6 shows an example of the alkylation reaction
with iodoacetic acid, this alkylation reaction can also be done with iodoacetamide (C2H4INO)
with the same reaction mechanism.
Figure 6: Alkylation reaction mechanism with iodoacetic acid.[15]

13
In the reduction of protein disulfides must be followed by alkylation and these steps eliminate
artifacts in the 2D maps [19]. It is also found necessary to carry out reduction and alkylation
of the proteins before tryptic digestion prior to LC and MS analysis [20].
1.3 Protein NMR
Protein nuclear magnetic resonance spectroscopy –Protein NMR is used to obtain
information about the structure and dynamics of proteins. Magnetic fields above 500 MHz is
generally required for analysis of proteins and peptides [21]. NMR analysis can be done both
on unlabeled and 13C, 15N, labelled proteins and analysis of these samples often gives spectra
with a large number of peaks. Determination of the nuclei responsible for a given peak
involves both determining the amino acid, its sequence position and assignment of which
specific nuclei is responsible for a NMR peak. Amide protons are typically found in the one
dimensional (1D) and two dimensional (2D) spectrum in the region commonly known as the
amide region.
COrrelation SpectroscopY (COSY), TOtal Correlation SpectroscopY (TOCSY) and Nuclear
Overhauser Effect SpectroscopY (NOESY) techniques are mostly used in the assignment
process and is describes further in chapter 4 of the compendium by Kristiansen [21].
However, in investigation of large polypeptides, Heteronuclear Single - Quantum Correlation
(HSQC) experiment is used besides NOESY and TOCSY experiments. With the HSQC
experiment, observation (acquisition) is done on protons, and nitrogen (15 N) and carbon (13C)
nuclei are observed indirectly. The 15N-HSQC is often referred to as fingerprint of protein
because each protein has a unique pattern of signal positions. The NH in the protein is seen
here. However, it is not possible to assign peaks to specific atoms from HSQC alone. On
natural abundance protein the 15N HSQC usually gives the chemical shifts of the hetero atoms
as well as help in the assignment of certain amino acid residues such as Gly, Asn, Gln and Trp
[21]. Furthermore, 1H-15N HSQC is often used as a technique for investigating the degree of
structuring and to improve the solvent conditions of protein sample prior to more time
consuming structural NMR work; and in some cases this is used to test whether an unknown
sample contains protein for further identification. However, NMR is still a method which
usually requires samples in microgram or milligram to obtain spectra that help to elucidate the
structure of an unknown sample.

14
1.4 Capillary Liquid Chromatography
Analysis of proteinaceous binding media in paintings can be done by chromatographic
methods [8]. Generally, combination of HPLC with MS has evolved into a sensitive, rugged
and widely used technique. Different chromatographic modes such as reverse phase, ion-pair,
size- exclusion or immunoaffinity separations are compatible with electrospray (ES) and
atmospheric-pressure chemical ionization (APCI) MS [22]. However, ES LC-MS is best done
with capillary liquid chromatography (cap LC). Cap LC uses smaller column internal
diameters (I.D.) than conventional HPLC. Smaller I.D. columns provide better detection
limits for electrospray mass spectrometry, which is concentration sensitive. Furthermore, the
sensitivity of electrospray ionization is inversely proportional to flow rate, thus the cap LC
system which has low flow rate, is also more favourable for keeping the best sensitivity of this
ionization technique.
Cap LC-MS is more and more the method of choice for the separation and identification of
complex protein and peptide mixtures [23-26] and even quite complicated system like SPE-
HILIC-SPE-RP-MS *can be performed online for separation of complex peptide samples
[27].
1.5 Mass spectrometry
In the last decade mass spectrometry has emerged as a prominent detection technique for
determination of biological molecules [28]. The fast instrumentation improvements have made
mass analyzers applicable in the bioresearch [29]. Different MS instruments can be used such
as Time-of-flight (TOF), Ion trap (IT), Ion trap-Linear ion trap ( IT-LIT), hybrid quadrupole
time-of-flight (Q-Q-TOF), tandem time-of-flight (TOF-TOF), Fourier transform-ion
cyclotron resonance (FT-ICR), triple quadrupole (Q-Q-Q) and quadrupole ion trap (Q-Q-
LIT) [30]. Data collected from the mass spectrometers can be used either to measure simply
the mass of a polypeptide or to determine additional structure features. MS-based strategies
have become the most commonly used techniques for compound identification in bioresearch.
* Solid Phase Extraction - Hydrophilic interaction chromatography - Solid Phase Extraction - Reverse Phase - MS

15
Electrospray ionization (ESI) or matrix-assisted laser desorption/ionization (MALDI) coupled
with MS give high sensitivity, high specificity and likewise structure information [31]. With
the tandem mass spectrometry, MS/MS modes of operation, amino acid sequence of a
specific peptide can also be determined [31, 32]. This technique is possible on instruments
equipped with MS/MS capabilities.
The high mass resolution of the time-of-flight (TOF) MS has made MALDI-TOF MS a
standard tool in proteomic studies and enables precise mass-to-charge (m/z) measurement and
compound identification [33].
Ion trap mass analyzer is characterized by MS/MS capabilities with unmatched sensitivity and
fast data acquisition, though it lacks mass measurement accuracy due to limited-resolution,
low-ion trapping capacity and space-charging effects [30]. Their unique capacity to trap
certain ions, and subsequently fragment them a few times, results in detailed compound
structural information, and this type of instrument has been implemented in many applications.
However, the choice of MS platform and favorable strategy depend on whether the
application focuses on identification or quantification, (and the availability of mass
spectrometers at the place and time of analysis is also a consideration factor in an analysis
process).
Mass spectrometry-based proteomic workflow consists of three distinct stages. Firstly,
protein samples are isolated from their biological sources and optionally fractionated, the final
protein sample is then digested with an enzyme and the resulting peptide sample is further
fractionated. Secondly, the peptides are subjected to qualitative and quantitative mass-
spectrometric analysis. Finally, the large data sets generated are analyzed by suitable software
tools to deduce the amino acid sequence and the quantity of the proteins in sample if applied.
The peptide identification is assigned to the MS/MS spectra by database searching.
1.6 Aim of Study
A sample from the Scream painting which had been analyzed by Infrared Spectroscopy (IR)
with the diamond attenuated total reflectance (ATR) technique, and found to contain amide
bands [34], was to be further characterized by different methods to reveal the type of glue

16
use. With IR, determination of the presence of proteinaceous materials on the basis of the
characteristic amide bands is possible, though the identification of a specific binding medium
is not generally feasible. The following study aimed at finding analytical procedures, including
sample preparation which could provide more information of the glue. A reference glue (from
the Munch Museum in Oslo) which was suspected to be similar to the one that Edvard Munch
used in the Scream painting was used for the method development, and the Scream painting
sample was analyzed by the method developed.

17
2. EXPERIMENTAL
2.1 Materials and reagents
Deuterium oxide 100 % was obtained from Cambridge Isotope Laboratories, Inc (Andover,
MA, USA). Hydrochloric acid (HCl) 37 % solution (analytical grade) was purchased from
Merch KGaA (Darmstadt, Germany). Trishydroxymethylaminomethane (Tris or 2-amino-2-
hydroxymethyl-1, 3-propanediol), Trizma base reagent grade; DL- Dithiolthreitol (DTT) for
electrophoresis 99 %; iodoacetamide (IAM); β-lactoglobulin A (beta-A) from bovine milk;
Cytochrome C (cyto-C) from bovine herat and trypsin from bovine pancreas, TPCK† treated,
were obtained from Sigma Aldrich GmbH (Steinheim, Germany). Acetic acid 50% solution
(HPLC grade) was from Fluka (Buchs, Switzerland). Grade 1 water was provided by Milli-Q
ultrapure water purification system (Millipore, Bedford, MA, USA). HPLC grade acetonitrile
(ACN) was purchased from Rathburn Chemical Ltd. (Walkerburn,UK). HLPC grade water,
formic acid (F.a) 50% solution, were obtained from Fluka (Buchs, Switzerland). All fused
silica cappilaries were purchased from Polymicro Technologies Inc. (Phoenix, AZ, USA).
Nitrogen was produced by a Nitrox N2-generator from Domnick Hunter (Durham, UK) and
helium (99.9999 %) was obtained from AGA (Oslo, Norway). GHP Acrodics syringe filter,
0.45 µm and 0.20 µm, were obtained from Pall Coporation.
Table 1: structure of Tris, DTT, IAM and trypsin molecules
Tris molecule
DTT molecule
IAM molecule
Trypsin molecule
† Trypsin is treated with L-1-tosylamido-2-phenylethyl chloromethyl ketone (TPCK) to inhibit contaminating chymotrypsin activity without affecting trypsin activity.

18
2.2 Reference glue samples
The reference glue was obtained from the Munch museum (Olso). The reference glue is a
solid consisting of spherical particles in size a bit bigger than a sesame seed. They have brown
colour, some are darker brown than the others. One glue bead weighs about 22 mg, the size
of these glue beads are quite similar and about 4 mm, though some are a bit bigger or smaller
than others. A picture of glue beads is shown in Figure 7.
Figure 7: The reference glue sample in a 7cm plate..
2.3 NMR analysis of reference glue
2.3.1 NMR Sample preparation
131 mg reference glue was dissolved in 900 µL H2O and 100 µL D2O, with 30 minutes
ultrasonic treatment (Ultrasonic cleaner, USC 100T, from VWR international with an
effective power of 30 W). This 131 mg/mL solution was filtrated through a 0.45 µm filter and
transferred to a 5mm NMR sample tube (WG-5M, Wilmad glass CO. INC) for NMR analysis.
Another reference glue sample, dissolved in D2O and H2O (1:9) and adjusted to pH of 3 with
1 M HCl, was also prepared. pH 3 was obtained by adding 2.5 µL 1 M HCl to a 1 mL

19
solution of 100 µL D2O and 900 µL H2O. To this solution 137.2 mg glue was added and
subjected to 5 minutes ultrasonic treatment. The lid of the glass vial was opened to reduce
pressure twice dissolving the glue after a total of 15 minutes ultrasonic treatment. This glue
solution had pH of 5.5, which was adjusted to pH 3 by adding 70 µL 1 M HCl. The solution
was then filtrated through a 0.45 µm filter and submitted to NMR analysis. The pH
measurement was done by using pH – paper Acelit pH 0-6 (Merck Darmstadt, Germany).
2.3.2 NMR Experiments
Both 1D and 2D experiments were preformed on the neutral reference glue sample prepared
as described in 2.3.1. These NMR experiments were acquired on a 600 MHz NMR
instrument, Bruker AV600 with cryo probe (Bruker 5 mm TCI cryo probe 1H, 13C, 15N), with
solvent locked on D2O. The instrument is controlled by three software packages which are
installed in parallel on a Dell Windows XP PC: XwinNmr 3.5, patch level 6 (spectrometer
license), TopSpin 1.3, patch level 7 (spectrometer license) and TopSpin 2.0, patch level 5
with automatic gradient shimming program Topshim. 1D proton experiment was acquired
with pulse program zgpr; 1D carbon experiment with pulse program zgpg30; 2D HSQC
experiments were acquired with pulse program hsqcetgp for 1H-13C correlation and
hsqcetf3gp for 1H-15N correlation. The HSQC experiments were acquired at 311 K with
Biotools NMR optimization for H2O suppression.
In 2D HSQC experiments acquisitions were done with, hsqcetgp and hsqcef3gp, 1H and X-
nucleus (13 C/ 15N) correlation via double inept transfer, phase sensitive using Echo/Antiecho-
TPPI gradient selection, decoupling during acquisition and trim pulses were also used in inept
transfer. These acquired spectra were processed and phased to obtain the desired spectra
which were used in assignment of the peaks obtained.
The same experiments were also acquired on the reference glue sample with pH 3.

20
2.4 Total protein measurement of reference glue
2.4.1 Reference glue solutions
A solution of 50 mg/mL reference glue was made by dissolving 204.4 mg glue in 4.08 mL
grade 1 water. Other concentration of reference glue solutions were made by diluting this
glue solution with water as shown in Table 2.
Table 2: Three glue samples concentrations were prepared with the volume reagents shown.
Glue sample concentration Preparation
10 mg/mL 200 µL (50 mg/mL) glue + 800 µL water
1 mg/mL 100 µL (10 mg/mL) glue + 900µL water
0.3 mg/mL 150 µL (1 mg/mL) glue + 350 µL water
2.4.2 Calibration solutions
Bovine Serum Albumin (BSA) 1 mg/mL solution was obtained from Sigma Aldrich GmbH
(Steinheim, Germany). 0.5 mL BSA calibration solutions were made by appropriate dilutions
a volume of the 1 mg/mL BSA solution as shown in Table 3.
Table 3: Volume (microliters) of BSA (1 mg/mL) and water used in seven calibration solutions.
Calibration solutions 1 2 3 4 5 6 7
Volume 1mg/mL BSA ( µL) 0 25 50 75 100 125 150
Volume water (µL) 500 475 450 425 400 375 350
2.4.3 Total protein measurement
The total protein determination of the reference glue was obtained according to the Bradford
protein assays with Wallac Victor3 instrument from Perkin Elmer (model 1420 Multilabel
Counter, Wallac Oy, Turku, Finland). 10 microliters of the samples or standards were added
to each well in a microliter plate and 200 µL Coomassie reagent was added to all these wells

21
and incubated at room temperature for 5 minutes. Victor3 instrument were set to 25º C. The
instrument measured each standard and sample twice and the concentrations given are
obtained as average from the two series. The method measured total protein concentration
between 50 and 350 µg/mL proteins.
2.5 Trypsination procedure
The tryptic cleavage method described on pages 41-42 in Lund’s thesis [35] with reduction
and alkylation steps was applied. Trypsination procedure in the present study combined the
procedure used by Tran [36] with the reagent volumes and concentration from Lund’s thesis,
and tested with standard proteins and reference glue.
2.5.1 Materials and reagents
DTT, IAM, trypsin, beta-A and cyto-C were the same as listed in 2.1 and structure of DTT,
IAM and trypsin is shown in Table 1. A Thermo Orion pH-meter (model 720 Aplus, was
calibrated with 2 buffers, BHD buffer solution (phosphate, pH 7.00±0.02) and BDH buffer
solution (phthalate, pH 4.00±0.02) before the pH measurement. Both of the BHD buffers
were obtained from VWR international Ltd (England).
2.5.2 Solutions and sample preparations
1 M HCl solution was made by diluting 826 µL HCl (37 % solution, 12.1 M) to a volume of
10 mL with grade 1 water.
100 mM tris buffer was made by dissolving 1.21 g Tris firstly in 80 mL water. This solution
with pH 10.69 was then adjusted to pH 8.50 with 1 M HCl. The pH-meter was calibrated
with 2 buffers before the pH measurement. After approximately 3.5 mL 1 M HCl was added
to the tris solution the pH was down to 8.50; this solution was then diluted with water to 100
mL. After the dilution the 100 mM tris buffer (Table 4) was pH checked and the solvent had
the pH 8.50.
45 mM DTT solutions was made by firstly weighing out an amount of this reducing agent,
secondly, adding the calculated amount of grade 1 water (Table 4), knowing from Lund’s

22
thesis that 6.9 mg DTT is needed to 1mL water. The solutions were made when they were
used.
100 mM IAM solution was made by firstly weighing out an amount of IAM, secondly,
adding the calculated amount of grade 1 water (Table 4), knowing from Lund’s thesis that 56
mg DTT is needed to 3 mL water. This solution was made fresh for the alkylation.
Standard protein solutions, cyto-C and beta-A were prepared by dissolving an amount of
standard protein in the appropriate volume of tris buffer (Table 4).
Reference glue solutions, 25 mg/mL glue solution was made by dissolving an amount of glue
in tris buffer and ultrasonically treated for 30 minutes. The solution was filtrated with 0.45
µm filter. Other concentrations of the reference glue were made by diluting the reference glue
solutions with tris buffer (Table 4)
The 0.01 % (v/v) acetic acid solution had pH 4, was prepared by diluting the acetic acid (50
% solution purchased from Fluka) with Fluka water.
Trypsin solutions, 1 mg/mL trypsin stock solution was prepared by dissolving an amount of
tryps in 0.01 % (v/v) acetic acid solution. Other solutions were made by diluting stock
solution with 0.01% acetic acid. (Table 4)
Table 4: Overview of the solutions and samples prepared.
100mM Tris buffer 1.21 mg tris + water. pH 8.50 (pH adsjusted with 1M HCl)
Reference glue sample (1 mg/mL)
25 mg/mL: 243.3mg + 9.74 mL tris buffer
10 mg/mL: 400 µL (25 mg/mL) +600 µL tris buffer
1 mg/mL: 100 µL (10 mg/mL) + 900 µL tris buffer
Beta- A (1 mg/mL) 2.4 mg beta-A + 2.4 mL tris buffer
Cyto-C (1 mg/mL) 1.6 mg cyto-C + 1.6 mL tris buffer
45 mM DTT 12.5 mg DTT + 1.81 mL water
14.5 mg DTT + 2.10 mL water
100 mM IAM 18.4 mg IAM + 0.99 mL water
Trypsin
(0.1 mg/mL)
(0.01 mg/mL)
1 mg/mL stock solution: 1.8 mg trypsin + 1.8 ml 0.01 acetic acid
0.1 mg/mL: 100 µL (1mg/mL) + 900 µL 0.01 % acetic acid
0.01 mg/mL: 10 µL (1mg/mL) + 990 µL 0.01 % acetic acid

23
2.5.3 Reduction, alkylation and tryptic digestion
The reduction reaction was conducted in 1.5 mL polypropylene vials by adding DTT to each
sample solutions, incubated for 2 hours at 37ºC. After reduction was assumed to be
completed and cooling to room temperature, IAM was added and the alkylation reaction was
conducted at room temperature, in the dark for 70 minutes. When the alkylation time was
ended, excess DTT was added to quench the alkylation and also Tris buffer was added.
Finally, trypsin was added and tryptic digestion was carried out at 37º C overnight (16
hours).The trypsination was stopped by freezing the samples at -20ºC and they were kept
frozen until use. The samples and reagents in the reactions are listed in Table 5.
Table 5: Overveiw of the reactions and reaction reagents added in microliters unit. Trypsin used for the standard proteins were 0.1 mg/mL trypsin solution. The reference glue sample used 0.01 mg/mL trypsin solution.
Sample solutions
µL 1mg/mL
µLDTT 45mM
µL IAM 100mM
µL DTT 45mM
µL tris buffer
µL trypsin
Beta A (20µg) 20 5 5 20 30 10 (1µg)
Cyto C (20µg) 20 5 5 20 30 10 (1 µg)
Ref. glue (20µg) 20 5 5 20 30 10 (0.1µg) .
2.6 Sample preparation Scream painting
2.6.1 Scream painting sample
The sample from the Scream painting (S-sample), with unknown compounds/proteins,
consisted of a few tiny pale yellow particles. The sample contained in a 5 mL glass vial was
firstly dissolved in 20 µL Tris buffer, using the same pipette tip to work with this solution.
The pipette tip was used to repeatedly suck and push out the solution to dissolve the
particles. Another 20 µL of Tris buffer was added through the same pipette tip and the
sucking and pushing was repeated. Finally 5 µL Tris buffer was added through the same
pipette tip before the solution (S-sample) was transferred to a 1.5 mL polypropylene vial and
treated as described in 2.6.2.
24
2.6.2 Reduction, alkylation and tryptic digestion
Three samples, the reference glue sample, the standard protein sample (beta A) and the
Scream painting sample, were reduced, alkylated and tryptic digested separately in 1.5 mL
polypropylene vials. The reactions were conducted as described in trypsination procedure
2.5.3. The reference glue and beta-A solutions were prepared as described in 2.5.2.
2.7 LC – MS analysis
2.7.1 The LC system
Sample was loaded onto a C18 analytical column (0.5 mm I.D. x 150 mm, from Agilent,
Germany) with mobile phase (MP) composition 5:95 (v/v) A : B. The loading and gradient
mobile phase were delivered with flow rate 10 µL/min, using an Agilent 1100 Series capillary
gradient pump (Agilent, Palto Alto, CA, USA) with an incorporated on-line vacuum
degasser. The mobile phase reservoir A contained 0.1 % (v/v) F.a. in water and B contained
0.1 % F.a. in ACN. The experimental in the LC systems are listed in Table 6. The outlet of
the analytical column was connected directly to the electrospray interface in the MS
instrument. The MS instruments were a Micromass LCT TOF-MS (Waters, Manchester,UK)
equipped with a Z-spray atmospheric pressure electrospray and a Esquires 3000+ IT mass
spectrometer (Bruker Daltons, Bremen, Germany) equipped with a micro flow ESI source.

25
Table 6: Overview of the LC system and the MS
samples Injection loop µL
Load time (minutes)
MP Gradient MS instument
Trysination procedure (2.5)
20 4 5 % -70% B over 60 min. ESI-TOF/
ESI-IT
Standard protein (beta A)
20 4 5 % -70% B over 60 min. ESI-IT
Blank gradient (Fluka water )
20 6 5 % - 40 % B over 60min
40%- 70 % B over 15min
ESI-IT
Reference glue 20 6 5 % - 40 % B over 60min
40% - 70% B over 15min
ESI-IT
Scream-sample 20 and 51 6 5 % - 40 % B over 60min
40% - 70% B over 15min
ESI-IT
2.7.2 The MS system
The ESI-IT was operated in positive ion mode with an accumulation time of 200ms. Data
acquisition was in the m/z range 215-3000, in both MS and Auto MS/MS mode, using
Esquire Control 3.5 from Bruker Daltonics. Three precursor ions at a time were used with the
MS/MS mode in all the experiments, and the fragmentation amplitude was ramped from 30 to
200 %. The signal intensity threshold for Auto MS/MS mode was set to 5×10⁵ counts
avoiding unwanted background fragmentation. The desolvation gas (dry gas) flow was set to
6 L/min and drying temperature at 250º C.
2.8 Database search
2.8.1 Data analysis
The data acquired with mass spectrometer were analyzed and processed using Data Analysis
3.1 and Biotools 2.2 software from Bruker Daltonics. The Mascot searching engine (Matrix
Science, http://www.matrixscience.com) was used for comparation of MS/MS spectra with
the protein sequence database at the National Center for Biotechnology Information (NCBI)

26
and Mass Spectrometry protein sequence DataBase (MSDB). The chosen enzyme in the
search was trypsin, variation of the taxonomy was chosen in the searching of the reference
glue and the S-sample. Fixed modification used was carbamidomethyl (C). Variable
modifications used were oxidation (M); cleavage by trypsin: cuts C-term side of KR unless
next residue is P. Other parameters and procedure for the searching process are described in
8.1.

27
3. RESULTS AND DISCUSSION
3.1 IR analysis and solubility
The reference glue were provided by the Munch Museum in Oslo for analysis because was
suspected to be the glue that Edvard Munch used in the Scream painting which needed
restoration as mentioned in 1.1. Some materials from the Scream painting were also provided
by the Munch Museum. A Scream painting sample and the reference glue were analyzed by
infrared spectroscopy [34].
Figure 8: IR spectrum of glue sample (Limperle-referanse) and sample from the Scream (Limprøve fra “Skrik”) [34]
The IR spectra obtained show two characteristic amides vibrational bands in both the
reference glue and Scream painting. These bands are known as amide-I and amide-II bands
due to the secondary amide structure and are noted with A in the spectrum in Figure 8.
Further information on the content of the glue was not possible with IR spectroscopy.

28
However, the amide bands identified in these samples gave ideas for further study and
analysis.
To check the solubility, a reference glue bead, 22 mg, was dissolved in 1 mL water with ultra
sonic treatment in 10 minutes (i). Four glue beads, totally 96.2 mg, in 1 mL water needed 25
minutes to be dissolved with ultrasonic treatment (ii). After dissolution, the glue solution was
pale yellow-brown. Glue solution i could be filtrated through a 0.45 µm filter, but did go
through a 0.20 µm filter. The second glue solution was more concentrated and was difficult
to filtrate. When the glue solution was left at room temperature over night, the solution
became solid, but got back to liquid like when warmed up a few minutes in warm water.
Dissolving the sample in an appropriate solvent is necessary for many analytical techniques.
When the reference glue was dissolved in solution, to remove particles and components that
might interfere with the analysis, a filter was used.
The primary function of most filters is to remove or reduce bacteria and fungi that can
contaminate and interfere with protein analysis, as well as other contaminations. For this
purpose filters with pore size 0.20 µm is preferred. Since the glue solution was sticky and
thick, the 0.2 µm could not be used. And if the concentration of the reference glue needed
was less than 22 mg/mL, the sample could be diluted so that it can go though the 0.2 µm
filter; but this was not the case when sample was prepared for NMR analysis and other
purposes. Another consideration is the fact that the protein concentration in glue might be so
low that the concentration in diluted glue is too low for analysis. Therefore, 0.45 µm filter
was chosen in further glue sample preparations as described in the experimental
3.2 Protein NMR
One of the important parts of the NMR instrument is the magnet, and as mentioned earlier in
1.3, the magnet field needs to be at least 500 MHz for protein analysis. Another important
part is the probe which is responsible for holding the sample, transmitting magnetic pulses and
observing the signals. Different probes are designed for different applications, thus it is
important to have the proper probe when performing NMR on biomolecules such as proteins
and peptides. The cryoprobe was designed for one of these purposes and was used in the

29
NMR experiments in this study as described in 2.3.2. Generally, in the protein structure
determination process there are 4 basic steps that must be performed to obtain structure
information. These steps are described in chapter 4 of the compendium by Kristiansen [21],
and will not be discussed here. However, data obtained by the HSQC experiments in this
study are of great interest. The HSQC with 1H -13C correlation, when well resolved, may
assign most of the amino acid sequences since the 13C chemical shift is more amino acid
specific than the proton shift values.
Figure 9: Proton spectrum of the reference glue with integrated values.
The proton spectrum in Figure 9 shows that protons in the glue sample have aliphatic,
aromatic and amide shift. Protons belonging to amino groups in peptides or proteins are
usually in the shift region 7-10 ppm. Based on the proton spectrum and the carbon spectrum
(Figure 10), information from these 1D experiments alone give as expected not enough
information to characterize and identify the content of the reference glue, however, they are
the initial experiments for the HSQC experiments which will be more discussed below.

30
Figure 10: Carbon spectrum of the reference glue with peak labels
The 1H - 13C HSQC spectrum in Figure 11 shows correlated peaks and peak patterns that
have characteristics usually found in proteins and peptides. Aromat-CH are in the region 6-8
ppm (F2) and side chain CH-CH2-CH are in the region 1-5 ppm (F2) (Figure 11). The big
green line in the middle of the spectrum is not included as peaks since this is the strong water
signal line from the solvent.

31
Figure 11: NMR spectrum of the 1H - 13C HSQC of the reference glue, with the carbon on the left spectrum, the F1 axis; and proton spectrum on the top, F2 axis.
Furthermore, a closer look on the 1H-15N HSQC spectrum in Figure 12, identifies the amino
acid glycine (G) at 108 ppm on the N –axis and the duplet between 112 and 113 ppm belongs
to asparagines (N) and glutamine (Q). This confirmed the fact that 15N HSQC give not only
the chemical shifts of the hetero atoms, but also help in the assignment of certain amino acid
residues such as Gly, Asn and Gln which were found here. The assignments of these amino
acid residues are circled as shown in Figure 12. Each residue of the protein (except proline)
has an amide proton attached to a nitrogen atom in the peptide bond. The number of peaks in
the spectrum should match the number of residues in the protein (though side chains with
nitrogen bonded protons will add additional peaks). However, it is not possible to particularly
identify the proteins in the glue due to the fact that these spectra are average spectra of many
proteins; only signals of the amino acids in the amide bonds that are in plural are seen here.

32
Figure 12: 1H -15N HSQC spectrum of the reference glue with 15N spectrum on the left side, F1 axis; and the proton spectrum on the top, F2 axis.
Though not able to identify what kind of proteins that are presented here, these spectra
confirm that the reference glue contains proteins, as found in the IR analysis [34] The
amount sample from the Scream painting was too small and could not be analyzed by NMR.
A sample of the reference glue was pH adjusted to 3 since this often gives more signal
information in protein NMR analysis. However, the experiments done on this sample did not
give better results than these represented above. This is though quite reasonable since the glue
has been made by boiling processes and the proteins in the sample might have been degraded
or affected in these processes.
3.3 Total protein measurement of reference glue
During testing of this trypsination method for the reference glue sample, it was found
necessary to know the amount of protein in the glue sample. This is due to the fact, as
mentioned in 1.2.2, that trypsin autolysis and the amount of protein is of important for
efficient trypsination. Autolysis of trypsin is not wanted since its peptides will interfere with
identification of peptides from the target sample. In trypsination procedures, trypsin was

33
found to be among the highest score proteins in the Mascot search of the tryptic digested glue
sample.
The total amount of protein in the reference glue was determinated by the Bradford Assay
[37, 38]. This method is based on the direct binding of Coomassie brilliant blue G-250 dye
(CBBG) to proteins at arginine, tryptophan, tyrosine, histidine and phenyalanine residues.
Anionic CBBG binds to these residues producing an absorbance maximum at 595 nm; thus
the CBBG complex with proteins is measured at 595 nm in a spectrophotometer. The free
dye in solution has an absorbance at 470 nm [39]. The concentration of the target protein is
calculated by the instrument using a calibation curve made by a standard protein with known
concentrations. The total protein measurement results are shown in Table 7.
Table 7. The amount and procents of the protein in the reference glue obtained protein by Bradford method.
Reference glue samples concentrations
Protein concentrations obtained
Procent of the protein in the glue samples
300 µg/mL 23.2 µg/mL 7.73
1 mg/mL 78.2 µg/mL 7.82
10 mg/mL 264.1 µg/mL 2.64
The concentration obtained for the third glue sample is quite different from the first two as
listed (Table 7). The protein measurement method functions in certain range of protein
concentration [37, 40] Another fact is that the 3rd sample was much more concentrated and
the Coomassie reagents might not be able to complex with this sample so well to get good
absorbance for the measurement. Hence, the results from the first two concentrations are
more reliable with this method.
Information which was obtained by the total protein measurement listed above the amino
acids that are related to this assay. The primary response to arginine is eight times as much as
other listed amino acid residues, and there are variation of the others responses too,
dependent on the protein, therefore the calibration protein should contain the complexing
residues as similar as possible to the analyte proteins. However this is difficult to match in our
case since the protein sample is yet unknown. However, in the present case it was not the
purpose of the investigation to get the exact protein concentration, hence bovine serum

34
albumin (BSA) was chosen as calibration protein since it is often used with good result with
this assay. The reference glue sample showed less than 10 % (w/w) total protein
concentration. Hence in the further experiments, a trypsin amount corresponding to this
protein content was used as in 2.5.3
3.4 Tryptic digestion procedure
3.4.1 Tryptic digestion of standard proteins and reference glue
The trypsination was tested using the procedure described in Lund’s thesis with reduction and
alkylation steps, but in our hands the digested samples showed no or few peptides peaks (e.g.
double charged) when analyzed in LC-MS (ESI-TOF). The volume of TEA buffer (480 µL)
added before trypsination were considered to be too large for the small painting sample. An
alterative procedure used by Tran [36] combined with volumes and concentrations used in
Lund’ thesis, was tested. The combination of the two procedures in Lund’s thesis [35] and
Tran’s article [36] were based on a close study and calculation of the amount reagents used in
the two procedures. On calculation of the mol amount of DTT and IAM which were used by
Lund and Tran, the amount reagents are the same according to the amount protein which
submitted to be reducted and alkylated. The protein amount (1mg) used by Tran is 50 times
more than Lund’s. Thus the new procedure as described in 2.5.3 combined the two
procedures by keeping the small reagent volume and concentration in the procedure in Lund’s
thesis and using Tran’s article reaction steps. This reduction, alkylation and trypsination
method was tested for the reference glue and standard proteins. And the digested samples
were analyzed by LC-MS.
The ratio of amount trypsin: protein can be from 1: 10 to 1:50, in the present study a 1:20
protease ratio was chosen, taking into account the unknown protein compositions and
knowing that if there are more than 10% protein in the sample there are still enough trypsin.
In case of less protein, the amount of trypsin is not too high. Another fact that was found by
measuring the protein concentration is that the glue also contains other matter than
proteinaceous material. However, since the assay showed the presence of amino acids, most

35
probably also arginine, trypsinination with subsequent peptide identification, could be applied
for protein identification.
The reference glue and standard proteins which were tryptic digested by this procedure gave
lots of peptide peaks and the protein identification search (Mascot search engine) showed
high scores for the β-lactoglobulin-A. The tryptic digested samples analyzed by LC-MS
method showed separated peptide peaks (Figure 13).
betalactoglobulinA i urea tris buffer
Time5.00 10.00 15.00 20.00 25.00 30.00 35.00 40.00 45.00
%
0
100
lan021007_betaglobulinA_nr2_trypticdigested TOF MS ES+ BPI955
Figure 13: Chromatogram of the Beta A analyzed by LC-ESI-TOF-MS
When a scan over the chromatogram from 16-37 minutes, a lots of peptide masses revealed in
the mass spectrum (Figure 14). Figure 15 shows the mass spectrum of a doubly charged
peptide.

36
betalactoglobulinA i urea tris buffer
m/z200 300 400 500 600 700 800 900 1000 1100 1200 1300 1400 1500 1600 1700 1800 1900
%
0
100
lan021007_betaglobulinA_nr2_trypticdigested 966 (17.719) Cm (837:2012) TOF MS ES+ 1.71e4858.44
17139
419.2812849
390.177021
269.096077
317.264533
327.213379
467.317980
837.534783650.38
4737467.814331
597.382834485.14
2415
575.401530
673.424044
818.442864
794.521819
721.81975
858.9615713
933.599607
859.984217
901.763207
934.595037
1158.982945
1121.972627
935.622122
1070.391802
1424.2624801159.29
24661354.76
2012
1354.271495
1425.241721
1425.741045
1574.12795
1716.93773
Figure 14: Mass spectrum of the tryptic digested beta-A, scanned from 16-37 minutes in the cromatogram.
betalactoglobulinA i urea tris buffer
m/z853 854 855 856 857 858 859 860 861 862 863 864 865
%
0
100
lan021007_betaglobulinA_nr2_trypticdigested 966 (17.719) Cm (837:2012) TOF MS ES+ 1.71e4858.44
17139
858.9615713
859.469568
859.984217
860.471759
Figure 15: Mass spectrum of the tryptic digested beta-A..This spectrum showed a zoomed- in doubly charged peptide peak with m/z 859.44, 858.96, 859.46, 859.96.

37
Tris buffer and Urea tris buffer were used in the testing of trypsination procedure. Urea was
used to unfold proteins for better tryptic digestion. But, the results from the Urea tris buffer
trypsination of the reference glue showed few peptide peaks. Thus tris buffer was used in the
trypsination procedure. The proteins in the reference glue might be unfolded or degraded due
to the boiling process.
The m/z values obtained as doubly and triply charged by the TOF-MS instrument needed to
be converted to single mass values before submitting to the Mascot search engine for peptide
fingerprint protein identification. For the whole chromatogram one peptide peak at a time
needed to be looked up to get all the masses of interest. The singly charged masses obtained
were submitted to Mascot. One of the Mascot search results showed high score (158) of the
Beta A protein with 100 % sequence coverage when both calculated doubly and triply
charged mass were submitted.. This confirmed that the tryptic digestion procedure worked.
Mascot search results for the standard protein are shown in 8.2.
The reference glue was also analyzed in the same way and peptide peaks were also found here
which confirmed the trypsination of the sample. A chromatogram and mass spectrum of the
digested reference glue is shown in Figure 16 and Figure 17. Both doubly and triply charged
masses were found when the mass spectra of the glue sample were studied. The
chromatogram showed more than 30 peaks in the glue sample that can be peptides and these
peaks each revealed many masses.

38
lim i tris buffer
Time12.00 14.00 16.00 18.00 20.00 22.00 24.00 26.00 28.00 30.00
%
0
100
lan021007_lim_tris_nr8_trypticdigested TOF MS ES+ BPI241
Figure 16: Chromatogram of the tryptic digested reference glue analyzed by LC-ESI-TOF-MS
lim i tris buffer
m/z400 450 500 550 600 650 700 750 800 850 900 950 1000
%
0
100
lan021007_lim_tris_nr8_trypticdigested 927 (17.003) Cm (595:1638) TOF MS ES+ 5.17e3390.17
5171
364.072171
365.081393
389.031028
553.344934
421.104894
391.324386
420.782324
392.281664
542.191722
449.801712
434.781472
474.271662
450.30882
485.161233
486.15912 510.81
800
730.414293
620.904267
553.852803
589.352403
577.351701
554.351410
620.382071
589.851456
604.891050
644.393361
621.382776 659.41
2687
678.382311
718.401617
717.431267
730.913139
828.472718
731.421733 758.79
1613758.441423
793.941586
759.441214
825.471461
824.961036
828.992153 962.22
2072
952.221919
907.531659829.48
1535
851.481128 907.01
925856.47
900
951.871414
908.021222
928.20865
962.551798
962.901079
982.05866
988.58770
Figure 17: Mass spectrum of the tryptic digested reference glue analyzed by LC-ESI-TOF-MS. This spectrum is a zoomed-in spectrum of the mass spectrum scanned from 12-30 min of the chromatogram above.

39
The trypsination procedure was also tested with small sample volumes as described in 2.5.3.
The ion trap mass spectrometer was used for detection later on since it can provide tandem
MS/MS. The chromatograms from the procedure trypsination as described 2.5.3 are shown
in Figure 18 and Figure 19. The digested sample showed peptide peaks well separated for the
standard protein beta-A, though the reference glue sample might need other separation time
and gradient steps for better separation.
0 10 20 30 40 50 60 Time [min]0
1
2
3
4
5
6
7x10Intens.
Figure 18: chromtogram of the tryptic digested beta-A (20 µg).

40
0 10 20 30 40 50 60 Time [min]0
1
2
3
4
5
6x10Intens.
BPC 215-3000 ±Al l, Smoothed (5.5,1, GA)
Figure 19: Chromatogram of the reference glue. A sample of 20 µg was tryptic digested.
When MS data of this tryptic digested beta-A sample were submitted to Mascot search
engine, the protein identification score for this protein is 459 and with 68 % sequence
coverage.This again confirmed that the trypsination method was well functioning.When the
reference glue sample was submitted to Mascot search, no significant protein was identified.
However, peptides were found, (shown in red in the search results) and some of them are
listed in Table 8.
Table 8: some peptides were found in the mascot search of the glue sample.
MLNASVSASTANDGEPILHSEVGR.Q + Oxidation (M) (observed mass 824.430) FTSMLLIGEAAGYGSR.L + Oxidation (M) (563.16) FSINFFTAIGLGALTSSMR.K (678.59) LMNQAGVSFAILGNTEANSGDTAR.R + Oxidation (M) (818.14) MTTLCYALGIELVPLAGATSCGAGIVR.Q (931.84) AANTANIPIINAGDGPGQHPTQALLDMYTIK.R + Oxidation (M) (1074.44) QPFVALSGPSFALELMNNLPTAMVVASK.D + 2 Oxidation (M) (989.34) LPNSDMTAGNLALIGPASMMNIAMK.A + 3 Oxidation (M) (869.85) AMPYSDLFLMAIGLAVSAIPEGLPVAISVALAIGMR.R (1219.80) AWHNPTTNELIAAAAGGIVVVGGIAVLVLITVLR.R (1137.16) GTMHLGDDAVAAIESHR.W + Oxidation (M) (897.84) GDIGPAGLPGPR.G (553.36)

41
Peptides from trypsin were not found listed in the top of the search results. Collagen from
rabbit and mouse were suggested to match the peptide (553.36), though the score obtained
was not significant for identification. The peptides were not submitted to further identification
or peptide confirmation. They are listed as found in the search. The sample from the Scream
painting was to be prepared and analyzed with this method.
3.5 LC-MS analysis of Sream painting
Trypsination of the dissolved Scream painting sample (S-sample) was carried out using the
trypsination method as described in 2.5 and 3.4.
3.5.1 LC separations
Using a blank gradient before injection of the sample gives control and verification for the
peaks of the sample in the system. With 20µL injection of the S-sample showed peptide
peaks which were doubly charged, but the peaks were very small. Therefore the rest of the
sample volume, only 47 µL, was injected with the bigger loop which was prepared for this
step. The data obtained for the S- sample with the second loop was subjected to data analysis.
The position of a peak in a chromatogram is characterized by its retention time (tR). The
chromatogram of the S-sample and the chromatogram of the reference glue show different
peak patterns. It was of great interest to figure out whether the reference glue examined or a
similar one was used in the Scream painting. To leave out other factors that can unnecessary
contribute to changes in the chromatograms, these two samples’ introduction and separation
conditions were kept alike. Hence, if the two chromatograms show similar peaks and peak
patterns, they might contain the same components and materials. However, by comparing the
peaks and their pattern in the chromatograms of the reference glue sample and the S- sample
in overlaid chromatograms as showed in Figure 20 it can seen that the blue and black
chromatograms do not match each other in all peaks and patterns. Hence, the glues were not
identical.

42
0 10 20 30 40 50 60 70 80 90 T ime [min]
0.0
0.5
1.0
1.5
2.0
7x10Intens.
0 10 20 30 40 50 60 70 80 90 T ime [min]
0.0
0.5
1.0
1.5
2.0
7x10Intens.
0 10 20 30 40 50 60 70 80 90 T ime [min]
0.0
0.5
1.0
1.5
2.0
7x10Intens.
Figure 20: The chromatogram of the S-sample is in blue colour, the black is the reference glue and the green is the blank gradient chromatogram.
Another fact is that the S-sample is a mixture of glue, colour pigments and probably
cardboard materials, and was aged with the painting, while the glue sample is a mixture of
animal tissues making it the glue. In a LC system, it is not possible to extract one peak from
other peaks in the chromatogram. However, in a LC-MS system, it is possible to get an
extracted ion chromatogram when a mass of interest is applied. This will be discussed later in
3.5.2. At this point the reference glue does not seem to be the same one used in the Scream.
Further identification needs to be done and analysis by mass spectrometry to see whether it
would bring this matter closer.
3.5.2 Mass spectrometry
Automated tandem mass spectrometry or MS/MS data-dependent acquisition mode is the
most commonly used technique for detection and identifying peptides/proteins, and amino
acid sequence of a specific peptide can also be determined. As each peptide elutes from the

43
chromatographic system, the instrument automatically select collision induced dissociation
(CID) of the parent/precursor ions using automated scan functions. Target MS analyses use
the optimal tune parameters to obtain the best performance for the target compound.
However, with this data dependent acquisition (DDA) mode, it is necessary to use average
parameter settings in order to detect as many compounds as possible in a sample. To ensure
complete compound information three precursor ions at a time were used with the MS/MS
mode in all the experiments studied using the ion trap instrument. When a mass in a
compound were detected as a precursor ion, the ion would be further fragmented and a
tandem MS/MS mass spectrum obtained. An example of a MS spectrum and a MS/MS
spectrum shown in Figure 21and Figure 22.The red mark (Figure 21) indicated that the m/z
423.1 was fragmented further. The MS/MS spectrum obtained (Figure 22), was not a peptide,
since it revealed few masses and all below the blue mark. An example of a peptide MS/MS
spectrum will be shown later in 3.5.3.
421.11+
542.21+
841.1
1493.91819.6
7. +MS, 15.8min (#317)
0.0
0.5
1.0
1.5
2.0
6x10Intens.
500 1000 1500 2000 2500 m /z
Figure 21: MS spectrum of compound no.5 found in the S-sample at 15.8min (tr)
404.11+
7. +MS2(423.1), 15.9m in (#320)
0
2
4
6
5x10Intens.
500 1000 1500 2000 2500 m /z
Figure 22: MS/MS spectrum of compound no.5 found in the S-sample at 15.8min (tr)
With three precursor ions means that other ions will not be fragmented further even though
these ions might be of importance for the identification. This is a disadvantage, since
information might get lost when these peptide ions are in the same elution window as the
chosen ions. MS/MS mode gives further fragmentation of a peptide detected and this can be
used to identify the peptide and its amino acid sequence. With the fragmented mass spectrum,

44
peptide mass fingerprint searching engines can be used, and peptide identification can then be
confirmed. The protein and peptide identifications of the samples will be discussed in 3.5.3.
The most important fact of a mass spectrum is that it can serve as a fingerprint of the
molecule conveying information about its molecular mass, and when fragmentation occurs
during ionization or by collision, fragmentation ions are useful structural information of the
molecule. As mentioned earlier in 3.5.1, the possibility of obtaining information of separated
compounds is present in LC-MS. The known mass of a peptide or a compound can be used to
get an extracted ion chromatogram of the mass applied. In this way the peak with the mass of
interest is extracted or isolated from the total ion chromatogram. Peptide peaks can be
isolated and separated in the same way. However, when looking at the chromatogram for the
reference glue and the S-sample, there are so many compounds. When a mass is applied to
get extracted ion chromatogram, the extracted chromatogram obtained from this does not
show only one peak but several of them. An extracted ion chromatogram (EIC) of the mass
553 is shown in Figure 23.
0 10 20 30 40 50 60 70 80 90 T ime [min]0.0
0.5
1.0
1.5
2.0
2.5
3.0
5x10Intens.
EIC 553 ±All , Smoothed (5.2,1, GA)
Figure 23: Extracted ion chromatogram of the mass 553 of the S-sample.
This makes it more complex, and due to the amount of the compounds in the sample and the
masses they reveal, it is not easy to pick out which one to be further analyzed, now that most
of the compounds are unknown. When doing mass scan over the whole range of the
chromatogram to get masses and, a mass spectrum (to get an overview of the whole sample
compounds), only a few masses were revealed, those with high intensity, but this does not
45
mean that they are masses of interested peptides. It is indeed necessary to do only mass scan
over one peak at a time to get more correct mass information of the compound. However,
within one peak in the chromatogram there might be more than one compound and this makes
it a time consuming process to get all the peaks checked to find information about them.
Additionally, information in the reference glue needs to be compared with that of the S-
sample.
3.5.3 Data analysis and identification
Protein identification is mostly based on the electrospray MS analysis of peptides generated
by proteolyic digestion. As mentioned before, the most widely used enzyme is trypsin. The
advantage of using this enzyme is that every peptide other than the protein C terminus has at
least two sites for efficient protonation, the N-terminal amino group and the C-terminal basic
residue, so peptides are readily ionized and detected as positive ions by electrospray
ionization.
Though trypsin cleaves exclusively C- terminal to arginine and lysine residues [14]; when the
proteins in the reference glue sample and S-sample were of mixed origin and unknown
protein compositions, peptides generated from these digestion are in large numbers, thus
make the identification process more difficult, and time consuming data analysis work needed.
Besides, the databases for protein are developing and still not complete deposited protein
information bases .The match and probability scores system in e.g. Mascot has also been
considered as too strict [14], though modification in the searching process might add false
positives. Another fact is that when the detected compounds by MS/MS from the reference
glue sample and the S-sample are 500 and more compounds, the maximum compounds that
can be submitted to one Mascot search (free software version) is 300 compounds. Thus
other options in the search have to be changed to meet the compound limitation in the search.
One possibility is to change the intensity threshold in the data analysis before submitting to
Mascot search or by submitting only a fraction of the data. However, when changing the
intensity threshold, compounds that are excluded might be the ones that play a key part in the
protein identification. This also is the case when only fraction of the chromatogram is
submitted, leaving out peptides that might be an important part in matching the protein
identification.

46
To limit the compounds and mass list in the chromatogram of the S-sample, the intensity
threshold was set to 500000 and 287 compounds in the scan from 14-67 min were obtained.
When the 287 compounds mass list was submitted to Mascot search engine for protein
identification, the search results showed no significant protein Figure 24. The probability
scores were low, the top score was 21 (for gi|119902094, predicted: similar to T cell receptor
alpha chain (Bos Taurus), the score of 71 or higher would be significant for the match in this
search.
Figure 24: Mascot search results for the S-sample.
Another search for the reference glue showed better scores which were outside the green
square (Figure 25). But the protein match were the Heat shock protein 70 (Fragment)-
Trypanoplasma borreli, a bacteria protein and sequence coverage was only 8%. However, the
peptide sequences SQVFSTYADNQPGVHIQVYEGER and
MYQAGGGGGMPGGMPGGMPGGMPGGMPGGIPGG were found for the masses 875.75
and 961.30.
Figure 25: Mascot search for the reference glue.

47
Some of the suggested sequences from the data search engine may have very high scores, but
still does not necessary give the true peptide sequence. One possible way to overcome this
problem is to validate the results from one search engine by using suitable software and
manually check the results. This software can verify the search engine suggestion by
comparing the experimental MS/MS spectrum to the suggested sequence fragmentation. In
this way the sequence will gain additional score and increase the confidence of the suggested
sequence. In the present study, BioTool 2.2 software has been used for manual evaluation of
some MS/MS spectra.
Peptide sequences that were found in the reference glue (listed in Table 8.) were not
submitted to further identification at that time. However, when studying the S-sample, some
peptides found were submitted to identification and confirmation. The compounds in the
reference glue and the S-samples were not all peptides, the mass spectra as an example to this
were shown in Figure 21 and Figure 22 in 3.5.2. MS and MS/MS spectra of compound no.25
(553.8) of the S-sample were submitted to identification since the spectra looked like a
peptide, the MS/MS showed masses that are above its own mass marked with the blue dot.
250.1363.2
553.92+
647.21+
751.22+
822.51+
1105.81+
1225.51400.7
1948.7 2402.5
25. +MS, 22.1-22.8min (#464-#480)
0.0
0.5
1.0
1.5
2.0
5x10Intens.
500 1000 1500 2000 2500 m /z
Figure 26: MS spectrum of compound no.25 found in the S-sample at 22.1-22.8 min (tr)
382.82+ 667.4
1+
764.51+
932.61+
25. +MS2(553.8), 22.1-22.8min (#465-#481)
0
1
2
3
4
4x10Intens.
500 1000 1500 2000 2500 m /z
Figure 27: MS/MS spectrum of compound no.25 found in the S-sample at 22.1-22.8min (tr)
The MS/MS spectra was exported to BIOtools, all the peaks from the spectrum has to be
marked red manually before it can be submitted to the search (Figure 28)

48
m/z620 640 660 680 700 720 740 760 780 800 820 840 860
0
1
2
3
4
5
6
7
8
9
10
11
12
13
14
15
16
17
18
19
[A bs . Int. * 1000]
Figure 28: BIOtools window of the exported MS/MS spectrum.
The peptide were found to match the spectrum of the S-sample was chain A, the structure of
collagen type I, single type I collagen molecule and the peptide sequence was
GVEGPIGPAGPR. It was not identified in the search results the kind of animal (s) this
collagen protein belonged. This sequence was then copied to the sequence editor in BIOtools
and submitted for confirmation. More than 5 y and b were found in this match (Figure 29)
and showed an example for the assigned peptide sequence GVEGPIGPAGPR, possibly
originated from the protein suggested. And Figure 30 shows where the a, b and y are assigned
in a peptide chain. In this way peptide identification can be confirmed and this could be
applied to other peptide sequences that are found in the samples. However, hundreds of
compounds were found in the S-sample and the reference glue sample. Due to the time
limited in this thesis, this investigation could not be done.

49
Figure 29: Biotool window, presents the raw MS/MS spectrum overlaid to the first two databased suggestion for peptide structures. Bottom table are the list of the corresponding a-, b- and y-ions.
Figure 30: figure showing the a, b and y in the peptide chain( http://www.ionsource.com/tutorial/DeNovo/DeNovoTOC.htm)
In case of a single trypsinated protein, the results from the Mascot search engine for protein
identification are more reliable as discussed in 3.4.1.

50
4. CONCLUDING REMARKS
The approach which is utilized in the present study shows that identification of peptides and
peptide sequences from the target sample is possible by MS. However identified peptide can
originate from quite many proteins which make the identification of one particular protein
difficult. In this study protein identity confirmations were not possible, even though the
tryptic digestion was proved to function well in the method.
For better identification of the proteins in the samples, it would be necessary to isolate the
proteins one by one from the sample prior to trypsination and submission of peptide mixtures
to LC-MS analysis. Such protein separation can be done by LC or 2D gel electrophoresis.
The MS/MS spectra obtained can then be used in database searching for identification. In this
way, the 300 compounds limitation in the Mascot search will not be a problem. Furthermore,
the submitted peptides is generated from one protein which was isolated, thus the protein
found in the database match is more certainly confirmed.
However, both the reference glue sample and the S-sample have unknown protein
composition, and the amount of S-sample available was very limited and not sufficient for
optimization of the separation parameters. Besides, the S-sample contained not only proteins,
but also colour pigments and even cardboard materials, these have to be removed as well.
This might be a more difficult, time and sample consuming process. Thus, the approach used
in this study for characterizing the unknown samples was done in the possible way of
available time and sample, and the information obtained here confirmed that the S-sample
contain proteins similar to the reference glue, but not identical.

51
PART TWO
This second part of the thesis is not connected with the previous part of the present thesis. In
this study, experiments were done to investigate some new aspects for Liquid
Chromatography- Solid Phase Extraction- Nuclear Magnetic Resonance (LC-SPE-NMR)
analysis method. The coupling of liquid chromatography and NMR, combined with the use of
SPE, is gaining popularity due to technological improvements, but the coupling still has many
shortcomings to be overcome. The following describes both basics in the LC-SPE-NMR
method, some performed experiments, as well as results and discussions concerning the
subject.

52
5. INTRODUCTION
The coupling of Liquid chromatography with Nuclear Magnetic Resonance spectroscopy
(LC-NMR) and mass spectrometry (LC-MS) have been used in the last two decades to solve
many complex analytical problems [41-43]. Analytes are separated in the liquid
chromatography system and then detected by NMR spectrometry or MS. NMR analysis of a
compound often requires sample amounts in the microgram and milligram. Therefore,
analytes at low concentration need to be concentrated in order to be analysed by NMR. The
commercial LC-NMR systems do include a solid phase extraction (SPE) unit that is used to
trap and concentrate the analyte from the LC system, however, the commercial SPE system is
not well fitted for combination with the LC system and it has also been observed that the
materials in the commercial SPE columns have limited trapping capacity [44]. Therefore, an
improved on-line method for concentrating analytes from the LC column before NMR
analysis is necessary and attempts in this direction were tested.
Liquid chromatography is a widely used and robust separation technique, and NMR is
probably the most important tool for structure determination. Thus, the coupling of these two
techniques together makes a powerful analytical tool for determining the structures of
unknown organic compounds in complex samples. NMR analysis is relative insensitive, but
the combination of LC-NMR with solid phase extraction (SPE) can enable sample
enrichment, thus analytes at low concentration can be detected and structure elucidated.
5.1 NMR spectroscopy
Over fifty years since the first observations of Nuclear Magnetic Resonance (NMR) were
made in solids and liquid samples, NMR spectroscopy today represents the most versatile and
informative spectroscopy technique applied for structural and conformation analysis. Samples
can be examined with one-dimensional (1D) and two-dimensional (2D) NMR experiments.
Three or four-dimensional NMR (3D and 4D) spectra can in fact also be obtained, although
this rather specialized subject will not be discussed here.

53
Chemical environment influences the resonance frequency of a nucleus, and one nucleus can
influence the resonance of another through intervening chemical bonds. NMR spectra and
chemical shift, spin-spin coupling to 13C or 15N, 1H-1H coupling, 1H-1H splitting patterns, 13C
-13C coupling etc. can provide important information to obtain partial or complete structure
determination of unknown organic compounds. But NMR is very insensitive relative to other
techniques such as Infrared and Ultra Violet spectroscopy [45]. In UV similar chromophores
add up one signal intensity. In NMR each atomic position is giving a signal so increasing the
molecular weight does not improve S/N as in UV. The molarity of the sample is important.
Different NMR experiments require different amounts of sample. A two-dimensional long-
range proton-carbon correlation experiment obviously requires more sample than a
straightforward proton experiment. NMR spectroscopy is the only method, among various
spectroscopy method, that is capable of providing the full information needed for rigorous
structure determination of a compound e.g. natural product, including determination of its
relative stereochemistry and discrimination between positional isomers [46].
5.2 LC-NMR
Watanabe and Niki performed the first on-line LC-NMR experiments in the late 1970s [47].
Their work demonstrated stopped-flow measurements of a mixture of known compounds. LC
is easily coupled with UV detectors and mass spectrometry (MS). But coupling with NMR
has proven to be more difficult [41]. One of the problems is the difference between the
amount of sample required to obtain NMR spectra and the capacity of the LC system [41].
Further more, the LC peaks are often of larger volume than an LC-NMR cell, so not the
entire available sample is used [41]. Broadening of the peaks in the flow system can also be a
problem so that not the entire peak is used [41]. However, several technological advances
that have been made in recent years, such as solvent suppression methods [48] and
improvements on probe design [42] have increased the potential and stimulated the interest in
LC-NMR hyphenated technique. LC-NMR has been used as an analytical technique for the
study of e.g. drug impurities [41], drug metabolites [49], sugar nucleotides [50], and natural
products [43].

54
5.2.1 Modes of operation for LC-NMR
The connection between the LC system and the NMR flow cell can be done on-line with
polyether ether ketone (PEEK) tubing or fused silica capillaries [42]. The LC system can be
as close as 30-50 cm to the NMR magnet when the magnet is shielded [42]. The distance
between the LC and NMR is increased to 1.5-2 m when the magnet is unshielded [42]. To
monitor the chromatography and trigger the peak of interest, a UV detector is usually used in
the LC system [42]. There are different modes of operation for LC-NMR, on-flow
(continuous flow), stop- flow, loop collection and solid phase extraction (SPE) collection
[42].
On –flow LC-NMR
In this mode, the NMR spectrometer acts similar to a UV and MS detector in a
chromatographic system; the analytes are measured without stopping the flow. The outlet of
the chromatography system is connected to the NMR detection cell. The NMR spectra are
acquired continuously while the sample is flowing through the detection cell. Figure 31 shows
an example setup of this mode.
Figure 31: Schematic set-up of the on-flow mode in LC-NMR and LC-NMR/MS
On- flow experiments require more samples for analysis because the residence time in the
NMR flow cell is very short during the chromatographic run [42]. Short residence time within
the radio frequency (RF) coil often results in a poor signal to noise (S/N) ratio for the NMR
spectra [43]. Signal to noise ratio measurement in which the peak high of the analyte is
compared to the noise level in the spectrum is a sensitivity matter of the NMR instrument.
Decreasing the flow rate with a factor of 3-10 increases the residence time and the S/N ratio
for each compound [43]. On-flow mode allows rapid screening of 1D proton spectra,
however, only for the major peaks from the chromatographic separation [43].

55
Stop-flow LC-NMR
In this mode, the eluent is directly flowing from the chromatographic system into the NMR
probe. NMR measurement is carried out under no flow or static condition by the use of a
valve to stop the elution when the analyte reaches the flow cell volume within the RF coil.
Only selected peaks are measured by the NMR spectrometer. The separation is monitored in
parallel with a LC detector e.g. a UV detector. The separation is interrupted after a certain
time delay that is necessary to allow the peak to move from the LC detector to the NMR
detection flow cell. Figure 32 shows an example of the coupling.
Figure 32: Schematic set-up of the stop-flow mode in LC-NMR and LC-NMR/MS
It is necessary to calibrate this delay time which is dependent on the flow rate and the length
of the tubing connecting the LC with the NMR [42]. Separation is continued until the next
peak is positioned in the NMR detection cell when the chromatographic run is stopped when
the analyte peak is in the flow cell [42] resulting in a set of NMR spectra for the selected
compounds.
A stop- flow experiment requires that the retention time of the analyte is known [51]. The
method is difficult to apply when the eluting peaks are close such as in a complex crude plant
extracts when compounds are present in small amounts (g); hours of acquisition time are
required [51]. The frequent stops may also disturb the quality of the separation, and highly
concentrated compounds may pollute the NMR detection cell causing memory effect [43].
However, the stop- flow mode is much more sensitive than the on- flow mode [51] and all
kinds of 1D and 2D NMR measurements can in principle be carried out [51, 52].

56
Loop collection LC-NMR
A storage loop is used to collect the eluent directly from the chromatographic system without
interrupting the separation [42]. Analyte peaks can be trapped in the subsequent storage
loops. Loop collection can be used to collect more than one peak of interest in the same
chromatographic separation. After the separation is completed, the loop contents are
transferred sequentially into the NMR spectrometer for further analysis as shown in a setup of
this mode (Figure 33).
Figure 33: Schematic set-up of the loop collection mode in LC-NMR and LC-NMR/MS
All kind of 1D and 2D NMR measurements can be carried out [52]. However, the delay time
between the LC detector and the loop storage device and the delay time for transport from
these loops to the NMR flow cell must be calibrated [43]. The analytes must also be stable
inside the loops during the extended period of analysis.
SPE and LC-SPE-NMR
The traditional use of solid phase extraction (SPE) in analytical chemistry is a preparative step
for sample clean up and/or enrichment before chromatographic analysis. In LC-SPE-NMR,
SPE is used to trap and concentrate analytes after liquid chromatography separation (Figure
34).

57
Figure 34: Schematic set-ups of different LC-NMR modes including Solid-phase-extraction unit for LC-SPE-NMR system [43].
Solid phase extraction of analytes from the LC separation with sequent NMR analysis has
been carried [53-57]. The LC-SPE-NMR coupling allows increase of the sensitivity compared
to a conventional LC-NMR by a factor of at least 2 [53]. The peaks of interest from the
analytical LC-column are trapped in the SPE cartridges without any elution from the
cartridges while in contact with the mobile phase [56]. The compounds are extracted to the
chosen solid phase material that acts as a sorbent [54]. The trapping procedure can be a single
or multiple trapping of the compounds on the cartridges to achieve the wanted sample
amount [56]. The solvents and buffers that are in used for separation can be removed and the
concentrated compounds then dissolved in a suitable solvent prior to NMR analysis [54]. In
this way nondeuterated solvents can be used in the LC-SPE step, saving cost and also prevent
the exchange of acidic protons in like –OH, -NH, -NH2 with D2O.
Transfer of water in the mobile phase from LC system into the NMR is not wanted. This
water usually gives solvent suppression in NMR, in such case, analyte signals of interest will
not be observed [42, 48]. An approach to solve this problem is to have a column to absorb
the unwanted water. The column can be used in the connection between the LC and the
NMR, either in off- line or on-line LC- NMR. Traditionally MgSO4 is used in organic

58
chemistry to get rid of water in many chemical experiments. A column packed with MgSO4
might solve the water problem in NMR, however, such column is not commercial available,
and has not been investigated for removal of water in an LC-NMR system.
Solvents in LC-NMR system
In LC-NMR systems both nondeuterated and deuterated solvents are used to carry out
analysis. NMR spectra are preferably acquired in deuterated solvents, but use of deuterated
solvents for HPLC is expensive and of limited availability. Choice of solvent and its purity is
very important in NMR to obtain good NMR spectra and to avoid solvent suppression.
DMSOd6 is often used in NMR. The possibility of using DMSO in the LC system is therefore
of interest. In the LC system a UV detector is often used, and this raised the interest of
knowing the DMSO UV absorbance. DMSO is also more viscous than regular HPLC
solvents such as MeOH and ACN. The DMSO viscosity is 2.24 cP while the viscosity of
ACN is 0.34 cP. Hence, there may be pressure problems and pump instability using DMSO as
mobile phase solvent. A HPLC pump usually has a pressure limit of about 400 bar.
Furthermore, in a common LC system, mobile phase solvents are often degassed with helium
or by ultra sonic treatment. Such treatments of solvents in the LC part might give rise to
impurity signal(s) in NMR.
5.3 Aim of the study
The new aspect, which was aimed to investigate in this part, is how the solvent dimethyl
sulfoxide works as a LC mobile phase in a LC-NMR system. Additionally it was of interest to
see if a MgSO4 column could be used to remove water from the solvents used on a SPE
column in a LC-SPE-NMR system.

59
6. EXPERIMENTAL
6.1 DMSO UV absorbance measurement
A UV-Visible Spectrometer from Varian, Cary 100 Bio was used with quarts cuvettes to
measure the UV absorbance. Solutions of 1 % DMSO in ACN was prepared. DMSO was
bought from Merck (Germany) and HPLC grade ACN from Rathburn (Walkerburn, UK).
ACN was used in the reference cell, and the 1 % DMSO solution was scanned with baseline
correction.
6.2 Pressure measurement with DMSO as mobile phase
A Hitachi L-7110 isocratic LC pump was used, and a Hotsep Tracy, 1.0 mm× 5 mm,
Hypercarb column (5 µm particle size, 100 Å pore size) from G&T Septech (Kolbotn,
Norway). Nondeuterated DMSO from Merck and HPLC grade ACN from Rathburn were
used, and the column pressures using DMSO and ACN were measured at different flow rates.
6.3 He degassing of deuterated solvents and ultrasonic treatment
Deuterated water (D2O) (D: 99.96%) and deuterated acetonitrile (CD3CN) (D: 99.8%) were
obtained from Cambridge Isotope Laboratories, Inc (Andover, MA, USA). Deuterated water
and acetonitrile were degassed with helium and ultrasonic treatment in for 10 minutes in both
cases, before proton spectra of the solutions were acquired. Solutions of the same D2O and
CD3CN without treatment were included in the NMR acquisitions as references spectra.
NMR spectra were acquired on a 300 MHz NMR instrument (Bruker DPX 300), solvent
locked on D2O, and CD3CN, with 128 scans.

60
6.4 MgSO4 as SPE column
6.4.1 Column packing process
MgSO4 solid particles (Nowegian MedicalDepot AS (NMD)) was first sieved through a 36
µm and a 25 µm pore size sieve (Retsch test sieve, Retsch GmbH, Germany), then dried at
150º C for at least 12 hours to get rid of water in the material, cooled and kept in an exiccator
with drying agent Orange gel from Merck (Darmstadt, Germany). The MgSO4 water content
(18 %) was obtained by drying 2.00 g MgSO4 at 150º C overnight and by calculating the
weight loss (0.36 g) due to water evaporation. A steel column 0.3 mm I.D.x.30 mm was
slurry packed, the MgSO4 which was sieved through the 25 µm was used, and CCl4 as slurry
solvent. A Hitachi L-7110 isocratic LC pump from Merck (Darmstadt, Germany) was used to
pack the column using the downward pressure liquid slurry method which is developed in
house. The packed column was then dried at 150° C for at least 12 hours and kept in the
exiccator until further use.
6.4.2 Testing the MgSO4 column
The MgSO4 column was tested in a LC-UV system. The system consisted of a Hitachi L-
7110 isocratic LC pump, a 6- port Valco valve and a 50 µL loop, a Tracy Hypercarb column,
1.0mm I.D. x 5mm, and Spectra 100 UV detector equipped with a 100 µm I.D. on-capillary
flow cell. The mobile phase consisted of ACN / water (50/50, v/v), and the flow rate was 5
µL/min. A solution (0.5 µL) of ACN and water (50:50 v/v) was injected in the LC system
without MgSO4 column and this was repeated with the MgSO4 column coupled ahead of the
Tracy column.

61
7. RESULTS AND DISCUSSION
7.1 DMSO UV absorbance
DMSO has UV absorbance that is suitable in a LC-UV system. The UV scans of both
nondeuterated DMSO and deuterated DMSOd6 examined Figure 35 and Figure 36, were
within the wavelength of the UV detector which is between 200 – 400 nm. Due to high UV
absorbance of DMSO (Figure 35) and DMSOd6 (Figure 36), at low wavelengths UV
detection can only be used above approximately 245 nm.
Figure 35: UV scan of DMSO

62
Figure 36: UV scan of DMSOd6
7.2 DMSO as mobile phase
The pressure of DMSO was measured as described in 6.2 and the pressure obtained is
presented in Table 9 and a plot of the pressure as function of the flow rate is shown in Figure
37. DMSO can be used as LC mobile phase.
Table 9: Column pressure using DMSO and ACN and Hypercarb column.
Flow rate ( µL/min) Pressure (bar) DMSO
Pressure (bar) ACN
30 14 0
60 30 1
100 57 5
150 94 9

63
0123456789
10
30 60 100 150
Flow rate (uL/min)
AC
N p
ress
ure
(b
ar)
0102030405060708090100
DM
SO
Pre
ssu
re (
bar
)
ACN DMSO
Figure 37: Plot of DMSO and ACN pressure as a function of flow rate
7.3 Deuterated solvents and treatments
When deuterated solvents D2O and CD3CN were He degassed and ultrasonically treated,
NMR spectra (Figure 38, Figure 39) showed no impurity signals in the treated solutions and
thus it is concluded, that deuterated solvents can be degassed either by He or by ultrasonic
treatment.

64
Figure 38: NMR spectra of D2O without treatment at the bottom, with ultrasonic treatment in the middle and with helium degassing on the top. solvent peak, a singlet at 4.70 ppm.
Figure 39: NMR spectra of CD3CN without treatment at the bottom, with ultrasonic treatment in the middle and with helium degassing on the top. Solvent peaks a quintet at 1.96 ppm and water peak of the solvent a singlet at 2.15 ppm.

65
7.4 MgSO4 column
Different procedures for getting rid of water contamination in the slurry were tested e.g.
filtration, and drying with molseive. Proton NMR acquisitions of these solutions showed
water signal and also other contaminations. ACN as slurry solvent with MgSO4 particles was
also tested, but CCl4 give better homogeneity slurry with MgSO4 (Figure 40). The water from
the CCl4 solvent would vapour when the column was dried after packing. The column was
tested in the LC system as described in 6.4.2. The chromatograms of the testing show in
Figure 41 that the water peak is smaller and moved when the MgSO4 column were used in the
system.
Figure 40: Slurry of MgSO4 with ACN (on the left) and CCl4 (on the right)

66
0,0 0,5 1,0 1,5 2,0 2,5 3,0 3,5 4,0 4,5 5,0 5,5 6,0 6,5
Figure 41: The green is the water peak without MgSO4 in the system. The red, blue and pink peaks are those with the MgSO4 column in the system.

67
8. APPENDIX
8.1 Mascot seaching procedure ion trap MS
Data analysis
1. Choose “Open” in the Data analysis window. 2. Open folder and choose the desired analysis file. 3. Check and mark “TIC ± All.” 4. Choose Find in the Toolbar → parameters: a) AutoMS (n) parameters
Intensity threshold: variable (50000-1000000) Retention time window (min): 0.75 Spectrum type (Line/Profile): Profile spectra only Background subtraction (MS only): None Uncheck “Create individual AutoMS (n) chromatogram traces.”
b) Mass List parameters →Choose Apex page Peak width (FWHM) (m/z): 0.1 S/N threshold: 0.1 Relative intensity threshold (base peak): 0 Absolute intensity threshold: 0.1 Choose “Use peak finder to calculate peak position.”
c) Charge Deconvolute parameters Peptide / small molecules Adduct ions: +H (first window) and –H (second window) Deconvolute: Full scan, MS MaxRes Scan, MS (n) Low mass: 215 100 215 High mass: 3000 3000 3000 Abundance cut-off (%): 5 1 Resolved-isotope deconvolution Maximum charge: 3 3 2 Uncheck “Related-ion deconvolution (MS full scan only).”
d) Mascot export options parameters: “Set global charge limitation” (2+ and 3+) “Mixed list (non-deconvoluted and deconvoluted) Unchecked “Prefer full scan spectrum deconvolution results to MaxRes results”
Press OK! 5) Choose Find in the toolbar → Compounds- AutoMS (n) 6) Select and mark “Compounds mass spectra” so it is highlighted 7) Masslist in the toolbar → Find 8) Deconvolute in the toolbar → Mass Spectra 9) File in the toolbar → Export → Compounds and save as mgf file (MS search) and as bsc file (MS/MS search).

68
Bio Tools Open Bio Tools File → Open the target file Choose the MS or MS/MS icon at the toolbar Taxonomy: All entries chosen (or the right family if known) Database: MSDB (or NCBI) Enzyme: Trypsin Fixed modification: Variable modification: Peptide tolerance: ± 2 Da MS/MS: ± 1.5 Da Protein mass: leave open Charge state: variable (+1, +2, +3) Instrument: ESI-TRAP Report top: variable (20-100 hits) Press START Data will be transferred to Mascot to obtain Mascot searching results Biotools sequence editor -Open Sequence Editor in the upper Toolbar (Window � Start Sequence editior). -Click on the �icon at the left in the upper toolbar and the sequence will automatically be copied in the sequence editor page. If the sequence is not copied in the Sequence Editor automatically, copy the sequence, but not the flang amino acids, and paste it in the page. -To get information about b and y-ions, press Bio at the toolbar (both a, b and y ions will appear.
8.2 Mascot search results
Mascot search results standard protein beta-A
User : Lan Email : [email protected] Search title : MS data file : DATA.TXT Database : MSDB 20060831 (3239079 sequences; 1079594700 residues) Timestamp : 21 Oct 2007 at 15:08:51 GMT
Protein hits : 1BSQA beta-lactoglobulin mutant YES - bovine
1BSOA bovine beta-lactoglobulin a - bovine

69
LGBUI beta-lactoglobulin - water buffalo
Probability Based Mowse Score Ions score is -10*Log (P), where P is the probability that the observed match is a random event. Individual ions scores > 52 indicate identity or extensive homology (p<0.05). Protein scores are derived from ions scores as a non-probabilistic basis for ranking protein hits.
Mascot Search Results Protein View Match to: 1BSOA Score: 518 bovine beta-lactoglobulin a - bovine Found in search of DATA.TXT Nominal mass (Mr): 18641; Calculated pI value: 4.76 NCBI BLAST search of 1BSOA against nr Unformatted sequence string for pasting into other applications Taxonomy: Bos taurus Links to retrieve other entries containing this sequence from NCBI Entrez: 1BSY from Bos taurus 2BLG from Bos taurus 3BLG from Bos taurus Fixed modifications: Carbamidomethyl (C) Variable modifications: Oxidation (M) Cleavage by Trypsin: cuts C-term side of KR unless next residue is P Sequence Coverage: 77% Matched peptides shown in Bold Red 1 LIVTQTMKGL DIQKVAGTWY SLAMAASDIS LLDAQSAPLR VYVEELKPTP 51 EGDLEILLQK WENDECAQKK IIAEKTKIPA VFKIDALNEN KVLVLDTDYK 101 KYLLFCMENS AEPEQSLVCQ CLVRTPEVDD EALEKFDKAL KALPMHIRLS 151 FNPTQLEEQC HI

70
Show predicted peptides also
Sort Peptides By Residue Number Increasing Mass Decreasing Mass
Start - End Observed Mr(expt) Mr(calc) Delta Miss Sequence 1 - 8 933.6700 932.6627 932.5365 0.1262 0 -.LIVTQTMK.G (Ions score 37) 1 - 8 467.3400 932.6654 932.5365 0.1290 0 -.LIVTQTMK.G (Ions score 52) 9 - 14 673.4700 672.4627 672.3806 0.0821 0 K.GLDIQK.V (Ions score 28) 15 - 40 1354.3300 2706.6454 2706.3687 0.2768 0 K.VAGTWYSLAMAASDISLLDAQSAPLR.V (Ions score 108) 15 - 40 1354.3300 2706.6454 2706.3687 0.2768 0 K.VAGTWYSLAMAASDISLLDAQSAPLR.V (Ions score 70) 15 - 40 1354.3500 2706.6854 2706.3687 0.3168 0 K.VAGTWYSLAMAASDISLLDAQSAPLR.V (Ions score 107) 15 - 40 903.2900 2706.8482 2706.3687 0.4795 0 K.VAGTWYSLAMAASDISLLDAQSAPLR.V (Ions score 38) 15 - 40 1354.8300 2707.6454 2706.3687 1.2768 0 K.VAGTWYSLAMAASDISLLDAQSAPLR.V (Ions score 51) 15 - 40 1354.8400 2707.6654 2706.3687 1.2968 0 K.VAGTWYSLAMAASDISLLDAQSAPLR.V (Ions score 52) 41 - 60 1157.2500 2312.4854 2312.2515 0.2340 0 R.VYVEELKPTPEGDLEILLQK.W (Ions score 34) 41 - 60 771.8800 2312.6182 2312.2515 0.3667 0 R.VYVEELKPTPEGDLEILLQK.W (Ions score 36) 41 - 60 1157.7500 2313.4854 2312.2515 1.2340 0 R.VYVEELKPTPEGDLEILLQK.W (Ions score 38) 41 - 60 772.2400 2313.6982 2312.2515 1.4467 0 R.VYVEELKPTPEGDLEILLQK.W (Ions score 45) 84 - 91 458.8100 915.6054 915.4661 0.1393 0 K.IDALNENK.V (Ions score 59) 92 - 100 1065.7100 1064.7027 1064.5754 0.1273 0 K.VLVLDTDYK.K (Ions score 27) 92 - 100 533.3600 1064.7054 1064.5754 0.1301 0 K.VLVLDTDYK.K (Ions score 71) 102 - 124 1424.2800 2846.5454 2845.2907 1.2547 0 K.YLLFCMENSAEPEQSLVCQCLVR.T (Ions score 48) 125 - 135 623.3700 1244.7254 1244.5772 0.1482 0 R.TPEVDDEALEK.F (Ions score 61) 125 - 135 623.3700 1244.7254 1244.5772 0.1482 0 R.TPEVDDEALEK.F (Ions score 45) 125 - 135 623.3700 1244.7254 1244.5772 0.1482 0 R.TPEVDDEALEK.F (Ions score 60) 125 - 135 1245.7600 1244.7527 1244.5772 0.1755 0 R.TPEVDDEALEK.F (Ions score 31) 149 - 162 858.4900 1714.9654 1714.7985 0.1670 0 R.LSFNPTQLEEQCHI.- (Ions score 50) 149 - 162 858.4900 1714.9654 1714.7985 0.1670 0 R.LSFNPTQLEEQCHI.- (Ions score 34) 149 - 162 858.5000 1714.9854 1714.7985 0.1870 0 R.LSFNPTQLEEQCHI.- (Ions score 27)

71
>P1;1BSOA bovine beta-lactoglobulin a - bovine N;PDB title: 12-bromododecanoic acid binds inside the calyx of bovine beta-lactoglobulin C;Species 1BSOA: Bos primigenius taurus (cattle) C;Species 1BSY: Bos primigenius taurus (cattle) C;Species 2BLG: Bos primigenius taurus (cattle) C;Species 3BLG: Bos primigenius taurus (cattle) A;Note: var. variant a, breast, mammary gland R;Qin, B.Y.; Creamer, L.K.; Baker, E.N.; Jameson, G.B. submitted to the Protein Data Bank, August 1998 A;Reference number: A77091; PDB:1BSO R;Qin, B.Y.; Creamer, L.K.; Baker, E.N.; Jameson, G.B. Febs Lett. 438, 272, 1998 A;Title: 12-bromododecanoic acid binds inside the calyx of bovine beta-lactoglobulin. A;Reference number: TN079969 C;Resolution: 2.23 angstroms C;Determination: X-ray diffraction C;R-value: 0.234 C;Keywords: transport protein; beta-lactoglobulin; ligand binding; X-ray crystal structure transport protein F;29-32/Region: helix (right hand alpha) F;130-140/Region: helix (right hand alpha) F;153-156/Region: helix (right hand alpha) F;147-150,20-26,118-123,102-109,90-97,81-84/Region: beta sheet F;66-73,54-61,41-48/Region: beta sheet F;147-150,20-26,118-123,102-109,90-97,81-84,66-75,54-61,41-48/Region: beta sheet F;66-160/Disulfide bonds: F;106-119/Disulfide bonds: C;IDN_NRL_3D 1BSY; 2BLG; 3BLG; C;SRCDB NRL_3D

72
REFERENCES
1. http://news.bbc.co.uk/2/hi/europe/3588282.stm. 2004 retrieved 12.11.2007. 2. Langø, H.-I. http://www.nettavisen.no/ioslo/article751107.ece 2006 retrieved 2007
30.10. 3. Eggum, A. http://www.munch.museum.no/content.aspx?id=15. 2007 retrieved 2007
30.10. 4. Ensby, A.L. http://nrk.no/nyheter/distrikt/ostlandssendingen/1.985462. 2006
retrieved 2007 30.10. 5. Nevin, A., et al., Raman Spectra of Proteinaceas Materials Used in Paitings: A
Multivariate Analytical Approach for Classification and Identification. Anal.Chem., 2007. 79(16): p. 6143-6151.
6. Kuckova, S., R. Hynek, and M. Kodicek, Identification of proteinaceous binders used in artworks by MALDI-TOF mass spectrometry. Anal. Bioanal. Chem., 2007. 388: p. 201-206.
7. http://en.wikipedia.org/wiki/Animal_glue. 2007 retrieved 2007 31.10. 8. Grzywacz, C.M., Identification of proteinaceous binding media in paintings by
amino acid analysis using 9-fluorenylmethyl chloroformate derivatization and reversed-phase high-performance liquid chromatography J. Chromatogr. A, 1994. 676: p. 177-183.
9. Lleti, R., et al., Application of the Kohonen artificial neutral network in the identification of proteinaceous binders in samples of panel paiting using gas chromatography-mass spectrometry. Analyst, 2003. 128: p. 281-286.
10. Nevin, A., et al., Time-resolved flouresence spectroscopy and imaging of proteinaceous binders used in paitings. Anal. Bioanal. Chem., 2007. 388: p. 1897-1905.
11. http://en.wikipedia.org/wiki/Protein. 2007 retrieved 2007 02.11. 12.
http://www.biochem.arizona.edu/classes/bioc462/462a/NOTES/Amino_Acids/amino_acids.htm. 2007 retrieved 2007 02.11.
13. http://en.wikipedia.org/wiki/Trypsin. 2007 retrieved 2007 06.11. 14. Olsen, J.V., S.-E. Ong, and M. Mann, Trypsin Cleaves Exclusively C-terminal to
Arginine and Lysine Residues. Mol.Cell.Proteomics, 2004. 3: p. 608-614. 15. http://tonga.usip.edu/gmoyna/biochem341/lecture13.html. 2007 retrieved 2007
13.11. 16. Wedemeyer, W.J., et al., Disulfide Bonds and Protein Folding. Biochemistry, 2000.
39: p. 4207-4216. 17. Hale, J.E., et al., A simplified procedure for the reduction and alkylation of cysteine
residues in proteins prior to proteolytic digestion and mass spectral analysis. Anal. Biochem., 2004. 333: p. 174-181.
18. Smejkal, G.B., et al., Simultaneous Reduction and Alkylation of Protein Disulfides in a Centrifugal Ultrafiltration Device Prior to Two-Dimensional Gel Electrophoresis. 2006. p. 983-987.
19. Herbert, B., et al., Reduction and alkylation of proteins in preparation of two-dimensional map analysis: Why, when and how? Electrophoresis, 2001. 22: p. 2046-2057.

73
20. Jacobs, J.M., et al., Multidimensional Proteome Analysis of Human Mammary Epithelial Cells. 2004. p. 68-75.
21. Kristiansen, P.E., Biomolecular Nuclear Magnetic Resonance Spectroscopy, . 2006, Unvieveristy of Oslo. p. p.61.
22. Cole, R.B., Electrospray ionization mass spectrometry Fundamentals Instrumentation & Applications. John Willey & Sons, Inc., New York, NY, 1997.
23. Pepaj, M., et al., Two-dimensional capillary liquid chromatography: pH Gradient ion exchange and reserved phase chromatography for rapid separation of proteins. J. Chromatogr. A, 2006. 1120: p. 132-141.
24. Albena Miahilova, B.K., Roman Hauser, Elsa Lundanes, Tyge Greibrokk, Identification of neuropeptides in rat brain rhinencphalon. J. Sep. Sci., 2007. 30: p. 249-256.
25. Holm, A., et al., Combined solid-phase extraction and 2D LC-MS for characterization of the neuropeptides in rat-brain tissue. Anal. Bioanal. Chem., 2005. 382: p. 751-759.
26. McCormack, A.L., et al., Direct Analysis and Identification of Proteins in Mixtures by LC/MS/MS and Database Searching at the Low-Femtomole Level. Anal. Chem., 1997. 69: p. 767-776.
27. Wilson, S.R., et al., 2D LC Separation and Determination of Bradykinin in Rat Muscle Tissue Dialysate with On-Line SPE-HILIC-SPE RP-MS. Chromatographia, 2007. 66: p. 469-474.
28. Baldwin, M.A., Protein Identification by Mass Spectrometry. Mol.Cell.Proteomics, 2004(3): p. 1-9.
29. Domon, B. and R. Aebersold, Mass Spectrometry and Protein Analysis. Science, 2006. 312: p. 212-217.
30. Aebersold, B.D.a.R., Mass Spectrometry and Protein Analysis. Science, 2006. 312: p. 212-217.
31. Griffiths, W.J., et al., Electrospray and tandem spectrometry in biochemistry. Biochem. J., 2001. 355: p. 545-561.
32. Mihailova, A., et al., Identification of neuropeptides in rat brain rhinencphalon. J. Sep. Sci., 2007. 30: p. 249-256.
33. Wei, H., et al., Identification and Quantification of Neuropeptides in Brain Tissue by Cappillary Liquid Chromatography coupled Off-line to MALDI-TOF and MALDI-TOF/TOF-MS. Anal. Chem., 2006. 78: p. 4342-4351.
34. Nielsen, C., Intepretaion of the infrared spectrum of glue sample from the Scream painting. 2007.
35. Lund, H., Cand. Pharm. Thesis, in Department of Pharmacy. 2006, Universitiy of Oslo. p. p.41-42,37-38.
36. Tran, B.Q., et al., The Behaviour of Reduced, Alkylated and Native Proteins in a pH-Gradient LC System. Chromatographia, 2007. 66: p. 709-715.
37. Bradford, M.M., A Rapid and Sensitive Method for the Quantitation of Microgram Quantitaties of Protein Utilizing the Principle of Protein-Dye Binding. Anal. Biochem., 1976. 72: p. 248-254.
38. http://en.wikipedia.org/wiki/Bradford_protein_assay. 2007 retrieved 2007 11.10. 39.
http://www.mrw.interscience.wiley.com/emrw/9780471140863/cp/cpps/article/ps0304/current/html. 2007 retrieved 2007 11.10.
40. Olson, B.J.S.C., Assays for Determination of Protein Concentration. Current Protocols in Protien Science, 2007. 3.4(1-29).

74
41. Sharman, G.J. and I.C. Jones, Critical investigation of coupled liquid chromatography-NMR spectrometry in pharmaceutical impurity identification. Magn. Reson. Chem, 2003. 41: p. 448-454.
42. Elipe, M.V.S., Advantages and disadvantages of nuclear magnetic resonance spectroscopy as a hyphenated technique. Anal. Chim. Acta, 2003. 497: p. 1-25.
43. Exarchou, V., et al., LC-NMR coupling technology: recent advancements and applications in natural products analysis. Magn. Reson. Chem, 2005. 43: p. 681-687.
44. Wilson, S.R., et al., Controlling LC-SPE-NMR Systems. J. Sep. Sci., 2006. 29: p. 582-589.
45. Claridge, T.D.W., High-Resolution NMR techniques in Organic Chemistry. 1999. p. p.13.
46. Lambert, M., et al., HPLC-SPE-NMR Hyphenation in antural products research: optimization of analysis of Croton membrananceus extract. Magn. Reson. Chem, 2005. 43: p. 771-775.
47. Watanabe, N. and E. Niki, Direct-Coupling of FT-NMR to High Performance Liquid Chromatography. Proc. Japan. Acad., 1978. 54 (Ser. B): p. 194-199.
48. Smallcombe, S.H., S.L. Patt, and P.A. Keifer, WET Solvent Suppression and Its Applictions to LC NMR and High-Resolution NMR Spectroscopy. J. Magn. Reson. Ser. A, 1995. 117: p. 295-303.
49. Sohda, K.-y., et al., Application of LC-NMR for Characterization fo Rat Urinary Metabolites of Zonampanel Monohydrate (YM872). Chem. Pham. Bull., 2004. 52: p. 1322-1325.
50. Ramm, M., et al., Rapid analysis of nucleotide-actived sugers by high-performance liquid chromattgraphy coupled with diode-array detection, electrospray ionization mass spectrometry and nuclear magnetic resonance. J. Chromatogr. A, 2004. 1034: p. 139-148.
51. Wolfender, J.-L., K. Ndjoko, and K. Hostettmann, The potential of LC-NMR in Phytochemical Analysis. Phytochem. Anal., 2001. 12: p. 2-22.
52. Klaus, A., On-line LC-NMR and Related Techniques. 2002. p. p.26. 53. Godejoham, M., et al., Characterization of a paracetamol metabolite using on-line
LC-SPE-NMR-MS and a cryogenic NMR probe. J. Chromatogr. A, 2004. 1058: p. 191-196.
54. Nyberg, N.T., H. Baumann, and L. Kenne, Application of solid-phase extraction coupled to an NMR flow-probe in the analysis of HPLC fractions. Magn. Reson. Chem, 2001. 39: p. 236-240.
55. Griffiths, L. and R. Horton, Optimization of LC-NMR III -Increased Signal-to-Noise Ratio Through Column Trapping. Magn. Reson. Chem, 1998. 36: p. 104-109.
56. Sandvoss, M., et al., HPLC-SPE-NMR in pharmaceutical development: capabilities and appplications. Magn. Reson. Chem, 2005. 43: p. 762-770.
57. Xu, F. and A.J. Alexander, The design of an non-line semi-preparative LC-SPE-NMR system for trace analysis. Magn. Reson. Chem, 2005. 43: p. 776-782.

75
The Fragrance of Lavender God is good. He is colorful as the beautiful autumn leaves, the bright light of the sun and the sweet fragrance of lavender in my hand! Indeed, I feel God's presence, His helping hands touching my day with good work, love and results! I am grateful to God and to you who make my day shine so bright. Thank you! Lan T2 Nguyen Blindern, 12th Oct. 2007