
Imagination Ignited - Swarovski Crystal Wholesale Online Shop ...
Upload
khangminh22Category
view
1download
0
1
The Wholesale Demand for Food
in China An economic analysis of
the implications for Australia
A report for the Rural Industries Research & Development Corporation
by Fredoun Ahmadi-Esfahani
RIRDC Publication No 98/27
RIRDC Project No US-27A

2
© 1998 Rural Industries Research and Development Corporation. All rights reserved. ISBN 0 642 54047 0 ISSN 1321 2656 “The Wholesale Demand for Food in China - An Economic Analysis“ The views expressed and the conclusions reached in this publication are those of the authors and not necessarily those of persons consulted. RIRDC shall not be responsible in any way whatsoever to any person who relies in whole, or in part, on the contents of this report unless authorised in writing by the Managing Director of RIRDC. This publication is copyright. Apart from any fair dealing for the purposes of research, study, criticism or review as permitted under the Copyright Act 1968, no part may be reproduced in any form, stored in a retrieval system or transmitted without the prior written permission from the Rural Industries Research and Development Corporation. Requests and inquiries concerning reproduction should be directed to the Managing Director. Researcher Contact Details Associate Professor Fredoun Ahmadi-Esfahani Department of Agricultural Economics (A04) University of Sydney NSW 2006 Phone: 02 9351 3559 Fax: 02 9351 4953 Email: [email protected] RIRDC Contact Details Rural Industries Research and Development Corporation Level 1, AMA House 42 Macquarie Street BARTON ACT 2600 PO Box 4776 KINGSTON ACT 2604 Phone: 02 6272 4539 Fax: 02 6272 5877 email: [email protected] Internet: http://www.rirdc.gov.au Published in March 1998 Printed on recycled paper by Union Offset

3
AN ECONOMIC ANALYSIS OF THE WHOLESALE DEMAND FOR FOOD IN CHINA: IMPLICATIONS FOR AUSTRALIA
1 INTRODUCTION
1.1 General
China is a very important player in global food markets being the largest producer and consumer of food in the world. Food exports in 1994 reached $US100 billion increasing by about 20% on the previous year while imports grew twice as fast in the same year, amounting to $US32 billion (China Statistical Bureau, 1995). This substantial increase in trade has been largely due to internal reforms undertaken by the government in the late 1970s combined with significant linkages with international markets. These reforms included decreasing the role of centralised production planning in agriculture and reducing the level of commodities procured by the government making significant pricing policy changes.
China’s substantial income growth is expected to significantly influence the structure of food demand. For example, the rising demand for pork, poultry and eggs has resulted in greater demand for feed grain as opposed to food grain. Within the demand for food grain, consumption shifted toward higher quality grain (Garnaut and Ma, 1992).
China’s meat consumption is estimated to increase by 46% to 33 kg per person in the year 2000, while pork consumption is estimated to increase by 36% (Crompton and Phillips, 1993, p250). Even the less consumed beef and lamb are estimated to increase by 90% and 60% respectively (Ibid). China has relatively high income elasticities for fruit, vegetables and pork (Wu, Li and Samuel, 1995) which, with income growth, will shift the demand considerably toward these products. There is also likely to be increased demand for higher processed food products like canned meats and UHT soups.
Another factor that will considerably impact on China’s food demand is population growth. China’s population was 1.1 billion in 1989 and is expected to reach 1.3 billion in the year 2000 (Crompton and Philips, 1993). As China’s population grows, its import demand for food will increase, while its land/labour ratio decreases. The ability of China to meet this increased food demand is, thus, rather limited and with China’s growing economy its comparative advantage will continue moving away from agriculture toward labour-intensive manufactures.

4
Since 1978, the operation of Chinese food markets has changed considerably from being almost totally government controlled to being much more influenced by free market forces. One of the major changes in the industrial organisation of the Chinese food economy has been the expansion of the role of the wholesale food markets. The process of circulation of agricultural products in China is becoming of increasing importance to the investigation of the industrial organisation of the Chinese food economy (Ahmadi-Esfahani and Locke, 1998). The Vegetable Basket Project, established in the late 1980s has led to rapid development of agricultural wholesale markets, and increased emphasis on these institutions as the main model for food distribution throughout the country (Hua and Hill, 1996). Recent policy initiatives, aimed at expanding the number of these markets, have served only to cement this role (Xinhua, 1996). These markets, due to their emphasis on competitive price formation, are perhaps the best indicators of consumer preference currently available. Following recent initiatives in price collection and dissemination, especially by the larger markets, there are now growing data sets available for economic analysis of changes in consumption patterns in the Chinese food economy. However, studies on China’s food consumption structure, particularly on the wholesale markets, are limited. It is argued that these markets are both the key to analysing demand and consumption patterns and a major vehicle for the Chinese government’s food policy.
The influences on the world markets for China’s food industry are heavily dependent on its domestic markets, notably, the number and size distribution of sellers and the government’s role in influencing demand and supply forces. The government now has different forms of intervention in the markets, while the international market has a much greater influence on China's markets. A number of reforms have had wide-ranging and inter-related impacts on supply, demand and price formation. These different components are dealt with separately below in an attempt to isolate some of the key components of the way central planning has been modified in major segments of the food sector before focusing on China’s wholesale food markets.
1.2 Supply
Concern about agricultural productivity was the major catalyst for reform in China following the Great Leap Forward1, and clearly at the basis of Deng’s rural policy platform. In 1980, he argued that The key task is to expand the productive forces and
1 The Great Leap Forward was the first of Mao Zedong’s major social experiments aimed at bringing stability to the Chinese economy and society. The 1958 strategy involved a greater push toward collectivisation and away from private enterprise. The subsequent economic downfall and catastrophic famine are commonly held as symbols of the failure of this plan, which was discontinued in the early 1960s (Mackerras, Taneja and Young , 1994).

5
thereby create conditions for the further development of collectivisation. To be specific, the following four conditions should be realised: First, a higher level of mechanisation, one which is relatively well suited to local natural and economic conditions and welcomed by the people. Second, a higher level of management, combining accumulated experience and a contingent of cadres with fairly strong management abilities. Third, a developed diversified economy that leads to the establishment of a variety of specialised groups or teams, which in turn leads to the large-scale expansion of the commodity-economy in rural areas. Fourth, an increase in the income of the collective, both in absolute terms and in relation to the total income of the economic unit involved. (Deng, 1984, pp297–298). The motivation was, therefore, supply-driven with the aim of liberating price responsiveness in the supply process and improving the availability of resources to production.
According to Martellaro (1991), the actual policies introduced in 1979 included a number of changes to production. A program of crop diversification was introduced in order to allow supply to meet the growing demand for a wider variety of consumer goods. Additionally, the production responsibility system was introduced which more clearly defined the relationships between consumer and seller by allowing the production teams to directly contract with individual households (Riskin, 1988). As part of the new system, inputs were supplied to each family farm and the outputs were divided between the family and the state, under the banner of the “Household Responsibility System” (Ling, 1990). These changes signalled a period of substantial growth in total factor productivity; however, it is difficult to determine the end result for production due to discrepancies in official statistics (Johnson, 1994). Reforms were introduced to increase efficiency by increasing the incentives for private production and improving access to inputs, including increased use of alternative sources of investment capital (Martellaro, 1991; Fan, Wailes and Cramer, 1994). These reforms have been typified by a decline in state ownership across all sectors, although the exact extent of this in agriculture is difficult to determine (State Statistical Bureau, 1993).
The specifics of the past reform process involved two major stages. In the first stage, conducted from 1978 to 1984, the state maintained the existing design of state commercial planning for major agricultural products but adjusted state planned quotas and prices. It relaxed restrictions for public trade allowing producers to engage in private selling provided they fulfilled their delivery quotas (Sicular, 1988). In the second phase, this distinction between above and below quota production was also removed. In grains, the largest Chinese food industry, this gave freedom for farmers to produce at higher levels with state-guaranteed purchase, which was hampered only by poor handling and storage facilities and disparate quotas among regions. The increased production led to greater self-sufficiency which in turn allowed farmers to diversify into more profitable cash-crops. The net effect of this was to open access to alternative marketing chains and service providers, and to

6
more indirectly improve the demand for both food and food grain (Ceroils, 1994; Lyons, 1993; Carter and Zhong, 1988).
Rural communities are now largely left to themselves in managing their activities so long as they meet the production quotas set by the central government (Koo, 1990). To a great extent this has meant the reduction in influence of state in production decisions (as argued by Nee and Young, 1991, p295), although it has had the side-effect of making these interventions more difficult to measure. The reforms have encouraged specialisation by providing for market-determined resource allocation to a degree which has implied that the structure of food production has become much more diversified. Localities that were previously only planting grain crops diversified as opportunities arose, while many producers tried to move into higher-quality produce. More importantly, the farmers now have much greater freedom in their choice of crops as, aside from quotas and paying taxes, Chinese farmers now have the freedom to make cropping and input decisions and are allowed to retain any profits they earn (Feder, Lau, Lin and Luo, 1992, p1). Further, the ability of farmers to sell on the free market encourages them to specialise in certain crops and take advantage of economies of scale. A new organisational form of agriculture has arisen, orientated to the market and led by enterprises doing processing of agricultural and sideline produce, which has resulted in enterprises undertaking negotiations and signing production and marketing contracts directly with farmers (Agriculture Yearbook, 1993, p52). Farmers can now more readily respond to market opportunities as they emerge, an hypothesis that is supported by a number of empirical studies which have indicated that, since 1984, there have been limited moves toward positive and significant price elasticities, especially in soybeans (see, for example, Stanmore and Ahmadi-Esfahani, 1996).
With respect to the international market, until 1978 this was under-utilised because of the tight controls on imports and exports wielded by the central government. However, the provinces are now more open to the world in terms of importing seeds and technology with the reforms leading to large amounts of foreign capital flowing into agricultural development (Agriculture Yearbook, 1993, p71). More importantly, there is now much greater leverage for provinces and private companies to export. This has resulted in the Chinese food markets being much more open to the outside world as foreign companies are able to set up joint ventures in provinces to export certain foods, providing increased access to technology and investment capital (Khan, 1991). In all, exports from firms involving foreign investment in 1993 rose to $US25.2 billion, up 45%, while their imports were $US41.7 billion, up 59% from the previous year. The coastal areas have been the leaders in accelerating the pace of opening up to the outside world, for example, Zheijan province which began accepting direct orders from foreign traders and developing large scale collection and distribution centres (Agriculture Yearbook, 1993, p72). The most massive increases have been in the special economic zones (SEZs) of Shenzhen, Zhuhai,

7
Shunton, Xiamen and Hainan, where the level of new foreign investment contracts rose 190% from 1992 to 1993 (Ernst and Young, 1994).
The SEZs are different from the rest of China in two key areas: the autonomy that they enjoy over investment decisions and the freedom to manoeuvre in areas of pricing, taxation, housing, land and labour policies (World Bank, 1994). They have been seen by Deng Xiaoping as an important medium for introducing technology, management and knowledge, whilst being a window for foreign policy (Ding, 1994). The performance of these regions and the coastal cities has been impressive but variable, the main impact being the experience in opening the country to foreign investment – although the vision thus far may be overly optimistic (World Bank, 1994; Murray, 1994). In terms of the food economy, the inflow of investment that is likely to follow an expansion of this policy means that resources should be diverted out of agriculture into industrial production, which has raised government concerns about the security of food supplies. However, conversely, the introduction of productive capital should also improve the capital structure of agricultural supply, which would be of more benefit to the economy than antiquated self-reliance measures. This will be of particular importance as the freedoms associated with the SEZs expand, because their growth may lead to much needed infrastructure improvements.
The issue of the quality of this infrastructure is pivotal to the viability of food delivery. While the rise of supporting institutions, such as better financial markets, has been noted by many (see, for example, Agricultural Yearbook, 1993, p53), their shortcomings still persist as a major constraint on the productive potential of the Chinese food producers. As Johnson (1994) notes, farmers have often had to forego payments, or accept promissory notes in lieu, due to inefficiencies in directing funds from the central bank to their provincial branches. Similarly, there appear innumerable constraints on the access to international markets due to the influence of many different layers of bureaucracy with heterogeneous trade strategies. In general, as Byrd (1992) notes, the network of support services for the rural sector is inadequate, and compounded by difficulties in state institutions.
Underlying much of the policy intervention is the continued adherence to the goal of self-sufficiency in food production. Despite the fact that China has never been able to achieve this, the memories of past food shortages and the importance of independence continue to keep this goal high on political agendas. Riskin (1988) notes that the principle of self-reliance dates back to the policies of Mao in the cultural revolution, and has a more regional than national focus. As Park, Rozelle and Cai (1994) observe, this emphasis on regional stability has a number of implications for production, principally in emphasising a combination of technology, crop choice and infrastructure construction that minimises production variability. Since infrastructure is typically poorly developed, especially in the areas of storage,

8
these policy goals exist merely as constraints on production, rather than as a means of actual stability or self-sufficiency. It is anticipated that, as trade develops, and the population becomes more at ease with imported food products, resources will be able to move out of agriculture or into more diversified non-food production (see, for example, Anderson, 1992).
Of all the preceding changes, it would appear that the food sector is approaching a pattern of protection that is similar to many capitalist agricultural trading nations. Perhaps the possibility of making more concrete conclusions on these findings is prohibited by the complication brought about by the way that the changes in the policy environment have also directly impacted on supply, presenting an unusual source of departure from market-based norms. As Johnson (1994) observes, the way policies are implemented is in itself a major contributor to uncertainty, as vagaries in interpretation by a complex multi-layered political system contribute markedly to the final policies being implemented and the expectations built into the supply process.
1.3 Demand
The structure of demand in China has been the subject of a great deal of contention over recent times, empirical analysis of tastes and preferences only being possible recently with improvement in access to consumption data. Preferences vary with region, income classification, urban lifestyle, population, household structure, and education. Different components of the diet, which is normally a mixture of staples (fan) and luxury foods (ts’ai), are also often the subject of discrete consumption choices (Kutschukian and Brittan, 1995). While previous studies on the nature of these influences have produced conflicting results, a number of themes in terms of impacts of reforms are apparent. The first is that policy changes have led to some definite shifts in the structure of demand, notably for grain, that may be characterised by a decrease in income elasticities, generally conventionally signed price elasticities, across most of the provinces. There is also evidence of a shift away from grains toward meat and other luxury foodstuff in both wholesale and retail markets (Kutschukian and Brittan, 1995; Ahmadi-Esfahani and Stanmore, 1996). It would also appear from these studies that the changes in demand are not complete, and are perhaps just as transitional as the current policy directions.
Changes in demand have been influenced heavily, at least in wealthier urban areas, by the increased levels of foreign investment that were referred to earlier. While much has been made of the entry into these markets of McDonalds in 1992 and Kentucky Fried Chicken in 1988 (Murray, 1994), there exists a wide variety of different fast-food chains from a variety of foreign sources, which are attracting a range of different custom. Huang (1993) argues that this trend has stimulated a shift in the country's local fast-food trade from individual operation to chains with brand names, mass production and uniform standards. Huang argues that Chinese

9
consumers go to western style fast-food chains for the latter; however, they would prefer to eat more traditional styles of food. If this is the case then the implication of this trend for agriculture is for an increase in the derived demand for higher levels of processing, standardisation of production, improving quality control and reliability of supply and, consequently, a demand for improved signals to producers through the marketing chain. As these developments require changes to fundamental features of the market support structures, the effects of these changes in demand are yet to be fully realised.
The influence of China’s massive and growing population on world food demand will be considerable for years to come. It would appear that not only has population been a key to rising demand and also the need for reforms, it may have also been indirectly responsible for the way that these reforms were implemented. The main departure of the Chinese food economy’s current structure, from more traditional models of government intervention seen in capitalist economies, is the authoritarian nature of the government influence and the way that reforms have been slowly phased. This may be, as Mackerras et al (1994) have argued, because of the way that the large population has made China both difficult to govern and costly to reform, making harsher forms of governance seem more necessary.
Intertwined with the focus on population has been interest in the nature of income changes that have come out of this reform process. While incomes increase with economic growth, so too does inequality, leading to varying scenarios for the demand for raw and process food products. As previous interventions have involved massive consumer subsidies, there is significant evidence to show that the reforms, at least until the early 1990s, led to a substantial decrease in real wages as food costs rose (World Bank, 1990). While there is some evidence that this is changing, the problem has been compounded by the vagaries of policy implementation which have lowered expectations on permanent income.
The changes in the structure of demand have been strongly influenced by the policy changes on the supply side. The early reforms in agriculture, as indicated previously, had the impact of diversifying the products available, in turn stimulating latent demand in a number of differentiated markets (Martellaro, 1991). In the grains markets, for example, there are now quite distinct demands for food grain, feed grain and seed. The food demand consists mainly of the end consumers, while some government outlets also purchase grain, acting as a middle man between farmer and household. The different sources of grain mean that there exist various prices in different markets although arbitrage limits the price disparity. Different prices also exist for different quality grains, with grain quality actually determined by weight (Shun Yi County, 1994).

10
The demand for processed foods in China has also increased quickly, especially in the urban areas, where the market size is now estimated to be $A42 billion (Samuel, 1994, p31). In 1979, only 5% of meat was processed, whereas in 1994 this level has risen to 20% (Institute of Agricultural Economics, 1994). This reflects a change in Chinese preferences away from traditional home cooked foods toward commercially processed foods and the associated income growth. Meat, cereals and fruit and vegetable products account for the majority of consumer expenditure on processed food and beverage products (Samuel, 1994, p15). The government has very little control over prices in food processing, although it is involved in some big food processing firms (Ding, 1994). This creates incentives for the private sector which is reflected by the significant foreign investment into China in the processing area, mainly in the form of joint ventures. This area of the Chinese food industry is likely to experience further growth from the private sector.
As with the supply side, the exact impact of the reforms on demand is very difficult to interpret; however, it would appear that a number of general observations are warranted. The first is that consumers are increasingly free to choose the type and source of food goods that they wish to consume, and therefore they are growing much more responsive to the price system. The second is that consumption subsidies are much lower than previously, again implying the possibility of greater price responsiveness.
1.4 Price Formation
The importance of the preceding supply and demand developments is perhaps most significant when one considers the influence of this modified socialism on price formation or, more especially, the current impact of distortions. As Ahmadi-Esfahani and Stanmore (1993) note, reforms will lead to prices moving toward their imputed or ‘shadow’ values. This implies that, as factors of production approach their underlying value, resources will be diverted into areas of comparative advantage, and both positive and negative effects of the variability of certain sectors will be experienced as prices adjust. The way that these relative prices have been influenced both by past polices and reforms is crucial in assessing the impact of the movement to shadow prices.
One of the main objectives of the Great Leap Forward was to improve the terms of trade between the agricultural and industrial sectors of the economy by significantly increasing state procurement prices for agricultural products (Martellaro, 1991). In addition to this, the introduction of the production responsibility system necessitated a change in the way farmers were paid by the state with the two-tier remuneration system. Under this policy, the farmer derives revenue from two different sources – revenue from goods sold to the state under a mandated quota and procurement price, and from sale on the open market of any remaining produce. It has been

11
estimated that in 1989, on average, this policy gave rise to 38% of state-owned enterprise outputs being sold on markets and 56% of its inputs also procured on markets (Harrold, 1992). The major benefits of this two-tier price system are that it has allowed an underlying continuity of supply and facilitated marginal resource allocation decisions to be made on the basis of market prices.
The second stage reforms heralded significant changes to the possibility of private trading, with modifications to the design of procurement planning. The most significant change was the elimination of the distinction between quota and above-quota deliveries, which resulted in new prices being set equal to 30% of the quota price plus 70% of the above-quota price (Sicular, 1988, p291). During this phase, grain quotas were replaced with a program of contract and market purchases. In theory, these contracts were meant to be voluntary, but in practice they closely resembled the old procurement system (Sicular, 1988, p291). There was, to some extent, a redesigning of allocation mechanisms, notably substitution of markets and manipulation of prices (Lyons, 1993). Structural policies were introduced for further stimulating diversification of agriculture which reduced the emphasis on grains and encouraged the development of cash crops and livestock (Hartford, 1987, p212). Not surprisingly, this environment had different impacts on key sub-sectors within the food economy.
Of particular interest has been the effects of reforms on the grains sector. In April 1992, the state raised its monopolised selling prices of grain and realised the same prices for purchasing and marketing (Agriculture Yearbook, 1993, p54). This resulted in all provinces adjusting retail grain prices in line with purchase prices, while at the same time opening retail markets (Research Group on Annual Analysis of Rural Economy, 1994, p78). Further reforms occurred, including grain and oilseed prices in 1991, while there has also recently been the introduction of wholesale and futures markets in grain (World Bank, 1992, p43). The role of these wholesale markets, which can include futures contracts at national, regional and local levels, is likely to increase further (Weiling, 1994). Empirical studies on wholesale market data, such as Ahmadi-Esfahani and Stanmore (1996) demonstrate, however, a marked lack of price responsiveness in grains which was seemingly attributed to a continued high level of distortions in these markets, and to the fundamental nature of these products to the Chinese diet. This would appear a marked contrast to the meat and vegetables sectors.
While the meat industry is similarly characterised by free markets and some government intervention, meats are mostly sold through wholesale markets. Within this industry, the pig market is by far the most important. There are two main types of traders in the pig market; private market agents (which have around half the market) and state-run ones. There are also a couple of co-operatives, but their percentage of the market is small (Ke, 1992). There are hardly any business linkages

12
between the private and state-run firms as the state sector wants to protect itself from the private sector competition, and is largely better equipped (Ke, 1992). The private meat traders are mainly farmers and have no modern marketing facilities with no long-distance wholesale activities and often only limited information on price expectations (Zhou, 1992). The majority of private traders have no division of labour, with all undertaking purchasing, slaughtering and retailing activities (Ke, 1992). However, the advantages for the state-run agents are likely to decline as the number of state traders decreases, the private agents grow in size and gain access to technology and specialisation. Further, the private wholesale markets are likely to create greater opportunities for the private meat traders. To keep consumer prices low and stable, the prices at the retail level in the state-run meat shops are often fixed, while there may also be upper price limits for the private retailing activities at free markets (Ke, 1992). In this environment, it is not surprising that empirical studies indicate a high degree of price responsiveness in these markets (see, for example, Ahmadi-Esfahani and Stanmore, 1996).
In many ways similar to the meat sector, the vegetables industry is probably the most open of all the food markets with respect to price formation. Farmers sell vegetables either directly to consumers, through the free market or through the wholesale markets, with the purchasers being either households or retailers. The government does play a role in the administration and operation of some wholesale markets; however, the prices are determined by supply and demand. There are now more than 5000 wholesale markets for vegetables and fruits accounting for more than a third of the transactions while the degree of competition between the wholesale markets varies from province to province (Agriculture Yearbook, 1992, pp46–47). These wholesale markets are very competitive, for both the management who compete for sellers through their administration charges and between the sellers within each wholesale market. In a manner analogous to the studies on meat, the vegetables industry has shown a higher level of price responsiveness than the grains sector (see, for example, Ahmadi-Esfahani and Stanmore, 1997).
Generally, the food industries in China are now characterised by a greater role for free markets. In 1991, for example, there were 72 600 rural and urban fairs which accounted for a quarter of the social retail sales (Agriculture Yearbook, 1992, p46). This increased presence is readily apparent in all the major feed industries: grains, meat, fruits and vegetables as well as the food processing industry. However, the government still plays a major role in these industries, particularly grains, and has a tendency to step in whenever the market is not operating as it desires with a number of direct and indirect policy interventions. The state sector remains important in wholesaling agricultural products, retailing commodities under price controls and the ration system (World Bank, 1992, p45). The state-owned enterprises compete strongly with emerging enterprises which suffer from disadvantages in terms of technology, management and economies of scale (Research Group on Annual

13
Analysis of Rural Economy, 1994, p25). While since the reforms, 75% of all state-owned commercial and service companies had been sold or leased to private owners with free entry allowed for others (Harrold, 1992), freedom in this market is limited by the government’s reputation for intervention when the market does not behave as desired. Pork rationing in 1987, direct controls on prices and markets in 1988, subordinating exports to procurement objectives, imposition of price ceilings in 1989–91, and suspension of trading for rice and rapeseed futures in October 1994 are all recent examples of this (Ling, 1990; World Bank, 1990; Johnson, 1994; World Bank, 1992; and Jie, 1994). These incidences reflect the government practice of modifying policy to allow a greater role for free market forces by stepping in in the early stages to ensure that the markets operate in accordance with planning. Although this tendency to intervene is likely to decline over time, the government’s actions in this regard continue to put strong limits on the efficiency of the price formation process.
The methods of government intervention have undergone some subtle evolution. Rather than controlling both supply and the market, the government now uses its participation in the markets to influence price. Additionally, the government is now an owner of some markets which it attempts to run as commercial entities and compete with private markets and has made commitments to invest in infrastructure by building "standardised wholesale markets and farmers markets around the country" (Xinhua, 1994, p1).
1.5 Summary
In summary, China’s policy toward more-market-oriented food system opens various opportunities for existing as well as potential exporters. It appears that a major component of implementing this policy is the development of the wholesale food markets. However, there is a dearth of information on how these markets operate and studies on the effect of food demand structure in these markets are extremely limited.
To fill these gaps, the objectives of this study are two-fold: to analyse a profile of the existing nature and structure of a number of important wholesale markets, and to investigate the Chinese wholesale food demand structure and assess its implications for the Australian food industry. The Australian food industry will benefit from this research as this will identify the growth areas among the food products analysed in the study. Information on the responsiveness of demand on prices will also be useful for both existing and potential suppliers in formulating their marketing strategies. Thus, Australia will be able to target and develop the most appropriate production, marketing and trade strategies for food products that offer the greatest return to the agribusiness sector and economy.

14
The study is organised as follows. The nature and structure of the Chinese wholesale food market are analysed in Chapter 2 via the studies of a number of important wholesale markets in four geographic areas. This serves as a background for the subsequent investigation of food demand. It is argued that these wholesale markets reflect another form of government intervention and that their role and price discovery processes are not philosophically different from those in capitalist economies, despite some differences in the stage of development, and the actual mechanisms of intervention used. In Chapter 3, an overview of the models, data and procedures used in food demand analysis is presented. This is followed by the interpretation of the results in Chapter 4. Chapter 5 explores the implications of the study.

15
2 WHOLESALE FOOD MARKETS IN CHINA
2.1 General
There has been a growing interest in the role of the Chinese wholesale food markets in agricultural development and the food distribution system. Despite this attention, very little is known about these institutions and the way that they operate. In this section, some case studies are used to develop the profile of the existing nature and structure of a number of important wholesale markets. After an overview of the theoretical role of these markets and how they are perceived by Chinese policy makers, a review of some of the leading markets in Beijing, Nanjing, Guangzhou and Shanghai is provided. Observations are then made about how these markets operate in practice and how they contribute to the Chinese food economy.
2.2 Structure of Wholesale Markets
The Chinese government has recently committed itself to further development of wholesale marketing institutions. Sixty major wholesale markets for vegetables, meat, seafood and fruits are being established over the next five years by the Ministry of Agriculture to facilitate the handling and distribution of these products (Xinhua, 1996). In the light of this development, it is important to consider the structural characteristics of these markets, especially in comparison to those of developed countries. One of the key issues to consider is that these markets are currently in a state of under-development, and can only be seen in proper contrast to their developed country counter-parts when it is appreciated that the structure of all food markets is basically dynamic or evolving (Kohls and Uhl, 1990, p205).
Generally speaking, in advanced economies, the number of market functions are expanded, the marketing channels are longer, and firms specialise in performing separate but related marketing functions. By contrast, under-developed markets are likely to cover a range of marketing functions, and perhaps be the sole link between producers and retailers, or even producers and final consumers. In developed markets, a small number of “Limited Line” wholesalers may specialise, sometimes completely, in particular products. Similarly, “General Line” wholesalers may increase in size, and develop regional markets, more widespread use of computerisation, mechanisation, electronic ordering and billing, the inclusion of non-food lines, and increased ownership of retail food stores (Kohls and Uhl, 1990, p91).
At the heart of this evolutionary process is the development of structures that can facilitate more-efficient vertical market co-ordination. This trend is perhaps self-perpetuating, as the more co-ordinated the markets are, the more costly errors become, and more-accurate co-ordination is necessary (Kohls and Uhl, 1990, p205).

16
Beyond expansion of ownership to different levels on the marketing chain, contracts and improved price discovery are used increasingly to facilitate this process of information transfer. Should this evolution continue, it is likely to lead to the emergence of food retailing chains, which will compete with and restrain the power of the existing wholesale markets.
Another trend in the evolution of food markets is increasing decentralisation (Kohls and Uhl, 1990, p207). While, initially, economies of scale are likely to encourage centralisation of marketing, modern markets are becoming increasingly decentralised, to the extent that some of the wholesale activity occurs outside traditional terminal markets, by connecting buyer agents with the production area. This process minimises the physical need to move commodities into a central location. The degree to which this happens is often a function of increasing sophistication of producers in selling, and the previously mentioned greater use of market co-ordinating mechanisms (Ibid, p210). However, it is perhaps a function of the propensity of these products to spoil and the variability in production that a greater level of sophistication in handling, storage and transformation is also pursued. The central difficulty with these decentralised markets is in their ability to discover efficient prices, despite some potential gains in operation efficiency (Ibid, p212). The decentralisation would appear to lead to a greater departure from perfect competition, and may have led to terminal markets to become “thin”, and hence less effective in their price discovery (Ibid, p213).
To compete as decentralisation occurs, wholesale firms are increasingly involved in a greater range of marketing functions, buyer services, and specialist distance provision. This often involves relocation of the market structures to better locations. Large buyers integrate into this chain at various levels via buying offices, distribution centres and retail linkages. They may also be involved in regulating the flow to market through co-operative agreements between growers and shipping point firms. Such an understanding requires an appreciation that the role of wholesaling in the food marketing channel is not simply one of pass-through, as the efficiency of this link has major impacts on the remainder of the food industry, and it adds utility to food products (Kohls and Uhl, 1990).
Watson (1996) suggests a simplification of the distinction between wholesale markets in industrial economies and those being found in the planned Chinese environment that is worthy of re-iteration. Industrial markets are distinguished by being designed for speed of handling and exchange, having a large geographical reach, networked to good transport and storage infrastructure, standardised packaging and product descriptions, minimal handling by humans to avoid damage, having an increasing level of product preparation (packing, washing, etc) done by the producers, and including a range of support services and institutions. The planned, or pre-reform, Chinese model has none of these, and is based principally on the idea of supporting

17
urban self-sufficiency. Although much of this has changed with the progress of the reforms, the degree to which this distinction is somewhat valid is still indicative of the current stage in the reform process.
As the majority of the food markets under consideration here trade mainly in fruits and vegetables, it is important to note some commodity characteristics that have impacted on their structures. These include perishability, large price and quantity variations, seasonality, alternative product forms, bulkiness of products, and geographic specialisation of production (Kohls and Uhl, pp485–491). To preserve quality of these products during marketing requires a greater level of sophistication in handling to prevent spoilage. Sales have to be rapid, and may therefore be difficult to organise or formalise. Where supply is inherently unstable, contracts and agency agreements are used to try to bring this to processes where the possibilities for supply control may be limited. Seasonal effects may be limited by draining supply from a variety of growing regions, but these require infrastructure in transport and communications to be effective. Similarly, overcoming seasonal variation by transformation to close substitutes, such as producing juices and freezing them, also requires good infrastructure. This maintains the product in a form that can still be used by processors, but is less expensive to store.
According to the Price Research Centre of the Ministry of Agriculture (Xu, 1996), the wholesale market in China is seen as having four principal functions, which are not dissimilar to the preceding discussion: • To broaden commodity separation. • To bring the price mechanism into force. • To satisfy transaction needs, to save costs to consumers and to increase the
opportunities for transactions. • To provide information to sellers.
As indicated previously, the level of analysis of these markets is very limited, with recent analyses by Watson (1996) and Xu (1996) being new and useful exceptions to this observation. This may be partly explained by the fact that the role of the wholesale market in China is changing. These new markets are seen by the Centre of Commerce and Domestic Trade Ministry as existing on three levels. The most basic are less-structured free-retail markets, which account for around 83% of this trade. Nearly all the remainder (17%) are wholesale markets, which are more interventionist and exist in both cities and rural areas. A third group, which is still evolving, are the so called “modern” or futures markets (Ding, 1996). In all, according to the Price Research Centre of the Ministry of Agriculture, there are now approximately 2490 wholesale markets across China (Xu, 1996). These originated as vegetable and fruit markets and have developed to include meat, grain and seafood.

18
2.3 Government Intervention
The Price Research Centre of the Ministry of Agriculture classifies two types of wholesale market, those which formed spontaneously, for example Dazhongsi in Beijing, and those which are set up by the government. The characteristics of the first are high transaction volume but low levels of regulation. The second type is fully regulated but has a much lower level of activity. Most observers would argue that the latter markets will continue to be run by the government well into the future. The Price Research Centre of the Ministry of Agriculture is trying to meet the challenge of increasing the level of activity to this group (Xu, 1996). Part of the reason for the difficulties of the state-owned markets would appear to be in the inadequacies in infrastructure and lack of clarity of management objectives. Watson (1996) notes that the rapid, but haphazard, development of these markets from the early 1990s has produced a wide variety of administrative structures. These include indirect management by state agencies, by the railway authorities with other state agencies supervising, and by independent organisations on the outskirts of cities (Watson, 1996). There are also a wide variety of government departments involved in administering, licensing and servicing these markets. The Domestic Trade Ministry, which is involved in prices, is currently attempting to alter the structure of this industry to establish main markets (for example, grains, oils and sugar) in different provinces (Ding, 1996).
It is important to note that, in these highly regulated markets, the methods for government intervention in the price discovery process vary widely, and are not simply restricted to those products whose prices are determined by administrative arrangements. Gardner (1982) observes that there are a number of concerns raised about unregulated food markets that are succour to government desires to intervene in their conduct. These include a desire by the government to stabilise prices, a more fundamentalist argument about the “specialness” of food, and basic concerns about the structure of the economy. While it is debatable how valid these arguments are (see, for example, the discussion in Gardner, 1982), there would appear good anecdotal evidence that the government is keen to be involved in the development of agricultural production, even if at a cost to the industrial sector’s growth.
Kohls and Uhl (1990, pp355–368) observe how a range of policies aimed at supporting either producers or consumers can have a large impact on the processes and outcomes of price discovery. When considering administered prices, it is important to note that prices which are administered to protect consumers – a situation not uncommon in China – could have a major impact at the retail level, even if the effect on wholesale price discovery were not immediately apparent. Similarly, policies aimed at influencing the determination of domestic prices, the stability of these prices over time, and the price differentials that are created across time and space would all have varied effects on the activities of wholesale markets

19
(Timmer, 1986). For instance, control of urban prices may imply that it is more profitable to ship goods back to less-regulated production areas or store production outside the cities. Broader general equilibrium effects of policy are also of importance and impact on the structure and function of the whole marketing chain.
What is interesting to note is the interdependence between the process of price discovery and government policy operations. For example, in the case of formula pricing, a government may be able to use this as an easy way of administering prices (see, for example, Hayenga and Schrader, 1980). However, a limitation may be that base prices are not representative, and increasing use of the formula will limit the sample from which an alternatively discovered base price is drawn (Tomek and Robinson, 1990). Administrative decisions on their own are an alternative to this, but even these rely on adopting prices close to the free-market values, or a high level of monopoly power in the market.
2.4 Discovery of Prices for Agricultural Products
Central to the role of the wholesale market, as outlined above, is the process of price formation. This process was seen to be fundamental to the continuing problems in wholesale markets by the Chinese Ministry of Commerce (Ding, 1996). The same qualities are often shown to give widely different prices, anecdotal evidence suggesting variations of several hundred per cent were not unheard of. Large variations exist also from more easily explained causes, such as an enormous seasonal effect, and large differentials in provincial prices which follow from different production technology and marketing infrastructure. The prices between state-run and more-autonomous markets are nonetheless claimed to be very similar, although it is hard to conclude this exactly as they often deal in different goods (Ding, 1996). Watson (1996) observes that the prices in these markets generally reflect supply and demand, with government policies, in effect, acting to curb excessive price movements and speculation.
It is useful to consider a range of mechanisms for the discovery of prices for agricultural products. A number of surveys have been conducted in the area of the institutional arrangements used to establish the price of farm commodities,

20
including Tomek and Robinson (1990) and Kohls and Uhl (1990). Five categories may be used to summarise these approaches: • informal negotiation or bargaining (private treaty pricing); • trading on organised exchanges or auctions; • formula pricing; • collective bargaining between producer groups and first handlers or buyers
and between government agencies; and • administrative decision between both private and public agencies.
It would appear that the movement toward the wholesale market structure is both a movement away from the first category, and the more interventionist modes of discovery that are typically ascribed to a planned economy.
It would appear that the price discovery mechanisms do vary somewhat among different commodities, or a combination of alternative discovery methods may be in place for the same commodity (Tomek and Robinson, 1990). When considering the difficulties and benefits associated with the formalised exchanges like wholesale markets, it is useful to consider some of the implications for other forms of price discovery. Individual negotiations will only approximate equilibrium prices if neither buyers nor sellers possess market power or if information is symmetric. The prices returned will tend to be in a range rather than a specific value, implying that price reporting becomes time-consuming and expensive (Ibid, p203). Auction markets, to some extent, tend to facilitate the determination of prices for commodities that may be difficult to standardise. Physical inspection is facilitated by assembly of the produce, which can add to the expense of these operations. Collective bargaining solutions, such as selling through voluntary co-operatives, may benefit farmers but are subject to inherent free-rider problems (Ibid). Tomek et al (1990) argue that this form of exchange will more closely approximate the equation of short-run supply and demand, especially where the volume of transactions is large, the quality of the produce is broadly representative of total production, unbiased information is available to all participants, and prices are above the government support levels (Ibid, p203–204).
One of the main difficulties associated with commodity markets is that of instability in prices due to speculation. This would appear to be a greater problem where buyers and sellers do not physically meet, and determining representative prices may be more difficult (Tomek and Robinson, 1990). An additional difficulty, the “thin market” phenomenon noted previously, is where aggregate supply and demand are not truly reflected by the trading on the market (Nelson and Turner, 1995). That is, only a very small portion of the transactions determines the price. The thin market pricing imperfections may occur when the terminal market is viewed as a place for dropping temporary surpluses or by buyers when other sources evaporate

21
(Tomek and Robinson, 1990, p205). Although empirical evidence on this phenomenon is inconclusive (Nelson and Turner, 1995), there would appear a prima facie case for assuming inefficiencies where prices are formed in the presence of these distortions. It would also appear possible to overcome these problems by alternative methods of information provision, such as in electronic trading.
It is also useful to consider the possibilities of computer trading in more detail. Tomek and Robinson (1990) argue that this is only likely to be successful where the commodities can be accurately described (graded), the equipment and its maintenance costs are sufficiently inexpensive, and that the products of descriptions are seen as credible. For vegetables, these criteria may be difficult to obtain without a larger leap in technological innovation. It is possible that future markets as an alternative method of organising exchange are similarly limited by the difficulties in specifying futures contracts.
In most cases in China, the levels of arbitrage are low, and conducted exclusively by the government, although there is some anecdotal evidence that this activity is increasing in the more entrepreneurial wholesale markets. The government retains much of its influence on trade flows by imposing heavy levies, taxes and fees on transportation. Notwithstanding this, transportation infrastructure is improving, and government control is declining. For example, the total grain market is 445 million tonnes, of which 100 million tonnes are under government control, 170 million tonnes are brought by the government to the market, 150 million tonnes commercial. That is, the government controls about a third of the grain market, buying only one tenth of the grain supply from the market, and the rest is exchanged in free markets (Ding, 1996). This grain market development is of particular interest as the government is now trying to develop the wholesale grain markets since vegetable markets are largely seen as a success.
Rapid advancement of the levels of retail market of food in China has also put pressure on the development of wholesalers to become more open to market forces (Watson, 1996). This has brought concomitant pressure to improve market facilities of services, communication and other infrastructure to support the wholesale marketing system. This has resulted in many clearly different types of agricultural wholesale markets in different cities, which have different stories to tell about the current status and future directions of the reform process.
2.5 “Chinese Characteristics”
Although this topic is of obvious importance, there has been very little research conducted on the structure and function of the Chinese agricultural products markets, particularly by western researchers. While this is in some ways reflected by the lack of data available, it is also indicative of the dynamism in the Chinese food

22
economy. There is still evidence of strong government controls in these markets, some of which will be discussed later, there is also good anecdotal evidence of only a recent arrival of entrepreneurialism to this sector. This serves to highlight the timeliness of this analysis to an area which should be fertile ground for future research.
At this juncture, a caveat on reliability is in order. While every effort has been made to confirm statistics and to cross-check observations from independent sources, the exactness of the data that follow is obviously open to question. It is believed, however, that the figures and comments reported here are only those which show a reasonable consistency with those from other sources and, while exact figures may not necessarily be correct, they are illustrative of the points being made. In the absence of alternatives, this seems the most appropriate way to provide initial information on this important topic.
2.6 Beijing Region
2.6.1 Background
There are at least four major wholesale markets that provide food to Beijing. In the north it is the Dazhongsi Agricultural Products Wholesale Market (mentioned in Watson, 1996); and in the south, Huaken Yuegezhuang Wholesale Market, Xinfadi Agricultural and Side-Line Products Wholesale Market and the neighbouring state-run Central Markets. Currently, it is the first three that appear to supply over 90% of food for Beijing, with Dazhongsi commonly cited as being the largest, followed closely by Yuegezhuang and Xinfadi, with the latter having a larger share of the quality meat and seafood markets.
2.6.2 Structure and Performance
The Dazhongsi Agricultural Products Wholesale Market in Beijing is one of the largest in China, and arguably the most important in Beijing. This market was established in 1986, following the government's relaxation of price controls for many foods in 1985 and the "open door to Beijing" policy (Dazhongsi, 1994). Similarly, the Huaken Yuegezhuang Wholesale Market was formed only in 1986, built on the land of the Yuegezhuang Village and financed by the Ministry of Agriculture. Through close co-operation with the Ministry of Agriculture the latter market is to receive special funding from the World Bank ($US8m) for development of its facilities. A more transparent example of co-operative ownership in Beijing is in the Xinfadi Agricultural and Side-Line Products Wholesale Market, established in 1988 (Xinfadi, 1995). Xinfadi is the 3000-member Village co-operative that owns the land on which the market is sited, and to which the managers are accountable. While these markets

23
are all of similar age and supply large shares of the Beijing market, Dazhongsi is a recognised leader in terms of price and innovation. However, increased government backing of Yuegezhuang, particularly its focus on higher-value goods and more-modern infrastructure, may soon change this. There is little interaction between market managers, except an informal arrangement to get together once a year to discuss common issues.
The value of sales from all these markets has grown substantially from year to year. At Dazhongsi, for example, sales were initially minor but grew to an average value of 27.9 million Yuan ($US5.34m) per month in 1991, 113 million Yuan in 1994 ($US13.36m), and 253 million Yuan per month in 1995 (Dazhongsi, 1996). Yuegezhuang is also said to be trading approximately one billion kilograms per year, or in value terms about two billion Yuan (Huaken Yuegezhuang Wholesale Market, 1996). In Xinfadi, the expected annual turnover for 1995 was 1400 million kilograms and 1050 million Yuan (Xinfadi, 1995). Vegetables account for the majority of sales in the Dazhongsi market, at times approaching 80% of the volume of turnover, while seafood, fruits, meat and poultry are the next most important, followed by grains and edible oil (Dazhongsi, 1996). There is almost no storage, apart from a cold room which is used for seafood, and no retail sales. Dazhongsi is thought to supply about 30% of Beijing’s vegetable requirements, compared with the 20% figures for 1992 reported in Watson (1996). In a similar manner, Yuegezhuang deals mainly in vegetables; however, it has a strong interest in seafood and pork through the development of large, special-purpose, food halls. Vegetables account for over 50% of all products sold, fruits over 20%, then meats, seafood, grains and oils. In contrast, Xinfadi is exclusively a vegetable and fruit market, with no storage facilities for meat or seafood. It also claims to supply around 30% of the Beijing vegetable demand, with 90% vegetables, and the remainder fruits, grains and oils, and meats and eggs.
Dazhongsi is seen as a reasonably large employer for such a market, with currently around 500 workers. Similarly, the management of Yuegezhuang consists of one general manager and five managers who oversee the conduct of about 550 workers. In Xinfadi, there are a general manager, four managers, and around 115 other employees. With regard to fees for supporting their management services, in Dazhongsi, sellers are required to pay a trading fee, which in line with government regulation, can be up to a value of 2% of their turnover. In 1995 their annual revenue was around 22 million Yuan (Dazhongsi, 1996). However, the markets often charge discount rates to encourage new sellers and attract participants from other markets (Dazhongsi Wholesale Market 1994 and Xinfadi 1995). The Xinfadi and Yuegezhuang management structures are both supported by a lower 1% fee on sellers.
Each of these three markets has a large geographical reach. The participants in Dazhongsi, which include state, collective and private enterprises, reputedly come from over 600 counties across 28 provinces (Dazhongsi Wholesale Market 1994).

24
Similarly, Xinfadi draws sellers and buyers from all over the country, averaging around 10 000 to 20 000 buyers and sellers per day, although around 60% of this activity is retail. Dazhongsi has an operation in Shandong province, a rural centre outside Beijing, which allows closer access to the producers. All markets compete to attract buyers and sellers through the provision of information packages, food, medical, financial and accommodation services, security and contract enforcement, assistance in transport and handling, and even branch markets in provinces (Xinfadi, 1995).
With regard to vertical integration of markets, the experience here seems limited but growing. There is some co-operation between Dazhongsi and food-processing factories, most in meat (especially pork) processing. This movement into vertical linkages appears aimed at eventually stopping the smaller sellers from remaining in the markets. These processed goods are sold mainly in Beijing, for example cooked meat with designer packaging. The Dazhongsi market also owns twelve discount retail vegetable markets, and is establishing a centre for special (Chinese) vegetables at Dazhongsi to exploit a niche market provided by Beijing’s growing restaurant trade (Dazhongsi, 1996). The latter will draw vegetables from all over China, and specialise in the more exotic or wild vegetables demanded by the biggest restaurants. They are also trialing a delivery centre project, which directs sales around 200 tonnes of vegetables per month to over 30 corporations and institutions in Beijing (Dazhongsi, 1996). Similarly, in processing, Yuegezhuang has a 300-tonne cold room for meat and seafood, but it does not at this stage do the actual freezing and processing on site. Transport activities were restricted to the air-freighting of some high-value vegetables and the delivery of local orders.
When asked about future directions for their markets, the managers of all three markets perceived a shortage of experience in their staff, specifically when coming to terms with a market environment, as being one of the key weaknesses of their current enterprise. Reforms to management and labour relations were common themes in Dazhongsi and Xinfadi, and were seen to be promoting productivity, accountability, and wage flexibility (Dazhongsi, 1996 and Xinfadi, 1995). They were also all concerned about the level of infrastructure in their markets, and were in the process of expanding, initially their office facilities, and later working on future infrastructure development. The Yuegezhuang manager also perceived major problems from a shortage of capital, exacerbated by high interest rates and heavy tax levels (20% to Beijing government alone). Xinfadi, on the basis of reasonably healthy profits, was less concerned about this, as it intends to use its assets to invest in cold storage for vegetables, fruits and seafood and possibly further packaging and processing. The major threat to this latter market appears political, as it was at the time attempting to stop the Beijing municipal government from taking-over the site for a new, larger food market.

25
2.6.3 Regulation and Government Intervention
The role of government intervention in these three markets was claimed to be minimal, and perhaps best encompassed by the somewhat intangible notion of how supportive the government was perceived to be of the development of the market by the managers. Yuegezhuang, for example, appeared to be subject to greater government influence; however, it was also more secretive about its activities. Conversely, in the case of Xinfadi, there is an obvious sense of rivalry between the village and the central government, especially over the issue of the control of the site. In Dazhongsi, it is interesting to note that the local government is very active in both promoting the market, and modifying its structure. In 1995 the city council arranged for Dazhongsi to establish direct sales relationships between this market and those in the provinces to increase turnover, supply and the variety of foods available. These arrangements involved agreements among markets and a variety of government bodies through the government-sponsored Second Vegetable Products Marketing Conference in November 1995 (Dazhongsi, 1996). Broader areas of government influence, such as in infrastructure development, are also important. The Dazhongsi Annual Report for 1996 notes that police barricades on highway and excessive transportation fines and charges, are posing particular difficulties to members of the Dazhongsi Circulation Association (Dazhongsi, 1996). Roads around the market were also observed to be too narrow and congested to enable buyers and sellers to move freely.
2.6.4 Price Discovery
The announcing of prices is not very advanced in these markets, despite some recent innovations. In all markets, average daily prices were available by phone to producers, and were occasionally included in television broadcasts. The Ministry of Agriculture, which keeps a large national database of vegetable price movements for traders, also supplemented this process by reporting weekly prices in farmer newspapers (Xinfadi, 1996). In Dazhongsi, perhaps the leader in using new technology to announce prices, the recent erection of a billboard-sized television has meant that daily prices are now displayed outside the market. Additionally, a facsimile service and a Dazhongsi newsletter were being introduced to support this communication process. A new database and information network with nine other government information centres and other agricultural trading companies is also being developed (Dazhongsi, 1996). All markets were generally prepared to volunteer these prices to one another, both Yuegezhuang and Xinfadi purporting to send prices to Dazhongsi on a regular basis.
In all markets, the supply and demand were claimed as the main determinants of these prices. Differences between wholesale and retail prices are very seasonal; however, they perceive little difference in day-to-day prices. According to the

26
managers at Xinfadi, prices are decided mainly by the bargaining of large buyers and sellers. There is good anecdotal evidence of growing consumer sovereignty, such as a small retailer at Xinfadi complaining that “the market is competitive and the consumers are picky and prudent” (Xinfadi, 1996). Of perhaps greater interest is the degree of co-ordination between prices in these markets. Some markets are perceived to be cheaper for a small selection of specific goods, but generally differences in prices are seen to be mainly transportation costs – and while arbitrage may be useful for addressing small market imbalance, it was generally not seen as a profitable enterprise.
2.7 Nanjing Region
2.7.1 Background
The old capital of China, Nanjing, supports a smaller population of around 4.5 million people. The city is an important industrial base for the Chinese motor vehicle, electronics and machine-tool industries, whose populous is served by a number of smaller food markets. The principal two wholesale markets in this city are the Beiyunting Agricultural Products Market and the Zijinshan (Purple Mountain) Agricultural Products Market.
2.7.2 Structure and Performance
The Nanjing Beiyunting Wholesale Market for Agricultural Products is a privately-owned enterprise managed by the Nanjing Beiyunting Market Development Company (Beiyunting, 1996). Founded in 1984, it is expanding rapidly under sponsorship from the district government administration. Zijinshan Market, which is on the western side of Nanjing, is fully state-owned and controlled by the Vegetables Department of the Ministry of Agriculture. Founded in the early 1990s, its most significant growth has come in the last four years. The Beiyunting market is what the managers refer to as a “second class market”, ie it draws its supplies from smaller traders who buy directly from producers, and is not involved in retail. Like Xinfadi, it deals mainly with vegetables, which account for over 95% of its trade. The remainder is mainly grains, with a small amount of seafood, which is facilitated by a limited amount of cold storage (30 tonnes) (Beiyunting, 1996). This market has the largest throughput of all markets in this city, trading 1090 million Yuan per year and 1030 million kilograms of product in 1995, which accounts for 60–80% of Nanjing’s demand (Beiyunting, 1996). In contrast, the smaller Zijinshan market trades a much wider variety of products. While again this is mainly vegetables (80%), it also deals in poultry and eggs (15%), and some drinks (alcohol, wine, beer), seafood, meats and fruits. The total value of all commodities traded has risen from 30 million Yuan in 1992 to 150 million Yuan in 1996. This market supplies the consumption needs of closer to 15% of the city’s population.

27
There are 20 managers and 50 active workers in the Zijinshan market. On average, 2000–3000 traders use the market each day, with around 95% of the products coming from other provinces. In the larger Beiyunting market there are around 550 workers including four managers and a general manager. In both markets, trading takes place around the clock in summer, while in winter, business is conducted only during the day. This activity is supported by strictly regulated management fees which have to be spent on developing and maintaining equipment and facilities, cleaning, and administration. The maximum levies allowed are 2% of the value of transaction, as at Zijinshan. The Beiyunting market charges both buyers and sellers less than 1%, reducing or removing the levy on producers in times of shortage. Some special classes of customers are also given discounts, eg soldiers, universities and disabled individuals (0.3–0.5%).
Beiyunting is not involved in transportation at this stage but may do so in the future. The government wants this market to get more heavily involved in on-site packaging, freezing and processing of raw commodities. Interestingly, the management is reluctant to expand in this direction as it does not believe that customers desire anything beyond fresh foods at this stage. Most processing taking place at the first level only, for example, dried fruits and vegetables. The market has established long-term supply agreements with 1300 traders in over twenty provinces in China (Beiyunting, 1996). Beiyunting was more expansionary, and was hoping to develop a group of wholesale markets, with a hotel (nearly completed), restaurant, and an expanded range of commodities that includes grains and fruits. It is also worthy of note that the market, like many others, has as one of its objectives to improve the economic and social conditions of Nanjing and its vicinity (Beiyunting, 1996 and 1994).
2.7.3 Regulation and Government Intervention
There is some direct intervention in the retail side of vegetable markets in this city. A few commodities (around six) in each season have their prices controlled by the Price Bureau. These are commonly set as wholesale price plus 30%. For example, in summer, Chinese greens, Chinese cabbage and tomatoes are controlled items. By way of comparison, for other commodities in Zijinshan, prices for retail were 50–150% higher than the wholesale prices. Notwithstanding this margin, the basic price levels are highly seasonal.
It is interesting to note that despite its emphasis on market-led growth, the Beiyunting management saw the stabilisation of market supply as an important objective. The management claimed to be able to assist in doing this via its control on prices and quantities, as well as the availability of information (Beiyunting, 1996).

28
2.7.4 Price Discovery
At Beiyunting, prices are arrived at by bargaining, the previous days prices being displayed on a large blackboard to form the basis for subsequent trading. The managers suggested that their prices are a little lower than some of those in the other markets, and about 30% of the buyers take produce from here to the smaller markets such as Zijinshan. While 95% of its business is wholesale, it claims that the change in price from wholesale to retail is around 100%. Markets in Nanjing share price information via the city government’s computerised Vegetable Price network. These provide information to the central government and allow the markets to view one another’s daily prices and quantities of sales of key vegetables across the city.
2.8 Guangzhou/Shenzhen Region
2.8.1 Background
There is an intriguing mix of wholesale markets in the southern city of Guangzhou, and its neighbouring special economic zone city of Shenzhen. As both have ready access to nearby Hong Kong, the foods available are more familiar to western observers. In particular, there was a high level of imports from other countries. There also appears to be a mix of more-local, state-owned markets (similar to Zijinshan in Nanjing), larger, showcase markets, and highly entrepreneurial markets (similar to Dazhongsi). Shenzhen, in particular, contains a large proportion of higher income consumers from the booming special economic zone, and has one of the largest population growth rates in the world, averaging 45% per annum in the last decade (Lonely Planet, 1994).
2.8.2 Structure and Performance
One of the smaller, state-owned markets is the Tin Ping Fruit Wholesale Market in Guangzhou. This market started as part of a more comprehensive agricultural market which began in 1986, separating in 1989 to focus almost exclusively on fruits. The land on which the 11 000-mu (730-ha) market stands is owned by a local village, the government providing the administration of the market. The focus on fruits makes this market more specialised than others in the city, especially the more famous Qing Ping Agricultural Products Market. Established in 1979, Qing Ping is a showcase of “comprehensive” marketing. The market covers an enormous range of products, physically including a network of produce stalls that criss-cross many avenues and lanes of the older part of the city in Guangzhou.
In Shenzhen, by stark comparison, is the Buji Market, run by the Shenzhen Agricultural Products Share Co. Ltd. Established in 1987, this market has developed
29
very quickly and been the subject of some keen government attention. It has no state ownership although the government has contributed to its initial capital, along with private investment from seven large private enterprise organisations (Hua and Fan, 1993). The Buji market is possibly the largest in China, although making a definitive statement may not be possible with the markets sampled.
In Tin Ping, there are around 400 sellers using the market each day, utilising 144 separate stands. Around 200 trucks come each day from buyers, with about 7000 to 8000 wholesalers buying here each day. On average they would trade around 500 tonnes daily of fruits from all over China, at an average price of 2 Y/kg (around 365 million Yuan per year) (Tin Ping, 1993). In Tin Ping, they import only fruit products, mainly from Thailand and also more widely via Hong Kong. There are two other fruit markets in Guangzhou of similar size, with Tin Ping being about middle in terms of price. There is some trade between the three markets, especially in the imported foods (eg apples). While Qing Ping was obviously more comprehensive in format it is difficult to obtain information on its product mix. It claims to have traded 55 million kilograms last year, at a value of 780m Yuan. However, it is unclear to what extent this reflects a trade in non-food products, or retail sales, which were also in evidence.
Compared to the other two, the size of the Buji market is massive, possibly being the largest distribution centre in China (Hua and Fan, 1993). The market supplies all of Shenzhen City – a population of around 3.5 million, but clearly also has a much extended geographical reach. In 1995 it reported exchanging 115 million tonnes of goods valued at 5.6 billion Yuan. The trade in this market is also comprehensive – dealing in around 2000 commodities, with about 10% of these originating from overseas. However, the main focus remains on vegetables, then fruits and other agricultural products. The market has agencies within it for 26 Provinces and Hong Kong, which act as buyers for a wide variety of these products. They are very important suppliers to Hong Kong, supplying 60% of the primary traded agricultural goods market to this country. As an example of this distribution, it was noted that on average 1300 tonnes were exchanged each day, with 800 tonnes going to Shenzhen, 200 tonnes to Hong Kong, and 300 tonnes to other provinces. By contrast, for fruits they would mainly supply locally except a limited range of specialist products, for example, lychees and honeymelon, which are exported. Importers in this market also import directly from Australia: grapes, apples, pears, chicken, kangaroo, ostrich. They export lychees, honeymelon, pears to Southeast Asia and South Africa.
Tin Ping has four managers and employs 13 security staff. The four head managers are from the government, with the other managerial staff coming from the villages and private employers. There are also 42 workers involved in cleaning, handling, and other customer services throughout the 24 hours of operation. By contrast, the Buji market itself covers two levels including 36 000 m2 of fruits, which is being expanded

30
to 80 000 m2 in the near future. Its main staff includes 80 managers, 4000–5000 service people, and wholesalers (3000–4000). Each day, around 5000 trucks of buyers come through this market (about 10 000 people) which is operating 24 hours a day.
This infrastructure is supported by the customary management fees, the Tin Ping market charges 1.5% of the value of the transaction on both producers and consumers. This amounts to around 8m Yuan/year, and around 1m Yuan of this is spent on wages, costs and investment. After costs, the balance is split 30% to government and 70% to villages, the latter using these funds to make “social contributions” to other projects which are not necessarily related to the market (Tin Ping, 1993). The Qing Ping market charges the more familiar flat rate of 1.5–2% of the value of transactions, only charged to sellers. In an interesting departure, the Buji market does not charge on the value but on floor area occupied. The current rate is 7 Yuan/m2/day plus an additional rent of 40 Yuan/m2/month. The producers also have to pay a value added tax to the government, but this does not go through the market.
The Tin Ping managers are not really interested in developing any relations with other wholesale markets, and take a more parochial view of their operations. When asked about their future plans, they indicated a desire to expand and modernise their facilities. While increasing their area somewhat they were having difficulties in securing financing to provide roofing to permit all-weather trading and cold storage. Developing standards and procedures for management to provide a civilised, safe and stable trading environment was also seen as important (Tin Ping, 1993). In contrast, the Buji market was already rapidly expanding, primarily to service the future greater access to the Hong Kong markets, developing an entirely new site with larger facilities for trading, dry storage, and the potential for greater use of cold storage.
2.8.3 Regulation and Government Intervention
As with other markets, there appeared little evidence of direct government intervention in prices. Being state-owned, the Tin Ping Market appeared to have the lack of clarity in management objectives that was highlighted previously as being ascribed to perfectly regulated markets by Xu (1996). Beyond this, however, direct intervention in prices was not noted. Shenzhen, being a special economic zone, was the most liberated of all the markets visited, showing very little sign of government involvement in management. As even the funding for this venture was largely independent, indirect controls were also assumed to be minimal. The differences in the performance of these markets, even when comparing the massive Buji and Dazhongsi enterprises, would, at least superficially, attest to the way that government regulation of other markets may have inhibited their development.

31
2.8.4 Price Discovery
In all markets they indicated that prices were arrived at by bargaining. In Tin Ping and Qing Ping there is some mixture of wholesale and retail, which normally amounted to different prices depending on how much was bought, the former being mainly wholesalers, with a high incidence of retail in Qing Ping. Buji was primarily wholesale in its trade, and indicated that it had a highly competitive price discovery process.
2.9 Shanghai Region
2.9.1 Background
Shanghai, being the largest and one of the most industrialised cities in China, is an interesting case study in food distribution. Higher incomes have meant that the food products are often more elaborate and come through a wider variety of marketing channels, which may account for the main and largest wholesale market not having the same market share as similar size ventures in Beijing. This is also partly explained by the presence of initiatives by the municipal government to funnel in food from outside the city.
2.9.2 Structure and Performance
The largest wholesale market in the city is the Caoan Wholesale Market, which supplies around 20% of Shanghai’s vegetables. The managers of Caoan believe that there are only ten markets of this size in the country. The government has 5–7 state-owned markets which are much smaller, often in regional areas. Caoan exists as a product of government and business co-operation, and is governed by a “Committee of Holders” of seven people. The market employs around 300 staff in total. Surrounding Shanghai are a number of rural areas with their own market structures that help service the city. One such area is Xinchang Town in Nanhui County on the eastern side of Shanghai. In Xinchang Town, there are plans to form a major agricultural market, although this will be mainly retail (1.4 ha). At present, the town and village enterprises are combined as an official unit providing a very small market for fruits, vegetables, and agricultural side products (peaches, watermelons). The main products sold by the Caoan market are vegetables and grains. This also includes around 200 t/day of grains, 500 pigs a day, and a small amount of fish. The total value of exchange rose from 40m Yuan in 1992 to 560m Yuan in 1995. The vegetables are drawn from 20 provinces, with around 30% of these actually coming from Shanghai. Unlike Guangzhou there are no imports from overseas.

32
Aside from the vegetables traded in Xinchang Town, it is interesting to note some of their other activities. Better transport infrastructure has led to a higher level of trade due to their proximity to Shanghai’s deep ocean port, the soon-to-be opened second international airport, and these projects’ related transport links. For instance, the town exports selected flowers and fruits to Japan and Hong Kong through joint ventures. It also sells some local vegetables to other provinces, although it is not directly involved in production.
Of the estimated 3400 food trucks in Shanghai, Caoan has around 700–800 through its market each day – roughly equating to 5000 to 6000 buyers and sellers. The buyers are a mix of wholesale and retail, with probably around 60% being the former. To service these customers, the market also collects fees, in line with slightly different government regulations which allow levies of 4% of the value for vegetables and 0.8% of values for grains. Everyone entering the market grounds is also charged 0.5 Yuan. In the Xinchang Town markets, fees are charged at the more common rate 2% of the value of transaction, levied on sellers only. The retail market is run by 4–5 managers, who are supported by fees based on “seats” or selling space. The standard for these fees is around 600 Y/5m2/month. Virtually all the income is spent on wages, salaries, maintenance and cleaning. There are only seven people involved in management in the market, made up of two managers and five support staff. No fees are spent on new investment, major investment projects like the proposed new market coming directly from the government (around 10m Yuan).
Despite good growth and government support, the Caoan manager suggested that there were three major problems facing the market. The level of management expertise, the quality of the service, and the need to improve the physical security of the surroundings. The Xinchang Town market complains of a shortage of capital for operations. This and the infrastructure problems are compounded by the distance to the central city markets. It is not seemingly possible at this stage for this market to move out of its production area.
2.9.3 Regulation and Government Intervention
Xinchang Town produces both food for its own use and food for the city. That produced for the city falls under the auspices of the Shanghai City Municipal Government’s “Shanghai Vegetable Market Basket Project”, which co-ordinates growers in different regions around Shanghai. There are both wholesale and retail markets in the Xinchang Town that service this activity. The municipal government is seeking to guarantee food since in the past it has been adversely impacted by increases in demand from other provinces. The Town and County Governments are jointly responsible for wholesale through the “Vegetable Office” of the Town government. The Vegetable Office is the employer of the four managers that run the Xinchang Town wholesale market.

33
The Xinchang Town market managers see this intervention as exacerbating the main problems of transport and storage infrastructure. If the market oversupplies, it cannot sell the residual to the regional markets of the municipal governments, and therefore has to transfer these products itself into the cities at a very high cost. Similarly, it has no cold or dry storage and can have high losses due to spoilage (for example, it once lost up to 50% of a green vegetable crop). While an Israeli firm has invested recently in a two-room cold storage facility in the area, this is seen as insufficient to make a major difference. Coupled with this issue are the variances between free and open markets in the counties around Shanghai. For example, in some seasons supply is seriously low, meaning that the town government will have difficulty collecting the full amount required by the Shanghai Municipal Government. During this time farmers have a strong incentive to sell on the free market – resulting in the government having to pay more to retrieve it.
2.9.4 Price Discovery
The managers of Caoan claim that Shanghai is cheaper compared to Beijing, because it has a better growing climate for a larger local production area. However, the Xinchang Town managers conceded that arbitrage was not uncommon and could be profitable. As much as two thirds of the products is transferred from their first level markets to second level ones that service Shanghai. The management at Caoan argues that the prices in Shanghai are fairly stable as the market is able to draw from a range of production regions and because of the control by the government on the prices of grains. They also suggested that the profits from wholesaling might be lower here than in other cities, and that especially the profits to be obtained from trading in meat were very low due to the weak nature of consumer demand for these products.
In Xinchang Town, market prices are perceived to be determined by free-trade in the smaller markets; however, for those servicing the Market Basket Project the pricing system is more complicated. This consists of wholesale prices for “pedlars” and higher prices for local citizens. Prices in the wholesale markets are regulated by the Vegetable Basket Project, which provides for specific offices to monitor and manage supply and demand for key commodities. The government gives different guarantees on prices to producers of different commodities in various counties, in return for guarantee on the flow of production. The term “Basket” relates to a collection of main vegetables, chicken, pork, fish, eggs (excluded: beef, rice and fruits). Vegetables and pork have the highest level of price control, as they are perceived to have the largest share of daily consumption. Notwithstanding this intervention, significant seasonal variations in Shanghai’s food prices were again noted, with large differences between wholesale and retail levels.

34
2.10 Synthesis
The preceding survey contains a great deal of detailed information on a select group of markets across China. From this, some general observations from our conceptual framework on wholesale markets, of the “Chinese Characteristics”, can be drawn. Central to this discussion is the recognition that the Chinese markets are as evolutionary as their western counterparts, if not more so. Although the current stage of development is reasonably low, all markets are growing rapidly and have changed significantly over the last decade.
With this rapid growth has come an expanded number of marketing functions in the larger cities; however, these were typically still not as complex as those seen in western markets. Information systems, handling, and packing were rudimentary or non-existent in all case-studies. Marketing channels were also very limited, often with the wholesale markets existing as the sole link between producers and consumers (especially in the smaller cities). While some markets focussed on a limited range of products, the general tendency was not to specialise in a traditional “Limited Line” sense. Although a few markets were attempting to establish special sections for high-value produce, they were still trading large numbers of other products. Similarly, those markets which currently traded only a limited range of fruits or vegetables were expressing a desire to move into a broader range of commodities.
In keeping with this general-line approach, the wealthier markets were steadily expanding in size, developing regional sub-branches, and making limited forays into mechanisation, information technology, non-food lines, value-adding and retail ownership. Although these developments are still generally in their infancy, this would seem a good indicator of future directions. Formal development of marketing chains through vertical integration was not observed, although the more entrepreneurial markets were looking toward this possibility in the future.
As would be expected with this current emphasis on general trading, there was also no evidence of the thin-market problem, as it would appear that the general trend is still one of centralisation of markets, rather than decentralisation. In this case, the wholesale markets would appear to remain the main fora for price setting. Sellers are generally not very sophisticated in their dealings with these institutions and poor storage and handling facilities require that the vast majority of produce still be moved to markets for price discovery. Current investment plans in the markets are not likely to reverse this trend. Indeed, rather than attempting to address these limitations, current investment priorities appear to be in developing buyer services in situ, such as accommodation and administrative support, in a manner that may further encourage centralisation.

35
The key question, when discussing the nature of the prices formed in these markets, given that a large volume is traded through them, is the nature of government distortions. While the regulation versus transaction volume distinction of Xu (1996) was observable, the impact of state ownership on price discovery would appear to be limited. State-owned markets appeared to be generally smaller, less entrepreneurial, and suffering a malaise of complex administrative arrangements; however, this did not seem to influence their actions in price setting. In all markets, informal negotiation or private treaty bargaining appeared the main mode of price discovery. The only direct policy that was often referred to was that Vegetable Basket Project or its variants, which is worthy of closer examination.
The “Vegetable Basket Project [or Plan]” is the title of the set of policies which continue to hold a high level of central government support in this area. As Hua and Hill (1996) note its main purpose is to increase the supply of agricultural products both in the large towns such as Beijing, Shanghai, Guangzhou and Chengdu and in the agricultural, but rapidly industrialising provinces such as Guangdong, Sechuan, Shandong and Hernan. Conceived in 1986, and fully implemented by 1989, the main philosophy underlying this instrumentation has been to develop wholesale markets for fruits, vegetables, and agricultural-based products. The primary resources for this is via investment by urban centres, as these markets are designed to facilitate a greater flow of food from rural to urban areas (Watson, 1996 and Hua and Hill, 1996). Although it was most active from 1987 to 1989, the key elements of the Vegetable Basket Project remain in place today, and continue to be influential. It is important to reinforce the fact that the aim of this project is not to sweep away market forces, indeed the current incarnation appears to give producers considerable freedom to sell in a range of markets, only impacts on a limited range of products, and focuses on controlling wholesale-retail margins, rather than the wholesale price directly. While the results of this project have served to increase production and sale of agricultural products, and improve the supplies of fruits, vegetables and other perishable products to the cities (Ibid), it is also likely that some of the specific initiatives were pivotal in the rapid growth of these structures.
The wholesale food markets, therefore, reflect a very important and growing part of the Chinese food circulation system. Currently, they appear to be following the conventions of the western model of a general-line centralised wholesale food market, if only at an earlier stage of development. It would be expected that in the future there will be increased evidence of marketing chains lengthening, an increasing use of these centralised and organised exchanges in price formation, improved geographical reach and market integration, better commodity separation, and a growing expertise in the dissemination of market information. These characteristics are seemingly evolving with steady sponsorship from the government.

36
2.11 Concluding Comments
As indicated in the case studies, growth in these markets has brought some difficulties and opportunities. It would appear that there is general agreement between our observations and those of other authors on these matters. These include the observations by Hua and Hill (1996) of the lack of integration between disparate markets which makes both price discovery and nation-wide distribution difficult, the continued dominance of small-scale farmers and traders, the persistent shortcomings of facilities and infrastructure, the unclear market rules and systems of operations, and the deficiency of effective market information systems. Hua and Fan (1993) note also the importance of appropriate placement of these markets, and the way that they are often handicapped by being located somewhere on the grounds of historical precedence or political factors. Xu (1996) adds to this the difficulties associated with uncoordinated and overlapping administration by different authorities, and “arbitrary interference in management by government departments”. It would seem, however, that the future development and implementation of these policies is inextricably linked with the future development and performance of the agricultural wholesale markets, and their Chinese characteristics.
While the descriptive nature of the survey of these markets has meant that any analysis is necessarily ad hoc, the previous material provides some intriguing insights into the experience of the rapidly developing wholesale markets in the Chinese food economy. The focus on these institutions in policy actions and recent pronouncements by the central government suggest that these markets will be pivotal to the structure and conduct of food markets in China’s future development. The dynamism in this development also suggests a number of broad observations on the particular characteristics of these markets.
Firstly, it is important to reinforce the notion that these markets are only in their earliest stages of development. They have also been derived from varied initial stages of ownership and development, exhibiting different focuses and diverse levels of managerial prowess. Despite this, they do generally display all the characteristics of a developing centralised wholesale market in a capitalist country. Their uniqueness, if any, might lie in the difficulties that they are encountering in this stage of development. These include the level of infrastructure available to support markets operation, transfer and storage of produce, the shortages in capital for further market investment, the dearth of experience in market operation and appropriate fora for professional interaction by the managers and, finally, the difficulties associated with the location of these markets being largely determined by political actions or historical precedence.
Secondly, it is also essential to realise that, despite the significance of these difficulties, the number of these markets, and their share in supplying Chinese

37
consumers, are substantially increasing. As these markets are also rapidly developing their information technology, there is now increased opportunity for economists to be more involved in more-rigorous and empirical analyses of the nature of Chinese food consumption. Additionally, there is also a significant number of opportunities for other countries to be involved in providing the expertise that is in such demand by this sector. Similarly, there is also an important role for policy development in this bastion of free-market competition to assist in developing appropriate institutional frameworks.
In summary, the understanding of development of wholesale food market with “Chinese Characteristics” will be of increasing importance as the Chinese food economy develops, and as more and more of the system of circulation of agricultural products comes to depend on this model. The problems experienced by many of the markets would appear too insignificant to prevent their role from expanding in the near future. These markets are therefore possible keys to analysing future food demand and consumption patterns in China.

38

39
3 METHODOLOGY
3.1 General
The preceding chapters have outlined the background to our investigation into the demand for food in China. This chapter discusses the methodology adopted in actually estimating wholesale demand elasticities for food in China. A review of the Chinese food demand studies is presented followed by the conceptual framework underlying, the Linear Approximation of the Almost Ideal Demand System, (LA/AIDS). The nature and quality of the data-sets utilised are then discussed. Finally, the procedures involved in the estimation and statistical inference of the LA/AIDS model are presented.
3.2 Chinese Food Demand Studies – A Literature Review
There has been a number of previous studies that have analysed the consumption of food in China, including: Tang and Stone (1980), Van der Gaag (1984), Yang (1985), Carter and Zhong (1988), Lewis and Andrews (1989), Halbrendt and Gempesaw (1990), Peterson, Lan and Ito (1991), Huang and David (1993), Wu, Li and Samuel (1995), Chang (1994), Chern and Wang (1994), Fan, Cramer and Wailes (1994), Fan, Wailes and Cramer (1994) and Samuel (1994).
Tang and Stone (1980) estimated consumption by a method of moving averages. Their underlying assumption was that the total grain consumption was determined by the government, which set the consumption level on the basis of current supply. Operationally, this meant the government set consumption equal to the average supplies of the current and two preceding years. The moving average was then multiplied by a trend factor. However, this approach did not provide any detail on the determinants of demand.
Van der Gaag (1984) made improvements on Tang and Stone's model by placing greater emphasis on the impact of income on demand. Van der Gaag's projections of consumption were based on the Engel Curve, which was estimated using pooled provincial data for 1981 and 1982. Using these estimates, Van der Gaag calculated income elasticities for various components of the consumer budget, including food, housing and clothing. From these estimates it became apparent that a rise in per capita income would have a significant impact on the current consumption patterns. In order to distinguish these possible changes in consumption, Van der Gaag used three alternative income growth projections. Van der Gaag highlighted some theoretical limitations in his model, notably that he took total expenditure on consumer goods to represent income, as this disregards two important sources of income, viz income-in-kind and government subsidies. A large proportion of the

40
Chinese population, particularly the rural sector, consume without spending. Furthermore, Van der Gaag failed to take account of rationing.
The approach of Yang (1985) was to assume that an individual's consumption is determined by personal income. Yang used the national income in order to derive personal income per capita. A gap was identified between rural and urban per capita income so different growth rates for both were assumed.
Carter and Zhong (1988) specified per capita consumption levels as a function of personal income and established consumption habits. Consumption habits are in turn determined by historical levels of income. The consumption function was estimated for both rural and urban groups. In the rural model, like Van der Gaag, no consideration was given to income-in-kind payments. In the urban model, the fact that consumers are constrained by the government rationing policy was disregarded and the impact of government subsidies was not accounted for.
Lewis and Andrews (1989) analysed rural household demand using the Linear Expenditure System (LES) and urban household demand using the extended LES (ELES). The LES demand functions are derived from a Stone-Geary utility function, implying that a specific form of utility function underlies theses models. The general form is:
piqi = piai + bi (C − pj
j=1
n
∑ aj )
where pi= price of the commodity i, qi= quantity consumed of commodity i, C= total consumption expenditure, n= number of commodities, ai= subsistence quantity of commodity i, and bi= marginal budget share of commodity i.
The corresponding elasticities are:
expenditure ee =bi
wi
own-price eii = −1+ (1− bi )( piai pi qi )
cross-price eij = −bi (pja j ) / ( piqi )
Any test detecting alteration in the parameters may represent structural change, but rejection may simply be rejection of a specific functional form. Thus, the LES is inappropriate for testing structural change. Further, for elasticity equations of the
41
LES or ELES demand functions, the second order conditions imply that the bi is constrained to be between 0 and 1, regardless of the data used in the model (Lewis and Andrews, 1989, p796). The LES and ELES models are further limited because they are static unless the model is formulated under habit formation. The data used in Lewis and Andrews (1989) are from 1982 to 1985 having different data sets for rural and urban. The rural data are from surveys of peasants, being ranked according to income. They take the average farm procurement as the marginal prices facing rural households (Gaurnaut and Ma, 1992, p44). The price and consumption data were used to derive expenditure data (Lewis and Andrews, 1989, p799). In the rural sector, four foods were analysed: grain, pork, poultry and fish. The data on urban demand are combined cross sectional and time series with income and expenditure obtained from the Statistical Yearbook of China. Four food groups were considered: staple food; non staple food; tobacco; liquor and tea and other food. The major findings of Lewis and Andrews (1989) are that the demand for food and non-commodities2 is inelastic with respect to income and expenditure, indicating that these two groups are necessities. They also find that for food about a 10% fall in price is roughly the same as an 8% increase in income.
Halbrendt and Gempesaw (1990) estimate consumption equations, in an analysis of China's total wheat economy. Separate urban and rural per capita consumption equations were specified. Urban wheat consumption was specified as a function of available supply and the real price of wheat. Rural wheat consumption was specified as a function of wheat price and production. Data from 1960 to 1987 were obtained from various publications of China's State Statistical Bureau and the USDA – China Situation and Outlook series (Halbrendt and Gempesaw, 1990, p271). The model was estimated using Ordinary Least Squares (OLS) with dummy variables used to capture policy impacts. Price elasticities estimates over the period 1970–87 were found to vary from -0.2 to -0.055, with a trend toward more inelastic responses, which appears surprising (Halbrendt and Gempesaw, 1990, p273).
Peterson, Lan and Ito (1991), modelled rice consumption in China utilising data from 1960 to 1986, obtained from the Statistical Yearbook of China, IMF and USDA. The following relationship was modelled using OLS:
2includes house rent, water, power,transportation, posts and telecommunications, school fees, child care.
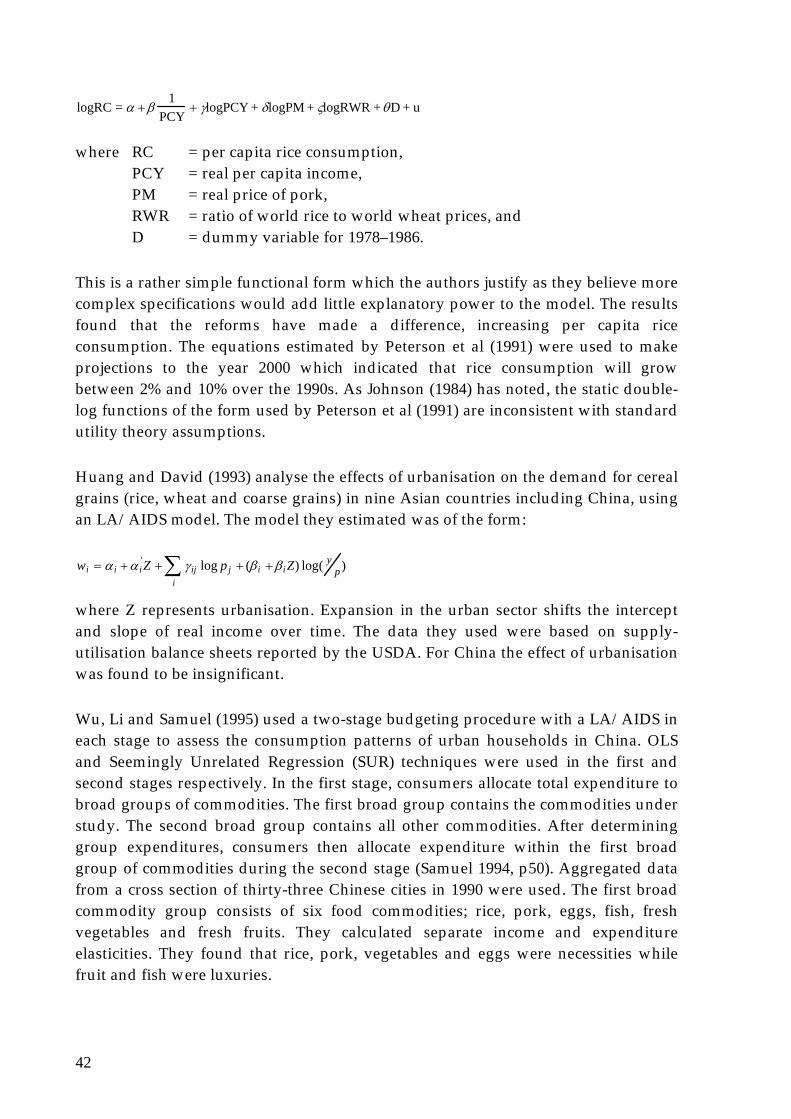
42
logRC = α +β1
PCY+ γlogPCY + δlogPM + ςlogRWR +θD + u
where RC = per capita rice consumption, PCY = real per capita income, PM = real price of pork, RWR = ratio of world rice to world wheat prices, and D = dummy variable for 1978–1986.
This is a rather simple functional form which the authors justify as they believe more complex specifications would add little explanatory power to the model. The results found that the reforms have made a difference, increasing per capita rice consumption. The equations estimated by Peterson et al (1991) were used to make projections to the year 2000 which indicated that rice consumption will grow between 2% and 10% over the 1990s. As Johnson (1984) has noted, the static double-log functions of the form used by Peterson et al (1991) are inconsistent with standard utility theory assumptions.
Huang and David (1993) analyse the effects of urbanisation on the demand for cereal grains (rice, wheat and coarse grains) in nine Asian countries including China, using an LA/AIDS model. The model they estimated was of the form:
wi = α i +α i'Z + γ ij
i∑ log pj + (βi +βiZ) log( y
p )
where Z represents urbanisation. Expansion in the urban sector shifts the intercept and slope of real income over time. The data they used were based on supply-utilisation balance sheets reported by the USDA. For China the effect of urbanisation was found to be insignificant.
Wu, Li and Samuel (1995) used a two-stage budgeting procedure with a LA/AIDS in each stage to assess the consumption patterns of urban households in China. OLS and Seemingly Unrelated Regression (SUR) techniques were used in the first and second stages respectively. In the first stage, consumers allocate total expenditure to broad groups of commodities. The first broad group contains the commodities under study. The second broad group contains all other commodities. After determining group expenditures, consumers then allocate expenditure within the first broad group of commodities during the second stage (Samuel 1994, p50). Aggregated data from a cross section of thirty-three Chinese cities in 1990 were used. The first broad commodity group consists of six food commodities; rice, pork, eggs, fish, fresh vegetables and fresh fruits. They calculated separate income and expenditure elasticities. They found that rice, pork, vegetables and eggs were necessities while fruit and fish were luxuries.

43
Chang (1994) analysed food grain consumption in China using a dummy variable model of the form:
Yit = βijDjt
j∑ + β k
k= 2
k
∑ Xkit + ε it
where Y = the quantity consumed of food grain, X = explanatory variables including income, total food expenditure and
retail prices of food grains, meat and vegetables, and D = dummy variable for different time periods (1975–79, 1980–84,
1985–89).
The data source was China's Statistical Yearbooks. He found that people in different regions have different food consumption habits (Chang 1994, p222). No elasticities were reported.
Chern and Wang (1994) econometrically estimated Engel functions and food demand systems, based on household survey data aggregated at the provincial level from 1985 to 1990, for the urban population. After examining several functional forms, they utilised the double log model to estimate the Engel function, via OLS. They found an income elasticity for food of 0.42, and that more would be spent for pork, poultry and fish and less for grain, oil and beef. The rationing of grain and oil was shown to have significant impacts on the consumption of non-rationed foods.
Fan, Cramer and Wailer (1994) applied the AIDS model to estimate food demand parameters for Chinese rural households. Pooled provincial level time series data from 1982 to 1990 were used. The following food items were included in the study: rice, wheat, coarse grain, meat (pork, beef and mutton), vegetables, alcohol and tobacco. Price data were taken from China's Commodity Price Statistical Yearbooks and China's Price Yearbooks (in Chinese). Again, expenditure data were derived from consumption and price data. They formulated the habit behaviour of consumers over time, which allows the parameters of the demand function to change over time along with consumers tastes and preferences. Habit formation was formulated into the demand equations by assuming:
α i = α i0 + δi t
γ i = γ i0 + θi t
βi =βi0 +ρi t
where t is a time trend. Firstly, they tested the following demand equations using iterative SUR techniques with demand restrictions imposed, after substituting in the above habit formation.

44
wi = α i + γ ijj=1
I
∑ log pj + βi(log x − log a[p])
where wi(t ), χ(t), p denote the budget share of good i, total expenditure, and prices respectively.
W (Wald) test was employed to determine whether price and expenditure elasticities have changed over time (the test is that of ς = 0, θ = 0 and ρ = 0 ) The results rejected the null hypothesis that the constant term and price parameters have changed over time except for tobacco. They did not reject that the expenditure elasticities have changed. The model was re-estimated with price parameters not changing and expenditure parameters changing. Elasticities were then calculated. The results showed that the food commodities listed above all had positive expenditure elasticities. Rice, wheat and coarse grains were necessities while meat, vegetables, alcohol and tobacco were luxuries (Ibid, pp65–69).
Samuel (1994) analysed the effect of household income and demographic factors on food consumption and estimated an equation using OLS that included income, the number of people employed in the household, and dummy variables for educational level (primary, secondary, tertiary) and number of persons of certain age categories in the household. He estimated this model for total processed food consumption and each individual processed food. He found income and age of households members to be significant variables but not the education variable.
3.3 Conceptual Framework
3.3.1 The Systems-Wide Approach
Generally speaking, the conceptual framework upon which this analysis is based is commonly referred to as the systems-wide approach. In a nutshell, this approach tackles the interdependencies of demand for specified commodities. It does this basically by blending the neoclassical theory of consumer demand with the empirical tools of functional specification and estimation. In effect, it provides a bridge between the textbook theory of consumer demand, on the one hand, and its empirical estimation on the other (Barten 1977, p47). As such, it provides demand analysts with an invaluable tool in describing and predicting empirical consumer behaviour. It is hardly surprising, therefore, that the systems-wide approach has come to dominate the field of demand estimation.
Since the systems-wide approach essentially comprises two components: the theoretical and the empirical, it is instructive for the purposes of coming to terms
45
with the workings of the LA/AIDS model, to briefly review each of these components.
3.3.2 Consumer Demand Theory
Recall that the systems-wide approach is grounded in the micro-economic domain of neoclassical consumer behaviour.3 The central tenet of this theory, as initially propounded, is that an individual consumer, who is assumed to be rational on the basis of the six axioms of choice (Deaton and Muelbauer 1980a, pp26–30), pursues happiness by seeking to attain an optimal quantity of commodities. In a more operational sense, the theory embraces the mathematical tools of optimisation to derive a set of ‘constraints’, which form the basic ground-rules for determining how individual consumers allocate their means over the purchase of various commodities. These constraints, which are more specifically known as adding-up, homogeneity, symmetry and negativity, may be imposed by construction or as restrictions, depending on the functional form of the model adopted. The particular implications of each of these constraints will be discussed in more specific detail below. For the moment, however, it is pertinent to review the optimisation principles from which these constraints are in fact derived.
Optimisation in consumer theory, like that of the producer, is typically viewed within a duality framework. Naturally, this is because there are two alternative methods of determining an individual’s optimal bundle of goods, ie either via the maximisation of utility or via the minimisation of cost. With the maximisation method, an indirect utility function is adopted, such that consumers are said to maximise utility for a given cost. The solution here is a set of Marshallian demands. With the minimisation method, a cost function is adopted with consumers selecting those goods which will minimise the outlay necessary to attain a given level of utility. The solution in this case is known as the set of Hicksian or compensated demand functions. Hicksian demand functions are labelled as ‘compensated’ because the composition bundle of goods and services demanded, adjusts in accordance with changes in prices, to ensure that utility is held constant. While the maximisation and minimisation methods are essentially alternative ways of obtaining the same thing, ie optimal values of the quantity demanded, there is clearly one crucial difference. With maximisation the solution is a set of uncompensated demands, while with minimisation the solution is a set of compensated demands. The notion of compensation thus needs to be further clarified.
The notion of compensating consumers, or adjusting their consumption bundles to ensure that a consumer’s welfare level remains constant in the wake of price changes, 3For a review of the current state of development in this and alternative theories of consumer behavior, see Fine (1995).

46
is one that dates back to the pioneering work of the economists Hicks and Slutsky and in particular their individual efforts to decompose a price change into a substitution effect and an income effect.4 Adopting the Hicksian approach, the substitution effect measures the impact of a change in price on the composition of a bundle, holding utility constant, while the income effect measures the change in consumption due to the change in purchasing power, with prices held constant. Decomposition of the impact of price changes into these two separate effects can be used to highlight the true implications of the compensation principle for the derivation of demand systems. Marshallian demand functions contain both the substitution and income effects of a price change, while Hicksian demand functions contain only the substitution effects. The fundamental implication therefore is that Marshallian demands are functions of prices and nominal income or expenditure, while Hicksian demands are functions of prices and real income or expenditure (Swamy and Binswanger 1983, p677).
Having covered the salient aspects of the optimisation framework, underlying demand theory, the discussion now turns to the all-important constraints which that theory imposes. As previously noted, there are four: adding-up, homogeneity, symmetry and negativity. The first two are a consequence of the specification of a linear budget constraint and the fact that consumption expenditure is inevitably limited to one degree or another by income. More specifically, the adding-up constraint, ensures that changes in prices and expenditure cause rearrangements in purchases that do not violate the budget constraint (Deaton and Muellbauer, 1980a, p16).5
Homogeneity, as the name suggests, requires that demand functions be homogeneous of degree zero. Basically, this is an assumption implying that the actual units in which prices and outlay are expressed do not affect the consumption decision or, more specifically, a consumer’s perception of opportunities (Deaton and Muellbauer 1980a, p15). Put more simply, the individual consumer makes his or her decisions irrespective of the monetary unit of account. Also known more aptly as the ‘absence of money illusion’, homogeneity carries the implication that if prices and income are doubled the budget set must remain unchanged, such that the consumer, who is assumed to have consistent preferences, will necessarily choose exactly the
4 Hicks and Slutsky each measured the separate impacts of price changes on a consumer’s welfare in two fundamentally different ways. Hicks measured them in utility levels while Slutsky did so in terms of consumption bundles. Hicksian decomposition is thus common to the indifference curve approach to consumer demand theory, while Slutsky decomposition has more in common with the revealed preference approach. 5Estimated versions of the demand systems typically satisfy the adding-up condition automatically, although a rare few do so on average for the sample period, depending on the type of functional form used (Barten 1977, p27).

47
same bundle of goods. Homogeneity is thus a simplifying assumption designed to eliminate the consequences of inflation.6
The remaining two constraints, symmetry and negativity relate to the existence of consistent preferences and are associated with functional specification as distinct from the budget constraint. Symmetry, more specifically, relates to the cross-price derivatives or elasticities of a demand system. Basically it requires that the substitution effect of a particular price change between two products is identical. This means that for Marshallian demands, the cross-price derivatives will be of the same sign but not necessarily the same value, since account needs to be made for the income effect. With Hicksian demands, however, because only the substitution effect is being measured, the cross-price derivatives must not only share the same sign but also the same value. In both cases, the point to note is that symmetry is effectively a guarantee of and test of the consumer’s consistency of choice (Deaton and Muellbauer 1980a, p45).
Negativity, on the other hand, relates to the own-price derivatives or elasticities of a demand system and, as the name suggests, requires that these be negative. Intuitively, the implication is very simple; an increase in price must cause demand for that good to fall or at least remain unchanged. As with symmetry, the nature of the demand curve in terms of being either Marshallian or Hicksian will determine the more precise implications of negativity on demand. For instance, with Marshallian demands the income effect may be stronger than the substitution effect to the extent that the own-price derivatives or elasticities could in fact be positive, resulting in an upward sloping demand curve. With Hicksian demands, however, negativity strictly applies, and thus makes possible the ‘law of demand’, which states that compensated demand functions can never slope upward (Deaton and Muellbauer 1980a, p44).
3.3.3 Empirical Estimation
Having covered the theoretical underpinnings of the system-wide approach, the discussion now turns to empirical matters. Although theory provides crucial insights when modelling the real world, it cannot provide all the answers. In this section a number of key problems and how they have been tackled by econometricians are discussed.
6 As Barten (1977) notes, this is likely to be more true in the long-run than in the short-run (p27). Indeed, when estimating demand equations, it is important to recognise conditions of strong inflation and adjust the data accordingly. Otherwise, in tests for its validity, homogeneity will be rejected – an all too common occurrence in demand system estimation.
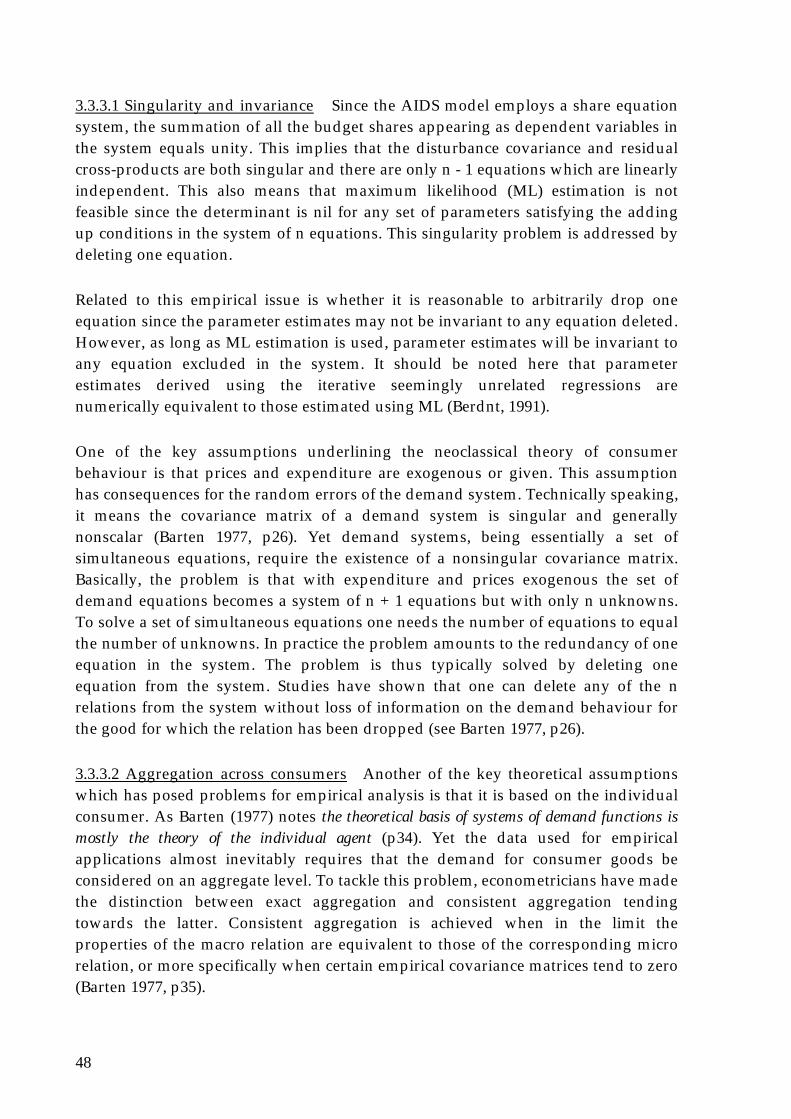
48
3.3.3.1 Singularity and invariance Since the AIDS model employs a share equation system, the summation of all the budget shares appearing as dependent variables in the system equals unity. This implies that the disturbance covariance and residual cross-products are both singular and there are only n - 1 equations which are linearly independent. This also means that maximum likelihood (ML) estimation is not feasible since the determinant is nil for any set of parameters satisfying the adding up conditions in the system of n equations. This singularity problem is addressed by deleting one equation.
Related to this empirical issue is whether it is reasonable to arbitrarily drop one equation since the parameter estimates may not be invariant to any equation deleted. However, as long as ML estimation is used, parameter estimates will be invariant to any equation excluded in the system. It should be noted here that parameter estimates derived using the iterative seemingly unrelated regressions are numerically equivalent to those estimated using ML (Berdnt, 1991).
One of the key assumptions underlining the neoclassical theory of consumer behaviour is that prices and expenditure are exogenous or given. This assumption has consequences for the random errors of the demand system. Technically speaking, it means the covariance matrix of a demand system is singular and generally nonscalar (Barten 1977, p26). Yet demand systems, being essentially a set of simultaneous equations, require the existence of a nonsingular covariance matrix. Basically, the problem is that with expenditure and prices exogenous the set of demand equations becomes a system of n + 1 equations but with only n unknowns. To solve a set of simultaneous equations one needs the number of equations to equal the number of unknowns. In practice the problem amounts to the redundancy of one equation in the system. The problem is thus typically solved by deleting one equation from the system. Studies have shown that one can delete any of the n relations from the system without loss of information on the demand behaviour for the good for which the relation has been dropped (see Barten 1977, p26).
3.3.3.2 Aggregation across consumers Another of the key theoretical assumptions which has posed problems for empirical analysis is that it is based on the individual consumer. As Barten (1977) notes the theoretical basis of systems of demand functions is mostly the theory of the individual agent (p34). Yet the data used for empirical applications almost inevitably requires that the demand for consumer goods be considered on an aggregate level. To tackle this problem, econometricians have made the distinction between exact aggregation and consistent aggregation tending towards the latter. Consistent aggregation is achieved when in the limit the properties of the macro relation are equivalent to those of the corresponding micro relation, or more specifically when certain empirical covariance matrices tend to zero (Barten 1977, p35).

49
3.3.3.3 Aggregation across products A third problem which empirical analysts have had to counter is the aggregation over commodities. The theory of consumer behaviour relates the number of commodities to be analysed in terms of a very simplifying algebraic abstraction, that is ‘n’. Yet as Deaton and Muellbauer (1980a) note in reality there are literally millions of commodities and that econometric analysis can only hope to deal with numbers of commodities which are minute by comparison (p80). Reality thus dictates that analysts deal not with individual commodities but with groups of commodities. A theory known as ‘separability’ has emerged to tackle this problem. For the purposes of this analysis it is not necessary to go into this theory in great detail except to define some key terms. Firstly, a group of commodities is said to be ‘separable’ when the conditional ordering on goods in the group is independent of consumption levels outside the group (Deaton and Muellbauer 1980a, p127). Secondly, a group of commodities is said to be ‘weakly separable’ when the marginal rate of substitution between any two commodities in the group is independent of the quantity of any commodity outside the group (Green 1990, p151). Thirdly, a group of commodities is said to have strong separability when the marginal rate of substitution in any two distinct groups is independent of the quantity of any commodity in any third group.
3.3.3.4 Functional form specification The fourth and arguably the most profound problem left unanswered by the theory relates to the specification of functional form. As Barten (1977) notes, there is an infinite variety of possible functional forms for demand equations (p38). The most notable of which are the Linear Expenditure System, the Rotterdam model, the Quadratic Expenditure System and arguably the most popular demand system to date, the Almost Ideal Demand System (AIDS) of Deaton and Muellbauer (1980b). What specifically distinguishes all of these models is their functional form and as such it should come as no surprise that it is the model’s functional form which lies at the very crux of the modelling decision. To be more specific, a model’s functional form pre-determines its ability to be consistent with any theoretical assumptions that may need to be imposed and also pre-determines the model’s ability to satisfy the overriding objectives of an analysis. The popularity of the AIDS model stems primarily from the fact that it offers flexibility in its functional form and in doing so facilitates considerable capacity to accommodate the fundamental principles of consumer demand theory as well as a range of project objectives, such as elasticity estimations. It is essentially for these reasons that in investigating the demand for food in China’s wholesale food markets a version of the AIDS has been adopted.
3.3.4 The LA/AIDS Model
The AIDS is derived within a duality framework in that rather than maximising utility for a given outlay or cost, it minimises the expenditure necessary to attain a specific utility level at given prices. The reason for this indirect approach to the

50
estimation of a demand system is that individual functions are not readily observable and as such it is inherently difficult to put down an explicit consumer utility function. By employing Shephard’s Lemma7, the AIDS is able to derive a set of demand equations from the specification of an indirect cost function, which in turn is based on a specific class of preferences known as the PIGLOG (price-independent-generalised linear) class. In doing so it permits exact aggregation over consumers, ie it allows for the representation of market demand curves as if they were the outcome of decisions by a rational individual and representative consumer.
The AIDS model is typically described in an algebraic form as follows:
wi = α i + γ ij
i∑ log pj +βi log(
yP)
where: wi = budget share of the ith commodity,
pj = is the price of the jth commodity,
y = expenditure or income within the system, and
P = price index, which can be defined as
log P = αo + α i
i∑ logpi + 1
2 γ ij logpi log p j
j∑
i∑
where: γ ij = the change in the ith budget share following a 1% change in pj, with real income held constant.
With substitution of the price index log P, the AIDS model is rendered non-linear in the parameters and because of the difficulties associated with non-linear estimation, the AIDS model consequently loses much of its appeal. This problem was overcome early on by substituting Stone’s geometric price index instead of the original price index log P on the grounds that it is a reasonable approximation of the original price index. It can be written as follows:
log P = wi log Pi
i∑
Utilising Stone’s index linearises the AIDS model, producing a version of the model which can be denoted as the linear AIDS or LAIDS. While Stone’s index and the linearisation of the AIDS lends the model to ease of estimation, this facility does not come without a price. By approximating the original price index, LAIDS loses the ability to satisfy the integrability conditions of the original model. This trade-off between ease of estimation and loss of integrability can be overcome, or at the very 7States that the price derivatives of a cost function are the quantities demanded.

51
least minimised, by adopting an OLS systems estimation approach, in which equations are estimated simultaneously rather than one by one.
Since with the LAIDS model the utility function is derived indirectly via the specification of an expenditure or cost function, the constraints implied by theory, ie Engel aggregation, homogeneity and symmetry are not imposed by construction, as would occur if the utility function were specified directly. This means that for the LAIDS equations to exhibit the aforementioned properties they must be imposed as restrictions. These restrictions can be written as follows:
Engel aggregation: α i = 1, γ ij = 0
i =1
k
∑i =1
k
∑ , β i = 0i =1
k
∑ and ensure that
wi
i =1
k
∑ = 1
Homogeneity: γ ij = 0 for i =1, 2, .... k
j=1
k
∑
Symmetry: γ ij = γ ji
When these three restrictions are imposed the LAIDS model represents a system of demand functions for which the coefficients or, more commonly, the derived elasticities, are in accordance with the theoretical propositions of consumer demand theory. Furthermore because the LAIDS is indirectly non-additive, then the marginal utility of a good within the system is dependent upon the marginal utility of all other goods in the study. This is a noteworthy advantage of the LAIDS model investigating patterns of food demand behaviour since the utility associated with a particular food item will generally be affected by the consumption of other foods.
In summary, the adoption of the LAIDS model in this analysis is rationalised basically on the grounds of its theoretical and practical merits, and essentially for its ability as a system, to capture the interdependencies between different food commodities. There are, however, a number of caveats which ought to be noted. The first has already been indicated and that is the loss of integrability associated with the linearisation of the true AIDS model. The second caveat relates to the fact that the LAIDS model assumes weak separability, or that the commodity items under investigation have no relationship to those outside the focus. This assumption is a drawback because in reality the demand for a good is likely to be a function of all other goods in the economy. However, by assuming weak separability, LAIDS limits the bias that would inevitably arise from the omission of relevant variables if it were not imposed. The third and final drawback of the LAIDS is that is that it estimates market demands using the PIGLOG8 class and yet the restrictions imposed are based 8A specific class of preferences which allows exact aggregation over consumers consistent with the representation of market demands based on the decision of a rational consumer. These preferences are represented via the cost expenditure function (Deaton and Muellbauer, 1980b).

52
on assumptions concerning the behaviour of individuals. The generality of the LAIDS model arising from the estimation of market as distinct from individual demands is a moot point. However, in opting for the LAIDS model it must be noted that its generality does make it less restrictive than other non-additive models, and indeed the generality lies at the very essence of the model’s flexible functional form. Overall, and in spite of the drawbacks just mentioned, we consider that the theoretical and practical advantages of the LAIDS model far outweigh its disadvantages and thus justifies its use. Further justification is provided by its popularity.
3.4 Data
3.4.1 General
Primary data sets were utilised in this analysis having been sourced directly from the reporting systems of the various wholesale markets under investigation. The data sets are unique in that the most part previous studies have tended to rely on household survey data collected and provided by China’s Statistical Bureau. This analysis appears to be the first which uses wholesale market data to estimate the demand for food in China. Understandably some may question the relevance of using wholesale market data as opposed to retail in modelling China’s food consumption patterns. The primary justification is that wholesale markets are a good proxy for retail prices. Indeed there is strong anecdotal evidence to suggest that the differences between wholesale and retail are small and basically confined to seasonal impacts. In addition, with their decided emphasis on competitive price formation, wholesale markets provide data which are arguably the best indicators of consumer preferences. Finally and most importantly, the recent and considerable expansion of wholesale markets in China suggests that it is with these structures that the key to analysing the developments within China’s food system lies.
In order to formulate a comprehensive model of food demand in China, ideally the data sets should be pooled. However, due to the markets specialising in different commodities, together with differences in both the method and sophistication of the various markets’ reporting systems, it was not in fact possible to pool the data. Actually, this is not a great disadvantage and indeed it is the view here, that the diversity of the data sets lends weight to their intrinsic worth. Aggregation tends to lessen the applicability and interpretive power of the results. Given that these data provide fine commodity detail and a relatively low level of aggregation, the fact that it cannot be pooled is rather beneficial to the credibility of the results.
The key characteristics of the data sets are outlined in Appendix 1. The main differences relate to periodicity, time span, sample size and the type and number of commodities covered. The periodicity of the data sets is well balanced, with three

53
markets providing daily figures and another three monthly figures with only one exception (Zijanshan) reporting figures on a ten-daily basis. In light of variations in the periodicity and the time span the sample size varies considerably with Caoan posting the smallest sample size at 30 monthly observations and Dazhongsi the largest at 360 daily observations. The final distinguishing feature between the data sets lies in the type and number of commodities covered by the various markets. Dazhongsi and Beiyunting compensate for a degree of aggregation by providing a broad cross section of commodities, while Zijinshan and Caoan compensate for a lack of commodity diversity with highly disaggregated data on a wide cross section of vegetables.
In addition to the superficial differences, the quality of the individual data sets also varied quite considerably. The Buji, Caoan and Beiyunting markets provided the most reliable data sets in that there were few if any missing observations, thus averting the need for manipulation. This was not the case, however, for Dazhongsi, Zijinshan and Xinchang where gaps of considerable size and number in each of the sets required they be manipulated if estimation by computer were to take place. Basically, the manipulations amounted to aggregating like commodities into single groups, by summing the quantities and values to derive average prices weighted according to the expenditure shares. It is important to note that the model does not make any adjustments for inflation and that overall prices are undeflated unit values. This is due to the fact that, as Balcombe and Davis (1996) point out, when the LAIDS model is estimated with the homogeneity restriction imposed, undeflated prices must be used since the restriction implies that demand equations are functions of relative rather than nominal prices (p51).
Generally speaking, the data sets are of considerable quality in that firstly, they consist of direct observations from wholesale market databases; secondly, they are reasonably current in their coverage, ending only as recently as mid 1996; and thirdly, they provide highly disaggregated information on a cross-section of agricultural products. In the light of the fact that previous studies into China’s consumption patterns have been significantly constrained by the availability of complete, consistent and reliable data sets, the merits of this data set becomes even more apparent. Nonetheless, there are still some inevitable caveats associated with their use, the most noteworthy being the degree of accuracy. Naturally, accurate data collection requires sophisticated systems. While such systems are beginning to emerge in China there is still a long road to travel before they reach a universal and acceptable standard. Analytically, the implication is that the plausibility of our results may be open to question. However, in the light of the commendable qualities noted, it may nonetheless be argued that our figures are illustrative and indeed highly satisfactory given the absence of any suitable alternatives.
Below are the descriptive statistics of the data used presented by market.
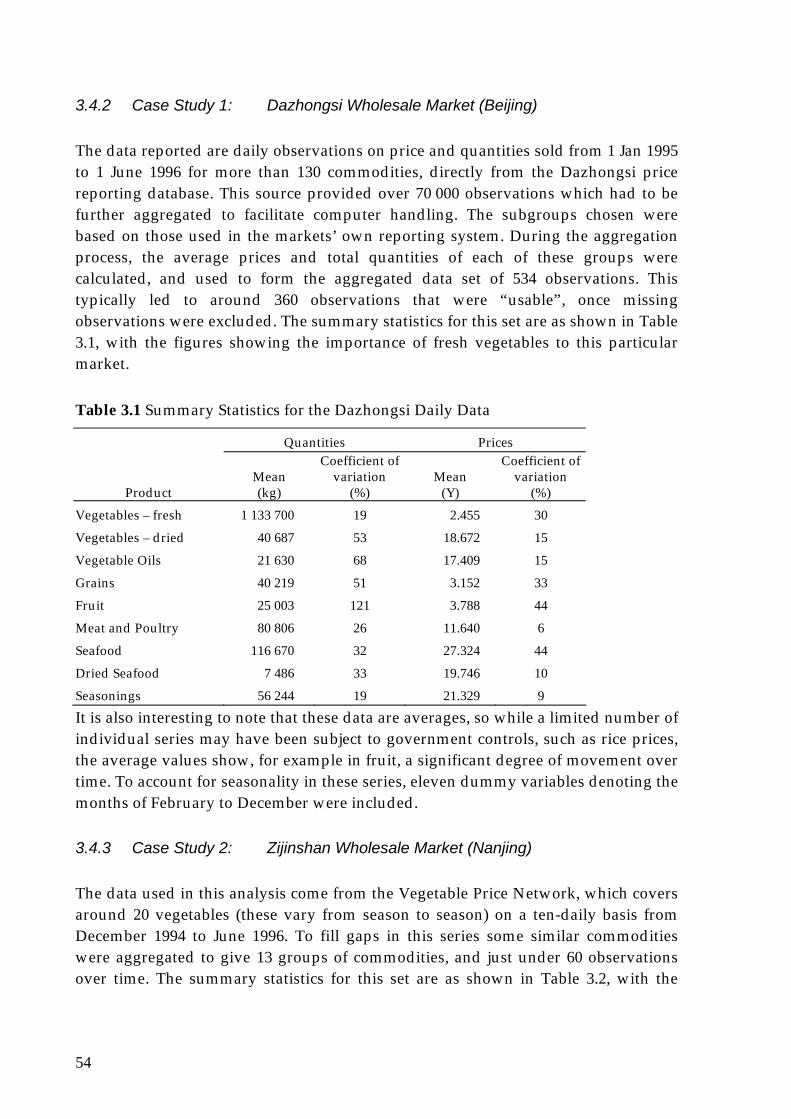
54
3.4.2 Case Study 1: Dazhongsi Wholesale Market (Beijing)
The data reported are daily observations on price and quantities sold from 1 Jan 1995 to 1 June 1996 for more than 130 commodities, directly from the Dazhongsi price reporting database. This source provided over 70 000 observations which had to be further aggregated to facilitate computer handling. The subgroups chosen were based on those used in the markets’ own reporting system. During the aggregation process, the average prices and total quantities of each of these groups were calculated, and used to form the aggregated data set of 534 observations. This typically led to around 360 observations that were “usable”, once missing observations were excluded. The summary statistics for this set are as shown in Table 3.1, with the figures showing the importance of fresh vegetables to this particular market.
Table 3.1 Summary Statistics for the Dazhongsi Daily Data
Quantities Prices
Product
Mean (kg)
Coefficient of variation
(%)
Mean
(Y)
Coefficient of variation
(%) Vegetables – fresh 1 133 700 19 2.455 30
Vegetables – dried 40 687 53 18.672 15
Vegetable Oils 21 630 68 17.409 15
Grains 40 219 51 3.152 33
Fruit 25 003 121 3.788 44
Meat and Poultry 80 806 26 11.640 6
Seafood 116 670 32 27.324 44
Dried Seafood 7 486 33 19.746 10
Seasonings 56 244 19 21.329 9
It is also interesting to note that these data are averages, so while a limited number of individual series may have been subject to government controls, such as rice prices, the average values show, for example in fruit, a significant degree of movement over time. To account for seasonality in these series, eleven dummy variables denoting the months of February to December were included.
3.4.3 Case Study 2: Zijinshan Wholesale Market (Nanjing)
The data used in this analysis come from the Vegetable Price Network, which covers around 20 vegetables (these vary from season to season) on a ten-daily basis from December 1994 to June 1996. To fill gaps in this series some similar commodities were aggregated to give 13 groups of commodities, and just under 60 observations over time. The summary statistics for this set are as shown in Table 3.2, with the

55
figures showing the importance of cabbages and other fresh vegetables to this particular market.
Table 3.2 Summary Statistics for the Zijinshan 10-Daily Data
Quantities Prices
Product
Mean (kg)
Coefficient of variation
(%)
Mean
(Y)
Coefficient of variation
(%) Spinach 5 403 189 0.67 55
Garlic 6 610 165 1.46 53
Tomato 16 021 123 0.94 31
Leek 22 439 148 0.6 49
Green Capsicum 24 571 178 1.79 54
Carrot 28 215 135 0.39 44
Celery 46 932 114 0.5 40
Spring Onion 112 760 136 0.71 27
Gourds 122 560 190 0.91 51
Potato 138 020 65 0.54 15
Cabbage 143 510 90 0.36 38
Chinese Cabbage 521 620 110 0.31 60
Other Fresh Vegetables 580 100 127 0.62 58
Despite there being some mention of government control, a graphical analysis of these data indicated significant variability in the price series, reflected in the high coefficients of variation noted above. There was also evidence of a seasonal pattern, which motivated the inclusion of three dummy variables, denoting quarters, to allow movement in the intercepts. The parameters were estimated by the exclusions of potato, whose elasticities were calculated by inference.
3.4.4 Case Study 3: Beiyunting Wholesale Market (Nanjing)
Beiyunting Wholesale Market is the second market studied in Nanjing area. The summary statistics for this market are indicated in Table 3.3.
Table 3.3 Summary Statistics for the Beiyunting Monthly Data Quantities Prices
Product
Mean (kg)
Coefficient of variation
(%)
Mean
(Y)
Coefficient of variation
(%) Grain 138 400 66 2.90 23 Oil 107 480 66 4.45 8 Fruit 1 826 800 23 1.64 52 Seafood 6 653 14 18.96 29

56
Vegetables 73 076 000 16 1.26 21
3.4.5 Case Study 4: Buji Market (Shenzhen)
The data used in this analysis come from the market reports on the most important products traded, their price, value and quantity information for key food products on a monthly basis from January 1993 until May 1996. These commodities were not aggregated or altered from these sources, noting that the mixture of commodities, in particular the processed meat products, is somewhat different from the other markets. The summary statistics for these data appear in Table 3.4. Seasonal variation was less apparent in the plots of these data, so while seasonal dummy variables were initially tried, they were removed in the final version of the model due to insignificance.
Table 3.4 Summary Statistics for the Buji Monthly Data Quantities Prices
Product
Mean (kg)
Coefficient of variation
(%)
Mean
(Y)
Coefficient of variation
(%) Canned Ham 46 750 34 7.60 15 Frozen Cutlass Fish 80 525 34 9.13 13 Meat – frozen 1 374 800 61 11.11 18 Pork Ribs – frozen 1 658 300 72 11.70 22 Red Fish – frozen 44 175 51 10.19 19 Fruit 20 267 000 52 4.90 51 Gourd & Pea 8 647 700 39 2.87 29 Leaf Veg 13 588 000 43 2.30 45 Root 10 507 000 31 1.66 25 Sandwich Ham 122 580 25 11.72 13 Silk Rice 1 457 400 34 2.84 23 Winter Rice 3 797 700 60 2.21 29
The table above suggests the importance of different meat products to the vegetables that have been discussed in relation to other markets. While graphical analysis of the data suggests significant variation and seasonality in these vegetable prices, the processed products, such as the canned and sandwich ham, appear to be fairly constant. These may not necessarily reflect fixing of prices by the government, although this is known to happen in the pork markets, as it may also suggest a relatively price unresponsive consumer market or the way that changes in the type of meats in these products can be used to remove some of the need for price changes.
3.4.6 Case Study 5: Caoan Wholesale Market (Shanghai)
The data used in this analysis were copied directly from the markets’ report books, which provide price, quantity and value data for fifteen commodities over thirty

57
months from January 1994 to June 1996. The summary of these data appears in Table 3.5. To account for seasonality, quarterly dummy variables were also included.
Table 3.5 Summary Statistics for the Caoan Monthly Data
Quantities Prices
Product
Mean (kg)
Coefficient of variation
(%)
Mean
(Y)
Coefficient of variation
(%) Green Veg 874 910 47 0.90 45
Brussels Sprouts 1 098 400 66 0.83 38
Chinese Spinach 1 757 800 108 0.85 40
Celery 631 980 93 1.66 79
Leek 292 090 103 1.53 39
Cucumber 1 910 800 76 2.00 51
Egg Plant 369 180 136 2.52 71
Persimmon 593 030 126 2.20 49
Sweet Capsicum 905 750 104 2.96 62
Lettuce Root 559 780 127 0.96 32
Potato 2 005 800 68 1.15 22
Carrot 661 270 87 1.09 50
Spring Onion 299 140 56 2.22 43
3.4.7 Case Study 6: Xinchang Wholesale Market (Shanghai)
Similar to Nanjing, there are two wholesale markets analysed in Shanghai. Below are the descriptive statistics of Xinchang Wholesale market, the second market analysed in Shanghai.
Table 3.6 Summary Statistics for the Xinchang Daily Data Quantities Prices
Product
Mean (kg)
Coefficient of variation
(%)
Mean
(Y)
Coefficient of variation
(%) Cabbage 100 39 55 26
Spinach 67 56 107 62
Chinese Cabbage 437 25 43 35
Other 78 66 71 20
Celery 63 61 127 32

58
3.5 Procedures
3.5.1 General
To know more about the data being analyzed, descriptive statistics were computed and graphical analysis was done to check for outliers and trends. Recognizing that most of the time series data are non-stationary, test for stationarity using the augmented Dickey-Fuller test was conducted using Shazam 7.0 (White, 1993).
This is particularly important because the parameter estimates will be biased if the variables are non-stationary. Estimating OLS or the AIDS model, for that matter, assumes that variables are stationary, ie the variance or autocovariances of the time series variables are unchanged if displaced through time. If the data are non-stationary or integrated, one is likely to finish up with a model showing promising diagnostic test statistics even in the case where there is no sense in the regression analysis(Charemza and Deadman, 1993, p124). High R2 and low Durbin-Watson (D-W) statistic usually indicate non-stationarity of data (Bewley and Elliot, 1989). However, the D-W statistic becomes limited outside the single equation context (Cashin, 1991).
Moreover, aside from dynamic misspecification related to habit formation and appropriateness of test statistic, it has been shown that non-stationarity is one of the major reasons for over-rejecting homogeneity and symmetry restrictions in demand models (Bewly and Elliot, 1989). As argued by Balcombe and Davis (1996), estimation of AIDS model should be done within contemporary time series methodology, that is using cointegration theory (p47) to address the problem of non-stationary variables. One way to avoid this problem is to detrend the time series by estimating the model in first difference instead of levels. Deaton and Muelbauer (1980b) and Eales and Unnevehr (1988) are examples of this approach. However, estimating in difference form may lead to biased estimates due to misspecification as the long-run relationship between the variables is omitted. This can be addressed, however, by estimating a quasi-difference model (Bewley and Elliott, 1986).
3.5.2 LA/AIDS Estimation
Independent estimations of the LA/AIDS were carried out for each of the wholesale markets under investigation. In each instance, the budget share equations were estimated as a system of equations using the SHAZAM package (White, 1993, pp278–289). The system approach was adopted in preference to single equation estimation because essentially, by its very nature it accounts for the relationship between different goods. More specifically, the system approach accommodates the presence of contemporaneous correlation between the error terms of different equations

59
within the system and in doing so allows for the imposition of demand theory restrictions, particularly the cross equation restriction of symmetry. It also provides possibly more-efficient parameter estimates than single OLS estimation of each equation. Different explanatory variables across equations can also improve efficiency of estimates but this does not apply in the model estimated since all equations have the same explanatory variables.
The actual steps followed in estimating the LA/AIDS model are as follows:
1 Impose homogeneity and symmetry restrictions in the LA/AIDS model (constrained model)
2 Include dummy variables in the empirical models for all markets except Buji and Beiyunting where seasonality based on the patterns of the data is not apparent.
3 Run constrained models in first difference and levels for markets with non-stationary and stationary variables respectively from which the final elasticity estimates were derived. This involves deletion of the nth equation and iteration of the SUR model to approximate maximum likelihood estimates. The number of iterations used ranged from 20 to 200 or until convergence. Using Shazam 7.0, convergence criterion is the maximum desired percentage change in the coefficients with default equal to 0.001.
4 For comparative purposes, estimate in first difference and levels form for all markets.
5 Carry out diagnostics and compute elasticity estimates using procedures as discussed below.
3.5.3 Diagnostics
Once estimations were complete, diagnostics were carried out, the primary objective being to confirm whether the estimated models upheld the imposed demand theory restrictions and indeed whether the results they produced were consistent with theory.
A Breusch Pagan Langrange Multiplier test was done to check for contemporaneous covariances in the demand system. Rejecting the null hypothesis that all covariances are equal to zero, implies that the system approach using LA/AIDS will give more efficient estimates of parameters than single equation OLS. This test together with the non-stationarity tests of the variables is necessary before any validation of

60
restrictions imposed in the model. This necessarily requires that first a series of tests be conducted to confirm the validity of the model. As Cashin (1991) points out there is little point in testing restrictions on an invalid model (p268).
The tests themselves are of the likelihood ratio (LR) kind as applied by Cashin (1991) in validating homogeneity and symmetry restrictions. Our study not only applied these tests but, as discussed, also tested for stationarity or whether the errors are independent of the variables used. This is critical since LR test is invalid when the data are non-stationary or when errors are not strictly exogenous to the regresssors (Park, 1992). In testing restrictions, the LR requires the estimation of both the restricted and unrestricted forms of the model. It is calculated as minus twice the difference in the log likelihoods and is asymptotically distributed as χ2.
Once the validation tests were completed, tests of demand restrictions were carried out. Here lies what is arguably the most perplexing problem for researchers endeavouring to estimate demand systems. With duality based models such as LAIDS, it is common for asymptotic tests like the Wald, Lagrange Multiplier and Likelihood Ratio to reject the imposed demand theory restrictions all too often. The commonality of rejection raises a dilemma for researchers. If the restricted version is adopted whilst conceding the restrictions do not hold, then the results are open to criticism and scepticism. Alternatively, if the unrestricted version of the model is adopted the model is again subject to criticism for its apparent theoretical inconsistency. Cashin (1991) notes that evidence from work by Laitinen (1978), Meisner (1979) and Bera, Byron and Jarque (1981) indicates that asymptotic tests statistics tend to over-reject restrictions derived from utility theory when imposed on demand systems in finite samples (p271). In other words, it is likely that the tendency for restrictions to be rejected is an example of a type 1 error, ie hypotheses are being falsely rejected. The implication being that in many instances it is likely that the restrictions in fact do hold. Accordingly it is the contention in this analysis that where restrictions of the demand theory do not hold they should nonetheless be treated as maintained hypotheses.
3.5.4 Elasticity Estimates
With the statistical inference tests completed and the model validated, the results were prepared for presentation in the form of uncompensated price and expenditure elasticities. It is important to note the method of calculating the elasticities particularly in estimating the LA/AIDS. According to Green and Alston (1990, 1991), when the LA/AIDS is estimated, all the previously reported approaches to compute elasticities are theoretically incorrect. This was due to the fact that they tended to treat expenditure shares as constant parameters in the Stone’s price index (P) when taking derivatives for elasticities. Given that the index is a function of expenditure shares (ie lnP = ℜj wj lnPj.), the usual approach was incorrect because it failed to take account of

61
the effects of price changes on the shares in the price index. Following the corrected formulas of Green and Alston (1990), the elasticities presented in this analysis were calculated as follows:
ηi = 1+βi
Wi
expenditure elasticity of demand
ε ii = −1+γ ii
Wi
− βi uncompensated (Marshallian) own-price elasticity of demand
ε ij =γ ij
Wi
−βi
Wj
Wi
uncompensated (Marshallian) cross-price elasticity of demand
3.5.5 Concluding Comments
This chapter has covered the main methodological issues underlying the estimation of the demand for food in China. In relation to theory, the discussion drew attention to the differences between compensated and uncompensated demands and covered in detail the implications of the constraints which the theory imposes. In terms of empirical estimation, we highlighted some of the key problems left unanswered by the theory and, more importantly, discussed some of the methods which econometricians have devised to counter these problems. Here the most profound problem was the ambiguity which typically surrounds the specification of functional form. The discussion pointed to a number of models and most importantly provided sound justification for the adoption of the LA/AIDS model in this analysis. Finally, the chapter provided specific details on the nature and quality of the data utilised as well as precise details on the estimation procedures adopted.

62
4 RESULTS OF DEMAND ANALYSIS
4.1 Introduction
This chapter presents the results of the estimation of the LA/AIDS model following the procedures outlined in the previous chapter. Generally, the discussion proceeds by market. For each case, the results of estimation are discussed with the evaluation of the models used presented in the relevant appendices. The elasticity estimates are then compared across wholesale markets and to some previous studies on the demand for food in China.
4.2 Case Study 1: Dazhongsi Wholesale Market (Beijing)
Results of the estimated parameters are reported in Appendix 2. The constant term does not appear in the table because it cancelled out when data were transformed into first difference. Thus, the model was estimated explicitly without a constant using Shazam version 7.0. About half of the estimated parameters excluding seasonal dummy variables are significant at 5% level. Most of the expenditure and own-price elasticities are significant. A number of cross-price estimates are likewise significant, but only a few of the seasonal dummy variables are significant at 5% level. This is expected since the data are already detrended when taking first difference.
Perhaps of greater interest is the way that these coefficients can be interpreted as elasticities. Table 4.1 below shows that all products have expenditure elasticities which are positive and slightly higher than unity. This implies that as total expenditure increases, the share of the budget devoted to these products will more than proportionately increase. Vegetable oils posted the highest expenditure elasticity, followed by grains.
On the other hand, the own-price elasticities are smaller than unity except for dried vegetables and seasoning. Grains are the most inelastic followed by seafood, meat and poultry products, fresh vegetables, vegetable oils and fruit in that order. The inelastic values of these products are both consistent with the daily nature of the data and Chinese food consumption characteristics in general. For example, grains, being the most basic product in the basket of goods analysed, have the lowest own-price elasticity. They do not have significant substitutes but have high complementary effects with seasonings and seafood. In addition, fresh vegetables have lower own-price elasticity than dried vegetables reflecting their more essential nature compared to the latter.
Results also show that all own-price elasticities are conventionally signed except for dried seafood which is inelastic but positive. This indicates that this product is a

63
Giffen good, ie as price decreases demand decreases or vice versa, which may be due to a number of factors. Firstly, although the own-price elasticity estimate is significant at 5% level, coefficients of most independent variables in the model including that for expenditure variable are not significant. Thus, it is possible that other significant non-price effects such as taste and preferences are not captured in the model. Secondly, since dried seafood is still relatively a broad category, it is important to differentiate between product quality and price difference to explain possible buying behaviour. For low-quality, low-price dried seafood, consumers are expected to decrease their demand and buy other high value or better quality products as a result of increased purchasing power due to a decrease in price. On the other hand, for high-price and high-quality dried seafood, consumers increase their demand as price increases. Here, dried seafood is considered as a high luxury or “status” food, such that as price increases, status-conscious consumers increase their demand. As indicated by the expenditure elasticity of more than one, this product is considered as a luxury and therefore may be purchased for special occasions such as weddings and cultural festivals and in such cases may not only be affected by its own price.
Generally, cross-price elasticities have lower values than own-price elasticities indicating that the products analysed are more responsive to their own prices. However, there are a number of significant cross-price elasticities worth noting. For fresh vegetables, vegetable oils, grains, dried seafood, fruits and seafood are complements while dried vegetables, meat and poultry are substitutes. The values of substitutes are quite low compared to the values of complements, indicating that fresh vegetables are subject to more complementary effects. Seafood appears to have the strongest complementary effect along with dried seafood and fruits. All these three complements are statistically significant at 5% level. Thus, there are no significant substitutes for fresh vegetables, only complements. This may be due to the fact that fresh vegetables are basic components in the Chinese diet.
Six out of the seven products are substitutes for dried vegetables and only seafood is a complement. However, only fresh vegetables and seafood are significant variables at 5% level. As expected, fresh and dried vegetables are substitutes. The high substitution effects of dried vegetables also reflect their relatively less essential role in the Chinese diet compared to the other products being analysed.
Grains, fresh vegetables, meat and poultry and seafood are complementary products, while dry vegetables, vegetable oils, fruit and dried seafood are substitutes but only seafood is significant. Dried vegetables and seafood are significant substitutes and complements respectively for vegetable oils. Seafood and vegetables oils have the highest complementary effect which may be explained by the fact that seafood dishes use a lot of oil relative to the other products analysed, with the exception of meat and poultry. Seasonings, as expected, have strong complementary effects.

64
It is also interesting to note that fruit is subject to some complementarities with other fresh and more perishable products such as fresh vegetables, and seafood. It is also subject to substitute effects to less perishable products such as dried vegetables, vegetable oils, grains, meat and poultry and dried seafood. Fresh and dried seafood products are significant substitutes for meat and poultry, while only fruits are significant complements. For seafood, grains and fruit are significant substitutes while fresh vegetables, dried vegetables, vegetable oils, and meat and poultry are significant complements. Dried seafood has more substitutes than complements but its only significant substitute is dried vegetables. All complements, namely fresh vegetables, seafood and meat and poultry emerged significant.
Table 4.1 Calculated Uncompensated Elasticities of Wholesale Demand for Food in Dazhongsi (Beijing) Product
Fresh Veg
Dried Veg
Vege-table Oils
Grains
Fruit
Meat & Poultry
Fresh Sea-food
Dried Sea-food
Season-ing
Expen-diture Elastic-ities
Fresh Veg -0.67 0.01 -0.04 -0.01 -0.03 0.02 -0.39 -0.02 -0.02 1.13
Dried Veg 0.06 -1.78 0.50 0.01 0.02 0.09 -0.32 0.02 0.30 1.11
Vegetable Oils -0.29 1.00 -0.76 0.02 -0.06 -0.19 -1.10 -0.02 0.22 1.21
Grains -0.13 0.04 0.05 -0.10 0.04 -0.12 -0.33 0.00 -0.63 1.19
Fruit -1.05 0.05 -0.28 0.04 -0.91 0.12 -0.53 -0.01 -0.09 1.09
Meat & Poultry 0.09 0.07 -0.07 -0.01 0.02 -0.54 -0.17 -0.04 -0.39 1.05
Fresh Seafood -0.32 -0.07 -0.13 -0.01 -0.01 -0.05 -0.24 -0.02 -0.16 1.01
Dried Seafood -0.33 0.11 -0.05 0.00 0.00 -0.27 -0.31 0.30 -0.47 1.02
Seasoning -0.02 0.19 0.07 -0.06 -0.01 -0.30 -0.40 -0.06 -1.17 1.06
4.3 Case Study 2: Zijinshan Wholesale Market (Nanjing)
For the Zijinshan market, the results in Appendix 3 show that there are a number of significant parameters but relatively fewer than those for Dazhongsi market. This may be due to the impact of government control, particularly on vegetable prices which are the only products being analyzed in this particular market. Later, it can be observed that results are different for Beiyunting wholesale market in which products other than vegetables are sold. In Nanjing, there is some direct intervention in the retail side of vegetables markets. Some vegetables in each season have their prices controlled by the Price Bureau which are set at wholesale price plus 30%. This price intervention has possibly affected the results of the study.
All expenditure elasticities are positive implying that the expenditure for all goods will increase as income increases (Table 4.2). The majority are below one, indicating that most of the products are necessities, eg Chinese cabbage, spinach, celery, leek, gourds, garlic, tomato, green capsicum and potato. Cabbage, carrot and spring onion

65
have expenditure elasticities greater than one. Carrot has the highest elasticity while tomato has the lowest. It should be noted, however, that only carrot and other fresh vegetables have significant expenditure elasticities.
All own-price elasticities are conventionally signed and generally higher than unity. The latter is expected since the data are relatively disaggregated and the products are purely vegetables. Elastic products are celery, leek, cabbage, gourds, garlic, other fresh vegetables and green capsicum. Inelastic vegetables, on the other hand, are spinach, carrot, tomato, spring onion and potato. Most inelastic is potato, while celery appeared to be most elastic. This seems to be inconsistent with observed Chinese consumption habits since potato is more of a western staple product. However, this may be a reflection of a changing consumption pattern considering the fact that the data used here are recent (1994–96).
Prices of substitutes and complements appear to play more important roles than own prices as shown by the number of significant cross-price parameters. This may be due to the fact that in this market, prices of vegetables are government controlled. It is also possible that consumers based their decisions on prices of substitutes or complements when given an array of choices falling into one category. Zijinshan trades a variety of products, 80% of which are vegetables. For example, cabbage is a significant substitute for Chinese cabbage as expected. Spinach has more complements than substitutes but only garlic turned out to be significant at 10% level. Note that this is insignificant in the levels form but tomato, celery and cabbage are significant complements.
Celery, on the other hand, has more substitutes than complements but only tomato which is a complement appears to be significant. Spring onion and other fresh vegetables are significant substitutes and complements respectively for leek. Gourds on the other hand, complement cabbage and Chinese cabbage. Tomato is a significant substitute for garlic, while leek is for other vegetables. Leek is a significant complement for spring onion which is consistent with the observed Chinese consumption pattern. Leek is usually used for garnishing and final flavouring in most Chinese dishes while onions are usually sauteed with meat.
Table 4.2 Calculated Uncompensated Elasticities of Wholesale Demand for Food in Zijinshan (Nanjing) Product
Chinese Cabbage
Spinach
Celery
Leek
Cabbage
Carrot
Gourds
Garlic
Other Fr. Veg.
Tomato
Green Caps.
Spring Onion
Potato
Expen-diture Elastic-ities
Chinese Cab. -1.01 0.02 0.01 0.08 0.24 -0.03 0.19 0.03 -0.25 -0.05 -0.15 -0.03 -0.50 0.86 Spinach 0.84 -0.53 -1.30 -0.35 -0.81 -0.37 -0.29 1.08 -0.22 0.22 0.94 -0.05 0.67 0.57 Celery 0.04 -0.21 -2.45 0.32 0.75 -0.05 0.41 -0.30 0.30 -0.90 0.58 0.54 1.41 0.93

66
Leek 0.71 -0.10 0.57 -1.43 0.96 0.29 -0.98 0.30 1.31 0.62 -0.78 -2.35 -0.25 0.67 Cabbage 0.49 -0.06 0.32 0.23 -1.28 -0.04 -0.68 0.17 0.09 0.10 0.07 -0.51 -0.64 1.21 Carrot -0.69 -0.18 -0.19 0.43 -0.29 -0.61 0.48 -0.31 0.84 -0.63 0.29 -0.52 -0.78 1.97 Gourds 0.40 -0.02 0.16 -0.21 -0.58 0.07 -1.19 -0.11 0.32 -0.16 0.11 0.31 -0.12 0.78 Garlic 0.44 0.41 -0.73 0.41 0.98 -0.24 -0.70 -1.16 -0.66 1.15 0.17 -0.97 -0.24 0.72 Other Fr. Veg -0.18 -0.01 0.03 0.08 0.02 0.03 0.08 -0.04 -1.42 -0.01 0.21 0.03 0.05 1.23 Tomato -0.23 0.05 -1.15 0.47 0.32 -0.26 -0.54 0.63 -0.03 -0.82 -0.39 1.01 1.25 0.49 Green Caps. -0.49 0.11 0.42 -0.31 0.13 0.09 0.21 0.06 1.36 -0.21 -1.97 -0.26 -1.02 0.68 Spring Onion -0.08 0.00 0.15 -0.41 -0.35 -0.06 0.23 -0.12 0.09 0.22 -0.12 -0.71 0.08 1.19 Potato 0.03 0.00 0.01 0.01 0.01 0.01 0.01 0.01 0.05 0.04 0.01 0.05 -0.29 0.80
4.4 Case Study 3: Beiyunting Wholesale Market (Nanjing)
In this case, expenditure elasticities are highly significant except for fruit. There are more significant seasonal dummies in the levels form than in the difference form as expected. Two of the five own-price parameters are significant at 5% level. However, only half of the cross-price elasticities are significant (see Appendix 4). All expenditure elasticities are positive, which implies that budget shares of these products will increase as expenditure increases. Most of the expenditure elasticities are more than one except for grain (Table 4.3). This reflects the basic role of grains in the Chinese diet. Seafood is most responsive followed by oil, vegetables and fruit in that order, implying that as expenditure increases a relatively greater share will be spent on these products compared to grain.
Interestingly, there are some consistencies with the findings in Zijinshan. As indicated earlier, there is evidence of consumption changes as potato appears to be more of a necessity as shown by its low own-price elasticity and expenditure elasticity of less than one. It is possible that in Nanjing, potato is becoming a substitute for grains such as rice. In addition, oil appears to have high growth potential similar to the findings in Dazhongsi market in Beijing.
Own-price elasticities are conventionally signed except for grain. However, own- price elasticity for grain is insignificant. One can easily attribute such behaviour to government price fixing which is common in China. It is also possible, that other non-price factors such as quality, could play more significant roles in explaining buying behaviour for grains. For example, in urban centres, particularly for higher-income groups, it has been observed that high-quality rice such as Thai rice has been in demand despite its significantly higher price compared to local grains. Thus, it is possible that the entry of high-quality imported rice has affected the results. Most of the products are elastic particularly seafood, oil, fruits and vegetables. This implies that increasing production of these products will benefit both producers and consumers.

67
There are a number of significant cross-price elasticities particularly for grains, oil and seafood. In fact, for grains, cross-price elasticities are more significant compared to the own-price elasticity. Vegetables and fruits are complements while seafood and oils are substitutes. All cross-price elasticities are significant except fruit. Oil and seafood are complements similar to the findings in Dazhongsi.
Table 4.3 Calculated Uncompensated Elasticities of Wholesale Demand for Food in Beiyunting (Nanjing) Product
Grain
Oil
Fruit
Seafood
Vegetables
Expenditure Elasticities
Grain 0.45 2.13 -0.42 1.60 -2.67 0.77
Oil 2.28 -2.67 0.42 -1.60 -0.20 1.26
Fruit -0.09 0.09 -1.16 0.05 0.03 1.05
Seafood 6.10 -5.49 1.77 -5.62 1.73 1.96
Vegetables -0.02 0.00 0.00 0.00 -1.04 1.06
4.5 Case Study 4: Buji Market (Shenzhen)
In this market, most of the variables are significant at 5% level. All own-price parameters are highly significant and a number of expenditure elasticities are also significant. Most cross-price parameters are significant, particularly for fruit where all are highly significant (see Appendix 5). It should be noted that the levels form has more significant expenditure parameter estimates but again plagued with autocorrelation problem and therefore unreliable. There were about five equations with D-W statistics outside acceptable levels.
R2 values are reasonable, ranging from 0.19 to 0.76. Again, it should be noted that R2 in difference form is usually lower and should not be compared with the levels form because the explained variables are different (Madalla, 1988). Frozen cutlass fish has the lowest R2 value, indicating that the variability in the budget share is not adequately explained by prices and expenditure variables. On the other hand, frozen pork ribs has the highest R2 value.
Expenditure elasticities are quite high, with most of the products exceeding unity, eg frozen meat, frozen pork ribs, frozen red fish, fruit, gourd and pea, leaf vegetables, root and sandwich ham (Table 4.4). This implies growth potentials in these products as a 1% increase in expenditure would necessitate more than 1% increase in their budget shares. Expenditure elasticities are all positive except winter rice which is negative. There are several possible explanations for this. First, it may be that winter rice is indeed an inferior product considering the fact that the market basically caters to Hong Kong and Shenzhen which are highly urbanized. Thus, it is possible that in these urban centres, winter rice is inferior relative to its substitutes such as bread.

68
Secondly, this may be due to government price fixing which is common among grains. However, it is argued that this market has highly competitive price discovery process. Thirdly, it can be argued that this figure may be inaccurate or unreliable since this is indirectly computed from the expenditure elasticities of other products. Considering the number of significant expenditure parameters which is only about four of the twelve products, accuracy of this estimate may be affected.
The own-price elasticities have mixed signs. Seven products have positive signs and five have negative values. Most of the frozen and processed meats and fish have positive signs. Fruits and vegetables, on the other hand, have conventional signs. There may be several reasons to explain this consumption behaviour. The affluence of the markets served could be a factor such that income and demographic variables could have greater effects than own price. Quality, taste and preference are more important factors than price for affluent consumers. Moreover, with a closer look at the data, it can be observed that these seven products with positive price elasticities have the lowest coefficients of variation in prices. This supports the aforementioned explanation that there may be other possible non-price factors that were not captured in the model. For example, sandwich ham and frozen cutlass fish have the lowest coefficient of variation. Canned ham, frozen red fish and frozen meat have coefficient of variation of less than 20%. Additionally, the positive own-price elasticities could be attributed to government price fixing, although the market generally has competitive price discovery process.
Fruit is subject to large complementarities except canned ham. Also, the majority are complementary products for canned ham, except frozen cutlass fish and frozen meat. Sandwich ham complements canned ham which is not expected. But this is not a significant variable compared to frozen cutlass fish, frozen meat, frozen red fish, fruit and leaf vegetables. Like canned ham, frozen cutlass fish has more complements than substitutes. There are about seven complements compared to three substitutes. Most of these products are significant, except canned ham, frozen pork ribs and fruit. There are no significant substitutes for frozen meat but frozen pork ribs, frozen red fish, gourd and pea and leaf vegetables are significant complements.
For frozen pork ribs, there are no significant substitutes but frozen meat and fruit appear to be significant complements. Canned ham and fruit are significant complements with no significant substitutes. Gourd and pea have frozen cutlass fish and fruit as significant complements. Leafy vegetables and fruits are complementary products just like frozen meat and sandwich ham. Silk rice, as expected, is a significant substitute for winter rice.
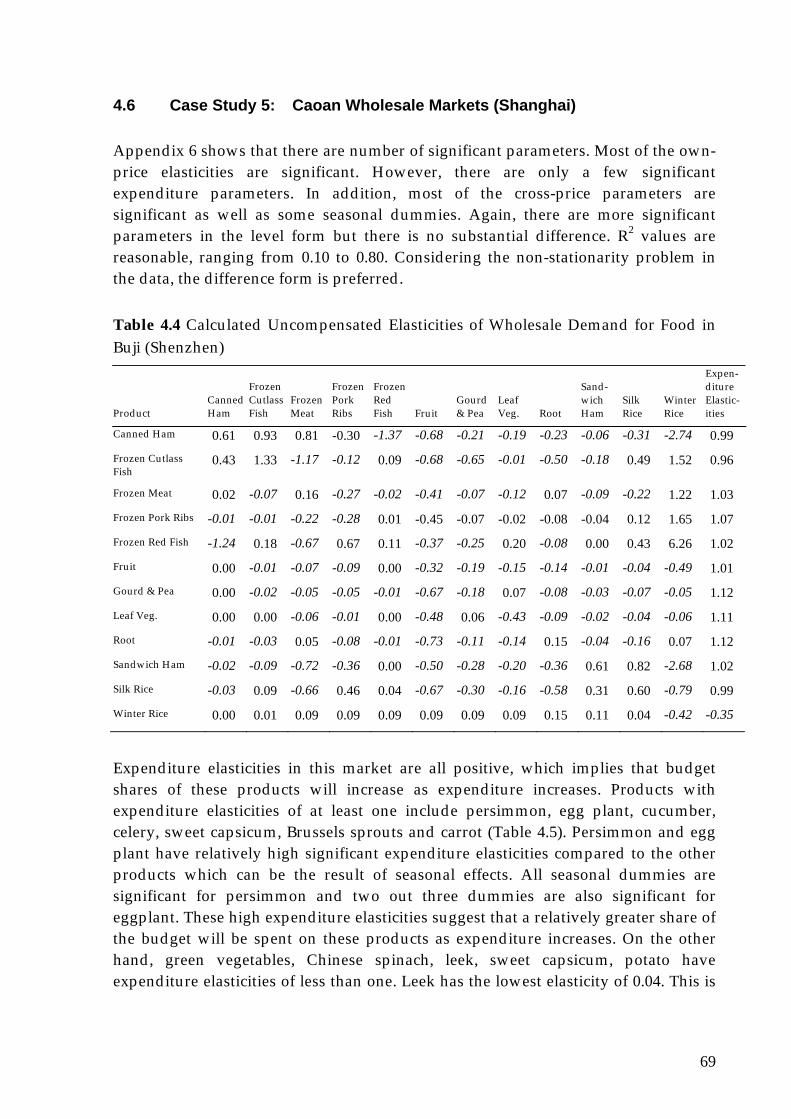
69
4.6 Case Study 5: Caoan Wholesale Markets (Shanghai)
Appendix 6 shows that there are number of significant parameters. Most of the own-price elasticities are significant. However, there are only a few significant expenditure parameters. In addition, most of the cross-price parameters are significant as well as some seasonal dummies. Again, there are more significant parameters in the level form but there is no substantial difference. R2 values are reasonable, ranging from 0.10 to 0.80. Considering the non-stationarity problem in the data, the difference form is preferred.
Table 4.4 Calculated Uncompensated Elasticities of Wholesale Demand for Food in Buji (Shenzhen) Product
Canned Ham
Frozen Cutlass Fish
Frozen Meat
Frozen Pork Ribs
Frozen Red Fish
Fruit
Gourd & Pea
Leaf Veg.
Root
Sand-wich Ham
Silk Rice
Winter Rice
Expen-diture Elastic-ities
Canned Ham 0.61 0.93 0.81 -0.30 -1.37 -0.68 -0.21 -0.19 -0.23 -0.06 -0.31 -2.74 0.99 Frozen Cutlass Fish
0.43 1.33 -1.17 -0.12 0.09 -0.68 -0.65 -0.01 -0.50 -0.18 0.49 1.52 0.96
Frozen Meat 0.02 -0.07 0.16 -0.27 -0.02 -0.41 -0.07 -0.12 0.07 -0.09 -0.22 1.22 1.03 Frozen Pork Ribs -0.01 -0.01 -0.22 -0.28 0.01 -0.45 -0.07 -0.02 -0.08 -0.04 0.12 1.65 1.07 Frozen Red Fish -1.24 0.18 -0.67 0.67 0.11 -0.37 -0.25 0.20 -0.08 0.00 0.43 6.26 1.02 Fruit 0.00 -0.01 -0.07 -0.09 0.00 -0.32 -0.19 -0.15 -0.14 -0.01 -0.04 -0.49 1.01 Gourd & Pea 0.00 -0.02 -0.05 -0.05 -0.01 -0.67 -0.18 0.07 -0.08 -0.03 -0.07 -0.05 1.12 Leaf Veg. 0.00 0.00 -0.06 -0.01 0.00 -0.48 0.06 -0.43 -0.09 -0.02 -0.04 -0.06 1.11 Root -0.01 -0.03 0.05 -0.08 -0.01 -0.73 -0.11 -0.14 0.15 -0.04 -0.16 0.07 1.12 Sandwich Ham -0.02 -0.09 -0.72 -0.36 0.00 -0.50 -0.28 -0.20 -0.36 0.61 0.82 -2.68 1.02 Silk Rice -0.03 0.09 -0.66 0.46 0.04 -0.67 -0.30 -0.16 -0.58 0.31 0.60 -0.79 0.99 Winter Rice 0.00 0.01 0.09 0.09 0.09 0.09 0.09 0.09 0.15 0.11 0.04 -0.42 -0.35
Expenditure elasticities in this market are all positive, which implies that budget shares of these products will increase as expenditure increases. Products with expenditure elasticities of at least one include persimmon, egg plant, cucumber, celery, sweet capsicum, Brussels sprouts and carrot (Table 4.5). Persimmon and egg plant have relatively high significant expenditure elasticities compared to the other products which can be the result of seasonal effects. All seasonal dummies are significant for persimmon and two out three dummies are also significant for eggplant. These high expenditure elasticities suggest that a relatively greater share of the budget will be spent on these products as expenditure increases. On the other hand, green vegetables, Chinese spinach, leek, sweet capsicum, potato have expenditure elasticities of less than one. Leek has the lowest elasticity of 0.04. This is

70
consistent with Chinese consumption pattern considering its popularity and necessity nature in their diet.
Table 4.5 Calculated Uncompensated Elasticities of Wholesale Demand for Food in Caoan (Shanghai) Product
Green Veg.
Brussels Sprouts
Chinese Spinach
Celery
Leek
Cucum-ber
Egg Plant
Persim-mon
Sweet Caps.
Lettuce Root
Potato
Carrot
Expen-diture Elastic-ities
Green Vegetables 0.28 0.35 -0.11 0.04 -0.32 0.12 -0.01 -0.34 -0.10 -0.34 0.25 -0.11 0.65 Brussels Sprouts 0.32 -1.15 0.55 0.13 -0.75 -0.35 -0.57 -0.94 0.36 0.26 2.01 -0.52 1.02 Chinese Spinach -0.04 0.37 0.25 -0.32 0.07 -0.50 0.32 -0.12 -0.24 0.21 -1.14 0.25 0.41 Celery 0.02 0.11 -0.64 -0.24 -0.03 0.08 0.21 -0.05 0.13 0.24 -0.79 -0.70 1.28 Leek -0.50 -1.09 0.18 0.02 -1.81 -0.74 -1.54 -1.44 1.74 1.77 2.04 0.09 0.04 Cucumber 0.02 -0.11 -0.27 0.02 -0.15 -1.04 -0.01 0.29 0.05 0.35 -0.21 0.19 1.15 Egg Plant -0.10 -0.91 0.71 0.25 -1.47 -0.05 -1.97 -2.33 1.27 1.10 1.44 0.17 1.99 Persimmon -0.41 -0.99 -0.31 -0.12 -0.91 0.86 -1.52 -3.39 1.59 0.99 2.71 -0.69 2.39 Sweet Capsicum -0.05 0.22 -0.24 0.09 0.60 0.11 0.52 1.02 -1.33 -0.59 -0.51 -0.01 0.80 Lettuce Root -0.73 0.49 0.62 0.45 2.11 2.41 1.53 2.23 -2.13 -2.92 -2.41 0.64 1.20 Potato 0.11 0.78 -0.75 -0.26 0.48 -0.25 0.40 1.16 -0.34 -0.45 -0.35 -0.27 0.75 Carrot -0.18 -0.72 0.57 -0.90 0.05 0.94 0.20 -0.98 -0.05 0.46 -1.02 0.95 1.00
Own-price elasticities have mixed signs but mostly negative. Green vegetables, Chinese spinach and carrot have positive own-price elasticities and the rest are negative. This may be due to the fact that in this market prices of vegetables and pork are controlled by the Vegetable Basket Project of the government.
The majority of products have own-price elasticities exceeding unity. These include Brussels sprouts, leek, cucumber, egg plant, persimmon, sweet capsicum and lettuce root. This is similar to Zijinshan with disaggregated and purely vegetable products in the model, which may explain the relatively high own-price elasticities. The inelastic products are mostly positive, except for celery.
Green vegetables are subject to complementary effects with other vegetables but only leek and lettuce root are significant at 5% level. Brussels sprouts are the only significant substitute. It is interesting to note that Brussels sprouts’ own-price and expenditure elasticities are not significant but the majority of its cross-price parameters are significant. Leek, eggplant, persimmon, and carrot are significant complements while green vegetables, Chinese spinach, sweet capsicum and potato are significant substitutes. Celery and potato are significant complements, for Chinese spinach while Brussels sprouts, carrot and eggplant are significant substitutes. Cucumber does not have significant complements but only significant substitutes namely carrot and lettuce root. Sweet capsicum and potato have

71
insignificant own-price elasticities but a number of cross-price elasticities are highly significant.
4.7 Case Study 6: Xinchang Wholesale Market (Shanghai)
In this case, all own-price elasticities are significant at 5% level except cabbage. Only one expenditure parameter is significant at 10% level but there are a number of significant cross-price elasticities (Appendix 7). R2 value is low but this is expected with the difference model. Again, the levels form had higher R2 but low and unacceptable Durbin-Watson statistics. Thus, the difference model is preferred.
All own-price elasticities are conventionally signed and lower than unity. Cabbage is the most elastic and celery is relatively inelastic. It should be noted that the relationship between cabbage and Chinese cabbage in this market is similar to that in Zijinshan. Cabbage has higher elasticity than Chinese cabbage but both are relatively elastic in Zijinshan, which is possibly due to the level of disaggregation implying that Chinese cabbage is a more basic or essential component of the Chinese diet than cabbage.
The result for spinach is again consistent with that indicated in Zijinshan. It is inelastic in both markets although for Zijinshan it is higher in terms of magnitude than for Xinchang. Celery and Chinese cabbage are complements in both markets but Chinese cabbage is a substitute in Zijinshan and a complement in Xinchang. It should be noted, however, that the parameter is significant in Xinchang and not in Zijinshan. Celery is most elastic in Xinchang but most inelastic in Zijinshan. However, elasticities are generally higher in Zijinshan which may be due to the level of disaggregation as mentioned earlier.
All expenditure elasticities are positive in both markets, implying that demand will increase as income increases. Spinach has a relatively higher expenditure elasticity particularly compared to celery, with only 0.5 expenditure elasticity. Expenditure elasticities of cabbage and Chinese cabbage are not significantly different but cabbage is more elastic than Chinese cabbage again indicating that the latter is more basic than the former. In general, a greater share of the budget will be spent on spinach, cabbage, and other vegetables as income increases, at the expense of cabbage and celery.
Table 4.6 Calculated Uncompensated Elasticities of Wholesale Demand for Food in Xinchang (Shanghai) Product
Cabbage
Spinach
Chinese Cabbage
Other
Celery
Expenditure Elasticities
Cabbage -0.83 0.17 -0.14 0.04 -0.21 0.98
Spinach 0.10 -0.38 -0.82 0.20 -0.45 1.35

72
Chinese Cab. -0.05 -0.24 -0.44 -0.26 -0.03 1.02
Other 0.01 0.25 -0.91 -0.40 -0.15 1.20
Celery -0.11 -0.27 0.13 -0.02 -0.23 0.50
4.8 Comparison of Results Across Markets and Previous Findings
4.8.1 Introduction
In this section, results across markets are compared to identify similarities and differences. This would reflect, among other things, peculiarities in the markets they serve and therefore be useful in gaining more insights on demand patterns across China. In the same manner, the findings are also compared with previous studies to spot trends and generally validate the results.
4.8.2 Market Comparison
It is quite difficult to compare the results of the six wholesale markets since they have different commodities, level of aggregation, period covered, markets served, type of data (ie monthly, daily), etc. Other factors also come into play like the degree of government intervention and price discovery processes which to some extent vary across the markets analysed. Nevertheless, it is possible to make some general observations and identify some consistencies by comparing similar markets and products.
Zijinshan and Caoan markets are similar and could be appropriately compared. The commodities analysed are vegetables, data coverage is almost the same from 1994 to 1996 and data used were aggregated. In both markets, leek is price elastic but expenditure elasticities are less than unity. On the other hand, potato is inelastic relative to its own price and expenditure. These indicate that leek and potato are necessities. Leek is known to be a basic ingredient in most Chinese dishes but potato is not. However, it is likely that since the data covered is more recent (1994–96), this may reflect a changing consumption pattern. Also, the major markets served are the urban centres where these wholesale markets are located which are expected to have higher potato consumption. For example, Zijinshan supplies 80% while Caoan supplies 20% of Nanjing's and Shanghai’s vegetable requirements respectively. Moreover, both spinach and capsicum have inelastic expenditure elasticities indicating their necessity nature in the Chinese diet. Carrot and cabbage, on the other hand, have expenditure elasticities greater than unity and are therefore classified as luxury items within the food group.
A more general observation can be made by comparing the same products sold in the wholesale markets analyzed (Appendix 9). Fruits in Dazhongsi and Shenzhen have

73
expenditure elasticities greater than unity. Also, own-price elasticities are consistent in both markets, with values less than one. Grains are generally inelastic relative to its own price. However, in Beiyunting and for silk rice in Buji, own-price elasticities are also lower than unity but positive. As discussed previously, this may be attributed to government intervention which is common in grains. Generally, grains have expenditure elasticity of less than one except for Dazhongsi which exceeds unity. Winter rice in Buji is also inelastic but negative. This may be due to the variety and type of markets served. Silk rice may be considered superior to winter rice when expenditure increases. It is also possible, that since Buji mainly supplies urban centres, particularly Shenzhen and Hong Kong, grains in these markets may be considered an inferior food.
Generally, expenditure elasticities of meat, poultry and seafood are positive and high, indicating growth opportunities in these markets. This is expected since most of the wholesale markets analysed mainly cater to the urban centres particularly for Dazhongsi in Beijing and Buji in Shenzhen where these products are covered. Apparently, these cities are enjoying high income and growth rates thereby increasing consumption of these products. It should be noted, however, that of the six products in this category, only frozen cutlass fish has expenditure elasticity of about 0.90 which is still reasonably high.
Although appearing only in one market (Buji), frozen and processed meats have high expenditure elasticity greater than unity which implies that as expenditure increases, a relatively greater share of the budget will be spent on these products. This is consistent with earlier findings on the growth potential of processed food. Of the four products under this category, only one product (canned ham) has expenditure elasticity of less than one but at 0.99 is very close to unity.
It is also interesting to compare markets within the same area since most of them mainly serve the proximate sub-markets in the areas in which they are located. Thus, this would provide more accurate estimates of consumption patterns in these areas. However, this poses some problems because of the different products covered, level of aggregation, period covered and type of data used. Nevertheless, an attempt can be made for some products and categories. For Caoan and Xinchang wholesale markets in Shanghai, celery turned out to have very close own-price estimates with elasticities of -0.24 and -0.23 respectively. The big difference in their expenditure elasticities (1.28 for Caoan and 0.50 for Xinchang) may be due to the type of data used and period covered. Moreover, this can possibly be attributed to the specific type of market segments served. Generally, by averaging all vegetable products in the two markets based on expenditure share, own-price elasticities are roughly smaller than one, while expenditure elasticities are also low but close to unity. This implies that in Shanghai, vegetables are essential and may be considered as necessities.

74
In Nanjing, there is a greater difficulty of comparing the Zijinshan and Beiyunting markets because the products are different except when we group the vegetable products in Zijinshan into one broad category: fresh vegetables. By doing this, own-price elasticity for vegetables is close to unity with 1.02 and 1.04 for Zijinshan and Beiyunting respectively. This average is based on the expenditure shares of each product. Similarly, expenditure elasticities are close to unity. These figures imply that in Nanjing, vegetables are more responsive to own price compared to those in Shanghai. Also, vegetables are considered as necessities which is consistent with the observed Chinese consumption patterns. However, the expenditure elasticities on average are high, indicating opportunities in this food category.
In summary, price elasticities are generally lower than one, while a number of expenditure elasticities are greater than one. The magnitudes and signs of these elasticities are generally consistent, particularly when similarities and differences of the markets are considered.
4.8.3 Comparison with Previous Findings
As noted previously, a number of earlier studies have analysed the consumption of food in China, including Tang and Stone (1980), Van der Gaag (1984), Yang (1985), Carter and Zhong (1988), Lewis and Andrews (1989), Halbrendt and Gempesaw (1990), Peterson et al (1991), Huang and David (1993), Chang (1994), Chern and Wang (1994), Fan, Cramer and Wailes (1994), Fan, Wailes and Cramer (1994), Halbrendt, Tuan, Gempesaw and Dolk-Etz (1994), Samuel (1994), Wu, Li and Samuel (1995) and Ahmadi-Esfahani and Stanmore (1996). The results of these studies are summarised in Tables 4.7 and 4.8.
The earlier studies of Tang and Stone (1980), Van der Gaag (1984), Yang (1985) and Carter and Zhong (1988) are rather limited. Tang and Stone (1980) estimated grain consumption by a method of moving averages, with the underlying assumption that the total consumption was determined by the government. Van der Gaag (1984) made improvements on Tang and Stone's model by placing greater emphasis on the impact of income on demand, providing projections of consumption based on Engel curve analysis. Similarly, Yang (1985) based the individual's determination of consumption on income. Carter and Zhong (1988) specified per capita consumption levels for grain as a function of income and established consumption habits, providing estimates for both the rural and urban sector. These studies are very specific, dealing mostly with the grains sector, based on extremely aggregated data and involve highly simplified models of consumption. These limitations, along with the outdated data used, hamper the relevance of their findings.
Lewis and Andrews (1989) and Chern and Wang (1994) applied the Linear Expenditure System (LES), or adaptations of it, to data from Chinese government
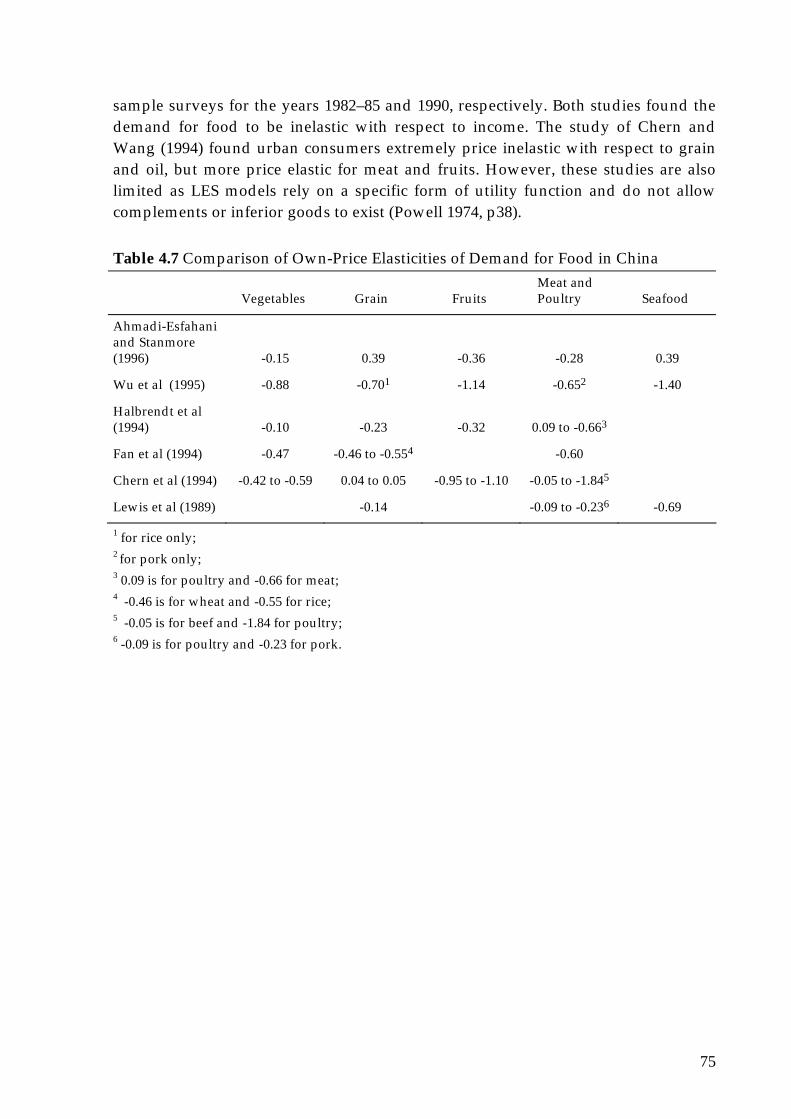
75
sample surveys for the years 1982–85 and 1990, respectively. Both studies found the demand for food to be inelastic with respect to income. The study of Chern and Wang (1994) found urban consumers extremely price inelastic with respect to grain and oil, but more price elastic for meat and fruits. However, these studies are also limited as LES models rely on a specific form of utility function and do not allow complements or inferior goods to exist (Powell 1974, p38).
Table 4.7 Comparison of Own-Price Elasticities of Demand for Food in China
Vegetables Grain
Fruits
Meat and Poultry
Seafood
Ahmadi-Esfahani and Stanmore (1996)
-0.15
0.39
-0.36
-0.28
0.39
Wu et al (1995) -0.88 -0.701 -1.14 -0.652 -1.40
Halbrendt et al (1994)
-0.10
-0.23
-0.32
0.09 to -0.663
Fan et al (1994) -0.47 -0.46 to -0.554 -0.60
Chern et al (1994) -0.42 to -0.59 0.04 to 0.05 -0.95 to -1.10 -0.05 to -1.845
Lewis et al (1989) -0.14 -0.09 to -0.236 -0.69
1 for rice only; 2 for pork only; 3 0.09 is for poultry and -0.66 for meat; 4 -0.46 is for wheat and -0.55 for rice; 5 -0.05 is for beef and -1.84 for poultry; 6 -0.09 is for poultry and -0.23 for pork.
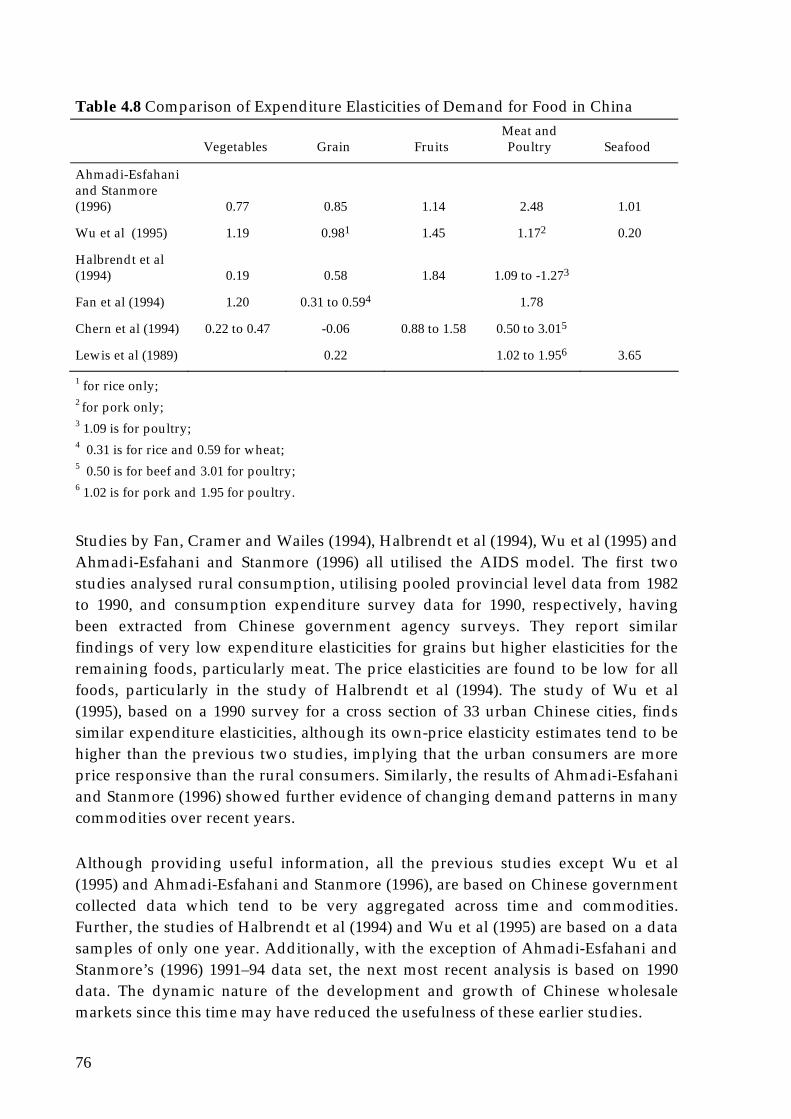
76
Table 4.8 Comparison of Expenditure Elasticities of Demand for Food in China
Vegetables Grain
Fruits
Meat and Poultry
Seafood
Ahmadi-Esfahani and Stanmore (1996)
0.77
0.85
1.14
2.48
1.01
Wu et al (1995) 1.19 0.981 1.45 1.172 0.20
Halbrendt et al (1994)
0.19
0.58
1.84
1.09 to -1.273
Fan et al (1994) 1.20 0.31 to 0.594 1.78
Chern et al (1994) 0.22 to 0.47 -0.06 0.88 to 1.58 0.50 to 3.015
Lewis et al (1989) 0.22 1.02 to 1.956 3.65
1 for rice only; 2 for pork only; 3 1.09 is for poultry; 4 0.31 is for rice and 0.59 for wheat; 5 0.50 is for beef and 3.01 for poultry; 6 1.02 is for pork and 1.95 for poultry.
Studies by Fan, Cramer and Wailes (1994), Halbrendt et al (1994), Wu et al (1995) and Ahmadi-Esfahani and Stanmore (1996) all utilised the AIDS model. The first two studies analysed rural consumption, utilising pooled provincial level data from 1982 to 1990, and consumption expenditure survey data for 1990, respectively, having been extracted from Chinese government agency surveys. They report similar findings of very low expenditure elasticities for grains but higher elasticities for the remaining foods, particularly meat. The price elasticities are found to be low for all foods, particularly in the study of Halbrendt et al (1994). The study of Wu et al (1995), based on a 1990 survey for a cross section of 33 urban Chinese cities, finds similar expenditure elasticities, although its own-price elasticity estimates tend to be higher than the previous two studies, implying that the urban consumers are more price responsive than the rural consumers. Similarly, the results of Ahmadi-Esfahani and Stanmore (1996) showed further evidence of changing demand patterns in many commodities over recent years.
Although providing useful information, all the previous studies except Wu et al (1995) and Ahmadi-Esfahani and Stanmore (1996), are based on Chinese government collected data which tend to be very aggregated across time and commodities. Further, the studies of Halbrendt et al (1994) and Wu et al (1995) are based on a data samples of only one year. Additionally, with the exception of Ahmadi-Esfahani and Stanmore’s (1996) 1991–94 data set, the next most recent analysis is based on 1990 data. The dynamic nature of the development and growth of Chinese wholesale markets since this time may have reduced the usefulness of these earlier studies.

77
Clearly, comparison of results with previous findings should be treated with caution since the date covered, nature of data used, models employed, level of aggregation and markets covered, whether rural or urban, affect the results. A number of general observations, however, can be derived with these limitations in mind.
Firstly, it can be seen that own-price elasticities for this analysis are less than unity and negative, which is generally consistent with the previous findings. For vegetables, the own-price elasticities of -0.88 by Wu et al (1995) is similar to this study especially when a rough average based on expenditure is derived which turned out to be -0.70. Shanghai in particular has an average of about -0.78. Moreover, expenditure elasticities are both higher than unity. This may be due to the fact that Wu et al study covered urban centres similar to the wholesale main markets for vegetables. In Nanjing and Shanghai, for example, the wholesale markets analyzed supply about 80% and 20% of the vegetable markets respectively.
Secondly, comparing the results of Ahmadi-Esfahani and Stanmore (1996) would give some indication of the consumption pattern in Beijing and the likely impact of reforms. They used 1991–94 data from the Dazhongsi wholesale market while this study used 1995–96 daily data for this and other wholesale markets. Moreover, both studies used AIDS model and the wholesale market supplies a substantial amount of Beijings’s food requirement. Vegetables, fruits, meat and poultry appear to be, on average, more price responsive in recent years (1995–96) than the previous period (1991–94). All average own-price elasticities of these products are higher than the previous period. It should be noted that the majority of the own-price parameters are significant at 5% level. Additionally, grains have positive own-price elasticity in the earlier period and became negative (-0.10) in the recent period. This is also true for seafood, with elasticity of -0.24 (1994–96) compared to 0.39 (1991–94). These positive own-price elasticities in the earlier period may be attributed to non-price factors and government intervention in pricing. Generally, the trend is toward more price responsive products indicating the impact of free-market reforms in recent years. On the other hand, expenditure elasticities have not changed significantly with fruits, grains, as well as seafood, except for vegetables and meat and poultry. Expenditure elasticity for vegetables has increased from 0.77 to 1.03, while meat and poultry has decreased from 2.48 to 1.02. Seafood has also increased from 1.01 to 1.3 but still elastic. This may indicate a possible change in consumption patterns.
Thirdly, by comparing expenditure changes in ‘similar’ studies, we can draw some possible conclusion with respect to the growth potentials of the products analysed. For Beijing, comparing results with those reported in Ahmadi-Esfahani and Stanmore (1996), indicates that there are growth potentials in vegetables and seafood. In addition, fruits, meat and poultry will continue to grow as the expenditure elasticities remain more than unity. Comparing results to those of Wu et al (1995) which used 1990 data and covered only urban cities shows that findings are

78
consistent, implying that vegetables, fruits, meat and poultry will continue to grow. However, there will be more opportunities in seafood as expenditure elasticity significantly increased from 0.20 to 1.3.

79

80
5 IMPLICATIONS OF THE STUDY
5.1 Introduction
In this chapter, the implications of the findings of the study in the areas of consumption, production and trade are explored. Basically, the approach is to analyse the implications of each of the six wholesale markets investigated. General trends across these markets are examined and their implications for Australia, specifically in terms of growth potentials and pricing strategies, are analysed. The impact of government intervention on consumption patterns are also assessed. In most cases, the consumption trends implied by the elasticities derived from the study, are validated and substantiated with import and export data. Hong Kong is included as an integral part of the analysis, as it appears to be a key player in the global food market, particularly in vegetables, fruits, and meat products, and its turnover to China has already occurred. Finally, since average figures of elasticities have limitations, discussion on general trends is augmented with analysis on specific products and areas covered.
5.2 Implications by Wholesale Market
5.2.1 Case Study 1: Dazhongsi Wholesale Market (Beijing)
The high positive expenditure elasticities of all products analysed imply growth potentials in these food items (Table 4.1). Among these products, vegetable oils appear to have the highest potential. This is consistent with the finding of Li and Samuel (1995) that as Chinese consumers improve their living standards, they would prefer vegetables oils to animal lard. It was also argued that imported oils were cheaper and of higher quality compared to the local oils. Thus, urban consumption increased by about 20% between 1985 to 1991 (West, 1994).
Moreover, grains posted a reasonably high expenditure elasticity. This can be attributed to the high growth potentials in its complementary products such as meat and poultry and seafood. It should be noted that these products have high complementary effects to grain. In addition, the relatively high expenditure elasticity is consistent with local consumption patterns. Grains in the northern part of China (eg Beijing) are not considered as basic compared to the Southern part of China (eg Shenzhen). Thus, its expenditure elasticity is expected to be high in magnitude. The high growth potentials in other products such as meat and poultry and seafood as shown by their high expenditure elasticities are expected since Dazhongsi mainly caters to Beijing which is a high income metropolis being the centre of government and major industries.

81
Generally, own-price elasticities are less than unity, implying little benefit in lowering prices (Table 4.1). This is true particularly for grains, seafood and meat and poultry. On the other hand, dried vegetables and seasonings have own-price elasticities exceeding unity, suggesting that a percentage increase in demand would be higher than the percentage decrease in price. Thus, lowering prices for these products would be beneficial for both consumers and producers. Moreover, expanding production of these products may be profitable for producers.
Although generally the cross-price elasticities have lower values than the own-price elasticities, there are products where the cross-price effects are substantial (Table 4.1). This is important for wholesalers and even retailers, particularly in merchandising their products. Dazhongsi, for instance, owns twelve discount retail vegetable markets and is establishing a centre for special vegetables to exploit a niche market provided by Beijing’s growing restaurant trade. While these retail outlets specialize in vegetables, results suggest that there may be an untapped niche for fresh or healthy products, particularly in combining fruits and vegetables as they have high complementary effects. Thus, specialty stores for fresh vegetables and fruits are perhaps a worthwhile strategy to explore. Moreover, whether in a retail or wholesale format, vegetable oils and seafood have high complementary effects as well as grains and seasonings. This does not imply that these products are the only products to be carried, as breadth and width of products are important factors to consider.
5.2.2 Case Study 2: Zijinshan Wholesale Market (Nanjing)
With rising incomes in China, particularly for the urban centres such as Nanjing, demand for fresh vegetables is expected to increase since the expenditure elasticities are all positive. Specifically, there are substantial growth potentials in cabbage, carrot and spring onion since these products have expenditure elasticities greater than one, implying that as expenditure increases greater shares will be allocated to these vegetables (Table 4.2). The products are generally elastic, suggesting that there are benefits in lowering price particularly for spinach, carrot, tomato, spring onion and potato as a percentage decrease in price will increase demand by more than 1%. It may also be profitable to expand production as this will decrease price and hence benefit both producers and consumers.
There is an indication in the change in consumption pattern. Potato appears to be the most price inelastic product and has expenditure elasticity of less than one (Table 4.2). These imply that potato is a basic product which is inconsistent with the observed traditional Chinese consumption pattern. However, this may reflect a changing consumption pattern considering that the data used are recent (1994–96). Moreover, Zijinshan basically caters to the population of Nanjing

82
which is highly urbanized and may have a consumption pattern different from the traditional Chinese eating habits. Studies have shown that with the rapid urbanization in China, increasing affluence and the emergence of new upper-middle class segment, lifestyle changes and demand for convenience and western food increases (Fahey, 1995). This includes french fries and chips.
Own prices appear to have less explanatory power compared to prices of substitutes and complements. This may be an indication of government control on prices of vegetables at the retail level. In Nanjing, the Price Bureau controls prices of some vegetables in every season set at wholesale price plus 30%. While the price discovery process appears to be competitive, government control is also impinging on price responsiveness of vegetables in this market.
5.2.3 Case Study 3: Beiyunting Wholesale Market (Nanjing)
All expenditure elasticities are positive, indicating an increase in demand as income increases (Table 4.3). As the level of income is expected to increase for most of the Chinese consumers, there are opportunities in most of the products analyzed, particularly oil, fruit, seafood and vegetables. Budget shares of these products are expected to increase faster than the growth in income as indicated by their high expenditure elasticities of more than one. All of these high potential products have price elasticities exceeding unity, implying that lowering price will be beneficial for producers and consumers. It is profitable to expand production to take advantage of the potentials and the responsiveness of these products to price.
Grains appear to have the least prospects in terms of growth compared to the other products. However, the expenditure elasticity of 0.77 is reasonably high. Given, the bright prospects in seafood which consequently increases demand for grains similar to poultry and meat products, a modest demand for grain may be expected. A more disaggregated analysis of grains will be more useful to support this conjecture. However, in the case of grain, domestic capacity is limited because of the scarcity of land due to the rapid urbanisation. Moreover, productivity improvement is also limited (Garnaut and Ma, 1992) and the budget for research and development in agriculture is decreasing (Colby, Crook and Tuan, 1995). Therefore, increase in grain imports is expected.
5.2.4 Case Study 3: Buji Wholesale Market (Shenzhen)
Growth opportunities are expected, particularly for frozen meat, frozen pork ribs, frozen red fish, fruit, gourd and pea, leaf vegetables, root and sandwich ham as expenditure elasticities of these products are positive and elastic (Table 4.4). As can be noted, a number of these products are processed or frozen which is consistent

83
with the expected consumption patterns of progressive markets served by this wholesale network. Buji wholesale market, being proximate to Hong Kong, supplies about 60% of the primary traded agricultural goods to this area. It also supplies the 3.5 million population of Shenzhen City. In addition to these two highly urbanized centres, it exports fruits to Southeast Asia and South Africa. These main markets have high purchasing power which may explain high expenditure elasticities in the frozen and convenience food such as sandwich ham.
It is interesting to note that some products are inelastic with positive own-price elasticity particularly for the frozen and processed products. This implies that pricing may not be a significant factor in marketing these products compared to other non-price effects such as taste and preferences. Grains, particularly winter rice, has low and positive own-price elasticity indicating a possible government control which is common to grains. However, this market is argued to have a highly competitive price discovery process.
Generally, it is important to study this market further for a number of reasons. First, it is a massive market and possibly the largest distribution centre in China (Hua and Fan, 1993) with established network in Hong Kong. For Australian exporters, penetrating this outlet may be worth pursuing. Currently, the market already imports grapes, apples, pears, chicken, kangaroo and ostrich meat from Australia. Secondly, its main focus is on fruits and vegetables and other products covering 2000 commodities. Analyzing demand for most of these commodities could provide valuable insights into the buying habits of the affluent markets covered.
5.2.5 Case Study 4: Caoan Wholesale Market (Shanghai)
All expenditure elasticities are positive, implying an increase in demand as income increases (Table 4.5). Among the products analysed, growth potentials are expected for persimmon, cucumber, eggplant, Brussels sprouts, celery and lettuce root. A relatively higher share of the budget will be allocated to these products as income improves compared to green vegetables, Chinese spinach, leek, sweet capsicum and potato.
The majority of the products are price responsive which implies that marketers should be conscious of their pricing strategies. It should be noted that most of these products with high potentials are also price elastic such as persimmon, Brussels sprouts, cucumber, eggplant, and lettuce root. This implies that for these products, lowering price would be more beneficial for producers and consumers. As demand for these products are expected to grow, expanding production may be profitable since the rate of decrease in price due to increased supply will be smaller compared to the growth in demand. It is interesting to note that persimmon appears to have the

84
highest potential since this has the highest price and expenditure elasticities. As indicated by the data, demand for this product is also affected by seasonality.
5.2.6 Case Study 6: Xinchang Wholesale Market (Shanghai)
Similar to Caoan market, the majority of the products in this market have significant own-price elasticities. In fact, only one out of five products have insignificant price elasticity, implying that sellers in this market should pay attention to their pricing strategies (Table 4.6). There are no benefits in lowering price for all the products covered since they are price inelastic.
Again, all expenditure elasticities are positive, implying an increase in consumption as income increases (Table 4.6). Specifically, a relatively higher share of the budget will be spent on spinach, Chinese cabbage and other vegetables, indicating growth potentials in these products.
5.3 Implications by Product
5.3.1 General
Generally, a number of products have high expenditure elasticities, implying growth potentials in food demand. With double-digit economic growth, rising income, proximity to Australia and market size of food wholesale market estimated at about $A83 billion in 1992 (Fahey, 1994), China is undoubtedly a market to watch for Australian exporters.
Findings of the study reveal that there are opportunities in vegetable oils, vegetables, fruits, meat and poultry, processed meat, and seafood as shown by their relatively high expenditure elasticities. Table 5.1 lists these products by wholesale market. To validate and substantiate the potentials implied by these figures, import and export trends are examined for each of these product categories. The focus of the validation and trend analysis is China. However, the combined market of China and Hong Kong is also investigated, as are the other markets in Asia.
5.3.2 Vegetable Oils
Expenditure elasticities of vegetable oils indicate promising growth potential. Interestingly, this is consistent with both import and export trends and with findings of some previous studies. Thus, the elasticities derived for vegetable oils may provide a plausible estimate of consumption patterns in China. However, only one of the six markets analysed (Dazhongsi in Beijing) has vegetable oils included in the basket of goods covered. Beiyunting (Nanjing) has oils but not specifically vegetable

85
oils. In these markets, expenditure elasticities are 1.21 and 1.26 respectively. These two markets serve mainly the urban centres where they are located. Beiyunting, for example, serves about 60% to 80% of Nanjing, while Dazhongsi supplies 30% of Beijing’s requirements.
Table 5.1 Products with Expenditure Elasticities Greater than One, by Market and Product Growth Areas Expenditure Elasticities Dazhongsi (Beijing) Vegetable Oils 1.21 Vegetables – fresh 1.13 Vegetables – dry 1.11 Fruit 1.09 Meat and Poultry 1.05 Seafood 1.01 Zijinshan (Nanjing) Carrot 1.97 Cabbage 1.21 Vegetables – fresh 1.23 Spring Onion 1.19 Beiyunting (Nanjing) Seafood 1.96 Oil 1.26 Vegetables 1.06 Fruit 1.05 Buji (Shenzhen) Vegetables – leaf 1.11 Gourd and Pea 1.12 Root 1.12 Sandwich Ham 1.02 Meat – frozen 1.03 Frozen Red Fish 1.02 Fruit 1.01 Caoan (Shanghai) Persimmon 2.39 Egg Plant 1.97 Celery 1.28 Lettuce Root 1.20 Cucumber 1.15 Brussels Sprouts 1.02 Carrot 1.01 Xinchang (Shanghai) Spinach 1.35 Chinese Cabbage 1.02

86
Similarly, trade data show that vegetable oil has high export potential as China is the second largest importer of this product in the world (Appendix 9). In 1995, it accounted for more than half of Asia's import which was approximately 15% of world total imports, amounting to about $US2.4 billion. As a result, Asia's share of world imports increased from 12% in 1991 to about 19% the following year, when China was included, and reached 26% in 1995. Hong Kong's imports of vegetable oils are also substantial as it is the second largest importer after China. Combining these two markets, total imports in 1995 amounted to $US3.0 billion, accounting for 70% and 19% of Asia and world imports respectively. China’s exports of vegetable oils, on the other hand, is minimal compared to its imports. In 1995, for example, imports were four times more than exports. Moreover, average growth of imports surpassed that of exports, growing by 105% and 99% per year respectively.
Although vegetable oil is still a broad sub-category, studies show for example that soybean oil imports from the US increased from 630 tons in 1993 to about 180 000 tons in 1994, valued at more than $US100m. This increase in demand was brought about by a change in consumption patterns due to higher income and relaxation of government restriction on imports of edible oil. Chinese urban residents prefer the taste of high-quality soybean oil and are shifting preference away from cottonseed and rapeseed oil. In 1993, China's government restricted imports of edible oil, but in 1994 it allowed imports to augment domestic supplies in order to reduce high prices. In addition, palm oil prices rose significantly in 1994, and firms in the food processing sector may have partially substituted soybean oil for palm oil in traditional uses (Colby et al, 1995).
China’s imports of oilseeds increased by 61% per year between 1991 and 1995, but its imports of vegetables oils during the same period increased faster by 105%. Moreover, as incomes rise, the Chinese prefer vegetable oil to animal lard (Li and Samuel, 1995, p72). While imports of animal oil/fat increased by 92% between 1991 and 1995, imports of vegetable oils increased faster, a situation similar to that of oil seeds (see Appendix 10).
5.3.3 Vegetables – Fresh and Frozen
Expenditure elasticities of vegetables are reasonably high and vary across markets and products. Vegetables with high potentials based solely on elasticities are: carrot, eggplant, lettuce root, spinach, cabbage, cucumber, and dry vegetables. Import and export data show that there are export opportunities in vegetables in China. While it exports more than it imports, the growth of importation is faster than that of exports. For example, China increased its imports from only $US17m in 1994 to $US79m in 1995, growing by 357% (Appendix 11). On the other hand, exports expanded from $US970m to $US1.3 billion in the same year. China is the largest exporter of

87
vegetables in Asia accounting for 60% and 8% of total exports of Asia and the world respectively.
It is interesting to note, that the substantial growth in China's imports of vegetables in 1995 supports the findings of the study. China's imports from 1994 to 1995 increased dramatically by over 300%, while imports decreased between 1993 and 1994 (Appendix 11). In this study, particularly for the wholesale markets of Dazhongsi and Caoan, expenditure elasticities of vegetables are high between 1994 and 1996.
5.3.4 Vegetables – Dried
Dried vegetables are another sub-category with high growth potentials. In this study, expenditure elasticity was estimated at 1.11. However, this product was covered only in Dazhongsi market. Here the opportunities for Australian agribusiness may not be in production but in joint venture arrangements where Australian firms may provide processing and packaging technology. China is already the largest exporter of this product, supplying more than one third of the world demand in 1992, mainly to Japan and Hong Kong which accounted for two thirds of its total exports.
5.3.5 Vegetable Root
Vegetable root appears to be one of the high growth potentials in the vegetable category with expenditure elasticities of more than one. Specifically, vegetable root in Buji market and lettuce root in Caoan market have 1.12 and 1.20 expenditure elasticities respectively. China's growth of imports of vegetable root has been increasing rapidly by 69% per year compared to the world's 7.3% per year. In 1992, it imported only $US2.8m but at the end of 1995, imports reached $US11.5m (Appendix 12). Although imports grew faster than exports, growth is small relative to the volume of exports. China is the largest exporter of vegetable roots in Asia. In 1995, it contributed 63% of the total exports of Asia valued at $US886m which was 10% of the world imports. China’s exports of vegetable roots grew by 19% per year between 1993 and 1995.
5.3.6 Meat – Fresh and Frozen
Estimates of expenditure elasticities also show that there are opportunities in meat and poultry as well as in processed and frozen meat products. Frozen meat, sandwich ham and frozen pork ribs all have expenditure elasticities of more than one. This trend is expected as China’s economy improves and consumers' purchasing power increases. It should be noted, however, that these products are sold only in the Buji (Shenzhen) market which supplies mainly to Shenzhen and Hong Kong. Thus,

88
implications from these results may apply only to these areas. However, other studies suggest that there is a high demand for processed high-value-added products in China because of rapid urbanization and rising incomes. For example, the US consumer-ready and processed products exports to China have increased rapidly by 49% in the 1990s (Colby et al, 1995). In addition, the processed food market is massive, estimated at $A60 billion in 1992/1993, of which $A1 billion is imported. It is projected to increase by about 4% annually over the period to the year 2000 (Fahey, 1995).
Meat imports by China amounted to $US90m in 1995 which was only about 1% of the total imports of Asia. China’s meat exports, on the other hand, accounted for more than half of Asia’s total exports in 1995, amounting to approximately $US600m making it the largest exporter of meat in Asia. It should be noted that China’s growth in exports (43%) is faster than its imports (20%). However, the growth of imports has been steadily increasing since 1991, while for exports it experienced a slight decrease between 1993 and 1994 (Appendix 13).
5.3.7 Grains – Feed
As China’s meat and poultry production expands due to increase in consumption, demand for feed grains consequently increases. Results of the study show that although the average grain expenditure elasticity is lower than unity, it is still reasonably high. While this is encouraging for enterprises seeking to service this market, the indirect demand from meat and poultry is likely to further exacerbate the shortages in grain.
Data show, for example, that animal feed imports by China has been increasing. In 1992, China imported large quantities of animal feeds amounting to $US462m which dropped by 33% the following year. However, from 1993 to 1995, imports picked up and, on average, increased by 17% per year. This increase in imports was primarily due to the increase in demand for meat products which consequently increases demand for grains. For instance, production of pork, beef, mutton, and poultry increased approximately 15% from 1993 to 43.5 million tons in 1994. As for feed supplies, oilseed meal production rose about 10% but grain (feed) output dropped 2.5%. In 1994, leaders in Beijing banned corn exports to increase domestic feed supplies and imported corn for the first time since 1990. At the end of 1994, China imported corn to supplement domestic output and to lower rising feed-grain prices. This was China's first move to import corn since 1990. As a result, corn imports in 1995 reached $US816m compared to only $US 179 000 imports the previous year (Colby et al, 1995).

89
5.3.8 Wheat and Barley
Wheat is the largest agricultural import of China. In 1995, total imports reached $US2 billion accounting for 14% and 37% of the world’s and Asia’s total imports respectively (Appendix 14). On average, from 1991 to 1995, total imports increased by 27%, faster than both the world and the whole Asia. With continuous increases in income and population, China’ s wheat import is expected to increase despite persistent high prices in world markets.
Imports of other grains such as barley, one of Australia’s exports to China, have also been increasing. On average, China’s barley imports increased by 23% per year from 1992 to 1995 mainly due to the growing beer-brewing industry in the country. In 1994, beer output reached 13 million tons, and some foreign investors are planning joint ventures with local breweries to expand output (Colby et al, 1995). This increase in demand is faster than the growth in Asia and the world which increased by 14% and decreased by 1% respectively in the same period. These trends show that, generally, the prospects for increased grain exports to China appear promising.
5.3.9 Seafood
While growth potentials in vegetables, fruits, meat, poultry and processed foods are generally consistent with other previous studies, this study shows that there is also an increase in demand for seafood. In all three wholesale markets where seafood is sold, expenditure elasticity is consistently high. The study by Wu et al (1995), which used 1990 data, found a low expenditure elasticity compared to the one reported in this study which averaged to about 1.3. The higher elasticity, however, is consistent with the previous study by Ahmadi-Esfahani and Stanmore (1996) which used 1991–94 data, more recent data than that of Wu et al (1995). This indicates an increasing demand for seafood. Although earlier study by Lewis and Andrews (1989) found a higher expenditure elasticity, comparison should be made with caution as the models and data used are quite different.
The combined imports of China and Hong Kong for fresh and frozen fish amounted to $US853m in 1995. Its growth of 27% per year from 1992 to 1995 is much faster that of the world and Asia which grew by 5% and 10% respectively during the same period. On the other hand, China exports a significant amount of fresh and frozen fish. In fact, it is the second largest exporter in Asia, with exports amounting to $US660m in 1995, accounting for 4.4% and 23% of the world and Asia's total imports respectively (Appendix 15).
Trade data of other seafood such as preserved or prepared fish and shellfish and crustaceans indicate increasing demand in China. For example, China's imports of

90
preserved fish increased by 27% on average from 1992 to 1995. Its imports, which are only $US10m in 1995, was small but if combined with Hong Kong, the total would be the second largest in Asia. It should be noted, however, that China and Hong Kong are the fastest growing exporters, increasing by 128% and 62% respectively from 1992 to 1995.
China accounted for 17% of the total exports of Asia in 1995, ranking second in Asia. Crustaceans are another aquatic product with increasing demand in China. While exports are larger than imports in terms of value, the growth rates of imports is much faster than that of exports. On average, from 1993 to 1995, imports increased by 32% per year while exports increased by only 7%.
5.3.10 Fruit
China’s total imports of fruits and nuts in 1995 was approximately $US84m. This was only 2.17% of the total imports of Asia. However, if we combine this with Hong Kong, total imports would be about $US1 billion. Hong Kong is the second largest importer of fruits and nuts in Asia, accounting for 24% of the total (Appendix 16).
China, on the other hand, is the largest exporter of fresh and dried fruits/nuts in Asia. In 1995, it exported $US397m or 29% of the total exports of Asia and about 2% of the world in 1995. Between 1993 and 1995, its exports increased by 22% higher, than the growth of Asia (14%) and the world (10%). However, its imports are growing faster than exports.
5.4 The Combined China/Hong Kong Market
It can be observed from the data that combined imports of China and Hong Kong are quite substantial. In fact, the sum of two markets is the third largest export market of Australia behind Japan and United States. With the current market size and growth trend, it is projected that the “Greater China” (China, Hong Kong, Macau/Taiwan) could be Australia’s largest trading partner by the turn of the century (Walker, 1997). For this reason, it is important to closely analyse the trade dynamics of the two markets, including the trends on the products identified as having growth potentials, to be able to explore insights on the possible impact of their integration on trade.
As noted earlier, Hong Kong is a major importer of agricultural commodities. Of the products analysed, Hong Kong imports more of fruits and nuts, fresh and frozen vegetables, vegetable roots, fruits and vegetable juices, live/fresh/frozen fish, preserved fish, dried fish and preserved fruits than China (Table 5.2). Meat appears to be the largest import of Hong Kong relative to China which amounted to approximately $US1.1 billion in 1995. Imports of seafood particularly fresh and

91
frozen fish, crustaceans, dried and preserved fish also appears to be very high, with total imports of $US1.7 billion in the same year. This is also true with vegetables and fruits.
It can also be observed that Hong Kong’s imports of processed products such as fruits and vegetable juice, dried and preserved fish, and preserved fruit are relatively high compared to China. This is not surprising as Hong Kong is more urbanised than China and therefore demand for processed food is higher. Consumers in urban areas pay a premium for convenience as they have less time to prepare meals. For example, while Hong Kong imported $US128m worth of preserved fruits in 1995, China imported only about $US5m. This is also true for preserved and dried fish as well as fruit and vegetable juices.
Total imports of products with high growth potentials are large particularly if we combine both markets. Their combined size reached $US13 billion in 1995 increasing by approximately 100% in four years (Table 5.2). It is interesting to note that in 1994/1995, combined imports of both markets for vegetable oils exceeded that of wheat imports, making it the largest agricultural import of both markets estimated at $US2.9 billion in 1995. This product accounted for 23% of the total imports of the products analysed. Wheat came second with combined imports of $US2.0 billion in the same year. These two products accounted for 39% of the total combined imports in 1995.
While market size of the two markets is quite substantial, their average growth rate is also promising. However, Hong Kong’s imports are declining in more recent years while those of China are increasing. Hong Kong’s imports with negative average growth in the period 1992–95 were preserved fish, wheat, vegetable roots, cereal grains, animal feed, oil seeds and rice. It is interesting to note that in almost all imports, China’s growth is faster than that of Hong Kong.
Hong Kong serves as a gateway to China, primarily because of its advanced and modern infrastructure facilities. The majority of the products exported to China are transhipped via Hong Kong (Colby et al, 1995). In fact, the bulk of exports to China are accounted for or credited to Hong Kong and re-exported to China. This becomes a problem especially in accounting trade deficits between countries. The United States, for instance, claims that its trade deficit with China amounted to $US40 billion in 1996 while China argued that it was only $US10 billion (Walker, 1997).
In 1993, Hong Kong’s re-exports to China as a destination, ie its imports from other countries re-exported to China, amounted to $US359m. It is also interesting to note that re-exports to other countries, ie products imported from China and re-exported to other countries is even larger. In the same year, this amounted to $US420m and

92
growing faster than re-exports to China. While the latter increased by 31% per year between 1984 and 1993, re-exports to other countries increased by 38% (Table 5.3).
Table 5.2 China and Hong Kong Imports of High Growth Potential Products, 1992–95 ($US 000) China (Hong Kong) Product 1992 1993 1994 1995 Beef 4 004 (111 618) 5 353 (111 405) 5 297 (126 907) 4 227 (145 011) Meat 52 142 (450 792) 62 763 (490 151) 79 727 (713 867) 89 851 (1 049 196) Dried Fish 33 023 (270 763) 35 475 (244 906) 32 584 (262 638) 24 213 (339 771) Crustac-eans
82 720
(640 764)
115 353
(641 371)
171 113
(799 392)
184 991
(884 678)
Fish – preserved
6 411
(126 831)
3 810
(131 288)
6 079
(161 403)
9 813
(141 245)
Fish 206 732 (347 711) 212 418 (352 346) 368 533 (414 710) 388 848 (455 445) Wheat 1 503 725 (28 110) 834 076 (17 143) 960 576 (20 176) 2 026 390 (17 921) Rice 39 053 (169 295) 34 968 (157 058) 141 488 (174 001) 433 529 (165 708) Maize 95 (7 825) 183 (4 336) 179 (2 196) 816 076 (8 346) Cereal 76 (2 015) 138 (1 724) 103 (1 140) 64 976 (1 006) Vegetable Root
2 845
(295 300)
4 231
(266 763)
4 582
(284 024)
11 450
(271 461)
Vegetables – fresh and frozen
42 279
(283 427)
26 049
(274 537)
17 260
(301 907)
78 823
(287 348) Fruit – preserved
4 730
(124 898)
10 070
(111 082)
7 921
(119 545)
4 805
(127 972)
Fruit and Vegetable Juices
7 166
(21 819)
12 546
(24 398)
5 946
(23 522)
5 521
(24 516) Fruits and Nuts
40 438
(700 907)
44 847
(745 210)
66 019
(812 295)
83 570
(916 453)
Animal Feeds
461 517
(112 442)
307 426
(98 205)
347 664
(84 555)
420 867
( 85 273)
Oilseeds 31 194 (42 461) 28 812 (40 825) 62 374 (38 968) 109 582 (36 625) Animal oil 27 844 (5 817) 36 307 (5 813) 51 997 (8 779) 156 710 (11 411) Vegetable Oil
486 143
(132 512)
456 566
(141 445)
1 744 287
(361 669)
2 436 129
(517 330)
Total 6 907 444 6 091 397 8 785 423 12 837 087
It cannot be denied that Hong Kong’s largest trade partner is China. In 1993, China accounted for more than half and 40% of Hong Kong’s imports and exports respectively. As shown in Table 5.4, the total imports of Japan, its next largest trade partner, was not even half compared to its total imports from China.
Hong Kong’s imports from China are larger than its exports. This is expected, as it has the necessary facilities to serve as a trading hub, making it China’s gateway to the world. In 1993, its imports were five times larger than exports. Moreover, its imports from China have been increasing faster than exports. From 1984 to 1993

93
imports grew by 25% per year while exports increased by 22% (Table 5.5). It is interesting to note that this trend is consistent with re-exports data. As shown in Table 5.3, imports of Hong Kong from China which were re-exported to other countries also increased faster than its re-exports to China of imports from other countries. This implies that Hong Kong acts more as a gateway for outgoing products than for incoming products.
Table 5.3 Hong Kong Re-exports to/from China ($USm) From China* To China** Year
Value ($USm)
Growth rate (% pa)
Value ($USm)
Growth rate (% pa)
1984 37 37 1985 45 23 60 64 1986 67 49 53 -11 1987 110 63 79 47 1988 172 56 124 58 1989 246 43 135 9 1990 314 28 145 7 1991 413 31 200 38 1992 528 28 277 38 1993 620 17 359 29 Average 38 31
*Hong Kong imports from China and re-exports to other countries **Hong Kong imports from other countries and re-exports to China Source: China Statistical Yearbook
Table 5.4 Hong Kong's Major Trading Partners, 1993 Imports Exports Country
Value ($USm)
Share (%)
Value ($USm)
Share (%)
China 526 50.16 83 39.67 Japan 233 22.20 79 37.74 Taiwan 123 11.72 18 8.75 United States 104 9.91 15 7.10 Rep. of Korea 63 6.01 14 6.74 Total 1048 100.00 209 100.00 Source: China Statistical Yearbook

94
Table 5.5 Hong Kong Imports and Exports to China, 1984–1993 ($USm)
Imports Exports Year
Value ($USm)
Share (%)
Value ($USm)
Share (%)
1984 72.9 14.7 1985 77.1 6 19.9 35 1986 106.7 38 23.6 19 1987 153.4 44 36.4 55 1988 203.4 33 49.7 36 1989 257.1 26 56.6 14 1990 308.6 20 62.0 10 1991 383.4 24 71.1 15 1992 463.1 21 81.0 14 1993 525.6 13 82.8 2 Average 25 22 Source: China Statistical Yearbook
The market size and rates of increase in imports of the combined markets imply that there are vast opportunities in the products identified as having high growth potentials. Australia, being one of the top ten exporters to China should reposition itself in penetrating these markets and in improving its competitive advantages. Interestingly, Australia performed very well in 1996, ranked as the 9th largest trading partner of China climbing up four notches from its 13th place the previous year. This strong performance was attributed to its faster growth in exports, particularly for aluminium, wheat, barley and cotton (Walker, 1997).
The return of Hong Kong to mainland China has a number of implications. First, as shown by the data, Hong Kong is a large importer, making the combined total with China even more attractive as a market. Thus, for the products identified with growth potentials, opportunities are compounded. However, since the two markets are different in terms of consumption patterns, the demand analyses conducted for the wholesale markets in China may not apply to Hong Kong. Thus, although Hong Kong and China are now integrated into one market, marketing strategies cannot be the same for both as these markets are heterogeneous. As is true with urban and rural consumption patterns, these markets have different consumption profiles because of different demographics and psychographics or lifestyles. This heterogeneity of consumer profiles and market environment in general is likely to be unaffected by the integration. In fact, it is stipulated under the accord and the 1990 Basic Law adopted by the Chinese government that Hong Kong will have a high degree of autonomy and that its social and economic systems, lifestyles and rights enjoyed by the people of Hong Kong will be untouched for at least 50 years (USDA, 1997). This
95
also implies a continued participation of Hong Kong in international trade agreements such as WTO. However, if we are to segmentalise the China and Hong Kong markets, Hong Kong can be included in an emerging single market of 100 million people around the Pearl River delta including Guangzho (McGregor, 1997). Finally, integration of Hong Kong and China will galvanise and further strengthen the existing trade between the two markets. Thus, it is interesting to look at the net imports/exports of the products analysed to estimate the amount of deficit or surplus after the two markets have catered to local demand of these products. Vegetable oil appears to have the largest deficit with an average of $US1.6 billion between 1993 and 1995. This is followed by wheat ($US1.3 billion), fruit and nuts ($US557m), meat ($US413m), dried fish ($US226m), fish ($US176m), beef ($US100m), animal oil ($US83m), and crustaceans ($US26m) (Table 5.6). This does not imply, however, that there are no opportunities in vegetables and other products with positive balance. As shown earlier, imports of these products increased faster than exports.
It should be noted that Hong Kong and China have different consumption profiles and results of the wholesale demand analyses conducted for China cannot be applied to Hong Kong. Hong Kong, being a trading hub, serves as a gateway and therefore the majority of the products are not consumed in Hong Kong but re-exported/traded to China.
5.5 The Asian Market as a Whole
5.5.1 General
From the trade data analysed, it can be concluded that the products identified as having growth potentials are generally consistent with export and import trends in China and Hong Kong. At this point, it is important to analyse the trends of these products relative to those in other countries, particularly in Asia which is considered to be the world’s fastest growing market for agricultural products (Rae, 1997). This is to identify other potential markets as well as assess Australia’s position as an exporter with other competitors in the region.
5.5.2 Vegetable Oils
Asia is a major importer of vegetable oils accounting for $US4.2 billion or 26% of the world’s total imports in 1995. Next to China and Hong Kong, Japan is the third largest importer with imports amounting to $US515m in the same year.

96
Table 5.6 China and Hong Kong Net Exports of High Growth Potential Products Exports/Imports (Net exports)
Product 1993 1994 1995 Beef 38 845 116 758 (77 913) 27 854 132 204 (104 350) 30 813 149 238 (118 425Meat 328211 552 914 (224 703) 317095 793 594 (476 499) 599769 1 139 047 (539 278Fish – dried 59 090 280 381 (221 291) 65 779 295 222 (229 443) 136 798 363 984 (227 186Crustaceans 936 311 756 724 179 587 770 962 970 505 (199 543) 1 013 110 1 069 669 (56 559Fish – preserved 209 141 135 098 74 043 318 808 167 482 151 326 553 799 151 058 402 74Fish 448 512 564 764 (116 252) 487 349 783 243 (295 894) 727 745 844 293 (116 548Wheat 295 851 219 (850 924) 8 237 980 752 (972 515) 10 055 2 044 311 (2 034 256Cereal 79 554 1 862 77 692 58 207 1 243 56 964 62 996 65 982 (2 986Vegetable root 655 745 270 994 384 751 682 063 288 606 393 457 911 437 282 911 628 52Fresh and Frozen Vegetables 932 509 300 586 631 923 970 148 319 167 650 981 1 326 356 366 171 960 18Fruit – preserved 233 600 121 152 112 448 215 103 127 466 87 637 277 115 132 777 144 33Fruit and Vegetable Juices 224 881 36 944 187 937 207 319 29 468 177 851 266 804 30 037 236 76Fruits and Nuts 268 312 790 057 (521 745) 331 613 878 314 (546 701) 396 530 1 000 023 (603 493Oilseeds 468 724 69 637 399 087 434 346 101 342 333 004 666 016 146 207 519 80Animal Oil 7 219 42 120 (34 901) 7 126 60 776 (53 650) 6 766 168 121 (161 355Vegetable Oil 138 817 598 011 (459 194) 204 422 2 105 956 (1 901 534) 495 527 2 953 459 (2 457 932
Source: ITC, 1997
97
However, while the imports of other large markets in Asia such as Korea and Singapore have been increasing in terms of value, their market shares have been shrinking. Singapore in 1991, was the largest importer in Asia, contributing 26% of Asia's total imports, slightly higher than Japan. In 1995, this plummeted to 5% which was only less than 10% of China's total imports excluding Hong Kong. Japan's share decreased by more than half from 26% to 12% during the same period, although growth was at pace with world trend, increasing by 18% per year. Similarly, Korea's share decreased from 16% to about 6% during the same period.
Asia, on average, grew by 49% from 1991 to 1995, faster than the world's rate of about 19% during the same period. From these figures, it can be concluded that Asia is a fast growing market for vegetables oils. However, this high average growth is mainly due to the fast growth rates of China and Hong Kong. Of the twelve countries in Asia, only four grew faster than the world, namely China, Hong Kong, Indonesia and Thailand. Indonesia's imports, however, have been decreasing since 1993 and the high average was due to a large increase in 1992.
In Asia, the largest exporter is Malaysia which accounted for 58% of the total exports of Asia in 1995 and approximately 22% of the world exports in the same year. This is followed by Indonesia with 21% and China with 9% share of Asia’s total exports. Australia’s exports of vegetable oils is very small compared to the major exporters in Asia, but increasing rapidly particularly during the more recent years. For example, exports between 1993 and 1994 increased by only 3% but jumped by 121% between 1994 to 1995.
5.5.3 Vegetables – Fresh and Frozen
Asia imports more vegetables than it exports. In 1995, its total imports reached $US20 billion while exports amounted to $US17 billion. The largest importer is Japan, accounting for 62% or $US1.8 billion of Asia’s total imports in 1995. Aside from Hong Kong and China, Singapore and Malaysia also import a relatively substantial amount. In the same year, their total imports amounted to $US240m and $US223m respectively. Generally, Asia’s vegetable imports are increasing faster than the world. While the world increased by only 4.5%, on average, between 1991 and 1995, Asia increased by 18%. Of the twelve countries in Asia, only Hong Kong and Bangladesh grew less than the world between 1991 and 1995. In 1995, the fastest growing countries were China, Malaysia, Indonesia and Singapore.
In the exports market, Thailand is the second largest exporter next to China with total exports of $US606m in 1995. Its share, however, decreased from 75% in 1992 to only 27% in 1995. Generally, exports have been increasing but less than imports. Between 1992 and 1995, exports grew by 20% while imports rose by 95% per year. It should be noted, however, that during the first two years after China’s entry in 1992,

98
exports grew faster than imports but imports rapidly increased in the third year, surpassing on average, the growth of exports.
5.5.4 Vegetable Root
Asia imported $US1.9 billion of vegetable roots in 1995 comprising 20% of world imports. Of the total imports in Asia, Japan contributed the bulk with a share of 66%. China’s share was less than 1% but when combined with Hong Kong, total imports reached $US282m or 15% in 1995. While Japan's growth in imports, on average, is stable and faster than the world, China's growth has been increasing rapidly by 69% per year compared to world's 7.3% per year. Generally, there is export potential not only in China and Japan, but also in other countries in Asia. Asia's growth of 19% is more than twice as fast as the world. Korea, Malaysia and Thailand have relatively stable and high growth rates, increasing by 16%, 20% and 12% respectively. Thailand is the second largest exporter in Asia next to China. In 1995, its exports amounted to US234m. While its average growth is positive between 1992 and 1995, its share has been declining due to the entry of China.
Asia’s exports of vegetable roots grew, on average, by 57% per year between 1993 and 1995. It should be noted, however, that this high growth rate was due to the entry of China in 1993. Generally, however, Asia has been growing faster than the world. Between 1994 to 1995, Asia’s total exports increased by 28% while the world increased by 16%.
5.5.5 Meat – Fresh and Frozen
The bulk of Asia’s import is accounted for by Japan. In 1995, Japan’s total imports reached to $US5.9 billion accounting for 80% and 29% of the total exports of Asia and the world respectively. Aside from China and Hong Kong, Korea and Singapore import a relatively significant amount, with total imports of $US200m and $US151m in 1995 respectively.
Generally, Asia’s demand for meat has been increasing rapidly as they continue to improve their economies. While the world imports increased by 8% per year from 1991 to 1995, Asia expanded by 20% during the same period. While Japan’s market is increasing faster than the world, its growth is less than that of Asia. China and Hong Kong’s imports grew by 20% and 34% per year respectively. Unlike other countries in Asia, their growth in imports is relatively stable and steadily increasing since 1992. While Korea, Indonesia, the Philippines and Thailand’s growth is faster than Asia’s average growth, it is not as stable as China's and Hong Kong's. For example, Korea posted an average growth rate of 39% per year from 1991 to 1995 but its imports

99
declined from 1991 to 1993. Similarly, Indonesia’s grew by 36%, on average, but its imports declined between 1992 and 1993.
Asia is a net importer of fresh and frozen meat. In 1995, its net imports amounted to $US6.3 billion. Its exports are mainly accounted for by China and Thailand contributing 52% and 36% of the total exports respectively. Similar to the vegetables market, Thailand’s market share has been eroded by China. Due to the rapid growth of China’s exports, Asia’s exports on average grew faster than the world’s.
5.5.6 Wheat and Other Grains
Among the products analysed, only wheat is basically imported outside Asia. In 1995, Asia’s total imports reached $US5.5 billion with a negligible amount of exports. Generally, Asia’s wheat imports have been growing faster than the world. Between 1991 and 1995, Asia’s total imports grew by 24% per year while world imports expanded by 17% per year. Next to China, Japan is the second largest wheat importer in Asia, accounting for a quarter of Asia’s total imports which amounted to $US1.3 billion in 1995. However, its average growth of 11% is below that of the region and the world. On the other hand, Indonesia’s imports, the third largest importer in Asia, grew by 22% on average, twice as fast as those at of Japan. It should be noted that the high average of Asia was due to the substantial increase in imports by China.
With an increasing demand for meat products, demand for animal feeds has also been increasing in Asia. In 1995, its imports amounted to $US4.8 billion with almost half accounted for by Japan. On average, its imports have been increasing faster than exports. Corn imports have also been increasing faster than the world, with about 75% accounted for by Japan and Korea.
5.5.7 Seafood
The largest market in Asia is Japan with imports amounting to $US7.2 billion in 1995 which accounted for 34% and 77% of the world's and Asia's total imports respectively. This is very large compared to the other Asian markets. South Korea, which ranked second in 1995 in terms of total imports, accounted for only 5.39% of Asia's imports which is almost the same as Thailand’s, ranking third.
Generally, Asia is a growing market for fresh and frozen fish. In fact, on average, it has been expanding twice as fast as the world. Japan's imports, on the other hand, have been growing faster than the world but slightly higher than Asia's average growth rate. China's imports are one of the fastest relative to the other Asian countries. While Indonesia and Brunei have faster growth rates, these countries have very small shares in total imports.

100
Import data of other seafood such as preserved or prepared fish and shellfish and crustaceans indicate expanding demand in Asia. The bulk of imports is accounted for by Japan, reaching $US2.3 billion, or 28% and 86% of the world and Asia's total imports respectively in 1995. Korea and Singapore are promising markets, with imports increasing by 58% and 20% per year respectively.
Generally, Asia's imports are growing faster than the world. Between 1994 and 1995, imports in Asia increased by 20% while total world imports increased by only 7%. Exports, on the other hand, are growing faster than the world but not as fast as imports. During the same period, total exports of Asia increased by 13% while the world increased by 10%. It should be noted, however, that China and Hong Kong are the fastest growing exporters, increasing by 128% and 62% respectively from 1992 to 1995. Thailand, which is the largest exporting country in the region, accounting for 21% and 48% of Asia and the world total respectively, grew only by 8% on average, lower than the growth of the world and Asia. Other Asian countries, except Malaysia, grew less than the average growth rate of Asia.
5.5.8 Fruit/Nuts – Fresh and Dried
Japan is the largest market with total imports of approximately $US2.0 billion in 1995. This is 50% and 7% of the total imports in Asia and the world respectively. Next to Hong Kong, Singapore imports a substantial amount with total imports of $US375m in 1995. However, its share has been declining as its average growth is below that of Asia and the world. Although Indonesia's imports are small, they have been growing rapidly at 59% per year from 1991 to 1995. Indonesia’s share was only less than 1 % in 1991 but it more than tripled by the end of 1995.
5.5.9 Summary
Asia imports more than it exports. In 1995, its total imports reached $US3.9 billion while its exports amounted to $US1.4 billion. Philippines, is the second largest exporter accounting for 25% of the total exports of Asia. Korea and Singapore also export substantial amounts contributing $US148m and $US143m respectively in the same period. In addition, Thailand's exports increased rapidly compared to other countries in Asia. Between 1991 and 1995, its exports expanded by 34% per year.
From the data examined, it can be concluded that, generally, the products identified as having growth potentials are consistent with import and export trends. The opportunities are not only true in China but also in the whole of Asia. But how does Australia fare in terms of exports of these products?

101
Generally, Australia’s exports of these commodities are increasing faster than the world but not as fast as Asia's. In vegetables, for example, exports have been steadily increasing at 16% per year from 1992 to 1995, higher than world growth rate of only 6.7%. During this period, however, its average growth was lower but more stable than Asia's. Total exports from Asia grew by approximately 31% per year. In 1994, its exports decreased and in the following year, grew even less than that of Australia. The average growth, however, was high because of its substantial increase in 1993. However, exports of most Asian countries with the exception of China have been relatively unstable, with periods of positive and negative growth. While Australia contributed only 1.7% of the world exports in 1995, its total exports are relatively substantial if compared to those of Asian countries, accounting for 13% of Asia’s total exports valued at $US285m.
In vegetable root market, Australia is a relatively small player with a total of $US21 million in 1995, accounting for only 1.5% of Asia’s total exports. Its exports, however, have been steadily increasing from 1992 to 1995 averaging to about 31% per year. This is higher than the growth of world exports. Excluding the rapid increase in Asia’s growth in 1993 due to the entry of China, Australia’s growth is also higher than Asia’s average growth.
Australia is a major exporter of fresh and frozen meat, with total exports amounting to $US565m in 1995. This is almost 50% of Asia’s total imports in 1995. Its growth of 9% per year between 1991 and 1995, however, was well below Asia’s average growth of 35%. However, this high average was due to the rapid growth of China, increasing, on average, by 43% per year.
Australia is one of the top five exporters of wheat in the world. In 1995, its exports reached $US1.7 billion, accounting for 13% of the world total. It is interesting to note that among the top five exporters of wheat in the world, Australia ranked second in terms of average growth rate from 1991 to 1995. Germany posted the highest growth rate by 31% on average, while Australia increased by 15%. The United States, the top exporter, increased by 8% while Canada (ranked second) and France (ranked third) decreased by 3% and 8% respectively. Exports from Germany, Australia and United States grew faster than the world which increased only by less than 1% per year from 1991 to 1995. The decline in wheat from the United States in 1995 and France in 1994 was due to bumper grain harvests for four consecutive years and because of sharp increases in wheat prices in world markets. With continuous increases in income and population, China’ s wheat import is expected to increase despite persistent high prices in world markets (Colby et al, 1995).
Australia's exports of fish totalled $US87m in 1995, which was only 3% of the Asia's total imports that year. While its growth rate is faster than the world, it is lower than Asia's growth.
102
Generally, China and Asia are promising markets for Australia, particularly for the products identified with growth potentials. However, they serve not only as markets but also as competitors for Australia. For instance, the entry of China in the international market, decreased Thailand’s exports for vegetables, while meat decreased by almost half in a span of two years.
5.6 Marketing Strategies
Price elasticities are useful indicators of the likely impact of price changes and hence can be applied in developing pricing strategies. Generally, the products covered in the study are price inelastic, which indicates that there is limited benefit in decreasing prices (Table 5.7) as the percentage increase in demand is lower than the percentage decrease in price. Products which are generally inelastic in the wholesale markets analysed are grains, potato, spinach, meat and poultry, and carrot. Fruits are inelastic for two of the three markets where these products are analysed.
On the other hand, elastic products where lowering prices could be more beneficial are dried vegetables, sweet and green capsicum, persimmon, leek, lettuce root and cucumber. Seafood including frozen red fish, which have high expenditure elasticities, are inelastic in Beijing and Shenzhen but elastic in Nanjing. This suggests that marketing strategies will vary depending on the markets targeted. It should be noted that there are few products where prices may not play an important part, such as dried seafood and some processed products. However, one way of increasing profitability in marketing these products is to add value through processing. As indicated by the results of the study, expenditure elasticities of processed foods are elastic, particularly for affluent urban centres like Shenzhen.
Cross-price elasticities are also useful indicators, particularly for retailers and wholesalers in merchandising their products and for existing and potential exporters in mapping out their product strategies. Fresh and dried seafood are significant substitutes for meat and poultry. Seasonings have strong complementary effects as expected. Fresh vegetables have no significant substitutes but only complements, which indicates their necessity nature in the Chinese diet. In particular, they appeared to have strong complementary effects with other perishable products such as fruit. This is important information for merchandising products. For example, while demand for the processed category is increasing, the demand for the fresh food category might also be expanding possibly due to the shift to ‘health foods.’
5.7 Impact of Government Intervention on Consumption Patterns
Although the evidence is quite limited, there are some indications of the likely impact of government intervention on food consumption patterns. In this study,

103
these can be gleaned from two areas. Firstly, in markets where there is less government intervention, products were generally price responsive. Secondly, as government continues to implement free market policies over time, consumers become more price responsive.
Government control on prices for a number of markets in China apparently affect consumption patterns. Products in Zijinshan (Nanjing), for example, are relatively not responsive to own prices, ie prices of these products are not generally significant in explaining consumption patterns. This can be attributed to government control on prices of vegetables. While the price control implemented by the Price Bureau is at the retail level, apparently the effects are passed on to the wholesale markets. Interestingly, of the two wholesale markets covered in the Nanjing City, only Zijinshan market showed less price responsiveness. This is due to the fact that in this market, the basket of goods being analysed covered purely vegetables; while in Beiyunting, the vegetables category is aggregated and there are other products included such as grains, oil, and seafood. On the contrary, in markets where there is less intervention, the products are generally price responsive as in the case of Dazhongsi (Beijing).
Comparing data from Dazhongsi, vegetables, fruits, meat and poultry emerged to be, on average, more price responsive in recent years (1994–96) than the previous period (1991–94) (Table 5.8). For example, seafood and grains had positive own-price elasticities in the earlier period but became negative in the recent period. This can be attributed to non-price factors such as government intervention in pricing. In general, however, the trend is toward more price responsive products, indicating the impact of free-market reforms in the recent years. Lesser government intervention in pricing, greater number of sellers and alternative markets and increasing efforts in disseminating information to improve the price discovery system are likely to have contributed to fostering competition in these wholesale markets.
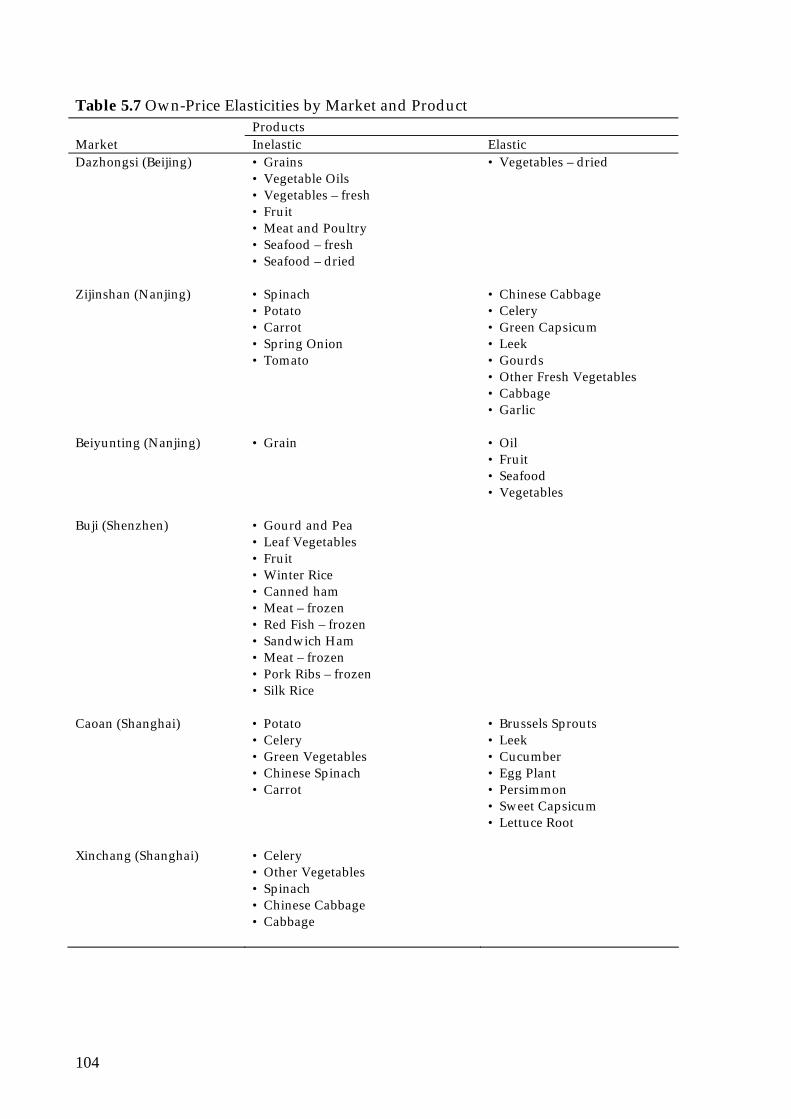
104
Table 5.7 Own-Price Elasticities by Market and Product Products Market Inelastic Elastic Dazhongsi (Beijing) • Grains
• Vegetable Oils • Vegetables – fresh • Fruit • Meat and Poultry • Seafood – fresh • Seafood – dried
• Vegetables – dried
Zijinshan (Nanjing) • Spinach • Potato • Carrot • Spring Onion • Tomato
• Chinese Cabbage • Celery • Green Capsicum • Leek • Gourds • Other Fresh Vegetables • Cabbage • Garlic
Beiyunting (Nanjing) • Grain • Oil • Fruit • Seafood • Vegetables
Buji (Shenzhen) • Gourd and Pea • Leaf Vegetables • Fruit • Winter Rice • Canned ham • Meat – frozen • Red Fish – frozen • Sandwich Ham • Meat – frozen • Pork Ribs – frozen • Silk Rice
Caoan (Shanghai) • Potato • Celery • Green Vegetables • Chinese Spinach • Carrot
• Brussels Sprouts • Leek • Cucumber • Egg Plant • Persimmon • Sweet Capsicum • Lettuce Root
Xinchang (Shanghai)
• Celery • Other Vegetables • Spinach • Chinese Cabbage • Cabbage
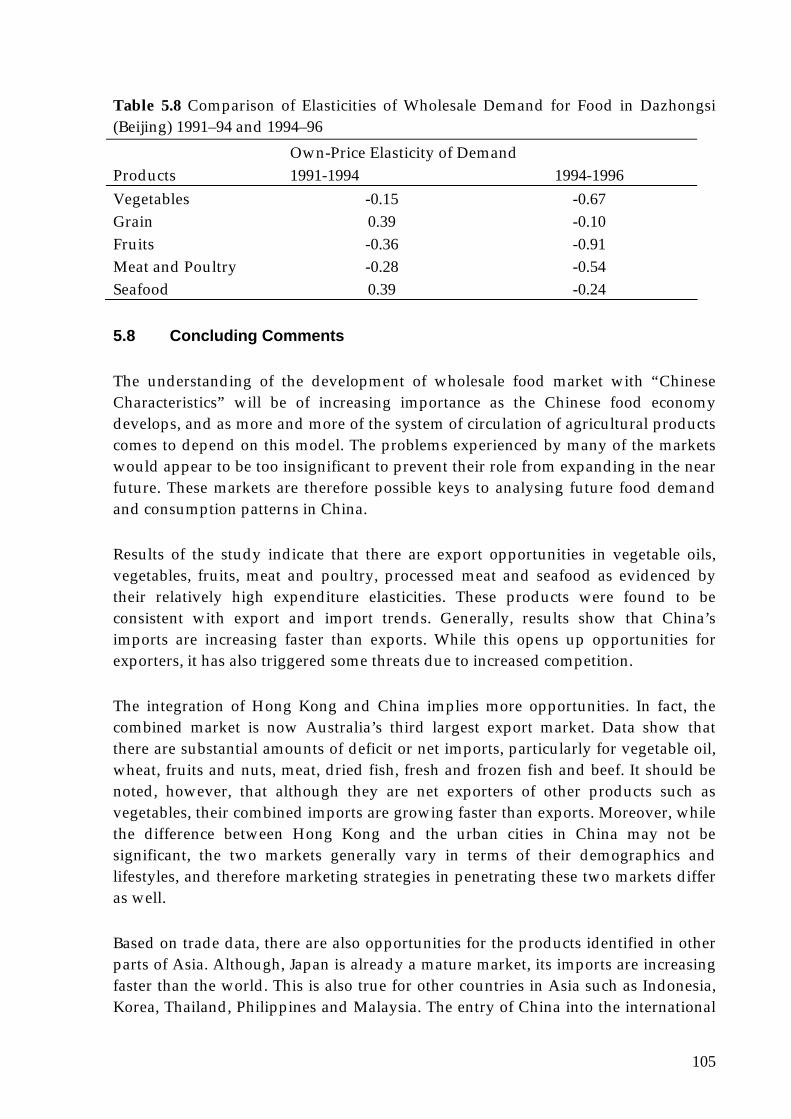
105
Table 5.8 Comparison of Elasticities of Wholesale Demand for Food in Dazhongsi (Beijing) 1991–94 and 1994–96 Own-Price Elasticity of Demand Products 1991-1994 1994-1996 Vegetables -0.15 -0.67 Grain 0.39 -0.10 Fruits -0.36 -0.91 Meat and Poultry -0.28 -0.54 Seafood 0.39 -0.24
5.8 Concluding Comments
The understanding of the development of wholesale food market with “Chinese Characteristics” will be of increasing importance as the Chinese food economy develops, and as more and more of the system of circulation of agricultural products comes to depend on this model. The problems experienced by many of the markets would appear to be too insignificant to prevent their role from expanding in the near future. These markets are therefore possible keys to analysing future food demand and consumption patterns in China.
Results of the study indicate that there are export opportunities in vegetable oils, vegetables, fruits, meat and poultry, processed meat and seafood as evidenced by their relatively high expenditure elasticities. These products were found to be consistent with export and import trends. Generally, results show that China’s imports are increasing faster than exports. While this opens up opportunities for exporters, it has also triggered some threats due to increased competition.
The integration of Hong Kong and China implies more opportunities. In fact, the combined market is now Australia’s third largest export market. Data show that there are substantial amounts of deficit or net imports, particularly for vegetable oil, wheat, fruits and nuts, meat, dried fish, fresh and frozen fish and beef. It should be noted, however, that although they are net exporters of other products such as vegetables, their combined imports are growing faster than exports. Moreover, while the difference between Hong Kong and the urban cities in China may not be significant, the two markets generally vary in terms of their demographics and lifestyles, and therefore marketing strategies in penetrating these two markets differ as well.
Based on trade data, there are also opportunities for the products identified in other parts of Asia. Although, Japan is already a mature market, its imports are increasing faster than the world. This is also true for other countries in Asia such as Indonesia, Korea, Thailand, Philippines and Malaysia. The entry of China into the international

106
market, however, dampened export market shares of some Asian countries, particularly Thailand, which used to be the leading exporter of vegetables and meat in Asia.
On the whole, there appear to be reasonable opportunities in a number of the Chinese food industries. The scope of these opportunities for any participant will depend on Chinese government policies with respect to the particular industry and pertinent import regulations. Market forces, however, appear to play an increasingly significant role in shaping Chinese food markets. In addition, estimated price elasticities imply that lowering prices could be more beneficial for dried vegetables, sweet and green capsicum, leek, lettuce root and cucumber. However, there are limited benefits in doing the same for grains, potato, spinach, meat and poultry, and carrot. Moreover, there are indications that government intervention affected food consumption patterns as reflected in higher price elasticities of demand with less government intervention. Results also reveal that, over time, consumers are becoming more price responsive.
Given the likely continued growth and development of these markets, there are a number of avenues for further studies to validate the consistency or divergence of the current study. A more disaggregated analysis of the individual vegetables, grains, fruits and meats may provide more plausible empirical knowledge on food demand preferences. Moreover, an analysis of buyer’s profile or characteristics of a specific wholesale market and corresponding area served (ie Shenzhen, Shanghai, etc) would be helpful to gain more insights into the market needs and consumption patterns in general. Answers to questions such as what the demand patterns of institutional buyers in wholesale markets such as fast-food outlets, retailers, hotels, and restaurants are useful for existing and potential wholesalers and exporters. In addition, an investigation of the extent of price integration among China wholesale markets is also important to design a more effective export strategies. Furthermore, a study on the role of China in the international market for vegetables may be warranted considering the fact that it is the largest producer of vegetables in Asia. Finally, the implications of the integration of Hong Kong and China for the international food market are deemed worthy of exploration.

107

108
Appendix 1 Data-Set Characteristics
Market Dazhongsi
(Beijing) Zijinshan (Nanjing)
Beiyunting (Nanjing)
Buji (Shenzhen)
Cao(Sha
Data Source Dazhongsi Price Reporting Database
Nanjing City Vegetable Price Network
Nanjing Beiyunting Market Dev’t Co.
Shenzhen Agricultural Products Share Co. Ltd.
CaoRep
Time Series Daily 10-Daily Monthly Monthly Mon Time Period 1/1/95–1/6/96 12/94–6/96 1/91–6/96 1/93–5/96 1/9 No. of Observations 364 57 66 41 30 No. of Commodities 9 13 5 12 12 Commodities • Fresh Vegetables
• Seafood • Fruits • Vegetables –
dried • Grain • Meat and
Poultry • Seasoning • Vegetable Oils • Seafood – dried
• Chinese Cabbage • Spinach • Celery • Leek • Potato • Carrot • Gourds • Garlic • Tomatoes • Green Capsicum • Spring Onion • Cabbage • Other Fresh
Vegetables
• Grain • Oil • Fruits • Seafood • Vegetables
• Leaf Vegetables • Gourd and Peas • Root • Fruits • Silk Rice • Winter Rice • Canned Ham • Meat – frozen • Pork Rib –
frozen • Sandwich Ham • Cutlass Fish –
frozen • Red Fish –
frozen
• GV
• C• C• L• B• C• E• P• S• C• L• P
Aggregated Yes Yes Yes No Yes Equation Estimated Implicitly
Seasoning
Potato
Vegetables
Winter Rice
Car

109

110
Appendix 2 Dazhongsi (Beijing): Estimated Parameters and Model Validation
A2.1 Estimated Parameters
Table A2.1 Estimated Parameters for Wholesale Demand for Food in Dazhongsi in First Difference Seasonal Dummy Variables Prices
Name
2
3
4
5
6
7
8
9
10
11
12
Veg – fresh
Veg – dry
Veg Oils
Grains
Frui
Veg – fresh 0.001 0.016 0.018 0.009 -0.010 0.002 -0.001 -0.001 -0.003 -0.004 0.001 0.107 0.007 -0.009 -0.001 -0.0
(0.12) (1.84) (1.53) (0.68) (-1.09) (0.25) (-0.11) (-0.06) (-0.27) (-0.45) (0.12) (8.16) (0.66) (-1.19) (-0.42) (-2.4
Veg – dried -0.002 -0.004 -0.012 -0.009 0.000 0.000 0.000 0.000 0.001 0.001 -0.006 0.007 -0.061 0.040 0.001 0.00
(-0.25) (-0.55) (1.26) (-0.75) (-0.02) (-0.04) (-0.05) (0.01) (0.11) (0.15) (-0.64) (0.66) (-3.98) (4.76) (0.24) (0.3
Veg Oils -0.009 -0.003 -0.015 0.003 0.001 -0.001 0.001 -0.002 0.003 0.000 0.000 -0.009 0.040 0.010 0.001 -0.0
(-1.35) (-0.56) (-2.05) (0.32) (0.14) (-0.13) (0.19) (-0.28) (0.57) (-0.05) (0.02) (-1.19) (4.76) (1.09) (0.34) (-0.9
Grains 0.000 0.000 -0.001 -0.006 -0.001 0.000 0.000 0.000 0.001 0.000 0.000 -0.001 0.001 0.001 0.012 0.00
(0.16) (0.28) (-0.49) (-2.55) (-0.51) (.024) (-0.01) (-0.11) (0.34) (0.25) (-0.14) (-0.42) (0.24) (0.34) (9.55) (0.6
Fruit 0.002 0.000 -0.001 -0.004 -0.001 0.000 0.000 0.000 -0.001 0.001 -0.001 -0.008 0.001 -0.002 0.001 0.00
(0.56) (-0.18) (-0.39) (-1.01) (-0.36) (-0.05) (-0.06) (0.05) (-0.20) (0.50) (-0.25) (-2.46) (0.38) (-0.94) (0.63) (6.2
Meat & Poultry 0.096 0.093 0.084 0.097 0.111 0.112 0.097 0.103 0.086 0.093 0.103 0.010 0.008 -0.007 -0.001 0.00
(10.7) (12.5) (8.26) (8.21) (13.6) (13.9) (11.9) (12.6) (10.4) (11.2) (11.4) (0.82) (0.53) (-0.60) (-0.30) (0.4
Seafood 0.002 -0.003 0.016 0.014 0.016 -0.003 0.000 0.004 -0.001 0.002 0.003 -0.101 -0.022 -0.041 -0.004 -0.0
(0.19) (-0.33) (1.17) (0.86) (1.52) (-0.29) (-0.04) (0.39) (-0.08) (0.20) (0.29) (-21.18) (-5.40) (-13.39) (-4.41) (-1.8
Seafood – dried
0.000 0.001 -0.001 -0.001 -0.001 0.000 0.000 0.000 0.000 0.000 0.000 -0.005 0.002 -0.001 0.000 0.00
(-0.25) (0.92) (-0.46) (-0.90) (-0.76) (0.12) (-0.11) (-0.18) (-0.12) (0.14) (-0.28) (-3.18) (0.84) (-0.47) (.001) (0.0

111
A2.2 Model Validation
As discussed previously, data were examined for non-stationarity and outliers before running the regression routines. A number of relevant tests were also conducted particularly for the validation of demand restrictions.
Recognizing that most time series are non-stationary or integrated, a test for the order of integration for each variable was conducted using the Augmented Dickey Fuller Test. Results show that only four of the sixteen variables used are non-stationary and integrated of order one (Table A2.2). Cointegration test of these non-stationary variables revealed that residuals are stationary. The consequences are not trivial, thus we transformed the data and estimated the model in first difference. It was generated without a constant term since this is cancelled out in difference form and used iterative seemingly unrelated regression which approximate the maximum likelihood estimates.
Table A2.2 Test for Non-stationarity Using Augmented Dickey-Fuller Test, Dazhongsi Test Statistic Asymptotic Critical Value Variables
Constant, no trend
Constant, trend
Constant, no trend
Constant, trend
Remarks
Dependent (wi) Veg – fresh -11.79 -12.89 -2.57 -3.13 stationary Veg – dried -8.53 -9.34 -2.57 -3.13 stationary Veg. Oils -6.20 -7.00 -2.57 -3.13 stationary Grains -7.12 -7.59 -2.57 -3.13 stationary Fruit -5.09 -5.85 -2.57 -3.13 stationary Meat & Poultry -5.62 -7.03 -2.57 -3.13 stationary Seafood -5.22 -6.55 -2.57 -3.13 stationary Seafood – dried -4.62 -5.78 -2.57 -3.13 stationary Independent (LPi) Veg – fresh -5.49 -5.89 -2.57 -3.13 stationary Veg – dried -5.52 -6.45 -2.57 -3.13 stationary Veg. Oils -6.62 -6.62 -2.57 -3.13 stationary Grains -13.47 -4.33 -2.57 -3.13 stationary Fruit -4.70 -4.74 -2.57 -3.13 stationary Meat & Poultry -0.810 -0.145 -2.57 -3.13 non-stationary Seafood -1.58 -2.56 -2.57 -3.13 non-stationary Seafood – dried -1.82 -1.71 -2.57 -3.13 non-stationary Expenditure -0.528 -1.94 -2.57 -3.13 non-stationary
It should be noted, however, that using the first difference model also has some setbacks. Firstly, we lose one observation, but this is not critical considering the number of observations in the model (about 364). Secondly, the errors might still be correlated but this was addressed by the cointegration test which showed that the

112
errors are stationary. Thirdly, there is the problem of over-differencing where the variables which are significant in the levels form become insignificant in difference form. This is, however, difficult to implement in the AIDS model since all n equations have the same independent variables. Thus, even if there is only one non-stationary independent variable, all equations should be differenced since the variable appears in all equations.
Nevertheless, to validate the consequences of the third issue, both levels and quasi-difference form were generated. The quasi-difference form was modified such that only the non-stationary variables were differenced and not the equations where these variables appear. As expected, serial correlation is still present because the variables have different orders of integration or not cointegrated (Charemza and Deadman, 1993). Hence, the residuals are non-stationary. This non-stationary problem is reflected in the low D-W statistics of the levels and quasi-difference form.
As expected, some of the variables which are significant in the levels form are insignificant in the difference form. Although the decrease in the number of significant variables excluding seasonal dummy variables from 38 to 28 is quite substantial, most of the own-price and expenditure variables remained significant at 5% level (Appendix A2.1). In addition, the quasi-difference form appeared to be the most promising in terms of the number of significant variables but, like levels form, it was plagued with the problem of serial correlation.
In addition, one cannot compare the R2 in levels and first difference since the explained variables are different. Usually, R2 is low in first difference model using time-series data (Madalla, 1988). However, results show that they are close, ranging from 0.17 to 0.79 and 0.15 to 0.85 for the levels and difference form respectively. These values appear to be reasonable for a mixture of cross-section and time-series data.
In summary, the difference model is preferred to the levels and quasi-difference functional forms. Despite the setbacks mentioned, it addressed the problem of non-stationarity of the data and provided reasonable results in terms of the number of significant variables and R2 statistics. Moreover, the difference form also minimizes the problem of multicollinearity (Gujarati, 1988).
Table A2.3 shows that all three models have rejected the null hypothesis that all covariances were equal to zero as the Chi-square value is greater than the critical value. Thus, given the restrictions imposed, the system approach using LA/AIDS will produce more-efficient parameter estimates compared to those estimated in single equations.

113
Table A2.3 Langrange Multiplier Test for Contemporaneous Covariances Breusch Pagan LM Test Model Chi-square Value Critical Value (5%) Difference 261 41.3 Quasi-difference 610 41.3 Levels 326 41.3
All three models were subjected to test for validity of demand restrictions. Table A2.4 shows that the hypotheses of homogeneity and symmetry are rejected for all three models except for symmetry restriction for the levels form. If the Log Likelihood (LR) statistic is lower than the critical value, then we accept the null hypothesis of homogeneity/symmetry. Figures show that the LR values are higher than the critical value, thus we reject the restrictions imposed in the model. As discussed in the previous chapter, rejection of demand restrictions are common in empirical work and this is caused by a number of factors such as habit formation, non-price effects, and non-stationarity of data, particularly for times series. Since the latter has been addressed, it is possible that this is due to habit formation and non-price effects not considered in the model.
Table A2.4 Test for Validity of Demand Restrictions Value of Log Likelihood LR Critical Value Test/Model Restricted Unrestricted Statistic 5% 1% Homogeneity (DF=8) Difference 7025 7100 150 15.5 20.1 Quasi-difference 7866 7880 28 Levels 8224 8197 (54) Symmetry (DF=28) Difference 7047 7100 106 41.3 48.3 Quasi-difference 7830 7880 100 Levels 8188 8197 18 Homogeneity & Symmetry (DF=36) Difference 6961 7100 278 51.3 59.4 Quasi-difference 7801 7880 158 Levels 8030 8197 334

114
Appendix 3 Zijinshan (Nanjing): Estimated Parameters and Model Validation
A3.1 Estimated Parameters
Table A3.1 Estimated Parameters for Wholesale Demand for Food in Zijinshan in Difference
Other Seasonal Dummy
Variables Chinese Fresh Green Spring Ex
Name 2 3 4 Cabbage
Spinach Celery Leek Cabbage
Carrot Gourds Garlic Veg Tomato Capsicum
Onions di
Chinese Cabbage
-0.01 0.00 0.04 0.00 0.00 0.00 0.01 0.04 -0.01 0.03 0.01 -0.03 -0.01 -0.03 -0.01 -0
-0.83 0.63 2.32 -0.19 1.39 0.10 1.35 2.56 -1.29 1.58 0.93 -1.69 -0.76 -1.48 -0.40 -1Spinach 0.01 0.00 0.00 0.00 0.00 -0.01 0.00 0.00 0.00 0.00 0.01 0.00 0.00 0.00 0.00 0 2.33 -0.91 1.66 1.39 0.86 -1.64 -1.11 -0.96 -0.76 -0.60 1.99 -0.87 0.76 0.83 0.30 -1Celery 0.00 0.00 -0.01 0.00 -0.01 -0.05 0.01 0.02 0.00 0.01 -0.01 0.01 -0.03 0.02 0.02 0 -0.23 -0.18 -0.58 0.10 -1.64 -3.51 0.91 1.87 -0.35 1.07 -1.30 0.55 -2.98 1.37 1.05 -0Leek -0.01 0.00 0.01 0.01 0.00 0.01 0.00 0.02 0.01 -0.02 0.00 0.02 0.01 -0.01 -0.04 -0 -1.82 0.26 0.77 1.35 -1.11 0.91 -0.33 1.79 0.98 -1.34 0.35 2.23 0.92 -1.01 -2.64 -0Cabbage -0.01 0.00 0.00 0.04 0.00 0.02 0.02 -0.02 0.00 -0.05 0.01 0.01 0.01 0.01 -0.04 0 -0.54 0.22 -0.20 2.56 -0.96 1.87 1.79 -0.70 -0.35 -2.33 1.17 0.37 0.49 0.32 -1.38 1Carrot 0.00 0.01 -0.01 -0.01 0.00 0.00 0.01 0.00 0.00 0.01 0.00 0.01 -0.01 0.00 -0.01 0 -0.14 1.90 -1.71 -1.29 -0.76 -0.35 0.98 -0.35 0.75 0.77 -0.79 1.59 -1.21 0.59 -0.59 2Gourds 0.01 0.00 -0.02 0.03 0.00 0.01 -0.02 -0.05 0.01 -0.02 -0.01 0.03 -0.02 0.01 0.03 -0 0.47 0.23 -1.15 1.58 -0.60 1.07 -1.34 -2.33 0.77 -0.58 -0.84 1.01 -1.09 0.45 0.86 -1Garlic -0.01 0.00 0.00 0.01 0.01 -0.01 0.00 0.01 0.00 -0.01 0.00 -0.01 0.02 0.00 -0.01 0 -1.48 -0.24 0.17 0.93 1.99 -1.30 0.35 1.17 -0.79 -0.84 -0.12 -1.27 2.45 0.10 -0.80 -0Other Fresh Veg
0.02 0.00 0.01 -0.03 0.00 0.01 0.02 0.01 0.01 0.03 -0.01 -0.10 0.00 0.06 0.01 0
0.63 0.81 0.29 -1.69 -0.87 0.55 2.23 0.37 1.59 1.01 -1.27 -2.17 -0.13 2.16 0.21 2Tomato 0.01 -0.01 0.00 -0.01 0.00 -0.03 0.01 0.01 -0.01 -0.02 0.02 0.00 0.01 -0.01 0.03 -0 0.79 -0.61 0.45 -0.76 0.76 -2.98 0.92 0.49 -1.21 -1.09 2.45 -0.13 0.54 -1.01 1.48 -1Green Capsicum
0.01 -0.03 0.00 -0.03 0.00 0.02 -0.01 0.01 0.00 0.01 0.00 0.06 -0.01 -0.04 -0.01 -0
0.74 -1.10 0.75 -1.48 0.83 1.37 -1.01 0.32 0.59 0.45 0.10 2.16 -1.01 -1.28 -0.40 -0Spring Onion -0.01 0.00 0.00 -0.01 0.00 0.02 -0.04 -0.04 -0.01 0.03 -0.01 0.01 0.03 -0.01 0.04 0 -0.32 0.46 0.73 -0.40 0.30 1.05 -2.64 -1.38 -0.59 0.86 -0.80 0.21 1.48 -0.40 0.65 0

115
A3.2 Model Validation
The number of non-stationarity data exceeds the stationarity data reaching 18 variables out of 25 (Table A3.2). This includes, however, two variables which are only non-stationary in one case, ie with or without trend.
Table A3.2 Tests for Non-stationarity Using Augmented Dickey-Fuller Test, Zijinshan Test Statistic Asymptotic Critical Value Variables
Constant, no trend
Constant, trend
Constant, no trend
Constant, trend
Remarks
Dependent (wi) Chinese Cabbage -1.73 -1.72 -2.57 -3.13 non-stationary Spinach -2.43 -2.68 -2.57 -3.13 non-stationary Celery -3.14 -3.41 -2.57 -3.13 stationary Leek -3.27 -3.78 -2.57 -3.13 stationary Cabbage -3.52 -3.59 -2.57 -3.13 stationary Carrot -3.28 -3.32 -2.57 -3.13 stationary Gourds -1.76 -1.90 -2.57 -3.13 non-stationary Garlic -2.68 -3.12 -2.57 -3.13 stationary Other Fresh Veg -1.82 -3.15 -2.57 -3.13 non-stationary Tomato -2.88 -2.87 -2.57 -3.13 non-stationary* Green Capsicum -2.26 -2.30 -2.57 -3.13 non-stationary Onion -2.85 -3.27 -2.57 -3.13 stationary Independent (LPi) Chinese Cabbage -2.52 -2.90 -2.57 -3.13 non-stationary Spinach -3.11 -3.02 -2.57 -3.13 non-stationary* Celery -2.14 -2.04 -2.57 -3.13 non-stationary Leek -1.39 -1.31 -2.57 -3.13 non-stationary Cabbage -1.92 -1.54 -2.57 -3.13 non-stationary Carrot -2.54 -2.43 -2.57 -3.13 non-stationary Gourds -1.74 -1.74 -2.57 -3.13 non-stationary Garlic -3.16 -2.62 -2.57 -3.13 non-stationary* Other Fresh Veg -2.04 -2.07 -2.57 -3.13 non-stationary Tomato -1.40 -1.17 -2.57 -3.13 non-stationary Green Capsicum -1.62 -1.52 -2.57 -3.13 non-stationary Onion -1.52 -2.43 -2.57 -3.13 non-stationary Expenditure -3.43 -4.2 -2.57 -3.13 stationary
*not for both cases, ie with and without trend
Results show that there are more significant parameters in levels than in difference form. Moreover, R2 values are higher without differencing as expected. The difference form is nevertheless preferred since the levels form has non-stationary variables as reflected in low D-W statistics. For example, Chinese cabbage has R2 of 0.8 but with D-W statistics below the critical level. Other fresh vegetables and spring onion have R2 of 0.58 and 0.51 respectively but D-W statistics show positive autocorrelation. One should not fall into the “R2 syndrome” trap where there is the

116
tendency to run the model in levels rather than in difference form because of a higher R2. This is critical because in the presence of autocorrelation, data may reveal that there is a strong relationship between the dependent and independent variables when in reality there is none (Madalla, 1988).
Breusch Pagan Langrange Multiplier test showed that the system would give more efficient parameter estimates than the single equations. As shown in Table A3.3, the Chi-square value is higher than the critical value thus we reject the null hypothesis that all covariances are equal to zero.
Table A3.3 Langrange Multiplier Test for Contemporaneous Covariances, Zijinshan
Breusch Pagan LM Test Model Chi-square Value Critical Value (5%) Difference 103 85.2 Levels 140 85.2
Homogeneity restriction in the model is valid at 5% level as shown in Table A3.4. Symmetry restriction is also valid at 1% level. Simultaneous restriction of homogeneity and symmetry was accepted at 1% level.
Table A3.4 Test for Validity of Demand Restrictions, Zijinshan Value of Log Likelihood LR Critical Value Test/Model Restricted Unrestricted Statistic 5% 1% Homogeneity (DF=12) Difference 1426 1435 18 21.0 26.2 Levels 1579 1511 (136) 21.0 26.3 Symmetry (DF=66) Difference 1391 1435 88 85.2 92.3 Levels 1535 1511 (48) 85.2 92.3 Homogeneity & Symmetry (DF=78) Difference 1384 1435 102 98.6 111.3 Levels 1520 1511 (18) 98.6 111.3

117

118
Appendix 4 Beiyunting (Nanjing): Estimated Parameters and Model Validation
A4.1 Estimated Parameters
Table A4.1 Estimated Parameters for Wholesale Demand for Food in Beiyunting in Difference
Seasonal Dummy Variables Expen- Products S1 S2 S3 Grain Oil Fruit Seafood Veg. diture R2 D-W
Grain 0.00 0.00 0.00 0.01 0.01 0.00 0.01 -0.01 0.00 0.23 2.39 0.08 0.32 0.17 1.18 5.85 -0.69 6.54 -2.75 -2.49 Oil 0.00 0.00 0.00 0.01 -0.01 0.00 -0.01 0.00 0.00 0.36 2.42 -0.48 0.42 -0.05 5.85 -3.22 1.75 -6.04 -0.43 4.66 Fruit -0.02 0.00 0.00 0.00 0.00 0.00 0.00 0.00 0.00 0.24 2.51 -1.64 -0.12 -0.19 -0.69 1.75 -0.45 1.65 0.11 1.16 Seafood 0.00 0.00 0.00 0.01 -0.01 0.00 -0.01 0.00 0.00 -0.30 -0.57 -2.02 6.54 -6.04 1.65 -5.81 1.63 6.83 0.60 2.80 Veg. 0.02 0.00 0.00 -0.01 0.00 0.00 0.00 0.01 0.05 1.90 0.14 -0.26 -2.75 -0.43 0.11 1.63 1.40 52.61 0.99 2.42
A4.2 Model Validation
It is interesting to note that among the six wholesale markets analyzed, only this market has minimal non-stationarity problem in the data. Of the 10 variables, only one was non-stationary. However, since the variable appears in all equations, all variables were transformed into first difference (Table A4.2).
Table A4.2 Tests for Non-stationarity Using Augmented Dickey-Fuller Test, Beiyunting Test Statistic Asymptotic Critical Value Variables
Constant, no trend
Constant, trend
Constant, no trend
Constant, trend
Remarks
Dependent (wi) Grain -4.70 -4.78 -2.57 -3.13 stationary Oil -3.99 -3.98 -2.57 -3.13 stationary Fruit -4.62 -4.63 -2.57 -3.13 stationary Seafood -4.51 -4.52 -2.57 -3.13 stationary Vegetables -2.56 -2.58 -2.57 -3.13 non-stationary Independent (LPi) Grain -7.74 -7.74 -2.57 -3.13 stationary Oil -6.20 -6.26 -2.57 -3.13 stationary Fruit -4.75 -4.75 -2.57 -3.13 stationary Seafood -15.15 -15.33 -2.57 -3.13 stationary Vegetables -4.70 -4.70 -2.57 -3.13 stationary Expenditure -3.24 -3.40 -2.57 -3.13 stationary
As expected, the number of significant variables decreased when the data were transformed into first difference, particularly for the seasonal dummy variables. The

119
results in terms of the signs and magnitudes of elasticities are similar, apparently because, unlike other markets analyzed, the problem of non-stationarity was not severe in this market. The difference form is still preferred since the levels form has non-stationary variable and the estimate would therefore be biased and unreliable.
Results of Breusch Pagan Langrange Multiplier test showed that the system will give more efficient parameter estimates than the single equations. As shown in Table A4.3, the Chi-square value is higher than the critical value, thus we reject the null hypothesis that all covariances are equal to zero.
Table A4.3 Langrange Multiplier Test for Contemporaneous Covariances, Beiyunting
Breusch Pagan LM Test Model Chi-square Value Critical Value (5%) Difference 37.65 18.3 Levels 25.8
Likelihood ratio test revealed that homogeneity restriction on the demand model is accepted at 5% level but not for symmetry restrictions. Simultaneous imposition of these two restrictions was not accepted (Table A4.4).
Table A4.4 Test for Validity of Demand Restrictions, Beiyunting Value of Log Likelihood LR Critical Value Test/Model Restricted Unrestricted Statistic 5% 1% Homogeneity Difference 464 468 8 11.1 15.1 Levels 517 520 6 Symmetry Difference 452 468 32 18.3 23.2 Levels 510 520 10 Homogeneity & Symmetry Difference 430 468 76 25.0 30.6 Levels 507 520 26

120
Appendix 5 Buji (Shenzhen): Estimated Parameters and Model Validation
A5.1 Estimated Parameters
Table A5.1 Estimated Parameters for Wholesale Demand for Food in Buji in Difference Name
Canned Ham
Frozen Cutlass Fish
Frozen Meat
Frozen Pork Ribs
Frozen Red Fish
Fruit
Gourd & Pea
Leaf Veg
Root
Sand-wich Ham
Silk Rice
Winter Rice
E
Canned Ham 0.00 0.00 0.00 0.00 0.00 0.00 0.00 0.00 0.00 0.00 0.00 0.00 3.26 1.90 1.73 -0.61 -4.53 -3.65 -0.86 -0.91 -0.80 -0.24 -0.24 -0.61 Frozen Cutlass Fish 0.00 0.01 0.00 0.00 0.00 0.00 0.00 0.00 0.00 0.00 0.00 0.00 1.90 4.46 -2.05 -0.25 0.39 -3.14 -2.25 -0.56 -1.34 -0.64 -0.64 0.79 Frozen Meat 0.00 0.00 0.08 -0.02 0.00 -0.03 0.00 -0.01 0.00 -0.01 -0.01 -0.01 1.73 -2.05 8.72 -2.48 -1.48 -3.75 -0.60 -1.22 0.69 -2.22 -2.22 -1.93 Frozen Pork Ribs 0.00 0.00 -0.02 0.06 0.00 -0.04 -0.01 0.00 -0.01 0.00 0.00 0.01 -0.61 -0.25 -2.48 7.01 1.52 -4.08 -0.68 -0.12 -0.85 -1.19 -1.19 1.41 Frozen Red Fish 0.00 0.00 0.00 0.00 0.00 0.00 0.00 0.00 0.00 0.00 0.00 0.00 -4.53 0.39 -1.48 1.52 3.47 -2.23 -1.22 1.12 -0.28 0.20 0.20 0.87 Fruit 0.00 0.00 -0.03 -0.04 0.00 0.29 -0.08 -0.07 -0.06 0.00 0.00 -0.01 -3.65 -3.14 -3.75 -4.08 -2.23 6.48 -4.02 -3.95 -5.87 -3.12 -3.12 -2.58 Gourd & Pea 0.00 0.00 0.00 -0.01 0.00 -0.08 0.10 0.01 -0.01 0.00 0.00 -0.01 -0.86 -2.25 -0.60 -0.68 -1.22 -4.02 4.90 0.67 -0.75 -1.44 -1.44 -0.97 Leaf Veg. 0.00 0.00 -0.01 0.00 0.00 -0.07 0.01 0.08 -0.01 0.00 0.00 0.00 -0.91 -0.56 -1.22 -0.12 1.12 -3.95 0.67 5.46 -1.22 -1.17 -1.17 -0.63 Root 0.00 0.00 0.00 -0.01 0.00 -0.06 -0.01 -0.01 0.10 0.00 0.00 -0.01 -0.80 -1.34 0.69 -0.85 -0.28 -5.87 -0.75 -1.22 7.30 -1.41 -1.41 -1.58 Sandwich Ham 0.00 0.00 -0.01 0.00 0.00 0.00 0.00 0.00 0.00 0.01 0.01 0.01 -0.24 -0.64 -2.22 -1.19 0.20 -3.12 -1.44 -1.17 -1.41 7.15 7.15 2.13 Silk Rice 0.00 0.00 -0.01 0.01 0.00 -0.01 -0.01 0.00 -0.01 0.01 0.01 0.04
-0.61 0.79 -1.93 1.41 0.87 -2.58 -0.97 -0.63 -1.58 2.13 2.13 2.84

121
A5.2 Model Validation
The majority of the variables are non-stationary. Only seven of the 22 variables are stationary (Table A5.2). There are four non-stationary variables but not for both cases, ie with or without trend. With this nonstationarity problem which is also reflected in low D-W statistics, the data were transformed to difference form.
Table A5.2 Tests for Non-stationarity Using Augmented Dickey-Fuller Test, Zijinshan Test Statistic Asymptotic Critical Value Variables
Constant, no trend
Constant, trend
Constant, no trend
Constant, trend
Remarks
Dependent (wi) Canned Ham -3.45 -3.49 -2.57 -3.13 stationary Frozen Cutlass Fish -3.00 -3.15 -2.57 -3.13 stationary Frozen Meat -1.73 -1.05 -2.57 -3.13 non-stationary Frozen Pork Ribs -1.63 -1.68 -2.57 -3.13 non-stationary Frozen Red Fish 0.900 1.53 -2.57 -3.13 non-stationary Fruit -2.03 -4.62 -2.57 -3.13 non-stationary* Gourd & Pea -4.06 -4.19 -2.57 -3.13 stationary Leaf Vegetables -3.62 -3.47 -2.57 -3.13 stationary Root -2.43 -3.23 -2.57 -3.13 non-stationary* Sandwich Ham -3.15 -3.82 -2.57 -3.13 stationary Silk Rice -2.95 -3.43 Independent (LPi) Canned Ham -0.968 1.26 -2.57 -3.13 non-stationary Frozen Cutlass Fish -1.19 0.210 -2.57 -3.13 non-stationary Frozen Meat -0.982 1.85 -2.57 -3.13 non-stationary Frozen Pork Ribs -1.58 -0.305 -2.57 -3.13 non-stationary Frozen Red Fish -1.62 -0.150 -2.57 -3.13 non-stationary Fruit -2.73 -4.23 -2.57 -3.13 stationary Gourd & Pea -3.00 -2.86 -2.57 -3.13 non-stationary* Leaf Vegetables -3.34 -3.27 -2.57 -3.13 stationary Root -2.68 -2.63 -2.57 -3.13 non-stationary* Sandwich Ham -3.80 -4.35 -2.57 -3.13 stationary Silk Rice -1.40 1.16 -2.57 -3.13 non-stationary Winter Rice -1.53 1.61 -2.57 -3.13 non-stationary Expenditure -0.761 0.435 -2.57 -3.13 non-stationary
*not true for both cases, ie with and without trend
Contemporaneous covariance is non-diagonal which implies that the model will give more efficient estimates than the single equation estimation. This is shown in Table A5.3 where the Chi-square value from the Breusch Pagan Langrange Multiplier test is greater than the critical value at 5% level.

122
Table A5.3 Langrange Multiplier Test for Contemporaneous Covariances, Buji Breusch Pagan LM Test Model Chi-square Value Critical Value (5%) Difference 342 73.2 Levels 482 73.2
Homogeneity and symmetry restrictions imposed in the model were both rejected at 5% level. As mentioned earlier, this is common in empirical work on demand estimations (Table A5.4).
Table A5.4 Test for Validity of Demand Restrictions, Buji Value of Log Likelihood LR Critical Value Test/Model Restricted Unrestricted Statistic 5% 1% Homogeneity Difference 1738 1753 30 19.7 24.7 Levels 1839 1856 34 19.7 24.7 Symmetry Difference 1690 1753 126 73.2 82.2 Levels 1753 1856 206 73.2 82.2 Homogeneity & Symmetry Difference 1681 1753 144 85.2 92.2 Levels 1746 1856 220 85.2 92.2

123
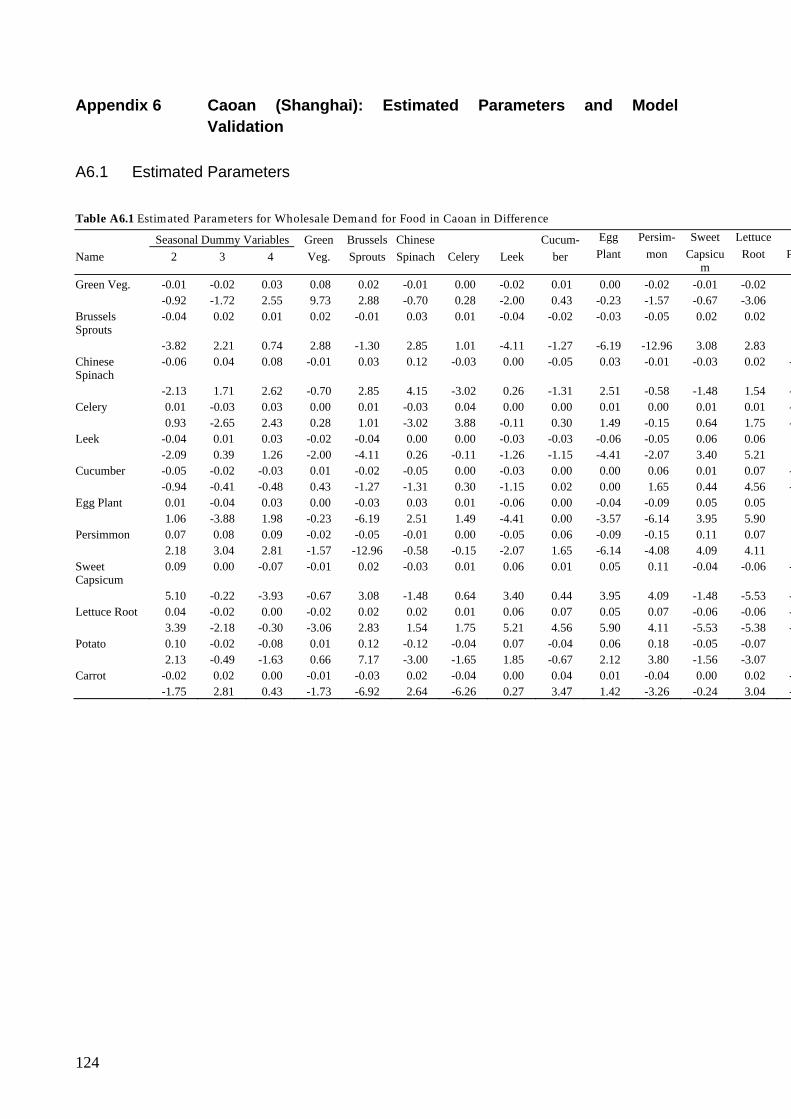
124
Appendix 6 Caoan (Shanghai): Estimated Parameters and Model Validation
A6.1 Estimated Parameters
Table A6.1 Estimated Parameters for Wholesale Demand for Food in Caoan in Difference
Seasonal Dummy Variables Green Brussels Chinese Cucum- Egg Persim- Sweet Lettuce
Name 2 3 4 Veg. Sprouts Spinach Celery Leek ber Plant mon Capsicum
Root P
Green Veg. -0.01 -0.02 0.03 0.08 0.02 -0.01 0.00 -0.02 0.01 0.00 -0.02 -0.01 -0.02 -0.92 -1.72 2.55 9.73 2.88 -0.70 0.28 -2.00 0.43 -0.23 -1.57 -0.67 -3.06 Brussels Sprouts
-0.04 0.02 0.01 0.02 -0.01 0.03 0.01 -0.04 -0.02 -0.03 -0.05 0.02 0.02
-3.82 2.21 0.74 2.88 -1.30 2.85 1.01 -4.11 -1.27 -6.19 -12.96 3.08 2.83 Chinese Spinach
-0.06 0.04 0.08 -0.01 0.03 0.12 -0.03 0.00 -0.05 0.03 -0.01 -0.03 0.02 -
-2.13 1.71 2.62 -0.70 2.85 4.15 -3.02 0.26 -1.31 2.51 -0.58 -1.48 1.54 -Celery 0.01 -0.03 0.03 0.00 0.01 -0.03 0.04 0.00 0.00 0.01 0.00 0.01 0.01 - 0.93 -2.65 2.43 0.28 1.01 -3.02 3.88 -0.11 0.30 1.49 -0.15 0.64 1.75 -Leek -0.04 0.01 0.03 -0.02 -0.04 0.00 0.00 -0.03 -0.03 -0.06 -0.05 0.06 0.06 -2.09 0.39 1.26 -2.00 -4.11 0.26 -0.11 -1.26 -1.15 -4.41 -2.07 3.40 5.21 Cucumber -0.05 -0.02 -0.03 0.01 -0.02 -0.05 0.00 -0.03 0.00 0.00 0.06 0.01 0.07 - -0.94 -0.41 -0.48 0.43 -1.27 -1.31 0.30 -1.15 0.02 0.00 1.65 0.44 4.56 -Egg Plant 0.01 -0.04 0.03 0.00 -0.03 0.03 0.01 -0.06 0.00 -0.04 -0.09 0.05 0.05 1.06 -3.88 1.98 -0.23 -6.19 2.51 1.49 -4.41 0.00 -3.57 -6.14 3.95 5.90 Persimmon 0.07 0.08 0.09 -0.02 -0.05 -0.01 0.00 -0.05 0.06 -0.09 -0.15 0.11 0.07 2.18 3.04 2.81 -1.57 -12.96 -0.58 -0.15 -2.07 1.65 -6.14 -4.08 4.09 4.11 Sweet Capsicum
0.09 0.00 -0.07 -0.01 0.02 -0.03 0.01 0.06 0.01 0.05 0.11 -0.04 -0.06 -
5.10 -0.22 -3.93 -0.67 3.08 -1.48 0.64 3.40 0.44 3.95 4.09 -1.48 -5.53 -Lettuce Root 0.04 -0.02 0.00 -0.02 0.02 0.02 0.01 0.06 0.07 0.05 0.07 -0.06 -0.06 - 3.39 -2.18 -0.30 -3.06 2.83 1.54 1.75 5.21 4.56 5.90 4.11 -5.53 -5.38 -Potato 0.10 -0.02 -0.08 0.01 0.12 -0.12 -0.04 0.07 -0.04 0.06 0.18 -0.05 -0.07 2.13 -0.49 -1.63 0.66 7.17 -3.00 -1.65 1.85 -0.67 2.12 3.80 -1.56 -3.07 Carrot -0.02 0.02 0.00 -0.01 -0.03 0.02 -0.04 0.00 0.04 0.01 -0.04 0.00 0.02 - -1.75 2.81 0.43 -1.73 -6.92 2.64 -6.26 0.27 3.47 1.42 -3.26 -0.24 3.04 -

125
A6.2 Model Validation
There is a problem of non-stationarity data. About half of the variables are non-stationary so we transformed the data into first difference (Table A6.2) It should be noted that although after differencing there are some relatively low D-W statistics, they are still within acceptable limits. Also, D-W statistics are only indicative and become limited when there are non-stationary data (Madalla, 1988).
Table A6.2 Tests for Non-stationarity Using Augmented Dickey-Fuller Test, Caoan Test Statistic Asymptotic Critical Value Variables
Constant, no trend
Constant, trend
Constant, no trend
Constant, trend
Remarks
Dependent (wi) Green Veg. -2.69 -5.16 -2.57 -3.13 stationary Brussels Sprouts -2.67 -2.57 -2.57 -3.13 non-stationary* Chinese Spinach -4.31 -4.35 -2.57 -3.13 stationary Celery -3.37 -4.08 -2.57 -3.13 stationary Leek -3.45 -3.46 -2.57 -3.13 stationary Cucumber -3.44 -3.43 -2.57 -3.13 stationary Egg Plant -2.66 -2.64 -2.57 -3.13 stationary Persimmon -2.60 -3.55 -2.57 -3.13 stationary Sweet Capsicum -3.16 -3.16 -2.57 -3.13 stationary Lettuce Root -2.98 -2.99 -2.57 -3.13 non-stationary* Potato -3.36 -3.45 -2.57 -3.13 stationary Carrot -3.05 -2.93 -2.57 -3.13 non-stationary* Spring Onion -2.43 -4.21 -2.57 -3.13 non-stationary* Independent (LPi) Green Veg. -3.15 -3.12 -2.57 -3.13 non-stationary* Brussels Sprouts -2.55 -2.31 -2.57 -3.13 non-stationary Chinese Spinach -1.70 -3.08 -2.57 -3.13 non-stationary Celery -2.82 -2.81 -2.57 -3.13 non-stationary* Leek -3.25 -2.53 -2.57 -3.13 non-stationary* Cucumber -3.52 -3.44 -2.57 -3.13 stationary Egg Plant -2.51 -3.32 -2.57 -3.13 non-stationary* Persimmon -2.76 -3.62 -2.57 -3.13 stationary Sweet Capsicum -3.22 -4.08 -2.57 -3.13 stationary Lettuce Root -4.15 -6.44 -2.57 -3.13 stationary Potato -2.40 -2.78 -2.57 -3.13 non-stationary Carrot -2.96 -2.89 -2.57 -3.13 non-stationary* Spring Onion -4.67 -4.74 -2.57 -3.13 stationary Expenditure -2.58 -3.79 -2.57 -3.13 stationary
*not true for both cases, ie with and without trend

126
Contemporaneous covariance is non-diagonal which implies that the model will give more efficient estimates than the single equation estimation. This is shown in Table A6.3 where the Chi-square value from the Breusch Pagan Langrange Multiplier test is greater than the critical value at 5% level.
Table A6.3 Langrange Multiplier Test for Contemporaneous Covariances, Caoan
Breusch Pagan LM Test Model Chi-square Value Critical Value (5%) Difference 149.87 85.2
Both levels and difference form were subjected to test for validity of demand restrictions. Table A6.4 shows that the hypotheses of homogeneity and symmetry are rejected for both models. If the LR-statistic is lower than the critical value, then we accept the null hypothesis of homogeneity/symmetry. Figures show that the LR values are higher than the critical value, thus we reject the restrictions imposed in the model. As discussed previously, rejection of demand restrictions is common in empirical work and this is caused by a number of factors such as habit formation, non-price effects, and non-stationarity of data particularly for times series. Since the latter has been addressed, it is possible that this is due to habit formation and non-price effects not considered in the model.
Table A6.4 Test for Validity of Demand Restrictions, Caoan Value of Log Likelihood LR Critical Value Test/Model Restricted Unrestricted Statistic 5% 1% Homogeneity (DF=12) Difference 994 1028 68 21 26.2 Levels 1081 1117 72 Symmetry (DF=66) Difference 933 1028 190 85.2 92.3 Levels 996 1117 242 Homogeneity & Symmetry (DF=78) Difference 868 1028 320 98.6 111.3 Levels 977 1117 280

127

128
Appendix 7 Xinchang (Shanghai): Estimated Parameters and Model Validation
A7.1 Estimated Parameters
Table A7.1 Estimated Parameters for Wholesale Demand for Food in Xinchang in Difference
Name
Cabbage
Spinach
Chinese Cabbage
Other
Expend- diture
R2
D-W
Cabbage 0.02 0.02 -0.02 0.00 0.00 0.003 2.70 1.62 1.54 -1.13 0.28 -0.14 Spinach 0.02 0.10 -0.10 0.04 0.05 0.19 2.52 1.54 3.08 -3.47 1.50 1.90 Chinese Cabbage -0.02 -0.10 0.24 -0.11 0.01 0.17 2.48 -1.13 -3.47 5.13 -3.58 0.26 Other 0.00 0.04 -0.11 0.08 0.03 0.08 2.84 0.28 1.50 -3.58 2.25 0.81
A7.2 Model Validation
A number of variables are non-stationary thus we used the difference model similar to the other markets. This non-stationarity problem is reflected in low D-W statistics outside acceptable levels (A7.2).
Contemporaneous covariance is non-diagonal which implies that the model will give more-efficient estimates than the single-equation estimation. This is shown in Table A7.3 where the Chi-square value from the Breusch Pagan Langrange Multiplier test is greater than the critical value at 5% level.
The hypothesis of homogeneity is accepted at 5% level but rejected the symmetry restriction. Simultaneous imposition of homogeneity and symmetry constraints was also rejected (Table A7.4).

129
Table A7.2 Tests for Non-stationarity Using Augmented Dickey-Fuller Test, Xinchang Test Statistic Asymptotic Critical Value Variables
Constant, no trend
Constant, trend
Constant, no trend
Constant, trend
Remarks
Dependent (wi)
Cabbage -1.52 -2.82 -2.57 -3.13 non-stationary
Spinach -2.11 -3.08 -2.57 -3.13 non-stationary
Chinese Cabbage -3.58 -3.81 -2.57 -3.13 stationary
Other Veg – fresh -2.15 -2.55 -2.57 -3.13 non-stationary
Celery -2.70 -2.84 -2.57 -3.13 non-stationary*
Independent (LPi)
Cabbage -3.56 -3.62 -2.57 -3.13 stationary
Spinach -1.00 -1.38 -2.57 -3.13 non-stationary
Chinese Cabbage -1.36 -1.21 -2.57 -3.13 non-stationary
Other Veg – fresh -2.96 -4.25 -2.57 -3.13 non-stationary*
Celery 0.973 -1.12 -2.57 -3.13 non-stationary
Expenditure -3.05 -3.39 -2.57 -3.13 stationary
*not true for both cases, ie with and without trend
Table A7.3 Langrange Multiplier Test for Contemporaneous Covariances, Xinchang
Breusch Pagan LM Test Model Chi-square Value Critical Value (5%) Difference 41.8 18.3 Levels 54.8
Table A7.4 Test for Validity of Demand Restrictions, Xinchang Value of Log Likelihood LR Critical Value Test/Model Restricted Unrestricted Statistic 5% 1% Homogeneity Difference 789 792 6 9.5 13.3 Levels 752 757 10 Symmetry Difference 779 792 26 12.6 16.8 Levels 745 757 24 Homogeneity & Symmetry Difference 778 792 28 18.3 23.2 Levels 766 757 (18)

130
Appendix 8 Comparison of Elasticity Estimates by Product and by Market
Table A8.1 Vegetables Own-Price Elasticities by Market
Wholesale Market Dazhongsi Zijinshan Beiyunting Buji Caoan Xinchang Product (Beijing) (Nanjing) (Nanjing) (Shenzhen) (Shanghai) (Shanghai) Vegetables – fresh -0.67 Vegetables -1.04 Chinese Cabbage -1.01 -0.44 Spinach -0.53 -0.38 Celery -2.45 -0.24 -0.23 Leek -1.43 -1.81 Cabbage -1.28 -0.83 Carrot -0.61 0.95 Gourds -1.19 Gourds & Pea -0.18 Garlic -1.16 Spring Onion -0.71 Tomato -0.82 Potato -0.29 -0.35 Vegetables – dried -1.78 Vegetable Oils -0.76 Oil -2.67 Green Vegetables 0.28 Other Vegetables -1.42 -0.40 Brussels Sprouts -1.15 Leaf Vegetables -0.43 Sweet Capsicum -1.33 Green Capsicum -1.97 Root 0.15 Chinese Spinach 0.25 Cucumber -1.04 Egg Plant -1.97 Lettuce Root -2.92 Persimmon -3.39

131
Table A8.2 Vegetables Expenditure Elasticities by Market
Wholesale Market Dazhongsi Zijinshan Beiyunting Buji Caoan Xinchang Product (Beijing) (Nanjing) (Nanjing) (Shenzhen) (Shanghai) (Shanghai) Vegetables – fresh 1.13 Vegetables 1.06 Chinese Cabbage 0.86 1.02 Spinach 0.57 0.86 Celery 0.93 1.28 0.50 Leek 0.67 0.04 Cabbage 1.21 0.98 Carrot 1.97 1.00 Gourds 0.78 Gourds & Pea 1.12 Garlic 0.72 Spring Onion 1.19 Tomato 0.49 Potato 0.80 0.75 Vegetables – dried 1.11 Vegetable Oils 1.21 Oil 1.26 Green Vegetables 0.65 Other Vegetables 1.23 1.20 Brussels Sprouts 1.02 Leaf Vegetables 1.11 Sweet Capsicum 0.80 Green Capsicum 0.68 Root 1.12 Chinese Spinach 0.41 Cucumber 1.15 Egg Plant 1.99 Lettuce Root 1.20

132
Table A8.3 Grains, Meat, Poultry and Seafood Own-Price Elasticities by Market
Wholesale Market Dazhongsi Zijinshan Beiyunting Buji Caoan Xinchang Product (Beijing) (Nanjing) (Nanjing) (Shenzhen) (Shanghai) (Shanghai) Fruits -0.91 -1.16 Grain & Rice -0.10 Grains 0.45 Silk Rice 0.60 Winter Rice -0.42 Meat & Poultry -0.54 Canned Ham 0.28 Frozen Meat -0.13 Frozen Pork Ribs -0.31 Sandwich Ham 0.49 Meat & Poultry W Av* -0.54 -0.21 Seafood -0.24 -5.62 Seafood – dried 0.30 Frozen Cutlass Fish 1.05 Frozen Red Fish 0.41 Seafood W Av* -0.21 0.83
*based on expenditure share
Table A8.4 Grains, Meat, Poultry and Seafood Expenditure Elasticities by Market
Wholesale Market Dazhongsi Zijinshan Beiyunting Buji Caoan Xinchang Product (Beijing) (Nanjing) (Nanjing) (Shenzhen) (Shanghai) (Shanghai) Fruits 1.09 1.26 Grain & Rice 1.19 Grains 0.77 Silk Rice 0.99 Winter Rice -0.35 Meat & Poultry 1.05 Canned Ham 0.99 Frozen Meat 1.03 Frozen Pork Ribs 1.07 Sandwich Ham 1.02 Meat & Poultry W Av* 1.05 1.04 Seafood 1.01 Seafood – dried 1.02 Frozen Cutlass Fish 0.96 Frozen Red Fish 1.02 Seafood W Av* 1.01 0.98
*based on expenditure share

133

134
Appendix 9 Vegetable Oils/Fat (SITC*.3=421 & 422) Trade Data
Imports Imports
Table A9.1 Value ($US 000) Table A9.2 Share to World by Country (%)
1991 1992 1993 1994 1995 COUNTRY 1991 1992 1993 1994 1995
269 057 337 559 326 584 403 773 514 636 Japan 3.16 3.45 3.38 2.91 3.14 132 512 141 445 361 669 517 330 Hong Kong 1.35 1.46 2.61 3.15 486 143 456 566 1 744 287 2 436 129 China 4.96 4.72 12.59 14.85 11862 19 048 20 865 26 316 41 100 Thailand 0.14 0.19 0.22 0.19 0.25 136 112 122 162 149 020 203 508 132 822 Malaysia 1.60 1.25 1.54 1.47 0.81 17 664 25 956 14 008 25 801 19 382 Philippines 0.21 0.26 0.14 0.19 0.12 270 177 225 492 204 548 211 359 221 829 Singapore 3.17 2.30 2.12 1.53 1.35 3 852 3 143 3 658 Brunei Dar. 0.04 0.03 0.03 0.00 3 487 4 464 4 282 5 686 6 202 Macau 0.04 0.05 0.04 0.04 0.04 29 852 137 152 87 167 84 736 78 073 Indonesia 0.35 1.40 0.90 0.61 0.48 123 013 187 314 124 352 Bangladesh 1.44 1.91 1.29 0.00 158 565 151 022 147 457 200 823 236 420 Korea Rep. 1.86 1.54 1.53 1.45 1.44 1 019 789 1 832 676 1 679 437 3 271 616 4 203 923 Total 11.96 18.71 17.38 23.62 25.63
8 524 483 9 797 439 9 665 479 13 852 790 16 400 740 World Total 100.00 100.00 100.00 100.00 100.00
Imports Exports
Table A9.3 Share to Asia by Country (%) Table A9.4 Growth Rates (%)
1991 1992 1993 1994 1995 COUNTRY
1992 1993 1994 1995
26.38 18.42 19.45 12.34 12.24 Japan 0.68 0.49 0.51 0.36 7.23 8.42 11.05 12.31 Hong Kong 0.23 0.21 0.19 26.53 27.19 53.32 57.95 China 3.56 5.30 8.85
1.16 1.04 1.24 0.80 0.98 Thailand 0.19 0.14 0.13 0.26 13.35 6.67 8.87 6.22 3.16 Malaysia 65.69 59.35 61.26 57.97 1.73 1.42 0.83 0.79 0.46 Philippines 10.61 13.17 9.69 8.68
26.49 12.30 12.18 6.46 5.28 Singapore 6.24 4.66 3.67 2.96 0.21 0.19 0.11 0.00 Brunei
Dar.
0.34 0.24 0.25 0.17 0.15 Macau 2.93 7.48 5.19 2.59 1.86 Indonesia 16.55 18.26 19.13 20.65
12.06 10.22 7.40 0.00 Bangladesh 15.55 8.24 8.78 6.14 5.62 Korea
Rep. 0.02 0.13 0.10 0.08
Australia 0.09 0.07 0.07 0.10
100.00 100.00 100.00 100.00 100.00 Total 100.00 100.00 100.00 100.00
* Standard for International Trade Classification

135

136
Appendix 10 Oilseeds (SITC.3=421 & 422) Trade Data
Imports
Table A10.1 Value ($US 000) Table A10.2 Share to World by Country (%)
1991 1992 1993 1994 1995 COUNTRY 1991 1992 1993 1994 1995
1 928 966 1 992 186 2 127 729 2 282 552 2 297 161 Japan 19.20 18.41 20.65 18.00 17.88 42 461 40 825 38 968 36 625 Hong Kong 0.39 0.40 0.31 0.29 31 194 28 812 62 374 109 582 China 0.29 0.28 0.49 0.85 8 251 44 302 20 084 35 044 71 609 Thailand 0.08 0.41 0.19 0.28 0.56 160 829 158 484 154 324 166 489 165 928 Malaysia 1.60 1.46 1.50 1.31 1.29 24 650 20 170 31 530 57 818 58 923 Philippines 0.25 0.19 0.31 0.46 0.46 88 690 63 038 81 067 90 609 83 558 Singapore 0.88 0.58 0.79 0.71 0.65 220 567 223 572 271 125 339 558 287 004 Indonesia 2.20 2.07 2.63 2.68 2.23 19 844 50 423 57 790 8 711 Bangladesh 0.20 0.47 0.56 0.07 341 060 391 619 346 109 447 009 482 923 Korea Rep. 3.40 3.62 3.36 3.52 3.76 2792857 3017 449 3 159 395 3 529 132 3 593 313 Total 27.80 27.89 30.66 27.83 27.97
10 044 587 10 819 709 10 304 907 12 681 880 12 848 967 World Total 100.00 100.00 100.00 100.00 100.00
Imports
Table A10.3 Share to Asia by Country (%) Table A10.4 Growth Rates (%)
1991 1992 1993 1994 1995 COUNTRY 1991–92 1992–93 1993–94 1994–95 Av gr rate
69.07 66.02 67.35 64.68 63.93 Japan 3.28 6.80 7.28 0.64 4.50 1.41 1.29 1.10 1.02 Hong Kong -3.85 -4.55 -6.01 -4.80 1.03 0.91 1.77 3.05 China -7.64 116.49 75.69 61.51
0.30 1.47 0.64 0.99 1.99 Thailand 436.93 -54.67 74.49 104.34 140.27 5.76 5.25 4.88 4.72 4.62 Malaysia -1.46 -2.62 7.88 -0.34 0.87 0.88 0.67 1.00 1.64 1.64 Philippines -18.17 56.32 83.37 1.91 30.86 3.18 2.09 2.57 2.57 2.33 Singapore -28.92 28.60 11.77 -7.78 0.92 7.90 7.41 8.58 9.62 7.99 Indonesia 1.36 21.27 25.24 -15.48 8.10 0.71 1.67 1.83 0.25 Bangladesh 154.10 14.61 -84.93 27.93
12.21 12.98 10.95 12.67 13.44 Korea Rep. 14.82 -11.62 29.15 8.03 10.10 100.00 100.00 100.00 100.00 100.00 Total 8.04 4.70 11.70 1.82 6.57
Not applicable World Total 7.72 -4.76 23.07 1.32 6.84

137
Exports
Table A10.5 Value ($US 000) Table A10.6 Share to World Total by Country (%)
1992 1993 1994 1995 COUNTRY 1992 1993 1994 1995
7 901 6 198 2 165 1 478 Japan 0.09 0.06 0.02 0.01 468 724 434 346 666 016 China 4.86 4.58 5.98 14 790 11 817 6 623 13 315 Thailand 0.17 0.12 0.07 0.12 15 684 18 386 13 919 12 427 Malaysia 0.18 0.19 0.15 0.11 19 703 13 351 8 620 9 079 Philippines 0.23 0.14 0.09 0.08 54 291 40 431 36 925 41 093 Singapore 0.62 0.42 0.39 0.37 11 996 12 292 7 620 22 466 Indonesia 0.14 0.13 0.08 0.20 45 439 43 473 56 235 92 389 Australia 0.52 0.45 0.59 0.83 4 263 317 4 765 273 4 921 653 4 681 645 USA,PR,US
VI 48.96 49.38 51.86 42.02
450 353 811 744 948 394 1 320 198 Brazil 5.17 8.41 9.99 11.85 124 365 571 199 510 218 765 874 Total 1.43 5.92 5.38 6.87
Not applicable World Total 100.00 100.00 100.00 100.00
Exports
Table A10.7 Share to Asia by Country (%) Table A10.8 Growth Rates (%)
1992 1993 1994 1995 COUNTRY 1992 1993 1994 1995
6.35 1.09 0.42 0.19 Japan -21.55 -65.07 -31.73 -39.45 82.06 85.13 86.96 China -7.33 53.34 23.00
11.89 2.07 1.30 1.74 Thailand -20.10 -43.95 101.04 12.33 12.61 3.22 2.73 1.62 Malaysia 17.23 -24.30 -10.72 -5.93 15.84 2.34 1.69 1.19 Philippines -32.24 -35.44 5.32 -20.78 43.65 7.08 7.24 5.37 Singapore -25.53 -8.67 11.29 -7.64 9.65 2.15 1.49 2.93 Indonesia 2.47 -38.01 194.83 53.10
36.54 7.61 11.02 12.06 Australia -4.33 29.36 64.29 29.77 3428.07 834.26 964.62 611.28 USA,PR,US
VI 11.77 3.28 -4.88 3.39
362.12 142.11 185.88 172.38 Brazil 80.25 16.83 39.20 45.43 100.00 100.00 100.00 100.00 Total 359.29 -10.68 50.11 132.91
Not applicable World Total 10.82 -1.65 17.39 8.85

138
Appendix 11 Vegetables (fresh/chilled/frozen, SITC.3=054) Trade Data
Imports
Table A11.1 Value ($US 000) Table A11.2 Share to World by Country (%)
1991 1992 1993 1994 1995 COUNTRY 1991 1992 1993 1994 1995
1 040 046 1 137 880 1 347 178 1 731 036 1 821 312 Japan 6.20 6.48 8.16 9.30 9.17 283 427 274 537 301 907 287 348 Hong Kong 1.61 1.66 1.62 1.45 42 279 26 049 17 260 78 823 China 0.24 0.16 0.09 0.40 37 956 48 702 48 067 63 256 67 687 Thailand 0.23 0.28 0.29 0.34 0.34 125 679 138 354 159 972 169 115 223 318 Malaysia 0.75 0.79 0.97 0.91 1.12 19 884 14 160 14 447 33 184 30 614 Philippines 0.12 0.08 0.09 0.18 0.15 178 249 179 936 202 640 195 633 239 203 Singapore 1.06 1.03 1.23 1.05 1.20 7 438 6 986 10 267 Brunei Dar. 0.04 0.04 0.06 0.00 4 207 4 367 4 659 5 079 5 159 Macau 0.03 0.02 0.03 0.03 0.03 46 257 50 425 56 574 97 649 120 197 Indonesia 0.28 0.29 0.34 0.52 0.60 41 760 42 563 26 783 Bangladesh 0.25 0.24 0.16 59 482 79 806 80 751 119 515 79 310 Korea Rep. 0.35 0.45 0.49 0.64 0.40 1 553 520 2 029 337 2 248 643 2 743 901 2 952 971 Total 9.26 11.56 13.62 14.75 14.86
16 779 110 17 554 445 16 509 406 18 608 150 19 871 126 World Total 100.00 100.00 100.00 100.00 100.00
Imports
Table A11.3 Share to Asia by Country (%) Table A11.4 Growth Rates (%)
1991 1992 1993 1994 1995 COUNTRY 1991–92 1992–93 1993–94 1994–95 Av gr rate
66.95 56.07 59.91 63.09 61.68 Japan 9.41 18.39 28.49 5.22 15.38 13.97 12.21 11.00 9.73 Hong Kong -3.14 9.97 -4.82 0.67 2.08 1.16 0.63 2.67 China -38.39 -33.74 356.68 94.85
2.44 2.40 2.14 2.31 2.29 Thailand 28.31 -1.30 31.60 7.00 16.40 8.09 6.82 7.11 6.16 7.56 Malaysia 10.09 15.63 5.72 32.05 15.87 1.28 0.70 0.64 1.21 1.04 Philippines -28.79 2.03 129.69 -7.74 23.80
11.47 8.87 9.01 7.13 8.10 Singapore 0.95 12.62 -3.46 22.27 8.09 0.37 0.31 0.37 0.00 Brunei Dar. -6.08 46.97 20.44
0.27 0.22 0.21 0.19 0.17 Macau 3.80 6.69 9.01 1.58 5.27 2.98 2.48 2.52 3.56 4.07 Indonesia 9.01 12.19 72.60 23.09 29.22 2.69 2.10 1.19 Bangladesh 1.92 -37.07 -17.58 3.83 3.93 3.59 4.36 2.69 Korea Rep. 34.17 1.18 48.00 -33.64 12.43
100.00 100.00 100.00 100.00 100.00 Total 30.63 10.81 22.02 7.62 17.77
Not applicable World Total 4.62 -5.95 12.71 6.79 4.54

139
Exports
Table A11.5 Value ($US 000) Table A11.6 Share to World by Country (%)
1992 1993 1994 1995 COUNTRY 1992 1993 1994 1995
11 480 8 352 6 525 6 007 Japan 0.08 0.06 0.04 0.04 932 509 970 148 1 326 356 China 6.19 6.50 7.88 878 441 1 054 070 794 339 606 296 Thailand 6.32 7.00 5.32 3.60 15 630 23 492 42 277 36 232 Malaysia 0.11 0.16 0.28 0.22 13 160 11 464 17 691 19 904 Philippines 0.09 0.08 0.12 0.12 52 732 47 314 60 433 79 085 Singapore 0.38 0.31 0.40 0.47 134 861 148 022 140 321 111 093 Indonesia 0.97 0.98 0.94 0.66 3 824 6 332 9 462 Bangladesh 0.04 0.06 69 077 92 773 37 308 35 942 Korea Rep. 0.50 0.62 0.25 0.21 183 614 224 164 244 095 285 076 Australia 1.32 1.49 1.64 1.69 1 179 205 2 324 328 2 078 504 2 220 915 Total 8.48 15.44 13.92 13.20
13 907 728 15 054 144 14 928 271 16 827 718 World Total 100.00 100.00 100.00 100.00
Exports
Table A11.7 Share to Asia by Country (%) Table A11.8 Growth Rates (%)
1992 1993 1994 1995 COUNTRY 1992–93 1993–94 1994–95 Av gr rate
0.97 0.36 0.31 0.27 Japan -27.25 -21.88 -7.94 -19.02 40.12 46.68 59.72 China 4.04 36.72 20.38
74.49 45.35 38.22 27.30 Thailand 19.99 -24.64 -23.67 -9.44 1.33 1.01 2.03 1.63 Malaysia 50.30 79.96 -14.30 38.66 1.12 0.49 0.85 0.90 Philippines -12.89 54.32 12.51 17.98 4.47 2.04 2.91 3.56 Singapore -10.27 27.73 30.86 16.11
11.44 6.37 6.75 5.00 Indonesia 9.76 -5.20 -20.83 -5.42 0.27 0.46 Bangladesh 65.59 49.43 57.51
5.86 3.99 1.79 1.62 Korea Rep. 34.30 -59.79 -3.66 -9.71 15.57 9.64 11.74 12.84 Australia 22.08 8.89 16.79 15.92
100.00 100.00 100.00 100.00 Total 97.11 -10.58 6.85 31.13
Not applicable World Total 8.24 -0.84 12.72 6.71

140
Appendix 12 Vegetables (Root /Tuber Prep/Pres, SITC.3=056) Trade Data
Imports
Table A12.1 Value ($US 000) Table A12.2 Share to World by Country (%)
1991 1992 1993 1994 1995 COUNTRY 1991 1992 1993 1994 1995
735 823 843 477 953 973 1 102 353 1 236 146 Japan 10.46 10.68 13.38 13.49 13.49 295 300 266 763 284 024 271 461 Hong Kong 3.74 3.74 3.48 2.96 2 845 4 231 4 582 11 450 China 0.04 0.06 0.06 0.12 8 264 7 512 7 352 10 178 12 367 Thailand 0.12 0.10 0.10 0.12 0.13 23 531 27 378 32 473 42 963 49 046 Malaysia 0.33 0.35 0.46 0.53 0.54 7 631 13 835 14 946 17 700 17 692 Philippines 0.11 0.18 0.21 0.22 0.19 105 892 112 906 100 465 113 029 117 771 Singapore 1.51 1.43 1.41 1.38 1.29 3 838 3 565 5 073 Brunei Dar. 0.05 0.05 0.06 0.00 2 867 2 679 2 716 3 591 3 537 Macau 0.04 0.03 0.04 0.04 0.04 8 596 9 761 13 369 22 115 18 171 Indonesia 0.12 0.12 0.19 0.27 0.20 1 620 1 257 1 415 Bangladesh 0.02 0.02 0.02 70 705 83 771 80 930 94 406 121 789 Korea Rep. 1.01 1.06 1.13 1.16 1.33 964 929 1 404 559 1 482 198 1 700 014 1 859 430 Total 13.72 17.79 20.79 20.81 20.29
7 034 503 7 894 902 7 131 010 8 170 528 9 164 242 World Total 100.00 100.00 100.00 100.00 100.00
Imports
Table A12.3 Share to Asia by Country (%) Table A12.4 Growth Rates (%)
1991 1992 1993 1994 1995 COUNTRY 1991–92 1992–93 1993–94 1994–95 Av gr rate
76.26 60.05 64.36 64.84 66.48 Japan 14.63 13.10 15.55 12.14 13.86 21.02 18.00 16.71 14.60 Hong Kong -9.66 6.47 -4.42 -2.54 0.20 0.29 0.27 0.62 China 48.72 8.30 149.89 68.97
0.86 0.53 0.50 0.60 0.67 Thailand -9.10 -2.13 38.44 21.51 12.18 2.44 1.95 2.19 2.53 2.64 Malaysia 16.35 18.61 32.30 14.16 20.36 0.79 0.99 1.01 1.04 0.95 Philippines 81.30 8.03 18.43 -0.05 26.93
10.97 8.04 6.78 6.65 6.33 Singapore 6.62 -11.02 12.51 4.20 3.08 0.27 0.24 0.30 0.00 Brunei Dar. -7.11 42.30 17.59
0.30 0.19 0.18 0.21 0.19 Macau -6.56 1.38 32.22 -1.50 6.38 0.89 0.69 0.90 1.30 0.98 Indonesia 13.55 36.96 65.42 -17.83 24.53 0.17 0.09 0.10 Bangladesh -22.41 12.57 -4.92 7.33 5.96 5.46 5.55 6.55 Korea Rep. 18.48 -3.39 16.65 29.01 15.19
100.00 100.00 100.00 100.00 100.00 Total 45.56 5.53 14.70 9.38 18.79
Not applicable World Total 12.23 -9.68 14.58 12.16 7.32

141
Exports
Table A12.5 Share to Asia by Country (%) Table A12.6 Growth Rates (%)
1992 1993 1994 1995 COUNTRY 1992–93 1993–94 1994–95 Av gr rate
14.40 5.42 4.63 4.24 Japan -8.14 -14.70 17.19 -1.88 2.16 1.50 1.81 Hong Kong -30.66 54.25 11.80 57.60 60.82 63.26 China 5.32 33.12 19.22
49.70 18.89 17.44 16.71 Thailand -7.22 -7.91 22.70 2.52 4.77 2.21 2.12 1.59 Malaysia 13.34 -4.25 -3.97 1.71 0.47 0.83 1.13 0.80 Philippines 332.03 36.89 -9.97 119.65 7.93 3.62 3.75 3.82 Singapore 11.52 3.40 30.33 15.08
10.53 4.46 3.29 3.01 Indonesia 3.35 -26.49 17.27 -1.96 12.21 4.81 5.31 4.75 Korea Rep. -3.81 9.98 14.51 6.89 2.20 1.09 1.19 1.50 Australia 20.62 9.37 61.52 30.51
100.00 100.00 100.00 100.00 Total 144.15 -0.26 27.99 57.29
Not applicable World Total 19.16 -0.69 16.37 11.61

142
Appendix 13 Meat (fresh/chilled/frozen, SITC.3=012) Trade Data
Imports
Table A13.1 Value ($US 000) Table A13.2 Share to World by Country (%)
1991 1992 1993 1994 1995 COUNTRY 1991 1992 1993 1994 1995
3435629 4 071 207 4 034 081 4 526 391 5 868 096 Japan 22.04 21.59 24.33 24.34 28.60 450 792 490 151 713 867 1 049 196 Hong Kong 0.00 2.39 2.96 3.84 5.11 52 142 62 763 79 727 89 851 China 0.00 0.28 0.38 0.43 0.44 748 1 617 1 315 1 463 1 159 Thailand 0.05 0.04 0.03 0.02 0.02 1513 2 754 2 254 4 729 6 225 Philippines 0.01 0.01 0.01 0.03 0.03 108466 108 733 112 323 146 788 150 527 Singapore 0.70 0.58 0.68 0.79 0.73 17 460 17 098 30 720 Brunei Dar. 0.00 0.09 0.10 0.17 0.00 7584 7 108 5 304 4 571 4 729 Macau 0.05 0.04 0.03 0.02 0.02 5801 10 423 8 278 12 540 16 552 Indonesia 0.04 0.06 0.05 0.07 0.08 1764 1 169 2 404 Bangladesh 0.01 0.01 0.01 0.00 0.00 86169 66 119 55 835 143 072 199 920 Korea Rep. 0.55 0.35 0.34 0.77 0.97 3 647 674 4 789 524 4 791 806 5 663 868 7 386 255 Total 23.40 25.40 28.90 30.45 36.00
15 589 199
18 858 332
16 578 730
18 599 577
20 518 622
World Total
100.00 100.00 100.00 100.00 100.00
Imports
Table A13.3 Share to Asia by Country (%) Table A13.4 Growth Rates (%)
1991 1992 1993 1994 1995 COUNTRY 1991–92 1992–93 1993–94 1994–95 Av gr rate
94.19 85.00 84.19 79.92 79.45 Japan 18.50 -0.91 12.20 29.64 14.86 9.41 10.23 12.60 14.20 Hong Kong 8.73 45.64 46.97 33.78
0.00 1.09 1.31 1.41 1.22 China 20.37 27.03 12.70 20.03 0.02 0.04 0.03 0.02 0.02 Thailand 116.18 -18.68 11.25 -20.78 21.99 0.04 0.06 0.05 0.08 0.08 Philippines 82.02 -18.16 109.80 31.63 51.33 2.97 2.27 2.34 2.59 2.04 Singapore 0.25 3.30 30.68 2.55 9.19 0.00 0.36 0.36 0.54 0.00 Brunei Dar. -2.07 79.67 -100.00 -7.47 0.21 0.04 0.03 0.02 0.02 Macau -6.28 -25.38 -13.82 3.46 -10.50 0.16 0.22 0.17 0.22 0.22 Indonesia 79.68 -20.58 51.49 31.99 35.64 0.05 0.02 0.05 0.00 0.00 Bangladesh -33.73 105.65 -100.00 1.88 2.36 1.38 1.17 2.53 2.71 Korea Rep. -23.27 -15.55 156.24 39.73 39.29
100.00 100.00 100.00 100.00 100.00 Total 31.30 0.05 18.20 30.41 19.99
Not applicable World Total
20.97 -12.09 12.19 10.32 7.85

143
Exports
Table A13.5 Value ($US 000) Table A13.6 Share to World by Country (%)
1992 1993 1994 1995 COUNTRY 1992 1993 1994 1995
6 793 6 319 4 932 2 971 Japan 0.05 0.04 0.03 0.02 328 211 317 095 599 769 China 1.95 1.99 3.30 415 618 427 281 370 159 409 482 Thailand 2.93 2.54 2.33 2.25 6 925 8 923 10 941 13 956 Malaysia 0.05 0.05 0.07 0.08 1 102 79 82 4 Philippines 0.01 0.00 0.00 0.00 18 451 19 667 20 567 26 011 Singapore 0.13 0.12 0.13 0.14 24 501 31 853 24 837 22 403 Indonesia 0.17 0.19 0.16 0.12 2 333 1 622 65 Bangladesh 0.02 0.01 0.00 42 209 68 245 81 628 79 629 Korea Rep. 0.30 0.41 0.51 0.44 436 436 494 204 515 357 564 663 Australia 3.08 2.93 3.24 3.11 517 932 892 200 830 306 1 154 225 Total 3.66 5.30 5.22 6.35
14 163 997 16 844 430 15 903 749 18 179 336 World Total 100.00 100.00 100.00 100.00
Exports
Table A13.7 Share to Asia by Country (%) Table A13.8 Growth Rates (%)
1992 1993 1994 1995 COUNTRY 1992–93 1993–94 1994–95 Av gr rate
1.31 0.71 0.59 0.26 Japan -6.98 -21.95 -39.76 -22.90 36.79 38.19 51.96 China -3.39 0.891449 42.88
80.25 47.89 44.58 35.48 Thailand 2.81 -13.37 10.62 0.02 1.34 1.00 1.32 1.21 Malaysia 28.85 22.62 27.56 26.34 0.21 0.01 0.01 0.00 Philippines -92.83 3.80 -95.12 -61.39 3.56 2.20 2.48 2.25 Singapore 6.59 4.58 26.47 12.55 4.73 3.57 2.99 1.94 Indonesia 30.01 -22.03 -9.80 -0.61 0.45 0.18 0.01 Bangladesh -30.48 -95.99 8.15 7.65 9.83 6.90 Korea Rep. 61.68 19.61 -2.45 26.28
84.27 55.39 62.07 48.92 Australia 13.24 4.28 9.57 9.03 100.00 100.00 100.00 100.00 Total 72.26 -6.94 39.01 34.78
Not applicable World Total 18.92 -5.58 14.31 9.22

144
Appendix 14 Wheat (Meslin, SITC.3=041) Trade Data
Imports
Table A14.1 Value ($US 000) Table A14.2 Share To World by Country (%)
1991 1992 1993 1994 1995 COUNTRY 1991 1992 1993 1994 1995
917 766 1 175 282 1 136 398 1 352 460 1 342 411 Japan 11.37 9.92 10.17 11.38 9.20 28 110 17 143 20 176 17 921 Hong Kong 0.24 0.15 0.17 0.12 1 503 725 834 076 960 576 2 026 390 China 12.70 7.46 8.08 13.88 72 580 91 368 110 876 134 553 136 169 Thailand 0.90 0.77 0.99 1.13 0.93 181 860 162 256 184 665 214 774 239 430 Malaysia 2.25 1.37 1.65 1.81 1.64 218 441 271 826 297 757 368 859 409 586 Philippines 2.71 2.30 2.66 3.10 2.81 35 040 37 988 31 584 38 654 30 804 Singapore 0.43 0.32 0.28 0.33 0.21 366 360 403 853 442 005 579 681 803 408 Indonesia 4.54 3.41 3.96 4.88 5.50 207 619 182 919 152 543 Bangladesh 2.57 1.54 1.36 577 379 543 690 673 928 783 445 467 083 Korea Rep. 7.15 4.59 6.03 6.59 3.20 2 577 045 4 401 017 3 880 975 4 453 178 5 473 202 Total 31.92 37.16 34.73 37.47 37.49
8 073 423 11 842 303
11 175 578
11 883 939
14 599 052
Total World 100.00 100.00 100.00 100.00 100.00
Imports
Table A14.3 Share to Asia by Country (%) Table A14.4 Growth Rates (%)
1991 1992 1993 1994 1995 COUNTRY 1991–92 1992–93 1993–94 1994–95 Av gr rate
35.61 26.70 29.28 30.37 24.53 Japan 28.06 -3.31 19.01 -0.74 10.76 34.17 21.49 21.57 37.02 China -39.01 17.69 -11.18 -10.83 0.64 0.44 0.45 0.33 Hong Kong -44.53 15.17 110.96 27.20
2.82 2.08 2.86 3.02 2.49 Thailand 25.89 21.35 21.35 1.20 17.45 7.06 3.69 4.76 4.82 4.37 Malaysia -10.78 13.81 16.30 11.48 7.70 8.48 6.18 7.67 8.28 7.48 Philippines 24.44 9.54 23.88 11.04 17.22 1.36 0.86 0.81 0.87 0.56 Singapore 8.41 -16.86 22.38 -20.31 -1.59
14.22 9.18 11.39 13.02 14.68 Indonesia 10.23 9.45 31.15 38.59 22.36 8.06 4.16 3.93 Bangladesh -11.90 -16.61 -14.25
22.40 12.35 17.36 17.59 8.53 Korea Rep. -5.83 23.95 16.25 -40.38 -1.50 100.00 100.00 100.00 100.00 100.00 Total 70.78 -11.82 14.74 22.91 24.15
Not applicable World Total
46.68 -5.63 6.34 22.85 17.56

145
Exports
Table A14.5 Value ($US 000) Table A14.6 Share To World by Country (%)
1992 1993 1994 1995 COUNTRY 1992 1993 1994 1995
295 8 237 10 055 China 0.00 0.06 0.08 3 581 2 234 479 1 037 Singapore 0.03 0.01 0.00 0.01 3 350 182 4 496 443 4 667 791 4 056 479 USA,PR,USV
I 24.69 27.19 32.17 30.73
1 160 735 1 081 292 1 511 210 1 670 747 Australia 8.56 6.54 10.42 12.66 3 314 751 3 883 153 2 195 028 2 577 985 Canada 24.43 23.48 15.13 19.53 2 792 977 3 290 320 3 060 842 1 998 973 France 20.59 19.89 21.10 15.14 462 853 878 038 619 105 827 004 Germany 3.41 5.31 4.27 6.26 478 738 715 788 734 865 669 978 Argentina 3.53 4.33 5.07 5.07 757 282 773 230 654 596 522 560 United
Kingdom 5.58 4.67 4.51 3.96
12 321 099 15 120 793 13 452 153 12 334 818 Total 90.82 91.42 92.72 93.43
13 566 740 16 539 840 14 507 889 13 202 078 World Total 100.00 100.00 100.00 100.00
Exports
Table A14.7 Growth Rates (%)
COUNTRY 1992–93 1993–94 1994–95 Av gr rate
China 2692.20 22.07 1357.14 Singapore -37.62 -78.56 116.49 0.11
USA,PR,USVI
34.21 3.81 -13.10 8.31
Australia -6.84 39.76 10.56 14.49 Canada 17.15 -43.47 17.45 -2.96 France 17.81 -6.97 -34.69 -7.95
Germany 89.70 -29.49 33.58 31.26 Argentina 49.52 2.67 -8.83 14.45
United Kingdom
2.11 -15.34 -20.17 -11.14
Total 22.72 -11.04 -8.31 1.13
World Total 21.91 -12.29 -9.00 0.21

146
Appendix 15 Fish (live/fresh/chilled/frozen, SITC.3=034) Trade Data
Imports
Table A15.1 Value ($US 000) Table A15.2 Share to World by Country (%)
1991 1992 1993 1994 1995 COUNTRY 1991 1992 1993 1994 1995
4 981 329 5 655 878 6 074 411 6 746 100 7 242 315 Japan 28.15 29.89 33.83 33.91 33.90 347 711 352 346 414 710 455 445 Hong Kong 0.00 1.84 1.96 2.08 2.13 206 732 212 418 368 533 388 848 China 0.00 1.09 1.18 1.85 1.82 962 013 816 503 644 044 556 152 500 388 Thailand 5.44 4.32 3.59 2.80 2.34 88 880 150 961 159 488 180 430 185 289 Malaysia 0.50 0.80 0.89 0.91 0.87 67 590 63 887 51 517 53 786 66 320 Philippines 0.38 0.34 0.29 0.27 0.31 5 034 4 861 8 760 Brunei Dar. 0.00 0.03 0.03 0.04 0.00 4 556 4 955 5 044 5 783 7 773 Macau 0.03 0.03 0.03 0.03 0.04 1 965 4 038 10 244 10 652 11 088 Indonesia 0.01 0.02 0.06 0.05 0.05 397 207 340 228 360 338 431 802 505 278 Korea Rep. 2.24 1.80 2.01 2.17 2.37 6 503 540 7 595 927 7 874 711 8 776 708 9 362 744 Total 36.76 40.14 43.86 44.11 43.83
17 693 561
18 921 735
17 955 082
19 895 387
21 363 527
World Total 100.00 100.00 100.00 100.00 100.00
Imports
Table A15.3 Share to Asia by Country (%) Table A15.4 Growth Rates (%)
1991 1992 1993 1994 1995 COUNTRY 1991–92 1992–93 1993–94 1994–95 Av gr rate
76.59 74.46 77.14 76.86 77.35 Japan 13.54 7.40 11.06 7.36 9.84 0.00 0.00 0.00 0.00 0.00 Hong Kong NA 1.33 17.70 9.82 9.62 0.00 0.00 0.00 0.00 0.00 China NA 2.75 73.49 5.51 27.25
14.79 10.75 8.18 6.34 5.34 Thailand -15.13 -21.12 -13.65 -10.03 -14.98 1.37 1.99 2.03 2.06 1.98 Malaysia 69.85 5.65 13.13 2.69 22.83 1.04 0.84 0.65 0.61 0.71 Philippines -5.48 -19.36 4.40 23.30 0.72 0.00 0.07 0.06 0.10 0.00 Brunei Dar. NA -3.44 80.21 NA 38.39 0.07 0.07 0.06 0.07 0.08 Macau 8.76 1.80 14.65 34.41 14.90 0.03 0.05 0.13 0.12 0.12 Indonesia 105.50 153.69 3.98 4.09 66.82 2.24 1.80 2.01 2.17 2.37 Korea Rep. -14.34 5.91 19.83 17.02 7.10
100.00 100.00 100.00 100.00 100.00 Total 16.80 3.67 11.45 6.68 9.65
Not applicable World Total 6.94 -5.11 10.81 7.38 5.00
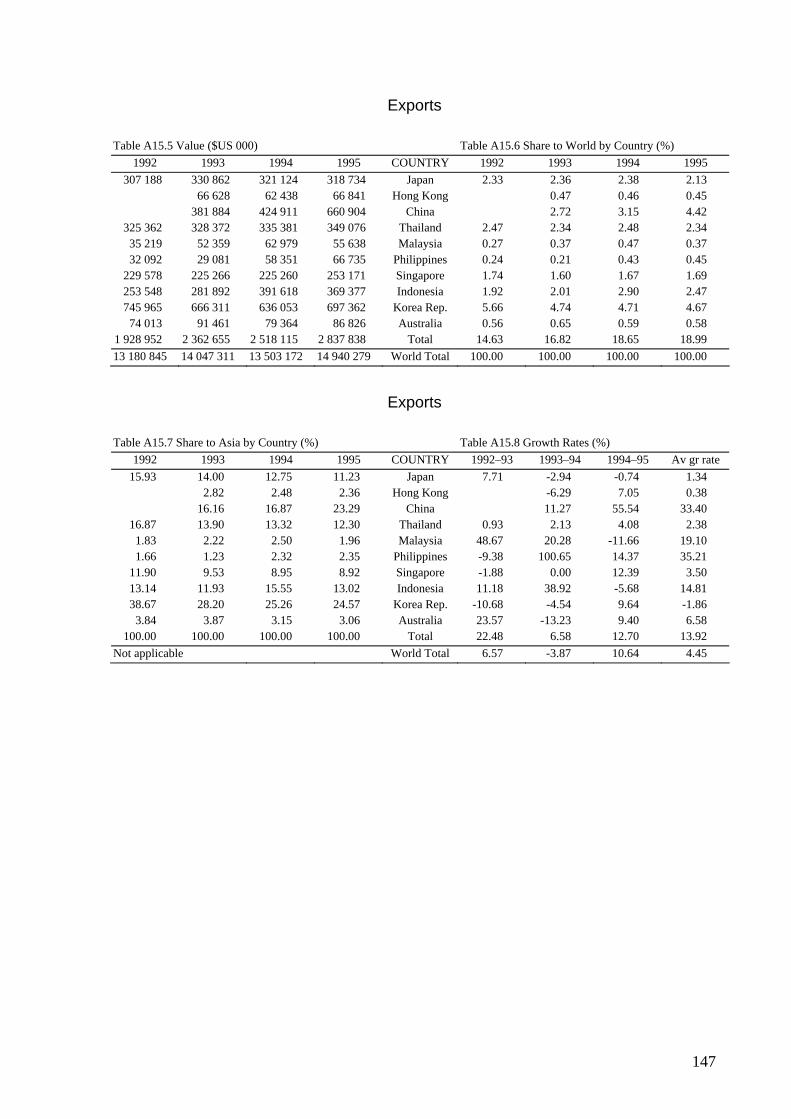
147
Exports
Table A15.5 Value ($US 000) Table A15.6 Share to World by Country (%)
1992 1993 1994 1995 COUNTRY 1992 1993 1994 1995
307 188 330 862 321 124 318 734 Japan 2.33 2.36 2.38 2.13 66 628 62 438 66 841 Hong Kong 0.47 0.46 0.45 381 884 424 911 660 904 China 2.72 3.15 4.42 325 362 328 372 335 381 349 076 Thailand 2.47 2.34 2.48 2.34 35 219 52 359 62 979 55 638 Malaysia 0.27 0.37 0.47 0.37 32 092 29 081 58 351 66 735 Philippines 0.24 0.21 0.43 0.45 229 578 225 266 225 260 253 171 Singapore 1.74 1.60 1.67 1.69 253 548 281 892 391 618 369 377 Indonesia 1.92 2.01 2.90 2.47 745 965 666 311 636 053 697 362 Korea Rep. 5.66 4.74 4.71 4.67 74 013 91 461 79 364 86 826 Australia 0.56 0.65 0.59 0.58 1 928 952 2 362 655 2 518 115 2 837 838 Total 14.63 16.82 18.65 18.99
13 180 845 14 047 311 13 503 172 14 940 279 World Total 100.00 100.00 100.00 100.00
Exports
Table A15.7 Share to Asia by Country (%) Table A15.8 Growth Rates (%)
1992 1993 1994 1995 COUNTRY 1992–93 1993–94 1994–95 Av gr rate
15.93 14.00 12.75 11.23 Japan 7.71 -2.94 -0.74 1.34 2.82 2.48 2.36 Hong Kong -6.29 7.05 0.38 16.16 16.87 23.29 China 11.27 55.54 33.40
16.87 13.90 13.32 12.30 Thailand 0.93 2.13 4.08 2.38 1.83 2.22 2.50 1.96 Malaysia 48.67 20.28 -11.66 19.10 1.66 1.23 2.32 2.35 Philippines -9.38 100.65 14.37 35.21
11.90 9.53 8.95 8.92 Singapore -1.88 0.00 12.39 3.50 13.14 11.93 15.55 13.02 Indonesia 11.18 38.92 -5.68 14.81 38.67 28.20 25.26 24.57 Korea Rep. -10.68 -4.54 9.64 -1.86
3.84 3.87 3.15 3.06 Australia 23.57 -13.23 9.40 6.58 100.00 100.00 100.00 100.00 Total 22.48 6.58 12.70 13.92
Not applicable World Total 6.57 -3.87 10.64 4.45

148
Appendix 16 Fruit and Nuts (fresh/dried, SITC.3=057) Trade Data
Imports
Table A16.1 Value ($US 000) Table A16.2 Share to World by Country (%)
1991 1992 1993 1994 1995 COUNTRY 1991 1992 1993 1994 1995
1 646 113 1 754 383 1 727 377 1 844 164 1 946 265 Japan 6.90 6.81 7.40 6.90 7.15 700 907 745 210 812 295 916 453 Hong Kong 2.72 3.19 3.04 3.37 40 438 44 847 66 019 83 570 China 0.16 0.19 0.25 0.31 28 425 45 334 77 970 97 406 105 097 Thailand 0.12 0.18 0.33 0.36 0.39 80 251 99 311 118 951 135 125 145 129 Malaysia 0.34 0.39 0.51 0.51 0.53 17 903 25 031 32 106 48 129 52 571 Philippines 0.08 0.10 0.14 0.18 0.19 324 962 345 935 358 980 358 447 374 931 Singapore 1.36 1.34 1.54 1.34 1.38 12 855 12 534 19 499 Brunei Dar. 0.05 0.05 0.07 12 238 13 450 11 249 11 743 11 487 Macau 0.05 0.05 0.05 0.04 0.04 16 290 36 702 57 261 69 631 93 815 Indonesia 0.07 0.14 0.25 0.26 0.34 249 686 131 043 111 608 116 879 127 589 Korea Rep. 1.05 0.51 0.48 0.44 0.47 2 375 868 3 205 389 3 298 093 3 579 337 3 856 907 Total 9.96 12.44 14.13 13.39 14.17
23 864 705
25 767 074
23 341 904
26 732 283
27 213 075
World Total 100.00 100.00 100.00 100.00 100.00
Imports
Table A16.3 Share to Asia by Country (%) Table A16.4 Growth Rates (%)
1991 1992 1993 1994 1995 COUNTRY 1991–92 1992–93 1993–94 1994–95 Av gr rate
69.28 54.73 52.38 51.52 50.46 Japan 6.58 -1.54 6.76 5.54 4.33 21.87 22.60 22.69 23.76 Hong Kong 6.32 9.00 12.82 9.38 1.26 1.36 1.84 2.17 China 10.90 47.21 26.58 28.23
1.20 1.41 2.36 2.72 2.72 Thailand 59.49 71.99 24.93 7.90 41.07 3.38 3.10 3.61 3.78 3.76 Malaysia 23.75 19.78 13.60 7.40 16.13 0.75 0.78 0.97 1.34 1.36 Philippines 39.81 28.26 49.91 9.23 31.80
13.68 10.79 10.88 10.01 9.72 Singapore 6.45 3.77 -0.15 4.60 3.67 0.40 0.38 0.54 Brunei Dar. -2.50 55.57 26.54
0.52 0.42 0.34 0.33 0.30 Macau 9.90 -16.36 4.39 -2.18 -1.06 0.69 1.15 1.74 1.95 2.43 Indonesia 125.30 56.02 21.60 34.73 59.41
10.51 4.09 3.38 3.27 3.31 Korea Rep. -47.52 -14.83 4.72 9.16 -12.12 100.00 100.00 100.00 100.00 100.00 Total 34.91 2.89 8.53 7.75 13.52
Not applicable World Total 7.97 -9.41 14.52 1.80 3.72

149

150
REFERENCES
Agriculture Yearbook, China Agricultural Yearbook. Beijing, Agriculture Publishing House (various issues).
Ahmadi-Esfahani, F. Z. and C. G. Locke (1998) ‘The Industrial Organisation of the Chinese Food Economy: Socialistic or Capitalistic?’. Contemporary Economic Policy 16, forthcoming.
Ahmadi-Esfahani, F. Z. and R. G. Stanmore (1997) ‘Demand for Vegetables in a Chinese Wholesale Market’. Agribusiness: An International Journal 13, 549–559.
Ahmadi-Esfahani, F. Z. and R. G. Stanmore (1996) ‘Demand Responsiveness in Beijing’s Largest Wholesale Market’. Paper presented at the 40th Annual Conference of the Australian Agricultural and Resource Economics Society held at the University of Sydney, 11–16 February.
Ahmadi-Esfahani, F. Z. and R. G. Stanmore (1993) ‘Some Methodological Issues in the Measurement of Shadow Prices in a Centrally Planned Economy’. Paper presented at the 37th Annual Conference of the Australian Agricultural and Resource Economics Society held at the University of Sydney, 9–11 February.
Anderson, K. (1992) ‘China's Industrialisation and Fibre Self-Sufficiency’. Challenges of Economic Reform and Industrial Growth: China's Wool War, C. Findlay, ed., Sydney, Allen & Unwin, 78–97.
Balcombe, K. and J. Davis (1996) ‘An application of cointegration theory in the estimation of the Almost Ideal Demand System for food consumption in Bulgaria’. Agricultural Economics 15, 47–60.
Barten, A., (1977) ‘The Systems of Consumer Demand Functions Approach: A Review’ Econometrica 45, 23-51.
Beiyunting (1994) To Realise its Functions – Stimulating Market Development [in Chinese]. Nanjing Beiyunting Market Development Company, May, Nanjing.
Beiyunting (1996) An Introduction to Nanjing Beiyunting Agricultural Products Wholesale Market [in Chinese]. Nanjing Beiyunting Market Development Company, March, Nanjing.

151
Bera, A. K., R. P. Byron and C. M Jarque (1981) ‘Further Evidence on Asymptotic Tests for Homogeneity and Symmetry in Large Demand Systems’. Economics Letters 8,101–105.
Berndt, E. R. (1991) The Practice of Econometrics. Addison-Wesley Publishing Company, New York.
Bewley, R. and G. Elliott ( 1989) ‘The Rejection of Homogeneity in Demand and Supply Analysis: An Explanation and Solution’. Research Methods in Agricultural Economics, Lecture Notes in Econometrics.
Byrd, W. (1992) ‘Rural Collective and Private Industry’. The Sectoral Foundations of China's Development, Shahid Javed Burki and Shahid Yusuf, eds, 1-13, World Bank Discussion Paper 148: China and Mongolia Department Series, World Bank, Washington DC.
Carter, C. A. and F. Zhong (1988) China's Grain Production and Trade: An Economic Analysis. Westview Press: Boulder and Co.
Cashin, P. (1991) ‘A Model of the Disaggregated Demand for Meat in Australia’ Australian Journal of Agricultural Economics 35, 263–283.
Ceroils, Personal Communication, Beijing, 1994.
Chang, P. (1994) ‘Planned Marketing Channel and its Impacts upon the Quantitative Pattern of the Chinese Food – Grain Consumption’. Agribusiness: An International Journal 10, 207–228.
Charemza, W. and D. Deadman (1993) New Directions in Econometric Practice: General to Specific modelling, Cointegration and Vector Autoregression. Aldershot, UK.
Chern, W. S. and G. Wang (1994) ‘The Engel Function and Complete Food Demand System for Chinese Urban Households’. China Economic Review 5, 35–37.
China Statistical Bureau, China Statistical Yearbook, China Statistical Presses, Beijing (various issues).
Colby, H. W., F. W. Crook and F. C. Tuan (1995) International Agriculture and Trade Reports. China Situation Outlook Series, USDA.
Crompton, P. and B. Philips (1993) ‘Effect on Feedgrains of China’s rising demand for livestock products’. Agriculture and Resources Quarterly 5, 242–253.

152
Dazhongsi (1994) Beijing Dazhongsi Farm and Sideline Products Wholesale Market [in Chinese]. Dazhongsi Wholesale Market, Beijing.
Dazhongsi (1996) Annual Report [in Chinese]. Dazhongsi Agricultural Products Wholesale Market, Beijing.
Deaton, A. and J. Muellbauer (1980a) Economics and Consumer Behaviour. Cambridge University Press, Cambridge.
Deaton, A. and Muellbauer, J. (1980b) ‘An Almost Ideal Demand System’. American Economic Review 70, 312–326.
Deng Xiaoping (1984) Selected Works of Deng Xiaoping (1975-1982). Foreign Language Press, Beijing.
Ding, S. (1994) Personal Communication. Internal Trade Ministry of China, Beijing.
Ding, S. (1996) The Centre of Commerce Domestic Trade Ministry, personal communication, Beijing.
Eales, J. S. and L. J. Unnevehr (1988) ‘Demand for Beef and Chicken Products: Separability and Structural Change’. American Journal of Agricultural Economics 70, 521–532.
Ernst and Young (1994) Asia Pacific Profiles: China. Asia-Pacific Studies Group, Sydney.
Fahey, K. (1994) Food Distribution in China and Hong Kong: Market Profile and Directory. Research Paper No. 94/6, Rural Industries Research and Development Corporation, Canberra.
Fahey, K. (1995) Feeding the Dragon: Processed Asian Food Opportunities in China and Hong Kong. Research Paper No. 95/18, Rural Industries Research and Development Corporation Research, Canberra.
Fan, S., E. Wailes and G. Cramer (1994) ‘Impact of Eliminating Government Interventions on China's Rice Sector’. Agricultural Economics 11, 71–81.
Fan, S., G. Cramer and E. Wailes (1994) ‘Food Demand in Rural China: Evidence from Rural Household Survey’. Agricultural Economics 11, 61–69.

153
Feder, G., L. Lau, J. Lin and X. Luo (1992) ‘The Determinants of Farm Investment and Residential Construction in Post-reform China’. Economic Development and Cultural Change 41, 1–26.
Fine, B. (1995) ‘From Political Economy to Consumption’. Acknowledging Consumption: A Review of New Studies, D. Miller (ed.), Routledge, London.
Gardner, B. L. (1982) The Governing of Agriculture, Lawrence : Published for the International Centre for Economic Policy Studies and the Institute for the Study of Market Agriculture by the Regents Press of Kansas.
Garnaut, R. and G. Ma (1992) Grain in China, East Asia Analytical Unit, Department of Foreign Affairs and Trade, AGPS, Canberra.
Green, H.(1990) Consumer Theory. The MacMillan Press, London.
Green, R. and J. Alston (1991) ‘Elasticities in AIDS Models: A Clarification and Extension,’. American Journal of Agricultural Economics 73, 874–875.
Green, R. and J. Alston (1990) ‘Elasticities in AIDS Models’. American Journal of Agricultural Economics 72,442–445.
Gujarati, Danodar N. (1988) ‘Basic Econometrics’ (2nd ed). McGraw Hill, New York.
Halbrendt, C. and C. Gempesaw (1990) ‘A Policy Analysis of China's Wheat Economy’. American Journal of Agricultural Economics 72, 268–277.
Halbrendt, C., F Tuan, C. Gempesaw, and D. Dolk-Etz (1994) ‘Rural Chinese Food Consumption : The Case of Guangdong’. American Journal of Agricultural Economics 76, 794–799.
Harrold, P. (ed.) (1992) China’s Reform Experience to Date. World Bank Discussion Paper 180: China and Mongolia Department Series, World Bank, Washington DC.
Hartford, K. (1987) ‘Socialist Countries in the World Food System: the Soviet Union, Hungary and China’. Food Research Institute Studies 20, 181–243.
Hayenga, M. L. and L. F. Schrader (1980) ‘Formula Pricing in Five Commodity Marketing Systems’. American Journal of Agricultural Economics 62, 753–59.

154
Hua, J. and Z. Fan (1993) ‘The Construction and Development of the Wholesale Agricultural Products Market in China’. R. W. Hill (ed.), A Report on the Wholesale Marketing of Agricultural Products which was held in Chengdu, Sichuan Province, The People's Republic of China in November/December 1993. Silsoe College, Cranfield University, UK.
Hua, J. and R. W. Hill (1996) ‘The Vegetable Basket Project and the Development of a Marketing System for Agricultural Products in China’. Working Paper of the South China Agricultural University, College of Economics and Trade, Guangzhou.
Huaken Yuegezhuang Wholesale Market (1996) Huaken Yuegezhuang Wholesale Market, Yuegezhuang, Beijing.
Huang Wei (1993) ‘Local Versus Foreign Fast Food’. Beijing Review 36, March 15–22, 13–16.
Huang, J. and C. David (1993) ‘Demand for Cereal Grains in Asia: The Effect of Urbanisation‘. Agricultural Economics 8, 107–124.
Hussain, A. and N. Stern (1991) ‘Effective Demand, Enterprise Reforms and Public Finance in Rural China’. Economic Policy, April, 142–185.
Institute of Agricultural Economics (1994) Personal Communication, Chinese Academy of Agricultural Sciences, Beijing.
International Trade Center (1997), URL/http://www.intracen.org/itc/infobase/itcinfb. htm# STATISTICS.
Jie, X. (1994) ‘State Orders Supervision of Rice, Rapeseed Futures’. China Daily Business Weekly, November, Beijing.
Johnson, D. G. (1994) ‘Does China Have a Grain Problem?’. China Economic Review 5, 1–14.
Ke Bingsheng (1992) Marketing of Pork and Vegetables in China. Boulder, Westview Press, Colorado.
Khan, Zafar Shah, ed. (1991) Patterns of Foreign Direct Investment in China. World Bank Discussion Paper 130: China and Mongolia Department Series, World Bank, Washington DC.
155
Kohls, R. L. and J. N. Uhl (1990) Marketing of Agricultural Products, 7th Ed. MacMillan, New York.
Koo, A (1990 ) ‘The Contract Responsibility System: Transition from a Planned to a Market Economy’. Economic Development and Cultural Change 38, 797–820.
Kutschukian, J. M. and B. Brittan (1995) The Demand for Food in China. Unpublished undergraduate thesis, Department of Agricultural Economics, University of Sydney.
Laitinen, K. (1978) ‘Why is Demand Homogeneity So Often Rejected?’. Economics Letters 1, 231–233.
Lewis, P. and N. Andrews (1989) ‘Household Demand in China’. Applied Economics 21, 793–807.
Li, E. and S. N. Samuel (1995) ‘Income Elasticities and Socio-demographic factors influencing demand for selected processed food and beverage products in urban China’. One in a series of papers and reports produced from a database funded by the Rural Industries Research and Development Corporation (RIRDC).
Ling, Z. (1990) ‘The Development of Operating Mechanisms in Chinese Agriculture’. Journal of Development Studies 26, 229–242.
Lonely Planet (1994) China. Lonely Planet Publications, Hawthorn.
Lyons, T. P. (1993) ‘Commercial Reform in China: The Grain Trade of Fujian Province, 1978–88’. Economic Development and Cultural Change 41, 691–736.
Mackerras, C., P. Taneja and G. Young (1994) China Since 1978 – Reform, Modernisation and ‘Socialism with Chinese Characteristics’. Longman Cheshire, Melbourne.
Madalla, G. S. (1988) Introduction to Econometrics. MacMillan Publishing Company, New York.
Martellaro, J. A. (1991) ‘Some Aspects of Agricultural Reform in the PRC’. Singapore Economic Review 36, 58–69.
McGregor, R. (1997) ‘Promises of a Pearl’. Inside Asia (The Australian), July 21, p13.

156
Meisner, S. E. (1979) ‘The Sad Fate of the Asymptotic Slutsky Symmetry Test for Large Systems’. Economics Letters 2, 231–233.
Murray, G. (1994) Doing Business in China – The Last Great Market. Allen and Unwin, St. Leonards.
Nee, V. and F. Young (1991) ‘Peasant Entrepreneurs in China's "Second Economy", An Institutional Analysis’. Economic Development and Cultural Change 39, 293–310.
Nelson, R. G. and S. C. Turner (1995) ‘Experimental Examination of a Thin Market: Price Behaviour in a Declining Terminal Market Revisited’. Journal of Agricultural and Applied Economics 27, 149–60.
Park, A., S. Rozelle and F. Cai (1994) ‘China’s Grain Policy Reforms: Implications for Equity, Stabilisation and Efficiency’, China Economic Review 5, 15–33.
Park, J. Y. (1992) ‘Canonical cointegrating regression’. Econometrica 60, 119–143.
Peterson, E., J. Lan and S. Ito (1991) ‘An Econometric Analysis of Rice Consumption in the People's Republic of China’. Agricultural Economics 6, 67–78.
Rae, A. N. (1997) ‘Changing Food Consumption Patterns in East Asia: Implications of the Trend Towards Livestock Products’. Agribusiness: An International Journal 13, 33–44.
Research Group on Annual Analysis of the Rural Economy (1994) Green Report: Annual Report on Economic Development of Rural China in 1993 and the Development Trends in 1994, China Social Sciences Publishing House, Beijing.
Riskin, Carl (1988) China’s Political Economy – The Quest for Development Since 1949, Oxford University Press, Oxford.
Samuel, N. (1994) The Market for Processed Food & Beverage Products in Urban China. Research Paper No 94/11, Rural Industries Research and Development Corporation, Union Offset, Canberra.
Samuel, Nicholas (1994) The Market for Processed Foods and Beverage Products in Urban China. Research Paper 94/11, Rural Industries Research and Development Corporation, Canberra.

157
Shun Yi County (1994) Personal Communication, Beijing.
Sicular, Terry (1988) ‘Plan and Market in China's Agricultural Commerce’. Journal of Political Economy 96, 283–306.
Stanmore, R. G. and F. Z. Ahmadi-Esfahani (1996) ‘Chinese Grain Supply Response in a Reform Environment’. Working Paper, Department of Agricultural Economics, University of Sydney.
State Statistical Bureau (1993) China Statistical Yearbook. China Statistical Information and Consultancy Service Centre, Beijing.
Swamy, G. and H. Binswanger (1983) ‘Flexible Consumer Demand Systems and Linear Estimation: Food in India’. American Journal of Agricultural Economics 65, 675–684.
Tang, A. M. and B. Stone (1980) Food Production in the People's Republic of China. International Food Policy Research Institute, Research Report No. 15, Washington DC.
Timmer, C. P. (1986) Getting Prices Right: the Scope and Limits of Agricultural Price Policy, Ithaca, Cornell University Press.
Tin Ping (1993) An Introduction to Tin Ping Fruit Wholesale Market [in Chinese], Tin Ping Market, Guangzhou.
Tomek, W. G. and K. L. Robinson (1990) Agricultural Product Prices, 3rd Ed. Cornell University Press, Ithaca and London.
United States Department of Agriculture Foreign Agricultural Service (1997) ‘China and Hong Kong: One Country, Two Markets’. AgExporter 9, 18–19.
Van der Gaag, J. (1984) ‘Private Household Consumption in China’. World Bank Staff Working Paper 701, World Bank, Washington DC.
Walker, T. (1997) ‘Riding on the Sheep’s Back’. Inside Asia (The Australian), July 21 1997, p11.
Watson, A. (1996) ‘Conflict Over Cabbages: the Reform of Wholesale Marketing’. The Third Revolution in the Chinese Countryside, Ross Garnaut, Guo Shutian and Ma Guonan, eds, 144–166, Cambridge University Press, Cambridge.
158
Weiling, L. (1994) ‘Futures Exchanges Brace for Upcoming Regulation’. Chinese Daily Business Weekly, Beijing.
West, L. A. (1994) ‘Opening China’s Market to U.S. Agriculture’. Choices, Third Quarter, 1994.
White, K. (1993), Shazam User’s Reference Manual Version 7.0, McGraw-Hill, New York.
World Bank (1994) China: Foreign Trade Reform, World Bank, Washington DC.
World Bank (1992) China: Reform and the Role of the Plan in the 1990s, Washington DC.
World Bank (1990) China: Between Plan and Market, World Bank, Washington DC.
Wu, Y., E. Li and N. S. Samuel (1993) ‘Food Consumption in Urban China: An Empirical Analysis’. Paper presented at the Chinese Economic Association Conference, Canberra.
Wu, Y., E. Li and N. S. Samuel (1995) ‘Food Consumption in Urban China: an Empirical Analysis’. Applied Economics 27, 509–515.
Xinfadi (1995) Strive for Innovations in Development [in Chinese] Xinfadi Agricultural Product Wholesale Market, November 25, Beijing.
Xinfadi (1996) Market Interview [in Chinese], Xinfadi Information Newspaper, 18 June, volume 4, Beijing.
Xinhua (1994) ‘Study of Deng’s Works Seen as Crucial for Party’. China Daily, Beijing, 1, 4, 1994.
Xinhua (1996) ’Wholesale Markets to be Erected’. China Daily, Wednesday, July 10, p2, Beijing.
Xu Boyuan (1996) ‘Agricultural Wholesale Markets’ The Third Revolution in the Chinese Countryside, Ross Garnaut, Guo Shutian and Ma Guonan (ed.), Cambridge University Press, Cambridge, pp113–119.
Yan Huai (1995) ‘Organizational Hierarchy and the Cadre Management System’. Decision-Making in Deng's China: Perspectives from Insiders, Hamrin, Carol Lee and Zhao, Suisheng (ed.), 39–50, Studies on Contemporary China, M. E. Sharpe, Armonk.

159
Yang, S. (1985) ‘Using a statistical data approach to forecast consumption structure for a comfortable standard of living’. The Structure of China's Domestic Consumption - Analyses and Preliminary Forecasts, World Bank Staff Working Paper 755, World Bank, Washington DC.
Zhou, Z. (1992) ‘Expert Judgement on the Effects of the Grain Marketing System on Grain Production in China: A Survey’. Paper presented at the 36th Annual Conference of the Australian Agricultural Economics Society, held at the Australian National University, Canberra, 10–12 February 1992.
Copyright © 2022 FDOKUMEN