
The Value for Money added by Community Based Behaviour Change Communication for Maternal Health...
112
The Value for Money added by Community Based Behaviour Change Communication for Maternal Health Service Improvement in Nigeria Findings of Phase 2 Study Richard Johnson Opeyemi Aanuoluwapo Kunle Akerele December 2014 Value for Money of CBCC December 2014 1
-
Upload
independent -
Category
Documents
-
view
0 -
download
0
Transcript of The Value for Money added by Community Based Behaviour Change Communication for Maternal Health...

The Value for Money added by CommunityBased Behaviour Change Communication
for Maternal Health Service Improvementin Nigeria
Findings of Phase 2 Study
Richard Johnson
Opeyemi Aanuoluwapo
Kunle Akerele
December 2014
Value for Money of CBCC December 2014 1

ACKNOWLEDGEMENT
The authors wish to thank the staff and consultants of PATHS2in Kano, Enugu, Jigawa, Kaduna, Lagos and Abuja, and alsoMannion Daniels for all their contributions to this study.
The authors are also grateful to the members of the studySteering Group, which has continued to support the study, bothin person and in making PATHS2’s considerable resourcesavailable to us. We are grateful to the former PATHS2statistician, Kunle Akerele, who has applied both professionalexpertise and professional independence to this study, andjoins us as co-author. We are also grateful for the advice andsupport provided by Olufemi Adegoke who was an author on theoriginal study. Finally, we thank Dr Sophie Witter for herguidance and critical review of this study.
Richard Johnson
Opeyemi Aanuoluwapo
Value for Money of CBCC December 2014 2

Table of Contents
1 INTRODUCTION..........................................81.1 Background...............................................81.2 Types of CBCC Intervention..............................101.2.1Safe Motherhood Initiative – Demand..................101.2.2Rapid Awareness Raising..............................111.2.3Facility-based Community Outreach....................11
1.3 Research Objectives.....................................111.4 Development of Research Protocol........................121.5 Literature Review.......................................121.6 Estimating Effect of CBCC...............................161.6.1Sampling and Selection of Facilities.................161.6.2Sources of data......................................181.6.3HMIS data quality....................................191.6.4Analysis.............................................21
1.7 Estimating expenditure on CBCC..........................221.7.1Cost of CBCC Interventions...........................221.7.2Cost Outcome Model Used..............................221.7.3Definitions of Costs of CBCC.........................221.7.4Preparation of provider costs for CBCC Interventions. 23
1.8 Estimating Value for Money provided by CBCC.............241.9 Qualitative Research....................................241.10 Open Access to Data.....................................251.11 Ethical Clearance.......................................25
2 FINDINGS.............................................262.1 Estimating the Effect of CBCC...........................262.1.1Overall & Regional Results...........................26
2.2 Cost of CBCC Interventions..............................272.2.1Cost of providing Safe Motherhood Initiative – Demand 282.2.2Cost of providing Rapid Awareness Raising............292.2.3Cost of providing Facility-based Community Outreach and mini-outreach..............................................302.2.4Indicative costs per intervention and per population anddelivery...................................................31
2.3 Estimating expenditure on CBCC..........................322.4 Estimating Value for Money for CBCC.....................32
Value for Money of CBCC December 2014 3

2.5 Qualitative research....................................332.5.1Safe Motherhood Initiative – Demand..................332.5.2Rapid Awareness Raising..............................352.5.3Facility-based Outreach..............................372.5.4Qualitative research summary.........................42
2.6 Findings from Household Surveys.........................442.6.1Use of ANC and Delivery Services.....................442.6.2Barriers to Service Utilisation......................472.6.3Satisfaction with services...........................482.6.4Knowledge and attitudes..............................49
2.7 Findings from Mini Surveys..............................49
3 DISCUSSION...........................................513.1 What did the study show and fail to show?...............513.2 Why did the study fail to show more?....................533.3 What are the implications for Phase 1 of the study?.....553.4 What lessons emerge from the study?.....................55
4 ANNEXES..............................................56Annex 1 Facilities included in the Study....................56Annex 2: Stepped wedge Distribution of facilities...........60Annex 3: Rates of change by state and year..................62Annex 4: Mean monthly rates of utilisation..................65Annex 5 PATHS2 Expenditure..................................68Annex 6 Life Years Gained...................................69Annex 7 Costs of CBCC Interventions.........................70Annex 8 ......................Key informants interview guide
74Annex 9 Discussion group guide..............................76Annex 10 Steering Group.....................................78
REFERENCES.............................................79
Value for Money of CBCC December 2014 4

ABBREVIATIONS
ANC Antenatal Care
ANC1 First ANC visit
ANC4+ Fourth or subsequent ANC visit
BCC Behavioural Change Communication
BEOC Basic Emergency Obstetric Centre
CBCC Community-based Behavioural ChangeCommunication
CEOC Comprehensive Emergency Obstetric Centre
DALY Disability Adjusted Life Year
DFID UK Department for International Development
DHIS2 District Health Information System 2
EAP Economic Analysis of PATHS2
FBD Facility-based Deliveries
FCO Facility-based Community Outreach
GBP UK (Great Britain) Pounds
HMIS Health Management Information System
IMEP Independent Monitoring and EvaluationProgramme
LGA Local Government Authority
LTA Local Technical Assistance
M&E Monitoring and Evaluation
MO Mini-Outreach
NGN Nigerian Naira
PHC Primary Health Centre
PATHS Partnership for Transforming Health Systems
PATHS2 Partnership for Transforming Health Systems II
RAR Rapid Awareness Raising
RCT Randomised Controlled Trial
SBA Skilled Birth Attendance
Value for Money of CBCC December 2014 5

SD Service Delivery
SD + BCC Service Delivery and Behavioural ChangeCommunication
SMI-D Safe Motherhood Initiative-Demand
UK United Kingdom
VFM Value for Money
EXECUTIVE SUMMARY
Background
The Partnership for Transforming Health Systems II (PATHS2) isa partnership between the UK Government and the NigerianFederal Ministry of Health. It operated between 2009 and 2014in five of Nigeria’s 36 states: Kano, Kaduna, Jigawa, Enuguand Lagos. In 2011, Year 3 of PATHS2, it implemented a newstrategy focused on increasing the uptake of services, througha linked programme of Service Delivery (SD) improvements andCommunity-based Behaviour Change Communication (CBCC).
The objective of this research was to assess the additionaleffect of CBCC interventions over and above SD interventionson uptake of antenatal care and facility deliveries. The studythereby sought to assess the Value for Money of expenditure inCBCC. The study included a retrospective analysis of data onantenatal care and facility-based deliveries between July 2011and June 2014 in all Basic Emergency Obstetric Care Centres(BEOC) supported by PATHS2; an analysis of the costs of CBCCinterventions; a qualitative study of CBCC interventions inselected sites; and a review of related studies andliterature.
Findings
The results of the study were inconclusive.
The results do not show any significant effect of CBCC on therate of change in mean monthly utilisation of ANC and facilitydeliveries, either overall or at state levels. There was adifference in the mean monthly utilisation rates between the
Value for Money of CBCC December 2014 6

intervention and control groups. However, in the absence ofany significant difference in the rate of change between the twogroups, these differences may reflect starting values or othercontext differences and cannot be attributed to theintervention.
Analysis of provider costs showed that first year costs forCBCC interventions range from $0.47 (USD) to $2.86 (USD) perbirth according to the type of intervention. These costsreduced in the second year, as needs for training and supportdeclined. PATHS2’s expenditure of Output 5, of which CBCC isthe major component, was 14% of total PATHS2 costs in theperiod. However, without conclusions on the effect of CBCC, itwas impossible to quantify the value for money provided byCBCC.
The qualitative evidence obtained from four states indicatedthat CBCC plays a significant part in improving demand andservice uptake. Key informants and community members portrayedCBCC as an important component in a holistic approach toimproving service uptake. Community discussions indicated thatCBCC had had an important effect on participants’understanding of the benefits of health services, influencingthe attitudes of women, men, traditional and religiousleaders, to take a positive attitude towards ANC, delivery andother health services such as immunisation. However, communityattitudes and knowledge were not the only barriers to access.Closed facilities, staff skills, shortage of resources, costand transport were all identified as barriers. SMI-D played apart in overcoming some of these, through its support forcommunity savings, community transport and blood services.
Household surveys and mini-surveys conducted for PATHS2indicated that uptake of ANC and deliveries was probablyrising before and possibly during the study period. Thesurveys identified the principal barriers to access: that theservice is viewed as unnecessary; husband or family not givingpermission; cost; and cultural or religious barriers. The CBCCinterventions provided were very relevant to these. However,the surveys suggest that education on health came from anumber of sources, not just PATHS2.
Value for Money of CBCC December 2014 7

Why the study was inconclusive
Three broad reasons are offered why the quantitative study wasinconclusive.
1. The complexity of factors affecting service utilisation:this made it difficult to identify a control and todiscern which changes were brought about by CBCC. Highstarting values for some of the variables, externalconfounders, and contamination within non-focal areaswere some of the reasons that may explain the lack ofsignificant results.
2. Survey design: as a retrospective study, this study wasconstrained by the historic design of PATHS2, whoseprimary objective was to deliver its intendeddevelopment outcomes, rather than to contribute toscientific research.
3. Data quality: the review of data conducted as part of thestudy showed serious problems in the completeness andvalidity of data.
Implications for Phase 1 results
On the basis of the Phase 2 results, the results found byPhase 1 on the Year 3 data have to be challenged for tworeasons. First, the criteria for distinguishing between thefour intervention arms used in Phase 1 were found to beunclear. Second, although differences were found betweenfacilities that had benefited from CBCC and those without, itis unclear that this was a result of improvements, rather thana pre-existing difference between the control and theintervention groups.
Lessons for future studies
The study offers useful lessons for future studies:1. the need for establishing clear intervention and control
groups at the outset
2. the importance of taking a balanced view of all sourcesof evidence, including pre-existing research, qualitativeand quantitative studies
Value for Money of CBCC December 2014 8

3. the value of a sceptical scientific perspectivethroughout the research process
4. the importance of focusing on, improving and testing datavalidity
5. the limitations of retrospective studies conducted onprogrammes designed primarily to meet social rather thanscientific objectives.
Value for Money of CBCC December 2014 9

1 INTRODUCTION
1.1 Background
Partnership for Transforming Health Systems II (PATHS2) is apartnership between the UK Government and the Nigerian FederalMinistry of Health. It operated between 2009 and 2014 in fiveof Nigeria’s 36 states: Kano, Kaduna, Jigawa, Enugu and Lagos.
Behaviour Change Communication in the PATHS2 Strategy
Behaviour Change Communication (BCC) is one of PATHS2’s fiveOutputs. It is an important “demand-side” contribution that isintended to complement improvements in health services“supply”.
In 2011, Year 3 of PATHS2, it implemented a new strategy witha stronger focus on increasing the uptake of services. Thestrategy had five components:
Output 1: National health sector governance and managementsystems improved
Output 2: State and LGA/District health sector governance andmanagement systems to support appropriate healthservices improved
Output 3: Replicable model to deliver quality maternal andchild health services demonstrated in selected LGAs
Output 4: Ability of citizens and civil society to demandresponsiveness of the health system improved
Output 5: Capacity of citizens to make informed choices aboutprevention, treatment and care strengthened
Whereas Outputs 1 and 2 focus on governance and managementsystems, Outputs 3, 4 and 5 seek to increase service uptake onthe ground.
Output 3 is a “supply-side” intervention seeking todemonstrate improved service in selected “focal” LGAs, throughinterventions in human resource, infrastructure, equipment andsupplies.
Value for Money of CBCC December 2014 10

Output 4 and 5 are “demand-side” interventions to complementimprovements in service delivery. Output 4 strengthens thevoice and accountability of citizens to drive improvement inservice. Output 5 seeks to increase demand for servicesthrough behaviour change communication (BCC).
Community-based Behaviour Change Communication (CBCC) has beenthe core activity undertaken for Output 5, and has beensupplemented in Year 5 by mass media messages, includingpublic service broadcasts.
From Year 3 to Year 5, PATHS focused on supply-side anddemand-side interventions, in and around 68 Basic EmergencyObstetric Care (BEOC) facilities linked to 148 Primary HealthCentres (PHC) in 17 geographical clusters.
In response to the very different conditions in the Northernand Southern states, three different types of CBCCinterventions have been established: Safe MotherhoodInitiative-Demand (SMI-D) and Rapid Awareness Raising (RAR) inthe North; and Facility-based Community Outreach (FCO)followed by Mini-Outreach events (MO) in the South.
Value for money
Value for Money is a major concern for both the Nigerian andthe UK Governments. The 2012 Economic Analysis of PATHS2 (EAP)found that it was expected to save 833,764 life years saved ata cost of £104 million, giving a cost per life year gained of£124 ($197). While this analysis showed PATHS2 as a whole asgood value for money, the contributions of the variouscomponents of PATHS2’s activities were not assessedseparately.
Value for Money is concerned with the economy, efficiency andeffectiveness of programme implementation. PATHS2 has had somesuccess in demonstrating and improving the economy andefficiency of its BCC activities, by reducing the cost ofinputs, economy, and the efficiency with which inputs aretransformed into outputsi. It has also sought to show throughsurveys that BCC affects the knowledge and attitudes ofservice users and the wider community. However, these studiesdo not demonstrate whether changes in knowledge and attitude
Value for Money of CBCC December 2014 11

are effective in bringing about the changes in serviceutilisation that result in safer births and improved health.This study therefore has been designed to draw on theincreasing availability of health service utilisation data tosee whether there is any link between BCC and increasedservice utilisation. The present study therefore builds on theprevious study conducted in 2013 to consider whether or notthe CBCC interventions are effective interventions as measured byincreased service uptake at the supported facilities. Withoutdemonstrating this effectiveness, we cannot confirm that CBCCis good value for money, however economically or efficientlyit may be delivered.
The 2013, Phase 1, study considered statistical evidence forany correlation between CBCC interventions and an actualchange in behaviour. However, this evidence needed to beenriched and triangulated by research into the chain ofcausation. The initial study was undertaken on a relativelysmall set of facilities over 1-2 years. This study uses alarger data set over 2-3 years, and makes fuller provisionboth for validation and analysis of data. This study formspart of a programme of research into the VFM of BCC beingundertaken by PATHS2. Alongside this, PATHS2 is commissionedmini-surveys to help determine the effectiveness of BCC inincreasing knowledge of beneficiaries.
The objective of the present, Phase 2, study is to assess thecombined effects of Community-based Behaviour ChangeCommunication (CBCC) interventions over and above the servicedelivery interventions by PATHS2 on uptake of antenatal careattendance and facility-based deliveries. The study therebyseeks to assess the Value for Money of expenditure in CBCCwith regard to uptake of ANC and delivery services at thefacilities.
The study is a retrospective analysis between July 2011 andJune 2014 of programme and facility service utilization datausing a stepped wedge quasi-experimental design to assess theimpact of CBCC interventions.
Expenditure by the PATHS2 programme on CBCC is also comparedwith total expenditure by PATHS2 in the same period. This
Value for Money of CBCC December 2014 12

should allow the estimated percentage in expenditure incurredfor CBCC to be compared with the percentage change in theoutcome. The 2012 Economic Analysis of PATHS2 (EAP) provided aframework for future economic studies of PATHS2. Both Phase 1and Phase 2 studies have therefore followed the methods usedby the EAP where appropriate.
This second stage of this study compares quantified findingswith those from focus group discussions and key interviews inthe field, and with findings from the mini-surveys on improvedcollective knowledge in specific communities.
The Phase 1 study was discussed with stakeholders in thestates. One finding of this was that public sector decision-makers need specific information to inform future decisions onwhether and how to commission CBCC. Phase 2 therefore sets outto provide relevant costing for CBCC and also to provideindications of the benefits that they can expect from these.
As with Phase 1, it was intended that, once finalised, thestudy findings should be properly disseminated to stakeholdersat Federal and state levels by ensuring that they receive acopy of the study findings and are invited to briefingmeetings. Phase 2 has been conducted by two independentconsultants, contracted by PATHS2, and working in closecollaboration with PATHS2 team, one of whom co-authors thepresent study.
1.2 Types of CBCC Intervention
In response to the very different levels of education, socio-cultural practices, health awareness and service utilisationin the Northern and Southern states, different sets ofinterventions have been established. There are three basicmodels: Safe Motherhood Initiative-Demand (SMI-D) and RapidAwareness Raising (RAR) in the North; and Facility-basedCommunity Outreach (FCO) followed by Mini-Outreach events (MO)in the South. These models are designed to generate decision-making knowledge and social approval for uptake of ANC andfacility-based delivery (FBD).
Each of these models requires on-going activities after aninitial intervention support in order to sustain its effect.
Value for Money of CBCC December 2014 13

1.2.1 Safe Motherhood Initiative – Demand
SMI-D is conducted in rural areas of the North and is designedto avert maternal deaths by facilitating community referralfor emergency obstetric care, as well as ANC and FD. Like allthe CBCC interventions used by PATHS2, SMI-D uses drama andmusic to build awareness of danger signs in pregnancy and theimportance of antenatal care and facility-based delivery. Itembraces a broad approach of education and sensitisationacross the community, working closely with traditional andreligious leaders, men and women. This provides authority forwomen to attend facilities, and is coupled with practicalsteps to establish community-based systems for emergencytransport, blood donation and community funds for emergencies.
Local staff and technical assistants are trained to undertakeadvocacy with community and religious leaders. A community forum is thenheld to train 4 Community Volunteers (2 males and 2 females)from each community in SMI-D, so that they can lead communitydiscussions. Thirty more volunteers from each community arealso trained on Emergency Maternal Care in an LGA. This is adeep intervention requiring regular and on-going support tocommunity volunteers.
1.2.2 Rapid Awareness Raising
RAR is a rapid intervention, typically over two days, working inurban or peri-urban neighbourhoods in groups of 30-60participants. Like SMI-D it provides broad education andsensitisation across the community. It is a more rapidintervention than SMI-D, but RAR requires repeated interventions,with accompanying support, around twice a year, depending onlocal conditions.
1.2.3 Facility-based Community Outreach
FCO is conducted in Southern states. It is a one-off event,engaging groups ranging from 60-200 or more participants indrama, music and education. Its purpose is to mobilizecommunities around a particular BEOC facility. It is followedby two mini-outreach events sponsored by PATHS2 to mentor thehealth facility managers in two of the outlying communities.Health facilities subsequently arrange regular mini-outreach
Value for Money of CBCC December 2014 14

events in communities around the facility, and may evenconduct a further major FCO event. However, these activitiesdo not receive funding from outside the community and localhealth services.
1.3 Research Objectives
The objective of this stage of the study is to assess theadditional effect of Community-based Behaviour ChangeCommunication (CBCC) over and above the service deliveryinterventions by PATHS2 on uptake of antenatal care attendanceand facility-based deliveries. The study thereby seeks toassess the Value for Money of expenditure in community-basedBCC with regard to uptake of ANC and delivery services at thefacilities.
Specifically the study seeks to address the following:
1. Effect of Community-based Behaviour Change Communication interventions on the uptake of ANC and delivery services
2. Expenditure by PATHS2 on Community-based Behaviour ChangeCommunication activities provided by PATHS2
3. Value for Money of the expenditure made on Community-based Behaviour Change Communication activities on healthimpact, based on observed changes in service utilization.
In the following sections, the study addresses each of thesetopics in turn.
1.4 Development of Research Protocol
The Steering Group agreed to the research protocol for thisstudy in June 2014, following extensive and consultativediscussions. PATHS2 will be requested to make the reportavailable, along with the source data used for this study athttp://www.paths2.org
1.5 Literature Review
The review of literature used PubMed, Google and GoogleScholar to search for published and “grey” literature relatedto behaviour change communication, effectiveness and costeffectiveness, and value for money. References were alsoreceived from colleagues, and from within documents found.
Value for Money of CBCC December 2014 15

From our review of literature, we understand BCC to refer totargeted messages and tailored approaches to promote “healthy”behaviours. BCC encompasses health communication, social andcommunity mobilization and also has components ranging frominterpersonal communication to multi-level mass mediacampaigns. Much of PATHS2’s BCC work fits within thisdefinition. However, PATHS2’s SMI-D notably includes verypractical forms of community mobilization, includingmobilization of volunteer drivers, blood donors andencouraging the development of community savings pots.
Evidence-based and theory-driven BCC interventions are anintegral part of all types of health promotion and diseaseprevention, and have been shown to significantly improvebehaviours, notably in the areas of maternal and child health,family planning and HIV prevention (Bhuttaii, Hornikiii,Albarraciniv). Strategically targeting messages and approachesallows CBCC to focus on specific individuals, household, orcommunities to maximize results of health interventions. CBCCinterventions have been used in a variety of settings toassess or change health-seeking behaviour, and strong evidencesuggests that quality CBCC can improve health outcomes (Synder2007, Synder 2004, Bowen 2013).
While there is some evidence about the effectiveness of sometypes of BCC in supporting health programmes, only a smallnumber of these studies address cost-effectiveness. Of thesemost are concerned with mass media communications, rather thaninter-personal or community-based communication (Hutchinsonv).However, while there is positive evidence for theeffectiveness of mass media communications, there is no commonstandard allowing comparability of cost-effectiveness.
Part of the difficulty in obtaining evidence about theeffectiveness of BCC, let alone its cost effectiveness, is thedifficulty of research design. Randomised controlled trials(RCT) are rarely feasible in large real-life settings,particularly for CBCC (Guilkeyvi). Quasi-experiments that seekto identify intervention arms and controls in the real worldinevitably lack the “gold standard” features of an RCT, andare particularly subject to confounding factors. This was the
Value for Money of CBCC December 2014 16

case with a quasi-experimental evaluation of an interpersonalcommunication intervention to increase insecticide-treated netuse among children in Zambiavii: in the context wheredissemination of information from a range of sources was highto both control and intervention arms, and net use was growingrapidly across the district (from 54% to 82% in under-fivesbetween 2008 and 2010), there was no evidence that theinterpersonal interventions by community health workers understudy made a significant difference.
Two relevant RCTs are noted. A community-based campaign toimprove uptake of intermittent preventive antimalarialtreatment in pregnancy in Burkina Faso (Giesviii) found thatcommunity-based promotion increased uptake of 3 or more ANCvisits. With promotion, 64.2% completed 3 or more ANC visitscompared with 44.7% without. However, it found no improveduptake among adolescents. Another RCT in Burkina Faso is beingconducted by Development Media Internationalix undersupervision from the London School of Hygiene and TropicalMedicine to test the proposition that a radio campaign focusedon child health can reduce under-five mortality. This uses adifference-in-differences method to identify changes betweenintervention zones and control zones, and notes a meanimprovement in behaviour change of 8.7 percentage pointscompared to control across 10 health behaviours. The effect,however, varies for different behaviours: seeking treatmentfor diarrhoea in a clinic (+16%), giving birth in a facilityor with a skilled birth attendant (+0.2%) and exclusivebreastfeeding aged 0 to 5 months (-1.8%). An RCT for acommunity-based BCC intervention was not found.
Despite the limitations of evidence, both individual studiesand systematic reviews indicate some positive results fromBCC. A field trial (McPhersonx) of a birth-preparednessprogramme in Nepal found that communication interventions bycommunity health workers increased knowledge, use of somehealth services and preparation for emergencies, but notskilled birth attendance or emergency obstetric care. Asystematic review of the effectiveness of mass communicationprograms to change HIV/AIDS-related behaviours in developingcountries (Bertrandxi) found some evidence that at least half
Value for Money of CBCC December 2014 17

of studies showed some positive impact on some aspects ofknowledge and behaviour (knowledge of HIV transmission andavoidance of high-risk behaviour), but not on others; however,the effect size was sometimes small (1%).
Targeted local interventions are seen as important either asan adjunct to mass media or alone. PATHS2 and other programmesin Nigeria have been strong advocates of communitycommunication interventions where these are integrated withstrengthened skilled birth attendant services (PATHSxii;Aradeonxiii). They have also been advocates of further researchto ensure value for money of such interventions.
A review of health communication campaigns and their impact onbehaviour in nutrition concluded that “nutrition campaignsthat pay attention to the specific behavioural goals of theintervention, target populations, communication activities andchannels, message content and presentation, and techniques forfeedback and evaluation should be able to change nutritionbehaviour (Snyderxiv). Likewise, Koenkerxv draws lessons from BCCacross the health spectrum for the role of BCC in malariacontrol. He emphasises the importance of structural changes inthe delivery of services to support behaviour change. “It isclear that BCC interventions are most effective when acombination of approaches is used, weaving together massmedia, interpersonal communication and structural approachesto promote new or modified behaviours.”
Not only is there complexity in the range and design of BCCinterventions, but these form part of a complex system offactors affecting use of delivery services. Thus a review(Gabryschxvi) of the determinants of delivery service use findsthat higher “maternal age, education and household wealth andlower parity increase use, as does urban residence. Facilityuse in the previous delivery and antenatal care use are alsohighly predictive of health facility use.” Other importantfactors are obstetric complications, quality of care anddistance to health facilities.
Any study, therefore, of the effectiveness of CBCC is made inthe context of large numbers of confounding factors within acomplex system. The large number of these makes it difficult
Value for Money of CBCC December 2014 18

in practice to define random samples for the purpose either ofan RCT or a retrospective quasi-experiment.
The notion of Value for Money has been articulated in a rangeof contexts, for instance as a way of examining reforms thatare aimed at improving the quality of services (more value)and efficiency (less money) by central government(Organisation for Economic Cooperation and Developmentxvii). Itis also used in a general way to suggest improved costeffectiveness or return on investment, but this is not alwaysclearly defined, as in the case of Koenker’s review xiii.
The United Kingdom’s Department for International Developmenttakes a particular view on the application of VfM tointernational development programmes (DFIDxviii). “We maximisethe impact of each pound spent to improve poor people’slives.” This, however, refers specifically to each pound spentby UK government as funder, rather than the full economiccost, which takes into account expenditure by otherstakeholders, including citizens’ out of pocket expenditureand host governments. Although, then, DFID refers to “cost-effectiveness” as the totality of value derived fromefficiency, economy and effectiveness, the cost only includescosts from the perspective of the UK government as funder.This differs from standard practice of looking at the totaleconomic cost, in which attempts may be made to conduct micro-costing at the facility or intervention level, or to projectcosts from ministry of health and other sources (Newlands Dxix).
DFID’s guidance on value for money does not explicitly referto the standard measures of cost utility commonly used ineconomic evaluations of health interventions: the QualityAdjusted Life Year and Disability Adjusted Life Year (DALY).However, the DALY has been a longstanding feature of DFIDeconomic appraisal of health projectsxx.
Beyond BCC, in other aspects of health development, there hasbeen a drive for consistency of measurement of cost utility inwhich the World Health Organisation’s CHOICE publicationsxxi
have played an important part. These enable users to selectcost effective interventions in terms of DALYs, from a menu ofinterventions, based on a review of evidence. However, the
Value for Money of CBCC December 2014 19

accompanying study for maternal and neonatal does not identifyany BCC interventions to be offered at the primary, includingoutreach (Adamxxii), or referral levels. It does not thereforehelp decision makers to decide whether to invest in BCC or notin order to maximise the cost effectiveness or cost utility ofmaternal health services. This reflects the stronger focus inthe literature on the cost effectiveness of contraception andthe development of maternity services, than on BCC, includingstudies specific to Nigeria (Erimxxiii
In the absence of standard practice for measuring costeffectiveness and value for money in BCC, there is at leastguidance on how data should be presented to provide a degreeof transparency from the Consolidated Health EconomicEvaluation Reporting Standards (CHEERS)xxiv.
Value for Money of CBCC December 2014 20

1.6 Estimating Effect of CBCC
The methodology adopted in this study to assess the Value forMoney of Community-based Behaviour Change Communicationactivities based on observed rate of change in serviceutilisation. A retrospective analysis of programme andfacility services utilisation data using a clustered steppedwedge (phase-in) quasi-experimental design (Brownxxv) wasadopted to assess the impact of CBCC interventions in eachstate.
Several modifications were made to the study protocol, becauseof concerns about the data that arose during the process ofanalysing results. These are discussed below.
1.6.1 Sampling and Selection of Facilities
The study considered three cohorts of BEOCs supported byPATHS2. Support by PATHS2 for these BEOCs commenced in Year 3,Year 4 or Year 5 of the PATHS2 programme, and continued in allcases until the end of Year 5. These cohorts comprised all theBEOCs in all clusters and in all five focal states supportedby PATHS2. The table below shows the distribution of allPATHS2-supported facilities and the subsets of eligiblefacilities (BEOC) for the study.
Table 1 Cumulative facilities supported by PATHS2 by State by end ofyear 5
State Total Number ofFacilities
Total number ofBEOC
Enugu 119 30Jigawa 108 36Kaduna 168 56Kano 192 71Lagos 96 32Total 690 225
The PATHS2 programme from year 3 to year 5 has supported 690facilities; of these 225 facilities are BEOCs. Table 2 belowshows the distribution of the BEOCs across the 3 cohorts.There were 68 facilities in Year 3, with an additional 119
Value for Money of CBCC December 2014 21

facilities and 36 facilities in Year 4 and Year 5respectively.
Table 2 Cumulative total of BEOC receiving PATHS2 support
Enugu Jigawa Kaduna Kano Lagos TotalYear 3 12 12 16 16 12 68Year 4 14 16 32 47 12 119Year 5 4 8 8 8 8 36
CumulativeTotal
30 36 56 71 32 225
Of these, 22 facilities with incomplete data were excludedfrom the study. Facilities included in the analysis had atleast 10 months data reported during in each reporting year(i.e. Year 3 facilities reported at least 30 months data whileYear 5 facilities had at least 10 months data).
Table 3 BEOCs included in the study
Enugu Jigawa Kaduna Kano Lagos TotalTotal 28 34 55 63 23 203
Intervention and Control Groups
Facilities were assigned to the control or intervention armaccording to when they received CBCC interventions. Data oninterventions undertaken for the facility, and the period inwhich they were implemented, was provided by PATHS2 programmereport. This was extracted from the database of PATHS2’sBehaviour Change Communication programme report.
Facilities whose catchment populations were benefiting from
CBCC improvements were categorized into those receiving
Rapid Awareness Raising (RAR)
Safe Motherhood Initiative – Demand (SMI-D)
Facility Community Outreach (FCO)
Value for Money of CBCC December 2014 22

It had been proposed in the protocol to categorise facilitiesadditionally according to whether or not they had receivedService Delivery (SD) interventions. This would have createdfour groups: SD only, CBCC only, SD+CBCC and Control. Duringresearch, significant problems with the proposed approach wereidentified. First, it was not possible to distinguish reliablybetween the SD group and the Control group. The protocolidentified SD facilities as “having benefited from improvedhealth commodities, beyond recapitalisation of a drugrevolving fund, improved basic infrastructure, improved humanresources capacity – which will include availability of stafftrained in Advanced Life Saving Skills and Focused AntenatalCare”. In practice, the only criterion provided forimprovements beyond this was whether or not one or more staffhad obtained one of the training courses specified above. Thiswas a relatively modest marker, compared with the improvedavailability of commodities, capitalisation of the drug fundand improved infrastructure. There was no evidence that thetraining was a more significant indicator of service deliveryimprovement than the other criteria, singly or in combination.This made the distinction between SD and Control questionable.It was therefore decided to focus on two groups:
Intervention Group: facilities that had benefited from CBCC
Control Group: facilities that had not benefited fromCBCC
Both cases shared the principal criterion for inclusion, whichwas selection as a BEOC site supported by PATHS2 in Year 3, 4or 5 of its programme.
The study used a stepped-wedge approach for the Control group.This can be applied where there is a sequential rollout ofinterventions, as described above. The order in whichfacilities received the intervention was determinedretrospectively from PATHS2 reports. The table below presentsthe distribution of the 203 BEOC facilities into therespective intervention arms at the end of the review period;
Value for Money of CBCC December 2014 23

the table showing the distribution in a stepped-wedge manneris annexed.
Table 4 Distribution of Facilities by intervention arm and state
State ControlInterventio
n TotalEnugu 11 17 28Jigawa 10 24 34Kaduna 23 32 55Kano 23 40 63Lagos 4 19 23Total 71 132 203
1.6.2 Sources of dataData elements for this study were extracted from the PATHS2version of the District Health Information System, DHIS 2.0.The analysis used data from the last 36 months, 24 months and12 months for the cohorts of Year 3, Year 4 and Year 5facilities, respectively. It had originally been proposed touse 40 months of data, but it was decided that, as nofacilities were reported to have introduced CBCC beforeJanuary 2012, there was no merit in extending the data periodbeyond 36 calendar months, or 3 calendar years. It was alsodiscovered that earlier data quality was more likely to beproblematic, as discussed in the next session.
Table 5 Data points for annual cohorts
Cohort Period Number of datapoints
Year 5 July 2013 – June2014 12 months
Year 4 July 2012 – June2014 24 months
Year 3 July 2011 – June2014 36 months
To test whether CBCC contributed to the eventual utilizationof maternal health services in the BEOC facilities, the
Value for Money of CBCC December 2014 24

outcome measures proposed by the protocol for the study werethe following indicators captured in the DHIS2:
Facility deliveries (FBD) ANC 1st attendance (ANC1) ANC 4th or later attendance (ANC4+)
However, data checks and earlier reports identified during theresearch showed serious limitations on data reliability: ANC1and especially ANC4+ were found to be prone to error. However,it was also noted that Total ANC might be less prone to error.One possible reason for this is that it is easier to transferTotal ANC from facility registers to Summary Sheets than ANC1and ANC4+. Total ANC also provided a larger number than ANC1and ANC4+, potentially increasing the statistical power of thestudy.
Although monthly data on the four data elements was extractedfrom the database, a quarterly (three monthly) average wascalculated for each facility to be inserted into the model,which was adjusted for missing values. This was to reduce theeffect of seasonal variation on the data.
1.6.3 HMIS data quality
HMIS data is captured on manual registers in the healthfacility. Facilities use standard Ministry of Health registersfor antenatal care and delivery services. Facility staffrecord registered data to a monthly HMIS Summary. Thisprovides a carbonless copy that can be retained by thefacility. The Summary is then inputted by local governmentstaff to the District Health Information System II (DHIS2).PATHS2 accesses the DHIS database and provided the dataset forthe purpose of this study. The study therefore depends on thecompleteness and validity of the dataset provided.
The researchers conducted a brief review of availability ofdata in four of the focal BEOCs visited for qualitativeresearch, and compared data there with data reported on HMIS.They chose a month at random in 2012, 2013 and 2014, andsought data totals for ANC1, ANC4+ and deliveries. The
Value for Money of CBCC December 2014 25

availability of data in the register and HMIS record wasbetter for 2013 and 2014 than for 2012. Registers infacilities provided 100% of data items requested for 2014, 92%in 2013 and 25% in 2012. The main reason for absence of datawas that old registers could not be found, as there was noregular system for archiving old registers. Availability ofdata on the HMIS itself showed a similar pattern, with 100%completeness for 2014, 92% for 2013 and 42% in 2012.
Comparing the data in the registers and HMIS showed greatvariations. It was also found that there were sometimesdiscrepancies between the HMIS summary and the data on theHMIS recorded from DHIS.
67% of deliveries shown on registers were within 10% of thevalue recorded on HMIS. 56% of ANC1 were within 10% of thevalue on HMIS, but only 22% of ANC4+. ANC 4+ errors could beparticularly high: the highest error was 424% above the totalshown on the register. We noted that ANC4+ is more complicatedto calculate from the registers than the other data, becausestaff had extract the numbers manually, and then include the5th and subsequent attendances in ANC4+.
This data check therefore raised important questions ofvalidity, particularly of ANC4+. These questions werereinforced by three other sources of data review that providedduring the research.
A 2013 data quality report1 provided by the IndependentMonitoring and Evaluation Project, IMEP, reviewed data from16facilities within focal clusters supported by PATHS2 in Lagosand Jigawa between December 2012 and May 2013. The reportexamined data relating to ANC and Deliveries, but did notreport on differences between reporting of ANC and Deliveries.The review found that 98% of registers and other core dataelements were available in Lagos and 83% in Jigawa. However,only 68% of data was available in Jigawa for the earliestmonth reviewed. The report provided a composite validity score
1 Draft HMIS Data Quality Report (August 2013), IndependentMonitoring and Evaluation Project for the State level Programmes(IMEP), P Bacon E Adegbe
Value for Money of CBCC December 2014 26

for each facility. For Lagos, the average monthly validityscore for facilities in focal clusters was between 63 and 89%.For Jigawa, the average was between 50 and 61%. The problemswere greatest in more remote facilities where registers, toolsor training were inadequate. Overall, however, the reportnoted the relatively high rate of completion of the HMIS instates supported by PATHS2 compared with other Nigerianstates.
The 2012 Rapid Data Quality Review 2 was an internal PATHS2review of 60 facilities, of which 19 were BEOCs, in all 5states supported by PATHS2. The report covered both facilityregisters and HMIS Summaries, but not the DHIS itself. Thereview noted good availability of registers, but examinationof their completeness showed that only around 50% offacilities were recording ANC attendances fully. Deliverieswere being fully recorded in around 90% of facilities. Avalidation test found that the “Agreement Ratio” betweenregisters and the HMIS Summary was poor ranging from under 60%of ANC1 data being transferred with an accuracy within 5%, toover 80% for deliveries. The report found that outliers havelarge effects on overall reporting, especially for ANC4+,while the errors for deliveries are relatively small. Wherethe error was over 5%, the mean error of up to 176% for ANC4+in December 2011. ANC1 data was also skewed in favour of over-reporting on HMIS rather than under-reporting. Lack oftraining and numerical errors were given as major reasons forerrors.
Table 6: Mean percent error between observed HMIS value and actualregister value
(includes reports with errors over 5% only)Mean percent error for all 5
states
Indicator September2011
December2011
January2012
Total ANC 25.7% -0.57% 19.3%
2 The Rapid Data Quality Review of Select PATHS2 ServiceDelivery Statistics, PATHS2 Monitoring & Evaluation Team May2012
Value for Money of CBCC December 2014 27

ANC 1 44.6% 35% 101.4%ANC 4+ 47.7% 176.4% 85.3%Facility
births/SkilledBirth Attendant
-0.2% 6.2% 1.2%
Source RDQR, 2012
A number of reports on data quality have been conducted atstate level. These were reported to us to be of variablequality, and only one was made available. The Kaduna StateData Quality Assessment 20133 reviewed 6 months of data from64. Overall it recorded modest improvements in datamanagement. Data was available in 74-81% of facilities. Datavalidity was in the range of 50-62%.
The emerging picture of data quality is as follows.
Overall, focal BEOCs selected by PATHS2 have a stronger reporting rate to DHIS than non-focal BEOCs and facilities outside the PATHS2 focal states.
Data appears to be reasonably well recorded in registers,but registers are not systematically retained for checking.
There are many variations between register data from registers to HMIS Summaries and to the DHIS. These may behighest in ANC4+ recording, where errors over 100% are common. These errors tend to overstate ANC1 and ANC4+ attendances.
Data for Deliveries and Total ANC may be more likely to be valid than ANC1 and ANC4+.
Older data is less likely to be complete and valid than data since 2013.
1.6.4 Analysis
The protocol proposed that the study will primarily measurethe effect of CBCC on average rates of change in quarterly ANCand delivery services in facilities. This will be computedusing the difference in rate of change in utilisation (ANC and
3 Kaduna State Data Quality Assessment 2013, no author given
Value for Money of CBCC December 2014 28

delivery service) of facilities exposed to CBCC and theircounterparts not exposed to CBCC (difference-in-difference).
The quarterly means of ANC1, ANC 4+, Total ANC and facilitydeliveries were estimated for each facility. These weredisaggregated by state, by year of intervention, and by typeof intervention (SMI-D, RAR or FBO). For each of thesequarterly means, the following calculations were made.
The difference between intervention and control groups inmean monthly utilisation
The difference between intervention and control groups,in the percentage rate of change in mean monthlyutilisation from one quarter to the next.
Differences in rate of change between the control group andthe intervention group were tested using the student t test,using p=0.05 as the level of significance.
1.7 Estimating expenditure on CBCC
1.7.1 Cost of CBCC Interventions
The findings summarise the costs of the three interventionsdiscussed in this report. These are actual cost data reportedin the field and by the PATHS2 national office. It wasreported that PATHS2 had succeeded in reducing both unit costsand the number of units required considerably between Year 1and Year 3. As a principle purpose of collecting these costswas to inform future budget decisions for CBCC, the latestcosts were used.
To date, community and local government contributions havebeen non-cash contributions of volunteer time, staff time andmaterials such as premises and equipment for events. Tables inthe Annex report the number of units required, costs andsources of funding and other resources.
Value for Money of CBCC December 2014 29

1.7.2 Cost Outcome Model Used
It was intended that this Phase 2 study would follow themethodology applied by the Economic Analysis of PATHS24, infocusing on the financial costs to PATHS2 of the interventionand the benefits provided by it.
The Economic Analysis provided a benchmark for future studiesof PATHS2. It acknowledges its own limitations, and the needfor bold assumptions. It defines its model as follows:
“Incremental cost and benefits have been calculated using thestatus quo as a comparator assuming the baseline continues,without PATHS2 interventions. In the absence of this truecomparator case, this analysis is a partial economicevaluation defined as a cost-outcome description.”
However, the findings have not made it possible to provide aclear statement of the benefit provided by CBCC. This istherefore not provided.
1.7.3 Definitions of Costs of CBCC
Financial costs, rather than economic costs, are used for thepurposes of calculating the costs of CBCC.
Overall costs are presented in United Kingdom Pounds (GBP), asreported by PATHS2, and as obtained when consolidatingexpenditure in Nigerian Naira (NGN) and GBP, for the purposesof accounting and reporting to the UK-based funder, DFID.
The generation of costings for individual CBCC interventionsat cluster or LGA level are provided in NGN, and were thelatest available in mid 2014. In the absence of actualaccounting records showing currency exchange, these costs areconverted to United Kingdom Pounds (GBP) at 278.8 NGN = 1GBP,being a mid-year exchange rate for 20145.
4 Economic Analysis of PATHS2 from inception to end of project (July2009 to July 2014), PATHS2 2012
5 Financial Times Guide to World Currencies 1 July 2014.
Value for Money of CBCC December 2014 30

Overall costs of CBCC are calculated from PATHS2’s annualfinancial report. The Year 3 to year 5 CBCC programme largelyconsisted of one-off events and then smaller follow-up eventsfor SMI-D, RAR and FCO. Most of these activities were fundedfrom expenditure in the three financial years August 2011 toJuly 2014. Costs outside CBCC were considered small up to2013. However, more costs may have been undertaken for radioand other work since August 2013. This is therefore anoverestimate of PATHS2 expenditure on CBCC.
Following the practice of the Economic Analysis of PATHS2,costs for each of the outputs have been adjusted to include aportion of operational research, monitoring and evaluation,and administration costs, both locally and in the home officesof the contractor and sub-contractor. The rationale for thisgiven in the Economic Analysis is that PATHS2’s work onmonitoring and evaluation and operational research, as well aswork at Federal level, all contribute to the adoption ofimprovements promoted by PATHS2. These result in a healthgain, not only in facilities directly supported by PATHS2, butin other facilities across the state. The EAP calculation isshown in the Annex. The apportionment is based on the portionof the direct cost incurred by each Output.
Finally the cost is converted to US Dollars at the rate usedby the Economic Analysis6.
1.7.4 Preparation of provider costs for CBCC Interventions
This study generated bottom-up cost data for the direct inputcosts of the three BCC interventions through consultation withPATHS2 staff. Budgets prepared and used by PATHS2 for eachactivity were collected for each intervention.
The purpose of these costs is to provide an indication of thedirect costs to be budgeted by public sector providers or
6 Derived in the Economic Analysis from the World Bank Databasewww.web.worldbank.org/countries accessed 20/09/12. 2011 GNI percapita calculated using the purchasing power parity method, atapproximately UK £1.59 = US$1
Value for Money of CBCC December 2014 31

external funders, in order to provide CBCC to a statedpopulation.
Costs were limited to direct financial costs to communitymembers, public services and external programmes of materials,labour and capital equipment for CBCC. The following costswere excluded in financial calculations:
costs of public sector staffing were noted but not costed(as these are sunk fixed costs)
non-labour community contributions, e.g. of facilities,hospitality and equipment were noted, but not costed,which was not judged feasible within the research design
management costs by both PATHS2 and public services werenot noted or valued
The calculation of each intervention is explained in thefindings, supported by appropriate annexes.
The above costs are not comparable to the total costs incurredby PATHS2 under Output 5, because PATHS2’s costs include costsat state, national and international level.
1.8 Estimating Value for Money provided by CBCC
The Economic Analysis of PATHS2 (EAP) compares the benefitsprovided by PATHS2 with the financial costs incurred byPATHS2. This study adopts the EAP approach.
The EAP used the number of life years gained by reductions inmaternal and perinatal mortality to calculate the benefit ofPATHS2’s work. The analysis was calculated from the increasednumber of births attended by skilled birth attendants.
This study was intended to show whether there was anysignificant difference in the rate of change of serviceutilisation with and without CBCC. More specifically it wasintended to show an increased rate in facility baseddeliveries , thereby providing an approximation of increasedbirths attended by skill birth attendants.
Value for Money of CBCC December 2014 32

This aimed to show whether there was a change in the benefits,including number of lives saved, and the cost of this.However, as shown below, the findings have not provided clearevidence for this.
1.9 Qualitative Research
Local, qualitative research was conducted in order to considerwhether local evidence on the ground supported or refuted thetheory of change. Primary data collected in this studyincluded qualitative information from key informant and focusgroup discussions. A group discussion guide and keyinformants’ interview guide are provided in the Annexes.Facilities whose catchment areas are benefiting from CBCCimprovements were categorized into those receiving:
Rapid Awareness Raising (RAR), used in urban areas of
Northern states
Safe Motherhood Initiative – Demand (SMI-D), used in
rural areas of Northern states
Facility-based Community Outreach (FCO), used in Southern
states.
Community focus group discussions was held with a group of menand women averaging 15 in a sample of the catchment areas ofat least one BEOC facilities in each state. These discussionswere guided to elicit additional information on CBCC andwhether/how it has impacted on knowledge and behaviours and totest validity of the theory of change and conceptual frameworkunderlying the research. Two discussants visited eachcommunity and held discussions separately with a group of menand women in SMI-D and RAR communities in the North butjointly in FCO communities in the South. Two discussions wereheld in each state and discussions included knowledge andunderstanding of purpose of ANC and delivery services;experience of ANC and delivery services; and experience ofCBCC.
In addition, this phase elicited information from keyinformants in the BEOC facilities and LGAs visited in the four
Value for Money of CBCC December 2014 33

states and key informants from the State Ministry of Health inboth Enugu and Lagos. Questions were asked using a preparedguide that allowed for further probing to elicit keyinformant’s opinions on the CBCC issues and their level ofinvolvement.
1.10 Open Access to Data
The datasets used for this study are to be made available fromwww.paths2.org, along with the protocol and any relateddocuments.
1.11 Ethical Clearance
Ethical clearance for this study was provided by the NigeriaHealth Research Ethics Committee (NHREC).
Value for Money of CBCC December 2014 34
2 FINDINGS
2.1 Estimating the Effect of CBCC
2.1.1 Overall & Regional Results
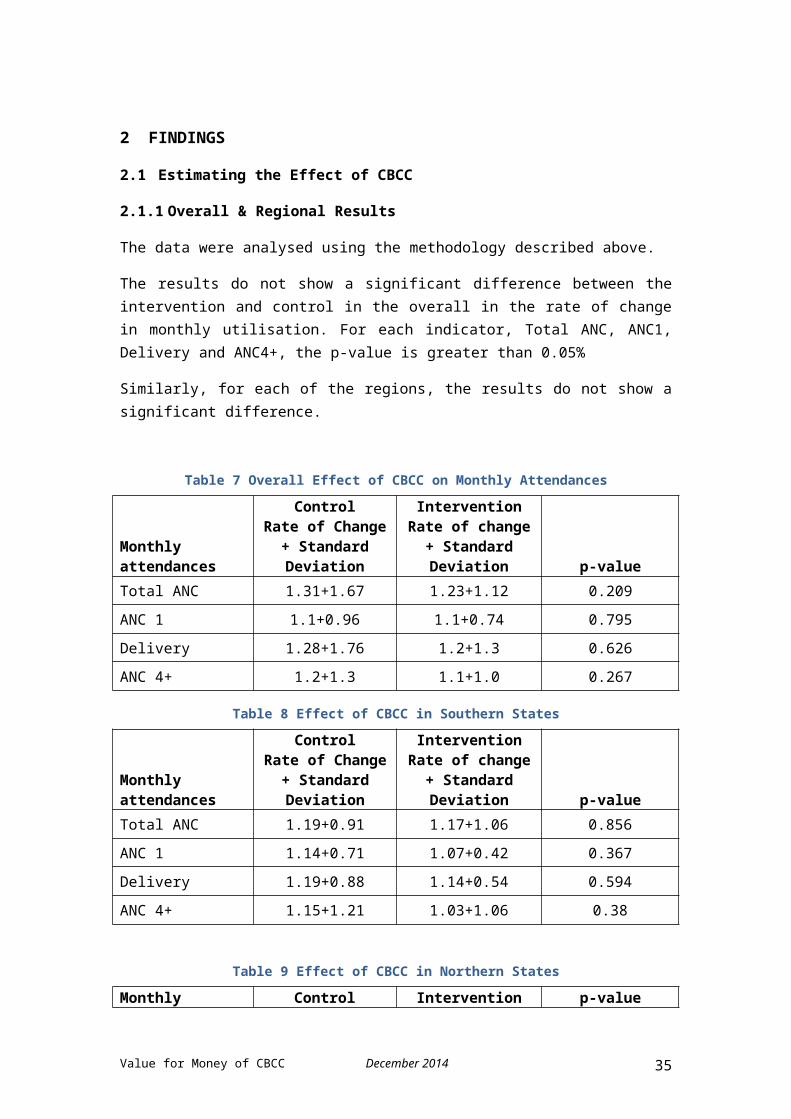
The data were analysed using the methodology described above.
The results do not show a significant difference between theintervention and control in the overall in the rate of changein monthly utilisation. For each indicator, Total ANC, ANC1,Delivery and ANC4+, the p-value is greater than 0.05%
Similarly, for each of the regions, the results do not show asignificant difference.
Table 7 Overall Effect of CBCC on Monthly Attendances
Monthlyattendances
ControlRate of Change+ StandardDeviation
InterventionRate of change
+ StandardDeviation p-value
Total ANC 1.31+1.67 1.23+1.12 0.209ANC 1 1.1+0.96 1.1+0.74 0.795Delivery 1.28+1.76 1.2+1.3 0.626ANC 4+ 1.2+1.3 1.1+1.0 0.267
Table 8 Effect of CBCC in Southern States
Monthlyattendances
ControlRate of Change+ StandardDeviation
InterventionRate of change+ StandardDeviation p-value
Total ANC 1.19+0.91 1.17+1.06 0.856ANC 1 1.14+0.71 1.07+0.42 0.367Delivery 1.19+0.88 1.14+0.54 0.594ANC 4+ 1.15+1.21 1.03+1.06 0.38
Table 9 Effect of CBCC in Northern States
Monthly Control Intervention p-value
Value for Money of CBCC December 2014 35

attendances
Rate of Change+ StandardDeviation
Rate of change+ StandardDeviation
Total ANC 1.3+1.9 1.2+1.3 0.129ANC 1 1.13+1.06 1.13+0.97 0.957Delivery 1.32+2.08 1.25+1.50 0.595
ANC 4+ 1.19+1.3 1.11+1.14 0.367
It was noted that the descriptive statistics showedconsiderable differences between the intervention and controlgroups. However, in the absence of any significant differencein the rate of change between the two groups, these differencesshould be regarded as unrelated to the intervention. They donot provide evidence of any intervention. However, thesedifferences indicate the likelihood of a pre-existing ordissimilarity between the control and intervention groups, andthis is significant for the interpretation of results. This isconsidered further in the discussion section.
Table 10 Mean Monthly Attendances – total study period
Monthlyattendances Control Intervention
All states
Total ANC 82.4 124.8ANC 1 78.09 103.5Delivery 21.3 33.3ANC 4+ 57.2 62.8
Southern states
Total ANC 43.1 87.1ANC 1 21.9+29.3 23.5+19.1Delivery 9.20+13.6 12.7+9.51ANC 4+ 30.0+58.9 23.8+22.4
Northern states
Total ANC 102.8 134.2ANC 1 107.3+104.2 123.5+116.8
Value for Money of CBCC December 2014 36

Delivery 27.60. 38.5
ANC 4+ 71.3 72.5
As expected from the higher level results, results at thelevel of each state do not show any significant effect of CBCCon the rate of change in mean monthly utilisation. For eachindicator, Total ANC, ANC1, ANC4+ and Delivery, the p-value isgreater than 0.05%. The sole exception to this is Jigawa wherethe intervention rate of change is lower, at p-value=0.32.However, in the context, this isolated example should not beseen as significant. Further details of results by state andby year are given in Annexes 3 and 4.
2.2 Cost of CBCC Interventions
This section summarises findings on the costs of the threeinterventions discussed in this report. They are based onactual cost data reported in the field and by the PATHS2national office. The costs summarised below are the cash coststo PATHS2 of providing these interventions at mid 2014 prices.
See Annex 7 Costs of CBCC Interventions for details.
To date, community and local government contributions havebeen non-cash contributions of volunteer time, staff time andmaterials such as premises and equipment for events. Tables inthe Annex show the number of units required, costs and sourcesof funding and other resources. These are intended to be ofuse to public sector providers or others preparing budgets forCBCC costs.
In all cases, PATHS2 incurred a significant cost in the yearof introducing the intervention for on-going support bynational and local technical assistance, and local governmentstaff. For SMI-D and RAR this need was reduced in year two, byapproximately 50% (with a range of 25% to 75%), and expectedto decrease further in year 3. FBO activities were expected tobe self-sustaining after Year 1, so had no need for furtherfunding.
Value for Money of CBCC December 2014 37

2.2.1 Cost of providing Safe Motherhood Initiative – Demand
For the SMI-D intervention, the costing was again preparedusing data from Kano and Kaduna states, with input from thenational PATHS2 office. The costing per cluster variesdepending on the number of LGAs in the cluster, but regardlessof the number of LGA in the cluster, 18 communities areselected within a typical SMI-D cluster of 500,000 people.
As with RAR, the National Technical Assistant and BehaviouralChange Communication Officer (BCCO) train the Local Technical Assistant(LTAs) and staff after which they undertake advocacy with community andreligious leaders. A community forum is then held for four days where4 Community Volunteers (2 males and 2 females) from eachcommunity are selected and introduced to SMI-D, so that theycan lead community discussions.
Four Community Volunteers and two cluster facilitators fromeach community are trained over four days. Thirty morevolunteers from each community are also trained on EmergencyMaternal Care in an LGA for three days. After this, communityreview meetings are held in each community. The last componentof the SMI-D cost is the on-going support provided by theNational Technical Assistant, Coordinating LTAs and the LocalLTAs who live within and oversee the six communities in oneLGA.
There is an on-going requirement for SMI-D in subsequent yearsto sustain the benefit provided by SMI-D. Since this takesplace in the same community, the cost of scoping and trainingof technical assistants, staff and community volunteers isreduced by 75% and reflects the need for on-going replacementand re-orientation. The cost of on-going support is reduced by50%.
Table 11 Annual cost of conducting SMI-D in a cluster made up of 4LGAs
ActivitiesYear 1
NGN
Year 2
NGN
Training for Local Technical 1,698,100 424,525
Value for Money of CBCC December 2014 38

Assistants (LTAs) and staff
Advocacy with community andreligious leaders 64,000 64,000
Training of 4 CVs and 2 ClusterFacilitators per community 1,298,800 324,700
Training of 30 CVs on EmergencyMaternal Care 1,728,000 432,000
Community review meeting 240,000 240,000
Ongoing support to SMI-D (NationalTechnical Assistant, CoordinatingLTA and LTA)
4,611,000 2,305,500
Total NGN 9,639,9007 3,790,725
2.2.2 Cost of providing Rapid Awareness Raising
For the Rapid Awareness Raising (RAR) intervention, thecosting was prepared using data from Kano and Kaduna states,with input from the national PATHS2 office. The costingprovides for two RAR sessions to be provided on six siteswithin a cluster of 500,000 people over a one year period.
The first year intervention requires a two-day training for LocalTechnical Assistants (LTAs) and staff from the LGA and sometimes targeted BEOCfacilities in the cluster. Training is provided by a BehaviourChange Communication Officer (BCCO) and a National TechnicalAssistant. This is then followed by a two day scoping visit to theBEOC catchment areas to decide on which community to conduct theintervention. The training of Community Volunteers (CVs) followsimmediately after scoping. 14-16 CVs are trained, of whom aminimum of 12 are required to conduct the RAR sessions while
7
Value for Money of CBCC December 2014 39

the remaining are on standby. The last component of the costis on-going support to RAR by the National Technical Assistant andLTA.
There is an on-going requirement for two RARs a year insubsequent years to sustain the benefit provided by RAR. Sincethis takes place in the same community, the cost of scopingand training of technical assistants, staff and communityvolunteers is reduced by 75% and reflects the need for on-going replacement and re-orientation. The cost of on-goingsupport is reduced by 50%.
Table 12 Annual cost of conducting two RAR sessions on six sites
ActivitiesYear 1
NGN
Year 2
NGN
Training for Local TechnicalAssistants (LTAs) and staff 606,300 151,575
Scoping visit to BEOC catchments - -
Training for RAR CommunityVolunteers
1,305,000 326,250
RAR Session 1,094,400
1,094,400
Ongoing support to RAR 6,108,000
3,054,000
Total NGN 9,133,700
4,626,225
Value for Money of CBCC December 2014 40

2.2.3 Cost of providing Facility-based Community Outreach and mini-outreach
For the Facility-based Community Outreach (FCO) intervention,the costing was prepared using data from Lagos and Enugustates, with input from the national PATHS2 office. Thiscosting provides FCO for four BEOC followed by mini-outreachesfor the four BEOCs and eight PHCs serving a cluster of 500,000people.
FCO is a one-off event to mobilize communities around aparticular BEOC facility. It is followed by two mini-outreachevents sponsored by PATHS2 to mentor the health facilitymanagers. The intervention commences with advocacy and training ofthe Community Volunteers (1 day for advocacy and 2 days fortraining) within selected communities around a BEOC. This isfollowed by the main Facility-based Outreach event, which lasts oneday. The National Technical Assistant provides support to theFCO but not necessarily to the mini-outreaches. LTAs conductthe remaining two sponsored mini-outreaches in the catchment areaof the 4 BEOC and 8 PHC facilities in the cluster.
After the two mini-outreaches supported by PATHS2 after themain FCO, health facility managers then replicate the processin other health facilities, without further external support.
Some of the resources for the FCO event are provided by thecommunity, including provision of space, canopies, chairs andpublic address system from local schools or places of worship.
Table 13 Cost of conducting one round of FCO for 4 BEOCs in 1 cluster
ActivitiesYear 1
NGN
Year 2
NGN
Advocacy/Training of CVs 192,000 -
Facility-based Outreachevent
168,000 -
Support to FCO (National 872,00 -
Value for Money of CBCC December 2014 41

Technical Assistant <A) 0
Mini-outreaches 348,000 -
Total NGN I,580,000 -
2.2.4 Indicative costs per intervention and per population anddelivery
Table 14 Indicative costs for Service Providers of CBCC Interventions
Year 1 Year 2Safe Motherhood Initiative - DemandTotal NGN / 500,000 population
9,639,900 3,790,725
Total NGN / birth 465 183
Total USD $59,250 $23,299Total USD / birth $2.86 $1.12
Rapid Awareness RaisingTotal NGN / 500,000 population
9,113,700 4,626,225
Total NGN per birth 439 223
Total USD $56,015 $28,434Total USD per birth $2.70 $1.37
Facility-based CommunityOutreachTotal NGN / 500,000 population
1,580,000 0
Total NGN per birth 76 -
Total USD per 500,000 pop
$9,711 $0
Total USD per birth $0.47 $0.00
Value for Money of CBCC December 2014 42

2.3 Estimating expenditure on CBCC
CBCC is the main component of Output 5 of PATHS2. During theperiod of the study it comprised 14% of PATHS2 costs, as shownbelow.
Table 15 PATHS2 Summary Expenditure Year 3 to Year 5
GBP Aug 11-Jul
12 Aug 12-Jul
13 Aug 13-Jul
14 Total
Cost by output including apportioned shared costs
Output 1 5,816,554 3,199,487 2,504,03211,520,0
74 13%
Output 2 10,297,724 5,787,543 4,687,922 20,773,
189 24%
Output 3 15,064,430 8,620,674 10,353,056 34,038,
159 39%
Output 4 4,108,657 2,460,998 2,155,588 8,725,2
44 10%
Output 5 4,517,414 2,952,279 4,546,707 12,016,
400 14%
Total cost 39,804,780 23,020,981 24,247,306 87,073,
066 100%
See Annex 5 PATHS2 Expenditure for details.
The expenditure shown above includes all expenditure incurredwithin the state, at Federal level and outside Nigeria. Itincludes an apportionment of shared costs includingmanagement, administration, knowledge management, monitoringand evaluation. This, however, is an overstatement of the costof CBCC, as it includes some Output 5 expenditure on non-community based activities, particularly public servicebroadcasts in Year 5. The PATHS2 financial reports do notbreak down cost components within Output 5.
2.4 Estimating Value for Money for CBCC
It had been intended to show a relationship between the costof CBCC and the benefit provided.
Value for Money of CBCC December 2014 43

However, as set out in 2.1 above, the results do not showwhether or not there is any significant overall effect of CBCCon the rate of change in mean monthly utilisation. For eachindicator, Total ANC, ANC1, ANC4+ and Deliveries, the p-valueis greater than 0.05%
The Economic Analysis of PATHS2 (Annex 6 Life Years Gained)provided an estimate of life years gained from reducedmaternal and perinatal deaths. The survey design proposed thatevidence of changes utilisation of services associated withCBCC would make it possible to show the expected contributionby CBCC relative to the total effect of PATHS2. By comparingthis with the cost of providing CBCC, it would be possible toestimate value for money.
Although this analysis was provided in Phase 1 for this study,Phase 2 does not corroborate the evidence for Phase 1. This isfurther considered in the concluding discussion of thisreport.
2.5 Qualitative research
2.5.1 Safe Motherhood Initiative – Demand
Reported understanding of pregnancy and associated risks
Both women’s and men’s groups in the two SMI-D communitiesvisited in Kano and Kaduna states knew the problems andillnesses associated with pregnancy in the community. Bothgroups were very familiar with a song alerting them to ninedanger signs of pregnancy, including headache, anaemia, severebleeding and stomach pains.
Some of these signs had been observed or experienced by someof the female group members. They claimed that whenever any ofthese signs were observed, necessary steps were always takento take affected women to hospital.
Reported factors affecting attendance at health facilities
Both men’s and women’s groups highlighted the benefits that(a) health staff in the facilities can take better care of apregnant woman than at home, (b) they advise what food to eat
Value for Money of CBCC December 2014 44

and how to rest well, (c) medicines needed to reduce fever andother problems like malaria and anaemia are given and (d) theyadvise against harmful practices: “they advise women not to doharmful things like beat themselves with hot water and leaves,or take potash in pap” said one of the respondents.
In the SMI-D communities women identified several problemsthat prevented them from attending ANC in the PHC facilityclose to the community. These included non-availability ofhealth staff, causing pregnant women to have to travel furtherto the BEOC facility; excess waiting time for ANC because ithas become so popular; requiring women to leave home early inorder to ensure that they will be attended to; user fees of800 Naira for a scan and 200 Naira for blood test; andunpleasant attitudes of health care workers towards pregnantwomen.
A facility manager identified transportation as one of themain impediment against facility utilisation: “transport isthe biggest problem. Apart from market day, it’s difficult forpeople to get here, because of crossing the river. If thehusband does not come to town or is at the farm, it’s hard forwomen to get here.”
The manager further emphasised that SMI-D communities havesome difficulties retaining Emergency Transport Scheme (ETS)drivers and cars, because drivers move on or vehicle ownersre-assign vehicles, requiring constant recruitment of newdrivers to prevent collapse of the ET scheme.
Experience of CBCC Interventions
Pregnant women reported increased support from their husbandsand the community as a result of increased level of awareness,knowledge and involvement of all. “Men give help. My husbandtook me to hospital. Men give standing permission, so whetheryour husband is around or not, men will help you” said a womanparticipant.
A male participant said: “we men take responsibility now. Wetake them (women) to hospital. We also pay. Our pot hasN18,500 for those who have no money.”
Value for Money of CBCC December 2014 45

SMI-D sustains regular group meetings of 15 to 18 people inseparate men’s and women’s groups. Such meetings occur 3 timesa month.
Support from community can be exemplified by evidence of the:
Contribution made by men in the community to supporttheir pregnant women.
A standing order given by most husbands within thecommunity to take their wives to hospital when thehusband is away.
The Emergency Transport Scheme (ETS). One of the ETSdrivers confirmed that he is happy to do this for nocharge.
Men also reported that they had donated blood to pregnantwomen when necessary under a system established by SMI-D.
Key informants at facilities used by the SMI-D communitiesconfirmed increase and steady utilization of the healthfacility for ANC and facility delivery by pregnant women. Thisfacility informant identified the on-going SMI-D in thecommunities as responsible to the increased ANC visits. Theimportance of other sources of information like radio was alsohighlighted by community leaders and staff: however, severalkey informants and community members emphasised that it isbetter to go to the community, and to engage with villagersand village heads, mosques and churches.
Experience of obstetric emergencies
Interventions in SMI-D communities had addressed some of thefactors that lead to delays in seeking and obtaining careduring obstetric emergencies. Whenever any of the danger signsare observed in a pregnant woman, members of the SMI-Dcommunities confirmed that such a woman is taken to a healthfacility upon her request, or the decision of her husband orthe community. The initial response of any member of the SMI-Dcommunity will be to rush a pregnant woman to the hospitalwithout delay especially in an emergency case, althoughchallenges such as delayed transportation were noted. Both
Value for Money of CBCC December 2014 46

men’s and women’s groups reported that emergency transport hadsaved the lives of pregnant women in the community.
Implementation facilitators and constraints in SMI-Dcommunities
Apart from getting support from PATHS2 key informantsemphasised the willingness of the people to accept change andimprove their lives. The facility head mentioned thatcommunities were able to identify their problems and becameaware of the danger associated with delayed presentation of apregnant woman.
However, there were some constraints. One of the keyinformants from PATHS2 explained that in the North, women weresupposed to give birth normally at home with the assistance ofrelatives, but in case of any problem, a more experiencedTraditional Birth Attendant (TBA) would be called. The TBAsare still popular in communities that have not been reached byCBCC.
An LGA representative emphasised the issue of funding which iscritical to participation and monitoring at the LGA and statelevel: the LGA received no support whatsoever in terms ofbudgeted money for BCC activities. The only financial supportcame from partner organisations. One of the key informantssaid “There’s no money for supporting visits, we only try todo what we can do and leave the rest.”
2.5.2 Rapid Awareness Raising
Reported understanding of pregnancy and associated risk
Both men and women in the communities supported by RAR, RiminGado and Sarai, were aware of the RAR intervention put inplace by PATHS2 and were able to identify problems andillnesses associated with pregnancy. They were also moderatelyfamiliar with 9 danger signs to look out for during pregnancyusing songs and demonstrations, but less so than SMI-Dcommunities. They claimed that pregnant women were usuallywent or asked to be taken to the health facility as soon asany of the danger signs is observed.
Value for Money of CBCC December 2014 47

Reported factors affecting attendance at the health facility
All the women interviewed in these RAR communities claimedthat their husbands encourage them to go for ANC, and askquestions about their health while reminding them to followthe drug prescriptions given at the health facility. Women inone community reported that their husbands also support themin child spacing which was reflected in the ages of the lastchildren of pregnant women interviewed. The Imams also givetheir support, they hold gatherings in the mosque and atprayers and discuss health as it concerns pregnant women.
Notably in one of the RAR communities, some women would rathernot come for delivery despite the support they get from theirmen and community. Some were afraid of injections while someclaimed they were shy. Six out of 11 of one group interviewedhad not come for their last delivery in the hospital. Theothers had come in because of particular problems observed –two had convulsions.
As with SMI-D, the difficulty of getting transport to thefacility was identified by both men and women groups. Peoplewere less aware of ETS or other community drivers than in theSMI-D communities, although details were reported to beavailable in health facilities. It was reported that mostwomen give birth before the arrival of a driver. Healthfacility staff commented: “for the ETS, the drivers were notwilling to continue because of lack of incentives. Thevehicles were also sometimes collected from the traineddrivers by the owners.”.
The cost of delivery in a public facility was also an issue:women claimed that about 5000 Naira was usually required foritems like gloves, drugs and gauze in the referral hospitalwhich they usually visit. Therefore, women especially in RiminGado community preferred to have a normal delivery at home,but would rush any pregnant woman with danger signs tohospital. Shortage of beds for delivery and absence of skillbirth attendant (SBA) at night in the BEOC were alsohighlighted as major problems discouraging facility delivery.
Value for Money of CBCC December 2014 48

On the advantages of health services utilization, one of thewomen said: “In the hospital, they test our blood, bloodpressure, check position of baby, check if baby’s growing,treat malaria and give injection.” The men’s group confirmedthat women get treatment for bleeding and other critical signswhile one of them said: “If they can’t do it at the healthcentre, they refer. It reduces illness. They also offeradvice, drugs and safe delivery.”
Experience with CBCC intervention
One women’s group reported that they collectively get involvedin CBCC campaigns through songs and demonstration in theirmeetings and go round to inform other women within and outsidetheir communities. Two out of about over 20 participants eachin both male and female groups had led community awareness onhealth and they claimed they were well received even by otherneighbouring communities. “We don’t face rejections, evenwomen from other communities we normally visit give us giftssuch as fresh cow milk” said one of the women in Sarai.
Health messages especially those that concern women’s healthare announced about three times a day on the radio. Both LGAstaff and facility staff found both town criers and radiomessages helpful, but emphasised the value of face-to-facediscussions at community level, because these allow people tointeract and discuss, as well as just to hear a message, andbecause not everyone has a radio or TV. The LGA employs towncriers to go round with megaphones to sensitise people,especially women, when community events and ANC services arebeing provided.
Health staff believe that the level of awareness created bythe combination of RAR and other communication in the two RARcommunities, is the reason for high demand for ANC, which nowgoes on all day till late afternoon because of the number ofwomen visiting. Both state and local staff emphasised that theuse of RAR needs to be on-going. According to a key informantin one of the health facility: “The campaign needs to continuebecause there are so many problems to overcome. Money,transport are big problems, and so are poverty and ignorance.These are the things that keep people at home.”
Value for Money of CBCC December 2014 49

Experience of obstetric emergencies
In handling emergency obstetric cases, the RAR communitiesclaimed that timely actions are taken since they are aware ofthe dangers of delay. The women in the RAR communities saidthat most deliveries came at night or at dawn. However, inSarai community, for instance, the facility serving thecommunity does not run a 24 hours service. In case ofobstetric emergencies, pregnant women have to travel furtherto a better equipped 24-hour health facility in town.Transport to this facility sometimes poses a great problem.One RAR community claimed that no maternal death had occurredfor several years.
Implementation facilitators and constraints in RAR communities
One of the facility managers and the LGA representativeemphasised sensitivity to people’s culture and religiousbeliefs had facilitated implementation: the considered thatthe RAR communities believed that their culture and religionare not tampered with, and that PATHS2 and the government hadbrought an initiative to improve their lives and especiallythose of women. Another implementation facilitator was the useof drama, songs and real life events to show people how theycan find a solution to problems happening in their community.Most women find these interesting and educating and alwayswant to take part. One key informant in the facility servingRAR community said:
“The women now like coming for ANC because they sing anddance. They also meet their fellow women.” One majorconstraint mentioned by an LGA official was lack of politicalwill to financially support the health department. However,the key informant said that when other partners release fundfor immunisation and other campaigns, the LGA healthdepartment uses every opportunity to pass messages to pregnantwomen to go for ANC visits and facility delivery.
Value for Money of CBCC December 2014 50

2.5.3 Facility-based Outreach
Reported understanding of pregnancy and associated risk
Some of the women in the FCO communities mentioned pregnancy-related problems that were personally experienced while menparticipating in the discussions also mentioned experiences oftheir wives during pregnancy. Some of the problems highlightedincluded oedema, malaria, bleeding, convulsion, weakness andvomiting followed by constant cough, which was quite common.Generally, women in the FCO communities knew the danger signsto look out for during pregnancy as they sang anddemonstrated, but the men did not seem to bother much aboutthese danger signs, but emphasised that their major role is tosupport their wives with transportation and pay hospital billswhen the need arises. Men in Nkerefi community of Enugu andAwoyaya community in Lagos also support their women byreminding them to take their drugs as prescribed. One of themsaid: “I encouraged my wife to do exercise because the nursesaid so. I also assist her with house work because of hercondition, although people don’t have to know about men doinghouse work.”
Many of women participating in the discussion at Awoyayacommunity were not aware of existence of any outreach byPATHS2. However, they had moderate knowledge of the dangersigns which was said to be acquired during ANC visits made tothe Primary Health Care facility in the community and fromradio and television. One of the community members claimedthat PATHS2 had a FCO about 2 years ago and a few of theparticipants were aware of a mini outreach held 4 months agoin the community.
Reported factors affecting attendance at the health facility
Both men and women knew the benefits of attending ANC andfacility delivery. Getting free medications, a mosquito netand better health care from skilled health worker were some ofthe benefits mentioned. Both communities in Enugu alsoreported that using government health facility is cheaper thanthe Traditional Birth Attendants (TBA).
Value for Money of CBCC December 2014 51

According to respondents from communities in both FCO statesand all the key informants, the TBAs have great influence onfacility attendance. This influence is more pronounced inEnugu as TBAs are generally against health facilityutilization by pregnant women. However, Lagos State Governmentdecided to work with the group and incorporated the TBAs intothe health system by conducting a six weeks training for theTBAs while PATHS2 focused on pregnant women’s knowledge ofdanger signs and quick referral. The key informant from theLagos State Ministry of Health stated: “population of Lagos ismuch and some community people prefer to patronise TBAs, so wenow work with them, They have their department in the Ministryof Health, so a pregnant woman can deliver her baby either atthe health facility or with TBAs but the TBAs must allowpregnant women to register for ANC at the nearest government-approved facility.”
In Nkerefi community, despite the cost of services of about6000 Naira of these birth attendants, many women still preferto visit the TBAs especially for delivery even if suchpregnant woman attended ANC in a health facility.
The key informant in the health facility visited in Nkereficommunity confirmed that TBAs only referred pregnant women incritical health condition, and they would not refer to theBEOC in the community with trained staff, but to the stategeneral hospital about an hour into the main town. This wasalways deliberately done to discourage women from using thePHC in the community, and resulted in most maternal andneonatal death observed in the communities.
In Ijede community of Lagos, four of 10 women had their lastchild with a TBA. One of the women said: “I go for ANC to feelgood when am pregnant, but I prefer to have my babies at homebecause the health workers are never patient with us. Theydon’t give us enough time to labour, they just refer us to thegeneral Hospital for operation. Tell them to always be patientwith us.” Most of the women immediately made comments inaffirmation of the statement.
In Lagos, the people’s custom and religion were not againstfacility utilization, but a particular religious denomination
Value for Money of CBCC December 2014 52

does not believe in taking drugs/medicine or in healthfacility utilization.
“They don’t believe in coming to the hospital, they say it isa sin,” said one female member of the group.
One of the Key Informants at the health facility said: “Manyof them (pregnant women) still prefer to use TBAs in thecommunity. They are many and have a way of persuading andmanipulating the women not to come to the health centre.”
Another challenge mentioned by an LGA staff was lack of fundsfor outreaches and that the LGA lack manpower coupled with badterrain. The key informant said: “We can’t do much, especiallyin the rainy season, so we do not conduct outreach after arainfall. This also affects hospital visits by pregnantwomen.”
Lack of political will to support community-based BCC wasmentioned by one LGA staff in Enugu. The key informant haddoubts that the BCC intervention that has been put in place byPATHS2 is sustainable. In Lagos a facility manager said:“Mini-outreach enables things to be explained, especiallytaboos, and it increases understanding and awareness. Thehealth committee members and I find out issues throughcommunity engagement empowerment.”
Facility health staff in Awoyaya PHC reported that before apregnant woman would be attended to for ANC, she must havedone all recommended laboratory tests. This decision was madeto discourage the number of women attending ANC as staff areinadequate to attend to all available pregnant women comingfor ANC. Moreover, any woman who is not registered in thehealth facility would always be rejected when in labourregardless of the state. This attitude of the health workersis discouraging pregnant women.
One elderly woman in the group described her experiencesaying: “I brought a woman from this community who was inlabour around 1 a.m. last month. She was rejected by the nursebecause she wasn’t registered at the PHC, and she gave birthin the tricycle on our way to another hospital.”
Value for Money of CBCC December 2014 53

One of the LGA key informants also threw light on the poorcommunication skills of some health workers. She said some ofthe health workers are quite aggressive towards the visitingpregnant women. Another problem that may hinder thesustainability of community based outreached in Lagos Statesmentioned was the rate of transfer of PATHS2 trained healthfacility staff across LGAs and between health facilities bythe state government. According to this informant, though manyhospital staff have been trained, this affects the workforceand leads to loss of trained staff. New staff may not beprovided with training so as to interact with the communitypeople and conduct outreaches.
Experience with CBCC intervention
Awareness has increased gradually within the communities ashealth facility managers go into the villages to sensitise thecommunity as well as facilitates outreach. Churches are alsovery important means of reaching the people, especially inEnugu. One of the ways this was done is by going through thepriests of the main churches in the communities to involvethem. Whenever a woman has a successful facility delivery andgoes for thanksgiving, the priest uses it to encourage otherwomen to use the health facilities.
“We conduct monthly outreach in churches. They give date andtime to invite health care staff to attend church activitieswhere they can inform members about the health facility andcare that is provided in the hospital,” said a health manager.
The manager believed that 80% of the women now attend thehealth facility (a proportion higher that the 50% given by amember of the same community).
However, the health manager further confirmed the rejection ofhealth services by a particular church: “the church (namewithheld) is against coming to hospital, but sometimes lastyear, a man brought one of the women who confided in him thatshe would like to deliver in the hospital, she deliveredaround 3 a.m. and left secretly around 5 a.m.”
One of the LGA staff was on several occasions called by somePATHS2 trained health facility managers to support outreaches
Value for Money of CBCC December 2014 54

among social clubs, motorbike riders, National Union of RoadTransport workers, a photographers’ association and others.There are also trained Town Criers in each community visited,and community champions in Lagos state.
Concerning the impact of the PATHS2 CBCC in one of thecommunities visited, the facility health manager emphasisedthat there had been improvement in ANC visits but that notonly BCC was responsible for the observed increase. “Now wehave ANC every Tuesday unlike before that we used to have twotimes a month. There is also increase in delivery but notpronounced.”
Group members emphasised that outreaches are better than theinformation they hear or see on radio or television. Theyexplained that people were able to ask questions, andsometimes power outage wouldn’t allow people to hearinformation from the media (Radio Nigeria, Dream FM and SolidFM). One key informant from PATHS2 and another from the LagosState Ministry of Health had a different opinion: hey bothexplained separately that CBCC only reaches a fraction ofLagos state population but millions of people listen to radiostations and television.
“The ‘Gbogbo Eko Song’ explaining the danger signs to look outfor in pregnancy composed by PATHS2 is now an anthem known bymany people and has increased the knowledge of more peoplecompared to the number of people BCC has reached,” said thekey informant from the SMoH.
Experience of obstetric emergencies
Response to obstetric emergencies in the FCO communities inEnugu depends on the belief of the pregnant woman and herhousehold. However, some members of the group said, if thedanger sign is serious, pregnant women would rather gostraight to the health facility. In Nkerefi community onewoman and three from two close communities had died this yeardue to pregnancy-related problems. The community womenconfirmed that all these death occurred at the TBA’s house oron the way to the state general hospital after the victimswere referred late by the TBA. “The one of last month (June)
Value for Money of CBCC December 2014 55

died after losing plenty blood in the house of the traditionalhealer. Another wanted to go to hospital, but the TBA saidthat she would deliver the baby for her, and she eventuallydied before reaching the hospital.”
Support from men and the community especially in Enugu is notas evident as in the SMI-D and RAR communities. Some men werenot showing much interest to get involved, but some reportedthat they transport their wives to the health facility for ANCand pay any expenses.
None of the communities visited in the Enugu or Lagoscomplained about the cost of seeking care at the healthfacilities where PATHS2 is engaging health staff for BCC.
Implementation facilitators and constraint in FCO communities
The health manager in two facilities in the South mentionedthat both men and women are interested in the songs and dramaused during outreaches, but most times only few men come forthe outreaches because they are busy elsewhere. The approachthrough which FCO intervention is delivered is an externalfacilitator. For example, in Lagos State, religious leadersare trained on maternal and child health issue to communicatehealth messages to their followers. In Enugu also, priests arekey promoters of increased ANC visits and facility delivery.
In Nkerefi, both the health manager and LGA representativesaid that the dilapidated state of the health facilitydiscourages women from using the facility. Also in Enugu, bothLGA representative and state representative mentioned lack ofpolitical will to fund outreaches. One key informant said:“the government prefers to construct road that people can see,but is not releasing money to the health sector.” The terrainin Enugu was also a serious issue: the key informantemphasised that some communities are hard to reach especiallyin the rainy season, Health staff serving such communitiesfind it difficult to go there and also, women cannot come forANC unless their husbands have something to do in town.
In one of the health facilities visited in Lagos, the healthmanager confirmed the report of the discussions that women
Value for Money of CBCC December 2014 56

don’t like coming for delivery if they have other choicesbecause of the space.
She said “We cannot take more than three deliveries at a time.The hospital doesn’t have enough bed and space, so the womencomplain we discharge them quickly when they should still beresting in the hospital.”
Aside from transportation problem due to bad terrain,Traditional Birth Attendants are a rival to health facilities’skilled birth attendants in Enugu. The TBAs influence thelevel of facility utilisation that should have resulted fromthe outreaches and awareness creation being regularlyconducted.
Other views
In all the communities visited in both the Northern andSouthern States, it was discovered that community heads,religious leaders and leader of women group were firstcontacted and consulted with other key stakeholders before anyCBCC activity began. There was thorough engagement of theleadership of the communities. Community mobilization occurredusually during celebrations and festivals through songs.
Before the introduction of outreaches (FCO and MO) in theSouth, there were lots of beliefs and taboos. For instance, ina community of Enugu State, people believe that when a womangives birth at the health facility, she has been unfaithful toher husband and is therefore running away, but things havechanged. Activities performed during outreaches are bothentertaining and educative. They include drama with realisticstory lines targeting problems faced among women in thecommunities. After these discussions were held and specificproblems were identified. Communities themselves were allowedto proffer solution to their problems.
A staff of PATHS2 gave an example of a man who threatened notto provide any money towards the birth on his child because ofa misunderstanding between the couple. The wife being a memberof the pregnant women’s support group shared her problem withthe group and all the women numbering about 20 went to theman’s compound, knelt down (a sign of respect in Southern
Value for Money of CBCC December 2014 57

Nigeria) and begged on behalf of the wife, causing the man tochange his mind afterwards.
According to the health staff from the State Ministry ofHealth, many women now know the difference between a trainedand untrained birth attendant. They are also aware that womencan die due to lack of proper care during pregnancy and childbirth. The State health staff who had also been involved inthe BCC activities by PATHS2 said there is adequate staffingat the state level but believed that in the absence of PATHS2,the BCC intervention may not survive for so long due to lackof funds.
2.5.4 Qualitative research summary
The discussions held with the various community groups werefocused and elicited quality information needed to support thefindings of the first phase of this study.
The communities researched demonstrated a strong awareness ofthe value of ANC and emergency obstetric intervention, coupledwith a strong awareness of danger signs in pregnancy. Bothcommunity and staff respondents, in facilities, government andPATHS2, attributed these changes to the introduction andmaintenance of CBCC.
Sustained community involvement of leaders, and of both menand women in the community were important factors for success.Regular repeats of all the interventions were required.
CBCC is clearly used to convey important messages healthmessages on ANC and delivery, and to support action on thedanger signs in pregnancy. SMI-D, RAR and FCO all contributeto changing the attitude and behaviours of both men and womentowards seeking health, judging from the responses of themembers of the communities visited and key informant at alllevels.
This evidence on the ground generally supports the theory ofchange for this research that CBCC may have an effect onincreasing demand and thereby uptake of services. Althoughthere are still several factors across the communities visitedin all states militating against facility utilization for ANC
Value for Money of CBCC December 2014 58

and especially facility delivery, the overall reportedbehaviour of many had changed in terms of where to go whenfaced with maternal health challenges and obstetricemergencies. However, this behaviour change was less evidentin the communities visited in Enugu State.
The availability and quality of service was frequentlyreported as a constraint on service utilisation. Closedfacilities, especially at night, having to pay for some drugs,and poor staff attitudes all prevented or discouraged womenfrom attending them. Some reported cost of service as abarrier, but others were willing to pay for privatefacilities, which generally had higher fees than publicservices.
Transport was also cited as a problem. Even where SMI-D hadfacilitated emergency transport services, transport to get toANC, and to get to a facility in time for a regular deliveryremained a problem for many.
Even where services and affordable drugs were available,health staff considered that service utilization by pregnantwomen is still hampered by beliefs, attitudes and poverty.
Despite these obstacles, ANC in these communities is now seenas the norm for women. However, many considered they had noneed to attend a facility for birth, particular afterexperiencing births without apparent difficulties at home.These women also doubted they could get to a facility in time,once they started labour.
Especially in the South, women generally believe that ANCattendance could well prepare them for proper and safedelivery either at home, at the home of a TBA or at the healthfacility. However, in the case of complication duringdelivery, these communities see hospitals, especially thosewith adequate health professionals and that operate 24 hours,as the major means of survival. The level of acceptance offacility utilisation varies from community to community, andalso within of the communities. The influence of TBAs andchurches was important in this. In the North, traditionalbirth attendants were not reported as a problem in terms of
Value for Money of CBCC December 2014 59

influencing the attitude or behaviour of the communities onfacility utilisation, though this may be because people wereless willing to talk about them.
Although some communities, particularly more urban ones, wereaware of other methods of communication, including radio,these were seen as useful additions to interpersonal communitycommunication, but no substitute for it.
Communities reported that they suffered fewer maternal deathsand attributed this to increased knowledge of the people andhealth facility utilisation. The men’s and women’s groupsconfirmed that ongoing SMI-D and RAR has increased andsustained service utilization. Women reported major changes intheir ANC attendance as the normal thing to do duringpregnancy.
CBCC interventions appear to have built better relationshipsbetween communities and the governments through health stafffrom hospitals and LGAs. LGA personnel LGA staff and ANC staffprovide drama, songs, and educational talks that make ANCvisits interesting to pregnant women. The SMI-D interventionhas also reduced financial and transport barriers to obtainingmedical care through men’s and women’s community savingschemes, ETS and blood donation.
Most health staff interviewed considered that the communitydiscussions and engagement brought by CBCC is linked toincreases in ANC visits, but has much less effect ondeliveries than ANC in most health facilities of the fourstates visited.
Resource shortages in most state owned health facilities weremajor barriers. Adequate and suitably skilled staffing, aswell as staff accommodation, were central to these. AlthoughLGA staff were involved in CBCC, the lack for funding by LGAsand state government for CBCC was a problem. Although thehealth department had submitted action plans and budgetseveral times, no amounts were reported to have been releasedrecently across the sites visited, although reports fromJigawa, on an earlier visit by one of the researchers,indicated a higher level of state commitment.
Value for Money of CBCC December 2014 60

2.6 Findings from Household Surveys
2.6.1 Use of ANC and Delivery Services
PATHS2 conducted surveys to provide a baselinexxvi (conducted2009), mid-term reviewxxvii (conducted 2012) and end of programmereview (conducted 2014). The findings of the 2014 survey werenot available.
The surveys provide useful descriptive results about theutilisation of services. However, the absence of a controlmakes it hard to determine whether any changes or trends areassociated with PATHS2 interventions or other factors. Boththe baseline and mid-term surveys included household surveysin the states served by PATHS2. The mid-term studydifferentiated between focal areas directly benefitting fromPATHS2 interventions and non-focal areas. However, there is noanalysis of the significance of differences between focal andnon-focal groups. It is also noted that PATHS2’s strategy isto have a wider impact across the state than purely in focalareas, so non-focal areas may be influenced by PATHS2. Thereis no comparison with states outside the five focal statessupported by PATHS2. In the absence of control populationwithin or outside the state, it is therefore hard to know howmuch the results reflect PATHS2 interventions.
Antenatal Care
Use of antenatal care varied widely according to location,state and wealth. However, in all states it is well above 50%.This reduces the potential for discerning change within thepresent study.
Table 16 Percentage of women who received antenatal care during thelast pregnancy by selected characteristics (mid 2012)
Received antenatalcare for lastpregnancy Total
LocationUrban 91.3 1,442Rural 65.9 2,488State
Value for Money of CBCC December 2014 61

Kaduna 70.7 693Jigawa 62.3 891Lagos 93.5 895Kano 67.7 1,106Enugu 96.2 345InterventionFocal 75.2 1681Non-focal 78.9 2249Wealth quintilePoorest 59 845Second 70.9 805Middle 78.8 766Fourth 85.7 788Richest 94.0 720
Source: table 3.7 Mid-term evaluation
In mid 2012, one year into the three year period under review,over 90% of women in Southern states had accessed ANC in theirlast pregnancy, as had urban women and richer women.Facilities serving these populations are therefore unlikely tosee major growths in ANC1.
Although the number of times women had attended ANC variedsimilarly according to location, state and wealth, the overallnumber achieving ANC+ was much lower. Only 38% of urban womenand 56% of urban women achieved ANC4+.
Table 17: percentage of times antenatal care was received in a healthfacility during last pregnancy by selected characteristics (mid 2012)
Number of times antenatal care wasreceived
Onetime
Twotimes
Threetimes
Fourtimesor
more
Don’t
know
Didnot
receiveANC
Numberof
respond-ents
LocationUrban 2.7 3.3 13.9 56.0 15.4 8.7 1442Rural 1.8 6.1 11.9 38.2 8.0 34.1 2488StateKaduna 2.7 3.9 10.7 42.0 11.4 29.3 693
Value for Money of CBCC December 2014 62

Jigawa 2.4 4.1 10.6 39.5 5.7 37.7 891Lagos 2.5 2.8 12.9 58.7 16.6 6.5 895Kano 1.7 8.2 16.7 35.4 5.7 32.3 1106Enugu 1.2 4.4 6.0 60.4 24.2 3.8 345InterventionFocal 1.8 3.8 9.8 48.5 11.4 24.8 1681Non-focal 2.5 5.4 14.8 44.9 11.2 21.2 2249WealthquintilePoorest 1.8 5.7 10.6 30.5 10.4 41.0 845Second 2.0 5.0 13.7 40.5 9.7 29.1 805Middle 2.4 5.3 13.3 47.3 10.6 21.2 766Fourth 2.2 4.9 11.6 55.8 11.2 14.3 788Richest 2.8 3.0 15.1 58.9 14.1 6.0 720Total 2.2 4.8 12.8 46.3 11.3 22.6 3930
Source Table 3.1 Mid-term evaluation
Thus although there was relatively little scope for growth inANC1 in all the populations identified, there was aconsiderable scope for increasing repeat ANCs, towards theimportant goal of ANC4+ in most population groups.
The differences between focal and non-focal areas for ANCutilisation are in many cases small.
Comparison between the baseline and mid-term surveys suggeststhat there had been rapid growth in the number of ANC4+between 2009 and 2012.
Table 18 Percentage of pregnant women making at least 4 ANC visits2009 - 2012
Atbaseline
At midterm
Enugu 35.7% 60.4%Jigawa 7.5% 39.5%
Kaduna 25.7% 42.0%
Kano 16.7% 35.4%Lagos 34.2% 58.7%
Source: Section 3.1.2.3.2 Mid-term evaluation
Value for Money of CBCC December 2014 63

There was only a small difference between the percentages ofwomen making 4 ANC visits in non-focal (44.9%) and focalfacilities (48.5%). However, in the absence of baseline dataspecific to focal and non-focal facilities, it is unclearwhether this change is a result of changes introduced byPATHS2, or is part of a wider trend.
Deliveries
Overall numbers for delivery were reported to be lower thanfor ANC, and with even greater disparity between populationgroups.
Table 19: Percent distribution of place of delivery by selectedcharacteristics (mid-2012)
Place of last delivery
HomeGovernment
hospital/Clinic
Privatehospital/Cl
inic
Number ofrespondents
LocationUrban 28.1 28.0 44.0 1800Rural 78.1 16.5 5.6 2165StateKaduna 69.8 21.9 8.3 630Jigawa 81.7 15.8 2.9 680Lagos 17.1 25.9 57.1 1283Kano 81.9 16.7 1.4 1125Enugu 23.7 39.2 37.0 248WealthquintilePoorest 70.3 12.7 17.2 812Second 64.5 16.3 19.4 814Middle 58.0 19.7 22.5 789Fourth 51.3 26.7 22.0 798Richest 31.1 33.9 35.0 753Total 55.3 21.6 23.1 3965
Source Table 3.15 Mid-term evaluation
Because reported facility-based delivery rates were generallylower than ANC, there appears to be greater scope forfacilities to increase the number of facility-based deliveriesthan ANC.
Value for Money of CBCC December 2014 64

Comparison between the baseline and mid-term surveys suggeststhat there had been rapid growth in the number of deliveriesbetween 2009 and 2002. However, as with ANC, it is unclearwhether this change is a result of changes introduced byPATHS2, or is part of a wider trend.
Table 20 Percentage of deliveries that take place in a public healthfacility 2009 - 2012
Atbaseline
At midterm
Enugu 21.4% 38.6%Jigawa 4.5% 15.3%
Kaduna 15.4% 21.9%
Kano 10.0% 16.7%Lagos 20.5% 25.8%
Source: Section 3.1.2.3.3 Mid-term evaluation
2.6.2 Barriers to Service Utilisation
Whatever may be the causes of these changes, the householdsurveys provide indications of the barriers to further serviceutilisation, and whether therefore these might be addressed byCBCC interventions.
Table 21 Percentage distribution of reasons for not accessing ANC byselected characteristics
Costtoomuch
Facilitynotopen
Toofar/ notrans-portati
on
Don’ttrustfacility
Nofemaleprovider
Attitude of
providers
Husband/familydid notallow
Notimportan
t/necessa
ry
Cultural/
religious
reason
Others Total
Location
Urban 15.9 0.8 5.0 3.4 0.5 3.7 13.4 18.4 7.2 12.4 146
Rural 10.9 1.4 8.2 0.2 0.2 1.0 18.2 35.5 10.5 5.4 831
State
Kaduna 11.9 1.2 7.3 0.5 0.7 2.0 19.2 31.8 3.5 4.9 207
Jigawa 14.2 0.6 7.0 0.0 0.0 0.0 5.8 37.0 20.4 6.5 331
Lagos 21. 0.0 5.9 5.2 1.1 2.9 8.5 9.1 9.8 19.8 67
Value for Money of CBCC December 2014 65

1Kano 7.5 1.9 8.7 0.4 0.0 2.1 27.0 35.3 6.1 4.7 358
Enugu 27.8 9.9 9.6 0.0 0.0 0.0 0.0 22.6 0.0 0.0 14
InterventionNon-focal 14.
31.6 9.6 0.7 0.0 2.1 18.7 34.6 6.1 6.0 548
Focal 8.4 1.0 5.2 0.9 0.6 0.8 15.6 29.8 14.9 7.4 429Wealthquintile
Poorest 14.9 1.1 9.4 1.0 0.7 1.2 16.1 36.7 8.0 4.8 372
Second 88.5 1.9 8.3 0.0 0.0 1.9 20.8 34.4 6.0 6.6 254
Middle 94.2 0.9 5.3 1.1 0.0 0.6 21.1 30.1 14.9 5.5 183
Fourth 86.9 1.6 6.0 1.0 0.0 2.7 10.4 25.1 14.5 7.7 122
Richest 91.2 1.0 4.6 2.1 0.0 2.5 12.1 19.6 14.5 20.6 46
Total 11.8 1.3 7.7 0.8 0.2 1.5 17.8 32.5 9.9 6.6 977
Source: Table 3.14 Mid-term evaluation
Barriers vary according to locations, states and wealth.However, overall, the most frequently mentioned barriers arethat ANC is not important or necessary (32.5%), husband orfamily do not give permission (17.8%), cost (11.8%) andcultural or religious reasons (9.9%). CBCC is designed toaddress three out of four of the most frequently mentionedbarriers, and could also address “distrust” among the otherbarriers mentioned: facility not open, distance, distrust,lack of female provider and staff attitudes.
A similar picture appears in the reasons given for non-delivery in a hospital or clinic. Overall, the same fourbarriers are important: facility delivery is not important ornecessary (45.5%), husband or family permission not given(11.9%), cost (10.3%) and cultural or religious reasons(11.1%). However, a fifth, distance or lack of transportationis also important (10.2%). It is hard to see major differencesbetween focal and non-focal groups.
Value for Money of CBCC December 2014 66

Table 22 Percentage distribution of reasons for not delivering in ahospital/clinic by selected characteristics
Costtoomuch
Facility notopen
Toofar/no
transportati
on
Don’ttrustfacili
ty
Nofemaleprovide
r
Attitudeof
providers
Husband/familydid notallow
Notimportant/necessary
Cultural/
religious
reason
Others Total
LocationUrban 12.8 2.5 9.2 4.1 0.1 6.7 13.3 33.2 8.9 20.7 554Rural 9.5 3.6 10.5 0.5 0.8 2.2 11.5 50.0 11.8 9.8 1690StateKaduna 10.8 3.2 9.1 1.0 0.0 4.3 12.0 51.2 6.6 9.1 440Jigawa 8.5 1.7 10.9 0.4 0.9 0.4 8.4 51.1 15.7 10.9 556Lagos 20.0 1.4 13.0 8.3 0.0 8.5 11.8 19.2 11.7 24.0 268Kano 6.5 4.7 7.9 0.1 1.0 3.2 14.4 50.0 10.9 11.3 921Enugu 40.0 6.8 32.4 2.0 0.0 2.8 7.0 5.5 2.0 18.2 60InterventionFocal 8.5 2.0 9.8 1.0 0.5 1.8 14.6 42.5 12.7 14.4 948Non-focal 11.6 4.3 10.4 1.6 0.7 4.5 9.9 47.6 9.9 11.0 1296WealthquintilePoorest 14.3 3.4 13.3 0.9 1.0 3.5 12.5 48.8 11.0 6.7 578Second 11.3 3.4 9.8 0.4 0.4 3.1 13.4 48.9 11.1 9.8 538Middle 7.0 2.8 8.2 1.6 0.6 3.3 12.1 44.5 12.0 11.6 465Fourth 10.9 3.3 8.8 2.2 0.6 3.0 10.8 40.0 12.2 18.3 424Richest 3.9 4.2 9.5 2.7 0.3 4.1 9.1 41.5 7.7 23.4 238Total 10.3 3.3 10.2 1.4 0.6 3.3 11.9 45.5 11.1 12.4 2244
Source: Table 3.17 Mid-term evaluation
2.6.3 Satisfaction with services
The baseline and mid-term facility surveys also show changingperceptions of the quality of services. As above, however,there is no control group for comparison.
Table 23 Percentage of clients reporting satisfaction with service2009 - 2012
Atbaseline
At midterm
Enugu 32.4% 47.6%Jigawa 30.5% 76.2%
Kaduna 33.8% 66.4%
Value for Money of CBCC December 2014 67

Kano 24.3% 60.7%Lagos 58.0% 68.9%
Source: Section 3.1.2.4.1 Mid-term evaluation
2.6.4 Knowledge and attitudes
The mid-term survey shows a strong interest in health and alsothat people surveyed were receiving a large number ofmessages, whether with or without the support of PATHS2. Over90% of people in all demographic groups surveyed wereinterested in knowing more about their health rights (Table3.43 Mid-term evaluation).
Around 50% of households reported attendance at health eventsin their communities. Notably, this high level of attendancewas taking place both in focal areas supported by PATHS2 andothers.
Table 24 Percent of respondents who attended a public event abouthealth care held in their community in the last 3 months (mid 2012)
SelectedCharacteristics
Attendance ofmeeting bySomeone in
your household
Totalrespondents
LocationUrbanRural
44.554.0
407738
StateKadunaJigawaLagosKanoEnugu
53.553.844.650.360.9
62189311418165
InterventionFocalNon focal
49.350.1
372773
WealthQuintilePoorestSecondMiddleFourthRichest
51.648.946.550.951.6
278267239241177
Total 49.8 1203
Value for Money of CBCC December 2014 68

Source: Section 3.1.5.1 Mid-term evaluation
2.7 Findings from Mini Surveys
Randomised household surveysxxviii of women were conducted in2013 and 2014 within a 5 km radius of two BEOC facilitieswithin clusters supported by PATHS2 in each of the fivestates. The surveys tested knowledge and attitudes of women inrelation to the treatment of diarrhoea, delivery intention andknowledge of four danger signs in pregnancy.
The first study was conducted around facilities that hadundertaken BCC interventions. The second study, a year later,was conducted around facilities that had not undertaken BCCactivities, but may have heard BCC-related announcements onthe radio. The 2014 survey was intended as a control enablingthe contribution of BCC to changes in knowledge of healthissues. However, as shown in the household surveys, this was aperiod when behaviour was changing rapidly.
Round 2 of the survey showed that women outside the areaformally supported by PATHS2 were nevertheless receiving alarge number of messages about health, whether by spill-overfrom BCC conducted by PATHS2 elsewhere or otherwise. The womensurveyed in Round 2 for the control group reported learningabout danger signs in pregnancy from 3 major sources: 36.5%from Hospital/Clinic Staff; 27.1% from neighbours/friends and26.1% from radio messages which were being broadcast withPATHS2 support twice a week. Radio listening was high, with48.1% of women listening to the radio once a day or more, and31.8% listening all day every day.
The findings showed overall higher levels of knowledge amongthe populations directly served by BCC than the control groupin two out of three areas.
Table 25 Differences in overall knowledge of health issues
Round 1
Populations servedby BCC
Round 2
“Control”
2014
Statistical
Significance ofresult
Value for Money of CBCC December 2014 69

2013 (p>=0.95)
Overall knowledge of diarrhoea management
98% 12% Yes
Overall intention to deliver in a health facility
85% 70% Yes
Overall knowledge of maternal danger signs
66% 75% No
Source Women’s Knowledge of Health Issues, Round 2
The results showed a statistically significant differencebetween the Round 1 and Round 2 surveys on the overallknowledge of appropriate Diarrhoea Management and intention todeliver at a health facility while the overall knowledge ofmaternal danger signs across the states for both rounds ofsurvey was not statistically significant. In all cases, theknowledge of women in the populations served by BCC was high.However, because the “control” was conducted at a differentdate and in a different population from the interventionpopulation, the results are questionable.
3 DISCUSSIONThis report covers the second phase of a two-part study, intothe effect and value for money provided by Community-basedBehaviour Change Communication in maternal health serviceimprovement. The study failed to provide adequate evidence ofa statistically significant link between CBCC and improvedutilisation of services. It therefore was unable to determinethe value for money provided by CBCC.
This discussion covers the following issues. What did thestudy show and fail to show? Why did the study fail to show
Value for Money of CBCC December 2014 70

more? What are the implications for Phase 1? What lessonsemerge from the study?
3.1 What did the study show and fail to show?Rate of improvement in service utilisationThe study did not find any significant difference in rate ofimprovement between facilities with CBCC and those without. Atthe overall level, the p-value was in the range of 0.2 to 0.7,much higher than the specified test that p=<0.05. Because ofhigh variance in ANC1 and ANC4+ data, Total ANC data wasanalysed too, but again yielded no results. Data qualityissues identified during the study, and reported above, wereprobably a factor in this.
The same problem was found at all levels of analysis, bystate, by region and by year. Although it had been proposed todisaggregate the three types of interventions, it was clearthat this would not yield usable results either.
Mean service utilisation was higher in the intervention groupthan the control group. However, in the absence of anincreased rate of improvement in the intervention group, thisis likely to be a pre-existing difference between the controland intervention groups. According to this, therefore,facilities that had benefited from CBCC started from a higherbaseline than the control group, but did not improve theirservice utilisation rate any faster than the control.
Cost of interventionsFinancial data provided useful costings of the main threeinterventions. These costings were calculated from theperspective of a provider budgeting for a CBCC to serve apopulation of 500,000 people or two LGAs. These costs arebased on PATHS2 data but provide a useful indication of costsfor budgeting purposes by a public sector provider or externalfunder.
Costs for all three interventions decline considerably insubsequent years as training and technical assistance costsdecline. FCO is designed to be self-sustaining after one year.Costs per birth range between $0.49 for FCO to $2.86 for SMI-Din year 1. However, the utilisation data does not tell usabout the relative effectiveness of the three interventions.
Value for Money of CBCC December 2014 71

It is important to note that these interventions are notinterchangeable, but specific to their social context.
Value for moneyOutput 5, whose main component was CBCC, cost £12.01 million(GBP) including shared costs, or 14% of total PATHS2expenditure from Year 3 to Year 5 of the programme. This is,however, an overstatement of CBCC cost, because it includesother interventions, including public service broadcasting inyear 5.
Because of the lack to support significant conclusions onservice utilisation, it is not possible to determine whetherCBCC provided a benefit greater or smaller than theinvestment. This does not mean that CBCC failed to perform,only that the size of the achievement is unclear.
Qualitative evidenceThe qualitative evidence obtained from four states indicatedthat CBCC plays a significant part in improving demand andservice uptake.
Key informants and community members portrayed CBCC as a keycomponent in a holistic approach to improving service uptake.Community discussions indicated that CBCC had had an importanteffect on participants’ understanding of the benefits ofhealth services, influencing the attitudes of women, men,traditional and religious leaders, and encouraging them tohave a positive attitude to ANC, delivery and other healthservices such as immunisation. Several discussions noted areduction or absence of maternal mortality in communitiessince more women had started using ANC and delivery services.CBCC had apparently contributed to a high level of awarenessof danger signs in pregnancy and the value of ANC. Theevidence around deliveries was less clear, with many womenreporting that they would continue to have their babies athome.
Many key informants saw CBCC as an essential complement tomass-media communications and service improvements. Theystressed the need for frequent and regular communityinterventions to sustain awareness. Many community memberswere also members of community groups that had been
Value for Money of CBCC December 2014 72

strengthened through PATHS2’s work on improving voice andaccountability.
However, community attitudes and knowledge were not the onlybarriers to access. Closed facilities, staff skills, shortageof resources, cost and transport were all identified asbarriers. SMI-D played a part in overcoming some of these,through its support for community savings, community transportand blood services. Although CBCC interventions, workingalongside the strengthening of community structures for voiceand accountability, may have potential to advocate for better,affordable services, this was not researched in depth.
Findings from household surveysBaseline and mid-term surveys conducted for PATHS2 examinedchanges across the states where PATHS 2 was active, in bothfocal and non-focal areas. These surveys indicated aconsiderable rise in uptake of ANC and deliveries between 2009and 2012, regardless of the interventions being studied.
The mid-term survey show relatively small differences betweenfocal areas where PATHS2 supported facilities directly, andnon-focal areas, although the latter may nevertheless havebenefitted indirectly from PATHS2. The absence of a controloutside the influence of PATHS2 makes it hard to identify howmuch of this rise was related to PATHS2 interventions, and inany case largely preceded the present study period.
The survey identified the principal barriers to access: thatthe services are perceived as unnecessary; husband or familynot granting permission; cost; and cultural or religiousreasons. These indicate the relevance of CBCC activities inaddressing them. However, the mid-term survey showed thateducation on health came from a number of sources, mostlybefore the PATHS2 BCC programme had got underway. The level ofengagement on health topics was high in non-focal areas: 50%of households in non-focal areas were reported to haveattended a public health event in their community in the lastmonth, compared with 49% in focal areas, even before the startof the BCC component.
This reflects a complex pattern of interventions and change inhealth services.
Value for Money of CBCC December 2014 73

Findings from mini-surveysLike the household surveys above, the mini-surveys show acomplex situation in which knowledge and attitudes areinfluenced by many different factors. Women in focal areaswhere CBCC had been supported by PATHS2 had a high knowledgeabout danger signs in pregnancy, and high intention to deliverin a facility. However, so did a group of women interviewed ayear later outside these focal areas, reporting that theirknowledge came from health staff, friends/neighbours and radiobroadcasts supported by PATHS2.
3.2 Why did the study fail to show more?Three broad reasons are offered why the quantitative study wasinconclusive.
Complexity of factors affecting service utilisationMany factors affect service utilisation. This made itdifficult to discern distinct changes in the CBCC interventiongroups, and to identify an adequate control.
The household surveys show that PATHS2 was operating in acomplex environment, where many factors were affecting boththe supply and demand for services. People in both non-focaland focal areas appear to have been finding out about healthand using health services in new ways. The household surveysshowed that service utilisation was probably alreadyincreasing before PATHS2’s new strategy got underway.
PATHS2 was not a unique actor in influencing supply and demandfor service. Service utilisation may have been influenced byhistoric behaviours introduced by an earlier programme (suchthe earlier PATHS programme), or by the provision of new staff(by Nigeria’s Subsidy Reinvestment and Empowerment Programme,SURE-P). Furthermore, each of PATHS2’s interventions was partof a complex, interdependent strategy. Improvements in supply,voice and accountability, and BCC were not intended to bestand-alone outputs. Each was intended to reinforce the other,and itself consisted of many components. Particularly withService Delivery, it was impossible to identify a firmdivision between facilities that had or had not benefited fromService Delivery improvements.
Value for Money of CBCC December 2014 74

Together these factors were likely to reduce the effectattributable to a particular type of CBCC intervention byPATHS2. Utilisation rates were already high and rising at thestart of the study period, especially for ANC. This made ithard to isolate progress. There is evidence of contaminationby other sources of education, including radio, healthworkers, information from neighbours and health meetings.
Survey designThis was a retrospective study, a “quasi-experiment” ratherthan a randomised controlled trial. As such, the research wasconducted in a programme whose primary objective was todeliver the development outcomes, rather than to contribute toscientific research The literature review showed that theseare common conditions imposing constraints in BCC research,and that changes brought about by BCC may be difficult todiscern.
The chosen methodology of difference-in-difference relies onthe assumption that the two sites or groups are travelling onparallel paths to begin with (so that any divergence in thepath of the intervention site can be attributed to theintervention). In this case, too few data points wereavailable before the intervention to establish that this isthe case. In the absence of this data, it was assumed that thegroups were comparable pre-BCC, which may not have been thecase.
The proposed criterion for distinguishing a BEOC that hadundergone service development from one that had not was foundto be inadequate. The only firm criterion for inclusion in thestudy was selection by PATHS2 as a BEOC. This group washeterogeneous in levels of service utilisation. Although wehad understood the two arms to be essentially similar, theresults suggested significant differences between the controlarm and the intervention arm in pre-existing levels of serviceutilisation.
A second limitation of survey design is that it did notcapture the immediate effect of CBCC interventions in the daysand weeks after CBCC intervention. PATHS2 records identifiedthe quarter in which these took place, but not the month or
Value for Money of CBCC December 2014 75

week. Key informants reported immediate changes resulting fromCBCC, but the survey design did not capture an immediatebefore-and-after comparison.
A third limitation was the stepped wedge design. This providedonly a relatively short period to measure rates of change inthe control group. Facilities only remained in the controlgroup for 1-3 quarters, providing only 2 data points for rateof change.
Finally, DHIS2 reports did not distinguish between an absentdata point and a zero data point. The effective exclusion ofthese points may have distorted results.
All these factors reduced the likelihood of achieving clearresults.
Data qualityThe literature review had shown that changes brought about byBCC can be quite subtle, and therefore require robust data.
However, the review of data conducted as part of the studyshowed serious problems in the completeness and validity ofdata. The transfer of data from registers to HMIS Summarieswas weak – only 22% of ANC4+ were summarised within 10% of thefigure shown on the register. There were further errors intransferring the summary to DHIS. These problems wereconfirmed by data quality reports provided by PATHS2 duringthe study. As a result, the variance of data was very high,making it hard to establish statistically significant results.
3.3 What are the implications for Phase 1 of the study?On the basis of the Phase 2 results, the results found byPhase 1 on the Year 3 data have to be challenged for tworeasons.
First, the Phase 1 study divided the Year 3 cohort into fourarms rather than two. However, Phase 2 found that thecriterion for establishing the distinction between groups thathave benefited from SD and those that have not is not valid.Phase 1 found that utilisation was much higher in “CBCC+SD”group than the control group, but that there was nosignificant difference between the “CBCC alone” group andcontrol. However, as there is no valid distinction between
Value for Money of CBCC December 2014 76

“CBCC+SD” and “CBCC alone”, this is not a valid result, andthe cause of the high result in the CBCC+SD group may not beCBCC.
Second, the Phase 1 study refers to this difference as anincrease. However, the study in fact looked at mean serviceutilisation over the entire period, rather than examining therelationship between utilisation and time. It did not show animproved rate of utilisation. It cannot be assumed that thiswas a result of improved performance brought about by CBCC. Analternative explanation suggested by the Phase 2 study showsthat the control and intervention groups are likely to havehad different pre-existing mean rates of service utilisation.
3.4 What lessons emerge from the study?The study shows the importance of taking balanced view of allsources of evidence. The lessons from qualitative researchindicate a positive contribution by CBCC in a complexenvironment. However, the household and mini-surveys, as wellas the quantitative results, are inconclusive, partly becauseof their design.
This study shows the value of a sceptical scientificperspective throughout the research process. The involvementof a specialist academic adviser helped the study to sustainthis, enabling it to follow through the significance ofevidence that challenges initial “positive” results.
The study shows the need for clarity in study design, and ofestablishing clear intervention and control groups at theoutset. The study drew on internal sources of data andstatistical analysis. The cooperation of an internal team maybe essential for a retrospective study, and therefore needs tobe scrutinised at all stages to ensure scientificindependence. The study illustrates the limitations ofretrospective quasi-experimental studies. Research that isplanned prospectively alongside the implementation process maybe more likely to yield results.
The study showed the importance of focusing on, improving andtesting data validity. Although PATHS2 has made significantimprovements to the quality of HMIS data from facilities,research requires a higher level of completeness and validity.
Value for Money of CBCC December 2014 77

Without these, research is unlikely to reveal statisticallysignificant results.
Value for Money of CBCC December 2014 78

4 ANNEXES
Annex 1 Facilities included in the Study
1 ENUGU en Aguibeje Health Centre2 ENUGU en Aguobu Owa Health Centre3 ENUGU en Akegbe Ugwu Health Centre4 ENUGU en Amadim Model Primary Health Centre5 ENUGU en Amagunze Model Health Centre6 ENUGU en Eha Amufu Health Centre7 ENUGU en Ekwegbe Comprehensive Health Centre8 ENUGU en Hill Top Health Centre9 ENUGU en Ibagwa Aka Health Centre10 ENUGU en Iji Nike Cottage Hospital11 ENUGU en Inyi Cottage Hospital12 ENUGU en Isu Model Primary Health Centre13 ENUGU en Mother of Christ Specialist Hospital14 ENUGU en Mpu Health Centre15 ENUGU en Nara Health Centre16 ENUGU en Nkpologwu Basic Health Clinic
17 ENUGUen Ntasi Obi Ndi No N’Afufu Catholic Community Specialist Hospital
18 ENUGU en Obollo Afor Health Centre
19 ENUGUen Oji River General Hospital (Sub District Hospital)
20 ENUGU en Olo Health Centre21 ENUGU en Onueme Neke Health Post22 ENUGU en Orba Health Centre (MPHCC)23 ENUGU en Owelli Health Centre24 ENUGU en Ozalla Model Health Centre25 ENUGU en The Good Shepherd Special Hospital26 ENUGU en Ukana Health Clinic27 ENUGU en Umuabi Health Centre28 ENUGU en Uwani Cottage Hospital29 LAGOS STATE la Apakin PHC30 LAGOS STATE la Agboju Primary Health Centre31 LAGOS STATE la Aniyun Hospital32 LAGOS STATE la Awoyaya PHC 133 LAGOS STATE la Festac Primary Health Centre34 LAGOS STATE la Ibeju PHC35 LAGOS STATE la Igbogbo PHC36 LAGOS STATE la Ikosi Oke Primary Health Center37 LAGOS STATE la Imota Primary Health Center
Value for Money of CBCC December 2014 79

38 LAGOS STATE la Ipakodo Primary Health Centre39 LAGOS STATE la Isheri Olowora Mutual Clinic40 LAGOS STATE la Ketu Mascara Primary Health Centre41 LAGOS STATE la King Solomon Hospital42 LAGOS STATE la Lekki PHC43 LAGOS STATE la Life Foundation Medical Clinic44 LAGOS STATE la Majidun Primary Health Center45 LAGOS STATE la Mile 2 Primary Health Centre46 LAGOS STATE la Odo-Nla Primary Health Center47 LAGOS STATE la Ogudu Primary Health Centre48 LAGOS STATE la Okeeletu Primary Health Center49 LAGOS STATE la Oworo Primary Health Centre50 LAGOS STATE la Saheed Memorial Hospital51 LAGOS STATE la Satelite Primary Health Centre52 JIGAWA jg Aujara Primary Health Centre53 JIGAWA jg Bulangu Cottage Hospital54 JIGAWA jg Chamo Health Clinic55 JIGAWA jg Dandi Dispensary56 JIGAWA jg Diginsa Health Clinic57 JIGAWA jg Dumadumin Toka Dispensary58 JIGAWA jg Gagarawa Health Clinic59 JIGAWA jg Gantsa Primary Health Centre60 JIGAWA jg Garki Primary Health Centre61 JIGAWA jg Garun Gabas Primary Health Centre62 JIGAWA jg Guri Primary Health Centre63 JIGAWA jg Gwaram Primary Health Centre64 JIGAWA jg Gwiwa Primary Health Center65 JIGAWA jg Kadowawa Health Clinic66 JIGAWA jg Kanya Health Clinic (Babura)67 JIGAWA jg Karkarna Health Clinic68 JIGAWA jg Katanga Dispensary69 JIGAWA jg Kaugama Primary Health Centre70 JIGAWA jg Kazura Primary Health Centre71 JIGAWA jg Kiri Kasamma Primary Health Centre72 JIGAWA jg Kiyawa Primary Health Centre73 JIGAWA jg Kofar Arewa Maternal Clinic (Hadeja)74 JIGAWA jg Maigatari Primary Health Centre75 JIGAWA jg Malam Madori Primary Health Centre76 JIGAWA jg Miga Health Clinic77 JIGAWA jg Roni Primary Health Centre78 JIGAWA jg Sakwaya Health Clinic79 JIGAWA jg Sankara Health Clinic80 JIGAWA jg Sule Health Clinic81 JIGAWA jg Sundimina Health Clinic
Value for Money of CBCC December 2014 80

82 JIGAWA jg Taura Primary Health Centre83 JIGAWA jg Unguwar Ya Health Clinic84 JIGAWA jg Zango Health Clinic85 JIGAWA jg Zareku Health Clinic86 KADUNA kd (PHC Barnawa) Haj A.Ahmed .Makarfi87 KADUNA kd C.H.C Jaji88 KADUNA kd Health Centre Anchau89 KADUNA kd Health Centre Dutse90 KADUNA kd Health Centre Fadankarshi91 KADUNA kd Health Centre Galadimawa92 KADUNA kd Health Centre Maganda93 KADUNA Kd Lere PHC94 KADUNA kd MCH K/Magani95 KADUNA kd MCH Kajuru96 KADUNA kd MCH Mayir97 KADUNA kd Multi Public Health Centre Dogon Dawa98 KADUNA kd PHC Kubau99 KADUNA kd PHC Kujama (Tunduwada )100 KADUNA kd PHC Manchok101 KADUNA kd PHC Soba102 KADUNA kd PHC Tudun Wada103 KADUNA kd PHC U/Sanusi104 KADUNA kd PHC Ungwar Muazu105 KADUNA kd Primary Health Center B/Dodo106 KADUNA kd Primary Health Center D/Abba107 KADUNA kd Primary Health Center Dambo108 KADUNA kd Primary Health Center Farman109 KADUNA kd Primary Health Center Kamuru110 KADUNA kd Primary Health Center Richifa111 KADUNA kd Primary Health Centre Saulawa112 KADUNA kd Primary Health Centre Abdukwari11 KADUNA kd Primary Health Centre Aboro
Value for Money of CBCC December 2014 81

3114 KADUNA kd Primary Health Centre Ankung A115 KADUNA kd Primary Health Centre Asso116 KADUNA kd Primary Health Centre Auchan117 KADUNA kd Primary Health Centre Awon118 KADUNA kd Primary Health Centre Badarawa119 KADUNA kd Primary Health Centre Daddu120 KADUNA kd Primary Health Centre Damakasuwa121 KADUNA kd Primary Health Centre Dan Alhaji122 KADUNA kd Primary Health Centre Dandaura123 KADUNA kd Primary Health Centre F/Ninzo124 KADUNA kd Primary Health Centre Fada kagoro125 KADUNA kd Primary Health Centre Gadan Gayam126 KADUNA kd Primary Health Centre Godogodo127 KADUNA kd Primary Health Centre Gubuchi128 KADUNA kd Primary Health Centre Hunkuyi129 KADUNA kd Primary Health Centre Jere130 KADUNA kd Primary Health Centre Kaya131 KADUNA kd Primary Health Centre Kubacha132 KADUNA kd Primary Health Centre Kwata133 KADUNA kd Primary Health Centre Makera 1134 KADUNA kd Primary Health Centre Mando135 KADUNA kd Primary Health Centre Sabon Sarki
Value for Money of CBCC December 2014 82

136 KADUNA kd Primary Health Centre U/Sarki137 KADUNA kd Primary Health Centre U/Shanu138 KADUNA kd Primary Health Centre Zakari Isa139 KADUNA kd Public Health Centre (Kuyello)140 KADUNA kd Public Health Centre Randagi141 KANO kn Abbas Primary Health Center142 KANO kn Ajingi Public Health Center143 KANO kn Akilu Memorial CHC(Madobi PHC)144 KANO kn Albasu Primary Health Center145 KANO kn Babawa Model Primary Health Center146 KANO kn Birji Primary Health Center147 KANO kn Bunkure Basic Health Center148 KANO kn Burum Burum Health Center149 KANO kn D/Dakata Clinic150 KANO kn Dal MPHC151 KANO kn Danhassan Primary Health Center152 KANO kn Danzabuwa Model Primary Health Center153 KANO kn Durun MCH154 KANO kn F/Ma'aji Dispensary155 KANO kn Fagwalawa Cottage Hospital156 KANO kn Gabasawa Model Primary Health Center157 KANO kn Ganduje Primary Health Center15 KANO kn Gandurwawa Basic Health Center
Value for Money of CBCC December 2014 83

8159 KANO kn Gano Basic Health Center160 KANO kn Garko Primary Health Center161 KANO kn Garo Primary Health Center162 KANO kn Garun Malam Primary Health Center163 KANO kn Gayawa Health Center164 KANO kn Getso Model Health Center165 KANO kn Giginyu Basic Health Center166 KANO kn Gofaro Health Post167 KANO kn Goron Maje BHC168 KANO kn Gurjiya Dispensary169 KANO kn Gwagwarwa Primary Health Center170 KANO kn Hotoro Arewa PHC171 KANO kn Ja oji Public Health Center172 KANO kn Kadawa Health Center173 KANO kn Kadawa Primary Health Center174 KANO kn Kademi Primary Health Center175 KANO kn Karaye Comprehensive Health Center176 KANO kn Kibiya Primary Health Center177 KANO kn Kiru Health Center178 KANO kn Koguna Primary Health Center179 KANO kn Kore Dispensary180 KANO kn Kunchi Primary Health Center
Value for Money of CBCC December 2014 84

181 KANO kn Kunya Basic Health Center182 KANO Kn Makoda MPHC183 KANO kn Panshekara Basic Health Center184 KANO kn Rimin Gado Basic Health Center185 KANO kn Riruwai Basic Health Center186 KANO kn Rurum Health Post187 KANO kn Shanono Comprehensive Health Center188 KANO kn Shekar Barde Primary Health Center189 KANO kn Shuwaki Model Primary Health Center190 KANO kn T/fulani Health Center191 KANO kn Takai NYSC Public Health Center192 KANO kn Tarauni Public Health Center193 KANO kn Tiga General Hosptal194 KANO kn Toranke Health Center195 KANO kn Tsakuwa Primary Health Center196 KANO kn Tsanyawa Comprehensive Health Center197 KANO kn Ungogo Basic Health Center198 KANO kn Unguwa Uku Public Health Center199 KANO kn Unguwar Gini Primary Health Center200 KANO kn Warawa Basic Health Center201 KANO kn Y Zumunta Clinic202 KANO kn Yako Basic Health Center20 KANO kn Zakirai Health Center
Value for Money of CBCC December 2014 85

3
Annex 2: Stepped wedge Distribution of facilities
State ControlInterventio
n TotalEnugu Quarter 1 10 0 10Enugu Quarter 2 10 0 10Enugu Quarter 3 7 3 10Enugu Quarter 4 6 4 10Enugu Quarter 5 12 4 16Enugu Quarter 6 8 8 16Enugu Quarter 7 7 9 16Enugu Quarter 8 7 9 16Enugu Quarter 9 7 9 16Enugu Quarter 10 6 10 16Enugu Quarter 11 5 11 16Enugu Quarter 12 5 11 16
Enugu
TotalReportingFacilityPeriods 90 78 168
Jigawa Quarter 1 6 0 6Jigawa Quarter 2 6 0 6Jigawa Quarter 3 6 0 6Jigawa Quarter 4 6 0 6Jigawa Quarter 5 11 5 16Jigawa Quarter 6 11 5 16Jigawa Quarter 7 10 6 16Jigawa Quarter 8 9 7 16Jigawa Quarter 9 9 9 18Jigawa Quarter 10 7 11 18Jigawa Quarter 11 3 15 18Jigawa Quarter 12 3 15 18
Jigawa
TotalReportingFacilityPeriods 87 73 160
Kaduna Quarter 1 11 1 12Kaduna Quarter 2 10 2 12Kaduna Quarter 3 10 2 12Kaduna Quarter 4 10 2 12Kaduna Quarter 5 37 3 40
Value for Money of CBCC December 2014 86

Kaduna Quarter 6 35 5 40Kaduna Quarter 7 33 7 40Kaduna Quarter 8 31 9 40Kaduna Quarter 9 22 19 41Kaduna Quarter 10 17 24 41Kaduna Quarter 11 15 26 41Kaduna Quarter 12 15 26 41
Kaduna
TotalReportingFacilityPeriods 246 126 372
Kano Quarter 1 8 2 10Kano Quarter 2 9 2 11Kano Quarter 3 8 3 11Kano Quarter 4 6 5 11Kano Quarter 5 15 9 24Kano Quarter 6 16 8 24Kano Quarter 7 15 9 24Kano Quarter 8 7 17 24Kano Quarter 9 5 19 24Kano Quarter 10 4 20 24Kano Quarter 11 4 20 24Kano Quarter 12 4 20 24
Kano
TotalReportingFacilityPeriods 101 134 235
Lagos Quarter 1 8 0 8Lagos Quarter 2 7 1 8Lagos Quarter 3 6 2 8Lagos Quarter 4 5 3 8Lagos Quarter 5 10 6 16Lagos Quarter 6 11 5 16Lagos Quarter 7 7 9 16Lagos Quarter 8 6 10 16Lagos Quarter 9 3 13 16Lagos Quarter 10 3 13 16Lagos Quarter 11 2 14 16Lagos Quarter 12 2 14 16
Lagos
TotalReportingFacilityPeriods 70 90 160
Value for Money of CBCC December 2014 87

Value for Money of CBCC December 2014 88

Annex 3: Rates of change by state and year
Results by state
Table 26 ANC 1 Facility Rate of Change by state
Monthlyattendances
ControlRate of Change+ StandardDeviation
InterventionRate of change
+ StandardDeviation p-value
Enugu 1.2+0.6 1.0+0.4 0.266
Jigawa 1.2+1.9 1.0+0.44 0.339
Kaduna 1.1+0.7 1.2+1.1 0.154
Kano 1.0+0.6 1.3+1.4 0.907
Lagos 1.2+0.9 1.0+0.4 0.395
Table 27 Total ANC Facility Rate of Change by state
Monthlyattendances
ControlRate of Change+ StandardDeviation
InterventionRate of change
+ StandardDeviation p-value
Enugu 1.2+1.3 1.3+1.2 0.757
Jigawa 1.1+1.0 1.0+0.3 0.271
Kaduna 1.4+2.0 1.5+1.9 0.789
Kano 1.6+2.4 1.2+0.6 0.068
Lagos 1.08+0.39 1.06+0.41 0.798
Table 28 Facility Deliveries Rate of Change by state
Monthlyattendances
ControlRate of Change+ StandardDeviation
InterventionRate of change
+ StandardDeviation p-value
Enugu 1.1+0.8 1.2+0.82 0.769
Jigawa 1.4+3.9 1.0+0.4 0.287
Kaduna 1.2+1.1 1.5+2.3 0.132
Kano 1.3+1.4 1.2+0.8 0.239
Value for Money of CBCC December 2014 89

Lagos 1.2+1.04 1.1+0.47 0.51
Table 29 ANC 4+ Facility Rate of Change by state
Monthlyattendances
ControlRate of Change+ StandardDeviation
InterventionRate of change
+ StandardDeviation p-value
Enugu 1.3+1.8 1.0+0.53 0.076
Jigawa 1.3+2.1 0.9+.4 0.032
Kaduna 1.1+1.1 1.4+1.7 0.186
Kano 1.1+0.84 1.0+0.6 0.277
Lagos 1.09+0.69 1.00+0.75 0.391
Results by year
Table 30 ANC 1 Rate of Change – Year 3
Monthlyattendances
ControlRate of Change+ StandardDeviation
InterventionRate of change
+ StandardDeviation
Enugu 1.23+0.94 1.07+0.44
Jigawa 1.4+2.7 1.05+0.42
Kaduna 1.2+0.9 1.2+1.0
Kano 1.1+0.7 1.1+0.8
Lagos 1.09+0.60 1.06+0.42
Table 31 Total ANC Rate of Change – Year 3
Monthlyattendances
ControlRate of Change+ StandardDeviation
InterventionRate of change
+ StandardDeviation
Enugu 1.04+0.49 1.22+1.07
Jigawa 1.03+0.36 1.06+0.32
Kaduna 1.4+1.6 1.2+1.4
Value for Money of CBCC December 2014 90

Kano 1.3+1.1 1.2+0.49
Lagos 1.07+0.42 1.04+0.28
Table 32 Facility Deliveries Rate of change – Year 3
Monthlyattendances
ControlRate of Change+ StandardDeviation
InterventionRate of change
+ StandardDeviation
Enugu 1.1+0.76 1.1+0.77
Jigawa 1.8+5.9 1.04+0.44
Kaduna 1.2+1.4 1.3+1.2
Kano 1.2+0.8 1.1+0.6
Lagos 1.2+1.1 1.08+0.42
Table 33 ANC 4 Rate of Change – Year 3
Monthlyattendances
ControlRate of Change+ StandardDeviation
InterventionRate of change
+ StandardDeviation
Enugu 1.04+0.49 1.22+1.07
Jigawa 1.03+0.36 1.06+0.32
Kaduna 1.4+1.6 1.2+1.4
Kano 1.3+1.1 1.2+0.49
Lagos 1.07+0.42 1.04+0.28
Table 34 ANC 1 Facility Rate of Change – Year 4
Enugu 1.1+0.39 1.1+0.57
Jigawa 1.09+0.85 1.06+0.49
Kaduna 1.0+0.6 1.3+1.3
Kano 1.09+0.65 1.05+0.35
Lagos 1.4+1.5 1.1+0.46
Value for Money of CBCC December 2014 91

Table 35 Total ANC Facility Rate of Change – Year 4
Monthlyattendances
ControlRate of Change+ StandardDeviation
InterventionRate of change
+ StandardDeviation
Monthlyattendances Control InterventionEnugu 12.7+18.5 8.1+4.6
Jigawa 326+395 210+98
Kaduna 33.0+35.5 38.2+35.6
Kano 28.6+27.6 38.9+30.5
Lagos 83.4+50.8 77.8+68.6
Table 36 Total ANC Rate of Change + SD – Year 4
Monthlyattendances
ControlRate of Change+ StandardDeviation
InterventionRate of change+ StandardDeviation
Enugu 1.4+1.5 1.3+1.0
Jigawa 1.3+1.36 1.0+0.32
Kaduna 1.3+1.8 1.7+2.3
Kano 1.7+3.0 1.2+0.7
Lagos 1.1+0.27 1.09+0.57
Table 37 Facility Delivery Rate of Change + SD – Year 4
Monthlyattendances
ControlRate of Change+ StandardDeviation
InterventionRate of change+ StandardDeviation
Enugu 1.2+0.77 1.3+1.0
Jigawa 1.2+0.7 1.04+0.34
Kaduna 1.2+0.9 1.6+3.0
Kano 1.4+1.6 1.1+1.0
Lagos 1.03+0.61 1.1+0.52
Value for Money of CBCC December 2014 92

Table 38 ANC 4+ Rate of Change + SD – Year 4
Monthlyattendances
ControlRate of Change+ StandardDeviation
InterventionRate of change+ StandardDeviation
Enugu 1.3+1.0 0.89+0.34
Jigawa 1.5+2.3 0.86+0.35
Kaduna 1.2+1.1 1.6+2.3
Kano 1.1+0.9 0.9+0.4
Lagos 0.81+0.42 1.02+0.53
Annex 4: Mean monthly rates of utilisation
ANC 1 Facility mean monthly utilisation by stateControl Intervention
Enugu 29.7 12.7Jigawa 117.7 150.6Kaduna 59.1+61.3 67.8Kano 159.0+114.2 152.6Lagos 19.4 27.1
Total ANC Facility mean monthly utilisation by stateControl Intervention
Enugu 10.1 5.3Jigawa 343.2 339.6Kaduna 45.0 53.9Kano 38.5 46.2Lagos 100.2 103.8
Facility Deliveries mean monthly utilisation by stateControl Intervention
Enugu 11.0 5.7Jigawa 28.1 43.8Kaduna 18.4 26.2Kano 38.5 45.5Lagos 9.5 14.2
Value for Money of CBCC December 2014 93

ANC 4 Facility mean monthly utilisation by stateControl Intervention
Enugu 36.5 15.7Jigawa 81.3 109.3Kaduna 45.1 53.7Kano 97.0+118.1 61.4+63.4Lagos 32.7+29.4 27.5+25.4
ANC 1 Facility mean monthly utilisation – Year 3Control Intervention
Enugu 10.4 11.1Jigawa 114.3 156.3Kaduna 61.1 90.6Kano 165.4 170Lagos 19.6 30.7
Total ANC Facility mean monthly utilisation – Year 3Control Intervention
Enugu 5.9 4.7Jigawa 355.9 395.7Kaduna 60.2 68.0Kano 53.6 58.6Lagos 105.4 124.7
Facility Deliveries mean monthly utilisation – Year 3Control Intervention
Enugu 4.3 5.1Jigawa 25.8 44.2Kaduna 22.2 34.2Kano 53.2 57.2Lagos 9.2 15.5
ANC 4 Facility mean monthly utilisation – Year 3Control Intervention
Enugu 11.9 13.7Jigawa 104.7 132Kaduna 60.2 67.6Kano 108.2 77.7Lagos 34.9 39.4
Value for Money of CBCC December 2014 94

ANC 1 Facility mean monthly utilisation – Year 4Control Intervention
Enugu 41.5 20.1Jigawa 119 165Kaduna 53.2 43.9Kano 151.4 142.2Lagos 18.3 22.3
Total ANC Facility monthly utilisation – Year 4Control Intervention
Enugu 12.7 8.1Jigawa 326 210Kaduna 33.0 38.2Kano 28.6 38.9Lagos 83.4 77.8
Facility Delivery mean monthly utilisation – Year 4Control Intervention
Enugu 15.2 8.7Jigawa 28.7 43.9Kaduna 14.8 18.2Kano 28.3 38.6Lagos 10.2 12.4
ANC 4+ Facility mean monthly utilisation – Year 4Control Intervention
Enugu 51.6 25.7Jigawa 64.4 78Kaduna 33.2 38.2Kano 84.2 51.5Lagos 25.1 12.6
Value for Money of CBCC December 2014 95

Annex 5 PATHS2 Expenditure
Table 39 PATHS2 Expenditure Year 3 to Year 5
GBP Aug 11-Jul
12 Aug 12-Jul
13 Aug 13-Jul
14
Direct costsOutput 1 4,107,356 2,259,316 1,768,221Output 2 7,271,731 4,086,869 3,310,373Output 3 10,637,737 6,087,483 7,310,804Output 4 2,901,326 1,737,832 1,522,167Output 5 3,189,969 2,084,750 3,210,654Total direct costs 28,108,119 16,256,250 17,122,219
Shared costsGen tech & knowledge mgt 2,035,324 1,050,820 696,270Management and admin 7,995,422 4,310,434 3,662,992M&E & Operations Research 1,665,916 1,219,035 576,321Total shared costs 11,696,661 6,580,289 4,935,582
Total cost 39,804,780 22,836,539 22,057,801
Cost by output including apportioned shared costs
Output 1 5,816,554 3,199,487 2,504,032Output 2 10,297,724 5,787,543 4,687,922Output 3 15,064,430 8,620,674 10,353,056Output 4 4,108,657 2,460,998 2,155,588Output 5 4,517,414 2,952,279 4,546,707
Total cost 39,804,780 23,020,981 24,247,306
Source: PATHS2 Expenditure by Output and Location 2014, PATHS2September 2014
Value for Money of CBCC December 2014 96

Annex 6 Life Years GainedTable 40 Life Years Gained – Economic Analysis of PATHS2
Value for Money of CBCC December 2014 97

Annex 7 Costs of CBCC Interventions
The tables below refer to the costings of CBCC interventions in 1.7.1 above.
Year 1 cost of conducting SMI-D in 1 cluster of4 LGAs
Cost:Naira
Days
Units
UnitCost
LGAs Community
Government
Externalresources
TotalYear 1
TotalYear 2
Initial training for Local Technical Assistants(LTAs) and staffPer diem (facilitators) 4 3 7,500 90,000 90,000Training allowance 4 13 4,000 208,000 208,00
0Accommodation 4 18 15,00
0 1,080,000 1,080,
0002 Tea breaks/ Lunch 3 18 3,000 162,000 162,00
0Venue 3 1 50,00
0 150,000 150,00
0Training materials 1 18 450 8,100 8,100Sub-total 1,698,
100 424,52
5
AdvocacyMCH Coordinator; Health educator; Officer in charge
2 2 Staffcosts
Refreshments 2 10 800 4 64,000 64,000Sub-total 64,000 64,000
Community forumMCH Coordinator; Health educator; OIC
4 2 4 Facility Staffcosts
-
Training of 24 Community Volunteers & 12 Cluster Facilitators
Volunteers
MCH Coordinator; Health educator; OIC
4 2 4 Staffcosts
Staff transport allowance 4 2 2,000 4 64,000 64,000Transport allowance 4 36 1,000 4 576,000 576,00
0Refreshments 4 45 800 4 576,000 576,00
0Training materials 1 45 460 4 82,800 82,800Sub-total 1,298,
800 324,70
0
Emergency Maternal Care Training
Volunteers
MCH Coordinator; Health educator; Officer in charge
3 2 4 Staffcosts
Refreshments 3 180 800 4 1,728,000 1,728,000
Sub-total 1,728,000
432,000
Community Review Meeting Volunteers
MCH Coordinator; Health educator; Officer in charge
6 2 4 Staffcosts
Refreshment 6 100 100 4 240,000 240,000
Sub-total 240,000
240,000
On-going support - year 1
National Technical Assistant fees
15 1 25,000
4 1,500,000 1,500,000
National Technical Assistant car hire and
15 1 15,000
4 900,000 900,000
Value for Money of CBCC December 2014 98

expensesCoordinating LTA fees 17 1 10,00
04 680,000 680,00
0Staff transport allowance 15 2 5,000 4 600,000 600,00
0LGA Transport allowance 15 1 5,000 4 300,000 300,00
0LGA Communication 15 1 500 4 30,000 30,000LTA Fees 15 2 3,000 4 360,000 360,00
0LTA Transport allowance 15 2 2,000 4 240,000 240,00
0LTA Communication 15 2 4 1,000 1,000Sub-total 4,611,
000 2,305,500
Total NGN 9,639,900
3,790,725
Total NGN per birth 465 183exchange rate
mid 2014Total USD 162.7 $59,250 $23,299Total USD per birth (Population 500,000; crude birth rate
41.5/1000)$2.86 $1.12
Total GBP 278.8 £34,576 £13,597Total GBP per birth (Population 500,000; crude birth rate
41.5/1000)£1.67 £0.66
Value for Money of CBCC December 2014 99

Year 1 cost of conducting 2 RAR campaigns at6 sites
Cost: Naira
Days Units
UnitCost
Campaigns Community Government
Externalresource
s
TotalYear 1
TotalYear 2
Initial training for Local Technical Assistants (LTAs) and staffHealth and LGA staff 2 4 - Staff
costs -
LTA 2 12 - - -Staff Transport allowance 2 4 7,500 - 60,000 60,000Transport allowance 2 12 7,500 - 180,000 180,00
0Tea break & Lunch 2 20 4,000 - 160,000 160,00
0Venue 2 1 100,0
00- 200,000 200,00
0Stationery 1 14 450 - 6,300 6,300Sub-total - 606,30
0 151,57
5
Scoping visit to BEOC catchmentsBEOC staff 2 2 Staff
costsLGA MCH Coordinator, health educator and other
2 3 6 Staff costs
Training for RAR Community Volunteers
Volunteers
BEOC staff 2 2 Staff costs
MCH Coordinator; Health educator
3 2 6 Staff costs
Staff Transport allowance 3 2 2,000 12 144,000 144,000
Transport allowance 3 16 2,000 6 576,000 576,000
Tea break & Lunch 3 25 1,300 6 585,000 585,000
Sub-total 1,305,000
326,250
RAR Session Volunteers
BEOC staff 2 2 12 Staff costs
MCH Coordinator; Health educator
2 2 12 Staff costs
Staff Transport allowance 2 2 3,000 12 144,000 144,000
CF Transport allowance 2 12 2,000 12 576,000 576,000
CF Fee/Per diem 2 12 1,300 12 374,400 374,400
Sub-total 1,094,400
1,094,400
On-going support - year 1National Technical Assistant 10 1 25,00
012 3,000,0
00 3,000,
000National Technical Assistant car hire and expenses
10 1 15,000
12 1,800,000
1,800,000
LTA Fees 10 1 8,000 12 960,000 960,000
Communication 10 1 500 12 60,000 60,000Transport Allowance 8 1 3,000 12 288,000 288,00
0Sub-total 6,108,
000 3,054,
000
Total NGN 9,113,700
4,626,225
Total NGN per birth 439 223exchange
Value for Money of CBCC December 2014 100

rate mid2014
Total USD 162.7 $56,015 $28,434Total USD per birth (Population 500,000; crude birth rate
41.5/1000)$2.70 $1.37
Total GBP 278.8 £32,689 £16,593Total GBP per birth (Population 500,000; crude birth rate
41.5/1000)£1.58 £0.80
Value for Money of CBCC December 2014 101

Year 1 cost of conducting one round of FCO with 4 BEOCs in1 cluster
Cost:Naira
Budget for 1 Cluster FCO/MO - Year 1 (1FCO + 2 MO)
Days
Units
UnitCost
Campaign
Community Government
External
resources
TotalYear 1
Total Year2
Advocacy/Training of CVsMCH Coordinator; Health educator, OIC
3 2 Staffcosts
LGA Staff transport allowance
3 2 3,000
4 72,000 72,000
Drama facilitator + LTA 3 2 5,000
4 120,000 120,000
Sub-total 192,000
Outreach eventMCH Coordinator; Health educator, OIC
1 2 Facility,awnings,seating,PA system
Staffcosts
Drama facilitator (DF) + LTA fees
1 2 8,000
4 64,000 64,000
Communication for DF & LTA 1 2 500 4 4,000 4,000Trasport allowance for LTA& DF
1 2 5,000
4 40,000 40,000
LGA Staff transport allowance
1 3 5,000
4 60,000 60,000
Sub-total 168,000
Other CostItems needed for outreach 1 4 Outreach
itemsSub-total
On-going support - year 1National Technical AssistantFees 4 1 25,0
004 400,000 400,000
National Technical Assistant car hire and expenses
4 1 15,000
4 240,000 240,000
Local Technical AssistantTransport 4 1 4,00
04 64,000 64,000
Stipends 4 1 10,000
4 160,000 160,000
Communication 4 1 500 4 8,000 8,000Sub-total 872,000
Mini Outreach (MO)MCH Coordinator; Health educator, OIC
2 2 Staffcosts
Transport for LTA 2 1 4,000
12 96,000 96,000
Stipend for LTA 2 1 10,000
12 240,000 240,000
Communication for LTA 2 1 500 12 12,000 12,000Sub-total 348,000
Total NGN 1,580,000 0Total NGN per birth 76 -
exchangerate mid
2014Total USD 162.7 $9,711 $0Total USD per birth (Population 500,000; crude birth rate
41.5/1000)$0.47 $0.00
Total GBP 278.8 £5,667 £0Total GBP per birth (Population 500,000; crude birth rate
41.5/1000)£0.27 £0.00
Value for Money of CBCC December 2014 102

Annex 8 Key informants interview guide
Key Informants Community/Facility
1. Do you know anything about CBCC within your community? (In other words, were you aware of any CBCC activity around your health facility?
2. Have you ever been personally involved in any CBCC activity inyour community?
3. If yes, how many times? and what effect does it (specific CBCC) have on Total delivery/ANC 1 & 4 visits (In other words,was there any change in people’s attitude and practice especially health seeking behaviour?
4. Did you notice any increase in Total deliver/ANC visits after this particular CBCC intervention(s)? (Be specific with date/period of intervention)
5. Was this observed increase (if any) sustained or did it reduceover time?
6. If the increase was sustained or reduced with time, what do you think was responsible for the (specific CBCC intervention with date) sustainability/drop?
7. What do you personally do to ensure sustainability of such CBCC intervention in the community?
8. Do you think CBCC has any negative effect on service utilization?
9. Do you consider CBCC more effective than other sources of information/communication like radio/TV?
Key Informant Interview LGA
1. Has your LGA ever been involved or informed of any CBCC withinyour LGA? (In other words, were you aware of any CBCC activityin the LGA?)
2. If yes, have you personally been involved in any CBCC activityin your LGA?
3. If yes, how many times? Could you recall when?4. What effect does such CBCC activity have on Total delivery/ANC
1 & 4 visits (In other words, was there any change in people’sattitude and practice especially health seeking behaviour around the period?)
Value for Money of CBCC December 2014 103

5. Did you notice any increase in Total deliver/ANC visits after this particular CBCC intervention(s)? (Be specific with date/period of intervention)
6. Was this observed increase (if any) sustained or reduced over time?
7. If the increased was sustained or reduced with time, what do you think was responsible for the (specific CBCC intervention with date) sustainability/drop?
8. What does the LGA do to ensure sustainability of such CBCC interventions in the community?
9. Do you think CBCC has any negative effect on service utilization?
10. How does this particular CBCC intervention compare with alternatives in terms of its effectiveness and value for money?
11. Do you think that further CBCC activities would be useful?
12. Do you have any plans for further CBCC activities? (If no, what barriers would you have to overcome to implement plans for CBCC?)
13. Do you have plans for other ways to increase utilisation of delivery and ANC services, such as radio and TV?
Value for Money of CBCC December 2014 104

Key Informants Interview at state level
1. Were you ever aware of any CBCC intervention by PATHS2 within your State?
2. Have you ever been personally involved in any of these CBCC activities in your State?
3. Did you notice increase in Total deliver/ANC visits after a particular CBCC intervention? (Be specific with date/period ofintervention)
4. Was this observed increase (if any) sustained or reduced over time
5. If the increase was sustained or reduced with time, what do you think was responsible for the (specific CBCC intervention with date) sustainability/drop?
6. What do you do at state level to ensure sustainability of suchCBCC interventions?
7. Do you think CBCC has any negative effect on service utilization in your state?
8. Do you consider CBCC more effective than other sources of information/communication like radio/TV? How does this particular CBCC intervention compare with alternatives in terms of its effectiveness and value for money?
9. Do you think that further CBCC activities would be useful? 10. Do you have any plans for further CBCC activities? (If
no, what barriers would you have to overcome to implement plans for CBCC?)
11. Do you have plans for other ways to increase utilisation of delivery and ANC services, such as radio and TV?
Value for Money of CBCC December 2014 105

Annex 9 Discussion group guide
I. Introduction - [3 minute]
Welcome and thank you for taking time to participate in thisdiscussion today. My name is [Moderator] and this is [note-taker]and we are working on behalf of SMOH in collaboration with PATHS2.We wish to get your opinion on the impact of [refer to the specificCBCC intervention] on use of health facilities particularly forpregnant women and children. This information is to help us to solvehealth problems of families in Nigeria and to give them more healthchoices. Your comments and those of other participants will help usto develop an effective program to improve people’s health.
II. Ground Rules - [2 minute]
We are interested in all of your opinions and feelings. There are noright or wrong answers. We need your ideas, so any criticisms youhave will not hurt our feelings. We encourage you to provide frankcomments that will improve our study. Some of you may agree ordisagree with each other, which is perfectly normal and we encourageyou to openly share your ideas. Do not wait for the moderator to askfor your opinion: feel free to speak at any time. However, pleasetry to avoid interrupting others while they are talking. Everyonewill have a chance to speak and all ideas, concerns, and opinionsare of value. The session will last approximately 1 hour.
III. Confidentiality - [2 minute]
Everything that is said in this room is confidential and we will nottell anyone that you participated in this discussion. A recordingmachine will record what is said so that we have an accurate accountof your views. My assistant will also take some notes to help us inthis task. Does anyone have any questions?
IV. Introduction of participants (Warm Up) -[5 minute]
We would like each of you to introduce yourself. Also, please tellus your marital status. Please tell us how many children you havegiven birth to, and also tell me the year of your last pregnancy(For Female Groups Only).
Value for Money of CBCC December 2014 106

V. Research questions
Concepts and terms about Pregnancy (10 minutes)
1. Could you tell me about the problems and illnesses associated with pregnancy in your community, including your own pregnancies (for female groups only)?
2. Do you know of any danger signs to look out for during pregnancy? Probe
Social norms affecting attendance at health facilities (10 minutes)
1. What are the advantages and disadvantage of pregnant womenattending a health facility?
2. Do pregnant women receive support from their family to attendhealth facility? Why?
3. Do pregnant women who attend health facilities receive supportfrom their community? Why?
4. Do your customs and religions allow pregnant women to go to ahealth facility during pregnancy and for delivery. Why?
5. What other reasons would prevent pregnant women from attendinga health facility during pregnancy and for delivery?
Community-based behaviour change intervention (15 minutes)
1. Has anyone talked to you about the benefit of attending ahealth facility during pregnancy and delivery? Have youlearned anything from other sources, such as the radio? Probethe nature of this discussion? Was it one on one or a groupdiscussion? Also Probe frequency of the discussion? Was it oneoff or periodic?
2. Has any of you taken part in leading [the CBCC intervention]in your community?
3. Describe how [the CBCC intervention] functions in yourcommunity. Have there been difficulties with the intervention,either at first or now?
4. How has this intervention affected people’s understanding ofthe benefit of attending a health facility during pregnancyand delivery?
5. Are more women attending health facilities as a result of [theCBCC interventions? Probe if more women, less women or samenumber of women are attending facility.
6. Is [the CBCC intervention] in your community consideredvaluable? Should the intervention be continued?
Dealing with obstetric emergencies (15 minutes)
1. Suppose a pregnant woman in this community is observed to have
Value for Money of CBCC December 2014 107

one of the danger signs (i.e. bleeding), what would happen?2. How would she and her family know she needed help?3. Who would they seek help from?4. If she needs to go to a facility, how would she get there?5. What facility would she normally go to – probe for whether it
can offer BEOC or CEOC service.
Wrap-up (5 minutes)
We have discussed a lot of issues about Pregnancy, CBCC and facilitydelivery today and we want to thank you for your participation. Thisinformation will help us to plan Community-Based Communicationinterventions for pregnant women in your community. Before we close,do you have any questions for us?
Value for Money of CBCC December 2014 108

Annex 10 Steering Group
The core group of PATHS2 staff and consultants comprises:
Dr Benson Obonyo, Director of Programmes
Dr Ibrahim Yisa, Director of M&E
Dr Amina Aminu, Lead for Service Delivery
Oko Igado, Lead for Voice and Accountability
Anselm Okoro, Monitoring and Evaluation
Kunle Akerele, Monitoring and Evaluation
Jennifer Armitage, Consultant in Value for Money
Value for Money of CBCC December 2014 109

REFERENCES
The Independent Monitoring and Evaluation Project for the Statelevel Programmes (IMEP). 2012. Annual Review PATHS2
PATHS2. 2012. Service Delivery Strategy: Expanding the Delivery ofQuality Health Care to the Poor. Revised 2012
PATHS2. 2012. Behaviour Change Communication Strategy 2012
PATHS2. 2012. Economic analysis of PATHS2 from inception to end ofproject (July 2009 to July 2014)
Value for Money of CBCC December 2014 110

i Armitage J and others, PATHS2 Value for Money Self Assessment Report 2012ii Bhutta ZA, Ahmed T, Black RE, Cousens S, Dewey K, Giugliani E, Haider BA, Kirkwood B, Morris SS, Sachdev HP, Shekar M, Maternal and Child Undernutrition Study Group: What works? Interventions for maternal and child undernutrition and survival. Lancet 2008, 371:417–440iii Hornik RC: Public Health Communication: Evidence for Behaviour Change.Mahwah, N.J: L. Erlbaum Associates; 2002iv Albarracin D, McNatt PS, Klein CT, Ho RM, Mitchell AL, Kumkale GT: Persuasive communications to change actions: an analysis of behavioral and cognitive impact in HIV prevention. Health Psychol 2003, 22:166. v Hutchinson P, Wheeler J: The Cost-Effectiveness of Health CommunicationPrograms: What Do We Know? Journal of Health Communication: InternationalPerspectives Volume 11, Supplement 2, 2006vi Guilkey D.K, Hutchinson P, Lance P: The Cost-Effectiveness Analysis for Health Communication Programs, Journal of Health Communication: International Perspectives Volume 11, Supplement 2, 2006vii Keating J, Hutchinson P, Miller J M, Larsen D A, Hamainza B, Changufu C, Shilya N, Eisele T P: A quasi-experimental evaluation of an interpersonal communication intervention to increase insecticide-treated net use among children in Zambia, Malaria Journal 2012, 11:313viii Gies S, Coulibaly SO, Ky C, Ouattara FT, Brabin BJ, D’Alessandro U: Acommunity-based campaign to improve update of intermittent preventive antimalarial treatment in pregnancy in Burkina Faso, American Journal of Tropical Medicine and Hygiene March 2009 Vol 80: no 3ix Development Media International: Burkina Faso RCT: Midline Results, www.developmentmedia.net 2014x MacPherson R, Khadka N, Moore J M, Sharma M: Are Birth-preparedness Programmes Effective? Results from a Field Trial in Siraha District, Nepal, Journal of Health and Population Nutrition 2006, Dec 24(4)xi Bertrand J T, O’Reilly K, Denison J, Anhang R and Sweat M: systematic review of the effectiveness of mass communication programs to change HIV/AIDS-related behaviours in developing countries Health Education Research 2006, 21 (4)xii PATHS, Increasing Access to Safe Motherhood Services, Partnership forTransforming Health Services in Nigeriaxiii Aradeon S, Aminu A, Doctor H: Integrating Community Communication Into the SBA Model for Reducing Maternal Mortality 2014
xiv Snyder L B: Health Communication Campaigns and Their Impact on Behavior, Journal of Nutritional Education Behavior 2007; 39; S32-S40

xv Koenker H, Keating J, Alilio M, Acosta A, Lynch M, Fatoumata Nafo-Troare: Strategic roles for behavior change communication in a changing malaria landscape, Malaria Journal 2014, 13:1 xvi Gabrysch S, Campbell O M R: Still too far to walk: Literature review of the determinants of delivery service use, BMC Pregnancy and Childbirth2009, 9;14xvii OECD, Value for Money in Government Series 2010-2013: Organisation for Economic Cooperation and Developmentxviii DFID: DFID’s Approach to Value for Money (VfM), United KingdomDepartment for International Development 2011xix Newlands D, Belemsaga-Ugbare D, Ternent L, Hounton S, Chapman G: Assessing the costs and cost-effectiveness of a maternity health strategyin Burkina Faso, Immpact, University of Aberdeen xx Pearson M, DALYs and Essential Packages Briefing Paper, DFID HealthSystems Resource Centre 2000xxi CHOICE Choosing Interventions that are Cost Effective: see www.WHO-int/choice/cost-effectiveness/en/ xxii Adam T, Lim S S, Mehta S, Bhutta Z A, Fogstad H, Mathai M, Zupan J Darmstadt G L: Cost effective analysis of strategies for maternal and neonatal health in developing countries, British Medical Journal 2005;331;1107-xxiii Erim D, Resch S, Goldie S, Assessing health and economic outcomes of interventions to reduce pregnancy-related mortality in Nigeria, BMC Public Health 2012, 12:786xxiv Husereau D, Drummond M, Petrou S, Carswell C, Moher D, Greenberg, D, Augustovski F, Briggs A, Mauskopf J, Loder E, CHEERS: The Consolidated Health Economic Evaluation Reporting Standards Statement, Cost Effectiveness and Resource Allocation 2013 11:6xxv Brown, C., and Lilford, R., 2006 The stepped wedge trial design: a systematic review; BMC Medical Research Methodology 2006, 6:54 doi:10.1186/1471-2288-6-54xxvi PATHS2 Baseline Study, PATHS2, 2010xxvii Sangowawa A and others, Draft Mid term Evaluation Report (report number 16044-1108) PATHS2, March 2013 xxviii Ene N, Survey of Nigerian Women’s Knowledge of Key Health Issues, Rounds 1 and 2, Preston Health Consulting Ltd, 2013 and 2014