
THE USES AND BENEFITS OF SPLUNK IN CONTINUOUS ...
37
Robert Barker THE USES AND BENEFITS OF SPLUNK IN CONTINUOUS INTEGRATION
-
Upload
khangminh22 -
Category
Documents
-
view
0 -
download
0
Transcript of THE USES AND BENEFITS OF SPLUNK IN CONTINUOUS ...
Robert Barker
THE USES AND BENEFITS OF SPLUNK IN CONTINUOUS INTEGRATION
THE USES AND BENEFITS OF SPLUNK IN CONTINUOUS INTEGRATION
Robert Barker Bachelor’s Thesis Spring 2020
Information Technology Oulu University of Applied Sciences

3
ABSTRACT
Oulu University of Applied Sciences Information and Communication Technology
Author: Robert Barker Title of Bachelor´s thesis: The Uses and Benefits of Splunk in Continuous Integration Supervisors: Teemu Korpela, Heli Ketola, Ismo Simonen, Tero Heikkinen Term and year of completion: Spring 2020 Number of pages: 37
The main purpose of this project was to improve the efficiency of the continuous integration team by implementing a faster and more useable solution to view the stability of the continuous integration system. This thesis project was requested by the 4G Continuous Integration team at Nokia. There is a current web application used to show the testing data, however it is very slow, and many functions are not working properly. The proposed solution was to utilize Splunk to build a new system to replace this older implementation. The key functions that the team desired for the project was to implement a fail trend graph, top failing test cases, scalable deployment, crash log, and other visualizations representing the test data. This project was successful by increasing the efficiency of the workplace and the usability of viewing the test data. Using the previous system, it would take approximately two minutes in order to fetch the data but the Splunk implementation takes only several seconds to fetch the same data. This Splunk instance has reduced the amount of time it takes for developers to view the data and uses visualizations of the data to increase the usability.
Keywords: Splunk, Testing, Continuous Integration

4
CONTENTS
ABSTRACT..................................................................................................................................... 3
PREFACE ....................................................................................................................................... 5
ABBREVIATIONS ........................................................................................................................... 6
1 INTRODUCTION .................................................................................................................... 7
1.1 Problem Statement ..................................................................................................... 8
2 CONTINUOUS INTEGRATION ............................................................................................ 10
3 SYSTEM ARCHITECTURE .................................................................................................. 12
3.1 Environment .............................................................................................................. 12
3.1.1 Server ......................................................................................................... 12
3.1.2 Git / Gerrit ................................................................................................... 12
3.1.3 Operating System ....................................................................................... 14
3.1.4 Database .................................................................................................... 14
3.2 Software Utilized ....................................................................................................... 15
3.2.1 Splunk ......................................................................................................... 16
3.2.2 Docker ........................................................................................................ 18
3.2.3 Jenkins........................................................................................................ 19
3.2.4 Java Runtime Environment ......................................................................... 19
3.2.5 Java Database Connectivity (JDBC)........................................................... 19
3.2.6 MySQL Connector/J ................................................................................... 19
4 IMPLEMENTATION.............................................................................................................. 20
4.1 Phase One ................................................................................................................ 20
4.2 Phase Two ................................................................................................................ 21
4.2.1 Database Connection ................................................................................. 22
4.2.2 Data Manipulation ....................................................................................... 23
4.2.3 Visualizations .............................................................................................. 24
4.2.4 Dashboards ................................................................................................ 25
4.2.5 Links ........................................................................................................... 29
4.3 Phase Three.............................................................................................................. 30
4.3.1 Second Iteration.......................................................................................... 31
5 CONCLUSION AND FUTURE DEVELOPMENT ................................................................. 33
REFERENCES ............................................................................................................................. 35
5
PREFACE
This thesis was completed during a six-month period at Nokia Solutions and Networks. I hope that
my work here will improve the efficiency and effectiveness of the teams at Nokia. I have learned so
much during this time and am so grateful for the new friends I was able to work alongside.
I would like to thank Nokia for giving me the opportunity to work for one of the most prestigious
companies and to learn from some of the best. Speaking of the best, I would like to thank all my
coworkers who immediately took me in and were more than hospitable. I would also like to thank
my line manager, Heli Ketola, for always keeping me on track with deadlines and her support. Also,
want to thank my technical supervisors Ismo Simonen and Tero Heikkinen for all their help during
this project. Furthermore, I would like to thank Janne Laitila who spent many hours taking me to
the labs and helping me set up the servers for the project. Additionally, I want to thank Ilkka Ollila
for helping me throughout the project.
From the Oulu University of Applied Sciences, I would like to thank my supervisor Teemu Korpela
who offered a great deal of knowledge and resources during this thesis. I also want to thank Kaija
Posio for acting as a second examiner of this thesis.
Most importantly I would like to thank my wife Lyndsie. Without her caring for our children, the
house and myself, I would never have gotten anything done. She is my biggest supporter and I am
so grateful.
March 10, 2020
Oulu, Finland
Robert Barker
6
ABBREVIATIONS
4G
API
CD
CI
CPU
CSV
DB
GUI
HTML
HTTP
IP
JDBC
JRE
JSON
LTS
NoSQL
OS
SCT
SPL
SSH
UI
URL
UTC
VCS
XML
Fourth Generation Mobile Network
Application Programming Interface
Continuous Delivery / Deployment
Continuous Integration
Central Processing Unit
Comma-Separated Values
Database
Graphical User Interface
Hypertext Markup Language
Hypertext Transfer Protocol
Internet Protocol
Java Database Connectivity
Java Runtime Environment
JavaScript Object Notation
Long Term Support
Non-Relational Database
Operating System
System Component Test
Splunk Search Processing Language
Secure Shell
User Interface
Uniform Resource Locator
Universal Coordinated Time
Version Control System
Extensible Markup Language

7
1 INTRODUCTION
One of the most common ‘buzzwords’ heard in the technology community today is data. Everything
in this industry runs on and produces data well. This leads to an enormous amount of machine data
being processed daily. Many of today’s technological advances have been ways to better interact
with this data, whether this means how to store, process, read, and organize it.
One of the tools that has capitalized on this is Splunk. Splunk is a platform which captures, indexes,
and correlates big data into a searchable container. The main uses of this indexed data are
searching, monitoring, and visualizing the system. Splunk offers a wide range of report, graph, alert,
dashboard, and visualization tools which are used to more efficiently analyze data.
Continuous Integration (CI) is the process of automating the integration of many developers’ code
changes into a shared repository several times a day [1]. This operation often includes automating
tests on the code and syntax reviews among others. Depending on the size of the system, there
could be a very large amount of data traveling through these pipelines at any given second. Usual
examples of data that is being passed through these pipelines are test results, performance
measurements, and logs. Depending on a company’s implementation, this data can be distributed
across multiple servers and it can be difficult to find a specific piece of data or see how the
performance is being affected by certain operations. Splunk offers a great solution to this issue and
greatly increases employees’ efficiency while reducing company costs of lost time.
FIGURE 1. CI/CD Pipeline Diagram [2]

8
Figure 1 represents the modern CI/CD workflow in the software industry. CI has been covered
previously and CD stands for either Continuous Delivery or Continuous Deployment.
Continuous Delivery is an extension of CI which gives developers the opportunity to deploy new
changes to the customers in an efficient manner. CI automates the build and test phases and then
with CD on top, the release process is also automated, giving the developer the ability to manually
deploy by simply pressing a button [3]. Using CD, it is possible to schedule release cycles based
on the company’s needs whether that be weekly, monthly or daily. It is recommended to deploy
small batches so that the developers can easily go back and troubleshoot in case any problems
arise [3].
Continuous Deployment is practically the same as continuous delivery accept deployment takes
the automation a step further. Every change that successfully passes all the stages of the pipeline
is then automatically released to the customers. Deployment creates an efficient feedback loop
between the developers and the customers [3].
In order to utilize any of these systems, there needs to be a very strong test suite which covers
most of the codebase. If the tests are not comprehensive, then the code being produced and
deployed could be filled with errors and cause a large issue. Having a strong CI/CD system may
give a company many advantages. With more frequent releases, developers as well as customers,
can see their work almost immediately creating a better customer feedback loop. With the releases
coming weekly or even daily, customers are seeing the product constantly growing and improving,
which increases customer retention.
1.1 Problem Statement
This thesis will be detailing the process of implementing a system where the test results and Git
data is indexed in a Splunk instance. The system is currently utilizing both Subversion and Git so
parts of the data will not be used in this project. Subversion and Git are both version control systems
used by developers in order to integrate their code. This thesis will be used in one of the Nokia 4G
continuous integration teams. 4G is one of the largest products currently and the continuous CI
machinery runs thousands of automated tests and integrations daily. This results in a massive
amount of data which can be time consuming to access.

9
With the current system, it is an arduous task to locate specific sets of data and the current
technique used for visualization requires expertise and time. Currently the visualizations of the data
are on a web application made by one of the team members. This application takes frontend web
development, backend web development, and time to build and run. Since the application is built
from scratch, it is a very time-consuming task to make changes or update the application. This
takes an experienced developer away from their normal work tasks and is not the most efficient
solution.
The reporting and alert systems for unstable tests and errors is a spam of emails which clog up a
large group of employees’ emails making normal workplace tasks, such as finding and responding
to important emails, difficult. The email alerts are also very hard to distinguish from one test line to
the other due to a lack of organization. These emails are sent for many different cases including
when the test becomes unstable, still unstable, stable, back to normal, failed, still failing. The
number of cases which trigger alerts cause the large amount of emails. Using Splunk in this system
will help to organize the reporting and alerting of failing test cases. First of all, limiting the number
of cases which warrant an alert can help clear up the emails and then Splunk offers stacking of
alerts so that if a test is constantly failing within a certain time frame, it will combine the alerts as to
not clutter the system.
During this project, Splunk will be used to gather data from the team’s database where it will then
be parsed and indexed in order to create a searchable dataset. From here the Splunk graphical
user interface (GUI) will be used along with the Splunk search processing language (SPL) in order
to group data in real-time. From here, reports, alerts, graphs, and visualizations will be used to
create responsive and useful dashboards that can be utilized by many employees. Developers will
be able to utilize the data to check their code changes, the CI teams will be able to detect failing
test lines and bottlenecks, and management can use the data in order to see performance and
collect data which can be used for presentations internally and for investment.
Another aim of this project is that this solution should be easily scalable and transferrable. Making
this Splunk implementation easily transferrable to different teams could save a great amount of
time and money for the company. Several other teams are already using Splunk in their work
environment for different purposes. This project will not be using any of the other teams’ Splunk
instances and will have much different functionality. By utilizing Splunk, these issues will be solved
and helped to create a more efficient and motivated workforce.

10
2 CONTINUOUS INTEGRATION
Continuous integration is a common software development process wherein developers should
merge their code changes at least daily, but preferably multiple times a day [4]. In the CI process,
each merge triggers automated test and build sequences in a short amount of time. This process
is utilized throughout the industry and is a great practice when working on large projects with
several developers. When utilizing a CI system, the code changes should be rather small, usually
solving one issue instead of committing a massive amount of code changes over a long period of
time [4]. This makes for less code conflicts, and if conflicts do arise, it is much easier to pinpoint
and rectify the error.
The CI process gathers many ideals from the Agile software development principle. Agile
development was developed in 2001 to streamline efficiency and efficacy of the code base. This
Agile manifesto, “Agile Manifesto: Manifesto for Agile Software Development”, outlines twelve main
principles for agile and proficient code [5]. CI derives its main processes from one of those twelve
which states “Deliver working software frequently, from a couple of weeks to a couple of months,
with a preference to the shorter timescale” [5]. CI in recent years has stepped up this timescale to
everyday or multiple times per day.
FIGURE 2. Agile Methodology Diagram [6]
Figure 2 visualizes the Agile methodology. This figure shows how Agile uses smaller sprints which
contain all development components in order to release a workable product more often. CI is
considered a production phase where new code changes are built, tested, verified and released.
These tests include unit tests, system component tests and many other static and dynamic tests.
Continuous integration is also known by its subcomponents including: continuous delivery,

11
continuous releasing, continuous deployment, continuous verification, continuous testing, and
continuous improvement. The master branch is being deployed and released multiple times a day
and it is called continuous delivery. This process gives companies the opportunity to have the latest,
working software available for either development or the customers [7].
12
3 SYSTEM ARCHITECTURE
In this chapter the system architecture including hardware, software, and installation processes will
be overviewed. This system is meant to facilitate data transfer from the CI servers and Git in real-
time.
3.1 Environment
This section details the servers and operating systems utilized for this thesis.
3.1.1 Server
An in-house server with a barebones Ubuntu installation is being used as the home for the Splunk
instance.
3.1.2 Git / Gerrit
Git is the most used version control system (VCS) in the industry. Git is a distributed VCS which
means that the code base is distributed on all the developers’ computers instead of just one place.
The Distributed VCS perform better for teams because they can work offline and do not need to
wait for locks on the code, such as Centralized VCS. Currently the team is migrating all the code
from Subversion to Git [8].
Gerrit is a web-based code review and repository management system for the Git version control.
The main purpose of a code review system is to catch the bugs and design issues before they are
combined with the main code base. There are two stages in the basic Gerrit workflow. First, the
contributor uploads changes to Gerrit with Git. After this, the other developers can use the web
browser to review the code, publish comments, and either approve or abandon the changes [9].
Figure 3 shows the Git and Gerrit repository structure. Gerrit can manage multiple repositories and
stores the changes.

13
FIGURE 3. Git / Gerrit Repository Structure [9]
Subversion (SVN) is the current version control system in which Nokia is working to migrate away
from. SVN is an open source, centralized version control system. Many developers prefer Git to
SVN due to offline availability, no single point of failure, and the ease of use with branching and
merging code contributions [10]. Figure 4 displays the differences in the workflows of SVN which
is centralized and Git which is distributed.
FIGURE 4. SVN vs GIT Workflow Diagram [11]

14
3.1.3 Operating System
This project was completed with two separate implementations due to blockers experienced in the
first implementation. The first implementation is on a remote server which will be utilized for a
scalable option. The operating system which is being used on the Splunk server is a barebones
Ubuntu 18.04 LTS (Long Term Support) installation. Ubuntu was chosen due to its high
customization options and the ability to easily scale the system to fit different needs [12].
The second implementation was built on the author’s local machine which is running Windows 10
Enterprise in order to bypass certain blockers discussed later.
3.1.4 Database
All the data from the CI system is saved to a MySQL database. The data is saved in real-time as
the builds are executed and when they are completed.
MySQL is one of the most popular open source relational database management systems
(RDBMS) in the industry being used by many websites and database-driven web applications.
Originally a Swedish company, it is now owned by Oracle Corporation [13].
The data is collected by a Python script which searches through the test cases in Jenkins. This
script is run every night due to the large number of tests run every day. The following Figure 5 is a
more detailed diagram of what actions the script is performing.

15
FIGURE 5. Diagram of Python Script
3.2 Software Utilized
This thesis uses several different software including both licensed and open-source. The software
includes Splunk, Docker, Jenkins, Java Runtime Environment, and MySQL Connector/J. Jenkins
has been previously setup and configured by an on-site team so there will be no installation details
in this report.

16
3.2.1 Splunk
Splunk is a commercial software which was developed by Splunk Inc. in 2003. Splunk is a big data
tool that can benefit developers, sales teams, managers, and many other teams within a company.
Splunk can receive any type of data whether structure or unstructured, they nicknamed themselves
“The Data-to-Everything Platform” [14]. An example of unstructured data would be log files and
structured would be data, such as XML, JSON, or CSV.
Splunk Enterprise 8.0.1 was used in this project.
There are several licensing options for Splunk including the paid Enterprise version, Free Trial
Enterprise which will expire after a determined amount, and Free Splunk which limits data
consumption to 500 MB per day.
Splunk offers many products which are tailored for specific operations. There are five main
categories which each contain several products. These categories are Splunk Core which contains
the normal Splunk Enterprise and Cloud instances, Splunk for IT Operations, Splunk for Security,
Splunk for IoT, and Splunk for Business Analytics.
There are four different stages in Splunk’s data pipeline including input, parsing, indexing and
searching. During the input stage, Splunk consumes the raw data from whichever source, breaks
the data into 64K blocks and finally annotates each block with metadata keys. These keys apply to
the whole input source overall and include host, source, and sourcetype of the data. The keys are
also able to include values used internally, e.g. character encoding of the data stream. There are
also values which will determine the future processing of the data, such as which index the data
will be stored in. During the input stage, Splunk does not look at the contents of the data so the
keys apply to the whole source and not individual events. From here the data moves into the next
stage of the pipeline, which is the parsing stage [14].
The second stage is the parsing stage where Splunk examines, analyzes, and transforms the data.
This is the stage where the data stream is broken into individual events. During this stage, there
are four sub-stages which include;
• Breaking the data into separate lines.
17
• Identifying, parsing and setting timestamps.
• Annotating individual events with the metadata copied from the source-wide keys.
• Transforming event data and metadata according to regex transform rules [14].
In the third stage, indexing, Splunk writes the parsed events onto the index which was assigned
during the input stage. The compressed raw data as well as the corresponding index files are
written on the disk. At a high level view the indexing and parsing stages are combined into one
stage but when one needs to examine the data in a more precise way, it is better to separate the
two stages [14].
The last stage is the search stage which manages how the user accesses, views, and uses the
indexed data. The search function stores user-created knowledge objects which include reports,
event types, alerts, field extractions, and dashboards. This stage also obviously handles the search
process itself [14].
During these stages of the data pipeline, Splunk utilizes three main components which are
forwarders, indexers, and search heads. A forwarder is a separate Splunk instance which forwards
data to other Splunk instances, such as an indexer or another forwarder. There are three different
types of forwarders:
• A universal forwarder is a dedicated, streamlined version of Splunk that contains only the
essential components needed to send data.
• A heavy forwarder is a full Splunk instance which has some features disabled to achieve
a smaller footprint.
• A light forwarder is a full Splunk instance which has most features disabled. This forwarder
has been deprecated because the universal forwarder works better in almost every
situation [15].
The indexer is a Splunk instance which indexes data, indexes the raw data into events and places
it into an index. The indexer also searches the indexed data when responding to search requests.
The indexer can also perform other functions, such as a data input and search management in
smaller deployments without the need of a search head [16].

18
A search head is a Splunk instance which handles the search management functions in larger
distributed search environments. The search head directs search requests to the indexer and then
merges the results back to the user [17]. Figure 6 is a diagram of a larger distributed search
environment and displays how the different Splunk components interact with each other.
FIGURE 6. Splunk Distributed Search Overview [18]
3.2.2 Docker
Docker is one of the most popular tools in the modern software development process. Docker
creates containers which contain an application’s source code and scripts for running it. One of the
main advantages of using Docker is that it makes creating and deploying applications on different
systems much easier, thus increasing scalability. Docker is similar to a virtual machine but instead
of creating a whole new environment and operating system, Docker allows the application to use
the same kernel as the system it is running on.

19
3.2.3 Jenkins
Jenkins is an open-source software written in Java which is used to automate the build, test, and
release processes of the code. The main purpose of Jenkins is to automate tasks within a CI
environment which would be too time consuming for developers to perform. This increases the
workplace efficiency greatly by freeing up employees’ time to work on other issues instead of
focusing on these tasks [19].
3.2.4 Java Runtime Environment
The Java Runtime Environment (JRE) contains the Java virtual machine, runtime class libraries,
and Java application launcher, which are all necessary to run Java programs [20]. Splunk DB
Connect requires the Server JRE version 8 in order to properly operate.
3.2.5 Java Database Connectivity (JDBC)
JDBC is a Java API which comes with the JRE. It is utilized to connect and execute queries with
the connected database [21]. There are four types of JDBC drivers including;
Type 1: JDBC-ODBC bridge driver
Type 2: Native-API driver (partially java driver)
Type 3: Network Protocol driver (fully java driver)
Type 4: Thin driver (fully java driver)
For this project the Type 4 driver needed to be used. It is referred to as a Thin driver because it
converts JDBC calls into the vendor specific database protocol [22].
3.2.6 MySQL Connector/J
The MySQL Connector/J provides driver support when connecting to MySQL from Java
applications using the Java Database Connectivity (JDBC) API [23]. This is also required for Splunk
DB Connect to function.

20
4 IMPLEMENTATION
4.1 Phase One
One of the main aims of this project was to make a scalable solution which can be used by many
different teams without much setup. Considering this, the main plan was to setup the Splunk
instance in a Docker container on a remote server within the company. This way teams would be
able to build the container on their own servers and configure it to suit their teams’ purposes.
The first task was to setup the physical hardware for the system. The author was assisted by a
colleague with installing and configuring the physical server and installing a barebones Linux OS
on the server. Next a Docker instance was installed on the server and a Splunk instance was
created within a Docker container. The database is running on a separate system and the server
where the Splunk instance is located has enough storage for the project.
There were several blockers which caused these setup issues. Nokia has many security protocols
when dealing with software which is outside of the contained intranet. Proxies within the system
and Docker container were required in order to install the necessary software.
Splunk itself brought up several issues during configuration. Due to extensive company firewalls,
the Splunk licensed applications page was unable to properly load, shown below in Figure 7. To
bypass these blockers, the author was able to download the files on his local host and then transfer
them via SSH to the remote server containing the Splunk container. This way I could directly upload
them to the Splunk instance. One of the main applications that was needed for this project was
Splunk DB Connect. This application was used to setup database connections between the target
database and the Splunk instance.
FIGURE 7. Remote Splunk instance app page error

21
The greatest issue that arose during the first stage of implementation was that the Splunk DB
Connect application was having multiple issues. Since the Splunk DB Connect app was behind
several walls of system (remote server behind company firewalls and inside of a Docker container),
it was having a very difficult time finding the $JAVA_HOME variable. DB Connect requires a valid
Java Runtime Environment (JRE) in order to complete its processes. Several weeks were spent
investigating and experimenting with this issue until the author decided to bypass the blocker in
order to secure the project timeline and progress. The temporary solution currently was to switch
to a local implementation. Figure 8 is a picture of the previously mentioned error.
FIGURE 8. Splunk DB Connect $JAVA_HOME error
4.2 Phase Two
Phase two includes the theory behind Splunk and several of its components as well as the first
draft of the implemented features.
After consulting several Splunk and Docker experts within the company and scouring the internet,
the author decided to switch to a ‘localhost’ implementation in order to provide the company with a
Proof of Concept (POC) implementation and then, once completed, return to the scalable
implementation. This implementation was made without the use of Docker.
The team is looking for several functionalities with this Splunk instance. The four main
functionalities that are desired are a fail trend, crash log, result browser, and the top 25 failed test
cases. Currently, this information is available in the database, however it is a very arduous and
time-consuming task to retrieve this information. The maintenance on the current system takes time
and expertise. Splunk can be used by anyone due to its usable GUI and plenty of documentation.

22
4.2.1 Database Connection
One of the best ways to transfer data from a database into a Splunk instance is by using the Splunk
DB Connect application. This application can quickly integrate structured data sources with your
instance and it supports many databases. Figure 9 shows a high-level view of how the Splunk DB
Connect application connects the Splunk user to the database.
FIGURE 9. Splunk DB Connect High-Level Diagram [24]
On the localhost implementation Splunk DB Connect was able to work without any issues. Since
the Splunk instance was on the same level as the home OS, it was easily able to locate the
$JAVA_HOME variable and was able to connect to the team’s database. This database contains
the test data for the 4G continuous integration team.
The first step for connecting a database is to setup a connection using the application’s GUI. In
order to complete this step, you need the database JDBC (Java Database Connectivity) URL and
access rights to the database. During this step, an error occurred where Splunk DB Connect was
unable to determine the time-zone configurations for the database and would not connect. To
bypass this, all that was required was to add “serverTimezone=UTC” to the end of the JDBC URL.
After the database has been successfully connected, new data inputs must be created. The inputs
are created again using the GUI, which runs a SQL query, imports the structured data into the
Splunk instance and is then indexed. Inputs are used to collect specified data. This means that
usually there will be several different inputs in order to gather different data. After the input is
created, it can be used to search for data in the Search and Reporting application. Figure 10 shows
the GUI for setting up a new database input using the Splunk DB Connect application.

23
FIGURE 10. Splunk DB Connect New Input
4.2.2 Data Manipulation
Now that there is data flowing into the Splunk instance, the next step is to manipulate this data into
responsive reports, alerts, and dashboards. This process is completed using the Splunk Search
and Reporting application. Here it is possible to use SPL queries to collect and organize the data.
The following is an example of an SPL query.
FIGURE 11. SPL Search Query
The query in Figure 11 first defines the index where the data has been indexed to and the source
type which is “dbmon:kv (Key-Value)". The next section of the query defines how Splunk will
manipulate the data. This query first changes the time from milliseconds to seconds, then defines
the fields that will be used to construct a table, the next section lets Splunk know to only choose
rows where the “crashed” field is equal to “1”. The last section renames the field names to a more
human readable format for the table. SPL uses pipes to delimitate the next command. One of the
most important variables when using Splunk is the time picker. Every search is filtered through a
time picker and all that data that has been indexed into Splunk has a time stamp. The default is
24
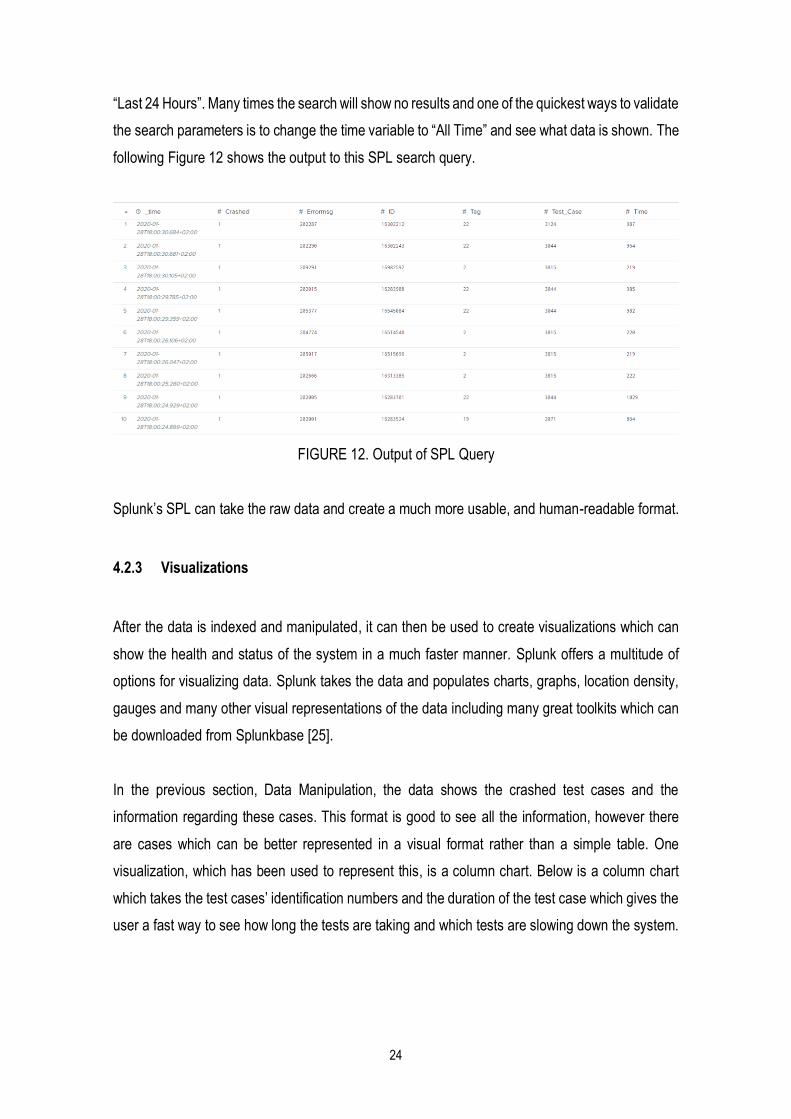
“Last 24 Hours”. Many times the search will show no results and one of the quickest ways to validate
the search parameters is to change the time variable to “All Time” and see what data is shown. The
following Figure 12 shows the output to this SPL search query.
FIGURE 12. Output of SPL Query
Splunk’s SPL can take the raw data and create a much more usable, and human-readable format.
4.2.3 Visualizations
After the data is indexed and manipulated, it can then be used to create visualizations which can
show the health and status of the system in a much faster manner. Splunk offers a multitude of
options for visualizing data. Splunk takes the data and populates charts, graphs, location density,
gauges and many other visual representations of the data including many great toolkits which can
be downloaded from Splunkbase [25].
In the previous section, Data Manipulation, the data shows the crashed test cases and the
information regarding these cases. This format is good to see all the information, however there
are cases which can be better represented in a visual format rather than a simple table. One
visualization, which has been used to represent this, is a column chart. Below is a column chart
which takes the test cases’ identification numbers and the duration of the test case which gives the
user a fast way to see how long the tests are taking and which tests are slowing down the system.

25
FIGURE 13. Column chart representing crashed test case duration
From this visualization in Figure 13 the user can determine which test cases are taking the most
amount of time. It gives the user the opportunity to investigate these cases and determine the issue
causing this. In the current system the user is only able to see one test case at a time, therefore,
utilizing the Splunk implementation allows the users to see the status of multiple cases at once
which saves time.
Behind every visualization is an SPL query which specifies what data is to be retrieved and
visualized. The visualization in Figure 13 is controlled by this SPL query in Figure 14. This query
defines the data source, uses the ‘eval’ command to set the variable ‘newtime’ equal to the time
divided by 1000, defines the fields utilized in the chart, and then sorts the results by ‘newtime’.
FIGURE 14. Example SPL Query
4.2.4 Dashboards
Splunk’s top level GUI is the dashboard. Dashboards are very useful for combining multiple reports
and visualizations onto a single page in order to see a large amount of information in a short amount
of time. The dashboards are fully customizable, and a single data source can be utilized by all
members of a company no matter what position they are in.

26
FIGURE 15. Early stage dashboard
Figure 15 is an early development dashboard which covers one of the main desired functionalities.
This dashboard displays the number of crashed tests in the last 24 hours, the data behind these
test cases, and a chart displaying the durations of the test cases. Having all this information on one
page increases the efficiency of employees greatly. Instead of having to search for this information
in the database or through hard to read log files, the information is displayed in a convenient and
easy to read view.
Dashboards can be created using Splunk’s dashboard editor GUI or by converting the dashboard
frame to HTML (Hypertext Markup Language). When converting to HTML, users can build the
dashboard, e.g. a webpage, using HTML and JavaScript for all the functionality. This is a great tool
because if the user is confused as to what Splunk is doing behind the dashboard GUI, the user can
convert to HTML and get a better picture of how the dashboard is functioning. This simple
dashboard in Figure 15 contains around 700 lines of code, therefore there is a lot of information
hidden in the code that the user could miss by solely using the GUI.

27
At the top of Figure 15 there are several dropdown menus which give the viewer the opportunity to
filter the data by any available parameters. Since this CI system is very large with thousands of test
cases, it can be a very useful tool when looking for specific issues. This dashboard offers filters by
branch, deployment, test list, environment, tag, job, suite, and test case.
Splunk is a very great tool and has been developed to speed up the work environment. They have
developed many key functionalities that seem basic but are very time saving. For example, Splunk
knows what inputs you have selected and will filter out the remaining dropdowns automatically to
remove any invalid selections.
Previously mentioned was the importance of the time filter when using Splunk, and the dashboards
are no different. The very first filter on Figure 14 is a time filter. In the dashboard any visualizations
can be connected to the data filters so that when an option is chosen, the visualizations can properly
populate the correct data. It is possible to have individual filters on each visualization or have a
single filter which controls all the data on the dashboard.
Not only do dashboards make viewing information much faster, but they are also fully customizable.
Most of the visualizations have many structure and design options that may be utilized to improve
the usability of the dashboard. In the technology industry there are several design techniques, two
that stand out are the age-old information first design and the newer usability and aesthetic design.
Many older websites and corporate software can be found with what looks like an out of date user
interface (UI). Even though the UI can look unprofessional or hard to read, the computations and
accuracy of the data are perfectly fine.

28
FIGURE 16. phpMyAdmin GUI example [26]
Figure 16 shows a common database table view. All the information is correct; however, the overall
UI can make it difficult to navigate the different tools and even just look at the data due to over
crowding of buttons, poor color schemes, and bad layouts.
On the other hand, there is the newer designs which are more focused on ease of use and the
“look” of the application. Some companies become too interested in making it look nice that they
forget to put the extra effort into the actual data.
Each theory has its pros and cons but there is a sweet spot in between these two which can provide
the user with accurate data in a usable environment. The system utilized on Splunk merges these
two design theories and gives the user all the options.
29
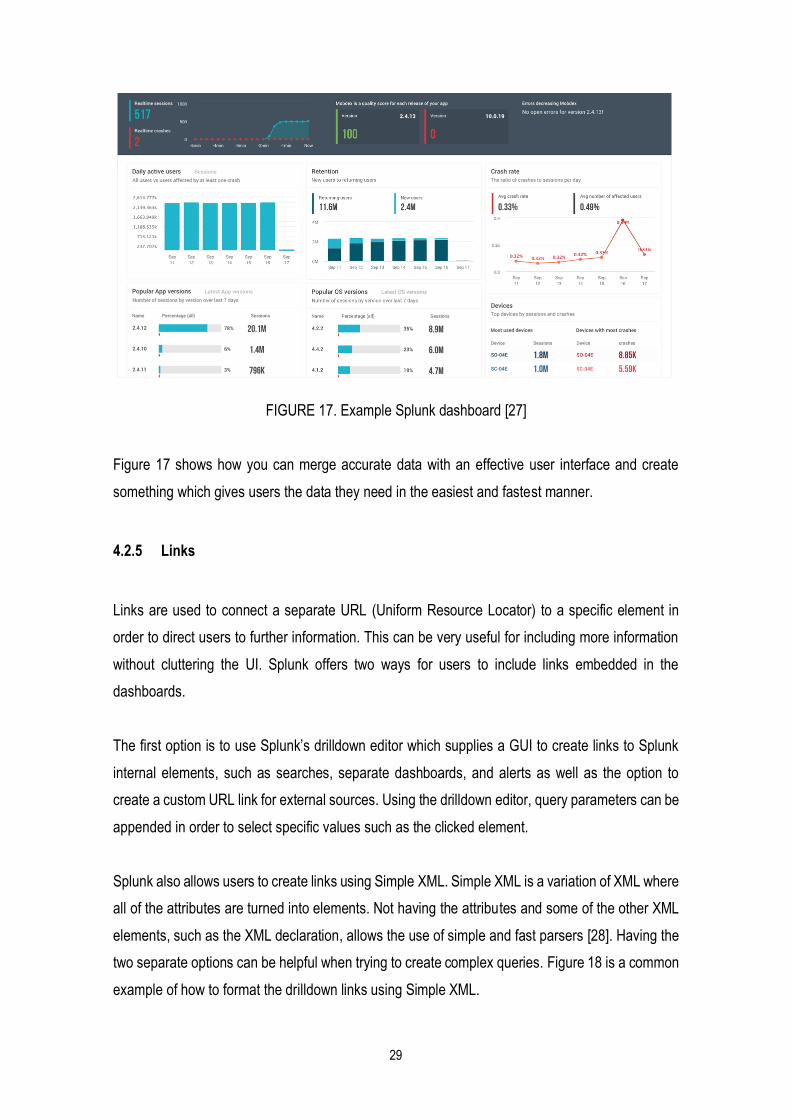
FIGURE 17. Example Splunk dashboard [27]
Figure 17 shows how you can merge accurate data with an effective user interface and create
something which gives users the data they need in the easiest and fastest manner.
4.2.5 Links
Links are used to connect a separate URL (Uniform Resource Locator) to a specific element in
order to direct users to further information. This can be very useful for including more information
without cluttering the UI. Splunk offers two ways for users to include links embedded in the
dashboards.
The first option is to use Splunk’s drilldown editor which supplies a GUI to create links to Splunk
internal elements, such as searches, separate dashboards, and alerts as well as the option to
create a custom URL link for external sources. Using the drilldown editor, query parameters can be
appended in order to select specific values such as the clicked element.
Splunk also allows users to create links using Simple XML. Simple XML is a variation of XML where
all of the attributes are turned into elements. Not having the attributes and some of the other XML
elements, such as the XML declaration, allows the use of simple and fast parsers [28]. Having the
two separate options can be helpful when trying to create complex queries. Figure 18 is a common
example of how to format the drilldown links using Simple XML.

30
FIGURE 18. Drilldown Simple XML Example [29]
In a CI team there are many levels of data that need to be gone through in order to gauge the
efficiency of the test cases. Having all this data on the dashboard would make it cluttered and hard
to use, therefore links have been utilized to direct the user to extra information.
Links have been used in two ways on the dashboard. First, the dashboard shows the failed test
cases and links have been added to the cases which lead to an external URL that shows detailed
information on the selected test case.
The dashboard also shows the error message ID for the failed test case. There are thousands of
different error messages in the system, so the ID number really does not help the user decipher
what is failing in the test. Links directing to an external URL lead the user to a list of all the error
messages which includes detailed information so the user can understand what caused the error.
4.3 Phase Three
At this time, it was decided to disregard the Docker setup on the remote sever and install the Splunk
instance directly to the server. By installing Splunk directly to the server, the issues that were
causing Splunk DB Connect to not function properly were bypassed and it can now connect to the
database. All knowledge objects that were implemented on the local machine were transferred to
the remote server. The server is accessible to all the team members which makes the effectiveness
and the scalability of Splunk much higher.

31
4.3.1 Second Iteration
In the second iteration of the Splunk instance there were improvements made to the current
dashboards and additional visualizations implemented into the instance. The first iteration was a
more generic setup which showed all the results for failed test cases. Showing all the results in
such a large system can slow down the fetching of data and make it very difficult for the user to find
a specific case. To solve this issue, form inputs were implemented to filter the data into a more
user-friendly user interface. Figure 19 shows the statistics table and form inputs which filter the
data in the table.
FIGURE 19. Table Utilizing Form Inputs
Using this setup, the user can immediately see the most recent failed cases and then quickly search
for a specific case using the form inputs. Splunk offers the use of tokens within the search strings,
therefore each form input will have a distinct token which is then used to filter the results of the
search.
The next improvement to the dashboard was the introduction of column charts representing failures
in the system. Each chart in Figure 20, which is shown below, represents a separate layer of the
testing process as to display a more detailed view of how the system is functioning. The first chart
represents the amount of failures based on the revision number. There is also a time picker which
is connected to all three charts controlling the time range of the displayed results. The second chart
goes another level deeper by displaying the top failures by job. Finally, the last chart shows the top
failing test cases.

32
FIGURE 20. Column Charts for Failures
A trend graph was also implemented in order to check the activity in a specified revision over a
specified duration of time which is displayed in Figure 21.
FIGURE 21. Fail Trend by Revision
Having a trend graph which shows the amount of fails per day can give the developers a better
look into what could be causing certain issues.

33
5 CONCLUSION AND FUTURE DEVELOPMENT
The aim of this thesis was to study and implement a more efficient way to access and view CI test
results. The current system was a web-based application which takes a developer with frontend
and backend development expertise to construct. This system takes the developer a long time to
implement which removes them from their everyday tasks.
The requirements were to implement a real-time solution which presents test data in a centralized
location to reduce the time spent searching test results. This solution was made using Splunk to
visualize the test data in a more useable and efficient manner. The aims presented in the problem
statement were met except for the Git and Gerrit data due to blockers in the early stages which
delayed the project’s timeline. If there was something that could have been changed during this
project, it would have been to not have spent so much time in the early stages on trying to configure
the Docker container on the remote server. This issue caused a large amount of time to be lost
which could have been used to further the features of the implementation.
Splunk helps to increase efficiency in several ways. First, Splunk offers prebuilt visualizations which
are quickly implemented without much development expertise making implementations and
alterations must faster. Another improvement is in the speed in which it can fetch the data. With
the previous system it was averaging around two minutes to fetch the test data for larger datasets.
With the current solution these same datasets can be fetched within a manner of several seconds.
This project covered a small portion of what Splunk can do to improve the efficiency in the
workplace and there are many more cases in which the team would like to expand into. One of the
most important use cases that will be developed in the future is to incorporate the team’s Git/Gerrit
data into the system. Visualizing the Git and Gerrit data will give the user a great representation of
how the project is progressing and what is happening in the code base. Using the Gerrit API the
team will be able to view the commit history.
There are many teams which could benefit from utilizing Splunk in their workflow. Now when the
Splunk instance has been implemented on the remote server, it is available to many employees
within the company. Once the implementation proves its efficiency benefits, hopefully other teams
will begin to use Splunk. In every company, time management is crucial to success and by refining

34
every process of the workflow for the maximum efficiency a company can thrive. In a large
company, a small improvement can lead to a very large effect.

35
REFERENCES
[1] Atlassian (2018) What is Continuous Integration. URL:
https://www.atlassian.com/continuous-delivery/continuous-integration Accessed
11.12.2019
[2] GitLab. (2019) Readme · Ci · Help URL: https://forge.etsi.org/rep/help/ci/README.md
Accessed 11 March 2020
[3] Atlassian (2018) Continuous integration vs. continuous delivery vs. continuous
deployment. URL: https://www.atlassian.com/continuous-delivery/principles/continuous-
integration-vs-delivery-vs-deployment Accessed 7 Feb. 2020
[4] Semaphore (2020) Continuous Integration (CI) Explained - Semaphore. URL:
https://semaphoreci.com/continuous-integration Accessed 28 Dec. 2019
[5] Beck K. (2001) Agile Manifesto URL: http://agilemanifesto.org/ Accessed 19 Feb. 2020
[6] Ikubinfo.al (2019) Ikubinfo Software Engineering Company | Nearshoring | Outsourcing In
Albania URL: https://ikubinfo.al/home/international/ Accessed 11 March 2020
[7] Fritzgerald B & Stol K (2014) Continuous Software Engineering and Beyond: Trends and
Challenges. Proc. RCoSE 2014 Proceedings of the 1st International Workshop on Rapid
Continuous Software Engineering. Hyperabad, India, 1-9.
[8] Cheshire, N. (2018) Centralized vs Distributed Version Control Systems - What's Best for
Notes Development? — Teamstudio. URL: https://www.teamstudio.com/blog/distributed-
vs-centralized-version-control-systems-for-lotus-notes Accessed 1 Feb. 2020
[9] Wiki.qt.io (2019) Gerrit Introduction - Qt Wiki. URL: https://wiki.qt.io/Gerrit_Introduction
Accessed 02 Feb. 2020
[10] Perforce Software (2017) What Is SVN (Subversion)? | Perforce Software. URL:
https://www.perforce.com/blog/vcs/what-svn Accessed 11 Feb. 2020
[11] Securityonline.info (2018) The Difference Between GIT And SVN • Penetration Testing
URL: https://securityonline.info/difference-git-svn/ Accessed 11 March 2020

36
[12] Ahdoot, A. (2019) What You Need to Know about Ubuntu Dedicated Servers. Colocation
America. URL: https://www.colocationamerica.com/blog/know-about-ubuntu-dedicated-
servers?amp Accessed 11 Feb. 2020
[13] En.wikipedia.org (2017) MySQL URL: https://en.wikipedia.org/wiki/MySQL Accessed 25
Feb. 2020
[14] Splunk (2020) SIEM, AIOps, Application Management, Log Management, Machine
Learning, and Compliance | Splunk. URL: https://www.splunk.com/ Accessed 5 Feb.
2020
[15] Docs.splunk.com (2017) Splexicon:Forwarder - Splunk Documentation URL:
https://docs.splunk.com/Splexicon:Forwarder Accessed 25 Feb. 2020
[16] Docs.splunk.com (2017) Splexicon:Indexer - Splunk Documentation URL:
https://docs.splunk.com/Splexicon:Indexer Accessed 25 Feb. 2020
[17] Docs.splunk.com (2017) Splexicon:Searchhead - Splunk Documentation URL:
https://docs.splunk.com/Splexicon:Searchhead Accessed 25 Feb. 2020
[18] Subscription.packtpub.com (2020) Splunk Components URL:
https://subscription.packtpub.com/book/big_data_and_business_intelligence/9781789531
091/1/ch01lvl1sec12/splunk-components Accessed 11 March 2020
[19] Cloudbees.com (2020) URL: https://www.cloudbees.com/jenkins/what-is-jenkins
Accessed 11 Feb. 2020
[20] Oracle.com (2018) JRE 8 README. URL:
https://www.oracle.com/technetwork/java/javase/jre-8-readme-2095710.html Accessed
11 Feb. 2020
[21] www.javatpoint.com (2018) JDBC Tutorial | What is Java Database Connectivity (JDBC)
– javatpoint. URL: https://www.javatpoint.com/java-jdbc Accessed 11 Jan. 2020
[22] www.javatpoint.com (2018) Java JDBC Driver – javatpoint URL:
https://www.javatpoint.com/jdbc-driver Accessed 11 Jan. 2020
[23] Dev.mysql.com (2019) MySQL:: MySQL 5.7 Reference Manual :: 27 Connectors and
APIs. URL: https://dev.mysql.com/doc/refman/5.7/en/connectors-apis.html Accessed 10
Jan. 2020

37
[24] Docs.splunk.com (2019) How Splunk DB Connect Works - Splunk Documentation URL:
https://docs.splunk.com/Documentation/DBX/3.2.0/DeployDBX/HowSplunkDBConnectwo
rks Accessed 11 March 2020
[25] Splunkbase.splunk.com (2019) Home | Splunkbase. URL: https://splunkbase.splunk.com/
Accessed 11 March 2020
[26] I.stack.imgur.com (2016) URL: https://i.stack.imgur.com/j27G1.png Accessed 11 March
2020
[27] Splunk-Blogs (2019) Bugsense Is Now Splunk MINT Express—Why The Change? URL:
https://www.splunk.com/en_us/blog/tips-and-tricks/bugsense-is-now-splunk-mint-
express-why-the-change.html Accessed 11 March 2020
[28] En.wikipedia.org (2018) Simple XML URL: https://en.wikipedia.org/wiki/Simple_XML
Accessed 17 Feb. 2020
[29] Docs.splunk.com (2018) Simple XML Reference - Splunk Documentation. URL:
https://docs.splunk.com/Documentation/Splunk/8.0.2/Viz/PanelreferenceforSimplifiedXM
L Accessed 11 March 2020