The threat of protectionism - Open Knowledge Repository
21
The threat of protectionism More than twenty-five years of progressive liberal- ization of trade, from 1947 to 1974, saw unprece- dented growth in world prosperity. Then the eco- nomic climate changed for the worse. Currency crises, oil crises, debt crises, world recession, and high unemployment produced an atmosphere in which demands for protection increased dramati- cally. The success of Japanese exports, and then of exports from the newly industrializing countries (NICs), produced pressure for changes in the older industrial nations. Such changes are painful when unemployment is high. Attempts to avoid the pain are the main cause of today's protectionism in the industrial countries. Trade in textiles was the first victim, followed closely by trade in footwear, leather goods, steel, shipbuilding, cars, and con- sumer electronics. Instead of tariffs, which are now very low, the main instrument of recent protection has been the nontariff barrier (NTB). It contravenes widely ac- cepted principles of nondiscrimination and trans- parency in measures to restrict tradeprinciples which remain sound. NTBs usually discriminate against the lowest-cost sources of imports, so they raise prices to consumers and keep inefficient in- dustries in business. The costs to the country im- posing the NTB, and to the world as a whole, are higher than under an equivalent tariff. Moreover, NTBs are unfair, because they do not treat ex- porters equally. Often it is the exporters with the least bargaining power whose exports are most re- duced. Although demands for protection have prolifer- ated and the quantity of trade covered by nontariff barriers has increased, the effects on trade are not easy to quantify. Many trade barriers have proved porous: businessmen in the Republic of Korea and Hong Kong, for example, have to some extent overcome the restrictive effects of NTBs, and their exports of manufactures have continued to grow. But the latest Multifibre Arrangement (MFA) has broader coverage and tighter restrictions than its predecessors. New exporters will find its barriers harder to penetrate. If protection in the industrial nations increases still further, it will be hard for the developing countries to expand their exports. Although the developing countries have been able to avoid some of the effects of industrial coun- tries' protection, the industrial countries them- selves have not. Clearly the main costs of protec- tion fall on the importing country. NTBs cause higher prices for consumers, lost tariff revenue for governments, inefficient resource allocation, and diminished competition. The pattern of trade cannot remain static. Since the early 1%Os developing countries have been in- creasing their exports not only to industrial coun- tries but also to other developing countries. Today their exports account for nearly one-third of world exports to developing countries. They have also expanded trade with the centrally planned econo- mies (CPEs), although these exports have stag- nated in the past few years. But it remains unlikely that exports to these other countries will expand enough to lessen the importance of industrial country markets or the significance of the threat of industrial country protectionism (see Boxes 8.1 and 8.2). The international trading system since World War II has, at least in principle, been guided by the rules and procedures agreed to by the signatories to the General Agreement on Tariffs and Trade 133
-
Upload
khangminh22 -
Category
Documents
-
view
1 -
download
0
Transcript of The threat of protectionism - Open Knowledge Repository
The threat of protectionism
More than twenty-five years of progressive liberal-ization of trade, from 1947 to 1974, saw unprece-dented growth in world prosperity. Then the eco-nomic climate changed for the worse. Currencycrises, oil crises, debt crises, world recession, andhigh unemployment produced an atmosphere inwhich demands for protection increased dramati-cally. The success of Japanese exports, and then ofexports from the newly industrializing countries(NICs), produced pressure for changes in the olderindustrial nations. Such changes are painful whenunemployment is high. Attempts to avoid the painare the main cause of today's protectionism in theindustrial countries. Trade in textiles was the firstvictim, followed closely by trade in footwear,leather goods, steel, shipbuilding, cars, and con-sumer electronics.
Instead of tariffs, which are now very low, themain instrument of recent protection has been thenontariff barrier (NTB). It contravenes widely ac-cepted principles of nondiscrimination and trans-parency in measures to restrict tradeprincipleswhich remain sound. NTBs usually discriminateagainst the lowest-cost sources of imports, so theyraise prices to consumers and keep inefficient in-dustries in business. The costs to the country im-posing the NTB, and to the world as a whole, arehigher than under an equivalent tariff. Moreover,NTBs are unfair, because they do not treat ex-porters equally. Often it is the exporters with theleast bargaining power whose exports are most re-duced.
Although demands for protection have prolifer-ated and the quantity of trade covered by nontariffbarriers has increased, the effects on trade are noteasy to quantify. Many trade barriers have proved
porous: businessmen in the Republic of Korea andHong Kong, for example, have to some extentovercome the restrictive effects of NTBs, and theirexports of manufactures have continued to grow.But the latest Multifibre Arrangement (MFA) hasbroader coverage and tighter restrictions than itspredecessors. New exporters will find its barriersharder to penetrate. If protection in the industrialnations increases still further, it will be hard for thedeveloping countries to expand their exports.
Although the developing countries have beenable to avoid some of the effects of industrial coun-tries' protection, the industrial countries them-selves have not. Clearly the main costs of protec-tion fall on the importing country. NTBs causehigher prices for consumers, lost tariff revenue forgovernments, inefficient resource allocation, anddiminished competition.
The pattern of trade cannot remain static. Sincethe early 1%Os developing countries have been in-creasing their exports not only to industrial coun-tries but also to other developing countries. Todaytheir exports account for nearly one-third of worldexports to developing countries. They have alsoexpanded trade with the centrally planned econo-mies (CPEs), although these exports have stag-nated in the past few years. But it remains unlikelythat exports to these other countries will expandenough to lessen the importance of industrialcountry markets or the significance of the threat ofindustrial country protectionism (see Boxes 8.1and 8.2).
The international trading system since WorldWar II has, at least in principle, been guided by therules and procedures agreed to by the signatoriesto the General Agreement on Tariffs and Trade
133
/
Box 8.1 Trade options for the developing countries:trade with centrally planned economies
If developing countries had to face increased protec-tionism in the industrial market economies, could theyexpand their exports of manufactured products to Eu-ropean centrally planned economies? At present, theCPEs (defined here as Bulgaria, Czechoslovakia, Ger-man Democratic Republic, Hungary, Poland, Romania,and the U.S.S.R.) import only 5 percent of developingcountries' exports, compared with 66 percent importedby the industrial countries. But if increased protection-ism in the industrial countries were to hinder develop-ing countries' exports, the CPEs would become muchmore important.
The external trade contacts of the CPEs have alwaysbeen limited. While imports from the developing coun-tries have increased from 3.4 to 5.0 percent in the1980s, they still lag far behind both developing andindustrial country trade. In addition, these importsconsist almost entirely of primary goods and fuels. Pri-mary goods and fuels account for 85 percent of EasternEurope's and 81 percent of the U.S.S.R. 's imports fromdeveloping countries. In contrast to a shift in favor ofmanufactures in their exports to the EC, the share ofmanufactures in developing countries' exports to theCPEs fell during the period 1980-84.
Several factors restrict trade between the CPEs andthe rest of the world. First, the U.S.S.R. is the CPEs'main supplier of raw materials (with the exception offood) and mineral fuels. Only when the U.S.S.R. isunable to supply the other CPEs' needs do they turn todeveloping country sources. Romania, the only coun-try not dependent on Soviet fuel supplies, has ex-panded its trade with the developing countries. Its im-ports from developing countries form a larger share ofits total imports than is the case for any other CPE.
Second, most CPEs borrowed heavily in the 1970s
and now have sizable foreign debts. A study byKaminski (background paper) shows that the CPEswith the highest debt have the lowest level of tradewith the developing countries. Kaminski estimates thatexports from the developing countries would havebeen 34 percent higher between 1982 and 1985 if theindebted CPEs had not deliberately run surpluses bycutting imports from developing countries. Of course,the CPEs with large foreign debts had to find some wayof generating trade surpluses to repay these debts. It isjust an unfortunate result of these policies that thissignificantly reduced their imports from developingcountries and seems likely to continue to do so.
Third, among the CPEs, geographic and politicalconsiderations are important in determining tradingpartners. Cuba, for example, accounts for one-third ofall Soviet trade with developing countries. About one-fourth of U.S.S.R. trade is with neighboring develop-ing countries.
Fourth, with a few recent exceptions, particularlyHungary, CPEs have generally followed economic poli-cies which insulate domestic producers from both in-ternal and external competition. Their inconvertibleand overvalued exchange rates and other import sub-stitution policies are far more restrictive than any barri-ers to trade erected in the industrial countries.
The lure of advanced Western technology is a motivefor increased trade between the CPEs and the indus-trial countries. But the continued lack of emphasis oncomparative advantage in most CPEs means that theyhave no incentive to increase their imports of manufac-tures from developing countries. An appropriate em-phasis on comparative advantage could generate anincrease in exports to developing countries as easily asit could an increase in imports.
(GAIT). The GATF is simply an agreement signedby member nations which are admitted on the ba-sis of their willingness to accept the GAIT disci-plines; it provides rules governing trade betweenthe signatories, a forum for negotiations, andmechanisms for resolving disputes. As a legal doc-ument it is detailed, complex, and in various areasopen to differing interpretations. But the main ob-jectives are the reduction of trade barriers and theprevention of discrimination in trade. The meansby which these objectives have been pursued inthe GAIT include: first, successive rounds of tradenegotiations about tariffs, other barriers to trade,and specific disputes; second, the GAIT rule ofmost favored nation (MFN) treatment, which says
134
that the lowest tariff (or other trade barrier) appliedby a signatory to the GAIT on a product must beapplied to all signatories; third, the principle ofreciprocity, whereby trade barriers are lowered inreturn for changes of rough equivalence by tradingpartners. (Box 9.1 in Chapter 9 gives the origins,objectives, and rules of the GAIT.)
The rise and fall of trade liberalization
From the end of World War II until 1974, protec-tionism seemed to be in decline. Successiverounds of negotiations in the GAIT had cut tariffson trade in manufacturesfrom an average level of40 percent in 1947 to between 6 and 8 percent formost of the industrial countrieseven before the
Box 8.2 Trade options for the developing countries: intradeveloping country trade
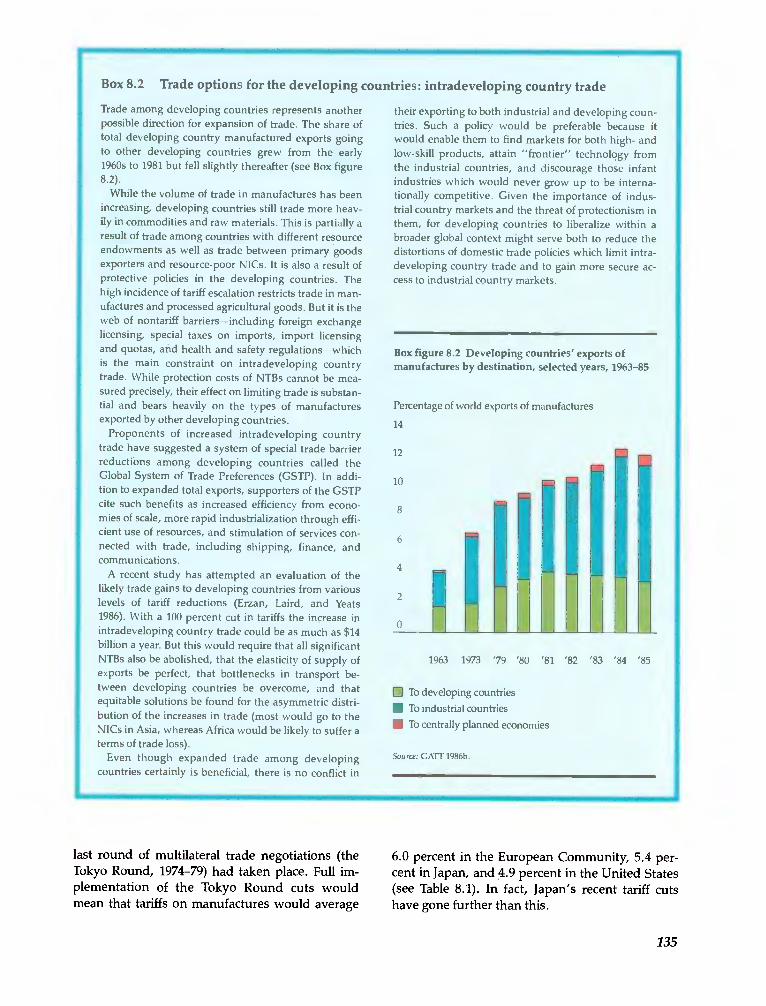
Trade among developing countries represents anotherpossible direction for expansion of trade. The share oftotal developing country manufactured exports goingto other developing countries grew from the early1960s to 1981 but fell slightly thereafter (see Box figure8.2).
While the volume of trade in manufactures has beenincreasing, developing countries still trade more heav-ily in commodities and raw materials. This is partially aresult of trade among countries with different resourceendowments as well as trade between primary goodsexporters and resource-poor NICs. It is also a result ofprotective policies in the developing countries. Thehigh incidence of tariff escalation restricts trade in man-ufactures and processed agricultural goods. But it is theweb of nontariff barriers_including foreign exchangelicensing, special taxes on imports, import licensingand quotas, and health and safety regulations_whichis the main constraint on intradeveloping countrytrade. While protection costs of NTBs cannot be mea-sured precisely, their effect on limiting trade is substan-tial and bears heavily on the types of manufacturesexported by other developing countries.
Proponents of increased intradeveloping countrytrade have suggested a system of special trade barrierreductions among developing countries called theGlobal System of Trade Preferences (GSTP). In addi-tion to expanded total exports, supporters of the GSTPcite such benefits as increased efficiency from econo-mies of scale, more rapid industrialization through effi-cient use of resources, and stimulation of services con-nected with trade, including shipping, finance, andcommunications.
A recent study has attempted an evaluation of thelikely trade gains to developing countries from variouslevels of tariff reductions (Erzan, Laird, and Yeats1986). With a 100 percent cut in tariffs the increase inintradeveloping country trade could be as much as $14billion a year. But this would require that all significantNTBs also be abolished, that the elasticity of supply ofexports be perfect, that bottlenecks in transport be-tween developing countries be overcome, and thatequitable solutions be found for the asymmetric distri-bution of the increases in trade (most would go to theNICs in Asia, whereas Africa would be likely to suffer aterms of trade loss).
Even though expanded trade among developingcountries certainly is beneficial, there is no conflict in
last round of multilateral trade negotiations (theTokyo Round, 1974-79) had taken place. Full im-plementation of the Tokyo Round cuts wouldmean that tariffs on manufactures would average
their exporting to both industrial and developing coun-tries. Such a policy would be preferable because itwould enable them to find markets for both high- andlow-skill products, attain "frontier" technology fromthe industrial countries, and discourage those infantindustries which would never grow up to be interna-tionally competitive. Given the importance of indus-trial country markets and the threat of protectionism inthem, for developing countries to liberalize within abroader global context might serve both to reduce thedistortions of domestic trade policies which limit intra-developing country trade and to gain more secure ac-cess to industrial country markets.
Box figure 8.2 Developing countries' exports ofmanufactures by destination, selected years, 1963-85
Percentage of world exports of manufactures
14
:0
!!I!!!tII1963 1973 '79 '80 '81 '82 '83 '84 '85
O To developing countries0 To industrial countries
0 To centrally planned economies
Source: GATT 1986b.
6.0 percent in the European Community, 5.4 per-cent in Japan, and 4.9 percent in the United States(see Table 8.1). In fact, Japan's recent tariff cutshave gone further than this.
135

Table 8.1 Tariff averages before and after the implementation of the Tokyo Round and percentagechanges in tariffs in the major industrial countries
Source: GAIl' 1980, p. 37.
136
Box 8.3 The history of the Arrangement Regarding International Trade in Textiles,or the Multifibre Arrangement
In 1935 the United States negotiated the first voluntaryexport quota on Japanese textile exports. This was de-spite the fact that the U.S. textile industry was alreadyhighly protected by tariffs of 40 to 60 percent. Althoughthese tariff levels have been substantially reduced, thesingle voluntary export quota has been replaced by theMultifibre Arrangement (MFA), a worldwide system ofmanaged trade in textiles and clothing.
Managed trade in cotton textiles, 1961-73
The precursor of the MFA, the Short Term Cotton Tex-tile Arrangement, negotiated in 1961 under GATT aus-pices at the request of the United States, was replacedin October 1962 by the Long Term Arrangement Re-garding International Trade in Cotton Textiles (LTA),which controlled cotton textile exports for the next tenyears. Although the LTA was a multilateral document,it essentially functioned as a set of bilateral agreementswhich allowed importing countries to negotiate quotason a country-by-country basis and in some cases toimpose unilateral quotas without penalty.
MFA I, 1974-77
The LTA remained in place until 1974, when the MFAtook its place. Supporters deemed the new textileagreement necessary for several reasons. First, the useof synthetic fibers which were not restricted under theLTA had increased tremendously. Second, overall pro-ductivity in the textile industry had grown substan-tially during this period, which led to a decline in tex-tile employment in the industrial countries. Third,
because the LTA placed quota restrictions on large ex-porters such as Japan, smaller developing countrieshad gained a progressively larger market share.Among the most rapidly growing were the AsianNICs.
The United States was willing to accept a fairly liber-al MFA because it wished to broaden the agreementto include synthetic fibers. As a result, the UnitedStates made concessions on quantitative restrictions.The MFA specified a minimum of 6 percent annualgrowth in imports, more flexibility in negotiating thebilateral agreements in which quotas for each countrywere set, and the right of an exporting country totransfer quotas among categories of goods andbetween years. The Textile Surveillance Body was es-tablished by the GATT to supervise the implementationof the agreement and to arbitrate disputes arisingfrom it.
MFA H, 1978Si
The United Kingdom and France, which experienced a21 percent increase in textile imports from 1973 to 1977,supported a more restrictive MFA in 1977. The failureof the EC to negotiate quickly with its major suppliers,the worldwide recession, and increased productivity inthe EC textile industry led to a 16 percent decrease intextile employment from 1973 to 1977.
MFA II reflected the strong protectionist sentimentsof the EC. It allowed more restrictive quotas than didMFA I. The EC negotiated bilateral agreements with all
Country or count ry group
Tariffs on total importsof finished and semifinished
manufactures
Tariffs on imports fromdeveloping countries of
finished and semifinishedmanufactures
Pre-Tokyo Post-TokyoPercentage
change Pre-Tokyo Post-TokyoPercentage
change
European CommunityWeighted 8.3 6.0 28 8.9 6.7 25Simple 9.4 6.6 30 8.5 5.8 32
JapanWeighted 10.0 5.4 46 10.0 6.8 32Simple 10.8 6.4 41 11.0 6.7 39
United StatesWeighted 7.0 4.9 30 11.4 8.7 24Simple 11.6 6.6 43 12.0 6.7 44
This picture of a progressive liberalization oftrade has to be qualified in several respects:
Agriculture. Agricultural trade is a clear excep-tion. Far from becoming freer, trade in agriculturebecame progressively more distorted by the sup-port given to farmers in the industrial nations.Support took the form of severe barriers to im-ports, subsidized inputs, and subsidies to exports.The policies and their costs were analyzed in WorldDevelopment Report 1986.
Economic integration. A second qualificationstems from the trend toward economic integration,which culminated in the enlarged European Com-munity. The formation of free trade areas and cus-toms unions has an ambiguous effect upon worldtrade and welfare. On the one hand, a customsunion abolishes barriers to trade among its mem-
bers. This creates new trade flows between them.But, on the other hand, the union now has a com-mon tariff which discriminates against externalsuppliers. Goods which were formerly boughtfrom nonmembers would be replaced by more ex-pensively produced substitutes from other mem-bers of the union.
Textiles. A third important exception to thegeneral decline in trade barriers is textiles. The firstinternational cotton textiles agreement was set upin 1961. The Long Term Arrangement RegardingInternational Trade in Cotton Textiles followed inOctober 1%2. Its claimed purpose was to controldisruption in industrial countries' markets stem-ming from imports from low-wage developingcountries. At the same time it was supposed toprovide developing countries with growing access
its major suppliers which reduced and in some casescompletely stopped the growth of imports. Althoughthe EC initiated measures to restrict import quotas se-verely, other industrial countries were quick to followsuit. For the first time, global ceilings were placed oncertain categories of "sensitive products" and therebyput an absolute limit on some types of imports.
MFA III, 1982-86
MFA III maintained the restrictions of earlier arrange-ments and added some additional constraints on largeexporters and a "surge mechanism" which limitedgrowth of medium-size exporters. Under MFA III, theUnited States negotiated forty-one bilateral agreementswith its major suppliers, which covered the growthrate of specific types of clothing and textile exports.The United States also initiated a "call" system, whichallows the restriction of exports not covered by anyspecific bilateral agreement.
The call system attempts to add a greater degree ofrestrictiveness by limiting the export potential of newentrants and is therefore particularly harmful to coun-tries which are starting at a very low export base. Itmaintains the status quo in both the industrial andnewly industrialized countries at the expense of thenewer, and possibly more efficient, textile-exportingcountries.
Under MFA lIthe EC had developed a similar devicefor restricting imports which are not directly coveredby any bilateral agreement. This device, known as the
"basket extractor," allows the EC to limit any textile orclothing import when it reaches a designated percent-age of the preceding year's total.
MFA IV, 1986-91
Despite the severe limitations, textile and clothing ex-ports to the industrial countries have continued togrow. In response to this the latest agreement, signedin July 1986, specifically adds silk, linen, ramie, andjute to the existing fibers in an attempt to finally controltrade in all products. In effect, the new agreement willrestrict additional tradeincluding (using 1985 figures)$813 million of Hong Kong's exports, $368 million ofthe Republic of Korea's exports, and $203 million ofChina's exports (Pelzman, background paper).
MFA IV continues the historic tradition of includingall conceivable fibers in the MFA and of plugging all the"leaks" which allowed imports of clothing and textilesto grow under the previous arrangements. With theinclusion of these natural fibers, the industrial coun-tries have at least temporarily eliminated the possibilityof having trade diverted into non-MFA fibers. Despiteits elaborate new extension, MFA IV still cannot pre-clude the possibility of increased uncontrolled indus-trial country exports. It will be through extending in-creasingly restrictive bilateral agreements to everytextile producer, as well as the call and basket extractorsystems, that the industrial countries will continue toexert protectionist pressures on developing country ex-porters.
137
to these markets. In due course, the agreementevolved into the MFA (see Box 8.3). Far from prov-ing temporary, the MFA's successively tougherversions have acquired an air of permanence.
The trade of developing countries. Against thebroad trend of trade liberalization, many develop-ing countries have retained or increased their ownimport barriers; these remain considerably higherthan those of industrial countries. But developingcountries' exports gained significantly less fromtariff reductions in the GAiT rounds than did ex-ports from the industrial nations. This was mainlybecause relatively few of the MFN tariff cuts af-
138
fected the types of products which developingcountries traditionally exported. As shown in Ta-ble 8.1, even after the Tokyo Round reductions,the average tariffs facing developing countries' ex-ports remained higher than those facing the ex-ports of industrial countries.
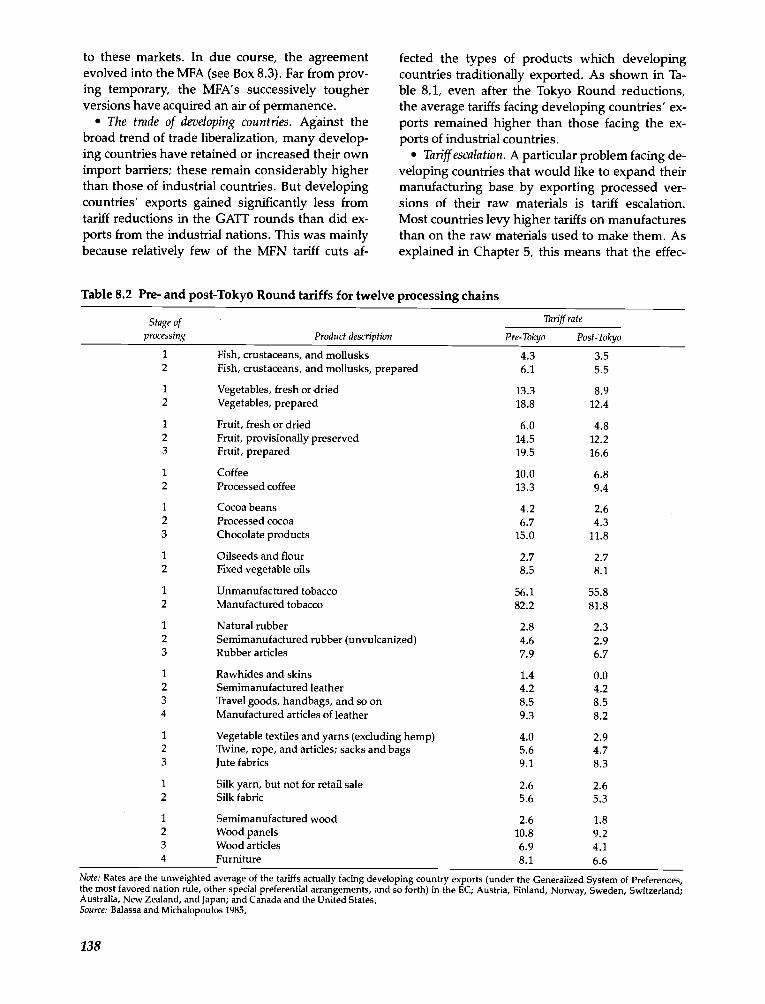
Tariff escalation. A particular problem facing de-veloping countries that would like to expand theirmanufacturing base by exporting processed ver-sions of their raw materials is tariff escalation.Most countries levy higher tariffs on manufacturesthan on the raw materials used to make them. Asexplained in Chapter 5, this means that the effec-
Note: Rates are the unweighted average of the tariffs actually facing developing country exports (under the Generalized System of Preferences,the most favored nation rule, other special preferential arrangements, and so forth) in the EC; Austria, Finland, Norway, Sweden, Switzerland;Australia, New Zealand, and Japan; and Canada and the United States.Source: Balassa and Michalopoulos 1985.
Table 8.2 Pre- and post-Tokyo Round tariffs for twelve processing chains
Stage ofprocessing Product description
Tariff rate
Pre-Tokyo Post-Tokyo
1 Fish, crustaceans, and mollusks 4.3 3.52 Fish, crustaceans, and mollusks, prepared 6.1 5.5
I Vegetables, fresh or dried 13.3 8.92 Vegetables, prepared 18.8 12.4
I Fruit, fresh or dried 6.0 4.82 Fruit, provisionally preserved 14.5 12.23 Fruit, prepared 19.5 16.6
I Coffee 10.0 6.82 Processed coffee 13.3 9.4
I Cocoa beans 4.2 2.62 Processed cocoa 6.7 4.33 Chocolate products 15.0 11.8
1 Oilseeds and flour 2.7 2.72 Fixed vegetable oils 8.5 8.1
I Unmanufactured tobacco 56.1 55.82 Manufactured tobacco 82.2 81.8
I Natural rubber 2.8 2.32 Semimanufactured rubber (unvulcanized) 4.6 2.93 Rubber articles 7.9 6.7
1 Rawhides and skins 1.4 0.02 Semimanufactured leather 4.2 4.23 Travel goods, handbags, and so on 8.5 8.54 Manufactured articles of leather 9.3 8.2
1 Vegetable textiles and yarns (excluding hemp) 4.0 2.92 Twine, rope, and articles; sacks and bags 5.6 4.73 Jute fabrics 9.1 8.3
I Silk yarn, but not for retail sale 2.6 2.62 Silk fabric 5.6 5.3
I Semimanufactured wood 2.6 1.82 Wood panels 10.8 9.23 Wood articles 6.9 4.14 Furniture 8.1 6.6
tive protection, or protection given to domesticvalue added, is much higher than the nominal tar-iff. This discriminates against processing in devel-oping countries. The Tokyo Round did little ornothing to reduce tariff escalation. As can be seenfrom Table 8.2, it remains a distinctive feature ofprotection for products in the twelve processingchains displayed there.
Despite these exceptions, the general trend up tothe early 1970s was one of liberalization of themore rapidly growing areas of international trade,particularly manufactures. Trade did not just growquickly, it grew more quickly than world output.Liberal trade policies were not the only reason forthis. There were other factors: buoyant demand,postwar reconstruction, a catching-up process inEurope and Japan on American industrial know-how, and favorable demographics. (But several of
these factors were also present in the period afterWorld War I without any similar expansion oftrade and growth.) During this great liberalizationof trade, unemployment was not a serious prob-lem in the industrial market economies. For theindustrial nations as a group it never exceeded 3.3percent up until the 1973 oil crisis. Indeed, onemotive for creating the GATT was the view that theprotectionism of the 1930s had hastened thespread of unemployment from one nation to an-other and had deepened the recession (see Box8.4).
The increase in protectionist measures
From the end of World War II until 1974 the UnitedStates was a force for trade liberalization. Itadopted special measures of protection for manu-
Box 8.4 "Beggar thy neighbor" icies in the 1930s
Inappropriate monetary policies in the United Statesand Europe and the subsequent boom and crash of theU.S. stock market are commonly held responsible forthe Great Depression of the 1930s. Other factors, mostnotably the U.S. Smoot-Hawley tariff of 1930 and theretaliation which followed, also contributed to theworldwide depression.
Some policymakers in the late 1920s understood thethreat to world and national welfare posed by the useof high retaliatory tariffs. In 1927 and again in 1930 theWorld Economic Conference met to consider a tarifftruce. But it was already too late. The Smoot-Hawleytariff was signed into law on June 17, 1930. It raised theeffective rate of tariffs in the United States by almost 50percent between 1929 and 1932 and triggered retalia-tory tariffs. Spain passed the Wais tariff in July in reac-tion to tariffs on grapes, oranges, cork, and onions.Switzerland, objecting to new tariffs on watches, em-broideries, and shoes, boycotted U.S. exports. Italy re-taliated against tariffs on hats and olive oil with hightariffs on U.S. and French automobiles in June 1930.Canada reacted to high duties on many food products,logs, and timber by raising tariffs threefold in August1932. Australia, Cuba, France, Mexico, and NewZealand also joined in the tariff wars (Kindleberger1973).
Other "beggar thy neighbor" policies, including cur-rency depreciations and foreign exchange controls,were used in attempts to improve domestic economiesat the expense of foreign countries. The attempt by allcountries to run a trade surplus by cutting imports ledto a breakdown of the entire system of trade.
As a result of these policies, all countries suffered
from idle productive capacity and low prices. The in-creased domestic demand for U.S. farm products pro-tected by high tariffs, for example, was more than off-set by the loss of export markets. Exports of U.S.agricultural products dropped 66 percent from 1929 to1932 (Brunner 1981). This aggravated the decline infarm prices, which in turn contributed to rural bankfailures.
Some economists disagree with this assessment ofretaliatory tariffs during the 1930s. They argue that,although tariff levels were substantially raised, theymade little difference to the volume or direction oftrade. They argue that the reason for the drop in thevolume of trade in manufactures during the Depres-sion was not beggar thy neighbor policies, but the fallin the demand for primary commodities. The failure ofinternational financial markets and the lack of credit,rather than tariffs, crippled trade.
While a consensus on the causes of the Depression isyet to be reached, it is probable that the beggar thyneighbor trade policies at least added to the severity ofthe Depression and contributed to the breakdown ofinternational trade. It was the intention of the framersof the postwar economic order to disallow a repetitionof 1930s-style trade policies. Thus the General Agree-ment on Tariffs and Trade supports tariff liberalizationand specifies the use of nondiscriminatory, bound tar-iffs as the only acceptable form of protection except inextraordinary circumstances. Despite the rise of thenew protectionism, it is likely that the memories of theDepression have played a role in checking the increas-ing calls for protection.
139
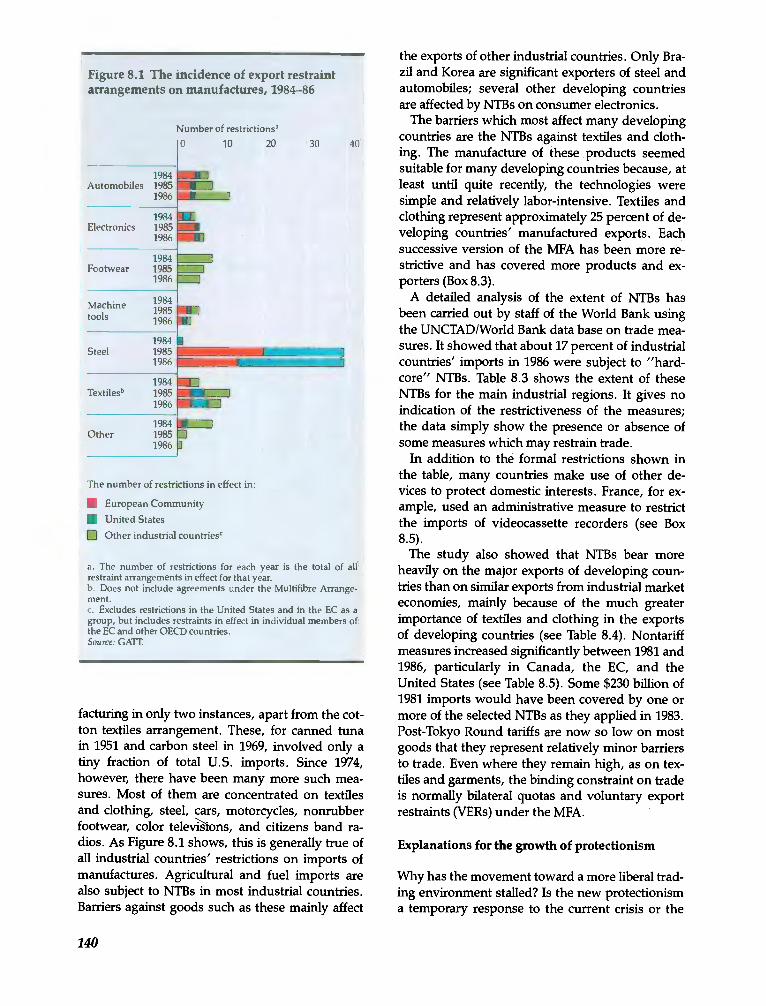
Figure 8.1 The incidence of export restraintarrangements on manufactures, 1984-86
1984Automobiles 1985
1986
1984Electronics 1985
1986
1984Footwear 1985
1986
Machinetools
198419851986
Number of restrictions'0 10 20
1984 1j[JTextiles' 1985 L F I
1986 L _J_J
The number of restrictions in effect in:
European CommunityUnited States
O Other industrial countries
The number of restrictions for each year is the total of allrestraint arrangements in effect for that year.
Does not include agreements under the Multifibre Arrange-ment.
Excludes restrictions in the United States and in the EC as agroup, but includes restraints in effect in individual members ofthe EC and other OECD countries.Source: GAT1.
30 40
facturing in only two instances, apart from the cot-ton textiles arrangement. These, for canned tunain 1951 and carbon steel in 1969, involved only atiny fraction of total U.S. imports. Since 1974,however, there have been many more such mea-sures. Most of them are concentrated on textilesand clothing, steel, cars, motorcycles, nonrubberfootwear, color televilions, and citizens band ra-dios. As Figure 8.1 shows, this is generally true ofall industrial countries' restrictions on imports ofmanufactures. Agricultural and fuel imports arealso subject to NTBs in most industrial countries.Barriers against goods such as these mainly affect
140
the exports of other industrial countries. Only Bra-zil and Korea are significant exporters of steel andautomobiles; several other developing countriesare affected by NTBs on consumer electronics.
The barriers which most affect many developingcountries are the NTBs against textiles and cloth-ing. The manufacture of these products seemedsuitable for many developing countries because, atleast until quite recently, the technologies weresimple and relatively labor-intensive. Textiles andclothing represent approximately 25 percent of de-veloping countries' manufactured exports. Eachsuccessive version of the MFA has been more re-strictive and has covered more products and ex-porters (Box 8.3).
A detailed analysis of the extent of NTBs hasbeen carried out by staff of the World Bank usingthe UNCTAD/Worid Bank data base on trade mea-sures. It showed that about 17 percent of industrialcountries' imports in 1986 were subject to "hard-core" NTBs. Table 8.3 shows the extent of theseNTBs for the main industrial regions. It gives noindication of the restrictiveness of the measures;the data simply show the presence or absence ofsome measures which may restrain trade.
In addition to the formal restrictions shown inthe table, many countries make use of other de-vices to protect domestic interests. France, for ex-ample, used an administrative measure to restrictthe imports of videocassette recorders (see Box8.5).
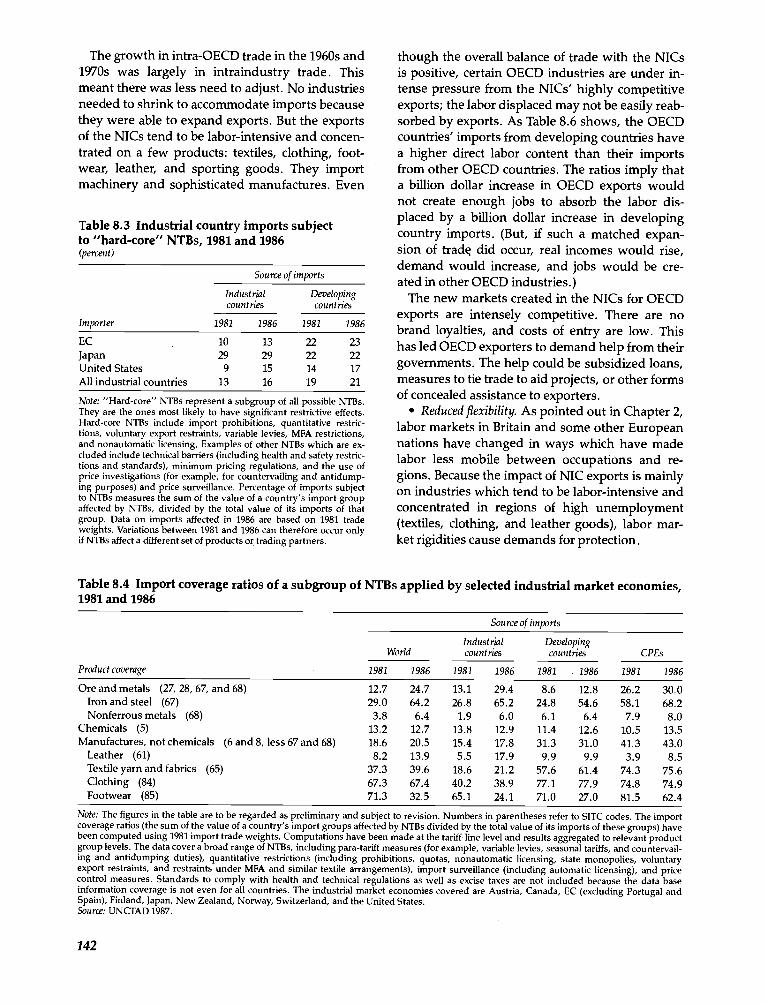
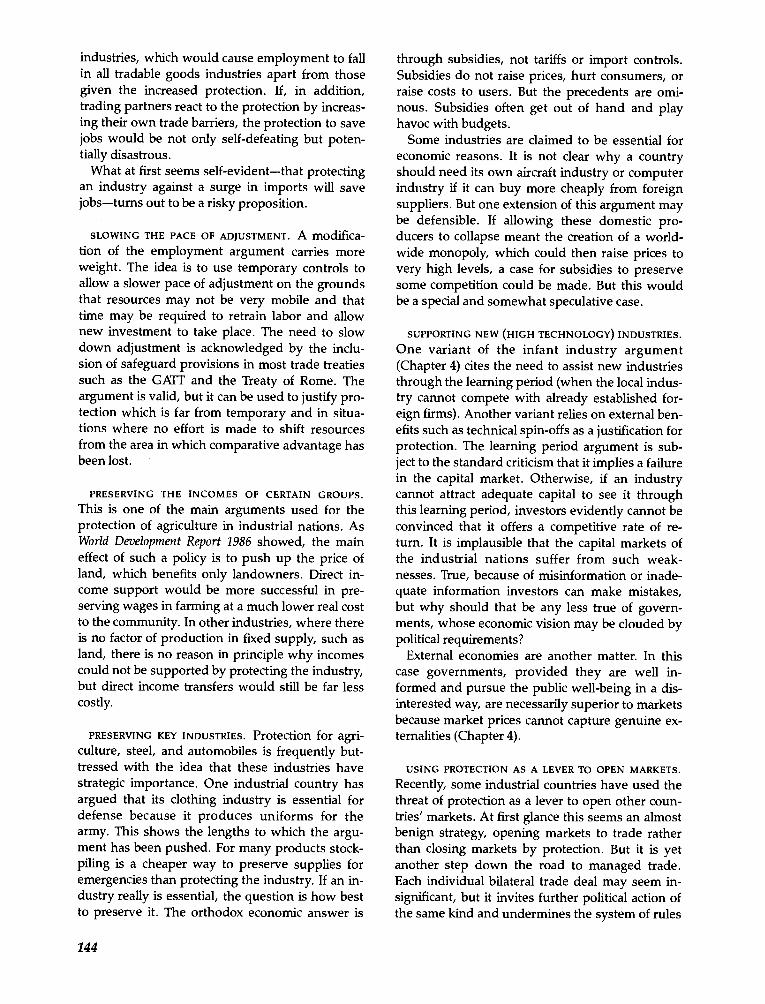
The study also showed that NTBs bear moreheavily on the major exports of developing coun-tries than on similar exports from industrial marketeconomies, mainly because of the much greaterimportance of textiles and clothing in the exportsof developing countries (see Table 8.4). Nontariffmeasures increased significantly between 1981 and1986, particularly in Canada, the EC, and theUnited States (see Table 8.5). Some $230 billion of1981 imports would have been covered by one ormore of the selected NTBs as they applied in 1983.Post-Tokyo Round tariffs are now so low on mostgoods that they represent relatively minor barriersto trade. Even where they remain high, as on tex-tiles and garments, the binding constraint on tradeis normally bilateral quotas and voluntary exportrestraints (VERs) under the MFA.
Explanations for the growth of protectionism
Why has the movement toward a more liberal trad-ing environment stalled? Is the new protectionisma temporary response to the current crisis or the
1984 USteel 1985
1986
1984Other 1985
1986
Box 8.5 The Poitiers effect"
The "new protectionism" usually refers to the use ofnontariff barriers such as VERs and orderly marketingarrangements. But it only takes a little ingenuity tointroduce an administrative regulation which can be aneffective barrier to trade.
In October 1982, citing a "Japanese invasion" in con-sumer electronics, the French government decreed thatall imports of videocassette recorders (VCRs) wouldhave to pass through Poitiers. Although not the mostobvious point of entry, Poitiers could hardly be bettersuited to the purpose. It is a town hundreds of milesinland from France's northern ports where the VCRsare landed. It has a tiny customs crew that is obviouslyinadequate to the task of clearing hundreds of thou-sands of VCR imports. As the town where the Frenchrepelled an earlier invader, the Moors, Poitiers seemedan apt choice.
Moreover, a particularly long and tedious set of cus-toms regulations were strictly enforced at Poitiers. Allthe accompanying documents were thoroughly exam-ined and each container opened. A large number ofVCRs were taken out of their boxes by the customsinspectors, who carefully checked their serial numbersand made sure that instructions were written inFrench. Finally, a number of VCRs were dismantled tomake sure that they were actually built in their re-ported country of origin. The regional customs directorresponsible for Poitiers said of the new regulations:"Before the new policy, it took a morning to clear alorry-load of video recorders. Now it takes two to threemonths. We are still clearing consignments that arrivedhere [three months agol when the policy went intoeffect" (Lewis 1982).
As planned, the "Poitiers effect" severely limitedVCR imports into France. Before the use of Poitiers,more than 64,000 VCRs, mostly from Japan, enteredFrance each month for the first ten months of 1981.Afterward, less than 10,000 VCRs cleared the customspoint at Poitiers each month, while the rest of the sup-ply waited in bonded warehouses throughout thetown. Exporters did not passively concede to theFrench barriers. Denmark, the Federal Republic of Ger-many, and the Netherlands, which also export VCRs toFrance, filed a complaint with the EC Executive Com-mittee in Brussels, which in turn brought chargesagainst France at the European Court of Justice forbreach of EC free trade rules. Japan brought its com-plaint to the GATT and then suspended or curbed VCRshipments to France.
It is not clear what the French hoped to gain from theuse of the Poitiers weapon. The French electronics firmThomas-Brandt did not make its own VCRs, but soldJapanese VCRs under its own label. It experienced ashortage of these when the government required allthe imports to go through Poitiers. Shortly after theestablishment of Poitiers, the EC Commission negoti-ated a VER limiting Japan's exports to the entire Euro-pean Community. This was followed by an agreementbetween Thomas-Brandt and Japan's JVC to manufac-ture component parts in France and later the lifting ofthe Poitiers restrictions. It is likely that several complexissues concerning intragovernment and government-industry relations played a role in the Poitiers scheme.Yet, although the motives remain somewhat obscure,the protective effect of it is clear.
beginning of a new trend brought about by a lackof faith in an open trading system? If the former,the tide of protectionism may ebb with economicrecovery. But if major countries no longer feel thattheir interests are served by the GAiT rules, thenan open trading system is indeed in peril.
The demand for protection
Protection is demanded by groups who see theirinterests damaged by imports and is supplied bygovernments that see their interests served by giv-ing way to these demands. Economic argumentsplay a role, but probably a minor one. The demandfor protection has usually involved an alliance ofowners and workers (although the international-ization of production through multinational corpo-
rations and international subcontracting may beundermining such alliances to some extent). Threefactors seem likely to have stimulated such domes-tic interest groups to demand protection in recentyears:
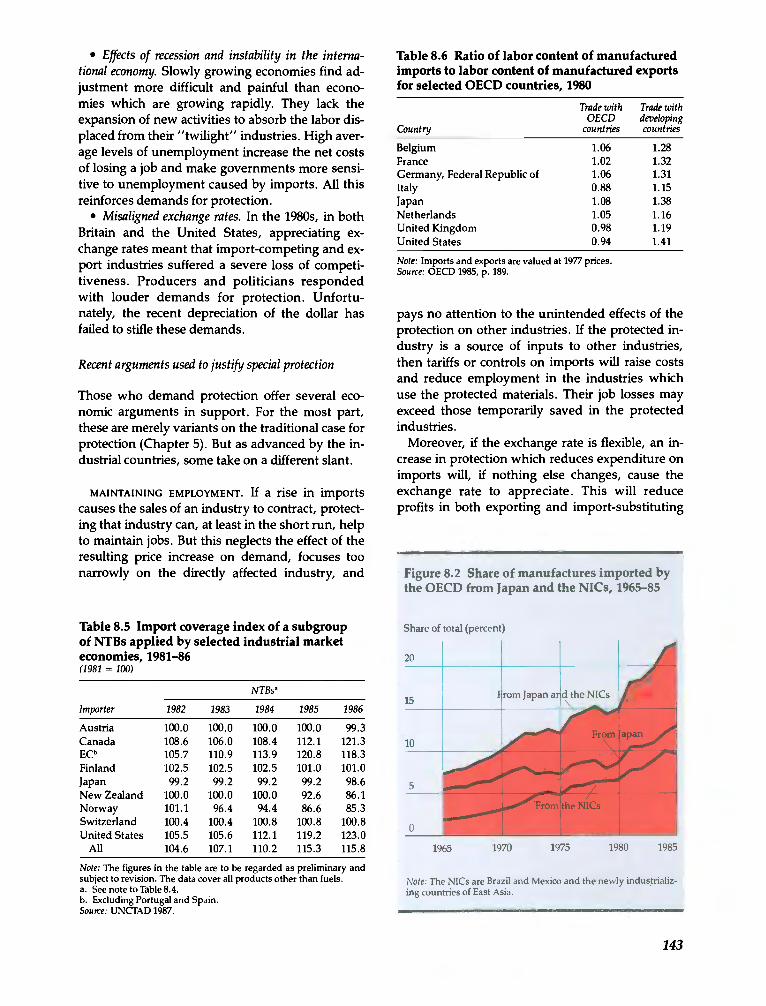
Structural changes in trade. Japan's dependenceon imports of energy and raw materials forced it tobecome an even more aggressive exporter of man-ufactures in response to the oil crises and a slow-down in growth. Since 1978 it has consistently hada trade surplus. The rise in Japan's share of im-ports of manufactures from other members of theOrganisation for Economic Co-operation and De-velopment (OECD) coincided with an increase inthe NICs' share from 1980 onward; the pressureon some OECD countries' import-competing in-dustries was great (see Figure 8.2).
141
The growth in intra-OECD trade in the 1960s and1970s was largely in intraindustry trade. Thismeant there was less need to adjust. No industriesneeded to shrink to accommodate imports becausethey were able to expand exports. But the exportsof the NICs tend to be labor-intensive and concen-trated on a few products: textiles, clothing, foot-wear, leather, and sporting goods. They importmachinery and sophisticated manufactures. Even
Table 8.3 Industrial country imports subjectto "hard-core" NTBs, 1981 and 1986(percent)
Source of imports
Note: "Hard-core" NTBs represent a subgroup of all possible NTBs.They are the ones most likely to have significant restrictive effects.Hard-core NTBs include import prohibitions, quantitative restric-tions, voluntary export restraints, variable levies, MFA restrictions,and nonautomatic licensing. Examples of other NTBs which are ex-cluded include technical barriers (including health and safety restric-tions and standards), minimum pricing regulations, and the use ofprice investigations (for example, for countervailing and antidump-ing purposes) and price surveillance. Percentage of imports subjectto NTB5 measures the sum of the value of a country's import groupaffected by NTBs, divided by the total value of its imports of thatgroup. Data on imports affected in 1986 are based on 1981 tradeweights. Variations between 1981 and 1986 can therefore occur onlyif NTB5 affect a different set of products or trading partners.
though the overall balance of trade with the NICsis positive, certain OECD industries are under in-tense pressure from the NICs' highly competitiveexports; the labor displaced may not be easily reab-sorbed by exports. As Table 8.6 shows, the OECDcountries' imports from developing countries havea higher direct labor content than their importsfrom other OECD countries. The ratios imply thata billion dollar increase in OECD exports wouldnot create enough jobs to absorb the labor dis-placed by a billion dollar increase in developingcountry imports. (But, if such a matched expan-sion of trade did occur, real incomes would rise,demand would increase, and jobs would be cre-ated in other OECD industries.)
The new markets created in the NICs for OECDexports are intensely competitive. There are nobrand loyalties, and costs of entry are low. Thishas led OECD exporters to demand help from theirgovernments. The help could be subsidized loans,measures to tie trade to aid projects, or other formsof concealed assistance to exporters.
Reduced flexibility. As pointed out in Chapter 2,labor markets in Britain and some other Europeannations have changed in ways which have madelabor less mobile between occupations and re-gions. Because the impact of NIC exports is mainlyon industries which tend to be labor-intensive andconcentrated in regions of high unemployment(textiles, clothing, and leather goods), labor mar-ket rigidities cause demands for protection.
Note: The figures in the table are to be regarded as preliminary and subject to revision. Numbers in parentheses refer to SITC codes. The importcoverage ratios (the sum of the value of a country's import groups affected by NTBs divided by the total value of its imports of thesegroups) havebeen computed using 1981 import trade weights. Computations have been made at the tariff-line level and results aggregated to relevant productgroup levels. The data cover a broad range of NTBs, including pars-tariff measures (for example, variable levies, seasonal tariffs, and countervail-ing and antidumping duties), quantitative restrictions (including prohibitions, quotas, nonautomatic licensing, state monopolies, voluntaryexport restraints, and restraints under MFA and similar textile arrangements), import surveillance (including automatic licensing), and pricecontrol measures. Standards to comply with health and technical regulations as well as excise taxes are not included because the data baseinformation coverage is not even for all countries. The industrial market economies covered are Austria, Canada, EC (excluding Portugal andSpain), Finland, Japan, New Zealand, Norway, Switzerland, and the United States.Source: UNClAD 1987.
142
Product coverage
Source of imports
WorldIndustrialcountries
Developingcountries CPEs
1981 1986 1981 1986 1981 1986 1981 1986
Ore and metals (27, 28, 67, and 68) 12.7 24.7 13.1 29.4 8.6 12.8 26.2 30.0Iron and steel (67) 29.0 64.2 26.8 65.2 24.8 54.6 58.1 68.2Nonferrous metals (68) 3.8 6.4 1.9 6.0 6,1 6.4 7.9 8.0
Chemicals (5) 13,2 12.7 13.8 12.9 11.4 12.6 10.5 13.5Manufactures, not chemicals (6 and 8, less 67 and 68) 18,6 20.5 15.4 17.8 31.3 31.0 41,3 43.0
Leather (61) 8.2 13.9 5.5 17.9 9.9 9.9 3.9 8.5Textile yarn and fabrics (65) 37.3 39.6 18.6 21,2 57.6 61,4 74.3 75,6Clothing (84) 67.3 67.4 40.2 38,9 77.1 77.9 74.8 74.9Footwear (85) 71.3 32.5 65.1 24.1 71.0 27.0 81.5 62.4
Industrialcountries
Developingcountries
Importer 1981 1986 1981 1986
EC 10 13 22 23Japan 29 29 22 22United States 9 15 14 17All industrial countries 13 16 19 21
Table 8.4 Import coverage ratios of a subgroup of NTBs applied by selected industrial market economies,1981 and 1986
Effects of recession and instability in the interna-tional economy, Slowly growing economies find ad-justment more difficult and painful than econo-mies which are growing rapidly. They lack theexpansion of new activities to absorb the labor dis-placed from their "twilight" industries. High aver-age levels of unemployment increase the net costsof losing a job and make governments more sensi-tive to unemployment caused by imports. All thisreinforces demands for protection.
Misaligned exchange rates. In the 1980s, in bothBritain and the United States, appreciating ex-change rates meant that import-competing and ex-port industries suffered a severe loss of competi-tiveness. Producers and politicians respondedwith louder demands for protection. Unfortu-nately, the recent depreciation of the dollar hasfailed to stifle these demands.
Recent arguments used to justify special protection
Those who demand protection offer several eco-nomic arguments in support. For the most part,these are merely variants on the traditional case forprotection (Chapter 5). But as advanced by the in-dustrial countries, some take on a different slant.
MAINTAINING EMPLOYMENT. If a rise in importscauses the sales of an industry to contract, protect-ing that industry can, at least in the short run, helpto maintain jobs. But this neglects the effect of theresulting price increase on demand, focuses toonarrowly on the directly affected industry, and
Table 8.5 Import coverage index of a subgroupof NTBs applied by selected industrial marketeconomies, 1981-86
Note: The figures in the table are to be regarded as preliminary andsubject to revision. The data cover all products other than fuels.
See note to Table 8.4.Excluding Portugal and Spain.
Source: UNCTAD 1987.
Table 8.6 Ratio of labor content of manufacturedimports to labor content of manufactured exportsfor selected OECD countries, 1980
Note: Imports and exports are valued at 1977 prices.Source: OECD 1985, p. 189.
pays no attention to the unintended effects of theprotection on other industries, if the protected in-dustry is a source of inputs to other industries,then tariffs or controls on imports wifi raise costsand reduce employment in the industries whichuse the protected materials. Their job losses mayexceed those temporarily saved in the protectedindustries.
Moreover, if the exchange rate is flexible, an in-crease in protection which reduces expenditure onimports will, if nothing else changes, cause theexchange rate to appreciate. This will reduceprofits in both exporting and import-substituting
Figure 8.2 Share of manufactures imported bythe OECD from Japan and the NICs, 1965-85
Share of total (percent)
rom Japan ar d the NICs
/the NICs
Note: The NICs are Brazil and Mexico and the newly industrializ-ing countries of East Asia.
143
(1981 = 100)
NTBs'
Importer 1982 1983 1984 1985 1986
Austria 100.0 100.0 100.0 100.0 99.3Canada 108.6 106.0 108.4 112.1 121.3ECb 105.7 110.9 113.9 120.8 118.3Finland 102.5 102.5 102.5 101.0 101.0Japan 99.2 99.2 99.2 99.2 98.6New Zealand 100.0 100.0 100.0 92.6 86.1Norway 101.1 96.4 94.4 86.6 85.3Switzerland 100.4 100.4 100.8 100.8 100.8United States 105.5 105.6 112.1 119.2 123.0
All 104.6 107.1 110.2 115.3 115.8
Country
Trade withOECD
countries
Trade withdevelopingcountries
Belgium 1.06 1.28France 1.02 1.32Germany, Federal Republic of 1.06 1.31Italy 0.88 1.15Japan 1.08 1.38Netherlands 1.05 1.16United Kingdom 0.98 1.19United States 0.94 1.41
1965 1970 1975 1980 1985
industries, which would cause employment to fallin all tradable goods industries apart from thosegiven the increased protection. If, in addition,trading partners react to the protection by increas-ing their own trade barriers, the protection to savejobs would be not only self-defeating but poten-tially disastrous.
What at first seems self-evidentthat protectingan industry against a surge in imports will savejobsturns out to be a risky proposition.
SLOWING THE PACE OF ADJUSTMENT. A modifica-tion of the employment argument carries moreweight. The idea is to use temporary controls toallow a slower pace of adjustment on the groundsthat resources may not be very mobile and thattime may be required to retrain labor and allownew investment to take place. The need to slowdown adjustment is acknowledged by the inclu-sion of safeguard provisions in most trade treatiessuch as the GAIT and the Treaty of Rome. Theargument is valid, but it can be used to justify pro-tection which is far from temporary and in situa-tions where no effort is made to shift resourcesfrom the area in which comparative advantage hasbeen lost.
PRESERVING THE INCOMES OF CERTAIN GROUPS.This is one of the main arguments used for theprotection of agriculture in industrial nations. AsWorld Development Report 1986 showed, the maineffect of such a policy is to push up the price ofland, which benefits only landowners. Direct in-come support would be more successful in pre-serving wages in farming at a much lower real costto the community. In other industries, where thereis no factor of production in fixed supply, such asland, there is no reason in principle why incomescould not be supported by protecting the industry,but direct income transfers would still be far lesscostly.
PRESERVING KEY INDUSTRIES. Protection for agri-culture, steel, and automobiles is frequently but-tressed with the idea that these industries havestrategic importance. One industrial country hasargued that its clothing industry is essential fordefense because it produces uniforms for thearmy. This shows the lengths to which the argu-ment has been pushed. For many products stock-piling is a cheaper way to preserve supplies foremergencies than protecting the industry. If an in-dustry really is essential, the question is how bestto preserve it. The orthodox economic answer is
144
through subsidies, not tariffs or import controls.Subsidies do not raise prices, hurt consumers, orraise costs to users. But the precedents are omi-nous. Subsidies often get out of hand and playhavoc with budgets.
Some industries are claimed to be essential foreconomic reasons. It is not clear why a countryshould need its own aircraft industry or computerindustry if it can buy more cheaply from foreignsuppliers. But one extension of this argument maybe defensible. If allowing these domestic pro-ducers to collapse meant the creation of a world-wide monopoly, which could then raise prices tovery high levels, a case for subsidies to preservesome competition could be made. But this wouldbe a special and somewhat speculative case.
SUPPORTING NEW (HIGH TECHNOLOGY) INDUSTRIES.
One variant of the infant industry argument(Chapter 4) cites the need to assist new industriesthrough the learning period (when the local indus-try cannot compete with already established for-eign firms). Another variant relies on external ben-efits such as technical spin-offs as a justification forprotection. The learning period argument is sub-ject to the standard criticism that it implies a failurein the capital market. Otherwise, if an industrycannot attract adequate capital to see it throughthis learning period, investors evidently cannot beconvinced that it offers a competitive rate of re-turn. It is implausible that the capital markets ofthe industrial nations suffer from such weak-nesses. True, because of misinformation or inade-quate information investors can make mistakes,but why should that be any less true of govern-ments, whose economic vision may be clouded bypolitical requirements?
External economies are another matter. In thiscase governments, provided they are well in-formed and pursue the public well-being in a dis-interested way, are necessarily superior to marketsbecause market prices cannot capture genuine ex-ternalities (Chapter 4).
USING PROTECTION AS A LEVER TO OPEN MARKETS.
Recently, some industrial countries have used thethreat of protection as a lever to open other coun-tries' markets. At first glance this seems an almostbenign strategy, opening markets to trade ratherthan closing markets by protection. But it is yetanother step down the road to managed trade.Each individual bilateral trade deal may seem in-significant, but it invites further political action ofthe same kind and undermines the system of rules
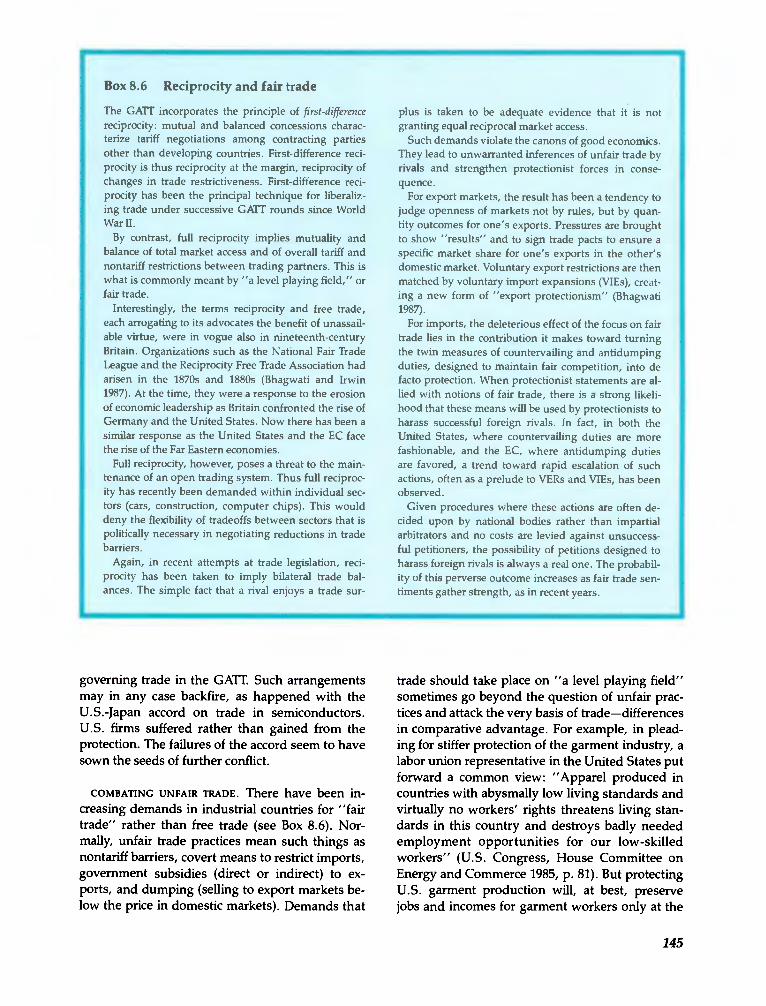
Box 8.6 Reciprocity and fair trade
The CAT!' incorporates the principle of first-differencereciprocity: mutual and balanced concessions charac-terize tariff negotiations among contracting partiesother than developing countries. First-difference reci-procity is thus reciprocity at the margin, reciprocity ofchanges in trade restrictiveness. First-difference reci-procity has been the principal technique for liberaliz-ing trade under successive CATT rounds since WorldWar II.
By contrast, full reciprocity implies mutuality andbalance of total market access and of overall tariff andnontariff restrictions between trading partners. This iswhat is commonly meant by "a level playing field," orfair trade.
Interestingly, the terms reciprocity and free trade,each arrogating to its advocates the benefit of unassail-able virtue, were in vogue also in nineteenth-centuryBritain. Organizations such as the National Fair TradeLeague and the Reciprocity Free Trade Association hadarisen in the 1870s and 1880s (Bhagwati and Irwin1987). At the time, they were a response to the erosionof economic leadership as Britain confronted the rise ofGermany and the United States. Now there has been asimilar response as the United States and the EC facethe rise of the Far Eastern economies.
Full reciprocity, however, poses a threat to the main-tenance of an open trading system. Thus full reciproc-ity has recently been demanded within individual sec-tors (cars, construction, computer chips). This woulddeny the flexibility of tradeoffs between sectors that ispolitically necessary in negotiating reductions in tradebarriers.
Again, in recent attempts at trade legislation, reci-procity has been taken to imply bilateral trade bal-ances. The simple fact that a rival enjoys a trade sur-
governing trade in the GATF. Such arrangementsmay in any case backfire, as happened with theU.S.-Japan accord on trade in semiconductors.U.S. firms suffered rather than gained from theprotection. The failures of the accord seem to havesown the seeds of further conflict.
COMBATING UNFAIR TRADE. There have been in-creasing demands in industrial countries for "fairtrade" rather than free trade (see Box 8.6). Nor-mally, unfair trade practices mean such things asnontariff barriers, covert means to restrict imports,government subsidies (direct or indirect) to ex-ports, and dumping (selling to export markets be-low the price in domestic markets). Demands that
plus is taken to be adequate evidence that it is notgranting equal reciprocal market access.
Such demands violate the canons of good economics.They lead to unwarranted inferences of unfair trade byrivals and strengthen protectionist forces in conse-quence.
For export markets, the result has been a tendency tojudge openness of markets not by rules, but by quan-tity outcomes for one's exports. Pressures are broughtto show "results" and to sign trade pacts to ensure aspecific market share for one's exports in the other'sdomestic market. Voluntary export restrictions are thenmatched by voluntary import expansions (VIEs), creat-ing a new form of "export protectionism" (Bhagwati1987).
For imports, the deleterious effect of the focus on fairtrade lies in the contribution it makes toward turningthe twin measures of countervailing and antidumpingduties, designed to maintain fair competition, into defacto protection. When protectionist statements are al-lied with notions of fair trade, there is a strong likeli-hood that these means will be used by protectionists toharass successful foreign rivals. In fact, in both theUnited States, where countervailing duties are morefashionable, and the EC, where antidumping dutiesare favored, a trend toward rapid escalation of suchactions, often as a prelude to VERs and VIEs, has beenobserved.
Given procedures where these actions are often de-cided upon by national bodies rather than impartialarbitrators and no costs are levied against unsuccess-ful petitioners, the possibility of petitions designed toharass foreign rivals is always a real one. The probabil-ity of this perverse outcome increases as fair trade sen-timents gather strength, as in recent years.
trade should take place on "a level playing field"sometimes go beyond the question of unfair prac-tices and attack the very basis of tradedifferencesin comparative advantage. For example, in plead-ing for stiffer protection of the garment industry, alabor union representative in the United States putforward a common view: "Apparel produced incountries with abysmally low living standards andvirtually no workers' rights threatens living stan-dards in this country and destroys badly neededemployment opportunities for our low-skilledworkers" (U.S. Congress, House Committee onEnergy and Commerce 1985, p. 81). But protectingU.S. garment production will, at best, preservejobs and incomes for garment workers only at the
145
cost of jobs and incomes elsewhere in the economyand wifi make it more difficult for workers in de-veloping countries to raise their "abysmally low"living standards.
The supply of protection
A combination of domestic and international fac-tors seems likely to influence the readiness of gov-ernments to be persuaded by such arguments andto accede to demands for protection. Policymakersare influenced by the relative power and persua-siveness of different interest groups in the econ-omy. On the side of protection are the injuredimport-competing industries. On the other sideare users of imported products: consumers; retail-ers; industries, including multinational corpora-tions which use the products as inputs; and ex-porting firms. In the past, opponents of protectionhave found it hard to organize effective lobbyingagainst it. The costs of protection seem too smalland too diffuse to arouse public opinion, whereasthe benefits, such as jobs saved directly in thethreatened industries, have appealed to publicsentiment.
DOMESTIC FACTORS. The wfflingness of policy-makers to respond to demands for trade barriersdepends partly on the alternatives at their dis-posal. For most of the postwar era, governmentshave responded to rising unemployment with ex-pansionary policies to create new jobs or with re-gional policies to switch investment to new activi-ties in the area where unemployment had risen. InFrance, Italy, and the United Kingdom, regionalpolicies were used vigorously in the 1950s and1960s. By creating new jobs in the electrical goodsand other light manufacturing industries, theyprobably helped to cope with some of the labordisplaced by competition from textile imports andthe loss of shipbuilding orders to Japan and Swe-den. (Whether regional policies brought net gainsto these economies is a subject of considerable con-troversy.) The much tighter fiscal restraints im-posed upon governments by the need to controlinflation and reduce tax burdens in the 1970s and1980s have reduced their ability to use fiscal poli-cies to expand demand and to increase subsidies.
In the United States, the policies to assist adjust-ment which were introduced in the trade act thatpreceded the Kennedy Round have provoked con-siderable disillusionment, although the UnitedStates still favors the principle. Other countries,such as the Netherlands, have experimented with
146
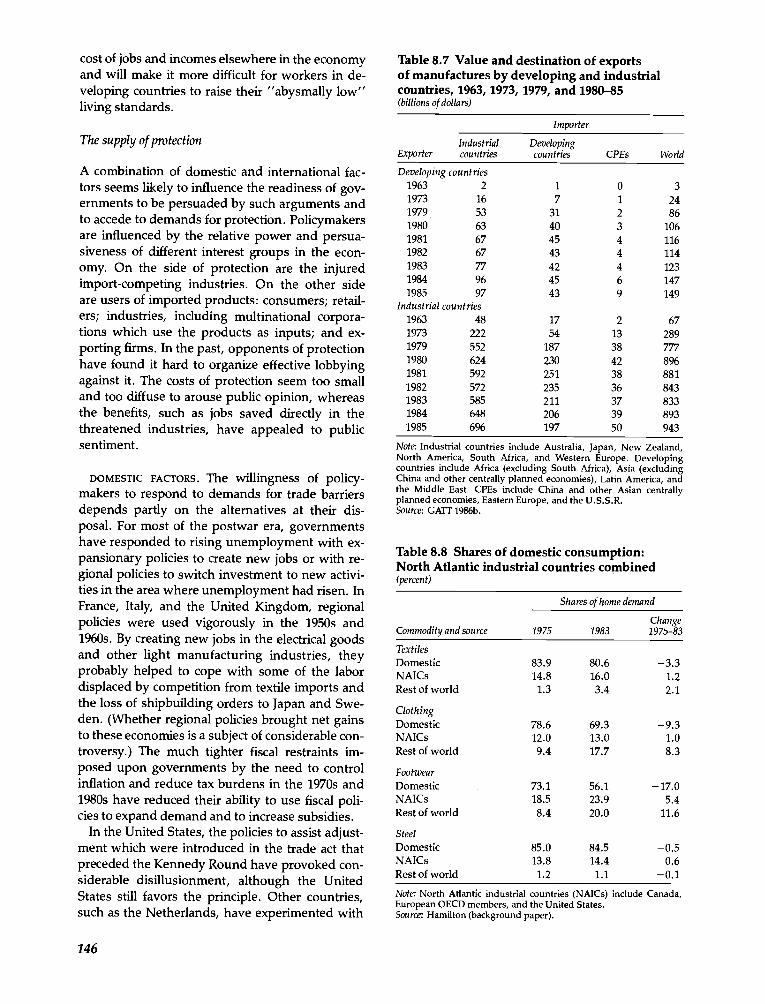
Table 8.7 Value and destination of exportsof manufactures by developing and industrialcountries, 1963, 1973, 1979, and 1980-85(billions of dollars)
Note: Industrial Countries include Australia, Japan, New Zealand,North America, South Africa, and Western Europe. Developingcountries include Africa (excluding South Africa), Asia (excludingChina and other centrally planned economies), Latin America, andthe Middle East. CPEs include China and other Asian centrallyplanned economies, Eastern Europe, and the U.S.S.R.Source: GATF 1986b.
Table 8.8 Shares of domestic consumption:North Atlantic industrial countries combined
Note: North Atlantic industrial countries (NAIC5) include Canada,European OECD members, and the United States.Source: Hamilton (background paper).
Exporter
Importer
Industrialcountries
Developingcountries CPEs World
Developing countries1963 2 1 0 31973 16 7 1 241979 53 31 2 861980 63 40 3 1061981 67 45 4 1161982 67 43 4 1141983 77 42 4 1231984 96 45 6 1471985 97 43 9 149
Industrial countries1963 48 17 2 671973 222 54 13 2891979 552 187 38 7771980 624 230 42 8961981 592 251 38 8811982 572 235 36 8431983 585 211 37 8331984 648 206 39 8931985 696 197 50 943
(percent)
Shares of home demand
ChangeCommodity and source 1975 1983 1975-83
TextilesDomestic 83.9 80.6 -3.3NAICs 14.8 16.0 1.2Rest of world 1.3 3.4 2.1
ClothingDomestic 78.6 69.3 -9.3NAICs 12.0 13.0 1.0Rest of world 9.4 17.7 8.3
FootwearDomestic 73.1 56.1 -17.0NAICs 18.5 23.9 5.4Rest of world 8.4 20.0 11.6
SteelDomestic 85.0 84.5 -0.5NAICs 13.8 14.4 0.6Rest of world 1.2 1.1 -0.1
special assistance for import-displaced workers;they too have been less than satisfied. As theirpolicy options have narrowed, governments havebeen more willing to concede to demands for pro-tection.
INTERNATIONAL FACTORS. Risk of retaliation alsoinfluences governments. The United States andthe EC are important customers for each other'sexports. Both sides have used retaliation, or thethreat of it, to attack barriers against their exports.Most of the developing countries import relativelyfew manufactures for consumption. The goodsthey import from OECD nations tend to be neces-sary inputs into their own production. This makesit difficult for them to produce a credible retaliatorythreat. The inability to retaliate may be one reasonthe developing countries now face the tough bilat-eral constraints of the MFA in textiles and otherNTBs in agriculture, footwear, and leather goods.
The combination of increasing demands for pro-tection and governments' diminishing will to resistaccounts for the rise of the new protectionism inthe 1970s and 1980s. The current multilateral nego-tiations in the Uruguay Round are an opportunityto check this trend, but that can happen only ifgovernments make a determined effort.
Has protectionism retarded trade?
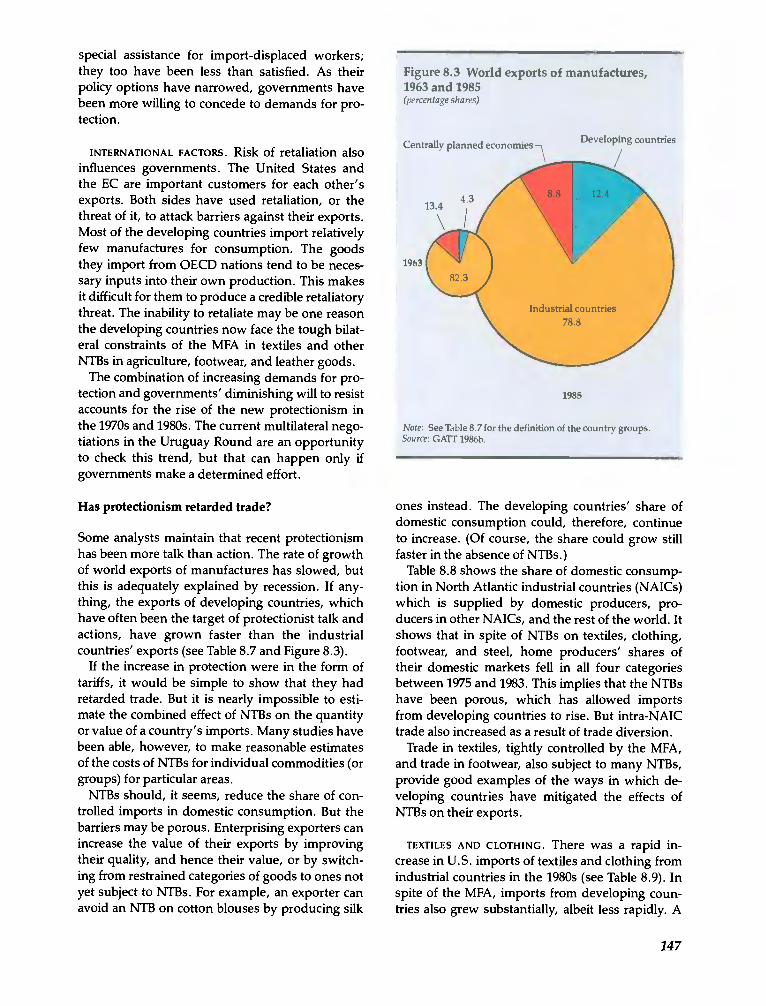
Some analysts maintain that recent protectionismhas been more talk than action. The rate of growthof world exports of manufactures has slowed, butthis is adequately explained by recession. If any-thing, the exports of developing countries, whichhave often been the target of protectionist talk andactions, have grown faster than the industrialcountries' exports (see Table 8.7 and Figure 8.3).
If the increase in protection were in the form oftariffs, it would be simple to show that they hadretarded trade. But it is nearly impossible to esti-mate the combined effect of NTBs on the quantityor value of a country's imports. Many studies havebeen able, however, to make reasonable estimatesof the costs of NTBs for individual commodities (orgroups) for particular areas.
NIBs should, it seems, reduce the share of con-trolled imports in domestic consumption. But thebarriers may be porous. Enterprising exporters canincrease the value of their exports by improvingtheir quality, and hence their value, or by switch-ing from restrained categories of goods to ones notyet subject to NTBs. For example, an exporter canavoid an NIB on cotton blouses by producing silk
Figure 8.3 World exports of manufactures,1963 and 1985(percentage shares)
Centrally planned economies Developing countries
1963
1985
Note: See Table 8.7 for the definition of the country groups.Source: GATr 1986b.
ones instead. The developing countries' share ofdomestic consumption could, therefore, continueto increase. (Of course, the share could grow stillfaster in the absence of NIBs.)
Table 8.8 shows the share of domestic consump-tion in North Atlantic industrial countries (NAICs)which is supplied by domestic producers, pro-ducers in other NAICs, and the rest of the world. Itshows that in spite of NIBs on textiles, clothing,footwear, and steel, home producers' shares oftheir domestic markets fell in all four categoriesbetween 1975 and 1983. This implies that the NIBshave been porous, which has allowed importsfrom developing countries to rise. But intra-NAICtrade also increased as a result of trade diversion.
Trade in textiles, tightly controlled by the MFA,and trade in footwear, also subject to many NIBs,provide good examples of the ways in which de-veloping countries have mitigated the effects ofNTBs on their exports.
TEXTILES AND CLOTHING. There was a rapid in-crease in U.S. imports of textiles and clothing fromindustrial countries in the 1980s (see Table 8.9). Inspite of the MFA, imports from developing coun-tries also grew substantially, albeit less rapidly. A
147
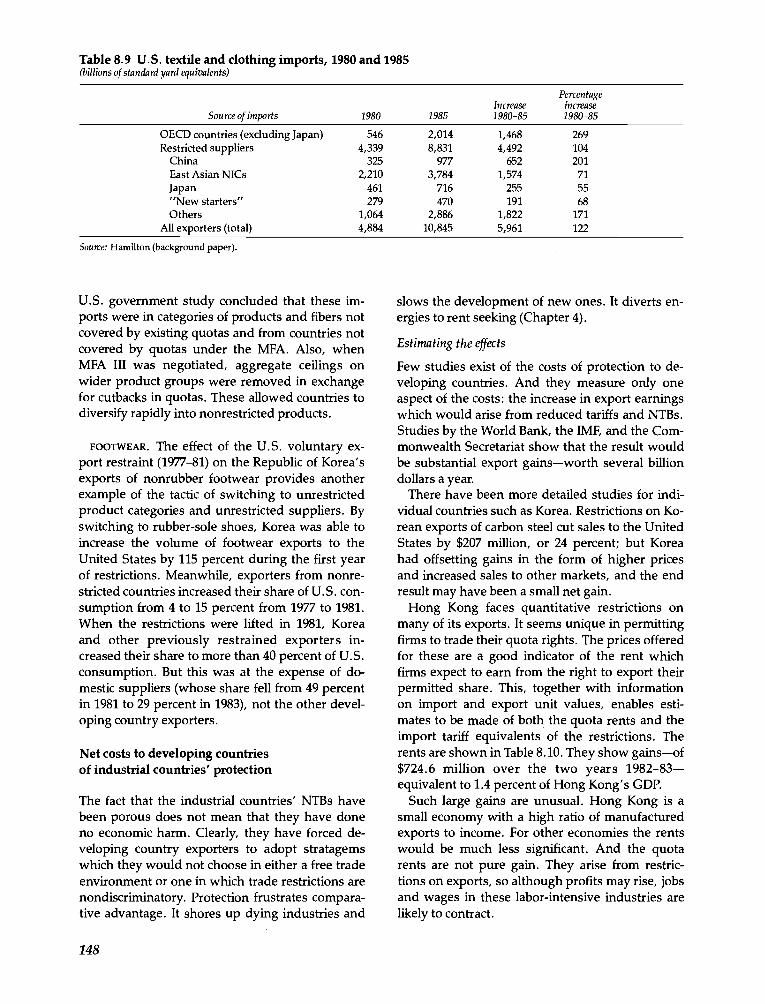
Table 8.9 U.S. textile and clothing imports, 1980 and 1985
Source: Hamilton (background paper).
U.S. government study concluded that these im-ports were in categories of products and fibers notcovered by existing quotas and from countries notcovered by quotas under the MFA. Also, whenMFA III was negotiated, aggregate ceilings onwider product groups were removed in exchangefor cutbacks in quotas. These allowed countries todiversify rapidly into nonrestricted products.
FOOTWEAR. The effect of the U.S. voluntary ex-port restraint (1977-81) on the Republic of Korea'sexports of nonrubber footwear provides anotherexample of the tactic of switching to unrestrictedproduct categories and unrestricted suppliers. Byswitching to rubber-sole shoes, Korea was able toincrease the volume of footwear exports to theUnited States by 115 percent during the first yearof restrictions. Meanwhile, exporters from nonre-stricted countries increased their share of U.S. con-sumption from 4 to 15 percent from 1977 to 1981.When the restrictions were lifted in 1981, Koreaand other previously restrained exporters in-creased their share to more than 40 percent of U.S.consumption. But this was at the expense of do-mestic suppliers (whose share fell from 49 percentin 1981 to 29 percent in 1983), not the other devel-oping country exporters.
Net costs to developing countriesof industrial countries' protection
The fact that the industrial countries' NTBs havebeen porous does not mean that they have doneno economic harm. Clearly, they have forced de-veloping country exporters to adopt stratagemswhich they would not choose in either a free tradeenvironment or one in which trade restrictions arenondiscriminatory. Protection frustrates compara-tive advantage. It shores up dying industries and
148
slows the development of new ones. It diverts en-ergies to rent seeking (Chapter 4).
Estimating the effects
Few studies exist of the costs of protection to de-veloping countries. And they measure only oneaspect of the costs: the increase in export earningswhich would arise from reduced tariffs and NTBs.Studies by the World Bank, the IMF, and the Com-monwealth Secretariat show that the result wouldbe substantial export gainsworth several billiondollars a year.
There have been more detailed studies for indi-vidual countries such as Korea. Restrictions on Ko-rean exports of carbon steel cut sales to the UnitedStates by $207 million, or 24 percent; but Koreahad offsetting gains in the form of higher pricesand increased sales to other markets, and the endresult may have been a small net gain.
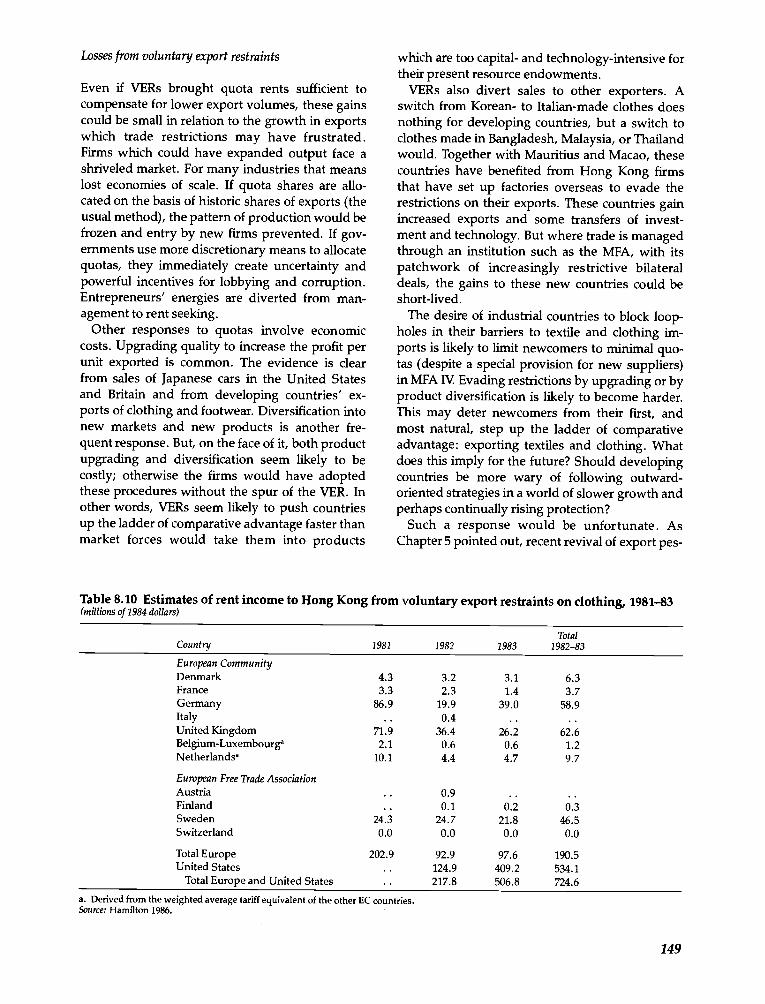
Hong Kong faces quantitative restrictions onmany of its exports. It seems unique in permittingfirms to trade their quota rights. The prices offeredfor these are a good indicator of the rent whichfirms expect to earn from the right to export theirpermitted share. This, together with informationon import and export unit values, enables esti-mates to be made of both the quota rents and theimport tariff equivalents of the restrictions. Therents are shown in Table 8.10. They show gainsof$724.6 million over the two years 1982-83equivalent to 1.4 percent of Hong Kong's GDP.
Such large gains are unusual. Hong Kong is asmall economy with a high ratio of manufacturedexports to income. For other economies the rentswould be much less significant. And the quotarents are not pure gain. They arise from restric-tions on exports, so although profits may rise, jobsand wages in these labor-intensive industries arelikely to contract.
(billions of standard yard equivalents)
IncreasePercentage
increaseSource of imports 1980 1985 1980-85 1980-85
OECD countries (excluding Japan) 546 2,014 1,468 269Restricted suppliers 4,339 8,831 4,492 104
China 325 977 652 201East Asian NICs 2,210 3,784 1,574 71Japan 461 716 255 55"New starters" 279 470 191 68Others 1,064 2,886 1,822 171
All exporters (total) 4,884 10,845 5,961 122
Losses from voluntary export restraints
Even if VERs brought quota rents sufficient tocompensate for lower export volumes, these gainscould be small in relation to the growth in exportswhich trade restrictions may have frustrated.Firms which could have expanded output face ashriveled market. For many industries that meanslost economies of scale, If quota shares are allo-cated on the basis of historic shares of exports (theusual method), the pattern of production would befrozen and entry by new firms prevented. If gov-ernments use more discretionary means to allocatequotas, they immediately create uncertainty andpowerful incentives for lobbying and corruption.Entrepreneurs' energies are diverted from man-agement to rent seeking.
Other responses to quotas involve economiccosts. Upgrading quality to increase the profit perunit exported is common. The evidence is clearfrom sales of Japanese cars in the United Statesand Britain and from developing countries' ex-ports of clothing and footwear. Diversification intonew markets and new products is another fre-quent response. But, on the face of it, both productupgrading and diversification seem likely to becostly; otherwise the firms would have adoptedthese procedures without the spur of the VER. Inother words, VERs seem likely to push countriesup the ladder of comparative advantage faster thanmarket forces would take them into products
Table 8.10 Estimates of rent income to Hong Kong from voluntary export restraints on clothing, 1981-83(millions of 1984 dollars)
a. Derived from the weighted average tariff equivalent of the other EC countries.Source: Hamilton 1986.
which are too capital- and technology-intensive fortheir present resource endowments.
VERs also divert sales to other exporters. Aswitch from Korean- to Italian-made clothes doesnothing for developing countries, but a switch toclothes made in Bangladesh, Malaysia, or Thailandwould. Together with Mauritius and Macao, thesecountries have benefited from Hong Kong firmsthat have set up factories overseas to evade therestrictions on their exports. These countries gainincreased exports and some transfers of invest-ment and technology. But where trade is managedthrough an institution such as the MFA, with itspatchwork of increasingly restrictive bilateraldeals, the gains to these new countries could beshort-lived.
The desire of industrial countries to block loop-holes in their barriers to textile and clothing im-ports is likely to limit newcomers to minimal quo-tas (despite a special provision for new suppliers)in MFA IV. Evading restrictions by upgrading or byproduct diversification is likely to become harder.This may deter newcomers from their first, andmost natural, step up the ladder of comparativeadvantage: exporting textiles and clothing. Whatdoes this imply for the future? Should developingcountries be more wary of following outward-oriented strategies in a world of slower growth andperhaps continually rising protection?
Such a response would be unfortunate. AsChapter 5 pointed out, recent revival of export pes-
149
TotalCountry 1981 1982 1983 1982-83
European CommunityDenmark 4.3 3.2 3.1 6.3France 3.3 2.3 1.4 3.7Germany 86.9 19.9 39.0 58.9Italy 0.4 ..United Kingdom 71.9 36.4 26.2 62.6Belgium-Luxembourg' 2.1 0.6 0.6 1.2Netherlands' 10.1 4.4 4.7 9.7
European Free Trade AssociationAustria 0.9 ..Finland . 0.1 0.2 0.3Sweden 24.3 24.7 21.8 46.5Switzerland 0.0 0.0 0.0 0.0
Total Europe 202.9 92.9 97.6 190.5United States 124.9 409.2 534.1
Total Europe and United States 217.8 506.8 724.6
simism has been an exaggerated response to thethreat of protectionism. But if the worst were tohappen and the industrial nations were to increaseprotection, how should developing countries re-act? The best response is flexibilitythat is, theability to shift resources rapidly from an exportwhere sales are proving difficult to an export orimport substitute where profit opportunities arenow superior. This seems more likely to be donesuccessfully where managers in developing coun-tries are faced with international prices and therequirement to make profits than where they aresheltered by protection. Their decisions shouldtake account of different levels of risk in differentactivities in exporting or replacing imports. But, ofcourse, this is politically a difficult line of action tofollow. The instinctive reaction to increased pro-tection, encouraged by the idea of reciprocity, is torespond with increased protection of one's own.
150
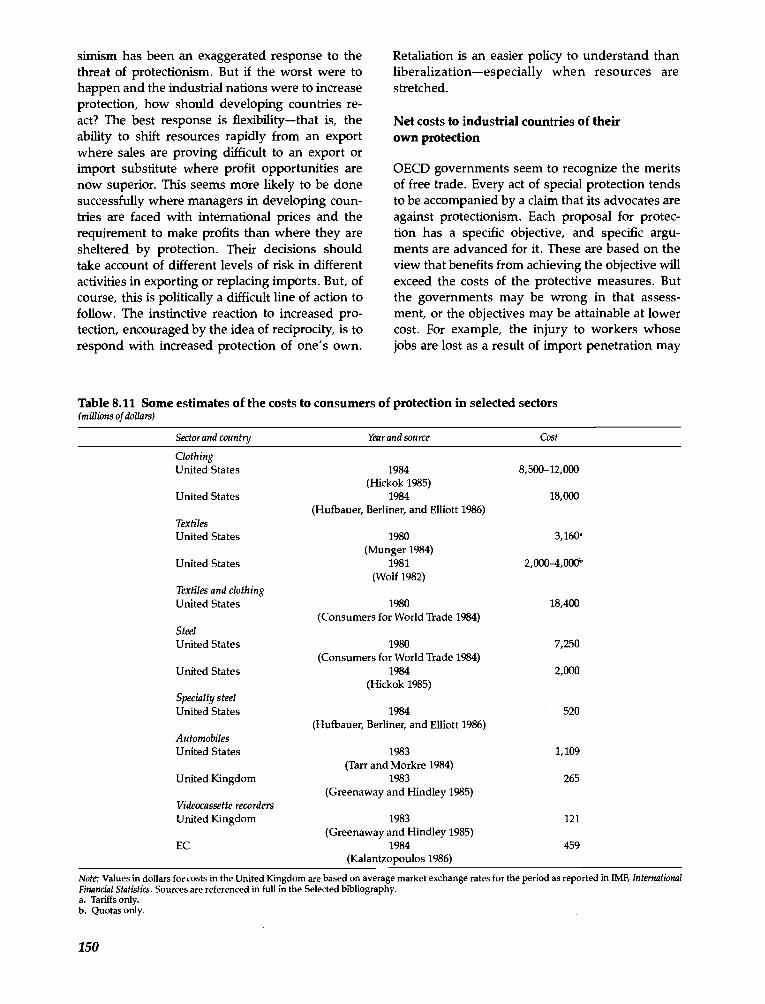
Sector and country
ClothingUnited States
United States
TextilesUnited States
United States
Textiles and clothingUnited States
SteelUnited States
United States
Specialty steelUnited States
AutomobilesUnited States
United Kingdom
Retaliation is an easier policy to understand thanliberalizationespecially when resources arestretched.
Net costs to industrial countries of theirown protection
OECD governments seem to recognize the meritsof free trade. Every act of special protection tendsto be accompanied by a claim that its advocates areagainst protectionism. Each proposal for protec-tion has a specific objective, and specffic argu-ments are advanced for it. These are based on theview that benefits from achieving the objective willexceed the costs of the protective measures. Butthe governments may be wrong in that assess-ment, or the objectives may be attainable at lowercost. For example, the injury to workers whosejobs are lost as a result of import penetration may
Table 8.11 Some estimates of the costs to consumers of protection in selected sectors(millions of dollars)
Year and source Cost
1984(Hickok 1985)
1984(Hufbauer, Berliner, and Elliott 1986)
1980(Munger 1984)
1981(Wolf 1982)
1980(Consumers for World Trade 1984)
1980(Consumers for World Trade 1984)
1984(Hickok 1985)
1984 520(Hufbauer, Berliner, and Elliott 1986)
1983 1,109(Tarr and Morkre 1984)
1983 265(Greenaway and Hindley 1985)
8,500-12,000
18,000
3,160'
2,000-4,000'
18,400
7,250
2,000
Note: Values in dollars for costs in the United Kingdom are based on average market exchange rates for the period as reported in IMF, InternationalFinancial Statistics. Sources are referenced in full in the Selected bibliography.
Tariffs only.Quotas only.
Videocassette recordersUnited Kingdom 1983 121
(Greenaway and Hindley 1985)EC 1984 459
(Kalantzopoulos 1986)
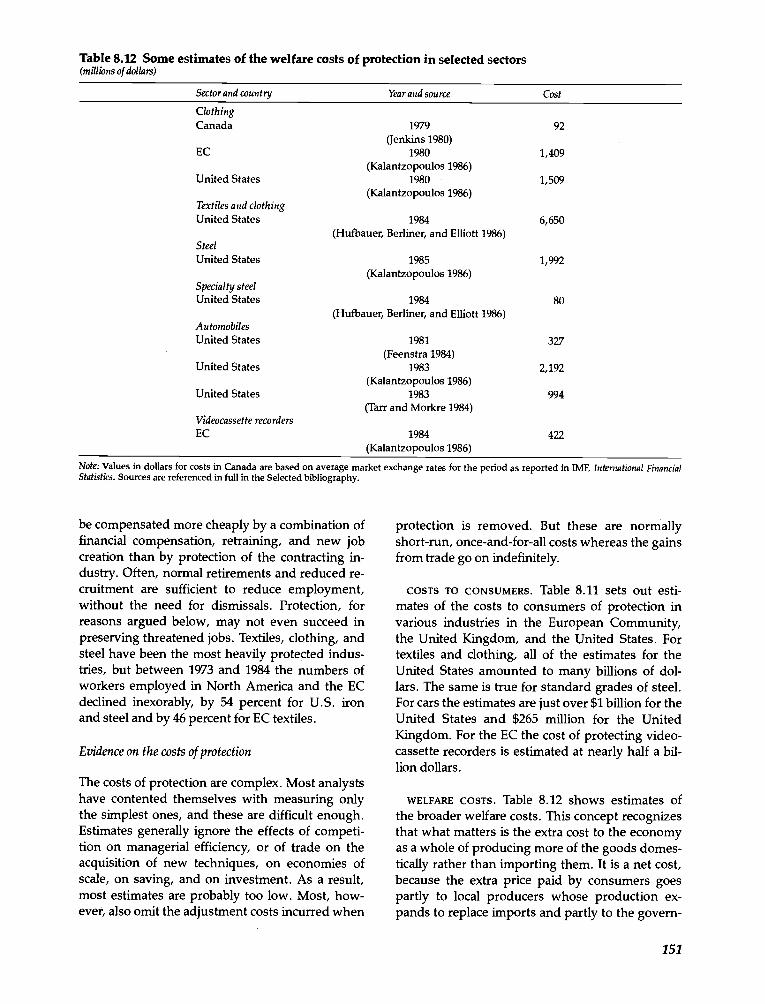
Table 8.12 Some estimates of the welfare costs of protection in selected sectors(millions of dollars)
AutomobilesUnited States
United States
United States
Videocassette recorders
be compensated more cheaply by a combination offinancial compensation, retraining, and new jobcreation than by protection of the contracting in-dustry. Often, normal retirements and reduced re-cruitment are sufficient to reduce employment,without the need for dismissals. Protection, forreasons argued below, may not even succeed inpreserving threatened jobs. Textiles, clothing, andsteel have been the most heavily protected indus-tries, but between 1973 and 1984 the numbers ofworkers employed in North America and the ECdeclined inexorably, by 54 percent for U.S. ironand steel and by 46 percent for EC textiles.
Evidence on the costs of protection
The costs of protection are complex. Most analystshave contented themselves with measuring onlythe simplest ones, and these are difficult enough.Estimates generally ignore the effects of competi-tion on managerial efficiency, or of trade on theacquisition of new techniques, on economies ofscale, on saving, and on investment. As a result,most estimates are probably too low. Most, how-ever, also omit the adjustment costs incurred when
1981(Feenstra 1984)
1983(Kalantzopoulos 1986)
1983(Tarr and Morkre 1984)
327
2,192
994
Note: Values in dollars for costs in Canada are based on average market exchange rates for the period as reported in IMF, International FinancialStatistics. Sources are referenced in full in the Selected bibliography.
protection is removed. But these are normallyshort-run, once-and-for-all costs whereas the gainsfrom trade go on indefinitely.
COSTS TO CONSUMERS. Table 8.11 sets out esti-mates of the costs to consumers of protection invarious industries in the European Community,the United Kingdom, and the United States. Fortextiles and clothing, all of the estimates for theUnited States amounted to many billions of dol-lars. The same is true for standard grades of steel.For cars the estimates are just over $1 billion for theUnited States and $265 million for the UnitedKingdom. For the EC the cost of protecting video-cassette recorders is estimated at nearly half a bil-lion dollars.
WELFARE COSTS. Table 8.12 shows estimates ofthe broader welfare costs. This concept recognizesthat what matters is the extra cost to the economyas a whole of producing more of the goods domes-tically rather than importing them. It is a net cost,because the extra price paid by consumers goespartly to local producers whose production ex-pands to replace imports and partly to the govern-
151
Sector and country Year and source Cost
ClothingCanada 1979 92
(Jenkins 1980)EC 1980 1,409
(Kalantzopoulos 1986)United States 1980 1,509
(Kalantzopoulos 1986)Textiles and clothingUnited States 1984 6,650
(Hufbauer, Berliner, and Elliott 1986)SteelUnited States 1985 1,992
(Kalantzopoulos 1986)Specialty steelUnited States 1984 80
(Hufbauer, Berliner, and Elliott 1986)
EC 1984 422(Kalantzopoulos 1986)
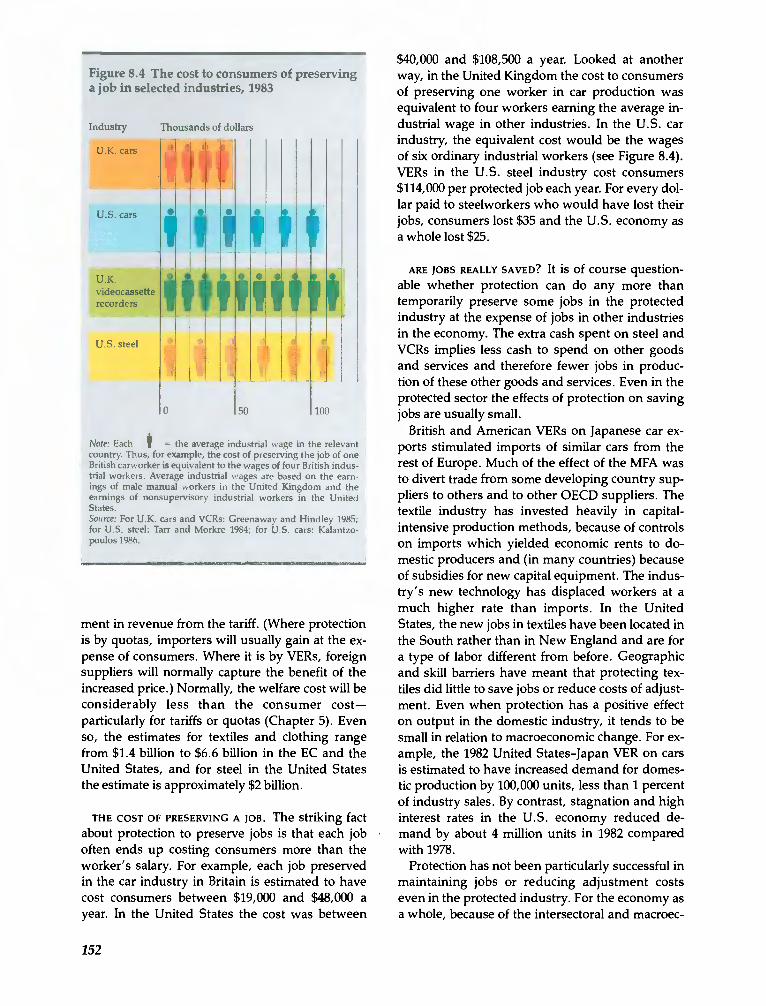
Figure 8.4 The cost to consumers of preservinga job in selected industries, 1983
Industry Thousands of dollars
U.K. cars
U.S. cars
U.K.videocassetterecorders
U.S. steel
0 50 100
Note: Each the average industrial wage in the relevantcountry. Thus, for example, the cost of preserving the job of oneBritish carworker is equivalent to the wages of four British indus-trial workers. Average industrial wages are based on the earn-ings of male manual workers in the United Kingdom and theearnings of nonsupervisory industrial workers in the UnitedStates.Source: For U.K. cars and VCRs: Greenaway and Hindley 1985;for U.S. steel: Tarr and Morkre 1984; for U.S. cars: Kalantzo-poulos 1986.
ment in revenue from the tariff. (Where protectionis by quotas, importers will usually gain at the ex-pense of consumers. Where it is by VERs, foreignsuppliers will normally capture the benefit of theincreased price.) Normally, the welfare cost will beconsiderably less than the consumer costparticularly for tariffs or quotas (Chapter 5). Evenso, the estimates for textiles and clothing rangefrom $1.4 billion to $6.6 billion in the EC and theUnited States, and for steel in the United Statesthe estimate is approximately $2 billion.
THE COST OF PRESERVING A JOB. The striking factabout protection to preserve jobs is that each joboften ends up costing consumers more than theworker's salary. For example, each job preservedin the car industry in Britain is estimated to havecost consumers between $19,000 and $48,000 ayear. In the United States the cost was between
152
$40,000 and $108,500 a year. Looked at anotherway, in the United Kingdom the cost to consumersof preserving one worker in car production wasequivalent to four workers earning the average in-dustrial wage in other industries. In the U.S. carindustry, the equivalent cost would be the wagesof six ordinary industrial workers (see Figure 8.4).VERs in the U.S. steel industry cost consumers$114,000 per protected job each year. For every dol-lar paid to steelworkers who would have lost theirjobs, consumers lost $35 and the U.S. economy asa whole lost $25.
ARE JOBS REALLY SAVED? It is of course question-able whether protection can do any more thantemporarily preserve some jobs in the protectedindustry at the expense of jobs in other industriesin the economy. The extra cash spent on steel andVCRs implies less cash to spend on other goodsand services and therefore fewer jobs in produc-tion of these other goods and services. Even in theprotected sector the effects of protection on savingjobs are usually small.
British and American VERs on Japanese car ex-ports stimulated imports of similar cars from therest of Europe. Much of the effect of the MFA wasto divert trade from some developing country sup-pliers to others and to other OECD suppliers. Thetextile industry has invested heavily in capital-intensive production methods, because of controlson imports which yielded economic rents to do-mestic producers and (in many countries) becauseof subsidies for new capital equipment. The indus-try's new technology has displaced workers at amuch higher rate than imports. In the UnitedStates, the new jobs in textiles have been located inthe South rather than in New England and are fora type of labor different from before. Geographicand skill barriers have meant that protecting tex-tiles did little to save jobs or reduce costs of adjust-ment. Even when protection has a positive effecton output in the domestic industry, it tends to besmall in relation to macroeconomic change. For ex-ample, the 1982 United States-Japan VER on carsis estimated to have increased demand for domes-tic production by 100,000 units, less than 1 percentof industry sales. By contrast, stagnation and highinterest rates in the U.S. economy reduced de-mand by about 4 million units in 1982 comparedwith 1978.
Protection has not been particularly successful inmaintaining jobs or reducing adjustment costseven in the protected industry. For the economy asa whole, because of the intersectoral and macroec-
onomic effects, it probably lowered employment.Few jobs have been saved, and the costs have beeninordinate.
Conclusion
Protectionism has been growing since the mid-1970s. Measures such as VERs and orderly market-ing arrangements have been porous. The NICsand some other developing countries have beeningenious in finding ways to penetrate these mea-sures or to turn them to their advantage. Never-theless, the measures have had adverse effects.The increased coverage and tighter administrationof the MFA and increased vigilance in administer-ing NTBs may mean worse to come. As it is, pro-tection has diverted trade from developing country
exporters to OECD suppliers. The response of thedeveloping countries has not been costless.
The industrial countries bear the main costs oftheir own protection. Estimates of the costs seemsmall in relation to GNP, but they are probablyunderestimates. Moreover, the appropriate test isnot to compare the costs with GNP. As with anyeconomic policy, protection should be evaluatedon the balance of costs and benefits. On that basisprotection should win few friends.
Traditionally, pressure for protection eases whena new round of trade negotiations is in the offing.This reinforces the need to make a success of thenew multilateral trade negotiations. The best wayto overcome protectionism is to renew the momen-tum of progress toward multilateral liberalizationof trade. This is the subject of Chapter 9.
153