THE THEFT OF MEDICINES from ITALIAN HOSPITALS
68
1 THE THEFT OF MEDICINES from ITALIAN HOSPITALS Michele Riccardi Marco Dugato Marcello Polizzotti Università Cattolica del Sacro Cuore Università degli Studi di Trento
-
Upload
independent -
Category
Documents
-
view
1 -
download
0
Transcript of THE THEFT OF MEDICINES from ITALIAN HOSPITALS

1
THE THEFT OF MEDICINES
from ITALIAN HOSPITALS
Michele RiccardiMarco Dugato
Marcello PolizzottiUniversità Cattolica del Sacro CuoreUniversità degli Studi di Trento

2

3
The theft of medicines from Italian hospitals
Authors:
Michele Riccardi (Transcrime) [email protected]
Marco Dugato (Transcrime) [email protected]
Marcello Polizzotti
Transcrime – Joint Research Centre on Transnational Crime
Università Cattolica del Sacro Cuore di Milano – Università degli Studi di Trento
Milan office (headquarters): Largo Gemelli 1 - 20123 Milan (Italy)
Phone: +39 02 7234 3715/3716; Fax: +39 02 7234 3721
www.transcrime.it
2014
ISBN: 978-88-8443-528-6
© 2014 Transcrime – Joint Research Centre on Transnational Crime
All rights reserved. No part of this publication may be reproduced, stored in a retrieval
system or transmitted in any form or by any means electronic, mechanical, photocopying,
recording or otherwise, without the prior written permission of the authors.
Suggested citation:
Riccardi M., Dugato M. and Polizzotti M. (2014), The theft of medicines from Italian hospitals,
Milan-Trento: Transcrime – Joint Research Centre on Transnational Crime
Credits: ThomasThomas (cover)
Graphic project: Ilaria Mastro

4

5
executive summary
Together with counterfeiting, theft of medicines is emerging as the new frontier of
pharmaceutical crime. In Italy between 2006 and 2013 one hospital out of ten registered
thefts of pharmaceuticals, suffering, on average, an economic loss of about 330 thousand
EUR in each episode.
This report is the first study on this booming but almost unknown criminal phenomenon.
In particular, it carries out:
• an exploration of the background behind pharmaceutical theft and of the drivers that
influence the demand for and the supply of stolen medicines (Chapter 1);
• an analysis, based on cases reported by the Italian media, of thefts of medicines from
Italian hospitals between 2006 and 2013 (Chapter 2);
The analyses provide clear evidence on the magnitude of this illicit market and on the
harm caused to patients, pharmaceutical companies, and the Italian national health
system’s budget. In addition, they furnish important information on where and how stolen
medicines are trafficked and on the actors (both criminal and legal) involved in this illicit
market. There follow some summary findings:
• Between 2006 and 2013, the Italian media reported about 68 cases of thefts from
Italian hospitals (51 in 2013 alone), for a total economic loss of at least 18.7 million
EUR (see 2.2.1).
• Although the whole of the country seems affected, the regions of Campania and Apulia
represent more than 45% of the cases (with respectively 17 and 14 thefts).
• In terms of rates, Molise (7.1 thefts for every 10 hospitals), Apulia (3.8) and Campania
(3.1) record the highest values. The highest rate among northern regions is recorded by
Friuli Venezia Giulia (2 for every 10 hospitals) (see 2.2.2).
• The geography of thefts confirms the hypotheses formulated in section 1.4. Southern
Italy and the eastern Italian regions are more exposed to thefts of medicines because
of the greater activity of organized crime groups (both Italian mafia-type and foreign
OCGs, especially Eastern-European ones) and their geographical proximity to Eastern
Europe and Greece, which appear to be destinations for stolen medicines (see 2.2.2).
• Indeed, a positive and statistically significant correlation between thefts and the
presence of mafia groups (especially Camorra and Apulian OCGs) can be measured (see
2.2.6 for details).
6
• Among hospitals, the larger (in particular more than 800 beds), more complex (more
than 21 disciplines) are the ones most affected because they may have a higher turnover
among the medical staff and hence weaker monitoring (see 1.3.6 and 2.2.3).
• Some hospitals have been victimized more than once: in particular the Federico II
hospital of Naples and the Cardarelli hospital of Campobasso have suffered respectively
5 and 3 thefts. Other hospitals have been targeted twice.
• As hypothesized (see 1.3.1), high-price medicines are the ones most frequently stolen
since they can give criminals higher returns on their risk; in particular, cancer drugs
(stolen in 32 cases) are those most frequently stolen, followed by immunosuppressive
(13), antirheumatic (12) and biological (10) drugs (see 2.2.4).
• Most of these are Class H or Class A pharmaceuticals (see 2.2.4) fully covered by the
Italian National Health System. This may confirm the hypothesis, suggested in 1.4, that
stolen products are also sold on the illegal markets of foreign countries (especially
Eastern Europe and Greece) where reimbursement regimes are weaker (1.3.3), or the
legal supply is insufficient (1.3.5), or where they can enter the parallel trade and be
exported to high-price countries (1.3.6 and 1.3.9).
• However, it cannot be excluded that stolen medicines are re-used on the internal
illegal market (see 1.3.4): for instance, in the synthesis of illegal drugs, in sport doping
(e.g. EPO) or in illegal healthcare structures (e.g. during medical treatment of wanted
criminals at a large). Possible, but less likely, are thefts commissioned in order to create
shortages in hospital pharmacies in order to favour friendly vendors (see 2.2.3).
• To be highlighted are also the overlaps between the trafficking of stolen medicines and
the parallel trade (i.e. the legal trade based on price differentials across countries). It
cannot be excluded that, because of loopholes in traceability systems across jurisdictions
(see 1.3.7) and the high level of liberalization of the pharmaceutical market, stolen
medicines re-enter the legal trade through fictitious wholesale companies (perhaps set
up in foreign countries) or corrupt brokers, and are then sold to high-price countries
(e.g. Germany, Sweden) or exported back to Italian hospitals or pharmacies (see 1.3.6
and 1.3.9 for details).
• All these cases confirm the crucial role played in pharmaceutical thefts by specialized
and organized criminal groups able to infiltrate or corrupt medical personnel and
wholesalers (1.3.9) and possessing sufficient knowledge to identify, store, transport
and place stolen products on illegal markets, in Italy and abroad (1.3.8).
• These groups may be connected with indigenous mafia OCGs (e.g. Camorra in
Campania), or they may be linked to foreign OCGs, especially those already involved in
property crimes and organized thefts (such as some Eastern European OCGs, see 1.3.8
for details).
• Indeed, a correlation between thefts of medicines and other property crimes (especially
thefts and robberies against trucks) is evident and statistically significant (see 2.2.6).

7
The analysis yields a picture of a criminal activity undergoing rapid expansion and often
underrated. The high profitability and the low risks (to criminals) guaranteed by the theft
of medicines may shift some OCGs from less profitable and more risky activities (e.g. illicit
drugs, human trafficking, etc) to this new lucrative illegal trade.
Although still based on preliminary evidence, this study provides important information
that could be used by law enforcement and supervisory authorities to strengthen the fight
against pharmaceutical theft and the illicit trafficking of stolen medicines. However further
analyses are needed, ones which also focus on other targets (e.g. trucks and couriers) and
use other information and data sources (e.g. police statistics, company data).
In particular, closer attention should be paid to how the trafficking of stolen drugs may
overlap and integrate with the parallel trade thanks to the complicity of corrupted
wholesalers or brokers. In this regard, study of this phenomenon would certainly benefit
from stronger public-private partnerships (among research institutions, law enforcement
agencies, supervisory bodies and pharmaceutical companies) and from the use of better-
quality data.

8

9
Executive summary
Table of Contents
Acronyms
Introduction
1. Background and drivers
2. The analysis: the thefts from Italian hospitals
5
11
9
12
28
14
32
35
15
33
36
17
33
36
39
48
57
61
67
18
34
45
52
50
table of contents
1.1 Crime and pharmaceuticals: the reasons of an attraction
1.2 Crime and pharmaceuticals: not only counterfeiting
1.3 Theft of medicines: the drivers
1.4 Theft of medicines: the hypotheses
2.1.1 Data and sources
2.1.2 Bias and limitations in the data collection
2.1.3 Methodology of analysis
2.2.1 Trends and seasonality
2.2.2 Thefts by region and province
2.2.3 Thefts by type of hospital
2.2.4 Thefts by type of medicine
2.2.5 Modus operandi
2.2.6 Relationships with contextual factors
2.2 Analysis
2.1 Methodology
Conclusions
References
Acknowledgements

10

11
AIFA Agenzia Italiana del Farmaco
ASL Aziende Sanitarie Locali
ATC Anatomical Therapeutic Chemical
EFPIA European Federation of Pharmaceutical Industries and Associations
EPO Erythropoietin
GDP Gross Domestic Product
ISTAT Istituto nazionale di statistica
LEA Law Enforcement Agency
MPI Mafia Presence Index
NHS National Health System
ÖBIG Österreichisches Bundesinstitut für Gesundheitswesen
OCG Organized Crime Group
OCTA Organized Crime Threat Assessment
OECD Organisation for Economic Co-operation and Development
OSMED Osservatorio sull’impiego dei medicinali
OTC Over The Counter
R&D Research and Development
RFID Radio Frequency Identification
RP Reference Pricing
SHI Social Health Insurance
UNICRI United Nations Interregional Crime and Justice Research Institute
WHO World Health Organization
AIFA Agenzia Italiana del Farmaco
ASL Aziende Sanitarie Locali
ATC Anatomical Therapeutic Chemical
EFPIA European Federation of Pharmaceutical Industries and Associations
EPO Erythropoietin
GDP Gross Domestic Product
ISTAT Istituto nazionale di statistica
LEA Law Enforcement Agency
Acronyms

12
The pharmaceutical industry plays a crucial role in the European economy. In 2012 its
turnover in Europe was estimated at around 210 billion EUR (EFPIA, 2013), a figure higher
than the gross national products of many EU countries, and it employed about 700 thousand
persons. It records the highest rate of R&D investments among all business sectors (The
European House-Ambrosetti, 2012), and its importance is bound to increase due to the
ageing of the population and to the change of habits among consumers, who are steadily
increasing their consumption of pharmaceuticals (OECD, 2009).
In this context, Italy plays a leading role, ranking second in Europe after Germany in terms of
turnover (25.7 billion EUR in 2012, about 2% of its GDP) and the number of pharmaceutical
companies (Farmindustria, 2013), which employ more than 70 thousand workers. Despite
current difficulties, the pharmaceutical industry is still one of the most powerful drivers of
the Italian economy, and among the sectors attracting the highest rates of foreign direct
investments.
However, in recent years Italy has also witnessed an emerging criminal threat related to the
pharmaceutical sector: the theft of medicines, which is important in terms of both volume
(about 70 cases identified since 2006 considering only thefts in hospitals, see 1.2.2) and
value (about 20 million EUR stolen), fuelling the illegal trade in pharmaceuticals and often
overlapping both with counterfeiting (see 1.2) and the legal parallel trade (1.3.6 and 1.3.9).
The Italian media have reported numerous cases of theft in hospitals, both in the south and
north of Italy, but there is also a great deal of evidence on the stealing of pharmaceuticals
from pharmacies, warehouses and trucks.
It is evident that the theft of medicines is a threat to people’s health, to the government
budget (since the stolen medicines may be covered by the national health system, and
the illegally trafficked pharmaceuticals may also involve a loss of taxes), to companies’
revenues, and to competition within the legal industry.
Despite this evidence, there is a lack of studies on this issue. To date, most research on
crime and pharmaceuticals has focused on the counterfeiting of medicines (see 1.2), while
theft has often been underrated or completely ignored.
introduction

13
This study intends to fill this gap. Through an analysis of 68 cases of thefts of medicines
in Italy since 2006 to 2013, with a focus on those in hospitals, it aims to furnish more
thorough understanding of:
- why medicines are stolen;
- what medicines are most frequently appropriated;
- where and how these thefts occur, in what types of hospitals and using what methods;
- how stolen goods may fuel the illicit trafficking of pharmaceuticals;
- what actors play a role in this criminal activity;
- what damage the theft of medicines produces in terms of patients’ health and
government budget, and on the legal industry.
Although this study is only a first step towards more thorough knowledge of this
phenomenon, the results of the analysis may already assist not only the on-going
investigations of Italian law enforcement agencies but also the prevention activities of
hospitals and pharmaceutical companies.
The study is structured as follows:
• Chapter 1 provides some background information about the relationship between
crime and the pharmaceutical industry, highlighting the reasons why this sector may be
attractive to criminals (Section 1.1) and briefly reviewing the literature regarding the
two main types of criminal activities connected to pharmaceuticals: counterfeiting and
theft (Section 1.2). Section 1.3 focuses on theft, highlighting the drivers that influence
the demand for and supply of stolen medicines, which are then summarized in terms of
hypotheses in Section 1.4.
• Chapter 2 describes the methodology adopted for the analysis of thefts of medicines
in Italy, presenting the data, sources used and their limits (Section 2.1). It then reports
the main results of the analysis (Section 2.2), focusing on the quantification, trends
and seasonality of thefts of medicines in Italy, on their location, and on the types of
hospitals victimized. Moreover, it focuses on the kinds of medicines stolen and the modi
operandi adopted by criminals. Finally, it analyses the relationship between thefts of
medicines and the presence of organized crime groups, other property crime types, and
other contextual factors.

14
01Backgroundand drivers

15
Besides being a driver of the modern economies, the pharmaceutical sector has historically
attracted the interest of criminals and organised crime groups. It has become commonplace
to speak of pharmaceutical crime, defined as the “manufacture, trade and distribution of
fake, stolen or illicit medicines and medical devices” (Interpol, 2012). This broad definition
encompasses numerous illicit conducts, such as the counterfeiting and falsification of
medical products, their packaging and associated documentation, as well as theft, fraud,
illicit diversion, smuggling, trafficking, and the illegal trade of pharmaceuticals (Interpol,
2012).
It is consequently possible to refer to a dual nature of the pharmaceutical market consisting
of a legal and an illegal component that relate across countries and regions according to
the cultural, social and economic factors affecting the structure of the sector (Transcrime,
2012). As in other industries (e.g. clothing, tobacco, waste disposal, firearms), the illegal
trafficking of medicines hampers the legal market by causing not only losses and image
damage to the legal companies operating in the sector but also harm to patients’ health
and to governments’ budgets (e.g. taxes, loss of subsidies of the national health system, etc.).
Theft CounterfeitingSmuggling
Storage conditions and irregular transportation
Lack of medical treatment and high risk of harm to patient
Manufacturer: economic loss an image demage
High risk of harm to patient
Adulteration
Figure 1 The illicit trafficking of medicines
The reasons why the pharmaceutical sector is vulnerable to crime and to illicit trafficking
are numerous. They depend both on the structure of the market and on the specific nature
of the products:
• Primary goods: medicines are essential goods which cannot be easily replaced
(Transcrime, 2010, p. 22; Vander Beken, 2007). The pharmaceutical sector hence relies
on a wide and stable consumer base that may be exploited, besides by legal companies,
also by counterfeiters and illegal traffickers.
Crime and pharmaceuticals: the reasons of an attraction
1.1
Source: Grimald 2012

16
• Growing demand: as well as being inelastic, the demand for and the consumption of
medicines is also growing. This is due to some important factors, including ageing of
the population (Eurostat, 2012), changing habits in consumer lifestyles (OECD, 2009),
and higher incomes which give people greater access to medicines. This growing
demand may be satisfied by both a legal and an illegal supply of pharmaceuticals.
• High price: pharmaceuticals are generally characterized by high commercial value,
especially those used in the treatment of severe diseases (e.g. cancer, multiple sclerosis,
etc). By way of example, the retail price of a single package of Rebif® (interferon beta-
1a)1 has been fixed in Italy at about 1,300 EUR.2 The high commercial value of medicines
may generate huge profits for those operating on the illegal side of this market (Vander
Beken, 2007, p. 14).
• Restricted access: not all medicines can be easily accessed on the free market. Depending
on the characteristics of the national health system (see 1.3) and of the medicine itself
(e.g. risk of toxicity, addiction, abuse), some categories of pharmaceuticals can only be
distributed under the strict control of a medical practitioner. In Italy this is the case, for
example, of Class H medicines (see 1.3.3), which can be only be administered within
hospitals or other public structures by doctors (OsMed, 2012). In other cases, the access
to medicines may be made more difficult by exogenous factors (e.g. an interruption
in the supply chain due to cuts to the government budget or to the bankruptcy of the
supplier company, see 1.3.5). In all these circumstances, consumers may be induced
to obtain the medical product on the black market, thus boosting the illegal trade of
pharmaceuticals and theft itself.
• Small and light: owing to their small size and low weight, medicines can generally
be easily concealed, moved and transported (Transcrime, 2010, p. 22). This is a crucial
requirement for those illegal organizations that traffic stolen or counterfeit medicines
on a transnational scale.
• New technologies: the emergence of new technologies and skills has simplified both
the production and the distribution of fake or stolen pharmaceuticals. On the production
side, it has become much easier to synthesize counterfeit medicines (Vander Beken,
2007, p. 14) thanks to developments in the biological, chemical and technical sectors;
on the distribution side, the Internet has allowed to set up online pharmacies from
which it is possible to order or purchase illegal products. The difficulty of regulating
these virtual pharmacies (EFPIA, 2012; IMPACT, 2013) allows criminals to exploit
these online platforms in order to place counterfeit or stolen medicines anonymously
(Europol, 2011; Interpol, 2011; UNICRI, 2012, p. 60).
1. Rebif® is used to treat relapsing forms of multiple sclerosis (MS) to decrease the frequency of re-lapses and delay the occurrence of some of the physical disability that is common in people with this disease (www.rebif.com).2. Intended as the price of a 22mcg (injectable solution) package (see Determinazione/C 2729/2011, Gazzetta Ufficale Serie Generale n.274 del 24-11-2011).

17
As explained above (see 1.1), the demand for pharmaceuticals is growing, on both the
legal and illegal markets, and for a variety of reasons. Criminals seek to satisfy this illegal
demand by using all possible means, including the counterfeiting or theft of medicines.
These illicit activities often overlap, and criminals may exploit the same supply chains (e.g.
online pharmacies or brokers) to place both fake and stolen pharmaceuticals. Moreover,
stolen medicines may also be used to synthesize of fake drugs.
However, most research has to date focused on the counterfeiting of medicines.
Counterfeiting concerns medicines “which are deliberately and fraudulently mislabeled
with respect to identity and/or source. Counterfeiting can apply to both branded and
generic products and may include products with the correct ingredients, wrong ingredients
or with fake packaging” (WHO, 1999).
Several studies by scholars and agencies have analyzed this phenomenon and estimated
its magnitude. For example, according to Transcrime (2010), 6% of the total value of the
global pharmaceutical market may be counterfeited. This figure is confirmed by estimates
which attribute a 7% share of the global trade in pharmaceuticals to fake medicines
(Ministero della Salute, 2014). At European level, the Council of Europe (2012) estimates
that counterfeit medicines account for 10% of the entire European pharmaceutical market,
with an annual economic loss of about 500 billion EUR.
By contrast, no data or estimates have been produced about thefts of medicines. In Italy,
almost all the information that can be found on this issue derives from journalistic
investigations (e.g. Foschini & Tonacci (2013) and Giunti (2014)). However, to be noted
is that, among others, AIFA-Agenzia Italiana del Farmaco (2014) and Farmindustria are
implementing projects to strengthen analysis and monitoring on thefts of medicines,
especially from hospitals.
Also to be noted is that this specific kind of crime is not only an Italian problem. Some
South American countries have been experiencing a similar magnitude of medicine thefts.
In particular, Mexico (Cruz Martínez, 2011; El Diario, 2013) and Argentina (Caruso, 2012;
Martínez Terán, 2008) are much affected by this phenomenon, which has recently also led
to murders among employees of local pharmaceutical wholesalers.
Crime and pharmaceuticals: NOT ONLY COUNTERFEITING
1.2
All these reasons may explain the success of pharmaceutical crime and the increase in
offences such as pharmaceutical counterfeiting or the theft of medicines, the latter of
which is analysed in this study.
18
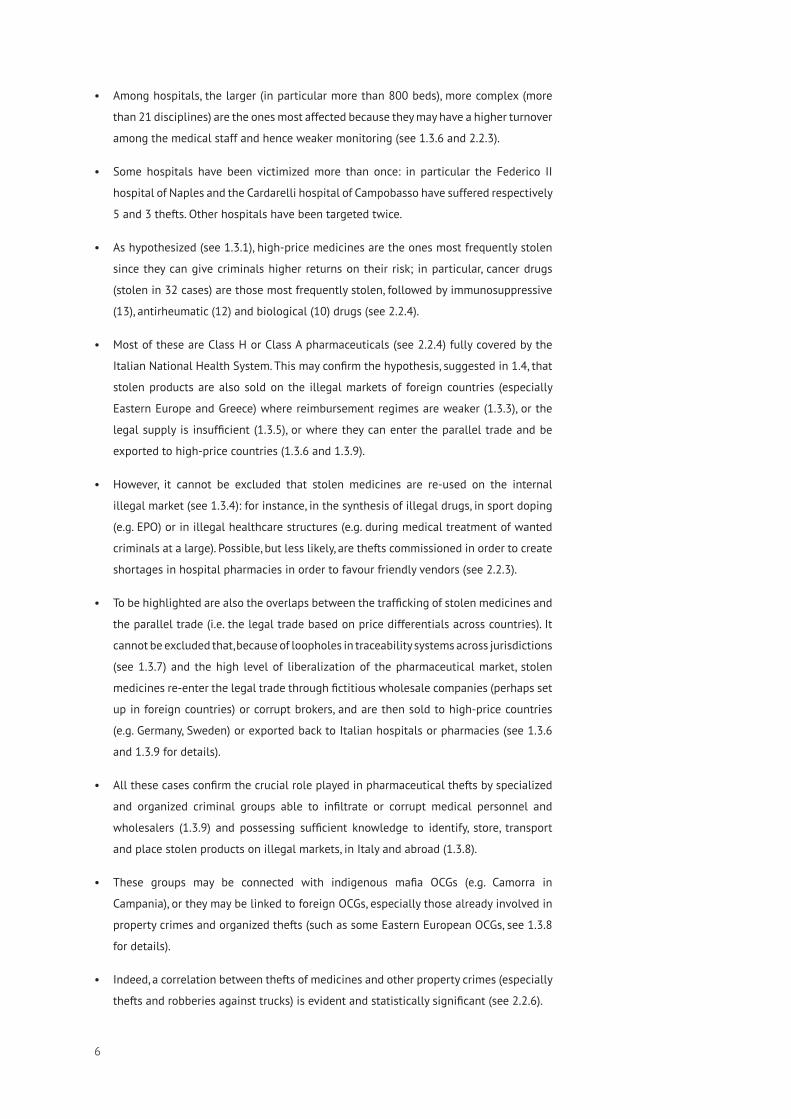
To conclude, the demand for medicines is satisfied not only by the legal supply but also by
an illegal one. The latter comes about not only through counterfeiting but also through
the trafficking of stolen pharmaceuticals. The legal supply (especially the parallel trade),
counterfeiting, and the trade in stolen drugs often overlap and interrelate with each other.
Therefore, scientific studies on thefts of medicines and other related crimes (e.g. robberies of
trucks) and on how theft relates with the parallel trade and counterfeiting are necessary to
gain better understanding of pharmaceutical crime and effectively to deal with its growth.
Why do criminals steal medicines? What medicines are stolen, and where? To whom are
the stolen goods sold? All the factors highlighted above (see 1.1) may help to explain why
pharmaceutical crime in general may be attractive to criminals. But what are the drivers
that influence the illegal trade of stolen medicines in particular?
The demand for stolen pharmaceuticals may be determined by a variety of factors: for
example, a desire to acquire medicines at prices lower than on the legal market (if they
are not reimbursed by the NHS); the need to obtain pharmaceuticals that are not supplied
adequately on the legal market (e.g. because of constraints on the NHS budget); or the
desire to use legal medicines or active ingredients for illegal purposes (e.g. EPO in sport
doping).
The supply of stolen medicines (i.e. the theft itself and then the distribution) is also
influenced by various important drivers, including the price of medicines, vulnerabilities in
the supply chain, the problems caused to criminals by the traceability of pharmaceuticals,
the need for high organizational skills, and the possibility of relying on corrupted
wholesalers or medical staff.
All these drivers are discussed in detail below. Given the focus of this study, references are
made to the Italian situation, and to theft of medicines from hospitals in particular.
1.3.1 Price of medicines
Price may influence the decision concerning what medicines to steal. In line with rational
choice theory, it can be hypothesized that thieves opt for high-priced medicines that can
guarantee a higher return on risk than cheaper ones. Assuming that the risk of being
arrested and the effort required to steal aspirins and interferon are the same, criminals
would prefer the latter, since, when sold on the illegal market, it would most likely produce
higher profits.
THEFT OF MEDICINES: THE DRIVERS
1.3

19
3. Sometimes referred to in the literature as “external price referencing”, i.e. the practice of comparing pharmaceutical prices across countries using various methods and different country baskets (Espìn & Rovira, 2007).
Although very helpful, ranking pharmaceuticals according to their price is not an easy task:
the pricing of medicines is the result of a complex interaction among private companies’
strategies, public interventions and regulations, demand patterns and national health
policies, usually conducted at country level (Espìn & Rovira, 2007); and pricing mechanisms
vary widely across countries (see ÖBIG (2006) for a review at EU level).
1.3.2 Price differentials
Besides price itself, also price differentials are key drivers of the illicit trade in pharmaceuticals,
and they influence both demand and supply. First, it is important to consider the difference
between the prices of the same medicine among different countries. Price differentials
still remain although, at least in the EU, pharmaceutical companies are now interested in
having similar prices in order to minimize the parallel trade (Espìn & Rovira, 2007, p. 173),
and although the use of international pricing benchmarks3 still prevails in most countries
(especially in the smallest ones unable to set their own criteria) (Espìn & Rovira, 2007).
As a result, low-priced countries may act as parallel exporters to high-priced ones. In this
framework, there is evidence that Italy, owing to its low price level, is a major exporter of
pharmaceuticals in the parallel trade (ÖBIG, 2006, p. 382). This feature does not exert a
direct effect on the theft of medicines itself (stolen medicines, by definition, are “acquired”
at zero cost and hence may guarantee a profit when sold in any market, whatever the legal
price). However, it may imply the existence of a parallel network of distribution to other
countries that may also be exploited by thieves of medicines (see 1.3.6), especially given
the high degree of liberalization of the wholesale trade of pharmaceuticals across EU
countries (Fornaro, 2014).
In this framework, corrupted wholesalers or brokers may acquire stolen medicines and then
re-sell them legally to other high-priced countries (e.g. Germany, Sweden) in order to make
higher profits on the parallel trade and “launder” the illicit origin of the product.
The second differential to consider is that between prices of medicines on the legal market
and on the illegal one. It is likely that the wider this differential, the higher will be the
demand for medicines on the black market. Unfortunately, whilst studies on the theft of
pharmaceuticals are sparse (see 1.2), those analyzing the functioning and pricing of illegal
pharmaceutical markets are even fewer: for instance, what would be the cost of anti-cancer
drugs on the black market in Romania?

20
4. On average, reimbursement accounts for 75% of the total pharmaceutical market (Mrazek, 2002).
1.3.3 Reimbursement of medicines
Prices and price differentials must be analyzed in conjunction with another factor: the
reimbursement of drugs. In most countries, the cost of medicines is not directly borne by
consumers but is covered, totally or partially, by a third party, either a private entity (e.g. a
private insurance) or a public one (e.g. the NHS).
Reimbursement mechanisms affect both the legal and the illegal demand for medicines:
in legal markets, the higher the coverage, the greater the incentive to consume medicines
(Espìn & Rovira, 2007, p. 30). By contrast, in illegal markets the lower the reimbursement,
the greater the incentive to resort to the illegal trade in order to acquire pharmaceuticals
at lower prices.
It may hence be hypothesized that the demand for stolen medicines is higher:
- for those products that are not reimbursed;
- from those countries with lower reimbursement regimes;
- from those countries characterized by private insurance based systems.
Although cost-sharing regimes apply in almost all EU MS (Espìn & Rovira, 2007, p. 34; Mrazek,
2002),4 reimbursement regimes vary widely among countries depending on the national
health system, the type of medicine (e.g. cancer or diabetic drugs may be reimbursed at
100%), and the type of patient/consumer (e.g. low-income people may usually benefit from
higher reimbursement percentages). In some cases, the reimbursement regime may even
vary within the same country – as in Italy where the “ticket” system differs significantly from
region to region.
In Italy there are three classes of medicines (AIFA, 2005; ÖBIG, 2006, p. 385; OsMed, 2012):
- Class A: 100% reimbursed by the national health system (SSN –Servizio Sanitario
Nazionale).
- Class H: 100% reimbursed by the national health system and only provided by and/or
administered in hospitals;
- Class C: 0% reimbursement, the cost is fully covered by patients.
Class A drugs are, for example, medicines used to treat multiple sclerosis (such as interferon
beta-1A), or morphines or growth hormones which may be used in sport doping (e.g.
somatropin) (AIFA, 2005). Class H medicines are, for example, certain cancer drugs such
as Alimta® or biological ones such as Humira® used in arthritis diseases, some types of
erythropoietin or nytroglicerine.

21
5. The use of fentanyl, a potent opioid analgesic for the treatment of serious diseases including cancer, to lace heroin has been increasingly reported by the media and law enforcement agencies, especially in the United States, and it is often related to overdose deaths. See for example Mohney (2014). 6. The Pharmaceutical Society of Ireland has advised members to be cautious about people who ask for significant quantities of cough syrups, warning that they could be abused and used to make meth-amphetamines, including crystal meth (Reilly, 2012).7. See for example De Lucia (2013).
In Italy, whenever 100%-reimbursed medicines (i.e. Class A or H drugs) are stolen, it may
hence be hypothesized that they respond to:
- an international demand from countries where these pharmaceuticals are not
reimbursed or not supplied adequately (see also 1.3.5);
- an internal/international demand for the purposes of illegal use (see 1.3.4).
This latter point is discussed below.
1.3.4 Illegal use of legal medicines
Medicines sold on the legal market and used for healthcare treatments may also be
consumed for illegal purposes or in illicit activities.
The most common example is doping in sports: exogenous erythropoietin (EPO) may be
used, for instance, as an agent to stimulate erythropoiesis and hence enhance sporting
performance. Although still controversial, EPO usage has been endemic to some sports (e.g.
cycling) for the past twenty years (e.g. Lodewijkx & Brouwer, 2011).
Besides doping, legal medicines or legal active ingredients may be used not only for
clinical treatment but also as illegal drugs or in the synthesis of illegal drugs (e.g.
morphine, benzodiazepines, codeine, fentanyl5 or even cough syrups),6 to produce counterfeit
pharmaceuticals, or in other illicit activities (e.g. nitroglycerine as explosives).
“Illegal” use of medicines is also made by illegal clinics (i.e. structures that are not
authorized or do not fulfill all legal requirements), which may resort to the illegal trade,
including theft, to satisfy their demand for pharmaceuticals or to reduce operating costs.
In Italy, although the media periodically report that law enforcement agencies have
dismantled illegal structures of this kind – often related to illegal abortions7– the extent of
the phenomenon is not yet well known. A related phenomenon is the medical treatment of
fugitives or most-wanted criminals (e.g. mafia bosses at large, etc), who cannot access legal
healthcare structures and hence must resort to compliant doctors and acquire medicines
on the illegal market (see also 1.3.8 and 1.3.9).

22
Finally, there is wide evidence that consumers of psychopharmacological drugs or of
“lifestyle” drugs8 (e.g. medications used to treat impotence, erectile dysfunction, baldness,
overweight or wrinkles) may prefer to access, not the legal market, but the illegal one
through web pharmacies or illegal distributors (e.g. sex aid shops in the case of erectile
dysfunction drugs) for many reasons, including the need to conceal their consumption
habits or avoid embarrassment (IMPACT, 2013).
All these illegal usages may fuel the demand on illegal markets, thereby boosting, among
other things, the theft of medicines.
1.3.5 Difficulties in accessing pharmaceuticals through legal channels
The structure and the vulnerabilities of the supply-chain influence both the demand and
the supply of stolen pharmaceuticals.
First, the demand for medicines on illegal markets may be stronger in countries where the
legal supply is not sufficient, widespread, or is liable to interruptions due to exogenous
factors (e.g. NHS defaults, bankruptcy of wholesalers, etc). Some categories of medicines
may be more affected than others: in Italy, for instance, problems in the availability of so-
called contingentati (i.e. rationed) pharmaceuticals have been highlighted by some reports
(Fornaro, 2014).
In all these cases, the demand not fulfilled by the legal supply may be satisfied by stolen
medicines. There is evidence that the recent financial crisis has obliged some countries to
reduce their budgets for healthcare or the reimbursement of pharmaceutical consumption
(The European House-Ambrosetti, 2012, pp. 110-112). In Greece, for instance, some
important pharmaceutical companies have apparently decreased their shipments of
medicines due to delays in payments by hospitals and the NHS (Sukkar & Smith, 2013;
Tamburini, 2013), thereby boosting, according to some reports, the trafficking of stolen
products to the country.
In other countries, such as some Eastern European ones, where the NHS is rapidly developing
and still has to deal with some loopholes, legal providers linked to organized crime may
import stolen pharmaceuticals that are then legally sold to the local public healthcare
system or re-exported, legally through parallel trade channels, to high-price countries or
even to the country where the medicines were first stolen (see also 1.3.2 and 1.3.6).
8. It is not easy to define these drugs clearly. See Møldrup (2004) for a review.

23
1.3.6 Vulnerabilities in the supply chain
The structure of the supply chain and its vulnerabilities are crucial for criminals when
deciding how and where to steal medicines.
Although it has been estimated that, in Europe, 80% of medicines are distributed through
wholesalers (Vander Beken, 2007, p. 38), the structure of the supply chain differs according
to the country, the national health system, and/or the type of medicine. In general, once
medicines have been manufactured, they may be supplied to wholesalers or directly
to pharmacies and/or hospitals, where they then reach end-consumers. Brokers may
sometimes play a role in the distribution at both national and international level. Because
they are located in different countries or regions, all these stages involve some form of
transportation (Figure 2).
Figure 2 The supply chain of pharmaceuticals
delivery delivery
delivery
delivery
Manufacturer Wholesaler
BrokerHospitals
Pharmacies
End-consumers
Once the demand for a certain type of drugs has been identified, therefore, criminals may
decide to steal pharmaceuticals at different stages:
- at the manufacturing level;
- at the wholesale or broker level;
- in the delivery stage;
- in retail pharmacies;
- in hospitals.
To be noted is that not all these stages are necessary: for example, cancer drugs may be
delivered directly from the manufacturer to the hospital without relying on wholesalers,
and this obviously reduces the options available to criminals.
Whatever the structure of the distribution process may be, it is likely that criminals will
target the weakest links of the supply chain.
In the Italian case, it can be hypothesized that hospitals and delivery are the stages most
vulnerable to thefts and robberies of medicines, while manufacturers and retail pharmacies
seem less exposed. By contrast, companies involved in wholesale/brokering may be
involved directly, wittingly or otherwise, in the trading of stolen products. This hypothesis
is based on the following considerations.

24
First, retail pharmacies may attract, even frequently, small-scale thefts of over-the-counter
(OTC) drugs carried out by individuals or groups, not necessarily organized. But they will
not easily attract large-scale robberies: in fact, they do not usually handle large quantities
of pharmaceuticals and cannot manage high-priced medications such as Class H drugs
(e.g. oncologic, immunosuppressant, etc), which are only administered within healthcare
structures.
Second, manufacturing is a highly concentrated sector with a small number of enterprises
and relatively high levels of corporate security. Excluding thefts by employees (see
Mugellini and Caneppele (2012) for a review of crimes against businesses in Italy), wide-
scale connections with organized crime groups must be ruled out.
Wholesalers and brokers may be involved in the sense that they can purchase back, wittingly
or unwittingly, the stolen goods and re-sell them on the legal market, especially abroad
so as to benefit from the price differentials in the parallel trade (see 1.3.2). For instance,
according to police intelligence reports, in at least one case numerous medicines stolen in
Italy have been found in the warehouse of a broker in the same country, apparently legally
acquired from an East Europe wholesaler, and ready to be shipped to northern Europe.
Similarly, the delivery stage has high risks of theft for a variety of reasons. First, there is
evidence that robberies against trucks in Italy have been increasing in recent years (+514%
between 2010 and 2012)9 throughout the country. Second, the transportation sector has
been showing increasing signs of infiltration by organized crime groups, both mafia-type
(Riccardi, 2014; Transcrime, 2013) and foreign (especially from Eastern-European OCGs),
and this may lead to thefts and robberies with the complicity of the courier company itself.
Finally, this sector is highly fragmented: there is a large number of padroncini (small single-
owner transport firms) that often subcontract transportation services to even smaller
businesses, with a consequent lower monitoring of pharmaceutical manufacturers and a
concomitant increase in the risk of losses and thefts. To be noted is that pharmaceutical
couriers in Italy often act as multi-brand agents, so that the same truck may transport
different brands and different types of medicines.
Hospitals are very vulnerable. Healthcare services in Italy have historically registered infiltration
by Italian mafia-type organized crime groups (Transcrime, 2013), and they represent the second
business sector in terms of the rate between confiscated and registered companies (Riccardi,
2014, p. 204). The links are particularly strong in Southern Italy, where numerous public health
agencies (ASL – Aziende Sanitarie Locali) have been dismantled because of mafia infiltration.10
The strong connections with mafia groups may be correlated with higher levels of corruption
and involvement of medical staff in criminal acts including thefts. Secondly, hospitals are
generally weakly monitored structures characterized by a high turnover of medical staff (nurses,
doctors, etc), which may again decrease control and increase the risk of thefts and losses.
9. Figure calculated by Transcrime using Italian Ministry of the Interior data on reported crimes.10. At least four local public health agencies have been dismantled since 1991 in Italy (Trocchia, 2011).

25
Large hospitals are those most vulnerable because of their higher personnel turnover and
the greater availability of pharmaceuticals that thieves can access.
1.3.7 Traceability of pharmaceuticals
The good traceability of pharmaceuticals may affect the supply of stolen medicines because
it makes it difficult for criminals to move and place stolen products at both national and
international level without leaving trails for law enforcement agencies to follow.
At present, there are various medicine identification systems, including RFID (Radio
Frequency Identification), datamatrix and/or bar codes. Although numerous countries
and manufacturers have implemented traceability systems, this has often happened with
incompatible proprietary coding and identification requirements (Grimald, 2012, p. 4). No
mandatory international standards exist: in some countries regulations are very ambiguous
and do not detail either coding or technology for code carrier (Grimald, 2012, p. 4). All these
loopholes may complicate the activity of investigators while favouring criminals, especially
those involved in the trafficking of stolen products across borders and jurisdictions.
In Italy, a database for the identification of medicines (Banca dati della Tracciabilità del
farmaco) has existed since 2005 (Ministero della Salute, 2013). The system requires that
each pack of medicines must be individually traceable back from the end-user to the
producer, and that each actor involved in the supply chain (manufacturer, wholesaler, retail
pharmacy, etc) must be attributed a unique identifier (D.m. 15 luglio 2004). The traceability
system has been implemented with different timings according to the type of medicine
(e.g. Class H pharmaceuticals, for hospital use only, since 2010) (Ministero della Salute,
2013). The traceability issue can be read from a different perspective. Assuming that some
corrupted operators (e.g. employees, medical staff, wholesalers, etc) have always been
interested in diverting medicines from the legal to the illegal trade, it may be hypothesized
that the number of thefts reported to the police and the media has increased since the
introduction of full traceability. Indeed, when no identification was in place (e.g. before
2010 for Class H pharmaceuticals), medicines could have been appropriated more easily or
without it being necessary to commit thefts or robberies. Specifically, an increase in thefts
of Class H medicines should have been recorded since 2010 (see also 2.2.1).
1.3.8 The activity of organized crime groups
Given all the factors and drivers discussed above, it is evident that in order to steal medicines
it is necessary to possess a high level of organization (e.g. to steal pharmaceuticals in one
country and place them in another), extensive knowledge (e.g. of patterns in the demand
for medicines, of the healthcare system, of the supply chain, of the methods used to store
and transport medicines), and advanced skills (e.g. the ability to enter highly-monitored
buildings or to shield GPS signals sent by victimized trucks).

26
This means that thefts of pharmaceuticals are most likely carried out, not by individuals,
but by criminal groups with a strong organization and a wide range of contacts across the
whole supply chain – at both national and international level – both among “legal” actors
(e.g. brokers, transportation companies, doctors) and within the illegal market. These groups
may be characterized by a high level of specialization, and they may operate across the
entire country, committing serial thefts and relying on a large availability of funds and cash
that they can use to corrupt the medical staff of hospitals or to pay underground couriers
– or, alternatively, they may rely on a high capacity to exercise intimidation, violence, and
political influence.
These actors may overlap or be connected with well-established local gangs or organized
crime groups (OCGs).11 In Italy, mafia-type groups are widespread across the entire country,
with a higher prevalence in Southern provinces (Figure 3), and according to geographical
features: Camorra OCGs mainly operate in Campania and northern Apulia, Apulian OCGs
(the most famous is Sacra Corona unita) in Apulia, ‘Ndrangheta in Calabria, Cosa Nostra
in Sicily. The northern regions witness the simultaneous presence of all these criminals
groups (see Transcrime (2013) for a detailed map of mafia OCGs in Italy). These mafia
organizations can rely on a high capacity to exercise intimidation, violence, and corruption,
and they have close connections with the political and administrative elite (Riccardi, 2014),
including the managers of the healthcare sector. It can consequently be hypothesized that
episodes of thefts and robberies of medicines are more frequent in southern provinces
with a stronger presence of mafia OCGs.
BZ
PZ
FG
TO
CS
CN
TN
PGSI
FI
PA
SA
RM
BS
UD
AQ
SS
CA
GR
VI
VT
BL
RI
NU
CT
BA
AL
PI
PRBO
FR
OTMT
VR
AR
PV
RC
SO
LE
AO
AV
ME
FE
CB
OR
AG
TA
LT
TV
CE
PC
VE
EN
PU
TP
BG
CZ
CH
MC
FC
MORE
PNVB
IS
TR
CL
PD
TE
SR
MNVC
CI
BN
MI
AN
LU
BR
RAGE
RO
KR
AT
OG
SV
BT
VS
RG
LI
IM
PE
BIVA
NO
VV
PT
CR
AP
CO
NA
MSSP
LC
RN
FM
LO
GO
MB
PO
LI
TS Index Value
Mafia Presence Index
Very low
Low
Medium
High
Very High
Figure 3 Mafia Presence Index at provincial level
BZ
PZ
FG
TO
CS
CN
TN
PGSI
FI
PA
SA
RM
BS
UD
AQ
SS
CA
GR
VI
VT
BL
RI
NU
CT
BA
AL
PI
PRBO
FR
OTMT
VR
AR
PV
RC
SO
LE
AO
AV
ME
FE
CB
OR
AG
TA
LT
TV
CE
PC
VE
EN
PU
TP
BG
CZ
CH
MC
FC
MORE
PNVB
IS
TR
CL
PD
TE
SR
MNVC
CI
BN
MI
AN
LU
BR
RAGE
RO
KR
AT
OG
SV
BT
VS
RG
LI
IM
PE
BIVA
NO
VV
PT
CR
AP
CO
NA
MSSP
LC
RN
FM
LO
GO
MB
PO
LI
TS Index Value
Mafia Presence Index
Very low
Low
Medium
High
Very High
11. Although the successes and high profits of these activities may have attracted newcomer groups and criminals.
Source: Transcrime 2013

27
However, also foreign OCGs must be considered. In Italy, OCGs originating from the
Western Balkans (Albania and former Yugoslavia) and Eastern Europe (Romania, Bulgaria,
Georgia, Russia) are increasingly attracting the interest of law enforcement agencies, at
both Italian (Ministero dell’Interno, 2012, p. 18) and European level (Europol, 2011). In
Italy they are often linked with organized property crimes (Ministero dell’Interno, 2012,
p. 18): in particular, metal thefts12 and thefts/robberies against residential houses, trucks,
and warehouses. They may rely on legal shell companies operating in the import-export
business sector to transfer stolen goods to Eastern Europe: for example, in Apulia some
Russian/Georgian clans (e.g. Vor-Y-Zakone) run export businesses also used to traffic stolen
property (Bianconi & Santucci, 2013).
1.3.9 Involvement of the medical staff and of wholesalers
Given the high level of organization required in order to steal and place stolen medicines, it
cannot be excluded that those involved in the legal supply (e.g. employees of manufacturers,
wholesalers, pharmacies or medical personnel) play a role in facilitating thefts of medicines.
In regard to hospitals, doctors, nurses, members of the medical personnel or private guards
may, for example, provide criminals with plans of the buildings, timetables, indications
about when and how the structures are more vulnerable; or they may give information on
how to store stolen pharmaceuticals or to whom to sell them.
Members of the medical staff may act as intermediaries (e.g. because they have been
bribed or intimidated), or they may be directly involved in the illegal trafficking of stolen
pharmaceuticals. For instance, they may share the profits of the illicit trade, or themselves
use the stolen medicines in parallel illegal activities (e.g. doping, medical treatment of
fugitives or mafia bosses, etc). They may benefit from frauds against the NHS or, less likely,
they may intentionally provoke shortages in hospital stocks in order to favour friendly
suppliers.
As said above (see 1.3.2 and 1.3.6), wholesalers and brokers may also be involved in the
trade of stolen medicines: for example, through acquiring, wittingly or unwittingly, the
stolen products and then reselling them on the legal market, within the country or in
foreign countries in order to profit from price differentials in the parallel trade.
1.3.10 The level of law enforcement
Effective law enforcement may impact on both the demand for and the supply of stolen
medicines, in that it may dismantle illegal markets or reduce the opportunities available
to criminals and thieves of pharmaceuticals. Many countries have special agencies and
authorities that deal specifically with pharmaceutical crime, either the counterfeiting of
medicines or their theft.
12. About 41% of the persons arrested by the Italian police for metal theft in 2012 were Romanian, while 7.1% were from the former Yugoslavia or Bulgaria (Ministero dell’Interno, 2012).

28
In Italy, the AIFA, besides being the national authority responsible for regulation of the
supply of medicines, also coordinates several projects and protocols aimed at combatting
pharmaceutical crime. It links the government, law enforcement agencies (especially
the Comando Carabinieri per la Tutela della Salute),13 pharmaceutical companies, retail
pharmacies, and industry representatives in combating these criminal phenomena.
Although there is close cooperation among all the institutional actors involved (government,
police, industry), loopholes may arise – in both regulation and law enforcement – that may
produce opportunities for those involved in the commission of medicine thefts.
13. The Comando Carabinieri per la Tutela della Salute coordinates the N.A.S. - Nucleo Anti Sofisticazioni department.14. i.e. the theft and sale of stolen medicines.
Drivers influencing the demand of stolen medicines
Drivers influencing the supply 14 of stolen medicines
• Price differentials
• Reimbursement of medicines
• Illegal use of legal medicines
• Illegal use of legal medicines
• Difficulties in accessing pharmaceuticals through legal channels
• Price of pharmaceuticals
• Price differentials
• Vulnerabilities in the supply chain
• Traceability of pharmaceuticals
• Activity of organized crime groups
They may be then exported on parallel trade to high price
countries
Or sold to Italian hospitals or pharmacies
1.c
1.b
1.a
3.A
2
3.b
4.a
4.b
They may be then exported on parallel trade to high price
countries
Stolen medicinesmay be sold on illegal
markets in Italy or abroad (e.g. Greece or
Eastern Europe)
Or may be purchased, unwittingly or not, by
Italian brokers
Here they can be “laundered” through
fictitious local brokers/wholesalers
Hospitals
Brokers/Wholesalers
Illegal Markets
Retail Pharmacies
The overlapping between the illegal trafficking of stolen medicines, the legal market and the parallel trade. It cannot be excluded that stolen pharmaceuticals may re-enter the legal trade through fictitious shell companies, often registered abroad, and then exported to high-price countries or back to Italian wholesalers.

29
THEFT OF MEDICINES: THE HYPOTHESES
1.4
All the issues discussed above lead to the various hypotheses about the theft of medicines
that are discussed here. The next chapter will test some of them by focusing on thefts in
Italian hospitals. Not all of these hypotheses can be verified due to a lack of information.
However, some hints and suggestions are provided.
As regards the types of medicines stolen, it may be hypothesized that the most attractive
ones are those with the highest prices (e.g. Class H drugs such as cancer drugs), those used
in illicit activities such as sport doping (e.g. erythropoietin), or the “lifestyle” drugs (e.g. for
erectile dysfunction, baldness, obesity, etc) widely sold on illegal markets or on the Web.
In terms of demand, it can be hypothesized that medicines stolen in Italy address both
a national and international demand: the former implies the illegal use of medicines for
sport doping, illegal medical treatment (e.g. illegal clinics or healthcare of criminals at
large) or frauds against the NHS. But the demand may also derive from patients in foreign
countries with low reimbursement regimes, scant social protection, or an insufficiency of
legal supplies due, for instance, to NHS budget constraints (e.g. Greece). Moreover, in some
foreign countries (e.g. Eastern Europe) wholesalers colluding with criminals may act as
brokers to “launder” the stolen products and re-export them to high-price countries (e.g.
Northern Europe) through parallel trade channels.
In regard to the structures victimized, hospitals and trucks are the most vulnerable
targets. In particular, hospitals are exposed to the theft of Class H medicines (e.g. cancer
drugs, interferon, immunosuppressant, etc). Truck couriers, which often act as multi-brand
distributors, are also exposed to the theft of “lifestyle” pharmaceuticals (e.g. Viagra, Cialis,
etc). It may be hypothesized that large public hospitals are more vulnerable than small
private ones (see 1.3.6).
As regards the geography of thefts, it can be assumed that southern Italian regions, characterized
by a higher intensity of mafia organized crime groups (see 1.3.8), are more vulnerable than
northern ones. Moreover, considering the role that can be played by foreign OCGs, in particular
Eastern European ones, and the proximity of certain destination markets (e.g. Greece or
Western Balkans), those regions with seaports on the Adriatic Sea or land borders with Eastern
Europe (e.g. Friuli Venezia Giulia) may be more affected than others.
Given the high degree of organization needed to commit thefts (see 1.3.8), the involvement of
organized crime groups may be hypothesized: in particular of Italian mafia-type OCGs (Camorra
and Apulian OCGs) and Eastern European OCGs (Albanian, Romanian, Bulgarian, Russian and
Georgian). The latter are already often linked to organized property crimes (see 1.3.8).
Moreover, criminal groups may rely on a facilitating role played by some members of the
medical staff or wholesalers, who may be either corrupted, intimidated or fully involved in
the illicit trafficking of stolen medicines, and thus share the profits of the criminal activity.

30
Table 1 Theft of pharmaceuticals in Italy – Some hypotheses
• High-priced drugs (e.g. oncologic, biological, etc);
• Drugs that are used for illicit purposes (e.g. EPO);
• “Lifestyle” drugs (e.g. Viagra, Cialis, dietetic, etc);
Targets
• International demand: From subjects/patients living in: - Countries with low reimbursement regimes; - Countries with private insurance based health systems; - Countries with not adequate or widespread legal supply (e.g. due to NHS budget problems); - Countries acting as brokers towards on the parallel trade towards high-price markets;
• National/international demand: - Use of medicines for illegal purposes (e.g. doping); - Illegal medical structures (e.g. illegal clinics, medical treatment of fugitives); - Frauds to NHS;
• Hospitals
• Truck couriers
• Wholesalers
Geography of thefts
Authors
• Southern Italy (links with OCGs)
• Border regions (e.g. North-eastern Italy)
• Areas close to ports (e.g. Eastern regions on Adriatic sea)
• Involvement of organized crime groups (OCGs) - Mafia-type OCGs (e.g. Camorra, Apulian, etc) - Foreign OCGs (e.g. Eastern European OCGs)
• Possible involvement of: - corrupted medical staff; - wholeaslers/brokers in connection with OCGs;
Demand
Stolen Products

31
32
02The analysis: the thefts from Italian hospitals

33
2.1.1 Data and sources
Information about thefts of medicines from Italian hospitals was gathered from open
sources, specifically on-line newspaper articles and other media (television, radio) reports.
To identify the cases, keyword searches were conducted on the Web and on specific search
engines (e.g. Lexis Nexis).15
It was decided to rely on open sources because of the lack of scientific studies and official
data, at least publicly available, regarding thefts in hospitals. In fact, although some Italian
agencies and LEAs (e.g. AIFA, Comando Carabinieri per la Tutela della Salute, etc) have been
compiling lists of pharmaceutical crime incidents, a comprehensive dataset of thefts in
hospitals does not exist. On the other hand, administrative statistics (such as the number of
thefts reported to the police) made publicly available by the Italian Ministry of the Interior,
the Ministry of Justice, and the national statistical office (ISTAT) do not provide sufficiently
detailed information about what is stolen and where thefts occur.
After presenting the theoretical background behind pharmaceutical theft and the drivers
that influence the demand for and supply of stolen medicines, this section focuses on
thefts of medicines from hospitals. In particular, it presents an analysis of thefts in Italian
hospitals from 2006 to 2013.
It has been decided to focus on hospitals for two main reasons. First, hospitals play a crucial
role in the protection of public health, they represent a significant share of the national
healthcare budget and are key drivers of the Italian economy. They therefore warrant
closer attention than other victimized structures. Second, as will be better detailed in 2.1.2,
information about thefts in hospitals is much more widely available than is information
about thefts in other structures (e.g. trucks, wholesalers, etc) in particular considering the
methodology adopted to collect data (2.1.1).
The analysis presented here tested some of the hypotheses set out in the previous chapter
and provided figures, maps and charts about how frequently and where thefts occur, how they
are carried out, what medicines are stolen, what the most victimized hospitals are and what
the correlation is with the presence of organized crime groups and other contextual factors.
Methodology
2.1
15. A wide range of keywords, in Italian, were adopted, controlling for synonyms and word combinations.

34
Obviously, the use of media sources is subject to the biases and limitations that are
discussed in detail below (see 2.1.2). However, it was preferred to rely on a single type of
source in order to maximize the coherence of the analysis and the harmonization of the
findings.
The collection of media reports led to the identification of 68 cases of thefts that occurred
between January 2006 and December 2013. For each case, the following information was
collected (N = number of cases for which the information was available):
- name of the hospital involved (N=68)
- municipality, province, and region of the hospital involved (N=68)
- date of the theft (N=67)
- date of the newspaper article or media report (N=68)
- hour of the theft (N=50)
- names of the medicines stolen (N=9)
- Number of medicines stolen (N=9)
- economic value of the theft (N=57)
- information about the method used to commit the theft (N=48)
In this regard, regional and local newspapers (i.e. media and newspapers covering only a
limited geographic area) proved crucial in that they provided much more detailed data
than major national newspapers and media, which, instead, included only little information
about the incidents.
2.1.2 Bias and limitations in the data collection
The collection of cases through open sources has limitations and introduces biases that
should be discussed.
First, the actual number of thefts may be higher than those reported by the media, so
that the phenomenon may be underestimated. For example, the media may focus only on
those incidents above a certain economic value (e.g. “a 5,000 thousand EUR theft is not
interesting to the audience”) or involving only certain hospitals, or related only to certain
types of medicines (e.g. “thefts of cancer drugs are interesting while those of ophthalmic
or EPO drugs are not”).
Second, this latter issue may lead to an overestimation of the prevalence, among thefts, of
certain types of medicines (e.g. cancer drugs) with respect to others (e.g. erythropoietin,
ophthalmic, lifestyle medicines, etc), and to an underestimation of small-scale incidents.
Moreover, given that media interest in this phenomenon has increased only in recent
months, an over-representation of the thefts that occurred in 2013 with respect to those
that occurred in previous years may be registered.

35
Finally it should be borne in mind that, generally speaking, thefts in hospitals, like any other
crime against businesses, may register a high ‘dark number’ (i.e. a high number of incidents
that are not reported to the police or in any case are not made public). Managers, in fact,
may prefer not to involve police officers but to address crimes internally (e.g. through audit
or corporate security) in order to avoid damage in terms of reputation or budget (Dugato,
Favarin, Gergely & Agnes, 2013; Mugellini & Caneppele, 2012).
However, considering the very “public” nature of hospitals, it may be hypothesized that
the dark number is lower for hospitals than for private companies (e.g. manufacturers,
wholesalers, couriers) because it is more likely that thefts in hospitals are reported to the
police and hence to the media.
2.1.3 Methodology of analysis
After collecting all the available information on the 68 cases, the data were processed with
two types of analysis: a descriptive analysis and an inferential one.
The descriptive statistics focused on trends and the seasonality of thefts, distribution by
region and province, types of hospitals, and types of medicines. Finally, an analysis of the
modi operandi of thefts was carried out.
The aim of the inferential analysis was to estimate the correlation between thefts of
medicines in hospitals and other contextual factors, such as the presence of organized
crime groups, the intensity of property crimes, and other geographical characteristics.
Various classifications and indicators were adopted in performing the analysis. In particular,
hospitals were classified according to the standard classification of the Italian Ministry of
Health (see 2.2.3 for details), while medicines were classified according to a compromise
between the standard ATC classification and the categories mentioned by media reports
(see 2.2.4 for details).
A range of proxy variables were adopted in the analysis of contextual factors (see 2.2.6 for
details). In particular, the presence of mafia groups was measured through the MPI – Mafia
Presence Index developed by Transcrime (Calderoni, 2011; Transcrime, 2013), while account
was also taken of the number of cases of criminal association (art. 416 Italian penal code)
reported by the police. By contrast, in order to measure the extent of property crimes in a
province, the number and rate of thefts, thefts from trucks, robberies and robberies from
trucks were considered. Finally, also dummies were used in the analysis of the geography
of thefts (see 2.2.6 for details).

36
9 9
10
8
7
6
5
4 4 4
6 6 6 65
3
6
8
4
3
2
1
0Jan Feb Mar Apr May Jun Jul Aug Sep Oct Nov Dec
3,500
3,000
4,000
4,500
5,000
2,500
2,000
1,000
1,500
500
0
18
0
3
6
9
12
15
2011 2012 2013
Total economic value Average economic value Cases
Thou
sand
s of E
UR
Case
s
Total Value Average Value
9,000
8,000
10,000
7,000
6,000
5,000
4,000
3,000
2,000
1,000
0
3,000
0
500
1,000
1,500
2,000
2,500
Tota
l Val
ue (
Thou
sand
s EU
R)
Ave
rage
Val
ue (
Thou
sand
s EU
R)
CampaniaApulia
Veneto
LombardyCalab
riaMolise Lazio
Marche
SicilyAbruzziTuscan
yFriuli
Emilia
Romagna
OphtalmicNeurological
PsychopharmacologicalSedative
AniretroviralHematologic
HormonalBiological
AntirheumaticImmunosuppressive
Oncologic
EPO
11
22
3
0 5 10 15 20 25 30 35
32
555
1012
13
Total Value Average Value
9,000
8,000
10,000
7,000
6,000
5,000
4,000
3,000
2,000
1,000
0
3,000
0
500
1,000
1,500
2,000
2,500
Tota
l Val
ue (
Thou
sand
s EU
R)
Ave
rage
Val
ue (
Thou
sand
s EU
R)
Oncologic
Immunosuppressive
Antirheumatic
Biological
Hormonal
Hematologic
Aniretrovira
lSedativ
eEPO
Neurological
Ophtalmic
Dental
Psych
oph
armaco
logical
30
15
20
25
10
5
0
3
Hole in the wall
24
Break-in
17
No physical break-in
3
Fake medicalpersonnel
20
NA
0
30
40
60
50
70
20
10
2006 2007 2008 2009 2010 2011 2012 2013
Figure 5 Number of thefts from Italian hospitals and economic value stolen (average and total). Years 2011-2013.
Figure 4 Cumulate number of thefts of medicines from Italian hospitals. Years 2006-2013.
Figure 5, which focuses on the period 2011-2013, shows how the number of thefts (grey
line) increased after the second half of 2012, reaching a total number of 51 events reported
by the Italian media in 2013 alone (75% of the total number of thefts).
9 9
10
8
7
6
5
4 4 4
6 6 6 65
3
6
8
4
3
2
1
0Jan Feb Mar Apr May Jun Jul Aug Sep Oct Nov Dec
3,500
3,000
4,000
4,500
5,000
2,500
2,000
1,000
1,500
500
0
18
0
3
6
9
12
15
2011 2012 2013
Total economic value Average economic value Cases
Thou
sand
s of E
UR
Case
s
Total Value Average Value
9,000
8,000
10,000
7,000
6,000
5,000
4,000
3,000
2,000
1,000
0
3,000
0
500
1,000
1,500
2,000
2,500
Tota
l Val
ue (
Thou
sand
s EU
R)
Ave
rage
Val
ue (
Thou
sand
s EU
R)
CampaniaApulia
Veneto
LombardyCalab
riaMolise Lazio
Marche
SicilyAbruzziTuscan
yFriuli
Emilia
Romagna
OphtalmicNeurological
PsychopharmacologicalSedative
AniretroviralHematologic
HormonalBiological
AntirheumaticImmunosuppressive
Oncologic
EPO
11
22
3
0 5 10 15 20 25 30 35
32
555
1012
13
Total Value Average Value
9,000
8,000
10,000
7,000
6,000
5,000
4,000
3,000
2,000
1,000
0
3,000
0
500
1,000
1,500
2,000
2,500
Tota
l Val
ue (
Thou
sand
s EU
R)
Ave
rage
Val
ue (
Thou
sand
s EU
R)
Oncologic
Immunosuppressive
Antirheumatic
Biological
Hormonal
Hematologic
Aniretrovira
lSedativ
eEPO
Neurological
Ophtalmic
Dental
Psych
oph
armaco
logical
30
15
20
25
10
5
0
3
Hole in the wall
24
Break-in
17
No physical break-in
3
Fake medicalpersonnel
20
NA
0
30
40
60
50
70
20
10
2006 2007 2008 2009 2010 2011 2012 2013
2.2.1 Trends and seasonality
The graph reported in Figure 4 shows the booming growth of thefts of medicines from
hospitals in Italy over recent years. This type of crime was almost non-existent before
2011, with only 2 cases recorded, but then dramatically increased in the last three years
considered, finally reaching the total number of 68 cases of thefts from hospitals reported
by the media between 2006 and 2013.
Analysis
2.2

37
The total number of reported thefts increased by 1175% after 2011 (Table 2). As discussed
in detail in 2.1.2, this value may probably be underestimated owing to the bias in the
methodology adopted for the data collection. However, it gives a clear indication of how
this criminal phenomenon is important and topical.
The high number of cases is also reflected by the total value of the medicines stolen
(Table 1), which almost doubled from 2011 to 2013, reaching a total amount of 18,719,000
EUR (10,452,000 EUR in 2013 alone). Interestingly, this escalation was associated with a
significant decrease in the average value stolen.
2011
2012
2013
Total 2006-2013
Variation 2011-2013
Variation 2012-2013
5,000,000
3,252,000
10,452,000
18,719,000
+ 109%
+ 221%
2,500,000
406,500
227,217
328,404
- 91%
- 44%
4
10
51
68
+ 1,175%
+ 410%
# TheftsAverage Value16 (EUR)Year Total Value (EUR)
Table 2 Total and average economic value stolen by year. Years 2011-2013.
16. The average value was calculated considering only those cases in which information about the total amount stolen was available.17. However, some other experts discards this possibility by emphasing the wide time lag from the introduction of the system for Class H drugs (2010) to the rise of the number of thefts (2012). Moreover, they suggested that frauds through fake inventory shortages are not so widespread and profitable as to explain this growth, and hence that the increase in the reported thefts may have been due to a kind of crime displacement to this emerging and profitable illicit business.
There are various reasons for the dramatic increase in thefts from hospitals in the last
two years considered. As hypothesized in Section 1, they may be related to both demand
drivers (e.g. an increase in the illegal use of medicines – see 1.3.4 – and the stronger
demand from foreign countries such as Greece or Eastern European ones – see 1.3.5) and
to supply drivers (e.g. a surge in organized property crimes committed by some OCGs active
in Italy such as Eastern European groups – see 1.3.8 – or a shift of OCGs’ activities from
risky activities such as drug trafficking to more profitable and less risky ones, such as
pharmaceutical theft).
However, as hypothesized in 1.3.7, some of the experts suggest that this rise may have
been “artificially” inflated by the introduction, in 2010, of the new traceability sytem ( better
known as the bollini system, see 1.3.7) for Class H medicines. This improvement in tracking
and tracing may have made it more difficult to conceal fraudulent inventory shortages,
forcing corrupt employees to report or claim fictitious thefts in order to account for these
shortages. The finding of the stolen medicines abandoned not far from the victimized
hospitals in a couple of cases (see for example Coluzzi (2013)) can be seen as confirmation
of this hypothesis.17
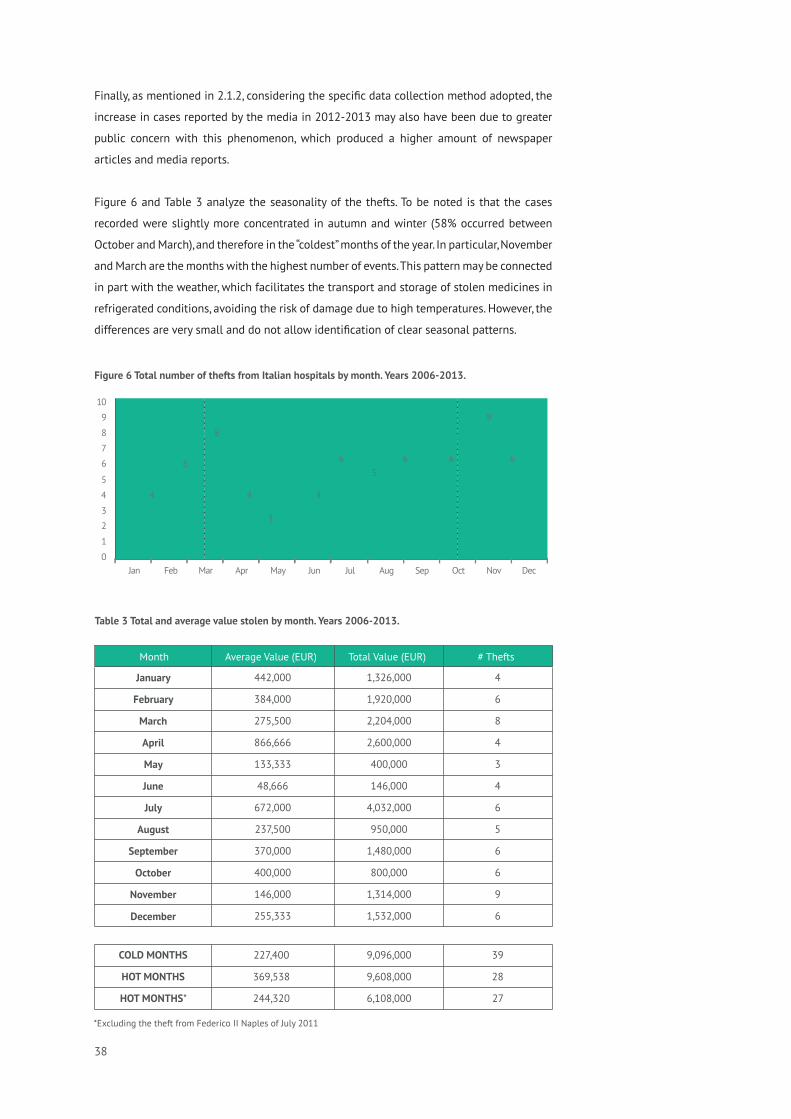
38
Table 3 Total and average value stolen by month. Years 2006-2013.
Finally, as mentioned in 2.1.2, considering the specific data collection method adopted, the
increase in cases reported by the media in 2012-2013 may also have been due to greater
public concern with this phenomenon, which produced a higher amount of newspaper
articles and media reports.
Figure 6 and Table 3 analyze the seasonality of the thefts. To be noted is that the cases
recorded were slightly more concentrated in autumn and winter (58% occurred between
October and March), and therefore in the “coldest” months of the year. In particular, November
and March are the months with the highest number of events. This pattern may be connected
in part with the weather, which facilitates the transport and storage of stolen medicines in
refrigerated conditions, avoiding the risk of damage due to high temperatures. However, the
differences are very small and do not allow identification of clear seasonal patterns.
9 9
10
8
7
6
5
4 4 4
6 6 6 65
3
6
8
4
3
2
1
0Jan Feb Mar Apr May Jun Jul Aug Sep Oct Nov Dec
3,500
3,000
4,000
4,500
5,000
2,500
2,000
1,000
1,500
500
0
18
0
3
6
9
12
15
2011 2012 2013
Total economic value Average economic value Cases
Thou
sand
s of E
UR
Case
s
Total Value Average Value
9,000
8,000
10,000
7,000
6,000
5,000
4,000
3,000
2,000
1,000
0
3,000
0
500
1,000
1,500
2,000
2,500
Tota
l Val
ue (
Thou
sand
s EU
R)
Ave
rage
Val
ue (
Thou
sand
s EU
R)
CampaniaApulia
Veneto
LombardyCalab
riaMolise Lazio
Marche
SicilyAbruzziTuscan
yFriuli
Emilia
Romagna
OphtalmicNeurological
PsychopharmacologicalSedative
AniretroviralHematologic
HormonalBiological
AntirheumaticImmunosuppressive
Oncologic
EPO
11
22
3
0 5 10 15 20 25 30 35
32
555
1012
13
Total Value Average Value
9,000
8,000
10,000
7,000
6,000
5,000
4,000
3,000
2,000
1,000
0
3,000
0
500
1,000
1,500
2,000
2,500
Tota
l Val
ue (
Thou
sand
s EU
R)
Ave
rage
Val
ue (
Thou
sand
s EU
R)
Oncologic
Immunosuppressive
Antirheumatic
Biological
Hormonal
Hematologic
Aniretrovira
lSedativ
eEPO
Neurological
Ophtalmic
Dental
Psych
oph
armaco
logical
30
15
20
25
10
5
0
3
Hole in the wall
24
Break-in
17
No physical break-in
3
Fake medicalpersonnel
20
NA
0
30
40
60
50
70
20
10
2006 2007 2008 2009 2010 2011 2012 2013
Figure 6 Total number of thefts from Italian hospitals by month. Years 2006-2013.
January
February
March
April
May
June
July
August
September
October
November
December
442,000
384,000
275,500
866,666
133,333
48,666
672,000
237,500
370,000
400,000
146,000
255,333
1,326,000
1,920,000
2,204,000
2,600,000
400,000
146,000
4,032,000
950,000
1,480,000
800,000
1,314,000
1,532,000
4
6
8
4
3
4
6
5
6
6
9
6
# TheftsAverage Value (EUR)Month Total Value (EUR)
COLD MONTHS
HOT MONTHS
HOT MONTHS*
227,400
369,538
244,320
9,096,000
9,608,000
6,108,000
39
28
27
*Excluding the theft from Federico II Naples of July 2011

39
Cases
1 2 3 4 5 6 7 8
Figure 7 Total number of thefts from hospitals by province. Years 2006-2013.
Surprisingly, both the total and average amount stolen are slightly higher in the hottest
months. But excluding the theft against the Polyclinic Federico II of Naples occurred in
July 2011 (3,500,000 EUR stolen value), the total value stolen during the “cold” semester
exceeds by 30% the hottest ones.
2.2.2 Thefts by region and province
Thefts of medicines from hospitals are highly concentrated geographically. Some Italian
regions seem to be particularly exposed to this type of crime, while others are totally
or almost unaffected. There are many possible reasons for these differences, and they
have been suggested in Section 1.4. The next sections will discuss the findings when the
hypotheses set out above were tested.
Figure 7 shows the geographical distribution of thefts throughout the country. In particular,
38 out of 110 Italian provinces18 (35%) experienced at least one theft of medicines from
hospitals in the period considered. The ones most affected were Bari and Naples with 8
cases each. These two provinces represented almost 24% of the total number of thefts from
hospitals. Among Italian regions (see Table 3), Campania and Apulia recorded the highest
number of cases, respectively 17 (25% of the total) and 14 (20.6%).
18. Provinces in Italy are the territorial units corresponding to the NUTS 3 level of disaggregation, while regions are NUTS 2-level territorial units. In particular, Italy has 110 provinces and 20 regions.

40
II quarter 2012
II quarter 2013
!(
!(
!(
!(
!(
!(
!(
!(
!(
III quarter 2012
!(
!(
III quarter 2013
!(
!(
!(
!(
!(
!(
!(
!(
!(
!(
!(!(
!(
!(
IV quarter 2012
IV quarter 2013
!(
!(
!(
!(
!(
!(
!(
!(
!(
!(
!(
!(
!(
!(
!(
!(
I quarter 2012
I quarter 2013
(
!(
!(
!
!!(
!(
!(
!(
!(
!(
!(
!(
!!(
(
Cases
! ! !1 2
Figure 8a Thefts from hospitals by provinces. Quarterly evolution, 2012-2013.
III Quarter 2012
I Quarter 2012
IV Quarter 2012
II Quarter 2012
Figure 8 shows the evolution of the spatial distribution of thefts by province between
2012 and 2013. It can be seen that no spatial patterns nor particular concentrations of the
crimes can be identified in 2012. The cases are few in number and irregularly distributed,
although Apulia and Campania begin to appear as the most interested areas. Only 3 out on
10 thefts in 2012 occurred outside these regions.
After early 2013, the phenomenon started to spread, and some sizeable clusters emerged.
In particular, thefts tended to be concentrated more in time and space, highlighting the
presence of geographical patterns: for example the “hot spot” in the area around Bari in
the first quarter of 2013; the cluster of cases in Calabria and East-Sicily in the third quarter;
and the rising number of thefts affecting the north of the country (especially Lombardy
and Friuli-Venezia Giulia) in the last three months of the year. These patterns suggest that,
apart from Apulia and Campania which appear to be constantly affected over time, other
regions of Italy may be targeted, as hypothesized in 1.3.8, by the activity of specialized
criminal groups that move around the country plundering different areas for a short period
of time (see also 2.2.6).

41
II quarter 2012
II quarter 2013
!(
!(
!(
!(
!(
!(
!(
!(
!(
III quarter 2012
!(
!(
III quarter 2013
!(
!(
!(
!(
!(
!(
!(
!(
!(
!(
!(!(
!(
!(
IV quarter 2012
IV quarter 2013
!(
!(
!(
!(
!(
!(
!(
!(
!(
!(
!(
!(
!(
!(
!(
!(
I quarter 2012
I quarter 2013
(
!(
!(
!
!!(
!(
!(
!(
!(
!(
!(
!(
!!(
(
Cases
! ! !1 2
Figure 8b Thefts from hospitals by provinces. Quarterly evolution, 2012-2013.
III Quarter 2012
I Quarter 2012
IV Quarter 2012
II Quarter 2012
In order to better understand the relevance of this crime across Italian regions and
provinces, Table 4 and Figure 9 show the rates calculated dividing the number of thefts by
the number of hospitals and of hospital beds.19 On average in Italy 1 hospital out of 10 has
suffered a theft of medicines in the period 2006-2013. Molise (more than 7 cases every 10
hospitals), Apulia (almost 4 victimized out of 10), Campania (3.1) and Friuli-Venezia Giulia
(2 out of 10) emerge as the most affected regions, having values higher than the national
average considering both the rates.
19. The number of hospital beds was considered to be a proxy for a hospital’s size.

42
In regard to Italian provinces (Figure 9), Trieste, Campobasso, Bari, Isernia and Benevento record the
highest rates between thefts and hospitals, whereas Frosinone, Vibo Valentia and again Campobasso,
Isernia and Benevento are the ones most affected on considering the total number of hospital beds.
The spatial distribution of thefts confirms the hypotheses formulated in 1.3 and 1.4: a
larger prevalence in southern (especially Campania and Apulia) and eastern Italian regions.
As will be shown better in 2.2.6, these patterns are related to the presence and activity of
criminal groups (Italian mafias and foreign OCGs) but also to geographical factors such as
the availability of seaports on the Adriatic Sea (e.g. Apulia, Marche, etc) or of borders with
Eastern Europe (e.g. Friuli Venezia Giulia). See 2.2.6 for more details.
4.88
10.72
0.00
6.05
12.74
1.27
6.82
3.23
1.52
1.49
1.89
34.06
0.00
0.00
2.97
0.00
1.64
3.49
0.00
1.12
3.51
Abruzzi
Apulia
Basilicata
Calabria
Campania
Emilia–Romagna
Friuli-Venezia Giulia
Lazio
Liguria
Lombardy
Marche
Molise
Piedmont
Sardinia
Sicily
Trentino - Alto Adige
Tuscany
Umbria
Valle d’Aosta
Veneto
ITALY
2
14
0
3
17
2
3
6
1
5
1
5
0
0
4
0
2
1
0
2
68
0.95
3.78
0.00
0.83
3.09
0.74
2.00
0.87
0.83
0.83
0.31
7.14
0.00
0.00
0.60
0.00
0.48
0.91
0.00
0.53
1.09
Rate by 10,000 Hospital Beds*Rate by 10 Hospitals*Year # Thefts
Table 4 Total number of thefts and rates by region. Years 2006-2013.
*The values above the national average are highlighted

43
0.66 - 3.433.44 - 6.12
6.13 - 11.70
11.71 - 21.70
21.71 - 37.28
Rate by 10,000 hospital beds
0.66 - 3.433.44 - 6.12
6.13 - 11.70
11.71 - 21.70
21.71 - 37.28
Rate by 10,000 hospital beds
Figure 9 Rate by hospital and by 1,000 hospital beds. Provinces. Years 2006-2013.
Rate by 10 hospitals
0.38 - 1.251.26 - 2.00
2.01 - 3.63
3.64 - 6.00
6.01 - 1.00
Rate by 10 hospitals
0.38 - 1.251.26 - 2.00
2.01 - 3.63
3.64 - 6.00
6.01 - 1.00
Figure 10 Thefts by class of medicines stolen. Provinces. Years 2006-2013.
3.5
Class HOthers or N/A
Inspection of the geographical distribution of thefts by class of medicine stolen, and in particular if
the theft involved Class H drugs (Figure 10), clearly shows that the theft of medicines of this type is
even more concentrated in a few regions. Campania and Apulia recorded 21 cases, about 61.7% of all
thefts of Class H medicines. This may confirm the high level of organization needed to steal medicines,
and in particular Class H drugs (see 1.3.8), and it suggests, as hypothesized in 1.4, the crucial role
of specialized criminal groups that move around the country, possess sufficient skills and contacts
with illegal networks, and are able to receive and sell the stolen medicines, especially abroad (see

44
1.4). Campania and Apulia are the regions that recorded the highest values in terms of economic loss,
respectively about 9.1 million EUR in Campania (48.5% of the total value stolen) and almost 3.5 million
EUR in Apulia (18.7%) (Figure 11).
These figures clearly show the huge impact of thefts of medicines on the health system’s budget,
especially if one considers that most of the stolen medicines are Class H drugs (see 2.2.4), which are
entirely covered by the Italian NHS.
Figure 11 Total and average value stolen by region. Years 2006-2013.
9 9
10
8
7
6
5
4 4 4
6 6 6 65
3
6
8
4
3
2
1
0Jan Feb Mar Apr May Jun Jul Aug Sep Oct Nov Dec
3,500
3,000
4,000
4,500
5,000
2,500
2,000
1,000
1,500
500
0
18
0
3
6
9
12
15
2011 2012 2013
Total economic value Average economic value Cases
Thou
sand
s of E
UR
Case
s
Total Value Average Value
9,000
8,000
10,000
7,000
6,000
5,000
4,000
3,000
2,000
1,000
0
3,000
0
500
1,000
1,500
2,000
2,500
Tota
l Val
ue (
Thou
sand
s EU
R)
Ave
rage
Val
ue (
Thou
sand
s EU
R)
CampaniaApulia
Veneto
LombardyCalab
riaMolise Lazio
Marche
SicilyAbruzziTuscan
yFriuli
Emilia
Romagna
OphtalmicNeurological
PsychopharmacologicalSedative
AniretroviralHematologic
HormonalBiological
AntirheumaticImmunosuppressive
Oncologic
EPO
11
22
3
0 5 10 15 20 25 30 35
32
555
1012
13
Total Value Average Value
9,000
8,000
10,000
7,000
6,000
5,000
4,000
3,000
2,000
1,000
0
3,000
0
500
1,000
1,500
2,000
2,500
Tota
l Val
ue (
Thou
sand
s EU
R)
Ave
rage
Val
ue (
Thou
sand
s EU
R)
Oncologic
Immunosuppressive
Antirheumatic
Biological
Hormonal
Hematologic
Aniretrovira
lSedativ
eEPO
Neurological
Ophtalmic
Dental
Psych
oph
armaco
logical
30
15
20
25
10
5
0
3
Hole in the wall
24
Break-in
17
No physical break-in
3
Fake medicalpersonnel
20
NA
0
30
40
60
50
70
20
10
2006 2007 2008 2009 2010 2011 2012 2013
On average, each theft between 2006 and 2013 produced an economic loss amounting to
328,404 EUR. This figure alone explains the huge profitability of this new illicit activity, although
stolen medicines may be sold at lower prices on the illegal market or in the parallel trade (see
1.3.1 and 1.3.2). With one single theft, criminals can acquire assets which may be equivalent in
value to four high-class SUV cars, or to 6.3 kilos of heroin, a quantity that (at the retail price in
Italy) may satisfy more than 200 heroin consumers for one year. Thefts of medicines may hence
open new prospects for criminal groups, which can shift from more risky and less profitable
activities to this less risky and more lucrative market (see 1.4), using it as a “bank” from which to
withdraw proceeds then invested in other illegal markets (e.g. to acquire illegal drugs) or in the
legal economy.
Only three regions exceed the Italian average: Campania, Marche and Veneto. Although
these two latter regions record 1 theft each,20 particularly impressive is Veneto, whose
mean value is more than three times the national average. Instead, the average loss caused
by the 17 thefts in Campania amounted to 567,187 EUR.
20. The number of hospital beds was considered to be a proxy for a hospital’s size.
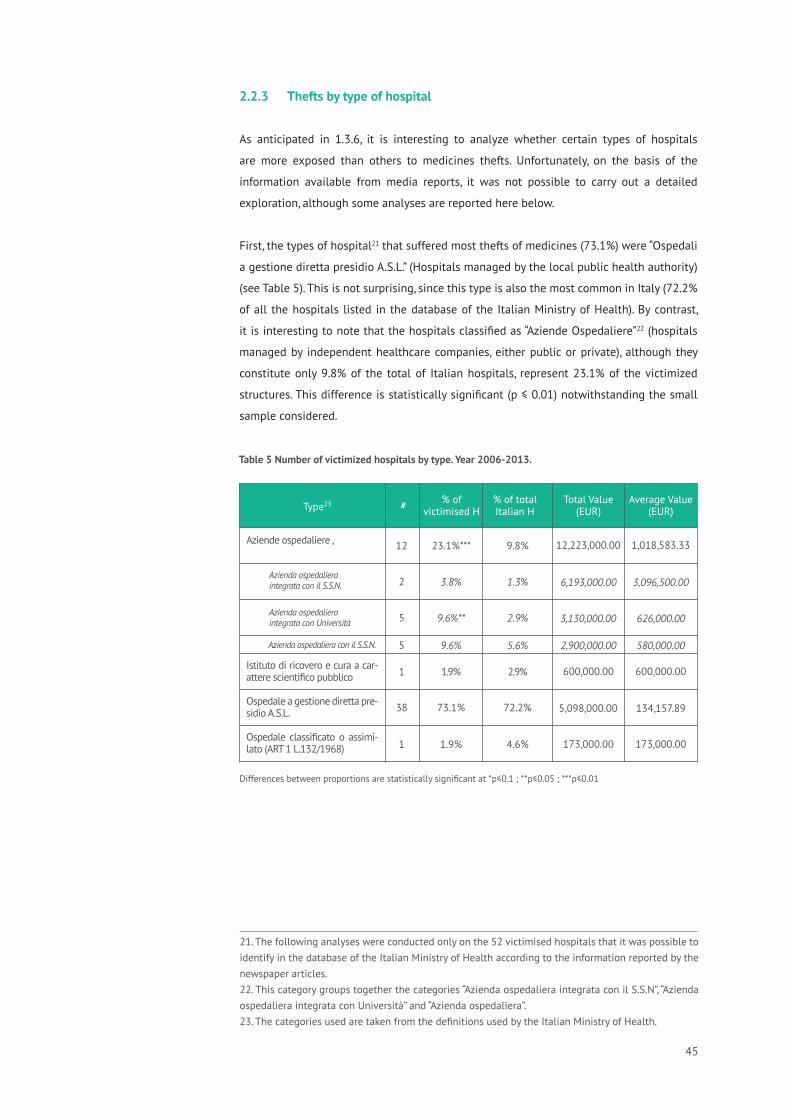
45
Table 5 Number of victimized hospitals by type. Year 2006-2013.
Aziende ospedaliere ,
Azienda ospedaliera integrata con il S.S.N.
Azienda ospedaliera integrata con Università
Istituto di ricovero e cura a car-attere scientifico pubblico
Ospedale a gestione diretta pre-sidio A.S.L.
Ospedale classificato o assimi-lato (ART 1 L.132/1968)
Azienda ospedaliera con il S.S.N.
12 23.1%*** 9.8%
6,193,000.00 3,096,500.00
1,018,583.33
2 3.8% 1.3%
3,130,000.00 626,000.005 9.6%** 2.9%
2,900,000.00 580,000.005 9.6% 5.6%
600,000.00 600,000.00
38
1
73.1%
1.9%
72.2%
4.6% 173,000.00 173,000.00
1 1.9% 2.9%
5,098,000.00
12,223,000.00
134,157.89
Total Value (EUR)
Average Value (EUR)
% of total Italian H
% of victimised H Type23 #
2.2.3 Thefts by type of hospital
As anticipated in 1.3.6, it is interesting to analyze whether certain types of hospitals
are more exposed than others to medicines thefts. Unfortunately, on the basis of the
information available from media reports, it was not possible to carry out a detailed
exploration, although some analyses are reported here below.
First, the types of hospital21 that suffered most thefts of medicines (73.1%) were “Ospedali
a gestione diretta presidio A.S.L.” (Hospitals managed by the local public health authority)
(see Table 5). This is not surprising, since this type is also the most common in Italy (72.2%
of all the hospitals listed in the database of the Italian Ministry of Health). By contrast,
it is interesting to note that the hospitals classified as “Aziende Ospedaliere”22 (hospitals
managed by independent healthcare companies, either public or private), although they
constitute only 9.8% of the total of Italian hospitals, represent 23.1% of the victimized
structures. This difference is statistically significant (p ≤ 0.01) notwithstanding the small
sample considered.
21. The following analyses were conducted only on the 52 victimised hospitals that it was possible to identify in the database of the Italian Ministry of Health according to the information reported by the newspaper articles.22. This category groups together the categories “Azienda ospedaliera integrata con il S.S.N”, “Azienda ospedaliera integrata con Università” and “Azienda ospedaliera”.23. The categories used are taken from the definitions used by the Italian Ministry of Health.
Differences between proportions are statistically significant at *p≤0.1 ; **p≤0.05 ; ***p≤0.01

46
Although there are some differences due to the different regional legislations, the “Aziende
Ospedaliere” are usually bigger medical structures with a higher level of economic and
managerial independence. Both those characteristics, as suggested in 1.3.7, may enhance
criminal opportunities and explain their attractiveness to thieves. The following Table 6 and
Table 7 confirm the hypotheses presented in 1.4. They show that the larger and more complex
the hospital is, the more it will be at risk of being victimized. In fact, hospitals with more than
21 disciplines (which may suggest greater complexity) and between 801-1500 beds (larger
size) are both overrepresented in the sample of victimized structures in comparison with the
total Italian population of hospitals. Both of these differences are statistically significant.
The following Table 8 lists hospitals that, according to media reports, suffered at least 1
episode of theft of medicines. As will be seen, some hospitals were victimized more than
once: in particular, the hospitals Federico II of Naples, Cardarelli of Campobasso, S. Paolo of
Bari and the ASL - Azienda Sanitaria Locale of Cerreto Sannita (Benevento) were victimized
respectively 5, 3 and 2 times.
Total Value (EUR)
Average Value (EUR)
% of total Italian H
% of victimised
H Number of Disciplines #
< 5
5-10
11-20
20-30
>30
5.8%
15.4%
36.5%
30.8%***
11.5%*
3
8
19
16
6
400,000.00
1,218,000.00
2,546,000.00
4,807,000.00
9,123,000.00
24.6%
23.5%
29.7%
15.7%
6.5%
133,333.33
152,250.00
134,000.00
300,437.50
1,520,500.00
Total Value (EUR)
Number of Hospital beds
Average Value (EUR)#
0-120
121-400
401-600
601-800
801-1500
>1500
11.5%
44.2%
11.5%
9.6%
21.2%***
1.9%
6
23
6
5
11
1
1,328,000.00
2,769,000.00
2,113,000.00
1,181,000.00
9,603,000.00
1,100,000.00
33.5%
40.6%
10.2%
7.3%
6.9%
1.4%
221,333.33
120,391.30
352,166.67
236,200.00
873,000.00
1,100,000.00
Table 6 Number of victimized hospitals by number of disciplines. Years 2006-2013.
Table 7 Number of victimized hospitals by number of hospital beds. Years 2006-2013.
Differences between proportions are statistically significant at *p≤0.1 ; **p≤0.05 ; ***p≤0.01
Differences between proportions are statistically significant at *p≤0.1 ; **p≤0.05 ; ***p≤0.01
% of victimised
H
% of total Italian H

47
Federico II
Cardarelli
S. Paolo
ASL - Azienda Sanitaria Locale
Miulli
S. Giuseppe
Asur
S. Ottone
S.S. Filippo e Nicola
Policlinico Bari
Giovanni Paolo II
Dimiccoli
Rummo
Umberto I
Perrino
S.S. Anna e Sebastiano
S. Scolastica
Azienda Unità Sanitaria Locale
TA 1
Vittorio Emanuele
Pugliese
Ospedale di Cattinara
Civile
S.S. Annunziata
Jaia
Ospedale Maggiore
S. Giuseppe
Camberlingo
Spaziani
Ospedale Civile
Veneziale
Poma
Policlinico Modena
Ospedale Maggiore
Hospice San Camillo
Franchini
Cardarelli
Umberto I
Barone Romeo
Luigi Curto
ASL Distretto 34
Naples
Campobasso
Bari
Cerreto Sannita
Acquaviva delle Fonti
Albano Laziale
Ancona
Ariano Irpino
Avezzano
Bari
Bari
Barletta
Benevento
Bisceglie
Brindisi
Caserta
Cassino
Castellaneta
Catania
Catanzaro
Cattinara
Ceccano
Chieti
Conversano
Cremona
Empoli
Francavilla Fontana
Frosinone
Gemona
Isernia
Mantua
Modena
Modica
Monopoli
Montecchio di Reggio
Emilia
Naples
Nocera Inferiore
Patti
Polla
Portici
Naples
Campobasso
Bari
Benevento
Bari
Rome
Ancona
Avellino
L’Aquila
Bari
Bari
BAT
Benevento
BAT
Brindisi
Caserta
Frosinone
Taranto
Catania
Catanzaro
Trieste
Frosinone
Chieti
Bari
Cremona
Empoli
Brindisi
Frosinone
Udine
Isernia
Mantua
Modena
Ragusa
Bari
Reggio Emilia
Naples
Salerno
Messina
Salerno
Napoli
Napoli
5
3
2
2
1
1
1
1
1
1
1
1
1
1
1
1
1
1
1
1
1
1
1
1
1
1
1
1
1
1
1
1
1
1
1
1
1
1
1
1
1
# TheftsProvinceName of the hospital Municipality
Table 8a List of victimized hospitals by number of thefts. Years 2006-2013.

48
Table 8b List of victimized hospitals by number of thefts. Years 2006-2013.
2.2.4 Thefts by type of medicine
Analysis of what types of medicine were stolen from Italian hospitals is crucial not only
to gain better understanding of the demand behind thefts of pharmaceuticals (e.g. internal
demand for illegal use or international demand from foreign countries: see 1.4 for details),
but also to collect information on the perpetrators of the thefts.
Again, given the lack of information available from media reports,24 it was difficult to carry
out a comprehensive analysis, however some interesting features can be already highlighted.
First, it is important to note that in 26 out of the 68 thefts considered (38.2%) the thieves
stole more than one type of medicine. Secondly, as can be seen in Figure 12, which shows the
number of times a particular category of medicine was reported by the media as having been
stolen, in 32 cases (47% of the total) the booty included oncologic medicines, which appear
by far the most attractive type of drug to criminals. The other most frequently stolen drugs
are immunosuppressive (13 cases), antirheumatic (12) and biological pharmaceuticals (10).
24. For example, the media may not report the name of the medicine stolen (available only in 9 cases) but only the category, or they may use a non-standard classification of medicines. Whenever the name was available, a more accurate categorization was possible; otherwise, the classifications reported in the articles or press releases were used (see Figure 12).
# TheftsProvinceName of the hospital Municipality
S. Maria delle Grazie
S. Michele in Monte Laureto
Ospedali Riuniti
Pertini
Ruggi
ASL
S. Paolo
Policlinico delle Scotte
ASP 8
S.S. Trinità
S. Matteo
Ospedale
S. Nicola Pellegrino
Ospedale Treviglio Caravaggio
Ca’ Foncello
Ospedale
SS. Rosario
Borgo Roma
Ospedale Civile
Ospedale
Pozzuoli
Putignano
Reggio Calabria
Rome
Salerno
Salerno
Savona
Siena
Siracusa
Sora
Spoleto
Tolmezzo
Trani
Treviglio
Treviso
Tropea
Venafro
Verona
Vigevano
Vizzolo Predabissi
Napoli
Bari
Reggio Calabria
Rome
Salerno
Salerno
Savona
Siena
Siracusa
Frosinone
Perugia
Udine
BAT
Bergamo
Treviso
Vibo Valentia
Isernia
Verona
Pavia
Milano
1
1
1
1
1
1
1
1
1
1
1
1
1
1
1
1
1
1
1
1

49
These results confirm the hypothesis formulated in 1.4, in that all these are high-priced
medicines that may yield higher profit margins when sold on the illegal market, and hence,
in line with rational choice theory, may be preferred by criminals in terms of return on risk.
At the same time, however, most of these are Class A or Class H pharmaceuticals (see Table 9)
covered by the Italian NHS, which indicates, as suggested in 1.4, that they may destined not
for internal but foreign illegal markets. For example, they may be transported to countries
where the public reimbursement regime is weaker (see 1.3.3), where the legal supply is
insufficient for structural or budgetary reasons (as in Greece: see 1.3.5) or where they can
be “laundered” by fictitious wholesale companies and then exported in the parallel trade
to high-price countries or back to Italy (see 1.3.2, 1.3.6 and 1.3.9 for details). However, as
suggested by the experts contacted and hypothesized in 1.4, the demand for this type of
medicines may also derive from private local illegal clinics or doctors involved in illegal
medical treatments (e.g. in the health care of mafia bosses at a large).
At the same time, the low number of cases involving EPO or psychopharmacological drugs
suggests that thefts do not usually fulfill the demand, both internal or foreign, for an illegal
use of medicines (e.g. in sport doping). However, it should be borne in mind that in 32 cases
(Table 9) information about the category of the stolen pharmaceuticals was not available, and
these may also have included medicines not mentioned above; in addition, as highlighted in
2.1.2, the media may focus on large-scale thefts of cancer or biological drugs and not report
thefts of other classes such as EPO, ophthalmic, etc.
9 9
10
8
7
6
5
4 4 4
6 6 6 65
3
6
8
4
3
2
1
0Jan Feb Mar Apr May Jun Jul Aug Sep Oct Nov Dec
3,500
3,000
4,000
4,500
5,000
2,500
2,000
1,000
1,500
500
0
18
0
3
6
9
12
15
2011 2012 2013
Total economic value Average economic value Cases
Thou
sand
s of E
UR
Case
s
Total Value Average Value
9,000
8,000
10,000
7,000
6,000
5,000
4,000
3,000
2,000
1,000
0
3,000
0
500
1,000
1,500
2,000
2,500To
tal V
alue
(Th
ousa
nds
EUR
)
Ave
rage
Val
ue (
Thou
sand
s EU
R)
CampaniaApulia
Veneto
LombardyCalab
riaMolise Lazio
Marche
SicilyAbruzziTuscan
yFriuli
Emilia
Romagna
OphtalmicNeurological
PsychopharmacologicalSedative
AniretroviralHematologic
HormonalBiological
AntirheumaticImmunosuppressive
Oncologic
EPO
11
22
3
0 5 10 15 20 25 30 35
32
555
1012
13
Total Value Average Value
9,000
8,000
10,000
7,000
6,000
5,000
4,000
3,000
2,000
1,000
0
3,000
0
500
1,000
1,500
2,000
2,500
Tota
l Val
ue (
Thou
sand
s EU
R)
Ave
rage
Val
ue (
Thou
sand
s EU
R)
Oncologic
Immunosuppressive
Antirheumatic
Biological
Hormonal
Hematologic
Aniretrovira
lSedativ
eEPO
Neurological
Ophtalmic
Dental
Psych
oph
armaco
logical
30
15
20
25
10
5
0
3
Hole in the wall
24
Break-in
17
No physical break-in
3
Fake medicalpersonnel
20
NA
0
30
40
60
50
70
20
10
2006 2007 2008 2009 2010 2011 2012 2013
Figure 12 Number of thefts by type of medicine stolen. Years 2006-2013.
Considering what was said above, it is not surprising that thefts involving oncologic and
immunosuppressive medicines are those with the highest values stolen (Figure 13). However,
it is also interesting to note that the theft of immunosuppressive drugs seems to yield the
best average profit for criminals (Figure 13), amounting to 653,076.92 EUR. This figure is
almost twice the average value of thefts involving oncologic drugs.

50
9 9
10
8
7
6
5
4 4 4
6 6 6 65
3
6
8
4
3
2
1
0Jan Feb Mar Apr May Jun Jul Aug Sep Oct Nov Dec
3,500
3,000
4,000
4,500
5,000
2,500
2,000
1,000
1,500
500
0
18
0
3
6
9
12
15
2011 2012 2013
Total economic value Average economic value Cases
Thou
sand
s of E
UR
Case
s
Total Value Average Value
9,000
8,000
10,000
7,000
6,000
5,000
4,000
3,000
2,000
1,000
0
3,000
0
500
1,000
1,500
2,000
2,500
Tota
l Val
ue (
Thou
sand
s EU
R)
Ave
rage
Val
ue (
Thou
sand
s EU
R)
CampaniaApulia
Veneto
LombardyCalab
riaMolise Lazio
Marche
SicilyAbruzziTuscan
yFriuli
Emilia
Romagna
OphtalmicNeurological
PsychopharmacologicalSedative
AniretroviralHematologic
HormonalBiological
AntirheumaticImmunosuppressive
Oncologic
EPO
11
22
3
0 5 10 15 20 25 30 35
32
555
1012
13
Total Value Average Value
9,000
8,000
10,000
7,000
6,000
5,000
4,000
3,000
2,000
1,000
0
3,000
0
500
1,000
1,500
2,000
2,500
Tota
l Val
ue (
Thou
sand
s EU
R)
Ave
rage
Val
ue (
Thou
sand
s EU
R)
Oncologic
Immunosuppressive
Antirheumatic
Biological
Hormonal
Hematologic
Aniretrovira
lSedativ
eEPO
Neurological
Ophtalmic
Dental
Psych
oph
armaco
logical
30
15
20
25
10
5
0
3
Hole in the wall
24
Break-in
17
No physical break-in
3
Fake medicalpersonnel
20
NA
0
30
40
60
50
70
20
10
2006 2007 2008 2009 2010 2011 2012 2013
Figure 13 Total and average value of thefts by type of medicine stolen. Years 2006-2013.
On considering the reimbursement category of stolen medicines, it can be noted that, as
anticipated above, Class H drugs were involved in almost all the thefts from hospitals
analyzed (Table 9), which might be obvious since Class H medicines can only be administered
by authorized medical structures (see 1.3.3).
Table 9 Number of thefts and value stolen by class of medicine taken. Year 2006-2013.
H
A
A and H
Others or N/A
265,766.67
3,500,000.00
800,000.00
235,250.00
7,973,000.00
3,500,000.00
1,600,000.00
5,646,000.00
32
2
2
32
Total Value (EUR)Class Average Value (EUR) # Thefts
2.2.5 Modus operandi
For those cases on which information was available, an analysis of the modus operandi (i.e. of
how the theft was conducted) was attempted.
According to the available information, the majority of the thefts (64.7%) took place at night.
This is probably due to the reduced nighttime activity of hospitals and the lower number of
personnel, which may increase the likelihood of success for the criminals. Moreover, the thefts
committed at night were related to significantly higher average economic values (Table 10).

51
Table 10 Number of thefts and value stolen by time of the theft. Year 2006-2013.
Night
Week End
N/A
358,170.73
197,500.00
270,333.33
14,685,000.00
790,000.00
3,244,000.00
44
5
19
64.7%
7.3%
27.9%
# Thefts % on TotalTotal Value (EUR)Period Average Value (EUR)
Figure 14 and Table 11 show that in 35.3% of the cases criminals physically broke
into the hospitals, usually by forcing a door or a grating, which was the method most
frequently used by thieves to enter the hospitals. However, in one theft out of four the
thieves entered without any physical break-in. This solution suggests the complicity of
the hospital’s personnel (see 1.3.9 and 1.4), which may be involved in the criminal activity
through bribes, intimidation or a share of the illicit profits. In these cases, the average
value stolen is also significantly higher than in the previous ones, suggesting that insiders’
information helped the thieves not only to enter but also to identify the most valuable
pharmaceuticals. Only marginal was the number of events in which the criminals entered
the hospital through a hole in the wall or by acting as fake medical personnel. According to
9 9
10
8
7
6
5
4 4 4
6 6 6 65
3
6
8
4
3
2
1
0Jan Feb Mar Apr May Jun Jul Aug Sep Oct Nov Dec
3,500
3,000
4,000
4,500
5,000
2,500
2,000
1,000
1,500
500
0
18
0
3
6
9
12
15
2011 2012 2013
Total economic value Average economic value Cases
Thou
sand
s of E
UR
Case
s
Total Value Average Value
9,000
8,000
10,000
7,000
6,000
5,000
4,000
3,000
2,000
1,000
0
3,000
0
500
1,000
1,500
2,000
2,500
Tota
l Val
ue (
Thou
sand
s EU
R)
Ave
rage
Val
ue (
Thou
sand
s EU
R)
CampaniaApulia
Veneto
LombardyCalab
riaMolise Lazio
Marche
SicilyAbruzziTuscan
yFriuli
Emilia
Romagna
OphtalmicNeurological
PsychopharmacologicalSedative
AniretroviralHematologic
HormonalBiological
AntirheumaticImmunosuppressive
Oncologic
EPO
11
22
3
0 5 10 15 20 25 30 35
32
555
1012
13
Total Value Average Value
9,000
8,000
10,000
7,000
6,000
5,000
4,000
3,000
2,000
1,000
0
3,000
0
500
1,000
1,500
2,000
2,500
Tota
l Val
ue (
Thou
sand
s EU
R)
Ave
rage
Val
ue (
Thou
sand
s EU
R)
Oncologic
Immunosuppressive
Antirheumatic
Biological
Hormonal
Hematologic
Aniretrovira
lSedativ
eEPO
Neurological
Ophtalmic
Dental
Psych
oph
armaco
logical
30
15
20
25
10
5
0
3
Hole in the wall
24
Break-in
17
No physical break-in
3
Fake medicalpersonnel
20
NA
0
30
40
60
50
70
20
10
2006 2007 2008 2009 2010 2011 2012 2013
Figure 14 Number of thefts by type of entry. Years 2006-2013.
Table 11 Number of thefts and value stolen by type of entry. Years 2006-2013.
Hole in the wall
Break-in
No physical break-in
Fake medical personnel
NA
3
24
17
3
21
591,000.00
211,391.30
518,500.00
350,000.00
275,000.00
1,773,000.00
4,862,000.00
7,259,000.00
700,000.00
4,125,000.00
Average Value (EUR) Total Value (EUR)Entrance # Thefts

52
According to media reports, in 12 cases out of 68 (17.6%) the investigators presumed
that the perpetrators of the thefts were connected to specialized criminal groups or
organizations. Moreover, those cases recorded a significantly higher average value stolen
(Table 12), suggesting that these groups focus on large-scale and high-profit thefts. These
results are in line with the hypothesis that most of these crimes are connected with
criminal organizations able to corrupt or infiltrate the medical personnel and then manage
the storage, transport and placement of stolen medicines on illegal markets, either in Italy.
Organized criminal group
N/A
12
56
489,300.00
294,170.21
4,893,000.00
13,826,000.00
Average Value (EUR) Total Value (EUR)Supposed Authors # Thefts
Table 12 Number of thefts and value stolen by presumed perpetrators. Years 2006-2013.
2.2.6 Relationships with contextual factors
As discussed above, thefts of medicines from Italian hospitals exhibit high levels of
concentration: hospitals in some areas of the country are much more likely to be victims
of thefts than others (see 2.2.2 for details). In order to gain better understanding of the
reasons for these differences, analysis was made of the relationship between the theft of
medicines and some contextual factors of Italian provinces.
In particular three hypotheses suggested in 1.4 were tested:
1. the number of thefts is higher where the activity of criminal organizations is
greater;
2. the number of thefts is higher where the number of property crimes is higher,
owing to the presence of criminal groups specialized in this illicit activity (e.g.
Eastern-European OCGs);
3. the number of thefts is higher in geographical areas closer to Eastern Europe or Greece.
For each of these characteristics, one or more proxy variables (described in detail below)
were used. These proxies were then linearly correlated with (A) the recorded number of
thefts from hospitals per province (expressing the concentration of the phenomenon) and
(B) the rate of thefts by total number of hospitals in the province (expressing the relative
risk of a hospital being victimized).
1. The number of thefts is higher where the activity of criminal organizations is greater
As suggested in 1.3.8 and 1.4 and already described in 2.2.4 and 2.2.5, medicine thefts
often involved a high level of organization, advanced skills and networks that suggest
the involvement of organized crime groups. It is therefore likely that the provinces with a
stronger presence of Italian mafias or other criminal organizations (e.g. foreign OCGs) also

53
record a higher number of thefts. The variables used to proxy the presence of mafias and
in general of criminal organizations were, respectively, the Mafia Presence Index25 and the
rate of reported cases of criminal association26 per 10,000 inhabitants.
The correlation matrix (Table 13) shows that the number of thefts reported was positive
and significantly correlated with the presence of Italian mafia OCGs in the province. This
crime therefore concentrated in areas where Italian mafias were particularly active. In
particular, the correlation is stronger where the presence of Camorra and Apulian OCGs
was greater. Indeed, the thefts concentrated in the provinces under the influence of these
groups, and also the relative risk of a medical structure being victimized was positive and
significantly correlated. This conclusion is in line with the evidence cited in the previous
sections and the hypotheses formulated above.
Moreover, the level of criminal associations proxied by the number of reported cases of art.
416 Italian penal code was positively correlated, but not as significantly as with the Mafia
Presence Index.
25. The Mafia Presence Index is a composite indicator of the Italian mafia organizations’ spatial distri-bution developed by Transcrime for the Italian Ministry of Interior (Transcrime, 2013).26. This crime refers to article 416 of the Italian criminal code.
B) Rate of Thefts by hospitals A) Number of thefts
Mafia Presence Index (all Italian OCGs)
Mafia Presence (Cosa Nostra)
Mafia Presence (Camorra)
Mafia Presence (‘Ndrangheta)
Mafia Presence (Apulian OCGs)
Mafia Presence (Others Italian OCGs)
Reported cases of criminal association
0.109
- 0.047
0.310***
- 0.199**
0.197**
- 0.116
0.105
0.432***
- 0.072
0.248*
- 0.217**
0.307***
- 0.095
0.103
Table 13 Correlations between thefts from hospitals and level of criminal organizations (N= 107 provinces)
*p≤0.01 ; **p≤0.05 ; ***p≤0.001
2. The number of thefts is higher where the number of property crimes is higher
A second hypothesis is that theft of medicines from hospitals is only a subtype of property
crime. Therefore, its distribution across Italian provinces should approximately replicate
that of other property crime types. The analysis now reported correlated the number and
rate of thefts from hospitals with the general rate of reported cases of thefts and robberies
per 10,000 inhabitants. Moreover, the phenomenon was related with theft and robberies
from trucks, which require similar skills in terms of organization and management of the
stolen goods, and which is often linked to specialized crime groups such as foreign OCGs
(in particular Eastern-European ones).
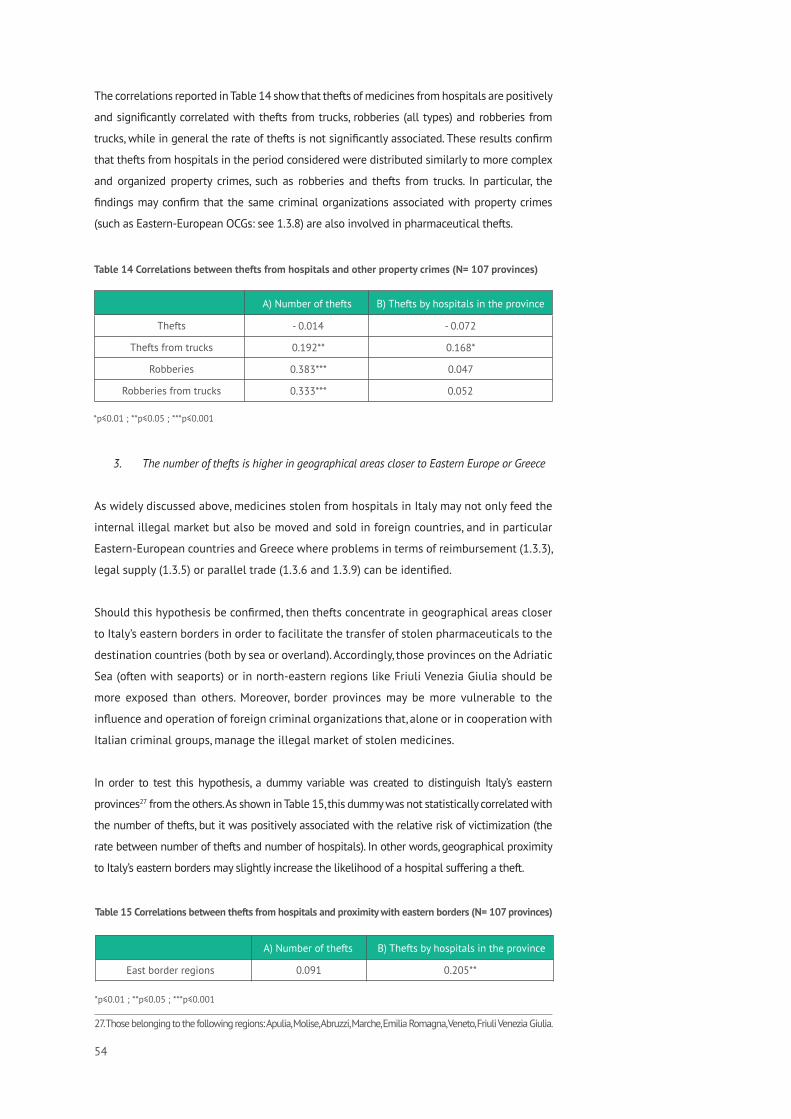
54
The correlations reported in Table 14 show that thefts of medicines from hospitals are positively
and significantly correlated with thefts from trucks, robberies (all types) and robberies from
trucks, while in general the rate of thefts is not significantly associated. These results confirm
that thefts from hospitals in the period considered were distributed similarly to more complex
and organized property crimes, such as robberies and thefts from trucks. In particular, the
findings may confirm that the same criminal organizations associated with property crimes
(such as Eastern-European OCGs: see 1.3.8) are also involved in pharmaceutical thefts.
Table 14 Correlations between thefts from hospitals and other property crimes (N= 107 provinces)
B) Thefts by hospitals in the provinceA) Number of thefts
Thefts
Thefts from trucks
Robberies
Robberies from trucks
- 0.072
0.168*
0.047
0.052
- 0.014
0.192**
0.383***
0.333***
3. The number of thefts is higher in geographical areas closer to Eastern Europe or Greece
As widely discussed above, medicines stolen from hospitals in Italy may not only feed the
internal illegal market but also be moved and sold in foreign countries, and in particular
Eastern-European countries and Greece where problems in terms of reimbursement (1.3.3),
legal supply (1.3.5) or parallel trade (1.3.6 and 1.3.9) can be identified.
Should this hypothesis be confirmed, then thefts concentrate in geographical areas closer
to Italy’s eastern borders in order to facilitate the transfer of stolen pharmaceuticals to the
destination countries (both by sea or overland). Accordingly, those provinces on the Adriatic
Sea (often with seaports) or in north-eastern regions like Friuli Venezia Giulia should be
more exposed than others. Moreover, border provinces may be more vulnerable to the
influence and operation of foreign criminal organizations that, alone or in cooperation with
Italian criminal groups, manage the illegal market of stolen medicines.
In order to test this hypothesis, a dummy variable was created to distinguish Italy’s eastern
provinces27 from the others. As shown in Table 15, this dummy was not statistically correlated with
the number of thefts, but it was positively associated with the relative risk of victimization (the
rate between number of thefts and number of hospitals). In other words, geographical proximity
to Italy’s eastern borders may slightly increase the likelihood of a hospital suffering a theft.
*p≤0.01 ; **p≤0.05 ; ***p≤0.001
27. Those belonging to the following regions: Apulia, Molise, Abruzzi, Marche, Emilia Romagna, Veneto, Friuli Venezia Giulia.
Table 15 Correlations between thefts from hospitals and proximity with eastern borders (N= 107 provinces)
*p≤0.01 ; **p≤0.05 ; ***p≤0.001
East border regions 0.205**0.091
B) Thefts by hospitals in the provinceA) Number of thefts

55

56

57
conclusions
This report sheds some light on the illicit trafficking of stolen medicines, and specifically
on thefts of pharmaceuticals from Italian hospitals. It is the first study to analyze this
booming but almost unknown criminal phenomenon.
In particular it has presented:
• an exploration of the background behind pharmaceutical theft and the drivers that
influence the demand for and the supply of stolen medicines (Chapter 1);
• an analysis, based on cases reported by the media, of thefts of medicines from Italian
hospitals between 2006 and 2013 (Chapter 2).
In regard to the background (Chapter 1), the demand for stolen medicines may be
determined by a variety of drivers: the price of medicines (see 1.3.1), the price differentials
among countries and between the legal and the illegal market (1.3.2), the regimes of
reimbursement of medicines (1.3.3), difficulties in accessing medicines through legal
channels (1.3.5) or the need to use legal pharmaceuticals for illegal purposes (e.g. EPO in
sport doping or fentanyl to synthesize illegal drugs, see 1.3.4).
By contrast, the supply (i.e. the theft and marketing) of stolen medicines may be influenced
also by the structure and the vulnerabilities of the legal supply chain (from the manufacture
to the patient, see 1.3.6), by the opportunities provided by the differences in the traceability
of medicines (1.3.7) and law enforcement (1.3.10) across jurisdictions, by the interest
and the activity of organized crime groups (1.3.8) and their ability to rely on networks
of contacts among corrupted pharmaceutical wholesalers or brokers, or within hospital
medical staff (1.3.9).
There emerges a picture of a very lucrative criminal activity that may overlap with the legal
market (in particular with the parallel trade, i.e. the legal trade based on price differentials
across countries) and that is often conducted by specialized OCGs, which may shift from
more risky and less profitable illicit markets (e.g. drugs, human trafficking, etc) to this
emerging criminal phenomenon.
Focusing on thefts of medicines from Italian hospitals, there is clear evidence of an increase
in episodes: between 2006 and 2013 the media reported around 68 cases of thefts, but
most of them occurred between 2012 and 2013 (see 2.2.1). While the total economic loss
in these cases can be estimated at least 18.7 million euros (2.2.1), on average each theft
produced a loss of 330 thousand euros (2.2.1).

58
In terms of spatial distribution, the regions of Campania and Apulia represented more than
45% of the cases (with respectively 17 and 14 thefts) while in terms of rates, Molise (7.1
thefts every 10 hospitals), Apulia (3.8) and Campania (3.1) recorded the highest values (see
2.2.2). Among northern regions, Friuli Venezia Giulia (2 in every 10 hospitals) presented
the highest rate, while Lombardy (5 thefts) and Lazio (6 thefts) were the most victimized.
The geography of thefts confirms the hypothesis concerning the prevalence of thefts in
southern Italy and eastern Italian regions owing to the stronger activity of organized crime
groups (both Italian mafia-type and foreign OCGs such as Eastern-European ones) and
geographical proximity to Eastern Europe and Greece, possible destinations for stolen
medicines (see 2.2.2).
The most victimized types of hospital are the larger (in particular with more than 800
beds), more complex (above 21 disciplines) and public ones, since they may have weaker
monitoring due to higher staff turnover (see 1.3.6 and 2.2.3).
High-price medicines and in particular cancer drugs (stolen in 32 cases), immunosuppressive
(13), antirheumatic (12) and biological (10) drugs are the medicines most frequently stolen
(see 2.2.4). Considering that these are often Class A or Class H medicines, fully reimbursed by
the Italian NHS, it is likely that the stolen products are sold in foreign countries (especially
Eastern Europe and Greece) where reimbursement regimes are weaker (1.3.3), or the legal
supply is insufficient (1.3.5) or where the products can enter the parallel trade and be
exported to high-price countries.
As regards contextual factors (2.2.6), thefts are positively and significantly correlated with
the presence of Italian mafia-type OCGs (especially Camorra and Apulian OCGs) and with
the rate of other property crimes (especially thefts and robberies against trucks), which
are often connected with the activity of Eastern-European OCGs (see 1.3.8). Finally, the
concentration of thefts is slightly higher in eastern Italian regions (on the Adriatic Sea and
on the borders) that may facilitate the transport (by sea or by land) of stolen medicines to
Eastern Europe.
Although these results provide some important information about medicine thefts, there is
a need for further studies addressing this issue. In particular, it is necessary:
• to perform the analysis on evidence collected also from other data sources, such
as police statistics and data provided by the hospitals themselves or pharmaceutical
companies;
• to focus on other targets as well, and in particular on trucks and couriers, which, for a
variety of reasons (see 1.3.6), appear as exposed as hospitals to medicine thefts;

59
• to investigate the interactions between the illicit trafficking of stolen medicines and
the legal parallel trade, and in particular analyze how, by exploiting the differences in
terms of traceability across jurisdictions, stolen drugs may re-enter the legal market;
• to identify the loopholes in the regulation of the pharmaceutical trade which may
create opportunities then exploited by OCGs for the trade of stolen products.
In this regard, stronger public-private partnerships (among researchers, law enforcement
agencies, supervisory bodies, pharmaceutical companies and industry representatives)
could engage in the wider sharing of perspectives, data, and information in order to
enhance understanding of this almost unknown phenomenon.

60

61
References
AIFA. (2005). Prontuario farmaceutico nazionale 2005. Rome: Istituto Poligrafico
e Zecca dello Stato S.p.A. Retrieved from http://www.agenziafarmaco.
gov.it/wscs_render_attachment_by_id/111.20096.1133834931742d4a5.
pdf?id=111.20102.1133834934023
AIFA. (2014). Contraffazione: due incontri in AIFA su importazione illegale e furti di
farmaci. Rome: AIFA. Retrieved from http://www.agenziafarmaco.gov.it/it/content/
contraffazione-due-incontri-aifa-su-importazione-illegale-e-furti-di-farmaci
Bianconi, G., & Santucci, G. (2013, June 30). La mafia russa nelle case degli italiani. Corriere
della Sera. Retrieved from http://www.corriere.it/cronache/13_luglio_09/mafia-
russa-georgiana-bari_e6d3541e-e87e-11e2-ae02-fcb7f9464d39.shtml
Calderoni, F. (2011). Where is the mafia in Italy? Measuring the presence of the mafia across
Italian provinces. Global Crime, 12(1), 41.
Caruso, L. (2012, February 12). Piratería del asfalto. Aumentaron los robos de medicamentos
y alimentos. Clarín. Retrieved from http://www.clarin.com/policiales/Aumentaron-
robos-medicamentos-alimentos_0_644935630.html
Coluzzi, C. (2013, November 15). Caserta, farmaci anticancro ospedalieri gettati in un
campo: valgono 3 milioni. Il Messaggero. Retrieved from http://www.ilmessaggero.
it/PRIMOPIANO/CRONACA/caserta-farmaci-anticancro-gettati-campo/
notizie/359142.shtml
Council of Europe. (2012). Counterfeit (fake) medicines. Retrieved February 27, 2014, from
http://www.coe.int/aboutcoe/index.asp?page=nosActions&sp=7
Cruz Martínez, A. (2011, October 30). Constante, el robo de fármacos en el sector público,
acepta el Issste. La Jornada, p. 33. Retrieved from http://www.jornada.unam.
mx/2011/10/30/sociedad/033n1soc
De Luca, M. (2013, May 23). 194, così sta morendo una legge. In Italia torna l’aborto clandestino.
La Repubblica. Retrieved from http://inchieste.repubblica.it/it/repubblica/rep-it/
inchiesta-italiana/2013/05/23/news/aborti_obiettori_di_coscienza-59475182/
Dugato, M., Favarin, S., Gergely, H., & Agnes, I. (2013). The crime against businesses in Europe:
A pilot survey. (M. Dugato, Ed.) European Commission.

62
EFPIA. (2012). The pharmaceutical industry in figures. Brussels: EFPIA. Retrieved from http://
www.efpia.eu/uploads/Modules/Documentsefpia_figures_2012_final-20120622-
003-en-v1.pdf/
EFPIA. (2013). Pharmacautical industry in Europe. Review of 2012 and outlook for 2013.
Brussels: EFPIA. Retrieved from http://www.efpia-annualreview.eu
El Diario. (2013, November 20). Dirigían desde Cereso robo de 7.4 mdp en medicamentos.
El Diario. Retrieved from http://diario.mx/Estado/2013-11-20_6484f020/dirigian-
desde-cereso-robo-de-74-mdp-en-medicamentos/
Espìn, J., & Rovira, J. (2007). Analysis of differences and commonalities in pricing and
reimbursement systems in Europe. Brussels: European Commission. Retrieved from
http://ec.europa.eu/enterprise/sectors/healthcare/files/docs/study_pricing_2007/
andalusian_school_public_health_report_pricing_2007_en.pdf
Europol. (2011). OCTA 2011. EU Organized Crime Threat Assessment. The Hague: Europol.
Retrieved from https://www.europol.europa.eu/sites/default/files/publications/
octa2011.pdf
Eurostat. (2012). Population structure and ageing, Eurostat: Statistics Explained. Retrieved
February 27, 2014, from http://epp.eurostat.ec.europa.eu/statistics_explained/
index.php/Population_structure_and_ageing
Farmindustria. (2013). Indicatori Farmaceutici. Luglio 2013. Rome: Farmindustria centro
studi. Retrieved from http://www.sanita.ilsole24ore.com/pdf2010/Sanita2/_
Oggetti_Correlati/Documenti/Imprese/INDICATORI_FARMINDUSTRIA2013.
pdf?uuid=139a3b16-e39d-11e2-b293-f4dc86f2e67f
Fornaro, A. (2014, February 11). Farmaci introvabili. Nuovo collegamento.
Foschini, G., & Tonacci, F. (2013, January 17). Ladri di farmaci. La Repubblica. Retrieved from
http://inchieste.repubblica.it/it/repubblica/rep-it/inchiesta-italiana/2013/01/17/
news/il_caso_vado_rubo_e_rivendo_la_razzia_di_medicine_preziose-50737147/
Giunti, A. (2014, January 24). Il business del traffico di farmaci. Così lucrano su chi sta male.
L’Espresso. Retrieved from http://espresso.repubblica.it/inchieste/2014/01/23/
news/il-business-del-traffico-di-farmaci-cosi-lucrano-su-chi-sta-male-1.149708
Grimald, P. (2012). Roche Argentina: Fighting counterfeit medicines using a treceability
system based on GS1 Standards. In AA.VV., 2011/2012 GS1 Healthcare Reference Book
(pp. 4-9). Brussels: GS1 Global Office. Retrieved from www.gs1.org.ar/documentos/
casos%20de%20exito/Caso_Roche.pdf

63
IMPACT. (2013). La normativa sulle farmacie on line. Retrieved February 27, 2014, from http://
www.iss.it/impa/faco/cont.php?id=210&lang=1&tipo=33
Interpol. (2011). The dangers of counterfeit medical products. Retrieved February 27, 2014,
from http://www.interpol.int/Crime-areas/Pharmaceutical-crime/The-dangers
Interpol. (2012). Pharmaceutical crime. Lyon: Interpol. Retrieved from http://www.interpol.
int/content/download/3902/37957/version/17/file/Factsheets_EN_mars2013_
DCO04%20web.pdf
Lodewijkx, H., & Brouwer, B. (2011). Some empirical notes on the epo epidemic in
professional cycling. Res Q Exerc Sport, 82(4), 740–754.
Martínez Terán, J. (2008, August). La mafia de los medicamentos. ParaTi. Retrieved from http://
www.parati.com.ar/lo-nuevo/actualidad/la-mafia-de-los-medicamentos/9966.
html
Ministero della Salute. (2004). Decreto ministeriale 15 Luglio 2004. Retrieved from www.
salute.gov.it/imgs/C_17_normativa_575_allegato.pdf
Ministero della Salute. (2013, July 9). Monitoraggio della distribuzione dei medicinali in Italia.
Retrieved February 27, 2014, from http://www.salute.gov.it/portale/temi/p2_6.jsp?l
ingua=italiano&id=3116&area=tracciabilita%20farmaco&menu=produzione
Ministero della Salute. (2014, January). Lotta alla contraffazione farmaceutica. Retrieved from.
Retrieved February 27, 2014, from http://www.agenziafarmaco.gov.it/it/content/
lotta-alla-contraffazione-farmaceutica
Ministero dell’Interno. (2012). Relazione al Parlamento sull’attività delle Forze di Polizia, sullo
stato dell’ordine e della sicurezza pubblica e sulla criminalità organizzata. Rome:
Ministero dell’Interno. Retrieved from http://www.interno.gov.it/mininterno/
export/sites/default/it/assets/files/28_2014/2014_02_14_Relazione_al_
Parlamento_2012.pdf
Mohney, G. (2014, February 5). Fatal overdoses in multiple states show dangers of fentanyl-
laced heroin. abcNews. Retrieved from http://abcnews.go.com/Health/dangers-
fentanyl-laced-heroin/story?id=22374848
Møldrup, C. (2004). The use of the terms ‘lifestyle medicines’ or ‘lifestyle drugs’. Pharm World
Sci., 26(4), 193-196.
Mrazek, M. F. (2002). Comparative approaches to pharmaceutical price regulation in the
European Union. Croat.Med.J., 453-61.

64
Mugellini, G., & Caneppele, S. (2012). Le Imprese Vittime Di Criminalità in Italia 16.
Transcrime Report. (G. Mugellini, Ed.) Milan: Università Cattolica del Sacro Cuore &
Università degli Studi di Trento. Retrieved from http://transcrime.cs.unitn.it/tc/fso/
pubblicazioni/TR/16_Le_imprese_vittime_di_criminalit%C3%A0_in_Italia.pdf
ÖBIG. (2006). Surveying, Assessing and Analysing the Pharmaceutical Sector in the 25 EU
Member States. Retrieved from http://ec.europa.eu/competition/mergers/studies_
reports/oebig.pdf
OECD. (2009). Pharmaceutical consumption. In Health at a Glance 2009: OECD Indicators
(pp. 108–109). Paris: OECD publishing. Retrieved from http://dx.doi.org/10.1787/
health_glance-2009-46-en
OsMed. (2012). L’uso dei farmaci in Italia. Rapporto nazionale anno 2011. Rome: Il Pensiero
Scientifico Editore.
Reilly, G. (2012, September 17). Pharmacists warned over use of cough syrup to make crystal
meth. TheJournal.ie. Retrieved from http://www.thejournal.ie/warning-cough-
syrup-crystal-meth-598467-Sep2012/
Riccardi, M. (2014). When Criminals Invest in Businesses: Are We Looking in the Right
Direction? An Exploratory Analysis of Companies Controlled by Mafias. In S.
Caneppele, & F. Calderoni (Eds.), Organized Crime, Corruption, and Crime Prevention.
Essays in Honor of Ernesto U. Savona (pp. 197-206). New York: Springer.
Sukkar, E., & Smith, H. (2013, February 27). Panic in greek pharmacies as hundreds of
medicines run short. The Guardian. Retrieved from http://www.theguardian.com/
world/2013/feb/27/greece-blames-drug-companies-shortages
Tamburini, F. (2013, March 29). Grecia, centinaia di farmaci bloccati dalle multinazionali.
Sanità in ginocchio. Il Fatto Quotidiano. Retrieved from http://www.ilfattoquotidiano.
it/2013/03/29/grecia-centinaia-di-farmaci-bloccati-dalle-multinazionali-sanita-
in-ginocchio/526250/
The European House-Ambrosetti. (2012). Meridiano Sanità. Le coordinate della salute.
Rapporto 2012. Milan: The European House-Ambrosetti. Retrieved from http://www.
ambrosetti.eu/it/download/ricerche-e-presentazioni/2012/meridiano-sanita.-le-
coordinate-della-salute-rapporto-finale-2012
Transcrime. (2010). FAKES – Fighting against brand counterfeiting in three key european
member states. Towards a more comprehensive strategy. Milan-Trento: Transcrime.
Retrieved from http://transcrime.cs.unitn.it/tc/890.php.

65
Transcrime. (2012). Analysis of the Draft Protocol to Eliminate Illicit Trade in Tobacco
Products. Milan: Transcrime. Retrieved from http://www.transcrime.it/wp-content/
uploads/2013/11/Transcrime-Analysis_of_the_Draft_Protocol_to_eliminate_ITTP1.
Transcrime. (2013). Progetto PON Sicurezza 2007-2013. Rome: Ministero dell’Interno.
Retrieved from http://www.investimentioc.it/
Trocchia, N. (2011, January 19). Comuni sciolti per mafia, dal 1991 sono 201. La Campania
guida la classifica italiana. Il Fatto Quotidiano. Retrieved from http://www.
ilfattoquotidiano.it/2011/01/19/comuni-sciolti-per-mafia-dal-1991-sono-201-
guida-la-classifica-la-campania/87217/
UNICRI. (2012). Counterfeit Medicines and Organised Crime. Turin: UNICRI. Retrieved from
http://www.unicri.it/topics/counterfeiting/medicines/report/Ctf_medicines_and_
oc_advance_unedited2013.pdf
Vander Beken, T. (2007). The European Pharmaceutical Sector and Crime Vulnerabilities.
Antwerp: Maklu Publishers.
WHO. (1999). Guidelines for the development of measures to combat counterfeit medicines.
Geneve: WHO.

66

67
acknowledgements
This exploratory study has been realized thanks to the suggestions and information
provided by a wide number of Italian and EU experts and stakeholders. In particular a
special thanks goes to (in alphabetical order): Lidio Brasola (Roche), Domenico Di Giorgio
(AIFA – Agenzia Italiana del Farmaco), Franco Fantozzi (BMS – Bristol-Myers Squibb), Ashley
How (PSI – Pharmaceutical Security Institute), Nicola Silvestri (Azienda Ospedaliera dei
Colli di Napoli) and Laura Velardi (AGENAS).

68