The South African Index of Multiple Deprivation for Children
72
Free download from www.hsrcpress.ac.za Helen Barnes, Gemma Wright, Michael Noble & Andrew Dawes The South African Index of Multiple Deprivation for Children Census 2001 Centre for the Analysis of South African Social Policy, Oxford University
-
Upload
independent -
Category
Documents
-
view
0 -
download
0
Transcript of The South African Index of Multiple Deprivation for Children
Free
dow
nloa
d fr
om w
ww
.hsr
cpre
ss.a
c.za
Helen Barnes, Gemma Wright, Michael Noble & Andrew Dawes
The South African Index of Multiple Deprivation for Children Census 2001
Centre for the Analysis of South African Social Policy,Oxford University

Free
dow
nloa
d fr
om w
ww
.hsr
cpre
ss.a
c.za
Research project funded by Save the Children, Sweden, Southern Africa Region
Published by HSRC PressPrivate Bag X9182, Cape Town, 8000, South Africawww.hsrcpress.ac.za
First published 2007
ISBN 978-0-7969-2216-8
© 2007 Human Sciences Research Council
The University of Oxford and the Human Sciences Research Council have taken care to ensure that the information in this report and the accompanying data are correct. However, no warranty, express or implied, is given as to its accuracy and the University of Oxford and the Human Sciences Research Council do not accept any liability for error or omission. The University of Oxford and the Human Sciences Research Council are not responsible for how the information is used, how it is interpreted or what reliance is placed on it. The University of Oxford and the Human Sciences Research Council do not guarantee that the information in this report or in the accompanying file is fit for any particular purpose. The University of Oxford and the Human Sciences Research Council do not accept responsibility for any alteration or manipulation of the report or the data once it has been released.
Print management by comPress
Distributed in Africa by Blue Weaver Tel: +27 (0) 21 701 4477; Fax: +27 (0) 21 701 7302www.oneworldbooks.com
Distributed in Europe and the United Kingdom by Eurospan Distribution Services (EDS)Tel: +44 (0) 20 7240 0856; Fax: +44 (0) 20 7379 0609www.eurospanbookstore.com
Distributed in North America by Independent Publishers Group (IPG)Call toll-free: (800) 888 4741; Fax: +1 (312) 337 5985www.ipgbook.com
Suggested citationBarnes, H., Wright, G., Noble, M. and Dawes, A. (2007) The South African Index of Multiple Deprivation for Children: Census 2001. Cape Town: HSRC Press.

Free
dow
nloa
d fr
om w
ww
.hsr
cpre
ss.a
c.za
CONTENTS
Acknowledgements ivContributors vAcronyms vi
1 Background 1
1.1 Introduction 11.2 Conceptual framework for the SAIMDC 31.3 Review of previous research measuring child poverty in South Africa 4
2 Components of the SAIMDC 10
2.1 About the domains 102.2 About the indicators 10
3 Methodology 13
3.1 Creating domain indices 133.2 Combining domain indices into an index of multiple deprivation 13
4 The geography of deprivation 16
4.1 How to interpret the municipal-level results 164.2 Municipal-level results 16
5 Towards a SAIMDC at sub-municipal level 42
5.1 A new statistical geography 425.2 Harnessing administrative and survey data to create indices
of multiple deprivation 43
Appendix 1 44
Indicators used in the SAIMDC 44The Income and Material Deprivation Domain 44The Employment Deprivation Domain 45The Education Deprivation Domain 45The Living Environment Deprivation Domain 47The Adequate Care Deprivation Domain 49Other domains considered 50
Appendix 2 52
Exponential transformation 52
Appendix 3 54
Municipal identification maps 54
References 63

Free
dow
nloa
d fr
om w
ww
.hsr
cpre
ss.a
c.za
iv
The authors would like to thank Save the Children, Sweden for funding this project and the following people for reviewing and commenting on earlier drafts of the text: Lucie Cluver, Christopher Dibben, Sharmla Rama, Benjamin Roberts, Judith Streak and Cathy Ward.
ACKNOWLEDGEMENTS

Free
dow
nloa
d fr
om w
ww
.hsr
cpre
ss.a
c.za
v
CONTRIBUTORS
Helen Barnes Research Officer Centre for the Analysis of South African Social PolicyDepartment of Social Policy and Social Work University of Oxford
Andrew Dawes Research Director Child, Youth, Family and Social Development Research Programme Human Sciences Research CouncilandAssociate Professor Emeritus University of Cape Town
Michael Noble Professor of Social Policy, Director Centre for Analysis of South African Social Policy and Social Disadvantage Research Centre Department of Social Policy and Social Work University of Oxford.
Gemma Wright Senior Research Fellow andDeputy Director Centre for the Analysis of South African Social Policyand Social Disadvantage Research Centre Department of Social Policy and Social Work University of Oxford

Free
dow
nloa
d fr
om w
ww
.hsr
cpre
ss.a
c.za
vi
CASASP Centre for the Analysis of South African Social Policy
CRC Convention on the Rights of the Child
DMA District Management Area
GIS Geographic Information System
HSRC Human Sciences Research Council
IES Income and Expenditure Survey
NPA National Programme of Action for Children
NYVS National Youth Victimisation Survey
OECD Organisation for Economic Co-operation and Development
OHS October Household Survey
PIMD Provincial Indices of Multiple Deprivation
RDP Reconstruction and Development Programme
PSLSD Project for Statistics on Living Standards and Development
SAIMDC South African Index of Multiple Deprivation for Children
SDRC Social Disadvantage Research Centre
Stats SA Statistics South Africa
YPLL Years of Potential Life Lost
ACRONYMS
Free
dow
nloa
d fr
om w
ww
.hsr
cpre
ss.a
c.za
1
CHAPTER 1
Background
1.1 Introduction
Child poverty and child rights
A large number of studies have been carried out which demonstrate the detrimental impact of poverty on child development, educational outcomes, job prospects, health and behaviour (Lister, 2004).
Apart from compromising one’s childhood – a time to be filled with play, exploration, and discovery of one’s self and others – poverty at this early stage in life has enduring consequences for those who survive into adulthood. It condemns them to recurrent poverty spells or even a life full of hardship, increasing the chances of passing their poverty onto the next generation (Grinspun, 2004: 2).
Governments worldwide have committed themselves to eradicating child poverty and consequently the inter-generational transmission of poverty. The Millenium Development Goals agenda promotes policies that improve the lives of poor children worldwide (Grinspun, 2004). South Africa is no exception, and since 1994 the government has been active in committing itself to protecting child rights and reducing child poverty (Cassiem et al., 2000). The National Programme of Action for Children (NPA) is the driving force behind the government’s child poverty alleviation strategy (Cassiem et al., 2000), prioritising the protection of the rights of all children in South Africa.
The South African Constitution provides that every child – that is a person under the age of 18 years – in South Africa has the right, amongst others, to family care or parental care, or to appropriate alternative care when removed from the family environment; to basic nutrition, shelter, basic health care services and social services; and to be protected from maltreatment, neglect, abuse, or degradation (Republic of South Africa, 1996: Article 28). These are in addition to the rights to which all South Africans are entitled. South Africa also ratified the Convention on the Rights of the Child (CRC) in 1995 (United Nations, 1990), and the African Charter on the Rights and Welfare of the Child in 2000 (Organisation of African Unity, 1999). It is also a signatory to Convention 138 and 182 of the International Labour Organisation regarding child labour. New legislation, the Children’s Act (No. 38 of 2005), and the associated Children’s Amendment Bill (No. 19 of 2006), although not yet in force, further supplements these rights.
Although these rights are guaranteed by the Constitution and other legislation, in practice, the fact that the majority of South African children live in poverty, and that rates of mortality and maltreatment remain high (Dawes et al., 2007), suggests that these rights are not always realised (Monson et al., 2006). In order to realise the rights of all children and tackle child poverty, it is critical that robust measures are developed to quantify the nature and extent of social deprivation experienced by children at sub-national level and thereby accurately identify the areas of greatest need (i.e. the most deprived areas). It is also essential that these measures focus specifically on children. The current study is a first attempt to generate data of this nature to map child deprivation, in order to inform local level policy and intervention.
Free
dow
nloa
d fr
om w
ww
.hsr
cpre
ss.a
c.za
The South African Index of Multiple Deprivation for Children
2
Provincial Indices of Multiple Deprivation
In 2006, a team of researchers from the Centre for the Analysis of South African Social Policy (CASASP) at the University of Oxford, the Human Sciences Research Council (HSRC) and Statistics South Africa (Stats SA) produced nine ward level Provincial Indices of Multiple Deprivation (PIMD), using the 2001 Census (Noble, Babita et al., 2006a and 2006b). The PIMD were built on the model of multiple deprivation which was first developed in the late 1990s with Oxford University’s UK work on Indices of Multiple Deprivation (Noble, Smith, Penhale et al., 2000; Noble, Smith, Wright et al., 2000; Noble et al., 2001; Noble et al., 2003; Noble et al., 2004; Noble et al., 2005). The 100% Census data was used as it enables the index to be mapped at ward level.
The model of deprivation underpinning the PIMD assumes that deprivation is multi-dimensional, and that multiple deprivation can be conceptualised as the combination of individual dimensions or domains of deprivation. The PIMD made use of information available from the 2001 Census about different aspects of deprivation: income, employ-ment, education, health and living environment, and measured deprivation for the total population (i.e. children and adults of all ages). These domains were then combined to form an overall index of multiple deprivation.
South African Index of Multiple Deprivation for Children
Following the release of the PIMD, CASASP scholars and the HSRC began to consider the importance of constructing a child-focused index which would specifically consider deprivation experienced by children. The result is the South African Index of Multiple Deprivation for Children (SAIMDC) 2001, which is presented in this report. A child-centred index has the key quality of separating children out from household level data or data presented for the total population. Children are normally lost as a unit of analysis in the analysis of household surveys and the SAIMDC seeks to foreground deprivation from a child perspective. Such child-centred data enables the child to emerge from the background of adult centred survey data, and may enhance the sensitivity of interventions to children’s rights and needs (e.g. Saporiti, 1999; Ennew, 1999). We elaborate on this point in Section 1.3.
The SAIMDC is based on the same conceptual framework and model of deprivation as the PIMD (discussed in Section 1.2) but focuses exclusively on children, and additionally draws from the models and recommendations contained within Dawes et al. (2007). It also takes into account the breadth of research on child poverty in South Africa (summarised in Section 1.3), and parallel work by CASASP’s sister research centre (SDRC – the Social Disadvantage Research Centre) on Income Deprivation Affecting Children Indices in the UK (e.g. Noble et al., 2004), and an ongoing study called the ‘Child Well-being Index’ which is being undertaken by SDRC and the University of York for the UK government.
Chapter 2 of this report introduces the indicators and domains which were included in the SAIMDC, and Chapter 3 summarises the methodological approach. Chapter 4 presents the key findings. The final chapter outlines directions for future research to further develop small area level measurement of child deprivation in South Africa.

Free
dow
nloa
d fr
om w
ww
.hsr
cpre
ss.a
c.za
Background
3
1.2 Conceptual framework for the SAIMDC1
Townsend defined people as poor if ‘they lack the resources to obtain the types of diet, participate in the activities and have the living conditions and amenities which are customary, or at least widely encouraged or approved in the societies to which they belong’ (Townsend, 1979: 31). Conversely he defined people as deprived if ‘they lack the types of diet, clothing, housing, household facilities and fuel and environmental, educational, working and social conditions, activities and facilities which are customary’ (Townsend, 1987: 131 and 140). Deprivation therefore refers to peoples’ unmet needs, whereas poverty refers to the lack of resources required to meet those needs. This conceptualisation underpins our model of multiple deprivation. In addition Townsend (1987) also laid down the foundation for articulating multiple deprivation as an accumulation of single deprivations – a concept which also underpins this project.
In South Africa this multi-dimensionality was asserted in the Reconstruction and Development Programme (RDP) of the first post-Apartheid government:
It is not merely the lack of income which determines poverty. An enormous proportion of very basic needs are presently unmet. In attacking poverty and deprivation, the RDP aims to set South Africa firmly on the road to eliminating hunger, providing land and housing to all our people, providing access to safe water and sanitation for all, ensuring the availability of affordable and sustainable energy sources, eliminating illiteracy, raising the quality of education and training for children and adults, protecting the environment, and improving our health services and making them accessible to all (African National Congress, 1994).
More recently it has been argued that poverty should be seen:
… in a broader perspective than merely the extent of low income or low expenditure in the country. It is seen here as the denial of opportunities and choices most basic to human development to lead a long, healthy, creative life and to enjoy a decent standard of living, freedom, dignity, self-esteem and respect from others (Statistics South Africa, 2000: 54).
During the past three decades there have been significant developments in the way that this multi-dimensional approach to poverty has been interpreted and measured (Thorbecke, 2004).
Although Townsend’s work mainly (though not entirely) referred to individuals experiencing deprivations – single or multiple – the arguments can, in modified form, extend to area based measures2. At an area level it is possible to look at single deprivations and state that a certain proportion of the population experiences that deprivation (e.g. lack of sanitation), while another proportion experiences some other form of deprivation (e.g. lack of formal housing). These single deprivations may then be combined to describe the degree of multiple deprivation in that area. The area itself can then be characterised as deprived relative to other areas, in a particular dimension of deprivation, or using a combined multiple deprivation index.
1 This is the same theoretical framework that underpins the PIMD (Noble, Babita et al., 2006a) and this section is drawn from that report.
2 An area based measure (e.g. of child deprivation) refers to a geographic space chosen to plot the extent of deprivation in the (child) population living in that area. It could be a province, a municipality or other spatial unit.

Free
dow
nloa
d fr
om w
ww
.hsr
cpre
ss.a
c.za
The South African Index of Multiple Deprivation for Children
4
Why is it important to measure child deprivation at a small area level? First, geographical patterns of social disadvantage (or advantage) are not random: the spatial distribution reflects the results of dynamic social processes, economic change, migration, availability and costs of living space, community preferences, and policies that may distribute particular groups to certain areas or exclude them from others. Second, the spatial concentration of multi-dimensional deprivation means that – when correctly measured – the most deprived areas can effectively be targeted (Smith, 1999; Kleinman, 1999; Smith et al., 2001). Third, the concentration of poor children in an area may mean that local services struggle to meet high demand, or that areas lack resources to support certain services. Fourth, when a range of deprivation measures is collected on an area basis, the exact mix of problems will vary from area to area.
Measuring different aspects of deprivation and combining these into an overall multiple deprivation measure raises a number of questions (e.g. Noble, Wright et al., 2006). For example, how should the different dimensions of deprivation be weighted? To what extent should the same children or households be represented in more than one of the dimensions of deprivation? These and other issues are addressed in this report.
To summarise, the model which emerges from this theoretical framework is of a series of uni-dimensional domains of deprivation which may be combined, with appropriate weighting, into a single child-focused measure of multiple deprivation.
1.3 Review of previous research measuring child poverty in South Africa
This section focuses on research that specifically measures child poverty in South Africa. Although there are no studies that measure child poverty at a sub-provincial level across the whole of South Africa, a review of previous research measuring poverty at a small area level for the population as a whole can be found in Noble, Babita et al. (2006a).
Income measures of child poverty
Child poverty is typically defined as a head count of children living in households where the resources fall below the minimum subsistence level or an equivalent poverty depth measure (Noble, Wright and Cluver, 2006). Many, although not all, of the studies of poverty and child poverty in South Africa have been based on an absolute concept and a subsistence definition. Others make use of a relative concept and definition, such as a poverty line that looks at children in the poorest X % of all households (when households are ranked according to their expenditure or income per individual).
Streak (2000) identifies two studies measuring child poverty at the national level: Children, Poverty and Disparity Reduction by the National Institute of Economic Policy (1996) and The Living Conditions of South Africa’s Children by Haarmann (1999). The first study adopted a relative concept of poverty, defining the bottom 40% of households (and thus children within the households) in terms of income as poor. Haarmann’s study used an absolute concept of poverty, defining a child as poor if s/he received less than R319 per month, which was derived from research by Potgieter (1997) on the subsistence level of income required for a person living in Cape Town. Both studies made use of the Project for Statistics on Living Standards and Development (PSLSD) survey data collected in 1993.

Free
dow
nloa
d fr
om w
ww
.hsr
cpre
ss.a
c.za
Background
5
May (1998) used the 1995 October Household Survey (OHS) and Income and Expenditure Survey (IES) data to estimate a child poverty rate at national and provincial level. Using a relative definition of child poverty, a child was counted as poor if s/he fell into the bottom 40% of households. Dieden and Gustafson (2003) assessed child poverty in South Africa, again at national and provincial level, by estimating multivariate models, also using OHS and IES data from 1995. The applied poverty line defined children as poor if they live in households with a disposable per capita income less than US$1 Purchasing Power Parity (estimated to be R122.56 in 1995 Rands). Woolard (2001, discussed in Streak, 2001) used a relative concept to measure the extent of child poverty at national and provincial level. This analysis made use of the OHS 1999. A child was counted as poor if s/he resided in a household in the bottom 40% of households. Woolard also counted the number of children living in households that reported that they often experienced hunger, in order to examine the extent of severe child poverty in South Africa. Finally, Woolard (2003, discussed in Streak, 2004) also used the IES 2000 to estimate child poverty at national and provincial level. For this, two absolute income poverty lines were constructed: R215 per month per capita and R430 per month per capita (both in 2000 Rands).
Multidimensional measures of child poverty
The need for a broader conceptualisation of child poverty is increasingly recognised in the literature on child poverty and well-being in South Africa (Dawes et al., 2007; Monson et al., 2006; Noble, Wright and Cluver, 2006) as well as internationally. White et al. (2002) conclude that a multidimensional approach is both necessary and achievable in the developing world.
An example of the multidimensional approach can be seen in the UK Department for Education and Skills’ outcomes framework in Every Child Matters: Change for Children. They identified 25 specific aims for children and young people and the support needed from parents, carers and families in order to achieve those aims. The broad headings under which these aims fall are: be healthy, stay safe, enjoy and achieve, make a positive contribution, and achieve economic well-being (Department for Education and Skills, 2004). The aims include: physical health; mental and emotional health; safety from maltreatment, neglect, violence and sexual exploitation; safety from accidental injury and death; attend and enjoy school; achieve personal and social development and enjoy recreation; engage in decision making and support the community and environment; live in decent homes and sustainable communities; and live in households free from low income.
Gordon et al. (2003) measured the extent and severity of child poverty in the developing world. They looked at a range of severe deprivations, including food (children whose heights and weights for age were more than -3 standard deviations below the median of the international reference population), safe drinking water (children who only had access to surface water or water more than 15 minutes away), sanitation facilities (children with no private or communal toilets or latrines), health (children who had not been immunised, young children who had recent illness involving diarrhoea but did not receive medical advice), shelter (children in dwellings with more than five people per room or with no flooring material), education (children aged between 7 and 18 who had never been to school), access to information (children aged between 3 and 18 with no access to radio, television, telephone or newspapers at home) and access to basic services (children living 20 km or more from any school and 50 km or more from any medical facility). They defined a child as living in absolute poverty if s/he suffers from two or more of the severe deprivations.
Free
dow
nloa
d fr
om w
ww
.hsr
cpre
ss.a
c.za
The South African Index of Multiple Deprivation for Children
6
In South Africa, Haarmann (1999, discussed in Streak, 2000) used the PSLSD to produce a composite index that ranks children into five deprivation groupings. The index contained nine indicators, grouped into four categories: expenditure (standardised monthly house-hold expenditure), housing (type of house, number of durables, type of energy used for cooking), health (type of water access, type of sanitation facilities, accessed health facilities), and employment opportunities (share of employment amongst adult household members, average years of education among household members over 16 years). Each of the indicators ranged from 1 to 5 on a deprivation scale (1 being the poorest and 5 being the richest). The final score for each household was computed as the average of each mean of the four groups. Expenditure below the household subsistence level (i.e. below R319 per month per child) was given a weighting three times greater than any of the other indicators to reflect the importance of a person’s economic characteristics in determining poverty. If a household’s overall score on the index was less than 3, it was classified as poor, and all children (aged 0-6) were seen to be poor if they lived in these households. This contains many of the elements of the model of multiple deprivation used in the SAIMDC: domains of deprivation combined, with appropriate weighting, into a single measure of multiple deprivation. However, unlike the SAIMDC, it only provides a measure of child poverty at national and provincial level.
Cassiem et al. (2000) identified four pillars or groups of children’s rights on which the CRC and NPA are built. These are:
Survival rights: a child’s right to an adequate living standard, including shelter and nutrition, and access to medical services;Development rights: a child’s right to education, play and leisure, cultural activities, access to information, and freedom of thought, conscience and religion;Protection rights: a child’s right to be protected from all forms of exploitation and cruelty, arbitrary separation from family and abuse in the criminal justice system; andParticipation rights: a child’s right to the freedom to express opinions and to have a say in matters affecting his or her life (Cassiem et al., 2000: ix).
They provide examples of the four categories of deprivation and propose indicators that can be used to monitor each aspect of child poverty. Streak (2000) used some of these indicators to measure child poverty outcomes at provincial level. Indicators include: income (share of children living in bottom 40% of SA household income distribution for different ages); health (share of child 0-5 years deaths, share of stunted children); education (matric failure rate, share of matric failures, matric exemption rate); physical insecurity (share of crimes against children); and economic insecurity (HIV infection rate amongst pregnant women). However, the data are presented only for discrete indicators rather than dimensions of deprivation or composite indices. Furthermore the indicators are not presented at sub-provincial level.
Bray (2002) examined available data on children’s lives in South Africa to see whether it is possible to trace changes in child poverty and well-being over time, and to link these changes to broader social, political and economic trends. She looked at child poverty and economic well-being, child health, education and development, and civil rights and social inclusion. Her review of the available data and identification of major gaps highlight the broad range of indicators that are useful in measuring child poverty and well being. The Children’s Institute at the University of Cape Town is currently engaged in a project monitoring the situation of children in South Africa: their living conditions, their care arrangements, their health status, and their access to schools and other services (Jacobs
•
•
•
•

Free
dow
nloa
d fr
om w
ww
.hsr
cpre
ss.a
c.za
Background
7
et al., 2005; Monson et al., 2006). The project, Children Count – Abantwana Babalulekile (isiXhosa for ‘children are important’), presents data from Stats SA as well as admini stra-tive data from relevant government departments on a number of important areas relating to children’s socio-economic rights, in order to monitor the realisation of their rights. Examples of indicators include children who are underweight, children experiencing hunger, take up of child grants, children living in formal housing, children living in houses with an electricity connection, infant mortality rate, HIV prevalence among children, children with access to drinking water on site, children attending an education institution, and learner to teacher ratio. Although comprehensive, again these are discrete indicators and are not combined into domains or an index. The indicators are also only measured at national and provincial level which constrains their appropriateness for planning interventions at local level.
Dawes et al. (2007) provide an evidence and rights-based approach to monitoring the well-being of children and adolescents in South Africa. The book sets out the conceptual basis for the development of a rights-based approach to monitoring child well-being over a range of domains including child poverty and the quality of children’s neighbourhoods and home environments; child health, HIV and AIDS, mental health and disability; early child development and education; and child protection, children in statutory care, children in the justice system, children on the streets and children affected by the worst forms of labour. Indicators (rights based and aligned to current policy) for these domains are provided, with recommended measurement and data sources.
Need for child specific measures of child poverty
As mentioned in the introduction and in relation to income measures of child poverty, child specific measures of deprivation and poverty are essential. This has been widely recognised in the literature, both South African and international. For example, Micklewright (2002) identifies child-specific dimensions of exclusion, such as child development and education, and criticises the lack of specific indicators intended to capture exclusion among children. White et al. (2002) argue that research and policy in developing countries need to embrace a broader agenda and conception of child welfare which (amongst others) accepts that child welfare indicators need to be different from standard poverty indicators used for adults. Feeny and Boyden (2004) further assert that adult perspectives that often bear little resemblance to the actual experience of the child are frequently prioritised.
Recent studies on child poverty in South Africa highlight the need for wider, child-focused, and child-participatory definitions of poverty (Guthrie et al., 2003; Coetzee and Streak, 2004; Streak, 2005). For example:
The South African Constitution accords children special socio-economic rights in recognition of their particular vulnerability and need for special protection. Steps to effect these rights have been targeted at the child and family. However, the impact of such interventions are difficult to measure and track due to the shortage of child well-being and poverty data. This problem is exacerbated by the limitations encountered in using national survey data as most surveys use the household as a unit of analysis. Consequently there is very little data on household members disaggregated by age and gender (Guthrie et al., 2003: 3).
Free
dow
nloa
d fr
om w
ww
.hsr
cpre
ss.a
c.za
The South African Index of Multiple Deprivation for Children
8
A child-focused multidimensional child poverty model
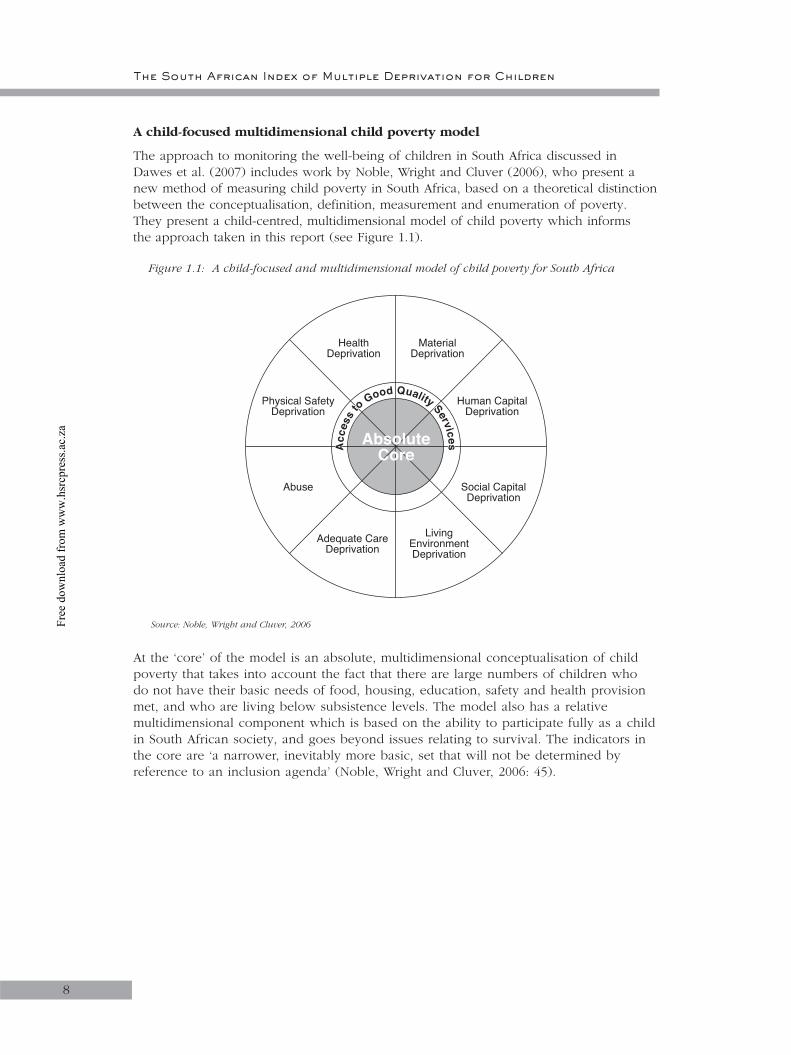
The approach to monitoring the well-being of children in South Africa discussed in Dawes et al. (2007) includes work by Noble, Wright and Cluver (2006), who present a new method of measuring child poverty in South Africa, based on a theoretical distinction between the conceptualisation, definition, measurement and enumeration of poverty. They present a child-centred, multidimensional model of child poverty which informs the approach taken in this report (see Figure 1.1).
Figure 1.1: A child-focused and multidimensional model of child poverty for South Africa
At the ‘core’ of the model is an absolute, multidimensional conceptualisation of child poverty that takes into account the fact that there are large numbers of children who do not have their basic needs of food, housing, education, safety and health provision met, and who are living below subsistence levels. The model also has a relative multidimensional component which is based on the ability to participate fully as a child in South African society, and goes beyond issues relating to survival. The indicators in the core are ‘a narrower, inevitably more basic, set that will not be determined by reference to an inclusion agenda’ (Noble, Wright and Cluver, 2006: 45).
HealthDeprivation
MaterialDeprivation
Adequate CareDeprivation
LivingEnvironmentDeprivation
Physical SafetyDeprivation
Human CapitalDeprivation
Abuse Social CapitalDeprivation
Acc
ess
toGood Quality ServicesA
cces
sto
Good Quality ServicesAbsoluteCore
Source: Noble, Wright and Cluver, 2006

Free
dow
nloa
d fr
om w
ww
.hsr
cpre
ss.a
c.za
Background
9
The same domains run through both the absolute core and the relative component, and access to good quality services is relevant to all domains in both the absolute and relative spheres. The exemplar domains cover many of the socio-economic rights for children enshrined in the Constitution and other legislation:
Material deprivation – indicators relating to material possessions and financial resources;Human capital deprivation – indicators relating to education (as a determinant of a child’s prospects);Social capital deprivation – indicators relating to support networks that prevent social exclusion;Living environment deprivation – indicators relating to adequate shelter and features of the neighbourhood such as air pollution, noise pollution and prevalence of crime;Adequate care deprivation – indicators relating to loss of caregivers, supervision, neglect and exploitation;Abuse – indicators relating to physical, emotional or sexual abuse, and intentional neglect, at home, school or in the neighbourhood;Physical safety deprivation – indicators relating to crimes against children, accidental injury and death; andHealth deprivation – indicators relating to physical and mental health.
•
•
•
•
•
•
•
•
Free
dow
nloa
d fr
om w
ww
.hsr
cpre
ss.a
c.za
10
CHAPTER 2
Components of the SAIMDC
2.1 About the domains
As seen in Chapter 1, the conceptual model is based on the idea of distinct domains of deprivation which can be recognised and measured separately. These are experienced by children living in an area (e.g. a municipality). Children may be counted as deprived in one or more of the domains, depending on the number of types of deprivation that they experience. The overall index of multiple deprivation is conceptualised as a weighted area level aggregation of these specific domains of deprivation.
For this report, five domains of deprivation were produced using the Census to form an index of multiple deprivation:
Income and Material Deprivation;Employment Deprivation;Education Deprivation;Adequate Care Deprivation; andLiving Environment Deprivation.
The indicators in the Income and Material Deprivation and Living Environment Deprivation domains are the same as those used in the PIMD, except that they only take into account children aged 0–17 years. The indicators used in the Employment Deprivation and Education Deprivation domains are different from those used for the PIMD (see Appendix 1 for details), while Adequate Care Deprivation is a new domain with specific relevance for children.
Each domain is presented as a separate domain index reflecting a particular aspect of deprivation. Thus the Education Deprivation Domain represents educational disadvantage and does not include non education indicators which may contribute to education deprivation such as the lack of electric lighting to undertake homework. Such an indicator would be captured in the Living Environment Deprivation Domain. This approach avoids the need to make any judgments about the complex links between different types of deprivation, and enables clear decisions to be made about the contribution that each domain should make to the overall index.
While the domains represent distinct dimensions of deprivation, it is perfectly possible, indeed likely, that the same child could be captured in more than one domain. So, for example, if a child was in a low income household, not in school and in a household with no piped water, they would be captured in the Income and Material Deprivation, Education Deprivation and Living Environment Deprivation domains. This is entirely appropriate because one individual can experience more than one type of deprivation at any given time.
2.2 About the indicators
The aim for each domain was to include a parsimonious (i.e. economical in number) collection of indicators that comprehensively captured the deprivation for each domain. Three further criteria were kept in mind when selecting indicators:
•••••
Free
dow
nloa
d fr
om w
ww
.hsr
cpre
ss.a
c.za
11
Components of the SAIMDC
They should be ‘domain specific’ and appropriate for the purpose (as direct as possible measures of that form of deprivation);They should measure major features of that deprivation (not conditions just experienced by a very small number of children or areas); andThey should be statistically robust.
The public availability of the 10% sample of the 2001 Census enabled the research team to test different indicators and combinations of indicators to be used in the SAIMDC3. A total of 14 indicators were used in the SAIMDC and full details about these indicators are given in Appendix 1.
All the indicators were derived from the 10% sample of the 2001 Census of Population and therefore relate to 10 October 2001 (Census night). Unless stated otherwise, the indicators listed below take into account children aged 0–17 years inclusive.
There was general consensus that the SAIMDC should be constructed at the smallest practicable spatial scale and that the ideal geography should possess relatively even sized populations. It was not possible to obtain the necessary permissions to produce the SAIMDC at sub-provincial level, and so the SAIMDC was produced at municipal level which is the smallest geographical unit at which the 10% sample of the 2001 Census is robust. Recommendations for further work including sub-provincial level analysis are discussed in Chapter 5.
The SAIMDC is designed to be updated in three ways: first, to allow for the re-evaluation of the number and nature of the dimensions of deprivation; second, to allow for new and more direct measures of those dimensions to be incorporated; and third, to measure changing deprivation ‘on the ground’ as required. Domains and indicators which were considered but which could not be included are also described in Appendix 1.
The Income and Material Deprivation Domain
The purpose of this domain is to capture the proportion of children experiencing income and/or material deprivation in an area:
Number of children living in a household that has a household income (need-adjusted using the modified Organisation for Economic Co-operation and Development – OECD – equivalence scale) that is below 40% of the mean equivalent household income (approximately R850 per month in 2001 Rands); orNumber of children living in a household without a refrigerator; orNumber of children living in a household with neither a television nor a radio.
A simple proportion of children living in households experiencing one or more of the deprivations was calculated (i.e. the number of children living in a household with low income and/or without a refrigerator and/or without a television and radio divided by the total child population).
3 Imputation was carried out on the full Census by Stats SA to allocate values for unavailable, unknown, incorrect or inconsistent responses. A combination of ‘logical’ imputation and ‘hot deck’ imputation was used when inconsistencies were found in the data. Further details on the imputation techniques used, and also the Census in general, are available from Stats SA.
•
•
•
•
••

Free
dow
nloa
d fr
om w
ww
.hsr
cpre
ss.a
c.za
The South African Index of Multiple Deprivation for Children
12
The Employment Deprivation Domain
The purpose of this domain is to measure the proportion of children living in workless households in an area:
Number of children living in households where no adults aged 18 or over are in employment.
A simple proportion of children living in households experiencing this type of deprivation was calculated (i.e. the number of children living in a household with no employed adults divided by the total child population).
The Education Deprivation Domain
The purpose of this domain is to capture the extent of children’s educational deprivation in an area:
Number of children (9–15 years inclusive) who are in the wrong grade for their age; orNumber of children (7–15 years inclusive) who are not in school.
This domain was not created as a simple rate but the details are provided in Appendix 1.
The Living Environment Deprivation Domain
The purpose of this domain is to identify children living in poor quality environments:Number of children living in a household without piped water inside their dwelling or yard or within 200 metres; orNumber of children living in a household without a pit latrine with ventilation or flush toilet; orNumber of children living in a household without use of electricity for lighting; orNumber of children living in a household without access to a telephone; orNumber of children living in a household that is a shack; orNumber of children living in a household that is crowded.
A simple proportion of children living in households experiencing one or more of the deprivations was calculated (i.e. the number of children living in a household without piped water and/or without adequate toilet and/or without electricity for lighting and/or without access to a telephone and/or that is a shack and/or that is crowded divided by the total child population).
The Adequate Care Deprivation Domain
The purpose of this domain is to capture children in an area who are at risk of lacking adequate care:
Number of children whose mother and father are no longer alive or not living in the household; orNumber of children living in a child-headed household.
A simple proportion of children experiencing either of the deprivations was calculated (i.e. the number of children whose mother and father are not present in the household or the number of children living in a child-headed household divided by the total population).
•
••
•
•
••••
•
•

Free
dow
nloa
d fr
om w
ww
.hsr
cpre
ss.a
c.za
13
CHAPTER 3
Methodology
3.1 Creating domain indices
Combining indicators into domain indices
For each domain of deprivation (Income, Employment, etc.) the aim is to obtain a single summary measure whose interpretation is straightforward in that it is, if possible, expressed in meaningful units (e.g. proportions of children or of households experiencing that form of deprivation). Apart from the Education Deprivation Domain, all of the other domains were created as simple rates. This avoided the key issue of weighting indicators, which is necessary when combining indicators into a single measure. Because the domain scores are rates they are easy to interpret (i.e. X% of children in the municipality are experiencing this type of deprivation). There were different denominators for the two Education Deprivation Domain indicators. These indicators were created as separate rates (i.e. proportion of 9–15 year olds in the wrong grade and proportion of 7–15 year olds not in school), weighted according to a ratio of indicator denominator to total denominator for the two indicators, and added together.
There is no double counting of individuals within a domain. An individual may be captured in more than one domain but this is not double counting: it is simply identifying that they are deprived in more than one way.
After combining the indicators into domains, District Management Areas4 (DMAs) were omitted, as well as one municipality which had a child population of less than 1000.
3.2 Combining domain indices into an index of multiple deprivation
Standardisation and transformation
Domains are conceived as independent domains of deprivation, each with their own contribution to multiple deprivation. The strength of this contribution should vary between domains depending on their relative importance. Once the domains had been constructed, it was necessary to combine them into an overall index. In order to do this the domain indices were standardised by ranking. They were then transformed to an exponential distribution.
The exponential distribution was selected for the following reasons. First, it transforms each domain so that they each have a common distribution, the same range and identical maximum/minimum value, so that when the domains are combined into a single index of multiple deprivation, the (equal) weighting is explicit; that is there is no implicit weighting as a result of the underlying distributions of the data. Second, it is not affected by the size of the municipality’s population. Third, it effectively spreads out the part of the distribution in which there is most interest; that is the most deprived municipalities in each domain.
The exponential transformation procedure is set out in more detail in Appendix 2.
4 Areas such as game reserves and mining complexes with small populations with special characteristics. They produce anomalous results and are customarily excluded by Stats SA from small area analyses.

Free
dow
nloa
d fr
om w
ww
.hsr
cpre
ss.a
c.za
The South African Index of Multiple Deprivation for Children
14
Weighting
An important issue in constructing an overall index of multiple deprivation is the question of what ‘explicit weight’ should be attached to the various components. The weight is the measure of importance that is attached to each component in the overall composite measure. How can one attach weights to the various aspects of deprivation? That is, how can one determine which aspects are more important than others?
There are at least five possible approaches to weighting: Driven by theoretical considerations – use the available research evidence to inform the theoretical model of multiple deprivation and select weights which reflect this theory.Empirically driven – either use a commissioned survey or re-analysis of an existing survey to generate weights, or apply a technique such as factor analysis to extract some latent ‘factor’ called ‘multiple deprivation’, assuming that is, that the analysis permitted a single factor solution (see Senior, 2002).Determined by policy relevance – release the individual domain scores and weight for combination in accordance with and proportional to the focus of particular policy initiatives or weight in accordance with public expenditure on particular areas of policy.Determined by consensus – consult policy makers and other ‘customers’ or experts for their views and examine the results for consensus.Entirely arbitrary – choose weights without reference to the above or even select equal weights in the absence of empirical evidence.
Weighting always takes place when elements are combined together. Thus if the domains are summed together to create an index of multiple deprivation, this means they are given equal weight. It would be incorrect to assume that items can be combined without weighting.
For the SAIMDC, equal weights were assigned to the exponentially transformed domains in the absence of evidence suggesting differential weights should be used.
Figure 3.1 summarises the components of the SAIMDC in diagrammatic form.
1.
2.
3.
4.
5.

Free
dow
nloa
d fr
om w
ww
.hsr
cpre
ss.a
c.za
15
Methodology
Figure 3.1: Components of the South African Index of Multiple Deprivation for Children
Wei
gh
t in
div
idu
al d
om
ain
exp
on
enti
al s
core
s w
ith
eq
ual
wei
gh
ts a
nd
co
mb
ine
to p
rod
uce
a S
ou
th A
fric
an In
dex
of
Mu
ltip
le D
epri
vati
on
fo
r C
hild
ren
Inco
me
An
d M
ater
ial
Dep
riva
tio
n D
om
ain
Em
plo
ymen
t D
epri
vati
on
Do
mai
nE
du
cati
on
Dep
riva
tio
nD
om
ain
Liv
ing
En
viro
nm
ent
Dep
riva
tio
n D
om
ain
Ad
equ
ate
Car
eD
epri
vati
on
Do
mai
n
Chi
ldre
n liv
ing
in a
hou
seho
ldth
at h
as a
hou
seho
ld in
com
ebe
low
40%
of t
he m
ean
equi
vale
nt h
ouse
hold
inco
me
(A)
Chi
ldre
n in
a h
ouse
hold
with
out
a fr
idge
(B
)
Chi
ldre
n in
a h
ouse
hold
with
neith
er a
TV
nor
a r
adio
(C
)
Chi
ldre
n liv
ing
in a
hou
seho
ldw
here
no
adul
ts a
re in
empl
oym
ent (
A)
Chi
ldre
n (9
–15
year
s) in
the
wro
ng g
rade
for
thei
r ag
e (A
)
Chi
ldre
n (7
–15
year
s) n
ot in
scho
ol (
B)
Chi
ldre
n in
a h
ouse
hold
with
out
pipe
d w
ater
in th
eir d
wel
ling
orya
rd o
r w
ithin
200
met
res
(A)
Chi
ldre
n in
a h
ouse
hold
with
out
a pi
t lat
rine
with
ven
tilat
ion
orflu
sh to
ilet (
B)
Chi
ldre
n in
a h
ouse
hold
with
out
use
of e
lect
ricity
for l
ight
ing
(C)
Chi
ldre
n in
a h
ouse
hold
with
out
acce
ss to
a te
leph
one
(D)
Chi
ldre
n liv
ing
in s
hack
(E
)
Chi
ldre
n in
a h
ouse
hold
that
iscr
owde
d (F
)
Chi
ldre
n w
hose
mot
her
and
fath
er a
re n
o lo
nger
aliv
e or
not i
n th
e ho
useh
old
(A)
Chi
ldre
n in
chi
ld-h
eade
dho
useh
olds
(B
)
(Chi
ldre
n ex
perie
ncin
g A
or
Bor
C)
/ mun
icip
al to
tal c
hild
popu
latio
n=
Inco
me
and
Mat
eria
lD
epri
vati
on
Do
mai
n S
core
A /
mun
icip
al to
tal c
hild
popu
latio
n=
Em
plo
ymen
t D
epri
vati
on
Do
mai
n S
core
A /
Mun
icip
al c
hild
pop
ulat
ion
aged
9–1
5+
B /
mun
icip
al c
hild
pop
ulat
ion
aged
7–1
5=
Ed
uca
tio
n D
epri
vati
on
Do
mai
n S
core
(Chi
ldre
n ex
perie
ncin
gA
or
B o
r C
or
D o
r E
or
F)
/ mun
icip
al to
tal c
hild
pop
ulat
ion
=L
ivin
g E
nvi
ron
men
tD
epri
vati
on
Do
mai
n S
core
(Chi
ldre
n ex
perie
ncin
g A
or
B)
/ mun
icip
al to
tal c
hild
pop
ulat
ion
=A
deq
uat
e C
are
Dep
riva
tio
nD
om
ain
Sco
re
Sta
nd
ard
ise
do
mai
n a
nd
tran
sfo
rm t
o e
xpo
nen
tial
dis
trib
uti
on
Sta
nd
ard
ise
do
mai
n a
nd
tran
sfo
rm t
o e
xpo
nen
tial
dis
trib
uti
on
Sta
nd
ard
ise
do
mai
n a
nd
tran
sfo
rm t
o e
xpo
nen
tial
dis
trib
uti
on
Sta
nd
ard
ise
do
mai
n a
nd
tran
sfo
rm t
o e
xpo
nen
tial
dis
trib
uti
on
Sta
nd
ard
ise
do
mai
n a
nd
tran
sfo
rm t
o e
xpo
nen
tial
dis
trib
uti
on

Free
dow
nloa
d fr
om w
ww
.hsr
cpre
ss.a
c.za
16
The geography of deprivation
4.1 How to interpret the municipal-level results
Six measures for each municipality are provided. They include five domain measures (which were combined to make the overall SAIMDC), and one overall SAIMDC.
The domain measures (each of which is given a score) can be used to describe each type of deprivation in a municipality. The domain scores can then be used to rank each municipality on that domain. A rank of 1 is assigned to the most deprived municipality. The ranks show how a municipality compares to all the other municipalities and are easily interpretable.
All five domains (Income and Material Deprivation, Employment Deprivation, Education Deprivation, Living Environment Deprivation and Adequate Care Deprivation) are then combined to provide an index of multiple deprivation for children in a municipality. This is called the SAIMDC score and each municipality may then be ranked for comparative purposes. A rank of 1 is assigned to the most deprived municipality. A limitation is that for large municipalities with considerable heterogeneity, the SAIMDC is a coarse measure that masks intra-municipality differences. It should be remembered that even the least deprived municipalities may contain deprived children within them and the most deprived municipalities may contain non deprived children. The only way for this matter to be addressed is for the SAIMDC to be based on the 100% Census. This was not possible for this project. However it is hoped that this will be achieved in the future with the assistance of Stats SA, the only party that can use the 100% Census for such analyses.
In spite of these limitations, the SAIMDC provides many useful tools for examining the geographical distribution of deprivation for children in South Africa.
In the rest of this chapter, the overall SAIMDC is presented, followed by the five domains that comprise the SAIMDC.
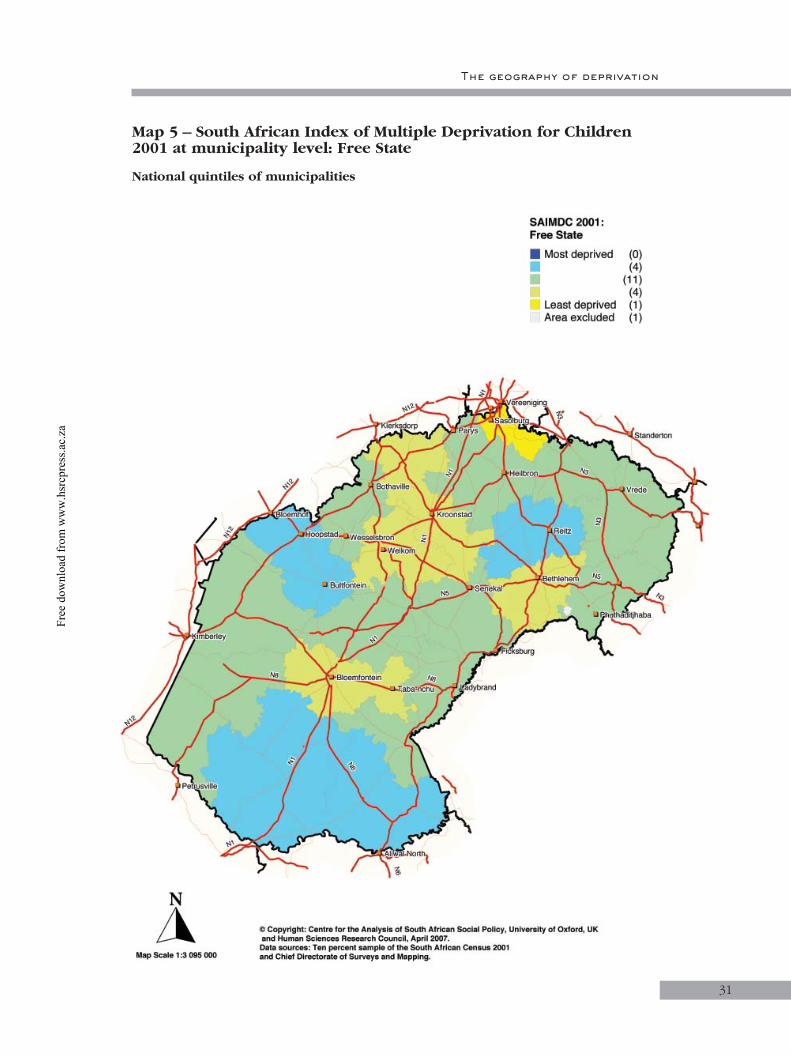
On the maps at the end of Section 4.2, the municipalities have been divided into quintiles of deprivation – five equal groups. On each map, the thin black lines depict the municipality boundaries and the thick black lines are the province boundaries. The most deprived 20% of municipalities are shaded in dark blue and the least deprived 20% of municipalities are shaded in bright yellow (areas left white are DMAs that were excluded). Maps identifying each municipality by name are provided in Appendix 3.
4.2 Municipal-level results
SAIMDC
The following table presents the most deprived ten municipalities on the SAIMDC, as well as the child population size (in the 2001 Census) of each of these municipalities.
CHAPTER 4

Free
dow
nloa
d fr
om w
ww
.hsr
cpre
ss.a
c.za
17
The geography of deprivation
Table 4.1: Most deprived municipalities on the SAIMDC
Municipality ProvinceChild population
in 2001 (to nearest ‘000)
SAIMDC score
1 Engcobo Eastern Cape 77 000 450.99
2 Intsika Yethu Eastern Cape 99 000 449.85
3 Port St Johns Eastern Cape 82 000 441.35
4 Ntabankulu Eastern Cape 73 000 437.79
5 Mbhashe Eastern Cape 135 000 433.09
6 Msinga KwaZulu-Natal 91 000 424.09
7 Emalahleni Eastern Cape 56 000 421.99
8 Mbizana Eastern Cape 136 000 406.41
9 Nyandeni Eastern Cape 151 000 398.02
10 Qaukeni Eastern Cape 138 000 396.81
In the map section on pages 27 to 41, Map 1 shows the SAIMDC. The majority of municipalities in both the Western Cape (24 of 25) and Gauteng (10 of 12) are in the top quintile, that is the least deprived 20% (shaded yellow on the map) in terms of child deprivation. Maps 2 and 8 show the SAIMDC for municipalities in the Western Cape and Gauteng respectively.
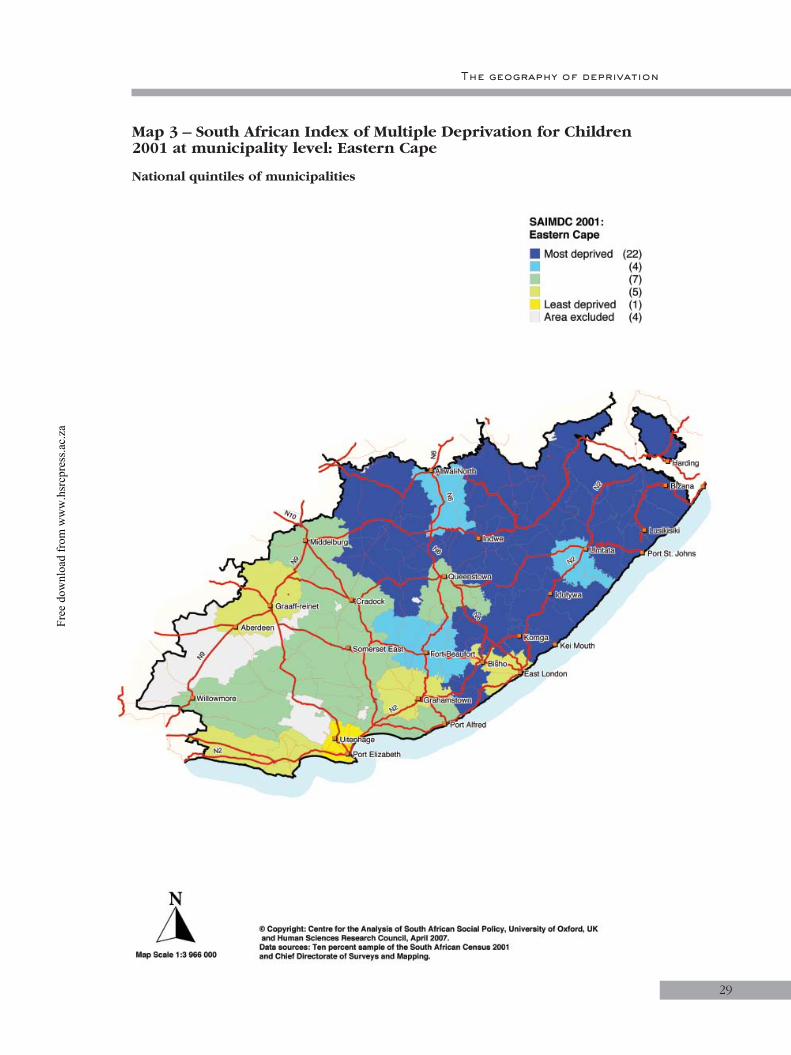
There is a more mixed picture in the other provinces. In the Eastern Cape, municipalities in the former Transkei fall into the bottom two quintiles, that is the most deprived 40% (shaded blue on the map) in terms of child deprivation. The majority of municipalities (22 of 39) are in the most deprived 20%. The former Ciskei area of the Eastern Cape has municipalities in each of the quintiles. Nelson Mandela municipality (the Port Elizabeth area) is in the least deprived 20%. Map 3 shows the SAIMDC for municipalities in the Eastern Cape.
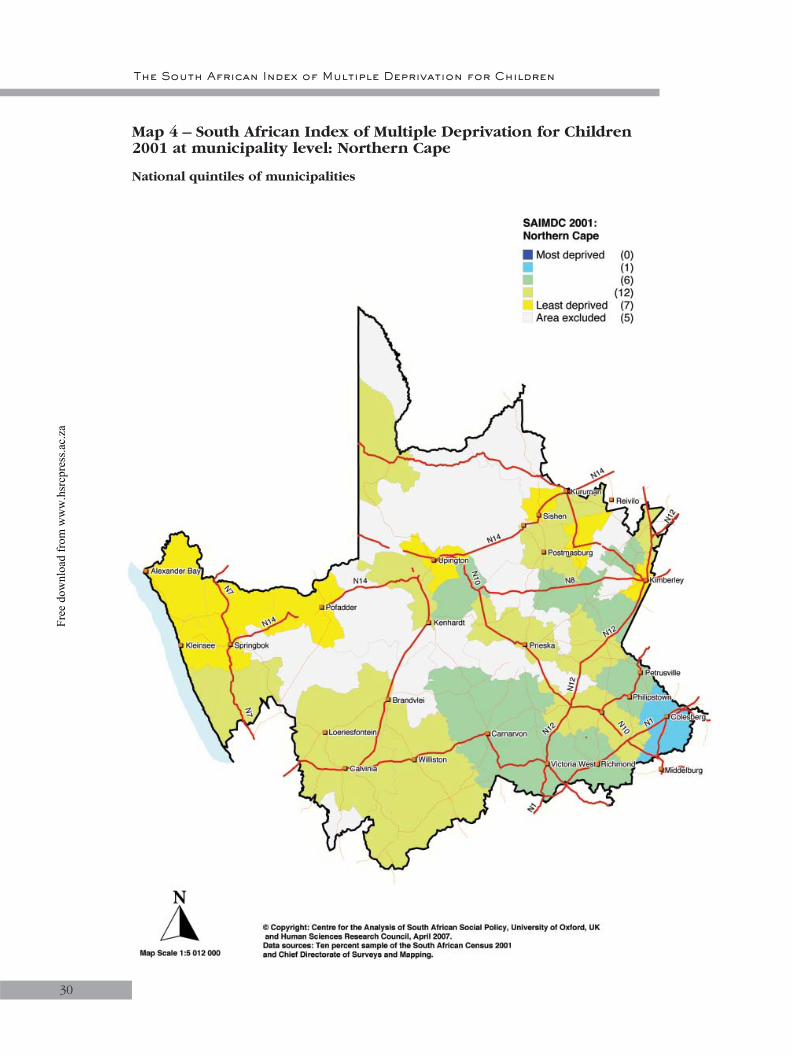
In the Northern Cape, there are no municipalities in the most deprived 20% in terms of child deprivation, and only one, Umsombomvu, in the most deprived 20-40%. The majority (19 of 26) are in the least deprived 40%, and half a dozen are in the middle quintile. Map 4 shows the SAIMDC for municipalities in the Northern Cape.
In Free State, there are no municipalities in the most deprived 20% in terms of child deprivation. Just over half (11 of 20) are in the middle quintile, and all but one split equally between the quintiles either side. The remaining municipality, Metsimaholo, is in the least deprived 20%. Map 5 shows the SAIMDC for municipalities in the Free State.
In KwaZulu-Natal, the majority of municipalities (35 of 51) are in the most deprived 40% in terms of child deprivation. One municipality, Ethekwini, is in the least deprived 20%. Map 6 shows the SAIMDC for municipalities in KwaZulu-Natal.
In North West, there are four municipalities in the most deprived 20% and two in the least deprived 20% in terms of child deprivation. Ten of the 25 municipalities are in the middle quintile and the remaining municipalities are split fairly evenly between the quintiles either side. Map 7 shows the SAIMDC for municipalities in North West.
Free
dow
nloa
d fr
om w
ww
.hsr
cpre
ss.a
c.za
The South African Index of Multiple Deprivation for Children
18
In Mpumalanga, there are no municipalities in the most deprived 20% in terms of child deprivation. The majority (18 of 21) are in the middle three quintiles. Three municipalities are in the least deprived 20%. Map 9 shows the SAIMDC for Mpumalanga.
In Limpopo, the majority of municipalities (16 of 26) are in the most deprived 40% in terms of child deprivation. There are no municipalities in the least deprived 20%. Map 10 shows the SAIMDC for Limpopo.
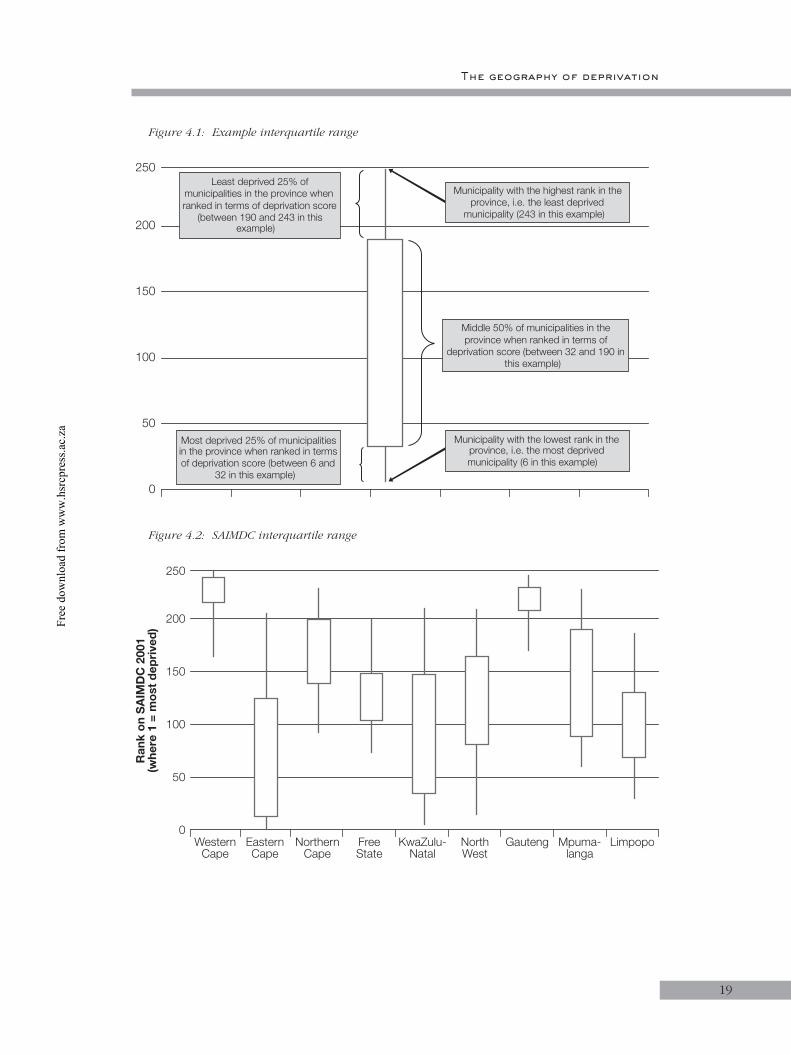
Figure 4.2 shows the patterns of deprivation for children in each province for the SAIMDC. In the chart the range of deprivation is illustrated by the vertical blue line. So in the example (see Figure 4.1) the most deprived municipality (from the child perspective) is ranked 6 (where 1 is the rank of the most deprived) and the least deprived municipality is ranked 243 (where 245 is the rank of the least deprived). The shaded grey box indicates the range of the middle 50% of municipalities in the province (the interquartile range5). If the grey box is relatively short this will indicate that municipalities are concentrated in a narrow range. If this box sits towards the bottom of the chart it tells us that child deprivation in the province is concentrated in the most deprived part of the national distribution. If the box sits towards the top of the chart it tells us that deprivation is concentrated in the least deprived part of the national distribution.
The Eastern Cape and KwaZulu-Natal have the greatest range of child deprivation. Gauteng and the Western Cape have the smallest range of child deprivation, and municipalities in these two provinces are concentrated in a narrow range in the least deprived part of the national distribution. Municipalities in the Eastern Cape and KwaZulu-Natal are concentrated in the most deprived part of the distribution, but in a fairly broad range. The municipalities in the remaining five provinces are concentrated in the middle of the distribution. The Northern Cape lies towards the least deprived end of the distribution.
5 The interquartile range (IQR) is ‘a measure of dispersion calculated by taking the difference between the first and third quartiles (that is, the 25th and 75th percentiles). In short, the IQR is the middle half of a distribution’ (Vogt, 1999: 143).
Free
dow
nloa
d fr
om w
ww
.hsr
cpre
ss.a
c.za
19
The geography of deprivation
Figure 4.1: Example interquartile range
Figure 4.2: SAIMDC interquartile range
Most deprived 25% of municipalitiesin the province when ranked in termsof deprivation score (between 6 and
32 in this example)
0
50
100
150
200
Least deprived 25% ofmunicipalities in the province when
ranked in terms of deprivation score(between 190 and 243 in this
example)
Middle 50% of municipalities in the
province when ranked in terms ofdeprivation score (between 32 and 190 in
this example)
Municipality with the lowest rank in theprovince, i.e. the most deprivedmunicipality (6 in this example)
Municipality with the highest rank in theprovince, i.e. the least deprived
municipality (243 in this example)
250
0
50
100
150
200
Ra
nk
on
SA
IMD
C 2
001
(wh
ere
1 =
mo
st
de
pri
ve
d)
250
WesternCape
EasternCape
NorthernCape
FreeState
KwaZulu-Natal
NorthWest
Gauteng Mpuma-langa
Limpopo

Free
dow
nloa
d fr
om w
ww
.hsr
cpre
ss.a
c.za
The South African Index of Multiple Deprivation for Children
20
It is perhaps unsurprising that areas experiencing one form of deprivation frequently also experience other forms of deprivation. Correlations between the five domain scores and the SAIMDC scores are given in Table 4.2. Four domains correlate fairly highly with the overall SAIMDC: the Income Deprivation, Employment Deprivation, Living Environment Deprivation and Adequate Care Deprivation domains all have a correlation of over 0.89. The Education Deprivation Domain correlates less well (0.68). The Income Deprivation Domain has the highest correlation with the overall SAIMDC (0.96) and correlates highly with the Living Environment Deprivation Domain (0.92) and the Employment Deprivation Domain (0.89). The Education Deprivation Domain has the lowest correlation with the other domains.
Table 4.2: Intra-domain and SAIMDC correlations
SAIMDC Income Employ-ment Education
Living Environ-
ment
Adequate Care
SAIMDC 1.0000
Income 0.9646 1.0000
Employment 0.9212 0.8936 1.0000
Education 0.6803 0.5823 0.4513 1.0000
Living Environment
0.9253 0.9236 0.8826 0.5228 1.0000
Adequate Care 0.8961 0.8455 0.8382 0.5066 0.7738 1.0000

Free
dow
nloa
d fr
om w
ww
.hsr
cpre
ss.a
c.za
21
The geography of deprivation
The Income and Material Deprivation Domain
Figure 4.4 shows the patterns of child deprivation in each province for the Income and Material Deprivation Domain. The North West, KwaZulu-Natal and the Eastern Cape have the greatest range of deprivation. Gauteng has the smallest range of deprivation. Municipalities in the Western Cape and Gauteng are concentrated in a narrow range in the least deprived part of the national distribution. The most deprived 25% of municipalities in the Western Cape are more deprived than those in Gauteng however. Municipalities in the Eastern Cape and KwaZulu-Natal are concentrated in the most deprived part of the distribution. The municipalities in the remaining five provinces are concentrated in the middle of the distribution. The Northern Cape lies towards the least deprived end of the distribution.
Figure 4.3: Income and Material Deprivation Domain interquartile range
Overall, 81% of children in South Africa experience income and material deprivation, as defined in this domain. Map 11 shows the Income and Material Deprivation Domain of the SAIMDC for the whole of South Africa. The municipalities with the highest rates of deprived children in the Income and Material Deprivation Domain are located in the Eastern Cape, KwaZulu-Natal, North West and Limpopo. The other five provinces do not have any of the most deprived municipalities. The majority of the least deprived municipalities are in the Western Cape and Gauteng, with pockets in all the other provinces except the Free State.
0
50
100
150
200
Ra
nk
on
In
co
me
Do
ma
in(w
he
re 1
= m
ost
de
pri
ve
d)
250
WesternCape
EasternCape
NorthernCape
FreeState
KwaZulu-Natal
NorthWest
Gauteng Mpuma-langa
Limpopo
Free
dow
nloa
d fr
om w
ww
.hsr
cpre
ss.a
c.za
The South African Index of Multiple Deprivation for Children
22
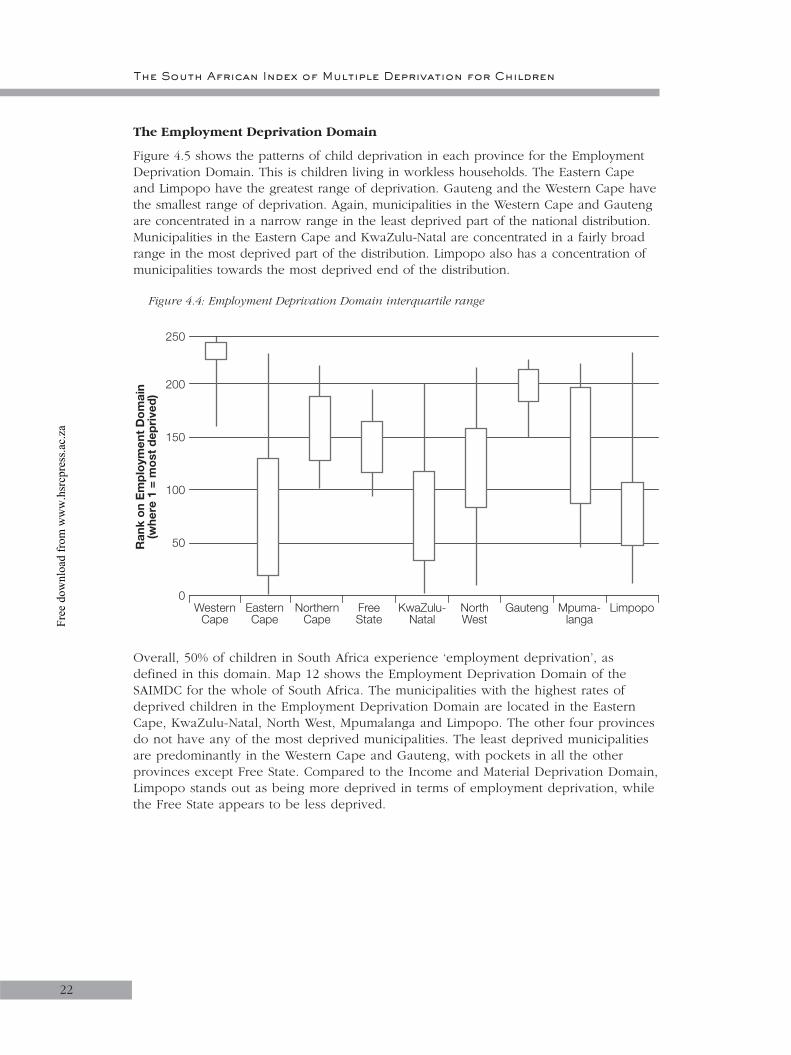
The Employment Deprivation Domain
Figure 4.5 shows the patterns of child deprivation in each province for the Employment Deprivation Domain. This is children living in workless households. The Eastern Cape and Limpopo have the greatest range of deprivation. Gauteng and the Western Cape have the smallest range of deprivation. Again, municipalities in the Western Cape and Gauteng are concentrated in a narrow range in the least deprived part of the national distribution. Municipalities in the Eastern Cape and KwaZulu-Natal are concentrated in a fairly broad range in the most deprived part of the distribution. Limpopo also has a concentration of municipalities towards the most deprived end of the distribution.
Figure 4.4: Employment Deprivation Domain interquartile range
Overall, 50% of children in South Africa experience ‘employment deprivation’, as defined in this domain. Map 12 shows the Employment Deprivation Domain of the SAIMDC for the whole of South Africa. The municipalities with the highest rates of deprived children in the Employment Deprivation Domain are located in the Eastern Cape, KwaZulu-Natal, North West, Mpumalanga and Limpopo. The other four provinces do not have any of the most deprived municipalities. The least deprived municipalities are predominantly in the Western Cape and Gauteng, with pockets in all the other provinces except Free State. Compared to the Income and Material Deprivation Domain, Limpopo stands out as being more deprived in terms of employment deprivation, while the Free State appears to be less deprived.
0
50
100
150
200
Ra
nk
on
Em
plo
ym
en
t D
om
ain
(wh
ere
1 =
mo
st
de
pri
ve
d)
250
WesternCape
EasternCape
NorthernCape
FreeState
KwaZulu-Natal
NorthWest
Gauteng Mpuma-langa
Limpopo
Free
dow
nloa
d fr
om w
ww
.hsr
cpre
ss.a
c.za
23
The geography of deprivation
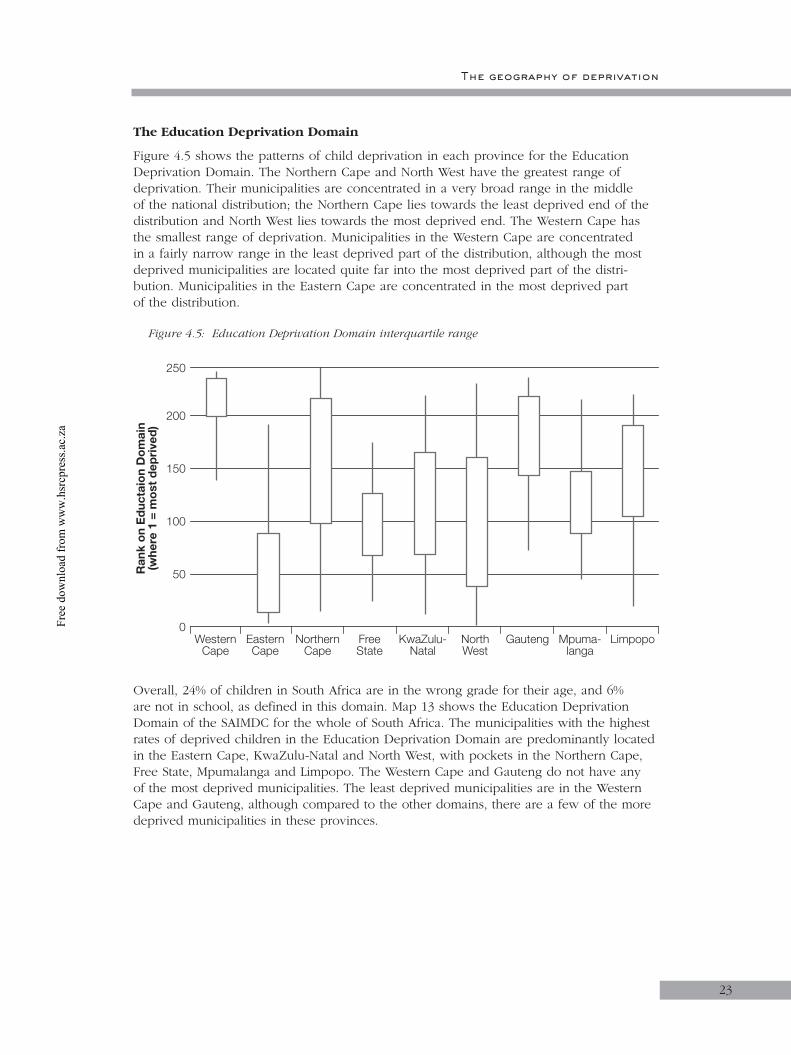
The Education Deprivation Domain
Figure 4.5 shows the patterns of child deprivation in each province for the Education Deprivation Domain. The Northern Cape and North West have the greatest range of deprivation. Their municipalities are concentrated in a very broad range in the middle of the national distribution; the Northern Cape lies towards the least deprived end of the distribution and North West lies towards the most deprived end. The Western Cape has the smallest range of deprivation. Municipalities in the Western Cape are concentrated in a fairly narrow range in the least deprived part of the distribution, although the most deprived municipalities are located quite far into the most deprived part of the distri-bution. Municipalities in the Eastern Cape are concentrated in the most deprived part of the distribution.
Figure 4.5: Education Deprivation Domain interquartile range
Overall, 24% of children in South Africa are in the wrong grade for their age, and 6% are not in school, as defined in this domain. Map 13 shows the Education Deprivation Domain of the SAIMDC for the whole of South Africa. The municipalities with the highest rates of deprived children in the Education Deprivation Domain are predominantly located in the Eastern Cape, KwaZulu-Natal and North West, with pockets in the Northern Cape, Free State, Mpumalanga and Limpopo. The Western Cape and Gauteng do not have any of the most deprived municipalities. The least deprived municipalities are in the Western Cape and Gauteng, although compared to the other domains, there are a few of the more deprived municipalities in these provinces.
0
50
100
150
200
Ra
nk
on
Ed
uc
taio
n D
om
ain
(wh
ere
1 =
mo
st
de
pri
ve
d)
250
WesternCape
EasternCape
NorthernCape
FreeState
KwaZulu-Natal
NorthWest
Gauteng Mpuma-langa
Limpopo

Free
dow
nloa
d fr
om w
ww
.hsr
cpre
ss.a
c.za
The South African Index of Multiple Deprivation for Children
24
The Living Environment Deprivation Domain
Figure 4.6 shows the patterns of child deprivation in each province for the Living Environment Deprivation Domain. The pattern is similar to the Income and Material Deprivation Domain. The Eastern Cape has the greatest range of deprivation. The Western Cape and Gauteng have the smallest range of deprivation. Municipalities in the Western Cape and Gauteng are concentrated in a narrow range in the least deprived part of the national distribution. Municipalities in the Eastern Cape and KwaZulu-Natal are concentrated in a fairly broad range in the most deprived part of the distribution. The municipalities in the remaining five provinces are concentrated in the middle of the distribution. The Northern Cape lies towards the least deprived end of the distribution and Limpopo lies towards the most deprived end.
Figure 4.6: Living Environment Deprivation Domain interquartile range
Overall, 77% of children in South Africa experience living environment deprivation, as defined in this domain. Map 14 shows the Living Environment Deprivation Domain of the SAIMDC for the whole of South Africa. The municipalities with the highest rates of deprived children in the Living Environment Deprivation Domain are predominantly located in the Eastern Cape, KwaZulu-Natal and Limpopo provinces, with pockets in North West. The other five provinces do not have any of the most deprived municipalities. The majority of the least deprived municipalities are in the Western Cape and Gauteng, with pockets in the Eastern Cape, Northern Cape, Free State, North West and Mpumalanga.
0
50
100
150
200
Ra
nk
on
Liv
ing
En
vir
on
me
nt
Do
ma
in(w
he
re 1
= m
ost
de
pri
ve
d)
250
WesternCape
EasternCape
NorthernCape
FreeState
KwaZulu-Natal
NorthWest
Gauteng Mpuma-langa
Limpopo

Free
dow
nloa
d fr
om w
ww
.hsr
cpre
ss.a
c.za
25
The geography of deprivation
The Adequate Care Deprivation Domain
Figure 4.7 shows the patterns of child deprivation in each province for the Adequate Care Deprivation Domain. Limpopo has the greatest range of deprivation. Gauteng has the smallest range of deprivation. Municipalities in the Western Cape and Gauteng are concentrated in a very narrow range in the least deprived part of the national distribution, although the most deprived 25% of municipalities in the Western Cape are more deprived than those in Gauteng. Municipalities in the Eastern Cape are concentrated in a fairly broad range in the most deprived part of the distribution. The remaining municipalities have a concentration of deprivation in the middle of the distribution, with KwaZulu-Natal towards the most deprived end.
Figure 4.7: Adequate Care Deprivation Domain interquartile range
Overall, 25% of children in South Africa experience ‘adequate care deprivation’, as defined in this domain. Map 15 shows the Adequate Care Deprivation Domain of the SAIMDC for the whole of South Africa. The majority of the municipalities with the highest rates of deprived children in the Adequate Care Deprivation Domain are located in the Eastern Cape, KwaZulu-Natal, North West and Limpopo provinces, with pockets in Free State and Mpumalanga. The other three provinces do not have any of the most deprived municipalities. The least deprived municipalities are predominantly in the Western Cape and Gauteng, with pockets in all other provinces.
0
50
100
150
200
Ra
nk
on
Ad
eq
ua
te C
are
Do
ma
in(w
he
re 1
= m
ost
de
pri
ve
d)
250
WesternCape
EasternCape
NorthernCape
FreeState
KwaZulu-Natal
NorthWest
Gauteng Mpuma-langa
Limpopo

Free
dow
nloa
d fr
om w
ww
.hsr
cpre
ss.a
c.za

Free
dow
nloa
d fr
om w
ww
.hsr
cpre
ss.a
c.za
27
The geography of deprivation
Map 1 – South African Index of Multiple Deprivation for Children 2001 at municipality level
National quintiles of municipalities

Free
dow
nloa
d fr
om w
ww
.hsr
cpre
ss.a
c.za
The South African Index of Multiple Deprivation for Children
28
Map 2 – South African Index of Multiple Deprivation for Children 2001 at municipality level: Western Cape
National quintiles of municipalities
Free
dow
nloa
d fr
om w
ww
.hsr
cpre
ss.a
c.za
29
The geography of deprivation
Map 3 – South African Index of Multiple Deprivation for Children 2001 at municipality level: Eastern Cape
National quintiles of municipalities
Free
dow
nloa
d fr
om w
ww
.hsr
cpre
ss.a
c.za
The South African Index of Multiple Deprivation for Children
30
Map 4 – South African Index of Multiple Deprivation for Children 2001 at municipality level: Northern Cape
National quintiles of municipalities
Free
dow
nloa
d fr
om w
ww
.hsr
cpre
ss.a
c.za
31
The geography of deprivation
Map 5 – South African Index of Multiple Deprivation for Children 2001 at municipality level: Free State
National quintiles of municipalities

Free
dow
nloa
d fr
om w
ww
.hsr
cpre
ss.a
c.za
The South African Index of Multiple Deprivation for Children
32
Map 6 – South African Index of Multiple Deprivation for Children 2001 at municipality level: KwaZulu-Natal
National quintiles of municipalities

Free
dow
nloa
d fr
om w
ww
.hsr
cpre
ss.a
c.za
33
The geography of deprivation
Map 7 – South African Index of Multiple Deprivation for Children 2001 at municipality level: North West
National quintiles of municipalities

Free
dow
nloa
d fr
om w
ww
.hsr
cpre
ss.a
c.za
The South African Index of Multiple Deprivation for Children
34
Map 8 – South African Index of Multiple Deprivation for Children 2001 at municipality level: Gauteng
National quintiles of municipalities

Free
dow
nloa
d fr
om w
ww
.hsr
cpre
ss.a
c.za
35
The geography of deprivation
Map 9 – South African Index of Multiple Deprivation for Children 2001 at municipality level: Mpumalanga
National quintiles of municipalities
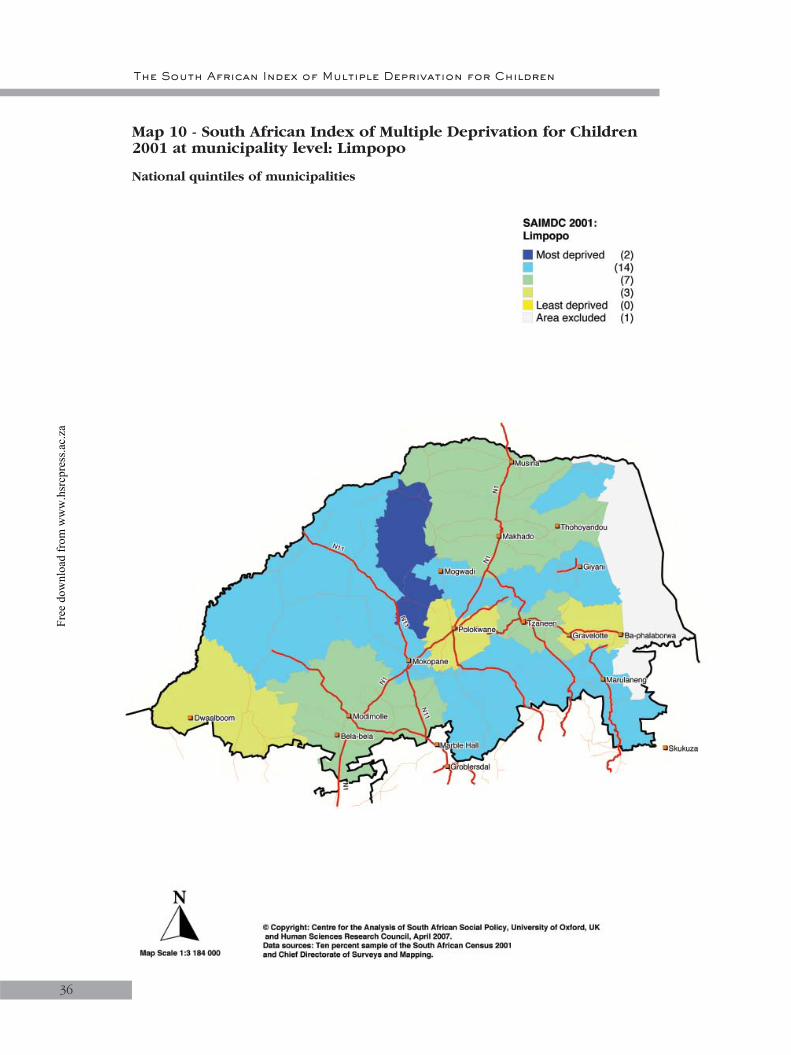
Free
dow
nloa
d fr
om w
ww
.hsr
cpre
ss.a
c.za
The South African Index of Multiple Deprivation for Children
36
Map 10 - South African Index of Multiple Deprivation for Children 2001 at municipality level: Limpopo
National quintiles of municipalities
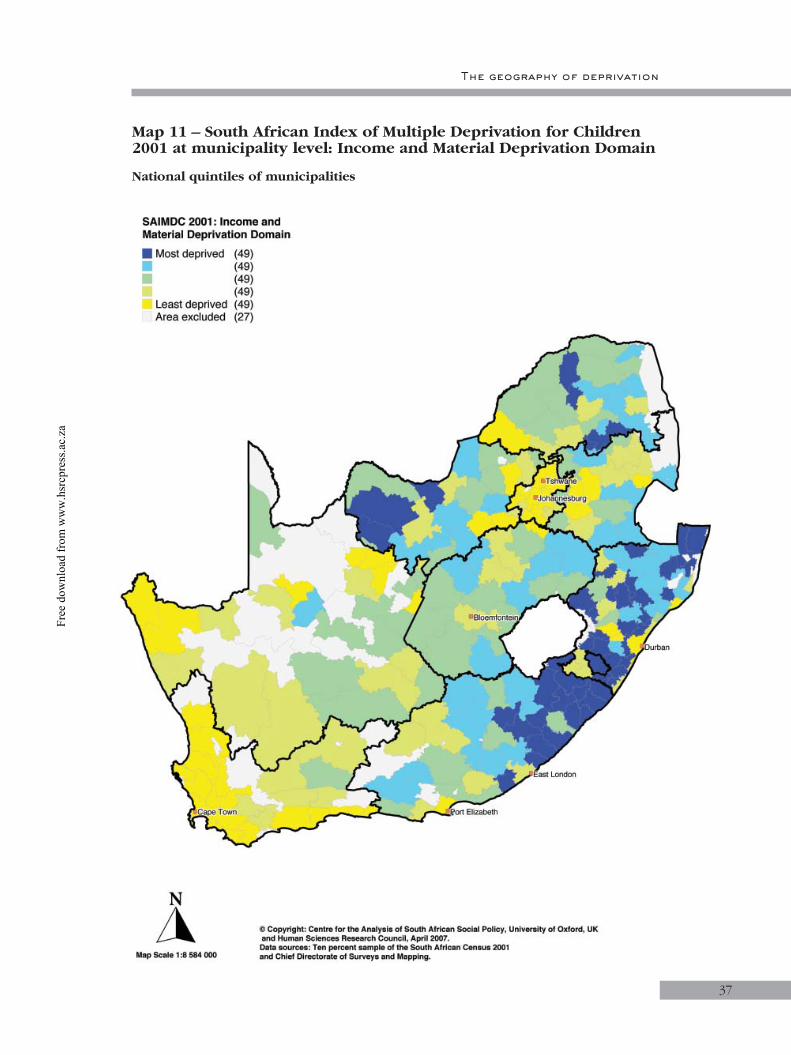
Free
dow
nloa
d fr
om w
ww
.hsr
cpre
ss.a
c.za
37
The geography of deprivation
Map 11 – South African Index of Multiple Deprivation for Children 2001 at municipality level: Income and Material Deprivation Domain
National quintiles of municipalities

Free
dow
nloa
d fr
om w
ww
.hsr
cpre
ss.a
c.za
The South African Index of Multiple Deprivation for Children
38
Map 12 – South African Index of Multiple Deprivation for Children 2001 at municipality level: Employment Deprivation Domain
National quintiles of municipalities

Free
dow
nloa
d fr
om w
ww
.hsr
cpre
ss.a
c.za
39
The geography of deprivation
Map 13 – South African Index of Multiple Deprivation for Children 2001 at municipality level: Education Deprivation Domain
National quintiles of municipalities

Free
dow
nloa
d fr
om w
ww
.hsr
cpre
ss.a
c.za
The South African Index of Multiple Deprivation for Children
40
Map 14 – South African Index of Multiple Deprivation for Children 2001 at municipality level: Living Environment Deprivation Domain
National quintiles of municipalities

Free
dow
nloa
d fr
om w
ww
.hsr
cpre
ss.a
c.za
41
The geography of deprivation
Map 15 – South African Index of Multiple Deprivation for Children 2001 at municipality level: Adequate Care Deprivation Domain
National quintiles of municipalities
Free
dow
nloa
d fr
om w
ww
.hsr
cpre
ss.a
c.za
42
CHAPTER 5
Towards a SAIMDC atsub-municipal level
5.1 A new statistical geography
Ideally, deprivation measures should be constructed at the smallest possible spatial scale that is consistent with robust measurement. The units should also be of more or less equal size in terms of population and should be relatively homogenous in terms of deprivation.
As noted in Noble, Babita et al. (2006a), although wards provide a more nuanced picture of deprivation at a sub-provincial level than municipalities, even moving to wards can be problematic: the country’s wards vary considerably in population size, especially by province. Although the national mean ward child population size is around 4 580, ward populations range from fewer than 50 children to more than 27 500 (standard deviation 2 841) across the country, and mean ward size by province ranges from around 1 900 in the Northern Cape to 6 100 in Gauteng. This raises two important issues: first, provinces with large wards will tend to be under-represented in national indices of deprivation; and second, pockets of deprivation in larger wards may be ‘diluted’ or hidden by relative non-deprivation in the vicinity.
To address these issues, it is recommended that a new small area unit be constructed that takes into account homogeneity and population size. Members of the research team have begun to develop Data Zones for South Africa, which use Enumeration Areas as building blocks. This exercise draws on work that has been carried out to create new small area geographies by the Office for National Statistics (England and Wales), the General Register Office for Scotland and the Northern Ireland Statistics and Research Agency. In these countries, similar problems with ward size and changing boundaries were encountered and it was therefore decided to develop a range of statistical areas that would be of consistent size and whose boundaries would not change6.
The key thing to note is that Data Zones would be analytical or statistical boundaries not political or administrative boundaries. They would be generated solely to ensure equity and consistency in the geographical measurement of deprivation.
6 For more information please visit the following websites:England and Wales – http://www.statistics.gov.uk/geography/soa.asp Northern Ireland – http://www.nisra.gov.uk/whatsnew/dep/super_output_areas.html Scotland – http://www.scotland.gov.uk/Publications/2004/02/18917/33243
Free
dow
nloa
d fr
om w
ww
.hsr
cpre
ss.a
c.za
43
Towards a SAIMDC at sub-municipal level
5.2 Harnessing administrative and survey data to create indices of multiple deprivation
The SAIMDC draws exclusively from the 2001 Census. This represents the picture as at October 2001. Inevitably, change will have occurred since then and although for most areas the relative position will not have altered greatly, it is important to explore ways to bring the measurement of multiple deprivation up to date. Furthermore, some types of deprivation could not be incorporated since there is no or insufficient data in the Census, for example the prevalence of crime in an area, and the extent of mortality or morbidity in an area (see Appendix 1 for further details).
It is therefore important to explore the availability of non-Census data sources. One focus would be on the possibilities of using administrative data7. Such data would enable deprivation indicators to be produced at a small area level that could generate a small area index of multiple deprivation for children which is both up to date and which can be updated more frequently8. Similarly, there are a number of synthetic estimation techniques, which can be used to model survey data down to a small area level, for example spatial microsimulation (Birkin and Clarke, 1995; Williamson, 2002).
7 See Smith and Noble (2000) on the merits of using administrative data in the UK context.8 See Barnes et al. (2007) for a review of currently available administrative data sources.
Free
dow
nloa
d fr
om w
ww
.hsr
cpre
ss.a
c.za
44
APPENDIX 1
Indicators used in the SAIMDC
This Appendix gives further details of the indicators that were used in the SAIMDC. All indicators were derived from the 2001 Census. Information on the Census question used and the responses (codes) selected to define a child as deprived are provided below. All numerators and denominators exclude children living in institutions. For all domains apart from the Education Deprivation Domain, the score was calculated as a simple rate: i.e. the percentage of children experiencing deprivation on one or more of the indicators in that domain. Unless otherwise indicated, the indicators (numerators and denominators) listed below take into account children aged 0-17 years, derived from Census question P-02 (“What is (the person’s) date of birth and age in completed years?”).
The Income and Material Deprivation Domain
Background
Income deprivation is a good proxy for general material deprivation and is included in this domain alongside two direct measures of material deprivation.
The indicators are the same as those used in the PIMD. With regards to material deprivation, it was felt that the arguments for including ownership of a refrigerator and ownership of a television or radio applied equally to children: ownership of a refrigerator represents a basic asset for safe storage of food, while ownership of a radio or television represents an important means of accessing information.
Numerator
1. Number of children living in a household that has a household income (need-adjusted using the modified OECD equivalence scale) that is below 40% of the mean equivalent household income
The Census question P-22 (“What is the income category that best describes the gross income of (this person) before tax?”) was used to calculate a household income. A household equivalent income was calculated using this household income, a modified OECD equivalence scale, and Census question P-02 (“What is (the person’s) date of birth and age in completed years?”). The cut-off used was ‘below 40% mean household equivalent income derived from the IES 2000 and adjusted using the CPI. Further details of the equivalence scale used (and sensitivity testing of other equivalence scales) and calculation of mean equivalent household income are given in the Technical Report produced for the PIMD 2001, (Noble, Babita et al., 2006b).
2. Number of children living in a household without a refrigerator This indicator used Census question H-29 (“Does the household have any of the
following (in working condition): radio, television, computer, refrigerator, telephone in the dwelling, cell-phone?”). Children were selected who lived in a household without a refrigerator (code 2).
3. Number of children living in a household with neither a television nor a radio This indicator used Census question H-29 (“Does the household have any of the
following (in working condition): radio, television, computer, refrigerator, telephone in the dwelling, cell-phone?”). Children were selected who lived in a household with neither a radio nor a television (code 2 for both radio and television).
Free
dow
nloa
d fr
om w
ww
.hsr
cpre
ss.a
c.za
45
Appendix 1
Denominator
This domain used the total child population as the denominator.
Other issues considered
A variety of issues were considered for this domain (for the PIMD), including use of banded income, missing incomes, the effects of different income thresholds, the effects of different equivalence scales, and income versus expenditure as the principal living standard indicator. These are discussed in Noble, Babita et al. (2006a and 2006b).
The Employment Deprivation Domain
Background
The presence of employed adults in a household is likely to improve the well-being of children as money is brought into the household, which in general is spent on the other household members, including children (Budlender, 2006). If children do not have access to employed adults, they are more likely to live in poverty. Budlender’s (2006) analysis of the GHS 2004 found that in poor households the unemployment rate is more than double that in non-poor households.
Numerator
Number of children living in households where no adults aged 18 or over are in employment The Census questions P-18 (“In the seven days before 10 October did (the person) do any work for pay (in cash or kind), profit or family gain, for one hour or more?”) and P-02 (“What is (the person’s) date of birth and age in completed years?”) were used to determine whether anyone in the household aged 18 or over was in employment. Children were selected who lived in a household where no adults are in employment (question P-18, code 5 ‘no: did not have work’).
Denominator
This domain used the total child population as the denominator.
Other issues considered
Children under the age of 15 years are prohibited, by law, from virtually all employment and there are restrictions on employment of children aged 15-17 years. It was therefore decided that it is inappropriate to examine anything other than the employment of adults in households in which children live.
The Education Deprivation Domain
Background
Education is important in many different ways, both in childhood and later when children become adults. Education is one of the key factors affecting the development of children. Getting an education is an important process for children, and equal access allows participation in and respect by society (Klasen, 2001). School, both on an everyday level, and through the extra-curricular activities provided, is crucial for social and cultural contact and different life experiences (Ridge, 2002).
Free
dow
nloa
d fr
om w
ww
.hsr
cpre
ss.a
c.za
The South African Index of Multiple Deprivation for Children
46
Access to quality education is an important factor for labour market participation and for securing an income above the poverty line in later life:
While delivery in many other social sectors alleviates the existing plight of the poor, education gives children the opportunity to change their situation in the future […] Access to quality education ensures that children grow up literate and able to participate in economic activities, thereby improving their living circumstances and ensuring broader economic development across the country (Robinson and Sadan, 1999).
Full participation in society as a child and as an adult therefore depends to a large extent on the ability to partake effectively in the education system.
Whereas the PIMD focused on adults aged 18 to 65 years, the primary focus for this measure is children of compulsory school age. Although it was explained in the PIMD report that examination of the distributions of the school attendance indicator at the small area level and the lack of correlation at the small area level with predictors of school attendance such as income suggested a possible lack of robustness, it was felt that it could be included in the SAIMDC. The school attendance indicator is combined with a second indicator, children in the wrong grade for their age, thereby making the domain sufficiently robust. Furthermore, the SAIMDC is not constructed at such a small area level as the PIMD.
Numerator
1. Number of children who are in the wrong grade for their age This indicator used Census questions P-02 (“What is (the person’s) date of birth
and age in completed years?”) and P-17 (“What is the highest level of education that (the person) has completed?”) to determine children (aged 9-15) in the wrong grade (one grade behind) for their age.
The choice of ages was determined by the Census question: highest level of education completed, rather than grade currently in. Those currently in grade 3 would have completed grade 2 and their highest level of education completed would therefore be grade 2. For a child to be in the wrong grade by one year, their highest level of education completed would therefore be grade 1. It is not possible to say whether those in grade 2 were one year behind as they would have completed grade 1 and their highest level of education completed would therefore be grade 1. For a child to be in the wrong grade by one year, their highest level of education completed would therefore be grade 0/reception, but this is not offered universally in schools, so had to be discounted. At the other end, those in grade 9, the last year of compulsory schooling, would have completed grade 8 and their highest level of education completed would therefore be grade 8. For a child to be in the wrong grade by one year, their highest level of education completed would therefore be grade 7. The Census question had to be asked in this way because it was asked of everyone, not just children. The Census metadata does note that the question may not always have been understood and some people may thus be mis classified by a year. For the purposes of this indicator, such a misclassification would result in under-estimation rather than over-estimation of the number of children in the wrong grade for their age, and so was not considered to be a great problem.
Free
dow
nloa
d fr
om w
ww
.hsr
cpre
ss.a
c.za
47
Appendix 1
2. Number of children who are not in school This indicator used Census questions P-02 (“What is (the person’s) date of birth and
age in completed years?”) and P-16 (“Does (the person) presently attend an educational institution?). Children (aged 7-15) not in school (P-16, code 1) were selected.
Denominator
This indicator used children aged 9-15 as the denominator.This indicator used children 7-15 as the denominator.
Other issues considered
Using different weights to combine the two indicators was discussed. It was questioned whether the ‘in wrong grade’ indicator should have a different (lower) weight than the ‘not in school’ indicator as it is arguably a worse situation to not be in school at all, than to be in school and fall behind. In the absence of empirical evidence on which to base the weighting (which is worse and by how much?) it was decided to use equal weights to combine the indicators.
Other issues considered in relation to education include attendance at Early Childhood Development (ECD) facilities, for which there was no information in the Census; financial resources to pay for school uniforms, school shoes and school fees, which is covered in the Income and Material Deprivation Domain; and adequate space and lighting for children to do homework, which fall under the Living Environment Deprivation Domain.
The Living Environment Deprivation Domain
Background
This domain considers different aspects of the immediate environment in which children live that impact on the quality of their day-to-day life. There are indicators measuring the quality of housing, the amenities within the dwelling, and access to adequate living space.
The indicators are the same as those used in the PIMD, with the exception of the crowding indicator. In the PIMD, the crowding indicator was two or more people per room. However, for the SAIMDC, the indicator was constructed using the Canadian National Occupancy Standard (see below), to take into account both household size and composition. Household composition is an important factor to take into account in a child index as it is inappropriate for adults to have to sleep with children, or for boys and girls to share the same bed. Such situations place children at greater risk of sexual abuse (Hall and Berry, 2006). This should be reflected by a measure of crowding/appropriate living space. The rationale for using the other indicators is provided in Noble, Babita et al. (2006a).
Numerator
1. Number of children living in a household that has no access to a telephone This indicator used Census question H-29a (“Where do members of this household
mainly use a telephone?”), which was asked only to people in households that answered ‘no’ to having a telephone in the dwelling or a cell-phone (question H-29). Children in households that responded ‘at another location not nearby’ (code 4), or ‘no access to a telephone’ (code 5) were selected.
1.2.
Free
dow
nloa
d fr
om w
ww
.hsr
cpre
ss.a
c.za
The South African Index of Multiple Deprivation for Children
48
2. Number of children living in a household that has no piped water inside the dwelling or yard or nearby
This indicator used Census question H-26 (“In which way does this household obtain piped water for domestic use?”) and selected children in households that responded ‘no access to piped (tap) water’ (code 1), or ‘piped (tap) water on community stand: distance greater than 200 m from dwelling’ (code 2).
3. Number of children living in a household that has no use of electricity for lighting This indicator used Census question H-28 (“What type of energy/fuel does this
household mainly use for cooking, for heating and for lighting?”) and selected children in households that responded ‘gas’ (code 2), ‘paraffin’ (code 3), ‘candles’ (code 6), ‘solar’ (code 8), and ‘other’ (code 9).
4. Number of children living in a household that is a shack This indicator used Census question H-23a (“Which type of dwelling or housing unit
does this household occupy?”) and selected children in households that responded ‘informal dwelling/shack in back yard’ (code 6), ‘informal dwelling/shack not in back yard, e.g. in an informal/squatter settlement’ (code 7).
5. Number of children living in a household that has neither a pit latrine with ventilation nor a flush toilet
This indicator used Census question H-27 (“What is the main type of toilet facility that is available for use by this household?”) and selected children in households that responded ‘chemical toilet’ (code 3), ‘pit latrine without ventilation’ (code 5), ‘bucket latrine’ (code 6), and ‘none’ (code 7).
6. Number of children living in a household that is crowded This indicator was calculated using Census questions, P-02 (“What is (the person’s) date
of birth and age in completed years?”), P-03 (“Is (the person) male or female?”), P-05a (“Who, in the household, is (the person’s) spouse or partner?”) and H-24 (“How many rooms, including kitchens, are there for this household?”).
The number of rooms needed by the household, based on the Canadian National Occupancy Standard, was calculated. This measures the bedroom requirements of a household by specifying that: there should be no more than two people per bedroom; children less than 5 years of age of different sexes may reasonably share a bedroom; children 5 years and over of opposite sex should not share a bedroom; children less than 18 years of age and of the same sex may reasonably share a bedroom; and household members 18 years and over should have a separate bedroom, as should parents or couples (Gray, 2001). If the number of rooms needed was greater than the number of rooms in the house then all children in the household were counted as living in crowded households.
Denominator
This domain used the total child population as the denominator.
Other issues considered
Two versions of the crowding indicator were explored: the Canadian National Occupancy Standard and children living in a house with one room only. The former was felt to be a more rigorous test of crowding in relation to the welfare of children, and so was adopted.
Free
dow
nloa
d fr
om w
ww
.hsr
cpre
ss.a
c.za
49
Appendix 1
The Adequate Care Deprivation Domain
Background
Extensive research has emphasised the importance of caregivers in promoting child well-being at all ages. There are no direct indicators in the Census which tell us whether care is ‘adequate’ or not. However, it is possible to identify groups of children who are at risk of inadequate care. Thus, child-headed households are included in this domain. Children who have neither of their biological parents living with them are also included. This does not mean that their care is necessarily inadequate – they may be being well looked after by friends or relatives. However, this group is more at risk of inadequate care.
Numerator
1. Number of children whose mother and father are no longer alive or not living in the household This indicator used Census questions P-14 (“Is (the person’s own biological mother still
alive?”), P-14a (“If yes, who in this household is (the person’s) mother?”), P-15 (“Is (the person’s own biological father still alive?”) and P-15a (“If yes, who in this household is (the person’s) father?”). Children were selected whose mother was not alive (question P-14, code 2) or not in the household (question P-14a, code 99) and whose father was not alive (question P-15, code 2) or not in the household (question P-15a, code 99).
2. Number of children living in a child-headed household Census questions P-02 (“What is (the person’s) date of birth and age in completed
years?”) and P-04 (“What is (the person’s) relationship to the head or acting head of the household?”). Children in households with a head of household (question P-04, code 1 ‘head/acting head’) under the age of 18 were selected.
Denominator
This domain used the total child population as the denominator.
Other issues considered
An indicator measuring the number of children living in single-carer households was considered, but was not included in the final domain. It was argued that having a single carer only does not necessarily result in inadequate care, and that such a situation may become problematic for children only when accompanied by low income. Low income is measured in the Income and Material Deprivation Domain.

Free
dow
nloa
d fr
om w
ww
.hsr
cpre
ss.a
c.za
The South African Index of Multiple Deprivation for Children
50
Other domains considered
Health
It was hoped that a domain measuring health deprivation could be included in the SAIMDC. Measures of premature mortality – a good indicator of the overall health (and socio-economic) status of a population – were explored but no measure could be satisfactorily produced using the 10% sample of the 2001 Census at Municipal level.
In the UK indices, the health domain has also included measures of physical morbidity. Unfortunately the Census does not provide suitable information on this aspect of health deprivation. In future work it is hoped that a measure of physical morbidity – as well as mortality – could be included using administrative and survey data. Examples of relevant aspects of physical morbidity to include are HIV infection (relating both to mother to child transmission and subsequent infection), respiratory diseases, tuberculosis, Foetal Alcohol Syndrome (of which South Africa has the highest prevalence in the world), low birth weight, stunting due to malnutrition, child mental health, and alcohol and substance misuse amongst children.
Physical safety
Physical safety was suggested as a domain of deprivation in the Noble, Wright and Cluver (2006) model of child poverty. Crime and social order are important elements in measuring deprivation at the small area level. In recent years, nationally representative attitudinal surveys conducted by the HSRC have demonstrated that crime is consistently reported as a key challenge facing the country. In addition, the first National Youth Victimisation Survey (NYVS) reports that between September 2004 and September 2005, 42% of South African youth aged between 12 and 22 years were victims of crime or violence, including assault, sexual assault/rape, theft and robbery. Young people in South Africa are twice as likely as adults to be victims of at least one crime (Burton, 2006). Research shows that crimes against children are significantly higher in poorer areas (Dawes, 2002). The existence of gangs in urban areas can also result in injuries and deaths from gang crossfire: for 15-19 year olds, firearm injuries were the leading cause of non-natural death between 2000 and 2001 (Prinsloo, 2001).
Another valuable input would therefore be data relating to fear of crime and the perception of community disorder. However, the Census does not include information on perceptions of crime, nor on crimes against children, and so a domain measuring crime or social order could not be included in the SAIMDC. As the emphasis shifts to administrative data in subsequent rounds of research, a number of crime-focused data sets and methodologies will need to be explored. An important concern in this regard will be the reliability of reporting and the levels of standardisation of crime recording practices, though it is recognised that substantive progress is being made in these areas. It is hoped that these ongoing advances will enable future updates of the index to incorporate crime and social order indicators. Although police data is clearly an important indicator of levels and trends in crime and disorder, other partner agencies also collect a great deal of data relevant to this domain. An example is the NYVS that was undertaken in 2005 by the Centre for Justice and Crime Prevention.
Free
dow
nloa
d fr
om w
ww
.hsr
cpre
ss.a
c.za
51
Appendix 1
Abuse
Abuse of children is a key indicator of deprivation and because of its prevalence in South Africa, the model of child poverty (Noble, Wright and Cluver, 2006) contains an abuse domain rather than including it in other domains. Child abuse can take place within the home, at school, or in the neighbourhood. There is a large body of research showing the negative outcomes of childhood abuse in areas such as mental health and education, both in childhood and in later years (Dawes, 2002). It could not be included in the SAIMDC due to data constraints, but it is important to keep in mind for future indices. However, it is unlikely that reliable data at small area level will be available.
Social capital
Social capital (extended family support, trusted adults, support from friends, religious institutions) was also included in the child poverty model (Noble, Wright and Cluver, 2006), but again could not be included because the Census does not contain suitable information.
Access to services
Access to good quality services is a feature that cuts across all domains in the model of child poverty (Noble, Wright and Cluver, 2006), although in the UK indices it has been included as a domain in its own right. These are services such as schools and clinics rather than utilities such as electricity, water and sanitation. Access to services was considered for inclusion as part of the SAIMDC, but there are no specific questions on this in the 2001 Census.
The types of services that are commonly used as indicators of access to services and that are relevant to children include health personnel and facilities and educational facilities (ECD and schools). Access to recreational facilities may also be important for children. As an example, access to school is a problem for children in South Africa, particularly those living in rural areas. Many children have to travel long distances to school (Alliance for Children’s Entitlement to Social Security, 2002; Berry and Guthrie, 2003; Berry and Rudolph, 2006). The National Household Travel Survey reveals that in 2003, the majority of learners (76%) usually walked to their place of education – the proportion was higher in rural than urban or metropolitan areas (91%, 71% and 57% respectively). For the majority of students (70%) the door to door travel time was 30 minutes or less, but for 17% the journey was longer than 45 minutes (Department of Transport, 2005).
Road distance, availability of public transportation and the quality of roads all need to be taken into account in assessing access to services. Noble, Wright and Cluver (2006) also suggest that the quality of the service also needs to be taken into account.
Free
dow
nloa
d fr
om w
ww
.hsr
cpre
ss.a
c.za
52
APPENDIX 2
Exponential transformation
Once the domains had been constructed, it was necessary to combine them into an overall index. In order to do this the domain indices were standardised by ranking. They were then transformed to an exponential distribution.
The exponential distribution was selected for the following reasons. First, it transforms each domain so that they each have a common distribution, the same range and identical maximum/minimum value, so that when the domains are combined into a single index of multiple deprivation the (equal) weighting is explicit; that is there is no implicit weighting as a result of the underlying distributions of the data. Second, it is not affected by the size of the municipality’s population. Third, it effectively spreads out the part of the distribution in which there is most interest; that is the most deprived municipalities in each domain.
Each transformed domain has a range of 0 to 100, with a score of 100 for the most deprived municipality. The research team judged that the exponential transformation that stretched out or emphasised the most deprived 25% of municipalities would be most appropriate. The chosen exponential distribution is one of an infinite number of possible distributions. Two other exponentials were explored: stretching out the most deprived 10% of municipalities (used in UK indices) and stretching out the most deprived 30% of municipalities. Given the much higher levels of deprivation in South Africa, it was thought that it was appropriate to spread out the most deprived quarter of the distribution.
When transformed scores from different domains are combined by averaging them, the skewness of the distribution reduces the extent to which deprivation on one domain can be cancelled by lack of deprivation on another. For example, if the transformed scores on two domains are averaged with equal weights, a (hypothetical) municipality that scored 100 on one domain and 0 on the other would have a combined score of 50 and would thus be ranked at the 75th percentile. (Averaging the untransformed ranks, or after trans form ation to a normal distribution, would result in such a municipality being ranked instead at the 50th percentile: the high deprivation in one domain would have been fully cancelled by the low deprivation in the other). Thus the extent to which deprivation in some domains can be cancelled by lack of deprivation in others is, by design, reduced.
The transformation used is as follows. For any municipality, denote its rank on the domain, scaled to the range [0,1], by R (with R=1/N for the least deprived, and R=N/N, i.e. R=1, for the most deprived, where N=the number of municipalities).
The transformed domain X = -�*log{1 - R*[1 - exp(-100/�)]}
where log denotes natural logarithm and exp the exponential or antilog transformation and � is a constant which determines the slope of the exponential. For the SAIMDC (where the most deprived 25% of municipalities are emphasised) �=45.5.
Free
dow
nloa
d fr
om w
ww
.hsr
cpre
ss.a
c.za
53
Appendix 2
There are a number of other ways in which domain scores could have been standardised/transformed prior to combination. Examples include z scores and the signed chi square technique. However each has major drawbacks. The former leads to unpredictable implicit weighting where there are significant outliers at either end of the distribution; the latter introduces size of population into the equation in an unpredictable way (for a discussion see Noble, Smith, Penhale et al., 2000: 53-56). In the case of the UK work, ranking and then transforming the ranks to an exponential transformation distribution proved most satisfactory (Noble, Smith, Penhale et al., 2000). For this reason the technique was used with modification in the South African situation.
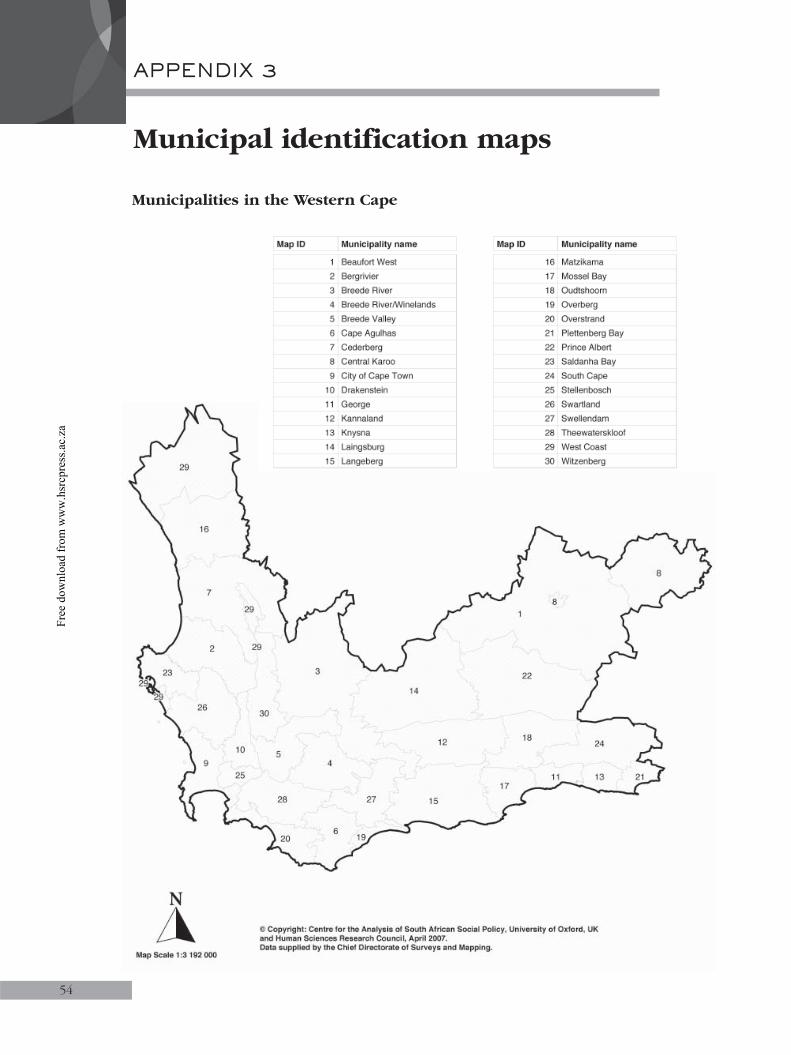
Free
dow
nloa
d fr
om w
ww
.hsr
cpre
ss.a
c.za
54
Municipal identification maps
APPENDIX 3
Municipalities in the Western Cape
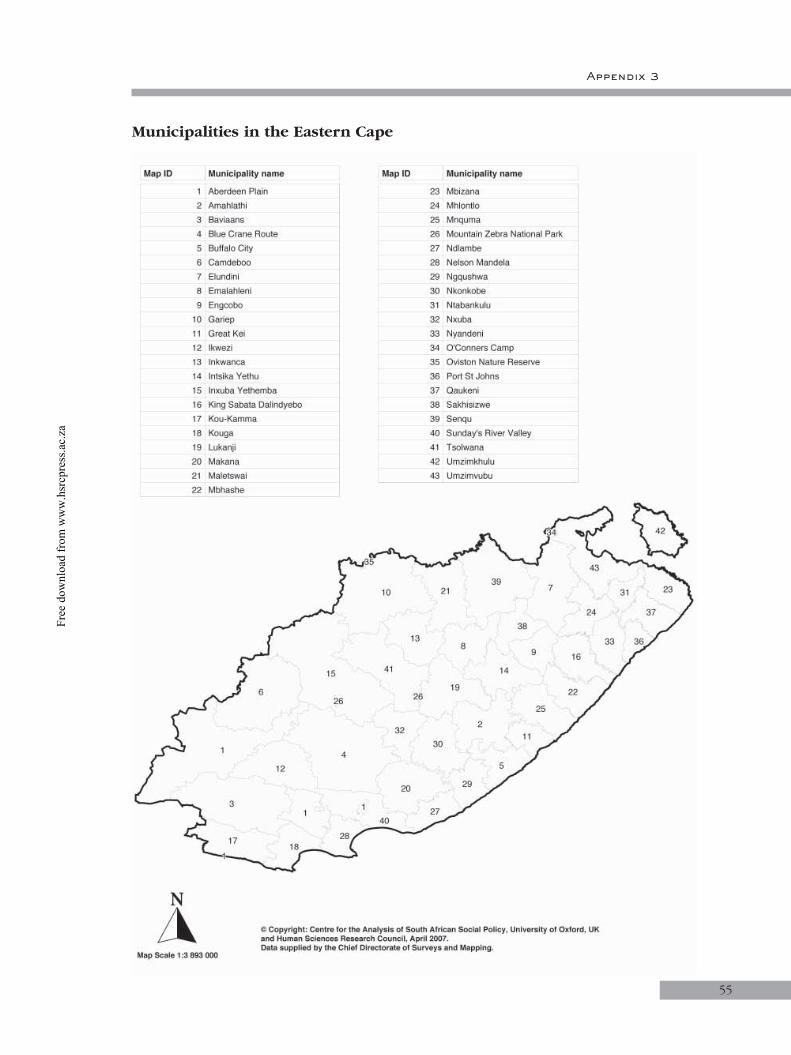
Free
dow
nloa
d fr
om w
ww
.hsr
cpre
ss.a
c.za
55
Appendix 3
Municipalities in the Eastern Cape
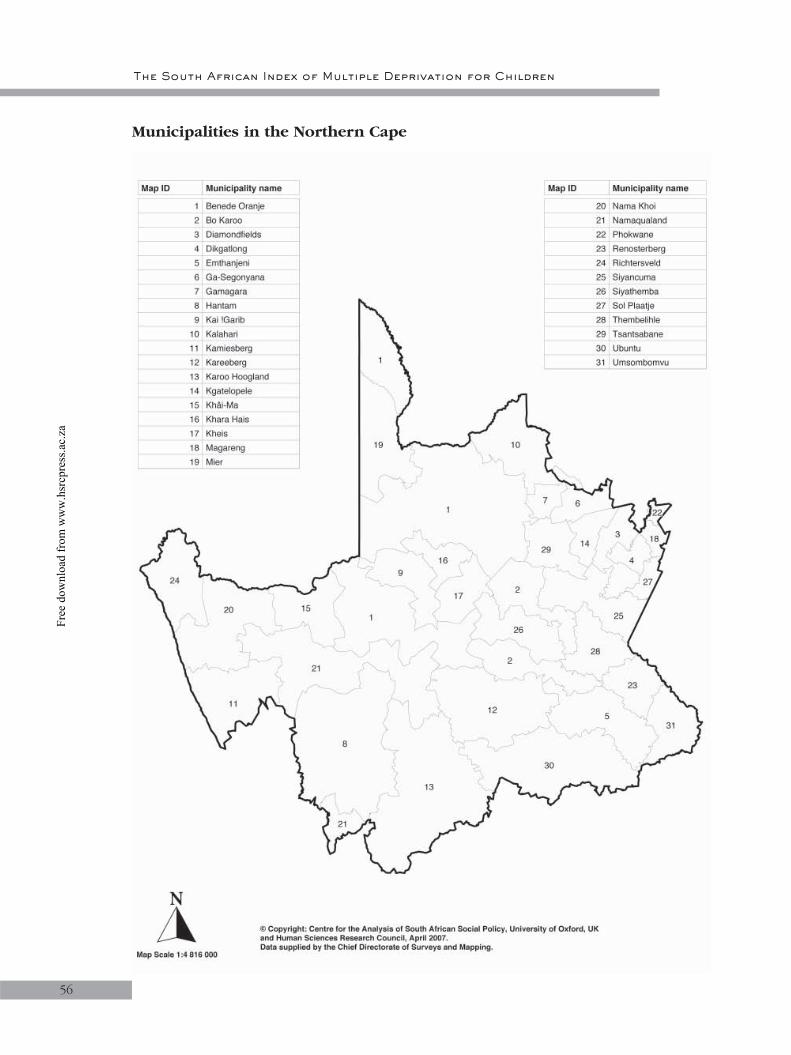
Free
dow
nloa
d fr
om w
ww
.hsr
cpre
ss.a
c.za
The South African Index of Multiple Deprivation for Children
56
Municipalities in the Northern Cape
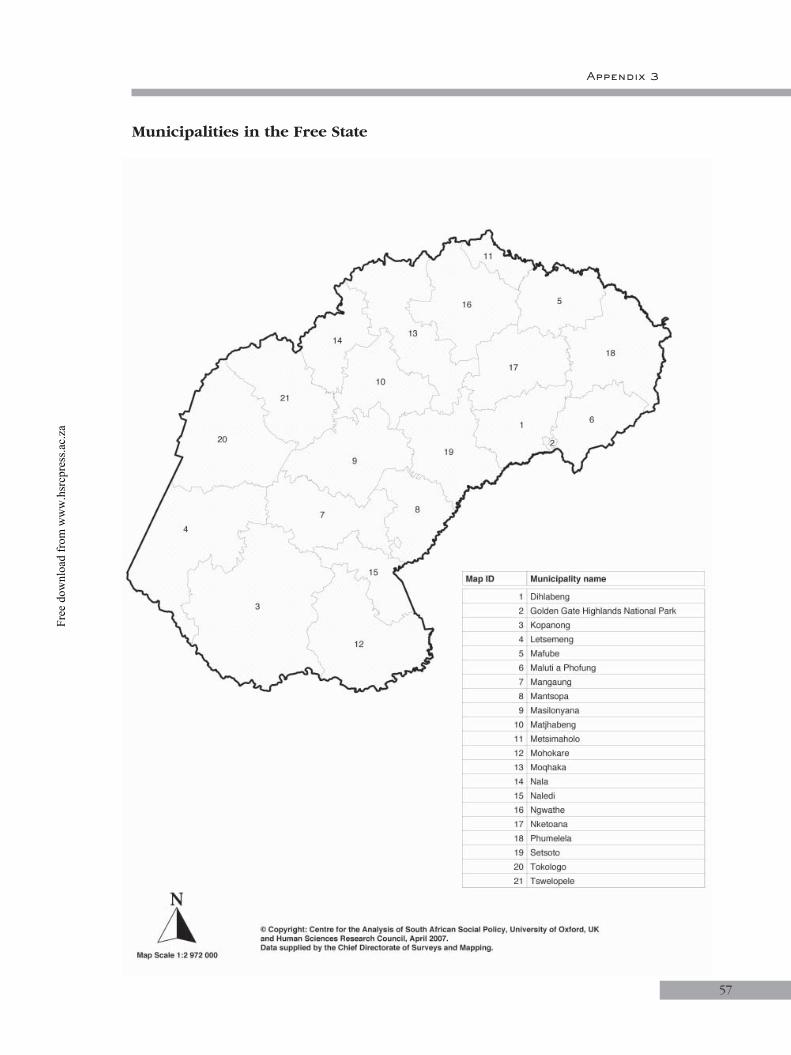
Free
dow
nloa
d fr
om w
ww
.hsr
cpre
ss.a
c.za
57
Appendix 3
Municipalities in the Free State
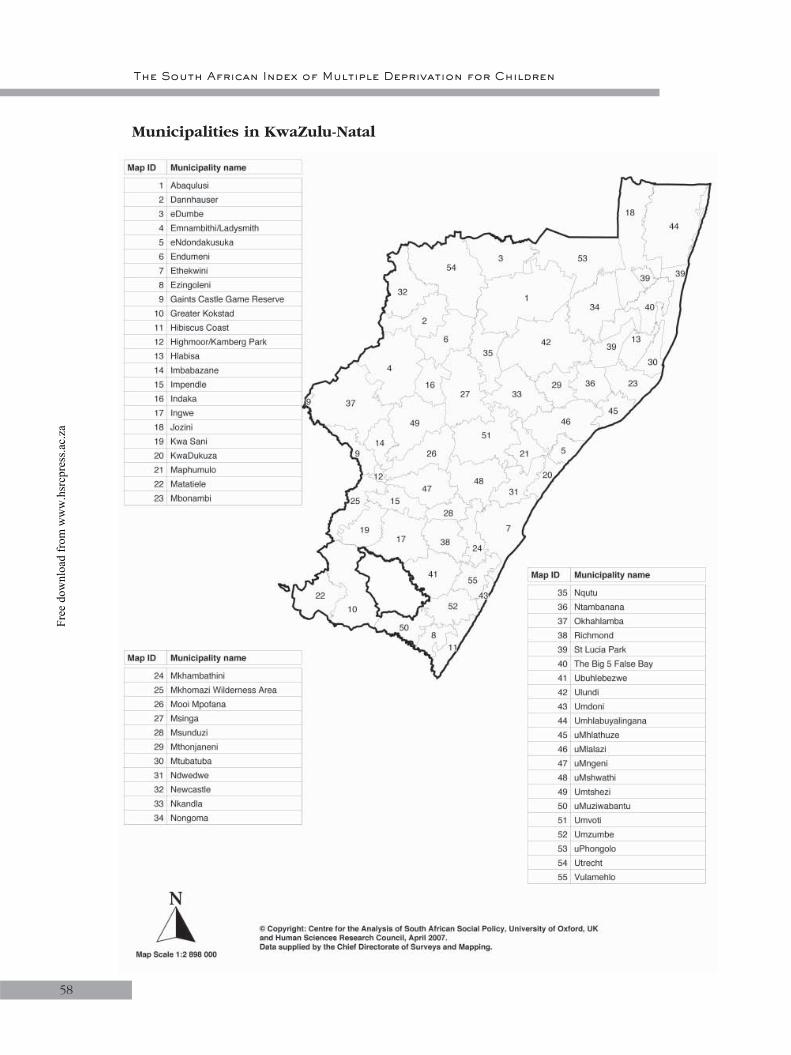
Free
dow
nloa
d fr
om w
ww
.hsr
cpre
ss.a
c.za
The South African Index of Multiple Deprivation for Children
58
Municipalities in KwaZulu-Natal
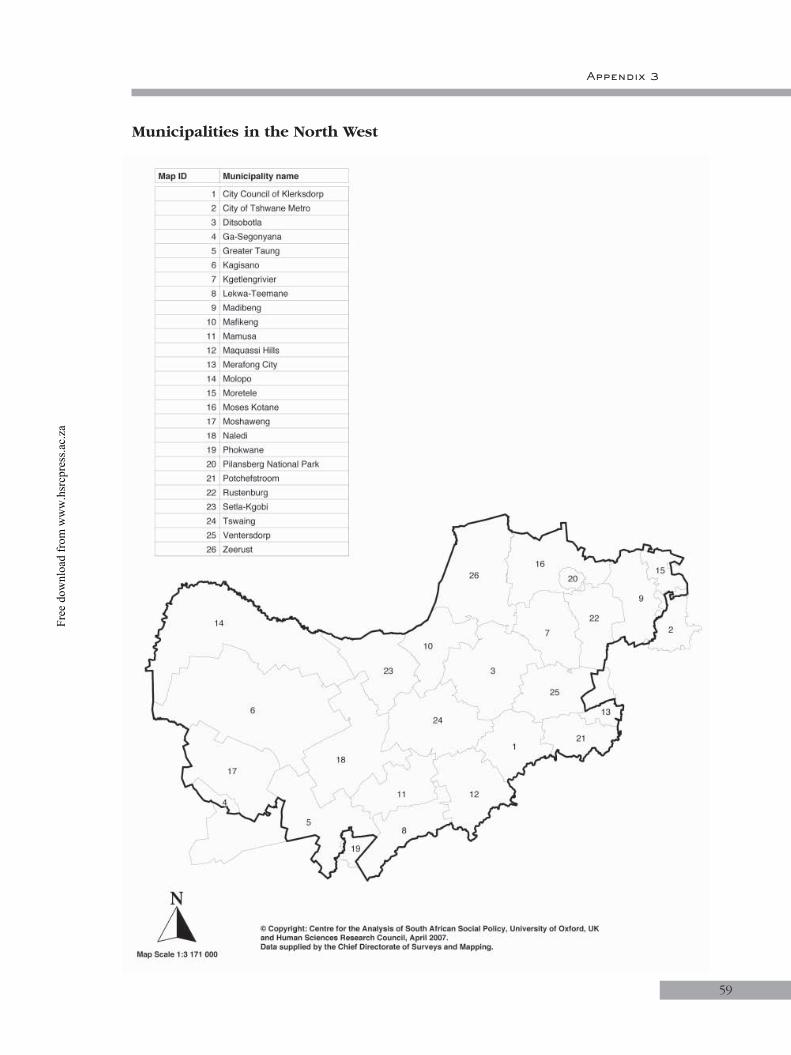
Free
dow
nloa
d fr
om w
ww
.hsr
cpre
ss.a
c.za
59
Appendix 3
Municipalities in the North West

Free
dow
nloa
d fr
om w
ww
.hsr
cpre
ss.a
c.za
The South African Index of Multiple Deprivation for Children
60
Municipalities in Gauteng
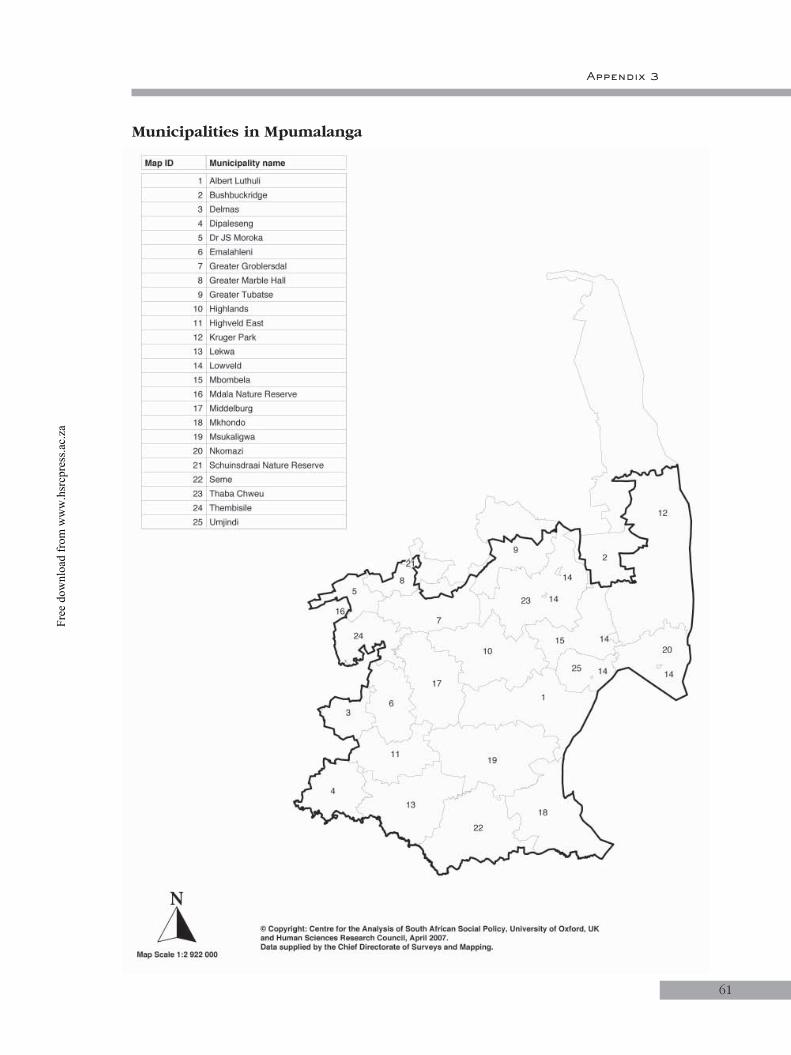
Free
dow
nloa
d fr
om w
ww
.hsr
cpre
ss.a
c.za
61
Appendix 3
Municipalities in Mpumalanga

Free
dow
nloa
d fr
om w
ww
.hsr
cpre
ss.a
c.za
The South African Index of Multiple Deprivation for Children
62
Municipalities in Limpopo

Free
dow
nloa
d fr
om w
ww
.hsr
cpre
ss.a
c.za
63
REFERENCES
Alliance for Children’s Entitlement to Social Security (2002) Children Speak Out on Poverty: Report on the ACESS child participation process, Cape Town: Children’s Institute, University of Cape Town.
African National Congress (1994) Reconstruction and Development Programme: A policy framework, Johannesburg: Umanyano Publications.
Barnes, H., Noble, M., Dibben, C., Meth, C., Wright, G. and Cluver, L. (2007) ‘South Africa microdata scoping study’, CASASP Working Paper No 6, Oxford: Department of Social Policy and Social Work, University of Oxford.
Berry, L. and Guthrie, T. (2003) Rapid Assessment: The situation of children in South Africa, Cape Town: Children’s Institute, University of Cape Town.
Berry, L. and Rudolph, N. (2006) ‘Children’s access to education’, in J. Monson, K. Hall, C. Smith and M. Shung-King (eds) South African Child Gauge 2006, Cape Town: Children’s Institute, University of Cape Town.
Birkin, M. and Clarke, G.P. (1995) ‘Using microsimulation methods to synthesise Census data’, in S. Openshaw (ed) Census Users’ Handbook, London: GeoInformation International.
Bray, R. (2002) ‘Missing links? An examination of the contributions made by social surveys to our understanding of child well-being in South Africa’, CSSR Working Paper No 23, Cape Town: Centre for Social Science Research, University of Cape Town.
Budlender, D. (2006) ‘Unemployment and children’s wellbeing: A statistical exploration’, in P. Graham (ed) Inheriting Poverty? The link between children’s wellbeing and unemployment in South Africa, Cape Town: IDASA.
Burton, P. (2006) Snapshot Results of the 2005 National Youth Victimisation Study, CJCP Research Bulletin No 1 May 2006, Cape Town: Centre for Justice and Crime Prevention.
Cassiem, S., Perry, H., Sadan, M. and Streak, J. (2000) Are Poor Children Being Put First? Child Poverty and the Budget 2000, Cape Town: IDASA.
Coetzee, E. and Streak, J. (eds) (2004) Monitoring Child Socio-Economic Rights in South Africa: Achievements and challenges, Cape Town: IDASA.
Dawes, A. (2002) Sexual Offences Against Children in South Africa, Cape Town: Children’s Institute, University of Cape Town.
Dawes, A., Bray, R. and Van Der Merwe, A. (2007) Monitoring Child Rights and Wellbeing: A South African approach, Cape Town: HSRC Press.
Department for Education and Skills, UK (2004) Every Child Matters: Change for Children, London: HMSO.
Department of Transport, Republic of South Africa (2005) National Household Travel Survey 2003: Technical Report, Pretoria: Government Printer.
Dieden S. and Gustafson B. (2003) ‘Child poverty in South Africa: an assessment based on microdata for 1995’, International Journal of Social Welfare, 12: 326–338.
Ennew, J. (1999) ‘Children’s rights indicators’, in E. Verhellen (ed) Understanding Children’s Rights: Collected papers presented at the fourth International Interdisciplinary Course on Children’s Rights, Ghent Papers on Children’s Rights No 5, Ghent: University of Ghent.

Free
dow
nloa
d fr
om w
ww
.hsr
cpre
ss.a
c.za
The South African Index of Multiple Deprivation for Children
64
Feeny, T. and Boyden, J. (2004) ‘Acting in adversity: Rethinking the causes, experiences and effects of child poverty in contemporary literature’, QEH Working Paper No 116, Oxford: Queen Elizabeth House, University of Oxford.
Gordon, D., Nandy, S., Pantazis, C., Pemberton, S. and Townsend, P. (2003) Child Poverty in the Developing World, Bristol: The Policy Press.
Gray, A. (2001) Definitions of Crowding and the Effects of Crowding on Health: A literature review, Wellington: The Ministry of Social Policy.
Grinspun, A. (2004) ‘Editorial’, in A. Grinspun (ed) In Focus. Children and Poverty, March 2004, Brasilia: United Nations Development Programme International Poverty Centre.
Guthrie, T., Cassiem, S., Kgample, L., Hlatiswayo, R., Mguye, U. and September, R. (2003) Child Well-Being and Poverty Indicators in South Africa, Cape Town: Children’s Institute, University of Cape Town.
Haarmann, D. (1999) The Living Conditions of South Africa’s Children, Research Monograph 9, Cape Town: Applied Fiscal Research Centre, University of Cape Town.
Hall, K. and Berry, L. (2006) ‘Children’s access to housing’, in J. Monson, K. Hall, C. Smith and M. Shung-King (eds) South African Child Gauge 2006, Cape Town: Children’s Institute, University of Cape Town.
Jacobs, M., Shung-King, M. and Smith, C. (eds) (2005) South African Child Gauge 2005, Cape Town: Children’s Institute, University of Cape Town.
Klasen, S. (2001) ‘Social exclusion, children and education: implications of a rights-based approach’, European Societies, 3(4): 413–445.
Kleinman, M. (1999) ‘There goes the neighbourhood: area policies and social exclusion’, New Economy, 6: 188–192.
Lister, R. (2004) Poverty, Cambridge: Polity Press.
May, J. (ed) (1998) Poverty and Inequality in South Africa, Report prepared for the Office of the Executive Deputy President and the Inter-Ministerial Committee for Poverty and Inequality, Durban: Praxis Publishing.
Micklewright, J. (2002) ‘Social exclusion and children: a European view for a US debate’, CASEPaper 51, London: Centre for the Analysis of Social Exclusion, London School of Economics.
Monson, J., Hall, K., Smith, C. and Shung-King, M. (eds) (2006) South African Child Gauge 2006, Cape Town: Children’s Institute, University of Cape Town.
National Institute of Economic Policy (1996) Children, Poverty and Disparity Reduction in South Africa: Towards fulfilling the rights of South Africa’s children, Pretoria: Government Printer.
Noble, M., Babita, M., Barnes, H., Dibben, C., Magasela, W., Noble, S., Ntshongwana, P., Phillips, H., Rama, S., Roberts, B., Wright, G. and Zungu, S. (2006a) The Provincial Indices of Multiple Deprivation for South Africa 2001, University of Oxford, UK. Available from: http://www.casasp.ox.ac.uk , http://www.hsrc.ac.za/Research_Programme-Page-64.phtml and http://www.statssa.gov.za/publications
Noble, M., Babita, M., Barnes, H., Dibben, C., Magasela, W., Noble, S., Ntshongwana, P., Phillips, H., Rama, S., Roberts, B., Wright, G. and Zungu, S. (2006b) The Provincial Indices of Multiple Deprivation for South Africa 2001: Technical Report, University of Oxford, UK. Available from: http://www.casasp.ox.ac.uk, http://www.hsrc.ac.za/Research_Programme-Page-64.phtml and http://www.statssa.gov.za/publications

Free
dow
nloa
d fr
om w
ww
.hsr
cpre
ss.a
c.za
65
References
Noble, M., Barnes, H., Smith, G.A.N., McLennan, D., Dibben, C., Avenell, D., Smith, T., Anttila, C., Sigala, M. and Mokhtar, C. (2005) Northern Ireland Multiple Deprivation Measures 2005, Belfast: Northern Ireland Statistics and Research Agency.
Noble, M., Smith, G.A.N., Penhale, B., Wright, G., Dibben, C., Owen, T. and Lloyd, M. (2000) Measuring Multiple Deprivation at the Small Area Level: The Indices of Deprivation 2000, London: Department of the Environment, Transport and the Regions.
Noble, M., Smith, G.A.N., Wright, G., Dibben, C., Lloyd, M. and Penhale, B. (2000) Welsh Index of Multiple Deprivation, London: National Statistics.
Noble, M., Smith, G.A.N., Wright, G., Dibben, C., and Lloyd, M. (2001) The Northern Ireland Multiple Deprivation Measure 2001, Occasional Paper No 18, Belfast: Northern Ireland Statistics and Research Agency.
Noble, M., Wright, G. and Cluver, L. (2006) ‘Developing a child-focused and multidimensional model of child poverty for South Africa’, Journal of Children and Poverty, 12(1): 39–53.
Noble, M., Wright, G., Dibben, C., Smith, G., McLennan, D., Anttila, C., Barnes, H., Mokhtar, C., Noble, S., Avenell, D., Gardner, J., Covizzi, I. and Lloyd, M. (2004) The English Indices of Deprivation 2004, London: Office of the Deputy Prime Minister.
Noble, M., Wright, G., Lloyd, M., Dibben, C., Smith, G.A.N., Ratcliffe, A., McLennan, D., Sigala, M. and Anttila, C. (2003) Scottish Indices of Deprivation, Edinburgh: Scottish Executive.
Noble, M., Wright, G., Smith, G.A.N. and Dibben, C. (2006) ‘Measuring multiple deprivation at the small-area level’, Environment and Planning A, 38:169–185.
Organisation of African Unity (1999) African Charter on the Rights and Welfare of the Child, OAU Doc. CAB/LEG/24.9/49, entered into force November 29 1999.
Potgieter, J.F. (1997) ‘The household subsistence level in the major urban centres of the Republic of South Africa’, IDPR Fact Paper No 105, Port Elizabeth: University of Port Elizabeth.
Prinsloo, M. (2001) ‘External causes of non-natural death’, in A Profile of Fatal Injuries in South Africa. Third Annual Report of the National Injury Mortality Surveillance System, Tygerberg: Medical Research Council and University of South Africa Crime, Violence and Injury Lead Programme.
Republic of South Africa (1996) The Constitution of the Republic of South Africa, Act No 108 of 1996, Pretoria: Government Printer.
Ridge, T. (2002) Childhood Poverty and Social Exclusion. From a child’s perspective. Bristol: The Policy Press.
Robinson, S. and Sadan, M. (1999) Where Poverty Hits Hardest: Children and the Budget in South Africa, Cape Town: Idasa.
Saporiti, A. (1999) ‘Statistics in childhood’, in E. Verhellen (ed) Understanding Children’s Rights: Collected papers at the fourth International Interdisciplinary Course on Children’s Rights, Ghent: Children’s Rights Centre.
Senior, M. (2002) ‘Deprivation indicators’, in P. Rees, and D. Martin (eds) The Census Data System, Chichester: Wiley.
Free
dow
nloa
d fr
om w
ww
.hsr
cpre
ss.a
c.za
The South African Index of Multiple Deprivation for Children
66
Smith, G.A.N. and Noble, M. (2000) ‘Developing the use of administrative data to study poverty’, in J. Bradshaw and R. Sainsbury (eds) Researching Poverty: Studies in cash and care, Aldershot: Ashgate.
Smith, G.A.N., Noble, M. and Wright, G. (2001) ‘Do we care about area effects?’, Environment and Planning A, 33: 1341–1344.
Smith, G.R. (1999) ‘Area-based initiatives: the rationale and options for area targeting’, CASEPaper 25, London: Centre for the Analysis of Social Exclusion, London School of Economics.
Statistics South Africa (2000) Measuring poverty in South Africa. Pretoria: Statistics South Africa.
Streak, J. (2000) ‘The extent and provincial distribution of child poverty in South Africa’, in S. Cassiem, H. Perry, M. Sadan and J. Streak (eds) Are Poor Children Being Put First? Child Poverty and the Budget 2000, Cape Town: IDASA.
Streak, J. (2001) New results on child poverty in South Africa, Budget Brief No 101, Cape Town: IDASA.
Streak, J. (2004) ‘Child poverty in South Africa and implications for policy: using indicators and children’s views to gain a perspective’, in E. Coetzee and J. Streak (eds) Monitoring Child Socio-Economic Rights in South Africa: Achievements and Challenges, Cape Town: IDASA.
Streak, J. (2005) Progress towards a conceptual framework and data systems for measuring child vulnerability in South Africa, Child Poverty Monitor No 2, Cape Town: IDASA.
Thorbecke, E. (2004) Conceptual and Measurement Issues in Poverty Analysis, Discussion Paper No 4, Helsinki: United Nations University and World Institute for Development Economics Research.
Townsend, P. (1979) Poverty in the United Kingdom, Harmondsworth, Middlesex: Penguin Books.
Townsend, P. (1987) ‘Deprivation’, Journal of Social Policy, 16(2): 125–146.
United Nations (1990) Convention on the Rights of a Child, adopted and opened for signature, ratification and accession by General Assembly resolution 44/25 of 20 November 1989, entry into force 2 September 1990.
Vogt, W.P. (1999) Dictionary of Statistics and Methodology: A nontechnical guide for the social sciences, Second Edition, Thousand Oaks, California: SAGE Publications.
White, H., Leavy, J. and Masters, A. (2002) ‘Comparative perspectives on child poverty: a review of poverty measures’, Working Paper No 1, London: Young Lives, Save the Children Fund UK.
Williamson, P. (2002) ‘Synthetic microdata’, in P. Rees, D. Martin and P. Williamson (eds) The Census Data System, Chichester: Wiley.
Woolard, I. (2001) ‘Results of a child poverty analysis of the October HouseholdSurvey 1999’, study commissioned by the Children’s Budget Unit, IDASA.
Woolard, I. (2003) ‘Note on the results of analysis of child poverty based on income poverty lines of R430/month and R215/month per capita in 2000’, study commissioned by the Children’s Budget Unit, IDASA.