The Social and Learning Environments Experienced by Underrepresented Minority Medical Students
13
Copyright © by the Association of American Medical Colleges. Unauthorized reproduction of this article is prohibited. Academic Medicine, Vol. 88, No. 11 / November 2013 1 Review Increasing minority representation in medicine has been identified as an opportunity to both improve clinical care and reduce health disparities. 1,2 It also may improve medical training, including expanding classroom discussions, 3 better preparing majority students to work in multicultural settings, 3,4 engendering a stronger endorsement of equitable access to care from all students, 4 and fostering students’ cognitive skills. 5 In addition, growing the ranks of underrepresented minority (URM) physicians will improve our capacity to provide culturally and linguistically appropriate care and, in turn, will increase patient satisfaction. 6,7 Likely, it also will increase the number of physicians who are willing to work in underserved areas and practice primary care. 2 The Association of American Medical Colleges (AAMC) defined URM in 2004 as “racial and ethnic populations that are underrepresented in the medical profession relative to their numbers in the general population.” 8 This definition applies to African Americans, Mexican Americans, Puerto Ricans, American Indians/Alaska Natives, and Native Hawaiians and other Pacific Islanders, groups that make up more than a quarter of the U.S. population but less than 13% of students enrolled in U.S. MD degree- granting medical schools 9 and less than 9% of practicing physicians in the United States. 10–12 Since the mid-1960s, when the remaining medical schools in the United States to do so were desegregated, several major national initiatives involving the AAMC, the National Institutes of Health, and other organizations have aimed to increase the enrollment and retention of URM students in medicine (e.g., Project 3000 by 2000). 13 Strategies have included pipeline and academic readiness programs, associated infrastructure building, and considering race and ethnicity in admissions decisions. 14 Hindered, in part, by anti–affirmative action ballot initiatives, 1,13 the enrollment of URM students remains disproportionately low at most medical schools. 15 Although current approaches are commendable, we need additional strategies to increase the enrollment and retention of URM medical students. Few have documented attempts to improve the quality of the learning and social environments experienced by URM medical students. However, whether URM students are academically successful, find their medical school environment supportive and collegial, and experience racial discrimination may influence their attrition. These factors may also have downstream effects on recruitment if current and past URM medical students influence both the perceptions of younger students and their likelihood of applying to medical school. Finally, URM students’ experiences during medical school may have an important influence on whether they Acad Med. 2013;88:00–00. First published online doi: 10.1097/ACM.0b013e3182a7a3af Abstract Purpose To review the literature on the social and learning environments experienced by underrepresented minority (URM) medical students to determine what type of interventions are needed to eliminate potential barriers to enrolling and retaining URM students. Method The authors searched MEDLINE, PubMed, Ovid HealthStar, and Web of Science, and the reference lists of included studies, published between January 1, 1980, and September 15, 2012. Studies of the learning and social environments and of students’ satisfaction, experiences with discrimination or unfair practices, and academic performance or progress, as well as assessments of programs or interventions to improve URM students’ academic performance, were eligible for inclusion. Results The authors identified 28 studies (27 unique data sets) meeting the inclusion criteria. The results of the included studies indicated that URM students experienced less supportive social and less positive learning environments, were subjected to discrimination and racial harassment, and were more likely to see their race as having a negative impact on their medical school experiences than non-URM students. Academic performance on standardized exams was worse, progress less timely, and attrition higher for URM students as well. Conclusions For URM students, an adverse climate may be decreasing the attractiveness of careers in medicine, impairing their academic performance, and increasing attrition. Improvements to the social and learning environments experienced by URM students are needed to make medicine a more inclusive profession. The current environment of health care reform creates an opportunity for institutions to implement strategies to achieve this goal. Correspondence should be addressed to Dr. Orom, State University of New York at Buffalo, Community Health and Health Behavior, 304 Kimball Tower, 3435 Main St., Buffalo, NY 14214; telephone: (716) 829-6682; e-mail: [email protected]. The Social and Learning Environments Experienced by Underrepresented Minority Medical Students: A Narrative Review Heather Orom, PhD, Teresa Semalulu, MPH, and Willie Underwood III, MD, MS, MPH Dr. Orom is assistant professor, Department of Community Health and Health Behavior, State University of New York at Buffalo, Buffalo, New York. Ms. Semalulu is practice facilitator, Primary Care Research Institute, Department of Family Medicine, State University of New York at Buffalo, Buffalo, New York. Dr. Underwood is associate professor, Department of Urology, Roswell Park Cancer Institute, Buffalo, New York.
Transcript of The Social and Learning Environments Experienced by Underrepresented Minority Medical Students
Copyright © by the Association of American Medical Colleges. Unauthorized reproduction of this article is prohibited.
Academic Medicine, Vol. 88, No. 11 / November 2013 1
Review
Increasing minority representation in medicine has been identified as an opportunity to both improve clinical care and reduce health disparities.1,2 It also may improve medical training, including expanding classroom discussions,3 better preparing majority students to work in multicultural settings,3,4 engendering a stronger endorsement of equitable access to care from all students,4 and fostering students’ cognitive skills.5 In addition, growing the ranks of underrepresented
minority (URM) physicians will improve our capacity to provide culturally and linguistically appropriate care and, in turn, will increase patient satisfaction.6,7 Likely, it also will increase the number of physicians who are willing to work in underserved areas and practice primary care.2
The Association of American Medical Colleges (AAMC) defined URM in 2004 as “racial and ethnic populations that are underrepresented in the medical profession relative to their numbers in the general population.”8 This definition applies to African Americans, Mexican Americans, Puerto Ricans, American Indians/Alaska Natives, and Native Hawaiians and other Pacific Islanders, groups that make up more than a quarter of the U.S. population but less than 13% of students enrolled in U.S. MD degree-granting medical schools9 and less than 9% of practicing physicians in the United States.10–12 Since the mid-1960s, when the remaining medical schools in the United States to do so were desegregated, several major national initiatives involving the AAMC, the National Institutes of Health, and other organizations have aimed to increase the enrollment and retention of URM students in medicine (e.g.,
Project 3000 by 2000).13 Strategies have included pipeline and academic readiness programs, associated infrastructure building, and considering race and ethnicity in admissions decisions.14 Hindered, in part, by anti–affirmative action ballot initiatives,1,13 the enrollment of URM students remains disproportionately low at most medical schools.15 Although current approaches are commendable, we need additional strategies to increase the enrollment and retention of URM medical students.
Few have documented attempts to improve the quality of the learning and social environments experienced by URM medical students. However, whether URM students are academically successful, find their medical school environment supportive and collegial, and experience racial discrimination may influence their attrition. These factors may also have downstream effects on recruitment if current and past URM medical students influence both the perceptions of younger students and their likelihood of applying to medical school. Finally, URM students’ experiences during medical school may have an important influence on whether they
Acad Med. 2013;88:00–00.First published onlinedoi: 10.1097/ACM.0b013e3182a7a3af
Abstract
PurposeTo review the literature on the social and learning environments experienced by underrepresented minority (URM) medical students to determine what type of interventions are needed to eliminate potential barriers to enrolling and retaining URM students.
MethodThe authors searched MEDLINE, PubMed, Ovid HealthStar, and Web of Science, and the reference lists of included studies, published between January 1, 1980, and September 15, 2012. Studies of the learning and social environments and of students’ satisfaction, experiences
with discrimination or unfair practices, and academic performance or progress, as well as assessments of programs or interventions to improve URM students’ academic performance, were eligible for inclusion.
ResultsThe authors identified 28 studies (27 unique data sets) meeting the inclusion criteria. The results of the included studies indicated that URM students experienced less supportive social and less positive learning environments, were subjected to discrimination and racial harassment, and were more likely to see their race as having a negative impact on their medical school experiences
than non-URM students. Academic performance on standardized exams was worse, progress less timely, and attrition higher for URM students as well.
ConclusionsFor URM students, an adverse climate may be decreasing the attractiveness of careers in medicine, impairing their academic performance, and increasing attrition. Improvements to the social and learning environments experienced by URM students are needed to make medicine a more inclusive profession. The current environment of health care reform creates an opportunity for institutions to implement strategies to achieve this goal.
Correspondence should be addressed to Dr. Orom, State University of New York at Buffalo, Community Health and Health Behavior, 304 Kimball Tower, 3435 Main St., Buffalo, NY 14214; telephone: (716) 829-6682; e-mail: [email protected].
The Social and Learning Environments Experienced by Underrepresented Minority Medical Students: A Narrative ReviewHeather Orom, PhD, Teresa Semalulu, MPH, and Willie Underwood III, MD, MS, MPH
Dr. Orom is assistant professor, Department of Community Health and Health Behavior, State University of New York at Buffalo, Buffalo, New York.
Ms. Semalulu is practice facilitator, Primary Care Research Institute, Department of Family Medicine, State University of New York at Buffalo, Buffalo, New York.
Dr. Underwood is associate professor, Department of Urology, Roswell Park Cancer Institute, Buffalo, New York.

Copyright © by the Association of American Medical Colleges. Unauthorized reproduction of this article is prohibited.
Review
Academic Medicine, Vol. 88, No. 11 / November 20132
decide to pursue a career in academic medicine—where URM physicians make up only 4% of medical school faculty.16
Leaders in academic medicine have shown a renewed interest in increasing URM enrollment in medical school and improving URM students’ academic performance.17 A review of the existing research on the social and learning environments experienced by URM medical students will provide insight into whether social and academic outcomes for URM students have improved over time and what type of new interventions are needed to change the medical school environment. Reviewing a variety of outcomes, as we have done, may help to identify the most significant issues faced by URM medical students, as well as gaps in the extant literature.
Method
At this point in time, studies of the social and learning environments experienced by URM medical students are too limited and the outcomes assessed too heterogeneous to use a meta-analytic approach to summarizing the state of the research; therefore, we used a narrative approach and included studies on a variety of topics that shed light on the nature of the social and learning environments experienced by URM medical students.
Search strategy
We searched MEDLINE, PubMed, Ovid HealthStar, and Web of Science for English-language studies published in peer-reviewed journals between January 1, 1980, and August 31, 2012. We extended our search to 1980 to understand trends over time in the number of studies published on the social and learning environments and in the outcomes reported, as well as shifts in results over time.
Our final search terms were underrepresented minorit*, minorit*, African-American, black, Mexican American, Mainland Puerto Rican, Native American, American Indians, Alaska Natives, Pacific Islanders, retention, satisfaction, depression, isolation, burnout, medical school, medical student, climate, prejudice, racism, medical education, discrimination, depression, anxiety and quality of life, support, interaction, learning, social, experience,
graduat*, performance, intervention, program, United States Medical Licensing Examination (USMLE), race, progress, grade, psychology. We also searched the reference lists of the included studies and related reviews for potentially relevant studies.
Study selection criteria and process
We included empirical studies if (1) the data were collected in or after 1980 or, if the data collection dates were not provided, the study was published in or after 1980; (2) the study participants were current or past students in a U.S. MD or DO degree-granting undergraduate medical program; (3) observational studies were cross-sectional or longitudinal and intervention studies included comparison data (e.g., pre- and posttest or control or comparison group); (4) the sample included and identified at the time the data were collected URM participants as defined by the AAMC; and (5) quantitative results were relevant to the following topics: learning or
social environment, student satisfaction, discrimination or unfair practices, academic performance or progress, and programs or interventions to improve academic performance or the learning or social environment in medical school. In many instances, the authors identified Hispanics in their sample but did not differentiate between URM and non-URM Hispanics. In our review, we included results for Hispanics, as the vast majority of Hispanic medical students in the United States are classified as URM, and we believe that omitting these results would eliminate valuable information.
See Figure 1 for our article selection process. Our electronic database search yielded a total of 889 studies (including duplicates). On the basis of a review of the titles from the reference lists of the relevant articles, we selected an additional 48 articles to review. One author (T.S.) performed an initial review of the titles and abstracts for possible topic and study design relevance, yielding 248 potentially eligible articles. Two authors (H.O. and
Records identified through database search (MEDLINE, PubMed, Ovid HealthStar, Web of Science) (n = 889)
Additional records identified through a search of the reference lists of the reviewed studies (n = 48)
Records screened (n = 937)
Records excluded (n = 689)
Abstracts/full texts assessed for eligibility (n = 248)
Full texts excluded (n = 220)
Studies included in review (n = 28)
Figure 1 Flowchart of the literature search and study selection process in a review of the literature on the social and learning environments experienced by underrepresented minority medical students published between January 1, 1980, and September 15, 2012. We excluded studies (1) that were not empirical research, (2) that were not relevant to the preselected content areas of the review, (3) if the results were not stratified by underrepresented minority (URM) or by URM subgroup versus non-URM students, (4) with no basis for comparing outcomes for intervention participants, (5) if data were collected before 1980, or (6) if data were not collected in the United States.
Copyright © by the Association of American Medical Colleges. Unauthorized reproduction of this article is prohibited.
Review
Academic Medicine, Vol. 88, No. 11 / November 2013 3
T.S.) reviewed these titles and abstracts and, if necessary, the full-text articles to determine study eligibility. Interrater reliability was good (kappa = 0.73). We resolved any discrepancies by consensus. This process yielded a total of 28 eligible articles.
Data extraction
Two authors (H.O. and T.S.) independently extracted the relevant data, including (1) the years during which the data were collected and the study design (cross-sectional versus longitudinal; observational versus intervention); (2) the type of data collected or, if an intervention, the content of the intervention; (3) the sample size, including the size of the URM subgroups; (4) the target topics addressed by the study; and (5) the results of all analyses conducted relevant to the target topics. To determine the quality of the study, we also extracted (6) whether the study incorporated data collected at a single or multiple institutions; (7) the response rate, if relevant and reported; and (8) whether tests of statistical significance were performed as part of the analyses. The same two authors (H.O. and T.S.) collected the data using a spreadsheet similar to Appendix 1 and resolved omissions and conflicts at joint meetings, during which they consulted the source articles and discussed the discrepancies. At a later date, the same two authors compared the data included in Appendix 1 against the source articles to ensure accuracy. They again discussed any inconsistencies and resolved them via consensus.
Results
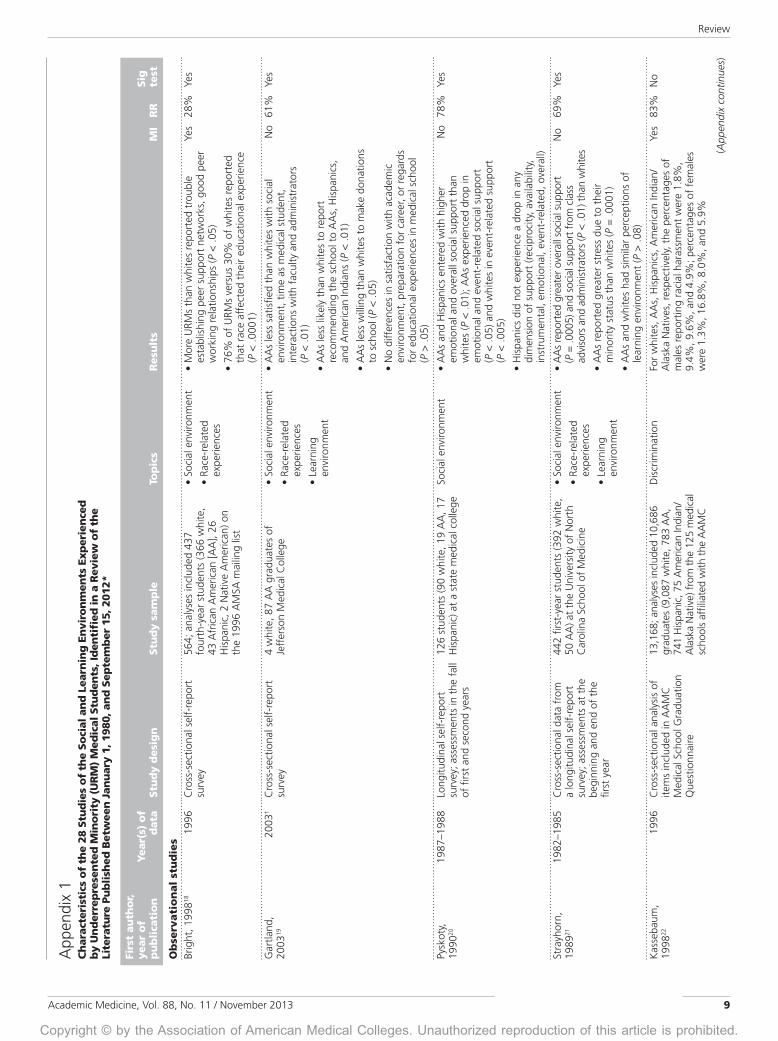
See Appendix 1 for a summary of the 28 studies (27 unique data sets) that we included in our review. Of those data sets, 6 were collected from 1980 to 1989, 18 from 1990 to 1999, and 10 from 2000 to 2010 (some studies overlapped time periods). Of the included studies, 25 were observational studies and 3 were intervention studies; 14 were single-institution studies and 14 were multi-institution studies. Topics covered included the social environment (4), discrimination (4), other race-related experiences (5), the learning environment (3), academic performance (11), and academic progress (5).
Social environment
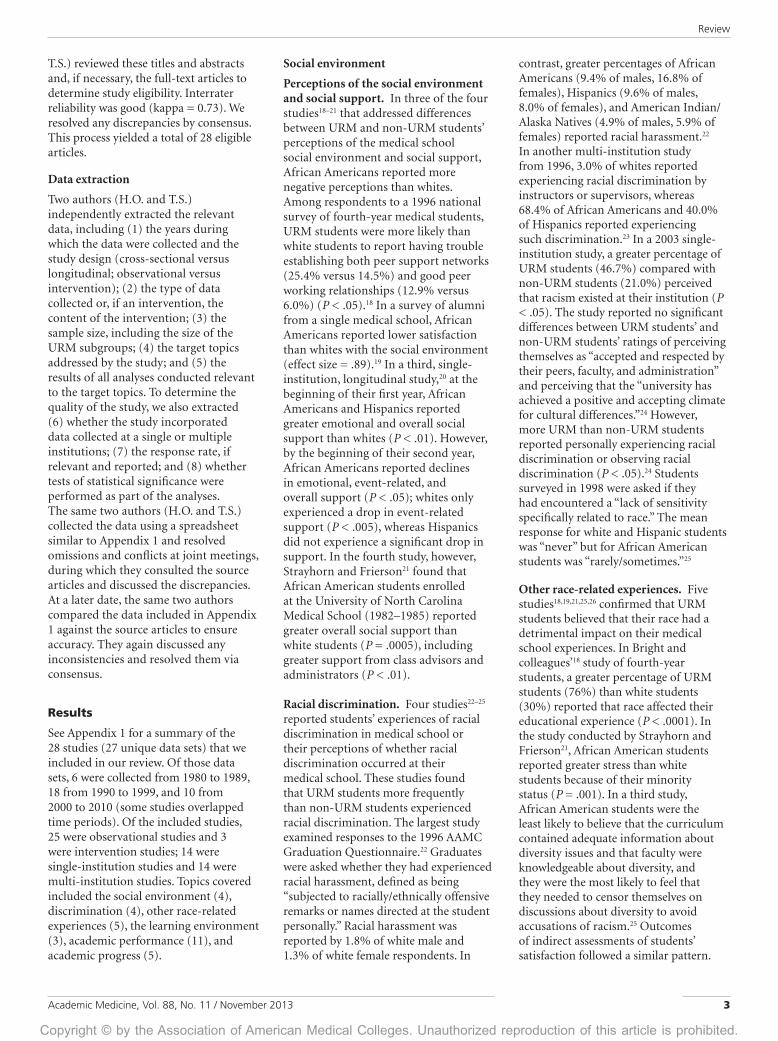
Perceptions of the social environment and social support. In three of the four studies18–21 that addressed differences between URM and non-URM students’ perceptions of the medical school social environment and social support, African Americans reported more negative perceptions than whites. Among respondents to a 1996 national survey of fourth-year medical students, URM students were more likely than white students to report having trouble establishing both peer support networks (25.4% versus 14.5%) and good peer working relationships (12.9% versus 6.0%) (P < .05).18 In a survey of alumni from a single medical school, African Americans reported lower satisfaction than whites with the social environment (effect size = .89).19 In a third, single-institution, longitudinal study,20 at the beginning of their first year, African Americans and Hispanics reported greater emotional and overall social support than whites (P < .01). However, by the beginning of their second year, African Americans reported declines in emotional, event-related, and overall support (P < .05); whites only experienced a drop in event-related support (P < .005), whereas Hispanics did not experience a significant drop in support. In the fourth study, however, Strayhorn and Frierson21 found that African American students enrolled at the University of North Carolina Medical School (1982–1985) reported greater overall social support than white students (P = .0005), including greater support from class advisors and administrators (P < .01).
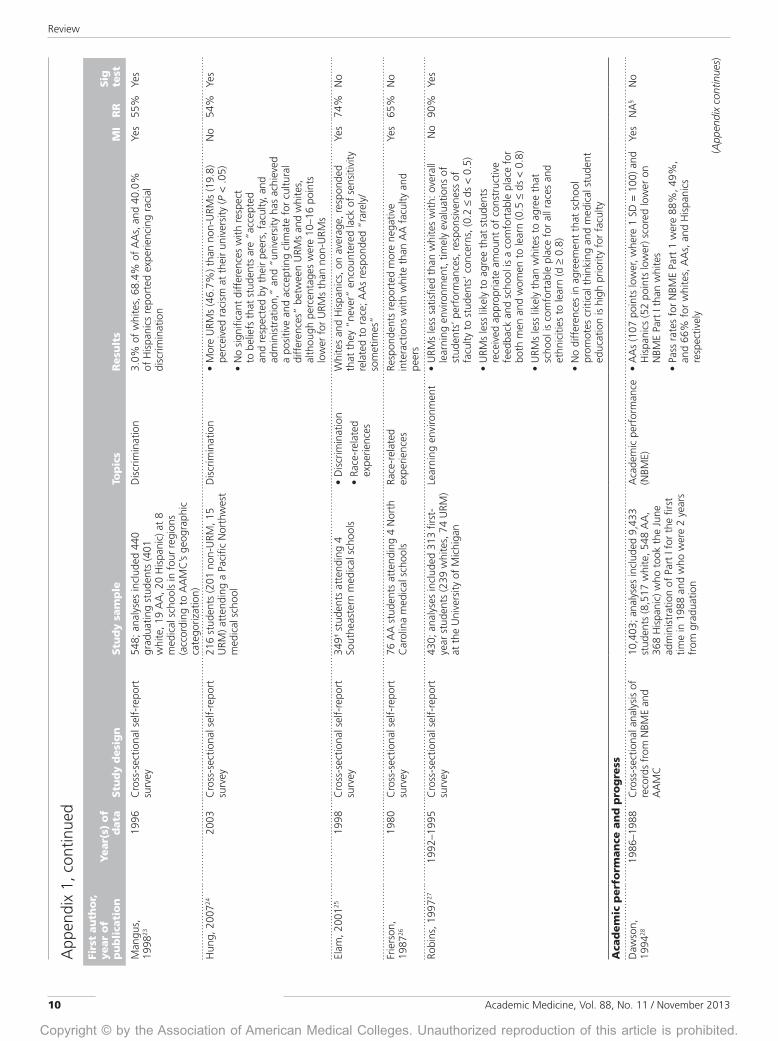
Racial discrimination. Four studies22–25 reported students’ experiences of racial discrimination in medical school or their perceptions of whether racial discrimination occurred at their medical school. These studies found that URM students more frequently than non-URM students experienced racial discrimination. The largest study examined responses to the 1996 AAMC Graduation Questionnaire.22 Graduates were asked whether they had experienced racial harassment, defined as being “subjected to racially/ethnically offensive remarks or names directed at the student personally.” Racial harassment was reported by 1.8% of white male and 1.3% of white female respondents. In
contrast, greater percentages of African Americans (9.4% of males, 16.8% of females), Hispanics (9.6% of males, 8.0% of females), and American Indian/Alaska Natives (4.9% of males, 5.9% of females) reported racial harassment.22 In another multi-institution study from 1996, 3.0% of whites reported experiencing racial discrimination by instructors or supervisors, whereas 68.4% of African Americans and 40.0% of Hispanics reported experiencing such discrimination.23 In a 2003 single-institution study, a greater percentage of URM students (46.7%) compared with non-URM students (21.0%) perceived that racism existed at their institution (P < .05). The study reported no significant differences between URM students’ and non-URM students’ ratings of perceiving themselves as “accepted and respected by their peers, faculty, and administration” and perceiving that the “university has achieved a positive and accepting climate for cultural differences.”24 However, more URM than non-URM students reported personally experiencing racial discrimination or observing racial discrimination (P < .05).24 Students surveyed in 1998 were asked if they had encountered a “lack of sensitivity specifically related to race.” The mean response for white and Hispanic students was “never” but for African American students was “rarely/sometimes.”25
Other race-related experiences. Five studies18,19,21,25,26 confirmed that URM students believed that their race had a detrimental impact on their medical school experiences. In Bright and colleagues’18 study of fourth-year students, a greater percentage of URM students (76%) than white students (30%) reported that race affected their educational experience (P < .0001). In the study conducted by Strayhorn and Frierson21, African American students reported greater stress than white students because of their minority status (P = .001). In a third study, African American students were the least likely to believe that the curriculum contained adequate information about diversity issues and that faculty were knowledgeable about diversity, and they were the most likely to feel that they needed to censor themselves on discussions about diversity to avoid accusations of racism.25 Outcomes of indirect assessments of students’ satisfaction followed a similar pattern.
Copyright © by the Association of American Medical Colleges. Unauthorized reproduction of this article is prohibited.
Review
Academic Medicine, Vol. 88, No. 11 / November 20134
African American alumni of Jefferson Medical College were less likely than white alumni to report recommending the school to African Americans, Hispanics, and American Indians (P < .01) and less willing to make donations to the school (P < .05).19 Finally, in a 1980 single-institution survey of African American medical students, respondents reported more negative perceptions of the behavior of and their interactions with white faculty and peers than with African American faculty and peers.26
Learning environment
Students’ satisfaction with the learning environment. In two of the three studies19,21,27 that evaluated students’ satisfaction with their learning environment, being a URM student was associated with a lower level of satisfaction than being a white student. In a single-institution study of first-year medical students, URM students were less satisfied than white students with their overall learning environment, the timeliness of evaluations of their performances, and the responsiveness of faculty to students’ concerns (0.2 ≤ ds < 0.5). They also were less likely to agree that students received the appropriate amount of constructive feedback and that the school was a comfortable place for men and women (0.5 ≤ ds < 0.8) and all races and ethnicities to learn (d ≥ 0.8).27 The study found no differences in perceptions that the school promoted critical thinking and that medical student education was a high priority for faculty.27 In the study of Jefferson Medical College alumni, African Americans were less satisfied than white alumni with their time as medical students and with their interactions with faculty and administrators (P < .01), but they were not less satisfied with the academic environment, the preparation for their career, or their educational experiences (P > .05).19 In contrast, in Strayhorn and Frierson’s21 study, African American and white students reported similar perceptions of the quality of the learning environment (P > .08).
Academic performance. Eleven studies28–38 compared the academic performance of URM and non-URM students. URM students consistently scored lower on, or were more likely to fail, standardized exams, such as the USMLE and its predecessor, the
National Board of Medical Examiners (NBME) exam.28,30–38 Specifically, in studies of national cohorts taking these exams in 1986–198828, 1992–199430, and 1991–1996,31 African American and Hispanic students scored lower than white students. Among students matriculating from 1994 to 1999, URM status was associated with 2.30 greater adjusted odds (95% confidence interval [CI] = 2.13–2.48) of not passing the USMLE Step 1 and/or Step 2 exam on the first attempt, compared with white status.37 Among students matriculating from 1993 to 2000 who failed the USMLE Step 1 exam, being a URM student, compared with being a white student, was associated with lower odds of passing the Step 2 Clinical Knowledge section of the exam (odds ratio [OR] = 0.59, 95% CI = 0.51–0.70).29 In two single-institution studies, URM students did not perform as well as white students on the NBME or USMLE exam.32,33 In the only study of Native Hawaiian and Pacific Islander students, members of this race/ethnicity graduating from 1996 to 2000 scored lower on the USMLE Step 1 exam than their classmates of other race/ethnicities, but their performance on the USMLE Step 2 exam was no different from that of several other groups, including whites.32
Studies also showed that URM students had lower GPAs30,38 and scores on periodic assessments33–36 than non-URM students. In two of the three studies comparing clerkship performance, URM students did not perform as well as non-URM students. A 2006 study found that URM students were more likely to receive lower grades than white students in all six of the required clerkships (P < .001).34 In the same sample, African American and Native American/Alaskan Native students reported receiving more negative comments, and African American students reported receiving fewer positive comments, than white students regarding their communication skills during clinical clerkships (no differences found between Hispanics and whites for either outcome).35 In a single-institution study of third-year clerkship students between 1996 and 2000, compared with white students, African American students scored lower on both clinical evaluations and objective structured clinical examinations (OSCEs), and Hispanic students scored lower on OSCEs.36 However, a study that compared the academic performance of white and
URM students who graduated between 1987 and 1991 found that although URM students had lower average scores on the family practice clerkship final exam (P < .01), they scored as well on the clinical and problem-solving components of the clerkship evaluation and only marginally lower on the OSCE (P =.02).33
Academic progress. Five studies37–42 found that URM students were more likely than non-URM students to experience graduation delays and failure. According to AAMC data for medical students matriculating between 1980 and 1988, all URM groups had lower four-year graduation rates than whites.39 In a 1992 study of matriculating students, URM status was associated with increased risk for experiencing withdrawal, leave of absence, dismissal, or delay of graduation, even after adjusting for MCAT score, science GPA, major, selectivity of undergraduate school, age, and gender.40 The same study found that ultimately 18% of URM students experienced one or more of these events by the end of their fourth year, compared with 3% of non-URM students.40 Among students matriculating between 1994 and 1999, URM students had increased odds of withdrawing or being dismissed because of both academic (OR = 2.96; 95% CI = 2.48–3.54) and nonacademic reasons (OR = 1.41; 95% CI = 1.22–1.64) compared with white students.37 Following the same pattern, in the 1992 and 1993 matriculating classes at the University of Illinois at Chicago College of Medicine, URM students were more likely to withdraw before graduation than non-URM students (18.26% versus 3.25%).38 Similarly, between 1993 and 1997, the attrition rate for URM students at the same institution was 16.2%, whereas the rate for non-URM students was 4.0%.42 Finally, URM students were disproportionately represented in decelerated programs; according to an early 2000s survey, 37.0% of students in decelerated programs were URM.41
Interventions to improve the environment experienced by URM medical students
All the studies that reported on interventions to the medical school environment to modify outcomes for URM students were aimed at improving the academic outcomes of

Copyright © by the Association of American Medical Colleges. Unauthorized reproduction of this article is prohibited.
Review
Academic Medicine, Vol. 88, No. 11 / November 2013 5
at-risk students; none were designed to improve the social environment or reduce racial discrimination in medical schools. Many have adopted prematriculation enrichment programs that are often required for URM students. These programs have been reviewed elsewhere,43,44 so we did not review them here. Three studies45–47 examined the impact of academic support interventions during medical school. In the first, 28 students (26 URM), who had either repeatedly failed academic course work or the USMLE Step 1 or Step 2 exam and were on academic probation, were referred to the University of Michigan Medical School’s Academic Support Program between 1994 and 1998.45 By 1998, 26 (93%) had either graduated or were progressing, and none were put on academic probation again. The intervention included support from “tutors, assistance with study skills, or accommodations in the classroom (e.g., extended time on examinations, assistance with note taking).”45 A second study examined the impact of curriculum change on USMLE Step 1 scores.46 In 1998, a new integrated medical curriculum was introduced at the University of Texas Medical Branch, which incorporated organ-system-based and problem-based learning, explicit preparation for the exam, and proactive remediation for at-risk students. Compared with students who matriculated between 1995 and 1997 and completed the traditional curriculum, students who matriculated between 2003 and 2005 and completed the integrated curriculum had lower failure rates and improved scores (difference of 9.7 points, d = 0.48). The largest difference was for URM students (difference of 11.9 points, d = 0.64), and, in particular, African American students (difference of 14.3 points, d = 0.77). In the traditional curriculum cohort, 12.9% of URM students failed Part 1, whereas in the integrated curriculum cohort, only 4.2% failed.46 A study of a larger sample of an overlapping cohort reported similar findings.47
Trends over time
Among the studies of the social and learning environments, discrimination, and students’ satisfaction, three trends emerged. First, most studies were conducted in the 1990s. Although the most recent data were collected in 2003
at a single institution, the most recent national data were collected in 1996. Second, URM students reported negative race-related experiences regardless of the year the data were collected, including in the 2003 study (46.7% of URM versus 19.8% of non-URM students perceived racism at their institution). Although the most recent study comparing URM and non-URM students’ academic achievement was conducted in 2006, most were conducted in the 1990s. All of these studies reveal a gap in achievement between URM and non-URM students. Finally, only three studies reported the results of interventions to improve the academic performance of at-risk students; the most recent data were collected in 2005.
Discussion
A limited number of studies conducted over the last three decades have examined URM students’ medical school experiences. Almost unanimously, they revealed that URM students have experienced less supportive social and less positive learning environments, have been subjected to discrimination and racial harassment, and have been more likely to perceive that their race negatively affected their medical school experiences, compared with non-URM students. These findings are consistent with those of qualitative reports that deepened our understanding of ways in which students’ medical school experiences are influenced by race or ethnicity. For example, in interviews conducted with URM medical students (88% black, 10% Hispanic, 2% Asian/Pacific Islander) in 2002–2003, interviewees reported being ignored by faculty, residents, and staff physicians, experiencing discrimination, being perceived as intellectually inferior, being socially isolated, and having difficulty forming study groups with non-URM students.48 These themes of invisibility, discrimination, and being perceived as inferior echo the findings from earlier qualitative studies.49,50 Opportunities to address these issues may be limited by a reported lack of institutional support for diversity and barriers to reporting race-related issues.48
Trends in studying the social and learning environments experienced by URM medical students indicate that empirical work in this area may have waned. Few data have been published on these topics
since 2000. Furthermore, after researchers identified gaps in achievement, they did not then conduct the necessary empirical work to develop evidence-based interventions and policy changes to eliminate URM students’ experiences with discrimination or to close the URM/non-URM gap in academic achievement. However, within the current health care reform movement, increasing attention is being paid to the argument that a diverse medical workforce is essential for efficient, quality health care51 (by increasing access to care in underserved populations, reducing health disparities, and improving quality of care).52 We expect that this shift will prompt a renewed interest in institutional changes that could make medicine, and in particular, academic medicine, a more inclusive profession for minorities.
Today’s adverse climate may affect URM medical students in a range of ways, including detracting from the attractiveness of medicine, and in particular, academic medicine, as a career choice, impairing academic performance, and increasing attrition. Numerous studies have shown that URM students have lower scores on standardized exams, progress more slowly, and have higher attrition rates than non-URM students. Without a doubt, these academic performance issues faced by URM medical students stem, in part, from racial/ethnic inequities in the quality of K–12 and undergraduate education; however, they also may be influenced by a negative medical school climate. For example, discrimination by instructors, supervisors, and peers22,23 and social isolation18,19 may reduce URM students’ opportunities for forming study groups with classmates and finding mentors. Strong evidence shows that the salience of racial/ethnic identity in combination with concerns about being perceived as less competent because of one’s race/ethnicity undermine performance, a phenomenon called stereotype threat.53 In Steele and Aronson’s53 original study, they randomly assigned African American and white students to complete items similar to those on the Graduate Record Exam after being told that the test was either a diagnostic of their verbal abilities or a measure of their problem-solving strategies. Both groups performed equally when they were told that the task was a measure of their problem-solving strategies, but African

Copyright © by the Association of American Medical Colleges. Unauthorized reproduction of this article is prohibited.
Review
Academic Medicine, Vol. 88, No. 11 / November 20136
Americans performed worse when they were told that the task was a diagnostic of their verbal abilities.53 Since then, over 300 hundred studies have demonstrated that when people are concerned about confirming a negative stereotype about a group with which they identify, their performance is impaired, not only on exams but also on tasks critical to the learning process, such as note taking.54
Strengths
Given that our health care system is currently undergoing systemic change, our review of the research on the social and learning environments experienced by URM medical students is timely, and it provides a basis for planning future research and interventions. From our review, we learned three key things. First, the number of studies conducted on this and related topics has waned over the past 15 years; thus, the literature must be updated. We need additional research to identify the social and learning challenges faced by URM medical students today. Second, almost no research has been conducted on the program, curriculum, and policy changes that will help institutions reduce the negative race-related experiences of URM students and improve their academic outcomes. Although the descriptions of three single-institution diversity interventions55–57 included in the recent theme issue of Academic Medicine on diversity and inclusion17 help to close this gap, the need still exists to test programs and policies across multiple institutions. Third, the outcomes studied to date have been limited, for the most part, to single-item measures of discrimination, social support, or satisfaction, or to standardized test scores. Future efforts might explore the different ways that students experience unfair treatment and the conditions that make unfair treatment permissible, as well as adopt research questions that align with the ultimate goal of improving health care quality. As Niu and colleagues58 asked in a recent study, these questions might include the following: Are medical students prepared to deliver culturally competent care? Do medical students intend to practice in underserved areas? Do URM students intend to enter academic medicine?
Limitations
An inherent limitation of any review is the difficulty associated with
summarizing studies that are diverse in their design and quality and that report a wide range of outcomes. As few studies have addressed the social and learning environments experienced by URM medical students, we could not focus only on the highest-quality, multi-institution studies or on the studies that reported a narrow range of outcomes. We attempted to provide enough information about each study in Appendix 1 (number of institutions and participants involved, response rate, whether tests of significance/effect size were performed) so that readers could evaluate it on their own. Given the heterogeneity of topics addressed by the studies, we did not perform a meta-analysis. A second limitation was our inability to draw conclusions based on the extant data about what processes contribute to URM students’ experiences of discrimination or social and academic isolation and the consequences of these experiences for their retention and career choices. Much work is needed to develop an understanding of, and standard ways of assessing, the institutional, interpersonal, and psychological processes that underlie the outcomes reported in the literature. A third limitation was our inability to report on the very current experiences of URM medical students. The most recent studies of the social environment and the academic performance/progress of URM students were conducted in 2003 and 2006, respectively. Given the slow pace of cultural change in academic medicine,59 we expect that the issues reported in the studies included in this review persist today; however, a large-scale study that includes a detailed analysis of students’ experiences and beliefs, which underlie students’ perceptions of discrimination or lower satisfaction, and their implications for students’ academic performance, progress, and career choice is warranted. This important step could galvanize support for using resources and promoting policy initiatives to address any problems in the social and learning environments that contribute to URM students’ academic failure, attrition, and reluctance to enter academic medicine. Another limitation is that we did not attempt to find and review unpublished studies, which, because of the bias toward publishing studies yielding statistically significant differences, would be more likely to have found small or null effects. Thus, if null effects have been reported in unpublished studies, we did not include
them in our analysis. Finally, we analyzed the outcomes of interventions to improve the social and learning environments experienced by URM medical students. The published literature includes few descriptions of attempts to improve the academic success of URM medical students and none, to our knowledge, to improve the social environment experienced by URM medical students. This dearth of studies may be due, in part, to researchers’ concerns about the ethics of randomizing students to experimental conditions as well as to a lack of awareness of and funding directed toward, in particular, the problem of unfair treatment of medical students. Leaders at medical schools also may be wary of such initiatives because they may have experienced unexpected resistance and challenges to previous efforts to resolve racial dynamics.60
Conclusions
The underrepresentation of some racial/ethnic groups in medicine is rooted in a history of segregated and unequal medical education as well as in the barriers to professional advancement, some of which continue in academic medicine today,61 a socioeconomic/political system in which racial/ethnic minorities receive lower-quality education at every level, and a culture in which institutional and interpersonal racial discrimination remains a reality. Yet, progress is not impossible, and medical schools can become better places for minorities to learn and work.62–64 In addition to the continued support for pipeline programs that increase the number of URM students entering medical school, our health care system would benefit from programs and policies that foster an institutional culture that is intolerant of the inequitable and disrespectful treatment of minorities, promotes an open dialogue about diversity and cultural sensitivity, and ensures support and mentoring to all students. The recent discussion in Academic Medicine about novel ways to increase diversity in medicine17 identified the need for a greater financial and administrative commitment from institutions to a strategic plan for recruiting and retaining minorities,57 the incorporation of diversity into institutions’ core missions, and the monitoring and self-evaluation of the current culture to promote change over

Copyright © by the Association of American Medical Colleges. Unauthorized reproduction of this article is prohibited.
Review
Academic Medicine, Vol. 88, No. 11 / November 2013 7
time.65 Although our findings indicate that change is needed to make medicine an inclusive profession for minorities, the current environment of health care reform creates an opportunity for institutions to implement these strategies.
Funding/Support: None.
Other disclosures: None.
Ethical approval: Not applicable.
Previous presentations: Poster presented at the 140th annual meeting of the American Public Health Association, San Francisco, California, October 2012.
References 1 Sullivan LW, Suez Mittman I. The state of
diversity in the health professions a century after Flexner. Acad Med. 2010;85:246–253.
2 Smedley BD, Butler AS, Bristow LR, eds. In the Nation’s Compelling Interest: Ensuring Diversity in the Health-Care Workforce. Washington, DC: National Academies Press; 2004.
3 Whitla DK, Orfield G, Silen W, Teperow C, Howard C, Reede J. Educational benefits of diversity in medical school: A survey of students. Acad Med. 2003;78:460–466.
4 Saha S, Guiton G, Wimmers PF, Wilkerson L. Student body racial and ethnic composition and diversity-related outcomes in US medical schools. JAMA. 2008;300:1135–1145.
5 Gurin P, Dey EL, Hurtado S, Gurin G. Diversity and higher education: Theory and impact on educational outcomes. Harv Educ Rev. 2002;72:330–366.
6 Laveist TA, Nuru-Jeter A. Is doctor–patient race concordance associated with greater satisfaction with care? J Health Soc Behav. 2002;43:296–306.
7 Cooper LA, Roter DL, Johnson RL, Ford DE, Steinwachs DM, Powe NR. Patient-centered communication, ratings of care, and concordance of patient and physician race. Ann Intern Med. 2003;139:907–915.
8 Association of American Medical Colleges. Underrepresented in medicine definition. 2004. https://www.aamc.org/initiatives/urm/. Accessed July 23, 2013.
9 Association of American Medical Colleges. Table 31: Total enrollment by U.S. medical school and race and ethnicity, 2011. https://www.aamc.org/download/160146/data/table31-enrll-race-sch-2011.pdf. Accessed July 23, 2013.
10 United States Census Bureau. The Hispanic Population: 2010. 2010 Census Briefs. May 2011. http://www.census.gov/prod/cen2010/briefs/c2010br-04.pdf. Accessed July 23, 2013.
11 United States Census Bureau. 2005–2009 American Community Survey 5-year estimates. 2010. http://www.census.gov/acs/www/data_documentation/2009_release/. Accessed July 23, 2013.
12 American Medical Association. Total physicians by race/ethnicity 2008. 2008. http://www.ama-assn.org/ama/pub/about-ama/our-people/member-groups-sections/minority-affairs-consortium/physician-
statistics/total-physicians-raceethnicity.page. Accessed July 23, 2013.
13 Butler WT. Project 3000 by 2000: Progress during tumultuous times. Acad Med. 1999;74:308–309.
14 Association of American Medical Colleges. Project 3000 by 2000. Progress to Date: Year Two Progress Report. Washington, DC: Association of American Medical Colleges; 1996.
15 Hoover E. An analysis of the Association of American Medical Colleges’ review of minorities in medical education. J Natl Med Assoc. 2005;97:1240–1242, 1244.
16 Association of American Medical Colleges. Table 3. Distribution of U.S. medical school faculty by rank and race/Hispanic origin. 2011. https://www.aamc.org/download/271898/data/11table3.pdf. Accessed July 23, 2013.
17 Reede JY, ed. Diversity and inclusion in Academic Medicine. Acad Med. 2012;87(11, theme issue):1453–1642.
18 Bright CM, Duefield CA, Stone VE. Perceived barriers and biases in the medical education experience by gender and race. J Natl Med Assoc. 1998;90:681–688.
19 Gartland JJ, Hojat M, Christian EB, Callahan CA, Nasca TJ. African American and white physicians: A comparison of satisfaction with medical education, professional careers, and research activities. Teach Learn Med. 2003;15:106–112.
20 Pyskoty CE, Richman JA, Flaherty JA. Psychosocial assets and mental health of minority medical students. Acad Med. 1990;65:581–585.
21 Strayhorn G, Frierson H. Assessing correlations between black and white students’ perceptions of the medical school learning environment, their academic performances, and their well-being. Acad Med. 1989;64:468–473.
22 Kassebaum DG, Cutler ER. On the culture of student abuse in medical school. Acad Med. 1998;73:1149–1158.
23 Mangus RS, Hawkins CE, Miller MJ. Prevalence of harassment and discrimination among 1996 medical school graduates: A survey of eight US schools. JAMA. 1998;280:851–853.
24 Hung R, McClendon J, Henderson A, Evans Y, Colquitt R, Saha S. Student perspectives on diversity and the cultural climate at a U.S. medical school. Acad Med. 2007;82:184–192.
25 Elam CL, Johnson MM, Wiggs JS, Messmer JM, Brown PI, Hinkley R. Diversity in medical school: Perceptions of first-year students at four southeastern U.S. medical schools. Acad Med. 2001;76:60–65.
26 Frierson HT Jr. Black medical students’ perceptions of the academic environment and of faculty and peer interactions. J Natl Med Assoc. 1987;79:737–743.
27 Robins LS, Gruppen LD, Alexander GL, Fantone JC, Davis WK. A predictive model of student satisfaction with the medical school learning environment. Acad Med. 1997;72:134–139.
28 Dawson B, Iwamoto CK, Ross LP, Nungester RJ, Swanson DB, Volle RL. Performance on the National Board of Medical Examiners. Part I Examination by men and women of different race and ethnicity. JAMA. 1994;272:674–679.
29 Andriole DA, Jeffe DB. A national cohort study of U.S. medical school students who initially failed Step 1 of the United States Medical Licensing Examination. Acad Med. 2012;87:529–536.
30 Koenig JA, Sireci SG, Wiley A. Evaluating the predictive validity of MCAT scores across diverse applicant groups. Acad Med. 1998;73:1095–1106.
31 Case SM, Swanson DB, Ripkey DR, Bowles LT, Melnick DE. Performance of the class of 1994 in the new era of USMLE. Acad Med. 1996;71(10 suppl):S91–S93.
32 Kasuya RT, Naguwa GS, Guerrero AP, Hishinuma ES, Lindberg MA, Judd NK. USMLE performances in a predominantly Asian and Pacific Islander population of medical students in a problem-based learning curriculum. Acad Med. 2003;78:483–490.
33 Campos-Outcalt D, Rutala PJ, Witzke DB, Fulginiti JV. Performances of underrepresented-minority students at the University of Arizona College of Medicine, 1987–1991. Acad Med. 1994;69:577–582.
34 Lee KB, Vaishnavi SN, Lau SK, Andriole DA, Jeffe DB. “Making the grade:” Noncognitive predictors of medical students’ clinical clerkship grades. J Natl Med Assoc. 2007;99:1138–1150.
35 Lee KB, Vaishnavi SN, Lau SK, Andriole DA, Jeffe DB. Cultural competency in medical education: Demographic differences associated with medical student communication styles and clinical clerkship feedback. J Natl Med Assoc. 2009;101: 116–126.
36 Reteguiz J, Davidow AL, Miller M, Johanson WG Jr. Clerkship timing and disparity in performance of racial-ethnic minorities in the medicine clerkship. J Natl Med Assoc. 2002;94:779–788.
37 Andriole DA, Jeffe DB. Prematriculation variables associated with suboptimal outcomes for the 1994–1999 cohort of US medical school matriculants. JAMA. 2010;304:1212–1219.
38 Tekian A. Cognitive factors, attrition rates, and underrepresented minority students: The problem of predicting future performance. Acad Med. 1998;73(10 suppl):S38–S40.
39 Kassebaum DG, Szenas PL. The longer road to medical school graduation. Acad Med. 1994;69:856–860.
40 Huff KL, Fang D. When are students most at risk of encountering academic difficulty? A study of the 1992 matriculants to U.S. medical schools. Acad Med. 1999;74:454–460.
41 McGrath B, McQuail D. Decelerated medical education. Med Teach. 2004;26:510–513.
42 Tekian A. Attrition rates of underrepresented minority students at the University of Illinois at Chicago College of Medicine, 1993–1997. Acad Med. 1998;73:336–338.
43 Shields PH. A survey and analysis of student academic support programs in medical schools focus: Underrepresented minority students. J Natl Med Assoc. 1994;86:373–377.
44 Tekian A. Minority students, affirmative action, and the admission process: A survey of 15 medical schools. Acad Med. 1998;73:986–992.
45 Segal SS, Giordani B, Gillum LH, Johnson N. The academic support program at the University of Michigan School of Medicine. Acad Med. 1999;74:383–385.
Copyright © by the Association of American Medical Colleges. Unauthorized reproduction of this article is prohibited.
Review
Academic Medicine, Vol. 88, No. 11 / November 20138
46 Lieberman SA, Frye AW, Thomas L, Rabek JP, Anderson GD. Comprehensive changes in the learning environment: Subsequent Step 1 scores of academically at-risk students. Acad Med. 2008;83(10 suppl):S49–S52.
47 Lieberman SA, Ainsworth MA, Asimakis GK, et al. Effects of comprehensive educational reforms on academic success in a diverse student body. Med Educ. 2010;44:1232–1240.
48 Odom KL, Roberts LM, Johnson RL, Cooper LA. Exploring obstacles to and opportunities for professional success among ethnic minority medical students. Acad Med. 2007;82:146–153.
49 Bullock SC, Houston E. Perceptions of racism by black medical students attending white medical schools. J Natl Med Assoc. 1987;79:601–608.
50 Shervington DO, Bland IJ, Myers A. Ethnicity, gender identity, stress, and coping among female African-American medical students. J Am Med Womens Assoc. 1996;51:153–154.
51 U.S. Department of Health and Human Services. HHS Action Plan to Reduce Racial and Ethnic Disparities: A Nation Free of Disparities in Health and Health Care. Washington, DC: U.S. Department of Health and Human Services; 2011.
52 Nivet MA. Commentary: Diversity and inclusion in the 21st century: Bridging the moral and excellence imperatives. Acad Med. 2012;87:1458–1460.
53 Steele CM, Aronson J. Stereotype threat and the intellectual test performance of African Americans. J Pers Soc Psychol. 1995;69: 797–811.
54 Appel M, Kronberger N, Aronson J. Stereotype threat impairs ability building: Effects on test preparation among women in science and technology. Eur J Soc Psychol. 2011;41:904–913.
55 Tull RG, Rutledge JC, Carter FD, Warnick JE. PROMISE: Maryland’s Alliance for Graduate Education and the Professoriate enhances recruitment and retention of underrepresented minority graduate students. Acad Med. 2012;87:1562–1569.
56 Deas D, Pisano ED, Mainous AG 3rd, et al. Improving diversity through strategic planning: A 10-year (2002–2012) experience at the Medical University of South Carolina. Acad Med. 2012;87:1548–1555.
57 Toney M. The long, winding road: One university’s quest for minority health care professionals and services. Acad Med. 2012;87:1556–1561.
58 Niu NN, Syed ZA, Krupat E, Crutcher BN, Pelletier SR, Shields HM. The impact of cross-cultural interactions on medical students’ preparedness to care for diverse patients. Acad Med. 2012;87:1530–1534.
59 Bloom SW. The medical school as a social organization: The sources of resistance to change. Med Educ. 1989;23:228–241.
60 Chang MJ. Improving campus racial dynamics: A balancing act among competing interests. Rev Higher Educ. 2000;23:153–175.
61 Fang D, Moy E, Colburn L, Hurley J. Racial and ethnic disparities in faculty promotion in academic medicine. JAMA. 2000;284:1085–1092.
62 Rainey TG, Shapiro MJ. Critical care medicine for the 21st century. Crit Care Med. 2001;29:436–437.
63 Hurtado S, Clayton-Pedersen AR, Allen WR, Milem JF. Enhancing campus climates for racial/ethnic diversity: Educational policy and practice. Rev Higher Educ. 1998;21:279–302.
64 Inglehart M, Quiney C, Kotowicz W, et al. Cultural audits: Introduction, process, and results. J Dent Educ. 1997;61:283–288.
65 Smith DG. Building institutional capacity for diversity and inclusion in academic medicine. Acad Med. 2012;87:1511–1515.
Copyright © by the Association of American Medical Colleges. Unauthorized reproduction of this article is prohibited.
Review
Academic Medicine, Vol. 88, No. 11 / November 2013 9
App
endi
x 1
Ch
arac
teri
stic
s o
f th
e 28
Stu
die
s o
f th
e So
cial
an
d L
earn
ing
En
viro
nm
ents
Exp
erie
nce
d
by
Un
der
rep
rese
nte
d M
ino
rity
(U
RM
) M
edic
al S
tud
ents
, Id
enti
fied
in a
Rev
iew
of
the
Lite
ratu
re P
ub
lish
ed B
etw
een
Jan
uar
y 1,
198
0, a
nd
Sep
tem
ber
15,
201
2*
Firs
t au
tho
r,
year
of
pu
bli
cati
on
Yea
r(s)
of
dat
aSt
ud
y d
esig
nSt
ud
y sa
mp
leTo
pic
sR
esu
lts
MI
RR
Sig
te
st
Ob
serv
ati
on
al
stu
die
sBr
ight
, 199
81819
96C
ross
-sec
tiona
l sel
f-re
port
su
rvey
564;
ana
lyse
s in
clud
ed 4
37
four
th-y
ear
stud
ents
(366
whi
te,
43 A
fric
an A
mer
ican
[AA
], 26
H
ispa
nic,
2 N
ativ
e A
mer
ican
) on
the
1996
AM
SA m
ailin
g lis
t
• So
cial
env
ironm
ent
• Ra
ce-r
elat
ed
expe
rienc
es
• M
ore
URM
s th
an w
hite
s re
port
ed t
roub
le
esta
blis
hing
pee
r su
ppor
t ne
twor
ks, g
ood
peer
w
orki
ng r
elat
ions
hips
(P <
.05)
• 76
% o
f U
RMs
vers
us 3
0% o
f w
hite
s re
port
ed
that
rac
e af
fect
ed t
heir
educ
atio
nal e
xper
ienc
e (P
< .0
001)
Yes
28%
Yes
Gar
tland
, 20
0319
2003
†C
ross
-sec
tiona
l sel
f-re
port
su
rvey
4 w
hite
, 87
AA
gra
duat
es o
f Je
ffer
son
Med
ical
Col
lege
• So
cial
env
ironm
ent
• Ra
ce-r
elat
ed
expe
rienc
es
• Le
arni
ng
envi
ronm
ent
• A
As
less
sat
isfie
d th
an w
hite
s w
ith s
ocia
l en
viro
nmen
t, t
ime
as m
edic
al s
tude
nt,
inte
ract
ions
with
fac
ulty
and
adm
inis
trat
ors
(P <
.01)
• A
As
less
like
ly t
han
whi
tes
to r
epor
t re
com
men
ding
the
sch
ool t
o A
As,
His
pani
cs,
and
Am
eric
an In
dian
s (P
< .0
1)
• A
As
less
will
ing
than
whi
tes
to m
ake
dona
tions
to
sch
ool (
P <
.05)
• N
o di
ffer
ence
s in
sat
isfa
ctio
n w
ith a
cade
mic
en
viro
nmen
t, p
repa
ratio
n fo
r ca
reer
, or
rega
rds
for
educ
atio
nal e
xper
ienc
es in
med
ical
sch
ool
(P >
.05)
No
61%
Yes
Pysk
oty,
19
9020
1987
–198
8Lo
ngitu
dina
l sel
f-re
port
su
rvey
; ass
essm
ents
in t
he f
all
of fi
rst
and
seco
nd y
ears
126
stud
ents
(90
whi
te, 1
9 A
A, 1
7 H
ispa
nic)
at
a st
ate
med
ical
col
lege
Soci
al e
nviro
nmen
t•
AA
s an
d H
ispa
nics
ent
ered
with
hig
her
emot
iona
l and
ove
rall
soci
al s
uppo
rt t
han
whi
tes
(P <
.01)
; AA
s ex
perie
nced
dro
p in
em
otio
nal a
nd e
vent
-rel
ated
soc
ial s
uppo
rt
(P <
.05)
and
whi
tes
in e
vent
-rel
ated
sup
port
(P
< .0
05)
• H
ispa
nics
did
not
exp
erie
nce
a dr
op in
any
di
men
sion
of
supp
ort
(rec
ipro
city
, ava
ilabi
lity,
in
stru
men
tal,
emot
iona
l, ev
ent-
rela
ted,
ove
rall)
No
78%
Yes
Stra
yhor
n,
1989
2119
82–1
985
Cro
ss-s
ectio
nal d
ata
from
a
long
itudi
nal s
elf-
repo
rt
surv
ey; a
sses
smen
ts a
t th
e be
ginn
ing
and
end
of t
he
first
yea
r
442
first
-yea
r st
uden
ts (3
92 w
hite
, 50
AA
) at
the
Uni
vers
ity o
f N
orth
C
arol
ina
Scho
ol o
f M
edic
ine
• So
cial
env
ironm
ent
• Ra
ce-r
elat
ed
expe
rienc
es
• Le
arni
ng
envi
ronm
ent
• A
As
repo
rted
gre
ater
ove
rall
soci
al s
uppo
rt
(P =
.000
5) a
nd s
ocia
l sup
port
fro
m c
lass
ad
viso
rs a
nd a
dmin
istr
ator
s (P
< .0
1) t
han
whi
tes
• A
As
repo
rted
gre
ater
str
ess
due
to t
heir
min
ority
sta
tus
than
whi
tes
(P =
.000
1)
• A
As
and
whi
tes
had
sim
ilar
perc
eptio
ns o
f le
arni
ng e
nviro
nmen
t (P
> .0
8)
No
69%
Yes
Kas
seba
um,
1998
2219
96C
ross
-sec
tiona
l ana
lysi
s of
ite
ms
incl
uded
in A
AM
C
Med
ical
Sch
ool G
radu
atio
n Q
uest
ionn
aire
13,1
68; a
naly
ses
incl
uded
10,
686
grad
uate
s (9
,087
whi
te, 7
83 A
A,
741
His
pani
c, 7
5 A
mer
ican
Indi
an/
Ala
ska
Nat
ive)
fro
m t
he 1
25 m
edic
al
scho
ols
affil
iate
d w
ith t
he A
AM
C
Dis
crim
inat
ion
For
whi
tes,
AA
s, H
ispa
nics
, Am
eric
an In
dian
/ A
lask
a N
ativ
es, r
espe
ctiv
ely,
the
per
cent
ages
of
mal
es r
epor
ting
raci
al h
aras
smen
t w
ere
1.8%
, 9.
4%, 9
.6%
, and
4.9
%; p
erce
ntag
es o
f fe
mal
es
wer
e 1.
3%, 1
6.8%
, 8.0
%, a
nd 5
.9%
Yes
83%
No
(App
endi
x co
ntin
ues)
Copyright © by the Association of American Medical Colleges. Unauthorized reproduction of this article is prohibited.
Review
Academic Medicine, Vol. 88, No. 11 / November 201310
Man
gus,
19
9823
1996
Cro
ss-s
ectio
nal s
elf-
repo
rt
surv
ey54
8; a
naly
ses
incl
uded
440
gr
adua
ting
stud
ents
(401
w
hite
, 19
AA
, 20
His
pani
c) a
t 8
med
ical
sch
ools
in f
our
regi
ons
(acc
ordi
ng t
o A
AM
C’s
geog
raph
ic
cate
goriz
atio
n)
Dis
crim
inat
ion
3.0%
of
whi
tes,
68.
4% o
f A
As,
and
40.
0%
of H
ispa
nics
rep
orte
d ex
perie
ncin
g ra
cial
di
scrim
inat
ion
Yes
55%
Yes
Hun
g, 2
00724
2003
Cro
ss-s
ectio
nal s
elf-
repo
rt
surv
ey21
6 st
uden
ts (2
01 n
on-U
RM, 1
5 U
RM) a
tten
ding
a P
acifi
c N
orth
wes
t m
edic
al s
choo
l
Dis
crim
inat
ion
• M
ore
URM
s (4
6.7%
) tha
n no
n-U
RMs
(19.
8)
perc
eive
d ra
cism
at
thei
r un
iver
sity
(P <
.05)
• N
o si
gnifi
cant
diff
eren
ces
with
res
pect
to
bel
iefs
tha
t st
uden
ts a
re “
acce
pted
an
d re
spec
ted
by t
heir
peer
s, f
acul
ty, a
nd
adm
inis
trat
ion,
” an
d “u
nive
rsity
has
ach
ieve
d a
posi
tive
and
acce
ptin
g cl
imat
e fo
r cu
ltura
l di
ffer
ence
s” b
etw
een
URM
s an
d w
hite
s,
alth
ough
per
cent
ages
wer
e 10
–16
poin
ts
low
er f
or U
RMs
than
non
-URM
s
No
54%
Yes
Elam
, 200
12519
98C
ross
-sec
tiona
l sel
f-re
port
su
rvey
349‡
stud
ents
att
endi
ng 4
So
uthe
aste
rn m
edic
al s
choo
ls•
Dis
crim
inat
ion
• Ra
ce-r
elat
ed
expe
rienc
es
Whi
tes
and
His
pani
cs, o
n av
erag
e, r
espo
nded
th
at t
hey
“nev
er”
enco
unte
red
lack
of
sens
itivi
ty
rela
ted
to r
ace;
AA
s re
spon
ded
“rar
ely/
so
met
imes
”
Yes
74%
No
Frie
rson
, 19
8726
1980
Cro
ss-s
ectio
nal s
elf-
repo
rt
surv
ey76
AA
stu
dent
s at
tend
ing
4 N
orth
C
arol
ina
med
ical
sch
ools
Race
-rel
ated
ex
perie
nces
Resp
onde
nts
repo
rted
mor
e ne
gativ
e in
tera
ctio
ns w
ith w
hite
tha
n A
A f
acul
ty a
nd
peer
s
Yes
65%
No
Robi
ns, 1
99727
1992
–199
5C
ross
-sec
tiona
l sel
f-re
port
su
rvey
430;
ana
lyse
s in
clud
ed 3
13 fi
rst-
ye
ar s
tude
nts
(239
whi
tes,
74
URM
) at
the
Uni
vers
ity o
f M
ichi
gan
Lear
ning
env
ironm
ent
• U
RMs
less
sat
isfie
d th
an w
hite
s w
ith: o
vera
ll le
arni
ng e
nviro
nmen
t, t
imel
y ev
alua
tions
of
stud
ents
’ per
form
ance
s, r
espo
nsiv
enes
s of
fa
culty
to
stud
ents
’ con
cern
s, (0
.2 ≤
ds
< 0
.5)
• U
RMs
less
like
ly t
o ag
ree
that
stu
dent
s re
ceiv
ed a
ppro
pria
te a
mou
nt o
f co
nstr
uctiv
e fe
edba
ck a
nd s
choo
l is
a co
mfo
rtab
le p
lace
for
bo
th m
en a
nd w
omen
to
lear
n (0
.5 ≤
ds
< 0
.8)
• U
RMs
less
like
ly t
han
whi
tes
to a
gree
tha
t sc
hool
is c
omfo
rtab
le p
lace
for
all
race
s an
d et
hnic
ities
to
lear
n (d
≥ 0
.8)
• N
o di
ffer
ence
s in
agr
eem
ent
that
sch
ool
prom
otes
crit
ical
thi
nkin
g an
d m
edic
al s
tude
nt
educ
atio
n is
hig
h pr
iorit
y fo
r fa
culty
No
90%
Yes
Aca
dem
ic p
erf
orm
an
ce a
nd
pro
gre
ss
Daw
son,
19
9428
1986
–198
8C
ross
-sec
tiona
l ana
lysi
s of
re
cord
s fr
om N
BME
and
AA
MC
10,4
03; a
naly
ses
incl
uded
9,4
33
stud
ents
(8,5
17 w
hite
, 548
AA
, 36
8 H
ispa
nic)
who
too
k th
e Ju
ne
adm
inis
trat
ion
of P
art
I for
the
firs
t tim
e in
198
8 an
d w
ho w
ere
2 ye
ars
from
gra
duat
ion
Aca
dem
ic p
erfo
rman
ce
(NBM
E)•
AA
s (1
07 p
oint
s lo
wer
, whe
re 1
SD
= 1
00) a
nd
His
pani
cs (5
2 po
ints
low
er) s
core
d lo
wer
on
NBM
E Pa
rt I
than
whi
tes
• Pa
ss r
ates
for
NBM
E Pa
rt 1
wer
e 88
%, 4
9%,
and
66%
for
whi
tes,
AA
s, a
nd H
ispa
nics
re
spec
tivel
y
Yes
NA
§N
o
App
endi
x 1,
con
tinue
d
Firs
t au
tho
r,
year
of
pu
bli
cati
on
Yea
r(s)
of
dat
aSt
ud
y d
esig
nSt
ud
y sa
mp
leTo
pic
sR
esu
lts
MI
RR
Sig
te
st
(App
endi
x co
ntin
ues)

Copyright © by the Association of American Medical Colleges. Unauthorized reproduction of this article is prohibited.
Review
Academic Medicine, Vol. 88, No. 11 / November 2013 11
And
riole
, 20
1229
1993
–200
1Lo
ngitu
dina
l ana
lysi
s of
re
cord
s fr
om s
tude
nts
mat
ricul
atin
g 19
93–2
000
6,59
4 st
uden
ts (2
,444
whi
te, 9
52
Asi
an/P
acifi
c Is
land
er, 3
,198
URM
) at
U.S
. med
ical
sch
ools
acc
redi
ted
by t
he L
CM
E w
ho f
aile
d th
e U
SMLE
St
ep 1
Aca
dem
ic p
erfo
rman
ce
(USM
LE)
• U
RMs
had
low
er o
dds
than
whi
tes
of p
assi
ng
USM
LE S
tep
2 C
linic
al K
now
ledg
e (O
R =
0.5
9;
95%
CI =
0.5
1–0.
70)
• N
o di
ffer
ence
in o
dds
of a
ttem
ptin
g St
ep 2
Yes
NA
Yes
Koe
nig,
19
9830
1992
–199
4Lo
ngitu
dina
l ana
lysi
s of
exa
m
scor
es11
,279
; (8,
142
whi
te, 6
67 A
A a
nd
279
His
pani
c) m
edic
al s
tude
nts
who
too
k St
ep 1
in J
une
1994
Aca
dem
ic p
erfo
rman
ce
(USM
LE)
AA
s an
d H
ispa
nics
had
low
er s
core
s th
an w
hite
s on
USM
LE S
tep
1 an
d lo
wer
yea
r 1
and
2 G
PAs
Yes
NA
No
Cas
e, 1
99631
1991
–199
6Lo
ngitu
dina
l ana
lysi
s of
U
SMLE
rec
ords
14,7
25; a
naly
ses
incl
uded
11,
710
stud
ents
(10,
290
whi
te, 8
65 A
A,
555
His
pani
c)
Aca
dem
ic p
erfo
rman
ce
(USM
LE)
• St
ep 1
pas
s ra
tes
by e
xpec
ted
grad
uatio
n da
te
for
whi
tes,
AA
s, a
nd H
ispa
nics
wer
e 98
.6%
, 87
.6%
, and
92.
3%, r
espe
ctiv
ely
• St
ep 2
pas
s ra
tes
by e
xpec
ted
grad
uatio
n da
te
for
whi
tes,
AA
s, a
nd H
ispa
nics
wer
e 93
.8%
, 70
.6%
, and
82.
5%, r
espe
ctiv
ely
Yes
NA
No
Kas
uya,
20
0332
1996
–200
0Lo
ngitu
dina
l ana
lysi
s of
st
uden
t re
cord
s fr
om
grad
uatin
g cl
asse
s 19
96–
2000
258
stud
ents
(40
Haw
aiia
n/Pa
cific
Is
land
er, 2
18 o
ther
) gra
duat
ing
from
the
Uni
vers
ity o
f H
awai
’i Sc
hool
of
Med
icin
e
Aca
dem
ic p
erfo
rman
ce
(USM
LE)
• H
awai
ian/
Paci
fic Is
land
ers
perf
orm
ed w
orse
th
an o
ther
gro
ups
on U
SMLE
Ste
p 1
but
not
Step
2
No
NA
Yes
Cam
pos-
O
utca
lt,
1994
33
1987
–199
1Lo
ngitu
dina
l stu
dy o
f gr
ade
and
exam
rec
ords
410
grad
uate
s (3
68 n
on-U
RM,
8 A
A, 2
8 H
ispa
nic,
6 N
ativ
e A
mer
ican
) of
the
Uni
vers
ity o
f A
rizon
a C
olle
ge o
f M
edic
ine
Aca
dem
ic p
erfo
rman
ce
(cle
rksh
ips,
OSC
E)U
RMs
had
low
er G
PA, l
ower
NBM
E Pa
rt I
and
II ex
am s
core
s th
an n
on-U
RMs
(P <
.01)
but
fam
ily
prac
tice
cler
kshi
p cl
inic
al e
valu
atio
ns a
nd 7
/12
OSC
E sc
ores
wer
e eq
uiva
lent
No
NA
Yes
Lee,
200
73420
06C
ross
-sec
tiona
l sel
f-re
port
su
rvey
; stu
dent
s w
ere
cont
acte
d th
roug
h N
MSA
da
taba
se a
nd s
choo
l dea
ns
of a
ll U
S M
D-d
egre
e gr
antin
g m
edic
al s
choo
ls
2,39
5; a
naly
ses
incl
uded
1,6
33
stud
ents
(1,3
68 w
hite
, 265
URM
) at
tend
ing
105
med
ical
sch
ools
Aca
dem
ic p
erfo
rman
ce
(cle
rksh
ips)
URM
s re
ceiv
ed lo
wer
gra
des
in 6
req
uire
d cl
erks
hips
(P <
.001
)Ye
s—
¶Ye
s
Lee,
200
93520
06C
ross
-sec
tiona
l sel
f-re
port
su
rvey
; sam
e da
tase
t as
Lee
, 20
0734
2,39
5; a
naly
ses
incl
uded
1,6
20
stud
ents
(1,3
57 w
hite
, 115
AA
, 11
6 H
ispa
nic,
32
Nat
ive
Am
eric
an/
Ala
ska
Nat
ive)
who
com
plet
ed a
t le
ast
one
requ
ired
clin
ical
cle
rksh
ip
Aca
dem
ic p
erfo
rman
ce•
AA
s re
port
ed r
ecei
ving
few
er p
ositi
ve
com
men
ts t
han
whi
tes
rega
rdin
g th
eir
com
mun
icat
ion
skill
s du
ring
clin
ical
cle
rksh
ips
• N
ativ
e A
mer
ican
s/A
lask
a N
ativ
es a
nd A
As
repo
rted
rec
eivi
ng m
ore
nega
tive
com
men
ts
than
whi
tes
rega
rdin
g th
eir
com
mun
icat
ion
skill
s du
ring
clin
ical
cle
rksh
ips
Yes
—¶
Yes
Rete
guiz
, 20
0236
1996
–200
0A
naly
sis
of e
xam
rec
ords
and
fa
culty
clin
ical
eva
luat
ions
650;
ana
lyse
s in
clud
ed 4
25
stud
ents
(321
whi
te, 4
5 A
A a
nd
59 H
ispa
nic)
at
UM
DN
J-N
ew
Jers
ey M
edic
al S
choo
l who
rot
ated
th
roug
h a
med
icin
e cl
erks
hip
Aca
dem
ic p
erfo
rman
ce
(cle
rksh
ips)
• A
As
had
low
er m
ean
test
sco
res
than
whi
tes
on c
linic
al e
valu
atio
ns, O
SCE,
and
NBM
E
• H
ispa
nics
had
low
er m
ean
test
sco
res
than
w
hite
s on
NBM
E
No
NA
Yes
App
endi
x 1,
con
tinue
d
Firs
t au
tho
r,
year
of
pu
bli
cati
on
Yea
r(s)
of
dat
aSt
ud
y d
esig
nSt
ud
y sa
mp
leTo
pic
sR
esu
lts
MI
RR
Sig
te
st
(App
endi
x co
ntin
ues)
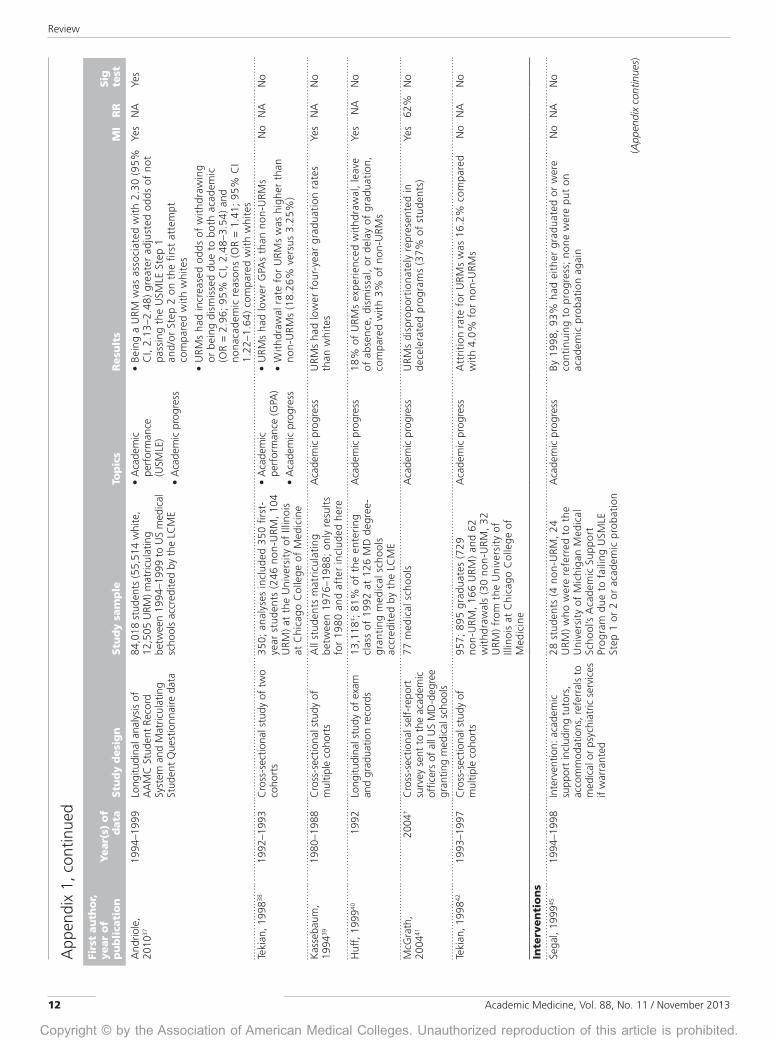
Copyright © by the Association of American Medical Colleges. Unauthorized reproduction of this article is prohibited.
Review
Academic Medicine, Vol. 88, No. 11 / November 201312
And
riole
, 20
1037
1994
–199
9Lo
ngitu
dina
l ana
lysi
s of
A
AM
C S
tude
nt R
ecor
d Sy
stem
and
Mat
ricul
atin
g St
uden
t Q
uest
ionn
aire
dat
a
84,0
18 s
tude
nts
(55,
514
whi
te,
12,5
05 U
RM) m
atric
ulat
ing
betw
een
1994
–199
9 to
US
med
ical
sc
hool
s ac
cred
ited
by t
he L
CM
E
• A
cade
mic
pe
rfor
man
ce
(USM
LE)
• A
cade
mic
pro
gres
s
• Be
ing
a U
RM w
as a
ssoc
iate
d w
ith
2.30
(95
%
CI,
2.13
–2.4
8) g
reat
er a
djus
ted
odds
of
not
pass
ing
the
USM
LE S
tep
1
and/
or S
tep
2 on
the
firs
t at
tem
pt
com
pare
d w
ith
whi
tes
• U
RMs
had
incr
ease
d od
ds o
f w
ithd
raw
ing
or b
eing
dis
mis
sed
due
to b
oth
acad
emic
(O
R =
2.9
6; 9
5% C
I, 2.
48–3
.54)
and
no
naca
dem
ic r
easo
ns (
OR
= 1
.41;
95%
CI
1.22
–1.6
4) c
ompa
red
wit
h w
hite
s
Yes
NA
Yes
Teki
an, 1
99838
1992
–199
3C
ross
-sec
tiona
l stu
dy o
f tw
o co
hort
s35
0; a
naly
ses
incl
uded
350
firs
t-
year
stu
dent
s (2
46 n
on-U
RM,
104
URM
) at
the
Uni
vers
ity
of Il
linoi
s at
Chi
cago
Col
lege
of
Med
icin
e
• A
cade
mic
pe
rfor
man
ce (G
PA)
• A
cade
mic
pro
gres
s
• U
RMs
had
low
er G
PAs
than
non
-URM
s
• W
ithd
raw
al r
ate
for
URM
s w
as h
ighe
r th
an
non-
URM
s (1
8.26
% v
ersu
s 3.
25%
)
No
NA
No
Kas
seba
um,
1994
3919
80–1
988
Cro
ss-s
ectio
nal s
tudy
of
mul
tiple
coh
orts
All
stud
ents
mat
ricu
lati
ng
betw
een
1976
–198
8; o
nly
resu
lts
for
1980
and
aft
er in
clud
ed h
ere
Aca
dem
ic p
rogr
ess
URM
s ha
d lo
wer
fou
r-ye
ar g
radu
atio
n ra
tes
than
whi
tes
Yes
NA
No
Huf
f, 1
99940
1992
Long
itudi
nal s
tudy
of
exam
an
d gr
adua
tion
reco
rds
13,1
18‡ ;
81%
of
the
ente
ring
cl
ass
of 1
992
at 1
26 M
D d
egre
e-
gran
ting
med
ical
sch
ools
ac
cred
ited
by
the
LCM
E
Aca
dem
ic p
rogr
ess
18%
of
URM
s ex
peri
ence
d w
ithd
raw
al,
leav
e of
abs
ence
, di
smis
sal,
or d
elay
of
grad
uati
on,
com
pare
d w
ith
3% o
f no
n-U
RMs
Yes
NA
No
McG
rath
, 20
0441
2004
†C
ross
-sec
tiona
l sel
f-re
port
su
rvey
sen
t to
the
aca
dem
ic
offic
ers
of a
ll U
S M
D-d
egre
e gr
antin
g m
edic
al s
choo
ls
77 m
edic
al s
choo
lsA
cade
mic
pro
gres
sU
RMs
disp
ropo
rtio
nate
ly r
epre
sent
ed in
de
cele
rate
d pr
ogra
ms
(37%
of
stud
ents
)Ye
s62
%N
o
Teki
an, 1
99842
1993
–199
7C
ross
-sec
tiona
l stu
dy o
f m
ultip
le c
ohor
ts95
7; 8
95 g
radu
ates
(72
9 no
n-U
RM,
166
URM
) an
d 62
w
ithd
raw
als
(30
non-
URM
, 32
U
RM)
from
the
Uni
vers
ity
of
Illin
ois
at C
hica
go C
olle
ge o
f M
edic
ine
Aca
dem
ic p
rogr
ess
Att
riti
on r
ate
for
URM
s w
as 1
6.2%
com
pare
d w
ith
4.0%
for
non
-URM
s N
oN
AN
o
Inte
rven
tio
ns
Sega
l, 19
9945
1994
–199
8In
terv
entio
n: a
cade
mic
su
ppor
t in
clud
ing
tuto
rs,
acco
mm
odat
ions
, ref
erra
ls t
o m
edic
al o
r ps
ychi
atric
ser
vice
s if
war
rant
ed
28 s
tude
nts
(4 n
on-U
RM,
24
URM
) w
ho w
ere
refe
rred
to
the
Uni
vers
ity
of M
ichi
gan
Med
ical
Sc
hool
’s A
cade
mic
Sup
port
Pr
ogra
m d
ue t
o fa
iling
USM
LE
Step
1 o
r 2
or a
cade
mic
pro
bati
on
Aca
dem
ic p
rogr
ess
By 1
998,
93%
had
eit
her
grad
uate
d or
wer
e co
ntin
uing
to
prog
ress
; no
ne w
ere
put
on
acad
emic
pro
bati
on a
gain
No
NA
No
(App
endi
x co
ntin
ues)
App
endi
x 1,
con
tinue
d
Firs
t au
tho
r,
year
of
pu
bli
cati
on
Yea
r(s)
of
dat
aSt
ud
y d
esig
nSt
ud
y sa
mp
leTo
pic
sR
esu
lts
MI
RR
Sig
te
st

Copyright © by the Association of American Medical Colleges. Unauthorized reproduction of this article is prohibited.
Review
Academic Medicine, Vol. 88, No. 11 / November 2013 13
Lieb
erm
an,
2008
4619
95–1
997,
20
03–2
005
Inte
rven
tion:
sw
itch
from
tr
aditi
onal
to
inte
grat
ed
curr
icul
um t
hat
inco
rpor
ated
sy
stem
- an
d pr
oble
m-b
ased
le
arni
ng, e
xam
pre
para
tion,
re
med
iatio
n fo
r at
-ris
k st
uden
ts
255
stud
ents
(74
non-
URM
, 181
U
RM) a
t th
e U
nive
rsity
of
Texa
s M
edic
al B
ranc
h
Aca
dem
ic p
erfo
rman
ce•
Impr
ovem
ent
in S
tep
1 sc
ores
gre
ates
t am
ong
URM
s (+
11.
9 po
ints
, d =
0.6
4), i
n pa
rtic
ular
A
As
(+ 1
4.3
poin
ts, d
= 0
.77)
• D
ecre
ase
in P
art
I fai
lure
(12.
9% t
o 4.
2%) f
or
URM
s
No
NA
Yes
Lieb
erm
an,
2010
4719
95–1
997,
20
03–2
005
Inte
rven
tion;
sam
e da
tase
t as
Li
eber
man
, 200
8461,
114
stud
ents
(771
non
-URM
, 32
9 U
RM) a
t th
e U
nive
rsity
of
Texa
s M
edic
al B
ranc
h
Aca
dem
ic p
erfo
rman
ce•
Impr
ovem
ent
in S
tep
1 sc
ores
gre
ates
t am
ong
URM
s (+
14.
6 po
ints
, d =
0.7
4), i
n pa
rtic
ular
A
As
(+ 2
0.8
poin
ts, d
= 1
.12)
• D
ecre
ase
in P
art
I fai
lure
(16.
6% t
o 3.
9%) f
or
URM
s
No
NA
Yes
* † ‡ § ¶
MI i
ndic
ates
mul
ti-in
stitu
tion
stud
y; R
R, r
espo
nse
rate
; sig
tes
t, a
ll di
ffer
ence
s or
eff
ects
wer
e te
sted
for
sta
tistic
al s
igni
fican
ce
or e
ffec
t si
ze; A
MSA
, Am
eric
an M
edic
al S
tude
nt A
ssoc
iatio
n; A
AM
C, A
ssoc
iatio
n of
Am
eric
an M
edic
al C
olle
ges;
NBM
E,
Nat
iona
l Boa
rd o
f M
edic
al E
xam
iner
s; L
CM
E, L
iais
on C
omm
ittee
on
Med
ical
Edu
catio
n; U
SMLE
, Uni
ted
Stat
es M
edic
al
Lice
nsin
g Ex
amin
atio
n; O
SCE,
obj
ectiv
e st
ruct
ured
clin
ical
exa
min
atio
n; N
MSA
, Nat
iona
l Med
ical
Stu
dent
Ass
ocia
tion;
SD
, st
anda
rd d
evia
tion;
OR,
odd
s ra
tio; C
I, co
nfide
nce
inte
rval
.D
ata
colle
ctio
n da
tes
not
prov
ided
, the
refo
re, p
ublic
atio
n da
te in
clud
ed in
stea
d.Br
eakd
own
of n
umbe
r of
res
pond
ents
by
race
not
pro
vide
d.N
ot a
pplic
able
(NA
) ind
icat
es t
hat
data
wer
e ex
trac
ted
from
stu
dent
rec
ords
.Re
spon
se r
ate
was
not
rep
orte
d an
d co
uld
not
be c
alcu
late
d.
App
endi
x 1,
con
tinue
d
Firs
t au
tho
r,
year
of
pu
bli
cati
on
Yea
r(s)
of
dat
aSt
ud
y d
esig
nSt
ud
y sa
mp
leTo
pic
sR
esu
lts
MI
RR
Sig
te
st