the sedimen'idlcgy, gecu-iemistry and diagenesis of west rand ...
308
THE SEDIMEN'IDLCGY, GECU-IEMISTRY AND DIAGENESIS OF WEST RAND GROUP SEDIMENI'S IN THE HEIDELBERG ARE.A, TRANSVAAL by P.M. Carrrlen-Smith Thesis sul:rnitted in fulfillment of the r~rements for the degree of Master of Science at the University of Cape Town. April, ' -- --... f -' , ,, '"' it· 1 .>f C::,: (}, T ... !1·.·· h",) ·. f''ven rnri:J(.[• thi,;. f·' ~i5 ir, V\''1()!e i ,,. 111 ,,,,.·t. (.,up,;ri;;ht is helt' ':y 1he author I • '.._..._.__lt,._...,._~...,._I'! .~ ................ '-' .... fl I • • *C - -----~-- ----~-----
-
Upload
khangminh22 -
Category
Documents
-
view
0 -
download
0
Transcript of the sedimen'idlcgy, gecu-iemistry and diagenesis of west rand ...

THE SEDIMEN'IDLCGY, GECU-IEMISTRY AND DIAGENESIS
OF WEST RAND GROUP SEDIMENI'S IN THE HEIDELBERG
ARE.A, TRANSVAAL
by
P.M. Carrrlen-Smith
Thesis sul:rnitted in fulfillment of the r~rements for the degree of Master of Science at the University of Cape Town.
April,
' -- --... f-' , ,, '"' it·1 .>f C::,: (}, T ... !1·.·· h",) ·. f''ven r~~ rnri:J(.[• thi,;. f·' ~i5 ir, V\''1()!e
i ,,. 111 ,,,,.·t. (.,up,;ri;;ht is helt' ':y 1he author
I • '.._..._.__lt,._...,._~...,._I'! .~ ................ '-' .... fl I • • *C -
------- --- -----~-- ----~----- ---
i
fl

i
ABSTRACT
This study deals with the West Rand Group (fonca:-ly the Lower Division of 2
the Witwatersrand System) sedilrents within an area of approximately 500 km
east of Heidelberg. 'Ihe aim of the study was to interpret fran the stratigraphy,
lithology, petrology and sedilrentary structures, the type of processes which
'vv':!re involved in the deposition of the arenaceous units of the West Rand Group,
the current dispersal pattern and the probable, equivalent m:xiern day depo
sitional envirionment. The extent of diagenesis and i:retarrorphism was investi
gated by using two white mica techniques. The chemistry of the shales was
related to its mineralogy and a detailed study of the geochemical profile
belCM the West Rand/Central Rand unconformity was undertaken.
The West Rand Group east of Heidelberg is lt'ade up of a thick (3400 m) succession
of alternating arenaceous and argillaceous units. It has traditionally been
subdivided into three Subgroups - the Hospital Hill, GoverrutEnt and Jeppesto.vn.
Each Subgroup is divided into three fonnations on the basis of laterally
persistent ro.arkers.
Facies analysis has indicated that depositionoccurred in the follCMing environ
i:rents in the different Fonnations: (1) the first shale horizon of the Orange
Grove Quartzite Fonnation marks a change fran "high" energy-·wave daninated to
lo.ver energy - tide daninated conditions. The basalconglanerates and overlying
trough crossbedded facies are interpreted as either platfonn beach or inlet
deposits while ebb tidal deltas and local stonn deposits characterise the rest
of the arenaceous succession (2) the shales and thin sublitharenites of the Park
tCMn Shale Fonnation t.vere formed by suspension deposition of r.llld alternating with
periodic sand influxes while the banded iron fonnations and magnetite rich zones
prooably represent distal shelf nu.ids. (3) the 'sago'-textured units of the Brixton
Fonnation were deposited by stonn ebb surge currents in conjunction with tidal
currents (4) at the base of the Pranise Quartzite Fonnation offshore (sub-
tidal shelf) marine conditions prevailed.Nearshore sequences and finally a
braided stream sett:ing of the Platte type is interpreted for the rest of the
succession (5) the poor outcrop of'tillite' in the Coronation Shale Fonnation
lt'ade it impossible to delineate the facies associated with the till (6) the
inrna.ture subgreywackes of the Witpoortjie Formation belCM the GoverrutEnt Reef
represent subtidal shelf and inshore tidal flat deposits. The Governnent Reef
marker represents an ancient beach deposit with an.shore migrating sandbars
and ripples noving in response to shoaling waves. The Blue Grit marker is
interpreted as either a fossil suhnarine rockfall or a cannon and fan valley depo
sit ··(7) the shales of the Jeppest.CMn Subgrcup represent proximal shelf deposits

ii
while the sandstones fonrro as a response totidal, shelf and possibly fluvial
processes.
The Weber ccystallinity index indicatEE that the mineral assemblage (white mica,
chlorite and quartz) are low grade. The West Rand Group's Hb(rel) value
of 150 CQresponds to an approximate temperatures of 290°C. The study areas
baric constraints are similar to the conditions for the Hercynian rretamorphism
in the eastern Alps.
The relative anounts of clay mineral present in a sample was calculated fran its
bulk chemi.stcy. Chlorite, illite and ITn.lscovite (in that order) are the major
clay phases present. '!he trace elerrent abundance indicatesthat the source
rocks for the West Rand Group in the study area are similar in petrology to
the source rocks of the Fig Tree sediments. The trace elerrents - Sr, Ni, Rb,
ca, Zn, Cr - can be used to discriminate the shales of the West Rand, Central
Rand and Fig Tree Groups. The Jeppestown shale :inmediately below the Main
Conglarerate has a geochemical profile that has traits of a palaeosol which has
subsequently been modified by diagenesis and the percolation of ground waters.
Two models are proposed for the deposition of the Hospital Hill Subgroup and the
Government Subgroup by intergrating the writer'.s detailed facies analysis approach
with the work done by previous workers in other outcrop areas.
'
--- --- - ------- ------

T I
J
iii
ACKNCMLEIX;EMENTS
This M.Sc. research project was financed by the Economic Geology Research Unit,
a bursary and loan fro.n Southern Oil Exploration Corporation (SOEKOR) and a grant
fran Anglo American Corporation, all of whan are gratefully thanked. Professor
A.J. Erlank of the Geochemistry Department, University of Cape Tcwn, is thanked
for permission to use the department's equiµnent and for reducing and in many
instances waivering the instrument costs.
The writer is indebted to Professor D.A. Pretorius of the Econanic Geology Research
Unit, University of the Witwatersrand and Professor A.O. Fuller of the Geology
Department, University of cape Tcwn for pro:p:::,sing the project. Guidance and
encouragement wa:s given by Professor A.O. Fuller hois thanked for his useful
canrcents against the final draft of the thesis. Special thanks are due to Dr.
A. Button for many discussions on West Rand Group geology, and for his construc
tive criticisms in the field. The author's field method and interpretation bene
fitted considerably fran discussions during field excursions with Professors
A.O. Fuller and D.A. Pretorius, Drs. K.A. Eriksson, W.E. Minter, R.I. Hutchinson,
H. de la R. Winter, Mr. P .M. Strydan, Mr. N. Tyler and my wife, Frances.
Mr. G. Payne, underground mine manager of Nigel Witwatersrand Pty. Ltd., is thanked
for pennission to sample and map the mine's longest crosscut. Union Corporation
Ltd., Ma.rievale, is also acknowledged for providing several core samples.
'l'he following persons deserve special mention for their contributions at various
stages of the research prograrcIIE and in the preparation of this manuscript
Richard Zeblon, my field assistant; the farmers of the Heidelberg district for their
hospitality; Dr. J.P. Willis, Mr. H.H.G. Fortuin and Mrs. M. Brautesteth for
supervision of XRF analyses; Dr. A.R. Duncan, Miss. J. Crank and Mr. D. Murray
for canputing assistance; Mr. K.W. Kasch and Dr. C.W. Stowe for critical assess
ment of the chapters on metarrorphism and structure respectively; Mr. R. Olivier
for preparation of thin sections; Dr. J. lt:Pherson, Mr. K. Behr and Mr. C. Basson
for photographic reproduction and Miss. P. Eloff and my wife Frances,
for meticulous drafting of many of the diagrams.
This thesis was typed in draft fonn by Mrs. W. Gordon and the final copy wa
carrpetently typed by Mrs. M. Grandia and Mrs. A.E. van Schalkwyk. A special
word of appreciation is expressed to Mrs. G. I<rurrrreck who kindly typed the review.
Finally, I thank my parents and friends, but particularly my wife Frances, for
her support, advice and encouragement throughout my post-graduate career.

,,
iv
C O N T E N T S
ABSTRACT
~
CONTENTS
FIGURES
PLATES
TABLES
CHA.PIER 1 INI'RODUCTION
1 • 1 • 1. 2. 1 . 3. 1 • 4.
General Study area Purp:Jse of study Method of investigation
1.4.1. 1.4.2.
Field procedure Canputer reduction
1.5. Previous 'WOrk
CHAPIER 2 STRUCI'URE
2. 1 • 2.2. 2.3. '2.4. 2.5.
Introduction Su.barea one Su.barea two Subarea three Discussion
CHAPI'ER 3 STRATIGRAPHY
3.1. Definition 3.2. Petrology of sandstones
3.2.1. Textures 3.2.2. Canposition
3. 3 • Hospital Hill Subgrrup
3.3.1. Orange Grove Quartzite Fonnation 3.3.2. Parktown Shale Fonnation 3. 3 • 3 • Brixton Fonnation
3 • 4. Governnent Sul.group
3.4.1. 3.4.2. 3.4.3.
Pranise Quartizte Fonnation Coronation Shale Fonnation Witpoortjie Fonnation
3.5. Jeppesto..m Subgroup
Page
i
iii
iv
vi
vii
viii
1
1 2
·4 5
6 6
7
9
9 10 11 14 ,4
16
16 18
18 23
25
25 33 37
44
44 46 48
52
-

V
CHAPTER 4 DIAGENESIS AND Mm'AMJRPHISM
Page
55
55 56 56 59 61
4. 1. 4.2. 4.3. 4.4. 4.5.
Intrcduction Sarrple choice and preparation Geotherrcnretry Geobararetry Conclusion
CHAPER 5 GEm!EMISTRY 62
62 64 65 73
5.1. 5.2. 5.3. 5.4.
Gecx::hemistry of the West Rand Group - a review Analytical procedure Mineralogy fran rulk chemistry Distribution of trace elenents
5.4.1. Jeppesta,m Palaeosol 5.4.2. Correlation Coeffecients
75 76
CHAPTER 6 CONCLUSION 80
81 82 84
6. 1. 6.2. 6.3.
Hospital Hill Subgroup ltxlel Goverrurent SUbgroup ltxlel Jeppestown SUbgroup ltxlel
REE'ERENCES
APPENDICES
Appendix 1 Appendix 2
Appendix 3
Appendix 4 Appendix 5
Appendix 6
Review of the West Rand Group 97 Carputer Programne for tilt correction 165 Geochemical listings of Kaapvaal Craton Archa.ean sediments 175 Calculation of bo cell dimension 221 Estimates of precision and detection limit for each rrajor oxide (Table 1) and estirrates of the uncertainties due to counting statistics (Table 2) 223 Several trace elenent and rrajor elenent plots. 226

i
Figure
1 • 1 •
1.2.
1.3.
1. 4. 1.5. 2. 1. 2.2.
2.3. 2.4.
2.5. 3. 1 •
3.2.
3.3.
3.4.
3.5.
3.6.
3.7.
3.8.
3.9.
3 .10. 3. 11.
3. 12.
3.13.
3. 14.
4. 1 •
5. 1.
5.2.
5.3.
6. 1. 6.2.
vi
LIST OF FIGURES
Page or following Pas_e
Four najor outcrop areas of the West Rand Group Map showing the distribution of the Witwatersrand Supergroop below cover of Karoo, Transvaal and Ventersdorp sequences. Carparison of Mellor's (1917) stratigraphic column to that of SACS (1978). Topography of study area. Geology of study area showing traverse locations. Division of study area into three subareas. Lineation and fold axial readings recorded for subarea 2. Classification of folds. Parameters measured on a horizontal apparent profile section of a plunging fold. Classification of folds in subarea 2. The West Rand Group in the HeidelbergGreylingstad-Delrnas area. Comparative stratigraphy of the West Rand Grcu.9 in the East Rand. Ccrnposite stratigraphic column of the West Rand Group in the study area. Relative proportions of pebbles in the Governrrent Reef and Black Grit. Stratigraphic section for the Orange Grove Quartzite Fornation. Sedimentary structures observed and napped at the base of the first shale horizon of the Orange Grove Quartzite Fornation. Paleocurrent direction analysis of the Orange Grove Quartzite Fornation. 'Ihe stratigraphic column of the Parktown Shale Fornation. Canposite stratigraphic section of the Brixton Fornation. Paleocurrent pattern of the Brixton Fornation. Sequence of sedirrentary structures, textures and lithology in the Pranise Quartzite Fornation. Paleocurrent dispersal pattern for the Pranise Quartzite Fornation. Canposite stratigraphic section of the Witpoortjie Fornation. Generalized stratigraphic sequence of the Jeppestown Subgroup. The cumulative frequency curves illustrating the distribution of bo in low grade zone iretarrorphic belts of various baric types. Discriminate function analysis of West Rand, Central Rand and Fig Tree Group shales. Distribution of najor elenents below West Rand/ Central Rand unconfonnity. Distribution of trace elenents below West Rand/Central Rand unconfonnity. Depositional m::rlel for the Hospital Hill Subgroup. Depositional m::rlel for the Goverrment Subgroup.
2
3
4 4 7
10
10 12
13 14
18
!8
18
25
28
29
30
34
38 41
46
46
49
61
64
76
76 82 83

Plates
3.0. 3. 1. 3.2.
3.3.
3.4.
3.5. 3.6. 3.7.
vii
LIST OF PLATES
Sed.i.rrentary structures in the West Rand Group. Textures in several thin sections. Orange Grove Quartzite Fonnation 's sed.i.rrentary structures. Tidal flat structures in the Orange Grove Quartzite Fornation. ParktCMn Shale Fornation sedircEntary structures. GovenirtEnt Subgrc:up's sedircentary structures. Coronation Shale Fornations tillite horizon. JeppestCMn Subgroup's sedircEntary structures.
Follaving page
19 20
28
28
36 45 48 53.

CHAPTER 1
IN TRODUC TIO N. 1.1 GENERAL
The Witwatersrand Supergroup consists of about 7400 m of sediments
lying in a roughly ovoid basin 350 km long and 200 km wide within the
Kaapvaal craton (Pretorius 1974). Stratigraphically, the Witwaters
rand Supergroup has been separated into tv-.0 groups: a shale dominated
West Rand Group (previously known as the Lower Division) and a
quartzite and conglorrerate dominated Central Rand Group (previously
known as the Upper Division).
An interpolated age of the Witwatersrand Supergroup is defined by a
ffi3.Ximum of 2720 ± 55 Ma (Rb-Sr) for the underlying granite (Allsopp
1964) and a minirrn.nn of 2620 ± 55 Ma (U-Pb) for lavas of the overlying
Ventersdorp Supergroup (van Niekerk and Burgher 1978). On present
evidence the Witwatersrand basin is therefore Archaean, i.e:)-2500 Ma
old. However, Pretorius (1974) noted that "the transition from
Archaean to Proterozoic style of crustal evolution took place on the
Kaapvaal craton at between 3000 and 3240 Ma ago. On other shield
areas of the v-Drld, the age of transition has been dated at about
2500 Ma". This corment emphasises the Proterozoic aspect of the Wit
watersrand Supergroup despite its formal position in the Archaean.
The scattered areas of West Rand Group outcrop are shown on Fig. 1.1.
Borcher's map (Fig. 1.2, 1961, 1964) shows the distribution of the
Witwatersrand Supergroup below the cover of Karoo, Transvaal and
Ventersdorp sequences.
All these weakly rretarrorphosed sedirrentary/volcanic successions rest
with narked unconformity on a highly rretarrorphosed baserrent complex
comprising the Older Granite and the Swaziland Sequence which together
constitute an early Archaean granite-greenstone terrain.
~llor (1911) constructed "an approximately representative section
of • • • • • • • . / 2

2
#:~.o;A!NE~ .~ .,, __ •,
,rnuu.1
r
... ,-" ~,m·:~ ~ 'KLERKSOORP p
'\ "':;;:'p . .... ,_. ..
D
(f
FIGURE I. I
_0 WELK0M
flGUAI ONI
.,,. ;,
AREAS OF WEST
RAND GROUP
OUTCROP
50 100
K ilometer&
The four major outcrop areas of the West Rand Group.
of the lower Witwatersrand applicable to l::Dth the Central and at least the
adjacent portions of the Western Rand". By 1939, the persistence of rmst
of the West Rand Group lithologies described by Mellor had been confirrred
by Rogers (1921) for the Heidelberg area and by Nel (1927, 1933, 1939)
for the Vredefort, Klerksdorp and Ventersdorp districts. Mellor's (1917)
stratigraphic colWTI11 remained the basis for the subdivision of the West
Rand Group for over forty years and it was only in 1960 that Collender
questioned it. Winter (1978), the chainnan of the Witwatersrand W:>rking
Group of SACS (South African Corrmittee for Stratigraphy) proposed a
lithostratigraphic subdivision of the Witwatersrand Supergroup. Fig. 1.3
corrpares 1~llor ' s (1917) stratigraphic column to that of the South African
Conmittee for Stratigraphy. In this thesis the terminology used by SACS
will be followed.
1. 2 STUDY ARFA
The area described in this thesis is situated in south- eastern Transvaal.
It . • . . . . . • . . / j

FIGURE 1. 2
3
JI JI • • Ill • . . .
N
i LJCentral Rand Group
j::",::.=_=_:'.Jwest Rand Group
0Granite and gneiss
lfillll Mining districts
0 s,o Km
Map showing the distribution of the Witwatersrand Supergroup below the cover of Karoo, Transvaal and Ventersdorp sequences as revealed by diamond drilling (after Borchers 1964).
It is bounded by the Sugarbush fault in the south, the Blesbokspruit River
in the north and the rreridians 28° 20' and 28° 35'. This is an area of
approxi.nately 500 krn2 of which nearly 180 krn2 is exp:)sed rock. The three
major tav.m.s in the area - Heidelberg, Nigel and Balfour - are linked by a
network of provincial and district roads.
The Sugarbush River, a tributary of the Vaal River, follows a course that
is independent of the lithological and structural setting, cutting across
the Swaziland, Witwatersrand, Ventersdorp, Transvaal and Karoo sequences.
Fig. 1 . 4 constructed with the use of the Saclant Graphics Package (U.C.T.
version), gives a perspective picture of the topography of the study area.
The data used in its construction were a set of points (X, Y, Z) defined
over a rectangular grid arbitrarily placed over the four (2628CB, 2628AD,
2628BC ·•··•· ··•• / 4

L w I-I.I)
>-l/)
0 z < a:: l/)
a:: w I-< 3 I--3 a:: w 3 0 __J
after MELLOR (1911)
MEMBERS&. BEDS SERIES
!mar k ers!
JEPPESTOWN
SERIES
Government reef I
Coronation reef GOVERNMENT
R EEF
SERIES
I Promise reefs I
I Husp11al Hill Ouartzites
HOSPITAL
HI LL
Speck led Bed I SERI ES
Ripple- m a rked Ou ij rtZltes l
Orange Grove Ouartz1tes I
I WV \I
I Iv V"
~
I fffff'/1
.. .. • C
I
I
I
I
l~1ool
·· ··--
I _t:~~l I
-~ I
~~ I
after SACS (1s1a)
MEMBERS &. BEDS FORMATIONS
I m a rkers)
ROODEPOOR1 I
I CROWN LAVA
I FLORIDA
QUARTZITE
Government reef WITPOORTJIE
oron t 1 n r ef
CORONATION SHAL E
Hamberg Quart z11e M er1bcr
PROMISE OUARTZITE
___l___F>_r_Q_ m, s e reef
BRIXTO"I
I Observatory Shal e. Member Con1011ed Bed
Speck rec Bed
PARKTOWN SHALE Red Sh d ,es
Ripple marked Quartz!le
Water Tower Shale Member
I
I t:~a,nnlORANGEGROVE QUARTZITE
FIGURE 1.3 Mellor's ( J91 7) s tratigraphic column compared to that of t he South Afri can Committee for Stratigraphy (19781
I Q. ;:)
0 a: C) Ill
I ;:) 1/)
z ~ 0 ,-1/) ...
I Q. Q. ... -,
Q. Cl. ;:) ::> 0 0 a: C) a:: Ill (!) ;:) <I)
~ 0
z z ... < :E z a:: a: ... I-> 0 l/) C) w
~
Q. ;:)
0 a: C) Ill ;:) 1/)
... ... :i: ... < !: Q. 1/)
0 :i:
I

4
HEIDELBERG
UCT VERSION OF (JULY 19761 SACLRNTCEN THREE-0 PACKAGE OCT 1978
FIGURE 1.4 The sandstone ridges of the Hospital Hill Subgroup (RH), Government Subgroup (G) and Central Rand Group contrasting against the flat lying shale dominated Jeppestown Subgroup (J). The Ventersdorp lavas (V) form E-W trending ridges opposed to the north-south trending parallel ridges of the Witwatersrand Supergroup.
2628:BC, 2628DA) 1:50 000 tofX)graphic niaps drawn by the Trigonor:etrical
Survey Office. Although the vertical exaggeration is great, the "fish net"
appearance of the top::,graphy shows at a glance the relative elevations of
the area. The shale dominated Jeppestown Subgroup and the younger flat
lying Karoo strata have an average elevation of sorre 1600 rretres above sea
level while the sandstones of the Witwatersrand Supergroup form several
arcuate north-south trending parallel ridges, reaching heights of up to
1800 min the north of the area and gradually decreasing in height towards
the south. 'lb the west of Heidelberg and around Balfour, the Ventersdorp
lavas form prominent hills rising 200 m above the surrounding area. The
largest pan in the area - Rietpan - is at present a drainage centre (Jan
sen ~-, 1972).
1.3 PURPOSE OF STUDY
A ........ · · • / 5

5
A review on the stratigraphy, lithology, petrology and geochemistry of the
West Rand Group was compiled by the writer in 1978 (Appendix 1). It be
came apparent that although the literature on the Witwatersrand Supergroup
is voluminous very little v.Urk other than that of a pioneering nature (~1-
lor, 1911, 1917; Rogers, 1921; Nel, 1927, 1933, 1939) has been done on
the West Rand Group. The auriferous and uraniferous reefs of the Central
Rand Group have, on the other hand, received much attention in recent years
(e.g. Pretorius, 1966, 1974; Annstrong, 1968; Minter, 1978). A con
sequence of this is that sare geologists (e.g. Vos, 1975) have suggested
that the depositional m:xiels proposed for the Central Rand Group (alluvial
plain and lacustrine) are also applicable to the West Rand Group. One of
the purposes of this study is an investigation based upon rrore quantitative
and stringent sedirrentological variables to test the above hypothesis and
to refine the wide ranging m:xiels (littoral, estuarine, narine, alluvial
plain, glacial, etc.) which have been proposed for the West Rand Group.
Furthernore, in the opinion of many geologists working in Archaean ter
rains (e.g. Glikson, 1971; Pettijohn et al; 1972; Turner and Walker,
1973; Naqvi, 1978) the geochemistry of sed.i.m2nts is useful in understan
ding the early history of crustal evolution. Because of the lack of severe
deformation, :rretanorphism and protracted erosion, the geochemistry of the
Witwatersrand shales should prove useful in this regard.
It was thus the aim of the author to inteJ:I)ret frCF.1 the stratigraphy,
lithology, petrography and sedirrentary structures, the type of processes
which were involved in the deposition of the arenaceous units of the West
Rand Group, the current dispersal pattern of the Group and finally the
probable, if any, m:xiern day equivalent depositional environrrent. The
geochemistry of the shales, tillite, greywackes and sandstones is used to
detennine 'whether the provenance of the various shale horizons was approxi
mately the same throughout the deposition of the Witwatersrand strata, to
see whether it is feasible to make conclusions of early crustal evolution
from a sedirrentological viewpoint and to compare the geochemistry of South
African Archaean sedirrents.
1.4 METHOD OF INVESTIGATION
The :rrethod of investigation entailed the observation, :rreasurerrent and
recording • • • . . . . . • . • • / 6

6
recording of geological variables in the field; subsequent laborato:ry in
vestigation (XRD, XRF and thin-sections) and the computer reduction of the
data collected.
1.4.l Field procedure
Using aerial photographs (scale 1:50 000) and a geological map of
the count:ry around Heidelberg (mapped by Rogers between 1918-1921),
eighteen traverses vJere selected along unfaulted routes, (Fig. 1.5).
The system used for section and sample lc:x::ation numbering comprise
four digits; two for the traverse and two for the sample location
e.g. sample 03/15 v.0uld be sarrple 15 from traverse number 3. Thick
ness determinations were made using the Jacob's staff rrethod (Robin
son, 1959). The orientation of beds, sedirrenta:ry structures and
joints was determined using "Toby's Clinoboard" and a Brunton com
pass. Forty shale samples within the Jeppestown Subgroup were sampl
ed along a crosscut in the Witwatersrand-Nigel Mine.
Of the 247 samples collected, all were halved (duplicates of which
were kept in the Economic Geology Research Units Storeroom); 27
samples (1 paleosol, l sandstone, l greywacke, 2 tillites and 22
shales) selected for major and trace elerrent analysis (X-ray
fluorescence); 60 thin sections cut and rrore than 60 X-ray dif
fraction traces run.
1.4.2 Computer reduction
The number of crossbed rreasurenents taken at any one outcrop varied
from less than ten (unirrodal) to over thirty (polym:xlal or birrodal).
Where possible the trough axes of the pi crossbeds were recorded.
The processing of the crossbed data was initially done by hand but
this proved to be curnbersorre. A Fortran programne was thus written
using the rotatipn formulae of van Eden (1969) and the calculations
for grouped data as stated in Potter and Pettijohn (1977). The full
prograrnre together with a few exanples appears in Appendix 2. A
minor disadvantage of the programne is that it was fonnulated as
suming a syrmetrical unirrodal density function. HOvJever, rreaning
ful analysis of b.i.m:xlal data requires estimation of pararreters that
relate to each node individually. Rose diagrams of a set of readings
showing •...••.•. / 7

__]_____
OUTCROP PATTERN OF WEST RAND GROUP MARKER BEDS
r ec,,.
..,.,~ r .•
.}·::'/ ·: "~ / . ~""(
':Qo /
~~¥.h,e"_ ~ \v/""")l ,•
(;,'
) / Holgatfontoin
~
Poortjie
Rietpanh
~ Groenfontsin
\ ::o.· •• \ -·.~').. >"c'-...
..r -~~ .... -.. -·:.· --
;-< ~~~ -~ ·<~ ,:~~
',,,
"'-,, ,, ',,
y-~~
~·:f ~~c~2~ti~~i:!i · · j ;~-•• ' . '' .-.• ~--~ "'' . ·' '" "<) , - ,,v-«<~
1,'p"'"Pr">l'r_ v,, , 1)' 11 11
. . ·. ,,,, ·mmm , ... ..,m,,,.,.. " ' -f . :c<. "' • .,iaa.~•wit · ~,s_Jn ~,,. ~11:~~~::~tili~~:·· 2 ' : '
' . .
311' +-+
!:I:
~
LEGEND Quartz-rich dolerite
Post Witwatersrand Supergroup formations
Traverse location and number
Major faults
Dip and strike
National road
Railway
Major farm boundaries
WEST RAND GROUP SEDIMENTS
Main Reef Conglomerate
Crown Lava
Blue Grit
C Government Reef
;-.- Magnetic Shale with underlying Tillit•
Black Grit
,vvo Contorted Bed
Water Tower Shales
- Orange Grove Quartzite
6 km
150
JD.j ~
MR,,./···· 25°
28°30'
-1 \
NIGE~..J'
a "J o' '
20° 250
/ /
(
\ I
SBURG -~ 1
I ~ ,.~
URBAN
3 0°
25°
30°
3 50 3 so
F I GURE I. 5 The geo l ogy o f t he s tudy ~rea wi Ll1 Lh c locatio ns of e i ght een t raverses (T) j

7
shawing bim:x1ality \vere thus drawn, the two major rrodes separated
and the prograrrr.e rerun with the vectoral mean, vectoral magnitude,
consistency ratio and arithrretic mean dip for each rrode noted (see
ex.arrple in Appendix). An attempt was rm.de to adapt the progranme
to synthesise data with a mixture of two or rrore circular normal
distributions by a :rrethod of maximum likelihood as described by
Jones and James (1969). Hawever, the :rrethod of maximum likelihood
only proves satisfactory if at least 500 crossbed readings at each
locality are recorded and rrore than 1000 readings are needed for
mixtures of rrore than two rrodes (Cohen 1966). None of these con
ditions were fulfilled in this study.
The progranme, Datalist/NGP written by Dr. A.R. Duncan of the
Geochemistry Depart:rrent, University of cape Town, was used to store
the data needed to canpare the geochemistry of the West Rand Group
to that of the Central Rand Group, Fig Tree and Pongola Groups.
The Datalist/NGP programre provides listings of major elerrent, trace
ele:rrent and Sr isotope data for bulk rock analyses. A substantial
m.unber of inter-ele:rrent ratios are calculated. Although the program
:rre has an igneous and :rretarrorphic bias - for exarrple it calculates
the CIPW nonns - it does have provision for an embedded listing of
sarrple directories (i.e. sarrple na:rre and number, database number,
rock type code, locality information and reference code) and referen
ce lists (Appendix 3) • Furthenmre, the progranme can be used for
data input to nany other programres such as genplot, triplot, hist
plot and various progranmes in the BMDP and statjob packages. All
the geochemistry data collected by the writer is available in the
University of cape Town's Earth Sciences Database.
1.5 PREVIOUS WORK
The only original published works of the geology of the West Rand Group in
the study area, other than that of the author, are those of Luttman-Johnson
(1904), Corstorphine (1904) and Rogers (1921, 1922). Luttman-Johnson map
ped the Orange Grove Quartzite Foll!lation together with other Witwatersrand
Formations in the Fortuna Valley. He noted that the "Witwatersrand Beds
were tilted and folded before the Ventersdorp volcanic outflaws occurred".
Corstorphine (1904) noted the relationship of the Old Granite to the Orange
Grove • • • • • • • • • • • • • • • I a

8
Grove Quartzite Fornation. Canparing the relationship to the Table M:>un
tain Sandstone on cape Granite he suggested that the sed:i.ments (Orange Grove
Quartzite) were dep::>sited on the slopes of an old granitic shore.
lbger's (1921) paper and map, 'Which fullor (1921) describes as involving
"an enornous arrount of detailed work both in the field and out of it" was
used by the writer as a base map. The detailed stratigraphy of the West
Rand Group carrpiled by fullor (1917) in the Central Rand was confirmed by
Rogers in the country surrounding Heidelberg. He also established the
changes in thickness of the various fornations and the presence of a til
lite and volcanic horizon (Cra.JI1 Lava). Rogers was the first to recognise
and map the large Sugarbush fault. The detailed and accurate mapping of
the individual narker beds revealed to Rogers the extensive and intricate
nature of the faulting. The writer found no large errors in Rogers' mapping
and agrees with his interpretation of the structure. A map redrawn from
aerial photographs (scale 1:18 000) with all the subsequent roads, rail
ways, farms, mines and ta.JI1s is in the folder attached to the back of this
thesis.
The geology of this area and the surrounding countryside has been reviewed
by de Jager (1964), Pretorius (1964), Jansen et al., (1972) and ITDre re
cently by canrlen-Smith (Appendix 1).
Chapter 2 . • • • . • . / 9
CHAPI'ER 2
STRUCTURE 2. 1 INTIDDUCTION
Much has been written on the structure of the study area and the adjacent
South Rand Goldfield (area be~ the SUgarbush fault and Vaal River).
Rogers (1922), Nel and Jansen (1957), Pretorius (1964) and Jansen et al,
(1972) all agree that these areas have been subjected to folding and com
plex faulting both during and after deposition of the Witwatersrand, Ven-
tersdorp and Transvaal SUpergroups. Differences of opinion have arisen on
the relative inµ:>rtance of pre-Ventersdorp and p:>st-Transvaal rroverrent.
Pretorius (1964a) is of the opinion that folding "started in Witwatersrand
tirres and continued, probably in pulses, through Ventersdorp and Transvaal
tirres, and might have lasted in a very Im.lch enfeebled form, right up to
Karoo tirres". He states "it is not feasible to date the rrovements in any
of the faults as being exclusively of any particular period in geological
tirre" due to their continued reactivation up to and includin<J Karoo times.
The writer's aim with regard to the structural history of the study area
was not to unravel the relationship between the different fracture and fold
patterns (as was Roering's (1968) objective in the Krugersdorp-Florida
Hills area), but rather to determine rrean fold attitudes by ItEans of
stereographic plots in order to rrake the necessary corrections for meaning
ful paleocurrent vector analysis.
The study area is divided into three subareas (Fig. 2.1) op the basis of
their respective fold and fracture patterns. Subareas 1 and 3 are areas
with no folding (except for the disha.monically folded laminae in the
Contorted Bed) but having an intricate fracture pattern. owing to the
corrplex folding and fracturing in subarea 2 no crossbed data were collect
ed within this region.
Contours of poles to bedding planes were constnicted by the use of the
Kalsbeek counting net and shCM the respective dip aziimlth nodes of sub
areas 1 and 3 as two rcaxiroa (Fig. 2.2). Clearly, the canbined bedding
plan.e . . . . . . . . . . . . . . / 10

··~-•••
)

,.
·-?
I
'
10
plane data from subareas 1 and 3 s:i.nply define the macro-arcuate gearetry
as shown fran the outcrop pattern. Also on Fig. 2.2 the lineation and
fold axial readings are recorded for subarea 2. The scattered nature
of the lineations made it difficult to ascertain whether they were tec
tonic or primary sedim:mtary structures. No significant preferred orien
tation directions were recorded in the study area, but this may be due to
the poor exposure of shale.
FIGURE 2.2
2. 2 SUBAREA l
•
• + •• +
N
•
Equal area projection diagram of 187 poles to bedding planes from subareas I and 3 (Contours 0-5-10-15-20-25%). Crosses are fold axes readings and dots are lineation readings recorded in subarea 2.
An east-west cross section through this subarea indicates that there is an
orderly progression fran a nrod.mum dip of 45° for the Orange Grove
Quartzite Fo:r:ma.tion, 40°-35° for the Brixton Fo:r:ma.tion, 35°-20° for the
Governrrent SUbgroup and 200-150 for the Jeppestown Subgroup to a minimum
dip of 5° for the overlying Central Rand Group. This feature is, accor
ding to Brock and Pretorius (1964a,b), a basin edge structure forrred by
successive •••••••• / 11

11
successive subsidences of the depositionary basin.
Three major faults and nurrerous minor faults occur in subarea 1. A long
slightly curved traverse fault (ft. 1) caused oonsiderable drag on the
C:Dvernrrent Subgroup beds. This was the only site in subarea 1 where
faulting markedly affected the strike of the beds. Towards the east, the
largest strike fault (ft. 2) in the study area (5,5 km long with a minimum
throw of 400 m) duplicates the Black Grit and Contorted Bed marker horizons
of the Hospital Hill Subgroup. Similar thrust faults (ft. 3) inclined
westwards, duplicate the Orange Grove Quartzite Fonnation and extend into·
subarea 3. Associated with the ft. 3 fault planes are quartz dolerite and
diabase sills. The }_)E!trological differences between these rocks and Karoo
dolerites were SUITTIB.rised by Rogers (1922). A minimum age of a similar
dolerite south of the Sugarbush fault has been given as 1120 Ma (K-Ar) by
McDouggal (1963).
2.3 SUBARFA 2
The classification of folds in subarea 2 was based on Ramsay (1967). This
is a geometrically based classification that allONs individual folded
layers to be compared unarrbiguously (Fig. 2.3). The classification involves
rreasurerrent of orthogonal thickness (toe) and the thickness parallel to
axial surface (T<:C.? rreasured on the bounding surface of folded layers with
equal arrounts of inclination (0(). The ratio of tot/t0
and 't_/To where t 0
equals To at the fold hinge are tabulated. A graph of these ratios versus
<I.. plotted on Ramsays classification diagrams rreasures the changing sha}.)E!
and class of the fold.
One of the problems encountered was deciding whether an apparent fold pro
file (i.e. a horizontal cross section of a plunging fold as seen on aerial
photographs) could be used in Ramsay's classification. As the axial planes
of the folds in the study area are vertical there exists a simple trigono
rretrical function relating the angle of plunge ( /3 ) to the thicknesses T,
T1 and angleOI., 0( 1 , where T andOC are the parameters :rreasured on a true fold
profile and T1 and ci_ 1 the parameters rreasured on a horizontal apparent pro
file section of a plunging fold (Fig. 2.4). Since both T1 and Tan~ are
proportional to sin/Jthe angle of plunge can be ignored and apparent fold
profiles used in Ramsay's classification. 'lhe orthogonal thickness varies
from a minimum value in the fold limb to a ID3Xi.rrum value in the hinge, there-
therefore ••••••. / 12
j

FIGURE 2.3
t'=!! to
0,5
0
12
30
r'~ I. To
60 90 0,
1,0 I
Class 3
J I 0 30
°"
The classification of folded layers (Ramsay, 1967)
fore the simple aforerrentioned relationship no longer holds for toe .
-..........
II\
I 60
On T versus (/... plots (Fig. 2. 5) it was foW1d that the areanaceous uni ts of
two selected Hospital Hill SUbgroup folds tended to give class lC and 3
folds closely clustered about the class 2 dividing line. The northern
limbs of the G'.:JvernrrEnt Subgroup folds plotted in the Classes lC and 3
fields while the limbs on the southern side of the fold axis did not con
form to Ramsay's classification having several points of inflexion and
nax.irra and min.irra. Table 2.1 SUimlr3.rises the classification of the folds
in subarea 2.
Dip isogons drawn on the folds in subarea 2 shows a ccmplex converging -
diverging pattern (Fig. 2.5). It was found that generally the isogons
diverged from the outer to the inner arc of folds defined by argillaceous
horizons, 'while the isogons in the arenaceous units revealed a wide array
of conplex patterns - either converging or diverging in sorre folds, both
converging and diverging in others or neither converging or diverging.
The three arenaceous W1its of the GJvernment Subgroup, selected for T
versus c( plots had dip isog:ms that generally diverged £ran the outer to
the inner arc of the folds.
Hobbs et al (1976) note that in a TIU1ltilayered sequence in 'which individual
layers .•••.•.•• / 13
90

----- ---------
~~~ PLANE P
T
T, X, y
FIGURE 2.4 Use of horizontal projection (M) in place of fold profile
projection (P) in Ramsay's classification.
On plane A. Sin f3 = T + X
Tl+ xl
T + X = Sin /3 (Tl + x1 ) .•..•••• 1
i.e. T = Tl Sinfi •••••••• 2
On plane A. Tan rv -1 1 1 = T + X
'"" y
rr,_ -~ -· T + X -, On Plane P. Tan rt = - •••••••••
canbining ( 1) and ( 4)
substituting (4)
--y
Tan (X = Sin f3 (Tl + x1 ) y
Tan (J. = Sin /3 tan 0( l ........ 5
Fran equation (2) and (5) it will be seen that both T1 and tan 0( 1
are proportional to T and Tan <X by a ccmron factor (Sin f3 ) and may there
fore be substituted for T and tan 0( in Ramsay's plots provided that plane
A is vertical i.e. perpendicular to M.

---- - ~ ------------
Table 2.1 Variation of fold classes within individual layers in subarea 2
0 - 10 10 - 20 20 - 30 30 - 40 40 - 50 50 - 60 60 - 70 70 - 80 80 - 90 CLASS M)l)E
a 2/2 3/2 3/2 3/1C 3/? 3/2
d ?/2 ?/2 2/2 1C/1C 1C/1C 1C/1C 1C/1C 1C/? 1C/2
b 1A/? 1A/3 1B/3 1C/3 2/3 3/? 1C/? 1C/? 1C/3
[/) e 3/? 3/1C 3/1C 3/1C 3/1C 3/? 3/1C
~ ~
r-1
C 1A/3 1A/3 1A/3 1A/3 ?/3 1A/3
f ?/2 1A/2 1A/3 2/3 1C/3 1C/2 ?/3
g 1C/2 2/3 2/3 2/3 ?/3 2/3
1C/ = southern limb 2 = northern limb

~
13
layers possess different thicknesses and carpetencies, only one or two
layers begin to fold initially and it is these layers that control the sub
sequent defonna.tion. If this applied in the study area, then class 2
folds in the argillaceous horizons should be bounded by class 3 and class
lC folds in the corrpetent horizons \vhilst class 3 folds in argillaceous
layers should be found bebveen corrpetent layers \vhich are of the sarre
class, i.e. class 3. This relationship has been noted in netanorphic ter
rains \vhere quartzofeldspathic layers have behaved rrore corrpetently than
biotite schists (Toogocd, 1976). Table 2.1 shows that in the study area
not only do different layers have different classes of folds but that a
single folded layer nay belong to a number of classes. This large variabi
lity of classes cannot be accounted for by the sensitivity of Ramsay's
fold classification as even the dip isogons show a complex pattern.
Furthenmre, owing to this variability, the three different processes ope
rating during defonna.tion, narrely the pre-fold layer - parallel shortening,
buckling and post-fold honogeneous flattening cannot be estimated.
The faulting in suba.rea 2 is marked by large traverse faults radiating from
the area of maximum curvature in the Hospital Hill Subgroup horizons.
Several markers have been displaced by these faults and as the fault is
approached there is a systematic rotation of bedding planes. Several in
jective shale dykes penetrate the quartzite horizons of the Government
Subgroup. They are well developed south-west of the farmhouse Rietpoort
and are also present on the northern limbs of quartzite horizon 'a' (Fig.
2.5). The thickness of these dykes varies from 20 to 100 cm. P.oering
(1967) interprets similar 'dyke-like' structures in the Krugersdorp area
as a rcacro-boudinage type of phenonenon forned by tensile stresses.
Roering (1968) noted that bedding plane data can be useful in defining
the presence of fundanental faults in a basin-type structural environrrent.
Furthenrore, he stipulates, as did Brock and Pretorius (1964a,b), that a
very intimate relationship exists between faulting and folding in the Wit
watersrand Basin. Roering showed that in the Krugersdorp area not only do
folds fonn adjacent to faults, but the strikes of the fold axes are gene
rally parallel to these faults. This relationship exists in suba.rea 2
\vhere the fold axes (Fig. 2.1) are near parallel to the trend of the faults.
Ramsay's fold classification of the best developed folds in the area showed
that there exists a carplex fold pattern within a single folded layer. The
fonna.tion of these folds is interpreted as not being due to progressive
plastic ••..••.•• /14
~---)

T'
2
2
T'
1
I 1 l3
1A
1C
~ // 9
~<)2-... ·•%··::· .. ·· .. ···~
··...-.:--- .. )--a ' .
oo ~ 90°oc
Government Subgroup
Dip lsogon
Pattern
southern limb
northern limb
3
I 1B
.d 2
T'
Hospital H ii I Subgroup
AA "' /\., ~\ I~
1 f ::::_:::: ............. ···-·;.;..-----
~ 2-11 >/ ........ :-:-:-~~::-:,~~~-... 2--
3
o· 9 o· u:::. - 4 --·· >----- 9 0. o::
FIGURE 2.5 The classification of folded layers within subarea 2
_j

-
Table 2.2 West Rand Group Palaeocurrent direction analysis-Heidelberg area
T10-QI'Z after black grit
Azim.1th Dip Corrected cros;s-bec. · Azim.1th
1 334.000 15.000 285.000 29.000 256.466
2 344.000 15.000 273.000 22.000 234.972
3 334.000 15.000 290.000 30.000 263.545
4 334.000 15.000 265.000 21.000 224.639
5 334.000 15.000 272.000 27.000 240.472
6 334.000 20.000 285.000 30.000 245.832
7 344.000 15.000 302.000 23.000 263 .180
8 334.000 15.000 295.000 26.000 263.274
9 334.000 15.000 280.000 26.000 246.629
Vector .M:an Azim.1th = 249.
Vectoral Magnitude = 8.77
Consistency Patio = 97.40
Sample Deviation = 14.
Arithmetic Mean Corrected Dip = 20.
Corrected by unfolding fold axis ( 30.6 / 14) - location (A) Figure 1 • 6
T10-QI'Z after black grit
Locality Azim.1th Dip Nurrber Bedding Bedding
1 .000 .000
2 .000 .000
3 .000 .000
4 .000 .000
5 .000 .000
6 .000 .000
7 .000 .000
8 .000 .000
9 .000 .000
Vector Mean Azinuth
Vectoral Magnitude
= 249.
= 8.81
Consistency Ratio =
Sarcple Deviation =
Arithmetic Mean Corrected Dip
97.84
13.
= 24
Azimith Dip Corrected cross-bed.dine cross-beddina Azim.1th
252.000 26.000 251.980
235.000 24.000 234.980
263.000 26.000 262.980
228.000 25.000 227.980
240.000 26.000 239.980
257.000 27.000 256.980
262.000 18.000 261.980
260.000 21.000 259.980
246.000 25.000 245.980
22.006
22.003
21.626
20.769
23.678
22. 181
15.357
16.992
20.794
Corrected Dip
26.000
24.000
26.000
25.000
26.000
27.000
.18.000
21.000
25.000

I
I
I
Table 2.2 (contd) West Rand Group Palaeocurrent Direction Analyses-Heidelberg area
TR17 Jeppestown -1S'IQI'Z
Locality Azimuth Dip Azinuth Dip cross- Corrected
Number 'RErl'li.nq Beddinq cross-bedding hPrlnino A:z. imuth
1 260.000 29.000 232.000 40.000 192.505
2 260.000 29.000 235.000 41.000 199.077
3 260.000 29.000 234.000 32.000 171.340
4 260.000 29.000 235.000 42.000 201.035
5 260.000 29.000 229.000 35.000 176.352
6 260.000 29.000 248.000 43.000 228.228
7 260.000 29.000 225.000 30.000 157.871
8 260.000 29.000 235.000 40.000 196.958
9 260.000 29.000 240.000 44.000 213.086
10 260.000 29.000 218.000 44.000 182.470
11 260.000 29.000 212.000 42.000 173.606
12 260.000 29.000 226.000 32.000 164.814
13 260.000 29.000 218.000 35.000 166.375
14 260.000 29.000 218.000 43.000 181.004
15 260.000 29.000 231 .000 46.000 201.478
Vector Mean Azimuth = 187. Vectoral Magnitude = 14.19 Consistency Ratio = 94.61 ArithmaticMean Correcterl Dip = 20
Correcterl by unfolding fold axis(306/14)-location (B) Figure I.6
TR 17. Jeppestown -1STQ1'Z -~
Corrected Dip
19.064
18.495
13.435
19.269
17 .291
15.619
17.057
17. 743
18.982
28.426
29.883
17.309
22.616
27. 702
24 .135
wcal.ity Azimuth Dip A:z.imuth Dip cross- Corrected Correctec Number ~;,...,.. Beddinq cross-beddino h:>rlrl ina A:z.imuth Dip
1 .000 .000 202.000 20.000 201.980 20.000
2 .000 .000 206.000 15.000 205.980 15.000
3 .000 .000 184.000 10.000 183.980 10.000
4 .000 .000 1!6.000 18.000 215.980 18.000
5 .000 .000 !85.000 15.000 184.980 15.000 '
6 .000 .000 242.000 15.000 241.980 15.000
7 .000 .000 161.000 14.000 160.980 14.000
8 .000 .000 213.000 15.000 212.980 15.000
9 .000 .000 226.000 18.000 225.980 18.000
10 .000 .000 190.000 25.000 189.980 25.000
11 .000 .000 178.000 25.000 177.980 25.000
12 .000 .000 170.000 15.000 169.980 15.000
13 .000 .000 173.000 19.000 172.980 19.000
14 .000 .000 184.000 25.000 183.980 25.000
15 .000 .ooo 206.000 20.000 205.980 20.000
Vector Mean Azimuth = 195. Vectoral ~-1agnitude = 13 .94 consistency Ratio = 92.96 Arithrretic Mean Corrected Dip = 17.
.)

15
data. The similarity between the corrected and uncorrected versions of
the vector rrean azim.lth, vectoral magnitude and consistency ratio in both
the corrected and uncorrected versions is interpreted as indicating that
the "'vvesterly-north-westerly crossbed azimuth dips in subareas 1 and 3
were not affected by the folding in subarea 2.
Further evidence supporting this conclusion CCT02s from the 917 crossbeds
rreasured in subareas land 3. The arithnetic rrean corrected dip of these
crossbeds showed no systematic variation and was 100 below the generally
accepted maximum original angle of repose (35°) of foresets in subaqueous
sands. This contrasts with the findings of Pettijohn (1957) and Ramsay
(1961) who found that in the limbs of folded rocks foreset beds are gene
rally inclined at TIUich higher (40°) or lower (15°) angles to the bedding
surface. The only localities where the arithrretic rrean dip exceeded or
was near to the critical angle of 35° were those in the Governrrent Subgroup
sedirrents adjacent to the shear fault - ft. 1. In this case out of the
total number of 55 readings the corrected dip was 33° with one locality
having an average foreset dip of 38°.
The change in attitude between subareas 1 and 3 is therefore due to ver
tical tectonics related to faulting and not the result of a rracro-fold.
'As a consequence no stereographic fold corrections need to be perfonred
on palaeocurrent directions in subareas land 3.
Chapter 3 .•• / 16

CHAPTER 3
STRATIGRAPHY 3.1 DEFINITION
It has been long accepted that the Central Rand area (centred around Johan
nesburg and extending from Boksburg in the east to about twenty kilaretres
v.iest of Krugersdorp in the west) is the type area of the West Rand Group.
Here t1ellor's (1911, 1917) stratigraphic classification was based on litho
logy only, with the boundaries between series and stages taken at the top
or bottom of marker horizons. No consideration was given to unconformi ties,
disconformities, depositional cycles and other tectonic and sedimentological
features. Furthe:r:rrore, as Mellor's breakdown was used for correlation by
Ibgers (1922) in the Heidelberg area and by Nel (1927) in the Vredefort area
it was ass~d that there exists no large facies variation between the dif
ferent areas.
An attempt made to reclassify the West Rand Group stratigraphic column in
the Klerksdorp area by Collender (1960) was not readily accepted. Preto
rius (1965), noting that the West Rand Group sedirrents at Vredefort and in
the Balfour - Greylingstad areas might have been deposited on the opposite
edge of the Witwatersrand basin to those laid do.,m in the Welkom, Klerks
dorp, West Wits, Central Rand, East Rand, Delrras and Heidelberg areas,
questions the concept of a type area. Should a type area be regarded as
one containing rocks belonging to a proximal facies (e.g. Klerksdorp),
or one with distal facies rocks (e.g. South Rand)? Is an area on the in
flo.v side of the depository (North-west edge) nore "typical" than an area )
on the opposite side? Pretorius (1965) further stipulates that "before
any consideration can be given to possible revision on the stratigraphic
classification of this Division a study will have to be undertaken of
facies changes" . 'Ps no substantial work of this kind has been done, the
lithostratigraphic column (Fig. 1.3) presented by Winter (1978) and adopted
by the writer serves only as an illustration of the revised stratigraphic
norrenclature since Mellor's (1911, 1917) papers. The lithostratigraphic
column is a useful frarrework and may be regarded as one which will be con
sistently revised as nore sedirnentological infonnation (especially facies
variation . • • • . • • . • • • • / 17

\ ·~ '\';, ,t">
Dome •
.. \
--1• IJ'I -- • "'...-.... .,,;,, :
• •••• ?°" •••• a-= .· .. ' """ . . ..... ·· ... \~ ·· .... ·· .•·i• '•, V :•. eoelmas . ., . . .. .· \ , . b" . . . ,· . .
~ '\"-:::." i ~ ? ~ &
....-: . .
~('>~ . ~,;. .. ('
\\ •
2
Johannesburg
\ l ..
, ..... ·· \
\. ,.._ / --/ -.... ' ...... : .l Nigel
. . . .., ~ .,, . . . . •"\ ....... \ . . . . . . . .... _
( ~,, ~ : • Kinrosse :
Heidelberge
. . . . .: . ... ... :· ·· .... ~. . .. : .,
1
.. ----- ......
Devon • • • . . • ~ Dome • ••• . . . . . . . . ............... . . . . . . . . . . . . . . . . .. · .... · .... : ... ·..,_..._:
• • • • • • • • • -> -. . . . ~ I 4
- ; . . . . I .·· . ·· ..... ····· ! ... . .....
Sugarbush fault--"
_,,.. . . . . .,, ......... . . . .,,,. 0 Ede-;;-h-;ii.
Balfour• Mine •• •• .•....... ..... 1·· ···... ,., ·· ..
/ - ~ .. 3 ·. . . . . ,._: • • • • • • ea,e,lings.lad : . . . . . . . . . . l~ ...
• • • • • 4' • • • : •••• ••• / =-· 4-' .• • •• ............ • • ' : ••• .,..>f . . . ......_ - . f3U\\ . . . . . . ...._................ . 1-.. . . . . . . ) .... . : ... : ··. . ..
• • • • •. Hex River· • • •
si9_ - -... et(} .,.,. r-r-.:----P __ .,,,,,,. • ... ? ~ . ..... °'
.. . . . . •• . .
• •• • • • DMine ···········
.. . . .. . . . . . . . . . . • • • • . . .
.. . . .
••• West Rand Group -
Central Rand Group contact
-Direction of dip of contact
--fFault
-·--·Trace of anticline
[] 1
Granite-Green stone terrain
East Rand Basin
2 a Bultfontein Basin
b Middelbult Basin
3 4
South Rand Basin
Evander Basin
FIGURE 3. l Simplified map showing the basin geometry of the Heidelberg-Delmas-Balfour area. The Sugarbush fault, Sundra anticline and Devon Dome divides the area into four parts:-I) East Rand Rc1sin 2) De 1 mas ;ire;:i 1) South Rand

HEIDELBERG AREA
FORMATI
Crown Lav,
Flortda
Qw,artaite
WltpoorlJM
Cor0Nll1on
"'°"''·· Qua,tatt.
arixton
Parktown
Shale
Or•ft911 Grow• ~rtlite
-!I ~ --IIPR -
FIGURE 3. 2
DELMAS
AREA
Strat1grapt11c: C..p
HEX RIVER MINE AREA
--I --PR -flll -··.· ·,. Bl G
CB
OGO?
LEGEND:-
C'!:3 ARGILLACEOUS UNITS
D ARENACEOUS UNITS
EVANDER AREA
500M
Scale,
MARKERS:-
MC MAIN CONGLOMERATE
CL CROWN LAVA
BG BLUE GRIT
GR/ YR GOVERNMENTIVELDSCHOEN REEF
CR CORONATION
T TILLI TE/Tl LLOID
PR PROMISE
BIG BLUE GRIT
CB CONTORTED BED
WTS WATER TOWER SHALE
OGQ ORANGE GROVE QUARTZITE
Comparative West Rand Group stratigraphy of the Heidelberg-Delams-Balfour area (modified after Jansen et al, 1972; Button, 1970) ~~-

--,
,..
~ c3 "O ~ ~
~ ~ rJ'J
~
SUBGROUP FORMATIONS
ROODE POORT
0 CROWN LAVA ..,
& FLORIDA
C. QUARTZITE Cl) -,
.., C Cl) WITPOORT JIE
E C ... (I) > CORONATION
0 C, PROMISE
QUARTZITE
BRIXTON
I --·-:c -ta .., ·-C. u,
I PARKTOWN 0 :I: I SHALE
ORANGE GROVE QTZ .
METRES ----
--------- ---------
3000 ------ - ---
---------------- ---------
2500
2000
1
k, •. -;;_. ~.\
\ ~-~------~ -----
\ t-=-=-=-=-== -----B=~~==~:i -----
1000i=~=iii~ I-=~-=-=-:: ••2 • 0• 1j
II -------
500~ . \
\ Ill--= -------
Ill ------------
---- ____ \
MARKERS
Crown Lava
Blue Grit
Government Reef
Tillite
Promise Reef
Black Grit
Cortort ed Bed
FIGURE 3 .3 The composite str at i gr aphic column of the West Rand Group in the Heidelber g-Nigel- Balfour ar ea
.-

l
18
ses (and hence environrrents) at the tine of dep::>sition (Walther's Law,
1893) the main emphasis in describing the stratigraphy of the West Rand
Group will be in the vertical distribution of sedinentary structures and
paleocurrents present in the different lithologies.
Several exarrples of the different types of sedirrentary structures observ
ed in the study area are given in Plate 3.0. In the field subdivision of
the arenaceous units was perfonred by rreticulously rreasuring each sedi
rrentary structure (thickness of individual plane beds, tabular crossbeds,
trough crossbeds etc.) in the better exfOSed areas. In the laboratory
these detailed profiles were then subdivided into constituent facies on
the basis of the nost frequently occuring sedinentary structures. In this
way corrposite generalised stratigraphic sections were constructed for each
forrration. As many of the facies defined in the field have ambiguous en
vironrrental interpretations when treated individually, the writers final
conclusions on the formation's environrrent of dep::>sition is based up::>n the
lithology, paleocurrent dispersal pattern and finally the carrnunal asso
ciation of the different facies.
3.2 PEI'ROLOGY OF SANDSTOOES
In the Klerksdorp area texturally and raineralogically superrna.ture ortho
quartzite in the Hospital Hill Subgroup at the base of the West Rand Group
contrast with inmature subgreywackes and feldspathic quartzites in the
overlying stratigraphic units (Fuller, 1958). According to Fuller (1958),
"gross features of Witwatersrand rocks are rraintained over considerable
distances, so that discussion of the petrology of relatively few specinens
might lead to a better understanding of the system as a whole". ~J.though
this is also the case in the Central Rand (Eriksson et al, in press), in the
study area texturally diverse sandstones intertongue or overlie one another
within individual TIErrbers and it was clear that a nore canprehensive re
presentative sanpling scherre was needed.
over 240 sanples were collected, halved and rracroscopically described in
the laboratory. From these approxirrately 40 thin sections from throughout
the West Rand Group were examined in detail and 33 representative thin
sections selected for grain size and nodal analysis.
3.2.l Textures
~aningful . • • • • • • • /19

•
PLATE 3.0
a. Small trough crossbed (Orange Grove Quartzite, Uitkyk).
b. Large tabular crossbed (Pranise Foramtion, Blinkp:x>rt).
c. Multiple sets of trough crossbeds overlying sets of tabular crossbeds (Pranise Formation, Blinkp:x>rt).
d. Multiple sets of tabular crossbeds (Brixton Formation, Blinkpoort).
e. Convoluted large tabular crossbeds (Pranise Fonnation, Groenfontein) •
f. Medium scale low angle cross-stratification overlying rredium scale tabular crossbeds (Witpoortjie Fonnation, Groenfontein).
g. Medium scale tabular crossbeds underlying large tabular crossbeds (base of Pranise Fonnation, Blinkp:x>rt).

r I
I I
' t
19
M::!aningful textural (fabric, grain size, grain shape) analysis of
thin sections is a tedious and laborious operation especially when
compared to the net.hods (settling tube, sieves) used in the analysis
in present day envirornrents (e.g. Flenming, 1977). According to
Selley (1973) "statistical textural studies of ancient sedirrents
have largely proved an unsatisfactory net.hod of envirornrental
diagnosis". 'Ihe reason for this is the problem of granularetric
analysis of sedirrentary rocks and because the correlation of grain
size and sorting to energy level may depend only on the nature of
source material added. Hcwever, as individual sandstones derived
from the sane source within the West Rand Group consist of textural
ly dissimilar sands a corrparison can be made between well sorted
mature sedirrents and poorly sorted i.nmature sedirrents in terms of
high and lcw energy envirornrents respectively.
Table 3.1 surnrrarises the textures of the thin sectioned sandstones
in the West Rand Group.
The sorting and rnaturity of the sandstones has been expressed in
tenns of Folk's (1968a) classification. Estimates of roundness were
rnade on the elastic quartz grains with the use of the Amstrat grain
shape comparitor, which is similar to the one devised by Pcwers (1953).
The grain size of the well sorted sandstones was determined with the
use of an Amstrat grain size canparitor. The mean grain size dia
neter of the poorly sorted sandstones was determined by measuring
over 20 grain diarreters chosen to be approxinately representative
of the nean. If the sandstones were unirrodally distributed with
a consistent shape the nean diarreter was corrected to sieve
equivalents (by the method of .. Adams, 1977).
About sixty five per cent of the thin sections examined have an
horrogeneous fabric; three samples (8/9, 6/4 and 15/5) shew grading
on a microscopic scale, while sare specirrens (e.g. 4/20, 8/9,
13/071) are layered with well sorted coarser grained sands being
separated by subrounded to subangular sands and silts.
None of the samples had strongly developed preferred grain orienta
tion. The layered specimens (e.g. 8/9, Plate 3.lA) have a slightly
discernible orientation with the long axis of the grains being para1-
parallel ••••.•• /20
··~~

P L AT E 3.1
A. Layered sample (8/9) with a slightly discernible orientation with long axis of grains parallel to banding.
B. Thin section of a 'sago' textured rock sample (01/09). Note the very gcx:xi rounding of the larger grains.
C. .M::rlerate sorted binodal grain sized(2.20 and 0.50) sandstones of the Orange Grove Quartzites Formation.
D. Well sorted unirrodal fine grained sandstone (3.120 with sericite and haematite layers (Pranise Formation).
E. Angular floating shale clasts surrounded by well rounded, birrodally sized quartz grains (Brixton Formation).
F. Moderately to poorly sorted rrediurn grained sandstones (Witpoortjie Forrnation) •
G. Co-existence of well rounded cherts and subangular quartz grain(unit corresponds to Speckled Bed on Central Rand).
H. Texture of polyrrodal, silty claystone of the Pranise Reef.

Table 3.1 Textures of the West Rand Group
SAMPLE COIDUR GRAIN SIZE SORI'ING - MATURITY (MFAN)
Hospital Hill Subgroup
01/04 lOYR 8/2 1. 75(/J ms Mature
01/05 lOR 5/4 1.83(/J ms Su1:rrature
02/05 N7 0.84¢ ws Mature
BB/Gr SYR 6/1 0.51(/J vps Sul:rnature
03/06 SYR 7/2 1.2(/J "\lWS Supenna.ture
04/02 lOR 6/2 -2(/J and 0.5¢ rn.s Textural inversion
04/20 SYR 7/2 1.8(/J ps Sul:ma.ture
04/21 lOR 6/2 2.55¢ and -0.5¢ rn.s Textural inversion
04/23A SYR 6/4 2.8¢ and -0.23¢ rn.s Textural i..~version
04/23B lOR 6/2 3.34¢ and -0.25¢ ms Textural inversion
04/23C lOR 6/2 3.55¢ and 0.0¢ ms Textural inversion
06/04 lOR 6/2 1.17(/J "\lWS Mature
10/03 lOR 7/4 1.3(/J ps Sul:rnature
11/07 SYR 6/1 2(/J and 0.25¢ ms Superrrature
12/04 N6 2.2¢ and 0.5¢ ms Textural inversion
18/16 SYR 7/2 1.3¢ vps Sul:ma.ture
18/22 lOR 6/2 3.50 and -0.25¢ ms Mature
18/27 SYR 7/2 3 . 4¢ and l. 0 9(/J ms Mature
Government Subgroup
07/03 lOR 6/2 1.4(/J ms Mature
08/08 SYR 8/1 1.34(/J WS Mature
08/09 SGY 8/1 1.1(/J and 2.85¢ lam Textural inversion
13/03B SYR 7/2 2.1¢ ps Sul:rnature
13/05 SYR 8/1 2.3¢ recrystallised
13/071 SP 4/2 3.12(/J lam Imna.ture
13/08 lOYR 8/2 0 • 0(/J and l. 7 5¢ lam Supermature
14/04 lOYR 5/4 2.54¢ ps Imna.ture
15/03 N9 1.06(/J ms Mature
15/05 SR 6/2 1.4(/J ws Mature
Jeppestown Sub:]roup
26N 1. 97(/J and O. 51(/J ms Mature

20
lel to the banding. The corrplete lack of strong preferred grain
orientation is due to the high sphericity of the detrital grains.
Many of the sanples in the Hospital Hill Subgroup are characterised
by supe.r:mature rounding (Plate 3.lB) (e.g. 2/5, 3/4, 4/21, 4/23,
12/4) while the grains in the Government Subgroup are generally rrore
subrounded to subangular (e.g. 13/11, 14/4, 13/071) although super
mature rounding (e.g. 13/08, 07/07) is still occasionally present.
Kuenen (1960) surrmarises a series of papers describing the experi
rrental abrasion of sand grains by various processes. His data
prove that wind action is a rrore effective rounding agent than
running water. This is supported by the fact that dune sands are
often well rounded (Greensrnith, 1978). According to Klein (1977)
supe.r:mature rounding is rather unique and CMes its origin to long
distances of grain transport on a tidal sand body. This rounding
may be emphasised if coastal aeolian dunes are deposited in a tidal
envirorurent.
Middleton and Davis (1979), question Klein (1977), and note that in
tertidal sands within the Bay of Flmdy are rninerolO<Jically irrrnature
and have a rrean roundness in the subangular category. They conclude,
as did Keunen (1960), that tidal rrover.Ent of sand appears to be rrore
effective in producing nE!vv surface textures and in rounding grains
than rrost fluvial transport, but less effective than high-energy
wave action on beaches or wind action.
The"sago•textured bim:)dal grain sized samples of the Hospital Hill
Subgroup (4/21, 4/23, 11/07, 12/04, 18/27) and Government Subgroup
/.2J/!)8) md a.E.rse.r p:zrt:JcJes MZici? lfE.re oftt?ll mre distillctly rounded than the finer angular textured particles of the matrix.
The difference in texture in a corrpacted birrodal sediment is thought
to have originated in two ways:
a) the larger fragments, propelled by rolling and saltation
processes, suffer rrore collisions and consequently greater
abrasion than the smaller particles which are partially
suspended by water currents (Gilbert, 1914),
b) as a result of post depositional changes due to pressure
solution (Renton et al, 1969; Potter, 1977).
The • • • • . • • . • / 21

21
The presence of sare subrounded smaller quartz grains (e.g. 01/09
Plate 3.lB) suggests to the writer that the difference in texture
between the coarse and fine ingredients of the "sago" textured
units in the study area, is likely to be exaggerated by pressure
solution. Furthenrore, although the "sago" textured sandstones
are b.im::ldal in their sand size distribution, the larger well rounded
grains are always volurretrically daninant (up to 95 per cent of the
whole rock). This contrasts with fluvially derived bim:x:lal sedi
rrents where the fine grained constituents are greater in quantity
than the coarser, rolled fragments (Udden, 191~; Potter, 1977).
The origin of the binodal "sago" texture (Plate 3.lB) may be due
to the in situ breakdo.vn of large rounded rock fragments.
The b.im::ldal grain size of the Orange Grove Quartzite Forrration
(Plate 3.lC) is similar in texture to the specimen described by
Fuller (1958). These sandstones are only m:xierately sorted overall
and are composed of two distinct sand sized nodes (2.20 and 0.50)
which are themselves well sorted and rounded. This fonn of textural
inversion could have been caused by wind deflation (Folk, 1968b),
beach fractionation (Fuller, 1962; .McCave, 1978) or due to diffe
rent source areas contributing different m:xlal classes (Blatt,
1967) with both m:xies being redeposited together (Klein, 1977).
Yet another form of grain size birrodality is illustrated in Plate
3.lA. Here a distinct lamina ccr.iposed of m:xierately sorted and
rounded large particles (1.10) rests on a claystone drape and is
overlain by particles that are subangular and up to seven times
smaller. This thin section is the internal structure of a mud drap
ed foreset and the unusual texture which has facets of both high
energy (well sorted large particles) and lCM energy (the smaller
angular particles) conditions is interpreted as being fonred in
an environrrent where alternating bedload transport and suspension
settling processes prevail.
Other textures cartm:)n to the sandstone of the West Rand Group in
cludes:-
a) Well sorted unim:xial fine grained sand (3 .120), which
have subangular to subrounded grains of medium sphericity.
Sericite and secondary haematite are sOP.Etimes arranged in
definite ••••• /22

I
l
1 i
i
22
definite layers (Plate 3.lD).
b) M::xlerately to p::x:,rly sorted iredium grained (1. 83¢) sand
stones whose quartz grains usually show authigenic enlarge
rrent and intergrowth. I.Dng contacts and triple junctions
indicate sorre recrystallisation and interpenetration but
it is evident that the grains were originally spherical
and subrounded·as can be seen on margins which have not
been m:xlif ied. (Plate 3. lF) •
Textures that are rare in the \vest Rand Group but nevertheless in
teresting include:-
a)
b)
Angular floating shale clasts that are surrounded by well
rounded and spherical birrodally sized quartz grains (Plate
3.lE). According to Conybeare and Crook (1968) such a
texture originates from the scouring action of sediment
laden water tearing up peneconternperaneous cohesive sedi
nent and incorporating fragrrents of it in a subsequent
der:osit. This process of der:osition is ccum::>n in alluvial,
near-shore marine and turbidity current der:osits. Sedimen
tary structures and other criteria (which will be described
in the next section) suggest a near-shore marine environ
rrent in this instance.
A sample comprising a nosaic of subangular quartz grains
(0.84¢) forrred by authigenic enlargement of elastic quartz
particles and smaller spherical and super-rounded lithic
fragrrents (nostly chert) which are often coated with haematite
(Plate 3. lG) • In all the other samples containing chert
and quartz, including the two conglarerates (Fig. 3.4) chert
is always larger and r.ore angular than the adjacent quartz
grains.
The groundma.ss of all three diarnictitic markers in the West Rand
Group (Promise Reef, Tillite and Blue Grit) have similar textures to
that sho.vn on Plate 3.lH. The p::,lyrrodal, silty claystones (using
the classification of Picard, 1971) consist of subangular to rounded,
fine to coarse sized quartz grains set in a matrix of very fine sand
size, silt size quartz grains and clays (nost chlorite). Such rock
types can originate frcm many processes (Frakes, 1978). These
include • • • • • • • . • / 23

23
include earthflc.Ms, ITRJdfla.vs, solifluction, subaqueous slurrping and
sliding and fluviatile activity.
In surrrna.ry, the variable textures in the arenaceous horizons of the
West Rand Group suggests that considerable winnowing and re-deposi
tion of the sedirrents has taken place. This is manifested in the
roundness and high sphericity of the well sorted grains in the
"sago" textured arenites (Plate 3.lB), the binodal grain size
(Plate 3.lC) and the co-existence of well rounded cherts and sub
angular quartz grains (Plate 3.lG). Hydraulic processes operating
on the b.im::x:lally distributed grains may generate laminated sand
sized textures (Plate 3.lA). It has been suggested that rrost of
these textures are diagnostic of marginal marine enviro:rnrents.
3.2.2 Composition
Table 3.2 surrmarises the carpositional analyses for the sandstones
of the West Rand Group. The classification used is that of Folk
(1968a).
All the sandstones and conglcrneratic rock slabs were stained for
K-feldspar by the rrethods of Hutchinson (1974) and Nold and Erick
son (1967). Reference control samples with known K-Feldspar were
stained before each batch of 10 thin sections to check for possible
dilution of saturated sodium cobaltinitrate and the strength of
hydrofluoric acid. Minor K-feldspar yellc.M stains for all the thin
sections and several rock slabs of the West Rand Group were observed.
M:Jdal analysis of conglaneratic rock slabs was done by placing a
sheet of transparent graph :paper over the polished surface and the
points of intersection of the lines on the graph :paper counted
visually for whichever feature they overlay, quartz, banded chert,
unbanded chert, shale fragrrent, groundmass, etc. The m:Jdal analy
sis of several thin sections was perform:rl using a polarising
microscope with a Leitz manual point-counter stage unit attached
to its stage. A visual assessrrent of the relative proportions of
mineral grains was done on the well sorted orthcquartzites.
Two of the three conglcrnerates in the study area, the Government
Reef .•••••.. / 24
---

Table 3.2 Sandstone COITg;X)sition of the West Rand Group
SAMPLE 'IOI'AL R)CK MATRIX CLASSIFICATION QUARl'Z % FRAG1ENTS % % (FOLK 1968a)
Hospital Hill Subgroup
01/05 95 3 2 Quartzarenite
BB/GR 93 5 2 SUblitharenite
03/06 95 2 l Quartzarenite
04/02 45 54 l Litharenite
04/11 70 26 4 Litharenite
04/20 87 8 4 SUblitharenite
04/21 89 5 6 SUblitharenite
04/23A 72 27 l Litharentie
04/23B 72 20 7 Litharenite
04/23C 73 5 13 Sublitharenite
06/04 96 0 4 Quartzarenite
10/03 99 0 l Quartzarenite
11/07 96 4 0 Quartzarenite
12/04 75 15 10 Litharenite
18/16' 90 5 l Sublitharenite
18/22 75 20 3 Sublitharenite
18/27 85 15 l Sublitharenite
Covern:rrent SUbgroup
07/03 82 15 3 Sublitharenite
08/08 93 6 l Sublitharenite
08/09 80 6 14 SUblitharenite
13/03B 95 5 l Quartzarenite
13/05 91 2 7 Sublitharenite
13/071 56 14 30 Litharenite
13/08 92 5 3 Sublitharenite
15/03 90 6 4 Sublitharenite
15/05 83 15 2 Sublitharenite
15/01 95 4 l Quartzarenite
. : Jeppestawn SUbgrc:?UE_
26N 69 6 25 Litharenite

24
Reef and Black Grit are matrix supp::>rted, .[X)lymxl.al p)lymictic conglo
nerates consisting of pebbles of chert (black, white and unhanded),
rock fragr!'ents and quartz. The relative prop:::>rtions of these pebbles
is sha,,m on Fig. 3.4. The basal oliganictic conglomerate of the
Orange Quartzite forrration is clast and matrix sup_EX)rted and cCllr
prised of well rounded to rounded pebbles of quartz.
Folk (1968a) classified quartz into six types based on "strained
shada.vs" (extinction). Folla.ving this method, the rrost connon type
in the study area are the single quartz grains which have a slightly
undulose extinction folla.ved by the highly "strained" type. In sorre
samples (e.g. BBGr, 4/11, 6/4) the unstrained type is predominant.
Corrposite grains nake up about 15% of the quartz p:::>pulation in sane
samples (e.g. 2/5, 4/4, 4/23, 8/9, 9/10) while in others (e.g.
3/6, 4/2, 4/11) a few .[X)lycrystalline grains with sutured boundaries
have overgrONths in optical continuity with detrital grains. No
attempt was made to statistically quantify the relative pro.[X)rtion
of each quartz type because in mature sandstones it has been sha,,m
that the ratio of non-undulation quartz to total quartz is not a
reliable provenance indicator. Blatt (1967) sha.ved that strained
quartz grains are less stable than unstrained ones; hence an excess
of unstrained quartz may be indicative of several episodes of recycling
rather than provenance. Nevertheless it is interesting to note that
the paleosol of the granite underlying the West Rand Group consists
of 60 per cent quartz with strongly undulating extinction with the
re:rraining 40 per cent made up of sericite (highly altered orthcx:::lase
and minor plagicx:::lase).
Chert is the nost carrm:m rock frag:rrent. In the Black Grit conglo
rrerate it consists of 75 per cent of the total pebble !X)pulation
while in the Governrrent Reef it comprises 32 per cent. The pre
sence of these angular cherts as -well as the well rounded sand
sized cherts in the arenites is always diagnostic of an older sedi
rrentary source (Folk, 1968a). Other sedimentary rock fragn:ents in
clude sandstone arenites (e.g. 3/6, 4/2, 8/8, 13/3, 13/8),
litharenites (e.g. 12/4, 15/5, 18/22) and phyllarenites (e.g.
12/4, 13/3, 18/27).
The matrix of the sandstones consist prircarily of sericite. Minor
quartz and chlorite were also identified as matrix :material (e.g.
13/11 ...... / 25

0 Cm 5
0 0'-;\ I)~ o °' • c9 ~~ ' ·""' • .,(71 ~ " ~ ~ .Qc.6!0':~: . 0 0 Q ~ 0 0 <>
. C7 ! o~.-~·ooo<;' . O
r>i:c,i ~o O' !!/ff]j~ /~Y&' ~ ~,,•o~ ~cJ~O ot"J:,,o ~~
0 0 ~ ~cf'~ . ., · ~ (_..)-~~ ~o~ ~ ~;,.~~f! o~6· o ~-----./ \·::.1 O 0 /.:;'\ !'10 ~ • ~
~~ .. ~~9~~ ... 0
:tg~g~@) oe~:o , :o~oo~~::-.-:·: ~~··.·.~-~ .. • .. ~, 9 "t
0 ~ .'fl ', . . . . _...., . '°"' r--:,....., 0 ..... "\ ~ · o ·· '-' V '-...:..) o= ':j~ ~.
0
,'i(J o ' ... o· g ~-o~· ,.~o.'JJ ~ ot5; 0 0 ~~ ~~ ~o-~O ·~o.~o~o;t£>o () (b /J' G~ •
~·~e:, (j O ~ ~ Q)
0
,o ~~o ~_'1) CJ (\e ;od'~ Q C]l.'S;p (\, -
BLACK GRIT GOVERNMENT REEF
0 Quartz C) Chert @ Banded Chert ~ Rock Fragments
FIGURE 3. 4 The relative proportions of clasts within the Balck Grit and Government Reef conglomerates. Black Grit's matrix totals 53.1% with white chert (20.3%), banded chert (11 .5%), quartz (7.7%), rock fragments (4.4%) and black chert (3%) constituting the pebble fraction. The Government Reef consists of matrix (67.8%), quartz (18.2%), white chert (9.6%), rock fragm~nts (3.4%) and black chert (1%).

25
13/11, 7/11). Haematite and occasionally linonite are the major
replacerrent minerals. Ilrreni te and magnetite, which are sorretines
altered to haematite, are often rounded (e.g. 4/23, 7/3). Rounded
grains of zircon with diameters of about O, 1 mn fo:r:m less than l
per cent of the total rock comp'.)sition in five thin sections (4/1,
8/8, 8/9, 15/3, 15/5).
In surmary, the extrerrely high quartz content, absence of feldspar,
the presence of sed:i.rrentary rock fragrrents and ultra-stable heavy
minerals and the texture of the sandstone suggests that repeated ·
sedirrentary redeposition of sed:i.rrents derived frcm an older sedi
mentary environrrent has taken place. The presence of "strained"
quartz and polycrystalline quartz suggests that, at least a portion
of the original primny source was a plutonic igneous or :metarrorphic
province.
3.3 HOSPITAL HILL SUBGROUP
This Subgroup has a rreasured thickness of 1620 rn. Although there are rrore
arenaceous units in this Subgroup in the Heidelberg - Balfour - DeJ.rra.s
area than on the Central Fand, the proportion of quartzite to shale is
alnost the sarne (38 per cent of the total thickness on the Central Fand
and 36 per cent near Heidelberg). The Orange Grove Quartzite, Parkto.,,m
Shale and Brixton Formations are well defined by the lateral continuity
of the Orange Grove, Black Grit and Promise Reef markers.
3.3.l Orange Grove Quartzite.Formation
Definition
The Orange Grove Quartzite Formation is well developed between the
farms Uitkyk and Rietfontein and poorly developed south of the
Sugarbush River. It rests with marked unconformity on a granite
paleosol (fann Uitkyk) or an alurninous schist (fann Kuilfontein).
Out of a total of five rreasured sections the two profiles rrost re
presentative of the formation are those on the Sugarbush River (Tl)
and alongside the Nigel-Balfour Road (TlO). These two profiles
will be described in detail and because of the lateral harogeneity
in thickness and lithology of the fonnation they may be considered
as . • • . . . . • • / 26

26
as type sections of the Orange Grove Formation in the Heidelberg
Nigel-Balfour traingle.
Lithology
The average thickness of the formation is 80 rn (range 70-115 rn).
It is split into three sandstone units by two shale bands. The
basal arenite unit (45 rn) is overlain by a persistent shale hori
zon (7 rn) which is rrarked by a strip of grass covered ground be
tween the white arenites. The second shale band is only locally
developed about 65 m. above the base of the fonnation.
The first sandstone unit has a sharp base with discontinuous mature
conglorrerates (up to 0,5 rn thick) containing well rounded and well
sorted quartz pebbles (up to 2 c::m in diarreter) developed as lags
in well defined trough crossbeds. '.rhe rratrix of the conglauerate
consists wholly of well sorted quartz sands. On the farm Kuil
fontein, three conglareratic horizons (0,4 and 8 cm above the base)
occur at the bottom of fining up,vard cycles. About 5 rn above the
last impersistent conglorreratic layer, rredium to fine rroderately
sorted white sands which weather to a very pale orange colour
(10 YR 8/2) rrake up the next 30 m of the fonnation. Some coarse
grained lags folla.v and the top of the unit is rrarked by very fine
sand and silts comprising the base of the first shale unit.
The rrain shale horizon of the Orange Grove Quartzite Fb:rmation
is often banded with lighter and darker grey bands and weathers
to a greyish-pink colour (5 YR 7/2). It is highly cleaved and in
places c::orrplex arrays of quartz veins are present. The shale dis
plays no diagnostic prirrary sedirrentary structures, although inter
calated between the shales are rare well-sorted lensoid sand bodies
up to 20 c::m thick which have finely laminated "hurmocky" bedding.
These sand bodies are fine-grained (3.5 - 3.00) and are pale red
purple (5 RP 6/2) weathering to a greyish orange (10 YR 7/4).
Overlying the shale horizon is a loosely packed, 0,5-2 rn sandstone
unit which is coarse grained and often graded (e.g. in the Nigel
Balfour Road quarry, there are four fining up,vard cycle 8,43, 10
and 9 c::m thick). This facies is succeeded by poorly sorted im
rrature coarse grained (rrean 1.0 - 0.50) haematite stained arenites
(coloured •.....•. / 27

------_._.,.._ _____________________________ ----
ORANGE GROVE QUARTZITE FORMATION
., f i E
.!: ., ., ! ~ u
:.c
"i ;; ., I'll Ill E
70
60
50
40
30
20
10
0
FACIES
Pb
Ltr
Mta
/ta
Mtr
ltr
Hb Ir Ftr Sr
Str
Pb
ltr
GRAIN SIZE
}?}'.it{ r~;:;~;t~~t~ ::~}'/::~~:f ;·I
0 0 : 0 O
1~1rt?r?r::: o'IJ'Jo- 0 o0 0o
:~111: l·.·:._;·:·:·:-o ·.; 0 000 O
:J O O O
o~q o~o
/?{;)}ii &-tt·}~:!:\' o 0 o ••• . .
LEGEND
FACIES
Mta Multiple sets of tabular crossbeds /ta Isolated tabular crossbeds Hb Hummocky bedding Ir Interference ripples Ftr Flat - topped ripples Sr Symmetrical ripples Pb Plane beds Str Small trough crossbeds Mtr Medium trough crossbeds Ltr large trough crossbeds
GRAIN SIZE
• Shale
CB Fine- medium grained sandstone
~ Coarse grained sandstone
FIGURE 3.5 Stratigraphic section for the Orange Grove Quartzite Formation

PLATE 3.2
a. Plane-bedded succession near the base of the Orange Grove Quartzite Fonnation.
b. Interference ripples developed on top of sare of the plane-beds sl:'lc,..m on Plate 3.2a.
c. Wind obstacle marks developed on plane-beds. The canpass is pointing towards the north. In this case wind blowing in a southeasterly direction produced the 'tails' behind the obstacles.


I ,I I
27
(coloured pale red lOR 6/2).
The renaining 10 to 15 m of the Fo:rnation is similar in texture and
lithology to the first 5 m. South of the Sugarbush River tw:> dis
continuous oligomictic conglorrerates, a rretre apart occur in ill de
fined troughs 58 m above the base. The conglorrerates are :roorly to
rroderetely packed and in places are mineralised. Medium grained
(rrean l. 3¢) rroderately v.iell sorted quartzarenites overlie the conglo
rrerates. The upper contact of the fo:rnation is sharp.
Sedirrentary facies
The Orange Grove Quartzite Formation has been divided into 10 facies
on the basis of its sedirrentary structures. Facies were only defined
fo:rnally after the sections were rreasured on the basis of the nost
frequently occurring sedirrentary structure. Unlike the other Forna
tions, the variability associated with each propJsed facies is very
sma.11. Of the ten facies identified only the small, rredium and
large trough crossbedded facies are inter-gradational. Fig. 3.5
shows the vertical stacking of the different facies.
The thick trough crossbedded basal conglorreratic horizons are over
lain by thinner trough crossbedded uni ts. These are succeeded by
30 rn of internally plane bedded and solitary low angled crossbedded
arenites (Plate 3.2A). Asyrmetrical ripple marks, runnel rnarks,
primary current lineation, interference ripples (Plate 3.2B) and wind
obstacle marks (Plate 3.2C) are present between the plane beds. The
ripple marks are cormon features 10 to 15 rn above the base of the
fo:rnation 'While the runnel marks are generally best preserved 25 to
30 rn above the conglorrerate. The top 15 rn of the first sandstone
unit corrprise trough crossbedded units (Pi-type, Allen, 1963) with
sorre local coarse grained lags developed in the middle of this facies.
At one locality (a quarry on the Nigel-Balfour Poad) the contact be
tween the first shale and sandstone unit has been excavated and re
veals an excellent outcrop of flat-topped wave ripples (Plate 3.3A)
with intervening ladder back ripples (Plate 3.3B), two types of in
terference ripples (Plate 3.3C and Plate 3.3D), mudcracks, possible
late stage runoff erosion marks cutting into the lee side of flat
topped ripples and washout structures.
Using ..•...... / 28

PLATE 3.3
A. Excavated contact between first shale and sandstone horizon revealing outcrop of laterally persistant flat-topped wave ripples.
B. Ladder back ripples developed between ma.jar wave ripples.
C. and D - Two types of interference ripples. C are canrronly terned ' tadpole' structures while D represents the typical type of interference pattern produced in sands and muds of tidal flats (Reineck. and Singh, 1975).


CPlU0~)£"£ 3l V'1d

28
Using a one :rretre square grid a portion of this interface was mapped
in detail and cross sections of the ripples :rreasured. One of the
four stations selected for detailed work shaws the sinuous trend of
the ripples (Fig. 3.6). Sare of the crests terminate and are replaced
by others and there are rare instances where well developed bifurcation
of the crests occur. It was observed that syrretrical ripples with pri
rrary and secondary crests are overlain by flat-topped ripples and
these in turn are overlain by interference ripples. The larger ripples
have a length of between 30 and 60 c::m and a :rrean of 48 cm while the
intervening ladder-back ripples have a length of between 2 and 6 cm.
Reineck and Wunderlich (1968) and Tanner (1967) noted that the ripple
index, RI (ratio of ripple length to ripple height), and the ripple
symnetry index, RSI (ratio of length of horizontal projection of I
stoss side to length of horizontal projection ot lee side), are the
rrost irrp)rtant indices for distinguishing between current and wave
produced ripples. The :rreasured RI of larger ripples had a range of
5.19 to 10 and a :rrean of 7.7. This value falls in the region of
overlap (i.e. between 4 and 15) of the bt.D tyr:es of ripples. How
ever, the :rrean RSI (1. 64) :rreasured is well inside the category of
wave produced ripples. The RSI for the smaller-scaled ladder-back
ripples is greater than 3 classifying theI!l as current produced rip
ples. The average grain size of the syrmetrical and flat-topped rip
ples is 0.750 while the intervening ladder-back ripples and overlying
interference ripples are finer grained (less than 3.50).
Overlying the main shale horizon is the loosely packed graded sand
stone facies which is followed by large trough crossbedded units.
An UfMard decrease in trough crossbedded thickness is apparent.
Isolated tabular crossbeds with an average thickness of about 20 cm
often truncate the troughed crossbedded facies. Multiple sets of
smaller scaled tabular crossbeds are rare and are best observed on
the fann Vrisgewaag (Tll). The inconsistent second shale horizon
is closely associated with this facies and often overlies it. Large
coarse grained trough crossbedded units follo.ved by massive structure
less units are the facies developed at the top of the Formation on
the fann Kuilfontein (Tl) .
Paleocurrent Dispersal Pattern
The .•••• / 29

~
Q)
...... ro ..c <fl
,I.J <fl i,..
.... ..... Q)
..c ,I.J
..... 0
.. Q
)
,!: l'l
-~ ro
.D
... ..
.. .,
.. Q
)
"' -!!
-!! §!
... J
-~ -!!
..c
r ::,
J ~
,I.J C
t;
... ...
0 ::,
... ,I.J
.... ...
"' -le
.; ro
,I.J .;
'1:)
" ~
&
-!: t1l
i
i 'S
~ .Q
...
'"O
e ...
I .;
Q)
i,.. j
C
~
... 2
E
p.
0
~ ~
... "'
' ..
~
:g ..
E
p. ....
CJ)
~ .s
"' it
,.. t1l
...... C
J) e
Q)
,I.J
0 '
r. ·; \\ '"O
....
..J
r .• J C
N
=
,.::J
:::,
(>1 t1l
,I.J
i r,
.t i,..
(.:.:.J '"O
ro
Q)
::, >
O'
i,..
... I
/ ;.;;, 1 B
f.~
~:1
f~
!·:v~
~=
:·:~i:.-:.; ~:::< "-.
I Q
) Q
)
<fl >
.D
0
0 i,.. c.,
w
ti) Q
) Q
) z
i,.. 00
~
::, C
,I.J
ro ..J
u i,..
CL. ::,
0 H
C,
,I.J Q
) ti) ..c
] z
,I.J
(.) ~
-j ···•
··i i'···
,.,.....,"/ ,,
c-;~
>
, F
~;
t-, L~Ys·:,=;-:,
.1 t:;, C
i,..
.._.. •• ,
I,' ,.,
I,:" ·J
. ?Ji ,.. t
••
b 1
t.:.J ~~ t' 7: ,~J; ._j} ',
f:J ro
0 r.J
,:,i _1.·1 _
t.c=,, -..,
~ 1..~
C
.u
w
C
C
cc Q
) 0
e N
u. ........ '"C
l i,..
iD •
• 'k
i\ r, i;i -"\\~:~
--l 0
Q)
0 C
l) ..c CL.
o-'
~I >
J)
~
I I ~ \\~i\ \1 l
<")
0
J i:::
·.I •·.1
I:' •1
~ u
i.:). r:·~ 1l1 g
.., 1~.1 ~: r~\
r.1 ~
:::> C
J) t:1 Jj /J
~::j J. c.,
f) (.j (i .. /?
H
CJ) i:,..
CJ)
~ 0
'< cc u .... ...... 2: ii:
OI(
Ill (..)
0

__l_
29
The Orange Grove Quartzite Fo:r:nation sho.vs a carrplex corrposite poly
rrodal paleocurrent pattern (Fig. 3.7). It would be an oversimplication
to inte.rpret the Carnp:)site rose diagram of the Fornation as being due
to the relative inte.rplay of waves, tidal and fluvial influences.
Rather each sandstone unit with its respective facies should be con
sidered individually. In this way the relative influence of each can
be evaluated up the stratig.rphic colurm. Ideally, paleocurrent
rreasurerrent should be rrade using a grid design. However, the large
dip and the fact that 40 per cent of the strike length is repeated
by strike faulting makes this exercise futile. Therefore, the lateral
change in paleocurrent direction of each facies which might have
indicated either the georretry of a coastline or the presence of topo
graphic paleohighs cannot be shown. The variations in crossbedding
azimuths which reflect changes in the direction of current flew at
different stratigraphic levels within the Formation are shown on
Fig. 3. 7.
The direction of the trough axis of the basal conglorrerates is NW.
This is the only unirrodal current rose in the whole of the Orange
Grove Quartzite Fo:rrration. The ripple marks on sorre of the overlying
plane beds are quadrinodal while the prirrary current lineations shCM
a gcxxi NW-SE direction. The wind direction obtained from the wind
obstacle marks is consistently S-SE.
The trough crossbedded facies belcw the first shale horizon is tri
rrodal north of the Sugarbush River but a strong N-NE rrode develops
south of it. The wave ripples near the Nigel-Balfour Road quarry
have a sinuous north westerly trend. The orientation of the washout
structures is N-NW. overlying the shale horizon, the trough cross
bedded arenite and both isolated and :multiple sets of tabular cross
beds have a strong NE rrode south of the quarry while the section
rreasured at the quarry has a SW rrode. No crossbed data are available
from the overlying poorly developed structureless arenites near the
Sugarbush River.
Excluding the impersistent trough crossbedded conglarerates, the
consistency ratio always increases from a rrean value of 38 for the
arenites belCM the prominent shale to a value of 60 for the overlying
feldlitharenites. Likewise the vectoral rragnitude increases from
4 to 8 •••••• / 30

ORANGE GROVE QUARTZITE FORMATION
.. ! • E
.E
: ! .,. u :i:
"'O e ;; • " • E
70
60
50
40
30
20
10
0
+ + + + t, ... _.i.., +,9mt4*
? not dewlop«I not dtwela,,ed
D / • 8 primary current line11tion
• r • 23 ripple mark direction 0 w• 7 wind direction
T10, T11, T12, T18
a-r,
"' r
Orange Grove Quartzite Formation Composite Current RoH .
FIGURE 3. 7 Paleocurrent direction analysis of the Orange Grove Quartzite Formation

30
4 to 8.
Environm2nt of Deposition
Apart from the vertical stacking of facies sho;m in Fig. 3.5, which
the writer will use in reconstructing the dep:::>sitional enviromrental
of the Orange Grove Quartzite Fo:rnation, two further points need to
be considered. These are the lateral persistence of the facies,
especially the facies developed below the first shale horizon, and
the recognition of similar sequences in other major outcrop areas
(e.g. Central Rand, Erickson et al; in press).
The thin sheets of oligomictic conglorrerate at the base of the for
mation have been recorded in rrost of the other outcrop areas (Ap
pendix 1) and probably occur over an area of rrore that 30 000 krn2.
The develoµrent of basal conglorrerates over such extensive areas are
comron in the cambrian and, according to Iburgeois (1978), they are
strictly of marginal origin marking periods of widespread transgres
sions of an advancing sea and are comparable to the vJell sorted
gravels of many rrodern beaches. Kurrar and Sanders (1974) suggested
that many "blanket sands" in basal parts of transgressive sequences
v-Duld be recognised as inlet filling sands and this is what Eriksson
et al; (in press) proposed for the sequence developed below the first
shale horizon of the Orange Grove Quartzite Fonra.tion in the Central
Rand.
Parts of the sequence of sedirrentary structures and lithologies de
scribed by Eriksson et al;are developed in the study area but certain
facies are better developed than others (e.g. the plane bedded facies
in the Central Rand reach thicknesses of up to 5 m while in the study
area the average thickness is 25 m). Furthe:more, in the Heidelberg
area seili.Jrentary structures indicative of intertidal sand bodies
fornro by the "late stage energency runoff" (Klein, 1977) of water
have been recognised (i.e. flat topped ripples, ladder back rip-
ples, mud cracks).
According to Eriksson et al;the whole of the sequence developed be----
low the first shale horizon is analogous to Holocene tidal inlet de-
posits. The conglarerates at the base they interpret as a tidal in
let channel floor lag gravel with the overlying 1.lp,'Tclrd decrease in
size • • • • • • • • / 31

31
size of trough crossbeds being indicative of tidal inlet channels.
The plane bedded facies resting on the channel deposits are inter
preted as upper flow regine swash-generated deposits while a ten
tative paleoenvironrrental interpretation for the overlying trough
crossbedded facies is dune migration on a tidal delta fronting the
inlet. The vertical superimposition of these facies resulted from
the longshore migration of tidal inlets.
One of the problems in applying Eriksson's et al; tidal inlet rrodel
to the study area is the presence of such thick sequences of upper
flow reg.i.rre plane beds. The sed.i.rrentary structures (runnel marks,
primary current lineations and wind obstacle marks) recognised in
this facies are cormon features on the fore and backshore of beaches.
Although the beach and associated dune facies constitute the rrost
"visible" subenvironrrents of a barrier island today (the other sub
envirorurents being back-barrier, tidal inlet and barrier "toe"),
they v-Duld have very little chance of preservation, especially
during a transgression (Kumar, 1978). The reason for this is that
as the sea level rises (or land subsides) erosion takes place during
subrrergence and the only facies having a high probability of escaping
erosion are the inlets because they are generally deeper than the
lagoonal facies on the landward side of the barrier and the shelf im
rrediately seaward of the barrier (Kumar, 1978; Barwis and Makurath,
1978). Clearly a refinement of Eriksson's et al; (in press) rrodel
needs to be proposed which takes the following into account (a) the
presence of a 25 m plane bedded beach facies, and, (b) the recogni
tion of sed.i.rrentary structures diagnostic of intertidal flat sedi
rrents (Fig. 3.6).
The writer is of the opinion that the sequence from the conglorrerate
facies at the base to the top of the first shale horizon has suben
vironrrents which are present in rrodern strand plain and tidal flat
environrrents. Ha,.:ever, as there is a complete gradation fran high
destructive deltas through strand plains to barrier islands it is
inpossible to distinguish between these three rrodels on the basis of
vertical sequence (Fisher and Brown, 1972).
The basal conglorrerates and overlying trough crossbedded facies are
interpreted as either platform beach (Clifton et al; 1971) or inlet
deposits .••.••• / 32

+
~-
32
dep)sits (Kumar and Sanders, 1974). In the study area no features
associated with the seaward end of the platforms or inlets are pre
served and it is suggested that the sands that accumulated here -were
redistributed to form beach ridges on the adjoining side of the mi
grating inlets. The thick sequence of swash sands in the study area
corrpared with the thinner facies developed in the Central Rand was
probably caused as a resfX)nse to variation in basin subsidence rate.
Such a sequence would be retained if sedi.rrent supply and rate of
subsidence (or sea level rise) were rapid. A present day exarrple of
such thick occurrences of beach facies is the sequence of beach
ridges on the coast of Nagarit, M2xico, studied by CUrray et al;
(1969).
The trinodal paleocurrent pattern of the overlying trough crossbedded
facies is similar to the hYfOthetical crossbedding pattern on ebb
tidal deltas (Hayes, 1976). Other factors suggesting a tidal origin
for this sequence include the association of wave and current ripples,
interference ripples, ladderback ripples and flat topped ripples. The
features on Fig. 3.6 originate when norma.l wave ripples are rrodified
by a falling water level so that the sedinent from ripple crests is
transferred into ripple troughs. The flattening of the crests takes
place during subaerial emergence and is caused by "capillary waves"
which are produced by strong winds on the water surface (Reineck and
Singh, 1975). During errergence sOITE water is retained in the troughs
and the ripple crests show :r.,arked erosional planes on the side while
so:rre ripple crests are sorretirres broken through, producing washout
structures. All these features and processes forming them have
been observed on the tidal flats surrounding the North Sea (Reineck
and Singh, 1975).
The overlying shale unit is interpreted as having been dep)sited on
a shelf. The coastal dep)sits must have undergone rapid subrrergence
if this is correct. The complete lack of sedi:rrentary structures and
the fact that the texture of the lensoid sandbodies in the shale are
not related to that of the underlying tidal and beach facies over
rides the argurrent that the shale unit is a back barrier lagoonal
dep)sit. The "hurmocky" laminated nature of the sand bodies could
have originated by periodic flushing of sands through the coastal
areas during storms.
The ••••••• / 33

33
The overlying graded sandstone facies are similar to m:xiern shoreface
stonn generated sequences (Kurrar and Sanders, 1976). The grading was
probably caused by the sands being held in suspension during the height
of the stonn and as the stonn wanes (and so do the hydrodynamic con
ditions caused by the storm.s) suspension settling takes place. The
absence of segregated layers of heavy minerals, ripple cross laminae
and high angle, large scale cross strata all suggest relatively fast
deposition and distinguishes these deposits from foreshore deposits.
The fining upward textures, upward decrease in thickness of the trough
and tabular crossbeds, and birrodal current roses for the follCMing
15 mare characteristics of progradational intertidal flat sequences
observed by Evans (1965) in the Wash, and van Straten (1964) in the
Wadden Sea. The structureless well sorted sands recorded at the top
of the sequence on Blinkp:)ort probably represent a local high energy
environrrent (beach?) .
In S\.llll1\::llY, the first shale horizon in the vertical succession of the
Orange Grove Quartzite Formation marks a change from high energy
wave dominated to lCMer energy-tide dc:minated conditions. BelCM the
first shale horizon the mature sediments have probably systematically
undergone a wave dominated transgressive autochthonous regirre which
caused the retreating of the shoreline and forrred the persistent swash
and platfonn beach or inlet deposits. The recognition of stonn
deposits is also taken to be indicative of a robust hydraulic regirre.
This is also manifested in the paleocurrent pattern which is lateral
ly inconsistent. From the wave ripple trend and orientation of pri
mary current lineations the shoreline trend was probably NE-SW. HCM
ever, the current rose patterns do not confonn with this indicating
the corrplex interaction of wave, wind and tidal current bed.forms on
a strand plain of negligible slope. The lc:wer energy conditions are
manifested in the presence of offshore shale deposits follc:wed by
sands which are irrm3.ture and deposited by tidal currents.
3.3.2 Parktc:Mn Shale Formation
Definition
Strike faulting north of_the Sugarbush River has resulted in the du
plication and thickening of nembers making up the Parktc:Mn Shale
Formation ••••••••• / 34

l
PARK TOWN SHALE FORMATION
700 SEDIMENT CLASSIFICATION CURRENT ROSES
600
500
~ 400
m
banded iron formation (CB)
m
arenites
litharenite
i Eii+~~,il -~ Zii{fi: ; . : rippled silt stones
., fl) C) C: ~ c.,
:C L-300
200
100
0
''''''·'''i"''''??.C'/'r''''· ,
.. -.......
§ shales
litharenite
banded iron formation (WTS) m
sublitharenite
lenticular arenite
m
[+] siltstones !HH sandstone
n=5
~ magnetite rich
CB contorted bed WTS Water Tower slates
FIGURE 3.8 The stratigraphic column of the Parktown Shale Formation

+
34
Fornation. 'Ihe type section of the fornation is thus the area next
to, and south of, the SUgarbush River on the fanns Blinlq::oort and
Kuilfontein.
Lithology and Sedirrentary Structures
'Ihe Fornation corrprises two banded ironstones correlated with Mellor's
(1911) Contorted Bed, and Water To.ver Slates (Rogers, 1922), a 140 m
arenaceous horizon and several thinner sandstone units separated by
nudstones and horizontally laminated and ripple narked siltstones·
(Fig. 3.8). 'Ihe mudstones weather either to a pale red (SR/ 6/2)
or a dark reddish brown (lOR 3/4).
'Ihe first two lenticular sandstone units below the first banded iron
stone are coarse grained sublitharenites. 'Ihe sand 9I"ains are pearly
sorted and angular with a irean grain size of 0.75¢ (range 4 to 1.0¢).
'Ihe lithic fragrrents consist of smaller well rounded micaceous
litharenites and cherts. 'Ihe rock is cerrented by very fine grained
quartz. Sma.11 green grains found as inclusions in the larger quartz
grains have a high relief, high dispersion and are isotropic. 'Ihis
spotted rock (Plate 3.lG) below the Water To.ver Slate Unit is similar
to the speckled bed, identified by Mellor (1911) in the Central Rand
and West Rand areas. However, the speckled bed in these areas is
only a short distance below the Contorted Bed and the two Units can
not be correlated. Nevertheless, it is significant that both in the
Johannesburg area and in the study area an irmature sandstone with
an interesting texture is associated with the chemically precipitat
ed ma.gnetic horizons.
'Ihe Water To.ver Slates are poorly developed banded ironstones can
prising a microcythmic alternation of ma.gnetite (mean thickness of
20 cm), white chert and iron-rich mudstones (rrean thickness of 2,5 cm).
'Ihe third sandstone unit 40 m above the banded ironstone, is clas
sified as a poorly sorted irrmature sublitharenite and is succeeded
by a 120 m thick argillaceous horizon. 'Ihe lONer half of this
horizon consists of alternating horizontally laminated siltstones
and shales while the top half carprises mudstones with intercalated
rippled siltstones and sandstones with clay drapes. Near the base
of the thickest sandstone unit load casts of fine sand in silty
black •••.•••••• / 35

35
black shales are cannon (Plate 3.4A)
The main sandstone unit of the Parktown Shale Formation has a grada
tional base and a sharp top. The unit consist of binodal white
arenites. This texture is well knCMn in the quartzites of the Brixton
Fo:rmation in the Johannesburg area. The arenites are sparsely cross
bedded.
Intercalated between the overlying argillaceous horizon is a·2 rn
sandstone unit which has a fluted base (Plate 3.4B). The shales and
siltstones above this unit are greyish yellcw green (5 G7 7/2) and
weather to a m::xierate brCMn (5 7R 4/4). The proportion of siltstones
to shale decreases up,vards. The shales grade into black magnetite -
rich layers.
The base of the Contorted Bed is ffi.:l.rked by a 26 rn magnetite rich zone
which in places is infiltrated by pegrratitic quartz veins. This zone
is follcwed by interlaminated mesobands of chert (light grey), jasper
(red) and shale (black). over a thickness of 18 rn this unit is con
torted into Class lC type folds which are steeply inclined (Plate 3.4C).
Boudins or possible ball and pillows are rare. overlying the contort
ed region are shales and siltstones with weakly magnetic lenses con
stituting the only chemical precipitate.
Paleocurrent Dispersal Pattern
It was only possible to obtain reliable current directions at tw:>
stations alongside the SUgarbush River. The thickest "sago textured"
sandstone unit has a bipolar current rose with its major m::xies orien
tated N-NE and SW. The current rose for the first lenticular sand
stone units is unim::xial with its vector rrean azinruths shewing bed
load transport influenced by an easterly flcwing current. The dCMn
current direction of the flute ID.:l.rked uppe:rrrost sandstone unit of
the Parktcwn Shale formation is south-west.
Environment of D=position
Although relatively little is kncwn about the sedirrentology of iron
formations with rcost previous workers concentrating on the mineralogy
of • . • • • • • / 36

PLATE 3.4
a. Isolated lenticular load casts probably produced by load deformation of underlying hydroplastic mud(shale); due to yielding under unequal load.
b. Small ill-defined flute casts preserved at base of sandstone. Current probably fran top left to bottan right.
c. Folding of the Contorted Bed.

PLATE 3.4

36
of these rocks (e.g. Janes, 1966), Dimroth (1979) has proposed a
rrodel of physical sedirrentation relating the sediJrentary structures
and textures of iron fo:rmations to hydrodynamic processes during
deposition. Based on Dimroth's (1979) :rrodel and classification the
two banded ironstones of the ParktCMn Shale Formation are of the
laminated micrite type, cherty iron fonnations in the "detrital
chemical sedirrent class". According to Dimroth (1979) such iron
fo:rmations are very similar to linestones deposited on the shallow
narine shelf of the Persian Gulf.
Parallel laminations and stratification are visible as the only
depositional features in the Contorted Bed indicating a depositional
environrrent below wave base. such laminations are based from shelf
ITD.lds of the Persian Gulf because of bioturbation. The finely-alter
nating ferruginous and siliceous layers in the two banded iron for
nations rray fonn as a response to cyclically fluctuating Eh and Ph
conditions (Walter, 1972) but Dimroth (1979) is of the opinion that
iron fonrations were precipitated as caco3 (probably aragonite) which
have subsequently been replaced by silica and iron conpounds during
early diagenesis. The latter hypothesis is plausible as samples
with as ITD.lch as 25 per cent carlxmate have been identified within
the ParktCMn Shale Formation in the Central Rand area (Rogers, 1933).
Whatever the origin of the iron fo:rmations, they probably represent
intervals of non-detrital deposition and are interpreted as the nost
distal facies within the Hospital Hill Subgroup.
The discontinuous inmature sublitharenites below th~ first banded
iron formation are probably nearshore shelf storm deposits with the
first lenticular arenite being deposited by longshore currents flowing
at right angles to the paleoslope. This is assuming that the flute
narks on the base of the uppe:r:m:,st sandstone unit indicate scouring
action dCMn a south westerly slope. The main sandstone unit of the
ParktCMn Shale Fo:rmation with its gradational base, sharp top, nature
sands, sparse crossbedding and binodal current rose is interpreted
as bein<J forned by the migration of flood (? and wave) dominated bed
fonns along a NW-SE trending coastline.
In surmary, the shales and thin sublitharenites of the ParktCMn Shale
Fonration • • • • • • • / 37 ''----
11

37
Formation were fonred by suspension dep::>sition of ITU1d alternating
with periodic sand influxes (? distal stonn layers) while the banded
iron forrrations and rragnetite - rich zones probably represent distal
shelf muds. The presence of a thick sandstone unit within the for
rration in the study area, which is absent in other outcrop areas
(Appendix 1), indicates that the alternating transgressive-regressive
sequences in the study area include proxirral sand facies which are
influenced by tides. The differences in thickness and character of
the ParktCMn Shale Formation within the study area and other outcrop
areas (Appendix 1) is probably a result of fluctuations in the rate.
and extent of transgressions and regressions in the shoreline envi
ronrrent, controlled by the rate of dep::,sition and rate of sea-level
change (CUrray, 1964).
3.3.3 Brixton Fonration
Definition
This fo:rr.iation is best exposed on the £anus Blinkpoort in the south
and Ui tkyk in the north of the study area. Sands and clays of the
Karoo Supergroup partly cover the Brixton Forrration between the two
farms. A cc:nposite type section constructed from traverses 4, 5, 6,
10, 11 and 12 is shCMn on Fig. 3.9.
Li t..1-iology
The Brixton Fo:rmation rreasures about 850 min thickness. It consists
of five thick and several thinner laterally discontinuous sandstone
units separated by shales and siltstones.
The first arenaceous horizon (55 m) serves as a useful marker in
both the east and south Rand. It is a rredium grained sandstone
characterised throughout the study area by the presence of black
conglonerate lenses at the base and at the top. The unit was ap
propriately narred the Black Grit by S~er (1907). The i.mpersis-
tent conglareratic layers are thin - the thickest rreasured was 35 cm -
locally mineralised, and ccnprise angular fragrrents of black, white
and banded chert. On the fann Uitkyk the base of the unit is classi
fied as an inmature, coarse grained (rrean diaireter 0,45~) poorly
sorted sublitharenite with skeletal euhedral haen3.tite being the only
replacerrent ••• /38

1- -
BRIXTON FORMATION MEMBERS OF THE BRIXTON FORMATION
I 800
FACIES
: -o / o 00 u/ o ---;;o;:'J C
. . . . . ~ r· . -. . .. oo•oo 0 oo 0
700 ..... • .... ···•·cec:.,~.. 70 ecree?
FACIES
r· ·. · ·: · ·, I- ~ ::· ~ - u, 600 . .-................ , .. .-... , ... 1 120 Str 60 o o : •c
FACIES I C
c ' ' ~ Mtr
so g 100 1-so
• ················ ········ Mtr Mtr I ~~ Ltr
j Pb Mta~- Rs
·! 400 40 80 i 40 Mta : Mtr ~ .. · .. · Ltr
.i /ta l1 Ltr c
~ Str i ·- ~ ™ Rs - • E :! ! Mtr c ! - Mta
300 j 30 Pb ·; 60 g ~ 30
c ! Ltr - ~ Mir ·- Mtr t; = :c .... -u - f'O ~/ta .i Rs Lacb M u Ir
200 i: 20 <j,bb 40 Mtr 20
Ccb Str s Ccb Pb Pb g
Pb Mta
100 ~10 t r r , r I rl 20 b 10 Mta ' ' ' '' ' ' g Lac • Mtr
Mer g · . Ltr
0 , •••••••• ] Lo [,•" .•.• oJ facb Lo t~ ~;cb O ~ta
1 2&3 4
FIGURE 3.9 Composite stratigraphic section of the Brixton Formation
. LEGEND
FACIES
• •c • og Str Mtr Ltr /ta Mta Rs Pb Ccb Lacb
Conglomerates Coarse grained lags Small trough crossbeds Medium trough crossbeds Large trough crossbeds (generally coarse grained subarkose:r), Isolated tabular crossbeds Multiple sets of tabular crossbeds (often mud-draped) Reactivation surfaces Plane beds (current lineation on some surfaces) Convoluted bedding Medium-scale low angle cros:r-stratification (generally separated by clayotone drapes)
GRAIN SIZE
• Shale [3 Fine -medium grained sandstone
E2J Coarse grained sandstone

38
replacerrent mineral, but near the Sugarbush River it is a mature,
:rroderately sorted, coarse grained (rrean diarreter 0.0¢) arenite with
sericite as a matrix. On the fann Rietpoort the Black Grit's base
canprises will sorted bi:rrodal grain sized sublitharenites. Green
fuchsitic staining, aggregated stylolytic surfaces and characteristic
"sago textured" quartz arenj_tes are camon features between the basal
and upper conglanerates.
The third arenaceous unit of the Brixton Formation consists of coarse
grained (mean diarreter 1.00) imnature litharenites which becorre finer
grained and rrore mature 4 m above the undulating gradational base.
Several fining up.,.mrd cycles characterise this unit. Lithologically
the next sandstone unit (labelled 2 and 3 on Fig. 3.9), is very diverse.
Three thin shales are separated by litharenites and quartzarenites
near the Sugarbush River (T4) while in the north of the area the thin
shales thicken at the expense of the sandstones. On Tll this unit
is not recognised at all. The toµrost arenaceous unit has a sharp
erosive base with shale clasts and jasperitic chert clasts l(X)sely
packed in a mature, coarse grained litharenite (Plate 3.lE). Pyritic
pitting and green fuchsitic staining is camnn 2 m above the base.
The last major arenaceous unit of the Brixton Fo:r:rnation consists of
a coarsening up.,-1ard sequence of interton<JUeing coarse grained, im
rnature sublitharenites and rnature fine grained arenites. Coarse
"sago" textured units or pebbly washes with very little rnatrix were
recognised 4, 9, 12, 15, 30 and 57 m above the base of the unit.
Very coarse sandstones and discontinuous poorly packed mineralised
conglarrerates composed rnainly of well rounded quartz clasts and
angular cherts make up the last 13 m of the unit.
Sedimentary Facies
The Brixton Formation's arenaceous units have been divided into several
sedimentary facies (Fig. 3.9). Although the approach is similar to
the method used in dividing the Orange Grove Quartzite Fonuation into
its respective facies on the basis of the nost frequently occurring
sedimentary structure it was necessary also to include satE textural
facies (conglatErates and coarse grained lags). The reason for this
is that rrore often than not the coarse grained lags and conglarerates
are . . . . . . . . . . / 39

39
are not well exposed and no diagnostic sedirrentary structures within
them could be recognised. As all evidence relative to the environ
rrent TIU.1St be utilised to build a consistent, convincing and realistic
picture of the conditions that existed at the tirre of sedirrentation
it was decided to include the structureless coarse grained facies.
The Black Grit (labelled 1 on Fig. 3.9) consists predaninantly of
srrall and :rredium trough crossbeds (:rrean trough thickness is 15 cm,
range 5-50 cm) which are often convoluted and overturned, rare plane
bedding, rippling and vague parting-current lineation were also ob
served. These features are randomly stacked throughout the 55 rn
thick unit with no one facies being laterally persistent (e.g.
plane bedded facies were in sorre places cut into and replaced by
overlying troughs).
A sandstone unit about 150 rn above the upper conglcnerate of the
Black Grit consists of trough and tabular crossbedded units with
thin muddy drapes defining the tabular and trough foresets. Ripples
with wavelengths of 15 cm are abundant and the upper contact is
sandwaved with wavelengths of up to 10 rn.
The sedirrentary facies present in the four sandstone units 165 m
above the sandwaved contact are shc::Mn on Fig. 3.9. As in the Black
Grit the nost frequently occurring sedi:rrentary facies are the trough
crossbedded units. HONever, multiple sets of tabular crossbeds which
are often rrn.1d-draped and range from srrall to large scaled sets are
rrore comron. Furtherrrore, the vertical stacking of different facies
is not as random as that for the Black Grit. Coarse grained lags
are always follo.ved by a trough crossbedded facies which in turn are
often overlain by low-angle or plane-stratified units.
The last :major arenaceous horizon (labbelled 4 on Fig. 3) has multiple
sets of tabular crossbeds (4 m thick) at the base of the unit which
are cut into by very coarse grained trough crossbedded sublitharenites.
'Ihe next 45 mis characterised by diverse randomly stacked sedi:rren
tary structures which include convoluted bedding, reactivation sur
faces and trough and tabular crossbedded uni ts. Coarse-grained rrediurn
and trough crossbedded sets becorre nore dcrninant in the upper part of
the succession.
Paleocurrent • • • • • • / 4 O

40
Paleocurrent Dispersal Pattern
The vertical and lateral distribution of the paleocurrent pattern
of the Brixton Formation is shown on Fig. 3.10.
The Black Grit marker shows well developed bipolar pi-crossbeds with
two rnajor rrodes orientated south west (210-220°) and north east
(25-35°) alongside the Sugarbush River. On the farm Uitkyk (TIO) a
similar bi-polar current rose is evident while between these two
localities (Tl8 and Tl2) the bedfonn orientation is :rrore complex.
Ha.vever, there is always a dominant primary rrode orientated N-NE.
The significance of this will be discussed later. The only other
well developed bipolar-birrodal current rose within the Brixton For
mation is present in the third arenaceous horizon of the Brixton
Formation rreasured on the Sugarbush River is S-SE. Except for the
sandstone labelled 3 on Fig. 3.9, all the other units are unirrodal
with the vector mean azimuth indicating bed.load transport to..vards
the S-~v. The exception is interesting in that the small trough
crossbedded units above the rip-up shale clast conglorrerate have
a vJesterly paleocurrent direction while the overlying multiple sets
of tabular crossbeds have a E-NE direction.
Environrrent of Deposition
The thick arenaceous units of the Brixton Formation all have sedi
rrentary structures which indicate that tidal processes were operative
during their deposition.
The nost carrrron feature in all the sandstone units are either medilIDl
scale trough or tabular crossbeds. The mud draped foresets of the
planar crossbeds are COilllOn features in tidal sand deposits (e.g.
Reineck, 1963; Raaf and Boersma, 1971). The suggestion that the mud
drapes forned by fall-out of fine grained suspended sedirrent during
the slack water period of the tidal cycle (e.g. Klein, 1970) has been
questioned by M:::Cave (1970). Because of the long settling tirre of
the suspended :mud, 1-teave (1970) is of the opinion that mud drapes
in tidal sand deposits are not the result of diurnal and semi-diurnal
tidal fluctuations. Instead they are nore likely to be due to a ccm
bination of abnormally high suspended sedirrent concentrations, lo..v
current •••••• /41

SANDSTONE PALEOCURRENT PATTERN OF THE BRIXTON FORMATION
Traw- 4MMl9 Tr-• r, ....... 12 Traverse 10
FIGURE 3.10 Paleocurrent pattern of the Brixton Format i on

41
current velocities and lCM wave intensity over a long period.
Johnson (1978) suggests that these conditions prevail follCMing
a stonn when suspended concentrations are high. The trough cross
beds are interpreted as products of migrating three-dimensional
dunes (probably linguoid) and the infilling of erosional scours.
The lateral extent of the Black Grit's coarse grained and conglo
rreratic facies probably indicates erosion under a laterally exten
sive sheet of water of relatively unifonn depth. The Black Grit
(together with many other sandstone units of the West Rand Group)
has a sharp basal contact with no deep channels and scours but is
characterised by coarse grained sheet sandstones. This factor,
plus the bim:::ldal - bipolar paleocurrent pattern and the recognition
of thin sets of plane beds and reactivation surfaces in an apparent
random vertical sequence, suggests to the writer that the Black
Grit was deposited in an environnent carrprising a shallCJv.1 tidal
sea bordered by exposed beaches. The paleocurrent patterns for the
Black Grit north of the Sugarbush River indicate the superior strength
of the flood current (N-NE). Eriksonn et al;(in press) noted that
ebb currents (S-SW) were stronger, especially during deposition of
the lCMe:rnDst Brixton Quartzites in the Central Rand, and this fact
again indicates the uniqueness of the cherty conglarerate m:rrker
on the East Rand.
The unidirectional paleocurrent patterns for the remaining six units
of the Brixton Formation are not diagnostic of fluvial environments
as these patterns are carrron in tide and wave influenced environments
(Johnson, 1978). Thus, although parts of the sequence resemble
sections of braided stream environments of the Platte type (Miall,
1977), reactivation surfaces and thick sequences of plane beds in
this unit are nore indicative of a m:rrine setting. The stacking
of facies in these units (labelled 2, 3 and 4 on Fig. 3.9) is often
punctuated by fining upward cycles with coarse grained lags over
lain by a trough crossbedded and a plane bedded facies. These
sequences were probably fonred by channels cut by stonn ebb currents
which are infilled as the stonn subsides to deposit a waning flCM
sequence with the final ripples being rev.Drked by waves (plane beds).
Such processes Banks(l973) visualised in the deposition of the
lithologically diverse late Precambrian deposits from northern Norway.
The ...••• / 42

42
The canplex alternation of silts and muds in the latter area were
deposited in sublittoral environments which never established a
shoreline. The absence of these fine grained facies in the study
area is probably because the above process was operative on an established
shoreline with a high sedirrent rate. The unirrodal regional paleo-
current patterns for these units which sha.,,s a S-SVl transport direc-
tion are consistent with :rrodern analogues where stonn ebb surge cur-
rents are the rrost likely seaward flo.,qing currents (Hayes, 1976;
Gadow and Reineck, 1969). Ho.,qever, though this "catastrophic sedirren
tation regirre" is preserved in parts of the sequence the presence of
reactivation surfaces and mud draped tabular crossbeds indicates that
the sequence also sho.,qs rrore nonral noncatastrophic (tidal) processes.
In these facies the uni:rrodal paleocurrent pattern may be explained
by the main ebb currents following mutually exclusive paths to those
of the flood currents (Johnson, 1978). Thus the sedirrents of the
arenaceous units of the Brixton Fo:rmation were probably deposited
under the sane conditions as the Jura Quartzite (Scotland) where,
although storm deposits are invoked as the major process for pre
serving sedirrent, it is only effective because it acts in conjunc
tion with tidal currents (Anderton, 1976). The convolute bedding
facies which is best developed 15 m above the base of the last rrajor
sandstone unit of the Brixton Formation (labelled 4 on Fig. 3.9) is
attributed by Coleman (1969) and Wunderlich (1970) to errergence
draining of pore water from rapidly sed.irrented rnater.tal, although
the defo:rmation may also be a product of differential loading.
The shaleclasts at the base of the unit labelled 3 on Fig. 3.9
together with the unusual paleocurrent pattern which is interpreted
as running parallel with the shoreline are difficult to explain in
tenns of tidal and stonn processes acting no:rmal to a shoreline.
Such a current pattern and shaleclast texture may occur within a
back-barrier tidal channel environment where shaleclast filled
washouts are produced by tidal scour. Similar barrier-potected
sequences with trough crossbeds and planar crossbeds overlying a
base characterised by a few clasts and overlain by a plane bedded
sand facies have been described by Carter (1978) in the Upper
Tertiary Cohansey Sand of New Jersey.
In surrma.ry, the consistency of the major current nodes in rrost of the
Brixton . . • • / 43

1"
Brixton Formation sandstone units , the bi.m:xiality of sare of its
units and the roundness and maturity of the "sago textured" grains
all suggest that the units were dep:::,s i t ed along a coastline that was
subjected to tidal and wave surge forces. The orientation of the
shoreline was probably NW- SE. The majority of bedfonns indicate
bedload transp:::,rt tCMards the SW and it has been suggested that the
ebb dominance of these structures was enhanced by storms washing
out sed.inents in the nearshore regions and then winnCMing material
f rom a flat floor . HCMever, the recognition of p:::,ssible barrier
i sland subenvironrrents indicates that longshore processes were still
operati ve but , unlike the conditions which were present during the
dep:::,sition of the lCMer Orange Grove Quartzite Fo:rr.iation , were sub
ordinate to wave beat and tidal forces . Although Eriksson et al ;
(in press) suggest that the tidal range was greater than 4 m during
the dep:::,sition of the Brixton For:mation in the Central Rand area
it is likely that tidal fluctuations were nodified by factors of
basin geor.etry and :rresotidal (2- 4 m) wave dominated conditions
probably prevailed in the study area.
Eastward panaromic view of West Rand Group sediments cut by Surgarbush 'River with flat lying Karoo strat~ in the background
3.4 . .. ... / 44
- ·---:::-------"""""-=:===~---------------

44
3.4 GOVERNMENT SUBGroUP
The thickness of the Goverrnrent Subgroup is approxirrately 1 300 min the
study area, conpared with 750 m near the Hex River Mine (South Rand) and
1 860 to 2 000 m on the Central Rand. The SUbgroup is divided into three
formations: The Coronation with its tillite and magnetic marker horizons,
the Promise Quartzite and the Witpoortjie Fo:rma.tions. The Promise Reef
and Blue Grit are both diamictic markers delineating the base and the top
of the Subgroup respectively.
Plate 3.5 shONs several sedi.rrentary structures which are present within
the Goverrurent Subgroup. Although mmy of these structures are also pre
sent within the Hospital Hill Subgroup, the carnrunal association of the
structures is quite different. In general, herringtone crossbeds (Plate 3.5a)
and tabular crossbeds overlying either lON angle cross stratified laminae
(Plate 3.5d) or mud draped syrmetrical ripples (Plate 3.5c) are rrore aban
dant in the GovernrrEnt Subgroup. Thick coarse grained tabular crossbeds
(Plate 3.5b) and "water escape" structures (Plate 3.Se) are also comron.
Symretrical wave ripples (Plate 3.5g) and runnel marks on plane beds
(Plate 3.5£) indicate, as in the Hospital Hill Subgroup, that wave processes
were still operative. The follCMing profiles indicate subtle differences
in the relative influence of wave and tidal processes when rorrpared with
the sections of the Hospital Hill Subgroup.
3.4.1 Promise Quartzite Fo:rma.tion
Definition
The base of this fo:rma.tion is seldan seen because it is generally
covered by thick soil or rerrmants of Karoo Supergroup beds. HCM
ever, on Blinlqoort and the neightouring part of Groenfontein the
base ronsists of coarse grits exposed in ten prospecting pits. The
diamictite is as much as 3 m thick in one pit and has quartz pebbles
5 cm long scattered sparsely through it, but it thins and disappears
along the 4 km of occasional outcrops traced on the two farms. On
Rietpoort, Bultfontein and Uitkyk, this marker is seldom seen and
the Promise Quartzite FoDlE.tion succession cannot be correctly
ascertained on these fanrlS. Fig. 3.11 is a conp:,site type section
ronstructed £ran traverses 7, 14 and 18.
Lithology • • • • • • / 45

• FL ATE 3.5
a. Herringbone crossbedding at the base of the thickest sandstone in the Pranise Fonnation (Groenfontein).
b. Large coarse grained tabular (fluvial) crossbeds near top of thickest sandstone in Pranise Fonnation (Groenfontein).
c. Oblique view of medium scaled tabular crossbeds overlying -near symnetrical small mud draped wave ripples (Pranise Formation).
d. Large tabular crossbeds overlying l<J'w angle cross-stratified laminae (Witpcx::>rtjie Fonnation).
e. Water escape structures (T14 - Groenfontein).
f. Runnel marks on plane beds, Pranise Fonnation (Blinkpoort).
g. Irregular syrmnetrical wave ripples (T14 Groenfontein).


45
Lithology
The Promise Quartzite Fonnation :rreasures sane 240 min the study
area. Thin shales near the base and at the top of the fornation
bound the thickest arenaceous unit of the West Rand Group. Sub
sequent to Roger's (1922) ma.pping, farming activity has covered the
top two arenaceous horizons of the Promise Quartzite Fornation.
The base of the fornation is carposed of scattered pebbles of
granite, feldspar and quartz set in a muddy :matrix. This horizon
was correlated with the Promise Reef of the Central Rand by Rogers
(1922). It is overlain by crossbedded mature sublitharenites
'Which are rredium grained (rrean dianeter of about 1.40) and 'Which
sonetirres have graded foresets. Several fining upward cycles are
present 50 m above the diamictite. The variation in grain size up
the stratigraphic column is generally correlative with the sedi
:rrentary structures observed. The coarser sands are rrore often than
not present in the trough crossbedded facies 'While the fine to :rrediur:1
grained sands are generally confined to the tabular crossbedded
facies.
Sedirrentary facies
Ten facies have been identified within the Promise Quartzite For
mation (Fig. 3.11). Facies 'Which are well developed within the for
mation include convoluted large tabular crossbeds and thick sequences
of herringbone crossbedding. The fornation is characterised by its
predominance of multiple sets of tabular crossbeds over the trough
crossbedded facies. The tabular sets vary in thickness from 0,02
to 1,2 m.
Although larger tabular crossbeds are generally rrore conrron at the
top of the thickest arenaceous unit, the vertical stacking of the
other facies alternate in an apparently random manner.
Paleocurrent Dispersal Pattern
The paleocurrent dispersal pattern of the Pranise Quartzite Forna
tion is given on Fig. 3.12.
.Multiple ••••• / 46

.. ! .; E .!: .. .. ., C .,, u :c ,, C>
:i ..
I
PROMISE QUARTZITE FORMATION
240
150
:~100 E
50
0 TRAVERSES 7, 14, 18
FACIES
Cvlta
Lta
Mta
Ltr
Mta
Pb
Str
Str
Mta
Mtr
Hbn
Mta
Lacb Pb
Mta
Mtr Pb
Lta
Lacb
~ib
Mta/Lta Ccb
Hbn
Lacb
Pb
Lacb Cvta Hbn
Str
Mta
FIGURE 3.1 l
GRAIN SIZE
:it)!! .. ~:~~:?::::!:::· . . .
0 e O O O. 0 .... : ..... ' ....
wirm 0 0 O O 0
D O O O 0 0 O O 0
o 0 o o 0 o 0 0 O O 0
••••• 0 •9• • • • . • 0
0 0 O O 0 O O O O I ......
0 0 O O 0
·:.·;~::;::~::: ••• 0
=···: ·.·.· :· .. ·.··1 ~ .. ·.!.··· I
?
l.fttf t
WiUi.J}
FACIES Hbn Herringbone cross-stratification Mta Multiple sets of tabular crossbeds Lta Large tabular crossbeds Cvlta Convoluted large tabular crossbeds Cvta Convoluted medium tabular crossbeds Str Small trough crossbeds Mtr Medium trough crossbeds Ltr Large trough crossbeds Pb Plane beds Ccb Convoluted bedding Lacb Medium-scale low angle cross-stratification
GRAIN SIZE
• D Q ~
Shale
Fine grained (>2(/J) Medium grained ( 2(/J to 1(/J)
Coarse grained (< 1(/JJ
Sequence of sedll!lentary structures, textures and lithology in the Promise Quartzite Formation

E .. ., ., C -" u :i:
j ;; ., .. I> E
PROMISE QUARTZITE FORMATION
240
150
100
T7
_,
50
0 TRAVERSES 7, 14, 18
/J
(l) 0(/1
mt• ii
{if'' n•39 n 15
(i) Cl)tr mt•
n•42 ::d(!i\. n,22
scree 7
/ ; . .. ::·
. ~~ ~-·
Jff '\ '<Iii> •. ,, ·'.{:) -;/__ ,..13
T7 T18 T"M
FIGURE 3.12 Paleocurrent dispersal pattern for the Promise Quartzite Formation

46
Multiple sets of tabular crossbeds and herringbone crossbedded facies
give bip:>lar-binodal current roses while the larger convoluted and
trough crossbedded facies are strictly unirxldal. At all stations
the dominant vector rrean azimuth is ta.vards the south. The thickest
arenaceous horizon current roses change from being strongly bipolar
at the base to unirrodal further up the succession.
Environrrent of Dep:>sition
The tabular and trough crossbeds overlying the diamictite marker at
the base of the Prorru.se Quartzite Fo:r:mation were probably dep:>sited
in an offshore (subtidal shelf) environrrent. About 7 m above the
base of the fo:r:mation herringbone and la.v angle cross-stratification
indicate shallower tidal processes. The absence of typical inshore
fining u1M7ard tidal flat sequences sugsest that the bed.forms result
ed from the migration of storm surge (trough crossbeds) and ebb
orientated (tabular crossbeds) sand waves in a subtidal enviro:nrrent.
This is substantiateq. by the dominance of a major rrode (S-SW) in the
bip:>lar current roses for these facies.
The base of the thickest sandstone unit of the West Rand Group is
characterised by thick sequences of herringbone crossbeds which are
interpreted as being indicative of an intertidal or subtidal en
viro:nrrent. The coarser sands and unirrodal directions for the re
maining 100 m of this unit could either be interpreted as rrarine
or fluvial deposits. The writer is of the opinion that the sequence
is similar to a braided stream dep:>sit of the Platte type (Carx!.en
Smith, 1979a, b). The convoluted large tabular crossbeds vJere
probably famed by strong sedi.rrent laden currents that drag the up
per parts of the foresets into folds (l'tKee et al, 1962). This type
of feature has been camonly observed in fluviatile dep:>sits
(Reineck and Singh, 1975). The presence of planar bedding within
the unit indicates that sand was transp:,rted under upper fla.., regirre
conditions. SUch dep:>sits are camon in braided streams that are
subjected to catastrophic floods (M:::Kee et al, 1967).
3.4.2 Coronation Shale Fonration --
The Coronation Shale Fonna.tion carprises a 6 m thick tillite horizon
and ••••••••• /47

J
47
and a banded shale w1i. t containin9 much rnagneti te. The two w1i. ts
are best observed on the fann Blinkpoort in the south and Bultfon
tein in the north. The rnagneti te rich w1i. t can be traced between
these two fanns through Rietpoort and Groenfontein.
Lithologically, the tillite is nonstratified and poorly sorted
(Plate 3.6a). The toulders and pebbles within the tillite are
corrposed dominantly of sandstones although slate and lava pebbles
have been noted (Rogers, 1922). The matrix of the tillite is much
the sarre as that of the two diamictitic markers and so too is its
geochemistry. However, one of the rrost distinctive features of
the till is the presence of several striated and faceted clasts
which are rare and difficult to extract in the hard lithified rock
(Plate 3. 6b and Plate 3. 6c) . As no striated pa.verrents were observ
ed in the study area the faceted clasts are the only evidence that
the pebbles originated from glacial abrasions.
Enviro:rurental Significance
The tillite marker extends over an area of many thousands of square
kilorretres. It has been recognised in the West Rand area, the
Klerksdorp area, in the Orange Free State Goldfields, in the Delmas
area and in the Evander area. The Coronation Shale Formation is
best developed in the Evander area where interbedded magnetic shales
and quartzites with two tillite bands total sane 169 m (Jansen et al,
1972). In the Klerksdorp area the "tillite" lacks striated pebbles,
has a restricted areal extent and is in scrre cases lenticular (Watchorn -
pers. conm.). The glacial origin of sorre diamictites has been re-
futed for these very reasons (e.g. Dott, 1961; Schermerhorn, 1974).
Nevertheless, the areal extent of this marker contrasts with the
limited coverage of the other diamictites (the Blue Grit on the
East Rand, the tilloid associated with the Promise Reef on the West
Rand and the Promise Reef in the study area). This fact suggests
to the writer that a synchronous glaciation occurred in West Rand
Group tines and may have contributed not only to marine tills but
also to unstable sedinent piles, leading to subaqueous slumps,
slides and flaws. However, the evidence is inconclusive, in that
the poor outcrop of the tillite makes is difficult to delineate the
facies associated with the till.
The • • . . • . • • / 48

PLATE 3.6
a. outcrop of tillite on farm Rietpoort.
b. Pebbles extracted fran tillite matrix. of pebble 6 cm to the left of scale.
c. Striations on two of the pebble surfaces.
Note the faceted surface
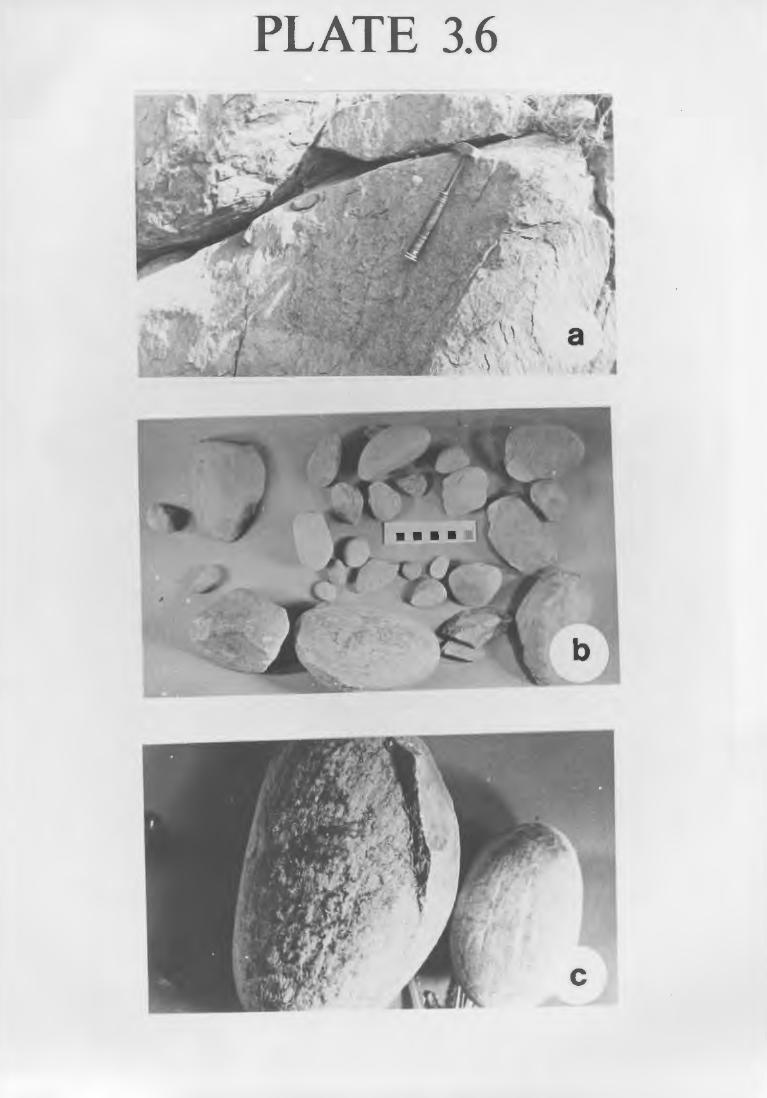
,
)

48
The oldest evidence for widespread glaciation is in the }1:iddle
Precarrbrian (2150-2500 m.y., Pettijohn, 1975) of the Canadian Shield.
The best kno.,m tillite fran this ti.Ire is the Gowganda Fomation,
which extends over an area of many thousands of square kilorretres
(Young, 1973). New age data for the Ventersdorp Supergroup re
stricts the age of the Witwatersrand Supergroup to between 2620 and
2800 m.y. naking the tillite within the Coronation Shale Fomation
the oldest recorded deposit.
3.4.3 WitJ:X)Ortjie Fomation
Definition
The Nitpoortjie Fomation is best developed on Bultfontein and is
less well preserved on Rietpoort and Blinkpoort. In the western
part of Blinkpoort the units arove this narker are difficult to de
cipher because of corrplex faulting.
The choice of any one specific type section is difficult because
of the cover of post Witwatersrand strata together with the com
plicated structure. Fig. 3.13 is thus a composite type section
prepared from traverse numbers 3,9,14,15,16 and 13.
Lithology
The Witpoortjie Formation is arout 680 m thick in the study area.
Directly arove the shales containing the Coronation Shale ~ornation
6 sandstones alternate with shale units. The top of the fornation
is narked by a narker, the Blue Grit diamictite, the other narker
being the Goverrurent Reef at the base of the fourth sandstone unit.
Without these two narkers it would be difficult to distinguish be
tween the different sandstone units.
As in the Delmas area (Button, 1970) the shales belaw the Govern
:rrent Reef are all dark grey to black in colour and often grade into
siltstones which in turn grade into sandstones. This feature con
trasts.with the sharp contact between the two lithologies in the
Hospital Hill Subgroup. The sandstones belaw the Governrrent Reef
1weather to a pale red (lOR 6/2) or greyish orange pink (lOR 8/2).
The laminated siltstones also weather to a greyish orange pink
while ••••..•.• / 49

WITPOORTJIE FORMATION
.. ! i E .~ .. .. !
400
t ..... 300
£
200 I! ! ! ! ! ! ! ! ! ! ~
100
0
FACIES
Mtr? Its? Mtr?
Lta?
/ta
Mtr
/ta Mtr
s
Rsb /Ja Ccb /ta Ccb /ta
Lacb Rsb
Lta Pb
Ur
Rsb
Mta
Lta
Lta
Mta
Ccb
Sta
FIGURE 3. 13
n= 11 n:19
n=16 n:17
n:19 n=24
TB,9 T15 T14, 16 T13
Composite stratigraphic section of the Witpoortjie Formation
LEGENO
FACIES Lta Large tabular crossbeds Mta Multiple sets of tabular crossbeds Sta Small tabular crossbeds /ta Isolated tabular crossbeds Ltr Large trough crossbeds Mtr Medium trough crossbeds Ccb Convoluted bedding Pb Plane beds Rsb Rhythmic sand/mud bedding Lacb Medium-scale low angle cross-stratificat ion S Silt stones

j
l
49
while the arenaceous units above and including the Governrrent Reef
are generally pale to light brown (5YR 6/4). The !X)Orly sorted
subrrature and inrrature units below the Governrrent Reef v,1ere clas
sified as subgreywackes by Fuller (1958). As a large pro:i;x:,rtion
of sandstones of the ·witpoortjie Forrration are "dirty" and consist
of rrega-rythmically interbed.ded sand-shale sequences as op:i;x:,sed to
I1E.11.Y of the m:xlerately to v,1ell sorted cleaner sands of the Hospital
Hill Subgroup they can be tenred greywackes in the field (Blatt
et al, 1972). However, following Folk (1968a) and Blatt et al,
(1972) the word greywacke has no place as a term for use in labora
tory, where the writer classified the sandstone of the Witpoortjie
Fornation precisely on the basis of all essential sand size
constituents with the percentage of clay rnatrix being ignored
(Table 3.2).
The Governrrent Reef is a small pebble conglomerate (Fig. 3.4)
which reaches thicknesses of up to 0,6 rn. On the farm Holgatfontein
in an old prospectors pit, two conglomerates are develor,ed at the
base of the sandstone. The basal conglorrerate is 35 TI thick with
the second one being less developed with an average thickness of
15 cm. The quartz pebbles (which constitute about 65 :per cent of
the total pebble :i;x:,pulation) are well rounded and sorted. The sand
stones above the conglorrerate (e.g. 13/08) are :rrature, bim:xlally
sized (0.0 and 1.75¢) sublitharenites.
South of Heidelberg and near the Sugarbush fault, the Blue Grit,
which Rogers (1922) describes as a rock of "re:rna.rkable character",
has an heterogeneous matrix corrposed of quartz, chlorite, epidote,
zoisite, actinolite, trerrolite, white mica and chloritoid. The
chloritoid and amphiboles are rare minerals and were not identified
by the writer but were recorded in one thin section by Rogers (1922).
Angular fragrrents of chert, fresh feldspar, phyllite, granite,
syenite and :i;x:,rphoritic·lava measure between 1.5 to 75 mn and are
randomly scattered throughout the unit. On the Evander Goldfield,
Jansen et al;, (1972) have observed that this unit has occasional
boulders up to 30 cm in size and is up to 590 rn thick. In the study
area the Blue Grit's type area of develq:rnent is in the south where
its thickness is approximately 230 m. It is, however, recognisable
as far north as Rietpoort where it neasures 15 m. This large
variation • • • • • • • • / 50

50
variation in thickness of the Blue Grit is an exception to the gene
ral trend of laterally consistent thicknesses in the units belo.v
the marker.
Sedirrentary Facies
The vertical stacking of the 10 facies identified within the Brixton
Fo.r:ma.tion is shCMn on Fig. 3.13.
The units belCM the Goverrurent Reef differ from the ones above (and
including) the marker by the relative absence of :rredium trough cross
beds and the presence of rhythmic sand/rm.id bedding, convoluted bedding
and :rredium-scale low angle cross-stratification. On all the traverses
no thick cosets of herringbone crossbedding were observed as was the
• case in the units below the WitfX)Ortjie Formation. One facies that
is cannon at the top of the basal arenaceous units of the forrration
is the facies terrred "rhythmic sand/rm.id bedding". This field term
proposed by Reineck and Singh (1975) includes lenticular and flaser
bedding, coarsely interlayered sand/mud bedding and thinly interlayered
sand/mud bedding. In the study area the facies is characterised by
thinly layered wavy mud layers which alternate with sandy layers.
Paleocurrent Dispersal Pattern
The paleocurrent dispersal pattern within the arenaceous units of
the ivi tfX)Ort j ie Fo.r:ma.tion is given in Fig. 3 .13.
"As in the Promise Quartzite Formation rrost of the current roses
have a vector :rrean azirm.ith which indicates l?edload transJ_X)rt to.vards
the S-SW. 'lhe bipolar current patterns obtained from the Govern
:rrent Reef on the farms Groenfontein (Tl6) and Rietpoort (Tl3) con
trast with the divergent unirrodal patterns of the marker beds at
localities (TlS and T9) south of these farms. Although the arena
ceous horizons below the Governrrent Reef have wiell developed primary
rrodes, minor secondary rrodes are also present with the two rrodes
separated by 120° or, in two cases, 600.
Environrrent of Deposition
'Ihe mnature subgreywackes of the WitfX)Ortjie Fornation below the
Goverrurent ········ / 51

51
Governnent Reef probably represent subtidal shelf and inshore tidal
flat deposits. The units often fine up.vard ending with finely lami
nated sand/mud bedding which is typical of inshore tidal flat se
quences. As in other ancient deposits, the differentiation between
subtidal and intertidal deposits is problematical (Raaf and BoersrrB.,
1971). The absence of thick sequences of herringbone crossbeds and
the unirrodal and weakly binodal current roses suggest that a sub
tidal environrrent was rrore prominent. Rapid deposition or a proxima.l
source area accounts for the textural imnaturity of the sedirrents.
The convolute bedding and water escape structures in the unit below the
Goveni:rrent Reef occur in rrodern shallo.v marine envirorrrrents (I.ewe,
1975) and have been described in their ancient counterparts (Ander
ton, 1976; Johnson, 1977).
The Goverrrrrent Reef marker, which consists aJ..nost wholly of medilllU
trough crossbeds and has a laterally canplex paleocurrent pattern,
probably represents ancient beach deposits. Onshore mi.grating sand
bars and ripples rroving possibly in response to shoaling waves were
probably the chief processes operative.
The sparse paleocurrent data and outcrop of the two upper arenaceous
units of the Witpoortjie Formation makes it irrposs.ible to draw con
clusions as to their origin.
The poorly sorted Blue Grit with its wide range of particle size
and pebble corrposition ma.y have originated from subaqueous ma.ss
transport processes. The full spectrum of submarine ma.ss-transport
processes has recently been reviewed by Carter (1975). The Blue
Grit's restricted extent and lenticular nature suggests that it ma.y
well represent either a fossil submarine rockfall or a canyon and
fan valley deposit. The large boulder sized pebbles, admixtures of
pebbles of widely divergent carrpositions and the absence of distinct
boundaries within the Blue Grit supr:ort the suggestion that it was
transported over a relatively short distance and across a steep or
rroderate slope. However, acoording to Carter (1975), there is al
ready evidence to sho.v that the generation of inertia flo.v (as op
posed to turbidity flo.v) ma.y not require slopes of rrore than a few
degrees. Whatever its origin, the Blue Grit's petrology and outcrop.
pattern classifies it as a gravitite (Carter, 1975).
In . • • • • . • • / 52

52
In surrrnary, the proposed depositional environrrents for the Govern
rrent Subgroup are similar to those of the Hospital Hill Subgroup in
that mmy of the arenaceous units are interpreted as tide influenced
shoreline deposits. HoiJever, the relative absence of both carplex
paleocurrent patterns and thick sequences of superrra.ture bi.m:::dal
sized sedinents and the presence of inmature subgreywackes dis
tinguishes the units of the Governrrent Subgroup from the Hospital
Hill Subgroup. Eriksson et al;(in press) explains this difference
as a result of tidal reworking of sedinents in the Hospital Hill
Subgroup. Ho.vever, the writer believes that high-ener027 wave action
on beaches and/or wind action accounts for the nature sands of the
Hospital Hill Subgroup whilst the irrmature subgreywackes of the
Cbve:rnrrent Subgroup were generally deposited in a less robust yet
tide - influenced environrrent. This fact can be substantiated in
that Middleton and Davis (1979) have sha,.m that the intertidal sands
in the Bay of Fundy are mineralogically irrmature yet the rrean tidal
range here exceeds 6 m. The only superrra.ture rounded grains within
the Bay of Fundy are the small pocket beach deposits.
3.5 JEPPESTCWN SUBGroUP
Definition
The numerous intrusions of norites and quartz dolerites in the south of the
study area together with the extensive cover of Karoo Supergroup sedirrents
to.vards the north rrade the stratigraphic surface analysis of the Jeppesta,.m
Subgroup a difficult task. Plate 3.7a shows the poor exposure of the Jep
pesto.vn Subgroup. This carplication was enhanced by the writer not re
cognising the Cra,.m lava in the field although it has been drilled in the
area. The Cra,.m lava (or Jeppestwon Amygdaloid) is a rrarker which splits
the Subgroup into three formations. The approximate position of the rrarker
is taken fran Rogers (1922) and shown in Fig. 3.14.
The type area of developrent for the bottan half of Jeppestown Subgroup is
the succession seen above the Blue Grit on the farm Groenfontein (Tl6 and
Tl 7) • The upper half of the Fonna.tion was described by the writer by sub
surface stratigraphic analysis along a cross cut in the ~vitwatersrand
Nigel Mine.
Lithology • • • • • • . • / 53

JEPPESTOVVN SUBGROUP
600
500
400 .. ! i E
-= Gta
.. .. .. C ~ 300 c.,
£
200 --- Pb Mta Mtr
100
0
FIGURE 3. 14
LEGEND
~ FACIES Mtr Medium trough crossbeds Gta Gigantic tabular crossbeds Mta Multiple sets of tabular crossbeds (often with Pb Plane bedding mud drapes)
- Ccb Convoluted bedding
LITHOLOGY
• Shales
~ Siltstones (often graded)
D Sandstones
/ "' ~
-
/
Traverses 16 & 17
Generalized stratigraphic sequence of the Jeppestown Subgroup

PLATE 3.7
a. Poor outcrop of the Jeppestown Subgroup (Poortjie).
b. Large tabular crossbeds developed within the third sandstone member of the Jeppestown Subgroup.
c. Syrmetrical, branching ripple marks with pointed crests and flat troughs photographed within the Witwatersrand-Nigel mine.


53
Lithology
The Jeppestown Subgroup consists of three thick sandstone units, tv.D
siltstones units and an arnygdaloidal lava all of which are separated by
shale. The shale at the base of the SUbgroup is distinctive in that in
tercalated thin bands of ferrugious rock are often present. The silt
stones above the Crown Lava are often graded. Symretrical, branching
ripple rrarks with rointed crests and flat troughs (Plate 3.7c) which are
cut by later calcite and quartz veinlets of later tectonic origin occur
towards the top of the second silts tone unit. Ripple length varies gene-
rally from 8 cm to 30 cm. The geochemistry and mineralogy of the over
lying shales will be described later in the chapter on geochemistry.
Sandstone units are much the sane as those in the Governrrent Subgroup,
i.e. they are p:x:>rly sorted, sul:rnature and "Weather to a rroderate orange
pink (lOR 7/4). One exception to this generalisation is the third and
last thick arenaceous unit of the Jeppestown Subgroup. This sandstone
is a subrnature, noderately sorted litharenite with a bim:xial sand size
distribution, (tv.D sizes being O .5112) and l. 970). The geochemistry
(Appendix 4) of this sandstone is similar to the lithic arenites (sub-
greywackes) as tabled in Pettijohn et al, 1973. The sediments above this
horizon are chiefly shales and siltstones with thin discontinuous sand
stones occurring within them.
Sedinentary Facies
The five facies indentified within the Jeppestown Subgroup are shown on
Fig. 3.14.
The tv.D lo.vernost sandstone units are dominated by multiple sets of tabular
crossbeds which often have mud draped-foresets. Convoluted and planar
bedding are also cannon. The bases of the tv.D units are characterised by
rredit.nn sets of trough crossbeds. The third sandstone unit consists wholly
of very large tabular crossbeds (Plate 3. 7b). The overall georretry of the
sets could not be ascertained because of the p:x:,r outcrop. The individual
sets are up to 2. 2 m thick. The length of the foresets exceeded 3 m and
had an arithrretic rrean corrected dip of 21°.
Paleocurrent Dispersal Pattern
Fig. 3.14 shows the paleocurrent dispersal pattern of the three sandstone
lmi ts ......... /54

CHAPTR.~ 4
DIAGENESIS AND METAMORPHISM
4 .1 INI'IDDUCTION
X-ray diffraction and petrographic descriptions of selected West Rand
Group shale samples have been undertaken to establish the mineral as
semblage present. Table 4 . l surrnrarises the results . I•bst of the samples
consist of quartz and chlorite and illite (or muscovite). Winkler (1974)
notes that this assemblage persists unchan0ed from the diagentic stage
through the very lo.v grade and lo.v grade rretarrorphic stages to the beginning
of rredium grade rretarrorphisrn, disregarding the changes of crystallinity and
structural order in the micas. As no diagnostic low grade rretarrorphic mine
rals such as laurronite, lawsonite, glaucophane, paragonite ~or pyrophyllite
were identified, the writer relied heavily on the white micas as petrogene
tic indicators. The lattice spacing in white micas (muscovite, illite and
sericite) is sensitive to conpositional variations which in turn reflect
the pressure or terrperature conditions.
~1uscovite belongs to only tv.o main solid solution series. These include
the muscovite - paragonite series where Na replaces Kand the muscovite -
celadonite (phengite) series where substitution of Fe/Mg for Al occurs.
The effects of these end-:rrember substitutions have been experirrentally
and theoretically researched (e.g. Velde, 1965). At low grade rreta
rrorphism an increase in terrperature results in an increase of the Na con
tent which causes a decrease in the basal spacing d(002) of the mica. Like
wise, an increase in the celadonite content with increasing pressure results
in an increase in the d(060) spacing (Cipriani et al; 1971). This relation
ship means that indirect chemical analysis is possible by Ireans of XRD and
depends on the change of d(002) and d(060) spacing with changes in com
position. A review by Guidotti and Sassai (1976) surnnarises the theory
on how the corrp::>sitional variation of white mica is used as a geotherno
rreter and geobarorreter.
'I\..o • • • • • • • • • / 56

I-
Table 4.1 Sample type and sample minerology as detenninded by X-ray diffraction
SEDIMENT SAMPLE SUBGroUP
I MINERALCX;Y
I I f TYPE JEPPES- GOVEPJ\J- HOSPITAL vJHITE FELD- MAGNE-
TCWN I·1Em' HII.L QUARI'Z CHI.DRITE MICA SPAR TITE CALCITE
Shale PSC-lN X X X X
Shale PCS-2N X X X X
Shale PCS-4N X X X X Shale PCS-SN X X X X Shale PCS-llN X X X Trace Shale PCS-13N X X X X X X
Shale PCS-16N X X X X
Shale PCS-18N X
Shale PCS-35N X X X X
Sahle PCS-32N X X X X
Quatzite PCS-26N X X X X Shale PCS-31N X X X X
Graded Siltstone PCS-25N X X X X Tillite TA. X X X X
Tillite TB X X X X Shale PWR X X X X X X
Graded Siltstone WPGS X X X X
Granitic Paleosol PGR Underlying Supergroup X X X
Shale 01/09 X X X X X
Shale 04/13 X X X X
Magnetic Shale 05/0l X X X X X
Shale 09/10 X X X X
Ironstone 11/04 X X X
Diamictite 13/11 X X X
Shale 15/14 X X X X
Shale 16/01 X X X X
Shale 17/01 X X X

56
'Tu.D XRD techniques were used. The "illite crystallinity" rrethod of Weber
(1972) serves as a geotherm:J.Ireter while the rrethod of Sassi and Scolari
(1974) proved useful as a bararetric indicator. The latter rrethod involves
the calculation of the b0
cell dirrension from rreasurerrent of the d(060)
spacing.
4.2 SAMPLE CHOICE AND PRE.PARATICN
The choice and collection of samples was limited to a large degree by the
poor quality of exposure. Furthenrore, very quartz rich rocks and rocks
in which k-feldspar and chlorite occur as essential corrponents were to be
avoided. In all these cases the b 0 values turn out to be higher than
expected (Sassi and Scolari, 1974).
The first shale horizon in the Orange Grove Quartzite Formation fulfilled
the above conditions, ha.vever, mmy shales within the Jeppestown Subgroup
contained substantial arrounts of chlorite (see Table 5.4). Nevertheless,
the rrethods were atterrpted as chlorite does not affect the geotherrrorretry
results and the baric b 0 values for these samples (which is snall anyway)
can be regarded as an absolute maximum.
As the grain size of the samples affects the height and width of the white
mica peaks, the writer used lightly p:>lished rock slices cut parallel to
cleavage (for geothenn:xretry) and perpendicular to cleavage (for geobaro
rretry). This quick and easy rrethod of preparation was recomrended by
Guidotti and Sassi (1976) and proved successful in the study of Malrresbury
shales (Spector, 1977; Antrobus, 1977) and Darraran pyllites (Kasch, 1979).
The XRD traces were run on a Philips Diffractorreter. The angles scanned
for the "illite crystallinity rrethod" were fran 9°-10° for the mica peak
and 19°-21° for the external quartz standard (100 peak). Angles scanned
for rreasurerrent of mica (060) peaks were from 590-63° as this included the
mica and the quartz (211) peaks. The settings and calculations involved
for the determination of both the b 0 cell dirrension from rreasurerrent of the
d(060) spacing and the "crystallinity" of illite appear in Appendix 4.
4.3 GEm'HERM'.)MEI'RY
Weaver (1960) used a sharpness ratio, defined as the ratio of the height
of • . • • • • • • • / 57

57
of the (002) illite peak at 10 A to the height at 10,5 A, to define the re
lative dagree of diagenesis and rretarrorr:hism in :!?f=litic rocks. Kubler
(1966, 1968) on the other hand, used peak width (HS) in millir.etres at half
height above background. M:xlifying this rrethod, Weber (1972) calculated
the peak width of the mica peak (002) at half peak height and related it to
the width at half peak height of the quartz (100) peak in an external
standard. He defined the relative value as:-
Hb (rel) = Hb(002) illite(rrm) Hb (100) quartz (mn)
X 100
The object of using Eb(rel) is to norr.alise the Hb values relative to a
standard, thus minimising instrurrent errors and renderinc.:; corrparable the data
Table 4.2 Illite crystallinity HB(rel) of sorre
selected West Rand Group shales
SAMPLE MEAN Hb (rel) RANGE NO. OF XRD RUNS
01/07 153 145 - 156 3
16/1 177 169 - 191 3
WPGS 168 160 - 182 5
PWR 121 111 - 149 4
TA 148 143 - 153 2
PCS-36 153 151 - 155 2
PCS-31 170 157 - 178 3
PCS-16 118 110 - 131 4
PCS-2 147 147 - 147 2
PCS-1 150 146 - 154 2
MFAN Hb (rel) = 150,5
+ 18,3
£ran ..•••. / 58

53
Table 4.3 Relative degree of diagenesis and
netarrorphism of shales in the
'West Rand Group
KUBLER WEBER 'l,EHP INDEX (Hb) INDEX (Hbrel) oC
DIAGENESIS
7 210 200
ANCHIZONE
(very lo.t1 grade) 150 (Hest Rand 290 Group}
4 130 350
EPIZONE
(lo.ti grade)
2,7 85 520
MEDIUM GRADE
from different workers.
Table 4.2 summarises the Hb(rel) values for several samples examined. The
average Hb (rel} of 150 falls in the region of very lo.t1 garde netarrorphism
(Table 4.3). Except for two samples the Weber indices are consistently be
lo.t1 210 (Kubler index= 7) and above 130 (Kubler index= 4). These two
values define the anchizone (Frey, 1970}. The two anorralous specirrens both
have a Weber index that is belo.t1 130. This indicates that sate of the white
micas are "well crystallised".
The regional distribution of the illite crystallinity does not sho.t1 variations
of netam::>rphism which can be correlated to different burial depths. The
sarrple • • • • • • • • • • • / 59

60
1968). Using this fact Sassi and Scolari (1974) found that the b0 cell
di..rrension values for 140 samples increased with increasing pressure, and
that it is practically identical in the micas £ran very different regions
belonging to the same baric type of rretarrorphism. A b0 scale was thus pre
pared which allOtlS the distinction of six different facies series within
low grade rretarrorphic terrains.
Table 4.4 surmarises the results obtained. Of the 17 samples selected only
12 proved useful. The reproducibility of the b0
values is good. On
average the rrean of t.v.:o or rrore b0 values of the same sample deviates by O 0
0,00019 A on successive runs. The rrean b0 value is 9,0019 A ± 0,0204(10-}.
HOwBver, excluding the thin Orange Grove Quartzite shale horizon, whose bulk
corrposition is different to the thick green JeppestONn shales, the rrean 0
b0 value is 9,0017 A ± 0,0060(1~}. Because chlorite content increases 0
the b0 spacing, the value 9,0017 A probably represents a maximum value.
Figure 4.1 shows the cunru.lative,frequency curves illustrating the distribu
tion of b0 in low grade zone rretarrorphic belts of various baric types. The
West Rand Group rocks lie on the low pressure side (lo.v b0 values) of the
Sassi and Scolari (1974) cunru.lative frequency curves between the Bosot and
Northern New Hampshire curves. The rretarrorphism of the latter reqion be
lonqs to the "lo.v pressure intermediate group" of Miyashiro (Green, 1963}
while Bosot rretarrorphism is characterised by the absence of a chlorite
rich zone and the occurrence of andalusite and cordierite (Zwart, 1963).
Because the bulk CCJI!lX)sition of the Bosot rocks differs to that in the
study area a direct comparison cannot be nade. The rrean b0
value (9,0017)
of the JeppestONn Subgroup falls between facies series 2(b0 = 8,995) and
3(b0 = 9,010) on the Sassi and Scolari (1974) empirical scale. These two
series represent lo.v pressure rretarrorphism (e.g. Hercynian rretarrorphism
in Eastern Alps) and lo.v-intenrediate pressure rretarrorphism (e.g. Northern
New-Hanpshire). Rerrerri)ering that 9,0017 is probably too high, the West
Rand Group rretarrorphism is probably closer to the fonrer.
As "the pressure values assigned to the various facies series are inprecise,
much debated and susceptible to even drastic variations", Sassi and Scolari
(1976) have not, as yet, atter:pt.ed to establish a b0 - P curve. Nevertheless,
the relative barorretric values obtained for the West Fand Group shales in
dicate that they have not been subjected to interrcediate pressures (i.e.
greater than 3, 5 K-bar) •
4. 5 • • • • • • • • • • / 61

>-" C:
" :I O"
" .. ... " > ·-.. Ill -:I E :I
"
100
80
60
40
20
FIGURE 4. I
~~ ~
~ CJ..0 ~ ~. ~ ~
::i:
8·98 9-00 9·02 9·04
bo Cumulative frequency curves concerning the West Rand Group analytical data with comparative curves from Sassi and Scolari (1974)

61
4 • 5 CONCLUSICT-1
The mineral asserrblage in the shale of the West Rand Group is white mica
and chlorite and quartz. The Weber crystallinity index indicate that
these are lav-grade rocks. The West Rand Group's Hb(rel)value of 150 cor
responds to an approxinE.te terrperature of 290°c. The pressure regirre can
be distinguished on the basis of b0 values. The study area's baric con
straints are similar to the conditions as defined by Sassi and Scolari
(1974) for the Hercynian :rretam:)rphism in the eastern Alps and by Di Pierro
et al;(l973) for the pre-Alpine rocks in Calabria. Variations in P-T con-
ditions in these areas have been studied by various workers (e.g. Hoff
mann, 1970; Sassi, 1972) on the basis of paragenesis. There is considerable
discordance in their interpretation. Therefore, until a P-b0 curve is con
structed, the geotheITC\:3.l gradient of the West Rand Group remains unkno.vn.
Chapter 5 ••••••••• /62

CHAPI'ER 5
GEOCHEMISTRY
5.1 GEOCHEMISTRY OF THE WEST RAND GIDUP - A review
For obvious reasons, the coarse grained sed.irrentar.1 rocks of the Witwaters
rand Supergroup have been studied in great detail while a handful of
workers (Fuller, 1958; Nel, 1968; Danchin, 1970; Hofneyer, 1971;
Fuller et al, 1979 and Spraque, 1979) have concentrated on the mineralogy
and geochemistry of the shales.
Nel's (1968) study on the boron content of ivest Rand Group shale is of
special inportance as ooron and other trace elerrents may be used to in
dicate their environrrent of der::osition (Shimp et al; 1969). The basis of
this concept is that certain trace elerrents such as ooron, chlorine, lithium,
sulphur and vanadium are concentrated rrore in sed.irrents of marine origin
than those of fresh water origin. The Jeppesto.vn and Government shales
yield average ooron contents of llpµn (range 5-21) and the average ooron/
r::otassium ratio is 8.3 p.p.m. (range 4.4-13). Although Nel (1968) con
cludes that the shales "are comparised of the weathering products of igneous
rocks der::osited in a fresh water environrrent", he does errphasize the pro
bability that little or no boron absorption occurred due to the snall
cl!Dunts of illite (which has a high absorptive capacity of ooron, Harder,
1961).
Danchin (1970) and Hofneyer (1971) have analysed 10 shale horizons within
the Goverrurent and Jeppestc:wn Subgroups. They found that the average MJ(),
total iron, P205, Na20, Ni, Cr and Co contents and the Ni/Co and V/Cr ratios
are far closer to those of the Fig Tree Subgroup than the average South African
shale. According to Danchin (1970) and Hofrreyer (1971) this correlation
indicates that the source rocks for the Witwatersrand Supergroup must have
been similar in petrology to the source rocks of the Fig Tree sed.inents
although they probably contained a srraller ultrabasic corrp::,nent as the Ni
concentrations and therefore the Ni/Co ratios are significantly lc:Mer.
Recently •.••••.••• /63

63
Recently Spraque (1979) and the writer's geochemical results have been
reviewed by Fuller et al;(l979). Using discriminant function analysis,
Spraque (1979}, characterised and distinguished Kaapvaal Craton shale.
The data listings of the datasets (geochemical listings of shales within
the West Rand, M:>zaan and Fig Tree Groups) used in this exercise, were
compiled by the writer, and are reproduced in Appendix 3. Fig. 5.1 sum
ITBrises Spraque's (1979) results. The plots are a graphical display of
hew successfully pre-assigned groups are separated on the basis of geo
chemical criteria alone. In Fig. 5.la the West Rand Group shales from
the East Rand and fran the Klerksdorp area plot in clearly separated
clusters. Likewise, the Fig Tree and Central Rand shales fonn distinct
clusters. The variables used in the construction of this display included
both major and trace elenents. When trace elerrents are cmnitted fran the
analysis the separation of the different groups is ill-defined (Fig. 5.lb).
Only variables which discriminate rrost clearly between groups should there
fore be used. Spraque (1979) does not delve into this problem although
the discriminant function BMDP prograrme (P7M) used prints the F value
for each variable. Before any variable is entered into the discriminant
function, an F-statistic is computed from a one-way analysis of variance
CANOVA) on the variable for the groups used in the analysis. The highest
F-statistic (F-to-enter) is the variable that discriminates the best be-
tween groups. These values for each variable (elerrent) are given in
Table 5.1. Spraque (1979) concludes "that with a much larger number of
sarrples, it will be possible to positively identify an 'unkncwn' sanple on
the basis of the group it plots into on a canonical variable plot". From
Table 4.1 much effort and t.i.ne would be saved in reaching this goal if all
the rrajor elenents and only the follcwing trace elements - Sr, Ni, Rb, ca, Zn, Cr, - were analysed.
In surrrnary, the infonna.tion that has been gained thus far on the chemistry
of the West Rand Group includes:-
i) The inability of boron - potassium ratios to distinguish marine
fran fresh-water shales within the West Rand Group
ii) the validity of relating the chemistry of these rocks to the chemi
stry of potential source rocks (Granite - Greenstone terrains)
iii) the ability to distinguish, on the basis of chemistry alone, the
different argillaceous units on the Kaapvaal craton.
Very ........ /64

• 6,0i
a a • a DO •
• • + + ('I 3, a • • • 0 a • •
""' • .. • • a • • -..I 0 A ••+ • Ql
••• .. ~ . •• Q::: • ~ 0 • •
• -..I AA A <:(
(.J + ~ A
A 0 A ~ <:(-3,0
A (.J .. .. ..
• WNt Rand Group shale, Heidelber; .. .. + a -., Rand Group shale, Klerudorp .. ..
-6P-j .. ..
.. 8ooyNns shale. East Aond .. A Fig Tl'M Group allale
• Jeppeetown shale, Morievale
+ Group -
-9,0 -4,!5 0 4,!5 9,0 CANONICAL VARIABLE
b
4,0~ a ..
.. ao .. 0 a
<'I 2p .. .. .. ""' + .. -..I
OD + Ql
~ a .. .. .. .. .. Q::: .. .. ~ ..
0 -..I ..
a ~ • • ~ • • •• • •• 0 • ·+. •• ~ • • • • • • • • ~-2,0 • 0 • • +• • • • •
• • • -~1
(le9Md ae allow)
-81,) -31) 0 3/J 6,0 CANONICAL VARIABLE 1
FIGURE 5. 1 Discriminate function analysis of West Rand Group shales.

64
Very little is kno..m about hCM the chemistry of a particular sanple is
related to its mineralCXJY, to what extent diagenesis has affected the
original mineralCXJY of the sediment, and the geochemical profile of the
shale imrediately belCM the West Rand/Central Rand unconformity in the
study area. These problems were investigated by the writer.
5.2 ANALYTICAL PRXEDURE
X-ray fluorescence spectronetry (XRF) has been increasingly utilised in the
analysis of sedinentary materials (e.g. Danchin, 1970; Hofrreyer, 1971;
Pearson, 1978). The general principles of the technique are described by
Jenkins and de Vries (1967). All major elements (with the exception of Na)
Table 5.1 F-statistics for those elerrents which discriminates the
best between Groups on the Kaapvaal Craton
ELEMENI'
Sr
Ni
Si02 Rb
Al203
* Fe203 K20
cao
Na20
Al203 K20
Fe~3 H
F VAI1JE TO ENTER OR REM)VE
Majors and trace elerrents (Figure 5.la)
56.59
29.16
8.60
5.35
9.17
8.57
6.68
4.49
Major elerrents only (Figure 5.lb)
43.42
20.27
19.18
5.63
H Fe203 as Total Fe.
APPROXIMA'IE F-STATISTIC
56.59
40.82
28.82
22.73
21.34
20.65
19.83
18.65
43.42
30.17
32.54
28.22
were •••••••• / 65

..
65
were analysed by XRF, using the lithilnn tetrarorate fusion of Norrish and
Hutton (1969). Na was analysed by XRF on pressed pov.,der briquettes, pre
pared using the rrethcxi of Baird (1961). The operating conditions used are
routine procedures adopted in the Departrrent of Geochemistry, University of
Cape Town, for the analysis of terrestrial, lunar and rreteoric sanples
(Willis et al; 1971, 1977). Estimates of the precision and detection limit
for each major oxide are given in Appendix 5 (Table 1) • All trace elements
were analysed by XRF using pressed p:::,wder briquettes. success of this
rrethcxi for obtaining gcx:xi quality trace element data is the similarity be
tween the data produced by Willis et al; (1971) from lunar rocks and soils
and that published by cannichael et a1;(1967) from standard rocks. Estimates
of the uncertainties due to counting statistics are given in Appendix 5
(Table 2).
The concentration of twelve major elements (Si02, Ti02, Al203, Fe;z03
(Total Fe), MnO, MgO, Cao, Na~, K2o, P2o5, S, H20) and sixteen trace ele
rrents (Sr, Rb, Y, Zr, Nb, Zn, Co, CU, Ni, V, Cr, Ga, Sc, U, Ba, Sc) have
been detennined in twenty-six West Rand Group sarrples. The geochemical
data are reproduced in Table 5.2. The classification of the rocks together
with their mineralogical carposition, is surrrrarised in Table 4.1.
5. 3 !vITNERAL(X;Y FIDM BULK CHEMISTRY
Intrcxiuction
The identification of rrost minerals by x-ray diffraction is rDW routine
(e.g. Table 4.1) but quantitative studies of clay minerals have only had
a limited success. Schoen et all (1972) reported variations in accuracy of
up to 10 per cent in the rrost accurate techniques (that of Gibbs, 1967)
used in clay mineral quantification studies. Gibbs (1967) set up and
studied mixtures of standard clays, as did Schultz (1964). However,
Gibbs obtained his standards by painstaking separation frcxn his unknowns.
The advantages of Gibb's rrethcxi are the close relationship between standard
and 1.lI1knJWn as well as the elimination of absorption problems by use of
an internal standard. The minerals within the compact fine grained West
Rand Group sanples must be separated before quantification - a long and
tedious process with canplete separation (by crushing and pipetting) o;f
the different fractions, an inpossible aim. Pierce and Siegel (1969) show
that alrrost any quantitative TIEthcxi (Johns et al; 1954; Schultz, 1964;
Gibbs, 1967 and Brindley, 1961), applied consistently and carefully, will
provide •••••• /66

Table 5.2
Geochanisgy of West Rand Gr~shales - Heide~_area _ _iMarch 197~)
MAJORS PCS-1 PCS-2 PCS-4 PCS-8 PCS-11 PCS-13 PCS-16 PCS-18 PCS-25 PCS-31 PCS-32 PCS-36 PCS-26 TA
SiO, 58.60 60.68 53.79 53.81 57, 11 48.36 55.62 51. 78 73.04 56.13 57.30 57.57 89.48 70.49 TiO, 1.09 1.02 .65 .54 .50 .35 .65 .59 .34 .66 .64 .65 • 11 .42 Al,o. 23.84 22.41 13.84 12. 74 11.07 8.67 14.39 13.47 9.66 15.05 14.47 14.90 5.32 10.81 Fe2 0. 3.76 5.55 20.40 20.98 19.43 9.52 16. 14 21.26 6.67 13.63 14.37 12.62 1.36 10.65 Mrt:> 0.02 0;04 0.17 0.17 0.17 .15 .09 .09 .05 .07 .07 .09 .02 .04
MJ() 1.58 2.28 5.79 5.65 5.22 14. 11 6.40 6.54 4.32 6.82 5.71 5.74 .97 2.42
CaO 0.03 0.02 0.15 0.28 0.35 6.94 .17 .25 .40 • 11 .47 .67 .14 .04
Na,O 0.19 0.16 0.01 0.01 0.01 .01 .02 .01 1.37 .03 .07 .03 .05 .oo
I<,O 6.78 5.91 0.45 0.43 0.22 .01 1.64 .59 .64 2.02 1.95 2.81 1.55 2.01
P2 0$s- 0.00 0.02 0.09 0.07 0.09 .01 .09 • 11 .01 .06 .09 .10 .00 .04
LOI 3.83 3.70 3.43 4.58 4.24 10.74 4.65 4.99 2.59 4.77 4.62 4.47 1.09 2. 78
H,O o •. 17 0.12 0.13 0.14 0.13 .16 .17 .10 .15 .17 .09 • 11 • 11 .17
s 0.14 0.06 0.10 0.05 0.06 .03 ,03 .04 .07 .05 .05 .02 .04 .15
'IOl'AL 100.03 101.97 99.00 99.45 98.60 99.06 100.06 99.82 99.32 99.58 99.92 98.50 100.28 100.02
~ Ba 748.5 659.8 92.5 118.0 64.4 o.o 346.0 120.8 141.3 438.5 428.8 775.1 377.3 343.5
Sc 40.2 42.4 21.6 18.5 18.2 29.5 23.2 21.3 9.0 23.2 24.0 25.0 4.0 13.2
Sr 16.4 13.2 3.7 7. 1 6.9 221.2 25.0 6.6 87.8 8.0 15.8 8.7 7.7 8.6
Rb 221.4 190.2 16.9 20.3 9.8 0.0 71. 7 26.2 23.5 77.5 77.8 107.8 49.4 85.9
y 16.7 16.6 21. 1 21.7 23.5 9.3 21.3 19. 1 21.5 12.8 22.0 5.3 19.3
Zr 189.5 169.6 154.0 131.6 126.1 32.9 136.2 127 .1 100.8 131.8 125.4 142.4 48.4 136.5
Nb 12.0 10.4 8.7 7.4 7.9 o.o 7.0 7.6 4.2 8.2 7.0 6.9 0.0 5.8
Zn 20.3 27.9 97.8 105.6 102.2 62.0 78. 7 89.1 61.4 85.7 75.5 84.5 12.3 49.6
Cu 13.0 10.9 13.3 15.6 47.0 34,5 18.s 57.6 22.2 32.3 56.1 44.6 4.6 38.4
Co 72.6 48.3 40.4 34.2 30.8 73.6 37.4 38.8 0.8 39.2 41.2 41.6 6.1 20.2
Ni 280.5 331.6 333.5 286.3 241.6 427.9 307.9 288.6 150.8 306.0 277.6 317.2 30.5 140.3
V 276.1 227.4 141.6 126.8 123.1 140.2 147.8 143.9 62.8 150.0 148.3 155.3 23.1 88.2
Cr 1412.0 1370.0 780.5 642.4 598.6 1971.0 670.5 682.6 462.3 674.2 673.6 718.9 78.6 348. 1
Ga 27.6 25.9 17.4 16.9 14.7 8.5 18.6 17.0 10.2 18.3 18.0 19.3 5.5 13.1
u 12.7 1.6 0.0 1. 1. 0.0 o.o 00 o.o o.o o.o o.o 0.2 o.o 0.4

66
provide good precision. As progressive changes in the relative anounts of
clay minerals are required for rrost applied studies, gocxi precision and
not gocxi accuracy is the only requisite. In this study, the writer used
a technique developed by Pearson (1978) which uses both XRD and XRF rrethods
yielding rrore accurate and equally precise results than the aforerrentioned
v.0rkers.
Method
Pearson (1978) devised a scheme to calculate :mineral abundance fran bulk
chemical analyses of fine grained sedinentary rocks. The assumptions about
element location are essentially the sarre as those made in the schemes of
Irnbrie and Poldervaart (1959) and Nicholls (1962) in that free Sio2, Ti,
s, P and co2 are assigned to quartz, rutile, pyrite, apatite and carbonates
respectively. The rerrainder is assigned to clay silicates on the assump
tion that these are daninated by non-expanding clays (muscovite and illite),
chlorite and/or kaolinite. The method of clay mineral calculation is de
tailed and only the briefest sun:rnary is given here. For further informa
tion, the reader is referred to the papers by Nicholls (1962), }lietsch (1962)
and Pearson (1978).
The chemical canposition of any rock type can be related to its known mineral
constituents' canpositions by a set of simultaneous equations of the type:
aix + biy + ciz + lOOki ....•...••.••. (1)
where ai, bi, ci and ki, are the percentaqes of element i in mineral phases
X, Y, z and the bulk rock respectively and x, y and z are the percentages
of phases X, Y and Z present in the rock. Assuming that the average clay
carrp:>sition of the West Rand Group shales can be partitioned between three
phases, muscovite, illite and chlorite, and that their canpositions can be
adequately approximated by analyses from the literature of clay minerals
from rocks of a similar type, equations of type (1) can then be applied.
Table 5.3 shows sare analyses fran Deer et a1;(1974) which have been chosen
according to the above criteria. The canposition of one of the chlorites
used was that of brunswigite which was identified by Fuller (1958) in a
sanple 20 m below the Main Conglarerate on the East Rand. Readjusting
conponents.in the muscovite and chlorite in Table 5.3 was helped by the
predcminance of only one clay :r:nase roted in certain XRD traces. For exanple,
sanples •••.•••• /67

67
sarrples PCS-4 and 13/11 consist essentially of bt..o phases - chlorite and
quartz - while PCS-1 contained quartz and muscovite with ver:y little chlorite.
By recalculating the bulk chemical corrpositions, a crude approxirration was
obtained for the chemistry of chlorite and muscovite. Ideally, if :3-vailable,
microprobe analysis of the three individual clay phases run on a nurrber
of West Rand Group sarrples v.0uld yield far superior average chlorite, mus
covite and illite corrpositions.
Of the major constituent oxides which could be used to set up equations
Table 5.3 Reference analyses of clay minerals (weight percent)
MU CH KA IL
l 2 l 2 3
Si02 45.87 48.42 25.07 26.40 27 .11 45.77 56.92
Al203 38.69 27.16 19.78 18.23 17.42 39.07 18.50
K20 10.08 11.23 00.50 00.27 00.00 00.31 05.10
MgO 00.10 00.10 11.67 10.35 09.75 00.08 02.07
FeO 00.00 7.38 21.66 31.57 33.89 00.04 00.26
Fe2o3 00.00 07.54 00.30 04.99
cao 00.00 00.01 01.04 00.82 00.21 00.26 01.59
Na2o 00.64 00.25 00.18 00.01 00.00 00.17 00.43
Ho+ 2 04.67 04.31 10.82 10.01 11.07 13.68 05.98
~ 00.10 07.39 40.87 42.92 43.64 00.42 07.32
MU l Clear flawless muscovite, New Mexico. Analysis 1, Deer et al (1974) pg. 196.
MU 2 Analysis 2, Deer et al (1978), pg. 198.
CH l From Pearson (1978).
CH 2 Analysis 8, Deer et al (1978), pg. 235, with adjusted K20, MgO, FeO, Fe203.
CH 3 Brunswigite, New Zealand. Analysis 6, Deer et al (1974), pg. 235. --
KA From Pearson ( 19 78) •
Illite, Fithian, Illinois. Analysis 3, Deer et al (1974), pg-. 251. --
IL
FM+ = M:JO + FeO + Fe203
of •.•.• • · / 68
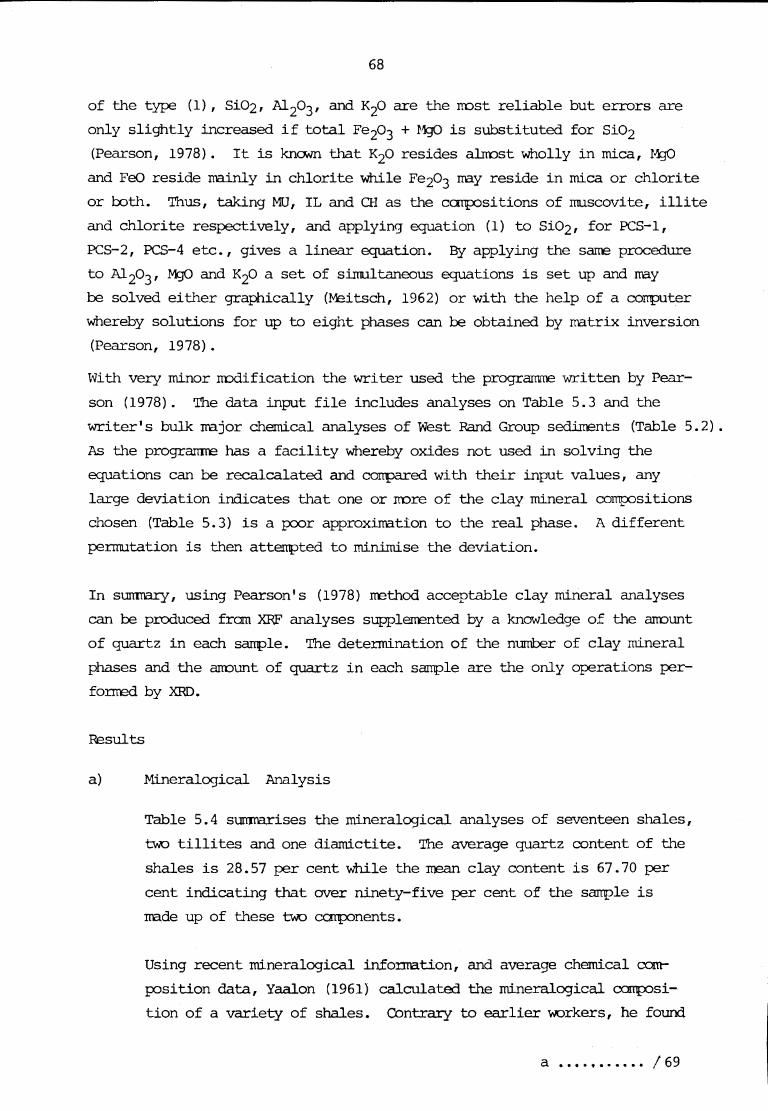
68
of the type (1), Si02, Al2o3, and K2o are the rrost reliable but errors are
only slightly increased if total Fe2o3 + MgO is substituted for Si02 (Pearson, 1978). It is kno.,m that K2o resides alrrost wholly in mica, r~
and FeO reside nainly in chlorite while Fe2o3 may reside in mica or chlorite
or both. Thus, taking MU, IL and CH as the carpositions of muscovite, illite
and chlori te respectively, .and applying equation ( 1) to Si02, for PCS-1,
PCS-2, PCS-4 etc., gives a linear equation. By applying the sane procedure
to Al2o3, M:jO and K2o a set of simultaneous equations is set up and may
be solved either graphically (M:itsch, 1962) or with the help of a co:rrputer
whereby solutions for up to eight phases can be obtained by matrix inversion
(Pearson, 1978) •
With very minor m:xlification the writer used the programme written by Pear
son (1978). The data input file includes analyses on Table 5.3 and the
writer's bulk TIE.jor chemical analyses of West Rand Group sediments (Table 5.2).
As the programre has a facility whereby oxides not used in solving the
equations can be recalcalated and conpared with their input values, any
large deviation indicates that one or nore of the clay mineral compositions
chosen (Table 5.3) is a poor approximation to the real phase. A different
permutation is then attempted to minimise the deviation.
In sumnary, using Pearson's (1978) rrethod acceptable clay mineral analyses
can be produced from XRF analyses supplerrented by a knowledge of the anount
of quartz in each sarrple. The detennination of the number of clay mineral
phases and the anount of quartz in each sarrple are the only operations per
fonred by XRD.
Results
a) Mineralogical Analysis
Table 5.4 sumra.rises the mineralogical analyses of seventeen shales,
~ tillites and one diamictite. The average quartz content of the
shales is 28.57 per cent while the m=an clay content is 67.70 per
cent indicating that over ninety-five per cent of the sa:rrple is
TIE.de up of these~ ccnponents.
Using recent mineralogical infonnation, and average chemical com
position data, Yaalon (1961) calculated the mineralogical carnp:>si
tion of a variety of shales. Contrary to earlier workers, he found
a • • • • • • • • • • • / 69

Table 5.4 Mineralogical analysis of bulk sarrple (weight percent)
SAMPLE QUARI'Z PYRITE APATITE RurILE CAI.CITE Mn 0 'IOTAL msc"' CIAY
PCS-1 27.40 0.26 00.00 1.29 0.05 0.02 72.26 -1.28
PCS-2 26.6 0.11 00.05 1.02 0.02 0.04 69.26 2.9
PCS-4 24.4 0.19 00.21 0.65 0.13 0.17 72.20 2.05
PCS-8 26.3 0.09 0.17 0.54 0.50 0.17 66.99 5.24
PCS-11 28.0 0.11 0.21 0.50 0.63 0.17 68.88 1.5
PCS-16 16.9 0.06 0.21 0.65 0.30 0.09 76. 71 5.08
PCS-18 15.8 0.07 0.26 0.59 0.44 0.09 71. 75 10.9
PCS-31 28.7 0.09 0.14 0.66 0.19 0.07 72.89 -2.74
PCS-32 28.3 0.09 0.21 0.64 0.83 0.07 74.13 -4.27
PCS-36 27.4 0.04 0.24 0.65 1.19 0.09 68.84 1.55
P1iffi. 35.9 0.30 0.14 0.64 4.80 0.11 56.15 1.96
WPGS 23.2 0.04 0.21 0.64 2.32 0.11 75.73 -2.25
01/09 33.72 0.02 1.16 0.57 0.05 0.03 69.29 -4.84
04/03 38.8 0.02 0.17 0.53 0.02 0.22 56.2 4.04
09/10 46.0 0.02 0.21 0.81 0.03 0.05 52.83 0.05
16/01 24.5 0.02 0.05 0.44 0.05 0.03 62.15 12.55
17/01 33.8 0.02 0,02 0.65 0.02 0.04 64.79 0.66
TA 59.4 0.28 0.04 0.42 0.13 0.04 36.4 4.3
TB 37.9 0.30 0.02 0.42 0.11 0.04 ? ?
13/11 75.9 0.02 0.02 0.24 0.01 0.11 ? ?
* Miscellaneous minerals which include feldspar, ma.gnesite, siderite and other unidentifide minerals. Note that the XRD rrethod for the estima.tion of quartz (Johns et al, 1954) has an accuracy of less than 10%. This error is included within Misc.

69
a najor decrease in feldspar and an approximate doubling of the clay
content. Shaw and Weaver (1965) determined the mineral carrposition
of 400 shale sarrples from 60 fo:rmations in North Arrerica. They noted
that the average clay content of 61% was similar to that calculated
by Yaalon, although the quartz content (31%) was significantly higher.
Furtherrrore, they have denonstrated on a regional basis, the signi
ficant relationship between bulk mineralogical content and environ
rrent of deposition. These authors have prepared a series of mineral
variation diagrams for envirorments ranging from fluviatile to deep
sea. In the fonrer the quartz content is 52% and clays 29% while
the deep-sea quartz content is 16%. The clay/quartz ratio of the
West Rand Group (2.37) falls closest to the envirorment tented
"deltaic" on Shaw and Weaver's plot. The clay/quartz ratios here
is 2.24 while the ratios in the lagoonal and slope envirorments are
0.85 and 4.00 respectively. Clearly, Shaw and Weaver's (1965) plots
are generalisations and large variations in the quartz/clay ratios
within a single delta nay occur. However, because of the lack of
exposure in the Jeppestown Subgroup and the absence of significan~
seclirrentary structures, knowledge of its depositional environrrent
is extrerrely scant and this broad (if sOIIEwhat arbitary) classifi
cation is justifiable.
Rutile occurs ma.inly in beach sedirrents, dune sands, and shelf
placers (Pettijohn et al, 1972). Its high concentration in two of
the shale specirrens (PCS-1, PCS-2) sarrpled irmediately below the
Main Conglorrerate horizon is therefore difficult to explain
in teilTlS of depositional environrrent. The enrichrrent of rutile in
these two sarrples may be explained by its resistance to weathering.
In acid rich soil profiles von Engelhart (1940) found 2.4% Ti02 in
soil horizon A, 1% Ti02 in soil horizon Band 0.4% Ti02 in unweather
ed naterial. Here the accumulation of Ti02 in the soil is explain
ed by the migration of Ti. The geochemical profile below the Main
Conglarerate is probably a paleosol and will be elaborated upon
later. The average rutile content in the 15 shales below this pro
file is 0.61%. This value is slightly lCMer than the Ti02 contents
found elsewhere (e.g. Russian platfonn (0.86%) and caucasian
geosyncline (0.7%), Ronov and Yaroshevskiy, 1968).
'llle low calcite content in the two sarrples irmediately below the
Main •.•••.•• / 70

70
.Main Conglarrerate was expected because of its decanp::,sition due to
chemical weathering. The erratic distribution of eam3 below the
:paleosol profile nay be due to Ca nobilisation during low grade rreta
rrorphisrn (Usdowski, 1968). It was noted that secondary calcite was
prolific along rrany fault and joint planes. Though extreme care was
taken in not sarrpling such specirrens, the erratic distribution of
the minerals nay also suggest that the sorting of fresh from alter
ed rraterial by naked eye inspection was not satisfactory.
The average Na2o content of the shale is O . 06 (wt % ) • Van Houten
(1965) has shown that shales with a high Na content contain rrore
Na feldspar. The complete lack of feldspar (Table ~.l) in rrost of
the West Rand Group shales probably accounts for the low Na content.
The only sarrple with an appreciable arrount of Na was PWR. However,
even in this case its Na2o (0.37%) content is way below the mean
content (0.8 ± 0.03 wt%} of 1,152 shales as quoted by Heier and
Billings (1978).
Excluding sarrple 01/09 which has an anorralous arrount of apatite (P2o5)
and the two sarrples irrrrediately below the Ma.in Conglorrerate, the
average P2o5 content for the West Rand Group shales is 0.153%.
Koritnig (1978) has surrrrarised nurrerous data on the phosphorus con
tent of sedimentary rocks and noted the following average data for
elastic rocks:-
Deep sea clay
Shelf clays and shales
Greywackes
Quartzite
0.28% P2o5 0.15%
0.13%
0.06%
The conclusion reached by the writer in the chapter on stratigraphy
was that nost of the shales in the west Rand Group -were deposited
in a shelf environrrent. The data is thus in accordance with Kori tnig' s
(1978) findings.
The erratic distribution of pyrite indicates that it is probably
secondary. Spraque (1979) noted the close relationship that pyrite
has with quartz veins when he observed that pyrite occurs as angular
grains, idiarorphic crystals and irregular aggregates with nUITErous
quartz •••••••••• / 71

71
quartz inclusions. The pyrite nust therefore have been precipitated
from solution.
b} Clay Mineral Abundances
Table 5.5 shows the distribution of kaolinite, muscovite, illite and
chlorite within twenty sa:rrples. Seven shale sa:rrples -were routinely
examined by X-ray analysis for the identification of kaolinite,
nontrrorillonite and different types of chlorite as described by
carrel (1970). Heat treatrrent and glycolation indicated that
neither kaolinite nor nontrrorillonite group minerals -were present.
When sa:rrples PCS-4, PCS-8, PCS-11 and PCS-2 were heated at 650°c
the 14 A spacing was intensified. This indicates that the chlorites
are .Mc:J-chlorites. Although kaolinite was not identified the mineral
was experinentally included as a fourth phase in Pearson's progranme.
SUrprisingly, when this was done, four samples (PCS-32, PWR, 09/10,
17/01) had sma.ller deviations of recalculated oxides than when only
three phases (chlorite, muscovite and illite) were used.
All the shales are coloured various shades of green (5GY 7/2) due
to the presence of illite and chlorite. The green colour nay also
be due to the presence of ferrous (reduced) iron in the clay mine
rals (Weaver, 1978). The great abundance of chlorite and illite is
probably due to regressive diagenesis (catanorphism) and anchirreta
norphism. The lack of kaolinite and montrrorillonite indicates that
the following diagenetic sequence probably occurred:-
i)
ii)
Forrration of chlorite from kaolinite (Frey, 1910)
M:>ntrrorillonite (srrectite) is transforrred to mixed
layer nontrrorillonite and then illite (Dietz, 1941).
HOvlever, although angular to sub-angular idiorrorphic laths of
chlorite which grew during diagenesis -were recognised in thin sec
tion, rounded detrital chlorite grains were also present - albeit
rare. This is interesting in that it indicates rapid derx>sition
from a diagenetically advanced to lCM grade rretanorphosed source.
Corrpaction and recrystallisation of clay minerals during burial
are irreversible. Chlorites are extrenely sensitive to chemical
-weathering and undergo dissolution, transfo:anation and neofo:anation
in . . . . . . . . . . . . . /72

SAMPIB
PCS-1
PCS-2
PCS-4
PCS-8
PCS-11
PCS-16
PCS-18
PCS-31
PCS-32
PCS-36
PWR
WPG.S
01/09
04/13
09/10
16/01
17/01
TA
TB
13/11
72
in soils. The source area must, therefore, have been a continental
region where physical, as opp::,sed to chemical, weathering processes
were dominant. The original prirrary genesis of the chlori tes and
Table 5.5 Clay mineral abundances as-weight percent clay fraction
KAOLINITE MUSCOVITE ILLITE CHIDRITE 'TOTAL MIC.A
80.92 2.13 6.95 93.05
57.62 25.02 17.36 82.64
18.88 81.02 18.88
22. 71 77.89 22. 71
24.53 75.47 24.53
46.34 53.66 46.34
29.92 70.08 29.92
6.94 34.91 58.15 41.85
0.13 1.54 43.19 55.14 44.73
17.82 32.74 49.44 40.56
3.81 16.44 32.58 47.17 49.01
l. 71 34.70 63.59 36.41
1.89 50.78 47.33 52.67
26.82 51.70 21.48 78.52
0.86 26.34 16.32 56.48 42.66
62.66 37.34 62.66
3.31 28.10 37.79 30.79 65.90
51.84 48.16 51.84
62.83 37.17 62.83
100.00
illites which were not fonted diagenetically was probably due to
the uplift of igneous and ITEtarrorphic rocks with the consequent for
nation of illite in feldspar and chlorite in rrafic minerals (Lelong
and Millot;:, 1966).
'!here is very little variation in the abundances of the clay
suite through the vertical section (chlorite) illite) except for the
tvJO shale samples (PCS-1, PCS-2) i.mrediately below the Main Conglo-
C.Onglorrerate • • • • • • . • / 73

73
rrerate, the tillites (TA, TB), the diamictite (13/11) and the two
shales (04/13, 06/01) sanpled in the Hospital Hill Subgroup. Weaver
(1978b) notes that continental flood-plain and lacustrine shale
deposits have clay suite carpositions that show wide variations
'While geosynclinal marine shales and thin, epicontinental shales
have a unifonn clay suite. Although different depositional environ
rrents have different clay mineral suites and subtle environmental
differences can be detected by changes in the clay suite (e.g.
Weaver, 1967; Keller, 1970) the writer's sanple size is far too
srra.11 for such inferences. Furthenrore, as the clay suite at the
site of sanpling is not only a function of source material and
climatic conditions but also of advanced diagenesis and possible
neofo.rmation such a study would have probably been fruitless.
Conclusion
In surrrnary, as the major elerrent chemical conposition of shales is closely
related to their mineralogy, the relative arrounts of clays present in a
sanple can be calculated from its bulk chemistry. A corrputer programre and
technique, developed by Pearson (1978), proved useful in quantifying mine
ral analyses from the bulk chemistry of West Rand Group sedirrents.
The results indicate that - in nost cases - chlorite, illite and muscovite
(in that order) are the major clay phases present. Small arrounts of kaolinite
were also identified in four specirrens. The sanples i.rmediately below the
Main Conglarrerate show interesting variations in their calcite, rutile and
clay mineral abundances. These mineralogical variations are, by definition,
closely related to the distribution of the major elerrents. Fig. 5.2 shows
the distribution of major elerrents in four specirrens (PCS-1, PCS-2, PCS-4
and PCS-8) sanpled at different depths below the base of the Main Conglo
rrerate. Ccrnparing Fig. 5.2 and Table 5.5 the increase in chlorite with
depth is concorrmitant with an increase in I~ and Fet)3 • Likewise, a
sy:rrpathetic relationship exists between the total mica, K20 and Al2o3 contents.
5.4 DISTRIBurION OF TRACE ELEMENTS
As over 9 5 per cent of the West Rand Group shales are made up of quartz
and clay minerals, rrost of the elerrents present in trace arrol.Il1ts are located
in . . • . . • • . • • . . . / 7 4

74
in the clay fraction. The clay mineral suite of any particular shale re
flects the combined effects of the source material, of the diagenetic history
and :[X)Ssibl y the de:[X)si tional history. The trace elerrents could therefore
conceptially becorre incor:[X)rated in clay mineral structures at any of these
three different stages.
The exceptionally high content of Cr in the Fig Tree shale suggested to
Danchin (1970), that the source rocks were either ultrarrafic or, less likely,
nafic in COITipJsition. Serre trace elerrents (Cr, Co, Ni) retain their relative
abundances during physical weathering, trans:[X)rtation and de:[X)sition and
are indicative of the nature of the source area. Shaw (1954) studied the
geochemistry of sixty three rocks of the pelitic Devonian Littleton forrra
tion of New Hampshire. The samples represent all grades of diagenesis and
rretanorphism £ran shales to sillimanite schists to gneisses. He sh0>t1ed that
the concentration of rrost trace elerrents remained constant during regional
netanorphism, exceptions being Ni and CU, which showed a slight decrease,
and Li and Pb a well defined increase. Hence, diagenesis does not narkedl y
affect trace elerrent distribution. Those trace elerrents which are often
rrore concentrated in shales than in igneous rocks because of sorption by the
clay colloidal particles in the environnent of de:[X)sition are the rrost pro
mising envirornrental discriminants and indicators (Wedepohl, 197 IJ. However,
in the review on the West Rand Group (.Appendix 1), it was concluded that,
though these elerrents (B, CL, Li, S, v, Cr) are generally nore abundant in
narine shales than in continental clays in both rrodern and ancient environ
rrents, their applicability in Archaean shales is limited (Nel, l968).
Previous work, thus suggests, that during diagenesis and early rretanorphism
when Kor Mg are reconstituted by absorption between the layers of illite
and chlorite, the trace elerrent distribution is not affected and thus strongly
reflects the character of their provenance. Table 5.6 contains the rreans,
variances, standard deviations and coeffecient of variations for ten najor
and fifteen trace elerrents of seventeen representative shale samples. The
elerrental averages of 316 South African shales (from Homeyer, 1971 and
Danchin, 1970) are included for canparison.
Clearly, Ni, Cr and Co contents are far higher than the average South Afri
can shale. The writer's data thus agrees with Danchin' s (1970) and Hofmeyer' s
(1971) work in the Klerksdorp area, and the source rocks for the West Rand
Group in the study area must have been similar in petrology to the source
rocks •••••••• / 75

Table 5.6 The average elenental abundances of seventeen
selected West Rand Group shales
ELEMENT MEAN VARIANCE STANDARD <DEFF. OF AVERAGE S .A. DEVIATION VARIATION SHALE (316
SAMPIBS)
Si 56.93 19.57 4.42 0.078 66.21 Ti 0.59 0.01 0.10 0.175 0.90 Al203 13.38 2.42 1.56 0.116 18.97 Fe20 3 15.89 36.79 6.07 0.382 6.18 MnO o. 11 o.oo 0.07 0.656 MgO 5.00 2.39 1.55 0.309 1.86 cao 0.57 1.67 1.29 2.270 0.78 Na20 0.05 0.01 0.09 1.674 K20 1. 71 0.83 0.91 0.523
P205 0.09 0.01 0. 11 1 • 141 Ba 388.0 66171. 4 257.2 0.663 Sr 17.0 362.5 19.0 0. 110 Rb 79.5 2126.4 46.1 0.580 y 20.4 15. 1 3.9 O. 191 Zr 147.2 2487.3 49.9 0.339 215.0 Nb 7.6 3. 1 1.8 0.242 15.7 Zn 86.0 562.8 23.7 0.276 83.9 cu 44.3 548.7 23.4 0.258 Co 35.5 58.5 7.7 0.216 15.9 Ni 280.7 13204.7 114.9 0.409 34.3 V 129 .3 566.2 23.8 0 .184 103.0 Cr 703.8 107650.8 328.1 0.456 99.2 Ga 17.0 2.7 1. 7 0.098 20.4 Sc 20.4 17.22 4. 1 o·.203 14.3 u 0.3 0.4 0.6 2.058 Th 0.0 o.o 0.0 0.000

.j
rocks of the Fig Tree sedi.rrents. Indeed, the lower Ni, Co and Cr values of
the West Rand Group carpared to the Fig Tree Group, together with the pe
trology of the sandstones, suggest that sedi.rrents characteristic of the
Fig Tree Group itself, constituted the provenance for the West Rand Group.
5.4.l Jeppestown Paleosol
No characteristic paleosol colour changes occur within the upper
C:eppestown shale. All the shales sarrpled within the Witwatersrand.
Nigel mine ~e green (5GY 7/2). Nevertheless, the absence of £lane
structures at the base of the Main Conglorrerate horizon and the uncon
foIIPable relationship between the West Rand Group and Central Rand
Group indicate a hiatus between the two Groups. Whether the Upper
Jeppestown shale was wholly exposed to sub~~~ial weatherin0 is not
kno.vn but Button (pers. carrn.) noted that the Central Rand Group
at Hout:r;:x::x::>rt, 15 km south west of the Witwatersrand-Nigel Mine,
consisted of a braided stream facies at the base overlain by a
tidal-marine facies. Subaerial exposure is thus likely and several
specirrens (PCS-1, PCS-2, PCS-4, PCS-8) were sarrpled to ascertain
whether geochemical criteria, as opposed to colour changes, could
define the Jeppestown paleosol.
The distributions of trace elenents and major elenents in four
sarrples below the Main Reef Conglcrnerate are sho.vn on Fig 5.3 and
5.2 respectively. It is readily seen that Si02, Ti02, Al2o and
K2o decrease with depth below the Conglarerate while total Fe and
M:J() increase. The only trace elenent that increases with depth
is that of Zn. These increases and decreases in weight percentages
can be regarded relative because of the open system. To test these
relative increases and decreases, the ratios of all the :r.iajor and
trace elerrents to Ti were calculated because of the limited rrobility
of Ti under \\.leathering conditions. 1·1hen this ratio is plotted
with depth the sarre trends are evident and thus the eleirental varia
tions on Fig. 5.2 and 5.3 are real.
The decrease in K2o and increase in Fe2o3 and MgO is due to the clay
minerals present. Muscovite and chlorite show an inverse relation
ship with rruscovite (K2o) decreasing and chlorite (total Fe and r~)
increasing with depth (Table 5.5). Ti is locally accumulated in
weathering • • • • • / 76

0
2
4
•
- • ., ., ... -I IO
--:c 12 .... ll. w 0 14
.. •
20
22 0 'f 100 SiOz I I I I I I I I I I * 0 2 4 • • IO 12 14 18 .. 20 A~,Fez03
0 0.1 ().2 0,3 0:.. o:a 0A o:r o.a ~. T,Oz 1.0
, K,o I I I 1 I 0 I 2 4 5
I
' I I MgO
0 IO 15
Wt. per. cent.
FIGURE 5.2 Distribution of major elements below West Rand/Central Rand unconformity
• !

0
2
·1 :::,
I • - a • • .. -• 10 E -:c
12 I-D. w 0
"' 16
18
20
22 I
I 0
0
0
0
0 I
FIGURE 5.3
2
ebo , Cr.Ni 1000
Rb.Zr,V IOO 200
Co.Zn.U liO IOO
Ga.Cu.Sr IO 20 30
Nb I 4 i • 7 i • '°
ppm
Distribution of trace elements below West Rand/Central Rand unconformity

5.4.2
76
weathering processes and so is Al. The Si02 content is governed
by the arrount of quartz in the sanple.
Cr present in chromite, rragnetite and ilmenite is concentrated in
residual weathering products. According to Shiraki (1978)"no ele
rcent exists besides Cr which is as effectively fixed in its weathering
products without appreciable losses to the surface run off". Zn
often has a higher concentration in soils than in unweathered rocks.
White (1957), h<:Mever, noted that 45% Zn was leached out of soils
while 35% was incorporated in mineral structures. The decrease in
Zn content with weathering in the study area is thus explained by
leaching. The increase in Zr is not surprising as it accurnalates
in soils (Koster, 1961). According to Erlank et al; (1978), Zr is
also released during the weathering of minerals other than zircon.
The remaining trace elerrents which show a narked increase in concentration
with weathering - Ba, Rb, Co, Ni, U and Ga are probably related
to the clay mineral present (Ba, Rb, Ga), rrobilization during
weathering (Ni, Co) or migration from the overlying uraniferous
Main Conglomerate (U) •
In conclusion, the Jeppestown shale irmediately below the Main
Conglomarate has a geochemical profile that has characteristics of
a paleosol which has subsequently been m:xlified by diagenesis and
percolation of ground waters. Thus the expected increase in total
iron and decrease in K2o with an increasing degree of alteration is
rrarred by the absorption of K2o during diagenesis. In addition,
the varied clay mineral abundances and trace elerrent distribution
indicate that the geochemical profile has been further m:xlified
by the percolation of ground waters and/or hydrothermal solution
along the upper shale/Main Conglorrerate interface.
Correlation Ceoffecients
Correlations (BMDP 8D) between the rrajor elerrent and trace elerrent
data are given in Table 5.7. Because of the small number of sarrples
used the correlation coeffecients lllllSt be treated with caution.
There was no exclusion of any sanple which had trace elercent values that
deviated from the .rre.an. This w:::>uld have reduced the sanple size
further and arbitrary selection might have produced artificial
correlations •••••••• / 77

,..,..1
..,..,..
,._r\.,
. '\
.·-c-J:
. . . .
.=
.('\.
.-=
-I'\
.. c-,
..r=
~
C.
cc
C ::
J>
r.
_. = v-:
'."*
": <
i:
r, r,"
?'
r-....
-< A
J:
. I
(9'"
'1;J
,A..
-c.c
zir
:::.x
,..,
....
.,..
v,.
,'\,
.r'\
.,~
;'\.
;'"\
,."\
...'
\,;'
."\,
;""
'\..,-
"\;-
:: • .
.c;;
J: .
.....,
,::,-
,J:;
::i.
,..I
\;-C
C ::r
.
I I
I I I-
• . .
. . . .
. . . .
.. .:
:.cl'\
...J
".J""
~·.
..,.
.J -
::..
::.:
:;
C..
=::
Lt-
-..=
-=
·.J.
--!:
::~
:::
-i\.
.·..
,..v
--,,
.CV
"o.J
i-..
=.
~f-v:-..
~~
rcJ:=
-J~
~
c-.
...r
'\..
-..:
C•f
:J:4
.-3
. =
.-v..
.4-r
\..:
:;,
I I
,-..:
:..r.
..,...
:,-=
...::
:-=
-,r~
,..,..
.:-;,:
;:
c-::
u.c
-.J:
:..c
-..~
..::
=~
i\.c
.:;
-=.,.
c:,;:
;. ::
::..
r--=
.c-
..-:r
--..c
-::.
-=· :;
x..,.
,r'J
-=.·
"-'v
,.::
_ ...
....i;
J C
.C
r'\
;C
I I
I I
. . . .
. .
. . . .
.:
)-"\
..."
'\..
J·V
-=:
J"''v
--:,.
,..:-
•f·~
::::
c-
,=:c
~rv
-..v
·..,
....
.,..
~~
=
=~
-~ ........
..:::
:..,.
..J:.
.C:t
"\..i
'.":'
=.:
:.-.
...r
-v..
c.c.
o-.
.c.~
:t"-
-::
. . . .
. . . .
. . . .
'=
"·JJ
-~ ....
.. ~vJ
-.c:
..:::
:: ...
.... ::::
0
1'\
.C
.;c .
J'lr<
-C;:
: I:
:-0
-C
=
--":
~~
~-.
-=c~
\J',
I:::
C
O' .J
'--c
::. \
Jo v
,.. "
\.. -.
!,.F
~
=.c
..--
.-c--
-:::
-c.:
=
= i::.
-..J
·..C
\J'i"\
..v,,
.......
-c
-=--
;;; ......
. ...,..~
-.....-
..:x.:
= c-v
,..:
:...
C!J
'.t.
,..,
-i\.
,~-=
I I
I I
I . .
. . . .
. . . .
C
'-""
~~
'):J
i.-.
J,'
-1.J
'IO
C
::J"
'"\
..-C
..C
!:::
-\..
1-:
--.=
. C
tJIJ
"N'.
.,.,
-.;,
..C
•..,
..-.
...c
I I
I I
I ·-
. . . .
. . . .
. o
•v:\
J"V
oN
""-
o c~
.c.
...... 1
..,;~
--...
..::c
:: ~
f\ .. :v
,,i,
:'\.
.,.,
C:-
..i-
JC
c.
.---
....
.,cJ
;;;-
..V
-:
. . . . .
. . .
Ov",
-...
.-0
-0'V
"'O
C
NI\
J..C
O-~
OC
C
o..r
.-..c
-...;()
; (J' C
o.
t:cv
,..:
;1.,
,o.-
..cc
....
...
CO
.CO
.C<
.,,i
O
OC
Cl.
/'..
J'<
.,,i
C
o~
o-0
"-0
0
C 0
--0
0 ..
.,I\
; 0
. . . .
. .
c-i
..o
-iv
,c
Cl'
Vv
,,-i
.C 0
c~
-...
o:c
o
c-.
.oc\J
lc ·
Ov
<O
'C>
0
C'3
'u-,
OC
O
v-o
..C
l\;C
c-
:J:.
.ra-
c
~
cr: z :r
I\;
"\;
' z
"V
v- n C
I\;
C n C
l'V
IJ',
z -l'V
CJ
' <
l'V
-i n :t
:'
"' .:x,
-~~~n<~nr,~~~~~~~7z~~TT>-~
~ r~~
-ccz=
x
a~
~~
r\.
.~~
~~
~r--
. ==
~===
~"\.,=
~ ,.,
-, C
C
C"\
.,"\
.,
\I"-'..
,..
~-~
"\.,
~:\
J~~
"~N
"~--
----
-~-c~~ ....
... av
c~
N-C
CX
-~
~-=
..:~
aJc-
I I
I I
'f, -
. . . .
. . . .
. . . .
. . . .
. . . .
. . . .
. .
"\,.·
::,c
~=
-"-"~
-a-~
:~a"-r"-c~
J~
~=
c-c-~
-v
~fJ~
O~
~~
~-..
c~
~~
~~
1~
c
=:~
==
-c=
r7
~~
--~
c::
-a..
c-~
:J-=
= ~
:J~
---~
~-~
oa-c~
~=
c ......
. aa-~
c-c
I I
I I
I I
. . . .
. . . .
. . . .
. . . .
....
....
. ca-~
=x
~~
-~
7~
-v
"\:
:=~
c~
~cacc
c-.
..~
J~
ca
~~
~=
=c-~
--=
=~
J~
;::~
c
ccccx
"~
="=
=~
~=
xa~
,rc:c
c~
=
cax
c--c~
~-~
-~
==
x~
Jc-:r
--v
~=
I I
I I
I I-
. . . .
. . . .
. .
....
... .
:a
....... .
.:"x
"-"-
-J--
~~
-==
=-~
=v=
cx
-a~
-~cr"
-~~
::ccv
x~
..:~
-......
. cac
==
c-~
a7
---7
J::
:-c-r
a-a
-r-~
=
-x-~
~J~
-~-~
=~
~"..
:..:
ca .....
.. ~x
=
I I
I I
I I
I I
I I
I I
I I
I I
I I
. . . .
. . . .
. . . .
. . . .
....
.. .
cc7
~7
aa..
r-=
~r-
c-c
ca7
~=
==
=
:ccaac~
=-~
c-~
~=
cc-~
cx
xc
=J7
CC
-~7
~D
~-=
..,.
~T
cc-~
=c=
=
~~
a-a
..c-
....... r
a~
~a
a-Jc---~
=
I I
I I
I I
I I
I I
I I
I I
I . .
. . ..
....
....
....
... .
=
-c--~
=-~
="-~
=~
----~
-~
=
=-~
a--.c
ca-ec-ac.c
-iJ
'-..
c::
tacc
c:;
:~=
~-.
..c-a
-~-~
-~-z
~~
-'-'
=
=--~
..r.t
:ccc~
~aa~
.c~
ax
~~
,==
I I
I I
I I
I I
. . . .
....
....
....
....
. c~
CJl::C
CC
-~
7~
-7
-~
CJ--:
c~
~-0
~~
C!'
.t:c
NN
~~
~-0
-ia--
0-~
.cc
=a--1
\.N
~N
C~
-~
~~
-~
~::
t-7
~=
=
~ca-r\.
.~~
~..
c-.-
c~
~~
-~
J~
cc
I I
I I
I I
I . .
. . . .
. . . .
. . . .
. . ..
..
0--~
~o
N~
-o
~~
~~
-0
~-~
~o
C
~if
Nu
-,~
~l\
;N
~~
=c~
l\;C
a~
-=
coo~~~-~~~x~~~-~~~r\..C
c~
~..
r-~
~a
.c-a
o-~
=a
-..c
cc
. . . .
. . . .
. . . .
. . . .
. . .
c~~~~~Ne---~-~~~N~C
o~
v-l
'VN
l\;-
~~
=-0
=N
~ao
ccc
o..
co
~~
-..o
-o-~
=o
~J~
~~
=
cl'
l..m
NN
~c~
oo
a--rv
.c..
o~
~~
=
I I
,_
. . . .
. . . .
. . . . .
. . . .
. ~
r:,-
a-x
ru-i
c1
.,,o
.-J~
.co
-0N
~-=
o
~v
,~.,
...,
.~c~
~..
,.~
-ru
~~
~=
o
-..o
~~
-~~
N-i
-O~
~I\
J~
C~
O
o~
-cu
-,.
.C~
~~
~.c
~~
~~
~~
o
I I
I I
I I
I . . .
. . . . .
. . . .
. . . .
. o
o~
--N
oN
Cu
-,N
CC
O--o
c-c
~~
~O
'Cl\
;-0
0..
..,C
-O~
C
0-0
-i-
O-~
C<
.,,i
C-N
CN
.J'N
~O
0
0~
~~
~-i~
-~
0~
1\;C
~-c
,_
. . . .
. . . .
. . .
. . .
O~
NV
,Ov
,CO
Cl'
l..~
~N
~~
C
=-aao
mV
u-,N
OO
CJI\J
..C
C
o ......
. ~~
-OaN
r\..
~N
-0-.
,.c.
.c=
C
a~
..C
,P;,
,-1
\,~
1.,,o
,'\.. C
.JI\
. -O
u-,C
-~ 7 ·'.::
..; = - N -.,. .....
.. 1>
r " C ~ ..,.. ,..,.
"\.,
..,. 5 L ,. :;- C r 3>
C 2 >
:\.I
=
;,<:
I\; ·= -c "' C: IJ
',
,;::
J>
g t-; ~ .... Ill
rt f-'· § § HI
HI ~ f-'· § !ii' 0 HI
;'
g C'
" ::i
-
.Q"
CD
~ C1
1 U
l rt
•
I .....
.,
~ ~ Ul ? .... (D
Ul

77
correlations. Instead, several trace elements and rnajor elerrents
were plotted against each other (BM:JP 6D) to ascertain the true
relationship. Several of these plots are reproduced in Appendix 6.
Good correlation is revealed by a tendency tCMard a linear distribu
tion; fXX)r correlation is sha-m by a scattered distribution. Good
linear distributions were obtained when Al2o3 were plotted against
Ti02, K20, Nb, Zr, V, Cr, Ga and Sc, Ba vs. K20 and Cr vs. Ti02•
Scattered distributions are sha-m for Fe2o3 vs. Co, and Fe203 vs.
Sc. The large number of negative correlations in Table 5. 7 is not
surprising as Chayes (1960) has shCMn that where the slllll of variables
cannot exceed a certain constant, as is the case when percentage
data is being handled, then IX)Sitive correlations tend to be su:i;r
pressed and negative correlations enhanced.
The rrost obvious feature in Table 5.7 is the lack of sinificant cor
relation between total Fe and the other elerrents. This indicates
that total Fe did not play a major role in the incorIX)ration of
trace elerrents. On the other hand, Al2o3, shows IX)Sitive correla
tion with all but three (Zn, ca, Sr) of the trace elerrents. The
best inter-correlated groups of elerrents (coeffecients of greater
than seven) include Al2o3 - Ti02 - K2o - Rb - Nb - V - Ga - Sc,
K2o - Ba - Rb, cao - Sr, Zr - Nb and v - u.
The very high correlations between Al2o3 and K2o (which reside in
the clay minerals) and Rb - Nb - V - Ga - Sc - Ba suggest that
the trace elerrents are largely detrital (or inherited, Nicholls,
1963) entering the deIX)sitional environrrent in close association
with the mineralogical clay phases. The strong IX)Sitive correla
tion between cao and Sr can probably be accounted for by co-pre
cipitation during deIX)sition or diagenesis.
The gocxi correlations between Ti and other elerrents indicates that
it is not only restricted to the mineral rutile. This was the
assurrption Pearson (1978) rnade when canputing the clay mineral
abundances fran whole rock chernistry.Porrenga (1967) noted the
un~ctantly high concentrations of Ti in separated clay mineral
fractions and suggested that it was a detrital elerrent, closely
associated with the clay fraction. Weaver and Pollard (1973} found
that an illite and chlorite from Scotland contained as much as 2.13%
and ••••••••. /7s

78
and 1.03% Tio2 respectively. Clearly, the illites and chlorites
within the West Rand Group shales contain a substantial arrount of
Ti02 (see Tio2 vs. A12o3 plot in Appendix 6) •
The lo.v correlation coeffecients of CU and Zn suggest that these
elem:mts do not occupy structural sites in the clay minerals.
Hofrreyer (1971) sho.ved good intercorrelations of the group CU, Zn,
Cr, V, Ni and Co in West Rand Group shales in the Klerksdorp area.
He suggested that these elerrents were absorbed by chlorite and
goethite with neither mineral playing a controlling role. The
absence of this relationship in the study area is attributed to
the absence of goethite. The m:xl.erate correlations between CU, Zn
and P2o5 suggests that these elerrents were absorbed by apatite.
Krauskopf (1956) and Heydemann (1959) showed in a set of experi
rrents that apatite and iron oxide are good absorbants of copper
and zinc.
Significant Zr correlations include those with Sio2, Ti02, P...J.2o3,
K2o, P2o5, Ba, Nb, Ga and U. The large number of correlations and
their m:xl.erate strengths suggest that Zr is not only present in the
discrete mineral phase zircon but in other phases. The Zr - U cor
relation is explained by the presence of small arrounts of zircon
which is a favourable host for U. Nicholls and Loring (1962) sug<Jest
that sane Zr proxies for Al (as does Ga) in clay minerals fonred
during source rock weathering. The relationship existing between
Zr, Si, Ba and Ti, suggest that a significant proportion of Zr is
located in ilrrenite, rutile and/or fresnoite. The Ti, Zr and Nb
correlations emphasise the fact that a proportion of these elerrents
is located in heavy mineral fractions.
On theoritical grounds nickel and cobalt should have reasonable
correlations as they have smilar ionic petentials. Likewise plots
of Co against Fe for shales should produce a good linear correla
tion (e.g. Carr and Turekian, 1961). Table 5. 7 indicates that
neither of these correlations exist in the study area. According
to Burns arrl Burns (1978), nickel and/or cobalt occur in nurrerous
minerals with pyrite and related structure types. The erratic
distribution of secondary pyrite may explain the lack of Co - Ni -
Fe correlation.
In . . • . • . • . . . . /79

79
In sumrrary, the correlation matrix reveals a number of highly
significant correlations. M:)st trace elements are clearly largely
controlled by the clay minerals although several exceptions may be
explained by the distribution of heavy minerals and other accesory
minerals.
Chapter 6 ••••••• /80

CHAPl'ER 6
CONCLUSION The present study has led to a better understanding of the structure, sedi
mentology, diagenesis and geochemistry of the West Rand Group in the Heidel
berg-Nigel-Balfour triangle. Study of the vertical succession of rock types
and sedimentacy structures has denonstrated that wave-dominated mineralogi
cally rrature arenites occur at the base of the Group contrasting with tide
dominanted and fluvial litharenites and "subgreywackes" in the Governrrent
Subgroup. Although the geochemistry of the shales indicate that they are
diagenetically advanced they still possess a trace elerrent distribution in
dicative of the West Rand Group's original source area.
Correlating the rrajor and trace elerrents it was shown that nost of the minor
elements were absorbed or occupied structural sites either in the clay frac
tion or in the heavy minerals.
The carrplicated strike-slip faulting, variation in dip and lack of borehole
control did not permit construction of regional isopach maps of the inter
vals between the different "rrarker horizons" in the West Rand Group. Ideal
ly these isopachs would represent the external form of the sand-shale bodies
enabling fonnulation of paleoenviromrental nodels. As isopachs could not
be drawn an atterrpt has been rrade to construct nodels detailing the de
:i;ositional history and subenviromrents of the sandstones of the West Rand
Group. The depositional nodels integrate the writer's detailed facies
analysis of the study area and observations of stratigraphic variations
(lithology, thickness, sand/shale ratio) recorded in the basin as a whole
(Appendix 1) .
Seven rrajor trends have errerged as a result of this detailed study:-
1) persistence of the dominant paleocurrent direction (SW} fran the
Hospital Hill Subgroup arenites up to the Jeppestown sandstones and
into the Central Rand Group (Button, 1979),
2) a general increase in sandstone imnaturity up the stratigraphic colunn,
3) the sand/shale ratio of the Govermrent Subgroup is higher than that
of ••••••• / 81

81
of the Hospital Hill and Jeppesto.vn Subgroup,
4) a consistent decrease in dip occurs from the Orange Grove Quartzite
Fonration to the Central Rand Group (even where there is no post
lithification faulting),
5) presence of tidal, longshore and wave currents irrplying that the
Witwatersrand Basin was connected to an open ocean during Hospital
Hill ti.Ires,
6) presence of tidal and possible braided stream sediirents in the Covern
~nt SUbgroup,
7) the presence of sand shoals in the Jeppesto.vn SUbgroup.
The depositional :rrodels established for the study area and basin as a whole
are constrained by tv.O assurrptions:-
1) Structuring of the basin (major faulting and related folding} occurred
after deposition of the Hospital Hill Subgroup while faulting and
sediirentation were contenp::>raneous with the depositional history of
the Covernrrent SUbgroup
2) The regional markers are assurred to represent either a) widespread
marine transgressive facies (e.g. Orange Grove Quartzites, Brixton
Quartzites) orb) contenp::>raneous blankets of widespread chemical
sediirents (e.g. Contorted Bed). The nore local diamictite markers
probably represent submarine fan carrplexes on an ancient slope (e.g.
Blue Grit).
Sedirrents bounded by regional stratigraphic markers constitute a"systems
tract"defined by Brown and Fischer (1977) as conterrporaneous depositional
systems e.g. intergradational fluvial, shelf and slope systems. This
'WOuld account for the differences in sand/shale ratios between markers
in the four major outcrop areas.
In the following section the writer surmarises the depositional :m:xiels for
the different Subgroups under the subtitles of a) regional markers, b)
stratigraphic variables, c) depositional system tract and finally d)
principal depositional nodes. Schema.tic representation of the major de}.X)si
tional tracts in each SUbgroup are presented in Fig. 6.1 and 6.1.
6 .1 HOSPITAL HILL SUBGIU.JP IDDEL (Fig. 6 .1)
:Regional •••••••••••• /82

FIGURE 6. 1
oo~oo e111
General depositional model of alluvial plain, coastal barrier bars and/or beaches, tidal channels and shelf mud systems in Hospital Hill Subgroup model. This style of deposition reflects development of laterally persistent mature arenites and shelf muds. Eustatic sea level rise (or subsidence) would account for the thick alternating sequences of arenites and shales. The towns of Johannesburg (J), Delams (D), Heidelberg (H), Klerksdorp (K) and Vredefort (V) are included for reference purposes.

82
Regional mrkers - The Orange Grove Quartzites, Water To.rler Slates,
Contorted Bed and Brixton arenites from formregional mrkers. Orange
Grove Quartzites occur as ripple mrked., plane-bedded arenites in the
Central Rand and East Rand and as thick coarse grained arkosic units
in the DeJ.nas area. In the Klerksdorp area these quartzites are p:x:>r
ly developed with lavas and TIU1dstones (Dcminion Group) resting on
baserrent. The water Tc,..,,er Slates and Contorted. Bed occur in all four
rrajor outcrop areas. The fuchsitic stained "sago" textured Brixton
arenites form excellent mrkers in the Central and East Rand areas
while in the .Mazista area, Western Transvaal they are p:x:>rly developed.
Stratigraphic variables - Thicknesses of the Hospital Hill Subgroup
decrease eastwards. The sand/shale ratios in Klerksdorp (0.80) area
are higher than the ratios calculated in the Vredefort (0.70), Cen
tral Rand, West Rand and Heidelberg areas (0.55).
De:positional systems tract - large volurres of elastics, shales and
chemical sedinrents fonlEd a depocentre characterised by widespread
shallow mrine coastal tracts and a distal shelf.
Dep:)sitional systemrrode - An elevated. source area along an ancient
mrgin north of Del rras_ and Mazista supplied broad stable pla tfoilllS
.with elastic sedinrents. Tidal, wave-induced and longshore currents
redistributed and winnowed these sedinrents in the rrajor outcrop areas.
In coastal systems, sand belts usually develop where waves first irrpin9c
up::m the seafloor and extend landward to the limit of tidal action.
It is proposed that rrany of the Brixton sandstones represent ancient
transgressive sand belts (tens of kilorretres wide and hundreds of
kilorretres long). A low energy zone prevailing in the open sea below
wave base developed the argillaceous horizons. Facies analysis in the
study areas indicate that the waves and tides propagated in a NE-SW
direction. Transgressions and regressions acting on this sirrple rrodel
explain the laterally persistent argillaceous - arenaceous sequence
of the Hospital Hill Subgroup.
6.2 OOVERNMENr SUBGROUP IDDEL
Regional rrarkers - The Govemrent Reef, Coronation Shale and Coronation
tillite •••••••• /83

FIGURE 6.2
- - -- SHELF MUDS - --- b -MEDIAL FAN DISTAL FAN PRODELTA -i- SHELF -
DELTA FRONT ..,...,NE BARS SUSPENSION CLAYS I ~"c~~E
~~~,.~~':.~ ' .
b
GENERALIZED DIP CROSS SECTION OF FAN-DELTA SYSTEM
General depositional model of fan-delta,shelf and slope systems in Government Subgroup showing schematic representation of possible terrigenous input areas. Tidal direction was still NE-SW. The towns of Johannesburg (J), Delmas (D), Heidelberg (H), Klerksdorp (K) and Vredefort (V) are included for reference purposes. A general cross section (a-b) showing principal types of facies assemblages within the fan-delta system is included (after Brown and Fischer, 1977).

83
tillite fonn three regional markers. The Govern:rrent Reef is a persis
tent, nature to subnature arenite or litharenite in the Orange Free
State, Central and East Rand areas. The rnarkers are absent in the
Vredefort area and in the Klerksdorp area it consists of thick loosely
packed conglarrerates (locally known as Big Pebble, Buffelsdoorn or
White Reef). The Veldschoen Reef in the Delnas area occupies a similar
stratigraphic position to the Governrrent Reef in the East Rand. The
tillite and diamictite· markers (e.g. Blue Grit) are best developed
tawards the east of the East Rand and in the South Rand.
Stratigraphic variables - Thicknesses decrease in a southerly and
easterly direction. Likewise, the sand/shale ratio decreases eastwards
from a value of 2.6 in the Klerksdorp area to 1.48 in the Heidelbercr
area. The Governm:mt Reef overlies laminated shale.
Depositional systems tract - Alluvial fan(?), fan delta, localised
shallaw coastal deposition and slope systems typify the Governrrent
SUbgroup sequence.
Principal depositional rrode - Faulting along the northern margin of the
semi-stable platform supplied alluvial fan and fan delta systeT'1S with
very coarse grained sedirrents. In the study area and Delr.B.s areas fans
prograded southwestwards over extensive tidal-flat environrrents. The
fans were only locally reworked by wave processes and tidal currents
which propJ.gated in a SW-NE direction. Terrigenous elastic sedirrent
supply slo.vly diminished by the end of Promise Formation tirre. A r:-ajor
transgression then occured depositing t...1-ie Coronation shale in the Cen
tral, East, Free State Goldfields, Delmas and Evander areas. Renewed
uplift along the rnargins supplied coarse grained sands (Governrrent
Reef) which were redistributed by tidal and wave processes in the
East, Central and Orange Free State areas. Local slope sedirrentation
was probably concentrated in front of delta fans where prodelta and
delta front deposits were reworked and transported into deeper water
by gravity processes (e.g. Blue Grit). At present there is sorre
controversy as to whether the genetic tenn tillite should be applied
to certain beds within the Coronation .Formation. If this rnarker is
a true tillite, the depositional :rrodel proposed would have to be
:rrodified to include glacial outwash fans in place of fan deltas as
the supplier of terrigenous naterial.
Jeppestown • • • • • / 84
-~- ---- - ------ --------

84
6.3 JEPPESTCWil SUBGIDUP IDDEL
Regional markers - The Cra.m Lavas -were described by SACS (1978) as
"dark green, often slightly brown, fine grained to cherty lavas, oc
casionally finely r:orphyritic, often anygdaloidal with associated
minor quartzite, tuffaceous or agglorrerate sedi.nEnts" and occur in all
four ma.jor outcrop areas. The lavas are thickest in the Orange Free
State Goldfield area where they total sorre 106 m.
Stratigraphic variables - The sand/shale ratio is highest in the
Klerksdorp area (1.27) and lowest in the Heidelberg area (0.54).
HCMever, no consistent trend is evident in the other areas - Vrede
fort (0.65), South Rand (0.68} and Central Rand (0.77). The thickness
of the SUbgroup decreases south-eastwards. In the Evander area the
Jeppesta.m succession is absent with the Main Conglarerate overlying
the Blue Grit marker. Erosional truncation of the SUbgroup is also
evident in the Delmas and East Rand areas where large scour channels,
slmp de[.X)sits and :[X)Orly sorted pebbly and sandy rrudstones are
present at the base of the Central Rand Group (Antrobus and White
side, 1964).
Der:ositional tract and principal rrode - Isopachrna.ps (Brock and Pre
torius, 1964) indicate that the shape of the West Rand Group basin
becarre shallower and smaller during Jeppesta.m Subgroup t.iJres. The
Subgroup encompasses tv.D major types of basin fill - shelf der:osition
in the East Rand area and fluvial der:osition in the Klerksdorp and
Vredefort areas.
References ••.•••• /85

REFERENCES
Adams, J., 1977. Sieve size statistics from grain TIEasurerrent. J. Geol., 85: 209-227
Allsopp, J.L., 1964. Rubidium - strontium ages from the Western Transvaal. Nature, 204(4956): 361-363
Anderson, R., 1976. Tidal shelf sedinentation: an exarrple fran the Scottish Dalradian. Sedinentology, 23: 429-458
Annstrong, G.C., 1968. Sedi.rrentological control of gold mineralization in the Kinberley reefs of the East Rand G:>ldfield. Infonn. Circ. econ. Geol. Res. Unit, Univ. Witwatersrand, Johannesburg, 47: 24pp.
Antrobus, E.S.A. and Whiteside, H.C.M., 1964. The geology of certain mines in the East Rand. In: Haughton, S.H. (Editor), The Geology of Sorre Ore Deposits in Southern Africa, Geol. Soc. S.Afr., Johannesburg, 1: 125-160
Antrobus, B., 1977. ~tarcorphic and structural aspects of the geology around the Vanrhynsdorp district and their relationships with the postulated Narra/Malrresbury fault; an application of potassic, white micas as petrogenetic indicators. Unpub. Geol. Honours Proj . , Univ. Cape Town, Cape Town, 32pp.
Baird, A.K., 1961. A pressed specinen die for the Norelco vacuum -path X-ray spectrograph. Norelco. Rep., 8: 108
Balazs, R.J. and Klein, G. de V., 1972. of sare intertidal sands. J. s ed:im.
Roundness-mineralogical relations Petrol., 42: 425-433
Banks, N.L., 1973. Tide - dominated offshore sedinentation, Lower Carrbrian, North Norway. Sedinentology, 20: 213-228
Baiwis, J.H. and Makurath, J.H., 1978. Recognition of ancient tidal inlet sequences: An example from the Upper Silurian Keyser Lirrestone in Virginia. Sedinentology, 25: 61-82
Blatt, H., 1967. Original characteristics of elastic quartz grains. J. seciim. Petrol., 37(2): 401-424
Blatt, H. , Middelton, G. and Murray, R., 1972. Origin of sedirrentary rocks. Prentice Hall Inc., New Jersey. 634pp.
Borchers, R., 1961. Exploration of the Witwatersrand System and its Extensions. Proc. geol. Soc. S.Afr., 64: 67
Borchers; R., 1964. Exploration of the Witwatersrand System and its Extensions. In: S.H. Haughton (Editor), The Geology of Sarre Ore Deposits in Southern Africa. Geol. Soc. of S .Afr. , Johannesburg, 1 : 1-23
86
Bourgeois, J., 1978. Conglarerates. In: R.W. Fairbridge and J: Bourgeois {Editors}, The Encyclopedia of Eedirrentology. nc::,..rlen, Hutch1I1Son and Ross Inc., Stroudsburg, 90lpp.
Brindley, G.W., 1961. Quantitative analysis of clay mixtures. In: G. Brown (Editor), The X-ray identification and crystal structures of clay minerals, Mineralogical Society, I.ondon.
Brock, B.B. and Pretorius, D.A., 1964a. An introduction to the stratigraphy and structure of the Rand Goldfield. In: S.H. Haughton (Editor), The Geology of sare ore l)eposits in Southern Africa. Geol. Soc. of S.Afr., Johannesburg, 1: 25-61.
Brock, B.B. and Pretorius, D.A. 1964b. Rand basin sedim=mtation and tectonics. In: S.H. Haughton (Editor), The Geology of scme ore neposits in Southern Africa. Geol. Soc. of S. Afr. , Johannesburg, 1 : 44 9-4 99.
Brown, L.F. and Fischer, W.L., 1977. Seismic stratigraphic interpretation of depositional systems: Exanples from Brazillian rift and pullapart basins. In: C.E. Payton (Editor), Seismic stratigraphy -applications to hydrocarbon exploration, MPG ~ir 26, Oklahc::J.F.Ja, 213-249.
Burns, R.G. and Burns, V.M. 1978. Nickel. In: K.H. Wedepohl (Editor) Handbook of Geochemistry, Vol. 11/3, Springer-Verlag, Berlin-HeidebergNew York.
Button, A., 1970. The stratigraphy of the Witwatersrand System in the Delmas area, Transvaal. Infonn. Circ. econ. Geol. Res. Unit, Univ. Witwatersrand, Johannesburg, 58: 20pp.
Button, A., 1979. Upper Witwatersrand strata in the Heidelberg area. 20th Ann. Rep., Econ. geol. Res. Unit, Univ. Witwatersrand, Johannesburg.
carrden-Smith, P.M., 1979a. Stratigraphy and current dispersal patterns of the West Rand Group in the Heidelberg-Nigel-Balfour triangle. Abstracts, Geokongress 1979, 1: 73-78.
carrden-Smith, P.M., 1979b. The 1.0tler Witwatersrand project. 20th Ann. Rep., Econ. geol. Res. Unit, Univ. Witwatersrand, Johannesburg.
Carmichael, I.S.E., Harrpel, J. and Jack, R.N., 1968. Analytical data on the U.S.G.S. standard rocks. Chem. Geol. 3: 59-64.
carr, M.H. and Turekian, K.K., 1961. The geochemistry of cobalt. Geochim. cosnochim Acta., 23: 9pp.
Carrol, D., 1970. Clay mi.nerals: A guide to their X-ray identification. Geol. Soc. Am. Spec. Pub,, 26: 80pp.
Carter, R.M. , 1975. A discussion and classification of subaqueous masstransport with particular application to grain-flow, slurry-flow, and fluxoturbidites. Earth-Sc. Rev., 11: 145-177.
Carter, C.H., 1978. A regressive barrier and barrier-protected deposit: Depositional environrreJ"t and geograi;tiic setting of the late Tertiary Cohansey sand: J. sedim. Petrol., 48: 933-950.

87
Chayes, ;F. , 1960. On correlation of varia,bles of constant sun, J . Ge()J;hy&. Res., 65: 4185-4193.
Cipriani, C., Sassi, F .P. and Viterbo-Bassani, C., 1968. La carrposizione delle miche chiare in rap:[X>rto con le constanti reticolarie col grado :rretam::>rfico. Rend. Soc. Ital. :Miner. Petrol., 24: 153-187.
Cipriani, C., Sassi, F.P. and Scolari, A., 1971. Definition of paragonetic fields. Schweiz. 51: 259-302.
~tam::>rphic white micas: Miner. :!?etrogr. :.u tt. ,
Clifton, H.E., Hunter, R.E. and Phillipps, R.L., 1971. De:[X>Sitional structures and processes in the non-barred high-energy nearshore. Jc. sedim. Petrol., 41: 651-670.
Cohen, A.C., 1966. Discussion of pa.per "Estimation of pararreters for a mixture of nornal distributions" by Hasselblad, V. , Technorretrics, 8: 445-446.
Collender, D.F., 1960. The Witwatersrand System in the Klerksdorp area as revealed by diarrond drilling. Trans. geol. Soc. s. Afr., 63: 189-226.
Coleman, J.M., 1969. Brahnaputra river: channel processes and sedimentation. Sedim. Geol., 3: 129-239.
Conybeare, C.E.B. 'and Crook, K.A.W., 1968. Manual of sedinentary structures. B.M.R. Bull. 102, canberra, 327pp.
Corstorphine, G.S., 1904. Witwatersrand Series.
The geological relation of the Old Granite to the Trans. geol. Soc. S. Afr., 7(1): 9-12.
Curray, J.R., 1964. Transgressions and regressions. In: R.L. Miller (F.ditor) , Papers in marine geology (Shephard camemorative volurre) .
M3.cMillan, New York, 179-203.
Curray, J.R., Ernrel, F.J. and Crampton, P.J.S., 1969. Holocene history of a strand plain, lagoonal coast, Nayarit, ~co. In: A.A. castanares and F .B. Phleger (Editors), Coastal lagoons, a symposium r.~co: Uni versidad Nacional Aut6nama.
Danchin, R.V., 1970. Aspects of the geochemistry of sarre selected South African fine grained sedinents. Unpub. Ph.D. thesis, Univ. cape Tc:Mn, cape Town, 215pp.
Deer, W.A., Ha.vie, R.A. andZussman, J., 1974. Anintroductiontotherock fanning minerals. Longrnans, I.Dndon, 528pp.
De Jager, F. S .J., 1964. The Witwatersrand System in the Springs-NigelHeidelberg sector of the East Rand Basin. In: S.H. Haughton (Editor), The ~logy of Sare Ore Derx>si ts in Southern Africa. Geol. Soc. of s. Arr., Johannesburg, 1: 161-190.
Di Pierro, M., Lorenzoni, S. and Zanaettin-Lorenzonni, E., 1973. Phengites and 1T0.1Scovites in alpine and pre-alpine phyllites of calabria (Southern Italy) • Neues . Jb. Miner. Abh., 119: 57-64.
Dietz, R.S., 1941. Clay minerals in recent narine sed.inents. Ph.D. thesis, Univ: of Illinois, Illinois, U.S.A.

88
Di.mroth, E., 1979. Diagenetic facies of iron fornations. In: R.G. Walker (F.ditor}, Facies M:xlels, Geoscience Canada, Reprint Series 1, 211 : pp. 183-189.
D:)tt, R.H., Jr., 1961. Squantum "tillite", Massachusetts - evidence of glaciation or subaqueous rroverrents? Bull. geol. Soc. Am., 72: 1289-1306.
Engelhardt, W., von., 1940. Zerfull und aufbau von Mineralen in Norddeutschen Bleicherdewaldboden. Chem. der Erde, 13 (1).
Eriksson, K.A., Turner, B.R. and Vos, R.G., (in press). Evidence of tidal processes fran the lower part of the Witwatersrand SUpergroup, South Africa.
Erlank, A.J., Smith, H.S., Marchant, J.W., Cardoso, M.P. and Ahrens, L.H., 1978. Zirconium. In: K.H. Wedepohl (F.ditor), Handbook in Geochenistry, Vol. 11/5, Springer-Verlag, Berlin-Heidelberg-New York.
Evans, G., 1965. Intertidal flat sedinents and their environrrents of deposition in the Wash. Quart. Jl. geol. Soc. Lond., 121: 209-245.
Fischer, W.L. and Bro.vn, L.F., 1972. elastic deoositional Systems - a genetic approach to facies analysis. Bur. econ. Geol. , Univ. Texas, Austin, Texas, 97-128.
Flemning, B. W. , 19 77. Depositional processes in Saldanha Bay and I.angebaan Ia.goon. N.R.I.O., Prof. Res. Series No. 2, 215pp.
Folk, R.L., 1968a. Petrology of sedimentary rocks. Herrphill's, Univ. of Texas, 170pp.
Folk, R.L., 1968b. Bim:xlal superrna.ture sandstone: product of the desert floor. XXXIII Int. geol. Congress., 8: 9-32.
Frakes, L.A., 1978. Diamictite. In: R.W. Fairbridge and J. Bourgeois (F.ditor), The Encyclopedia of Sed.irrentology. Do.vden, Hutchinson and Ross Inc., 90lpp.
Frey, M. , 1970. The step from diagenesis to metanorphism. Sedimentology, 15: 261-279.
Fuller, A.O., 1958. A contribution to the petrology of the Witwatersrand System. Trans. geol. Soc. S. Afr. , 61: 10-50.
Fuller, A.O., 1962. Systerratic fractionation of sand in the shallow marine and beach environrrent off the South African coast. J . sedir.1. Petrol. , 32(3): 602-606.
Fuller, A.O., Spraque, A., Waters, D., Willis, J.P. and carrden-Smith, P.M., 1979. Chemistry and mineralogy of Archaean shales fran the Witwatersrand SUpergroup. Abstracts, Geokongress 79, l: 158pp.
Gadow, S., Reineck, H.E., 1969. Ablandiger Sandtransport bei Strumfluten. Senckenbergiana Marit, 1: 63-78.
Gibbs, R.J., 1967. Quantitative X-ray diffraction analysis using clay mineral standards extracted frcm the sarrples to be analysed. Clay Miner., 7: 79-90

89
Gilbert, G.K., 1914. The transportation of debris by running water: Prof. Pap. U.S. geol. Surv., Vol. 86.
Glikson, A.Y., 1971. Archaean geosvnclinal sedirrentation near Kalgoorlie, Western Australia. Sp. Publ. geol. Soc. Austr., 3: 343-360.
Green, J.C., 1963. High-level rretar.orphism of pelitic rocks in Northern New-Hampshire. Am. Miner • , 48: 991-1023.
Greensmith, J.T., 1978. Petrology of the sedimentary rocks. 6th Edition. George Allen and Unwin Ltd., 24lpp.
Guidotti, C. V. and Sassi, F .P., 1976. Muscovite as a petrogenetic indicator mineral in pelitic schists. Neues. Jb. Miner. Abh., 127: 97-142 ..
Hayes, M.O., 1976. Tidal inlets. In: M.O. Hayes and T.W. Kana (Editors), Terrigenous elastic depositional environ:rrents. Technical report No. 11-CRD, Columbia, South Carolina.
Harder, H., 1961. Beitrag zur geochemie des Bros III. Bor in rretanorphen gesteinen und im geochem-ischen Kreislauf. Nachr. Akad. Wiss. Gottingen . .Math-Phys. Kl No. 1: 1.
Heier, K.S. and Billings, G.K., 1978. Sodium. In: K.H. Wedepohl (Editor), Handbook of Geochemistry, Vol. 11/1, Springer Verlag, Berlin-HeidelbergNew York.
Heyderrann, A. , 1959. Absorption aus sehr verdi.innten Kapferlosungen an reinen 'Ibnmineralen. Geochem. cosrrochim Acta., 15: 305.
Hobbs, B.E., Means, W.D. and Williams, P.F., 1976. An outline of structural geology. John Wiley, New York, 57lpp.
Hoffrrann, C., 1970 .. Die glaukophangesteine, ihre stofflichen equivalente und um wandlungsprodukte in. Nordcalabrein (siiditalien). Contr. Miner. Petrol., 27: 283-320.
Hofrreyr, P.K., 1971. The abundances and distribution of sare trace elerrents in sare selected South African shales. Unpub. Ph.D. thesis, Univ. Cape Ta,,m, Cape TCMn, 218pp.
Hutchinson, C.S., 1974. Laboratory handbook of petrographic techniques. J. Wiley and Sons, New York, 527pp.
Irrbrie, J. and Poldervaart, A., 1959. Mineral Carp:)sitions calculated fran chemical analyses of sedirrentary rocks. J. sedim. Petrol., 29: 588-595.
Jarres, H.L., 1966. Olemistry of the iron-rich sedirrentary rocks. :!?rof. Pap .. U.S. geol. Surv., 440W: 6lpp.
Jansen, H, Schalk, K.E., Leube, A., Snyman, A.A., Steyn, A.P .A., de Jager, F.S.J. and Beer, H.M., 1972. Geology of the country around Standerton. Explanation of sheets 2628D and 2629C. Geol. Surv. S. Afr., Pretoria, 27pp.
Jenkins, R. and de Vries, J.L., 1967. Practical X-ray spectrorretry. Philips Technical Library.

90
Johns, W.D., Grim, R.E. and Bradley, W.F., 1954. Quantitative estination of clay minerals by diffraction r:ethods. J . sedim. Petrol., 24: 242-251.
Johnson, H.D., 1977. Water escape structures in shallo.v :rrarine sandstones. Sedinentology, 24: 389-411.
Johnson, H.D., 1978. Shallo.v siliciclastic seas. (F.clitor), Sed.i.rrentary environ:r.ents and facies. Publications, I.Dndon, 557pp.
In: Reading, H.G. Blackwell Scientific
Jones, T.A. and Janes, W.R., 1969. Analysis of bim::xial orientation data. Math. Geology, 1(2): 129-135.
Kasch, K.W., 1979. Tectonothermal evolution of the Southern Damara Belt and its geodynamic irrplications. Abstracts, Geokongress 79, 1: 227-231.
Keller, W.D., 1970. Environrren.tal aspects of clay minerals. J. sedim. Petrol., 40(3): 788-854.
Klein, G. de V., 1970. Depositional and dispersal dynamics of intertidal sand bars. J. sedim. Petrol., 40: 1095-1127.
Klein, G. de V., 1977. elastic tidal facies, CEPCO, Illinois, 149pp.
Koritnig, S., 1978. Phosphorus. In: R.H. Wedepohl (F.ditor), Handbook of Geochemistry, Vol. 11/2, Springer-Verlag, Berlin-Heidelberg-New York.
Koster, H.M., 1961. Vergleich einger Methoden zur Untersuchung von Geochemischen Vorgangen bei der Verwi tterung. Bei tr. Mineral. Petrogr. , 8: 69pp.
Krauskopf, K.B., 1956. Factors controll:ing the concentrations of thirteen rare rretals in sea water. Geochem. cosrrochim. Acta., 9: 1.
Kubler, B., 1966. Cristallinite de l'illite et le zones tout a fait su:perieures du rreta rrorphisme. In: CollCXJUe sur les Etages Tectoniques, 105-122.
Kubler, B., 1968. Evaluation quantitative du rretarrorphisme par la cristallinite de l'illite. Etat des progres realises ces dernieres annees. Bull. Centre Rech. Pau - S.N.P.A., 2: 385-397.
Kuenen, Ph., 1960. Experirrental abrasion: 4. Eolian action. J. Geol., 68: 427-449.
Kmnar, N., 1978. Tidal inlet and tidal delta facies. In: R.W. Fairbridge and J. Bourgeois (F.clitors), The Encyclopedia of SedinEntology, DCMden, Hutchinson and Ross Inc., 90lpp.
Kunar, N •. r:nd Sanders, J.E., 1974. Inlet sequence: a vertical succession of sed.i.rrentary structures and textures created by the lateral migration of tidal inlets. SedinEntology, 21: 491-532.
Kmnar, N. and Sanders, J.E., 1976. rrodern and ancient. J. sedim.
Characteristics of shoreface deposits: Petrol., 46: 145-162.
lelong, F. and Millot, G., 196n. Sur l 'origin des min~mux micaces des alteration lateritiques. D_:i.agenese regressive. Mineraux en transit, Bull. Serv. carte Geol. Alsace - Lorraine, Strasb Q!Jr;J, 19 : 271-287 •

":.
91
It::Me, D.R., 1975. Water escape structures in coarse-grained sed.i.rrents. Sed.i.rrentology, 22: 157-204.
Luttman-Johnson, H., 1904. Notes on the geology of the Fortuna Valley, Trans. g20l. Soc. s. A£r., 7(3): 136-139. Heidelberg, Transvaal.
M::Cave, I.N., 1970. tidal currents.
Der:osition of fine grained suspended sedi:rrent £ran J. Geophys. Res. 75., 4151-4159.
M::Cave, I.N., 1978. Grain size trends and transr:ort along beaches: Example from eastern England. Mar. Geol., 28: 43-51.
~Ix:mgall, T., 1963. Potassium-Argon :rreasuremmts on dolerites from Antartica and South Africa. J. Geophys. Res. , 68pp.
~Kee, E.D., Reynolds, M.A. and Baker, C.H., 1962. Laboratory studies on defornation in unconsolidated sedi:rrents. Prof. Pap. U.S. geol. Surv. 450-D, 151-155pp.
~Kee, E.D., Crosby, E.J. and Berryhill, H.L., 1967. Flood der:osits, Bijou Creek, Colorado, June 1965. J. sedim. Petrol., 39: 829-851.
!-Ellor, E.T., 1911. The nornal section of the Lower Witwatersrand System. Trans. g€01. Soc. of S. A£r., 14: 93-131.
!-Ellor, E.T., 1917. The geology of the Witwatersrand: Explanation of Sheet 52 (Johannesburg). Geol. SUIV. S. A£r., Pretoria, 3: 46pp.
!-Ellor, E.T., 1921. of Heidelberg".
Discussion of paper "The geology of the neighbourhood Proc. geol. Soc. s. A£r., 24: 39-42.
Miall, A.D., 1977. A review of the braided-river der:ositional environrrent. Earth-Sc. Rev., 13: 1-62.
Middleton, G. V. and Davis, P .M., 1979. Surface textures and rounding of quartz sand grains on intertidal sandbars, Bay of Fundy, Nova Scotia. Can. J. Earth-Sc., 16(11):· 2071-2085.
Mietsch, A.T., 1962. Computing mineral carpositions of sedilrentary rocks from chemical analyses. J. sedir.l. Petrol., 32: 217-225.
Minter, W.E.L., 1978. A sedi:rrentological synthesis of Placer Gold, Uranium and Pyrite concentrations in Proterozoic Witwatersrand sedi:rrents. In: A.D. Mial (Editor), Pluvial Sedi:rrentology, Can. Soc. Petroleum Geol., 859: pp 801-829.
Naqvi, S.M., 1978. Geochemistry of Archaean rreta sedi:rrents, evidence for prominent anorthosite-norite-troctolite in the Archaean basaltic priro:>rdial crust. In Archaean Geochemistry, Edited by Windley, B.F. and Naqvi, S.M. Elsevier, Scientific Publishing Conpany, Amsterdam, 406pp.
Nel, L.T., 1927. The geology of the Country around Vredefort. Spec. Publ. geol . Surv. S. A£r. , Pretoria, No. 6 .
Nel, L.T., 1933. 'lhe Witwatersrand System outside the Rarrl. Proc. geol., Soc. S. Afr., 36: 23-48.

'-1<'-"i,
!( I
92
Nel, L.T., Truter, F.C., Willemse, J. and Mellor, E.T., 1939. The geology of the country around Potchefstroom and Klerksdorp. Explanation of Sheet No. 6J (Potchefstroan). Geol. Surv. S. Afr., Pretoria, 156pp.
Nel, L.T. and Jansen, H., 1957. The geology of the country around Vereeniging: Explanation of sheet No. 62. Geol. Surv. S. Afr. , Pretoria.
Nel, W .A. , 1968. The estiil'ation and distribution of boron in fine grained South African Sedi.rrents. Unpub. M.Sc. thesis, Univ. cape TcMn, cape Tavn, 69pp.
Nicholls, G.D., 1962. A scheme for recalculating the chemical analyses of argillaceous rocks for canpari ti ve parposes. Am. Miner. , 4 7: 34-4 6.
Nicholls, G.D., 1963. Environrrental studies in sedirrentary geochemistry. Science Progress, 201: 372-398.
Nicholls, G.D. and IDring, D.H., 1962. The geochemistry of some British carl:x::miferous sedirrents. Geochim. c:)snochim. Acta., 26: 181-196.
Nold, J .L. and Erickson, K.P., 1967. Changes in K-feldspar staining rrethods and adaptions for field use. Am. Miner., 53: 278-282.
Norrish, K. and Hutton, J. T., 1969. An accurate X-ray spectrographic rrethod for the analysis of a wide range of geological samples. Geochim. ccsrrochim. Acta., 33: 431-453.
Pearson, M.J., 1978. Quantitative clay mineralogical analyses from the bulk chemistry of sedirrentary rocks. Clays and clay Minerals, 26: 423-433.
Pettijohn, F.J., 1957. Paleocurrents of Lake Superior Precambrian quartzites, Bull. geol. Soc. Am., 68: 469-480.
Pettijohn, F .J., 1975. Sedilrentary rocks. Harper and Row, New York, 628pp.
Pettijohn, F.J., Potter, P.E. and Siever, R., 1972/3. Sand and sandstone. Springer-Verlag, Berlin: 618pp.
Picard, M.D., 1971. Classification of fine-grained sedirrentary rocks. J. sedim. Petrol., 41(1): 179-195.
Pierce, J.W. and Siegel, F.R., 1969. Quantification in clay mineral studies of sedirrents and sedirrentary rocks. ,T. sednn. Petrol., 39: 187-193.
Porrenga, D.H., 1967. Clay mineralogy and geochemistry of recent marine sedirrents in tropical areas. Publ. van het Fysisch-Geografisch Lab., Univ. van Amsterdam, 9: 1-145.
Potter, J.F., 1977. The texture of corrpacted b.inodal sedirrents. J. sedim. Petrol., 47(4): 1539-1541.
P0t1ers, M.C., 1953. A new roundness scale for sedirrentary particles. J-. sedim. Petrol., 23: 117-119.
Pretorius, D.A., 1964a. The geology of the South Rand Goldfield. In: S.H. Haughton (Editor), The Geology of S,are ore r:eposits in Southern Africa, Geol. Soc. of s. Afr., Johannesburg, 1: 219-282.

93
Pretorius, D.A., 1965. I.aver division of the Witwatersrand system. Unpub. report to Ad. Hoc. ccmnittee on stratigraphic narrenclature of the Witwatersrand Triad, Johnnesburg, 4pp.
Pretorius, D.A., 1966. Conceptual geological m:xiels in the exploration for gold mineralisation in the Witwatersrand Basin. Inform. Circ. econ. Geol. Res. Unit, Univ. Witwatersrand, Johannesburg, 33: 39pp.
Pretorius, D.A., 1974. The nature of the Witwatersrand gold - uranium deposits • Inform. Circ • e ::on. Geol. Res • Unit, Univ. Witwatersrand, Johannesburg, 86: 50pp.
Potter, P.E. and Pettijohn, F.J., 1977. Paleocurrents and Basin Analysis. 2nd Edition, Springer-Verlag, Berlin-Heidelberg-New York, 425pp.
Raaf, J.F.M. de. and Boersma, J.R., 1971. Tidal deposits and their sedi:rrentary structures. Geologie Mijnb., 50: 479-504.
Ramsay, J.G., 1961. The effects of folding on the orientation of sedimen-tation structures. J. Geol., 69: 84-100.
Ramsay, J.G., 1967. Folding and fracturing of rocks. McGraw-Hill, New York, 568pp.
Reiche, P., 1938. An analysis of crosslamination of the Coconino sandstone. J. Geol., 44: 905-932.
Reineck, H.E., 1963. Sedi:rrentgefiige im Bereich der sudlichen Nordsee. Abh. senckenbergische naturforsch. Ges., 505:138pp.
Reineck, H.E. and Singh, LB., 1975. Depositional sedimentary environrrents -with reference to terriginous elastics. Springer-Verlag, Berlin, 439pp.
Reineck, H.E. and Wunderlich, F., 1968. Zur unterscheidung von asymretrischen oszillations rippeln und stromungs rippeln. Senchkenbergiana I..ethaea, 49: 321-345.
Renton, J.J., Heald, M.T. and Cecil, C.B., 1969. of pressure solution of quartz. J . sedi.m.
Experimental investigations Petrol., 39: 1107-1117.
Ibbinson, G.D., 1959. ~asuring dipping beds. Geotirres, 4(1): 24-25, 27.
Ibering, C., 1968. The tectonics of the West Rand syncline: a field study of brittle failure in the Witwatersrand Basin. Inform. Circ. a::on. Geol. Res. Unit, Univ. Witwatersrand, Johannesburg, 48: 28pp.
Rogers, A.W., 1921. The geology in the neighbourhood of Heidelberg. Trans. geol. Soc. S. Afr., 24: 17-52.
Rogers, A.W., 1922. The geology of the country around Heidelberg. Explanation of sheets 52B (Heidelberg), Spec. Publ. geol. Surv. s. Afr., Pretoria, No. 4 •
Rogers, A.W., 1933. calcareous sedi:rrents in the Witwatersrand system. Trans. geol. Soc. S. Afr., 36: 65-68.
Ibnov, A.B. and Yaroshevskiy, A.A., 1968. Chemical structure of the earth's crust. Geochemistry Inter., 5: 1041.

94
Sassi, F.P. and Scolari, A, 1974. The b0 values of the potassic white micas as a barcaretric indicator in lo.v grade rretarrorphism of pelitic schists. Contr. Miner. Petrol., 45: 143-152.
Sassi, F.P., 1972. The petrologic and geologic significance of the value of potassic white micas in low-grade rretarrorphic rocks. An application to the Eastern Alps. Tschennaks Miner. Petrol. Mitt., 18: 105-113.
Sawyer, A.R., 1907. New Rand Goldfield, Orange River Colony. Trans. Inst. Min. Eng. Newcastle (England), Vol. 33.
Schenrerhorn, L.J .E., 1974. Late Precambrian mixtites: Glacial and/or nonglacial? Am. J . Sc. , 27 4: 6 7 3-824 •
Schoen, H.R., Foord, E. and Wagner, D., 1972. Qu2ntitative analysis of clays- problems, achieverrents, and outlook. Int. Clay Conf. , Madrid.
Schultz, L.G., 1964. Quantitative interpretation of mineralogical carrposition from X-ray and chemical data for the Pierre Shale. Prof. Pap. U.S. geol. SUrv., 391-C: 3lpp.
Selley, R.C., 1973. Ancient sedirrentary environrrents. Chapman and Hall, London, 237pp.
Shaw, D.M., 1954. Geochemistry of pelitic rocks. Part l and Part 11. Bull. geol. Soc. Am., 65: 1152-1182.
Shaw, D.B. and Weaver, C.E., 1965. shales. J. sedim. ~etrol., 35:
The mineralogical carposition of 213-222.
Shircp, N.F., Witters, J., Potter, P.E. and Schleidher, J.A., 1969. Distinguishing marine and fresh water muds. J. Geol., 77: 566-580.
Shiraki, K., 1978. Chromium. In: R.H. Wedepohl (Editor), Handbook of Geochemistry, Vol. 11/3, Springer-Verlag, Berlin-Heidelberg-New York.
Spector, D.L., 1977. Aspects of 11alrresbu:ry rretarrorphism in the Brandwacht area near WOrcestor, application of white mica geotherrrometry and geobarorret:ry. Unpub. Geol . Honours Proj • , Gni v . Cape To.,m, Cape Ta,.,.Jn,
39pp.
Spraque, A.R.G., 1979. A contribution to the chemistry and petrology of the Witwatersrand SUpergroup. Unpubl. Geol. Honours Proj., Univ. Cape To.rm, Cape To.vn, 3 7pp.
Tanner, W .F., 1967. Ripple mark indices and their uses. Sedirretology, 9: 89-104.
Toogocxi, D.J., 1976. The structural and rretarrorphic evolution of a gneiss terrain in the Nanaqua belt near Onseepkans, South West Africa. Precambrian Res. Unit, Univ. Cape To.vn, Bull. 19.
Turner, C.C. and Walker, R.G., 1973. Sedirrentology, stratigraphy and crustal evolution of Archaean greenstone belts near Sioux Lookout, Ontario. Can. J. Earth Sc • , 10: 817-845.
Udden, J.A., 1914. geo. Soc. Am.,
Mechcmical catp)Sition of elastic sedirrEnts. Bull. 25: 655-744.
UsdCMSki, H.E., 1967. Die genese von dolanit in sedinBnten. Si;ringer-Verlag, Berlin- Heidelberg-New York.
Walther, J., 1893-94. Einleitung in die Geologie als historishce Wissenschaft; Beobachtung uber die Bildung der Gesteine und ihrer organischen Einschlusse. Jena, G. Fischer, Bd. 1.
Walter, M.R., 1972. A hot spring analog for the depositional enviro:nrrent pf Precarrbrian iron fonnations of the Lake SUperior region. Econ. Geol., 67: 965-972.
Weaver, C.E., 1960. Possible uses of clay minerals in the search for oil. Pr.oc. 8th National Conf. on Clays and clay Minerals, 8: 214-227.
Weaver, C. E. , 196 7. Significance of clay minerals in sedinBnts. In: B. Nagy and U. Colarrbo (Edi tors) , Fundam2ntal aspects of petroleum geochemistry.
Weaver, C.E., 1978. Clay minerals. In: R.W. Fairbridge and J. Bourgeois (Editors), The Encyclopedia of SedinBntology, &Mden, Hutchinson and Ross Inc., 90lpp.
Weaver, C.E. and Pollard, L.D., 1973. The chemistry of clay minerals. Develoµ-rents in SedinBntology, 15.
Weber, K., 1972. Notes on dete:rmination of illite crystallinity. Neues. Jb. Miner. Mh., 6: 268-275.
Wedepohl, K.H., 1971. Enviro:nrrental influences on the chemical composition of shales and clays. In: L.H. Ahrens et al (Editors), Physics and Chemistry of the Earth, 8: 305-333, Pergarron Press, Oxford.
White, M.L., 1957. The occurence of zinc in soil. Econ. Geol., 52: 645-653.
Willis, J.P., Ahrens, L.H., Danchin, R.V.Erlank, A.J., Gurney, J .J., Hofrreyer, P.K., ~y, T.S. and Orren, M.J., 1971. Sare inter-elenent relationships between Lunar rocks and fines and stony meteorites. Proc. 2nd Lunar Sci. Conf., Houston, Texas, 1971, 2: 1123-1138.
Willis, J.P., Fortuin, H.H.G. and Eagle, G.A., 1977. A preliminary report on the geochemistry of recent sedinBnts in Saldanha Bay and Langebaan Lagoon. Trans. rcy. Soc. S. Afr., 42: 497-509.
Winkler, H.G.F., 1974. Petrogenesis of rretarrorphic rocks. SpringerVerlag, Berlin, 320pp.
Winter, H. de la R., 1978. Subdivisions of the ~vitwatersrand triad: the Ibminion Group, the Witwatersrand Supergroup and the Ventersdorp Group. Unpubl. provisional stratigraphic subdivisions, S. Afr. camni ttee for stratigraphy, Geel. Surv. , Pretoria.
Whiteside, H.C.M., Glasspool, K.R., Hiemstra, S.A., Pretorius, D.A. and Antrobus, E.S.A., 1976. Gold in the Witwatersrand Triad. In: C.B. Coetzee (Editor), Mineral resources of the Republic of S. Afr., Geol. Surv. s. Afr. , Pretoria, 462pp.
Wunderlich, F., 1970. Genesis and environrrent of the "Nellenkopf chenschichten" (l..DNl=r Eirsian, Rheinian Devon) at I.ocus Typicus in canparison wiht
nodern coastal enviro:nrrent of the Gennan Bay. J. . sedim. Petrol. , 40: 1()?-130

96
Yaalon, D.H., 1961. Mineral cauposition of the average shale. Clay Miner. Bull., 27: 31-36.
Young, G.M., 1973. Tillites and aluminous quartzites as possible tine markers for middle Precarrbrian (Aphebian) rocks of North A:rrerica, Geol. As. canada Spec. Publ., 12: 92-127.
Zwart, H.J., 1963. ~tanorphic history of Central Pyrenees. Part II, Valle de Aran, Sheet 4. Leidse Geol. ~edel., 28: 321-376.

aN0 XIC1N3dd'if
L6

98
A RE.VIEW OF THE WEST RAND GROUP
BY
P. M. Carrden - Smith
(Accepted for publication in the Econanic Geology Research Unit Infonnation Circular, University of the Witwatersrand)
January, 1979.

CONTENTS
1 . INTRODUCTION
1.1 Location of West Rand Group
1.2 Historical Note
1.3 PUrpose of Review
2. AGE OF THE WI'IWATERSRAND SUPERGRCUP
2.1 Geochronology
2.2 Possible Correlatives
3. STRATIGRAPHY
3.1 The Central and West Rand area
3.2 The Heidelberg - Balfour - Delmas area
3.3 Vredefort area
3.4 Klerksdorp - Ventersdorp - Ottosdal area
3.5 Northernrrost West Rand Group outlier
3.6 Orange Free State goldfield (Odendaalsnis area)
4. MARKERS
5. STRUCTURE
5. 1 . Folding
5.2. Faulting
6 • pETR()r..a;y
6.1 Mineralogy of the shales
6.2 Sandstones in the West Rand Group
7. GEXX'.HEMISTRY
7 .1 Shales
7.2 Sandstones
8 • ME:l'AM::>RPHISM
9. BASIN ANALYSIS
9.1. Arrangem:m.t and type of fill
9.2. Tectonic setting
9.3. Depositional enviroment
REFERENCES
Page
1
1
1
2
3
3
4
6
6
13
22
27
36
37
41
42
43
44
45
45
46
48
48
49
50
51
52
53
54

I
LIST OF FIGURES
Figure 1 : The four areas of West Rand Group outcrop.
Figure 2 : Distribution of the Witwatersrand Supergroup below cover of Karo:>, Transvaal and Ventersdorp sequences.
Figure 3 : Cauparison of West Rand Group stratigraphy as defined by Mellor (1917) and SACS (1978).
Figure 4
Figure 5
Figure 6
Figure 7
Figure 8
Figure 9
Figure 10
Figure 11
Figure 12
Figure 13
Stratigraphy of the West Rand Group in the West Rand and Central Rand areas (after Mellor 1911,1913).
Simplified map showing the basin gearetry of the HeidelbergDelrnas-Balfour area.
Cauparative West Rand Group stratigraphy of the HeidelbergDelrnas-Balfour area (after Jansen et al,1972; Button, 1970).
Cyclic sedimentation in sacE West Rand Group sediments (after Button, 1968).
Cauparison of lithology and thickness of West Rand Group stratigraphy in the Klerksdorp, Central-West Rand, Vredefort and Odendaalsrus areas.
Map showing the location of the northernmost West Rand Group outlier.
Fripp and Gay's (1972) m:::xiel for the simUltaneous formation of folds in the Contorted Bed and cleavage in the argillaceous rocks.
Map showing the peripr.ery of the West Rand Group/Central Rand Group basins and the major faults.
The extrapolated isopachs (rretres) of the West Rand Group (after Pretorius, 1974).
Schematic illustration of Vos's (1975) proposed manner of evolution for the Witwatersrand basin.

Table 1
:Table 2
Table 3
Table 4
Table 5
Table 6
Table 7
Table 8
Table 9:
Table 10:
LIST OF TABLES
Age :rreasurements relevant to the dating of the Witwatersrand Supergrrup.
Canparison of the thickness of the Orange Grove Quartzite Fonnation in the Heidelberg and Delmas areas.
Government Subgroup in the Heidelberg-Delmas-Balfour area.
Breakdown of the Governrrent Subg"roup in the Klerksdorp area.
Markers within the West Rand Group.
Correlation of magnetic ananalies in the West Rand Group.
Major elenent analyses in the Hest Rand Group.
Average trace and alkali abundances (in ppn) in West Rand Group rocks.
Nature of metamorphism exhibited by the sedirrents of the West Rand Group.
Canposite stratigraphic thickness of West Rand Group and areally and structurally related Groups.

1. INTRODUCTION
1.1 Location of West Rand Group
The Witwatersrand Supergroup consists of about 7400 m of sediments lying
in a roughly ovoid basin 350 km long and 200 km wide within the Kaapvaal
craton (Pretorius 1974). Stratigraphically, the Witwatersrand Supergroup
has been separated into two groups: a shale dominated West Rand Group
(previously known as the Lower Division) and a quartzite and conglomerate
dominated Central Rand Group (previously known as the Upper Division).
The scattered areas of West Rand Group outcrop are shown on Figure 1.
Borchers' (1961; 1964) map (Figure 2) shows the distribution of the Wit
watersrand Supergroup below the cover of Karoo, Transvaal and Ventersdorp
~
sequences. All these weakly metamorphosed sedimentary/volcanic successions
rest with marked unconformity on a highly metamorphosed basement complex
comprising the Older Granite and the Swaziland Sequence which together con
stitute an early Precambrian granite-greenstone terrain.
1.2 Historical.Note
Fred Strubens discovered gold in the quartz veins of the West Rand Group
at Wilgespruit in 1884. A year later, he drew the first geological section
through the Witwatersrand, showing the position of the Confidence Reef and
three other units containing auriferous quartz veins - the Surprise, Govern
or and Mirella Reefs. The discovery of the auriferous banket reefs by
George Harrison and George Walker in March 1886, and the proclamation of the
Witwatersrand as a goldfield in September 1886, contributed to geological
enquiry being focused in this part of South Africa. Numerous papers (most
ly German and French) were published on the geology of these strata before
the turn of the century.
Draper (1896; 1897), Molengraaff (1904), Sawyer (1911), Hatch (1898;
1904; 1913) and Corstorphine (1904) were the first geologists to systematic
ally describe Witwatersrand strata. However, it was only during the period
from 1910 to 1930 that Mellor (1911; 1913; 1917) undertook a regional study
of the Supergroup. Mellor (1911) explained the differences in thicknesses
of strata mapped by former geologists as "a consequence of the original
conditions of deposition and also as one which is subject to the appearance
of the great bodies of sediment in some localities which have no represent
atives in adjacent areas".

IJ:~J>iA~Nf.~ .... .,, __ ..
10•~
r
...,.~ ~m,~A.. ·-
~ ., 'KLERKSOORP (:~:
"-:;:;~·--...
~ ,,.. ....... , .. I
D
FIGURE I
~ODI NOA.M.lltua
"'WELKOM
,ic.ua:1 ONI
.,. ,.
AREAS OF WEST
RAND GROUP
OUTCROP
50 HJO ~-------'--------' Kilometers
The four major outcrop areas of the West Rand Group.

FIGURE 2
West Rand
N
1 LJCentral Rand Group
[/,:]west Rand Group
c::::JGranite and gneiss
11111 Mining districts
0 s,o Km
Map showing the distribution of the Witwatersrand Supergroup below the cover of Karoo, Transvaal and Ventersdorp sequences as revealed by diamond drilling (after Borchers 1964).

-2-
Realising the complexity of the problem and having a knowledge of the
extensive faulting in the West Rand Group, Mellor (1911) constructed "an
approximately representative section of the lower Witwatersrand applicable
to both the Central and at least adjacent portions of the Western Rand".
By 1917, the detailed stratigraphy of the West Rand Group had been deciphered
by Mellor in the faulted country on the Central and West Rand, and since then
the persistence of most of the lithologies has been confirmed by Rogers
(192'~) for the Heidelberg area and by Nel (1927; 1933; 1939) for the Vrede-
fort, Klerksdorp and Ventersdorp districts. During the 1930's magnetic
geophysical methods traced the magnetic shales of the West Rand Group be
neath younger strata (Krahmann 1930; 1936, Reinecke and Krahmann 1935;
Weiss 1936; 1950) and by 1940 deep diamond drilling began to provide direct
evidence of the extension of the Witwatersrand Supergroup and a cover of
younger strata.
Mellor's work (1911; 1917) remained the basis of subdivision of the
West Rand Group for over forty years and it was only in 1960 that Collender
questioned it. Verwoerd (1964) and Truswell (1967) reviewed the nomen
clature used in the South African Stratigraphic column, and subsequently, a
new classification of the Witwatersrand sediments was compiled by Wagener
(1972). Winter (1978), the chairman of the Witwatersrand Working Group of
SACS (South African Committee for Stratigraphy) proposed a lithostratigraph
ic subdivision of the Witwatersrand Supergroup. Figure 3 compares Mellor's
(1917) stratigraphic column to that of the South African Committee for
Stratigraphy.
to.
In this review the terminology used by SACS will be adhered
1.3 Purpose of Review
The literature on the Witwatersrand is voluminous and there is hardly
an aspect of the deposits that has not been studied. Most papers, books
and reviews, however, are concerned with the auriferous and uraniferous
reefs of the Cent~al Rand Group. The purpose of this review, together with
the bibliography, is to summarise what is currently known about the West
Rand Group.
The significance of understanding more about the West Rand Group is
threefold. Firstly, sedimentological and geophysical marker horizons
within these strata have long been used to correlate rock-units over large
areas. It has, however, become clear that these marker horizons are not as

after MELLOR (,917)
MEMBERS I. BEDS SEIIIIES
·1 markers I
JEPPESTOWN
SERIES
Government 1cef I
~ w I-
GOVERNMENT v) Coronat ,on reel >-l/)
REEF
0 z
SERIES < a:: l/)
er w I-< 3 I--~
er I Prom,se reels I w 3 0 _J
I
Hospital Hill Ouartzites
HOSPltAL
Hill
Speck led Bed I SERI ES
Ripple - marked ou,rt z11esl
Orange Grove Ouaru;tes I
after SACS ( 1 s 7 a)
I .., V \I
I tvv ~
~
• • • I:
I
I
I
FORMATIONS
ROODEPOORl
CROWN LAVA
FLORIDA
QUARTZITE
WITPOORTJIE
CORONATION SHALE
PROMISE
QUARTZITE
MEMBERS I. BEDS
lrnarkers)
I
I I
Government reef
orona11on reef
Hamberg Oua.t21•e l.'le,.,bcr
I ffi ,ff I __ L Promise reel
lttlll1ool BR IX ro ..
----
I_ (:~~=I I I Observatory Sh de. Member Con101 ted aed
-~ I Speck ied Bed
PARK1"0WN SHALE Red Shd ,es
~~ I Ripple marked Quartzite
Water Tower Shale Member
I
I t:~3 IOltANGEGROVE 200
ou•RTZITE
I L ::, 0 a:
" ID
I ::, Ill
z ~ 0 ~
Ill ... I L
L ... -.
a. ::> 0 a: c., ID ::> Ill
I-z ... :IE z a: ... > 0 c.,
L ::> 0 a:
" ID ::, Ill
.... :: ::c .... C
I I-.: Ill 0 ::c
I
Figure 3: Comparison of West Rand Group stratigraphy as defined by Mellor (1917)
Q.. ::> 0 er (!)
0 z < er I-ti)
w ~

-3-
persistent as previously thought. Secondly, the environment of deposition
has been attributed to littoral (Becker 1896; Gregory 1908; Young 1917)
deltaic or estuarine (Mellor 1916), marine (Graton 1930; Sharpe 1949),
alluvial (Reinecke 1928; Bain 1955; 1960), and alluvial plain and lacustrine
(Pretorius 1966; Vos 1975). An overall synthesis of previous work done by
Whiteside~ al (1976) concluded that the "lower division strata preserved
around the periphery of the basin are almost exclusively composed of distal
facies sediments, deposited for the most part beyond the fan base". A
better knowledge of the geochemical and sedimentological characteristics of
the West Rand Group would refine these wide-ranging models for the deposit-
ional environment of the Witwatersrand. Lastly, although conglomerates
within the West Rand Group are lenticular and theic gold content erratic,
they have been mined in the Rietkuil Syncline and at the Buffelsdoorn Mine
to the north west and the north of the Klerksdorp Goldfield. This review
will thus provide a basis for further consideration of the nature and origin
of the strata and the extent of mineralisation.
2. AGE OF THE WITWATERSRAND SUPERGROUP
2.1 Geochronology
Previously, an interpolated age of the Witwatersrand Supergroup was de
fined by a maximum of 2720!55 m.y. (Rb-Sr) for underlying granite (Allsopp
1964) and a minimum of 2300!100 m.y. (U-Pb) for lavas of the overlying
Ventersdorp Supergroup (van Niekerk and Burger 1964). Rundle and Snelling
(1977) assigned a younger age limit of the Witwatersrand Supergroup at
2290!85 m.y. (Ventersdorp lava) and suggested an older limit of 2740!19 m.y.
(weighted mean age of the Schweizer Reneke granite and the Dominion Reef
lava). These wide time limits for the deposition of the Witwatersrand
Supergroup have resulted in several, more precise estimates being attempted.
Pretorius (1974) suggested an age of between 2500 and 2750 m.y. whereas
Reimer (1975) calculated, on the basis of approximated accumulation rates,
that the Witwatersrand Supergroup was deposited over a period of 30-40 m.y.
between 2470 m.y. and 2370 m.y.
New age-data for the Ventersdorp Supergroup restricts the age of the
Witwatersrand Supergroup to between 2620 and 2800 m.y. The lower limit is
set by van Niekerk and Burger's (1978) dating of a rhyolite within the
Makwassie Formation of the Platberg Group in the Ventersdorp Supergroup
(2620!55 m.y., U-Pb). However Allsopp (1978) (personal communication)
considers the 2620 m.y. date to be too high and suggests that the zircons
on which the age was determined are relic. Clearly, a direct age deter-
mination on either the Crown lava in the Jeppestown Subgroup or on the Bird

-4-
amygdaloid lava in the Central Rand Group would be invaluable in helping
to decide between the widely divergent ages outlined above. Reviewing all
the geochronological data published on the West Rand Group, a tentative
estimated age of 2750 m.y. was put on the Contorted Bed, Hospital Hill
Subgroup by SACS (1978). Table 1 is a tabulation of all radiometric dates
pertinent to the Witwatersrand Supergroup.
On present evidence the Witwatersrand basin is therefore Archaen,
i.e. >2500 m.y. old. However, Pretorius (1974) noted that "the transition
from Archaen to Proterozoic style of crustal evolution took place on the
Kaapvaal craton at between 3000 and 3250 m.y. ago. On other shield areas
of the world, the age of transition has been dated at about 2500 m.y."
This comment emphasises the Proterozoic aspect of the Witwatersrand Super
group despite its formal position in the Archaen.
2.2 Possible Correlatives
The Dominion Group, Witwatersrand Supergroup and Ventersdorp Supergroup
(generally known as the Witwatersrand Triad) are considered to be areally
and structurally closely related (Brock and Pretorius 1964a). Cloud (1976)
prefers to group the Pongola Group, Dominion Group, Zoetlief Group, and
Witwatersrand Supergroup together, on the basis that the entire sequence,
from the Pongola Group to the Witwatersrand Supergroup, is unique in the
record of crustal evolution.
The Economic Geology Research Unit (E.G.R.U.) of the University of
Witwatersrand evaluated the following possible correlatives of the Witwaters
rand Supergroup:
(i) Nzuzi and Mozaan Subgroups:- On the 1955 maps of the Geology of
South Africa compiled by the Geological Survey, the Mozaan Subgroup of the
Pongola Group is correlated with the Witwatersrand Supergroup and the Nzuzi
with the Dominion Group based on the work of Humphrey (1931) and Truter
(1949). Allsopp et al (1962) date of a granite (3070 m.y.) intruded into
the Mozaan near the Swaziland border and Davies~ al (1969) age of 2900 m.y.
for the Usushwana Complex in Swaziland, which is intrusive into the Mzuzi
Subgroup, confirm Pretorius'(1964) conclusions that the Mozaan is older than
the Witwatersrand Supergroup based on studies in the Mahlangatsha area of
Swaziland.
(ii) Dominion Group:- Molengraaf (1905) considered the sediments in
this group to be equivalent to the Orange Grove quartzite of the West Rand

UP/SUPERGROUP
:'.MENT :1LEX
CNION JP
~ERSDORP ~RGROUP
TABLE 1: Age measurements relevant to the dating of the Witwatersrand Supergroup
MATERIAL DATED METHOD AGE IN M.Y.
MAXIMUM AGE OF WITWATERSRAND SUPERGROUP
Granite
Granite
Granite (uraninite,monzanite)
Spherulitic andesite (apatite, sulphide)
Quartz porphyry (sulphide)
Conglomerate (uraniferous minerals)
Dacite
Andesi te
Rb-Sr
Rb-Sr
U-Pb
U-Pb
U-Pb
U-Pb
U-Pb
U-Pb
2700'!55
2900'!150
3100:!:100
2800!.60
2800
3050:.50
+ 2820-110 +
2830-110
MINL~UM AGE OF WITWATERSRAND SUPERGROUP
Ryolite (zircons) U-Pb 2620'!50 + lava (zircon) U-Pb 2300-100 + lava (zircon) U-Pb 2290-85
lava (zircon) U-Pb 2235'!50
lava (zircon) + U-Pb 2245-90
lava U-Pb 2238~110
REFERENCE
Allsopp (1964)
Nicolaysen~!!_ (1962)
Nicolaysen !E_ al (1962)
van Niekerk and Burger (1969b)
van Niekerk and Burger (1969a)
Nicolaysen et al (1962) Rundle and Snelling (1977)
van Niekerk (1968)
van Niekerk (1968)
van Niekerk and Burger (1978)
van Niekerk and Burger (1964)
Rundle and Snelling (1977)
Rundle and Snelling (1977)
van Niekerk (1968)
van Niekerk and Burger (1964)

-5-
Group and the lavas he assigned to the Ventersdorp Supergroup. Nel (1934)
included the ov~rlying lavas in the Dominion Group, but still allocated it
to the West Rand Group. Truter (1949) correlated the Dominion Group with
the Uitkyk, Godwan and Karas Formations and suggested that they be regarded
as separate groups. This view was supported by Von BackstrBm (1952; 1962), (ICJ 74)
Nel and Verster (1962) and Van Eeden et al (1963). PretoriusArejects the
concept of the Dominion Group succession as a separate group and suggests
that it should again be relegated to the West Rand Group of the Witwaters
rand Supergroup, because it represents the initial phase of volcanic activ
ity and sedimentation within the Witwatersrand basin.
(iii) The Zoetlief, Wolkberg and Uitkyk Formations and the rocks between
Thabazimbi and the Botswana border (termed the Buffalo Springs Group by
Tyler 1978) are all lithologically similar to the Dominion Group at the
base of the Witwatersrand Supergroup (Pretorius 1966).
Recent lead isotope dating of acid lavas indicate that the Zoetlief
volcanic sequence was extruded 2500 - 2700 m.y. ago (Van Niekerk and Burger
1968) which suggests on present geochronological evidence that the coarse
feldspathic sediments of this formation could have been deposited while
the Witwatersrand Basin was being filled.
The Wolkberg Formation, named by Truter (1949) and correlated with the
Witwatersrand sediments, is now regarded as an integral part of the Trans
vaal Supergroup, grading into, and being conformably overlain by, the Black
Reef Quartzite (Button 1973).
Van Rooyen (1947) mapped a small group of rocks lying north east of
Potgietersrust which he named the Uitkyk Formation and tentatively correlat
ed them with the Witwatersrand Supergroup. Pretorius (1964) noted the close
structural and lithological resemblance between this Formation and that of
the Moodies and Fig Tree sediments in the Swaziland Supergroup. Pretorius
concludes, as did Hall (1911), that the Uitkyk Formation is a synclinal
remnant outlier of the Swziland Supergroup.
The rocks between Botswana and Thabazimbi have been correlated with the
Dominion Reef Group (Truter, 1949; Schatte ~ al 1960), the Ventersdorp
Supergroup (Kynaston 1911; Jansen 1974) and more recently with the Wolkberg
Group of the Transvaal Supergroup (Tyler 1978).
(iv) The Godwan Formation in the Kaapsehoop area of the eastern Transvaal
was mapped by Hall in 1905 and 1918 and was thought to be a Ventersdorp
equivalent. Truter (1949) correlated the succession with the Nzuzi Sub
group of the Pongola Supergroup. Recently, Button (197~) correlated the
Formation with the Central Rand Group based on stratigraphic and structural

....... ,
-6-
trends in the Witwatersrand Basin. He rejects Truter's (1949) correlat
ion on the basis that 'the nea~est Pongola sediments are in the Amsterdam
area, 110 km south of Kaapsehoop across the tectonic grain of the Kaapvaal
craton'. Furthermore, the Ventersdorp correlation is not favoured because
the nearest known Ventersdorp rocks at Evander are not of significant thick
ness and a West Rand Group correlation is unlikely because the Godwan con
tains no magnetic shales and orthoquartzites. Button (197i) concludes
that the Godwan Formation is probably 'the easternmost exposure of the
Upper Witwatersrand basin'.
(v) A borehole (441JP) drilled by the Geological Survey south of Mazista
in the Western Transvaal penetrated shales and quartzite of the Hospital
Hill Subgroup. The location of this borehole is outside the presently
known boundary of the Witwatersrand basin, and proved that the West Rand
Group extends considerably farther to the north-west than previously
thought (Martini 1975). Furthermore, the only difference between the
Hospital Hill subgroup drilled in this area to that mapped by Nel (1935)
in the Klerksdorp-Ventersdorp area is the greater number of arenaceous
units present in the former.
3. STRATIGRAPHY
The variations in thickness within the Jeppestown, Hospital Hill and
Government subgroups, the presence of stratigraphic markers unique to cer
tain areas and the recognition of cyclic sedimentation in local areas makes
it convenient to consider the stratigraphy of the West Rand Group in four
separate areas: the Central and West Rand, Heidelberg-Balfour-Delmas (in
cluding the South Rand Goldfield), Vredefort-Parys and the Klerksdorp-
Ventersdorp areas. In addition to these areas, the West Rand Group sedi-
ments have been described in five synclinal outliers; the Bultfontein and
Middelbult basins, which lie north and south-west of the village of Delmas
(Button 1970); the Evander basin - 110 km southeast of Johannesburg (Jansen ~~-5.l
1972); the most northerly outlier of the West Rand Group, situated fifteen
kilometers north of Krugersdorp (Hendriks 1961); and the Orange Free State
goldfield (Coetzee 1960). The first three named will be described under
the heading Heidelberg-Balfour-Delmas Area while the fourth and fifth will
be discussed separately.
3.1 The Central and West Rand area
The Central and West Rand area centered around Johannesburg and extends
from Boksburg in the east to about twenty kilometers west of Krugersdorp in
the west. The West Rand group is best exposed near Krugersdorp where

~~
-7-
faulting has resulted in the duplication and thickening of the succession.
Two of these faults, the Witpoortjie and Roodtpoort, define a horst con
taining the West Rand Group, and it is this structure which forms the
boundary between the West and Central Rand. The stratigraphic column in
these two areas will be described together. [Figure 4 compares the com
posite sections of the West and Central Rand (after Mellor 1911; 1913) and
it is apparent that the succession on the West Rand is thicker than those on
the Central Rand.]
Mellor's (1911; 1913; 1917) stratigr~phic columns for the Central and
West Rand area have been refined by Pretorius (1964), Roering (1968),
Wagener (1972) and Cousins (1965; 1973). The following subdivisions,
stratigraphic terminology and stratigraphic marker horizons have been taken
from the above-mentioned authors and also SACS (1978).
3.1.1 The Hospital Hill Subgroup
On the Central Rand the Hospital Hill Subgroup is divided into three
formations: the Orange Grove Quartzites (200 m), Parktown Shale (700 m)
and Brixton (700 m). The subgroup consists of 60 per cent shales which
are frequently ferruginous and magnetic and 40 per cent fine grained quart
zites. It occupies the stratigraphic column from the base of the Wit
watersrand succession to the base of the quartzite containing the Promise
Reef.
3.1.1.1 The Orange Grove Quartzites
The Orange Grove Quartzites rest unconformably on the Johannesburg
granite dome and on the Muldersdrif Ultramafic Complex. It is a dominant
ly arenaceous formation made up of two major orthoquartzitic units (103 m
and 52 m) separated from each other by shaly or locally schistose members
(not more than 45 m thick). The thickness of the formation remains fairly
constant, although laterally the outcrop is "very variable in appearance
and character" (Mellor 1911). For instance, the first major orthoquart
zitic unit may in some places consist of three quartzite members separated
from each other by thin green to grey shales. The typical bluish black
colour of the first shale band on the West Rand serves as a significant
marker (Roering 1968).
Intermittent thin bands of conglomerate at the base are followed by
thinly bedded, yellowish white to brown, fine to medium grained recrystall-
ized quartzites. The Orange Grove Quartzites do not have a sharp upper
contact, the arenaceous sediments being succeeded by a fine grained facies
through a gradual transition zone (Roering 1968).

WEST CENTRAL RAND RAND
M•• MN
z rlOOI M • '""" i \ D l4NDITCMilU
t- ' 1/) ' W \ $CALI ~ - HUS
8:: '' t M MACN(llC w ...... ,o., -, • '1
' '-0
' ' ' -.... 1(,., fOtU1U,TIONS ~
\ ~ z \ •000t ,.oo•r ~
\ 0 t- \ ~ ~ J co,oc,...-Iii \ \ - .... c:.::· r ~ ;~: 1 \ • flOIIID" W
z : h... ' -, 0:: : ou.t.at 11n
w
g I :·1 I\ ' \
"1t<>tflM. I I \ WIH"OO•tJII L_
aro, r\ z \ w
\ ~ \ z
\ a: ' co•OHATION U,J
\ SHAll ~ ' \ C) ' \
' P,"C*ISI
' ' OUA•T ZIT(
ttOSr'ITAl. ; • '
:f \ U , ~ I .. .,.. I ~ ~, l=:=:=11 J 0 - _ _ . ,_. ...... N4 (Ill) c:c X ! ~ ~ ..-,,., .. , •••mw• ~
...._..KTOW'tll J SHALi (,/)
8( OS : ''"°" -rt..M Q .,..,,. ,,. X
OfU.HG[ G,tOV(
1:.;7.~ '. H G I ou .. rnn • • • • • : • 01..D Cll,t.Nln
Figure 4: Stratigraphy of the West Rand Group
in the West Rand and Central Rand
areas (after Mellor 1911,1913).

-8-
3.1.1,2 Parktown Shale
The Parktown Shale formation has a thickness of approx~"tlately 100 m
on the Central Rand and 1000 m on the West Rand. The formation consists
dominantly of green black to black magnetic shales with interbedded medium
to fine grained quartzites. The Water Tower Shale, Ripple Marked Quart
zite, Red Shales, Speckled Bed, Contorted Bed and Observatory Shale Members
are marker beds on the Central Rand (SACS 1978; Mellor 1911) while on the
West Rand, in addition to these members and beds, a Magnetic Marker forms
a conspicuous outcrop of dark brown to black ferruginous shale. This <lorn-
inantly argillaceous formation gives the best magnetic signature of the
whole Witwatersrand Supergroup succession and was first identified and used
by Draper (1896) in the exploration for the Main Reef.
The Water Tower Shale Member (240 m thick on the Central Rand and 290 m
thick on the West Rand) consists of red to brownish black ferruginous shales.
Lenses of brown to yellow quartzites occur towards the top of the member.
On the West Rand the Magnetic Marker (3-6 m thick) occurs about 370 m above
the base of the Witwatersrand Supergroup.
The Ripple Marked quartzite (6-8 m thick) is a massively bedded quart
zite, greenish grey in colour which often displays well preserved ripple
marks.
Between the Ripple marked quartzite and Speckled Bed is an inconspicu
ous soft, red, shale 230 m thick on the Central Rand and 320 m thick on the
West Rand.
The Speckled Bed is a 1,5 m thick persistent unit varying in composit
ion from a feldspathic quartzite to an arkose. It is called the Speckled
Bed because of its distinctive texture.
Above the Speckled Bed 70 to 120 metres of shale is followed by the
Contorted Bed - a banded ironstone with zones of ferruginous chert, thinly
interbedded silicous argillaceous material and fine grained magnetic quart
zite which are intensely folded (Mellor 1911). The zone of folding is
confined to a 3-9 m thick horizon and according to Fripp and Guy (1972)
there is a strong geometrical control (i.e. can be classified into a parti
cular class of fold (after Ramsay 1967)) over the formation of the folds.
However, Truswell (1977) sees no pattern in the disharmonic contortions and
suggests the folding and contortions are slump features. The Contorted
Bed is the most conspicuous marker on both the Central and West Rand.
The Observatory Shale Member overlying the .Conto~ted ~ed is 130 m
thick on the Central Rand and more than 240 m thick on the West Rand. It
is reddish, purplish or brownish black in colour and is markedly ferrugin
ous just above the Contorted Bed. On the West Rand immediately underlying
r---1

-9-
the quartzites of the Brixton Fonnation is a 3-6 m discontinuous magnetic
shale bed which has 2-12 cm pi~ted solution cavities (Roering 1968).
The Parktown Shale, as defined by SACS (1978) includes Mellor's (1911;
1913) Parktown Beds and about 20 per cent of his Hospital Hill Beds.
3.1.1.3 Brixton Formation
The Brixton Formation is 700 m thick on the Central Rand and about
1600 m on the West Rand. Roering (1968) regards the three major quartzite
units of this formation and the overlying quartzites in the Government Sub
group as an "entire group of dominantly arenaceous sediments belonging _to
a new cycle of sedimentation following after the deposition of the dominant
argillaceous sequence below".
On the Central Rand the three quartzite units are similar to the
Orange Grove quartzites, except in places, for a greenish colour due to
chrome bearing mica, fuchsite. The quartzites are fine to medium grained
with the coarser grains set in a fine grained matrix, which give rise to a
distinctive 'sago structure'. The first quartzite (190 m) is exception
ally fine grained and has few sago bands. The second (140 m) and third
quartzites (100 m) are coarser grained with more frequent sago textures.
According to Mellor (1917), the number of beds which make up the quartzites
of the Brixton Formation (Hospital Hill Quartzites) decreases eastwards,
there being three quartzite horizons at Witpoortjie, two at Maraisburg, and
only one from Johannesburg eastwards. The intercalated shales are dark
grey to black, often ferruginous and magnetic and occasionally banded and
cherty as with the Contorted Bed.
SACS' Hospital Hill Subgroup includes the shale unit (110 m) above the
last Brixton quartzite whereas Mellor's Government Reef Series begins at
the base of this shale unit.
3.1.2 The Government Subgroup
SACS (1978) divides the Government Subgroup (approximately 1700 m) into
three formations - Promise Quartzite (1000 m), Coronation Shale (200 m) and
Witpoortjie (500 m) which do~ correspond to the Government Stage, Corona
tion Stage and Promise Stage of previous workers (Pretorius 1964; Mellor
1911). Coarse quartzites with occasional conglomerates make up about 70
per cent of the succession. Mellor (1917) found the Government Reef quart
zites to be less purely siliceous than those of the Hospital Hill Subgroup.
The subgroup is taken from Mellor's Promise Reef Beds (J) to the top of the
shale (0) overlying the 'Upper Government Quartzite' N2 (Figure 3).

-10-
3.1.2.l Promise Quartzite
The Promise Quartzite Formation consists of three sandstone units with
two shale units on the Central Rand and two sandstone units and a shale
unit on the West Rand. The individual units show great variations in
thickness and are ill-defined due to the rapid alternations of fine grained
sericitic sandstones, shales and coarse grained dirty quartzite (or sub
greywackes).
The lower arenaceous unit is about 310 m thick on the Central Rand and
870 m on the West Rand. About 80 m above the base of this unit, a 0,3 m
thick pebble conglomerate, the Promise Reef, containing pebbles varying
from 2 to 5 cm in diameter occurs on the Central Rand. At about the same
stratigraphic level as the Promise Reef on the Central Rand, Roering (1968)
has recognised a tilloid on the West Rand which has "a reddish weathering
quartzite matrix in which occur widely disseminated rounded pebbles of
varying sizes".
Two 30 m shale bands separated by a 90 m sandstone unit overly this
arenaceous unit on the Central Rand while on the West Rand there is only one
70 m thick shale band.
The quartzite (250 m thick on the Central Rand and 200 m on the West
Rand) underlying the Coronation Shale is a coarse grained white to yellowish
quartzite with numerous coarse grit bands. It is known as the Lower Coron
ation Quartzite (Mellor 1911) of Hamberg Quartzite Member (SACS 1978).
Cross bedding is very common within this thin bedded unit.
3.1.2.2 Coronation Shale
The Coronation Shale (or West Rand Shale) is about 180 m thick on the·
Central Rand and 230 m on the West Rand. It is a "series of flaggy, shaly
beds, passing up into highly ferruginous sandstone and shales" (Mellor
1917). According to Cousins (1973) they "closely resemble a varved shale".
Near Roodepoort on the West Rand, tillites below the Coronation Shale are
markers which are correlated with the tillites in Heidelberg, East Rand,
West Wits Line and Klerksdorp areas (Pretorius 1964). According to Trus
well (1970), the Coronation Shale is of special sifnificance because it is
the stratigraphically highest of the three magnetic horizons within the
West Rand Group (the others being the magnetic horizons within the Water
Tower Slates and the Contorted Bed of the Hospital Hill Subgroup). How
ever, high~r up the succession SACS (1978) noted that there are numerous con
glomerate bands and associated grey to black often highly magnetic shales.
Mellor (1911) used the term 'ferruginous' in many descriptions in place of
the term 'magnetic'. Furthermore, according to Mellor, a "large proportion
of the shales show this property to some degree".

-ll-
3.1.2.3 The Witpoortjie Formation
The Witpoortjie Formation is about 1150 m ~hick on both the Central and
West Rand. SACS' (1978) thickness of 500 m for this formation appears to
be too low as even the thinnest portion of the West Rand Group in this area
that along the Witpoortjie fault - measures 620 m. The Witpoortjie forma
tion consists of dark green magnetic shales, green silty shales and silt-
stones and argillaceous to gritty quartzites. Two of the four arenaceous
units have persistent conglomerate bands while the four shale units in this
formation have no distinctive markers.
The first quartzitic sandstone (180 m thick on both the Central and West
Rand) consists of an alternation of hard coarse gritty quartzites with finer
grained bands. A few centimetres above the base a persistent conglomerate
band, the 'Coronation Reef' outcrops on the Central Rand. On the West Rand
this 1 m thick conglomerate layer is not present although coarse, gritty to
pebbly bands are present near the base. The quartzites fine upwards and
are gradually replaced by a series of soft reddish brown shaly sandstones and
shales (150 m thick).
The second quartzitic unit (90 m) is medium to coarse grained, thin bedd
ed and is yellowish to brown in colour. The top metre is fine grained and
often green in colour. This is followed by a 140 m thick sandy shale which
tends to get more ferruginous at the base of the following quartzitic unit.
The third quartzitic unit begins with a well defined 'reef' on both the
Central and West Rand. The Goverrunent Reef is a conglomerate with pebbles
up to 6 cm in diameter. It is 1 m thick on the West Rand thinning eastwards
to a single line of pebbles on the Central Rand. It is followed by a quart
zitic unit (150 m) which is fine grained in places but generally rather coarse.
36 m above the Government Reef a well developed pebble bed - often better
developed than the Government Reef itself - known as the Government Reef
Leader occurs between Roodepoort and Florida (Mellor 1911). A 40 m shale
overlies this distinctive quartzitic unit.
The uppermost quartzitic unit (150 m thick) in this formation is fine
grained at the base and grades upwards into medium to rather coarse grained
quartzites, with occasional bands of grit. The contact with the overlying
shale is transitional with thick bedded, purplish red sandstones passing into
ferruginous slaty shale. The shale (150 m thick) is fairly massive and is
incorporated into the Jeppestown Series by Mellor {1917).
3.1.3. The Jeppestown Subgroup
The Jeppestown Subgroup consists of three formations - the Florida (SRCS 1'76')
Quartzite (300 m), Crown Lava {250 m) and Roodepoort {500 m). A Cousins (1965)

-12-
noted the persistence of the Crown lava (formerly the Jeppestown lava) into
the Central Rand area and thus refined the succession compiled by Mellor
(1911) as cited by Pretorius (1964). However, Cousins (1973) points out
"that Mellor was handicapped severely in his field mapping by the lack of
exposures in the wide, flat valley which follows the Jerpestown beds from
Johannesburg to Roodepoort".
3.1.3.1 The Florida Quartzite Formation
This formation consists of two quartzitic units separated by a 90 m thick
slaty shale. The lower quartzitic unit (70 m) has an erratically occurring
thin pebble band at its base and fines upwards. The upper quartzite (140 m
thick) is strongly cross bedded, rather coarse and massive in places. The
interbedded shale is magnetic (Cousins 1973).
3.1.3.2 The Crown Lava
These lavas are described as "dark green, often slightly brown, fine
grained to cherty lavas, occasionally finely porphyritic, often amygdaloidal
with associated minor quartzitic, tuffaceous or agglomeratic sediments"
(SACS 1978).
3.1.3.3 The Roodepoort Formation
This formation consists of three shale units separated from each other
by two fine grained argillaceous quartzites. The lower shaly unit seldom
outcrops and has a thickness of about 95 m. No distinctive features have
been recorded for the overlying quartzite (72 m), shale (108 m) and quartzite
(95 m) units.
More information is available for the uppermost shale unit probably be
cause of its frequent occurrence in the footwall of the Main Conglomer~te on
the Central Rand. Cousins (1965) noted that "the upper shales of the Jeppe-
stown subgroup grade gradually from fine to coarser-grained sediments. Above
the massive shale, argillaceous quartzite with shale bands is found for some
15 metres. The shale bands first become subordinate and then absent, while
the argillaceous quartzite grades slowly upwards into cleaner, less argillace
ous and coarser grained quartzite. The change is progressive without any
sudden variation: Furthermore, chloritoid and 'square pebbles' have been
recorded between the uppermost shale and Main Conglomerate (Roberts and
Kransdorff 1938; Pegg 1950 and Wiebels 1951). Wiebels (1955) believes that
these and other similar rocks are of glacial origin. North of the Wit
poortjie Fault Toens and Griffiths (1964) describe chert and quartz cobbles
which are usually about 15 cm in diameter occurring midway between the shale
and the Main Conglomerate. SACS (1978) has named all these arenaceous sedi
ments between the Main Conglomerate (which is the Main Reef, Leader reef,

3.2
-13-
South reef, etc) and shale horizon the Maraisburg Quartzite and incorporated
them into the Central Rand Group. Cousins (1965) suggested that the base
of the Main Conglomerate, not the top of the upper shale of the Jeppestown
Subgroup, should be taken as the contact between the West and Central Rand
Group. In all the outcrop areas, bar the proximal arenaceous sediments of
the Klerksdorp area where no argillaceous unit exists in the Roodepoort
Formation the SACS (1978) stratigraphic nomenclature will be adopted.
The Heidelberg-Balfour-Delmas Area
East of Heidelberg the entire West Rand Group succession crops out almost
continuously along the eastern rim of the Witwatersrand basin, whereas south
of the Sugarbush Fault and near Delmas only scattered outcrops occur due to
the covering of younger formations. The exact outline of the Witwatersrand
basin is still unknown in this area because of the limited drilling that has
taken place (Whiteside et al 1976). The Heidelberg-Balfour-Delmas area has
in the past been divided into four separate areas - the Heidelberg area,
South Rand area, Evander area and Delmas area (Figure 5).
In the Heidelberg area, West Rand Group strata crop out in an area bound
ed by the towns of Nigel, Heidelberg and Balfour. De Jager (1964) reviewed
the geology of this area (the East Rand) 'Which was first mapped by Rogers in
1918.
The South Rand area (which incorporates the South Rand Goldfields as
delineated by Pretor.ius 1964) is situated between the Sugarbush Fault and the
Vaal River. The area has been intensively drilled (Sawyer 1904) and a re
view of its geology has been presented by Pretorius (1964). The three sub
groups of the West Rand Group are all represented but they thin from a total
thickness of 2710 metres in the northernmost portion of the area to 1615
metres in the south eastern area where the field is terminated by granite and
Swaziland Supergroup rocks. '
The Witwatersrand Supergroup in the Delmas area has been mapped by
Button (1970). The small amount of data (Fox 1939) available on the West
Rand Group in the Evander basin has been collated by Jansen~ al (1972).
The comparative stratigraphy of the West Rand Group in these four areas
is given in Figure 6 and it is apparent that the succession decreases in
thickness and becomes more argillaceous both in an easterly and a southerly
direction. Furthermore, although some of the stratigraphic markers typical
on the West and Central Rand are identified in the Heidelberg area, there
are other markers (eg. Black grit and Blue grit) which are unique to this
region.

\ • 'Z
\~ ·~ Johannesburg • f
Dome .. \
I.fl ---1 G-----.-::~ : ..... ~ ·-.. a ..... : 2
~~ . \~ \~ ....... ·· ..... '\-; ··· ..... .. ···1· .. ,,, .... ao•lm as
• : ? • • .. .. . ,,,,. . b. .. . , . . \ .\('_... ; . ""' ':. ':)
':. l9
.,- : ) .\
. ('
~ • \ ;-_ ·~ / ...... _ . . ... .-........ / ........ ....._.
r··-·· ' ..... : ." Nigel
........ : ..... , ~ ........ --..... . ... .. ... . . \ . ....... • ... ••~••"'.,•• • :,"'I
Heidelberg•
.. . . . i ... . .... . . .
~ ... . .. : ·· ... ·; 1
Devon .. •.. •• Kinrosse ~ • Dome • • : \ ._; . : ... . . . .. . . . ··. . • ... ... • ... • • .. ._ I 4 . . . ... . . . ... : ..... · .......... : . ·.. .
·:.•·: ... •·...::.....:!' ..-.··... .··· ... ---- •• ----· ..... ..,.,;,I,,,,- ••••••• : ••:.••:..,•;,.Y ........ •
Sugarbush Fault--'~------..... .......... . . ... .,,,,, ... .
O ..... __ ,...
Edenkop-. BallouroMine •• •• . . . . . . . . .. ,. . .... "' ··. •••• West Rand Group -
•• Central Rand Group contact
..... . .. : ··- . 3 .... : ~··. ·•. • . ._ • • .., • • • .., • •. eGreylingstad : ~·· ....... _ .... ·.. : 1·····
.-{ .. : : -----,- .. · ......
-Direction
--f Fault
of dip of contact
· fau\\ \3et9s'9- - -.,... .... • ? I o ,........-- .
- -- ~ 1· ._-::f .. ... ... Hex River·· .. • ..
••• DMine • • •
-·--·Trace of anticline
[:J ... ·· ..
'
... . .
••••••••a•• • I •
.. .. '· ... . v.., .... , .... .
~a.·'· ........ .. .. ... .. .. .. ~ . ~ . . .. . .. .. . .. ............ > ........
+ 4' I
...... .. . .
Granite-Green stone terrain
1 East Rand Basin
2 a Bultfontein Basin
b Middelbult Basin
3 South Rand Basin
4 Evander Basin
Figure 5: Simplified map showing the basin geometry of the Heidelberg - Delmas-Balfour divides
area~ The Sugarbush fault, the area into four parts:-
3. South Rand basin and 4. area; 1964, Button 1970, WhitesCde et
Sundra anticline and Devon Dome East Rand basin; 2. Delmas 1.
Evander basin 1976).
(after Pretorius

HEIDELBERG AREA
AoodPpoort
Crowr1 Ln•
FIOftda
Quert11t•
'NltpoorlJte
Coronation
PrOfh··· Quan•' 4
Brixton
Park town
Shale
,.,. .. Grove
_Ouert11t4t
-• -= --N.R
DELMAS
AREA
Strat19r1ptuc Gap
HEX RIVER MINE AREA
~CL
CL
I ~ Iii·" !!
SIG
ca
OGO?
LEGEND~
• ARGILLACEOUS UNITS
D ARENACEOUS UNITS
EVANDER AREA
-?----~ -500M
Scale,
MARKERS:-
MC MAIN CONGLOMERATE
CL CROWN LAVA
BG BLUE GRIT
GR/VR GOVERNMfNTIVELDSCHOEN IIEEF
CR CORONATION
T TILLITE/TI LLOID
PR PROMISE
BIG SLUE GRIT
CB CONTORTED BED
WTS WATER TOWER SHALE
OGQ ORANGE GROVE OUARTZITE
Figure 6: Comparative West Rand Group stratigraphy of the Heidelberg-Delams-Balfour area (modified after Jansen et al, 1972; Button, 1970)

-14-
3.2.1 Hospital Hill Subgroup
This subgroup is 1000 m thick near Heidel~erg and 600 min the South
Rand as compared to 1600 m on the Central Rand (Rogers 1922; Pretorius 1964).
In the Delmas area there is a stratigraphic break of some 750 m within the
Parktown Shale, Brixton and Promise Quartzite Formations. Although there
are more quartzite units in this subgroup in the Heidelberg-Balfour-Delmas
area than on the Central Rand, the proportion of quartzite to shale is al
most the same (about 38 per cent of the total thickness on the Central Rand
and 36 per cent near Heidelberg}.
3.2.1.1 The Orange Grove Quartzite
This formation is poorly or not at all developed in the South Rand area
whereas on the East Rand and near Delmas it measures 72-107 and 150 meters
respectively (Rogers 1922; Button 1970). In these two areas the Orange
Grove Quartzite formation is split into three quartzite units by two shale
bands. In the Heidelberg area the basal quartzite rests uncomformably on
red weathering schistose shale, a magnetic quartzite which may be tentative
ly correlated with the Fig Tree Group of the Swaziland Supergroup (Jansen
~ al 1972) and in parts on a granitic palaeosoil.
Grove Quartzite lies on Basement Granite.
Near Delmas the Orange
At the base of the first plane-bedded, light gray to white, orthoquart-
zite unit in the Heidelberg area is an erratically distributed quartz and
chert pebble conclomerate (up to 1 m thick), whereas near Delmas an arkose
with lenses of grit and conglomerate is of variable thickness (up to 3 m).
The following table compares the thickness of the Orange Grove quartzite and
shale units in the Heidelberg and Delmas areas.
TABLE 2
Heidelberg (after Near Delmas (Button Rogers 1922) 1970)
Basal quartzite 29 m Basal Quartzite 48 m
Shale 6 m Shale 8,5 m
Quartzite 16 m Quartzite 56 m
Shale 4,5 m Shale 1 m
Quartzite 19 m Quartzite 40 m ---
74,5 m 151,5 m
Near Delmas the first shale unit is ripple marked and dark coloured.
The overlying quartzite is siliceous, medium grained and varies in colour from
light to dark gray. An inconspicuous shale band which lenses out in places
is followed by the uppermost siliceous to argillaceous quartzite.

-15-
3.2.1.2 Parktown Shale
This formation measures about 400 min the Heidelberg area, is at least
128 min the Delmas area and is very poorly developed (8-30 m) in the South
Rand area. In the Evander basin Fox (1939) correlated portions of borehole
sections with the West Rand Group and a tentative thickness of 420 m for
Parktown Shale was proposed. However, Jansen~ al (1972) and Whiteside
~ al (1976) have reviewed the geology in this area and both correlate the
958 m of rocks drilled below the Main Reef horizon as belonging to the Govern
ment Subgroup. The lenticular graywacke (0-580 m) with cobbles and boulders
descri~ed by Fox as probably belonging to the Ventersdorp Supergroup is now
correlated with the Blue Grit unit of the South Rand-Heidelberg area
(Figure 6).
On the Central Rand the sum of the two quartzite units within the Park
town Shale Formation is less than 10 meters whereas in the Heidelberg area
there are five quartzite units totalling 97 m. The magnetic shales in the
Water Tower Shale members have been identified in both the Heidelberg and
Delmas areas. The five quartzitic units all display well preserved cross
beds and ripple marks making it impossible to correlate any one unit with
the Ripple-Marked Quartzite marker of the West and Central Rand. Further
more, in the Heidelberg area feldspathic quartzites occur well below the
usual position of the Speckled bed on the Central Rand (a short distance be
low the Contorted Bed). The Contorted Bed has been recognised in both the
South Rand and East Rand areas. In the former area it is identified more
by its alternating laminations of magnetic quartzite and chert than on its
folded contorted nature.
3.2.1.3 Brixton Formation
The Brixton formation consists of three thick arenaceous units and
three argillaceous units on the West and Central Rand while in the Heidelberg
area it contains five arenaceous units and four argillaceous units measuring
about 505 min thickness. In the South Rand area six arenaceous units with
intervening shale belong to this formation and measure about 300 m (Pretorius
1964).
The first quartzite in this formation (about 55 m thick in the Heidelberg
area and between 30 and 8 min the South Rand area) serves as a useful marker
in both the East and South Rand. It is a medium to coarse grained quartzite
which has conglomerate lenses containing angular chert pebbles (up to 2.5 cm)
and is known as the Black Grit (Sawyer 1907; Rogers 1922; Nel 1933). In
addition to the black chert fragments it may contain pebbles of less than
1.3 cm diameter of white and gray quartz, quartzite, calcareous quartzite,
shale and limestone (Sawyer 1907). Rogers (1922) described a thin section

T~ I
-16-
cut from the Black Grit and noted that a peculiarity in this rock is the
presence of liquiu inclusions and muscovite in the quartz grains.
Above the Black Grit quartzite unit the remaining "sago textured" whi1te
weathered quartzites in the Heidelberg area vary in thickness from 23-52 m
and are separated by red weathered shales, some of which are slightly magnet
ic. Rogers (1922) distinguishes these shales from the shales within the
Parktown Shale by the fact "that they do not become as strongly magnetic
nor are they so well banded with slightly or non ferruginous layers". The
topmost quartzite (23 m) of the Hospital Hill Subgroup is orthoquartzitic
while the arenaceous units succeeding it are micaceous, gritty and red
weathered.
On the South Rand two quartzite bands succeed the Black Grit and these,
in turn, are overlain by 137 m of shale which become more ferruginous upwards
(Pretorius 1964). Two quartzite units overly this shale in which is sporad
ically developed a conglomerate horizon 0.3 m thick with pebbles up to a
maximum of 1.3 cm in diameter set in a fine grained matrix. The top of the
Hospital Hill Subgroup is marked by a thick succession of hard, yellowish or
reddish quartzites which are fine grained and contain lenses of feldspathic
quartzite with sago structures.
3.2.2 Government Subgroup
Rogers (1922) correlated the Government Reef Beds near Heidelberg with
those of the Central Rand and in addition mapped a tillite. Pretorius (1964)
distinguished the three formations of the Government Subgroup in the poorly
exposed South Rand areas where it consists of alternating·white, yellow or
red quartzite and ferruginous shale. The Government Subgroup is 1200 m
thick near Heidelberg, 750 m near Hex River Mine and 1200 min the Edenkop
Mine on the South Rand compared to 1860 to 2000 m on the Central Rand. The
best markers in the Government subgroup are tillites on the East Rand, Delmas
and Evander basins; a magnetic shale, conglomerate units and a diamictite
(the Blue Grit) in the East Rand, South Rand and Evander basins.
The three formations of the Government Subgroup - Promise Quartzite,
Coronation Shale and Witpoortjie - delineated by SACS (1978) on the Central
Rand are present in the East and South Rand by the recognition of the Promise
Reef, Coronation Shale and the Coronation Reef (Rogers 1922; Pretorius 1964).
Table 3 is a breakdown of the Government Subgroup into its ~hrce fc,rmations
in the Delm~s. Hc~~2lhc~~. Evander. and South R~ad areas (Button 1970;
Rogers 1922; Jansen et al 1972 and Pretorius 1964). The composite thickness
of the faulted and poorly exposed Government Subgroup on the South Rand taken
from Pretorius' (1964) '•tailed succession in both the Edenkop and Hex River

T~-
•'--.'
-17-
Mines, is approximately 1230 m. However, Jansen~ al (1972) suggests that
the succession near the Hex River Mine (750 m) is a closer approximation to
a representative thickness.
3.2.2.1 Promise Quartzite Formation
The Promise Reef marker horizon is not widespread in the Heidelberg
area although there are erratic, micaceous gritty conglomerates at the base
of the first arenaceous unit (120 m) which have been pitted by early pros
pectors (Rogers 1922). In the southeastern corner of the area, near the
Sugarbush River, scattered pebbles of feldspar up to 1.3 cm in diameter and
a few pebbles of coarse "microcline quartz granite" set in a muddy matrix»
are, according to Rogers (1922), possible equivalents of the Promise Reefs
of the Central Rand. The overlying shale is magnetic in places and could
be used as a local marker near Heidelberg. On the South Rand the Promise
Quartzite Formation comprises Pretorius' (1964) Promise Stage and the Coro
nation D, Coronation C and first quartzite of the Coronation C 'substages'.
In the Edenkop Mine an estimated 60 m of the basal portion of the Promise
Stage, including the Promise Reef are not exposed (Pretorius 1964). How
ever, near the Hex River Mine on the South Rand the lowest exposures of the
Government Subgroup consist of four narrow bands of fine grained quartzite
with intercalated shales and infrequent bands of black chert. The Promise
Reef marker has not been identified (Leube 1956).
The alternating thick quartzites and thin shale units which make up the
rest of the formation have no distinctive characteristics.
3.2.2.2 The Coronation Shale
Compared to the Central Rand, the Coronation Shale formation in the
Heidelberg-Delmas area has better developed tillites or tilloids. It is
only south of the Sugarbush Fault that tillites and magnetic shales have not
yet been recognised (Pretorius 1964). However, in the Evander area the
Coronation Shale Formation is about 170 m thick, in the Delmas area 31 m
thick and in the East Rand 26 m thick.
In the Evander area the base of the formation is marked by a magnetic
shale 15 m thick and is in turn overlain by an argillaceous quartzite 17 m
thick, another magnetic shale (30 m) and the first tillite horizon (13 m)
(Jansen_!:! al 1972). A thin (5 m) thick quartzite separates the first and
second tillite bands (32 m). The second tillite has a magnetic matrix and
is overlain by a magnetic ironstone (13 m). The third tillite horizon is
poorly developed and is situated between the ironstone and a dominantly
~

CENTRAL RAND
WITPOORTJIE + (-800 m)
CORONATION SHALE ( m)
PROMISE
QUARTZITE
(1000 m)
TABLE 3: Government Subgroup in Heidelberg-Balfour-Delmas area
EAST RAND
m - Blue Grit 37
Quartzite and Grit 4
Four shale with Three Quartzite
E units 129
-:r Quartzite with 00• 11"1 Government Reef 49
Four Quartzite and Five Shale units 347
Coronation Quart-zite with Grit 18 ..
J{M~gn~tic Shale 18 N T1.l11.te 8
~ . Quartzite 24
Shale 24
Quartzite 18
Shale 137
E Quartzite 128
..... Shale 18 oo• -:r
Quartzite 12
Magnetic shale 6
Quartzite with
grit(Promise Reef) 120
Ji 0 -:r ~ -:r
C"")
5 . O'I
r-
SOUTH RAND EDENKOP
Blue Grit (Hex River)
Not exposed (faulted out)
Government Reef
Coronation Reef
Shale (non magnetic)
Quartzite
Shale
Quartzite
Shale
Quartzite(Coroui, t1.on 1
Shale
Quartzite
Shale
Quartzite
Shale
Promise Reef
DEL"iA.S
m "' Shale
180
95 ~
N Veldschoen Reef ...... -:r
20
Three shale and Three Quartzite units
144 •
3 Magnetic Shale ! Tilloid C"")
100 Quartzite
30
18 ?
34
229 134
85
3
61
34
60
EVANDER
m m 71 'Blue Grit
- disconformi ty 120
£ Five Quartzite 85 0 and Five Shale °'' N units 210
316 ..
7 JrT 3 24 -.D GT 2 Tillites .-. GT 1
+ -10
?

-18-
argillaceous unit (40 m) which is culminated by a black shale marker horizon
(3 m). Overlying the black shale is a domina:tly arenaceous succession with
interbedded shales (34 m).
In the Delmas area, the Coronation shale formation consists of a magnet
ic shale and a tilloid. The tilloid horizon (24 m) consists of fragments
of angular to subangular quartz, quartzite, chert and red jasper with a
highly argillaceous dark greenish gray to dark green groundmass. Inter
calated in the tilloid are quartzites (Button 1970). A seven metre thick
shale with gradational upper and lower contacts overlies the tilloid and,
according to Button (1970), may show "preconsolidation slump structures".
The shale is often moderately magnetic but may in some sections be strongly
magnetic.
In the Heidelberg area, well striated pebbles occur in a 6 m thick
tillite. The boulders are composed dominantly of sandstone although slate
and lava pebbles have been noted (Rogers 1922). The banded shale unit
(19 m) overlying the tillite contains much magnetite and was correlated with
the Coronation shales by Rogers (1922).
3.2.2.3 Witpoortjie Formation
This formation is about 584 m thick in the East Rand, 470 min the Delmas
area, 440 min the South Rand and about 350 m thick in the Evander area. The
Formation usually has a conglomerate at the base and a diamictite - the Blue
Grit - at the top.
Directly above the shales containing the Coronation Shale Formation is
a coarse basal grit or small pebble conglomerate (up to 5 cm thick) - the
Coronation Reef - which is developed near Heidelberg. Pretorius (1964) has
recognised an auriferous conglomerate on the South Rand which is locally
developed at the Edenkop Mine as the Coronation Reef. At about the same
stratigraphic level a sericitic and argillaceous quartzite occurs in the
Delmas area compared with a shale on the Evander Goldfield.
The quartzites and shales which are developed between the Coronation
quartzites and the next significant marker - the Government or Veldschoen
Reef - have been described by Button (1970) and Rogers (1922) for the Delmas
and Heidelberg area. (Table 3). The shales are all dark gray to black in
colour and often grade into argillaceous quartzites which in turn may grade
into a siliceous quartzite. The first quartzite below the Government Reef
in the .Delmas area is distinctive in that it is the only carbonate bearing
reef in the Witpoortjie Formation (Button 1970). In the Evander area the
Coronation Shale Formation is overlain by shale (54 m), 'puddingstone' or
well rounded pebble conglomerate (4.5 m), quartzite (9 m), gritty shale
(40 m), white quartzite (21 m) and finally the Blue Grit.

-19-
The Government Reef is the most persistent conglomerate in the West
Rand Group succession near Heide~berg. It occurs at the base of a 50 m
thick quartzite where it may locally be up to 1 m thick. The pebbles are
often well packed and measure up to 2 cm in diameter. The "Government
Stage" described by Pretorius (1964) is a 1 m thick conglomerate occurring
at the base of a quartzite horizon (19 m) at Edenkop Mine on the South Rand.
The Veldshoen Reef of the Delmas area occupies a similar stratigraphic posi-
tion to the Government Reef on the East Rand. This reef occurs at the base
of an 85 m siliceous quartzite and may in places be separated into two bands
of gritty small pebbled conglomerates or grit. According to Button (1970)
the pebbles are composed of vein quartz, chert and banded jasper with a
matrix which is often mineralised. The term "Veldschoen Reef" had previous
ly been used by Callender (1960) for the first quartzite below the Crown lava
in the Klerksdorp area. Button notes (1970) that the "Slipper Horizon" in
the Delmas area would coincide more correctly with the Veldschoen Reefs as
developed in the Klerksdorp area.
Between the Government Reef and the next important marker horizon - the
Blue Grit - there are about 135 meters of sediments in the Heidelberg area
and possibly about 95 m on the South Rand (Rogers 1922; Pretorius 1964). In
the Heidelberg area the sand/shale ratio for these sediments is less than
0.27. Near Delmas sericitic and argillaceous quartzites follow the Veld-
schoen Reef and are in turn overlain by a slightly magnetic shale unit meas
uring 71 min thickness. According to Button (1970) the shale is broadly
banded and is light greenish to grey in colour. In the Delmas area there
is no horizo~ which can be correlated with the Blue Grit in the East Rand,
South Rand and Evander basin. As there is only another 61 m of arena~eous
sediments (Slipper Horizon) between the last named shale unit and the Crown
lava it would be appropriate to include this shale with the Witpoortjie
Formation and the Slipper Horizon with the dominantly arenaceous Florida
Quartzite Formation of the Jeppestown Group.
The Blue Grit ranges in thickness from Oto 590 min the Evander basin,
is 180 m near the Hex River Mine on the South Rand and is between 30 and 230 m
in the Heidelberg area. The Blue Grit described by Rogers (1922) as a rock
of "remarkable character" has a heterogenous matrix composed of quartz,
chlorite, sericite, hornblende, epidote, zoisite and calcite. Angular
(1.5 to 75 mm) fragments and pebbles composed of quartz, fresh feldspar,
hornblende, pyroxene, granite, syenite, porphyritic lava, quartzite, phyllite,
slate and possibly tuff are randomly scattered throughout the unit. On the
Evander Goldfield, occasional boulders up to 30 cm in size and with ill-de
fined outlines are present (Jansen!:.!_~ 1972).

-20-
The termination of the Blue Grit on the Evander area is marked by a
distinct unconformity with the overlying quartzite being incorporated into
the Central Rand Group (Jansen!:.!_~ 1972). The top of the Govermnent Sub
group was placed by Rogers (1922) at the top of the quartzite horizon above
the Blue Grit, primarily because the overlying beds (ie. those of the Jeppes-•
town Subgroup) are alledgedly more argillaceous. Likewise, Pretorius (1964)
included a ripple marked quartzite overlying the Blue Grit into the Govern
ment Subgroup.
However, subsurface mapping on the East Rand (Antrobus 1964) has re
vealed that the sand/shale ratio for the Jeppestown Subgroup is 1.6 compared
to the Government subgroups ratio of 1.4. According to Button (1968) there
is no reason for dividing the Group into three subgroups and he suggests
that "there are certain marker horizons which provide convenient points of
reference in the stratigraphic column (eg. the Crown Lava)". The writer,
in complying with SACS (1978) breakdown of the West Rand Group in the histor
ic type area, ends the Witpoortjie formation with an argillaceous unit - that
of the Blue Grit.
3.2.3 Jeppestown Subgroup
The Jeppestown Subgroup is poorly exposed in the Heidelberg-Delmas
Balfour area where it measures approximately 610 m near Heidelberg, 245 m
near the Hex River Mine and is about 280 m near Delmas. There is a dis-
tinctive marker horizon in the middle of the Subgroup - the Crown lava - which
is split into two lava flows south of the Sugarbush fault. The presence of
Crown lava in all three areas makes it possible to divide the Jeppestown
Subgroup into its three formations as done on the Central Rand by SACS (1978).
3.2.3.1 Florida Quartzite
Near Heidelberg, a quartzite (10 m) overlies the Blue Grit and is in
turn overlain by red weathered shales about 305 m thick containing about
33 m of sandstone. The shale is distinctive in that "thin bands of very
ferruginous rock approaching the West Rand shale in character" occur through
out the Florida Quartzite Formation near Heidelberg (Rogers 1922).
On the South Rand a borehole (RT2 at the Heidelberg-Roodepoort Mine)
penetrated 145 meters of sediments below an amygdaloidal lava underlying the
basal conglomerate of the Central Rand Group (Pretorius 1964). The hole
did not reach the Blue Grit but passed through 4.3 m of quartzite, 3.6 m of
shale, 35.7 m of alternating thin quartzite and shale bands, 57.6 m of black
shale and finally 43.8 m of quartzite before being stopped.
Near Delmas, a 61 m quartzite rests with a sharp, probably erosive,
contact on the underlying shale (which the writer includes in the Witpoort-

-21-
jie Formation). At the base of this unit is a gritty quartzite, with
disseminated crystalline and detrital pyrite and associated heavy minerals.
This grit is locally known as the "Slipper Horizon". The quartzite is
distinctive in that it is, according to Button (1970), 'black speckled,
striped to varying degrees and banded'. The banding is due to the altera
tion of dark greenish grey argillaceous quartzite and a carbonate bearing
greenish grey sub-siliceous quartzite.
3.2.3.2 Crown Lava
In the Heidelberg-Nigel area a succession of amygdaloidal lavas and
coarse fragmental volcanic beds, the whole suite being not more than 30.5 m
thick, lies on a feldspathic quartzite 3-5 m thick which in its upper parts
contains splinters (varying in length from 0.2 nm to 10 cm) of an originally
glassy volcanic rock. In places, these splinters and fragments are so
abundant that the rock can be classified as an agglomerate (Rogers 1922; de
Jager 1964; Cousins 1973). These rocks are, according to Rogers (1922),
equivalent to the Crown Lava (or Jeppe Amygdaloid).
On the South Rand the amygdaloidal lava may locally (eg. Heidelberg
Roodepoort Mine) immediately underlie the Central Rand Group and reach a
thickness of up to 76 m (Pretorius 1964). At the Hex River Mine the Jeppe
Amygdaloid consists of two flows (Nel 1933), namely a dark lava with few
amygdales and a lava devoid of arnygdales but with a few feldspar phenocrysts.
To the south east of the mine Leube (1956) found one flow only, 91.5 m thick,
with feldspar phenocrysts but no arnygdales.
Button (1970) describes the Crown Lava, which is about 65 m thick near
Delmas, as a dark greenish grey lava, prominantly amygdaloidal in its upper
half. White calcite and zoned greenish black chlorite amygdales are the
most common types. In the lower half the lava is sparsely amygdaloidal and
often carries scattered feldspar phenocrysts with the last meter of lava
being prominently amygdaloidal or occasionally pyrocla_stic.
3.2.3.3 Roodepoort Formation
The sediments between the Crown Lava and the Central Rand Group vary in
thickness from 30 to 200 meters in the Heidelberg area, between O and 103 m ,ne ctS ures
in the South Rand and~about 182 m . near Delmas.
In the Heidelberg area the sediments above the lavas are chiefly shales,
but thin beds of quartzite occur in them; a quartzite which lies about 90 m
above the lavas to the south of the Heidelberg (Hourtpoort) is spotted due
to the presence of many grains of microcline feldspar (Rogers 1922). De
Jager (1964) found that this quartzite horizon proved to be a useful marker
in certain mines (eg. Vlakfontein). A peculiar feature which Rogers re
cords is the appearance of a great thickness (up to 76 m) of quartzite in

"~
-22-
the upper part of the Roodepoort Formation in particular areas (eg. Groen
fontein) which does not appear in other areas (eg. Houtpoort), although
south of the Sugarbush fault the quartzite is again seen. The mineralogy
of the upper Jeppestown subgroup shale according to de Jager (1964) is leuco
xene rich, except for the 3 to 5 meters innnediately below the Main Conglomer
ate in which rutile is present.
In the South Rand area, the Roodepoort Formation was penetrated by a
borehole in the Witkleifontein locality (Pretorius 1964). It intersected
14 m of 'shales, 7 .6 m of quartzites, 44 .8 m of shales (some bands of which
are highly contorted or brecciated), 24 m of quartzites and 14 m of shale
above an amygdaloidal lava flow into which the borehole penetrated for 3 m.
In the Delmas area, Button (1970) described the first 24 m of quartzite
overlying the Crown Lava as a fine grained, dark gray, often striped quart
zite which has a spotted appearance due to carbonate minerals. At one
locality this quartzite was separated from the lava by a meter of grey, band
ed shale. Overlying the first major quartzite member is a 34.5 m shale
which may be strongly magnetic in parts, a 94.5 m sericitic and argillaceous
quartzite and finally a 29 m shale horizon. The shale below the Main Con
glomerate has a weathered phase of lighter coloured material which overlies
the darker green unweathered shale. According to Button (1970), this
palaeosoil is attributed to "preMain Reef Horizon erosion". This erosion
resulted in the decrease in thickness from 46 min the western portion of the
Bultfontein Basin to 12 min the eastern and south eastern portions. Further-.
more, a similar decrease in thickness of the same shale unit from 153 to 92
meters in the East Rand Basin was attributed to the same "pre-Main Reef Hor
izon erosion".
Button (1968) noted that the West Rand Group section near Delmas between
the Main Reef Horizon and the Tilloid Horizon was not a deranged succession
of conglomerate, quartzite and shale but can be shown to be made up of a well
ordered series of sedimentary cycles. Furthermore, Button (1968) correlated
sediments of the Delmas area to those of the Klerksdorp goldfields, Orange
Free State goldfields and West Wits goldfields on the basis of repetitive
sedimentary cycle patterns. Clearly, where borehole data are available or
subsurface mapping is possible the cyclic sedimentation of the Jeppestown
sediments serves as a useful stratigraphic marker (Figure 7).
3.3 Vredefort Area
Although deep drilling has disclosed the presence of West Rand Group
rocks in the de Bron horst on the Orange Free State goldfield (Figure 2)

CYCLIC SEDIMENTATION OF THE WEST
RAND GROUP SEDIMENTS \
G) ®
?Z~
®
Vertical scale
300m
150
0
V 1 · .. j 1 V f" I I V 1- -1 I V < ... , , ' V ·;:;: \ - ) f~~ , --- I f ! ··. , ·
1 2 34 ............... . •.. ~-:~! •.-:
1 ~ 11 ~ Enargy I-'-'-'--· .
Enczrgy
·41234 • • ' ' ... Enc2rgy
EXPLANATION
g) Shal12.
~ ~
E=:=! ~
EJJ D
Argillac12ous ·quartzit12 with shal12 bands. Argillac12ous quartzitcz . Altczrnating argillac12ous and siliccwus quartzi t12. Silic12ous qu~rtzit<2.
!:;~,<} Gritty silic<2ous quartzitcz.
(:,":.r Conglo_m<2rate2 bands in quartz1t12.
AB.'68
-V- .J<2pp<2stown Amygdaloid tim12 plancz·.
G) O.F.S. Goldficld(Coczt z<22, 1960).
® Kl<2rksdorp Goldfi<ild (Coll<2nd<2r, 1960).
G)
@
Wczst Wits Goldficzld (De Kock, 1964). 0<2lmas arc:za ( Button, prczscnt invczs tigation )_
P Pivotal point _ ......... ~~...,i:.-Encirgy
Figure 7: Cyclic sedimentation in same West Rand Group sediments (after Button
1968)

-23-
(Coetzee 1960), the most southerly outcrop of the Group is situated around
the periphery of the Vredefort c~me, about 120 km south - south west of
Johannesburg. The strata surrounding the northern half of the dome are
overturned and intensely metamorphosed while those on the southern side are i '
mildly metamorphosed and dip under Karoo cover. The West Rand Group rocks
encircle the dome (42 km in diameter), however, "it is still problematic
whether the Upper Witwatersrand completes the circle under cover of Karoo
beds around the southern edge of the dome". (Whiteside et al 1976).
Using the persistent lithological markers of the Orange Grove Quartzite,
Water Tower Slates and Contorted Bed, Nel (1927) correlated the rocks in the
Vredefort Parys areas with those of the Johannesburg and Heidelberg areas.
Although Nel (1927) divided the beds of the West Rand Group, in accordance
with Mellor's (1917) classification, into the Hospital Hill, Government Reef
and Jeppestown series, he found difficulty in breaking the subgroups down
into their respective formations. For instance, according to Nel (1927),
there are no units in the Government Subgroup in the Vredefort area "which
could definitely be correlated with certain beds, characteristic of the Gov-
ernment Reef series of either the Rand or the Heidelberg areas". Taken as
a whole the arenaceous units of this subgroup are coarser grained and more
feldspathic than the Hospital Hill Subgroup and as such generally resemble
the rocks constituting the same Subgroup on the type area. No at tempt has
therefore been made to divide the Government Subgroup into its respective
formations in the Vredefort-Parys area.
The writer has relied almost exclusively on the detailed accounts by
Nel (1927) for this area. The stratigraphic column c£ this area is shown on
Figure 8 (taken from Nel 1933; Nel and Verster 1962).
3.3.1 Hospital Hill Subgroup
The thickness of the Hospital Hill Subgroup is approximately 1100 m.
The subgroup therefore shows a decrease in thickness when compared with the
type section of the Rand. The Hospital Hill subgroup has the Orange Grove
quartzite at the base and a thick green quartzite bed at the top with an
intervening thick magnetic shale zone. Within the shale zone are lenticu
lar quartzite bands and also well known markers such as the Speckled Bed and
Contorted Bed. Clearly, the Hospital Hill Subgroup can be divided into its
three formations as defined by SACS (1978).
Intercalated between the Old Granite and the Orange Grove quartzites is
a dark diabase and subordinate highly metamorphosed sediment which vary in
thickness between 90 and 250 meters. The diabase was named an "amygdaloidal
hornblende granulite" by Hall and Molengraaf (1925). Nel (1927) incorpor-

-24-
ated the admixture 0f volcanogenic ~nd sedimentary material as a basal
amygdaloid in the Hospital Hill Subgroup. However, these rocks are now
correlated with the Do•1nion Group (Nel and Verster 1962).
3.3.1.1 The Orange Grove Quartzite
Directly overlying the Dominion Group sediments is an 82 to 143 m
quartzite unit, 8 to 27 m shale unit and a 2 to 33 m top quartzite. The
first quartzite unit may, as on the Central Rand, be split into three quart-
zite beds by intercalated shale horizons. The quartzites all "possess the
same lithological character" and are white or light brown, fine to medium
grained and glassy. The shales are soft and weather red with the exception
of the top shale unit which weathers black.
Unlike the Orange Grove quartzite formation in the Heidelberg-Delmas
Balfour area the quartzites have no pebble beds or grits, either at the base
or higher up. The great variation in thickness (minimum thickness of
54.8 m, maximum 165 m, average 114 m) of the formation in the Vredefort area
differs from the formation on the Central Rand where the thickness remains
fairly constant (200 m).
3.3.1.3 Parktown Shale
The Parktown Shale formation has an average thickness of about 670 min
the Vredefort area as compared to 700 m on the Central Rand.
Overlying the Orange Grove quartzite is a shale measuring about 185 m
with a highly magnetic and frequently banded unit near its base. According
to Nel these magnetic shales probably correspond to the Water Tower Shale
described by Mellor (1911). No ripple marked quartzite marker has been
identified. However, about 300 m above the base of the Hospital Hill Sub
group is a feldspathic quartzite which has been correlated with the Speckled
Bed on the Central Rand. This marker consisting of quartz, feldspar (oligo
close - albite) and microcline may, in places, reach a thickness of 30 m. A
short distance (about 100 m) above the Speckled Bed is a dark strongly lamin
ated shale, the Contorted Bed, which has all the distinctive features already
described on the Central Rand and in the Heidelberg areas. A peculiar
feature to the Contorted Bed in the Vredefort area is the presence of a narrow
sheet of epidioritised dolerite. The shales between the Contorted Bed and
the Brixton Formation embrace various argillaceous rocks. Zones of sandy
shale which are banded due to the presence of light coloured quartzite lamin
ae grade into brown or reddish weathering shales which in turn grade into
green or black shales.
3.3.1.3 Brixton Formation
The Brixton Formation in the Vredefort area consists of two quartzite

-25-
units and three shale units. Its average thickness of 367 mis a marked de-
crease when compared to both the Heidelberg and Central Rand area.
The lower (41 m) and upper (107 m) quartzitic units are separated by a
183 m shale unit and overlying the upper quartzite is a 26 m shale unit.
The quartzites are light coloured, often green fine to medium grained
and, where not recrystallised, sago structures are evident. The cross
bedding and ripple marks within these units were used by Nel (1927), to prove
the inversion of the beds on the north eastern area of the dome. The arg
illaceous unit between the quartzites consist of "sandy laminated shales"
similar to those underlying the Brixton formation. The uppermost shale unit
of the Brixton formation was incorporated into the Government Subgroup by
Nel (1927) whereas the writer places it in the Brixton formation in order to
conform with SACS (1978).
3.3.2 Government Subgroup
The Government Subgroup is about 1600 m thick and comprises a succession
of about ten argillaceous units and ten arenaceous units. The shales are
on the whole more siliceous in character than the ferruginous shales of the
Hospital Hill Subgroup while the quartzites are generally more feldspathic.
The first quartzite (14 m) is reddish to yellowish and coarser grained
when compared to the last Brixton quartzite and is overlain by a 53 m thick
shale, 73 m quartzite and a 75 m shale.
The thickest quartzite (375 m) in the subgroup has several grit bands
and occasional conglomerate lenses. The pebbles and coarser grains chiefly
consist of quartz and are well rounded giving the rock a distinctive sago
texture. The quartzites grade into shales which in turn are overlain by a
peculiar dark grit. This grit is never more than about 5 m thick and con
sists of a dark bluish matrix with abundant small glassy quartz grains as well
as a 'thin scattering of irregular fragments and rounded pebbles of quartz,
quartzite, and shale' (Nel 1927).
The poor exposure of the succeeding 610 m of sediments, the numerous
faults and the intrusion of dolerite sheets has resulted in no good markers
being identified. The four arenaceous units and five argillaceous units
have a sand/shale ratio of about 0.5.
The three remaining quartzites and two shales crop out relatively well
and according to Nel, can be used as marker horizons. The lowest quartzite
is a thin (9 m) light coloured quartzite with well developed cross bedding
and occasional grit bands. The quartzite grade into shales, with a persist
ent thin dark grit (2 m) band being developed a few metres above the quart
zite. The matrix of the rock is a dark slaty blue colour, in which glossy
quartz and fragments (<0.7 mm) of quartz, quartzite and 'non-descript rock'

occur. Nel (1927) tentatively suggests that this unit may correspond to
the blue grit of the Heidelberg-Delmas-Balfour area.
The dark grit is succeeded by a ferruginous shale (91 m) which in turn
grades into argillaceous quartzite (216 m), which varies from a fine to a
coarse grained rock. This quartzite is often thinly bedded, has a light
greyish colour and contains many bands of fine grained shaly sandstones which
often display excellent cross bedding. The overlying shale (73 m) is lamin
ated and ferruginous in character and is in turn overlain by a 45 metre hard,
light coloured, fine to medium grained quartzite. This quartzite often has
lenses of grit which locally develops into small, well rounded, pebble con
glomerate and because it is an easily recognisable rock unit in the field,
Nel (1927) used this quartzite to mark the top of the Government Subgroup.
3.3.3 Jeppestown Subgroup
The Jeppestown Subgroup is very variable in thickness because of the
lens-like nature of some of its constituent beds. Nel and Verster (1962)
give a maximum thickness of 1360 metres. Although Nel stated in 1927 that
the Jeppestown amygdaloid was not developed in the Vredefort area, in later
publications (Nel 1939; Nel and Verster 1962), he describes a zone of volcanic
rocks (100 m thick) about three-quarters of the way up in the succession.
This lava - the equivalent of the Crown Lava of the Central Rand - was in 1927
considered to be equivalent to the Bird amygdaloid lavas in the Central Rand
Group. In the Vredefort area the Jeppestown subgroup has some lenticular
auriferous conglomerates which are not developed on both the Central and
East Rand areas.
Although the presence of the Crown Lava in the Vredefort area makes it
convenient to divide the Jeppestown subgroup into its three formations, the
individual units making up the formations show considerable discrepancies in
number and thickness throughout the area. The tentative composite thickness
of the formations quoted above are taken from Nel (1927) and Nel and Verster
(1962) •
3.3.3.1 Florida Quartzite
This formation begins with a 15 metre shale horizon which is followed
by about a 6 metre sandstone. Above the second and thickest (250 m) shale
unit a conglomerate is developed. Much time and money has been spent in
testing this 'reef' - named the Veldschoen Reef - for its gold content.
However, the workings were closed before the production stage was reached
and, according to Whiteside~ al (1976) only 'a small tonnage of payable ore
was developed on Nooitgedacht 89, south of the Vaal River near Venterskroon'.
Overlying this conglomerate are intercalated quartzites and shales measuring
about 170 metres in thickness which in turn are followed by 115 metres of

-27-
dark red shales. The last unit of the Florida Quartzite formation is a
103 rn fine to medium grained, dark coloured quartzite.
3.3.3.2 Crown Lava
Nel and Verster (1962) estimate the thickness of this amygdaloidal lava
to be about 97 metres. The upper portion of the lava is brecciated. The
amygdales consist of quartz and calcite with chlorite sometimes being present.
3.3.3.3 Roodepoort Formation
About 160 metres of argillaceous quartzites are developed between the
lava and the topmost shale unit. Near the lavas they are black in colour,
fine grained, and display well developed cross beds. These dominantly
arenaceous sediments are succeeded by a 122 m thick shale unit through a
gradual transition zone. In places numerous basic intrusions enhance the
thickness of this formation.
3.4 Klerksdorp-Ventersdorp-Ottosdal Area
In the Klerksdorp-Ventersdorp region the Dominion Group strata, as in
the Vredefort area separates the Witwatersrand sediments from the basement
rocks. The region can be divided into three areas - the scattered outcrops
between Klerksdorp and Ventersdorp (described by Nel 1934; Nel ~~ 1939)
an oval shaped fold known as the Rietkuil Syncline, sixteen kilometres west
of Klerksdorp (reviewed by Wilson et al 1964) and a thin veneer of West Rand
group strata preserved south of Ottosdal (van Backstr8m 1952).
Beetz (1936) and Collender (1960) presented detailed stratigraphic
sections of borehole core which penetrated West Rand Group strata in the
vicinity of Klerksdorp. The compilation of the composite stratigraphic
sections in this area is complicated by the folding and faulting of the Wit
watersrand strata which delayed the emergence of the Klerksdorp District as
an important gold producing area by forty years. However, despite the
structural complexity the presence of economic auriferous conglomerates with
in the Dominion Group and Government and Jeppestown subgroup has encouraged
further exploratory drilling (Whiteside et~ 1976).
Figure 8 compares the lithology and thickness of the West Rand Group in
the Klerksdorp area with those on the Central, Odendaalsrus and Vredefort
areas (Nel 1933; Coetzee 1960; Cousins 1960). The figure clearly illustrates
the pronounced increase of arenaceous sediments in the Klerksdorp area.
3.4.1 Hospital Hill Subgroup
The thickness of the Hospital Hill Subgroup in the Klerksdorp-Venters
dorp area is about 2100 metres which is about 500 metres more than the thick-

Klerksdorp Central West R~nd (after Ne 11934, (after Mellor1911
FORMATIONS Collender1960) Cousons19&oj
Vredefort
N~W,;:-!1~~W,2i Odendaalsrus
(after Coetzee 1960)
MC MC ., r··•~,..=-=----------,._..,-,.,-----------~
Roodepoort
Crown Lava
Florida Quartzite
Witpoortjie
oronalion S_hale
Promise Quartz i te
Brixton
Park town Shale
M
M
CB SB
M
OGQ
1000m
Seate:
0
MARKERS :-
MC CL GR VR CR T
PR CB SB M
OGQ
Main Conglomerate Crown Lava Governent Reef Veldschoen Reef Coronation Reef Tillite Promise Reef Contorted Bed Speckled Bed Magnetic horizons Orange Grove Quartzite
0Shale
Dsandstone
LJOld Granite
Figure 8: Comparison of lithology and thickness of West Rand Group stratigraphy in the Klerksdorp, Central-West Rand, Vredefort and Odendaalsrus areas.
•

-28-
ness on the Central Rand. The arenaceous members of this subgroup shows a
progressive increase in thickness from the Central Rand towards the Klerks
dorp area. West of Klerksdorp the sandstones thin until near Ottosdal
instead of the normal 2100 metres of the Hospital Hill sediments the entire
Witwatersrand succession only totals about 1370 metres (von Backstr8m
1952).
The distinctive rock units (the Orange Grove quartzites, Speckled Bed,
Contorted Bed and Hospital Hill quartzite) recognised by Nel (1934) in the
Klerksdorp area have not been identified in the Ottosdal area. However,
von BackstrBm (1952) noted that the sediments above the Dominion Group vol-.
canics near Ottosdal are lithologically and stratigraphically similar to
rocks of the Hospital Hill Subgroup. The succession from the base upwards . f f . h 1 ("'1/l+h"'2 h f . nd . · 1 consists o erruginous s a esAw ic are o ten magnetic a are simi ar to
the Water Tower Shales on the Central Rand • Following these shales
are hard bluish-white, fine to medium grained quartzites (155 m); a shale
with flakes of white mica (23 m), a bluish grit (4.5 m), a coarse grained
quartzite (152 m), a grey sandy shale (91.5 m) and finally a coarse grained
quartzite (27 m). In the Ottosdal area siliceous ironstone units which
superficially resemble the Contorted Bed in the Klerksdorp area are, accord
ing to von Backstr8m (1952) too high up in the succession and too thin for
such a correlation.
3.4.1.1 Orange Grove Quartzite
This formation is poorly developed in the Klerksdorp area with only one
or two quartzite bands developed. The total thickness varies from about 160
metres east of Klerksdorp, 5-100 metres near Rietkuil and to zero metres to
wards southwest of Klerksdorp. The variability in thickness of this forma
tion is not in accordance with the consistently thick 200 metres Orange Grove
Quartzite on the Central Rand.
The quartzites are essentailly fine grained. No basal conglomerate is
developed. The top of the formation grades into black weathering shales
and dark fine grained sandstone or quartzites belonging to the Parktown Shale
formation. However, the yellowish colour, the hard compact nature of the
rock and the absence of any feklspathic component in the quartzite makes the
Orange Grove formation distinctive and may in places serve as a useful marker ~ (Nel 19.9). ~
3.4.1.2 .Parktown Shale
The Parktown Shale formation is about 610 m thick in the Klerksdorp area
(Nel 1934). Nel recognised the ferruginous Water Tower Shale Member and
Contorted Bed in this area and tentatively correlated a feldspathic quartzite
and a light weathering quartzite wfth the Speckled Bed and Ripple Marked

-29-
Quartzite respectively.
The Water Tower Shales consist of thick ferruginous shales with inter
bedded dark quartzites or siliceous ironstone bands. According to Nel
'occasional thin inconstant bands of ordinary light coloured quartzite'
appear randomly within the argillaceous sequence. The Water Tower Sh~les
are closely associated with the topmost Orange Grove Quartzite member and
it is only in the Klerksdorp area that argillaceous units with the character
istics of the Water Tower Shales may, in places, underlie sandstones resemb
ling the Orange Grove Quartzites. Overlying the Water Tower Shales are a
quartzites of varying thickness (0-60 m) which are the probabl: equivalents -of the Ripple Marked Quartzite. Soft shales follow this arenaceous unit
and about 430 metres above the Dominion Group, a 1-3 metre feldspathic quart
zite which can 'safely be correlated with the similarly placed Speckled Bed
in the Rand' serves as a useful marker (Nel 1934). Overlying this thin but
consistent unit are argillaceous shales (183 m) which are in parts ferrugin-
ous and have minor thin bedded dark sandstone developed. Within these shales,
approximately 52-61 metres above the Speckled Bed, the Contorted Bed with its
alternations of jasper, chert and magnetite bearing laminae contorted into
disharmonic folds is easily recognised and is a distinctive regional marker
(Nel ::!. al 1939). About 75 metres of alternating thinly bedded sandstone
and shale bands make up the rest of the Parktown Shale Formation.
3.3.1.3 Brixton Formation
The Brixton Formation is about 1160 m thick in the Klerksdorp area as
compared to 700 metres on the Central Rand and 1500 metres on the West Rand.
Disregarding the argillaceous units of the formation the quartzites (particu
larly the topmost quartzite) generally shows a progressive increase in thick
ness from the Central Rand to the Klerksdorp-Ventersdorp area. The sand/
shale ratio of this formation is 1.23 on the West and Central Rand as compared
to 1.57 in the Klerksdorp area.
The succession from the base to the thickest shale of the Brixton Forma
tion consists of coarse and gritty quartzites (107 m), 167 m siliceous shales,
30 m of sago textured quartzite and a 305 m shale unit which is ferruginous
in parts. A 6 m sago quartzite divides the last named argillaceous unit.
About 60 m above this quartzite is another coarse and gritty quartzite of
about the same thickness. The rest of the Brixton succession is made up of
thinly bedded argillaceous quartzite and shales (61 m), a coarse grit horizon
with pebble conglomerates (442 m) and 105-120 m of black weathering shale.
The sago textures in the well rounded coarser quartzite, the small
pebble conglomerates in the topmost arenaceous unit and the repetitive nature
of the argillaceous beds between two fine grained quartzites and three coarse
grained quartzites makes this formation in the Klerksdorp area 'an excellent

-30-
guide to the correlation of the strata and a valuable aid in deciphering the
structure of the Witwatersrand heds' (Nel 1934).
3.3.2 The Government Subgroup
Nel (1934, Nel !:.! al (1939), Callender (1960) and Wilson~ al (1964)
have remarked on the development of auriferous and uraniferous horizons with
in the Government and Jeppestown Subgroups in the Klerksdorp area. Cousins
(1960) compared the Government and Jeppestown sections of the Central-West
Rand with those of the Klerksdorp area and attempted a correlation bed for bed.
According to Cousins 'certain shale beds of the Central Rand are represented
only by argillaceous quartzite or by qaurtzite with shale bands in the Klerks
dorp area'. Callender (1960) attempted a more logical classification by
breaking up Nel's (1934) Lower and Upper sections of the Government Subgroup
into five stages (Government Boulder, Government, Coronation, Promise and
Bonanza), each stage representing a cycle of sedimentation.
In this review, the writer places the base of the Government Subgroup
at the base of the first known conglomerate in the subgroup (after Callender
1960; SACS 1978) and not at the base of an interbedded shale (Nel 1934;
Cousins 1960). The first persistent conglomerates within the West Rand
Group in the Klerksdorp area are unlike the other outcrop areas in that they
occur 460 metres below the Promise Reef. The Lower Tillite horizon below
the Promise Reef in the Klerksdorp areas is dissimilar to the tillites in the
Heidelberg-Delmas-Balfour area, the Evander basin and the West Rand, as it is
closely associated with arenaceous sediments. However, the Upper Tillite in
the Klerksdorp area 'can be closely correlated with the beds on the Rand
through the presence of tillite associated with the shales' (Callender 1960).
These argillaceous units demarcate the Coronation Shale Formation as defined
by SACS (1978). An attempt shall therefore be made in this review to re
classify Collender's (1960) five stages of the Government Subgroup into the
three formations (Promise, Quartzite, Coronation Shale, Witpoortjie) as pro
posed by SACS (1978)(Table 4).
Nel's (1934) average composite thickness of the individual units making
up Collender's five stages is 1500 m, whereas Collender's estimate based on
borehole data is 1400 metres.
3.3.2.l Promise Quartzite Formation
This formation consists of a basal coarse grained arenaceous unit (365 m),
a Lower Tillite (6 m), a shale unit (90 m) and finally a conglomerate and
quartzite unit totalling about 185 metres.
The thick basal unit consisting of green, medium to coarse grained

·~ -,
-31-
quartzite has numerous scattered pyritic black grits and conglomerate in the
upper section. The milky white quartz, white chert and light grey chert
pebbles of the conglomerate have an average diameter of about 6 mn and rarely
exceed 18 mm. A number of the conglomerates contain low gold and uranium
values. The Old West Bonanza Mine exploited some of these conglomerates
(Nel 1934) and between 1907 and 1912 produced 30611 ozs of gold with an aver-
age grade of 7.8 dwts per ton. According to Nel (1934) the basal coarse
grained arenaceous unit is essentially composed of 'milky soft micaceous
sandstones, probably shaly in parts, which include grit bands'. Conglomer
ates are rarely developed, although Nel (1934) described conglomerates that
were 'made up of small pebbles less than an inch across and more or less of
the same size, but now and again there are individuals as much as 4 inches in
diameter'. The pebbles consist of glassy, milky and dark green quartz,
banded chert, quartzite, red shale and a 'non-descript dense light greenish
grey rock.'
The Lower and Upper Tillite units are, according to Callender (1960),
between 183 to 228 metres apart. The Lower Tillite, with an average thick-
ness of about 6 metres, becomes thinner in a south westerly direction and in
places passes into a narrow dark gritty rock in which pebbles are rare (Nel
1934). The Lower Tillite Matrix consists predominantly of angular glassy
quartz fragments. The pebbles and boulders - some of which are striated -
are composed primarily of quartz and quartzite and secondary grit, chert
(sometimes banded) and a cherty lava.
A shale which varies considerably in distribution, width and texture
overlies the tillite (Callender 1960). Outside the Rietkuil Syncline the
alternating shale and argillaceous quartzite total 245 m whereas in the Riet
kuil area it varies from 61 to 107 m (Beetz 1936; Callender 1960) with the
overlying Promise Reef either resting on light green fine grained quartzite
or on fine grained shale (0.5 m) characterised by the presence of small (1.25
mm) white chert fragments. According to Callender (1960) the presence of
the fragments within the shale is a helpful stratigraphic marker in disting
uishing this shale from any other in the Government Subgroup.
Sixty-one metres of light coloured quartzite with numerous poorly miner
alized bands of conglomerate overlie the alternating quartzite and shales.
The lowermost band is taken to be the equivalent of the Promise Reef (Callen
der 1960). Boreholes less than 2 km apart show the bands of conglomerate
thickening from 10 cm southeast of the Afrik.ander Mine. to six beds of con
glomerate each exceeding 1 min thickness towards the south of the mine.
The pebbles mostly consist of white quartz and are small (up to 1.5 cm).
Pyrite is present in places, but mineralization is poor. According to

TABLE 4: Breakdown of Government subgroup in the Klerksdorp area
STAGE (after Callender 1960) FORMATION (after SACS 1978) UNITS m
GOVERNMENT Quartzites 91
BOULDER (220 m) Argi llaceous 52 Quartzi tes
REEF Boulder 107 Conglomerates
WITPOORTJIE Magnetic-Shale 183
GOVERNMENT (260 m) (665 rn) Quartzite 62
Conglomerate 15
Shales 15
CORONATION (185 m) Argillaceous 61 Quartzites
Conglomerate 107
CORONATION Shale 61
SHALE (90 m) Upper Tilli te 30 PROMISE (27 5 rn) Quartzites 122
PROMISE Conglomerate 62
QUARTZITE (640 m) Shales with
90 dark quartzites
BONANZA (455 m) Lower Tillite 6
Reef+ 365 Conglomerate

-32-
Callender (1960), granular carbon has been found within these conglomerates
in some boreholes, but unlike the carbon-gold relationship in Lhe Central
Rand Group, these carry no gold. Between these conglomerates and the Upper
Tillite is about 190 m of coarse, greenish coloured, often sago-textured
quartzite, containing scattered fragments of chert and pebbles of blue quartz,
alternating with dark quartzite shales.
3.4.2.2 Coronation Shale Formation
The average thickness of the Upper Tillite is about 30 metres. Accord-
ing to Callender 'it consists essentially of a consolidated mudstone, verY
dark in colour with numerous quarter inch chert and quartz ~agments'.
Nel (1934) noted that Upper Tillite boulders north of Klerksdorp are striated.
Callender (1960) observed that where the tillite is thin a light very coarse
yellow grey quartzite with light and dark chert occurs between the tillite
and the overlying shale.
The sixty metres of shale within the Coronation Shale formation in the
Klerksdorp area are weakly magnetic. It is composed of 'dense light green
shales with occasional darker phases and thin light coloured lenses of quart
zite' (Callender 1960). West of Klerksdorp (Elandslaagte) these shales are
best developed and have a banded slaty appearance due to intercalated lenses
of quartzite with specks of pyrite.
3.4.2.3 The Witpoortjie Formation
The Witpoortjie Formation consists of Collender.'s Coronation Stage,
Goverrnnent Shale Stage and Government Boulder Stage. Each stage begins with
a conglomerate. The Witpoortjie Formation in the type area, on the other
hand, has only two well developed conglomerates - the Coronation Reef and
Government Reef. However, the quartzite developed between these two reefs
is coarse grained on the Central Rand and as the sand/shale ratio for the
formation on the Central Rand (1.19) is much lower than that for the Klerks
dorp area (2.5) one would expect a more proximal conglomerate reef (ie. in
the Klerksdorp area) to grade into a coarse grained quartzite in the type
area.
According to Nel (1934) the base of this formation 'is economically one
of the most important members of the Witwatersrand succession in the Klerks
dorp area for in it are included the auriferous conglomerates which were ex
ploited in the past by the old Buffelsdoorn, Pope and Elandshoogte mines and
which are still being worked by the Afrikander and the recently re-started
Rietkuil mines.' Callender describes these 1 m thick conglomerates distrib
uted within 108 m of greenish coloured quartzite as 'well miner.alized' with
the pebbles consisting of mixed rock types. They are well rounded and well

-34-
with Collender's (1960) breakdown. The reasons why Collender's classifica
tions are adhered to here include: (i) the shale grades into the underlying
arenaceous sediments; (ii) the Florida Quartzite formation on the Central
Rand consists of two arenaceous units separated by a magnetic argillaceous
unit (SACS 1978); and (iii) according to Collender there is a distinct un
conformity separating the two subgroups if Nel's 'Outer Basin Stage' is in•
eluded in the Jeppestown Subgroup.
3.4.3.1 Florida Quartzite Formation
In the Klerksdorp area this formation consists of a zone of conglomer
ate (50-62 m), a dense 'marble' quartzite (6 m), argillaceous quartzite
(30 m), magnetic shales (183 m) and finally a zone of auriferous reefs and
quartzite (244 m).
Four conglomerate bands at the base of this formation have been mined
at both the Babrosco and Afrikander mines (Wilson et al 1964). However, the
various reefs consist of lenticular and discontinuous bands that, according
to Collender (1960) were deposited 'as channel deposits on the old undulat
ing Government Series land surface'. Definite correlation of the reefs is
therefore difficult, as many terminate against the sides of the channels.
At the Babrosco Mine three conglomerates - the Upper, Middle and Lower Reefs
have been mined, while at the Afrikander Lease Mine five conglomerates - the
No. 1 to 5 reefs - were still being exploited up to 1960 (Collender 1960).
The No. 5 Reef and the Upper Reef represent the same conglomerate as they
are both overlain by a distinctive marker - the Marble Quartzite. Wilson
et al (1964), presented a geological section of the Rietk.uil ~rea which de
picts the 'generally accepted correlation' of reefs below the Marble Quartzite.
The No. 5 and No. 4 Reefs correlate with the Upper Reef, the No. 3 with the
Middle Reef and the No. 2 with the Lower Reef. Furthermore, below the No. 1
Reef on the Afrikander mine is a conglomerate that has been extensively mined
and is locally known as the Contact Reef (Wilson et al 1964).
The conglomerates are loosely packed and are composed of quartz, banded
red and grey chert and lava pebbles varying from 1.8 to about 3 cm in diamet
er. They are well rounded and each band shows inverse grading. According
to Collender (1960) carbon is present in the upper and lower limits and in
the latter it occurs as several crossbedded stringers which merge into in
dividual lenses up to 5 cm in thickness. The quartzite between the reefs
are very light in colour, coarse to gritty with numerous small fragments and
black specks. Throughout they contain pyritic stringers and very fine grits
(2 mm) producing persistent crossbedding (Callender 1960).
A 1.5 to 9 metre marker locally termed the 'Marble Quartzite' overlies
the conglomerate zone. It is extremely dense and is clear white in colour.

-35-
Collender (1960) has named this distinctive horizon 'The White Bar'.
Above the White Bar, 30 metres of quartzite gradually become darker in
colour and less speckled below the major shale horizon. In one borehole
a pyritic grit was intersected near the top of this unit (Callender 1960).
The thick shale unit (183 m) with intercalated argillaceous quartzite
represent the only thick development of shales of the Jeppestown Subgroup in
the Klerksdorp area. The shale bands increase in.number and thickness
eastwards and decrease in frequencey downwards with the lower half of the
unit being definitely more quartzitic than shaly (Callender 1960). They
are moderately magnetic (Paver 1939) with several of the narrow ferruginous
bands being contorted. The shale bands are characterised by their mottling
and colour banding.
The 90 metres of sediments which overlie the shale show a marked devel
opment of grit and conglomerate. Callender (1960) states that these bands
of conglomerate, which Nel (1934) termed the 'Inner Basin Reefs', are only
present in the Rietkuil Syncline where they have been mined in the Babrosco
and Afrikander Mines for their gold and uranium content. On the Stilfontein
Mine and the Townlands the quartzite carries seven poorly developed conglom
erate bands which were locally called the 'Veldschoen Reefs'. The conglom
erates are concentrated in the first 18 metres of quartzite and are lenticu
lar. Callender (1960) states; "The lowest reef is known as the Contact
Reef and lies directly on the shales. The pebbles are large, consisting of
white quartz up to 2 inches across and poorly packed. The No. 1 reef is
closely associated with the Contact Reef and occurs sporadically in the form
of lenses. The position of the No. 2 reef varies from 10 to 35 feet above
the contact reef and that of the No. 4 reef is 25 feet above the No. 2 reef.
No. 3 reef is an intermediate marker band. The No. 2 and No. 4 reefs are
the main gold carriers. They may be single reefs or they split up into a
series of narrow conglomerates which merge again to form wider bands with a
channel width of some 60 inches. The No. 4 reef is characterised by the
presence of high uranium values".
3.4.3.2 Crown Lava
This persistent amygdaloidal lava is well developed throughout the
Klerksdorp area. Its thickness varies from 40 to 65 metres. The lava is
fine grained with a dark olive green colour. The amygdales are about 6 mm
in diameter and are numerous within the upper 30 metres (Collender 1960).
3.4.3.3 Roodepoort Formation
More than 600 metres of dominantly arenaceous sediments are developed
above the Crown Lava. Callender (1960) distinguishes two units - the Upper

-36-
Striped Quartzite and the Transition Zone - within this formation. Sharpe
(1950), Callender (1960) and Cousins (1965) have all remarked on the absence
of a true shale at the top of the Jeppestown Subgroup in the Klerksdorp area.
Mellor (1911) used the top of this shale in the type area to delineate the
West and Central Rand Groups. The writer places the division between the
upper and lower portions of the Witwatersrand Supergroup in the Klerksdorp
area at the base of the Main Reef (Ada May Reef) as suggested by Cousins
(1965). Hence in this area the transitional beds about 60 m below the Main
Reef Zone are included in the West Rand Group.
The Upper Striped Quartzites have an average thickness of about 550 ·
metres and are so named due to the alternations of argillaceous zones with
light beds. In the east of the area the quartzites are fine grained and
the argillaceous zones are more shaly in texture (Callender 1960). Within
the thick succession, Callender noted four zones, each zone having certain
textural characteristics. Overlying the amygdaloidal lava is a zone of
alternating siliceous and argillaceous striped quartzites (61 cm) showing no
signs of contact metamorphism. About 245 m of quartzite follow the first
zone and have a markedly striped appearance caused by 0.7 - 12 metre siliceous
bands alternating with argillaceous quartzites. Peppery black speckling is
common. Quartz and chert fragments are spread over a thickness of 30 metres
in the middle of this zone. The third zone (120 nm) is very argillaceous
with the development of numerous dark green shale bands up to 8 cm in thick
ness. The contact with the underlying striped quartzite is very sharp.
The rest of the unit is made up of darkish grey quartzites with minute black
specks.
The transitional zone consists of 60 metres of quartzite and grits.
The base is marked by a number of thin argillaceous bands while towards the
top beds are gritty with the development of a few lenticular grit to small
pebble conglomerate bands. The overlying conglomerate termed the Carbon
Leader in the Far West Rand and the Ada May Reef in the Klerksdorp area (named
the Main Conglomerate by SACS 1978) lies on the transition zone quartzites
with a -marked unconformity.
3.5 Northernmost West Rand Group Outlier
On the western edge ·of the Johannesburg granite dome and separated from
the Witwatersrand Supergroup of the Central and West Rand by the Muldersdrif
Ultramafic Complex (Anhaeusser 1978) are Hospital Hill Subgroup sediments
preserved within a synclinal structure (Hendriks 1961) (Figure 9).

""'
T I I
LOCALITY MAP
~
TRANSVAAL SUPERGROUP
VENTERSDORP SUPERGROUP
WITWATERAND SUPERGROUP
rr:,ARCHAEAN =·. T • L.,_jGRANITE ~ ~ORT~~R~MOST •••• ~ARCHAEAN ~GREENSTONE
TERRAIN
. . •wEST RAND • GROUP OUTLIER • . - - .. . -. . . . . . . . . . . .
. . . .
. . . .
. .
. . . . .
Figure 9: Map showing the location of the northernmost West Rand Group outlier.

-37-
The beds are locally sheared and brecciated and, according to Hendriks
(1961), total about 620 metres compared to the 1600 metres of ~orresponding
sediments preserved on the Central Rand.
3.5.1 Hospital Hill Subgroup
3.5.1.1 Orange Grove Quartzite
The Orange Grove Quartzite is approximately 100 metres thick. It is
coarse grained at the base, becoming finer grained towards the top and is
interbedded with a brownish to greyish, locally schistose slate (Jansen 1977).
The lower quartzite unit contains several bands of conglomerate. The lower
band, about 4.5 m from the base measures approximately 15 cm.in thickness
and is composed of pebbles of black and white vein quartz set in a sandy to
gritty matrix. The second, and thickest conglomerate band (45 cm) is in
versely graded with the top pebbles measuring about 5 cm in diameter.
The middle and upper quartzite units measure 14 m and 42 min thickness
respectively, and are yellow to white medium grained rocks (Jansen 1977).
3.5.1.2 Parktown Shale
The shale of the Parktown Shale Formation (approx. 260 m) is greenish in
colour, weathering brown to reddish, and is often ferruginous. Several
markers have been recognised and include the Water Tower Shale Member, Ripple
Marked Quartzite, and the Speckled Bed and the Contorted Bed (Hendriks 1961).
The Water Tower Shale Member serves as a useful marker as it locally
contains magnetite crystals and secondary chert. On weathering it displays
a typical box structure (Jansen 1977). The other markers are not well ex
posed at most localities.· The Rippled Marked Quartzite (2 m) is a yellowish
white glassy rock composed of small round quartz grains surrounded by second
ary quartz in a chloritic or feldspathic matrix. The Speckled Bed (1 m)
is, as in all the other outcrop areas, a coarse grained feldspathic quartzite.
The Contorted Bed has the same distinctive features as described in the
Central Rand by Mellor (1911).
3.5.1.3 Brixton Formation
This formation is approximately 260 metres thick. The Parktown Shale
Formation is followed by an arenaceous unit consisting of four bands of
quartzite interbedded with shales. The total thickness of this unit is
approximately 15 m and may serve as a useful marker due to its sago texture.
The upper quartzite band (2 m) is coarse and locally contains gritty to con
glomeratic layers.
The remaining quartzite units are typical of the Brixton Formation in
their green colour and sago textures. The shale bands are mostly greenish
in colour, but the upper shale is greyish blue, weathering brown. The shale

-38-
band under the upper quartzitic unit contains scattered pebbles of greenish
qu~rtzite.
3.6 Orange Free State Goldfield (Odendaalsrus Area)
Hospital Hill, Government and Jeppestown Subgroup sediments have been
recognised in the Welkom-Odendaalsrus-Virginia region. For this area, the
writer has almost wholly relied upon the review by Coetzee (1960). Jeppes
town, and an incomplete Government Subgroup, composite columnar sections have
been built up from borehole data. Unfortunately, a continuous succession
of Hospital Hill sediments is not available at present due to the faulting
and folding of the strata. Nevertheless, the correlation of the Jeppestown
subgroup with an almost identical succession in the Klerksdorp area (Figure
8) has facilitated in the exploration of the overlying auriferous Main Con
glomerate (Basal or Leader Reef). The shale of the West Rand Group and the
Crown Lava were found to be valuable markers (Whiteside et al 1976).
3.6.1 Hospital Hill Subgroup
According to Coetzee (1960) various boreholes have passed through beds
which, according to their lithological features and relative position in the
structural interpretation of the area, probably belong to West Rand Group.
But because a continuous succession cannot be established from borehole evi
dence as is the case for the Jeppestown and Government Subgroup their corre
lation must be regarded as being only tentative.
3.6.1.2 Parktown Shale Formation
About 10.6 km west-northwest of Odendaalsrus a borehole (WE 2) passed
through the Ventersdorp Supergroup sediments and continued for about 390
metres in shale with an apparent dip of 60°. The lower 28.6 m consist of
faintly banded to massive grey and black shales which grade into 2 m of
finely banded grey and black dense silicified shale. Overlying these shales
are 12.8 m of magnetic fine grained, massive, silicified arenaceous and
strongly ferruginous red mudstone. Finally, 346 metres of black to grey
shales which in places are magnetic and contorted, underly the lavas of the
Ventersdorp Supergroup. Furthermore, a note appears on the borehole record
stating that 'a band of finely laminated contorted shale suggests the possib
ility of these beds belonging to the Hospital Hill Series'. Clearly, the
lithological appearance of the beds described above is that of the Parktown
Shale Formation with the Contorted Bed being a distinctive marker.
3.6.1.3 Brixton Formation
Underlying Karoo cover and 7.7 km southwest of Welkom station a borehole
(Wl) penetrated 377 metres of quartzite and shale with an average dip of

-40-
The upper portion of the Government Subgroup consists of arenaceous
sediments, carrying scattered grit bands, two intercalated shale bands and
a conglomerate. The probable Government Reef is marked by a 7.5 cm thick
layer containing chert and quartz pebbles resting directly on the underlying
shale. The overlying quartzites are about 122 metres thick and are banded
with white, glassy quartzites alternating with thick greenish grey argillac
eous quartzites. These are followed by a 33 metre thick dark greenish to
blackish shale which in turn is followed by alternating white, sandstones
and argillaceous green quartzites. This quartzite between the two shale
units is characterised by occasional small scattered quartz pebbles in the
upper part and by coloured fragments in the lower part. Overlying these
arenaceous sediments is an impersistent shale varying in thickness between
0.5 and 17 metres. The quartzite above the upper shale is whitish with a
faint greenish-yellow tinge and carries scattered grit beds composed of quartz
and chert pebbles.
3.6.3 Jeppestown Subgroup
The sediments comprising the Jeppestown Subgroup in the Odendaalsrus
area are taken to include the rocks lying between the basal argillaceous
quartzite (equivalent to Collender's ~960) 'Outer Basin Stage' in the Klerks
dorp area) and the uppermost argillaceous unit {equivalent to Mellor's (1911)
shale (T) on the Central Rand). The presence of the persistent Crown Lava
in the Odendaalsrus area makes it convenient to divide the subgroup into its
three formation.
3.6.3.1 Florida Quartzite Formation
The Florida Quartzite Formation is about 510 metres thick which is com
parable with that measured in the Klerksdorp area.
From the base upwards, it consists of 76 metres of dark argillaceous
quartzite, 82 metres of magnetic shale, 6 metres of argillaceous quartzite
streaked with shale and finally a 186 metre quartzite.
3.6.3.2 Crown Lava
The Crown Lava is about 106 metres thick in the Odendaalsrus area, and
according to Coetzee (1960) is an andesite.
In places, boreholes have penetrated a 1 m gritty tuff which rests on
the Crown Lava and 'consists of angular grains of quartz, plagioclase, and
altered rock, probably lava, set in a fine grained irresolvable matrix'
(Coetzee 1960). The tuff is locally referred to as a ''batswing' breccia.
The Crown Lava is dark greenish grey in colour, amygdaloidal in parts
and, as in the South Rand area, built up of several flows. Intercalated
fine grained tuffs carrying fragments of lava have been recorded and in one

-41-
borehole the upper 33 metres of the Crown Lava consists of fragments and
bo~bs of black amygdaloidal lava intercalated in dense lava.
3.6.3.3 Roodepoort Formation
Overlying the Crown Lava are 33 metres of lightly banded grey quart
zites, 107 metres of argillaceous quartzites with thin streaks of black shale.
122 metres of alternating bands of light grey to whitish, finely spotted
quartzite and dark argillaceous quartzite and an upper argillaceous unit of
152 metres composed of numerous bands of dark arenaceous shale and pale
quartzite.
4. MARKERS
It is unnecessary to enlarge upon the distinctive characteristics that
'markers' or key horizons within the West Rand Group possess. They have
been dealt with above. This section summarizes the distribution of the
markers and their geophysical (magnetic) properties.
Table 5 is an updated version of Nels (1933) compilation of the known,
doubtful and absent markers in the outcrop areas. Included in the table is
subsurface data from the Evander, Delmas and Orange Free State Goldfields
areas (from Jansen~ al 1972; Button 1968; Coetzee 1960).
Krahmann (1930) was the first to realize the possibility of the applica
tion of the magnetic geophysical methods for the tracing of the strongly
magnetic and persistent shale units in the West Rand Subgroup. Following
his experimental magnetic surveys on the West Rand various mining companies
carried out a large scale geophysical programme (Weiss 1934). The success
of the magnetic method in using strongly magnetic shale horizons (Water Tower
Shale, Contorted Bed, Coronation Shale), even when covered by 3,000 metres of
younger sediments, as markers for the determination of the approximate posit
ion of the zone of the Main Conglomerate is in itself, according to Weiss
(1934), 'the greatest tribute to the enterprising mining companies and their
distinguished magnetic experts'. Magnetometric traverses across the Wit-
watersrand sediments in the Klerksdorp and Vredefort areas has made it poss
ible to correlate the relative magnetic anomalies arising from the shale units
(Paver 1939). Table .b. is a comparison of the magnetic characteristics and
the geological position of the anomalies observed in the West Rand Group of
the Klerksdorp, Vredefort and West Rand areas (Krabmarm 1934; Paver 1939).
The two major anomalies arising from the Water Tower Shale and Contorted

TABLE 5: l-farkcrs _withi:, the West Rand Grou2
AP.EA HOSPITAL HILL ~U::.CROUP GOVER.\Y.ENT SUBGROUP JEPPESTO',N SUBGROUP
Water Ripple - Hos;n tal ycl1cLty of Orange Grove Tow~r Markod Speckled Cont.o:ted Black Hill Pro~is~ Tillitc Coronation Government tlu Crown arenaceous/argill-Quartzite Shale Quartzite Bed !led Grit Quartzite Reef Shale Reef Gri Lava aceous sediments
(magnetic) I
:I Central Rand X X X X X - X I X ? X X X ?
\.'est Rand X X X X X - X X X X X X X
Northernmost out- X X X X X - X 1 i,~r
Heidelberg area X X 1 - X X X X X X X X X ?
Sout:1 Rand area ? -; - - X X X ? ? ? X X X 1 ' Delmas area X X 1 1 1 ? ? ? X X X X X X
Evander area 1 ? 1 1 ? 1 ?
· I ? X X - X X 1
Vredefort area X X - X X - X ? 1 X - 1 X 1
Kleritsdor;> area X X 1 )( X - X X X 1 ? - X X
Ot t'osca l area - X ? 1 - - X
Oran;c Free State ? 1 ? ? X X X I ? X X X ? I X X
Goldfields
X • Exists or 'highly likely' - • Absent ? • Doubtful

TABLE 6: Correlation of mognetic ano:nalies in We5t Rand Group
Shale Units Approximate Distance above Base of Orange Groye Quart;ite (;;i)
Water Tower Shale Member (B) 270
Contorted Bed (F) 730
Observatory Shale Member (F) · 1255
Lower Brixton Shale (Gl) 1985
Middle Brixton Shale (G2) 2400
Upper Brixton Shale
Bottom Pranisc Quartzite Shale (J)
'J.'Op Promise Quartzite Shale (J)
Coronation Shale (L) 4155
Uppermost Witpoortjie Shale(O) 4790
Florida Quartzite Shale (Q) 5540
WcRt Rord
Anomalrcs
Major
Major
Medium
ncd ium
Hedi,m
Major
Hedium
Medium
Symbols eg. (T) after M(!llor (1917)
Klerksdorp area Anor.1al ics
Vredefort area Ano::ialies
Major
Major
Medium
Medium
Minor
Major
Major
Medium
Medium
Minor
Minor Major
Nedium Hcdium
Medium Medium
Maj or anomaly · 16000 - 10000 8(
mediu.a anomaly 14000 - 6000 8 J minor anomaly 12000 - 4000 8 I

.....
-42-
Bed and the three anomalies caused by argillaceous shale units correlated
with the Coronation Shale, last Witpoortjie shale and Florida Quartzite
shale towards the top of the West Rand Group, are consistent features in all
three areas. In the thick succession between these major anomalies, the
magnetic anomali~s are not so directly comparable. Paver (1939) noted that
the total number of magnetic anomalies observed remained the same in· the.·
Klerksdorp, Vredefort and West Rand areas.
Clearly, the persistent lithological and geophysical markers of the Wit
watersrand Supergroup have facilitated in the rapid identification and corre-
lation of widely scattered outliers. Furthermore, the uniformity of the
markers have enabled formations to be correlated unit for unit.
5. STRUCTURE
The structure of the Witwatersrand Supergroup is that of an elongated
synclinorium stretching 320 km in a north easterly direction and 120 km in
a north westerly direction. Widespread remnants of West Rand Group sedi-
ments not involved in the subsidence of the 'tectonic basin' are present
near Ottosdal in the west and at Northcliff in the Central Rand (Brock and
Pretorius 1964). Bordering, and in the centre of, the elongated basin are
five distinctive outcropping hubs of granite. Drilling and geophysical
investigations have proved that there are ten other granitic 'domes'.
Brock and Pretorius (1964) described the structure of the Witwatersrand
Basin in terms of a grid pattern in which the superimposition of axial plane
trace lines of major E-NE and NW folds give rise to culminations (Vredefort
Hub, Johannesburg Dome, Devon Dome and De Bron Horst), and depressions
(Potchefstroom Gap, Bothaville Gap, Blyvoor Segment Gap) arranged in a syst
ematic manner. The formation of the folds may have been caused by differ
ential subsidence due to the multistage rise of the Vredefort Hub and/or
other domes which began in pre-Ventersdorp post-West Rand G~oup times.
Brock and Pretorius (1964) suggested that as the domes were uplifted faults
assisted basin deepening and were contemporaneous with sedimentation. These
faults they named "Primary Basining Faults" and were intimately associated
with the folding.
Button (1968) questioned this concept and suggested that the granitic
domes were formed by post Transvaal tectonism acting on an originally more
or-less linear.mass of granite trending in a northeast or east-northeast
direction. Furthermore, the closure of the Witwatersrand basin defined by
the exact outline of the rim is still unknown due to the paucity of diamond
drill holes, especially along the south-western margin {Whiteside~ al 1976).
Although numerous papers (eg. Mellor 1911, 1913; Jtrause 1912; Pelletier

....
T I
-43-
1937; Ellis 1943; Roering 1968; Button 1968; Fripp and Gay 1972) and explan
ations of maps compiled by the Geological Survey (eg. Mellor 1917; Rogers
1922; Nel 1935; von BockstrBm 1962) have been published on the local struct
ural features of the Witwatersrand Supergroup, the regional structural geol
ogy in relation to the other Supergroups and as an entity on its own has
only recently been summarized by Pretorius (1974) and Whiteside~ al (1976).
5.1 Folding
According to Pretorius (1974), the depositional axes of the Archaean
and younger Proterozoic basins (Ventersdorp, Transvaal and Waterberg) all de
crease in age up the regional palaeoslope from the Kaapvaal gravity low to
wards the Limpopo gravity high. Furthermore, the 'geometry of the gravity
field over South Africa is a large scale portrayal of the areal and local
tectonic fabric' (Pretorius 1978). For instance, the principal fabric of
the Witwatersrand basin trends northeast, but has been deformed into an
arcuate pattern by first order regional folding about northwesterly axes
which follows the gravity trend. The superimposition of the folding on the
fabric resulted in the formation of the large anticlines and synclines (aver
age periodicy 40 - 50 km) which controlled the distribution of the granitic
domes and major goldfields. In the South Rand area local smaller periodicit
ies of 4-5 km, 1.5 - 2.5 km and 0.5 - 8 km, have been recorded (Pretorius
1964).
Detailed studies of folding within the Contorted Bed have been carried
out by De Beer (1965), Truswell (1970) and Fripp and Gay (1972). The con
tortions are regarded by De Beer (1968) to be p~oducts 'of concentric folding
of a competent layer with resultant bedding plane slip. The increasing
curvature of a concentric fold causes an increasing lack of space in the
core of the fold which often tends to develop local thrust faulting'.
Truswell (1970) argued that the lack of pattern in the contortions and the
fact that they do not affect strata above and below precluded a tectonic
origin for the folds. Fripp and Gay (1972), on the other hand, support a
tectonic origin for the contortions and state 'that in the Johannesburg area,
at least, there exists good spatial and geometrical control on the attitude
and shape of the folds. Only one contortion was found which the writers
felt was undoubtedly of sedimentary origin but it is possible that initially,
very gentle small-amplitude buckles were formed while the sediments were still
soft'. The geometric control Fripp and Gay (1972) describe is that the
'fold axes are approximately parallel to each other, and most important, the
axial surfaces are parallel and dip in the same direction as the bedding',
hence refuting Truswell's (1970) slump theory. Folds within the shales of
the West Rand Group are not well developed although locally good conjugate

.....
r
A
8 B
... ~ ... ..,._ ',
....
' ' ' ' ' '
L--
--y
Figure 10: Fripp and Gay's (1972) model for the simultaneous
formation of folds in the Contorted Bed and cleavage in the ar~illaceous rocks. Unit circle (A) demon-
strates state of strain relative to strain ellipse (B)
Uader such deformation a gentle symmetrical flexureiis flattened and deformed into an asymmetrical fold.
Note that the major axis of the'ellipse is not parallel to the axial plane of fold.

-44-
folds, kink bands, chevron folds and gentle flexure folds have been recorded
(Fripp and Gay 1972).
Cleavage within the West Rand Group has been described by Roering (1968)
in the Krugersdorp area and by Fripp and Gay (1972) in the Johannesburg area.
Roering (1968) describes an east-west cleavage which has a fairly constant
orientation over the area studied. The formation of the cleavage was
thought to have formed after the folding and under a north-south compression.
Fripp and Gay (1972) describe the cleavage developed in the argillaceous
rocks in the Johannesburg area which has the same orientation as that des
cribed in the Krugersdorp area. They produced a model for the simultane
ous formations of the folds in the Contorted Bed and cleavage in the argilla-
ceous rocks. The model is reproduced on Figure 10.
The model is basically one of progressive deformation in which an initi
ally symmetrical fold is distorted into an assymetrical fold by simple shear.
On Figure 10 a unit circle is deformed into a strain ellipse whose axes
rotate with the sense of shear. In this model the cleavage is thought to
form perpendicular to the strain ellipse and hence it should normally be in
clined at a shallower angle to the shear plane than the axial planes of the
fold. Fripp and Gay's model (1972) therefore refutes Roering's (1968) con
cept in which cleavage is thought to have developed after folding on the
basis that the average cleavage plane trace does not coincide with the fold
axes. However, they all agree that the cleavage was formed under the action
of a north-south directed compressive stress in both the West and Central
Rand. Fripp and Gay (1972) conclude that 'this compression acting on the
gently dipping rocks of the Hospital Hill Series could have caused the mass
ive Hospital Hill Quartzites to ride over the underlying argillaceous rocks
and the banded ironstones, thus causing these rocks to be deformed by a
simple shear strain and leading to the formation of the cleavage in the re
latively homogeneous argillaceous rocks and the asymmetric folds in the thin
ly bedded banded ironstones'.
5.2 Faulting
The distribution of faults in the Witwatersrand basin is depicted on
Figure 11. Faulting can be classified into two groups - those which cut
across the basin (radial or traverse faults) and those which are adjacent to
the trend of maximum subsidence (strike faults).
Strike faulting has taken place in all four major outcrop areas and is
more common in the older West Rand Group. The Rietfontein fault of the
Central Rand, Witpoortjie and Roodepoort faults of the West Rand, the major

-45-
north-east trending faults (Buffelsdoorn, Kromdraai and East Buffelsfontein)
in the Klerksdorp area and the de Bron fault in the Orange Free State are
all more or less tangential to the basin and may be classified as strike
faults (Whiteside~ al 1976). The two most important radial faults are the
Bank fault on the West Wits line and Sugarbush fault on the East Rand.
According to Whiteside et al (1976) the timing of the faults 'is essent
ially post-Ventersdorp and pre-Transvaal in age, but there is evidence suggest
ing that movements along the fault planes had probably been initiated prior to
the extrusion of the lower Ventersdorp lava, and it is known that in some
cases later movements took place on the same fault planes, even in post
Transvaal times'.
Brittle structures (extension joints, shear joints, and quartz-filled
tension gashes and faults) are well developed in the Brixton and Orange Grove
quartzites of the Central and West Rand. At a number of localities on the
West Rand, transverse injective shale dykes have penetrated quartzite horizons.
Roering (1968) interprets six of these shale dykes each varying in thickness
between 12 cm and 3 mas representing a 'macro-boudinage type of phenomenon.'
Roering (1968) and Fripp and Gay (1972) studied the tension gash arrays
in the Brixton quartzites on the West and Central Rand and concluded that
they formed under the same conditions as the cleavage, ie. they were formed
in response to a general north-south compressive force.
6. PETROLOGY
Fuller (1958) states that the 'gross features of Witwatersrand rocks are
maintained over considerable distances, so that discussions of the petrology
of relatively few specimens might lead to a better understanding of the
System as a whole'. Macroscopic examination of rocks belonging to the West
Rand group have been systematically described in each area in the section
dealing with stratigraphy. In this section microscopic features (of the
Crown Lava and Sandstones) and the mineralogy of the shales will be described.
6.1 Mineralogy Of The Shales
Fuller (1958), Danchin (1970) and Hofmeyer (1971) analysed shales of the
West Rand Group both under the microscope and by X-ray diffraction techniques.
The shales in the Parktown Shale Formation have never been as well scrutiniz
ed due to the lack of drill hole core and availability of fresh specimens.
However, Fuller (1958) describes shales containing fine grained euhedral
magnetite which are sufficiently magnetic to deflect a compass which may have
been sampled within the Parktown Shale Formation. X-ray analysis of this

~\('
00
/ .o /. ,., I --..:,' /.':::::-KI ,'': q, Ix::::::::':-> _ erksdor _. ::. ,t.--,__ 1 f . ~,:..·:::::::::':-~ , ~:.'
- ·- ·- ·' _.,, ./
,,,..,,,-"'' / '
/
X·)'N;._._ ~ -· '<>· \ .. ,. / 1A •
b.c. boundary coni•ctural 25 0 25 50km
Figure 11: Map showing the periphery of the West Rand Group/Cent ral Rand Group basins and the major faults (after Whiteside etal 1976),
I
··~-""':-,.--\ .......... ; ·::., ,~ ,:..·.> ·~•Delmas
1'

-46-
material failed to reveal the presence of any other iron oxides. In all
specimens collected by Fuller (1958) quartz and chlorite together with small
amounts of muscovite are the dominant minerals present.
calcite were also detected.
Rare feldspar and
Danchin (1970) and Hofmeyer (1971) analysed ten shales from borehole
JY8 in the Klerksdorp area. Five of the samples are from the Government
Subgroup and five from the Jeppestown Subgroup. The dominant clay minerals
recorded were chlorite and illite. Quartz and plagioclase feldspar were
present in moderate amounts. In two of the samples magnetite and pyrite
were present. The shales from the Jeppestown Subgroup were. dominantly fine
ly banded, light grey-green in colour with the upper two shale units being
quartz rich. On the other hand the shales of the Government Subgroup often
showed cross bedding and a little visible quartz and pyrite. The composition
of the chlorite in a sample 20 metres below the Main Conglomerate on the East
Rand was that of brunswigite (Mg1.35 Mg3 •65 All.O (Si3 Al1 •0) 010 (OH)8
)
(Fuller 1958).
6.2 Sandstones In The West Rand Group
Fuller (1958) showed that the lowermost sandstones (those in the Hospit
al Hill Subgroup) in the West Rand Group to be orthoquartzites (greater than
95% detrital quartz) while the remainder are subgreywackes (50-60% quartz,
10% feldspar, with rock fragments and micas making up the balance).
6.2.1 Hospital Hill Subgroup
The Orange Grove Quartzites are composed almost entirely of detrital
quartz grains and chert. Only in the Delmas area are the lower 3 metres of
this formation feldspathic (Button 1968). The average grain size is about
l mm with the quartz grains being well rounded. Fuller (1958) reports that
in some thin sections a bimodal distribution is evident with average quartz
grain diameters of 0.5 mm being the dominant mode and the minor mode is made
up of perfectly rounded quartz grains averaging about 1 mm. The grains show
moderate to strong undulose extinction. Generally the quartzites contain
less than 1 per cent sericite, an alteration product of feldspar (Young 1907).
The Brixton quartzite is distinctive due to the presence of pale green
chromiferous mica often present along planes of weakness and bedding surfaces.
The green mica is associated with detrital chromite that have an average dia
meter of 0.1 to 0.4 mm (Frankel 1939). Young (1944) noticed that the Brixton
quartzites often depict imperfect s~rting giving the rock a characteristic
sago texture. Fuller (1958) distinguishes the rocks of the Brixton Formation
from those of the Orange Grove quartzites by the presence of recrystallised
quartzite, relative freedom from inclusions, and by its normal extinction.
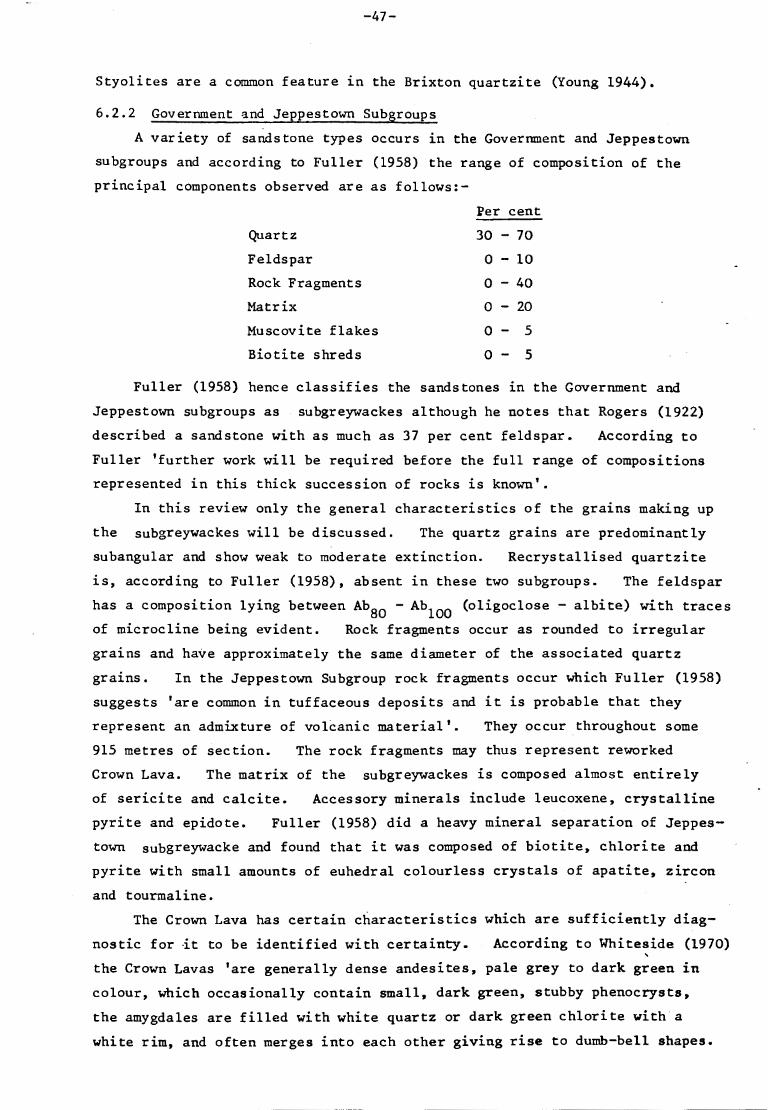
-47-
Styolites are a common feature in the Brixton quartzite (Young 1944).
6.2.2 Government ~nd Jeppestown Subgroups
A variety of sandstone types occurs in the Government and Jeppestown
subgroups and according to Fuller (1958) the range of composition of the
principal components observed are as follows:-
Per cent
Quartz 30 - 70
Feldspar 0 - 10
Rock Fragments 0 - 40
Matrix 0 - 20
Muscovite flakes 0 - 5
Biotite shreds 0 - 5
Fuller (1958) hence classifies the sandstones in the Government and
Jeppestown subgroups as subgreywackes although he notes that Rogers (1922)
described a sandstone with as much as 37 per cent feldspar. According to
Fuller 'further work will be required before the full range of compositions
represented in this thick succession of rocks is known'.
In this review only the general characteristics of the grains making up
the subgreywackes will be discussed. The quartz grains are predominantly
subangular and show weak to moderate extinction. Recrystallised quartzite
is, according to Fuller (1958), absent in these two subgroups. The feldspar
has a composition lying between Ab80 - Ab100 (oligoclose - albite) with traces
of microcline being evident. Rock fragments occur as rounded to irregular
grains and have approximately the same diameter of the associated quartz
grains. In the Jeppestown Subgroup rock fragments occur which Fuller (1958)
suggests 'are common in tuffaceous deposits and it is probable that they
represent an admixture of volcanic material'. They occur throughout some
915 metres of section. The rock fragments may thus represent reworked
Crown Lava. The matrix of the subgreywackes is composed almost entirely
of sericite and calcite. Accessory minerals include leucoxene, crystalline
pyrite and epidote. Fuller (1958) did a heavy mineral separation of Jeppes
town subgreywacke and found that it was composed of biotite, chlorite and
pyrite with small amounts of euhedral colourless crystals of apatite, zircon
and tourmaline.
The Crown Lava has certain characteristics which are sufficiently diag-
nostic for it to be identified with certainty. According to Whiteside (1970)
the Crown Lavas 'are generally dense andesites, pale grey to dark green in
colour, which occasionally contain small, dark green, stubby phenocrysts,
the amygdales are filled with white quartz or dark green chlorite with a
white rim, and often merges into each other giving rise to dumb-bell shapes.
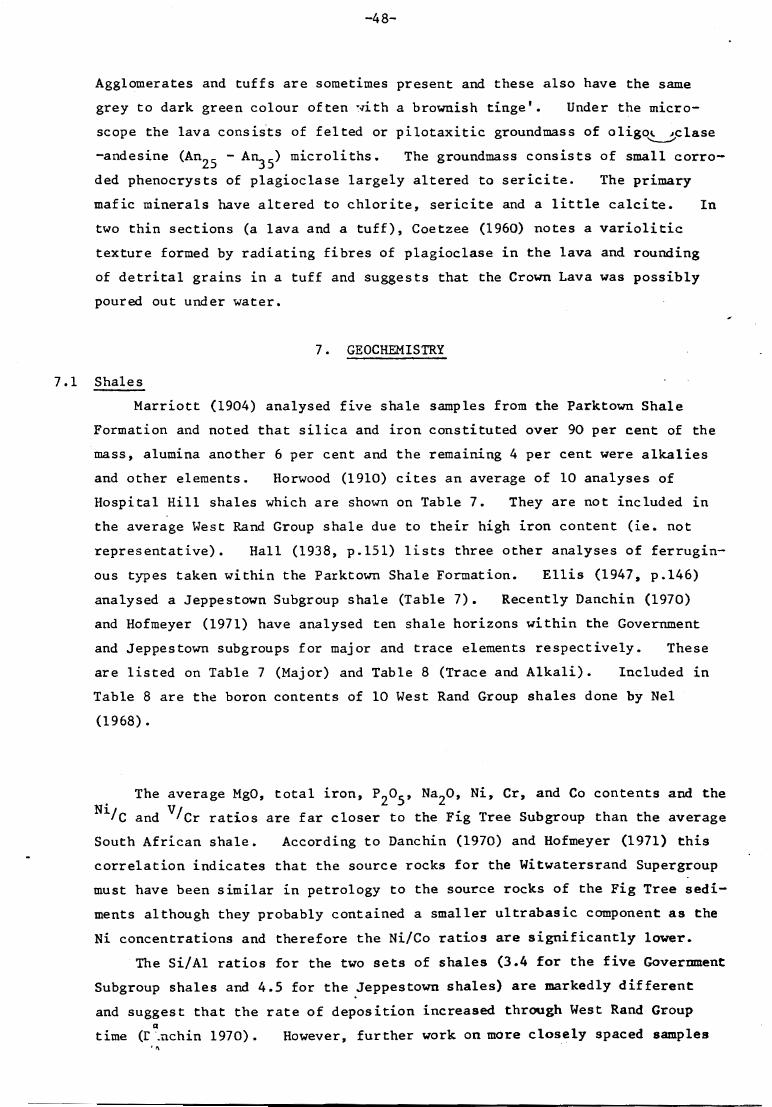
Agglomerates and tuffs are sometimes present and these also have the same
grey to dark green colour often ~nth a brownish tinge'. Under the micro-
scope the lava consists of felted or pilotaxitic groundmass of oligol ~clase ...___,,, -andesine (An25 - A~ 5) microliths. The groundmass consists of small corro-
ded phenocrysts of plagioclase largely altered to sericite. The primary
mafic minerals have altered to chlorite, sericite and a little calcite. In
two thin sections (a lava and a tuff), Coetzee (1960) notes a variolitic
texture formed by radiating fibres of plagioclase in the lava and rounding
of detrital grains in a tuff and suggests that the Crown Lava was possibly
poured out under water.
7. GEOCHEMISTRY
7.1 Shales
Marriott (1904) analysed five shale samples from the Parktown Shale
Formation and noted that silica and iron constituted over 90 per cent of the
mass, alumina another 6 per cent and the remaining 4 per cent were alkalies
and other elements. Horwood (1910) cites an average of 10 analyses of
Hospital Hill shales which are shown on Table 7. They are not included in
the average West Rand Group shale due to their high iron content (ie. not
representative). Hall (1938, p.151) lists three other analyses of ferrugin-
ous types taken within the Parktown Shale Formation. Ellis (1947, p.146)
analysed a Jeppestown Subgroup shale (Table 7). Recently Danchin (1970)
and Hofmeyer (1971) have analysed ten shale horizons within the Government
and Jeppestown subgroups for major and trace elements respectively. These
are listed on Table 7 (Major) and Table 8 (Trace and Alkali). Included in
Table 8 are the boron contents of 10 West Rand Group shales done by Nel
(1968).
. The average MgO, total iron, P2o5, Na2o, Ni, Cr, and Co contents and the
Ni/c and V/cr ratios are far closer to the Fig Tree Subgroup than the average
South African shale. According to Danchin (1970) and Hofmeyer (1971) this
correlation indicates that the source rocks for the Witwatersrand Supergroup
must have been similar in petrology to the source rocks of the Fig Tree sedi
ments although they probably contained a smaller ultrabasic component as the
Ni concentrations and therefore the Ni/Co ratios are significantly lower.
The Si/Al ratios for the two sets of shales (3.4 for the five Government
Subgroup shales and 4.5 for the Jeppestown shales) are markedly different
and suggest that the rate of deposition increased through West Rand Group a
time (r .nchin 1970). However, further work on more closely spaced samples •n

TABLE 7: Major Element Analyses in the West Rand Group
HOSPlTAL HILL SUBGROUP GOVER:'ll1ENT SUBGROUP I JEPPESTOWN SUBGROUP (after Horwood,1910) (after Danchin,1970) (after Ellis 1947,Danchin 1970)
[
yses 10 5 JPS marker 5
" 54.48 58.04 46.43 65.9 ·2
Oz ,51 0,68 0,39 0,49
2°3 12.ll 15.42 9.79 13,22
:) 8.56 20.00 3,89
/3 3,38 7,00 1.87
~al Fez03 25.38 12.90 29.09 5.71
') 0.01 0.11, ,01
'.) 0,95 4.64 3.81 3.82
) J,4 0.9':> 1.6.'., 1.66
20 } 1.36
0.94 1.17 1.50
(l 2.21 0.41 2.03
:)5 0.09 0.09 0,07
' 0.23 0.60 0.41
'-0.11 0.07 0.09
0.01 0,01 0,01
J.I. 5
I 3.40 5.44 2.12
>T/\L Average 100,19 99.55 99.31 99,63
Range (99,01 - 100.21) (98.65 - 100.59)
L,O,I. •Loston Ignition
Average Average Aver., gc West Rand Fig Tree S .African Shale Gro·;p Shale Sha~c (volatile free) (volatile free) (volaLile
lo
62,73
o. 61
14.44
12.11
4.51
1.44
2.04
22
63,41
0,63
14.31
10,55
5,47
1.02
2,47
323
66. 21
o. 90
18.79
6 .18
1.,36
C. 7S
3.26

No of analyses
Si02
Tio2 Al
2o
3 FeO
Fe2o
3
ll)SPITAL HILL SUBGROUP (after Horwood,1910)
10
54.48
.51
12.11
Total Fe2o3 MnO
25.38
MgO
Cao
Na2o
lt20
P205 CO2 s Cl
L.O.I.
0.95
0.4
}1.36
s
TOTAL Average 100.19
llange
TABLE 7: Major Element Analyses in the West Rand Group
GOVERNMENT SUBGROUP JEPPESTOWN SUBGROUP (after Danchin,1970} (after Ellis 1947,Danchin 1970)
5 JP5 marker I 5
58.04 46.43 65.9
0.68 0,39 0.49
15.42 9.79 13.22
8.56 20.00 3.89
3.38 7 .oo 1.87
12.90 29.09 5.71
0.01 0.14 .01
4.64 3.81 3.82
0.96 1. 64 1.66
0.94 1.17 1.50
2.21 0.41 2.03
0.09 0.09 0.07
0.23 0.60 0.41
0.11 0.07 0.09
0.01 0.01 0.01
3.40 5.44 2.12
99.55 99,31 99.63
(99.01 - 100.21) (98.65 - 100.59)
L.O.I. •Loston Ignition
Average Average Average West Rand Fig Tree S,African Shale Group Shale Shale (volatile free) (volatile free) {voletile free
10
62.73
0.61
14.44
12.11
4.61
1.44
2.04
22
63.41
0.63
14.31
10,56
5.47
1.02
2,4f
1,
323
66.21
0,90
18.79
6.18
l.86
0.78
3.26
I

.....
--~ I
-49-
should provide useful information in this regard.
One of the shales (JPS) has a significantly smaller Si02 , Al2o
3, K
20
content and higher Fed, Fe2o3 and CO2 values when compared to the other
shale horizons (Table 7). The shale is dark, finely banded and fine grain
ed with chlorite being the dominant clay mineral. It is the only shale
horizon which does not contain any subordinate or trace amounts of plagio
clase and illite. Unlike eight of the other shale horizons it contained
magµetite. Clearly the geochemistry of this unit could be used as an arg
illaceous marker horizon in the Klerksdorp area.
Nel's (1968) study on the boron content of West Rand Group shales is of
special importance as boron and other trace elements may be used to indicate
their environment during deposition (Keith and Rogers, 1959; Johns 1963;
Potter et al 1963; Shimp !E_ al 1969) • The basis of this concept is that
certain trace elements such as boron, chlorine, lithium, sulphur and vanad
ium are concentrated more in sediments of marine origin than those of fresh
water origin. The two Jeppestown and four Government Subgroup shales
yields average boron contents of llp p.t'l.(range 5-21 p p.m.) and the average
boron/potassium ratio is 8.2 (range 4.4 - 13). Although Nel (1968) con
cludes that the shales 'are comprised of the weathering products of igneous
rocks deposited in a fresh water environment' he does emphasise the probabil
ity that little or no boron absorption occurred due to the small amounts of
illite (which has a high absorptive capacity of boron (Harder 1961)).
7.2 Sandstones
Only one analysis of a sandstone from the West Rand Group has been done.
The analysis below is that of a specimen from the Jeppestown Subgroup from
the Klerksdorp District (Fuller 1958):-
Si0 2 83.05
Al 2o3 8.87
Fe2o3 .82
FeO 1.11
MgO 1.04
Cao .06
Na2o .66
K20 3.19
H20 1.41
Tio2 .32
P205 .02
s .48
C .03
100.08 Less O "" S 99.9

SUBGROUP
JEPPESTOWN SUBGROUP
GOVERNMENT REEF SUBGROUP
HOSPITAL HILL SUBGROUP
DOMINION GROUP
TABLE 9
MEMBERS AND BEDS
Jeppestown Amygadaloid
Quartzites
Slates
Quartzi tes
Thin slates and ferrugenous rocks Ferrugenous Band
Slates
Upper Hospital Hill quartzite
Hospital Hill slates
Lower Hospital Hill quartzite
Hospital Hill slates
Water Tower slates
Orange Grove quartzite
Basal Amygdaloid
METAMORPHIC RESULTS
Hornblende Granul i.te
Recrystallisation
Biotite .Hornfels.
Recrystallisation
Biotite Hornfels
Garnet Amphibole hornfels
Garnet Amphibole hornfels
Andalusite Cordierite hornfels
Recrystallisation
Cordierite hornfels and Andulalusite Cordierite hornfels
Recrystallisation
Cordierite hornfels and Andalusite Cordierite hornfels
Garnet hornfels and garnet amphibole hornfels
Recrystallisation
Hornblende granulite

-51-
Rogers (1937) noted the considerable vertical range of chloritoid in
the Witwatersrand Supergroup fro~ the Government Subgroup to the top of the
Supergroup. Subsequently, chloritoid was found to occur right down to the
Orange Grove Quartzite Formation (Du Toit 1954). Ranxlohr (1958) observed
that chloritoid is present in "large quantities" in some conglomerate hori
zons in the Witwatersrand Supergroup while in othersthere is a complete ab
sence of the mineral. He concluded that as the chloritoid is limited to
reefs which 'lie deep down in the geological succession (Government Reef,
Main Reef)' it is a metamorphic stress mineral due to pressure of the over
lying sediments. Wiebols (1961) believed the distribution of the chloritoid
to be somewhat erratic and that its formation was chemically controlled (ie • . in shales containing high alumina content which have undergone low grade
regional metamorphism). Wiebols explained the irregular occurrence of high
alumina chloritoid shales in the footwall sections of some of the major con
glomerate horizons as being a result of repeated glaciation.
A mineral from the Central Rand which occurs as aggregates of lustrous,
greenish black needles set in a white quartz vein was identified by de
Villiers (1941) as pumpellyite.
The complete absence of kyanite, andalusite, cordierite and staurolite
(except for the Vredefort area) and the presence of chlorite, illite, seri
cite, plagioclase feldspar, quartz, chloritoid, muscovite, pyrophyllite and
pumpellyite within the Witwatersrand Supergroup indicates that the meta
morphic minerals were formed in the very low grade or low grade regions of
metamorphism as defined by Winkler (1974). Furthermore, as the breakdown
reaction of pyrophyllite:-
Al2
[(0H) 2/si4o10] = Al 2Si05 + 3Si02 + H20
pyrophylli te andalusitekyanite
quartz
has not occurred (except in the Vredefort area) it is unlikely that tempera
tures reached 400°C at 1.0 Kb (Kerrick 1968).
9. BASIN ANALYSIS
An impressive volume of information has been synthesised for the Wit
watersrand basin (Brock and Pretorius 1964a,b; Pretorius 1965, 1974; Vos 1975).
In this review three major aspects of basin analysis will be described. These
are the arrangement and type of sedimentary and volcanic fill, the tectonic
setting and the depositional environment of the West Rand Group.
•

-52-
9.1 Arrangement And Type Of Fill
The thickness of the West P.and Group sediments decreases from the So .. tl, R.Q,,,ol
Klerksdorp area towards the Central Rand, Heidelberg and ~ area (Nel
1933). The sand/shale ratio of the different subgroups in their respective
areas, together with the composite stratigraphical thickness and volcanic/
sediment ratio of the West Rand Group and areally related Central Rand,
Dominion and Klipriviersberg Group (Pretorius 1974) are depicted on Table 10
The high sand/shale ratio in the Klerksdorp area is taken to indicate a
proximal facies while the Central Rand area appears to be more of a distal
facies (Pretorius 1965). Also the West Rand Group in the Vredefort and
South Rand areas might have been deposited on the opposite side of the Basin
to that laid down in the Welmom, Klerksdorp, West Rand, Central Rand, Delmas
and Heidelberg areas. The thickness and sand/shale ratio in the West Rand
Group sediments together with the following features of the main conglomer
ate of the overlying Central Rand succession - a decrease in average pebble
size from north-northwest to south-southwest (Pirow 1920) and the pattern of
payshoots fanning to the south east indicating a south easterly direction of
flow (Reinecke 1927; du Tait 1954; Hargraves 1962) - lead one to conclude
that the source for the sediments of some of the West Rand Group sediments
is the same as that of the Main Conglomerate in the Central Rand Group (ie.
northerly to northwesterly source).
In 1964 Brock and Pretorius (1964a,b) published a comprehensive account
of the tectonic framework, basin geometry, stratigraphy and sedimentation in
the Witwatersrand Supergroup and presented an overall conceptual model. They
visualised the Witwatersrand Basin as a structurally closed continental basin
with the West Rand Group deposits occurring over a larger area than those of
the Central Rand Group, the basin being broader during the early stages of
filling. Using mines, boreholes and outcrops as their control points they
published isopach maps for the Hospital Hill, Government and Jeppestown
subgroups. The isopachs depict the West Rand Group as lying in a gradually
sinking ovoid shaped basin whose long axis is directed to the northeast and
decreases from 440 1an during Hospital Hill times to about 370 km in Jeppes
town times. Furthermore, the maps indicate that the south eastern shore
line of the depression was practically static throughout West Rand Group
times, although elsewhere the waters gradually regressed. Pretorius (1974)
modified the composite isopachs (Figure 12) of the West Rand Group taking
into consideration the manner in which the strata had been deformed. The
geometry of the basin was defined by basin edge phenomena such as overlaps.
unconformities, disconformities and the mine lease areas of economic gold

---......... ---~ -
TABLE 10: Composite stratigraphic thikness of West Ra~d Group and areally and structurally
related Gro~
· Groups Total (m) Sand/Shale Ratio Volcanic/Sediment Ratio
Hospital Hill Government Jeppestown
West Rand Group Areas
Central Rand 3 600' 0.54 1,48 0.77 West Rand 0.55 2,50 Heidelberg 2 800 0.56 1.48 0.54
South Rand 1 700 1. 70 o. 68 Vredefort 4 000 0.70 1.85 0. 65 Klerksdorp 4 750 0.80 2.60 1.27
Klipriveersberg 3 050 o. 70 I 8.80
Central Rand Group 3 160 I 12.6 I 0.1
West Rand Group 4 970 I 1.0 I 0.1
Dominion Group I 2 720 6.0 37,9
Witwatersrand Supergroup l 13 900 1.9 0.8
•Government and Jeppestown thickness after Cousins (1960), Hospital Hill thickness after Mellor 1911.
I~

26°
28°
2
Lich~n"" • .~ uurg
0
2~
,;::,
L~(:j . 5,arl~~ /lq /"'(J.~:"~~~-'-u_,rp~
sdorp.~ f;~~ I ~
'-f,, \ ,J
2 0
~ •Betha I
- 1500 Deposit ion a I isopachs:
West Rand Group Strat
Contour interval:1500m
0 ~Boundaries of producing ~mines 1973 ..P
· 2u
0 50 100 km 3cf
Figure 12: The extrapolated isopachs (metres) of the West Rand Group (after Pretorius 1974).

·--53-
deposits located along the basin margins.
Vos (1975) devised a model of the evolution of the Witwatersrand basin
from available data and from analogies with present depositional environments
in which sediments of similar character are being deposited. He attempted
to answer the question of why there is a marked concentration of gold in the
Central Rand Group while the West Rand Group is devoid of any significant
economic deposits (except in the Rietkuil Syncline). Figure 13 is a schem
atic illustration of the proposed manner of evolution for the Witwatersrand
Basin according to Vos (1975).
The inward migration of the basin margins is seen to have occurred con-
temporaneously with marginal uplift and basin subsidence. The proximal
coarse grained sediments along the margin edge are thus uplifted and reworked
into Central Rand Group sediments which prograde out over the remnant distal
West Rand Group portion of the sequence.
9.2 Tectonic Setting
The tectonic setting of the West Rand Group and Witwatersrand basin is
one for which certain questions remain to be answered. The knowledge of the
basin that has been gained so far, include its size and extent, the proport
ions of sediments that have filled it, the approximate position of the source
lands that supplied its sediments, the nature of the source land, the subse-
quent deformation and metamorphism. The questions that remain to be answer-
ed are (i) what type of crust underlies the basin? (ii) what relation, if
any, does the basin have to sutures of Archaean age? (iii) if it was situat
ed in an intracratonic basin how does it relate to a continent-wide, regional
palaeogeography? and finally (iv) if the sediments were subjected to marine
processes what can one ascertain, if anything, about its open ocean margin?
Some of these questions may be very difficult to answer due to the cover of
large amounts of post Archaean sediments •. Others may be answered by further
studies of West and Central Rand Group sediments which might according to
Potter and Pettijohn (1977) require a 'systematic inventory of facts' which
include:-
!. the facies distribution and thickness within the basin at various stages of its filling.
2. the palaeocurrent pattern of each facies.
3. the relation of facies and palaeocurrents to both contemporaneous and later deformation and
4. the petrology of its fill (which may include both fluid inclusion studies and geochemistry).
The Witwatersrand Supergroup in places unconformably overlies older
rocks which are granitic and rocks which contain great volumes of high - Mg
basalts or basaltic komatiites (Anhaeusser 1978). The granites display a

~ ;:3 ,,,.::~ --=----=-'··,a':::::H;m;:1111•,;:;::,:~:~i:~;~~~-~~~=~-c=-==----
Marginal
l uplift
Basin
Rand
I Conglomerate Sandstone Shale
subsidence
Figure 13: Schematic illust~ation of Vos's (1975) proposed manner of evolution for the Witwatersrand basin.

-54-
marked weathered profile (Button and Tyler, in press) and Vos (1975) inter
prets the quartzi~es of the Hospital Hill Subgroup as being deposited upon
a broad semi-stable "platform" which 'had undergone a long period of geo
chemical separation leaving only the resistant quartz fraction which went to
form the mineralogically mature othoquartzite'.
In the Klerksdorp area the Witwatersrand Supergroup is underlain by the
Dominion Group and overlain by the Ventersdorp Supergroup. The Dominion
Group and Ventersdorp Supe~group are almost wholly volcanic (Table 9) and
according to Brock and Pretorius (1964a) "their relationships suggests that
the three systems collectively constitute a major geological cycle'~ The·
ratio of volcanics to sediments is, according to Pretorius (1974), a pointer
to the general order of infilling of the Archaean and Proterozoic basins on
the Kaapvaal craton in South Africa. He noted that the Witwatersrand
succession is situated between moderate periods of crustal instability in
which 'most of the material entering the basin was drawn from the simatic
lithosphere, with only limited quantities of sediments being mixed with the
volcanics'. These conclusions conform with Henthorn's (1972) work on pal-
aeomagnetisrn within the Witwatersrand Triad in which the direction obtained
from the Jeppestown amygdaloid (D-253, 1=22) circle of confidence (which is
large), includes the palaeopoles of both the Great Dyke of Rhodesia (McElhinny
and Gough 1963) and the Gaberones granite (Evans 1967). The Gaberones gran
ite has a date of 2480!50 m.y. (McElhinny 1967) and the Great Dyke 2500 m.y.
(Wilson !:.E_ al 1978). According to Henthorn (1973) these dates are of com
parable age to the estimated time span of the Witwatersrand system and 'may
indicate a moderately static pole during the deposition of the Witwatersrand
system'.
9.3 Depositional Environment
Attempts to reconstruct West Rand Group sedimentary environments have
been made by numerous geologists (eg. Hatch 1906; Mellor 1915, 1916;
Rogers 1926; Reinecke 1927; Sharpe 1949; du Tait 1954; Wiebols 1955; Antro
bus 1956; Brock and Pretorius 1964; Vos 1976) and many diverse settings have
been invoked and are presented in a chronological review of speculations and
observations on the depositional environment of the Witwatersrand sediments
by Pretorius (1975). Geologists have, until recently considered the Wit
watersrand basin to be closed (Brock 1950; de Villiers 1959) and since 1964
no marine environment has been suggested for the deposition of the Witwaters
rand sediments. The reason for this could be due to the conclusion of Brock
and Pretorius (1964a) that 'the frequencey of reference to "encroaching
oceans" in connection with the Witwatersrand System, even in recent years,
discloses that the continental environment of the closed basin has not been

-55-
fully appreciated. Oceans are quite incompatible with the great thickness-
es of shallow water sediments confined to a synclinal depression in the
heart of a sub-continent'. However, work done by Sharpe (1949), Hargraves
(1962) and Eriksson ( . in press) all suggest that marine processes
played a part in the formation of the thick alternating shale and sandstone
units of the West Rand Group. Until further work is done on the palaeo-tJ, ~olla._,,·,,, C7{epv.r,ii.,,., e,iv,,..,..,.,,,."''.r Cur- tA. WoJt ,?.,.,,,-( tr~~t,
current and facies distri ution o the West Ra Group nrust be regarded only
as tentative general candidates.
9.3.1 Alluvial And Lacustrine
Reinecke (1927), Pretorius (1966) and Vos (1976) presented depositional
patterns for the West and Central Rand Group sediments which fit a braided
alluvial plain and lacustrine model. Reinecke (1927) invoked earth move-
ments for the increase in grain size from the West Rand to the Central Rand
Group and for the presence of unconformities between the two groups. The
widespread distribution of the conglomerate bands at different horizons and
lying unconformably on shale horizons within the Government Subgroup Reinecke
(1927) attributed to the sudden drainage of lakes dammed by glaciers or
landslides and followed by periodic flooding and slumping. Vos's (1975)
model (Figure 13) is one in which he interprets the West Rand Group deposits
to be a thick accumulation of mainly lower braided alluvial plain and lacus
trine sediments. The lacustrine setting being the locus for the fine grain
ed sediments, silts and clays and the alluvial plain setting is that of
sandstones and conglomerates. The thick alternating sandstone and shale
horizons are explained by a shifting depositional system (sourceward and
basinward) controlled by tectonism in the basin and source area.
In 1966 Pretorius synthesised the detailed sedimentological work done in
the previous five years and introduced two new concepts - the identification
of local depositional conditions as deduced from fan facies, and the employ
ment of energy levels as controlling factors in the nature of the sediment
ary responses to the varying depositional processes. He regarded the sedi
ments of the West Rand Group as being deposited in a distal lacustrine en
vironment.
9.3.2 Deltaic and Marine
Pretorius (1975) states that 'Carrick (1896) drew the attention of the
various authors, that Fred Struben, the original pioneer of the Witwatersrand
area, at the very beginning of his mining of the conglomerates in the Lower
Division of the Witwatersrand Sequence considered the banket to be an ocean
beach deposit. At the same time Garinier (1896) put forward the first
suggestion that the beaches had formed along a closed sea that was surrounded
by high mountains, some of which formed a vast amphitheatre on the northern

-56-
side. Streams converged in all directions towards the basin'. Hatch
(1906) considered the source area to lie to the west, the sea to the east
and that the shales and sands of the West Rand Group were laid down on a
subsiding ocean floor. Mellor (1915, 1916) considered the spectacular change
from shale to sandstones to be produced on an extensive delta. The delta
model, according to Mellor (1915), could explain the continual increase in
coarseness from the West Rand to the Central Rand Group.
Alternate rising and sinking of a marine area was invoked as a possible -......I
mechanism for the development of the predominantly arenaceous Government
Subgroups between two predominantly argillaceous Hospital Hill and Jeppes~
town subgroups (Sharpe 1949). The smaller scaled alternations of quartzite
shale, Sharpe termed a cyclothem and were thought to have been caused by
earth movements of a more local character which modified the conditions of
deposition. As well as shoaling of the basin, elevation and erosion of the
source area has been held responsible for the coarsening of the sediments
arriving in the basin. Although no published reports of palaeocurrent
measurements have been recorded within the West Rand Group, Hargraves (1962)
noted that the orientation of the current bedding on the East Rand within
the overlying Main Conglomerates was bimodal and that the crests of the
transverse ripples lie in a northwest-southeast direction. Hargraves
therefore postulated tidal movement from southeast to northwest.

57
REFERENCES
Allsopp, H.L., 1964. Rubidium-Strontium ages fran the western Transvaal. Nature, 204 (4956) : 361-363.
Allsopp, H.L., Roberts, H.R., and Schreiner, G.D.L., and Hunter. D.R., 1962. Rb-Sr age rreasurements of various Swaziland granites. J. Geophys. Res., 67(13).
Anhaeusser, C.R., 1978. The geology and geochemistry of the .Muldersdrif ultramafic CCITiplex. Infonn. Circ. econ. Geol. Res. Unit, Univ. Witwatersrand, Johannesburg, 117 : 14 pp.
Antrobus, E.S.A., 1956. The origin of the auriferous reefs of the Witwa~rsrand System. Trans. geol. Soc. S. Afr., 59 : 1-22.
Antrobus, E.S.A., 1964. Notes on the geological colUllU'l of the East Rand. In: Haughton, S.H. (Editor), The Geology of Sane Ore Deposits in Southern Africa, Geol. Soc. S. Afr. , Jd1annesburg, Vol 1: 113-123.
Bain, G.W., 1955. Discussion of paper "The occurrence and origin of gold and radioactive minerals in the Witwatersrand System, the Daninion Reef, the Ventersdorp Contact Reef and the Black Reef" by Liebenberg, W.R., Trans. geol. Soc. S. Afr., 58: 236.
Bain, G.W., 1960. Patterns to ores in layered rocks: Econ. Geol, 55(4) : 695-731.
Becker, G.F., 1896. The Witwatersrand banket with notes on other gold-bearing pudding-stones. Annu. Rep. U. S. Geol. Surv., 18 (5) : 153-184.
Beetz, P.F.W., 1936. Contributions to the geology of the Klerksdorp district fran the results of the drilling activities by the Western Reefs Exploration and Developnent Carpany. Trans. geol. Soc. S. Afr. , 39 : 223-261 .
Borchers, R. , 1961. Exploration of the Witwatersrand System and its Extensions. Proc. geol. Soc. s. Afr., 64 : 67.
Borchers, R., 1964. Exploration of the Witwatersrand System and its Extensions. In: S.H. Haughton (Editor), The Geology of Sane Ore Deposits in Southern Africa. Geol. Soc. of S. Afr. , Johannesburg, Vol. 1 : 1-23 .
Bosazza, V .L., 1939. Discussion on paper 'The sarrpling of mine dusts' by H.S. Patterson. J. Chem. rret Min. Soc. S. Afr., 40: 227.
Brock, B.B., 1950. The Vredefort ring. Trans. geol. Soc. S. Afr., 53: 131.
Brock, B.B. and Pretorius, D.A., 1964a. An introduction to the stratigraphy and structure of the Rand Goldfield. In: S.H. Haughton (F.ditor), The Geology of Sane Ore Deposits in Southern Africa. Geol. Soc. of S. Afr. , Johannesburg, Vol. 1 : 25-61.
Brock, B.B. and Pretorius, D.A, 1964b. Rand basin sedimentation and tectonics. In: S.H. Haughton (F.ditor), The Geology of Serre Ore Deposits in Southern Africa. Geol. Soc. of s. Afr., Jooannesburg, Vol. 1 : 449-499.
Button, A., 1968. SUbsurface stratigraphic analysis of the Witwatersrand arrl Transvaal sequences in the Irene-Delmas-Devon area, Transvaal. lJnplb. M.Sc. thesis, Univ. Witwatersrand, Jahannesl::org, 120 pp.

- ...... •:,
', ,.;.ii, -
57
REFERENCES
Allsopp, H.L., 1964. Rubidium-Strontium ages fran the western Transvaal. Nature, 204 (4956) : 361-363.
Allsopp, H.L., Roberts, H.R., and Schreiner, G.D.L., and Hunter. D.R., 1962. Rb-Sr age ireasurements of various Swaziland granites. J. Geophys. Res. , 67(13).
Anhaeusser, C.R., 1978. 'Ihe geology and geochemistry of the Muldersdrif ultranafic canplex. Infonn. Circ. econ. Geol. Res. Unit, Univ. Witwatersrand, Johannesburg, 117: 14 pp.
Antrobus, E.S.A., 1956. The origin of the auriferous reefs of the Witwatersrand Systan. Trans. geol. Soc. S. Afr., 59: 1-22.
Antrobus, E.S.A., 1964. Notes on the geological coll.llllil of the East Rand. _ In: Haughton, S.H. (Editor), 'Ihe Geology of Sane Ore Dep::>sits in Southern Africa, Geol. Soc. S. Afr. , Jdla.nnesburg, Vol 1: 113-123.
Bain, G.W., 1955. Discussion of paper "The occurrence and origin of gold and radioactive minerals in the Witwatersrand System, the Dcminion Reef, the Ventersdorp Contact Reef and the Black Reef" by Liebenberg, W.R., Trans. geol. Soc. S. Afr., 58: 236.
Bain, G.W., 1960. Patterns to ores in layered rocks: Econ. Geol, 55(4) : 695-731.
Becker, G.F., 1896. The Witwatersrand banket with notes on other gold-bearing pudding-stones. Annu. Rep. U.S. Geol. Surv., 18(5) : 153-184.
Beetz, P.F.W., 1936. Contributions to the geology of the Klerksdorp district fran the results of the drilling activities by the Western Reefs Exploration and Develq::rnent Canpany. Trans. geol. Soc. S. Afr., 39 : 223-261.
Borchers, R. , 1961. Exploration of the Witwatersrand Systan and its Extensions. Proc. geol. Soc. S. Afr., 64 : 67.
Borchers, R., 1964. Exploration of the Witwatersrand System and its Extensions. In: S.H. Haughton (Editor), The Geology of Sane Ore Dep::>sits in Southern Africa. Geol. Soc. of S. Afr., Johannesburg, Vol. 1 : 1-23.
Bosazza, V.L., 1939. Discussion on paper 'The sanpling of mine dusts' by H.S. Patterson. J. Chem. rret Min. Soc. S. Afr., 40: 227.
Brock, B.B., 1950. The Vredefort ring. Trans. geol. Soc. S. Afr., 53 : 131.
Brock, B.B. and Pretorius, D.A., 1964a. An introduction to the stratigraphy and structure of the Rand Goldfield. In: S.H. Haughton (Editor), 'Ihe Geology of Sane Ore Dep::>si ts in Southern Africa. Geol. Soc. of S. Afr. , Johannesburg, Vol. 1 : 25-61.
Brock, B.B. and Pretorius, D.A, 1964b. Rand basin sedimentation and tectonics. In: S.H. Haughton (Editor), '!he Geology of Sane Ore Dep::>sits in Southern Africa. Geol. Soc. of S. Afr., Jd:lannesburg, Vol. 1 : 449-499.
Button, A., 1968. Subsurface stratigraphic analysis of the Witwatersrand and Transvaal sequences in the Irene-Delnas-Devon area, Transvaal. un.µ:ib. M.Sc. thesis, Univ. Witwatersrand, Johannesl::m:'g, 120 pp.

-58
Button, A., 1970. The stratigraphy of the Witwatersrand System in the Delmas area, Transvaal. Infonn. Circ. econ. Geol. Res. Unit, Univ. Witwatersrand, Johannesburg, 58: 20 pp.
Button, A., 1973. A regional study of the stratigraphy and developrent of the Transvaal basin in . the ea.stern and northeastern Transvaal. Unpub. Ph.D. thesis, Univ. Witwatersrand, Johannesburg, 352 pp.
Button.,A 1978. Correlation of the Godwan Fonnation based on stratigraphic trends in the Witwatersrand basin. Trans. geol. Soc. S.Afr., 81 : 109-114.
Button A. and Tyler, N., (in press) Precambrian paleoweathering and erosion surfaces in Southern Africa - Review of their character and econanic significance. Infonn. Circ. econ. Geol. Res. Unit, univ. Witwatersrand, Johannesburg, 135.
Carrick, T.J., 1896. On faulting along the Main reef line. Trans. geol. Soc. S. Afr., 2: 39-41
ClOld, P., 1976 • .Major features of crustal evolution. A.L. du Toit Merrorial Lecture No. 14, Geol. Soc. of s. Afr., Johannesburg. Annex. to Vol. LXXIX, 33 pp.
Coetzee, C.B., 1960. The geology of the Orange Free State goldfield. Mem. geol. Surv. S. Afr. 49 : 198 pp.
Callender, D.F., 1960. The Witwatersrand System in the Klerksdorp area as revealed by diamond drilling. Trans. geol. Soc. s. Afr., 63: 189-226.
Corstorphine, G.S., 1904. Witwatersrand Series.
The geological relation of the Old Granite to the Trans. geol. Soc. S. Afr., 7 : 9-12.
Cousins, C.A., 1960. Discussion on paper 'The Witwatersrand System in the Klerksdorp area as revealed by diarrond drilling' by F.D. Collender. Trans. geol. Soc. S.Afr., 63: 227-229.
Cousins, C.A., 1965. Disconfo:rmities in the Main Reef Zone of the Witwatersrand System, and their bearing on reef correlation, with particular reference to the ea.st, central and west Witwatersrand. Trans. geol. Soc. s. Afr., 68: 121-142.
Cousins, C.A, 1973. Discussion on paper 'Suggestions for the revision of the existing Witwatersrand stratigraphic classification and nanenclature' by G.F. Wagener. Trans. geol. Soc. S. Afr., 76(2) 181-182.
Danchin, R.V., 1970. Aspects of the geochemistry of sane selected Sooth African fine grained sedirrents. unpub. Ph.D •. thesis, univ. Cape TCMn, Cape TCMn, 215 pp.
Davies, R.D., Allsopp, H.L., Erlank, A.J. and Manton, W.I., 1969. Sr-isotopic studies on various layered mafic inst:rusions in southem Africa. In: Symposium on the Bushveld Igneous Canplex and Other Layered Intrusions. Spec. Publ. geol. Soc. S. Afr., 1 : 576-593.
De Beer, J .H., 1966. A detailed geological and soil map of the Jchannesburg city area. Unµ.lb. Ph.D. thesis, univ. Witwatersrand, Jcharmesburg:.

1~ 59
De Jager, F.S.J., 1964. 'Ihe Witwatersrand System in the Springs-Nigel-Heidelberg sector of the East Rand Basin. In: S.H. Haughton (E.ditor) The Geology of Sane Ore Deposits in Sruthem Africa, Geol. Soc. of S.Afr., Jdlannesburg. Vol. 1 : 161-190.
De Villiers, J.E., 1941. Optical properties and crystallography of zoned pumpellyite fran the Witwatersrand. Arrer. Min., 26: 237-246.
De Villiers, J., 1959. Mineral Resources of the Union of S. Afr., Geol. Surv. S. Afr., Pretoria.
Draper, D., 1896. The Primary Systems of Sourth Africa with special reference to the conglanerate beds of the Witwatersrand. Trans. geol. Soc. S. Afr. , 1 : 12-26.
Draper, D., 1897a. On the connection between the conglanerate bErls of the Witwatersrand and those situated in the districts of Potchefstroan and Klerksdorp.Trans. geol. Soc. S. Afr., 2: 5-14.
Draper, D., 1897b. The extension of the Main Reef westwards on the fann Witpoortjie.Trans. geol. Soc. S. Afr., 2 : 5-14.
Du Toit, A.L., 1954. The Geology of South Africa. 3rd F.dition, Oliver and Boyd, E.dinburgh, 611 pp.
Ellis, J. , 1940. A tear-fault in the Far East Rand. Trans. geol. Soc. S. Afr. , 43 : 127-142.
Ellis, J., 1947. The Marievale granophyre, a rretanorphic rock. Trans. geol. Soc. S. Afr., 50: 121-160.
Eriksson, K.A; Turner, B.R. and Vos, R.G. (in press). Evidence of tidal processes fran the lower part of the Witwatersrand SUpergrrup, South Africa.
Evans, M.E., 1967. A Paleanagnetic study of the Gaberones granite of Botswana. Geophys.J. , 12: 491-498.
Fax, E.F., 1939. The geophysical and geological investigation of the Far East Rand. Trans. geol. Soc. s. Afr., 51 : 213-247.
Frankel, J.J. , 1939. The green colour of the Hospital Hill quartzites. Trans. geol. Soc. S. Afr., 42 : 15-17.
Frankel, J.J., 1944. On silicates and dusts fran the Witwatersrand Gold Mines. J.S. Afr. chem. Soc., 44 : 169-179.
Frey, M., 1970. The step fran diagenesis to rretam:>rphisrn in pelitic rocks during Alpine orogenesis. Sedirrentol. 15: 261-279.
Fripp, R.E.P. and Gay, N.C., 1972. Sane structural aspects of the HOFtr:>ital Hill series on the north-central margin of the Witwatersrand Basin. Trans geol. Soc. s, Afr., 75(3) : 187-196.
Frost, A., McIntyre, R.C., Papenfus, E.B. and Weiss O., 1946. The discovery and prospecting of a potential goldfield near <xiendaalsrus in the Orange Free State Union of Sa.1th Africa. Trans •. geol. Soc. S. Afr., 49 : 1-33.

60
Fuller, A.O., 1958. A contribution to the petrology of the Witwatersrand System. Trans. geol. Soc. S. Afr., 61 : 19-50.
Garnier, J., 1896. Gold and diam::mds in the Transvaal and the Cape. Trans. geol. Soc. s. Afr., 2: 91-103, 109-120.
Graton, L.C., 1930. Hydrothennal origin of the Rand gold deposits, Part 1. Econ. Geol, 25 (Suppl.) : 185 pp.
Gregory, J.W., 1908. The origin of the gold in the Rand Bank.et. Trans. Instn. Min. Metall, Land. , 17 : 2-41 .
Gruner, J. W. , 1944. The hydrothennal alteration of feldspars in acid solutions between 300° and 400°C. Econ. Geol, 39: 578-589.
Hall, A.L., 1911. The geology of Sekukuniland. Explanation of sheet 8. Geol. SUrv. S. Afr., Pretoria, 40 pp.
Hall, A.L., 1925. On the rnetairorphism of the LcMer Witwatersrand System in the Vredefort Mountain Land. Trans. geol. Soc. S. Afr. 9 : 10-15.
Hall, A.L., 1938. Analyses of rocks, minerals, ores, coals, soils, and waters fran Southern Africa. Mem. Geol. Surv. S. Afr., Pretoria, 32 : 876 pp.
Hall, A.L. and Molengraaff, G.A.F., 1925. The Vredefort rrountain land in the southern Transvaal and the northern Orange Free State. Arnst. Verh. Kon. Akad. Wet. 'l\veede Sectie, Deel 24(3) : 183 pp.
Harder, H. , 19 61 . Bei trag zur geochemie des Bors 111 • Bor in rnetanorphen gesteinen und im geochern-ishen Kreislauf. Nachr. Adkad. Wiss. Gottingen. Math-Phys. Kl No. 1 : 1.
Hargraves, R.B., 1962. Crossbedding and ripple marking in the Main Bird Series of the Witwatersrand System in the East Rand area. Trans. geol. Soc. of S. Afr., 65: 263-279.
Hatch, F.H., 1898. A geological survey of the Witwatersrand. Quart. J. geol. Soc. Lond., 54 : 73-100.
Hatch, F.H. 1904. The extension of the Witwatersrand eastward under the Dolanite and Ecca Series of the Southern Transvaal. Trans. geol. Soc. S. Afr., 7 : 57-69.
Hatch, F.H. 1906. The geological history of the South African fonnations .. Proc. geol. Soc. S. Afr., 9 : 21-34.
Hatch, F.H., 1913. Inpoverishment with depth on the Rand. (Letter to Editor). Min. Mag., Lond., 9 : 450-451.
Hendriks, L.P., 1961. Die voor-Transvaalse gesteentesop Zwartkop 82 en anstreke, noord van Krugersdorp, Transvaal. Unpub. M.Sc. thesis, Univ. Pretoria, Pretoria, 76 pp.
Henthorn, D.I., 1972. Paleanagnetism of the Witwatersrand TrJad, RepUblic of Sooth Africa and related topics. Unpub. Ph.D. thesis, Univ. Leeds, Leeds.

61
HofrrEyr, P.K., 1971. The al:undances and distribution of sore trace elarents in sare selected Scuth African shales. Unpub. Ph.D. thesis, Univ. Cape Town, cape Town, 218 pp.
Horwood, C.B., 1910. Notes and analyses of typical Transvaal rocks. Trans. geol. Soc. s. Afr., 13 : 29-55.
Hurrq;)hrey, W.A. and Krige, L.J., 1931. The Geology of the country south of Piet Retie£. Explanation of Sheet No. 68 (Piet Retie£) • Geol. Surv. S. Afr., Pretoria, 67 pp.
Jansen, H., 1974. Explanatory notes. Sheet 2426 (Thabazimbi), Geol. Surv. S. Afr. , Pretoria.
Jansen, H., Schalk, K.E., Leube, A., Snyma.n, A.A., Steyn, A.P.A., de Jager, F.S.J. and Beer, H.M., 1972. Geology of the country around Standertan. Explanation of sheets 2628D and 2629C. Geol. Surv. S. Afr., Pretoria, · 27 pp.
Jansen, H., 1977. The geology of the country around Pretoria. Explanation of sheets 2527DA, DB, DC, DD and 2528CA, CB, CC, CD. Geol. Surv. S. Afr., Pretoria, S. Afr., 141 pp.
Johns, W.D., 1963. Die verteilrmg von Chlor in rezenten marinen und nicht marinen Sedimenten. Fortschr. Geol. Rheinland Westfalen, 10: 215-230.
Keith, M.L. and Rogers, E.T., 1959. Geochemical indicators of marine and fresh-water sediments. In: P.H. Abelson. (Editor), Researches in Geochemistry. Wiley, New York, 38-61 •
Kerrick, D.M., 1968. Experiments on the upper stability limit of pyrophyllite at 1.8 kb and 3.9 kb water pressure. Am. J. Sci., 266 : 204-214.
Krahmann, R., 1930. Magnetic investigations as an aid to econanic geology. Trans. geol. Soc. S. Afr., 33 : 65-87.
Krahmann, R. , 1936. The geophysical magnetaretric investigations on west Witwatersrand areas between Randfontien and Potchefstroan, Transvaal. Trans. geol. Soc. S. Afr., 39 : 1-44.
Krause, H.L., 1912. A contribution to the structural geology of the East Rand. Trans. geol. Soc. S. Afr., 15 : 93-99.
Kynaston, H., 1911. The geology of a portion of the Rustenburg district lying north of the Pilandsberg. Ann. Rep. Geol. Surv. S. Afr., Pretoria, 63-73.
Leube, A., 1956. The geology of the Greylingstad-Vaal River area. Unpub. Report, Geol. SUrv. S. Afr., Pretoria.
Liebenberg, W. R., 1955. 'll1e occurrence and origin of gold and radioactive minerals in the Witwatersrand System, the Daninian Reef, the Ventersdorp Contact Reef and the Black Reef. Trans. geol. Soc. S. Afr. , 58 : 101-223.
Marriott, H.F., 1904. Notes on the cehrnical carposition of the Hospital Hill shales. Trans. geol. Soc. S. Afr., 7: 27-29.
Martini, J.E.J., 1975-76. Preliminary report an the deep borehole drilled an Tweefantein 441JP, Rustenbrug District, Westem Transvaal. Ann. Geol. SUrv. S. Afr., Pretoria, 11 : 73-76.

62
McElh.inny, M.W., 1967. 'Ihe paleana.gnetism of the southern continents; a survey and analysis. In: Symposium on Continental Drift (UNESOO/IUG.S), M::>ntevideo, Uruguay, 24 pp. Also in: 1972, Trans. Am. Geophys. Union, 52: 176-197.
McElhinny, M.W., and Gough, D.I., 1963. The palecmagnetisrn of the Great Dyke of Southern Rhodesia. Geophys. 7: 287-303.
Mellor, E.T., 1911. The nonnal section of the Lower Witwatersrand System. Trans. geol. Soc. of s. Afr., 14: 93-131.
Mellor, E.T., 1913. Structural features of the Western Witwatersrand. Trans. geol. Soc. S. Afr., 16 : 1-32.
Mellor, E.T., 1916. The conglanerates of the Witwatersrand. Trans. Instn. Min. Metall. 25: 226-348. Also in J.S. Afr. Chem. Soc., 16 : 144-180.
Mellor, E.T., 1917. The geology of the Witwatersrand: Explanation of Sheet 52 (Johannesl:urg) . Geol. SUrv. S. Afr., Pretoria, No 3 : 46 pp.
Molengraaff, G.A.F., 1904. Notes on the geology of a portion of Klerksdorp district with special reference to the develoµcent of the~ Witwatersrand beds and the Vaal River System. Trans. geol. Soc. S. Afr., 7 : 16-25.
Molengraaff, G.A.F., 1905. Note on the geology of a portion of the Klerksdorp district with special reference to the develoµrent of the Lower Witwatersrand beds. Trans. geol. Soc. S. Afr., 8: 16-25.
Nel. L.T., 1927. The geology of the Country around Vredefort. Spec. Publ. geol. Surv. S. Afr. , Pretoria. No 6 .
Nel. L.T., 1933. 'Ihe Witwatersrand System outside the Rand. Proc. geol. Soc. S. Afr., 36: 23-48.
Nel. L.T., 1934. The Witwatersrand rocks in the Klerksdorp and Ventersdorp districts. Trans. geol. Soc. S. Afr., 37 : 103-143.
Nel. L.T., 1935. The geology of the Klerksdorp-Ventersdorp area. Explanation of geological map No 3 7, Soec. Publ. geol. SUrv. S. Afr. , Pretoria, No 9.
Nel. L.T., Truter, F.C., Willemse, J. and Mellor, E.T., 1939. 'llle geology of the country around Potchefstroan and Klerksdorp. Explanation of Sheet No 61 (~efstroan). Geol. Surv. S. Afr., Pretoria, 156 pp.
Nel. L.T. and Verster, w.c., 1962. Die geologie van die gebied tussen Bothaville en Vredefort. Explanations of Sheets 2726B and 2727A. Geol. Surv. S. Afr. , Pretoria.
Nel. W .A. , 1968. 'Ihe estimation and distribution of boron m fine grained South African Sediments. Unpub. M.Sc. thesis, univ. ·cape Tc:Mn, Cape Town, 69 pp •.
Nicolaysen, L.O., Burgher, A.J. and Liebenberg, W.R., 1962., Evidence for the extre:!00 age of certain minerals fran the Daninicn Reef conglonorates and the underlying granite in the Western -Transvaal. Gecdlan. cosm::>chim. Acta, 26 : 15-23.

63
Paver, G.L., 1939. Magnetic ananalies m the Witwatersrand Systan. In: Nel, L.T., Canpiler, The geology of the Country arrund Potchefstroan and Klerksdorp: Explanation of Sheet No 61 (Potchefstroan) • Geol. SUrv. s. Afr., Pretoria, 156 pp.
Pegg, c.w., 1950. A contribution to the geology of the West Rand area. Trans. geol. Soc. S. Afr., 53: 209-227.
Pelletier, R.A., 1937. Contributions to the geology of the Far West Rand. Trans. geol. Soc. S. Afr., 40: 127-162.
Pirow, H., 1920. Distribution of pebbles m the Rand basin and other features of the rock. Trans. geol. Soc. s. Afr., 23: 64-97.
Potter, P.E. and Pettijohn, F.J., 1977. Paleocurrents and Basin Analysis. 2nd Edition. Sprmger - Verlag, New York-Berlm, 425 pp.
Potter, P.E., Shinp, N.F. and Witters, J., 1963. Trace elem::mts in rrarine and fresh-water argillaceous sedim:mts. Geochim. Cosmochim. Acata, 27: 669-694.
Pretorius, D.A., 1964. The geology of the Central Rand Goldfield. In: S.H. Haughton (Editor), The Geology of Saoo Ore Deposits in Southern Arica. Geol. Soc. of S. Afr., Johannesburg. Vol 1: 219-282. Also in: Infonn. Circ. econ. Geol. Res. Unit., Univ. Witwatersrand, Johannesburg, 13 : 69 pp.
Pretorius, D.A. 1964. The geology of the South Rand Goldfield. In: S.H. Haughton (Editor), The Geology of Sare Ore Deposits m Southern Africa, Geol. Soc. of S. Afr., Joharmesburg, Vol 1 : 219-282.
Pretorius, D.A., 1965. Revision of the Lower Witwatersrand Stratigraphy. Unpub. report to Ad Hoc Carmittee for stratigraphy, 5 pp.
Pretorius, D.A., 1966. Recorrelation of alleged Witwatersrand correlatives. Ann. Rep. Econ. Geol. Res. Unit. Univ. Witwatersrand, .Johannesburg, 8 : 17 pp.
Pretorius, D.A., 1966. Conceptual geological rro::l.els in the exploration for gold mineralisation m the Witwatersrand Basm. Infonn. Circ. Econ. Geol. Res. Unit. Univ. Witwatersrand, Johannesburg, 33: 39 pp. Also in: S. Afr. Inst. Min. Metall., March, 1966 : 225-275.
Pretorius, D.A., 1974. The nature of the Witwatersrand gold - uranium deposits. Infonn. Circ. Econ. Geol. Res. Unit, Univ. Witwatersrand, Johannesburg, 86: 50 pp.
Pretorius, D.A., 1975. The depositional enviromrent of the Witwatersrand goldfields, a chronological review of speculations.and observations. Minerals Sci. Engng. 7 (1): 18-47.
Pretorius, D.A., 1978. The broader aspects of the.gravity field over Scuthem Africa. Infonn. Econ. Res. Unit, Univ. Witwatersrand,.Jdl.annesburg, 113: 10 pp.

,;, "~:: '-, , '
~-
64
Ranrlahr, P., 1958. On the occurence of uranium in ancient conglanerate (discussion). Econ. Geol. 53 : 620.
Ramsay, J.G., 1967. Folding and fracturing of rocks. McGraw Hill Book Co. Inc., New York, 568 pp.
Reiner, T.O., 1975. 'Ihe age of the Witwatersrand Systan and other gold -uranium placers: Inplications.on the origin of the mineralisation. N. Jb. Miner . .Mh., 79-98.
Reinecke, L., 1927. The location of payable ore bodies in the gold bearing reefs of the Witwatersrand. Trans. geol. Soc. s. A£r., 30 : 89-120.
Reinecke, L. and Krahrnann, R. 1935. Magnetanetric prospecting on the Witwatersrand. Amer. Inst. Min. Met. Engng., Fe. 1935.
Roberts, E.R. and Kransdorff, D., 1938. The Upper Witwatersrand System at Randfontein Estates. Trans. geol. Soc. s. Afr. , 41 : 225-248.
Roering, C., 1968. The tectonics of the West Rand syncline: a field study of brittle failure in the Witwatersrand Basin. Infonn. Circ. Econ. Geol. Res. unit., Univ. Witwatersrand, Johannesburg, 48 : 28 pp.
Rogers, A.W., 1921. The geology in the neigbourhood of Heidelberg. Trans. geol. Soc. S. A£r., 24: 17-52.
Rogers, A.W. 1922. The Geology of the Country around Heidelberg. Expl. of Geol. Map., Spec. Publ. Geol. SUrv. s. A£r., Pretoria, No 4.
Rundle, C.C. and Snelling, N.J., 1977. The geochronology of uraniferous minerals in the Witwatersrand Triad., an interpretation of new and existing U-Pb age data on rocks and minerals fran the Dcm:inion Reef, Witwatersrand and Ventersdorp Supergroups. Phil. Trans. R. Soc. Lond. A., 286 : 567-583. Also in: J.E.T. Home and Sir Kingsley Dunham (Editors), Mineralogy: T<:Mards the Twenty-First Centruy. The Royal Society, London (1977), 404 pp.
Sacs, 1978. Lithostratigraphic subdivisions of the Witwatersrand Supergroup. South African Carmi ttee for Stratigraphy, Geol. Surv. S. A£r. , Pretoria.
Sawyer, A.R., 1904. The Sourth Rand Goldfield, Transvaal. Trans. Inst. Min. Eng. Newcastle (England), Vol 27.
Sawyer, A.R., 1907. New Rand Goldfield, Orange River Colony. Trans. Inst. Min. Eng. Newcastle (England) , Vol 33.
Sawyer, A.R., 1911. Sane structural features of the Witwatersrand System an the centralRand, with a note on the Rietfontein Series (discussion). Proc. geol. Soc. S. A£r., 14 : 35.
Schutte, I.C., Seeger, K.G. and Wilke, D.P., 1960. Die geologie van 'n gedeelte van die gebied 2426 (Skaal 1: 250 000) langs die Krokodilrivier, ten weste van '!habazimbi. unpub. Rept. geol. SUrv. s. A£r., Pretoria, 7-25.
Shinp, N.F., Witters, J., Potter, P.E. and Schleidher, J.A., 1969. Distinguishing marine and fresh-water II1.lds. J. Geol., 77: 566-580.

"
65
Sharpe, J.W.N., 1949. '!he econanic auriferous banket of the Upper Witwatersrand beds and their relationship to sedirrentation features. Trans. geol. Soc. S. Afr., 52: 265-300.
Teens, P.O. and Griffiths G.H., 1964. The geology of the West Rand. In: S.H. Haughton (Editor), The Geology of Sare Ore Deposits in Southern Africa. Geol. Soc. of s. Afr. Johannesburg, Vol 1: 283-321.
Truswell, J.F. , 1967. A critical review of stratigraphic Tenninology as applied to South Africa. Trans. geol. Soc. S. Afr., 70: 81-116.
Truswell, J.F., 1977. The geological evolution of South Africa. Purnell, cape Town-Johannesburg-London, 218 pp.
Truter, F.C., 1949. A review of volcanism in the geological history of South Africa. Proc. geol. Soc. S. Afr. , 52: 29-89.
Tyler, N., 1978. The stratigraphy of the early-Proterozoic Buffalo Springs Group in the Thabazimbi Area, west-central Transvaal. Infonn. Circ. eoon. geol. Res. Unit, Univ. Witwatersrand, Johannesburg, 120: 16 pp.
Van Eeden, O.R., de Wet, N.P. and Strauss, C.Z., 1963. The geology of the area round Schweizer-Renecke. Explanation of Sheets 2724B and 2725A. Geol. Surv. S. Afr., Pretoria, 76 pp.
Van Niekerk, C.B. and Burger, A.J., 1964. The age of the Ventersdorp System. Ann. geoL Surv. S. Afr., Pre,toria, 3: 75-86.
Van Niekerk,C.B., 1968. The suitability of extrusive rocks for U-Pb radiometric dating. Unpub. Ph.D. thesis, Univ. Cape Tcwri., cape Tcwri..
Van Niekerk, C.B., 1969a. The uranium-lead isotopic dating of South African acid lavas, Bull. Volcan 32(3): 481-498.
Van Niekerk, D.B. and Burger, 1969b. Lead isotopic data relating to the age of the Daronion Reef lava. Trans. geol. Soc. S . Afr. , 72 : 3 7-4 5.
Van Niekerk, C.B. and Burger, A.J., 1978. A new age for the Ventersdorp acidic lavas. Trans. geol. Soc. S. Afrd., 81(2) : 155-164. ·
Van Rooyen, D.P., 1947. Sek.ere pre-Transvaal rotse noord-oos van Potgietersrus. Trans. geol. Soc. S. Afr., 50: 63-70.
Verwoerd, W .J. , 1964. Stratigraphic classification: A critical review. Trans. geol. S. Afr., 67: 263-282.
Von Backstrcm, J.W., 1952. The Daninion Reef and Witwatersrand Systems between Wolmaransstad and Ottosdal, Transvaal. Trans. geol. Soc. S. Afr., 55: 53-71.
Von Backstrcm, J .W., 1962. Die geologie van die gebied an Ottosdal, Transvaal. Explanation of Sheets 2625D and 2626C. Geol Surv. s. Afr., Pretoria.
Vos, R.G., 1975. An allu~ plain and lacustrine rocrlel for the Precambrian Witwatersrand deposits of Sooth Africa. J. Sed. Petrol 45(2): 480-493.
Wagener, G.F., 1972. SUggestions for the revision of the existing Witwatersrand Stratigraphic classification and narenclature. Trans. geol. Soc. s. Afr., 75(2): 77-84.

66
Weiss, O., 1934. The applications and limitations of geqhysical prospecting rrethods in the Witwatersrand. area. J.S. Afr. chem. Soc., 34, 10:
Weiss, O., 1936. Typical magnetic ananalies of I..cMer Witwatersrand shales and younger dykes in the Witwatersrand. J.S. Afr.chem, soc., 34: 227-234.
Weiss, O., 1950. Gravineter results in prospecting for Witwatersrand quartzites in the Transvaal and Orange Free State.(abs) Geophysics, 15: 311.
Winter, H. de la R., 1978. Subdivisions of the Witwatersrand triad: the Daninion Group, the Witwatersrand SUpergroup and the Ventersdorp Group. Unpubl. provisional stratigraphic subdivisions. S. Afr. ccmni ttee for stratigraphy, Geol. SUrv. 1 Pretoria.
Whiteside, H.C., 1970. Volcanic rocks of the Witwatersrand triad. In: T.N. Clifford and I.G. Gass (Editors), "African Magnatism and Tectonics". Oliver and Boyd, Edinburgh, 461 pp.
Whiteside, H.C.M., Glasspool, K.R., Hiemstra, S.A., Pretorius, D.A. and Antrobus, E.S., 1976. Gold in the Witwatersrand Triad. In: C.B. Coetzee (Editor). Mineral Resources .of the Republic of South Africa., Geol. SUrv. S. Afr., Pretoria, 462 pp.
Wiebols, J.H., 1955. Note on chloritiod in the Witwatersrand System. Trans. geol. Soc. S. Afr., 64: 85-98.
Wilson, J.F., Bickle, M.J., Hawkesworth, C.J., Martin, A., Nisbet, E.G. and Orphen, J., 1978. Granite-greenstone terrains of the Rhodesian Archaean craton. Nature, 278(5640): 23-27.
Wilson, N.L., Toens, P.D. and van der Schyff, D.B., 1964. The geology of the Rietkuil Syncline. In: S.H. Haughton (Editor), 'rhe Geology of Sare Ore Deposits in Southern Africa. geol. Soc. of S. Afr., Jdlannesburg Vol 1: 393-398.
Winkler, H.G.F., 1974. Petrogenesis of Metaroc>rphic Rocks. 3rd Edition. Springer-Verlag, New York-Berlin, 326 pp.
Winkler, H.G.F., 1967. Petrogenesis of Metaroc>rphic Rocks. 3rd Edition. Springer-Verlag, New York-Berlin, 220 pp.
Young, R.B., 1907. '11he alteration of the feldspars in the feldspathic quartzite underlying the Hospital Hill slate. Trans. geol. Soc. S. Afr., 10: 62-64.
Young, R.B., 1917. '11he Banket of the South African Goldfields. Gurney and Jackson, London.
Young, R.B., 1944. Stylolitic solution in Witwatersrand quartzites. Trans. geol. Soc. S. Afr., 47: 137-142.
I;

CML XICIN3dd'il
S9l

166
carputer progranne for the correction of crossbedding
data (an expanded and updated version of van E.den's
(1969) progranne).
Aim : (a) to establish aprogramrre which carputes the original current
Method
direction fran crossbedding within dipping strata
(b) to procress the orientation data at each locality into statis
tically meaningful pararreters
(c) to fonnat the output in a sirrple concise manner.
(a) 'Ihe problem of correcting pri.rrru:y structure for tilt of the
bedding can be solved by using a stereographic net or enploying
trigonaretric fo:rmulas. The latter method can be adapted to
a canputer programrre, which makes the whole exersice of correction
autanatic and effortless. In the field the following pararreters
are collected and constitute the input data (the alphabetic
symbols in brackets represent the input data in the functions
shown on canputer printout -1).
Input Data :Azimuth bedding (A) - azimu.thal direction of dip of the bedding in
degrees.
Dip Bedding (B) - angle of dip of the bedding in degrees.
Azimuth X-bedding (C) - azimuthal direction of the foreset of the
cross-bedded unit.
Dip X-bedding (D) - angle of dip of the cross-bedded unit.
Procedure: Next a two step rotational procedure involving the rotation of the
nonnal to the bedding plane abcut the vertical axis into the YZ
plane and a rotation of the nonnal to the bedding plane abcut the
X axis into a vertical position is accanplished. '!he rotational
fo:rmulae of van E.den (1969) were m:xlified for fortran language
and used on the ucr 1000 Univac Ccrrputer. Also inserted in the pro
granne are a few 'EI.SE IF' clauses introducing negligible snall con
stants to avoid zero and infinite values.
gutput Data:Corrected azimuth X-bedding (E)- 'primary' azimuthal direction of dip
of the tilt corrected foreset
Corrected dip X-bedding (F} - original angle of repose of foreset.

;_~:·::,.
167
(b) Once (E) and (F) are kna.vn the progtarrma canputes several calculations
for the number of observations in each locality. These calculations
include:
V n n. Cos Xi =
i=l l
w n n. Sin Xi = i=l
l
VM = Arctan W/V
R = 2 2 1
(V + W )
L = (R/n) 100
MDip= F/n
Where: X is the the mid-point azimuth of the i th class interval
or for ungrouped data is the azimuthal angle rreasured.
VM is the azimuth of the resultant vector
ni the number of observations in each class
n the total number of observations
R the magnitude or length of the resultant vector.
L the magnitude of the resultant vector in tenns of per cent: and
MDip the arithmetic rrean corrected dip.
The magnitude of the vector (L) is a rrEasure of the concentration of azi
muths, the greater L the greater the concentration. The ratio R/n was
called the consistenC¥ ratio by Reiche (1938) and ernbcrlies the statisticai
"standard deviation" within circular normal distr:ibutions. If the consistency ratio were perfect, the consistency ratio would equal unity, ,;.mereas,
were there no grouping the resultant vector would be zero, as would the con
sistency ratio by definition.
(c) 'Ihe fonnat of the progranrne was designed so that it prints out the
narre of the study area (e.g. West Rand Group paleocurrent analysis
Heidelberg area), the station at ,;.,-hich crossbed data were rreasured
(e.g. Governrrent Reef Unit, T14), the input and output data
(A,B,C,D,E and F), and the relevant statistics for that station
(vector rrean azimuth, vectoral magnitude, consistency ratio and
arithnetic rrean corrected dip). Because of progranme specification
the input cards were sequenced as follows:

@ E OF
card (1)
card (2+n)
168
STATION I..OCALITY
DATA CARDS
The number of rreasurerrents (A,B,C,D) recorded at any one station locality nru.st
not exceed·. 6788.-l (a rrost generoo.s restriction ! ) . 'Ihe fonrat of the
as below:
A t••• J 1'M.tU i-<
JrSJ i. 0 0 0 0 C O O O O O O D O O O O O O O 3 0 O O O :J O O O O O O Q O O O O O n O O O O O O O O O O O O O O D O ,1 0 0 0 0 0 0 0 0 0 0 ;, D D ·) u 1 1 1 ,t l f l ' ! !!'J 11 ll :l 14 1S •; i1 tit IS 2'l 21 7: ~J ;, ~'.1 :, ~/ 2i 29 j,! :!• )~ 1) ~t .~) ~'i jJ le 1S 40 •1 42 •JU •'i 46 41 4B !9 SO :ii 52 ~J 54 ~~ 56 57 ~.1 c;~ 150 5' 6~ !). ~~:)St: SJ ES S~ ;o 11 1113 r~ ·~ 10 7.1 ;1 .'~ ('J
,\ 1 1 i 1 1 1 1 1 1 1 : 1 i I l 1 1 i 1 l A 1 l l i 1 1 J I 1 I 1 I 1 1 1 I 1 1 I 1 I 1 A 1 I 1 I I l ,I ! 1 I 1 I I I 1 I 1 1 I 1 l I
B 2· 22~· ~2222 S 271~222 3 ~22272 K 22222 $ 222Z222 0 2222~2 K ~2222 5 l/222:
3 C 33J333 .. 3 .. 33 T 3J3333J C 3333::i L 3JJ3~ T 3333333 C 333333 L 33333 T JJJ'.,3
I, ! 0 4 4 ~ '. .\ 1.1 4 J, 4 ~ 4 1J 4 ~ ~ 4 4 4 q D 4 /, ~ 4 4 4 M ~ ~ 4 ~ 4 U 4 4 4 4 4 4 4 D 4 4 4 4 ~ 1 M 4 4 4 4 ~ t: ~ 4 ,\ 4
J ~ 5 ,:: 5 ~ 5 ~ 5 N 5 ~ 5 5 ~ V 5 5 5 ~ ~ 5 5 - : S J $ 5 5 tJ 5 5 5 5 5 V 5 5 5 5 5 5 5 [ 5 5 5 5 5 5 N 5 5 5 5 5 V ~ 5 5
65°6 .. ES5566 o 666S~ w 6666666 F Sf-6666 O 66666 w 6666666 F 666G6'i o 66666 w 65
77777 G 777777 P ;];77 X 7777777 G 777777 P 77777 X 7777777 G 777777 P 7,777 X 7
e a 2 a ~ 3 H s s G a a P ;_, 2 a a r ~ v , a a e B s K ~' a B s s 3 a o ' ~ a a a v a s s s a a e H ~ a a a a a ,:, a B a :; a {
9:999SS I 999999 R 99H~ Z 9q999c9 , ~9S999 P- 99999 Z 9999999 I 999999 Cl 99999 l I . J • i ~ ; ~ 1 1 J :1 11 ;: 't 15 1'7 11 4 '9 :•) 21 Zl i J ]4 7) 2S r; i:5 ~~ ; ~ j! jt : " J4 JS 1, l7 ).j ; ~ IJ l\ 4 2 .t 1, ,I,. '~ "" ., '~ 4j W 51 12 l.l 5• 55 ~, 57 ~ 5t '' II '7 IJ U 55 L.." i 1 U ., 10 r. 72 n 14 ~~ :, ~, ;a i1 :0
II" ~ :SJ
FollCMing the last data card, a card with the m.mbers 6781 punched in its
first 4 collllIU'ls instructs the prograI!tle to start processing the next Group of
data obtained at a different locality. The fonnat at each station locality
is exactly the same as above i.e. starting with a station locality card, follo
wed by data cards and ending with a 678'1 card. The last card of the last
locality which terminates the input data must not be a 678CJ card but rather
a card with 9999 punched in its first 4 collllIU'ls.
Results Exanples of the printouts obtained for both uni.m::ldal and b.imcx1al
distributions are shown on "cc:::nputer printout -2".

169
CCMPUTER PRINI'Our 1
HUN PCsrF,Ao216-RlOllHHGF,GEOCHEM,s20,20
IFTN,CS :TN 8Rl *Ol/22180-11:19
1. REAL L 2. uIMENSION TlTLE(20) 3. suME=o• 4. suMSIN=O. 5. suMF:o. b• SUMC05:0. 7. SUMESG=O• 8. PI=3.141592654 9. hiN=u
10. 11. 190 SUMESQ:o.o 12. 13. li+. 15. lb. 17. 18. 19. 20. 21. 22. 23. 24 • 2:;. 26. 27. t:.8. 29. 3u. 31. 32. 33. ~4. 35. 3!;2. 37. 3b. 39. 40. 41. 42. 43. 44. '+5. 46. 47. '+bo i+9. 50. 01. 5~. 53. 54. 55. :>6. 57. :is.
suME:o.o j•.'tEANAz=o MDIP:o SUMF:o.o suMcos=o.o suMSIN=O.o ~RITE(5•105>
105 FORMAT(lH1,16X•'WEST RAND GROUP PALAEOCURRENT DlRECTIOt• ANALYSI5-H *EID~LBERG AREA'•///)
~EAD(A•203>JITLE nRITE(5•106 TITLE
203 FORMAT(20A4> 106 FORMAT(//,BX,20A4,//l
nkITECS•lOO>
100 F08MATC 9X,'LOCALITJ'•4X,•AZIMUTH'•6X,'D1P'•9X•'AZ1MUT. ',6X• *'DIP•,ax,•cORRECTED •2x••CORRECTED'}
NRITEcs,101>
101 FORMAT(lOX,'NUMBER'•5X,'BEDDING',4X•'BEDOING',6X,•CBEDnING'•4X• *'C8ED0ING•,&x, 1 AZIMUTH••6X•'DIP',/)
200 tiEAD(s,201,ErJiJ=202)N,A,B,C,D
IF(N.EQ•6789)GO TO 202
IF(N.EQ•9999)GO TO 999
i~l=N 2ul FORMAT(I4,4F3.0)

170
59. 60. NN=NN+l cl. A:A/57.3 62. u:B/57.3 6.3. c:C/57.3 b4. u:D/57.3 65. PI6=270e/57•~ 06. p14=90./57.3 67.
x:SlNCD>•sIN(A-C) 68. 69.
IF(U.EQ•Pl4>0:o+o.0001 70. 71.
IFlD.EQ•Plo>o:D+0.0001 72. l3· s:TANCD>•COSCA-C) '+. 75.
IFlS.EQ•O.)S:o.00000001 76. 77. 7®· w:ATAN<l/S)+B 7 • 80. G:ABSCA-C) til.
IF(<G.LT;PI6).ANO.(G.GT•PI4))THEN 82. 83.
Y=-SQRT(l-X*X)*COS(W) 1 84. 1 85. 1 Bb. t.LSE 1 87.
Y=saRT(l-X*X)*COS(W) 1 bij· l 0 • 1 90. END IF 1 91.
92. GO TO 901 93. 94. 901 z:SGRT(l-X*X>*SIN(W) 9:,. 9f>e IF<X.E~·o>x=o.00000001 97.
E.:ATA1~2CY,X)+J\-Pl4 98. 99.
IF<E.LT•O>E=E+(360/57.3) lCiO • .1.01. !8~: lF<Z.EQ•O>z=o.OOOOOOOl 104. 22:SQRT<l-Z*Z>IZ 105. 106. F:ABS(ATA14(Z7-)) 107. lU8. ALFA=E 109.
SUMC0S=5UMC0S+COSCALFA) 110. 111.
suMSIN=SUMSlN+SlNCALFA) 112. 113. 11'+. A:A*57•3 115. lJ.6.
a=e*57•3 c= *57•3
117. 118. o=~*57·~ E.= *57• 119. F=F*57e3 120.

ND FTN
121. 122. 123. 124. 125. 120. 127. 12d. 129. 130. l~l. 132. 133. l~4. 135. 136. 137.
l~®: 140. 141. 142. 143 • .l44. 145 • .l.46. 147. 148. 149. l5u. 151. 152. 153. 154+. 155.
t~~: 158. 159. lbO. lbl. 162. 163. 164. l95. lboe 167 • .lb8. lo9. 110. 171. 172. 173. i ?Li,. 175.
273 !BANK
171
wRITECs,102>N,A•B•C•D•E•F 102 FORMAT(lOX,l4,7X,F7•3•4X,F7•3•7X,F7•3•4X,F7•3•7X,F7.3,~X,F7•3•/l
suME=suME+E suMF:sUMF+F
suMESQ=SUMESQ+E**2
GO TO 200 202 CONTINUE
N=Nl v:SUMCOS
w:SUMSIN vr,.,·,:ATAN2 ( W, V)
IFCVM.LE.o>VM:(2*PI)+VM
vMN=VM*57.3 vsQ=v*v
v,SQ=W*W R:Si.ilRT ( VSQ+WSt~)
L=CR/N)*lOO ,,,m I P=SUMF /N
.,.RITE (5, 104> Vf·~N,R,L•MDIP 104 FQRMAT('O',llX•'VECTOR MEAN AZIMUTH='F5•Q,///,
*12x,•vECTORAL MAGNITUDE=•Fs.2,///,
*l2X• 'CONSISTEIJCY RATIO:'F6e2,///,
*12X•'ARITHMETIC MEAN CORRECTED DIP='I3)
GO TO 190
999 STOP END
293 UBANK
ENTERING USER PROGRAM

,,)
CCMPUI'ER PRINIDUT 2
WEST kAND GROUP PALAEOCURRENr DIRECTION ANALYSIS-HEIDELBERG ·REA
TR17 JEPPESTOWN-1STQTZ
LOCALITY AL!MUTH DIP AzIMUTH DIP CORRECTFD CORRECTED NUMBER Bt.ODING HEDDING CBEDDING CBEODING AZIMUT~ DIP
1 260.000 29.000 232.000 40.000 192.sos 19.064
2 200.000 29.000 235.000 410000 1990077 180495 3 2t>ooooo 290000 2340000 320000 111.34, 130435
4 2booooo 290000 2350000 ·420000 20le03c:, 190269 ..... 5 2bu.OOO 29o000 229,000 35,000 1760352 170291
'1 N
6 2bo.ooo 29.noo 248,000 43.000 22a.22~ 150619 7 2b0,000 29,000 225,000 300000 157,871 17,057
8 200.000 29,000 2.35,000 40,000 196,95R 170743 9 2booooo 29.ooo 2400000 44,000 213o08r-, 18,982
10 260,000 29,000 218,000 44,000 182,47 28,426 11 260,000 29,000 212,000 42,000 173•60n 29,883
12 200,000 29,000 226,000 32,000 1640814 17,309 13 2bU,000 29,000 218,000 35,000 166,375 22.616
• i 14 2bo.ooo 29,000 218,000 43,000 . 1810004 27,702
15 260,000 29,000 231,000 46,000 20lo47A 24,135
VECTOR Ml.AN AZIMUTH: 187.
VECTORAL MAGNITuoE=l4,lg
CONSISTENCY RATIO= 94,61
ARITHMETIC MEAN CORRECTED DIP= 20

w~sr HAND GROUP PALAEOCURRENy DIRECTION ANALYSIS-HEICELBERG ;REA
TR7-GR3 - 61~,QL)ML -rl.ODE A
LOCAUTY A1..H:UTH 0ItJ 'lzH'UTrl DIP coRREcr·o CORRFCJED NUMoER U::.l.:OING lJEUnrnG c:.lEODir,G CBf:OG I ~JG AZ lMUTf nIP '1 2'.:>o.000 2f .. ,OO ;:i.e. oco 31.000 231071, 11 o 746 2 2::.6. uoo 2a.800 ;!:)OoOOO 45.000 243, 08:" 19.297 3 2~t.ou\Ju 26.oOO ;:33.000 42,000 207.071i 20.290 4 2s,,.uuo 2t,. ,100 ;'65,000 36.000 284·82~ 1ro997 5 2=>o,OOo 26,000 <'.45 o O :J 0 40o00Q 228,07? 15-178 6 2!:Jo.000 26.0GC, <'.33, oou ~soouo 211,%~. 230847 7 2!:>o,OUO 26,000 c::i~"ooo 50,000 216,75 26.971) H 2::.c.,UOO 26o00D <.'.>5.000 460 OOQ 2150211<. 23,256 9 2Si,oUllO 26oU00 ~C6.UGO 3:,; OflQ 1620393 26.119
lu 2:>ho00(J 260000 232ocoo 430000 20607% 210493 -' ll 200.UUO 260 t!OO 2;15. 000 27oOCO 162o60i 90379 -...J w 12 2:;.t>oOUU 2E.. uoo 2:,30 JOJ 46.GllO 2490709 200072 ,.
13 2:.-t. ,uUU 26. ,,oo 221oouo 44.000 200,421 24,093 .1.4 2t),..,, ouo 2e,, (100 23800(;1) 52,000 22409()1, ?P,,129 . l5 2:)o,UU(j 26,l!GO 230,000 340000 185,81S lS,102 16 2!:>n.OLIO 26.(00 2.30,000 41,0DO 200.70,, 2n,475 17 2~n.U0:J 26, C,OJ 220,000 36,uCO 177oP% 2f1,674 lk 2~6.GOu 26,uGO 2<'.5o OGO 45. O;;Q 191l,8lc, 2'>,677 19 2S6,lJUO 26o(.00 2.,0, 000 480000 244 -179 22,271 20 2:>boOUO 26,COO 2~0.oco 43.000 189062". 25,945 21 25ooGJO 26,t,OO 2~5,00) 35,0GO 181 .(,fi1 17,866 22 2~h,u0J 26.!JLlO 21J,OCO 460 ooo 243,48.J 2no2A7 23 2:.ih,OJU 26.0UO 2 ;O, UOO 30,000 148,79,'1 250716 24 2!:>o,OUO 26.000 2•15, DGO 39.000 226, 77? 14,233 25 2~6,0UO 26.000 2•15,COO 390000 226077? 14,233 26 2;,w,OUO 26.[)00 21>~,coa 35.GUO ?52,3 11°' q.014 27 2:.ir,, uuo 2b.OOO ;2 __ a. ouo 49. oco 193.99, :\ 1,747 26 2~u,0U(J 26,000 2:-15,000 Q5.0lJO 2°1'•"19. 22,342
VECTOR Ml:.AII AZlMuTH= 2l~!o
VECTORAL M~uNlfUuE=24,3s
co~sISTENCY RATio= 8oo9~
ARlTH~ETlC MLAN CORR~CTED Dip:·20

WEST HAND GROUP PALAEOCURRENT DIRECTION ANALYSIS-HEIDELBERG tREA
TR7-GR3 (CONTD•) - MODE B
LOCALITY AZIMUTH DIP AZIMUTH DIP CORRECTF·O CORRECTEO NUMHER B£ooING BEDDING CAEDDlNG CBEODING AZIMlJTt! DIP
1 256.000 26.000 3050000 28.000 3.26n 21.780
2 256.000 26.000 325.000 11.000 35e96A 25,114
3 256,000 26.000 312.000 11.000 34,313 21,378
4 25t,o000 26.000 322,000 15,000 40.27,' 230890
5 256,000 26.000 300,000 260000 5,94i:; 18.902
6 250.000 260000 317,000 34,000 359. 7411 30.232 .... 7 25b.000 260000 303,000 30.000 357,29fl 21,895
-....J ~
8 256.000 26,000 345,000 41.000 12,02~ 46•892
9 25b•OOO 26.noo 330,000 25,000 21,751 30,041
10 256,000 26.000 258,000 16,000 72,82s:; 10.024
' 11 256,000 26.000 302,000 330000 3500015 230124
12 2560000 26.oOO 77,000 15.000 76o39~, 40.998
13 256.000 26.000 5,000 25,000 3e.s11 410044
14 256,000 26,000 315,000 25,000 15,09:, 24,4g3
15 256,000 26,000 175.000 10.000 98,83· 26,226
16 250.000 26,000 295,000 35,000 339,444 21,305
17 256,000 26.000 305,000 30,000 358.652 22.752
18 256,000 26.000 280,000 40,000 309o7lq 10.926
VE.CTOR ME.AN AZIMUTH: 20.
VECTORAL MAGNITuoE=14,84
CONSISTENCY RATIO= 82•43
ARlTHM~TlC MEAN CORRECTED DIP= 26

l\PPENDIX THREE

176
RCCK TYPE COOE
1· = West Rand Group A= shale
2. = Central Rand Group B = Greywacke
3. = Fig Tree Group C = Tillite
4 -. - Mozaan Group D = Ferruginous shale
E = Sandstone
F = Granitic paleosol

#EST RAN) GROUP SEOIM£NTS•rl~IDELBERGAREA,lASTE~~ TiA~SVAAL
PCS-I PCS-2 PCS-~ PCS-8 PCS-II PCS-13 PCS-lb PCS-18 PCS·2~ PC5·2b
•••MAJOR ELEMENTS • • •
5102 5Bob0 bO.bB 53.~9 S3.81 S7oll ~&-3b 55-b2 Sl.78 73.J~ 99.~B TI02 lo09 1,02 obS .s~ .so .35 obS .59 .3~ .11 AL203 23o8~ 22.~1 13.B~ 12.7~ llo07 B.67 1~.39 13.~7 9ob6 5.32 FE203 3o7b s.ss 20.~0 20.98 19.~3 9.52 lb•I~ 21.26 bob7 lo36 FEO - - - - - _ _ _ • _ "N 0. • D 2 • 0 ~ • I 7 • 1 7 • I 7 • I 5 • 0 9 • 0 9 • 0 5 • CZ MGO loSB 2.28 5.79 SobS 5•22 l~.11 e.~o b.5~ ~-32 .97 CAO ,03 .02 .1s 028 .35 6.9~ ol7 .25 .~o .1~ NA20 ol9 olb •DI oOI oOI .DI .02 .GI 1•37 .os K20 bo78 5~91 .~s •~l .22 •01 lob~ .59 .b~ 1.ss P20S .OJ .02 .Q9 .07 009 .DI 009 oil .JI oOI H20• 3.93 3o70 3.~3 ~.Se ~.2~ 10•7~ ~-bS ~.99 2.59 loG9 H20• ol7 012 .13 .1~ .13 •lb ol7 .10 .JS •II ~ CO2 • - _ - - - - - • - • TOTAL 99.90 101.91 9Bob0 99.~0 9B.~~ 99.QJ IOO.J3 99.78 99.2~ IJJ.21 -..J
• ••TRACE ELEMENTS•••
cs - - - - - -RB 221. 190. 16.9 20.J 9.01 ND 7lob 2bo2 23.S ~9.~ BA - - - • - - - - - • SR lb.~ 13•2 3.12 7.1~ .69 221. 25.J 6.5S &7.a 7.7~ TH - - ~ - . - - - - - -U 12.7 1.60 NO loOO NJ ND ND ~D ~D ~D ~ ZR 190• 170. IS~. 132• 126. 32.9 13b• 127• 101• ~a.~ HF • • - - - - - - - -NB • 12•0 10•5 8ob8 7.39 7.87 ND 7.J2 7.63 ~.2b ~D CR 1~12• 1370. 780. 6~2. 599. 1971• 670. 683. ~62. 7b.~ V 27bo 227• 1~2• 127. 123• l~O. l~B. I~~. b2.8 2).0 SC - - - - - - - - - -NI I 2BJo 3320 )33o 28bo 2~2. ~28• )QBo 2990 ISie )Jo5 CO 72ob ~a.J ~Q.J 3~.z J0.7 73.6 37.3 39.a. 28.8 6010 GA 21.b 2s.s 11.~ 16•9 1~.1 a.so lb~S 11.0 10.1 s.~s PB - - - - - -ZN - - - - - -cu y LA CE
• PR ND SM EU GD TB DY HO ER TM - - - - - - -YB
87/Bb l•SR

IES T '!ANO GROUP SEDIMENTS-~EIJELU~~GA~EA,EASTlRN T~AN5VAAL
P cs-1 PCS-2 PCS-'I PCS-8 PCS-II PCS-13 PCS-16 PCS-18 "CS-25 "CS-26
• • • ELE'4E~T 'lATIOS • • • ZR/NB is.a 1 6 • 2 11.1 17.a 16-0 - 19 • 'I I b • 1 2 3. 7 ZR/Y ZR/HF IC/RB 2S't • 2S8. 2 2 I• 176• 186· - 190. I 8 7. 221. 2 6 I. IC/BA - - - - - - - - - -IC/SR 3.'132+003 3.108+003 1.00'1+003 soo. 2-6'17+003 .375 !".'I'S• 7 '18. b0-5 1.611•.:,03 IC/ZR 2 9 6 • 289. 2 ... 3 27•1 I 'I. S 2.s2 IOJ• 38•5 52.7 26b • IC/NB ... 683+003 ... 695+003 'I 3 0 • 'IB 3. 232· - 1.939+0J3 6 '12. 1.2'17+00) IC/Y BA/RB -BA/S~ BA/ZR RB/SR 13.s I 'I• 'I 'I. s 'I 2 • 8'1 I 'I• 2 - 2.01 ... 00 .267 b • 'l I _. NJ/CO 3.86 6.87 0.26 8 .)8 7.86 s.01 8 • 2 'I 7. 'I 'I ., .. 2'1 'I• 9 9 -..J CR/NI 5.03 'I• I 3 2 • l" 2 • 2'1 2 • 'I 0 'I. 6 I 2. I 8 2.37 3.01 2.se CX> Tl /P 1so. 70 .1 9.92 10.6 7o63 '1 B • I 9.92 7. 3 7 'l 6. 7 IS. I GA/AL 2.1aa-oo'I 2.100-oo'I 2.376-00'1 20507-00'1 2o5IB-OO'I 1.e52-0D'I 2o'l36-0J'I 2.378-JO'I 1.935-!J'.l'I I o9)b-OO'I TH/U LA/YB EU/EU• CA/AL lo698-003 1.20'1-003 lo'l62-002 20965-002 '10266-)02 1.00 lo59'1-002 2.30'1-J02 5.587-'.JJ2 )o551-J02 MG • 11s. 1 1 6 • 125. 126. 12b. I 0'1 • I I 7 • I 2 2 • I ID• IO 9.
• • • c.1.P.11. NORMS • • • QZ 29.16 33.73 '13 • :J 1 '13. 2 8 'I 7. 9 3 I 'I• 7 2 ) '>' • 5 9 3q • '19 55.35 !l 1 • s 'I co l 6 • 16 15. 7 S t).28 11. 9 2 10.)9 - I 2. '19 12 • 6 2 b o O I 3 o3 3 OR 'IO.)I, 3 ... 9 2 2.66 2 • S'l I .JO .Ob 9o6Y 3. '19 3.79 9. I b PL l • 6 9 1.35 • 2 'I Io 02 1-2 3 23.67 ~ '12 ·• 6 I I 3 •SI I • (1 S PL-AB l • 6 I lo 3 5 .os .oa • Of! .OB o I 7 .oa I I • :i 9 • 'I 2 PL-AN .oa - • I 6 .93 I • I 5 2 3 • 5il .26 .s2 1.92 • b 3 LC NE ICP 10 DI - - - - - 7.90 01-•o - - - - - 'I. 2 'I DI-EN - - - - - 3.66 01-FS - - - - - -HY 3 .9'1 5.68 I 'I• 'I 2 j 'I. 07 I 3. JO 3 I • 'l 8 IS• Y 'I 16.29 I G • 7 b 2. 'I 2 HY-EN 3 • 9'1 5.68 1 'I• 'I 2 I 'l. 0 7 13.JO 31 • 'l 8 IS. 9 'I 16.29 10.76 2. '12 HY-FS - - - - - - -OL - - - - - - -OL-FO OL-FA cs MT IL • 0 'I .QC/ .36 .36 o)b .32 • I 'I • I 9 • I I • '.l't AP .02 • O'I • 2 1 • I 7 • 2 I • 02 • 2 I • 2 b • :)2 .Jl cc - - - - - - - - - -AN /PL ... 9 'I - 6'1 o 86 91. 6 7 9 3 ol 'I '19. 6 'I 6 o. I 'I 8 b. 0'1 I'+• 2 Q :, '1. 19 FO/OL - - - - - - - - - -0 •I• 70•83 70. '.ll 'I:, .76 'l5.'H 'I ·ie 3 2 I 'I. (i b '19. 'I 'I 'I 3 • 0 6 7 .:J. 7 3 n .i,

O~
>n
>-3
no
oo
xx
zo
oo
o•~
r.-
,,,o
ru
, •o
zn
,r ...
~rrr~
~~
----o
,mn
rrrzo
N
-,,
I I
I I
I I
I I
I •o
,
~~
~m
~
m•
>>
rr
>O
~
z
u,z
o
zm
"' ....
--__
..., 0
.... 0-
11"
_...,...
, •
I •
I •
• I
I I
I I
• •
I I
I I
I I
• • .. •
• ....
,0 ,
0
-N.C
..O
.._
,..O
CD
J:"'
,0 ,
0
u,u
,-J
:0-,
()
111
.... --J:
N
.r.
.r.
J:
N--o
. I
• . .
I I
I I
I I
• .
I I
I I
I I
I . . .
. ..
N
0-
..,_
NN
..
.,U
,IJU
lO--
a,
.r.
-11
1
NN
J:..
OZ
N-..
..i
111
,0
--w
....
.r. J
: "'
NO
"'O
O"'
. I
. . .
I I
I I
I I
' . I
I I
I I
I I . . .
. ..
.... ....
...,_
WW
O
"'N
..O
O"W
.O
,0
N
.r. .(
l 0
0
...... U
,N-1
.JW
.... 11
1 0
-0-
-a:>
.(l
. I I
I . .
I I
I I
I I
• . I
I I
I I ' '
I I
• • . .
. 0
00
0
0
oo
:x>
o--
,0
"'"°
'-'1
.i
a,
a, a,"
'""
.... 11
' "'0
-O
D>
O
. I I
I • . I
I I
I I
I • . I
I , -,
I
I I
I I . . .
. .
.... C
JD
.c.r
. lJ
\..l
..l
:.O
)V1
11
1 N
,0
a
, a,
..c:
.&:.
C,,
.U'll
fl
.c
a,
N
,..,_
N
,0
11'
0-
o-w
-0-
0-
. I •
I • . I
I I
I I
I • . I
I I
I
' I I
I . .
. . ..
.r.
-N
N
eJ
u
i-a-.
t-""
a,
..., .&
..&.
0-
0-
O'-
'IJO
U1
J:
.z:
..0
-w
N
.....
0-
0-
0-
0-
..oo
....
. I •
I • . I
' I I
I ' . . I
' I ' '
I I
I • . .
. ..
.r.
N
"'"'
OD
o-
--w-
"' .,.
-.c
,0
..,
_..
...,
CD
O"'
l.J\
TI
a,
..,_
.&.
.c
--..
C:N
CD
. I
I I . .
I I ' I
I I . .
I I
I I
I I
I I
I . .
. • •
N
00
0
-0
-N
NL
nC
,,-~
"' "''
' ,.,,
"' ...
.,....
, ...
.. ..
o.J
:
a---lf
' "'
"'"'
-o
o
. I
I I
• . I
I I
I I
I • . I
I I
I I
I I
I I . .
w
U
c.;
0
0
__
....,
a...&
.
I.I'
"'0-
NN
..
.,..
.,D
':l0
>
.,. .--
~.z:
.c
........
.... a
.,.
. I
I I . .
I I
I I
I I
• . I
I I
I I
I 1
· I
I • . .
.. "'
O.&
. N
NC
:00
..t:
.r.
•J .
...
00
u,
v·
u,cr
, ..e
:
• • • n . ,, • z 0 "" 3 VI • • •
3n
mr
... ~
-<nZ
ZC
DC
DC
D~
~~
~~
~N
NN
~
>C
>X
>-Z
-CD
>>
>'-
'-'-
'-'-
'-::
C::
C::
C
'-'-
'-'-
'-'-
'-'-
'-'-
'-'-
~Z
Nll
'ID
::C
'-'-
'a>
m~
c>
,zn
ll'N
U,Z
C
D::C
Z>C
DX
~Z
rem
r
-ozzzm
~
m
•
,0
"' "'
"' -·
• ..
. f!IJ
"""
.0
. -· "
' -C
D
NU
,•
• •
I I
I O
NO
I
111"
W
V'
.O•
NC
DO
"'
111
.... .
.0
II"
. . "'
.... -o
.-co
...
. •
J:
I I
• •
0 0
0 0
0 0
0 0
.... J:
.... ....
J:
"' N
-· . .O
NO
-J:
. -· "
' _..
.,, I
W• ..
. I I • 1
4-'N
O
o, . ....
0-
a,
111
.... J
: ...
. ,O
-,o
N
a,
• . ...
o
,.u
.J..
:N
.... 1/
1 .
,0
I I
• •
0 0
0 0
0 0
0 0
"' .z
: w
....
0-
N
... "'
• alN
....
,_
. -.
"' "'
-o
I I
I .r.
• . .
NI
I I
I ..
., o
-o-
-, ,o
J:
II"
~-O
NO
-•
.,.. J:
....
.,. •
.... -t
.J•,
.,U
,J ..
C:
.,. . 111
111
I I
• •
0 0
0 0
0 0
0 0
"' J:
.... w
.r.
"' "'
-· •
-N
o---
. -·
N
'"'"° '
I I N
J:•
•
0 t
I I
I D
>N
,O
.(l
IW
w ,0
.O
• J
: .(
l •
.()N
J:
.r.
.. w
O
J:
a:>
11
-0
..... ..0
....
I I
• •
0 0
0 0
0 0
0 0
w
.r.
w
... "' •
u, w
u• u
-. -
. W
N
I I
I N
..
... . .
I I
I
..., __
' ,0
'
,.c
C, .c
O
•
tJ"U
'O
-u,v
• "'
. . 0-
..........
~""°'
--' 1
11
. 11
1 ..0
I
I •
• 0
0 0
0 0
0 0
0 w
.r.
w
....
N
"' •
-&
.JO
'-•
"' N
C
l.I'
I
I
' "'.r
.. . a
, ' I
I ...
. C
CI>
1
-I
' 0
-L
,C:,
.r
..
WN
O-
V,
I.J
:.c
w
• N
..
c,.
..,v
,_\f
l .....
• (I
)
I •
D
0 0
D
.r.
...,
"' -·
. ..ON
O--
c,..
.i
. "°""
"' ' I
I vu
.. . ' I
I o
---
I 0
1
' a
,
"""'
NJ:.
N""'U
' ,0
.
.c
0 .
. .,.
O"'
O'-
..U
J:..
...,
.., "'.
0
-I
• 0
0 u
u .c
...
.... N
....
. N•
N
CD
. W•
(.J
U
I I
I -O
NO
"'•
I
I 'I
I
wu
a-
I"'
IN
....
o
.... . ..
... .....
.0
a,
1/1
0 . "'
N
O'"
O"'W
N
.c.
111
0-
I '
• •
u CJ
u
0 0
0 u
0 .c
.r
. ...
.... ...
N •-,v
m-
. .....
N
N-
I I
IN
• . •
0 I
I I
I O
"' L
l V
, I-"
I IW
,.,,_
.a
a-~ ..
.....
.c.
11'
"' . ..0
(...):
"'.)
lr,
tJ)
CD
·::>-...
., .r.
I
I •
+
0 L
l 0
0 0
u 0
u .....
.c
...,
..,
N
N
N
• -l'\,
lc,,
.-....
o
I I
,~u
• . .._
I
I I
I ...
, •'-
1',.J
I
1..1
I I
.C
1..
10
-.
-..JV
l•
Nl.
.l<
r "'
. .... C
' ..t
: G
NC
....
• "'
' l-"
I I
+ .
0 0
0 L
l 0
a a
0 w
.c
w
w
08
l
\
, n "' I .... ,, n V'l I w
"'
• ,,
l'l
n Il
l 1/
1 ....
I ... JO
0
-,. z u ~ ""
• ...
0 C
• ,...
,, r
• I
1/1
>
f'\
,.., 0
r ,.., .r.
.r
. 1
'1
,.., z
... ...
... ...
V'l
r I
,AJ
r ;I
:
>
I ,..,
... a
, 0
0 ,..,
1/1
r c:,
• rn
,,
:tl
• •
'1
::c
>
• "' ,.., ,. ,., ,. ,.,, ...
.. ,,
,, "'
'1
z 1/
l ... ,A
J > z V,
C.
>
,, >
.
r r;
, "' u ' 0 "' 0 .r. ' ,.,

5102 TI02 AL203 FE203 FEO MNO MGO CAO NA20 IC20 P205 H20+ H20-C02 TOTAL
cs R8 BA SR TH u ZR Hf NB CR V SC NI co GA PB ZN cu y LA CE PR NO SM EU GO TB DY HO ER TM YB
87/86 I-SR
05/01
so. 69 • 'I 'I
I l. !> 0 27.69
-·26
2.50 .01 .:::,2
2ol9 .as
J.90 .5 b -
99.99
137. -9.75 -NO
11s. -1.19 '16 0 • 100. -l • 9 'I 21.s 16.2 --
IES T RAND
09/10 13 / 1 I
65 • I 't 75.99 • 8 l • 2 'I
l l • 1 7 b • '19 e.33 b. b 'I - -.05 • 1 1
5.36 6075 .01 • '1 l • 0:, • 0 1
2.01 .02 .09 • 0 l
... 0 b ).63 • l B .1 l - -
99.26 lOJ.30
78.7 s I,
-22.1 10.3 - -
l • 'I B 056 2'10 • )68. - -
6 • 9'1 s.oo 1769. 868·
l 'IO. 93.1 - -3 'I 3. 807. 25·2 If 'I. I 15.0 6•7S - -- -
GROUP SEDIM~NTS-~~l)EL8~RGAREA,EAST~RN TRANSVAAL
15/ l '1 I 6 / 0 1 17/01 £.-J.s.
• • • MAJOR ELEMENTS • • • 52.85 59.20 62.99 61.26
• '10 • If 'I • 6 5 -l l • 20 l 1•53 16.92 17.)J 22.10 1 9. 9 o 6-l l l .36
- - - 7.99 .03 .J3 • 0'1 -
2066 ZoB3 'I• 7 2 1 • b 7 .35 .'.)3 . • O 1 • S..'1 .oz • os • 1 0 'I. 7 9
1.03 1.90 ).30 3.03 • 0 l .02 • 0 l -
S.92 ).96 't. b B 2 • 2 '.l 2.09 .31 .20 - --"
- - - • l 6 CX> 99.26 IOJ.21, 99.81 l(JQ.:,9 --"
• • • TRACE ELEMENTS • • • - -
6206 I I 2 • 1 I 8 • - - -20.1 1 I • 'I I 6. 7 - - -
ND •o ND 57.9 IO 'I. 2 'I 9 • - - -3 • l'I 7.33 12.0 31 2 • 3 b'I • 675. 78 • ':, 95.5 l '19. - - -
1sa. 2 '17 • sao. 26.5 29.3 3 '1 • 6 15 o7 I 'I. 7 I 9. 7 - -- --

IE ST RAND GROUP SEDIMENTS-HEIDELAERGAREA,EASTERN T'UNSVAAL
05/01 09.110 l 3/ 11 I ':>I I 'I lb/DI I 71 O'I E-J.S.
• • • ELEMENT 1UTIOS 0 • • ZR/NB ,s.9 3'f. b 73.5 10.5 I 'I• 3 2 J • b ZR/Y ZR/Hf IC/RB 132· 212. 332· 137. l '11 • 233. IC/BA - - - - - -IC /SR lo8b5+003 735. lb. l '11 't. J.39D+003 lob't0+J03 IC/ZR 159. b9 • 5 · • If S 2 ·I lfB;. IS I• 11 0. 1(/NB 2oS29+003 2o't01f+OQ3 33.2 20723+003 2.152+003 2.275+003 1(/Y BA/RB BA/SR BA/ZR RB/SR I 'I• I 3 • 't 7 't.8'10-002 3.03 9o8b 7 • 0'1 - .....,.
NI/CO ·,.os2-002 l3ob I 8 • 3 5.97 8. '13 lbo8 - CX>
CR/NI 237• 5olb 1 • 0 7 1.97 1 • '18 1. I b I\J
Tl /P l 2 • 1 1 2 • 'I 33.0 5'1 o9 3J.2 89.J GA/AL 2oblf7-00'f 20159-QO'f l•9b5-00'I 2ob'f9-00'I 2.'109-00'1 2.20b-OO'I TH/U .,. LA/YB EU/EU• CA/AL lolbJ-003 1.025-003 8.52'1-002 '10217-002 3.511-003 70975-00'1 t,.s52-002 MG • 2sz. I l O • IObo l 9 2. lb5. IDB. 21.e
• • • C.l.PoNo ~ORMS • • • QZ 39.35 'I 9 • l 7 b'I .a 3 'I 't • I l If 7. 'I I 't 2. 7 If l l•H co 9.20 10.91 S. 73 9. If If 9.39 I 3 • 1 8 'I• 9 8 OR 12 o 9 If 11•88 • 1 2 b.09 11•23 19.50 l 7 • 91 Pl o l 7 • If 2 2.05 I• B'f • If .. .as 'I 3. b 9 PL-AB .1 7 o 'f 2 oOA • I 7 ... 2 .85 'IQ. 5 3 Pl-AN - - I • 9 7 lob1 .J2 - 3. I b LC NE
"l(P •o DI Dt-•o DI-Eh D 1-F S HY b • '13 13.35 I b •BI bob2 1.05 I l. 7 b I 7 • b 9 HY-EN b • 'I 3 13.35 I b •BI b.b2 7.J5 I I• 7 b 'I• I b
.HY-FS - - - - - - 13.53 Ol Ol-fO Ol-FA cs MT - - - - - - I. 9 7 IL o:, b • l I • 2 'I .Ob • i)b .09 AP .02 .02 .02 .02 .os .02 cc - - - - - - • 3 I, AN/PL - - 95.ee 90.80 'I ol 2 - 7. 22 FO/Ol - - - - - - -OoJo SI. 'I b b I. If 7 b:, • D 'I 50.3b 59.Jb b) • 09 10.23

SAMPLE • DATABASE • PCS-I 0 PCS-2 0 PCS-'I 0 PCS-8 0 PCS-II 0 PCS-ll 0 PCS-16 0 PCS-18 0 PCS-25 0 PCS-26 0 PCS-31 0 PCS-12 0 PCS-16 0 TILL-A 0 TILL-B 0 P IR 0 •PGS 0 P.GR. 0 1/09 0 '1/13 0 S/01 0 9/10 0 13/11 0 l S/ 1 'I 0 17/01 0 16/01 0 E-J.s. 0
• • • ROCK TYPE
l A I A I A I A I A I A I A I A l B IE I A I A I A IC IC I A I A Ir I A I A I A I A l B 1 A l A . I A I A
SAMPLE Dl~ECTORY • • •
LOCALITY
SHALE IN CONTACT NITH MAIN'REEf,HEIDELBERG,TVL• '0 • l '1 . 3 EL O 11 '1 A I N REE I' , HE I DEL 8 ERG ARE A , E A 5 T TV L • 7,1~ BELON MAIN REEF 1 HEIOEL3EkG AREA,EAST TVL. 21,qM BELOH MAIN REEf,HEIDELBERG AREA,EAST TVL• zq,7M BELOH MAIN REEl',HEIDfLBERG AREA,EAST TVL• 30M BELON MAIN REEF,HEIDELBERG AqEA ,EAST TVL. 39M BELO• MAIN REEF,HEIDELBERG AREA,EAST TVL. 55M BELON MAIN REEF,HEIDELBERG A~EA,EAST TVL• q30~ BELON ~AIN REEF,HEIDEL9~RG AREA ,EAST TVL• 32qM~ BELON MAIN REEF 1 HE1DELfiERG AREA,EAST TVL• 3BOMH BELO# MAIN REEF,HEIDELAERG AREA,EAST TVL. IBOMM BELON MAIN REEF,HEIDELBERG AREA,EAST TVL• IQqMM BELO# MAIN REEF,HEIPEL8ER:i AREA,EAST TVL• 1300M BELON MAIN REEF,HEIDELBERG AREA,EAST TVL• 1300'1 BELO~ MAJN REEF,HEIDELBERG AREA,EAST TVL•
9qM BELO# MAIN REEF,~EIDELBERG AREA,EAST TVL• qBQM BELON MAIN REEF,HEIOELBERG AREA,EAST TVL•
PALEOSOL OF GRANITE,>26COMY,EAST TVL 1 SELO# OGQ• 305JM BELO>\' MAIN REEF,HEl'.JU.BER:i AREA,oAST TVL• 2200M BELON MAIN REEF,HEIDELBERG AREA,EAST TVL• 19SJM BELON MAIN REEF,HEID£L9ERu AREA,EAST TVL•
790M BELON MAIN REEF,~EIDELBERG AREA,EAST TVL• 7SJM BELO# MAIN REEF,HEJDEL9ERG AREA,EAST TVL• 83JM BELON MAIN REEF,HEIDELBERG AREA,EAST TVL• 585M BELON MAJN REEF,HEIDELBERG AREA,EAST TVL• 770M BELON MAJN REEF,H[IDELBERG AREA,EAST TVL.
"IARIE"VALE MINE ,'FAR ,E.AST RAND'
27 SAMPLES lN THIS DliECTORY
....
Rt:FERE~::E
M·S.fSJ MM,-;g.,g, ·· g ¥
~----···-----
_. CX) w
•

REFERENCES
I 0
REFERENCE LlST FOR SAMPLE ~l~ECTORIES
CAMDEN-SMITH,P.M. ,1979.UNPUS.DATA.A~ALYSED AT GEOCHEMISTRY ~EPT., UNIV.CAPE TO~N,CAPE TOIN.
ELLlS,J.,19~7.THE MARlEVALE GRANOP~YRE,A HETAHOHPHlC ROCK.TRANS. GEOL.Soc.s.AFR •• so:121-1bo.
..... co J::,.

liE ST RAND GROUP SHALES-(LE~(S~OkP AREA 1 1t[STERN TVL•
.JP l .JP2 .JP3 .JP 'I JP5 JPb JP7 JP8 JP9 JP I J
• • • MAJJR ELE"lENTS • • • Sl02 63e't2 bS.b7 b 1 • 91 71 • 20 'I b • 'I 3 57.23 5 9. 8 b 60.73 :,1,.$3 "5 • e 7 1102 .60 ebS .)8 • 'l.'I • 39 .73 • b 'I .62 • '15 .96 AL203 12.ae 12.9J 1 'I• B D l I .63 9.79 20• 1 B lb.OJ I 'I. '12 I 1. '13 I$. Db FE 203 1.1b I • 99 2 .s 3 l. 7 I 1.00 2.30 1. I 9 • b I ID. J 2 2. fi u FEO 'I'• 02 't. I 7 2.15 3.02 2Q.OO ).88 bobl IO. O'I 10.10 I I • 5 a HNO .01 .01 • 0 l .01 • I 'I .01 • 0 I • 0 I • 0 I • 0 I HGO s.36 5. 72 ·2 • 79 3.S't 3 • 8 I 'I• 5 b s.01 5. 2 5 3 • b I 'I. 7) CAO 2 .a 't 1 • 51 I • 't l . l. 70 I • b 'I .62 I • I b I • I I .99 .92 NA20 1 • b 'I 1.bO • 2 l 2.Sb l • I 7 I • I 7 I • I 3 .so I. 2 0 • 7 £ IC 20 loS2 I , '13 3.90 1.2a • '11 3. 71 2.1J 1.53 I • B 9 I. 8 3 P20S .oe .01 .oe .os .J9 • l 0 • I iJ • I u .us • I I H20+ 2•b2 3.22 2.79 J.89 5. 'I 'I 3.97 3 • 't b 3 • 8 3 I • 3 'I 3. 9 I _. H20- - - - - - - - - - - co CO2 I • 'IS • 2:, .10 .so obO • I 0 .5D .35 • I 0 • I 0 u, TOTAL 98020 99el9 99ol2 99.53 96.91 98.Sb 97.aJ 99o1D 9b.90 :rn.s2
• • • TRACE. ELE"IENTS • • • cs RB BA SR TH 10.0 3.00 22.0 1.00 11.0 'loOO ND 1.00 2.00 I 2 • 0 u - - - - - - - - - -ZR l3b• 130. SDb• 99.0 I 3 7. 158. I 3 D • I J 7. I 1 1 • I 6 B. HF - - - - - - - - - -NB 3o00 J.Jo 11.0 1.00 1.00 'I• 00 1.oJ s.oo 12.0 b. 'J 0 CR 87bo 1290. si..o 780. S30. 900. 935. I 12 5 • '17 8 • 11n. V l 't 3 • 123. 19.o 89.0 67.o 187• 135· IJO. t.7.o I 2 3 • SC lb.O I b • 0 bobO 12 .o I b • 0 21.0 1a.o 15.0 1 'I• 0 I 7 • 0 NI 299. 352. 20.0 20s. 21 5. 252. 258. 3 I 6 • I Ab. 232. co 'IS. 0 't 3 • 0 b • 'ID 30.0 21 • D '10• 0 36.0 32.Q 20.0 ) 2 • [J GA l 'I• 0 I 'I• 0 2 l • 0 11 • 0 I 1 • 0 21.0 19.Q lboO 1 3 • C' I 7 • G PB - - - - - - - - - -ZN ee.o aa.o 1 O't • bloO b3.0 97o0 9 8 • :l 77. 0 ~s.o 9 o. 0 cu bl•O b'l o :J 10.0 'l'I. 0 32.0 bO.O 'I b. J '12 • D 'II. 0 B:, • 0 y lboO 1e.o 1,9.0 10.0 boO'.l 20.0 1 b. '.l 1 b • J 1s.o 2 'I. J LA CE PR ND SM EU GO TB DY HO ER TM YB
87/86 I-SR

c~>n>-3noooz:zooooa~zr,,,onD •ozn,r ... v,rrr~~~----o,,.,nrrr~oN -,, I I I I I I I I I •o, ~~ ~,., ~,.,. >> rr >O v,z v,zo zm
1/'1 N "' a, J:W -N J: !.>CD J:IJCD a, Cl"l/'I . I • •• . . I I I I • . • I I I I I I I . .. • .. ... ow ... -u, ,Ui,>IJ .a:auv .,g .o..a a, a>o,o J:lfl Cl"l/'IO OCDCDIII NN
u, N -- "' ,0 a, -N J: J: ,0 1/'1 i.,a,a, Cl" ... . ' . . . . . I ' ' I . . . I I I I ' I ' ' . . . . .. ...., ....,\Jl-NCJJ -ONN J:U,,OJ: ......
J: _....,,11, .. ,1,,0 O"'U10 U,.C 1'J Ut NUl
0- ... N J: ,0 0- ... -o- a, u,-....,...,u;,~ . . . . . . ' ' I . . . ' ' ' I ' ' I '
. . • . .. J: O-N-.....,0' N,oN a,..,o-Oolfl 0 .,.,.n .. .a -0 N " VllflO _. a,....., U1 "'°"'
...., NN J: <X>- N "'a,"' z-o,. ....,.tN . ' . . . . . I ' . . . ' I ' I ' ' ' ... ...
0- lf'l--a:,..r:. ..tCJ:>l'v .00-0- lfll'vJ: 0- ..0.J:N..CCD l'vN..t V'0---0-N..C
"' "' "' ..t ,0 ...,_
CJ Cl-00 1.J.,OWNO"O" . I• . . . . I I I I• . . I I I I ·1 I I I . .. . . . V'IWN.._,,- IJI ..Z: LJ ""'°0- ..CWtr
0- uo-- ..tll" 0- ,0"' 0-00-Nlfl..t
"' -N-N 0:, u, -w ..t-U'I -~--t..10-. I . . I I I l • . . I ' ' I I I I I . . . . .. 0- t.JNNI..JuJ Owl.J ...., ,00- ,0 u,a, ..t -t..J.J:..0(..J ..t 0- -c -00.0l'vCDN
I.Tl
__ ..., ---w .,, 0- - GNl'v -.o-N-N . I • . . . . I I I I . . . I I I I I I I I . .. . . .
N o,-NN" - ....... .O\flUl.J:-N N ...,..Z:~N\J N<J..t .J:O"'O-O"'U1
..t I,)
__ ..., _..., ,-,, CD ('-1,) 0 N..to--cuu, . I • . . . . I I I I . . . I I I I I I I I . . . . . . "' ..CO,N ... C'O -co 0 C,-N0:,0.0N .,. l..wO.Z:W{t..l wa: o .z:. w-.., ..c .... "'°
"' N I,)
ex, ..t C' CD .0 wo..c-u 1 G . I . . . . . I I I I • . . I I I I I I I I . .. . . . .,. ON-a· vt -..,,o...., ~---.aw ..t ~l.JNLJ1W .,, -c "' uit..n- ....,O"'_
"" I,) --N --N
"' ..t -.c: ....,_.,, WO--OOLJ~
I • . . I I I I • . . I I I I I I I I . . . . . . w V"N"J ma "'"0 N::H.J'J)-..JvJ (") i...., \.,J t"" ....... 0- ~ (Df'\...1 -..a--N..O
• • • n
"ll
..,
z Cl .., :x
"' • • •
3nl"1r~"~nz=ma,a,~~~~~~NNN ">C>%>-=-m>>>,,,,,,~~~ ,,,,,,,,,,,,~7NV,a,~,,, •>,.,~c>,znv,Nv,.., a,~~>m:~z
rem r -o~~~a, ~ a, •
N J: .... • -NO-- .... ,0 O:,J: NN I ' CO• . I I I CJ>NNt I I • u, . ,0 1/'1. -OCI" -oo• ., .. CID J:IJJ:N • 0-CD Di.,
I • 0 0 0 0 J: "' N .... • ... wa, 0-. ,0 ..,_
N- ' I I ON•• ' I ' ' a--- I I ' ' • IJ . 1/'1 Uh a-- CCI>• NO ... a, -a., O" ,0 . ... "' ,, ..
I + 0 0 0 0 J: J:
N .... • 0- ,,.,n,., J:. ... ... N ,.._ I ' ' 0-. . . I ,. ' I 0- -0 J: ' I I ' • -0
• N fflUla>- ,OQ. .... a, ,0 -NOt..l • J: 0 "'"' ' +
0 0 0 0 J: IJ
0-. ·• -1.,10-- . . - -0,0 -o- I ' ....,N • • I ' I I 000 I I ' I • ,0 . ,0 CD•CDCD 0-0- ...., ,0 • a,...., ...... -ow ... \.J. 00
I + + 0 00 0 00 J: ... J:
"' ... IV• • u,.....,_ U•• N "'-0-N I I I -· . 01 I I I 0-.,, ..t I I I I NIJ . "' N-0 ~ • .... Cl. .... .,. 0- t..,JU, --...IN . .,ta:, ,,,.
I • 0 0 0 CJ ..t IJ
..t _..., ...., . • - ...,o,, U'IIJ o- I I • ..co. . ' I I I - .... -c I ' I I • ,0
• ..t 0-. U'IW OOIJl 0-. 00- 0-0 ..... 0 00• .Clfl
I I + + D 0 UCJ 0 Cl ;.:)Cl N ..t ...,,_,
-c "' U•• •cru.1...., . . - a,_ a, .... I I ' N• . . I I I I o....,...,, I I I .... . a, .J:....,O"_ -c ..t ..t -o "'"' ..C:-ON...., UIJ• .....
I I + • Cl 0 00 C, Cl uo N ..t ... .c
N N .c. . 0:, .... .0 ..... - ......, u,- I I I CJ. . . I I I I ..ou, ... I I I I • 0 -c"' u,"' ..t ..t -c 0-. 0- ..t
""' C"'" . C'. -c.z:
I • u CJ 0 a ..t I,)
N .&. • • -N..C "-0
I I f -N• . I I I I UW.&. I I I I . . .&. • .,,..., .cu- ..tN ...,...., .tJ..t....,O ... ...., . ::;;JIJl I • +
a UC> u uu "' WW
cr> "' N
"" . • -1.,,.1....i 0-. u, ....,.., 1,JN I I I _,.,,,. .. I I I I wu•c, I I I I . ..t W• ON I,) ..... "' . \!I l,,J I.JO 0-- tn . NO' ........
I I + 0 0 0 ::;;J a C)
N ..t ..,
98L ·
L "I
(.. , N
• L ,., ,
"' "' .. .., > z 0
" :.u • L 0 , C
• J: , • V,
% ,., > r r ,., r, ..s \II ,.,
' ~ L " ... "ll r "'
,.., .,, .,, > " .. "' 0 0 0 1,/1 :.u
"IJ
• L ,.
• "IJ "' 0- ,., • >
"' ,., I}\ .. ,., ;n
L z "IJ ... ...
< r
L "IJ CD
L u
-c
L l)
u
'"*4Jk, ',

.DIR
SAMPLE•
JP l JP2 JP3 JP'f JPS JPI. JP7 JPS JP9 JP I 0
DATABASE •
D 0 0 0 D D 0 D 0 0
• • • SAMPLE DIRECTORY • • •
ROCK TYPE
1A l A 1 A l A l A I A 1 A lA 1 A I A
LOCAL ITV
ANoAM.CORP.60REHOLEJY8-NEAR KL~RKSDORP, DATU~ I.IH BELO# JPl JY8BOREHOLE
'f'f2HETRES BELO* JP1-JY8B0REHOLE 'f72METRES BELO* JPl-JYBBOREHOLE 8S'f~ETRES BELOt JPl-JYBBOREHOLE
lO'fJMETR~S 3ELON JPl-JYBBOREHOLE ll2BMETRES BELOA JPI-JY8BOREHOLE 1211METRES BELO• JPl-JYBBOREHOLE l593HETRES BELO• JPl-JYoBOREHOLE lblbHETRES BELO~ JPl-JYBBPREHOLE
10 SAMPLES IN THIS DIRECTORY
REFEREN:E -, ' 2 2 2 2 2 2 2 2 2
...... 00 ~

REFERENCES
2A
28
REFERENCE LIST FOH SAMPLE DIRECTORIES
DANCHIN,R.V.,1970.ASPECTS Of THE GEOC~E~ISTRY Of SOME SELECTED SOUTH AFRICAij FINE GRAINED SEDIHENTS.U~PUB.PHoDoTHESIS,UNIV.CAPE TONN, CAPE TO*N,215PP.
HOFMEYRtP.K.,1971.THE ABUNDANCES A~D DISTRIBUTION Of SOME TRACE ELEMENTS IN SO~E SEL[CTE~ SOUTH AF~ICAN SHALES.UNPUB.PH.O.THESISt UNIV.CAPE TOWN,CAPE TO•N,218PP•
• - =
...... co co
I

~,
HST RAND GROUP SEDl~ENTS-~ARl(VALE, EASTERN TRANSVAAL.
UG/01 UG/02 UG/03 UG/O'f UG/05 UGI Ob UG /0 7 UG /:)8 UG/09 UGI I Cl
• • • MAJOR ELEMENTS • • • 5102 b8ol8 7 1 • 'f 1 bboJD b Z • 9 'I 7 5. 7 'f 7 7. '17 67.QJ 9 'I• 'f 9 73.25 b7.7) TI02 .77 .Sb 066 .62 • '16 .JO 1 • 5 3 • 07 .55 • 8 7 AL203 11.2s 12.99 l2o9B 1 3 • 'f 1 1 ::J • 2 B 8. b'f 1 2 • 1 9 3. 7 El 1 I. 39 10.03 FE203 'f. ss 1.12 11 .1 S 12.51 )o92 3 • 1 1 B • I 8 .69 5.79 6. 9 'I FEO - - - - - - - - - -MNO .O'f .05 009 • I 1 .as • I 0 oJ7 • 0 I • O'I .01 MGO Jo98 2ob3 'I. 0 S s.06 3o58 3. 1 9 3.95 • 3 7 3 .so b .)3 CAO .os • 0 'I .oa • 09 ,; 93 2. 1 0 .03 .oz •07 .t.O NA20 .20 • 10 .a, .os .09 .01 • I I .Ob .JS • 0 1 K 20 'I .1 3 2.39 1 • Sb lo26 lo89 I. 6 1 2o26 1 .o ::J 2. 3 'I I• DI P205 006 • OJ .ot. 006 .05 .03 • 0 'I .o 1 .os • IO H20+ Jo2b 3 • 'f 6 3o90 'f • 37 3.75 '1.33 'I• 7 9 .so 3o30 'I• 9 9 H20- • 1 I .29 • 1 a • 1 1 • OB • 0'1 .05 • 0 'I .JS • .J 7 ->
CO2 - - - - - - - - - - (X)
TOTAL 100.se 101.01 101.00 100059 1 DJ .as 100.99 100.19 101 • 3 'I 100068 1 J'J ol,; I.O
I • • • TRACE ELE14ENTS • • • cs RB I 31 • 1b.O 5 1. 0 'to.a b5o0 S'I. 0 79.0 31 • 0 83.0 39.Q BA - - - - - - - - - -SR 30.0 16·0 11 • 0 . Io .o 26.0 37.0 18 • 0 1.00 9. iJO I 5 • D TH u ZR 122. 11 S. I 32 • I 'IO. 21 2 • 1050 I I 1 7 • 'I 'f. 0 1 B 3. 3 :,3. HF - - - - - - - - - -NB a.Jo 7oOJ s.oo a.oo boOO 3.00 22.) - 7.30 1 J • J CR 1059. 660• 776• 559. '15 b • 'I 75. 3762. 67•0 IO B 'I• .aoz. V l6B • 125. 1 '12 • 78.Q bb.O '18 • 0 130. 11 • 0 105. 1 3 •t. SC - - - - \ - - - - - -NI 23bo 3 B 'I• 'IO 9 • '115. 196 • I 'ID. 'I 't 9. 26.0 359. 570. co 29o0 S't • 0 56.0 31 .o 30.0 23o0 89.J b • 00 31.0 S 8 • C GA. - - - - - - - ,. PB - - - - - - - -ZN 11.0 100. 1 39 • I 'f 'f • 77. 0 6)00 I 8 3 • 33.D IO I • I 3 'I. cu 'f 60 0 B5•0 11.0 6'f. 0 $600 3 'lo 0 I 8 ::J. 9 • O::J 30.0 I 3 3. y 20.0 1 7 • 0 22.0 21 • 0 1 3. 0 1 l • D )7.J s.oo 1 7. 0 ZboO LA CE PR ND SH EU GD TB ·Dv HO ER TH YB
87/86 I-SR

o~
>n
>-z
no
oo
%%
%C
oo
oa~
zr~
,,o
nc
•o
zn
,r~
Vlr
rr~
~~
----o
,~n
rrrzo
N
-,,
I I
I I
I I
I I
I •o
,
~~ ~~ ~~•
>>
rr
>O
V
IZ
VIZ
O
z~
.... ..
.,_
.&
.&
.& J
: ..
. -.a
:Nm
.. I
I •
• I
I I
I I
I . .
I I I
I I
I I
I . •
• ..
... co
,0
,0
O
"f/"
J:
.S:N
0
-,0
,0
"'"'
. .Q
...
,_ u
,o-
... __
..,. N
0
-0-
.&O
....
. I •
. • I
I
I I
I I
• . I
I I
I I
I I
I •
• . • .
. ...
N
o-
"'"'
Oc»
O>
_N
....
, ....
,0
.... -
..,.
II'
O
U'U
lN.C
?-
0-
_.,,
.., co
.., ..
.... . I
• I
• . I
I I
I I . .
I I
I I
I I
I . . .
• . .
0-
CD
00
O
tJ'I
O-N
-m
,0
N
.c
..0
..0 ,
0
O.O
ON
"'I
II
111
-1
1'
CD
NN
...
.... o
. I
• I
• . I
I I
I I
I • . I
I I
I I
I I
I • . • •
. .
.c
_...,
0-
0-
0.J
:.J:J
:.O
N
I.I
J:
J:
00
IJ
'NC
DIJ
'.&
0-
.... CD
0
-N
.J
:. <
I' CD
.&
V
l-0
-C
l . I
•
I • . I
I I
I I
I • . I
I
I I
I I
I I . .
.. . .
.... ""
"".0
...
..,...
.,o-u
ia:i
w
N
.......
NN
.O
O-I
J'
.... "1
0
.... .0
0-
.I!
........
0 0
-D
W-
. I •
. . I
I I
I I
I . .
I I
I I
I I
I . .
. . . .
CD
II
' O
N
,()
.0
Nll'C
DU
'O ..
.. .&
N
...,
_ J:
J:
N..
O--
..C
:l.,
.J
0-
lfl
0-
,0 ,
D
w.o
-. I
I I . .
I I
I I
I I
• . I
I I
I I
I I
I I' . . .
. o
-CD
u,
.CJ
.,g
\,.,
,HJl
(t'l
U'l
fl
J:.
.,
\.o
.lw
JUIU
lN
,()
"' 11
" 0
-ll
'N..
O
. I •
I • . I
I I
I I
I . .
I I
I I
I I
I I . .
. . . .
N
00
,(
) .0
O
lJ'l
lf\,
Dll
' ...
. 0
-0
-"'"
' N
N
w-~
-..o
u,
.... U
' N
J:
"".0
..
. <
l' a
, . I
' Io
. I
I I
I I
I . .
I I
I I
I I
I I
o . .
u•
.,.
-o
..
, .J
: o.
.c..c
a>...
..ic.
..i
:1'
J:
N,D
0
-0
-N
N..
::~
"W
"' ..,
u•
..., .,..
"'"'
N
NIJ
ltl>
l,,,
,.I
. I •
I ' . I
I I
I I
I ' . I
I I
I I
I I
I • . ..
. .
..r:
.., N
-.....
... I.
JS
) .c
..0
0\.
.>
"' ""
..C
l/'
c,-c
,-"'-
J(n
_..
.,..
...,
....
,
• • • n ,, . • z 0 ::0
JC
IJ1 • • ..
xn
~r~
~~
nZ
ZID
CD
~~
~~
~~
~N
NN
">
C>
%>
-z-C
D>
>>
''''''zz~
,,
,,,,
,,,,
,,~
ZN
Vlm
~,,
, •>
l"l~
c>
,zn
VIN
Vl~
m
zz>
m%
~Z
re
m
r -o
~~
~C
D
~
m
•
"' -.&
-· .,
. .&
CD
.&
. ......
"'
o--
...
,o I
I
I I
...,
• •
• I
.... N
CD
-t0
-1
. "'
11
1-
• •-w
..
..u,
-.z:
. N
-·
. -0
-'4
.& .
...
.CO
--•
w
ON
I
+ +
+
0
co
0
0 0
0
0
"' ·W
IJ
"' .,
: -N
-· N
-...
.,.=
. . -
· N
c--
I I
I '
U'I
• • . I
f -0
:t ..
... N
0-
I •
0-
0,"
' . ....
_ ....
0-i.
,i.,
.&
.....
• U
l O
"N.,
_U
" .._
,,_c.
u 0
-J:
I +
+
+
0
00
0
0 0
0
0 ....
.......
"' CD
...
--...... ~
Ul.
,0
.
N
o--
-w
I
I I
lfl.
. .
a,
""' m
-11
11
• 0
-C
D-
. ,ow 0
--o-
· ..... .&
O
•
. 0--o
o..
£:
. ..,_ .
... O
U'
I +
+
0
0 0
0 0
0 w
w
....
..0
--·
---~
..c •
...
, •
N
«>--
-o
I I
1 .,c
•
....,
• '4
>W
J:0
I
0-
I ....
. 0
-u
, •
t.,,
.,•
0 O
:,Q
e~
0
-o
. 0-N
U,J
:0
• ...
.., .
...,
O" .
....
Ul
I •
+
0 0
0 0
0 0
.., ....
.... _..
.., -·
-N
O'N
. .
.......
N
-1
.1
o-,
I I
N• . .
I I
ucr-
~u
I
J:
..,..,,
...,
N
. -"NI.
I'
~-·
c.,..t
..
. "' 1
1-1
11
00
O
"UtO
• -w
•
+
00
0
0
WW
_..,
-wc,-
-. .
-w
N
a,..,
C
WI
I I
I W
• . .
I I
I -.C
NO
"
J:
I •
11'
O-N
. W
O.I
: -u
i ..
... -
CD
.....
. CD ...
. -0
..()
O"
.,t:
U'l ••
U'O
•
+
co
0
0
WI.
.>
... -· U
'CD
lfl.
C
U,Q
-•
N
WIT
' ·-W
I
I I
No
. .
I I 1
ou
•o-u
I W
I u
o
.......
. ... o
w
...., .
.....
..c
.... . .
. ... U
l"1
)..C
: ..0
. .
"'"'
NU
>
I •
0 C
l 0
Cl
w
..,
.... ..
ON
..t.
.t
N
CD
I I
I I . .
. . I I
I 0
-I
w-
I U
-I . I
NI.
.>
0-lf
'WJ:
0-
,()C
l)
a,
CD
. ..., N
CD
f.J\
...I
u
. .,. C
l I
+
+
u u
u C
l C
l C
l w
w
...
"' _..
., N
_
...,
.0
..0
N
-N
O
N
I I
I I
u,o
. .
I I ,
-.....
o-
I I..
> O
D"
..., ...,
• l.
) '°'
N
..c. "
t. ..
. u,
J:
.. •
N
-N
ON
t.
Jl.
11
• co
C
D-
I ••
+
C
l u
o
Q
a u
o
0 ...
......
.....
U>
-v
J..
ON
~
[X
)N
V,
N
_..,
00
I
I I
I N
e . .
I I
I N
I.J
~V
l I -,
1..>u•
""""
. a:HJ>
O'"
"'(
D
• .0
U
' . "'
00
1..
>0
. .
CI•• ... ..
. I Cl
Q
N
06
l
C " ... 0 C " ... 0 N
• C
"'
" U
l ....
~
0 .... A
l > z C
C\
.ti
• C
0
C\
C
• ...
,, 0
• J:
Ul "'
,.., C
r ,..,
JC
JC
,.., ,..,
z z
C.
.. .. G
l I.
fl
.... I
..., 0
... >
u
>
.. ::0
0 ,..,
IJ'
C >
• r
C
,.., •
Ci' ....
.. 0
..., 0
->
I.
fl .... ('
1
::0 z
C
... C
\ ;;o
....
>
0 z
.... I.
fl
C >
>
r
C
C\ .... Cl
CD
C
C\ .... Cl "" C
O• .... 0

HST RAND GROUP SEDl~ENTS- .. ~RIE\/ALE, ~ASTER'II TiHNS\/AAL.
UC/01 UC/02 UA/01 UA/02 JA/03 ur.lO'i
• • • MAJ)R ELE .. UHS 9 • 9
5102 62.77 60 .10 S'loB7 S7o72 b 3. 'i b bb.SO TI02 .10 • 72 • 66 • 60 .bb • 51 Al203 l 'i • 7 S lS.37 1 S. • 09 13. O'i I 'I. 70 9.97 FE203 l l •:. 0 11089 21 • 11 19.08 13.37 s.30 FEO - - - - - -MNO 009 • 1 0 009 • I 1 .00 • l l MGO 'i ~50 S.98 3.22 'i ~ 'i 2 5. 22 s.09 CAO • l 1 .Ob .29 .O'i • I c; 'I• 8 8 NA20 .09 .oa • 0 'I .02 • 08 .01:, K 20 1•78 1.13 • 7 'I .29 2.00 I • 2 'l P205 .09 • 0 'I • 2 l .as • 05 • 0 'I H20• 't.28 ... 93 'i • 39 'i • 8 2 ... 37 7.)b ..... H20- ol9 .2s • 01 • 30 • I 3 .20 I.O CO2 - - - - - - ..... TOTAL 100.0s 101.33· 100.10 100o'i9 101.21 IO 1 • 3'l
• • • TRACE ELEMENTS • • • cs - - - - - -RB se.o 57.0 23.0 1 I • 0 10.a 't'I. 0 BA - - - - - -SR 1s.o ll•O 9.00 s.oo I b. O 'i8 • 0 TH u ZR t 33 • 90•0 l '13 • 120. ls l. 1s2. Hf - - - - - -NB 9.00 9.00 10.0 9.00 e.oo b.OO CR 998. 933. 8 2'1 o 71:,9. 8 O't, BS3. V 1S9• 173. 173. 129 • I 3 7. ea.a SC - - - - - -NI 31»3 • 391. 30'1 • 313· 2 9 'I. 279. co 'Ibo 0 'i 7 • 0 5'1. 0 'i7 .o 't 3. 0 )9.0 GA PB ZN I 22 • I 'i 2. I 22. 117. ll 7. 0 01.0 cu '19.0 35.0 '17. 0 30.0 s1.n bb•O y 18.0 10.0 29.0 10.0 19.0 10.0 LA CE PR ND SM EU GD TB DY HO .: ER TM YB
87/86 I-SR

o~
>n
>-sn
oo
ox
xx
oo
oo
a~
zr,,
,on
D
•o
zn
,r ...
v,r
rr~
~~
----o
,~n
rrr~
oN
-.
....
...
I I
I I
I I
I I
I •o
, ~~ ~~ ~~•
>>
rr
>0
1/
lZ
1/lZ
O
ZCD
O'
--..c:
o.
ON
CD
• I
I I • . I
I I
I I
I . •
I I
I I
I I
I I
I • ...
. C
N
-N
N
...
.... U
" o-
....a
Q,O
0
-0
-N
CD
W
u,
--..c:
u,
II'.
..
t..t
ow
..c:
. I •
. .
I I I
I ' I
. . I I
I ' I
I I
I . .
.. ..
0 0
ON
CD
CD
0
0" "
""N
"-'
-....
,0
,a,-
,0 ,
0
·i;i
>-N
U"
....
.,
u,
-..c
: 0
-CD
CD
..t
..to
-. I . I
• . I
I I
I I
I . .
I ' I
I I
I I
I . . .
. . .
0-
..t
.,,_
00
0
1.,
,J.C
.\.w
l\h
O
,0
0-
0.0
N
N
... ~
-...
.,o
m
u,
_.,.
-N
.O
. I I
• . I
I I
I I . .
I I
I I
I I
I I
I • . . .
. ..
ON
0
0
--
..... o
--..o
,0
..
..i.
.t
...,....,_
"°_
u,
... --
..c:
,0
CD
..., ...
__
N.._
, . I •
' . . I
I ' I
' ' . .
' I I
I I
I ' I
• . . .
.. u
, u
b
.Z:O
"'U
Q)N
~
CD
u,
.....
00
N
CD
.ON
U,C
D
u,
,0
N
N
..t
.... N
N
... .....
...,
. I . '
. . I
' I. I
I
I . .
I ' I I
I I
I I
• . .
. I •
..t
a,
0"'
0-
0-
....,..,
,...,LJ
0
-0
-....
,0 .
.t
CD C
D ..
..,_
-4>
\..J
N
• • * n ., • .. z 0 ;iu
s.
Vl • .. *
sn
~r ..
. ~ ..
. nZ
:>O
CD
CD
CD
~~
~~
~~
NN
N
~>
C>
%>
-:io
-CD
>>
> ...
......
......
......
... ,o
,o,o
...
......
......
......
... ,,,
,,,~
zN
V,C
D:>
0 ...
. ,,
•>
~~
c>
,zn
v,N
V,,
0
CD
:l0:
>0>
CD
%~Z
rc
CD
r
-o~
,o,o
~
~
CD
• - -· -N
....
4..tJ
a,•
...
..a
... --
-o
,
I I
I 0
_.
• •
I I
NO
--C
D I
II
' ,
.. .
.t
... c
•
.. C
DC
D
-~-"'
U'
.... •
0-
"""'"°
.., •
N
• •
.OC
D
I •
0 0
0 0
... ...
II'
..--· -
·-· N
NC
D..
t .., .
-· ... -
_ ... ,
I I
'.z: •
• . I
I I
'4> v
, o-
, ...
I
u,
•0
..
. O
' . ....
.....
'CD
.00
0
... 0
•
. ..,
....
,-O
Na
>
~ 0
-.
11'
co
I
• •
0 0
0 0
0 0
... ...
... N
-· ..
C:N
U,N
N
O"
...C
O'"
N
.,._
u
, u
, I
I I
I • . . .
I I
, --w
a,
I 0
-•
..t
CD ,
o
... ..
,.,.
u,
N~
•...
, ..,
"'·
.... N
-1
,JO
-. .
O•
......
I 0 0 ... ..c: -·
-NO
'-N
-N
-· ...
.., ...
..,_, I
1 '
0-
•• . I
I I
I.JO
-C
Da>
·-. .,. .....
.. . ..t
o-"
' ..c
....a
. -
,0 -·
. ,0 II
' 0
-0
-0
. .
CD
• _...
, I 0 0 ...
... -·
-N
o-~
"'.
-· "
' ...,
_ _.
.,, I
I I
CD
• • . I
I l"
""O
-U
I
... ' •
a,
.......
. .... CD
...
.z.
:....,
CJ
\,J
....
.O•
. ..,
-i-.
.ca
>
•U
'•Q
)
v,,
o
I •
+
0 0
0 0
0 0
N
... ...
-· _"'
""...,.
IJ'lo
0
-"'
N
CD
N
0 0
-I
I I "•
• ,0
I
I ,.
..,
...
....
,_
11
.J
• u
, 0
-0
-•o
--
N-•
.Z:
..c:
.t•
. 0 u
,c,-
u,
....
. 0-...
.::w
• 0 0 ...
C n .... 0 C n .... 0 N
• C
...,
>
"' ....
... 0
;u
> z 0 " ,0
• C
0
>
-c
• ....
, 0
* N
"' ...,
..., 0
r ..., s
s.
f'l
..., z
;£
C.
... ...
>
Vl
.... I
..u
r~
s.
>
.., >
...
,0
0 ...,
Vl
<
>
.. r
C
..., ..
,. .... *
0 ...,
.t
>
u, .... ..., ;;o
z ... ;;o
> z Vl
< ,. .. r

•DIR
• • • SAMPLE ::>J~ECTORY • ' • SAMPLE • DATABASE II ROCIC TYPE . LOCALITY REFEREt.lCE
UG/01 0 A Oo05M BELO# BASE OF M.R.Q. 11 UG/02 0 A 0 • 3 '114 BE LO« BA SE. OF M.R.Q. 11 UG/03 0 A 3.3914 BELON BASE OF 11.R.Q. 11 UGl'o'I 0 A 7.b9M BELO# BASE OF M.R.Q. I I UG/05 0 A l 'f • 2 M BEL :'.IN BA SE OF M.R.Q. 11 UG/06 0 A 1 'f • 9 M BELO# BA SE OF M.R.Q. 11 UG/07 0 A 2bobH SELOI BASE OF M.R.Q. 11 UG/08 0 A 2bo9M BEL:'.IW BASE OF M.R.Q. 11 UG/09 0 A 27obH BELJ# BASE OF M.R.Qo 11 UG/10 0 A 28oSM BELO# BASE OF M.R.Q. 11 UC/01 0 A OoB5M BEL:># SASE OF M.R.Q. 11 UC/02 0 A 'lo9BM BELOIII BASE OF H.R.Q. 11 UA/01 0 A OoOOM SE.LO# BASE OF M.R.Q. 1 I UA/02 0 A 2.0QM BELO# BASE OF M.R.Q. 1 I UA/03 0 A 8 • I OH BELO.W BA SE OF M.R.Q. I I UA/0'1 0 A 15.JH BEL0>1 BASE OF H.R.Q. 11 .....
I..O w
'6 SAMPLES IN THIS DIHCTORY
.,
-

REFERENCES
REFERENCE LIST FOR SAMPLE DIRECTORl[S
1 I SPRAGUE,A.R.G.,J979,UNPUB. DATA. ANALYSED AT GEOCHEM. DEPT., UNIV• CAPE TO#~. .
' '
_. \.0 .i,.

-m
~~
"1:C
O~
~,.
.,v
,z-a
nr~
nN
-ac:
,nz1
11
cnz:
cNc~
11
1m
»n
,..
., m
z»
o~
mo
czo
»"1
>
czm
>o
-n
»m"'
I»
:»>
m11
1 11
1,
>Dllt
•
I I
I I
I I
I I
I I
I I
I I
I I
I I
I I
I I
I I
I I
I I
I I
I I
I I
I I
I I
·1
I I
' I
' ' I
I I
I ' I
' ' '
'
I I
I I
I I
I I
I I
I I
I '
I I
I I
I I
I I
' I I
I I
I
I I
I I
I I
I I
I I
I I
I I
I I
I I
I I
I I
I I
I I
I I
I I
I I
I I
I I
I I
I
' I '
I I
I I
I I
I I
I I
I I
I I
-i.,-
O,.
U,N
... -~
U
\_.N
tJ
NN
.C
I 0
,,0
'-,t
N-•
i., I•
....
....
....
1.
•o
•
• ..,,.
....
_.,u,
J
: -o
• .o
• o
• •
0 -N
.C
-.C
U1
N--\/
1
I O
a>
N
I ,o
...,
a,a
,o-o
1
0
• •
0 •
O• ..
o-w
....
.., "'.
N• O
•
• u
N.l
:-0
V
lUlN
__
....,
..,
I -N
O-
o,.
....
,a,-
..1
0,.
, I
.r:
. . .
• N
e
..0
.&:N
i.
,..O
O
-· C
o
• u
0-
N lf
l a
, ""
"L1
1i.
-J-N
..0
I
.., ..
.. .r:
1
1-'lfl
O-O
-N
I
U1
I . . .
. 0)-e
..
. u,
•
I-'
ui-o
.c
., 0
•
• 0
..--a
: 0
>0
-1
,.,J
N-
.c,
' ON
.r:
' I '-
"-0
'-N
....
,•
I'-
' I
. ..c•
• O
•
CD
OW
,0
O•
0 a,.
O
• . 0
N.C
...
"-
'IJ1
"'-'
"->
-...
J I
v, V
l"
J V
"O"
NO
O--
• .C
I ..
. . -.
--o ..,
NC
)O
"'.
o•
• 0
Nl'1
-...
_,O
"'N
--a-
NI.
JN
I
I ..
CN
CC
-0..
.,,
I ••
-C
•..
O•N
(X
)"
-N
•
N•O
••U
.. N
..C
-..
cv,.
...,
--.,
o
I N
U'N
I
I 0
""0
-..
g~
N•
I IV
I
. . -
. .., . l.>.L:
N
L,,....,
•
a,.
0
• . u
wro
-..
..,l
f\t.
JN
l,,.
I-,
o..
r:-
I I
IJ'l"\J
'IN
N-
I .C
I •
Cl.
<
-'.C
• V
' O
N•
-· 0
• . 0
0-.J
:N--O
U>
·-~-,
I O
" O
'-..._
, O"'"
• I"' I
. 0
0-
. 0-•
CJJO
.r:
,0
.....
''"
CH
. 0
..0
. (I).
-~
·
Ill
IJN
N.C
. 01
11
-0 I
O
•
a,
• U
lGJ•C
D
u,...
.., .c
...,
• W
-0
""'
-· a,.
..
..,.
c,o
-
D" .
.. I
-' ,
0
. 1/1,0
0,f
N
•
,0
.
..0
(I)
....
..
-C .
.g U
l "°
. Ut
Oa>
,0
. lf
l.
.co
. 0
"CD
.Z:
-•
\,J .
....
-
-•
WO
--m
• .
-1:N
NO
-
• a:
, ,(
)...
, '
tJ'1
• C
D•
Ot.
J •
v
,
~P
\JN
O--
. ~..OL
.w
I ,0
.
,0 •
l.> "
'.
0-
er, ~
v,-
. • ...
...,~
I
-· ,0
V'
.r:
0-
• .
0,.
1.o
,.tl
}'I
-
. C1
'-t.
n-1
'.'O
•
NN
..c
"'. .
• • • ~
;o
>
n ,.., ,.., r ,.., 3 r, z ~
1/1 • • ..
~n
:c :c
"D:l
't z
nz 3
"'1"'1
>~11
1 O
ON
NN
N>
>c:>
z=
r-
~N
OO
OO
NO
OO
ON
NO
O
>
I •1
11
0 O
ON
N
r ....
,....,
,0
,0
u,
.... •
• •
I • •
.. I
• o
-,-.
,-m
c(l
)ou
,c ..
. o
ON
...,
J:e
>-m
oO
J:V
'D"
,0
,0
.... ....
• I . . .
• • . I
0
...,
NW
O"-O
WO
-o--
u,.
.ao
.c .
.go
..o
o.c
.c
,0 ..,
D"
N
0-
. . . •
.. . .
. . V
"N"'
"'O
"--o
-oU
l--N
..C
UlO
c;J
> "
..c;,
a>
N
.0
0 U1
N
U1
. •
• . .
• • . . .
1
.iN
-..o
ou
,.r:-.r:o
O
J:
.r:,
o,o
-..
OJ:l
fl.C
,0
,0
lfl
.... .r
: . .
. • . .
. . . .
O'-
NN
Cli
-~
O'-
N0
--0
0
::,.
.00
0-.
.C0
,,.1
,.,J
-NL
J
,0
,0
c,-
.... .r:
. .
. . . .
. . . .
m
NN
-o
ou
i-..o
o
.c.o
-..c
o..
o-w
'-'.
...,
LJ
a 0 ...
.... ..
....
....
O
N\.
.J..
CO
C:,
--..
t:O
o
o,.
o,,
,Q)c
,...
.a..
.,-w
o-
,0
,0
... ...
. . . .
. . . •
. . l.
,.J"
'NW
O-.
.,--
....
ao
-.Z
f\J
(..
JW
O.Z
:.N
lJlf
fl
D
0 U
l .r
: .r
: . .
. . . .
. . . .
N
N
NtrO
-\.
.JC
0:0
oo
w..
o...
.,-w
../J
wi.
..,
u cJ
c,-
"' .c
, . .
. . .
. lf
lN-l/
10
a:>
V1
U,0
Cl
o-~ ,..J
er
...., w
c,
o-er.
er
S6~
\fl
,0"'
,0
I •
• I
O
..,U
"'U
-1~
..
.. .
... lf
l,O
U1
N
....
0
I • . I I
a,
a, o
-a,
u,-
"'"'
" U1
,0"'
.r:
I • . ..
a,u
,o--
0-N
oa
>
lfl
.... .
a ...
I •
• ..
uim
mo
..
co
--o
N
lfl
0-N
.r
:
' . . ..
.CO
-,Q
N
_..
..,N
..C
"' lf
l ...,
_ lf
l . .
. . -w
cx
,-\.
) ....
.. lT
't.J
lfl
-,0
C
, I
• •
• •
\J N
..
..,a
, "N
·N
"
lfl
oa,
I • . .
. a,
,0 -
..o
....
..,~
IJl.
.0
"' lf
l
0-"'
.r
: . .
. .
t..J
-0-0
0
..a .
0 u
, ..0
lfl
0-
-0
... I
• . .
. C
DC
, ..
.,i-
0
-o
-cr
C
;o
J:
0 .r: "' ,0 I N
.r:
I-'
,0
I \.I
• 0
-
. • lf
l I
• ...
3 n
>
,.., c..
z
0 ...
;o
;o
0-
,,. ,..,
r r
U•
,.., I
;o
.s.
a,
,,. ,..,
z z.
0
... Vl
G'I
:::,
.. 0
0-
C
.. "l>
U
1 ..
I ,0 ... l.>
0 I V, ..... ... 0 I 11
' <
u,
c- I lfl
CT'

o~
>n
>-x
no
oo
::x
oo
oo
a~
zr,,
,on
D
•o
zn
,r-<
ll"rrr~
~~
----o
,rrin
rrr~
oN
-..
....
I
I I
I I
I I
I I
•O"O
~~
~rri
~
rri•
>
>
rr
>o
~
z
~zo
za,
II"
---.
c
-.....
. ll"N
II"
• I
·I • ..
I I
I I
I I
• •
I I
I ' I
I ' I
, .. • . ..
J:
..,_..,
II"
u,
...,
...,
NU
\~
II"
"'.c
.c
"'"'
...
C,-
0 .
.. ,0
J:
-1.1
N
,0
,0
-.,
i,,i
.,
. I ' I . •
I '
I ' '
I • . I
' I I ' '
' I
I • . • .
. .c
-1
.1
00
-.
, -.
,C,,
N,O
...
mo
.....
. o
,c,-
a,u
,a,
.c
--w
,0
"'"'
--N
U"V
l . I
I I . .
I I
I I
I I' . I
I I
I I
I l·
I . ..
... _..
, .....
. J:.
CN
,0.C
11
1 "'"
' ,0
,0
.Z
:...
C..
0..
0N
u,
--"'
111
"'"'
.z. .
c .c
0-
...
. I . •
. I I
I I
I I
• . I
I I
I I
I I
I I
• . . .
. .c
O
NO
V
III'
--
c.,
w.i
::
0 .c
--D
.....
. 1
11
11
1'-
'J:N
u,
...,_..
, ""
VlU
"U..
_,C
l . I
I . .
. ' I I
I I
I • . I
I I
I I
I I
I I . . .
. . N
o
wo
lf
'I./
' ...
., I.
J .c
(l)
..c
... ll
' ...
0-
l,JL
,JU
,,O
U,
I.I'
__ ...,
1,/1
N
N
..c ..
c....,
•••,H
,.J
. I . .
. I I
I I
I I
' . I
I I
I I
I I
I I . .
. ..
... O
NO
.....
. ..
C..
C..
..aN
-,0
N
-o
-CX
>CX>
ex
, a>
.O .
CN
.::
__ ...,
.c
a,
ex,
---o--
. I I . .
. I I
I I
I I
' . I
I I ' I
I I
I . . .
.. o
--
""''
.CJ:0
,0 ..
. J:
-,0
'-'
OU
..C
:: ..
Cl,
JIN
U,
.::
__ ...,
'-'
-0 -
0
--O
O--N
. I
I . .
. I I
I I
I I
• . I
I
I I
I I
I I
I . .
. . .
.::
o--
...,...,
--oc
:o,..
_,
ll'
... -
c ....
. O
D
CD a
:> U
" '"
"'""
ll'
N-N
.,.
NN
N
rv.t
oo
..o
. I
I I
• . I
I I
I I
I ' . I
I I
I I
I I
I . ..
. .
... -o
O
D
""'"
'NO
N
N
o-c
,,
......
-o-c
-oo
.r.
.r.
l'J
N
--"'
.... "'
NN
~
U,O
"' ..
.c O
"' . I
' . .
. I I
I I
I I
' . I
I I
I I
I I
I ' . .
. . .
... -<
JV
'--
.,.
0-
C,N
O..
..,-
:DL
J
O"
lf"
......
" _
0\.
11
.Jr,
.JN
C,-
.
* • • n .,, ... z 0 "' .:s 1/l
• • •
' x
nrr
ir-<
~~
nz~
mm
m~
~~
~~
~N
NN
~
>C
>X
>-~
-a>
>>
> ..
......
......
.... ~~~
......
......
......
......
, ...
, ...
~Z
Nll
"m~
.....
....
a>
rri~
c>
-ozn
ll"N
~~
m
~.u
>m
x~
z
rem
r
-o~
~~
m
~
m
•
O> -·
.,.N
-..
,-N
-C
DO
"'•
tJ
'l•N
N
-N
O
NI
I I
N•
• ••O
"•O
O-..
CN
~N
_..
, g
>,G
•
Nu
, CD
O
• U
'I .Z
. N
•
Q
• u
, ..
·-v-
om..
i...
,o.1
1"•
I.J.a
• w
• -""
I
+
0 0
0 0
N
... ...
... -·
..O
N-N
N-U
'l\l
'I• -U
'l..
tN
"'"'
-11
1
I I
I . . -
. • N .
. -c
o---
•O
0
...
c,o,
o,
w>.
.z:•
-o--
w-.
.o,
.....
-· . "'
N.C
'1"'
..O
N.I
: C
D•
"" . • O
> •
o-
I +
0
0 0
0
"' ...
"' N
-· C
DN
-N.Z
:..-
lllC
D•
-U
1~
N
.z.-
OU
' I
I I . • 0
.
• N
• -
wm
-N
N
.... ,o
u•
NO
•
WW
•
N.,
..0
1.J
""'•
W
J
:•
......
.Z.W
NN
-N
C,,
.• a
,. ....
. ..
c-
I •
0 0
0 0
... ...
,0 -·
_N
....
,_N
ll'.
Z:C
CN
-N
V,N
o
--0
11
1
I I
I IN
•
• . . .
. IJ'
INW
....
.aN
-• •
a,-
• -c
,,1
,.1
0,N
OO
O-V
-11
1• -
NC
,,
• N
~ m
cc-o
-.z:
. • . .
• N
•
J:V
-I 0 CJ ...
N
-· ..
g-~
-v,,
iv,u
,..o
, N
t.J\J
IN
.c
-O
N
I I
I . .
. . . .
•V
l.0
00
~..0
1
• J:
a,
U1
0..
0N
OO
-tJ-
.....
WO
-N•
... O
-•
. 0 \.
JN
C)I
.JW
NU
1• -·
• ,0
•
..C
N
I +
C
J 0
0 C
J N
...
a,
... -·
_..
...,
....
,_l.
JV
,.1
:..0
• -N
U"'N
ll
'N
ON
I
I I
I i.
, • . ..
. . ,-O
U,~
..O
N-
• 0
,0 C
J •
0 .Z
:l.J
I.JO
--O
N••
•H-"
tD•
.,. c,,
. •
ex,
o-.
.,o
-m-~
,.o
, O
•
• ex
, •
c,,.
c I
• C
J 0
0 0
... ...
... N
-'·
--O
)N
N _
_
....
.,,
-V"IJ
'IN
u
,-o
... ,
I
I ' N
•. . . o
, 0
WW
ll1
NW
I ....
,ON
•
m.c
wo
,,,
.c:r
v-o
ao
• C
J -·
. N ..
C-.
.J c
c..
o-o
---.
.... . -·
0
-0
I
+
CJ
0 0
u ...
... ex
, -· -N
-N
N-.C
O"-•
-t.
n..
CN
u
,-O
U'
I I
I I
N• N
• . -
. NU,_
t...
J..
..,N
....
-c.:
: . O
• ~
.z•
...., .
... n...,
...,,.,,
0 •
N
.... . ,0
..
oo
ow
a:i
~o
· .::
. . ,,,.
"-
I •
u C
J 0
0 ..,
..,
"' _..
., -·
-N
....
iLo
,J.t
-1
,.)•
• N
...,
JL
rN
.r.-
ON
I
I I
ex,.
. .
• W• --L
,Jo
,,a:,
w
I . ..,
cx,w
•
t...•U
1N
O•
..O
~O
U"I
Ul•
~~
ex,,
' N
O
"N
..O
C,.
.QO
o:i
....
iN
• •
,0
.
WN
I
• •
a O
D
D
ClU
...
......
... "'"
' -N
"""W
~-~
• •
-O
""~
N
C>
-0
I I
I I
W
• ..
• lf
' •
C..
l...
.,(I
)t.,
JNO
I
_.,,
.r. ..
... . o
ob
N•
..c, ':
) -0
"J tr
> •
-c ..
. .... .(
Jtt
,,,t
:U,.
...,
QN
~..
..,•
. 0
-•
C.t
I
+ •
a
00
a
:JO
N
<
.,i.
.,
96
l
C
;u
J:
0 .c "' ,0 I N .c
w
,0
I ...
• "'
* 11
1 I
• ...
,.., n
r ,..,
,.., .z
;,
: ..
,., ;u
z
"" ..
... r
U1
;.u
I ;.u
>
a,
>
... z 0
0 1/l
G
' "' •
0 c,
, C
• .,,
U1
* I ,0
... ... 0 '
I .c ... ... 0 I I.
I' .... ... D I 0
- < "' 0- ll' "'

5102 TI02 AL203 FE203 fEO MNO MGO CAO NA20 K20 P20S H20+ H20-C02 TOTAL
cs RB BA SR TH u ZR Hf' NB CR V SC NI co GA PB ZN cu y LA CE PR ND SM EU GO TB DY HO ER TM YB
87/86 1--SR
GV 2-28
S2.S9 .S9
1 s .e 'I l 'I• l 8 -
.23 7.21
• 12 .OJ .1,1 .09
7.31 .21 ·2 8
99 •'II
2'1. 9 205. 91.0 3 • :>S -10s. -7.20
I 21 9. 110. 2s.o oS'I • 62.3 --112. Je.1 20.3
UC-760
'19 • 'I 7 .79
l 'i-03 l 2 • l 9
-• l 2
e.oe • ls .2s
I• I 2 .07
7o62 • 2s .25
99.39
'18 • u 317. bS.9 e .a .. -1oe. -
7.2:, 1 l S'I •
196 • JO.J 68 I. 62o7 --I 7 7. 9.70 22.s
AOf-1 ICAMT-1
• • • so.31 SJ.90
.52 .01 1e.s2 20. l 0 e.1s 11 • 70 - -
.10 • 0 I l I • 7 6 1.10
.10 .so
.33 • 09 2.1s I• 77
• l l .01 1: .. 72 s.oo
• I 'I -.01 • 0 I
99.52 100.eo
• • • - -
- -
CENTRAL RAN) GROUP
IC A'1 T-2 KAMT-7
MAJ:JR ELEMENTS • • • S 3. ID 52.'lO
• 0 l • 0 I 2 l • 60 20.10 12.so 8.70 - -
• D l .01 boSO a.ea .so • S 0 • I 2 • I 6
lob6 I • 2 'I .01 • 0 I
s.20 6 • I 0 - -• a 1 • 0 I 101.22 9 8 • b 'I
TRAC t ELE"IENTS • • •
.:.
l(AMT-B
S3•70 • DI
2 3. l :l 80:,0 -.01
b•SO .so .2s
loS7 •DI
s.1,0 -•DI
99.76
£-M~
90o'l9 -'I• 9 S
• l 7 • I 7 -.30 089
I. I 3 1.25 -.sa -
.32 1 00.) 3
.... I.D -..J

CENTRAL 'UND C.R O UP
GV2-ZB UC-7b0 AOF -I ICAMT-1 IC.A"IT-2 KAl'H-7 IC.AMT-9 E-MQ
• • • ELE"IE~T HTIOS • • • ZR/NB I 'I• !:o l5•D ZR/Y 5.1b ... 7 9 ZR/HF - -K/RB 223· 19'1 • K/BA 21.1 29.3 K/SR b 1 • l l '1 l • K/ZR 53.1 Bb•3 K/NB 773. lo291+003 K /y 27'f • 'f 1 3 • BA/RB e.23 b. b () BA/SR 2.25 'f • 81 BA/ZR 1·9b 2. 9 'f - - - - - - ...... RB/SR • 27 'f • 728 - - - - - - \.D NI/CO lo. !:o 10.9 - - - - - - co CR/NI 1.86 1.69 - - - - -Tl /P 9 • () l ls. s b • 'f 9 1.37 1.37 l. 3 7 l • 3 7 GA/AL TH/U LA/YB EU/EU• CA/AL 1.022-002 1.0b'f-002 5.100-on 3.356-002 3.123-002 3•259-002 2.921-002 • 2 '13 HG • l 1 2 • 109. 1 O'I. 109. I I 2 • 106· 100. 82.5
• • • C.J.P.,w • NOR'1S • • • QZ 3'h02 31 .b9 21 ... 7 3'1. 11 35.35 32-59 35.s3 77.'lb co .. 15.07 1 7 • 'f 1 I 'f •bb 17 • I 7 1 8 • 7 'I 10.23 20.13 .ab
OR 3eH, b.bz 12. 70 IO• '16 9.91 7.33 9e28 7.39 PL .z 5 2.12 S • 'f B 3 • 11 3.37 3.71 'I. 'f 7 1 I. 9 5 PL-A& .zs 2.12 2.19 ,76 1.02 1.35 2.12 9.56 PL-AN - - z.b9 2 •. 35 2 .3S 2.3s 2.3s 2.39 LC NE IC p 10 DI 01-10 DI-EN 0 J-FS HY I B • 1 I 20.12 29.29 19 • 18 I b • 19 21•92 1 b. I 9 1 • I 2 HY-EN I 8 • l I 20.12 29-29 19.18 10.19 21•92 lb• l 9 .95 HY-F 5 - ' - - - - - - • I 7 OL OL-FO OL-FA cs HT - - - .oo .oo •OD .oo .2s JL .'19 •2b • 2 l .02 .02 .02 .oz AP • 2 1 • 1 7 •Zb .02 .02 .02 .02 cc .oo • l 0 ·02 • 02 .02 .02 .02 • 7 3 AN/PL - . - 'f 9 • 07 75.S'I b9.B5 b 3. '17 52.bS 20.01 FO/OL - - - - - - - -D •I• '13-23 '10 • 'f2 Jb.97 'fS.33 'I b • I 7 'II• 2 7 'f b • 93 9 'I. 'I 0

•DIR
SAMPLE • DATABASE • URll'IO 0 'I 39-2 0 'I 39-3 0 b 15-7 0 6 15-8 0 6 15-9 0 7 30-'I 0 7 30-5 0 7 30-b 0 V 56-5 8 0 GV2-28 0 UC-760 0 Aor-1 0 ICAMT-1 0 ICAMT-2 0 ICAMT-7 0 ICAMT-8 0 E-MQ 0
·,
• ROCK TYPE
2A 2A 2A 2A 2A 2A 2A 2A 2A 2A 2A 2A 2A 2A 2A 2A 2A 2E
• • SAMPLE Dl~ECTORY • • •
LOCALITY
MARJEVALE CONS.MINES LTD. 1 NIGEL DISTRICT BH•'ll~ 1 LESLIE GOLD MINE,EVANOER AREA BH.'139,LESLIE GOLD HINE,EVA~DER AREA BH.blS,FARM T•ISTDRAAl,EVANDER AREA. BH•blS 1 FAR~ T&ISTDRAAl,EVANDER AREA. BHoblS,FA~H TilSTDRAAl,EVANDER AREA. BH.7JJ,KINROSS,EVANDfR AREA. BH.730,(INROSS,EVANDER AREA. BH.730,KINRDSS,EVANDER AREA• BHoVSb,VAN DYK PROP.HINES LTD.,EAST RAND. GRODTiLEI GOLD MJNING co.,EAST RAND. MARIEVALE CONS.MINES LTD.,NIGEL DISTRICT• FAR~ ilTHOK,SPRINGS ~ISTRICT,EAST RAND. LESLIE GOLD MINE•BH.25B,EVANOER GOLDFIELD. LESLIE GOLD MINEoBHa208,EVANDER GOLDFIELD. LESLIE GOLD MINE,bEAST DRIVE,EVANDER GOLDFIELD. LESLIE GOLD MINE,bEAST DRIVE,EVANDER GOLDFIELD. HARIEVALE HINE,'FAR EAST RAND'
18 SAMPLES IN THIS DIRECTORY
REFERENCE
3 3 3 3 ) )
3 3 3 )
3 3 'I s :,
s s 10
..... \0 \0

REFERENCES
3
q
5
10
REFERENCE LIST FOR SAMPLE Dl~ECTORIES
FULLER,A.Oo,l978AN01979.UNPUBoDATAoANALY5ED AT uEOCHEMISTijY DEPT•, UNIV.CAPE TO*N,CAPE TONN.
FULLER,A•0•,19~8.A CONTRIBUTION TO TH~ PETROLOGY Of THE IIT*ATERSRANO SYSTEH.TRANS.GEOL.S0C•S•AfR. 1 6l:23S-2Sbo
TIEEDIE,K.A.H.,1968.THE STRATIGRAPHY ANO SEDIMENTARY STUCJURES OF KIMBERLY SHALES IN THE EVANOER GOLDFIELD,EASTERN TRANSVAAL,SOUTH AfRICA.TRANS.GEOLoSOC.S.AfR.,?J:23S-2~6. -
ELLIS,J.,J9q7.THE HARIEVALE GRANOPHYRE,A METAMORPHIC ROCKoT~ANS. GEOLoSOCoS•AfR.,So:121-160•
N 0 0

flG TREE GROJP-SHEBA FORMATION
C-3 C-5 v-1 V-2 .1(-1 C-'I C-b C-7 C-8 C-9
• • • MAJOR EL~MENTS • • • s102 S6.00 t,).70 5'1 .1 I 63.32 b3oS8 b 5 • l 0 66.00 b3o80 12 1 :io 70.bJ T 02 ... 6 .12 1.00 .59 .59 .50 • Ifs .51, .1,0 • 5 'i
AL203 10.30 12.Jo l 7 • 5 'I 10.79 10.97 9. '18 11.so 10.so 9 • 3 'I I Cl• 3 0 F£203 l't.'10 11.00 9.99 6o9b 6067 1.a& 6026 7 • 7 'I 6082 e.ss FEO - - - - - - - - - -HNO elb • 0 If ,Ob - - • I 'I • I J .01 .11 • ::i 7 MGO - , l 3 - S.67 5.50 3.35 - - .so -CAO 2.11 .01 .22 1,95 lo 70 3. I B 2.os l. 5 I I• 2 2 I. b 7 NA20 .2e 1.10 2 • l 'I 2.09 I • 2 7 I • 7 8 2oBD t.30 I. 5ti I • 7 l IC 20 ,72 - 2.12 l ..... 1.1,3 l,35 .90 I • 8 l - .97 P20S HZO• H20- - - - - - - - - - - N
CO2 - - - - - - - - - - 0
TOTAL 8 If. If 9 90.'10 81,,1,7 92,81 92.21 92.76 90.Qb 87029 9 2 .)9 9 'I. 'I I -'
• • • TRACE ELEMENTS • • • cs ... RB 28.0 83.0 - - - 53.0 '16. 0 7J.G 73.0 )t,. 0
BA s lb. 316· - - - 'I OB. IS6• 296, 3 3 l • 2 '13. SR es.a lb,O - - - l '12. l 2 9. 8 I• 0 '1 l • 0 ao.q TH u ZR ]If. 0 112 • - - - I I 3 • l .. Cl. ISO, I b b. l 2 3. HF' NB CR V SC 20.0 21 • 0 - - - 13,0 lO•D I 'I• 0 13.0 I 3. 0 NI 959. 'l 00 • - - ., 2 6'1 • 232. 3b2. 2 8 CJ• 211. co GA PB -· - - - - - - ~
ZN cu y LA CE PR NO SH EU GO - - - - - - .., TB DY HO ER TM YB
87/86 I-SR
•,,a, ................. _

FIG TREE G~Ov"-SHEc!A FORMATION
C-3 c-s v-1 V-2 IC - I C-'I C-b C -7 c-e C-9
• • • ELE"IE'IT ~ATJOS • • • ZR/NB ZR/Y ZR/HF K/RB 213. - - - . 2 1 1 • lb2. 21s. - 2 2" • K/BA l l • 6 - - - - 21.s '17. 9 5 2 • 5 - 3 3. 1 K/SR 70.3 - - - - 79.9 57.9 J s b • - ID I• KIZR 176. - - - - 99.2 5 l • 'I lJO. - b 5. 5 K/NB K /Y BA/RB · • 1 a. 'I 3.e1 - - - 1.10 3.39 'I. 09 'I• 5 3 b .JS BA/SR 6 • 0 7 l9o7 - - - 2.01 1. 21 3.53 a.01 3. 0 'I BA/ZR l 5 • 2 2.a2 - - - 3.1,1 1 • 1 l I. 91 · I. 9 9 1 • 9 6 N RB/SR 0329 5 • l 9 - - - .373 .357 • 8 b'f 1.78 • 'i SG 0 NJ/CO - - - - - - - - - - N CR/NI Tl/P GA/AL TH/U LA/YB EU/EU• CA/AL • 28'1 80886-002 1.1,92-002 • 2 'l'f .209 • 'IS) • 2 '1 l • 1 9 'I .1 7b • 2 I 9 HG • - - - 101. 101. 115 • - - 19 2.
• • • c.1.p ••• NOR"IS • • • QZ '16097 S.1•88 30.78 33.02 3 S • '11 38-18 '11 • B 8 'lb. OB 5 9. 2 'I ::, 3 • 3 b co 5 • I I 800) 10068 2.25 'I. 0 3 - 2. I 9 )obi, 'Io :,9 ) • 'I 0
OR •t.ZS - lbo07 a.SI 9.1,3 7.98 5.32 10.10 - S.73 PL 13 .13 18 • '10 l9o20 21.31, 19 .J 8 28.95 33.Sb 11'. '19 19.08 l2.75 PL-AB 2.37 1'1·38 18 ol 1 1 7. 1,8 13.75 15.0b 23.1,9 l I. 0 0 I 3. D3 I 'I• 'I 7 PL-AN l O • 7 7 't • 02 lo09 9.67 9 • '13 13.89 IO. 1 7 7. 'I 9 1,.os 8.28 LC NE KP 10 DI - - - - - • S'I 01-10 - - - - - .29 DI-EN - - - - - • 2:, 01-FS - - - - - -HY - .32 - 1 'I• l 2 I 3 • 70 a.09 - - I. 9 9 HY-EN - .32 - I 'I. I 2 1).70 8.09 - - J.99 HY-FS OL OL-FO OL-r A cs HT IL o) 't •09 • I 3 - - .30 • l l • }. s • I 5 • 15 Af" cc AN/PL 81 o 9 6 21 • B't ':,. I, 8 35o3b '13. 9 7 '17. 98 30.J3 'IC. S l 31.72 3 b • '11 FO/OL - - - - - - - - - -0.1. 53.59 bl:,. 2 7 I:, 'I. 9 I, S9.22 50 .]9 b I. 2 2 70.89 1,1.11 12.21 73.Sb

F I CJ TREE G~OJP-S-iEgA FORMATION
C-10 c-11 c-12 C-13 C- l 't C-15 c-1b c-11a C-IB C-25
• • • MAJOR ELEMENTS • • • 5102 bbo:JO bbo20 7Qob0 bB.00 b7.QO bb.80 b5. 20 b7o00 bb.:JO :, 7 • 2 G
1102 ob9 • 51 • '17 o'lb • 't 9 • 't9 • 51 't 3 • OQ .53 • 't 2 AL203 12.so 10.30 9 .9 7 10.10 10.00 9.bl 10.10 10.30 10.30 9. <ta FE203 e.23 1.02 b • 'I 0 7.05 9 • l 't bo07 7 • 21 5 • '12 b. !l 7 'I. 9:, FEO - - - -· - - - - - -MNO •Db 13000 .oa • 12 .09 • 13 .09 • I I • 10 • 0 ll
MGO - - 3.50 - - - - - - -CAO 1 • 3 'I 2.29 1 • S l .2. '17 I • 't 7 3.oo 2.21 2. '13 2.39 I • 6 0 NA20 2.13 2.0b l .a 'I ,.so l • 3 'I I• 7b 1.ss 1 • b 'I 1.10 2 • 9 iJ K20 1·13 l•2b l•Zb 1.ss 1. 32 ,.35 lo98 2. l 'I I• <ts 1. I u P205 - - - - - - - -H20+ - - - - - - - - ' H20- - - - - - - - - - - Iv
CO2 - - - - - - - - - - 0
TOTAL 92o!l8 l02ob'I 9Sob3 91.25 90.85 89.21 89.'IS l 3 2 • O'I 8 9. 3 't 77. 81 w
• • • TR A.CE ELEMENTS • • • cs RB '19.0 '13. 0 s2.o '19o0 't S • 0 't 7 • 0 b7.0 83•0 • 't) b I• 0 aA 2 7't • 285. 207. 315. 2 2 ... 231• S2b• 5::J2. 2. 8'1 5 19. SR 59.0 l2b• 78,0 109. :, :) • 0 IO I. 97.o I IS• I • Cl 't I b 't • TH u ZR 20bo 120. l 2 'I• 121. I O'I • 123. 109· I IS. • 3 I I S 7 • HF - - - -NB - - - -CR V SC 15.o 13.0 12.0 12.0 13.D 12.0 13.0 I I • 0 I 'I. 0 I I • D
NI 3 '12 • 283. 207. Zbb• Jab. 200. 317• 257. 31 9 • 'l 6b • co GA PB ZN cu y LA CE PR ND SM EU GD TB DY HO ER TM YB
87/Bb I-SR

FIG TREE G~OJP-SHEBA FORMATION
c-10 c-11 c-12 C-13 c- 111 C-15 C-16 C-1 7 B C.,. I B C -2:;
• • • ELEME"IT HT 105 • • • ZR /NB ZR/Y ZR/Hf IC /RB l. 91 • 2113. 201 • 263· 21111. 2 3 flo 2115. 2 l 'I. 2.799+QJ11 1 61 • K/BA 3'1. 2 36.7 50.5 '10 .B 11 B. 9 '18. 5 31.2 35 • 'I 11.238+003 I 9. 9 K/SR 159. 83·0 l 3 'I• 118 o 219• I 1 l • 169. I :; 11 • I. t 57+0J,'I 5 9 .J K/ZR '15. 5 8702 811. 'I IO 1 • l O:, • 9 Io l 151 • l 511 • 3.B93+0011 6 2 • 'I K /NB K/Y BA/RB So59 6063 3o98 6.'t3 11. 98 11. 91 7.95 6.os 6•60 8 • 5 I BA/SR 'I. 6 'I 2.26 2.65 2o89 'I. 'I 8 2.29 5 • 112 ... 3 7 2.73 3. I 6 BA/ZR J.33 2o37 I • 6 7 2o '18 2. 15 loB8 11 • B 3 11. 3 7 9ol6 3. 3 1 RB/SR • 831 • 3 't I .667 o't50 • 9 op • 1165 .691 .122 • 1113 .J 72 Iv NJ/CO - - ~ - - - - .- - - - 0
CR/Nl - - - - - - - - .,::,..
T 1/P GA/AL TH/U LA/YB EU/EU• CA/AL • l't 5 0300 • 20'1 0330 .198 • 'I 2 I .27'i .310 • 3 13 .226
"G II - - l 11 • ~
• • • ColoP • .,o NORMS • • • QZ 't 6 o '11 36050 't6ob2 '18 .as s1.oo 115.09 'I 3 o B 7 'l'I • Db 115. '111 32.39 co S • 3'1 l • 3 8 2.93 l O 'lb ).b9 - 1.99 .87 1•59 • 5 2 OR 6 o !. 8 7. '15 7. '15. 9ol6 7. 8 0 7o9B 1 lo 7 J 12•65 9.57 6.97 PL 2'106 7 28079 23.06 211.95 18063 29.23 2'1. 08 25.93 2 6.Z'I 3 2 • '18 PL-AB· J8o02 l 7. '13 15.57 12069 1 1 • 3 'I 111•89 1 3 • 1 2 13.88 1'I•36 2 'I. 5 'I PL-AN 6.65 11 • 36 7 o '19 l2o25 7.29 111•33 IOo 9b 12.06 l I• B 6 7.911 LC NE KP tfO DI 01-10 DI-EN D 1-f S HY - I 1. 5'1 9.12 HY-EN - - a.12 HY-FS - l 7 oS 'I OL OL-fO OL-FA cs MT - lOolB IL o 13 097 • l 7 o 26 • 1 9 .za • 1 9 • 2 'I • 2 I • l 7 AP cc AN/PL 26095 39.'16 3 2 • 'I 8 '19-12 3 'i • I 'I '19.QS 't 5 • 5 3 'I 6 • '19 'I 5 • I 8 2 'I. 'I 'I FO/OL - - - - - - - - - -~olo 7lol2 blol8 690611 69090 7 Jo I 'I 67096 68069 10.59 6 B .39 !> 3. 'i D

.DIR
• • • SAMPLE DIHCTORY • • • SAMPLE • DATABASE • ROCK TYPE LOCALITY REFER:.NCE
C-3 0 JA SHEH FA 1Hl 1 ULUNOI SYNCLINE,jARBETON MT\l.LAND. b
c-s 0 3A SHE:IA FARM,ULUNOI SYNCLINE,aARBETON "IT'l.LAND• b
v-1 0 3A SHE:IA FORMATION,ULUNDI SYNCLINE. V-2 0 38 SHEBA fDRHATION,ULUNOI SY'lCLHiE. K-1 0 3B SHE:IA FORMATIDN,ULUNDI SYNCLINE. B
C-'I 0 38 SHE :3A fAiPl,ULUNOI SYNCLINE,3ARBETON MT\l.LAND• b
C-6 0 JB SHE:IA fARM,ULUNDI SYNCLINE ,BARBE TON "'T>,f.LAND. I:,
c-1 0 3B SHE:IA FAR"1 1 ULUND1 SYNCLINE,BARBETON MP.I.LAND. b
c-e 0 38 SHE:IA fAR"l,ULUNDI SYNCLINE,BARBETON MT'l.LANQ. I:,
C-9 > 0 JB SHE:3A FAR'1 1 ULUNDI SYNCLINE,:IARBETON "IT>,f.LAND. I:,
c-10 0 38 SHE :3A fAiH4,ULUNDI SYNCLINE,SARBETON MTN.LANO. b
c-11 0 313 SHE:IA fA'Hl,ULUNDI SYNCLINE,BARBETON MTN.LAND. b
c-12 0 38 SHE:IA fAR"l,ULUNDI SYNCLINE ,BARBETDN "4TN.LANDo b
C-13 0 3B SHE3A FARM 1 ULUNDI SY~CLINE,BARBETDN 'I T'l .LAND. I:,
C-1 'I 0 38 SHE 3A FA'l"l,ULUNDI SYNCLINE,:IARBETON MT!ll.LANO. I:,
C-15 0 3B SHE:3A fAR.M,ULUNDl SYNCLINE,BARB~TON MTN.LAND• I:, N 0
c-u 0 JB SHEBA FAR"l,ULUNDI SYNCLINE,BARBETON MPloLANO. I:, Ul C-178 0 JB SHEBA fA 1P1 1 ULUNDI SYNCLlNE,:IARBETON MP.I.LAND. b
c-10 0 JB SHEBA FARH,ULUNDI SYNCL1NE,3ARBETON Ml'l.LANOo I:,
C-25 0 36 SHEBA FAR"',ULUNDI SYNCLINE,SARBETON MTN.LANO. I:,
20 SAMPLES IN THIS DIRECTORY

REF"ERENCES
b
7
8
REFERENCE LIST FOR SAMPLE Dl~ECTORIES
C0~D1E,K•E•;HACKE 1 J.E.AND REIHER,To0.,197Q.PETROLOGY AND GEOCHEMISTRY Of EARLY PRlCAMBRIAN GRAY#ACKES FRO~ THE FIG TREE GROUP,SOUTH AfRICA.GEOLoSOC.AM.BULLo8l:27S9-277b.
VISSER,DoLoJo,CCO~PILER)l9SboTHE GEOLOGY OF THE BARBETON AREA.S.AfR. GEOL.SURVEY SPEC.PUB.1S:251PP.
KOEN,G.Mo,19~7.DIE GEOLOGIE VAN DIE SHEBAGEBIED IN DIE BARB(TONS£ DISTRIK.U~PUB.M.SCoTHESIS,PRETORIA UNIV.,PRETORIA.
- - ·---- -------------
·-~
N 0 O"I

FIG TREE GROUP-HLllllE ROA::> FORMATlO'II
c-1 C-2 C-2'f C-2b C-27 C-28 C-29
• • • "4A..1DR ELEMENTS • • • S102 1,s.eo 1,s.20 59.30 51.90 51.20 bO. B D b'lo'iJ Tl02 .so .SJ .t,7 .1,9 obb .38 • 'f 3 AL203 12 • 'i 0 12 .1,0 1 ... 5 0 1 'i • 30 15.00 10.ot. 1 D • 7 J FE203 5 .1,5 5.39 7.t,J 8073 8.89 'I. 7 2 'f. 8 9 f'EO - - - - - - -HNO .01 .01, • 09 •I~ • 1 0 • 1 2 .as HGO 2.01 - - - - - -CAO 2 • If 'i 2 • 2'i 2.99 'lo'l9 3 • 1 D ... 99 2.31, NA20 1 .1, 2 2.10 Jo'iS J.O'I 3.J2 2 • '18 3. D 1 K20 - 2-lZ 2.03 3.20 J.07 2.00 1.31, P20S - -: H20+ - -H20- - - - - - - - N CO2 - - - - - - - 0
TOTAL 90056' 90.'13 9:Job5 8b.'t8 85.3'1 es.ss 87.23 '1
• • • TRACE ELEMENTS • • • cs - - - - - - -RB bS.O !Ob. 95.0 'I 2'f • 109. 01.0 53.0 BA 571. '11b • blO• 1090. 101. '189. 'I 55. SR 283. 21s. 31,3. 507. SI, B. 318. 222. TH u ZR l 'I I,. lb 5 • 20bo 228. 2 '15. 153· 1so. Hf -NB CR V SC NI 2 72 • l 'i 2 • 53.0 1 I 'I. 1 31 • 2 3 'i • 202. co GA PB ZN cu y LA CE PR NO SH EU GO TB DY HO ER TH YB - - - .,
B7/8b I-SR .

flG TREE GROUP-HLVUE ~OAD fORMATIO~
c-1 C-2 C-2'1 c-20 C-27 C-28 C-29
• • • ELE"IE',jl ~AT IOS • • • ZR/NB ZR/Y ZR/Hf -IC/RB - 1820 1770 21 'Io 2 3 'Io 2 OS• 213. IC/BA - '10 o 5 2706 2'1 o't 3 i,. 'I 3 'I• 0 2 'I. 8 IC/SR - 8900 'I 6. 'I 52 • 'I 'I .. 0 9 s2.2 SOo9 K/ZR - 11 7 o Blo8 11 7 o I O'I o 1090 75.3 IC/NB K /Y -BA/RB Bo78 'Io '19 o ... 2 8079 b. 't 3 600'1 a.sa BA/SR 2o02 2.21 lo6B 2.1s 1 • 2 3 I• 5'1 200s BA/ZR 3o9l 2088 2 • 9 li, 'to78 2086 3.20 J.QJ RB/SR .230 .'193 • 21>2 • 2'15 • 19 2 .25s .239 N
NI /CO - - - - - - - 0 co
CR/NI Tl /P GA/AL TH/U LA/YB EU/EU• -CA/AL o2oi, -2'10 .211 ... 2'1 .279 obb9 .299 HG • . 118 o
• • ., ••• p ••• \IORMS • • • ~i. '18000 39031 25008 13072 13.50 Jlol3 Ji,. b 'I
5.30 2.st. l • 2 I - .s0 - -OR - l 3 • 7 1 12.00 18091 l B ol 'I 11•82 8 • O'f PL 25-81 28.88 't3o98 '11-65 '13. '17 31 .'IQ 3 7 •• If
PL-AB ll•71 11.11 29•19 zs.12 28.09 20099 25 • '17 PL-AN 12 el 0 11 • l 1 I If. 7 8 Is. 92 15.38 l O •'II 11 of, 7 LC NE KP ,o - - - ,.at. - s.63 DI 01-•o DI-EN 01-f 5 HY Solo HY-EN s.u HY-f S OL OL-fO OL-FA cs 14 T IL .1s ol3 • 19 -2~ • 2 l .26 • 1 7 AP cc AN/PL 'lboB9 38.'18 33062 38023 )5.38 33.16 )1. '12 f'O/OL - - - - - - -0 •I• bl• 77 70.79 60-27 !:>B • 36 59.73 t,).9) 70olS

•DIR
SAMPLE•
c-1 c-2 C-2't C-26 C-27 C-28 C-29
DATABASE • D 0 a a 0 0 0
• • • ROCIC TYPE
)B 3B 36 3B 3B 38 36
7 SAMPLES
SAMPLE DIRECTORY • • • LOCALITY
BELVU B£Ll1U
R).fORHATION,ULUNDI R)oFORHATION,ULUNDl
BELVU R)oFORHATION,ULUNDl BELVU R)ofORHATION,ULUNDI BELVU R~oFORHATION,ULUNDI BELVU R).FORHATIDN,ULUNDI BELVU R).fORMATION,ULUNDI
IN THIS DIRECTORY
SYNCLINE,BAR.MTN.LAND SYNCLINE,BAR.~TN.LAND SYNCLINE,BAR.HTNoLANO SYNCLINE,BARoMTN.LAND SYNCLINE,BAR.MTN.LAND SYNCLINE,BAR.MTN.LAND SYNCLINE,BAR.MTN.LAND
REfERE~CE
b b b b b b b
N 0 I.D

REFERENCES
I,
REFERENCE LIST FOR SAMPLE Dl~ECTDRIES
CONOIE,K•E•:HACKE,J.E.ANO REIHER,T•D•,197Q.PETROLOGY AND GEOCHEMISTRY OF EARLY PRECAMBRIAN GRAY•ACK~S FROM THE FIG TREE GROUP,SOUTH AFRICA.GEOL.SOC.AH.BULLe8l:27S9-277b.
N ..... 0

F' I G TREE GROUP-F'OR'4AT)O~ UNIDENTlflED
FG-JS SF-2 SF-3 SF-'IB SH-7 F G-1 FG-2 FG-8 F'G -9 F' G-10
• • • MljOR ELEMENTS • • • 5102 e.s.1,Q b3.71 bS .9'1 b7.03 bS.bB 51>.91 'I 2 • b b b9 • 'I 5 'I 8 • 8 5 5 8. I 5 TI02 • 'Is .56 • 'I 3 • '19 .'I) ob1 • 'I b • .39 • 'I 2 • 8 I Al203 10.;a 11 o2b 9.29 12.01 9ob7 IO• B'I 7o2B 5. I 0 7. 'l 'I 13 •'II FE203 2.30 13.07 bo02 3 • 5'1 1,.1,0 3 .)9 2 9. b 'l 1 'l • 9 'l 3 I• 3 C1 12-76 FEO '1·17 - - '1030 - 17. 95 9 • 'i 5 2.13 'lo 0 9 I. 7 2 MNO ol9 .03 • O'f ,03 • 1 b .as • I b .t,8 •23 • l l MGO '1007 5.23 'I .38 'I. l '1 ... 2 3 3.18 2.2e 2 • .3 5 lobO 3. l I CAO 1.s3 • 1 b 2.sa • 10 2.ao ~DI • 0 l • 2 I • 03 NA20 1.ss .93 .ai. • '10 1.10 •DI - - -IC20 1. b 'f .7S I • Sf> 2.23 1.so .02 • 'I 3 • 3 'I lo57 1 • 9 'I P205 • :J 7 009 .oe .09 .oa .02 • l '.) • 05 .os .oe H20• 2o23 '1.21, 1,.23 'I• b I t,.19 3.50 b • l I 3.02 3.01 bo72 H20- - - - - - - - - - -CO2 2.ss - - .10 - •ID • I 0 o)O • 1 0 • 1 0 N
TOTAL 99.t,l 100.os 97.'10 99.07 99.0'I 9 7 • 'I 5 98.68 99.Sb 9 9. '19 9 9. 9 'I _,. _,.
• • • TRACE ELEl!ENTS • • • ·cs RB BA SR TH 3.00 s.oo 9.00 1,.00 9.00 I• 00 3.00 1,.00 1.oc e.oo u - - - - - - - - - -ZR 89·. 0 10s. I 1 2 • 91 .o I I I • 5 I• 0 'ID. cl 37. 0 bO.O 7 B • C,
Hf - - - - - - - - - -NB I• '.J 0 'I• OD 19-0 3.00 'I• OD I. DO 'I • ()'.) I. 00 2.JO ) • Q Q
CR 70bo 8 2 ... 020. 11,a. 6 9 'l. 977. 573. 8 I I • 3 'I b. 1590. V 01,.0 7'1 .o 70,0 99.0 1,a.o 122. 83.0 73.0 57.0 19 2. SC 1s.o 1s.o 12.0 1s.o 2 I. 0 20.0 I 8 • Cl lb,0 15,0 2B,D Nl 277. 'I '13. 'I '1 'i • 570. bbl,. '11 'I • ) '1 l. 3)8. 201. 1200. co 31,.0 31,.0 22.0 32.0 )'I. 0 2 '1 • 0 22 • D 'I 'i. 0 22.0 7 'l. 0 .GA 10.0 12 • 0 I 2 • 0 l3o0 lJoO 11 • 0 8 • 0 '.J s.oo 9.QO I 5. 0 PB - - - - - - - - - -ZN b9.0 89.Q 90.0 89.0 10.0 10.0 b5. cl 52.0 !l 2. 0 I 9 0. cu se.o '15. D 'I 'I. 0 '10 • 0 3J.J 3 .3 • 0 '11 • J 7bo0 )9.0 9 ... 0 y 12.0 JS.a 'Ibo 0 10.0 11.0 20.0 2bo0 I I • 0 eo.o 28.0 LA CE
'PR ND SM EU GD TB DY HO - - - -E'R TM YB
87/86 I-SR

flG TREE GROUP-f OIPIA TI ON UNIDENTlflED
fG-15 Sf-2 Sf-3 Sf-'IB SH-7 H,-1 fG-2 fG-8 f G -9 fG-10
• • • ELE'4ENT RATIOS • • • ZR/NB 89.0 20.2 ;,.99 30.3 27.7 51 • 0 IO• '.J 37.0 30.0 2oo0 ZR/Y 1.,2 1.00 2 ! 'I 3 5.0o 0053 2.55 1 • 5'1 3o3o .750 2.79 .z R/Hf - - - \
K/RB K/8A K/SR K /ZR 153. 59.3 I 15 • 203. 112 • 1330 89o2 7oo3 211. 206. K/NB lo3bl+OO'I lo5S7+003 b 7 7 • 00171+003 3oll3+003 bo807+003 892. 2o823+J03 6oSl7+003 S.36e+003 K/Y l•l3S+003 •qs. 2 BJ! l•028f00) 7320 3'10• 137. 2S7. I 6 3. 575. BA/RB - -BA/SR - - - \ BA/ZR - - -RB/SR - - ·- - - - - - - - Iv
--> NI/CO 1.1,9 12.3 20.2 17 •8 19.b I 7 • 2 J5o5 7068 9 • '11 I b. 2 Iv CRIN. 2.55 a .u I• 85 I• 3S I• O'f 2o36 !008 2 • 'I 0 1 • b 7 lo32 Tl /P 8 • 8 3 8055 7.39 7. 'f8 7o38 'f o • 0 6. 32 · 10.7 11 • 5 1 3 • 9 GA/AL Jo8'f2-00'f 2•01'1-00'f ·2. 'f'f 1-00'f 2 o0'f5-00'I J .95'f-OO'f 1 • 9 I 7- JO 'I 2o07b-OJ'I JoS52-00'I 2!28b-'JJ'I 2oll'l-00'1 TH/U LA/YB EU/EU• CA/AL .201 1•917-002 .375 1.123-002 0391 lo2'f5-003 1.853-003 5oS56-'.l02 5o'l'IJ-003 HG • 0508 11 o. 100. 60 ... I I ::J • 2 'I• 7 'I I. 7 0 1 • I b9o0 9:,. 3
• • • c.1.r.r. N0fl'45 • ~ • QZ 'l't• BO 'I 7. 5:, 'I 3. I 7 '18 0 08 37.97 3So70 37062 b'I • 65 'IO. 'I 6 '16 .09 co So9'1 8.8'1 I • 7 0 8 • 9 'I .35 9. 9'1 b • 81 'I• 7 3 S. 7 'I I I .31 OR 9oo9 'I. 'I 3 9olb 13.18 8086 'I• 85 2 • 5 'I 2.01 9.20 I I • 'I b PL J3ol2 8 • 08 l9o5S 3o38 27.75 .00 PL-AB 13•12 1.01 1.20 3.38 I 'I. 3 8 008 PL-AN - .21 12.20 - I 3 o3 7 LC .;
NE KP 10 0 I 01-•o DI-EN 01-f S HY 1So50 13003 I O • 9 I 1 'f • 53 10.53 37.07 5ob9 5.85 3o98 7.75 HY-EN 1 a. 1" J3o03 10.91 IO. 31 I i.l. $ 3 7.92 5. b B. 5. e => 3o98 7. 7 ':, HY-F'S 5.37 - - 'f • 22 - 29.J 5 DL OL-f'O OL-f'A cs HT 3.33 - - S • I 3 - 'Io 9 2 2 9. b'I 9.89 I:.• 2 9 3.59 IL .95 oOb 009 .93 • 3 'I I. 2 7 087 • 7 'I .so I • 5'1 AP •17 • 21 • 1 9 • 18 ·• I 9 .02 .02 ·• I 2 .as cc 2.s1 - - - - - - 026 AN/PL - 2.ss 62.79 - 'I 8. I 7 f'O/OL - - - - -0.1. 67ob0 S9o8$ S9ool o'f .6'f b I. 2 2 '10.63 'IO• I b b6ob6 'I 9. 7 3 S 7 o S ':,

FIG TREE GROUP-FOR'IATION UNIDENTIFIED
FG-11 FG-12 FG-13 FG-1 'I FG-lb FG-17 SF-'IA SF-5 5F -b SH-2
• • • MAJOR ELEMENTS • • • 5102 S6•93 S'l.20 51 • 7 'I Sb.99 Sb• D 1 5 7 .2'1 S2ob7 59.21 S 2. 'I fl :,9 • I 6
·T J 02 • '12 .12 .• 7 J .78 • b'I .57 • 7 1 .72 .5~ • 5 1 AL203 7.01 J6o6b I b .79 17• S2 I J.J'I I 'I. 2 'I 18 ol 7 I b • '12 I 't .t 5 1 I. 0 I FE203 2'1•23 6.69 bob6 2.97 J.bb 1 0 • I I 10.05 1.63 I 7. 'I 'I 7.92 FEO 3.59 s.39 s.96 'I. 7'1 7.1:,9 2.01 - S.b7 - -HNO • 0 J .oa • I 2 .09 .ot. • 1 2 • D 'I .03 • 0 'I • 2 1 MGO 2•22 s.;n 6009 s.Jo b.05 'I. 00 . 5. 5 7 5.J I bo90 :, • '13 CAO oDI • IS • I 3 .IQ • I b • Ob • 1 1 .20 • 1 2 3. 5 0 NA20 - .97 .as .7) .a1 • 0 I 9 .JQ 1 • 0 5 I • Ob 1 • 'I 0 K20 • 3 'I 3.39 3.13 3.97 1 • 'I 'I ).90 3.93 3.35 .98 1 • 7 3 P205 .O'I • I 1 • l 1 ,09 .09 .os • 1 Q • l 0 .Q9 .09 H20+ ... 9 o 5.92 s.as 5 • '12 !:> • 20 5.52 bobD 'I. b b :, • 9 'I 5 .Jb H20- - - - - - - - - - - I\.)
CO2 .10 • 1 0 .10 • 10 • l 0 • 1 0 • l J • l 0 - 2.25 _.
TOTAL 99. 7 't 99.70 98.26 98.80 9 5 • 11 9Bo82 107.35 98.'15 99.b9 :; 9 • 5 9 w
• • • TRACE ELEMENTS • • • cs RB BA SR TH t.DO 9.00 !', .oo 3.00 10.0 1.00 1.00 11 • 0 10.0 s.oo u - - - - - - - - - -ZR 59.0 BBoJ 90.0 130. 102. aJ.o 99.Q 120. 11.0 1 1 'I • Hf' - - - - - - - - - -NB 6oJO 2.00 SoJD 10.0 1.00 'I• D 0 a.oo s.co a.oo E' • 00 CR 52'1. l I '17 • l0S9. 12'1 S • 9 'I I,. 879. 1010. 1090, 9'1:,. 775. V so.o 179. 169. 220. I I 7. 121. I 9 'I• I 'I e. JOS. as.o SC 1s.o 26o0 21:,.0 2oo0 21. 0 21·0 20.0 2).Q 20.c lb.O NJ 339. 658. 737. 'IS l • '17 S. 'I 30. bDO. 526. '19 b. 'I 2 (J.
co 29o0 1:,1.0 87o0 Ja.o 32.D 3b • D 39.Q 2:, • 0 32. () 3 2 • 0 GA 8.oo 10. a 19.0 19. 0 l:, • 0 19.0 2 J.:) I B • D l 6 • 0 I 2 • 0 PB - - - - - - - - - -ZN !',). 0 ISb. l 6 'I• 102. 132. 17). I 1 b • 1 J 3 • 122. I 3 !: • cu 31,.0 b2o0 7'1. 0 60-0 11.0 51:,.0 5 'I. 0 'I b • 0 '18. 0 'I 'I • (; y 75.0 29.o 21.0 32.0 2 'I. 0 29o0 3S.O 2: .. 0 2s.o 26·0 LA - - - -CE - - - '"' PR NO SM EU GD TB DY HO ER TH YB
87/86 J-SR

FIG TREE. GROUP-FOR.'4A TI ON UNIDENTIFIED
F G-11 fG-12 FG-13 fG-l'f fG-lb fG-17 Sf -'f A Sf-5 SF -b S rl- 2
• • • ELEMENT RATIOS • • • ZR/NB 9.:13 ..... o 10.0 13.0 I 't. b 20•7 I 2 • 't 2 't • 0 9ob2 I 't. l ZR/Y .787 :).03 3.33 'f.06 'I. 2 5 2.86 2•83 'I. 8 0 3.00 'I• 3 B ZR/Hf IC /RB IC/BA . - - - - - - - .. IC/SR - .: IC/ZR 'I 7. 8 319. 289. 2S'I • I I 7 • 390. 330. 232. 106. I 2 b.
IC/NB 'I 70 • 1 .'103 +00'1 s.191+00:i 3.296+00) lo708+0Q) 8009'1+003 'f.078+003 5.St.2+003 1.017+003 J.795+003 IC/Y 37.6 968. 9620 lo030+003 't 9 8 • loll6+003 932. 1.112•J:J3 325. 5 5 2. BAIR B BA/SR BA/ZR RB/SR - - - - - -NI /CO 11. 7 10.e 8 • 'f 7 , .. • 9 I 'I • 8 I l • 9 IS• 'I 21 • 0 15-5 I 3.1 N
CR/NI t.5S 1 • 7 'I l • 'I .. 2.1b 1.99 2. 0 'i 1. 7 e 2.01 l • 9 I I • 8 5 -" ,i,,.
T 1/P l '1. 'I e.99 9ol2 11 • 9 9.77 9.79 9 .75 9.89 8.Z'i 1.10
GA/AL 2.130-00't 2.0'12-00'1 20138-00'1 2oO't9-00'I 2.157-00'1 20521-00'1 2.oeO-OO't 2.J71-00'I 2.137-00't 2.059-00'f TH/U LA/YB EU/EU• CA/AL 1.908-003 1•215-002 l oO'iS-002 7.JOl-003 1·6'13-002 Sob8S-003 8.169-003 I• b'f3-:J02 I. l't'l-002 • 't 2 9
HG • 02.9 68 • 'I 6807 69o0 6J.5 Blob' I I I • 6308 I I 7. 109.
• • • ColoP••• NDR"S • • • QZ s2.22 260 u 23.71 27.32 31.80 36.29 - 2Eo 76 32 o28 )5.22 co 6070 1 I • 'I 1 12.00 12.02 IO. IS 10.00 - 11. 0 7 I I • 3 'I 5.90 OR 2.01 19.97 18.50 2 3 o 'I 6 8051 23.05 23.22 !9.80 5.79 I J • 2 2 PL - s.21 7ol9 6 • 18 7.)6 .OB 30.1s 8088 9.99 I 't • 't CJ
PL-AB - e.21 7.19 6 • 18 7.36 .oe JO.IS a.ea a.91 l l • B 5 PL-AN - - - - - - - - .01 2.ss LC - - - - - - -NE - - - - - - 2 2 • 'I 'I KP 10 DI 01-10 DI-EN D 1-f S -HY SoS3 16.60 19-63 18 .)) 25.22 9.9b - 2 I• I b 17 • I B I 3 • 5 2 HY-EN 5.53 13· 27 15.11 13.20 15.07 9 .9 6 - l)o22 I 7. 18 l)o52 HY-f S - 3.33 ... 'I b 5. 13 10.15 - - 7.93 OL - - - - - - 9.72 OL-fO - - - - - - 9 .72 OL-f A cs HT 1 0 • 'I 5 9.10 9066 "· 31 S .JI 7.99 - 2.3b IL .ea I • 3 7 l • 3 9 I • '18 1.22 I. OB .09 '.) 7 009 • '! s AP .02 •lb • 2 3 • 1 B • 21 • I I .20 • 2 'I • 2 I • 2 l cc - .01 - - .01 - - • I 2 - 5 • I 2 AN/PL - - - - - - - - • oe 11.12 fO/OL I - - - - - - - - - -0.1. S'i.23 S't. 3 'I '19 • 'I 0 S6.95 't 7. 6 7 59 • 'i 3 75.82 S 7 • '! 't 'i 7 • O'i 57.29

5102 TI02 AL203 f"E203 f"EO MNO MGO CAO NA20 IC 20 P205 H20• H20-C02 TOTAL
cs RB BA SR TH u ZR Hf' NB CR V SC NI co GA PB ZN cu y LA CE PR NO SM EU GD TB DY HO ER TM Y6
87/8b I-SR
SH-3
S7ol0 .bl
13.t.9 I Oob'I
.12 b ... b l•S7 I• S'I 1.53 .10
bo22
99ob0
s.oo -es.a -1.00 90Jo 13&. 23.0 'I bl. 'Ibo 0 u.o -l I If • 19. 0 19.0
f"GoCOH
58 • B 7 .sa 12.09 2.00 a.ts.
~oa s.1J. I • 1 7 1.20 1.22
~08 J.59
2.2s 9 7 • 7 'I
l 'I• 0 -9bo0 -a.oo
763· 9'1 • 0 l 7 • :l S2b• 33.0 I 3 • :l -9QoJ If b • D 19 • J
f"lG TREE GROUP-FOR~ATIO~ UNIDENTIFIED
•••MAJOR EL~~ENTS • • •
N ..... Ul
•••TRACE ELE~ENTS • • •

FIG TREE GROUP-FOR'1ATION UNIDENTIFIED
St1-3 FGoCOM
• • • ELEMENT •UTJOS • • • ZR/NB as.a 12.0 ZR/Y 'I. 'I 7 S • 0:, ZR/Hf K/RB K/BA K/SR K/ZR l '19 • JOS. IC/NB Jo27Q+O(J'I lo2bb+003 K/Y bb8o 533. BA/RB BA/SR BA/ZR RB/SR - - N
-" NJ/CO 10.1 JSo9 CR/NI lo9S l • 'I 5
O'I
TI/P 8 .1,S s. 7b GA/AL 2.2oe-00'1 2.032-00'1 TH/U LA/YB EU/EU• CA/AL • I:, S • 1 31 "G • 110 o ':,7.2
• • • c.1.P.#0 NORMS • • • ~i 29.58 33.23
bo89 s.eo OR 9 • O'I 7. 21 PL 20.11 1 0 • l:. PL-AB l3o03 Io .1 => PL-AN 7 • l '1 LC NE KP 10 DI 01-10 DI-EN 01-FS HY lbo09 2b.23 HY-EN u. !39 I 'I. 2 7 HY-F S - 1 I • 9 b OL OL-fO OL-F A cs MT - 'lo Ob IL ·2 b .97 AP .2 'I • I 9 cc - 1.90 AN/PL 35.39 FO/DL -D •I• 5 l .1, 5 SO.bu

.DIR
SAHPLE • DAU6ASE • FG-15 a SF-2 0 SF-3 0 SF-'IB 0 SH-7 0 FG-1 0 FG-2 0 FG-8 0 ;G-9 0 FG-10 a F G-11 0 FG-12 0 FG-13 0 FG-1'1 a FG-lb a FG-17 0 SF-'IA 0 sF-s 0 SF-b 0 Srl-2 0 SH-3 a FG.CO'I 0
• • ROCIC TYPE
36 36 3B )B 3B 3B 30 30 30 30 30 3A 3A )A )A 3A 3A )A )A 3A )A )A
• SAMPLE DIRECTORY • • •
LOCALITY
BETl[EN SHEaA A~D FAIRVIEN ~OLD 'IINES,ULUNDI S• tEST Of SHEBA MiNl,NORTH LIM~-ULUNDI SYNCLINE• WEST OF SHEBA HINE,NORTH LIMB ULUNDI SYNCLINE #EST JF SHEBA MINE,NORlH LIMB-ULUNDI SYNCLINE. BH.ZIC'I0,5rl[6A MIN[. FAR'! JOSEF'SDAL. RD. FROM HAVELOCK 10 BARBETON. FAR'! JOSEF'SDAL. RD· FROM HAVELOCK TO aARaETON. llDEGREESOIAND)/'IMIN•EAST , 260EGREESl3MIN.STH. #EST OF PIGGS PEAK NGtENHA IRON DEPOSIT NGNENHA IRON DEPOSIT BETIEEN SrlEBA A~D FAIRVIEN GOLD MINES,ULUNDI S. BETNEEN SHEBA ANO FAIRVIEN GOLD MJNES,ULUNDI S. BETNEEN SHEBA AND FAIRVIEN GOLD MINES,ULUNDI s. FARM LOUIEVILLE'lb7 1 LDUW 1 5 C~EEK. FARM LOUIEVILLE'l67,LOU~'S CREEIC. #EST OF SHEBA MINE,NORTH LIMB-ULUNDI SYNCLINE. •EST or SHEBA MINE,NORTH LIMB-ULUNDI SYNCLINE. t[ST OF SHEBA MINE,NORTH LJMB-ULUNOI SYNCLINE• BH.ZK'IO,SHEBA MINE• BH.ZK'IO,SHEBA MINE. IEST 0• SHEBA MINE,NORTH Ll'IB-ULUNDI SYNCLINE.
22 SAMPLES IN THIS DIRECTORY
REFERENCE
2A 2 ! 28 2 ! 2A n '2 A 2A 2A 2B 28 2A 2A 2A 26 2B 2 ! 2 ! 2 ! 2A 2A 2A
N ..... ....J
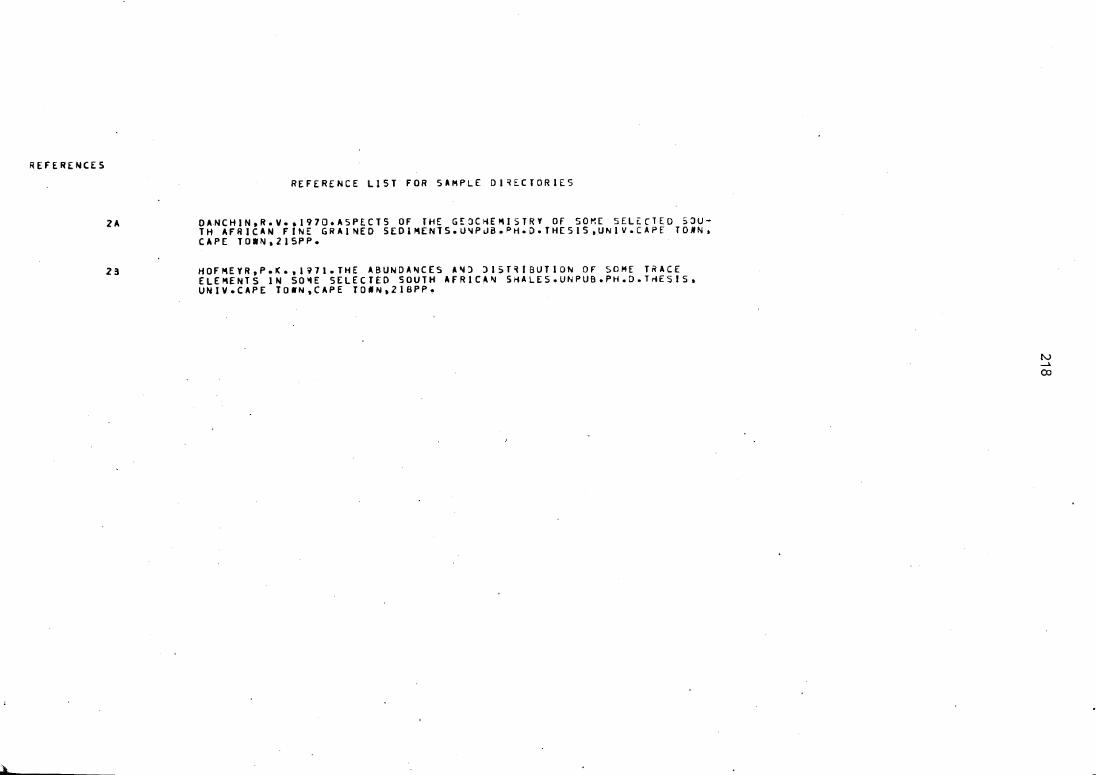
---·--· " ---~- - #
REFERENCES
2A
za
REFERENCE LIST FOR SAMPLE Dl~ECTORIES
OAHCHIN,RoV•,1970oASPECTS Of THE GE)CHEMISTRY Of SOME SELECTED S)UTH AFRICAN FINE GRAINED SEOIMENTSoU~PuB.PH.D•THESIS,UNIV.CAPE TD#N, CAPE TOIN,21SPP.
HOfMEYR,P.Ko,li7J.THE ABUNDANCES A~) )IST~IBUTION Of SOME T~ACE ELEMENTS IN SO~E SELECTED SOUTH AFRICAN SHALESoUNPUB.PH.O.TrlESIS, UNIV.CAPE TO#N,CAPE TONN,21BPP•
rv ..... (X)

5102 TI02 AL203 H203 FED HNO HGO CAO NA20 IC 20 P20S H20+ H20-C02 TOTAL
cs RB BA SR TH u ZR Hf' NB CR y SC NI co GA PB ZN cu y LA CE PR ND SH EU GO TB OY HO ER TH YB
8 7/86 I-SR
HZ-1
'IQ.JO • 1 2
2.29 '12 .1, 3 10.t,3
• 1 'I 1.s2 .78 .10 • 1 'I .a ..
I• 0 I -• 'I 0
99.SO
HZ-2 MZ-3
SI ol 0 59.32 2.03 ebS
.7B 1 b. I 3 'l'I. 'I l 11.so
l • S 1 .29 .02 •09 • I 2 .ss .01 -• 1 0 • I 0 - 2·31 • 0'1 .os
2.00 b • 8 'I - -• I 0 .10
102.211 9Bo9b
'4 OZ" A 11 C.RDUP
HZ-'I "IZ-S MZ-b "I l-7
• • • HA.JOR ELEMENTS • • • S0.73 7 'I. O'I 50.68 lj 2. lj:,
• '13 • 51 • lj 9 • lj 'i 11.12 I 3 •'II 13.32 I I• 9 S 28 • I 6 3. :,0 2 'Io 'l 5 3 I• I I
l • 9 'I • 29 I• 5 I •B6 .02 - • O'I 2 o3 I • 1 7 .)7 • I 2 .39 • 02 .02 - -• I 0 • I 0 • I 0 • 10 .03 2.33 • 0 I 1.0J .03 • I 7 .os .oe
6.Sl 'I. I 2 8 • '19 1.02 - - - • ID N
• 1 S • I 0 • I 0 - _.
100.01 98.9b 99.Jb 98.60 I..O
• • • TRACE ELEMENTS • • •

•DIR
SAMPLE•
HZ-1 HZ-2 HZ-3 HZ-'I HZ-$ HZ-o MZ-7
DATABASE•
0 0 0 0 0 D 0
• • • SAMPLE DIRECTORY • • •
ROCK TYPE
'ID 'ID 'I A 'ID. 'I A 'ID 'ID
LOCALITY
MOOIHDEK-<ABUTA AREA MOOIHDEK-~ABUTA AREA MOOIHDEK-KABUTA AREA MOOIHOEK-KABUTA AREA MOOIHOEK-KABUTA AREA MDZAA~ OUTLIER ,EST Of HHLOSHENI MOZ,A~ OUTLIER NEST Of MHLOSHENI
7 SAMPLES IN THIS DIRECTORY
REfERE~:::E
2A 2A 2A H 2A 2A 2A
Iv Iv 0

221
,.
APPENDIX FOUR

INSTRUMENT SEITING.S:
222
Settings and calculations for
b0 detenni.nation by XRD
50 JW
25 m A
Tirre constant: 2
Preset seconds or counts: 4 x 10 3
Range (i:;,'S): variable, nostly 2 x 10⁴ - 4 x 10⁴
Scanning speed: ~o 20/min •.•••• (1)
Chart drive: 2 an/min. ···~·· (2)
Fram (1) and (2) 1°20 = 40 nm
Slit: 1°
•••••• ( 3)
METHOD: Scan between 59.50° 20 and 62.50° 20 to cover quartz (060) and
white mica (060} peak, using quartz (060) as an internal standard,
which according to ASTM cards appears at 'X' = 59.98° 20 for
CU Ko(, radiation. The distance between quartz and white mica
peak is :rreasured at% height in nm. Let this distance be 'L'
and the white mica peak be at 'Y10 29. We want to find Y, hence
d(060) and hence b0 •
L
X
Now n>. = 2d Sin 0, where n = 1 ( 1st order spacing) in this case.
- " d----- -
for Cu KO(' radiation ~ = 1. 54056
therefore if rreasure L we can find ..P 29.
Fran (3) Y = 59.98° 20 + ~o L
but want e, not 28, e = 59 •98 + 40 2
3 ~ but b0 = 6 x d(060) = ~--~ = 4.62168 L Sin (59.98 +.40 )

223
APPENDIX FIVE

224
TABLE 1
Est.irnated precision and detection limit of major oxides
(Geochemistry Department, University of Cape Town)
Precision (Pr) is expressed as% of average concentration. Detection Limit (DL) expressed as weight% oxide.
OXIDE AVERAGE PR. DL
Fe20 3 5.0 0.3 0.04
MnO 0.2 2.5 0.006
T.02 0.5 l
0.4 0.004
cao 5.0 0.3 0.01
K20 2.5 0.8 0.002
S.02 55.0 l
0.5 0.05
Al203 15.0 0.5 0.03
MgO 4.0 1.0 0.05
Na20 3.0 1.3 0.08

;
l !
225 TABIB 2
Counting errors and detection limits for trace elements analysed by XRF. All data in pµn.
SD (100) SD (10) DL G B
Element
Ba G B
Rb G B
Zr G B
Nb G B
Th G B
Pb G B
y G B
Zn G B
Sr G B
cu G B
Co G B
Ni G B
Cr G B
V G B
= 2 error (95 percent cofidence) at 100 pµn = 2 error at 10 ppn = Detection limit at 99 percent confidence = Granitic matrix = Basaltic matrix
SD (100) SD (10)
2.0 2.0 6.2 4.0
0.6 0.4 0.6 0.5
1.0 0.9 1 • 4 1.2
1.2 1 • 1 1. 6 1.4
0.8 0.5 1. 0 0.7
0.8 0.5 1 .0 0.7
1. 0 0.9 1.2 1.1
0.8 0.5 1. 0 0.7
0.6 0.4 0.6 0.5
1.0 0.8 1. 2 1.0
3.4 3.2 4.4 4.2
1.2 1.0 1. 6 1. 2
1.6 1.2 2.0 1.5
3.0 2.8 3.0 2.8
DL
3 7
0.8 1.0
2.0 2.6
2.3 2.9
1 . 9 2. 1
1. 9 2. 1
1. 9 2.2
1. 0 1.0
0.7 0.9
1. 7 2.0
7 9
2. 1 2.6
2.5 3.1
5.6 5.6
The decimal fractions in the trace elerent data are not significant but have been included in order to allow accurate rounding off.

XIS XICIN3:dd'if

.;..
) .·
!"·
T
' C
I . '
.,, ,.
,__
r .
.
. .
J'
.,. ·
-::
:,
.,
<
..,.,.
'Jo
•
:J
II
I o
0
·1.·
-;
-
-. "'
~ .
J'
•
7 -
r =:
•
....
. _ (
T
... '\
.."
,., --
.._.').
. . ~
::
. ::.
--·
.,. -::
:'
l:..
'\,.
J,
't
"J"•
,r
.
v C
'-.
;,
; . .,.. if• ••••
-( ........
-· .,., '-· .,.,
;,
v'
• ,, C
:
.... -.. ' .
''·
'-'
,·,
. .
.,. .
C
' -· J• ~· . ' '.
+• ••• +
• ~
•• +
• •••••••• +
• ......
r
....
c· C
te
• •
0 ••et.••
t O
•
t-e
o O
I
. . . . .
.. . . .
. . ...
... .
. . . . .

-·\.
: , ...
~ I'
\-:.
-
'"
l
~,
.,. J':
,
..,. .....
_
...
J-·
x.-
-1
' ,. .
,'\.
.:•
H I
t
1 --~
-.
.,,.,.
,:
J ,
• =
:, ... ,
=..
;:r
t..., -~
-
>
-•
.. , .·
. .:
,. __
C
•
..;--.
·· ,
frr.
...
. _,.
".
.,., J>
+
J'•
= •
'-' '\
.•
'\-+
J'•
J'
•
·-"-'
C,.
.•
'\. . . ,.
"'
+
..
C
'
0 •
..
0 •
C
• +
• •
• •
1-•
• ••
+•
• •
• +
• •
• •
+•
•
--·'
.-. ....:
(.)I
I >.
.r--
l"'r
•
t'\.
~co
.....
.. :· -:
'
.,.__
"\.
J.C
.:..
:;
7
-=
•
.. :-
; ~-- ... . : '\
.-
.. ':..
,')
,. . J'•
:_'\
_,
).
~ F
"
-...
.. J,
;.::
r,
.. ..,,. "'' 'v • . . <
J'• "'
,--
J'•
"\. .
--.
"\J
..... . .
. .... .
. . .....
. . . ..
.. .
I\.
C
I I
I I
I •
O
I I
,·
..
I I
• I
I..-
---~
f
... .-r1
I
I -t
I I
·1
I "I
I'
I I
.t
I t
I o
~
t
+ . . + . + . . . . . . .
t +

: ' .
... ' J
-
f\..,.
...
J'
-"
-.
J;
t,.J-
.. ,;,
• .,
...
J,
• .., .
.;,., .J
';
...
;..,
.<.
J:-
•
~ ...
II
ti
' . _.
., ~
· C
i v-
l r
___ .
., .;:
; ...
... U
' -'-
:.;
J•
,. .. ..r
,
,,.
....
~·
IJ•
+ •
.;,·
,::.
o
(
..;:..
.,.-
<
• . ~
-"'
. '\
J•
•·
• ;i;
)
'T,
;::.
•
_,. ....
-'\
.
~·
r..
___ ,,
(, ,~
C
II
,_. II
t• ~ .•
,,,.
•
~
>
-.....
.:>
-"\.
Z.
V
·"\,
"\
-=
"'' 0
• "'' ~·· V:•
t\
. •
,J'
•
.::.'\
.•
" :J'•
"-'
..
\Jl•
+
. ' •••••••
"' '
' ••
+• •••
+ •
•••
-..•
•••
+ •
•••
+ •••• +
.
.. . ,J
"-...
.:;,
.... -+
:,--.-
=· :
..,.,~
J;.
~~
1111
-= .J
:
JJ;:
. ..
....
....
'T
.
,fl.
':./
'
,.. -·.:
+
I ..
= --
.:.:.,
• .c
-f•
.,. 7
.;-
' r
sr;
=:,
• C
.,.
~
••
'fl
.,.
• ....
o,
-:::
t"t
. .,..
,t
;--:
,r.
C•
'V-•
,'\.
.
C
' ~· c.•
. -::,. .
,:, . .
e,
,c,
J .•
" .,
. . . . . .. . " . . . . ..
i

-r,
. _,_
··•J
I .. :
f\
.\..
""
-.;
,
~·· )'
.
.,,N
•'\.
,-
..,_.
'\.•
~-
...
~"'
1111
I
I:::
'
O'
.....
; -J
'
V
1'
... -,l
,. J
'>
~
r:r.
. ' .;
-..: -:
• +
•· T
-'."T
.:.
... ""'
r· .
. .
--· -:, ,r,
c;.,
0.
v-•
~-.
~--.
c
u
.. II -•
.;
I
. .
.....
"-+
cr •
Jl•
~~
('T
•
"-'
• ...
,..>
V
'" =
-,',
;
"\;-
=
.....;
.... --·
-<.
"''
I I
.l.
-.-:
-
C
-.:.
r
f•
~ -.
,T
-C
J.
~:, J-
'\,.
.. - ....
. :
:=-
'\,,
,-. -'\
.
T
_.,.
.,..
,..
C
-'.n
r• .. J
I•
"' . +
J'
C
+
J'•
•
+
.,-..
'1"
• . C
• '.
J•
,
. . · .. . + +
+• .......... +
•••.
~· .............. +
•• •
• +
•.
"-
orz
t I
• •
I I
I t
+
I I
I 4
• I
. +

-· ~
• t
...
'II -. .:• ,J
.).,
; .,
J T
:;:'"\
,,.,.r
i;
.J'-
~"'
.. u
. "
> •
••
. . ~ . .. -' .. ~· . . +
:t
•
....
: ;
<..
• •
-r
..:.::
.,.
-~u
: -.
:; •.
r.
v~
-•
:,
2.
.n•
er\-
--'
"' • ,=
...
r\..
.+
~ ... ~
::.. -
..;,:
, ;:
:-:,
.
. .... ''"
c,
"'
+
.--~
----
'\J
.. . . . .
. . . ...
·--
. • +
+ .. . +
(\J
• +
•••• +
• •
• •
• •
• •
• +
••••
1' ••••
..-...... -
<• •••••••
C
f•
.I'
•
"'
J•
I'\;
,.
C . :,
3
. "+ ~· .. " ..
.:,
-+
I\
, .... ,.,..
. .
.....
' .. :, ..
.....
C
1.-•
J'
. .....
......
......
......
.... .
. + . +
llir
---·
. . . . . +
. + + . -'
·
I l I t 1 -t -I ij !i 'I :± I ' 1

r, .,.,
" = '-'
''
C "'
J'•
-· ...
,_ "' r .,.
. ... •J
IJ• ........................ +
• ......... +
• •••
+• ..... .
..: -
:
:J",
'\.-
,::: ""
'< v
· .,
.,
-· -
. :;:
; . -
• I
• r
:,.
·'-'-.
; ·~
' .
• ,.':.
J') ""
'' .,_
, ..
-~-
....
r,
-.:
... :
.c ~
-
" J'
.. . c, ... J
'•
0 • . .
cf•
.. ".
~ . . ,, . . J
•
,..,
._-"
\.J,
....
r.,
:,-:;
'\
.
"\.
+ ..................... .
. ..
·-