The RV Dr Fridtjof Nansen in the Western Indian Ocean
255
The RV Dr Fridtjof Nansen in the Western Indian Ocean Voyages of marine research and capacity development 1975 to 2016
-
Upload
khangminh22 -
Category
Documents
-
view
2 -
download
0
Transcript of The RV Dr Fridtjof Nansen in the Western Indian Ocean
The RV Dr Fridtjof Nansen in the Western Indian Ocean
Voyages of marine research and capacity development
1975 to 2016
The “Nansen book” on the voyages of the iconic research ship, Dr Fridtjof Nansen, documents how marine research in the Western Indian Ocean evolved from exploratory surveys in the 1970s to
fi nd new fi sheries stocks, to the present ecosystem surveys in support of bett er fi sheries management. The book provides a rare glimpse into the practi cal realiti es of conducti ng research at sea. It also shows how ocean features, biological producti vity and the abundance and diversity
of marine life forms link together in marine ecosystems, from the Horn of Africa, to southern Mozambique and Madagascar, and eastwards to the tropical islands of Seychelles and Mauriti us.
In parallel with Nansen surveys at sea, scienti fi c capacity development, support for policy development and implementati on of Ecosystems Approaches to Fisheries management (EAF) form
the other pillars of the broader Nansen Programme. The fi nal chapters of the book evaluate the impacts of this programme in the region, and highlight the historic and new emerging challenges
in knowledge and capacity. As such, the book is of strategic importance.
The Nansen book is aimed at the great many people with a passion for the oceans, and what lies beneath the waves. It is also meant for specialist marine scienti sts, fi sheries managers, and policy makers dealing with the use and conservati on of marine resources. Students reading it will gain
insights into how science is conducted on-board a research ship, and how the results can be applied to sustainable fi shing practi ces, and to marine conservati on. Chapters were writt en
by eminent marine scienti sts from the Western Indian Ocean region, counter-balanced by Norwegian scienti sts with long experience of Nansen surveys.
I7652EN/1/08.17
ISBN 978-92-5-109872-1
9 7 8 9 2 5 1 0 9 8 7 2 1
“Few people will deny that doing marine research in tropical waters from the
deck of a modern research ship sounds idyllic. But not many will know
what the scientists on board actually do, or why they do it.”
Th
e RV
Dr Frid
tjof Nan
sen in
the W
estern In
dian
Ocean
Voy
ages of marin
e research an
d cap
acity d
evelop
men
t

Edited by Johan C. Groeneveld and Kwame A. Koranteng
Voyages of marine research and capacity development
The RV Dr Fridtjof Nansen in the Western Indian Ocean
The designations employed and the presentation of material in this information product do not imply the expression of any opinion whatsoever on the part of the Food and Agriculture Organization of the United Nations (FAO) concerning the legal or development status of any country, territory, city or area or of its authorities, or concerning the delimitation of its frontiers or boundaries. The mention of specific companies or products of manufacturers, whether or not these have been patented, does not imply that these have been endorsed or recommended by FAO in preference to others of a similar nature that are not mentioned.
The views expressed in this information product are those of the author(s) and do not necessarily reflect the views or policies of FAO.
ISBN 978-92-5-109872-1
© FAO, 2017
FAO encourages the use, reproduction and dissemination of material in this information product. Except where otherwise indicated, material may be copied, downloaded and printed for private study, research and teaching purposes, or for use in non-commercial products or services, provided that appropriate acknowledgement of FAO as the source and copyright holder is given and that FAO’s endorsement of users’ views, products or services is not implied in any way.
All requests for translation and adaptation rights, and for resale and other commercial use rights, should be made via www.fao.org/contact-us/licence-request or addressed to [email protected].
FAO information products are available on the FAO website (www.fao.org/publications) and can be purchased through [email protected].
This publication has been printed using selected products and processes so as to ensure minimal environmental impact and to promote sustainable forest management.
Groeneveld, J.C. & Koranteng, K.A. (Eds). 2017. The RV Dr Fridtjof Nansen in the Western Indian Ocean: Voyages of marine research and capacity development. FAO. Rome, Italy.
Table of ContentsAbout the editors.............................................................................................................................................................iv
Authors.................................................................................................................................................................................v
Reviewers..........................................................................................................................................................................vii
Foreword.......................................................................................................................................................................... ix
Preface................................................................................................................................................................................xi
Acknowledgements.....................................................................................................................................................xiii
Chapter 1: The Nansen – more than just a research ship................................................................................1
Johan Groeneveld, Kwame Koranteng and Julius Francis
Chapter 2: Historical overview of the Nansen Programme.............................................................................9
Gabriella Bianchi, Kwame Koranteng and Tore Strømme
Chapter 3: Study area, vessels and surveys.........................................................................................................23
Bernadine Everett
Chapter 4: Physical oceanography.........................................................................................................................37
Issufo Halo, Bernardino Malauene and Marek Ostrowski
Chapter 5: Ocean productivity................................................................................................................................55
Jenny Huggett and Margareth Kyewalyanga
Chapter 6: Pelagic resources based on acoustic recordings and trawl sampling...................................81
Jens-Otto Krakstad, Cosmas Munga and Tore Strømme
Chapter 7: Demersal resources based on bottom trawl and other sampling methods.......................101
Sean Fennessy, Jens-Otto Krakstad, Johan Groeneveld, Gabriella Bianchi and Bernadine Everett
Chapter 8: Impact on science, capacity development, policy and fisheries management...............125
Julius Francis, Kwame Koranteng, Magnus Ngoile, Tore Strømme and Dixon Waruinge
Chapter 9: The Nansen Programme in the Western Indian Ocean — a synthesis of results..........143
Johan Groeneveld, Kwame Koranteng, Gabriella Bianchi and Julius Francis
Chapter 10: The way forward — where the Nansen Programme should focus in future.................161
Julius Francis, Kwame Koranteng, Gabriella Bianchi and Johan Groeneveld
Appendix for Chapter 3..............................................................................................................................................175
Appendix for Chapter 4..............................................................................................................................................177
Appendix for Chapter 5..............................................................................................................................................189
Appendix for Chapter 6..............................................................................................................................................217
Appendix for Chapter 7..............................................................................................................................................221
About the editors
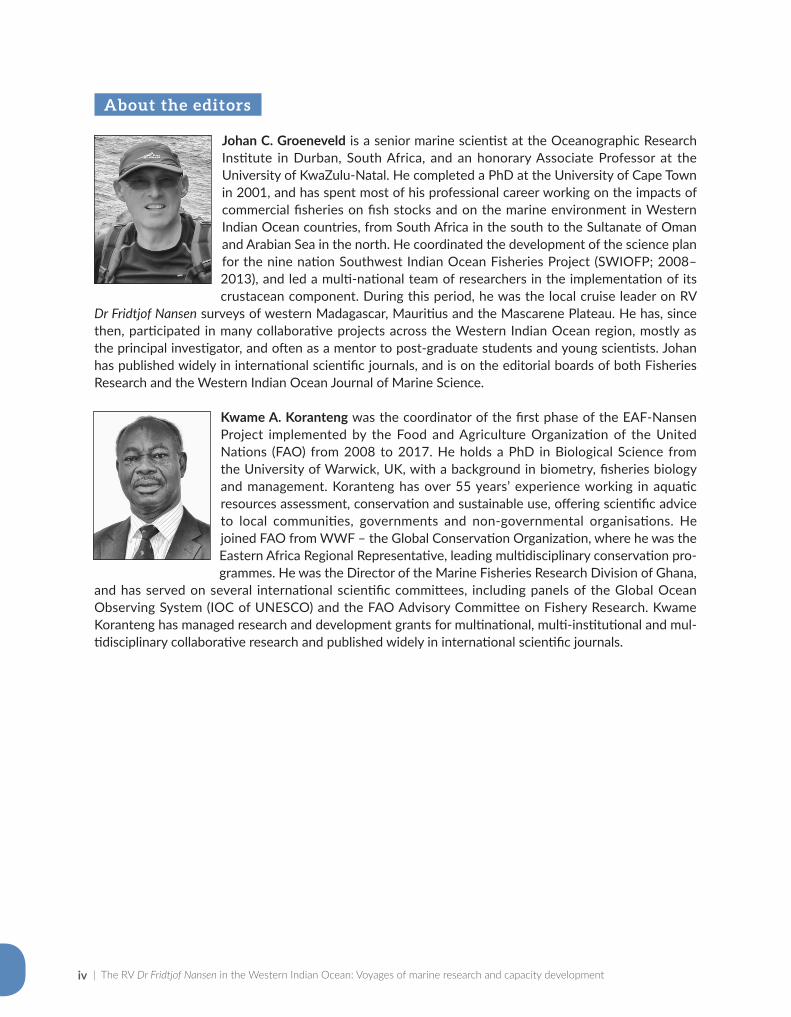
Johan C. Groeneveld is a senior marine scientist at the Oceanographic Research Institute in Durban, South Africa, and an honorary Associate Professor at the University of KwaZulu-Natal. He completed a PhD at the University of Cape Town in 2001, and has spent most of his professional career working on the impacts of commercial fisheries on fish stocks and on the marine environment in Western Indian Ocean countries, from South Africa in the south to the Sultanate of Oman and Arabian Sea in the north. He coordinated the development of the science plan for the nine nation Southwest Indian Ocean Fisheries Project (SWIOFP; 2008–2013), and led a multi-national team of researchers in the implementation of its crustacean component. During this period, he was the local cruise leader on RV
Dr Fridtjof Nansen surveys of western Madagascar, Mauritius and the Mascarene Plateau. He has, since then, participated in many collaborative projects across the Western Indian Ocean region, mostly as the principal investigator, and often as a mentor to post-graduate students and young scientists. Johan has published widely in international scientific journals, and is on the editorial boards of both Fisheries Research and the Western Indian Ocean Journal of Marine Science.
Kwame A. Koranteng was the coordinator of the first phase of the EAF-Nansen Project implemented by the Food and Agriculture Organization of the United Nations (FAO) from 2008 to 2017. He holds a PhD in Biological Science from the University of Warwick, UK, with a background in biometry, fisheries biology and management. Koranteng has over 55 years’ experience working in aquatic resources assessment, conservation and sustainable use, offering scientific advice to local communities, governments and non-governmental organisations. He joined FAO from WWF – the Global Conservation Organization, where he was the Eastern Africa Regional Representative, leading multidisciplinary conservation pro-grammes. He was the Director of the Marine Fisheries Research Division of Ghana,
and has served on several international scientific committees, including panels of the Global Ocean Observing System (IOC of UNESCO) and the FAO Advisory Committee on Fishery Research. Kwame Koranteng has managed research and development grants for multinational, multi-institutional and mul-tidisciplinary collaborative research and published widely in international scientific journals.
| The RV Dr Fridtjof Nansen in the Western Indian Ocean: Voyages of marine research and capacity developmentiv
Authors
Gabriella Bianchi Fisheries and Aquaculture Department, Food and Agriculture Organization of the United Nations, Viale delle Terme di Caracalla, 00153 Rome, Italy
Bernadine I. Everett Oceanographic Research Institute, South African Association for Marine Biological Research, 1 King Shaka Avenue, PO Box 10712, Marine Parade, Durban 4056, South Africa
Sean T. Fennessy Oceanographic Research Institute, South African Association for Marine Biological Research, 1 King Shaka Avenue, PO Box 10712, Marine Parade, Durban 4056, South Africa; School of Life Sciences, University of KwaZulu-Natal, Westville Campus, Durban 4000, P. Bag 54001, South Africa
Julius Francis Western Indian Ocean Marine Science Association, Mizingani Street, House No. 13644/10, PO Box 3298 Zanzibar, United Republic of Tanzania; Department of Aquatic Sciences and Fisheries Technology, University of Dar es Salaam, PO Box 35091, Dar es Salaam, United Republic of Tanzania
Johan C. Groeneveld Oceanographic Research Institute, South African Association for Marine Biological Research, 1 King Shaka Avenue, PO Box 10712, Marine Parade, Durban 4056, South Africa; School of Life Sciences, University of KwaZulu-Natal, Westville Campus, Durban 4000, P. Bag 54001, South Africa
Issufo Halo Department of Conservation and Marine Sciences, Faculty of Applied Sciences, Cape Peninsula University of Technology, Cape Town Campus, 8000, South Africa; Nansen-Tutu Center for Marine Environmental Research, Department of Oceanography, University of Cape Town 7700, South Africa
Jenny Huggett Oceans and Coastal Research, Department of Environmental Affairs, P. Bag X4390, Cape Town 8000, South Africa;Marine Research Institute, Department of Biological Sciences, University of Cape Town, P. Bag X3, Rondebosch 7701, South Africa
Kwame A. Koranteng Fisheries and Aquaculture Department, Food and Agriculture Organization of the United Nations, Viale delle Terme di Caracalla, 00153 Rome, Italy
Jens-Otto Krakstad Institute of Marine Research, Centre for Development Cooperation in Fisheries, Postboks 1870, Nordnes, N-5817 Bergen, Norway
vAuthors |
Margareth S. Kyewalyanga Institute of Marine Sciences, University of Dar es Salaam, PO Box 668, Zanzibar, United Republic of Tanzania
Bernardino S. Malauene Instituto Nacional de Investigação Pesqueira (IIP), Av. Mao Tse Tung 389, PO Box 4603, Maputo, Mozambique
Cosmas N. Munga Department of Environment and Health Sciences, Marine and Fisheries Programme, Technical University of Mombasa, Tom Mboya Avenue, PO Box 90420 - 80100, Mombasa, Kenya
Magnus A.K. Ngoile Department of Aquatic Sciences and Fisheries Technology, University of Dar es Salaam, PO Box 35091, Dar es Salaam, United Republic of Tanzania
Marek Ostrowski Institute of Marine Research, Postboks 1870, Nordnes, N-5817 Bergen, Norway;Bjerknes Centre for Climate Research, Allégaten 70, N-5007 Bergen, Norway
Tore Strømme Institute of Marine Research, Centre for Development Cooperation in Fisheries, Postboks 1870, Nordnes, N-5817 Bergen, Norway
Dixon Waruinge Secretariat for the Nairobi Convention, Division of Environmental Policy Implementation, United Nations Environment Programme, PO Box 30552 (00100), Nairobi, Kenya
| The RV Dr Fridtjof Nansen in the Western Indian Ocean: Voyages of marine research and capacity developmentvi
viiReviewers |
Reviewers
Johann Augustyn South African Deepsea Trawl Industry Association, Cape Town, South Africa
Manuel Barange Food and Agriculture Organization of the United Nations, Rome, Italy
Gabriella Bianchi Food and Agriculture Organization of the United Nations, Rome, Italy
Poul Degnbol Boldhusgade 2, 1062 Copenhagen K, Denmark
Wayne Goschen Nelson Mandela University, Port Elizabeth, South Africa
Antonio Hoguane Eduardo Mondlane University, Quelimane, Mozambique
Dave Japp CapFish, Cape Town, South Africa
Melckzedeck Osore Kenya Marine and Fisheries Research Institute, Mombasa, Kenya
Jorge Santos University of Tromso, Tromso, Norway
Frank Shillington University of Cape Town, Cape Town, South Africa
Reidar Toresen Institute of Marine Research, Bergen, Norway
Rudy van der Elst Oceanographic Research Institute, Durban, South Africa
Hans Verheye Department of Environmental Affairs, Cape Town, South Africa
David Vousden Rhodes University, Grahamstown, South Africa

| The RV Dr Fridtjof Nansen in the Western Indian Ocean: Voyages of marine research and capacity developmentviii
ixForeword |
ForewordMarine scientists and oceanographers from many countries have cooperated on research in the Indian Ocean since the end of the 1950s. This collaboration stemmed from the International Indian Ocean Expedition (IIOE), which evolved into a major international venture, attracting roughly 40 research ves-sels from 20 countries, between 1959 and 1965. Partly as a consequence of this outcome, the sec-ond session of the FAO Committee on Fisheries (COFI), in 1968, recommended the establishment of an Indian Ocean Fishery Commission (IOFC).
Experience gained from the first Norwegian fisheries cooperation with the Indian State of Kerala (1952–1972) highlighted the need – and importance – of research and trial fishing in development cooperation in fisheries. This was an area in which Norway had expertise that could be shared. In 1970 Norad offered to build a research vessel for use by the FAO Fisheries Department, with operational costs to be shared between the two parties. The research vessel (RV) Dr Fridtjof Nansen was then built, and began opera-tions in 1975. Nine of its first ten years (1975–1984) were spent in the Indian Ocean.
The United Nations Law of the Sea negotiations during the 1970s made it clear that coastal states would eventually be able to establish exclusive economic zones (EEZ) up to 200 nm from the coastline. This would give the states ownership of resources inside the EEZ, but also the responsibility to manage them sustainably. Knowledge about the quantity and extent of resources within 200 nm of the shore thus became paramount. The Nansen surveys in the Western Indian Ocean showed, inter alia, that the abun-dance of marine fisheries resources in the EEZs of riparian countries were relatively modest, a finding that prevented over-investment in the fisheries sector.
Norway has retained close ties with several East African states following their independence in the early 1960s, and marine, maritime and fisheries issues have been important elements in Norad’s development cooperation with the countries in question.
Since 2006 the EAF-Nansen Project has stepped up Norwegian fisheries research and management cooperation with Western Indian Ocean states. The 2015 Nansen survey from Jakarta, Indonesia to Durban, South Africa, closely preceded the Second International Indian Ocean Expedition, some 50 years after the first. Norad was particularly pleased to see so many African scientists participating in the 2015 Nansen survey, unlike during the last IIOE when there were so few. The link that the survey has created between marine research and scientists on both sides of the Indian Ocean is also heartwarming. I hope that the new Nansen Programme will continue to support research and management on marine resources to the benefit of coastal states bordering the Indian Ocean, and that the third RV Dr Fridtjof Nansen will provide a further platform for international cooperation on ocean sustainability long into the future.
Mr Jon Lomøy Director-General Norwegian Agency for Development Cooperation (Norad)Oslo, Norway, May 2017

| The RV Dr Fridtjof Nansen in the Western Indian Ocean: Voyages of marine research and capacity developmentx
xiPreface |
PrefaceFew people will deny that doing marine science in tropical waters from the deck of a modern research ship sounds idyllic. But not many will know what the scientists on board actually do, and why they do it. The marine research vessel (RV) Dr Fridtjof Nansen is a case in point – it is an iconic presence in the coastal waters and ports of many developing countries around the world, where its expeditions have spanned a period of more than four decades. In many of these developing countries, the accumulated knowledge of fisheries, biodiversity, ocean productivity and ecosystems are now used by governments to better manage marine resources. In this book, we review the Nansen surveys in one of the least-known ocean regions of the world: the Western Indian Ocean. The origin and history of the Nansen Programme, what the expeditions intended to do, and how it was done, are explained. This book provides a rare glimpse into the practical realities of conducting research at sea, and also shows what its outcomes can be used for.
The book is aimed at the great many people with a passion for the oceans, and what lies beneath the waves. It is also intended for specialist marine scientists, fisheries managers, and policy-makers dealing with the conservation of marine resources on a daily basis. Indirectly and over time, it will also benefit coastal communities depending on the oceans for their livelihoods, through improved resource management strategies. Students reading the book will gain insights into how science is done on board a research ship, and how the results can be applied to marine conservation or sustainable fish-ing practices. Donors will be able to judge whether their contributions have been spent wisely. To reach all these groups, ranging from specialists to lay persons, highly technical explanations or terminology have been replaced with text that is easier to understand, and appendixes have been used for technical information of interest only to specialists.
The golden thread that runs through this book can be summarized in a single word: fish. Initial Nansen surveys identified new fish stocks in order to develop or support fisheries. Trawl nets and acoustic equip-ment were used primarily to sample and estimate fish biomass and species composition. Sampling of whole ecosystems and the ocean features that support them can also be seen as investigating the envi-ronment in which fish interact with other species. For example, ocean currents, temperature gradients and upwelling (Chapter 4) were assessed to determine biological productivity, through recycling nutri-ents into upper ocean layers. These nutrients then give rise to phytoplankton blooms, when sunlight is captured by chlorophyll (Chapter 5), forming the base of the food chains that sustain fish, leading to dense fish schools where productivity is high, and fewer fish where it is low (Chapters 6 and 7). These systems are highly dynamic over space and time, and are influenced by human activities (such as harvest-ing fish) and environmental (climate) change, placing fish habitats and recruitment patterns at risk. The final chapters (Chapters 8 to 10) evaluate scientific outputs and capacity development, and assess how survey information has been used by recipient countries.
Preparation of this book relied mainly on information derived from individual survey reports, available as open-access material. Additional data analyses, based on extracts from the main Nansis (Nansen Survey Information System) database, were performed where it could assist with interpretation – although in-depth spatio-temporal analyses were not attempted. The book has ten chapters that follow the basic structure used in the Nansen survey reports, as these cover the various sampling methods used on the Nansen in a systematic way, i.e. physical oceanography, followed by ocean productivity and the abun-dance of fisheries resources.
| The RV Dr Fridtjof Nansen in the Western Indian Ocean: Voyages of marine research and capacity developmentxii
The authors of individual chapters were selected to provide a balance between Norwegian scientists with extensive experience of the Nansen surveys and regional scientists with on-board experience of surveys in the Western Indian Ocean. In this way the chapters of the book capture different perspectives of the Nansen surveys. From a Norwegian point of view the primary focus is on institutional history, programme development and evolution, objectives in the developing world, technological advances, sampling strat-egies, as well as data and its interpretation. From a regional point of view the important aspects are the use of information in research, capacity development, fisheries management and conservation strate-gies. In itself, the close collaboration fostered between Norwegian and regional scientists during the preparation of the book chapters has further strengthened capacity development. Three authors’ work-shops were held to refine the structure and content of the book, and to ensure a harmonized approach across all chapters. The workshops were held in three different countries, to reflect the regional nature of the work. All chapters were subjected to both an internal review by authors of other chapters at the workshops, and an external peer-review by at least two experts in the relevant field.
Sætersdal et al. (1999) compiled an early synopsis of Nansen surveys carried out in the maritime waters of Africa (including the Western Indian Ocean), Asia and Latin America between 1975 and 1993, by the first vessel named Dr Fridtjof Nansen. The second, more advanced Dr Fridtjof Nansen was used between 1994 and 2016, a 22-year period of unprecedented technological, geopolitical and environmental change on a global scale. The replacement of the second vessel with a third one in 2017 is an opportunity to review the accomplishments of the Nansen Programme to date – to identify strengths, weaknesses and infor-mation gaps to guide future surveys.
Several fora in the Western Indian Ocean region have recommended that such a book would greatly benefit fisheries and environmental management. These fora include sessions of the Southwest Indian Ocean Fisheries Commission (an FAO regional fisheries body) and meetings of partner projects such as the Southwest Indian Ocean Fisheries Project, the UNEP-assisted Nairobi Convention for the Protection, Management and Development of Marine and Coastal Environment of the Western Indian Ocean Region and the UNDP-assisted Agulhas and Somali Currents Large Marine Ecosystem project.
Many people contributed to the development and production of this book and we acknowledge them all. In particular, the authors wish to thank their many colleagues who assisted them with their chapters. We also thank the external reviewers for their comments, and the Norwegian Institute of Marine Research that operates the Nansen and is a custodian of the data and related literature. The project was conducted under the auspices of the EAF-Nansen Project implemented by FAO, funded by the Norwegian Agency for Development Cooperation (Norad).
xiiiAcknowledgements |
AcknowledgementsMany individuals and organizations have contributed immensely to bringing this project and book to fruition. First and foremost, we would like to thank Norad, FAO, IMR and all the officers involved in guiding and implementing the Nansen Programme over the past 40 years. The many contributions from participating scientists and technicians from IMR and the Western Indian Ocean region, as well as the tireless crew of the RV Dr Fridtjof Nansen, during long surveys at sea, are gratefully acknowledged. We thank the governments and private institutions in the countries where surveys took place for supporting the participation of their scientists and technicians on the Nansen surveys. The in-kind contributions made by the institutions employing the authors and editors of this book are much appreciated. The man-agement of the Western Indian Ocean Marine Science Association (WIOMSA) and the Oceanographic Research Institute (ORI) in South Africa merit special mention: the former for coordinating the logistics of this project, the latter for providing scientific and editorial support. The editors would also particu-larly like to mention the influence of Rudy van der Elst (retired, ORI Director and Senior Scientist) for his guidance on how to make this book interesting to a broader audience. It would certainly take too long to mention all the individuals who have helped the authors in different ways, but the authors of Chapter 5 would like to extend their special thanks to Norman Kuring (NASA) for ocean colour images, Carolina Sá (University of Lisbon) for phytoplankton data from the 2007 Mozambique survey, Mark Gibbons and Riaan Cedras (University of the Western Cape, South Africa), Jaclyn Hill (Rhodes University, South Africa) and Zo Rasoloarijao (IH-SM, Madagascar) for sharing their zooplankton data from various surveys. Lucy Scott (ASCLME) and Thomas Bornman (SAEON) are thanked for the information on the status of ASCLME sample analysis and data access, and Bernadine Everett (ORI) for redrawing many of the plots. The authors of Chapter 6 and Chapter 8 also thank Bernadine Everett, Innocent Wanyonyi and Mondy Muhando (WIOMSA) for assisting with data handling and graphics in these chapters, Elaine Heemstra (South African Institute for Aquatic Biodiversity) and Sean Fennessy (ORI) for helping to obtain some of the photos for Chapter 8. The reviewers of the ten chapters of this book were selected based on their fields of expertise; they are gratefully acknowledged for critically reviewing the chapter drafts. Their useful comments were incorporated throughout, resulting in both scientifically verified work and an interesting read. Thanks are also due to Deborah Catena (FAO), Oddgeir Alvheim and Magne Olsen (IMR) for some of the drawings and excellent photos used in this book; to Desiré Pelser for the layout and Marianne Guyonnet (FAO) for her role in preparing the document for publication.

| The RV Dr Fridtjof Nansen in the Western Indian Ocean: Voyages of marine research and capacity developmentxiv
Chapter 1
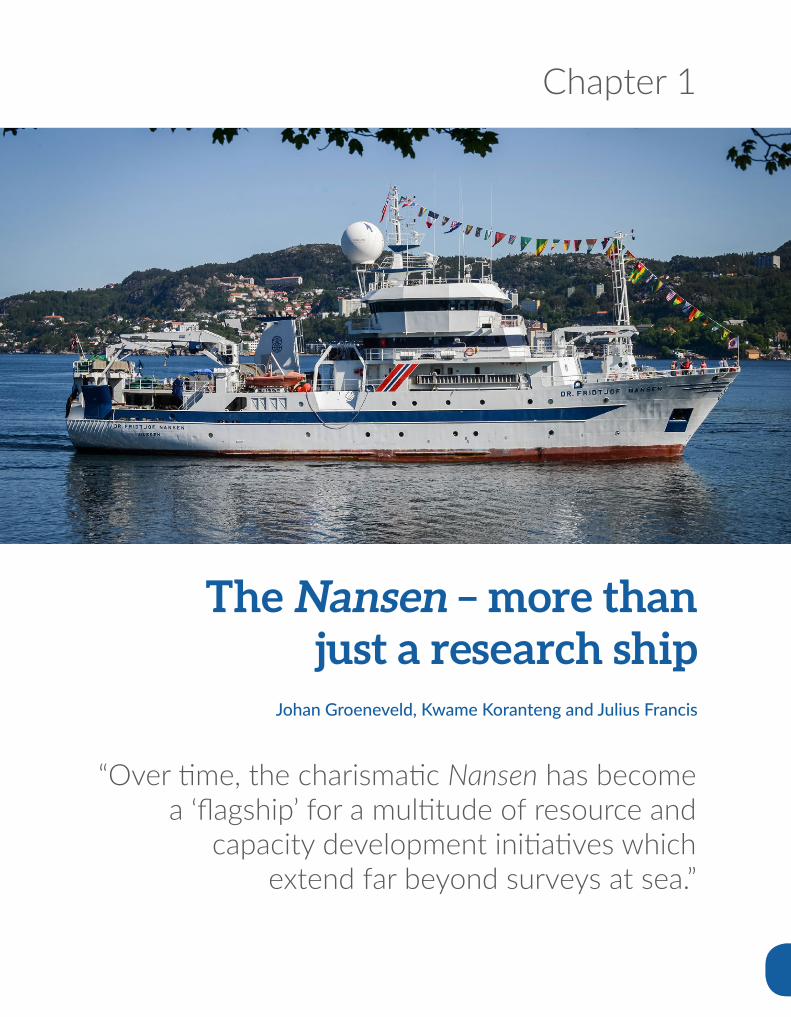
“Over time, the charismatic Nansen has become a ‘flagship’ for a multitude of resource and
capacity development initiatives which extend far beyond surveys at sea.”
The Nansen – more than just a research ship
Johan Groeneveld, Kwame Koranteng and Julius Francis
| The RV Dr Fridtjof Nansen in the Western Indian Ocean: Voyages of marine research and capacity development2
Abstract
The marine research vessel (RV) Dr Fridtjof Nansen is a familiar visitor to the coastal waters of developing countries around the world. Since its first expedition in 1975, to survey fish abundance in an upwelling region of the Western Indian Ocean, the Nansen has returned to this “least known” of the world’s oceans numerous times. The Nansen surveys first focussed on finding new fish resources, but expanded later to sample whole ecosystems and complex oceanographic processes. Over time, the charismatic Nansen has become a “flagship” for a multitude of resource and capacity development initiatives, extending far beyond surveys at sea. Along with the Nansen surveys, these initiatives form part of the broader Nansen Programme (after 2006 the EAF-Nansen Project), a cooperative development programme shared by the Norwegian government and the FAO. We showcase the research done to discover new resources, and to decipher the linkages between fish abundance, ocean productivity, and the oceanographic processes that maintain ecosystems. The review shows the enduring impact of the Nansen Programme on fisheries and marine science in the Western Indian Ocean, and highlights crucial gaps in information. Based on past experience, recommendations for future work are made. The review coincides with the transition from the EAF-Nansen Project (2006–2016) to the new and enlarged EAF-Nansen Programme in 2017, and with the launch of a new ship, the third RV Dr Fridtjof Nansen, better-equipped and technologically more advanced than its predecessors.
Previous page: The second RV Dr Fridtjof Nansen returning to Bergen in 2016 after 22 years of service in developing countries. © Kjartan Mæstad
Chapter 1: The Nansen – more than just a research ship | 3
1.1 Introduction
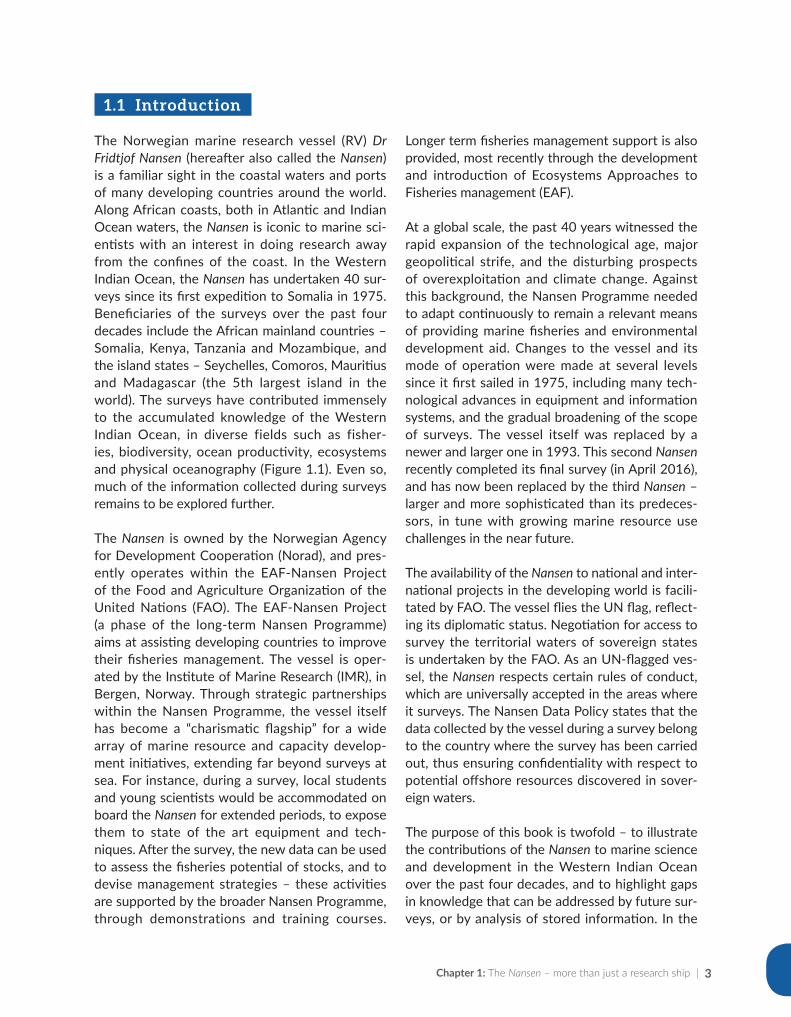
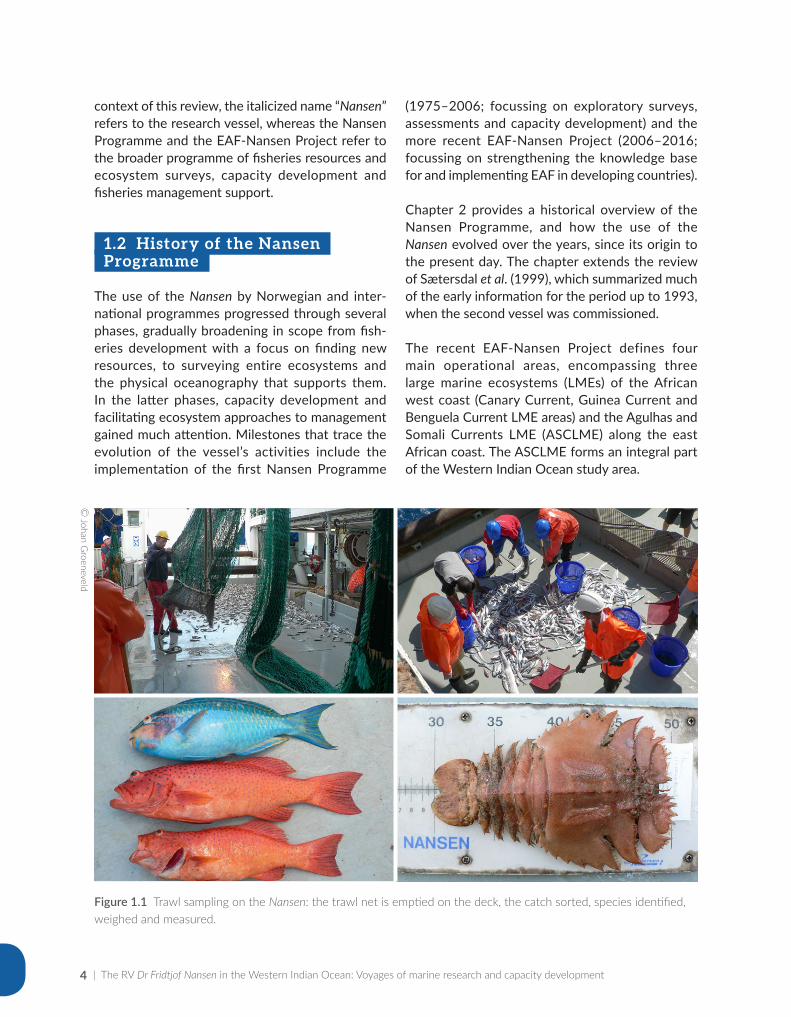
The Norwegian marine research vessel (RV) Dr Fridtjof Nansen (hereafter also called the Nansen) is a familiar sight in the coastal waters and ports of many developing countries around the world. Along African coasts, both in Atlantic and Indian Ocean waters, the Nansen is iconic to marine sci-entists with an interest in doing research away from the confines of the coast. In the Western Indian Ocean, the Nansen has undertaken 40 sur-veys since its first expedition to Somalia in 1975. Beneficiaries of the surveys over the past four decades include the African mainland countries – Somalia, Kenya, Tanzania and Mozambique, and the island states – Seychelles, Comoros, Mauritius and Madagascar (the 5th largest island in the world). The surveys have contributed immensely to the accumulated knowledge of the Western Indian Ocean, in diverse fields such as fisher-ies, biodiversity, ocean productivity, ecosystems and physical oceanography (Figure 1.1). Even so, much of the information collected during surveys remains to be explored further.
The Nansen is owned by the Norwegian Agency for Development Cooperation (Norad), and pres-ently operates within the EAF-Nansen Project of the Food and Agriculture Organization of the United Nations (FAO). The EAF-Nansen Project (a phase of the long-term Nansen Programme) aims at assisting developing countries to improve their fisheries management. The vessel is oper-ated by the Institute of Marine Research (IMR), in Bergen, Norway. Through strategic partnerships within the Nansen Programme, the vessel itself has become a “charismatic flagship” for a wide array of marine resource and capacity develop-ment initiatives, extending far beyond surveys at sea. For instance, during a survey, local students and young scientists would be accommodated on board the Nansen for extended periods, to expose them to state of the art equipment and tech-niques. After the survey, the new data can be used to assess the fisheries potential of stocks, and to devise management strategies – these activities are supported by the broader Nansen Programme, through demonstrations and training courses.
Longer term fisheries management support is also provided, most recently through the development and introduction of Ecosystems Approaches to Fisheries management (EAF).
At a global scale, the past 40 years witnessed the rapid expansion of the technological age, major geopolitical strife, and the disturbing prospects of overexploitation and climate change. Against this background, the Nansen Programme needed to adapt continuously to remain a relevant means of providing marine fisheries and environmental development aid. Changes to the vessel and its mode of operation were made at several levels since it first sailed in 1975, including many tech-nological advances in equipment and information systems, and the gradual broadening of the scope of surveys. The vessel itself was replaced by a newer and larger one in 1993. This second Nansen recently completed its final survey (in April 2016), and has now been replaced by the third Nansen – larger and more sophisticated than its predeces-sors, in tune with growing marine resource use challenges in the near future.
The availability of the Nansen to national and inter-national projects in the developing world is facili-tated by FAO. The vessel flies the UN flag, reflect-ing its diplomatic status. Negotiation for access to survey the territorial waters of sovereign states is undertaken by the FAO. As an UN-flagged ves-sel, the Nansen respects certain rules of conduct, which are universally accepted in the areas where it surveys. The Nansen Data Policy states that the data collected by the vessel during a survey belong to the country where the survey has been carried out, thus ensuring confidentiality with respect to potential offshore resources discovered in sover-eign waters.
The purpose of this book is twofold – to illustrate the contributions of the Nansen to marine science and development in the Western Indian Ocean over the past four decades, and to highlight gaps in knowledge that can be addressed by future sur-veys, or by analysis of stored information. In the
| The RV Dr Fridtjof Nansen in the Western Indian Ocean: Voyages of marine research and capacity development4
context of this review, the italicized name “Nansen” refers to the research vessel, whereas the Nansen Programme and the EAF-Nansen Project refer to the broader programme of fisheries resources and ecosystem surveys, capacity development and fisheries management support.
1.2 History of the Nansen Programme
The use of the Nansen by Norwegian and inter-national programmes progressed through several phases, gradually broadening in scope from fish-eries development with a focus on finding new resources, to surveying entire ecosystems and the physical oceanography that supports them. In the latter phases, capacity development and facilitating ecosystem approaches to management gained much attention. Milestones that trace the evolution of the vessel’s activities include the implementation of the first Nansen Programme
(1975–2006; focussing on exploratory surveys, assessments and capacity development) and the more recent EAF-Nansen Project (2006–2016; focussing on strengthening the knowledge base for and implementing EAF in developing countries).
Chapter 2 provides a historical overview of the Nansen Programme, and how the use of the Nansen evolved over the years, since its origin to the present day. The chapter extends the review of Sætersdal et al. (1999), which summarized much of the early information for the period up to 1993, when the second vessel was commissioned. The recent EAF-Nansen Project defines four main operational areas, encompassing three large marine ecosystems (LMEs) of the African west coast (Canary Current, Guinea Current and Benguela Current LME areas) and the Agulhas and Somali Currents LME (ASCLME) along the east African coast. The ASCLME forms an integral part of the Western Indian Ocean study area.
Figure 1.1 Trawl sampling on the Nansen: the trawl net is emptied on the deck, the catch sorted, species identified, weighed and measured.
© Johan G
roeneveld
Chapter 1: The Nansen – more than just a research ship | 5
1.3 The Western Indian Ocean – geographic scope, oceanography and natural resources
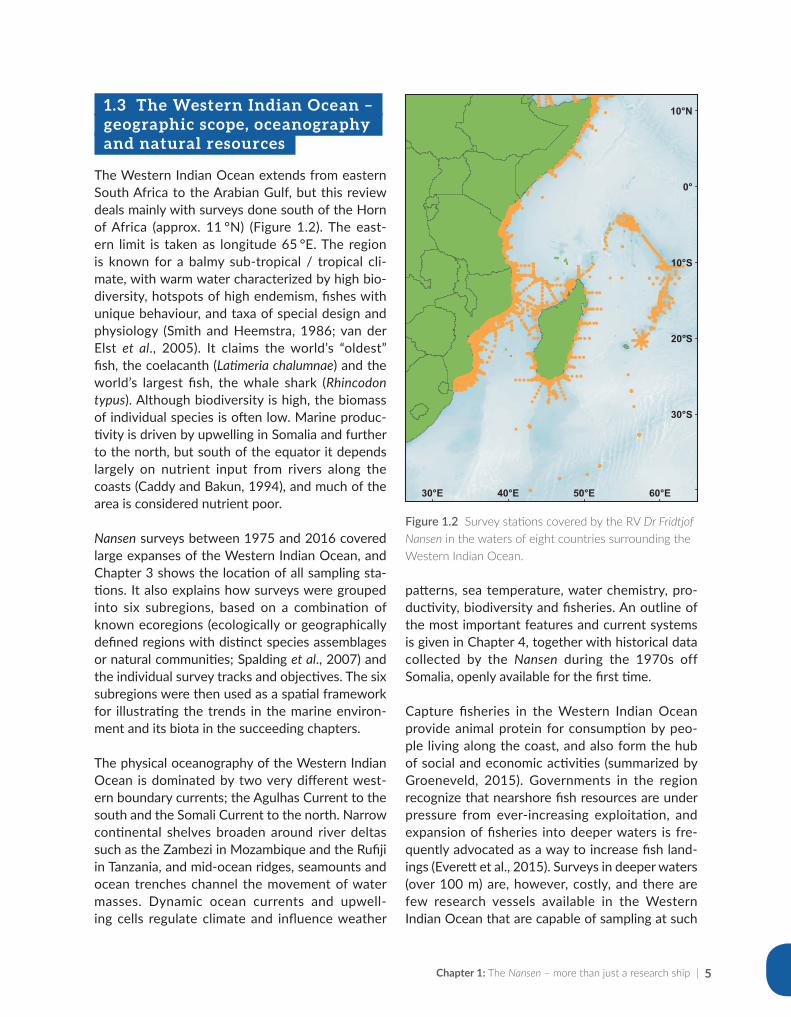
The Western Indian Ocean extends from eastern South Africa to the Arabian Gulf, but this review deals mainly with surveys done south of the Horn of Africa (approx. 11 °N) (Figure 1.2). The east-ern limit is taken as longitude 65 °E. The region is known for a balmy sub-tropical / tropical cli-mate, with warm water characterized by high bio-diversity, hotspots of high endemism, fishes with unique behaviour, and taxa of special design and physiology (Smith and Heemstra, 1986; van der Elst et al., 2005). It claims the world’s “oldest” fish, the coelacanth (Latimeria chalumnae) and the world’s largest fish, the whale shark (Rhincodon typus). Although biodiversity is high, the biomass of individual species is often low. Marine produc-tivity is driven by upwelling in Somalia and further to the north, but south of the equator it depends largely on nutrient input from rivers along the coasts (Caddy and Bakun, 1994), and much of the area is considered nutrient poor.
Nansen surveys between 1975 and 2016 covered large expanses of the Western Indian Ocean, and Chapter 3 shows the location of all sampling sta-tions. It also explains how surveys were grouped into six subregions, based on a combination of known ecoregions (ecologically or geographically defined regions with distinct species assemblages or natural communities; Spalding et al., 2007) and the individual survey tracks and objectives. The six subregions were then used as a spatial framework for illustrating the trends in the marine environ-ment and its biota in the succeeding chapters.
The physical oceanography of the Western Indian Ocean is dominated by two very different west-ern boundary currents; the Agulhas Current to the south and the Somali Current to the north. Narrow continental shelves broaden around river deltas such as the Zambezi in Mozambique and the Rufiji in Tanzania, and mid-ocean ridges, seamounts and ocean trenches channel the movement of water masses. Dynamic ocean currents and upwell-ing cells regulate climate and influence weather
patterns, sea temperature, water chemistry, pro-ductivity, biodiversity and fisheries. An outline of the most important features and current systems is given in Chapter 4, together with historical data collected by the Nansen during the 1970s off Somalia, openly available for the first time.
Capture fisheries in the Western Indian Ocean provide animal protein for consumption by peo-ple living along the coast, and also form the hub of social and economic activities (summarized by Groeneveld, 2015). Governments in the region recognize that nearshore fish resources are under pressure from ever-increasing exploitation, and expansion of fisheries into deeper waters is fre-quently advocated as a way to increase fish land-ings (Everett et al., 2015). Surveys in deeper waters (over 100 m) are, however, costly, and there are few research vessels available in the Western Indian Ocean that are capable of sampling at such
Figure 1.2 Survey stations covered by the RV Dr Fridtjof Nansen in the waters of eight countries surrounding the Western Indian Ocean.
666666
666
6 6666666
6666666666666666666
6666
66
6 66
666
66666
6
666 6
666 6
66
666
6
66666
66
66666666666666666
66666666
6666
66666
6666666 66666
6666666666
66666666
6666 66 666
66
66666666666666
6666666666666
6666
66 6666666666666
6666666666666666666666666666666666666666 666666
6 666666666666666
66666666666666666 66666
6
666666666666666666666666666666 6666666666666666
666666 6
6666666666666666666666666666666666666666666666
666666666666 6 666666666 6666666666
666 6666666
666666
666666666666666666666666666666666666666666666666666 6666 6666666666 6666666
66666666666666
666
6666666666666666
666666 6666666666
666
66666666666666666666666666666666666666666666666
666666666666666666666666666
66666666666666666666666666666666666666666666666666666666666666666666666666666666666666666666666666666666666666666 6666666666666666666
6666666666666666666666
6666666666666666666666666666666666666666666666666666666666666666666 666666666 66
666666666666666666666
66666666666666666666666666666
6 66666666666666666666666666666666666666666666666666666
6666666666666
666666666666666 66666 6666666
6666666666666666666666666666666
66666666666666666666666666666
6666666666666666666666666666666
6666666666666666666666666666666666666666666 666666 66666666
666666 6666666 66666666666
6666666666666666666
6666666666666666666666666666666666666
66666666666666666666666666666666666666666
6666
66666666 66666666666666666666666666666666666666666666666666666666666
6 6666666666666666666666666666666666666666666666
6666666
6666666666666666666666666666666666666666666666666666666666666666666666666666666666666666666666666666666666666666666666666666666666666666666666666666666666666666666666
66666666666666666666666666666666666666666 666666
6666666666666666666666666666666666666666666666666666666666666666666666666666666666666666666666666
66666
6
6
6 6666666666666666
6
666666
66
66666666666
6666 66
6
66
6666666666666666666
6
6
666666
6666 66
666666666 6 66
6666666
666
6
6
666
66666666
66
66
66666666666666666666666666666666666666666666666
6666666666666
66666666666
666666666666666666 66
666666666 6666666666666666666666666 66666666666666666 6
6
66
66
66
6666
66666
66666666666
666666666666666
66666
6666666 6666
6666 66 6666666
66666 66666666666666666 66666
66666 6666666666666 6666666666666666666666666666666666666666666666666666666666666
666666666
6666
66666
66666
6666 666 6
6666666666
66666
6666
6666
6666666666666
6666
6666
6666
6666 6
6666
6666
6666
6666 666666
666
6666
6666
66666
6666666
66666666666666
6666666
6666666
666666
6666666
66666666666666666666666666666
666666666
6666666
6666666
66666666666666666666666
6666666
66666666666666
6666666
6666666
666666
6666666
66666666666666666666666666666666666666
6666666
6666666
6666666
666666666666666
666 66
6666666666666666666666666666
666666666666666666
6
6666
66666666666666666
66666666
66666666666666666
66666666666
666666666666666666666666666666666666
66666666666666666666666666666666
6666666666666
6666666666666
6666666
6666666 66666666666666
666666 6666
6666666666666
66666 6666666666666666666
66666666666 66 66666666666666666666666666666666666666666666 666666666666666
66666666666666666666666666666666666666666666666666666666666666666666666666666666666666666666666666666666666666666666666
6666
6666
666
6666666666666666666666666666666666666666666666666666666666666666666666666666666666
66666666
666666666
66666666666666666666666666666666666
666666666666666666666666
6666666666 6 6 6 6 6 66666666666
666
66666666666 6666
6666666666666666 6 6 6
6666666 66
6666666 6
6666666666666666
6666666666
66666666
66666666666
66666666666666666666666666666666666666666666666 66
66 666666666666666 66666666666666666666666666 66666
666666666
66666 666 666666666666666666666666666
666666
666666
666666666 6 666666666666666666666666666 6666 666
6666
6666
6 66
66
66666
66666 66
666666666666
66 666 6666666
666666666666
6666666666666666666666666666666666
666
6666
6666666
6666666666666666666666666666666666666666666666
666 6666666666666666666666
6666666666666666666
666666666
66666666
6666666666666666666666
66666666666666666
666666666 6
666666666666666666666666666666666666666666666666666666666666
666666666666666666666666
666666666
6666666666666666666666
666666666
666666666666666 6666
666666
66666666666666
666666666666
6666666666
666666666666666666 6
6
6
6
6
6666666666666666666666666666666666666666666666666666666666
6
66666666666666666666666666666666666 6
66666666666
666666666666666666
6666 666666666666666
6666666666666666 666666666666666666666666666666666666666666666666666666666666666666666666666666666666666666666666666666666666666666666
60°E50°E40°E30°E
10°N
0°
10°S
20°S
30°S
| The RV Dr Fridtjof Nansen in the Western Indian Ocean: Voyages of marine research and capacity development6
depths. The Nansen has partially filled this gap, by undertaking surveys for pelagic and demersal fishes between 1975 and 2016.
Further, the influence of environmental fluctua-tions on fish stocks and ecosystem functioning are weakly understood – a factor exacerbated by global climate variability and predicted tempera-ture, pH and sea level changes. These may affect ocean productivity (Chapter 5), in turn affecting the distribution and abundance of pelagic fishes in the water column (Chapter 6) and demersal fishes and crustaceans on the seafloor (Chapter 7).
1.4 Nansen surveys in the Western Indian Ocean
Nansen surveys in the Western Indian Ocean spanned two periods, from 1975–1990 by the first vessel, and then after a 17 year gap, from 2007–2016 by the second vessel. While the ear-lier surveys were mostly based on country part-nerships, the more recent surveys involved col-laboration with regional programmes such as the Agulhas and Somali Currents Large Marine Ecosystem Project (ASCLME) and the Southwest Indian Ocean Fisheries Project (SWIOFP). Later surveys in the Mozambique Channel generated much data on primary and secondary productivity, as chronicled in Chapter 5, as well as fish biodiver-sity and genetics.
A major reason for the absence of Nansen surveys in the Western Indian Ocean during the 1990s and early 2000s was the focus of the Nansen Programme on other areas during that period. At that time, the programme focussed on Southwest Africa (Namibia, Angola and Atlantic coast of South Africa) and Northwest Africa (Senegal, Gambia, Mauritania and Morocco) (Sætersdal et al., 1999; see Chapter 2). There were no activities in the Western Indian Ocean region during that phase.
The deteriorating security situation in the region after 2007, with piracy threatening shipping off Somalia, Kenya, Tanzania and Seychelles, led to an embargo on the operation of the Nansen in areas
north of 10 °S in the Western Indian Ocean. This constraint scuppered planned regional surveys for the ASCLME and SWIOFP projects after 2008.
Given the size of the second Nansen (56.75 m LOA, 6.9 m draft), it rarely sampled coastal waters at depths of less than 20 m – this meant that fish in these shallow areas would have been under- sampled. The high daily cost of operating a large ship encourages cost-effective sampling, relying on remote sensing and occasional pelagic and demersal trawls. Physical and oceanographic data are collected while steaming, or at set stations, where sophisticated instruments and multinets can take multiple readings or samples while being deployed and retrieved. However, more traditional sampling methods such as setting of traps or long-lines with hooks are generally avoided, because they are considered too time-consuming – and hence, costly.
1.5 Impacts of the Nansen in the Western Indian Ocean
Over a period of four decades, the impact of the Nansen on marine science, fisheries management, and capacity development has been considerable. It can be measured, inter alia, by counting outputs, or following the evolution/modernization of man-agement/governance systems. Some impacts are, however, less measurable, such as the growing confidence with which regional structures are able to address local challenges.
Chapter 8 describes the broad impact of the Nansen on fisheries development, capacity devel-opment, and management strategies, including the Ecosystems Approach to Fisheries, since the programme inception in 1975. The scientific out-put is analysed, through shared projects and the output in peer-reviewed literature. In a synthesis (Chapter 9), the strengths and weaknesses of the Nansen survey programme relative to the needs of the Western Indian Ocean region, are inferred. Finally, Chapter 10 formulates recommendations for future work, in particular to be done by the third RV Dr Fridtjof Nansen, from 2017 onwards.
Chapter 1: The Nansen – more than just a research ship | 7
References
Caddy, J.F. & Bakun, A. 1994. A tentative classification of coastal marine ecosystems based on dominant processes of nutrient supply. Ocean & Coastal Management, 23(3): 201–211.
Everett, B.I., Groeneveld, J.C., Fennessy, S.T., Dias, N., Filipe, O., Zacarias, L., Igulu, M., Kuguru, B., Kimani, E. & Munga, C.N. 2015. Composition and abundance of deep-water crustaceans in the Southwest Indian Ocean: Enough to support trawl fisheries? Ocean & Coastal Management, 111: 50–61.
Groeneveld, J.C. 2015. Chapter 21 – Capture fisheries. In: J. Paula, ed. The Regional State of the Coast Report: Western Indian Ocean, pp. 273–286. Nairobi, Kenya, UNEP–Nairobi Convention and WIOMSA.
Sætersdal, G., Bianchi, G., Strømme, T. & Venema, S.C. 1999. The Dr Fridtjof Nansen Programme. 1975–1993. Rome, Italy, FAO Fisheries Technical Paper.
Smith, M. & Heemstra, P. 1986. Smiths’ Sea Fishes. Johannesburg, South Africa, Macmillan.Spalding, M.D., Fox, H.E., Allen, G.R., Davidson, N., Ferdana, Z.A., Finlayson, M.A.X., Halpern, B.S., Jorge, M.A.,
Lombana, A.L. & Lourie, S.A. 2007. Marine ecoregions of the world: a bioregionalization of coastal and shelf areas. BioScience, 57(7): 573–583.
van der Elst, R., Everett, B., Jiddawi, N., Mwatha, G., Afonso, P.S. & Boulle, D. 2005. Fish, fishers and fisheries of the Western Indian Ocean: their diversity and status. A preliminary assessment. Philosophical Transactions of the Royal Society A: Mathematical, Physical and Engineering Sciences, 363(1826): 263–284.

| The RV Dr Fridtjof Nansen in the Western Indian Ocean: Voyages of marine research and capacity development8
Chapter 2
“The Nansen Programme needed to evolve continuously to remain a relevant means
of providing development aid in marine fisheries research and management.”
Historical overview of the Nansen Programme
Gabriella Bianchi, Kwame Koranteng and Tore Strømme
| The RV Dr Fridtjof Nansen in the Western Indian Ocean: Voyages of marine research and capacity development10
Abstract
The past 40 years witnessed a rapid expansion of the technological age, resulting in increased opportu-nities for exploitation of the oceans and their resources, but also in disturbing prospects of their over-exploitation and depletion. Against this background, the Nansen Programme needed to evolve con-tinuously, to remain a relevant means of providing development aid in marine fisheries research and management. The activities of the programme covered the continental shelf waters of more than 60 countries in Africa, Central America and Southeast Asia, and its scope and objectives evolved through four phases. During Phase 1 (1975–1980), the RV Dr Fridtjof Nansen, a prominent feature of the pro-gramme and key to the achievement of its development objectives, undertook exploratory surveys, to find fish resources in the waters of newly independent states. The 1982 United Nations Law of the Sea Convention allowed for the establishment of Exclusive Economic Zones (EEZ), thus extending mari-time jurisdictions of coastal states to 200 nautical miles from the shore. Phase 2 (1980–1990) provided detailed maps and inventories of fish resources within the EEZs of beneficiary countries. Phase 3 (1990–2006) focussed on capacity development and support for fisheries research and management institu-tions. This phase, which also saw the building of a new research vessel, was limited to Southwest Africa (Benguela Current area) and Northwest Africa, with no activities in the Western Indian Ocean. In Phase 4 (2006–2016), the Nansen Programme was transformed to become the EAF-Nansen Project, man-aged directly by FAO, and with the vessel operating costs co-funded by Norad and beneficiaries. In the Western Indian Ocean, the project supported the Agulhas and Somali Currents Large Marine Ecosystem project, and the Southwest Indian Ocean Fisheries Project. The scope of the surveys expanded to cover issues that are set to become central in future phases – such as ecosystem assessment, marine pollution, and impacts of climate variability and change on fish resources and biodiversity. Strong partnerships with the FAO, national institutions, GEF-funded large marine ecosystems projects and regional fisheries bod-ies have been key to achieving the objectives set by the Nansen Programme.
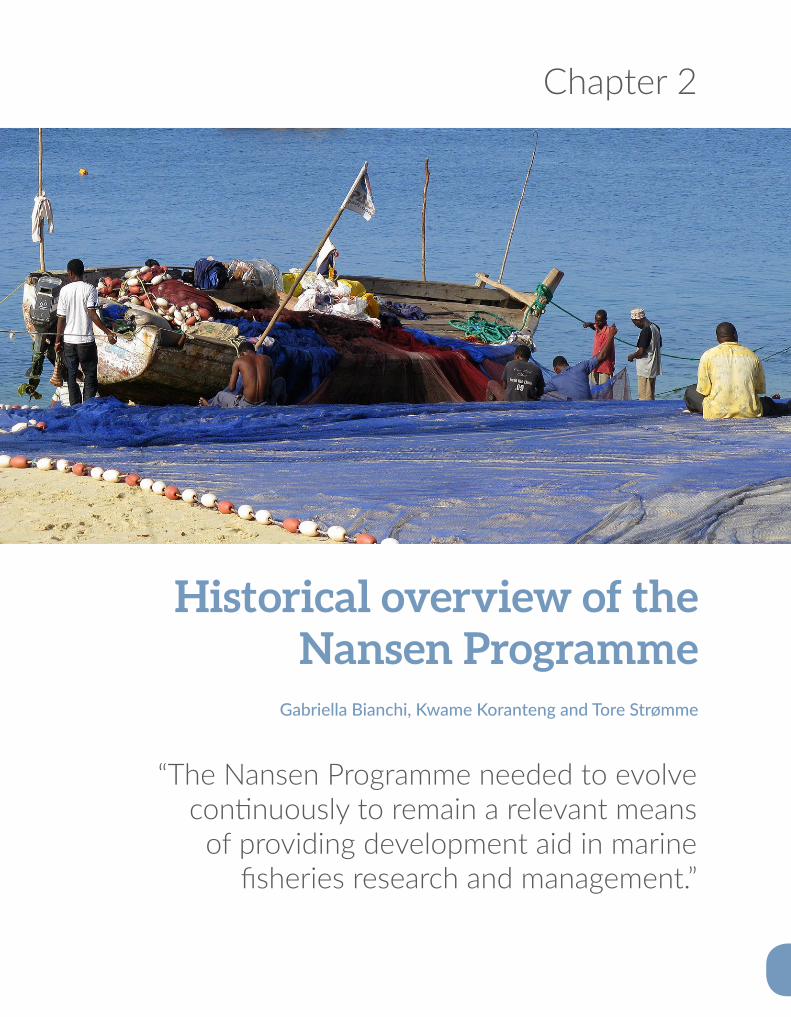
Previous page: Fishers mending their nets after a fishing outing off Zanzibar, Tanzania. © Bernadine Everett
Chapter 2: Historical overview of the Nansen Programme | 11
2.1 Introduction
The idea of supporting developing countries with a research vessel originated in Norway in 1963, and came from experiences gained during the earlier Indo-Norwegian fisheries development project in the 1960s (Sætersdal et al., 1999). At that time, sparse information on fisheries resources and ecosystems hindered the expansion of fisheries in developing countries, where there was a keen interest in developing commercial fish-eries for local marine resources. The importance of reliable information describing fish resources available for exploitation was clear, as this would guide the level of investment required, relative to the stock size and value. Human and financial resources for fisheries research were, however, limited in most developing countries, and required support from the international community. Norway’s position as a leading fishing nation gave rise to an expectation that its government would support the development of sustainable fisheries in countries without the capacity to do so.
A research vessel to survey the waters of devel-oping countries was proposed as a meaningful form of aid. The vessel would be operated by the Norwegian Institute of Marine Research (IMR), able to survey multiple countries in more than one ocean region, and co-operate with the FAO and regional fisheries organizations. This project was put into effect during the early 1970s. The opera-tional costs of the vessel would be shared between FAO and Norway, the former with financial con-tributions from UNDP. In 1974, the research ves-sel named after Dr Fridtjof Nansen, the Norwegian explorer, scientist and humanitarian (Box 2.1), was completed, and what became known as the “Nansen Programme” was established.
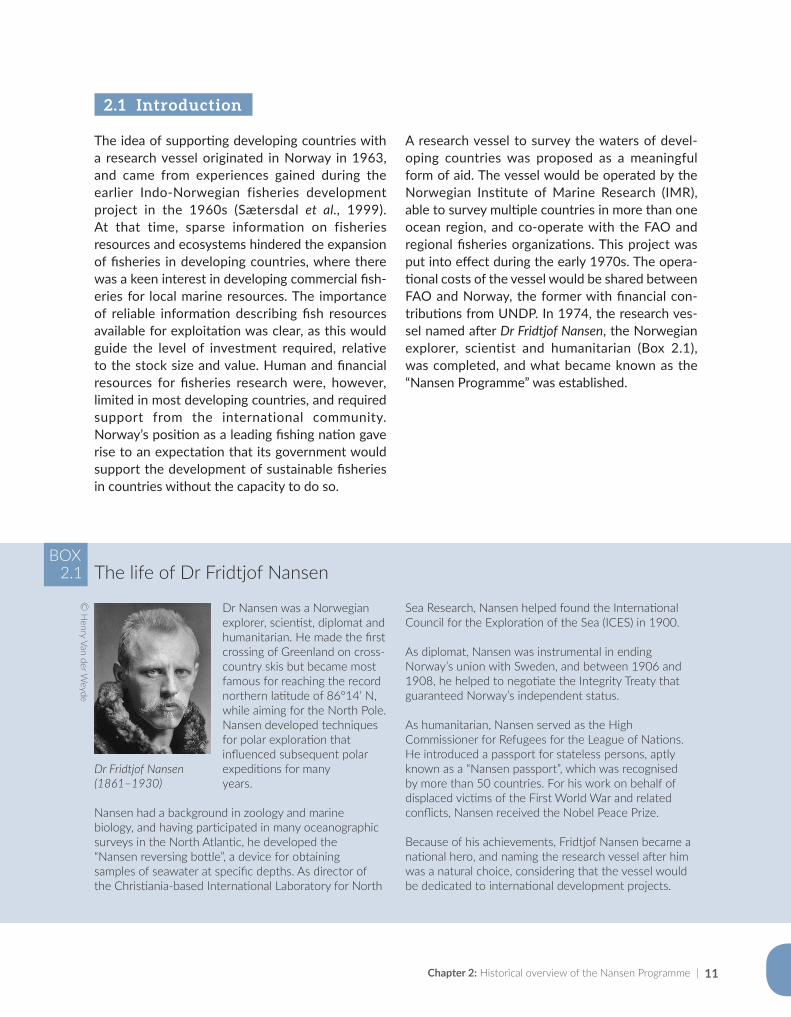
Sea Research, Nansen helped found the International Council for the Exploration of the Sea (ICES) in 1900.
As diplomat, Nansen was instrumental in ending Norway’s union with Sweden, and between 1906 and 1908, he helped to negotiate the Integrity Treaty that guaranteed Norway’s independent status.
As humanitarian, Nansen served as the High Commissioner for Refugees for the League of Nations. He introduced a passport for stateless persons, aptly known as a “Nansen passport”, which was recognised by more than 50 countries. For his work on behalf of displaced victims of the First World War and related conflicts, Nansen received the Nobel Peace Prize.
Because of his achievements, Fridtjof Nansen became a national hero, and naming the research vessel after him was a natural choice, considering that the vessel would be dedicated to international development projects.
Dr Nansen was a Norwegian explorer, scientist, diplomat and humanitarian. He made the first crossing of Greenland on cross-country skis but became most famous for reaching the record northern latitude of 86°14’ N, while aiming for the North Pole. Nansen developed techniques for polar exploration that influenced subsequent polar expeditions for many years.
Nansen had a background in zoology and marine biology, and having participated in many oceanographic surveys in the North Atlantic, he developed the “Nansen reversing bottle”, a device for obtaining samples of seawater at specific depths. As director of the Christiania-based International Laboratory for North
Dr Fridtjof Nansen (1861–1930)
© H
enry Van der Weyde
BOX2.1 The life of Dr Fridtjof Nansen
| The RV Dr Fridtjof Nansen in the Western Indian Ocean: Voyages of marine research and capacity development12
2.2 General objectives and phases of the Nansen Programme
The original goal of the Nansen Programme was to assess and map the living resources available for fisheries development in the Indian Ocean, at that time one of the least known of the world’s oceans. The goals and objectives of the programme evol-ved over time, responding to new global challen ges and the needs of recipient countries.
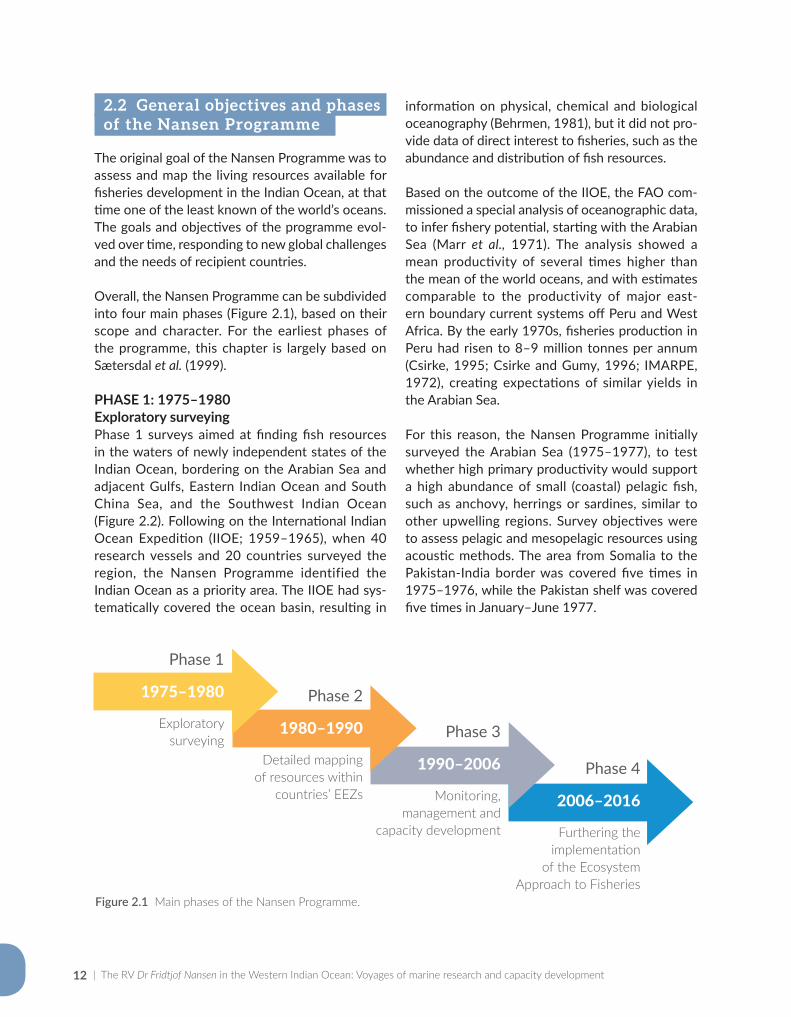
Overall, the Nansen Programme can be subdivided into four main phases (Figure 2.1), based on their scope and character. For the earliest phases of the programme, this chapter is largely based on Sætersdal et al. (1999).
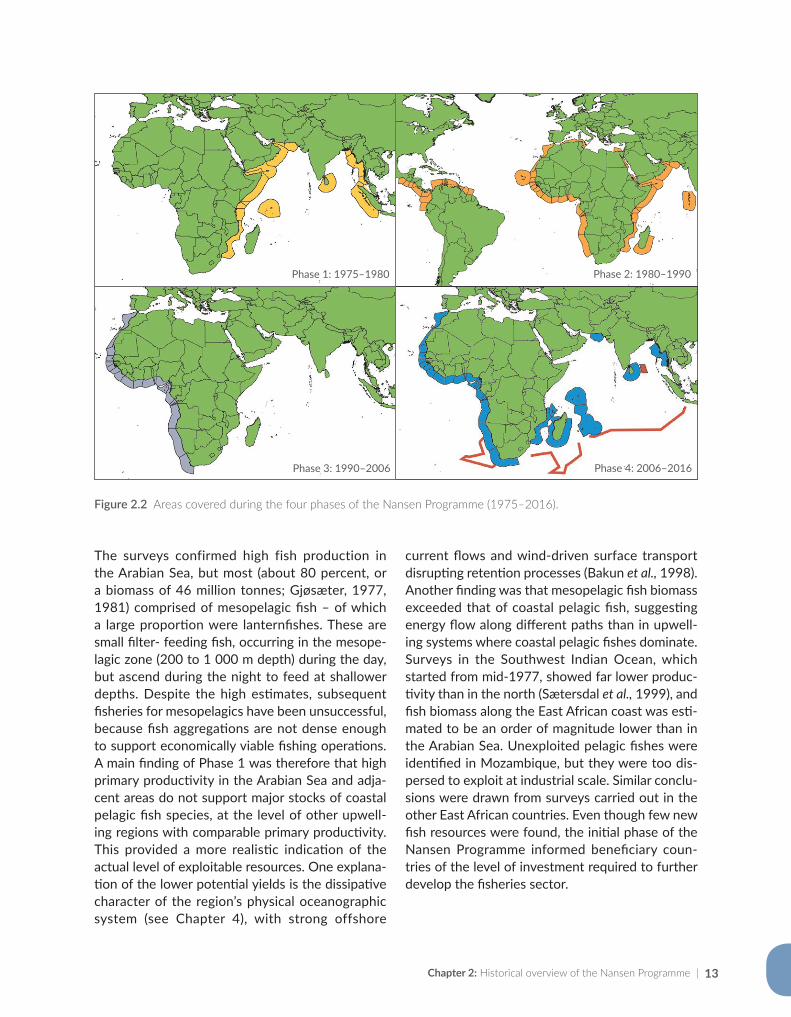
PHASE 1: 1975–1980Exploratory surveying Phase 1 surveys aimed at finding fish resources in the waters of newly independent states of the Indian Ocean, bordering on the Arabian Sea and adjacent Gulfs, Eastern Indian Ocean and South China Sea, and the Southwest Indian Ocean (Figure 2.2). Following on the International Indian Ocean Expedition (IIOE; 1959–1965), when 40 research vessels and 20 countries surveyed the region, the Nansen Programme identified the Indian Ocean as a priority area. The IIOE had sys-tematically covered the ocean basin, resulting in
information on physical, chemical and biological oceanography (Behrmen, 1981), but it did not pro-vide data of direct interest to fisheries, such as the abundance and distribution of fish resources.
Based on the outcome of the IIOE, the FAO com-missioned a special analysis of oceanographic data, to infer fishery potential, starting with the Arabian Sea (Marr et al., 1971). The analysis showed a mean productivity of several times higher than the mean of the world oceans, and with estimates comparable to the productivity of major east-ern boundary current systems off Peru and West Africa. By the early 1970s, fisheries production in Peru had risen to 8–9 million tonnes per annum (Csirke, 1995; Csirke and Gumy, 1996; IMARPE, 1972), creating expectations of similar yields in the Arabian Sea.
For this reason, the Nansen Programme initially surveyed the Arabian Sea (1975–1977), to test whether high primary productivity would support a high abundance of small (coastal) pelagic fish, such as anchovy, herrings or sardines, similar to other upwelling regions. Survey objectives were to assess pelagic and mesopelagic resources using acoustic methods. The area from Somalia to the Pakistan-India border was covered five times in 1975–1976, while the Pakistan shelf was covered five times in January–June 1977.
Figure 2.1 Main phases of the Nansen Programme.
Phase 1
Exploratorysurveying
1975–1980 Phase 2
Detailed mapping of resources within
countries’ EEZs
1980–1990 Phase 3
Monitoring, management and
capacity development
1990–2006 Phase 4
Furthering the implementation
of the Ecosystem Approach to Fisheries
2006–2016
Chapter 2: Historical overview of the Nansen Programme | 13
The surveys confirmed high fish production in the Arabian Sea, but most (about 80 percent, or a biomass of 46 million tonnes; Gjøsæter, 1977, 1981) comprised of mesopelagic fish – of which a large proportion were lanternfishes. These are small filter- feeding fish, occurring in the mesope-lagic zone (200 to 1 000 m depth) during the day, but ascend during the night to feed at shallower depths. Despite the high estimates, subsequent fisheries for mesopelagics have been unsuccessful, because fish aggregations are not dense enough to support economically viable fishing operations. A main finding of Phase 1 was therefore that high primary productivity in the Arabian Sea and adja-cent areas do not support major stocks of coastal pelagic fish species, at the level of other upwell-ing regions with comparable primary productivity. This provided a more realistic indication of the actual level of exploitable resources. One explana-tion of the lower potential yields is the dissipative character of the region’s physical oceanographic system (see Chapter 4), with strong offshore
current flows and wind-driven surface transport disrupting retention processes (Bakun et al., 1998). Another finding was that mesopelagic fish biomass exceeded that of coastal pelagic fish, suggesting energy flow along different paths than in upwell-ing systems where coastal pelagic fishes dominate.Surveys in the Southwest Indian Ocean, which started from mid-1977, showed far lower produc-tivity than in the north (Sætersdal et al., 1999), and fish biomass along the East African coast was esti-mated to be an order of magnitude lower than in the Arabian Sea. Unexploited pelagic fishes were identified in Mozambique, but they were too dis-persed to exploit at industrial scale. Similar conclu-sions were drawn from surveys carried out in the other East African countries. Even though few new fish resources were found, the initial phase of the Nansen Programme informed beneficiary coun-tries of the level of investment required to further develop the fisheries sector.
Figure 2.2 Areas covered during the four phases of the Nansen Programme (1975–2016).
Phase 4: 2006–2016
Phase 2: 1980–1990
Phase 3: 1990–2006
Phase 1: 1975–1980
| The RV Dr Fridtjof Nansen in the Western Indian Ocean: Voyages of marine research and capacity development14
PHASE 2: 1980–1990 Detailed mapping of resources within EEZs of countries Following on the 1982 United Nations Law of the Sea Convention, countries around the world extended their maritime jurisdiction through establishing Exclusive Economic Zones (EEZs; from the coast to 200 nautical miles offshore). The second phase of the Nansen Programme focussed on detailed mapping and taking inventory of fish resources within the EEZs of beneficiary countries. During this phase, the Nansen surveyed the coastal waters of the Western Indian Ocean, Eastern and Western tropical Atlantic, and the Eastern Central Pacific.
In the Western Indian Ocean, the Nansen surveyed the waters of most coastal countries as well as the
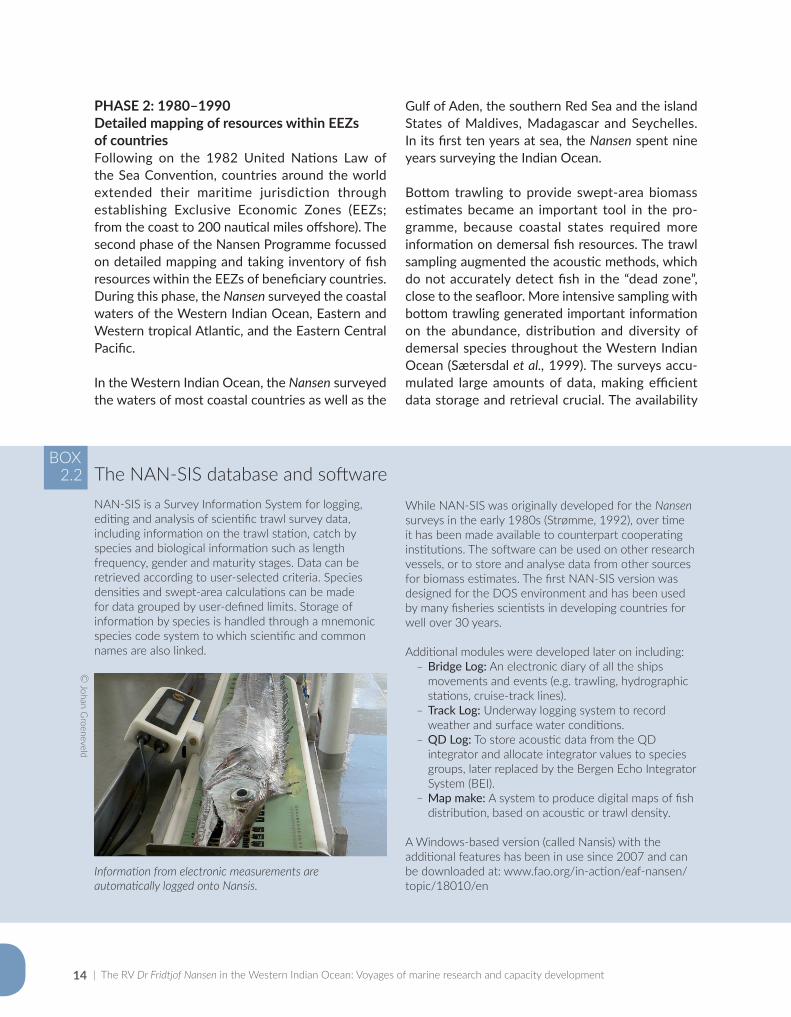
While NAN-SIS was originally developed for the Nansen surveys in the early 1980s (Strømme, 1992), over time it has been made available to counterpart cooperating institutions. The software can be used on other research vessels, or to store and analyse data from other sources for biomass estimates. The first NAN-SIS version was designed for the DOS environment and has been used by many fisheries scientists in developing countries for well over 30 years.
Additional modules were developed later on including: ҽ Bridge Log: An electronic diary of all the ships movements and events (e.g. trawling, hydrographic stations, cruise-track lines).
ҽ Track Log: Underway logging system to record weather and surface water conditions.
ҽ QD Log: To store acoustic data from the QD integrator and allocate integrator values to species groups, later replaced by the Bergen Echo Integrator System (BEI).
ҽ Map make: A system to produce digital maps of fish distribution, based on acoustic or trawl density.
A Windows-based version (called Nansis) with the additional features has been in use since 2007 and can be downloaded at: www.fao.org/in-action/eaf-nansen/topic/18010/en
NAN-SIS is a Survey Information System for logging, editing and analysis of scientific trawl survey data, including information on the trawl station, catch by species and biological information such as length frequency, gender and maturity stages. Data can be retrieved according to user-selected criteria. Species densities and swept-area calculations can be made for data grouped by user-defined limits. Storage of information by species is handled through a mnemonic species code system to which scientific and common names are also linked.
Gulf of Aden, the southern Red Sea and the island States of Maldives, Madagascar and Seychelles. In its first ten years at sea, the Nansen spent nine years surveying the Indian Ocean.
Bottom trawling to provide swept-area biomass estimates became an important tool in the pro-gramme, because coastal states required more information on demersal fish resources. The trawl sampling augmented the acoustic methods, which do not accurately detect fish in the “dead zone”, close to the seafloor. More intensive sampling with bottom trawling generated important information on the abundance, distribution and diversity of demersal species throughout the Western Indian Ocean (Sætersdal et al., 1999). The surveys accu-mulated large amounts of data, making efficient data storage and retrieval crucial. The availability
BOX2.2 The NAN-SIS database and software
© Johan G
roeneveld
Information from electronic measurements are automatically logged onto Nansis.
Chapter 2: Historical overview of the Nansen Programme | 15
of portable computers in the 1980s provided a conducive environment for the development of a purpose-made database for Nansen surveys, called NAN-SIS (Box 2.2).
PHASE 3: 1990–2006Monitoring, management and capacity development In January 1994, a new RV Dr Fridtjof Nansen star ted operations, replacing its older namesake. The Nansen Programme focussed mainly on the southwest African subregion, (Namibia, Angola and western South Africa), in line with Norwegian development policy, and to support Namibia as a newly independent state. Activities included resource and ecosystem monitoring, follow-up research through regional collaboration, and capacity development in fishery research and man-agement. The strengthened regional collaboration between the three countries resulted in the estab-lishment of the BENEFIT (Benguela Environment, Fisheries, Interaction and Training) programme.
BENEFIT significantly increased knowledge of the dynamics of key resources and the processes that support them in the Benguela Current Large Marine Ecosystem (BCLME). Capacity and awareness of environmental monitoring was strengthened (Hampton and Sweijd, 2008) during BENEFIT, which was followed by other regional marine research and management proj-ects, such as the BCLME Programme, which in turn led to the creation of the Benguela Current Commission. During Phase 3, the Nansen also surveyed Northwest Africa (Senegal, the Gambia, Mauritania and Morocco) and West Africa (Côte d’Ivoire, Ghana, Togo and Benin), but there were no activities in the Western Indian Ocean.
During this phase, the scope of capacity devel-opment, research focus and support to insti-tutional development in fishery research and management at the national and regional levels were significantly expanded. The programme’s commitment to development reached an apex in Phase 3, compared to other phases which were more research-orientated and spanned a broader geographic scope.
PHASE 4: 2006–2016The Ecosystem Approach to Fisheries In Phase 4, the Nansen Programme was trans-formed to become the EAF-Nansen Project, managed directly by FAO. This followed the FAO Committee on Fisheries endorsement of an eco-system approach to fisheries (EAF) as the prac-tical implementation of the 1995 FAO Code of Conduct for Responsible Fisheries (Fletcher et al., 2012). The aims of the EAF-Nansen Project were to (i) develop and implement fisheries policy and legislation, (ii) improve fisheries research and man-agement skills, and (iii) strengthen cooperation across regions, among others.
Phase 4 coincided with implementation of the large marine ecosystem (LME) projects sup-ported by the Global Environment Facility (GEF) in Africa. In the Western Indian Ocean, Nansen sur-veys supported the Agulhas and Somali Currents LME (ASCLME) project and the Southwest Indian Ocean Fisheries Project (SWIOFP). Surveys were also carried out in the Eastern Indian Ocean, mainly off Myanmar (Figure 2.2). Surveys were expanded to cover issues that are set to become central in future phases – such as marine pollution, climate variability and its potential impact on fish resources and biodiversity. The first five years of Phase 4 (2006–2011) was followed by a transition period (2012–2016), during which preparations for a follow-up project and construction of a new research vessel were made. The project continued to support ongoing activities, with a focus on fish-eries management and EAF implementation. The project assisted several countries to prepare man-agement plans for specific fisheries.
A survey of seamounts in the southern Indian Ocean in 2009 was carried out in collaboration with the Zoological Society of London, the World Conservation Union (IUCN) and the ASCLME project. Five seamounts of the Southwest Indian Ocean Ridge, and one further north at Walters Shoals, were surveyed for physical oceanography, phytoplankton, zooplankton, fish and seabirds (Rogers et al., 2009). Seamounts are known hot-pots of biodiversity and attract a range of oceanic predators, including seabirds, whales and sharks.
| The RV Dr Fridtjof Nansen in the Western Indian Ocean: Voyages of marine research and capacity development16
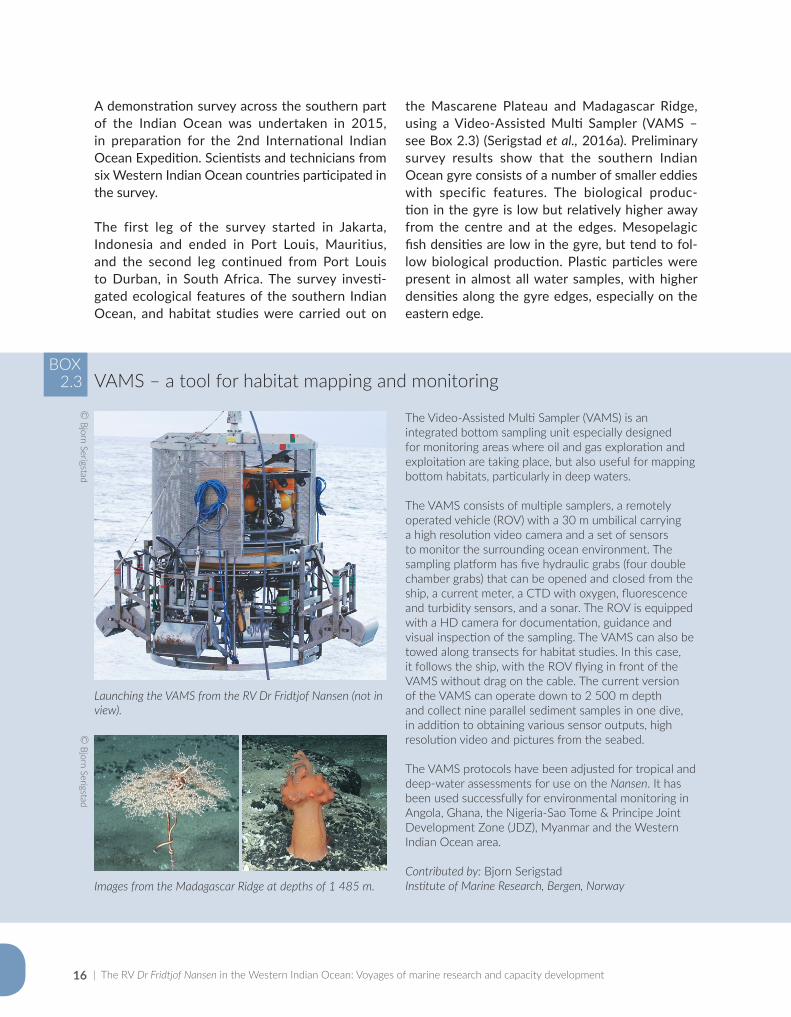
The Video-Assisted Multi Sampler (VAMS) is an integrated bottom sampling unit especially designed for monitoring areas where oil and gas exploration and exploitation are taking place, but also useful for mapping bottom habitats, particularly in deep waters.
The VAMS consists of multiple samplers, a remotely operated vehicle (ROV) with a 30 m umbilical carrying a high resolution video camera and a set of sensors to monitor the surrounding ocean environment. The sampling platform has five hydraulic grabs (four double chamber grabs) that can be opened and closed from the ship, a current meter, a CTD with oxygen, fluorescence and turbidity sensors, and a sonar. The ROV is equipped with a HD camera for documentation, guidance and visual inspection of the sampling. The VAMS can also be towed along transects for habitat studies. In this case, it follows the ship, with the ROV flying in front of the VAMS without drag on the cable. The current version of the VAMS can operate down to 2 500 m depth and collect nine parallel sediment samples in one dive, in addition to obtaining various sensor outputs, high resolution video and pictures from the seabed.
The VAMS protocols have been adjusted for tropical and deep-water assessments for use on the Nansen. It has been used successfully for environmental monitoring in Angola, Ghana, the Nigeria-Sao Tome & Principe Joint Development Zone (JDZ), Myanmar and the Western Indian Ocean area.
Contributed by: Bjorn SerigstadInstitute of Marine Research, Bergen, Norway
BOX2.3 VAMS – a tool for habitat mapping and monitoring
Images from the Madagascar Ridge at depths of 1 485 m.
© Bjorn Serigstad
© Bjorn Serigstad
A demonstration survey across the southern part of the Indian Ocean was undertaken in 2015, in preparation for the 2nd International Indian Ocean Expedition. Scientists and technicians from six Western Indian Ocean countries participated in the survey.
The first leg of the survey started in Jakarta, Indonesia and ended in Port Louis, Mauritius, and the second leg continued from Port Louis to Durban, in South Africa. The survey investi-gated ecological features of the southern Indian Ocean, and habitat studies were carried out on
Launching the VAMS from the RV Dr Fridtjof Nansen (not in view).
the Mascarene Plateau and Madagascar Ridge, using a Video-Assisted Multi Sampler (VAMS – see Box 2.3) (Serigstad et al., 2016a). Preliminary survey results show that the southern Indian Ocean gyre consists of a number of smaller eddies with specific features. The biological produc-tion in the gyre is low but relatively higher away from the centre and at the edges. Mesopelagic fish densities are low in the gyre, but tend to fol-low biological production. Plastic particles were present in almost all water samples, with higher densities along the gyre edges, especially on the eastern edge.
Chapter 2: Historical overview of the Nansen Programme | 17
2.3 Development of survey types and methods
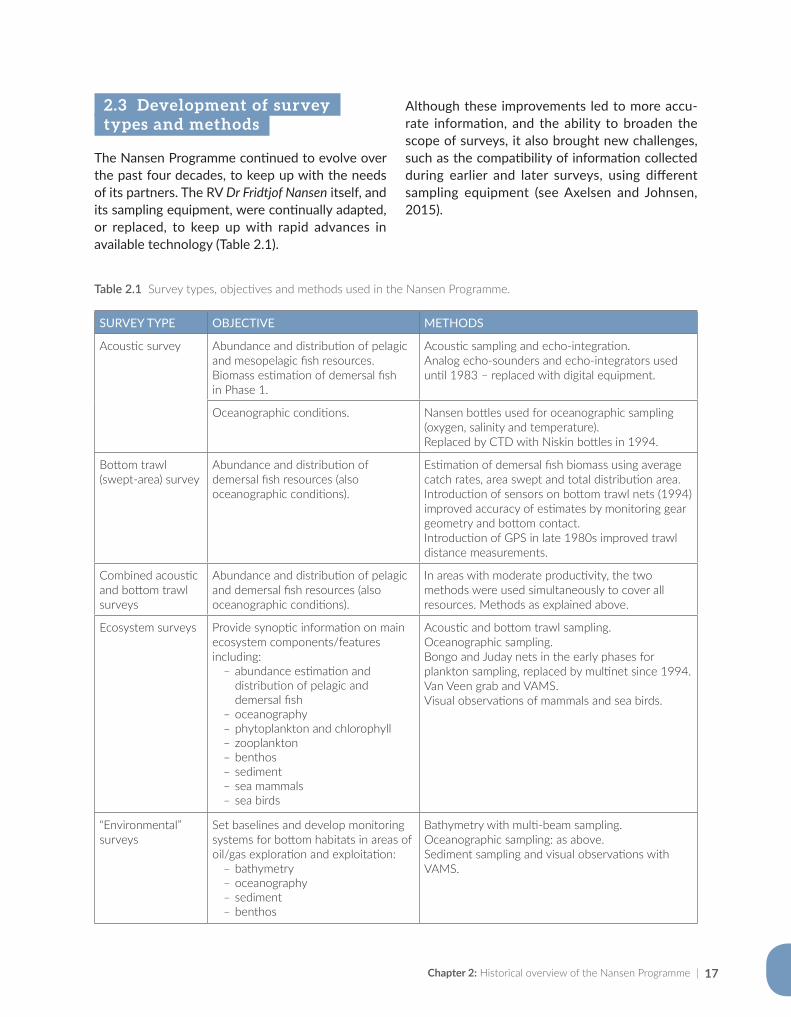
The Nansen Programme continued to evolve over the past four decades, to keep up with the needs of its partners. The RV Dr Fridtjof Nansen itself, and its sampling equipment, were continually adapted, or replaced, to keep up with rapid advances in available technology (Table 2.1).
Although these improvements led to more accu-rate information, and the ability to broaden the scope of surveys, it also brought new challenges, such as the compatibility of information collected during earlier and later surveys, using different sampling equipment (see Axelsen and Johnsen, 2015).
SURVEY TYPE OBJECTIVE METHODS
Acoustic survey Abundance and distribution of pelagic and mesopelagic fish resources.Biomass estimation of demersal fish in Phase 1.
Acoustic sampling and echo-integration.Analog echo-sounders and echo-integrators used until 1983 – replaced with digital equipment.
Oceanographic conditions. Nansen bottles used for oceanographic sampling (oxygen, salinity and temperature). Replaced by CTD with Niskin bottles in 1994.
Bottom trawl (swept-area) survey
Abundance and distribution of demersal fish resources (also oceanographic conditions).
Estimation of demersal fish biomass using average catch rates, area swept and total distribution area.Introduction of sensors on bottom trawl nets (1994) improved accuracy of estimates by monitoring gear geometry and bottom contact.Introduction of GPS in late 1980s improved trawl distance measurements.
Combined acoustic and bottom trawl surveys
Abundance and distribution of pelagic and demersal fish resources (also oceanographic conditions).
In areas with moderate productivity, the two methods were used simultaneously to cover all resources. Methods as explained above.
Ecosystem surveys Provide synoptic information on main ecosystem components/features including:
ҽ abundance estimation and distribution of pelagic and demersal fish
ҽ oceanography ҽ phytoplankton and chlorophyll ҽ zooplankton ҽ benthos ҽ sediment ҽ sea mammals ҽ sea birds
Acoustic and bottom trawl sampling.Oceanographic sampling.Bongo and Juday nets in the early phases for plankton sampling, replaced by multinet since 1994.Van Veen grab and VAMS.Visual observations of mammals and sea birds.
“Environmental” surveys
Set baselines and develop monitoring systems for bottom habitats in areas of oil/gas exploration and exploitation:
ҽ bathymetry ҽ oceanography ҽ sediment ҽ benthos
Bathymetry with multi-beam sampling.Oceanographic sampling: as above.Sediment sampling and visual observations with VAMS.
Table 2.1 Survey types, objectives and methods used in the Nansen Programme.
| The RV Dr Fridtjof Nansen in the Western Indian Ocean: Voyages of marine research and capacity development18
2.4 Funding
Through the Norwegian Agency for Development Cooperation (Norad), the government of Norway funded most of the Nansen Programme. During Phase 1 and up to 1983, the UNDP, through various FAO/UNDP projects, covered about 40 percent of vessel operation costs, but this was reduced to about 20 percent in 1987 (Sætersdal et al., 1999). In the following years, and up to the start of Phase 4 in 2006, the programme became fully funded by Norway.
Co-funding of vessel operations became a con-dition of use in Phase 4. At that time, the LME projects around Africa needed to collect updated information on the state of resources and eco-systems. They became natural partners of the EAF-Nansen Project and provided co-funding for several surveys. Co-funding has also been pro-vided by some coastal countries for national sur-veys, through budgetary allocations or externally-funded national programmes; for instance, the Mozambican government provided co-funding for an ecosystem survey in 2014.
2.5 Partnerships
National, regional and international partnerships have been key to the broad dissemination of the project objectives, and reflective of its underly-ing principles of ownership, accountability and co operation. Partnerships during the early phases were mainly between Norad, FAO and UNDP, with IMR as the scientific arm. Scientists from benefi-ciary countries were invited to participate in sur-veys, with training opportunities offered through the University of Bergen’s international pro-gramme on fisheries biology and management.
During the early years of the Nansen Programme, the scanty literature on the marine biota of the Western Indian Ocean, and lack of experience of Norwegian scientists with tropical fish taxonomy, gave rise to a strong partnership with the FAO’s Species Identification and Data Programme (SIDP).
This collaboration was based on mutual interests: FAO provided a tropical fish expert for surveys, while at the same time collecting valuable field information. Records of new occurrences, or range extensions, were confirmed by sending speci-mens to specialist taxonomists. The JLB Smith Institute of Ichthyology in South Africa (now the South African Institute for Aquatic Biodiversity, or SAIAB) also assisted with fish taxonomy.
During Phases 1 and 2 of the Nansen Programme, its objectives, areas of deployment and sur-vey plans were decided by the FAO, UNDP and Norway. National experts were invited to partici-pate in surveys, and contribute to survey reports, but were not actively involved in survey design. In Phase 3, governments and regional projects, such as the BENEFIT and BCLME programmes, became formal partners of the Nansen Programme. Some countries entered the partnership through the Norad bilateral programmes, with access to the vessel through the Nansen Programme. At national level, fisheries research and management institu-tions contributed to project objectives by commit-ting staff to surveys and training programmes.
By Phase 4, formal partnerships were established with all the LME programmes in Africa and also in Southeast Asia. In the Western Indian Ocean, part-nerships with the World Bank-assisted SWIOFP and the UNDP-managed ASCLME projects facil-itated the introduction of Ecosystems Approachs to Fisheries (EAF). The Nansen surveys were co-funded by the two projects, and the planning of surveys and their objectives were shared among partners. Partnerships with the Southwest Indian Ocean Fisheries Commission (SWIOFC) and the Fishery Committee for the Eastern Central Atlantic (CECAF) facilitated the implementation of EAF-aligned management plans.
The EAF-Nansen Project also partnered with the Norwegian Oil for Development Programme, to investigate the impact of oil and gas extraction at sea on ecosystems and fish stocks. Environment monitoring systems were set up in areas of future oil exploration.
Chapter 2: Historical overview of the Nansen Programme | 19
2.6 Capacity development
Although not part of the initial objectives of the Nansen Programme, an increasing need for the capacity to manage fisheries in a sustainable way became apparent over time. Capacity develop-ment took place through ad-hoc training, including design of survey methods, analysis of survey data, and use of NAN-SIS. Together with the University of Bergen, the Nansen Programme provided an opportunity for students from developing coun-tries to study fisheries science and management at diploma and masters levels. Practical training has been integral to the programme, mainly though visits to Norwegian institutions and conducting research on board the Nansen during surveys.
The most intensive capacity development period was perhaps during the BENEFIT programme, when a Training Working Group for ad-hoc and short courses in resource and environmental research was established. It also created oppor-tunities for overseas training, mainly at mas-ter’s degree level, through direct participation in research projects. BENEFIT was co-funded by the Nansen Programme.
In the Western Indian Ocean, at sea training was used to develop capacity during the first two phases of the Nansen Programme. Capacity development expanded during the EAF-Nansen Project phase, making use of partnerships with SWIOFP and the ASCLME surveys in 2008–2010. Fisheries scientists, technicians and managers from the region participated in training activities on land and at sea on the Nansen. Group train-ing covered subjects such as survey methodology and data analysis, stock assessments, fisheries management based on EAF principles, and fish species identification. Courses were presented in Mauritius, Kenya, South Africa and Mozambique. The 2015 demonstration survey to the southern Indian Ocean seamounts introduced sampling for microplastics, and detailed habitat studies using the VAMS.
2.7 Use of the data
Initial surveys collected data on fisheries resources, which were used by Norwegian scien-tists to produce biomass estimates. Survey reports also provided abundance and length frequencies for main commercial species, and information on oceanographic conditions sampled along hydro-graphic transects. Bathymetric charts of the sur-vey areas were substantially improved, to show the main bottom characteristics of the shelf and slope areas. The increased accuracy was made possible by improvements in satellite navigation and higher echo-sounder resolution.
The information provided realistic estimates of the level of resources, as basis for future fisher-ies development in newly established EEZs. For example, Norad sponsored national seminars in the early 1980s to review marine fish stocks in Mozambique (Sætersdal et al., 1999), Tanzania and Kenya (Iversen and Myklevoll, 1984a, b). The out-come was a down-sizing of investment in offshore fishing fleets, because Nansen survey data showed low biomass and fisheries potential (NORAD, 1982), with some exceptions, such as prawn resources in Mozambique.
The Nansen Programme provided credible infor-mation on fish resources at national and regional levels, independent of information obtained from fishing companies. In some countries, including those outside the Western Indian Ocean, surveys conducted as far back as the early 1980s are still used as reference points when decisions must be made. In Namibia, for example, biomass esti-mates obtained after independence became the main source of information for the management of pelagic and demersal fish stocks, at least during the first years (see Box 2.4). Likewise, Angola uses Nansen survey results as the main source of information for fisheries management. In South Africa, the Nansen undertook surveys when the regular survey vessel was unavailable. The Nansen Programme also facilitated transboundary demer-sal surveys between Namibia and South Africa.
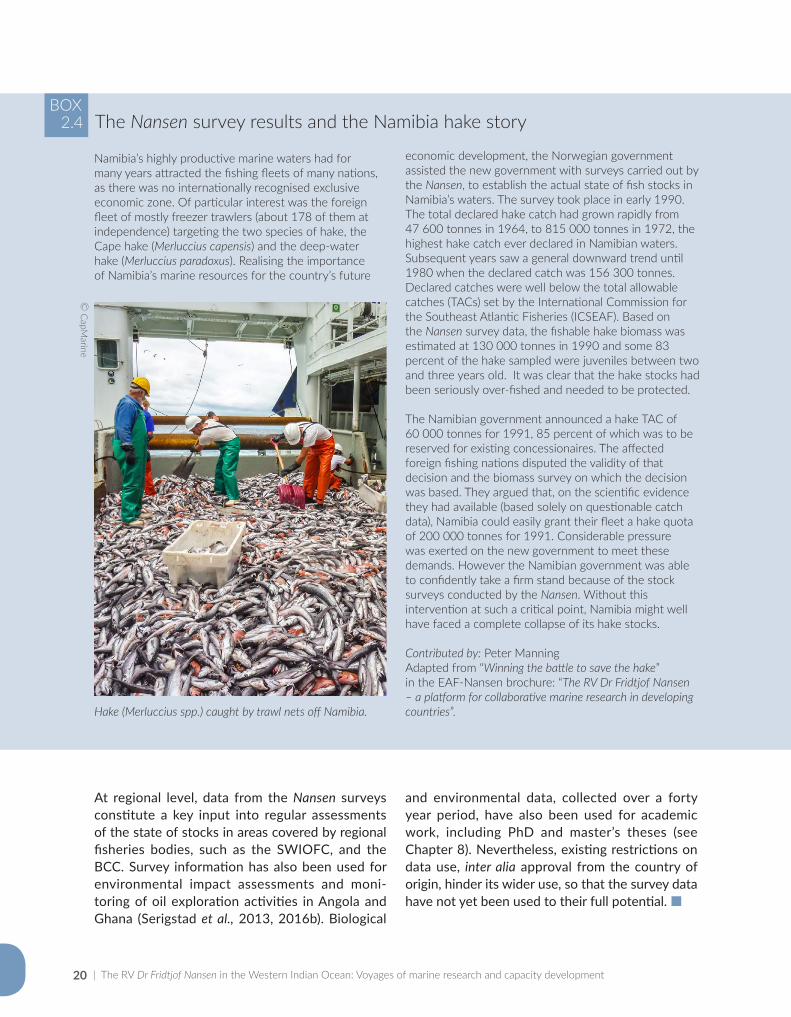
| The RV Dr Fridtjof Nansen in the Western Indian Ocean: Voyages of marine research and capacity development20
economic development, the Norwegian government assisted the new government with surveys carried out by the Nansen, to establish the actual state of fish stocks in Namibia’s waters. The survey took place in early 1990.The total declared hake catch had grown rapidly from 47 600 tonnes in 1964, to 815 000 tonnes in 1972, the highest hake catch ever declared in Namibian waters. Subsequent years saw a general downward trend until 1980 when the declared catch was 156 300 tonnes. Declared catches were well below the total allowable catches (TACs) set by the International Commission for the Southeast Atlantic Fisheries (ICSEAF). Based on the Nansen survey data, the fishable hake biomass was estimated at 130 000 tonnes in 1990 and some 83 percent of the hake sampled were juveniles between two and three years old. It was clear that the hake stocks had been seriously over-fished and needed to be protected.
The Namibian government announced a hake TAC of 60 000 tonnes for 1991, 85 percent of which was to be reserved for existing concessionaires. The affected foreign fishing nations disputed the validity of that decision and the biomass survey on which the decision was based. They argued that, on the scientific evidence they had available (based solely on questionable catch data), Namibia could easily grant their fleet a hake quota of 200 000 tonnes for 1991. Considerable pressure was exerted on the new government to meet these demands. However the Namibian government was able to confidently take a firm stand because of the stock surveys conducted by the Nansen. Without this intervention at such a critical point, Namibia might well have faced a complete collapse of its hake stocks.
Contributed by: Peter Manning Adapted from “Winning the battle to save the hake”in the EAF-Nansen brochure: “The RV Dr Fridtjof Nansen – a platform for collaborative marine research in developing countries”.
BOX2.4 The Nansen survey results and the Namibia hake story
Namibia’s highly productive marine waters had for many years attracted the fishing fleets of many nations, as there was no internationally recognised exclusive economic zone. Of particular interest was the foreign fleet of mostly freezer trawlers (about 178 of them at independence) targeting the two species of hake, the Cape hake (Merluccius capensis) and the deep-water hake (Merluccius paradoxus). Realising the importance of Namibia’s marine resources for the country’s future
At regional level, data from the Nansen surveys constitute a key input into regular assessments of the state of stocks in areas covered by regional fisheries bodies, such as the SWIOFC, and the BCC. Survey information has also been used for environmental impact assessments and moni-toring of oil exploration activities in Angola and Ghana (Serigstad et al., 2013, 2016b). Biological
© C
apMarine
Hake (Merluccius spp.) caught by trawl nets off Namibia.
and environmental data, collected over a forty year period, have also been used for academic work, including PhD and master’s theses (see Chapter 8). Nevertheless, existing restrictions on data use, inter alia approval from the country of origin, hinder its wider use, so that the survey data have not yet been used to their full potential.
21
References
Axelsen, B.E. & Johnsen, E. 2015. An evaluation of the bottom trawl surveys in the Benguela Current Large Marine Ecosystem. Fisheries Oceanography, 24(S1): 74–87.
Bakun, A., Claude, R. & Lluch-Cota, S. 1998. Coastal upwelling and other processes regulating ecosystem productivity and fish production in the Western Indian Ocean. In: K. Sherman, E. Okemwa & M. Ntiba, eds. Large Marine Ecosystems of the Indian Ocean: Assessment, Sustainability and Management, pp. 103–141. Malden, USA, Blackwell Science, Inc.
Behrmen, D. 1981. Assault on the largest unknown. Paris, France, The Unesco Press.Csirke, J. 1995. Fluctuations in abundance of small and mid-size pelagics. In: C. Bas, J. Castro & J. Lorenzo, eds.
International Symposium on Middle-Sized Pelagic Fish, Scientia Marina pp. 481–490.Csirke, J. & Gumy, A.A. 1996. Análisis bioeconómico de la pesqueria pelágica peruana. Bol. Inst. Mar Perú. Callao, 15:
25–68.Fletcher, R., Vasconcellos, M. & Attwood, C. 2012. EAF toolbox: the ecosystem approach to fisheries. Report No.
9251072671. Rome, Italy, Food and Agriculture Organization of the United Nations. Gjøsæter, J. 1977. Indian Ocean Fishery and Development Programme: Pelagic Fish Assessment Survey North Arabian Sea
– Aspects of the distribution and ecology of the Myctophidae from the western and northern Arabian Sea. Bergen, Norway.
Gjøsæter, J. 1981. Abundance and production of lanternfish (Myctophidae) in the western and northern Arabian Sea. Fiskeridirektoratets skrifter, Serie Havundersøkelser, 17(6): 215–251.
Hampton, I. & Sweijd, N. 2008. Achievements and lessons learned from the Benguela Environment, Fisheries, Interaction and Training (BENEFIT) research programme. African Journal of Marine Science, 30(3): 541–564.
IMARPE. 1972. Informe sobre la segunda reunión del panel de expertos en dinámica de la población de la anchoveta peruana. Bol. Inst. Mar Perú. Callao 2: 373–458.
Iversen, S.A. & Myklevoll, S. 1984a. The proceedings of the Norad-Kenya seminar to review the marine fish stocks and fisheries in Kenya, Mombasa, Kenya, 13–15 March 1984. Bergen, Norway, Institute of Marine Research.
Iversen, S.A. & Myklevoll, S. 1984b. The proceedings of the Norad-Tanzania seminar to review the marine fish stocks and fisheries in Tanzania, Mbegani, Tanzania, 6–8 March 1984. Bergen, Norway, Institute of Marine Research.
Marr, J., Ghosh, D., Pontecorvo, G., Rothschild, J. & Tussing, R. 1971. A plan for fishery development in the Indian Ocean. Rome, Italy, Food and Agriculture Organization of the United Nations.
NORAD, 1982. Evaluation Report. Report No. 482. Fisheries Research Vessel Dr Fridtjof Nansen, FAO/UNDP/NORAD.Rogers, A., Alvheim, O., Bemanaja, E., Benivary, D., Boersch-Supan, P., Bornman, T., Cedras, R., du Plessis, N., Gotheil,
S., Hoines, A., Kemp, K., Kristiansen, J., Letessier, T., Mangar, V., Mazungula, N., Mørk, T., Pinet, P., Read, J. & Sonnekus, T. 2009. Cruise Report Dr Fridtjof Nansen, Southern Indian Ocean Seamounts IUCN/UNDP/ASCLME/ NERC/EAF Nansen Project 2009, Cruise 410. Bergen, Norway, Institute of Marine Research.
Sætersdal, G., Bianchi, G., Strømme, T. & Venema, S. 1999. The Dr Fridtjof Nansen programme 1975–1993. Investigations of fishery resources in developing regions. History of the programme and review of results. FAO Fisheries Technical Paper No. 391. Food and Agriculture Organization of the United Nations.
Serigstad, B., Ensrud, T., Olsen, M. & Ostrowski, M. 2013. Benthic Marine Environmental Survey. Baseline studies of Angola, Block 38 and 39 Nansen cruise in cooperation with Statoil Angola. Angolan environmental consultants and INIP Angola, June 2013.
Serigstad, B., Ensrud, T., Olsen, M., Ostrowski, M., Adu-Kumi, S., Akoto, L., Aggrey-Fynn, J., Blazewicz-Paszkowycz, M., Jozwiak, P., Pabis, K. & Siciński, J. 2016a. Environmental monitoring Ghana 2012, chemical and biological analysis. Report No. GCP/003/Dr Fridtjof Nansen-EAF/N2012/7. Bergen, Norway, Institute of Marine Research.
Serigstad, B., Ramah, S., Sivertsen, K., Ensrud, T., Olsen, M., Beazley, L., Murillo Perez, F., Blows, B. & Rasoloarijao, Z. 2016b. Survey of the Southern Indian Ocean, Port Louis to Durban, IOS leg II, 18 June–6 July 2015. NORAD–FAO PROJECT GCP/003/Dr Fridtjof Nansen-EAF/N2015/7. Bergen, Norway, Institute of Marine Research.
Chapter 2: Historical overview of the Nansen Programme |

| The RV Dr Fridtjof Nansen in the Western Indian Ocean: Voyages of marine research and capacity development22
Strømme, T. 1992. NAN-SIS software for fishery survey data logging and analysis. User manual. FAO Computerized Information Series (Fisheries). Report No. 4. Rome, Italy, Food and Acriculture Organisation of the United Nations.
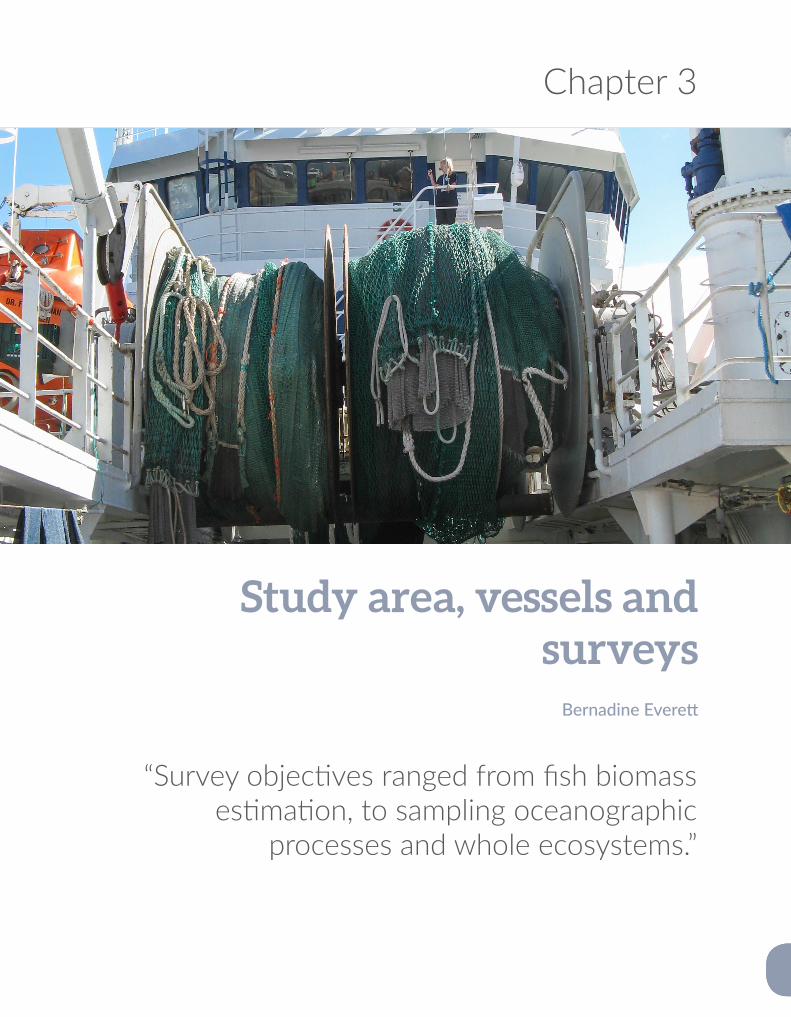
Chapter 3
“Survey objectives ranged from fish biomass estimation, to sampling oceanographic
processes and whole ecosystems.”
Study area, vessels and surveys
Bernadine Everett
| The RV Dr Fridtjof Nansen in the Western Indian Ocean: Voyages of marine research and capacity development24
Abstract
For the purpose of this study, the Western Indian Ocean was divided into six subregions, based on a combination of known marine ecoregions, geopolitical boundaries, and the spatial coverage by past RV Dr Fridtjof Nansen surveys. The Somali Coast, East Africa Coastal Current subregion (including Kenya and Tanzania), Mozambique, Madagascar and Comoros, Mascarene and Seamounts subregions extended 200 nautical miles seawards from the coast. The first Nansen (active between 1975 and 1993) surveyed in the Western Indian Ocean between 1975 and 1990, where after there was a 17 year gap before the second Nansen (active between 1994 and 2016) returned to the region in 2007. Survey objectives ranged from fish biomass estimation, to sampling oceanographic processes and whole ecosystems. The Mozambique subregion was surveyed most frequently (14 times) and over the broadest time period (1977–1990 and 2007–2014). Other subregions were surveyed only once, or a few times over four decades, thus providing point estimates, but not time-series information. Chapter 3 is intended as a reference chapter, showing the locations of all sampling stations attended by the Nansen between 1975 and 2014, and their grouping into six geographic subregions for comparative purposes in the following chapters.
Previous page: Pelagic and demersal trawl nets on the RV Dr Fridtjof Nansen. © Bernadine Everett
Opposite page: Disclaimer – The designation employed and the presentation of material in the maps are for illustration only and do not imply the expression of any opinion whatsoever on the part of the authors concerning the legal or constitutional status of any country, territory or sea area, or concerning the delimination of frontiers and boundaries.
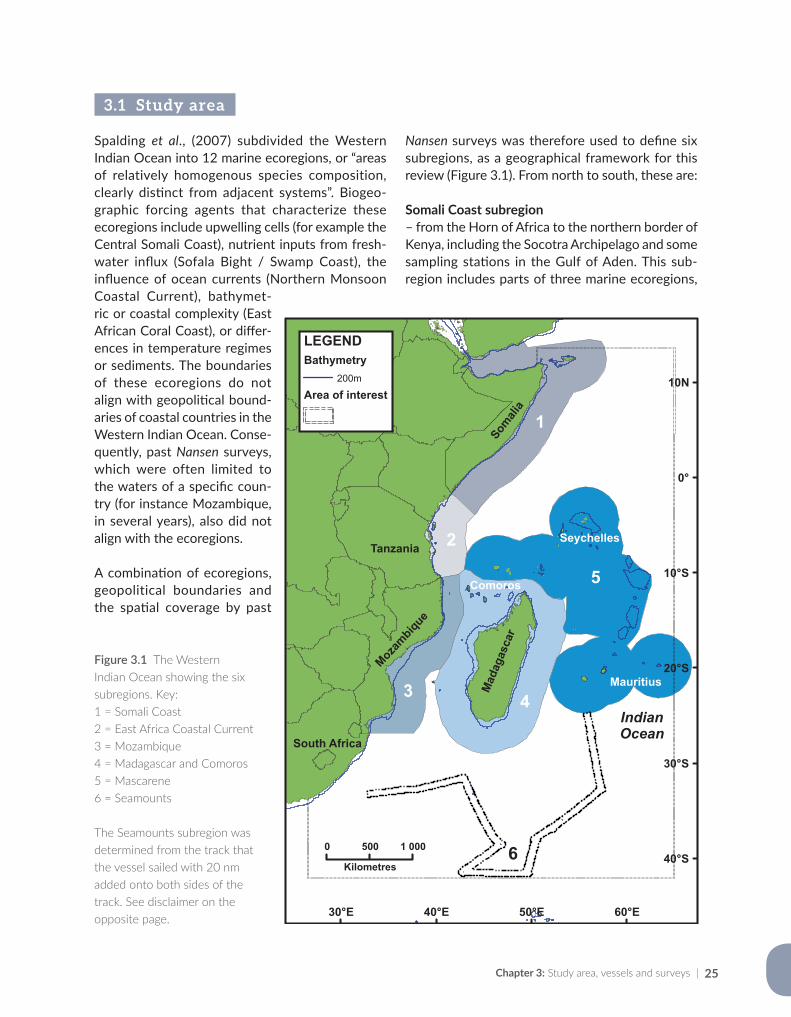
Chapter 3: Study area, vessels and surveys | 25
3.1 Study area
Spalding et al., (2007) subdivided the Western Indian Ocean into 12 marine ecoregions, or “areas of relatively homogenous species composition, clearly distinct from adjacent systems”. Biogeo-graphic forcing agents that characterize these ecoregions include upwelling cells (for example the Central Somali Coast), nutrient inputs from fresh-water influx (Sofala Bight / Swamp Coast), the influence of ocean currents (Northern Monsoon Coastal Current), bathymet-ric or coastal complexity (East African Coral Coast), or differ-ences in temperature regimes or sediments. The boundaries of these ecoregions do not align with geopolitical bound-aries of coastal countries in the Western Indian Ocean. Conse-quently, past Nansen surveys, which were often limited to the waters of a specific coun-try (for instance Mozambique, in several years), also did not align with the ecoregions.
A combination of ecoregions, geopolitical boundaries and the spatial coverage by past
Nansen surveys was therefore used to define six subregions, as a geographical framework for this review (Figure 3.1). From north to south, these are:
Somali Coast subregion– from the Horn of Africa to the northern border of Kenya, including the Socotra Archipelago and some sampling stations in the Gulf of Aden. This sub-region includes parts of three marine ecoregions,
Figure 3.1 The Western Indian Ocean showing the six subregions. Key: 1 = Somali Coast 2 = East Africa Coastal Current3 = Mozambique 4 = Madagascar and Comoros 5 = Mascarene 6 = Seamounts
The Seamounts subregion was determined from the track that the vessel sailed with 20 nm added onto both sides of the track. See disclaimer on the opposite page.
0 500 1 000
Kilometres
0°
10°S
20°S
30°S
10N
40°S
30°E 40°E 50°E 60°E
LEGEND
Area of interest200m
Bathymetry
1
2
4
5
6
Somali
a
Kenya
Tanzania
Mozambique
South Africa
Mad
agas
car
Mauritius
Comoros
IndianOcean
Seychelles
3
| The RV Dr Fridtjof Nansen in the Western Indian Ocean: Voyages of marine research and capacity development26
namely the Gulf of Aden, Central Somali Coast and most of the Northern Monsoon Current Coast (see Spalding et al., 2007). It is typically an upwell-ing area, influenced by the Socotra Eddy, Great Whirl, Southern Gyre and the East Africa Coastal Current (Schott and McCreary, 2001). Surveys in this subregion were restricted to the early years of the Nansen’s surveys in the Western Indian Ocean: from 1975 to 1976, and 1984. The Somali Coast subregion was also the very first to be surveyed by the Nansen Programme.
East Africa Coastal Current subregion– from the northern border of Kenya to the south-ern border of Tanzania, encompassing most of the East African Coral Coast marine ecoregion (Figure 3.1), as well as the southernmost extreme of the Northern Monsoon Current Coast. This subregion is characterized by distinct seasonality, caused by the effects of the Northeast and Southwest mon-soons. The seasonality affects annual patterns of physical, chemical and biological processes, reflected in seasonal changes in species com-position of fish in catches (McClanahan, 1988). The Nansen surveys in this subregion were also restricted to the early years of the study period, between 1980 and 1983.
Mozambique subregion – from the northern to southern borders of Mozambique, including surveys done in the Mozambique Channel in 2008. The subregion is ecologically diverse, and includes the southern extent of the East African Coral Coast marine ecoregion in northern Mozambique, the Sofala Bight / Swamp Coast in central Mozambique and the Delagoa ecoregion in southern Mozambique. Eastern South Africa was not surveyed by the Nansen, and therefore the southern part of the Delagoa ecoregion and the Natal ecoregion were excluded from the study area. The Mozambique subregion was extensively surveyed by the Nansen between 1977 and 2014, albeit with a 17 year gap between 1990 and 2007.
Madagascar and Comoros subregion – surrounds Madagascar and the Comoros islands in the northern part of the Mozambique Channel,
and combines two marine ecoregions: Southeast Madagascar and Western and Northern Mada-gascar. This subregion is also ecologically diverse, with upwelling along southeast Madagascar, oce-anic waters along the Madagascar east coast, and turbid waters along the west coast, where river outflows augment nutrient and sediment loads. Large shallow-water prawn fisheries operate along the west coast of Madagascar. The Nansen under-took three surveys off Madagascar in 1983, 2008 (east coast) and 2009 (west coast). The Comoros gyre in the Mozambique Channel was surveyed in 2009.
Mascarene subregion – includes the waters around the Seychelles and Mauritius, and along the Mascarene Plateau between them. The submarine Mascarene Plateau, located north and east of Madagascar, extends approximately 2 000 km, from the Seychelles in the north to Réunion Island in the south. It cov-ers an area of over 115 000 km2 of shallow water, with depths ranging from 8 to 150 m, plunging to the abyssal plain at 4 000 m deep at its edges. This subregion is tropical and oceanic, and combines the Seychelles, Cargados Carajos / Tromelin Island, and Mascarene Islands marine ecoregions. Nansen surveys in the Mascarene subregion took place in 1978, 2008 and 2010.
Seamounts subregion – includes seamounts in the high-seas to the south of Madagascar, which the Nansen surveyed in 2009. These seamounts fall outside the marine ecoregions defined for the Western Indian Ocean (Spalding et al., 2007). Seamounts form hotspots of biological activity in the oceans, with higher primary productivity around them than in sur-rounding oceanic waters. Another source of enhanced production is the advection of phy-toplankton, zooplankton, larger organisms, par ticulate organic material and nutrients from far-afield into the sphere of influence of a sea-mount (White et al., 2007). In such cases, enclosed or semi-enclosed circulation patterns may act to retain the new arrivals. The seamounts surveyed by the Nansen are located in warm-temperate waters.
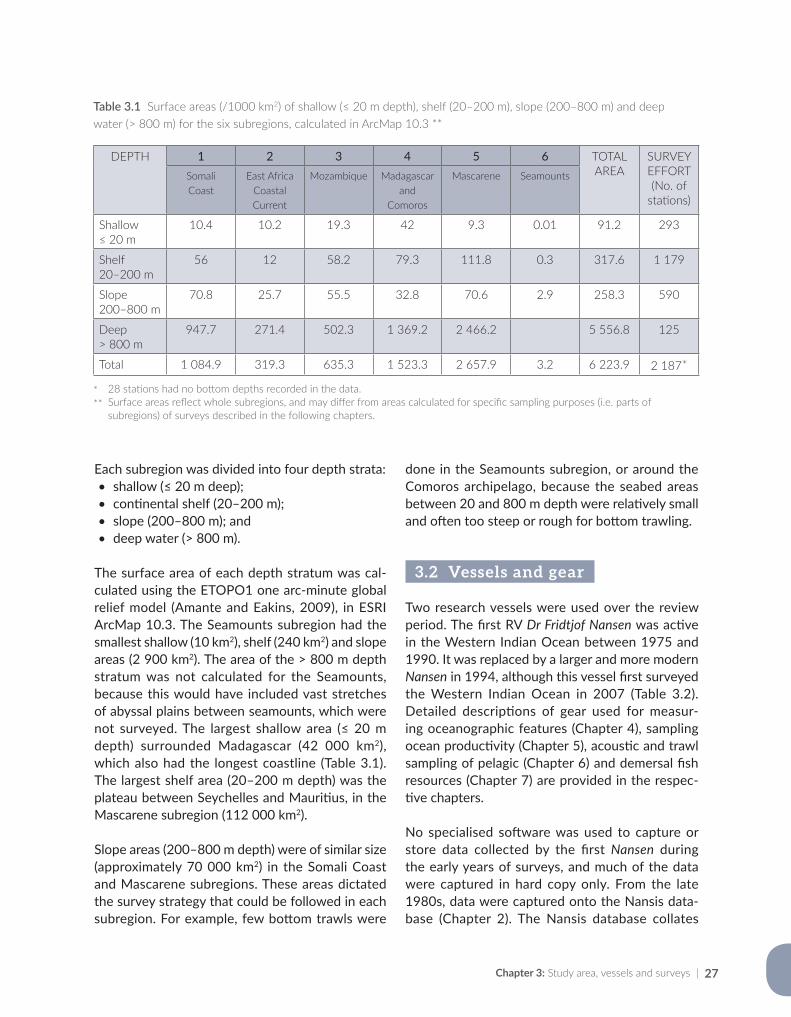
Chapter 3: Study area, vessels and surveys | 27
Each subregion was divided into four depth strata: • shallow (≤ 20 m deep); • continental shelf (20–200 m); • slope (200–800 m); and • deep water (> 800 m).
The surface area of each depth stratum was cal-culated using the ETOPO1 one arc-minute global relief model (Amante and Eakins, 2009), in ESRI ArcMap 10.3. The Seamounts subregion had the smallest shallow (10 km2), shelf (240 km2) and slope areas (2 900 km2). The area of the > 800 m depth stratum was not calculated for the Seamounts, because this would have included vast stretches of abyssal plains between seamounts, which were not surveyed. The largest shallow area (≤ 20 m depth) surrounded Madagascar (42 000 km2), which also had the longest coastline (Table 3.1). The largest shelf area (20–200 m depth) was the plateau between Seychelles and Mauritius, in the Mascarene subregion (112 000 km2).
Slope areas (200–800 m depth) were of similar size (approximately 70 000 km2) in the Somali Coast and Mascarene subregions. These areas dictated the survey strategy that could be followed in each subregion. For example, few bottom trawls were
done in the Seamounts subregion, or around the Comoros archipelago, because the seabed areas between 20 and 800 m depth were relatively small and often too steep or rough for bottom trawling.
3.2 Vessels and gear
Two research vessels were used over the review period. The first RV Dr Fridtjof Nansen was active in the Western Indian Ocean between 1975 and 1990. It was replaced by a larger and more modern Nansen in 1994, although this vessel first surveyed the Western Indian Ocean in 2007 (Table 3.2). Detailed descriptions of gear used for measur-ing oceanographic features (Chapter 4), sampling ocean productivity (Chapter 5), acoustic and trawl sampling of pelagic (Chapter 6) and demersal fish resources (Chapter 7) are provided in the respec-tive chapters.
No specialised software was used to capture or store data collected by the first Nansen during the early years of surveys, and much of the data were captured in hard copy only. From the late 1980s, data were captured onto the Nansis data-base (Chapter 2). The Nansis database collates
DEPTH 1 2 3 4 5 6 TOTAL AREA
SURVEY EFFORT(No. of
stations)
SomaliCoast
East Africa Coastal Current
Mozambique Madagascar and
Comoros
Mascarene Seamounts
Shallow≤ 20 m
10.4 10.2 19.3 42 9.3 0.01 91.2 293
Shelf20–200 m
56 12 58.2 79.3 111.8 0.3 317.6 1 179
Slope200–800 m
70.8 25.7 55.5 32.8 70.6 2.9 258.3 590
Deep> 800 m
947.7 271.4 502.3 1 369.2 2 466.2 5 556.8 125
Total 1 084.9 319.3 635.3 1 523.3 2 657.9 3.2 6 223.9 2 187*
Table 3.1 Surface areas (/1000 km2) of shallow (≤ 20 m depth), shelf (20–200 m), slope (200–800 m) and deep water (> 800 m) for the six subregions, calculated in ArcMap 10.3 **
* 28 stations had no bottom depths recorded in the data.** Surface areas reflect whole subregions, and may differ from areas calculated for specific sampling purposes (i.e. parts of subregions) of surveys described in the following chapters.
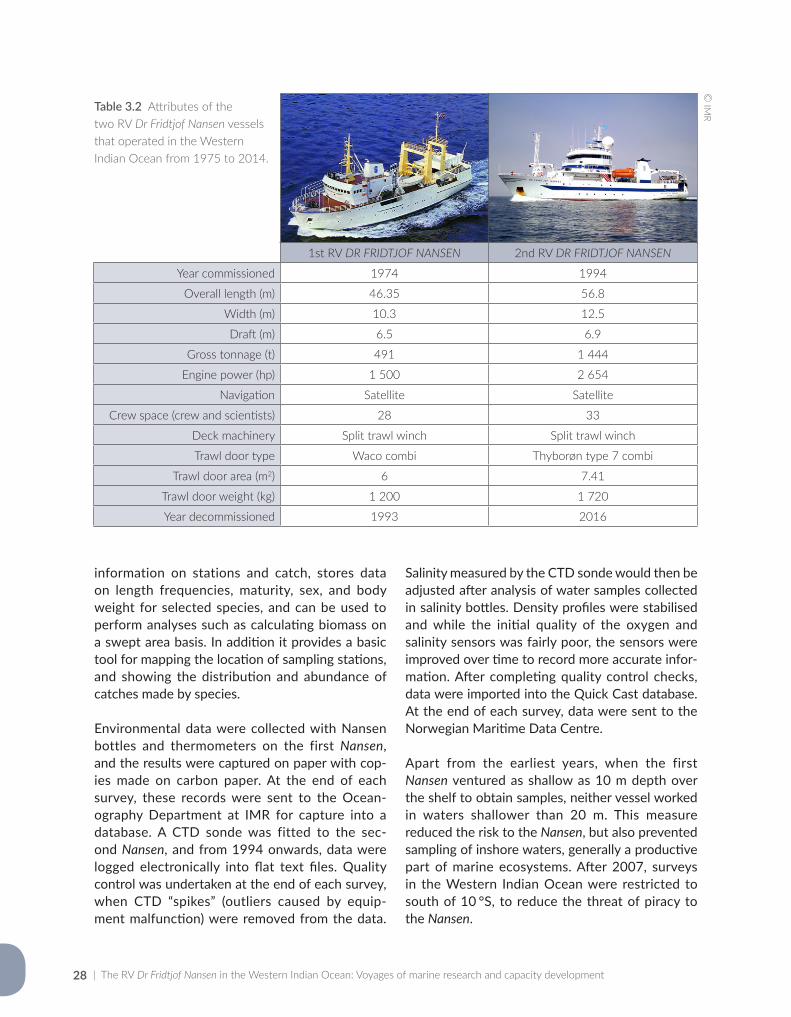
| The RV Dr Fridtjof Nansen in the Western Indian Ocean: Voyages of marine research and capacity development28
information on stations and catch, stores data on length frequencies, maturity, sex, and body weight for selected species, and can be used to perform analyses such as calculating biomass on a swept area basis. In addition it provides a basic tool for mapping the location of sampling stations, and showing the distribution and abundance of catches made by species.
Environmental data were collected with Nansen bottles and thermometers on the first Nansen, and the results were captured on paper with cop-ies made on carbon paper. At the end of each survey, these records were sent to the Ocean-ography Department at IMR for capture into a database. A CTD sonde was fitted to the sec-ond Nansen, and from 1994 onwards, data were logged electronically into flat text files. Quality control was undertaken at the end of each survey, when CTD “spikes” (outliers caused by equip-ment malfunction) were removed from the data.
Salinity measured by the CTD sonde would then be adjusted after analysis of water samples collected in salinity bottles. Density profiles were stabilised and while the initial quality of the oxygen and salinity sensors was fairly poor, the sensors were improved over time to record more accurate infor-mation. After completing quality control checks, data were imported into the Quick Cast database. At the end of each survey, data were sent to the Norwegian Maritime Data Centre.
Apart from the earliest years, when the first Nansen ventured as shallow as 10 m depth over the shelf to obtain samples, neither vessel worked in waters shallower than 20 m. This measure reduced the risk to the Nansen, but also prevented sampling of inshore waters, generally a productive part of marine ecosystems. After 2007, surveys in the Western Indian Ocean were restricted to south of 10 °S, to reduce the threat of piracy to the Nansen.
Table 3.2 Attributes of the two RV Dr Fridtjof Nansen vessels that operated in the Western Indian Ocean from 1975 to 2014.
1st RV DR FRIDTJOF NANSEN 2nd RV DR FRIDTJOF NANSEN
Year commissioned 1974 1994
Overall length (m) 46.35 56.8
Width (m) 10.3 12.5
Draft (m) 6.5 6.9
Gross tonnage (t) 491 1 444
Engine power (hp) 1 500 2 654
Navigation Satellite Satellite
Crew space (crew and scientists) 28 33
Deck machinery Split trawl winch Split trawl winch
Trawl door type Waco combi Thyborøn type 7 combi
Trawl door area (m2) 6 7.41
Trawl door weight (kg) 1 200 1 720
Year decommissioned 1993 2016
© IM
R
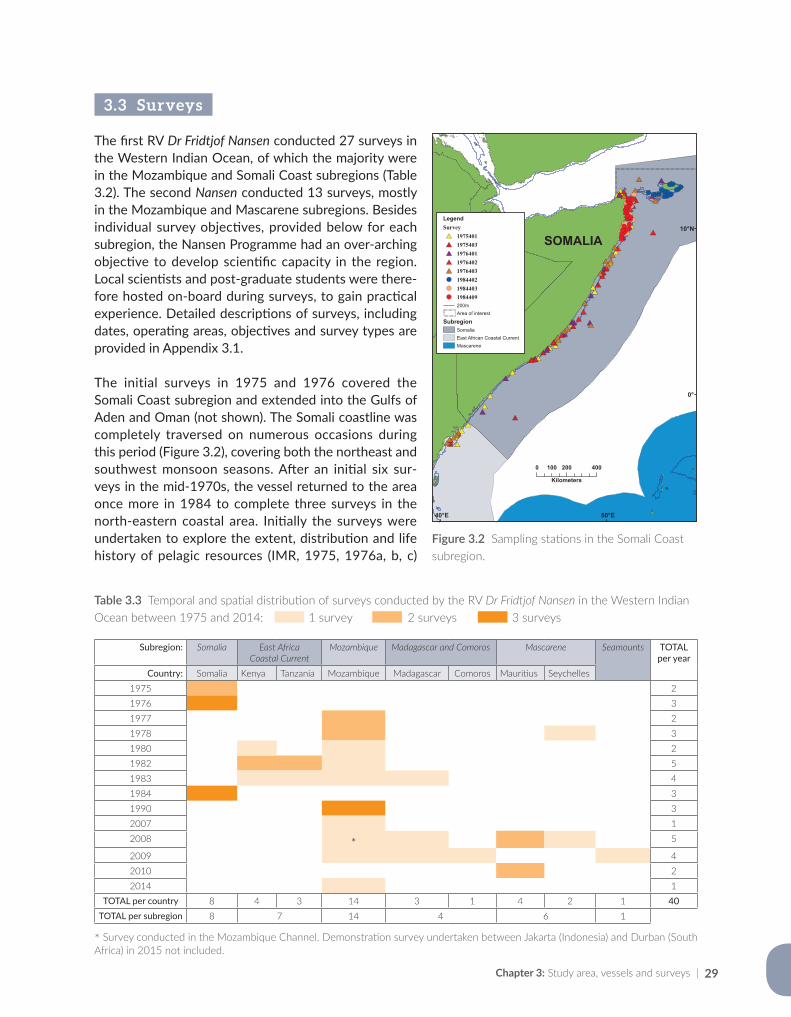
Chapter 3: Study area, vessels and surveys | 29
3.3 Surveys
The first RV Dr Fridtjof Nansen conducted 27 surveys in the Western Indian Ocean, of which the majority were in the Mozambique and Somali Coast subregions (Table 3.2). The second Nansen conducted 13 surveys, mostly in the Mozambique and Mascarene subregions. Besides individual survey objectives, provided below for each subregion, the Nansen Programme had an over-arching objective to develop scientific capacity in the region. Local scientists and post-graduate students were there-fore hosted on-board during surveys, to gain practical experience. Detailed descriptions of surveys, including dates, operating areas, objectives and survey types are provided in Appendix 3.1.
The initial surveys in 1975 and 1976 covered the Somali Coast subregion and extended into the Gulfs of Aden and Oman (not shown). The Somali coastline was completely traversed on numerous occasions during this period (Figure 3.2), covering both the northeast and southwest monsoon seasons. After an initial six sur-veys in the mid-1970s, the vessel returned to the area once more in 1984 to complete three surveys in the north-eastern coastal area. Initially the surveys were undertaken to explore the extent, distribution and life history of pelagic resources (IMR, 1975, 1976a, b, c)
Figure 3.2 Sampling stations in the Somali Coast subregion.
#*#*#*#*#*
#*
#*#*
#*#*
#*#*#*#*#*
#*#*
#*#*#*
#*#*#*#*
#*#*#*#*#*#*#*#*#*#*#*#*#*#*
#* #*#*#*#*#*
#*#*#*
#*
#*#*
#*#*
#*
#*#*#*
#*#*#*#*#*#*#*#*#*
#*#*#*#*#*#*#*#*
#*
#*
#*#*#*
#*#*#* #*
#*
#*
#*
#*#*#*#*
#*#*
#*
#*#*#*
#*#*
#*#*
#*#*#*
#*#*#*
#*#*#*#*#*#*
#*#*#* #*#* #*
#*#*#*#*#*#*#*#*#*#*#*
#*#*#*#*#*
#*
#*
#*#*#*#*#*
#*#*#*#*#*
!(!( !(!(!(!(!(!(!(!(!(!(!(!(!(!(!(!(!(!(!(!(!(!(!(!(!(!(!(!(!(
!(!(!(!(!(!(!(!(!(
!(!(!(!(!(!(!(!(!(!(!(!(
!(!(!(!(!(!(!(!(!(!(!(!(!(
50°E40°E
0 200 400100
Kilometers
LegendSurvey#* 1975401#* 1975403#* 1976401#* 1976402#* 1976403!( 1984402!( 1984403!( 1984409
200mArea of interest
Subregion
East African Coastal CurrentMascarene
Somalia
0°
10°N
SOMALIA
Subregion: Somalia East Africa Coastal Current
Mozambique Madagascar and Comoros Mascarene Seamounts TOTALper year
Country: Somalia Kenya Tanzania Mozambique Madagascar Comoros Mauritius Seychelles1975 21976 31977 21978 31980 21982 51983 41984 31990 32007 12008 * 5
2009 42010 22014 1
TOTAL per country 8 4 3 14 3 1 4 2 1 40TOTAL per subregion 8 7 14 4 6 1
Table 3.3 Temporal and spatial distribution of surveys conducted by the RV Dr Fridtjof Nansen in the Western Indian Ocean between 1975 and 2014: 1 survey 2 surveys 3 surveys
* Survey conducted in the Mozambique Channel. Demonstration survey undertaken between Jakarta (Indonesia) and Durban (South Africa) in 2015 not included.
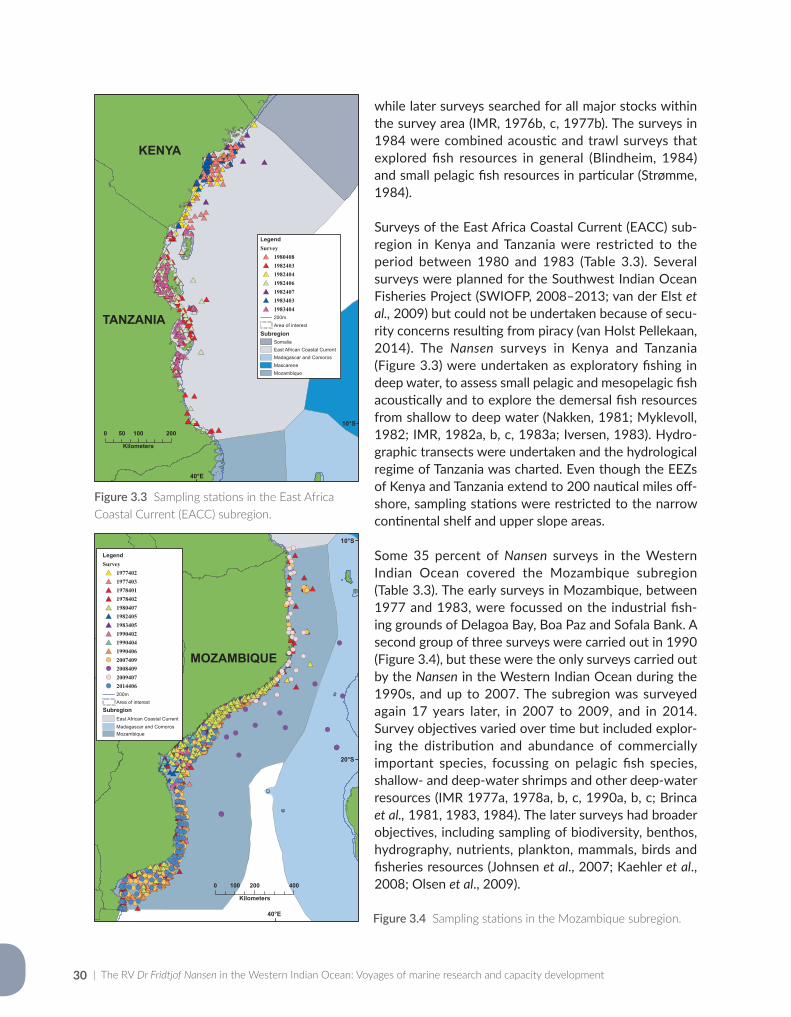
| The RV Dr Fridtjof Nansen in the Western Indian Ocean: Voyages of marine research and capacity development30
while later surveys searched for all major stocks within the survey area (IMR, 1976b, c, 1977b). The surveys in 1984 were combined acoustic and trawl surveys that explored fish resources in general (Blindheim, 1984) and small pelagic fish resources in particular (Strømme, 1984).
Surveys of the East Africa Coastal Current (EACC) sub-region in Kenya and Tanzania were restricted to the period between 1980 and 1983 (Table 3.3). Several surveys were planned for the Southwest Indian Ocean Fisheries Project (SWIOFP, 2008–2013; van der Elst et al., 2009) but could not be undertaken because of secu-rity concerns resulting from piracy (van Holst Pellekaan, 2014). The Nansen surveys in Kenya and Tanzania (Figure 3.3) were undertaken as exploratory fishing in deep water, to assess small pelagic and mesopelagic fish acoustically and to explore the demersal fish resources from shallow to deep water (Nakken, 1981; Myklevoll, 1982; IMR, 1982a, b, c, 1983a; Iversen, 1983). Hydro-graphic transects were undertaken and the hydrological regime of Tanzania was charted. Even though the EEZs of Kenya and Tanzania extend to 200 nautical miles off-shore, sampling stations were restricted to the narrow continental shelf and upper slope areas.
Some 35 percent of Nansen surveys in the Western Indian Ocean covered the Mozambique subregion (Table 3.3). The early surveys in Mozambique, between 1977 and 1983, were focussed on the industrial fish-ing grounds of Delagoa Bay, Boa Paz and Sofala Bank. A second group of three surveys were carried out in 1990 (Figure 3.4), but these were the only surveys carried out by the Nansen in the Western Indian Ocean during the 1990s, and up to 2007. The subregion was surveyed again 17 years later, in 2007 to 2009, and in 2014. Survey objectives varied over time but included explor-ing the distribution and abundance of commercially important species, focussing on pelagic fish species, shallow- and deep-water shrimps and other deep-water resources (IMR 1977a, 1978a, b, c, 1990a, b, c; Brinca et al., 1981, 1983, 1984). The later surveys had broader objectives, including sampling of biodiversity, benthos, hydrography, nutrients, plankton, mammals, birds and fisheries resources (Johnsen et al., 2007; Kaehler et al., 2008; Olsen et al., 2009).
Figure 3.3 Sampling stations in the East Africa Coastal Current (EACC) subregion.
#*#*#*#*#*#*#*#*#*#*#*#*#*#*#*
#*#*#*
#*
#*#*#*#*#*#*#*
#*
#*
#*#*#*#*#*#*
#*#*#*#*#*#*#* #*#*
#*#*#*#*#*
#*
#*
#*#*#*#*
#*#*#*
#*#*#*#*
#*#*#*#*#*#*#*
#*#*#*#*#*#*#*#*#*#*#*#*#*#*#*#*#*
#*#*#*#*#*#*#*#*#*#*#*#*#*#*#*
#*#*#*#*#*#*#*#*#*#*#*#*#*#*#*#*#*#* #*#*#*#*#*#*#*#*#*#* #*#*#*#*#* #*#*#*#*#*
#*#*
#*#*
#*#*#*#*#*#*#*#*#*#*#*#* #*#*#*#*#*
#*#*#*#*
#*#*#*#*#*#*#*
#*#*#*#*#*#*#*#*#*#*
#*#* #*#*#*#*#*#*#*#*#* #*#*#*#*#*#*#*
#*#*#*#*#*#*#*#*#*#*#*
#* #*#*#*#*#*#*#*#*#*#*#*#*#*#*#*#*#*#*#*#*#*#*#* #*#*#*
#*#*#*#*#*#*#*#*#*#*#*#*#*#*
#*#*#*#* #*
#*
#*#*#*#*#*#*#*
#*
#*
#*#* #*#*#*#*#*#*#*#*#*
#*#*
#*
#*#*#*#*#*#*#*
#*
#*#*#*#* #*#*#* #*#* #*#*#*#*#*#*#*
#*
#*#*#*#*#*#*#*#*#*#*#*#*#*#*#*#*#*#*#*#*#* #*
#*#*#*#*
#*#*#*#*
#*#*#*#*
#*#*#*#*#*#*#*#*#*#*#*#*#*#*
#*#*#*#*#*#*#*#*#*#*#*
#*#*#*#*#*#*#*
#*#*#*#*
#*#*#*#*#*#*#*#*#*
#*#*
#*#*#*#*#*#*#*#*#*
#*#*#*#* #*#*#*#*#*#*
#* #*#*#*#*#*#*#*#*#*#*#*#*#*#*#*#*#*#*#*#*#*#*#*#*#*#*
#*#*#*#*#*#*#*
#*#*
40°E
0 100 20050
Kilometers
10°S
LegendSurvey#* 1980408#* 1982403#* 1982404#* 1982406#* 1982407#* 1983403#* 1983404
200mArea of interest
Subregion
East African Coastal CurrentMadagascar and ComorosMascareneMozambique
Somalia
KENYA
TANZANIA
Figure 3.4 Sampling stations in the Mozambique subregion.
#*#*#*#*#*
#*
#* #*
#*#*#*
#*
#*
#*#*#*
#*#*#*#*#*#*
#*#*
#*#*
#*
#*
#*#*
#*#*
#*#*#*#*#* #*#*
#*#*
#*#*#*#*
#*#*#*
#*#*#*
#*#*#*#*
#*#*#*
#*
#*#*#*#*#*#*#*
#*#*
#*#*#*
#*
#*
#*#*#*#*#*#*#*#*
#*#*
#*#*#*#*
#*#*#*
#*#*#*#*#*#*#*#*#*#*
#*#*#*
#*#*
#*
#*
#*#*#*
#*#*#*#*#*
#*#*#*#*
#*
#*#*#*#*#*#*
#*#*#*#*#*#*
#* #*#*
#*
#*#*#*#*#*#*#*
#*#*#*#*#*#*
#*
#* #*#*#*#*#*#*#*
#*
#*#*
#*#*#*
#*#*#*#*
#*#*#*
#*
#*#*#*#*#* #*#*#*#*#*#*#*#*#*#*#*#*#*#*#*#* #*#*#*#*#*#*#*#*#*
#*#*#*#*#*#*#*#*#*#*#*#*#*#*#*#*
#*#*
#*#*#*#* #*
#*#*#*#*#*#*#*
#*#*#*#*#*#*#*#*#*#*#*#*#*
#*#*#*#*#*#*#*#*#*#*#*#*
#*#*#*#*#*#*#*#*#*#*#*#*#*#*
#*#*#*#*#*
#*#*
#*#*#*#*
#*#*#*#*#*
#*#*#*#*#*#*
#*#*#*#*#*#*#*#*#*#*#*#*#*#*#*#*#*#*#*#*#*#*#*
#*#*#*#*#*#*
#*#*#*#*#*#*#*#*#*#*#*#*#*#*#*#*#*#*#*#*#*#*#*#*#*#*#*#*#*#*#*#*#*#*#*#*#*
#* #*#*#*#*#*
#*#*#*#* #*#*
#*#*#*#*#*#*#*#*#*#*#*#*#*#*#*#*#*#*#*#*#*#*#*#*#*#*#*#*#*#*#*#*#*#*#*#*
#*#*#*#*#*#*#*#* #*#*#*#*#*#* #*#*#*#*#*#*#*#*
#*#*#*#*#*#*#*#*#*#*#*#*#*#*#*#*#*#*#*#*#*#*#*#*#*#*#*#*#*#*#* #*#*#*#*#*#*#*#*#*#*
#*#*#*#*
#*#*#*#*#*#*#*#* #*#*#*#*#*#*#*#* #*#*#*#*#*#*#*#*#*#*#*#*#*#*#*#*#*#*#*#*#*#*#*#*#*
#*#*#*#*#*#*
#*#*#*#*#*#*#*#*#*#*#*#*
#*#*
#*#*#*#*#*#*
#*#*#*#*#*#*#*
#*#*#*#*#*#*#*#*#*#*#*#*#*#*#* #*#*#*#*
#*#*#*#*#*#*#*#*#*#*#*
#*#*#*#*#*#*#*
#* #*#*
#*#*#*#*
#*#*#*
#*#*#*#*#*#*#*#*#*#*#*#*#*#*#*#*#*#*#*#*#*#*#*#*#*#*#*#*#*#*#*#*#*#*#*#*#*#*#*#*#*#*#*
#*#*#*#*#*#*#*#*#*#*#*#*#*#*#*#*#*#*#*#*#*#*#*#*#*#*#*#*#*#*#*#*#*#*#*#*#*#*#*#*#*#*#*#*#*#*#*#*#*#*#*#*#*#*#*#*#*#*#*#*#*#*#*#*#*#*#*#*#*#*#*#*#*#*#*#*#*#*#*#*#*#*#*#*#*#*#*#*#*#*#*#*#*#*#*#*#*#*#*#*#*#*#*#*#*#*#*#*#*#*#*#*#*#*#*#*#*#*#*#*#*#*
#*#*#*#*#*#*#*#*#*#*
#*#*#*#*#*#*
#*#*#*#*#*#*#*#*#*#*#*#*#*#*#*#*#*!(!(!(!(!(!(!(!(!( !(!(!(!(!(!(
!(!(!(!(!( !(!(!(!(!(!(!(!(!(
!(!(!(!(!(!(!(!(!(!(!(!(!(!(
!(!(
!(!(!(!(!(!(!(!(!(!(!(!(!(
!( !(!(!(!(!(!(!(!(!(!(!(!(!(!(!(!(
!(!(!( !(
!(!(!( !( !(!(!(!(
!(
!(!(!(!(
!(!(!(!(
!(!(!(!(!(!(!(!(!(!( !(!(
!( !(!(!( !(
!(!(!(!(
!(
!(
!(
!(!(!(!(!(!(!(!(!(
!(!(!(!(!(!(
!(
!(
!(!(!(!(!(!(
!(!(
!(!(!(!(!(!(!(
!(!(!(!(
!(
!(
!(
!(!(
!(!(!(
!(
!(!(
!(!(
!(
!(
!(!(
!(!(!(!(!(!(!(!(
!(!(!(!(!(!(!(!(!( !(!(!(!(
!(!(!(!(
!(!(
!(!(!(
!(!(
!(!(!(!(
!(!(!(!(!(!(!(
!(!(!(!(
!(!(!(!(!(!(!(!(!(
!(!( !(!(!(!(!(!(!(!(!(
!(!( !( !( !(!(!(!(!(!(!(!(!(!( !(!(
!(!(!(!(!(!(!(!(!(!(!(!(!(!(!(!(!(!(!(
!(!(!(!(!(!(!(!(!(!(
!(!(!(!(!(!(
!(!(!(!(!(!(!(
!(!(!(
!(!(
!(!(!(!(!(!(
!(!(!(!(!(
!(!(!(!(!(!(!(!(
!(!(!(!(
#*#*#* #*#*#*
#*#*#*#*#*#*#*#*#*#*
#*#*#*#*#*#*#*#*#*#*#*#*#*#*#*#*#*#*#*#*#*#*#*#*#*#*#*#*#*#*#*#*#*#*#*#*#*#*#*#*#*#*#*#*#*#*#*
#*#*
#*#*
#*#*
#*#* #*#*#*#*#*
#*#*#*#*#* #*#*#*#*#*
#*#*#*#*#*#*#*#*
#*#*#*#*#*#*#*
#*#*#*#*
#*#*#*#*#*#*#*#*#*#*#*#*#*
#* #*#*#* #*
#*#*#*#* #*#*#*
#*#*#*#*#*#*#*
#*#*#*#*
40°E
0 200 400100
Kilometers
10°S
20°S
LegendSurvey#* 1977402#* 1977403#* 1978401#* 1978402#* 1980407#* 1982405#* 1983405#* 1990402#* 1990404#* 1990406!( 2007409!( 2008409!( 2009407!( 2014406
200mArea of interest
East African Coastal CurrentMadagascar and ComorosMozambique
MOZAMBIQUE
Subregion
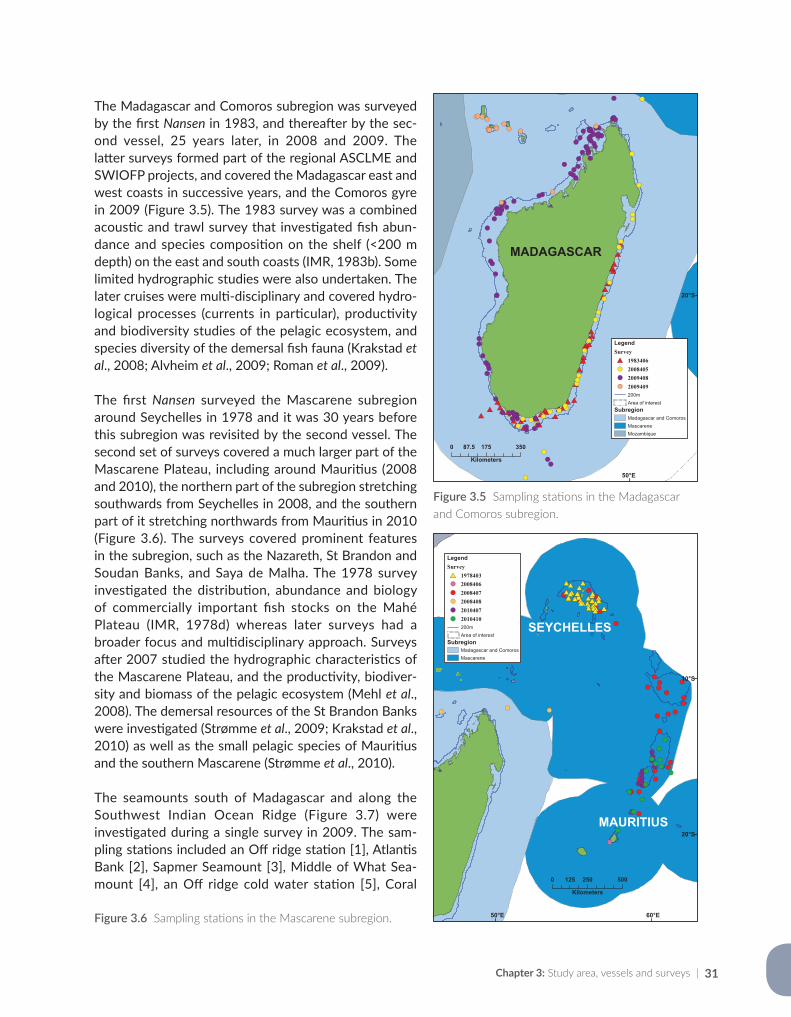
Chapter 3: Study area, vessels and surveys | 31
Figure 3.5 Sampling stations in the Madagascar and Comoros subregion.
#*#*#*#*#*#* #*
#*#*#*#*#*#* #*#*#*#*#*
#* #*#*#*#*
#*#*
#*#*#*#*#*#*#*#*#*#*
#*#*#*#*#*#*#*#*#*
!(!(!(!(
!(!(
!(
!(
!(
!( !( !(!(
!(!(!(
!(!(
!(!(
!(
!(
!(!(
!(!(
!(
!(
!(
!(!(
!(!(!(!(!(
!(!(!(!(!(!(!(!(!(
!(
!(!(!(!(!(
!(!(
!(!(
!(
!(!(
!(
!(!(!(!(!(!(!(!(!(!(!( !(
!(!(
!(!(!(!(
!(!(!(!(
!(!(!(!(!(!(
!( !(!(!(!(!(
!( !(!(!(!(!( !(
!(!(!(!(!(!(
!(!(!(
!(
!(!(!( !(!(!(
!(!(
!(!(!(!(
!(!(
!(
!(
!(!(
!(
50°E
0 175 35087.5
Kilometers
LegendSurvey#* 1983406!( 2008405!( 2009408!( 2009409
200mArea of interest
Madagascar and ComorosMascareneMozambique
20°S
MADAGASCAR
Subregion
!(
!(!(
!(!( !(!(
!(!(!(
!( !(!(
!(
!( !(!(
!(!(
!(!(!( !( !(!(
!(!(!(
!(!(
!(!(
!(!(!(
!(!(!(!(!(!(!( !(
!(!(!(
!(
!(!(
!(!(
!( !(!(!(!( !(!(!(
#*#*#*#*#*#*#*#*#*#*#*#* #* #*#*#*#*#*#*#*#*#*#* #*#*#*#*#*#*#*
#*#* #*#*#*#*#*#*#*#*
60°E50°E
0 250 500125
Kilometers
LegendSurvey#* 1978403!( 2008406!( 2008407!( 2008408!( 2010407!( 2010410
200mArea of interest
Madagascar and ComorosMascarene
SEYCHELLES
MAURITIUS20°S
10°S
Subregion
Figure 3.6 Sampling stations in the Mascarene subregion.
The Madagascar and Comoros subregion was surveyed by the first Nansen in 1983, and thereafter by the sec-ond vessel, 25 years later, in 2008 and 2009. The latter surveys formed part of the regional ASCLME and SWIOFP projects, and covered the Madagascar east and west coasts in successive years, and the Comoros gyre in 2009 (Figure 3.5). The 1983 survey was a combined acoustic and trawl survey that investigated fish abun-dance and species composition on the shelf (<200 m depth) on the east and south coasts (IMR, 1983b). Some limited hydrographic studies were also undertaken. The later cruises were multi-disciplinary and covered hydro-logical processes (currents in particular), productivity and biodiversity studies of the pelagic ecosystem, and species diversity of the demersal fish fauna (Krakstad et al., 2008; Alvheim et al., 2009; Roman et al., 2009).
The first Nansen surveyed the Mascarene subregion around Seychelles in 1978 and it was 30 years before this subregion was revisited by the second vessel. The second set of surveys covered a much larger part of the Mascarene Plateau, including around Mauritius (2008 and 2010), the northern part of the subregion stretching southwards from Seychelles in 2008, and the southern part of it stretching northwards from Mauritius in 2010 (Figure 3.6). The surveys covered prominent features in the subregion, such as the Nazareth, St Brandon and Soudan Banks, and Saya de Malha. The 1978 survey investigated the distribution, abundance and biology of commercially important fish stocks on the Mahé Plateau (IMR, 1978d) whereas later surveys had a broader focus and multidisciplinary approach. Surveys after 2007 studied the hydrographic characteristics of the Mascarene Plateau, and the productivity, biodiver-sity and biomass of the pelagic ecosystem (Mehl et al., 2008). The demersal resources of the St Brandon Banks were investigated (Strømme et al., 2009; Krakstad et al., 2010) as well as the small pelagic species of Mauritius and the southern Mascarene (Strømme et al., 2010).
The seamounts south of Madagascar and along the Southwest Indian Ocean Ridge (Figure 3.7) were investigated during a single survey in 2009. The sam-pling stations included an Off ridge station [1], Atlantis Bank [2], Sapmer Seamount [3], Middle of What Sea-mount [4], an Off ridge cold water station [5], Coral
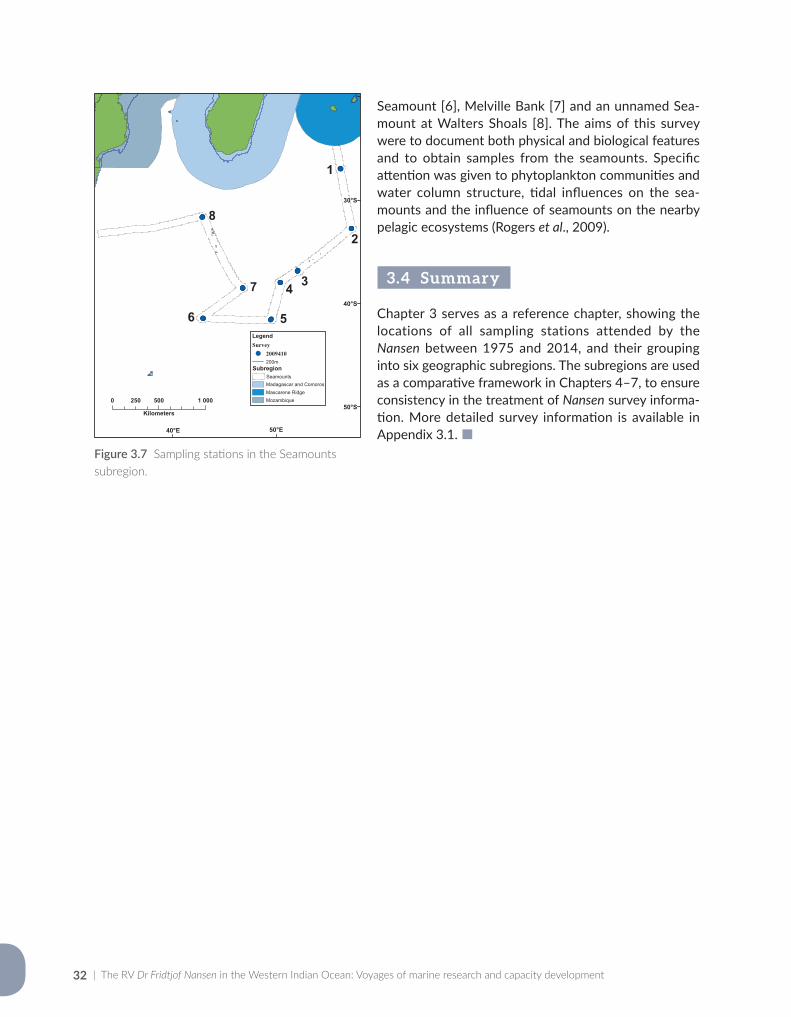
| The RV Dr Fridtjof Nansen in the Western Indian Ocean: Voyages of marine research and capacity development32
Seamount [6], Melville Bank [7] and an unnamed Sea-mount at Walters Shoals [8]. The aims of this survey were to document both physical and biological features and to obtain samples from the seamounts. Specific attention was given to phytoplankton communities and water column structure, tidal influences on the sea-mounts and the influence of seamounts on the nearby pelagic ecosystems (Rogers et al., 2009).
3.4 Summary
Chapter 3 serves as a reference chapter, showing the locations of all sampling stations attended by the Nansen between 1975 and 2014, and their grouping into six geographic subregions. The subregions are used as a comparative framework in Chapters 4–7, to ensure consistency in the treatment of Nansen survey informa-tion. More detailed survey information is available in Appendix 3.1.
Figure 3.7 Sampling stations in the Seamounts subregion.
50°E40°E
30°S
40°S
50°S
!(!(!(!(
!(!(!(!(!(
!(!(!(!(!(!(!(!(!(!(!(
!(!(!(!(!(!(!(!(!(
!(!(!(!(!(!(
!(!(!(!(!(
0 500 1 000250
Kilometers
LegendSurvey!( 2009410
200m
SeamountsMadagascar and ComorosMascarene RidgeMozambique
1
2
34
56
7
8
Subregion
Chapter 3: Study area, vessels and surveys | 33
References
Alvheim, O., Torstensen, E., Fennessy, S., MacKay, F., Zaera, D. & Bemiasa, J. 2009. West Madagascar: Cruise Reports Dr Fridtjof Nansen. Pelagic Ecosystem Survey SWIOFP/ASCLME/FAO, Cruise 2, 25 August–3 October 2009. Preliminary report. Bergen, Norway, Institute of Marine Research.
Amante, C. & Eakins, B. 2009. ETOPO1 1 Arc–Minute Global Relief Model: Procedures, data sources and analysis. NOAA Technical Memorandum NESDIS NGDC–24. Boulder, Colorado, National Geophysical Data Center.
Blindheim, J. 1984. Preliminary Cruise Report – R/V Dr Fridtjof Nansen. Fishery resources surveys in P.D.R. Yemen and Ethiopia, 11 February–21 March 1984. Bergen, Norway, Institute of Marine Research.
Brinca, L., Rey, F., Silva, C. & Sætre, R. 1981. A survey on the marine fish resources of Mozambique. October–November 1980. Bergen, Norway, Institute of Marine Research.
Brinca, L., Jorge da Silva, A., Sousa, L., Sousa, I. & Sætre, R. 1983. A survey on the fish resources at Sofala Bank, Mozambique. September 1982. Bergen, Norway, Institute of Marine Research.
Brinca, L., Mascarenhas, V., Palha de Sousa, B., Palha de Sousa, L., Sousa, I., Sætre, R. & Timochin, I. 1984. A Survey on the fish resources at Sofala Bank, Mozambique. May–June 1983. Bergen, Norway, Institute of Marine Research.
IMR. 1975. Report on Cruise No. 1 and No. 2 of R/V Dr Fridtjof Nansen. Indian Ocean Fishery and Development Programme – Pelagic fish assessment survey, North Arabian Sea. Bergen, Norway, Institute of Marine Research.
IMR. 1976a. Report on Cruise No. 3 of R/V Dr Fridtjof Nansen. Indian Ocean Fishery and Development Programme – Pelagic fish assessment survey, North Arabian Sea. Bergen, Norway, Institute of Marine Research.
IMR. 1976b. Report on Cruise No. 4 of R/V Dr Fridtjof Nansen. Indian Ocean Fishery and Development Programme – Pelagic fish assessment survey, North Arabian Sea. Bergen, Norway, Institute of Marine Research.
IMR. 1976c. Report on Cruise No. 5 of R/V Dr Fridtjof Nansen. Indian Ocean Fishery and Development Programme – Pelagic fish assessment survey, North Arabian Sea. Bergen, Norway, Institute of Marine Research.
IMR. 1977a. Cruise Report No. 1 of R/V Dr Fridtjof Nansen. Joint NORAD/Mozambique/FAO Project to investigate the fish resources off the coast of Mozambique. Bergen, Norway, Institute of Marine Research.
IMR. 1977b. Report on Cruise No. 6 of R/V Dr Fridtjof Nansen. Indian Ocean Fishery and Development Programme – Pelagic fish assessment survey, North Arabian Sea. Bergen, Norway, Institute of Marine Research.
IMR. 1978a. Cruise Report No. 2 of R/V Dr Fridtjof Nansen. Joint NORAD/Mozambique/FAO Project to investigate the fish resources off the coast of Mozambique, October–December 1977. Bergen, Norway, Institute of Marine Research.
IMR. 1978b. Cruise Report No. 3 of R/V Dr Fridtjof Nansen. Joint NORAD/Mozambique/FAO Project to investigate the fish resources off the coast of Mozambique, January–March 1978. Bergen, Norway, Institute of Marine Research.
IMR. 1978c. Cruise Report No. 4 of R/V Dr Fridtjof Nansen. Joint NORAD/Mozambique/FAO Project to investigate the fish resources off the coast of Moçambique, April–June 1978. Bergen, Norway, Institute of Marine Research.
IMR. 1978d. Survey results of R/V Dr Fridtjof Nansen. Joint NORAD/Seychelles Project to investigate the fish resources in Seychelles waters, July 1978. Bergen, Norway, Institute of Marine Research.
IMR. 1982a. Cruise Report R/V Dr Fridtjof Nansen. Second fisheries resources survey, Tanzania, 12 November–3 December. Bergen, Norway, Institute of Marine Research.
IMR. 1982b. Survey of the abundance and distribution of the fish resources off Kenya. Preliminary Cruise Report Dr Fridtjof Nansen. Bergen, Norway, Institute of Marine Research.
IMR. 1982c. Survey of the abundance and distribution of the fish resources off Kenya. Preliminary Cruise Report Dr Fridtjof Nansen. Bergen, Norway, Institute of Marine Research.
IMR. 1983a. Fisheries resources survey, Madagascar. Cruise Report R/V Dr Fridtjof Nansen. 16–28 June 1983. Bergen, Norway, Institute of Marine Research.
IMR. 1983b. Third fisheries resources survey, Tanzania. Cruise Report R/V Dr Fridtjof Nansen. 11–26 May 1983. Bergen, Norway, Institute of Marine Research.
IMR. 1990a. Survey for deep water shrimp resources in Mozambique. Preliminary Cruise Report No III, R/V Dr Fridtjof Nansen. Bergen, Norway, Institute of Marine Research.
| The RV Dr Fridtjof Nansen in the Western Indian Ocean: Voyages of marine research and capacity development34
IMR. 1990b. Survey of the fish resources of Mozambique. Preliminary Cruise Report No I. R/V Dr Fridtjof Nansen. Bergen, Norway, Institute of Marine Research.
IMR. 1990c. Survey of the fish resources of Mozambique. Preliminary cruise report No II. R/V Dr Fridtjof Nansen. Bergen, Norway, Institute of Marine Research.
Iversen, S. 1983. Preliminary Cruise Report R/V Dr. Fridtjof Nansen. Survey of the abundance and distribution of fish resources off Kenya, 2–8 May 1983. Bergen, Norway, Institute of Marine Research.
Johnsen, E., Krakstad, J., Ostrowski, M., Serigstad, B., Strømme, T., Alvheim, O., Olsen, M., Zaera, D., André, E., Dias, N., Sousa, L., Sousa, B., Malauene, B. & Abdula, S. 2007. Surveys of the living marine resources of Mozambique: Ecosystem survey and special studies. 27 September–21 December 2007. Report No. 8/2007–2007409. Bergen, Norway, Institute of Marine Research.
Kaehler, S., Gammelsrød, T., Hill, J., Ternon, J.-F., Cotel, P., Potier, M., Huggett, J., Miggel, A., Pillay, K., Dyer, B., Backeberg, B., Langa, A., Malaune, B., Benivary, D., Morris, T., O’Reilly, B. & Olsen, M. 2008. 2008 ASCLME Survey No 4. Preliminary Cruise Report No 8/2008. 28 November–17 December 2008. Bergen, Norway, Institute of Marine Research.
Krakstad, J.-O., Krafft, B., Alvheim, O., Kvalsund, M., Bernardes, I., Chacate, O., Mutombene, R., Filipe, O., Hajy, B., Zacarias, L., Zivane, F., M, P. & Varela, D. 2015. Marine Ecosystem Survey of Mozambique. Cruise report Dr Fridtjof Nansen. 11 November–02 December 2014. Report No. GCP/INT/003/NOR. FAO–NORAD.
Krakstad, J.-O., Mehl, S., Roman, R., Escobar-Porras, J., Stapley, J., Flynn, B., Olsen, M. & Beck, I. 2008. Cruise Reports Dr Fridtjof Nansen. East Madagascar Current Ecosystem Survey ASCLME/FAO 2008 Cruise 1, 24 August–1 October 2008. Bergen, Norway, Institute of Marine Research.
Krakstad, J.-O., Zaera, D., Aasen, A. & Soondron, V. 2010. Cruise Reports Dr Fridtjof Nansen. Survey of the demersal resources on the western slopes of St. Brandon and Nazareth Bank, Mauritius, 16–25 September 2010. Report No. EAF-N2010/7, Bergen, Norway, Institute of Marine Research.
McClanahan, T. 1988. Seasonality in East Africa’s coastal waters. Marine Ecology Progress Series, 44(2): 191–199.Mehl, S., Roman, R., Bornman, T., Bernard, K., Flynn, B. & Beck, I. 2008. Cruise Reports Dr Fridtjof Nansen. Mauritius
ecosystem survey ASCLME/FAO 2008 Cruise 2, 4–7 October 2008. Bergen, Norway, Institute of Marine Research.Myklevoll, S. 1982. Cruise Report R/V Dr Fridtjof Nansen. Fisheries resources survey, Tanzania. 16 June–8 July 1982.
Bergen, Norway, Institute of Marine Research.Nakken, O. 1981. Report on Cruise with R/V Dr Fridtjof Nansen off Kenya, 8–19 December 1980. Bergen, Norway,
Institute of Marine Research.Olsen, E., Padera, M., Funke, M., Pires, P., Wenneck, T. & Zacarias, L. 2009. Cruise Reports Dr Fridtjof Nansen. Survey
of the living marine resources of North Mozambique (SWIOFP/ASCLME 2009 Cruise 1) 6 August–20 August 2009. Report No. EAF-N/2009/7. Bergen, Norway, Institute of Marine Research.
Rogers, A., Alvheim, O., Bemanaja, E., Benivary, D., Boersch-Supan, P., Bornman, T., Cedras, R., Du Plessis, N., Gotheil, S., Hoines, A., Kemp, K., Kristiansen, J., Letessier, T., Mangar, V., Mazungula, N., Mørk, T., Pinet, P., Read, J. & Sonnekus, T. 2009. Cruise Reports Dr Fridtjof Nansen. Southern Indian Ocean Seamounts (IUCN/ GEF/ UNDP/ ZSL/ ASCLME/ NERC/ EAF Nansen Project/ ECOMAR/ ACEP 2009 Cruise 410). 12 November–19 December 2009. Bergen, Norway, Institute of Marine Research.
Roman, R., Kaehler, S., Michalsen, K., Olsen, M. & Perri, M. 2009. Cruise Reports Dr Fridtjof Nansen. Survey of the Comoros Gyre (ASCLME & SWIOFP) 5 October–3 November 2009. Report No. EAF-N2009/9. Bergen, Norway, Institute of Marine Research.
Schott, F. & McCreary, J. 2001. The monsoon circulation of the Indian Ocean. Progress in Oceanography, 51(1): 1–123.Spalding, M., Fox, H., Allen, G., Davidson, N., Ferdana, Z., Finlayson, M., Halpern, B., Jorge, M., Lombana, A. & Lourie,
A. 2007. Marine ecoregions of the world: a bioregionalization of coastal and shelf areas. BioScience, 57(7): 573–583.
Strømme, T. 1984. Cruise Report Dr Fridtjof Nansen. Second fisheries resource survey of the northeast coast of Somalia, 24–30 August 1984. Bergen, Norway, Institute of Marine Research.
Chapter 3: Study area, vessels and surveys | 35
Strømme, T., Ansorge, I., Bornman, T., Kaehler, S., Ostrowski, M., Tweddle, D. & Alvheim, O. 2009. Cruise Reports Dr Fridtjof Nansen. ASCLME Survey No. 3. 8 October–27 November 2008. Report No. EAF-N2008/7. Bergen, Norway, Institute of Marine Research.
Strømme, T., Groeneveld, J., Alvheim, O., Fossheim, O. & Svoren, T. 2010. Cruise Reports Dr Fridtjof Nansen. Mauritius and Southern Mascarene: Pelagic Ecosystem Survey SWIOFP/FAO 2010 Cruise 1. 6–21 December 2010. Final report. Report No. EAF-N2008/7. Bergen, Norway, Institute of Marine Research.
van der Elst, R., Groeneveld, J., Baloi, A., Marsac, F., Katonda, K., Ruwa, R. & Lane, W. 2009. Nine nations, one ocean: A benchmark appraisal of the South Western Indian Ocean Fisheries Project (2008–2012). Ocean & Coastal Management, 52(5): 258–267.
van Holst Pellekaan, J. 2014. Implementation Completion Report (ICR) Review – South West Indian Ocean Fisheries Project. Project P072202 completed for the World Bank Group [Online]. The World Bank. Available: http://lnweb90.worldbank.org/oed/oeddoclib.nsfDocUNIDViewForJavaSearch/8525682E0068603785257C4400833EB5?opendocument. Accessed 29 June 2016.
White, M., Bashmachnikov, I., Arístegui, J. & Martins, A. 2007. Physical processes and seamount productivity. Seamounts: Ecology, fisheries & conservation, pp. 65–84. Oxford, United Kingdom, Fish and Aquatic Resources Series 12, Blackwell Publishing.

| The RV Dr Fridtjof Nansen in the Western Indian Ocean: Voyages of marine research and capacity development36
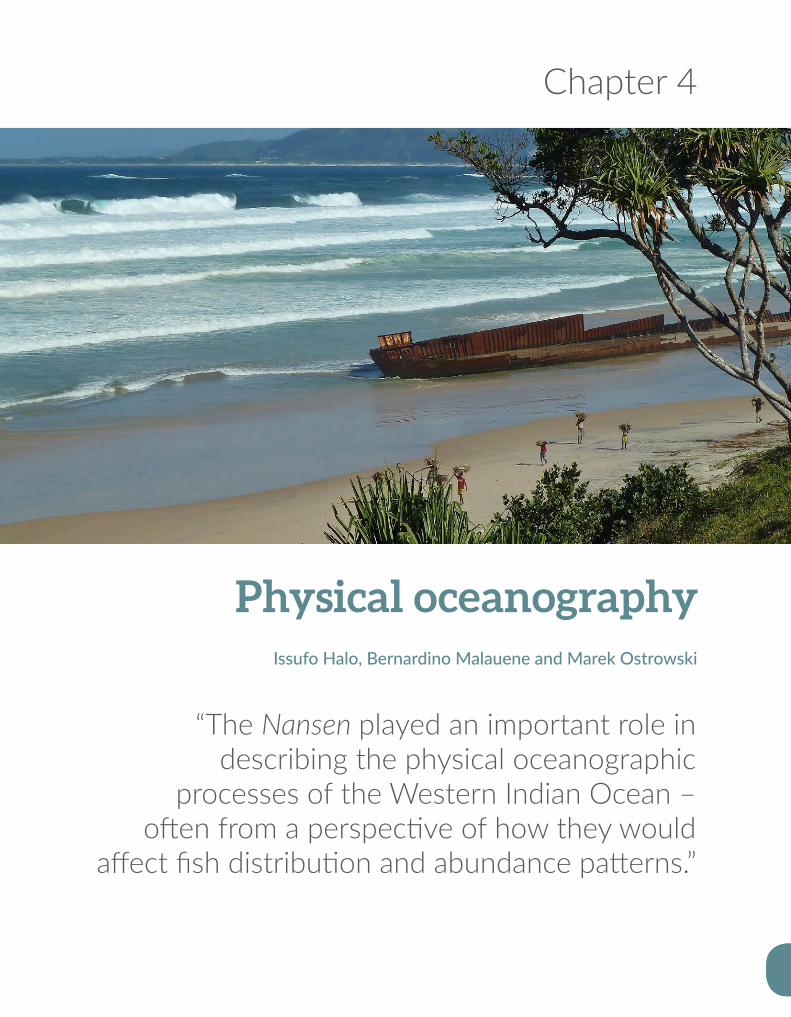
Chapter 4
“The Nansen played an important role in describing the physical oceanographic
processes of the Western Indian Ocean – often from a perspective of how they would
affect fish distribution and abundance patterns.”
Physical oceanography Issufo Halo, Bernardino Malauene and Marek Ostrowski

| The RV Dr Fridtjof Nansen in the Western Indian Ocean: Voyages of marine research and capacity development38
Abstract
Data on the physical properties (water temperature, salinity and oxygen profiles, fluorescence) and ocean processes (ocean circulation, heat transfer, upwelling, riverine outflow) have been collected since the early RV Dr Fridtjof Nansen surveys in the Western Indian Ocean. These physical processes influence ocean productivity on spatial and temporal scales, and thus determine the distribution and abundance of fisheries resources. Nansen surveys between 1975 and 1990 focussed on fisheries exploration, with routine hydrographic observations made, using the Nansen reversing bottle to sample temperature, salinity and oxygen in the water column. The Nansen bottle was replaced by a CTD with Niskin bottles in 1994, when the first RV Dr Fridtjof Nansen was replaced with a more modern second vessel. Recent surveys (post-2007) used technologically more advanced sensory techniques – such as satellite imagery and high resolution underway sensors. The later surveys followed a broader multi-disciplinary strategy, in which the collection and analysis of oceanographic information received far more attention. Chapter 4 reviews the Nansen’s contributions to oceanographic discovery in the Western Indian Ocean, with a focus on the Somali Coast and East Africa Coastal Current subregions (surveys in 1975–1984), Mozam-bique and Madagascar (1977–2014), and the Mascarene subregion (1978–2010). Whereas many of the early observations were inconclusive at the time, more recent studies during the “satellite era” have corroborated earlier findings. For instance, Nansen data contributed to the first identification of eddies in the Gulf of Aden, and in the Mozambique Channel. Nansen data from a 2008 survey described the flow structure of the Southeast Madagascar Current. Upwelling events were observed near Angoche in Mozambique and off southeast Madagascar. Surveys to the Mascarene subregion in 2008 and 2010 sug-gested sub-surface (approximately 60–100 m depth) maximum phytoplankton densities – a major factor in explaining the functioning of local marine ecosystems. In retrospect, the Nansen played an important role in describing the physical oceanographic processes of the Western Indian Ocean – often from a perspective of how they would affect fish distribution and abundance patterns.
Previous page: Coastal ocean off southeast Madagascar. © Johan Groeneveld
Chapter 4: Physical oceanography | 39
4.1 Introduction
Initial surveys by the RV Dr Fridtjof Nansen in the Western Indian Ocean (1975–1990) focussed pri-marily on fisheries research, but oceanographic observations were routinely made. Following on a 17 year absence, renewed surveys with the Nansen after 2007 used far more advanced sam-pling techniques – such as satellite imagery and high resolution underway sensors – to map ocean-ographic features. The latter era (2007–2016) was characterized by a multi-disciplinary survey strat-egy to support broader ecosystems approaches to fisheries research. Within this set-up, oceano-graphic studies received far more attention, and in some cases, such as the 2008 survey of east Madagascar, focussed on studying the physical oceanography of specific ocean current systems. Post-2007 Nansen surveys in the Western Indian Ocean were restricted to the waters of Mozam-bique, Madagascar, Comoros and the Mascarene Plateau, well south of areas affected by piracy.
Chapter 4 presents an overview of oceanographic information collected by the Nansen, with a focus on the Somali Coast and East Africa Coastal Cur-rent subregions (EACC; surveys in 1975 to 1984); Mozambique and Madagascar subregions (surveys in 1977 to 2014); and the Mascarene subregion (surveys in 1978 to 2010). The contributions of the Nansen surveys to regional knowledge of the Western Indian Ocean are highlighted. Further, Chapter 4 outlines the known oceanographic fea-tures of the region – such as ocean circulation, temperature, salinity and oxygen profiles, water masses, upwelling areas and riverine input. These features influence ocean productivity on spatial and temporal scales (Chapter 5), and thus they also determine the distribution and abundance of pelagic (Chapter 6) and demersal (Chapter 7) fisheries resources. The strong link between phys-ical oceanography, ocean productivity and fish resources is demonstrated in a Western Indian Ocean context. In addition, selected oceano-graphic information from pioneering surveys to eastern Somalia, Kenya and Tanzania was reanal-ysed, to assess the influence of monsoon seasons on water column structure (see Appendix 4.1).
4.2 General circulation of the Western Indian Ocean
The South Equatorial Current (SEC) is the principal pathway along which eastern and central Indian Ocean water masses move towards the African continent (Figure 4.1). East of Madagascar, at about 17 °S, the SEC branches into a southward flowing Southeast Madagascar Current (SEMC) and a northward flowing Northeast Madagascar Current (NEMC). At the southern tip of Madagas-car, the SEMC sheds a sequence of eddies and dipoles that propagate southwestwards, towards the coasts of southern Mozambique and eastern South Africa (de Ruijter et al., 2002; Quartly et al., 2006; Ridderinkhof et al., 2013).
The NEMC branch passes the northern tip of Madagascar, where a portion of its flow becomes unsteady and sheds eddies into the Mozambique Channel (MCE). These eddies propagate south-wards through the channel, to feed into the upper Agulhas Current, off eastern South Africa. The remainder of the NEMC continues westwards after passing northern Madagascar, feeding into the EACC; this current flows northwards off Tanza-nia, but off Kenya (north of 4 °S), its flow direction changes with alternating monsoon seasons.
During the Southwest (SW) monsoon (June to September), the EACC feeds into the northward-flowing Somali Current (SC). At about 3 °N, a part of it retroflects to the south of the equator, where it feeds into the South Equatorial Counter Cur-rent (SECC). The Somali Current flows northwards along the Somali coast during this time, forming a gyral circulation, or Great Whirl (GW) in the north (Figure 4.1a). An upwelling centre forms at the lee side of the Somali Current branch towards the Great Whirl (Schott, 1983). Further north, Gulf of Aden Eddies (GAE) dominate the upper layer circulation year-round (Al Saafani et al., 2007; Fratantoni et al., 2006). During the Northeast (NE) monsoon (December to March), the Somali Current flows southwards (Figure 4.1b), collid-ing with the northwards flowing EACC off Kenya; their confluence feed into the SECC. The dom-inant northeasterly winds induce downwelling
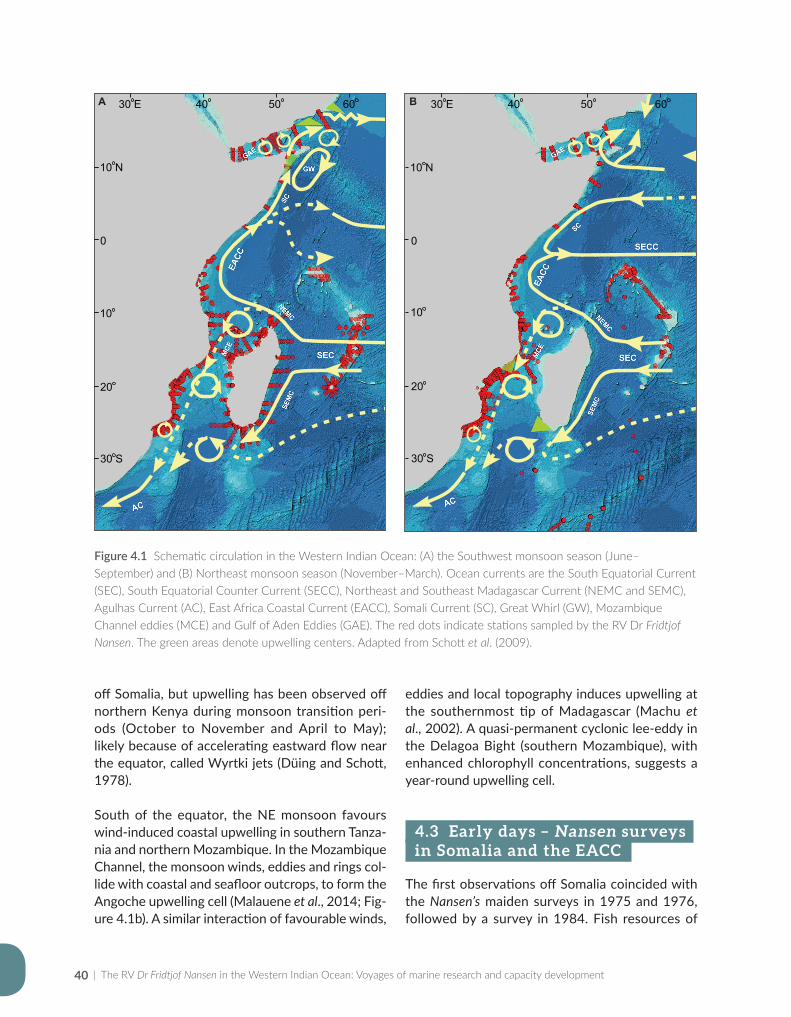
| The RV Dr Fridtjof Nansen in the Western Indian Ocean: Voyages of marine research and capacity development40
off Somalia, but upwelling has been observed off northern Kenya during monsoon transition peri-ods (October to November and April to May); likely because of accelerating eastward flow near the equator, called Wyrtki jets (Düing and Schott, 1978).
South of the equator, the NE monsoon favours wind-induced coastal upwelling in southern Tanza-nia and northern Mozambique. In the Mozambique Channel, the monsoon winds, eddies and rings col-lide with coastal and seafloor outcrops, to form the Angoche upwelling cell (Malauene et al., 2014; Fig-ure 4.1b). A similar interaction of favourable winds,
eddies and local topography induces upwelling at the southernmost tip of Madagascar (Machu et al., 2002). A quasi-permanent cyclonic lee-eddy in the Delagoa Bight (southern Mozambique), with enhanced chlorophyll concentrations, suggests a year-round upwelling cell.
4.3 Early days – Nansen surveys in Somalia and the EACC
The first observations off Somalia coincided with the Nansen’s maiden surveys in 1975 and 1976, followed by a survey in 1984. Fish resources of
Figure 4.1 Schematic circulation in the Western Indian Ocean: (A) the Southwest monsoon season (June–September) and (B) Northeast monsoon season (November–March). Ocean currents are the South Equatorial Current (SEC), South Equatorial Counter Current (SECC), Northeast and Southeast Madagascar Current (NEMC and SEMC), Agulhas Current (AC), East Africa Coastal Current (EACC), Somali Current (SC), Great Whirl (GW), Mozambique Channel eddies (MCE) and Gulf of Aden Eddies (GAE). The red dots indicate stations sampled by the RV Dr Fridtjof Nansen. The green areas denote upwelling centers. Adapted from Schott et al. (2009).
00
30 E 40 50 60 30 E 40 50 60
10 N
30 S
20
10
10 N
30 S
20
10
00
30 E 40 50 60 30 E 40 50 60
10 N
30 S
20
10
10 N
30 S
20
10
A B
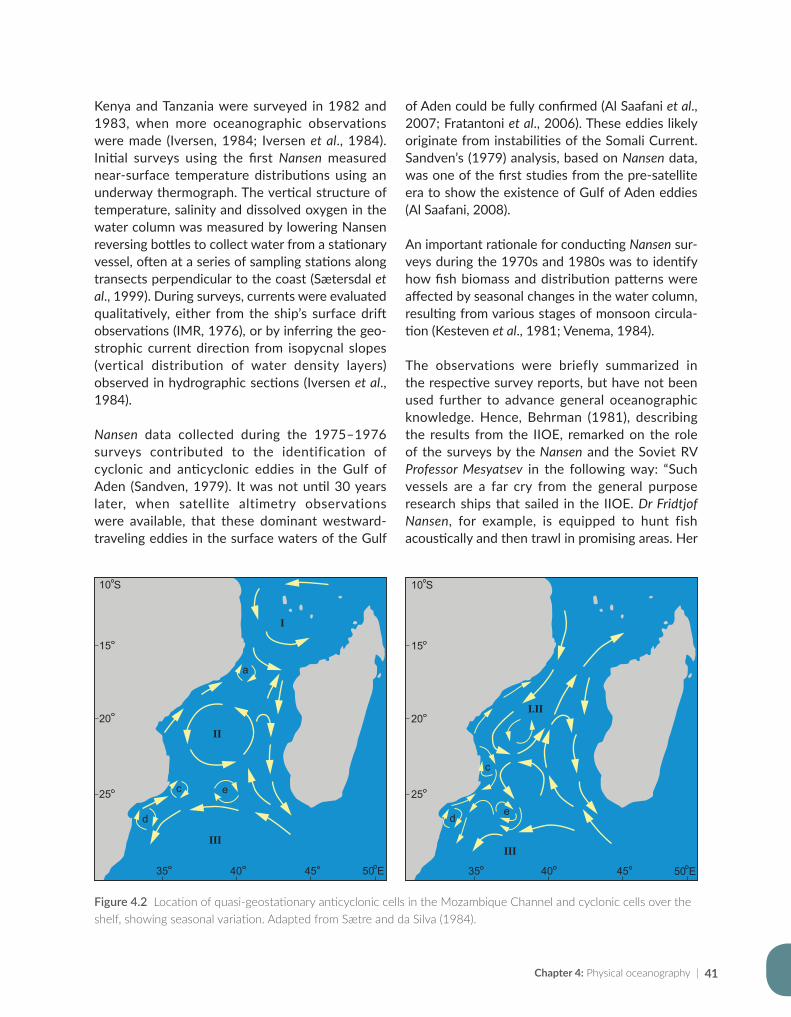
Chapter 4: Physical oceanography | 41
Kenya and Tanzania were surveyed in 1982 and 1983, when more oceanographic observations were made (Iversen, 1984; Iversen et al., 1984). Initial surveys using the first Nansen measured near-surface temperature distributions using an underway thermograph. The vertical structure of temperature, salinity and dissolved oxygen in the water column was measured by lowering Nansen reversing bottles to collect water from a stationary vessel, often at a series of sampling stations along transects perpendicular to the coast (Sætersdal et al., 1999). During surveys, currents were evaluated qualitatively, either from the ship’s surface drift observations (IMR, 1976), or by inferring the geo-strophic current direction from isopycnal slopes (vertical distribution of water density layers) observed in hydrographic sections (Iversen et al., 1984).
Nansen data collected during the 1975–1976 surveys contributed to the identification of cyclonic and anticyclonic eddies in the Gulf of Aden (Sandven, 1979). It was not until 30 years later, when satellite altimetry observations were available, that these dominant westward-traveling eddies in the surface waters of the Gulf
of Aden could be fully confirmed (Al Saafani et al., 2007; Fratantoni et al., 2006). These eddies likely originate from instabilities of the Somali Current. Sandven’s (1979) analysis, based on Nansen data, was one of the first studies from the pre-satellite era to show the existence of Gulf of Aden eddies (Al Saafani, 2008).
An important rationale for conducting Nansen sur-veys during the 1970s and 1980s was to identify how fish biomass and distribution patterns were affected by seasonal changes in the water column, resulting from various stages of monsoon circula-tion (Kesteven et al., 1981; Venema, 1984).
The observations were briefly summarized in the respective survey reports, but have not been used further to advance general oceanographic knowledge. Hence, Behrman (1981), describing the results from the IIOE, remarked on the role of the surveys by the Nansen and the Soviet RV Professor Mesyatsev in the following way: “Such vessels are a far cry from the general purpose research ships that sailed in the IIOE. Dr Fridtjof Nansen, for example, is equipped to hunt fish acoustically and then trawl in promising areas. Her
Figure 4.2 Location of quasi-geostationary anticyclonic cells in the Mozambique Channel and cyclonic cells over the shelf, showing seasonal variation. Adapted from Sætre and da Silva (1984).
a
c e
d
II
I
III
15
20
25
35 40 45
10 S
50 E
c
ed
I.II
III
15
20
25
35 40 45 50 E
10 S
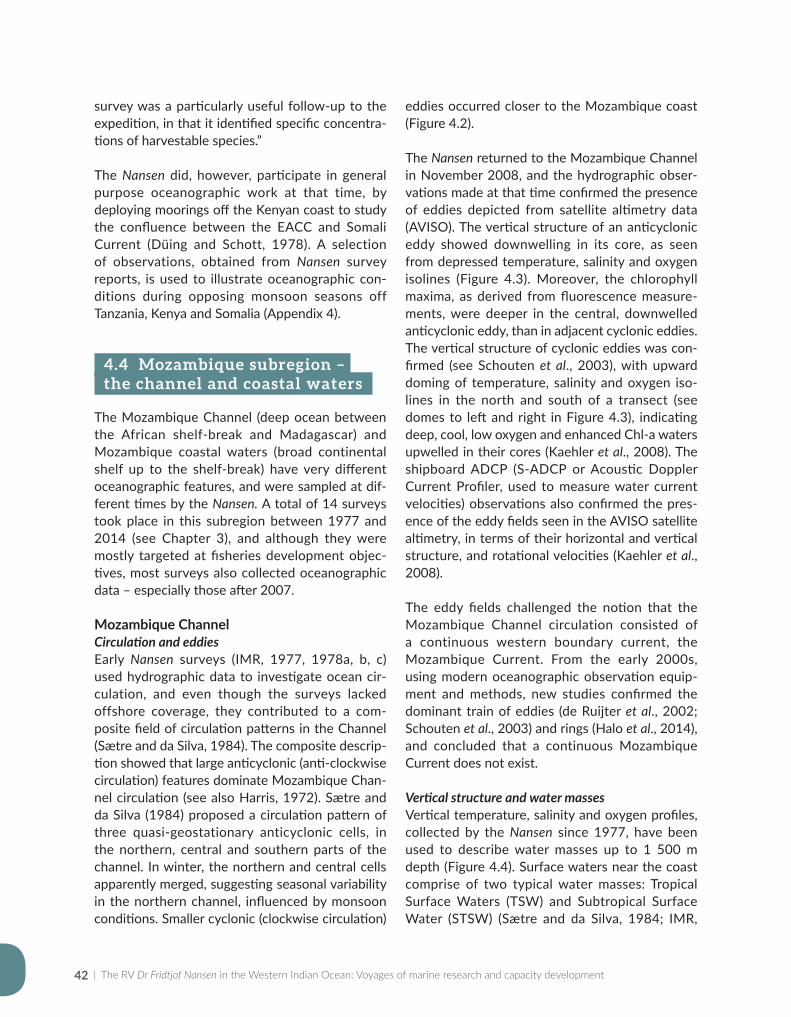
| The RV Dr Fridtjof Nansen in the Western Indian Ocean: Voyages of marine research and capacity development42
survey was a particularly useful follow-up to the expedition, in that it identified specific concentra-tions of harvestable species.”
The Nansen did, however, participate in general purpose oceanographic work at that time, by deploying moorings off the Kenyan coast to study the confluence between the EACC and Somali Current (Düing and Schott, 1978). A selection of observations, obtained from Nansen survey reports, is used to illustrate oceanographic con-ditions during opposing monsoon seasons off Tanzania, Kenya and Somalia (Appendix 4).
4.4 Mozambique subregion – the channel and coastal waters
The Mozambique Channel (deep ocean between the African shelf-break and Madagascar) and Mozambique coastal waters (broad continental shelf up to the shelf-break) have very different oceanographic features, and were sampled at dif-ferent times by the Nansen. A total of 14 surveys took place in this subregion between 1977 and 2014 (see Chapter 3), and although they were mostly targeted at fisheries development objec-tives, most surveys also collected oceanographic data – especially those after 2007.
Mozambique Channel Circulation and eddiesEarly Nansen surveys (IMR, 1977, 1978a, b, c) used hydrographic data to investigate ocean cir-culation, and even though the surveys lacked offshore coverage, they contributed to a com-posite field of circulation patterns in the Channel (Sætre and da Silva, 1984). The composite descrip-tion showed that large anticyclonic (anti-clockwise circulation) features dominate Mozambique Chan-nel circulation (see also Harris, 1972). Sætre and da Silva (1984) proposed a circulation pattern of three quasi-geostationary anticyclonic cells, in the northern, central and southern parts of the channel. In winter, the northern and central cells apparently merged, suggesting seasonal variability in the northern channel, influenced by monsoon conditions. Smaller cyclonic (clockwise circulation)
eddies occurred closer to the Mozambique coast (Figure 4.2).
The Nansen returned to the Mozambique Channel in November 2008, and the hydrographic obser-vations made at that time confirmed the presence of eddies depicted from satellite altimetry data (AVISO). The vertical structure of an anticyclonic eddy showed downwelling in its core, as seen from depressed temperature, salinity and oxygen isolines (Figure 4.3). Moreover, the chlorophyll maxima, as derived from fluorescence measure-ments, were deeper in the central, downwelled anticyclonic eddy, than in adjacent cyclonic eddies. The vertical structure of cyclonic eddies was con-firmed (see Schouten et al., 2003), with upward doming of temperature, salinity and oxygen iso-lines in the north and south of a transect (see domes to left and right in Figure 4.3), indicating deep, cool, low oxygen and enhanced Chl-a waters upwelled in their cores (Kaehler et al., 2008). The shipboard ADCP (S-ADCP or Acoustic Doppler Current Profiler, used to measure water current velocities) observations also confirmed the pres-ence of the eddy fields seen in the AVISO satellite altimetry, in terms of their horizontal and vertical structure, and rotational velocities (Kaehler et al., 2008).
The eddy fields challenged the notion that the Mozambique Channel circulation consisted of a continuous western boundary current, the Mozambique Current. From the early 2000s, using modern oceanographic observation equip-ment and methods, new studies confirmed the dominant train of eddies (de Ruijter et al., 2002; Schouten et al., 2003) and rings (Halo et al., 2014), and concluded that a continuous Mozambique Current does not exist.
Vertical structure and water massesVertical temperature, salinity and oxygen profiles, collected by the Nansen since 1977, have been used to describe water masses up to 1 500 m depth (Figure 4.4). Surface waters near the coast comprise of two typical water masses: Tropical Surface Waters (TSW) and Subtropical Surface Water (STSW) (Sætre and da Silva, 1984; IMR,
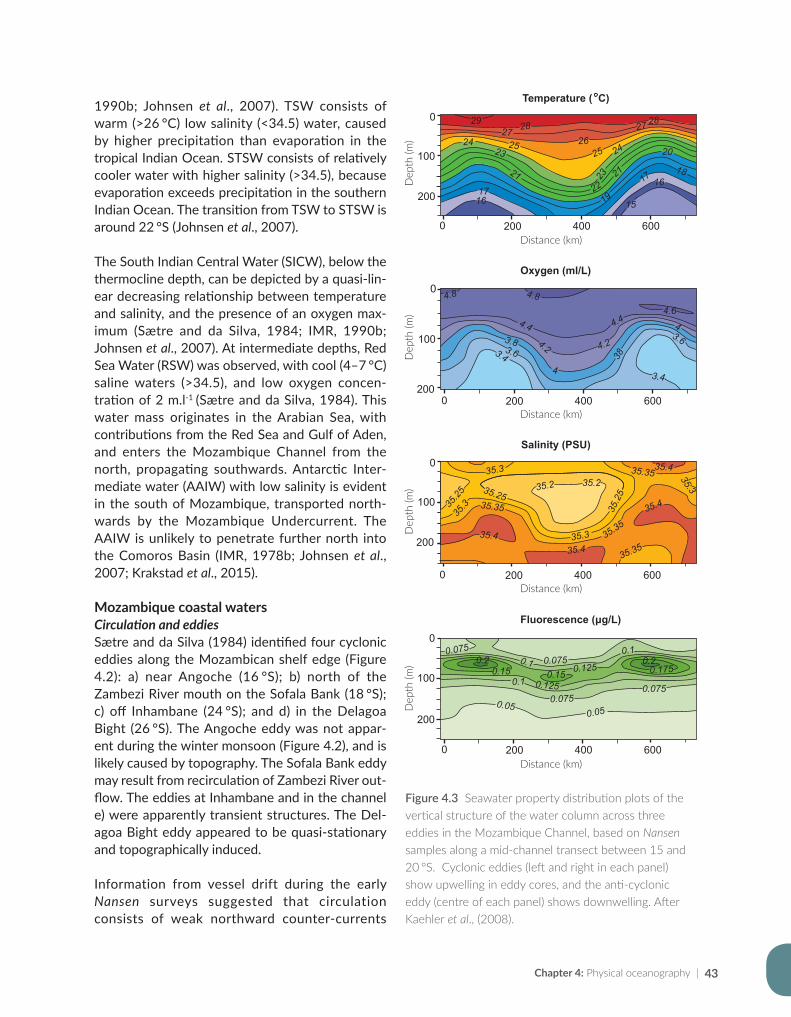
Chapter 4: Physical oceanography | 43
1990b; Johnsen et al., 2007). TSW consists of warm (>26 °C) low salinity (<34.5) water, caused by higher precipitation than evaporation in the tropical Indian Ocean. STSW consists of relatively cooler water with higher salinity (>34.5), because evaporation exceeds precipitation in the southern Indian Ocean. The transition from TSW to STSW is around 22 °S (Johnsen et al., 2007).
The South Indian Central Water (SICW), below the thermocline depth, can be depicted by a quasi-lin-ear decreasing relationship between temperature and salinity, and the presence of an oxygen max-imum (Sætre and da Silva, 1984; IMR, 1990b; Johnsen et al., 2007). At intermediate depths, Red Sea Water (RSW) was observed, with cool (4–7 °C) saline waters (>34.5), and low oxygen concen-tration of 2 m.l-1 (Sætre and da Silva, 1984). This water mass originates in the Arabian Sea, with contributions from the Red Sea and Gulf of Aden, and enters the Mozambique Channel from the north, propagating southwards. Antarctic Inter-mediate water (AAIW) with low salinity is evident in the south of Mozambique, transported north-wards by the Mozambique Undercurrent. The AAIW is unlikely to penetrate further north into the Comoros Basin (IMR, 1978b; Johnsen et al., 2007; Krakstad et al., 2015).
Mozambique coastal waters Circulation and eddiesSætre and da Silva (1984) identified four cyclonic eddies along the Mozambican shelf edge (Figure 4.2): a) near Angoche (16 °S); b) north of the Zambezi River mouth on the Sofala Bank (18 °S); c) off Inhambane (24 °S); and d) in the Delagoa Bight (26 °S). The Angoche eddy was not appar-ent during the winter monsoon (Figure 4.2), and is likely caused by topography. The Sofala Bank eddy may result from recirculation of Zambezi River out-flow. The eddies at Inhambane and in the channel e) were apparently transient structures. The Del-agoa Bight eddy appeared to be quasi-stationary and topographically induced.
Information from vessel drift during the early Nansen surveys suggested that circulation consists of weak northward counter-currents
Figure 4.3 Seawater property distribution plots of the vertical structure of the water column across three eddies in the Mozambique Channel, based on Nansen samples along a mid-channel transect between 15 and 20 °S. Cyclonic eddies (left and right in each panel) show upwelling in eddy cores, and the anti-cyclonic eddy (centre of each panel) shows downwelling. After Kaehler et al., (2008).
21 21
1922
24
16
151617
17
20
18
23
23
2625 2425
2727282829
0
100
200
200 400 600
0
Dep
th (m
)
Distance (km)
Temperature ( C)
35.235.35 35.3
35.4
35.25
35.2
5
35.2
35.4
35.4
35.35
35.435.3
35.35
35.335
.25
35.35
35.3
100
200
0
Dep
th (m
)
Salinity (PSU)
0 200 400 600Distance (km)
4.6
4.8
4.4 4
3.63.44.2
3.4
4.23.63.8
4.4
38
4.8
4
100
200
0
Dep
th (m
)
Oxygen (ml/L)
0 200 400 600Distance (km)
0.1750.150.1
0.20.2
0.0750.15
0.10.1
0.125
0.125
0.075
0.0750.075
0.050.05
100
200
0
Dep
th (m
)
Fluorescence (μg/L)
0 200 400 600Distance (km)
21 21
1922
24
16
151617
17
20
18
23
23
2625 2425
2727282829
0
100
200
200 400 600
0
Dep
th (m
)
Distance (km)
Temperature ( C)
35.235.35 35.3
35.4
35.25
35.2
5
35.2
35.4
35.4
35.35
35.435.3
35.35
35.335
.25
35.35
35.3
100
200
0
Dep
th (m
)
Salinity (PSU)
0 200 400 600Distance (km)
4.6
4.8
4.4 4
3.63.44.2
3.4
4.23.63.8
4.4
38
4.8
4
100
200
0D
epth
(m)
Oxygen (ml/L)
0 200 400 600Distance (km)
0.1750.150.1
0.20.2
0.0750.15
0.10.1
0.125
0.125
0.075
0.0750.075
0.050.05
100
200
0
Dep
th (m
)
Fluorescence (μg/L)
0 200 400 600Distance (km)
Dep
th (m
)
Distance (km)
Dep
th (m
)Distance (km)
Dep
th (m
)
Distance (km)
Dep
th (m
)
Distance (km)
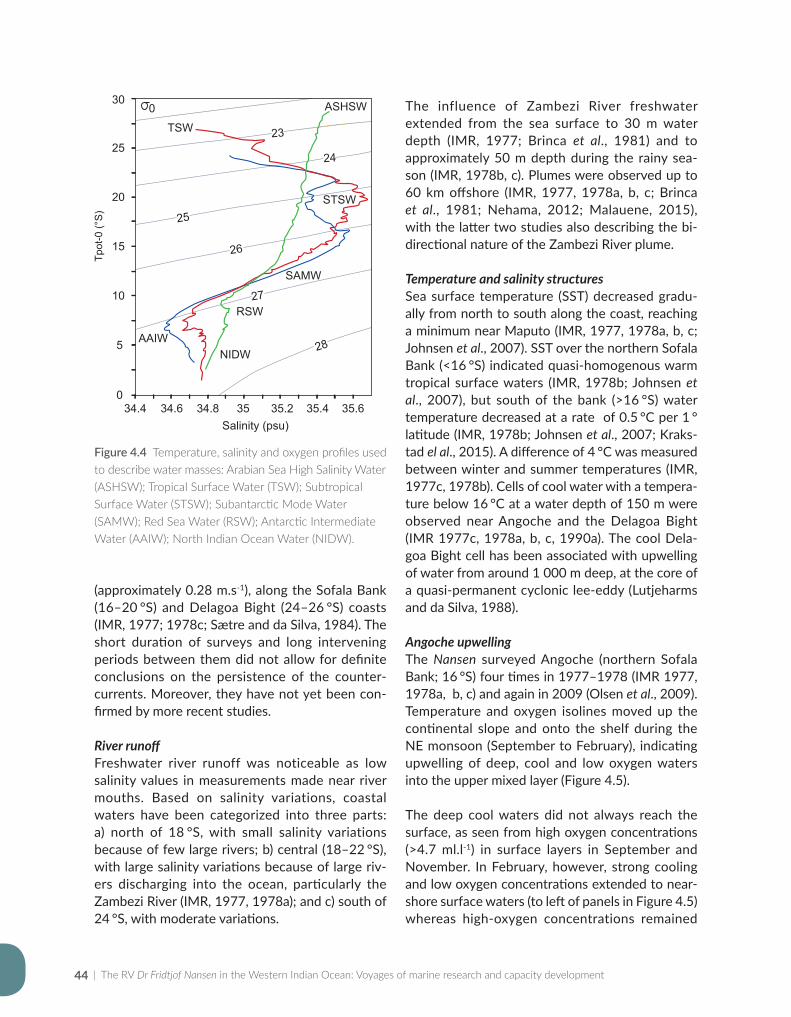
| The RV Dr Fridtjof Nansen in the Western Indian Ocean: Voyages of marine research and capacity development44
(approximately 0.28 m.s-1), along the Sofala Bank (16–20 °S) and Delagoa Bight (24–26 °S) coasts (IMR, 1977; 1978c; Sætre and da Silva, 1984). The short duration of surveys and long intervening periods between them did not allow for definite conclusions on the persistence of the counter-currents. Moreover, they have not yet been con-firmed by more recent studies.
River runoffFreshwater river runoff was noticeable as low salinity values in measurements made near river mouths. Based on salinity variations, coastal waters have been categorized into three parts: a) north of 18 °S, with small salinity variations because of few large rivers; b) central (18–22 °S), with large salinity variations because of large riv-ers discharging into the ocean, particularly the Zambezi River (IMR, 1977, 1978a); and c) south of 24 °S, with moderate variations.
The influence of Zambezi River freshwater extended from the sea surface to 30 m water depth (IMR, 1977; Brinca et al., 1981) and to approximately 50 m depth during the rainy sea-son (IMR, 1978b, c). Plumes were observed up to 60 km offshore (IMR, 1977, 1978a, b, c; Brinca et al., 1981; Nehama, 2012; Malauene, 2015), with the latter two studies also describing the bi-directional nature of the Zambezi River plume.
Temperature and salinity structuresSea surface temperature (SST) decreased gradu-ally from north to south along the coast, reaching a minimum near Maputo (IMR, 1977, 1978a, b, c; Johnsen et al., 2007). SST over the northern Sofala Bank (<16 °S) indicated quasi-homogenous warm tropical surface waters (IMR, 1978b; Johnsen et al., 2007), but south of the bank (>16 °S) water temperature decreased at a rate of 0.5 °C per 1 ° latitude (IMR, 1978b; Johnsen et al., 2007; Kraks-tad el al., 2015). A difference of 4 °C was measured between winter and summer temperatures (IMR, 1977c, 1978b). Cells of cool water with a tempera-ture below 16 °C at a water depth of 150 m were observed near Angoche and the Delagoa Bight (IMR 1977c, 1978a, b, c, 1990a). The cool Dela-goa Bight cell has been associated with upwelling of water from around 1 000 m deep, at the core of a quasi-permanent cyclonic lee-eddy (Lutjeharms and da Silva, 1988).
Angoche upwellingThe Nansen surveyed Angoche (northern Sofala Bank; 16 °S) four times in 1977–1978 (IMR 1977, 1978a, b, c) and again in 2009 (Olsen et al., 2009). Temperature and oxygen isolines moved up the continental slope and onto the shelf during the NE monsoon (September to February), indicating upwelling of deep, cool and low oxygen waters into the upper mixed layer (Figure 4.5).
The deep cool waters did not always reach the surface, as seen from high oxygen concentrations (>4.7 ml.l-1) in surface layers in September and November. In February, however, strong cooling and low oxygen concentrations extended to near-shore surface waters (to left of panels in Figure 4.5) whereas high-oxygen concentrations remained
Figure 4.4 Temperature, salinity and oxygen profiles used to describe water masses: Arabian Sea High Salinity Water (ASHSW); Tropical Surface Water (TSW); Subtropical Surface Water (STSW); Subantarctic Mode Water (SAMW); Red Sea Water (RSW); Antarctic Intermediate Water (AAIW); North Indian Ocean Water (NIDW).
Tpot
-0 (
C)
Salinity (psu)
30
25
20
15
10
5
034.4 34.6 34.8 35.2 35.4 35.635
STSW
0
TSW
25
26
27
28
23
24
RSW
NIDW
SAMW
AAIW
ASHSWTp
ot-0
(°S
)
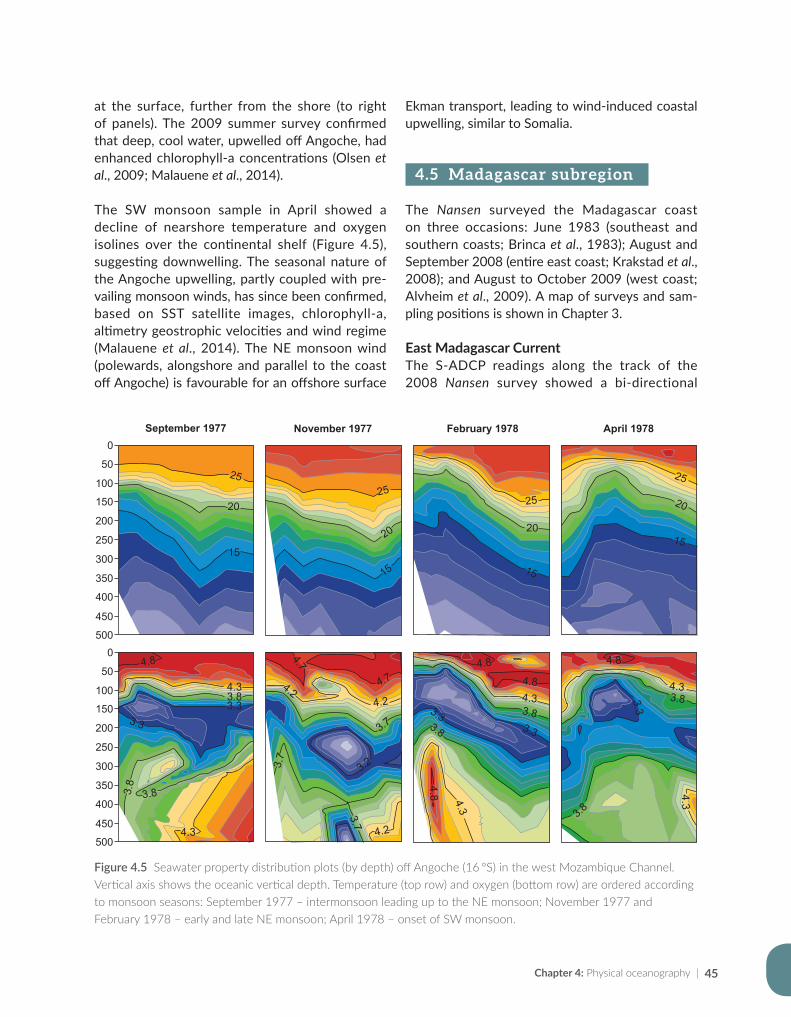
Chapter 4: Physical oceanography | 45
at the surface, further from the shore (to right of panels). The 2009 summer survey confirmed that deep, cool water, upwelled off Angoche, had enhanced chlorophyll-a concentrations (Olsen et al., 2009; Malauene et al., 2014).
The SW monsoon sample in April showed a decline of nearshore temperature and oxygen isolines over the continental shelf (Figure 4.5), suggesting downwelling. The seasonal nature of the Angoche upwelling, partly coupled with pre-vailing monsoon winds, has since been confirmed, based on SST satellite images, chlorophyll-a, altimetry geostrophic velocities and wind regime (Malauene et al., 2014). The NE monsoon wind (polewards, alongshore and parallel to the coast off Angoche) is favourable for an offshore surface
Ekman transport, leading to wind-induced coastal upwelling, similar to Somalia.
4.5 Madagascar subregion
The Nansen surveyed the Madagascar coast on three occasions: June 1983 (southeast and southern coasts; Brinca et al., 1983); August and September 2008 (entire east coast; Krakstad et al., 2008); and August to October 2009 (west coast; Alvheim et al., 2009). A map of surveys and sam-pling positions is shown in Chapter 3.
East Madagascar CurrentThe S-ADCP readings along the track of the 2008 Nansen survey showed a bi-directional
Figure 4.5 Seawater property distribution plots (by depth) off Angoche (16 °S) in the west Mozambique Channel. Vertical axis shows the oceanic vertical depth. Temperature (top row) and oxygen (bottom row) are ordered according to monsoon seasons: September 1977 – intermonsoon leading up to the NE monsoon; November 1977 and February 1978 – early and late NE monsoon; April 1978 – onset of SW monsoon.
April 1978September 1977 February 1978November 1977
20
25
1520
25
15
20
25
15
20
25
15
4.8
3.8
3.8
4.3
4.3
3.3
4.84.8
4.8
4.33.8
3.8 3.3
3.3
4.3
4.24.2
3.7
3.7
3.7
3.2
4.2
4.7
4.7
4.33.83.3
3.8
4.3
3.8
3.3
4.8
November 1977 February 1978 April 19780
50
100
150
200
250
300
350
400
450
5000
50
100
150
200
250
300
350
400
450
500
April 1978September 1977 February 1978November 1977
20
25
1520
25
15
20
25
15
20
25
15
4.8
3.8
3.8
4.3
4.3
3.3
4.84.8
4.8
4.33.8
3.8 3.3
3.3
4.3
4.24.2
3.7
3.7
3.7
3.2
4.2
4.7
4.7
4.33.83.3
3.8
4.3
3.8
3.3
4.8
September 1977
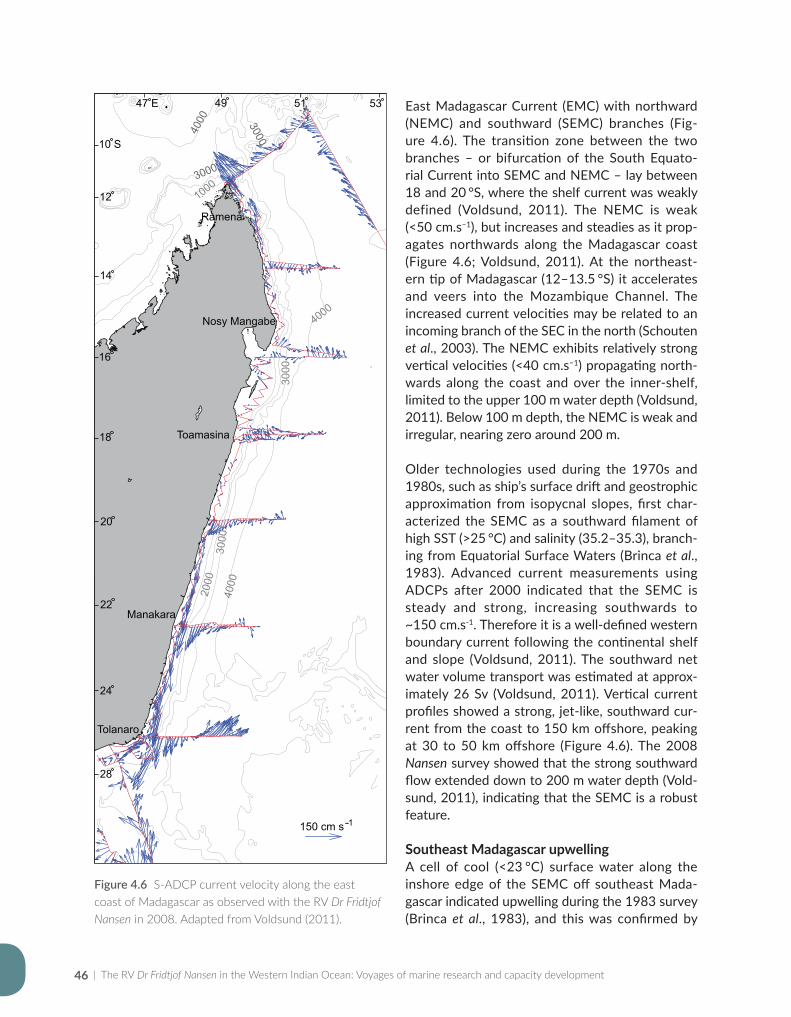
| The RV Dr Fridtjof Nansen in the Western Indian Ocean: Voyages of marine research and capacity development46
East Madagascar Current (EMC) with northward (NEMC) and southward (SEMC) branches (Fig-ure 4.6). The transition zone between the two branches – or bifurcation of the South Equato-rial Current into SEMC and NEMC – lay between 18 and 20 °S, where the shelf current was weakly defined (Voldsund, 2011). The NEMC is weak (<50 cm.s−1), but increases and steadies as it prop-agates northwards along the Madagascar coast (Figure 4.6; Voldsund, 2011). At the northeast-ern tip of Madagascar (12–13.5 °S) it accelerates and veers into the Mozambique Channel. The increased current velocities may be related to an incoming branch of the SEC in the north (Schouten et al., 2003). The NEMC exhibits relatively strong vertical velocities (<40 cm.s−1) propagating north-wards along the coast and over the inner-shelf, limited to the upper 100 m water depth (Voldsund, 2011). Below 100 m depth, the NEMC is weak and irregular, nearing zero around 200 m.
Older technologies used during the 1970s and 1980s, such as ship’s surface drift and geostrophic approximation from isopycnal slopes, first char-acterized the SEMC as a southward filament of high SST (>25 °C) and salinity (35.2–35.3), branch-ing from Equatorial Surface Waters (Brinca et al., 1983). Advanced current measurements using ADCPs after 2000 indicated that the SEMC is steady and strong, increasing southwards to ~150 cm.s-1. Therefore it is a well-defined western boundary current following the continental shelf and slope (Voldsund, 2011). The southward net water volume transport was estimated at approx-imately 26 Sv (Voldsund, 2011). Vertical current profiles showed a strong, jet-like, southward cur-rent from the coast to 150 km offshore, peaking at 30 to 50 km offshore (Figure 4.6). The 2008 Nansen survey showed that the strong southward flow extended down to 200 m water depth (Vold-sund, 2011), indicating that the SEMC is a robust feature.
Southeast Madagascar upwelling A cell of cool (<23 °C) surface water along the inshore edge of the SEMC off southeast Mada-gascar indicated upwelling during the 1983 survey (Brinca et al., 1983), and this was confirmed by
Figure 4.6 S-ADCP current velocity along the east coast of Madagascar as observed with the RV Dr Fridtjof Nansen in 2008. Adapted from Voldsund (2011).
Nosy Mangabe
Toamasina
Manakara
150 cm s
Tolanaro
Ramena
4000 3000
3000
1000
4000
4000
2000
3000
3000
16
20
24
12
14
18
22
28
10 S
47 E 49 51 53
Chapter 4: Physical oceanography | 47
equatorial current and eastward counter-currents dominating the time-averaged flow field. The equatorial dynamics of the region is further influenced by monsoonal climate wind systems, which modulate the latitudinal placement of the South Equatorial Current (SEC). The SEC is a branch of the South Indian Ocean anticyclonic gyre circulation, which also include waters from the Indonesian Throughflow (ITF; Stramma and Lutjeharms, 1997). The complexity of the upper ocean circulation is further influenced by the meridional and shallow Mascarene Plateau, which obstructs the westwards flow of the SEC almost perpendicularly, between roughly 9 and 20 °S. This obstruction splits the broad SEC into several narrow branches, which flow through gaps in the plateau (Figure 4.7). The southern branch of the SEC dominates circulation and water mass charac-teristics around Mauritius (New et al., 2007; Pous et al., 2014).
From a physical oceanography perspective, research questions asked during the 2008 sur-vey of the Mascarene Plateau were as follows (Strømme et al., 2009): i) How is the SEC flow affected by the gaps in the Mascarene Plateau? ii) What is the effect of the Mascarene Plateau between Seychelles and Madagascar on the over-all flow of SEC waters? iii) Does the Mascarene subregion between Seychelles and Madagascar differ from the section between Mauritius and Seychelles, and what are the linkages?
Atmospheric circulation Meteorological information (wind direction and speed, air temperature and pressure, relative humidity, and near-surface temperature at 5 m depth) were logged automatically on a WIMDA ship-mounted meteorological station during the 2008 and 2010 surveys. To the south of 10 °S, the Mascarene subregion was characterized by steady southeast trade winds, but north of 10 °S, the winds varied considerably in response to the reversal of the monsoons (Schott et al., 2009).
Hydrographic measurements The hydrographic measurements made by the Nansen during the 2008 survey corroborate the
vertical temperature and oxygen measurements at that time. Satellite imagery and a hydro-graphic survey carried-out in March 2001 on board of the Dutch RV Pelagia (DiMarco et al., 2000; Machu et al., 2002) confirmed the upwell-ing – probably resulting from a combination of topography-induced eddies and upwelling- favourable wind conditions (Machu et al., 2002).
4.6 Mascarene subregion
The Nansen surveyed the Mascarene subregion on three occasions: Seychelles in 1978 (IMR, 1978d), when few physical oceanography observations were made; an oceanographic survey of Mauritius and the Mascarene Plateau in 2008 (Strømme et al., 2010); and a multi-disciplinary survey of Mau-ritius and the southern Mascarene Plateau in 2010 (Strømme et al., 2010).
The submerged Mascarene Plateau is one of the most prominent topographic features of the West-ern Indian Ocean seafloor (Parson and Evans, 2005). It has volcanic origin, is crescent-shaped along a north-south axis between 4 and 24 °S, and is 2 200 km long (Spencer et al., 2005; Weijer, 2008). The plateau is bounded to the north and south by the Seychelles Bank and Mauritius Island, respectively (see Figure 4.1). Shallow banks on the plateau, such as Saya de Malha, Nazareth, and Car-gados Carajos (20–100 m deep) rise steeply from about 4 000 m depth in the Mascarene (west) and Central Indian (east) basins (Parson and Evans, 2005). The plateau may have significant impact on meteorological and oceanographic circulation, including the distribution of heat, nutrients, and biological material (Spencer et al., 2005). On its southern edge, Mauritius is also of volcanic ori-gin, with no southern or western shelf areas. The fundamental physical processes that control ocean currents and water mass properties in the region are not yet well understood (Spencer et al., 2005; New et al., 2007; Weijer, 2008; Pous et al., 2014).
Oceanic circulationThe large-scale circulation around the Mascarene Plateau is complex, with a westwards-flowing
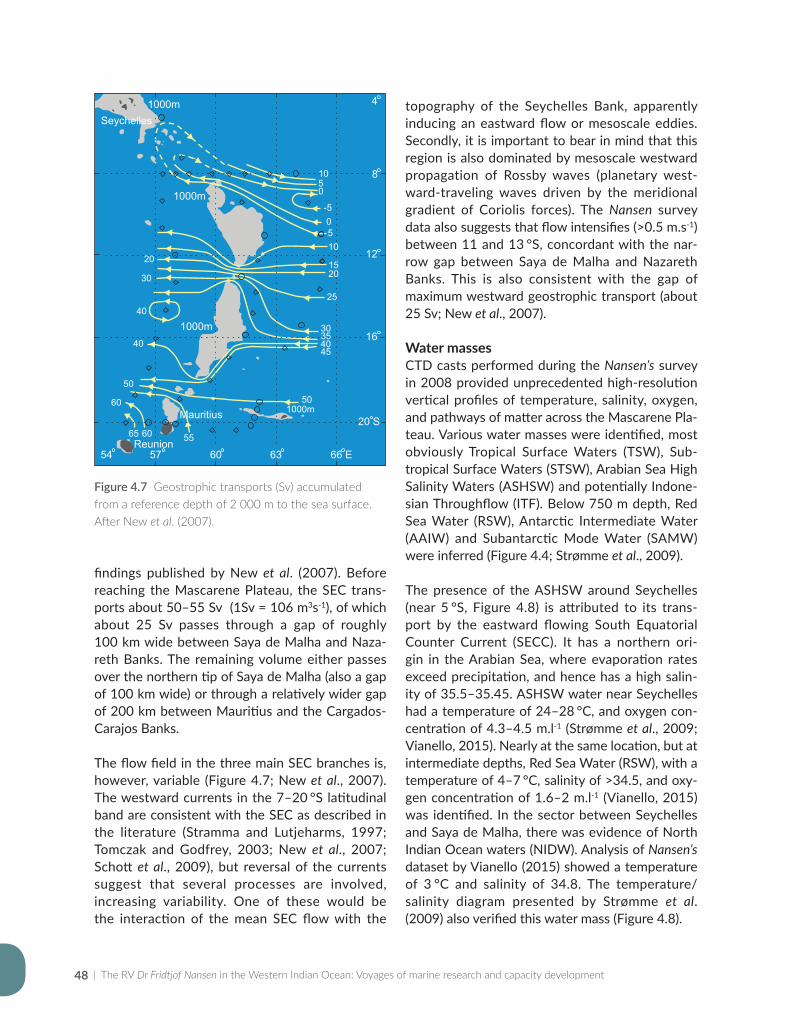
| The RV Dr Fridtjof Nansen in the Western Indian Ocean: Voyages of marine research and capacity development48
findings published by New et al. (2007). Before reaching the Mascarene Plateau, the SEC trans-ports about 50–55 Sv (1Sv = 106 m3s-1), of which about 25 Sv passes through a gap of roughly 100 km wide between Saya de Malha and Naza-reth Banks. The remaining volume either passes over the northern tip of Saya de Malha (also a gap of 100 km wide) or through a relatively wider gap of 200 km between Mauritius and the Cargados- Carajos Banks.
The flow field in the three main SEC branches is, however, variable (Figure 4.7; New et al., 2007). The westward currents in the 7–20 °S latitudinal band are consistent with the SEC as described in the literature (Stramma and Lutjeharms, 1997; Tomczak and Godfrey, 2003; New et al., 2007; Schott et al., 2009), but reversal of the currents suggest that several processes are involved, increasing variability. One of these would be the interaction of the mean SEC flow with the
topography of the Seychelles Bank, apparently inducing an eastward flow or mesoscale eddies. Secondly, it is important to bear in mind that this region is also dominated by mesoscale westward propagation of Rossby waves (planetary west-ward-traveling waves driven by the meridional gradient of Coriolis forces). The Nansen survey data also suggests that flow intensifies (>0.5 m.s-1) between 11 and 13 °S, concordant with the nar-row gap between Saya de Malha and Nazareth Banks. This is also consistent with the gap of maximum westward geostrophic transport (about 25 Sv; New et al., 2007).
Water massesCTD casts performed during the Nansen’s survey in 2008 provided unprecedented high-resolution vertical profiles of temperature, salinity, oxygen, and pathways of matter across the Mascarene Pla-teau. Various water masses were identified, most obviously Tropical Surface Waters (TSW), Sub-tropical Surface Waters (STSW), Arabian Sea High Salinity Waters (ASHSW) and potentially Indone-sian Throughflow (ITF). Below 750 m depth, Red Sea Water (RSW), Antarctic Intermediate Water (AAIW) and Subantarctic Mode Water (SAMW) were inferred (Figure 4.4; Strømme et al., 2009).
The presence of the ASHSW around Seychelles (near 5 °S, Figure 4.8) is attributed to its trans-port by the eastward flowing South Equatorial Counter Current (SECC). It has a northern ori-gin in the Arabian Sea, where evaporation rates exceed precipitation, and hence has a high salin-ity of 35.5–35.45. ASHSW water near Seychelles had a temperature of 24–28 °C, and oxygen con-centration of 4.3–4.5 m.l-1 (Strømme et al., 2009; Vianello, 2015). Nearly at the same location, but at intermediate depths, Red Sea Water (RSW), with a temperature of 4–7 °C, salinity of >34.5, and oxy-gen concentration of 1.6–2 m.l-1 (Vianello, 2015) was identified. In the sector between Seychelles and Saya de Malha, there was evidence of North Indian Ocean waters (NIDW). Analysis of Nansen’s dataset by Vianello (2015) showed a temperature of 3 °C and salinity of 34.8. The temperature/salinity diagram presented by Strømme et al. (2009) also verified this water mass (Figure 4.8).
Figure 4.7 Geostrophic transports (Sv) accumulated from a reference depth of 2 000 m to the sea surface. After New et al. (2007).
Seychelles
4
8
12
20 S
66 E63605754
1000m
1000m
10
10
1520
20
25
30
30
354040
40
45
50
50
55 65 60
60
5
5
-5
0
0
1000m
1000mMauritius
Reunion
16
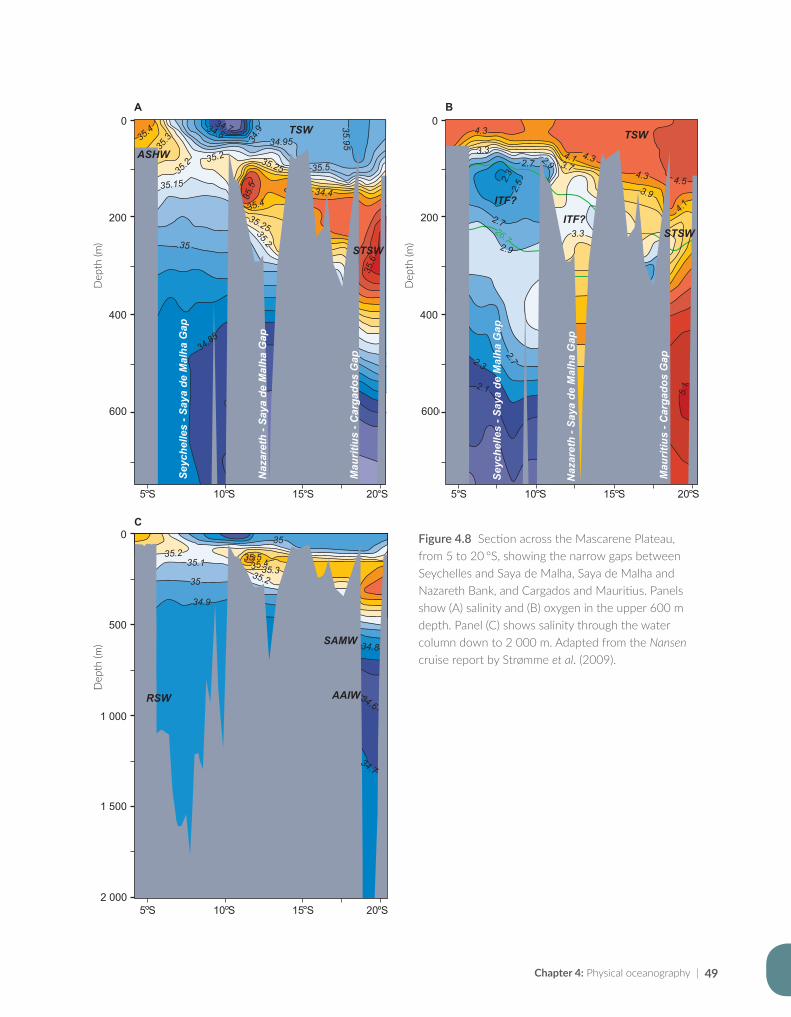
Chapter 4: Physical oceanography | 49
Figure 4.8 Section across the Mascarene Plateau, from 5 to 20 °S, showing the narrow gaps between Seychelles and Saya de Malha, Saya de Malha and Nazareth Bank, and Cargados and Mauritius. Panels show (A) salinity and (B) oxygen in the upper 600 m depth. Panel (C) shows salinity through the water column down to 2 000 m. Adapted from the Nansen cruise report by Strømme et al. (2009).
35.3
35.2
35.5
35.95
35.5
35.6
35.435.2535.2
35.434.9534
.9
34.734.8
35.2 35.25
35.15
34.85
34.4
35
200
0
Dep
th (m
)
400
600
Seyc
helle
s - S
aya
de M
alha
Gap
Naz
aret
h - S
aya
de M
alha
Gap
Mau
ritiu
s - C
arga
dos
Gap
5 S 10 S 15 S 20 S
TSW
ASHW
STSW
Dep
th (m
)
4.3
4.3
4.3
4.5
2.9
26.7
4.13.7
2.7
2.7
2.72.3
2.1 5.1
2.9
3.3
2.52.
3
4.1
3.9
3.3
200
0
Dep
th (m
)
400
600
Mau
ritiu
s - C
arga
dos
Gap
5 S 10 S 15 S 20 SSe
yche
lles
- Say
a de
Mal
ha G
ap
Naz
aret
h - S
aya
de M
alha
Gap
TSW
ITF?
ITF?
STSW
Dep
th (m
)
35.535.2
35.235.335.4
35
35
34.9
34.8
34.6
34.7
35.1
500
0
Dep
th (m
)
1000
1500
20005 S 10 S 15 S 20 S
SAMW
RSW AAIW
A B
C
Dep
th (m
)
200
0
400
600
200
0
400
600
500
0
1 000
1 500
2 000
| The RV Dr Fridtjof Nansen in the Western Indian Ocean: Voyages of marine research and capacity development50
Tropical Surface Waters (TSW) with low salinity were present at nearly all stations across the pla-teau; this layer has been linked to the westward propagation of the SEC (New et al., 2007). Sub-tropical Surface Water (STSW), with high salinity, induced by higher evaporation than precipitation in the subtropical South Indian Ocean, occurred in subsurface layers. In the gap (channel) between Mauritius and the Cargados-Carajos Bank, STSW had a temperature of >23 °C, a subsurface salinity maximum of 35.6 and oxygen minimum of 3 m.l-1 (Vianello, 2015).
AAIW, with a typical salinity minimum below 34.6 and temperature range of 5–7 °C, was found between Saya de Maya and Nazareth Banks, and between Mauritius and Cargados-Carajos Bank. Vianello (2015) also observed ITF water in the gaps between Seychelles and Saya de Malha; Saya de Malha and Nazareth Banks; and Cargados-Carajos and Mauritius (Figure 4.8). The ITF layer occurred at 100–250 m depth, with salinity of 35.2, and a subsurface oxygen minimum of 2.5 m.l-1 (Strømme et al., 2009). ITF originates from the west Pacific, has typical high temperature and low salinities induced by high precipitation rates, and its pres-ence around the Mascarene Plateau relies on the westward progression of the SEC (Tomczak and Godfrey, 2003).
4.7 Conclusions
Physical oceanography research was often approached from the perspective of explain-ing the distribution and abundance of fisheries resources. Nevertheless, its importance grew from mainly routine observations conducted during the era covered by the first Nansen (1975–1990 in the Western Indian Ocean), to the use of tech-nologically far more advanced on-board sensory equipment and satellite imagery in surveys under-taken after 2007, by the second Nansen. Recent surveys followed a multi-disciplinary approach, and in some cases even focussed on describing large scale oceanographic systems (for example the 2008 and 2010 surveys of east Madagascar and the Mascarene subregion).
The role of the Nansen in describing the physical oceanography of the Western Indian Ocean can-not be overstated, with many of its earlier findings being confirmed by later, more detailed studies, or by subsequent satellite imagery data. More detailed exploration of the stored Nansen data is recommended, to investigate oceanographic pro-cesses that remain enigmatic – for instance, the Southeast Madagascar Current retroflection, or the Mozambican coastal counter-currents.
Chapter 4: Physical oceanography | 51
References
Al Saafani, M.A., Shenoi, S.S.C., Shankar, D., Aparna, M., Kurian, J., Durand, F. & Vinayachandran, P.N. 2007. Westward movement of eddies into the Gulf of Aden from the Arabian Sea. Journal of Geophysical Research: Oceans, 112(C11): doi:10.1029/2006JC004020.
Al Saafani, M.A. 2008. Physical Oceanography of the Gulf of Aden. Dona Paula, Goa 403 004, Goa University (PhD Thesis).
Alvheim, O., Torstensen, E., Fennessy, S., MacKay, F., Zaera, D. & Bemiasa, J. 2009. West Madagascar: Pelagic Ecosystem Survey SWIOFP/ASCLME/FAO 2009 Cruise 2, 25 August–03 October 2009. Preliminary report. Bergen, Norway, Institute of Marine Research.
Behrman, D. 1981. Assault on the largest unknown; the International Indian Ocean Expedition 1959–65. Paris, France, The Unesco Press.
Brinca, L., Rey, F., Silva, C. & Sætre, R. 1981. A Survey on the Marine Fish Resources of Mozambique, October–November 1980. Bergen, Norway, Institute of Marine Research.
Brinca, L., Jorge da Silva, A., Sousa, L., Sousa, I. & Sætre, R. 1983. A Survey on the Fish Resources at Sofala Bank – Mozambique, September 1982. Bergen, Norway, Institute of Marine Research.
de Ruijter, W.P.M., Ridderinkhof, H., Lutjeharms, J.R.E., Schouten, M.W. & Veth, C. 2002. Observations of the flow in the Mozambique Channel. Geophysical Research Letters, 29(10): 1502–1504.
DiMarco, S.F., Chapman, P. & Nowlin, W.D. 2000. Satellite observations of upwelling on the continental shelf south of Madagascar. Geophysical Research Letters, 27(24): 3965–3968.
Düing, W. & Schott, F. 1978. Measurements in the source region of the Somali Current during the monsoon reversal. Journal of Physical Oceanography, 8(2): 278–289.
Fratantoni, D.M., Bower, A.S., Johns, W.E. & Peters, H. 2006. Somali Current rings in the eastern Gulf of Aden. Journal of Geophysical Research: Oceans, 111(C9): doi:10.1029/2005JC003338.
Halo, I., Backeberg, B., Penven, P., Ansorge, I., Reason, C. & Ullgren, J.E. 2014. Eddy properties in the Mozambique Channel: A comparison between observations and two numerical ocean circulation models. Deep Sea Research Part II: Topical Studies in Oceanography, 100: 38–53.
Harris, T.F.W. 1972. Sources of the Agulhas current in the spring of 1964. Deep Sea Research and Oceanographic Abstracts, 19(9): 633–650.
IMR. 1976. Report on Cruise No. 3 of R/V Dr Fridtjof Nansen. Indian Ocean Fishery and Development Programme, Pelagic Fish Assessment Survey North Arabian Sea. Bergen, Norway, Institute of Marine Research.
IMR. 1977. Cruise Report No. 1 of R/V Dr Fridtjof Nansen. Joint NORAD/Mozambique/FAO Project to Investigate the Fish Resources off the Coast of Mozambique. Bergen, Norway, Institute of Marine Research.
IMR. 1978a. Cruise Report No. 2 of R/V Dr Fridtjof Nansen. Joint NORAD/Mozambique/FAO Project to Investigate the Fish Resources off the Coast of Mozambique, October–December 1977. Bergen, Norway, Institute of Marine Research.
IMR. 1978b. Cruise Report No. 3 of R/V Dr Fridtjof Nansen. Joint NORAD/Mozambique/FAO Project to Investigate the Fish Resources off the Coast of Mozambique, January–March 1978. Bergen, Norway, Institute of Marine Research.
IMR. 1978c. Cruise Report No. 4 of R/V Dr Fridtjof Nansen. Joint NORAD/Mozambique/FAO Project to Investigate the Fish Resources off the Coast of Mozambique, April–June 1978. Bergen, Norway, Institute of Marine Research.
IMR. 1978d. Survey results of R/V Dr Fridtjof Nansen. Joint NORAD/Seychelles Project to Investigate the Fish Resources in Seychelles waters, July 1978. Bergen, Norway, Institute of Marine Research.
IMR. 1990a. Cruise Report No. 1 of R/V Dr Fridtjof Nansen. Joint NORAD/Mozambique/FAO Project to Survey of the Fish Resources of Mozambique, April–May 1990. Bergen, Norway, Institute of Marine Research.
IMR. 1990b. Cruise Report No. 3 of R/V Dr Fridtjof Nansen. Joint NORAD/Mozambique/FAO Project to Survey of the Fish Resources of Mozambique, November–December 1990. Bergen, Norway, Institute of Marine Research.
Iversen, S.A. 1984. Kenyan marine fish resources in water deeper than 10 m investigated by R/V Dr Fridtjof Nansen. Report presented at a joint Kenyan/Norwegian seminar, Mombasa, Kenya, 13–15 March 1984. Bergen, Norway, Institute of Marine Research.
| The RV Dr Fridtjof Nansen in the Western Indian Ocean: Voyages of marine research and capacity development52
Iversen, S.A., Myklevoll, S., Lwiza, K. & Yonazi, J. 1984. Tanzanian marine fish resources in the depth region 10–500 m investigated by R/V Dr Fridtjof Nansen. S.A. Iversen, ed. pp. 45–83. The proceedings of the NORAD/Tanzania seminar to review the marine fish stocks and fisheries in Tanzania, 6–8 March 1984, Mbegani, Tanzania. Bergen, Norway, Institute of Marine Research.
Johnsen, E., Krakstad, J., Ostrowski, M., Serigstad, B., Strømme, T., Alvheim, O., Olsen, M., Zaera, D., André, E., Dias, N., Sousa, L., Sousa, B., Malauene, B. & Abdula, S. 2007. Surveys of the living marine resources of Mozambique: Ecosystem Survey and Special Studies. 27 September–21 December 2007. Report No. 8/2007–2007409. Bergen, Norway, Institute of Marine Research.
Kaehler, S., Gammelsrød, T., Hill, J., Ternon, J.-F., Cotel, P., Potier, M., Huggett, J., Miggel, A., Pillay, K., Dyer, B., Backeberg, B., Langa, A., Malaune, B., Benivary, D., Morris, T., O’Reilly, B. & Olsen, M. 2008. 2008 ASCLME Survey No 4. Preliminary cruise report No 8/2008. 28 November–17 December 2008. Report No. EAF-N2008/7. Bergen, Norway, Institute of Marine Research.
Kesteven, G.L., Nakken, O. & Strømme , T. 1981. The small-pelagic and demersal fish resources of the north-west Arabian Sea. Further analysis of the results of the R/V Dr Fridtjof Nansen Survey, 1975–1976. Bergen, Norway, Institute of Marine Research.
Krakstad, J.-O., Mehl, S., Roman, R., Escobar-Porras, J., Stapley, J., Flynn, B., Olsen, M. & Beck, I. 2008. Cruise Report Dr Fridtjof Nansen. East Madagascar Current Ecosystem Survey ASCLME / FAO 2008 Cruise 1, 24 August–1 October 2008. Bergen, Norway, Institute of Marine Research.
Krakstad, J.-O., Zaera, D., Aasen, A. & Soondron, V. 2010. Survey of the demersal resources on the western slopes of St. Brandon and Nazareth Bank, Mauritius. 16–25 September 2010. Report No. EAF-N2010/7. Bergen, Norway, Institute of Marine Research.
Krakstad, J.-O., Krafft, B., Alvheim, O., Kvalsund, M., Bernardes, I., Chacate, O., Mutombene, R., Filipe, O., Hajy, B., Zacarias, L., Zivane, F., M, P. & Varela, D. 2015. Cruise report Dr Fridtjof Nansen. Marine Ecosystem Survey of Mozambique, 11 November–02 December 2014. Report No. GCP/INT/003/NOR. Bergen, Norway, Institute of Marine Research.
Lutjeharms, J. & da Silva, A. 1988. The Delagoa bight eddy. Deep Sea Research Part A. Oceanographic Research Papers, 35(4): 619–634.
Machu, E., Lutjeharms, J.R.E., Webb, A.M. & Van Aken, H.M. 2002. First hydrographic evidence of the southeast Madagascar upwelling cell. Geophysical Research Letters, 29(21): doi:10.1029/2002GL015381.
Malauene, B.S., Shillington, F.A., Roberts, M.J. & Moloney, C.L. 2014. Cool, elevated chlorophyll-a waters off northern Mozambique. Deep Sea Research Part II: Topical Studies in Oceanography, 100: 68–78.
Malauene, B.S. 2015. Environmental influences on banana shrimps of the Sofala Bank, Mozambique Channel. Cape Town, South Africa, University of Cape Town (PhD thesis).
Nehama, F.P.J. 2012. Modelling the Zambezi River plume using the Regional Oceanic Modelling System. Cape Town, South Africa, University of Cape Town (PhD thesis).
New, A.L., Alderson, S.G., Smeed, D.A. & Stansfield, K.L. 2007. On the circulation of water masses across the Mascarene Plateau in the South Indian Ocean. Deep Sea Research Part I: Oceanographic Research Papers, 54(1): 42–74.
Olsen, E., Padera, M., Funke, M., Pires, P., Wenneck, T. & Zacarias, L. 2009. Survey of the living marine resources of North Mozambique, 6–20 August 2009. SWIOFP/ASCLME 2009 Cruise 1. Report No. EAF-N/2009/7. Bergen, Norway, Institute of Marine Research.
Parson, L.M. & Evans, A.J. 2005. Seafloor topography and tectonic elements of the Western Indian Ocean. Philosophical Transactions of the Royal Society of London A: Mathematical, Physical and Engineering Sciences, 363(1826): 15–24.
Pous, S., Lazure, P., André, G., Dumas, F., Halo, I. & Penven, P. 2014. Circulation around La Réunion and Mauritius islands in the south-western Indian Ocean: A modeling perspective. Journal of Geophysical Research: Oceans, 119(3): 1957–1976.
Quartly, G.D., Buck, J.J.H., Srokosz, M.A. & Coward, A.C. 2006. Eddies around Madagascar – the retroflection reconsidered. Journal of Marine Systems, 63(3): 115–129.
Chapter 4: Physical oceanography | 53
Ridderinkhof, W., Le Bars, D., Heydt, A.S. & de Ruijter, W.P.M. 2013. Dipoles of the South East Madagascar Current. Geophysical Research Letters, 40(3): 558–562.
Sætersdal, G., Bianchi, G., Strømme , T. & Venema, S. 1999. The Dr. Fridtjof Nansen programme: 1975–1993. Investigations of fishery resources in developing regions. History of the programme and review of results. FAO Fisheries Technical Paper No. 391. Food and Agriculture Organization of the United Nations.
Sætre, R. & da Silva, A.J. 1984. The circulation of the Mozambique Channel. Deep Sea Research Part A. Oceanographic Research Papers, 31(5): 485–508.
Sandven, S. 1979. Coastal oceanography of the Arabian Sea. Data processing and interpretation. Bergen, Norway, University of Bergen.
Schott, F. 1983. Monsoon response of the Somali Current and associated upwelling. Progress in Oceanography, 12(3): 357–381.
Schouten, M.W., de Ruijter, W.P.M., Van Leeuwen, P.J. & Ridderinkhof, H. 2003. Eddies and variability in the Mozambique Channel. Deep Sea Research Part II: Topical Studies in Oceanography, 50(12): 1987–2003.
Spencer, T., Laughton, A. & Flemming, N. 2005. Variability, interaction and change in the atmosphere–ocean–ecology system of the Western Indian Ocean. Philosophical Transactions of the Royal Society of London A: Mathematical, Physical and Engineering Sciences, 363(1826): 3–13.
Stramma, L. & Lutjeharms, J.R.E. 1997. The flow field of the subtropical gyre of the South Indian Ocean. Journal of Geophysical Research: Oceans, 102(C3): 5513–5530.
Strømme, T., Ansorge, I., Bornman, T., Kaehler, S., Ostrowski, M., Tweddle, D. & Alvheim, O. 2009. 2008 ASCLME Survey No 3 Cruise report No 7/2008. 8 October–27 November 2008. Report No. EAF-N2008/7. Bergen, Norway, Institute of Marine Research.
Strømme, T., Groeneveld, J., Alvheim, O., Fossheim, O. & Svoren, T. 2010. Mauritius and Southern Mascarene: Pelagic Ecosystem Survey SWIOFP/FAO 2010 Cruise 1 2010. 6–21 December 2010. Final report. Report No. EAF-N2008/7. Bergen, Norway, Institute of Marine Research.
Tomczak, M. & Godfrey, J.S. 2003. Regional Oceanography: an Introduction 2nd edn. Delhi, India, Daya Publishing House.
Venema, S.C. 1984. Fishery resources in the North Arabian Sea and adjacent waters. Deep Sea Research Part A. Oceanographic Research Papers, 31(6–8): 1001–1018.
Vianello, P. 2015. A qualitative and physical analysis of processes around Mascarene Plateau. Cape Town, South Africa, University of Cape Town (PhD thesis).
Voldsund, A. 2011. The dynamics of the East Madagascar Current System and its influence on the biological production associated to the shelf - an observational study. Bergen, Norway, University of Bergen (MSc thesis).
Weijer, W. 2008. Normal modes of the Mascarene Basin. Deep Sea Research Part I: Oceanographic Research Papers, 55(1): 128–136.

| The RV Dr Fridtjof Nansen in the Western Indian Ocean: Voyages of marine research and capacity development54
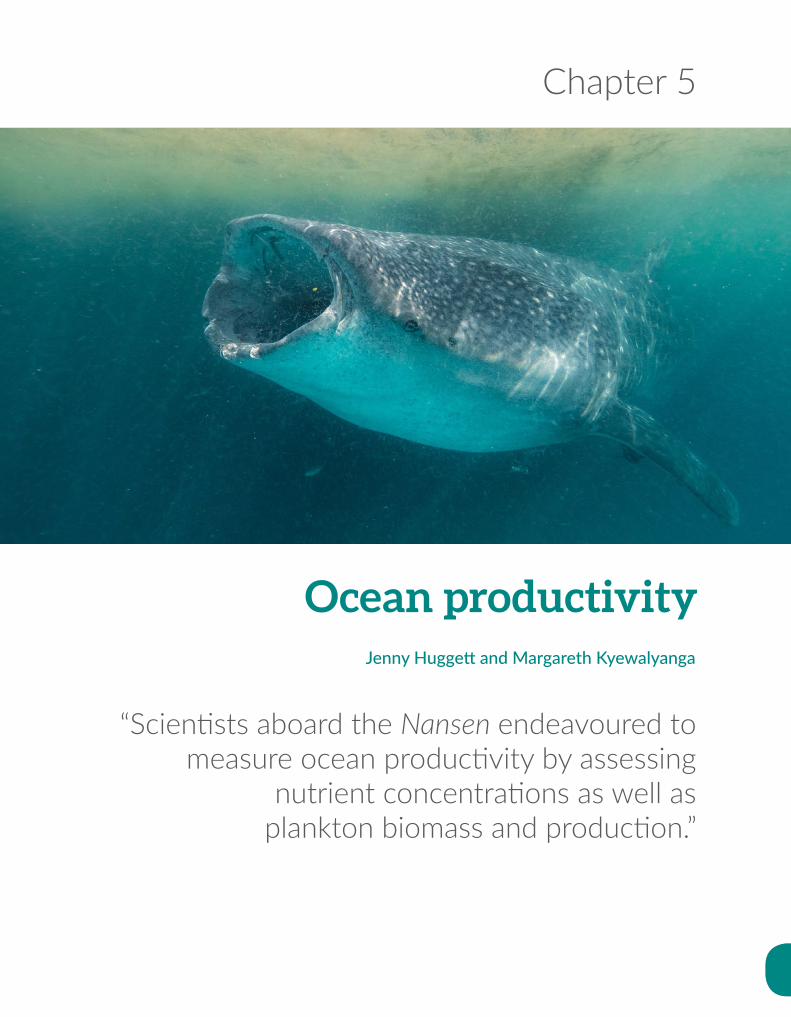
Chapter 5
“Scientists aboard the Nansen endeavoured to measure ocean productivity by assessing
nutrient concentrations as well as plankton biomass and production.”
Ocean productivityJenny Huggett and Margareth Kyewalyanga

| The RV Dr Fridtjof Nansen in the Western Indian Ocean: Voyages of marine research and capacity development56
Abstract
Plankton forms the base of the marine food web, providing nourishment to higher trophic levels from squid and fish to whales and seabirds. Over the course of 22 surveys between 1975 and 2015, sci-entists aboard the RV Dr Fridtjof Nansen have endeavoured to measure ocean productivity within the Western Indian Ocean, by assessing nutrient concentrations as well as plankton biomass and production. Ecosystem-focussed surveys since 2007 have provided important baseline data and yielded new insights into this largely oligotrophic (low-nutrient) and under-studied region. The monsoon-influenced Somali Current system north of the Equator exhibits the highest productivity of all, with high nutrient concen-trations driven by strong upwelling. The most productive areas over the Mozambique shelf are Delagoa Bight in the south, the central Sofala Bank, influenced by seasonal nutrient input from the Zambezi delta, and Angoche in the north. All are influenced to some extent by the southward passage of mesoscale eddies through the Mozambique Channel, which may induce upwelling on the shelf, enhancing local production, or entrain coastal production offshore. These eddies strongly influence the distribution of mesozooplankton biomass in the Mozambique Channel, with significantly greater biomass found in cyclonic eddies compared to anticyclonic eddies. Mesozooplankton biomass was largely concentrated within the upper 100 m layer of water. Off Madagascar, both satellite and in situ data indicate enhanced productivity over the southern shelf, particularly around the south-eastern corner, an area character-ised by regular blooms of nitrogen-fixing bacteria. Smaller productivity hotspots were observed off Cap St André and Nosy Be on the west coast, and at the northern tip of Madagascar. A survey along the axis of the Mascarene Plateau showed the northern sector (N of 12 °S) to be most productive, with fluorescence maxima at 30 to 100 m depth, elevated phytoplankton biomass over the Saya de Malha Bank and at the south-eastern edge of the Seychelles Bank, and an extensive bloom of diatoms along the Amirantes Ridge. Sampling at six seamounts (five along the Southwest Indian Ridge and one on the Madagascar Ridge) showed a latitudinal gradient in phytoplankton biomass (highest at the southernmost seamount) and composition (more dinoflagellates in the tropics, more diatoms in the south). There was no general seamount effect on the phytoplankton, although biomass was enhanced over two seamounts with a relatively shallow summit (<200 m). A coordinated, regional plankton monitoring programme for the Western Indian Ocean is recommended, to provide indicators of ecosystem change.
Previous page: A hotspot of productivity – a whale shark Rhincodon typus feeds in a dense patch of the planktonic shrimp Lucifer hanseni beneath a bloom of cyanobacteria Trichodesmium sp. off Mafia Island, Tanzania. © Chris Rohner
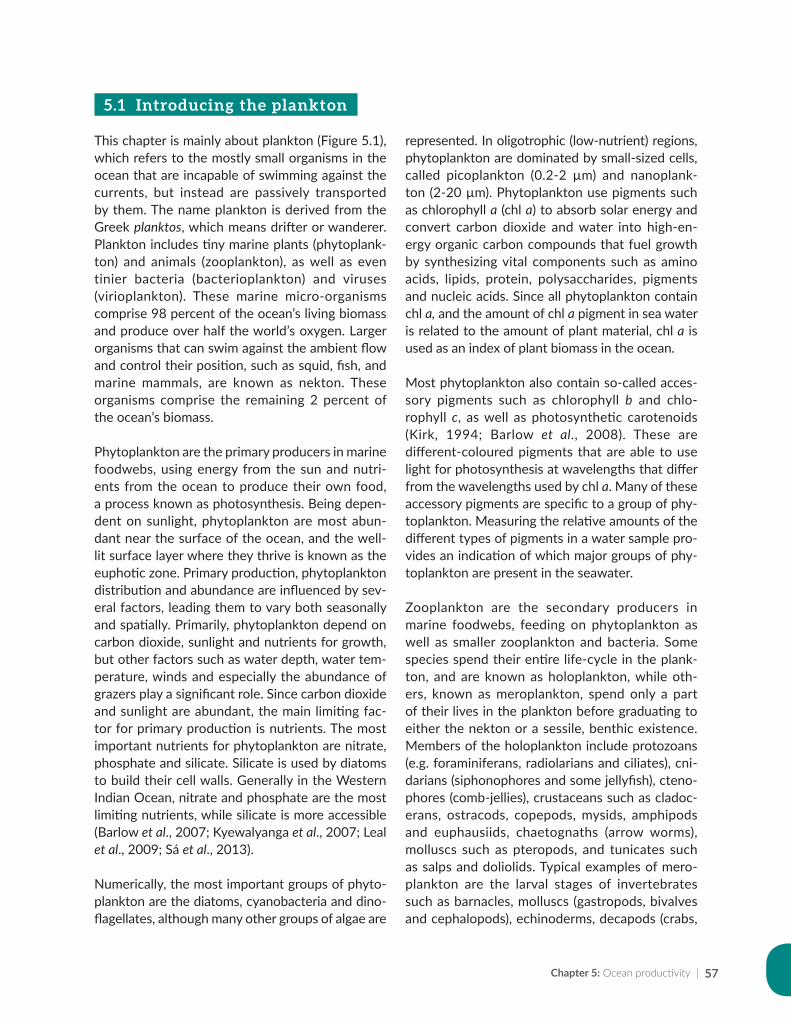
Chapter 5: Ocean productivity | 57
5.1 Introducing the plankton
This chapter is mainly about plankton (Figure 5.1), which refers to the mostly small organisms in the ocean that are incapable of swimming against the currents, but instead are passively transported by them. The name plankton is derived from the Greek planktos, which means drifter or wanderer. Plankton includes tiny marine plants (phytoplank-ton) and animals (zooplankton), as well as even tinier bacteria (bacterioplankton) and viruses (virioplankton). These marine micro-organisms comprise 98 percent of the ocean’s living biomass and produce over half the world’s oxygen. Larger organisms that can swim against the ambient flow and control their position, such as squid, fish, and marine mammals, are known as nekton. These organisms comprise the remaining 2 percent of the ocean’s biomass.
Phytoplankton are the primary producers in marine foodwebs, using energy from the sun and nutri-ents from the ocean to produce their own food, a process known as photosynthesis. Being depen-dent on sunlight, phytoplankton are most abun-dant near the surface of the ocean, and the well-lit surface layer where they thrive is known as the euphotic zone. Primary production, phytoplankton distribution and abundance are influenced by sev-eral factors, leading them to vary both seasonally and spatially. Primarily, phytoplankton depend on carbon dioxide, sunlight and nutrients for growth, but other factors such as water depth, water tem-perature, winds and especially the abundance of grazers play a significant role. Since carbon dioxide and sunlight are abundant, the main limiting fac-tor for primary production is nutrients. The most important nutrients for phytoplankton are nitrate, phosphate and silicate. Silicate is used by diatoms to build their cell walls. Generally in the Western Indian Ocean, nitrate and phosphate are the most limiting nutrients, while silicate is more accessible (Barlow et al., 2007; Kyewalyanga et al., 2007; Leal et al., 2009; Sá et al., 2013).
Numerically, the most important groups of phyto-plankton are the diatoms, cyanobacteria and dino-flagellates, although many other groups of algae are
represented. In oligotrophic (low-nutrient) regions, phytoplankton are dominated by small-sized cells, called picoplankton (0.2-2 µm) and nanoplank-ton (2-20 µm). Phytoplankton use pigments such as chlorophyll a (chl a) to absorb solar energy and convert carbon dioxide and water into high-en-ergy organic carbon compounds that fuel growth by synthesizing vital components such as amino acids, lipids, protein, polysaccharides, pigments and nucleic acids. Since all phytoplankton contain chl a, and the amount of chl a pigment in sea water is related to the amount of plant material, chl a is used as an index of plant biomass in the ocean.
Most phytoplankton also contain so-called acces-sory pigments such as chlorophyll b and chlo-rophyll c, as well as photosynthetic carotenoids (Kirk, 1994; Barlow et al., 2008). These are different-coloured pigments that are able to use light for photosynthesis at wavelengths that differ from the wavelengths used by chl a. Many of these accessory pigments are specific to a group of phy-toplankton. Measuring the relative amounts of the different types of pigments in a water sample pro-vides an indication of which major groups of phy-toplankton are present in the seawater.
Zooplankton are the secondary producers in marine foodwebs, feeding on phytoplankton as well as smaller zooplankton and bacteria. Some species spend their entire life-cycle in the plank-ton, and are known as holoplankton, while oth-ers, known as meroplankton, spend only a part of their lives in the plankton before graduating to either the nekton or a sessile, benthic existence. Members of the holoplankton include protozoans (e.g. foraminiferans, radiolarians and ciliates), cni-darians (siphonophores and some jellyfish), cteno-phores (comb-jellies), crustaceans such as cladoc-erans, ostracods, copepods, mysids, amphipods and euphausiids, chaetognaths (arrow worms), molluscs such as pteropods, and tunicates such as salps and doliolids. Typical examples of mero-plankton are the larval stages of invertebrates such as barnacles, molluscs (gastropods, bivalves and cephalopods), echinoderms, decapods (crabs,
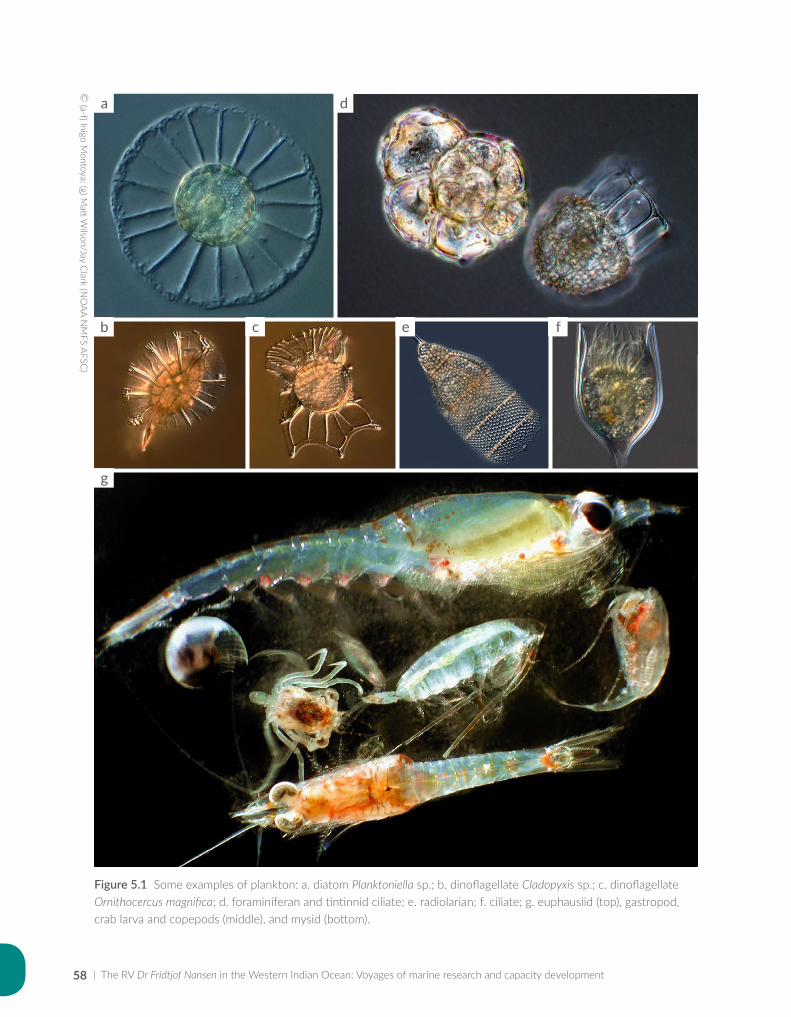
| The RV Dr Fridtjof Nansen in the Western Indian Ocean: Voyages of marine research and capacity development58
© (a-f) Inigo M
ontoya; (g) Matt W
ilson/Jay Clark (N
OAA N
MFS AFSC
)
Figure 5.1 Some examples of plankton: a. diatom Planktoniella sp.; b. dinoflagellate Cladopyxis sp.; c. dinoflagellate Ornithocercus magnifica; d. foraminiferan and tintinnid ciliate; e. radiolarian; f. ciliate; g. euphausiid (top), gastropod, crab larva and copepods (middle), and mysid (bottom).
a d
b c e f
g
Chapter 5: Ocean productivity | 59
prawns and spiny lobsters), as well as fish larvae. Jellyfish are a special case, as most have alternating generations of sexual reproduction by the pelagic medusae and vegetative propagation by benthic polyps. Crustacean zooplankton are usually much more abundant than the gelatinous forms, with copepods the most numerous of all, forming the biggest source of protein in the oceans.
Although at the mercy of currents, most zooplank-ton are able to move vertically in the water col-umn. Many zooplankton species perform what is known as diel vertical migration (DVM), a daily pat-tern whereby the population lives at depth during the day, ascending at dusk to feed in the upper food-rich surface layers at night, then around dawn descending once more to the deeper, darker water layers where the risk of being seen by visual predators is greatly reduced. Such a strategy is most beneficial to larger organisms or those with strong colouration. Although predator avoidance is thought to be the major reason for DVM, organ-isms may also use the depth-temperature differen-tial to incur metabolic advantages, or use deep and shallow currents to find food patches or to main-tain a geographical location (Kerfoot, 1985).
Zooplankton size varies enormously, from tiny protists a few microns wide up to giant jellyfish with a bell diameter of almost 2 metres. To cope with such a vast size range, a size classification revised by Sieburth et al., (1978) is now widely accepted (see the Glossary in Appendix 5.1). There are five size classes for zooplankton: nanoplankton (2–20 µm), microplankton (20–200 µm), meso-zooplankton (0.2–20 mm), macro-zooplankton (2–20 cm) and megaloplankton (20–200 cm). The mesozooplankton category corresponds to the size spectrum of traditional zooplankton samples collected with a mesh size of 200–300 µm, which contains the bulk of crustacean zooplankton as well as meroplankton (Harris et al., 2000).
Productivity refers to the rate of production of organic matter, either by phytoplankton through the process of photosynthesis (primary produc-tion), or by zooplankton through the processes of body growth and reproduction (secondary
production). Plankton productivity is the founda-tion of marine food webs and determines energy flow to higher trophic levels such as fish, shell-fish, seabirds and marine mammals (Verheye et al., 2016). In a simple food chain, phytoplankton are consumed directly by zooplankton, which are then eaten by fish larvae, and the chain goes on to small fish, larger fish and all the way to top preda-tors such as seals, birds, dolphins and whales. This creates a link between plankton productivity and fisheries production as well as management.
For the purposes of this book, ocean productivity is defined broadly to include nutrient concentra-tions, chl a concentration as well as that of other phytoplankton pigments, phytoplankton species composition, primary production, zooplankton biomass, zooplankton species composition and secondary production.
5.2 Historical background
The most comprehensive study of nutrient concen-trations (inorganic nitrate, phosphate and silicate) in the Indian Ocean unfolded during the pioneer-ing International Indian Ocean Expedition (IIOE) of 1959 to 1965 (McGill, 1973), the first coopera-tive project coordinated by the Intergovernmental Oceanographic Commission (Rao, 1973). The first measurements of primary production in the Indian Ocean using the 14C technique were conducted during an expedition by the Galathea (a Danish corvette) in 1950 to 1952, and subsequent mea-surements were made during the IIOE (Aruga, 1973). Taylor (1973) reported on dinoflagellates collected by the Anton Bruun during the IIOE, and chlorophyll concentrations were measured during the IIOE Discovery survey (1963–1964).
The earliest zooplankton collections in the Indian Ocean date back to 1857 to 1859 during a cir-cumglobal scientific expedition by the Austro-Hungarian naval frigate SMS Novara (Rao, 1973). Subsequent major collections over the next 100 years include those by the Danish RRS Dana between 1928 and 1930, and the British RRS Discovery II between 1930 and 1938 (Rao, 1973).
| The RV Dr Fridtjof Nansen in the Western Indian Ocean: Voyages of marine research and capacity development60
However, the most comprehensive study of the planktonic realm took place during the IIOE (Rao, 1973). Most zooplankton samples were col-lected in the upper 200 m using an Indian Ocean Standard Net, which had a mesh size of 330 µm and a mouth diameter of 130 cm (Currie, 1963).
Subsequent to the IIOE, considerable research effort was concentrated in the productive Arabian Sea, such as the Indian Ocean Experiment (INDEX) in 1979, and in particular during the Joint Global Ocean Flux Study (JGOFS) Process Studies of the Arabian Sea. Expeditions undertaken by Germany, India, Pakistan, United Kingdom and the United States of America focussed on the northern Arabian Sea during 1992/97, while the Netherlands studied the Somali Current sys-tem during 1992/93 (Watts et al., 2002). Within the framework of the Netherlands Indian Ocean Programme (NIOP), RV Tyro conducted several surveys off the Somali coast and in the Somali Basin, and two surveys off the Kenyan coast, during which data on nutrients, chlorophyll, pri-mary production and zooplankton biomass and species composition were collected (Baars et al., 1998; Heip et al., 1995). The first studies in the Indian Ocean conducted by the RV Dr Fridtjof Nansen were also in this region (1975–1976; see Table A5.1; A refers to Tables and Figures in Appendix 5.2 and Appendix 5.3 respectively).
After a lull in offshore oceanographic research in the Western Indian Ocean, a series of ocean-ographic surveys was undertaken in its south-ern part from 2002 onwards, during the African Coelacanth Ecosystem Programme (ACEP) in the Delagoa Bight off southern Mozambique and in the KwaZulu-Natal Bight off the east coast of South Africa. Between 2007 and 2010, the Nansen undertook a series of surveys with a strong eco-system focus, many within the ASCLME (Agulhas and Somali Currents Large Marine Ecosystems) and SWIOFP (Southwest Indian Ocean Fisheries Project) frameworks, which are the subject of much of this chapter. Over the same period, several other multidisciplinary surveys were undertaken to study mesoscale eddies in the Mozambique Channel, in addition to one during
the ASCLME project in 2008. Collectively, these surveys in the new millennium have made a fun-damental contribution to our understanding of ocean productivity in the Western Indian Ocean, with the Nansen unquestionably a key role player.
5.3 Sampling methodology
A summary of all the surveys undertaken in the Western Indian Ocean by the Nansen is provided in Table A5.1, along with a record of sample collec-tion for all ocean productivity-related parameters mentioned above (see Figure A5.1 for a map of all hydrographic stations where productivity-related sampling was conducted).
Nutrients and phytoplanktonDuring the first phase of exploratory and descrip-tive surveys, from 1975 to 1990, the surveys focussed mainly on fish resources, and environ-mental sampling was restricted to temperature, salinity and dissolved oxygen. There were no measurements of productivity except for the sur-vey of 1980 off Mozambique, when samples were collected for nutrient and chl a analysis. During the second survey phase from 2007 onwards, there was a more ecosystem-based approach to sampling, particularly with the advent of the ASCLME programme. For these surveys, sampling for nutrients and phytoplankton followed a stan-dard method through which water samples were collected using Niskin bottles attached to the CTD (Figure 5.2a), the instrument used to determine conductivity, temperature and depth of the ocean. As the CTD was lowered, in addition to profiles of temperature, salinity and oxygen by depth, fluo-rescence profiles were obtained via a Chelsea Mk III Aquatracka fluorometer and used to detect the depth of maximum fluorescence (fMax).
Some sampling procedures were similar in all the cruises. For example, where the station was deep enough, water samples for nutrient analysis and for calibration of temperature and oxygen sen-sors were usually collected at 12 standard depths (m): 3 000, 2 500, 1 750, 1 250, 1 000, 800, 500, 300, 100, 85, 50 and surface (4–5 m). For chl a
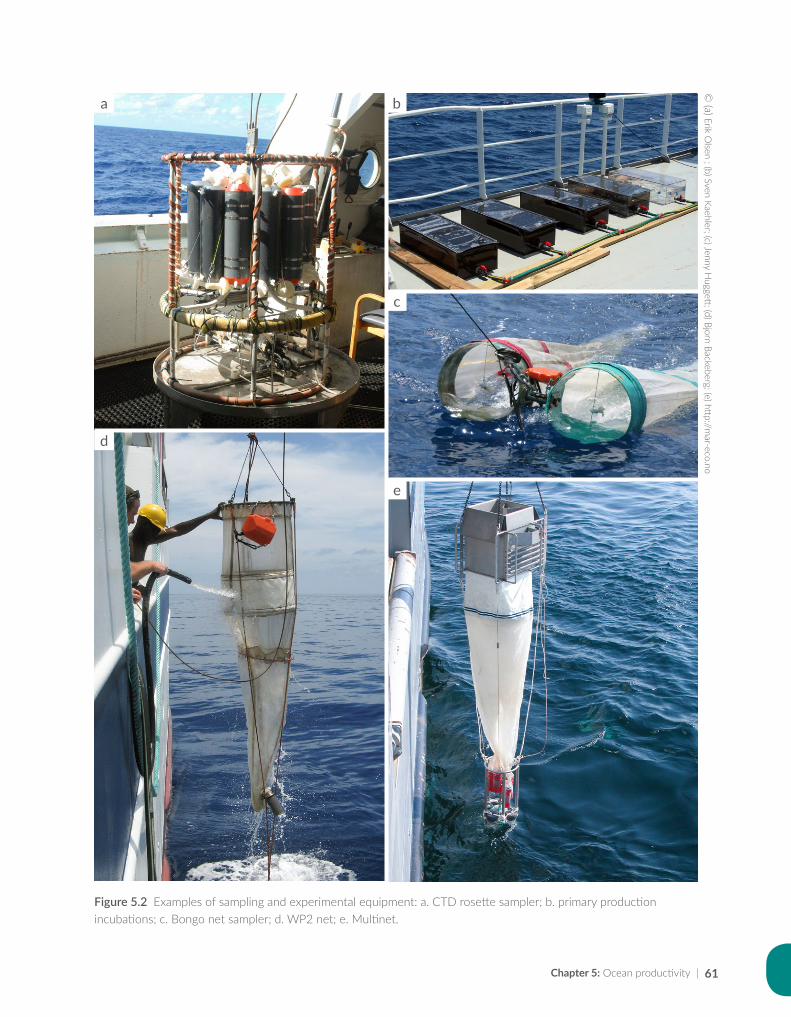
Chapter 5: Ocean productivity | 61
Figure 5.2 Examples of sampling and experimental equipment: a. CTD rosette sampler; b. primary production incubations; c. Bongo net sampler; d. WP2 net; e. Multinet.
ba
c
e
d
© (a) Erik O
lsen ; (b) Sven Kaehler; (c) Jenny Huggett; (d) Bjorn Backeberg; (e) http://m
ar-eco.no
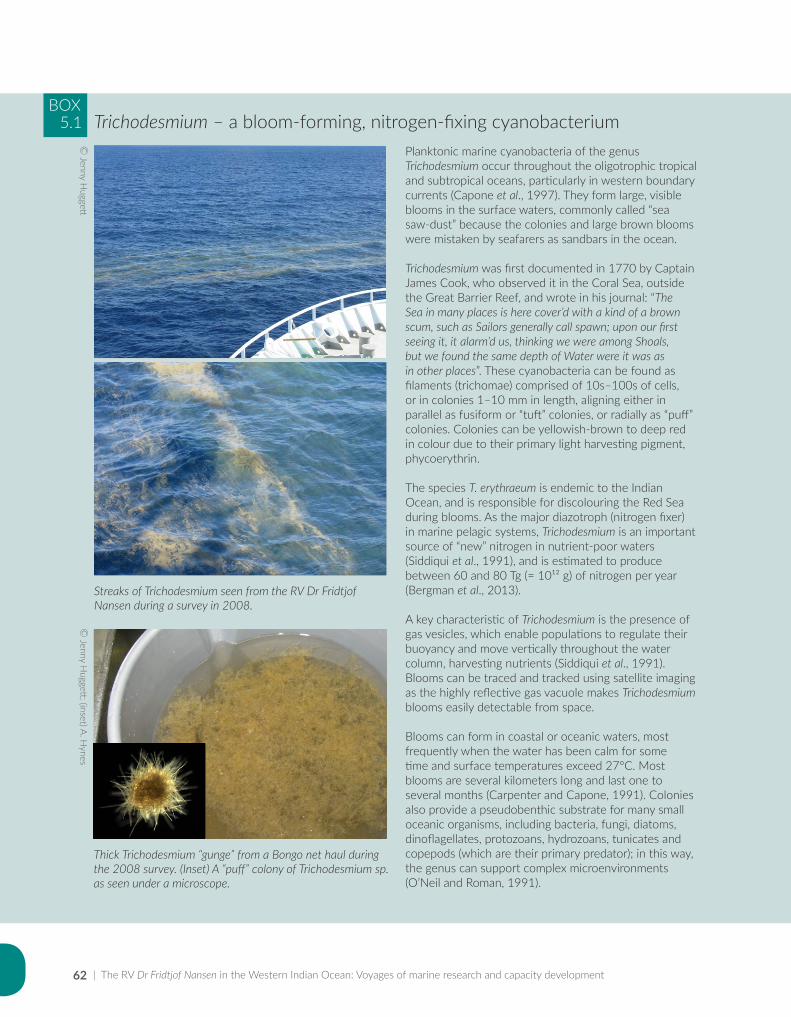
| The RV Dr Fridtjof Nansen in the Western Indian Ocean: Voyages of marine research and capacity development62
Planktonic marine cyanobacteria of the genus Trichodesmium occur throughout the oligotrophic tropical and subtropical oceans, particularly in western boundary currents (Capone et al., 1997). They form large, visible blooms in the surface waters, commonly called “sea saw-dust” because the colonies and large brown blooms were mistaken by seafarers as sandbars in the ocean.
Trichodesmium was first documented in 1770 by Captain James Cook, who observed it in the Coral Sea, outside the Great Barrier Reef, and wrote in his journal: “The Sea in many places is here cover’d with a kind of a brown scum, such as Sailors generally call spawn; upon our first seeing it, it alarm’d us, thinking we were among Shoals, but we found the same depth of Water were it was as in other places”. These cyanobacteria can be found as filaments (trichomae) comprised of 10s–100s of cells, or in colonies 1–10 mm in length, aligning either in parallel as fusiform or “tuft” colonies, or radially as “puff” colonies. Colonies can be yellowish-brown to deep red in colour due to their primary light harvesting pigment, phycoerythrin.
The species T. erythraeum is endemic to the Indian Ocean, and is responsible for discolouring the Red Sea during blooms. As the major diazotroph (nitrogen fixer) in marine pelagic systems, Trichodesmium is an important source of “new” nitrogen in nutrient-poor waters (Siddiqui et al., 1991), and is estimated to produce between 60 and 80 Tg (= 10¹² g) of nitrogen per year (Bergman et al., 2013).
A key characteristic of Trichodesmium is the presence of gas vesicles, which enable populations to regulate their buoyancy and move vertically throughout the water column, harvesting nutrients (Siddiqui et al., 1991). Blooms can be traced and tracked using satellite imaging as the highly reflective gas vacuole makes Trichodesmium blooms easily detectable from space.
Blooms can form in coastal or oceanic waters, most frequently when the water has been calm for some time and surface temperatures exceed 27°C. Most blooms are several kilometers long and last one to several months (Carpenter and Capone, 1991). Colonies also provide a pseudobenthic substrate for many small oceanic organisms, including bacteria, fungi, diatoms, dinoflagellates, protozoans, hydrozoans, tunicates and copepods (which are their primary predator); in this way, the genus can support complex microenvironments (O’Neil and Roman, 1991).
BOX5.1 Trichodesmium – a bloom-forming, nitrogen-fixing cyanobacterium
© Jenny H
uggett
Streaks of Trichodesmium seen from the RV Dr Fridtjof Nansen during a survey in 2008.
Thick Trichodesmium “gunge” from a Bongo net haul during the 2008 survey. (Inset) A “puff” colony of Trichodesmium sp. as seen under a microscope.
© Jenny H
uggett; (inset) A. Hynes
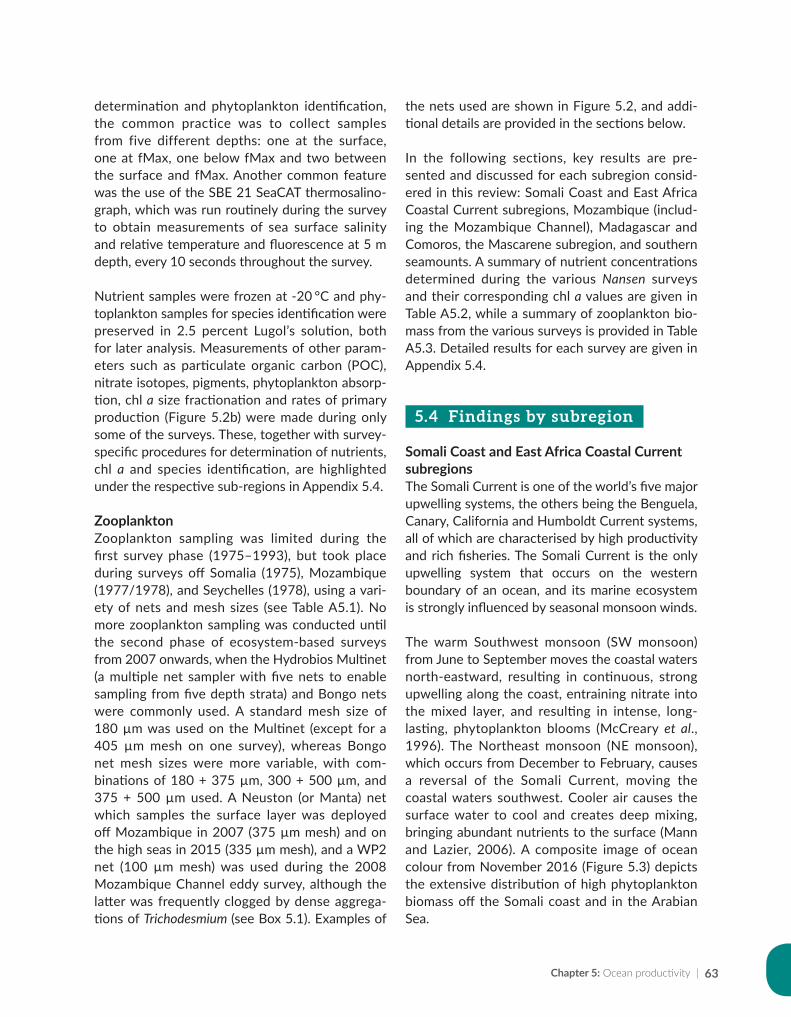
Chapter 5: Ocean productivity | 63
determination and phytoplankton identification, the common practice was to collect samples from five different depths: one at the surface, one at fMax, one below fMax and two between the surface and fMax. Another common feature was the use of the SBE 21 SeaCAT thermosalino-graph, which was run routinely during the survey to obtain measurements of sea surface salinity and relative temperature and fluorescence at 5 m depth, every 10 seconds throughout the survey.
Nutrient samples were frozen at -20 °C and phy-toplankton samples for species identification were preserved in 2.5 percent Lugol’s solution, both for later analysis. Measurements of other param-eters such as particulate organic carbon (POC), nitrate isotopes, pigments, phytoplankton absorp-tion, chl a size fractionation and rates of primary production (Figure 5.2b) were made during only some of the surveys. These, together with survey-specific procedures for determination of nutrients, chl a and species identification, are highlighted under the respective sub-regions in Appendix 5.4.
ZooplanktonZooplankton sampling was limited during the first survey phase (1975–1993), but took place during surveys off Somalia (1975), Mozambique (1977/1978), and Seychelles (1978), using a vari-ety of nets and mesh sizes (see Table A5.1). No more zooplankton sampling was conducted until the second phase of ecosystem-based surveys from 2007 onwards, when the Hydrobios Multinet (a multiple net sampler with five nets to enable sampling from five depth strata) and Bongo nets were commonly used. A standard mesh size of 180 µm was used on the Multinet (except for a 405 µm mesh on one survey), whereas Bongo net mesh sizes were more variable, with com-binations of 180 + 375 µm, 300 + 500 µm, and 375 + 500 µm used. A Neuston (or Manta) net which samples the surface layer was deployed off Mozambique in 2007 (375 µm mesh) and on the high seas in 2015 (335 µm mesh), and a WP2 net (100 µm mesh) was used during the 2008 Mozambique Channel eddy survey, although the latter was frequently clogged by dense aggrega-tions of Trichodesmium (see Box 5.1). Examples of
the nets used are shown in Figure 5.2, and addi-tional details are provided in the sections below.
In the following sections, key results are pre-sented and discussed for each subregion consid-ered in this review: Somali Coast and East Africa Coastal Current subregions, Mozambique (includ-ing the Mozambique Channel), Madagascar and Comoros, the Mascarene subregion, and southern seamounts. A summary of nutrient concentrations determined during the various Nansen surveys and their corresponding chl a values are given in Table A5.2, while a summary of zooplankton bio-mass from the various surveys is provided in Table A5.3. Detailed results for each survey are given in Appendix 5.4.
5.4 Findings by subregion
Somali Coast and East Africa Coastal Current subregionsThe Somali Current is one of the world’s five major upwelling systems, the others being the Benguela, Canary, California and Humboldt Current systems, all of which are characterised by high productivity and rich fisheries. The Somali Current is the only upwelling system that occurs on the western boundary of an ocean, and its marine ecosystem is strongly influenced by seasonal monsoon winds.
The warm Southwest monsoon (SW monsoon) from June to September moves the coastal waters north-eastward, resulting in continuous, strong upwelling along the coast, entraining nitrate into the mixed layer, and resulting in intense, long- lasting, phytoplankton blooms (McCreary et al., 1996). The Northeast monsoon (NE monsoon), which occurs from December to February, causes a reversal of the Somali Current, moving the coastal waters southwest. Cooler air causes the surface water to cool and creates deep mixing, bringing abundant nutrients to the surface (Mann and Lazier, 2006). A composite image of ocean colour from November 2016 (Figure 5.3) depicts the extensive distribution of high phytoplankton biomass off the Somali coast and in the Arabian Sea.
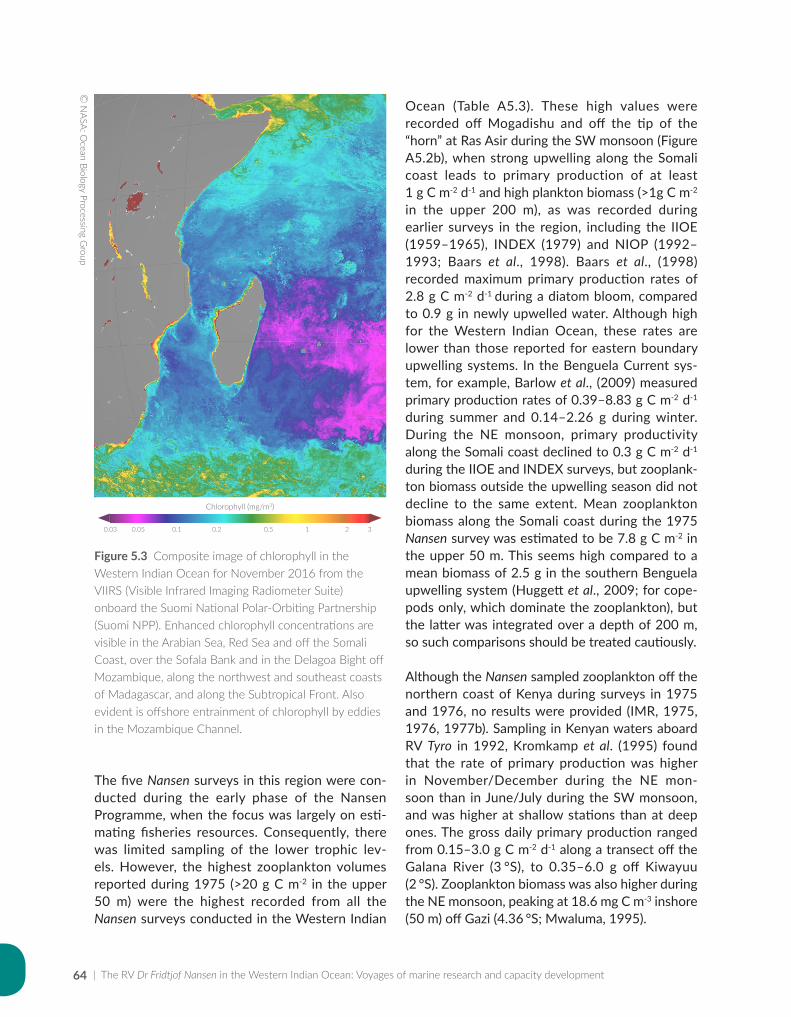
| The RV Dr Fridtjof Nansen in the Western Indian Ocean: Voyages of marine research and capacity development64
The five Nansen surveys in this region were con-ducted during the early phase of the Nansen Programme, when the focus was largely on esti-mating fisheries resources. Consequently, there was limited sampling of the lower trophic lev-els. However, the highest zooplankton volumes reported during 1975 (>20 g C m-2 in the upper 50 m) were the highest recorded from all the Nansen surveys conducted in the Western Indian
Ocean (Table A5.3). These high values were recorded off Mogadishu and off the tip of the “horn” at Ras Asir during the SW monsoon (Figure A5.2b), when strong upwelling along the Somali coast leads to primary production of at least 1 g C m-2 d-1 and high plankton biomass (>1g C m-2 in the upper 200 m), as was recorded during earlier surveys in the region, including the IIOE (1959–1965), INDEX (1979) and NIOP (1992–1993; Baars et al., 1998). Baars et al., (1998) recorded maximum primary production rates of 2.8 g C m-2 d-1 during a diatom bloom, compared to 0.9 g in newly upwelled water. Although high for the Western Indian Ocean, these rates are lower than those reported for eastern boundary upwelling systems. In the Benguela Current sys-tem, for example, Barlow et al., (2009) measured primary production rates of 0.39–8.83 g C m-2 d-1 during summer and 0.14–2.26 g during winter. During the NE monsoon, primary productivity along the Somali coast declined to 0.3 g C m-2 d-1 during the IIOE and INDEX surveys, but zooplank-ton biomass outside the upwelling season did not decline to the same extent. Mean zooplankton biomass along the Somali coast during the 1975 Nansen survey was estimated to be 7.8 g C m-2 in the upper 50 m. This seems high compared to a mean biomass of 2.5 g in the southern Benguela upwelling system (Huggett et al., 2009; for cope-pods only, which dominate the zooplankton), but the latter was integrated over a depth of 200 m, so such comparisons should be treated cautiously.
Although the Nansen sampled zooplankton off the northern coast of Kenya during surveys in 1975 and 1976, no results were provided (IMR, 1975, 1976, 1977b). Sampling in Kenyan waters aboard RV Tyro in 1992, Kromkamp et al. (1995) found that the rate of primary production was higher in November/December during the NE mon-soon than in June/July during the SW monsoon, and was higher at shallow stations than at deep ones. The gross daily primary production ranged from 0.15–3.0 g C m-2 d-1 along a transect off the Galana River (3 °S), to 0.35–6.0 g off Kiwayuu (2 °S). Zooplankton biomass was also higher during the NE monsoon, peaking at 18.6 mg C m-3 inshore (50 m) off Gazi (4.36 °S; Mwaluma, 1995).
Figure 5.3 Composite image of chlorophyll in the Western Indian Ocean for November 2016 from the VIIRS (Visible Infrared Imaging Radiometer Suite) onboard the Suomi National Polar-Orbiting Partnership (Suomi NPP). Enhanced chlorophyll concentrations are visible in the Arabian Sea, Red Sea and off the Somali Coast, over the Sofala Bank and in the Delagoa Bight off Mozambique, along the northwest and southeast coasts of Madagascar, and along the Subtropical Front. Also evident is offshore entrainment of chlorophyll by eddies in the Mozambique Channel.
© N
ASA: Ocean Biology Processing G
roup
Chlorophyll (mg/m3)
0.03 0.05 0.1 0.2 0.5 1 2 3
Chapter 5: Ocean productivity | 65
Most international programmes investigating the Arabian Sea focussed on the region further north, such as the US Arabian Sea Expedition of 1994–1996 (Smith et al., 1998; Smith, 2001) and the UK contribution to the JGOFS (Joint Global Ocean Flux Study) Process Studies in the Arabian Sea, ARABESQUE (Burkill, 1995, 1999). More recent planned initiatives in the Somali and East Africa Coastal Current subregions as part of the ASCLME project (2008–2010) were not possible due to pirate activity.
Mozambique subregionMozambique has an extensive coastline of some 2 300 km, spanning 16 degrees of latitude. Of the six subregions considered in this study, Mozambique has been the most frequently studied by the Nansen, with 14 surveys conducted, nine of which collected samples related to ocean produc-tivity. The most consistently productive areas over the continental shelf (in terms of phytoplankton biomass, at least) seem to be the Delagoa Bight, Sofala Bank, and Angoche regions. Satellite imag-ery of ocean colour from late 2007 (Figure A5.4a), in situ measurements of chl a during the 2007 sur-vey (Figure A5.4b) as well as the 2009 and 2014 surveys (Figure A5.5) confirm the elevated produc-tivity. At the Angoche and Delagoa Bight regions, it appears to be partly linked to the frequent pas-sage of eddies, while the Sofala Bank productivity is influenced by the Zambezi delta discharge as well as mesoscale oceanographic features (Leal et al., 2009); this is discussed further below.
Between September and December 2007, the Nansen conducted the first multidisciplinary sur-vey of the entire Mozambique continental shelf, which yielded valuable baseline information on nutrients and the phytoplankton community, and which is comprehensively documented by Sá et al., (2013). Both nutrients and phytoplankton changed with region and depth (see Sá et al., 2013, their Figures 3, 4, 5), as shown by other studies in the region (Barlow et al., 2008, 2014). Nutrient results revealed similar phosphate (P) concentrations in all regions (~0.25 μM), with minimum values in the north. Silicate (Si) concentrations generally varied between 6 and 10 μM, except for a peak
of 17.27 μM in the Delagoa Bight, and a few sta-tions south of Bazaruto where results were below detection limit. Nitrate + nitrite (N) concentrations were generally low along the coast, often below detection limit. In contrast, higher concentrations were observed in a few surface samples from the Delagoa Bight and the northern region. No clear trend or differences in nutrient concentrations were observed between surface and fMax sam-ples (Sá et al., 2013).
Pigment analysis via high-performance liquid chromatography (HPLC) allowed determina-tion of phytoplankton biomass and identifica-tion of major phytoplankton groups present in Mozambican waters (Sá et al., 2013), in partic-ular Prochlorophytes (Divinyl chl a), Haptophytes (19’Hexanoylofucoxanthin), Bacillariophytes (Fucoxanthin), Cyanophytes (Zeaxanthin) and Dinophytes (Peridinin). Microscopy indicated the diatoms Chaetoceros spp., Proboscia alata, Pseudo-nitzschia spp., Cylindrotheca closterium and Hemiaulus haukii were the most abundant micro-phytoplankton taxa, while Discosphaera tubifera and Emiliania huxleyi were the most abundant coc-colithophores, or nanophytoplankton. The smaller picoplankton were associated with warmer north-ern waters and dominated surface waters, while the larger nano- and microplankton were abun-dant at the fMax and were mostly associated with the cooler southern and central waters, including north of Angoche to ~15 °S (Sá et al., 2013).
There was a latitudinal gradient in phytoplank-ton biomass (as with temperature and salinity), with chl a increasing from north to south (Sá et al., 2013), and for all regions surface chl a values were lower than those at the fMax (Table A5.2). An exception was for the southern region (with cool, nutrient-rich waters) where values at the sur-face were similar to those at the fMax, reaching a maximum of 1.62 mg m-3. In the less-productive central and northern regions, maximum chl a con-centration ranged from 0.37 to 0.53 mg m-3 at the surface, and from 0.31 to 0.95 mg m-3 at the fMax (Table A5.2). Measurements of mesozooplank-ton biovolume (>180 µm) during later surveys in 2009 and 2014 also indicated higher biomass in
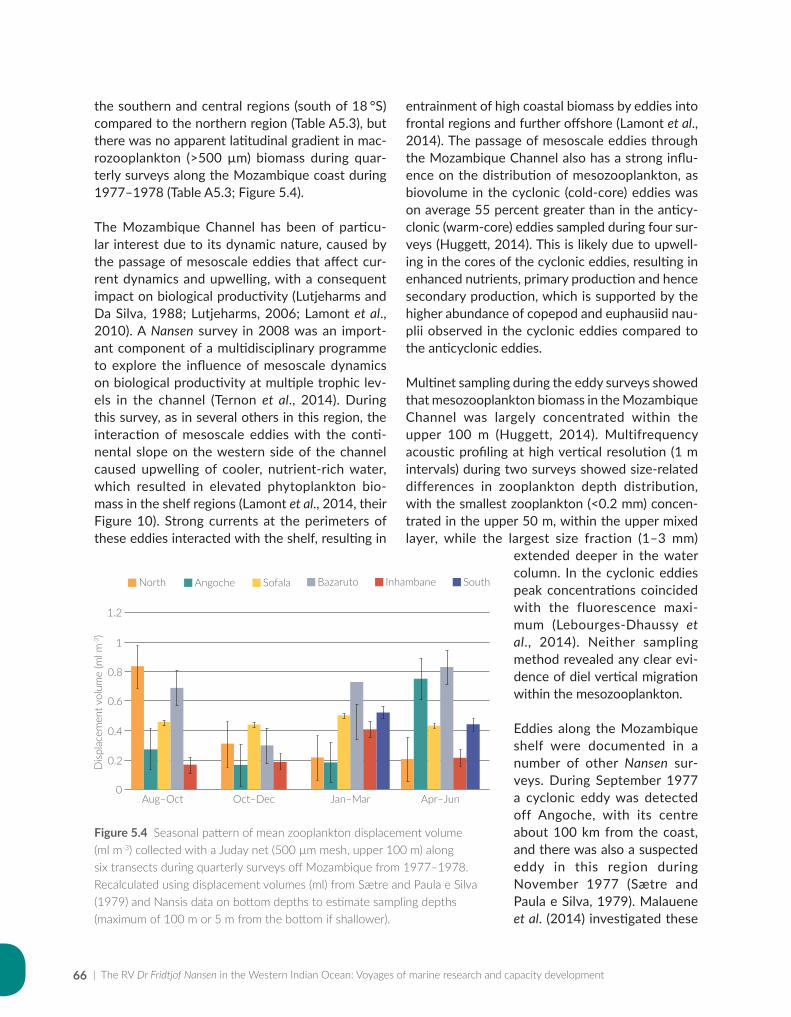
| The RV Dr Fridtjof Nansen in the Western Indian Ocean: Voyages of marine research and capacity development66
the southern and central regions (south of 18 °S) compared to the northern region (Table A5.3), but there was no apparent latitudinal gradient in mac-rozooplankton (>500 µm) biomass during quar-terly surveys along the Mozambique coast during 1977–1978 (Table A5.3; Figure 5.4).
The Mozambique Channel has been of particu-lar interest due to its dynamic nature, caused by the passage of mesoscale eddies that affect cur-rent dynamics and upwelling, with a consequent impact on biological productivity (Lutjeharms and Da Silva, 1988; Lutjeharms, 2006; Lamont et al., 2010). A Nansen survey in 2008 was an import-ant component of a multidisciplinary programme to explore the influence of mesoscale dynamics on biological productivity at multiple trophic lev-els in the channel (Ternon et al., 2014). During this survey, as in several others in this region, the interaction of mesoscale eddies with the conti-nental slope on the western side of the channel caused upwelling of cooler, nutrient-rich water, which resulted in elevated phytoplankton bio-mass in the shelf regions (Lamont et al., 2014, their Figure 10). Strong currents at the perimeters of these eddies interacted with the shelf, resulting in
entrainment of high coastal biomass by eddies into frontal regions and further offshore (Lamont et al., 2014). The passage of mesoscale eddies through the Mozambique Channel also has a strong influ-ence on the distribution of mesozooplankton, as biovolume in the cyclonic (cold-core) eddies was on average 55 percent greater than in the anticy-clonic (warm-core) eddies sampled during four sur-veys (Huggett, 2014). This is likely due to upwell-ing in the cores of the cyclonic eddies, resulting in enhanced nutrients, primary production and hence secondary production, which is supported by the higher abundance of copepod and euphausiid nau-plii observed in the cyclonic eddies compared to the anticyclonic eddies.
Multinet sampling during the eddy surveys showed that mesozooplankton biomass in the Mozambique Channel was largely concentrated within the upper 100 m (Huggett, 2014). Multifrequency acoustic profiling at high vertical resolution (1 m intervals) during two surveys showed size-related differences in zooplankton depth distribution, with the smallest zooplankton (<0.2 mm) concen-trated in the upper 50 m, within the upper mixed layer, while the largest size fraction (1–3 mm)
extended deeper in the water column. In the cyclonic eddies peak concentrations coincided with the fluorescence maxi-mum (Lebourges-Dhaussy et al., 2014). Neither sampling method revealed any clear evi-dence of diel vertical migration within the mesozooplankton.
Eddies along the Mozambique shelf were documented in a number of other Nansen sur-veys. During September 1977 a cyclonic eddy was detected off Angoche, with its centre about 100 km from the coast, and there was also a suspected eddy in this region during November 1977 (Sætre and Paula e Silva, 1979). Malauene et al. (2014) investigated these
1
Disp
lace
men
t vol
ume
(ml m
-3)
0.8
0.6
0.4
0.2
0
1.2
Sofala
Aug–Oct
North Angoche SouthBazaruto Inhambane
Oct–Dec Jan–Mar Apr–Jun
Figure 5.4 Seasonal pattern of mean zooplankton displacement volume (ml m-3) collected with a Juday net (500 µm mesh, upper 100 m) along six transects during quarterly surveys off Mozambique from 1977–1978. Recalculated using displacement volumes (ml) from Sætre and Paula e Silva (1979) and Nansis data on bottom depths to estimate sampling depths (maximum of 100 m or 5 m from the bottom if shallower).
Chapter 5: Ocean productivity | 67
phenomena and describe intermittent periods of relatively cool surface water and elevated chl a signatures indicative of upwelling near Angoche between August and March. They suggest that these conditions are primed and formed by wind-driven coastal upwelling, in response to the along-shore north-easterly monsoon winds that prevail during this period. The waters are enriched in chl a and advected further offshore by the interaction of anti-cyclonic/ cyclonic eddy pairs with the shelf. Cyclonic eddies were also observed off Inhambane during surveys in November 1977 and March 1978 (Sætre and Paula e Silva, 1979), as well as slightly north of Inhambane in October 2007. The passage of cyclonic eddies in this region has been found to influence the water masses of the Delagoa Bight through upwelling onto the shelf, resulting in enhanced productivity (Quartly and Srokosz, 2004; Kyewalyanga et al., 2007; Lamont et al., 2010). Kyewalyanga et al., (2007) recorded high chl a and primary production values in the northern part of the Delagoa Bight, and intermit-tent acoustic recordings of pelagic fish, mostly round herring (Etrumeus teres), were noted here during the survey in Oct/Nov 1980 (Brinca et al., 1981).
The cyclonic eddy observed in 2007 was bounded by a large anticyclonic eddy to the north, and high chlorophyll concentrations at the fMax along a transect between Bazaruto and Inhambane were presumed to be associated with a frontal zone between the two counter-rotating eddies (Johnsen et al., 2007). This would have resulted in coastal biomass being advected offshore by strong currents between these eddies, as observed by Lamont et al. (2014). An inshore northward coastal current is also commonly observed in the Delagoa Bight, which may cause upwelling depending on the interaction of eddies with the topography of the shelf and slope (Lamont et al., 2010).
The Sofala Bank is one of the more productive regions off the Mozambican coast (Sá et al., 2013); it is markedly influenced by the Zambezi River, being characterised by strong tidal currents and estuarine runoff that determines hydrological features (Lutjeharms, 2006), with river discharges
relatively rich in nutrients. The region is also influ-enced by the passage of mesoscale eddies, and interactions of eddies with the shelf are likely to bring nutrients into the region, thereby enhancing productivity. However, during an intensive study off the Zambezi River mouth during 2007, phy-toplankton biomass was very low, between 0.003 and 0.202 mg m-3, and the community was domi-nated by microflagellates, specifically Haptophytes (coccolithophorids; Leal et al., 2009). This study was conducted in December, at the end of the dry season, and before the onset of the rainy sea-son (Leal et al., 2009). Salinity near the coast was around 35, which is considerably higher than salin-ity values of around 20, as described by Lutjeharms (2006) for the Sofala Bank region during the wet season, indicating minor estuarine runoff. Nutrient ratios were strongly influenced by depleted nitrate + nitrite concentrations, indicating low estuarine discharges typical of the dry season. The very low N:P ratio obtained (0–0.9) suggests the phyto-plankton communities were strongly nitrogen lim-ited, supporting the low phytoplankton abundance observed. The influence of seasonal river dis-charge on productivity in this region is highlighted by results from surveys over the Sofala Bank in 1977–1978, when zooplankton biovolume was roughly three times higher in January to March 1978, during the wet season, than in October to December 1977 (Sætre and Paula e Silva, 1979).
The Sofala Bank area off Beira and the shelf area off the Zambezi River have also been noted as the most important distribution areas for pelagic fish such as buccaneer anchovy (Encrasicholina puncti-fer; Sætre and Paula e Silva, 1979).
Trichodesmium is an important diazotroph (nitro-gen fixer) in nutrient-poor tropical and subtrop-ical oceans. Dense Trichodesmium blooms were observed at least twice during Nansen surveys off Mozambique. The first time was north of Beira in autumn 1977 (IMR, 1977a) and the second time was in December 2008, while sampling in a cyclonic eddy also north of Beira (see stations forming a cross in Figure A5.3). The bloom was vis-ible as broad streaks at the ocean surface (see Box 5.1 for more details.
| The RV Dr Fridtjof Nansen in the Western Indian Ocean: Voyages of marine research and capacity development68
Madagascar and Comoros subregionAlthough the Nansen surveyed 22 transects around Madagascar in 2008 and 2009, and ten transects in the Comoros gyre during 2009 (Figure A5.6), quantitative data on ocean productivity in this subregion remain limited, particularly for zooplankton. Composite maps of near-surface (5 m) temperature and fluorescence from 2008 and 2009 (Figure A5.7a, b) indicate considerable spatial variation in chl a, but mostly low concen-trations (≤0.2 mg m-3). There was evidence of upwelling and offshore surface flow off south-east Madagascar near Fort Dauphin in 2008, supported by relatively high chlorophyll concen-trations there (a maximum of 1.1 mg m-3) and to the immediate north. A cyclonic eddy with a diam-eter of approximately 250 km was observed off the southern tip of Madagascar, to the lee side, and similar observations of eddies in this region have been associated with high productivity (Quartly and Srokosz, 2004). Furthermore, stud-ies off southern Madagascar have shown a large phytoplankton bloom most years in late austral summer (February–April), which propagates to the east, away from Madagascar (Poulton et al., 2009; Srokosz and Quartly, 2013; Srokosz et al., 2015). The bloom to the south of Madagascar in 2005 comprised the nitrogen-fixing cyanobacte-ria (Trichodesmium), while diazotrophic diatoms (Rhizosolenia spp., harbouring the extracellular endosymbiont cyanobacterium Richelia intracellu-laris, which also fixes nitrogen, in a symbiotic rela-tionship) were observed to the east of Madagascar (Poulton et al., 2009). These authors calculated nitrogen fixation rates in the order of 1 to 5 mM N m-2 d-1 and 0.24 to 2.4 mM N m-2 d-1, off the south and east coasts respectively. The presence of these nitrogen fixers as nitrogen sources (ammo-nia or dissolved nitrogen) is likely to enhance pro-ductivity along the southeast coast of Madagascar, a region characterised by elevated net primary production (NPP) in 2009 (Pripp et al., 2014).
In 2009, Pripp et al. (2014) identified three upwell-ing regions off Madagascar – along the south-ern coast, near Cap St André at approximately 16 °S, and a small area north of Nosy Be Island at 13 °S. All upwelling cells were associated with
elevated surface chl a, but low concentrations were observed along the central west coast. Chl a and NPP (Pripp et al., 2014, their Figure 2) dis-played similar patterns, except in the central region where NPP was high near the coast but there was no ship-track to monitor the chl a. Both total copepod abundance and copepod species diver-sity appeared to be greatest in samples collected off Cap St Marie in the south, compared to sam-ples collected from transects along the west coast (Remanevy, 2014). Moving up the food chain, acoustic estimates, trawling and whale observa-tions indicated high biological productivity in the three upwelling regions, whereas such estimates for the entire western coast were low, typical for tropical waters (Pripp et al., 2014).
The Comoros basin was characterised by warm water in 2009, suggesting low nutrient concen-trations. Near-surface fluorescence indicated low chl a concentrations (<0.1 µg m-3; Figure A5.7b), implying low surface productivity at the time of sampling. Zooplankton dry biomass (>375 µm, upper 200 m) ranged from 0.17 to 1.42 g m-2 (Table A5.3). The larger (>2 mm) size fraction tended to make up a large proportion of the bio-mass at night, when the larger euphausiids and decapods were most abundant (Roman et al., 2009). Spatially, biomass was highly variable, but was greatest southeast of the Comoros Islands and lowest to the southwest (Figure A5.8). This pattern coincided closely with the locations of a cyclonic (cold-core) eddy and an anticyclonic (warm-core) eddy respectively, supporting pre-vious observations from this region that warm-core eddies contain less zooplankton compared to cold-core eddies and frontal boundary regions (Kolasinski et al., 2012; Huggett, 2014).
Mascarene subregionThe Mascarene Plateau is a crescent-shaped ridge approximately 2 200 km in length, running from the Seychelles Bank in the north (4 °S) to the island of Mauritius in the south (20 °S). It forms a partial barrier to the predominantly westward flowing South Equatorial Current (SEC; Gallienne et al., 2004). It has been suggested that divergence on the leeward (western) side of the plateau might

Chapter 5: Ocean productivity | 69
Particulate organic matter (POM) suspended in the water column plays a key role in the regulation of recycling and export of organic materials into and out of the euphotic zone and is particularly important in oceanic biogeochemical cycles (Volkman and Tanoue, 2002). It is a principal component of many food webs, both in open-ocean and coastal communities and may contain variable proportions of phytoplankton, bacteria and detritus, among others (Savoye et al., 2003; Miller et al., 2013).
Stable isotope signatures of POM can be useful for investigating nitrogen (N) and carbon (C) sources driving primary production, which ultimately supports multiple food webs. δ15N and δ13C signatures of POM collected at the surface and fluorescence maximum (fMax) of the water column across the Mascarene Plateau during an ASCLME survey in 2008 provided some insight into nutrient dynamics and sources in this otherwise oligotrophic region of the Western Indian Ocean.
Substantial concentrations of both N and C in surface water (Figure A5.11) were shown across the entire plateau, particularly on the southeastern plateau shelf (Saya de Malha), with concentrations at fMax on a much lower scale. The range of δ13C signatures of POM were similar at both the surface and fMax, suggesting that C sources (and contributions) to POM in the water column were likely comparable across all sections of the plateau. However, at fMax, POM from the open ocean region between the two main shelves of the plateau was slightly more enriched in δ13C, most likely reflecting changes in either C source or composition at the fMax. This trend was not evident in surface POM and suggests
BOX5.2 Isotopic investigations of POM over the Mascarene Plateau
Pictured below: Dr Sven Kaehler, the principal isotope ecologist on this project, died in September 2014 and is sorely missed.
Stable isotopic values (δ15N and δ13C) from particulate organic matter (POM) collected from the fluorescence maximum (fMax) of the water column, across the Mascarene Plateau on the ASCLME survey on the RV Dr Fridtjof Nansen in 2008.
© Jenny H
uggett
that C sources at the surface are routinely transported between shelf sections of the plateau, which is also supported by the variability in δ15N values in surface POM. Furthermore, high variability in δ15N suggests a dynamic mix of N sources included in surface POM composition. δ15N POM signatures at the fMax on the plateau shelves were more enriched relative to those between the shelves in the open ocean.
Higher δ15N is usually associated with greater propor- tions of re-suspended detritus and likely also with phytoplankton species associated with shelf commun-ities, while the depleted, lower δ15N values are clearly indicative of N generated via nitrogen-fixation at depth.
The apparent differences in isotopic values between surface and fMax, and clear changes in C and N signatures between shelf and open ocean regions of the plateau at the fMax, likely reflect dynamic and shifting nutrient pools, which will ultimately influence trophic subsidies to higher trophic-level fauna.
Contributed by: Jaclyn Hill1 and Sven Kaehler2
1 Department of Zoology & Entomology, Rhodes University, South Africa2 IsoEnvironmental cc, South African Institute for Aquatic Biodiversity, South Africa
| The RV Dr Fridtjof Nansen in the Western Indian Ocean: Voyages of marine research and capacity development70
result in upwelling, with nutrient enrichment and enhanced chlorophyll and secondary production levels downstream (Gallienne and Smythe-Wright, 2005). This followed the observation in 2001 of ten times greater mesozooplankton biomass downstream from the plateau, north of 13 °S, compared to the region away from the influence of the Mascarene ridge (Gallienne et al., 2004).
A subsequent survey in 2002 found contrasting results, with little evidence of topographically induced upwelling enhancing primary and second-ary production north of 13 °S. Nevertheless, there was some enhancement of phytoplankton and zooplankton biomass downstream of the plateau, south of 13 °S, possibly associated with turbulent mixing as water passed through the large gaps in the plateau (Gallienne and Smythe-Wright, 2005).
During three consecutive surveys by the Nansen in 2008, sampling was conducted along the axis of the Mascarene Plateau (Figure A5.9), in order to assess the productivity, biodiversity and bio-mass of the pelagic ecosystem. Whether primary production may be enhanced through upwelling along the leeward edge and in the three main gaps through the plateau, was also assessed (Strømme et al., 2009). Mean chl a concentration across the plateau was 0.26 mg m-3 near the surface and 0.96 mg m-3 at the depth of maximum fluorescence (Figure A5.10a, b), which varied between 30 and 100 m (Figure A5.10c). Microplankton (2–20 µm) dominated the biomass, with nano- and picoplank-ton biomass rarely exceeding 1 mg m-3. No indi-cation of upwelling was discovered, except for the Amirantes Ridge, where chl a biomass exceeded 30 mg m-3. The highest phytoplankton biomass between Mauritius and Seychelles was recorded on the Saya da Malha Bank (Figure A5.10b, c). The phytoplankton bloom along the Amirantes Ridge (Figure A5.10b) consisted of chain-forming diatoms (Strømme et al., 2009). The most import-ant outcomes from these particular surveys are higher phytoplankton biomass in the northern part of the plateau (north of 12 °S), higher biomass at depth (30–100 m; also see Box 5.2), and no evi-dence of leeward or gap-related enhancement of production.
During the Nansen surveys of Oct/Nov 2008, zoo-plankton biomass was also observed to increase towards the north of the plateau, with highest mean biomass measured over the Seychelles Bank (0.25 ml m-3 in the upper 50 m; Table A5.3). Euphausiid species diversity increased northwards too, although abundance increased towards the southeast of the plateau (Box 5.3). Biomass over the Seychelles Bank in July 1978, during the first Nansen survey in this region, was approximately four times higher over the same depth range, which points to either high variability for the region or a strong seasonal effect (or both). Given that chlorophyll biomass was consistently highest in subsurface waters over the plateau, seasonal and interannual patterns in productivity are unlikely to be discerned from satellite observations of ocean colour, but will require more frequent in situ sam-pling in the region. Nonetheless, these studies highlight the importance of the Mascarene Plateau to enhanced productivity in the Mascarene Basin, and the need for more sampling to discern both broad- and fine-scale variability in productivity in relation to remote and local forcing.
Seamounts subregionSeamounts are isolated topographic features, rising steeply from the deep-sea floor, and are thought to be hotspots of biological biodiver-sity and productivity (Read and Pollard, 2017). In 2009, the Nansen explored six seamounts in the Southwest Indian Ocean to determine whether they were centres of enhanced biological produc-tivity – Atlantis Bank, Sapmer Seamount, Middle of What Seamount, Melville Bank and Coral Seamount along the Southwest Indian Ridge, and an un-named seamount north of Walters Shoals on the Madagascar Ridge (Figure A5.13). The sea-mounts cover a large area, spanning over 10 ° of latitude and longitude, with a correspondingly wide range in SST, from as high as 27 °C in the north to as low as 8 °C in the south, the largest difference occurring across the Subtropical Front and the Agulhas Return Current (Read and Pollard, 2017). In the vicinity of each seamount, mesoscale eddies dominated the flow, with mean speeds ranging from 15 to 25 cm s-1, which was associ-ated with generation of internal tides interacting
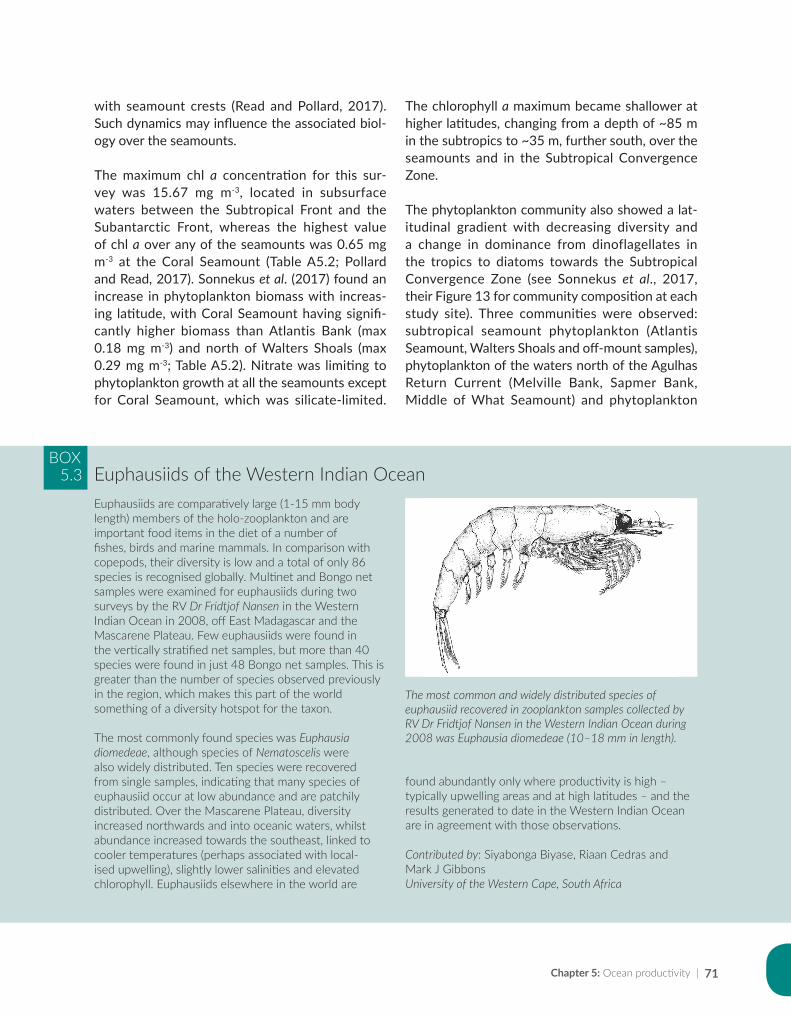
Chapter 5: Ocean productivity | 71
with seamount crests (Read and Pollard, 2017). Such dynamics may influence the associated biol-ogy over the seamounts.
The maximum chl a concentration for this sur-vey was 15.67 mg m-3, located in subsurface waters between the Subtropical Front and the Subantarctic Front, whereas the highest value of chl a over any of the seamounts was 0.65 mg m-3 at the Coral Seamount (Table A5.2; Pollard and Read, 2017). Sonnekus et al. (2017) found an increase in phytoplankton biomass with increas-ing latitude, with Coral Seamount having signifi-cantly higher biomass than Atlantis Bank (max 0.18 mg m-3) and north of Walters Shoals (max 0.29 mg m-3; Table A5.2). Nitrate was limiting to phytoplankton growth at all the seamounts except for Coral Seamount, which was silicate-limited.
The chlorophyll a maximum became shallower at higher latitudes, changing from a depth of ~85 m in the subtropics to ~35 m, further south, over the seamounts and in the Subtropical Convergence Zone.
The phytoplankton community also showed a lat-itudinal gradient with decreasing diversity and a change in dominance from dinoflagellates in the tropics to diatoms towards the Subtropical Convergence Zone (see Sonnekus et al., 2017, their Figure 13 for community composition at each study site). Three communities were observed: subtropical seamount phytoplankton (Atlantis Seamount, Walters Shoals and off-mount samples), phytoplankton of the waters north of the Agulhas Return Current (Melville Bank, Sapmer Bank, Middle of What Seamount) and phytoplankton
Euphausiids are comparatively large (1-15 mm body length) members of the holo-zooplankton and are important food items in the diet of a number of fishes, birds and marine mammals. In comparison with copepods, their diversity is low and a total of only 86 species is recognised globally. Multinet and Bongo net samples were examined for euphausiids during two surveys by the RV Dr Fridtjof Nansen in the Western Indian Ocean in 2008, off East Madagascar and the Mascarene Plateau. Few euphausiids were found in the vertically stratified net samples, but more than 40 species were found in just 48 Bongo net samples. This is greater than the number of species observed previously in the region, which makes this part of the world something of a diversity hotspot for the taxon.
The most commonly found species was Euphausia diomedeae, although species of Nematoscelis were also widely distributed. Ten species were recovered from single samples, indicating that many species of euphausiid occur at low abundance and are patchily distributed. Over the Mascarene Plateau, diversity increased northwards and into oceanic waters, whilst abundance increased towards the southeast, linked to cooler temperatures (perhaps associated with local-ised upwelling), slightly lower salinities and elevated chlorophyll. Euphausiids elsewhere in the world are
BOX5.3 Euphausiids of the Western Indian Ocean
The most common and widely distributed species of euphausiid recovered in zooplankton samples collected by RV Dr Fridtjof Nansen in the Western Indian Ocean during 2008 was Euphausia diomedeae (10–18 mm in length).
found abundantly only where productivity is high – typically upwelling areas and at high latitudes – and the results generated to date in the Western Indian Ocean are in agreement with those observations.
Contributed by: Siyabonga Biyase, Riaan Cedras and Mark J GibbonsUniversity of the Western Cape, South Africa
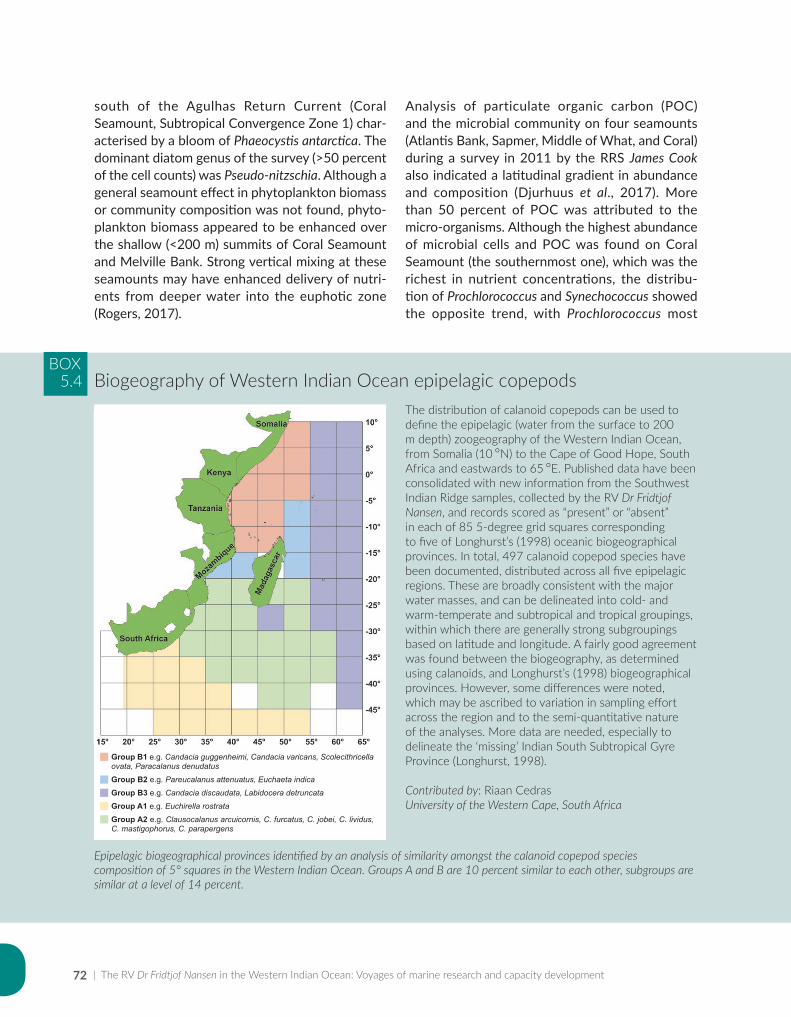
| The RV Dr Fridtjof Nansen in the Western Indian Ocean: Voyages of marine research and capacity development72
south of the Agulhas Return Current (Coral Seamount, Subtropical Convergence Zone 1) char-acterised by a bloom of Phaeocystis antarctica. The dominant diatom genus of the survey (>50 percent of the cell counts) was Pseudo-nitzschia. Although a general seamount effect in phytoplankton biomass or community composition was not found, phyto-plankton biomass appeared to be enhanced over the shallow (<200 m) summits of Coral Seamount and Melville Bank. Strong vertical mixing at these seamounts may have enhanced delivery of nutri-ents from deeper water into the euphotic zone (Rogers, 2017).
Analysis of particulate organic carbon (POC) and the microbial community on four seamounts (Atlantis Bank, Sapmer, Middle of What, and Coral) during a survey in 2011 by the RRS James Cook also indicated a latitudinal gradient in abundance and composition (Djurhuus et al., 2017). More than 50 percent of POC was attributed to the micro-organisms. Although the highest abundance of microbial cells and POC was found on Coral Seamount (the southernmost one), which was the richest in nutrient concentrations, the distribu-tion of Prochlorococcus and Synechococcus showed the opposite trend, with Prochlorococcus most
The distribution of calanoid copepods can be used to define the epipelagic (water from the surface to 200 m depth) zoogeography of the Western Indian Ocean, from Somalia (10 °N) to the Cape of Good Hope, South Africa and eastwards to 65 °E. Published data have been consolidated with new information from the Southwest Indian Ridge samples, collected by the RV Dr Fridtjof Nansen, and records scored as “present” or “absent” in each of 85 5-degree grid squares corresponding to five of Longhurst’s (1998) oceanic biogeographical provinces. In total, 497 calanoid copepod species have been documented, distributed across all five epipelagic regions. These are broadly consistent with the major water masses, and can be delineated into cold- and warm-temperate and subtropical and tropical groupings, within which there are generally strong subgroupings based on latitude and longitude. A fairly good agreement was found between the biogeography, as determined using calanoids, and Longhurst’s (1998) biogeographical provinces. However, some differences were noted, which may be ascribed to variation in sampling effort across the region and to the semi-quantitative nature of the analyses. More data are needed, especially to delineate the ‘missing’ Indian South Subtropical Gyre Province (Longhurst, 1998).
Contributed by: Riaan CedrasUniversity of the Western Cape, South Africa
BOX5.4 Biogeography of Western Indian Ocean epipelagic copepods
Epipelagic biogeographical provinces identified by an analysis of similarity amongst the calanoid copepod species composition of 5° squares in the Western Indian Ocean. Groups A and B are 10 percent similar to each other, subgroups are similar at a level of 14 percent.
Group B1 e.g. Candacia guggenheimi, Candacia varicans, Scolecithricella ovata, Paracalanus denudatus
Group B2 e.g. Pareucalanus attenuatus, Euchaeta indica
Group B3 e.g. Candacia discaudata, Labidocera detruncata
Group A1 e.g. Euchirella rostrata
Group A2 e.g. Clausocalanus arcuicornis, C. furcatus, C. jobei, C. lividus, C. mastigophorus, C. parapergens
Chapter 5: Ocean productivity | 73
abundant in the northwest while Synechococcus dominated in the southeast. Djurhuus et al. (2017) attributed these patterns to differences in the water masses that formed three biological regimes: north of the Subtropical Front, the central convergence zone, and south of the Subtropical Front. Overall, more POC was found in the south-west and within the convergence zone than in the northeast, implying that more nutrients were available there, probably caused by upwelling due to ocean currents, thereby supporting high pri-mary productivity (Djurhuus et al., 2017).
A study on pelagic backscatter also pointed to the fronts as being foraging hotspots for top predators in the Southwest Indian Ocean (Boersch-Supan et al., 2017). Structurally distinct scattering layer regimes were found across the Subantarctic Front, which corresponded to the boundary regions of the distinct communities identified for phyto-plankton, microbial plankton and cephalopods (Djurhuus et al., 2017; Laptikhovsky et al., 2017; Sonnekus et al., 2017). This implies that acoustic observations could be used to delineate biogeo-graphical regions (Boersch-Supan et al., 2017). Similarly, the presence or absence of copepod species in samples collected during the 2011 sea-mount survey were used to refine the oceanic biogeographical provinces proposed by Longhurst (1998; Box 5.4).
5.5 Regional synthesis
Results from the many surveys (spanning 40 years, from 1975 to 2015; Table A5.1) conducted in the Western Indian Ocean by the Nansen have contributed significantly to regional knowledge, through enhanced understanding of distribution and abundance of phytoplankton and zooplank-ton biomass and productivity. These variables are controlled by hydrodynamics, which in turn is influenced by winds, currents, tides as well as sea bottom topography.
As primary production is mainly influenced by light and nutrient availability, water movements that bring nutrients to the ocean layers, which are
adequately illuminated, stimulate production. The main mechanisms which act in the Western Indian Ocean to control biomass, abundance and distri-bution were shown to be upwelling, mesoscale eddy circulation, frontal systems, riverine flow, and monsoon winds causing turbulence (strong, mixing) or stratification (calm, and associated con-sequences such as blooms of Trichodesmium that fix nitrogen).
In general, high chl a concentration was also asso-ciated with high zooplankton biomass, although this was not always the case. Organisms at higher trophic levels were also found to follow this trend, for example off Mozambique and in the Southern Seamounts subregion. The Western Indian Ocean is relatively low in terms of productivity, especially in surface waters, where chlorophyll concentra-tions were generally lower than in the sub-surface layers. Exceptions were coastal embayments, such as around Madagascar, and productive continen-tal shelves, such as Delagoa Bight. Nutrients were also relatively low in surface concentrations, but increased with depth in deeper waters. This was mostly true for nitrate, nitrite, ammonia and phos-phate, while silicate was non-limiting in surface waters.
Highest zooplankton biomass was measured off the Somali Coast, reaching approximately dou-ble the highest biomass found elsewhere in the region. The second highest biomass was recorded over the Sofala Bank during the rainy season, fol-lowed by the Seychelles Bank, but these were all for relatively shallow depths (40–50 m) where bio-mass is more concentrated. In addition to variabil-ity in sampling depths (40–500 m), regional com-parisons are complicated by the use of different mesh sizes (180–500 µm), particularly during the early surveys.
During the ecosystem surveys there was an effort to standardise methods, and for all surveys from 2008 onwards the use of a Multinet (180 µm mesh) enabled an equitable comparison of biomass in the upper 200 m for the Mozambique, Mascarene and Seamount subregions. Using this methodol-ogy, highest mean biovolumes were associated

| The RV Dr Fridtjof Nansen in the Western Indian Ocean: Voyages of marine research and capacity development74
with eddies in the Mozambique channels (0.4 ml m-3), and lowest mean biovolumes were recorded over the southern Mascarene Ridge (0.05 ml m-3). Intermediate mean biovolumes of 0.1–0.3 ml m-3 were recorded around the seamounts, supporting the hypothesis that these are often hotspots of productivity in an otherwise oligotrophic ocean.
5.6 Conclusions and recommendations
The ecosystem surveys since 2007 have made a significant contribution to improving our knowl-edge of ocean productivity in the Southwest Indian Ocean, in particular. In terms of regional coverage, knowledge gained has been greatest for the Mozambique shelf, followed by the Mascarene subregion. The East Africa Coastal Current subre-gion remains to be explored, and effort expended in the Madagascar and Comoros subregion far exceeds the outputs. In terms of discipline, knowl-edge gained has been greatest for phytoplankton and zooplankton biomass, to a moderate degree in terms of species composition, and minimally in terms of primary and secondary production mea-surements. Whilst the collection and processing of nutrient samples have been extensive, analyses using these data are scarce.
From a technical perspective, the Nansen has proven to be an excellent platform for multidisci-plinary sampling, which facilitated capacity devel-opment such as during the ASCLME surveys. Each survey included local scientists and stu-dents from the country or region under investiga-tion, as well as more experienced scientists from other countries, thus providing an ideal mentoring environment.
Some of the practical problems typically encoun-tered with plankton sampling during the surveys were comprehensively summarised by Rogers et al. (2009). They include poor condition of the nets, damage to nets due to contact with the other cod-ends and the cod-end frames (with the sug-gestion that the cod-end frame design be modi-fied), loose-fitting cod-ends resulting in the loss of
cod-end contents, lack of spares for survey equip-ment, and provision of a full equipment list well in advance of a survey.
An important concern has been the inadequate record-keeping of plankton samples sometimes, as well as oversight of their off-loading subsequent to a survey, including who the responsible agent(s) will be for sample curation and analysis. This should be clearly documented, and should ideally be available in an online metadatabase. Linked to this is the issue of data archiving and access. It has been a difficult task to establish exactly what samples and data have been analysed for some surveys. The survey reports have been of varying quality and content, proving invaluable in some cases, and frustratingly thin in others.
A real challenge encountered during post-2007 surveys was that although considerable expense was put to facilitating regional participants in the numerous surveys, there were no funds allocated for sample analysis after the surveys. While anal-ysis of physical data from CTD casts, for example, is a relatively rapid process, analysis of biological samples such as phytoplankton and zooplankton (particularly for taxonomic identification) can be extremely time-consuming and requires scarce taxonomic skills. The end result has been far fewer outputs, as well as a much longer time to eventual publication, than should be expected. For future large programmes, such as may ensue in support of the IIOE-2, it is recommended that bursaries are made available for students to facilitate the timely analysis of samples.
As plankton are ideal indicators of ecosystem change, transboundary and basin-scale monitor-ing of their communities is recommended. The Nansen could assist with a coordinated monitor-ing programme, by including previously sampled transects when revisiting an area, and by towing a Continuous Plankton Recorder (CPR) during long transits. The CPR collects phytoplankton and zooplankton abundance and community structured data over large temporal and spatial scales (Verheye et al., 2016). It is a robust, tried and tested, cost-effective plankton sampling
Chapter 5: Ocean productivity | 75
device deployed at high speeds (>20 knots) from commercial ships-of-opportunity on their nor-mal trading routes, although it can also be towed behind research vessels at a minimum speed of 10 knots. Such a programme would ultimately provide a suite of plankton indicators for a num-ber of marine environmental management issues: climate change (for example, distributional shifts and range expansions of plankton populations), ocean acidification (impacts on calcifying species), eutrophication (algal blooms and consequential “dead zones” of bloom decay), productivity sup-porting fisheries (plankton hotspots, fish depen-dence on biomass, composition and timing of their plankton prey), invasive species (invertebrates via their planktonic stages), ecosystem health (HABs – harmful/toxic algal blooms, marine pathogens) and biodiversity (community changes, unusual species records; pers. comm. H. Verheye). There is currently no coordinated CPR survey active in the Western Indian Ocean, although two CPR tows were recently undertaken between South Africa and Madagascar, on the RV Algoa in 2013 and the Nansen in 2015. Such a programme would require access to a centre with expertise in the enumera-tion and identification of CPR-collected plankton, which is currently lacking in the region.
| The RV Dr Fridtjof Nansen in the Western Indian Ocean: Voyages of marine research and capacity development76
References
Alvheim, O., Torstensen, E., Fennessy, S., MacKay, F., Zaera, D. & Bemiasa, J. 2009. West Madagascar: Pelagic Ecosystem Survey SWIOFP/ASCLME / FAO 2009 Cruise 2, 25 August–3 October 2009. Preliminary report. Bergen, Norway, Institute of Marine Research.
Aruga, Y. 1973. Primary production in the Indian Ocean II. In: B. Zeitzschel & S. Gerlach, eds. The Biology of the Indian Ocean, pp. 127–130. Berlin, Heidelberg, Springer.
Baars, M., Schalk, P. & Veldhuis, J. 1998. Seasonal fluctuations in plankton biomass and productivity in the ecosystems of the Somali Current, Gulf of Aden and Southern Red Sea. In: K. Sherman, E. Okemwa & M. Ntiba, eds. Large Marine Ecosystems of the Indian Ocean: Assessment, Sustainability, and Management. New Jersey, U.S.A., Wiley-Blackwell.
Baker, A. de C., Boden, B.P. & Brinton, E. 1990. A practical guide to the euphausiids of the world. London: Natural History Museum Publications.
Barlow, R., Stuart, V., Lutz, V., Sessions, H., Sathyendranath, S., Platt, T., Kyewalyanga, M., Clementson, L., Fukasawa, M. & Watanabe, S. 2007. Seasonal pigment patterns of surface phytoplankton in the subtropical southern hemisphere. Deep Sea Research Part I: Oceanographic Research Papers, 54(10): 1687–1703.
Barlow, R., Kyewalyanga, M., Sessions, H., van den Berg, M. & Morris, T. 2008. Phytoplankton pigments, functional types, and absorption properties in the Delagoa and Natal Bights of the Agulhas ecosystem. Estuarine, Coastal and Shelf Science, 80(2): 201–211.
Barlow, R., Lamont, T., Mitchell-Innes, B., Lucas, M. & Thomalla, S. 2009. Primary production in the Benguela ecosystem, 1999–2002. African Journal of Marine Science, 31(1): 97–101.
Barlow, R., Lamont, T., Morris, T., Sessions, H. & van den Berg, M. 2014. Adaptation of phytoplankton communities to mesoscale eddies in the Mozambique Channel. Deep Sea Research Part II: Topical Studies in Oceanography, 100: 106–118.
Bergman, B., Sandh, G., Lin, S., Larsson, J., & Carpenter, E.J. 2013. Trichodesmium – a widespread marine cyanobacterium with unusual nitrogen fixation properties. FEMS Microbiology Reviews 37 (3): 286–302.
Boersch-Supan, P., Rogers, A. & Brierley, A. 2017. The distribution of pelagic sound scattering layers across the southwest Indian Ocean. Deep Sea Research Part II: Topical Studies in Oceanography, 136: 108–121.
Brinca, L., Rey, F., Silva, C. & Sætre, R. 1981. A Survey on the Marine Fish Resources of Mozambique, October–November 1980. Bergen, Norway, Institute of Marine Research.
Burkill, P. 1995. Arabian Sea Process Study. Report No. 17. Scientific Committee on Ocean Research JGOFS.Burkill, P. 1999. ARABESQUE: an overview. Deep Sea Research Part II: Topical Studies in Oceanography, 46(3–4):
529–547.Capone, D., Zehr, J., Paerl, H., Bergman, B. & Carpenter, E. 1997. Trichodesmium, a globally significant marine
cyanobacterium. Science 276 (5316): 1221–1229.Carpenter, E. & Capone, D. 1991. Nitrogen fixation in Trichodesmium blooms. In: Carpenter E, Capone D, Rueter
J (eds.), Marine Pelagic Cyanobacteria: Trichodesmium and other Diazotrophs. Dordrecht, Netherlands: Kluwer Academic Publishers. pp. 75–94.
Cook, J. 1771. From Torres Strait to Batavia. Captain Cook’s Journal during his first voyage round the world made in H.M. Bark “Endeavour” 1768–71. Adelaide, South Australia: University of Adelaide.
Currie, R. 1963. The Indian ocean standard net. Deep Sea Research and Oceanographic Abstracts, 10(1–2): 531–632.Djurhuus, A., Read, J.F. & Rogers, A.D. 2017. The spatial distribution of particulate organic carbon and microorganisms
on seamounts of the South West Indian Ridge. Deep Sea Research Part II: Topical Studies in Oceanography, 136: 73–84.
Gallienne, C., Conway, D., Robinson, J., Naya, N., William, J., Lynch, T. & Meunier, S. 2004. Epipelagic mesozooplankton distribution and abundance over the Mascarene Plateau and Basin, south-western Indian Ocean. Journal of the Marine Biological Association of the UK, 84(01): 1–8.
Chapter 5: Ocean productivity | 77
Gallienne, C.P. & Smythe-Wright, D. 2005. Epipelagic mesozooplankton dynamics around the Mascarene Plateau and Basin, Southwestern Indian Ocean. Philosophical Transactions of the Royal Society of London A: Mathematical, Physical and Engineering Sciences, 363(1826): 191–202.
Harris, R., Wiebe, P., Lenz, J., Skjoldal, H. & Huntley, M. 2000. ICES zooplankton methodology manual. San Diego, Academic Press.
Heip, C., Hemminga, M. & de Bie, M. 1995. Cruise reports Netherlands Indian Ocean Programme, Vol. 5: Monsoons and coastal ecosystems in Kenya. Leiden, Netherlands, National Museum of Natural History.
Huggett, J., Verheye, H., Escribano, R. & Fairweather, T. 2009. Copepod biomass, size composition and production in the Southern Benguela: Spatio-temporal patterns of variation, and comparison with other eastern boundary upwelling systems. Progress in Oceanography, 83(1): 197–207.
Huggett, J. 2014. Mesoscale distribution and community composition of zooplankton in the Mozambique Channel. Deep Sea Research Part II: Topical Studies in Oceanography, 100: 119–135.
IMR. 1975. Report on Cruise No. 1 and No. 2 of R/V Dr Fridtjof Nansen. Indian Ocean Fishery and Development Programme. Pelagic Fish Assessment Survey North Arabian Sea. Bergen, Norway, Institute of Marine Research.
IMR. 1976. Report on Cruise No. 3 of R/V Dr Fridtjof Nansen. Indian Ocean Fishery and Development Programme. Pelagic Fish Assessment Survey North Arabian Sea. Institute of Marine Research. Bergen, Norway.
IMR. 1977a. Cruise Report No. 1 of R/V Dr Fridtjof Nansen. Joint NORAD/Mozambique/FAO Project to Investigate the Fish Resources off the Coast of Mozambique. Bergen, Norway, Institute of Marine Research.
IMR. 1977b. Report on Cruise No. 6 of R/V Dr Fridtjof Nansen. Indian Ocean Fishery and Development Programm. Pelagic Fish Assessment Survey North Arabian Sea. Bergen, Norway, Institute of Marine Research.
IMR. 1978a. Cruise Report No. 2 of R/V Dr Fridtjof Nansen. Joint NORAD/Mozambique/FAO Project to Investigate the Fish Resources off the Coast of Mozambique, October–December 1977. Bergen, Norway, Institute of Marine Research.
IMR. 1978b. Cruise Report No. 3 of R/V Dr Fridtjof Nansen. Joint NORAD/Mozambique/FAO Project to Investigate the Fish Resources off the Coast of Mozambique – January–March 1978. Bergen, Norway, Institute of Marine Research.
IMR. 1978c. Cruise Report No. 4 of R/V Dr Fridtjof Nansen. Joint NORAD/Moçambique/FAO Project to Investigate the Fish Resources off the Coast of Mozambique. April–June 1978. Bergen, Norway, Institute of Marine Research.
IMR. 1978d. Survey results of R/V Dr Fridtjof Nansen in July 1978. Joint NORAD/Seychelles Project to Investigate the Fish Resources in Seychelles waters. Bergen, Norway, Institute of Marine Research.
Johnsen, E., Krakstad, J., Ostrowski, M., Serigstad, B., Strømme, T., Alvheim, O., Olsen, M., Zaera, D., André, E., Dias, N., Sousa, L., Sousa, B., Malauene, B. & Abdula, S. 2007. Surveys of the living marine resources of Mozambique: Ecosystem Survey and Special Studies. 27 September–21 December 2007. Report No. 8/2007 – 2007409. Bergen, Norway, Institute of Marine Research.
Kaehler, S., Gammelsrød. T., Hill, J., Ternon, J-F., Cotel, P., Potier, M., Huggett, J., Miggel, A., Pillay, K., Dyer, B., Backeberg, B., Langa, A., Malauene, B., Benivary, D., Morris, T., O’Reilly, B. & Olsen, M. 2008. 2008 ASCLME Survey No 4 Preliminary cruise report No 8/2008. 28 November–17 December 2008. Report No. EAF-N2008/7.
Kerfoot, W. 1985. Adaptive value of vertical migration: Comments on the predation hypothesis and some alternatives. Contributions in Marine Science, 27: 91–113.
Kirk, J. 1994. Light and photosynthesis in aquatic ecosystems. 2nd edition. Cambridge, Cambridge University Press.Kolasinski, J., Kaehler, S. & Jaquemet, S. 2012. Distribution and sources of particulate organic matter in a mesoscale
eddy dipole in the Mozambique Channel (south-western Indian Ocean): Insight from C and N stable isotopes. Journal of Marine Systems, 96: 122–131.
Krakstad, J.O., Mehl, S., Roman, R., Escobar-Porras, J., Stapley, J., Flynn, B., Olsen, M. & Beck, I. 2008. East Madagascar Current Ecosystem Survey ASCLME / FAO 2008 Cruise 1, 24 August–1 October 2008. Cruise Report Dr Fridtjof Nansen. Bergen, Norway, Institute of Marine Research.
| The RV Dr Fridtjof Nansen in the Western Indian Ocean: Voyages of marine research and capacity development78
Krakstad, J.O., Zaera, D., Aasen, A. & Soondron, V. 2010. Survey of the demersal resources on the western slopes of St. Brandon and Nazareth Bank, Mauritius. 16–25 September 2010. Report No. EAF–N2010/7. Bergen, Norway, Institute of Marine Research.
Krakstad, J.O., Krafft, B., Alvheim, O., Kvalsund, M., Bernardes, I., Chacate, O., Mutombene, R., Filipe, O., Hajy, B., Zacarias, L., Zivane, F., M, P. & Varela, D. 2015. Marine Ecosystem Survey of Mozambique. Cruise report Dr Fridtjof Nansen. 11 November–2 December 2014. Report No. GCP/INT/003/NOR. FAO–NORAD.
Kromkamp, J., Peene, J., van Rijswijk, P., Sinke, J. & Goosen, N. 1995. Primary production of phytoplankton in the coastal ecosystem of Kenya. In: C. Heip, M. Hemminga & M. de Bie, eds. Cruise reports Netherlands Indian Ocean Programme, Vol. 5: Monsoons and coastal ecosystems in Kenya, pp. 93–99. Leiden, Netherlands, National Museum of Natural History.
Kyewalyanga, M., Naik, R., Hegde, S., Raman, M., Barlow, R. & Roberts, M. 2007. Phytoplankton biomass and primary production in Delagoa Bight, Mozambique: Application of remote sensing. Estuarine, Coastal and Shelf Science, 74(3): 429–436.
Lamont, T., Roberts, M., Barlow, R., Morris, T. & van den Berg, M. 2010. Circulation patterns in the Delagoa Bight, Mozambique, and the influence of deep ocean eddies. African Journal of Marine Science, 32(3): 553–562.
Lamont, T., Barlow, R., Morris, T. & van den Berg, M. 2014. Characterisation of mesoscale features and phytoplankton variability in the Mozambique Channel. Deep Sea Research Part II: Topical Studies in Oceanography, 100: 94–105.
Laptikhovsky, V., Boersch-Supan, P., Bolstad, K., Kemp, K., Letessier, T. & Rogers, A. 2017. Cephalopods of the Southwest Indian Ocean Ridge: A hotspot of biological diversity and absence of endemism. Deep Sea Research Part II: Topical Studies in Oceanography, 136: 98–107.
Leal, M., Sá, C., Nordez, S., Brotas, V. & Paula, J. 2009. Distribution and vertical dynamics of planktonic communities at Sofala Bank, Mozambique. Estuarine, Coastal and Shelf Science, 84(4): 605–616.
Leal, M., Pereira, T., Brotas, V. & Paula, J. 2010. Vertical migration of gold-spot herring (Herklotsichthys quadrimaculatus) larvae on Sofala Bank, Mozambique. Western Indian Ocean Journal of Marine Science 9 (2): 175–183.
Lebourges-Dhaussy, A., Huggett, J., Ockhuis, S., Roudaut, G., Josse, E. & Verheye, H. 2014. Zooplankton size and distribution within mesoscale structures in the Mozambique Channel: a comparative approach using the TAPS acoustic profiler, a multiple net sampler and ZooScan image analysis. Deep Sea Research Part II: Topical Studies in Oceanography, 100: 136–152.
Longhurst, A. 1998. Ecological geography of the sea. San Diego: Academic Press.Lutjeharms, J. & Da Silva, A. 1988. The Delagoa bight eddy. Deep Sea Research Part A. Oceanographic Research Papers,
35(4): 619–634.Lutjeharms, J. 2006. The Agulhas Current. New York, Springer.Malauene, B., Shillington, F., Roberts, M. & Moloney, C. 2014. Cool, elevated chlorophyll-a waters off northern
Mozambique. Deep Sea Research Part II: Topical Studies in Oceanography, 100: 68–78.Mann, K. & Lazier, J. 2006. Dynamics of Marine Ecosystems: Biological-physical interactions in the oceans, 3rd Edition.
Oxford, Wiley-Blackwell.McCreary, J., Kohler, K., Hood, R. & Olson, D. 1996. A four-component ecosystem model of biological activity in the
Arabian Sea. Progress in Oceanography, 37(3–4): 193–240.McGill, D. 1973. Light and nutrients in the Indian Ocean. In: B. Zeitzschel & S.A. Gerlach, eds. The biology of the
Indian Ocean, pp. 53–102. Berlin, Heidelberg, Springer Berlin Heidelberg.Mehl, S., Roman, R., Bornman, T., Bernard, K., Flynn, B. & Beck, I. 2008. Mauritius Ecosystem Survey ASCLME / FAO
2008 Cruise 2, 4–7 October 2008. Preliminary report. Bergen, Norway, Institute of Marine Research.Mwaluma, J. 1995. Zooplankton species distribution and abundance during the monsoons off the Kenyan coast,
1992. In: C. Heip, M. Hemminga & M. de Bie, eds. Cruise reports Netherlands Indian Ocean Programme, Vol. 5: Monsoons and coastal ecosystems in Kenya, pp. 113–115. Leiden, Netherlands, National Museum of Natural History.
Chapter 5: Ocean productivity | 79
Olsen, E., Padera, M., Funke, M., Pires, P., Wenneck, T. & Zacarias, L. 2009. Survey of the living marine resources of North Mozambique (SWIOFP/ASCLME 2009 Cruise 1) 6–20 August 2009. Report No. EAF–N/2009/7. Bergen, Norway, Institute of Marine Research.
O’Neil, J. & Roman, M. 1991. Grazers and associated organisms of Trichodesmium. In: Carpenter E, Capone D, Rueter J (eds.), Marine Pelagic Cyanobacteria: Trichodesmium and other Diazotrophs. Dordrecht, Netherlands: Kluwer Academic Publishers. pp. 61–74.
Pollard, R. & Read, J. 2017. Circulation, stratification and seamounts in the Southwest Indian Ocean. Deep Sea Research Part II: Topical Studies in Oceanography, 136: 36–43.
Postel, L., Fock, H. & Hagen, W. 2000. Biomass and abundance. In: Harris R, Wiebe P, Lenz J, Skjoldal H, Huntley (eds.), ICES zooplankton methodology manual. London, Academic Press.
Poulton, A., Stinchcombe, M. & Quartly, G. 2009. High numbers of Trichodesmium and diazotrophic diatoms in the southwest Indian Ocean. Geophysical Research Letters, 36(15): doi:10.1029/2009GL039719.
Pripp, T., Gammelsrød, T. & Krakstad, J. 2014. Physical influence on biological production along the western shelf of Madagascar. Deep Sea Research Part II: Topical Studies in Oceanography, 100: 174–183.
Quartly, G. & Srokosz, M. 2004. Eddies in the southern Mozambique Channel. Deep Sea Research Part II: Topical Studies in Oceanography, 51(1): 69–83.
Rao, T. 1973. Zooplankton studies in the Indian Ocean. In: B. Zeitzschel & S.A. Gerlach, eds. The biology of the Indian Ocean, pp. 243–255. Berlin, Heidelberg, Springer Berlin Heidelberg.
Read, J. & Pollard, R. 2017. An introduction to the physical oceanography of six seamounts in the southwest Indian Ocean. Deep Sea Research Part II: Topical Studies in Oceanography, 136: 44–58.
Remanevy, S. 2014. Etude de la distribution horizontale et verticale des zooplanctons de la côte sud-ouest de Madagascar, cas des copépodes. Madagascar, Institut Halieutique et des Sciences Marines, Université de Toliara.
Rogers, A., Alvheim, O., Bemanaja, E., Benivary, D., Boersch-Supan, P., Bornman, T., Cedras, R., Du Plessis, N., Gotheil, S., Hoines, A., Kemp, K., Kristiansen, J., Letessier, T., Mangar, V., Mazungula, N., Mørk, T., Pinet, P., Read, J. & Sonnekus, T. 2009. Southern Indian Ocean Seamounts (IUCN/ GEF/ UNDP/ ZSL/ ASCLME/ NERC/ EAF Nansen Project/ ECOMAR/ ACEP 2009 Cruise 410). 12 November–19 December, 2009. Bergen, Norway, Institute of Marine Research.
Rogers, A. 2017. Pelagic ecology of the South West Indian Ocean Ridge seamounts: Introduction and overview. Deep Sea Research Part II: Topical Studies in Oceanography, 136: 1–4.
Roman, R., Kaehler, S., Michalsen, K., Olsen, M. & Perri, M. 2009. Survey of the Comores Gyre (ASCLME & SWIOFP) 5 October–3 November 2009. Report No. EAF–N2009/9. Bergen, Norway, Institute of Marine Research.
Sá, C., Leal, M., Silva, A., Nordez, S., André, E., Paula, J. & Brotas, V. 2013. Variation of phytoplankton assemblages along the Mozambique coast as revealed by HPLC and microscopy. Journal of Sea Research, 79: 1–11.
Sætre, R. & Paula e Silva, R. 1979. The marine fish resources of Mozambique. Bergen, Norway, Institute of Marine Research.
Savoye, N., Aminot, A., Treguer, P., Fontugne, M., Naulet, N. & Kerouel, R. 2003. Dynamics of particulate organic matter δ15N and δ13C during spring phytoplankton blooms in a macrotidal ecosystem (Bay of Seine, France). Marine Ecology Progress Series 255: 27–41.
Siddiqui, P., Carpenter, E. & Bergman, B. 1991. Trichodesmium: Ultrastructure and protein localization. In: Carpenter E, Capone D, Rueter J (eds.), Marine Pelagic Cyanobacteria: Trichodesmium and other Diazotrophs. Dordrecht, Netherlands: Kluwer Academic Publishers. pp. 9–28.
Sieburth, J.M., Smetacek, V. & Lenz, J. 1978. Pelagic ecosystem structure: heterotrophic compartments of the plankton and their relationship to plankton size fractions. Limnology and Oceanography, 23(6): 1256–1263.
Smith, S., Codispoti, L., Morrison, J. & Barber, R. 1998. The 1994–1996 Arabian Sea Expedition: An integrated, interdisciplinary investigation of the response of the northwestern Indian Ocean to monsoonal forcing. Deep Sea Research Part II: Topical Studies in Oceanography, 45(10–11): 1905–1915.
Smith, S. 2001. Understanding the Arabian Sea: reflections on the 1994–1996 Arabian Sea expedition. Deep Sea Research Part II: Topical Studies in Oceanography, 48(6): 1385–1402.
| The RV Dr Fridtjof Nansen in the Western Indian Ocean: Voyages of marine research and capacity development80
Sonnekus, M., Bornman, T. & Campbell, E. 2017. Phytoplankton and nutrient dynamics of six South West Indian Ocean seamounts. Deep Sea Research Part II: Topical Studies in Oceanography, 136: 59–72.
Srokosz, M. & Quartly, G. 2013. The Madagascar bloom: a serendipitous study. Journal of Geophysical Research: Oceans, 118(1): 14–25.
Srokosz, M., Robinson, J., McGrain, H., Popova, E. & Yool, A. 2015. Could the Madagascar bloom be fertilized by Madagascan iron? Journal of Geophysical Research: Oceans, 120(8): 5790–5803.
Strømme, T., Ansorge, I., Bornman, T., Kaehler, S., Ostrowski, M., Tweddle, D. & Alvheim, O. 2009. 2008 ASCLME Survey No. 3 Cruise report No 7/2008. 8 October–27 November 2008. Report No. EAF–N2008/7. Bergen, Norway, Institute of Marine Research.
Strømme, T., Alvheim, O. & Groeneveld, J. 2010. Mauritius and Southern Mascarene: Pelagic Ecosystem Survey SWIOFP/FAO 2010 Cruise 1. 6–21 December 2010. Final report. Bergen, Norway, Institute of Marine Research.
Taylor, F. 1973. General features of dinoflagellate material collected by the Anton Bruun during the International Indian Ocean Expedition. In: B. Zeitzschel & S.A. Gerlach, eds. The Biology of the Indian Ocean, pp. 243–255. Berlin, Heidelberg, Springer.
Ternon, J., Bach, P., Barlow, R., Huggett, J., Jaquemet, S., Marsac, F., Ménard, F., Penven, P., Potier, M. & Roberts, M. 2014. The Mozambique Channel: From physics to upper trophic levels. Deep Sea Research Part II: Topical Studies in Oceanography, 100: 1–9.
Verheye, H., Lamont, T., Huggett, J., Kreiner, A. & Hampton, I. 2016. Plankton productivity of the Benguela Current Large Marine Ecosystem (BCLME). Environmental Development, 17: 75–92.
Volkman, J. & Tanoue, E. 2002. Chemical and biological studies of particulate organic matter in the ocean. Journal of oceanography 58 (2): 265-279.
Watts, L., Burkhill, P. & Smith, S. 2002. Report of the Indian Ocean Synthesis Group on the Arabian Sea Process Study. Report No. 35. SCOR, Norway, JGOFS.
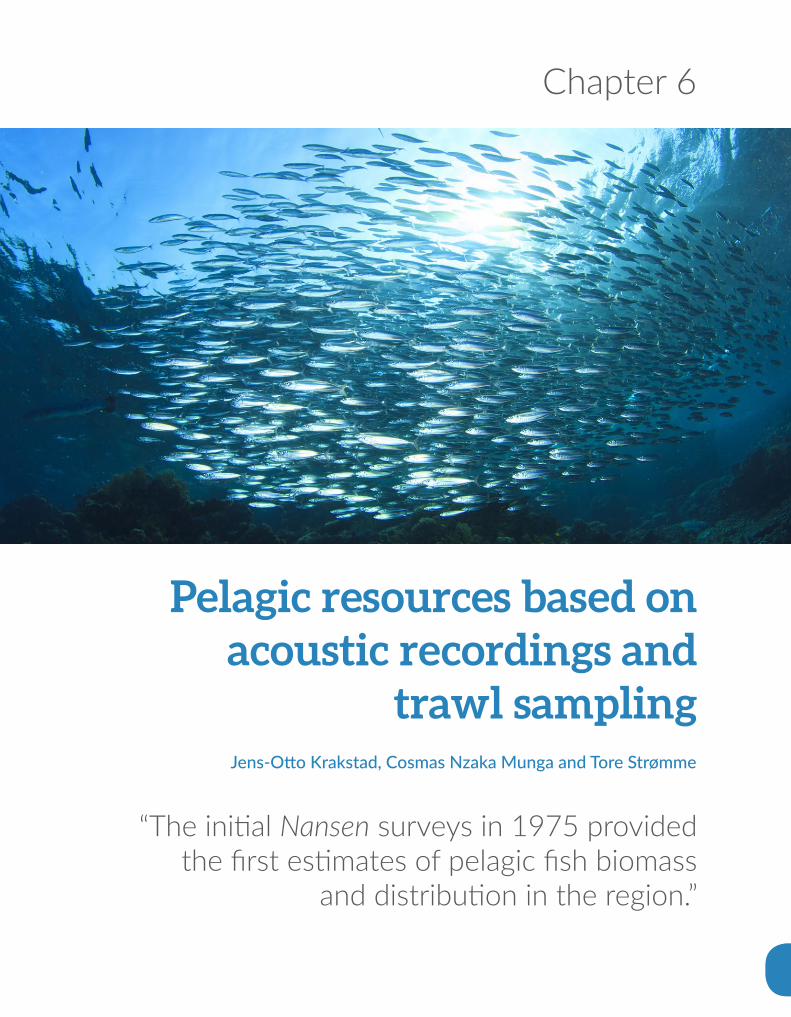
Chapter 6
“The initial Nansen surveys in 1975 provided the first estimates of pelagic fish biomass
and distribution in the region.”
Pelagic resources based on acoustic recordings and
trawl samplingJens-Otto Krakstad, Cosmas Nzaka Munga and Tore Strømme
| The RV Dr Fridtjof Nansen in the Western Indian Ocean: Voyages of marine research and capacity development82
Abstract
Pelagic fishes live in the upper layers of the water column, below the sea surface but well-above the seafloor. Many pelagic fish species form vast schools in areas of high primary productivity. They range in size from small coastal forage fish species, such as anchovies and sardines, to large oceanic predators, such as tunas and swordfish. The RV Dr Fridtjof Nansen used a combination of acoustic methods (echo- integration) and trawl sampling to quantify the “small pelagic fish” resources of the Western Indian Ocean. Large pelagic fish species were not sampled. The initial Nansen surveys in 1975 provided the first estimates of pelagic fish biomass and distribution in the region, and these early estimates remain the only reference points for some countries. Common families were clupeids (sardines), engraulids (ancho-vies), carangids (jacks, scads), scombrids (mackerels), sphyraenids (barracudas), trichiurids (hairtails) and myctophids (mesopelagic fishes). Carangids and clupeids were distributed in shallow shelf areas, from the Horn of Africa, along the coast to the Mozambique Channel, and around Madagascar, Mauritius, the Mascarene Plateau, and the Seychelles. Engraulids were more abundant in the southern part of the East Africa Coastal Current subregion, the Mozambique Channel and around Madagascar, associ-ated with areas of high primary production. Myctophids were widely distributed off the shelf through-out the Western Indian Ocean, with high densities off the Horn of Africa. Nansen surveys in Kenya and Tanzania during the early 1980s found low biomass of pelagic resources, and this information averted overcapitalization on a new fishing fleet. Surveys, done 25 years apart, found similar abundance, distri-bution patterns and species composition of pelagic fishes along the southeast coast of Madagascar. In Mozambique, clupeid biomass was markedly lower in surveys done in 2007 and 2014, than in pre-1990 surveys. This finding was supported by declining catches experienced in the artisanal fishery. Pelagic fish often migrate widely, and stocks that cross international boundaries are therefore regional, instead of belonging to a specific country. Detailed studies are required to determine seasonal migrations, and to develop a more regional management approach, based on information from acoustic surveys over a large geographical area. The Nansen is well-suited to undertaking regional surveys of this kind.
Previous page: Sardine shoals in inshore waters. © Shutterstock.com/Rich Carey

Chapter 6: Pelagic resources based on acoustic recordings and trawl sampling | 83
6.1 Introduction
Pelagic fish live in the layer of water between the sea surface and the seafloor, unlike demersal fish (see Chapter 7), which live on or near the seafloor. Pelagic fish range in size from small coastal for-age fish, such as herrings and sardines, to large oceanic predators, such as tunas, swordfish and oceanic sharks. They are usually agile swim-mers with streamlined bodies, and many species form dense schools. Depending on the ocean layer that they inhabit, pelagic fish can be subdi-vided into species occurring in the sunlight zone
between the surface and 200 m depth (epipe-lagic), those living in the twilight zone between 200 and 1 000 m depth (mesopelagic; Box 6.1), and those living in the midnight zone between 1 000 and 4 000 m depth (bathypelagic). Few known species live deeper than 4 000 m (abys-sopelagic), in complete darkness, cold tempera-tures and under high pressure.
Early surveys of pelagic fish resources in the Western Indian Ocean showed relatively low stock
eggs and larvae in the area (Nellen, 1973). Follow-up surveys of mesopelagic resources in the Sea of Oman and the Arabian Sea were carried out by the Nansen in 1975 to 1981 and in 1983 to 1984 (Gjøsæter, 1984). Systematic surveys in both Omani and Iranian waters led to an estimate of 8 to 20 million tonnes of mesopelagic fish (Gjøsæter, 1984).
Fishing trials by the Nansen in the Sea of Oman in 1983, using commercial trawls with mouth openings of 500 and 800 m2 (Gjøsæter, 1984) reported a mean catch rate of 4.7 t/h, and the two best hauls recorded 18 and 100 t/h, respectively. Further trial fishing between 1993 and 1998 (Valinassab et al., 2007) concluded that the average catch of about 25 t/day was too low to cover fishing costs, and that more trials were needed to identify the best fishing method.
Contributed by: Jakob GjøsæterInstitute of Marine Research, Norway
Mesopelagic fish (mostly lanternfish belonging to the Myctophidae family) are small fish of many different species living in the ocean’s twilight zone, at depths between 200 and 1 000 m. They form one of the most characteristic features on echo-sounder displays of ships sailing the world’s oceans, namely the deep scattering layer. This layer has been known for as long as echo-sounders have been used on ocean-going ships. However, only since the late 1970s have mesopelagic fish attracted attention as a potentially harvestable fisheries resource (Gjøsæter and Kawaguchi, 1980).
The global estimate of mesopelagic fish biomass amounts to more than 100 million tonnes (Lam and Pauly, 2005; Irigoien et al., 2014), making it the world’s most abundant vertebrate group. Gjøsæter and Kawaguchi (1980) pointed out that most of the gears used in surveys obviously underestimate mesopelagic fish biomass, and Kaartvedt et al. (2012) concluded, from an acoustic study in a Norwegian fjord, that a potential upgrading of the current global estimate of mesopelagic fish to 1010 tonnes — which is 100 times greater than the world’s yearly fishery catch — would force us to rethink their role as predators on zooplankton, as prey for top predators, and as daily vertical transporters of organic matter from the surface to the deeper ocean.
The exploratory surveys of the RV Dr Fridtjof Nansen in the northwest Indian Ocean in 1975 and 1976 found that small pelagic fishes, such as sardines, anchovies and mackerels, were less abundant than expected, whereas mesopelagic fish were far more abundant than any other fish group (Sætersdal et al., 1999). This confirmed previous observations of abundant mesopelagic fish
BOX6.1 Mesopelagic fish - living in the twilight zone
© O
ddgeir Alvheim
Benthosema fibulatum is one of several lanternfish species found in the Indian ocean.
| The RV Dr Fridtjof Nansen in the Western Indian Ocean: Voyages of marine research and capacity development84
biomass, at least an order of magnitude lower than along the Atlantic coast of Africa, where two highly productive eastern boundary upwelling areas support millions of tonnes of pelagic fish (FAO, 2016). Nevertheless, pelagic fish make up the bulk of reported landings from the Western Indian Ocean, with contributions from industrial fisheries for tunas and tuna-like species, reported to the Indian Ocean Tuna Commission (IOTC), and from artisanal fisheries, which land mainly small pelagic species for local consumption.
Pelagic surveys using hydro-acoustics were under-taken from the onset of the Nansen Programme in 1975, when the Nansen surveyed Somali waters. Hydro-acoustics based on echo-integration was a new and promising technology in the mid-1970s, with major technological advances taking place since then. Nevertheless, in design, acoustic sur-veys are still carried out in a similar manner as in the past. The quality of these early estimates (1970s and 1980s) was not of the same standard as in the later years. Evaluations of historic data have produced reliable (although less precise) time series information, comparable to more recent data. At present, acoustics are used as the method of choice in surveys of pelagic fish stocks around the world.
Apart from acoustics, trawl surveys (pelagic and demersal) were also used to estimate fish abun-dance. Ecosystem surveys in the Western Indian Ocean relied on simultaneous acoustic and trawl sampling, the latter relying on catches in a known “swept area”. Pelagic trawls are mainly targeted at dense pelagic fish schools, to investigate the catch composition. Demersal (or bottom) trawls also catch some pelagic fish, near the seafloor or in the water column while descending or ascending from the sea surface. Trawl data from targeted trawls cannot be used for direct abundance estimation; such estimates rely on random trawling accord-ing to a statistical sampling design (see Chapter 7). This chapter deals with biomass estimates obtained from acoustic methods as well as catch rates reported from the swept area method for pelagic fishes.
6.2 Methods
The acoustics method can be used to estimate the density of pelagic fish, by transmitting sound waves of a certain frequency (commonly 38 kHz) into the water column, and then measuring the reflected (backscattered) sound energy. Data are collected by a research vessel carrying out a sys-tematic survey grid covering the expected full dis-tribution area of the fish stock. Through a process of interpretation and conversion, this reflected energy (measured as Area Backscattering Strength - sA on the decibel scale) is translated into den-sity of a certain fish species or fish target group per area. The conversion formula used includes the so-called target strength (TS) equation, which describes how much energy a specific fish spe-cies and body size reflects. The mean fish density per area is further multiplied with the size of the area surveyed, to calculate abundance. Several books (such as MacLennan and Simmonds, 1992) describe the techniques in detail. Recent surveys with the second Nansen in the Western Indian Ocean relied on two species categories when separating acoustic sA values between groups of pelagic fish, as these two groups show differ-ent acoustic properties. PEL1 comprised of fish species belonging to the families Clupeidae (sar-dines) and Engraulidae (anchovies), whereas PEL2 comprised of members of the Carangidae (scads, jacks) Scombridae (mackerels), Sphyraenidae (bar-racudas) and Trichiuridae (hairtails) families (Figure 6.1). Biomass estimates are therefore reported for these fish groups.
During acoustic surveys, targeted trawling is car-ried out to identify species composition in the sur-vey path, to determine the proportion by species, and to obtain representative samples of fish size distribution. Both pelagic and demersal trawls are used for sampling, depending on the position of the fish in the water column, as well as the trawled depth.
Some of the Nansen surveys in the Western Indian Ocean combined a swept area survey with an acoustic survey (for example, in Kenya and Tanzania in 1982–1983 and several surveys in
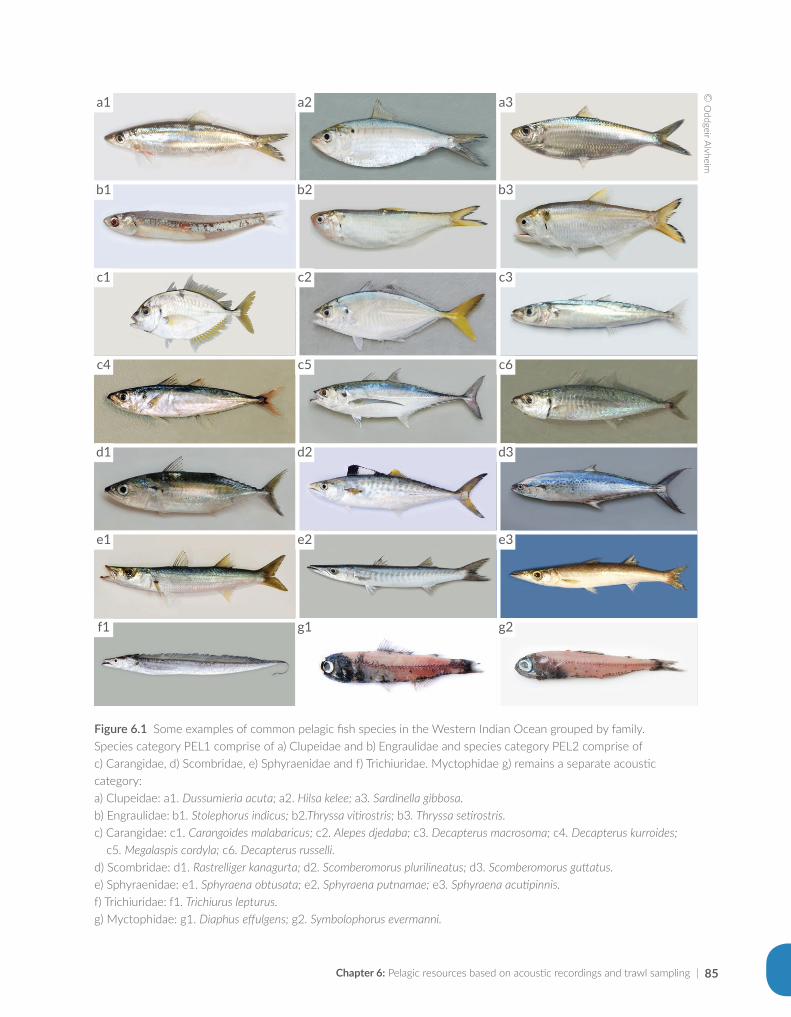
Chapter 6: Pelagic resources based on acoustic recordings and trawl sampling | 85
© O
ddgeir Alvheim
Figure 6.1 Some examples of common pelagic fish species in the Western Indian Ocean grouped by family. Species category PEL1 comprise of a) Clupeidae and b) Engraulidae and species category PEL2 comprise of c) Carangidae, d) Scombridae, e) Sphyraenidae and f) Trichiuridae. Myctophidae g) remains a separate acoustic category:a) Clupeidae: a1. Dussumieria acuta; a2. Hilsa kelee; a3. Sardinella gibbosa.b) Engraulidae: b1. Stolephorus indicus; b2.Thryssa vitirostris; b3. Thryssa setirostris.c) Carangidae: c1. Carangoides malabaricus; c2. Alepes djedaba; c3. Decapterus macrosoma; c4. Decapterus kurroides;
c5. Megalaspis cordyla; c6. Decapterus russelli.d) Scombridae: d1. Rastrelliger kanagurta; d2. Scomberomorus plurilineatus; d3. Scomberomorus guttatus.e) Sphyraenidae: e1. Sphyraena obtusata; e2. Sphyraena putnamae; e3. Sphyraena acutipinnis.f) Trichiuridae: f1. Trichiurus lepturus. g) Myctophidae: g1. Diaphus effulgens; g2. Symbolophorus evermanni.
a1
b1
c1
c4
d1
e1
f1
a2 a3
b2 b3
c2 c3
c5 c6
d2 d3
e2 e3
g1 g2
| The RV Dr Fridtjof Nansen in the Western Indian Ocean: Voyages of marine research and capacity development86
Mozambique), to provide biomass estimates based on both survey methods. These surveys reported average catches of pelagic fish in kg/h from bot-tom trawls, in addition to the acoustic estimates. Catch rates based on swept area surveys have been used to determine the proportional compo-sition of pelagic species in bottom trawls, and to compare catch rates of pelagic species to those of demersal species.
Acoustic instrumentation Echo integration instruments used in fisheries research has changed considerably since its intro-duction in the late 1960s, to satisfy the quest for ever more accurate measurements of fish density (see Appendix 6.1). Analog equipment was ini-tially used on the Nansen (1970s and early 1980s), and the integrator values (energy reflected by fish and other items in the water column) were recorded manually on paper. Already at that time, the Nansen used two different sound frequencies for fish detection. The echo signals and integrator values were later processed and recorded digitally, and after 1991, whole echograms were stored digitally in computer files. With the change-over to the second Nansen in 1994, further advances included four operating frequencies and a drop keel, to avoid the effects of bubbles under the hull of the vessel on data recordings. The interpreta-tion of acoustic data also progressed, from manual scrutiny of black and white prints, to colour prints, and to successive stages of software developed to aid with interpretation of echograms and data on computer screens. Whereas acoustic methodology has remained conceptually much the same, the technological advances have gradually improved the accuracy of estimates.
Findings from the pre-digital phase are still of a high quality and valuable, with the information reflecting the exploration of new geographical areas. The pre-digital data likely underestimate fish abundance in the early period (before 1984), because instruments became electronically satu-rated in areas of high fish densities. Likewise, early calibration techniques of the echosounder instru-mentation were less precise than the sphere cali-bration method introduced in the early 1980s and
used today. The early abundance estimates may have been affected, as a result.
Target identification by trawlingTargeted trawling on acoustically observed fish schools are routinely carried out to obtain rep-resentative samples of catch composition, such as species type and body size. Either pelagic or demersal trawl gear can be used, depending on cir-cumstance. At water depths of less than 30 m, the bottom trawl net is often used as a pelagic trawl, by attaching floats to the headline with 5–15 m long ropes to keep the trawl close to the sur-face. Once the fish are on board, they are sorted by species, and the total number and weight per species determined. The body lengths of samples of target species are measured, to estimate the size distribution of the fish school. Individual fish species or size classes have different escape suc-cess when confronted by trawl nets, which may introduce bias in measurements (see Slotte et al., 2007). Furthermore, several different pelagic trawl nets, with different selectivity properties, have been used on the Nansen (see Appendix 6.2). Axelsen and Johnsen (2015) described the factors that affect the selectivity of bottom trawl surveys undertaken by the second Nansen.
Spatio-temporal coverage of surveysAn underlying assumption of pelagic surveys is that the whole stock distribution area is cov-ered in each survey. This is not always possible, because pelagic fish stocks are generally widely distributed and migratory, with movements and distribution patterns affected by seasons, avail-ability of food and spawning behaviour. In the early days of acoustic surveys, the main goal of the Nansen Programme was to identify new fisher-ies resources – hence it had a broad geographical focus, and surveyed the waters of several coun-tries consecutively. During this period, stocks with a regional distribution were often surveyed across their entire range for the first time in history.
Later, the focus shifted gradually to individual countries, with surveys coupled to Norwegian bilateral aid programmes. Several surveys were carried out on the same stocks in a single year, but
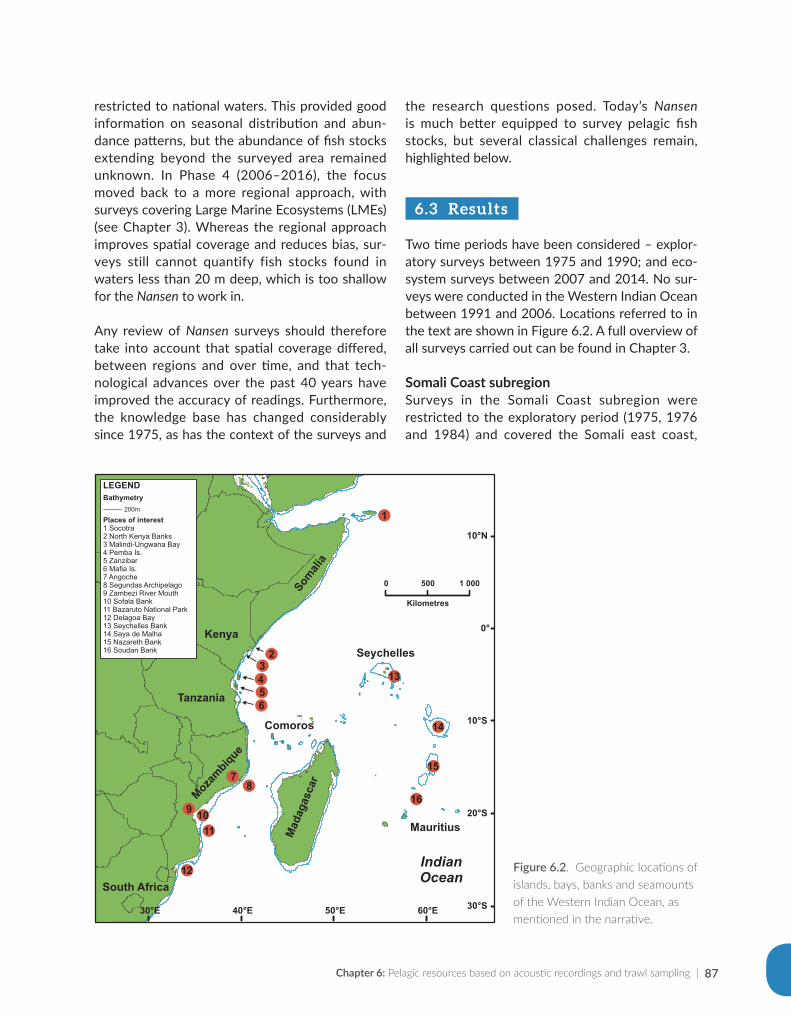
Chapter 6: Pelagic resources based on acoustic recordings and trawl sampling | 87
restricted to national waters. This provided good information on seasonal distribution and abun-dance patterns, but the abundance of fish stocks extending beyond the surveyed area remained unknown. In Phase 4 (2006–2016), the focus moved back to a more regional approach, with surveys covering Large Marine Ecosystems (LMEs) (see Chapter 3). Whereas the regional approach improves spatial coverage and reduces bias, sur-veys still cannot quantify fish stocks found in waters less than 20 m deep, which is too shallow for the Nansen to work in.
Any review of Nansen surveys should therefore take into account that spatial coverage differed, between regions and over time, and that tech-nological advances over the past 40 years have improved the accuracy of readings. Furthermore, the knowledge base has changed considerably since 1975, as has the context of the surveys and
Figure 6.2. Geographic locations of islands, bays, banks and seamounts of the Western Indian Ocean, as mentioned in the narrative.
the research questions posed. Today’s Nansen is much better equipped to survey pelagic fish stocks, but several classical challenges remain, highlighted below.
6.3 Results
Two time periods have been considered – explor-atory surveys between 1975 and 1990; and eco-system surveys between 2007 and 2014. No sur-veys were conducted in the Western Indian Ocean between 1991 and 2006. Locations referred to in the text are shown in Figure 6.2. A full overview of all surveys carried out can be found in Chapter 3.
Somali Coast subregion Surveys in the Somali Coast subregion were restricted to the exploratory period (1975, 1976 and 1984) and covered the Somali east coast,
1
23456
8
11
12
14
0°
10°S
20°S
30°S
10 N°
30°E 40°E 50°E 60°E
Somali
a
Kenya
Tanzania
Mozambique
South Africa
Mad
agas
car
Mauritius
Comoros
0 500 1 000
Kilometres
IndianOcean
Seychelles
7
10
13
15
169
LEGEND
Places of interest1 Socotra2 North Kenya Banks3 Malindi-Ungwana Bay4 Pemba Is.5 Zanzibar6 Mafia Is.7 Angoche8 Segundas Archipelago9 Zambezi River Mouth10 Sofala Bank11 Bazaruto National Park12 Delagoa Bay13 Seychelles Bank14 Saya de Malha15 Nazareth Bank16 Soudan Bank
200m
Bathymetry
| The RV Dr Fridtjof Nansen in the Western Indian Ocean: Voyages of marine research and capacity development88
Socotra, and Somali north coast during the Northeast Monsoon (NE monsoon; December–March) and Southwest Monsoon (SW monsoon; July–September) seasons. Mesopelagic- (see Box 6.1) and small pelagic fish were the main catch, dominated by species with commercial potential, especially clupeids Sardinella longiceps and Etrumeus teres, engraulids Engraulis japoni-cus and Stolephorus spp. and scombrids Scomber japonicus (but probably S. australasicus) and Scomberomorus commerson. Clupeids were caught in 85 percent of 13 trawls in 1975 and 1976, and made up 50 percent of the total weight; engraulids were caught in 8 percent of trawls, making up 11 percent by weight; and scombrids were caught in 31 percent of trawls making up 39 percent by weight. Individuals of these species were found to be smaller and immature during the SW monsoon survey, compared to larger and mature during the NE monsoon survey. Schools were commonly mixed with the non-commercial porcupine fish (Diodon maculifer) and cardinal fish (Synagrops sp.) during the SW monsoon season.
Original acoustic biomass estimates from the 1970s were affected by saturation, and were therefore adjusted by 3 decibel (db) in 1984, effec-tively doubling the original estimates (Sætersdal et al., 1999). Concentrations of small pelagic fish were detected along the Somali Coast, with an average biomass of 1 million tonnes after adjust-ments. Fish densities were particularly high along the Somali east coast (Kesteven et al., 1981), and mackerel (identified as Scomber japonicus but most probably Scomber australasicus) were observed in relatively high quantities. Schools of this species showed a bentho-pelagic behaviour and were taken with the bottom trawl during the day, while appearing at night as a pelagic scattering layer at 150–200 m depth (Kesteven et al., 1981). Pelagic abundance estimates were considerably lower along the Socotra and north Somali coasts and these resources were therefore considered to be of lower commercial value.
The 1984 surveys off northeast Somalia covered the NE monsoon and SW monsoon seasons, respectively. Only the acoustic biomass from the
first survey (245 000 tonnes pelagic fish) was considered reliable (Sætersdal et al., 1999). This estimate was substantially lower than in 1975 and 1976. Species composition included clupeids (Dussumieria acuta, Etrumeus teres, and Sardinella longiceps), carangids (Decapterus macrosoma and D. russelli), and a few Scomber spp. individuals.
East Africa Coastal Current (EACC) subregionFour surveys were conducted off Kenya, and three off Tanzania, between 1980 and 1983. Surveys in Kenya covered the North Kenya Bank, Malindi-Ungwana Bay, and southern Kenya (shelf area of 4 245 nm2; 10–500 m depth). Survey results were described in cruise reports (IMR, 1982d; Nakken, 1981; Iversen, 1983) and summarized in special reports by Iversen (1984) and Iversen and Myklevoll (1984a). In Tanzania, pelagic trawls were conducted at Pemba, Zanzibar, Mafia and south-ern Tanzania (13 500 nm2; 10–500 m depth) with results described in cruise reports (Myklevoll, 1982; IMR, 1982a, 1983) and special reports (Iversen and Myklevoll, 1984b; Iversen et al., 1984).
The surveys showed low abundance of pelagic fish but high species diversity. At least 260 fish species were identified in Kenya (Sætersdal et al., 1999). Two expert taxonomists participated in the surveys, and their findings underlined the need for taxonomic support during surveys – this gave rise to a stronger focus on taxonomy within the Nansen Programme. The EACC subregion was characterized by scattered aggregations of pel-agic fish, and in Kenya, these were confined to Malindi-Ungwana Bay. The pelagic fish biomass from echo integration was lower in Kenya (mean of 25 250 tonnes) than in Tanzania (74 700 tonnes).
The clupeids were the most speciose (Pellona ditchela, Sardinella gibbosa, Ilisha melastoma, Dussumieria acuta). Other pelagic fish families included carangids (Decapterus russelli, D. kur-roides, Atule mate, Carangoides spp.), scombrids (Rastrelliger kanagurta, Scomberomorus commer-son), sphyraenids (Sphyraena forsteri, S. putnam-iae, S. obtusata) and engraulids (Thryssa vitrirostris, Stolephorus commersonii). The estimated pelagic
Chapter 6: Pelagic resources based on acoustic recordings and trawl sampling | 89
fish biomass of the EACC subregion included semi-pelagic ponyfish (Leiognathus spp.). Based on the Kenya surveys, it was concluded that the pelagic fish resources would not be able to support the planned development of industrial fisheries. The Tanzania surveys suggested that the present yield of about 40 000 tonnes could potentially be increased slightly, if fishing areas were extended beyond the fringing reefs. Low fish densities and predominance of ponyfish limited fisheries poten-tial (Iversen, 1984; Iversen et al., 1984).
Mozambique subregionSeveral surveys were carried out in Mozambique between 1975 and 1983, to explore pelagic and demersal fish resources using acoustic methods in combination with bottom trawl surveys (see Chapter 7). Survey results are described in cruise reports (IMR, 1977, 1978a, b), and summary reports (Sætre and Paula e Silva, 1979; Brinca et al., 1981, 1983). Two pelagic surveys were also conducted in 1990 (IMR, 1990a, b).
The first survey period (1977–1978) covered the entire Mozambique coast in four trips, but the acoustic abundance estimate was considered unreliable and is not reported further. The later surveys, up to 1990, covered the Sofala Bank, and in some cases also Delagoa Bay. Biomass estimates ranged between 100 000 and 210 000 tonnes of pelagic fish – note, however, that estimates are not all directly comparable, because the surveys cov-ered different areas. On the Sofala Bank, the high-est biomass occurred inshore, around 50 m depth. The Nansen could not survey waters shallower than 20 m, and pelagic fish abundance shallower than this depth therefore remained unsampled.
Most bottom and pelagic trawls were carried out in 1982 and 1990, and Sætersdal et al. (1999) considered these data to represent species com-position and distribution well. Carangids were most frequently encountered, followed by clupe-ids and engraulids. A high abundance of anchovy (Stolophorus spp.) was found in the 1977, 1978 and 1983 surveys, however the biomass of short-lived fish species fluctuated widely, and they were not abundant in 1982, nor in 1990.
After an absence of 17 years, the second RV Dr Fridtjof Nansen carried out an ecosystem survey in Mozambique in 2007 (Johnsen et al., 2007). As part of the survey, pelagic resources between 20 and 1 000 m depth were assessed in three survey regions: south (South African border to 21°30’S); central (21°30’S–17°15’S, including Sofala Bank); and north (17°15’S to Tanzanian border). The trawl catches were further separated into inner shelf (20–50 m depth), outer shelf (50–200 m) and deep slope stations (200–800 m).
Acoustic results indicated low to medium pelagic fish densities over most of the shelf, and much lower than in surveys undertaken 17 years before. Mesopelagic fish species were common in the water column beyond the shelf break. The esti-mated acoustic biomass for clupeids (PEL1) was 20 000 tonnes in the central and south regions combined, while the biomass of carangids, sphy-raenids, trichiurids and scombrids (PEL2) was 34 000 tonnes. Clupeid biomass was particularly low in the south, and between Beira and Angoche.
The 2007 ecosystem survey undertook 115 bot-tom trawls, but only 4 pelagic trawls. Trawl catches were used to compare species composition by region. In the south (inner shelf), pelagic fishes made up 65 percent of the total catch weight, similar to early surveys. Carangids were the most common (48 percent) followed by sphyraenids (15 percent). Further from the coast pelagic fishes made up 55 percent of the bottom trawl catch weight on the outer shelf, again mainly carangids (18 percent) followed by sphyraenids (4 percent). In deeper water than this (deep slope) pelagic fishes contributed less than 1 percent of the total catch.
In the central region (Sofala Bank) pelagic fishes contributed 31 percent of the total catch on the inner shelf, 37 percent on the outer shelf, and again, almost nothing on the deeper slope. Clupeids were the most abundant (18 per-cent) over the inner shelf, followed by carangids (8 percent), trichiurids (4 percent), sphyraenids (3 percent) and scombrids (2 percent), respec-tively. Carangids were most abundant on the
| The RV Dr Fridtjof Nansen in the Western Indian Ocean: Voyages of marine research and capacity development90
outer shelf (35 percent). The northern region of Mozambique, up to the border with Tanzania, has a very different habitat than the rest of the coast. This coast is dominated by coral reef systems and deep trenches. In this region, the mean pelagic fish catch contributed only 1.8 percent to the total weight caught in bottom trawls.
A detailed study using bottom trawls at selected locations along the Mozambique coast, as part of the 2007 survey, found high variability of pelagic fish catch rates. At the Segundas Archipelago (central-north Mozambique) catch rates of pelagic fishes were low (7.7 kg/h), whereas those at the Zambezi River mouth were two orders of mag-nitude higher (761 kg/h and 77 percent of total catch volume). Catch rates were 680 kg/h for clu-peids, 74 kg/h for carangids, and 5 kg/h for sphy-raenids. At Bazaruto National Park, the mean catch rate for pelagics was 10 kg/h, including carangids (3 percent) and scombrids (2 percent). These vari-ations are linked to the availability of food for pelagic species. The Zambezi River, for example, brings vast amounts of nutrients to the sea, and is responsible for enhancing nearby primary and secondary production. Higher productivity in the vicinity of the plume creates favorable feeding conditions for pelagic species.
A 2008 survey focused on process studies asso-ciated with eddies in the Mozambique Channel (Kaehler et al., 2008). The survey focussed on deeper offshore waters, and no small pelagic fish were observed – apart from some mesopelagic species. A 2009 ecosystem survey in northern Mozambique (Olsen et al., 2009) focussed on pelagic resources, and reported biomass values of 15 000 tonnes (PEL1) and 40 000 tonnes (PEL2).
A 2014 ecosystem survey, similar to the one con-ducted in 2007 (see above), covered the south and central regions (Krakstad et al., 2015). In the south, acoustic abundance of PEL1 was 6 000 tonnes, and trawl catches showed that clupeids con-tributed 63 percent and engraulids 37 percent. PEL2 families were common between 20 and 50 m depth, but at low densities. Their acous-tic abundance estimate was 21 000 tonnes,
with carangids contributing 70 percent to trawl catch weight. Bottom trawls in the south caught 53 percent pelagic species (by weight) on the inner shelf, 16 percent on the outer shelf and 4 percent on the deep slope.
In the central region (Sofala Bank), acoustic abun-dance of PEL1 was only 9 400 tonnes, compared to traditionally much higher abundance values in the past. Clupeid species were mainly Sardinella albella, Encrasicholina punctifer, Thryssa vitrirostris and Pelona ditchela. PEL2 species were recorded across most of the Bazaruto shelf between 20 and 100 m depth, generally at low densities. The acoustic abundance estimate of 46 000 tonnes comprised mainly Decapterus russelli, Decapterus macrosoma, Selar crumenophthalmus, Carangoides malabaricus, Trichiurus lepturus and Scomberomorus commerson. Swept area estimates of pelagic fish biomass (usually biased downwards) showed remarkably similar results to the 2007 survey, with carangids dominating and a total pelagic biomass of around 42 000 tonnes.
Mascarene subregion A single acoustic survey around Seychelles in 1978 found pelagic fish scattered over most of the main bank. Trawl catch rates of carangids aver-aged 1 083 kg/h, mostly Decapterus maruadsi and D. macrosoma. Small-sized individuals (3.5–15 cm) were sampled off the Mahé Plateau, suggesting a nursery area for this genus.
Two ecosystem surveys in 2008 focussed on process studies on the offshore banks between Mauritius and Seychelles (Strømme et al., 2009). Acoustic estimates of mesopelagic fishes found a low abundance towards the south (north coast of Mauritius and around Nazareth Bank) but higher densities in the north, around Saya de Malha and Seychelles Bank, and in the wide channel between them. The highest recordings were associated with the margins of the banks. No commercially viable densities of pelagic fish were observed, but PEL2 species were thinly scattered over shallow parts of Nazareth Bank, with low-density aggregations on the northern Saya de Malha and the southwestern edges of Seychelles Bank.
Chapter 6: Pelagic resources based on acoustic recordings and trawl sampling | 91
The 2010 survey of the pelagic resources of Mauritius covered the shelf and slope to about 1 000 m bottom depth (Strømme et al., 2010). Continuous acoustic recording and analysis throughout the survey of the narrow shelf around Mauritius, and the banks and plateau further north, found no aggregations of PEL1 species, and PEL2 species were absent from the southern part between Mauritius and Soudan Bank.
A low-density aggregation of PEL2 species formed around 15°30’S on the western side of the pla-teau, in a similar location as observed during 2008. This area appears to be more productive than the generally oligotrophic upper pelagic ecosystem of the Mascarene Plateau. The abundance of pelagic fish was assessed at 6 000 tonnes (PEL2) located at Nazareth Bank.
Madagascar and Comoros subregion A 1983 Nansen survey relied on acoustic record-ings, demersal and pelagic trawls to determine the composition and abundance of fish resources at depths of 20 to 200 m in three areas: south coast (south of 25 °S); southeast coast (25–22 °S), and; northeast coast (22–17 °S). The mean catch rate varied by area, and pelagic biomass along the south and east coasts was estimated at 50 000 tonnes, with carangids, clupeids, engra-ulids, scombrids, leiognathids and sphyraenids the most common families.
The first ecosystem survey of Madagascar took place 25 years later, in 2008, along the south and east coasts. The focus was on physical processes and acoustic assessment of pelagic fish resources (Krakstad et al., 2008). Biomass estimation was carried out in the same three shelf areas, with some adjustments (i.e. southeast coast, 25–20 °S and northeast coast, 20–12 °S). Biomass estimates of PEL1 and PEL2 species groups were uncertain, because pelagic fish were found close to the sea-floor. The seafloor along much of the coastline was unsuitable for bottom trawling, thus complicating accurate species identification. In the south, PEL1 species were found in two small low density areas with a total biomass of 15 000 tonnes.
The most common pelagic species were Engraulis japonicus, with small quantities of Sardinella gibbosa and Etrumeus teres also found. The PEL2 species were also distributed in two low density areas on the south shelf, with a continuous low density on the southeast shelf, up to 20 °S. The biomass esti-mate for the south coast was 54 000 tonnes, with approximately 9 000 tonnes and 14 000 tonnes estimated for the southeast and northeast coasts, respectively. The most abundant PEL2 species were Trachurus delagoa and Decapterus macrosoma.
An ecosystem survey of western Madagascar in 2009 covered the south coast (south of 25 °S); southwest coast (25–20 °S) and northwest coast (20–12 °S). The survey area overlapped with the 2008 survey area in the south. The 2009 survey estimated a biomass of 30 500 tonnes of pelagic fish (2 500 tonnes PEL1 and 28 000 tonnes PEL2 species) compared to 54 000 tonnes in 2008. Even though some differences in areas covered in 2008 and 2009 may affect estimates, both PEL1 and PEL2 groups covered smaller distribution ranges at lower densities in 2009 than in 2008. Almost no pelagic fish were registered acoustically or caught in trawl nets along the southwest coast, up to 20 °S. The cruise report from the survey suggests that pelagic fishes were distributed inshore of the area surveyed (Alvheim et al., 2009).
In the northwest, two small, low density areas (0–300 sA) of PEL1 were observed, with Herklot-sichthys quadrimaculatus the most common spe-cies. PEL2 were observed in low densities, and among them, the carangid Selar crumenophthalmus occurred in small numbers in most samples. The most abundant species was Carangoides caeru-leopinnatus, but not in large numbers. The highest catches were of Carangoides fulvoguttatus, Caranx speciosus and Decapterus kurroides, caught in a few hauls. Two species of barracuda were common, Sphyraena forsteri and S. helleri. The most common scombrid was Scomberomorus commerson.
The low pelagic fish biomass estimates from the west coast of Madagascar is likely a result of a reef-like ridge extending northwards along the
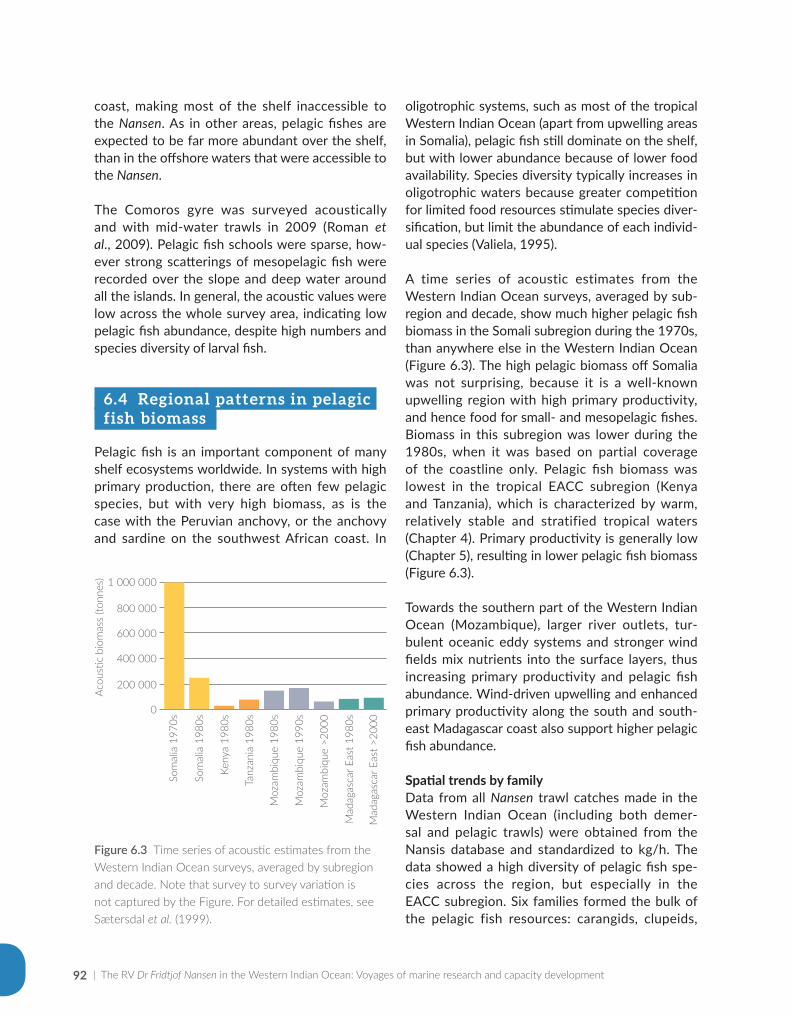
| The RV Dr Fridtjof Nansen in the Western Indian Ocean: Voyages of marine research and capacity development92
coast, making most of the shelf inaccessible to the Nansen. As in other areas, pelagic fishes are expected to be far more abundant over the shelf, than in the offshore waters that were accessible to the Nansen.
The Comoros gyre was surveyed acoustically and with mid-water trawls in 2009 (Roman et al., 2009). Pelagic fish schools were sparse, how-ever strong scatterings of mesopelagic fish were recorded over the slope and deep water around all the islands. In general, the acoustic values were low across the whole survey area, indicating low pelagic fish abundance, despite high numbers and species diversity of larval fish.
6.4 Regional patterns in pelagic fish biomass
Pelagic fish is an important component of many shelf ecosystems worldwide. In systems with high primary production, there are often few pelagic species, but with very high biomass, as is the case with the Peruvian anchovy, or the anchovy and sardine on the southwest African coast. In
oligotrophic systems, such as most of the tropical Western Indian Ocean (apart from upwelling areas in Somalia), pelagic fish still dominate on the shelf, but with lower abundance because of lower food availability. Species diversity typically increases in oligotrophic waters because greater competition for limited food resources stimulate species diver-sification, but limit the abundance of each individ-ual species (Valiela, 1995).
A time series of acoustic estimates from the Western Indian Ocean surveys, averaged by sub-region and decade, show much higher pelagic fish biomass in the Somali subregion during the 1970s, than anywhere else in the Western Indian Ocean (Figure 6.3). The high pelagic biomass off Somalia was not surprising, because it is a well-known upwelling region with high primary productivity, and hence food for small- and mesopelagic fishes. Biomass in this subregion was lower during the 1980s, when it was based on partial coverage of the coastline only. Pelagic fish biomass was lowest in the tropical EACC subregion (Kenya and Tanzania), which is characterized by warm, relatively stable and stratified tropical waters (Chapter 4). Primary productivity is generally low (Chapter 5), resulting in lower pelagic fish biomass (Figure 6.3).
Towards the southern part of the Western Indian Ocean (Mozambique), larger river outlets, tur-bulent oceanic eddy systems and stronger wind fields mix nutrients into the surface layers, thus increasing primary productivity and pelagic fish abundance. Wind-driven upwelling and enhanced primary productivity along the south and south-east Madagascar coast also support higher pelagic fish abundance.
Spatial trends by familyData from all Nansen trawl catches made in the Western Indian Ocean (including both demer-sal and pelagic trawls) were obtained from the Nansis database and standardized to kg/h. The data showed a high diversity of pelagic fish spe-cies across the region, but especially in the EACC subregion. Six families formed the bulk of the pelagic fish resources: carangids, clupeids,
1 000 000
Acou
stic
biom
ass
(tonn
es)
800 000
600 000
400 000
200 000
0
Som
alia
197
0s
Som
alia
198
0s
Keny
a 19
80s
Tanz
ania
198
0s
Moz
ambi
que
1980
s
Moz
ambi
que
1990
s
Moz
ambi
que
>200
0
Mad
agas
car E
ast 1
980s
Mad
agas
car E
ast >
2000
Figure 6.3 Time series of acoustic estimates from the Western Indian Ocean surveys, averaged by subregion and decade. Note that survey to survey variation is not captured by the Figure. For detailed estimates, see Sætersdal et al. (1999).
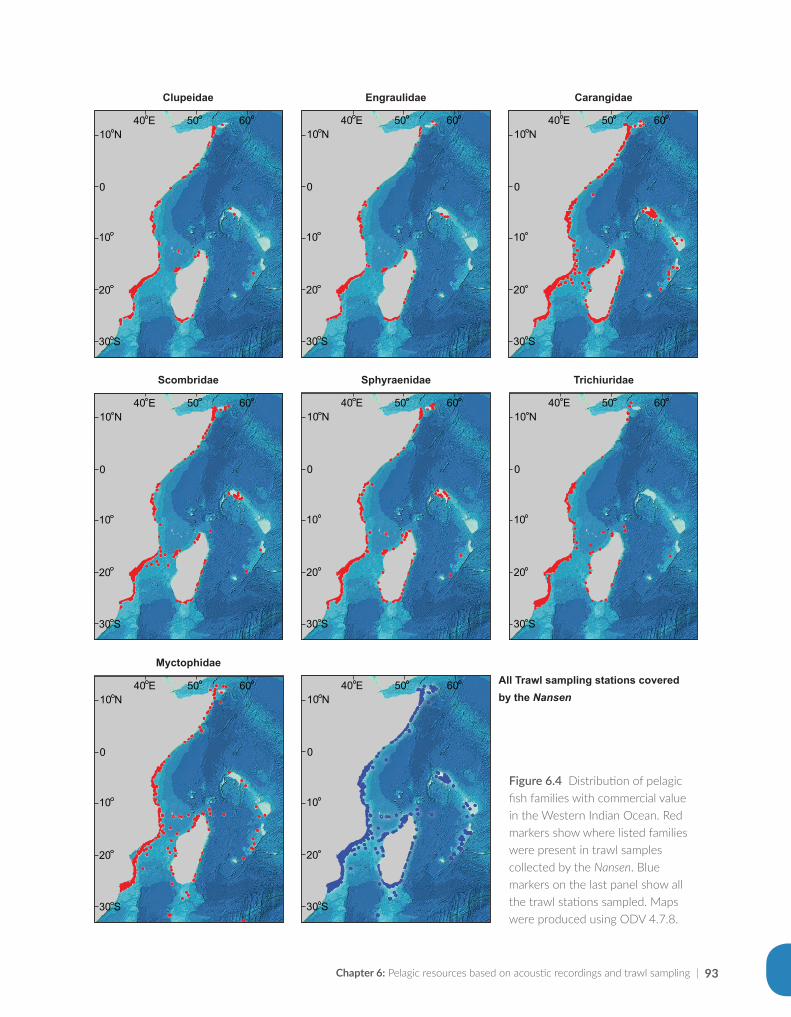
Chapter 6: Pelagic resources based on acoustic recordings and trawl sampling | 93
Figure 6.4 Distribution of pelagic fish families with commercial value in the Western Indian Ocean. Red markers show where listed families were present in trawl samples collected by the Nansen. Blue markers on the last panel show all the trawl stations sampled. Maps were produced using ODV 4.7.8.
10 N
0
10
20
30 S
40 E 50 60 10 N
0
10
20
30 S
40 E 50 60 10 N
0
10
20
30 S
40 E 50 60
Clupeidae Engraulidae Carangidae
10 N
0
10
20
30 S
40 E 50 60 10 N
0
10
20
30 S
40 E 50 60 10 N
0
10
20
30 S
40 E 50 60
Scombridae Sphyraenidae Trichiuridae
10 N
0
10
20
30 S
40 E 50 60 10 N
0
10
20
30 S
40 E 50 60
Myctophidae All Trawl sampling stations covered by the Nansen
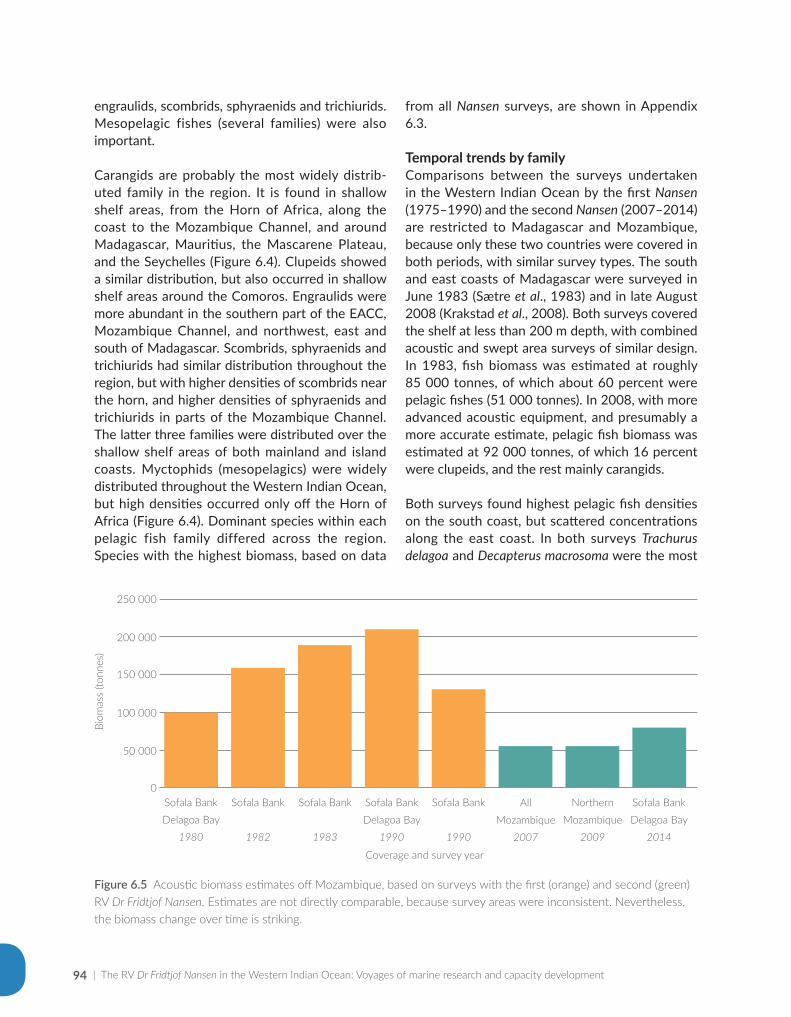
| The RV Dr Fridtjof Nansen in the Western Indian Ocean: Voyages of marine research and capacity development94
engraulids, scombrids, sphyraenids and trichiurids. Mesopelagic fishes (several families) were also important.
Carangids are probably the most widely distrib-uted family in the region. It is found in shallow shelf areas, from the Horn of Africa, along the coast to the Mozambique Channel, and around Madagascar, Mauritius, the Mascarene Plateau, and the Seychelles (Figure 6.4). Clupeids showed a similar distribution, but also occurred in shallow shelf areas around the Comoros. Engraulids were more abundant in the southern part of the EACC, Mozambique Channel, and northwest, east and south of Madagascar. Scombrids, sphyraenids and trichiurids had similar distribution throughout the region, but with higher densities of scombrids near the horn, and higher densities of sphyraenids and trichiurids in parts of the Mozambique Channel. The latter three families were distributed over the shallow shelf areas of both mainland and island coasts. Myctophids (mesopelagics) were widely distributed throughout the Western Indian Ocean, but high densities occurred only off the Horn of Africa (Figure 6.4). Dominant species within each pelagic fish family differed across the region. Species with the highest biomass, based on data
from all Nansen surveys, are shown in Appendix 6.3.
Temporal trends by familyComparisons between the surveys undertaken in the Western Indian Ocean by the first Nansen (1975–1990) and the second Nansen (2007–2014) are restricted to Madagascar and Mozambique, because only these two countries were covered in both periods, with similar survey types. The south and east coasts of Madagascar were surveyed in June 1983 (Sætre et al., 1983) and in late August 2008 (Krakstad et al., 2008). Both surveys covered the shelf at less than 200 m depth, with combined acoustic and swept area surveys of similar design. In 1983, fish biomass was estimated at roughly 85 000 tonnes, of which about 60 percent were pelagic fishes (51 000 tonnes). In 2008, with more advanced acoustic equipment, and presumably a more accurate estimate, pelagic fish biomass was estimated at 92 000 tonnes, of which 16 percent were clupeids, and the rest mainly carangids.
Both surveys found highest pelagic fish densities on the south coast, but scattered concentrations along the east coast. In both surveys Trachurus delagoa and Decapterus macrosoma were the most
Figure 6.5 Acoustic biomass estimates off Mozambique, based on surveys with the first (orange) and second (green) RV Dr Fridtjof Nansen. Estimates are not directly comparable, because survey areas were inconsistent. Nevertheless, the biomass change over time is striking.
250 000
Biom
ass
(tonn
es)
200 000
150 000
100 000
50 000
0Sofala BankDelagoa Bay
1980
Sofala Bank
1982
Sofala Bank
1983
Sofala BankDelagoa Bay
1990
Sofala Bank
1990
AllMozambique
2007
NorthernMozambique
2009
Sofala BankDelagoa Bay
2014
Coverage and survey year
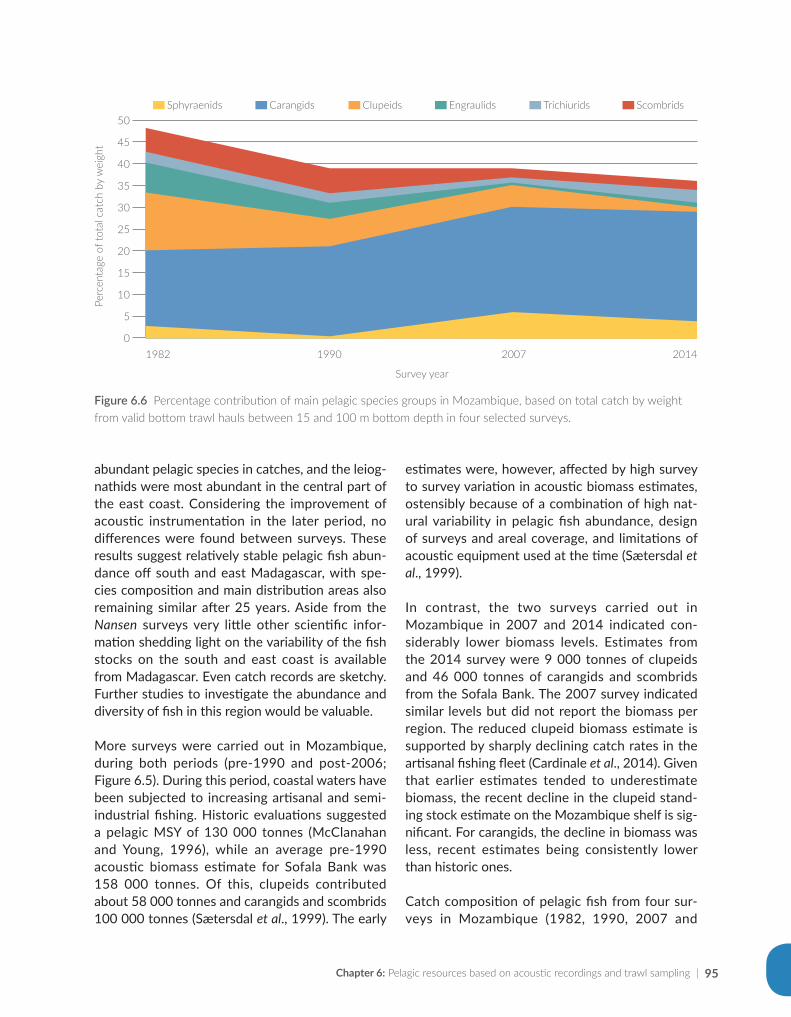
Chapter 6: Pelagic resources based on acoustic recordings and trawl sampling | 95
abundant pelagic species in catches, and the leiog-nathids were most abundant in the central part of the east coast. Considering the improvement of acoustic instrumentation in the later period, no differences were found between surveys. These results suggest relatively stable pelagic fish abun-dance off south and east Madagascar, with spe-cies composition and main distribution areas also remaining similar after 25 years. Aside from the Nansen surveys very little other scientific infor-mation shedding light on the variability of the fish stocks on the south and east coast is available from Madagascar. Even catch records are sketchy. Further studies to investigate the abundance and diversity of fish in this region would be valuable.
More surveys were carried out in Mozambique, during both periods (pre-1990 and post-2006; Figure 6.5). During this period, coastal waters have been subjected to increasing artisanal and semi-industrial fishing. Historic evaluations suggested a pelagic MSY of 130 000 tonnes (McClanahan and Young, 1996), while an average pre-1990 acoustic biomass estimate for Sofala Bank was 158 000 tonnes. Of this, clupeids contributed about 58 000 tonnes and carangids and scombrids 100 000 tonnes (Sætersdal et al., 1999). The early
estimates were, however, affected by high survey to survey variation in acoustic biomass estimates, ostensibly because of a combination of high nat-ural variability in pelagic fish abundance, design of surveys and areal coverage, and limitations of acoustic equipment used at the time (Sætersdal et al., 1999).
In contrast, the two surveys carried out in Mozambique in 2007 and 2014 indicated con-siderably lower biomass levels. Estimates from the 2014 survey were 9 000 tonnes of clupeids and 46 000 tonnes of carangids and scombrids from the Sofala Bank. The 2007 survey indicated similar levels but did not report the biomass per region. The reduced clupeid biomass estimate is supported by sharply declining catch rates in the artisanal fishing fleet (Cardinale et al., 2014). Given that earlier estimates tended to underestimate biomass, the recent decline in the clupeid stand-ing stock estimate on the Mozambique shelf is sig-nificant. For carangids, the decline in biomass was less, recent estimates being consistently lower than historic ones.
Catch composition of pelagic fish from four sur-veys in Mozambique (1982, 1990, 2007 and
Figure 6.6 Percentage contribution of main pelagic species groups in Mozambique, based on total catch by weight from valid bottom trawl hauls between 15 and 100 m bottom depth in four selected surveys.
50
Perc
enta
ge o
f tot
al c
atch
by
wei
ght
Sphyraenids Carangids Clupeids Engraulids Trichiurids Scombrids
45
40
35
30
25
20
15
10
5
1982 1990 2007 2014
Survey year
0
| The RV Dr Fridtjof Nansen in the Western Indian Ocean: Voyages of marine research and capacity development96
2014) show reduced proportions of clupeids and engraulids in bottom trawls over time, and a slight increase in carangids (Figure 6.6). Changes in trawl equipment and increased catch efficiency after the change-over from the first to the second Nansen does not explain the variation in catch composi-tion and quantities (Axelsen and Johnsen, 2015).
Another likely cause for the reduced biomass of clupeids, and especially engraulids, is a combina-tion of fishing pressure and the effects of reduced primary productivity available for pelagic stock growth. These species are commonly found near the mouth of the Zambezi River. Three major dams were completed along this river since the begin-ning of the 1970s, with negative ecological effects on the lower delta (da Silva, 1986; Gammelsrød, 1992; Hoguane and Armando, 2015). A substan-tial reduction of the flood plain and reduced dis-charge of nutrients to shelf waters after 1975 have resulted in decreased shrimp and fish catches (Gammelsrød, 1992; Hoguane and Armando, 2015). In addition, the coast became more acces-sible, and fishing pressure escalated after the end of the civil war in 1992. The escalation in fishing pressure continues to the present day (Vølstad et al., 2014).
6.5 Conclusions
Echo-integration to detect and quantify fish schools, combined with trawling to determine the species and body size of fish in a school, are rou-tine sampling activities on Nansen surveys. These methods have been used since the onset of Nansen surveys in 1975, and data are available for most of the Western Indian Ocean shelf, albeit collected irregularly over space and time. Major technologi-cal advances in echo-integration instruments, data processing and interpretation over the past 40 years have revolutionized the accuracy and range of acoustics – contemporary records are there-fore not directly compatible with those collected by the first RV Dr Fridtjof Nansen during the 1970s and 1980s. Findings from the pre-digital phase are, however, still of a high quality and valuable, with the information reflecting the exploration of
new geographical areas. The pre-digital data likely underestimate fish abundance in the early period (before 1984), because the instruments used at that time became electronically saturated in areas of high fish densities. In retrospect, the high (but underestimated) biomass values recorded in the past, compared to the lower (but more accurate) biomass estimates at present, suggest that some of the observed declines in pelagic fish resources, for example in Mozambique, have been more severe than what the numbers show. Conversely, pelagic fish stocks off southeast Madagascar have remained similar over time, in terms of species composition, distribution patterns and biomass.
Historical data from Nansen surveys comprise mainly biomass estimates, distribution maps of pelagic fish and species composition from trawl sampling. However, it lacks detailed informa-tion useful for investigating seasonal distribution patterns, feeding and spawning behaviour and nursery grounds. In general, clupeids spawn in the vicinity, (mainly down-current) of areas with enhanced primary production, such as near river outlets and local upwelling cells (especially off Somalia, but also in Mozambique and southern Madagascar). These productive areas often coin-cide with greater aggregations of pelagic fish in the historical data. Carangids have been observed to spawn in deeper waters, often at the shelf edge. Although seasonality in pelagic fish distribution and behaviour is clear from fisheries data (Fondo et al., 2014; Munga et al., 2015), the oceanographic drivers thereof remain unclear. Future surveys can address this important knowledge gap.
Commercially important small pelagic fish stocks are most likely shared between countries in the Western Indian Ocean, because of their move-ments across international boundaries. Regional surveys over large geographical areas are there-fore required to identify seasonal migration and distribution patterns, and to define individual fish stocks. The third RV Dr Fridtjof Nansen, commis-sioned in 2017, is equipped with modern acous-tic and trawl equipment, and it is therefore well-suited to undertaking such surveys.
Chapter 6: Pelagic resources based on acoustic recordings and trawl sampling | 97
References
Alvheim, O., Torstensen, E., Fennessy, S., MacKay, F., Zaera, D. & Bemiasa, J. 2009. West Madagascar: Pelagic Ecosystem Survey SWIOFP/ASCLME / FAO 2009 Cruise 2, 25 August–3 October 2009. Preliminary report. Bergen, Norway, Institute of Marine Research.
Axelsen, B.E. & Johnsen, E. 2015. An evaluation of the bottom trawl surveys in the Benguela Current Large Marine Ecosystem. Fisheries Oceanography, 24(S1): 74–87.
Brinca, L., Rey, F., Silva, C. & Sætre, R. 1981. A Survey of the Marine Fish Resources of Mozambique, October–November 1980. Bergen, Norway, Institute of Marine Research.
Brinca, L., Jorge da Silva, A., Sousa, L., Sousa, I. & Sætre, R. 1983. A Survey of the Fish Resources at Sofala Bank –Mozambique, September 1982. Bergen, Norway, Institute of Marine Research.
Cardinale, M., Chacate, O., Casini, M., Chaúca, I. & Vølstad, J. 2014. CPUE trends of Hilsa kelee and Thryssa vitrirostris exploited by the artisanal finfish fisheries in Mozambique derived from an on-shore sampling of catches by trip. Scientia Marina, 78(1): 55–64.
da Silva, A.J. 1986. River runoff and shrimp abundance in a tropical coastal ecosystem—the example of the Sofala Bank (central Mozambique). The role of freshwater outflow in coastal marine ecosystems, pp. 329–344. Berlin, Germany, Springer Verlag.
FAO. 2016. FAO Yearbook. Fishery and Aquaculture Statistics. 2014. Rome, Italy, Food and Agriculture Organization of the United Nations.
Fondo, E., Kimani, E., Munga, C., Aura, C., Okemwa, G. & Agembe, S. 2014. A Review on Kenyan Fisheries Research: 1970–2009. Western Indian Ocean Journal of Marine Science, 13(2): 143–162.
Gammelsrød, T. 1992. Variation in shrimp abundance on the Sofala Bank, Mozambique, and its relation to the Zambezi River runoff. Estuarine, Coastal and Shelf Science, 35(1): 91–103.
Gjøsæter, J. & Kawaguchi, K. 1980. A review of the world resources of mesopelagic fish. FAO Fisheries Technical Paper No. 193. Rome, Italy, Food and Agriculture Organisation of the United Nations.
Gjøsæter, J. 1984. Mesopelagic fish, a large potential resource in the Arabian Sea. Deep Sea Research Part A. Oceanographic Research Papers, 31(6–8): 1019–1035.
Hoguane, A. & Armando, E. 2015. The influence of the river runoff in the artisanal fisheries catches in tropical coastal waters – the case of the Zambezi River and the fisheries catches in the northern Sofala Bank, Mozambique. Journal of Integrated Coastal Zone Management, 15(4): 443–451.
IMR. 1977. Cruise Report No. 1 of R/V Dr Fridtjof Nansen. Joint NORAD/Mozambique/FAO Project to Investigate the Fish Resources off the Coast of Mozambique. Bergen, Norway, Institute of Marine Research.
IMR. 1978a. Cruise Report No. 3 of R/V Dr Fridtjof Nansen. Joint NORAD/Mozambique/FAO Project to Investigate the fish Resources off the Coast of Mozambique, January–March 1978. Bergen, Norway, Institute of Marine Research.
IMR. 1978b. Cruise Report No. 4 of R/V Dr Fridtjof Nansen. Joint NORAD/Mozambique/FAO Project to Investigate the Fish Resources off the Coast of Mozambique. April–June 1978. Bergen, Norway, Institute of Marine Research.
IMR. 1982a. Cruise Report R/V Dr Fridtjof Nansen. Second Fisheries Resources Survey, Tanzania, 12 November–3 December. Bergen 1982, Norway, Institute of Marine Research.
IMR. 1982b. Cruise Report R/V Dr Fridtjof Nansen. Survey of the Abundance and Distribution of the Fish Resources off Kenya. 7–15 December 1982. Bergen, Norway, Institute of Marine Research.
IMR. 1983. Cruise Report R/V Dr Fridtjof Nansen. Third Fisheries Resources Survey Tanzania. 11–26 May 1983. Bergen, Norway, Institute of Marine Research.
IMR. 1990a. Preliminary cruise report No II. Survey of the Fish Resources of Mozambique. Bergen, Norway, Institute of Marine Research.
IMR. 1990b. Preliminary cruise report No III. Survey for deep water shrimp resources in Mozambique. Bergen, Norway, Institute of Marine Research.
| The RV Dr Fridtjof Nansen in the Western Indian Ocean: Voyages of marine research and capacity development98
Irigoien, X., Klevjer, T., Røstad, A., Martinez, U., Boyra, G., Acuña, J., Bode, A., Echevarria, F., Gonzalez-Gordillo, J., Hernandez-Leon, S., Agusti, S., Aksnes, D., Duarte, C. & Kaartvedt, S. 2014. Large mesopelagic fishes biomass and trophic efficiency in the open ocean. Nature Communications, 5: 3271.
Iversen, S. 1983. Preliminary Cruise Report R/V Dr Fridtjof Nansen. Survey of the Abundance and Distribution of Fish Resources off Kenya. 2–8 May 1983. Bergen, Norway, Institute of Marine Research.
Iversen, S. 1984. Kenyan marine fish resources in water deeper than 10 m investigated by R/V Dr Fridtjof Nansen. Report presented at a joint Kenyan/Norwegian seminar, Mombasa, Kenya, 13–15 March 1984. Bergen, Norway, Institute of Marine Research.
Iversen, S.A., Myklevoll, S., Lwiza, K. & Yonazi, J. 1984. Tanzanian marine fish resources in the depth region 10–500 m investigated by R/V Dr Fridtjof Nansen. S.A. Iversen, ed. pp. 45–83. The proceedings of the NORAD/Tanzania seminar to review the marine fish stocks and fisheries in Tanzania, 6–8 March 1984, Mbegani, Tanzania. Bergen, Norway, Institute of Marine Research.
Iversen, S.A. & Myklevoll, S. 1984a. The proceedings of the Norad-Kenya seminar to review the marine fish stocks and fisheries in Kenya, Mombasa, Kenya, 13–15 March 1984. Bergen, Norway, Institute of Marine Research.
Iversen, S.A. & Myklevoll, S. 1984b. The proceedings of the Norad-Tanzania seminar to review the marine fish stocks and fisheries in Tanzania, Mbegani, Tanzania, 6–8 March 1984. Bergen, Norway, Institute of Marine Research.
Johnsen, E., Krakstad, J., Ostrowski, M., Serigstad, B., Strømme, T., Alvheim, O., Olsen, M., Zaera, D., André, E., Dias, N., Sousa, L., Sousa, B., Malauene, B. & Abdula, S. 2007. Surveys of the living marine resources of Mozambique: Ecosystem Survey and Special Studies. 27 September–21 December 2007. Report No. 8/2007 - 2007409. Bergen, Norway, Institute of Marine Research.
Kaartvedt, S., Staby, A. & Aksnes, D. 2012. Efficient trawl avoidance by mesopelagic fishes causes large underestimation of their biomass. Marine Ecology Progress Series, 456: 1–6.
Kaehler, S., Gammelsrød, T., Hill, J., Ternon, J.-F., Cotel, P., Potier, M., Huggett, J., Miggel, A., Pillay, K., Dyer, B., Backeberg, B., Langa, A., Malauene, B., Benivary, D., Morris, T., O’Reilly, B. & Olsen, M. 2008. ASCLME Survey No 4. Preliminary cruise report No 8/2008. 28 November – 17 December 2008. Report No. EAF-N2008/7.
Kesteven, G., Nakken, O. & Strømme , T. 1981. The small-pelagic and demersal fish resources of the north-west Arabian Sea—further analysis of the results of the R/V Dr Fridtjof Nansen survey, 1975–1976. Bergen, Norway, Institute of Marine Research.
Krakstad, J-O., Mehl, S., Roman, R., Escobar-Porras, J., Stapley, J., Flynn, B., Olsen, M. & Beck, I. 2008. Cruise Reports Dr Fridtjof Nansen. East Madagascar Current Ecosystem Survey ASCLME / FAO 2008 Cruise 1, 24 August–1 October 2008. Bergen, Norway, Institute of Marine Research.
Krakstad, J.-O., Krafft, B., Alvheim, O., Kvalsund, M., Bernardes, I., Chacate, O., Mutombene, R., Filipe, O., Hajy, B., Zacarias, L., Zivane, F., M, P. & Varela, D. 2015. Cruise report Dr Fridtjof Nansen. Marine Ecosystem Survey of Mozambique, 11 November–2 December 2014. Report No. GCP/INT/003/NOR. FAO-NORAD.
Lam, V. & Pauly, D. 2005. Mapping the global biomass of mesopelagic fishes. Sea Around Us Project Newsletter, 30: 4.MacLennan, D. & Simmonds, E. 1992. Fisheries acoustics. London, Chapman and Hall.McClanahan, T. & Young, T. 1996. East African ecosystems and their conservation. New York, Oxford University Press.Munga, C., Mwangi, S., Ong’anda, H., Ruwa, R., Manyala, J., Groeneveld, J., Kimani, E. & Vanreusel, A. 2014. Fish
catch composition of artisanal and bottom trawl fisheries in Malindi-Ungwana Bay, Kenya: A cause for conflict? Western Indian Ocean Journal of Marine Science, 13: 177–188.
Myklevoll, S. 1982. Cruise Report R/V Dr Fridtjof Nansen. Fisheries Resources Survey, Tanzania, 16 June–8 July 1982. Bergen, Norway, Institute of Marine Research.
Nakken, O. 1981. Report on Cruise with R/V Dr Fridtjof Nansen off Kenya 8–19 December 1980. Bergen, Norway, Institute of Marine Research.
Nellen, W. 1973. Kinds and abundance of fish larvae in the Arabian Sea and the Persian Gulf. The biology of the Indian Ocean, pp. 415–430. Berlin, Germany, Springer.
Chapter 6: Pelagic resources based on acoustic recordings and trawl sampling | 99
Olsen, E., Padera, M., Funke, M., Pires, P., Wenneck, T. & Zacarias, L. 2009. Survey of the living marine resources of North Mozambique (SWIOFP/ASCLME 2009 Cruise 1) 6–20 August 2009. Report No. EAF-N/2009/7. Bergen, Norway, Institute of Marine Research.
Roman, R., Kaehler, S., Michalsen, K., Olsen, M. & Perri, M. 2009. Survey of the Comores Gyre (ASCLME & SWIOFP) 5 October–3 November 2009. Report No. EAF-N2009/9. Bergen, Norway, Institute of Marine Research.
Sætersdal, G., Bianchi, G., Strømme, T. & Venema, S. 1999. The Dr Fridtjof Nansen programme: 1975–1993. Investigations of fishery resources in developing regions. History of the programme and review of results. FAO Fisheries Technical Paper No. 391. Food and Agriculture Organization of the United Nations.
Sætre, R. & Paula e Silva, R. 1979. The marine fish resources of Mozambique. Bergen, Norway, Institute of Marine Research.
Sætre, R., Strømsnes, K., Hansen, K., Abrahamsen, H., Schmidt, G. & Rakotondralambo, A. 1983. Cruise Report R/V Dr Fridtjof Nansen. Fisheries resources survey Madagascar, 16–28 June 1983. Bergen, Norway, Institute of Marine Research.
Slotte, A., Skagen, D. & Iversen, S. 2007. Size of mackerel in research vessel trawls and commercial purse-seine catches: implications for acoustic estimation of biomass. ICES Journal of Marine Science: Journal du Conseil, 64(5): 989–994.
Strømme, T., Ansorge, I., Bornman, T., Kaehler, S., Ostrowski, M., Tweddle, D. & Alvheim, O. 2009. 2008 ASCLME Survey No 3 Cruise report No 7/2008. 8 October–27 November 2008. Report No. EAF-N2008/7. Bergen, Norway, Institute of Marine Research.
Strømme, T., Groeneveld, J., Alvheim, O., Fossheim, O. & Svoren, T. 2010. Mauritius and Southern Mascarene: Pelagic Ecosystem Survey SWIOFP/FAO 2010 Cruise 1 2010. 6–21 December 2010. Final report. Report No. EAF-N2008/7. Bergen, Norway, Institute of Marine Research.
Valiela, I. 1995. Marine ecological processes (2nd ed.). New York, Springer.Valinassab, T., Pierce, G. & Johannesson, K. 2007. Lantern fish (Benthosema pterotum) resources as a target for
commercial exploitation in the Oman Sea. Journal of Applied Ichthyology, 23(5): 573–577.Vølstad, J., Afonso, P., Baloi, A., de Premegi, N., Meisfjord, J. & Cardinale, M. 2014. Probability-based survey to
monitor catch and effort in coastal small-scale fisheries. Fisheries Research, 151: 39–46.

| The RV Dr Fridtjof Nansen in the Western Indian Ocean: Voyages of marine research and capacity development100
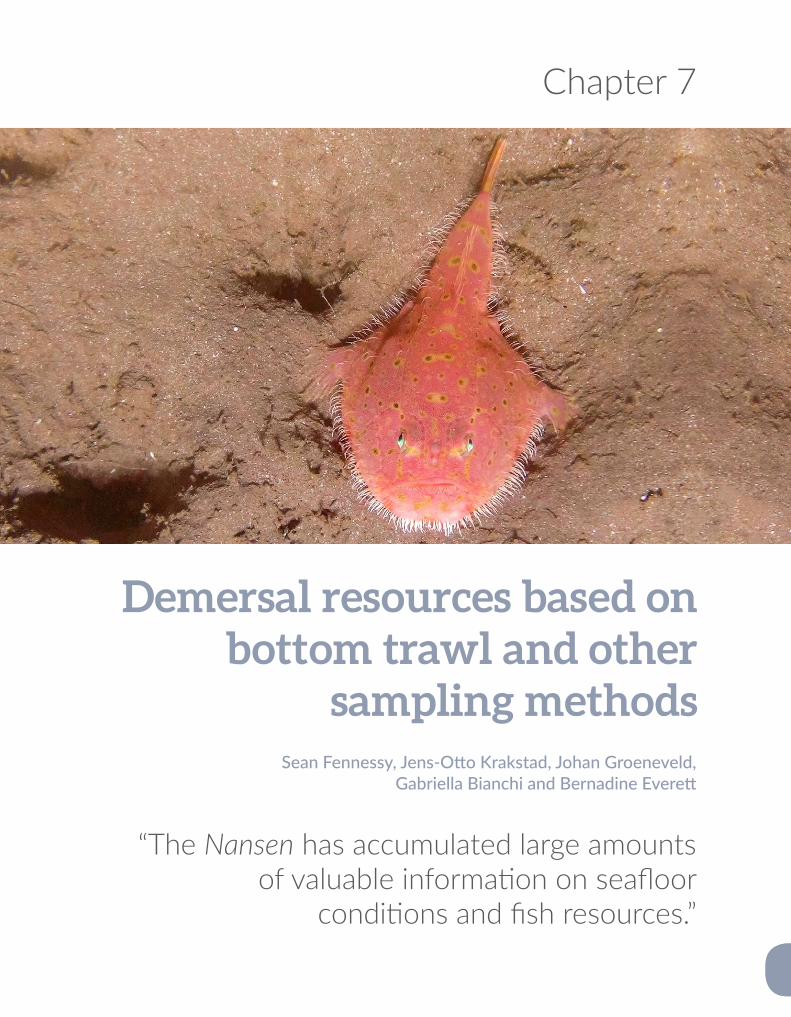
Chapter 7
Demersal resources based on bottom trawl and other
sampling methodsSean Fennessy, Jens-Otto Krakstad, Johan Groeneveld,
Gabriella Bianchi and Bernadine Everett
“The Nansen has accumulated large amounts of valuable information on seafloor
conditions and fish resources.”
| The RV Dr Fridtjof Nansen in the Western Indian Ocean: Voyages of marine research and capacity development102
Abstract
The RV Dr Fridtjof Nansen has accumulated large amounts of valuable information on seafloor conditions and fish resources, based mainly on bottom trawling and acoustic recordings. In some regions, these data are the only information that exist. Over 1 500 trawls have been completed, mostly (68 percent) on the shelf (<200 m depth). Rocky or steep areas that could not be trawled have, in some cases, been sampled with baited traps and hook-and-line methods. Despite the unbalanced distribution of surveys over time and space, broad patterns in fish distribution and densities are apparent. Pelagic taxa such as scads (Carangidae) and sardinella (Clupeidae) were often abundant in demersal trawls, and these taxa were included in the analyses. Fish densities were relatively higher in the Somali Coast subregion than elsewhere, and also higher on the shelf than on the slope, between 200 and 800 m depth. Densities of snappers (Lutjanidae) were consistent across shelf subregions, particularly after 2007, whereas seabreams (Sparidae) exhibited a subequatorial distribution, occurring in Somalia in the north, and in southern Mozambique/southern Madagascar, but not in-between. Crustaceans predominated on the Mozambique shelf, consistent with the information from prawn trawl fisheries. Estimates produced from Nansen surveys are not dissimilar to those produced by other surveys in the Western Indian Ocean. The consistency of the Nansen’s sampling approach over the years means that valid spatio-temporal compar-isons of catch composition, catch rates and size frequencies can be undertaken, to build on the broad overview presented here. Overall, Nansen surveys reflect a high diversity of demersal fauna, but apart from prawns and deep-water crustaceans, found only limited fisheries potential on the generally narrow shelf and upper continental slope. The concentration of the main demersal fisheries where there is riv-erine input suggests that terrestrial nutrient sources are of greater importance than upwelled nutrient sources for demersal species in Kenya, Tanzania, Mozambique and Madagascar. In Somalia, where there are few rivers, upwelled nutrients give rise to high productivity, and greater demersal fish densities than further to the south. The recent focus on wider ecosystem aspects of demersal habitats using non-trawl methods holds promise, even though sampling protocols are still being developed.
Previous page: Chaunax atimovatae from ACEP ROV off Thukela. © DST/NRF ACEP Spatial Solutions Project
Chapter 7: Demersal resources based on bottom trawl and other sampling methods | 103
7.1 Introduction
Demersal species (fish and crustaceans) live and feed on the seafloor, which usually consists of mud, sand, gravel or rocks. Demersal fish are either benthic (rest on the seafloor) or bentho-pelagic (float in the water column just above the seafloor). Most demersal fish species are bentho- pelagic, and all of them are bottom-feeders, inhab-iting the continental shelf of coastal waters, and the upper part of the continental slope. They are also found on seamounts and around islands, but are uncommon in the deepest waters, such as the abyssal plains.
Demersal fish have many different body types, many of them flattened in one way or the other (for example flatfish, skates and rays), or in the case of bentho-pelagic species, they often have a flabby body type with large head and reduced body size (such as rattails and cusk-eels) or they can be robust and muscular swimmers (such as squaloid sharks or orange roughy). Crustaceans that live on the seafloor include many groups that are important to commercial fisheries, because of their high unit value, for instance, lobsters, prawns and crabs.
The initial focus of the RV Dr Fridtjof Nansen sur-veys in the Western Indian Ocean was on assess-ing fisheries potential, particularly of pelagic fishes, using the acoustic method for biomass estimation (Chapter 6). Over the years, using bottom trawl-ing and the “swept area” method to estimate the biomass of demersal fisheries resources near the seabed also became important. However, these demersal trawl surveys could only cover trawlable sandy or muddy grounds; consequently fish or crustaceans living on coral reefs or rocky outcrops could not be sampled. More recently, technologi-cally advanced acoustic methods have been used to assess demersal fish in untrawlable areas. Static sampling methods, such as hook-and-line fishing and setting baited traps have also occasionally been used to sample untrawlable areas, but these methods are time-consuming and require many replicates before confident conclusions can be drawn.
Pelagic fish (see Chapter 6) are frequently caught in bottom trawls, together with demersal species, presumably because they school low down in the water column at certain times. The approach taken in Chapter 7 was to include all catches made by bottom trawl gear (demersal and pelagic species) in the analyses. This differs from the approach taken in Chapter 6, which dealt only with the pelagic component of trawl catches.
Trawl catches were also used to collect biologi-cal data of common fish and crustacean species, including their size structure, gender and repro-ductive condition. Nansen surveys in Mozambique focussed mainly on assessing shallow- and deep-water prawn resources. Recent surveys have incorporated sampling to characterize macro-benthos (small invertebrates associated with the seafloor) and to assess pollutants in sediments, as part of the increasing focus on ecosystem con-siderations (Chapter 2). These data can be used to establish environmental baselines prior to the commencement of oil and gas operations in the Western Indian Ocean. Acoustic scanning is used during all surveys to map the seabed while steam-ing between trawl stations, as a means of identify-ing trawlable areas. Chapter 7 reviews the demer-sal activities of the Nansen, including bottom trawling, acoustic recordings, trap and hook-and-line sampling, benthic sediment grabs and seabed mapping.
7.2 General sampling and analysis
The trawl gear used by the Nansen includes trawl warps, winches, a bottom (demersal) trawl which is retrieved onto a net drum, and combi-nation trawl doors (see Appendix 7.1 for details on trawl gear, sampling protocols and analyses). Most trawling occurred on the continental shelf (20–200 m depth) and the upper continental slope (200–800 m depth), with sampling stations situ-ated along transects perpendicular to the coast. Trawls were only deployed after ensuring that
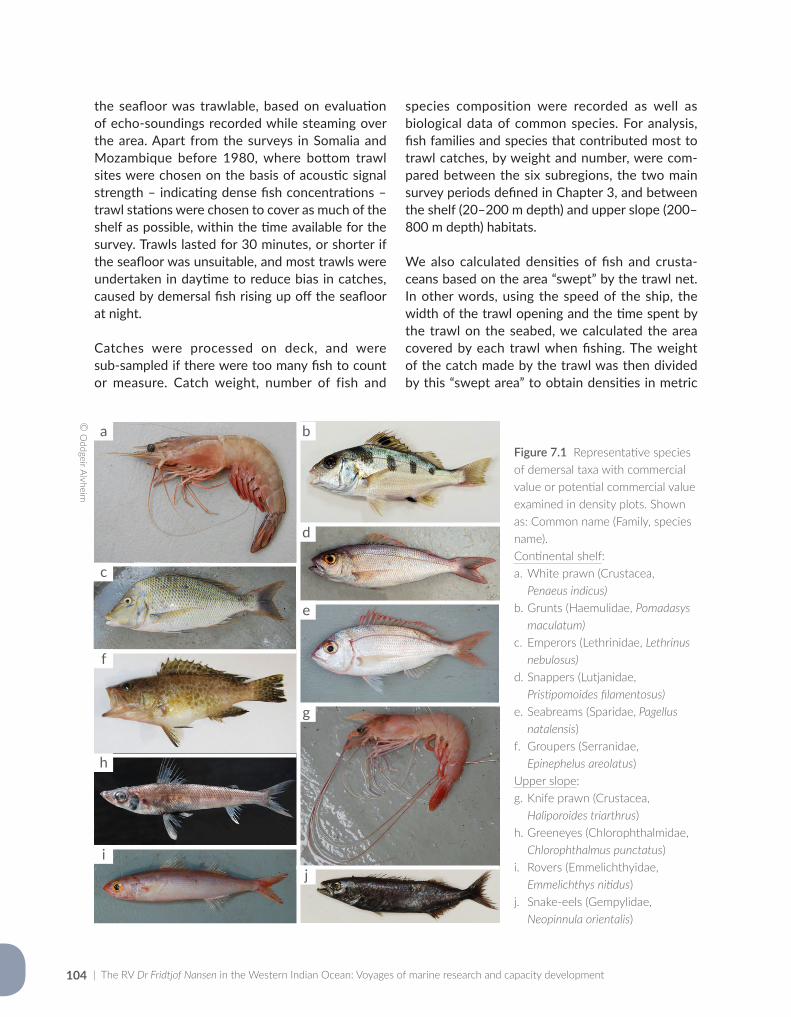
| The RV Dr Fridtjof Nansen in the Western Indian Ocean: Voyages of marine research and capacity development104
the seafloor was trawlable, based on evaluation of echo-soundings recorded while steaming over the area. Apart from the surveys in Somalia and Mozambique before 1980, where bottom trawl sites were chosen on the basis of acoustic signal strength – indicating dense fish concentrations – trawl stations were chosen to cover as much of the shelf as possible, within the time available for the survey. Trawls lasted for 30 minutes, or shorter if the seafloor was unsuitable, and most trawls were undertaken in daytime to reduce bias in catches, caused by demersal fish rising up off the seafloor at night.
Catches were processed on deck, and were sub-sampled if there were too many fish to count or measure. Catch weight, number of fish and
species composition were recorded as well as biological data of common species. For analysis, fish families and species that contributed most to trawl catches, by weight and number, were com-pared between the six subregions, the two main survey periods defined in Chapter 3, and between the shelf (20–200 m depth) and upper slope (200– 800 m depth) habitats.
We also calculated densities of fish and crusta-ceans based on the area “swept” by the trawl net. In other words, using the speed of the ship, the width of the trawl opening and the time spent by the trawl on the seabed, we calculated the area covered by each trawl when fishing. The weight of the catch made by the trawl was then divided by this “swept area” to obtain densities in metric
Figure 7.1 Representative species of demersal taxa with commercial value or potential commercial value examined in density plots. Shown as: Common name (Family, species name). Continental shelf: a. White prawn (Crustacea, Penaeus indicus)b. Grunts (Haemulidae, Pomadasys maculatum)c. Emperors (Lethrinidae, Lethrinus nebulosus)d. Snappers (Lutjanidae, Pristipomoides filamentosus) e. Seabreams (Sparidae, Pagellus natalensis)f. Groupers (Serranidae, Epinephelus areolatus)Upper slope: g. Knife prawn (Crustacea, Haliporoides triarthrus)h. Greeneyes (Chlorophthalmidae, Chlorophthalmus punctatus) i. Rovers (Emmelichthyidae, Emmelichthys nitidus)j. Snake-eels (Gempylidae, Neopinnula orientalis)
© O
ddgeir Alvheim
a b
c
d
e
g
j
f
h
i
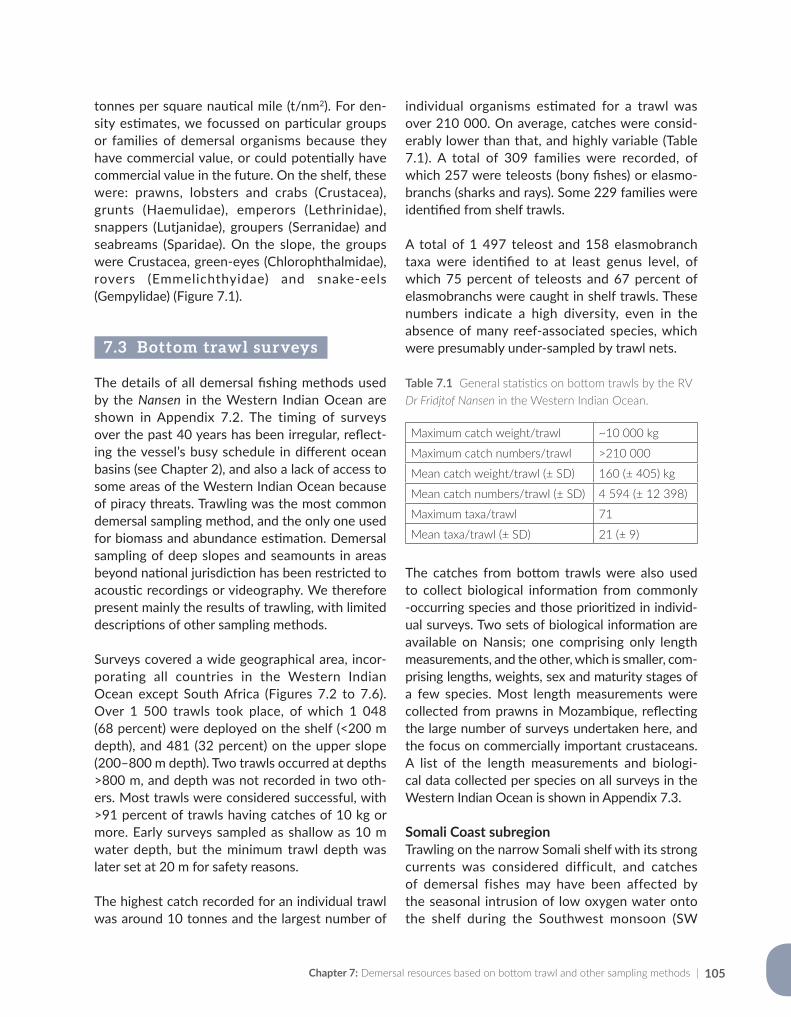
Chapter 7: Demersal resources based on bottom trawl and other sampling methods | 105
tonnes per square nautical mile (t/nm2). For den-sity estimates, we focussed on particular groups or families of demersal organisms because they have commercial value, or could potentially have commercial value in the future. On the shelf, these were: prawns, lobsters and crabs (Crustacea), grunts (Haemulidae), emperors (Lethrinidae), snappers (Lutjanidae), groupers (Serranidae) and seabreams (Sparidae). On the slope, the groups were Crustacea, green-eyes (Chlorophthalmidae), rovers (Emmelichthyidae) and snake-eels (Gempylidae) (Figure 7.1).
7.3 Bottom trawl surveys
The details of all demersal fishing methods used by the Nansen in the Western Indian Ocean are shown in Appendix 7.2. The timing of surveys over the past 40 years has been irregular, reflect-ing the vessel’s busy schedule in different ocean basins (see Chapter 2), and also a lack of access to some areas of the Western Indian Ocean because of piracy threats. Trawling was the most common demersal sampling method, and the only one used for biomass and abundance estimation. Demersal sampling of deep slopes and seamounts in areas beyond national jurisdiction has been restricted to acoustic recordings or videography. We therefore present mainly the results of trawling, with limited descriptions of other sampling methods.
Surveys covered a wide geographical area, incor-porating all countries in the Western Indian Ocean except South Africa (Figures 7.2 to 7.6). Over 1 500 trawls took place, of which 1 048 (68 percent) were deployed on the shelf (<200 m depth), and 481 (32 percent) on the upper slope (200–800 m depth). Two trawls occurred at depths >800 m, and depth was not recorded in two oth-ers. Most trawls were considered successful, with >91 percent of trawls having catches of 10 kg or more. Early surveys sampled as shallow as 10 m water depth, but the minimum trawl depth was later set at 20 m for safety reasons.
The highest catch recorded for an individual trawl was around 10 tonnes and the largest number of
individual organisms estimated for a trawl was over 210 000. On average, catches were consid-erably lower than that, and highly variable (Table 7.1). A total of 309 families were recorded, of which 257 were teleosts (bony fishes) or elasmo-branchs (sharks and rays). Some 229 families were identified from shelf trawls.
A total of 1 497 teleost and 158 elasmobranch taxa were identified to at least genus level, of which 75 percent of teleosts and 67 percent of elasmobranchs were caught in shelf trawls. These numbers indicate a high diversity, even in the absence of many reef-associated species, which were presumably under-sampled by trawl nets.
Table 7.1 General statistics on bottom trawls by the RV Dr Fridjtof Nansen in the Western Indian Ocean.
The catches from bottom trawls were also used to collect biological information from commonly-occurring species and those prioritized in individ-ual surveys. Two sets of biological information are available on Nansis; one comprising only length measurements, and the other, which is smaller, com-prising lengths, weights, sex and maturity stages of a few species. Most length measurements were collected from prawns in Mozambique, reflecting the large number of surveys undertaken here, and the focus on commercially important crustaceans. A list of the length measurements and biologi-cal data collected per species on all surveys in the Western Indian Ocean is shown in Appendix 7.3.
Somali Coast subregionTrawling on the narrow Somali shelf with its strong currents was considered difficult, and catches of demersal fishes may have been affected by the seasonal intrusion of low oxygen water onto the shelf during the Southwest monsoon (SW
Maximum catch weight/trawl ~10 000 kg
Maximum catch numbers/trawl >210 000
Mean catch weight/trawl (± SD) 160 (± 405) kg
Mean catch numbers/trawl (± SD) 4 594 (± 12 398)
Maximum taxa/trawl 71
Mean taxa/trawl (± SD) 21 (± 9)
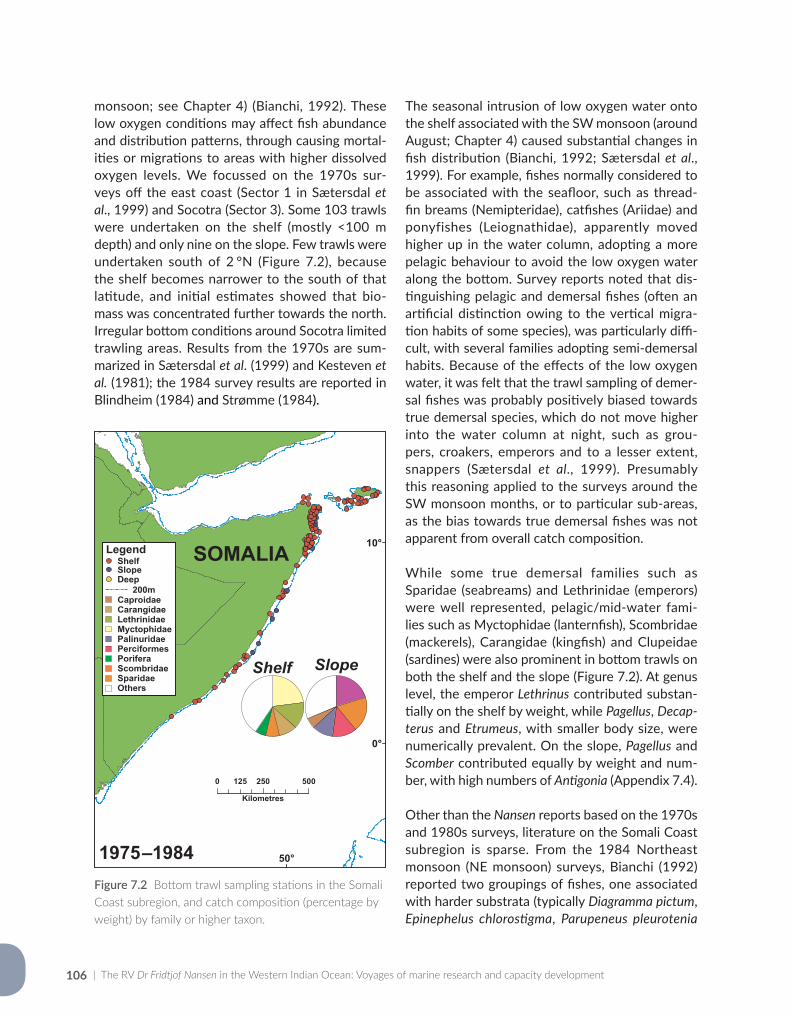
| The RV Dr Fridtjof Nansen in the Western Indian Ocean: Voyages of marine research and capacity development106
monsoon; see Chapter 4) (Bianchi, 1992). These low oxygen conditions may affect fish abundance and distribution patterns, through causing mortal-ities or migrations to areas with higher dissolved oxygen levels. We focussed on the 1970s sur-veys off the east coast (Sector 1 in Sætersdal et al., 1999) and Socotra (Sector 3). Some 103 trawls were undertaken on the shelf (mostly <100 m depth) and only nine on the slope. Few trawls were undertaken south of 2 °N (Figure 7.2), because the shelf becomes narrower to the south of that latitude, and initial estimates showed that bio-mass was concentrated further towards the north. Irregular bottom conditions around Socotra limited trawling areas. Results from the 1970s are sum-marized in Sætersdal et al. (1999) and Kesteven et al. (1981); the 1984 survey results are reported in Blindheim (1984) and Strømme (1984).
The seasonal intrusion of low oxygen water onto the shelf associated with the SW monsoon (around August; Chapter 4) caused substantial changes in fish distribution (Bianchi, 1992; Sætersdal et al., 1999). For example, fishes normally considered to be associated with the seafloor, such as thread-fin breams (Nemipteridae), catfishes (Ariidae) and ponyfishes (Leiognathidae), apparently moved higher up in the water column, adopting a more pelagic behaviour to avoid the low oxygen water along the bottom. Survey reports noted that dis-tinguishing pelagic and demersal fishes (often an artificial distinction owing to the vertical migra-tion habits of some species), was particularly diffi-cult, with several families adopting semi-demersal habits. Because of the effects of the low oxygen water, it was felt that the trawl sampling of demer-sal fishes was probably positively biased towards true demersal species, which do not move higher into the water column at night, such as grou-pers, croakers, emperors and to a lesser extent, snappers (Sætersdal et al., 1999). Presumably this reasoning applied to the surveys around the SW monsoon months, or to particular sub-areas, as the bias towards true demersal fishes was not apparent from overall catch composition.
While some true demersal families such as Sparidae (seabreams) and Lethrinidae (emperors) were well represented, pelagic/mid-water fami-lies such as Myctophidae (lanternfish), Scombridae (mackerels), Carangidae (kingfish) and Clupeidae (sardines) were also prominent in bottom trawls on both the shelf and the slope (Figure 7.2). At genus level, the emperor Lethrinus contributed substan- tially on the shelf by weight, while Pagellus, Decap-terus and Etrumeus, with smaller body size, were numerically prevalent. On the slope, Pagellus and Scomber contributed equally by weight and num-ber, with high numbers of Antigonia (Appendix 7.4).
Other than the Nansen reports based on the 1970s and 1980s surveys, literature on the Somali Coast subregion is sparse. From the 1984 Northeast monsoon (NE monsoon) surveys, Bianchi (1992) reported two groupings of fishes, one associated with harder substrata (typically Diagramma pictum, Epinephelus chlorostigma, Parupeneus pleurotenia
Figure 7.2 Bottom trawl sampling stations in the Somali Coast subregion, and catch composition (percentage by weight) by family or higher taxon.
50°
10°
0°
0 250 500125
Kilometres
SOMALIA
1975 - 1993
Shelf Slope
LegendShelfSlope
200mDeep
CaproidaeCarangidaeLethrinidaeMyctophidaePalinuridaePerciformesPoriferaScombridaeSparidaeOthers
1975 –1984
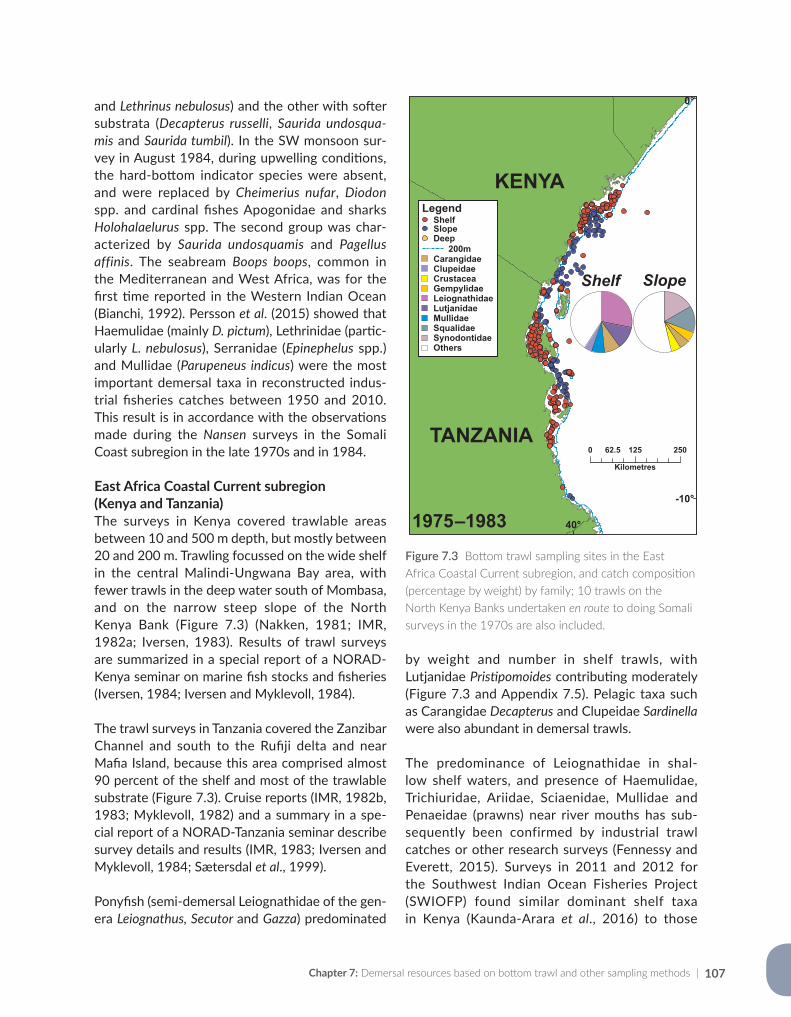
Chapter 7: Demersal resources based on bottom trawl and other sampling methods | 107
and Lethrinus nebulosus) and the other with softer substrata (Decapterus russelli, Saurida undosqua-mis and Saurida tumbil). In the SW monsoon sur-vey in August 1984, during upwelling conditions, the hard-bottom indicator species were absent, and were replaced by Cheimerius nufar, Diodon spp. and cardinal fishes Apogonidae and sharks Holohalaelurus spp. The second group was char-acterized by Saurida undosquamis and Pagellus affinis. The seabream Boops boops, common in the Mediterranean and West Africa, was for the first time reported in the Western Indian Ocean (Bianchi, 1992). Persson et al. (2015) showed that Haemulidae (mainly D. pictum), Lethrinidae (partic-ularly L. nebulosus), Serranidae (Epinephelus spp.) and Mullidae (Parupeneus indicus) were the most important demersal taxa in reconstructed indus-trial fisheries catches between 1950 and 2010. This result is in accordance with the observations made during the Nansen surveys in the Somali Coast subregion in the late 1970s and in 1984.
East Africa Coastal Current subregion (Kenya and Tanzania)The surveys in Kenya covered trawlable areas between 10 and 500 m depth, but mostly between 20 and 200 m. Trawling focussed on the wide shelf in the central Malindi-Ungwana Bay area, with fewer trawls in the deep water south of Mombasa, and on the narrow steep slope of the North Kenya Bank (Figure 7.3) (Nakken, 1981; IMR, 1982a; Iversen, 1983). Results of trawl surveys are summarized in a special report of a NORAD-Kenya seminar on marine fish stocks and fisheries (Iversen, 1984; Iversen and Myklevoll, 1984).
The trawl surveys in Tanzania covered the Zanzibar Channel and south to the Rufiji delta and near Mafia Island, because this area comprised almost 90 percent of the shelf and most of the trawlable substrate (Figure 7.3). Cruise reports (IMR, 1982b, 1983; Myklevoll, 1982) and a summary in a spe-cial report of a NORAD-Tanzania seminar describe survey details and results (IMR, 1983; Iversen and Myklevoll, 1984; Sætersdal et al., 1999).
Ponyfish (semi-demersal Leiognathidae of the gen-era Leiognathus, Secutor and Gazza) predominated
by weight and number in shelf trawls, with Lutjanidae Pristipomoides contributing moderately (Figure 7.3 and Appendix 7.5). Pelagic taxa such as Carangidae Decapterus and Clupeidae Sardinella were also abundant in demersal trawls.
The predominance of Leiognathidae in shal-low shelf waters, and presence of Haemulidae, Trichiuridae, Ariidae, Sciaenidae, Mullidae and Penaeidae (prawns) near river mouths has sub-sequently been confirmed by industrial trawl catches or other research surveys (Fennessy and Everett, 2015). Surveys in 2011 and 2012 for the Southwest Indian Ocean Fisheries Project (SWIOFP) found similar dominant shelf taxa in Kenya (Kaunda-Arara et al., 2016) to those
Figure 7.3 Bottom trawl sampling sites in the East Africa Coastal Current subregion, and catch composition (percentage by weight) by family; 10 trawls on the North Kenya Banks undertaken en route to doing Somali surveys in the 1970s are also included.
40°
0°
-10°
0 125 25062.5
Kilometres
KENYA
TANZANIA
1975 –1983
Shelf Slope
LegendShelfSlope
200mDeep
CarangidaeClupeidaeCrustaceaGempylidaeLeiognathidaeLutjanidaeMullidaeSqualidaeSynodontidaeOthers
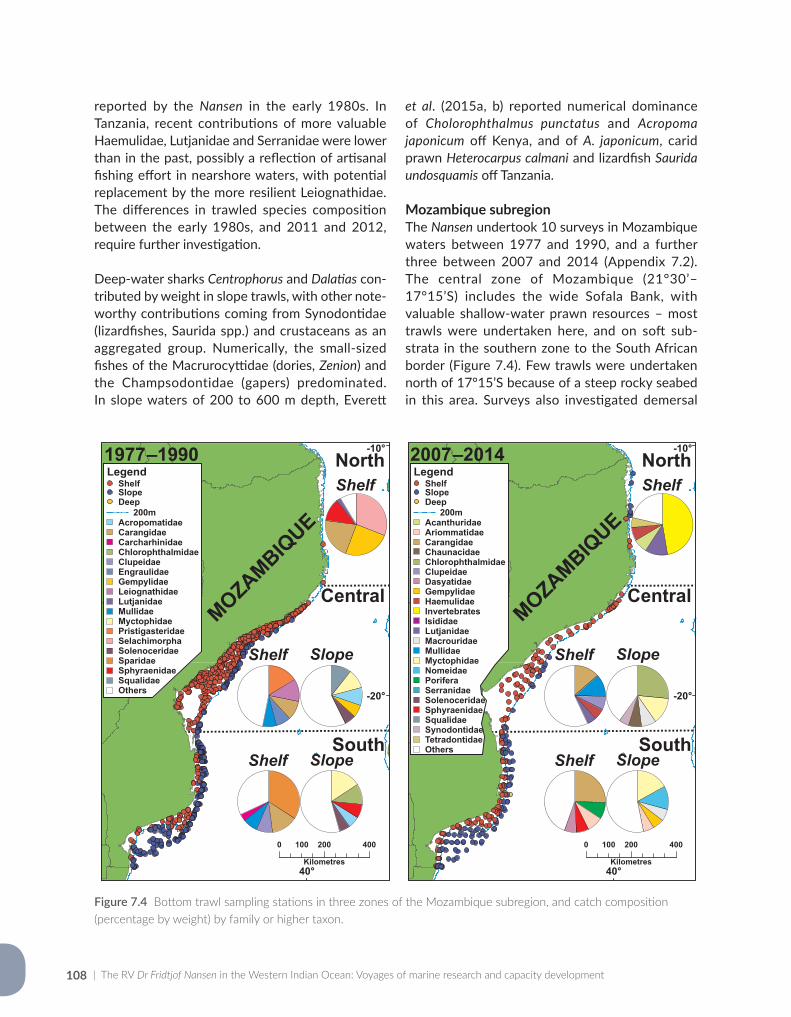
| The RV Dr Fridtjof Nansen in the Western Indian Ocean: Voyages of marine research and capacity development108
reported by the Nansen in the early 1980s. In Tanzania, recent contributions of more valuable Haemulidae, Lutjanidae and Serranidae were lower than in the past, possibly a reflection of artisanal fishing effort in nearshore waters, with potential replacement by the more resilient Leiognathidae. The differences in trawled species composition between the early 1980s, and 2011 and 2012, require further investigation.
Deep-water sharks Centrophorus and Dalatias con-tributed by weight in slope trawls, with other note-worthy contributions coming from Synodontidae (lizardfishes, Saurida spp.) and crustaceans as an aggregated group. Numerically, the small-sized fishes of the Macrurocyttidae (dories, Zenion) and the Champsodontidae (gapers) predominated. In slope waters of 200 to 600 m depth, Everett
et al. (2015a, b) reported numerical dominance of Cholorophthalmus punctatus and Acropoma japonicum off Kenya, and of A. japonicum, carid prawn Heterocarpus calmani and lizardfish Saurida undosquamis off Tanzania.
Mozambique subregionThe Nansen undertook 10 surveys in Mozambique waters between 1977 and 1990, and a further three between 2007 and 2014 (Appendix 7.2). The central zone of Mozambique (21°30’–17°15’S) includes the wide Sofala Bank, with valuable shallow-water prawn resources – most trawls were undertaken here, and on soft sub-strata in the southern zone to the South African border (Figure 7.4). Few trawls were undertaken north of 17°15’S because of a steep rocky seabed in this area. Surveys also investigated demersal
Figure 7.4 Bottom trawl sampling stations in three zones of the Mozambique subregion, and catch composition (percentage by weight) by family or higher taxon.
40°
-10°
-20°
0 200 400100
Kilometres
MOZAMBIQUE
40°
-10°
-20°
0 200 400100
Kilometres
MOZAMBIQUE
North
Central
South
North
Central
South
Shelf Slope
Shelf
Shelf Slope
LegendShelfSlope
200mDeep
AcropomatidaeCarangidaeCarcharhinidaeChlorophthalmidaeClupeidaeEngraulidaeGempylidaeLeiognathidaeLutjanidaeMullidaeMyctophidaePristigasteridae
SolenoceridaeSparidaeSphyraenidaeSqualidae
Selachimorpha
Others
LegendShelfSlope
200mDeep
AcanthuridaeAriommatidaeCarangidaeChaunacidaeChlorophthalmidaeClupeidaeDasyatidaeGempylidaeHaemulidaeInvertebratesIsididaeLutjanidaeMacrouridaeMullidaeMyctophidaeNomeidaePoriferaSerranidaeSolenoceridaeSphyraenidaeSqualidaeSynodontidaeTetradontidaeOthers
Shelf
Shelf Slope
Shelf Slope
1977 –1990 2007 –2014
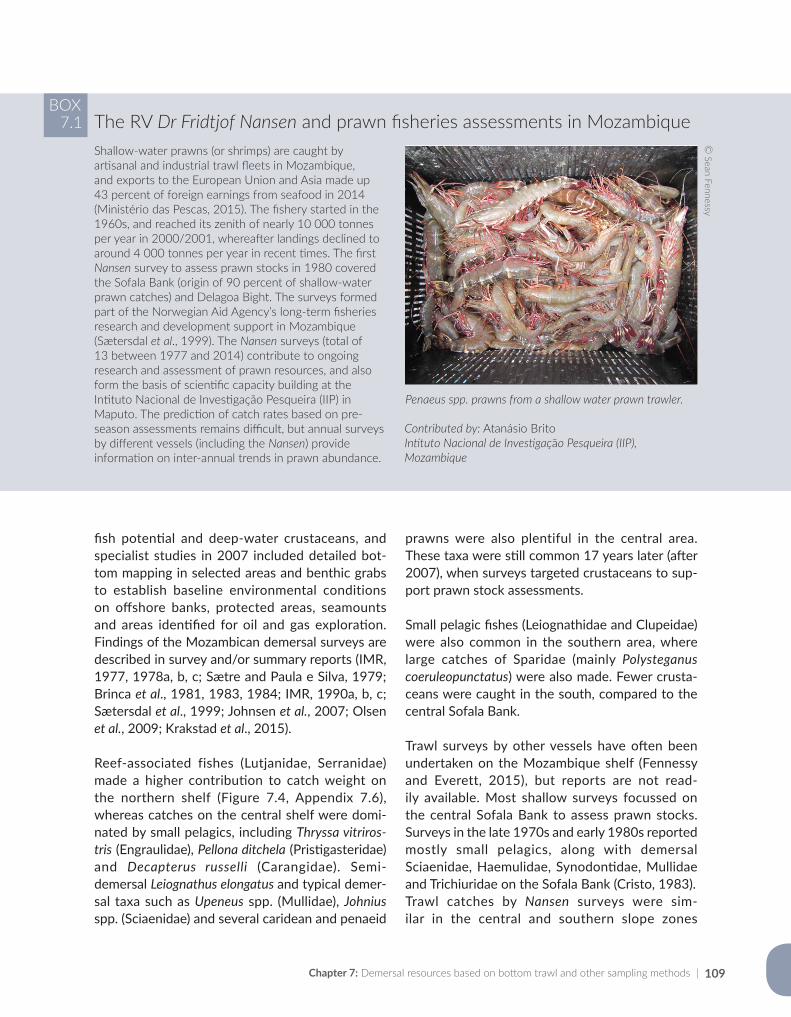
Chapter 7: Demersal resources based on bottom trawl and other sampling methods | 109
fish potential and deep-water crustaceans, and specialist studies in 2007 included detailed bot-tom mapping in selected areas and benthic grabs to establish baseline environmental conditions on offshore banks, protected areas, seamounts and areas identified for oil and gas exploration. Findings of the Mozambican demersal surveys are described in survey and/or summary reports (IMR, 1977, 1978a, b, c; Sætre and Paula e Silva, 1979; Brinca et al., 1981, 1983, 1984; IMR, 1990a, b, c; Sætersdal et al., 1999; Johnsen et al., 2007; Olsen et al., 2009; Krakstad et al., 2015).
Reef-associated fishes (Lutjanidae, Serranidae) made a higher contribution to catch weight on the northern shelf (Figure 7.4, Appendix 7.6), whereas catches on the central shelf were domi-nated by small pelagics, including Thryssa vitriros-tris (Engraulidae), Pellona ditchela (Pristigasteridae) and Decapterus russelli (Carangidae). Semi-demersal Leiognathus elongatus and typical demer-sal taxa such as Upeneus spp. (Mullidae), Johnius spp. (Sciaenidae) and several caridean and penaeid
prawns were also plentiful in the central area. These taxa were still common 17 years later (after 2007), when surveys targeted crustaceans to sup-port prawn stock assessments.
Small pelagic fishes (Leiognathidae and Clupeidae) were also common in the southern area, where large catches of Sparidae (mainly Polysteganus coeruleopunctatus) were also made. Fewer crusta-ceans were caught in the south, compared to the central Sofala Bank.
Trawl surveys by other vessels have often been undertaken on the Mozambique shelf (Fennessy and Everett, 2015), but reports are not read-ily available. Most shallow surveys focussed on the central Sofala Bank to assess prawn stocks. Surveys in the late 1970s and early 1980s reported mostly small pelagics, along with demersal Sciaenidae, Haemulidae, Synodontidae, Mullidae and Trichiuridae on the Sofala Bank (Cristo, 1983). Trawl catches by Nansen surveys were sim-ilar in the central and southern slope zones
Contributed by: Atanásio BritoIntituto Nacional de Investigaҫão Pesqueira (IIP), Mozambique
Shallow-water prawns (or shrimps) are caught by artisanal and industrial trawl fleets in Mozambique, and exports to the European Union and Asia made up 43 percent of foreign earnings from seafood in 2014 (Ministério das Pescas, 2015). The fishery started in the 1960s, and reached its zenith of nearly 10 000 tonnes per year in 2000/2001, whereafter landings declined to around 4 000 tonnes per year in recent times. The first Nansen survey to assess prawn stocks in 1980 covered the Sofala Bank (origin of 90 percent of shallow-water prawn catches) and Delagoa Bight. The surveys formed part of the Norwegian Aid Agency’s long-term fisheries research and development support in Mozambique (Sætersdal et al., 1999). The Nansen surveys (total of 13 between 1977 and 2014) contribute to ongoing research and assessment of prawn resources, and also form the basis of scientific capacity building at the Intituto Nacional de Investigaҫão Pesqueira (IIP) in Maputo. The prediction of catch rates based on pre-season assessments remains difficult, but annual surveys by different vessels (including the Nansen) provide information on inter-annual trends in prawn abundance.
BOX7.1 The RV Dr Fridtjof Nansen and prawn fisheries assessments in Mozambique
© Sean Fennessy
Penaeus spp. prawns from a shallow water prawn trawler.
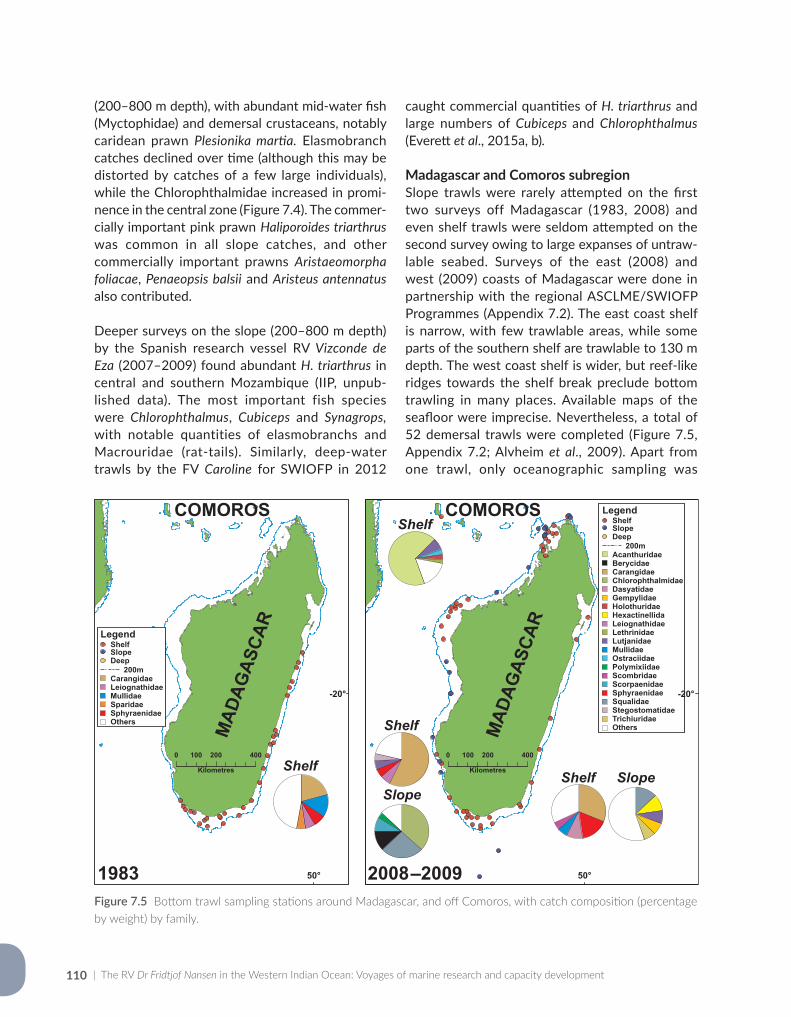
| The RV Dr Fridtjof Nansen in the Western Indian Ocean: Voyages of marine research and capacity development110
(200–800 m depth), with abundant mid-water fish (Myctophidae) and demersal crustaceans, notably caridean prawn Plesionika martia. Elasmobranch catches declined over time (although this may be distorted by catches of a few large individuals), while the Chlorophthalmidae increased in promi-nence in the central zone (Figure 7.4). The commer-cially important pink prawn Haliporoides triarthrus was common in all slope catches, and other commercially important prawns Aristaeomorpha foliacae, Penaeopsis balsii and Aristeus antennatus also contributed.
Deeper surveys on the slope (200–800 m depth) by the Spanish research vessel RV Vizconde de Eza (2007–2009) found abundant H. triarthrus in central and southern Mozambique (IIP, unpub-lished data). The most important fish species were Chlorophthalmus, Cubiceps and Synagrops, with notable quantities of elasmobranchs and Macrouridae (rat-tails). Similarly, deep-water trawls by the FV Caroline for SWIOFP in 2012
caught commercial quantities of H. triarthrus and large numbers of Cubiceps and Chlorophthalmus (Everett et al., 2015a, b).
Madagascar and Comoros subregionSlope trawls were rarely attempted on the first two surveys off Madagascar (1983, 2008) and even shelf trawls were seldom attempted on the second survey owing to large expanses of untraw-lable seabed. Surveys of the east (2008) and west (2009) coasts of Madagascar were done in partnership with the regional ASCLME/SWIOFP Programmes (Appendix 7.2). The east coast shelf is narrow, with few trawlable areas, while some parts of the southern shelf are trawlable to 130 m depth. The west coast shelf is wider, but reef-like ridges towards the shelf break preclude bottom trawling in many places. Available maps of the seafloor were imprecise. Nevertheless, a total of 52 demersal trawls were completed (Figure 7.5, Appendix 7.2; Alvheim et al., 2009). Apart from one trawl, only oceanographic sampling was
Figure 7.5 Bottom trawl sampling stations around Madagascar, and off Comoros, with catch composition (percentage by weight) by family.
50°
-20°
0 200 400100
Kilometres
MAD
AGAS
CAR
COMOROS
1975 - 1993 50°
-20°
0 200 400100
Kilometres
MAD
AGAS
CAR
COMOROS
1994 - 2014
LegendShelfSlope
200mDeep
CarangidaeLeiognathidaeMullidaeSparidaeSphyraenidaeOthers
ShelfShelf Slope
Shelf
Slope
ShelfLegend
ShelfSlope
200mDeep
AcanthuridaeBerycidaeCarangidaeChlorophthalmidaeDasyatidaeGempylidaeHolothuridaeHexactinellidaLeiognathidaeLethrinidaeLutjanidaeMullidaeOstraciidaePolymixiidaeScombridaeScorpaenidaeSphyraenidaeSqualidaeStegostomatidaeTrichiuridaeOthers
1983 2008 –2009
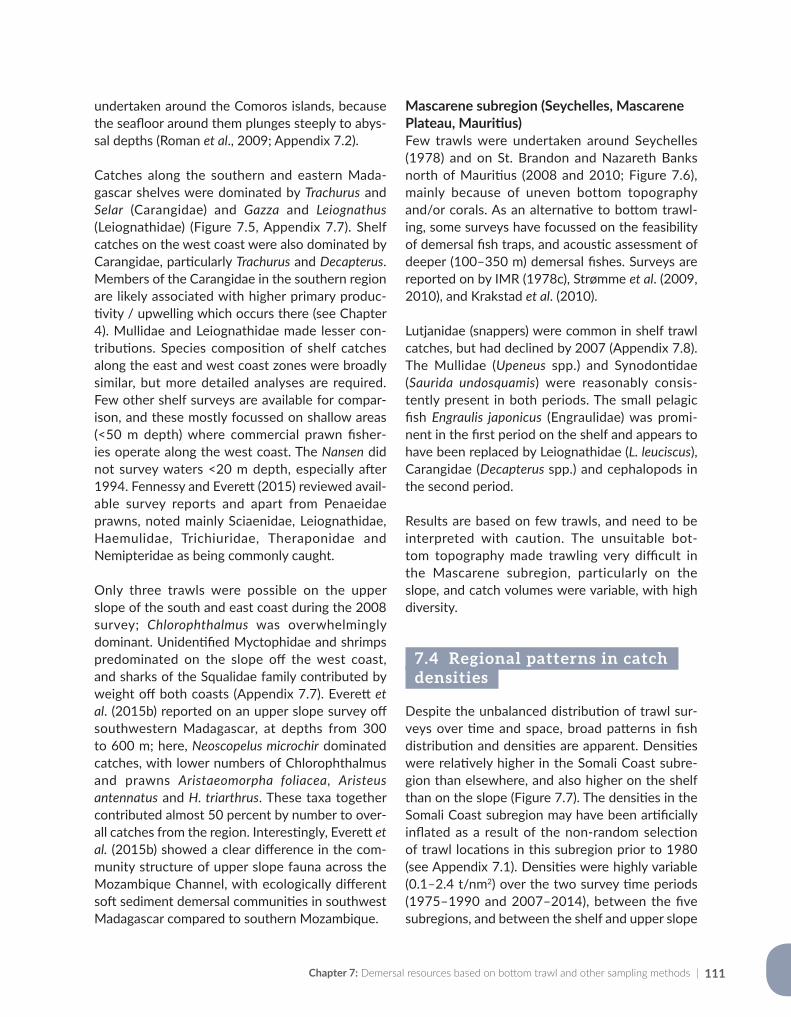
Chapter 7: Demersal resources based on bottom trawl and other sampling methods | 111
undertaken around the Comoros islands, because the seafloor around them plunges steeply to abys-sal depths (Roman et al., 2009; Appendix 7.2).
Catches along the southern and eastern Mada- gascar shelves were dominated by Trachurus and Selar (Carangidae) and Gazza and Leiognathus (Leiognathidae) (Figure 7.5, Appendix 7.7). Shelf catches on the west coast were also dominated by Carangidae, particularly Trachurus and Decapterus. Members of the Carangidae in the southern region are likely associated with higher primary produc-tivity / upwelling which occurs there (see Chapter 4). Mullidae and Leiognathidae made lesser con-tributions. Species composition of shelf catches along the east and west coast zones were broadly similar, but more detailed analyses are required. Few other shelf surveys are available for compar-ison, and these mostly focussed on shallow areas (<50 m depth) where commercial prawn fisher-ies operate along the west coast. The Nansen did not survey waters <20 m depth, especially after 1994. Fennessy and Everett (2015) reviewed avail-able survey reports and apart from Penaeidae prawns, noted mainly Sciaenidae, Leiognathidae, Haemulidae, Trichiuridae, Theraponidae and Nemipteridae as being commonly caught.
Only three trawls were possible on the upper slope of the south and east coast during the 2008 survey; Chlorophthalmus was overwhelmingly dominant. Unidentified Myctophidae and shrimps predominated on the slope off the west coast, and sharks of the Squalidae family contributed by weight off both coasts (Appendix 7.7). Everett et al. (2015b) reported on an upper slope survey off southwestern Madagascar, at depths from 300 to 600 m; here, Neoscopelus microchir dominated catches, with lower numbers of Chlorophthalmus and prawns Aristaeomorpha foliacea, Aristeus antennatus and H. triarthrus. These taxa together contributed almost 50 percent by number to over-all catches from the region. Interestingly, Everett et al. (2015b) showed a clear difference in the com-munity structure of upper slope fauna across the Mozambique Channel, with ecologically different soft sediment demersal communities in southwest Madagascar compared to southern Mozambique.
Mascarene subregion (Seychelles, Mascarene Plateau, Mauritius)Few trawls were undertaken around Seychelles (1978) and on St. Brandon and Nazareth Banks north of Mauritius (2008 and 2010; Figure 7.6), mainly because of uneven bottom topography and/or corals. As an alternative to bottom trawl-ing, some surveys have focussed on the feasibility of demersal fish traps, and acoustic assessment of deeper (100–350 m) demersal fishes. Surveys are reported on by IMR (1978c), Strømme et al. (2009, 2010), and Krakstad et al. (2010).
Lutjanidae (snappers) were common in shelf trawl catches, but had declined by 2007 (Appendix 7.8). The Mullidae (Upeneus spp.) and Synodontidae (Saurida undosquamis) were reasonably consis-tently present in both periods. The small pelagic fish Engraulis japonicus (Engraulidae) was promi-nent in the first period on the shelf and appears to have been replaced by Leiognathidae (L. leuciscus), Carangidae (Decapterus spp.) and cephalopods in the second period.
Results are based on few trawls, and need to be interpreted with caution. The unsuitable bot-tom topography made trawling very difficult in the Mascarene subregion, particularly on the slope, and catch volumes were variable, with high diversity.
7.4 Regional patterns in catch densities
Despite the unbalanced distribution of trawl sur-veys over time and space, broad patterns in fish distribution and densities are apparent. Densities were relatively higher in the Somali Coast subre-gion than elsewhere, and also higher on the shelf than on the slope (Figure 7.7). The densities in the Somali Coast subregion may have been artificially inflated as a result of the non-random selection of trawl locations in this subregion prior to 1980 (see Appendix 7.1). Densities were highly variable (0.1–2.4 t/nm2) over the two survey time periods (1975–1990 and 2007–2014), between the five subregions, and between the shelf and upper slope
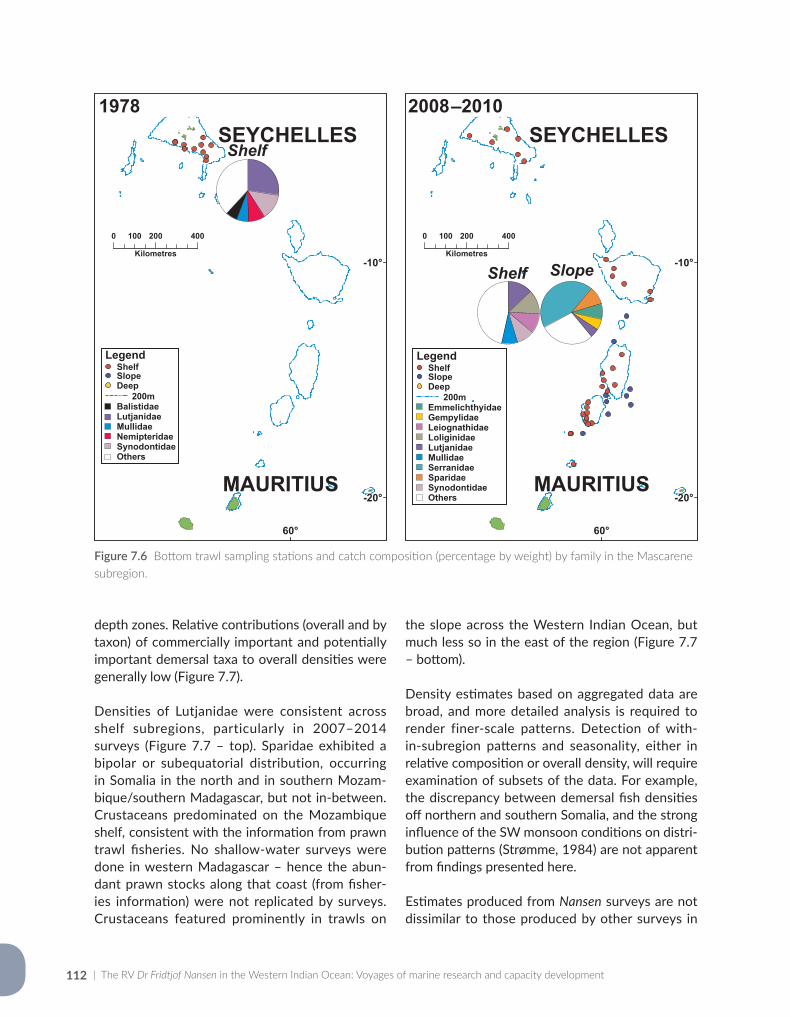
| The RV Dr Fridtjof Nansen in the Western Indian Ocean: Voyages of marine research and capacity development112
depth zones. Relative contributions (overall and by taxon) of commercially important and potentially important demersal taxa to overall densities were generally low (Figure 7.7).
Densities of Lutjanidae were consistent across shelf subregions, particularly in 2007–2014 surveys (Figure 7.7 – top). Sparidae exhibited a bipolar or subequatorial distribution, occurring in Somalia in the north and in southern Mozam- bique/southern Madagascar, but not in-between. Crustaceans predominated on the Mozambique shelf, consistent with the information from prawn trawl fisheries. No shallow-water surveys were done in western Madagascar – hence the abun-dant prawn stocks along that coast (from fisher-ies information) were not replicated by surveys. Crustaceans featured prominently in trawls on
the slope across the Western Indian Ocean, but much less so in the east of the region (Figure 7.7 – bottom).
Density estimates based on aggregated data are broad, and more detailed analysis is required to render finer-scale patterns. Detection of with-in-subregion patterns and seasonality, either in relative composition or overall density, will require examination of subsets of the data. For example, the discrepancy between demersal fish densities off northern and southern Somalia, and the strong influence of the SW monsoon conditions on distri-bution patterns (Strømme, 1984) are not apparent from findings presented here.
Estimates produced from Nansen surveys are not dissimilar to those produced by other surveys in
Figure 7.6 Bottom trawl sampling stations and catch composition (percentage by weight) by family in the Mascarene subregion.
LegendShelfSlope
200mDeep
EmmelichthyidaeGempylidaeLeiognathidaeLoliginidaeLutjanidaeMullidaeSerranidaeSparidaeSynodontidaeOthers
60°
-10°
-20°
0 200 400100
Kilometres
SEYCHELLES
MAURITIUS
1975 - 1993
60°
-10°
-20°
0 200 400100
Kilometres
SEYCHELLES
MAURITIUS
1994 - 2014
Shelf
LegendShelfSlope
200mDeep
BalistidaeLutjanidaeMullidaeNemipteridaeSynodontidaeOthers
Shelf Slope
1978 2008 –2010

Chapter 7: Demersal resources based on bottom trawl and other sampling methods | 113
Figure 7.7 Densities (t/nm2) and percentage relative contributions of commercially important/ potentially important demersal taxa, based on bottom trawl surveys in two time periods, on the shelf (top; 20–200 m depth) and slope (bottom; 200–800 m depth).
60°E50°E40°E
0 250 500
Kilometres
20°S
10°N
0°
10°S
CrustaceaHaemulidaeLethrinidaeLutjanidaeSerranidaeSparidae
MASCARENE0.7 t/nm (31%)2
SOMALIA2.3 t/nm (29%)2
EACC1.0 t/nm (21%)2
MOZAMBIQUECentral
1.3 t/nm (8%)2
MOZAMBIQUENorth
0.1 t/nm (4%)2
MOZAMBIQUESouth
1.1 t/nm (49%)2
MADAGASCAR0.7 t/nm (12%)2
SHELF1975 - 1993Somalia
Kenya
Tanzania
Mozam
bique
Mad
agas
car
Mauritius
Seychelles
Comoros
60°E50°E40°E
0 250 500
Kilometres
20°S
10°N
0°
10°S
CrustaceaHaemulidaeLethrinidaeLutjanidaeSerranidaeSparidae
MASCARENE0.4 t/nm (29%)2
MOZAMBIQUECentral
0.8 t/nm (23%)2
MOZAMBIQUENorth
0.5 t/nm (22%)2
MOZAMBIQUESouth
1.0 t/nm (12%)2
MADAGASCARWest (2009)
0.7 t/nm (9%)2
COMOROS0.5 t/nm (10%)2
MADAGASCAREast (2008)
0.7 t/nm (6%)2
SHELF1994 - 2014Somalia
Kenya
Tanzania
Mozam
bique
Mad
agas
car
Mauritius
Seychelles
Comoros
60°E50°E40°E
0 250 500
Kilometres
20°S
10°N
0°
10°S
SOMALIA1.5 t/nm (11%)2
EACC0.3 t/nm (24%)2
MOZAMBIQUECentral
0.9 t/nm (23%)2
MOZAMBIQUESouth
0.8 t/nm (23%)2
ChlorophthalmidaeCrustaceaEmmelichthyidaeGempylidae
SLOPE1975 - 1993Somalia
Kenya
Tanzania
Mozam
bique
Mad
agas
car
Mauritius
Seychelles
Comoros
60°E50°E40°E
0 250 500
Kilometres
20°S
10°N
0°
10°S
MASCARENE0.2 t/nm (9%)2
MOZAMBIQUECentral
0.1 t/nm (33%)2
MOZAMBIQUENorth
0.5 t/nm (14%)2
MOZAMBIQUESouth
1.0 t/nm (16%)2
MADAGASCARWest (2009)
0.4 t/nm (17%)2
MADAGASCAREast (2008)
1.3 t/nm (37%)2
ChlorophthalmidaeCrustaceaEmmelichthyidaeGempylidae
SLOPE1994 - 2014Somalia
Kenya
Tanzania
Mozam
bique
Mad
agas
car
Mauritius
Seychelles
Comoros
1975 –1990 2007 –2014
2007 –20141975 –1990
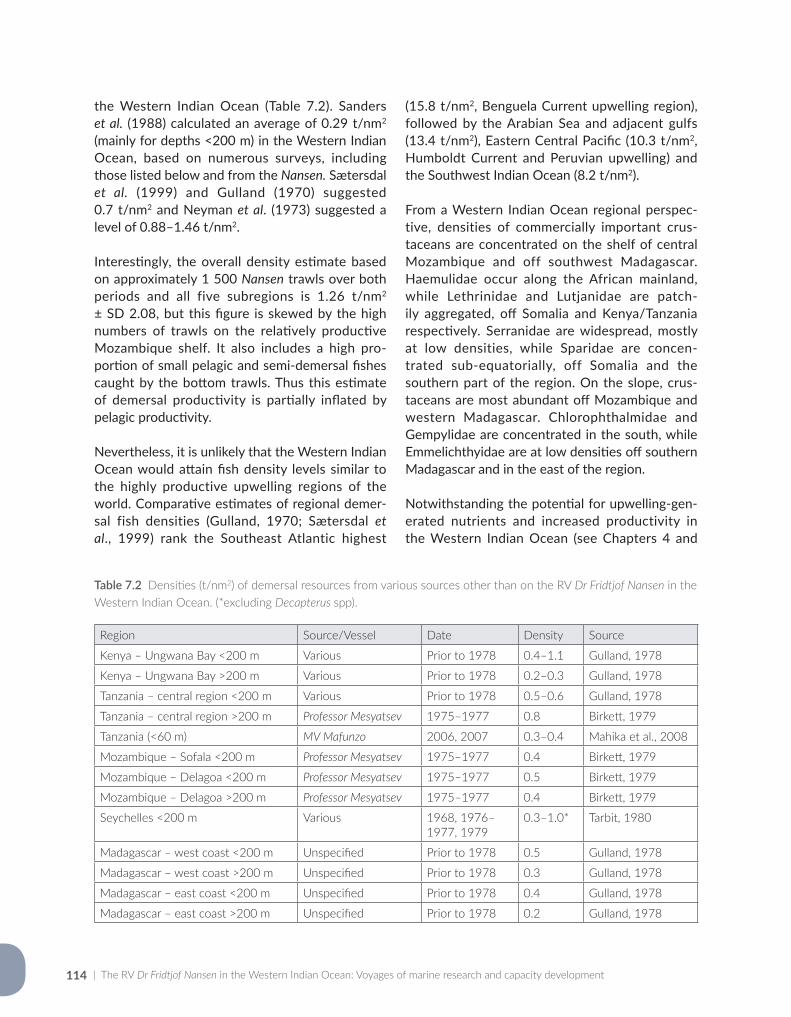
| The RV Dr Fridtjof Nansen in the Western Indian Ocean: Voyages of marine research and capacity development114
the Western Indian Ocean (Table 7.2). Sanders et al. (1988) calculated an average of 0.29 t/nm2 (mainly for depths <200 m) in the Western Indian Ocean, based on numerous surveys, including those listed below and from the Nansen. Sætersdal et al. (1999) and Gulland (1970) suggested 0.7 t/nm2 and Neyman et al. (1973) suggested a level of 0.88–1.46 t/nm2.
Interestingly, the overall density estimate based on approximately 1 500 Nansen trawls over both periods and all five subregions is 1.26 t/nm2 ± SD 2.08, but this figure is skewed by the high numbers of trawls on the relatively productive Mozambique shelf. It also includes a high pro-portion of small pelagic and semi-demersal fishes caught by the bottom trawls. Thus this estimate of demersal productivity is partially inflated by pelagic productivity.
Nevertheless, it is unlikely that the Western Indian Ocean would attain fish density levels similar to the highly productive upwelling regions of the world. Comparative estimates of regional demer-sal fish densities (Gulland, 1970; Sætersdal et al., 1999) rank the Southeast Atlantic highest
(15.8 t/nm2, Benguela Current upwelling region), followed by the Arabian Sea and adjacent gulfs (13.4 t/nm2), Eastern Central Pacific (10.3 t/nm2, Humboldt Current and Peruvian upwelling) and the Southwest Indian Ocean (8.2 t/nm2).
From a Western Indian Ocean regional perspec-tive, densities of commercially important crus-taceans are concentrated on the shelf of central Mozambique and off southwest Madagascar. Haemulidae occur along the African mainland, while Lethrinidae and Lutjanidae are patch-ily aggregated, off Somalia and Kenya/Tanzania respectively. Serranidae are widespread, mostly at low densities, while Sparidae are concen-trated sub-equatorially, off Somalia and the southern part of the region. On the slope, crus-taceans are most abundant off Mozambique and western Madagascar. Chlorophthalmidae and Gempylidae are concentrated in the south, while Emmelichthyidae are at low densities off southern Madagascar and in the east of the region.
Notwithstanding the potential for upwelling-gen-erated nutrients and increased productivity in the Western Indian Ocean (see Chapters 4 and
Region Source/Vessel Date Density Source
Kenya – Ungwana Bay <200 m Various Prior to 1978 0.4–1.1 Gulland, 1978
Kenya – Ungwana Bay >200 m Various Prior to 1978 0.2–0.3 Gulland, 1978
Tanzania – central region <200 m Various Prior to 1978 0.5–0.6 Gulland, 1978
Tanzania – central region >200 m Professor Mesyatsev 1975–1977 0.8 Birkett, 1979
Tanzania (<60 m) MV Mafunzo 2006, 2007 0.3–0.4 Mahika et al., 2008
Mozambique – Sofala <200 m Professor Mesyatsev 1975–1977 0.4 Birkett, 1979
Mozambique – Delagoa <200 m Professor Mesyatsev 1975–1977 0.5 Birkett, 1979
Mozambique – Delagoa >200 m Professor Mesyatsev 1975–1977 0.4 Birkett, 1979
Seychelles <200 m Various 1968, 1976–1977, 1979
0.3–1.0* Tarbit, 1980
Madagascar – west coast <200 m Unspecified Prior to 1978 0.5 Gulland, 1978
Madagascar – west coast >200 m Unspecified Prior to 1978 0.3 Gulland, 1978
Madagascar – east coast <200 m Unspecified Prior to 1978 0.4 Gulland, 1978
Madagascar – east coast >200 m Unspecified Prior to 1978 0.2 Gulland, 1978
Table 7.2 Densities (t/nm2) of demersal resources from various sources other than on the RV Dr Fridtjof Nansen in the Western Indian Ocean. (*excluding Decapterus spp).
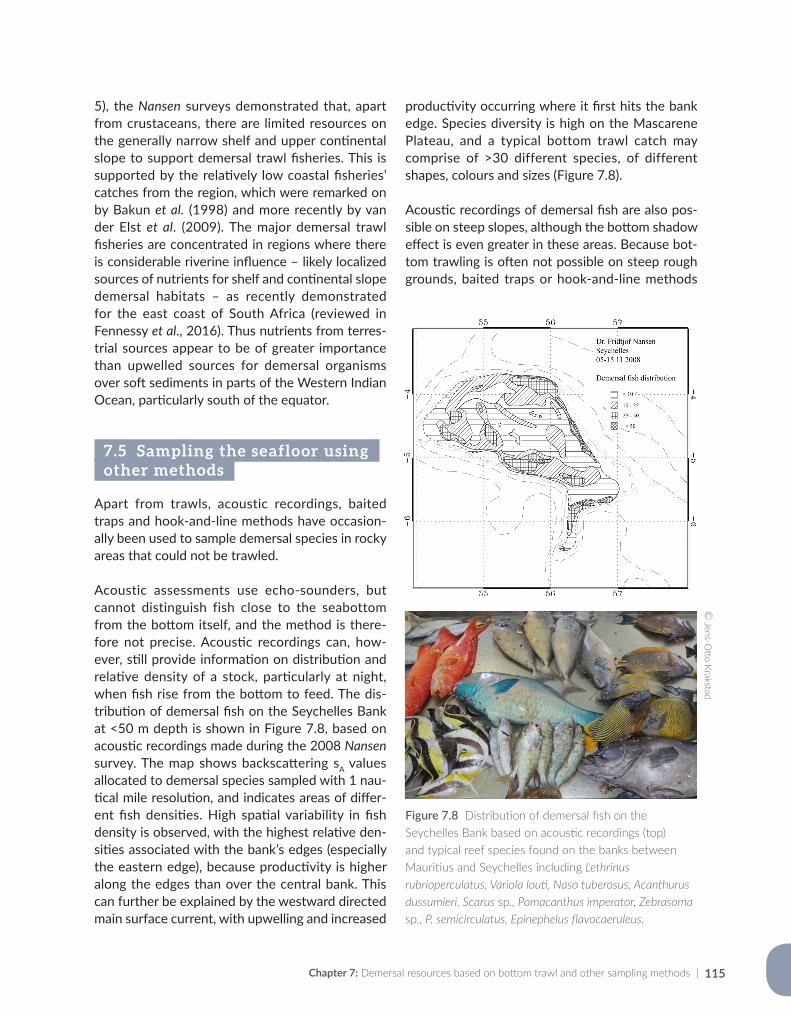
Chapter 7: Demersal resources based on bottom trawl and other sampling methods | 115
5), the Nansen surveys demonstrated that, apart from crustaceans, there are limited resources on the generally narrow shelf and upper continental slope to support demersal trawl fisheries. This is supported by the relatively low coastal fisheries’ catches from the region, which were remarked on by Bakun et al. (1998) and more recently by van der Elst et al. (2009). The major demersal trawl fisheries are concentrated in regions where there is considerable riverine influence – likely localized sources of nutrients for shelf and continental slope demersal habitats – as recently demonstrated for the east coast of South Africa (reviewed in Fennessy et al., 2016). Thus nutrients from terres-trial sources appear to be of greater importance than upwelled sources for demersal organisms over soft sediments in parts of the Western Indian Ocean, particularly south of the equator.
7.5 Sampling the seafloor using other methods
Apart from trawls, acoustic recordings, baited traps and hook-and-line methods have occasion-ally been used to sample demersal species in rocky areas that could not be trawled.
Acoustic assessments use echo-sounders, but cannot distinguish fish close to the seabottom from the bottom itself, and the method is there-fore not precise. Acoustic recordings can, how-ever, still provide information on distribution and relative density of a stock, particularly at night, when fish rise from the bottom to feed. The dis-tribution of demersal fish on the Seychelles Bank at <50 m depth is shown in Figure 7.8, based on acoustic recordings made during the 2008 Nansen survey. The map shows backscattering sA values allocated to demersal species sampled with 1 nau-tical mile resolution, and indicates areas of differ-ent fish densities. High spatial variability in fish density is observed, with the highest relative den-sities associated with the bank’s edges (especially the eastern edge), because productivity is higher along the edges than over the central bank. This can further be explained by the westward directed main surface current, with upwelling and increased
productivity occurring where it first hits the bank edge. Species diversity is high on the Mascarene Plateau, and a typical bottom trawl catch may comprise of >30 different species, of different shapes, colours and sizes (Figure 7.8).
Acoustic recordings of demersal fish are also pos-sible on steep slopes, although the bottom shadow effect is even greater in these areas. Because bot-tom trawling is often not possible on steep rough grounds, baited traps or hook-and-line methods
Figure 7.8 Distribution of demersal fish on the Seychelles Bank based on acoustic recordings (top) and typical reef species found on the banks between Mauritius and Seychelles including Lethrinus rubrioperculatus, Variola louti, Naso tuberosus, Acanthurus dussumieri, Scarus sp., Pomacanthus imperator, Zebrasoma sp., P. semicirculatus, Epinephelus flavocaeruleus.
© Jens-O
tto Krakstad
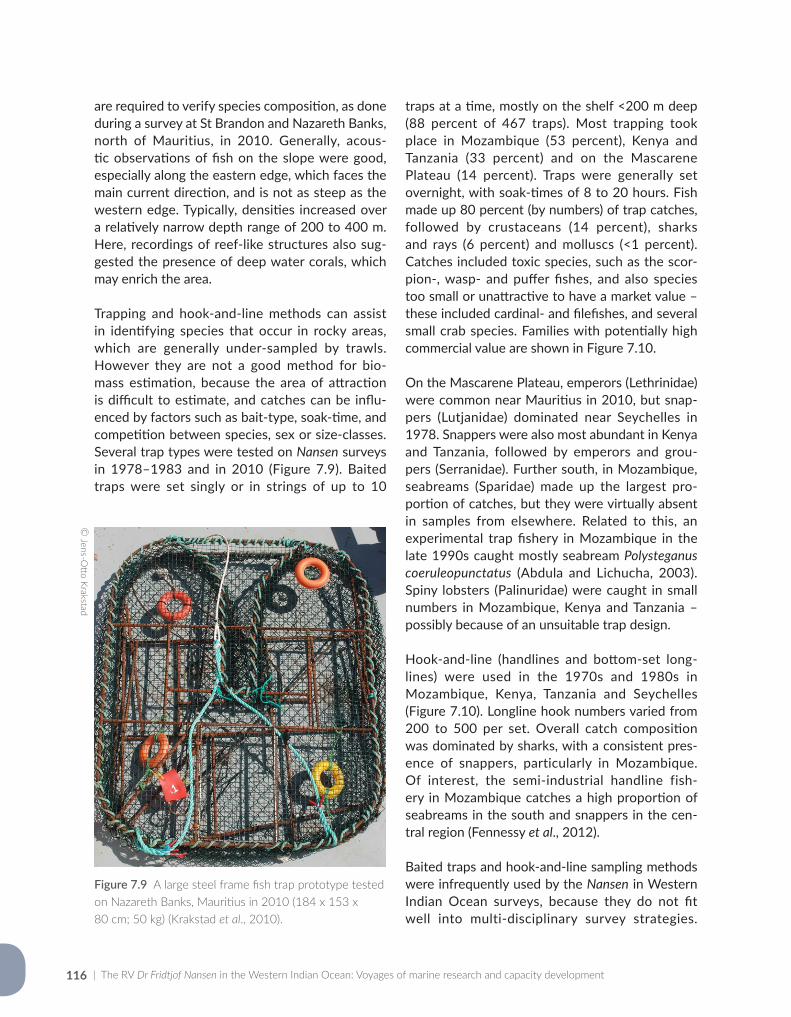
| The RV Dr Fridtjof Nansen in the Western Indian Ocean: Voyages of marine research and capacity development116
are required to verify species composition, as done during a survey at St Brandon and Nazareth Banks, north of Mauritius, in 2010. Generally, acous-tic observations of fish on the slope were good, especially along the eastern edge, which faces the main current direction, and is not as steep as the western edge. Typically, densities increased over a relatively narrow depth range of 200 to 400 m. Here, recordings of reef-like structures also sug-gested the presence of deep water corals, which may enrich the area.
Trapping and hook-and-line methods can assist in identifying species that occur in rocky areas, which are generally under-sampled by trawls. However they are not a good method for bio-mass estimation, because the area of attraction is difficult to estimate, and catches can be influ-enced by factors such as bait-type, soak-time, and competition between species, sex or size-classes. Several trap types were tested on Nansen surveys in 1978–1983 and in 2010 (Figure 7.9). Baited traps were set singly or in strings of up to 10
traps at a time, mostly on the shelf <200 m deep (88 percent of 467 traps). Most trapping took place in Mozambique (53 percent), Kenya and Tanzania (33 percent) and on the Mascarene Plateau (14 percent). Traps were generally set overnight, with soak-times of 8 to 20 hours. Fish made up 80 percent (by numbers) of trap catches, followed by crustaceans (14 percent), sharks and rays (6 percent) and molluscs (<1 percent). Catches included toxic species, such as the scor-pion-, wasp- and puffer fishes, and also species too small or unattractive to have a market value – these included cardinal- and filefishes, and several small crab species. Families with potentially high commercial value are shown in Figure 7.10.
On the Mascarene Plateau, emperors (Lethrinidae) were common near Mauritius in 2010, but snap-pers (Lutjanidae) dominated near Seychelles in 1978. Snappers were also most abundant in Kenya and Tanzania, followed by emperors and grou-pers (Serranidae). Further south, in Mozambique, seabreams (Sparidae) made up the largest pro-portion of catches, but they were virtually absent in samples from elsewhere. Related to this, an experimental trap fishery in Mozambique in the late 1990s caught mostly seabream Polysteganus coeruleopunctatus (Abdula and Lichucha, 2003). Spiny lobsters (Palinuridae) were caught in small numbers in Mozambique, Kenya and Tanzania – possibly because of an unsuitable trap design.
Hook-and-line (handlines and bottom-set long-lines) were used in the 1970s and 1980s in Mozambique, Kenya, Tanzania and Seychelles (Figure 7.10). Longline hook numbers varied from 200 to 500 per set. Overall catch composition was dominated by sharks, with a consistent pres-ence of snappers, particularly in Mozambique. Of interest, the semi-industrial handline fish-ery in Mozambique catches a high proportion of seabreams in the south and snappers in the cen-tral region (Fennessy et al., 2012).
Baited traps and hook-and-line sampling methods were infrequently used by the Nansen in Western Indian Ocean surveys, because they do not fit well into multi-disciplinary survey strategies.
Figure 7.9 A large steel frame fish trap prototype tested on Nazareth Banks, Mauritius in 2010 (184 x 153 x 80 cm; 50 kg) (Krakstad et al., 2010).
© Jens-O
tto Krakstad
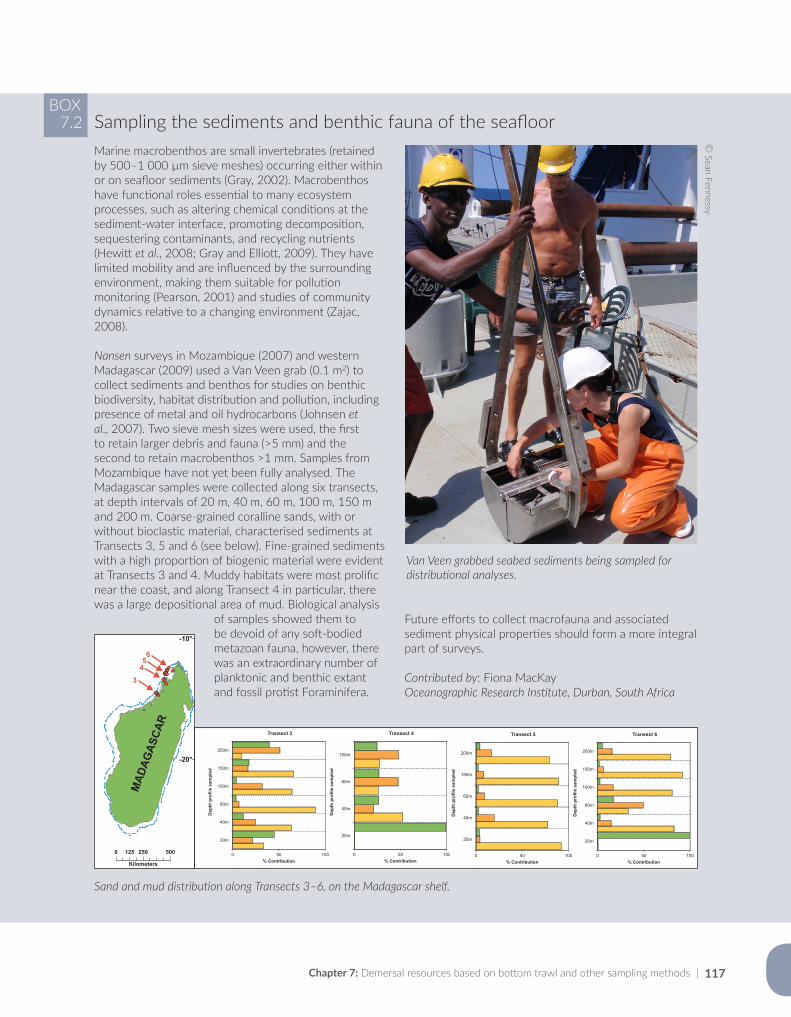
Chapter 7: Demersal resources based on bottom trawl and other sampling methods | 117
0 50 100
20m
40m
60m
100m
150m
200m
% Contribution
Dep
thpr
ofile
sam
pled
Transect 3
0 50 100
20m
40m
60m
100m
% Contribution
Dep
thpr
ofile
sam
pled
Transect 4
0 50 100
20m
40m
60m
150m
200m
% Contribution
Dep
thpr
ofile
sam
pled
Transect 5
0 50 100
20m
40m
60m
100m
150m
200m
% Contribution
Dep
thpr
ofile
sam
pled
Transect 6
Marine macrobenthos are small invertebrates (retained by 500–1 000 µm sieve meshes) occurring either within or on seafloor sediments (Gray, 2002). Macrobenthos have functional roles essential to many ecosystem processes, such as altering chemical conditions at the sediment-water interface, promoting decomposition, sequestering contaminants, and recycling nutrients (Hewitt et al., 2008; Gray and Elliott, 2009). They have limited mobility and are influenced by the surrounding environment, making them suitable for pollution monitoring (Pearson, 2001) and studies of community dynamics relative to a changing environment (Zajac, 2008).
Nansen surveys in Mozambique (2007) and western Madagascar (2009) used a Van Veen grab (0.1 m2) to collect sediments and benthos for studies on benthic biodiversity, habitat distribution and pollution, including presence of metal and oil hydrocarbons (Johnsen et al., 2007). Two sieve mesh sizes were used, the first to retain larger debris and fauna (>5 mm) and the second to retain macrobenthos >1 mm. Samples from Mozambique have not yet been fully analysed. The Madagascar samples were collected along six transects, at depth intervals of 20 m, 40 m, 60 m, 100 m, 150 m and 200 m. Coarse-grained coralline sands, with or without bioclastic material, characterised sediments at Transects 3, 5 and 6 (see below). Fine-grained sediments with a high proportion of biogenic material were evident at Transects 3 and 4. Muddy habitats were most prolific near the coast, and along Transect 4 in particular, there was a large depositional area of mud. Biological analysis
of samples showed them to be devoid of any soft-bodied metazoan fauna, however, there was an extraordinary number of planktonic and benthic extant and fossil protist Foraminifera.
BOX7.2 Sampling the sediments and benthic fauna of the seafloor
© Sean Fennessy
Future efforts to collect macrofauna and associated sediment physical properties should form a more integral part of surveys.
Contributed by: Fiona MacKayOceanographic Research Institute, Durban, South Africa
0 50 100
20m
40m
60m
100m
150m
200m
% Contribution
Dep
thpr
ofile
sam
pled
Transect 3
0 50 100
20m
40m
60m
100m
% Contribution
Dep
thpr
ofile
sam
pled
Transect 4
0 50 100
20m
40m
60m
150m
200m
% Contribution
Dep
thpr
ofile
sam
pled
Transect 5
0 50 100
20m
40m
60m
100m
150m
200m
% Contribution
Dep
thpr
ofile
sam
pled
Transect 6
Sand and mud distribution along Transects 3–6, on the Madagascar shelf.
Van Veen grabbed seabed sediments being sampled for distributional analyses.
-10°
-20°
0 250 500125
Kilometers
MAD
AGAS
CAR
3456
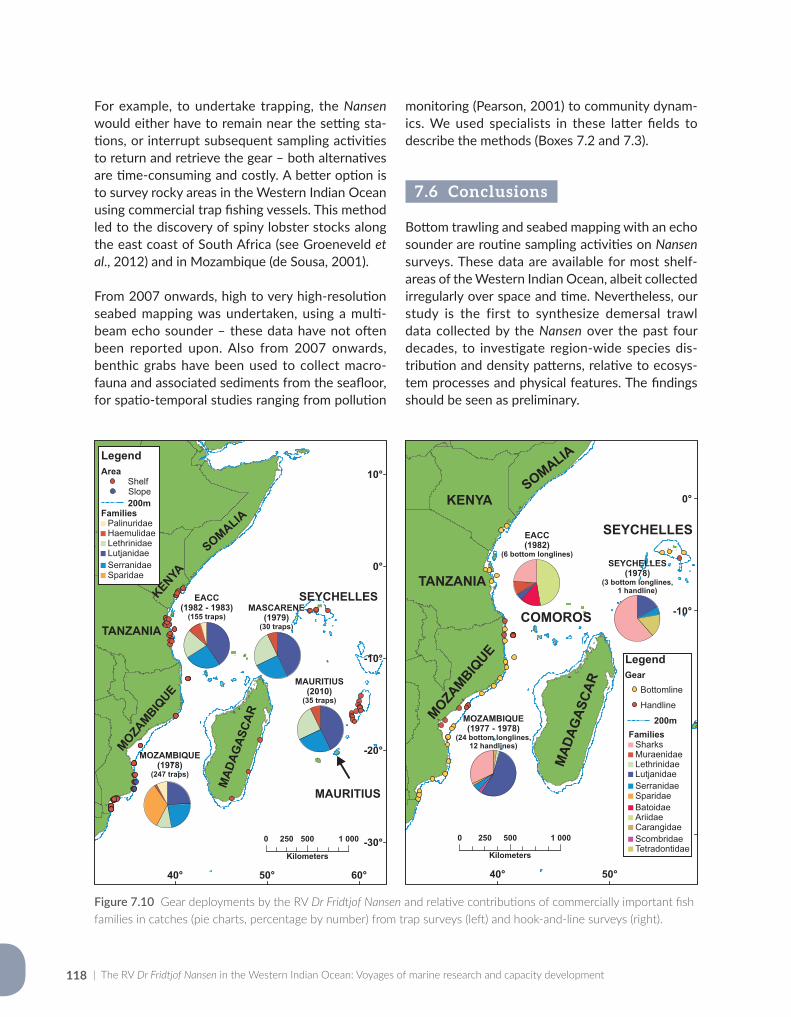
| The RV Dr Fridtjof Nansen in the Western Indian Ocean: Voyages of marine research and capacity development118
For example, to undertake trapping, the Nansen would either have to remain near the setting sta-tions, or interrupt subsequent sampling activities to return and retrieve the gear – both alternatives are time-consuming and costly. A better option is to survey rocky areas in the Western Indian Ocean using commercial trap fishing vessels. This method led to the discovery of spiny lobster stocks along the east coast of South Africa (see Groeneveld et al., 2012) and in Mozambique (de Sousa, 2001).
From 2007 onwards, high to very high-resolution seabed mapping was undertaken, using a multi-beam echo sounder – these data have not often been reported upon. Also from 2007 onwards, benthic grabs have been used to collect macro-fauna and associated sediments from the seafloor, for spatio-temporal studies ranging from pollution
monitoring (Pearson, 2001) to community dynam-ics. We used specialists in these latter fields to describe the methods (Boxes 7.2 and 7.3).
7.6 Conclusions
Bottom trawling and seabed mapping with an echo sounder are routine sampling activities on Nansen surveys. These data are available for most shelf- areas of the Western Indian Ocean, albeit collected irregularly over space and time. Nevertheless, our study is the first to synthesize demersal trawl data collected by the Nansen over the past four decades, to investigate region-wide species dis-tribution and density patterns, relative to ecosys-tem processes and physical features. The findings should be seen as preliminary.
Figure 7.10 Gear deployments by the RV Dr Fridtjof Nansen and relative contributions of commercially important fish families in catches (pie charts, percentage by number) from trap surveys (left) and hook-and-line surveys (right).
50°40°
0°
-10°
-20°
-30°0 500 1 000250
Kilometers
SOMALIA
KENYA
TANZANIA
MOZAMBIQ
UE
MAD
AGAS
CAR
COMOROS
SEYCHELLES
LegendGear
BottomlineHandline
200m
SharksMuraenidaeLethrinidaeLutjanidaeSerranidaeSparidae
Families
BatoidaeAriidaeCarangidaeScombridaeTetradontidae
MOZAMBIQUE(1977 - 1978)
(24 bottom longlines,12 handlines)
EACC(1982)
(6 bottom longlines)SEYCHELLES
(1978)(3 bottom longlines,
1 handline)
60°50°40°
10°
0°
-10°
-20°
-30°0 500 1 000250
Kilometers
LegendArea
ShelfSlope200m
PalinuridaeHaemulidaeLethrinidaeLutjanidaeSerranidaeSparidae
Families
SOMALIA
KENYA
TANZANIA
MOZAMBIQ
UE
MAD
AGAS
CAR
MAURITIUS
SEYCHELLES
MOZAMBIQUE(1978)
(247 traps)
EACC(1982 - 1983)
(155 traps)MASCARENE
(1979)(30 traps)
MAURITIUS(2010)
(35 traps)
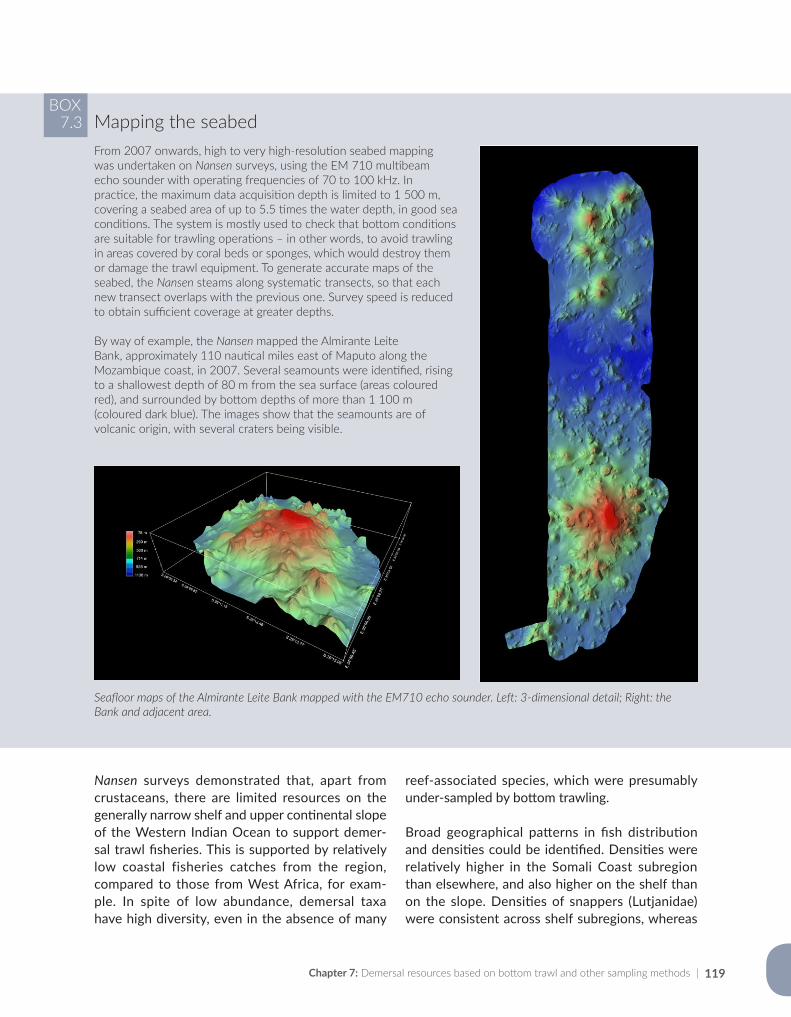
Chapter 7: Demersal resources based on bottom trawl and other sampling methods | 119
From 2007 onwards, high to very high-resolution seabed mapping was undertaken on Nansen surveys, using the EM 710 multibeam echo sounder with operating frequencies of 70 to 100 kHz. In practice, the maximum data acquisition depth is limited to 1 500 m, covering a seabed area of up to 5.5 times the water depth, in good sea conditions. The system is mostly used to check that bottom conditions are suitable for trawling operations – in other words, to avoid trawling in areas covered by coral beds or sponges, which would destroy them or damage the trawl equipment. To generate accurate maps of the seabed, the Nansen steams along systematic transects, so that each new transect overlaps with the previous one. Survey speed is reduced to obtain sufficient coverage at greater depths.
By way of example, the Nansen mapped the Almirante Leite Bank, approximately 110 nautical miles east of Maputo along the Mozambique coast, in 2007. Several seamounts were identified, rising to a shallowest depth of 80 m from the sea surface (areas coloured red), and surrounded by bottom depths of more than 1 100 m (coloured dark blue). The images show that the seamounts are of volcanic origin, with several craters being visible.
BOX7.3 Mapping the seabed
Seafloor maps of the Almirante Leite Bank mapped with the EM710 echo sounder. Left: 3-dimensional detail; Right: the Bank and adjacent area.
Nansen surveys demonstrated that, apart from crustaceans, there are limited resources on the generally narrow shelf and upper continental slope of the Western Indian Ocean to support demer-sal trawl fisheries. This is supported by relatively low coastal fisheries catches from the region, compared to those from West Africa, for exam-ple. In spite of low abundance, demersal taxa have high diversity, even in the absence of many
reef-associated species, which were presumably under-sampled by bottom trawling.
Broad geographical patterns in fish distribution and densities could be identified. Densities were relatively higher in the Somali Coast subregion than elsewhere, and also higher on the shelf than on the slope. Densities of snappers (Lutjanidae) were consistent across shelf subregions, whereas
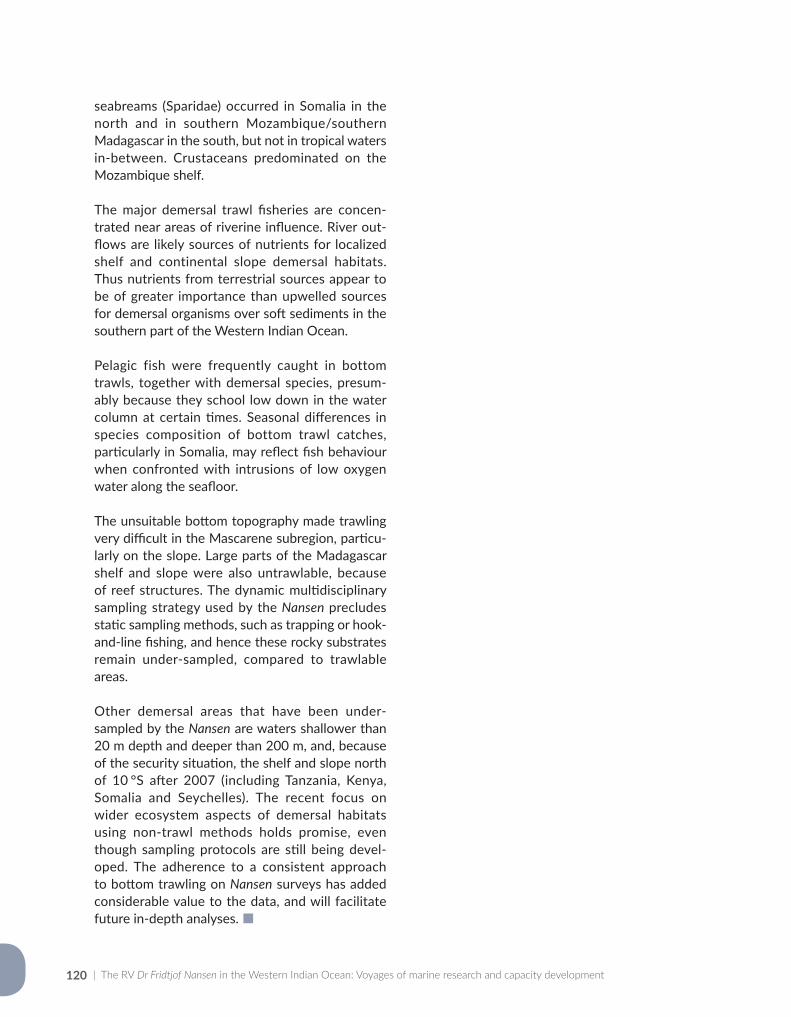
| The RV Dr Fridtjof Nansen in the Western Indian Ocean: Voyages of marine research and capacity development120
seabreams (Sparidae) occurred in Somalia in the north and in southern Mozambique/southern Madagascar in the south, but not in tropical waters in-between. Crustaceans predominated on the Mozambique shelf.
The major demersal trawl fisheries are concen-trated near areas of riverine influence. River out-flows are likely sources of nutrients for localized shelf and continental slope demersal habitats. Thus nutrients from terrestrial sources appear to be of greater importance than upwelled sources for demersal organisms over soft sediments in the southern part of the Western Indian Ocean.
Pelagic fish were frequently caught in bottom trawls, together with demersal species, presum-ably because they school low down in the water column at certain times. Seasonal differences in species composition of bottom trawl catches, particularly in Somalia, may reflect fish behaviour when confronted with intrusions of low oxygen water along the seafloor.
The unsuitable bottom topography made trawling very difficult in the Mascarene subregion, particu-larly on the slope. Large parts of the Madagascar shelf and slope were also untrawlable, because of reef structures. The dynamic multidisciplinary sampling strategy used by the Nansen precludes static sampling methods, such as trapping or hook-and-line fishing, and hence these rocky substrates remain under-sampled, compared to trawlable areas.
Other demersal areas that have been under- sampled by the Nansen are waters shallower than 20 m depth and deeper than 200 m, and, because of the security situation, the shelf and slope north of 10 °S after 2007 (including Tanzania, Kenya, Somalia and Seychelles). The recent focus on wider ecosystem aspects of demersal habitats using non-trawl methods holds promise, even though sampling protocols are still being devel-oped. The adherence to a consistent approach to bottom trawling on Nansen surveys has added considerable value to the data, and will facilitate future in-depth analyses.
121Chapter 7: Demersal resources and biodiversity based on bottom trawl and other sampling methods |
References
Abdula, R. & Lichucha, I. 2003. Análise de dados colhidos a bordo da embarcação Cassiopeia de 7 a 15 de Maio de 1999 [Analysis of data collected on board the vessel Cassiopeia 7 to May 15, 1999]. Boletim de Divulgação, Instituto de Investigação Pesqueira, Mozambique, 36: 1–20.
Alvheim, O., Torstensen, E., Fennessy, S., MacKay, F., Zaera, D. & Bemiasa, J. 2009. West Madagascar: Pelagic Ecosystem Survey SWIOFP/ASCLME/FAO 2009 Cruise 2, 25 August–03 October 2009. Preliminary report. Bergen, Norway, Institute of Marine Research.
Bakun, A., Claude, R. & Lluch-Cota, S. 1998. Coastal upwelling and other processes regulating ecosystem productivity and fish production in the Western Indian Ocean. In: K. Sherman, E. Okemwa & M. Ntiba, eds. Large Marine Ecosystems of the Indian Ocean: Assessment, Sustainability and Management, pp. 103–141. Malden, USA, Blackwell Science, Inc.
Bianchi, G. 1992. Demersal Assemblages of Tropical Continental Shelves. A study based on the data collected through the surveys of the R/V ‘Dr Fridtjof Nansen’. Bergen, Norway, University of Bergen (Thesis for the fulfillment of the Dr. Scient. degree).
Birkett, L. 1979. Western Indian Ocean Fishery Resources Survey. Report on the Cruises of RV “Professor Mesyatsev” December 1975–June 1976 / July 1977–December 1977. Report No. 26. Techical Report Indian Ocean Programme.
Blindheim, J. 1984. Preliminary Cruise Report of R/V “Dr Fridtjof Nansen”. Fishery Resources Surveys in P.D.R. Yemen and Ethiopia, 11 February–21 March 1984. Bergen, Norway, Institute of Marine Research.
Brinca, L., Rey, F., Silva, C. & Sætre, R. 1981. A Survey of the Marine Fish Resources of Mozambique, October–November 1980. Bergen, Norway, Institute of Marine Research.
Brinca, L., Jorge da Silva, A., Sousa, L., Sousa, I. & Sætre, R. 1983. A Survey of the Fish Resources at Sofala Bank, Mozambique, September 1982. Bergen, Norway, Institute of Marine Research.
Brinca, L., Mascarenhas, V., Palha de Sousa, B., Palha de Sousa, L., Sousa, I., Sætre, R. & Timochin, I. 1984. A Survey of the Fish Resources at Sofala Bank, Mozambique, May–June 1983. Bergen, Norway, Institute of Marine Research.
Cristo, M. 1983. Compilaçao de dados sobre fauna acompanhante do camarão em Moçambique [Compilation of data on shrimp accompanying fauna in Mozambique]. Boletim de Divulgação, Instituto de Investigação Pesqueira, Mozambique, 2: 1–12.
de Sousa, B. 2001. Fishery for the deep-water spiny lobster Palinurus delagoae in Mozambique, 1980 to 1999. Marine and Freshwater Research, 52(8): 1535–1540.
Everett, B., Groeneveld, J., Fennessy, S., Dias, N., Filipe, O., Zacarias, L., Igulu, M., Kuguru, B., Kimani, E. & Munga, C. 2015a. Composition and abundance of deep-water crustaceans in the Southwest Indian Ocean: Enough to support trawl fisheries? Ocean & Coastal Management, 111: 50–61.
Everett, B., Groeneveld, J., Fennessy, S., Porter, S., Munga, C., Diaz, N., Filipe, O., Zacarias, L., Igulu, M. & Kuguru, B. 2015b. Demersal trawl surveys show ecological gradients in Southwest Indian Ocean slope fauna. Western Indian Ocean Journal of Marine Science, 14(1&2): 73–92.
Fennessy, S., Mutombene, R., Simango, A., Cuco, C. & van der Elst, R. 2012. Mozambique linefish assessment 2011. Report No. 14. Mozambique, Relatório Interno de Investigação Pesqueira.
Fennessy, S. & Everett, B. 2015. Crustacean shallow-water trawl fisheries, a retrospective analysis of their status in the Southwest Indian Ocean. In: R. van der Elst & B. Everett, eds. Offshore fisheries of the Southwest Indian Ocean: their status and the impact on vulnerable species, pp. 448. Durban, South Africa, Oceanographic Research Institute, Special Publication, 10.
Fennessy, S., Roberts, M. & Barlow, R. 2016. An editorial synthesis of the ACEP project: Ecosystem Processes in the KwaZulu-Natal Bight. African Journal of Marine Science, 38(sup1): S217–S223.
Gray, J. 2002. Species richness of marine soft sediments. Marine Ecology Progress Series, 244: 285–297.Gray, J. & Elliott, M. 2009. The ecology of marine sediments: from science to management. Oxford, Oxford University
Press.
| The RV Dr Fridtjof Nansen in the Western Indian Ocean: Voyages of marine research and capacity development122
Groeneveld, J., Kirkman, S., Boucher, M. & Yemane, D. 2012. From biomass mining to sustainable fishing—using abundance and size to define a spatial management framework for deep-water lobster. African Journal of Marine Science, 34(4): 547–557.
Gulland, J. 1970. The fish resources of the ocean. FAO Fisheries Technical Paper No. 97. Rome, Italy, Food and Agriculture Organisation of the United Nations.
Gulland, J. 1978. Report of the FAO/IOP workshop on the fishery resources of the Western Indian Ocean South of the Equator. Mahé, Seychelles 23 October–4 November 1978. Dev. Rep. Indian Ocean Programme. Report No. 45. Rome, Italy, Food and Agriculture Organisation of the United Nations.
Hewitt, J., Thrush, S. & Dayton, P. 2008. Habitat variation, species diversity and ecological functioning in a marine system. Journal of Experimental Marine Biology and Ecology, 366(1): 116–122.
IMR. 1977. Cruise Report No. 1 of R/V “Dr Fridtjof Nansen”. Joint NORAD/Moçambique/FAO Project to Investigate the Fish Resources off the Coast of Moçambique. Bergen, Norway, Institute of Marine Research.
IMR. 1978a. Cruise Report No. 2 of R/V “Dr Fridtjof Nansen”. Joint NORAD/Moçambique/FAO Project to Investigate the Fish Resources off the Coast of Moçambique, October–December 1977. Bergen, Norway, Institute of Marine Research.
IMR. 1978b. Cruise Report No. 3 of R/V “Dr Fridtjof Nansen”. Joint NORAD/Moçambique/FAO Project to Investigate the fish Resources off the Coast of Moçambique, January–March 1978. Bergen, Norway, Institute of Marine Research.
IMR. 1978c. Cruise Report No. 4 of R/V “Dr Fridtjof Nansen”. Joint NORAD/Moçambique/FAO Project to Investigate the Fish Resources off the Coast of Moçambique, April–June 1978. Bergen, Norway, Institute of Marine Research.
IMR. 1982a. Cruise Report R/V “Dr Fridtjof Nansen”. Second Fisheries Resources Survey, Tanzania, 12 November– 3 December. Bergen, Norway, Institute of Marine Research.
IMR. 1982b. Cruise Report R/V “Dr Fridtjof Nansen”. Survey of the Abundance and Distribution of the Fish Resources off Kenya, 7–15 December 1982. Bergen, Norway, Institute of Marine Research.
IMR. 1983. Cruise Report R/V “Dr Fridtjof Nansen”. Third Fisheries Resources Survey Tanzania , 11–26 May 1983. Bergen, Norway, Institute of Marine Research.
IMR. 1990a. Preliminary cruise report No III. Survey for deep water shrimp resources in Mozambique. Bergen, Norway, Institute of Marine Research.
IMR. 1990b. Preliminary cruise report No I. Survey of the Fish Resources of Mozambique. Bergen, Norway, Institute of Marine Research.
IMR. 1990c. Preliminary cruise report No II. Survey of the Fish Resources of Mozambique. Bergen, Norway, Institute of Marine Research.
Iversen, S. 1983. Preliminary cruise report R/V “Dr Fridtjof Nansen”. Survey of the Abundance and Distribution of Fish Resources off Kenya, 2–8 May 1983. Bergen, Norway, Institute of Marine Research.
Iversen, S. 1984. Kenyan marine fish resources in water deeper than 10 m investigated by R/V “Dr Fridtjof Nansen”: Report presented at a joint Kenyan/Norwegian seminar, Mombasa, Kenya, 13–15 March 1984. Bergen, Norway, Institute of Marine Research.
Iversen, S.A. & Myklevoll, S. 1984. The proceedings of the Norad-Kenya seminar to review the marine fish stocks and fisheries in Kenya, Mombasa, Kenya, 13–15 March 1984. Bergen, Norway, Institute of Marine Research.
Johnsen, E., Krakstad, J., Ostrowski, M., Serigstad, B., Strømme, T., Alvheim, O., Olsen, M., Zaera, D., André, E., Dias, N., Sousa, L., Sousa, B., Malauene, B. & Abdula, S. 2007. Surveys of the living marine resources of Mozambique: Ecosystem Survey and Special Studies. 27 September–21 December 2007. Report No. 8/2007–2007409. Bergen, Norway, Institute of Marine Research.
Kaunda-Arara, B., Munga, C., Manyala, J., Kuguru, B., Igulu, M., Chande, M., Kangwe, S., Mwakiti, S., Thoya, P. & Mbaru, E. 2016. Spatial variation in benthopelagic fish assemblage structure along coastal East Africa from recent bottom trawl surveys. Regional Studies in Marine Science, 8: 201–209.
Kesteven, G., Nakken, O. & Strømme, T. 1981. The small-pelagic and demersal fish resources of the north-west Arabian Sea — further analysis of the results of the R/V ‘Dr Fridtjof Nansen’, Survey, 1975–1976. Bergen, Norway, Institute of Marine Research.
Chapter 7: Demersal resources based on bottom trawl and other sampling methods | 123
Krakstad, J.O., Zaera, D., Aasen, A. & Soondron, V. 2010. Survey of the demersal resources on the western slopes of St. Brandon and Nazareth Bank, Mauritius. 16–25 September 2010. Report No. EAF-N2010/7. Bergen, Norway, Institute of Marine Research.
Krakstad, J.O., Krafft, B., Alvheim, O., Kvalsund, M., Bernardes, I., Chacate, O., Mutombene, R., Filipe, O., Hajy, B., Zacarias, L., Zivane, F., M, P. & Varela, D. 2015. Marine Ecosystem Survey of Mozambique. Cruise report “Dr Fridtjof Nansen”. 11 November–02 December 2014. Report No. GCP/INT/003/NOR. FAO–NORAD.
Mahika, C., Kangwe, S., Mwakosya, C., Mhitu, H., Kulekana, J., Shayo, S., Matola, H., Ulotu, E., Ululu, J., Silas, M., Mahongo, S. & Hatibu, H. 2008. Report on near-shore demersal fish stock assessment survey in trawlable areas along the Tanzanian coast. Tanzania, Tanzania Fisheries Research Institute.
Ministério das Pescas. 2015. Boletim estatístico 2007–2014 [Statistical Bulletin 2007–2014]. Angola, Governo de Angola.
Myklevoll, S. 1982. Cruise Report R/V “Dr Fridtjof Nansen”. Fisheries Resources Survey, Tanzania 16 June–8 July 1982. Bergen, Norway, Institute of Marine Research.
Nakken, O. 1981. Report on Cruise with R/V “Dr Fridtjof Nansen” off Kenya 8–19 December 1980. Bergen, Norway, Institute of Marine Research.
Neyman, A., Sokolova, M., Vinogradova, N. & Pasternak, F. 1973. Some patterns of the distribution of bottom fauna in the Indian Ocean. In: B. Zeitzschel & S. Gerlach, eds. The biology of the Indian Ocean. Berlin, Heidelberg, Springer.
Olsen, E., Padera, M., Funke, M., Pires, P., Wenneck, T. & Zacarias, L. 2009. Survey of the living marine resources of North Mozambique (SWIOFP/ASCLME 2009 Cruise 1) 6–20 August 2009. Report No. EAF-N/2009/7. Bergen, Norway, Institute of Marine Research.
Pearson, T. 2001. Functional group ecology in soft-sediment marine benthos: The role of bioturbation. Oceanography and marine biology, 39: 233–267.
Persson, L., Lindop, A., Harper, S., Zylich, K. & Zeller, D. 2015. Failed state: reconstruction of domestic fisheries catches in Somalia 1950–2010. In: F. Le Manach & D. Pauly, eds. Fisheries catch reconstructions in the Western Indian Ocean, 1950–2010. Fisheries Centre Research Reports 23(2). Vancouver, Canada, Fisheries Centre, University of British Columbia.
Roman, R., Kaehler, S., Michalsen, K., Olsen, M. & Perri, M. 2009. Survey of the Comores Gyre (ASCLME & SWIOFP) 5 October–3 November 2009. Report No. EAF-N2009/9. Bergen, Norway, Institute of Marine Research.
Sætersdal, G., Bianchi, G., Strømme, T. & Venema, S. 1999. The Dr Fridtjof Nansen programme 1975–1993. Investigations of fishery resources in developing regions. History of the programme and review of results. FAO Fisheries Technical Paper No. 391. Food and Agriculture Organization of the United Nations.
Sætre, R. & Paula e Silva, R. 1979. The marine fish resources of Mozambique. Bergen, Norway, Institute of Marine Research.
Sanders, M., Sparre, P. & Venema, S. 1988. Proceedings of the workshop on the assessment of the fishery resources in the Southwest Indian Ocean. Report No. RAF/79/065/WP/41/88/E. Albion, Mauritius, Food and Agriculture Organisation of the United Nations.
Strømme, T. 1984. Cruise Report “Dr Fridtjof Nansen”. Second Fisheries Resource Survey of the North-East Coast of Somalia, 24–30 August 1984. Bergen, Norway, Institute of Marine Research.
Strømme, T., Ansorge, I., Bornman, T., Kaehler, S., Ostrowski, M., Tweddle, D. & Alvheim, O. 2009. 2008 ASCLME Survey No. 3. Cruise report No 7/2008. 8 October–27 November 2008. Report No. EAF-N2008/7. Bergen, Norway, Institute of Marine Research.
Strømme, T., Groeneveld, J., Alvheim, O., Fossheim, O. & Svoren, T. 2010. Mauritius and Southern Mascarene: Pelagic Ecosystem Survey SWIOFP/FAO 2010 Cruise 1 2010. 6–21 December 2010. Final report. Report No. EAF-N2008/7. Bergen, Norway, Institute of Marine Research.
Tarbit, J. 1980. Demersal trawling in Seychelles waters (Fisheries Bulletin). Report No. 4. Seychelles, Fish. 1980 Div. Seychelles Govt.
| The RV Dr Fridtjof Nansen in the Western Indian Ocean: Voyages of marine research and capacity development124
van der Elst, R., Groeneveld, J., Baloi, A., Marsac, F., Katonda, K., Ruwa, R. & Lane, W. 2009. Nine nations, one ocean: A benchmark appraisal of the South Western Indian Ocean Fisheries Project (2008–2012). Ocean & Coastal Management, 52(5): 258–267.
Zajac, R. 2008. Macrobenthic biodiversity and sea floor landscape structure. Journal of Experimental Marine Biology and Ecology, 366(1): 198–203.
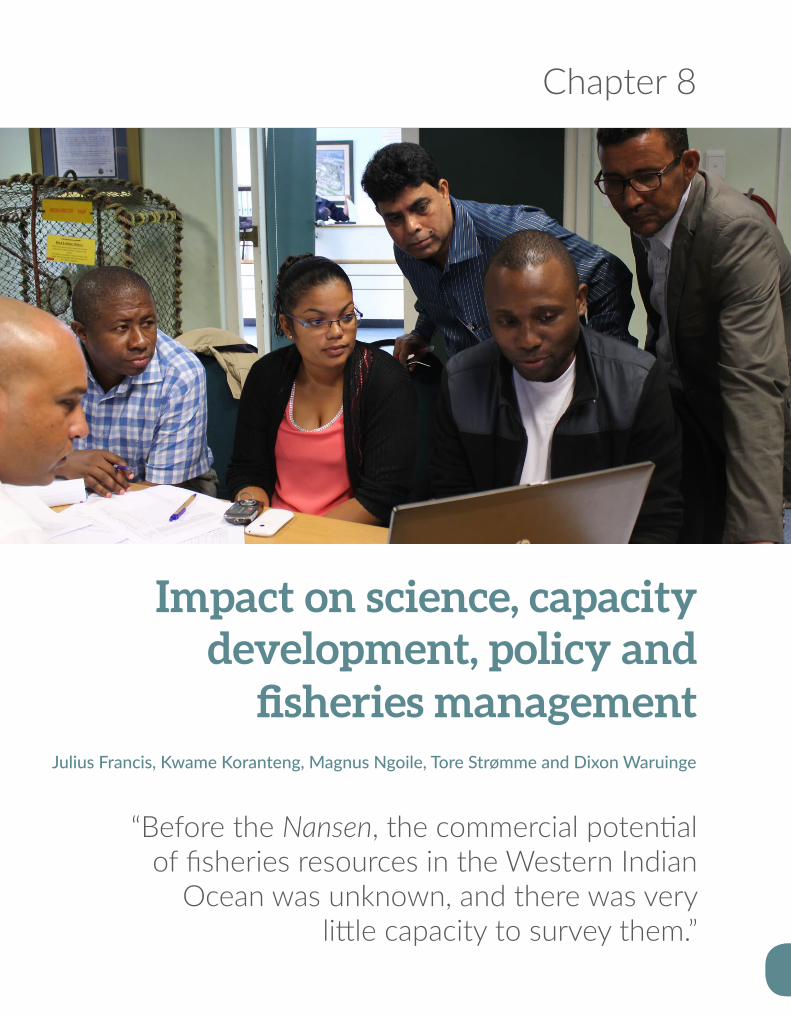
Chapter 8
“Before the Nansen, the commercial potential of fisheries resources in the Western Indian
Ocean was unknown, and there was very little capacity to survey them.”
Impact on science, capacity development, policy and
fisheries management Julius Francis, Kwame Koranteng, Magnus Ngoile, Tore Strømme and Dixon Waruinge
| The RV Dr Fridtjof Nansen in the Western Indian Ocean: Voyages of marine research and capacity development126
Abstract
Several Western Indian Ocean countries became independent between the early 1960s and mid-1970s, and the new administrations soon showed a keen interest in fisheries development as a means of economic growth. At that time, the commercial potential of fisheries resources in marine waters was unknown, and very little capacity to survey them existed in the region. Against this background, the newly commissioned RV Dr Fridtjof Nansen conducted its first surveys in 1975 off Somalia, a decade after the completion of the first International Indian Ocean Expedition. Initial surveys were to explore offshore fisheries potential and map their distribution, but since then the Nansen Programme has grown through several phases (see Chapter 2). From ownership modality to mode of operation and relationships with recipient countries, the Nansen Programme differs from most other vessel-based programmes. Apart from surveys at sea, it has focussed on capacity development in marine science, policy and fisheries management. Capacity development approaches included exposure to state of the art research at sea, training courses and degree programmes, and dissemination of training materials and tools, such as spe-cies identification guides. From 2006 to 2016, a total of 232 regional scientists participated in Nansen surveys. Fisheries policy and management plans could be developed on the basis of survey data, which indicated realistic targets for fisheries development goals. Peer-reviewed journal articles highlighted the quality of science done and new discoveries from the region. In 2011, the EAF-Nansen Project was selected as one of ten “FAO Success Stories” – a prestigious acknowledgement based on its performance against multiple development aid criteria. The impact of the Nansen Programme on science, capacity development, policy and management in the Western Indian Ocean is here described in four sections: 1) Pre-independence context shapes the focus; 2) Capacity development 3) Broad impacts of the Nansen Programme; and 4) Key challenges and lessons learnt since 1975.
Previous page: Some participants of the 2015 EAF-Nansen Project trawling and acoustics surveys training course held at ORI, Durban, South Africa. © Deborah Catena
Chapter 8: Impact on science, capacity development, policy and fisheries management | 127
8.1 Introduction
Origins of marine research in the WesternIndian OceanScientific expeditions that covered parts of the Indian Ocean date from at least 250 years ago, when James Cook and the HMS Endeavour (1769–1771) passed through it on their circumnavigation of the globe. Darwin’s journey on the HMS Beagle (1831–1835), to collect biological specimens and plankton samples is equally famous, and those by the HMS Challenger (1873–1876) covered a distance of 130 000 km while exploring, and cat-alogued over 4 000 previously unknown species. Up to the 1960s, scientific expeditions (or surveys) in the coastal waters of the Western Indian Ocean were carried out by the colonial powers, within a pre-independence context. Most of the countries in the Western Indian Ocean region became inde-pendent between the early 1960s and mid-1970s. In the process, they inherited the foundations of marine science in the region, including some of the fisheries research institutes that continue to exist to this day, albeit in different forms.
Several of the present research institutes in Kenya, Tanzania, Mozambique and Madagascar started as marine biological stations established before independence. The East African Marine Fisheries Research Organisation (EAMFRO, 1958) com-prised of two substations, the Mombasa Marine Station in Kenya (1953) and the Kunduchi Marine Station in Tanzania. The substations were at first subject to the East Africa High Commission and the East Africa Common Market, but EAMFRO became part of the East Africa Community (EAC) from 1967 to 1977.
Between 1951 and 1977, EAMFRO operated three research vessels, MV Research, MV Manihine and RV Kaskazi. The Research operated for six years from 1951 to 1957 and conducted 117 surveys to study the hydrography of East African coastal waters, and the abundance and distribu-tion of pelagic fishes (EAMFRO, 1958). It was later replaced with the Manihine, a 33 m long steel ves-sel, which operated with a 9 m work boat, Chermin; this was essential for estuarine and shallow
water investigations (EAMFRO, 1962). In Kenya, EAMFRO owned several research boats, including RV Menika and RV Kusi. Between 1964 and 1969, Menika conducted several surveys with technical support from FAO/UNDP, using dip-nets for bait fish and trammel nets to explore reef ecosystems, creeks and the coastline for spiny lobsters, tuna-like and demersal fish species (IOC-UNESCO, 2016). The vessels were not purpose-built for research, and their modest size restricted their work to nearshore waters and precluded multi-dis-ciplinary research. EAMFRO commissioned the building of RV Kaskazi. The RV Mafunzo was used for training and fishing gear development at the Mbegani Fisheries Training Institute.
When the EAC collapsed in 1977, the EAMFRO Headquarters in Zanzibar, Tanzania, became the Institute of Marine Science (IMS) of the University of Dar es Salaam, the Kunduchi substation became the Tanzania Fisheries Research Institute (TAFIRI), and the Mombasa substation became the Kenya Marine and Fisheries Research Institute (KMFRI). Today, these form the backbone of marine research in East Africa. Other stations with colo-nial origins and still surviving today are the Inhaca Island Marine Biological Station (Mozambique, established in 1953); Station Marine de Tulear (Madagascar, 1961) and the Nosy-Be Marine Station (Madagascar, 1962).
Between 1959 and 1965, the International Indian Ocean Expedition (IIOE) facilitated a major upsurge in studies of the Indian Ocean, involving scientists from 23 countries, 44 research ves-sels from 13 countries and numerous airborne data-collection devices (Morcos, 2002). The IIOE encompassed almost all marine science disciplines, and contributed a wealth of knowledge on basic oceanographic processes. The IIOE described the dynamics of the Somali Current, the mid-Indian Ocean ridges, effects of monsoonal winds on sur-face currents, productivity of upwelling areas, geo-chemistry and geophysics (Behrmen, 1981; Rao and Griffiths, 1998).
The International Indian Ocean Expedition
| The RV Dr Fridtjof Nansen in the Western Indian Ocean: Voyages of marine research and capacity development128
Apart from the vast amounts of data collected, the IIOE also resulted in over 1 000 scientific papers and unique atlases on plankton, hydrography and the geology of the Indian Ocean. It strengthened international scientific cooperation amongst sci-entists from many countries, and provided a plat-form for international oceanographic programmes, such as the Indian Ocean Experiment (INDEX) (Morcos, 2002). However, the IIOE was largely uncoordinated and without a systematic coverage in time and space. Also, with the exception of India and Pakistan, scientists from countries bordering on the Western Indian Ocean did not actively par-ticipate in the IIOE, because of limited research capacity.
Several oceanographic surveys took place in the Indian Ocean between 1965 (when the IIOE ended) and 1977; records show a total of 22 vessels, from France (3 vessels); Japan (5); United Kingdom (1); former USSR (11) and the USA (2) (IOC-UNESCO, 2016). Romanov (2003) reviews Soviet and Ukranian scientific and commercial fishing operations between 1972 and 1994 on the deep-water ridges of the southern Indian Ocean.
Status of fisheries managementPrior to independence, fisheries in Kenya and Tanzania received little government attention, as the sector was considered to be of low economic value. This changed after independence, when fishing was recognized as a potential contributor to economic development. In Tanzania, develop-ment of the fisheries sector was recognized as a priority in the first Three Years Development Plan (1961–1964) and also in the second Five Years Development Plan (1969–1974) (GOT, 1969). The first plan recommended a survey of fisher-ies resources and their marketing potential; the second plan noted that 20 percent of fish supply came from the sea (the rest from lakes and rivers) and that offshore fisheries had potential. It was argued that expanding fishing operations offshore would increase catches of fish, prawns and lob-sters tenfold (GOT, 1969).
In Kenya, the Fisheries Department was estab-lished after independence in 1964, and the
principal statutes regulating and governing fish-eries were the Fish Protection Act (Cap 163) of 1902, which was later replaced by the Fisheries Act (Cap 378) of 1989 and Regulations (1991). In Tanzania, the Fisheries Division was established in 1965, and regulation and governance of the fish-eries sector deferred to the Fisheries Act of 1970 and Fisheries Regulations (1982).
Fisheries development was also a high priority in post-independence Mozambique and Seychelles. Within three years of independence in 1975, the Mozambique government signed an agreement with Norad (then NORAD) for the RV Dr Fridtjof Nansen to conduct surveys to map the distri-bution of commercially important fish stocks in Mozambican waters (Sætre and Paula e Silva, 1979). Surveys with similar objectives were con-ducted in Seychelles in 1978, two years after inde-pendence. These surveys were carried out in col-laboration with the fisheries departments of the newly emerging administrations, hence contribut-ing to capacity development.
These examples show a keen post-independent interest in fisheries development during the 1960s and 1970s. It was, however, based on the assump-tion that fisheries resources in sovereign waters could be exploitable at industrial scale. Despite these ambitious plans, actual knowledge of the potential of fisheries resources was very limited.
Early development and evolution of the Nansen ProgrammeThree factors informed the focus of Nansen sur-veys during the exploratory phase (1975–1980). Firstly, whereas newly independent countries recognized the potential contribution of fisher-ies to their economic development, they had lim-ited knowledge of the size of their fish resources. Secondly, the IIOE provided a wealth of informa-tion on many aspects of the Indian Ocean, but very little on fish resources (Rao and Griffiths, 1998). Nansen surveys could fill this gap. And thirdly, the FAO created the Indian Ocean Programme (IOP), aiming to support fisheries development in the Indian Ocean. This idea originated from the find-ing of high productivity areas during the IIOE,
Chapter 8: Impact on science, capacity development, policy and fisheries management | 129
suggesting that large fish stocks might be present (Marr et al., 1971). The IOP plan contained a series of pre-investment fishery development surveys, with priority given to a pelagic fish assessment survey in the northwest Arabian Sea.
Whereas the initial objective, to provide informa-tion on the potential of fish resources, remained the same over the past four decades, specific objectives and the focus of the programme have changed over time, to align with changing needs and the global agenda on fisheries. As a result, the Nansen Programme evolved through four main phases: exploratory surveys (1975–1980), mapping of resources (1980–1990), monitoring, management and capacity development (1990–2006), and support for implementing ecosystem approaches to fisheries (2006–2016). These four phases are described in detail in Chapter 2.
How does the Nansen Programme differ from other ship-based programmes? Several other research vessels surveyed the Western Indian Ocean over the same period (1975–2015) than the Nansen. These were the RV Marion Dufresne II (France, 1995 to present), RV Meteor (Germany, 1995 to present) and RV Discovery (UK, 1979–2010). The approach taken by the Nansen Programme differs from the other vessel-based programmes in several ways, rang-ing from ownership modality to mode of opera-tion and relationship with recipient countries. The Nansen Programme is much broader than its con-temporaries, and forms one of the cornerstones of the Norwegian government’s development assistance programme through the Norwegian Agency for Development Cooperation (Norad). The Nansen is the only vessel managed by a United Nations agency, and therefore it flies a UN flag, although operated by the Norwegian Institute of Marine Research (IMR). The UN flag enables the Nansen to move freely across maritime boundaries of member countries.
In comparison, the RV Meteor is owned by the German Government, but is operated by private companies, F. Laeisz GmbH. (1995–2012) and Briese Schiffahrt (2013 to date). Like the Nansen,
the current Meteor is the third vessel bearing the same name. Similarly, the RV Marion Dufresne II, named after the French explorer Marc-Joseph Marion du Fresne, and operating from Reunion Island, is owned by a private company, Compagnie Maritime d’Affrètement – Compagnie Général Maritime (CMA-CGM) and chartered every year by the French government’s Territoire des Terres Australes et Antarctiques Françaises (TAAF) to carry out surveys in the Western Indian Ocean. While the Nansen surveys focus on support for fisheries development and its management by gov-ernments and regionally, the Marion Dufresne and Meteor focus on basic research in oceanography.
The support given by the Norwegian government to the Nansen Programme forms part of a frame-work of cooperation between Norway and benefi-ciary governments. Scientists from the region are involved in all stages of the Nansen operations, from planning to participation in the surveys, and in the use of data for management and policy pur-poses. Conversely, the research priorities of sci-entists participating in the Marion Dufresne and Meteor surveys form the basis of sampling strate-gies followed by the vessels; these may not always be aligned with national and regional priorities.
8.2 Capacity development
Capacity development was not a major objec-tive during the initial two phases of the Nansen Programme, when training was mainly geared towards ship-based sampling. It became more important in Phase 3 (but not in the Western Indian Ocean because the programme focussed on the Atlantic coast of Africa; see Chapter 2) and Phase 4 (2006–2016), when a major objective of the programme was to improve the capacity to manage fisheries, through introduction of the EAF concept, and support for its implementation (FAO, 2009, 2013).
Capacity development in the Nansen Programme encompasses a range of techniques, including ship-based training, short-term courses, long-term degree programmes and development and
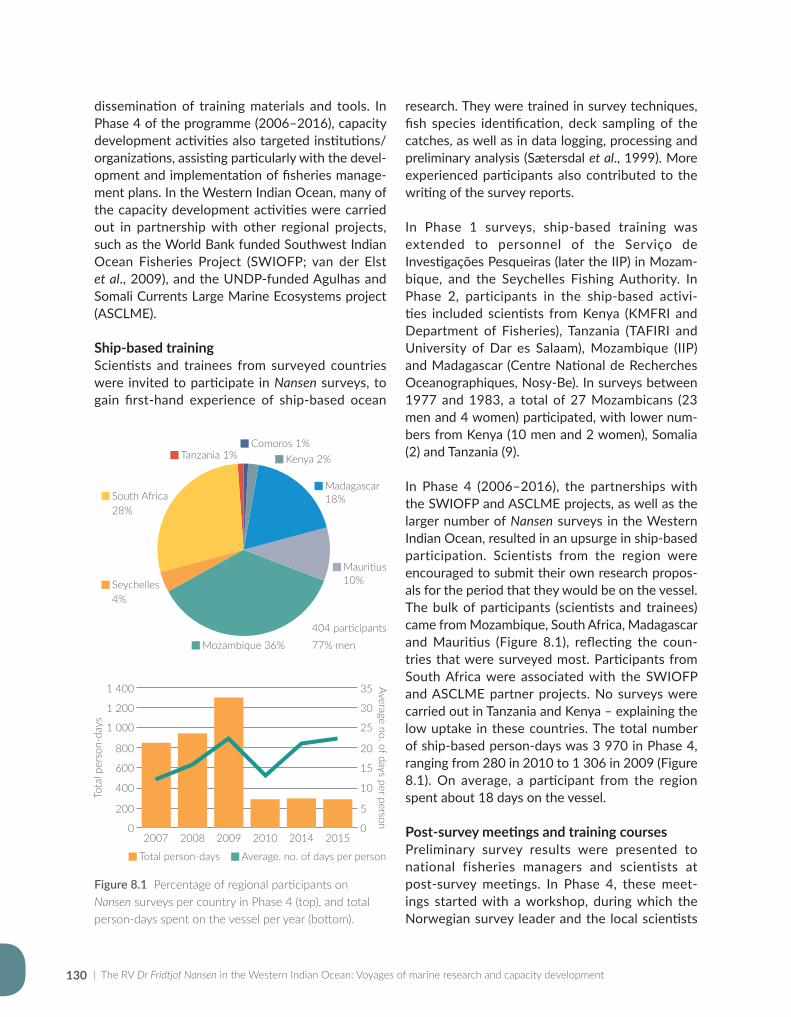
| The RV Dr Fridtjof Nansen in the Western Indian Ocean: Voyages of marine research and capacity development130
dissemination of training materials and tools. In Phase 4 of the programme (2006–2016), capacity development activities also targeted institutions/organizations, assisting particularly with the devel-opment and implementation of fisheries manage-ment plans. In the Western Indian Ocean, many of the capacity development activities were carried out in partnership with other regional projects, such as the World Bank funded Southwest Indian Ocean Fisheries Project (SWIOFP; van der Elst et al., 2009), and the UNDP-funded Agulhas and Somali Currents Large Marine Ecosystems project (ASCLME).
Ship-based trainingScientists and trainees from surveyed countries were invited to participate in Nansen surveys, to gain first-hand experience of ship-based ocean
research. They were trained in survey techniques, fish species identification, deck sampling of the catches, as well as in data logging, processing and preliminary analysis (Sætersdal et al., 1999). More experienced participants also contributed to the writing of the survey reports.
In Phase 1 surveys, ship-based training was extended to personnel of the Serviço de Investigações Pesqueiras (later the IIP) in Mozam-bique, and the Seychelles Fishing Authority. In Phase 2, participants in the ship-based activi-ties included scientists from Kenya (KMFRI and Department of Fisheries), Tanzania (TAFIRI and University of Dar es Salaam), Mozambique (IIP) and Madagascar (Centre National de Recherches Oceanographiques, Nosy-Be). In surveys between 1977 and 1983, a total of 27 Mozambicans (23 men and 4 women) participated, with lower num-bers from Kenya (10 men and 2 women), Somalia (2) and Tanzania (9).
In Phase 4 (2006–2016), the partnerships with the SWIOFP and ASCLME projects, as well as the larger number of Nansen surveys in the Western Indian Ocean, resulted in an upsurge in ship-based participation. Scientists from the region were encouraged to submit their own research propos-als for the period that they would be on the vessel. The bulk of participants (scientists and trainees) came from Mozambique, South Africa, Madagascar and Mauritius (Figure 8.1), reflecting the coun-tries that were surveyed most. Participants from South Africa were associated with the SWIOFP and ASCLME partner projects. No surveys were carried out in Tanzania and Kenya – explaining the low uptake in these countries. The total number of ship-based person-days was 3 970 in Phase 4, ranging from 280 in 2010 to 1 306 in 2009 (Figure 8.1). On average, a participant from the region spent about 18 days on the vessel.
Post-survey meetings and training courses Preliminary survey results were presented to national fisheries managers and scientists at post-survey meetings. In Phase 4, these meet-ings started with a workshop, during which the Norwegian survey leader and the local scientists
Figure 8.1 Percentage of regional participants on Nansen surveys per country in Phase 4 (top), and total person-days spent on the vessel per year (bottom).
1 000
Tota
l per
son-
days
800
600
400
200
02007
1 400
1 200
25
20
15
10
5
0
35
30
Average no. of days per person
2008 2009 2010 2014 2015
Total person-days Average. no. of days per person
Comoros 1%Kenya 2%Tanzania 1%
Madagascar 18%
Mauritius 10%
Mozambique 36%
Seychelles 4%
South Africa 28%
404 participants77% men
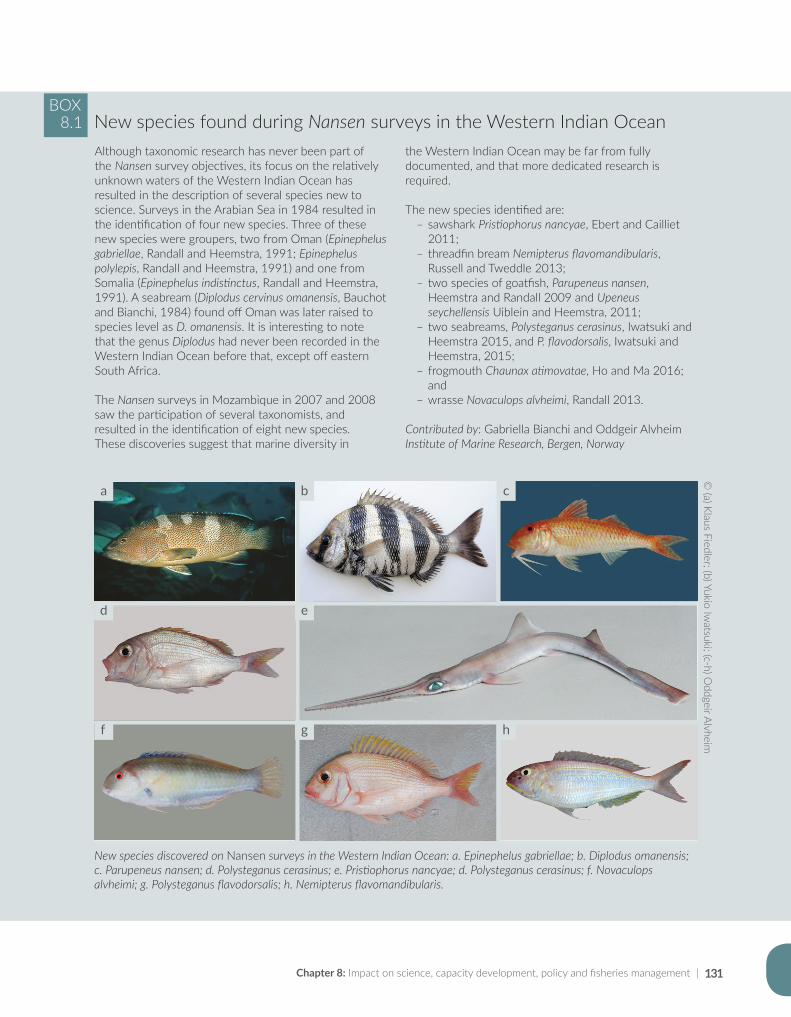
Chapter 8: Impact on science, capacity development, policy and fisheries management | 131
the Western Indian Ocean may be far from fully documented, and that more dedicated research is required.
The new species identified are: ҽ sawshark Pristiophorus nancyae, Ebert and Cailliet 2011;
ҽ threadfin bream Nemipterus flavomandibularis, Russell and Tweddle 2013;
ҽ two species of goatfish, Parupeneus nansen, Heemstra and Randall 2009 and Upeneus seychellensis Uiblein and Heemstra, 2011;
ҽ two seabreams, Polysteganus cerasinus, Iwatsuki and Heemstra 2015, and P. flavodorsalis, Iwatsuki and Heemstra, 2015;
ҽ frogmouth Chaunax atimovatae, Ho and Ma 2016; and
ҽ wrasse Novaculops alvheimi, Randall 2013.
Contributed by: Gabriella Bianchi and Oddgeir AlvheimInstitute of Marine Research, Bergen, Norway
Although taxonomic research has never been part of the Nansen survey objectives, its focus on the relatively unknown waters of the Western Indian Ocean has resulted in the description of several species new to science. Surveys in the Arabian Sea in 1984 resulted in the identification of four new species. Three of these new species were groupers, two from Oman (Epinephelus gabriellae, Randall and Heemstra, 1991; Epinephelus polylepis, Randall and Heemstra, 1991) and one from Somalia (Epinephelus indistinctus, Randall and Heemstra, 1991). A seabream (Diplodus cervinus omanensis, Bauchot and Bianchi, 1984) found off Oman was later raised to species level as D. omanensis. It is interesting to note that the genus Diplodus had never been recorded in the Western Indian Ocean before that, except off eastern South Africa.
The Nansen surveys in Mozambique in 2007 and 2008 saw the participation of several taxonomists, and resulted in the identification of eight new species. These discoveries suggest that marine diversity in
BOX8.1 New species found during Nansen surveys in the Western Indian Ocean
New species discovered on Nansen surveys in the Western Indian Ocean: a. Epinephelus gabriellae; b. Diplodus omanensis; c. Parupeneus nansen; d. Polysteganus cerasinus; e. Pristiophorus nancyae; d. Polysteganus cerasinus; f. Novaculops alvheimi; g. Polysteganus flavodorsalis; h. Nemipterus flavomandibularis.
© (a) Klaus Fiedler; (b) Yukio Iw
atsuki; (c-h) Oddgeir Alvheim
a b c
d e
gf h
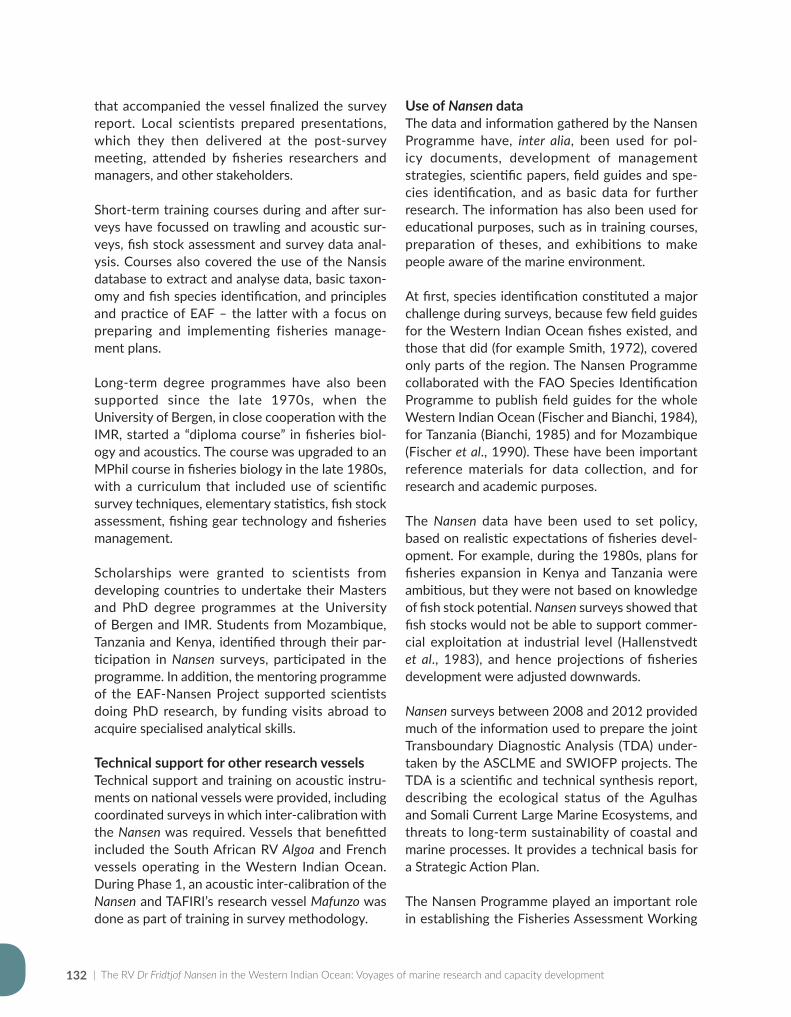
| The RV Dr Fridtjof Nansen in the Western Indian Ocean: Voyages of marine research and capacity development132
that accompanied the vessel finalized the survey report. Local scientists prepared presentations, which they then delivered at the post-survey meeting, attended by fisheries researchers and managers, and other stakeholders.
Short-term training courses during and after sur-veys have focussed on trawling and acoustic sur-veys, fish stock assessment and survey data anal-ysis. Courses also covered the use of the Nansis database to extract and analyse data, basic taxon-omy and fish species identification, and principles and practice of EAF – the latter with a focus on preparing and implementing fisheries manage-ment plans.
Long-term degree programmes have also been supported since the late 1970s, when the University of Bergen, in close cooperation with the IMR, started a “diploma course” in fisheries biol-ogy and acoustics. The course was upgraded to an MPhil course in fisheries biology in the late 1980s, with a curriculum that included use of scientific survey techniques, elementary statistics, fish stock assessment, fishing gear technology and fisheries management.
Scholarships were granted to scientists from developing countries to undertake their Masters and PhD degree programmes at the University of Bergen and IMR. Students from Mozambique, Tanzania and Kenya, identified through their par-ticipation in Nansen surveys, participated in the programme. In addition, the mentoring programme of the EAF-Nansen Project supported scientists doing PhD research, by funding visits abroad to acquire specialised analytical skills.
Technical support for other research vessels Technical support and training on acoustic instru-ments on national vessels were provided, including coordinated surveys in which inter-calibration with the Nansen was required. Vessels that benefitted included the South African RV Algoa and French vessels operating in the Western Indian Ocean. During Phase 1, an acoustic inter-calibration of the Nansen and TAFIRI’s research vessel Mafunzo was done as part of training in survey methodology.
Use of Nansen data The data and information gathered by the Nansen Programme have, inter alia, been used for pol-icy documents, development of management strategies, scientific papers, field guides and spe-cies identification, and as basic data for further research. The information has also been used for educational purposes, such as in training courses, preparation of theses, and exhibitions to make people aware of the marine environment.
At first, species identification constituted a major challenge during surveys, because few field guides for the Western Indian Ocean fishes existed, and those that did (for example Smith, 1972), covered only parts of the region. The Nansen Programme collaborated with the FAO Species Identification Programme to publish field guides for the whole Western Indian Ocean (Fischer and Bianchi, 1984), for Tanzania (Bianchi, 1985) and for Mozambique (Fischer et al., 1990). These have been important reference materials for data collection, and for research and academic purposes.
The Nansen data have been used to set policy, based on realistic expectations of fisheries devel-opment. For example, during the 1980s, plans for fisheries expansion in Kenya and Tanzania were ambitious, but they were not based on knowledge of fish stock potential. Nansen surveys showed that fish stocks would not be able to support commer-cial exploitation at industrial level (Hallenstvedt et al., 1983), and hence projections of fisheries development were adjusted downwards.
Nansen surveys between 2008 and 2012 provided much of the information used to prepare the joint Transboundary Diagnostic Analysis (TDA) under-taken by the ASCLME and SWIOFP projects. The TDA is a scientific and technical synthesis report, describing the ecological status of the Agulhas and Somali Current Large Marine Ecosystems, and threats to long-term sustainability of coastal and marine processes. It provides a technical basis for a Strategic Action Plan.
The Nansen Programme played an important role in establishing the Fisheries Assessment Working
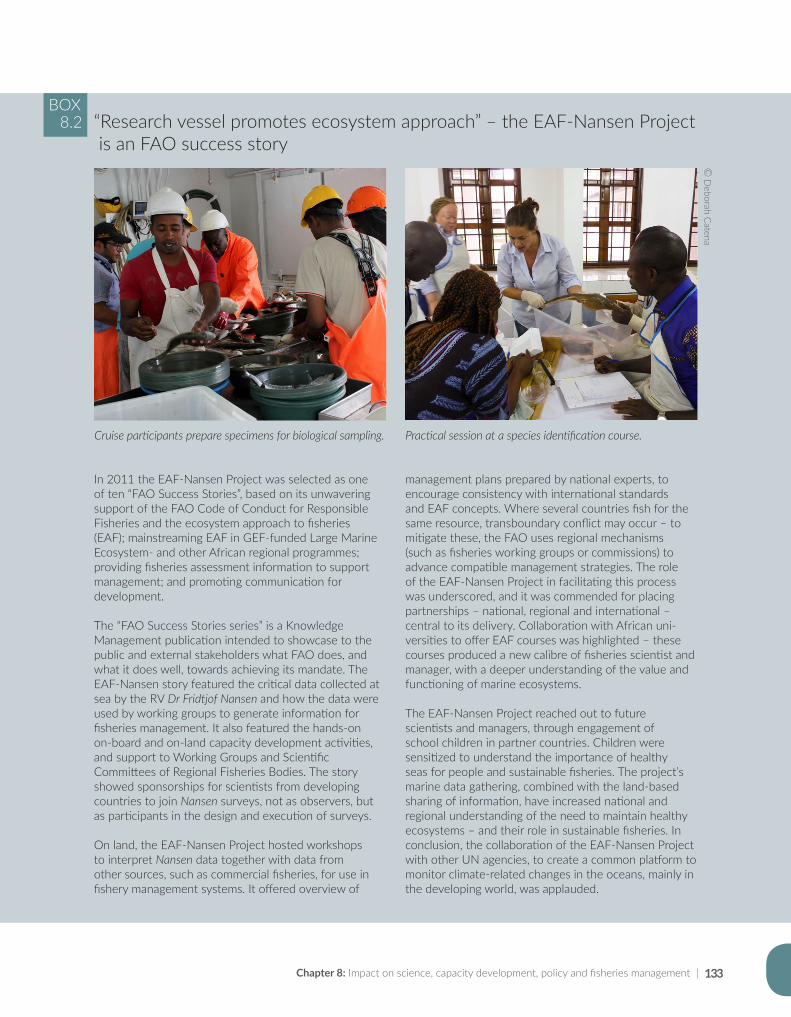
Chapter 8: Impact on science, capacity development, policy and fisheries management | 133
management plans prepared by national experts, to encourage consistency with international standards and EAF concepts. Where several countries fish for the same resource, transboundary conflict may occur – to mitigate these, the FAO uses regional mechanisms (such as fisheries working groups or commissions) to advance compatible management strategies. The role of the EAF-Nansen Project in facilitating this process was underscored, and it was commended for placing partnerships – national, regional and international –central to its delivery. Collaboration with African uni-versities to offer EAF courses was highlighted – these courses produced a new calibre of fisheries scientist and manager, with a deeper understanding of the value and functioning of marine ecosystems.
The EAF-Nansen Project reached out to future scientists and managers, through engagement of school children in partner countries. Children were sensitized to understand the importance of healthy seas for people and sustainable fisheries. The project’s marine data gathering, combined with the land-based sharing of information, have increased national and regional understanding of the need to maintain healthy ecosystems – and their role in sustainable fisheries. In conclusion, the collaboration of the EAF-Nansen Project with other UN agencies, to create a common platform to monitor climate-related changes in the oceans, mainly in the developing world, was applauded.
In 2011 the EAF-Nansen Project was selected as one of ten “FAO Success Stories”, based on its unwavering support of the FAO Code of Conduct for Responsible Fisheries and the ecosystem approach to fisheries (EAF); mainstreaming EAF in GEF-funded Large Marine Ecosystem- and other African regional programmes; providing fisheries assessment information to support management; and promoting communication for development.
The “FAO Success Stories series” is a Knowledge Management publication intended to showcase to the public and external stakeholders what FAO does, and what it does well, towards achieving its mandate. The EAF-Nansen story featured the critical data collected at sea by the RV Dr Fridtjof Nansen and how the data were used by working groups to generate information for fisheries management. It also featured the hands-on on-board and on-land capacity development activities, and support to Working Groups and Scientific Committees of Regional Fisheries Bodies. The story showed sponsorships for scientists from developing countries to join Nansen surveys, not as observers, but as participants in the design and execution of surveys.
On land, the EAF-Nansen Project hosted workshops to interpret Nansen data together with data from other sources, such as commercial fisheries, for use in fishery management systems. It offered overview of
BOX8.2 “Research vessel promotes ecosystem approach” – the EAF-Nansen Project
is an FAO success story
© D
eborah Catena
Practical session at a species identification course. Cruise participants prepare specimens for biological sampling.
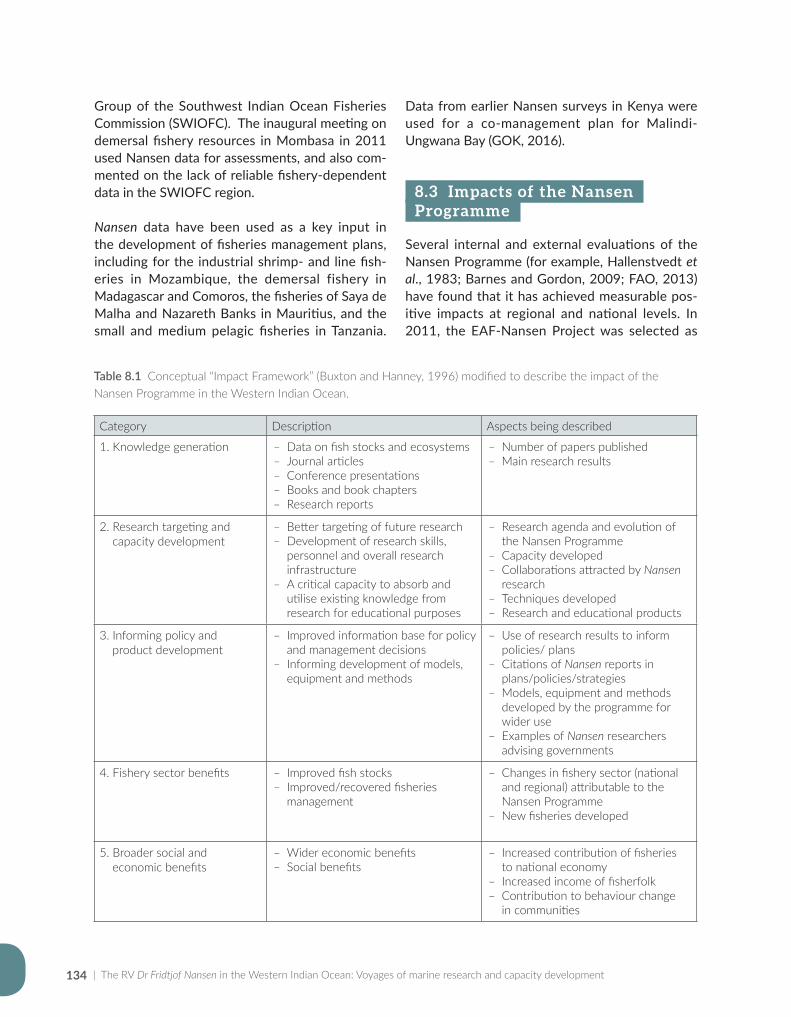
| The RV Dr Fridtjof Nansen in the Western Indian Ocean: Voyages of marine research and capacity development134
Group of the Southwest Indian Ocean Fisheries Commission (SWIOFC). The inaugural meeting on demersal fishery resources in Mombasa in 2011 used Nansen data for assessments, and also com-mented on the lack of reliable fishery-dependent data in the SWIOFC region.
Nansen data have been used as a key input in the development of fisheries management plans, including for the industrial shrimp- and line fish-eries in Mozambique, the demersal fishery in Madagascar and Comoros, the fisheries of Saya de Malha and Nazareth Banks in Mauritius, and the small and medium pelagic fisheries in Tanzania.
Data from earlier Nansen surveys in Kenya were used for a co-management plan for Malindi-Ungwana Bay (GOK, 2016).
8.3 Impacts of the Nansen Programme
Several internal and external evaluations of the Nansen Programme (for example, Hallenstvedt et al., 1983; Barnes and Gordon, 2009; FAO, 2013) have found that it has achieved measurable pos-itive impacts at regional and national levels. In 2011, the EAF-Nansen Project was selected as
Category Description Aspects being described
1. Knowledge generation ҽ Data on fish stocks and ecosystems ҽ Journal articles ҽ Conference presentations ҽ Books and book chapters ҽ Research reports
ҽ Number of papers published ҽ Main research results
2. Research targeting and capacity development
ҽ Better targeting of future research ҽ Development of research skills,
personnel and overall research infrastructure
ҽ A critical capacity to absorb and utilise existing knowledge from research for educational purposes
ҽ Research agenda and evolution of the Nansen Programme
ҽ Capacity developed ҽ Collaborations attracted by Nansen
research ҽ Techniques developed ҽ Research and educational products
3. Informing policy and product development
ҽ Improved information base for policy and management decisions
ҽ Informing development of models, equipment and methods
ҽ Use of research results to inform policies/ plans
ҽ Citations of Nansen reports in plans/policies/strategies
ҽ Models, equipment and methods developed by the programme for wider use
ҽ Examples of Nansen researchers advising governments
4. Fishery sector benefits ҽ Improved fish stocks ҽ Improved/recovered fisheries
management
ҽ Changes in fishery sector (national and regional) attributable to the Nansen Programme
ҽ New fisheries developed
5. Broader social and economic benefits
ҽ Wider economic benefits ҽ Social benefits
ҽ Increased contribution of fisheries to national economy
ҽ Increased income of fisherfolk ҽ Contribution to behaviour change
in communities
Table 8.1 Conceptual “Impact Framework” (Buxton and Hanney, 1996) modified to describe the impact of the Nansen Programme in the Western Indian Ocean.
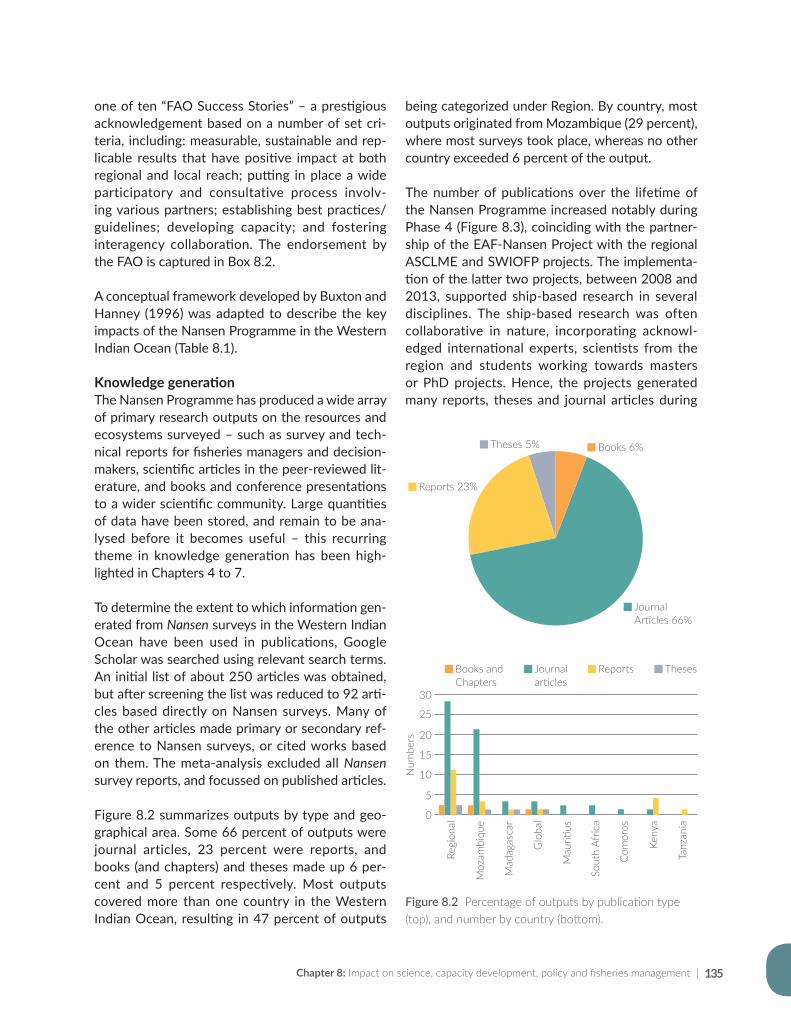
Chapter 8: Impact on science, capacity development, policy and fisheries management | 135
one of ten “FAO Success Stories” – a prestigious acknowledgement based on a number of set cri-teria, including: measurable, sustainable and rep-licable results that have positive impact at both regional and local reach; putting in place a wide participatory and consultative process involv-ing various partners; establishing best practices/guidelines; developing capacity; and fostering interagency collaboration. The endorsement by the FAO is captured in Box 8.2.
A conceptual framework developed by Buxton and Hanney (1996) was adapted to describe the key impacts of the Nansen Programme in the Western Indian Ocean (Table 8.1).
Knowledge generationThe Nansen Programme has produced a wide array of primary research outputs on the resources and ecosystems surveyed – such as survey and tech-nical reports for fisheries managers and decision- makers, scientific articles in the peer-reviewed lit-erature, and books and conference presentations to a wider scientific community. Large quantities of data have been stored, and remain to be ana-lysed before it becomes useful – this recurring theme in knowledge generation has been high-lighted in Chapters 4 to 7.
To determine the extent to which information gen-erated from Nansen surveys in the Western Indian Ocean have been used in publications, Google Scholar was searched using relevant search terms. An initial list of about 250 articles was obtained, but after screening the list was reduced to 92 arti-cles based directly on Nansen surveys. Many of the other articles made primary or secondary ref-erence to Nansen surveys, or cited works based on them. The meta-analysis excluded all Nansen survey reports, and focussed on published articles.
Figure 8.2 summarizes outputs by type and geo-graphical area. Some 66 percent of outputs were journal articles, 23 percent were reports, and books (and chapters) and theses made up 6 per-cent and 5 percent respectively. Most outputs covered more than one country in the Western Indian Ocean, resulting in 47 percent of outputs
being categorized under Region. By country, most outputs originated from Mozambique (29 percent), where most surveys took place, whereas no other country exceeded 6 percent of the output.
The number of publications over the lifetime of the Nansen Programme increased notably during Phase 4 (Figure 8.3), coinciding with the partner-ship of the EAF-Nansen Project with the regional ASCLME and SWIOFP projects. The implementa-tion of the latter two projects, between 2008 and 2013, supported ship-based research in several disciplines. The ship-based research was often collaborative in nature, incorporating acknowl-edged international experts, scientists from the region and students working towards masters or PhD projects. Hence, the projects generated many reports, theses and journal articles during
Figure 8.2 Percentage of outputs by publication type (top), and number by country (bottom).
25
Num
bers 20
15
10
5
0
30
Books andChapters
Books 6%Theses 5%
Journal Articles 66%
Reports 23%
Journalarticles
Reports Theses
Regi
onal
Moz
ambi
que
Mad
agas
car
Glo
bal
Mau
ritius
Sout
h Af
rica
Com
oros
Keny
a
Tanz
ania
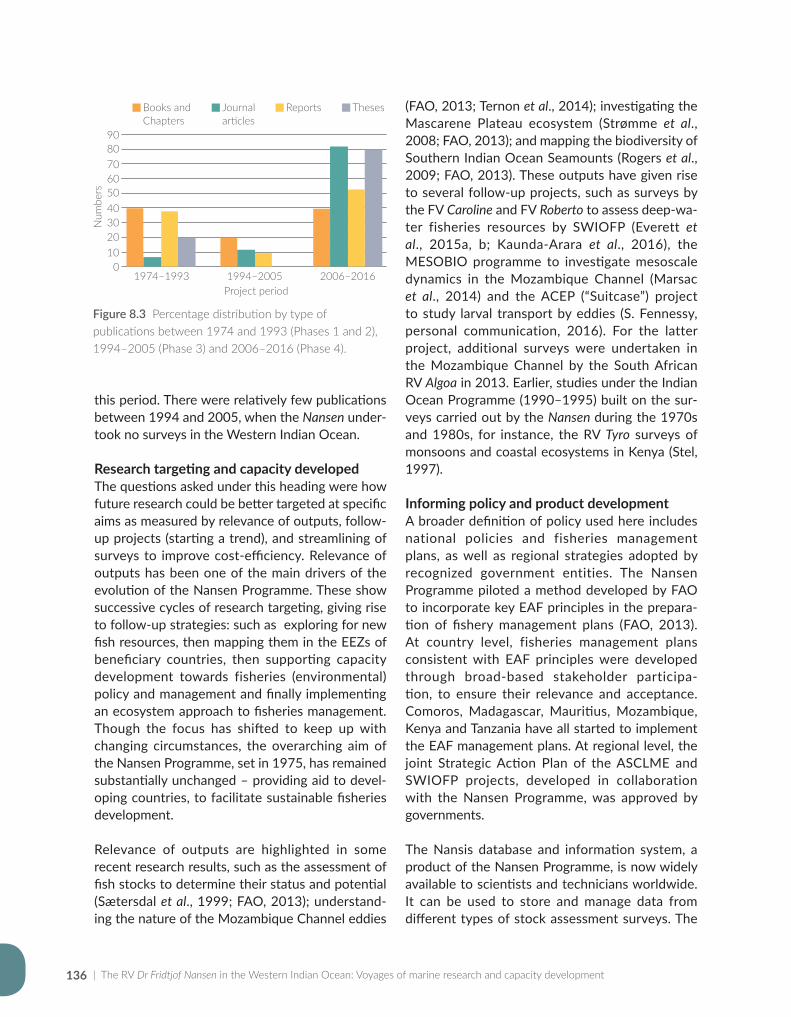
| The RV Dr Fridtjof Nansen in the Western Indian Ocean: Voyages of marine research and capacity development136
this period. There were relatively few publications between 1994 and 2005, when the Nansen under-took no surveys in the Western Indian Ocean.
Research targeting and capacity developedThe questions asked under this heading were how future research could be better targeted at specific aims as measured by relevance of outputs, follow- up projects (starting a trend), and streamlining of surveys to improve cost-efficiency. Relevance of outputs has been one of the main drivers of the evolution of the Nansen Programme. These show successive cycles of research targeting, giving rise to follow-up strategies: such as exploring for new fish resources, then mapping them in the EEZs of beneficiary countries, then supporting capacity development towards fisheries (environmental) policy and management and finally implementing an ecosystem approach to fisheries management. Though the focus has shifted to keep up with changing circumstances, the overarching aim of the Nansen Programme, set in 1975, has remained substantially unchanged – providing aid to devel-oping countries, to facilitate sustainable fisheries development.
Relevance of outputs are highlighted in some recent research results, such as the assessment of fish stocks to determine their status and potential (Sætersdal et al., 1999; FAO, 2013); understand-ing the nature of the Mozambique Channel eddies
(FAO, 2013; Ternon et al., 2014); investigating the Mascarene Plateau ecosystem (Strømme et al., 2008; FAO, 2013); and mapping the biodiversity of Southern Indian Ocean Seamounts (Rogers et al., 2009; FAO, 2013). These outputs have given rise to several follow-up projects, such as surveys by the FV Caroline and FV Roberto to assess deep-wa-ter fisheries resources by SWIOFP (Everett et al., 2015a, b; Kaunda-Arara et al., 2016), the MESOBIO programme to investigate mesoscale dynamics in the Mozambique Channel (Marsac et al., 2014) and the ACEP (“Suitcase”) project to study larval transport by eddies (S. Fennessy, personal communication, 2016). For the latter project, additional surveys were undertaken in the Mozambique Channel by the South African RV Algoa in 2013. Earlier, studies under the Indian Ocean Programme (1990–1995) built on the sur-veys carried out by the Nansen during the 1970s and 1980s, for instance, the RV Tyro surveys of monsoons and coastal ecosystems in Kenya (Stel, 1997).
Informing policy and product developmentA broader definition of policy used here includes national policies and fisheries management plans, as well as regional strategies adopted by recognized government entities. The Nansen Programme piloted a method developed by FAO to incorporate key EAF principles in the prepara-tion of fishery management plans (FAO, 2013). At country level, fisheries management plans consistent with EAF principles were developed through broad-based stakeholder participa-tion, to ensure their relevance and acceptance. Comoros, Madagascar, Mauritius, Mozambique, Kenya and Tanzania have all started to implement the EAF management plans. At regional level, the joint Strategic Action Plan of the ASCLME and SWIOFP projects, developed in collaboration with the Nansen Programme, was approved by governments.
The Nansis database and information system, a product of the Nansen Programme, is now widely available to scientists and technicians worldwide. It can be used to store and manage data from different types of stock assessment surveys. The
Figure 8.3 Percentage distribution by type of publications between 1974 and 1993 (Phases 1 and 2), 1994–2005 (Phase 3) and 2006–2016 (Phase 4).
5040302010
0
60
1974–1993
Num
bers
90
Books andChapters
Journalarticles
Reports Theses
8070
1994–2005 2006–2016Project period
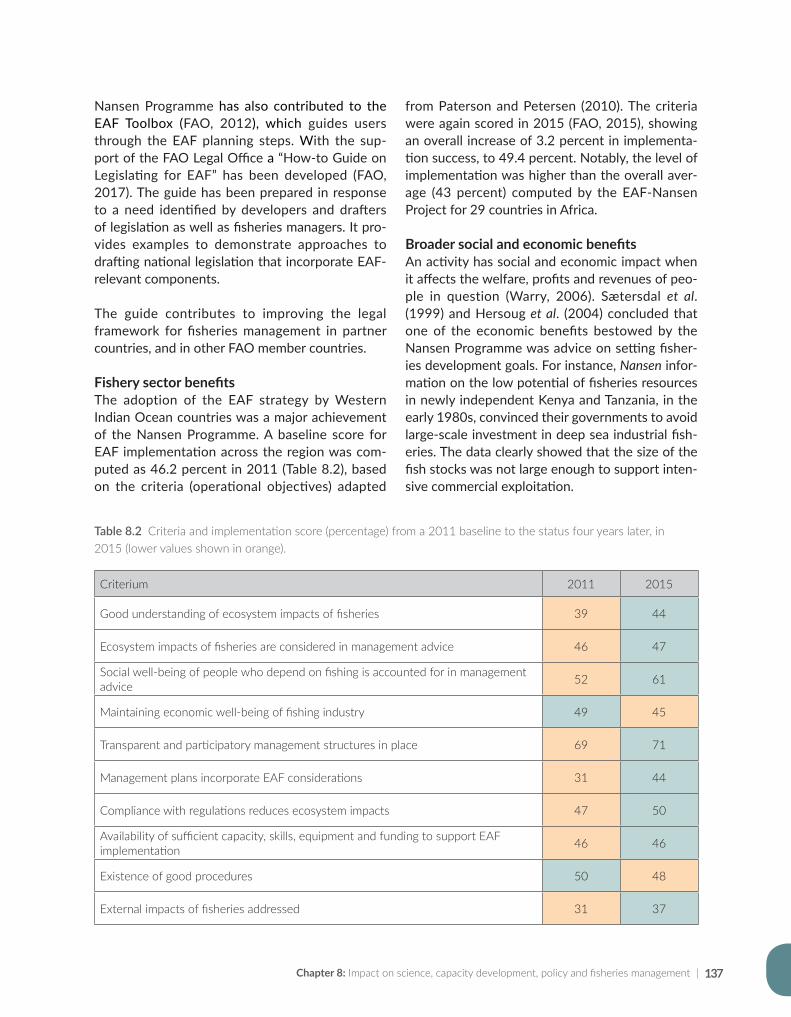
Chapter 8: Impact on science, capacity development, policy and fisheries management | 137
Nansen Programme has also contributed to the EAF Toolbox (FAO, 2012), which guides users through the EAF planning steps. With the sup-port of the FAO Legal Office a “How-to Guide on Legislating for EAF” has been developed (FAO, 2017). The guide has been prepared in response to a need identified by developers and drafters of legislation as well as fisheries managers. It pro-vides examples to demonstrate approaches to drafting national legislation that incorporate EAF-relevant components.
The guide contributes to improving the legal framework for fisheries management in partner countries, and in other FAO member countries.
Fishery sector benefitsThe adoption of the EAF strategy by Western Indian Ocean countries was a major achievement of the Nansen Programme. A baseline score for EAF implementation across the region was com-puted as 46.2 percent in 2011 (Table 8.2), based on the criteria (operational objectives) adapted
from Paterson and Petersen (2010). The criteria were again scored in 2015 (FAO, 2015), showing an overall increase of 3.2 percent in implementa-tion success, to 49.4 percent. Notably, the level of implementation was higher than the overall aver-age (43 percent) computed by the EAF-Nansen Project for 29 countries in Africa.
Broader social and economic benefitsAn activity has social and economic impact when it affects the welfare, profits and revenues of peo-ple in question (Warry, 2006). Sætersdal et al. (1999) and Hersoug et al. (2004) concluded that one of the economic benefits bestowed by the Nansen Programme was advice on setting fisher-ies development goals. For instance, Nansen infor-mation on the low potential of fisheries resources in newly independent Kenya and Tanzania, in the early 1980s, convinced their governments to avoid large-scale investment in deep sea industrial fish-eries. The data clearly showed that the size of the fish stocks was not large enough to support inten-sive commercial exploitation.
Criterium 2011 2015
Good understanding of ecosystem impacts of fisheries 39 44
Ecosystem impacts of fisheries are considered in management advice 46 47
Social well-being of people who depend on fishing is accounted for in management advice 52 61
Maintaining economic well-being of fishing industry 49 45
Transparent and participatory management structures in place 69 71
Management plans incorporate EAF considerations 31 44
Compliance with regulations reduces ecosystem impacts 47 50
Availability of sufficient capacity, skills, equipment and funding to support EAF implementation 46 46
Existence of good procedures 50 48
External impacts of fisheries addressed 31 37
Table 8.2 Criteria and implementation score (percentage) from a 2011 baseline to the status four years later, in 2015 (lower values shown in orange).
| The RV Dr Fridtjof Nansen in the Western Indian Ocean: Voyages of marine research and capacity development138
Fisheries management plans supported by the EAF-Nansen Project and the SWIOFC include, as objectives: optimization of social and economic benefits to local community, national and regional economies; ensuring long-term biological sus-tainability and ecological integrity of the pelagic fishery; and improved governance of fisheries. Although fairly generic, these objectives should lead to improved food security and livelihoods, if management plans are effectively implemented.
8.4 Future challenges
The Nansen cannot be everywhere at the same time, and projects that are initiated when it is pres-ent, cannot always be sustained after it has left. For example, protocols for collection of fisheries data for stock status assessments have been estab-lished by the Nansen Programme, but the sur-veys need to be repeated regularly, so that stock trends can be measured. Once the Nansen leaves the region, there are often no other research ves-sels available to continue with monitoring, hence follow-up data are not collected and assessments become dated and of little use in practice.
The Nansen adheres to a minimum depth limit of 20 m, and can therefore not survey shallower wat-ers over the shelf, where many pelagic and demer-sal fish resources are concentrated. This can bias estimates of abundance based on acoustic record-ings and trawling, especially of small pelagic spe-cies that use shallower water on a seasonal basis, for reproductive or other biological functions.
One of the strengths of the Nansen Programme is on-board training of regional scientists by sci-entific and technical staff of IMR. Whereas a core of IMR staff regularly participate in surveys, there are, however, few “counterparts” from the region, with long-term experience of the Nansen, at the level of the Norwegian scientists or cruise lead-ers. The root cause for this lack of “counterparts” is two-fold; that the Nansen ship-based training is geared towards giving opportunities to as many trainees as possible, and also that the Nansen
moves between ocean basins, and is not always active in the Western Indian Ocean.
Collections during Nansen surveys have resulted in numerous samples and specimens, which are sent for identification to laboratories in Norway or in the countries being surveyed. This includes validation of fish species identification, identifica-tion of zooplankton, phytoplankton and benthic fauna and chemical analysis of sediment samples. In-depth analyses often take too long, resulting in delays in completing reports.
The inadequate use of survey data is a long-stand-ing challenge. The Nansen collects large quantities of data during each survey, spanning from bottom mapping, to continuous collections of oceano-graphic information and acoustic recordings of fish densities while steaming, as well as ocean produc-tivity information and trawl samples of biological specimens. Apart from their use in survey reports, most of these data are stored, and not used to its full potential. Limited capacity for data analysis and interpretation, especially in fields not directly related to fisheries resource use, appears to be an important factor in most Western Indian Ocean countries.
Another challenge in the Nansen Programme is the inadequate data management resources to secure the Nansen survey data in national research and management institutions. In several of the programme evaluations, remarks had been made on the non-availability of Nansen data to local scientists. Training of local scientists (by SWIOFP in partnership with the EAF-Nansen Project) to access and use Nansis data, and support for local central data repositories have had limited success.
Survey reports are not intended to directly provide advice to policy makers or managers, particularly in Phase 4 of the Nansen Programme, in which multidisciplinary research was done to support the adoption and implementation of EAF-based management. The linkage between the scientific information, and its application in policy or man-agement remains a challenge.
Chapter 8: Impact on science, capacity development, policy and fisheries management | 139
A continuous monitoring programme of marine ecosystems, showing their status and trends, and based on systematic and long-term data, is absent in the Western Indian Ocean. The quality of infor-mation available for EAF-based management is therefore compromised, despite the efforts of the Nansen Programme. Potential solutions to these challenges are discussed in Chapter 10.
8.5 Conclusions
The Nansen Programme is uniquely placed to sup-port broad-based fisheries development assistance in the Western Indian Ocean and in other develop-ing world regions. The approach developed over the past four decades – to assist with collecting offshore fisheries data (using the RV Dr Fridtjof Nansen), and with capacity development to sup-port science, policy and fisheries management – is now well-established showing clear and enduring gains. This conclusion is based on an assessment of key impacts, in categories for knowledge gener-ation; research targeting and capacity developed; informing policy and product development; fishery sector benefits; and broader social and economic benefits. The partnership between Norad and FAO, and the availability of the Nansen and IMR expertise were crucial elements in the success of the Nansen Programme to date. As a counterbal-ance to the achievements of the programme, some challenges remain unresolved.
| The RV Dr Fridtjof Nansen in the Western Indian Ocean: Voyages of marine research and capacity development140
References
Barnes, C. & Gordon, C. 2009. Mid-Term review of the EAF-Nansen Project “Strengthening the Knowledge Base for and Implementing an Ecosystem Approach to Marine Fisheries in Developing Countries” Report No. GCP/INT/003/NOR. Rome, Italy, Food and Agriculture Organization of the United Nations.
Bauchot, M. & Bianchi, G. 1984. Diplodus cervinus amanensis, nouvelle sous-espèce de Diplodus cervinus (Lowe, 1841), capturée en mer d’Arabie (Pisces, Perciformes, Sparidae). Cybium, 8(3): 103–105.
Behrmen, D. 1981. Assault on the largest unknown. Paris, France, The Unesco Press.Bianchi, G. 1985. Field guide to the commercial marine and brackish-water species of Tanzania. FAO Species identification
sheets for fishery purposes. Prepared and published with the support of TCP/URT/4406 and FAO (FIRM) Regular Programme. Rome, Italy, Food and Agriculture Organization of the United Nations.
Buxton, M. & Hanney, S. 1996. How can payback from health services research be assessed? Journal of Health Services Research, 1(1): 35–43.
EAMFRO. 1958. East African Marine Fisheries Research Organization Annual Report, 1956–1957. Uganda, East African Marine Fisheries Research Organization.
EAMFRO. 1962. East African Marine Fisheries Research Organization Annual Report, 1962. Uganda, East African Marine Fisheries Research Organization.
Ebert, D. & Cailliet, G. 2011. Pristiophorus nancyae, a new species of sawshark (Chondrichthyes: Pristiophoridae) from southern Africa. Bulletin of Marine Science, 87(3): 501–512.
Everett, B., Groeneveld, J., Fennessy, S., Dias, N., Filipe, O., Zacarias, L., Igulu, M., Kuguru, B., Kimani, E. & Munga, C. 2015a. Composition and abundance of deep-water crustaceans in the Southwest Indian Ocean: Enough to support trawl fisheries? Ocean & Coastal Management, 111: 50–61.
Everett, B., Groeneveld, J., Fennessy, S., Porter, S., Munga, C., Diaz, N., Filipe, O., Zacarias, L., Igulu, M. & Kuguru, B. 2015b. Demersal trawl surveys show ecological gradients in Southwest Indian Ocean slope fauna. Western Indian Ocean Journal of Marine Science, 14(1&2): 73–92.
FAO. 2009. Strengthening the Knowledge Base for and Implementing an Ecosystem Approach to Marine Fisheries in Developing Countries (EAF-Nansen). Mid Term Review. Report No. GCP/INT/003/NOR. Rome, Italy, Food and Agriculture Organization of the United Nations.
FAO. 2012. The EAF Toolbox: the Ecosystem Approach to Fisheries. Rome, Italy, Food and Agriculture Organization of the United Nations.
FAO. 2013. Final Evaluation of the EAF-Nansen project (Phase I): Strengthening the Knowledge Base for and Implementing an Ecosystem Approach to Marine Fisheries in Developing Countries. Report No. GCP/INT/003/NOR. Rome, Italy, Food and Agriculture Organization of the United Nations.
FAO. 2015. Report of the sixth session of the Scientific Committee of the South West Indian Ocean Fisheries Commission. Dar-es-Salaam, Tanzania, 18–21 March 2015. Report No. FAO Fisheries and Aquaculture No. R1169. Rome, Italy, Food and Agriculture Organization of the United Nations.
FAO. 2017. A how-to guide on legislating for an Ecosystem Approach to Fisheries. Report No. 27, FAO EAF-Nansen Project, Rome, Italy, Food and Agriculture Organization of the United Nations.
Fischer, W. & Bianchi, G. 1984. FAO species identification sheets for fishery purposes: Western Indian Ocean (Fishing Area 51). Rome, Italy, Food and Agriculture Organization of the United Nations.
Fischer, W., Sousa, I., Silva, C., de Freitas, A., Poutiers, J., Schneider, W., Borges, T., Féral, J. & Massinga, A. 1990. Guía de campo das espécies comerciais marinhas e de águas salobras de Moçambique. Rome, Italy, Food and Agriculture Organization of the United Nations.
GOK. 2016. The Malindi-Ungwana Bay Area Co-management Plan (2016–2021). Kenya, Government of Kenya.GOT. 1969. Tanzania second five-year plan for economic and social development, 1 July 1969–30 June 1974. Tanzania,
Government of Tanzania.
Chapter 8: Impact on science, capacity development, policy and fisheries management | 141
Hallenstvedt, A., Ellis, R. & Watson, C. 1983. Evaluation report of the survey programme and operations of the research vessel “Dr Fridtjof Nansen”. Report No. 4.82. FAO/UNDP/NORAD Project Evaluation Report, Oslo, Norway, NORAD.
Heemstra, E. & Randall, J. 2009. Three new goatfishes of the genus Parupeneus from the Western Indian Ocean, with resurrection of P. seychellensis. Smithiana Bulletin, 10: 37–50.
Hersoug, B., Jentoft, S. & Degnbol, P. 2004. Fisheries Development: The Institutional Challenge. The Netherlands: Eburon.
Ho, H. & Ma, W. 2016. Revision of southern African species of the anglerfish genus Chaunax (Lophiiformes: Chaunacidae), with descriptions of three new species. Zootaxa, 4144(2): 175–194.
IOC-UNESCO. 2016. Information on Oceanographic Cruises and Datasets from the African Oceans and Coasts – Case of the Western Indian Ocean region. Paris, France, Intergovernmental Oceanographic Commission of UNESCO.
Iwatsuki, Y. & Heemstra, P. 2015. Redescriptions of Polysteganus coeruleopunctatus (Klunzinger 1870) and P. lineopunctatus (Boulenger 1903), with two new species from Western Indian Ocean. Zootaxa, 4059(1): 133–150.
Kaunda-Arara, B., Munga, C., Manyala, J., Kuguru, B., Igulu, M., Chande, M., Kangwe, S., Mwakiti, S., Thoya, P. & Mbaru, E. 2016. Spatial variation in benthopelagic fish assemblage structure along coastal East Africa from recent bottom trawl surveys. Regional Studies in Marine Science, 8: 201–209.
Marr, J., Gosh, D., Pontecorvo, G., Rotschild, B. & Tussing, A. 1971. A plan for fishery development in the Indian Ocean. Report No. IOFC/DEV/71/1. Rome, Italy, FAO/UNDP Indian Ocean Programme.
Marsac, F., Barlow, R., Ternon, J., Ménard, F. & Roberts, M. 2014. Ecosystem functioning in the Mozambique Channel: Synthesis and future research. Deep Sea Research Part II: Topical Studies in Oceanography, 100: 212–220.
Morcos, S. 2002. The Education Mission of Marine Sciences: A case study of East Africa, the early initiatives, 1930–1980. In: K. Benson & P. Rehbock, eds. Oceanography History: The Pacific and Beyond, pp. 215–223. Seattle, U.S.A., University of Washington Press.
Paterson, B. & Petersen, S.L. 2010. EAF implementation in Southern Africa: lessons learnt. Marine Policy, 34(2): 276–292.
Randall, J. & Heemstra, P. 1991. Revision of Indo-Pacific groupers (Perciformes: Serranidae: Epinephelinae) with descriptions of five new species. Honolulu, Hawaii, Bernice Pauahi Bishop Museum.
Randall, J. 2013. Seven new species of labrid fishes (Coris, Iniistius, Macropharyngodon, Novaculops, and Pteragogus) from the Western Indian Ocean. Journal of the Ocean Science Foundation, 7: 1–43.
Rao, T. & Griffiths, R. 1998. Understanding Indian Ocean: Perspective on Oceanography. Paris, France, The United Nations Educational, Scientific and Cultural Organization.
Rogers, A., Alvheim, O., Bemanaja, E., Benivary, D., Boersch-Supan, P., Bornman, T., Cedras, R., Du Plessis, N., Gotheil, S., Hoines, A., Kemp, K., Kristiansen, J., Letessier, T., Mangar, V., Mazungula, N., Mørk, T., Pinet, P., Read, J. & Sonnekus, T. 2009. Southern Indian Ocean Seamounts (IUCN/ GEF/ UNDP/ ZSL/ ASCLME/ NERC/ EAF Nansen Project/ ECOMAR/ ACEP 2009 Cruise 410). 12 November–19 December, 2009. Bergen, Norway, Institute of Marine Research.
Romanov, E. 2003. Summary and review of Soviet and Ukrainian scientific and commercial fishing operations on the deepwater ridges of the southern Indian Ocean. Rome, Italy, Food and Agriculture Organization of the United Nations.
Russell, B. & Tweddle, D. 2013. A new species of Nemipterus (Pisces: Nemipteridae) from the Western Indian Ocean. Zootaxa, 3630(1): 191–197.
Sætersdal, G., Bianchi, G., Strømme , T. & Venema, S. 1999. The Dr Fridtjof Nansen programme 1975–1993. Investigations of fishery resources in developing regions. History of the programme and review of results. FAO Fisheries Technical Paper No. 391. Food and Agriculture Organization of the United Nations.
Sætre, R. & Paula e Silva, R. 1979. The marine fish resources of Mozambique. Bergen, Norway, Institute of Marine Research.
| The RV Dr Fridtjof Nansen in the Western Indian Ocean: Voyages of marine research and capacity development142
Smith, J. 1972. The Sea Fishes of Southern Africa. Third Edition. Cape Town, South Africa, Central News Agency Ltd.Stel, J. 1997. Partnerships in Marine Science: The Dutch Experience in Transfer of Knowledge. In: B. Haq, S. Haq, G.
Kullenberg & J. Stel, eds. Coastal Zone Management Imperative for Maritime Developing Nations. The Netherlands, Kluwer Academic Publishers.
Strømme, T., Ansorge, I., Bornman, T., Kaehler, S., Ostrowski, M., Tweddle, D. & Alvheim, O. 2008. Survey of the Mascarene Plateau. ASCLME Survey number 3. ASCLME FAO Preliminary report. Bergen, Norway, Institute of Marine Research.
Ternon, J., Bach, P., Barlow, R., Huggett, J., Jaquemet, S., Marsac, F., Ménard, F., Penven, P., Potier, M. & Roberts, M. 2014. The Mozambique Channel: From physics to upper trophic levels. Deep Sea Research Part II: Topical Studies in Oceanography, 100: 1–9.
Uiblein, F. & Heemstra, P. 2011. A new goatfish, Upeneus seychellensis sp. nov.(Mullidae), from the Seychelles Bank, with remarks on Upeneus guttatus and a key to Western Indian Ocean Upeneus species. Marine Biology Research, 7(7): 637–650.
van der Elst, R., Groeneveld, J., Baloi, A., Marsac, F., Katonda, K., Ruwa, R. & Lane, W. 2009. Nine nations, one ocean: A benchmark appraisal of the South Western Indian Ocean Fisheries Project (2008–2012). Ocean & Coastal Management, 52(5): 258–267.
Warry, P. 2006. Increasing the Economic Impact of the Research Councils – Advice to the Director General of Science and Innovation, DTI from the Research Council Economic Impact Group. London, GOV.UK, Department for Business, Energy & Industrial Strategy.
Chapter 9
The Nansen Programme in the Western Indian Ocean
– a synthesis of results Johan Groeneveld, Kwame Koranteng, Julius Francis and Gabriella Bianchi
“The enduring success of the Nansen Programme has been ascribed to its ability
to identify emerging needs within a changing political landscape, and to evolve accordingly.”
| The RV Dr Fridtjof Nansen in the Western Indian Ocean: Voyages of marine research and capacity development144
Abstract
The Nansen Programme has been active for more than four decades, making it the longest-lasting fish-eries development initiative in Norwegian history. Over this period, it has identified with “fish” as a key source of food, livelihoods and economic growth in developing countries. The programme undertakes surveys of fish resources and ecosystems, facilitates capacity development through training, and sup-ports fisheries management and policy implementation. Key events that influenced its scope and pri-orities in the Western Indian Ocean were: limited knowledge of fish resources, combined with a post-colonial need for fisheries development in newly independent states (1960s and 1970s); the UNCLOS resolution to adopt a 200 nautical mile exclusive economic zone (early 1980s); emerging resolutions for responsible fisheries (early 1990s); and the introduction of ecosystems considerations into fisheries management (Reykjavik Declaration, 2001). The RV Dr Fridtjof Nansen played a key role in the activi-ties of the Nansen Programme, both as a research platform for collecting data at sea, and as an icon of marine research. Nansen data have contributed to the identification of eddies in the Gulf of Aden and Mozambique Channel, described the flow structure of the Southeast Madagascar Current, and observed upwelling events in several locations. Consolidated information from Nansen surveys and other research programmes have shown that the main mechanisms that control fish biomass, abundance and distribu-tion in the Western Indian Ocean are upwelling, mesoscale eddy circulation, frontal systems, riverine outflow, and monsoon winds. Productivity in surface waters was generally low, with a chlorophyll maxi-mum at around 100 m depth. Coastal embayments and productive continental shelves, such as Delagoa Bight and Sofala Bank were exceptions. During the monsoon-driven upwelling, zooplankton biomass along the Somali Coast reached about double the highest value found elsewhere in the region. Pelagic fish surveys by the Nansen, done 25 years apart in southern Madagascar, found comparable fish distribu-tion and abundance patterns. Conversely, surveys in Mozambique found markedly lower clupeid biomass in 2007–2014 than prior to 1990. Bottom trawls reflected a high diversity of demersal fauna, but apart from prawns and deep-water crustaceans, surveys showed only limited fisheries potential. Demersal fish densities were higher along the Somali Coast than further to the south, on the shelf than on the slope, and near river outflows. After 2007, the Nansen Programme extended its activities from a national to a regional Western Indian Ocean level, to support the Nairobi Convention and Southwest Indian Ocean Fisheries Commission mandates. We show how the Nansen Programme has evolved to retain its rele-vance, and synthesize findings into a “big picture”, by linking ocean processes, productivity and resources at a Western Indian Ocean regional level. The drivers of success, remaining challenges and unresolved issues are explained.
Previous page: The three Dr Fridtjof Nansen research vessels (1975–2017). Artist: Yves Berube. Photo: Magne Olsen, IMR. © IMR.
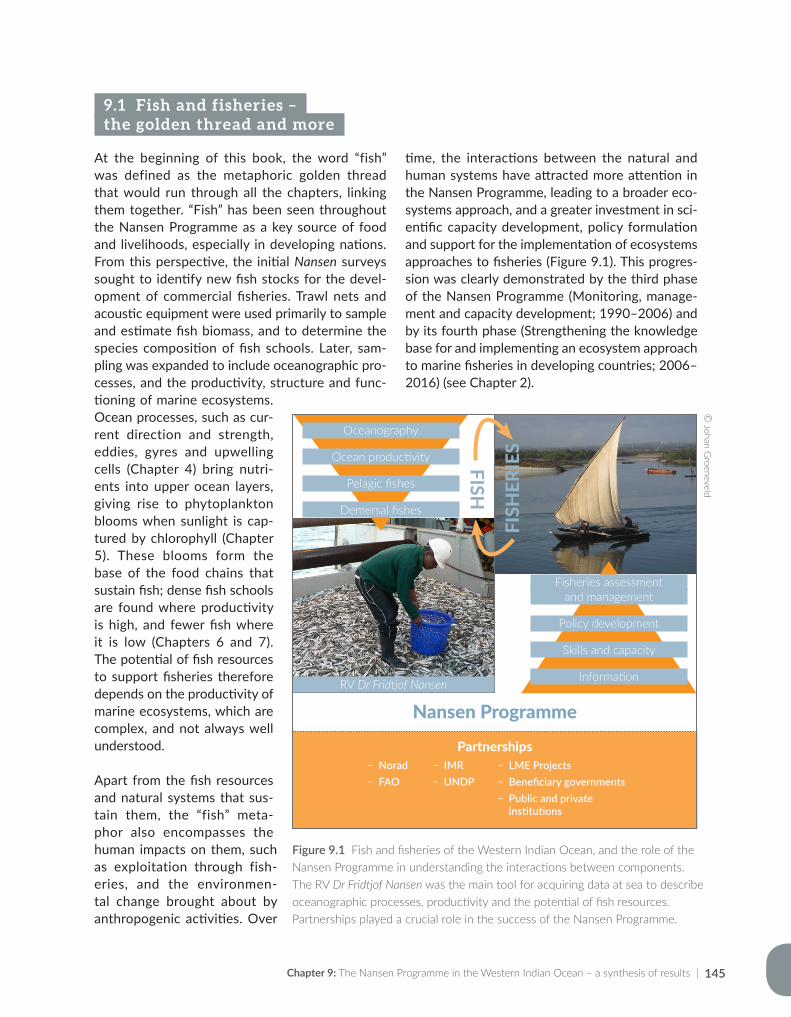
Chapter 9: The Nansen Programme in the Western Indian Ocean – a synthesis of results | 145
9.1 Fish and fisheries – the golden thread and more
At the beginning of this book, the word “fish” was defined as the metaphoric golden thread that would run through all the chapters, linking them together. “Fish” has been seen throughout the Nansen Programme as a key source of food and livelihoods, especially in developing nations. From this perspective, the initial Nansen surveys sought to identify new fish stocks for the devel-opment of commercial fisheries. Trawl nets and acoustic equipment were used primarily to sample and estimate fish biomass, and to determine the species composition of fish schools. Later, sam-pling was expanded to include oceanographic pro-cesses, and the productivity, structure and func-tioning of marine ecosystems. Ocean processes, such as cur-rent direction and strength, eddies, gyres and upwelling cells (Chapter 4) bring nutri-ents into upper ocean layers, giving rise to phytoplankton blooms when sunlight is cap-tured by chlorophyll (Chapter 5). These blooms form the base of the food chains that sustain fish; dense fish schools are found where productivity is high, and fewer fish where it is low (Chapters 6 and 7). The potential of fish resources to support fisheries therefore depends on the productivity of marine ecosystems, which are complex, and not always well understood.
Apart from the fish resources and natural systems that sus-tain them, the “fish” meta-phor also encompasses the human impacts on them, such as exploitation through fish-eries, and the environmen-tal change brought about by anthropogenic activities. Over
time, the interactions between the natural and human systems have attracted more attention in the Nansen Programme, leading to a broader eco-systems approach, and a greater investment in sci-entific capacity development, policy formulation and support for the implementation of ecosystems approaches to fisheries (Figure 9.1). This progres-sion was clearly demonstrated by the third phase of the Nansen Programme (Monitoring, manage-ment and capacity development; 1990–2006) and by its fourth phase (Strengthening the knowledge base for and implementing an ecosystem approach to marine fisheries in developing countries; 2006–2016) (see Chapter 2).
Figure 9.1 Fish and fisheries of the Western Indian Ocean, and the role of the Nansen Programme in understanding the interactions between components. The RV Dr Fridtjof Nansen was the main tool for acquiring data at sea to describe oceanographic processes, productivity and the potential of fish resources. Partnerships played a crucial role in the success of the Nansen Programme.
Norad FAO
LME Projects Beneficiary governments Public and private institutions
Partnerships IMR UNDP
Nansen Programme
FISH
FISH
ERIE
S
Oceanography
Ocean productivity
Pelagic fishes
Demersal fishes
Fisheries assessmentand management
Policy development
Skills and capacity
InformationRV Dr Fridtjof Nansen
© Johan G
roeneveld
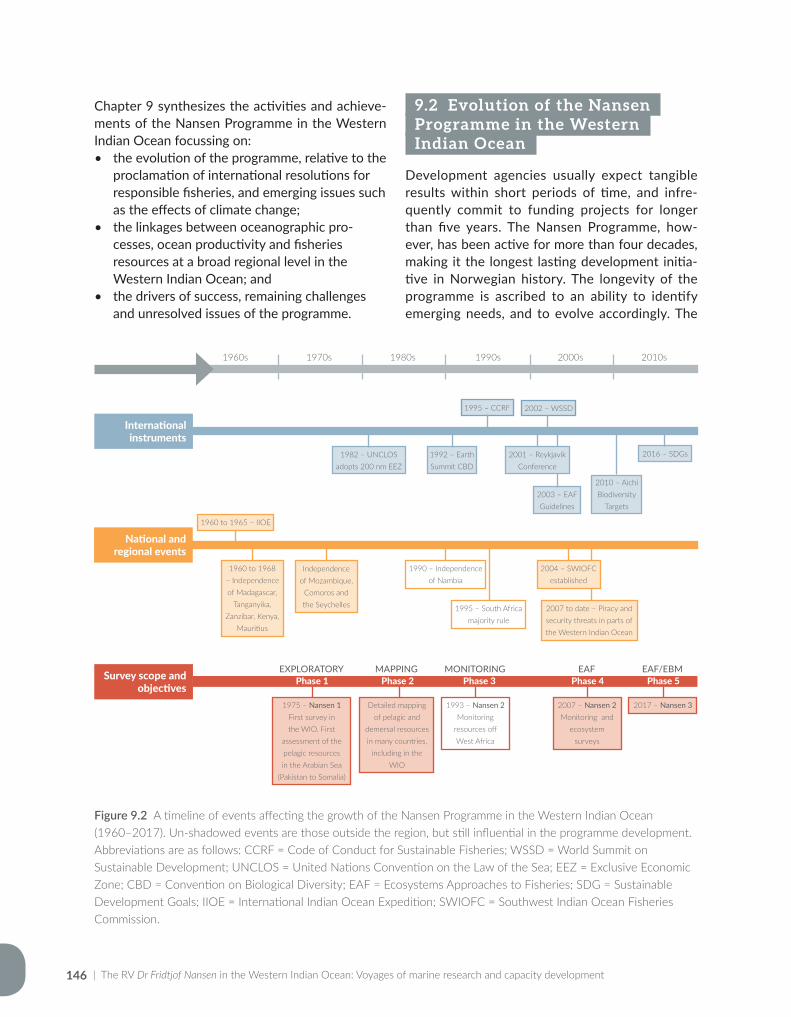
| The RV Dr Fridtjof Nansen in the Western Indian Ocean: Voyages of marine research and capacity development146
Chapter 9 synthesizes the activities and achieve-ments of the Nansen Programme in the Western Indian Ocean focussing on:• the evolution of the programme, relative to the
proclamation of international resolutions for responsible fisheries, and emerging issues such as the effects of climate change;
• the linkages between oceanographic pro-cesses, ocean productivity and fisheries resources at a broad regional level in the Western Indian Ocean; and
• the drivers of success, remaining challenges and unresolved issues of the programme.
9.2 Evolution of the Nansen Programme in the Western Indian Ocean
Development agencies usually expect tangible results within short periods of time, and infre-quently commit to funding projects for longer than five years. The Nansen Programme, how-ever, has been active for more than four decades, making it the longest lasting development initia-tive in Norwegian history. The longevity of the programme is ascribed to an ability to identify emerging needs, and to evolve accordingly. The
Figure 9.2 A timeline of events affecting the growth of the Nansen Programme in the Western Indian Ocean (1960–2017). Un-shadowed events are those outside the region, but still influential in the programme development. Abbreviations are as follows: CCRF = Code of Conduct for Sustainable Fisheries; WSSD = World Summit on Sustainable Development; UNCLOS = United Nations Convention on the Law of the Sea; EEZ = Exclusive Economic Zone; CBD = Convention on Biological Diversity; EAF = Ecosystems Approaches to Fisheries; SDG = Sustainable Development Goals; IIOE = International Indian Ocean Expedition; SWIOFC = Southwest Indian Ocean Fisheries Commission.
Internationalinstruments
1982 – UNCLOS adopts 200 nm EEZ
1992 – Earth Summit CBD
2003 – EAF Guidelines
2010 – Aichi Biodiversity
Targets
2016 – SDGs
1995 – CCRF 2002 – WSSD
2001 – Reykjavik Conference
Survey scope andobjectives
1975 – Nansen 1 First survey in the WIO. First
assessment of the pelagic resources in the Arabian Sea
(Pakistan to Somalia)
National and regional events
1960 to 1965 – IIOE
1960 to 1968 – Independence of Madagascar,
Tanganyika, Zanzibar, Kenya,
Mauritius
Independence of Mozambique,
Comoros and the Seychelles 1995 – South Africa
majority rule
1990 – Independence of Nambia
2007 to date – Piracy and security threats in parts of the Western Indian Ocean
2004 – SWIOFC established
Detailed mapping of pelagic and
demersal resources in many countries,
including in the WIO
1993 – Nansen 2 Monitoring
resources off West Africa
2007 – Nansen 2 Monitoring and
ecosystem surveys
2017 – Nansen 3
Phase 1 Phase 2 Phase 3 Phase 4 Phase 5EXPLORATORY MAPPING MONITORING EAF EAF/EBM
1960s 1970s 1980s 1990s 2000s 2010s
Chapter 9: The Nansen Programme in the Western Indian Ocean – a synthesis of results | 147
RV Dr Fridtjof Nansen has been available to the programme throughout all its phases, but the ves-sel was absent from the Western Indian Ocean between 1990 and 2007, when it was deployed in the Atlantic. The objectives, scope and priorities of the Nansen Programme have changed over time (see Chapter 2) – to adapt to changing political landscapes, and in response to emerging interna-tional agreements and instruments for the sus-tainable use of the oceans and marine resources (Figure 9.2).
Several Western Indian Ocean countries became independent during the 1960s and 1970s, and the new administrations prioritized economic devel-opment. At the time, a lack of knowledge of fish resources and biomass hindered fisheries devel-opment in the region, thus providing a rationale – to provide information on fish resources – for building the first RV Dr Fridtjof Nansen. Within a few years of operation, information collected during Nansen surveys showed that prior expecta-tions of high fish biomass in the Western Indian Ocean would not be met, and advised that eco-nomic investment in the fishing industry should be moderate. This advice, to avoid overinvestment in fishing fleets relative to the available resources, contributed to a new approach, where resource surveys were seen as crucial input to making development and investment decisions.
Having accomplished this initial mission, a new focus for the Nansen Programme was provided by the nascent United Nation Convention on the Law of the Sea (UNCLOS, also described as “Constitution for the oceans”) with an agreement reached in December 1982, in which the interna-tional community established rights and respon-sibilities of coastal states (Box 9.1). Developing countries, and especially newly independent states such as Mozambique, Tanzania, Kenya, Madagascar, and Seychelles, were not then in a position to fulfil the responsibilities required in terms of the Law of the Sea Convention (such as setting sustainable quotas for fishery resources), because of a lack of information, infrastructure and scientific expertise. Article 202 of UNCLOS encourages scientific assistance to developing
countries, in relation to the marine environment. Within this context, the Nansen Programme assisted the then newly-independent administra-tions in the Western Indian Ocean with detailed mapping of marine resources, and estimates of fish abundance, from which maximum sustainable yields (MSY) could be established.
A first evaluation of the Nansen Programme in 1982 pointed out that more had to be done to enable partner countries to make good use of the knowledge generated through surveys (Hallenstvedt et al., 1983). It was recognized that a lack of knowledge on resources and ecosystems was not the only limitation for sustainable resource use, but that support to fisheries administrations and capacity development were equally important. Another assessment in 1989 (CIC-Marine, 1989) recommended that the ageing first RV Dr Fridtjof Nansen be replaced by a new research vessel.
The final decision to build a second RV Dr Fridtjof Nansen in 1991 (the vessel was commissioned in 1993) was motivated mainly by political devel-opments in southern Africa. Norway had been supporting the liberation movements in Namibia and South Africa. Following on Namibian inde-pendence in 1990, and given the highly produc-tive (but potentially over-exploited) fish resources along its coastline, the Nansen Programme entered a new phase to strengthen resource monitoring and capacity development in fishery research and management in Namibia. The vessel was also used to monitor the resources in Angola, as a platform for collaborative research between Angola, Namibia and South Africa, through the BENEFIT programme. Unique time series data were recorded, and at the same time the capacity to monitor their own resources was established in Namibia – a task done locally for both pelagic and demersal resources since 2000. That phase of the Nansen Programme kept the vessel away from the Indian Ocean for more than a decade, resulting in a 17-year gap in the time series information col-lected by the Nansen in the Western Indian Ocean.
For some years after 2000, the Nansen Pro-gramme’s rationale became more diffuse. Norad
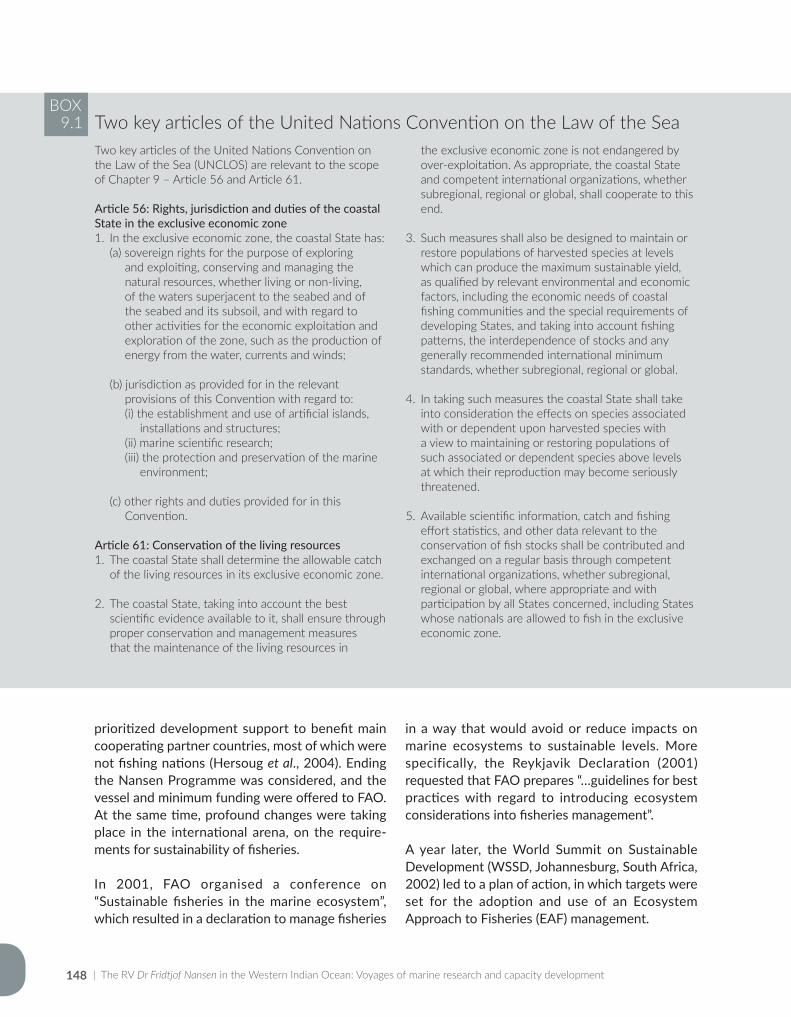
| The RV Dr Fridtjof Nansen in the Western Indian Ocean: Voyages of marine research and capacity development148
prioritized development support to benefit main cooperating partner countries, most of which were not fishing nations (Hersoug et al., 2004). Ending the Nansen Programme was considered, and the vessel and minimum funding were offered to FAO. At the same time, profound changes were taking place in the international arena, on the require-ments for sustainability of fisheries.
In 2001, FAO organised a conference on “Sustainable fisheries in the marine ecosystem”, which resulted in a declaration to manage fisheries
in a way that would avoid or reduce impacts on marine ecosystems to sustainable levels. More specifically, the Reykjavik Declaration (2001) requested that FAO prepares “…guidelines for best practices with regard to introducing ecosystem considerations into fisheries management”.
A year later, the World Summit on Sustainable Development (WSSD, Johannesburg, South Africa, 2002) led to a plan of action, in which targets were set for the adoption and use of an Ecosystem Approach to Fisheries (EAF) management.
the exclusive economic zone is not endangered by over-exploitation. As appropriate, the coastal State and competent international organizations, whether subregional, regional or global, shall cooperate to this end.
3. Such measures shall also be designed to maintain or restore populations of harvested species at levels which can produce the maximum sustainable yield, as qualified by relevant environmental and economic factors, including the economic needs of coastal fishing communities and the special requirements of developing States, and taking into account fishing patterns, the interdependence of stocks and any generally recommended international minimum standards, whether subregional, regional or global.
4. In taking such measures the coastal State shall take into consideration the effects on species associated with or dependent upon harvested species with a view to maintaining or restoring populations of such associated or dependent species above levels at which their reproduction may become seriously threatened.
5. Available scientific information, catch and fishing effort statistics, and other data relevant to the conservation of fish stocks shall be contributed and exchanged on a regular basis through competent international organizations, whether subregional, regional or global, where appropriate and with participation by all States concerned, including States whose nationals are allowed to fish in the exclusive economic zone.
Two key articles of the United Nations Convention on the Law of the Sea (UNCLOS) are relevant to the scope of Chapter 9 – Article 56 and Article 61.
Article 56: Rights, jurisdiction and duties of the coastal State in the exclusive economic zone1. In the exclusive economic zone, the coastal State has:
(a) sovereign rights for the purpose of exploring and exploiting, conserving and managing the natural resources, whether living or non-living, of the waters superjacent to the seabed and of the seabed and its subsoil, and with regard to other activities for the economic exploitation and exploration of the zone, such as the production of energy from the water, currents and winds;
(b) jurisdiction as provided for in the relevant provisions of this Convention with regard to:(i) the establishment and use of artificial islands,
installations and structures;(ii) marine scientific research;(iii) the protection and preservation of the marine
environment;
(c) other rights and duties provided for in this Convention.
Article 61: Conservation of the living resources1. The coastal State shall determine the allowable catch
of the living resources in its exclusive economic zone.
2. The coastal State, taking into account the best scientific evidence available to it, shall ensure through proper conservation and management measures that the maintenance of the living resources in
BOX9.1 Two key articles of the United Nations Convention on the Law of the Sea
Chapter 9: The Nansen Programme in the Western Indian Ocean – a synthesis of results | 149
Guidelines for an EAF were published in 2003, and adopted shortly thereafter by the FAO Committee on Fisheries. The publication of these guidelines, combined with a need to train EAF implementors in developing countries, gave rise to a new phase of the Nansen Programme, designed to facilitate EAF implementation. The RV Dr Fridtjof Nansen would be used to study ecosystem features that may be impacted by fishing, such as vulnerable habitats, biodiversity or other factors important for resource productivity. The return of the Nansen to the Indian Ocean, in 2007, after a 17-year absence, was expedited by collaboration with the Southwest Indian Ocean Fisheries Project (SWIOFP) and the Agulhas and Somali Currents Large Marine Ecosystem Project (ASCLME), which also co-funded the vessel operation costs.
Collaboration with LME programmes was a natu-ral development, given the converging objectives of these programmes (Bianchi et al., 2016a). Also, the implementation of an EAF (which concerns mainly fisheries management) complements EBM (Ecosystem Based Management), which entails multi-sectoral management (Bianchi et al., 2016b). Importantly, EBM is the conceptual framework adopted by the LME programme.
The replacement of the second Nansen with a new one coincided with a period when ocean issues were again receiving attention in the international discourse, and with the formulation of a dedi-cated sustainable development goal on the oceans (SDG 14) in 2016. The “blue economy” concept, combining aspects of growth and conservation, was also relevant. In March 2017, the Norwegian government announced an ocean strategy, to support development cooperation which empha-sizes growth and sustainability aspects. In this strategy, the Nansen Programme forms the pri-mary instrument for cooperation on ocean issues with developing world partners. In its new form, the programme will assess the status of biological resources, ecosystems, and how they are affected by climate change, pollution, and oil and gas activ-ities. The new RV Dr Fridtjof Nansen and the next phase of the Nansen Programme have, therefore, once more been realigned to address emerging
issues in the international arena. As such, its return to the Western Indian Ocean is imminent.
9.3 Regional synthesis of survey results
Throughout the preceding chapters, Nansen sur-veys and scientific results have been shown from a subregional perspective, based on six subre-gions (Somali Coast, East Africa Coastal Current [EACC], Mozambique, Madagascar and Comoros, Mascarene, and Seamounts). These subdivisions were based on a combination of marine ecore-gions described by Spalding et al. (2007), political boundaries between countries, and the spatial coverage by past Nansen surveys (see Chapter 3). The subregional approach was necessitated by an unbalanced survey coverage across the Western Indian Ocean, and over time. As such, some sub-regions, such as Mozambique, were sampled reg-ularly, whereas others, such as the Somali Coast and EACC, were sampled only during the 1970s and 1980s. Mauritius and Comoros were only sampled recently, after 2007.
Apart from flexibility to cope with unbalanced coverage, a subregional approach allowed for a better description of features unique to individual areas, and formed a framework for comparisons between them. The regional synthesis provided here attempts to combine the findings into a “big picture”, by linking ocean processes, productiv-ity and resources at a Western Indian Ocean regional level. This approach is in line with the move towards EAF described above. Importantly, the synthesis below is not based on Nansen data alone, but includes information from many other surveys and studies – each contributing to the body of knowledge on the Western Indian Ocean. Physical properties (water temperature, salinity and oxygen profiles, fluorescence, etc.) and ocean processes (ocean circulation, heat transfer, upwell-ing, riverine input) influence ocean productivity on spatial and temporal scales, and thus deter-mine the distribution and abundance of fisheries resources. Early Nansen surveys between 1975 and 1993 focussed on fisheries exploration and
| The RV Dr Fridtjof Nansen in the Western Indian Ocean: Voyages of marine research and capacity development150
resource mapping, and used the Nansen reversing bottle to sample temperature, salinity and oxygen in the water column (see Chapter 4 and Appendix 4.1). The Nansen bottle was replaced by a CTD with Niskin bottles in 1994, when the first RV Dr Fridtjof Nansen was replaced with a more modern second vessel. Surveys conducted in the Western Indian Ocean during the EAF-Nansen phase after 2007 used technologically much more advanced sensory techniques – such as satellite technology and high resolution underway sensors to measure sea surface temperature, chlorophyll concen-trations and water current velocities. As part of broader ecosystems surveys, the collection and analysis of oceanographic information received far more attention than previously.
Chapter 4 reviewed the contributions of the Nansen to oceanographic findings with a focus on the Somali Coast and EACC subregions (surveys in 1975–1984), Mozambique and Madagascar (1977–2014), and the Mascarene subregion (1978–2010). The Nansen surveys followed on several oceanographic surveys done during the first International Indian Ocean Expedition (IIOE, 1959–1965), which provided baseline informa-tion. Together with surveys of contemporary research vessels, such as the RV Meteor (Germany) and the RV Marion Dufresne (France) the Nansen has provided much of the information, have pro-vided the information that underlies the present understanding of Western Indian Ocean features, and its dynamics.
Whereas many of the early observations on the Nansen were inconclusive at the time, more recent studies, by other vessels and during the “sat-ellite era” (after 2001, when the Global Ocean Ecosystem Dynamics or GLOBEC programme was launched) have corroborated earlier findings. For instance, Nansen data contributed to the first iden-tification of eddies in the Gulf of Aden, and the Mozambique Channel eddies. Nansen data from a 2008 survey described the flow structure of the Southeast Madagascar Current. Upwelling events were observed near Angoche in Mozambique and off southeast Madagascar. Surveys on the Mascarene Plateau in 2008 and 2010 suggested
sub-surface maximum phytoplankton densities at around 100 m depth, a major factor in explaining the functioning of local marine ecosystems. With hindsight, the Nansen played an important role in describing the physical oceanographic processes of the Western Indian Ocean – often from a per-spective of how they would affect productivity, fish distribution and abundance patterns.
As primary production is mainly influenced by sun-light and nutrient availability (see Chapter 5), water movements that bring nutrients to the upper ocean layers which are adequately illuminated stimulate photosynthesis, and hence primary pro-duction. In the Western Indian Ocean, the main mechanisms that control biomass, abundance and distribution are upwelling, mesoscale eddy circulation, frontal systems, riverine outflow, and monsoon winds. Seasonal monsoon winds either cause turbulence (strong SW monsoon winds that mix layers) or result in stratified water layers under calm conditions (weak NE monsoon winds, with associated consequences such as blooms of Trichodesmium that fix nitrogen). In the Somali Coast subregion, monsoon-related upwelling is the most important driver of productivity. Further to the south, in the Mozambique and EACC sub-regions, riverine outflow, particularly during rainy seasons, enriches shelf waters near river outlets (for example the Zambezi, Rufiji, Tana and Sabaki rivers), giving rise to localized higher productivity (Munga et al., 2013).
In general, high chlorophyll a concentrations, the result of photosynthesis, were also associated with high zooplankton biomass, although this was not always the case. Organisms at higher tro-phic levels were also found to follow this trend, for example the relatively more abundant prawn and fish resources off Mozambique. The Western Indian Ocean is relatively impoverished, in terms of productivity, especially in surface waters. Chlorophyll concentrations and fluorescence were always lower than in the sub-surface layers, with the deep chlorophyll maximum usually located at around 100 m depth. Exceptions were coastal embayments (such as around Madagascar) and productive continental shelves, such as Delagoa
Chapter 9: The Nansen Programme in the Western Indian Ocean – a synthesis of results | 151
Bight. Nutrients were also observed to be rela-tively low in surface concentrations, but increased with depth. This was mostly true for nitrate, nitrite, ammonia and phosphate, while silicate was not limiting in surface waters.
The highest zooplankton biomass in the Western Indian Ocean was measured along the Somali Coast during the monsoon-driven upwelling, reaching approximately double the highest bio-mass found elsewhere in the region (see Chapter 5). The second highest biomass was recorded over the Sofala Bank during the rainy season, followed by the Seychelles Bank, but these were all for rel-atively shallow depths (40–50 m) over large shelf areas. The correlation between phyto- and zoo-plankton can be extended to higher trophic levels, especially fish. Simply stated, phytoplankton are consumed by zooplankton (also known as second-ary producers), and these are then consumed by fish larvae and forage fishes and so the chain goes on to the top predators. Because phytoplank-ton are at the base of the food webs, any impact on them is transmitted to higher trophic levels – either directly or indirectly. Thus, understanding the dynamics of the primary and secondary pro-ducers will lead to a better understanding of eco-system functioning.
The Nansen used a combination of acoustic meth-ods (echo-integration) and trawl sampling to quan-tify “small pelagic fish” resources in the Western Indian Ocean (see Chapter 6). The initial Nansen surveys in the Somali Coast and EACC subregions in 1975 provided the first estimates of pelagic fish biomass and distribution in the region, and these early estimates remain the only reference points in some areas. Sardines (clupeids), anchovies (engraulids), jacks and scads (carangids), macker-els (scombrids), barracudas (sphyraenids) and hair-tails (trichiurids) are common pelagic families in the Western Indian Ocean. Carangids and clupe-ids were common in shallow shelf areas, from the Horn of Africa, along the coast to the Mozambique Channel, and around Madagascar and the smaller islands. Engraulids were more abundant in the southern part of the EACC subregion, the Mozambique Channel, and around Madagascar.
Mesopelagic fishes (mainly lanternfish belonging to the Myctophidae, and occurring in the 200–1 000 m depth range) were widely distributed throughout the Western Indian Ocean, but they were far more abundant than any other fish group in the northwest (Horn of Africa, Arabian Sea, Gulf of Oman; Nellen, 1973; Sætersdal et al., 1999).
Surveys done 25 years apart found relatively unchanged abundance, distribution patterns and species composition of fish populations along the southeast Madagascar coast. In Mozambique, however, clupeid biomass was markedly lower in surveys done in 2007 and 2014, than in pre-1990 surveys. This finding was supported by declining catches made by the artisanal fishery off Mozambique. Pelagic fish migrate widely, and many of the stocks can be better considered as regional, rather than belonging to a specific coun-try. Information from acoustic surveys over large geographical areas is therefore required to deter-mine seasonal migrations, and to develop regional fisheries management approaches.
Demersal species (fish and crustaceans) live and feed on the seafloor, which usually consists of mud, sand, gravel or rocks (see Chapter 7). The Nansen has accumulated large amounts of valu-able information on seafloor topography and fish communities, based mainly on bottom trawling and acoustic recordings. Over 1 500 trawls have been completed, mostly (68 percent) on the shelf (less than 200 m depth). Rocky or steep areas that cannot be trawled have, in some cases, been sam-pled with baited traps and hook-and-line methods. Despite the unbalanced distribution of surveys over time and space, broad patterns in fish distri-bution and densities across the Western Indian Ocean were apparent. Pelagic taxa such as scads (Carangidae) and sardinella (Clupeidae) were often also abundant in demersal trawls.
In general, demersal fish diversity was high in near-bottom habitats, with an average of around 21 taxa caught per trawl. A total of more than 300 families have been recorded, more than 80 percent of which were fishes from around 1 660 genera. There was considerable variability in abundance
| The RV Dr Fridtjof Nansen in the Western Indian Ocean: Voyages of marine research and capacity development152
between surveys, subregions and depth strata. From a commercial marketing perspective, the traditionally valuable demersal fish families from shelf waters (Haemulidae, Lethrinidae, Lutjanidae Serranidae and Sparidae) were generally found in low densities. No traditionally valuable fishes were found in commercially viable quantities on the continental slopes. Invertebrate resources were chiefly represented by crustaceans, which were found mainly on the shelf and slope on both sides of the Mozambique Channel, along the central coast of Mozambique (Sofala Bank) and off west-ern Madagascar.
Demersal fish densities were relatively higher in the Somali Coast subregion than elsewhere, and also higher on the shelf than on the slope. Densities of snappers (Lutjanidae) were consistent across shelf subregions, particularly after 2007, whereas seabreams (Sparidae) exhibited a subequatorial distribution, occurring in Somalia and in the south-ern parts of Mozambique and Madagascar, but not in equatorial waters in-between. Crustaceans predominated on the Mozambique shelf, consis-tent with the information from prawn trawl fish-eries. Estimates produced from Nansen surveys are similar to those produced by other surveys in the Western Indian Ocean (Gulland, 1978; Birkett, 1979; Tarbit, 1980; Mahrika et al., 2008).
Overall, Nansen surveys reflect a high diversity of demersal fauna, but apart from prawns and deep-water crustaceans, the surveys show only limited fisheries potential on the generally narrow shelf and upper continental slope. Apart from the Somali Coast subregion, where upwelling domi-nated, the main Western Indian Ocean demersal fisheries are located near river mouths, suggesting that nutrients from terrestrial sources are of major importance to demersal fish communities and abundance.
9.4 The Nansen Programme – drivers of success, remaining challenges and unresolved issues
Drivers of successIn 2011, the EAF-Nansen Project was selected as an FAO Success Story – an acknowledgement of its performance against multiple development aid criteria. But what made the programme suc-cessful? Undoubtedly, the approach used – to assist with collecting offshore fisheries data (using mainly the RV Dr Fridtjof Nansen), with capac-ity development to support science, policy and fisheries management, and with implementation support – was a major factor (Figure 9.3). This approach evolved over time, and is now well-es-tablished in the Western Indian Ocean, showing clear and enduring gains. A long-term commitment by Norway, in terms of providing the vessel, exper-tise and funding was also an important success factor, as opposed to other shorter programmes, in which gains have often been transient, or unsus-tainable. The strategic partnership with FAO, as the management arm of the Nansen Programme, sets it apart from its contemporaries, because its objectives are thus aligned with the UN develop-ment aid mandates. Within this context, the ability of the Nansen Programme to adapt, and to service emerging needs brought by changes in interna-tional legislation or UN resolutions, ensured its continued relevance in fisheries development.
Partnerships with regional fisheries manage-ment organizations (such as the Southwest Indian Ocean Fisheries Commission, or SWIOFC), regional research projects (such as the SWIOFP and ASCLME projects), and bilateral agreements with individual governments, were central driv-ers of success. Also important were the hands-on on-board and on-land capacity development activ-ities, through sponsoring developing scientists at multiple levels, such as participation in Nansen surveys, training courses and workshops, as well as support for formal post-graduate studies.
To achieve success, many challenges integral to the developing world, or to the Western Indian Ocean had to be overcome, and in some cases, remain
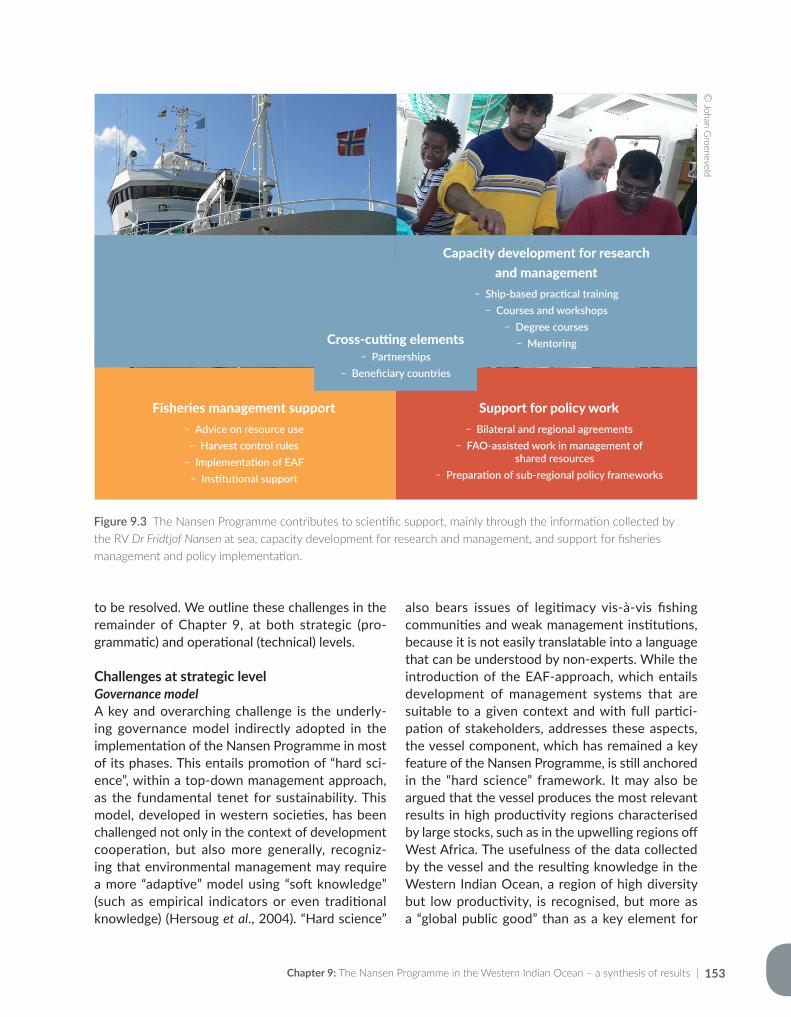
Chapter 9: The Nansen Programme in the Western Indian Ocean – a synthesis of results | 153
to be resolved. We outline these challenges in the remainder of Chapter 9, at both strategic (pro-grammatic) and operational (technical) levels.
Challenges at strategic levelGovernance model A key and overarching challenge is the underly-ing governance model indirectly adopted in the implementation of the Nansen Programme in most of its phases. This entails promotion of “hard sci-ence”, within a top-down management approach, as the fundamental tenet for sustainability. This model, developed in western societies, has been challenged not only in the context of development cooperation, but also more generally, recogniz-ing that environmental management may require a more “adaptive” model using “soft knowledge” (such as empirical indicators or even traditional knowledge) (Hersoug et al., 2004). “Hard science”
also bears issues of legitimacy vis-à-vis fishing communities and weak management institutions, because it is not easily translatable into a language that can be understood by non-experts. While the introduction of the EAF-approach, which entails development of management systems that are suitable to a given context and with full partici-pation of stakeholders, addresses these aspects, the vessel component, which has remained a key feature of the Nansen Programme, is still anchored in the “hard science” framework. It may also be argued that the vessel produces the most relevant results in high productivity regions characterised by large stocks, such as in the upwelling regions off West Africa. The usefulness of the data collected by the vessel and the resulting knowledge in the Western Indian Ocean, a region of high diversity but low productivity, is recognised, but more as a “global public good” than as a key element for
Figure 9.3 The Nansen Programme contributes to scientific support, mainly through the information collected by the RV Dr Fridtjof Nansen at sea, capacity development for research and management, and support for fisheries management and policy implementation.
Scientific support Surveys at sea Data collection
Information technology (Nansis) Fish biomass
estimates
Support for policy work Bilateral and regional agreements
FAO-assisted work in management of shared resources
Preparation of sub-regional policy frameworks
Fisheries management support Advice on resource use Harvest control rules
Implementation of EAF Institutional support
Capacity development for research and management
Ship-based practical training Courses and workshops
Degree courses MentoringCross-cutting elements
Partnerships Beneficiary countries
© Johan G
roeneveld
| The RV Dr Fridtjof Nansen in the Western Indian Ocean: Voyages of marine research and capacity development154
improved fisheries management at community/fisheries level. Other issues that remain unresolved are related to the weaknesses of governance systems and related institutions in developing countries. In addition to capacity issues, overall poor trans-parency and overall democratic processes may undermine efforts to improve the performance of an individual sector, such as fisheries. The implica-tions thereof, relative to achieving the objectives of the Nansen Programme, need to be assessed to a greater extent than in the past.
Broad-based approachThe broad approach used by the Nansen Pro-gramme in the Western Indian Ocean (see Figure 9.3) evolved over time, and is geared towards both short- and long term outcomes. Over the short term, while local infrastructure and the capacity to collect and interpret information are lacking, assistance is provided with all the steps required to implement sustainable fishing practices. At the same time, and with a view towards longer term self-reliance, local scientific capacity and infra-structure are gradually strengthened, through sup-port for research institutes and training of prom-ising fisheries scientists. All three of the key steps in the broad approach (expanding the knowledge base; capacity development; and support for pol-icy and management plans) have some limitations, and may not be entirely efficient, in design or in the way it has been implemented.
Through surveys, the RV Dr Fridtjof Nansen has provided new data on marine resources and eco-systems, spanning from 1975 to 1990 and 2007 to 2015 (expanding the knowledge base). These data would otherwise not have been available to science, nor for the management of the use of those resources. The Nansen can, however, not be everywhere at the same time, and therefore the spatio-temporal coverage of data collected by the vessel is severely limited. Further, the Nansen is not suitable for regular collections of site-specific time-series data, even though such data are important for assessing changes in the physical environment, ecosystem functioning, or the status
of fisheries resources. Relying on the Nansen, as the primary tool for data gathering, therefore imposes some severe limitations on the Nansen Programme, particularly in the Western Indian Ocean, where most fisheries are near the coast, in shallow waters. An important question to ask then, is how such a limitation can be overcome. A change in focus, from using only the Nansen, to also using other methods for data collection, bet-ter suited to the Western Indian Ocean environ-ment, might hold promise.
Capacity development in the Nansen Programme focussed on strengthening of both human resources and institutional capacity. Human resources development has included a range of initiatives, such as ship-based training and short-term courses in data management (including with Nansis), taxonomy and fish species identification, trawling and acoustic surveys, fish stock assess-ment and EAF principles. It has also facilitated studies towards masters and doctoral degrees, where students from coastal states have used data collected by the Nansen for their theses. Capacity development efforts have targeted both scientific and management levels, and have often been car-ried out in partnership with other regional proj-ects, such as SWIOFP and ASCLME.
Nevertheless, whether the capacity develop-ment efforts have achieved the desired out-comes, remains unclear. The numbers of train-ees have been impressive, but where have they gone? Capacity development has not been based on specific assessments, but rather on priorities set on the basis of what the Nansen Programme could offer. In many cases, interactions between a particular trainee and the Nansen Programme occurred once only, or over a short-term (for example, a few days on the vessel during a survey), without a longer term plan. The student reten-tion rate has therefore been low, and the present capacity development programme appears to be inefficient, at least in terms of markedly increasing the numbers of active fisheries researchers and managers in the region. Tuning capacity develop-ment efforts to specific needs, identified through a more formal process (for example, capacity
Chapter 9: The Nansen Programme in the Western Indian Ocean – a synthesis of results | 155
assessments), might assist in increasing the num-bers of skilled scientists, as well as extending the Nansen Programme’s working relationships with selected alumni.
In terms of support for policy implementation and fisheries management plans, the Nansen Programme has piloted the use of key EAF prin-ciples in the preparation of fishery management plans (FAO, 2013). The implementation of these management plans has started in Comoros, Madagascar, Mauritius, Mozambique, Kenya and Tanzania. At regional level, the joint Strategic Action Plan of the ASCLME and SWIOFP proj-ects, developed in collaboration with the Nansen Programme, was approved by governments. The programme has also contributed to the EAF Toolbox (FAO, 2012), which guides users through the EAF planning steps. With the support of the FAO Legal Office a “How-to Guide on Legislating for EAF” has been developed (FAO, 2017), in response to a need identified by legislators and fisheries managers. The guide shows how to draft national legislation that incorporates EAF-relevant components, and strengthens the legal frame-work for fisheries management in FAO member countries.
Fisheries management plans for the industrial shrimp- and line fisheries in Mozambique, the demersal fishery in Madagascar and Comoros, the Saya de Malha and Nazareth Banks fisheries in Mauritius, and the small and medium pelagic fish-eries in Tanzania, among others, have been based on Nansen data as a key input. Data from earlier Nansen surveys in Kenya were used for a co- management plan for Malindi – Ungwana Bay (GOK, 2016). Whereas the process of develop-ing the management plans has been positively received, they have often not been fully imple-mented. A lack of political will to implement man-agement plans, which by definition will restrict fishing, is perhaps not surprising, because for many coastal fishing communities, there are few other livelihood alternatives. It appears that there are more fundamental issues that will have to be resolved among fishing communities along the Western Indian Ocean coastline, before fisheries
management initiatives will be accepted. Among these are the role of traditional fishing rights and practices, human population growth and depen-dence on fish for food security along the coast, and developing alternative livelihood strategies at least as attractive as fishing.
PartnershipsThe Nansen is owned by Norad, operated by the IMR, and managed by FAO. This partnership binds the vessel to the FAO fisheries development agenda, but also facilitates its access to the waters of many FAO member countries. Apart from sail-ing under a UN flag, which allows the vessel to move more freely across maritime boundaries, the negotiating power of the FAO with governments far exceeds that of unaligned development pro-grammes. Thus, the tripartite relationship between the vessel owner (Norad), operations and scientific expertise (IMR) and management (FAO) has been crucial to the success of the Nansen Programme. Partnerships with other regional projects in the Western Indian Ocean (such as SWIOFP and ASCLME) are also important, but have been more ephemeral. The potential for conflicting interests, when engaging with multiple partners within a limited survey period, should not be ignored.
Use of the Nansen dataData and information gathered by the Nansen Programme have been used for policy documents, development of management strategies, scientific papers, field guides and as basic data for further research (Chapter 8). Nansen data have also been used for educational purposes, such as in training courses, theses, and exhibitions to make people aware of the marine environment. But to what extent has the Nansen data been used by indi-vidual scientists from the Western Indian Ocean region?
Information technology (IT), including data stor-age, accessibility and processing have undergone major developments over the past decade or two. Large databases can now be shared over the inter-net, and specialist software has revolutionized data exploration and analysis. The data process-ing systems used by the Nansen Programme have
| The RV Dr Fridtjof Nansen in the Western Indian Ocean: Voyages of marine research and capacity development156
kept pace with technological advances. The Nansis database and software are good examples of the technology developed by the Nansen Programme – it is now widely available to scientists and tech-nicians worldwide, and can be used to store and manage data from different types of surveys.
There is concern that the uptake, or use of Nansen data, by scientists in the Western Indian Ocean have been below expectations. It is not yet clear what the reasons may be, although it is probably a combination of various factors, such as: a lack of scientific support at local level; a small number of users in the region (for example few oceanog-raphers, marine ecologists and fisheries research-ers); a lack of access to data stored on Nansis, either because of IT shortcomings, or lack of data processing skills; too few local supervisors for post-graduate students; or the limited relevance of Nansen data to nearshore fisheries, or to local issues of concern.
An investigation of why the uptake of Nansen data is suboptimal would be worthwhile, and may also shed light on the type of data that would be most useful to researchers confronted with local issues in the Western Indian Ocean region.
Challenges at operational (technical) level Practical issues at the level of individual surveys, and the quality of the data that can be made avail-able, are explained below. Some of these are long-standing issues, related to the limitations brought by using the Nansen as the primary tool for data collection, or as a result of political instability in parts of the Western Indian Ocean region, or to skills and infrastructure shortages. Potential solu-tions are held over to Chapter 10, where they are discussed within the context of the future of the Nansen Programme in the Western Indian Ocean.
Spatio-temporal distribution of surveysThe spatio-temporal coverage of Nansen surveys across the Western Indian Ocean was uneven, resulting in many data gaps. Drawbacks of the “gappy” data are that time series information to assess long-term trends are not available, that recent data are only available for some subregions,
and that seasonality cannot easily be taken into account in analyses.
Gaps in geographical coverageAlthough surveys were conducted in the Somali Coast and EACC subregions before 1984, no nutrient, phytoplankton or zooplankton data were collected. The two subregions were not sur-veyed after 2007, because of security concerns. Therefore, contemporary data from these two subregions are sparse.
Deep and shallow areas under-sampledSampling of deep-water demersal resources and habitats on the continental slopes and on sea-mounts has been less intensive than on shallower shelf areas, with only 30 percent of demersal trawls undertaken at depths beyond 200 m. To an extent, this reflects the initial purpose of Nansen surveys – to provide information on potential fisheries, expected to be more prevalent on pro-ductive shelf areas. Shallow water less than 20 m deep has also been excluded from surveys, owing to vessel safety concerns. Consequently, fish resources that inhabit shallow areas, either per-manently or seasonally, would have remained under-sampled. For example, the survey along the west coast of Madagascar in 2009 found excep-tionally low acoustic abundances of small pelagic fishes. The question then arises whether small pelagic fishes may simply have been in shallower waters, closer to the coast, at that time of the year. It is important to note that all research vessels of the size of the Nansen would have similar limita-tions in shallow areas.
Sampling rocky and other untrawlable substratesSeafloor topography made bottom trawling very difficult in the Mascarene subregion, and reef-like structures also prevented trawling on large parts of the Madagascar shelf and slope, and in north-ern Mozambique. The dynamic multidisciplinary sampling strategy used by the Nansen largely pre-cludes static sampling methods, such as trapping and hook-and-line methods, and hence these rocky substrates remain under-sampled, compared to trawlable areas. The lack of samples from dif-ferent habitats perhaps accounts for the limited
Chapter 9: The Nansen Programme in the Western Indian Ocean – a synthesis of results | 157
efforts in reviewing the demersal fish biodiver-sity of the region since the early work by Bianchi (1992). A preliminary review was undertaken by Fennessy and Everett (2011), but a more detailed analysis is overdue.
Record-keeping of samplesAn important concern has been the sometimes inadequate record-keeping of samples, as well as oversight of their off-loading after surveys, includ-ing who the responsible agent(s) would be for sample curation and analysis. Linked to this is the issue of archiving and access – it is often a diffi-cult task to establish exactly which samples and data have been analysed for some surveys. Survey reports have been of varying quality and content, proving invaluable in some cases, and frustratingly thin in others, thus emphasizing the need to tabu-late survey data, showing its quality and availabil-ity to researchers.
Post-survey analysis of samples While analysis of physical data from CTD casts, for example, is a relatively rapid process, analysis of biological samples such as phytoplankton and zooplankton (particularly for taxonomic identifica-tion) can be time-consuming and requires scarce taxonomic skills. In many cases the post-survey analysis was not followed up, with an end result of far fewer outputs than would be expected, as well as a much longer time to eventual publication. Substantial volumes of underway recordings of bathymetry and data for modelling the nature of the substrate have been collected since 1994, but have not been analysed.
Verification of species namesThe identification of species in the database requires attention with respect to verification of names assigned during the surveys. There has been very limited collection of voucher specimens to assist with this, and local fish experts did not always participate in surveys, which may have compromised this aspect of data collection.
Utilization of biological dataThe biological data of crustaceans and fish col-lected by the Nansen are extensive. However,
their use have been limited and the rationale and related sampling strategy have not always been clear. Demersal species such as groupers and snappers are considered to be commercially important and therefore their length frequen-cies have been measured. Prawns are particularly important in Mozambique, where they are mea-sured. Small pelagic fishes are often measured. In most cases, however, the data are stored and not used to their full potential. A rationale for the col-lection of specific biological data should be clearly stated – and where possible, linked to collabora-tive projects which will use the data.
9.5 Conclusion
Three key aspects of the Nansen Programme in the Western Indian Ocean were assessed: a) its evolution over the past four decades; b) its role in understanding the linkages between ocean-ographic processes, productivity and fisher-ies resources; and c) the factors contributing to its success, the challenges that remain and the unresolved issues. The synthesis provided here prepares the way for Chapter 10, on the future of the Nansen Programme in the Western Indian Ocean.
| The RV Dr Fridtjof Nansen in the Western Indian Ocean: Voyages of marine research and capacity development158
References
ASCLME/SWIOFP. 2012. Transboundary Diagnostic Analysis for the western Indian Ocean. Volume 1: Baseline.Bianchi, G. 1992. Demersal assemblages of tropical continental shelves. A study based on the data collected through
the surveys of the RV Dr Fridtjof Nansen. Thesis for the fulfilment of the Dr. Scient. degree, University of Bergen, Bergen, Norway.
Bianchi, G., Bjordal, A., Koranteng, K., Tandstad, M., Sambe, B. & Strømme, T. 2016a. Collaboration between the Nansen Programme and the Large Marine Ecosystem Programmes. Environmental Development, 17: 340–348.
Bianchi, G., Funge-Smith, S., Hermes, R., O’Brien, C., Sambe, S. & Tandstad, M. 2016b. Sustainable fisheries within an LME context. Environmental Development 17: 182–192.
Birkett, L. 1979. Western Indian Ocean Fishery Resources Survey. Report on the Cruises of RV Professor Mesyatsev, December 1975–June 1976 / July 1977–December 1977. Report No. 26. Technical Report, Indian Ocean Programme.
CIC-Marine. 1989. Review of available information material in order to reach a decision on the possible continuation of the work of the fishery survey vessel Dr Fridtjof Nansen through the building of a replacement vessel. NORAD, Oslo.
FAO. 2012. The EAF Toolbox: the Ecosystem Approach to Fisheries. Rome, Italy, Food and Agriculture Organization of the United Nations.
FAO. 2013. Final evaluation of the EAF-Nansen project (Phase I): Strengthening the knowledge base for and implementing an ecosystem approach to marine fisheries in developing countries. Report No. GCP/INT/003/NOR. Rome, Italy, Food and Agriculture Organization of the United Nations.
FAO. 2017. A how-to guide on legislating for an Ecosystem Approach to Fisheries. Report No. 27, FAO EAF-Nansen Project, Rome, Italy, Food and Agriculture Organization of the United Nations.
Fennessy, S. & Everett, B. 2011. Fishes without passports – similarities and differences in SWIO demersal fish diversity. 7th WIOMSA Scientific Symposium, White Sands Hotel, Mombasa, Kenya. 24–29 October 2011.
GOK, 2016. The Malindi-Ungwana Bay area co-management plan (2016–2021). Kenya, Government of Kenya.Gulland, J. 1978. Report of the FAO/IOP workshop on the fishery resources of the Western Indian Ocean south of the
equator. Mahé, Seychelles 23 October–4 November 1978. Dev. Rep. Indian Ocean Programme. Report No. 45. Rome, Italy, Food and Agriculture Organisation of the United Nations.
Hallenstvedt, A., Ellis, R. & Watson, C. 1983. Evaluation report of the survey programme and operations of the research vessel Dr Fridtjof Nansen. Report No. 4.82. FAO/UNDP/NORAD Project Evaluation Report, Oslo, Norway, NORAD.
Hersoug, B., Jentoft, S. & Degnbol, P. 2004. Fisheries Development: the institutional challenge. Eburon Publishers, 228 p.
Mahika, C., Kangwe, S., Mwakosya, C., Mhitu, H., Kulekana, J., Shayo, S., Matola, H., Ulotu, E., Ululu, J., Silas, M., Mahongo, S. & Hatibu, H. 2008. Report on near-shore demersal fish stock assessment survey in trawlable areas along the Tanzanian coast. Tanzania, Tanzania Fisheries Research Institute.
Munga, C.N., Mwangi, S., Ong’anda, H., Ruwa, R., Manyala, J., Groeneveld, J.C., Kimani, E. & Vanreusel, A. 2013. Species composition, distribution patterns and population structure of penaeid shrimps in Malindi-Ungwana Bay, Kenya, based on experimental bottom trawl surveys. Fisheries Research, 147: 93–102.
Nairobi Convention. 2015. Report of the Eighth Conference of Parties to the Convention for the Protection, Management and Development of the Marine and Coastal Environment of the Western Indian Ocean (Nairobi Convention). Mahe, Seychelles, 22–24 June 2015.
Nellen, W. 1973. Kinds and abundance of fish larvae in the Arabian Sea and the Persian Gulf. The Biology of the Indian Ocean, pp. 415–430. Berlin, Germany, Springer.
Sætersdal, G., Bianchi, G., Strømme, T., & Venema, S. 1999. The Dr Fridtjof Nansen programme 1975–1993. Investigations of fishery resources in developing regions. History of the programme and review of results. FAO Fisheries Technical Paper No. 391. Rome, Italy, Food and Agriculture Organization of the United Nations.
Chapter 9: The Nansen Programme in the Western Indian Ocean – a synthesis of results | 159
Tarbit, J. 1980. Demersal trawling in Seychelles waters (Fisheries Bulletin). Report No. 4. Seychelles, Fish. 1980 Div. Seychelles Govt.
van der Elst, R., Groeneveld, J., Baloi, A., Marsac ,F., Katonda, K., Ruwa, R., & Lane, W. 2009. Nine nations, one ocean: A benchmark appraisal of the South Western Indian Ocean Fisheries Project (2008–2012). Ocean & Coastal Management 52 (5): 258–267.

| The RV Dr Fridtjof Nansen in the Western Indian Ocean: Voyages of marine research and capacity development160
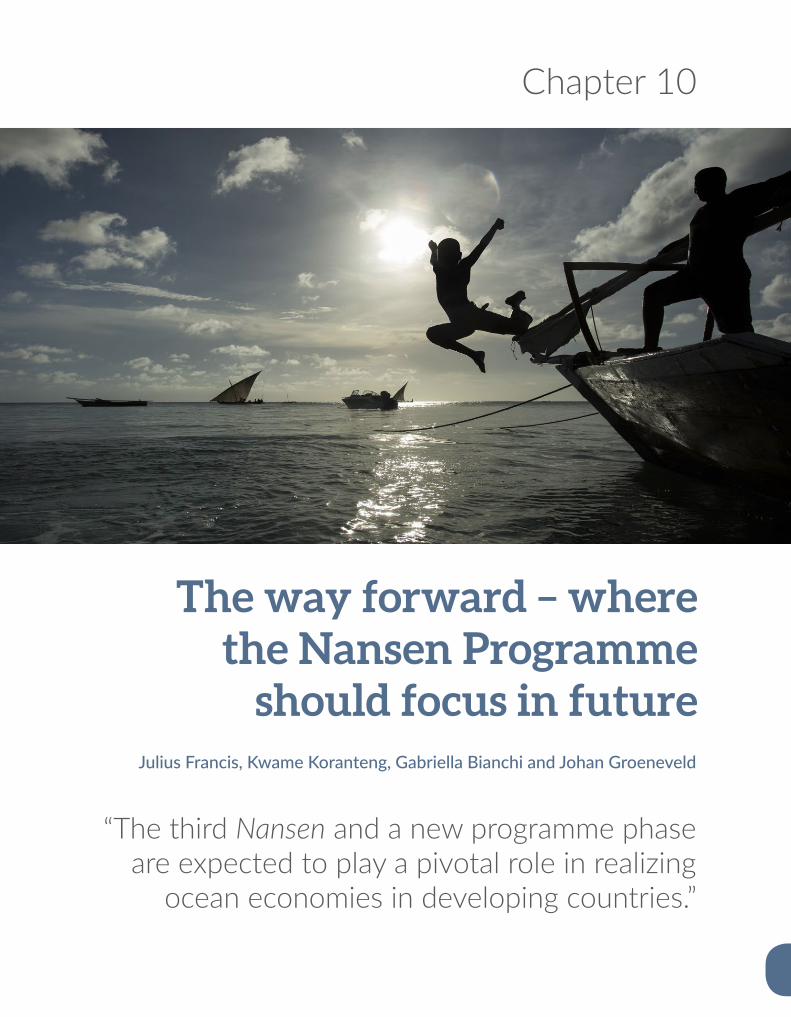
Chapter 10
The way forward – where the Nansen Programme
should focus in futureJulius Francis, Kwame Koranteng, Gabriella Bianchi and Johan Groeneveld
“The third Nansen and a new programme phase are expected to play a pivotal role in realizing
ocean economies in developing countries.”
| The RV Dr Fridtjof Nansen in the Western Indian Ocean: Voyages of marine research and capacity development162
Abstract
Increasingly, it is recognized that oceans can be vital components of economic growth. They are influ-ential in regulating climate, sustaining ecosystems and abundant marine resources, and supporting the livelihoods of people around the world. Their importance has given rise to a global “blue economy” ini-tiative, in which continued economic growth and the sustainable use of ocean and coastal resources are closely coupled. Within this context, the launch of a third RV Dr Fridtjof Nansen and a new EAF-Nansen Programme phase in 2017 were important events, because they are expected to play a pivotal role in realizing ocean economies in developing countries. In the Western Indian Ocean region, fast-growing economies and increasing coastal populations rely on the ocean as an essential source of food security, economic activity and livelihoods. Nearshore fisheries are dominated by local small-scale operations, whereas industrial fleets, many of foreign origin, harvest tunas and related species in offshore waters. Offshore oil and gas exploration continues to increase. To a large extent, the use of marine resources remains uncoordinated and weakly regulated, with signs of overexploitation and degradation of coastal habitats. The preceding chapters of this book dealt with the contributions of the Nansen Programme to understanding the physical oceanographic processes in the region, ocean productivity, and the distribu-tion and abundance of fisheries resources. The progress in strengthening scientific capacity, policy devel-opment and the implementation of fisheries management strategies was also evaluated. Chapter 10 now looks towards the future, where the objectives of the new EAF-Nansen Programme will be to investigate the potential of fisheries resources; understand the ecological impacts of oil and gas activities, and land-based pollution; and measure the impacts of climate change on coastal and marine resources. In combi-nation, these objectives are geared towards promoting an ocean (or “blue”) economy, using mechanisms such as ecosystem-based management, marine spatial planning and regional collaboration.
Previous page: Ocean, people and fishing boats in Zanzibar – towards a sustainable future. © Shutterstock.com/damn12.
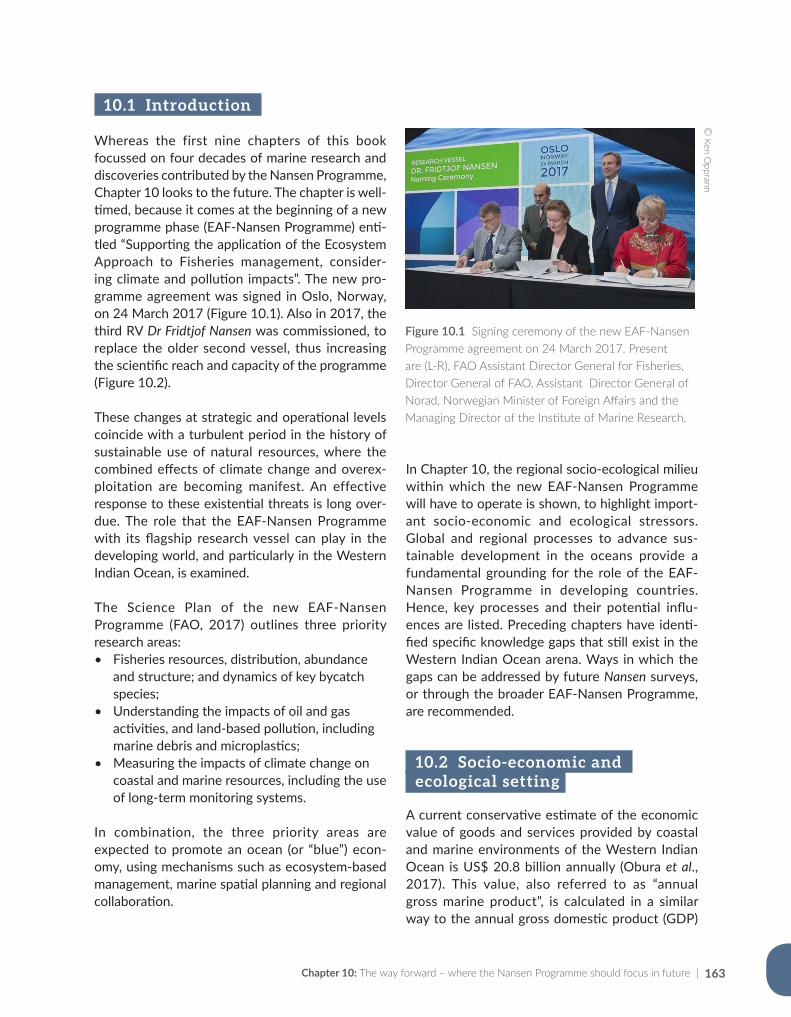
Chapter 10: The way forward – where the Nansen Programme should focus in future | 163
10.1 Introduction
Whereas the first nine chapters of this book focussed on four decades of marine research and discoveries contributed by the Nansen Programme, Chapter 10 looks to the future. The chapter is well-timed, because it comes at the beginning of a new programme phase (EAF-Nansen Programme) enti-tled “Supporting the application of the Ecosystem Approach to Fisheries management, consider-ing climate and pollution impacts”. The new pro-gramme agreement was signed in Oslo, Norway, on 24 March 2017 (Figure 10.1). Also in 2017, the third RV Dr Fridtjof Nansen was commissioned, to replace the older second vessel, thus increasing the scientific reach and capacity of the programme (Figure 10.2).
These changes at strategic and operational levels coincide with a turbulent period in the history of sustainable use of natural resources, where the combined effects of climate change and overex-ploitation are becoming manifest. An effective response to these existential threats is long over-due. The role that the EAF-Nansen Programme with its flagship research vessel can play in the developing world, and particularly in the Western Indian Ocean, is examined.
The Science Plan of the new EAF-Nansen Programme (FAO, 2017) outlines three priority research areas: • Fisheries resources, distribution, abundance
and structure; and dynamics of key bycatch species;
• Understanding the impacts of oil and gas activities, and land-based pollution, including marine debris and microplastics;
• Measuring the impacts of climate change on coastal and marine resources, including the use of long-term monitoring systems.
In combination, the three priority areas are expected to promote an ocean (or “blue”) econ-omy, using mechanisms such as ecosystem-based management, marine spatial planning and regional collaboration.
In Chapter 10, the regional socio-ecological milieu within which the new EAF-Nansen Programme will have to operate is shown, to highlight import-ant socio-economic and ecological stressors. Global and regional processes to advance sus-tainable development in the oceans provide a fundamental grounding for the role of the EAF-Nansen Programme in developing countries. Hence, key processes and their potential influ-ences are listed. Preceding chapters have identi-fied specific knowledge gaps that still exist in the Western Indian Ocean arena. Ways in which the gaps can be addressed by future Nansen surveys, or through the broader EAF-Nansen Programme, are recommended.
10.2 Socio-economic and ecological setting
A current conservative estimate of the economic value of goods and services provided by coastal and marine environments of the Western Indian Ocean is US$ 20.8 billion annually (Obura et al., 2017). This value, also referred to as “annual gross marine product”, is calculated in a similar way to the annual gross domestic product (GDP)
Figure 10.1 Signing ceremony of the new EAF-Nansen Programme agreement on 24 March 2017. Present are (L-R), FAO Assistant Director General for Fisheries, Director General of FAO, Assistant Director General of Norad, Norwegian Minister of Foreign Affairs and the Managing Director of the Institute of Marine Research.
© Ken O
pprann
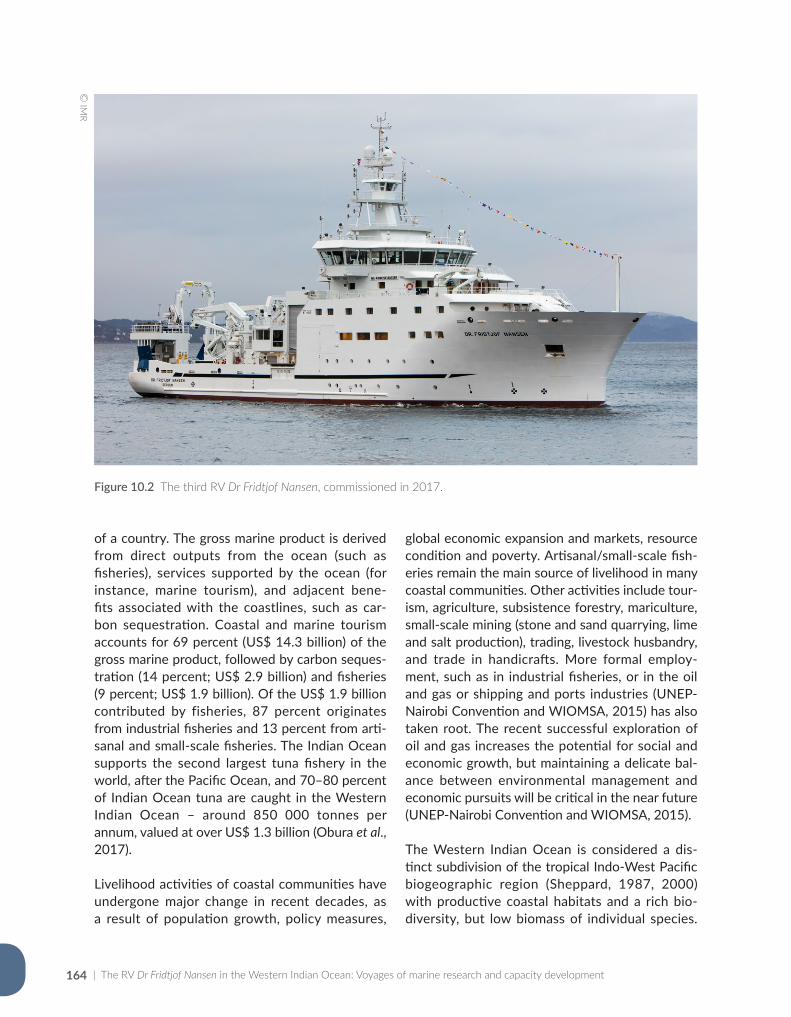
| The RV Dr Fridtjof Nansen in the Western Indian Ocean: Voyages of marine research and capacity development164
of a country. The gross marine product is derived from direct outputs from the ocean (such as fisheries), services supported by the ocean (for instance, marine tourism), and adjacent bene-fits associated with the coastlines, such as car-bon sequestration. Coastal and marine tourism accounts for 69 percent (US$ 14.3 billion) of the gross marine product, followed by carbon seques-tration (14 percent; US$ 2.9 billion) and fisheries (9 percent; US$ 1.9 billion). Of the US$ 1.9 billion contributed by fisheries, 87 percent originates from industrial fisheries and 13 percent from arti-sanal and small-scale fisheries. The Indian Ocean supports the second largest tuna fishery in the world, after the Pacific Ocean, and 70–80 percent of Indian Ocean tuna are caught in the Western Indian Ocean – around 850 000 tonnes per annum, valued at over US$ 1.3 billion (Obura et al., 2017).
Livelihood activities of coastal communities have undergone major change in recent decades, as a result of population growth, policy measures,
global economic expansion and markets, resource condition and poverty. Artisanal/small-scale fish-eries remain the main source of livelihood in many coastal communities. Other activities include tour-ism, agriculture, subsistence forestry, mariculture, small-scale mining (stone and sand quarrying, lime and salt production), trading, livestock husbandry, and trade in handicrafts. More formal employ-ment, such as in industrial fisheries, or in the oil and gas or shipping and ports industries (UNEP-Nairobi Convention and WIOMSA, 2015) has also taken root. The recent successful exploration of oil and gas increases the potential for social and economic growth, but maintaining a delicate bal-ance between environmental management and economic pursuits will be critical in the near future (UNEP-Nairobi Convention and WIOMSA, 2015).
The Western Indian Ocean is considered a dis-tinct subdivision of the tropical Indo-West Pacific biogeographic region (Sheppard, 1987, 2000) with productive coastal habitats and a rich bio-diversity, but low biomass of individual species.
Figure 10.2 The third RV Dr Fridtjof Nansen, commissioned in 2017.
© IM
R
Chapter 10: The way forward – where the Nansen Programme should focus in future | 165
Until recently, the region was relatively unknown, and less heavily impacted than many other ocean basins (Halpern et al., 2008; Stojanovic and Farmer, 2013). Rapid economic growth in recent decades, and concomitant increases in coastal popula-tions, fishing, shipping, oil and gas exploitation, agriculture and urbanization have escalated envi-ronmental impacts, and are eroding the resource base. Hence ocean-dependent communities in the region often face economic hardship – including food insecurity (UNEP-Nairobi Convention and WIOMSA, 2015).
In addition to institutional weaknesses, manage-ment processes are often hamstrung because of the lack of reliable information. In several cases, environmental or fisheries management strategies have been adopted, but cannot be implemented because of a lack of basic information. Investment in research remains low, and collaboration between research institutions and management authorities is inadequate. Novel and integrated legal and management solutions to existing prob-lems are required; these can be facilitated by the experience brought by partners, such as the EAF-Nansen Programme.
10.3 Global and regional processes towards sustainable development in oceans
The global discourse on the state of the envi-ronment places increasing emphasis on the sus-tainable use of ocean and coastal resources, in what has become known as the “blue economy” or “sustainable ocean economy”. This is manifest in an increasing number of formal processes, at global, regional and national levels, aimed at sus-tainable development in oceans. These processes guide strategic thinking within the EAF-Nansen Programme, and are essential to the understand-ing of its role in the Western Indian Ocean over the next decades.
In September 2015, the UN General Assembly adopted the 2030 Agenda for Sustainable Development with 17 Sustainable Development
Goals (SDGs) and 169 underlying targets. SDG 14 – “to conserve and sustainably use the oceans, seas and marine resources for sustainable development” – confirms the importance of conservation and sus-tainable use of the coastal and marine resources for long-term economic growth, food security and poverty alleviation. It further provides impetus to the development of solutions to cross-sector threats, such as the impacts of the fisheries sector on the conservation of biodiversity.
The Paris Agreement of December 2015 is gro-unded in the UN Framework Convention on Climate Change (UNFCCC), and aims to streng-then the global response to climate change. It recognizes the importance of oceans within the Preamble and in the Agreement itself, under the banner of Ecosystem Integrity. Articles 4 and 5 exhort parties to promote sustainable manage-ment, and in article 7.7.b, parties are invited to strengthen climate science, including research, sys-tematic observation, and early warning systems.
In 2012, the African Union (AU) approved Africa’s Integrated Maritime (AIM) Strategy – 2050 (African Union, 2012), thus recognizing the vast poten-tial for wealth creation of the continent’s inland waters, oceans and seas. The 2050 AIM Strategy proposes Marine Spatial Planning as a mechanism to balance competing sector-based interests, and that a blue economy is implemented. This was followed in 2014 by the Policy Framework and Reform Strategy for Fisheries and Aquaculture in Africa (PFRS) (African Union, 2014).
FAO launched the Blue Growth Initiative (BGI) in 2013, based on the blue economy concept that emerged from the Rio+20 Conference in 2012 and on the Code of Conduct for Responsible Fisheries (FAO, 1995). The BGI aims to restore the potential of oceans and wetlands by introducing sustainable approaches to reconciling economic growth and food security.
The First Global Integrated Marine Assessment (World Ocean Assessment) was accepted by the UN General Assembly in January 2016 (www.worldoceanassessment.org). It provides a scientific
| The RV Dr Fridtjof Nansen in the Western Indian Ocean: Voyages of marine research and capacity development166
basis for dealing with ocean issues, and is targeted at governments and intergovernmental processes. It reinforces the science-policy interface and establishes a basis for future assessments.
The Regional State of the Coast Report for the Western Indian Ocean (UNEP-Nairobi Convention and WIOMSA, 2015) was launched during the 8th Conference of the Parties (COP) of the Nairobi Convention in June 2015. It reported on the eco-nomic potential of the Western Indian Ocean, and the consequential demand for marine ecosystem goods and services. It also provided a summary for policy makers (UNEP-Nairobi Convention and WIOMSA, 2016). The report highlights the increas-ing human population, pace and scale of environ-mental changes, and opportunities to avoid seri-ous degradation. It presents exploratory scenarios and policy analyses to assist with decision-making. Key recommendations were to: increase levels of funding for marine research; expand the knowl-edge of resources, their environment and social aspects of exploitation; invest in human capacity development; promote equitable access and bene-fit sharing; and to adopt a blue economy.
At national level, Seychelles has adopted the blue economy concept, Mauritius is investing in ocean economy, South Africa relies on its Operation Phakisa to unlock its ocean economy, and Kenya now has a State Department of Fisheries and Blue Economy, under the Ministry of Agriculture, Livestock, Fisheries and Blue Economy.
The global, regional and national processes have similar higher level priorities in common, all of which provide strategic guidance to the nascent new EAF-Nansen Programme phase in the Western Indian Ocean. Key guidelines that emerge from these processes, and that can inform the EAF-Nansen Programme, revolve primarily around potential benefits inherent in a blue economy. In a blue economy, benefits are derived in an envi-ronmentally responsible and sustainable manner. It is suggested that this important emerging theme of “blue economy” represents the fourth compo-nent of the overall Science Plan with the following guidelines:
• Greater emphasis on the sustainable use of ocean and coastal resources, through promo-tion of sustainable ocean economy (or blue economy);
• Use of ecosystem-based management and marine spatial planning as mechanisms to sup-port blue economy; and
• Establishment of comprehensive monitoring schemes for the marine environment.
10.4 Knowledge gaps and the future role of the EAF-Nansen Programme
In the preceding chapters, specific knowledge gaps which could potentially be filled by a future EAF-Nansen Programme, have been identified. Here we list the most important of these, and suggest ways in which they can be approached by the pro-gramme. The gaps and recommendations below are specific to the individual disciplines addressed in each preceding chapter, but in practice they can often best be resolved in an integrated way, by conducting multidisciplinary surveys.
Physical oceanography Knowledge gap: Backlog in analysis of oceanographic data (discussed in Chapter 4)Large quantities of oceanographic data have been collected with advanced on-board sen-sory equipment and satellite imagery during past Nansen surveys (especially after 2007), and the amount of data collected will likely increase in future surveys. Given the past scar-city of manpower to analyze the data, much of the data have been (and will be) stored, without further detailed analysis.
Suggestions for future work:a) Detailed exploration of the archived Nansen data, to investigate oceanographic processes that remain enigmatic – for instance, the Southeast Madagascar Current retroflection, or the Mozambican coastal counter-currents; b) More targeted sampling of oceanographic features of interest during future surveys;
Chapter 10: The way forward – where the Nansen Programme should focus in future | 167
c) Use of “Big Data” technologies able to han-dle data of vast size and high complexity (Chen and Zhang, 2014).
Ocean productivity Knowledge gap: Absence of plankton indicators of environmental change (discussed in Chapter 5)Plankton are model organisms for monitoring ecosystem health, biodiversity and environ-mental variation in the marine environment, because they respond rapidly to environmental stressors. A plankton monitoring programme, to provide a suite of plankton indicators for marine environmental management issues, is suggested. Potential applications might include: climate change (for example, distri-butional shifts and range expansions of plank-ton populations), ocean acidification (impacts on calcifying species), eutrophication (algal blooms and consequential “dead zones” of bloom decay), productivity supporting fisheries (plankton hotspots, fish dependence on bio-mass, composition and timing of their plankton prey), invasive species (invertebrates via their planktonic stages), ecosystem health (harmful/toxic algal blooms, marine pathogens) and bio-diversity (community changes, unusual species records).
Suggestions for future work:a) The EAF-Nansen Programme could assist with a coordinated monitoring programme by including previously sampled transects when revisiting an area. Such a programme would require close collaboration with local part-ners who would continue regular monitoring during periods when the Nansen is elsewhere; b) The Nansen can tow a Continuous Plankton Recorder (CPR) during long transits. Such a pro-gramme would require access to a centre with expertise in the enumeration and identification of CPR-collected plankton, which is currently lacking in the region.
Pelagic resources Knowledge gap:Ecology and abundance of migrating small pelagic fishes (discussed in Chapter 6)Small pelagic fish stocks are most likely to be transboundary resources, which require regional scale surveys designed to identify sea-sonal migration and distribution patterns, and to define individual fish stocks. To date, surveys have mainly been restricted to narrow geo-graphical ranges, to fall within country borders. Shelf areas shallower than 20 m depth have been under-sampled, because of vessel safety – a potential bias when assessing the fisheries potential of migratory species. Biomass esti-mates for the northern part of the Western Indian Ocean date from the 1970s and 1980s, and may not reflect recent biomass levels. Suggestions for future work:a) The Nansen undertakes regional scale sur-veys designed to identify migrations, abun-dance and distribution patterns of small pelagic fishes, and to define individual fish stocks; b) The Nansen undertakes surveys to gener-ate up-to-date biomass estimates and species composition indices of pelagic fish resources in the Somali Coast and East Africa Coastal Current (EACC) subregions – when the security situation in the area improves; c) A subsampling technique for nearshore waters (5–20 m depth) is developed – potentially in collaboration with regional partners.
Demersal resourcesKnowledge gap: Spatio-temporal gaps in trawl data (discussed in Chapter 7)Demersal trawl surveys have been conducted mainly at national level, without consideration for an overall regional design. Hence the long-term database is permeated with spatio-tem-poral gaps, for which no trawl data exist for long periods (up to 17 years) and large areas (Somali Coast, EACC, Madagascar). The unbalanced nature of the database restricts the potential for generating long-term abundance indices. In addition, few trawls have been conducted
| The RV Dr Fridtjof Nansen in the Western Indian Ocean: Voyages of marine research and capacity development168
shallower than 20 m depth or indeed on the continental slope > 200 m. Other untrawlable areas also remain under-sampled. Although few past surveys specifically covered demer-sal fish biodiversity, Everett et al. (2015) noted the existence of a large quantity of stored trawl data (>1 500 trawls), which apart from Bianchi (1992), have not yet been analyzed in detail.
Suggestions for future work:a) The Nansen undertakes demersal trawl sam-pling according to a survey design developed to improve the spatio-temporal distribution of data at a regional level. Greater coverage is suggested for areas that have not been sur-veyed recently; b) A subsampling technique for nearshore waters (5–20 m depth) is to be developed; c) Surveys of untrawlable areas are increased, using methods other than trawling; d) Data-mining to study patterns in biodiver-sity and to verify ecozones (see Spalding et al., 2007) is done – these can be used to refine the spatial survey design in the future, for example, by basing survey design on ecozones instead of national boundaries.
Impact on science, capacity development, policy and fishery management
Knowledge gap: Limited use of Nansen data and inefficient transfer into policy and management (discussed in Chapter 8)The limited use of data collected during Nansen surveys may be attributed to a lack of capac-ity for data analysis and interpretation in the Western Indian Ocean region – especially in fields related to fisheries resource use. While the cruise reports provide timely scientific information, their format is not geared towards advising policy-makers or managers. Hence the new information is not incorporated into policy formulation or management in an efficient way.
Suggestions for future work:a) Encourage the use of data collected during past Nansen surveys. For example, funding of postgraduate research at local universi-ties, based on analysis of stored Nansen data,
and co-supervised by local and IMR scientists, would address several issues – such as use of data and development of regional scien-tific capacity; b) Improve the access to cruise reports and Nansen data within the Western Indian Ocean region, thereby encouraging their use; c) Generate specific fisheries man-agement / policy advice reports – designed to efficiently convey scientific information to decision-makers at national and regional levels; d) Strengthen ties with regional fisheries man-agement bodies, as a mechanism to increase uptake of management / policy advice at regional level.
Synthesis of results of the Nansen ProgrammeKnowledge gap: Inadequate regional infrastructure and expertise to sustain projects when the Nansen is not available (discussed in Chapter 9)The broad-based approach used by the Nansen Programme – to assist with collecting offshore data, encourage capacity development through training, and support policy implementation and fisheries management – is now well-es-tablished in the Western Indian Ocean, show-ing clear and enduring gains. However, there remains a shortfall in the region’s institutions and individual scientists, to successfully con-tinue and sustain the programme’s longer-term projects without infrastructure support, for example, when the Nansen is deployed outside the Western Indian Ocean. Suggestions for future work:a) Identify specific regional nodes and projects that can be supported over a longer term, espe-cially in the absence of the Nansen. For exam-ple, a plankton monitoring programme in a specific area would require local infrastructure and expertise to conduct regular sampling, and to develop and monitor indicators. Logistically, sampling sites should therefore be located close to existing research facilities, with access to vessels (even smaller vessels) and the appro-priate sampling gear; b) Longer-term collabora-tive projects between regional- and Norwegian scientists should benefit both parties – through
Chapter 10: The way forward – where the Nansen Programme should focus in future | 169
a transfer of scientific expertise to regional scientists, and a deeper understanding, by the Norwegian scientists, of the cultural and logis-tical challenges faced by their Western Indian Ocean contemporaries.
These suggestions should feed into the regional planning processes, such as that initi-ated in Durban (EAF-Nansen Project meeting, FAO, 2016). This meeting identified priority areas including:• the identification of new resources to be
exploited, especially deep-sea and small pelagics;
• assessment of exploited resources and examining possible connectivity between different populations;
• understanding enrichment processes such as upwelling and riverine nutrients and their variability and drivers, especially in relation to climate change;
• habitat characterization and setting base-lines in areas where oil/gas exploitation is being planned.
10.5 Conclusion
The new EAF-Nansen Programme presents an exciting suite of activities, informed by emerging needs, pressing priorities and outstanding knowl-edge gaps, all of which adhere to the four themes of the envisaged Science Plan:1. Fisheries resources2. Impact of human activities3. Climate change4. Blue Economy
This makes the Programme well-positioned to contribute to research on any of the ten themes of the World Ocean Assessment: climate change, over-exploitation, food security, biodiversity, increased use of ocean space, pollution, cumula-tive impacts, inequalities in benefit distribution, management of human impacts, and delays in implementing known solutions.
Our review of the previous phases of the Nansen Programme identified some survey data limita-tions, mainly associated with uneven geographical coverage, temporal discontinuity, and undersam-pling of shallow, deep and untrawlable habitats. However, suggestions to redress the spatio-tem-poral imbalance of past surveys by developing techniques to sample shallow and rocky areas, and to set up baselines for long-term monitoring, should be approached in collaboration with local and regional institutions.
The limited use of past Nansen data in policy and management may be attributed to a regional lack of capacity for data analysis and interpretation. Scientific capacity can be enhanced through tar-geted interventions, such as building synergies between the EAF-Nansen Programme and univer-sities in the region. Both partners could gain from such a network, in which the Nansen data gets used for applied research, while simultaneously, scientific capacity is developed at a post-graduate level.
It is increasingly recognized that sustained dia-logue between scientists and policy makers is more effective than the traditional pipelines of just sending technical reports or publications to poli-cy-makers and managers. A dialogue platform to strengthen the links between science, policy and action was proposed at the Eighth Conference of the Parties to the Nairobi Convention (Seychelles, June 2015). Further, the Southwest Indian Ocean Fisheries Commission (SWIOFC) provides a high-level forum for member countries to cooperatively decide on regional fisheries policy, management and research. The EAF-Nansen Programme could use the SWIOFC platform and structures more effectively to disseminate information and advice, including facilitation of data analysis, assessment and reporting.
Ecosystem-based marine spatial planning is recog-nized as an essential component for the implemen-tation of a blue economy in the Western Indian Ocean. The EAF-Nansen Programme can con-tribute to the integrated ecosystem assessment process, as the basis for establishing sustainable
| The RV Dr Fridtjof Nansen in the Western Indian Ocean: Voyages of marine research and capacity development170
governance of ocean-based activities. Global indi-cators to assist countries in measuring progress towards achieving SDGs will depend on the abil-ity to efficiently collect data, monitor targets and measure progress.
The EAF-Nansen Programme can assist partners in setting up baselines and tracking progress. Partnerships with governments, fisheries research and management authorities, regional and interna-tional organisations, and non-governmental orga-nizations have played a key role in the successes of the EAF-Nansen Programme to date. These partnerships need to be maintained and expanded, where possible, to ensure that the projected out-comes of the programme are achieved.
Chapter 10: The way forward – where the Nansen Programme should focus in future | 171
References
African Union. 2012. 2050 Africa’s Integrated Maritime Strategy (2050 AIM Strategy). Available at: www.au.int/maritime.
African Union. 2014. Policy Framework and Reform Strategy for Fisheries and Aquaculture in Africa. Available at: www.au.int/web/en/documents/30266/policy-framework-and-reform-strategy-fisheries-and-aquaculture-africa.
Bianchi, G. 1992. Demersal assemblages of tropical continental shelves. A study based on the data collected through the surveys of the R/V Dr Fridtjof Nansen. Thesis for the fulfilment of the Dr. Scient. Degree. Bergen, Norway, University of Bergen.
Chen, C.P. & Zhang, C.Y. 2014. Data-intensive applications, challenges, techniques and technologies: A survey on Big Data. Information Sciences, 275: 314–347.
Economist Intelligence Unit (EIU). 2015. The blue economy: Growth, opportunity and a sustainable ocean economy. 20pp.
Everett, B., Groeneveld, J., Fennessy, S., Porter, S., Munga, C., Diaz, N., Filipe, O., Zacarias, L., Igulu, M. & Kuguru, B. 2015. Demersal trawl surveys show ecological gradients in Southwest Indian Ocean slope fauna. Western Indian Ocean Journal of Marine Science, 14(1&2): 73–92.
FAO. 1995. Code of Conduct for Responsible Fisheries. Rome, Italy, Food and Agriculture Organization of the United Nations.
FAO. 2016. The EAF-Nansen Programme 2016–2020. Identifying areas of collaboration with fisheries research and management institutions in the South Western Indian Ocean Region. Rome, Italy, Food and Agriculture Organization of the United Nations.
FAO. 2017. FAO working for SDG 14: Healthy oceans for food security, nutrition and resilient communities. Rome, Italy, Food and Agriculture Organization of the United Nations.
Halpern, B.S., Walbridge, S., Selkoe, K.A., Kappel, C.V., Micheli, F., D’agrosa, C., Bruno, J.F., Casey, K.S., Ebert, C., Fox, H.E. & Fujita, R., 2008. A global map of human impact on marine ecosystems. Science, 319(5865):948–952.
Obura, D. et al. 2017. Reviving the Western Indian Ocean Economy: Actions for a Sustainable Future. WWF International, Gland, Switzerland. 64 pp.
Sheppard, C.R.C. 1987. Coral species of the Indian Ocean and adjacent seas – a synonymized compilation and some regional distributional patterns. Atoll Research Bulletin, 307: 1–33.
Sheppard, C.R.C. 2000. Coral reefs of the Western Indian Ocean: An overview. In: McClanahan, T.R., Sheppard, C.R.C. and Obura, D.O. (eds.) Coral Reefs of the Indian Ocean – their ecology and conservation. Oxford University Press. 525 pp.
Spalding, M., Fox, H., Allen, G., Davidson, N., Ferdana, Z., Finlayson, M., Halpern, B., Jorge, M., Lombana, A. & Lourie, A. 2007. Marine ecoregions of the world: a bioregionalization of coastal and shelf areas. BioScience, 57(7): 573–583.
Stojanovic, T.A. & Farmer, C.J.Q. 2013. The development of world oceans and coasts and concepts of sustainability. Marine Policy, 42:157–165.
UNEP-Nairobi Convention & WIOMSA. 2015. The Regional State of the Coast Report: Western Indian Ocean. UNEP and WIOMSA, Nairobi, Kenya, 546 pp.
UNEP-Nairobi Convention & WIOMSA. 2016. The Regional State of the Coast Report: Western Indian Ocean. A Summary for Policy Makers. UNEP and WIOMSA, Nairobi, Kenya, 107 pp.

| The RV Dr Fridtjof Nansen in the Western Indian Ocean: Voyages of marine research and capacity development172
“Along African coasts, both in Atlanticand Indian Ocean waters, the Nansen is
iconic to marine scientists with an interest in doing research away from
the confines of the coast.”
Appendixes

| The RV Dr Fridtjof Nansen in the Western Indian Ocean: Voyages of marine research and capacity development174
Previous page: The RV Dr Fridtjof Nansen 1994–2016. © Johan Groeneveld
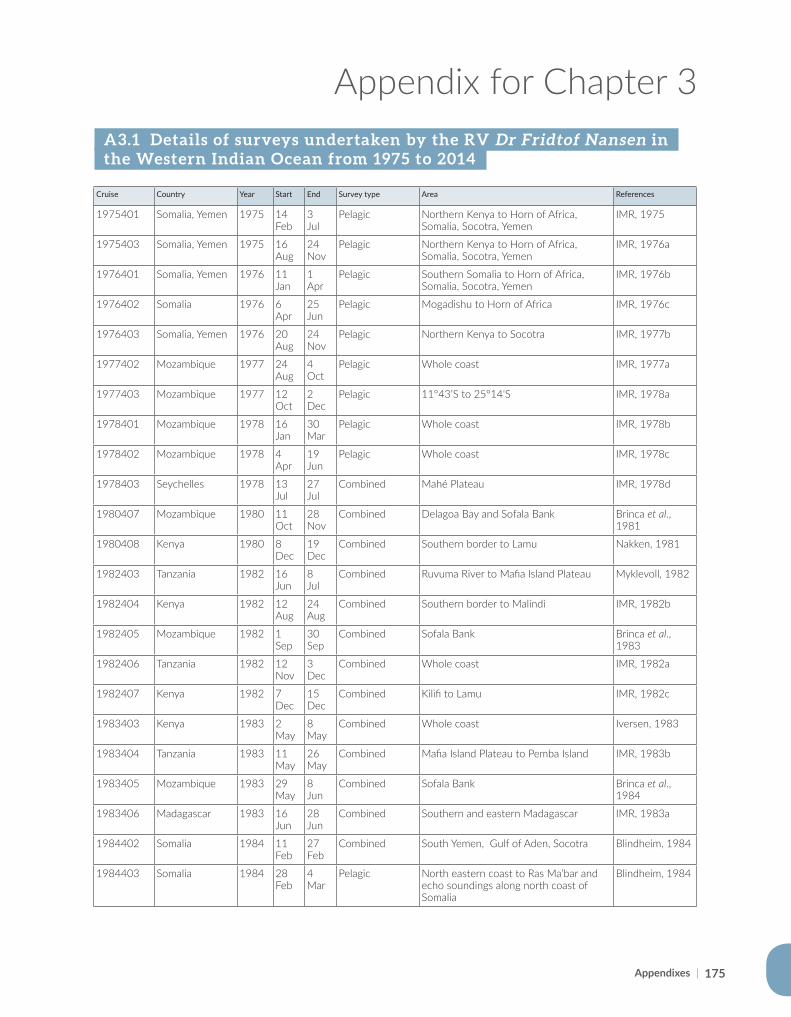
Appendixes | 175
Appendix for Chapter 3 A3.1 Details of surveys undertaken by the RV Dr Fridtof Nansen in the Western Indian Ocean from 1975 to 2014
Cruise Country Year Start End Survey type Area References
1975401 Somalia, Yemen 1975 14 Feb
3 Jul
Pelagic Northern Kenya to Horn of Africa, Somalia, Socotra, Yemen
IMR, 1975
1975403 Somalia, Yemen 1975 16 Aug
24 Nov
Pelagic Northern Kenya to Horn of Africa, Somalia, Socotra, Yemen
IMR, 1976a
1976401 Somalia, Yemen 1976 11 Jan
1 Apr
Pelagic Southern Somalia to Horn of Africa, Somalia, Socotra, Yemen
IMR, 1976b
1976402 Somalia 1976 6 Apr
25 Jun
Pelagic Mogadishu to Horn of Africa IMR, 1976c
1976403 Somalia, Yemen 1976 20 Aug
24 Nov
Pelagic Northern Kenya to Socotra IMR, 1977b
1977402 Mozambique 1977 24 Aug
4 Oct
Pelagic Whole coast IMR, 1977a
1977403 Mozambique 1977 12 Oct
2 Dec
Pelagic 11°43’S to 25°14'S IMR, 1978a
1978401 Mozambique 1978 16 Jan
30 Mar
Pelagic Whole coast IMR, 1978b
1978402 Mozambique 1978 4 Apr
19 Jun
Pelagic Whole coast IMR, 1978c
1978403 Seychelles 1978 13 Jul
27 Jul
Combined Mahé Plateau IMR, 1978d
1980407 Mozambique 1980 11 Oct
28 Nov
Combined Delagoa Bay and Sofala Bank Brinca et al., 1981
1980408 Kenya 1980 8 Dec
19 Dec
Combined Southern border to Lamu Nakken, 1981
1982403 Tanzania 1982 16 Jun
8 Jul
Combined Ruvuma River to Mafia Island Plateau Myklevoll, 1982
1982404 Kenya 1982 12 Aug
24 Aug
Combined Southern border to Malindi IMR, 1982b
1982405 Mozambique 1982 1 Sep
30 Sep
Combined Sofala Bank Brinca et al., 1983
1982406 Tanzania 1982 12 Nov
3 Dec
Combined Whole coast IMR, 1982a
1982407 Kenya 1982 7 Dec
15 Dec
Combined Kilifi to Lamu IMR, 1982c
1983403 Kenya 1983 2 May
8 May
Combined Whole coast Iversen, 1983
1983404 Tanzania 1983 11 May
26 May
Combined Mafia Island Plateau to Pemba Island IMR, 1983b
1983405 Mozambique 1983 29 May
8 Jun
Combined Sofala Bank Brinca et al., 1984
1983406 Madagascar 1983 16 Jun
28 Jun
Combined Southern and eastern Madagascar IMR, 1983a
1984402 Somalia 1984 11 Feb
27 Feb
Combined South Yemen, Gulf of Aden, Socotra Blindheim, 1984
1984403 Somalia 1984 28 Feb
4 Mar
Pelagic North eastern coast to Ras Ma’bar and echo soundings along north coast of Somalia
Blindheim, 1984
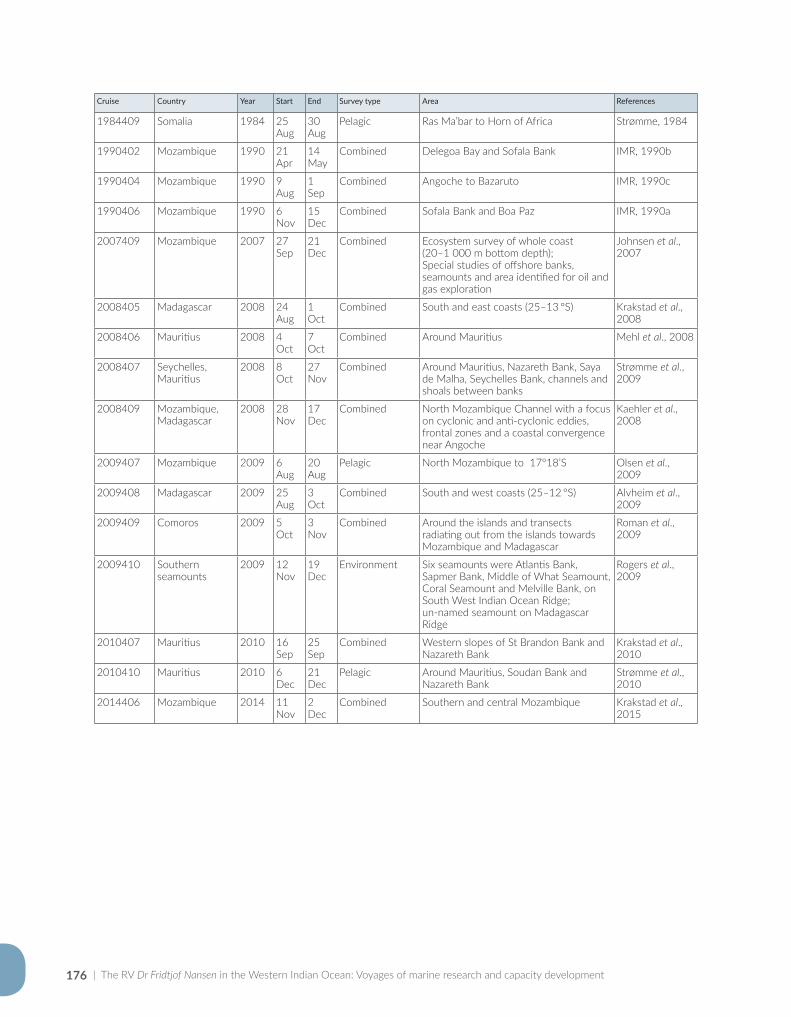
| The RV Dr Fridtjof Nansen in the Western Indian Ocean: Voyages of marine research and capacity development176
Cruise Country Year Start End Survey type Area References
1984409 Somalia 1984 25 Aug
30 Aug
Pelagic Ras Ma’bar to Horn of Africa Strømme, 1984
1990402 Mozambique 1990 21 Apr
14 May
Combined Delegoa Bay and Sofala Bank IMR, 1990b
1990404 Mozambique 1990 9 Aug
1 Sep
Combined Angoche to Bazaruto IMR, 1990c
1990406 Mozambique 1990 6 Nov
15 Dec
Combined Sofala Bank and Boa Paz IMR, 1990a
2007409 Mozambique 2007 27 Sep
21 Dec
Combined Ecosystem survey of whole coast (20–1 000 m bottom depth); Special studies of offshore banks, seamounts and area identified for oil and gas exploration
Johnsen et al., 2007
2008405 Madagascar 2008 24 Aug
1 Oct
Combined South and east coasts (25–13 °S) Krakstad et al., 2008
2008406 Mauritius 2008 4 Oct
7 Oct
Combined Around Mauritius Mehl et al., 2008
2008407 Seychelles, Mauritius
2008 8 Oct
27 Nov
Combined Around Mauritius, Nazareth Bank, Saya de Malha, Seychelles Bank, channels and shoals between banks
Strømme et al., 2009
2008409 Mozambique, Madagascar
2008 28 Nov
17 Dec
Combined North Mozambique Channel with a focus on cyclonic and anti-cyclonic eddies, frontal zones and a coastal convergence near Angoche
Kaehler et al., 2008
2009407 Mozambique 2009 6 Aug
20 Aug
Pelagic North Mozambique to 17°18’S Olsen et al., 2009
2009408 Madagascar 2009 25 Aug
3 Oct
Combined South and west coasts (25–12 °S) Alvheim et al., 2009
2009409 Comoros 2009 5 Oct
3 Nov
Combined Around the islands and transects radiating out from the islands towards Mozambique and Madagascar
Roman et al., 2009
2009410 Southern seamounts
2009 12 Nov
19 Dec
Environment Six seamounts were Atlantis Bank, Sapmer Bank, Middle of What Seamount, Coral Seamount and Melville Bank, on South West Indian Ocean Ridge; un-named seamount on Madagascar Ridge
Rogers et al., 2009
2010407 Mauritius 2010 16 Sep
25 Sep
Combined Western slopes of St Brandon Bank and Nazareth Bank
Krakstad et al., 2010
2010410 Mauritius 2010 6 Dec
21 Dec
Pelagic Around Mauritius, Soudan Bank and Nazareth Bank
Strømme et al., 2010
2014406 Mozambique 2014 11 Nov
2 Dec
Combined Southern and central Mozambique Krakstad et al., 2015
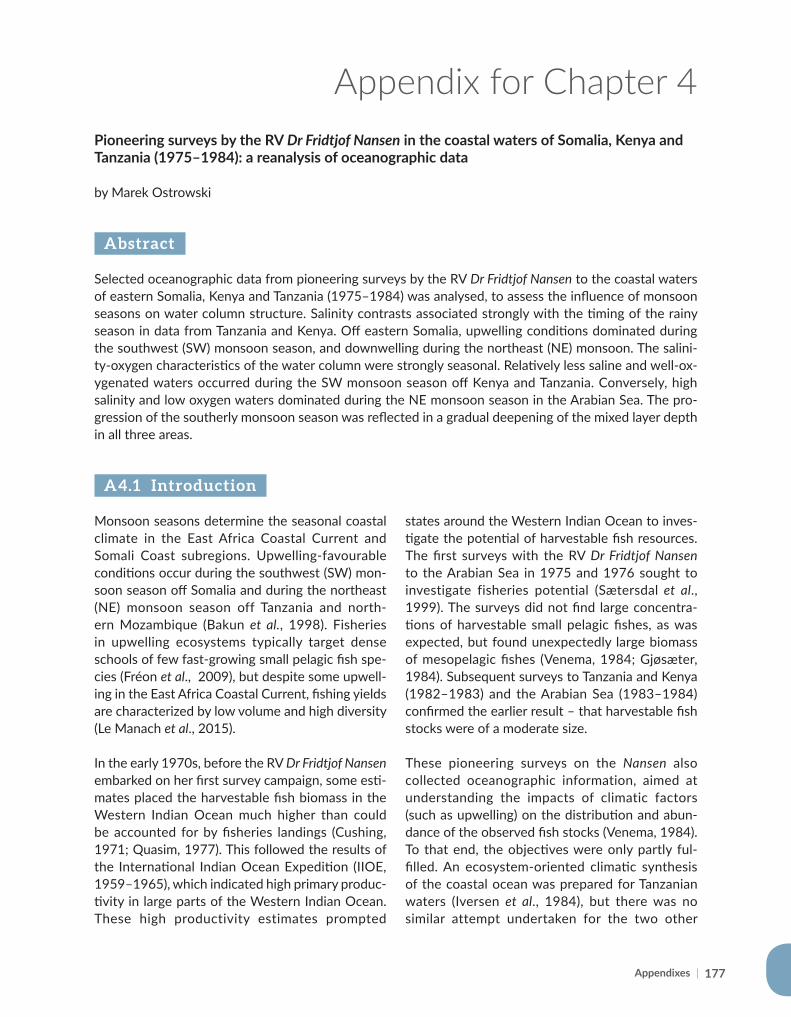
177
Pioneering surveys by the RV Dr Fridtjof Nansen in the coastal waters of Somalia, Kenya and Tanzania (1975–1984): a reanalysis of oceanographic data
by Marek Ostrowski
Abstract
Selected oceanographic data from pioneering surveys by the RV Dr Fridtjof Nansen to the coastal waters of eastern Somalia, Kenya and Tanzania (1975–1984) was analysed, to assess the influence of monsoon seasons on water column structure. Salinity contrasts associated strongly with the timing of the rainy season in data from Tanzania and Kenya. Off eastern Somalia, upwelling conditions dominated during the southwest (SW) monsoon season, and downwelling during the northeast (NE) monsoon. The salini-ty-oxygen characteristics of the water column were strongly seasonal. Relatively less saline and well-ox-ygenated waters occurred during the SW monsoon season off Kenya and Tanzania. Conversely, high salinity and low oxygen waters dominated during the NE monsoon season in the Arabian Sea. The pro-gression of the southerly monsoon season was reflected in a gradual deepening of the mixed layer depth in all three areas.
A4.1 Introduction
Monsoon seasons determine the seasonal coastal climate in the East Africa Coastal Current and Somali Coast subregions. Upwelling-favourable conditions occur during the southwest (SW) mon-soon season off Somalia and during the northeast (NE) monsoon season off Tanzania and north-ern Mozambique (Bakun et al., 1998). Fisheries in upwelling ecosystems typically target dense schools of few fast-growing small pelagic fish spe-cies (Fréon et al., 2009), but despite some upwell-ing in the East Africa Coastal Current, fishing yields are characterized by low volume and high diversity (Le Manach et al., 2015).
In the early 1970s, before the RV Dr Fridtjof Nansen embarked on her first survey campaign, some esti-mates placed the harvestable fish biomass in the Western Indian Ocean much higher than could be accounted for by fisheries landings (Cushing, 1971; Quasim, 1977). This followed the results of the International Indian Ocean Expedition (IIOE, 1959–1965), which indicated high primary produc-tivity in large parts of the Western Indian Ocean. These high productivity estimates prompted
states around the Western Indian Ocean to inves-tigate the potential of harvestable fish resources. The first surveys with the RV Dr Fridtjof Nansen to the Arabian Sea in 1975 and 1976 sought to investigate fisheries potential (Sætersdal et al., 1999). The surveys did not find large concentra-tions of harvestable small pelagic fishes, as was expected, but found unexpectedly large biomass of mesopelagic fishes (Venema, 1984; Gjøsæter, 1984). Subsequent surveys to Tanzania and Kenya (1982–1983) and the Arabian Sea (1983–1984) confirmed the earlier result – that harvestable fish stocks were of a moderate size.
These pioneering surveys on the Nansen also collected oceanographic information, aimed at understanding the impacts of climatic factors (such as upwelling) on the distribution and abun-dance of the observed fish stocks (Venema, 1984). To that end, the objectives were only partly ful-filled. An ecosystem-oriented climatic synthesis of the coastal ocean was prepared for Tanzanian waters (Iversen et al., 1984), but there was no similar attempt undertaken for the two other
Appendix for Chapter 4
Appendixes |
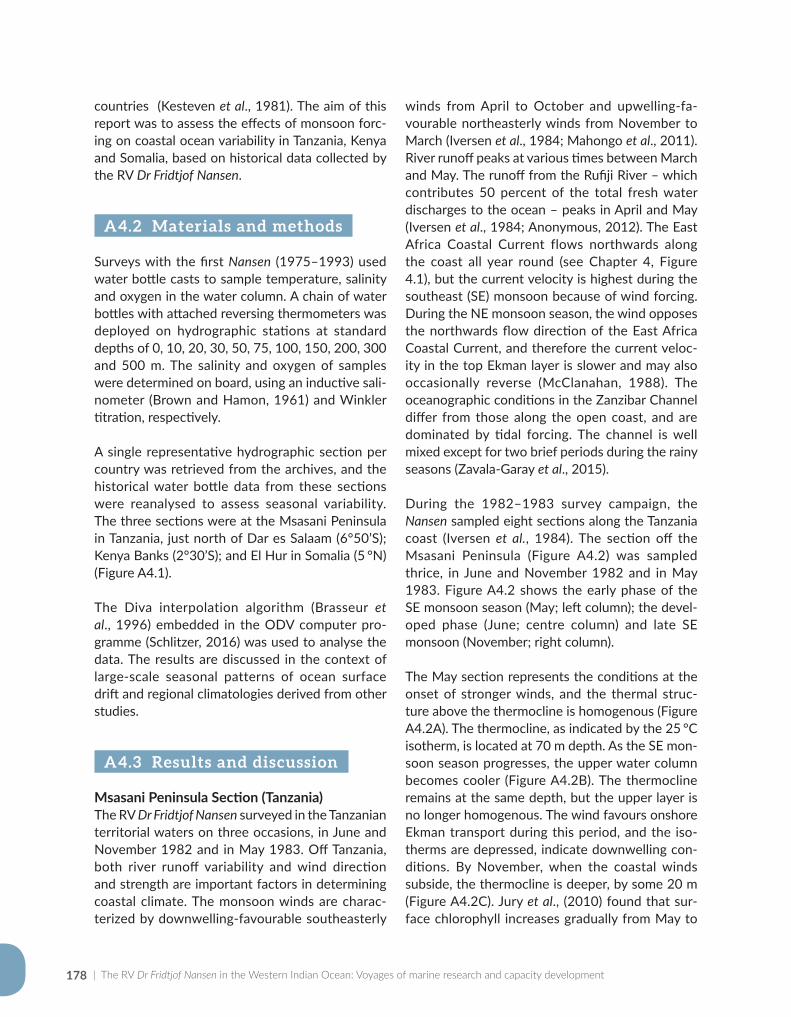
| The RV Dr Fridtjof Nansen in the Western Indian Ocean: Voyages of marine research and capacity development178
countries (Kesteven et al., 1981). The aim of this report was to assess the effects of monsoon forc-ing on coastal ocean variability in Tanzania, Kenya and Somalia, based on historical data collected by the RV Dr Fridtjof Nansen.
A4.2 Materials and methods
Surveys with the first Nansen (1975–1993) used water bottle casts to sample temperature, salinity and oxygen in the water column. A chain of water bottles with attached reversing thermometers was deployed on hydrographic stations at standard depths of 0, 10, 20, 30, 50, 75, 100, 150, 200, 300 and 500 m. The salinity and oxygen of samples were determined on board, using an inductive sali-nometer (Brown and Hamon, 1961) and Winkler titration, respectively.
A single representative hydrographic section per country was retrieved from the archives, and the historical water bottle data from these sections were reanalysed to assess seasonal variability. The three sections were at the Msasani Peninsula in Tanzania, just north of Dar es Salaam (6°50’S); Kenya Banks (2°30’S); and El Hur in Somalia (5 °N) (Figure A4.1).
The Diva interpolation algorithm (Brasseur et al., 1996) embedded in the ODV computer pro-gramme (Schlitzer, 2016) was used to analyse the data. The results are discussed in the context of large-scale seasonal patterns of ocean surface drift and regional climatologies derived from other studies.
A4.3 Results and discussion
Msasani Peninsula Section (Tanzania) The RV Dr Fridtjof Nansen surveyed in the Tanzanian territorial waters on three occasions, in June and November 1982 and in May 1983. Off Tanzania, both river runoff variability and wind direction and strength are important factors in determining coastal climate. The monsoon winds are charac-terized by downwelling-favourable southeasterly
winds from April to October and upwelling-fa-vourable northeasterly winds from November to March (Iversen et al., 1984; Mahongo et al., 2011). River runoff peaks at various times between March and May. The runoff from the Rufiji River – which contributes 50 percent of the total fresh water discharges to the ocean – peaks in April and May (Iversen et al., 1984; Anonymous, 2012). The East Africa Coastal Current flows northwards along the coast all year round (see Chapter 4, Figure 4.1), but the current velocity is highest during the southeast (SE) monsoon because of wind forcing. During the NE monsoon season, the wind opposes the northwards flow direction of the East Africa Coastal Current, and therefore the current veloc-ity in the top Ekman layer is slower and may also occasionally reverse (McClanahan, 1988). The oceanographic conditions in the Zanzibar Channel differ from those along the open coast, and are dominated by tidal forcing. The channel is well mixed except for two brief periods during the rainy seasons (Zavala-Garay et al., 2015).
During the 1982–1983 survey campaign, the Nansen sampled eight sections along the Tanzania coast (Iversen et al., 1984). The section off the Msasani Peninsula (Figure A4.2) was sampled thrice, in June and November 1982 and in May 1983. Figure A4.2 shows the early phase of the SE monsoon season (May; left column); the devel-oped phase (June; centre column) and late SE monsoon (November; right column).
The May section represents the conditions at the onset of stronger winds, and the thermal struc-ture above the thermocline is homogenous (Figure A4.2A). The thermocline, as indicated by the 25 °C isotherm, is located at 70 m depth. As the SE mon-soon season progresses, the upper water column becomes cooler (Figure A4.2B). The thermocline remains at the same depth, but the upper layer is no longer homogenous. The wind favours onshore Ekman transport during this period, and the iso-therms are depressed, indicate downwelling con-ditions. By November, when the coastal winds subside, the thermocline is deeper, by some 20 m (Figure A4.2C). Jury et al., (2010) found that sur-face chlorophyll increases gradually from May to
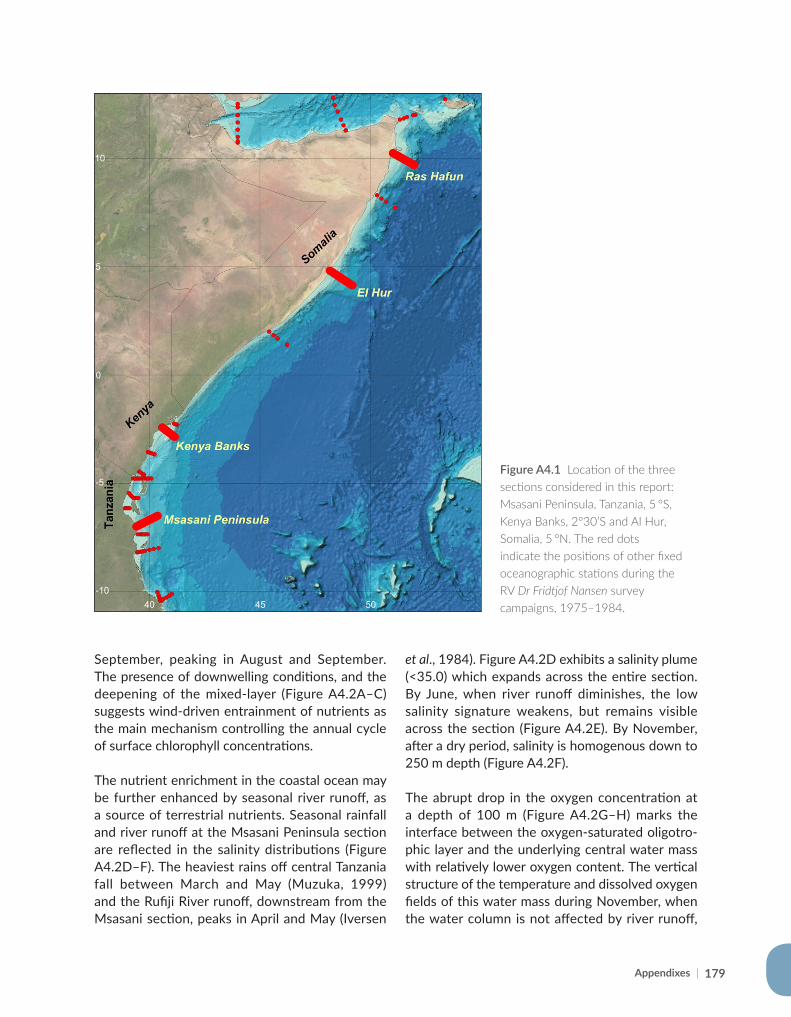
179
September, peaking in August and September. The presence of downwelling conditions, and the deepening of the mixed-layer (Figure A4.2A–C) suggests wind-driven entrainment of nutrients as the main mechanism controlling the annual cycle of surface chlorophyll concentrations.
The nutrient enrichment in the coastal ocean may be further enhanced by seasonal river runoff, as a source of terrestrial nutrients. Seasonal rainfall and river runoff at the Msasani Peninsula section are reflected in the salinity distributions (Figure A4.2D–F). The heaviest rains off central Tanzania fall between March and May (Muzuka, 1999) and the Rufiji River runoff, downstream from the Msasani section, peaks in April and May (Iversen
et al., 1984). Figure A4.2D exhibits a salinity plume (<35.0) which expands across the entire section. By June, when river runoff diminishes, the low salinity signature weakens, but remains visible across the section (Figure A4.2E). By November, after a dry period, salinity is homogenous down to 250 m depth (Figure A4.2F).
The abrupt drop in the oxygen concentration at a depth of 100 m (Figure A4.2G–H) marks the interface between the oxygen-saturated oligotro-phic layer and the underlying central water mass with relatively lower oxygen content. The vertical structure of the temperature and dissolved oxygen fields of this water mass during November, when the water column is not affected by river runoff,
10
5
0
-5
-1040 45 50
Figure A4.1 Location of the three sections considered in this report: Msasani Peninsula, Tanzania, 5 °S, Kenya Banks, 2°30’S and Al Hur, Somalia, 5 °N. The red dots indicate the positions of other fixed oceanographic stations during the RV Dr Fridtjof Nansen survey campaigns, 1975–1984.
Appendixes |
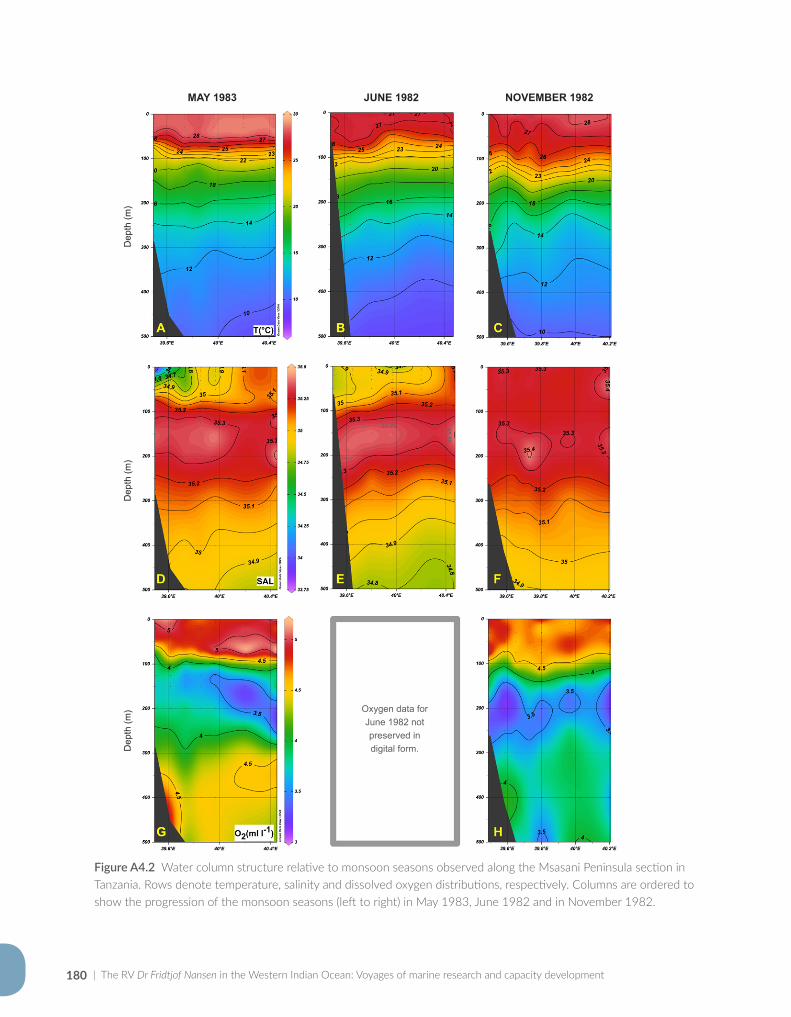
| The RV Dr Fridtjof Nansen in the Western Indian Ocean: Voyages of marine research and capacity development180
Figure A4.2 Water column structure relative to monsoon seasons observed along the Msasani Peninsula section in Tanzania. Rows denote temperature, salinity and dissolved oxygen distributions, respectively. Columns are ordered to show the progression of the monsoon seasons (left to right) in May 1983, June 1982 and in November 1982.
MAY 1983 JUNE 1982 NOVEMBER 1982
Dep
th (m
)D
epth
(m)
Dep
th (m
)
Oxygen data for June 1982 not preserved in digital form.
Appendixes | 181
resembles that observed by Vianello (2015) in the core of the South Equatorial Current (SEC) to the west of the Mascarene Plateau. The SEC feeds into the East Africa Coastal Current (Chapter 4, Figure 4.1), thus suggesting that water masses observed by the Nansen originated from a south-ern source, probably nutrient-poor Indian Central Water (ICW). The T-S analysis by Iversen et al. (1984) confirmed the dominance of ICW on all Tanzanian sections sampled by the Nansen in 1982 and 1983.
Kenya Banks SectionThe offshore current system in Kenya is part of a seasonally alternating cycle of southerly and northeasterly monsoons (Chapter 4, Figure 4.1). During the southerly monsoon season, locally known as the Kusi, the East Africa Coastal Current overshoots the equator and penetrates further north to Somalia (Beal et al., 2013; Schott et al., 2009). During the NE monsoon, known as Kaskazi in Swahili, the northward flowing East Africa Coastal Current and the southward flowing Somali Current converge off the Kenya Banks (2–2°30’S), forming the origin of the eastward flowing South Equatorial Counter Current (Düing and Schott, 1978).
Figure A4.3 shows the seasonal evolution of tem-perature, salinity and oxygen across the Kenya Banks based on Nansen data collected between 1975 and 1983. There was no survey off Kenya during the developed phase of the southerly mon-soon in 1982 / 1983, thus a section sampled on the Kenya Banks during the first Nansen survey to the Arabian Sea in 1975 was included. Note that the sections were sampled at different peri-ods, and do not follow the exact same ship tracks – hence the differences in the presented bottom topographies. Further, the temperature in the upper water column in August 1975 was about 4 °C cooler than observed during 1982 and 1983.Seasonal variation alone might not explain such a large departure from the mean.
The Indian Monsoon Index (Wang and Fan, 1999) shows that wind conditions between June and September 1975 were much stronger (MOI of
+1.5) than in 1982 (MOI of -0.5). A stronger south-erly wind would induce stronger mixing, a deeper mixed layer, and a cooler water column, thus explaining the 4°C difference seen in the Nansen data (Figure A4.3A–C).
The observation in August 1975 corresponds to the period when the climatological cross-equa-torial flow in the East Africa Coastal Current strengthens, forced by the prevailing winds (Schott and McCreary, 2001). The Ekman transport is thus expected to be directed towards the coast, induc-ing downwelling there. However, no downwelling can be identified on the inshore edge of Figure A4.3A. There is a depression of the 20 °C isotherm below 200 m depth, but it is at the seaward end of the section. The depression suggests a deepening of the seasonal mixed layer resulting from strong wind mixing.
The isotherms are uplifted in the vicinity of the continental slope, which, given the prevailing southerly wind direction, cannot be explained by the wind-driven upwelling mechanism. A topo-graphically driven dynamic upwelling mechanism may be an alternative (Johnson et al., 1982), as the area is known for a high frequency of topographi-cally controlled transient flows.
Figure A4.3B shows a temperature field observed in December 1982, during the NE monsoon season.Climatologically, the flow across the Kenya Banks section should be dominated by a confluence of the northward flowing East Africa Coastal Current and the southward flowing Somali Current (Chapter 4, Figure 4.1b). Simultaneously, with the northeasterly wind strengthening, the Ekman transport should be directed offshore, resulting in upwelling-favourable conditions along the Kenyan coast. However, upwelling is unlikely to be pro-ductive when the upwelled water is drawn from a nutrient-poor depth range above the thermocline (Bakun et al., 1998). The inshore uplift of the tem-perature and oxygen contours (Figure A4.3B–H)apparently demonstrates such a case of low-productivity upwelling. Alternatively, the upwell-ing off Kenya Banks may also be remotely forced, induced in the wake of strong zonal flows in the
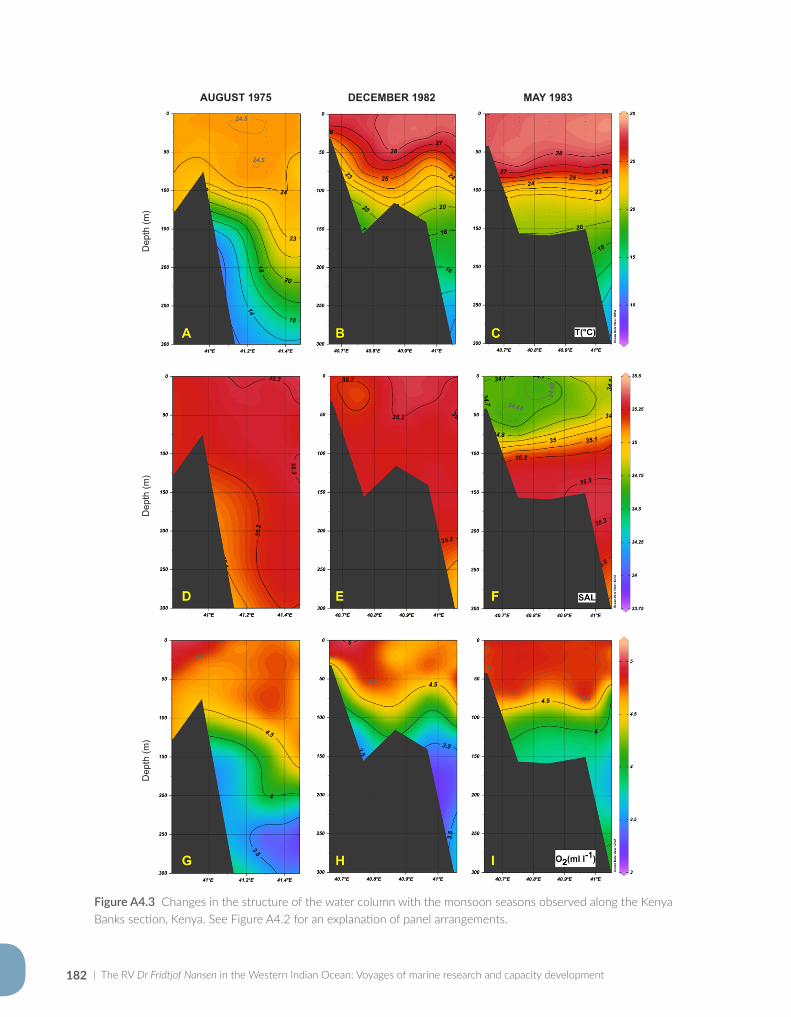
| The RV Dr Fridtjof Nansen in the Western Indian Ocean: Voyages of marine research and capacity development182
Figure A4.3 Changes in the structure of the water column with the monsoon seasons observed along the Kenya Banks section, Kenya. See Figure A4.2 for an explanation of panel arrangements.
AUGUST 1975 DECEMBER 1982 MAY 1983
Dep
th (m
)D
epth
(m)
Dep
th (m
)
183
South Equatorial Current, termed Wyrtki jets, typ-ically during the intermonsoon season (Düing and Schott, 1978), about a month before our sampling.
The distributions of temperature and salinity in May 1983 (Figure A4.3C, F) resembled the condi-tions discussed for Tanzania (Figure A4.2 A, D; but note the scaling of depth). In particular, the fresh-ening of the water column seen in the salinity dis-tribution (Figure A4.3F) relates to river runoff and precipitation in the coastal ocean during the long rainy season in the preceding months. The oxy-gen concentration below the upper mixed layer was visibly lower during the NE monsoon period (Figure A4.3H) compared to the southerly mon-soon conditions five months later (Figure A4.3I). This suggests a seasonal inflow of oxygen-poor water masses from the north, with the Somali Current (Chapter 4, Figure 4.1).
Marine fisheries resources of Kenya are character-ized by high biodiversity (Le Manach et al., 2015) and by many different habitats associated with shallow shelf waters and intertidal zones, includ-ing mangrove forests, coral reefs and seagrasses. Oceanographic conditions in these regions are generally highly localized, and not necessary rep-resented by the large-scale cross-shelf sections discussed here. The thermal and oxic conditions across the water column discussed here are more relevant to offshore tuna fisheries. Ochumba (1983) showed that yellowfin tuna is caught more frequently during southerly monsoon season, when strong wind mixing supports short food chains based on phytoplankton, zooplankton and small nekton, which are fed on by tuna.
El Hur Section (Somalia)The Somali seasonal upwelling during the SW monsoon induces the strongest offshore Ekman transport anywhere in the world (Bakun et al., 1998). The upwelling is highly productive, but high primary and secondary productivity do not translate to high production of harvestable fish. This phenomenon had not been fully realized prior to the early Nansen surveys in the Arabian Sea in 1975 and 1976. Figure A4.4A–F shows vertical temperature, salinity and oxygen sections
associated with the two opposing current seasons: the SW monsoon in August 1975 at left, and the following NE monsoon in January 1976 at right. According to climatology (Chapter 4, Figure 4.1), the region of the El Hur section experiences strong opposing seasonal currents associated with mon-soonal circulation (Schott et al., 2009; Schott and McCreary, 2001; Schott, 1983; Beal et al., 2013). Ship drift observations reported on the Nansen described strong northward surface drift during the SW monsoon, and southward drift during the NE monsoon seasons (IMR, 1976a, b), consistent with the above.
During the SW monsoon season the climatologi-cal Somali Current flows northwards (Chapter 4, Figure 4.1b; Figure A4.4G). The temperature distri-bution in August 1975 exhibited strong upwelling conditions (Figure A4.4A) manifested, for exam-ple, by the 24 °C isotherm uplift from about 120 m depth to the surface. Despite this, the sea sur-face cooling across the section was only moder-ate, by less than 2 °C between the inshore and off-shore extremes of the section. The relatively small inshore-offshore temperature gradient is a typical pattern of hydrographic sections sampled with the Nansen off eastern Somalia, and is a cumulative effect of three physical mechanisms induced by the wind forcing: offshore Ekman transport; wind-curl induced Ekman pumping; and entrainment cooling (Lee et al., 2000). The former mechanism drives the surface cooling near the coast; the two latter ones contribute to a homogenous cooling of the water column across the entire section.
During the NE monsoon season, the climatologi-cal Somali Current flowed southwards (Chapter 4, Figure 4.1b; Figure A4.4H). The temperature dis-tribution in January 1976 indicated downwelling (Figure A4.4B). The shoreward downslope of the isotherms also suggested the southward flow, consistent with the climatology. The salinity and oxygen distributions (Figure A4.4C–F) revealed the influx of different water masses during the SW and NE monsoon seasons. The SW monsoon in August 1975 comprised of relatively low-sa-line and well-oxidized waters, apparently sourced from the south and transported northwards by the
Appendixes |
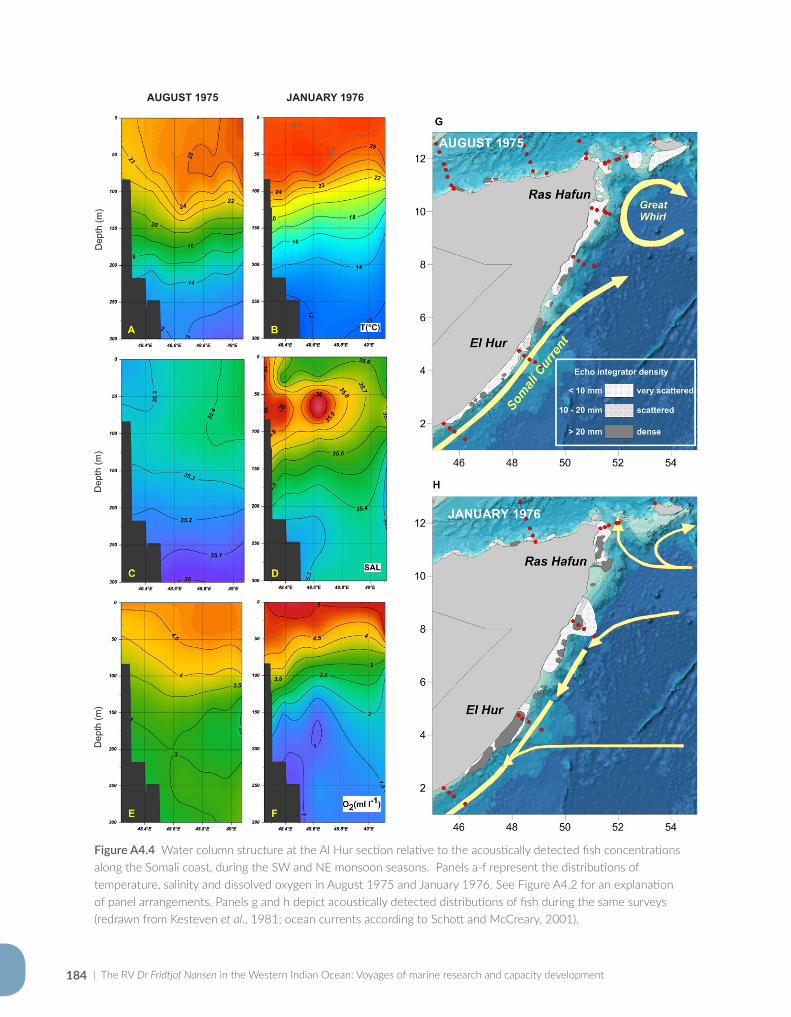
| The RV Dr Fridtjof Nansen in the Western Indian Ocean: Voyages of marine research and capacity development184
Figure A4.4 Water column structure at the Al Hur section relative to the acoustically detected fish concentrations along the Somali coast, during the SW and NE monsoon seasons. Panels a-f represent the distributions of temperature, salinity and dissolved oxygen in August 1975 and January 1976. See Figure A4.2 for an explanation of panel arrangements. Panels g and h depict acoustically detected distributions of fish during the same surveys (redrawn from Kesteven et al., 1981; ocean currents according to Schott and McCreary, 2001).
AUGUST 1975 JANUARY 1976D
epth
(m)
Dep
th (m
)D
epth
(m)
185
East Africa Coastal Current. During the NE mon-soon, a high salinity layer within the upper mixed layer (Figure A4.4D) and the anoxic oxygen region below the thermocline (Figure A4.4F) traced the origin of the observed water mass to the oxy-gen minimum zone (OMZ) of the Arabian Sea (Morrison et al., 1999). The OMZ-sourced waters were likely transported towards the Somali coast by the North Monsoon Current (Beal et al., 2013).
Acoustically derived fish distributions (Figure A4.4G–H) showed that fish densities observed near the Somali coast during the NE monsoon were much higher than those observed during the SW monsoon season. According to Strømme (1984) the total fish biomass estimated off the east coast of Somalia in January 1976 (NE monsoon) was 1 090 000 tonnes, as opposed to 390 000 tonnes in August 1975 (SW monsoon).
A4.4 Conclusions
Across the Msasani Peninsula section in Tanzania, seasonal contrasts in salinity were associated with rainy seasons. Wind entrainment was sug-gested as the principal mechanism for seasonal water column cooling during the SE monsoon season; no upwelling was observed. A similar sea-sonal salinity contrast linked to the rainy season was observed across the Kenya Banks section. Weak upwelling was present during the NE mon-soon season – possibly topographically driven upwelling at the continental slope. The structure of the water column across the Al Hur section in Somalia exhibited the strongest seasonal contrast. Upwelling was observed during the SW monsoon and downwelling during the NE monsoon seasons. Water masses were sourced from the south and transported northwards by the East Africa Coastal Current during the SW monsoon season.
During the NE monsoon season, water masses were sourced from the Arabian Sea OMZ and transported southwards by the North Monsoon Current. It must be stressed that the analyses presented here were based on rather limited data coverage, both in time and in space. Its aim was,
however, not to fully describe the coastal climate conditions of the three counties, but rather to present selected oceanographic observations from the historical surveys carried out with the Nansen during the 1970s and 1980s.
Appendixes |
| The RV Dr Fridtjof Nansen in the Western Indian Ocean: Voyages of marine research and capacity development186
References
Anonymous. 2012. Tanzania. National Marine Ecosystem Diagnostic Analysis (MEDA). ASCLME.Bakun, A., Claude, R. & Lluch-Cota, S. 1998. Coastal upwelling and other processes regulating ecosystem
productivity and fish production in the Western Indian Ocean. In: K. Sherman, E. Okemwa & M. Ntiba, eds. Large Marine Ecosystems of the Indian Ocean: Assessment, Sustainability and Management, pp. 103–141. Malden, USA, Blackwell Science, Inc.
Beal, L.M., Hormann, V., Lumpkin, R. & Foltz, G.R. 2013. The response of the surface circulation of the Arabian Sea to monsoonal forcing. Journal of Physical Oceanography, 43(9): 2008–2022.
Brasseur, P., Beckers, J.-M., Brankart, J.M. & Schoenauen, R. 1996. Seasonal temperature and salinity fields in the Mediterranean Sea: Climatological analyses of a historical data set. Deep Sea Research Part I: Oceanographic Research Papers, 43(2): 159–192.
Brown, N.L. & Hamon, B.V. 1961. An inductive salinometer. Deep Sea Research (1953), 8(1): 65–75.Cushing, D.H. 1971. Upwelling and the production of fish. Advances in Marine Biology, 9: 255–334.Düing, W. & Schott, F. 1978. Measurements in the source region of the Somali Current during the monsoon reversal.
Journal of Physical Oceanography, 8(2): 278–289.Fréon, P., Barange, M. & Aristegui, J. 2009. Eastern boundary upwelling ecosystems: integrative and comparative
approaches. Pergamon.Gjøsæter, J. 1984. Mesopelagic fish, a large potential resource in the Arabian Sea. Deep Sea Research Part A.
Oceanographic Research Papers, 31(6–8): 1019–1035.IMR. 1976a. Report on Cruise No. 3 of R/V Dr Fridtjof Nansen. Indian Ocean fishery and development programme –
Pelagic fish assessment survey, North Arabian Sea. Bergen, Norway, Institute of Marine Research.IMR. 1976b. Report on Cruise No. 4 of R/V Dr Fridtjof Nansen. Indian Ocean fishery and development programme –
Pelagic fish assessment survey, North Arabian Sea. Bergen, Norway, Institute of Marine Research.Iversen, S.A., Myklevoll, S., Lwiza, K. & Yonazi, J. 1984. Tanzanian marine fish resources in the depth region 10–500 m
investigated by R/V Dr Fridtjof Nansen. S.A. Iversen, ed. pp. 45–83. The proceedings of the NORAD/Tanzania seminar to review the marine fish stocks and fisheries in Tanzania, 6–8 March 1984, Mbegani, Tanzania. Bergen, Norway, Institute of Marine Research.
Johnson, D.R., Nguli, M.M. & Kimani, E.J. 1982. Response to annually reversing monsoon winds at the southern boundary of the Somali Current. Deep Sea Research Part A. Oceanographic Research Papers, 29(10): 1217–1227.
Jury, M., McClanahan, T. & Maina, J. 2010. West Indian Ocean variability and East African fish catch. Mar Environ Res, 70(2): 162–170.
Kesteven, G.L., Nakken, O. & Strømme , T. 1981. The small-pelagic and demersal fish resources of the northwest Arabian Sea – further analysis of the results of the R/V Dr Fridtjof Nansen Survey, 1975–1976. Bergen, Norway, Institute of Marine Research.
Le Manach, F., Abunge, C.A., McClanahan, T.R. & Pauly, D. 2015. Tentative reconstruction of Kenya’s marine fisheries catch, 1950–2010. In: F. Le Manach & D. Pauly, eds. Fisheries catch reconstructions in the Western Indian Ocean, 1950–2010, pp. 37–51. Fisheries Centre, University of British Columbia, Fisheries Centre Research Reports 23(2).
Lee, C.M., Jones, B.H., Brink, K.H. & Fischer, A.S. 2000. The upper-ocean response to monsoonal forcing in the Arabian Sea: seasonal and spatial variability. Deep Sea Research Part II: Topical Studies in Oceanography, 47(7): 1177–1226.
Mahongo, S.B., Francis, J. & Osima, S.E. 2011. Wind patterns of coastal Tanzania: their variability and trends. Western Indian Ocean Journal of Marine Science, 10(2): 107–120.
McClanahan, T. 1988. Seasonality in East Africa’s coastal waters. Marine Ecology Progress Series, 44(2): 191–199.Morrison, J.M., Codispoti, L.A., Smith, S.L., Wishner, K., Flagg, C., Gardner, W.D., Gaurin, S., Naqvi, S.W.A., Manghnani,
V. & Prosperie, L. 1999. The oxygen minimum zone in the Arabian Sea during 1995. Deep Sea Research Part II: Topical Studies in Oceanography, 46(8): 1903–1931.

187
Muzuka, A.N.N. 1999. Sources of organic matter in the Msasani Bay and Dar es Salaam Harbour. In: M.D. Richmond & J. Francis, eds. Marine Science Development in Tanzania and Eastern Africa. Proceedings of the 20th Anniversary Conference on Advances of Marine Scence in Tanzania, pp. 61–76. Zanzibar, Tanzania, WIOMSA.
Ochumba, P.B.O. 1983. Oceanographic features along the Kenyan Coast: implications for fisheries management and development. Oregon State University (Master thesis).
Quasim, S.Z. 1977. Biological productivity of the Indian Ocean. Indian Journal of Marine Sciences, 6: 122–137.Sætersdal, G., Bianchi, G., Strømme, T. & Venema, S. 1999. The Dr. Fridtjof Nansen programme 1975–1993.
Investigations of fishery resources in developing regions. History of the programme and review of results. FAO Fisheries Technical Paper No. 391. Food and Agriculture Organization of the United Nations.
Schlitzer, R. 2016. Ocean Data View [Online]. Available: http://odv.awi.de.Schott, F. 1983. Monsoon response of the Somali Current and associated upwelling. Progress in Oceanography, 12(3):
357–381.Schott, F.A. & McCreary, J.P. 2001. The monsoon circulation of the Indian Ocean. Progress in Oceanography, 51(1):
1–123.Schott, F.A., Xie, S.P. & McCreary, J.P. 2009. Indian Ocean circulation and climate variability. Reviews of Geophysics,
47(1): 1–46.Strømme, T. 1984. The pelagic and demersal fish resources off northeast Somalia. Results of two Surveys with R/V Dr
Fridtjof Nansen in 1984 – Final Report. Report No. EAF–N2008/7. Bergen, Norway, Institute of Marine Research.Venema, S.C. 1984. Fishery resources in the North Arabian Sea and adjacent waters. Deep Sea Research Part A.
Oceanographic Research Papers, 31(6–8): 1001–1018.Vianello, P. 2015. A qualitative and physical analysis of processes around Mascarene Plateau. Cape Town, South Africa,
University of Cape Town (PhD thesis).Wang, B. & Fan, Z. 1999. Choice of South Asian summer monsoon indices. Bulletin of the American Meteorological
Society, 80(4): 629–638.Zavala-Garay, J., Theiss, J., Moulton, M., Walsh, C., van Woesik, R., Mayorga-Adame, C.G., García-Reyes, M., Mukaka,
D.S., Whilden, K. & Shaghude, Y.W. 2015. On the dynamics of the Zanzibar Channel. Journal of Geophysical Research: Oceans, 120(9): 6091–6113.
Appendixes |

| The RV Dr Fridtjof Nansen in the Western Indian Ocean: Voyages of marine research and capacity development188
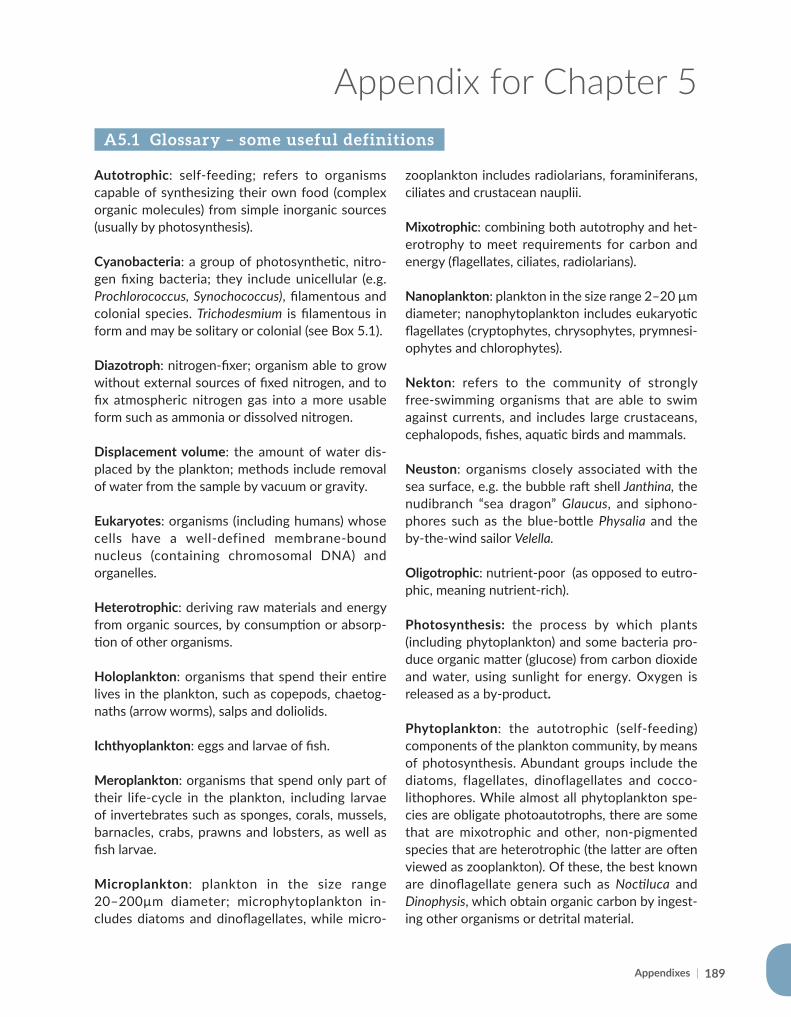
189
Appendix for Chapter 5
Autotrophic: self-feeding; refers to organisms capable of synthesizing their own food (complex organic molecules) from simple inorganic sources (usually by photosynthesis).
Cyanobacteria: a group of photosynthetic, nitro-gen fixing bacteria; they include unicellular (e.g. Prochlorococcus, Synochococcus), filamentous and colonial species. Trichodesmium is filamentous in form and may be solitary or colonial (see Box 5.1).
Diazotroph: nitrogen-fixer; organism able to grow without external sources of fixed nitrogen, and to fix atmospheric nitrogen gas into a more usable form such as ammonia or dissolved nitrogen.
Displacement volume: the amount of water dis-placed by the plankton; methods include removal of water from the sample by vacuum or gravity.
Eukaryotes: organisms (including humans) whose cells have a well-defined membrane-bound nucleus (containing chromosomal DNA) and organelles.
Heterotrophic: deriving raw materials and energy from organic sources, by consumption or absorp-tion of other organisms.
Holoplankton: organisms that spend their entire lives in the plankton, such as copepods, chaetog-naths (arrow worms), salps and doliolids.
Ichthyoplankton: eggs and larvae of fish.
Meroplankton: organisms that spend only part of their life-cycle in the plankton, including larvae of invertebrates such as sponges, corals, mussels, barnacles, crabs, prawns and lobsters, as well as fish larvae.
Microplankton: plankton in the size range 20–200µm diameter; microphytoplankton in-cludes diatoms and dinoflagellates, while micro-
zooplankton includes radiolarians, foraminiferans, ciliates and crustacean nauplii.
Mixotrophic: combining both autotrophy and het-erotrophy to meet requirements for carbon and energy (flagellates, ciliates, radiolarians).
Nanoplankton: plankton in the size range 2–20 µm diameter; nanophytoplankton includes eukaryotic flagellates (cryptophytes, chrysophytes, prymnesi-ophytes and chlorophytes).
Nekton: refers to the community of strongly free-swimming organisms that are able to swim against currents, and includes large crustaceans, cephalopods, fishes, aquatic birds and mammals.
Neuston: organisms closely associated with the sea surface, e.g. the bubble raft shell Janthina, the nudibranch “sea dragon” Glaucus, and siphono-phores such as the blue-bottle Physalia and the by-the-wind sailor Velella.
Oligotrophic: nutrient-poor (as opposed to eutro-phic, meaning nutrient-rich).
Photosynthesis: the process by which plants (including phytoplankton) and some bacteria pro-duce organic matter (glucose) from carbon dioxide and water, using sunlight for energy. Oxygen is released as a by-product.
Phytoplankton: the autotrophic (self-feeding) components of the plankton community, by means of photosynthesis. Abundant groups include the diatoms, flagellates, dinoflagellates and cocco-lithophores. While almost all phytoplankton spe-cies are obligate photoautotrophs, there are some that are mixotrophic and other, non-pigmented species that are heterotrophic (the latter are often viewed as zooplankton). Of these, the best known are dinoflagellate genera such as Noctiluca and Dinophysis, which obtain organic carbon by ingest-ing other organisms or detrital material.
A5.1 Glossary – some useful definitions
Appendixes |
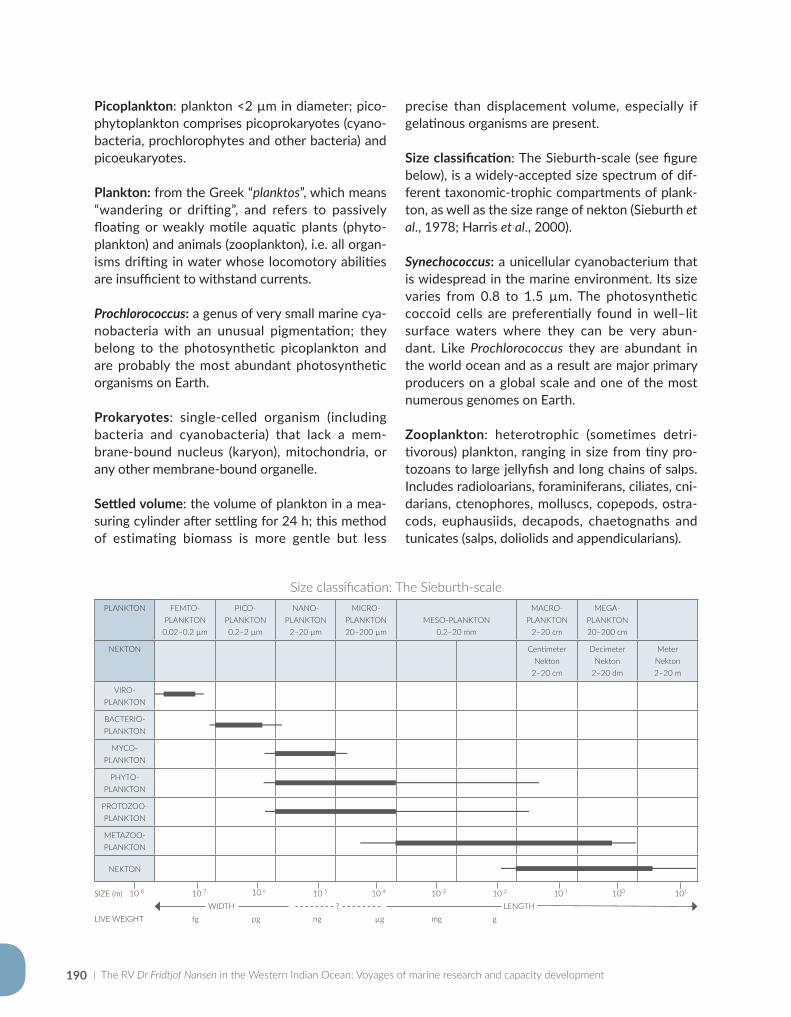
| The RV Dr Fridtjof Nansen in the Western Indian Ocean: Voyages of marine research and capacity development190
Picoplankton: plankton <2 µm in diameter; pico-phytoplankton comprises picoprokaryotes (cyano-bacteria, prochlorophytes and other bacteria) and picoeukaryotes.
Plankton: from the Greek “planktos”, which means “wandering or drifting”, and refers to passively floating or weakly motile aquatic plants (phyto-plankton) and animals (zooplankton), i.e. all organ-isms drifting in water whose locomotory abilities are insufficient to withstand currents.
Prochlorococcus: a genus of very small marine cya-nobacteria with an unusual pigmentation; they belong to the photosynthetic picoplankton and are probably the most abundant photosynthetic organisms on Earth.
Prokaryotes: single-celled organism (including bacteria and cyanobacteria) that lack a mem-brane-bound nucleus (karyon), mitochondria, or any other membrane-bound organelle.
Settled volume: the volume of plankton in a mea-suring cylinder after settling for 24 h; this method of estimating biomass is more gentle but less
precise than displacement volume, especially if gelatinous organisms are present.
Size classification: The Sieburth-scale (see figure below), is a widely-accepted size spectrum of dif-ferent taxonomic-trophic compartments of plank-ton, as well as the size range of nekton (Sieburth et al., 1978; Harris et al., 2000).
Synechococcus: a unicellular cyanobacterium that is widespread in the marine environment. Its size varies from 0.8 to 1.5 µm. The photosynthetic coccoid cells are preferentially found in well–lit surface waters where they can be very abun-dant. Like Prochlorococcus they are abundant in the world ocean and as a result are major primary producers on a global scale and one of the most numerous genomes on Earth.
Zooplankton: heterotrophic (sometimes detri-tivorous) plankton, ranging in size from tiny pro-tozoans to large jellyfish and long chains of salps. Includes radioloarians, foraminiferans, ciliates, cni-darians, ctenophores, molluscs, copepods, ostra-cods, euphausiids, decapods, chaetognaths and tunicates (salps, doliolids and appendicularians).
Size classification: The Sieburth-scalePLANKTON FEMTO-
PLANKTON0.02–0.2 µm
PICO-PLANKTON0.2–2 µm
NANO-PLANKTON
2–20 µm
MICRO-PLANKTON20–200 µm
MESO-PLANKTON0.2–20 mm
MACRO-PLANKTON
2–20 cm
MEGA-PLANKTON20–200 cm
NEKTON Centimeter Nekton
2–20 cm
Decimeter Nekton
2–20 dm
Meter Nekton2–20 m
VIRO-PLANKTON
BACTERIO-PLANKTON
MYCO-PLANKTON
PHYTO-PLANKTON
PROTOZOO-PLANKTON
METAZOO-PLANKTON
NEKTON
SIZE (m) 10-8 10-7 10-6 10-5 10-4 10-3 10-2 10-1 100 101
WIDTH ? LENGTHLIVE WEIGHT fg pg ng µg mg g
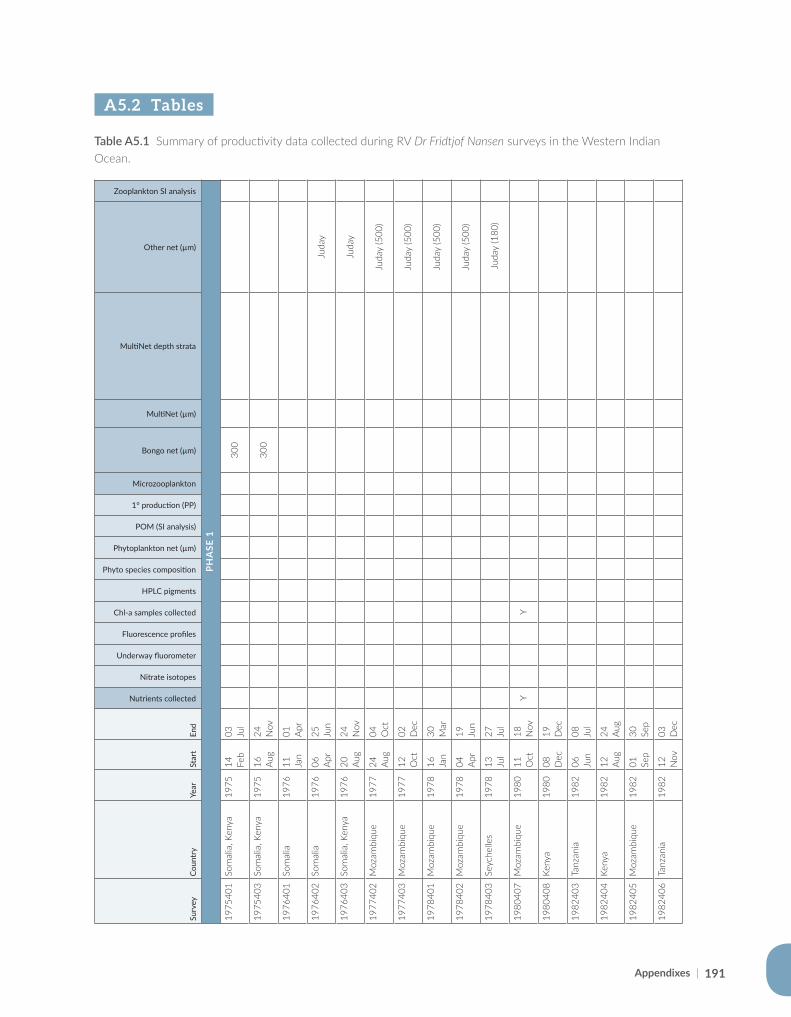
191
A5.2 Tables
Table A5.1 Summary of productivity data collected during RV Dr Fridtjof Nansen surveys in the Western Indian Ocean.
Surv
eyCo
untr
yYe
arSt
art
End
Nutrients collected
Nitrate isotopes
Underway fluorometer
Fluorescence profiles
Chl-a samples collected
HPLC pigments
Phyto species composition
Phytoplankton net (µm)
POM (SI analysis)
1° production (PP)
Microzooplankton
Bongo net (µm)
MultiNet (µm)
MultiNet depth strata
Other net (µm)
Zooplankton SI analysis
PHA
SE 1
1975
401
Som
alia
, Ken
ya19
7514 Fe
b03 Ju
l30
0
1975
403
Som
alia
, Ken
ya19
7516 Au
g24 N
ov30
0
1976
401
Som
alia
1976
11 Jan
01 Apr
1976
402
Som
alia
1976
06 Apr
25 Jun
Juda
y
1976
403
Som
alia
, Ken
ya19
7620 Au
g24 N
ovJu
day
1977
402
Moz
ambi
que
1977
24 Aug
04 Oct
Juda
y (5
00)
1977
403
Moz
ambi
que
1977
12 Oct
02 Dec
Juda
y (5
00)
1978
401
Moz
ambi
que
1978
16 Jan
30 Mar
Juda
y (5
00)
1978
402
Moz
ambi
que
1978
04 Apr
19 Jun
Juda
y (5
00)
1978
403
Seyc
helle
s19
7813 Ju
l27 Ju
l Ju
day
(180
)
1980
407
Moz
ambi
que
1980
11 Oct
18 Nov
YY
1980
408
Keny
a19
8008 D
ec19 D
ec
1982
403
Tanz
ania
1982
06 Jun
08 Jul
1982
404
Keny
a19
8212 Au
g24 Au
g
1982
405
Moz
ambi
que
1982
01 Sep
30 Sep
1982
406
Tanz
ania
1982
12 Nov
03 Dec
Appendixes |
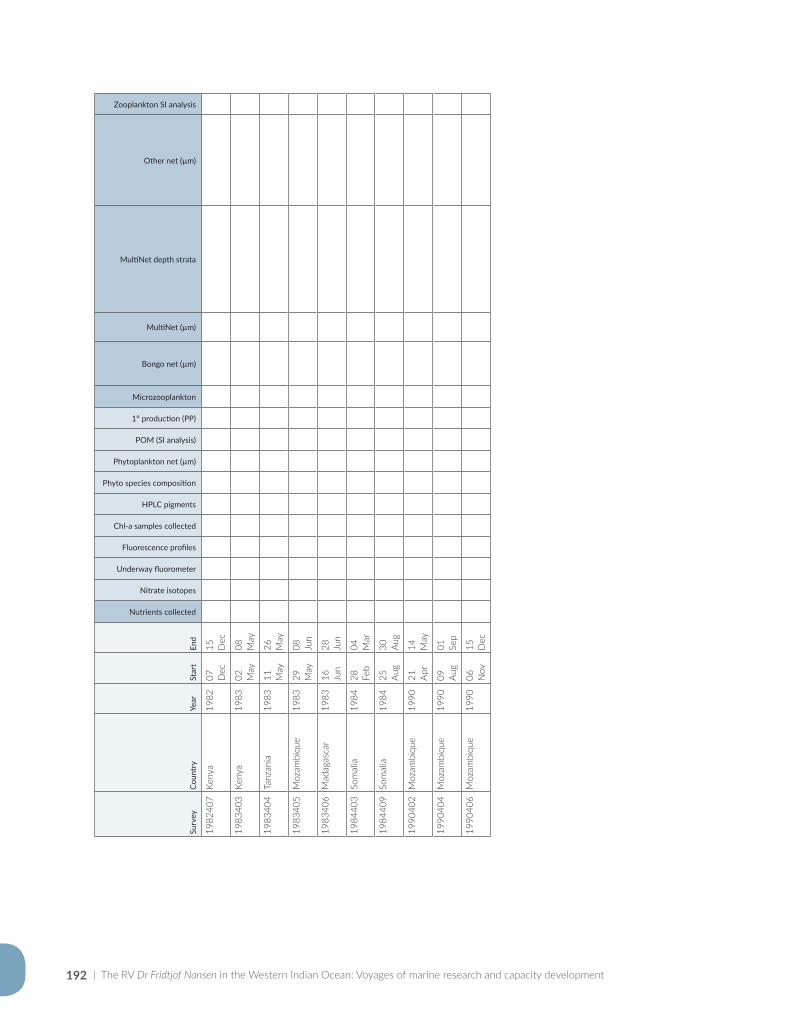
| The RV Dr Fridtjof Nansen in the Western Indian Ocean: Voyages of marine research and capacity development192
Surv
eyCo
untr
yYe
arSt
art
End
Nutrients collected
Nitrate isotopes
Underway fluorometer
Fluorescence profiles
Chl-a samples collected
HPLC pigments
Phyto species composition
Phytoplankton net (µm)
POM (SI analysis)
1° production (PP)
Microzooplankton
Bongo net (µm)
MultiNet (µm)
MultiNet depth strata
Other net (µm)
Zooplankton SI analysis
1982
407
Keny
a19
8207 D
ec15 D
ec
1983
403
Keny
a19
8302 M
ay08 M
ay
1983
404
Tanz
ania
1983
11 May
26 May
1983
405
Moz
ambi
que
1983
29 May
08 Jun
1983
406
Mad
agas
car
1983
16 Jun
28 Jun
1984
403
Som
alia
1984
28 Feb
04 Mar
1984
409
Som
alia
1984
25 Aug
30 Aug
1990
402
Moz
ambi
que
1990
21 Apr
14 May
1990
404
Moz
ambi
que
1990
09 Aug
01 Sep
1990
406
Moz
ambi
que
1990
06 Nov
15 Dec
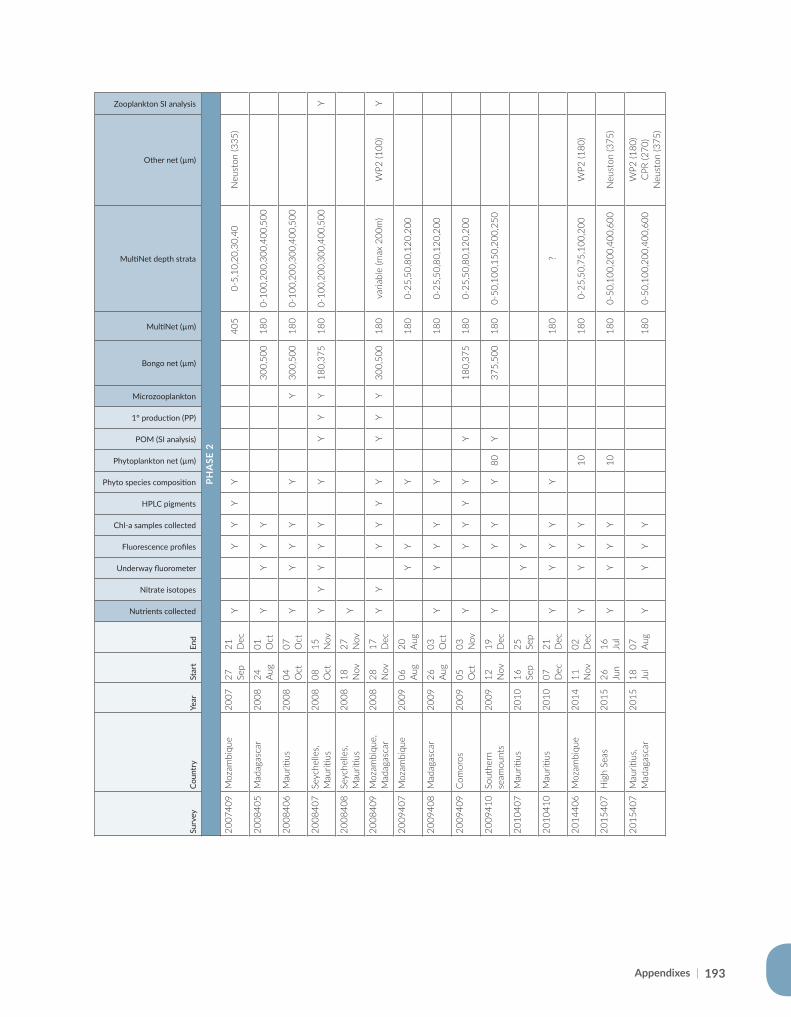
Appendixes | 193
Surv
eyCo
untr
yYe
arSt
art
End
Nutrients collected
Nitrate isotopes
Underway fluorometer
Fluorescence profiles
Chl-a samples collected
HPLC pigments
Phyto species composition
Phytoplankton net (µm)
POM (SI analysis)
1° production (PP)
Microzooplankton
Bongo net (µm)
MultiNet (µm)
MultiNet depth strata
Other net (µm)
Zooplankton SI analysis
PHA
SE 2
2007
409
Moz
ambi
que
2007
27 Sep
21 Dec
YY
YY
Y40
50-
5,10
,20,
30,4
0N
eust
on (3
35)
2008
405
Mad
agas
car
2008
24 Aug
01 Oct
YY
YY
300,
500
180
0-10
0,20
0,30
0,40
0,50
0
2008
406
Mau
ritius
2008
04 Oct
07 Oct
YY
YY
YY
300,
500
180
0-10
0,20
0,30
0,40
0,50
0
2008
407
Seyc
helle
s, M
auriti
us20
0808 O
ct15 N
ovY
YY
YY
YY
YY
180,
375
180
0-10
0,20
0,30
0,40
0,50
0Y
2008
408
Seyc
helle
s, M
auriti
us20
0818 N
ov27 N
ovY
2008
409
Moz
ambi
que,
M
adag
asca
r20
0828 N
ov17 D
ecY
YY
YY
YY
YY
300,
500
180
varia
ble
(max
200
m)
WP2
(100
)Y
2009
407
Moz
ambi
que
2009
06 Aug
20 Aug
YY
Y18
00-
25,5
0,80
,120
,200
2009
408
Mad
agas
car
2009
26 Aug
03 Oct
YY
YY
Y18
00-
25,5
0,80
,120
,200
2009
409
Com
oros
2009
05 Oct
03 Nov
YY
YY
YY
180,
375
180
0-25
,50,
80,1
20,2
00
2009
410
Sout
hern
se
amou
nts
2009
12 Nov
19 Dec
YY
YY
80Y
375,
500
180
0-50
,100
,150
,200
,250
2010
407
Mau
ritius
2010
16 Sep
25 Sep
YY
2010
410
Mau
ritius
2010
07 Dec
21 Dec
YY
YY
Y18
0?
2014
406
Moz
ambi
que
2014
11 Nov
02 Dec
YY
YY
1018
00-
25,5
0,75
,100
,200
WP2
(180
)
2015
407
Hig
h Se
as20
1526 Ju
n16 Ju
lY
YY
Y10
180
0-50
,100
,200
,400
,600
Neu
ston
(375
)
2015
407
Mau
ritius
, M
adag
asca
r20
1518 Ju
l07 Au
gY
YY
Y18
00-
50,1
00,2
00,4
00,6
00W
P2 (1
80)
CPR
(270
)N
eust
on (3
75)
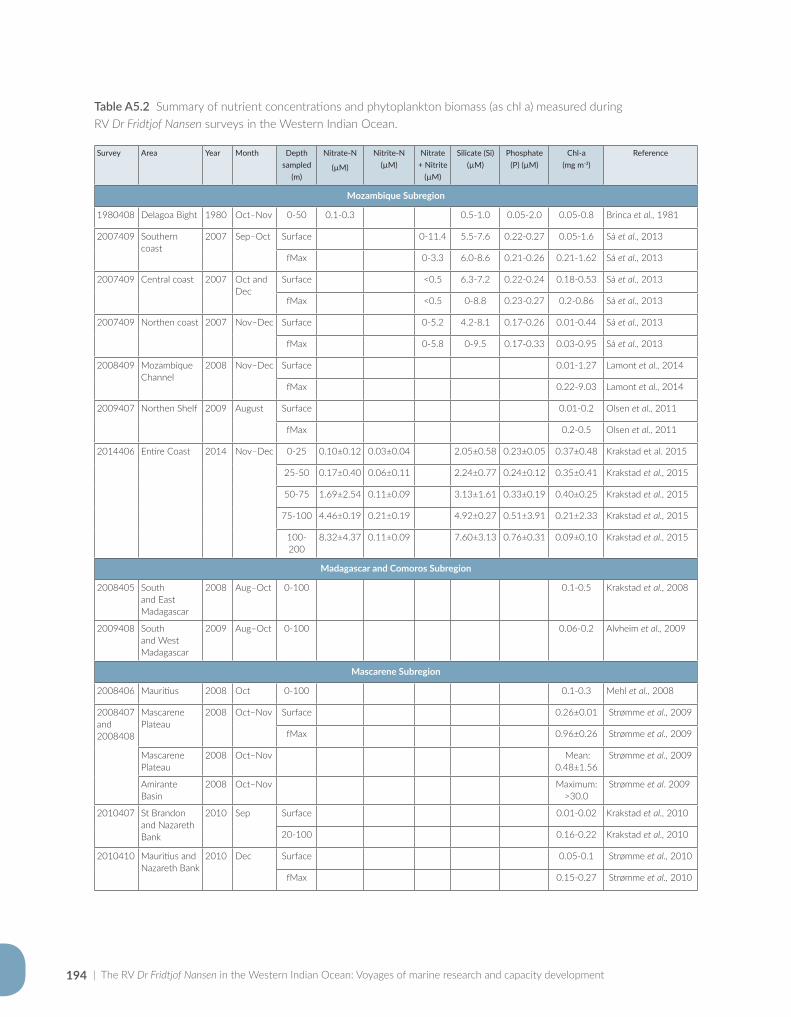
| The RV Dr Fridtjof Nansen in the Western Indian Ocean: Voyages of marine research and capacity development194
Survey Area Year Month Depth sampled
(m)
Nitrate-N
(µM)
Nitrite-N (µM)
Nitrate + Nitrite
(µM)
Silicate (Si) (µM)
Phosphate (P) (µM)
Chl-a (mg m-3)
Reference
Mozambique Subregion
1980408 Delagoa Bight 1980 Oct–Nov 0-50 0.1-0.3 0.5-1.0 0.05-2.0 0.05-0.8 Brinca et al., 1981
2007409 Southern coast
2007 Sep–Oct Surface 0-11.4 5.5-7.6 0.22-0.27 0.05-1.6 Sá et al., 2013
fMax 0-3.3 6.0-8.6 0.21-0.26 0.21-1.62 Sá et al., 2013
2007409 Central coast 2007 Oct andDec
Surface <0.5 6.3-7.2 0.22-0.24 0.18-0.53 Sá et al., 2013
fMax <0.5 0-8.8 0.23-0.27 0.2-0.86 Sá et al., 2013
2007409 Northen coast 2007 Nov–Dec Surface 0-5.2 4.2-8.1 0.17-0.26 0.01-0.44 Sá et al., 2013
fMax 0-5.8 0-9.5 0.17-0.33 0.03-0.95 Sá et al., 2013
2008409 Mozambique Channel
2008 Nov–Dec Surface 0.01-1.27 Lamont et al., 2014
fMax 0.22-9.03 Lamont et al., 2014
2009407 Northen Shelf 2009 August Surface 0.01-0.2 Olsen et al., 2011
fMax 0.2-0.5 Olsen et al., 2011
2014406 Entire Coast 2014 Nov–Dec 0-25 0.10±0.12 0.03±0.04 2.05±0.58 0.23±0.05 0.37±0.48 Krakstad et al. 2015
25-50 0.17±0.40 0.06±0.11 2.24±0.77 0.24±0.12 0.35±0.41 Krakstad et al., 2015
50-75 1.69±2.54 0.11±0.09 3.13±1.61 0.33±0.19 0.40±0.25 Krakstad et al., 2015
75-100 4.46±0.19 0.21±0.19 4.92±0.27 0.51±3.91 0.21±2.33 Krakstad et al., 2015
100-200
8.32±4.37 0.11±0.09 7.60±3.13 0.76±0.31 0.09±0.10 Krakstad et al., 2015
Madagascar and Comoros Subregion
2008405 South and East Madagascar
2008 Aug–Oct 0-100 0.1-0.5 Krakstad et al., 2008
2009408 South and West Madagascar
2009 Aug–Oct 0-100 0.06-0.2 Alvheim et al., 2009
Mascarene Subregion
2008406 Mauritius 2008 Oct 0-100 0.1-0.3 Mehl et al., 2008
2008407 and 2008408
Mascarene Plateau
2008 Oct–Nov Surface 0.26±0.01 Strømme et al., 2009
fMax 0.96±0.26 Strømme et al., 2009
Mascarene Plateau
2008 Oct–Nov Mean:0.48±1.56
Strømme et al., 2009
Amirante Basin
2008 Oct–Nov Maximum: >30.0
Strømme et al. 2009
2010407 St Brandon and Nazareth Bank
2010 Sep Surface 0.01-0.02 Krakstad et al., 2010
20-100 0.16-0.22 Krakstad et al., 2010
2010410 Mauritius and Nazareth Bank
2010 Dec Surface 0.05-0.1 Strømme et al., 2010
fMax 0.15-0.27 Strømme et al., 2010
Table A5.2 Summary of nutrient concentrations and phytoplankton biomass (as chl a) measured during RV Dr Fridtjof Nansen surveys in the Western Indian Ocean.
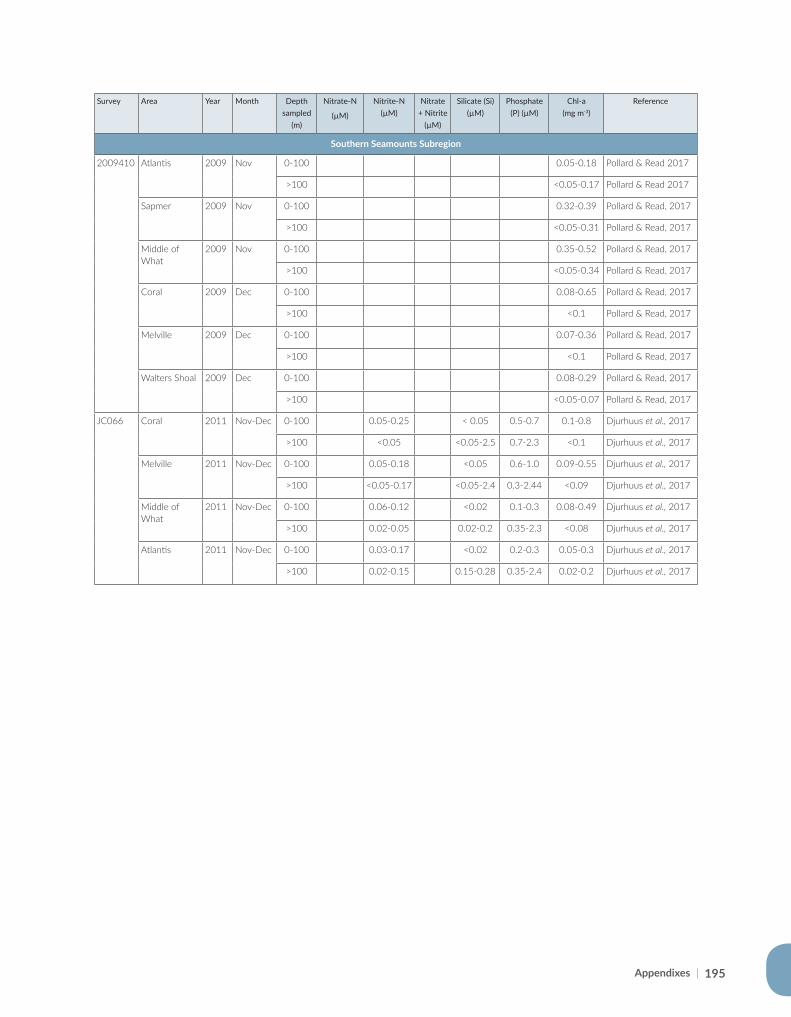
Appendixes | 195
Survey Area Year Month Depth sampled
(m)
Nitrate-N
(µM)
Nitrite-N (µM)
Nitrate + Nitrite
(µM)
Silicate (Si) (µM)
Phosphate (P) (µM)
Chl-a (mg m-3)
Reference
Southern Seamounts Subregion
2009410 Atlantis 2009 Nov 0-100 0.05-0.18 Pollard & Read 2017
>100 <0.05-0.17 Pollard & Read 2017
Sapmer 2009 Nov 0-100 0.32-0.39 Pollard & Read, 2017
>100 <0.05-0.31 Pollard & Read, 2017
Middle of What
2009 Nov 0-100 0.35-0.52 Pollard & Read, 2017
>100 <0.05-0.34 Pollard & Read, 2017
Coral 2009 Dec 0-100 0.08-0.65 Pollard & Read, 2017
>100 <0.1 Pollard & Read, 2017
Melville 2009 Dec 0-100 0.07-0.36 Pollard & Read, 2017
>100 <0.1 Pollard & Read, 2017
Walters Shoal 2009 Dec 0-100 0.08-0.29 Pollard & Read, 2017
>100 <0.05-0.07 Pollard & Read, 2017
JC066 Coral 2011 Nov-Dec 0-100 0.05-0.25 < 0.05 0.5-0.7 0.1-0.8 Djurhuus et al., 2017
>100 <0.05 <0.05-2.5 0.7-2.3 <0.1 Djurhuus et al., 2017
Melville 2011 Nov-Dec 0-100 0.05-0.18 <0.05 0.6-1.0 0.09-0.55 Djurhuus et al., 2017
>100 <0.05-0.17 <0.05-2.4 0.3-2.44 <0.09 Djurhuus et al., 2017
Middle of What
2011 Nov-Dec 0-100 0.06-0.12 <0.02 0.1-0.3 0.08-0.49 Djurhuus et al., 2017
>100 0.02-0.05 0.02-0.2 0.35-2.3 <0.08 Djurhuus et al., 2017
Atlantis 2011 Nov-Dec 0-100 0.03-0.17 <0.02 0.2-0.3 0.05-0.3 Djurhuus et al., 2017
>100 0.02-0.15 0.15-0.28 0.35-2.4 0.02-0.2 Djurhuus et al., 2017
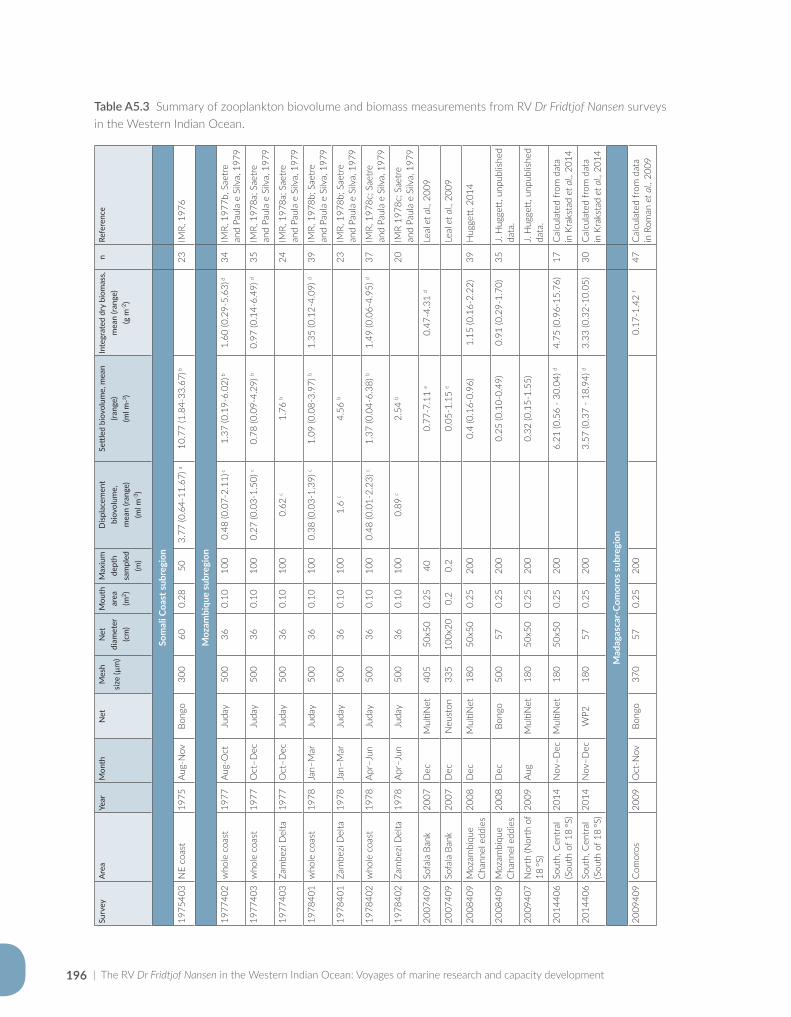
| The RV Dr Fridtjof Nansen in the Western Indian Ocean: Voyages of marine research and capacity development196
Surv
eyA
rea
Year
Mon
thN
etM
esh
size
(µm
)
Net
di
amet
er
(cm
)
Mou
th
area
(m
2 )
Max
ium
de
pth
sam
pled
(m
)
Disp
lace
men
t bi
ovol
ume,
mea
n (ra
nge)
(ml m
-3)
Sett
led
biov
olum
e, m
ean
(rang
e)(m
l m-3 )
Inte
grat
ed d
ry b
iom
ass,
mea
n (ra
nge)
(g m
-2)
nRe
fere
nce
Som
ali C
oast
subr
egio
n
1975
403
NE
coas
t19
75Au
g-N
ovBo
ngo
300
600.
2850
3.77
(0.6
4-11
.67)
a10
.77
(1.8
4-33
.67)
b23
IMR,
197
6
Moz
ambi
que
subr
egio
n
1977
402
who
le c
oast
1977
Aug-
Oct
Juda
y50
036
0.10
100
0.48
(0.0
7-2.
11) c
1.37
(0.1
9-6.
02) b
1.60
(0.2
9-5.
63) d
34IM
R, 1
977b
, Sae
tre
an
d Pa
ula
e Si
lva,
197
9
1977
403
who
le c
oast
1977
Oct
–Dec
Juda
y50
036
0.10
100
0.27
(0.0
3-1.
50) c
0.78
(0.0
9-4.
29) b
0.97
(0.1
4-6.
49) d
35IM
R, 1
978a
; Sae
tre
an
d Pa
ula
e Si
lva,
197
9
1977
403
Zam
bezi
Del
ta19
77O
ct–D
ecJu
day
500
360.
1010
00.
62 c
1.76
b24
IMR,
197
8a; S
aetr
e
and
Paul
a e
Silv
a, 1
979
1978
401
who
le c
oast
1978
Jan–
Mar
Juda
y50
036
0.10
100
0.38
(0.0
3-1.
39) c
1.09
(0.0
8-3.
97) b
1.35
(0.1
2-4.
09) d
39IM
R, 1
978b
; Sae
tre
and
Paul
a e
Silv
a, 1
979
1978
401
Zam
bezi
Del
ta19
78Ja
n–M
arJu
day
500
360.
1010
01.
6 c
4.56
b23
IMR,
197
8b; S
aetr
e
and
Paul
a e
Silv
a, 1
979
1978
402
who
le c
oast
1978
Apr–
Jun
Juda
y50
036
0.10
100
0.48
(0.0
1-2.
23) c
1.37
(0.0
4-6.
38) b
1.49
(0.0
6-4.
95) d
37IM
R, 1
978c
; Sae
tre
an
d Pa
ula
e Si
lva,
197
9
1978
402
Zam
bezi
Del
ta19
78Ap
r–Ju
nJu
day
500
360.
1010
00.
89 c
2.54
b20
IMR
1978
c; S
aetr
e
and
Paul
a e
Silv
a, 1
979
2007
409
Sofa
la B
ank
2007
Dec
Mul
tiNet
405
50x5
00.
2540
0.77
-7.1
1 e
0.47
-4.3
1 d
Leal
et a
l., 20
09
2007
409
Sofa
la B
ank
2007
Dec
Neu
ston
335
100x
200.
20.
20.
05-1
.15
eLe
al e
t al.,
2009
2008
409
Moz
ambi
que
Cha
nnel
edd
ies
2008
Dec
Mul
tiNet
180
50x5
00.
2520
00.
4 (0
.16-
0.96
)1.
15 (0
.16-
2.22
)39
Hug
gett,
201
4
2008
409
Moz
ambi
que
Cha
nnel
edd
ies
2008
Dec
Bong
o50
057
0.25
200
0.25
(0.1
0-0.
49)
0.91
(0.2
9-1.
70)
35J.
Hug
gett,
unp
ublis
hed
data
.
2009
407
Nor
th (N
orth
of
18 °S
)20
09Au
gM
ultiN
et18
050
x50
0.25
200
0.32
(0.1
5-1.
55)
J. H
ugge
tt, u
npub
lishe
d da
ta.
2014
406
Sout
h, C
entr
al
(Sou
th o
f 18
°S)
2014
Nov
–Dec
Mul
tiNet
180
50x5
00.
2520
06.
21 (0
.56
- 30.
04) d
4.75
(0.9
6-15
.76)
17C
alcu
late
d fr
om d
ata
in
Kra
ksta
d et
al.,
2014
2014
406
Sout
h, C
entr
al
(Sou
th o
f 18
°S)
2014
Nov
–Dec
WP2
180
570.
2520
03.
57 (0
.37
- 18.
94) d
3.33
(0.3
2-10
.05)
30C
alcu
late
d fr
om d
ata
in
Kra
ksta
d et
al.,
2014
Mad
agas
car-
Com
oros
subr
egio
n
2009
409
Com
oros
2009
Oct
-Nov
Bong
o37
057
0.25
200
0.17
-1.4
2 f
47C
alcu
late
d fr
om d
ata
in
Rom
an e
t al.,
2009
Table A5.3 Summary of zooplankton biovolume and biomass measurements from RV Dr Fridtjof Nansen surveys in the Western Indian Ocean.
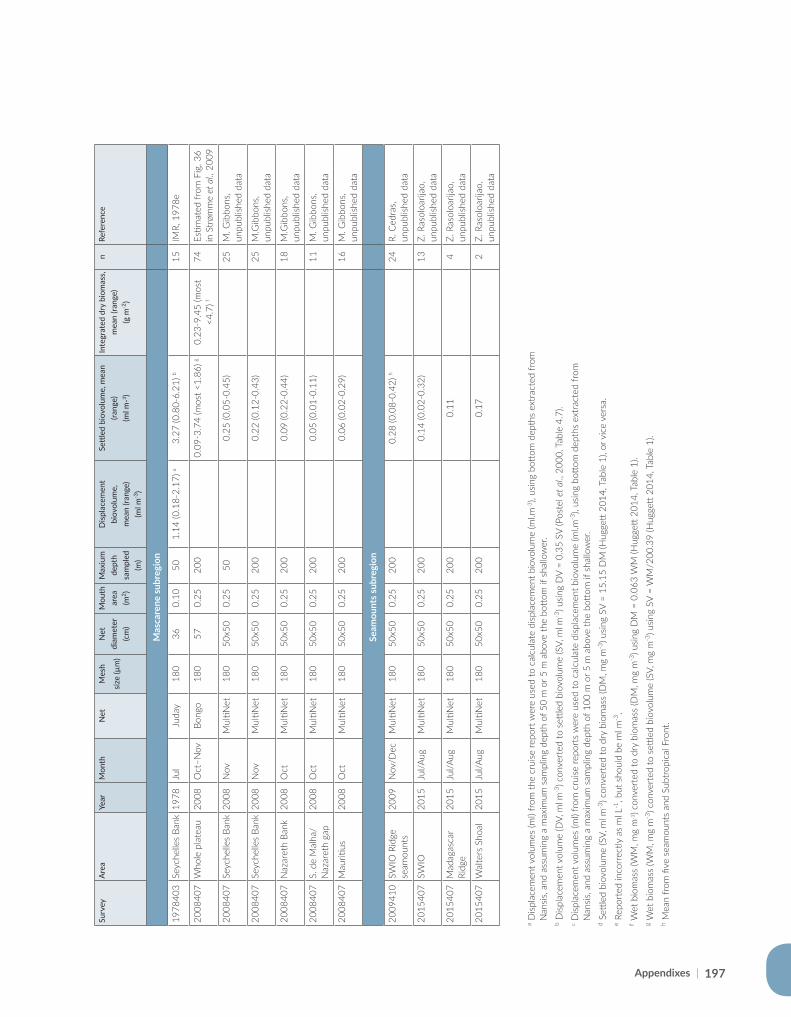
Appendixes | 197
Surv
eyA
rea
Year
Mon
thN
etM
esh
size
(µm
)
Net
di
amet
er
(cm
)
Mou
th
area
(m
2 )
Max
ium
de
pth
sam
pled
(m
)
Disp
lace
men
t bi
ovol
ume,
mea
n (ra
nge)
(ml m
-3)
Sett
led
biov
olum
e, m
ean
(rang
e)(m
l m-3 )
Inte
grat
ed d
ry b
iom
ass,
mea
n (ra
nge)
(g m
-2)
nRe
fere
nce
Mas
care
ne su
breg
ion
1978
403
Seyc
helle
s Ba
nk19
78Ju
lJu
day
180
360.
1050
1.14
(0.1
8-2.
17) a
3.27
(0.8
0-6.
21) b
15IM
R, 1
978e
2008
407
Who
le p
late
au20
08O
ct–N
ovBo
ngo
180
570.
2520
00.
09-3
.74
(mos
t <1.
86) g
0.23
-9.4
5 (m
ost
<4.7
) f74
Estim
ated
from
Fig
. 36
in S
trøm
me
et a
l., 20
09
2008
407
Seyc
helle
s Ba
nk20
08N
ovM
ultiN
et18
050
x50
0.25
500.
25 (0
.05-
0.45
)25
M. G
ibbo
ns,
unpu
blish
ed d
ata
2008
407
Seyc
helle
s Ba
nk20
08N
ovM
ultiN
et18
050
x50
0.25
200
0.22
(0.1
2-0.
43)
25M
.Gib
bons
, un
publ
ished
dat
a
2008
407
Naz
aret
h Ba
nk20
08O
ctM
ultiN
et18
050
x50
0.25
200
0.09
(0.2
2-0.
44)
18M
.Gib
bons
, un
publ
ished
dat
a
2008
407
S. d
e M
alha
/N
azar
eth
gap
2008
Oct
Mul
tiNet
180
50x5
00.
2520
00.
05 (0
.01-
0.11
)11
M. G
ibbo
ns,
unpu
blish
ed d
ata
2008
407
Mau
ritius
2008
Oct
Mul
tiNet
180
50x5
00.
2520
00.
06 (0
.02-
0.29
)16
M. G
ibbo
ns,
unpu
blish
ed d
ata
Seam
ount
s sub
regi
on
2009
410
SWIO
Rid
ge
seam
ount
s20
09N
ov/D
ecM
ultiN
et18
050
x50
0.25
200
0.28
(0.0
8-0.
42) h
24R.
Ced
ras,
unpu
blish
ed d
ata
2015
407
SWIO
2015
Jul/A
ugM
ultiN
et18
050
x50
0.25
200
0.14
(0.0
2-0.
32)
13Z.
Ras
oloa
rijao
, un
publ
ished
dat
a
2015
407
Mad
agas
car
Ridg
e20
15Ju
l/Aug
Mul
tiNet
180
50x5
00.
2520
00.
114
Z. R
asol
oarij
ao,
unpu
blish
ed d
ata
2015
407
Wal
ters
Sho
al20
15Ju
l/Aug
Mul
tiNet
180
50x5
00.
2520
00.
172
Z. R
asol
oarij
ao,
unpu
blish
ed d
ata
a Disp
lace
men
t vol
umes
(ml)
from
the
crui
se re
port
wer
e us
ed to
cal
cula
te d
ispla
cem
ent b
iovo
lum
e (m
l.m-3
), us
ing
botto
m d
epth
s ex
trac
ted
from
N
ansis
, and
ass
umin
g a
max
imum
sam
plin
g de
pth
of 5
0 m
or 5
m a
bove
the
botto
m if
sha
llow
er.
b Disp
lace
men
t vol
ume
(DV,
ml m
-3) c
onve
rted
to s
ettle
d bi
ovol
ume
(SV,
ml m
-3) u
sing
DV
= 0.
35 S
V (P
oste
l et a
l., 2
000,
Tab
le 4
.7).
c Disp
lace
men
t vol
umes
(ml)
from
cru
ise re
port
s w
ere
used
to c
alcu
late
disp
lace
men
t bio
volu
me
(ml.m
-3),
usin
g bo
ttom
dep
ths
extr
acte
d fr
om
Nan
sis, a
nd a
ssum
ing
a m
axim
um s
ampl
ing
dept
h of
100
m o
r 5 m
abo
ve th
e bo
ttom
if s
hallo
wer
.d S
ettle
d bi
ovol
ume
(SV,
ml m
-3) c
onve
rted
to d
ry b
iom
ass
(DM
, mg
m-3
) usin
g SV
= 1
5.15
DM
(Hug
gett
2014
, Tab
le 1
), or
vic
e ve
rsa.
e Rep
orte
d in
corr
ectly
as
ml L
-1, b
ut s
houl
d be
ml m
-3.
f Wet
bio
mas
s (W
M, m
g m
-3) c
onve
rted
to d
ry b
iom
ass
(DM
, mg
m-3
) usin
g D
M =
0.0
63 W
M (H
ugge
tt 20
14, T
able
1).
g Wet
bio
mas
s (W
M, m
g m
-3) c
onve
rted
to s
ettle
d bi
ovol
ume
(SV,
mg
m-3
) usin
g SV
= W
M/2
00.3
9 (H
ugge
tt 20
14, T
able
1).
h Mea
n fr
om fi
ve s
eam
ount
s an
d Su
btro
pica
l Fro
nt.
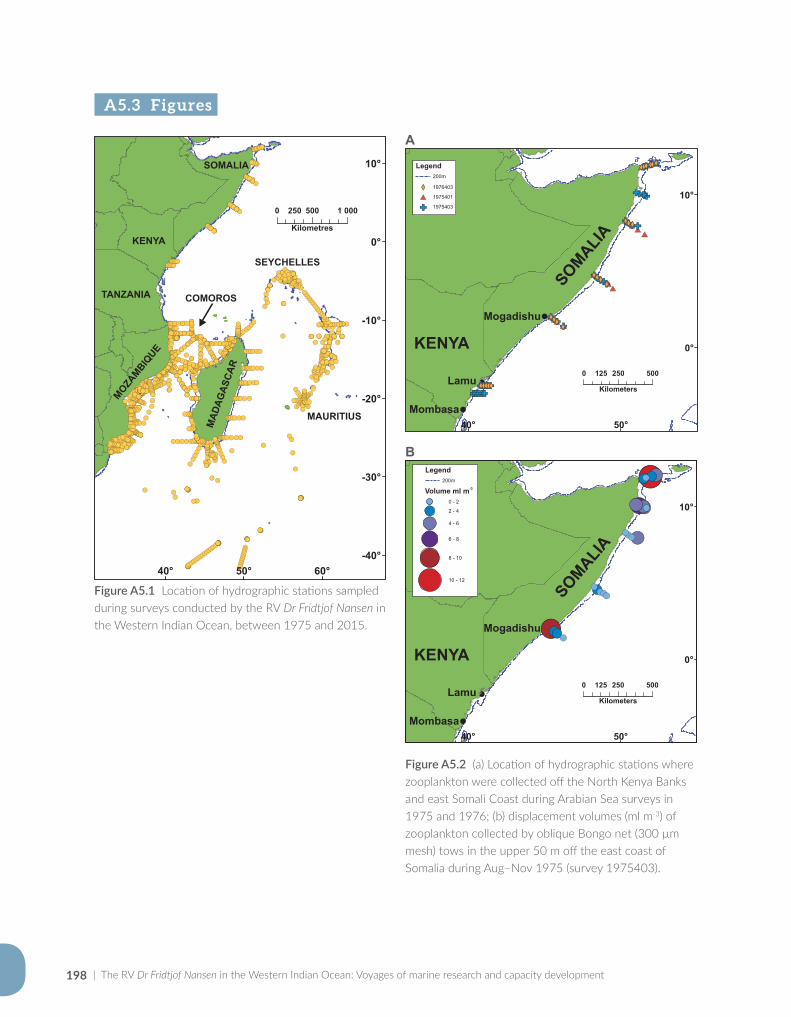
| The RV Dr Fridtjof Nansen in the Western Indian Ocean: Voyages of marine research and capacity development198
A5.3 Figures
Figure A5.1 Location of hydrographic stations sampled during surveys conducted by the RV Dr Fridtjof Nansen in the Western Indian Ocean, between 1975 and 2015.
!(!(!(!(!(!(!(!(!(
!(!(!(!(
!(!(!(!(!(
!(!(!(!(!(
!(!(!(!(!(!(
!(!(!(!(!(!(!(!(!(!(
!(!(!(!(!(
!(!(!(!(
!(!(!(!(
!(!(!(!(!(
!(!(!(!(!(!(
!(!(!(!(
!(!(!(!(
!(!(!(!(
!(!(!(!(!(
!(!(!(
!(!(!(!(
!(!(!(!(
!(!(!(!(!(
!(!(!(!(!(!(
!(!(!(!(!(!(!(
!(!(!(!(!(!(!(!(!(!(!(!(!(!(
!(!(!(!(!(!(!(
!(!(!(!(!(!(!(
!(!(!(!(!(!(!(
!(!(!(!(!(!(!(!(!(!(!(!(!(!(
!(!(!(!(!(!(!(!(!(!(!(!(!(!(!(!(!(!(!(!(!(!(!(!(
!(!(!(!(!(!(!(
!(!(!(!(!(!(!(
!(!(!(!(!(!(!(!(!(!(!(!(!(!(!(!(!(!(!(!(!(!(!(
!(!(!(!(!(
!(!(!(!(!(!(!(!(!(!(!(!(!(!(
!(!(!(!(!(!(!(
!(!(!(!(!(!(!(
!(!(!(!(!(!(
!(!(!(!(!(!(!(
!(!(!(!(!(!(!(
!(!(!(!(!(!(!(!(!(!(!(!(!(!(!(!(!(!(!(!(!(!(!(!(!(!(!(!(!(!(!(
!(!(!(!(!(!(!(
!(!(!(!(!(!(!(
!(!(!(!(!(!(!(!(!(!(!(!(!(!(!(!(!(!(!(!(!(!(!( !(!(!(!(!(!(!(
!(!(!(!(!(!(!( !(!(!(!(!(!(!(!(!(!(!(
!(
!(!(!(!(
!(!(!(!(!(!(!(!(!(!(!(!(!(!(!(!(!(!(!(!(!(!(!(!(!(!(!(!(!(!(!(!(!(!(!(!(!(!(!(!(!(!(!(!(!( !(!(!(!(!(!(!(!(!(!(!(!(!(!(!(
!(!(!(!(!(!(!(!(!(!(!(!(!(!(!(!(!(!(!(!(!(!(!(!(!(!(!(!(!(!(!(!(!(!(!(!(!(!(!(!(!(!(!(!(!(!(!(!(!(!(!(!(!(!(!(!(!(!(!(!(!(!(!(!(!(!(!(!(!(!( !(!(!(!(!(!(!(!(!(!(!(!(!(!(!(!(!( !(!(!(!(!(!(!(!(!(!(!(!(!(!(!(!(!(!(!(!(!(!(!(!(!(!(!(!(!(!(!(!(
!(!(!(!(!(!(!(!(!(!(!(!(!(!(!(!(!(!(!(!(!(!(!(!(!(!(!(!(!(!(!(!(!(!(!(!(!(!(!(!(!(!(!(!(!(!(!(!(!(!(!(!(!(!(!(!(!(!(!(!(!(!(!(!(!(!(!(!(!(!(!(!(!(!(!(!(!(!(!(!(!(!(!(!(!(!(!(!(!(!(
!(!(!(!(!(!(!(!(!(!(!(!(!(!(!(!(!(!(!(!(
!(!(!(!(!(!(!(!(!(!(!(!(!(!(!(!(!(!(!(!(!(!(!(!(!(!(!(!(!(!(!(!(!(!(!(
!(!(!(!(!(!(!(!(!(!(!(!(!(!(!(!(!(!(!(!(!(!(!(!(
!(!(!(!(!(!(!(!(!(!(
!(!(!(!(!(!(!(!(!(!(!(!(!(!(!(!(!(!(!(!(!(!(!(!(!(
!(!(!(!(!(!(!(!(!(!(
!(!(!(!(!(!(!(!(!(!(!(!(!(!(!(!(!(!(!(!(!(!(!(!(!(!(!(!(!(!(!(!(!(!(!(!(
!(!(!(!(!(!(!(!(!(!(!(!(!(!(!(!(!(!(!(!(!(!(!(!(!(!(
!(!(!(!(
!(!(!(!(!(!(!(!(!(!(!(!(!(!(!(!(!(!(!(!(!(!(!(!(!(!(!(
!(!(!(!(!(!(!(!(!(!(!(!(!(
!(!(!(!(!(!(!(!(!(
!(!(!(!(!(!(!(!(!(!(!(!(!(!(!(!(!(!(!(!(!(
!(!(!(!(!(!(!(!(!(!(!(!(!(!(!(!(!(!(!( !(!(!(!(!(!(!(!(!(!(!(
!(!(!(!(!(!(!(!(!(!(!(!(!(!(!(!(!(!(!(!(!(!(!(
!(!(!(!(!(!(!(!(!(
!(!(!(!(!(!(!(!(
!(!(!(!(!(!(!(!(!(!(!(!(!(!(!(!(
!(!(!(!(!(!(!(!(!(!(
!(!(!(!(!(!(!(!(
!(!(!(!(!(!(!(!(!(!(
!(
!(!(!( !(!(!(!(!(!(!(!(!(!(!(!(!(!(
!(!(!(!(!(!(!(!(!(!(!(!(!(!(!(!(!(!(!(!(!(!(!(
!(!(!(!(!(!(!(!(!(!(!(!(!(!(!(!(!(!(!(!(!(
!(!(!(!(!(!(!(!(!(!(!(!(!(!(!(!(!(!(!(!(!(!(!(!(!(!(!(!(!(!(
!(!(!(!(!(!(!(!(!(!(!(!(!(!(!(!(!(
!(!(!(!(!(!(!(!(!(!(!(!(!(
!(!(!(!(!(!(!(!(!(!(!(!(!(!(!(!(!(!(!(!(!(!(!(!(!(!(!(!(!(!(!(!(!(!(!(!(!(!(!(!(!(!(!(!(!(!(!(!(!(
!(!(!(!(!(!(!(!(!(!(!(!(!(!(!(!(!(!(!(!(!(!(!(
!(!(!(!(!(!(!(!(!(!(
!(!(!(!(!(!(!(!(!(!(!(!(!(!(!(!(!(!(!(!(!(!(
!(!(!(!(!(!(!(!(!(
!(!(!(!(!(!(!(!(!(!(!(!(!(!(!(!(!(!(!(!(!(!(!(!(!(!(!(!(!(!(!(!(!(!(!(!(!(
!(!(!(!(!(!(!(!(!(!(!(!(!(!(!(!(!(!(!(!(!(!(!(!(!(!(!(!(!(!(!(!(!(
!(!(!(!(!(!(!(!(!(!(
!(
!(!(!(!(!(!(!(!(!(!(!(!(!(!(!(
!(!(!(!(!(!(!(!(!(!(!(!(!(!(!(!(!(!(!(!(!(!(!(!(!(!(!(!(!(!(
!(!(!(!(!(!(!(!(!(!(!(!(!(!(!(!(!(
!(!(!(!(!(!(!(!( !(!(!(!(!(!(!(!(!( !(!(!(!(!(!(!( !(!(!(!(!(!(!(!(!(!(!(!(!(!(!(!(!(!(!(!(!( !(!(!(!(!(!(!(!(
!(!(!(!(!(!(!(
!(!(!(!( !(!(
!(!(!( !(!(!(!(!(!(!(!(!(!(!(!(!(!(!(!(!(!(!(!( !(!(!(!(!(!(!(
!(!(!(!(!(!(
!(!(!(!(!(
!(!(!(!(!(!(!(!(!(!(!(!(!(!(!(!(!(!(!(!(!(!(!(!(!(!(!(!(!(!(!(!(
!(!(!(!(!(!(!(!(!(!(!(
!(!(!(!(!(!(!(!(!( !(!(
!(
!(!(!(!(!(!(!(!(!(!(!(!(!(!(!(!(!(!(!(!(!(!(!(!(!(!(!(!(!(
!(!(!(!( !(!(!(!(!(!(!(!(!(!(!(!(!(!(!(
!(
!(
!(
!(!(!(!(!(!(!(!(!(!(!(!(!(!(
!(!(!(!(!(!(!(!(!(!(!(!(!(!(!(!(!(!(!(!(!(!(!(!(!(!(!(!(!(!(!(!(!(!(
!(!(!(!(!(!(!(!(
!(!(!(!(!(!(!(!(!(!(!(!(!(!(!(!(!(!(!(
!(!(!(!(!(!(!(!(!(
!(!(
!(!(!(!(!(!(!(!(!(!(
!(!(
!(!(!(!(
60°50°40°
10°
0°
-10°
-20°
-30°
-40°
0 500 1 000250
Kilometres
SOMALIA
KENYA
TANZANIA
MAD
AGAS
CAR
SEYCHELLES
MAURITIUS
MOZAMBIQ
UE
COMOROS
4#*#*#*#*#*
#*#*#*#*
#*#*#*#*
#*#*#*#*#*
#*#*#*#*#*
#*#*#*#*#*#*
GFGFGFGFGFGFGFGFGFGF
GFGFGFGFGF
GFGFGFGF
GFGFGFGF
GFGFGFGFGF
GFGFGFGFGFGF
XWXWXW
XWXWXWXW
XWXWXWXW
XWXWXWXWXW
XWXWXWXWXWXW
450°40°
10°
0°
0 250 500125
Kilometers
4
KENYA
SOMALIA
Lamu
Mombasa
Mogadishu
Legend200m
XW 1976403
#* 1975401
GF 1975403
4
#*#*#*#*#*#*GFGFGFGFGFGFXWXWXWXWXWXW
450°40°
10°
0°
0 250 500125
Kilometers
4
KENYA
SOMALIA
Lamu
Mombasa
Mogadishu
!(
!(
!(!(
!(!(!(!(!(!(
!(
!(!(
!(
!(!(
!(!(
!(
!(
!(
!(
!(
!(
Legend200m
0 - 2
2 - 4
4 - 6
!!!!!!
6 - 8
8 - 10
10 - 12
Volume ml m-3
Figure A5.2 (a) Location of hydrographic stations where zooplankton were collected off the North Kenya Banks and east Somali Coast during Arabian Sea surveys in 1975 and 1976; (b) displacement volumes (ml m-3) of zooplankton collected by oblique Bongo net (300 µm mesh) tows in the upper 50 m off the east coast of Somalia during Aug–Nov 1975 (survey 1975403).
B
A
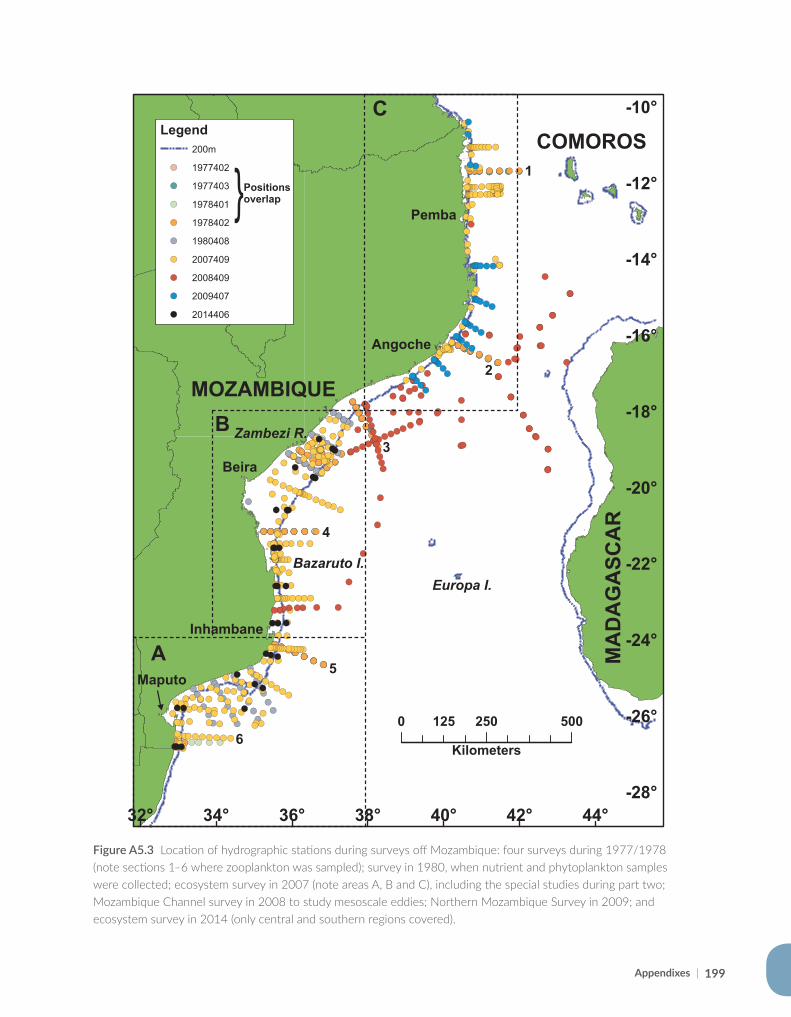
Appendixes | 199
Figure A5.3 Location of hydrographic stations during surveys off Mozambique: four surveys during 1977/1978 (note sections 1–6 where zooplankton was sampled); survey in 1980, when nutrient and phytoplankton samples were collected; ecosystem survey in 2007 (note areas A, B and C), including the special studies during part two; Mozambique Channel survey in 2008 to study mesoscale eddies; Northern Mozambique Survey in 2009; and ecosystem survey in 2014 (only central and southern regions covered).
!(!(!(!(!(!(!(
!(!(!(!( !( !( !(
!(!(!(!(!(!(
!(
!(!(!(!( !( !( !(
!(!(!(!( !( !( !(
!(!(!(!(!(!(!(
!(!(!(!( !( !( !(
!(!(!(!(!(!(
!(
!(!(!(!(!(!(!(!(!(!(!(!(!(!(
!(!(!(!(!(!(!(!(!(!(
!(!(!(!( !( !( !(
!(!(!(!( !( !( !(
!(!(!(!(!(!(!( !(!(!(!(
!(!(!(!(!(!(!(!(!(!(!(!(
!(!(!( !( !(
!(!(!(!( !( !( !(
!(!(!(!(!(!(!(
!(!(!(!(!(!(!(
!(!(!(!(!( !( !(
!(!(!(!( !( !(
!(!(!( !( !( !( !(
!(!(!(!( !( !( !(
!(!(
!(!(!(
!(!(
!(!(!(!(!(!(!(!(
!(!(!(!(!(!(!(!(!(!(!(!(!(
!(!(!(
!(!(!(!( !( !( !(
!(!(!(!( !( !( !(
!(!(
!(!(!(!(!(!(
!(!(!(!(!(
!(!(
!( !(!(
!(!(!(
!(!(
!(!(!(!(
!(!(!(
!(!(!(!(!(
!(!( !(!(!(!(!(
!(
!(!(!(!(!(
!(
!(!(!(!(
!(!(!(!(!(!(!(!(!(!(!(!(!( !(!(!(!(!(!(!(!(!(!(!(!(
!( !( !(!(!( !( !(!(!(!(!(!(!(!(!(
!(!( !(!( !( !(!(!(!(
!(!(!(!(
!(!(!(!(!(!(
!(
!(!(!(!(!(!(!(!(!(!(!(!(!(!(!(!(!(
!(!(!( !(
!(!(!(!(!(!(!(!(!(!(!(!(!(
!(!( !(!( !(!(!(!(!(!(!(!(!(!(!(!(!(!(!(!(!(!(!(!(!(!(
!(!(!(!(!(!(
!(!(!( !(
!(!(!(!(!(!(
!(!(!(!(!(!(!(!(!(!(!( !(!(!(
!( !(
!( !( !(!(!(!(!(!(!(
!(!(!(!(!(!(!(!(!(
!(
!( !(!(!(
!(!(!(!(
!(!(!(!(
!(
!( !(!(!(!(!(
!(
!(!(!(
!(!(
!(!(!(!(!(!(
!(!(!(!(!(!(!(!(!(!(!(!(!(!(!(!(!(!(!(!(!(!(!(!(!(!(!(!(!(!(!(!(!(!(!(!(!(!(!(!(!(!(!(!(!(!(
!(!(!(
!(!(!(!(!(!(!(!(!(!(!(!(!(
!(!(!(!(!(
!(!(
!(
!(
!(
!(!(!(!(!(!(!(!(!(!(!(!(!(
!(!(
!(!(!(!(!( !(!(!(!(
!(!( !(!(!(!(!(!(!(!(!(!(!(!(!(!(!(!(!(!(!(!(!(!(!(!(
!(!(!(!(!(!(!(!(!(!(!(!(!(!(!(!(!(!(!(
!(!(!(!(!(
!(!(!(!(!(!(!(!(!(
!(
!(
!(
!(!(
!(!(!(!(
!(!(!(
!(!(
!(!(
!(!(!(!(!(!(
!(!(
!(!(
!(
!(!(!(
!(!(
!(!(!(!(
!(!(!(
!( !(!(!(!(!(!(!(
!( !( !(
!(!(
!(
!(!(!(
!(!(!(!(!(!(!(!(!(!(!(!(!(!(!(
!(
!(!(!(!(!(!(!(!(!(!(!(!(!(!(
!(
!(
!(
!(
!(!(!(!(!(!(!(!(
!(!(
!(!(
!(!(!(!(!(!(!(
!(!(!(!(!(!(
!(!(!(!(!(!(!(
!(!(!(!(!(!(!(
!(!(!(!(!(!(!(
!(!(!(!(!(!(
!(!(!(
!(!(!(
!(!(!(
!(!(!(
!(!(!(
!(!(!(
!(!(!(
!(!(!(
!(!(!(
!(!(!(
44°42°40°38°36°34°32°
-10°
-12°
-14°
-16°
-18°
-20°
-22°
-24°
-26°
-28°
0 250 500125
Kilometers
Legend200m
!( 1977402
!( 1977403
!( 1978401
!( 1978402
!( 1980408
!( 2007409
!( 2008409
!( 2009407
!( 2014406
}Positionsoverlap
A
B
C
MOZAMBIQUE
COMOROS
MA
DA
GA
SCA
REuropa I.
Pemba
Angoche
Beira
Inhambane
Maputo
Zambezi R.
Bazaruto I.
1
2
3
4
5
6
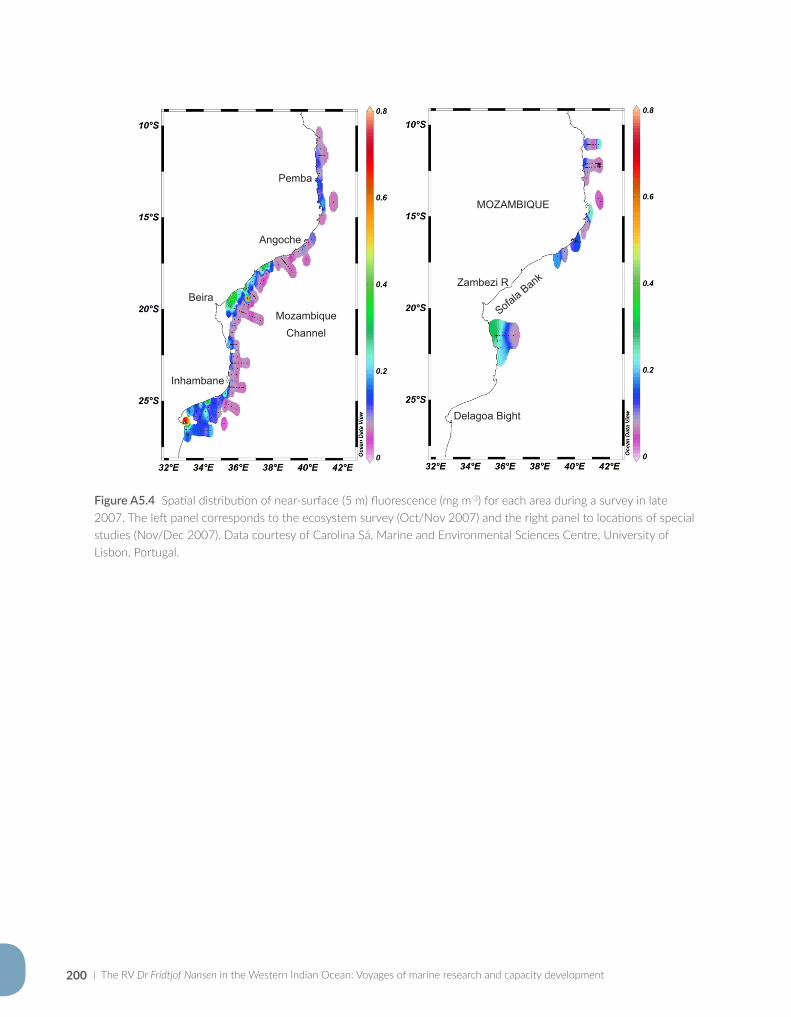
| The RV Dr Fridtjof Nansen in the Western Indian Ocean: Voyages of marine research and capacity development200
Pemba
Angoche
Beira
Inhambane
MozambiqueChannel
MOZAMBIQUE
Zambezi R
Sofala Bank
Delagoa Bight
Figure A5.4 Spatial distribution of near-surface (5 m) fluorescence (mg m-3) for each area during a survey in late 2007. The left panel corresponds to the ecosystem survey (Oct/Nov 2007) and the right panel to locations of special studies (Nov/Dec 2007). Data courtesy of Carolina Sá, Marine and Environmental Sciences Centre, University of Lisbon, Portugal.
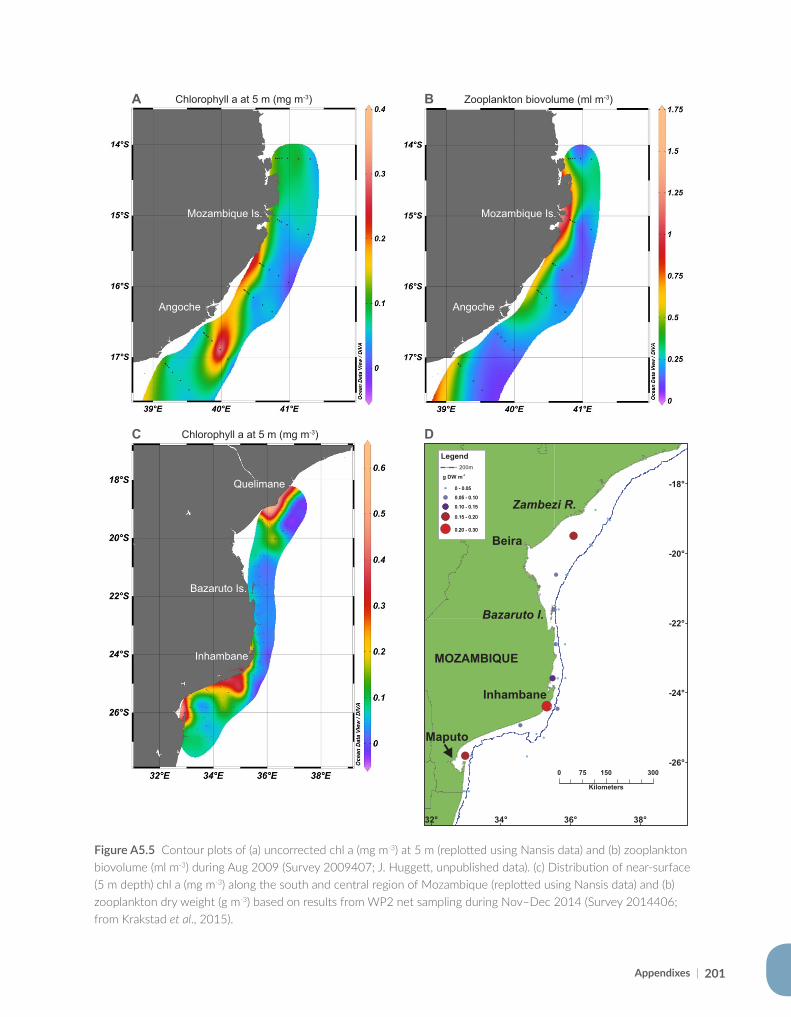
Appendixes | 201
Figure A5.5 Contour plots of (a) uncorrected chl a (mg m-3) at 5 m (replotted using Nansis data) and (b) zooplankton biovolume (ml m-3) during Aug 2009 (Survey 2009407; J. Huggett, unpublished data). (c) Distribution of near-surface (5 m depth) chl a (mg m-3) along the south and central region of Mozambique (replotted using Nansis data) and (b) zooplankton dry weight (g m-3) based on results from WP2 net sampling during Nov–Dec 2014 (Survey 2014406; from Krakstad et al., 2015).
!(
!(
!(
!(
!(
!(
!(
!(
!(
!(
!(
!(
!(
!(
!(
!(
!(
!(
!(
!(
!(
!(
!(
!(
!(
!(
!(
!(
!(
!(
38°36°34°32°
-18°
-20°
-22°
-24°
-26°0 150 30075
Kilometers
Legend200m
g DW m-3
!( 0 - 0.05
!( 0.05 - 0.10
!( 0.10 - 0.15
!( 0.15 - 0.20
!( 0.20 - 0.30
!( 0 - 0.05
!( 0.05 - 0.10
!( 0.10 - 0.15
!( 0.15 - 0.20
0.20 - 0.30
Beira
Maputo
Bazaruto I.
Inhambane
Zambezi R.
MOZAMBIQUE
A B
C D
Mozambique Is.
Angoche
Mozambique Is.
Angoche
Quelimane
Bazaruto Is.
Inhambane
Chlorophyll a at 5 m (mg m-3) Zooplankton biovolume (ml m-3)
Chlorophyll a at 5 m (mg m-3)
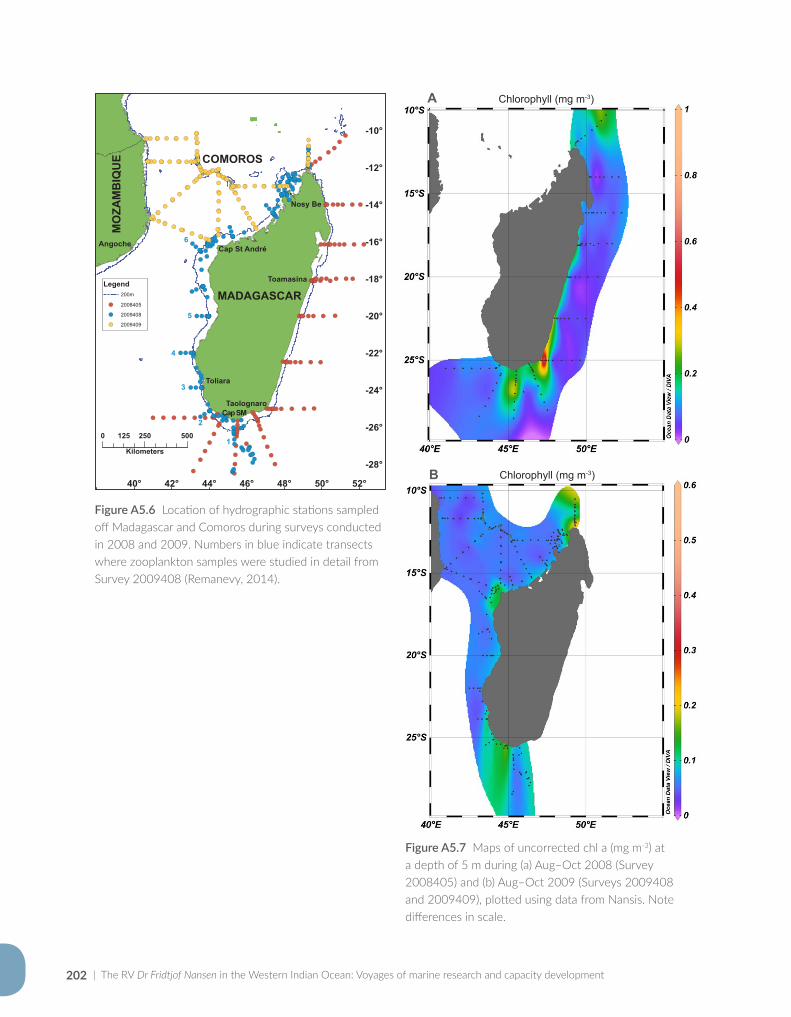
| The RV Dr Fridtjof Nansen in the Western Indian Ocean: Voyages of marine research and capacity development202
Figure A5.6 Location of hydrographic stations sampled off Madagascar and Comoros during surveys conducted in 2008 and 2009. Numbers in blue indicate transects where zooplankton samples were studied in detail from Survey 2009408 (Remanevy, 2014).
!( !( !( !( !( !( !(!(!(!(!(!(!(!(
!(!(
!(!(
!( !(!(!(!(!(!(!(!(!(!(
!(
!(!(
!(!(
!(!(!(!(!(!(!(!(!(
!(!(!(!(!(!(!( !( !( !(
!(!(!(!(!(!(!( !( !(
!(!(!(!(!(!( !( !(
!(!(!(!(!(!(!(!( !(!(!(!(!( !( !( !(
!(!(!(!(!(!(!(!( !( !(
!(!(!( !(!(!( !( !(
!(!(!(!(!(!(!(
!( !(!(!(
!(!(!(!(!(!(!(!(!(!(!(!(!(!(
!(!(!(
!(!(!(!(!(!(!(!(!(!(!(!(!(
!(!(!(!(!(!(!(!(!(!(!(
!(!(!(!(!(!(!(!(!(!(!(!(
!(!(!(!(!(!(!(!(
!(!(!(!(!(!(!(!(!(!(!(!(!(
!(!(!(
!(!(!(!(!(!(
!(!( !(!(!(!(!(
!(!( !(!(!(!(!(!(!(!(!(!(
!( !(!(!(!(!(!(
!(
!(!(!(!(!(!(!(!(!(!(!(
!( !(!(!(!(!(!(!(!(
!(!( !(!(!(!(!(!(!(!(!(!(
!( !(!(!(!(!(!(!(!(!(!(
!( !(!(!(!(!(!(!(!(!(!(
!(!(!(!(!(!(
!(!(!(!(!(!(!(!(!(
!(!(!(!(!(!(!(!(!(!(!(!(!(
!(!(!(!(!(!(!(!(!(!(
!(
!(!(!(!(!(!(!(!(!(!(!(!(!(
!(!(!(!(!(!(!(!(!(
!(!(!(!(!(!(!(!(!(
!(!(!(!(!(!(!(!(!(!(!(!(!(!(!(!(
!(!(!(!(!(!(!(!(!(!(!(!(!(
!(!(!(!(!(!(!(!(!(!(!(!(!(!(!(!(!(!(
!(!(!(
!(!(!(
!(!(!(!(
!(!(!(!(!(!(!(!(!(!(!(!(!(
!(!(!( !(!( !( !(!( !( !(
!(
52°50°48°46°44°42°40°
-10°
-12°
-14°
-16°
-18°
-20°
-22°
-24°
-26°
-28°
0 250 500125
Kilometers
Legend200m
!( 2008405
!( 2009408
!( 2009409
1
2
3
4
5
6
COMOROS
MADAGASCAR
MO
ZAM
BIQ
UE
Nosy Be
Cap St André
Toamasina
Toliara
TaolognaroCapSM
Angoche
Figure A5.7 Maps of uncorrected chl a (mg m-3) at a depth of 5 m during (a) Aug–Oct 2008 (Survey 2008405) and (b) Aug–Oct 2009 (Surveys 2009408 and 2009409), plotted using data from Nansis. Note differences in scale.
A
B
Chlorophyll (mg m-3)
Chlorophyll (mg m-3)
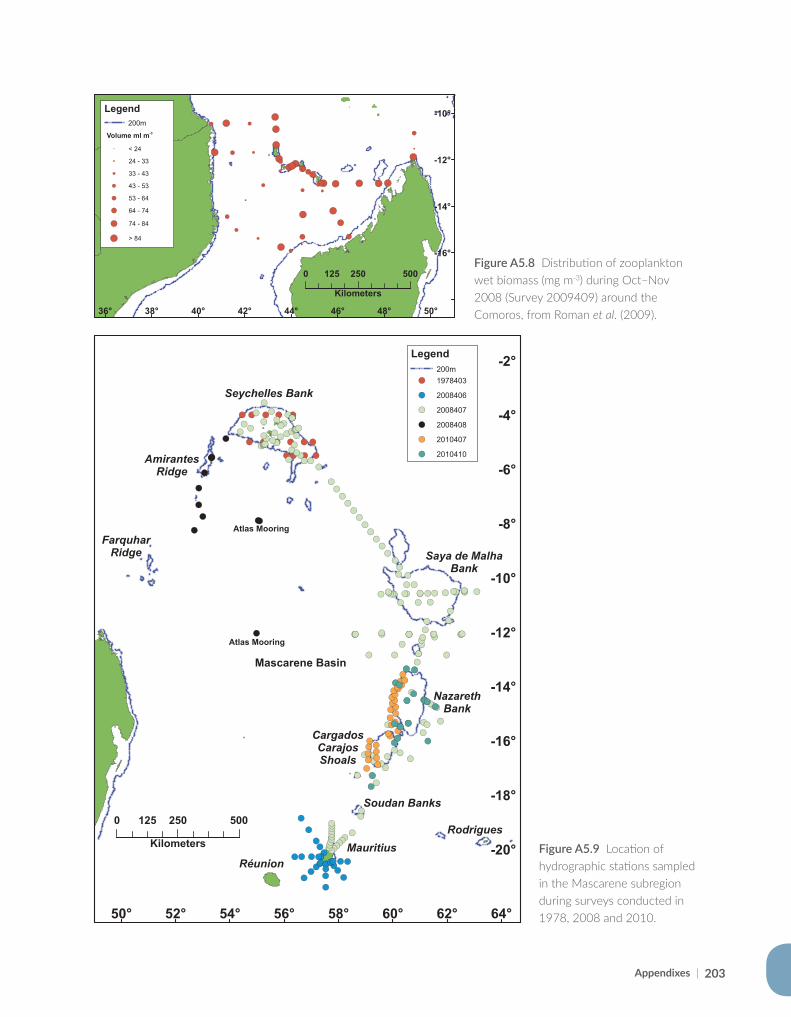
Appendixes | 203
Figure A5.8 Distribution of zooplankton wet biomass (mg m-3) during Oct–Nov 2008 (Survey 2009409) around the Comoros, from Roman et al. (2009).
!(
!(
!(
!(
!(!(
!(
!(
!(
!(
!(!(!(
!(
!(
!(
!( !(
!(
!(!(!(!(
!(!(
!(
!(!(
!(
!(
!(
!(
!(
!(
!(
!(
!(
!(
!(
!(
!(
!(
!(
!(
!(
!(
!(
50°48°46°44°42°40°38°36°
-10°
-12°
-14°
-16°
0 250 500125
Kilometers
Legend200m
Volume ml m-3
< 24
24 - 33
33 - 43
43 - 53
53 - 64
64 - 74
74 - 84
> 84
!(
!(
!(
!(
!(
!(!(!(
Figure A5.9 Location of hydrographic stations sampled in the Mascarene subregion during surveys conducted in 1978, 2008 and 2010.
!( !( !( !( !( !(!(!(!(!(
!(!(!(!(!(
!(!(!(!(!(!(!(!(!(!(!(
!(!(!(!(!(!(!(!(!(!(
!(!(!(
!(!(!(!(!(!(
!(!(!(!(!(!(!(!(!(!(!(!(!(!(!(!(!(
!(!(
!(!( !(
!(!(!( !(!(!(!( !(!(
!(!(!(
!(!(!( !(!( !(
!(!(!(!(!(!(
!(!(!(
!(!(!(!(!(!(
!(!(!(!(!(!(!(
!(!(!(
!(
!(!(!(
!(
!(!(!(!(
!(
!(!(
!(
!(!(!(!(!(
!( !( !(!(!(!(!(!(!(!(!(!(!(!(!(!(!(!(!(!(!(!(!(
!(!(!(!(
!(!(
!(!(
!(!(
!(!(
!(!(
!(!(
!(!(!(!(!( !(!(!(
!(!(
!(!(!(!(!(!(!(!(!(!(!(!(!(!(!(!(!(!(
!(!(!(!(!(
!(!(!(
!(!( !(!(!(!(!(!(!(
!( !(!(!(!(!(!(!(!(!(!( !(!(!(!(!(!(!(!(!(!(!(!(!(!(!(!(!(!(
!(!(
!(!( !(!(!(!( !(
!(
!(!(!( !(!(!(!(
!(!(
!(
!(!(!(!(
!(
!(!(
!(!(!(
!(
64°62°60°58°56°54°52°50°
-2°
-4°
-6°
-8°
-10°
-12°
-14°
-16°
-18°
-20°
0 250 500125
Kilometers
Legend200m
!( 1978403
!( 2008406
!( 2008407
!( 2008408
!( 2010407
!( 2010410
Seychelles Bank
AmirantesRidge
FarquharRidge Saya de Malha
Bank
NazarethBank
CargadosCarajosShoals
Soudan Banks
MauritiusRodrigues
Réunion
Mascarene Basin
Atlas Mooring
Atlas Mooring
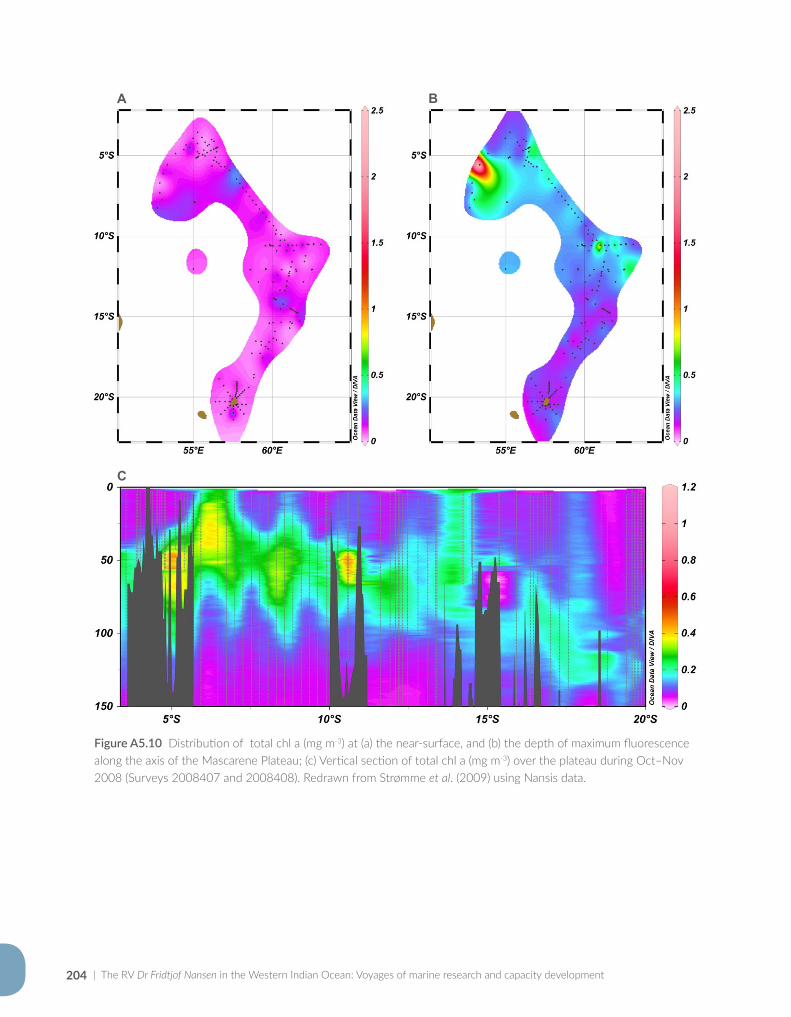
| The RV Dr Fridtjof Nansen in the Western Indian Ocean: Voyages of marine research and capacity development204
A B
C
Figure A5.10 Distribution of total chl a (mg m-3) at (a) the near-surface, and (b) the depth of maximum fluorescence along the axis of the Mascarene Plateau; (c) Vertical section of total chl a (mg m-3) over the plateau during Oct–Nov 2008 (Surveys 2008407 and 2008408). Redrawn from Strømme et al. (2009) using Nansis data.
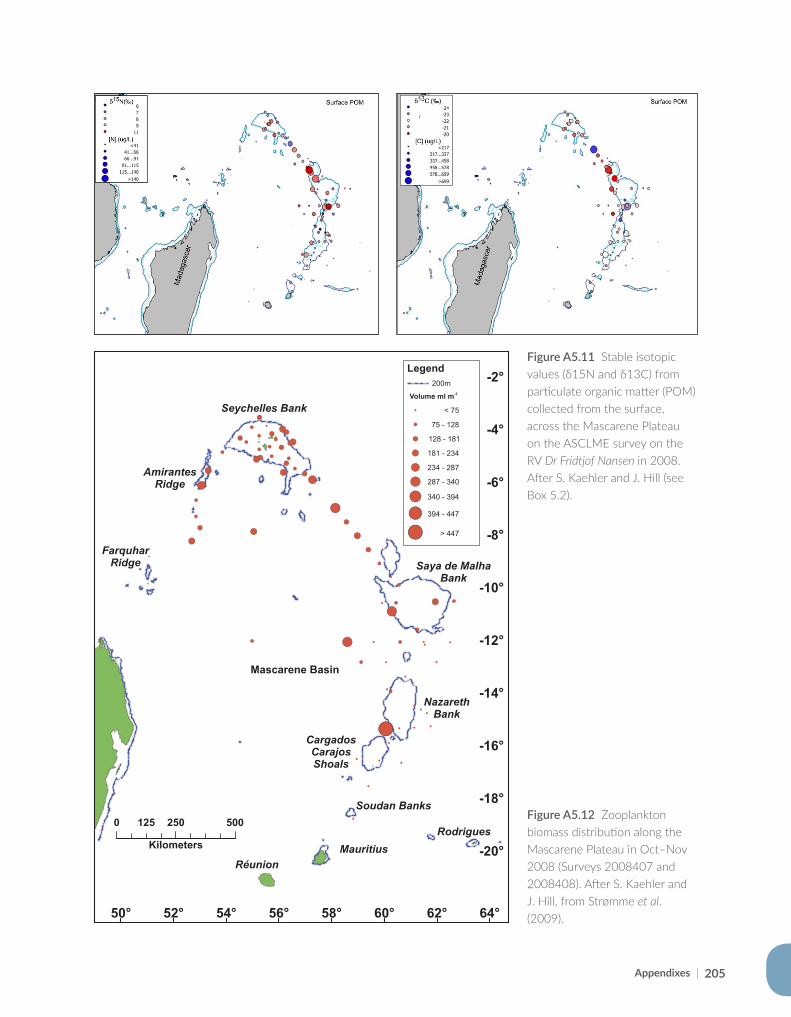
Appendixes | 205
Figure A5.11 Stable isotopic values (δ15N and δ13C) from particulate organic matter (POM) collected from the surface, across the Mascarene Plateau on the ASCLME survey on the RV Dr Fridtjof Nansen in 2008. After S. Kaehler and J. Hill (see Box 5.2).
64°62°60°58°56°54°52°50°
-2°
-4°
-6°
-8°
-10°
-12°
-14°
-16°
-18°
-20°
0 250 500125
Kilometers
Seychelles Bank
AmirantesRidge
FarquharRidge Saya de Malha
Bank
NazarethBank
CargadosCarajosShoals
Soudan Banks
MauritiusRodrigues
Réunion
Mascarene Basin
!(
!(
!(
!(
!(!(
!(
!(
!(
!(
!(
!(
!(
!(
!(
!(
!(
!(
!(!( !(
!(
!(
!(
!(!(
!(
!(
!(
!(
!(
!(
!(
!(!(
!(
!(
!(
!(
!(
!(
!(
!(
!(
!(
!(
!(
!(
!(
!(
!(
!(
!(
!(
!(
!(
!(
!(
!(
!(
!(!(!(
!(
!(
!(
!(
!(!(
!(
!(
!(
Legend
!( < 75
!( 75 - 128
!( 128 - 181
!( 181 - 234
!( 234 - 287
!( 287 - 340
!( 340 - 394
!( 394 - 447
!( > 447
Volume ml m-3
200m
Figure A5.12 Zooplankton biomass distribution along the Mascarene Plateau in Oct–Nov 2008 (Surveys 2008407 and 2008408). After S. Kaehler and J. Hill, from Strømme et al. (2009).
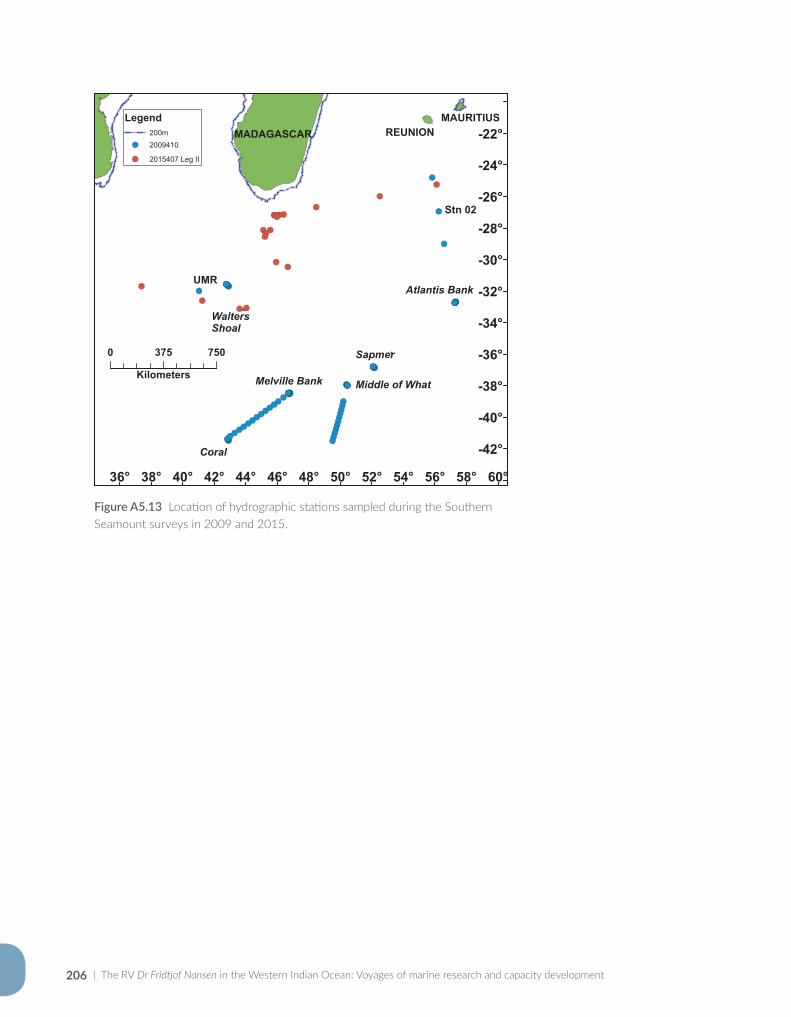
| The RV Dr Fridtjof Nansen in the Western Indian Ocean: Voyages of marine research and capacity development206
!(
!(
!(
!(!(!(!(!(!(!(!(!(!(!(!(!(!(
!(!(!(!(!(!(!(
!(!(!(!(!(!(!(!(!(!(!(!(!(!(!(!(!(!(!(!(!(!(!(!(!(!(
!(!(!(!(!(!(!(!(!(!(!(!(
!(!(!(!(!(!(!(!(!(!(!(!(!(!(!(!(
!(!(!(!(!(!(!(!(!(
!(!(
!(!(!(!(!(!(
!(!(!(!(
!( !(
!(!(!(
!(
60°58°56°54°52°50°48°46°44°42°40°38°36°
-22°
-24°
-26°
-28°
-30°
-32°
-34°
-36°
-38°
-40°
-42°
0 375 750
Kilometers
Legend200m
!( 2009410
!( 2015407 Leg II
MADAGASCAR REUNIONMAURITIUS
Stn 02
Atlantis Bank
Sapmer
Middle of WhatMelville Bank
WaltersShoal
UMR
Coral
Figure A5.13 Location of hydrographic stations sampled during the Southern Seamount surveys in 2009 and 2015.
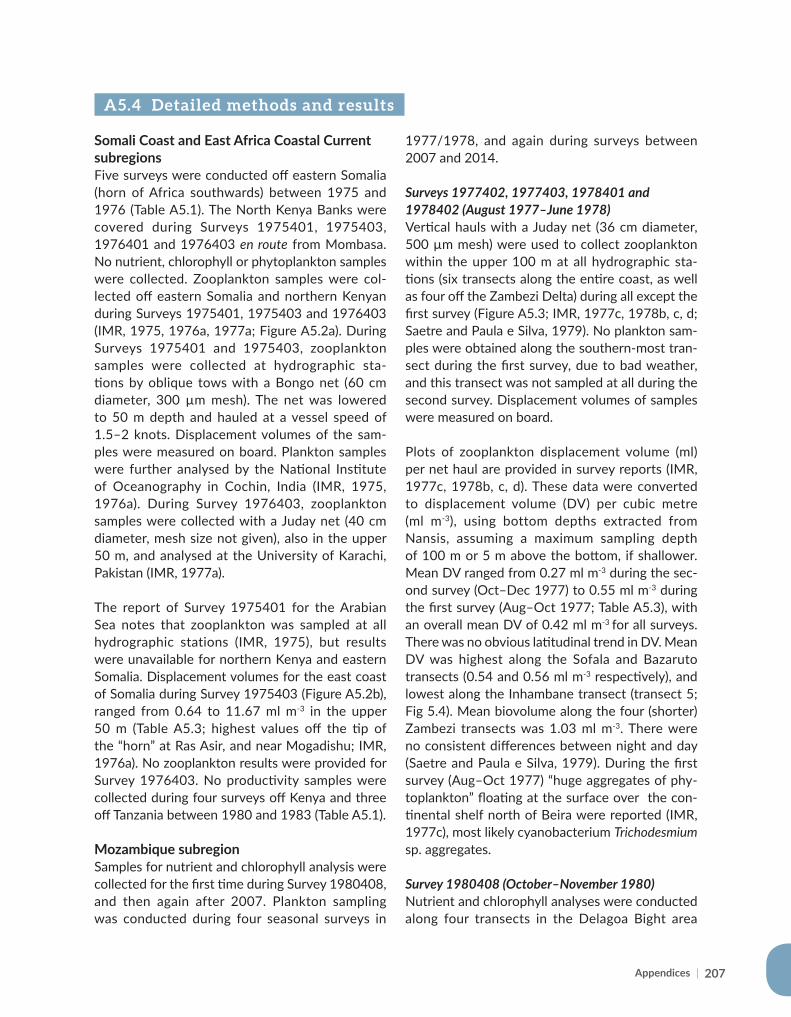
207Appendices |
Somali Coast and East Africa Coastal Current subregionsFive surveys were conducted off eastern Somalia (horn of Africa southwards) between 1975 and 1976 (Table A5.1). The North Kenya Banks were covered during Surveys 1975401, 1975403, 1976401 and 1976403 en route from Mombasa. No nutrient, chlorophyll or phytoplankton samples were collected. Zooplankton samples were col-lected off eastern Somalia and northern Kenyan during Surveys 1975401, 1975403 and 1976403 (IMR, 1975, 1976a, 1977a; Figure A5.2a). During Surveys 1975401 and 1975403, zooplankton samples were collected at hydrographic sta-tions by oblique tows with a Bongo net (60 cm diameter, 300 µm mesh). The net was lowered to 50 m depth and hauled at a vessel speed of 1.5–2 knots. Displacement volumes of the sam-ples were measured on board. Plankton samples were further analysed by the National Institute of Oceanography in Cochin, India (IMR, 1975, 1976a). During Survey 1976403, zooplankton samples were collected with a Juday net (40 cm diameter, mesh size not given), also in the upper 50 m, and analysed at the University of Karachi, Pakistan (IMR, 1977a).
The report of Survey 1975401 for the Arabian Sea notes that zooplankton was sampled at all hydrographic stations (IMR, 1975), but results were unavailable for northern Kenya and eastern Somalia. Displacement volumes for the east coast of Somalia during Survey 1975403 (Figure A5.2b), ranged from 0.64 to 11.67 ml m-3 in the upper 50 m (Table A5.3; highest values off the tip of the “horn” at Ras Asir, and near Mogadishu; IMR, 1976a). No zooplankton results were provided for Survey 1976403. No productivity samples were collected during four surveys off Kenya and three off Tanzania between 1980 and 1983 (Table A5.1).
Mozambique subregionSamples for nutrient and chlorophyll analysis were collected for the first time during Survey 1980408, and then again after 2007. Plankton sampling was conducted during four seasonal surveys in
A5.4 Detailed methods and results
1977/1978, and again during surveys between 2007 and 2014.
Surveys 1977402, 1977403, 1978401 and 1978402 (August 1977–June 1978)Vertical hauls with a Juday net (36 cm diameter, 500 µm mesh) were used to collect zooplankton within the upper 100 m at all hydrographic sta-tions (six transects along the entire coast, as well as four off the Zambezi Delta) during all except the first survey (Figure A5.3; IMR, 1977c, 1978b, c, d; Saetre and Paula e Silva, 1979). No plankton sam-ples were obtained along the southern-most tran-sect during the first survey, due to bad weather, and this transect was not sampled at all during the second survey. Displacement volumes of samples were measured on board.
Plots of zooplankton displacement volume (ml) per net haul are provided in survey reports (IMR, 1977c, 1978b, c, d). These data were converted to displacement volume (DV) per cubic metre (ml m-3), using bottom depths extracted from Nansis, assuming a maximum sampling depth of 100 m or 5 m above the bottom, if shallower. Mean DV ranged from 0.27 ml m-3 during the sec-ond survey (Oct–Dec 1977) to 0.55 ml m-3 during the first survey (Aug–Oct 1977; Table A5.3), with an overall mean DV of 0.42 ml m-3 for all surveys. There was no obvious latitudinal trend in DV. Mean DV was highest along the Sofala and Bazaruto transects (0.54 and 0.56 ml m-3 respectively), and lowest along the Inhambane transect (transect 5; Fig 5.4). Mean biovolume along the four (shorter) Zambezi transects was 1.03 ml m-3. There were no consistent differences between night and day (Saetre and Paula e Silva, 1979). During the first survey (Aug–Oct 1977) “huge aggregates of phy-toplankton” floating at the surface over the con-tinental shelf north of Beira were reported (IMR, 1977c), most likely cyanobacterium Trichodesmium sp. aggregates.
Survey 1980408 (October–November 1980)Nutrient and chlorophyll analyses were conducted along four transects in the Delagoa Bight area
| The RV Dr Fridtjof Nansen in the Western Indian Ocean: Voyages of marine research and capacity development208
and three transects over the Sofala Bank during Oct/Nov 1980 (Figure A5.3), but no zooplankton sampling was conducted. Water samples for nutri-ent analysis were collected using Nansen bottles deployed at standard depths to the bottom or max-imum 500 m. At some of the hydrographic stations samples for chl a analysis were collected from six depths between the surface and 50 m. Samples for nutrients were deep-frozen and stored for analysis using an auto-analyzer in Bergen. Samples for chl a analysis were filtered through 0.45 µm pore-size membrane filters, which were kept frozen for later extraction and fluorometric analysis in Bergen (Brinca et al., 1981).
Nutrient concentrations in the upper 50 m layer of Delagoa Bight ranged from 0.05 to 0.2 µM for phosphate, 0.1 to 0.3 µM for nitrate, and 0.5 to 1.0 µM for silicate (Table A5.2). A sharp gradient of increasing concentration was observed between 75 and 125 m depth, or in the upper part of the main thermocline. The corresponding chl a con-centrations were very low in the upper 20 m, and within the top 50 m chl a generally ranged from 0.05 to 0.8 mg m-3.
Over the Sofala Bank, nutrient concentrations were low (<0.5 µM) in the upper 50 m, or totally depleted in the case of nitrate. Both phosphate and silicate showed a minimum above the edge of the continental shelf with increasing concen-trations toward the coast. A sharp gradient of increasing nutrient concentrations was observed at 100–150 m depth over the upper part of the continental slope. The distribution of chl a had a similar range to the Delagoa Bight, with maximum values in the upper 50 m not exceeding 0.7 mg m-3. Very low concentrations were found in the upper 10–20 m over the mid- to outer shelf. In the inshore area, an increase in chl a was observed throughout the water column, in the same region where higher phosphate and silicate concentra-tions were observed (Brinca et al., 1981).
Survey 2007409 (September–December 2007)Survey 2007409 was the first in a new phase of multidisciplinary ecosystem surveys (Johnsen et al., 2007). The survey was divided into two parts:
an ecosystem survey of the continental shelf between 20 and 1 000 m bottom depth (Figure A5.3), and special studies on offshore banks, seamounts and an area identified for oil and gas exploration. These included (from north to south) the Quirimbas National Park, St. Lazarus Bank (NE of Pemba), Paisley Seamount (50 nm off Nacala), the Segundas Archipelago (south of Angoche), the Zambezi Delta, Bazaruto National Park and Almirante Leite Bank (east of Maputo). Diel ver-tical migration (DVM) of larval shrimp near the Zambezi Delta was sampled along three transects, including a 48h fixed station with intensive (two-hourly) phytoplankton and zooplankton collection.
A total of 387 CTD profiles were conducted during the entire survey, while 79 phytoplankton and 67 zooplankton samples were collected. Samples for nutrient and pigment analysis (including High Performance Liquid Chromatography (HPLC) analysis) and phytoplankton taxonomic identifi-cation were collected and preserved following standard procedures, and were analysed at the Centre of Oceanography of University of Lisbon, Portugal (Johnsen et al., 2007; Sá et al., 2013). Ocean colour data corresponding to the cruise period were downloaded from the NASA website and processed. A Multinet (405 µm) was used to collect zooplankton (at irregular intervals) during the ecosystem survey, a Neuston net (335 µm) was deployed at three stations in the Segundas Archipelago, and both Multinet and Neuston nets were deployed off the Zambezi Delta. All zooplankton samples were stored for analysis in Portugal (Johnsen et al., 2007; Leal et al., 2009, 2010).
Maps of ocean colour and phytoplankton biomass (from near-surface fluorescence; Figure A5.4), showed that Angoche, Sofala Bank and Delagoa Bight were the most productive areas during the ecosystem survey and the special studies. Nutrient concentrations and phytoplankton community structure varied among regions and depths (Sá et al., 2013) , as reported by Barlow et al. (2008, 2014). Nutrient results revealed similar P concen-trations in all regions (~0.25 μM), with minimum values in the north (region C1; see Sá et al., 2013,
Appendixes | 209
their Figure 3). Maximum Si concentration was observed at station 3 (17.27 μM) and generally varied between 6 and 10 μM at other stations, except for occasional minima and region B, where results were below detection limits. N concentra-tions were generally low along the coast, often below detection limits. By contrast, higher con-centrations were observed in few surface samples in regions A and C1. No clear trend in nutrient concentrations could distinguish between surface and SSM samples (Sá et al., 2013).
Pigment analysis using HPLC allowed determi-nation of phytoplankton biomass and identifi-cation of major phytoplankton groups present in Mozambican waters (Johnsen et al., 2007; Sá et al., 2013), in particular Prochlorophytes (Divinyl chl a), Haptophytes (19’Hexanoylofucoxanthin), Bacillariophytes (Fucoxanthin), Cyanophytes (Zeaxanthin) and Dinophytes (Peridinin). The smaller picoplankton were associated with warmer northern waters and dominated surface waters, while the larger nano- and microplankton were abundant at the fMax, mostly associated with cooler southern waters (see Sá et al., 2013, their Figure 5).
Total chl a (TChl a) also differed between regions (southern [A], middle [B] and northern [C] coasts), and between surface and fMax layers (see Sá et al., 2013, their Figure 4). Surface TChl a values were lower than those at the fMax (Table A5.2), except in the southern region (cool and nutrient-rich) where surface values were similar to those at the fMax. In the less-productive central and northern regions, the minimum TChl a concentrations in surface waters ranged from 0.03 to 0.18 mg m-3, while the maximum surface values ranged from 0.37 to 0.53 mg m-3. The corresponding fMax val-ues had minimum TChl a of 0.03 to 0.2 mg m-3 while maximum values were 0.31 to 0.95 mg m-3
(Table A5.2).
The phytoplankton community on the Sofala Bank was dominated by microflagellates, specif-ically Haptophytes (coccolithophorids). Phyto- and zooplankton were most abundant near the bottom (40 m depth), although cyanobacteria
were concentrated at mid-water column depths (10–20 m). Zooplankton biovolume (>405 µm) ranged from 0.77 to 7.11 ml m-3 (Table A5.3) and was generally higher inshore than offshore. At a 48-h sampling position, zooplankton abundance was higher in the upper strata during the night and in deeper strata during the day, in accor-dance with typical diel vertical migration (DVM) behaviour (Leal et al., 2009). Catches of goldspot herring (Herklotsichthys quadrimaculatus) larvae were greater at dusk and night, although this may potentially have been biased by visual net avoid-ance during lighter periods (Leal et al., 2010). Larvae were generally concentrated in the upper 20 m of the water column, with larger larvae most abundant in the neuston, and smaller larvae slightly deeper in the water column, down to 20 m.
At the Segundas Archipelago, relative chlorophyll values (uncorrected fluorescence) in the upper 100 m ranged from 0.1 to 0.5 mg m-3. The high-est values were associated with the narrow shelf area, decreasing inshore and offshore of this stra-tum. The diversity and abundance of the neuston, which included fish eggs and larvae and crustacean larvae, was reported to be greatest at night (due to DVM), although only three samples were collected (Johnsen et al., 2007). Chlorophyll values along a W-E transect north of the Bazaruto Archipelago ranged from 0.1–0.5 mg m-3, with highest values at the shelf break, declining offshore. Similarly, sam-ples collected along a N-S transect near the coast (<50 m), east of the archipelago, revealed high chl a associated with the narrow shelf, decreasing off-shore and inshore of this shelf area (Johnsen et al., 2007).
The Almirante Leite Bank is situated directly east of Maputo, about 110 nm off the coast of Mozambique, and comprises a number of sea-mounts varying in depth from 80 to several hun-dred metres. Three CTD deployments revealed low chl a (0.1 mg m-3) over the bank. A transect from the bank to the coast revealed slightly higher values (0.1 to 0.3 mg m-3) near the coast, between the surface and 300 m depth, with a DCM at about 100 m depth further offshore (Johnsen et al., 2007).
| The RV Dr Fridtjof Nansen in the Western Indian Ocean: Voyages of marine research and capacity development210
Survey 2008409: Mozambique Channel (November–December 2008)The survey investigated the physical and bio-logical characteristics of mesoscale eddies in the Mozambique Channel, as part of the regional research programme MESOBIO (Ternon et al., 2014). The survey grid (Figure A5.3) encom-passed three cyclonic eddies, one anticyclonic eddy, a frontal zone and a coastal convergence zone south of Angoche (see Lamont et al., 2014, their Figure 3). Samples were collected for nutri-ents, phytoplankton taxonomic identification, HPLC pigment analysis and chl a concentration, and were preserved following standard methods. Samples were also collected for total chlorophyll size fractionation, phytoplankton absorption (stored at -20 oC), nitrate isotopes (samples from four different depths), and particulate organic mat-ter (POM), which was collected at the surface and fMax on pre-combusted GF/F filters for later anal-yses of stable isotopes. Satellite data (sea surface colour for chl a, and sea surface temperature) were regularly down-loaded. Primary production incu-bation experiments were carried out at selected stations (Kaehler et al., 2008).
Microzooplankton (20–200 µm) samples were collected from the surface and fMax, washed and preserved in Lugol’s solution and strontium sul-phate as per JGOFS protocols, and stored in dark-ness for later analysis. Mesozooplankton (>200 µm) were collected using oblique tows with a Multinet (180 µm mesh) and Bongo nets (300 µm and 500 µm mesh) in the upper 200 m. A vertical WP2 net (100 µm mesh) haul was also made in the upper 200 m. The 300 µm Bongo samples were size-fractionated by washing through serial 4 mm, 2 mm, 1 mm, 500 μm and 250 µm sieves for later isotope analysis (Kaehler et al., 2008).
Results from the survey were compared with those from other mesoscale eddy studies during 2007, 2009 and 2010 (see Barlow et al., 2014; Huggett, 2014; Lamont et al., 2014). Discriminant Function Analysis was used to clas-sify stations into five categories, namely cyclonic, anti-cyclonic, frontal, divergence and shelf (Lamont et al., 2014). In all these studies, chl a
concentrations in the surface waters tended to be low (0.01–1.27 mg m-3), with little variation between categories. Subsurface concentrations were significantly greater (0.22–9.03 mg m-3), and varied between categories (Lamont et al., 2014; Table A5.2). On average, the depth of the fMax varied from 60–70 m at cyclonic and divergence stations to 80–90 m at frontal, anti-cyclonic, and shelf stations. Barlow et al. (2014) found prokary-otes to be the most prominent phytoplankton group at the surface, with small flagellates of sec-ondary importance, while flagellates dominated at the fMax. The small flagellates in the Mozambique Channel were composed mostly of Haptophytes, although Pelagophytes and Prasinophytes were also detected at the fMax. A high proportion of flagellates were pico-eukaryotes (<2 µm); >50 percent of chl a was found in the <2 µm size fraction at both the surface and the fMax (T. Bornman, personal communication).
Mesozooplankton biovolume was greatest (0.8–1.0 ml m-3) along the Mozambique shelf-edge near Angoche, characterised by high chl a, and at a shelf station off Madagascar (Huggett, 2014). Moderate concentrations (0.3–0.6 ml m-3) were associated with divergence areas and the relatively weak cyclonic eddy, whereas lowest biovolumes (<0.3 ml m-3) were associated with the anticyclonic eddy. Mesozooplankton bio-volume was largely concentrated in the upper 100 m, with a weighted mean depth (WMD) of 54.7 m. Species analysis of samples collected during the eddy study in 2007 showed that the zooplankton community was dominated by small calanoid and cyclopoid copepods (74.3 percent) followed by appendicularians (3.6 percent), ostra-cods (3.0 percent) and chaetognaths (2.5 percent; Huggett, 2014). Depth was more important than station classification (e.g. cyclonic or anticyclonic) in discriminating the taxonomy or species compo-sition of zooplankton assemblages.
Survey 2009407 (August 2009)The survey covered the northern shelf region of Mozambique, a region thought to experience shelf-edge upwelling driven by passing eddies. Environmental sampling, which included CTD
Appendixes | 211
profiling of fluorescence and Multinet (180 µm) hauls for zooplankton, was conducted along six transects approximately 30 nm long (Figure A5.3). Additional CTD casts were taken farther north, to a maximum depth of 1 500 m.
Fluorescence profiles indicated low concentra-tions of chl a (mostly <0.3 mg m-3) with maxi-mum values varying both with depth and distance offshore for each transect (Olsen et al., 2011). Highest near-surface (5 m) concentrations of chl a were located south and offshore of Angoche (Figure A5.5a). Mean zooplankton biovolume for the survey was 0.32 ml m-3 (Table A5.3; J. Huggett, unpublished data), with elevated concentrations along the coast north of Angoche (Figure A5.5b), peaking near Mozambique Island (~15 °S).
Survey 2014406 (November–December 2014)The survey was similar to survey 2007409, for comparative purposes, but could not be completed due to engine failure. CTD stations were located along 10 transects to a depth of 1 000 m, between the border with South Africa and the Zambezi Delta, with samples collected for nutrients, chl a, phytoplankton identification and zooplankton along the 500 m, 100 m and 30 m depth contours (Figure A5.3; Krakstad et al., 2015). Nutrient sam-ples were preserved with 0.2 ml chloroform and refrigerated for later analysis at IMR (Norway), while chl a samples were filtered on GF/C 25 mm diameter filters and stored in the dark at -18 °C.
For taxonomic analysis, 58 phytoplankton sam-ples were collected using a 10 µm mesh-sized net, with a diameter of 35 cm, which was hauled upwards (at less than 0.1 m s-1) from 30 m to the surface. Samples were preserved with 2 ml 20 per-cent formalin and stored in 100 ml glass bottles, in the dark. Zooplankton samples were collected from the upper 200 m with a Multinet and a WP2 net (both 180 µm mesh). Each sample was divided into two; the first half preserved in 4 percent for-malin for later taxonomic analysis, and the second half was size-fractionated (>2 000 μm, 2 000–1 000 μm, and 1 000–180 μm), dried and frozen at -18 °C for dry weight determination (Krakstad et al., 2015).
In general, surface waters exhibited low concen-trations of nutrients and chl a, typical of oligotro-phic waters (Krakstad et al., 2015). All nutrients increased with depth, with nitrate, nitrite and phosphate being lower relative to silicate levels (Table A5.2). Chl a concentration (denoted by flu-orescence levels) ranged from <0.05 mg m-3 in off-shore oligotrophic waters to >0.5 mg m-3 inshore, with highest concentrations off the Zambezi Delta (~19 °S) and in the Delagoa Bight (Fig A5.5c). Vertical sections of fluorescence along each tran-sect are provided by Krakstad et al. (2015).
Mean zooplankton biomass for the area surveyed was 3.33 ± 2.31 (SD) g m-2 dry weight, based on results from the WP2 net (upper 200 m). Highest biomass was observed in the Inhambane/Delagoa Bight area, where chl a was high, and along the offshore region of the Sofala Bank (Fig A5.5d). The zooplankton size fraction analyses showed that overall 21 percent of the zooplankton biomass was >2 000 μm, 32 percent in the 1 000–2 000 μm fraction and 47 percent <1 000 μm. The regions with the highest concentrations of zooplankton showed a pattern of smaller sized zooplankton closest to shore, and a gradual increase in zoo-plankton size with distance offshore (Krakstad et al., 2015).
Madagascar and Comoros subregionSurvey 2008405: South and east Madagascar (August–October 2008)Hydrographic and plankton sampling was con-ducted along 11 transects (Figure A5.6). Water samples for nutrients and chl a analysis were col-lected from 115 stations following standard pro-cedures. Nutrient samples were frozen while chl a samples were analysed on board, using the acidifi-cation technique (Krakstad et al., 2008). As some uncertainty existed around the accuracy of the fluorometer, duplicate samples were taken once per transect from the fMax and deep frozen for later analysis. Zooplankton samples collected with the Multinet and Bongo nets remain unaccounted for.
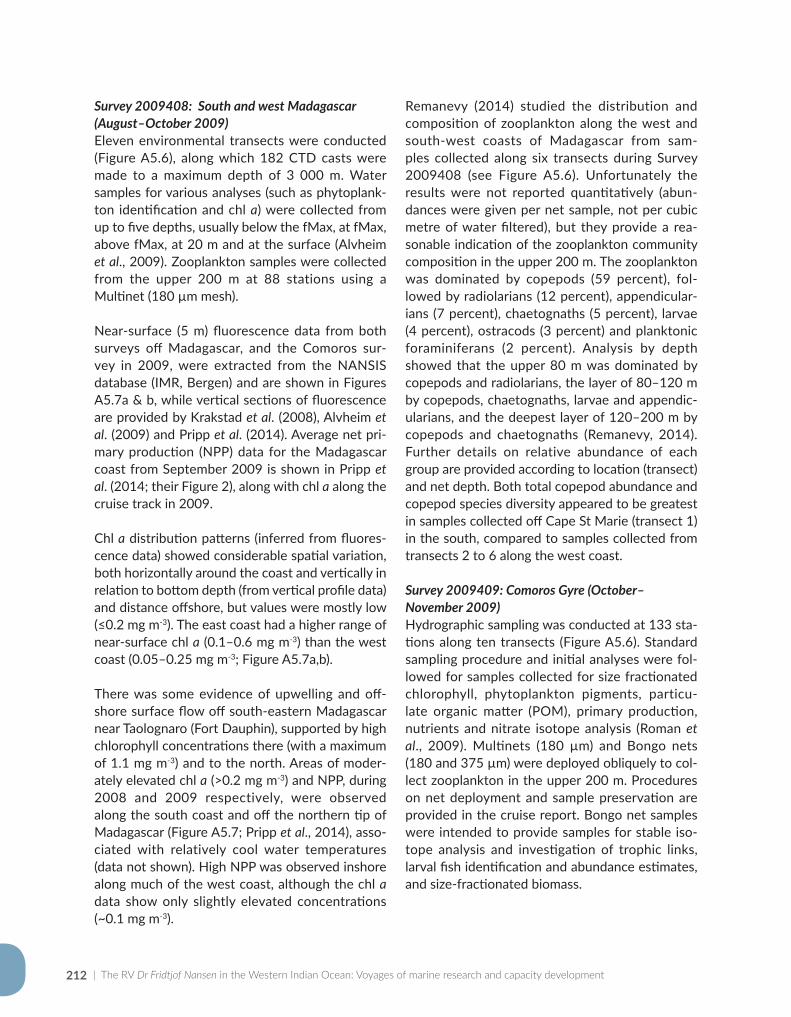
| The RV Dr Fridtjof Nansen in the Western Indian Ocean: Voyages of marine research and capacity development212
Survey 2009408: South and west Madagascar (August–October 2009) Eleven environmental transects were conducted (Figure A5.6), along which 182 CTD casts were made to a maximum depth of 3 000 m. Water samples for various analyses (such as phytoplank-ton identification and chl a) were collected from up to five depths, usually below the fMax, at fMax, above fMax, at 20 m and at the surface (Alvheim et al., 2009). Zooplankton samples were collected from the upper 200 m at 88 stations using a Multinet (180 µm mesh).
Near-surface (5 m) fluorescence data from both surveys off Madagascar, and the Comoros sur-vey in 2009, were extracted from the NANSIS database (IMR, Bergen) and are shown in Figures A5.7a & b, while vertical sections of fluorescence are provided by Krakstad et al. (2008), Alvheim et al. (2009) and Pripp et al. (2014). Average net pri-mary production (NPP) data for the Madagascar coast from September 2009 is shown in Pripp et al. (2014; their Figure 2), along with chl a along the cruise track in 2009.
Chl a distribution patterns (inferred from fluores-cence data) showed considerable spatial variation, both horizontally around the coast and vertically in relation to bottom depth (from vertical profile data) and distance offshore, but values were mostly low (≤0.2 mg m-3). The east coast had a higher range of near-surface chl a (0.1–0.6 mg m-3) than the west coast (0.05–0.25 mg m-3; Figure A5.7a,b).
There was some evidence of upwelling and off-shore surface flow off south-eastern Madagascar near Taolognaro (Fort Dauphin), supported by high chlorophyll concentrations there (with a maximum of 1.1 mg m-3) and to the north. Areas of moder-ately elevated chl a (>0.2 mg m-3) and NPP, during 2008 and 2009 respectively, were observed along the south coast and off the northern tip of Madagascar (Figure A5.7; Pripp et al., 2014), asso-ciated with relatively cool water temperatures (data not shown). High NPP was observed inshore along much of the west coast, although the chl a data show only slightly elevated concentrations (~0.1 mg m-3).
Remanevy (2014) studied the distribution and composition of zooplankton along the west and south-west coasts of Madagascar from sam-ples collected along six transects during Survey 2009408 (see Figure A5.6). Unfortunately the results were not reported quantitatively (abun-dances were given per net sample, not per cubic metre of water filtered), but they provide a rea-sonable indication of the zooplankton community composition in the upper 200 m. The zooplankton was dominated by copepods (59 percent), fol-lowed by radiolarians (12 percent), appendicular-ians (7 percent), chaetognaths (5 percent), larvae (4 percent), ostracods (3 percent) and planktonic foraminiferans (2 percent). Analysis by depth showed that the upper 80 m was dominated by copepods and radiolarians, the layer of 80–120 m by copepods, chaetognaths, larvae and appendic-ularians, and the deepest layer of 120–200 m by copepods and chaetognaths (Remanevy, 2014). Further details on relative abundance of each group are provided according to location (transect) and net depth. Both total copepod abundance and copepod species diversity appeared to be greatest in samples collected off Cape St Marie (transect 1) in the south, compared to samples collected from transects 2 to 6 along the west coast.
Survey 2009409: Comoros Gyre (October–November 2009)Hydrographic sampling was conducted at 133 sta-tions along ten transects (Figure A5.6). Standard sampling procedure and initial analyses were fol-lowed for samples collected for size fractionated chlorophyll, phytoplankton pigments, particu-late organic matter (POM), primary production, nutrients and nitrate isotope analysis (Roman et al., 2009). Multinets (180 µm) and Bongo nets (180 and 375 µm) were deployed obliquely to col-lect zooplankton in the upper 200 m. Procedures on net deployment and sample preservation are provided in the cruise report. Bongo net samples were intended to provide samples for stable iso-tope analysis and investigation of trophic links, larval fish identification and abundance estimates, and size-fractionated biomass.
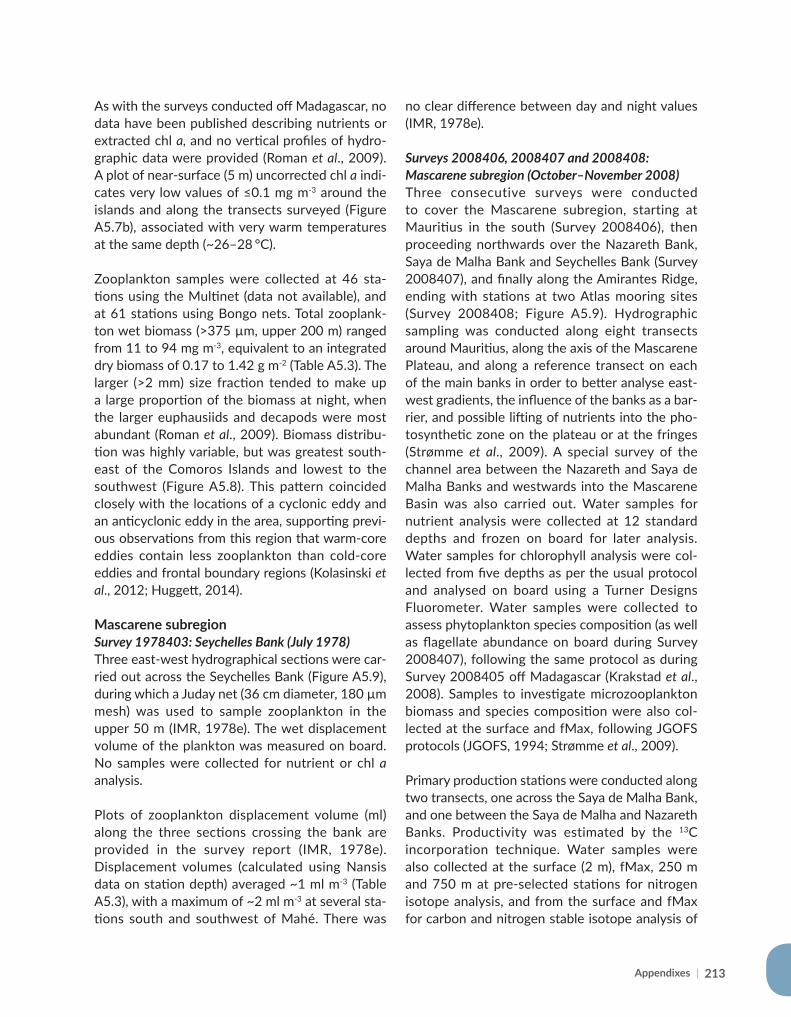
Appendixes | 213
As with the surveys conducted off Madagascar, no data have been published describing nutrients or extracted chl a, and no vertical profiles of hydro-graphic data were provided (Roman et al., 2009). A plot of near-surface (5 m) uncorrected chl a indi-cates very low values of ≤0.1 mg m-3 around the islands and along the transects surveyed (Figure A5.7b), associated with very warm temperatures at the same depth (~26–28 °C).
Zooplankton samples were collected at 46 sta-tions using the Multinet (data not available), and at 61 stations using Bongo nets. Total zooplank-ton wet biomass (>375 µm, upper 200 m) ranged from 11 to 94 mg m-3, equivalent to an integrated dry biomass of 0.17 to 1.42 g m-2 (Table A5.3). The larger (>2 mm) size fraction tended to make up a large proportion of the biomass at night, when the larger euphausiids and decapods were most abundant (Roman et al., 2009). Biomass distribu-tion was highly variable, but was greatest south-east of the Comoros Islands and lowest to the southwest (Figure A5.8). This pattern coincided closely with the locations of a cyclonic eddy and an anticyclonic eddy in the area, supporting previ-ous observations from this region that warm-core eddies contain less zooplankton than cold-core eddies and frontal boundary regions (Kolasinski et al., 2012; Huggett, 2014).
Mascarene subregionSurvey 1978403: Seychelles Bank (July 1978) Three east-west hydrographical sections were car-ried out across the Seychelles Bank (Figure A5.9), during which a Juday net (36 cm diameter, 180 µm mesh) was used to sample zooplankton in the upper 50 m (IMR, 1978e). The wet displacement volume of the plankton was measured on board. No samples were collected for nutrient or chl a analysis.
Plots of zooplankton displacement volume (ml) along the three sections crossing the bank are provided in the survey report (IMR, 1978e). Displacement volumes (calculated using Nansis data on station depth) averaged ~1 ml m-3 (Table A5.3), with a maximum of ~2 ml m-3 at several sta-tions south and southwest of Mahé. There was
no clear difference between day and night values (IMR, 1978e).
Surveys 2008406, 2008407 and 2008408: Mascarene subregion (October–November 2008)Three consecutive surveys were conducted to cover the Mascarene subregion, starting at Mauritius in the south (Survey 2008406), then proceeding northwards over the Nazareth Bank, Saya de Malha Bank and Seychelles Bank (Survey 2008407), and finally along the Amirantes Ridge, ending with stations at two Atlas mooring sites (Survey 2008408; Figure A5.9). Hydrographic sampling was conducted along eight transects around Mauritius, along the axis of the Mascarene Plateau, and along a reference transect on each of the main banks in order to better analyse east-west gradients, the influence of the banks as a bar-rier, and possible lifting of nutrients into the pho-tosynthetic zone on the plateau or at the fringes (Strømme et al., 2009). A special survey of the channel area between the Nazareth and Saya de Malha Banks and westwards into the Mascarene Basin was also carried out. Water samples for nutrient analysis were collected at 12 standard depths and frozen on board for later analysis. Water samples for chlorophyll analysis were col-lected from five depths as per the usual protocol and analysed on board using a Turner Designs Fluorometer. Water samples were collected to assess phytoplankton species composition (as well as flagellate abundance on board during Survey 2008407), following the same protocol as during Survey 2008405 off Madagascar (Krakstad et al., 2008). Samples to investigate microzooplankton biomass and species composition were also col-lected at the surface and fMax, following JGOFS protocols (JGOFS, 1994; Strømme et al., 2009).
Primary production stations were conducted along two transects, one across the Saya de Malha Bank, and one between the Saya de Malha and Nazareth Banks. Productivity was estimated by the 13C incorporation technique. Water samples were also collected at the surface (2 m), fMax, 250 m and 750 m at pre-selected stations for nitrogen isotope analysis, and from the surface and fMax for carbon and nitrogen stable isotope analysis of
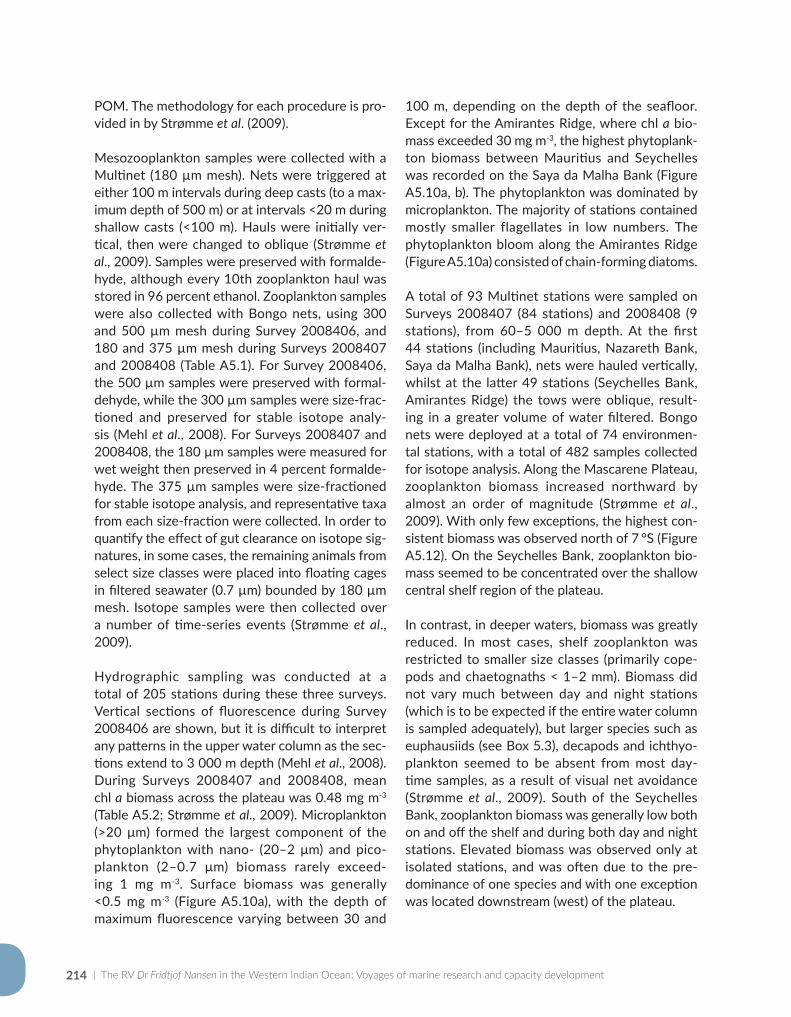
| The RV Dr Fridtjof Nansen in the Western Indian Ocean: Voyages of marine research and capacity development214
POM. The methodology for each procedure is pro-vided in by Strømme et al. (2009).
Mesozooplankton samples were collected with a Multinet (180 µm mesh). Nets were triggered at either 100 m intervals during deep casts (to a max-imum depth of 500 m) or at intervals <20 m during shallow casts (<100 m). Hauls were initially ver-tical, then were changed to oblique (Strømme et al., 2009). Samples were preserved with formalde-hyde, although every 10th zooplankton haul was stored in 96 percent ethanol. Zooplankton samples were also collected with Bongo nets, using 300 and 500 µm mesh during Survey 2008406, and 180 and 375 µm mesh during Surveys 2008407 and 2008408 (Table A5.1). For Survey 2008406, the 500 µm samples were preserved with formal-dehyde, while the 300 µm samples were size-frac-tioned and preserved for stable isotope analy-sis (Mehl et al., 2008). For Surveys 2008407 and 2008408, the 180 µm samples were measured for wet weight then preserved in 4 percent formalde-hyde. The 375 µm samples were size-fractioned for stable isotope analysis, and representative taxa from each size-fraction were collected. In order to quantify the effect of gut clearance on isotope sig-natures, in some cases, the remaining animals from select size classes were placed into floating cages in filtered seawater (0.7 µm) bounded by 180 µm mesh. Isotope samples were then collected over a number of time-series events (Strømme et al., 2009).
Hydrographic sampling was conducted at a total of 205 stations during these three surveys. Vertical sections of fluorescence during Survey 2008406 are shown, but it is difficult to interpret any patterns in the upper water column as the sec-tions extend to 3 000 m depth (Mehl et al., 2008). During Surveys 2008407 and 2008408, mean chl a biomass across the plateau was 0.48 mg m-3 (Table A5.2; Strømme et al., 2009). Microplankton (>20 μm) formed the largest component of the phytoplankton with nano- (20–2 μm) and pico-plankton (2–0.7 μm) biomass rarely exceed-ing 1 mg m-3. Surface biomass was generally <0.5 mg m-3 (Figure A5.10a), with the depth of maximum fluorescence varying between 30 and
100 m, depending on the depth of the seafloor. Except for the Amirantes Ridge, where chl a bio-mass exceeded 30 mg m-3, the highest phytoplank-ton biomass between Mauritius and Seychelles was recorded on the Saya da Malha Bank (Figure A5.10a, b). The phytoplankton was dominated by microplankton. The majority of stations contained mostly smaller flagellates in low numbers. The phytoplankton bloom along the Amirantes Ridge (Figure A5.10a) consisted of chain-forming diatoms.
A total of 93 Multinet stations were sampled on Surveys 2008407 (84 stations) and 2008408 (9 stations), from 60–5 000 m depth. At the first 44 stations (including Mauritius, Nazareth Bank, Saya da Malha Bank), nets were hauled vertically, whilst at the latter 49 stations (Seychelles Bank, Amirantes Ridge) the tows were oblique, result-ing in a greater volume of water filtered. Bongo nets were deployed at a total of 74 environmen-tal stations, with a total of 482 samples collected for isotope analysis. Along the Mascarene Plateau, zooplankton biomass increased northward by almost an order of magnitude (Strømme et al., 2009). With only few exceptions, the highest con-sistent biomass was observed north of 7 °S (Figure A5.12). On the Seychelles Bank, zooplankton bio-mass seemed to be concentrated over the shallow central shelf region of the plateau.
In contrast, in deeper waters, biomass was greatly reduced. In most cases, shelf zooplankton was restricted to smaller size classes (primarily cope-pods and chaetognaths < 1–2 mm). Biomass did not vary much between day and night stations (which is to be expected if the entire water column is sampled adequately), but larger species such as euphausiids (see Box 5.3), decapods and ichthyo-plankton seemed to be absent from most day-time samples, as a result of visual net avoidance (Strømme et al., 2009). South of the Seychelles Bank, zooplankton biomass was generally low both on and off the shelf and during both day and night stations. Elevated biomass was observed only at isolated stations, and was often due to the pre-dominance of one species and with one exception was located downstream (west) of the plateau.
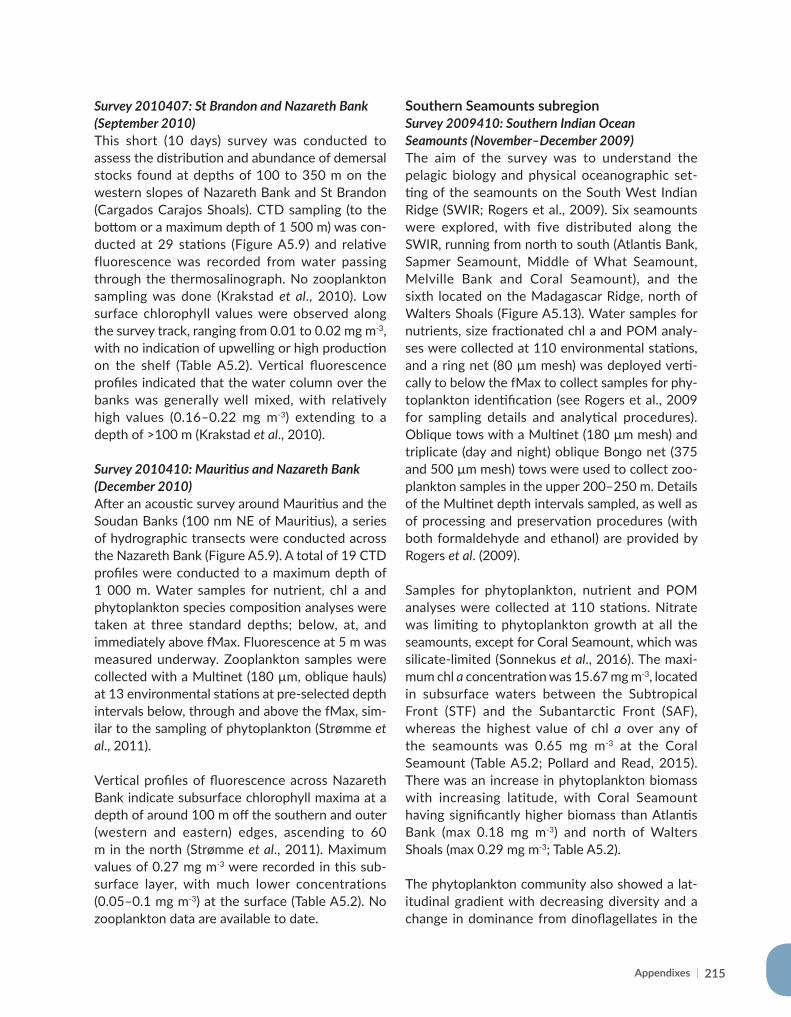
Appendixes | 215
Survey 2010407: St Brandon and Nazareth Bank (September 2010)This short (10 days) survey was conducted to assess the distribution and abundance of demersal stocks found at depths of 100 to 350 m on the western slopes of Nazareth Bank and St Brandon (Cargados Carajos Shoals). CTD sampling (to the bottom or a maximum depth of 1 500 m) was con-ducted at 29 stations (Figure A5.9) and relative fluorescence was recorded from water passing through the thermosalinograph. No zooplankton sampling was done (Krakstad et al., 2010). Low surface chlorophyll values were observed along the survey track, ranging from 0.01 to 0.02 mg m-3, with no indication of upwelling or high production on the shelf (Table A5.2). Vertical fluorescence profiles indicated that the water column over the banks was generally well mixed, with relatively high values (0.16–0.22 mg m-3) extending to a depth of >100 m (Krakstad et al., 2010).
Survey 2010410: Mauritius and Nazareth Bank (December 2010)After an acoustic survey around Mauritius and the Soudan Banks (100 nm NE of Mauritius), a series of hydrographic transects were conducted across the Nazareth Bank (Figure A5.9). A total of 19 CTD profiles were conducted to a maximum depth of 1 000 m. Water samples for nutrient, chl a and phytoplankton species composition analyses were taken at three standard depths; below, at, and immediately above fMax. Fluorescence at 5 m was measured underway. Zooplankton samples were collected with a Multinet (180 µm, oblique hauls) at 13 environmental stations at pre-selected depth intervals below, through and above the fMax, sim-ilar to the sampling of phytoplankton (Strømme et al., 2011).
Vertical profiles of fluorescence across Nazareth Bank indicate subsurface chlorophyll maxima at a depth of around 100 m off the southern and outer (western and eastern) edges, ascending to 60 m in the north (Strømme et al., 2011). Maximum values of 0.27 mg m-3 were recorded in this sub-surface layer, with much lower concentrations (0.05–0.1 mg m-3) at the surface (Table A5.2). No zooplankton data are available to date.
Southern Seamounts subregionSurvey 2009410: Southern Indian Ocean Seamounts (November–December 2009)The aim of the survey was to understand the pelagic biology and physical oceanographic set-ting of the seamounts on the South West Indian Ridge (SWIR; Rogers et al., 2009). Six seamounts were explored, with five distributed along the SWIR, running from north to south (Atlantis Bank, Sapmer Seamount, Middle of What Seamount, Melville Bank and Coral Seamount), and the sixth located on the Madagascar Ridge, north of Walters Shoals (Figure A5.13). Water samples for nutrients, size fractionated chl a and POM analy-ses were collected at 110 environmental stations, and a ring net (80 µm mesh) was deployed verti-cally to below the fMax to collect samples for phy-toplankton identification (see Rogers et al., 2009 for sampling details and analytical procedures). Oblique tows with a Multinet (180 µm mesh) and triplicate (day and night) oblique Bongo net (375 and 500 µm mesh) tows were used to collect zoo-plankton samples in the upper 200–250 m. Details of the Multinet depth intervals sampled, as well as of processing and preservation procedures (with both formaldehyde and ethanol) are provided by Rogers et al. (2009).
Samples for phytoplankton, nutrient and POM analyses were collected at 110 stations. Nitrate was limiting to phytoplankton growth at all the seamounts, except for Coral Seamount, which was silicate-limited (Sonnekus et al., 2016). The maxi-mum chl a concentration was 15.67 mg m-3, located in subsurface waters between the Subtropical Front (STF) and the Subantarctic Front (SAF), whereas the highest value of chl a over any of the seamounts was 0.65 mg m-3 at the Coral Seamount (Table A5.2; Pollard and Read, 2015). There was an increase in phytoplankton biomass with increasing latitude, with Coral Seamount having significantly higher biomass than Atlantis Bank (max 0.18 mg m-3) and north of Walters Shoals (max 0.29 mg m-3; Table A5.2).
The phytoplankton community also showed a lat-itudinal gradient with decreasing diversity and a change in dominance from dinoflagellates in the
| The RV Dr Fridtjof Nansen in the Western Indian Ocean: Voyages of marine research and capacity development216
tropics to diatoms towards the SCZ (Sonnekus et al., 2016; see their Figure 13 for community composition at each site). The dominant diatoms included chain forming species belonging to the genera Pseudo-nitzschia, Chaetoceros, Fragilariopsis, Melosira and Thalassiosira; large centric diatoms, such as Planktoniella and Coscinodiscus; and others, including the large Rhizosolenia spp. There were also several dinoflagellate species belonging to the genus Ceratium. In the Subantarctic water, the high-latitude flagellate Phaeocystis sp. (probably P. antarctica) appeared in large numbers, although diatoms remained dominant (Rogers et al., 2009).
The zooplankton catches showed high temporal and spatial variability in quantity and taxonomic composition (Rogers et al., 2009). The 500 µm net yielded consistently greater catches than the 375 µm net, and the Bongo net generally caught animals of a greater size range than the Multinet (180 µm). The highest catch of mesozooplankton was made at depths that incorporated the highest fluorescence reading (fMax). Most stations were dominated by copepods (see Box 5.4), euphausi-ids, chaetognaths and amphipods. Typical oceanic taxa (pteropods, thaliaceans) were present at the far south and STF. Settled volumes of zooplank-ton were fairly similar across the sampled stations (mean = 0.28 ml m-3 in the upper 200 m, R. Cedras, unpublished data; Table A5.3) but lowest at the open ocean station and Atlantis Bank. The great-est number of euphausiids was caught during net deployments at night. A large collection of salps and deeper-living crustaceans (for instance shrimp Systellaspis debilis) were caught off Walters Shoals using an Åkra trawl (4 mm cod-end mesh size) to target micronekton and nekton (Rogers et al., 2009).
Survey 2015407: Indian Ocean Survey, Leg II(July–August 2015)Two locations on the Madagascar Ridge were cho-sen for this study (Figure A5.13). At each location, two transects were sampled across the seamount or shoal. The CTD was deployed at all stations to obtain vertical profiles of fluorescence, and sam-ples were collected for analysis of nutrients and chl a. Zooplankton samples were collected with
a Multinet (180 µm mesh) at 19 stations, from five standardized sampling depths: 600–400 m, 400–200 m, 200–100 m, 100–50 m, and 50–0 m. After each haul, jellyfish were removed before the sample was split and the volume measured. The sample was split in two equal parts: one half was fixed with 10 ml 40 percent formaldehyde and borax in a 100 ml plastic bottle giving a concen-tration of approximate 4 percent formaldehyde for taxonomy analysis. The remaining half, to be used for biomass estimates, was passed through three sieves (2 000, 1 000, 180 μm) and dried for about 24 h. Large organisms such as krill and fish were placed on separate trays, which were all shipped back to Bergen for dry weight analy-sis. A WP2-net (180 µm) was used at five stations when weather conditions were too rough for Multinet deployment. In addition, around 30 neus-ton samples were collected using a Manta trawl (375 µm mesh). Samples were sorted on a 200 µm sieve, from which all microplastic particles were removed, and the remaining contents were fixed either in formalin or 96 percent ethanol. During transits a Continuous Plankton Recorder (CPR) was towed at ~10 knots. The main transits were from Mauritius to Walters Shoals (11 days) and from Walters Shoals to Durban (3 days).
During this leg, a total distance of 1 254 nautical miles was covered by the CPR, and 12 day-time stations and seven night-time stations were sam-pled, although samples were lost from three sta-tions due to bad weather. Mean zooplankton bio-mass was highest at Walters Shoals, which was partly attributed to the abundance of fish larvae and shrimps.
[Note: zooplankton biomass data provided in the preliminary cruise report are not mentioned here, as the values appear to be unrealistically high. Refer to Table A5.3 for mean biovolume data cal-culated and validated subsequent to the cruise.]
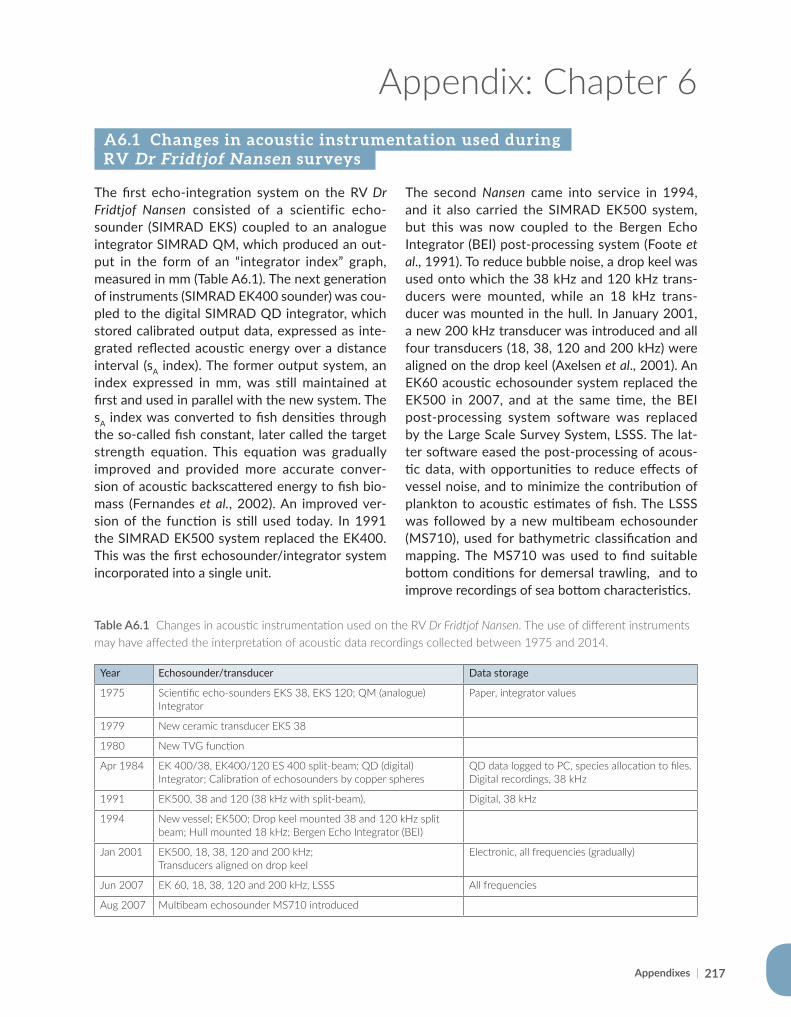
Appendixes | 217
Appendix: Chapter 6
Year Echosounder/transducer Data storage
1975 Scientific echo-sounders EKS 38, EKS 120; QM (analogue) Integrator
Paper, integrator values
1979 New ceramic transducer EKS 38
1980 New TVG function
Apr 1984 EK 400/38, EK400/120 ES 400 split-beam; QD (digital) Integrator; Calibration of echosounders by copper spheres
QD data logged to PC, species allocation to files.Digital recordings, 38 kHz
1991 EK500, 38 and 120 (38 kHz with split-beam), Digital, 38 kHz
1994 New vessel; EK500; Drop keel mounted 38 and 120 kHz split beam; Hull mounted 18 kHz; Bergen Echo Integrator (BEI)
Jan 2001 EK500, 18, 38, 120 and 200 kHz; Transducers aligned on drop keel
Electronic, all frequencies (gradually)
Jun 2007 EK 60, 18, 38, 120 and 200 kHz, LSSS All frequencies
Aug 2007 Multibeam echosounder MS710 introduced
Table A6.1 Changes in acoustic instrumentation used on the RV Dr Fridtjof Nansen. The use of different instruments may have affected the interpretation of acoustic data recordings collected between 1975 and 2014.
The first echo-integration system on the RV Dr Fridtjof Nansen consisted of a scientific echo-sounder (SIMRAD EKS) coupled to an analogue integrator SIMRAD QM, which produced an out-put in the form of an “integrator index” graph, measured in mm (Table A6.1). The next generation of instruments (SIMRAD EK400 sounder) was cou-pled to the digital SIMRAD QD integrator, which stored calibrated output data, expressed as inte-grated reflected acoustic energy over a distance interval (sA index). The former output system, an index expressed in mm, was still maintained at first and used in parallel with the new system. The sA index was converted to fish densities through the so-called fish constant, later called the target strength equation. This equation was gradually improved and provided more accurate conver-sion of acoustic backscattered energy to fish bio-mass (Fernandes et al., 2002). An improved ver-sion of the function is still used today. In 1991 the SIMRAD EK500 system replaced the EK400. This was the first echosounder/integrator system incorporated into a single unit.
The second Nansen came into service in 1994, and it also carried the SIMRAD EK500 system, but this was now coupled to the Bergen Echo Integrator (BEI) post-processing system (Foote et al., 1991). To reduce bubble noise, a drop keel was used onto which the 38 kHz and 120 kHz trans-ducers were mounted, while an 18 kHz trans-ducer was mounted in the hull. In January 2001, a new 200 kHz transducer was introduced and all four transducers (18, 38, 120 and 200 kHz) were aligned on the drop keel (Axelsen et al., 2001). An EK60 acoustic echosounder system replaced the EK500 in 2007, and at the same time, the BEI post-processing system software was replaced by the Large Scale Survey System, LSSS. The lat-ter software eased the post-processing of acous-tic data, with opportunities to reduce effects of vessel noise, and to minimize the contribution of plankton to acoustic estimates of fish. The LSSS was followed by a new multibeam echosounder (MS710), used for bathymetric classification and mapping. The MS710 was used to find suitable bottom conditions for demersal trawling, and to improve recordings of sea bottom characteristics.
A6.1 Changes in acoustic instrumentation used during RV Dr Fridtjof Nansen surveys
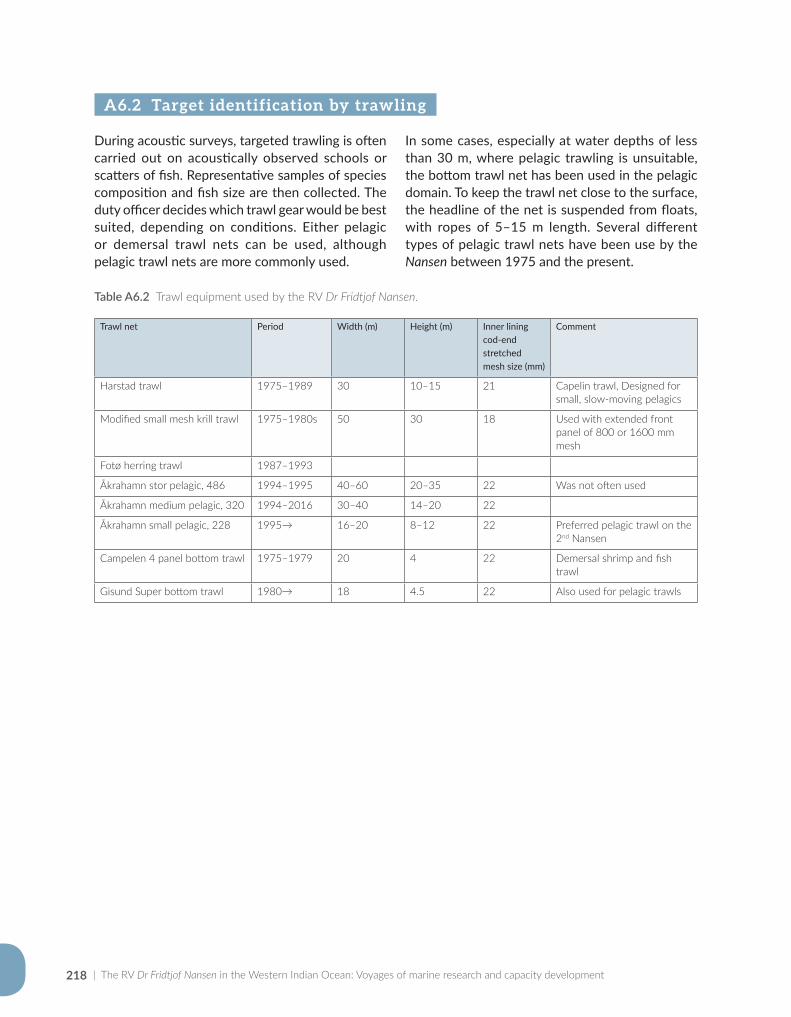
| The RV Dr Fridtjof Nansen in the Western Indian Ocean: Voyages of marine research and capacity development218
Trawl net Period Width (m) Height (m) Inner lining cod-end stretched mesh size (mm)
Comment
Harstad trawl 1975–1989 30 10–15 21 Capelin trawl, Designed for small, slow-moving pelagics
Modified small mesh krill trawl 1975–1980s 50 30 18 Used with extended front panel of 800 or 1600 mm mesh
Fotø herring trawl 1987–1993
Åkrahamn stor pelagic, 486 1994–1995 40–60 20–35 22 Was not often used
Åkrahamn medium pelagic, 320 1994–2016 30–40 14–20 22
Åkrahamn small pelagic, 228 1995→ 16–20 8–12 22 Preferred pelagic trawl on the 2nd Nansen
Campelen 4 panel bottom trawl 1975–1979 20 4 22 Demersal shrimp and fish trawl
Gisund Super bottom trawl 1980→ 18 4.5 22 Also used for pelagic trawls
Table A6.2 Trawl equipment used by the RV Dr Fridtjof Nansen.
During acoustic surveys, targeted trawling is often carried out on acoustically observed schools or scatters of fish. Representative samples of species composition and fish size are then collected. The duty officer decides which trawl gear would be best suited, depending on conditions. Either pelagic or demersal trawl nets can be used, although pelagic trawl nets are more commonly used.
In some cases, especially at water depths of less than 30 m, where pelagic trawling is unsuitable, the bottom trawl net has been used in the pelagic domain. To keep the trawl net close to the surface, the headline of the net is suspended from floats, with ropes of 5–15 m length. Several different types of pelagic trawl nets have been use by the Nansen between 1975 and the present.
A6.2 Target identification by trawling
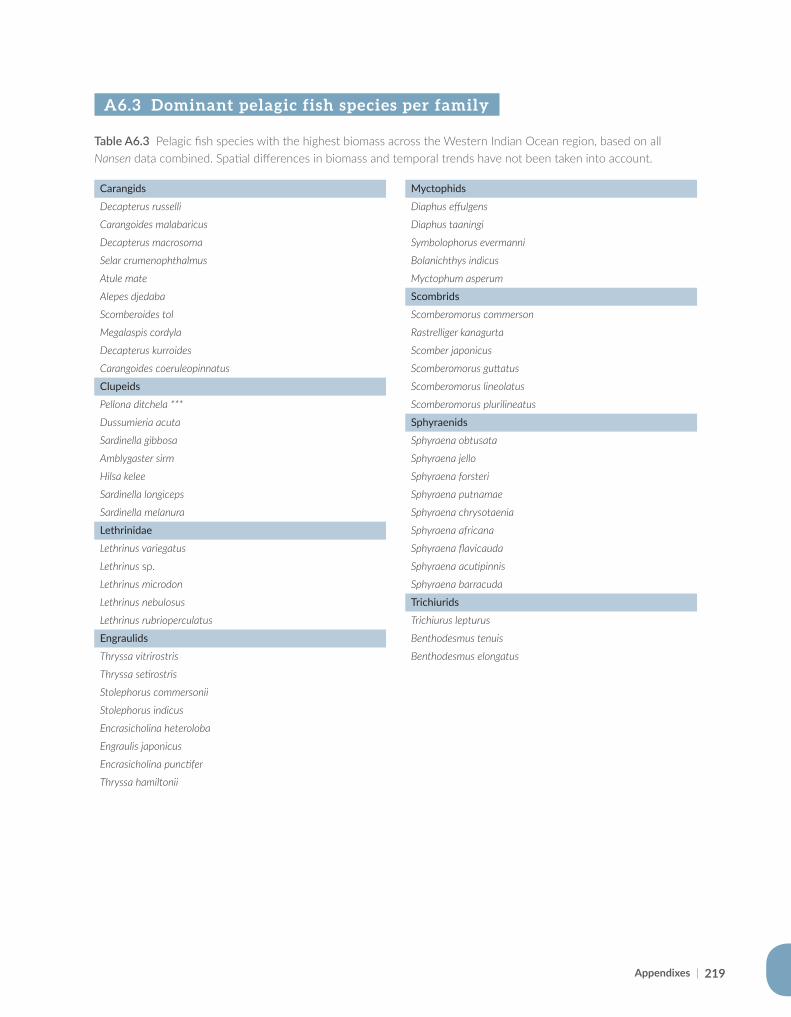
Appendixes | 219
A6.3 Dominant pelagic fish species per family
Carangids
Decapterus russelli
Carangoides malabaricus
Decapterus macrosoma
Selar crumenophthalmus
Atule mate
Alepes djedaba
Scomberoides tol
Megalaspis cordyla
Decapterus kurroides
Carangoides coeruleopinnatus
Clupeids
Pellona ditchela ***
Dussumieria acuta
Sardinella gibbosa
Amblygaster sirm
Hilsa kelee
Sardinella longiceps
Sardinella melanura
Lethrinidae
Lethrinus variegatus
Lethrinus sp.
Lethrinus microdon
Lethrinus nebulosus
Lethrinus rubrioperculatus
Engraulids
Thryssa vitrirostris
Thryssa setirostris
Stolephorus commersonii
Stolephorus indicus
Encrasicholina heteroloba
Engraulis japonicus
Encrasicholina punctifer
Thryssa hamiltonii
Table A6.3 Pelagic fish species with the highest biomass across the Western Indian Ocean region, based on all Nansen data combined. Spatial differences in biomass and temporal trends have not been taken into account.
Myctophids
Diaphus effulgens
Diaphus taaningi
Symbolophorus evermanni
Bolanichthys indicus
Myctophum asperum
Scombrids
Scomberomorus commerson
Rastrelliger kanagurta
Scomber japonicus
Scomberomorus guttatus
Scomberomorus lineolatus
Scomberomorus plurilineatus
Sphyraenids
Sphyraena obtusata
Sphyraena jello
Sphyraena forsteri
Sphyraena putnamae
Sphyraena chrysotaenia
Sphyraena africana
Sphyraena flavicauda
Sphyraena acutipinnis
Sphyraena barracuda
Trichiurids
Trichiurus lepturus
Benthodesmus tenuis
Benthodesmus elongatus

| The RV Dr Fridtjof Nansen in the Western Indian Ocean: Voyages of marine research and capacity development220
221
Appendix for Chapter 7
1975 to 1980 1980 onwards
Doors Waco combi doors, each with a surface area of 6 m2 and a weight of 1 200 kg.
Initially as before but replaced in 1995 with Thyborøn type 7 combi doors which weigh 1 720 kg and have a surface area of 7.41 m2.
Net Four-seam, high-opening, shrimp-cum-fish trawl (Campelen Super), 1 800 meshes in circumference, with bridles of 40 m, a 30–40 m headline, 40 mm mesh in the trawl body and 20 mm mesh in the cod end. Bobbins of 50 cm diameter were also used intermittently, on rough seafloors.
Gisund super bottom trawl, with sweeps of 40 m, a headline of 31 m, a footrope of 47 m and with 20 mm mesh size in the cod end with an inner net liner of 10 mm mesh size. Bobbins of 30 cm diameter were used from 1994; Danleno buoys were added which reduced the total clearance distance from the footrope to the substrate by roughly 20 cm.
Table A7.1 Trawl gear details after Sætersdal et al. (1999) and Axelsen and Johnsen (2015).
Trawl gearTrawl gear details are provided in Table A7.1. The small-mesh cod-end was lined with finer mesh of about 10 mm, to sample a wide range of fish and crustaceans (Sætersdal et al., 1999). Instrumented tows with the first RV Dr Fridtjof Nansen indicated a headline height of approximately 6 m and a dis-tance between wing tips of 18 to 19 m. After 1993, with the second Nansen, the distance between doors was kept constant at about 50 m, by using a 9.5 m strap between the warps at 130 m distance from the doors. This was normally used at depths greater than 80 m, and gave a consistent effective trawl sweep of 18.5 m at a speed of three knots. Also, after 1993, the SCANMAR system of sen-sors, a hydrophone, a receiver, a display unit and a battery charger was used on all trawl hauls to pro-vide estimates of the distance between the doors, trawl opening dimensions, bottom clearance and the amount of fish entering the trawl (Johnsen et al., 2007). Typical vertical opening during towing was 4.5 m (Axelsen and Johnsen, 2015).
Transects, trawls and catchesDemersal trawls undertaken during the early sur-veys in Somalia and Mozambique targeted fish concentrations on the basis of acoustic target strength. From 1980 onwards, stratified, semi-
random hauls were carried out within pre-identified depth strata and seabed areas. Whereas transects were generally perpendicular to the coast, trawl direction was parallel to the coast, following bathymetric contours and remaining within a narrow depth band. The number of trawl stations per transect depended on the availabil-ity of trawlable grounds and shelf-width. Large trawl catches were subsampled and results were then raised by a factor equal to the ratio between total catch weight and the sample weight. Catch and associated station data were captured in the Nansis database. Biological data of length fre-quency distribution, gender and reproductive con-dition were collected from commonly-occurring species, or from priority species specified in sur-vey objectives.
Catch compositionFor Chapter 7, original data extracted from the Nansis database were reanalysed, rather than rely-ing on survey reports in which spatial coverage and metrics varied across surveys. Originally-assigned species names on the Nansis database were ver-ified and updated by consulting the FAO Aquatic Sciences and Fisheries Information System (ASFIS); if no matches could be found, correct names were assigned based on FishBase or the World Register
A7.1 Detailed demersal sampling methods
Appendixes |
| The RV Dr Fridtjof Nansen in the Western Indian Ocean: Voyages of marine research and capacity development222
of Marine Species (WoRMS). Where taxa were only broadly identified (for example as “rays”), or “shrimps” we categorized them into groupings such as elasmobranchs, or crustacea. To facilitate comparison, we grouped nominal species into families, and determined the most important con-tributions to catches by weight and number per subregion. Two sampling periods were considered, namely 1975–1990 (surveys using the first RV Dr Fridtjof Nansen) and 2007–2014 (using the second Nansen). Taxonomic knowledge of marine species was still poor in the 1970s and early 1980s and this has affected data quality of the early surveys. As taxonomic knowledge evolved and compre-hensive identification guides became available (for example, Bianchi and Fischer, 1984 and Smith et al., 2003), survey protocols also evolved, resulting in improved species identification. When looking at trends in biodiversity or changes in distribution and abundance of individual species or taxa over time, erroneous species identification as a possi-ble source of bias should be carefully considered.
Sætersdal et al. (1999) noted that the catch-ing efficiency of the bottom trawl on the RV Dr Fridjtof Nansen is likely to have varied considerably between species, especially when bobbins were used on unknown or rough seafloors. Comparisons with commercial catches and comparative fishing trials suggested that the trawl used by the Nansen had a low efficiency for species closely associ-ated with the seabed such as shrimp and flatfish (soles). For this reason, the summaries in Chapter 7 focussed on the main taxa caught in the bottom trawls, regardless of whether they are usually con-sidered to be demersal, pelagic, bentho-pelagic or semi-demersal. These categories can be quite arti-ficial, because the behaviour of fish depends on factors such as life history stage, water tempera-ture, oxygen levels and diurnal effects.
Catch densities We relied on a standardized measure of nominal density (t/nm2) based on trawl swept area, rather than on the estimated biomass, because biomass is sensitive to catchability parameters, which may vary widely between species. Densities are described for the shelf (20–200 m depth) and the
slope (200–800 m) for the various subregions. Prior to 1991, the distance trawled was deter-mined from the ship’s log adjusted for currents, as observed by navigational instruments. Thereafter, the trawl distance was estimated directly from GPS locations, with considerably higher accuracy. Some bias might therefore be expected when comparing densities with those from earlier sur-veys. Trawl start-time was taken as the moment when the gear started fishing, in other words, when the trawl doors and sweeps were set.
Swept area (a) was estimated by: a = (V * t) * E, where V = velocity of the trawl over the ground when trawling (nm/h), t = time spent trawling (h), and E = effective net width (m). Thus the area swept by the trawl net during 30 minutes trawl time with an average horizontal trawl opening of 18.5 m effective net width (see above), at a speed of 3 nm/h (knots), would be 0.015 square nauti-cal miles. Trawl velocities and time spent trawling were used as recorded in Nansis, without further validation.
Nominal densities were determined by dividing the catch weight by total swept area. The densi-ties per survey depth zone were averaged and extrapolated to produce estimates per subregion for the 1975–1990 and 2007–2014 time peri-ods, respectively. In the cases of Mozambique and Madagascar, where the coastlines are very long and within-subregion habitat differences occur, subzones within the subregions were also consid-ered. In Mozambique, one trawl on the northern shelf in 2012 consisted almost entirely of jellyfish, and was excluded from analyses. Overall densities (total catch) as well as the relative contributions of commercially important shelf taxa - Crustacea, Haemulidae (grunts), Lethrinidae (emperors), Lutjanidae (snappers), Serranidae (groupers) and Sparidae (seabreams) – were calculated. For slope taxa, we determined overall densities and the rel-ative contributions of taxa with potential commer-cial value – Crustacea, Chlorophthalmidae (green-eyes), Emmelichthyidae (rovers) and Gempylidae (snake-eels), based on catch quantities.
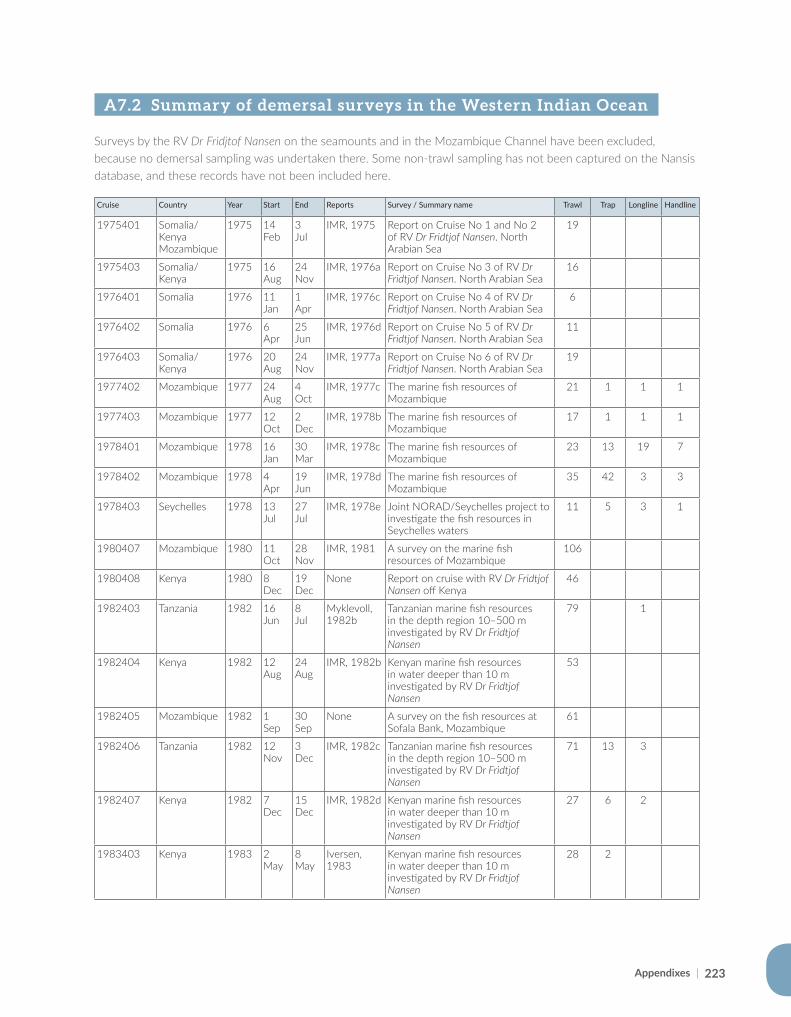
223
A7.2 Summary of demersal surveys in the Western Indian Ocean
Surveys by the RV Dr Fridjtof Nansen on the seamounts and in the Mozambique Channel have been excluded, because no demersal sampling was undertaken there. Some non-trawl sampling has not been captured on the Nansis database, and these records have not been included here.
Cruise Country Year Start End Reports Survey / Summary name Trawl Trap Longline Handline
1975401 Somalia/KenyaMozambique
1975 14Feb
3Jul
IMR, 1975 Report on Cruise No 1 and No 2 of RV Dr Fridtjof Nansen. North Arabian Sea
19
1975403 Somalia/Kenya
1975 16Aug
24Nov
IMR, 1976a Report on Cruise No 3 of RV Dr Fridtjof Nansen. North Arabian Sea
16
1976401 Somalia 1976 11Jan
1Apr
IMR, 1976c Report on Cruise No 4 of RV Dr Fridtjof Nansen. North Arabian Sea
6
1976402 Somalia 1976 6Apr
25Jun
IMR, 1976d Report on Cruise No 5 of RV Dr Fridtjof Nansen. North Arabian Sea
11
1976403 Somalia/Kenya
1976 20Aug
24Nov
IMR, 1977a Report on Cruise No 6 of RV Dr Fridtjof Nansen. North Arabian Sea
19
1977402 Mozambique 1977 24Aug
4Oct
IMR, 1977c The marine fish resources of Mozambique
21 1 1 1
1977403 Mozambique 1977 12Oct
2Dec
IMR, 1978b The marine fish resources of Mozambique
17 1 1 1
1978401 Mozambique 1978 16Jan
30Mar
IMR, 1978c The marine fish resources of Mozambique
23 13 19 7
1978402 Mozambique 1978 4Apr
19Jun
IMR, 1978d The marine fish resources of Mozambique
35 42 3 3
1978403 Seychelles 1978 13Jul
27Jul
IMR, 1978e Joint NORAD/Seychelles project toinvestigate the fish resources in Seychelles waters
11 5 3 1
1980407 Mozambique 1980 11Oct
28Nov
IMR, 1981 A survey on the marine fish resources of Mozambique
106
1980408 Kenya 1980 8Dec
19Dec
None Report on cruise with RV Dr Fridtjof Nansen off Kenya
46
1982403 Tanzania 1982 16Jun
8Jul
Myklevoll, 1982b
Tanzanian marine fish resources in the depth region 10–500 m investigated by RV Dr Fridtjof Nansen
79 1
1982404 Kenya 1982 12Aug
24Aug
IMR, 1982b Kenyan marine fish resources in water deeper than 10 m investigated by RV Dr Fridtjof Nansen
53
1982405 Mozambique 1982 1Sep
30Sep
None A survey on the fish resources at Sofala Bank, Mozambique
61
1982406 Tanzania 1982 12Nov
3Dec
IMR, 1982c Tanzanian marine fish resources in the depth region 10–500 m investigated by RV Dr Fridtjof Nansen
71 13 3
1982407 Kenya 1982 7Dec
15Dec
IMR, 1982d Kenyan marine fish resources in water deeper than 10 m investigated by RV Dr Fridtjof Nansen
27 6 2
1983403 Kenya 1983 2May
8May
Iversen, 1983
Kenyan marine fish resources in water deeper than 10 m investigated by RV Dr Fridtjof Nansen
28 2
Appendixes |
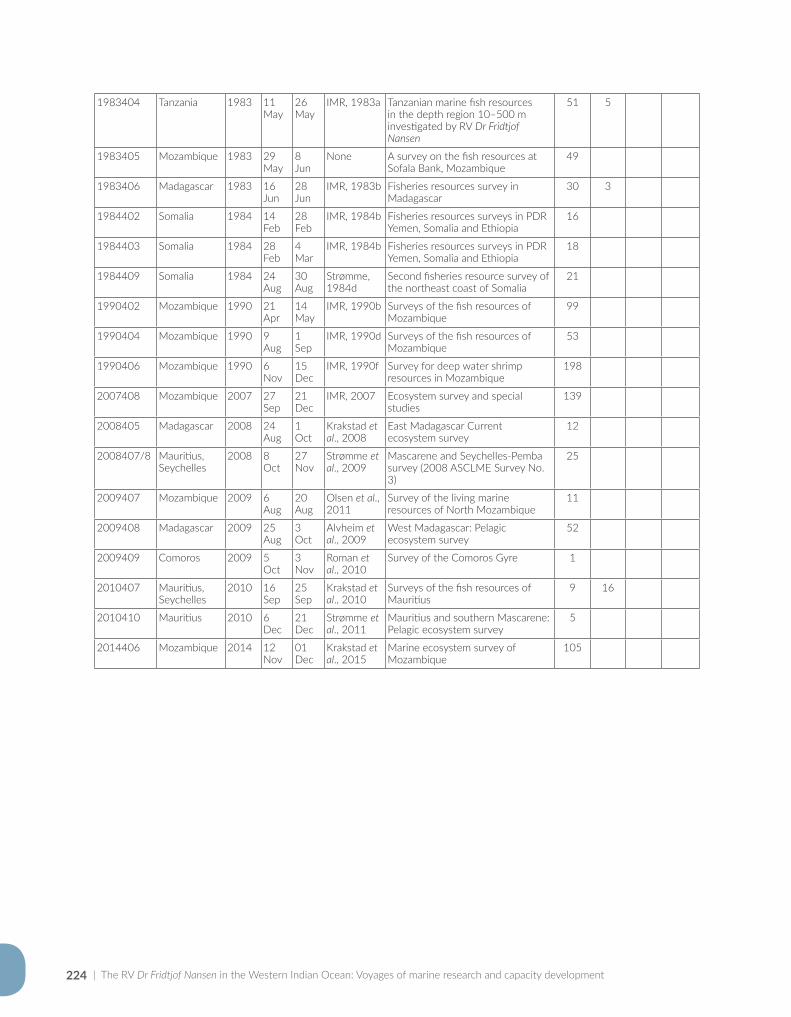
| The RV Dr Fridtjof Nansen in the Western Indian Ocean: Voyages of marine research and capacity development224
1983404 Tanzania 1983 11May
26May
IMR, 1983a Tanzanian marine fish resources in the depth region 10–500 m investigated by RV Dr Fridtjof Nansen
51 5
1983405 Mozambique 1983 29May
8Jun
None A survey on the fish resources at Sofala Bank, Mozambique
49
1983406 Madagascar 1983 16Jun
28Jun
IMR, 1983b Fisheries resources survey in Madagascar
30 3
1984402 Somalia 1984 14Feb
28Feb
IMR, 1984b Fisheries resources surveys in PDR Yemen, Somalia and Ethiopia
16
1984403 Somalia 1984 28Feb
4Mar
IMR, 1984b Fisheries resources surveys in PDR Yemen, Somalia and Ethiopia
18
1984409 Somalia 1984 24Aug
30Aug
Strømme, 1984d
Second fisheries resource survey of the northeast coast of Somalia
21
1990402 Mozambique 1990 21Apr
14May
IMR, 1990b Surveys of the fish resources of Mozambique
99
1990404 Mozambique 1990 9Aug
1Sep
IMR, 1990d Surveys of the fish resources of Mozambique
53
1990406 Mozambique 1990 6Nov
15Dec
IMR, 1990f Survey for deep water shrimp resources in Mozambique
198
2007408 Mozambique 2007 27Sep
21Dec
IMR, 2007 Ecosystem survey and special studies
139
2008405 Madagascar 2008 24Aug
1Oct
Krakstad et al., 2008
East Madagascar Current ecosystem survey
12
2008407/8 Mauritius, Seychelles
2008 8Oct
27Nov
Strømme et al., 2009
Mascarene and Seychelles-Pemba survey (2008 ASCLME Survey No. 3)
25
2009407 Mozambique 2009 6Aug
20Aug
Olsen et al., 2011
Survey of the living marine resources of North Mozambique
11
2009408 Madagascar 2009 25Aug
3Oct
Alvheim et al., 2009
West Madagascar: Pelagic ecosystem survey
52
2009409 Comoros 2009 5Oct
3Nov
Roman et al., 2010
Survey of the Comoros Gyre 1
2010407 Mauritius, Seychelles
2010 16Sep
25Sep
Krakstad et al., 2010
Surveys of the fish resources of Mauritius
9 16
2010410 Mauritius 2010 6Dec
21Dec
Strømme et al., 2011
Mauritius and southern Mascarene: Pelagic ecosystem survey
5
2014406 Mozambique 2014 12Nov
01Dec
Krakstad et al., 2015
Marine ecosystem survey of Mozambique
105
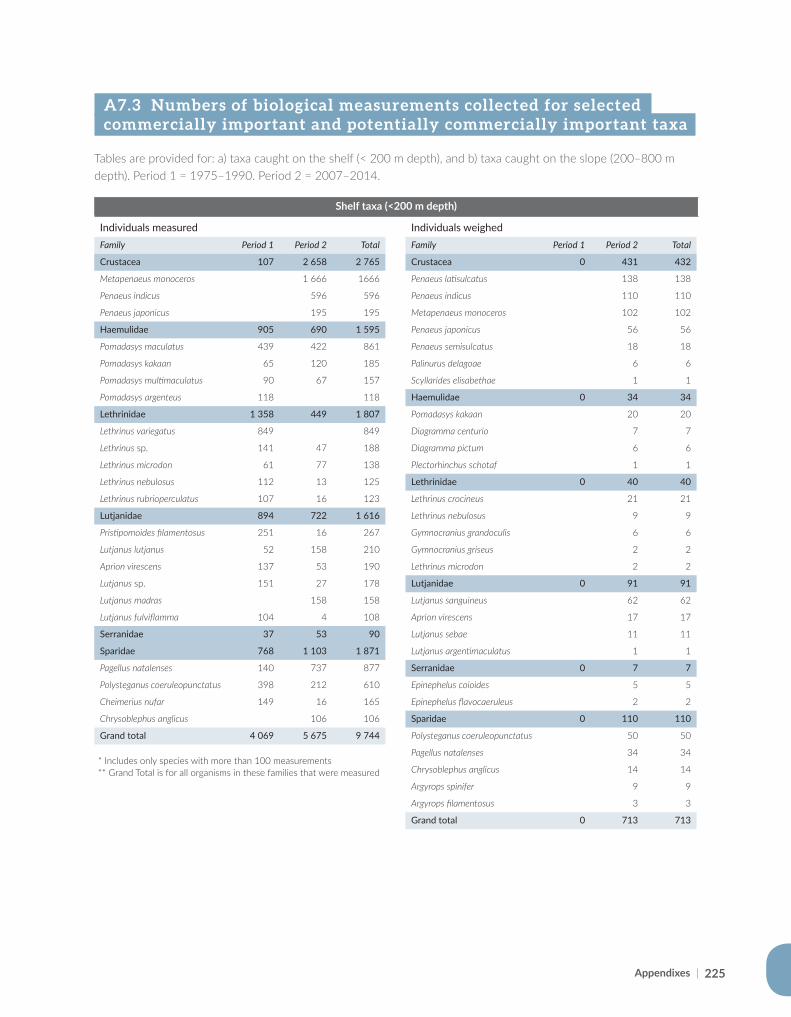
Appendixes | 225
A7.3 Numbers of biological measurements collected for selected commercially important and potentially commercially important taxa
Tables are provided for: a) taxa caught on the shelf (< 200 m depth), and b) taxa caught on the slope (200–800 m depth). Period 1 = 1975–1990. Period 2 = 2007–2014.
Individuals measuredFamily Period 1 Period 2 Total
Crustacea 107 2 658 2 765
Metapenaeus monoceros 1 666 1666
Penaeus indicus 596 596
Penaeus japonicus 195 195
Haemulidae 905 690 1 595
Pomadasys maculatus 439 422 861
Pomadasys kakaan 65 120 185
Pomadasys multimaculatus 90 67 157
Pomadasys argenteus 118 118
Lethrinidae 1 358 449 1 807
Lethrinus variegatus 849 849
Lethrinus sp. 141 47 188
Lethrinus microdon 61 77 138
Lethrinus nebulosus 112 13 125
Lethrinus rubrioperculatus 107 16 123
Lutjanidae 894 722 1 616
Pristipomoides filamentosus 251 16 267
Lutjanus lutjanus 52 158 210
Aprion virescens 137 53 190
Lutjanus sp. 151 27 178
Lutjanus madras 158 158
Lutjanus fulviflamma 104 4 108
Serranidae 37 53 90
Sparidae 768 1 103 1 871
Pagellus natalenses 140 737 877
Polysteganus coeruleopunctatus 398 212 610
Cheimerius nufar 149 16 165
Chrysoblephus anglicus 106 106
Grand total 4 069 5 675 9 744
* Includes only species with more than 100 measurements ** Grand Total is for all organisms in these families that were measured
Shelf taxa (<200 m depth)
Individuals weighedFamily Period 1 Period 2 Total
Crustacea 0 431 432
Penaeus latisulcatus 138 138
Penaeus indicus 110 110
Metapenaeus monoceros 102 102
Penaeus japonicus 56 56
Penaeus semisulcatus 18 18
Palinurus delagoae 6 6
Scyllarides elisabethae 1 1
Haemulidae 0 34 34
Pomadasys kakaan 20 20
Diagramma centurio 7 7
Diagramma pictum 6 6
Plectorhinchus schotaf 1 1
Lethrinidae 0 40 40
Lethrinus crocineus 21 21
Lethrinus nebulosus 9 9
Gymnocranius grandoculis 6 6
Gymnocranius griseus 2 2
Lethrinus microdon 2 2
Lutjanidae 0 91 91
Lutjanus sanguineus 62 62
Aprion virescens 17 17
Lutjanus sebae 11 11
Lutjanus argentimaculatus 1 1
Serranidae 0 7 7
Epinephelus coioides 5 5
Epinephelus flavocaeruleus 2 2
Sparidae 0 110 110
Polysteganus coeruleopunctatus 50 50
Pagellus natalenses 34 34
Chrysoblephus anglicus 14 14
Argyrops spinifer 9 9
Argyrops filamentosus 3 3
Grand total 0 713 713
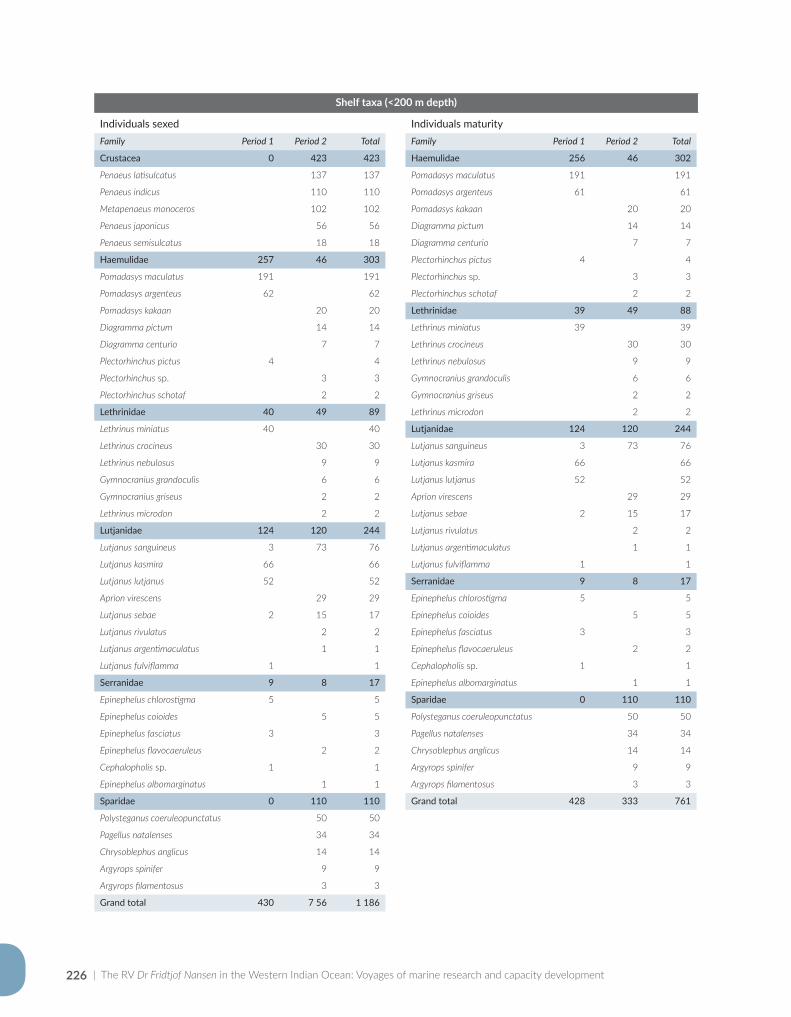
| The RV Dr Fridtjof Nansen in the Western Indian Ocean: Voyages of marine research and capacity development226
Individuals sexedFamily Period 1 Period 2 Total
Crustacea 0 423 423
Penaeus latisulcatus 137 137
Penaeus indicus 110 110
Metapenaeus monoceros 102 102
Penaeus japonicus 56 56
Penaeus semisulcatus 18 18
Haemulidae 257 46 303
Pomadasys maculatus 191 191
Pomadasys argenteus 62 62
Pomadasys kakaan 20 20
Diagramma pictum 14 14
Diagramma centurio 7 7
Plectorhinchus pictus 4 4
Plectorhinchus sp. 3 3
Plectorhinchus schotaf 2 2
Lethrinidae 40 49 89
Lethrinus miniatus 40 40
Lethrinus crocineus 30 30
Lethrinus nebulosus 9 9
Gymnocranius grandoculis 6 6
Gymnocranius griseus 2 2
Lethrinus microdon 2 2
Lutjanidae 124 120 244
Lutjanus sanguineus 3 73 76
Lutjanus kasmira 66 66
Lutjanus lutjanus 52 52
Aprion virescens 29 29
Lutjanus sebae 2 15 17
Lutjanus rivulatus 2 2
Lutjanus argentimaculatus 1 1
Lutjanus fulviflamma 1 1
Serranidae 9 8 17
Epinephelus chlorostigma 5 5
Epinephelus coioides 5 5
Epinephelus fasciatus 3 3
Epinephelus flavocaeruleus 2 2
Cephalopholis sp. 1 1
Epinephelus albomarginatus 1 1
Sparidae 0 110 110
Polysteganus coeruleopunctatus 50 50
Pagellus natalenses 34 34
Chrysoblephus anglicus 14 14
Argyrops spinifer 9 9
Argyrops filamentosus 3 3
Grand total 430 7 56 1 186
Shelf taxa (<200 m depth)
Individuals maturityFamily Period 1 Period 2 Total
Haemulidae 256 46 302
Pomadasys maculatus 191 191
Pomadasys argenteus 61 61
Pomadasys kakaan 20 20
Diagramma pictum 14 14
Diagramma centurio 7 7
Plectorhinchus pictus 4 4
Plectorhinchus sp. 3 3
Plectorhinchus schotaf 2 2
Lethrinidae 39 49 88
Lethrinus miniatus 39 39
Lethrinus crocineus 30 30
Lethrinus nebulosus 9 9
Gymnocranius grandoculis 6 6
Gymnocranius griseus 2 2
Lethrinus microdon 2 2
Lutjanidae 124 120 244
Lutjanus sanguineus 3 73 76
Lutjanus kasmira 66 66
Lutjanus lutjanus 52 52
Aprion virescens 29 29
Lutjanus sebae 2 15 17
Lutjanus rivulatus 2 2
Lutjanus argentimaculatus 1 1
Lutjanus fulviflamma 1 1
Serranidae 9 8 17
Epinephelus chlorostigma 5 5
Epinephelus coioides 5 5
Epinephelus fasciatus 3 3
Epinephelus flavocaeruleus 2 2
Cephalopholis sp. 1 1
Epinephelus albomarginatus 1 1
Sparidae 0 110 110
Polysteganus coeruleopunctatus 50 50
Pagellus natalenses 34 34
Chrysoblephus anglicus 14 14
Argyrops spinifer 9 9
Argyrops filamentosus 3 3
Grand total 428 333 761
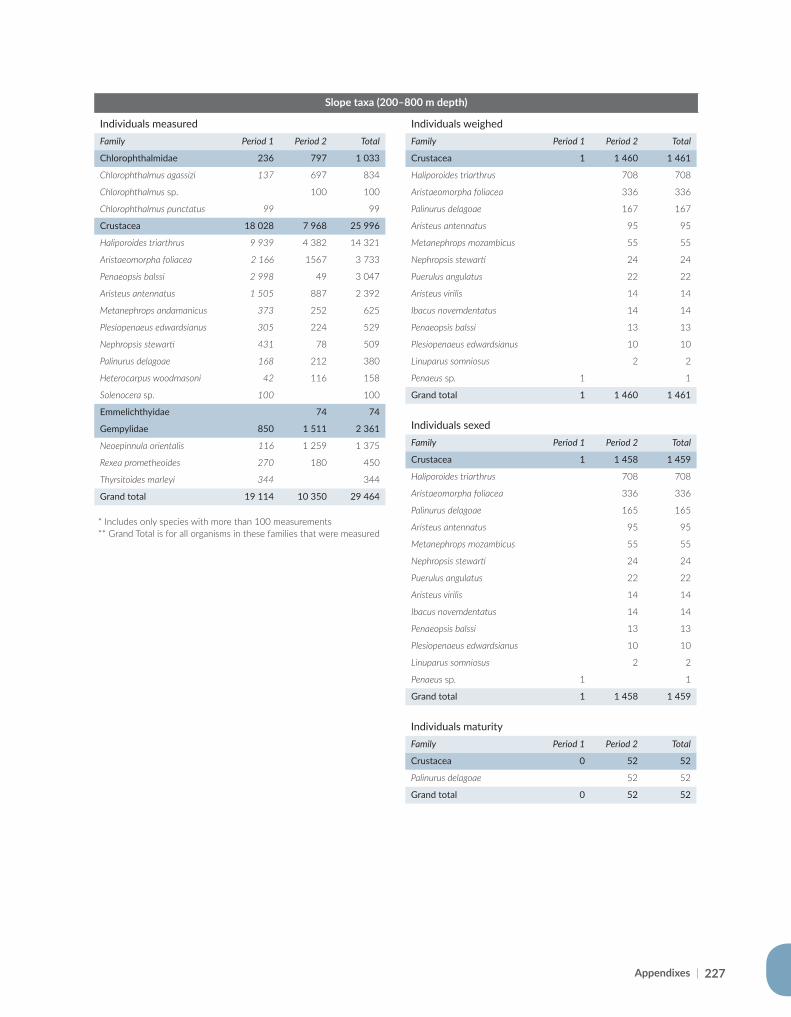
Appendixes | 227
Individuals measuredFamily Period 1 Period 2 Total
Chlorophthalmidae 236 797 1 033
Chlorophthalmus agassizi 137 697 834
Chlorophthalmus sp. 100 100
Chlorophthalmus punctatus 99 99
Crustacea 18 028 7 968 25 996
Haliporoides triarthrus 9 939 4 382 14 321
Aristaeomorpha foliacea 2 166 1567 3 733
Penaeopsis balssi 2 998 49 3 047
Aristeus antennatus 1 505 887 2 392
Metanephrops andamanicus 373 252 625
Plesiopenaeus edwardsianus 305 224 529
Nephropsis stewarti 431 78 509
Palinurus delagoae 168 212 380
Heterocarpus woodmasoni 42 116 158
Solenocera sp. 100 100
Emmelichthyidae 74 74
Gempylidae 850 1 511 2 361
Neoepinnula orientalis 116 1 259 1 375
Rexea prometheoides 270 180 450
Thyrsitoides marleyi 344 344
Grand total 19 114 10 350 29 464
* Includes only species with more than 100 measurements ** Grand Total is for all organisms in these families that were measured
Slope taxa (200–800 m depth)
Individuals weighedFamily Period 1 Period 2 Total
Crustacea 1 1 460 1 461
Haliporoides triarthrus 708 708
Aristaeomorpha foliacea 336 336
Palinurus delagoae 167 167
Aristeus antennatus 95 95
Metanephrops mozambicus 55 55
Nephropsis stewarti 24 24
Puerulus angulatus 22 22
Aristeus virilis 14 14
Ibacus novemdentatus 14 14
Penaeopsis balssi 13 13
Plesiopenaeus edwardsianus 10 10
Linuparus somniosus 2 2
Penaeus sp. 1 1
Grand total 1 1 460 1 461
Individuals sexedFamily Period 1 Period 2 Total
Crustacea 1 1 458 1 459
Haliporoides triarthrus 708 708
Aristaeomorpha foliacea 336 336
Palinurus delagoae 165 165
Aristeus antennatus 95 95
Metanephrops mozambicus 55 55
Nephropsis stewarti 24 24
Puerulus angulatus 22 22
Aristeus virilis 14 14
Ibacus novemdentatus 14 14
Penaeopsis balssi 13 13
Plesiopenaeus edwardsianus 10 10
Linuparus somniosus 2 2
Penaeus sp. 1 1
Grand total 1 1 458 1 459
Individuals maturityFamily Period 1 Period 2 Total
Crustacea 0 52 52
Palinurus delagoae 52 52
Grand total 0 52 52
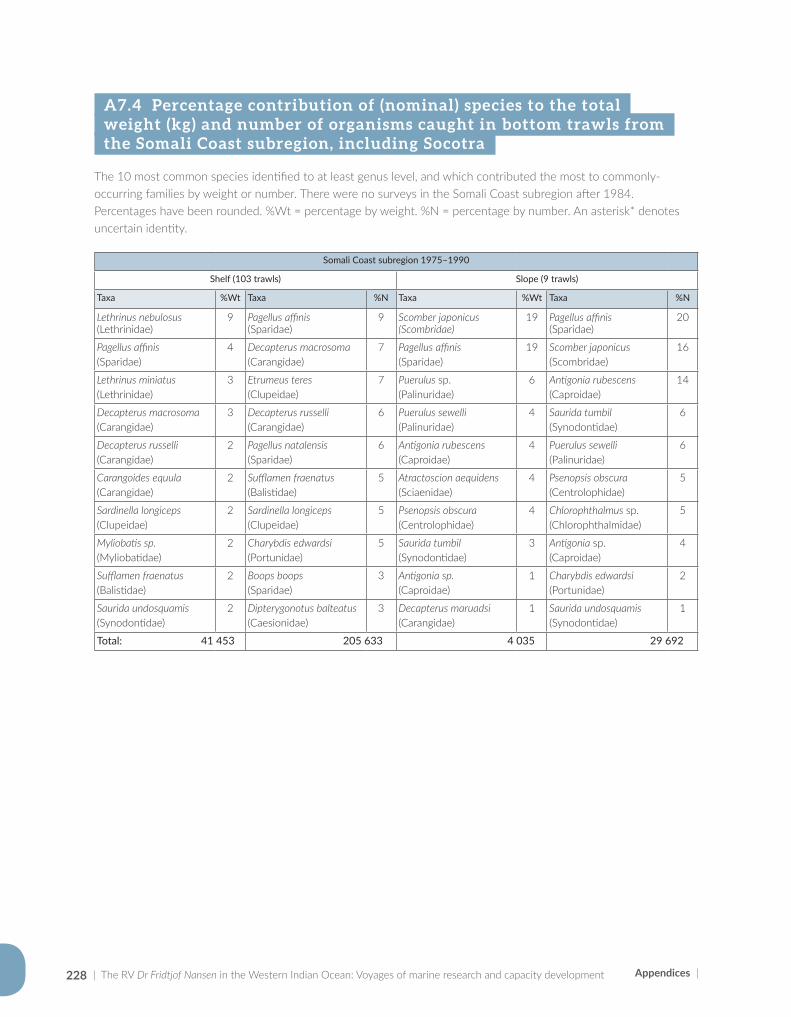
| The RV Dr Fridtjof Nansen in the Western Indian Ocean: Voyages of marine research and capacity development228
A7.4 Percentage contribution of (nominal) species to the total weight (kg) and number of organisms caught in bottom trawls from the Somali Coast subregion, including Socotra
The 10 most common species identified to at least genus level, and which contributed the most to commonly-occurring families by weight or number. There were no surveys in the Somali Coast subregion after 1984. Percentages have been rounded. %Wt = percentage by weight. %N = percentage by number. An asterisk* denotes uncertain identity.
Somali Coast subregion 1975–1990
Shelf (103 trawls) Slope (9 trawls)
Taxa %Wt Taxa %N Taxa %Wt Taxa %N
Lethrinus nebulosus (Lethrinidae)
9 Pagellus affinis (Sparidae)
9 Scomber japonicus (Scombridae)
19 Pagellus affinis (Sparidae)
20
Pagellus affinis (Sparidae)
4 Decapterus macrosoma (Carangidae)
7 Pagellus affinis (Sparidae)
19 Scomber japonicus (Scombridae)
16
Lethrinus miniatus (Lethrinidae)
3 Etrumeus teres (Clupeidae)
7 Puerulus sp. (Palinuridae)
6 Antigonia rubescens (Caproidae)
14
Decapterus macrosoma (Carangidae)
3 Decapterus russelli (Carangidae)
6 Puerulus sewelli (Palinuridae)
4 Saurida tumbil (Synodontidae)
6
Decapterus russelli (Carangidae)
2 Pagellus natalensis (Sparidae)
6 Antigonia rubescens (Caproidae)
4 Puerulus sewelli (Palinuridae)
6
Carangoides equula (Carangidae)
2 Sufflamen fraenatus (Balistidae)
5 Atractoscion aequidens (Sciaenidae)
4 Psenopsis obscura (Centrolophidae)
5
Sardinella longiceps (Clupeidae)
2 Sardinella longiceps (Clupeidae)
5 Psenopsis obscura (Centrolophidae)
4 Chlorophthalmus sp. (Chlorophthalmidae)
5
Myliobatis sp. (Myliobatidae)
2 Charybdis edwardsi (Portunidae)
5 Saurida tumbil (Synodontidae)
3 Antigonia sp. (Caproidae)
4
Sufflamen fraenatus (Balistidae)
2 Boops boops (Sparidae)
3 Antigonia sp. (Caproidae)
1 Charybdis edwardsi (Portunidae)
2
Saurida undosquamis (Synodontidae)
2 Dipterygonotus balteatus (Caesionidae)
3 Decapterus maruadsi (Carangidae)
1 Saurida undosquamis (Synodontidae)
1
Total: 41 453 205 633 4 035 29 692
Appendices |
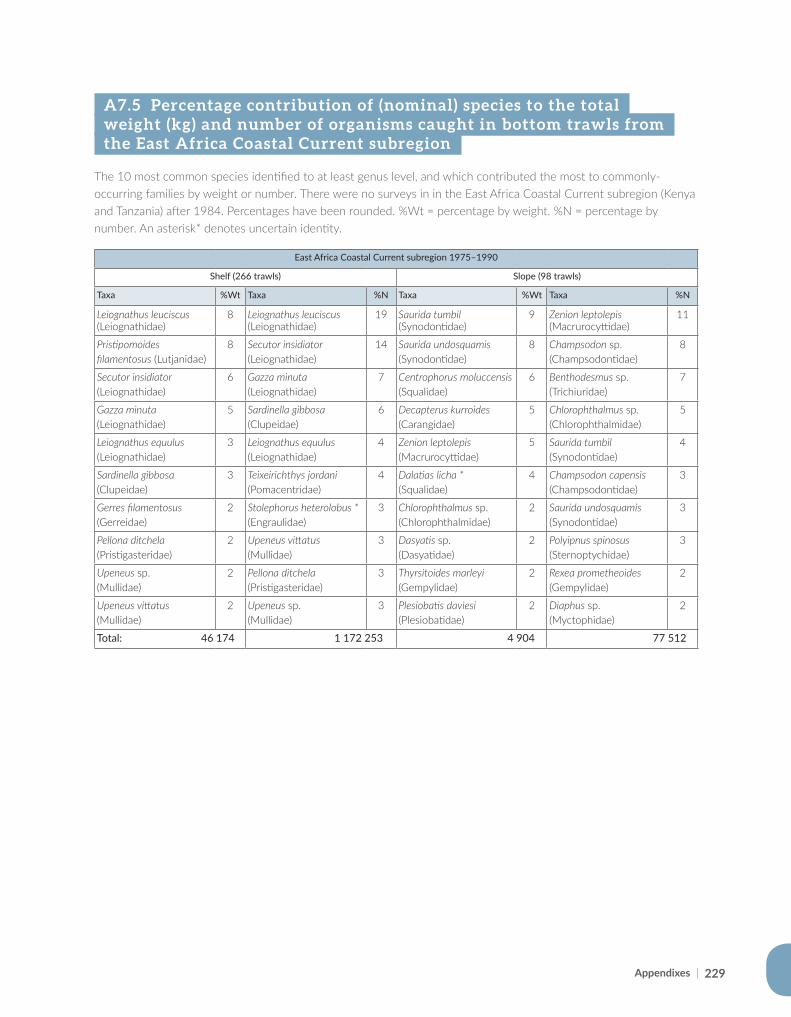
Appendixes | 229
A7.5 Percentage contribution of (nominal) species to the total weight (kg) and number of organisms caught in bottom trawls from the East Africa Coastal Current subregion
The 10 most common species identified to at least genus level, and which contributed the most to commonly-occurring families by weight or number. There were no surveys in in the East Africa Coastal Current subregion (Kenya and Tanzania) after 1984. Percentages have been rounded. %Wt = percentage by weight. %N = percentage by number. An asterisk* denotes uncertain identity.
East Africa Coastal Current subregion 1975–1990
Shelf (266 trawls) Slope (98 trawls)
Taxa %Wt Taxa %N Taxa %Wt Taxa %N
Leiognathus leuciscus (Leiognathidae)
8 Leiognathus leuciscus (Leiognathidae)
19 Saurida tumbil (Synodontidae)
9 Zenion leptolepis (Macrurocyttidae)
11
Pristipomoides filamentosus (Lutjanidae)
8 Secutor insidiator (Leiognathidae)
14 Saurida undosquamis (Synodontidae)
8 Champsodon sp. (Champsodontidae)
8
Secutor insidiator (Leiognathidae)
6 Gazza minuta (Leiognathidae)
7 Centrophorus moluccensis (Squalidae)
6 Benthodesmus sp. (Trichiuridae)
7
Gazza minuta (Leiognathidae)
5 Sardinella gibbosa (Clupeidae)
6 Decapterus kurroides (Carangidae)
5 Chlorophthalmus sp. (Chlorophthalmidae)
5
Leiognathus equulus (Leiognathidae)
3 Leiognathus equulus (Leiognathidae)
4 Zenion leptolepis (Macrurocyttidae)
5 Saurida tumbil (Synodontidae)
4
Sardinella gibbosa (Clupeidae)
3 Teixeirichthys jordani (Pomacentridae)
4 Dalatias licha * (Squalidae)
4 Champsodon capensis (Champsodontidae)
3
Gerres filamentosus (Gerreidae)
2 Stolephorus heterolobus * (Engraulidae)
3 Chlorophthalmus sp. (Chlorophthalmidae)
2 Saurida undosquamis (Synodontidae)
3
Pellona ditchela (Pristigasteridae)
2 Upeneus vittatus (Mullidae)
3 Dasyatis sp. (Dasyatidae)
2 Polyipnus spinosus (Sternoptychidae)
3
Upeneus sp. (Mullidae)
2 Pellona ditchela (Pristigasteridae)
3 Thyrsitoides marleyi (Gempylidae)
2 Rexea prometheoides (Gempylidae)
2
Upeneus vittatus (Mullidae)
2 Upeneus sp. (Mullidae)
3 Plesiobatis daviesi (Plesiobatidae)
2 Diaphus sp. (Myctophidae)
2
Total: 46 174 1 172 253 4 904 77 512
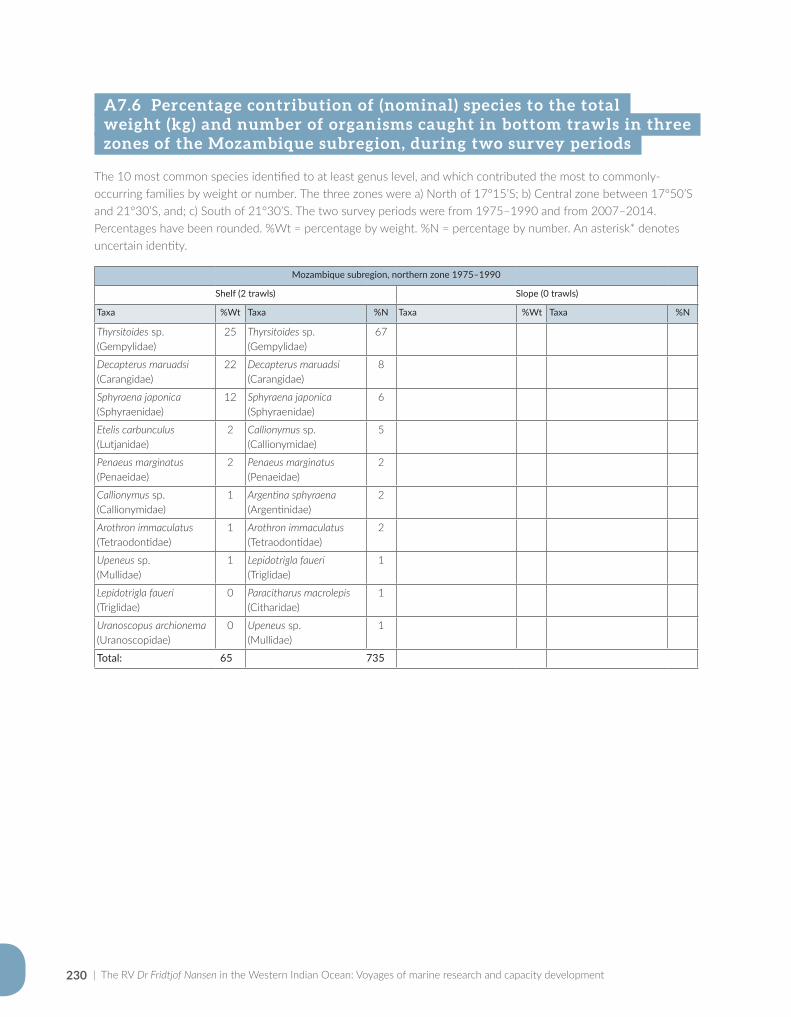
| The RV Dr Fridtjof Nansen in the Western Indian Ocean: Voyages of marine research and capacity development230
A7.6 Percentage contribution of (nominal) species to the total weight (kg) and number of organisms caught in bottom trawls in three zones of the Mozambique subregion, during two survey periods
The 10 most common species identified to at least genus level, and which contributed the most to commonly-occurring families by weight or number. The three zones were a) North of 17°15’S; b) Central zone between 17°50’S and 21°30’S, and; c) South of 21°30’S. The two survey periods were from 1975–1990 and from 2007–2014. Percentages have been rounded. %Wt = percentage by weight. %N = percentage by number. An asterisk* denotes uncertain identity.
Mozambique subregion, northern zone 1975–1990
Shelf (2 trawls) Slope (0 trawls)
Taxa %Wt Taxa %N Taxa %Wt Taxa %N
Thyrsitoides sp. (Gempylidae)
25 Thyrsitoides sp. (Gempylidae)
67
Decapterus maruadsi (Carangidae)
22 Decapterus maruadsi (Carangidae)
8
Sphyraena japonica (Sphyraenidae)
12 Sphyraena japonica (Sphyraenidae)
6
Etelis carbunculus (Lutjanidae)
2 Callionymus sp. (Callionymidae)
5
Penaeus marginatus (Penaeidae)
2 Penaeus marginatus (Penaeidae)
2
Callionymus sp. (Callionymidae)
1 Argentina sphyraena (Argentinidae)
2
Arothron immaculatus (Tetraodontidae)
1 Arothron immaculatus (Tetraodontidae)
2
Upeneus sp. (Mullidae)
1 Lepidotrigla faueri (Triglidae)
1
Lepidotrigla faueri (Triglidae)
0 Paracitharus macrolepis (Citharidae)
1
Uranoscopus archionema (Uranoscopidae)
0 Upeneus sp. (Mullidae)
1
Total: 65 735
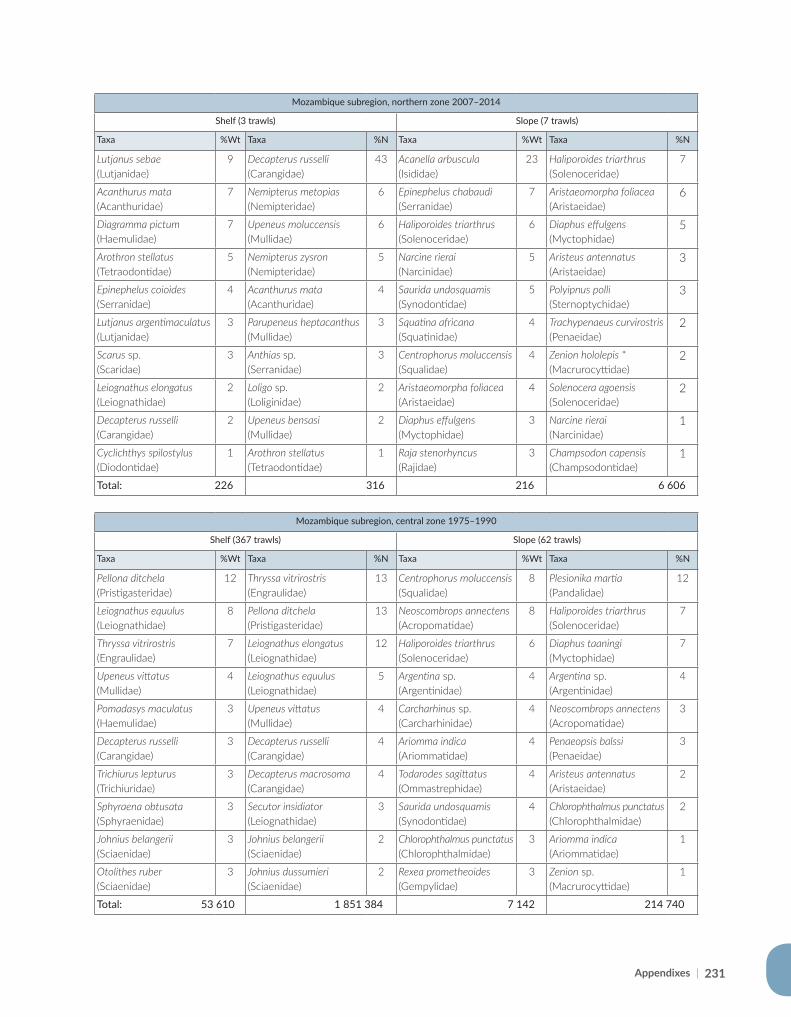
Appendixes | 231
Mozambique subregion, central zone 1975–1990
Shelf (367 trawls) Slope (62 trawls)
Taxa %Wt Taxa %N Taxa %Wt Taxa %N
Pellona ditchela (Pristigasteridae)
12 Thryssa vitrirostris (Engraulidae)
13 Centrophorus moluccensis (Squalidae)
8 Plesionika martia (Pandalidae)
12
Leiognathus equulus (Leiognathidae)
8 Pellona ditchela (Pristigasteridae)
13 Neoscombrops annectens (Acropomatidae)
8 Haliporoides triarthrus (Solenoceridae)
7
Thryssa vitrirostris (Engraulidae)
7 Leiognathus elongatus (Leiognathidae)
12 Haliporoides triarthrus (Solenoceridae)
6 Diaphus taaningi (Myctophidae)
7
Upeneus vittatus (Mullidae)
4 Leiognathus equulus (Leiognathidae)
5 Argentina sp. (Argentinidae)
4 Argentina sp. (Argentinidae)
4
Pomadasys maculatus (Haemulidae)
3 Upeneus vittatus (Mullidae)
4 Carcharhinus sp. (Carcharhinidae)
4 Neoscombrops annectens (Acropomatidae)
3
Decapterus russelli (Carangidae)
3 Decapterus russelli (Carangidae)
4 Ariomma indica (Ariommatidae)
4 Penaeopsis balssi (Penaeidae)
3
Trichiurus lepturus (Trichiuridae)
3 Decapterus macrosoma (Carangidae)
4 Todarodes sagittatus (Ommastrephidae)
4 Aristeus antennatus (Aristaeidae)
2
Sphyraena obtusata (Sphyraenidae)
3 Secutor insidiator (Leiognathidae)
3 Saurida undosquamis (Synodontidae)
4 Chlorophthalmus punctatus (Chlorophthalmidae)
2
Johnius belangerii (Sciaenidae)
3 Johnius belangerii (Sciaenidae)
2 Chlorophthalmus punctatus (Chlorophthalmidae)
3 Ariomma indica (Ariommatidae)
1
Otolithes ruber (Sciaenidae)
3 Johnius dussumieri (Sciaenidae)
2 Rexea prometheoides (Gempylidae)
3 Zenion sp. (Macrurocyttidae)
1
Total: 53 610 1 851 384 7 142 214 740
Mozambique subregion, northern zone 2007–2014
Shelf (3 trawls) Slope (7 trawls)
Taxa %Wt Taxa %N Taxa %Wt Taxa %N
Lutjanus sebae (Lutjanidae)
9 Decapterus russelli (Carangidae)
43 Acanella arbuscula (Isididae)
23 Haliporoides triarthrus (Solenoceridae)
7
Acanthurus mata (Acanthuridae)
7 Nemipterus metopias (Nemipteridae)
6 Epinephelus chabaudi (Serranidae)
7 Aristaeomorpha foliacea (Aristaeidae)
6
Diagramma pictum (Haemulidae)
7 Upeneus moluccensis (Mullidae)
6 Haliporoides triarthrus (Solenoceridae)
6 Diaphus effulgens (Myctophidae)
5
Arothron stellatus (Tetraodontidae)
5 Nemipterus zysron (Nemipteridae)
5 Narcine rierai (Narcinidae)
5 Aristeus antennatus (Aristaeidae)
3
Epinephelus coioides (Serranidae)
4 Acanthurus mata (Acanthuridae)
4 Saurida undosquamis (Synodontidae)
5 Polyipnus polli (Sternoptychidae)
3
Lutjanus argentimaculatus (Lutjanidae)
3 Parupeneus heptacanthus (Mullidae)
3 Squatina africana (Squatinidae)
4 Trachypenaeus curvirostris (Penaeidae)
2
Scarus sp. (Scaridae)
3 Anthias sp. (Serranidae)
3 Centrophorus moluccensis (Squalidae)
4 Zenion hololepis * (Macrurocyttidae)
2
Leiognathus elongatus (Leiognathidae)
2 Loligo sp. (Loliginidae)
2 Aristaeomorpha foliacea (Aristaeidae)
4 Solenocera agoensis (Solenoceridae)
2
Decapterus russelli (Carangidae)
2 Upeneus bensasi (Mullidae)
2 Diaphus effulgens (Myctophidae)
3 Narcine rierai (Narcinidae)
1
Cyclichthys spilostylus (Diodontidae)
1 Arothron stellatus (Tetraodontidae)
1 Raja stenorhyncus (Rajidae)
3 Champsodon capensis (Champsodontidae)
1
Total: 226 316 216 6 606
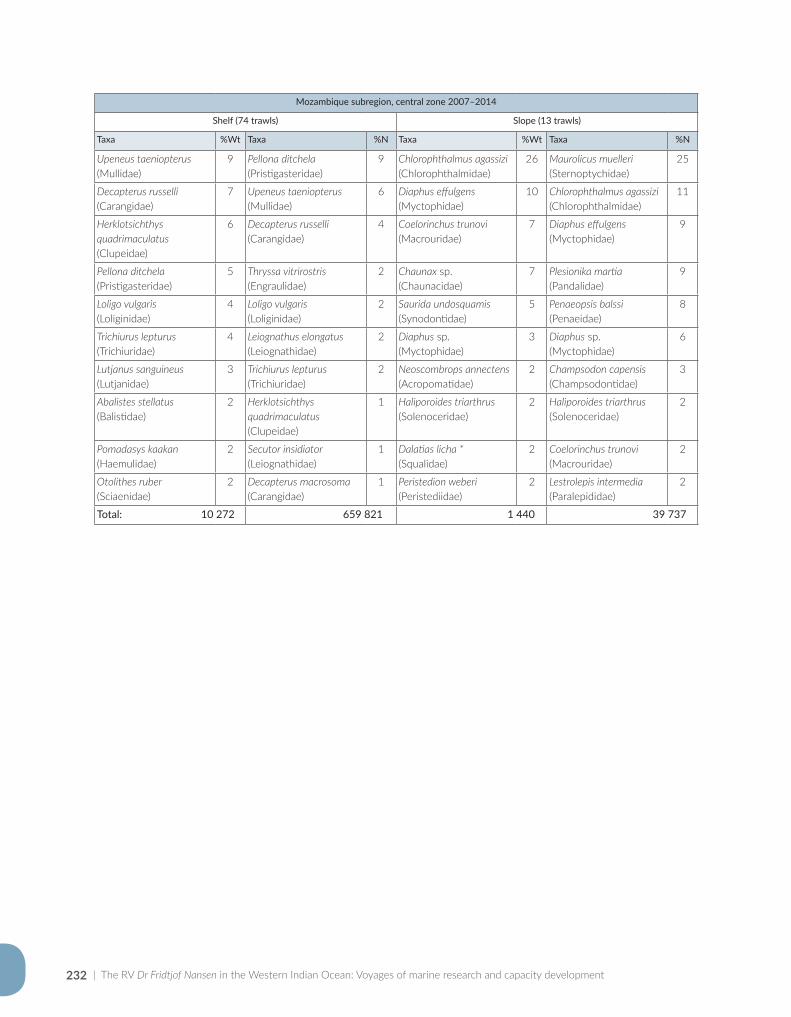
| The RV Dr Fridtjof Nansen in the Western Indian Ocean: Voyages of marine research and capacity development232
Mozambique subregion, central zone 2007–2014
Shelf (74 trawls) Slope (13 trawls)
Taxa %Wt Taxa %N Taxa %Wt Taxa %N
Upeneus taeniopterus (Mullidae)
9 Pellona ditchela (Pristigasteridae)
9 Chlorophthalmus agassizi (Chlorophthalmidae)
26 Maurolicus muelleri (Sternoptychidae)
25
Decapterus russelli (Carangidae)
7 Upeneus taeniopterus (Mullidae)
6 Diaphus effulgens (Myctophidae)
10 Chlorophthalmus agassizi (Chlorophthalmidae)
11
Herklotsichthys quadrimaculatus (Clupeidae)
6 Decapterus russelli (Carangidae)
4 Coelorinchus trunovi (Macrouridae)
7 Diaphus effulgens (Myctophidae)
9
Pellona ditchela (Pristigasteridae)
5 Thryssa vitrirostris (Engraulidae)
2 Chaunax sp. (Chaunacidae)
7 Plesionika martia (Pandalidae)
9
Loligo vulgaris (Loliginidae)
4 Loligo vulgaris (Loliginidae)
2 Saurida undosquamis (Synodontidae)
5 Penaeopsis balssi (Penaeidae)
8
Trichiurus lepturus (Trichiuridae)
4 Leiognathus elongatus (Leiognathidae)
2 Diaphus sp. (Myctophidae)
3 Diaphus sp. (Myctophidae)
6
Lutjanus sanguineus (Lutjanidae)
3 Trichiurus lepturus (Trichiuridae)
2 Neoscombrops annectens (Acropomatidae)
2 Champsodon capensis (Champsodontidae)
3
Abalistes stellatus (Balistidae)
2 Herklotsichthys quadrimaculatus (Clupeidae)
1 Haliporoides triarthrus (Solenoceridae)
2 Haliporoides triarthrus (Solenoceridae)
2
Pomadasys kaakan (Haemulidae)
2 Secutor insidiator (Leiognathidae)
1 Dalatias licha * (Squalidae)
2 Coelorinchus trunovi (Macrouridae)
2
Otolithes ruber (Sciaenidae)
2 Decapterus macrosoma (Carangidae)
1 Peristedion weberi (Peristediidae)
2 Lestrolepis intermedia (Paralepididae)
2
Total: 10 272 659 821 1 440 39 737
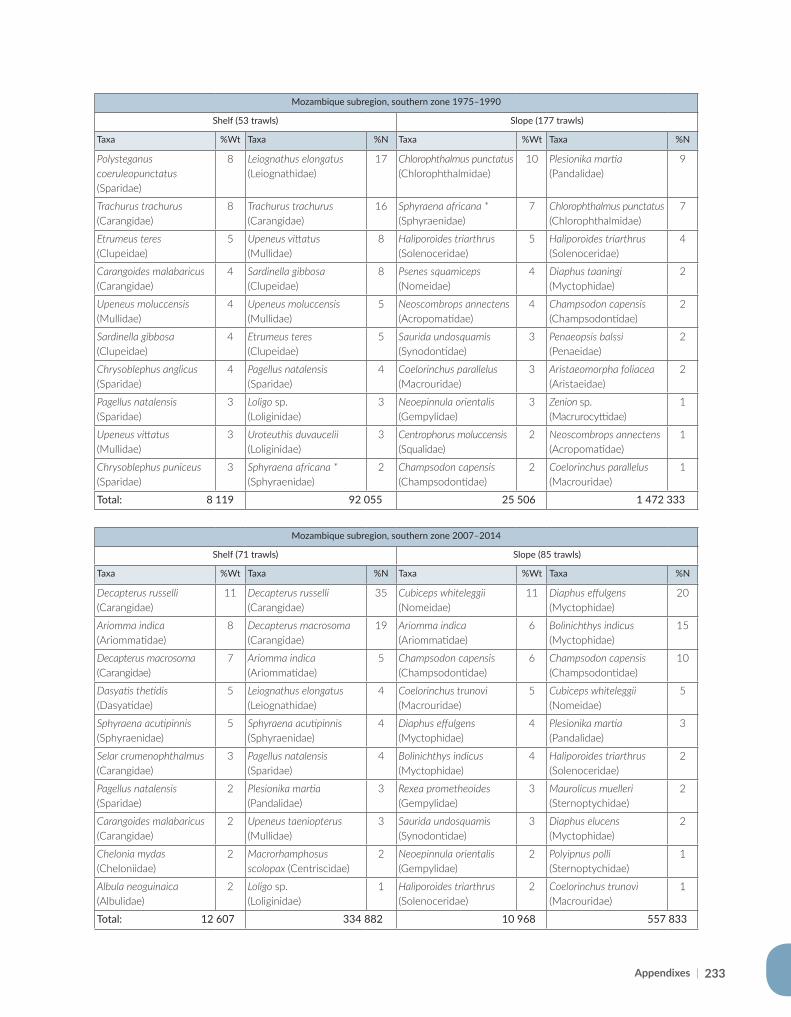
Appendixes | 233
Mozambique subregion, southern zone 1975–1990
Shelf (53 trawls) Slope (177 trawls)
Taxa %Wt Taxa %N Taxa %Wt Taxa %N
Polysteganus coeruleopunctatus (Sparidae)
8 Leiognathus elongatus (Leiognathidae)
17 Chlorophthalmus punctatus (Chlorophthalmidae)
10 Plesionika martia (Pandalidae)
9
Trachurus trachurus (Carangidae)
8 Trachurus trachurus (Carangidae)
16 Sphyraena africana * (Sphyraenidae)
7 Chlorophthalmus punctatus (Chlorophthalmidae)
7
Etrumeus teres (Clupeidae)
5 Upeneus vittatus (Mullidae)
8 Haliporoides triarthrus (Solenoceridae)
5 Haliporoides triarthrus (Solenoceridae)
4
Carangoides malabaricus (Carangidae)
4 Sardinella gibbosa (Clupeidae)
8 Psenes squamiceps (Nomeidae)
4 Diaphus taaningi (Myctophidae)
2
Upeneus moluccensis (Mullidae)
4 Upeneus moluccensis (Mullidae)
5 Neoscombrops annectens (Acropomatidae)
4 Champsodon capensis (Champsodontidae)
2
Sardinella gibbosa (Clupeidae)
4 Etrumeus teres (Clupeidae)
5 Saurida undosquamis (Synodontidae)
3 Penaeopsis balssi (Penaeidae)
2
Chrysoblephus anglicus (Sparidae)
4 Pagellus natalensis (Sparidae)
4 Coelorinchus parallelus (Macrouridae)
3 Aristaeomorpha foliacea (Aristaeidae)
2
Pagellus natalensis (Sparidae)
3 Loligo sp. (Loliginidae)
3 Neoepinnula orientalis (Gempylidae)
3 Zenion sp. (Macrurocyttidae)
1
Upeneus vittatus (Mullidae)
3 Uroteuthis duvaucelii (Loliginidae)
3 Centrophorus moluccensis (Squalidae)
2 Neoscombrops annectens (Acropomatidae)
1
Chrysoblephus puniceus (Sparidae)
3 Sphyraena africana * (Sphyraenidae)
2 Champsodon capensis (Champsodontidae)
2 Coelorinchus parallelus (Macrouridae)
1
Total: 8 119 92 055 25 506 1 472 333
Mozambique subregion, southern zone 2007–2014
Shelf (71 trawls) Slope (85 trawls)
Taxa %Wt Taxa %N Taxa %Wt Taxa %N
Decapterus russelli (Carangidae)
11 Decapterus russelli (Carangidae)
35 Cubiceps whiteleggii (Nomeidae)
11 Diaphus effulgens (Myctophidae)
20
Ariomma indica (Ariommatidae)
8 Decapterus macrosoma (Carangidae)
19 Ariomma indica (Ariommatidae)
6 Bolinichthys indicus (Myctophidae)
15
Decapterus macrosoma (Carangidae)
7 Ariomma indica (Ariommatidae)
5 Champsodon capensis (Champsodontidae)
6 Champsodon capensis (Champsodontidae)
10
Dasyatis thetidis (Dasyatidae)
5 Leiognathus elongatus (Leiognathidae)
4 Coelorinchus trunovi (Macrouridae)
5 Cubiceps whiteleggii (Nomeidae)
5
Sphyraena acutipinnis (Sphyraenidae)
5 Sphyraena acutipinnis (Sphyraenidae)
4 Diaphus effulgens (Myctophidae)
4 Plesionika martia (Pandalidae)
3
Selar crumenophthalmus (Carangidae)
3 Pagellus natalensis (Sparidae)
4 Bolinichthys indicus (Myctophidae)
4 Haliporoides triarthrus (Solenoceridae)
2
Pagellus natalensis (Sparidae)
2 Plesionika martia (Pandalidae)
3 Rexea prometheoides (Gempylidae)
3 Maurolicus muelleri (Sternoptychidae)
2
Carangoides malabaricus (Carangidae)
2 Upeneus taeniopterus (Mullidae)
3 Saurida undosquamis (Synodontidae)
3 Diaphus elucens (Myctophidae)
2
Chelonia mydas (Cheloniidae)
2 Macrorhamphosus scolopax (Centriscidae)
2 Neoepinnula orientalis (Gempylidae)
2 Polyipnus polli (Sternoptychidae)
1
Albula neoguinaica (Albulidae)
2 Loligo sp. (Loliginidae)
1 Haliporoides triarthrus (Solenoceridae)
2 Coelorinchus trunovi (Macrouridae)
1
Total: 12 607 334 882 10 968 557 833
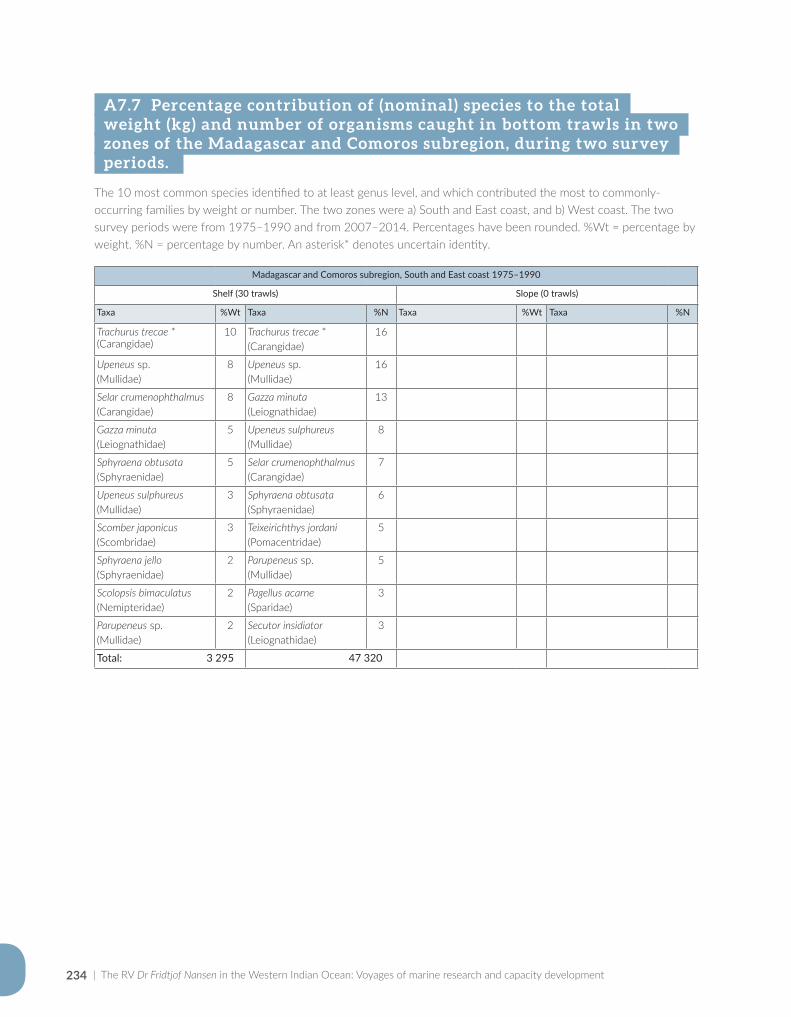
| The RV Dr Fridtjof Nansen in the Western Indian Ocean: Voyages of marine research and capacity development234
A7.7 Percentage contribution of (nominal) species to the total weight (kg) and number of organisms caught in bottom trawls in two zones of the Madagascar and Comoros subregion, during two survey periods.
The 10 most common species identified to at least genus level, and which contributed the most to commonly-occurring families by weight or number. The two zones were a) South and East coast, and b) West coast. The two survey periods were from 1975–1990 and from 2007–2014. Percentages have been rounded. %Wt = percentage by weight. %N = percentage by number. An asterisk* denotes uncertain identity.
Madagascar and Comoros subregion, South and East coast 1975–1990
Shelf (30 trawls) Slope (0 trawls)
Taxa %Wt Taxa %N Taxa %Wt Taxa %N
Trachurus trecae *(Carangidae)
10 Trachurus trecae * (Carangidae)
16
Upeneus sp. (Mullidae)
8 Upeneus sp. (Mullidae)
16
Selar crumenophthalmus (Carangidae)
8 Gazza minuta (Leiognathidae)
13
Gazza minuta (Leiognathidae)
5 Upeneus sulphureus (Mullidae)
8
Sphyraena obtusata (Sphyraenidae)
5 Selar crumenophthalmus (Carangidae)
7
Upeneus sulphureus (Mullidae)
3 Sphyraena obtusata (Sphyraenidae)
6
Scomber japonicus (Scombridae)
3 Teixeirichthys jordani (Pomacentridae)
5
Sphyraena jello (Sphyraenidae)
2 Parupeneus sp. (Mullidae)
5
Scolopsis bimaculatus (Nemipteridae)
2 Pagellus acarne (Sparidae)
3
Parupeneus sp. (Mullidae)
2 Secutor insidiator (Leiognathidae)
3
Total: 3 295 47 320
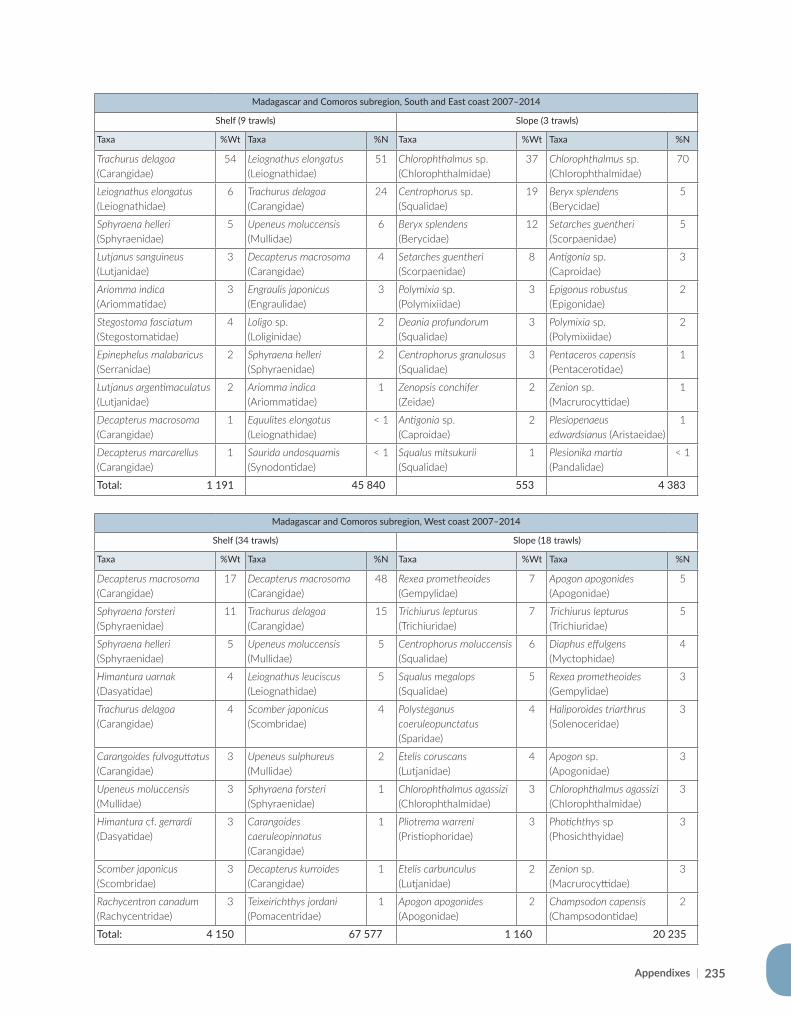
Appendixes | 235
Madagascar and Comoros subregion, South and East coast 2007–2014
Shelf (9 trawls) Slope (3 trawls)
Taxa %Wt Taxa %N Taxa %Wt Taxa %N
Trachurus delagoa (Carangidae)
54 Leiognathus elongatus (Leiognathidae)
51 Chlorophthalmus sp. (Chlorophthalmidae)
37 Chlorophthalmus sp. (Chlorophthalmidae)
70
Leiognathus elongatus (Leiognathidae)
6 Trachurus delagoa (Carangidae)
24 Centrophorus sp. (Squalidae)
19 Beryx splendens (Berycidae)
5
Sphyraena helleri (Sphyraenidae)
5 Upeneus moluccensis (Mullidae)
6 Beryx splendens (Berycidae)
12 Setarches guentheri (Scorpaenidae)
5
Lutjanus sanguineus (Lutjanidae)
3 Decapterus macrosoma (Carangidae)
4 Setarches guentheri (Scorpaenidae)
8 Antigonia sp. (Caproidae)
3
Ariomma indica (Ariommatidae)
3 Engraulis japonicus (Engraulidae)
3 Polymixia sp. (Polymixiidae)
3 Epigonus robustus (Epigonidae)
2
Stegostoma fasciatum (Stegostomatidae)
4 Loligo sp. (Loliginidae)
2 Deania profundorum (Squalidae)
3 Polymixia sp. (Polymixiidae)
2
Epinephelus malabaricus (Serranidae)
2 Sphyraena helleri (Sphyraenidae)
2 Centrophorus granulosus (Squalidae)
3 Pentaceros capensis (Pentacerotidae)
1
Lutjanus argentimaculatus (Lutjanidae)
2 Ariomma indica (Ariommatidae)
1 Zenopsis conchifer (Zeidae)
2 Zenion sp. (Macrurocyttidae)
1
Decapterus macrosoma (Carangidae)
1 Equulites elongatus (Leiognathidae)
< 1 Antigonia sp. (Caproidae)
2 Plesiopenaeus edwardsianus (Aristaeidae)
1
Decapterus marcarellus (Carangidae)
1 Saurida undosquamis (Synodontidae)
< 1 Squalus mitsukurii (Squalidae)
1 Plesionika martia (Pandalidae)
< 1
Total: 1 191 45 840 553 4 383
Madagascar and Comoros subregion, West coast 2007–2014
Shelf (34 trawls) Slope (18 trawls)
Taxa %Wt Taxa %N Taxa %Wt Taxa %N
Decapterus macrosoma (Carangidae)
17 Decapterus macrosoma (Carangidae)
48 Rexea prometheoides (Gempylidae)
7 Apogon apogonides (Apogonidae)
5
Sphyraena forsteri (Sphyraenidae)
11 Trachurus delagoa (Carangidae)
15 Trichiurus lepturus (Trichiuridae)
7 Trichiurus lepturus (Trichiuridae)
5
Sphyraena helleri (Sphyraenidae)
5 Upeneus moluccensis (Mullidae)
5 Centrophorus moluccensis (Squalidae)
6 Diaphus effulgens (Myctophidae)
4
Himantura uarnak (Dasyatidae)
4 Leiognathus leuciscus (Leiognathidae)
5 Squalus megalops (Squalidae)
5 Rexea prometheoides (Gempylidae)
3
Trachurus delagoa (Carangidae)
4 Scomber japonicus (Scombridae)
4 Polysteganus coeruleopunctatus (Sparidae)
4 Haliporoides triarthrus (Solenoceridae)
3
Carangoides fulvoguttatus (Carangidae)
3 Upeneus sulphureus (Mullidae)
2 Etelis coruscans (Lutjanidae)
4 Apogon sp. (Apogonidae)
3
Upeneus moluccensis (Mullidae)
3 Sphyraena forsteri (Sphyraenidae)
1 Chlorophthalmus agassizi (Chlorophthalmidae)
3 Chlorophthalmus agassizi (Chlorophthalmidae)
3
Himantura cf. gerrardi (Dasyatidae)
3 Carangoides caeruleopinnatus (Carangidae)
1 Pliotrema warreni (Pristiophoridae)
3 Photichthys sp (Phosichthyidae)
3
Scomber japonicus (Scombridae)
3 Decapterus kurroides (Carangidae)
1 Etelis carbunculus (Lutjanidae)
2 Zenion sp. (Macrurocyttidae)
3
Rachycentron canadum (Rachycentridae)
3 Teixeirichthys jordani (Pomacentridae)
1 Apogon apogonides (Apogonidae)
2 Champsodon capensis (Champsodontidae)
2
Total: 4 150 67 577 1 160 20 235
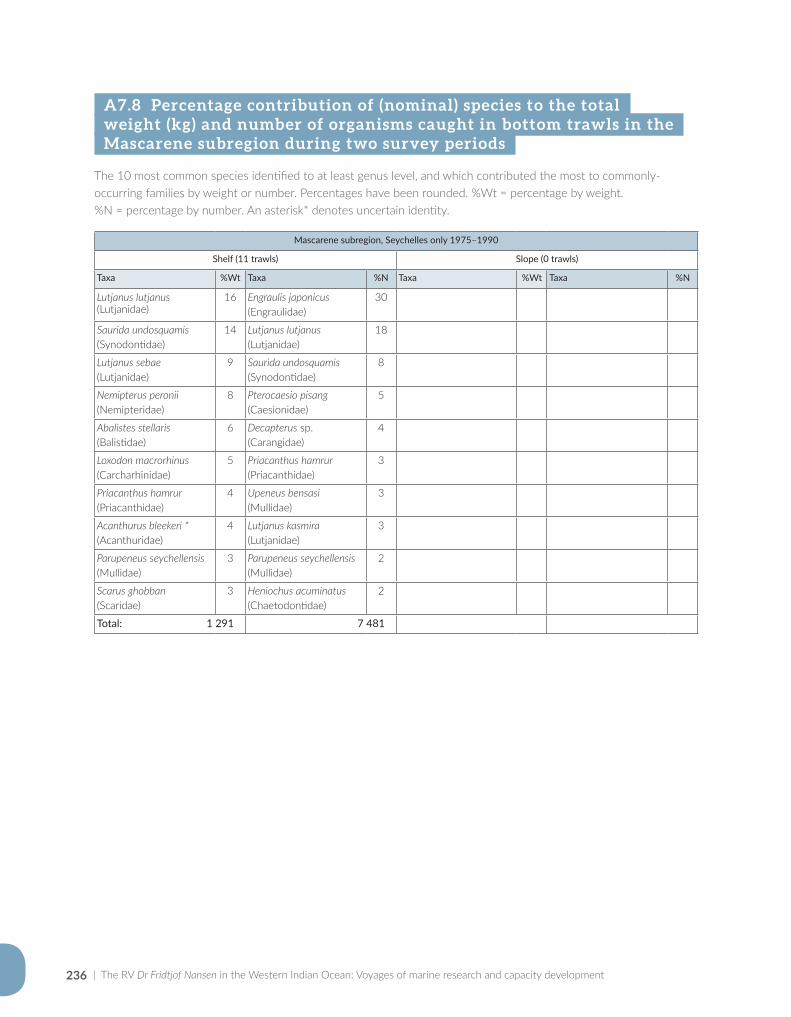
| The RV Dr Fridtjof Nansen in the Western Indian Ocean: Voyages of marine research and capacity development236
A7.8 Percentage contribution of (nominal) species to the total weight (kg) and number of organisms caught in bottom trawls in the Mascarene subregion during two survey periods
The 10 most common species identified to at least genus level, and which contributed the most to commonly-occurring families by weight or number. Percentages have been rounded. %Wt = percentage by weight. %N = percentage by number. An asterisk* denotes uncertain identity.
Mascarene subregion, Seychelles only 1975–1990
Shelf (11 trawls) Slope (0 trawls)
Taxa %Wt Taxa %N Taxa %Wt Taxa %N
Lutjanus lutjanus (Lutjanidae)
16 Engraulis japonicus (Engraulidae)
30
Saurida undosquamis (Synodontidae)
14 Lutjanus lutjanus (Lutjanidae)
18
Lutjanus sebae (Lutjanidae)
9 Saurida undosquamis (Synodontidae)
8
Nemipterus peronii (Nemipteridae)
8 Pterocaesio pisang (Caesionidae)
5
Abalistes stellaris (Balistidae)
6 Decapterus sp. (Carangidae)
4
Loxodon macrorhinus (Carcharhinidae)
5 Priacanthus hamrur (Priacanthidae)
3
Priacanthus hamrur (Priacanthidae)
4 Upeneus bensasi (Mullidae)
3
Acanthurus bleekeri * (Acanthuridae)
4 Lutjanus kasmira (Lutjanidae)
3
Parupeneus seychellensis (Mullidae)
3 Parupeneus seychellensis (Mullidae)
2
Scarus ghobban (Scaridae)
3 Heniochus acuminatus (Chaetodontidae)
2
Total: 1 291 7 481
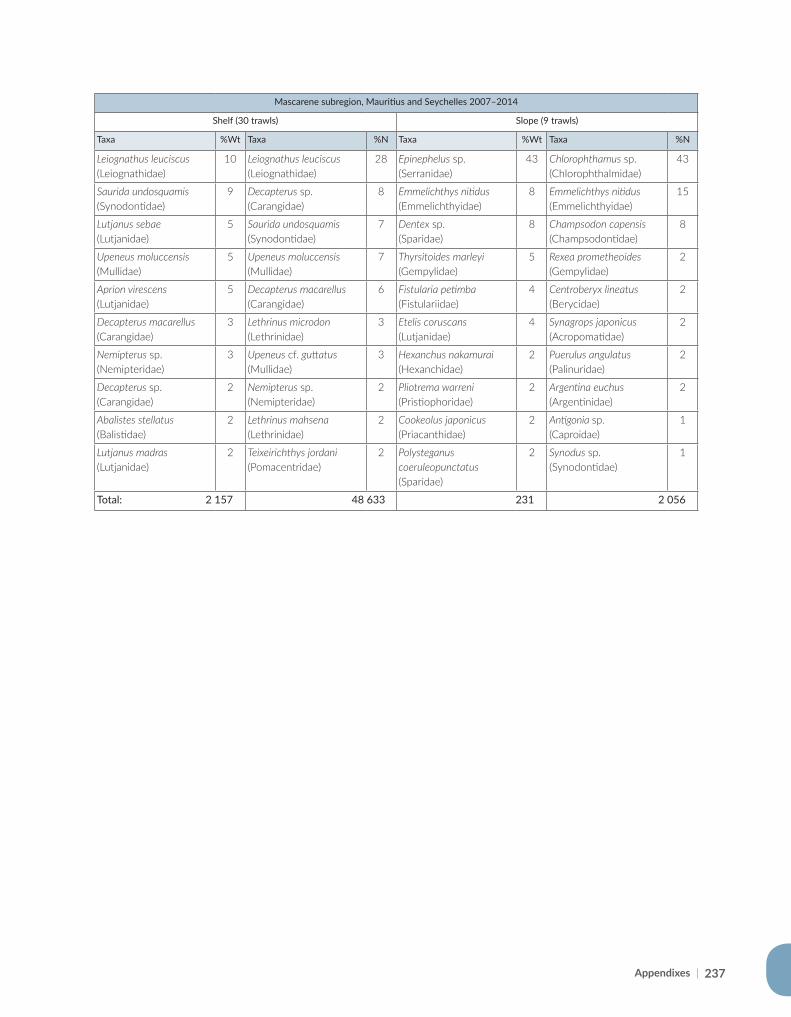
Appendixes | 237
Mascarene subregion, Mauritius and Seychelles 2007–2014
Shelf (30 trawls) Slope (9 trawls)
Taxa %Wt Taxa %N Taxa %Wt Taxa %N
Leiognathus leuciscus (Leiognathidae)
10 Leiognathus leuciscus (Leiognathidae)
28 Epinephelus sp. (Serranidae)
43 Chlorophthamus sp. (Chlorophthalmidae)
43
Saurida undosquamis (Synodontidae)
9 Decapterus sp. (Carangidae)
8 Emmelichthys nitidus (Emmelichthyidae)
8 Emmelichthys nitidus (Emmelichthyidae)
15
Lutjanus sebae (Lutjanidae)
5 Saurida undosquamis (Synodontidae)
7 Dentex sp. (Sparidae)
8 Champsodon capensis (Champsodontidae)
8
Upeneus moluccensis (Mullidae)
5 Upeneus moluccensis (Mullidae)
7 Thyrsitoides marleyi (Gempylidae)
5 Rexea prometheoides (Gempylidae)
2
Aprion virescens (Lutjanidae)
5 Decapterus macarellus (Carangidae)
6 Fistularia petimba (Fistulariidae)
4 Centroberyx lineatus (Berycidae)
2
Decapterus macarellus (Carangidae)
3 Lethrinus microdon (Lethrinidae)
3 Etelis coruscans (Lutjanidae)
4 Synagrops japonicus (Acropomatidae)
2
Nemipterus sp. (Nemipteridae)
3 Upeneus cf. guttatus (Mullidae)
3 Hexanchus nakamurai (Hexanchidae)
2 Puerulus angulatus (Palinuridae)
2
Decapterus sp. (Carangidae)
2 Nemipterus sp. (Nemipteridae)
2 Pliotrema warreni (Pristiophoridae)
2 Argentina euchus (Argentinidae)
2
Abalistes stellatus (Balistidae)
2 Lethrinus mahsena (Lethrinidae)
2 Cookeolus japonicus (Priacanthidae)
2 Antigonia sp. (Caproidae)
1
Lutjanus madras (Lutjanidae)
2 Teixeirichthys jordani (Pomacentridae)
2 Polysteganus coeruleopunctatus (Sparidae)
2 Synodus sp. (Synodontidae)
1
Total: 2 157 48 633 231 2 056

The RV Dr Fridtjof Nansen in the Western Indian Ocean
Voyages of marine research and capacity development
1975 to 2016
The “Nansen book” on the voyages of the iconic research ship, Dr Fridtjof Nansen, documents how marine research in the Western Indian Ocean evolved from exploratory surveys in the 1970s to
fi nd new fi sheries stocks, to the present ecosystem surveys in support of bett er fi sheries management. The book provides a rare glimpse into the practi cal realiti es of conducti ng research at sea. It also shows how ocean features, biological producti vity and the abundance and diversity
of marine life forms link together in marine ecosystems, from the Horn of Africa, to southern Mozambique and Madagascar, and eastwards to the tropical islands of Seychelles and Mauriti us.
In parallel with Nansen surveys at sea, scienti fi c capacity development, support for policy development and implementati on of Ecosystems Approaches to Fisheries management (EAF) form
the other pillars of the broader Nansen Programme. The fi nal chapters of the book evaluate the impacts of this programme in the region, and highlight the historic and new emerging challenges
in knowledge and capacity. As such, the book is of strategic importance.
The Nansen book is aimed at the great many people with a passion for the oceans, and what lies beneath the waves. It is also meant for specialist marine scienti sts, fi sheries managers, and policy makers dealing with the use and conservati on of marine resources. Students reading it will gain
insights into how science is conducted on-board a research ship, and how the results can be applied to sustainable fi shing practi ces, and to marine conservati on. Chapters were writt en
by eminent marine scienti sts from the Western Indian Ocean region, counter-balanced by Norwegian scienti sts with long experience of Nansen surveys.
I7652EN/1/08.17
ISBN 978-92-5-109872-1
9 7 8 9 2 5 1 0 9 8 7 2 1
“Few people will deny that doing marine research in tropical waters from the
deck of a modern research ship sounds idyllic. But not many will know
what the scientists on board actually do, or why they do it.”
Th
e RV
Dr Frid
tjof Nan
sen in
the W
estern In
dian
Ocean
Voy
ages of marin
e research an
d cap
acity d
evelop
men
t


![% :.I COPY AVAILA']RV lj£gIE ~l - DTIC](https://static.fdokumen.com/doc/165x107/631e931825add517740b1bd2/-i-copy-availarv-ljgie-l-dtic.jpg)