the role of special economic zone on job - University of Rwanda
56
1 THE ROLE OF SPECIAL ECONOMIC ZONE ON JOB CREATION IN RWANDA A CASE STUDY OF KIGALI SPECIAL ECONOMIC ZONE (2014-2017) A Dissertation Submitted to the University of Rwanda, College of Business and Economics in Partial Fulfillment of the Requirements for the Award of a Master Degree of Business Administration (Project Management Option) SUBMITTED BY: NDUWIMANA Emmanuel REG. NUMBER: 217299059
-
Upload
khangminh22 -
Category
Documents
-
view
3 -
download
0
Transcript of the role of special economic zone on job - University of Rwanda
1
THE ROLE OF SPECIAL ECONOMIC ZONE ON JOB
CREATION IN RWANDA
A CASE STUDY OF KIGALI SPECIAL ECONOMIC ZONE
(2014-2017)
A Dissertation Submitted to the University of Rwanda, College of Business
and Economics in Partial Fulfillment of the Requirements for the Award of a
Master Degree of Business Administration (Project Management Option)
SUBMITTED BY: NDUWIMANA Emmanuel
REG. NUMBER: 217299059
i
DECLARATION
I, NDUWIMANA Emmanuel hereby declare that this thesis entitled the “Role of Special
Economic Zone on Job Creation in Rwanda, a case study of Kigali Special Economic Zone, in
the period of the Study from 2014-2017” is my work and it has not been submitted for any degree.
All the sources I have used or quoted have been indicated and acknowledged by complete
references.
Signature…………………………………… Date………/………/……..
NDUWIMANA Emmanuel
ii
APPROVAL
This is to certify that this thesis entitled the “Role of Special Economic Zone on Job Creation in
Rwanda, a case study of Kigali Special Economic Zone, in the period of the Study from 2014-
2017” was conducted by NDUWIMANA Emmanuel under my supervision and guidance.
Signature…………………………….. Date……………………
Supervisor: ………………………………………………

iii
DEDICATION
To
The almighty God,
My family members,
My lecturers from all levels,
My dissertation’s supervisor, and
My friends as well as my colleagues.

iv
ACKNOWLEDGEMENTS
My special gratitude goes to Almighty GOD for his enormous love, guidance, protection and
blessing towards me while doing this study. My thanks are addressed to parents, brothers and
sisters for their encouragement and moral support while I was conducting this study.
My deep appreciation goes to my Supervisor, for his vital professional guidance, sacrifice and
careful Supervision which had made this research project feat. Dear sir Prof. Bideri Ishuheli
NYAMULINDA, I appreciate and recognize your kind support for my work.
I would like to appreciate all those who contributed, immaterial or moral support that leads me to
the accomplishment of this study. I would also like to recognize all the staff of UR-CBE especially
all my lecturers and my classmates for their generous and bright encouragement given to me to
overcome some hindrances throughout my studies
Lastly, I also wish to extend my sincere gratitude to my friends and classmates with whom I used
to share materials and ideas and others. I also appreciate anyone who contributed to my academic
success, for that thing, any contribution offered is valued.
NDUWIMANA Emmanuel

v
TABLE OF CONTENTS
DECLARATION............................................................................................................................ i
APPROVAL .................................................................................................................................. ii
DEDICATION.............................................................................................................................. iii
ACKNOWLEDGEMENTS ........................................................................................................ iv
TABLE OF CONTENTS ............................................................................................................. v
LIST OF TABLES ..................................................................................................................... viii
LIST OF FIGURES ..................................................................................................................... ix
LIST OF ABBREVIATIONS/ ACRONYMS ............................................................................. x
ABSTRACT .................................................................................................................................. xi
CHAPTER ONE ........................................................................................................................... 1
GENERAL INTRODUCTION .................................................................................................... 1
1.1 Background of the Study .................................................................................................. 1
1.2 Kigali Special Economic Zone .............................................................................................. 2
1.3 Problem Statement ................................................................................................................ 3
1.4 Objectives of the Study ......................................................................................................... 5
1.4.1 General objective ......................................................................................................................... 5
1.4.2 Specific objectives ........................................................................................................................ 5
1.5 Research Questions ............................................................................................................... 5
1.6 Significance of the Study ...................................................................................................... 5
1.7 Scope and Delimitation ......................................................................................................... 6
CHAPTER TWO .......................................................................................................................... 7
LITERATURE REVIEW ............................................................................................................ 7
2.1 Definition of Key Concepts and Measurements ................................................................... 7
Special Economic Zone (SEZ) ................................................................................................................. 7
vi
Job Creation .......................................................................................................................................... 8
2.2 Categories of jobs created in SEZ’s inception ...................................................................... 8
Direct job creation ................................................................................................................................ 8
Indirect job creation .............................................................................................................................. 9
2.3 Industries that have created more job opportunities. ............................................................ 9
2.4 Duration of Employment in SEZs ....................................................................................... 10
2.5 Theoretical Review ............................................................................................................. 12
2.5.1 Human capital theory ................................................................................................................ 12
2.5.2 Employment creation and structural transformation theory .................................................... 13
2.6 Empirical Studies ................................................................................................................ 14
2.7 Conceptual Framework .................................................................................................... 16
CHAPTER THREE .................................................................................................................... 18
RESEARCH METHODOLOGY .............................................................................................. 18
3.1 Research Design .................................................................................................................. 18
3.2 Study Population ................................................................................................................. 18
3.3 Sample Size ......................................................................................................................... 18
3.4 Data Collection .................................................................................................................... 19
3.4.1 Instrument Development ........................................................................................................... 19
Open ended Questions ....................................................................................................................... 19
Documentation .................................................................................................................................. 19
3.4.2 Data Collection Techniques ....................................................................................................... 19
3.4.3 Data Analysis Methods .............................................................................................................. 20
CHAPTER FOUR ....................................................................................................................... 21
ANALYSIS, AND INTERPRETATION OF FINDINGS ....................................................... 21
4.1 Systematic Presentation and Analysis of Data .................................................................... 21
4.1.1 Characteristics of Respondents.................................................................................................. 21
Gender of Respondents ...................................................................................................................... 21
Age of respondents ............................................................................................................................. 22

vii
Marital Status of Respondents............................................................................................................ 22
4.1.2 The categories of jobs created in KSEZ implemented from different offices in KSEZ................ 23
4.1.3 The companies that created more Job opportunities in KSEZ ................................................... 27
4.1.4 The duration of employment contract ...................................................................................... 29
4.15 Suggestions for creating more jobs in KSEZ ................................................................................ 31
CHAPTER FIVE ........................................................................................................................ 32
SUMMARY OF FINDINGS, CONCLUSION AND RECOMMENDATIONS ................... 32
5.1 Summary of Major Findings ............................................................................................... 32
5.1.1 Findings on the categories of jobs created in KSEZ implemented from different offices in KSEZ
............................................................................................................................................................ 32
5.1.2 Findings on the companies that created more Job opportunities in KSEZ ................................ 33
5.1.3 Findings on the duration of employment contract .................................................................... 33
5.1.4 Findings on suggestions for creating more jobs in KSEZ ............................................................ 33
5.2 Conclusions ......................................................................................................................... 34
5.3 Recommendations ............................................................................................................... 34
5.4 Suggestions for Further Studies .......................................................................................... 34
REFERENCES ............................................................................................................................ 35
APPENDICES ............................................................................................................................. 41
viii
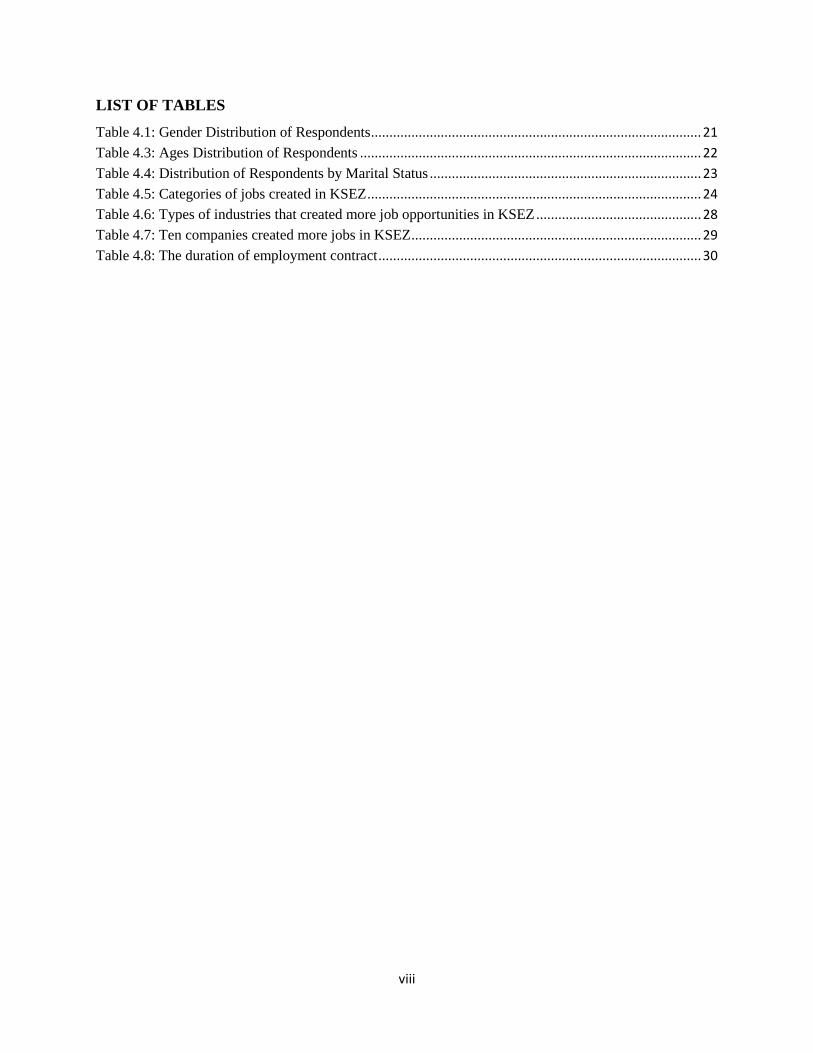
LIST OF TABLES
Table 4.1: Gender Distribution of Respondents .......................................................................................... 21
Table 4.3: Ages Distribution of Respondents ............................................................................................. 22
Table 4.4: Distribution of Respondents by Marital Status .......................................................................... 23
Table 4.5: Categories of jobs created in KSEZ ........................................................................................... 24
Table 4.6: Types of industries that created more job opportunities in KSEZ ............................................. 28
Table 4.7: Ten companies created more jobs in KSEZ ............................................................................... 29
Table 4.8: The duration of employment contract ........................................................................................ 30

ix
LIST OF FIGURES
Figure 1: Statistics of jobs created in KSEZ ........................................................................................... 25
Figure 2: Comparison of industries that created more Job opportunities in KSEZ .................................... 29
Figure 3: Duration of employment contract ................................................................................................ 30
x
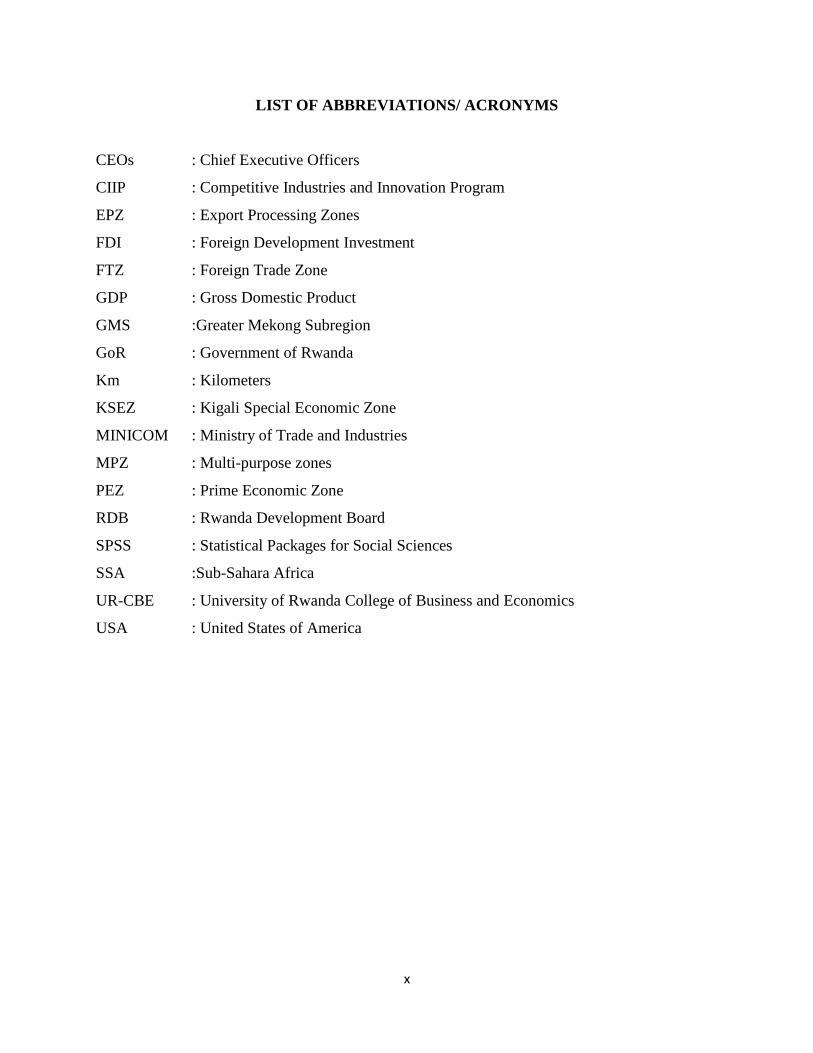
LIST OF ABBREVIATIONS/ ACRONYMS
CEOs : Chief Executive Officers
CIIP : Competitive Industries and Innovation Program
EPZ : Export Processing Zones
FDI : Foreign Development Investment
FTZ : Foreign Trade Zone
GDP : Gross Domestic Product
GMS :Greater Mekong Subregion
GoR : Government of Rwanda
Km : Kilometers
KSEZ : Kigali Special Economic Zone
MINICOM : Ministry of Trade and Industries
MPZ : Multi-purpose zones
PEZ : Prime Economic Zone
RDB : Rwanda Development Board
SPSS : Statistical Packages for Social Sciences
SSA :Sub-Sahara Africa
UR-CBE : University of Rwanda College of Business and Economics
USA : United States of America
xi
ABSTRACT
The study investigated the role of special economic zone on job creation in Rwanda. The objectives
of this study were to find out categories of jobs created since KSEZ’s inception; to find out which
industries have created more job opportunities, to find out the duration of employment, and to seek
companies’ opinions on what should be done to create more jobs. The study acquired the
qualitative and quantitative approaches; the study used all 69 companies that are operational in
KSEZ Phase I&II. The respondents size of this study were 140 respondents included by sixty nine
human resource managers and sixty nine CEOs from 69 operational companies in KSEZ, and two
respondents from PEZ as operator of KSEZ. The Instruments of data collection were the open
ended Questions, and documentary instruments. During the study, the results are presented in
accordance with the research objectives. Where, there are more females (69.6 percent) in Human
resource management department than males, whereas males occupied 65.2 percent of chief
executive officers in KSEZ.
Thus the highest of number of human resource managers are found to be in 41-50 age bracket
(40.6 percent), whereas 55.1 percent of CEOs are above 51years of ages. Data obtained shows that
companies that are in clothing and garment industry and companies involved in food prcessing
generated more jobs respectively 38.5 percent of jobs created in KSEZ are tailors and 22.1 percent
of job created in KSEZ are food processing personnel, that is to say that two highlited jobs
occupied majority that is 60.6 percent of total jobs in KSEZ.
Findings on the propositions given for creating more jobs in KSEZ are that Rwanda Government
should continue to create other new industrial parks around the country which give more job
opportunity to citizens, they should also continue to sustaining the security and infrastructure
attracting foreign investors to invest in our country and reduce the rate of taxation to the industries
that create more jobs citizens like these garment companies, food processing companies. As to
conclude, the objectives of the study were achieved, the problem of the study was solved, and the
questions answered by saying that there is significant relationship between SEZs and job creation
in Rwanda based to information collect from KSEZ. Government of Rwanda is recommended to
continue looking different strategies to be used in reducing unemployment rate in Rwanda.
KEY WORDS: SEZ, Job creation, and KSEZ
1
CHAPTER ONE
GENERAL INTRODUCTION
The first special economic zone started in 1937 in New York, the United Stated of America. The
other name of SEZ is “Free Trade Zone”. In 1942 in USA invested in forming the SEZ in Puerto
Rico, since then, other countries have also established SEZ but might be in different name. Iceland
and Taiwan established SEZ in 1960. India established SEZ namely “Export Processing Zone” in
1980. One of the most well-known SEZ is Shenhzen special economic zone has been located in
more than 135 countries around the world, the inventor of SEZ has 257 areas of Free Trade Zone
and 545 area of FTZ subzone (Baeumler, Axel, et al., 2009).
1.1 Background of the Study
Many counties Worldwide have started to implement SEZs as the mechanism for their
industrialization process specifically as a way of interesting foreign direct investments mostly in
the manufacturing sector, creating job opportunity, generating exports and foreign exchanges, and
so on (Asian Development Bank, 2007).
China is one of the most effective country in terms of leveraging SEZs to achieve far-reaching
economic transformations which involves laws, regulations, taxation, land, labor, customs,
immigration, and etc. then it was estimated that in recent years, SEZs at national level accounted
for about 22% of national GDP, 46% of FDI, and 60% of exports and produced in excess of
30millions jobs (Zeng, 2010).
In the Sub-Sahara region, numerous countries launched zone agendas in the early 1970s (Liberia
in 1970, Mauritius in 1971, and Senegal in 1974, but they did not operationalize agendas until the
1990s or 2000s. Also, these zones are largely different from the modern large scale multi-use zones
that now being proposed (Farole, 2011). The lack of data makes it hard to have a comprehensive
analysis of Africa’s performance in SEZs in terms of investments, exports, and employment in
comparison to other regions (Lin et al,2011:UNECA, 2011).
IMF(2012), studying more African countries for over the longe time period, shades a more
optimistic representation of essential transformation of industry management by creating SEZs
and productivity change in African countries. Special Economic Zones are capable to interest
2
investment that would otherwise not have been able to come, then they create further jobs. There
is employment effect from SEZs where about 3,000 Zones in 135 countries, accounting for over
68 million direct jobs and $500billion direct trade-related value added inside zones (FIAS, 2008).
Generally Special Economic Zones do not show a large role in employment in most African
countries. Some 1 million SEZ jobs were found in 91 Special Econmic Zones in 20 Sub-Sahara
Africa are established in South Africa, but a important share of employment in EPZs is also found
Mauritius, Lesotho, Kenya, Nigeria and Madagascar (ILO, 2007). In Ghana, employment in SEZs
increased from 4,000 in 1998 to 27,798 in 2010. The share of SEZ employment as percent of Total
formal employment is around 3% in Tanzania and Ghana and around 1.5% in Kenya (where the
share of SEZs in manufacturing employment is 15%) (World Development Bank Report, 2013)
1.2 Kigali Special Economic Zone
The policy of special economic zone in Rwanda is intended to address domestic private sector
limits such as availability of industrial and commercial land, readiness and the cost of energy,
limited transport linkages, market access and reduced administration and availability of skills.
Special Economic Zone program offers selected serviced land for small and large scale industrial
development, as well as consistent, quality infrastructure, competitive fiscal and non-fiscal
regulations and modernized administration procedures. The poor labor and working conditions
from many zones permitting companies to fulfill with international and national principles
(Gabriel, Omoh, 2015).
The government of Rwanda introduced Kigali Special Economic Zone and started the acquisition
of KSEZ land in 2006 , KSEZ is owned, operated and developed by Prime Economic Zones (PEZ)
of which the government is one of seven shareholders, alongside RSSB, SONARWA, BRD,
MAGERWA, Crystal Ventures Ltd. and Prime Holdings. PEZ raised capital finance on the
domestic market for development, then Prime Economic Zone started the development of
infrastructure in KSEZ land in 2008, where 6.5 kilometers of asphalt concrete roads, industrial
designed water and electricity networks, centralized sewage treatment plant, fiber optic network
and firefighting system were developed.KSEZ phase II occupies a total area of 202 Hectares of
which 178 hectares are industrial use and 24 are for green belt.

3
Development of infrastructure in KSEZ phase II started in 2013 where as KSEZ phase 2 with 6.7
Km of asphalt concrete roads, industrial designed water and electricity networks, sewage treatment
plant, fiber optic network and firefighting system were developed. Some industries are already
operational in KSEZ phase II and others are under construction (PEZ, May 2018).
This research examines the role of SEZs in promoting employment and precisely examines
whether and how the creation of special economic zones (SEZs) can support to promote job
creation that can be sustained over time and which can raise an economy’s productivity and have
linkage effects on the rest of economy, including through effects on export advancement
technology and skills in Rwanda.
1.3 Problem Statement
Because of the inadequate conditions and absence of opportunities in rural Africa have stimulated
youth to migrate from rural to urban centers. Despite that most countries have not yet started their
transition to industrialization, urban centers cannot create a massive number of jobs. Hence, in the
short term, only rural activities, farm and non-farm, can successfully create occupation for most
job seekers. Given the challenges faced by youth in labor markets, success in pursuing employment
for young people require long term, concerted actions, spanning a wide range of policies and
programs. Indeed, success is not achieved and constant through split and isolated interventions
(Brȁutigam,D., and Tang, X., 2013).
For addressing the youth employment challenges is the need for integrated strategy for rural
development, growth and job creation which covers the demand and the supply sides of the labor
market, and takes into account the youth mobility from rural to urban areas. Combined with
targeted interventions to help young people overcome disadvantages in entering and remaining in
the labor market like SEZs implementation (Watson, P., 2012). By considering African special
economic zone plans, it is important to consider that most African countries are relatively
latecomers in executing modern special economic zone programs and many of these zones are still
in the initial phases. The revolution and rebalancing of the global value chain and industrial
organization can possibly provide a good opportunity for these special economic zones.
4
Considering the investment, exports and employment generation, the African special economic
zones ar falling behind the rest of the word. The major reason might be the weak business
environment (Farole, 2011).
Accessibility of employment in Rwanda is one of the major challenges that face unemployed
persons and workers wishing the improvement their working situation. As a fast growing
economy, Rwanda has envisaged several reforms aiming at rapidly transforming socio-economic
situation of the country where Special economic zone was initiated assuming also to be a way of
creating more jobs.
Rwanda’s Special Economic Zone policy was adopted in 2010 with the objective of ensuring the
successful development of existing and new SEZs.It were to contribute to the achievement of
several for the government’s ambitious developmental targets. Specifically, it would contribute to
increased foreign and domestic private sector investment; increased employment and income
generation(Direct and Indirect); export growth and diversification and increased foreign exchange;
development of industry and other sectors; and skills upgrade and technological transfer.
Kigali Special Economic Zone has accommodated different types of industries included by Light
and heavy manufacturing industries, large scale industrial plants, industries requiring excellent
national and international communication network, logistics industries that requiring close links
with other firms (those firms which produce component parts for the same product or those
involved in separate stages of the same industrial process), commercial wholesalers, chemical and
plastics and pharmacy, warehouses, service and tourism industry and ICT and telecommunications
are solution in job creation opportunities to many Rwandan citizens especially these industries like
garments manufacturing, fortified food processing, and biscuit manufacturing in the area, the
estimated number of job to be created in SEZs is 3,575 off-farm, fulltime jobs and $2.7m worth of
exports annually. However, no study has been done to investigate the role of KSEZ in job creation,
thus this study aims to fill this gap.

5
1.4 Objectives of the Study
The objective of this study is divided into two categories such as general objective and specific
objectives
1.4.1 General objective
The general objective of this study is to investigate the role of special economic zone on job
creation in Rwanda
1.4.2 Specific objectives
Specific objectives should be as follows:
i. To find out categories of jobs created since KSEZ’s inception.
ii. To find out which industries have created more job opportunities
iii. To find out the duration of employment
iv. To seek companies’ opinions on what should be done to create more jobs
1.5 Research Questions
The study seeks to answer the following research questions during this research
i. What are categories of jobs created since KSEZ’s inception?
ii. Which industries have been created more job opportunities?
iii. What is the duration of employment?
iv. What are the companies’ opinions on what should be done to create more jobs?
1.6 Significance of the Study
The findings of this study; would be used by development actors who include; the government,
community, and scientific and academic.
However, the government would be able to identify and review current policies on project
implementation in terms of access to better infrastructure(roads, water, electricity ,ICT and sewage
treatment system) than available elsewhere; better trade facilitation, both in terms of expedited
customs procedures and in terms of greater likelihood of entering into the duty remission
scheme(offering import duty exemptions; and better aware of tax incentives, new laws and
regulations, and can more easily push for policy change to address specific challenges in order to
create employment opportunity to youth population in Rwanda.
6
The local community would profit from the study through enhanced knowledge and information
of what should be their contribution, as they are the beneficiaries of the project execution like SEZ
and the way to obtain the job opportunity. In terms of scientific and academic, the research findings
will be used as reference document to the next generation of university of Rwanda; it completed
the gap left by previous literature.
1.7 Scope and Delimitation
This research was limited in the space, time and domain.
In space, this assesses the information from KSEZ which has been set up by the government of
Rwanda to address some key issues that may affect doing business by providing necessary
infrastructure and effective incentives.
The development of Kigali Special Economic Zone so far was done in two phases. Phase I of
KSEZ is on 98 hectares of land with all the plots (89 in total belonging to 61 investors) completely
booked and phase has been also developed but not fully booked some plots are available for willing
investors.
In time, the study covered the period of four years, from 2014-2017. This period is not haphazardly
chosen because it was in 2013 that KSEZ phase II has been started to run the activities and from
2014 up to 2017 is where break-even of the project in creating employment opportunity to citizens.
This research was specifically in the field of project management, where it assessed the role of
special economic zone on job creation in Rwanda.

7
CHAPTER TWO
LITERATURE REVIEW
This chapter looks at what has been already published by some accredited scholars and researchers
who wrote on related study. It illustrates the definition of key concepts, theoretical review, and
empirical studies where gap analysis of this study found.
2.1 Definition of Key Concepts and Measurements
Special Economic Zone (SEZ)
A special economic zone is an area a country that is subject to unique economic regulations that
differ from other areas in same country. The SEZ regulations tend to be conducive to foreign direct
investment. Conducting business in an SEZ typically implies that company will receive tax
incentives and the opportunity to pay lower tariffs (Watson, P., 2012).
Special economic zones (SEZs) are districts within a country in which businesses are exempt from
various government policies that apply in the rest of the country. Their usual purpose is to stimulate
foreign investment and trade and to attract technology transfers without having to alter policies
throughout the country. Special policies within zones may include lower tax rates, exemption from
foreign-exchange and price controls, suspension of labor standards or licensing requirements, and
so on (Chee, Kian, L., 2007).
According to the world Bank, (2008) SEZ is to determine individually by each country where
typically includes a geographically limited area, usually physically secured (fenced-in); single
management/ administration; eligibility for benefits based upon physically location within the
zone; separate customs area (duty-free benefits) and streamlined procedures. Special economic
zone are those industrial zone that have been set up by government to attract foreign companies to
invest in the country and creating job opportunity to people.
According to definitions given above, Special Economic zone (SEZ) is an administratively
separated part of polish territory where investors may run their business activity based on
specific preferential conditions

8
Job Creation
Job creation is the notion of jobs created in response to some sort of event or situation.
Conceptually, it is a proactive opposite of unemployment. It is the mostly term used for political
rhetoric. For example, a candidate might suggest that a particular taxation or subsidy program, or
regulatory framework, create new jobs (Aggarwal,A.,2005).
Job creation presumably would occur if the government grew and hired more people to operate it.
or if demand for goods and services grew substantially. For demand to grow there would need to
be a significant base of buyers for those goods and services. Job creation fails if the principal
consumers refuse to buy because they have insufficient money for them; further, if they feel
economic pressure, they borrow less (Baeumler, A al., 2009).
2.2 Categories of jobs created in SEZ’s inception
According to Zeng, (2010), they are two major types of profit from special economic zone , that
in part describe the popularity of SEZ that is static economic profit like as employment generation,
export growth, government revenues, and foreign exchange earnings; and more then dynamic
economic profit like skills advancement, technology transfer and innovation, economic
diversification and finally productivity improvement for local companies.
The categories of job created since SEZ’s inception are accountant; admin& clerical; general labor;
pharmaceutical; automotive; professional services; banking; purchasing; procurement; biotech;
health care; quality control; broadcast and journalist; hotel and hospitality; real estate coordinators;
business development; human resources; research construction; information technology;
restaurant; food services; consultant; installation; maint; repair; retail officer, customer service;
insurance; sales officers; designers; inventory and distribution managers; labor; engineers;
management; supply chain manager; marketing officers; transportation and warehouse officers.
Direct job creation
Considering labour-intensive activities, companies in special economic zone institute,an
important source of job opportunities.in developing countries we may found labour at low wages
which attract investment into simple handling labour intensive industries. This increases the
demand for unskilled labour within the zone. And it will lead to higher change value added

9
activities as Special economic zone increase, it will raise the demand for skilled labour ,
additionnaly it will generate employment for unskilled labour by creating demand for physical
infrastructure within the Zone.
As a result of that local construction industry giving employment to unskilled labour. Special
Economic Zone in Malaysian is facing labour scarcity the industry. There is demand for utilities
such as water, electricity, communication, and administration rises. The significance increase in
demand for various support services such as, hotels and restaurants,also in transportation, that is
estimated to have a significant impact on job creation (Sivalingam, 1994).
Indirect job creation
Major operations of the Special economic zone are indirectly showing indirect effect on
employment opportunities in the sectors of economy.which may comprise transport,
communication, automobile, shipping, tourism, civil aviation,hospitality, packaging, banking, and
insurance.The generation of employment opportunities for both unskilled and skilled labour.
Additionnaly there are three other channels from side to side which special economic zone create
impact on job crearion. The first one is that Special Economic Zones gives foreign exchange
earnings that release the foreign exchange limitations of the rest of the economy regarding the
import needs of the rest of the economy and speed up investment activities. Funds generated from
special economic zones facilitate generation of economic activities and jobs. Secondary it
generates economic activity outside the zone due to the change of investment funds into fixed
assets and purchase of service and input from the recreation of the economy. Finally revenues
generated,increase the demand for numerous goods and services such as housing, education, health
and transport. That has a multiplier special effects on income and job opportunities (Madani,
1999).
2.3 Industries that have created more job opportunities.
The creation of new jobs is the cornerstone of economic growth and development. Over the past
three decades, scholarly work on job creation has focused on understanding the contributions of
different populations of firms new and existing, large and small to the overall creation of new
employment (Birch, 1979; Neumark, Zhang, & Wall, 2006).
10
Despite the critical role of new firms in contributing to macro level of employment outcomes, there
exists little theoretical and empirical research at the individual and organization levels that can
help explain the specific factors that either enhance or constrain a new firm’s ability to create jobs
(Shane, 2003). Because of improved knowledge on the features influencing job creation in new
companies would not only be of key significance for the structural in labor market, considering
entrepreneurship literatures (Davidson, 2004; Ireland, Reutzel, &Webb, 2005), it would rather be
a vital attention to policy makers as governments seek to implement policies and plans to ensure
that citizens can find jobs (Osterman, Kochan, locke, &piore, 2002).
Jobs creation is noted in the following types light and heavy manufacturing industries, large scale
users industries plants, industries requiring excellent national and international communication
network, industries requiring close links with other firms, wholesalers, chemical, plastics and
pharmacy, warehouses, service and tourism industry and telecommunications, other services as
creating job opportunity to national and foreigners people (World Bank, 2008) companies create
jobs and boosting businesses to take root in development countries has been a long and creating
further.
2.4 Duration of Employment in SEZs
Special economic zones provides direct impact at the company level particulary impact on the
domestic compnanies presents a challenge, since there is a lack of data, then in part due to the
difficulty in finding suitable companies which can serve as controls with which to make valid
comparisons. On the other hand indirect measures suggest impact of special economic zone on
exports,employment, investment even on firms outside zones, however it is rare to find out those
assessments, the major source of information on the special economic zones’ overall impact as
international labor organization’s Export Processing Zone study (Boyenge, 2007).
According to Glick&Roubaud,(2006) argued that there are different duration of employment
contract in SEZs where some employees signed the contract of less than 1 year of employment
contract; between 2 to 4 years of contract; from 5 to7years of employment contract; between 8 to
9 years of employment opportunity in SEZs; and the 10 years and above of employment contract
or undetermined employment contract signed with SEZs. In terms of unionization. Both
11
Glick&and Roubaud, (2006) finded that there is more labour unions in Export Processing Zones
than private sector outside in Madagascar.
According to Gabriel M., et al., (2010) reviews of employment literature;perspectives for research
and development in Latin America on Temporary employment has become a key issue in the last
decades:it has been considered as the major point in this changing world. The effect of temporary
job for employees have not yet been established,due to many variables that affect the practical
outcomes. The research contributed on updated overview of the main characteristics associated
with temporary employment and the most recent empirical studies on outcomes associated with
temporary employment is presented. Additionnaly attention is drawn to temporary employment
research in Latin America, so that the it can contribute to the development of the field and the
viewpoints for future research.
Hillary T., Wandera, (2011) in his studies it has extent across industries from manufacturing to
services and other occupations, such as construction workers, bankers,registered nurses, and ICT
personnel. Findings was that there is an increase in usage of temporary employees since there is
an increase international competition then there is a need of cost benefit analysis in undertaking
businesses in order of remaining competitive. objective of the study was to determine the effects
of contracting staff on shortterm contract basis within the organization. It has been found that
Short-term employment contract affects productivity of staff in the companies since a lot of time
and effort is being used in training new employees as their turnover is always high. Additionnaly
the note on that was exact nature of temporary employment increases spirits of divided loyalty on
the part of temporary workers. Which reduces their level of commitment and productivity at work.
In order to overcome challenges of short term employment, the following would be proposed
gradually engaging temporary employees to permanent employment when suitable job
opportunities are available, providing on job trainings to short-term employees to equip them with
skills so that they could be more productive and often review their compensation and benefits
terms for staff with short term contracts. Additional recommendations were to adapt short term
employment contracts in times of economic crisis; and use the ssimilation of temporary employees
into the company once it offers induction and investment in skills by training in order to increase
productivity and improve loyalty of staff to company and commitment to the job.

12
2.5 Theoretical Review
2.5.1 Human capital theory
According to human capital theory, individuals possessing greater knowledge and experience will
be more successfully than individuals possessing lower levers of such human capital (Becker,
1964; Mincer, 1974). The recruitment of employees add more comlex responsibility and present
challenges to the role of company’s owner (Blanchflower, 2000), owners with higher human
capital should address these challenges easily and create more jobs than owners with less human
capital (Burke, FitzRoy,&Nolan, 2000), little is known about the kinds of human capital
appropriate job creation in new companies since there is few studies on it, on whether higher
human capital awards of company owners would top to more job creation.
Empoyees are considered to be the important asset of company, even few employers are able to
couple the full prospective from their employees. Lado and Wilson (1994) define a human resource
structure as a set of different but interconnected activities, functions, and processes that are
concentrating at attracting, developing, and maintaining a company’s staffs. Usually management
of this structure has extended more attention from service companies than manufacturing
companies. Still to enhance working performance, effectively managing this structural is equally
significant in both categories of companies.
A sophisticated technologies and innovative manufacturing practices alone can do very little to
enhance operational performance unless the required human resource management (HRM)
practices are in place to form a consistent sociotechnical system (Ahmad &Schroeder, 2003).
The impact that HRM policies and practices have on the overall firm performance is very
important, not only in terms of human resource management but also industrial relations, industrial
and organizational psychology (Huselid, 1995).And the main goal of all companies is to regularly
exploit and develop their bottom line. some managers consider human resource management as an
integral part of this, whereas others have questioned its rationality. Interest in this area has
increased in recent years as academics have claimed that a companny’s employees can provide an
organization with a typical from of competitive advantage that is hard for many competitors to
13
copy. Wright and McMahan,(1992) support this when they state that employees would provide a
source of sustained competitive advantage as long as four criteria are available.
1. Employees are adding productivity in production process within the comany, hereafter
the levels of individual contribution matters.
2. Because human performance is normally distributed, the skills the firm seeks must be rare.
3. Other companies cannot easily emulate the human capital investments that a firm’s
employees represent.
4. It is important too notice that employees of the company are not substitute by use of
technology or any other substitutes if the company is willing to provide company’s
sustainable competitive advantage.
According to Huselid (1995) Human resources practices should be in line with atleast two
measurements of its performance. As long senior HRM practices increase contribution of the staff
to the organization, and it has affect outcomes that employees have direct control over, like
turnover and productivity. It would in turn increase the corporate financial performance which
would come about as a result of lower turnover and improved productivity. Above rules are
supported by several empirical works that have been carried out by various Human resources
academics and specialists. Considering this theory supports us to examine some of the basic rules
and any gaps that exist in this area. Additionnaly it studies the applicability of some of these
common human resource theories in Rwandan contextbut also considering its relevance across
industries.
2.5.2 Employment creation and structural transformation theory
Employment creation and structural transformation are amongst the two major challenges facing
the countries of sub-Saharan African at Present. Based on the understanding that appropriate
growth policies will be able to address these challenges, the paper was examining whether SEZs
could be an important ingredient of such strategies. So far many African SEZs have been unable
to create significant employment or foster structural change. However, there are some positive
exceptions with respect to employment creation in countries such as Mauritus, Kenya, Lesotho,
Madagascar and Ghana.

14
The SEZs that have contributed to structural transformation are located mainly outside Africa
(e.g.Malaysia and Singapore) and these experiences show that it takes a great deal of
complementary policies to enhance the positive impacts. They argue that SEZs may still play a
more important role in SSA as long as SEZs are retooled to i) facilitate growth adequately using
good quality policies and adequate support institutions; ii) emphasize the clustering aspects of
zones and iii) are able to adapt to new global conditions. This involves taking risks which may
only pay off when policies can be implemented consistently backed up by significant capacity and
fit in with overall growth strategies.
The evidence on the success and failure of using SEZs as a growth and employment policy tool
seems to indicate that social cohesion, employment generation, and structural transformation are
often found together. We suggest there is a virtuous circle amongst social cohesion, good quality
growth policies and beneficial outcomes, which in turn increases social cohesion. We also provide
new econometric evidence which suggests that SEZs in Kenya have helped to create some 40,000
manufacturing jobs and increased manufacturing labour productivity by some 20% in the decade
to 2006 (2% per annum). This suggest that in principle it is possible for SEZs to be both job
creating and productivity enhancing, although there are also questions about whether the
transformative productivity effects can be sustained forever.
2.6 Empirical Studies
Michael Oborne, (1986): China’s special economic zones: the study aims to assess the effects of
establishing of SEZs on china’s national economy. The study provides a review of the policy
context and reforms, traces foreign trade and foreign direct investment performances, and then
evaluates the SEZs in China. Furthermore, it examines the future role SEZs in the light of China’s
experience. The study shows that SEZs were established as part of the new “open door policies”
that took place in the 1970s. The main findings of the study was that there was an increase in
foreign direct investment in SEZs and at the same time, there was an increase in the infrastructure
cost.
Wong, K., (2000) attempted to provide a review of the latest development of China’s SEZs,
assessing their achievements in terms of the attraction of foreign capital, export growth and foreign
exchange earnings and Technology transfer. Reforms and innovative measures initiated in the
15
zones that have implications for other parts of China are also discussed. Problems encountered in
course of SEZ development are examined, nothing in particular the heavy capital expenditure on
infrastructure provisions, the development of trade-based economy, the over-ambitions objectives
which would be difficult to achieve in short period of time as well as other economic and social
issues. It is observed that the development of the SEZs has been proceeding without careful and
coordinated planning and that the designation of economic development zones in the open coastal
cities stands to undercut the allures of SEZs and has made the latter much less “special” than they
used to be.
Aradhna, A., (2007) studied the impact of special economic zones on employment, poverty and
human development. This study aims at examining the impact of special economic zones (SEZs)
on human development and poverty reduction in India. It identifies three channels through which
SEZs address these issues: employment generation, skill formation (human capital development),
technology and knowledge upgradation. It examines how the impact of SEZs is passed through
each of these channels. The study finds that the modality differs significantly according to the
characteristics of the SEZs, in particular, the level of their development as reflected in the
composition of economic activities. Within this framework, the study examines the sectorial and
economic composition of SEZ activities in India. It finds that labour intensive; skill intensive and
technology intensive firms co-exist in India’s zones and, therefore argues that all the three effects
described above are likely to be important in the Indian Context.
UNPD (2015) shows comparative study on special economic zones in Africa and China. Economic
growth in Africa is progressing at an impressive rate, with projections for 2015 placing seven
African countries among the world’s ten fastest growing economies and forecasting strong growth
for most of the continent’s countries for years to come. Despite this strong economic growth, job
creation and poverty reduction remain major challenges for governments across Africa. Many
countries are looking to china, which has proven over the last three decades that industrialization
can create jobs and allow unprecedented numbers of people to move out of poverty.
GMS, (2016) carried out the role of special economic zones in improving effectiveness of GMS
economic corridors. Government in the Greater Mekong Subregion (GMS) are interested in
building special economic zones (SEZs) as an impectus to stimulate economic activity along GMS
16
economic corridors and especially in the border areas. A proposal for a study on the role of SEZs
is strengthening competitiveness of GMS economic corridors was endorsed at the February 2016
GMS senior officials meeting. The aim of that paper was to analyze factors behind the success or
failure of SEZs within GMS corridors, as well as to provide indications of the potential role of
SEZs in future GMS economic corridor development.
Albera G.Sehweinberger, (2003) special economic zones (SEZ) in developing transition
economics a policy proposal. The study was trying to analyze the role of establishing SEZs in the
host country with respect to taxes. The main finding of the study shows that establishment of SEZs
accompanied by appropriate tax policies, lead to an increase in government revenue. This revenue
may be sending to finance other investments in infrastructure or other public goods.
Ota T., (2003) analyzed the changing roles of SEZs in the context of China’s economic
development and some of emerging problems that SEZs were confronted with at the new stage of
development. An attempt is laid here on study of policy and performance of the SEZs in
comparison with those of Asian EPZs, which managed to shift their industrialization strategy from
the import-substitution to the export-orientation at the critical stage of development. The SEZs
were in a better position to elicit lessons from the experiences of Asian EPZs, despite various
conditions and limitations of economic reform policy in 1979, China’s economic development is
quite impressive with her average annual rate of economic growth of over 10% between 1980 and
1995, increasing her GDP from 451.8billion yuan to 5826 billion yuan. SEZs apparently triggered
her economic growth.
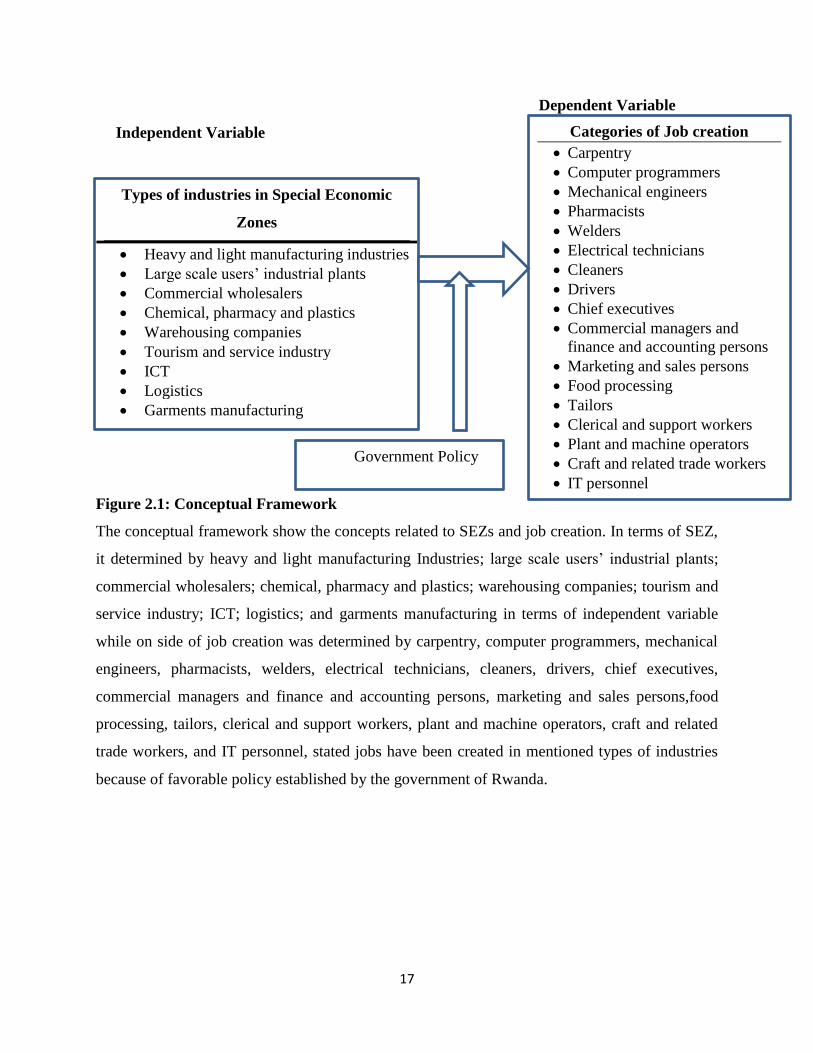
2.7 Conceptual Framework
In order to solve the problem, the researcher establishes the relationship between independent
variable in terms of effectiveness of SEZs and the dependent variable in terms of job creation. The
conceptual framework is shown in figure 2.1 as follows:
17
Dependent Variable
Independent Variable
Figure 2.1: Conceptual Framework
The conceptual framework show the concepts related to SEZs and job creation. In terms of SEZ,
it determined by heavy and light manufacturing Industries; large scale users’ industrial plants;
commercial wholesalers; chemical, pharmacy and plastics; warehousing companies; tourism and
service industry; ICT; logistics; and garments manufacturing in terms of independent variable
while on side of job creation was determined by carpentry, computer programmers, mechanical
engineers, pharmacists, welders, electrical technicians, cleaners, drivers, chief executives,
commercial managers and finance and accounting persons, marketing and sales persons,food
processing, tailors, clerical and support workers, plant and machine operators, craft and related
trade workers, and IT personnel, stated jobs have been created in mentioned types of industries
because of favorable policy established by the government of Rwanda.
Types of industries in Special Economic
Zones
Heavy and light manufacturing industries
Large scale users’ industrial plants
Commercial wholesalers
Chemical, pharmacy and plastics
Warehousing companies
Tourism and service industry
ICT
Logistics
Garments manufacturing
Categories of Job creation
Carpentry
Computer programmers
Mechanical engineers
Pharmacists
Welders
Electrical technicians
Cleaners
Drivers
Chief executives
Commercial managers and
finance and accounting persons
Marketing and sales persons
Food processing
Tailors
Clerical and support workers
Plant and machine operators
Craft and related trade workers
IT personnel
Government Policy
18
CHAPTER THREE
RESEARCH METHODOLOGY
This chapter presents the techniques of data collection and methods of data analysis. It shows also
the research design, study population, sample size, and sampling techniques. The instruments used
in data collection such as interview guide, observation, and documentary techniques. Source of
data, data processing and analysis methods are illustrated in this section.
3.1 Research Design
In respect of this research at KSEZs, the researcher acquires the qualitative and quantitative
approaches. The study used qualitative approach where it used open ended questions by asking
management of the companies in SEZ about opinions on what should be done to create more jobs.
The study used the quantitative approach by assessing secondary data on the categories of jobs
created since KSEZ’s inception; and industries that created more job opportunities; and the
duration of employment contract.
3.2 Study Population
A population is a group of individuals or a body of people or any collection of items under
consideration from which samples are taken for measurement (Jill, and Roger, 2003). In respect
of this research, the researcher used all 69 companies that are operational in KSEZ Phase I&II.
The specific people to to be asked questions are Human Resources manager and chief executives
of operational companies in KSEZ with two directors from Prime Economic zones Ltd that will
make the number of respondent to be 140.
3.3 Sample Size
The respondents size of this study included sixty nine human resource managers because they are
the one with information on categogories of job created since KSEZ’s inception and duration of
employment on the otherside sixty nine CEOs from 69 operational companies in KSEZ would be
asked on opinions on what should be done to create more jobs, finally two respondents from PEZ
as operator of KSEZ will be asked on industries that have created more job opportunities and give
opinions of what should be done to create more jobs.. This means, total number of respondents is
140 respondents. However, respondents’ size was determined using census sampling technique.
19
3.4 Data Collection
This part includes instrument development and the techniques of data collection used by the
researcher for gathering information from respondents.
3.4.1 Instrument Development
Open ended Questions
During this research at KSEZ, the instruments of data collection included by open ended questions
were addressed to HR and CEOs of operational companies respectively human resources managers
were asked about what are categories of jobs created since KSEZ’s inception? And what is the
duration of employment? Then, CEOs of operational companies were asked on what are the
opinions on what should be done to create more jobs? Additional, Prime Economic Zone directors
were asked on which industries have been created more job opportunities. The data collected from
respondents helps to determine role of special economic zone on job creation in Rwanda especially
Kigali Special Economic Zone.
Documentation
Documentary technique is used by the researcher as materials which contain the information about
a phenomenon that researcher wishes to study. In this study, the documents targeted are the
available reports about categories of jobs created since KSEZ;and the duration of employment
contract.
3.4.2 Data Collection Techniques
Information gathered come from a range of sources, and variety of techniques used when gathering
both primary and secondary data, in this research for primary data, open ended questions in
personal interview was used, and for secondary data; desk review which is an important part of
assessment by collecting, organizing and synthesizing available data(documents,report,and
company’s website and publications) was used to collect secondary data in KSEZ operational
companies, through that the researcher gains an understanding of the role of SEZ on job creation
in Rwanda.

20
3.4.3 Data Analysis Methods
Data analysis used for data found at KSEZ has two prominent methods: qualitative research and
quantitative research. With the help of Microsoft Excel 2016 and statistical package for social
sciences (SPSS) to analyze collected data, quantitative method is used to describe frequency and
percentages of respondents included by ages, gender, and marital status of respondents. It describes
also the opinions of respondents about what to be done for creating more jobs in KSEZ.
21
CHAPTER FOUR
ANALYSIS, AND INTERPRETATION OF FINDINGS
This chapter presents the findings obtained from data collected in relation with the role of special
economic zone on job creation in Rwanda specifically Kigali Special Economic Zone since 2014
to 2017. The results are presented and interpreted in accordance with the research objectives such
as to find out categories of jobs created since KSEZ’s inception; to find out which industries have
created more job opportunities; to find out the duration of employment; and to seek companies’
opinions on what should be done to create more jobs.
4.1 Systematic Presentation and Analysis of Data
The researcher went to the field of research (especially Kigali Special Economic Zone) to distribute
the questionnaire to the 140 of respondents where they were given three days of responding the
questions. After data collection, the findings indicated the participation rate was the 100.0% for
answering the questions. This helps the researcher to continue with editing, coding, and tabulation
in order to make statistical tables by using SPSS version 20.0.
4.1.1 Characteristics of Respondents
This section identifies the gender, age, and marital status of respondents who participated in this
research in KSEZ.
Gender of Respondents
Gender is the range of characteristics pertaining to, and differentiating between masculinity and
femininity. The gender influences job opportunities for people according to industry category. The
information contents on table 4.1 show gender distribution of respondents during this study at
KSEZ, PEZ.
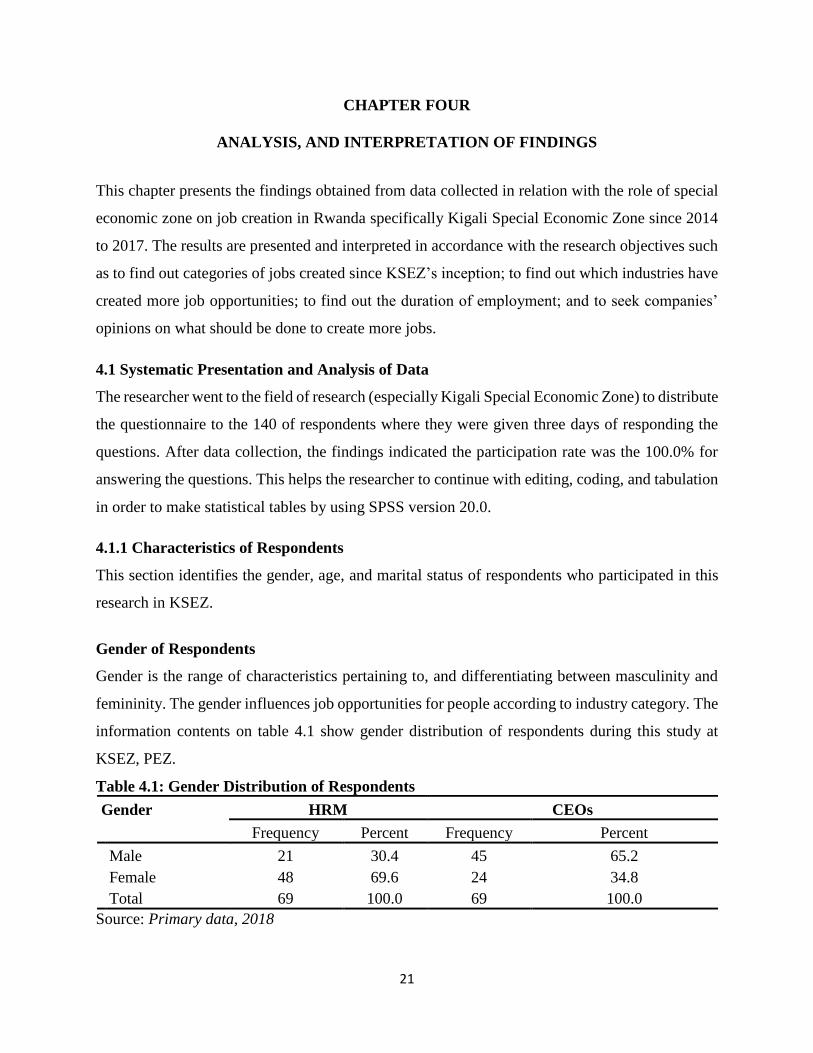
Table 4.1: Gender Distribution of Respondents
Gender HRM CEOs
Frequency Percent Frequency Percent
Male 21 30.4 45 65.2
Female 48 69.6 24 34.8
Total 69 100.0 69 100.0
Source: Primary data, 2018

22
According to Rwandan gender law expecting 30.0% of women in employment opportunities.
KSEZ creates job opportunity to all sexes. During data collection, the researcher found males who
were 30.4% of HRM, and 65.2% of CEOs in KSEZ. While female were 69.6% of HRM and 34.8%
of CEOs in KSEZ.
Age of respondents
Age is the time during which a person or animal has lived, or time during which a thing has existed.
It is found the average age of people in the workforce is getting higher, with increasing numbers
of middle-aged and older workers employed in many different jobs. Thus, it is important to know
whether job creation opportunity is higher or lower for older workers in comparison with younger
workers. During this study at KSEZ, the table 4.2 presents the data as follows:
Table 4.2: Ages Distribution of Respondents
Ages HRM CEOs
Frequency Percent Frequency Percent
Between 21 and 30 years 9 13.0 3 4.3
31 and 40 years 21 30.4 11 15.9
Between 41 and 50 years 28 40.6 17 24.6
51 years and above 11 15.9 38 55.1
Total 69 100.0 69 100.0
Source: Primary data, 2018
Table 4.3 presents the distribution of respondents by ages at KSEZ where 13.0% of HMR and
4.3% of CEOs aged between 21 and 30 years. 30.4% of HMR and 15.9% of CEOs were between
31 and 40 years. 40.6% of HMR and 24.6% of CEOs were between 41 and 50 years. 15.9% of
HRM and 55.1% of CEOs had 51years and above in the companies operating at KSEZ are active
and mature to get job opportunity at KSEZ. Thus this means the majority of 55.1% in CEOs were
in 51 years and above while majority of 40.6% in HRM were aged from 41 and 50 years
Marital Status of Respondents
Marital status is any of several distinct options that describe a person's relationship with a
significant other. Married, single, divorced, and widowed are examples of civil status. These have
23
any impact on the employment opportunities of some companies operating in KSEZ. In regard of
marital status, the table 4.4 presents the findings as follows.
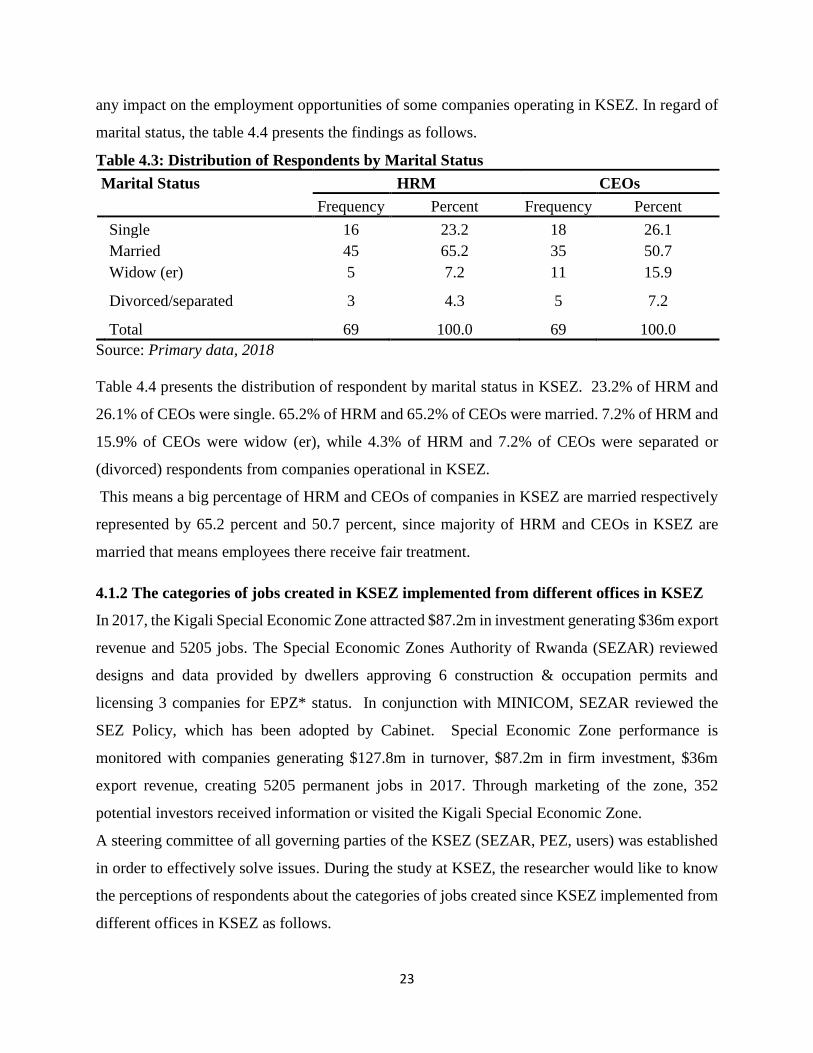
Table 4.3: Distribution of Respondents by Marital Status
Marital Status HRM CEOs
Frequency Percent Frequency Percent
Single 16 23.2 18 26.1
Married 45 65.2 35 50.7
Widow (er) 5 7.2 11 15.9
Divorced/separated 3 4.3 5 7.2
Total 69 100.0 69 100.0
Source: Primary data, 2018
Table 4.4 presents the distribution of respondent by marital status in KSEZ. 23.2% of HRM and
26.1% of CEOs were single. 65.2% of HRM and 65.2% of CEOs were married. 7.2% of HRM and
15.9% of CEOs were widow (er), while 4.3% of HRM and 7.2% of CEOs were separated or
(divorced) respondents from companies operational in KSEZ.
This means a big percentage of HRM and CEOs of companies in KSEZ are married respectively
represented by 65.2 percent and 50.7 percent, since majority of HRM and CEOs in KSEZ are
married that means employees there receive fair treatment.
4.1.2 The categories of jobs created in KSEZ implemented from different offices in KSEZ
In 2017, the Kigali Special Economic Zone attracted $87.2m in investment generating $36m export
revenue and 5205 jobs. The Special Economic Zones Authority of Rwanda (SEZAR) reviewed
designs and data provided by dwellers approving 6 construction & occupation permits and
licensing 3 companies for EPZ* status. In conjunction with MINICOM, SEZAR reviewed the
SEZ Policy, which has been adopted by Cabinet. Special Economic Zone performance is
monitored with companies generating $127.8m in turnover, $87.2m in firm investment, $36m
export revenue, creating 5205 permanent jobs in 2017. Through marketing of the zone, 352
potential investors received information or visited the Kigali Special Economic Zone.
A steering committee of all governing parties of the KSEZ (SEZAR, PEZ, users) was established
in order to effectively solve issues. During the study at KSEZ, the researcher would like to know
the perceptions of respondents about the categories of jobs created since KSEZ implemented from
different offices in KSEZ as follows.
24
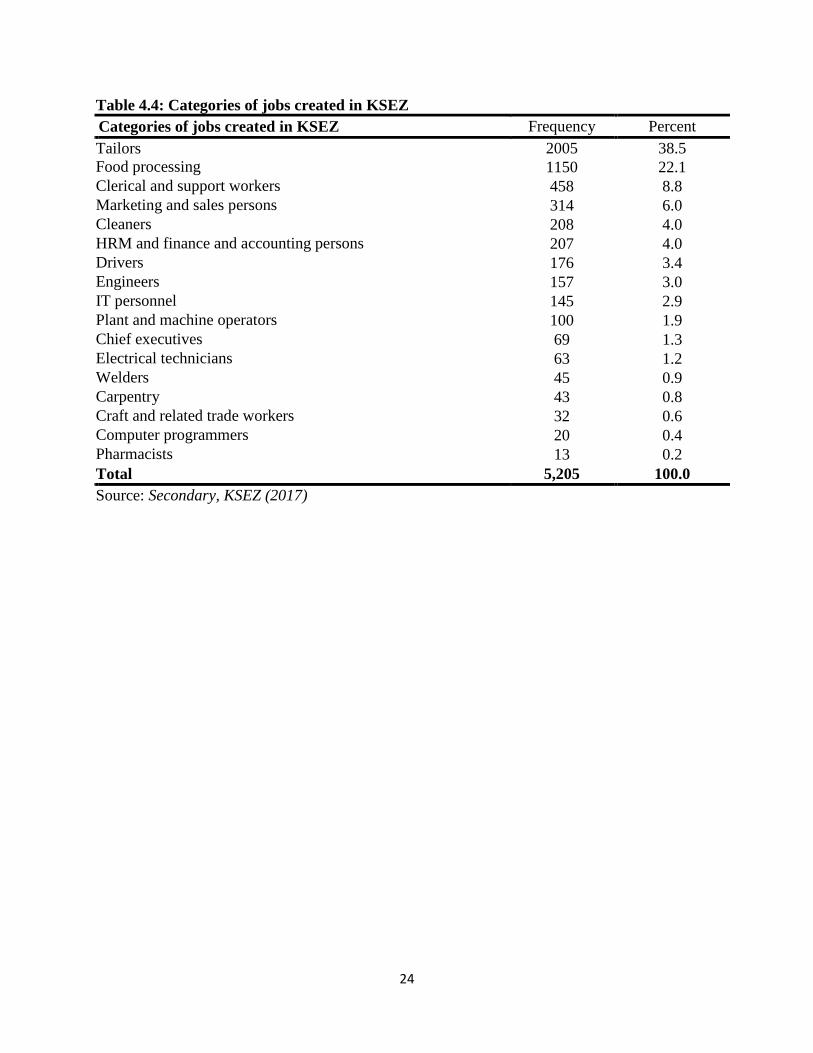
Table 4.4: Categories of jobs created in KSEZ
Categories of jobs created in KSEZ Frequency Percent
Tailors 2005 38.5
Food processing 1150 22.1
Clerical and support workers 458 8.8
Marketing and sales persons 314 6.0
Cleaners 208 4.0
HRM and finance and accounting persons 207 4.0
Drivers 176 3.4
Engineers 157 3.0
IT personnel 145 2.9
Plant and machine operators 100 1.9
Chief executives 69 1.3
Electrical technicians 63 1.2
Welders 45 0.9
Carpentry 43 0.8
Craft and related trade workers 32 0.6
Computer programmers 20 0.4
Pharmacists 13 0.2
Total 5,205 100.0
Source: Secondary, KSEZ (2017)
25
Figure 1: Statistics of jobs created in KSEZ
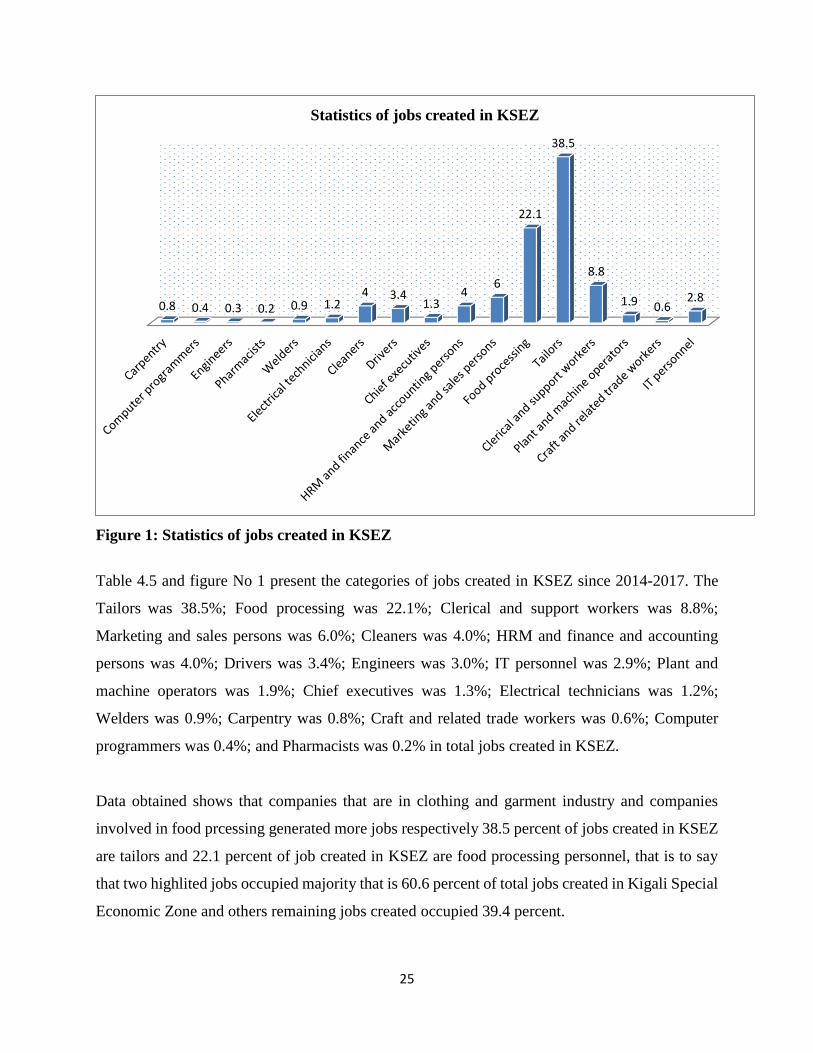
Table 4.5 and figure No 1 present the categories of jobs created in KSEZ since 2014-2017. The
Tailors was 38.5%; Food processing was 22.1%; Clerical and support workers was 8.8%;
Marketing and sales persons was 6.0%; Cleaners was 4.0%; HRM and finance and accounting
persons was 4.0%; Drivers was 3.4%; Engineers was 3.0%; IT personnel was 2.9%; Plant and
machine operators was 1.9%; Chief executives was 1.3%; Electrical technicians was 1.2%;
Welders was 0.9%; Carpentry was 0.8%; Craft and related trade workers was 0.6%; Computer
programmers was 0.4%; and Pharmacists was 0.2% in total jobs created in KSEZ.
Data obtained shows that companies that are in clothing and garment industry and companies
involved in food prcessing generated more jobs respectively 38.5 percent of jobs created in KSEZ
are tailors and 22.1 percent of job created in KSEZ are food processing personnel, that is to say
that two highlited jobs occupied majority that is 60.6 percent of total jobs created in Kigali Special
Economic Zone and others remaining jobs created occupied 39.4 percent.
0.8 0.4 0.3 0.2 0.9 1.24 3.4
1.34
6
22.1
38.5
8.8
1.9 0.62.8
Statistics of jobs created in KSEZ
26
Rwanda Labour Force Survey (2016) conducted its first national labour force survey (LFS) in
August to September 2016 and it was followed by the second round conducted in February to April
2017. The main objective of the survey was to collect current data on the size and characteristics
of the labour force, employment, unemployment and other labour market characteristics of the
population.
The survey was also designed to measure different forms of work, in particular, own-use
production work and other components of labour underutilization including time-related
underemployment and potential labour force in line with the new international standards, adopted
by the 19th International Conference of Labour Statisticians (ICLS) in 2013.
According to the new international standards, employment includes only persons working for pay
or profit, excluding persons engaged wholly or mostly in subsistence foodstuff production. The
effect of this is to lower the count of employment (according to the old definition) and to higher
the count of unemployment because some of the subsistence foodstuff producers would be looking
and available for work for pay or profit and thus be classified as unemployed. The comparison of
some key indicators using old and new definition is presented in this section as well as in the tables
at the end of the section. The scope of the survey covered all persons living in private households,
excluding the institutional population permanently residing in places such as hostels, health
resorts, correctional establishments etc., as well as persons living at their work-sites and in seasonal
dwellings.
The survey was designed as part of a regular survey programme to be conducted twice a year, in
February and August of each year, using a rotation sample scheme with a sample size of 9,344
households per round, selected by means of a stratified two-stage probability design based on
information from the Population and Housing Census 2012 updated at the second stage of
sampling with fresh listing of the selected enumeration areas. The resulting estimates of the main
labour force indicators at the national level have standard errors of about 0.6 percent.
According to the survey results, among the 6,709,000 persons 16 years old and over living in
private households, about 3,626,000 persons representing 54 percent were in the labour force,
either employed (3,019,000) or unemployed (607,000). The remainder 3,084,000 persons were
outside the labour force including some 1,766,000 persons engaged wholly or mostly in
27
subsistence foodstuff production, not classified as employment according to the new international
standards on statistics of work, employment and labour underutilization.
The unemployment rate stood at 16.7 percent, indicating that roughly for six persons in the labour
force there was one person unemployed. The unemployment rate was higher among women (17.5
percent) than among men (16.1 percent) and higher among young people (21.0) than among adults
(13.3%). It was also higher in the urban areas (18.1 percent) than in the rural areas (16.2 percent).
This situation is different from the one in August 2016, where the unemployment rate was higher
in rural areas (19.8 percent) than in urban areas (16.4 percent). This confirms the fact that during
the low season of agriculture a substantial number of people who are normally involved in
subsistence agriculture in rural areas are looking for an alternative job as they are waiting for the
next agricultural season. The median duration of seeking employment was only 4.2 months but
about 32 percent of the unemployed were seeking employment for 12 months or more (long-term
unemployment).
4.1.3 The companies that created more Job opportunities in KSEZ
Since KSEZ was implemented different activities were performed in various companies operating
in this area and they need to hire employees to work for companies’ performance. These industries
operational in KSEZ offered different activities/jobs to many unemployed people where they
provide the pastries production, mattress manufacturing, steel structures assembling, computer
assembling, LED lights assembling, pharmaceutical, products warehouse, sale of computers,
manufacturing of roofing sheets, paper bags manufacturing, plastic water tanks and pipes
manufacturing, warehouses, yoghurt manufacturing, garments manufacturing, hygienic paper
manufacturing, biscuit manufacturing, utensils manufacturing, paint manufacturing, production of
construction materials, warehouse for the storage of paints, wheat flour processing, cartons
manufacturing, doors and windows manufacturing, manufacturing of sacks, warehouse for the
storage of various products, medical consumables manufacturing, Soft and liqors manufacturing,
printing, warehouse for various products, warehouse for various products, manufacturing of pipes
and floor tiles, manufacturing of plastic boots (bodaboda), manufacturing of lead ingots,
manufacturing of household furniture, warehouse for the storage of medicines, manufacturing of
doors and windows, manufacturing of pavers, Paper bags manufacturing, warehouse for the
storage of fertilizers, manufacturing of roofing sheets, Fish food processing, coffee processing,

28
banking services, lubricant manufacturing, Fortified food processing, Paint manufacturing,
motorcycle assembling, warehouse for the storage of paints, warehouse for the storage of coffee,
HDPE pipes manufacturing, and manufacturing of prefabricated straw walls.
Kigali Special Economic Zone is managed as mixed use zone which has been designed to
accommodate the following types of investments in heavy and light manufacturing industries;
large scale users industrial plants; commercial wholesalers; chemical, pharmacy and plastics; and
warehousing. During this study at KSEZ, the industries created more job opportunities in KSEZ
are presented in the table 4.6 below.
Table 4.5: Types of industries that created more job opportunities in KSEZ
Industries have created more job opportunities Frequency Percent
Garments manufacturing 2021 38,8
Large scale users’ industrial plants 1215 23,3
Heavy and light manufacturing industries 714 13,7
Tourism and service industry 391 7,5
Commercial wholesalers 361 6,9
Warehousing companies 184 3,5
ICT 175 3,4
Chemical, pharmacy and plastics 87 1,7
Logistics 57 1,1
Total 5205 100.0
Source: Secondary, KSEZ (2017)
05
10152025303540

29
Figure 2: Comparison of industries that created more Job opportunities in KSEZ
Table 4.6 and figure 2 show the comparison of industries created more job opportunities in KSEZ
where Garments manufacturing was 38,8%; Large scale users’ industrial plants was 23,3%; Heavy
and light manufacturing industries was 13,7; Tourism and service industry was 7,5%;Commercial
wholesalers was 6,9%; Warehousing companies was 3,5%; ICT was 3,4%; Chemical, pharmacy
and plastics was 1,7%; and Logistics were 1,1%. Data above on industries that have created more
job opportunities are falling under Garments manufacturing cluster with 38.8 percent, followed by
Large scale users’ industrial plant with 23.3 percent and Heavy light manufacturing with 13.7
percent then others represent minor percentage in creation of job opportunities in KSEZ.
Table 4.6: Ten companies created more jobs in KSEZ
Company name Activity Number of
employees
C&H Garments Garments manufacturing 1870
Adma international Biscuit manufacturing 450
AMEKI colour Paint manufacturing 375
Africa improved foods Fortified food processing 360
Bakhresa grain milling
(AZAM) Wheat flour processing 200
SPERANZA Group Soft and Liqors manufacturing 90
VIVA Product Mattress manufacturing 81
Strawtec Manufacturing of prefabricated straw walls 80
Mikoani Traders (AZANIA) Wheat flour processing 78
RwandaFoam Mattress manufacturing 70
Source: Secondary, KSEZ (2017)
Table 4.7 illustrates the ranked first ten industries based on number of jobs created in KSEZ until
2017.
4.1.4 The duration of employment contract
An employment contract is a signed agreement between an employee and employer. It establishes
both the rights and responsibilities of the two parties: the worker and the company. Employment
contract can include Salary or wages: Contracts itemize the salary, wage, or commission that has
been agreed upon. Schedule: In some cases, an employment contract includes the days and hours
an employee is expected to work. Duration of an employment contract specifies the length of time
the employee agrees to work for the company. During this study, the researcher would like to know
the duration of employment contract in various companies operating in KSEZ.
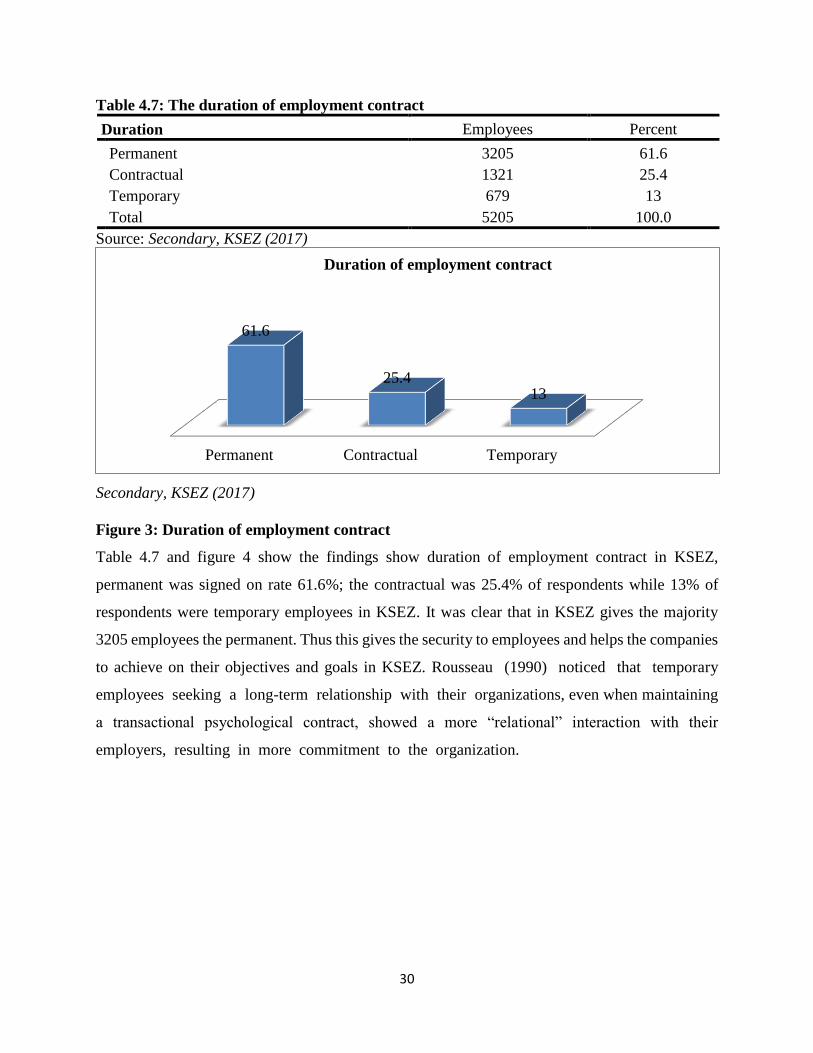
30
Table 4.7: The duration of employment contract
Duration Employees Percent
Permanent 3205 61.6
Contractual 1321 25.4
Temporary 679 13
Total 5205 100.0
Source: Secondary, KSEZ (2017)
Secondary, KSEZ (2017)
Figure 3: Duration of employment contract
Table 4.7 and figure 4 show the findings show duration of employment contract in KSEZ,
permanent was signed on rate 61.6%; the contractual was 25.4% of respondents while 13% of
respondents were temporary employees in KSEZ. It was clear that in KSEZ gives the majority
3205 employees the permanent. Thus this gives the security to employees and helps the companies
to achieve on their objectives and goals in KSEZ. Rousseau (1990) noticed that temporary
employees seeking a long-term relationship with their organizations, even when maintaining
a transactional psychological contract, showed a more “relational” interaction with their
employers, resulting in more commitment to the organization.
Permanent Contractual Temporary
61.6
25.413
Duration of employment contract
31
4.15 Suggestions for creating more jobs in KSEZ
SEZs provide the opportunity to cluster anchor tenants with suppliers and other service providers,
thereby creating jobs in skilled sectors and encouraging knowledge transfer thereby acceleration
the country’s economic activities in general. A world class Rwanda economic zone
program operating through a network of diverse sites and activities to deliver benefits and
opportunities to investors and Rwanda without any negative impacts.
Although KSEZ create more jobs to people in Rwanda, there are still numerous of unemployed
youth and older people around the country. Thus during this study at KSEZ, the researcher sought
information about suggestions that could support job creation given from staff of companies in
operational and directors from PEZ as developer; operator and manager of KSEZ inline of what
can be done to create more job opportunities.
In the discussion with both sides, confirmed that: “Rwandan Government should expand Kigali
special economic zone since two developed phases are almost occupied by investors. Additionally
the development of upcountry industrial parks would lead to the creation of more job opportunities
to rural and urban population. Moreover security sustainability all over the country, infrastructure
development such: as power access facilities, ICT infrastructure; water infrastructure , roads;
firefighting system and sewage treatment plants, will be a key in attracting foreign investors since
they found adequate infrastructures and incentives. Hence, created industries will give jobs to
Rwandese and country will benefit twice that through employability of local population and
collection of tax of that investment. The last will serve in the development of further developmental
infrastructure. This will justify an attractive investment environment; on the other hand giving tax
relief in newly created industrial parks will be a motivator to investors who want to enjoy that
relief, once more industries and companies are created, more job will be generated and lead to
reduction of unemployment rate in Rwanda particularly for youth and rural population.”
32
CHAPTER FIVE
SUMMARY OF FINDINGS, CONCLUSION AND RECOMMENDATIONS
This chapter summarizes the findings of the analyses of the data collected from Kigali Special
Economic Zone (KSEZ). It also involves proposed possible suggestions with a conclusion
pertaining to the whole study is drawn.
The study investigated the role of special economic zone on job creation in Rwanda. The objectives
of this study were to find out categories of jobs created since KSEZ’s inception; to find out which
industries have created more job opportunities, to find out the duration of employment, and to seek
companies’ opinions on what should be done to create more jobs.
The study acquired the qualitative and quantitative approaches; the study used all 69 companies
that are operational in KSEZ Phase I&II. The respondents size of this study were 140 respondents
included by sixty nine human resource managers and sixty nine CEOs from 69 operational
companies in KSEZ, and two respondents from PEZ as operator of KSEZ. The Instruments of data
collection were the open ended Questions, and documentary instruments. After data collection, the
findings indicated the participation rate of 100.0% of responding the questions.
5.1 Summary of Major Findings
During the study, the results are presented in accordance with the research objectives. Where, there
are more females (69.6 percent) in Human resource management department than males, whereas
males occupied 65.2 percent of chief executive officers in KSEZ.
Thus the highest of number of human resource managers are found to be in 41-50 age bracket
(40.6 percent), whereas 55.1 percent of CEOs are above 51years of ages.
5.1.1 Findings on the categories of jobs created in KSEZ implemented from different offices
in KSEZ
The results were shown on Table 4.5 and figure No 1 present the categories of jobs created in
KSEZ since 2014-2017. The Tailors was 38.5%; Food processing was 22.1%; Clerical and
support workers was 8.8%; Marketing and sales persons was 6.0%; Cleaners was 4.0%; HRM and
finance and accounting persons was 4.0%; Drivers was 3.4%; Engineers was 3.0%; IT personnel
was 2.9%; Plant and machine operators was 1.9%; Chief executives was 1.3%; Electrical
technicians was 1.2%; Welders was 0.9%; Carpentry was 0.8%; Craft and related trade workers
33
was 0.6%; Computer programmers was 0.4%; and Pharmacists was 0.2% in total jobs created in
KSEZ.
5.1.2 Findings on the companies that created more Job opportunities in KSEZ
The findings were shown on Table 4.6 and figure 2 show the comparison of industries created
more job opportunities in KSEZ where Garments manufacturing was 38,8%; Large scale users’
industrial plants was 23,3%; Heavy and light manufacturing industries was 13,7; Tourism and
service industry was 7,5%;Commercial wholesalers was 6,9%; Warehousing companies was
3,5%; ICT was 3,4%; Chemical, pharmacy and plastics was 1,7%; and Logistics were 1,1%.
5.1.3 Findings on the duration of employment contract
Duration of an employment contract specifies the length of time the employee agrees to work for
the company. The findings shown on table 4.7 and figure 4 confirmed that permanent employees
in KSEZ were on rate 61.6%; the contractual was 25.4%, while 13% were temporary employees
in KSEZ.
5.1.4 Findings on suggestions for creating more jobs in KSEZ
The suggestions from directors confirmed that Rwandan Government should expand Kigali special
economic zone since two developed phases developed are almost occupied by investors.
Additionally the development of upcountry industrial parks would lead to the creation of more job
opportunities to rural and urban population. Moreover security sustainability all over the country,
infrastructure development such: as power access facilities, ICT infrastructure; water infrastructure
, roads; firefighting system and sewage treatment plants, will be a key in attracting foreign
investors. Hence, created industries will give jobs to Rwandese and country will benefit twice that
through employability of local population and collection of tax of that investment. The last will
serve in the development of further developmental infrastructure. This will justify an attractive
investment environment; on the other hand giving tax relief in newly created industrial parks will
be am motivator to investors who want to enjoy that relief, once more industries and companies
are created, more job will be generated and lead to reduction of unemployment rate in Rwanda
particularly for youth and rural population.
34
5.2 Conclusions
This study at KSEZ, the researcher found that the policy objectives of GoR is to ensure successful
SEZs that contribute significant developmental goals of Rwanda. Whilst utilizing public resources
in the most effective way like an increase foreign and domestic private sector investment; export
growth and diversification, development of industry/ non agriculture sectors, and also creation of
off farm employment and income. According to the numbers of jobs created by KSEZ as findings
indicated above, we may confirm that the objectives of the study were achieved, the problem of
the study was solved, and the questions answered by saying that there is significant relationship
between SEZs and job creation in Rwanda based to information collect from KSEZ.
5.3 Recommendations
To Government of Rwanda
Government of Rwanda is recommended to continue looking for different strategies that can be
used in reducing unemployment rate in Rwanda, especially to youths who are not employed and
rural population that will contribute in reduction of rural migration rate.
It should create various opportunities like developing other new industrial parks so that rural
population and youth can have access to employment opportunities.
Rwandan Government should also continue to sustain security and infrastructure for attracting
foreign investors to invest in our country and this mean they should create an attractive investment
environment.
To Investors
Investors should maintain a conductive working environment through recruitment and training
processes, motivate employee through fair remuneration, and have effective strategies in retention
of competent staff.
5.4 Suggestions for Further Studies
The study did not exhaust all independent elements that job creation thus the need for other
researchers to conduct an exhaustive study on variables under listed.
The role of Free Trade Zones on job creation in Rwanda
The impact of Export Processing Zones job creation in Rwanda

35
REFERENCES
Aggarwal, A. (2005). “Performance of Export Process Zones: A Comparative Analysis of Inida,
Sri Lanka and Bangladesh”. Working Paper No. 155, Indian Council for Research on
International Economic Relations (ICRIER), New Delhi.
Aggarwal, A., et al. (2008). “Special Economic Zones in South Asia: Industrial Islands or Vehicles
for Diversification?” Working Paper, International Trade Department, the World
Bank. Washington, DC.
Ahmad &Schroeder, (2003) sophisticated technologies and innovative manufacturing practices
alone can do very little to enhance operational performance
Albera G.Sehweinberger, (2003) special economic zones (SEZ) in developing transition
economics a policy proposal
Alder, S., et al. (2013). “The Effect of Economic Reform and Industrial Policy in a Panel of Chinese
Cities.” Working Paper no. 207, Center for Institutions, Policy and Culture in the
Development Process, University of Zurich.
Aradhna, A., (2007) impact of special economic zones on employment, poverty and human
development.
Asian Development Bank. (2007). “Special Economic Zones and Competitiveness: A Case Study
of Shenzhen, China.” PRM (Pakistan Resident Mission) Policy Note, Islamabad.
Baeumler, Axel, et al. (2009). “Sino-Singapore Tianjin Eco-City: A Case Study of an Emerging
Eco-City in China.” Technical Assistance Report. Washington, DC: World Bank.
Becker, and Mincer, (1974) human capital theory, individuals possessing greater knowledge and
experience
Bernsein, A., (2012) “Special Economic Zones: Lessons for South Africa from international
evidence and local experience,”. Edited proceedings of a round Table convened by the
Centre for Development and Enterprise, the Centre for Development and Enterprise,
Johannesburg, 2012
Birch, D. L. (1979) The job generation process. Cambridge, MA: MIT Program on Neighborhood
and Regional Change.

36
Boyenge, J.P. S. (2007) “ILO Database on Export Processing Zones (Revised).” ILO working
paper 251. Geneva: ILO.
Bräutigam, D. A., and X. Tang. (2010) “China’s Investment in Africa’s Special Economic Zones.”
Washington, DC: World Bank.
Bräutigam, D. A., and X. Tang. (2014). “Going Global in Groups: Structural Transformation and
China’s Special Economic Zones Overseas.” World Development 63.
Brȁutigam, D., and Tang, X., (2013) The worst working conditions and lack of opportunities in
rural Africa
CAG (Comptroller and Auditor General of India). (2014). “Performance Audit of Special
Economic Zones SEZs of Union Government”, Report No. 21. New Delhi.
Carneiro, F.G., et al. (2008) “Resilient Growth, Persisting Inequality: Identifying Potential Factors
Limiting Shared Prosperity in the Dominican Republic”. Caribbean Knowledge Series,
World Bank Group.
Chee Kian Leong, (2007) A Tale of Two Countries: Openness and Growth in China and India,
Dynamics, Economic Growth, and International Trade, DEGIT Conference Paper pdf
Chen, J. (1993). “Social Cost-Benefit Analysis of China’s Shenzhen Special Economic Zone.”
Development Policy Review 11, no. 3: 261–71.
China Development Zones Association. (2011). China Development Zones Yearbook Beijing:
China Financial & Economic Publishing House.
China Knowledge Online. (2009). “China Special Report: Industrial Parks China’s Vehicles for
Manufacturing.” http//:www.chinaknowledge.com.
Cirera, X and Lakshman, R, (2014). “The impact of export processing zones on employment, wages
and labour conditions in developing countries”, 3ie Systematic Review 10. London:
International Initiative for Impact Evaluation (3ie).
Cling et al. (2005). “Export processing zones in Madagascar: a success story under threat?”
World development 33(5), pp.785–803.
Cling, J. P., and G. Letilly, (2009) “Export Processing Zones: A Threatened Instrument for Global
Economy Insertion?” DIAL/Unite de Recherche CIPRE Document de Travail
DT/2001/17 (2001).
37
Creskoff, S., and P. Walkenhorst. (2009) Implications of WTO Disciplines for Special Economic
Zones in Developing Countries. Washington: World Bank.
Davidson, and Ireland, Reutzel, &Webb, (2005) critical role of new firms in contributing to macro
level of employment outcomes
Davidson, P. (2004). Researching entrepreneurship. Boston: Springer Science & Business Media.
Engman, M., et al. (2007) “Export Processing Zones: Past and Future Role in Trade and
Development”, OECD Trade Committee.
Enright, Michael J., Edith Scott, and Ka-mun Chung. (2005) Regional Powerhouse: The Greater
Pearl River Delta and the Rise of China. Singapore: John Wiley & Sons (Asia).
Farole, T., and G. Akinci, eds. (2011) “Special Economic Zones: Progress, Emerging Challenges,
and Future Directions” Washington, DC: World Bank.
FIAS. (2008) “Special Economic Zones: Performance, Lessons Learned, and Implications for
Zone Development.” Washington, DC: World Bank. Foundation for Economic
Education. 1960. “Hong Kong—A Success Story.” First National City Bank.
Fruman, Cecile and Douglas Zhihua Zeng. (2015). “How to Make Zones Work Better in Africa?”
(blog), World Bank.
Fuller, B., and P. Romer. (2012) “Success and the City: How Chartered Cities Could Transform
the Developing World?” Ottawa, Ontario, Canada: MacDonald-Laurier Institute.
Gabriel Martínez, Nele De Cuyper, and Hans De Witte, (2010) Review of Temporary Employment
Literature: Perspectives for Research and Development in Latin America. PSYKHE
2010, Vol. 19, N˚ 1, 61-73 Copyright 2010 by Psykhe ISSN 0717-0297
Gabriel, Omoh, (2015) Rwanda’s Special Economic Zones program as designed to address
domestic private sector constraints
Gabriel, Omoh. (2012) “Lekki free trade zone attracts N170bn investment.” Vanguard, August
Ge, Wei. (1999) “Special Economic Zones and the Opening of the Chinese Economy: Some
Lessons for Economic Liberalization.” World Development 27 (7): 1267–85.
Glick, P and Roubaud, F. (2006) “Export processing zone expansion in Madagascar: What are
the labor market and gender impacts?” Journal of African Economies

38
GMS, (2016) the role of special economic zones in improving effectiveness of GMS economic
corridors
Guendelman, S and Silberg, M.J. (1993) “The health consequences of maquiladora work: women
on the US-Mexican border.” American Journal of Public Health
Hamada, K., (1974)“An Economic Analysis of Duty-Free Zones.” Journal of International
Economics 4.
Hamilton, C. and L.O. Svensson. (1982) “On the Welfare Effects of Duty-Free Zone.” Journal of
International Economics 13:45-64.
Hillary Thomas Wandera, (2011) the effects of short term employment contract on an
organization: a case of Kenya forest service. International Journal of Humanities and
Social Science Vol. 1 No. 21 [Special Issue - December 2011]
Hong Kong Trade Development Council. (2014). “China-Singapore Suzhou Industrial Park
(Including Suzhou Industrial Park Export Processing Zone).” Hong Kong, China.
Hovell et al. (1988) “Occupational health risks for Mexican women: the case of the maquiladora
along the Mexican-United States border.” International Journal of Health Services
18(4), pp.617–627.
Hsieh, and Klenow, (2014) Firms create jobs and encouraging businesses to take root in
development countries
Huselid, (1995) HRM policies and practices have on the overall firm performance is very
important, not only in terms of human resource management
IFC (2016) The World Bank Group’s Experiences with SEZ and Way Forward: Operational Note,
World Bank Group.
ILO (International Labor Organization). (1988). Economic and social effects of multinational
enterprises in export processing zones.
Ireland, Reutzel, &Webb, (2005) key relevance for the organizational, labor market, and
entrepreneurship literatures
Lado and Wilson (1994) human resource system as a set of distinct but interrelated activities
Lin et al., (2011) these zones are largely different from the modern large scale multi-use zones
39
Madani, (1999) various goods and services such as housing, education, health and transport
Michael Oborne, (1986) China’s special economic zones: the study aims to assess the effects of
establishing of SEZs on china’s national economy
MINICOM, (2018) the infrastructure constraint to industrialisation in Rwanda, Revised SEZ
Policy, January 2018 , page 15
National Institute of Statistics of Rwanda (NISR) (2017), Labour Force Survey February 2017
report, September 2017
Neumark, Zhang, & Wall, (2006) job creation as understanding the contributions of different
populations of firms new
Osterman, P., Kochan, T. A., Locke, R. M., & Piore, M. J. (2002) Working in America: A blueprint
for the new labor market. Cambridge, MA: MIT Press.
Ota T., (2003) roles of SEZs in the context of China’s economic development and some of
emerging problems
Rousseau, D. M. (1990). New hire perceptions of their own and their employer’s obligations: A
study of psychological contracts. Journal of Organizational Behavior, 11, 389-400.
Rwanda Development Board (RDB), RDB Annual Report 2017, 2017
Shane, S. (2003). A general theory of entrepreneurship: The individual-opportunity nexus.
Cheltenham, U.K.: Edward Elgar.
Shane, S., & Venkataraman, S. (2000) the promise of entrepreneurship as a field of research.
Academy of Management Review, 25: 217–226.
Sivalingam, (1994) local construction industry giving employment to unskilled labour. Malaysian
SEZs
UNECA, (2011) The lack of data makes it hard to have a comprehensive analysis of Africa’s
performance
UNPD (2015) comparative study on special economic zones in Africa and China.
Watson, Peggy (2012) "Sackings expose the harsh reality of Poland's junk jobs". The Guardian.
Wong, K., (2000) review of the latest development of China’s SEZs, assessing their
achievements
40
Woolfrey, Sean (2013). "Special economic zones and regional integration in Africa" (PDF). Trade
Law Center. Retrieved 25 May 2014.
World Bank, (2008) SEZ as determine individually by each country where typically includes a
geographically limited area
World Development Report, (2013) SEZs do not play a large role in employment in most African
countries
Wright and McMahan,(1992) human resources can provide a source of sustained competitive
advantage
Zeng, (2010) SEZs confer two main types of benefits, which in part explain their popularity:
“static” economic benefits

41
APPENDICES
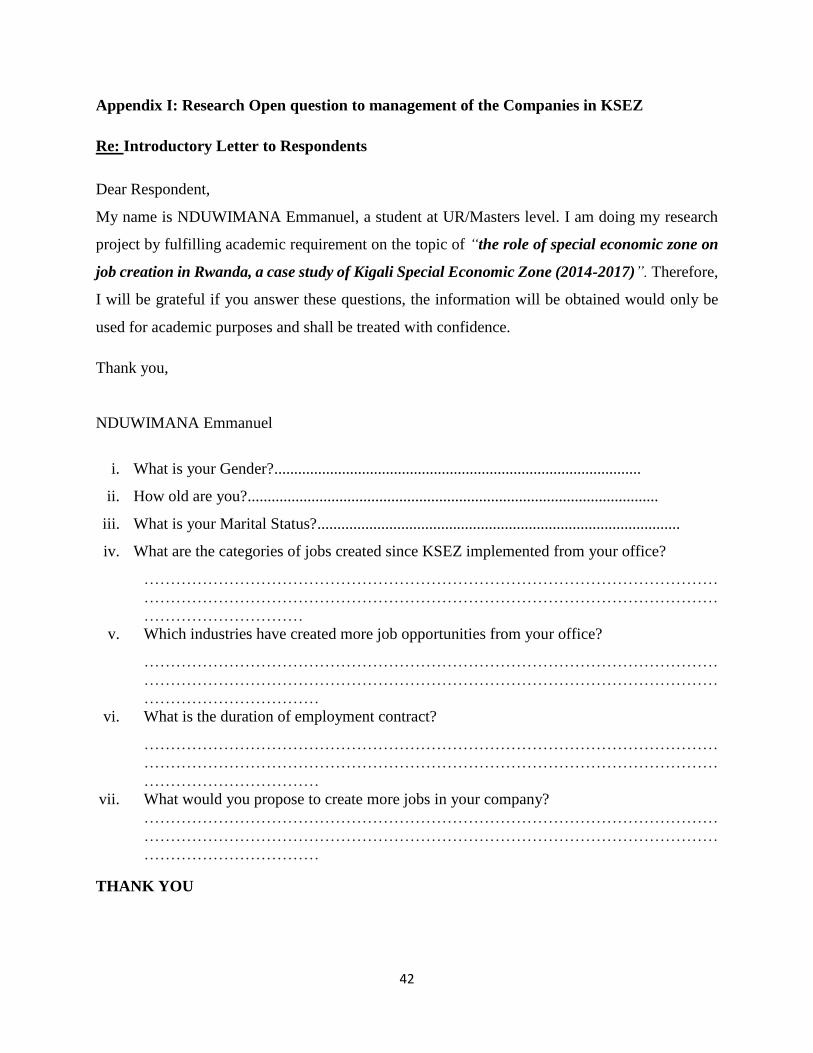
42
Appendix I: Research Open question to management of the Companies in KSEZ
Re: Introductory Letter to Respondents
Dear Respondent,
My name is NDUWIMANA Emmanuel, a student at UR/Masters level. I am doing my research
project by fulfilling academic requirement on the topic of “the role of special economic zone on
job creation in Rwanda, a case study of Kigali Special Economic Zone (2014-2017)”. Therefore,
I will be grateful if you answer these questions, the information will be obtained would only be
used for academic purposes and shall be treated with confidence.
Thank you,
NDUWIMANA Emmanuel
i. What is your Gender?............................................................................................
ii. How old are you?.......................................................................................................
iii. What is your Marital Status?...........................................................................................
iv. What are the categories of jobs created since KSEZ implemented from your office?
………………………………………………………………………………………………
………………………………………………………………………………………………
…………………………
v. Which industries have created more job opportunities from your office?
………………………………………………………………………………………………
………………………………………………………………………………………………
……………………………
vi. What is the duration of employment contract?
………………………………………………………………………………………………
………………………………………………………………………………………………
……………………………
vii. What would you propose to create more jobs in your company?
………………………………………………………………………………………………
………………………………………………………………………………………………
……………………………
THANK YOU

43
44