General guidelines for monitoring stress severity in drought ...
Upload
independentCategory
view
0download
0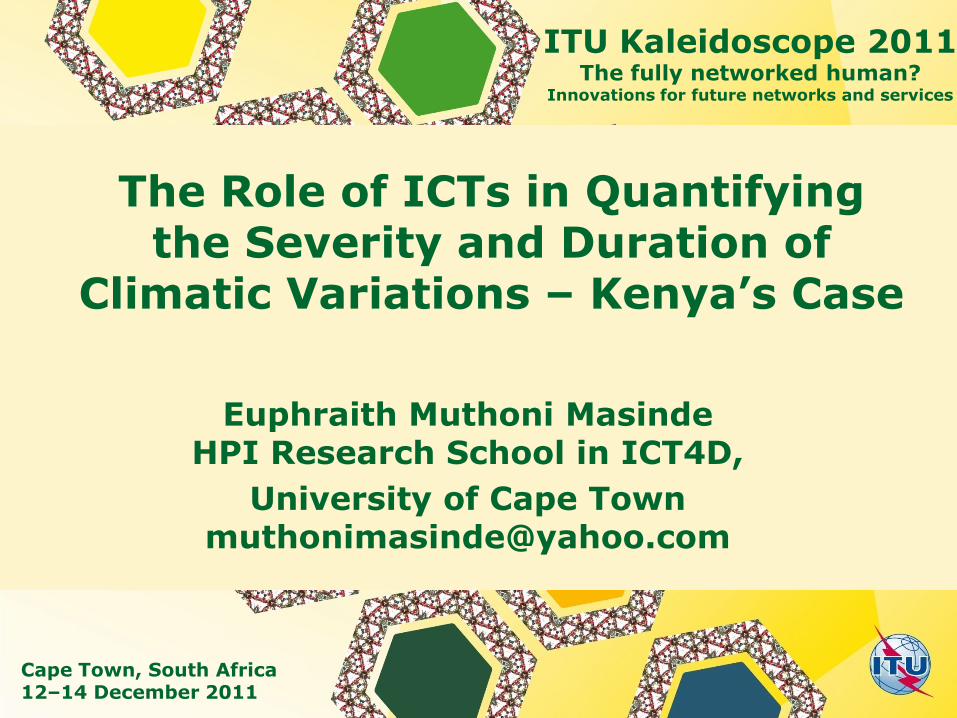
Cape Town, South Africa 12–14 December 2011
Euphraith Muthoni Masinde HPI Research School in ICT4D,
University of Cape Town [email protected]
The Role of ICTs in Quantifying the Severity and Duration of
Climatic Variations – Kenya’s Case
ITU Kaleidoscope 2011 The fully networked human?
Innovations for future networks and services
Cape Town, South Africa, 12-14 December 2011 ITU Kaleidoscope 2011 – The fully networked human? Innovations for future networks and services
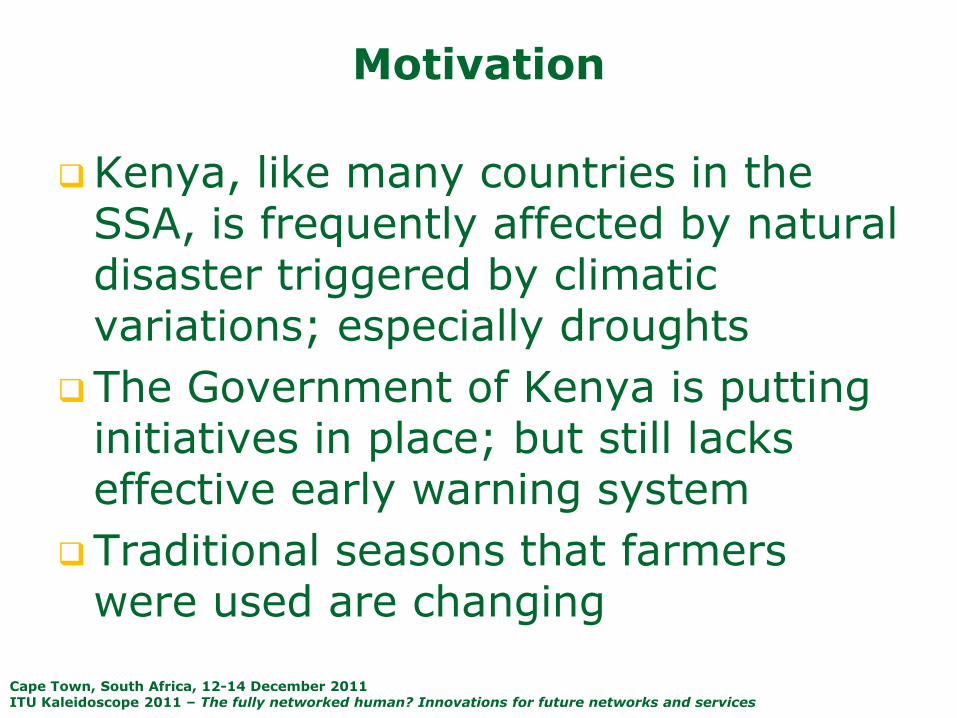
Motivation
Kenya, like many countries in the SSA, is frequently affected by natural disaster triggered by climatic variations; especially droughts
The Government of Kenya is putting initiatives in place; but still lacks effective early warning system
Traditional seasons that farmers were used are changing
Cape Town, South Africa, 12-14 December 2011 ITU Kaleidoscope 2011 – The fully networked human? Innovations for future networks and services
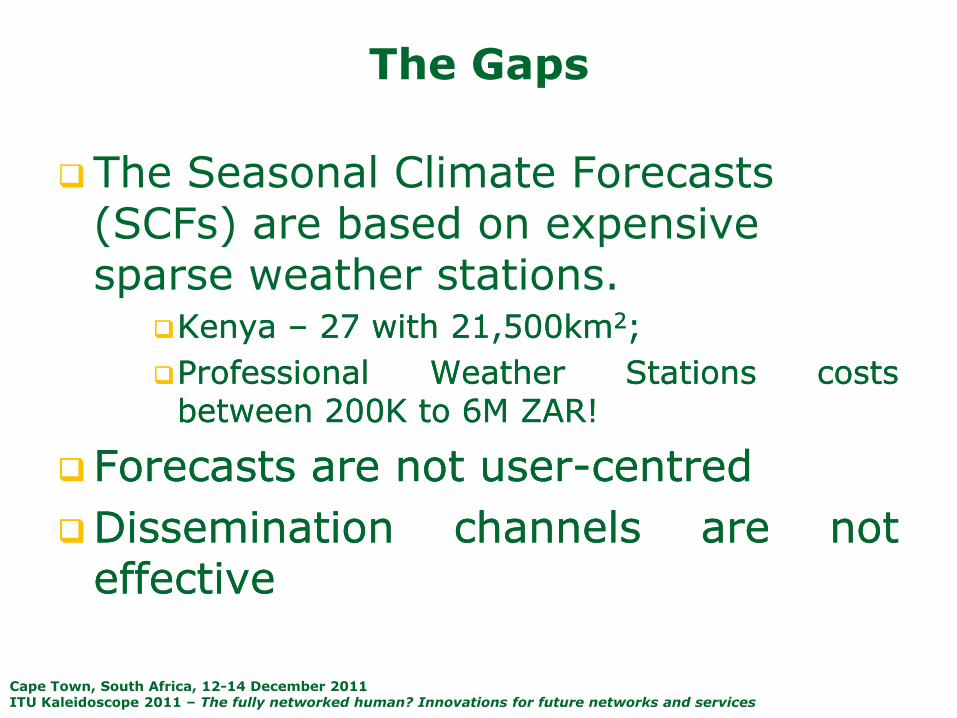
The Gaps
The Seasonal Climate Forecasts (SCFs) are based on expensive sparse weather stations.
KenyaKenya –– 2727 withwith 2121,,500500kmkm22;;
ProfessionalProfessional WeatherWeather StationsStations costscosts betweenbetween 200200KK toto 66MM ZAR!ZAR!
ForecastsForecasts areare notnot useruser--centredcentred
DisseminationDissemination channelschannels areare notnot effectiveeffective
Cape Town, South Africa, 12-14 December 2011 ITU Kaleidoscope 2011 – The fully networked human? Innovations for future networks and services
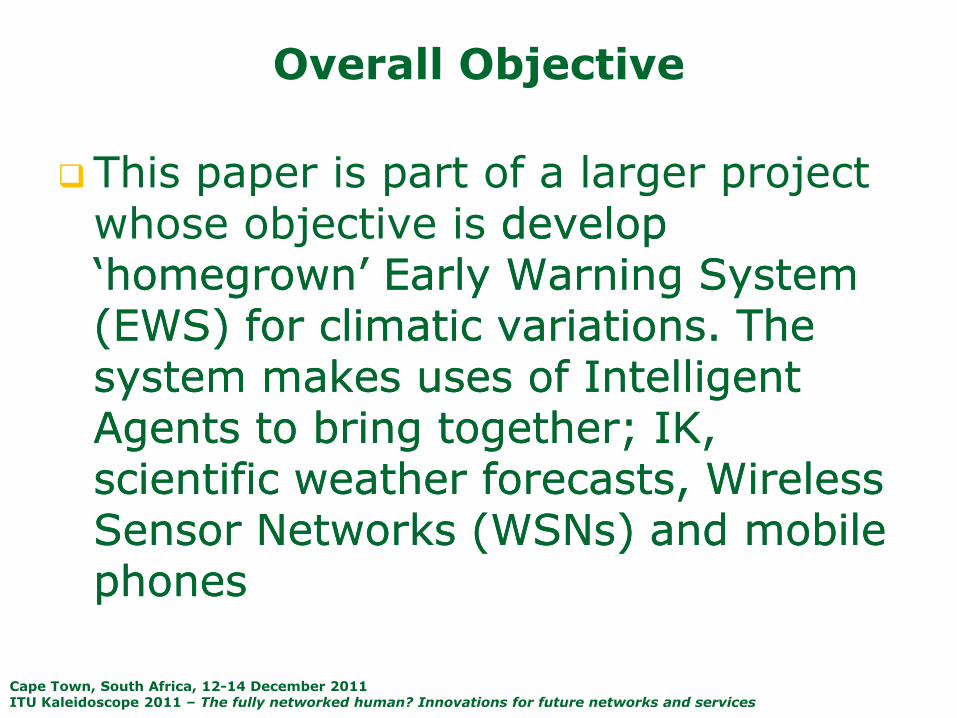
Overall Objective
This paper is part of a larger project whose objective is develop develop ‘homegrown’ Early Warning System ‘homegrown’ Early Warning System (EWS) for climatic variations. The (EWS) for climatic variations. The system makes uses of Intelligent system makes uses of Intelligent Agents to bring together; IK, Agents to bring together; IK, scientific weather forecasts, Wireless scientific weather forecasts, Wireless Sensor Networks (WSNs) and mobile Sensor Networks (WSNs) and mobile phones phones
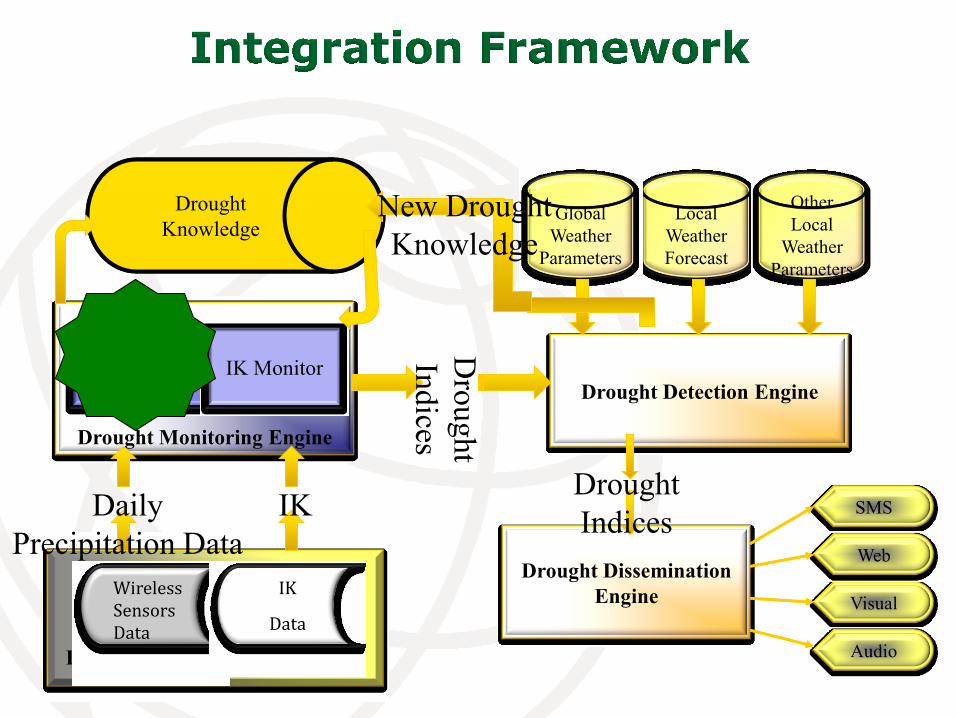
Drought Risk Knowledge Engine
Wireless Sensors Data
IK
Data
Drought Monitoring Engine
EDI Monitor IK Monitor Drought Detection Engine
Local
Weather
Forecast
Global
Weather
Parameters
Other
Local
Weather
Parameters
Drought
Knowledge
Dro
ught
Indices
Daily
Precipitation Data
IK
New Drought
Knowledge
Drought Dissemination
Engine
SMS
Visual
Web
Audio
Drought
Indices
Cape Town, South Africa, 12-14 December 2011 ITU Kaleidoscope 2011 – The fully networked human? Innovations for future networks and services
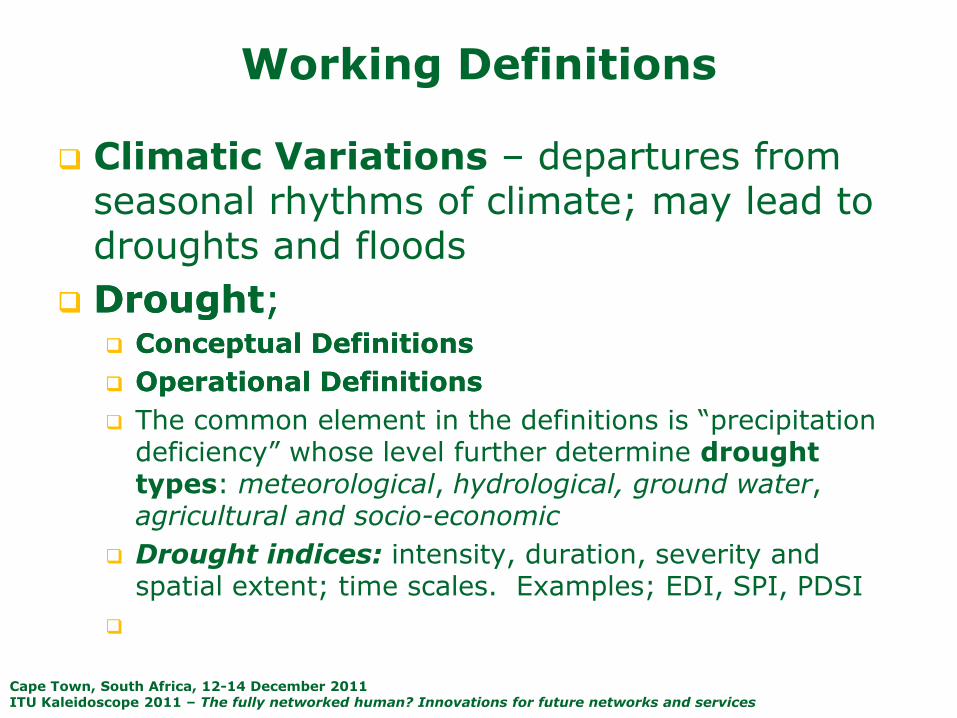
Working Definitions
Climatic Variations – departures from seasonal rhythms of climate; may lead to droughts and floods
DroughtDrought; ; Conceptual DefinitionsConceptual Definitions
Operational DefinitionsOperational Definitions
The common element in the definitions is “precipitation deficiency” whose level further determine drought types: meteorological, hydrological, ground water, agricultural and socio-economic
Drought indices: intensity, duration, severity and spatial extent; time scales. Examples; EDI, SPI, PDSI
Cape Town, South Africa, 12-14 December 2011 ITU Kaleidoscope 2011 – The fully networked human? Innovations for future networks and services
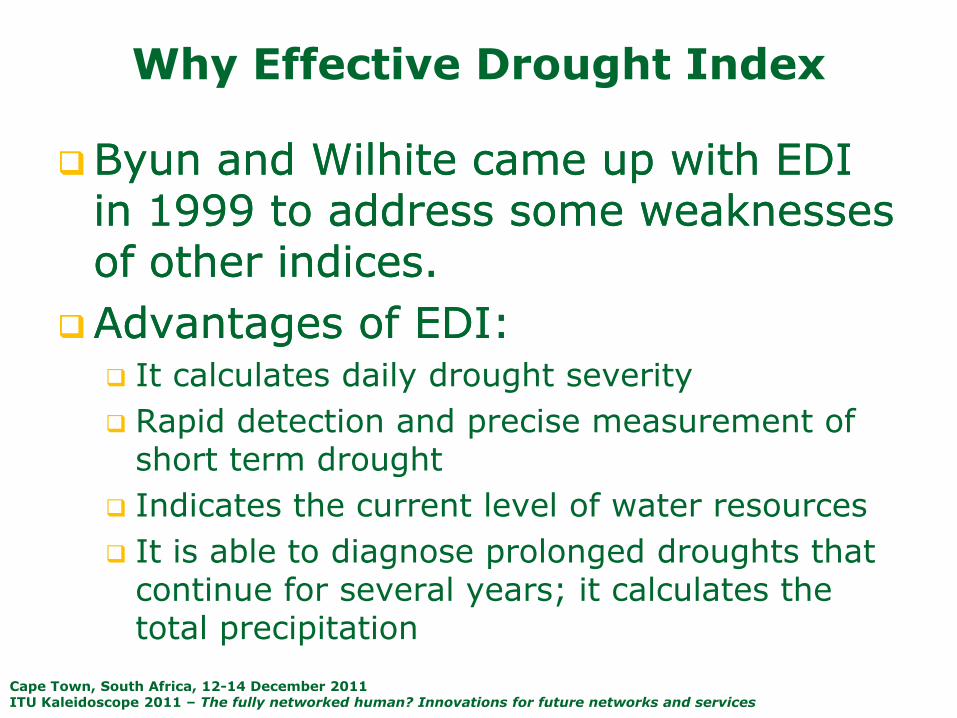
Why Effective Drought Index
ByunByun and and WilhiteWilhite came up with EDI came up with EDI in 1999 to address some weaknesses in 1999 to address some weaknesses of other indices. of other indices.
Advantages of EDI:Advantages of EDI: It calculates daily drought severity
Rapid detection and precise measurement of short term drought
Indicates the current level of water resources
It is able to diagnose prolonged droughts that continue for several years; it calculates the total precipitation
Cape Town, South Africa, 12-14 December 2011 ITU Kaleidoscope 2011 – The fully networked human? Innovations for future networks and services
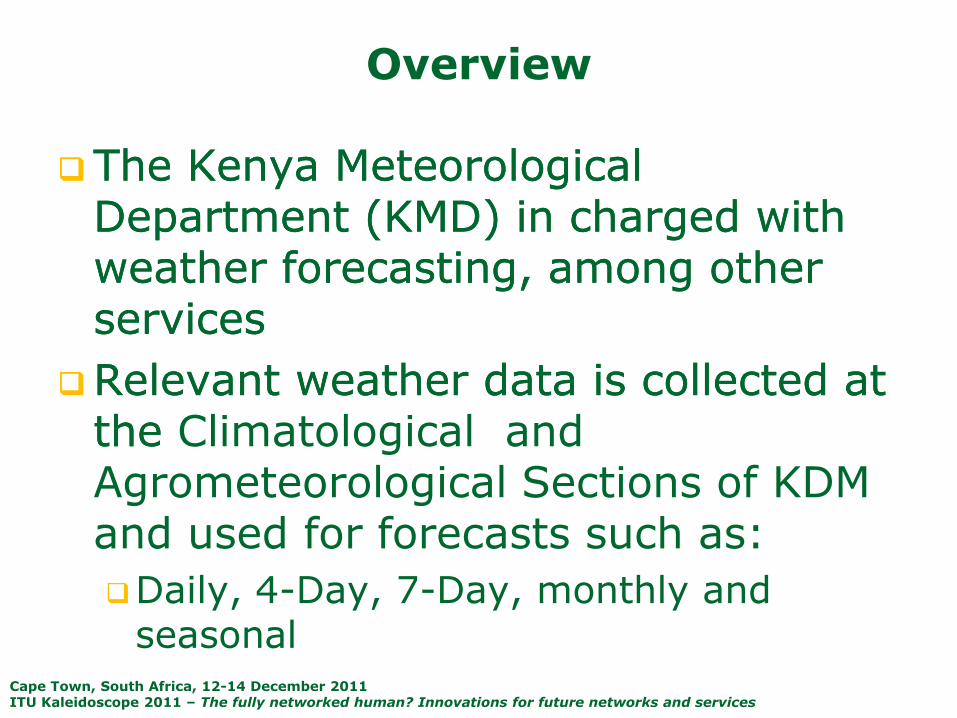
Overview
The Kenya Meteorological The Kenya Meteorological Department (KMD) in charged with Department (KMD) in charged with weather forecasting, among other weather forecasting, among other servicesservices
Relevant weather data is collected at Relevant weather data is collected at the the Climatological and Agrometeorological Sections of KDM and used for forecasts such as:
Daily, 4-Day, 7-Day, monthly and seasonal
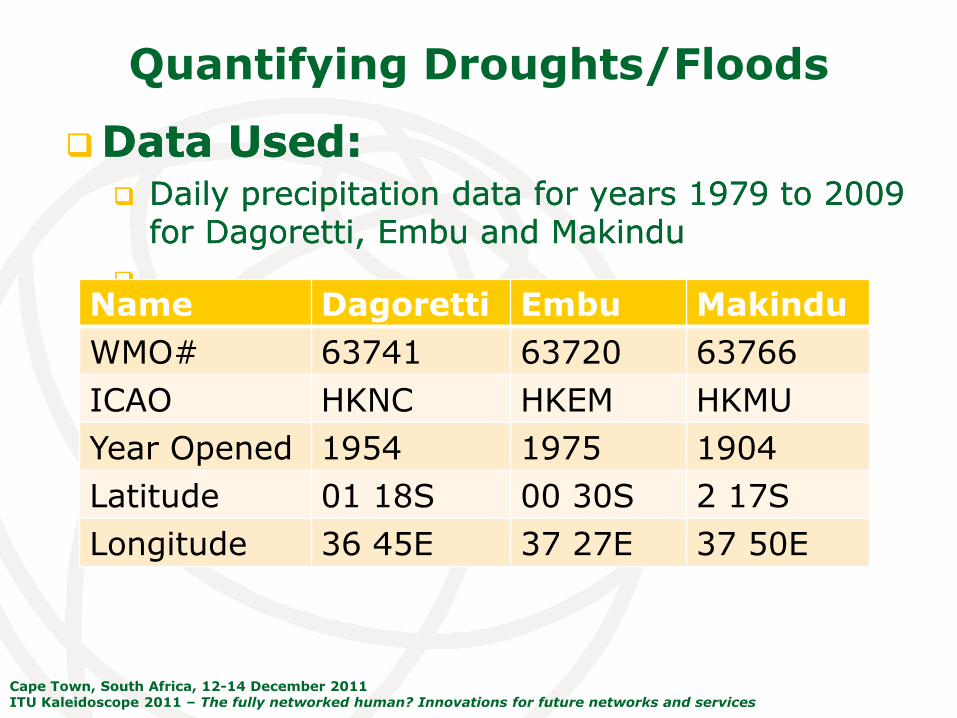
Quantifying Droughts/Floods
Cape Town, South Africa, 12-14 December 2011 ITU Kaleidoscope 2011 – The fully networked human? Innovations for future networks and services
DataData Used:Used: Daily precipitation data for years 1979 to 2009 Daily precipitation data for years 1979 to 2009
for Dagoretti, Embu and for Dagoretti, Embu and MakinduMakindu
Name Dagoretti Embu Makindu
WMO# 63741 63720 63766
ICAO HKNC HKEM HKMU
Year Opened 1954 1975 1904
Latitude 01 18S 00 30S 2 17S
Longitude 36 45E 37 27E 37 50E
Quantifying Droughts/Floods
Cape Town, South Africa, 12-14 December 2011 ITU Kaleidoscope 2011 – The fully networked human? Innovations for future networks and services
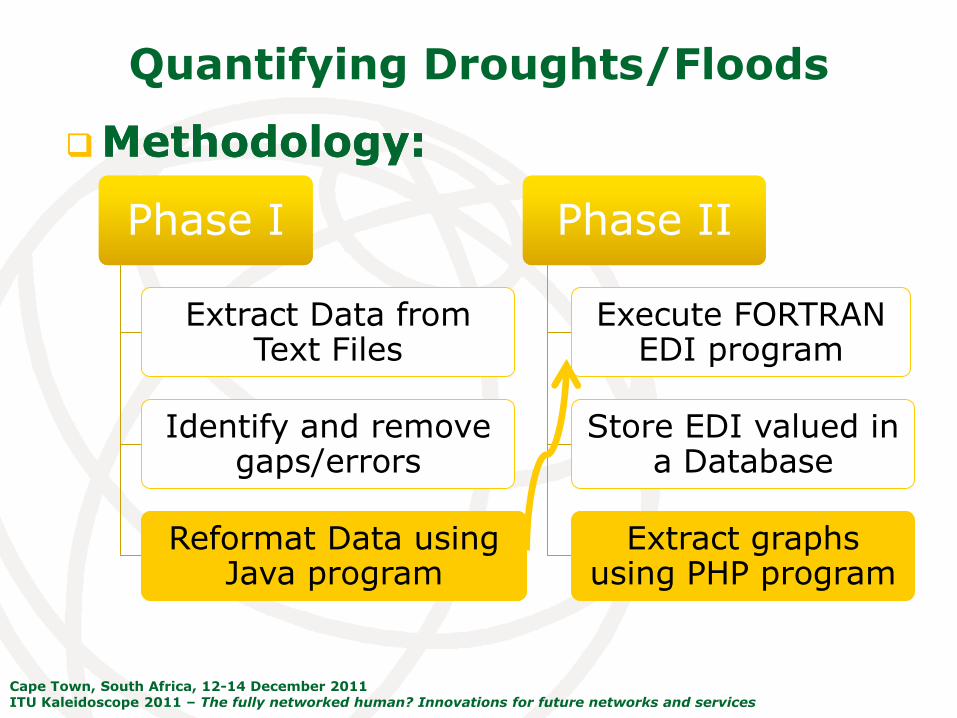
MethodologyMethodology::
Phase I Phase I
Extract Data from Text Files
Identify and remove gaps/errors
Reformat Data using Java program
Phase II Phase II
Execute FORTRAN EDI program
Store EDI valued in a Database
Extract graphs using PHP program
Quantifying Droughts/Floods
Cape Town, South Africa, 12-14 December 2011 ITU Kaleidoscope 2011 – The fully networked human? Innovations for future networks and services
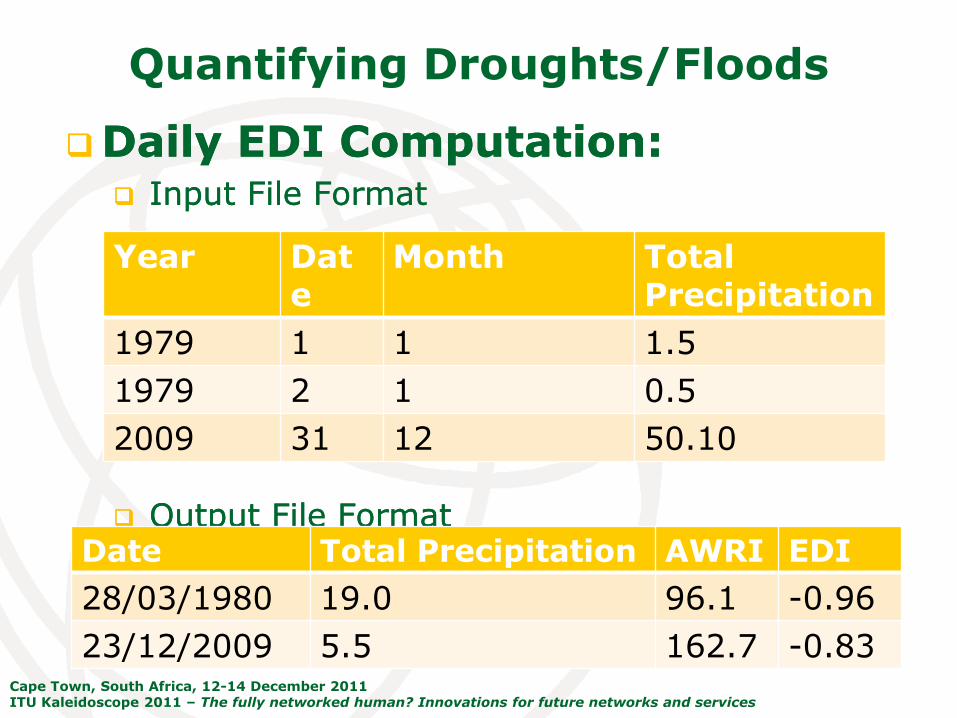
Daily EDIDaily EDI Computation:Computation: Input File FormatInput File Format
Output File FormatOutput File Format
Year Date
Month Total Precipitation
1979 1 1 1.5
1979 2 1 0.5
2009 31 12 50.10
Date Total Precipitation AWRI EDI
28/03/1980 19.0 96.1 -0.96
23/12/2009 5.5 162.7 -0.83
Quantifying Droughts/Floods
Cape Town, South Africa, 12-14 December 2011 ITU Kaleidoscope 2011 – The fully networked human? Innovations for future networks and services
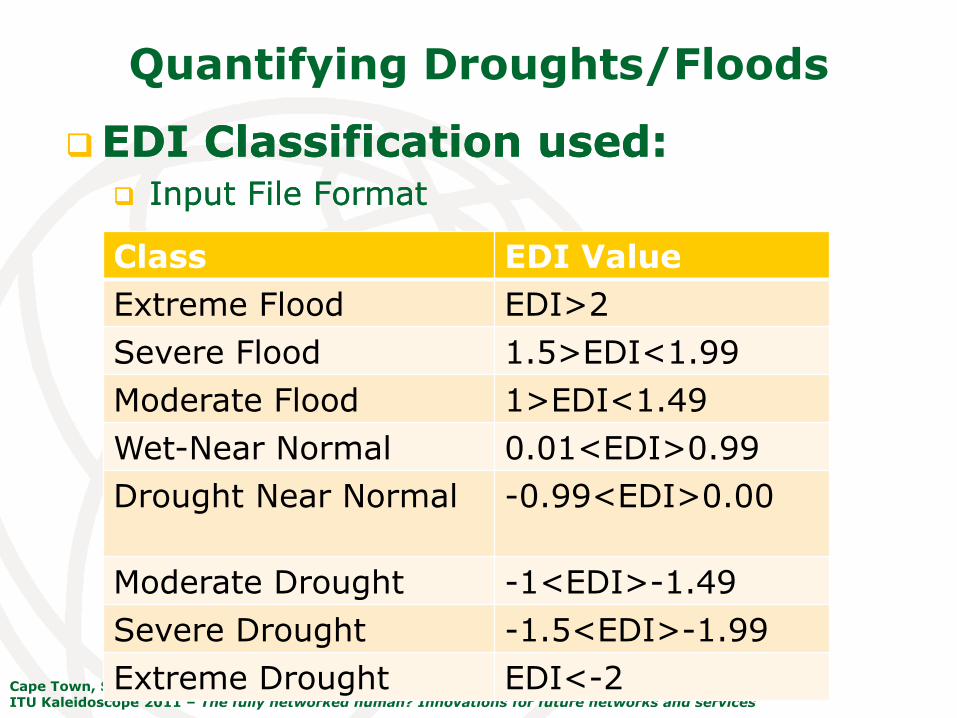
EDIEDI Classification used:Classification used: Input File FormatInput File Format
Class EDI Value
Extreme Flood EDI>2
Severe Flood 1.5>EDI<1.99
Moderate Flood 1>EDI<1.49
Wet-Near Normal 0.01<EDI>0.99
Drought Near Normal -0.99<EDI>0.00
Moderate Drought -1<EDI>-1.49
Severe Drought -1.5<EDI>-1.99
Extreme Drought EDI<-2
Results
Cape Town, South Africa, 12-14 December 2011 ITU Kaleidoscope 2011 – The fully networked human? Innovations for future networks and services
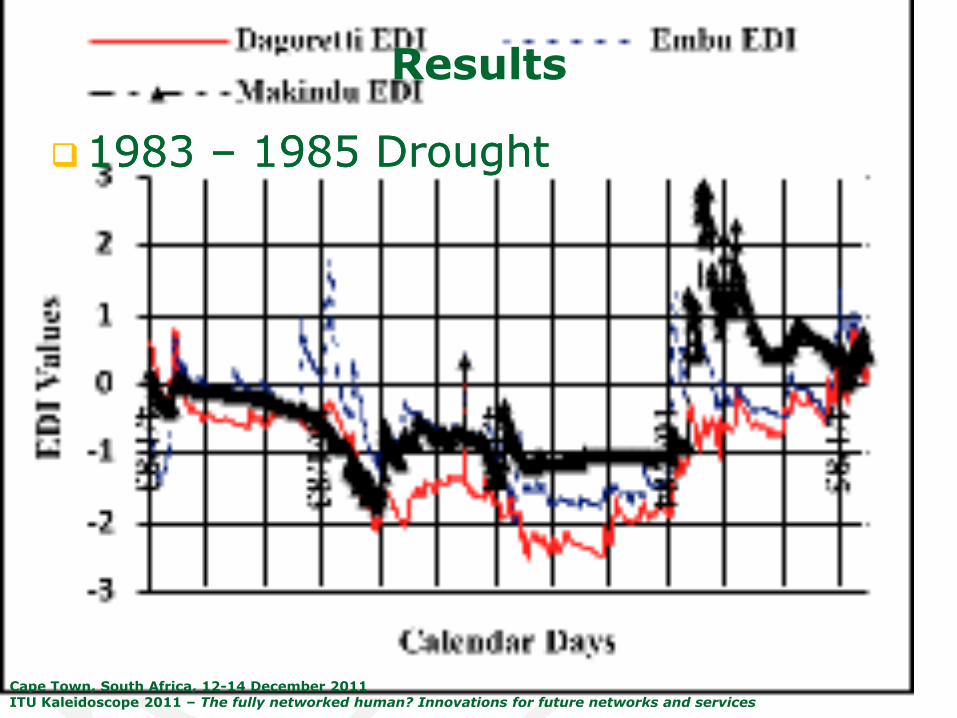
1983 1983 –– 1985 Drought1985 Drought
Results
Cape Town, South Africa, 12-14 December 2011 ITU Kaleidoscope 2011 – The fully networked human? Innovations for future networks and services
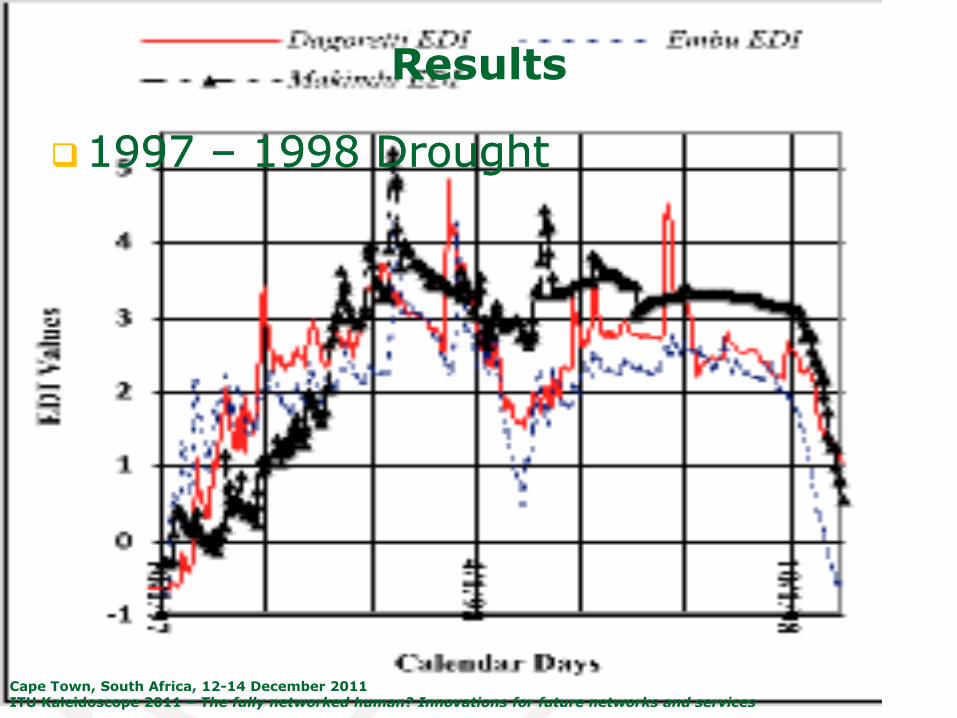
1997 1997 –– 1998 Drought1998 Drought
Results
Cape Town, South Africa, 12-14 December 2011 ITU Kaleidoscope 2011 – The fully networked human? Innovations for future networks and services
DiscussionDiscussion Drought was experienced in all the three regions
with Dagoretti leading with an average of -1.06 (compared to -0.49 and -0.33 for Embu and Makindu respectively)
Drought was worse in the November 1983 to November 1984 period
The graphs for Dagoretti and Embu have similar patterns
The October-November-December 1997 torrential rains triggered the floods. The March-April-May 1998 rains later worsened this
Web Based Decision Support System
Cape Town, South Africa, 12-14 December 2011 ITU Kaleidoscope 2011 – The fully networked human? Innovations for future networks and services
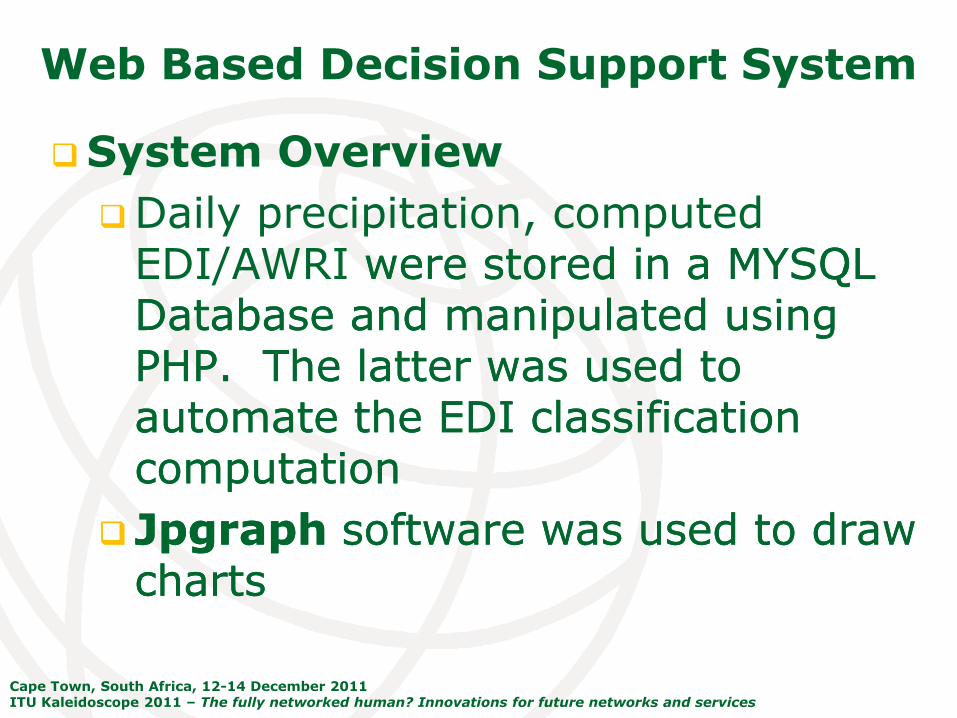
System Overview
Daily precipitation, computed EDI/AWRI were stored in a MYSQL were stored in a MYSQL Database and manipulated using Database and manipulated using PHP. The latter was used to PHP. The latter was used to automate the EDI classification automate the EDI classification computationcomputation
JpgraphJpgraph software was used to draw software was used to draw chartscharts
Cape Town, South Africa, 12-14 December 2011 ITU Kaleidoscope 2011 – The fully networked human? Innovations for future networks and services
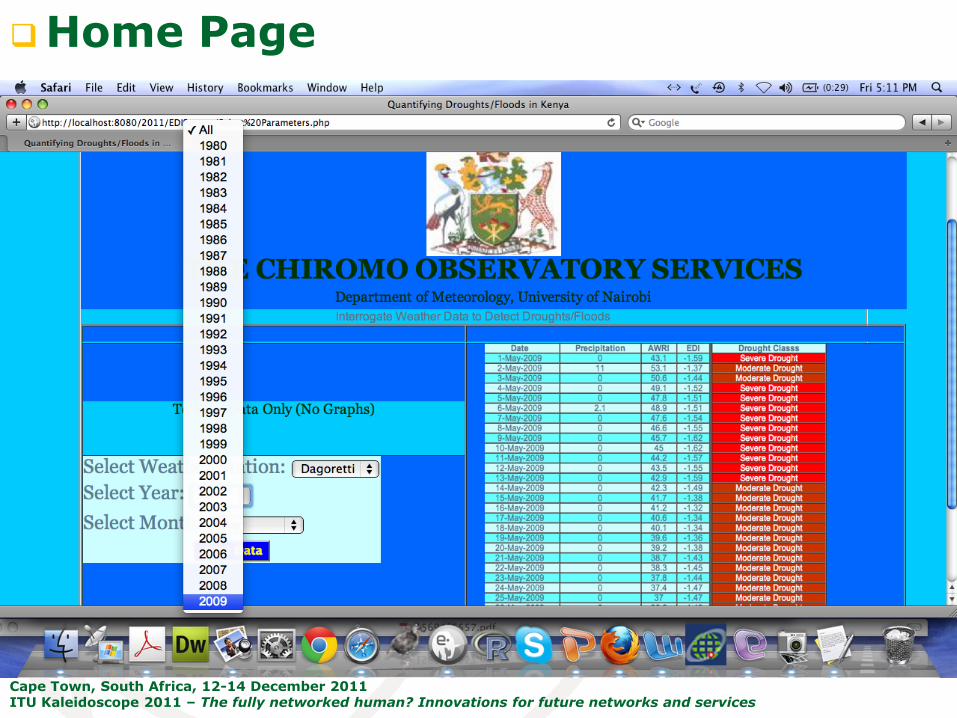
Home Page
Cape Town, South Africa, 12-14 December 2011 ITU Kaleidoscope 2011 – The fully networked human? Innovations for future networks and services
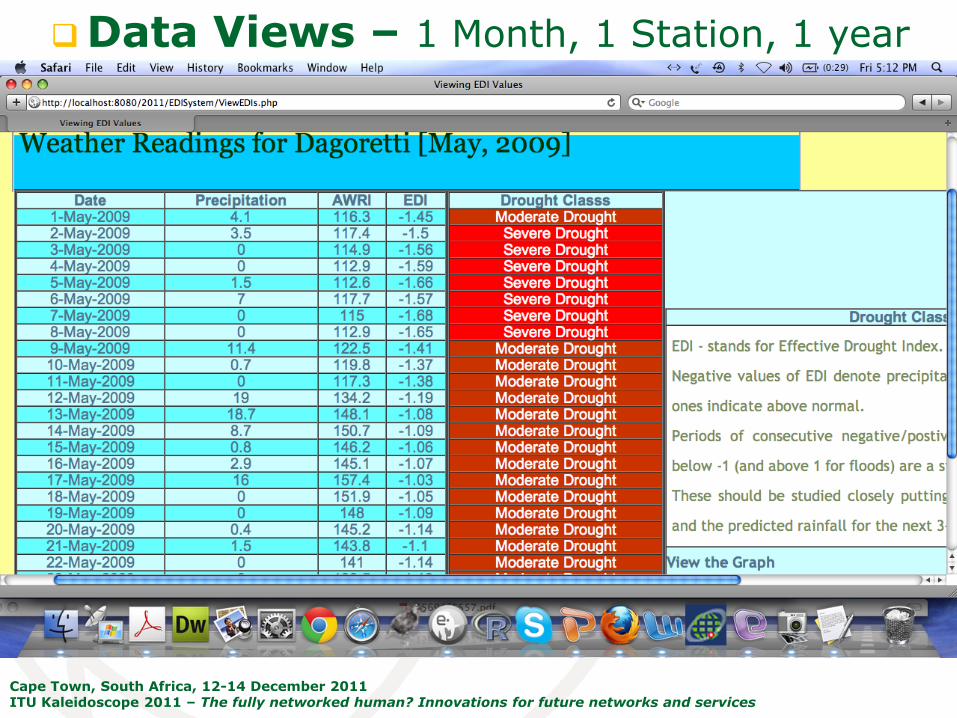
Data Views – 1 Month, 1 Station, 1 year
Cape Town, South Africa, 12-14 December 2011 ITU Kaleidoscope 2011 – The fully networked human? Innovations for future networks and services
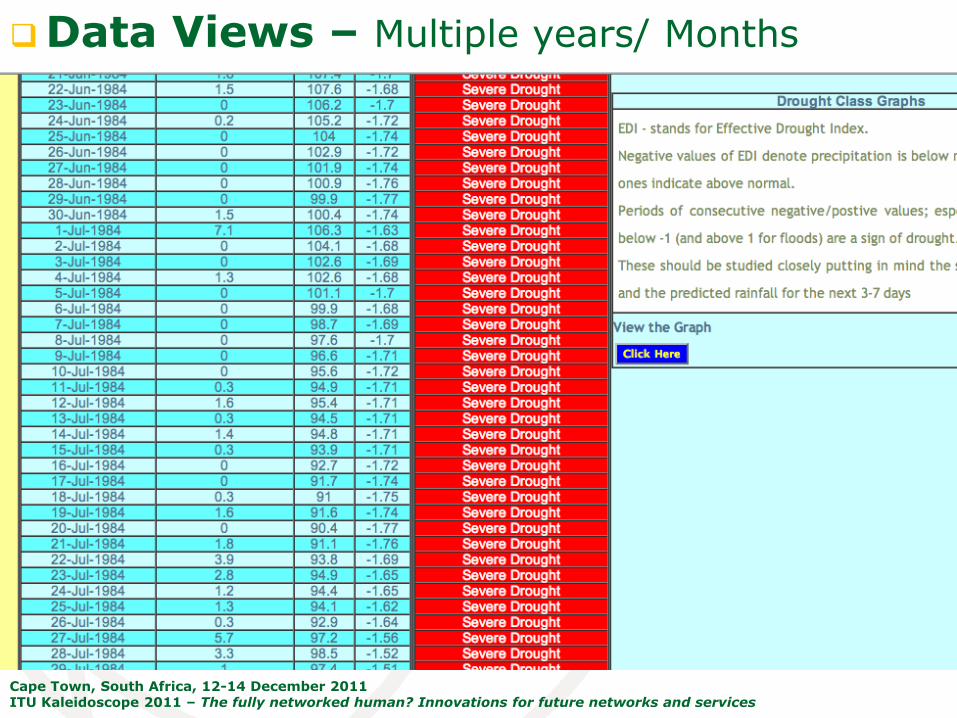
Data Views – Multiple years/ Months
Cape Town, South Africa, 12-14 December 2011 ITU Kaleidoscope 2011 – The fully networked human? Innovations for future networks and services
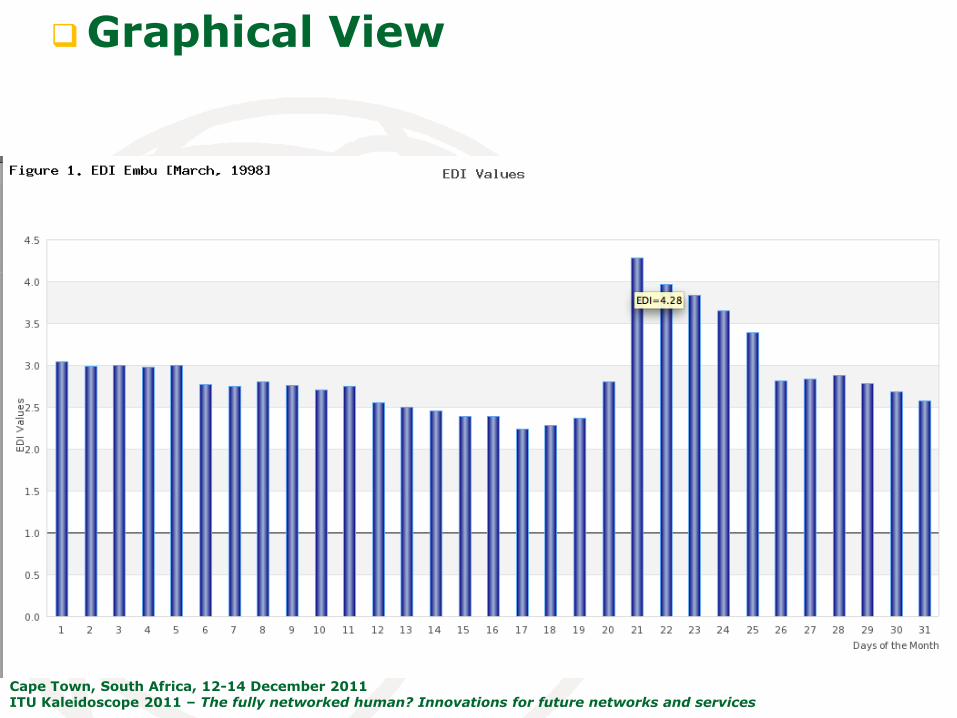
Graphical View
Cape Town, South Africa, 12-14 December 2011 ITU Kaleidoscope 2011 – The fully networked human? Innovations for future networks and services
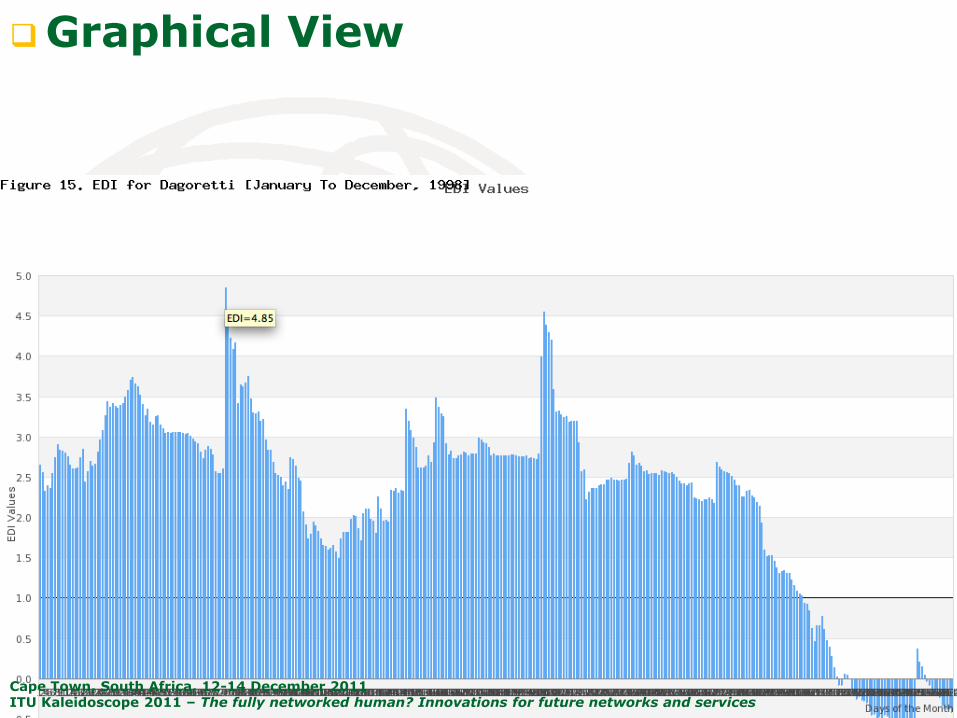
Graphical View
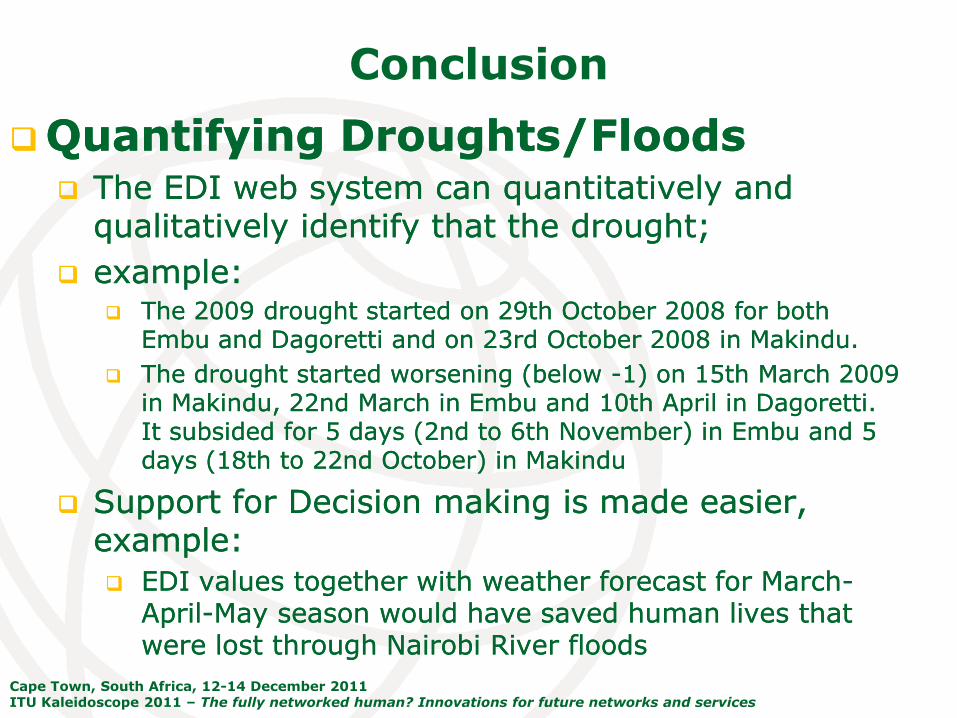
Conclusion
Cape Town, South Africa, 12-14 December 2011 ITU Kaleidoscope 2011 – The fully networked human? Innovations for future networks and services
QuantifyingQuantifying Droughts/FloodsDroughts/Floods TheThe EDI web system can EDI web system can quantitatively and quantitatively and
qualitatively identify that the qualitatively identify that the drought; drought;
example:example: The 2009 drought started on 29th October 2008 for both The 2009 drought started on 29th October 2008 for both
Embu and Dagoretti and on 23rd October 2008 in Makindu. Embu and Dagoretti and on 23rd October 2008 in Makindu.
The drought started worsening (below The drought started worsening (below --1) on 15th March 2009 1) on 15th March 2009 in Makindu, 22nd March in Embu and 10th April in Dagoretti. in Makindu, 22nd March in Embu and 10th April in Dagoretti. It subsided for 5 days (2nd to 6th November) in Embu and 5 It subsided for 5 days (2nd to 6th November) in Embu and 5 days (18th to 22nd October) in Makindudays (18th to 22nd October) in Makindu
Support for Decision making is made easier, Support for Decision making is made easier, example:example:
EDI EDI values together with weather forecast for Marchvalues together with weather forecast for March--AprilApril--May season would have saved human lives that May season would have saved human lives that were lostwere lost through Nairobi River floods through Nairobi River floods
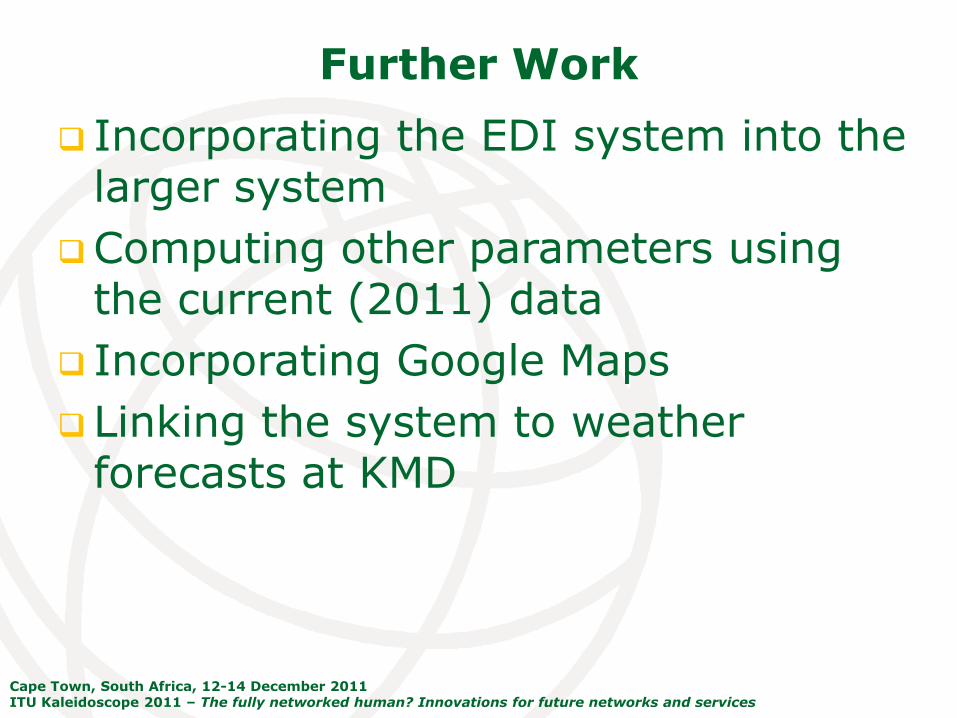
Further Work
Cape Town, South Africa, 12-14 December 2011 ITU Kaleidoscope 2011 – The fully networked human? Innovations for future networks and services
Incorporating the EDI system into the larger system
Computing other parameters using the current (2011) data
Incorporating Google Maps
Linking the system to weather forecasts at KMD
Cape Town, South Africa, 12-14 December 2011 ITU Kaleidoscope 2011 – The fully networked human? Innovations for future networks and services
END….
Cape Town, South Africa, 12-14 December 2011 ITU Kaleidoscope 2011 – The fully networked human? Innovations for future networks and services
Acknowledgement: KMD for allowing access to the weather data
Thank you
Q & A
Copyright © 2022 FDOKUMEN