The Role of Corporate Governance News: Evidence from Italy
22
Electronic copy available at: http://ssrn.com/abstract=1343631 1 The role of corporate governance news: evidence from Italy A. Carretta a , V. Farina a , F. Fiordelisi b,c, * , D. Martelli a , P. Schwizer d a. University of Rome Tor Vergata, Italy b. University of Rome III, Italy c. Essex Finance Centre, University of Essex, UK d. University of Parma, Italy Abstract Stock market prices reflect information on firms’ business environments, operations and, in general, firms’ fundamentals. Recently, various studies analyse the link between news coverage and stock prices showing that mass media has a significant impact on financial markets. This paper analyse the interactions between the mass media and the stock market focussing on corporate governance news release. By using a large sample of corporate governance news released between 2003 and 2007, we examine the link between abnormal stock returns and corporate governance news. We find evidence that stock returns are influenced by the semantic content of corporate governance news, by firm performance and health and by the interaction of these variables. JEL classification: G14, G34 Keywords: Corporate governance; shareholder value; event study; text analysis * Corresponding author: University of Rome III, Faculty of Economics, Via S. D’Amico 77, 00145 Rome, Italy, telephone: +39 06 57335967, fax. +39 06 57335797, e-mail: [email protected]
-
Upload
independent -
Category
Documents
-
view
0 -
download
0
Transcript of The Role of Corporate Governance News: Evidence from Italy
Electronic copy available at: http://ssrn.com/abstract=1343631
1
The role of corporate governance news:
evidence from Italy
A. Carrettaa, V. Farinaa, F. Fiordelisib,c, * , D. Martellia, P. Schwizerd
a. University of Rome Tor Vergata, Italy
b. University of Rome III, Italy
c. Essex Finance Centre, University of Essex, UK
d. University of Parma, Italy
Abstract
Stock market prices reflect information on firms’ business environments, operations and, in general,
firms’ fundamentals. Recently, various studies analyse the link between news coverage and stock
prices showing that mass media has a significant impact on financial markets. This paper analyse
the interactions between the mass media and the stock market focussing on corporate governance
news release. By using a large sample of corporate governance news released between 2003 and
2007, we examine the link between abnormal stock returns and corporate governance news. We
find evidence that stock returns are influenced by the semantic content of corporate governance
news, by firm performance and health and by the interaction of these variables.
JEL classification: G14, G34
Keywords: Corporate governance; shareholder value; event study; text analysis
* Corresponding author: University of Rome III, Faculty of Economics, Via S. D’Amico 77, 00145 Rome, Italy,
telephone: +39 06 57335967, fax. +39 06 57335797, e-mail: [email protected]
Electronic copy available at: http://ssrn.com/abstract=1343631
2
THE ROLE OF CORPORATE GOVERNANCE NEWS:
EVIDENCE FROM ITALY
1. Introduction
Market efficiency is based on the principle that asset prices reflect all relevant information.
According to the type of information captured by stock prices, Fama (1970) distinguish three forms
of efficiency: the “weak-form” (i.e. stock prices reflect all information about historical prices),
“semi-strong form” (i.e. stock prices catch all publicly available information) and “strong form”
efficiency (i.e. the stock prices reflect all publicly and privately available information).
Various studies (Tetlcok, Saar-Tsechansky, Mackassy, 2008; Tetlock, 2007; Antweiler, Frank, 2004;
Coval, Shumway, 2001) analysed the link between news coverage and stock prices showing that
mass media has a significant impact on financial markets. However, these studies do not provide
unambiguous evidence “whether” and “how” mass media amplifies or simply reflects investors’
expectation of stock market performance. The relationship between governance and mass media
has so far been treated only marginally in the literature and always in relation to the content of
information, ignoring the roles of channels and modes of communication (Dyck, Volchkova,
Zingales, 2008; Ellstrand, Dalton and Dalton, 2005).
Over the last decade, several factors (such as corporate scandals, regulatory reforms, corporate
crises etc.) have contributed to turn and raise the debate on corporate governance, to which the
mass media has given increasing importance. It is a widespread belief that good governance
increases the reliability, transparency and integrity of corporate events resulting in more valuable
firm, lowering cost of capital and increasing competitiveness (Bebchuk, Cohen, Ferrell, 2009;
Fiordelisi and Molyneux, 2009; El Mir, Seboui, 2008; Carretta, Farina, Schwizer, 2007; Lehn, Patra,
Zhao, 2007; Cremers, Nair, 2005; Klock, Mansi, Maxwell, 2005; Gompers, Ishii, Metrick, 2003).
This paper analyse the interactions between the mass media and the stock market focussing on
corporate governance news release. By using a large sample of corporate governance news released
between 2003 and 2007, we examine the link between abnormal stock returns and corporate
governance news. Our study focuses on the Italian market since during this period important
reforms regarding corporate governance have succeeded and this topic has been at the centre of the
public debate on mass media.
The contribution of our paper is manifold. First, our analysis accounts for the possibility (hitherto
neglected by other studies) that investors behaviour is influenced both by the value of governance
news (i.e. positive vs. negative) and the exposition of its tone (i.e. dramatized vs. soft). Second, we
consider the semantic content of corporate governance news, the corporate economic and financial
situations and their joint influence. Third, we analyze governance news based on a classification of
the types of news (i.e. news related to changes in the board of directors, to the board of directors
functioning, to firm’s ownership and other news). In order to use measures not affected by
“subjectivity” and hence obtain more accurate estimates of a large number of news items, we also
Electronic copy available at: http://ssrn.com/abstract=1343631
3
apply text analysis techniques to measure both the value (i.e. the semantic news meaning) and the
expositive tone (i.e. the strength exhibition of language in the news).
This paper is structured as follows. Section 2 reviews the related literature, section 3 outlines the
methodology, section 4 describes our sample, section 5 presents the results and conclusions are
drawn in section 6.
2. Theory and hypothesis
“The role of the media is to collect, select, certify and repackage information” (Dick, Volchkova and
Zingales, 2008, page. 1098). Mass media is an important source of information about firms’ values
since it plays two functions in financial markets (Deephouse, 2000) since it acts as: i) an
“information broker” by simply spreading information “passively” and ii) an “active participant”,
whose comments allow players operating in the market to better assess their investment choices.
Various studies (Tetlcok, Saar-Tsechansky, Mackassy, 2008; Tetlock, 2007; Antweiler, Frank, 2004;
Coval, Shumway, 2001) provide evidence of the existence of a statistically significant relationship
between the value (positive or negative) of news about firms and the impact on trading volumes,
yield and price volatility of their shares. These studies commonly posit that a small number of
investors directly observe firms’ activities, while most investors collect second hand information.
Tetlcok, Saar-Tsechansky and Mackassy (2008) find that variations in the indicators of profitability
and efficiency of market operations are function of the percentage of negative words in the news.
Moreover some news could have effects in a relatively short period and other news could have
effects in the medium and long term (such as news regarding core aspects of firm management).
Tetlock (2007) finds that high media pessimism predicts downward pressure on market prices
followed by a reversion to “fundamentals”, and unusually high or low pessimism predicts high
market trading volume. Antweiler and Frank (2004) do not find a statistically or economically
significant effect of positive messages on stock returns. However Antweiler and Frank (2004) find
evidence of relationships between message activity and trading volume and message activity and
return volatility. Similarly, Coval and Shumway (2001) establish that the ambient noise level in a
futures pit is linked to volume, volatility and depth but not returns.
Corporate governance news impacts on market reactions in two ways. First, based on agency
theory, it contributes to mitigate the effects of information asymmetry, helping to inform investors
on the behaviour of managers and to disclose problems within control mechanisms, with positive
effects on control costs (Jensen, Meckling, 1976; Fama, Jensen, 1983). Second, based on the theory of
social constructivism (Johnson, Ellstrand, Dalton, Dalton, 2005; Pollock, Rindova, 2003; Deephouse,
2000) governance news can contribute to the legitimacy of firms following comments based on the
comparison with standards commonly considered “good governance”.
4
Dyck, Volchkova and Zingales (2008) show that news about governance abuses increase the
pressure from investors and supervisory authorities. Johnson, Ellstrand, Dalton and Dalton (2005),
using event study, analyzed the impact of US firms’ board ratings published on “Business Week”
on stock returns. In an observation period ranging from 6 days prior to 9 days following the news
event, the publication of a favourable rating has positive impact (but significant only within 2 days
after) on the performance of the shares. The same authors also observed a mildly positive impact of
unfavourable ratings on returns before and after the event, considering this an issue worthy of
further investigations.
If literature provides important evidence that corporate governance news can influence the
behaviour of investors, no evidences exist on “how” content and ways of communication of this
news influence investor behaviour.
As shown by various cognitive studies (Baumeister, Bratslavsky, Finkenauer, Vohs, 2001; Rozin,
Royzman 2001; Fisk, Taylor, 1991; Brief, Motowidlo, 1986), a positive/negative news has a different
impact on people’ perception and negative news also produce a stronger impact on individuals
than positive ones.
Regarding ways of communication, the emotion aroused by news is likely to influence individuals’
behaviour (Reeve, 1992). Shoemaker and Reese (1996) argue that newspapers generally tend to put
certain emphasis in the news in order to make it more “engaging” to the public. As a consequence,
journalists may tend to “dramatize” news events in order to make their articles most interesting so
that they can maximize impact by making readers more attached to their writing style (Damton,
1975). This news’ dramatization increases readers’ involvement and provides more credit to the
content of items (Gibson, Zillmann, 1994).
Overall, linguistic communication seems to be a potentially important source of information about
firms’ values. A relevant question is: what are the effects of this dramatization on investors’
behaviour? In other terms, it is important to ask whether the communication (expositive tone high
or low) should not be investigated together with content (positive or negative value) for an
assessment of the effects of news on the behaviour of investors. In this perspective, our hypothesis
is:
H: The effects of corporate governance news on investors’ behaviour, measured by changes in the price of
shares, depend on both their value and expositive tone.
3. Methods
This section describes the research methods used in the paper. First, we outline the text analysis
methodology used to analyse the information contents of corporate governance news (sections 3.1),
we describe our event study employed to assess the new impact on stock market returns and,
finally, we present our econometric model to investigate the link between corporate news and stock
market returns.
5
3.1. Text analysis
Text analysis methodology (Stone, Dunphy, Smith, Ogilvie, 1966), engaged through the use of the
software Wordsmith 4 (Scott, 1999) of Oxford University, is instrumental in measuring the semantic
content of corporate governance news. This technique is justified by the need to provide measures
not affected by subjectivity of opinion and hence by the possibility of obtaining more accurate
classifications on a very large number of news.
We apply text analysis techniques to assess the value (positive/negative) and the expositive tone
(high/low) of corporate governance news by using the vocabulary Harvard IV Psycho - Social
(Kelly, Stone, 1975). Namely, these two items are estimated as follows (Osgood, Suci, Tannenbaum,
1957): 1) value is defined as the degree with which news have a positive or negative meaning. The
value of 1 means that corporate governance news has the highest positive value and the value -1
refers to the higher negative value; 2) expositive tone is defined as the degree with which news
express their meaning in a strong or weak manner. The value of 1 means that corporate governance
news has the strongest expositive tone, while the value of -1 means that corporate governance news
has lowest expositive tone. Scales are a way to deal with the content of some news on the basis of
the terms contained in it: value allows us to express the degree with which news are positive or
negative; power, instead, refers to the strength of the expositive tone of news. The representation of
the importance of the scales within the news is based on a formula like this: (X - Y) / (X + Y) where
X and Y are the number of terms contained in the dichotomous scale. The way to determine the
value of news is this: (P - N) / (P + N) where N and P are respectively the number of positive and
negative words in news, according to the classification given by the vocabulary Harvard IV Psycho
- Social. The value is obtained is comprised between -1 (completely negative news) and 1
(completely positive news). Similarly, the way to determine the strength of the expositive tone of
news is this: (S - W) / (S + W) where S and W are respectively the number of words contained in the
news that express strength or weakness, according to the classification given by the vocabulary
Harvard IV Psycho - Social. The value is obtained in this way is comprised between -1 (low
strength) and 1 (high strength exhibition).
3.2. Event study
Fama (1991) suggest that, if an abnormal return exists because the announcement of an event, the
market is inefficient. As such, we use an event methodology to analyse if the stock returns of firms
interested by corporate governance news display abnormal returns around the news date (t).
Similarly to previous studies (e.g. Tetlcok, Saar-Tsechansky, Mackassy, 2008; Tetlock, 2007;
Antweiler, Frank, 2004; Coval, Shumway, 2001), we posit that a small number of investors directly
observe firms’ activities, while most investors collect second hand information. As such, we assess
if the abnormal returns exists on the publication of the news on the “Il Sole 24 ore”, rather than on
the company’s announcement of the event.
6
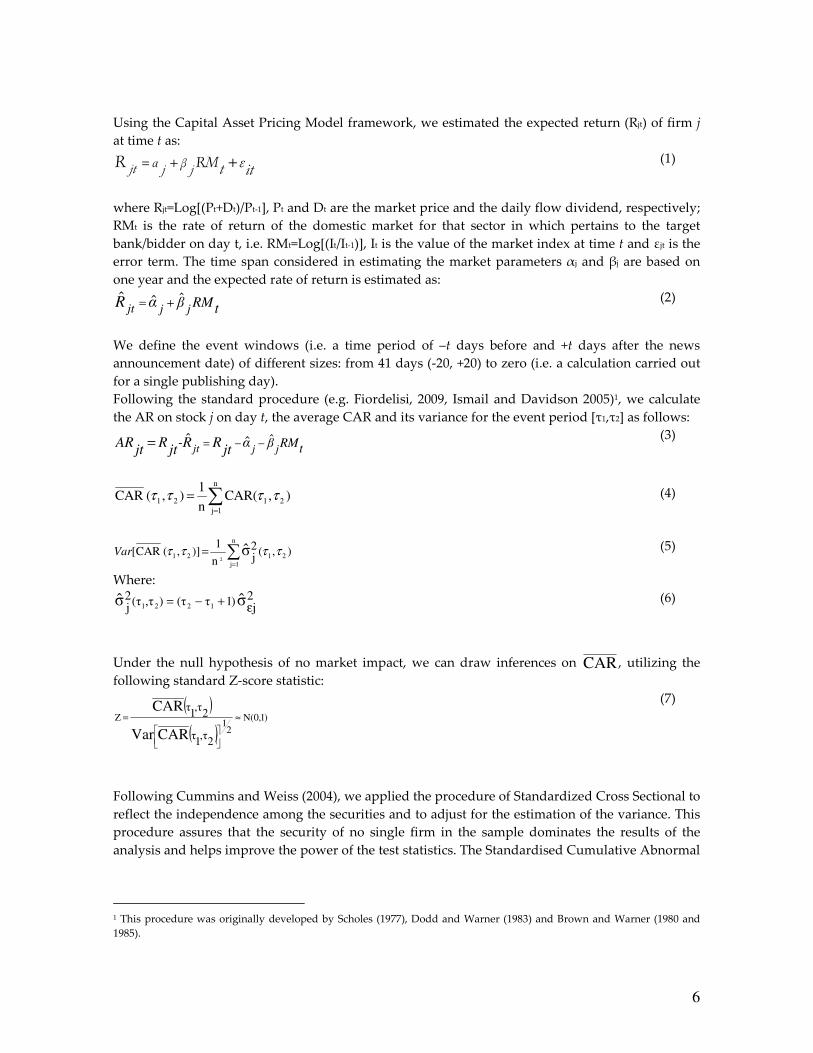
Using the Capital Asset Pricing Model framework, we estimated the expected return (Rjt) of firm j
at time t as:
itεtRM
jβ
jαjtR ++= (1)
where Rjt=Log[(Pt+Dt)/Pt-1], Pt and Dt are the market price and the daily flow dividend, respectively;
RMt is the rate of return of the domestic market for that sector in which pertains to the target
bank/bidder on day t, i.e. RMt=Log[(It/It-1)], It is the value of the market index at time t and εjt is the
error term. The time span considered in estimating the market parameters αj and βj are based on
one year and the expected rate of return is estimated as:
tRMβjjjt
αR ˆˆˆ += (2)
We define the event windows (i.e. a time period of –t days before and +t days after the news
announcement date) of different sizes: from 41 days (-20, +20) to zero (i.e. a calculation carried out
for a single publishing day).
Following the standard procedure (e.g. Fiordelisi, 2009, Ismail and Davidson 2005)1, we calculate
the AR on stock j on day t, the average CAR and its variance for the event period [τ1,τ2] as follows:
tRMβjjjt
αjt
RR-jt
Rjt
AR ˆˆˆ −−== (3)
∑=
=n
1j
2121 ),CAR(n
1 ),( CAR ττττ (4)
∑=
=n
1j
2121 ),(2jn
1 )],( CAR[ σ̂
2
ττττVar (5)
Where: 2j
)1τ(τ),τ(τ2j
σ̂σ̂ 1221 ε+−= (6)
Under the null hypothesis of no market impact, we can draw inferences on CAR , utilizing the
following standard Z-score statistic:
( )
( ))1,0N(
21
Z
2,τ
1τ
2,τ
1τ
CARVar
CAR≈
=
(7)
Following Cummins and Weiss (2004), we applied the procedure of Standardized Cross Sectional to
reflect the independence among the securities and to adjust for the estimation of the variance. This
procedure assures that the security of no single firm in the sample dominates the results of the
analysis and helps improve the power of the test statistics. The Standardised Cumulative Abnormal
1 This procedure was originally developed by Scholes (1977), Dodd and Warner (1983) and Brown and Warner (1980 and
1985).
7
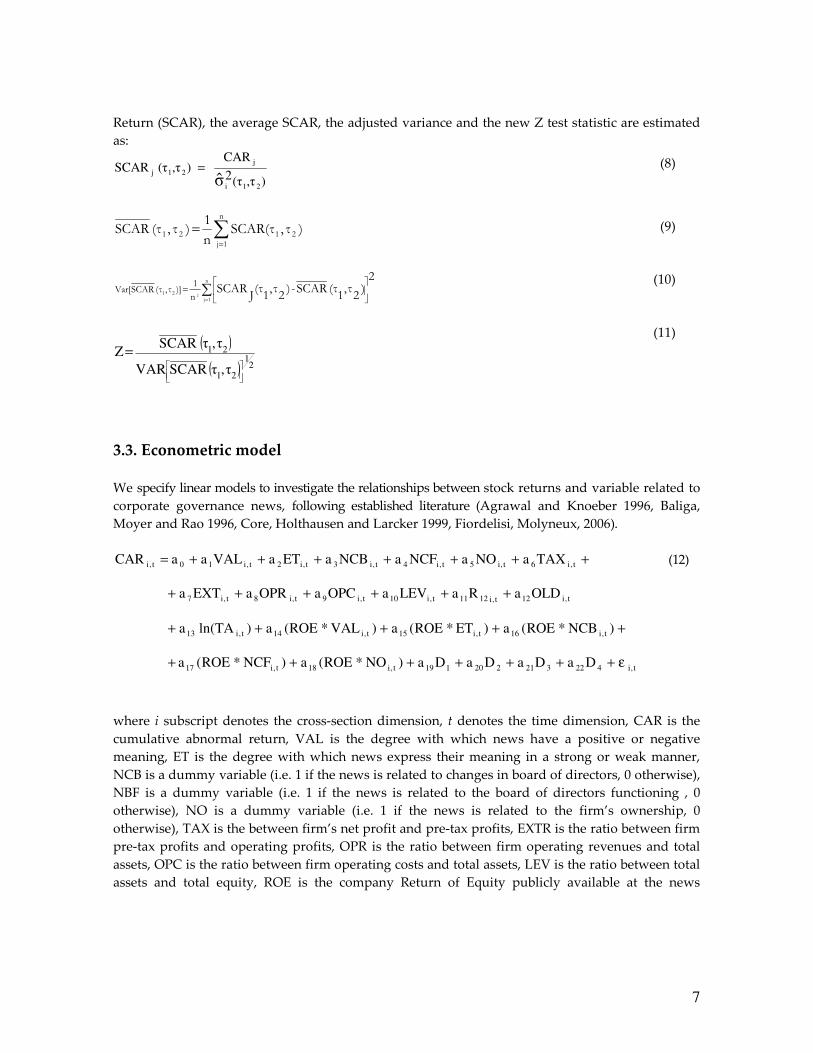
Return (SCAR), the average SCAR, the adjusted variance and the new Z test statistic are estimated
as:
),τ(τ2
CAR ) ,τ (τSCAR
21i
j
21j
σ̂= (8)
∑=
=n
1j
2121 )τ,SCAR(τn
1 )τ,(τ SCAR (9)
∑=
=
n
1j
21
2)2τ,
1(τ SCAR-)
2τ,
1(τJ
SCAR2n
1 )]τ,(τ SCARVar[
(10)
( )
( ) 21
21
21
τ,τSCARVAR
τ,τSCARZ
=
(11)
3.3. Econometric model
We specify linear models to investigate the relationships between stock returns and variable related to
corporate governance news, following established literature (Agrawal and Knoeber 1996, Baliga,
Moyer and Rao 1996, Core, Holthausen and Larcker 1999, Fiordelisi, Molyneux, 2006).
t,i422321220119t,i18t,i17
t,i16t,i15t,i14t,i13
t,i12t,i1211t,i10t,i9t,i8t,i7
t,i6t,i5t,i4t,i3t,i2t,i10t,i
DaDaDaDa)NO*ROE(a)NCF*ROE(a
)NCB*ROE(a)ET*ROE(a)VAL*ROE(a)TAln(a
OLDaRaLEVaOPCaOPRaEXTa
TAXaNOaNCFaNCBaETaVALaaCAR
ε+++++++
+++++
++++++
+++++++=
(12)
where i subscript denotes the cross-section dimension, t denotes the time dimension, CAR is the
cumulative abnormal return, VAL is the degree with which news have a positive or negative
meaning, ET is the degree with which news express their meaning in a strong or weak manner,
NCB is a dummy variable (i.e. 1 if the news is related to changes in board of directors, 0 otherwise),
NBF is a dummy variable (i.e. 1 if the news is related to the board of directors functioning , 0
otherwise), NO is a dummy variable (i.e. 1 if the news is related to the firm’s ownership, 0
otherwise), TAX is the between firm’s net profit and pre-tax profits, EXTR is the ratio between firm
pre-tax profits and operating profits, OPR is the ratio between firm operating revenues and total
assets, OPC is the ratio between firm operating costs and total assets, LEV is the ratio between total
assets and total equity, ROE is the company Return of Equity publicly available at the news
8
disclosure, OLD is the number of past corporate governance news published over the last 12
months, Di (i=1,2,3,4) are dummy variables for the year2, and ei,t is the random error term.
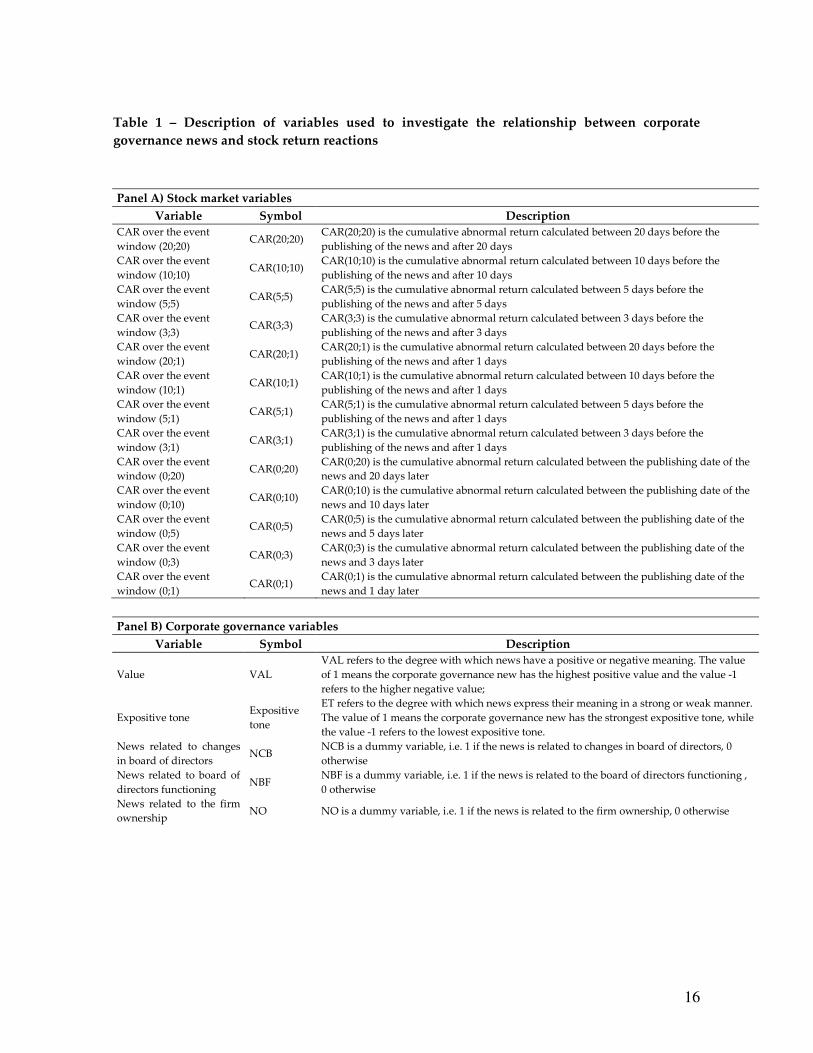
We consider three groups of variables (table 1). The first relates to variables dealing with corporate
governance: namely, we include various dummy variables capturing the “type” of news (e.g.
relating to changes in board of directors, to board of directors functioning, to firm’s ownership and
other governance news3). We also consider two variables estimated using the text analysing
referring to the value and the expositive tone of the news.
< INSERT TABLE 1 >
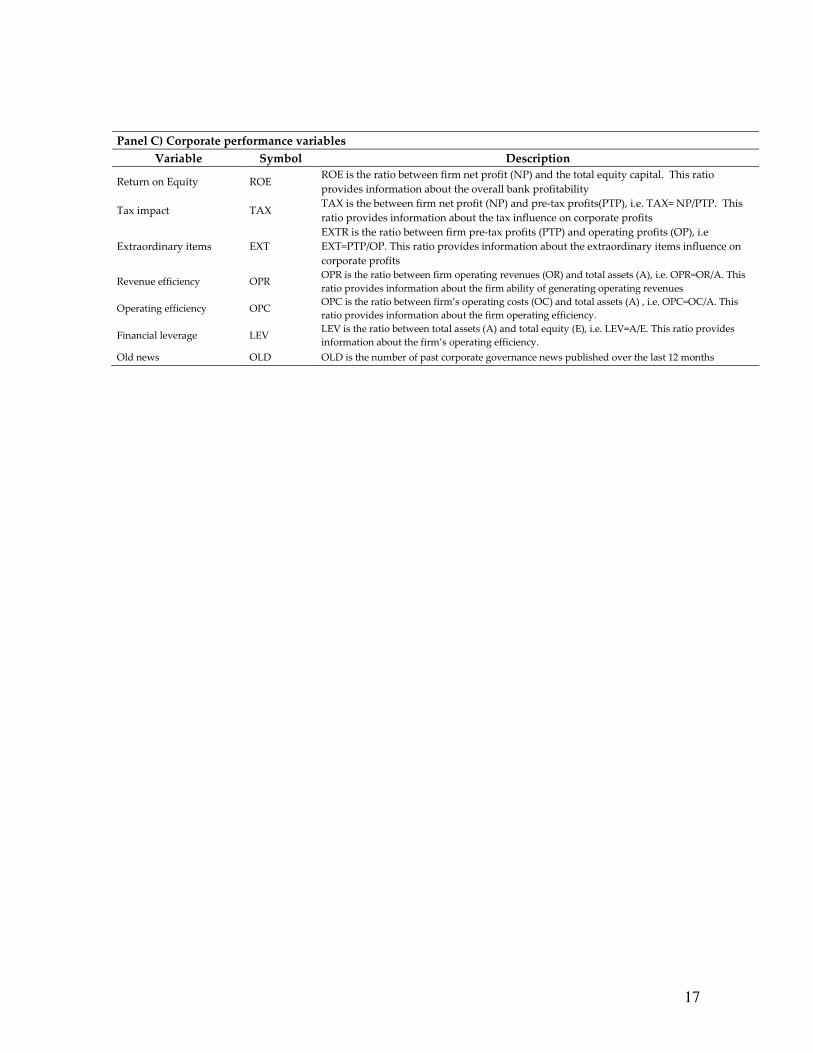
The second group of variables relates to firm performance. Namely, CARs are likely to be
influenced by firm’s performance. Rather than using a single performance indicator (e.g. the Return
on Equity), we include various variables to account for possible managerial factors influencing
performance obtained the following the Dupont’s five-part ROE decomposition4:
t,i
t,i
t,i
t,i
t,i
t,i
t,i
t,i
t,i
t,i
t,iE
Ax
A
OC
A
ORx
OP
PTPx
PTP
NPROE
−= (13)
where NP is net profit, PTP is pre-tax profits, OP is operating profits, OR is the total operating
revenues, OC is the total operating costs, A is total assets and E is the total equity capital. As a
consequence, the first ratio on the right side ratio (NP/PTP)
The third group considers variables obtained by multiplying corporate governance variables and
performance variables. These cross-variables recognise that firms’ stock returns are likely to be
influenced by corporate performance and health, by the semantic news contents and also by the
interaction of both factors.
4 Data description
Our sample includes corporate governance news topics of listed firms in the Italian Stock Exchange
market and published within “Il Sole 24 Ore” between 2003 and 2007. “Il Sole 24 Ore” is the most
influential financial newspaper in Italy (managed by the Confederation of Italian Industry
“Confindustria”) and the largest market share among financial newspaper5. All news of “Il Sole 24
Ore” were extracted from the database Factiva, which provides access to more than 10,000 sources
from newspapers, magazines, news agencies and information sites. In order to reduce the margins
of subjectivity in choosing the news, and then make replicable results, our classification of news
2 We consider four dummy variable for a 5 year period (i.e. 2002 is not included) to avoid multicollinearity problems. 3 This latter dummy variable is not included to avoid multicollinearity problems. 4 Since our sample comprises both financial and non-financial firms, the ROE decomposition used is slightly different from
the original one in order to keep consistency in the analysis among different firms. 5 Namely, 59% in terms of sold copies among Italian financial newspapers (source of data : Distribuzione Media Spa)
9
replicates the Factiva one. We define “governance news” all those falling in sub-categories
“Changes in Management” and “Corporate Governance / Investor Relations” within the broader
category “Corporate and Industrial News” of the Factiva database.
Regarding the event study analysis, for each news item, we calculate the daily return series of the
firm involved: stock market information was obtained from Datastream database. In order to
calculate the firm’s expected return, we used the following nine industry-benchmark indices: DJTM
Italy, DJTM Italy Automobiles, DJTM Italy Banks, DJTM Italy Electricity, DJTM Italy Insurance,
DJTM Italy Industrials, DJTM Italy Media, DJTM Italy Technology, DJTM Italy Telecom, DJTM
Italy Utilities.
Regarding firms’ financial ratios, we obtained data from Aida and Bankscope databases. Since
values come from different data sources, we take into consideration differences due to different
accounting principles (namely, from GAAP to IFRS) during the period analysed.
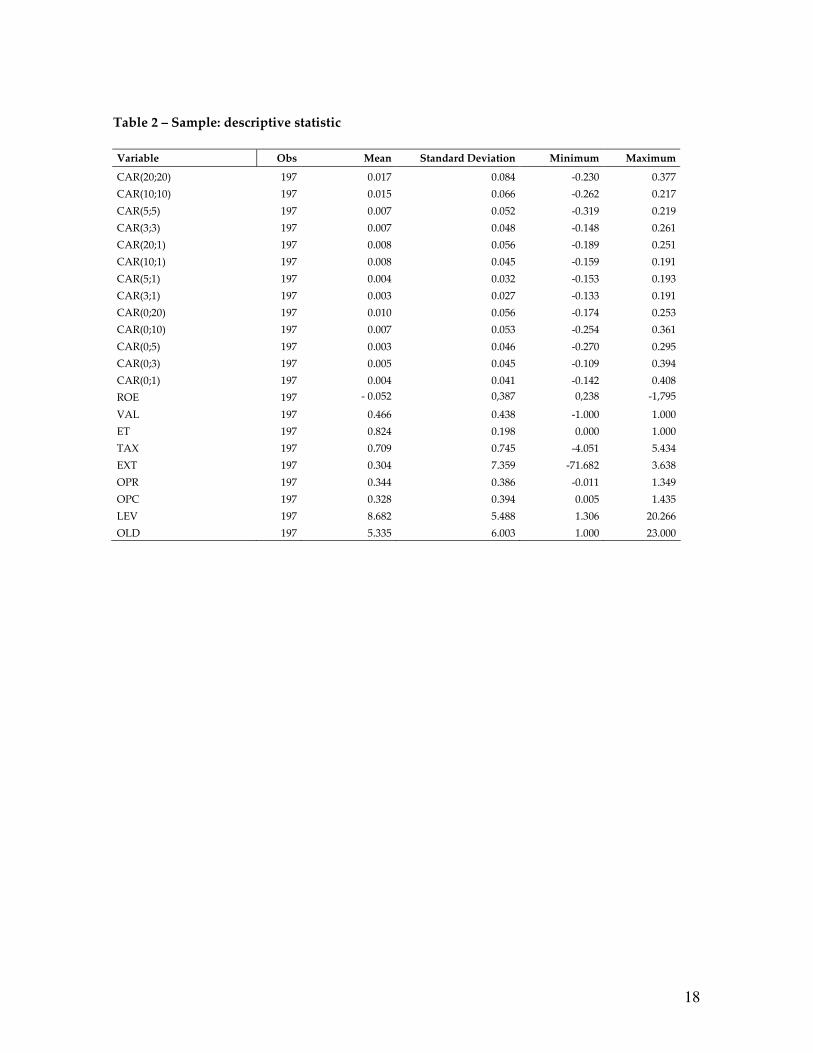
Table 2 reports some descriptive statistics for variable considered in the analysis. ROE displays a
negative mean value during that period analysed ranging from 23.8% (Mediaset in 2007) and -
179.5% (Alitalia in 2004). High standard deviations levels of tax and extraordinary items influence
on performance (TAX and EXT, respectively) are consistent with substantial accounting actions and
extraordinary operations made by Italian firms to smooth profits and losses. Revenues ability and
operating efficiency denote the ability of firms to generate value from their operating activities: in
particular both ratios show similar values in term of mean (0.343 the former and 0.328 the latter)
and standard deviations (38.5% and 39.3%). Finally the mean of financial leverage is extremely high
(over than 8.6). The highest level belongs to Generali, that in 2007 had a financial leverage equal to
20.26; on the other side, again in 2007, Fmr-Art’è shows the lowest level among all firms during that
period. Corporate governance news has usually a positive value and written with strong expositive
tones (i.e. the mean ET value is equal to 0.82).
< INSERT TABLE 2 >
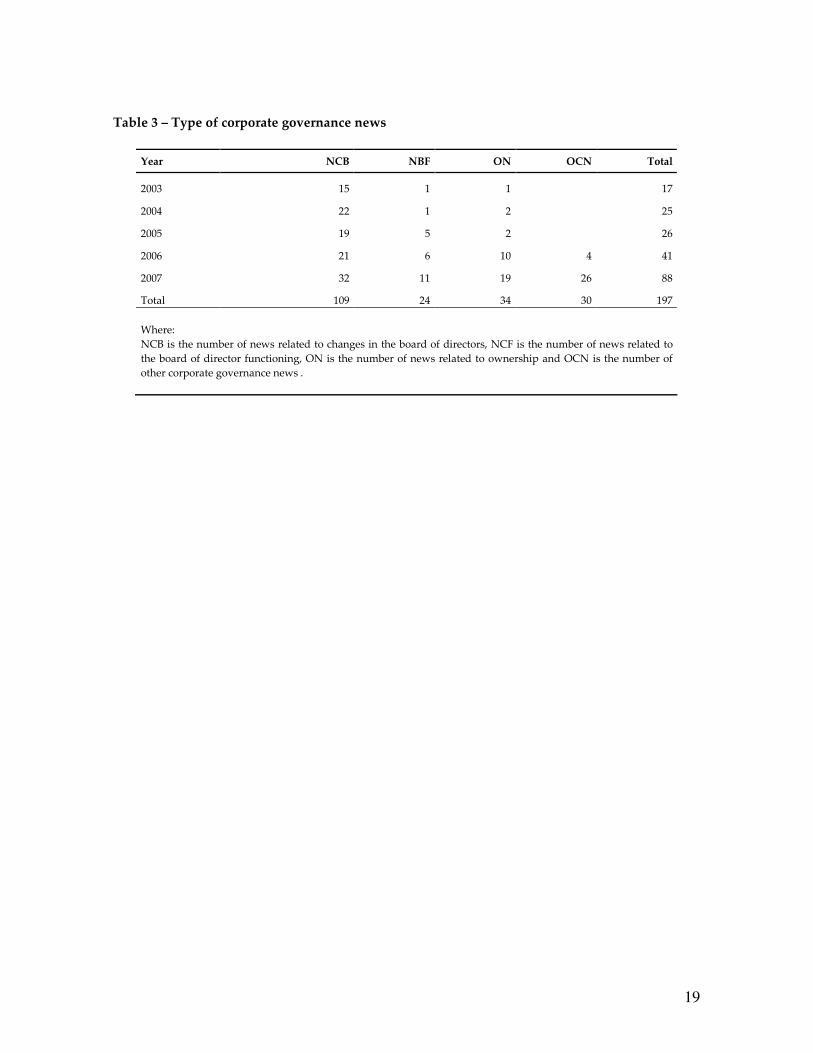
Table 3 summarises corporate governance news according to the “type” of news by distinguishing
news related to changes in the board of directors (NCB), news related to the board of director
functioning (NBF), news related to ownership (NO) and other corporate governance news (OCG).
The number of news related corporate governance has shown a strong upward trend during last
five years: the proportional increase is more than 400%, with a total number of governance news
items in 2007 close to 90. During the same period, changes in board news have represented the
main topic, with more than half of news talking about that. Starting from 2006, corporate
governance matters have become critical subjects also in Italians mass media; in fact, not only news
related to changes in board have been published but also ownership and board functioning subjects
have taken space in newspapers.
< INSERT TABLE 3 >
10
5. Results
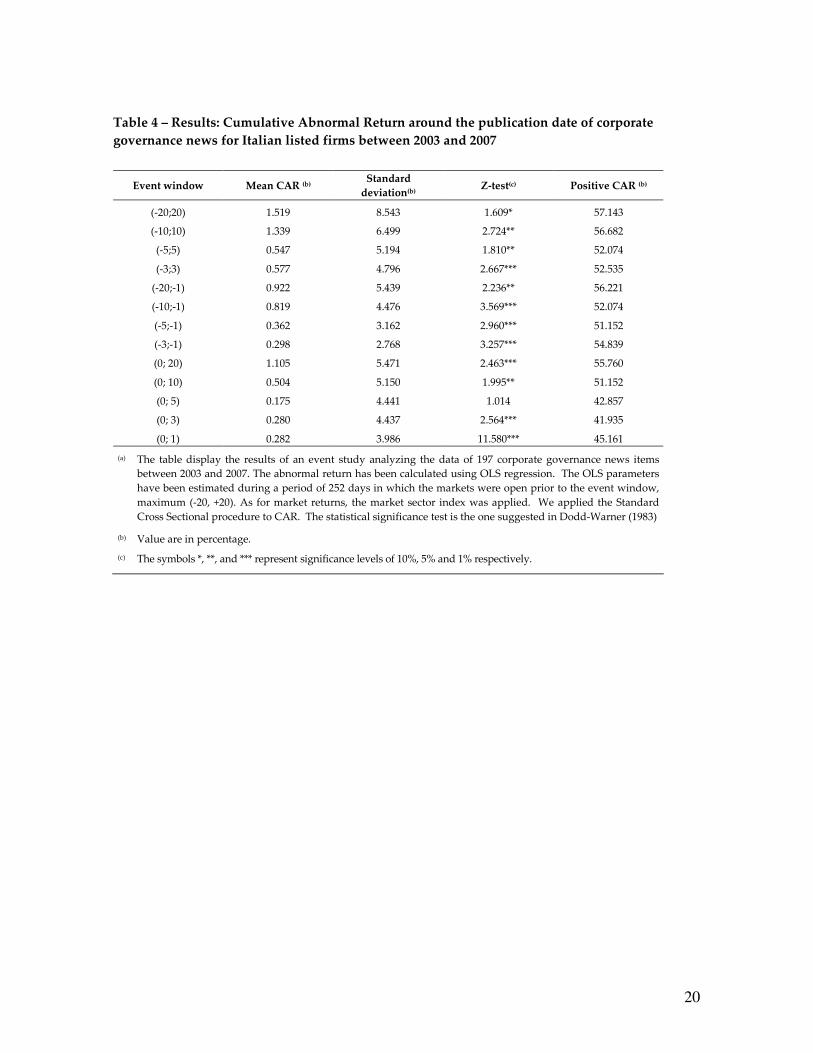
Table 4 displays the event study results obtained analyzing 197 corporate governance news items
for Italian listed firms published between 2003 and 2007. Percentage of positive CARs ranges
between 40% and 60%, showing substantial differences about stock return reactions to the news.
The results heterogeneity is consistent with the heterogeneity of corporate news included in the
sample. Focussing on symmetric event windows, mean CARs vary from 0.5% [in the event window
(-3,3)] and 1.5% [in the event window (-20,20)] and all results are statistically significant with the
10% confidence level or less. The percentage of positive CARs increases as the even windows
length increase ranging from 52.1% [in the event window (-3,3)] and 57.1% [in the event window (-
20,20)]. In order to assess if investors are able to anticipate news, we also select two set of event
windows, one preceding and the other following the news publishing date [respectively, (-20,-1), (-
10,-1), (-5,-1), (-3,-1) and (0,20), (0,10), (0,5), (0,3), (0,1)]. On average, we find positive CARs both
before and after the news publishing date and results obtained are statistically significant at the
10% confidence level or less. The percentage of CARs immediately after the news publishing date is
lower than 50%, while this percentage increases above 50% after 10 days from the news publication.
Despite all mean CARs estimates are positive (for all event windows analysed), we cannot conclude
that corporate governance news has a positive impact on firms’ stock returns. There is a substantial
heterogeneity of CAR estimates (e.g. in some event windows, the number of positive and negative
CARs is exactly equal) so that it is not possible to take cautions conclusions about the impact of
corporate governance news.
< INSERT TABLE 4 >
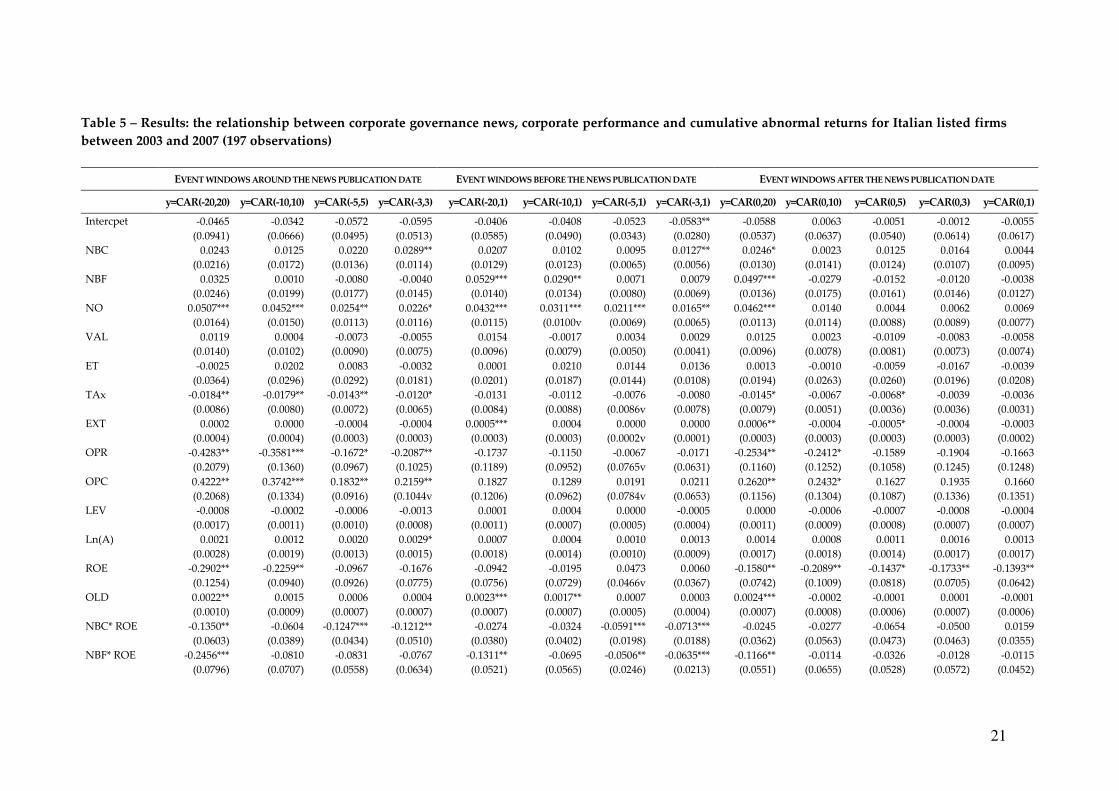
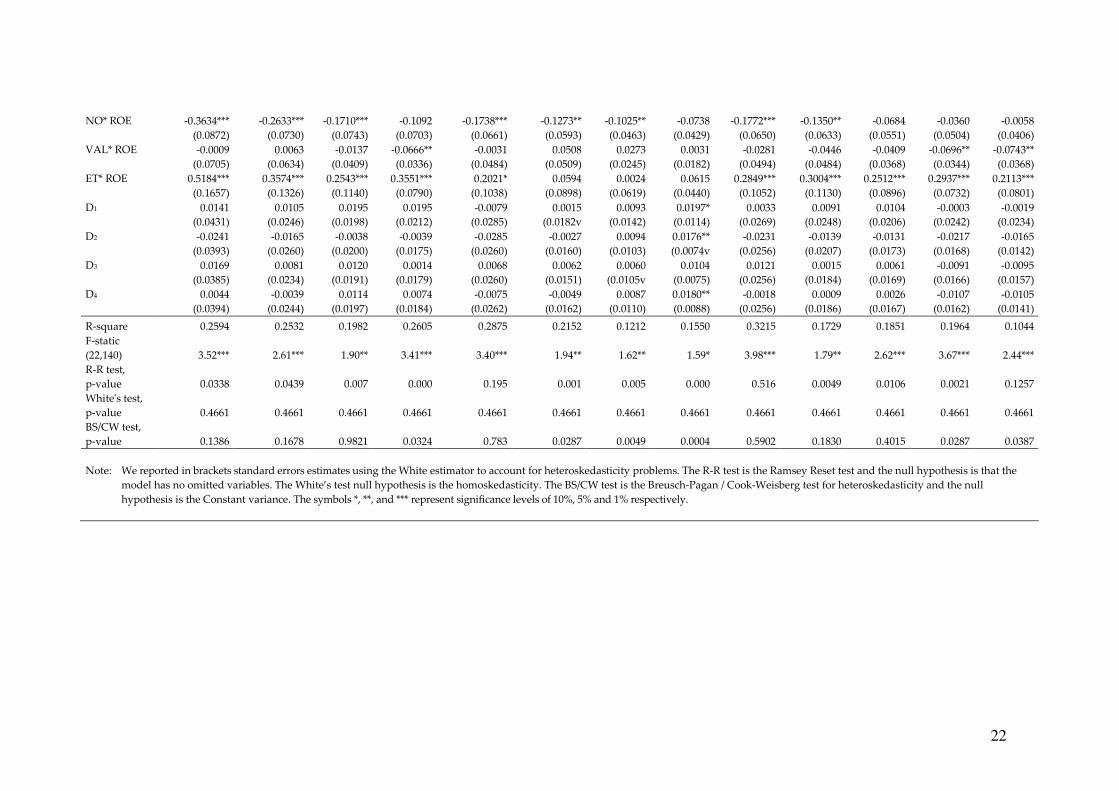
In order to assess the stock market reaction due to the semantic contents of news, corporate
performance and their interactions, table 5 reports results for our econometric model (1). First, we
observe that the Ramsey Reset test shows that, in most cases, it is possible to reject the null
hypothesis (at the 10% confidence level or less) that our models have no omitted variables:
although unpleasing, these results are largely expected since our aims is to asses the link between
corporate governance news and stock returns rather than to use an efficient forecasting methods.
As a consequence, it is not surprising that the explanatory power of models ranges between 10.4%
and 32.2%. In addition, the White’s test and the Breusch-Pagan/Cook-Weisberg test results display
that there are heteroskedasticity problems in few models: as a consequence, reported standard
errors and hypothesis tests are based on White variance estimator to account for these problems.
< INSERT TABLE 5 >
Focusing on symmetric event windows, CARs display a positive and statistically significant (at the
10% confidence level or less) relationship with NO, OPC and ET*ROE, while it is usually estimated
a negative and statistically significant link with TAX, OPR, ROE , NBC*ROE and NO*ROE. These
results are consistent with the view that stock returns tend to increase around ownership news if
the firm was not profitable, otherwise the overall effect on stock returns is substantially negative
(i.e. investors dislike ownership related news for profitable firms so that they tend to sell their
stocks). Our results also suggest that the value and expositive tone (stand-alone) of corporate
governance news are not statistically significant related to CARs, but the expositive tone for
11
profitable firms (i.e. R12>0) has a positive influence on CARs: this is consistent with the view that
investors are influenced by the expositive tone of news related to profitable firms and tend to buy
their stocks). The negative link between CARs and NBC* ROE display that stock returns are
negatively linked with news related to change in the board of directors for profitable firms, but not
in case on non-profitable firms. Overall, these results provide evidence that corporate governance
news has a statistical significant link with firms’ stock returns and the accurate assessment of these
links requires accounting for firm performance and soundness since investors seems to react
differently to the news. Overall, a naïve classification of corporate governance news seems to be
quite effective (even if subjective) and the text analysis of news shows the importance of their
exposition tone (although their values do not exhibit a statistically significant link with CARs).
In order to further confirm the aforementioned findings, we conducted a number of robustness checks by
selecting different event windows before and after the publications news. Focussing on the event studies
before the news publication date, results are strongly consistent with the abovementioned discussion,
especially that stock returns tend to increase before the news publication if this is an ownership
news and the firm was not profitable, otherwise the overall effect on stock returns is substantially
negative (i.e. investors dislike “rumors” for ownership news for profitable firms so that they tend to
sell their stocks). As expected, text analysis does not enable us to generate variables with a
statistically to CARs prior to the news publication, while a naïve and subjective classification of
news achieve this results. This suggests that investors are influenced by “rumors” about corporate
governance news and, before the news publication, are simply able to assess the “type” of news
(e.g. news related to ownership structure), while they are not able to accurately assess the value and
exposition tone. Focussing on the event studies after the news publication date, results are quite
consistent with the above presented ones. CARs display a positive and statistically significant (at the
10% confidence level or less) relationship with OPC and ET*ROE, while it is usually estimated a
negative and statistically significant link with OPR, ROE and VAL*ROE.
In these models, text analysis enables us to generate variables with a statistically to CARS, while a
naïve and subjective classification of news do not achieve this results. This is consistent with the
view that, after the news publications, investors’ behaviour is influenced by the value and the
exposition tone of the news, while they are not anymore influenced by the “type” of news.
6. Conclusions
Mass media has a significant impact on financial markets since news can contribute to the
formation of investor expectations.
This paper analyse the interactions between the mass media and the stock market focussing on
corporate governance news release. By using a large sample of corporate governance news released
between 2003 and 2007, we examine the link between abnormal stock returns and corporate
governance news Our analysis accounts for the possibility that the investors behaviour is
influenced both by the value of the news and the exposition tone. Both, semantic content of
corporate governance news and corporate financial situation and their jointly influence have been
considered in the empirical analysis. Our analysis is also based on a naïve and subjective
12
classification of corporate governance news and on text analysis techniques to measure both their
value and expositive tone.
Results provide the evidence that stock returns tend to increase around ownership news if the firm
was not profitable at the news release, otherwise the overall effect on stock returns is substantially
negative (i.e. investors dislike ownership related news for profitable firms so that they tend to sell
their stocks). Our results also suggest that the value and expositive tone (stand-alone) of corporate
governance news are not statistically significant related to CARs, but the expositive tone for
profitable firms has a positive influence on CARs: this is consistent with the view that investors are
influenced by the expositive tone of news related to profitable firms and tend to buy their stocks).
The negative link between CARs and NBC* ROE displays that stock returns are negatively linked
with news related to change in the board of directors for profitable firms, but not in case of non-
profitable firms.
Our paper also provides the find that investors are influenced by “rumors” about corporate
governance news and before the news publication they are simply able to assess the “type” of
news, while they are not able to accurately assess the value and exposition tone. After the news
publication, investors’ behaviour is influenced by the value and the exposition tone of the news,
while they are not anymore influenced by the “type” of news.
13
References
Agrawal A., Knoeber C.R. 1996. Firm Performance and Mechanisms to Control Agency Problems
between Managers and Shareholders, The Journal of Financial and Quantitative Analysis, 31/3: 377-
397.
Antweiler W., Frank M.Z., 2004. Is all that talk just noise? The information content of internet stock
message boards, Journal of Finance 59/3: 1259-1293.
Baliga B.R., Moyer R.C., Rao R.S. 1996. CEO Duality and Firm Performance: What's the Fuss?
Strategic Management Journal, 17/1: 41-53.
Baumeister, R.F., Bratslavsky, E., Finkenauer, C., Vohs, K.D., 2001. Bad is stronger than good,
Review of General Psychology 5: 323–370.
Bebchuk L., Cohen A., Ferrell A., 2009. What Matters in Corporate Governance?, Review of
Financial Studies, 22/ 2: 783-827.
Black B.S., Jang H., Kim W., 2006. Does corporate governance predict firms’ market values?
Evidence from Korea, Journal of Law, Economics, and Organization 22/2: 366-413.
Brief, A.P., Motowidlo, S.J., 1986. Prosocial organizational behaviour s, Academy of Management
Review, 11: 710-725.
Brown, S.J., Warner, J.B., 1980. Measuring security price performance. Journal of financial
economics 8: 205 – 258.
Carretta, A., Farina, V., Schwizer, P., 2007. Esistono competenze board-specific? Un assessment
sulle banche italiane. In (Eds) Bracchi G., Masciandaro D., XII Rapporto sul Sistema Finanziario
Italiano “Banche italiane: la metamorfosi?”. Edibank-Bancaria Editrice, Milan.
Chong, B.S., Liu, M.H., Tan, K.H., 2006. The wealth effect of forced mergers and cronyism. Journal
of Banking and Finance, 30: 3215-3233.
Collet, N., 2004. Reactions of the London Stock Exchange to Company Trading Statement
Announcements. Journal of Business Finance and Accounting, 31/1 & 2: 3-35.
Core J.E., Holthausen R.W., Larcker D.F. 1999. Corporate governance, chief executive officer
compensation, and firm performance, Journal of Financial Economics, 51: 371-406.
Coval J.D., Shumway T., 2001. Is sound just noise?, Journal of Finance 56/5: 1887- 1910.
Cremers K.J.M., Nair V.B., 2005. Governance mechanisms and equity prices, Journal of Finance
60/6: 2859-2894.
Cummins, J.D., Weiss, M.A., 2004. Consolidation in the European insurance industry: do mergers
and acquisitions create value for shareholders?, Brookings – Wharton Papers on Financial Services,
217–258
Damton, R., 1975. Writing News and Telling Stories, Daedalus, 104/2: 175-193.
Deephouse D.L., 2000. Media reputation as a strategic resource: an integration of mass
communication and resource-based theories, Journal of Management 26/6: 1091-1112.
14
Dodd, P., Warner, J.B., 1983. On corporate governance. A study of proxy contest. Journal of
Financial Economics, 11: 401 – 438.
Dyck I.J.A., Volchkova N., Zingales L., 2008. The Corporate Governance Role of the Media:
Evidence from Russia. The Journal of Finance, 63/3: 1093-1135
El Mir A., Seboui S., 2008 Corporate governance and the relationship between EVA and created
shareholder value, Corporate Governance 8/1: 46-58.
Fama, E., Jensen, M., 1983. Separation of ownership and control, Journal of Law and Economics 26:
301-326.
Fama, E., 1970. Efficient Capital Markets: A Review of Theory and Empirical Work. Journal of
Finance, 25/2, 383-417
Fama, E., 1991. Efficient Markets: II. Journal of Finance, 46/5, 1575-1617
Fiordelisi, F., 2009. M&A in banking and Finance. Palgrave-Macmillan, London, U.K.
Fiordelisi, F., Molyneux, P., 2006. Shareholder value in European Banking. Palgrave-Macmillan,
London, U.K.
Fiordelisi, F., Molyneux, P., 2009. Total Factor Productivity and shareholder return in banking. Omega
Journal, forthcoming
Fiske, S.T., Taylor, S.E., 1991. Social cognition, New York: McGraw-Hill.
Gibson, R., Zillmann, D., 1994. Exaggerated versus representative exemplification in news reports:
Perception of issues and personal consequences, Communication Research 21: 603-624.
Gleason, K., McNulty, J.E., Pennathur, A.K., 2005. Returns to acquirers of privatizing financial
services firms: an international examination. Journal of Banking and Finance, 29: 2043-2065
Gompers P.A., Ishii J.L., Metrick A., 2003. Corporate governance and equity prices, Quarterly
Journal of Economics 118/1: 107-155.
Jensen M., Meckling W.H., 1976. Theory of the firm: Managerial behaviour , agency costs and
ownership structure, Journal of Financial Economics, 3: 303-360.
Johnson J.L., Ellstrand A.E., Dalton D., Dalton C., 2005. The influence of the financial press on
stockholder wealth: the case of corporate governance, Strategic management Journal 26/5: 461- 471.
Klock M.S., Mansi S.A., Maxwell W.F., 2005. Does corporate governance matter to bondholders?,
Journal of Financial and Quantitative Analysis 40/4: 693-720.
Lehn K., Patro S., Zhao M., 2007. Governance Indexes and Valuation: Which Causes Which?,
Journal of Corporate Finance 13/5: 907-928.
Liu, P., Smith, S.F., Syed, A.A., 1990. Price reaction to the Wall’s Street Journal’s securities
recommendations. The journal of Financial and Quantitative Analysis, 25: 399-410.
MacKinlay, A.C., 1997. Event studies in economics and finance. Journal of Economic Literature, 35:
12 – 39.
Osgood, C.E. Suci, G.J., Tannenbaum, P.H., 1957. The Measurement of Meaning, University of
Illinois Press, Urbana.
15
Patell, J., 1976. Corporate forecast of earning per share and stock price behaviour: empirical tests,
Journal of Accounting Research, 14, p. 251 – 266
Pollock T.G., Rindova V.P., 2003. Media legitimation effects in the market for initial public
offerings, Academy of Management Journal 46/5: 631-642.
Reeve, J., 1992. Understanding motivation and emotion. Fort Worth, TX: Harcourt Brace
Jovanovich.
Rozin, P., Royzman, E., 2001. Negativity bias, negativity dominance, and contagion, Personality
and Social Psychology Review, 5: 296-320.
Sapienza H.J., Gupta A.K., 1996. Impact of agency risks and task uncertainty on venture capitalist-
entrepreneur relations, Academy of Management Journal 37/6: 1618-1632, 1994.
Scholes, M., Williams, J., 1977. Estimating betas from non-synchronous data. Journal of Financial
Economics. 5: 309 – 327.
Scholtens B., de Wit R., 2004. Announcement effects of bank mergers in Europe and the US.
Research in International Business and Finance, 18: 217-228.
Sharpe, W., 1963. A simplified model for portfolio analysis. Management Science, 9/2: 277-293.
Shoemaker P., Reese, S. Mediating the message: Theories of influence on mass media content, New
York: Longman.
Stone, P.J., Dunphy, D.C., Smith M.S., Ogilvie, D.M., 1966. The General Inquirer: a computer
approach to content analysis, MIT studies in comparative politics, MIT Press, Cambridge.
Stringa, M., Monks, A., 2007. Inter-industry contagion between UK life insurers and UK banks: an
event study. Bank of England, working paper, no. 325.
Tetlcok P.C., Saar-Tsechansky M., Mackassy S., 2008. More Than Words: Quantifying Language to
Measure Firms’ Fundamentals, The Journal of Finance 63/3: 1437-1467.
Tetlock P.C., 2007. Giving content to investor sentiment: the role of media in the stock market, The
Journal of Finance 62/3: 1139-1168.
16
Table 1 – Description of variables used to investigate the relationship between corporate
governance news and stock return reactions
Panel A) Stock market variables
Variable Symbol Description
CAR over the event
window (20;20) CAR(20;20)
CAR(20;20) is the cumulative abnormal return calculated between 20 days before the
publishing of the news and after 20 days
CAR over the event
window (10;10) CAR(10;10)
CAR(10;10) is the cumulative abnormal return calculated between 10 days before the
publishing of the news and after 10 days
CAR over the event
window (5;5) CAR(5;5)
CAR(5;5) is the cumulative abnormal return calculated between 5 days before the
publishing of the news and after 5 days
CAR over the event
window (3;3) CAR(3;3)
CAR(3;3) is the cumulative abnormal return calculated between 3 days before the
publishing of the news and after 3 days
CAR over the event
window (20;1) CAR(20;1)
CAR(20;1) is the cumulative abnormal return calculated between 20 days before the
publishing of the news and after 1 days
CAR over the event
window (10;1) CAR(10;1)
CAR(10;1) is the cumulative abnormal return calculated between 10 days before the
publishing of the news and after 1 days
CAR over the event
window (5;1) CAR(5;1)
CAR(5;1) is the cumulative abnormal return calculated between 5 days before the
publishing of the news and after 1 days
CAR over the event
window (3;1) CAR(3;1)
CAR(3;1) is the cumulative abnormal return calculated between 3 days before the
publishing of the news and after 1 days
CAR over the event
window (0;20) CAR(0;20)
CAR(0;20) is the cumulative abnormal return calculated between the publishing date of the
news and 20 days later
CAR over the event
window (0;10) CAR(0;10)
CAR(0;10) is the cumulative abnormal return calculated between the publishing date of the
news and 10 days later
CAR over the event
window (0;5) CAR(0;5)
CAR(0;5) is the cumulative abnormal return calculated between the publishing date of the
news and 5 days later
CAR over the event
window (0;3) CAR(0;3)
CAR(0;3) is the cumulative abnormal return calculated between the publishing date of the
news and 3 days later
CAR over the event
window (0;1) CAR(0;1)
CAR(0;1) is the cumulative abnormal return calculated between the publishing date of the
news and 1 day later
Panel B) Corporate governance variables
Variable Symbol Description
Value VAL
VAL refers to the degree with which news have a positive or negative meaning. The value
of 1 means the corporate governance new has the highest positive value and the value -1
refers to the higher negative value;
Expositive tone Expositive
tone
ET refers to the degree with which news express their meaning in a strong or weak manner.
The value of 1 means the corporate governance new has the strongest expositive tone, while
the value -1 refers to the lowest expositive tone.
News related to changes
in board of directors NCB
NCB is a dummy variable, i.e. 1 if the news is related to changes in board of directors, 0
otherwise
News related to board of
directors functioning NBF
NBF is a dummy variable, i.e. 1 if the news is related to the board of directors functioning ,
0 otherwise
News related to the firm
ownership NO NO is a dummy variable, i.e. 1 if the news is related to the firm ownership, 0 otherwise
17
Panel C) Corporate performance variables
Variable Symbol Description
Return on Equity ROE ROE is the ratio between firm net profit (NP) and the total equity capital. This ratio
provides information about the overall bank profitability
Tax impact TAX TAX is the between firm net profit (NP) and pre-tax profits(PTP), i.e. TAX= NP/PTP. This
ratio provides information about the tax influence on corporate profits
Extraordinary items EXT
EXTR is the ratio between firm pre-tax profits (PTP) and operating profits (OP), i.e
EXT=PTP/OP. This ratio provides information about the extraordinary items influence on
corporate profits
Revenue efficiency OPR OPR is the ratio between firm operating revenues (OR) and total assets (A), i.e. OPR=OR/A. This
ratio provides information about the firm ability of generating operating revenues
Operating efficiency OPC OPC is the ratio between firm’s operating costs (OC) and total assets (A) , i.e. OPC=OC/A. This
ratio provides information about the firm operating efficiency.
Financial leverage LEV LEV is the ratio between total assets (A) and total equity (E), i.e. LEV=A/E. This ratio provides
information about the firm’s operating efficiency.
Old news OLD OLD is the number of past corporate governance news published over the last 12 months
18
Table 2 – Sample: descriptive statistic
Variable Obs Mean Standard Deviation Minimum Maximum
CAR(20;20) 197 0.017 0.084 -0.230 0.377
CAR(10;10) 197 0.015 0.066 -0.262 0.217
CAR(5;5) 197 0.007 0.052 -0.319 0.219
CAR(3;3) 197 0.007 0.048 -0.148 0.261
CAR(20;1) 197 0.008 0.056 -0.189 0.251
CAR(10;1) 197 0.008 0.045 -0.159 0.191
CAR(5;1) 197 0.004 0.032 -0.153 0.193
CAR(3;1) 197 0.003 0.027 -0.133 0.191
CAR(0;20) 197 0.010 0.056 -0.174 0.253
CAR(0;10) 197 0.007 0.053 -0.254 0.361
CAR(0;5) 197 0.003 0.046 -0.270 0.295
CAR(0;3) 197 0.005 0.045 -0.109 0.394
CAR(0;1) 197 0.004 0.041 -0.142 0.408
ROE 197 - 0.052 0,387 0,238 -1,795
VAL 197 0.466 0.438 -1.000 1.000
ET 197 0.824 0.198 0.000 1.000
TAX 197 0.709 0.745 -4.051 5.434
EXT 197 0.304 7.359 -71.682 3.638
OPR 197 0.344 0.386 -0.011 1.349
OPC 197 0.328 0.394 0.005 1.435
LEV 197 8.682 5.488 1.306 20.266
OLD 197 5.335 6.003 1.000 23.000
19
Table 3 – Type of corporate governance news
Year NCB NBF ON OCN Total
2003 15 1 1 17
2004 22 1 2 25
2005 19 5 2 26
2006 21 6 10 4 41
2007 32 11 19 26 88
Total 109 24 34 30 197
Where:
NCB is the number of news related to changes in the board of directors, NCF is the number of news related to
the board of director functioning, ON is the number of news related to ownership and OCN is the number of
other corporate governance news .
20
Table 4 – Results: Cumulative Abnormal Return around the publication date of corporate
governance news for Italian listed firms between 2003 and 2007
Event window Mean CAR (b) Standard
deviation(b) Z-test(c) Positive CAR (b)
(-20;20) 1.519 8.543 1.609* 57.143
(-10;10) 1.339 6.499 2.724** 56.682
(-5;5) 0.547 5.194 1.810** 52.074
(-3;3) 0.577 4.796 2.667*** 52.535
(-20;-1) 0.922 5.439 2.236** 56.221
(-10;-1) 0.819 4.476 3.569*** 52.074
(-5;-1) 0.362 3.162 2.960*** 51.152
(-3;-1) 0.298 2.768 3.257*** 54.839
(0; 20) 1.105 5.471 2.463*** 55.760
(0; 10) 0.504 5.150 1.995** 51.152
(0; 5) 0.175 4.441 1.014 42.857
(0; 3) 0.280 4.437 2.564*** 41.935
(0; 1) 0.282 3.986 11.580*** 45.161
(a) The table display the results of an event study analyzing the data of 197 corporate governance news items
between 2003 and 2007. The abnormal return has been calculated using OLS regression. The OLS parameters
have been estimated during a period of 252 days in which the markets were open prior to the event window,
maximum (-20, +20). As for market returns, the market sector index was applied. We applied the Standard
Cross Sectional procedure to CAR. The statistical significance test is the one suggested in Dodd-Warner (1983)
(b) Value are in percentage.
(c) The symbols *, **, and *** represent significance levels of 10%, 5% and 1% respectively.
21
Table 5 – Results: the relationship between corporate governance news, corporate performance and cumulative abnormal returns for Italian listed firms
between 2003 and 2007 (197 observations)
EVENT WINDOWS AROUND THE NEWS PUBLICATION DATE EVENT WINDOWS BEFORE THE NEWS PUBLICATION DATE EVENT WINDOWS AFTER THE NEWS PUBLICATION DATE
y=CAR(-20,20) y=CAR(-10,10) y=CAR(-5,5) y=CAR(-3,3) y=CAR(-20,1) y=CAR(-10,1) y=CAR(-5,1) y=CAR(-3,1) y=CAR(0,20) y=CAR(0,10) y=CAR(0,5) y=CAR(0,3) y=CAR(0,1)
Intercpet -0.0465
(0.0941)
-0.0342
(0.0666)
-0.0572
(0.0495)
-0.0595
(0.0513)
-0.0406
(0.0585)
-0.0408
(0.0490)
-0.0523
(0.0343)
-0.0583**
(0.0280)
-0.0588
(0.0537)
0.0063
(0.0637)
-0.0051
(0.0540)
-0.0012
(0.0614)
-0.0055
(0.0617)
NBC 0.0243
(0.0216)
0.0125
(0.0172)
0.0220
(0.0136)
0.0289**
(0.0114)
0.0207
(0.0129)
0.0102
(0.0123)
0.0095
(0.0065)
0.0127**
(0.0056)
0.0246*
(0.0130)
0.0023
(0.0141)
0.0125
(0.0124)
0.0164
(0.0107)
0.0044
(0.0095)
NBF 0.0325
(0.0246)
0.0010
(0.0199)
-0.0080
(0.0177)
-0.0040
(0.0145)
0.0529***
(0.0140)
0.0290**
(0.0134)
0.0071
(0.0080)
0.0079
(0.0069)
0.0497***
(0.0136)
-0.0279
(0.0175)
-0.0152
(0.0161)
-0.0120
(0.0146)
-0.0038
(0.0127)
NO 0.0507***
(0.0164)
0.0452***
(0.0150)
0.0254**
(0.0113)
0.0226*
(0.0116)
0.0432***
(0.0115)
0.0311***
(0.0100v
0.0211***
(0.0069)
0.0165**
(0.0065)
0.0462***
(0.0113)
0.0140
(0.0114)
0.0044
(0.0088)
0.0062
(0.0089)
0.0069
(0.0077)
VAL 0.0119
(0.0140)
0.0004
(0.0102)
-0.0073
(0.0090)
-0.0055
(0.0075)
0.0154
(0.0096)
-0.0017
(0.0079)
0.0034
(0.0050)
0.0029
(0.0041)
0.0125
(0.0096)
0.0023
(0.0078)
-0.0109
(0.0081)
-0.0083
(0.0073)
-0.0058
(0.0074)
ET -0.0025
(0.0364)
0.0202
(0.0296)
0.0083
(0.0292)
-0.0032
(0.0181)
0.0001
(0.0201)
0.0210
(0.0187)
0.0144
(0.0144)
0.0136
(0.0108)
0.0013
(0.0194)
-0.0010
(0.0263)
-0.0059
(0.0260)
-0.0167
(0.0196)
-0.0039
(0.0208)
TAx -0.0184**
(0.0086)
-0.0179**
(0.0080)
-0.0143**
(0.0072)
-0.0120*
(0.0065)
-0.0131
(0.0084)
-0.0112
(0.0088)
-0.0076
(0.0086v
-0.0080
(0.0078)
-0.0145*
(0.0079)
-0.0067
(0.0051)
-0.0068*
(0.0036)
-0.0039
(0.0036)
-0.0036
(0.0031)
EXT 0.0002
(0.0004)
0.0000
(0.0004)
-0.0004
(0.0003)
-0.0004
(0.0003)
0.0005***
(0.0003)
0.0004
(0.0003)
0.0000
(0.0002v
0.0000
(0.0001)
0.0006**
(0.0003)
-0.0004
(0.0003)
-0.0005*
(0.0003)
-0.0004
(0.0003)
-0.0003
(0.0002)
OPR -0.4283**
(0.2079)
-0.3581***
(0.1360)
-0.1672*
(0.0967)
-0.2087**
(0.1025)
-0.1737
(0.1189)
-0.1150
(0.0952)
-0.0067
(0.0765v
-0.0171
(0.0631)
-0.2534**
(0.1160)
-0.2412*
(0.1252)
-0.1589
(0.1058)
-0.1904
(0.1245)
-0.1663
(0.1248)
OPC 0.4222**
(0.2068)
0.3742***
(0.1334)
0.1832**
(0.0916)
0.2159**
(0.1044v
0.1827
(0.1206)
0.1289
(0.0962)
0.0191
(0.0784v
0.0211
(0.0653)
0.2620**
(0.1156)
0.2432*
(0.1304)
0.1627
(0.1087)
0.1935
(0.1336)
0.1660
(0.1351)
LEV -0.0008
(0.0017)
-0.0002
(0.0011)
-0.0006
(0.0010)
-0.0013
(0.0008)
0.0001
(0.0011)
0.0004
(0.0007)
0.0000
(0.0005)
-0.0005
(0.0004)
0.0000
(0.0011)
-0.0006
(0.0009)
-0.0007
(0.0008)
-0.0008
(0.0007)
-0.0004
(0.0007)
Ln(A) 0.0021
(0.0028)
0.0012
(0.0019)
0.0020
(0.0013)
0.0029*
(0.0015)
0.0007
(0.0018)
0.0004
(0.0014)
0.0010
(0.0010)
0.0013
(0.0009)
0.0014
(0.0017)
0.0008
(0.0018)
0.0011
(0.0014)
0.0016
(0.0017)
0.0013
(0.0017)
ROE -0.2902**
(0.1254)
-0.2259**
(0.0940)
-0.0967
(0.0926)
-0.1676
(0.0775)
-0.0942
(0.0756)
-0.0195
(0.0729)
0.0473
(0.0466v
0.0060
(0.0367)
-0.1580**
(0.0742)
-0.2089**
(0.1009)
-0.1437*
(0.0818)
-0.1733**
(0.0705)
-0.1393**
(0.0642)
OLD 0.0022**
(0.0010)
0.0015
(0.0009)
0.0006
(0.0007)
0.0004
(0.0007)
0.0023***
(0.0007)
0.0017**
(0.0007)
0.0007
(0.0005)
0.0003
(0.0004)
0.0024***
(0.0007)
-0.0002
(0.0008)
-0.0001
(0.0006)
0.0001
(0.0007)
-0.0001
(0.0006)
NBC* ROE -0.1350**
(0.0603)
-0.0604
(0.0389)
-0.1247***
(0.0434)
-0.1212**
(0.0510)
-0.0274
(0.0380)
-0.0324
(0.0402)
-0.0591***
(0.0198)
-0.0713***
(0.0188)
-0.0245
(0.0362)
-0.0277
(0.0563)
-0.0654
(0.0473)
-0.0500
(0.0463)
0.0159
(0.0355)
NBF* ROE -0.2456***
(0.0796)
-0.0810
(0.0707)
-0.0831
(0.0558)
-0.0767
(0.0634)
-0.1311**
(0.0521)
-0.0695
(0.0565)
-0.0506**
(0.0246)
-0.0635***
(0.0213)
-0.1166**
(0.0551)
-0.0114
(0.0655)
-0.0326
(0.0528)
-0.0128
(0.0572)
-0.0115
(0.0452)
22
NO* ROE -0.3634***
(0.0872)
-0.2633***
(0.0730)
-0.1710***
(0.0743)
-0.1092
(0.0703)
-0.1738***
(0.0661)
-0.1273**
(0.0593)
-0.1025**
(0.0463)
-0.0738
(0.0429)
-0.1772***
(0.0650)
-0.1350**
(0.0633)
-0.0684
(0.0551)
-0.0360
(0.0504)
-0.0058
(0.0406)
VAL* ROE -0.0009
(0.0705)
0.0063
(0.0634)
-0.0137
(0.0409)
-0.0666**
(0.0336)
-0.0031
(0.0484)
0.0508
(0.0509)
0.0273
(0.0245)
0.0031
(0.0182)
-0.0281
(0.0494)
-0.0446
(0.0484)
-0.0409
(0.0368)
-0.0696**
(0.0344)
-0.0743**
(0.0368)
ET* ROE 0.5184***
(0.1657)
0.3574***
(0.1326)
0.2543***
(0.1140)
0.3551***
(0.0790)
0.2021*
(0.1038)
0.0594
(0.0898)
0.0024
(0.0619)
0.0615
(0.0440)
0.2849***
(0.1052)
0.3004***
(0.1130)
0.2512***
(0.0896)
0.2937***
(0.0732)
0.2113***
(0.0801)
D1 0.0141
(0.0431)
0.0105
(0.0246)
0.0195
(0.0198)
0.0195
(0.0212)
-0.0079
(0.0285)
0.0015
(0.0182v
0.0093
(0.0142)
0.0197*
(0.0114)
0.0033
(0.0269)
0.0091
(0.0248)
0.0104
(0.0206)
-0.0003
(0.0242)
-0.0019
(0.0234)
D2 -0.0241
(0.0393)
-0.0165
(0.0260)
-0.0038
(0.0200)
-0.0039
(0.0175)
-0.0285
(0.0260)
-0.0027
(0.0160)
0.0094
(0.0103)
0.0176**
(0.0074v
-0.0231
(0.0256)
-0.0139
(0.0207)
-0.0131
(0.0173)
-0.0217
(0.0168)
-0.0165
(0.0142)
D3 0.0169
(0.0385)
0.0081
(0.0234)
0.0120
(0.0191)
0.0014
(0.0179)
0.0068
(0.0260)
0.0062
(0.0151)
0.0060
(0.0105v
0.0104
(0.0075)
0.0121
(0.0256)
0.0015
(0.0184)
0.0061
(0.0169)
-0.0091
(0.0166)
-0.0095
(0.0157)
D4 0.0044
(0.0394)
-0.0039
(0.0244)
0.0114
(0.0197)
0.0074
(0.0184)
-0.0075
(0.0262)
-0.0049
(0.0162)
0.0087
(0.0110)
0.0180**
(0.0088)
-0.0018
(0.0256)
0.0009
(0.0186)
0.0026
(0.0167)
-0.0107
(0.0162)
-0.0105
(0.0141)
R-square 0.2594 0.2532 0.1982 0.2605 0.2875 0.2152 0.1212 0.1550 0.3215 0.1729 0.1851 0.1964 0.1044
F-static
(22,140) 3.52*** 2.61*** 1.90** 3.41*** 3.40*** 1.94** 1.62** 1.59* 3.98*** 1.79** 2.62*** 3.67*** 2.44***
R-R test,
p-value 0.0338 0.0439 0.007 0.000 0.195 0.001 0.005 0.000 0.516 0.0049 0.0106 0.0021 0.1257
White's test,
p-value 0.4661 0.4661 0.4661 0.4661 0.4661 0.4661 0.4661 0.4661 0.4661 0.4661 0.4661 0.4661 0.4661
BS/CW test,
p-value 0.1386 0.1678 0.9821 0.0324 0.783 0.0287 0.0049 0.0004 0.5902 0.1830 0.4015 0.0287 0.0387
Note: We reported in brackets standard errors estimates using the White estimator to account for heteroskedasticity problems. The R-R test is the Ramsey Reset test and the null hypothesis is that the
model has no omitted variables. The White’s test null hypothesis is the homoskedasticity. The BS/CW test is the Breusch-Pagan / Cook-Weisberg test for heteroskedasticity and the null
hypothesis is the Constant variance. The symbols *, **, and *** represent significance levels of 10%, 5% and 1% respectively.