The relationship between stress and retention within science ...
291
The relationship between stress and retention within science undergraduates, their use of support and the potential remedial effect of stress education. Patricia Jayne Harris A thesis submitted in partial fulfilment of the requirements of Edinburgh Napier University for the award of Doctor of Philosophy. March 2016
-
Upload
khangminh22 -
Category
Documents
-
view
0 -
download
0
Transcript of The relationship between stress and retention within science ...
The relationship between stress and
retention within science
undergraduates, their use of support
and the potential remedial effect of
stress education.
Patricia Jayne Harris
A thesis submitted in partial fulfilment of the requirements of
Edinburgh Napier University for the award of Doctor of Philosophy.
March 2016
ii
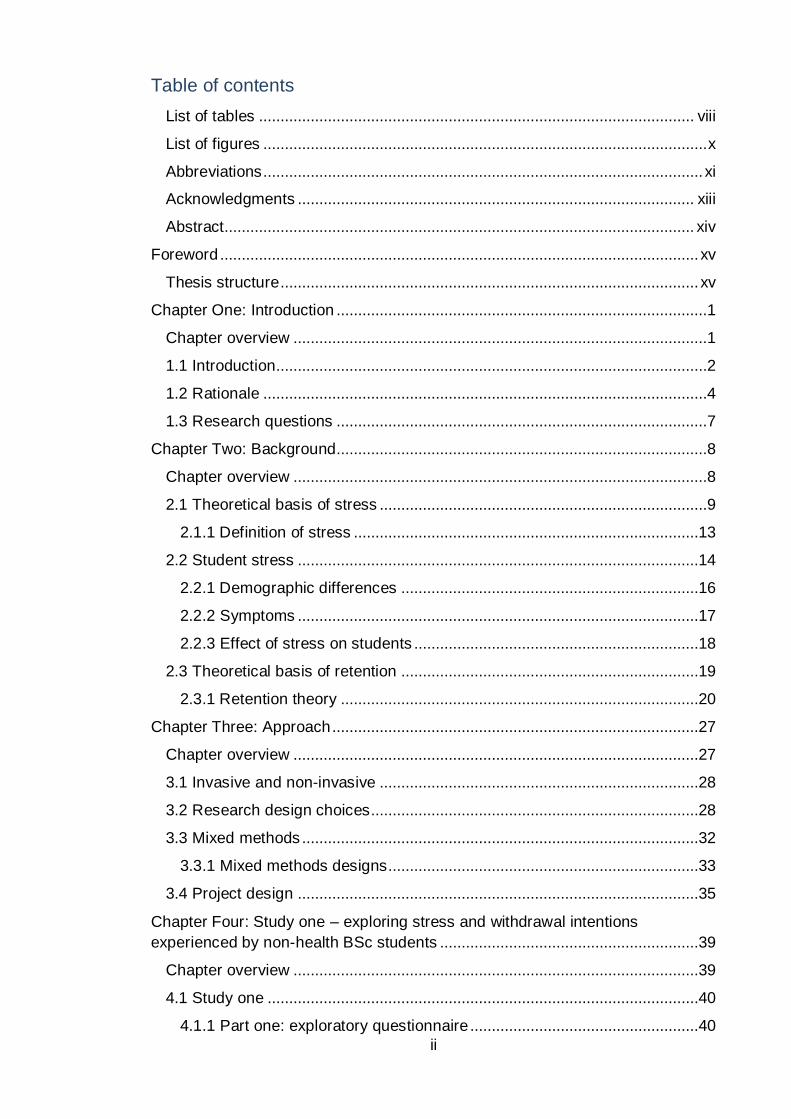
Table of contents
List of tables ..................................................................................................... viii
List of figures ....................................................................................................... x
Abbreviations ...................................................................................................... xi
Acknowledgments ............................................................................................ xiii
Abstract............................................................................................................. xiv
Foreword ............................................................................................................... xv
Thesis structure ................................................................................................. xv
Chapter One: Introduction ......................................................................................1
Chapter overview ................................................................................................1
1.1 Introduction....................................................................................................2
1.2 Rationale .......................................................................................................4
1.3 Research questions ......................................................................................7
Chapter Two: Background......................................................................................8
Chapter overview ................................................................................................8
2.1 Theoretical basis of stress ............................................................................9
2.1.1 Definition of stress ................................................................................13
2.2 Student stress .............................................................................................14
2.2.1 Demographic differences .....................................................................16
2.2.2 Symptoms .............................................................................................17
2.2.3 Effect of stress on students ..................................................................18
2.3 Theoretical basis of retention .....................................................................19
2.3.1 Retention theory ...................................................................................20
Chapter Three: Approach .....................................................................................27
Chapter overview ..............................................................................................27
3.1 Invasive and non-invasive ..........................................................................28
3.2 Research design choices............................................................................28
3.3 Mixed methods ............................................................................................32
3.3.1 Mixed methods designs........................................................................33
3.4 Project design .............................................................................................35
Chapter Four: Study one – exploring stress and withdrawal intentions
experienced by non-health BSc students ............................................................39
Chapter overview ..............................................................................................39
4.1 Study one ....................................................................................................40
4.1.1 Part one: exploratory questionnaire .....................................................40
iii
4.1.2 Method ..................................................................................................41
4.1.2.1 Quantitative analysis ......................................................................41
4.1.2.2 Distribution of questionnaire ..........................................................42
4.1.3 Results ..................................................................................................43
4.2 Part two .......................................................................................................48
4.2.1 Exploratory interviews ..........................................................................48
4.2.2 Methods ................................................................................................48
4.2.2.1 Qualitative analysis ........................................................................49
4.2.2.2 Participants .....................................................................................51
4.2.3 Results ..................................................................................................51
4.2.3.1 Variable starting stress ..................................................................56
4.2.3.1.1 Theme one synopsis ..............................................................60
4.2.3.2 Causes of stress ............................................................................60
4.2.3.3 Effect of stress on performance.....................................................61
4.2.3.4 Effect of stress on dropout .............................................................63
4.2.3.4.1 Theme three synopsis ............................................................65
4.2.3.5 Coping ............................................................................................65
4.2.3.5.1 Theme four synopsis ..............................................................70
4.3 Discussion ...................................................................................................70
4.3.1 Limitations .............................................................................................74
Summary ...........................................................................................................76
Chapter Five: Study two – use of psychometric tools to measure student’s
stress .....................................................................................................................77
Chapter overview ..............................................................................................77
5.1 Study two .....................................................................................................78
5.1.1 Quantification of stress .........................................................................78
5.2 Method.........................................................................................................79
5.2.1 Choice of scales ...................................................................................79
5.2.1.1 Perceived stress questionnaire .....................................................80
5.2.1.2 Life events scale for students ........................................................81
5.2.1.3 General health questionnaire-12 ...................................................82
5.2.2 Data collection ......................................................................................82
5.2.2.1 Time point one ...............................................................................82
5.2.2.2 Time point two ................................................................................83
5.2.3 Analysis .................................................................................................84
iv
5.2.3.1 Distribution of questionnaires ........................................................85
5.3 Results.........................................................................................................86
5.3.1 Validation of the Perceived Stress Scale .............................................86
5.3.2 Perceived stress in non-Health BSc students .....................................87
5.3.3 General health in non-Health BSc students ........................................89
5.3.4 Perceived stress in Business School ...................................................89
5.3.5 Comparisons across non-health student cohorts ................................90
5.3.6 Intentions to withdraw ...........................................................................92
5.3.7 Actual withdrawal ..................................................................................96
5.4 Discussion ...................................................................................................98
5.4.1 Limitations .......................................................................................... 101
Chapter summary ........................................................................................... 102
Chapter Six: Study three – focus groups to understand students’ use of support
services .............................................................................................................. 103
Chapter overview ........................................................................................... 103
6.1 Study three ............................................................................................... 104
6.1.1 Focus groups ..................................................................................... 104
6.2 Methods .................................................................................................... 105
6.2.1 Analysis .............................................................................................. 105
6.2.2 Student participants ........................................................................... 106
6.3 Results...................................................................................................... 106
6.3.1 Low support awareness .................................................................... 108
6.3.2 Stigma ................................................................................................ 109
6.3.3 Poor service use ................................................................................ 110
6.3.4 PDT over-reliance .............................................................................. 112
6.4 Study three – additional data collection .................................................. 113
6.4.1 PDT interviews ................................................................................... 114
6.4.2 Method ............................................................................................... 114
6.4.2.1 Staff recruitment .......................................................................... 114
6.4.2.2 Staff participants ......................................................................... 114
6.4.3 Results ............................................................................................... 115
6.5 Discussion ................................................................................................ 120
6.5.1 Limitations .......................................................................................... 122
Chapter summary ........................................................................................... 124
v
Chapter Seven: Study four – investigation of students’ individual coping
strategies............................................................................................................ 125
Chapter overview ........................................................................................... 125
7.1 Coping background .................................................................................. 126
7.1.1 Assessing coping ............................................................................... 128
7.2 Study four ................................................................................................. 132
7.2.1 Method ............................................................................................... 132
7.2.1.1 Analysis ....................................................................................... 133
7.2.1.2 Participants .................................................................................. 136
7.2.2 Results ............................................................................................... 136
7.2.2.1 Exploratory factor analysis on 14 sub-scales............................. 136
7.2.2.2 Confirmation of the four factor model ......................................... 140
7.2.2.3 Coping within the sampled cohort .............................................. 141
Gender differences ............................................................................. 141
Coping and withdrawal ....................................................................... 142
Coping and stress ............................................................................... 142
7.2.3 Discussion.......................................................................................... 143
7.2.3.1 Limitations ................................................................................... 144
Chapter summary ........................................................................................... 146
Chapter Eight: Study five – design, development and evaluation of an
intervention to improve student wellbeing and continuation. ........................... 147
Chapter overview ........................................................................................... 147
8.1 Stress interventions ................................................................................. 149
8.1.1 Effectiveness of stress management interventions .......................... 151
8.2 Study five .................................................................................................. 154
8.3 Part one: development of intervention .................................................... 154
8.3.1 Methods ............................................................................................. 158
8.3.1.1 Assess needs .............................................................................. 158
8.3.1.2 Design ......................................................................................... 160
8.3.1.3 Development ............................................................................... 164
8.3.1.4 Implementation ............................................................................ 166
8.3.1.5 Evaluation .................................................................................... 166
8.4 Part two: controlled trial ........................................................................... 166
8.4.1 Method ............................................................................................... 167
8.4.1.1 Recruitment ................................................................................. 168
vi
8.4.1.2 Analysis ....................................................................................... 169
8.4.1.3 Participants .................................................................................. 170
8.4.2 Results ............................................................................................... 171
8.5 Part three: feedback on intervention ....................................................... 177
8.5.1 Method ............................................................................................... 177
8.5.1.1 Participants .................................................................................. 178
8.5.2 Results ............................................................................................... 179
8.6 Part four: improving the model for predicting withdrawal ....................... 183
8.7 Discussion ................................................................................................ 184
8.7.1 Limitations .......................................................................................... 187
Chapter summary ........................................................................................... 189
Chapter Nine: Plenary discussion ..................................................................... 191
9.1 Main findings ............................................................................................ 191
9.1.1 Levels of stress reported by non-health BSc students ..................... 191
9.1.2 Link between stress and withdrawal ................................................. 193
9.1.3 Utilisation of support services ........................................................... 197
9.1.4 Variation in perceived stress due to gender, age and degree ......... 199
9.1.5 Effect of adding coping data to the predictive model of withdrawal . 200
9.2 Impact of the thesis .................................................................................. 202
9.2.1 Impact on author’s current practice .................................................. 202
9.2.2 Impact within host university ............................................................. 202
9.2.3 Potential impact on other Higher Education Institutions .................. 203
9.2.4 Impact on the wider higher education debate .................................. 204
9.2.4.1 Impact of this research on existing theory ................................. 205
9.3 Recommendations for future work .......................................................... 207
9.3.1 Refining the model to predict withdrawal from stress and coping 207
9.3.2 Developing a screening tool based on perceived stress .............. 207
9.3.3 Improving coping interventions ...................................................... 208
9.3.4 Stress and coping in widening participation .................................. 208
9.3.5 Information provided at key transitions within the student journey
................................................................................................................. 209
9.3.6 Different approaches ...................................................................... 210
9.4 Conclusion ................................................................................................ 211
References ..................................................................................................... 212
Appendix one – study one questionnaire ...................................................... 229
vii
Appendix two – study two questionnaire ....................................................... 233
Appendix three – support map ...................................................................... 239
Appendix four – LOC planner ........................................................................ 240
Appendix five – paper intervention ................................................................ 259
Appendix six – study five questionnaires ...................................................... 260
Pre-intervention questionnaire ................................................................... 260
Post-intervention questionnaire .................................................................. 268
viii
List of tables
Table 1: Common symptoms of stress
Table 2: Distribution of initial questionnaire within SLSSS
Table 3: Stressors and the frequency of stress they cause
Table 4: Student awareness of support
Table 5: Distribution of published questionnaires within SLSSS
Table 6: Distribution of published questionnaires within ENBS
Table 7: Difference in PSS-14 score between SLSSS males and females
Table 8: SLSSS Psychological morbidity suggested by the GHQ-12
Table 9: Difference in PSS-14 score between ENBS males and females
Table 10: Comparison of SLSSS and ENBS PSS-14 scores
Table 11: Comparison of SLSSS and ENBS GHQ-12 scores
Table 12: Binary logistic regression, variables in and not in the equation
Table 13: Binary logistic regression, variables in the equation
Table 14: LESS factors and dropout
Table 15: Binary logistic regression to predict actual withdrawal
Table 16: Focus group participant demographics
Table 17: PDT interview participant demographics
Table 18: Fit measures and residual variances for the brief COPE
Table 19: Promax rotated loadings for 4 factor solution
Table 20: Factor structure of the Brief COPE suggested for the life science
student sample.
Table 21: Factor correlations
Table 22: Student opinion of online intervention during pilot
Table 23: T1 distribution and completion of questionnaires
Table 24: T2 distribution and completion of questionnaires
ix
Table 25: Gender differences between dependent variables of interest at T1
Table 26: Comparison of T1 scores across the three treatment groups
Table 27: Frequency of compilers in the two treatment groups
Table 28: Difference in change over time between the three treatment groups
Table 29: Participants in telephone interviews
x
List of figures
Figure 1: General Adaptation Syndrome
Figure 2: Bean’s psychological model of college student retention
Figure 3: The major mixed-methods research designs
Figure 4: Study sequence within project
Figure 5: Study one
Figure 6: Student self-reported stress frequency
Figure 7: Student self-reported stress frequency – split by gender
Figure 8: Depictions of stress across trimester one 2011/2012
Figure 9: Study two
Figure 10: PSS-14 scores for whole cohort
Figure 11: Study three
Figure 12: Depiction of student stress, support use and retention
Figure 13: Study three – additional data collection
Figure 14: Study four
Figure 15: EFA Protocol
Figure 16: Study five
Figure 17: Suggested addition to Bean’s model of persistence
xi
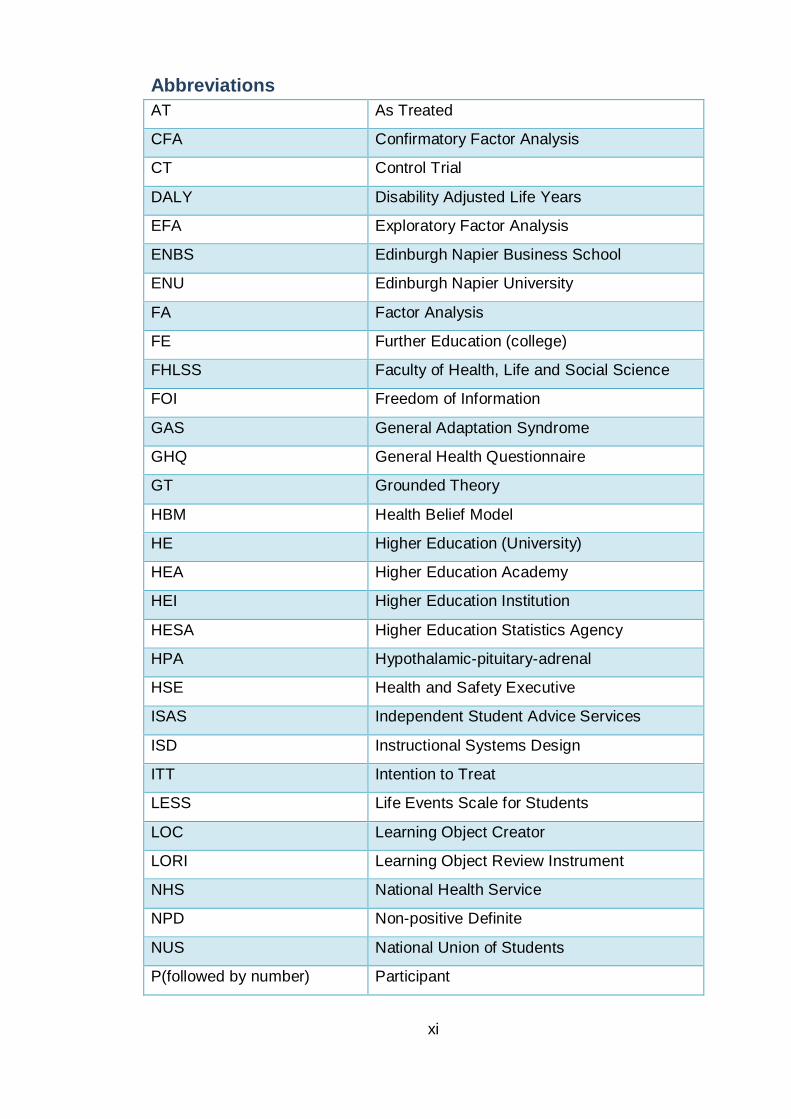
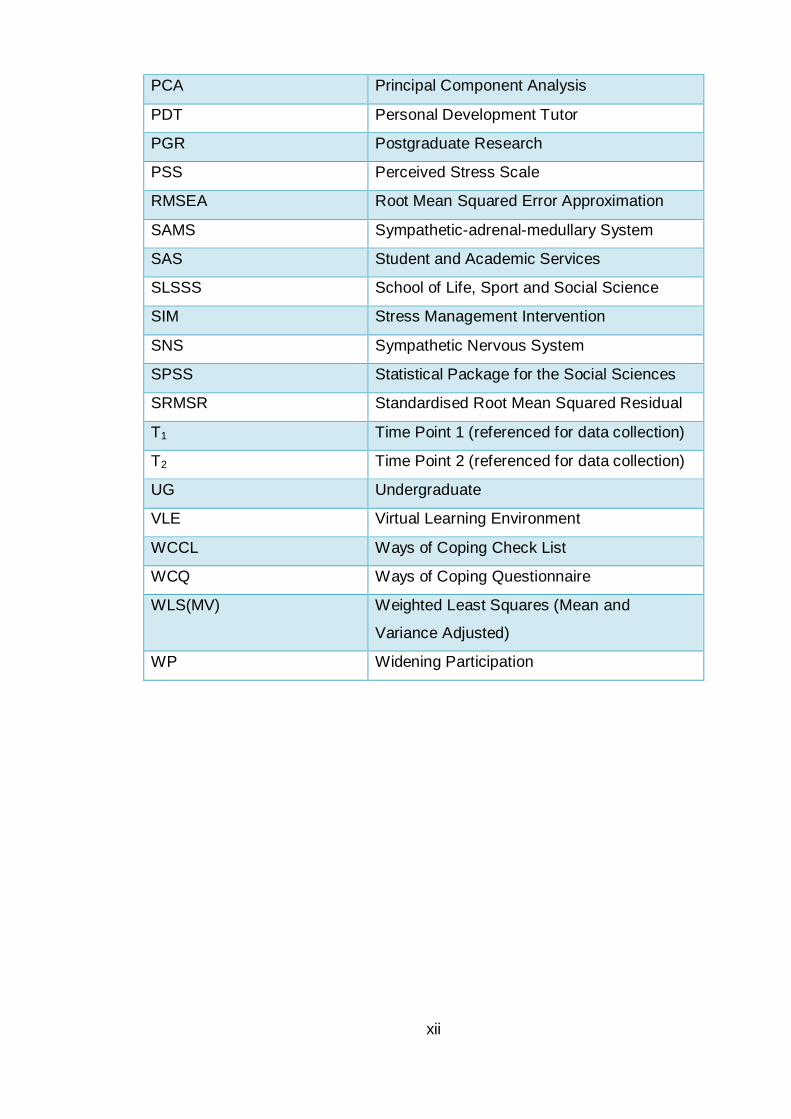
Abbreviations
AT As Treated
CFA Confirmatory Factor Analysis
CT Control Trial
DALY Disability Adjusted Life Years
EFA Exploratory Factor Analysis
ENBS Edinburgh Napier Business School
ENU Edinburgh Napier University
FA Factor Analysis
FE Further Education (college)
FHLSS Faculty of Health, Life and Social Science
FOI Freedom of Information
GAS General Adaptation Syndrome
GHQ General Health Questionnaire
GT Grounded Theory
HBM Health Belief Model
HE Higher Education (University)
HEA Higher Education Academy
HEI Higher Education Institution
HESA Higher Education Statistics Agency
HPA Hypothalamic-pituitary-adrenal
HSE Health and Safety Executive
ISAS Independent Student Advice Services
ISD Instructional Systems Design
ITT Intention to Treat
LESS Life Events Scale for Students
LOC Learning Object Creator
LORI Learning Object Review Instrument
NHS National Health Service
NPD Non-positive Definite
NUS National Union of Students
P(followed by number) Participant
xii
PCA Principal Component Analysis
PDT Personal Development Tutor
PGR Postgraduate Research
PSS Perceived Stress Scale
RMSEA Root Mean Squared Error Approximation
SAMS Sympathetic-adrenal-medullary System
SAS Student and Academic Services
SLSSS School of Life, Sport and Social Science
SIM Stress Management Intervention
SNS Sympathetic Nervous System
SPSS Statistical Package for the Social Sciences
SRMSR Standardised Root Mean Squared Residual
T1 Time Point 1 (referenced for data collection)
T2 Time Point 2 (referenced for data collection)
UG Undergraduate
VLE Virtual Learning Environment
WCCL Ways of Coping Check List
WCQ Ways of Coping Questionnaire
WLS(MV) Weighted Least Squares (Mean and
Variance Adjusted)
WP Widening Participation
xiii
Acknowledgments
It gives me great pleasure in acknowledging the help of my Supervisor Dr
Samantha Campbell Casey who facilitated my Honours project which lead to
this research study, and who provided support especially in obtaining funding.
Also, Dr Tony Westbury for covering maternity leave and stepping into the
Director of Studies role during my final year.
I extend my gratitude to Drs Mick Rae and Geraint Florida-James whose
feedback and opinions I truly appreciate and respect. Also to my internal and
external examiners who highlighted suggestions to improve the finished thesis.
The project is indebted to the students and staff who participated and facilitated
data collection across the university.
I owe sincere thanks to my Mum and Dad for their emotional and financial
support during both my undergraduate and postgraduate studies and to my
brother Aaron who volunteered his time and expertise in the development of
media for this project. I am also grateful to my partner Thomas for his belief in
me through what was an ironically stressful period.
Finally, I wish to express my appreciation for the support provided by my fellow
research students, above all to my friends Margaret and Lucy. 2.B.48 and
2.B.46, this is complete in no small part because of your encouragement,
guidance and friendship.
xiv
Abstract
Students experience stress due to many factors including educational
unpreparedness, financial strain and the inability to integrate socially. This mixed
methods study aimed to investigate stress levels of undergraduate students in a
post-1992, Scottish university and the potential for measures of stress to act as an
indicator of student withdrawal. Additionally, the project was concerned with
students’ use of support services and the development of a resource to facilitate
student resilience with the aim to impact positively on retention. The level of
perceived stress reported by students appeared to be high and was coupled with
intention to dropout across all study levels. Students’ psychological wellbeing
appeared to be much lower than results published for the general population and
actual withdrawal within the sampled cohort was higher than the University’s formal
figures would suggest. Perceived stress predicted a student’s intention to withdraw
but this association did not transfer to actual withdrawal suggesting that other
factors, most likely coping mechanisms, play a part in mediating the withdrawal
behaviour. Further data collection is required to confirm if a combination of
perceived stress and coping data more accurately predicts actual withdrawal,
however results showed that measures of perceived stress could be used to
indicate a proportion of ‘at risk’ students. Low use of avoidance and distraction
coping was a better predictor of low self-reported stress than was high use of
adaptive coping and this may have implications for interventions that endeavour to
reduce stress through improved coping. Despite the seemingly high levels of stress
and potential worry over dropout, students were reluctant to seek support and
many were unaware of the support services available. An online, stress education
resource was developed to build students’ understanding of stress and the support
available. It was envisaged that this would reduce stigma, aid in student self-
awareness and self-assessment and improve their coping repertoire. The
intervention was trialled alongside controls and results demonstrate that further
work needs to be done to embed stress resilience into the student life cycle. The
project reaffirms the need for concern over student wellbeing and highlights areas
for improvement. Given students in this study may be considered ‘engaged’, results
bring to light a population, previously thought to be ‘low risk’, but who could benefit
from additional support to prevent unnecessary underachievement or attrition.
xv
Foreword
Thesis structure
This thesis presents an account of research carried out by the author at
Edinburgh Napier University (ENU), mainly within the School of Life, Sport and
Social Sciences (SLSSS), to explore stress in the student population, the effect
it may have on retention and the potential mediatory effect of a stress education
intervention on measures of stress and retention. The research programme was
concerned with quantitative measures of stress using common psychometric
questionnaires, self-reported and University recorded withdrawal, and
qualitative analysis of verbal and written personal accounts to better understand
stress and retention within the cohort. A new predictive model of attrition is
proposed and the design, development and evaluation of an evidence-driven
intervention is discussed.
Chapter one provides an introduction to the project, the rationale for choosing
the topic for further investigation and culminates in the generation of research
aims which will be addressed throughout the thesis.
Chapter two provides a background of stress research along with a review of
stress conceptualisation, the definition of stress used in the current study and a
review of stress in the student population. The second major variable for this
project, retention, is also defined within this section and a review of the literature
surrounding withdrawal from higher education (HE) is presented.
Chapter three reviews approaches to stress research and provides a rationale
for the choice of methods used to answer the project’s aims.
Chapters four through eight describe the methods and results of the five studies
within the project. Study five discusses the design, development and evaluation
of an internet based intervention, online access to which will be provided
separately.
Finally, chapter nine draws together the findings within the context of the aims
set out at the beginning of the project. The impact of the study is discussed
along with suggestions for the direction of future research.
xvi
To aid the reader, chapters are preceded by an introduction which provides an
abstract-style overview of the content, and results chapters are concluded by a
summary section which details key findings and results taken forward for further
clarification in subsequent studies.
Results from this research project have been reported, in part, in the following
peer reviewed publication and conference proceedings:
Harris, P.J., Campbell Casey, S.A., Westbury, T. and Florida James, G. (2015).
Assessing the link between stress and retention and the existence of barriers to
support service use within HE. Journal of Further and Higher Education, UK
DOI:10.1080/0309877X.2015.10143161
Harris, P. J. (2014). ‘Effect of stress on retention and potential consequences
for teaching and learning within higher education.’ Paper presented at Higher
Education Academy STEM Conference, Edinburgh, UK, 30th April -1st May.
Harris, P.J. (2014). ‘Stress in the student population and its effect on retention
within higher education.’ Paper presented at the Scottish Federation of
University Women, Postgraduate Research Conference, Dundee, UK, 26th April.
1 Journal of Further and Higher Education paper reports only on undergraduate data.
1
Chapter One: Introduction
Chapter overview
It has been well documented that students within higher education (HE)
experience stress and given the current economic climate, the competitive
job market and the substantial financial outlay associated with tertiary
education, successful progression is of utmost importance to both
universities and the students themselves. The potential for stress to
influence decisions of persistence within HE could open an avenue for new
methods of identifying at-risk students and allow the development of
interventions to simultaneously tackle two issues of great significance to
the HE setting: student wellbeing and retention.
2
1.1 Introduction
In the past, students in higher education (HE) have been acknowledged as
being in a privileged position and therefore their stress and demands for support
were thought to be reduced in comparison to non-students (Royal College of
Psychiatrists, 2011). More recently however, it has been internationally reported
that HE students are experiencing increased stress in comparison to the
general population and to previous cohorts (Adlaf et al., 2001; Roberts et al.,
1999; Roberts et al., 2002; Robotham and Julian, 2006; Stallman, 2010;
Stewart-Brown et al., 2000) .
A student living report stated that 53% of students felt their stress levels had
significantly increased since the start of their studies (UNITE, 2002).The
National Union of Students (NUS) Scotland (2010, 2011) has also published
findings on student stress gained from their survey into student mental
wellbeing. They concluded that 75% of the 24 institutions who took part
reported an increase, on the previous academic year, in the number of students
seeking mental health support. The causes behind seeking support fell mainly
into three categories: stress over assessments and time management, worry
over prospective career and financial stress (NUS Scotland, 2010). The Mental
Wellbeing in HE Survey reported a significant increase in demand for mental
health services within 80% of responding institutions, and a further 13% of HEIs
reported a slight increase in provision demand (Grant, 2011 cited in Royal
College Psychiatrists 2011 p20).
The Independent Student Advice Services (ISAS) at Edinburgh Napier
University (ENU) also reported an increase in the percentage of presented
cases where mental wellbeing was an area of concern (personal
communication with Head of ISAS Maxine Wood, 21st October 2011). This has
been coupled with an increase in the complexity of cases being presented, with
many students reporting problems that are multi-factorial stemming from, but
not limited to, those issues mentioned in the NUS report.
NUS Scotland (2010) suggested the need for increased resources, such as
additional training for staff and extended student helpline hours, to meet the
increasing demand. Within universities that had made improvements to their
student welfare service, 40% still felt they were unable to meet demands for
3
support; indicating that mental wellbeing is a growing concern within HE
institutes (HEIs) where student stress appears to be on the increase.
In the UK relatively few studies have explored stress in the student population,
those that have focus on nursing or other healthcare profession degrees as
opposed to students enrolled on non-vocational BSc or BA courses. Robotham
(2006) also noticed this limitation suggesting that only two groups of students
have been explored in any depth: nursing and psychology students. It is
understandable that literature has placed an emphasis on healthcare courses
due to the potential detrimental effects medical, dental and nursing student
stress could have on the health service. However, a need for further
investigation of stress within the cohorts who have received little attention to
date is necessary to better understand the levels of stress experienced by
students across a broader range of degrees.
Retention is another extremely important issue to universities as it is seen as an
indicator of institutional excellence and failure to reach benchmarks can impact
the institution financially. Scotland is known to have the worst retention rates in
the UK with an average dropout rate of 7.9% for 2011/12 in comparison to 6.6,
6.5 and 6.3 percent for England, Wales and Northern Ireland, respectively
(Higher Education Statistics Agency (HESA), 2011/2012). Following the 2007
national audit of retention within HE, the Head of the National Audit Office John
Bourn was quoted stating that although the UK has lower rates of attrition in
comparison to other countries:
‘…the variations in retention rates between higher education institutions
indicate that retention could be increased further, bringing major benefits
to the extra students who would complete their studies and more value to
the taxpayer and the economy from the public funds expended on higher
education’ (National Audit Office, 2015).
Successful progression through university is also required for a student to exit
with their chosen degree. Setbacks and failure to reach an individual’s potential
at this stage can result in long term emotional scarring and can in the worst
cases hinder future personal and professional progression (Royal College of
Psychiatrists, 2011). It is therefore important to both parties for there to be as
few barriers to continuation as possible. Attrition also costs the taxpayer
4
considerably and equilibrium is yet to be found between spending and
graduation rates. Little data could be found to quantify financial loss through
attrition, none of which originated in the UK. It is difficult to price the loss of a
student; however a report by the Delta Cost Project at American Institutes for
Research suggest that each degree or certificate completed costs an average
of $55,800; $43,000 of which covers spending on the student who completes
and $12,800 in “loss” due to attrition (Yanagiura, 2012). An earlier report by
Schneider and Yin (2011), estimates that state and federal taxpayers spend
more than $9 billion educating first-year students who will not return the
following year. It must be noted that UK HE differs widely from the USA and
therefore it is difficult to translate these costs exactly; however, the sentiment of
the data, that attrition is costly to the taxpayer, can be extrapolated.
New outreach initiatives have opened university places to a wider audience and
as such have increased the number of students entering from under-
represented, non-traditional backgrounds. Although no evidence is yet available
on this topic, students entering via these routes may experience increased
stress due to feeling less prepared or less academically able than other
students, not fitting in with their peers or because of financial pressures.
Widening participation (WP) is also thought to have a negative impact on
retention as these students may have little or no family history of HE and may
come from lower socio-economic groups meaning that family support to persist
with studying, as opposed to working a paid job, may be lower than for students
from more traditional HE backgrounds (Yorke and Thomas, 2003).
1.2 Rationale
To date no research has focused solely on stress and retention within UK
students. A Canadian study found low perceived stress along with gender,
parental support, depression and high school grades to be predictors of
persistence (Wintre and Bowers, 2007). Some literature exists regarding stress,
self-efficacy and academic success in the USA where they find self-efficacy to
be a more important predictor for academic progression than stress (Sandler,
2000, Zajacova et al., 2005). These studies do not, however, recognise the role
of positive stress or coping which must be taken into consideration.
5
Some research has confirmed that increased stress does directly decrease
cognitive performance and/or academic achievement (Brazenor and Masterton,
1980; Roberts et al., 1999). It could also be surmised that a decrease in
cognitive ability may in return exacerbate stress levels through a feeling of
underachievement. Consequently students who suffer stress may face poor
performance or even academic failure. Stress therefore has the potential to lead
to a student’s non-progression or non-continuation with their studies through
involuntary withdrawal (academic failure). Students facing a decision of
withdrawal due to factors outwith their control will then likely experience further
stress due to socially constructed stigma around failing, feelings of inadequacy
in comparison to successful peers and confusion over the decision to re-sit or
leave.
Stress could also be a cause of voluntary withdrawal where students may feel
overwhelmed and unable to cope with the demands of being a student at
university. In keeping with this, Szulecka and colleagues’ (1987) study of
Nottingham University students showed that elevated psychological morbidity
scores (measured by General Health Questionnaire; GHQ) in students does not
necessarily predict poor performance as measured by exam failure, it did
however prelude voluntary dropout. This poses a problem for universities who
use only poor academic performance as an indicator of a student’s wellbeing
and/or their likelihood of continuing.
The depute president of NUS Scotland Jennifer Cadiz comments on the
potential for stress, caused by being unable to cope, to affect student’s
wellbeing and retention:
‘Going to college or university is meant to be the time of your life, but
what if it's not? Without the right support, stress and isolation can lead to
far deeper problems like depression and even drop out’ (NUS Scotland
2010, p.2).
The theoretical correlation between these two variables, stress and retention, is
clear to see; however, studies are yet to successfully quantify the relationship
and very little research involves UK samples. Broadly, this thesis aims to
investigate these two variables within a UK HE cohort to better understand the
correlation and to make suggestions for monitoring and supporting at risk
6
students. By exploring these two areas simultaneously the data generated could
help to support two important agendas faced by all educational institutes:
improving student wellbeing and reducing attrition.
Although models do exist which describe the interplay between key variables in
student persistence, they include indicators such as entry qualifications and
student-institution fit (Tinto, 1975; 1987) which are not, and in some cases
cannot, be widely used, outside of the research context, to provide practical
solutions to support student retention.
Institutions should consider how available theory can help address the practical
issues of persistence and move forward to actively tackle the problem. Barriers
to this could be that current theory utilises variables that are typically difficult to
measure and hard to translate into forms of institutional practice. Additionally a
number of models focus on matters that are not directly under the influence of
the institution or that cannot ethically be manipulated. For example, although
higher grade point average on entry is known to be correlated with increased
persistence this variable can only be moderately modified by an institution
before the course is seen to be selecting against academically disadvantaged
individuals and therefore acting against widening access agenda.
The motivation for this thesis was to explore the viability of a new method of
influencing students’ intentions to withdraw through monitoring another variable
of interest: stress. By exploring the correlation between stress and retention
variables it was thought that students could be encouraged to take part in
monitoring their own wellbeing through measures of stress and subsequently be
made aware of the potential for this to influence withdrawal. Additionally, by
better understanding these two areas of importance within a modern UK HE
setting the study would be adding to the limited British literature available and
through data collection could provide empirical evidence to inform and support
the host university’s practice and policy.
As alluded to earlier, British research to date has been carried out mainly within
the healthcare setting therefore it was decided that a relatively under
researched group, science students, should be examined. Given the differences
between healthcare courses and non-vocational degrees such as biological
7
science, sports science or social science it could be assumed that student
nurses, doctors and dentists would have a different student journey and thus
may experience stress differently to their non-vocational peers. Data from a
science cohort may therefore be more widely applicable to other non-vocational
courses and would be a valuable addition to the existing literature which
focuses mainly on student nurses.
Recently the discourse has shifted from retention of students in general to
increased participation and retention of students from the most deprived areas
and articulation of students from further to higher education. Widening access is
undoubtedly an important agenda and the findings of this project may be of
particular interest to those working in widening participation (WP). The current
studies wished to explore retention of all students and endeavoured to sample,
and thus support, students from all backgrounds.
1.3 Research questions
The thesis aimed to answer the following research questions:
1) What is the level of stress reported by non-health professional BSc
students at the host university and how does it compare to available
literature on students undertaking health professional BSc studies?
2) How do non-health professional BSc students utilise the university
support services and individual coping strategies to mediate stress and
intentions towards withdrawal?
3) Is there a link between stress and student withdrawal which could be
exploited to improve both student wellbeing and continuation through the
use of an intervention?
8
Chapter Two: Background
Chapter overview
A review of the available stress and retention theory confirms the
existence of theoretical correlations between the two variables. Literature
also elaborated on the potential for students to experience stress and for
stress to negatively affect academic and social aspects of university life
and thus interrupt a student’s successful journey through HE.
Stress is defined for this research using the Lazarus and Folkman (1984)
framework, as a transactional process whereby an individual’s perception
of their environment and appraisal of their ability to cope with that
environment results in a physiological and psychological response. The
response can be negative (distress) or positive (eustress) depending on
whether the individual perceives the situation as harmful / a threat or a
challenge.
Retention is operationalised as successful completion of one academic
year and subsequent entry into the next to culminate in the award of a
degree within a university’s accepted time frame. Thus withdrawal, attrition
and dropout are defined as the opposite. While retention can only be
measured retrospectively, Beans and Eaton’s (2001) psychological model
of retention demonstrates intention to withdraw can act as a suitable
indicator of attrition behaviour.
9
2.1 Theoretical basis of stress
It order to design a research study to answer the proposed research questions,
a review of stress theory is necessary because it is known that the way in which
stress is defined can impact on the interpretation of a study’s results.
The term stress originated from the field of physics where it defined an external
force acting against a resisting body. Walter Cannon (1932) was among the first
to apply the concept of stress, but not the term, to living organisms. He coined
the term ‘homeostasis’ to describe maintaining of internal physiological
equilibrium following deviations from the norm caused by internal or external
physiological stimuli. In his experimentations he also found that animals
undergo the same sympathetic nervous system activation, and subsequent
biological response when confronted with psychological stimuli. Cannon (1932)
described the evolutionary purpose of this response as the fight or flight
response (also known as the acute stress response) proposing that the
response primed the organism to either confront or evade the cause of the
stimuli.
Hans Selye (1936; 1956) expanded on Cannon’s work, undertaking research
with an emphasis on the response, and was the first recorded scientist to use
the term stress in this context. In retrospect this may have been a mistake;
stress would have been more accurately applied to the stimulus, and strain
would have been more appropriate to label the resulting response that he was
attempting to describe. In an attempt to reduce confusion he labelled the
stimulus (the cause of stress) a stressor.
Selye (1936) noted that under varying experimental conditions (including cold
shock, surgical injury, excessive exercise and sub lethal drug doses) rats
developed typical symptoms regardless of condition.
‘Experiments on rats show that if the organism is severely damaged by
acute non-specific nocuous agents a typical syndrome appears the
symptoms of which are independent of the nature of the damaging agent
or the pharmacological type of the drug employed, and represent rather a
response to damage as such’ (p32).
This led him to speculate that the stress response was non-specific and that
any significant change in conditions resulted in a stereotypical three staged
10
response (alarm, resistance and exhaustion) which he termed the General
Adaptation Syndrome (GAS).
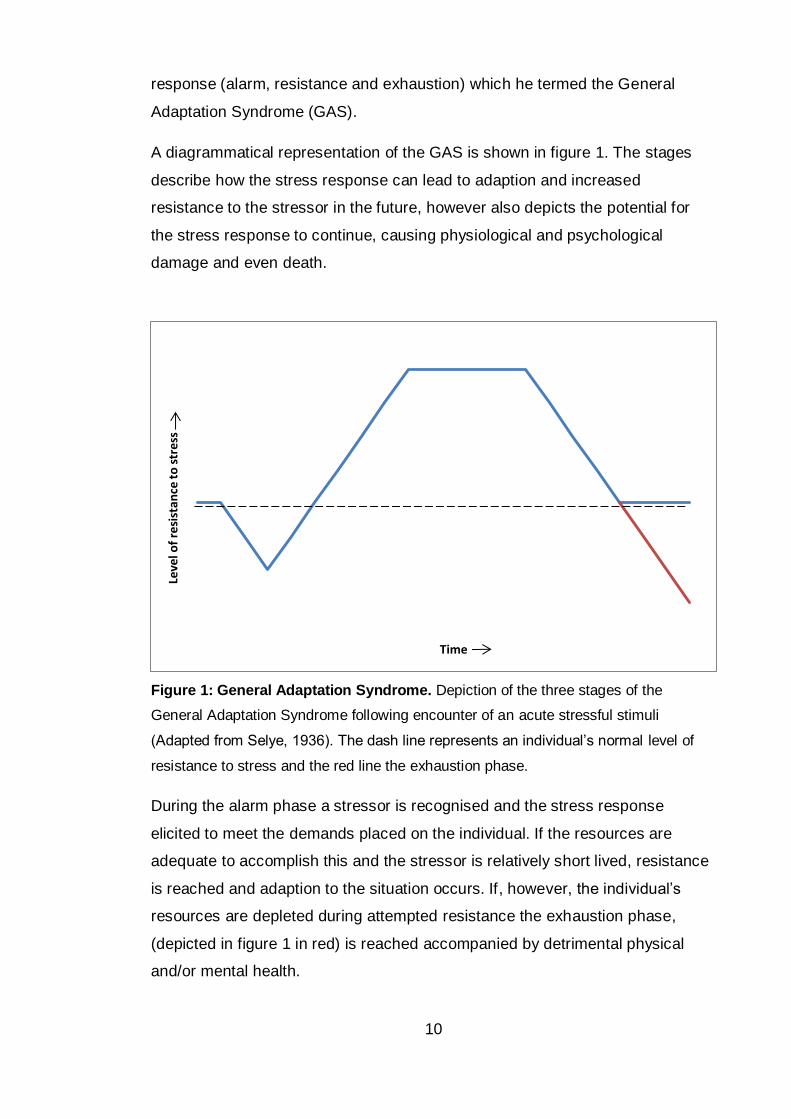
A diagrammatical representation of the GAS is shown in figure 1. The stages
describe how the stress response can lead to adaption and increased
resistance to the stressor in the future, however also depicts the potential for
the stress response to continue, causing physiological and psychological
damage and even death.
Figure 1: General Adaptation Syndrome. Depiction of the three stages of the
General Adaptation Syndrome following encounter of an acute stressful stimuli
(Adapted from Selye, 1936). The dash line represents an individual’s normal level of
resistance to stress and the red line the exhaustion phase.
During the alarm phase a stressor is recognised and the stress response
elicited to meet the demands placed on the individual. If the resources are
adequate to accomplish this and the stressor is relatively short lived, resistance
is reached and adaption to the situation occurs. If, however, the individual’s
resources are depleted during attempted resistance the exhaustion phase,
(depicted in figure 1 in red) is reached accompanied by detrimental physical
and/or mental health.
Leve
l of
resi
stan
ce t
o s
tre
ss
Time
11
A derivative of Selye’s systemic approach was the research of Holmes and
Rahe (1967), who focused on the cause of stress and reported that all critical
life events (positive or negative) stimulate change and therefore promote the
GAS.
John Mason (1968) observed that the typical stress response described by
Selye carried a common emotional link; the simulated situations were novel,
unpredictable and uncontrolled. Following this assumption, Mason (1968)
demonstrated that in experiments where uncertainty had been eliminated no
GAS was observed. Since Mason’s first works a fourth characteristic of stressful
situations has been added - threat. This makes the stress response specific to
events which have one or more of the four determinants of stress, disproving
Selye’s non-specific hypothesis.
Other areas of Selye’s theories still stand up to scrutiny including his
differentiation between positive and negative stress. He concluded that the
negative or positive nature of a stimulus is governed by how the individual
interprets it and chooses to react to it. Selye (1987) observed that the individual
determines whether the stressor is to be eustressful (positive) or distressful
(negative).
To improve understanding of psychological stress one must move from the
primary field of physiology to the field of cognitive psychology, where Lazarus
has been the notable contributor. Lazarus’s group (1952, 1966, 1978 and 1984)
has been developing stress theory to build and improve on Selye’s work. The
group expanded on his theory of ‘individual interpretation’ and how one chooses
to react to explain the cognitive transformation of an ‘objective’ noxious event
into the subjective experience of being distressed.
The changes in understanding of stress over the last century have resulted in a
variety of conceptualisations of the stress response. Since Selye’s early misuse
of the term stress there has been continuing confusion and disagreement on
nomenclature within the field (Levi, 1998). In lay terms stress is broadly
understood as being ‘bad’ and discourse may include phrases that indicate
stimulus such as ‘work is stressful’ or outcome such as ‘stress is detrimental to
health’. This view is simplistic and does not take into account the nuances of the
12
complete stress response which can lead to incorrect substitution with other
terms such as anxiety, worry and nerves, which would more correctly be
labelled as symptoms of distress. The general view that stress is always
negative overlooks the ability for the stress response to improve functioning and
for adaption and therefore increased resilience to future stress.
In the field of stress research the differing and sometimes conflicting definitions
of stress can also lead to incomparable results between studies. These
variances can arise through differences in stress conceptualisations where the
researcher choses to define stress as the stimuli, process or outcome. There
are common themes in these definitions however, namely an imbalance
between demands and the individual’s ability to manage the demands in a
context where failing to cope has negative consequences for the individual.
Lazarus’s transactional model of stress has undergone several revisions
(Folkman et al., 1986; Lazarus et al., 1952; Lazarus and Folkman, 1984;
Lazarus and Launier, 1978) which has resulted in the framework that is most
widely accepted today. In this theory, stress is not defined as a specific stimulus
or pattern of physiological, behavioural or subjective responses. Instead, stress
is viewed as a relationship or a transaction between the individual and their
environment.
`Psychological stress refers to a relationship with the environment that
the person appraises as significant for his or her wellbeing and in which
the demands tax or exceed available coping resources' (Folkman et al.,
1986 p63).
This definition highlights two processes as central mediators within the person–
environment transaction: cognitive appraisal and coping.
The idea of cognitive appraisal is based on the work of Arnold (1960), where
emotional processes are dependent on individuals’ expectations of an
encountered situation with regard to the relevance and impact of potential
outcomes. This concept explains why individual differences in strength,
frequency and duration of stress are observed in environments that are
objectively identical. The appraisals, in turn, are determined by a number of
personal and situational factors for example goals and controllability,
respectively. Lazarus’s theory differentiates two forms of appraisal, primary and
13
secondary, which rely on different sources of information (Lazarus, 1966).
Initially primary appraisal occurs where the relevance to the individual's
wellbeing is assessed, followed by secondary appraisal which concerns a
comparison of the demands against the individual’s resources and ability to
cope.
According to Lazarus and Folkman (1984), these appraisals are made with
respect to three discrete categories: Harm, which refers to the current existence
of psychological damage, i.e. where demands outweigh resources; Threat,
which is the anticipation of harm, i.e. demands could become greater than
current resources; Challenge, which occurs when an individual feels their
resources are sufficient to overcome the demands. It is this categorisation that
determines the individual’s emotional response to the stressor. In the cases
where the situation is perceived as within the individual’s coping abilities,
positive eustress aids in overcoming the challenge. Overcoming potentially
stressful situations leads to adaption and greater resilience to future causes of
stress.
The concept of coping within Lazarus and Folkman’s (1984) theory is defined
as:
‘…constantly changing cognitive and behavioural efforts to manage
specific external and/or internal demands that are appraised as taxing or
exceeding the resources of the person’ (p178).
Many methods of coping have been described and characterised within the
literature and individuals will have varying coping repertoires. Coping is
addressed in further detail in Chapter Seven.
2.1.1 Definition of stress
Having reviewed the history and the accompanying developments in
conceptualisation, stress can now be defined for this study as: a transactional
process by which a stimulus elicits a psychological and physiological response.
The stress response is individual and subjective and appraisal of the situation,
as well as the psychological and physiological response that follows positive
identification of a stressor, will depend on a number of factors including current
environmental and interpersonal characteristics, coping potential, genetic
predisposition, developmental influences and past experiences (Ice and James,
14
2007, Lazarus and Folkman, 1984). The resulting outcome can be negative
(distress) or positive (eustress) depending on whether the individual perceives
the situation as harmful / a threat or a challenge, respectively.
2.2 Student stress
Reasons for the increase in student stress, disproportional to that of the
employed sector, have been explored and stressors for the student
demographic have been suggested by researchers across different educational
groups using a variety of tools (Abouserie, 1994; Agolla and Ongori, 2009; Ross
et al., 1999). Many stressors found will be common for students and other
groups, such as those in full time employment, including: financial concerns,
balancing workload, meeting targets, work-life balance and insufficient
resources (Gillespie et al., 2001). Some stressors however are unique to
students such as examinations, problems with shared accommodation,
inadequate university resources, balancing university with a paid job and the
pressure of advancing academic content (Abouserie, 1994; Fisher, 1994; Ross
et al., 1999; Wilcox et al., 2005). It could be argued that the student population
is at increased risk of suffering stress compared to age matched populations
due to these additional academic related stressors.
Many students coming to university are moving away from home for the first
time and this is coupled with an increase in independence and responsibility
which some can find difficult to adjust to (Fisher, 1994). The inability to adapt
successfully to the different stressors and changes in the level of social support
and life style could increase a student’s vulnerability to stress. Stress can also
be exacerbated by alcohol or drug misuse, which is common in the further
education (FE) and higher education (HE) student age group (Gill, 2002; Webb
et al., 1996).
In the current socio-economic climate and due to recent changes in funding and
the enhanced competition for academic places, caused by an increasing
number choosing to stay in education, it is necessitating students to excel in
both academic and extra-curricular activities to compete for successful
employment after graduation (National Statistics, 2011; Robotham and Julian,
2006). These demands on top on the inevitable financial constraints of being a
15
student are likely to be causing increased stress. This presumption is in keeping
with reports from the Edinburgh Napier University (ENU) Independent Student
Advice Service (ISAS) that cases are becoming increasingly complex with many
reported cases stemming from multiple problems (personal communication with
Head of ISAS Maxine Wood, 21st October 2011).
At the same time as the changes to funding, those who were previously denied
access to HE are now being encouraged to study and this has seen an increase
in more socially and culturally diverse backgrounds, part-time and mature
students (Aimhigher Research and Consultancy Network, 2013). Within the HE
system this means that students are no longer just students and many have
additional responsibilities including being a parent or carer or working a part-
time or even full time job. The result is that students are presumably
experiencing the same stressors as those not in education but these are
compounded by the additional stressors related to academia.
Life satisfaction, which requires a comparison between one’s real life and their
ideal life, was measured by Weinstein and Laverghetta (2009) using the
satisfaction with life scale (Diener et al., 1985) and was compared to stress
levels of students in Oklahoma (measured via the College Student Stress
Scale; Feldt, 2008). They found that a decreased life satisfaction score was
significantly correlated with an increased stress score. It could therefore be
hypothesised that students who feel university has not matched up to their
expectations would experience stress due to possibly feeling misled,
disappointed and being underprepared and unable to cope with reality. This
was suggested to be the case in a study that followed US students learning
abroad for 15 months (Pitts, 2009). It could be said therefore, that the university
has a duty of care and it is incumbent upon them under wellbeing strategy to
prepare students appropriately for the transition to university life before and
after matriculation.
In summary students may experience stress due to varying causes; however,
the worry is that this increasing stress load on the students is not being met by
paralleling development in university support services and even those that have
made improvements are still seeing the need for further resources (NUS
Scotland, 2010). These reports, further justify research question two (see page
16
7), ‘How do non-health professional BSc students utilise the university support
services and individual coping strategies to mediate stress and intentions
towards withdrawal?
2.2.1 Demographic differences
Gender, age, academic level and social and cultural background all play a role
in the perception of stress and therefore the susceptibility to stress and
subsequently stress related ill-health.
Towbes and Cohen (1996) found first year students suffered more frequently
than other students. Although this could be linked to age, it is likely caused by
the difference between living at home while undertaking secondary school study
which is prescribed in nature and transitioning to life at HE which is more
independent. Transitions between subsequent years of HE are, in comparison,
less stressful as adjustment to the new environment has already taken place.
Due to the cultural differences in perceived stress it is difficult to make cross-
cultural comparisons, even if the method used for measuring was the same (Ice
and James, 2007). It could however be argued that with the increase in
emigration, data from other countries may be of increasing relevance and
should be consulted to give a better understanding of what stressors other
cultures experience which could help advance the diagnosis of stress in
minority groups and improve the provision of resources. This is especially
important for HE institutions with a high number of international students (Zhou
et al., 2008). Another reason educational institutions should be aware of the role
of cultural differences is the ability for it to also cause stress. This does not only
benefit international students adapting to living in a new country but all students
adapting to the unfamiliar culture of university life (Credé and Niehorster, 2012).
Many researchers have found females to perceive their life events as more
stressful (Matud, 2004) and to have higher levels of overall perceived stress
(Abouserie, 1994) than males, despite experiencing similar stressors
(Bebbington, 1996; Maciejewski et al., 2001). This information is consistent with
Health and Safety Executive’s (HSE; 2011) estimated incidents of stress related
illness in the workplace, where more women than men are absent due to stress.
Gender differences in emotional and physiological responses to stress are
17
thought to be the reason for higher prevalence of stress related disorders in
women (Kelly et al., 2008). Increased subjective distress and emotional
reactivity in women is well documented (Barlow, 2001; Craske, 2003; Nolen-
Hoeksema et al., 1999; Rudolph, 2002). However, there are inconsistencies in
literature surrounding gender differences in physiological responses including
neuroendocrine activity and autonomic responding to acute social, achievement
and instrumental stressors (Hedlund and Chambless, 1990; Katkin and
Hoffman, 1976; Kelly et al., 2006; Kirschbaum et al., 1992; Kirschbaum, et al.,
1999; Sgoifo et al., 2003; Stoney et al., 1987). It appears from the evidence
available that differences in psychology rather than physiology are responsible
for the increased subjective interpretations of stress and perceived and
objective symptomology in females.
Given the amount of literature which has reported gender differences across the
stress response, from appraisal to objective and subjective outcomes, this
thesis will need to consider the potential for differences in gender to mask
correlations between the variables of interest. The implications of potential
gender differences will therefore be examined throughout the research process
and will be considered in the analysis and interpretation of data.
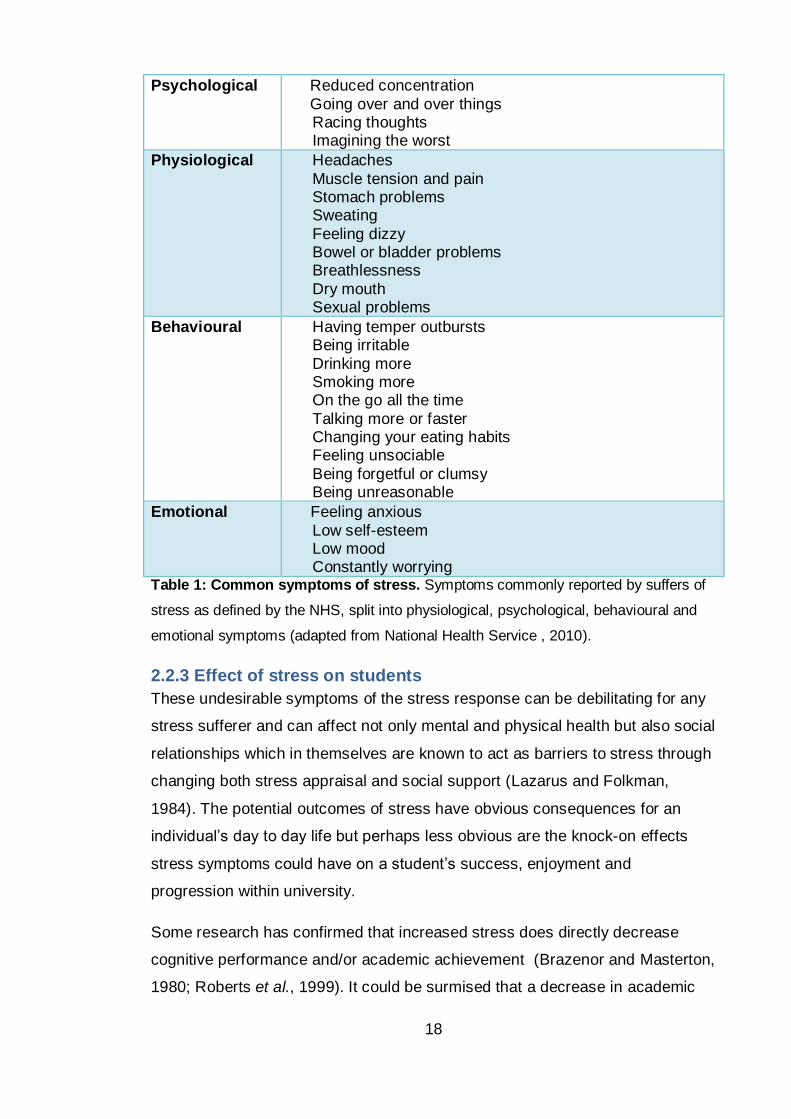
2.2.2 Symptoms
Regardless of gender, background or employment status, most individuals
report to suffer typical symptoms when they are unable to cope with the
demands placed upon them. Common symptoms of stress (table 1) are
provided by the National Health Service (NHS) and are available on their
website.
18
Psychological Reduced concentration
Going over and over things Racing thoughts Imagining the worst
Physiological Headaches
Muscle tension and pain Stomach problems Sweating
Feeling dizzy Bowel or bladder problems Breathlessness
Dry mouth Sexual problems
Behavioural Having temper outbursts Being irritable
Drinking more Smoking more On the go all the time
Talking more or faster Changing your eating habits Feeling unsociable
Being forgetful or clumsy Being unreasonable
Emotional Feeling anxious
Low self-esteem Low mood Constantly worrying
Table 1: Common symptoms of stress. Symptoms commonly reported by suffers of
stress as defined by the NHS, split into physiological, psychological, behavioural and
emotional symptoms (adapted from National Health Service , 2010).
2.2.3 Effect of stress on students
These undesirable symptoms of the stress response can be debilitating for any
stress sufferer and can affect not only mental and physical health but also social
relationships which in themselves are known to act as barriers to stress through
changing both stress appraisal and social support (Lazarus and Folkman,
1984). The potential outcomes of stress have obvious consequences for an
individual’s day to day life but perhaps less obvious are the knock-on effects
stress symptoms could have on a student’s success, enjoyment and
progression within university.
Some research has confirmed that increased stress does directly decrease
cognitive performance and/or academic achievement (Brazenor and Masterton,
1980; Roberts et al., 1999). It could be surmised that a decrease in academic
19
performance may intensify stress levels through a feeling of underachievement
which could lead to depressive symptoms and related behaviour such as
isolation and poor self-care. These outcomes are likely to prevent a student
from reaching their academic and social potential and could therefore hinder
future life progression.
It seems reasonable to suggest that if increased stress can cause a decrease in
immune function that students suffering from distress may fall ill more frequently
and that this could lead to reduced attendance and engagement with the
university. It has been recognised by ENU staff and other universities that
students who miss lectures and other contact time with staff are at increased
risk of poor academic achievement and therefore non-progression (Benzies and
Westwood, 2008; Herriot Watt University, 2007; University of Bolton, 2009).
The symptoms of stress can make it difficult for students to integrate
successfully into the social culture of a university. Feeling anxious and worried
about any aspect of university can make it difficult for individuals to be
comfortable and relaxed and therefore they may avoid social contact with their
peers. Weak social networks can exacerbate stress through a feeling of
loneliness and poor social support means that the individual would not be able
to take advantage of emotional and instrumental support from others who may
be going through the same.
Therefore, a worrying consequence of stress is that students may face non-
progression or non-continuation with their studies, further investigation and a
review of retention literature will allow this stress theory to be placed into
context with existing theory of retention.
2.3 Theoretical basis of retention
As the second main variable of interest within this study, retention must also be
defined. According to the Higher Education Academy (HEA, 2014), retention is
described in the UK as ‘students remaining in one HE institution and completing
their programme of study within a specific timeframe.’ Successful progression is
essential for retention and refers to the successful completion of one year and
subsequent entry into the next. A student’s withdrawal from their degree
programme (the opposite of retention) could be seen as falling into two possible
20
categories: voluntary or involuntary (Tinto, 1993). Voluntary dropout is the
consequence of a conscious decision to withdraw and can be due to many
factors or combinations of factors including the student being bored or
insufficiently challenged, disliking fellow students, lecturers or the subject,
feeling detached from the university culture or because they are not coping well
with the transition to university or between different stages within the university
journey. Compulsory disengagement, on the other hand, can result from
academic failure or regulation infringement where it is a university’s decision to
remove the student from study. By enforcing this binary some causes of
withdrawal may be overlooked such as suffering a long-term illness, being
required to care for a family member or not having enough money to continue.
In these situations students may wish to continue but due to factors outside
their control the decision is taken out of their hands and withdrawal in these
cases will often depend upon the extent to which the institution is willing to offer
additional support or how resilient the individual is.
In summary withdrawal is not always negative or a result of failure by the
student or the institution. Importantly, institutions should not define dropout in
ways which contradict the students' own understanding of their leaving. If the
leaver does not define their behaviour as representing a form of failure then
neither should the institution. It is important however, to understand if and when
institutions could have done more in order to support students who wanted to
stay in HE and to act on this information to prevent unnecessary withdrawal of
others in the future.
2.3.1 Retention theory
As alluded to in the introduction, student retention models are complex and
typically contain large numbers of variables that are assumed to relate to a
general underlying cause of retention, as such they are correlated with
withdrawal and affect it either directly or indirectly. Examples include
demographic variables, organisational factors, academic, social and
environmental factors, attitudes, intentions and psychological processes
(Aitken, 1982; Bean, 1985; Braxton and Lee, 2005; Tinto, 1975).
Although these models exist, traditional indicators of retention such as entry
qualifications and student-institution fit (Tinto, 1975; 1987) do not appear to be
21
widely used, outside of the research context, to provide support for students.
That is to say, although various factors have been found to be predictors of
either retention or withdrawal, universities seem to have been unable to
translate this into effective practice. This was attested to by Tinto (2006, p2):
‘The fact is that despite our many years of work on this issue, there is still
much we do not know and have yet to explore. More importantly, there is
much that we have not yet done to translate our research and theory into
effective practice.’
Institutions should be considering how the theory can help address the practical
issues of persistence and move forward to actively tackle the problem. Barriers
to this could be that current theory utilises variables that are typically difficult to
measure and hard to translate into forms of institutional practice. Additionally a
number of models focus on matters that are not directly under the influence of
the institution. For example, the concept of student-institution fit is both hard to
define and measure and does not directly tell practitioners how to achieve better
student integration within their establishment.
This section of the thesis will explore current models of withdrawal and will
cross reference model variables with psychological stress literature to report on
the viability of the thesis to use only measures of stress as predictors of a
student withdrawal.
Tinto (1975) is the most referred to theorist in this area and conceptualises
dropping out as the lack of congruency between students and institutions,
describing his model as a:
‘…theoretical model of dropout [which] argues that the process of
dropout from college can be viewed as a longitudinal process of
interactions between the individual and the academic and social systems
of the college during which a person’s experiences in those systems (as
measured by his normative and structural integration) continually modify
his goal and institutional commitments in ways which lead to persistence
and/or to varying forms of dropout’ (p94).
Cabrera et al. (1993) describes the theory more simply as the matching of a
student’s motivation, academic ability, family and individual attributes with the
academic and social characteristics of the institution to establish commitment to
the educational goal and commitment to remain at the institution. In
22
distinguishing between the academic and social domains of university life, Tinto
suggests that one might achieve integration in one domain without doing so in
the other. Wilcox et al. (2005) found this to be the case, where although some
students were coping with the academic aspects of university they were unable
to build a strong social network which led to their withdrawal. Stress has the
ability to impact on appraisal of integration and therefore commitment to
university and subsequently withdrawal. When a student is stressed they may
feel less academically and socially integrated with the institution through poor
perceived learning experiences and reduced formal and informal peer
interactions.
Tinto (1975) also incorporated elements of cost-benefit analysis into his model.
He stated:
‘…a person will tend to withdraw from college when he perceives that an
alternative form of investment of time, energies, and resources will yield
greater benefits, relative to costs, over time than will staying in college’
(p98).
Cost does not necessarily refer to financial burden, although it will likely play an
important role, but can refer to the mental, emotional and physical strain. In
other words, if a student perceives their life to be easier and less stressful
without the burden of HE, and the current or future benefit of HE is not
apparent, then external activities become more attractive than course
completion and the student will be more likely to dropout. In this view a
student’s inability to cope with the mental, emotional and physical stress of HE
could leave them vulnerable and at risk of withdrawal.
A second researcher, John Bean, has also been influential in the development
of models of persistence. Bean's model was based on the psychological theory
of attitude-behaviour which he used to show how academic and social
integration can be viewed as outcomes of psychological processes thus
‘fleshing out’ traditional models (Bean and Eaton, 2001 p75).
‘The flow of the model over time is as follows: pre-matriculation
behaviour and attitudes, student interaction with the institution and
external environment after enrolment, attitudes about school
experiences, intention to leave, departure from college’ (Bean, 2005
p218).
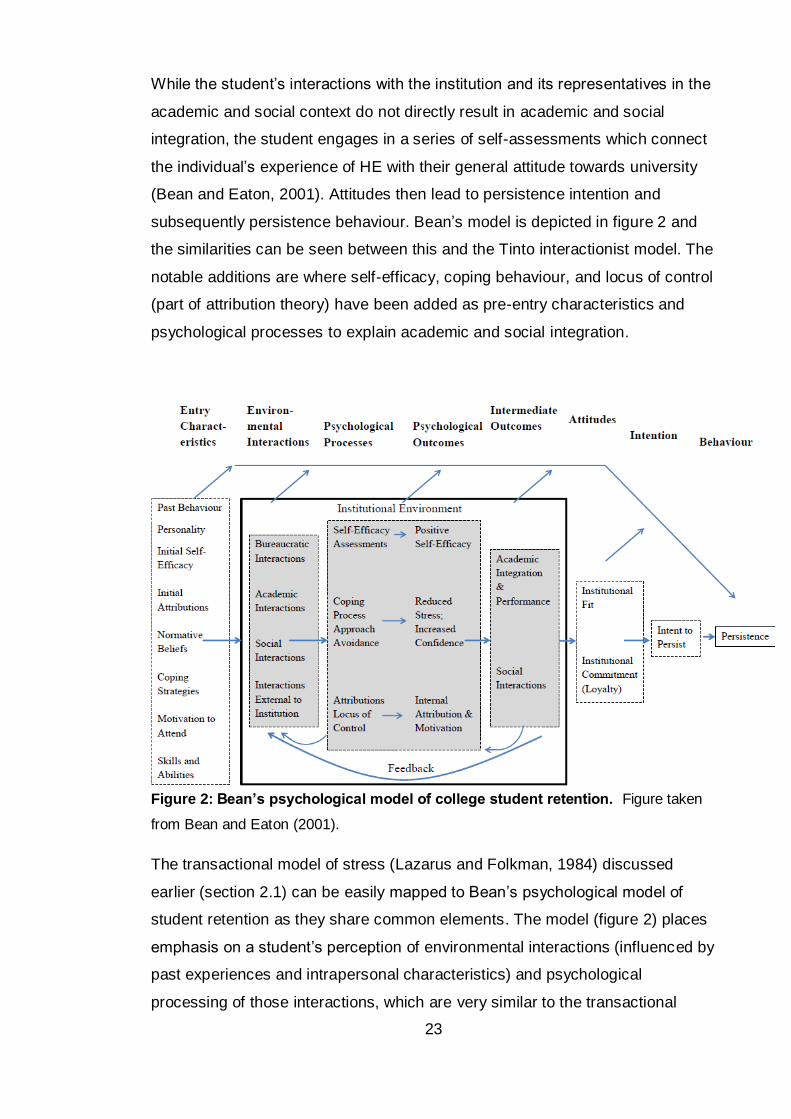
23
While the student’s interactions with the institution and its representatives in the
academic and social context do not directly result in academic and social
integration, the student engages in a series of self-assessments which connect
the individual’s experience of HE with their general attitude towards university
(Bean and Eaton, 2001). Attitudes then lead to persistence intention and
subsequently persistence behaviour. Bean’s model is depicted in figure 2 and
the similarities can be seen between this and the Tinto interactionist model. The
notable additions are where self-efficacy, coping behaviour, and locus of control
(part of attribution theory) have been added as pre-entry characteristics and
psychological processes to explain academic and social integration.
Figure 2: Bean’s psychological model of college student retention. Figure taken
from Bean and Eaton (2001).
The transactional model of stress (Lazarus and Folkman, 1984) discussed
earlier (section 2.1) can be easily mapped to Bean’s psychological model of
student retention as they share common elements. The model (figure 2) places
emphasis on a student’s perception of environmental interactions (influenced by
past experiences and intrapersonal characteristics) and psychological
processing of those interactions, which are very similar to the transactional
24
model of stress. Bean’s model also highlights the importance of a student’s
coping repertoire both prior to and post environment interaction which again is
very similar to the processes occurring at primary and secondary appraisal
stages of the transactional model of stress. Another communality between the
two models is the feedback loop, or constant re-appraisal, and ability to have
both positive and negative outcomes, i.e. persistence or withdrawal in Bean’s
model and eustress or distress in Lazarus and Folkman’s stress model.
Stress has known interactions with many variables within this model of
retention. Bean and Easton (2001) described self-efficacy as an individual’s
perception of his or her ability to perform a particular task to assure certain
outcomes. They proposed that as academic and social self-efficacy increase,
academic and social integration also increase. Self-efficacy and stress are
linked in that low self-efficacy can lead to the perception that a task is
unachievable which in turn can be stressful. Similarly, stress and the associated
feeling of being tired and burnt-out can lead to a reduced belief in one’s ability.
In Lazarus’s model of stress (Lazarus and Folkman, 1984), each transaction
between the individual and their environment is evaluated and compared to
categories of ‘threat’ or ‘challenge’, those with high self-efficacy have been
found to be more likely to evaluate the demands faced as the latter (Chemers,
Hu, and Garcia, 2001).
Using attribution theory Bean introduced locus of control to the retention model;
that is the extent to which individuals believe they can control events affecting
them. Bean believed that students with internal locus of control, as opposed to
external locus of control, will accept responsibility for their own successes or
failures and are likely to act in such a way as to achieve academic or social
success by studying and attending classes, for example, if they associated
these behaviours with academic achievement. Where locus of control is
internal, Bean expected students’ motivation to study and to socialise to be high
and believed that this would then lead to academic and social integration.
Stress and locus of control are also correlated, via coping behaviour, and
internal locus of control has been associated with reduced stress in students
(Abouserie, 1994; Whyte, 1977). Where stress threatens the ego, such as
failing an exam, the individual can make an attribution with an external locus of
25
control, e.g. the exam was unfairly written, as a protective mechanism
(Palestini, 2002 p30). This may result in a shift towards external locus of control
for similar future stressors with the result in this example being poor revision
and potential failure in the re-sit due to ‘the exam is unfair so why bother
revising if I’m going to fail anyway’. Stress can therefore have a detrimental
effect on self-efficacy, coping and locus of control and thus negatively affect
academic and social integration, attitudes towards the university and ultimately
progression behaviour.
Bean’s model also makes more explicit connections to stress and coping
behaviour theory where he suggests that coping behaviours allow a student to
adapt to the university environment and that adaptation is the process by which
a student becomes academically and socially integrated. In the opposite
direction it is also thought that prolonged stress and burn-out can promote the
use of maladaptive coping strategies, such as distraction and avoidance
(Thornton, 1992), which are thought to be less successful and results in poorer
adaption to the university environment.
Yorke and Longden (2004) distil the following four factors from the available
literature on student withdrawal. They suggest that students decide to leave for
the following reasons:
1. Flawed decision making about the programme or institution
2. Experience of the programme or institution
3. Failure to cope with the academic demands
4. Events that impact on student’s lives outside university
Of these, the latter two involve the notion of coping with difficulties, be they
academic or personal stressors. As can be seen from the literature reviewed,
stress management and coping have already been implicated in student attrition
however the correlation between these two variables has not been quantified or
explored within UK non-health professional students. Thus the current thesis
aims to address this literature gap using Bean’s model, and the literature
discussed above, as the theoretical platform from which to explore the link
between students’ stress and their withdrawal from HE and to test whether an
intervention to manipulate stress can be effective in reducing student
26
withdrawal. The research does not intend to test Bean's model directly but does
plan to make comparisons between the results generated in this thesis and the
existing models of student withdrawal.
27
Chapter Three: Approach
Chapter overview
Stress is a complex phenomenon and has been studied through both
psychological and biological lenses and with qualitative and quantitative
approaches. Respective advantages and disadvantages will be associated
with each but the research approach for a study should be decided based
upon the suitability of the approach to answer the proposed research
questions.
In this case psychological stress was explored using mixed methods, with
both quantitative and qualitative data collection and analysis chosen to
address the areas under inquiry.
28
3.1 Invasive and non-invasive
Many methods of measuring and understanding stress have been developed.
Quantitative measurements can be taken at the various junctions within the
psychophysiological pathways from stimulus to response. These can include
measures within the Sympathetic Nervous System (SNS), Hypothalamic-
pituitary-adrenal (HPA) axis, the Sympathetic-adrenal-medullary system
(SAMS) and the cardiovascular and immune systems. Although these provide
objective readings and are not reliant on self-reporting, the invasive nature of
biological measures is a significant drawback. Collection of biological samples
such as blood requires trained professionals and there is also a significant cost
associated with the analysis of these samples. Invasive sampling could be a
barrier to participation and may result in a reduced volunteer pool.
Taking the non-invasive route, quantitative measures of stress can be taken
using questionnaires designed to sample indicators of stress such as self-
reported symptoms, exposure to stressful events, perceived stressfulness of
events and changes in emotional and behavioural responses. Stress can also
be assessed qualitatively through the direct interaction with individuals on a
one-to-one basis or within a group, and through passive observations of
individuals and groups. A qualitative approach produces information that is
richer and can provide a deeper insight into the phenomenon under study which
cannot be gained through quantitative methods.
It was decided that a non-invasive approach would be taken for this project
given the aim was to understand stress within a large cohort. It was believed
that invasive procedures may reduce the number of students willing to
participate and the cost associated with large amounts of biological analysis
could not be supported by the available budget.
3.2 Research design choices
Much debate surrounds the choice between qualitative and quantitative
research approaches. Sale et al. (2002 p45) summarise the extent of the
differences by writing:
‘the underlying assumptions of the quantitative and qualitative paradigms
result in differences which extend beyond philosophical and
29
methodological debates. The two paradigms have given rise to different
journals, different sources of funding, different expertise, and different
methods.’
This chapter will investigate the relative advantages and disadvantages of the
non-invasive quantitative and qualitative methods but will not be distracted by
the philosophical debate. It is not the intention to provide an in-depth account of
the philosophy surrounding the two approaches but instead to outline the
differences between approaches and to introduce mixed methods.
Traditionally quantitative research is viewed as closed-ended, confirmatory and
deductive. Quantitative researchers generally operate under a positivist
worldview where one single reality is believed to exist and where that reality can
be sampled impartially and objectively by a researcher (Creswell and Clark,
2007). These statements relate to ontology and epistemology which describe
the researchers’ views regarding reality and how that reality can be sampled,
respectively. Under this view a quantitative researcher seeks to develop
knowledge by testing hypotheses through the use of variable measurements
with a cause and effect rationale to determine the magnitude and frequency of
relationships. Null hypothesis statistical testing has been criticised due to its
limitations, in particular because statistical significance is not the same as
scientific significance. Researchers on the whole have now moved towards the
use of effect sizes which report the size of an effect rather than whether the
effect exists.
Qualitative research on the other hand, is usually open-ended, exploratory and
inductive in nature. Qualitative researchers generally operate under a
constructivism worldview where multiple realities are believed to exist
(ontological position) and where the closeness of the researcher to the
participants and the topic leads to biases which the researcher openly
discusses (epistemological view) (Creswell and Clark, 2007). In this view a
qualitative researcher makes knowledge claims based on data collected from
individuals immersed in the setting in which the study is framed. Data analysis
is conducted on the accounts of how participants perceive their world and thus
produces an understanding of the problem based on contextual factors
(Creswell and Miller, 2000).
30
While this generally tends to be the case qualitative research can also be
confirmatory, and quantitative research exploratory. Similarly, open- versus
closed-ended differentiates between sources of data better than between either
qualitative or quantitative approaches. Creswell and Clark (2011) illustrate this
point using the example of LeCompte and Schensul (1999), where surveys
were used in ethnographic qualitative research.
Qualitative and quantitative research have both strengths and weaknesses
(Johnson and Onwuegbuzie, 2004). Much literature exists to assist in the
evaluation of quantitative and qualitative methods and the following summary
has been guided by sources including Onwuegbuzie et al. (2007) and Putwain
(2007). Questionnaires provide an inexpensive, quick and efficient way of
obtaining large amounts of information. Data are collected in a standardised
way as all participants are asked the same questions in the same format. The
numeric form of quantitative data allows it to be subject to mathematical based
statistical analysis, yielding descriptive results that can be tested for reliability
and validity thus ensuring outcomes can be generalised to a larger population.
When results are generalisable future situations can be predicted and related
variables modified to affect foreseen outcomes. Quantitative research does
however have its limitations. The large samples required for generalisation can
be logistically difficult to gather and the misuse of sampling and weighting can
undermine the accuracy, validity and generalisation of a quantitative research
study. Participants may also false-report on questionnaires in an attempt to
portray a positive image and through the desire to ‘look good’. Quantitative
research, by virtue of its short, rigid structure is not a flexible method of data
collection, topics are predefined and responses are limited to those offered to
the participant.
Most research to date has focused on quantitative approaches which utilise
questionnaires that are designed to measure perceived stress, experienced
stress, coping, stressors or stress symptoms. Examples of these inventories
include Perceived Stress Scale (PSS; Cohen et al., 1983), General Health
Questionnaire (GHQ; Goldberg and Williams, 1988), Primary Appraisal
Secondary Appraisal Scale (Gaab et al., 2005), Spielberger State-Trait Anxiety
Inventory (Spielberger et al., 1983), Ways of Coping Checklist (Vitaliano et al.,
31
1985) and the COPE scales (Carver et al., 1989). Some scales have been
developed specifically for the student population, for example: Student Life
Stress Inventory (Gadzella, 1991), Student Stress Scale (Insel and Roth, 1985)
and Academic Stress Scale (Abouserie, 1994). These instruments work on the
assumption that stress can indeed be measured in this way, and Robotham
(2008 p738) noted that concentrating on quantitative data ‘may lead to the
rejection of subjective, anecdotal and impressionistic information’. This would
potentially overlook the theory already discussed here; that it is the individual’s
perception of the situation and their perceived ability to cope which predicts
distress.
Qualitative research shares some of the same characteristics of quantitative
research in that it seeks to answer a research question by collecting evidence
and produces findings that were not determined in advance. In addition some
qualitative research seeks to understand a given topic from the perspectives of
the local population it involves. Qualitative research methods include participant
observation, in-depth interviews and focus groups which in turn can generate
field notes, audio and visual recordings and transcripts. The characteristic that
binds these qualitative approaches and differs from quantitative methods is the
desire to understand and explore phenomena in more depth than can be gained
from numerical quantification (Mack et al., 2005). Some of the advantages of
qualitative research mitigate the shortcomings of quantitative studies, for
example allowing issues to be examined in greater detail and for previously
unconsidered areas to be brought to light by participants. This permits the
direction of data collection to be quickly revised when new information emerges.
Qualitative research therefore has the ability to create knowledge about new
phenomena and complex interrelations where a thorough literature base does
not already exist. Qualitative collection and analysis is however, extremely
labour intensive and is dependent on the skill of the researcher. Unlike
quantitative studies, the small sample size used in qualitative research makes
generalisation to a larger population difficult and unwise. The issue of
inaccuracy in self-reports can apply to qualitative as well as quantitative
research; however a skilled interviewer should be able to reassure a participant
that confidentially is guaranteed. Literature suggests there is stigma attached to
admission of mental ill-health (National Union of Students (NUS) Scotland,
32
2010) and potentially, by extension, stress. When exploring such topics
researchers should be mindful of the potential for participants to withhold
information due to fear of judgement. Stress is a topic that could hold significant
emotional potential with participants and literature has identified challenges
related to qualitative research such as managing emotions (Dunn, 1991;
Gilbert, 2001; Rager, 2005) and maintaining boundaries (Dickson-Swift et al.,
2006; Gale, 1992), which are compounded when researching potential sensitive
topics such as stress (Alty and Rodham, 1998; Lee, 1993; Lee and Renzetti,
1993).
3.3 Mixed methods
Mixed methods utilises the strengths of both quantitative and qualitative
research while minimising the weaknesses of each approach alone and
therefore can answer a broader and more complete range of research
questions (Johnson and Onwuegbuzie, 2004). This is accomplished by allowing
both generalisation and depth of interpretation to be inferred from quantitative
measures and the lived experience, respectively. The rationale is that by mixing
qualitative and quantitative data a better understanding of the problem can be
ascertained than if either dataset was used alone. Utilising a mixed methods
approach in the study of stress will also improve on the limitations of previous
studies that focused only on quantitative investigations (Robotham, 2008).
Theoretically, the advantages of mixed methods are clear; however practically
there are disadvantages, including the potential of having to resolve
discrepancies that arise in the interpretation of the findings (Johnson and
Onwuegbuzie, 2004). Another difficulty is attempting to combine designs with
different ontology and epistemology. Constructivism and positivism dominate
the qualitative-quantitative debate discourse; however, mixed methods
researchers Tashakkori and Teddlie (2003) argue that the dichotomy should be
abandoned in favour of pragmatism. In pragmatism, researchers are less
confined within elements of ontology, epistemology and methodology, valuing
both objective and subjective knowledge (Creswell and Clark, 2007).
Pragmatism is problem centred and therefore uses diverse approaches chosen
on the basis of what works best for the research question. It is a pluralistic
approach which requires orientation towards the research question rather than
33
from a particular epistemological or ontological stance. Hoshmand (2003)
reports that pragmatism also helps to shed light on how research approaches
can be mixed productively. Johnson and Onwuegbuzie (2004 p17) claim that
pragmatism
‘… offers an immediate and useful middle position philosophically and
methodologically; it offers a practical and outcome-oriented method of
inquiry that is based on action and leads, iteratively, to further action and
the elimination of doubt; and it offers a method for selecting
methodological mixes that can help researchers better answer many of
their research questions.’
The aims of the current study require a pragmatic mixed methods approach as
both quantitative and qualitative datasets will provide a fuller understanding of
stress within the cohort and the potential links between stress and retention.
Quantitative measures will allow correlations between stress and retention to be
assessed which will address the aim of attempting to predict those students
who may be at a higher risk of withdrawal. The collection of qualitative data will
facilitate better understanding of significant associations and will inform
interventions that could increase persistence and resilience within the students.
Having reconciled the differences between the approaches, mixed methods
designs were then considered to decide how the two datasets would be
consolidated within one study to maximise the interpretation of findings.
3.3.1 Mixed methods designs
Mixing of data can occur in a number of ways including convergent, sequential
and embedded designs which are best described in the following illustration
(see figure 3).
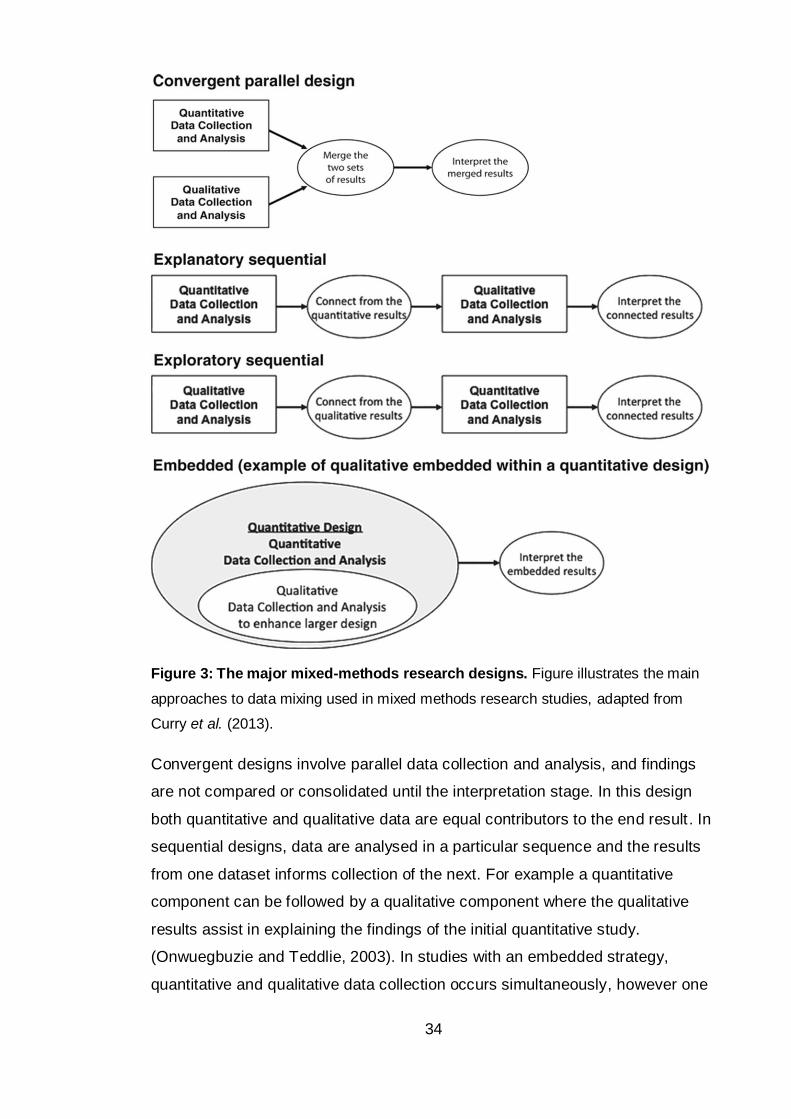
34
Figure 3: The major mixed-methods research designs. Figure illustrates the main
approaches to data mixing used in mixed methods research studies, adapted from
Curry et al. (2013).
Convergent designs involve parallel data collection and analysis, and findings
are not compared or consolidated until the interpretation stage. In this design
both quantitative and qualitative data are equal contributors to the end result. In
sequential designs, data are analysed in a particular sequence and the results
from one dataset informs collection of the next. For example a quantitative
component can be followed by a qualitative component where the qualitative
results assist in explaining the findings of the initial quantitative study.
(Onwuegbuzie and Teddlie, 2003). In studies with an embedded strategy,
quantitative and qualitative data collection occurs simultaneously, however one
35
component is predominant. In this design one datum type is providing a
supportive role for the other (Creswell and Clark, 2011).
3.4 Project design
A complex mixed methods plan was carried out to address the research
questions outlined for this project. Figure four represents the five separate
studies that were implemented, studies are colour coded blue, green, orange,
pink and purple, respectively. Collectively the studies aimed to answer the three
overarching research questions:
1) What is the level of stress reported by non-health professional BSc
students at the host university and how does it compare to available
literature on students undertaking health professional BSc studies?
2) How do non-health professional BSc students utilise the university
support services and individual coping strategies to mediate stress
and intentions towards withdrawal?
3) Is there a link between stress and student withdrawal which could be
exploited to improve both student wellbeing and continuation through
the use of an intervention?
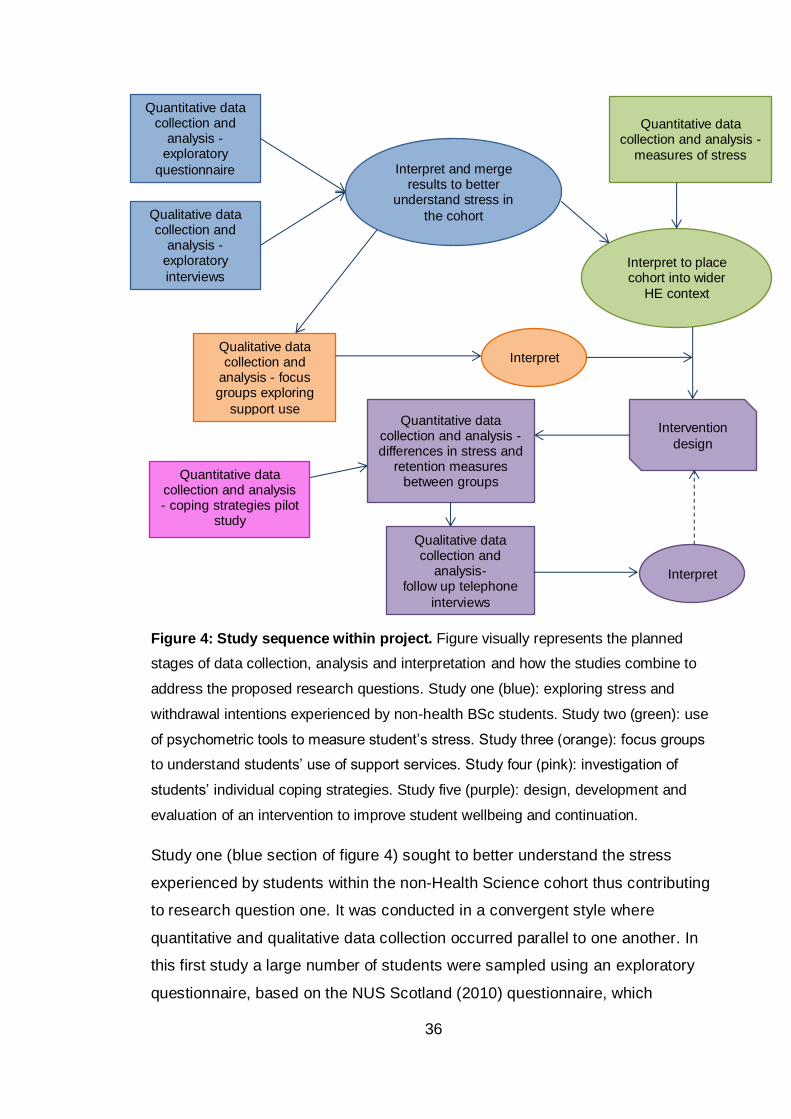
36
Figure 4: Study sequence within project. Figure visually represents the planned
stages of data collection, analysis and interpretation and how the studies combine to
address the proposed research questions. Study one (blue): exploring stress and
withdrawal intentions experienced by non-health BSc students. Study two (green): use
of psychometric tools to measure student’s stress. Study three (orange): focus groups
to understand students’ use of support services. Study four (pink): investigation of
students’ individual coping strategies. Study five (purple): design, development and
evaluation of an intervention to improve student wellbeing and continuation.
Study one (blue section of figure 4) sought to better understand the stress
experienced by students within the non-Health Science cohort thus contributing
to research question one. It was conducted in a convergent style where
quantitative and qualitative data collection occurred parallel to one another. In
this first study a large number of students were sampled using an exploratory
questionnaire, based on the NUS Scotland (2010) questionnaire, which
Quantitative data collection and
analysis -exploratory
questionnaire
Qualitative data collection and
analysis -exploratory
interviews
Interpret and merge results to better
understand stress in
the cohort
Qualitative data collection and
analysis - focus groups exploring
support use
Quantitative data collection and analysis -
measures of stress
Interpret to place cohort into wider
HE context
Interpret
Intervention
design
Quantitative data collection and analysis - differences in stress and
retention measures between groups
Qualitative data collection and
analysis- follow up telephone
interviews
Interpret
Quantitative data collection and analysis - coping strategies pilot
study
37
collected information on the causes and levels of stress they experienced along
with their use of support services and intentions to withdraw from their studies.
A small number of one-to-one interviews were also conducted to provide an in-
depth investigation of individual students’ experiences of stress during the
university trimester and their past experiences of withdrawal.
Study two (green section of figure 4) was a quantitative study and ran as a
convergent parallel design to study three. This study used psychometric
questionnaires to measure perceived stress, potential psychological morbidity
and experienced stress in the cohort to provide indications of distress in
comparison to available literature. This study also collected data relating to
intention to withdraw and included a follow up data collection to explore actual
withdraw one year later. Study two results contributed to answering research
question one regarding the level of stress experienced by non-health BSc
students but also fed into research question three regarding quantifying the
relationship between stress and withdrawal .
Data for the third study (orange section of figure 4) was collected sequentially in
an explanatory fashion where the qualitative investigation assisted in clarifying
aspects of the findings from study one. In this case focus groups were used to
explore the quantitative findings regarding students’ use of support services.
This study contributed to the understanding of research question two regarding
students’ use of support services.
The results from studies two and three were then combined with those from
study one to feed the development of interventions which were hoped to
manipulate students’ perception of stress and intention to withdraw, the success
of which was tested in the final study, thus addressing research question three
(Is there a link between stress and student withdrawal which could be exploited
to improve both student wellbeing and continuation through the use of an
intervention?).
Study four (pink section of figure 4) was a pilot study to better understand
student coping strategies within the cohort, contributing to research question
two. The data generated from this study allowed a factor structure for the
questionnaire to be interpreted which was then used during the evaluation of
38
the intervention in study five and to improve the inference between stress and
retention.
The design development and evaluation of the intervention in study five (purple
section of figure 4) was in itself an explanatory sequential design where
telephone interviews were used to further investigate quantitative measures of
student usage and perceived effect of the intervention. Study five related to
research question three.
39
Chapter Four: Study one – exploring stress and withdrawal intentions experienced by non-health BSc students
Chapter overview
Study one consisted of two parts, a paper-based questionnaire and one-to-
one interviews. It sought mainly to collect data which would answer research
question one regarding the levels of stress reported by non-health BSc
students but also contributed to research question two regarding student’s
coping and their use of support services. The study found Edinburgh Napier
University (ENU) students ranked hassles in the same order of stressfulness
as the larger Scotland-wide National Union of Students (NUS) survey.
Exams and assessments caused the most stress followed by time
management, not having enough money and considering future career.
Females reported higher stress than males but within gender there was no
difference in self-reported stress between year groups or degree routes.
Students fell into two major categories when stress across the trimester was
evaluated at interview: i) students with high stress at the start of a trimester
and ii) students with low stress at the start of a trimester. Most students went
on to demonstrate a typical stress profile for the second half of the trimester
where stress increased during assessment weeks. Students on the whole
demonstrated a lack of awareness of the support available to them, but
quantitative data and interview conversations found the majority of students
recognised and used the Personal Tutor service. The results from study one
suggest that students may be allowing stress to mount considerably before
acting to reduce stress due to the lack of support awareness and also a poor
knowledge of how to cope. It appeared that the link between stress and
withdrawal acts through poor academic performance; where stress causes
symptoms that are not conducive to learning and results in poorer than
expected performance which in turn negatively affects attitudes towards
persistence and subsequent retention behaviour.
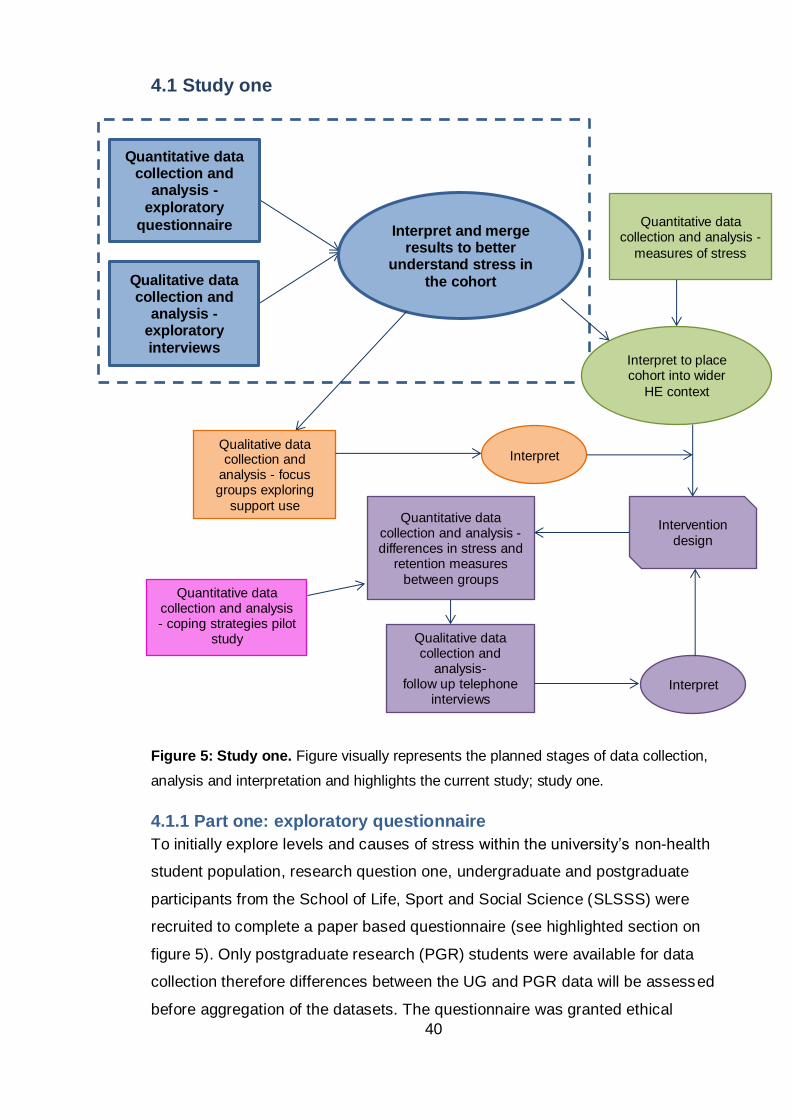
40
4.1 Study one
Figure 5: Study one. Figure visually represents the planned stages of data collection,
analysis and interpretation and highlights the current study; study one.
4.1.1 Part one: exploratory questionnaire
To initially explore levels and causes of stress within the university’s non-health
student population, research question one, undergraduate and postgraduate
participants from the School of Life, Sport and Social Science (SLSSS) were
recruited to complete a paper based questionnaire (see highlighted section on
figure 5). Only postgraduate research (PGR) students were available for data
collection therefore differences between the UG and PGR data will be assessed
before aggregation of the datasets. The questionnaire was granted ethical
Quantitative data collection and
analysis -exploratory
questionnaire
Qualitative data collection and
analysis -exploratory interviews
Interpret and merge results to better
understand stress in the cohort
Qualitative data collection and
analysis - focus groups exploring
support use
Quantitative data collection and analysis -
measures of stress
Interpret to place cohort into wider
HE context
Interpret
Intervention
design
Quantitative data collection and analysis - differences in stress and
retention measures
between groups
Qualitative data collection and
analysis- follow up telephone
interviews Interpret
Quantitative data collection and analysis - coping strategies pilot
study
41
approval by the relevant Faculty Committee in November 2011 and the design
was based on research carried out by National Union of Students (NUS)
Scotland (2010) to allow comparisons between our data and that found across
the rest of Scotland.
4.1.2 Method
The questionnaire included questions to record self-reported levels of stress
and causes of stress, which were akin to academic daily hassles. Demographic
information was also collected including gender, age, year of study and degree
route to allow for identification of any group under greater than average stress.
Medical information was requested from participants to understand the effect of
having a medical condition on the levels of stress experienced by students. This
information may also allow for estimation of those diagnosed with clinical stress
or stress related disorders, or who self-diagnose themselves as stressed.
Information collected on ethnic background may allow for cultural differences to
be examined, another factor that should be considered in stress research (Ice
and James, 2006). The questionnaire also examined students’ awareness and
use of current university support services, research question two. This
information will provide an idea of the current level of support and intervention
already sought by the students. Student participants were recruited at the end
of randomly selected timetabled classes between weeks 10 and 11 of trimester
one (November 2011) and their fully informed consent was given before
participating. A copy of the questionnaire is attached, see appendix one.
4.1.2.1 Quantitative analysis
Quantitative analysis was used to facilitate interpretation of level and causes of
stress across the cohort as recorded in completed questionnaires. The
quantitative method depended on the data generated, normally distributed data
were treated with parametric statistical techniques and non-normally distributed
data with the non-parametric equivalent. Shapiro-Wilk test statistics of <0.05
denoted data sets which were not normally distributed.
Given the literature already discussed (section 2.2.1) regarding differential
perceived stress reported by different demographic groups, differences within
demographic groups such as gender and year of study were explored using t-
tests where two groups exist or ANOVA where more than two groups exist (or
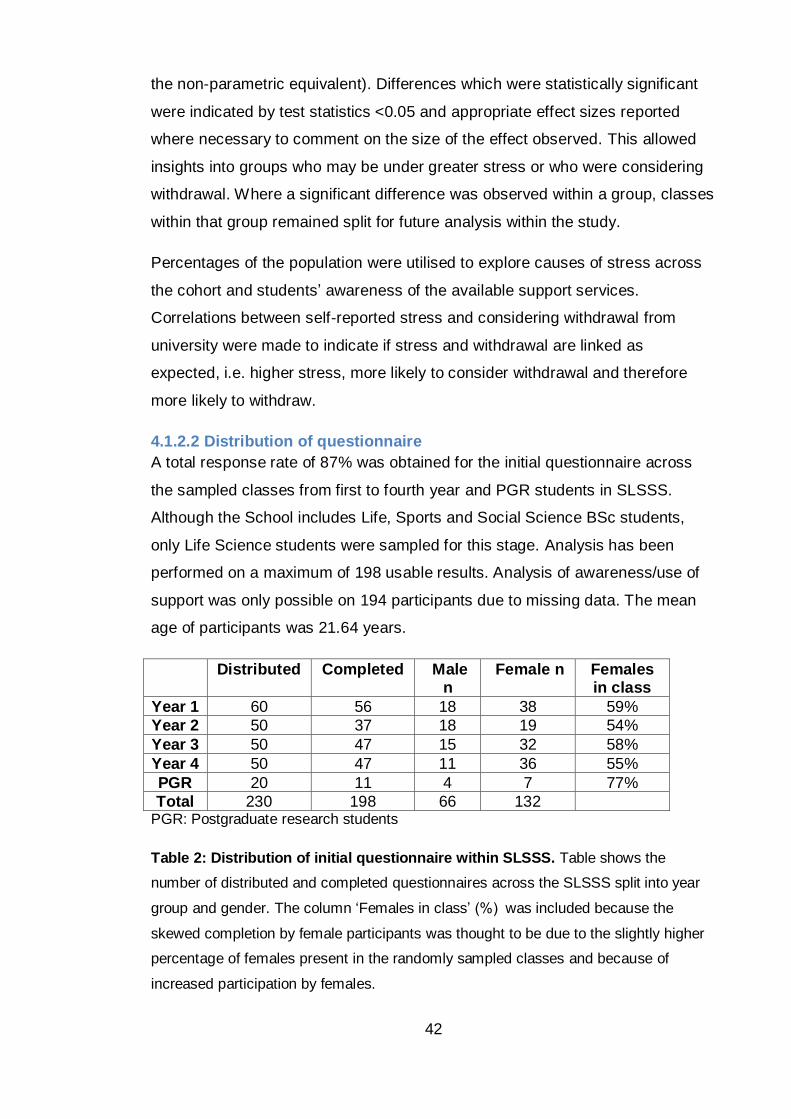
42
the non-parametric equivalent). Differences which were statistically significant
were indicated by test statistics <0.05 and appropriate effect sizes reported
where necessary to comment on the size of the effect observed. This allowed
insights into groups who may be under greater stress or who were considering
withdrawal. Where a significant difference was observed within a group, classes
within that group remained split for future analysis within the study.
Percentages of the population were utilised to explore causes of stress across
the cohort and students’ awareness of the available support services.
Correlations between self-reported stress and considering withdrawal from
university were made to indicate if stress and withdrawal are linked as
expected, i.e. higher stress, more likely to consider withdrawal and therefore
more likely to withdraw.
4.1.2.2 Distribution of questionnaire
A total response rate of 87% was obtained for the initial questionnaire across
the sampled classes from first to fourth year and PGR students in SLSSS.
Although the School includes Life, Sports and Social Science BSc students,
only Life Science students were sampled for this stage. Analysis has been
performed on a maximum of 198 usable results. Analysis of awareness/use of
support was only possible on 194 participants due to missing data. The mean
age of participants was 21.64 years.
Distributed Completed Male n
Female n Females in class
Year 1 60 56 18 38 59%
Year 2 50 37 18 19 54%
Year 3 50 47 15 32 58%
Year 4 50 47 11 36 55%
PGR 20 11 4 7 77%
Total 230 198 66 132 PGR: Postgraduate research students
Table 2: Distribution of initial questionnaire within SLSSS. Table shows the
number of distributed and completed questionnaires across the SLSSS split into year
group and gender. The column ‘Females in class’ (%) was included because the
skewed completion by female participants was thought to be due to the slightly higher
percentage of females present in the randomly sampled classes and because of
increased participation by females.
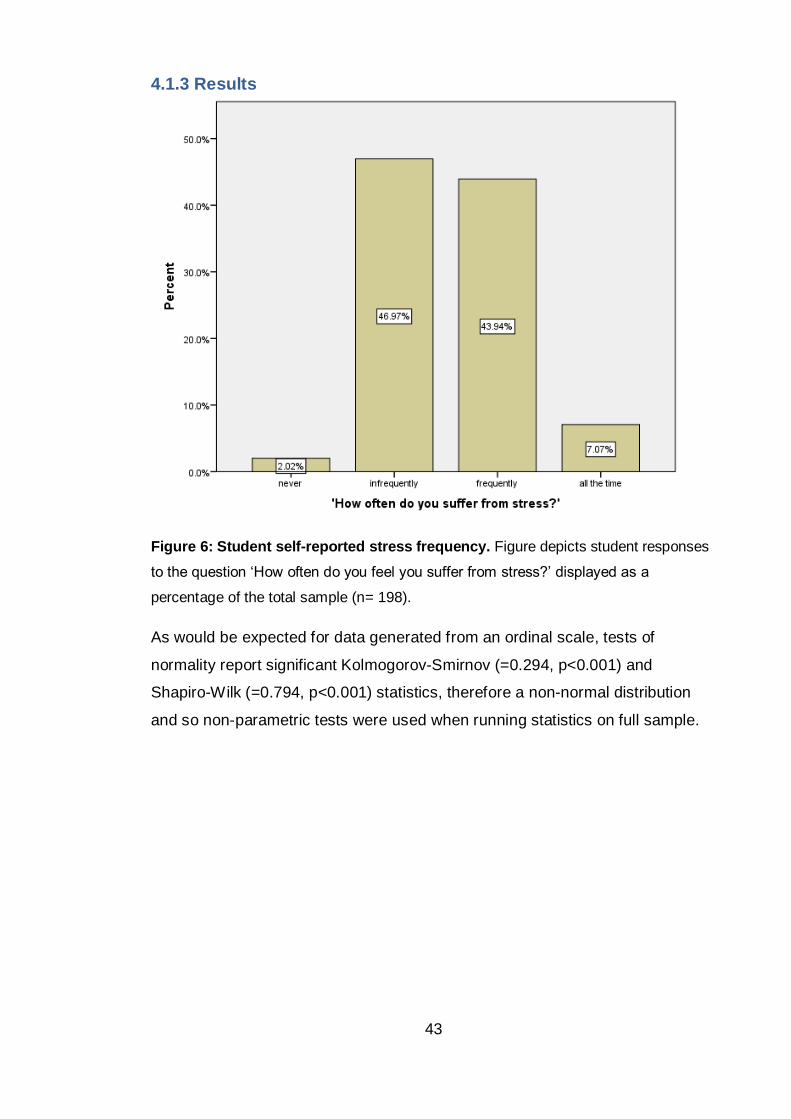
43
4.1.3 Results
Figure 6: Student self-reported stress frequency. Figure depicts student responses
to the question ‘How often do you feel you suffer from stress?’ displayed as a
percentage of the total sample (n= 198).
As would be expected for data generated from an ordinal scale, tests of
normality report significant Kolmogorov-Smirnov (=0.294, p<0.001) and
Shapiro-Wilk (=0.794, p<0.001) statistics, therefore a non-normal distribution
and so non-parametric tests were used when running statistics on full sample.
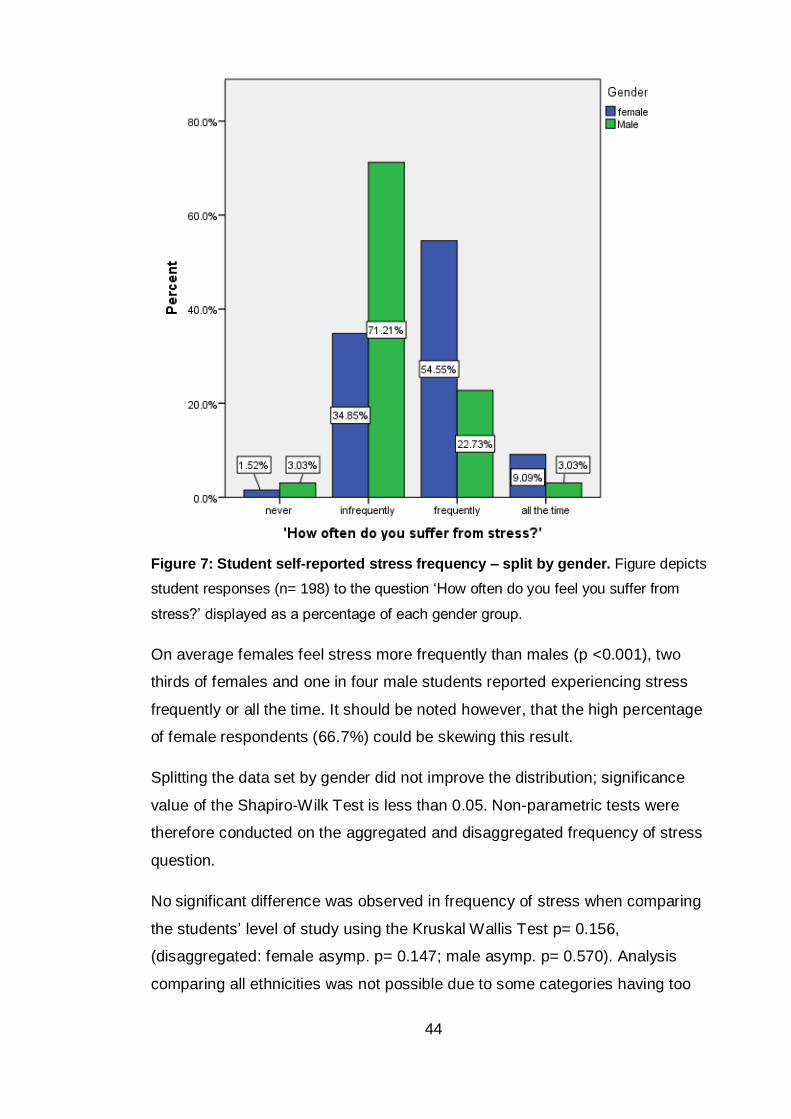
44
Figure 7: Student self-reported stress frequency – split by gender. Figure depicts
student responses (n= 198) to the question ‘How often do you feel you suffer from
stress?’ displayed as a percentage of each gender group.
On average females feel stress more frequently than males (p <0.001), two
thirds of females and one in four male students reported experiencing stress
frequently or all the time. It should be noted however, that the high percentage
of female respondents (66.7%) could be skewing this result.
Splitting the data set by gender did not improve the distribution; significance
value of the Shapiro-Wilk Test is less than 0.05. Non-parametric tests were
therefore conducted on the aggregated and disaggregated frequency of stress
question.
No significant difference was observed in frequency of stress when comparing
the students’ level of study using the Kruskal Wallis Test p= 0.156,
(disaggregated: female asymp. p= 0.147; male asymp. p= 0.570). Analysis
comparing all ethnicities was not possible due to some categories having too
45
few cases. However, no significant effect of ethnicity was found when
comparing the two largest categories using a Mann-Whitney Test: white British
and white non-British (p= 0.120). Similarly, no Significant difference in stress
between white British and other BME groups combined was found (p= 0.375).
Kruskal Wallis analysis suggests there is no significant difference (p= 0.356) in
frequency of stress between the undergraduate science degree routes Animal
biology (including Environmental and Marine biology), Biomedical (including
Microbiology, Immunology and Forensics) and Biological Science (where
modules can cross both animal and biomedical routes).
No difference was seen in self-reported stress between those entering HE from
employment, high school or college (p= 0.862). Neither was it affected by age
(brackets of 17-19 years, 20-22 years, 23-25 years and 26+ years); Kruskal
Wallis analysis produced a p value of 0.651.
Mann-Whitney Test showed 1st generation university students were no more
stressed than those with a parent educated to HE level (p= 0.165). This is only
tentative evidence of widening participation and further data would be required
to suggest similarities or differences between so called ‘traditional’ and ‘non-
traditional’ students.
Students declaring a diagnosed medical condition reported significantly higher
frequencies of stress than those with no condition (U= 1988.00, p <0.001).
Although not statistically significant for the sample as a whole (p= 0.204), the
few females (n= 3) that reported an undiagnosed condition also had above
average self-reported stress (exact p= 0.141; only one male reported an
undiagnosed medical condition but their score was not significantly different to
the male average, exact p= 0.781).
Causes of stress were explored using the same daily hassles examined in the
NUS Silently Stressed study (2010). Students were asked to respond indicating
how often they feel stress is caused by a variety of potentially stressful hassles
that a university student may face. This question allows the frequency of stress
to be measured which is more useful and less arbitrary than the question ‘do
you find this stressful?’ which only comments on the fact that a student has
found this to be stressful in the past. Commenting on frequency gives a better
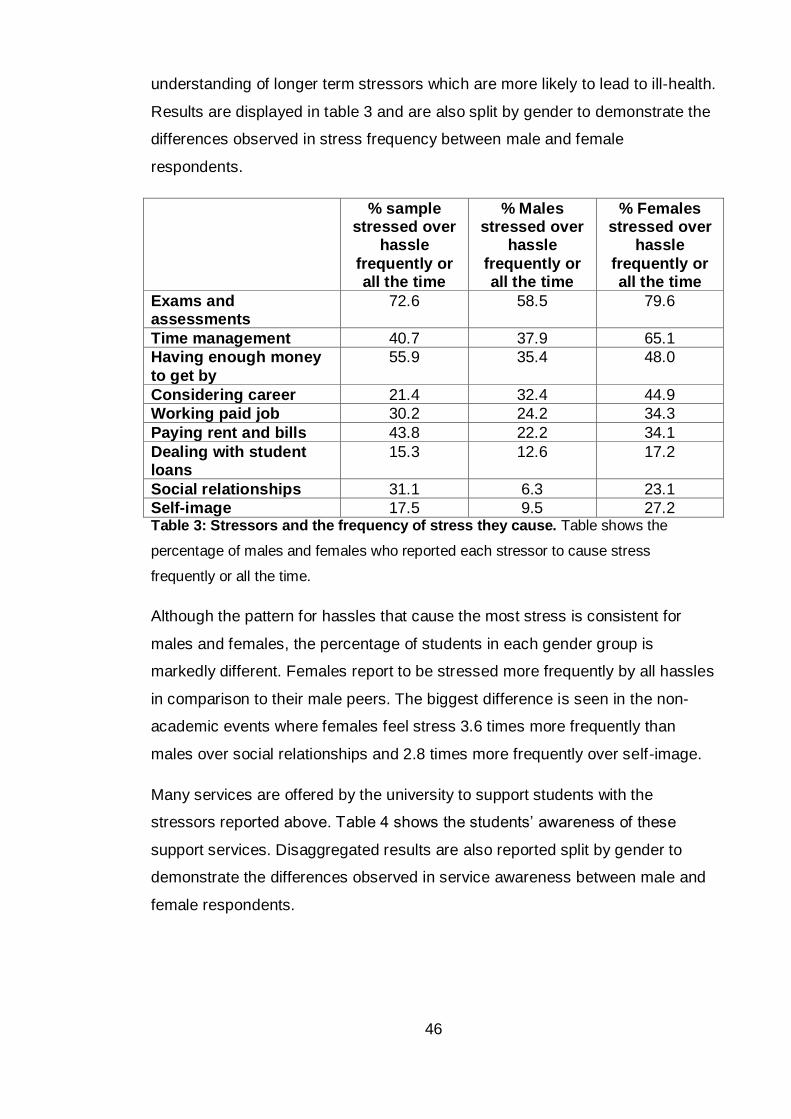
46
understanding of longer term stressors which are more likely to lead to ill-health.
Results are displayed in table 3 and are also split by gender to demonstrate the
differences observed in stress frequency between male and female
respondents.
% sample stressed over
hassle
frequently or all the time
% Males stressed over
hassle
frequently or all the time
% Females stressed over
hassle
frequently or all the time
Exams and assessments
72.6 58.5 79.6
Time management 40.7 37.9 65.1
Having enough money
to get by
55.9 35.4 48.0
Considering career 21.4 32.4 44.9
Working paid job 30.2 24.2 34.3
Paying rent and bills 43.8 22.2 34.1
Dealing with student loans
15.3 12.6 17.2
Social relationships 31.1 6.3 23.1
Self-image 17.5 9.5 27.2 Table 3: Stressors and the frequency of stress they cause. Table shows the
percentage of males and females who reported each stressor to cause stress
frequently or all the time.
Although the pattern for hassles that cause the most stress is consistent for
males and females, the percentage of students in each gender group is
markedly different. Females report to be stressed more frequently by all hassles
in comparison to their male peers. The biggest difference is seen in the non-
academic events where females feel stress 3.6 times more frequently than
males over social relationships and 2.8 times more frequently over self-image.
Many services are offered by the university to support students with the
stressors reported above. Table 4 shows the students’ awareness of these
support services. Disaggregated results are also reported split by gender to
demonstrate the differences observed in service awareness between male and
female respondents.
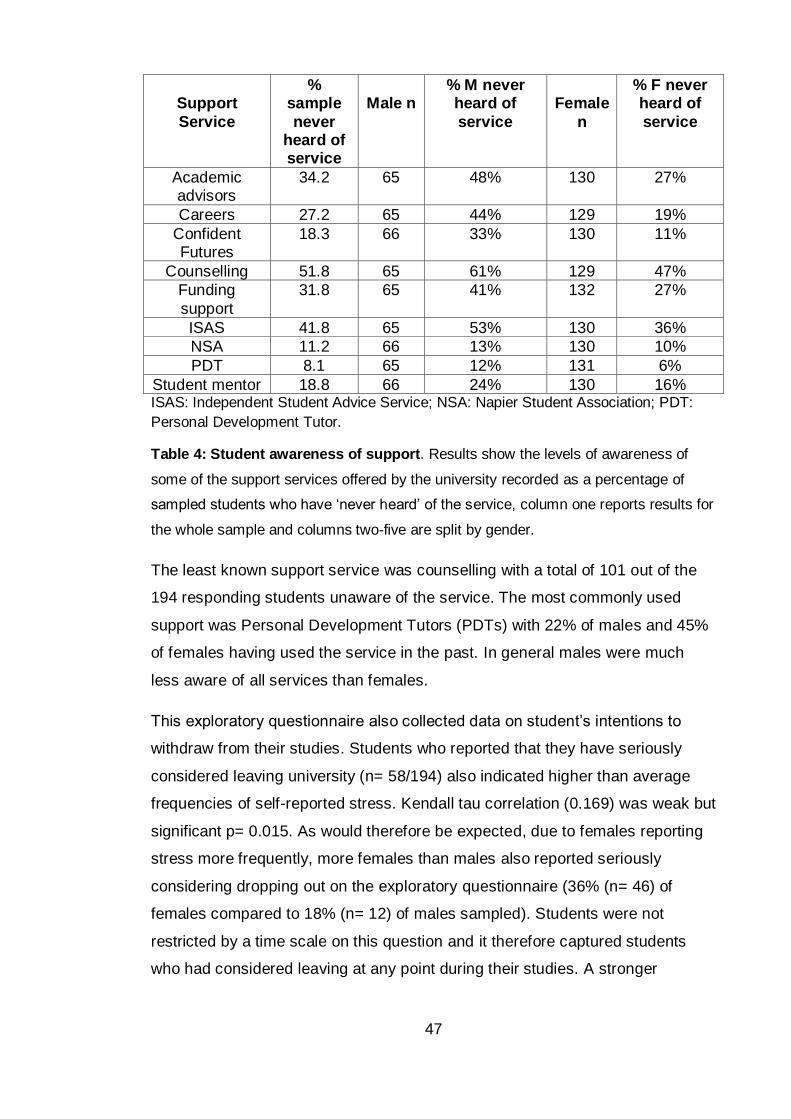
47
Support
Service
% sample
never heard of service
Male n
% M never heard of
service
Female
n
% F never heard of
service
Academic advisors
34.2 65 48% 130 27%
Careers 27.2 65 44% 129 19%
Confident Futures
18.3 66 33% 130 11%
Counselling 51.8 65 61% 129 47%
Funding
support
31.8 65 41% 132 27%
ISAS 41.8 65 53% 130 36%
NSA 11.2 66 13% 130 10%
PDT 8.1 65 12% 131 6%
Student mentor 18.8 66 24% 130 16% ISAS: Independent Student Advice Service; NSA: Napier Student Association; PDT:
Personal Development Tutor.
Table 4: Student awareness of support. Results show the levels of awareness of
some of the support services offered by the university recorded as a percentage of
sampled students who have ‘never heard’ of the service, column one reports results for
the whole sample and columns two-five are split by gender.
The least known support service was counselling with a total of 101 out of the
194 responding students unaware of the service. The most commonly used
support was Personal Development Tutors (PDTs) with 22% of males and 45%
of females having used the service in the past. In general males were much
less aware of all services than females.
This exploratory questionnaire also collected data on student’s intentions to
withdraw from their studies. Students who reported that they have seriously
considered leaving university (n= 58/194) also indicated higher than average
frequencies of self-reported stress. Kendall tau correlation (0.169) was weak but
significant p= 0.015. As would therefore be expected, due to females reporting
stress more frequently, more females than males also reported seriously
considering dropping out on the exploratory questionnaire (36% (n= 46) of
females compared to 18% (n= 12) of males sampled). Students were not
restricted by a time scale on this question and it therefore captured students
who had considered leaving at any point during their studies. A stronger
48
correlation with current stress might therefore be found if consideration of
withdrawal was restricted to more recent intentions.
4.2 Part two
4.2.1 Exploratory interviews
Interviews were run in parallel to the quantitative data collection (see highlighted
section on figure 5) to further explore stress in the student cohort and to better
examine the role of stress in student’s decisions to continue with university.
These interviews were used in addition to the quantitative data to expand
understanding of the relationship between stress and withdrawal intention over
time rather than the snap shot produced by part one of this study. Results from
both parts of study one will contribute to answering research question one
regarding the level and causes of stress in the non-health professional BSc
student population. Semi-structured interviews were used to explore a) stress
across a full trimester and b) the relationship between stressful events and
feelings of dropout. It was also anticipated that some information may be
collected during these interviews which would relate to students’ coping and
their use of support services and therefore may help to address research
question two. Ethical approval was granted for interviews from the Faculty of
Health, Life and Social Science’s Ethics and Governance Committee. Interviews
were held in weeks 1–4 of trimester two 2011/2012, avoiding interruption to
exams and revision and also to give students time to reflect on stressful events
from the previous trimester. It was thought that if interviews were held at the
end of trimester one, before the exams, perception of stressful events would be
skewed to focus on current exam preparation and therefore other important
events may have been over-looked. Students who had given their consent to be
contacted from the exploratory questionnaire were recruited for interview via
email and therefore students were self-selecting. Before participating, students
gave their informed consent for records to be taken during the interview and for
detailed transcripts to be written up after concluding the interview.
4.2.2 Methods
Students were first asked to rate their overall stress from the previous trimester
on a 1 (no stress) – 4 (constant stress) scale as was asked during the
49
exploratory questionnaire. Participants were invited to reflect upon their last
trimester and were asked to draw a graph representing their stress from
September – December 2011. Students were then asked to explain the causes
of the ‘ups and downs’ and if/how their perception of continuation changed. This
technique was devised to allow the students to visually place events into
chronological order and to record the level of stress caused in respect to other
events. Practice interviews were held to improve on interviewer technique and
to refine the interview prompts; these transcripts were not included in the
analysis. Practice interviews suggested that students were proficient at
describing their stress across time however required more prompting with
respect to their feelings around withdrawal and the effect of stress. Prompts
included ‘How did you feel about finishing your degree at this point?’, ‘Did you
ever feel like leaving your course?’, ‘Did you ever make a conscious decision to
continue/keep at the degree?’ and ‘Did that have an effect on university or
outside university?’
4.2.2.1 Qualitative analysis
There is no universal framework for the analysis of qualitative data and the
pragmatic research approach taken for this mixed methods study continued to
guide the choices on the basis of fitness for purpose. Given the study is
interested in better understanding stress and intentions of withdrawal within a
diverse student population and is therefore is not solely hypothesis testing it
seems appropriate that a grounded theory (GT) approach should be taken.
Several variations of GT methodologies now exist each with specific
philosophical positions (Breckenridge et al., 2012). GT was initially developed to
demonstrate how some forms of qualitative research could claim a robustness
and authority equal to quantitative research (Glaser and Strauss, 1967; Glaser
and Strauss, 1965; Glaser et al., 1968). They advocated the necessity for open-
mindedness and passivity of the researcher, the positivist or realist concept of
data and the reliance on induction. Strauss, in collaboration with Julie Corbin,
published Basics of Qualitative Research (1990) which was criticised by Glaser
and thus lead to the creation of two branches of GT. Charmaz (1995; 2000)
argued a third method of constructivist GT, an approach that assumes any
theoretical rendering offers an interpretive portrayal of the studied world, not an
exact picture of it.
50
GT has been successfully combined with a pragmatic approach and a
comprehensive review of the literature surrounding this and the history of GT
can be found in Bryant’s (2009) article on Grounded Theory and Pragmatism.
By adopting a pragmatic perspective on GT many of the issues separating the
different GT authors can be set aside and the pragmatist position on truth
reflects GTs emphasis on the development of concepts and theories. Bryant
(2009, p102) has suggested that the epistemological differences between
grounded theory versions may be reconciled through researcher focus on the
product:
‘the key issue becomes the extent to which their substantive research
produces conceptual innovations and theoretical insights that prove
useful …the ultimate criterion for good research is that it makes a
difference.’
Charmaz (2003, p270) suggests that, rather than looking for one main concern
(or core category), grounded theorists should seek to construct a ‘picture that
draws from, reassembles, and renders subjects’ lives’. Charmaz therefore
advocates a writing style that uses the notion of themes rather than one single
core category so as to report on a bigger picture. A central tenet of Charmaz’s
(2006) constructivist GT is to provide a voice to participants and she
encourages grounded theorists to incorporate the multiple voices, views and
visions of participants in rendering their lived experiences. This study follows
Charmaz’s guidelines on write up and uses a pragmatic approach to follow a
method rather than a methodology that has been termed ‘GT-lite’ by some
(Braun and Clarke, 2006) as although it follows some of the best practices of
classic GT it is less stringent regarding how one should sample and code and
usually stops short of full theory development. Instead choosing to reflect
multiple individual views on the same phenomenon and reaching saturation
when no new views are found. This method is appropriate for the current study
given the topics in which a greater understanding is sought (i.e. stress is a
transactional and therefore to a certain extend a constructivist phenomenon),
the time constraints on the project and the fact that this study forms only a part
of the larger mixed methods project.
Transcripts were analysed by an initial coding of important words and phrases
using labels and then categorisation of related labels into larger groups. When
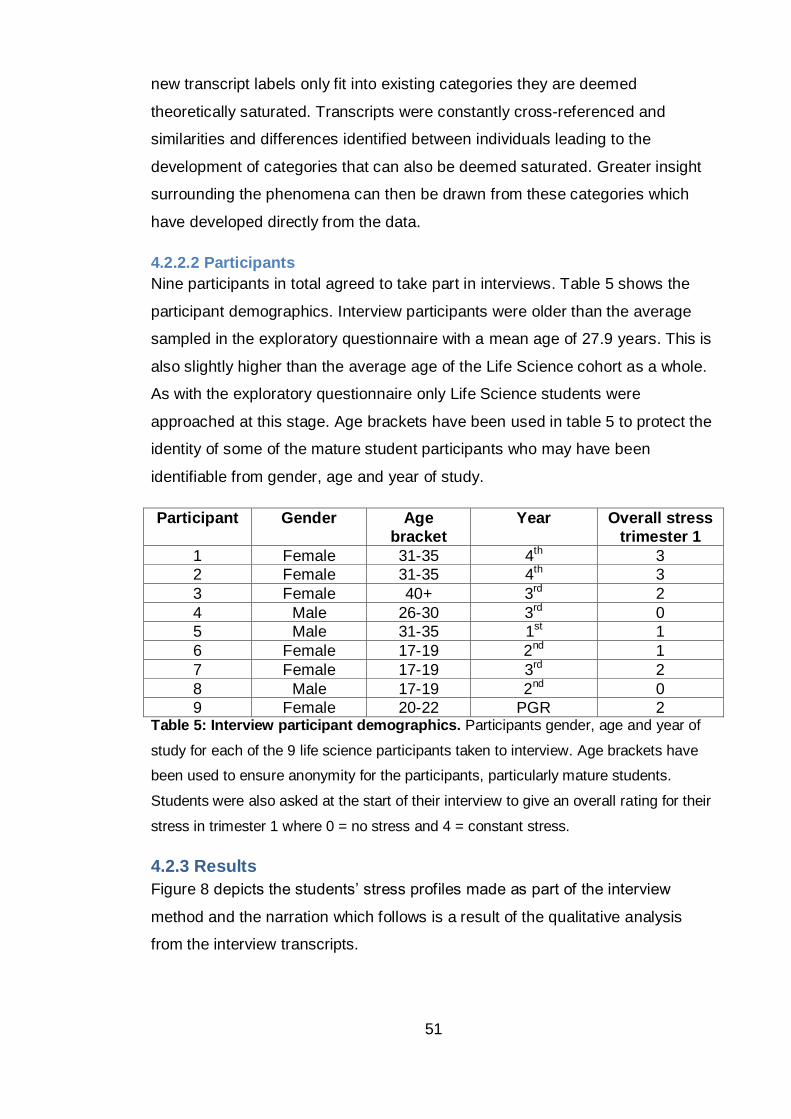
51
new transcript labels only fit into existing categories they are deemed
theoretically saturated. Transcripts were constantly cross-referenced and
similarities and differences identified between individuals leading to the
development of categories that can also be deemed saturated. Greater insight
surrounding the phenomena can then be drawn from these categories which
have developed directly from the data.
4.2.2.2 Participants
Nine participants in total agreed to take part in interviews. Table 5 shows the
participant demographics. Interview participants were older than the average
sampled in the exploratory questionnaire with a mean age of 27.9 years. This is
also slightly higher than the average age of the Life Science cohort as a whole.
As with the exploratory questionnaire only Life Science students were
approached at this stage. Age brackets have been used in table 5 to protect the
identity of some of the mature student participants who may have been
identifiable from gender, age and year of study.
Participant Gender Age
bracket
Year Overall stress
trimester 1
1 Female 31-35 4th 3
2 Female 31-35 4th 3
3 Female 40+ 3rd 2
4 Male 26-30 3rd 0
5 Male 31-35 1st 1
6 Female 17-19 2nd 1
7 Female 17-19 3rd 2
8 Male 17-19 2nd 0
9 Female 20-22 PGR 2 Table 5: Interview participant demographics. Participants gender, age and year of
study for each of the 9 life science participants taken to interview. Age brackets have
been used to ensure anonymity for the participants, particularly mature students.
Students were also asked at the start of their interview to give an overall rating for their
stress in trimester 1 where 0 = no stress and 4 = constant stress.
4.2.3 Results
Figure 8 depicts the students’ stress profiles made as part of the interview
method and the narration which follows is a result of the qualitative analysis
from the interview transcripts.
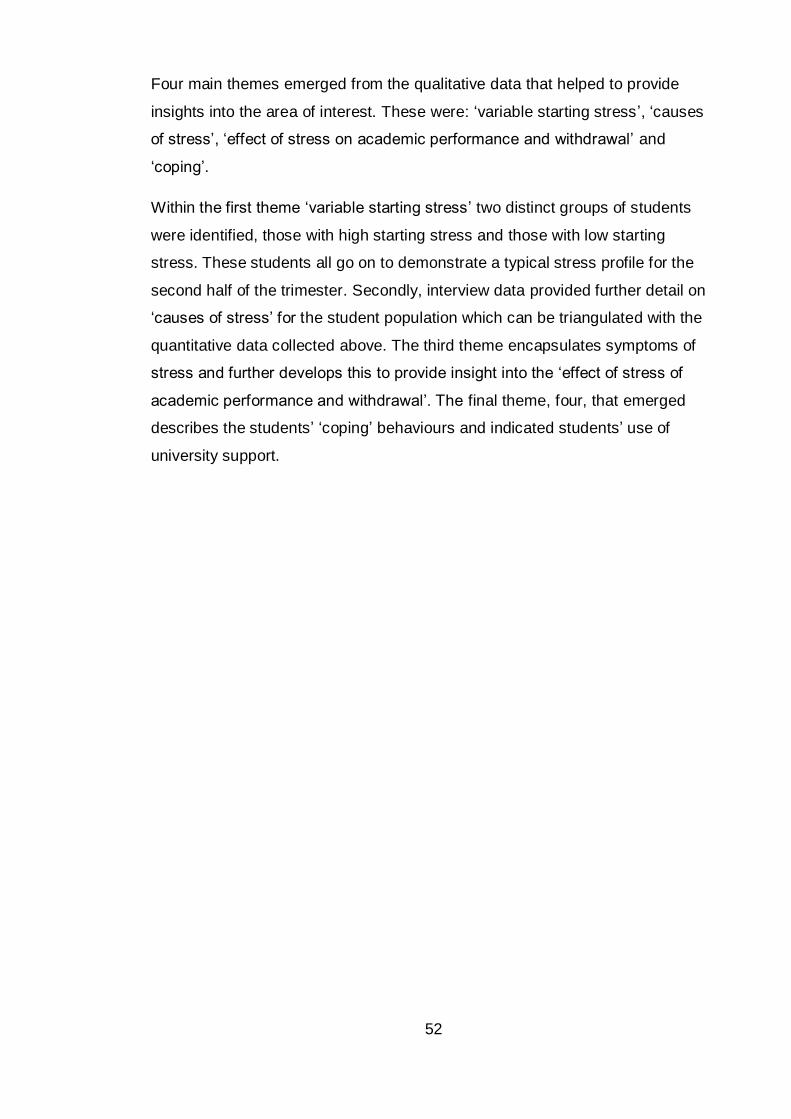
52
Four main themes emerged from the qualitative data that helped to provide
insights into the area of interest. These were: ‘variable starting stress’, ‘causes
of stress’, ‘effect of stress on academic performance and withdrawal’ and
‘coping’.
Within the first theme ‘variable starting stress’ two distinct groups of students
were identified, those with high starting stress and those with low starting
stress. These students all go on to demonstrate a typical stress profile for the
second half of the trimester. Secondly, interview data provided further detail on
‘causes of stress’ for the student population which can be triangulated with the
quantitative data collected above. The third theme encapsulates symptoms of
stress and further develops this to provide insight into the ‘effect of stress of
academic performance and withdrawal’. The final theme, four, that emerged
describes the students’ ‘coping’ behaviours and indicated students’ use of
university support.
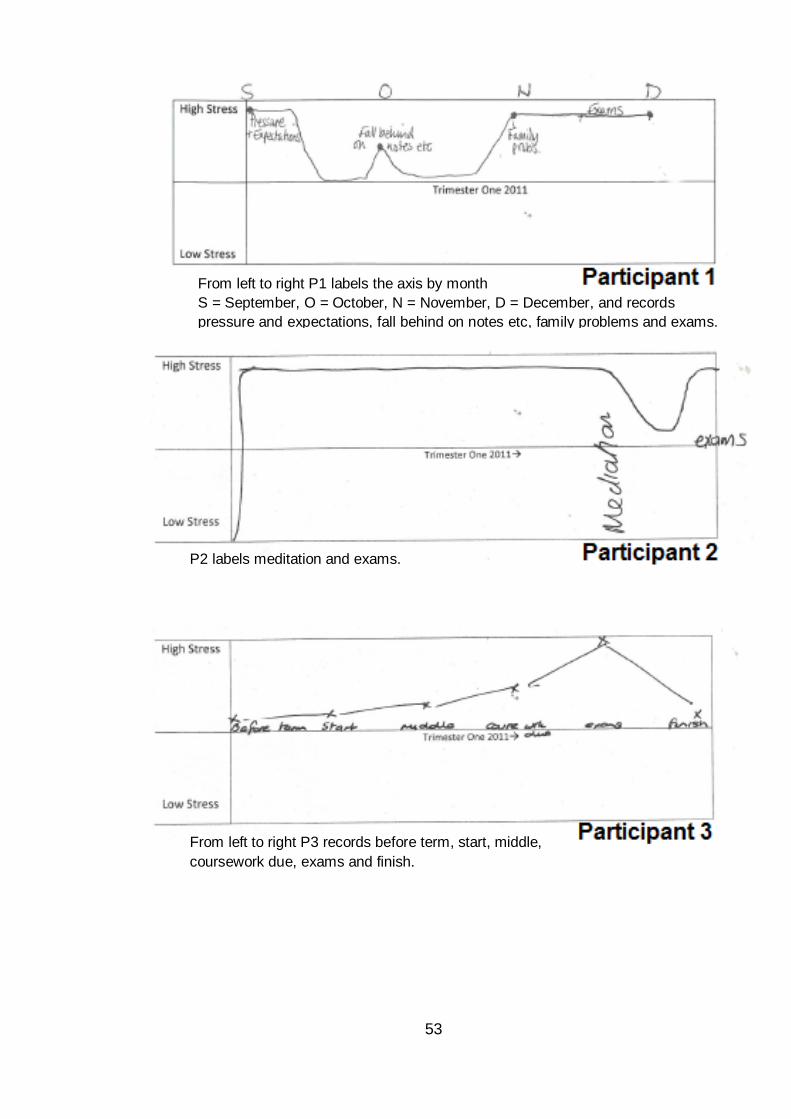
53
From left to right P1 labels the axis by month
S = September, O = October, N = November, D = December, and records
pressure and expectations, fall behind on notes etc, family problems and exams.
P2 labels meditation and exams.
From left to right P3 records before term, start, middle,
coursework due, exams and finish.
54
P4 uses the label exam.
P5 labels the axis from left to right: week 1 and Christmas. Star indicates a
revision made, during interview, to the level of stress experienced at that time.
P6 labels the axis from left to right: before term and end of term. P6 also records
dance show and exams.
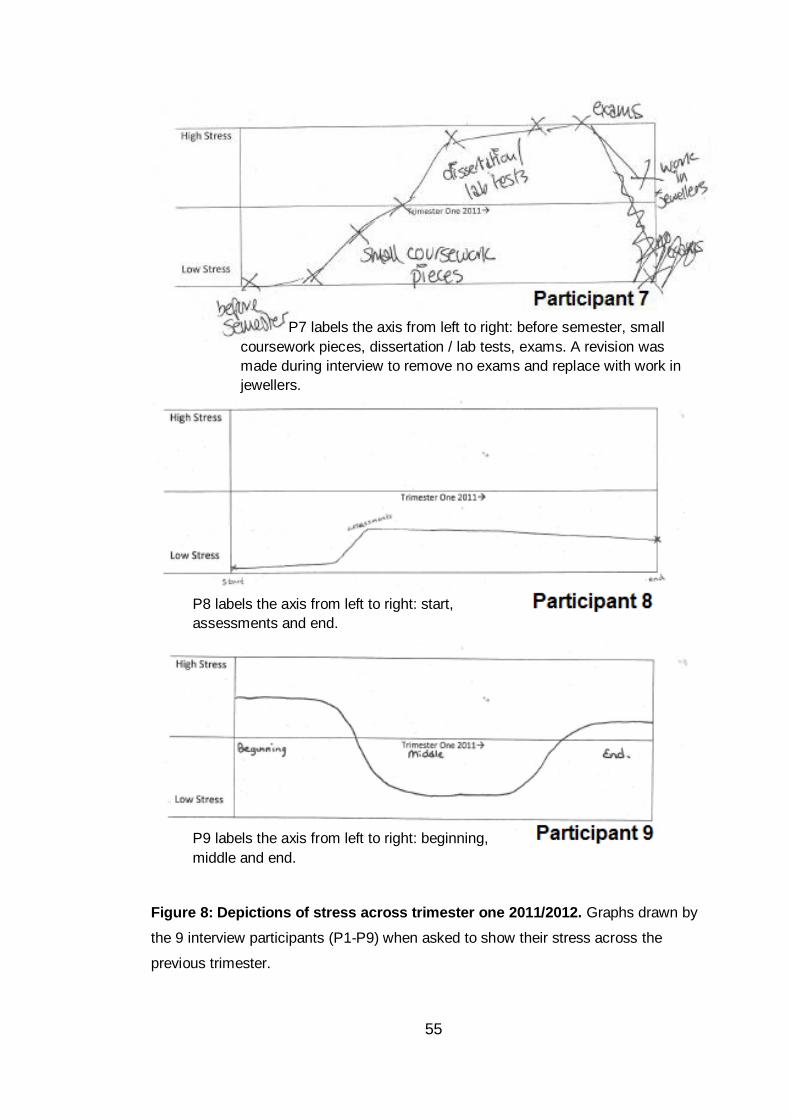
55
Figure 8: Depictions of stress across trimester one 2011/2012. Graphs drawn by
the 9 interview participants (P1-P9) when asked to show their stress across the
previous trimester.
P9 labels the axis from left to right: beginning,
middle and end.
P8 labels the axis from left to right: start,
assessments and end.
P7 labels the axis from left to right: before semester, small
coursework pieces, dissertation / lab tests, exams. A revision was
made during interview to remove no exams and replace with work in
jewellers.
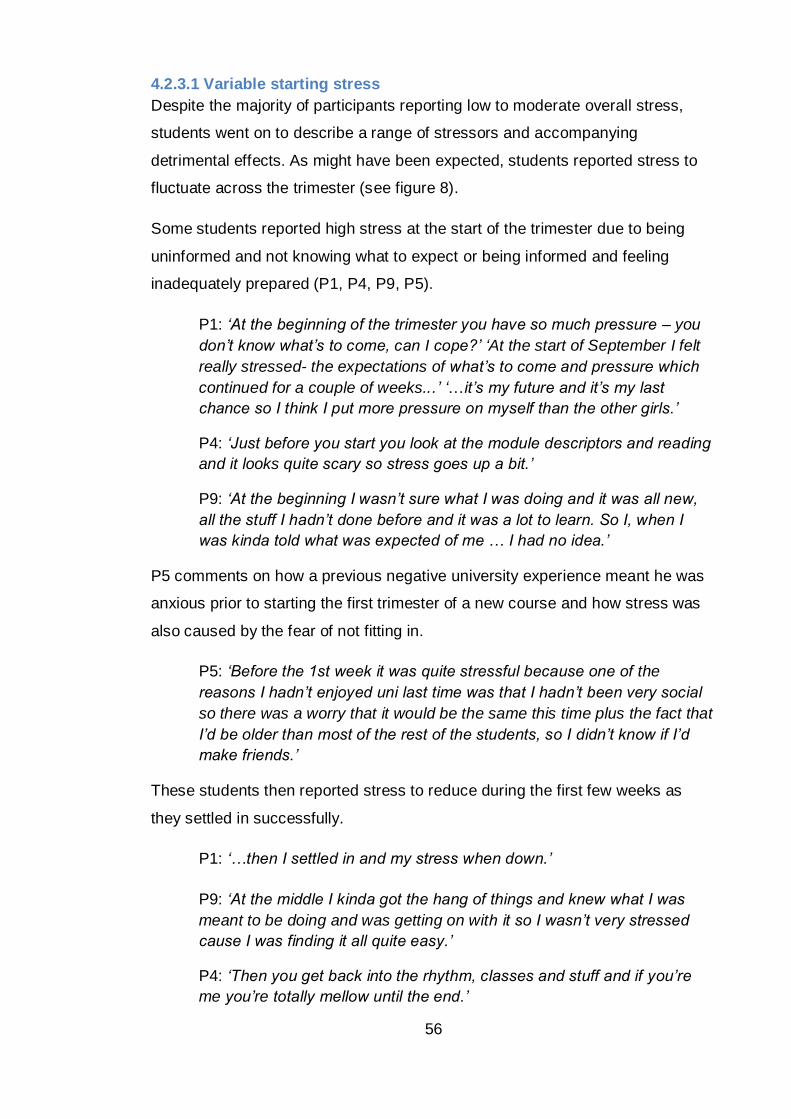
56
4.2.3.1 Variable starting stress
Despite the majority of participants reporting low to moderate overall stress,
students went on to describe a range of stressors and accompanying
detrimental effects. As might have been expected, students reported stress to
fluctuate across the trimester (see figure 8).
Some students reported high stress at the start of the trimester due to being
uninformed and not knowing what to expect or being informed and feeling
inadequately prepared (P1, P4, P9, P5).
P1: ‘At the beginning of the trimester you have so much pressure – you
don’t know what’s to come, can I cope?’ ‘At the start of September I felt
really stressed- the expectations of what’s to come and pressure which
continued for a couple of weeks...’ ‘…it’s my future and it’s my last
chance so I think I put more pressure on myself than the other girls.’
P4: ‘Just before you start you look at the module descriptors and reading
and it looks quite scary so stress goes up a bit.’
P9: ‘At the beginning I wasn’t sure what I was doing and it was all new,
all the stuff I hadn’t done before and it was a lot to learn. So I, when I
was kinda told what was expected of me … I had no idea.’
P5 comments on how a previous negative university experience meant he was
anxious prior to starting the first trimester of a new course and how stress was
also caused by the fear of not fitting in.
P5: ‘Before the 1st week it was quite stressful because one of the
reasons I hadn’t enjoyed uni last time was that I hadn’t been very social
so there was a worry that it would be the same this time plus the fact that
I’d be older than most of the rest of the students, so I didn’t know if I’d
make friends.’
These students then reported stress to reduce during the first few weeks as
they settled in successfully.
P1: ‘…then I settled in and my stress when down.’
P9: ‘At the middle I kinda got the hang of things and knew what I was
meant to be doing and was getting on with it so I wasn’t very stressed
cause I was finding it all quite easy.’
P4: ‘Then you get back into the rhythm, classes and stuff and if you’re
me you’re totally mellow until the end.’
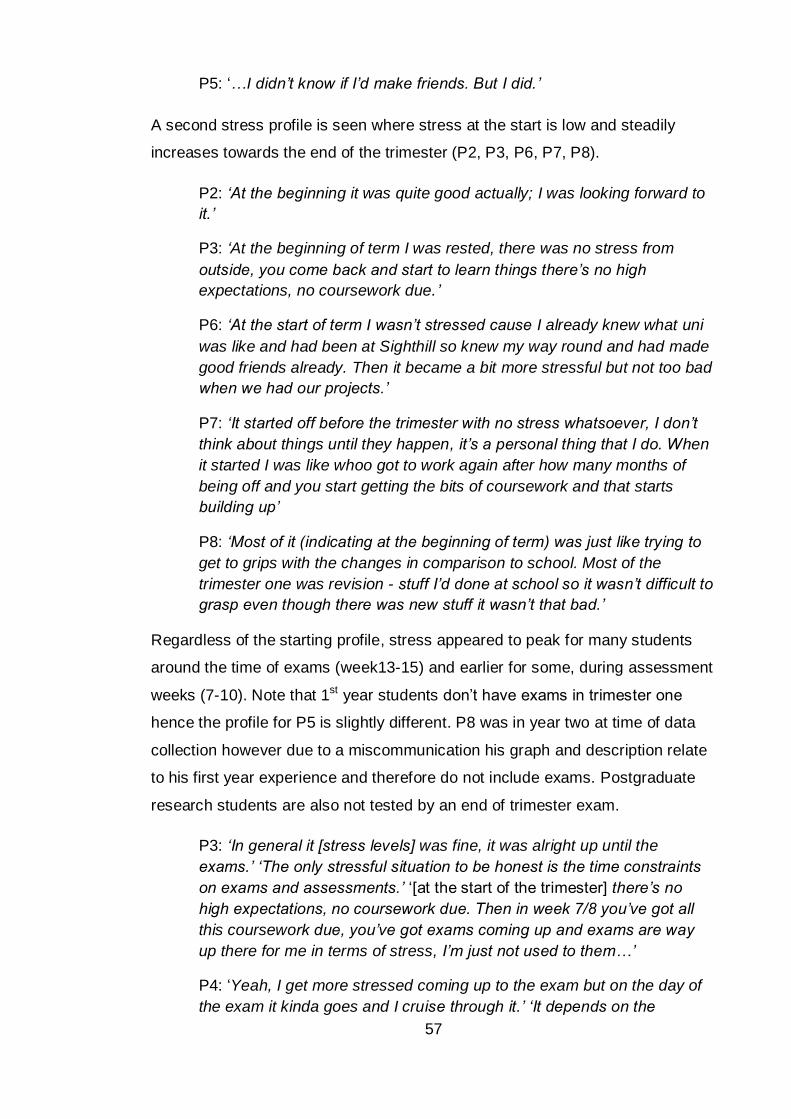
57
P5: ‘…I didn’t know if I’d make friends. But I did.’
A second stress profile is seen where stress at the start is low and steadily
increases towards the end of the trimester (P2, P3, P6, P7, P8).
P2: ‘At the beginning it was quite good actually; I was looking forward to
it.’
P3: ‘At the beginning of term I was rested, there was no stress from
outside, you come back and start to learn things there’s no high
expectations, no coursework due.’
P6: ‘At the start of term I wasn’t stressed cause I already knew what uni
was like and had been at Sighthill so knew my way round and had made
good friends already. Then it became a bit more stressful but not too bad
when we had our projects.’
P7: ‘It started off before the trimester with no stress whatsoever, I don’t
think about things until they happen, it’s a personal thing that I do. When
it started I was like whoo got to work again after how many months of
being off and you start getting the bits of coursework and that starts
building up’
P8: ‘Most of it (indicating at the beginning of term) was just like trying to
get to grips with the changes in comparison to school. Most of the
trimester one was revision - stuff I’d done at school so it wasn’t difficult to
grasp even though there was new stuff it wasn’t that bad.’
Regardless of the starting profile, stress appeared to peak for many students
around the time of exams (week13-15) and earlier for some, during assessment
weeks (7-10). Note that 1st year students don’t have exams in trimester one
hence the profile for P5 is slightly different. P8 was in year two at time of data
collection however due to a miscommunication his graph and description relate
to his first year experience and therefore do not include exams. Postgraduate
research students are also not tested by an end of trimester exam.
P3: ‘In general it [stress levels] was fine, it was alright up until the
exams.’ ‘The only stressful situation to be honest is the time constraints
on exams and assessments.’ ‘[at the start of the trimester] there’s no
high expectations, no coursework due. Then in week 7/8 you’ve got all
this coursework due, you’ve got exams coming up and exams are way
up there for me in terms of stress, I’m just not used to them…’
P4: ‘Yeah, I get more stressed coming up to the exam but on the day of
the exam it kinda goes and I cruise through it.’ ‘It depends on the
58
weighting and module but usually the exams are worse ‘cause they are
worth more.’
P4 appears to be able to combat nerves on the day of exams and to use stress
to his advantage. In support of this P4 showed knowledge of the stress
response during the interview stating that ‘Stress up to a point pushes you to do
the work but if it gets overwhelming it could be detrimental to the work’. It is also
worth noting however that this student reported no other stressors across the
trimester and P4 comments that ‘Uni hasn’t been a very stressful period of my
life’.
Some students suggest that exams in combination with other stressors were the
cause of the high stress peaks depicted on their graphs, presumably because of
being unable to cope with both stressors at once.
P1: ‘[personal problems] ran into the exams and I had nose bleeds 6
times a day from just trying to study and deal with my family.’
This student goes on to say that although exams are stressful family played the
biggest role in the increased stress at the end of the trimester.
P1: ‘That is my biggest problem with stress it’s not money, yes I get
stressed at exams but it’s mainly just family’
This suggests that it was the combination of the two stressors that caused her
to be unable to cope and experience the high levels of stress and
symptomatology.
Similar to P1, P2 reports that stress from non-academic sources experienced
before the exams had a negative effect on her ability to cope with exams.
P2: ‘Not being able to be at home really affected my studying badly.’ ‘My
last exam was really difficult because of stress and it was a hard subject.
When I get over stressed I get really tired and sleep loads so I couldn’t
revise as much. And now that I look back I can identify it. It’s exhaustive
trying not to think about it [problems at home].’
P6 describes stress due to two stressors, exams and a non-academic stressor,
however her discourse (‘quite’ and ‘a bit’ stressful) and graphical depiction
suggests that her perception of the stress was perhaps not as high as other
participants for example P1 or P2.
59
P6: ‘I have a dance class out of university and we were doing our first
show so that was quite stressful and then a week and a half later it was
my exams and they were a bit stressful...’
Possible reasons for the apparent resilience could be that the stressors did not
overlap. P6 also showed a degree of understanding regarding stress and a
positive attitude towards stress:
P6: ‘I think it [stress] makes it [performance] better, pressure, I work well
under pressure. It depends on what extent I guess, I was working badly
towards the dance show so I was stressed about things outside of uni but
once that was over I was stressed about exams but it was a good – I
should probably do some work – rather than a I can’t concentrate kinda
stress.’ ‘I’m very organised. I’ve been dancing my whole life and I did it
during my A-levels so I got good at time management. Plus the exercise
is a stress release in itself.’
One student (P7) verbally reported that their coursework was more stressful
than the exams (graph suggests equally stressful). The student provides
possible explanations for finding the exams less stressful; poor coursework time
management on their behalf and the fact that they were only revising for one
exam, as they had accepted that they had failed the other module.
P7: ‘…on week seven it kinda kicked off with a big test that we had that
everybody felt was hard so I wasn’t alone in that. And then it got to the
dissertation which I wrote the night before it was due so of course stress
levels were really at that point (participant held hand above head
indicating high) cause I knew I had to get it finished. The exams were
actually slightly less stressful than the dissertation cause I knew I’d failed
one [module] anyway before I sat it so it wasn’t a problem and the other
exam was “that’s fine I’ll do that”.’
Those who continued their graph past the end of the trimester showed their
stress to drop off quickly after the exam period.
P3: ‘…as soon as the exams are over my stress comes way down’
P6: ‘…but after that [exams] I chilled out with my friends and my stress
was completely gone.’
P7: ‘It was really a gradual increase and it went straight back down [after
the exams] … no actually I’ll make a change to the graph – it should go
to there (see change to P7 graph in figure 8)… cause then I had work
after finishing uni.’
60
4.2.3.1.1 Theme one synopsis
Differences in initial stress gave way to a ‘typical’ steady increase from mid to
late trimester, peaking during the assessment period for most students under
examination. Combinations of hassles appeared to culminate in higher stress
than if students were faced with one problem at a time.
4.2.3.2 Causes of stress
Both academic and non-academic events were reported by participants to
cause stress during the trimester. Earlier quotes have identified stressors to
include: balancing of home life and study (particularly for older students), the
uncertainty of what to expect from a new trimester, pressure from self to
succeed, social anxiety, exams and assessments and the time pressures
associated with the latter. Another stressor that was mentioned above by P7
was stress caused by working a paid job. Stress was also reported to be
caused by struggling academically.
P8: ‘Essays are not my strong point really so that’s what I tend to stress
about (indicating the increase in stress on graph) we didn’t have any
exams in trimester one (of 1st year) just those tests online you can have a
book in so they weren’t stressful.’
P5: ‘Then the 2nd up (2nd high stress peak indicated on graph) was
because I didn’t understand an essay title ...’
The jump in material complexity from first to second year was suggested as a
potential cause of stress and, it is possible that this could be adding to the
stress reported by those students with high stress before the start of the
trimester. Clashes in academic deadlines were also reported to cause stress;
this is an extension of the time pressure mentioned earlier by P3.
P8: ‘I guess that 1st year is so different to 2nd year. Everything is new and
you have to learn everything in 2nd year and there’s more assessments
and you have to put in quite a lot more work. But what I find is that
assessments clash from different modules that’s the stressful bit, doing
them all for the same week and also trying to do that and keep up with
classes and stuff.’
Another student commented on another cause of academic stress, teaching
inconsistency:
61
P5: ‘I got the feedback on the essay that I’d asked a lot of questions
about and I did what the lecturer said but then I got marked down and the
feedback was what I’d been asking about but she obviously told me the
wrong thing.’
4.2.3.3 Effect of stress on performance
P5 comments on how one problem with a single piece of academic work
prevented him from moving forward with the module. Although he comments
that he could not quantify the effect this had on performance as no work was
submitted for marking at the time.
P5: ‘I focused too much on that one problem and found it hard to move
forward from that. I wouldn’t have noticed a drop in marks cause there
was no other work due at the time.’
Stress from non-academic sources was also reported to impact on academic
performance and thus caused further stress for the individual. P1 comments on
finding it hard to concentrate on university material due to worrying about
problems at home.
P1: ‘My grades dropped a bit and I have really high standards for myself
so I found it embarrassing. I get really stressed out trying to take in what
people are saying but in the back of my head my family are always
there.’
P1 goes on to explain that in order to concentrate on her university work she
asked for her family to place fewer demands on her. This coping strategy in
itself caused P1 further stress and again affected her studies.
P1: ‘I felt very stressed telling my mum at the beginning of 4th year to
leave me alone. I felt guilty, it broke my concentration thinking how long
has it been since I checked on them.’
Another student who was struggling with a conflict at home reported that in an
attempt to cope with the problem she spent a lot of time away from home which
had a negative impact on her study routine.
P2: ‘…I tried to stay out of her way but I find it hard to study at uni and
that impacted on my uni work.’ ‘Not being able to be at home really
affected my studying badly.’
One student recalls a social stressor from their first year experience:
62
P8: ‘In 1st year I didn’t stay in halls and stayed quite far from everyone
else so that was a pain and it was my first year in Edinburgh and I didn’t
know anyone. I think the social side was a more stressful side. When you
come in the next day you can’t contribute to conversations about what
happened the night before.’
This student goes on to explain the importance of how being socially included
can have a positive effect on academic performance, explaining what sounds
like depressive symptoms as a result of social isolation:
P8: ‘…you need the social side to be going well, if you’re more happier
you tend to be more relaxed when you do work, rather than when your
stressed sometimes you feel lazier and you’re not in the mood for it and
you end up postponing assessments and stuff and just stay in bed and
do nothing.’
P7 reports how even seeking support to overcome stressors can put a strain on
studying and affect academic performance:
P7: ‘I had counselling last trimester which did affect my performance, I
missed classes, so that really built up because it was stuff that I was
having to learn that I hadn’t done before. So it was new stuff - and to be
fair I didn’t mention it to my lecturers - so personally keeping it in. So I
had a lot to catch up on that I missed - that was quite hard.’
Not strictly related to academic performance but rather cognitive function more
generally, one student comments on the ability of stress to prevent them from
‘thinking of the obvious’. The student discusses how despite accessing
counselling support in the past, during the current bout of stress she did not
think of accessing the support again.
P2: ‘…when I spoke to my PDT this year about my living situation (they
suggested counselling) and I must have been quite stressed cause I was
surprised that I didn’t think about it for myself considering I’d used
counselling before. That made me realise that it was a bigger problem
than I’d thought cause I wasn’t thinking of the obvious.’
When discussing their experience of stress related symptoms, some reported
changes to sleep patterns and vitality which are known to affect cognition and
performance.
P7: ‘I get a lot more tired easily, no sleep pattern – I don’t have one
anyway - but it’s worse than what it is normally. I get snappy with people,
63
I’ve got no patience with people even things I’m normally good with …’
‘There have been times that I’ve gotten very upset with being so sleep
deprived and tired…’
P2: ‘When I get over stressed I get really tired and sleep loads so I
couldn’t revise as much.’
P4: ‘Not sleeping too well, thinking about stuff, I don’t communicate it too
well so outside I could seem fine when inside it’s not. I don’t think it
affects me too badly but I would get withdrawn and sleep patterns
change.’
P9: ‘I sleep a lot worse; I wake up during the night and things. If I’ve got a
lot on my mind I wake up 2-3 times a night so I’m quite tired.’
P9 also reports on how stress caused changes in her eating behaviours which
in turn affected mood and concentration:
P9: ‘[stress] makes me feel worse cause I’m eating all the crap and I feel
guilty and get distracted from work.’
P6 made a similar observation regarding stress and eating behaviour and
comments on the effect stress can have on physical health.
P6: ‘Very high appetite and bad skin and I got a horrible cold – feeling
sick, runny nose – I only ever get sick when I’m stressed I think.’
Changes to mood and concentration as a result of changing sleeping and eating
habits, as reported by the students, are known to have detrimental effects on
performance.
4.2.3.4 Effect of stress on dropout
If students did not offer accounts of considering withdrawal during their recall of
stress in the previous trimester, participants were prompted to recall if they had
ever seriously considered leaving university and to give an account of why they
decided to stay.
P1, P2 and P3 reported that dropping out would have only occurred as the
result of poor academic achievement. All three students found a way to cope
with their respective problems which avoided failure and involuntary withdrawal.
P1: ‘I’ve never felt like I wanted to leave until this Christmas. It was – if –
I thought that if my exams are so low because of the family problems I
just wouldn’t do honours. Should I just be happy with my BSc? Should I
64
give it up for an easy life?’ ‘I’m too stubborn [to leave], I don’t like to ask
for help and I wouldn’t want to fail. I missed a lot, a friend’s wedding, that
couldn’t be for nothing! I’d rather my family fell out with me for a couple of
months but that four years weren’t wasted. I’ve had to find a balance
between the short term and long term.’
P2: ‘Did badly during all of 3rd year … and nearly dropped out at the end
of third year cause I obviously just wasn’t getting it. But then I thought
that if I came back and did my finial two failed modules I could get a BSc
at least. So I retook 3rd year and worked full time and did one module per
trimester which I really enjoyed so I thought I could stay on for fourth
year and that’s where I am now.’ ‘The reasons I stayed were when my
mum told me that my stepfather took six years to do his degree and it
reminded me of what people had said to me in the past “you never finish
anything”.’ ‘It was a case of telling myself that you’re not stupid you can
do it and just getting on with it.’
P3: ‘Yeah at the end of trimester one in 3rd year - the one that’s just
gone- I struggled with the statistics course content and I felt like if there
was any more of that that I wouldn’t have been able to cope and stay on.
But I spoke to [a lecturer] and he said that there wasn’t too much more
and my family told me that they hadn’t come this far for me to drop out so
I got on with it. I just had to put it into perspective, off-loading it, them
reassuring you that you have come this far. You know the help is there
and I would never hesitate to go and get help if I needed it.’
P7 comments that her feelings of withdrawal were not altogether serious but
arose when she felt stressed and unable to cope.
P7: ‘When I couldn’t be bothered with the coursework and also when I
had a full module to re-sit in a year I thought I’d leave rather than lose a
year. There’s been a couple of things… probably at least once a
trimester. So quite a lot. It’s not a continuous thing – it’s just that “I want
to leave, I can’t be bothered to do it” and then I’ll be like “its fine”. So it’s
not a continually “I want to drop out” it’s just on occasions that I feel
stressed and like “am I going to get to the other side of this?”.’
P5 remarked that worry stemming from a previous bad experience of HE was
nearly enough to stop him re-entering university.
P5: ‘No (never felt like leaving), maybe in the 1st week – thinking will the
same thing happen again (i.e. not fit in). I did wonder if I should even
come back and try again.’
65
P6 had never felt like leaving her current biology course but did leave a
previous nursing course. She comments that although the decision to continue
nursing was taken out of her hands following illness she would have left anyway
due to a change of heart towards the course and feeling overwhelmed on
placement.
P6: ‘Well my first term last year at nursing was good, I liked the theory.
Then it came to the placements and I realised that I didn’t want to do that
type of nursing, I found it very stressful when in my first day one of my
patients died and I found that very, very stressful.’ ‘Then a few weeks
later I went into hospital and I was there for months. And insurance wise
you can’t do nursing anymore but I think if I’d not been ill I would have
changed at the end of that year cause I wasn’t enjoying it on placement.’
P4 comments that he has coped well with the challenges of university and
describes how feelings of withdrawal would likely mean that something serious
had happened and he would therefore seek support.
P4: ‘No, never actually [felt like leaving]’ ‘I guess I really want to do well,
I’ve never reached a real tipping point in stress, I’ve been able to do
everything so far and haven’t really hit a wall that I couldn’t overcome.’
‘Because I’ve never felt like dropping out; I know if I started to feel like
that I would go and see someone.’
4.2.3.4.1 Theme three synopsis
Stress from both academic and non-academic sources were identified as
impacting on university performance. The worry over poor academic
achievement and stress associated psychophysiological symptoms such as
reduced concentration and insomnia then compounded stress within some
individuals. This creates a vicious circle where poor academic performance is
suggested as a main pathway between stress and withdrawal.
4.2.3.5 Coping
Earlier quotes referred to two students (P4 and P6) who appeared to be
potentially coping well with stress. Both were aware of eustress and the
importance of keeping stress within optimal limits. P6 also reports on the role of
self-organisation and exercise in stress management.
Other participants also mentioned coping. One student reports removing
distractions to reduce the stress of falling behind, she also demonstrates an
66
understanding of coping by commenting on the risk of isolation using this type
of strategy.
P1: ‘I tend to get more stressed when I feel I’ve fallen behind. I cut out
seeing my friends and going to the gym to reduce distraction, but then
you feel lonely which isn’t good. I managed to make the right amount of
sacrifices to keep on top of work.’
The use of instrumental and emotional support from friends, family and
university staff was reported by some students as a coping mechanism.
P3: ‘Support from family – offload to them a bit cause they are not in the
same situation so they can make it seem like it’s not an issue, down
grade it a bit. I don’t tend to seek help from other students ‘cause they
are stressed too. I feel it’s easier to take it outside and off-load there.’
P3’s comment demonstrates how stress is also an issue experienced by her
peers, or at least her social group, to such an extent that she feels they are too
overloaded to provide support or to burden them further with her concerns.
Although P4 did not himself report an incident of using social support, on
reflection he acknowledged it might have been helpful
P4: ‘…it might have been a good thing to do. You can get really wound
up but after sleeping on it it’s ok so if you spoke to someone before it
might have prevented you from going through that.’
When students reported accessing emotional and instrumental support from the
university staff, PDTs were the first port of call. This places emphasis on the
crucial role they play within the student journey.
P1: ‘With the PDT she was there and said ‘are you alright?’ and that’s all
it took. I just want someone to listen to me.’
P2: ‘I went and saw my PDT and they directed me to counselling’
P6: ‘PDTs are always useful people to talk to.’ ‘[my PDT] knows a lot
about me so knows what I’m capable of so she could take me aside if
she thinks something is up.’ ‘… being able to speak to the PDT is really
useful.’
A PGR student commented on the role older students can play in providing
support to younger students, advocating the role of student mentors in adding
depth to social support networks.
67
P9: ‘I think talking to older students helps cause when I speak to 1st
years now they have so many questions they don’t want to ask staff or
they don’t know who to go to – one girl asked me what she could actually
do with her degree and others ask what it’s like and things like that. They
ask me what’s to come cause they aren’t very well informed. The older
students have 1st hand knowledge but the lecturers are set back from it
all. Staff just set the stuff they don’t experience what it’s like to actually
do it.’
P7 reports an alternative to emotional social support by expressing feelings
through a different medium. The student goes on to say how she choose to
store problems and deal with them all at once, believing that short durations of
high stress are preferable to moderate stress over a longer period.
P7: ‘… I don’t talk to people - I put it out through art so if I can’t do that if I
can’t put what I’m feeling on paper then it just builds up in my head and I
can’t deal with it.’ ‘I just keep myself to myself, I try not to talk to people,
cause I still live at home so to get a bit of peace and quiet is impossible
so that again adds to it, but I just try and do it and keep myself to myself
and try and calm myself down. I keep myself calm for the majority of the
trimester ‘cause I don’t do the work till the last minute so everything kind
of piles up all at the one bit rather than if I was being half stressed
through the full trimester I’m fully stressed only in bits. It’s not bi-polar but
it is up and down.’
Despite being seemingly adverse to social support, P7 says that she would like
to see more PDTs actively enquiring about student’s stress and suggests not all
PDTs create an environment where students are comfortable to express their
worry.
P7: ‘… in your PDT meetings to ask about your stress, if you could say to
them they should be able to help or tell you where to get help and not all
of them do that.’
P7 also mentioned using acceptance as a coping mechanism. By accepting her
failure in one module she was able to concentrate efforts on the remaining
exam where a favourable mark could still be obtained.
P7: ‘I had problems with one of my modules which I ended up failing but I
was aware of that so it wasn’t, it was stressful to a point but then it went
into melt down and I didn’t really care anymore, like I just didn’t bother
cause I knew what I was going to get so it wasn’t stressing me out as
much.’
68
Although acceptance of the problem appears to have helped in this situation
seeking advice from a member of academic staff may have also been beneficial
for this student.
P2 reported how she had initially dealt badly with stress but then sought support
from a PDT who directed her to more appropriate services.
P2: ‘I started socialising a lot and drinking a lot … and my marks went
down really badly. I went and saw my PDT and they directed me to
counselling and I went for the 5 sessions which took me up to the end of
2nd year, and I thought I was ok.’
Unfortunately P2 suffered another setback in her personal life which caused her
to relapse to the maladaptive coping strategies.
P2: ‘That made me start going out again and socialising (drinking
insinuated). Did badly during all of 3rd year and went back to
counselling…’
This student again sought help from her PDT and feels she is now coping better
with her situation.
P2: ‘As well as going to the PDT and counselling I actually went to the
doctor for stress this time and they told me not to try and quit smoking at
the moment. I’d rather smoke than deal with it the way I did before. My
coping strategy was to remove myself from the situation, going to
counselling and a lot more contact with my family. In counselling they
give you tactics to deal with it, like breathing exercises to do when you
get stressed cause it turned out that I actually stop breathing when I got
stressed.’
The fact that this student relapsed to old bad coping habits suggests that
perhaps the counselling support was of an inadequate duration or that the
support did not teach the student how to overcome barriers for herself in the
future. More effort should be made to build students own coping rather than
temporally supporting students with the current problem. P2 also comments on
the fact that counselling is not as visible as the PDT service and therefore some
students may overlook this valuable resource: ‘...counselling is based at
Merchiston so it’s out of the way, I think that’s why I didn’t think of them first [this
trimester].’
69
As is demonstrated with the above excerpts, students reported a mixture of
coping strategies which did include seeking support. However there was a
suggestion of unwillingness to access support from some university staff and
indications of students letting problems mount before seeking support.
P1: ‘Well I struggle to ask for help so it is probably a problem with me not
coming and asking for help because I don’t like to be seen as weak. It
was a bad time for this cause the people I normally talk to (friends) had
problems of their own. I did last year end up going to my PDT and ended
up in tears because it was all building up and it was too much for me.
She advised I went to the councillor but because it’s my problem with
asking for help- I think it’s a weakness I felt I didn’t want to go. I felt
speaking to the PDT was my last option.’ ‘… the best thing I ever did was
going and speaking to my PDT. I felt I was going to melt down if I didn’t
do something so PDT was a great help.’
As earlier quotes have alluded to, P1 also choose to approach her PDT for help
when she felt she could not ask for support from outside the university.
However, this student reports feeling that approaching her PDT was a last
resort suggesting that she allowed problems to mount before seeking this form
of support.
When asked ‘was there anything the university could do to eliminate this
barrier?’ P1 replied:
P1: ‘The uni always says if you want to talk there are people to go to and
when I was hearing them say this I still felt like I can’t, I cant.’
P2 also reports letting problems grow considerably before seeking help due to
being unaware of the levels of stress and the maladaptive nature of her coping
until it had negatively impacted her studies.
P2: ‘I went and saw my PDT, I should have gone earlier but I thought I
was doing ok until I did badly in class…’
Another mature student commented that she thinks younger students are
embarrassed to admit needing help especially if all their peers are seemingly
coping by themselves.
P3: ‘I think as long as people recognise that they are stressed and know
that there are people there to help you you’ll be ok. I think when you’re
younger and you’re trying to keep up with your peers you are less likely
70
to go and get help. If everyone is suffering from stress and when you are
18/19 you don’t want to seem like you are not coping. But when you’re
older you, it’s like well I need help so I’m going to get help - You’re not
ashamed to ask for help.’
4.2.3.5.1 Theme four synopsis
Coping was variable within the interviewed students as was the knowledge of
stress and its potential detrimental effects if not dealt with appropriately.
Instrumental and emotional support were among the most commonly mentioned
strategies but worryingly a student reported that they felt their peers were not in
a position to offer this support due to their own high stress. As a result PDTs
appear to have been accessed for emotional support by some students, placing
additional responsibility on their role within the student journey. Some students
sampled reported high use of maladaptive strategies with detrimental effects on
health and academic performance. It must also be noted that seeking emotional
support, the most commonly referred to coping strategy, can be maladaptive in
some situations as it is not directly problem solving.
4.3 Discussion
This study within the thesis set out to better understand stress within a non-
Health professional BSc cohort and to make observations on the relationship
between stress and student retention. It sought to collect data which would
answer research question one regarding the levels of stress reported by non-
health BSc students. The data collected also contributed to research question
two regarding students’ coping and use of support services and, through data
analysis, began to explore any gender differences in reports of stress. The
questionnaire was based on that used by NUS Scotland (2010) and therefore
will allow comparison of stress at the host university and other Scottish
institutions.
There is clear evidence that self-reported frequencies of perceived stress is a
gendered phenomenon in this sample. Females reported higher frequencies of
stress on the questionnaire with 64% perceiving to suffer from stress frequently
or all the time in contrast to only 26% of males. Referring back to the literature,
similar gender differences are seen to exist across the entire stress response.
Almeida and Kessler (1998) and McDonough and Walters (2001) describe how
71
women find themselves, more often than men, in stressful circumstances. Miller
and Kirsch (1987) and Ptacek et al. (1992) show that females appraise the
same events to be more stressful than males and as having more of a negative
impact on their lives (Davis et al., 1999). Socially women are more likely to
experience gender specific stressors such as domestic violence and sexist
discrimination (Klonoff et al., 2000; Koss et al., 1991; Landrine et al., 1995) and
emotionally women are more affected by the stress of those close to them
(Kessler and McLeod, 1984; Turner et al., 1995). Kessler et al. (1985)
document that women report more stressful life events, particularly network
events, and therefore show greater vulnerability to psychological distress due to
their increased involvement in social networks.
Causes of stress were ranked similarly by this study’s participants and by the
larger NUS (2010) sample. The top four causes of stress from both studies
were: exams and assessments, managing time and deadlines, having enough
money to get by and considering career prospects. Data from the questionnaire
used in this study shows there to be no difference in the ranking of these
hassles by males and females and this was also apparent from qualitative
interview analysis where all students taking exams reported the hassle to cause
considerable stress. Although the causes of stress were ranked similarly the
rates and levels of stress caused were again gendered with females reporting
the same causes to produce more frequent stress than males.
Students who disclosed a diagnosed medical condition reported higher
frequencies of stress. Students reported many conditions including asthma,
arthritis and affective disorders and some students reported a condition but
choose not to disclose specifics. Many conditions have been reported to cause
stress as well as be worsened by stress, for example affective disorders
(Paykel, 2001), hypertension (Matthews et al., 2004), asthma (Liu et al., 2002)
and irritable bowel syndrome (Collins and Vallance, 1999). Further conditions
have been linked to Hypothalamic-pituitary-adrenal dysregulation such as
fibromyalgia or chronic fatigue syndrome (see Kudielkaa and Kirschbaumb,
2005 for review). This demonstrates the importance of encouraging students to
disclose any condition to their HE as they may benefit from additional support.
72
No differences in frequency of stress were seen between year groups or degree
routes suggesting that stress at a single time point is relatively constant across
the school. Within a school, academic timetabling for non-Health professional
courses will be reasonably stable across years and routes i.e. assessments and
exams occur during similar weeks. This may account for the lack of variation in
stress given that exams and assessments were the biggest cause of stress. A
wider sample collected across the university could provide an indication of how
far the consistency in stress spreads i.e. comparisons between subjects within
schools and between different schools in the university.
No difference in self-reported stress was observed between students entering
HE straight from school or via further education (FE) or employment, also no
difference was seen between first and second generation students. There were
also no significant indications of differences between traditional (entering
straight from school with Highers or equivalent) and non-traditional (post school
leaver age with alternative educational background) students taken to interview.
This may indicate that students potentially entering via a wider participation
(WP) route (indicated by first generation entering from FE) are experiencing
stress at similar levels to those from the more traditional backgrounds. It was
hypothesised that WP students may report higher levels or frequencies of stress
due to the potential for these students to have reduced financial support and
perhaps less understanding of the problems faced by students from family
members. Given the complex definition of deprivation used to indicate wider
access and low participation neighbourhoods, before the null hypothesis is
accepted further information should be collected to more accurately compare
these groups of students.
Interview data would suggest that mature students did have additional
pressures due to family commitments however this stressor did not affect older
students exclusively, a younger participant who still lived at home also
commented on problems caused and exacerbated by family commitments. It
appeared that students with additional responsibilities regardless of age were at
increased risk of suffering from stress.
73
Students fell into two distinct stress profile categories: those with high initial
stress and those with low initial stress. In the cases where stress was high prior
to the start of the trimester data suggested that students felt uninformed and
therefore underprepared for the year to come. Data from interviews also
suggested that increases in work load and academics’ expectations were
disproportionate between the different years. Perhaps more could therefore be
done to make the transition between years smoother and for expectations to be
made clear and achievable. The different starting stress levels did not appear to
be predisposing students to consider withdrawal and most students then
entered a ‘typical’ profile during which withdrawal was considered mainly in the
later stages in association with academic performance which is assessed later
in the trimester. It is suggested that the differences between those with high
initial stress and those with low initial stress are explored in more depth. Given
that this did not appear to predispose students to consider withdrawal , it was
decided that the data would be shared with members of the Student and
Academic Services (SAS) team to support a bid for further research into pre-
enrolment and transition support in an attempt to limit initial starting stress.
Students’ awareness and use of the support services was extremely low across
the sampled cohort. Qualitative results did not provide solid elaborations on this,
only one student commented on the fact that the counselling service was not
offered on every campus and may therefore be less prominent than other
services. The reasons for the poor knowledge regarding the support available
needs to be examined further to understand the role the university plays in
supporting students suffering from stress. Quantitative and qualitative results
suggest Personal Development Tutors (PDTs) are an integral source of support
with PDTs being the most commonly used service and the person most
participants reported going to regardless of the problem. Anecdotally it is known
that some students will regularly seek support from a member of lecturing staff
who is not their designated PDT but with whom the student somehow feels
affiliated. Other students continue to seek support from their first year PDT in
subsequent years due to making a connection with that staff member. Further
investigation should be directed at understanding why students choose PDT
support over arguably more specialised services. Knowledge of this may help to
improve the services all-round by sharing good practice.
74
Quantitatively, self-reported stress frequency had only a small effect on a
student’s intention to leave HE however a limitation of this study was that
participants were not asked to report on withdrawal within a timescale. It is
therefore believed that data were collected over too long a period to be
accurately correlated with current stress. A link between stress and intention to
withdraw was suggested in interview by some students. This pathway appeared
to revolve around poor academic performance; coping poorly with academic
and non-academic sources of stress caused symptoms such as poor sleeping
patterns and reduced concentration, which in turn led to poor academic
performance. Students reported that if their performance had been lower they
would have likely left. Further quantitative investigation will require a time scale
to be provided for reporting intention to leave. Students who actually leave the
university should also be followed up to better understand the correlations
between stress and intention to withdraw and stress and actual withdrawal.
An issue identified was that most students involved in interview initially reported
suffering from relatively little stress however went on to describe stress and
stress related symptoms that seemed to be higher than initially reported. One
student (P2) directly indicated that they had been unaware of the level of stress
they were under until poor academic performance brought it to their attention.
Another (P1) reported that there was something that prevented them from
seeking support but could not elaborate. Perhaps students are unaware of the
stress they are under and this, along with an unwillingness to seek support and
a lack of awareness of the support available, may account for the low support
service use. The data regarding coping also suggests that not all students are
aware of how best to cope and, without knowledge of adaptive coping, students
may not understand the benefit of early problem-focused intervention. Further
investigation may be able to shed light on the reasons for poor support use and
on students awareness of their own stress and coping.
4.3.1 Limitations
A limitation was identified in this study which should be corrected for further
studies within the project. Data regarding intention to leave HE should be
collected in a narrower time frame to improve inferences drawn between
75
current/recent stress and an individual’s current/recent consideration of
withdrawal.
Another limitation of this study, and of the project as a whole, is that fact that the
students sampled have not withdrawn from their studies. Although data
generated from discussions with these students provides insights into the
potential reasons for withdrawal, specifically the relationship between stress
levels and intentions to leave HE, it cannot describe the entire phenomena.
Ethically and logistically it is difficult and sometimes impossible to contact
students who have withdrawn from HE. Quantitative data in future studies within
this project could attempt to identify those students who do subsequently leave
through centrally collected data which are void of personal information and
therefore is more ethically viable.
76
Summary
Results from this study have indicated further areas of investigation,
besides the stark gender difference observed, self-reported stress
remained fairly constant across years and degree programmes. There is a
need to understand the scope of this consistency across a broader range
of degrees which will require data collection to encompass more Schools
and Faculties within the University. The following will therefore be
addressed as a specific study aim in study two: Does self-reported stress
fluctuate across degree programmes or academic years of study?
To fully investigate if stress fluctuates from one academic year to the next
longitudinal studies would be required. Unfortunately this would not be
possible in the timeframe of this thesis however generalisations can be
made by comparing students in the varying years of study.
A better understanding of the poor support awareness and use, suggested
by quantitative measures, will be gained through focus groups in study
three. These discussions with students may also provide a platform for
further investigation into the use of PDTs. It is hoped that collection of this
datum will provide information that could help improve the support already
offered and may bring to light additional support requirements that could
be delivered as part of an intervention for this study. The data collection
will be used to provide further evidence for answering research question
two: how are non-health BSc students utilising the university support
services and their individual strategies to help cope with stress and
intentions of withdrawal?
As discussed above, data regarding intention to leave HE should be
collected in a narrower time frame to improve inferences drawn between
current/recent stress and an individual’s current/recent consideration of
withdrawal. Future quantitative studies should also consider the possibility
of a follow- up to record longitudinal data on retention, thus providing more
accurate information on the relationship between stress and actual
withdrawal.
77
Chapter Five: Study two – use of psychometric tools to measure student’s stress
Chapter overview
Study two aimed to quantify perceived stress, general health and exposure
to stressful events, including intention to withdraw from university.
Therefore, data from this study contributed mainly towards research
question one. By measuring stress using validated tools comparisons can
be made between the current sample and other student samples. To
collect these data, a paper-based questionnaire containing the following
scales validated for student populations was used: Perceived Stress Scale
(PSS-14), General Health Questionnaire (GHQ-12) and Life Events Scale
for Students (LESS). The questionnaire was completed by 149 students
from SLSSS and a cross campus comparison sample of 66 students from
Edinburgh Napier Business School (ENBS).
The study found students’ perceived stress, as measured by the PSS-14,
to be consistent within and across the faculties tested. Females scored
higher than males on all questions suggesting female students perceive
higher stress, experience poorer psychological wellbeing and experience
more stressful life events. Perceived stress in the Edinburgh Napier
University (ENU) cohort was similar to that reported in other UK studies of
healthcare students. Psychological morbidity for ENU students was higher
than that reported for the general population.
PSS-14 scores predicted intention to withdraw from university however this
did not translate to actual withdrawal suggesting additional variables, most
likely coping strategies, need to be taken into consideration.
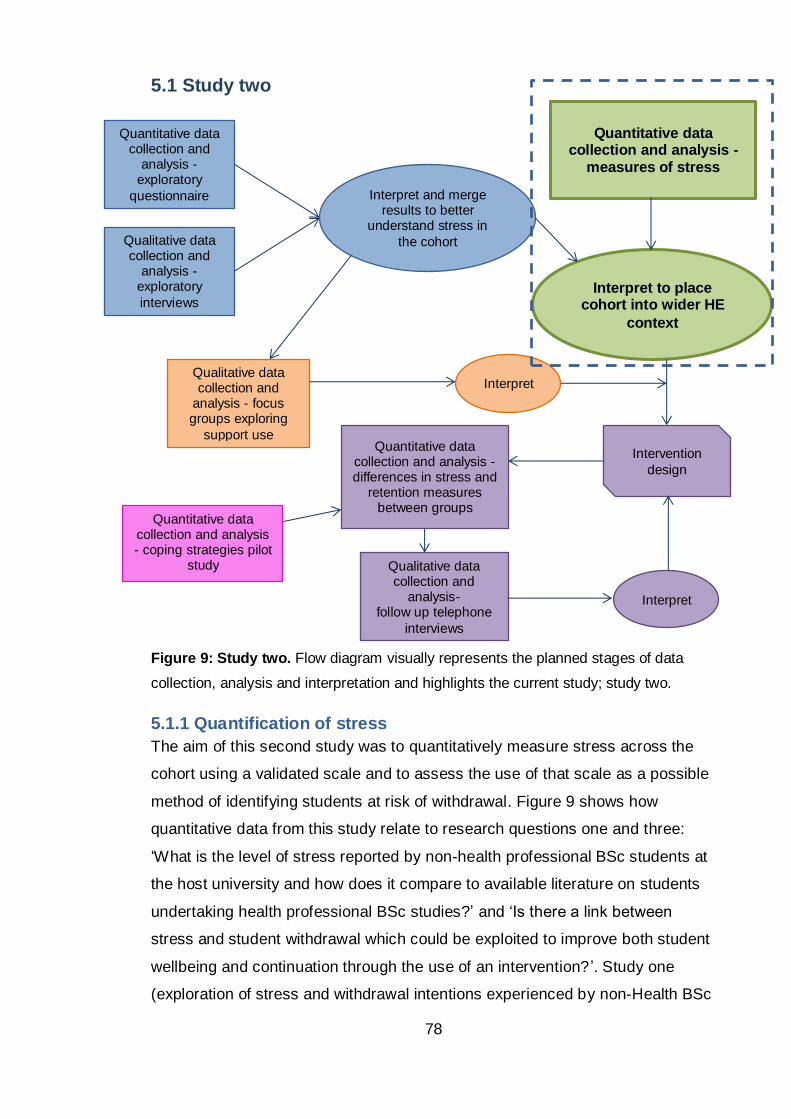
78
5.1 Study two
Figure 9: Study two. Flow diagram visually represents the planned stages of data
collection, analysis and interpretation and highlights the current study; study two.
5.1.1 Quantification of stress
The aim of this second study was to quantitatively measure stress across the
cohort using a validated scale and to assess the use of that scale as a possible
method of identifying students at risk of withdrawal. Figure 9 shows how
quantitative data from this study relate to research questions one and three:
‘What is the level of stress reported by non-health professional BSc students at
the host university and how does it compare to available literature on students
undertaking health professional BSc studies?’ and ‘Is there a link between
stress and student withdrawal which could be exploited to improve both student
wellbeing and continuation through the use of an intervention? ’. Study one
(exploration of stress and withdrawal intentions experienced by non-Health BSc
Quantitative data collection and analysis -
measures of stress
Interpret to place cohort into wider HE
context
Quantitative data collection and
analysis -exploratory
questionnaire
Qualitative data collection and
analysis -exploratory
interviews
Interpret and merge results to better
understand stress in
the cohort
Qualitative data collection and
analysis - focus groups exploring
support use
Interpret
Intervention
design
Quantitative data collection and analysis - differences in stress and
retention measures between groups
Qualitative data collection and
analysis- follow up telephone
interviews
Interpret
Quantitative data collection and analysis - coping strategies pilot
study
79
students) collected data relating to levels of stress that could be compared to
the NUS Scotland study whereas data collection in the current study utilised
commonly used psychometric scales and therefore allows comparisons to a
wider body of literature. Study two allowed for correlations between stress and
withdrawal to be assessed which would inform the ability of an intervention
directed at one variable to modify the other. This study also sought to improve
on a limitation of study one by restricting reports of intention to withdraw to the
current academic year. As discussed in earlier chapters, several scales exist
which report to measure aspects of stress including perceived stress,
experienced stress, coping, stressors or stress symptoms. As the project is
following the transactional model of stress, an individual’s perception is key to
their resulting stress response, therefore measures of perceived stress were
identified for use in this study.
5.2 Method
5.2.1 Choice of scales
Although psychological stress theory focuses on individual appraisal of events
there has been little development of perceived stress measures. When
consulting the literature for measures of perceived stress, one scale stands out
as being the most commonly used across a varied range of demographics
including students: The Perceived Stress Scale (PSS-14) developed by Cohen
et al. (1983). PSS measures the degree to which situations in one's life are
appraised as stressful.
An alternative measure which also relies on transactional model theory is the
Stress Appraisal Measure (Peacock and Wong, 1990). Although this scale has
been validated in college student cohorts it asks for participants to remark on
their primary appraisal of a specific stressor and therefore requires definition of
one single stressor and does not provide an overall measure of stress within the
individual’s life. The PSS has an advantage over this and other scales
specifically designed for student cohorts, for example Student Life Stress
Inventory (Gadzella, 1991), Student Stress Scale (Insel and Roth, 1985) and
Academic Stress Scale (Abouserie, 1994), because the PSS records life stress
rather than simply academic stress. Data from study one have shown that
80
stress from outside university has the ability to impact on performance and
intention to leave higher education (HE) so therefore a measure of perceived
stress in overall life is necessary.
The PSS-14 was therefore chosen to quantify stress and to be tested as a
potential early warning tool for withdrawal in the student cohort. Two other
questionnaires were included alongside the PSS. Firstly, the Life Event Scale
for Students (LESS) adapted by Linden (1984) from the Social Readjustment
Rating Scale (Holmes and Rahe, 1967) measures experience of stressful
events including the variable of interest, dropout. Secondly, the General Health
Questionnaire (GHQ-12) developed by Goldberg and Williams (1988) was
included to provide indications of the effect of stress on the student’s
psychological wellbeing. Justification for the choice of each questionnaire,
including its structure and validity, is expanded upon below and a copy of the
full questionnaire is attached, see appendix two.
5.2.1.1 Perceived stress questionnaire
In addition to being widely used, the PSS has been found to predict both
psychological and objective biological markers of stress and increased risk for
disease in a variety of populations (Burns et al., 2002; Cobb and Steptoe, 1996;
Cohen et al., 1999; Ebrecht et al., 2004). It has also been validated in
undergraduate populations across the world (Augustine et al., 2011; Burns et
al., 2002). This measure has the potential to allow quantification of the number
of students who are reporting high stress levels and who may therefore suffer
negatively as a result. The PSS is marked on a Likert scale (0-1-2-3-4) for the
negative items and reverse scored (4-3-2-1-0) for the positive items. Individuals’
item scores are summed to give an overall scale score from 0-56 for the 14 item
scale. The PSS is not a diagnostic instrument and therefore no score cut-offs
exist. Students would be regarded as ‘stressed’ in comparison to their previous
PSS scores and their peers. Normative data for interpreting the PSS-14 were
first published 30 years ago from a sample of 446 US freshmen, where male
and female average scores were reported as 22.06 and 24.64, respectively.
Coefficient alpha reliability was found to be 0.845 and test-retest within 2 days
was found to be r= 0.85 but dropped to r= 0.55 when the time between tests
increased to 6 weeks (Lee, 2012). The most recent study to report psychometric
81
properties of a PSS version in a British sample was Warttig et al., (2013) using
the short version PSS-4. Warttig and colleagues found PSS-4 items correlated
well with each other and correlations with each item and the total score were all
in the upper range (r > 0.73). The four items also had acceptable internal
consistence (Cronbach’s α= 0.77) confirming that at least the short version of
the scale can be considered reliable. Average Cronbach’s α for PSS-14 was
found to be greater than 0.7 for the 11 studies reviewed by Lee (2012).
5.2.1.2 Life events scale for students
The LESS asks students to report on their experience of items such as loss of a
close friend or failure of a module in the last year. In this study the LESS will
allow for detection of events that could affect students’ perceived stress and
intention to withdraw. Consistency of the measure within a British population
was suggested by Clements and Turpin (1996) by examining the stability with
which subjects report individual events, when asked at two time points. The
result, expressed as the percentage of the total number of events reported on
both occasions, was 54% accuracy on event recall after six months. Linden
(1984) validates this scale by providing evidence that shows high LESS scores
were predictive of more frequent reports of minor illnesses, seeking
psychological help and academic failure. The LESS is simply scored by
summing the corresponding weighted scores of the items experienced by the
student. For example death of a parent is weighted 100 and failing a module is
weighted 53. Although it has been suggested that students should work out and
record their total scores without indicating their exact experience to increase
confidentiality (Clements and Turpin, 2000), for this study the details of the
event were needed in order to suggest links between specific events, stress and
retention (the latter was indicated by item 14 on the LESS). The total number of
events experienced by a student can also be recorded.
Although daily hassles have been suggested as a better indicator of stress than
life events, the LESS scale was chosen because it included an item of interest
regarding retention (‘thinking about dropping out of university’) and because
academic daily hassles had already been explored in the previous
questionnaire. Another reason for choosing the LESS was because it includes
events that the university may be made aware of through general monitoring
82
such as assessment failure or through student services such as death of a
parent. Life events scales have also been used in conjunction with the PSS in
previous studies (Augustine et al., 2011; Cohen et al., 1993) so can allow
indications of the PSS validity based on previous literature reports of
correlations between the two measures and the LESS could highlight individual
events that correlate with increased stress amongst students. The LESS scale
was modified slightly, removing the Americanisms to suit our UK sample e.g.
the word course was replaced with module and college replaced with university.
5.2.1.3 General health questionnaire-12
Finally the GHQ-12 was chosen as a means of measuring short-term minor
psychiatric disorders that may be caused by excessive stress and will allow
suggestions of the level of mental ill-health within the cohort. The data will also
allow validation of the PSS based on previous literature reports of correlations
between the two measures. The GHQ-12 was marked by two methods: the
simple Likert (0-1-2-3) and the GHQ scoring (0-0-1-1), to increase the number
of comparable studies, the total score for each individual was gained by
summing the scores for each of the 12 items. The suggested threshold value for
the GHQ scoring method of greater than three was used to indicate potential
psychiatric morbidity (Goldberg et al., 1997). Above this threshold the chance of
positive identification of a psychological illness, following clinical diagnosis, is
increased. Individuals with above threshold scores are known as possible
‘cases’. An average Cronbach’s alpha value for the GHQ-12 was reported by
Banks et al. (1980) to be 0.85.
5.2.2 Data collection
5.2.2.1 Time point one
Ethical approval for the distribution of a questionnaire containing all three of the
above published scales was granted by the relevant Edinburgh Napier
University (ENU) Faculty committee, this also allowed for collection of
demographic information as in study one. To test the consistency of student
stress seen in study one, first year to fourth and postgraduate student
participants from Sports Science, as well as Life Science, were recruited.
Access was only available to postgraduate research (PGR) students rather than
taught postgraduates and therefore it is expected that the differing nature of UG
83
and PGR courses may result in differing results, this will be assessed before
aggregation of the UG and PGR datasets. Students were recruited for time
point one (T1) data collection the end of timetabled classes between weeks 3–4
of trimester two 2011/2012 and their fully informed consent was given before
participating.
As identified at the end of study one, wider distribution of the questionnaires
would allow for discussion around the consistency of stress across the
university given the apparent stability seen in the Non-Health Science students.
The Edinburgh Napier Business School (ENBS) was approached to allow
collection of data that would act as a comparative group to test the consistency
of student stress across faculties. ENBS provided approval for only the PSS-14,
GHQ-12 and demographic questions under the grounds that reading a list of
potentially stressful events could be distressing for students (appeal was
unsuccessful and caused delay in data collection). Data collection continued
without the LESS and questionnaires were again distributed during randomly
selected timetabled classes in weeks 10-11 of trimester two 2011/2012 and to
first through fourth year students. It was surmised that differences may be
observed between the schools due to the different routes potentially attracting
different types of students and because the course structure and assessment
timetabling differs from the SLSSS. The ENBS is also situated at another
campus and therefore differences could also be due to environmental factors
such as differing availability of resources.
5.2.2.2 Time point two
Study two also included a second, follow up data collection point (T2), one year
post T1 (trimester two of academic year 2012/2013). A sub set of SLSSS
students were followed up (n= 68) and their current student status recorded as
‘still enrolled’ or ‘withdrawn’. This allowed for insight into the relationship
between intention to withdraw and subsequent behaviour and to investigate the
effect of stress on actual withdrawal. Due to the time intensive nature of follow-
ups, only those students who fell into the following categories were pursued i)
reported considering dropout (n= 17), ii) PSS-14 score in top quartile for their
gender (male n= 10, female n= 14) or iii) PSS-14 score in bottom quartile for
their gender (male n= 14, female n= 13).
84
5.2.3 Analysis
As with study one, quantitative analysis depended on the data generated by the
questionnaires. Normally distributed data were treated with parametric statistical
techniques and non-normally distributed data treated with the non-parametric
equivalent. PSS-14 was tested for validity using predictive validity procedures
i.e. comparing expected and actual correlation with the other measures.
Because of: a) the differences in perceived stress due to academic and
demographic characteristics reported in the wider literature, b) significant
differences in self-reported stress between male and female participants in
study one and c) the consistency in stress across academic years seen in study
one; analysis in study two explored the magnitude of differences between males
and females, ethnic background, programme of study and academic year. To
understand any differences between male and female respondents and any
differences in stress between participants on different degree routes and in
different academic years, both aggregated and disaggregated analysis was
undertaken. Differences between demographic groups such as gender and year
of study were explored using t-tests where two groups existed or ANOVA where
more than two groups existed.
PSS-14 score of students considering withdrawal and those content within HE
were compared using t-tests given the binary dependent variable to indicate if
those considering withdrawal had higher stress as hypothesised. Comparisons
were made between intention to withdraw, as reported on the LESS, and actual
withdrawal of the followed-up sub-sample. Binary logistic regression was used
to indicate if PSS-14 score (alone or in combination with any measured
demographic variable) could be used to predict a student’s intention to withdraw
or actual withdrawal in the followed up sub-sample. The number of events
experienced and individual items reported on the LESS were also checked for
their ability to predict stress or withdrawal. These tests were applied to SLSSS
data and ENBS data separately and comparisons made between the two
schools to suggest the potential of any results found in SLSSS to be
generalised across the university. All test statistics with p values <0.05 were
classed as significant and appropriate effect sizes reported where necessary to
comment on the size of the effect observed. Note that the non-parametric
equivalent of these tests was applied if necessary i.e. Shapiro-wilk test statistic
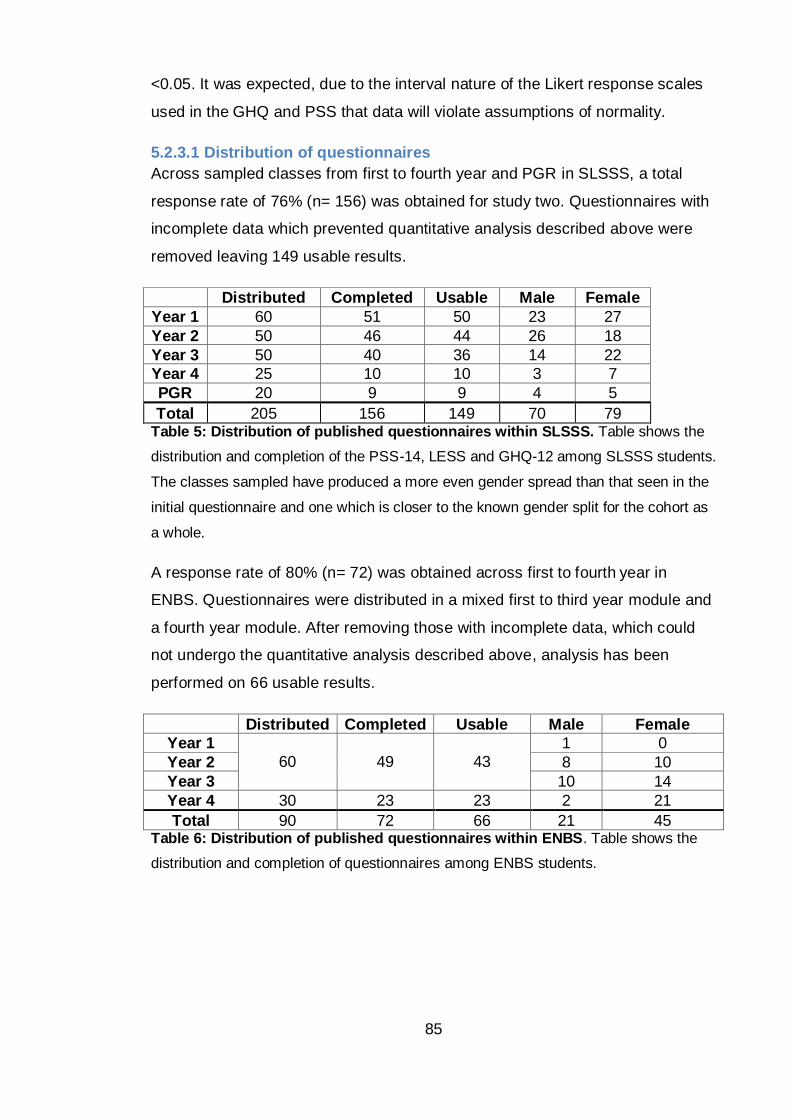
85
<0.05. It was expected, due to the interval nature of the Likert response scales
used in the GHQ and PSS that data will violate assumptions of normality.
5.2.3.1 Distribution of questionnaires
Across sampled classes from first to fourth year and PGR in SLSSS, a total
response rate of 76% (n= 156) was obtained for study two. Questionnaires with
incomplete data which prevented quantitative analysis described above were
removed leaving 149 usable results.
Distributed Completed Usable Male Female
Year 1 60 51 50 23 27
Year 2 50 46 44 26 18
Year 3 50 40 36 14 22
Year 4 25 10 10 3 7
PGR 20 9 9 4 5
Total 205 156 149 70 79 Table 5: Distribution of published questionnaires within SLSSS. Table shows the
distribution and completion of the PSS-14, LESS and GHQ-12 among SLSSS students.
The classes sampled have produced a more even gender spread than that seen in the
initial questionnaire and one which is closer to the known gender split for the cohort as
a whole.
A response rate of 80% (n= 72) was obtained across first to fourth year in
ENBS. Questionnaires were distributed in a mixed first to third year module and
a fourth year module. After removing those with incomplete data, which could
not undergo the quantitative analysis described above, analysis has been
performed on 66 usable results.
Distributed Completed Usable Male Female
Year 1
60
49
43
1 0
Year 2 8 10
Year 3 10 14
Year 4 30 23 23 2 21
Total 90 72 66 21 45 Table 6: Distribution of published questionnaires within ENBS. Table shows the
distribution and completion of questionnaires among ENBS students.
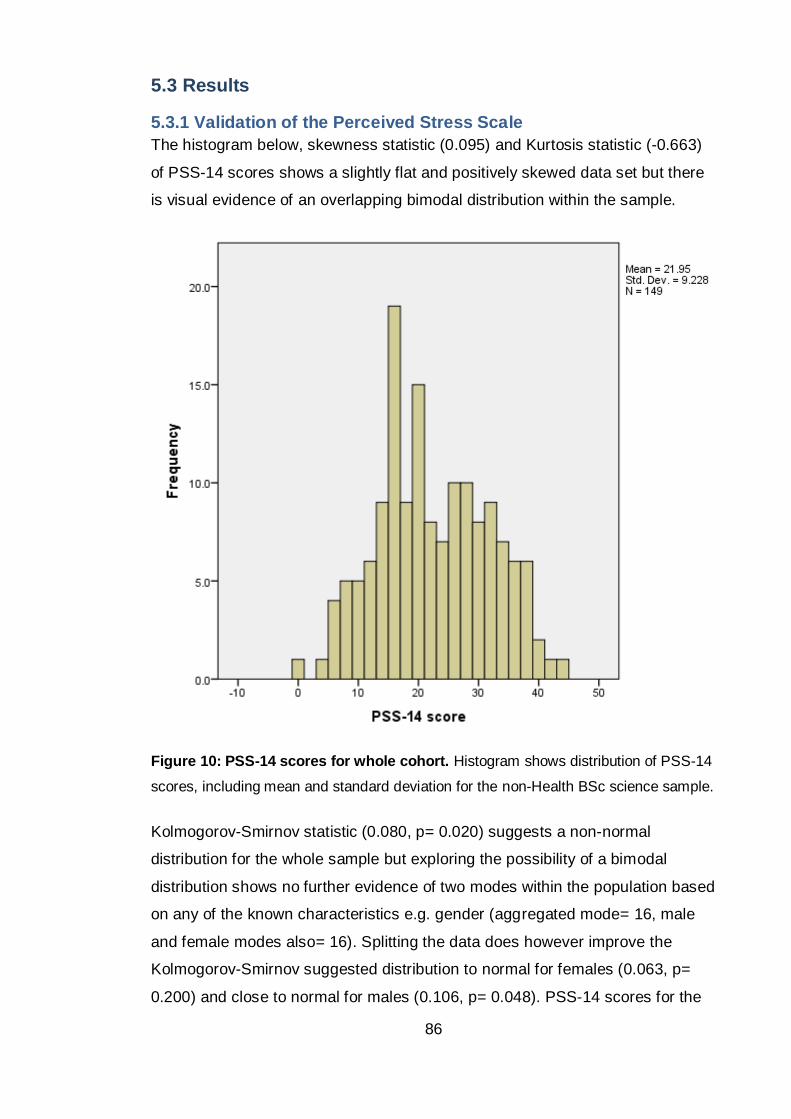
86
5.3 Results
5.3.1 Validation of the Perceived Stress Scale
The histogram below, skewness statistic (0.095) and Kurtosis statistic (-0.663)
of PSS-14 scores shows a slightly flat and positively skewed data set but there
is visual evidence of an overlapping bimodal distribution within the sample.
Figure 10: PSS-14 scores for whole cohort. Histogram shows distribution of PSS-14
scores, including mean and standard deviation for the non-Health BSc science sample.
Kolmogorov-Smirnov statistic (0.080, p= 0.020) suggests a non-normal
distribution for the whole sample but exploring the possibility of a bimodal
distribution shows no further evidence of two modes within the population based
on any of the known characteristics e.g. gender (aggregated mode= 16, male
and female modes also= 16). Splitting the data does however improve the
Kolmogorov-Smirnov suggested distribution to normal for females (0.063, p=
0.200) and close to normal for males (0.106, p= 0.048). PSS-14 scores for the
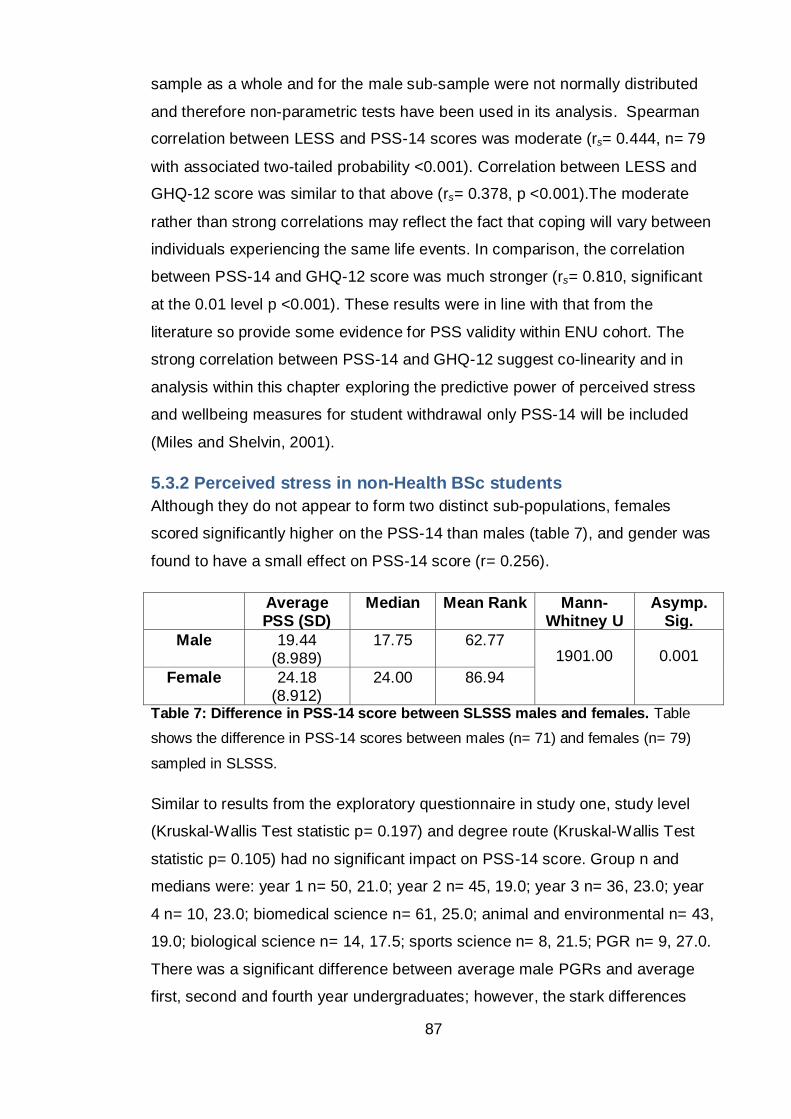
87
sample as a whole and for the male sub-sample were not normally distributed
and therefore non-parametric tests have been used in its analysis. Spearman
correlation between LESS and PSS-14 scores was moderate (rs= 0.444, n= 79
with associated two-tailed probability <0.001). Correlation between LESS and
GHQ-12 score was similar to that above (rs= 0.378, p <0.001).The moderate
rather than strong correlations may reflect the fact that coping will vary between
individuals experiencing the same life events. In comparison, the correlation
between PSS-14 and GHQ-12 score was much stronger (rs= 0.810, significant
at the 0.01 level p <0.001). These results were in line with that from the
literature so provide some evidence for PSS validity within ENU cohort. The
strong correlation between PSS-14 and GHQ-12 suggest co-linearity and in
analysis within this chapter exploring the predictive power of perceived stress
and wellbeing measures for student withdrawal only PSS-14 will be included
(Miles and Shelvin, 2001).
5.3.2 Perceived stress in non-Health BSc students
Although they do not appear to form two distinct sub-populations, females
scored significantly higher on the PSS-14 than males (table 7), and gender was
found to have a small effect on PSS-14 score (r= 0.256).
Average PSS (SD)
Median Mean Rank Mann-Whitney U
Asymp. Sig.
Male 19.44 (8.989)
17.75 62.77 1901.00 0.001
Female 24.18 (8.912)
24.00 86.94
Table 7: Difference in PSS-14 score between SLSSS males and females. Table
shows the difference in PSS-14 scores between males (n= 71) and females (n= 79)
sampled in SLSSS.
Similar to results from the exploratory questionnaire in study one, study level
(Kruskal-Wallis Test statistic p= 0.197) and degree route (Kruskal-Wallis Test
statistic p= 0.105) had no significant impact on PSS-14 score. Group n and
medians were: year 1 n= 50, 21.0; year 2 n= 45, 19.0; year 3 n= 36, 23.0; year
4 n= 10, 23.0; biomedical science n= 61, 25.0; animal and environmental n= 43,
19.0; biological science n= 14, 17.5; sports science n= 8, 21.5; PGR n= 9, 27.0.
There was a significant difference between average male PGRs and average
first, second and fourth year undergraduates; however, the stark differences
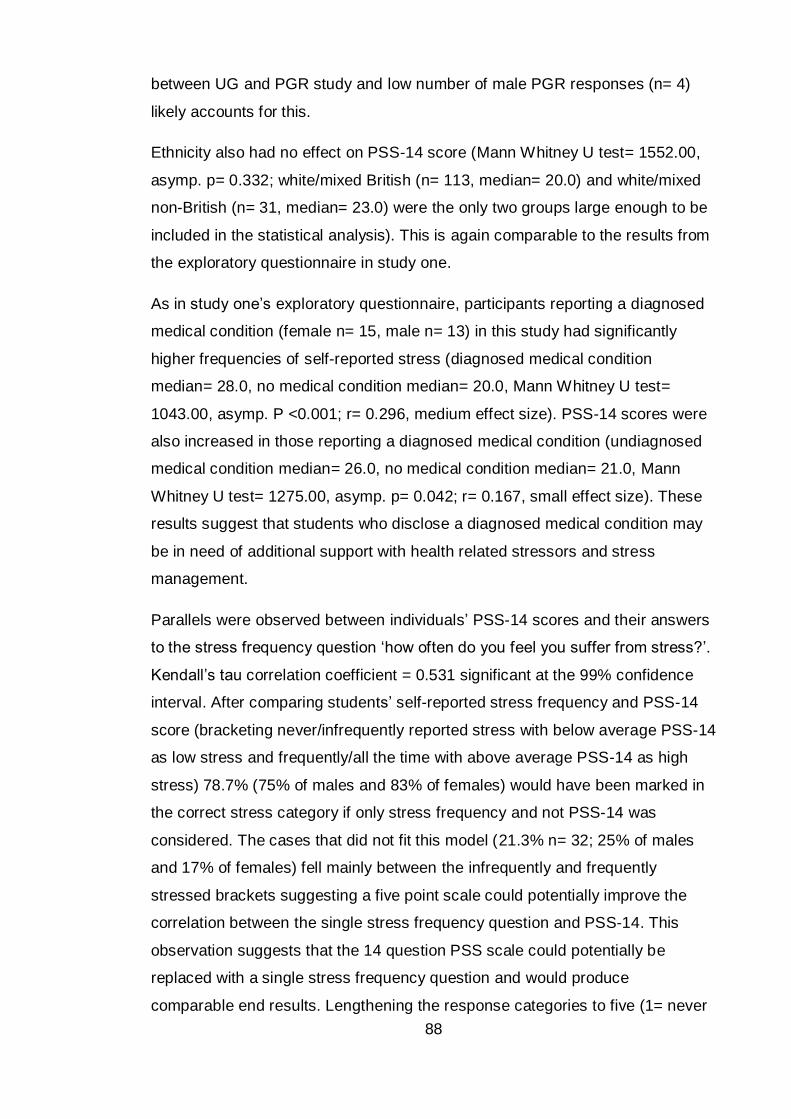
88
between UG and PGR study and low number of male PGR responses (n= 4)
likely accounts for this.
Ethnicity also had no effect on PSS-14 score (Mann Whitney U test= 1552.00,
asymp. p= 0.332; white/mixed British (n= 113, median= 20.0) and white/mixed
non-British (n= 31, median= 23.0) were the only two groups large enough to be
included in the statistical analysis). This is again comparable to the results from
the exploratory questionnaire in study one.
As in study one’s exploratory questionnaire, participants reporting a diagnosed
medical condition (female n= 15, male n= 13) in this study had significantly
higher frequencies of self-reported stress (diagnosed medical condition
median= 28.0, no medical condition median= 20.0, Mann Whitney U test=
1043.00, asymp. P <0.001; r= 0.296, medium effect size). PSS-14 scores were
also increased in those reporting a diagnosed medical condition (undiagnosed
medical condition median= 26.0, no medical condition median= 21.0, Mann
Whitney U test= 1275.00, asymp. p= 0.042; r= 0.167, small effect size). These
results suggest that students who disclose a diagnosed medical condition may
be in need of additional support with health related stressors and stress
management.
Parallels were observed between individuals’ PSS-14 scores and their answers
to the stress frequency question ‘how often do you feel you suffer from stress?’.
Kendall’s tau correlation coefficient = 0.531 significant at the 99% confidence
interval. After comparing students’ self-reported stress frequency and PSS-14
score (bracketing never/infrequently reported stress with below average PSS-14
as low stress and frequently/all the time with above average PSS-14 as high
stress) 78.7% (75% of males and 83% of females) would have been marked in
the correct stress category if only stress frequency and not PSS-14 was
considered. The cases that did not fit this model (21.3% n= 32; 25% of males
and 17% of females) fell mainly between the infrequently and frequently
stressed brackets suggesting a five point scale could potentially improve the
correlation between the single stress frequency question and PSS-14. This
observation suggests that the 14 question PSS scale could potentially be
replaced with a single stress frequency question and would produce
comparable end results. Lengthening the response categories to five (1= never
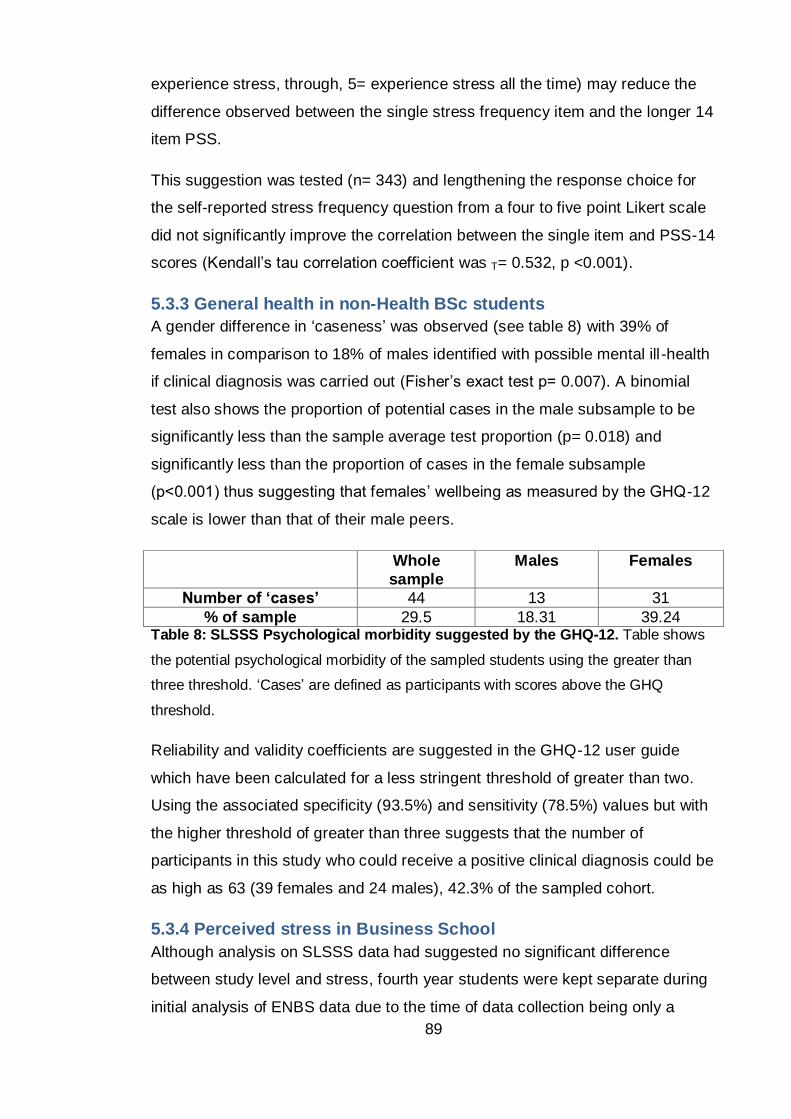
89
experience stress, through, 5= experience stress all the time) may reduce the
difference observed between the single stress frequency item and the longer 14
item PSS.
This suggestion was tested (n= 343) and lengthening the response choice for
the self-reported stress frequency question from a four to five point Likert scale
did not significantly improve the correlation between the single item and PSS-14
scores (Kendall’s tau correlation coefficient was T= 0.532, p <0.001).
5.3.3 General health in non-Health BSc students
A gender difference in ‘caseness’ was observed (see table 8) with 39% of
females in comparison to 18% of males identified with possible mental ill -health
if clinical diagnosis was carried out (Fisher’s exact test p= 0.007). A binomial
test also shows the proportion of potential cases in the male subsample to be
significantly less than the sample average test proportion (p= 0.018) and
significantly less than the proportion of cases in the female subsample
(p<0.001) thus suggesting that females’ wellbeing as measured by the GHQ-12
scale is lower than that of their male peers.
Whole
sample
Males Females
Number of ‘cases’ 44 13 31
% of sample 29.5 18.31 39.24 Table 8: SLSSS Psychological morbidity suggested by the GHQ-12. Table shows
the potential psychological morbidity of the sampled students using the greater than
three threshold. ‘Cases’ are defined as participants with scores above the GHQ
threshold.
Reliability and validity coefficients are suggested in the GHQ-12 user guide
which have been calculated for a less stringent threshold of greater than two.
Using the associated specificity (93.5%) and sensitivity (78.5%) values but with
the higher threshold of greater than three suggests that the number of
participants in this study who could receive a positive clinical diagnosis could be
as high as 63 (39 females and 24 males), 42.3% of the sampled cohort.
5.3.4 Perceived stress in Business School
Although analysis on SLSSS data had suggested no significant difference
between study level and stress, fourth year students were kept separate during
initial analysis of ENBS data due to the time of data collection being only a
90
week before their final project deadline. It was therefore thought that their stress
levels could be disproportionally higher than a) the other ENBS students and b)
SLSSS students whose data had been collected earlier in the trimester. As with
SLSSS, female students in ENBS have significantly higher average PSS-14
scores than ENBS males when fourth years are both included and excluded
(see table 9). PSS-14 scores for ENBS males and females were significantly
different and the gender-disaggregated data sets were normally distributed
allowing the use of parametric tests (Shapiro-Wilk statistic p= 0.074 for females
and p= 0.679 for males).
Gender Study level Average PSS-14
Standard deviation
T test Sig.
All (n= 66) 1 – 4 25.26 8.069
Male (n= 19) 1 – 3 19.42 6.577 0.011 Female (n= 24) 24.96 6.894
Male (n= 21) 1 - 4 19.71 6.739 <0.001
Female (n= 45) 27.44 7.433 Table 9: Difference in PSS-14 score between ENBS males and females. Average
PSS-14 score for whole ENBS sample and for males and females from ENBS split into
first through third years and first through fourth years to allow for correction of fourth
year students being sampled close to their finial year assessment deadline.
ANOVA analysis on the aggregated dataset shows significant differences in
PSS-14 scores between students studying in different year in ENBS (year 1
students removed as too few cases; p= 0.004, F= 5.902, df= 2). Post hoc
analysis suggests that the difference is due to fourth year students scoring
significantly higher on the PSS-14 than their academically younger peers.
Disaggregating the data shows that the ENBS males report similar stress
across all undergraduate years (p= 0.628, F= 0.477, df= 2) however significant
differences in average PSS-14 score were found within the female subsample
(p= 0.008, F= 5.489, df= 2) that account for the higher PSS-14 scores in fourth
years. Due to the higher fourth year PSS-14 scores, the ENBS and the SLSSS
were compared with fourth years included and excluded.
5.3.5 Comparisons across non-health student cohorts
When only undergraduates with known degree routes are considered, SLSSS
(n= 124) and ENBS (n= 66) PSS-14 scores are normally distributed therefore
parametric statistical tests can be run to compare PSS-14 scores between the
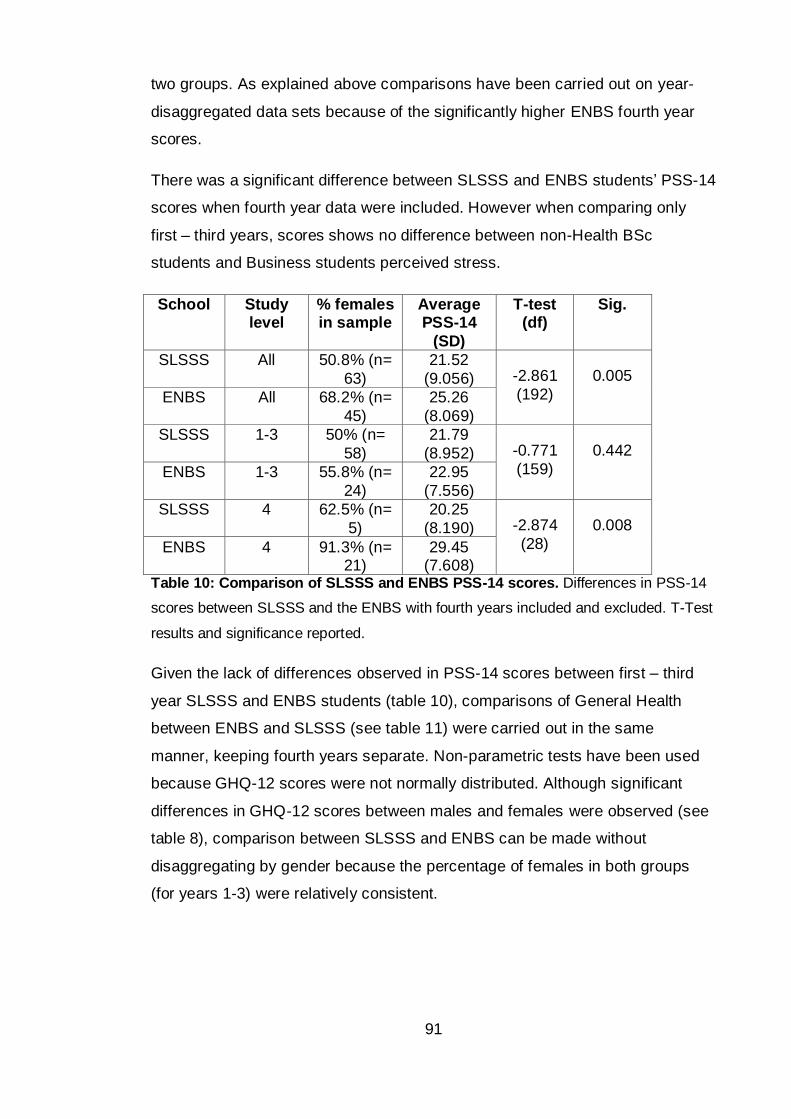
91
two groups. As explained above comparisons have been carried out on year-
disaggregated data sets because of the significantly higher ENBS fourth year
scores.
There was a significant difference between SLSSS and ENBS students’ PSS-14
scores when fourth year data were included. However when comparing only
first – third years, scores shows no difference between non-Health BSc
students and Business students perceived stress.
School Study level
% females in sample
Average PSS-14
(SD)
T-test (df)
Sig.
SLSSS All 50.8% (n=
63)
21.52
(9.056) -2.861
(192)
0.005
ENBS All 68.2% (n=
45)
25.26
(8.069)
SLSSS 1-3 50% (n=
58)
21.79
(8.952) -0.771
(159)
0.442
ENBS 1-3 55.8% (n=
24)
22.95
(7.556)
SLSSS 4 62.5% (n=
5)
20.25
(8.190) -2.874
(28)
0.008
ENBS 4 91.3% (n= 21)
29.45 (7.608)
Table 10: Comparison of SLSSS and ENBS PSS-14 scores. Differences in PSS-14
scores between SLSSS and the ENBS with fourth years included and excluded. T-Test
results and significance reported.
Given the lack of differences observed in PSS-14 scores between first – third
year SLSSS and ENBS students (table 10), comparisons of General Health
between ENBS and SLSSS (see table 11) were carried out in the same
manner, keeping fourth years separate. Non-parametric tests have been used
because GHQ-12 scores were not normally distributed. Although significant
differences in GHQ-12 scores between males and females were observed (see
table 8), comparison between SLSSS and ENBS can be made without
disaggregating by gender because the percentage of females in both groups
(for years 1-3) were relatively consistent.
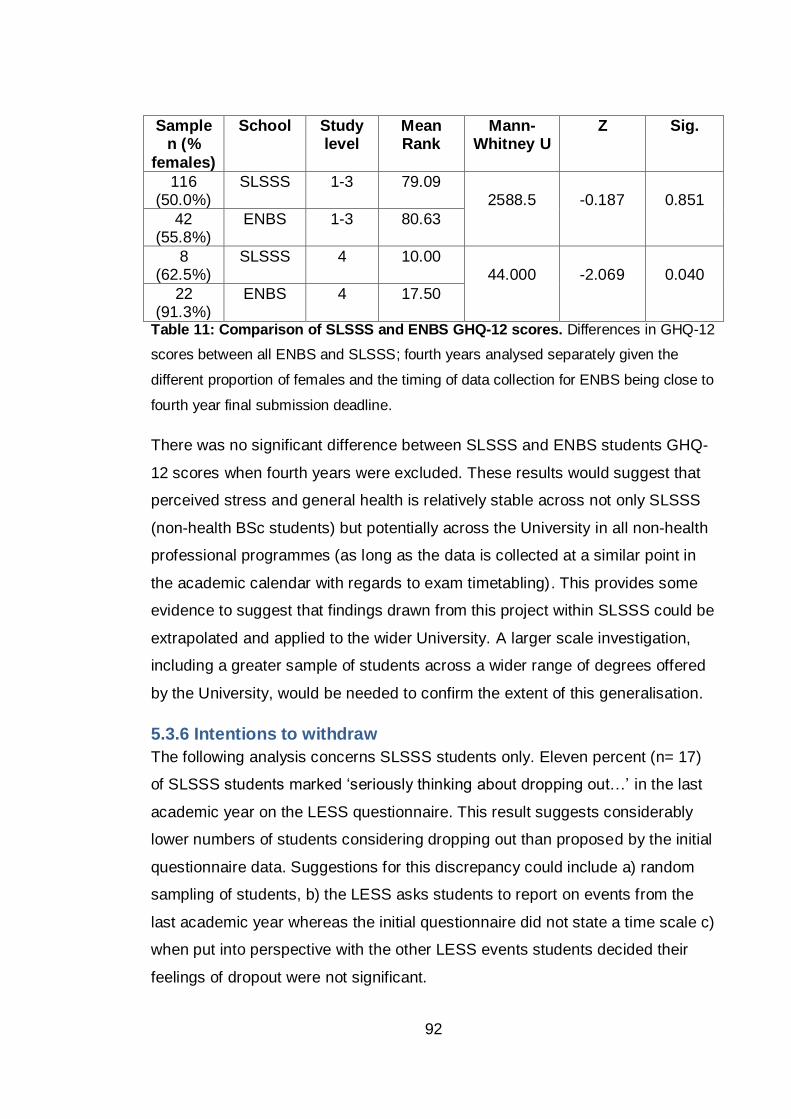
92
Sample n (%
females)
School Study level
Mean Rank
Mann-Whitney U
Z Sig.
116 (50.0%)
SLSSS 1-3 79.09 2588.5
-0.187
0.851
42 (55.8%)
ENBS 1-3 80.63
8 (62.5%)
SLSSS 4 10.00 44.000
-2.069
0.040
22 (91.3%)
ENBS 4 17.50
Table 11: Comparison of SLSSS and ENBS GHQ-12 scores. Differences in GHQ-12
scores between all ENBS and SLSSS; fourth years analysed separately given the
different proportion of females and the timing of data collection for ENBS being close to
fourth year final submission deadline.
There was no significant difference between SLSSS and ENBS students GHQ-
12 scores when fourth years were excluded. These results would suggest that
perceived stress and general health is relatively stable across not only SLSSS
(non-health BSc students) but potentially across the University in all non-health
professional programmes (as long as the data is collected at a similar point in
the academic calendar with regards to exam timetabling). This provides some
evidence to suggest that findings drawn from this project within SLSSS could be
extrapolated and applied to the wider University. A larger scale investigation,
including a greater sample of students across a wider range of degrees offered
by the University, would be needed to confirm the extent of this generalisation.
5.3.6 Intentions to withdraw
The following analysis concerns SLSSS students only. Eleven percent (n= 17)
of SLSSS students marked ‘seriously thinking about dropping out…’ in the last
academic year on the LESS questionnaire. This result suggests considerably
lower numbers of students considering dropping out than proposed by the initial
questionnaire data. Suggestions for this discrepancy could include a) random
sampling of students, b) the LESS asks students to report on events from the
last academic year whereas the initial questionnaire did not state a time scale c)
when put into perspective with the other LESS events students decided their
feelings of dropout were not significant.
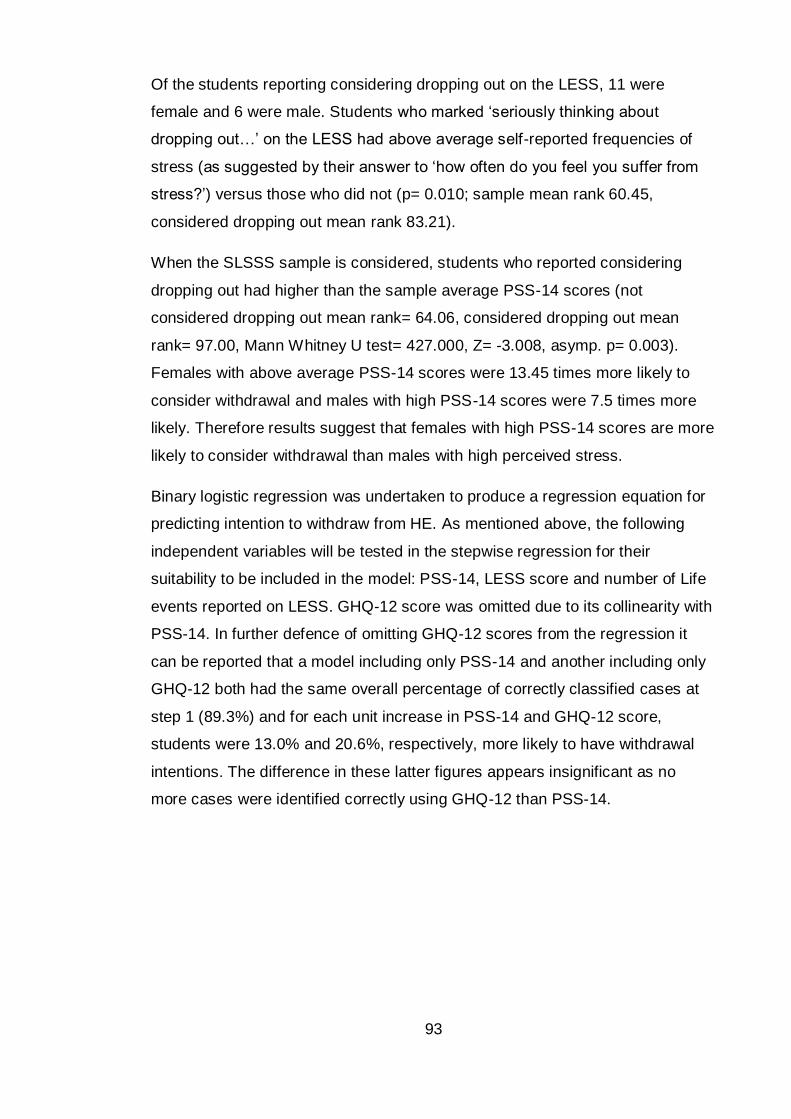
93
Of the students reporting considering dropping out on the LESS, 11 were
female and 6 were male. Students who marked ‘seriously thinking about
dropping out…’ on the LESS had above average self-reported frequencies of
stress (as suggested by their answer to ‘how often do you feel you suffer from
stress?’) versus those who did not (p= 0.010; sample mean rank 60.45,
considered dropping out mean rank 83.21).
When the SLSSS sample is considered, students who reported considering
dropping out had higher than the sample average PSS-14 scores (not
considered dropping out mean rank= 64.06, considered dropping out mean
rank= 97.00, Mann Whitney U test= 427.000, Z= -3.008, asymp. p= 0.003).
Females with above average PSS-14 scores were 13.45 times more likely to
consider withdrawal and males with high PSS-14 scores were 7.5 times more
likely. Therefore results suggest that females with high PSS-14 scores are more
likely to consider withdrawal than males with high perceived stress.
Binary logistic regression was undertaken to produce a regression equation for
predicting intention to withdraw from HE. As mentioned above, the following
independent variables will be tested in the stepwise regression for their
suitability to be included in the model: PSS-14, LESS score and number of Life
events reported on LESS. GHQ-12 score was omitted due to its collinearity with
PSS-14. In further defence of omitting GHQ-12 scores from the regression it
can be reported that a model including only PSS-14 and another including only
GHQ-12 both had the same overall percentage of correctly classified cases at
step 1 (89.3%) and for each unit increase in PSS-14 and GHQ-12 score,
students were 13.0% and 20.6%, respectively, more likely to have withdrawal
intentions. The difference in these latter figures appears insignificant as no
more cases were identified correctly using GHQ-12 than PSS-14.
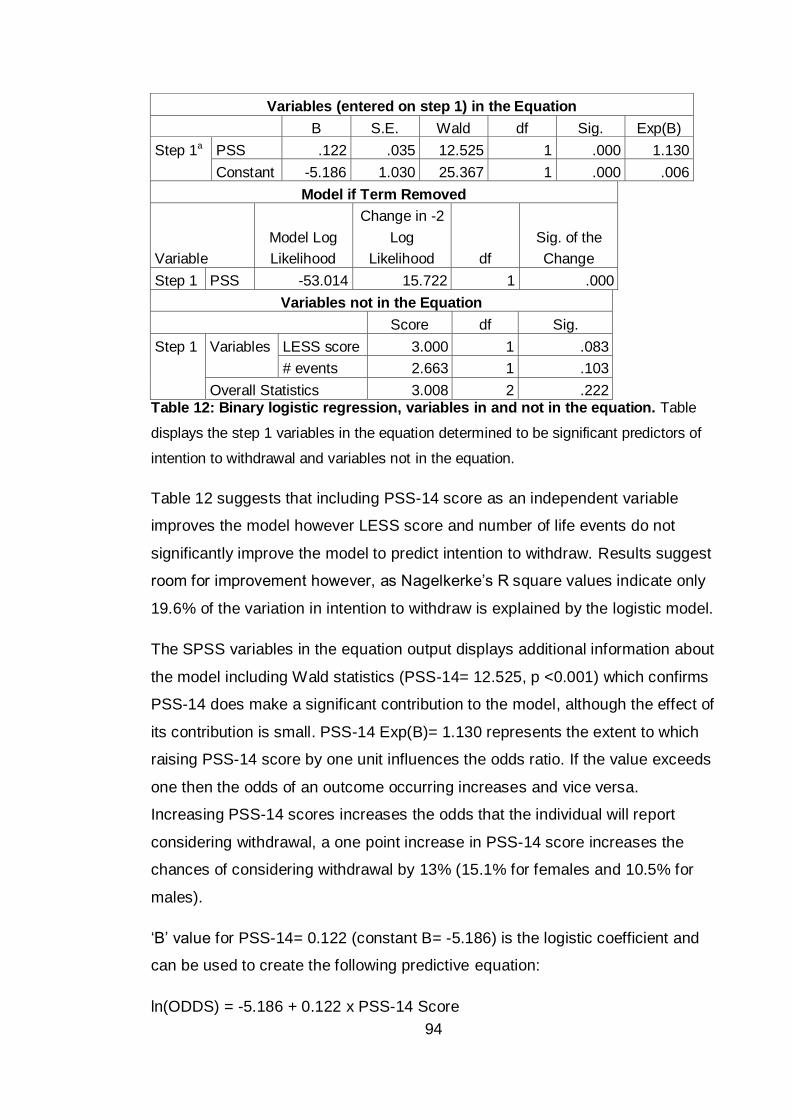
94
Variables (entered on step 1) in the Equation
B S.E. Wald df Sig. Exp(B)
Step 1a PSS .122 .035 12.525 1 .000 1.130
Constant -5.186 1.030 25.367 1 .000 .006
Model if Term Removed
Variable
Model Log
Likelihood
Change in -2
Log
Likelihood df
Sig. of the
Change
Step 1 PSS -53.014 15.722 1 .000
Variables not in the Equation
Score df Sig.
Step 1 Variables LESS score 3.000 1 .083
# events 2.663 1 .103
Overall Statistics 3.008 2 .222 Table 12: Binary logistic regression, variables in and not in the equation. Table
displays the step 1 variables in the equation determined to be significant predictors of
intention to withdrawal and variables not in the equation.
Table 12 suggests that including PSS-14 score as an independent variable
improves the model however LESS score and number of life events do not
significantly improve the model to predict intention to withdraw. Results suggest
room for improvement however, as Nagelkerke’s R square values indicate only
19.6% of the variation in intention to withdraw is explained by the logistic model.
The SPSS variables in the equation output displays additional information about
the model including Wald statistics (PSS-14= 12.525, p <0.001) which confirms
PSS-14 does make a significant contribution to the model, although the effect of
its contribution is small. PSS-14 Exp(B)= 1.130 represents the extent to which
raising PSS-14 score by one unit influences the odds ratio. If the value exceeds
one then the odds of an outcome occurring increases and vice versa.
Increasing PSS-14 scores increases the odds that the individual will report
considering withdrawal, a one point increase in PSS-14 score increases the
chances of considering withdrawal by 13% (15.1% for females and 10.5% for
males).
‘B’ value for PSS-14= 0.122 (constant B= -5.186) is the logistic coefficient and
can be used to create the following predictive equation:
ln(ODDS) = -5.186 + 0.122 x PSS-14 Score
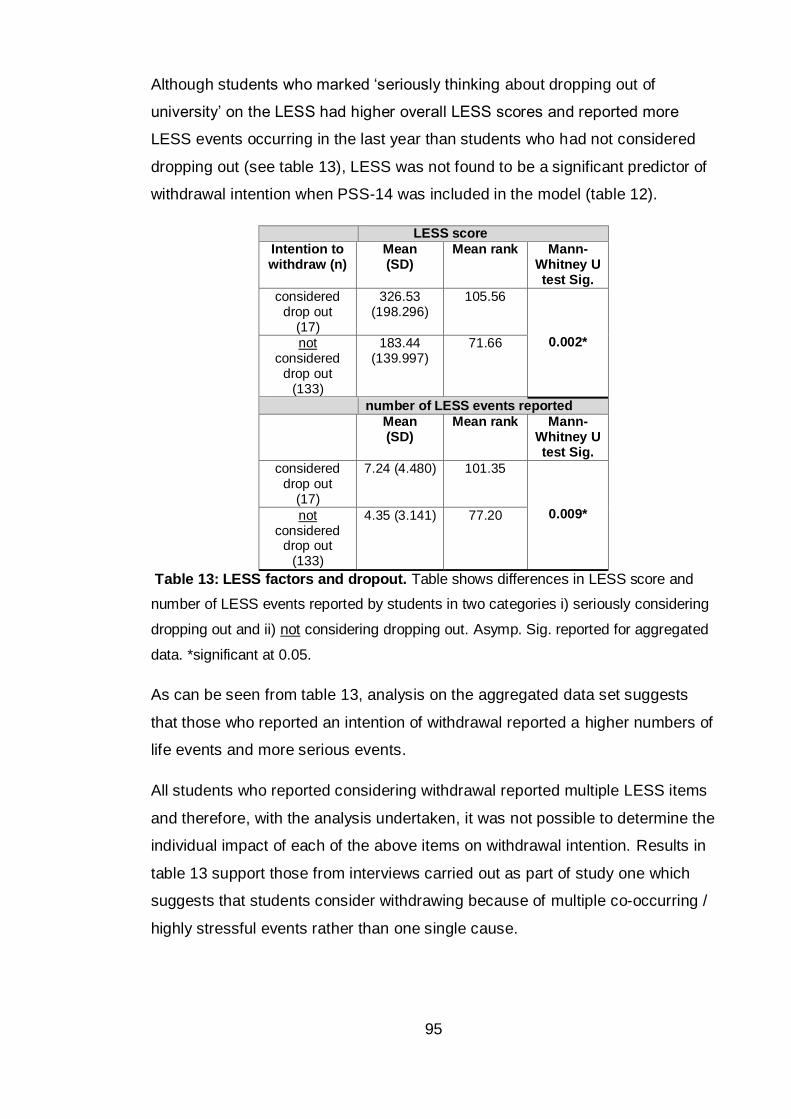
95
Although students who marked ‘seriously thinking about dropping out of
university’ on the LESS had higher overall LESS scores and reported more
LESS events occurring in the last year than students who had not considered
dropping out (see table 13), LESS was not found to be a significant predictor of
withdrawal intention when PSS-14 was included in the model (table 12).
LESS score
Intention to withdraw (n)
Mean (SD)
Mean rank Mann-Whitney U test Sig.
considered drop out
(17)
326.53 (198.296)
105.56
0.002* not considered
drop out (133)
183.44 (139.997)
71.66
number of LESS events reported
Mean (SD)
Mean rank Mann-Whitney U test Sig.
considered drop out
(17)
7.24 (4.480) 101.35
0.009* not considered
drop out (133)
4.35 (3.141) 77.20
Table 13: LESS factors and dropout. Table shows differences in LESS score and
number of LESS events reported by students in two categories i) seriously considering
dropping out and ii) not considering dropping out. Asymp. Sig. reported for aggregated
data. *significant at 0.05.
As can be seen from table 13, analysis on the aggregated data set suggests
that those who reported an intention of withdrawal reported a higher numbers of
life events and more serious events.
All students who reported considering withdrawal reported multiple LESS items
and therefore, with the analysis undertaken, it was not possible to determine the
individual impact of each of the above items on withdrawal intention. Results in
table 13 support those from interviews carried out as part of study one which
suggests that students consider withdrawing because of multiple co-occurring /
highly stressful events rather than one single cause.
96
5.3.7 Actual withdrawal
The following results relate to the 68 SLSSS students who were followed-up
one year after T1 data collection. Of the 17 students who reported ‘seriously
thinking about dropping out…’ at T1 it was found that 53% of these students
actually left the University within the next year. Fifty-one students who had not
considered leaving were also followed up, and 25.5% of these had
subsequently withdrawn. In total 22 of the 68 students had left (11 males and 11
females). This is a higher withdrawal percentage than would be expected given
the University’s published retention figures.
Males and females were equally accurate at predicting their own withdrawal
through reports of intention to withdraw (3/6 males and 6/11 females actually
left). A Pearson chi-square test revealed a significant association between
considering withdrawal and actual withdrawal (Chi square value= 4.390, df= 1,
p= 0.037). For males, intention to withdraw was 50% accurate at predicting
actual withdrawal and for females, intention to withdraw was 54.5% accurate.
Females were however, nearly twice as accurate at predicting their
continuation; 33% (8/24) of males in comparison to 18.5% (5/27) of females,
reported no intention to withdraw but subsequently left within a year. This may
suggest that once a female has reported an intention to stay they are less likely
to change their mind than males, in other words a male’s decision to leave
university may be more spontaneous. Unfortunately it was not possible, with the
data available, to understand this result fully. Additional information regarding
the timing of the student’s withdrawal would be required to see if withdrawal of
those who reported an intention at T1 occurred before those who reported ‘not
seriously think about dropping out’ at T1.
Although PSS-14 score was a statistically significant predictor of intention to
withdraw, measured by the ‘seriously thinking about dropping out…’ item on the
LESS, PSS-14 score alone does not significantly predict the variable of actual
withdrawal for either males or females. This suggests that high perceived stress
is indicative of current intention to withdraw but that additional factors determine
if that intention is realised within the next year.
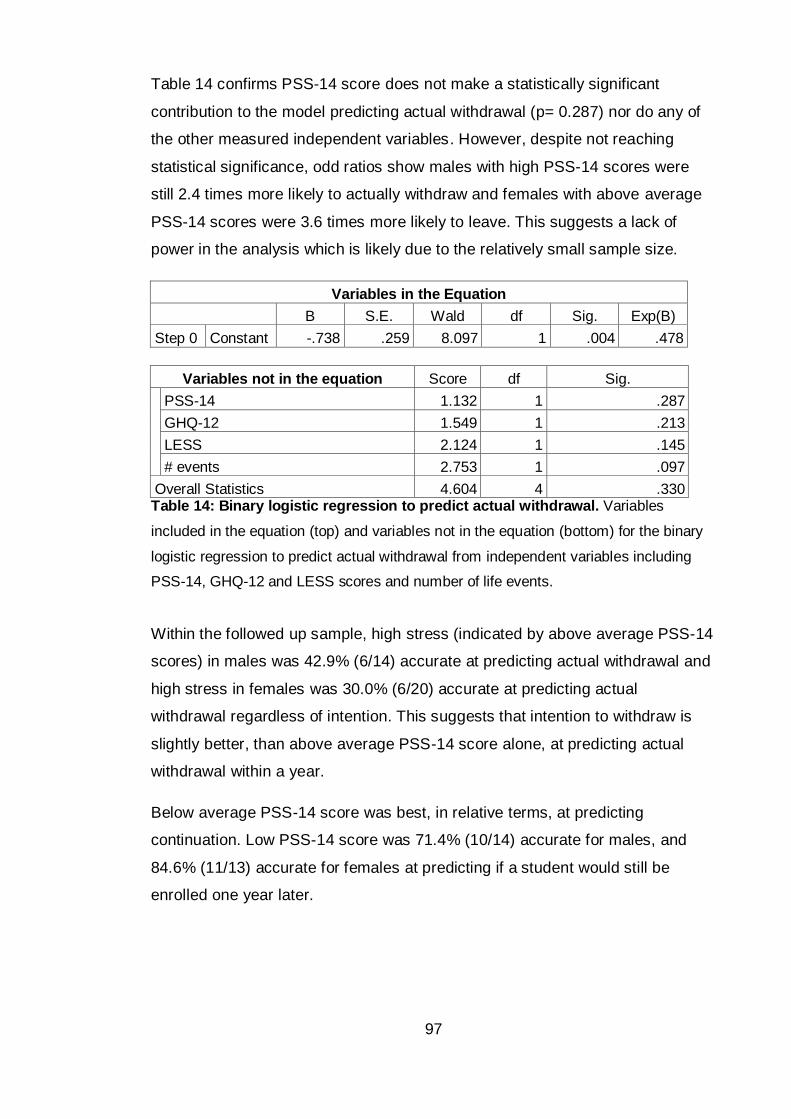
97
Table 14 confirms PSS-14 score does not make a statistically significant
contribution to the model predicting actual withdrawal (p= 0.287) nor do any of
the other measured independent variables. However, despite not reaching
statistical significance, odd ratios show males with high PSS-14 scores were
still 2.4 times more likely to actually withdraw and females with above average
PSS-14 scores were 3.6 times more likely to leave. This suggests a lack of
power in the analysis which is likely due to the relatively small sample size.
Variables in the Equation
B S.E. Wald df Sig. Exp(B)
Step 0 Constant -.738 .259 8.097 1 .004 .478
Variables not in the equation Score df Sig.
PSS-14 1.132 1 .287
GHQ-12 1.549 1 .213
LESS 2.124 1 .145
# events 2.753 1 .097
Overall Statistics 4.604 4 .330 Table 14: Binary logistic regression to predict actual withdrawal. Variables
included in the equation (top) and variables not in the equation (bottom) for the binary
logistic regression to predict actual withdrawal from independent variables including
PSS-14, GHQ-12 and LESS scores and number of life events.
Within the followed up sample, high stress (indicated by above average PSS-14
scores) in males was 42.9% (6/14) accurate at predicting actual withdrawal and
high stress in females was 30.0% (6/20) accurate at predicting actual
withdrawal regardless of intention. This suggests that intention to withdraw is
slightly better, than above average PSS-14 score alone, at predicting actual
withdrawal within a year.
Below average PSS-14 score was best, in relative terms, at predicting
continuation. Low PSS-14 score was 71.4% (10/14) accurate for males, and
84.6% (11/13) accurate for females at predicting if a student would still be
enrolled one year later.
98
5.4 Discussion
This study aimed to collect data on students’ perceived stress and wellbeing
which could be compared to the wider literature thus contributing to research
question one ‘what is the level of stress reported by non-Health BSc students
and how does that compare to available literature on other students and health
professional BSc students’. The study also aimed to explore the extent of the
consistency in self-reported stress, suggested in study one, by comparing
perceived stress and general health in non-health BSc students to students
from the business school – thus suggesting how widely findings from this thesis
may be applicable across the host university.
As with self-reported stress from the exploratory questionnaire in study one, a
gender difference in perceived stress was observed with females scoring higher
than males on the PSS-14. This is in keeping with other studies who have
implemented the PSS-14 in non-clinical samples for example Kelly et al. (2008).
In comparison to other studies implementing the PSS, students in this study
appear to have similar scores, with ENU males scoring slightly below other
published figures. Comparisons could only be made using mean values (SD) as
no medians were supplied by comparable studies (male 23.06 (7.52), female
24.86 (8.10), Lavoie and Douglas, 2012; male 23.18 (7.31), female 23.57 (7.55)
Cohen et al., 1983). A 2009 study assessing healthcare students within two
English universities reported PSS scores that were no different to those found
within our study (p= 0.372; Birks et al., 2009). The fact that no significant
difference was observed between scores from this and other studies suggests
the potential for conclusions regarding perceived stress to be applicable to
university cohorts outwith ENU. It also suggests that it is not only students
studying on health professional degree programmes who are experiencing high
levels of stress.
High levels of psychological morbidity were also measured within the student
population. Bromley et al. (2005) discuss findings from the Scotland 2003
Health Report, where females scored higher than males on the GHQ-12 and
that both males and females in Scotland have higher caseness (potential
number of positive diagnosis for psychological illness) than in England (13%
and 11% for males and 17% and 15% for females; GHQ threshold used was
99
>3). Using this threshold study two found potential caseness to be much higher
(18% males and 39% females scoring above three), suggesting that ENU
students are at increased risk of psychological morbidity compared to the
general community. The 2003 Health Report included an age range of 16 to 64
years, wider than that of the student population sampled in this study, and the
Report’s analysis also showed that the odds of having a high GHQ-12 score
increased with age. The 2003 Health Report does not provide raw data or a
breakdown of the scores by age and occupation, but given the markedly
younger age range sampled here, the fact that GHQ-12 score are considerably
higher is a potentially new and worrying finding for Scotland. It is suggested that
the high score in this age range may be linked to being in HE, however, without
a break down of the 2003 data by age and occupation this statement remains
tentative.
No significant difference was observed between SLSSS and ENBS which
suggests that stress is fairly consistent across at least these two schools within
the University. This would imply that findings from this study may be
generalised across the University. As mentioned above, a wider ranging study
could sample a larger number of students from a wider variety of non-health
and health-professional degrees offered by the University to better understand
the extent of any consistency.
Actual withdrawal in SLSSS was higher than would have been expected from
previously published University figures. A total dropout rate of 36.6% for males
and 28.9% for females was found at the T2 follow up (n= 68). Due to these
figures being biased by including a high proportion of students who had
reported an intention to withdraw it is more meaningful to compare published
figures to actual dropout recorded for those who had not reported an intention to
leave. Even taking this into consideration, an average attrition rate of 25.9% in
the student group who had not reported intentions to leave at T1 is still
considerably higher that the University’s most recent Higher Education Statistics
Agency (HESA) published withdrawal rate of 9.2%. It is also double the
withdrawal percentage reported for SLSSS in the year of data collection (13.3%
attrition reported by SLSSS, data received through Freedom of Information
(FOI)). The discrepancy could be due to the sampling of students or could be
100
due to the way in which students are recorded as withdrawn. Students who
leave at the end of year two or three can be recorded as ‘left with a qualification’
rather than ‘withdrawn’ which would therefore reduce published dropout figures
(personal communication with ENU, Systems and Student Records 25/10/12).
This potentially overlooks some students who, perhaps with additional support,
could have stayed in HE to complete the full degree on which they enrolled.
These findings also highlight the issues and potential bias with the current
system of recording withdrawal from HEIs.
A gender difference was also observed when comparing students’ intention to
leave with actual withdrawal. Although equal numbers of males and females
actually withdrew from HE, females were slightly more accurate at predicting
their likelihood of continuation. This could be due to the follow up sampling
methodology (only 45% of the original sample was followed up); however, there
is also the possibility that the data could indicate a female’s decision to
withdraw is more calculated and a male’s more spontaneous. Unfortunately it
will not be possible to explore this finding further as the data available to the
project from the university does not provide details of when withdrawal occurred
within the year between T1 and T2.
High PSS-14 scores better predicted current intention to withdraw than actual
withdrawal suggesting additional factors determine if that intention is realised.
Following the transactional model of stress it is suggested that further
investigation of student coping strategies could improve the correlation between
stress and actual withdrawal, increasing the predictive power of the model that
sought to identify students at risk of dropout. This will be tested further in the
subsequent studies with the aim of identifying if the addition of coping strategies
improves the predictive power of a withdrawal risk model containing PSS-14
scores.
The PSS-14 seems to be an appropriate tool to allow identification of students
with high levels of stress and who may therefore be currently considering
withdrawal. Given the similarities between the PSS-14 and the single self-
reported stress frequency question it could have been suggested that using just
the one question with an increased response scale may have increased the
correlation between stress frequency, the PSS-14 scores and withdrawal. When
101
this was tested however, lengthening the response scale for the self-reported
stress frequency question did not significantly increase the correlation between
the single item and PSS-14 or between the single item and intention to
withdraw. The PSS would therefore appear to be the better instrument, than the
single measure of self-reported stress, for predicting intention to withdraw. The
results also demonstrate that low perceived stress, as measured on the PSS-
14, was as accurate, if not more accurate, at predicting continuation, than was
high stress at predicting withdrawal.
5.4.1 Limitations
A limitation of this study was that, due to the time it takes to follow up a
student’s current enrolment status, only a percentage of the T1 sample was
traced one year later at T2. Although participants were selected from both the
upper and lower quartiles of PSS-14 score it is possible that the follow up
sample was not representative of the original sample and therefore future
studies within this project should endeavour to include all participants at follow
up.
Using standard thresholds, sensitivity and specificity values to estimate
potential caseness from GHQ-12 scores is not as accurate as holding clinical
assessment interviews to determine a cohort specific threshold. This was not a
viable option however as the research team were not qualified to diagnose
students and ethically it would have perhaps been unwise to allow students to
undergo clinical assessment and to officially label them as a ‘case’ for fear of
damaging self-image or self-esteem. In an attempt to prevent over estimation of
the number of potential cases reported by this study, conservative figures from
the literature were used.
102
Chapter summary
Data from this study demonstrate that stress as measured by the PSS-14
is consistent across the samples from ENU and other available UK studies
including research which sampled health professional students. This
suggests that outputs from this project could be applied to other
educational institutes and that health professional students should not be
the only student group for whom an HEI is concerned about their levels of
stress. Results also describe psychological morbidity at considerably
higher levels in our students than in the general population (on average
our students scored 50% higher than the Scottish, general population
sampled in 2003). This worrying finding demonstrates the necessity for
development of interventions for students, to address stress and wellbeing
as well as retention.
Actual withdrawal within the SLSSS sampled cohort was double that
reported by the University and this could be due to the way in which
students are recorded as withdrawn. This highlights the potential issues
with using university reported figures of retention as a means of
understanding student withdrawal.
Given that measures of perceived stress better predicted intention to
withdraw than actual withdrawal, it is thought that by better understanding
the coping strategies used by students that a more robust model for
predicting actual student withdrawal could be developed. This will be
tested further in the subsequent studies with the aim of identifying if the
addition of coping strategies improves the predictive power of a withdrawal
risk model containing PSS-14 scores.
103
Chapter Six: Study three – focus groups to understand students’ use of support services
Chapter overview
Study three aimed to gain further insights into how students utilise the
support services available to them during times of stress or when
considering withdrawal, and thus relates to research question two. This
study consisted of two focus groups to expand on results gathered during
study one regarding students’ knowledge and use of support services.
Three interconnecting themes emerged from the focus group data: ‘low
awareness’, ‘stigma’ and ‘low support use’. It appears that low awareness
and knowledge of the support services and stress itself could be leading to
stigma surrounding seeking support and therefore may affect a student’s
decision to access help or may delay them seeking help. Given the fact
that early intervention is likely to be more successful, delaying support
seeking will thus limit the effectiveness of such help. These obstacles
could affect student retention as services that may prevent a student from
dropping out are not being accessed at an appropriate time if at all.
Expanding on quantitative data from study one, study three found some
students to be over reliant on PDTs; this was in part due to the lack of
awareness of the alternative non-academic support available.
Unfortunately despite the over reliance, focus group conversations
indicated variable PDT quality across the Faculty.
An additional data collection was integrated into the project design as a
result of study three’s results regarding the variable PDT quality to explore
the level of training and support available for PDTs. Four PDTs agreed to
be interviewed and in general staff felt that more training would be
beneficial however they worried about the additional demands such
training would have on their busy schedules. This sub-study is included at
the end of Chapter six reflecting the content of study three rather than the
time frame in which the data were collected.
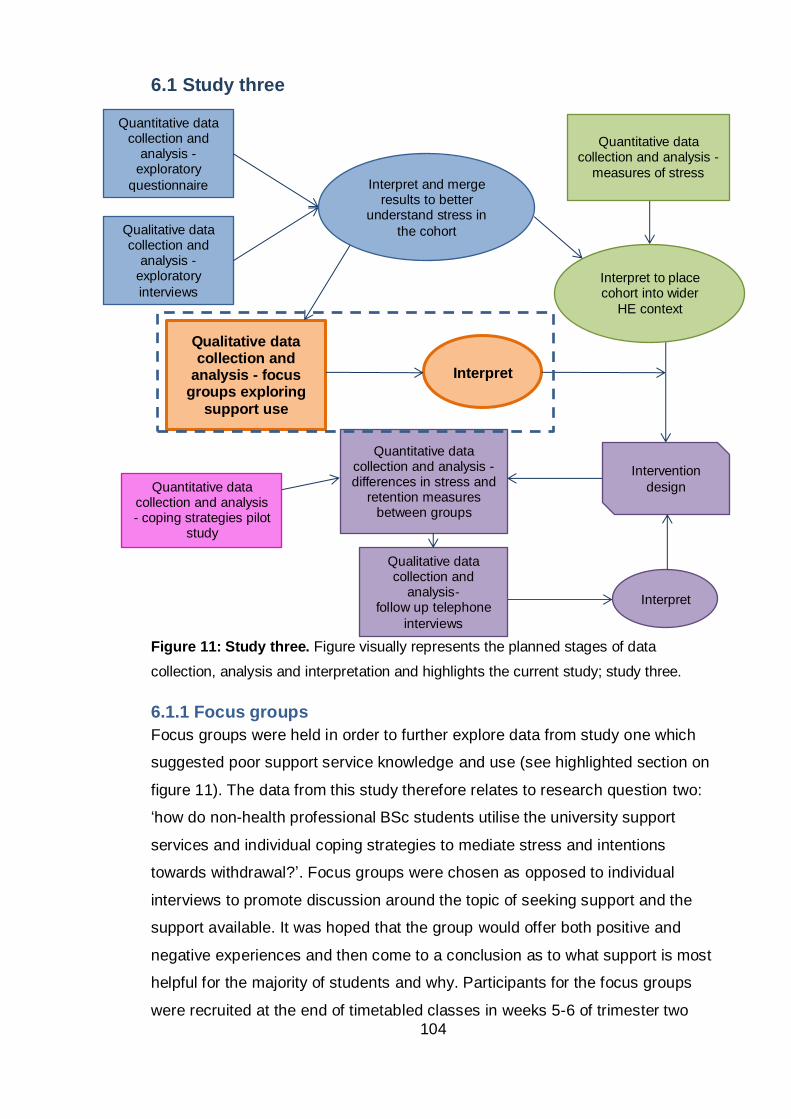
104
6.1 Study three
Figure 11: Study three. Figure visually represents the planned stages of data
collection, analysis and interpretation and highlights the current study; study three.
6.1.1 Focus groups
Focus groups were held in order to further explore data from study one which
suggested poor support service knowledge and use (see highlighted section on
figure 11). The data from this study therefore relates to research question two:
‘how do non-health professional BSc students utilise the university support
services and individual coping strategies to mediate stress and intentions
towards withdrawal?’. Focus groups were chosen as opposed to individual
interviews to promote discussion around the topic of seeking support and the
support available. It was hoped that the group would offer both positive and
negative experiences and then come to a conclusion as to what support is most
helpful for the majority of students and why. Participants for the focus groups
were recruited at the end of timetabled classes in weeks 5-6 of trimester two
Qualitative data collection and
analysis - focus groups exploring
support use
Interpret
Quantitative data collection and
analysis -exploratory
questionnaire
Qualitative data collection and
analysis -exploratory
interviews
Interpret and merge results to better
understand stress in
the cohort
Quantitative data collection and analysis -
measures of stress
Interpret to place cohort into wider
HE context
Intervention
design
Quantitative data collection and analysis - differences in stress and
retention measures between groups
Qualitative data collection and
analysis- follow up telephone
interviews
Interpret
Quantitative data collection and analysis - coping strategies pilot
study
105
2011/2012. Ethical approval was gained from the relevant Faculty committee
and participants gave their informed consent to participate and for
conversations to be recorded and then transcribed removing any identifiable
information.
6.2 Methods
Discussions were prompted to explore the current support available to students,
specifically the reasons for the observed poor awareness and knowledge of
support services. Students were first asked to introduce themselves to the
group and to share, if they wished, how stressful they find being a student and
what services they have used in the past (not the reason for seeking support).
Following introductions, the group was asked an open question ‘what do you
think about the support offered by the University?’ Where participants were not
already aware of the services available, the University support flyer was used
as a prompt (appendix three). Students’ discussions were left to develop from
here with prompts to encourage all participants to provide a view on each
service or their level of agreement with others opinions on the service. Prompts
were also devised to help draw out areas of particular interest for the
development of a stress intervention including what encouraged participants to
use the most commonly used support (Personal Development Tutors; PDTs)
and what barriers existed to accessing support through the less popular
services (e.g. counselling).
Prompts were pre-planned and included: ‘Has anyone used one of these
services? What was your experience?’; ‘Has anyone else had the same or a
different experience of [the service in question]?’; ‘Why did you choose to seek
support from [the service in question]?’; ‘What did you like / what could have
been better with the support provided/offered?’; ‘Who would you speak to about
stress and why?’; ‘Do you think students look for help when they need it, and
why?’.
6.2.1 Analysis
As with the interview transcripts; a pragmatic, grounded theory-lite method was
used to interpret the data collected during focus group discussions. Full
description of analysis can be found in section 4.2.2.1.
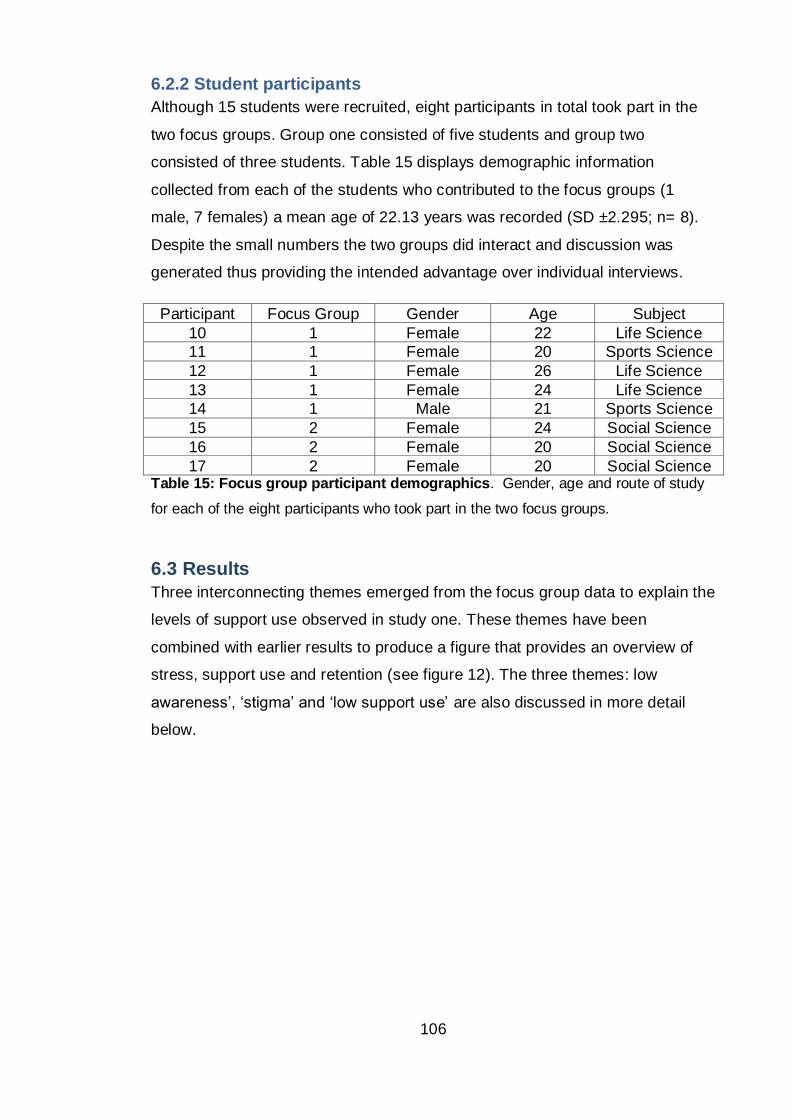
106
6.2.2 Student participants
Although 15 students were recruited, eight participants in total took part in the
two focus groups. Group one consisted of five students and group two
consisted of three students. Table 15 displays demographic information
collected from each of the students who contributed to the focus groups (1
male, 7 females) a mean age of 22.13 years was recorded (SD ±2.295; n= 8).
Despite the small numbers the two groups did interact and discussion was
generated thus providing the intended advantage over individual interviews.
Participant Focus Group Gender Age Subject
10 1 Female 22 Life Science
11 1 Female 20 Sports Science
12 1 Female 26 Life Science
13 1 Female 24 Life Science
14 1 Male 21 Sports Science
15 2 Female 24 Social Science
16 2 Female 20 Social Science
17 2 Female 20 Social Science Table 15: Focus group participant demographics. Gender, age and route of study
for each of the eight participants who took part in the two focus groups.
6.3 Results
Three interconnecting themes emerged from the focus group data to explain the
levels of support use observed in study one. These themes have been
combined with earlier results to produce a figure that provides an overview of
stress, support use and retention (see figure 12). The three themes: low
awareness’, ‘stigma’ and ‘low support use’ are also discussed in more detail
below.
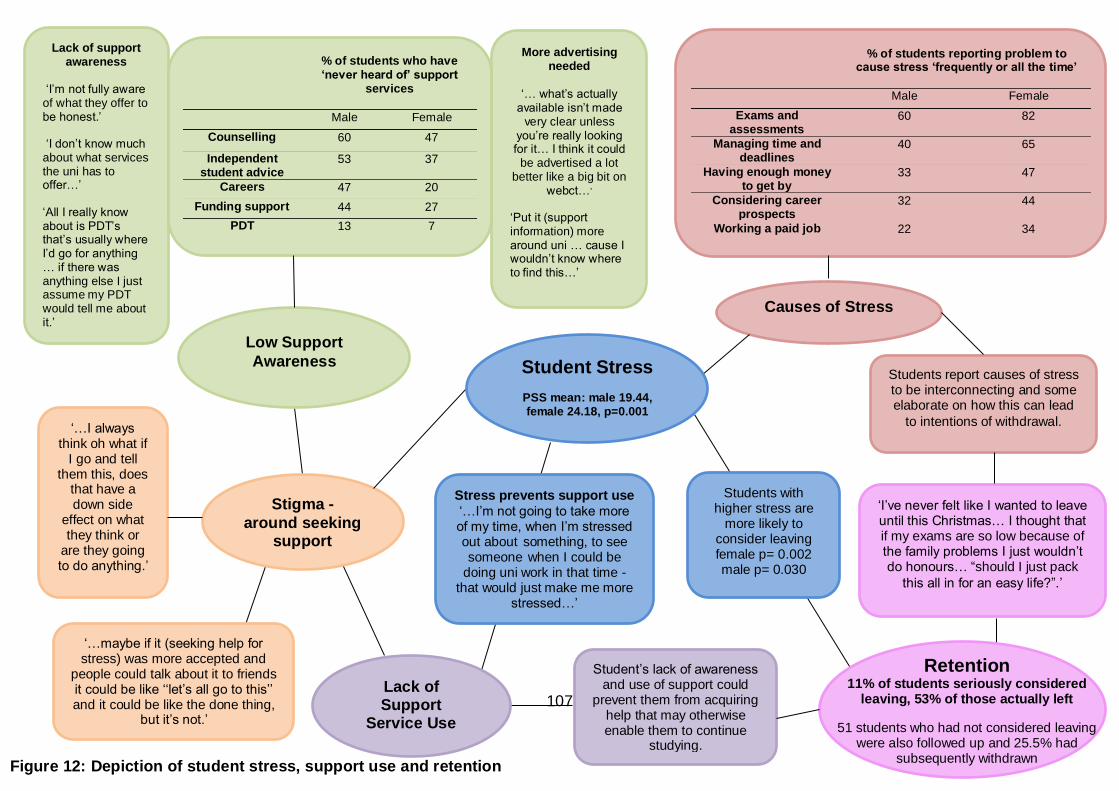
107
Figure 12: Depiction of student stress, support use and retention
Causes of Stress
‘I’ve never felt like I wanted to leave until this Christmas… I thought that if my exams are so low because of the family problems I just wouldn’t do honours… “should I just pack
this all in for an easy life?”.’
Low Support
Awareness
Lack of support awareness
‘I’m not fully aware of what they offer to be honest.’
‘I don’t know much about what services the uni has to offer…’
‘All I really know about is PDT’s that’s usually where I’d go for anything … if there was anything else I just assume my PDT would tell me about it.’
More advertising needed
‘… what’s actually
available isn’t made very clear unless
you’re really looking for it… I think it could
be advertised a lot better like a big bit on
webct…’
‘Put it (support information) more around uni … cause I wouldn’t know where to find this…’
Stigma -
around seeking support
‘…maybe if it (seeking help for stress) was more accepted and
people could talk about it to friends it could be like ‘‘let’s all go to this’’ and it could be like the done thing,
but it’s not.’
‘…I always think oh what if
I go and tell them this, does
that have a down side
effect on what they think or
are they going to do anything.’
Student’s lack of awareness and use of support could
prevent them from acquiring help that may otherwise enable them to continue
studying.
Students with higher stress are
more likely to consider leaving female p= 0.002 male p= 0.030
Students report causes of stress to be interconnecting and some elaborate on how this can lead
to intentions of withdrawal.
% of students reporting problem to cause stress ‘frequently or all the time’
Male Female
Exams and assessments
60 82
Managing time and deadlines
40 65
Having enough money to get by
33 47
Considering career prospects
32 44
Working a paid job 22 34
% of students who have ‘never heard of’ support
services
Male Female
Counselling 60 47
Independent student advice
53 37
Careers 47 20
Funding support 44 27
PDT 13 7
Stress prevents support use
‘…I’m not going to take more of my time, when I’m stressed out about something, to see someone when I could be
doing uni work in that time - that would just make me more
stressed…’
Lack of Support
Service Use
Student Stress
PSS mean: male 19.44, female 24.18, p=0.001
Retention 11% of students seriously considered
leaving, 53% of those actually left
51 students who had not considered leaving were also followed up and 25.5% had
subsequently withdrawn
108
6.3.1 Low support awareness
The first main theme that emerged confirmed quantitative results and was an
extension of the qualitative results from study one; students are unaware of the
University’s wider efforts to provide support services for both their personal and
academic wellbeing. This theme was termed ‘low support awareness’.
P15: ‘I don’t know really what we have’
P12: ‘There’s not a lot that I know about, it’s.. I guess I know about the
counselling that’s offered at Merchiston… but other than that, I just, yeah
that and Personal Development Tutors (PDTs) is all.
P10: ‘All I really know about is PDTs that’s usually where I’d go for
anything … if there was anything else I just assume my PDT would tell
me about it.’
P13: ‘I just know about the PDTs as well, like everyone else’
Some students suggested that the lack of awareness could be due to poor
advertising by the university:
P16: ‘… what’s actually available isn’t made very clear unless you’re
really looking for it… I think it could be advertised a lot better, like a big
bit on Webct…’
P15: ‘Put [support information] more around uni … cause I wouldn’t know
where to find this [university support flyer]…’
P12: ‘Unless you really look for them you don’t find them.’
P17: ‘I know people that have used counselling but not heard about it
other than that.’
Upon investigation the research team also found it difficult to identify
appropriate information on the institutions web pages about the services
offered.
As is demonstrated by the quote from P10 above, the low levels of support
awareness culminated with students accessing PDTs (the most well-known
service) for any problem that arose despite the fact that specialised services
existed for the majority of issues. The quotes below represent some of the
issues students involved in the focus groups have raised with their PDT which
are outside the typical PDT remit.
109
P10: ‘I had a lot of problems with funding with SAAS, my tuition fees
didn’t get paid and I went to my PDT and got it sorted … I didn’t know
about the funding help or who to go to so I asked the PDT and she
helped to sort it out.’
P11: ‘…in group work my group didn’t help at all I had to do everything
but I went to my PDT and he got it all sorted and it made it much better.’
Students are demonstrating an over reliance on the PDT service in part due to
the low levels of knowledge regarding the alternative services. This resulting,
underlying sub-theme of ‘PDT over reliance’ was evident throughout all three
main themes and is given more attention at the end of this chapter.
6.3.2 Stigma
A second main theme that was prominent within the focus group data were one
of misperception leading to stigma surrounding the use of support. Students
reported believing that accessing support was an indication of more severe
problems and suggested people would perhaps be too ashamed to admit
accessing help and that they would worry about how staff and their peers would
view them on admission of struggling.
P17: ‘I think sometimes that people that go and use them (support
services) … sometimes it’s maybe embarrassing stuff and then they
don’t mention it anyway so you won’t find out about it as well’
P11: ‘…[university support] it’s for people where things are happening
like bigger problems.’ ‘…maybe if [seeking help] was more accepted and
people could talk about it to friends it could be like “let’s all go to this” and
it could be like the done thing, but it’s not.’
P14: ‘I always think oh what if I go and tell them this does that have a
down side effect on what they (staff member) think (of the individual
seeking help)’
A subtheme of stigma surrounded the terminology used to label the support
offered. It appears that the negative perception attached to the counselling
service in particular, could be due to the uncertainty of what the service does
and who it is aimed at.
P14: ‘I think the term counselling puts a lot of people off, if you say you’re
going to see a counsellor it can be misinterpreted for so many different
things… they may think oh he must have something really (negative
emphasis) wrong.’
110
P10: ‘…you might think “I’m not bad enough to need counselling” … like
if you see the word [counselling]… it’s not a big enough thing to go to
counselling (negative emphasis) for’
P15: ‘Like the name support [would be better] instead of counselling
cause it’s …’ (interrupted) P17: ‘less extreme’
To access online information on the available support services a student must
click on a link entitled ‘Disability and Inclusion’. Although most students were
unaware of the existence of this link and the information accessible through it,
when focus group two was consulted, students felt this could be a barrier to
accessing support information.
P14: ‘… if you’re going to say that you are going to see someone from
disability and inclusion… it’s a very touchy subject if you say you have
any sort of disability… not many people want to talk about it. And if you
do, well it’s very good, but if I had one I wouldn’t tell anyone I was asking
for help.’
6.3.3 Poor service use
The two themes ‘low support awareness’ and ‘stigma surrounding seeking
support’ feed into a third, resulting theme of ‘lack of support service use’.
Figure 12 also shows the potential for stress itself to act as a barrier to seeking
support and also for the stigma surrounding admitting stress and needing help
to prevent use of the support services.
Students commented that although they believe they can recognise stress they
ignore it in what appears to be an attempt to prevent secondary stress from
worrying about the original stressor. Presumably seeking support would
therefore acknowledge the problem and students are avoiding the use of this
type of coping strategy.
P10: ‘I think I can recognise when I’m struggling, and that is stressful, but
you tend to want to get on with it and to ignore the worrying and stuff and
get the work done then usually everything is ok.’
P11: ‘You know, but you don’t want to give into it or then you’ll just do
nothing and get nowhere as if you work through it you should be ok and if
you’re not that’s when you need to get someone.’
111
P12: ‘Sometimes things are just too stressful to concentrate on so it’s
easier to push it to the back and do what you can do. But that’s just
putting it off isn’t it? But sometimes that’s all you do.’
Some students also appear unaware of the levels of stress they are suffering or
the levels of stress that necessitate seeking support. This was mentioned earlier
by a student during the exploratory interviews of study one.
P14: ‘I have had instances in the past where I’ve not realised just how
much pressure I’ve been putting on myself by trying to work through
things on my own.’
P17 ‘…I might not think that’s what was wrong, I was sick in the past and
the doctor said it could be stress related but I had not thought of that.’
P16: ‘I do think that I can recognise the symptoms of stress but then
sometimes you’ll be getting stressed out and a friend says ‘you need to
calm down’ and when you think about it you realise how you’ve been
acting.’
The quotes below show that students are ignoring stress until it becomes
significant, which echoes the student voice extracted during exploratory
interviews in study one. This can again be seen as an extension of the earlier
‘low awareness’ theme where understandings of stress and when to seek
support is low and thus further fuelling the theme of ‘lack of support service
use’.
P11: ‘Me personally, I just bottle it up to the point where it’s just like
(explosion gestured).’
P12: ‘Struggle through till you know you can’t anymore [before asking for
help]…’
P13: ‘…then burst into tears and run to your PDT… I’ve done that a few
times.’
This closes the vicious circle where a lack of knowledge regarding stress, when
to seek help and what help is available, results in higher levels of stigma
associated with support seeking which only leads to poor support use and
further exacerbates individuals’ stress.
112
6.3.4 PDT over-reliance
P13’s quote above mentions their PDT which, as mentioned earlier, are the
most commonly used support service and appear to be over-relied upon. In
addition to poor awareness of alternative services students suggested other
reasons that may explain the use of PDTs over non-academic based support
services. These included academic staff being more familiar and the belief that
academic staff had a better understanding of what is required to succeed.
P10: ‘I think it’s better if you know the person so if it’s your PDT or
lecturer you know them so you’re not going to go up to a stranger...’
P11: ‘they (PDT) know what’s expected of you on your course, rather
than going to someone out-with your course.’
P14: ‘I think if they are a lecturer they can to an extent understand what
you’re going through … at least they know what you actually have to
do…’
Despite many students reporting a reliance on PDTs, even for problems when
another service may be more appropriate, some students also comment on the
variability of the PDT service.
P15: ‘I wouldn’t discuss anything with my PDT to be honest, cause I don’t
find her very welcoming. She doesn’t look like she even cares so I
wouldn’t approach her at all. I would never go back and speak to her
cause she just wasn’t helpful at all. But I guess cause she has other
things to do so if there was someone who knew about the course but had
more time and was easier to speak to then yeah I maybe would… but it
does depend on who your PDT is some people have amazing ones.’
Given this over reliance and the student views that PDT quality varies across
the Faculty, the following question was raised ‘are PDTs trained sufficiently to
provide such a pivotal pastoral role?’. To explore this further, an additional data
collection was added to the project and PDTs were asked to attend an interview
to discuss their opinions on the PDT role and the training they undertook (see
figure 13).
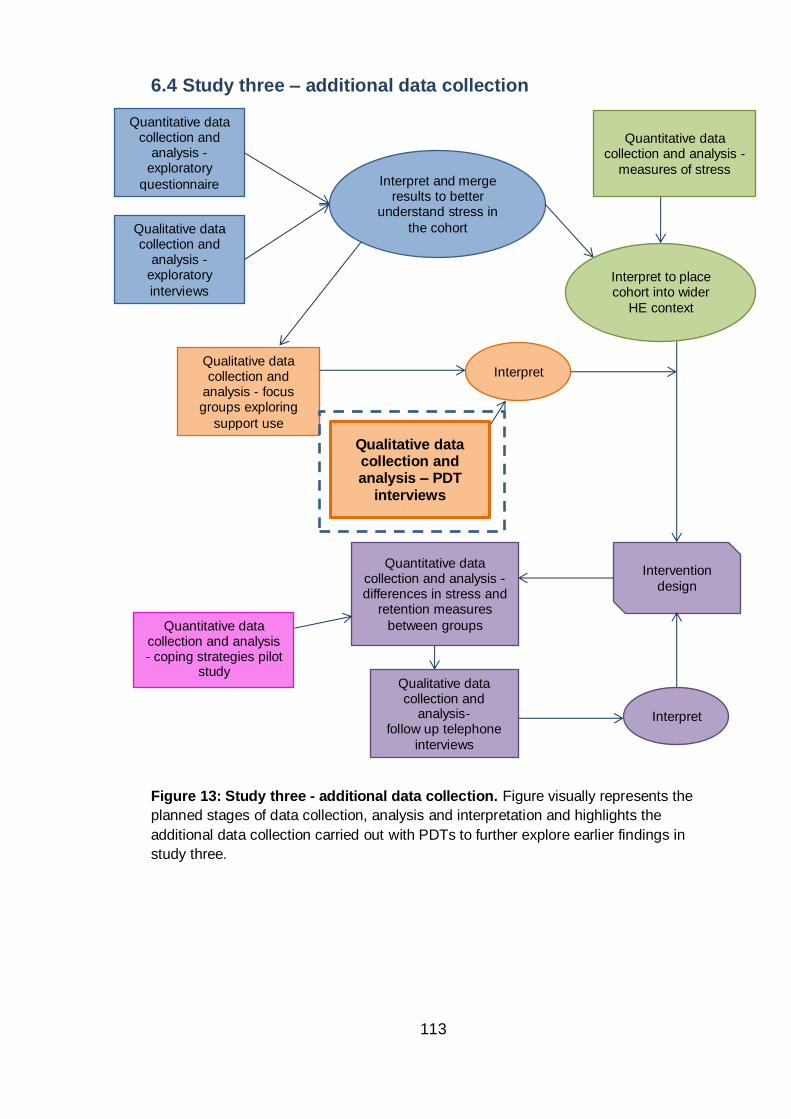
113
6.4 Study three – additional data collection
Figure 13: Study three - additional data collection. Figure visually represents the
planned stages of data collection, analysis and interpretation and highlights the
additional data collection carried out with PDTs to further explore earlier findings in
study three.
Qualitative data collection and analysis – PDT
interviews
Quantitative data collection and
analysis -exploratory
questionnaire
Qualitative data collection and
analysis -exploratory
interviews
Interpret and merge results to better
understand stress in
the cohort
Qualitative data collection and
analysis - focus groups exploring
support use
Quantitative data collection and analysis -
measures of stress
Interpret to place cohort into wider
HE context
Interpret
Intervention
design
Quantitative data collection and analysis - differences in stress and
retention measures
between groups
Qualitative data collection and
analysis- follow up telephone
interviews
Interpret
Quantitative data collection and analysis - coping strategies pilot
study
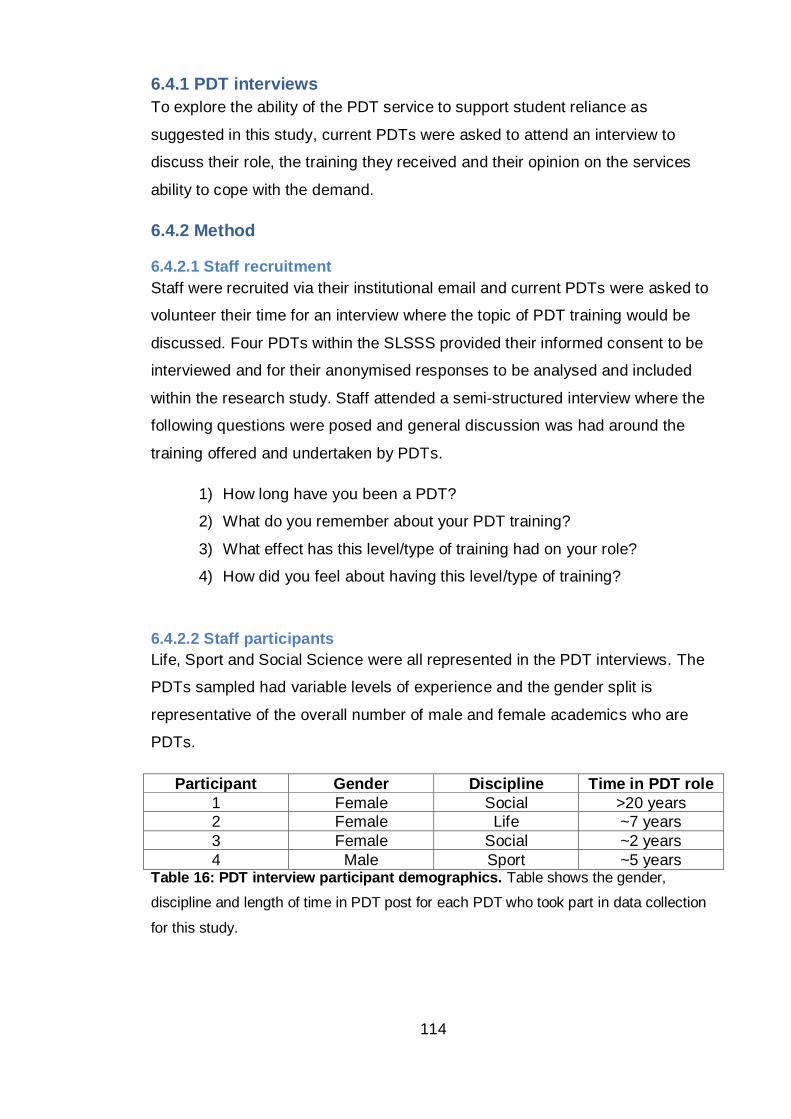
114
6.4.1 PDT interviews
To explore the ability of the PDT service to support student reliance as
suggested in this study, current PDTs were asked to attend an interview to
discuss their role, the training they received and their opinion on the services
ability to cope with the demand.
6.4.2 Method
6.4.2.1 Staff recruitment
Staff were recruited via their institutional email and current PDTs were asked to
volunteer their time for an interview where the topic of PDT training would be
discussed. Four PDTs within the SLSSS provided their informed consent to be
interviewed and for their anonymised responses to be analysed and included
within the research study. Staff attended a semi-structured interview where the
following questions were posed and general discussion was had around the
training offered and undertaken by PDTs.
1) How long have you been a PDT?
2) What do you remember about your PDT training?
3) What effect has this level/type of training had on your role?
4) How did you feel about having this level/type of training?
6.4.2.2 Staff participants
Life, Sport and Social Science were all represented in the PDT interviews. The
PDTs sampled had variable levels of experience and the gender split is
representative of the overall number of male and female academics who are
PDTs.
Participant Gender Discipline Time in PDT role
1 Female Social >20 years
2 Female Life ~7 years
3 Female Social ~2 years
4 Male Sport ~5 years Table 16: PDT interview participant demographics. Table shows the gender,
discipline and length of time in PDT post for each PDT who took part in data collection
for this study.
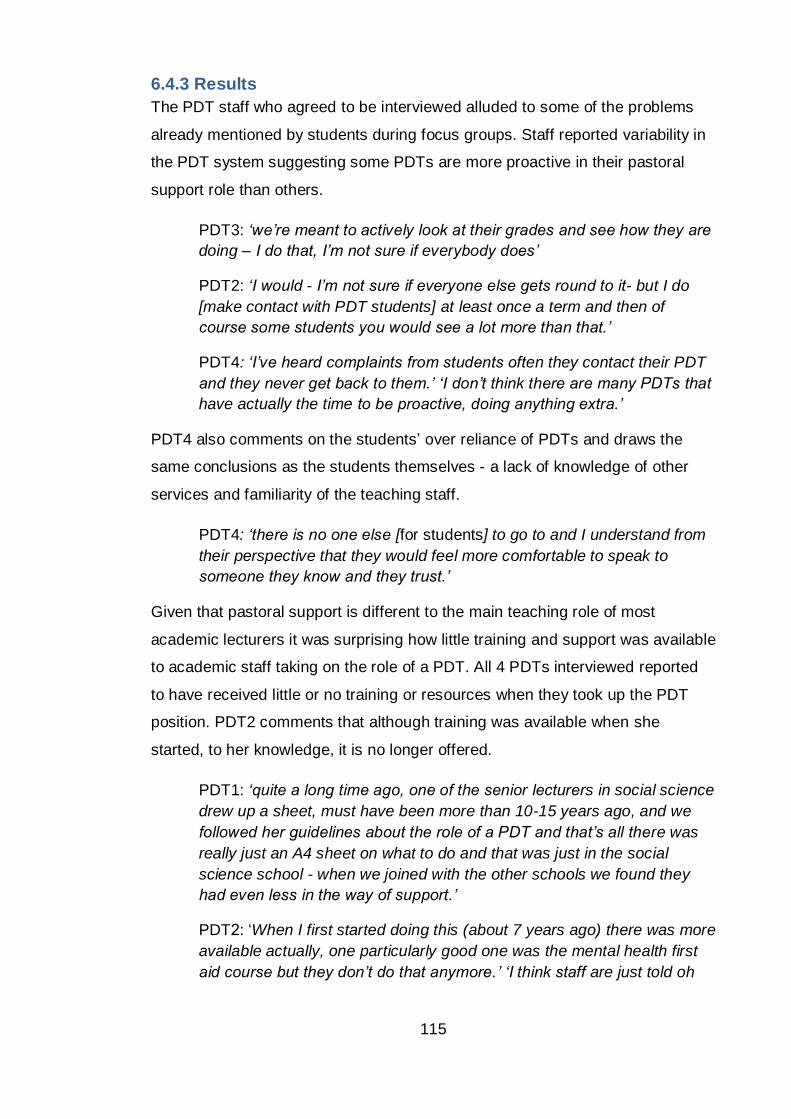
115
6.4.3 Results
The PDT staff who agreed to be interviewed alluded to some of the problems
already mentioned by students during focus groups. Staff reported variability in
the PDT system suggesting some PDTs are more proactive in their pastoral
support role than others.
PDT3: ‘we’re meant to actively look at their grades and see how they are
doing – I do that, I’m not sure if everybody does’
PDT2: ‘I would - I’m not sure if everyone else gets round to it- but I do
[make contact with PDT students] at least once a term and then of
course some students you would see a lot more than that.’
PDT4: ‘I’ve heard complaints from students often they contact their PDT
and they never get back to them.’ ‘I don’t think there are many PDTs that
have actually the time to be proactive, doing anything extra.’
PDT4 also comments on the students’ over reliance of PDTs and draws the
same conclusions as the students themselves - a lack of knowledge of other
services and familiarity of the teaching staff.
PDT4: ‘there is no one else [for students] to go to and I understand from
their perspective that they would feel more comfortable to speak to
someone they know and they trust.’
Given that pastoral support is different to the main teaching role of most
academic lecturers it was surprising how little training and support was available
to academic staff taking on the role of a PDT. All 4 PDTs interviewed reported
to have received little or no training or resources when they took up the PDT
position. PDT2 comments that although training was available when she
started, to her knowledge, it is no longer offered.
PDT1: ‘quite a long time ago, one of the senior lecturers in social science
drew up a sheet, must have been more than 10-15 years ago, and we
followed her guidelines about the role of a PDT and that’s all there was
really just an A4 sheet on what to do and that was just in the social
science school - when we joined with the other schools we found they
had even less in the way of support.’
PDT2: ‘When I first started doing this (about 7 years ago) there was more
available actually, one particularly good one was the mental health first
aid course but they don’t do that anymore.’ ‘I think staff are just told oh
116
well you’re not a counsellor so direct them somewhere else but actually it
doesn’t really work like that...’
PDT4: ‘I don’t think I had formal sort of training, I was given a sheet and
information of what the PT role is, it was a page long and there might
have been a seminar but I can’t recall anything, if there was I went to it
but I can’t recall anything so I would be lying to you if I said anything
specific.’ ‘There were some resources, we were given some documents
in terms of here is how you can provide advice to students as to where to
get, for example, maths and stats help or English language help or some
other courses but yeah it was a bit vague to start with not really a
specified role at the start.’ ‘…back then there was a range of different
practices across school and faculties so I don’t think there were really set
expectations with respect to what one PDT did for one group of students
compared to what another PDT did for another group of students…’
PDT4 recalls ‘back then’ suggesting that practices may have improved however
PDT3, the most recent to join the PDT role, describes a similarly poor if not
worse introductory experience.
P3: ‘Nothing [no training]. When I started I got a red folder that my line
manager made me with a whole wack of stuff in it … it was actually very
little about PDT … I read everything I was given, I was told to read the
website, that was it.’ ‘when you start at Napier you’ve got an awful lot of
induction events to go to, I’ve never been to a PDT induction event
though…’ ‘I had the stuff that’s given to students - you know that wee
flow chart - it was just, it looked like student hand-outs to be honest, it
wasn’t anything specific for staff.’
PDT4 indicates that, although he was not trained, he is comfortable in dealing
with some of the more sensitive issues brought to him as a PDT. PDT4 goes on
to explain that some other staff are not comfortable with this aspect of the role,
however these staff are still ‘expected’ to carry out the duty without formal
training. PDT4 finishes by admitting that without training or guidance he cannot
be sure if his approach to dealing with student’s sensitive topics is correct.
P4: ‘So obviously these are quite sensitive, and I’m comfortable in
dealing with issues, but not everybody is and people are being asked
to… not being asked really they are being told normally… to do the role
of the PDT but they have no idea what is expected and when they have
to deal with tough situations they are not sure how to do them either and
they might not be comfortable for example or trained, because I’m
comfortable but strictly speaking I’m not trained like I’m not a
117
psychologist or a consultant of any sort so my approach might as well be
wrong for all I know.’
Participants were then asked about the effect they felt this level of training had
on the PDT service offered and all staff were in agreement that poor training
resulted in a weaker service.
PDT1: ‘There’s a whole range of things that PDTs ought to be doing that
I think we could be more prepared for, that we could be better at
recognising - now we’re not counsellors, we’re not mental health advisors
but – but recognising some of these problems and pointing people in the
right direction. That might just mean we have more help to recognise the
signs.’
PDT2: ‘I think for people who are new to the role you really have to start
by giving them all that information [including] where to sign post students
and what you can deal with as a PDT, but also access to the mental
health first aid or something similar… it is helpful to give you a sort of
rounding and an idea of what to say and what not to say really ’
PDT3: ‘I was given 20 or 40 [students] or something like that – like on
your first day and they are all told to come and see you on your first day
you’re like ‘hello I don’t know what you’re doing here or what I’m doing
here… welcome’ it seems quite unprofessional when they are asking you
questions and you’re ‘um, don’t know’. ‘Over time I’ve created, I’ve made
my own stuff based on chasing people and finding out what’s what.
Cause I like to know what I’m talking about when I talk to a student.’ ‘But
it would have been quite nice to be given a pack, but no I’ve kinda got my
own way of doing it, I think most staff do to be honest.’
The participants of this study appear to have proactively sought information to
support their proficiency in the PDT role. It is suggested that not all staff have
undertaken this self-driven personal, professional development, and this has
resulted in the staff and student comments which allude to the existence of
‘sub-par’ PDTs.
Overall, staff were keen to see the implementation of additional training given
the pivotal role of the PDT in the students learning journey. However, they did
express worry over the additional demand such training might place on their
already hectic schedules.
PDT1: ‘Because we’re the single point of contact throughout their whole
time here … it’s absolutely essential that PDTs get a lot more help with
118
being PDTs because I think although we’ve been using the system for a
long time there’s not really been an awful lot.’
PDT2: ‘The difficulty is going to be fitting all this in, and of course the
other thing is that not all PDTs will want to take those up I don’t know if
you’d have to make it compulsory… (Laughs suggesting that compulsory
training would not be well received but then stops abruptly)… I think
there might be something in that actually. I mean I do know that some of
my colleagues who hadn’t been PDTs before were quite worried about it.
I think having a bit of training like that would maybe help to reassure
them and make them more confident in taking on extra duties and I
suppose be better at the role in general.’
PDT2’s narrative elaborates on the variation in PDT ability suggesting that it is
perhaps a lack of training that has resulted in some staff providing PDT support
which is perhaps inferior to that expected or necessary.
PDT4 suggests that the PDT role is too substantial and important to be provided
effectively as an add-on to the lecturing role. He suggests that a fewer number
of PDTs with a significantly reduced teaching and research allocation, would
allow these individuals to focus on pastoral support while still maintaining the
academic relationship that students report to be important when seeking
support.
PDT4: ‘I don’t know if dedicated PDT’s wouldn’t be better. So instead of
having all staff members being PDT, having someone that is dedicated.
Academics that have a reduced teaching load and research load and that
it’s something that they want to do…’ ‘And if that person, having a large
responsibility and more substantial PDT workload, that they would meet
with students individually or in small groups and they would have time to
do that. Because the reality is that people don’t have time, they are
always struggling for time, academic staff I mean, and PDT will be very
down the list of their priorities, so the worst case scenario is that they
won’t get back to students or will postpone it for too long which creates
more stress on the student of course, best case scenario at the moment
really is that they will be good at responding to requests but they will
never be proactive.’
PDT3 provides a suggestion for an annually distributed resource pack that
could be provided to support PDTs in their role. This quote also demonstrates
her frustration with the way in which staff are expected to stay informed in
119
general not just regarding the PDT role and she apologies for being blunt in her
portrayal of the current situation.
PDT3: ‘Well for new staff coming in, and even for older staff as a kind of
reminder, some kind of pack that you can have at your desk. Rather than
some horrific thing on email or online that you’re meant to go in and
check cause we do that far too much for absolutely everything. Whereas
if somebody shows up at your office you don’t want to go ‘hang on I’ll
check my computer’ it’s nicer to have something in front of you because
these meeting rooms (without computers) tend to be the ones that we all
use, I certainly use these types of rooms, so it would just be a wee bit
handier and it would take the onus off the staff member from having to
hunt everything down, which is something we always have to do for
everything. Sorry I’m making a very bleak picture … but some kind of
updating process for information like this is necessary where each year
PDTs know what things have been changed and preferably not via email,
so this week I’ve so far received 260 emails that aren’t junk and I think
most of us are sitting round about that. And that’s the kind of
communication we all get, that’s why people completely, almost
completely ignore what online stuff is available cause the amount of stuff
you’re getting through is way too much.’
The frustration and workload reported by PDT3 was worrying, it appears that at
least this PDT is not being well supported to carry out her role and that demand
on her and other’s time, limits access of what little information is available
online.
Another concern was mentioned by PDT4 who comments that those doing extra
in order to provide a good PDT experience without proper training are not being
recognised for their efforts.
PDT4: ‘…we [staff] don’t seem to get congratulated or appreciated much
for doing that part of our job… most people are now PDTs whether they
want it or not. But some people would think that they can’t be bothered
perhaps because even if they do it they have nothing to gain from that
other than the personal satisfaction of helping students. So that for many
is adequate thinking it’s part of your job, that’s why you work at a
university, if you don’t want to help students then why be here? But then
for others we might see that there is nothing linked to that (putting
yourself out for the PDT role) it’s never going to help me for example to
move through the ranks of the university or get a promotion or to get a
tap on the back or something like that. Perhaps more appreciation from
the university or more accountability, that’s not the right term, but from
120
experience …we are 12 PDTs [in Sport Science]… now does it make any
difference when you look at the worst and the best PDT? … It makes a
difference to the student’s individual experience but does the university
treat them any differently? In terms of the staff members being the best
or the worst PDT would it change anything in terms of your job? Probably
not … So I’ve seen during my time people doing next to nothing and then
they are never going to be told you know “listen you need to improve in
that aspect”. And the other side of the coin, people doing really well and
again from colleagues or from the university they would probably never
get any recognition for doing that. Given that it is not perhaps valued as
much as, it might be valued when people are talking generally about
what is valued by the university but it substantially, when it’s put in
perspective with other values it doesn’t seem to be.’
The current level of training and support offered to PDTs appears to be
unsatisfactory from the staff perspective, as is the level of recognition they
receive for carrying out the PDT role. As a result the participants of this study
noted some reluctance among staff to engage fully with aspects of the PDT role
which has in turn led some students to report dissatisfaction with the service.
Despite this, quantitative and qualitative results from this study still show an
over reliance on PDTs.
6.5 Discussion
The aim of this study was to investigate and further understand how students
use the university support services available to them. Data suggests that in
some students’ minds there is a negative stereotype associated with seeking
support through some services. It appears that the stigma is, in part, a product
of the poor awareness of the support services and knowledge of stress. The
stigma that is apparent in this study may affect a student’s decision to access
help or may limit the effectiveness of such help, given the fact that early
intervention is likely to be more successful. These obstacles could have a
knock-on effect on student retention in that services that may prevent a student
from dropping out are not being accessed. Better engagement with support
services will only be possible when the low awareness and stigma are
addressed.
Perceived stigma surrounding seeking help was explored by Eisenberg et al.
(2009) in a large college student study and results found that personal stigma
121
(an individual’s stereotypes and prejudices) was a significant barrier to help
seeking. In keeping with the findings from this study, National Union of Students
(NUS) Scotland (2010, 2011) also found stigma to be the biggest barrier to
students seeking support followed by not understanding the problem and not
knowing where to go for help. The similarities between NUS results and those
from the current study reinforce the potential for these issues to be reflective of
both further education (FE) and higher education (HE), in Scotland and perhaps
elsewhere in the UK.
These barriers to seeking support could have an effect on students who are
experiencing stress due to both academic and personal issues where the
university or outside services such as a GP could help. It is important that
students are not discouraged from seeking support due to the potential effect
that leaving the problem unaddressed may have on both their experience of
university and also their successful progression within the course. By providing
students with knowledge of stress (with an emphasis on the prevalence and that
admitting stress is not a sign of weakness), when to seek support and the
support available, they may be less likely to succumb to the stigma and seek
support early before problems escalate.
Students also provided examples where support services could be improved for
example, to help students choose which service to use through increased
advertising and providing examples of the types of issues each service
specialises in. Most students deemed PDTs to be their first choice of support
and it is suggested that the other services also emulate the practice that makes
the PDT service appealing i.e. familiarity and a sense of closeness to the
programme of study. The former could be achieved through advertising and
introducing students to the support staff. If students are more familiar with the
staff running support services they would also see that most support staff are
educated to degree level and therefore have first-hand experience of the
problems faced by students.
Although PDTs were the most commonly used form of support, students did
report variability in the quality of the PDT service from one staff member to
another. On further investigation staff reported low levels of training for the role
and limited time allocation which may be having a negative impact on the
122
support that is provided by PDTs. An increase in standardisation and increased
quality of academic and pastoral support training was called for by both staff
and students in this study and therefore HE Institutes, who see similar use of
their PDT service, should consider the training they provide to staff. It is
possible that over time and with sufficient training and resources, PDTs could
use the current over-reliance to encourage students to: monitor their own
stress, become knowledgeable in the support available, feel confident and
comfortable with accessing support to better their academic performance and
wellbeing, and ultimately access appropriate support at a stage when
intervention will be most successful. Thus, over time, building student resilience
by increasing their own skills and reducing the over-reliance on one service.
Data from this project regarding the PDT service was disseminated to a working
group set up to review the role of a PDT. In response to this and other data
presented, the School has acknowledged that PDTs are in a privileged position
to monitor and advise students and has changed practice. Students now have
one PDT throughout their four years at University to provide more stability which
should strengthen these important support networks and prevent students from
receiving differential support across their student journey. The level of training
received by academics taking on a PDT role was also raised in the forum;
however it is yet to be seen if changes to policy have been made.
6.5.1 Limitations
As with most qualitative research a limiting factor is the number of participant
views the analysis reflects. The relatively similar opinions found between
students provide some evidence that the findings are representative of at least
a proportion of the overall cohort. Although students were self-selecting it did
not appear that those who volunteered where doing so to self-indulge, complain
or to seek support. This can be a problem where research is sometimes seen
as a vessel through which to voice negative opinions or problems. Most
participants gave balanced and apparently honest reviews of their use of
services which provides further validation of the study’s findings.
Staff involved in the PDT interviews were also self-selecting and participation in
interview was low. The latter was most likely due to the timing of interviews
being in trimester three, when many members of staff are on holiday, and
123
because the high workload of academic staff limits their time to participate.
Despite the low numbers, PDTs from across the School all shared very similar
opinions regarding the service and their training for the PDT role. This helps to
confirm the generalisability of the findings by suggesting that the views sampled
are likely representative of many PDTs within the institute.
124
Chapter summary
Results from this study regarding students’ poor knowledge of stress and
the support available were used to inform the intervention proposed by the
overall project. In particular it was identified that students would benefit
from an increased understanding of stress, the fact it is a normal response
to common challenges at university, and that seeking support, especially
through formal channels, is not a sign of weakness. Results also showed
students were not familiar with the non-academic staff members who
provide support and that this was a barrier to accessing support.
Results regarding the variability of the PDT system were disseminated to
appropriate University staff and in response to these findings and others’
work within the faculty, the PDT system has been amended. Students now
have one PDT who moves with them through their four years of study,
therefore allowing students to build better working relationships with a
single staff member. Multiple PDTs are available for each year group and
swapping to a different PDT at the start of the student’s journey is
facilitated to ensure all students are comfortable with accessing the PDT
service.
It is yet to be seen if additional training will be made available to staff
undertaking the PDT role or if more time can be allocated to PDT duties
within academic’s schedules. It is possible that an intervention developed
as part of this research, which would provide information on the support
available to students, could double as a PDT resource for the sign posting
aspect of the role.
125
Chapter Seven: Study four – investigation of students’ individual coping strategies
Chapter overview
Results from study two (use of psychometric tools to measure student
stress) suggested that perceived stress, measured by PSS-14, predicts
current intention to withdraw, however less accurately predicts actual
withdrawal within the next year. It was hypothesised that by investigating
coping strategies, in addition to perceived stress, a more accurate
prediction of actual withdrawal could be obtained. Carvers COPE scales
are common measures of coping strategies and the 28 item, Brief version
was chosen to assess coping within this project. Before results could be
inferred, factor analysis was carried out to provide a latent structure for the
questionnaire, therefore allowing more meaningful analysis of the
differences between students’ ways of coping.
The current study consisted of a pilot study with the Brief COPE followed
by exploratory factor analysis of the data to suggest an overall higher order
factor structure. Four factors were extracted and were labelled avoidance
and distraction coping, active coping (and preparation for active coping),
cognitive restructuring and support seeking. The results from this study
could then be used during the analysis of study five data to report on the
effect of coping on retention within the non-health BSc population.
An interesting finding emerged from the coping data which suggests
students who employ lower levels of maladaptive strategies have lower
self-reported stress than those who employ high levels of adaptive
strategies. This may have significant implications on how interventions to
improve coping should be tailored.
126
7.1 Coping background
Not everyone who experiences high levels of stress will report distress and,
following the transactional model of stress, this is the result of individual
assessment of the situation and application of coping strategies. To improve the
inferences made between perceived stress and withdrawal in previous studies
within this project, students’ coping strategies were therefore investigated.
Until relatively recently research has focused on the negative emotions and
behaviours caused by encountering a stressful situation. The discovery of co-
occurring positive and negative emotions during a stressful period and positive
emotions following successfully overcoming a stressful event has, however,
placed new emphasis on coping (Folkman, 1997, Folkman and Moskowitz,
2000, Fredrickson and Joiner, 2002).
The transactional model of stress and coping is a framework for evaluating the
processes of coping with stressful events and has been used in health
education, health promotion and disease prevention. Stress does not affect all
people equally, but given the potential for stress to lead to ill-health it is
important to identify coping methods which may predict duration or intensity of
stress or secondary outcomes. The assessment of coping could provide useful
information about appraisals that facilitate or hinder certain lifestyle practices
and such information would be useful for interventions which include coping
skills training.
The theoretical underpinning of this model relies on cognitive-appraisal-initiated
coping following positive identification of a situation as stressful. That is, a
situation which is perceived as potentially harmful to the individual, those close
to them or goals relevant to them. In this view, coping is therefore contextual
and individual. Lazarus and Folkman (1984) take a cognitive approach by
describing coping as the thoughts and behaviours used to manage the internal
and external demands of situations that are appraised as stressful. As
explained earlier, appraisal occurs firstly to determine if the situation is relevant
to the individual and if so to what potential outcome. Secondary appraisal of the
individual’s ability to overcome the situation then occurs. The type of coping
strategy employed by the individual is thought to depend on the interplay
between these appraisals i.e. whether it is seen as a threat or a challenge.
127
Coping is a dynamic process and individuals can employ multiple strategies to
cope with the stress they face. Those who tend to be described as ‘good
copers’ will comfortably apply a range of strategies and will be flexible in their
application of coping, changing their strategy based on its effectiveness
(Parrott, 2001).
Coping strategies (thoughts and behaviours) are commonly grouped in order to
provide theoretical distinction between different types of coping, however, the
nomenclature varies between studies. Lazarus and Folkman (1984) proposed
two major groups: problem-focused coping, such as time management, which
involves manipulating the problem causing distress and emotion-focused
coping, such as venting or distraction, which aims to alleviate the negative
emotions associated with the stressful situation. It is thought that emotion-
focused coping is utilised, over problem-focused coping, when perceived control
over the stressful situation is low and that problem-focused coping is more
strongly associated with positive mood in comparison to emotion-focused types
of coping (Park et al., 2004).
Folkman along with Park (1997) has since suggested additional categories to
classify types of coping and extend the coping model presented in 1984 by
herself and Lazarus. Meaning focused coping, such as positive comparison, is
where the individual uses cognitive strategies to manage the meaning of a
situation, and social coping, such as confiding in others, describes attempts to
resolve issues through social interactions. Similar to problem-focused,
emotional-focused, meaning-focused and social coping; active coping,
avoidance, cognitive restructuring and social support seeking was proposed by
Zautra et al. (1996) to categorise coping dispositions.
Despite the differences in terminology it is largely accepted that categories
based on these four broad concepts provide an adequate fit to many coping
strategy data sets. Regardless of the description used for this primary
classification, coping strategies can also be further categorised into adaptive
and maladaptive. This secondary classification is not fixed with the coping
strategy as the adaptive qualities of a particular strategy are specific to the
context in which they are to be used. That is to say that the same strategy could
be adaptive for one stressful situation but maladaptive for another. Alternatively,
128
a strategy that was effective at the start of a stressful situation may not be
adaptive in the long term and a change in coping strategy may be required
during the course of the event. For example in the situation where someone is
being bullied at school, it may be advantageous to avoid or ignore the problem
the first time it happens in the hope the bullies become disinterested, however if
the problem persists, active coping and help should be sought in the form of
social support to provide emotional and instrumental guidance. In this way, an
individual with many coping strategies is likely to be able to cope more
effectively with a given situation than someone who favours only one form of
coping.
This study will aim to investigate if the addition of coping strategy information
improves the predictive power of a withdrawal risk model containing PSS-14
scores. Coping data, in this part of the thesis, will be utilised to attempt to
improve the model for identifying students at risk of withdrawal. Assessing
coping will not only allow identification of those who are perhaps coping poorly
but, given the potential for adaption to stress and therefore reduced individual
adversity, it is beneficial to understand if particular coping strategies are also
affiliated with low stress. Understanding how students with low stress cope
could help in the development of an intervention aimed at reducing student
stress by encouraging coping strategy modification. The latter point would relate
to research question three which is interested in designing an intervention to
improve student wellbeing and continuation.
7.1.1 Assessing coping
Coping can be assessed through many self-reported scales developed either
theoretically or empirically and scales are usually scored to report on categories
of coping. Thus, as explained above, scale outcomes will rely on the author’s
distinction between types of coping. For example the Ways of Coping Checklist
(WCCL; Folkman and Lazarus, 1980) asks respondents to record whether they
have carried out a behaviour or thought, which is related to a particular method
of coping, to deal with a given situation based on a yes or no scale. The WCCL
items fall into the two broad coping categories mentioned above: problem and
emotional focused coping. It was suggested however that this distinction was
too simple to be meaningful and that attempts to measure coping more
129
specifically should be made. The Ways of Coping Questionnaire (WCQ;
Folkman and Lazarus, 1988) was subsequently developed from the WCCL into
a scale with 50 items that load on 8 empirically derived factors: Confrontive
coping (6 items e.g. I expressed anger to the person who caused the problem);
Distancing (6 items e.g. I went along with fate; sometimes I just have bad luck.);
self-controlling (7 items e.g. I kept others from knowing how bad things were);
Seeking social support (6 items e.g. I talked to someone to find out more about
the situation); Accepting responsibility (4 items e.g. I criticized or lectured
myself); Escape-avoidance (8 items e.g. I slept more than usual); Planful
problem solving (6 items e.g. I came up with a couple of different solutions to
the problem) and Positive reappraisal (7 items e.g. I prayed).
Carver et al. (1989) suggests additional flaws in many published scales such as
measuring only a proportion of coping strategies believed to exist theoretically,
ambiguity of questions so that the participants’ responses cannot be reliably
interpreted and potential inaccuracies in the manner in which items are derived
or reduced within a scale. It was these findings from Carver et al.’s review of the
literature that lead to development of the 60 item COPE, a theory-based scale
that measures the extent to which respondents have used particular methods to
deal with a specific stressful situation (Carver et al., 1989). The methods listed
corresponded to 15 different types of coping; positive reinterpretation and
growth, mental disengagement, focus on and venting of emotions, use of
instrumental social support, active coping, denial, religious coping, humour,
behavioural disengagement, restraint, use of emotional social support,
substance use, acceptance, suppression of competing activities, and planning.
Each of these factors had four corresponding items whose scores were
summed to give the overall score for each type of coping.
Since then Carver has developed shortened forms of the COPE questionnaire
by reducing the number of items relating to each type of coping, omitting and
refocusing factors and adding a new factor - self-blame. The Brief COPE
therefore contains 28 items, with 2 items corresponding to each of the following
14 coping sub-scales: self-distraction, active coping, denial, substance use, use
of emotional support, use of instrumental support, behavioural disengagement,
venting, positive reframing, planning, humour, acceptance, religion, and self-
130
blame (Carver, 1997). Examples of Brief COPE items include ‘I’ve been getting
comfort and understanding from someone’ from the emotional support factor,
and ‘I’ve been refusing to believe that it has happened’ from the denial factor.
The WCQ and the COPE versions are the most commonly used scales to
assess how an individual copes with a given situation. Other scales rely on
measuring coping during a hypothetical situation for example, The Stress and
Coping Process Questionnaire (Perrez and Reicherts, 1992). Given the
subjective and dynamic nature of the coping process quantitative investigation
at a single time point can be problematic. Participants who are not currently
experiencing or coping with stress may find it difficult to record their methods of
coping from memory and therefore a qualitative approach to the data collection
may be more appropriate in some studies.
Given the aim was to incorporate coping data into the developing statistical
model for predicting withdrawal a quantitative approach was most appropriate
for this thesis. It was decided that the Brief COPE (Carver, 1997) would be
utilised for this study because it is one of the most commonly used in literature
and is the briefest measure to administer. The COPE inventory has been used
in many studies and with many participant groups including university students
(Devonport and Lane, 2006; Pritchard and Wilson, 2003; Pritchard et al., 2007;
Sreeramareddy et al., 2007).
Interpretation of scales such as the Brief COPE rely on the addition of multiple
item scores to provide an overall score for each of the pre-determined
categories of coping known as factors. There is however the possibility of items
within an a priori factor to be less correlated than expected, or for a priori factors
to be cross-correlated. Factor analysis (FA), the division of scale items into
higher order factors, therefore shows only situational and sample specific item
loading (Parker and Endler, 1992). Additionally, some controversy still
surrounds the higher order factor structure of coping, and by extension the Brief
COPE instrument (Parker and Endler, 1992; Skinner et al., 2003). It has
therefore been suggested that researchers carry out FA for their sample and
adjust interpretation accordingly for most useful results (Reise et al., 2000).
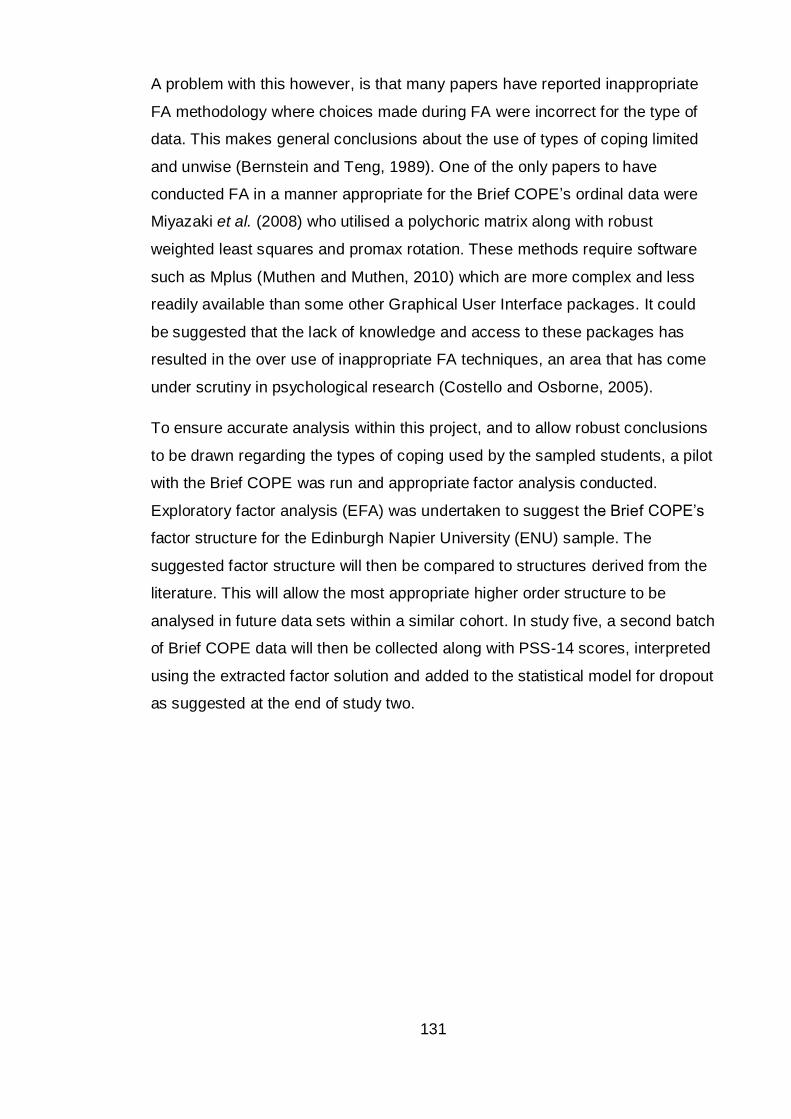
131
A problem with this however, is that many papers have reported inappropriate
FA methodology where choices made during FA were incorrect for the type of
data. This makes general conclusions about the use of types of coping limited
and unwise (Bernstein and Teng, 1989). One of the only papers to have
conducted FA in a manner appropriate for the Brief COPE’s ordinal data were
Miyazaki et al. (2008) who utilised a polychoric matrix along with robust
weighted least squares and promax rotation. These methods require software
such as Mplus (Muthen and Muthen, 2010) which are more complex and less
readily available than some other Graphical User Interface packages. It could
be suggested that the lack of knowledge and access to these packages has
resulted in the over use of inappropriate FA techniques, an area that has come
under scrutiny in psychological research (Costello and Osborne, 2005).
To ensure accurate analysis within this project, and to allow robust conclusions
to be drawn regarding the types of coping used by the sampled students, a pilot
with the Brief COPE was run and appropriate factor analysis conducted.
Exploratory factor analysis (EFA) was undertaken to suggest the Brief COPE’s
factor structure for the Edinburgh Napier University (ENU) sample. The
suggested factor structure will then be compared to structures derived from the
literature. This will allow the most appropriate higher order structure to be
analysed in future data sets within a similar cohort. In study five, a second batch
of Brief COPE data will then be collected along with PSS-14 scores, interpreted
using the extracted factor solution and added to the statistical model for dropout
as suggested at the end of study two.
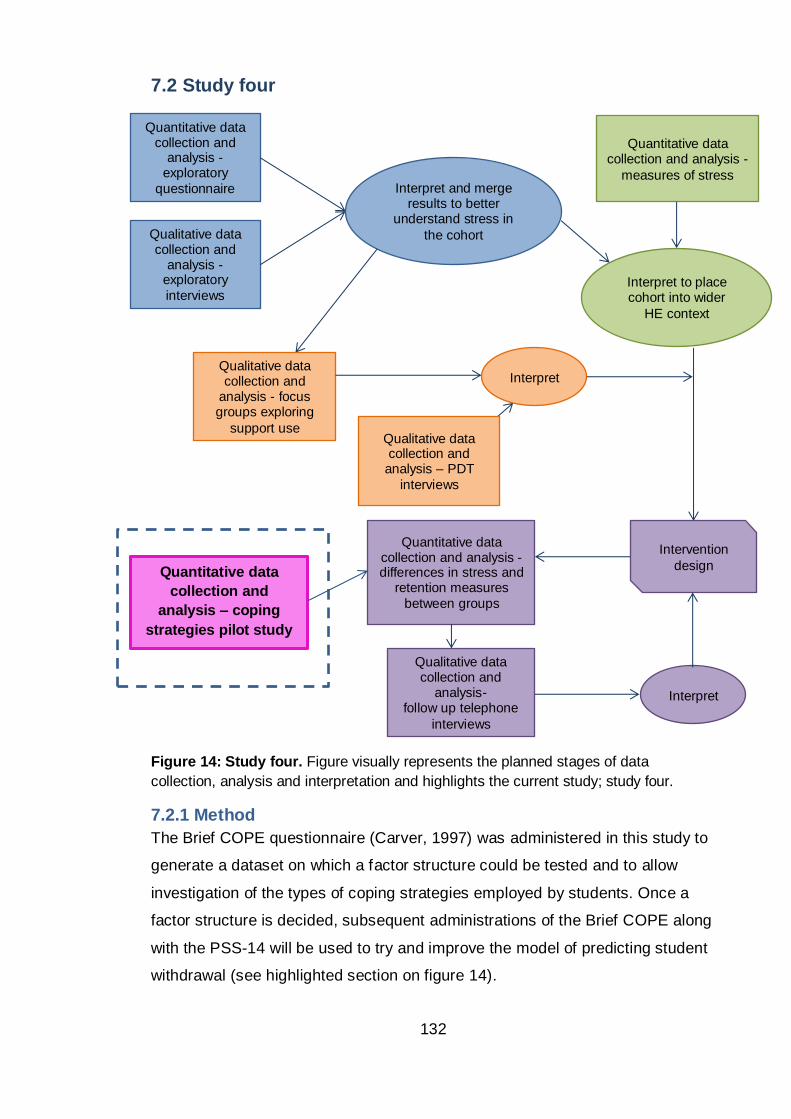
132
7.2 Study four
Figure 14: Study four. Figure visually represents the planned stages of data
collection, analysis and interpretation and highlights the current study; study four.
7.2.1 Method
The Brief COPE questionnaire (Carver, 1997) was administered in this study to
generate a dataset on which a factor structure could be tested and to allow
investigation of the types of coping strategies employed by students. Once a
factor structure is decided, subsequent administrations of the Brief COPE along
with the PSS-14 will be used to try and improve the model of predicting student
withdrawal (see highlighted section on figure 14).
Quantitative data
collection and
analysis – coping
strategies pilot study
Qualitative data collection and
analysis – PDT
interviews
Quantitative data collection and
analysis -exploratory
questionnaire
Qualitative data collection and
analysis -exploratory
interviews
Interpret and merge results to better
understand stress in
the cohort
Qualitative data collection and
analysis - focus groups exploring
support use
Quantitative data collection and analysis -
measures of stress
Interpret to place cohort into wider
HE context
Interpret
Intervention
design
Quantitative data collection and analysis - differences in stress and
retention measures
between groups
Qualitative data collection and
analysis- follow up telephone
interviews
Interpret
133
Carver’s Brief COPE inventory was included in the administered paper-based
questionnaire along with demographic questions (a copy of the Brief COPE
questionnaire is included in appendix six, question 22). PSS-14 was not
included in this pilot study to reduce demand on participants, however, a single
question to assess self-reported stress and one to assess intention to withdraw
were included.
The questionnaire was granted ethical approval from the relevant Faculty
committee in trimester one of academic year 2012/2013. Students were
instructed to answer the Brief COPE on a four-point Likert scale from one
(never) to four (all the time), based on how often they had used particular
strategies during recent stress.
Student volunteers had the project aims and objectives explained to them in
writing before obtaining their informed consent to participate. Data were
collected early in trimester two of academic year 2012/13 (weeks 3-4) to
minimise interference to exam and assessment deadlines. Participants were
informed that all data would be stored in a secure manner and that data may be
retained so that any findings could be published at a later date. Participants
were advised that all information would be kept anonymously so it could in no
way be linked back to them in any future publication, and that they had the right
to withdraw their participation at any point.
7.2.1.1 Analysis
Data from the brief COPE were used to generate a higher order factor structure
to allow for more meaningful conclusions to be drawn regarding coping within
the cohort. Comparison of latent factor scores then provided further insight into
the types and the potential quality of coping strategies used by the students.
Preliminary comparisons were also made between levels of self-reported stress,
intentions of withdrawal and the type of coping used.
As mentioned above it is wise to carryout EFA on scales such as the Brief
COPE to ensure the most accurate factor structure is being applied to interpret
the data collected. FA is a complex structural equation modelling method which
requires informed choices to be made at various junctures including extraction
134
and rotation. The stages in EFA are commonly divided into five steps which are
depicted in figure 15.
Figure 15: EFA protocol. Flow diagram representing the main steps in the EFA
Protocol and is taken from Williams et al. (2012).
Following the protocol steps of Williams et al. (2012) and good practice of
Miyazaki et al. (2008), data were checked for suitability to undergo FA and a
polychoric matrix created. This is an alternative to the standard Pearsons r
correlation matrix which is the default for most statistical software packages. A
polychoric matrix is more appropriate given the ordinal nature of the COPE data
(Tabachnick and Fidell, 2007 p729). For the same reason an asymptotically
distribution free method of data extraction should be chosen, either weighted
least squares (WLS) or a robust weighted least squares with mean and
variance adjustment (WLSMV) (Flora and Curran, 2004). The default extraction
135
method for most packages is Principal Component Analysis (PCA) however this
method has been shown to be inappropriate for non-continuous data and
specifically for the Brief COPE (Krägeloh, 2011). It is best practice to use a
combination strategy to determine the number of factors to be extracted
(Williams et al., 2012). For this study the number of factors to be retained was
denoted by Kaiser’s criterion (eigenvalues >1), Scree test (above the plot
‘elbow’), parallel analysis (actual eigenvalues greater than random order values)
and the following good fit indices: Chi-square test, root mean squared
approximation of error (RMSEA) and standardised root mean square residual
(SRMSR).
Rotation maximises high item loadings and minimises low item loadings,
therefore producing a more interpretable and simplified solution. For this type of
research oblique rotation should be used to allow for factors to be correlated. In
this study the factors will be correlated as they describe the overarching
variable of coping. Again, the default rotation in most packages, varimax, would
be inappropriate for the data set and therefore promax was used.
Finally the factor solution was interpreted and the variables loading on each of
the extracted factors were examined for theoretical and conceptual congruence
and the factors labelled descriptively.
Ideally EFA should have been carried out on both the disaggregated (28
individual items) and the partially aggregated (14 coping sub-scales) models.
However, when analysing the disaggregated model the matrix was found to be
non-positive definite (NPD) which prevents EFA.
Matrices can be NPD for various reasons, two of which are relevant for this
study. Firstly, a correlation matrix will be NPD if there are linear dependencies
among the variables (eigenvalues of <0). This would be expected given that
pairs of items within the Brief COPE are expected to measure the same coping
construct. Negative and close to zero eigenvalues were estimated from the
sample correlation matrix suggesting this could be the cause of the NPD error.
Secondly, a NPD matrix is also a common problem with polychoric matrices
especially when they contain a larger number of variables in relation to cases.
To test if this was a potential cause of the NPD error a Pearson correlation
136
matrix was successfully created which suggests the NPD problem lies with the
pairwise, rather than simultaneous, estimation of the polychoric matrix. The
latter problem cannot be easily fixed and would require additional software to
which access is not readily available. EFA was therefore only carried out on
Carver’s summed 14 sub-scales.
7.2.1.2 Participants
The coping pilot study consisted of 173 participants from across the School of
Life, Sport and Social Science (SLSSS). Of the total participants, 64 were male
and 107 were female (2 did not specify gender); an average age of 20.75 years
was reported. Volunteers were split between the years of study in SLSSS; 63
participants from first year, 63 were in their second year of study and 43 were
currently in third year (4 did not specify year of study). Fourth years were not
approached as students were completing Honours Projects and were therefore
not in a class appropriate for sampling.
7.2.2 Results
The data were found to be suitable for factor analysis; Bartlett’s test of
sphericity was significant, Kaiser-Mayer Olkin sampling adequacy was >0.6 and
the anti –image correlation matrix did not contain correlations of less than 0.5
on the diagonal.
7.2.2.1 Exploratory factor analysis on 14 sub-scales
Before carrying out factor analysis on Carver ’s 14 a priori scales internal
consistency within the 14 coping sub-scales using ordinal alpha, in preference
to Cronbach’s alpha, should be calculated given the non-continuous nature of
the Likert scale used in the Brief COPE (Gadermann et al., 2012; Zumbo et al.,
2007). Zumbo and colleagues report that although ordinal coefficients alpha
consistently provides more precise estimates, the difference between coefficient
alpha and ordinal coefficients alpha decreases with increasing scale length.
That is to say that a more prominent difference will be observed between the
two alpha coefficients when scales are measured by a binary response than by
a seven point Likert for example. Cronbach’s alpha can therefore be used for
convenience with the four point response scale of the Brief COPE in the
knowledge that only small underestimates in the coefficients will be observed in
137
comparison to the more robust but more complex ordinal coefficients alpha
method.
The Cronbach’s alpha reliability coefficients indicated that most of the 14 sub-
scales demonstrated acceptable internal consistency. Denial, substance use,
emotional support, behavioural disengagement, instrumental support, positive
reframing, humour, religion and self-blame had alpha coefficients above 0.7.
Active coping and planning had alpha coefficients above 0.6 which can still be
considered acceptable. Less acceptable were the internal reliability coefficients
for the scales venting and acceptance which were 0.543 and 0.496,
respectively. Self-distraction had an alpha coefficient of 0.091 which suggests
that the two items within the scale are measuring different aspects of coping.
The same poor internal consistency for self-distraction was noted by Doron et
al. (2014) and, like Doron, to avoid using just a single item for the self -
distraction sub-scale both items were retained. Similar internal consistency
results were obtained when male and female scores were calculated separately
therefore the factor structure can be calculated on the full dataset.
After accepting Carver’s 14 sub-scales, EFA was carried out on an estimated
polychoric matrix using WLSMV via Mplus (Muthén and Muthén, 2010).
According to Kaiser’s criterion five factors have eigenvalues greater than one,
the Scree plot showed three factors above the elbow and parallel analysis
indicated three factors with original eigenvalues greater than the values
generated by parallel analysis. Note that parallel analysis was conducted using
a Pearson’s matrix to generate random order eigenvalues instead of the more
correct polychoric matrix due to limitations in the available software. It has been
reported in the past that this method is acceptable as long as caution is
exercised and the result is considered in conjunction with other extraction
indicators (Cho et al., 2009). Disagreement between the methods suggests
between three and five latent factors exist. Table 17 shows the fit measures for
the number of factors from one to four. Models with the number of factors
greater than 4 were not included as they had a least one negative residual
variance estimate and on further investigation religion was found as a Heywood
case (Skrondal and Rabe-Hesketh, 2004 p206). Heywood cases, negative or
near zero variance estimates, can be due to sampling fluctuations which is most
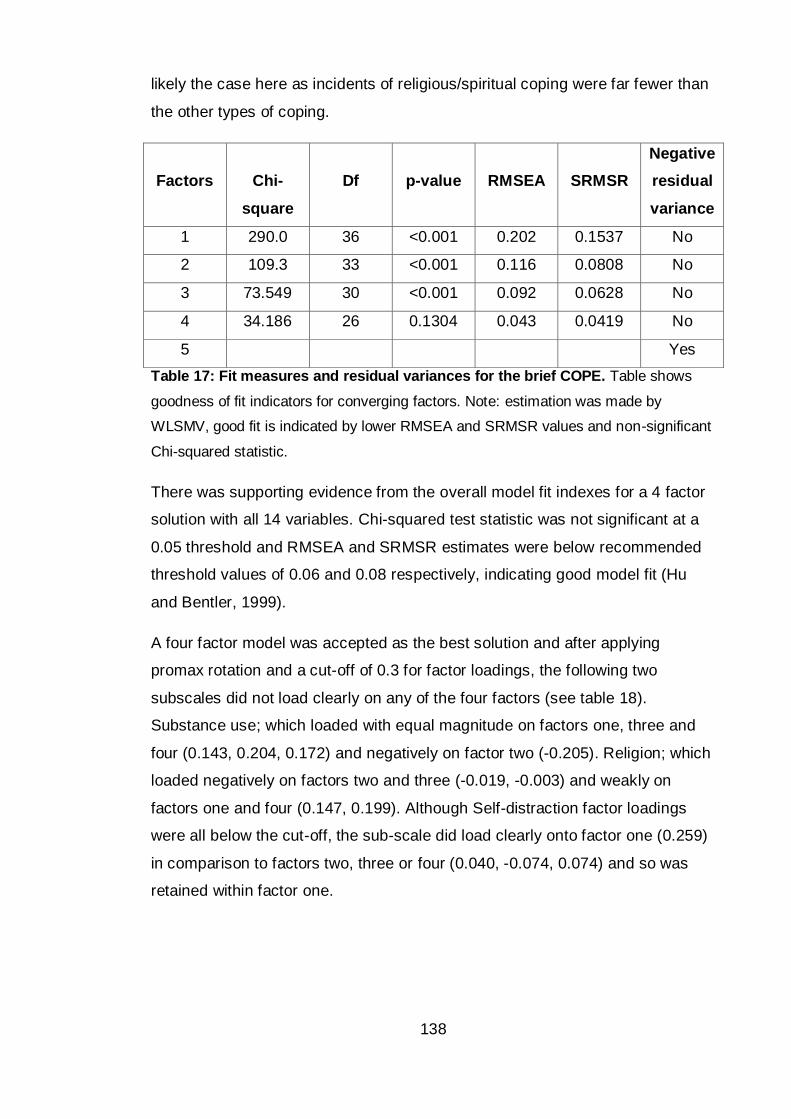
138
likely the case here as incidents of religious/spiritual coping were far fewer than
the other types of coping.
Factors
Chi-
square
Df
p-value
RMSEA
SRMSR
Negative
residual
variance
1 290.0 36 <0.001 0.202 0.1537 No
2 109.3 33 <0.001 0.116 0.0808 No
3 73.549 30 <0.001 0.092 0.0628 No
4 34.186 26 0.1304 0.043 0.0419 No
5 Yes
Table 17: Fit measures and residual variances for the brief COPE. Table shows
goodness of fit indicators for converging factors. Note: estimation was made by
WLSMV, good fit is indicated by lower RMSEA and SRMSR values and non-significant
Chi-squared statistic.
There was supporting evidence from the overall model fit indexes for a 4 factor
solution with all 14 variables. Chi-squared test statistic was not significant at a
0.05 threshold and RMSEA and SRMSR estimates were below recommended
threshold values of 0.06 and 0.08 respectively, indicating good model fit (Hu
and Bentler, 1999).
A four factor model was accepted as the best solution and after applying
promax rotation and a cut-off of 0.3 for factor loadings, the following two
subscales did not load clearly on any of the four factors (see table 18).
Substance use; which loaded with equal magnitude on factors one, three and
four (0.143, 0.204, 0.172) and negatively on factor two (-0.205). Religion; which
loaded negatively on factors two and three (-0.019, -0.003) and weakly on
factors one and four (0.147, 0.199). Although Self-distraction factor loadings
were all below the cut-off, the sub-scale did load clearly onto factor one (0.259)
in comparison to factors two, three or four (0.040, -0.074, 0.074) and so was
retained within factor one.
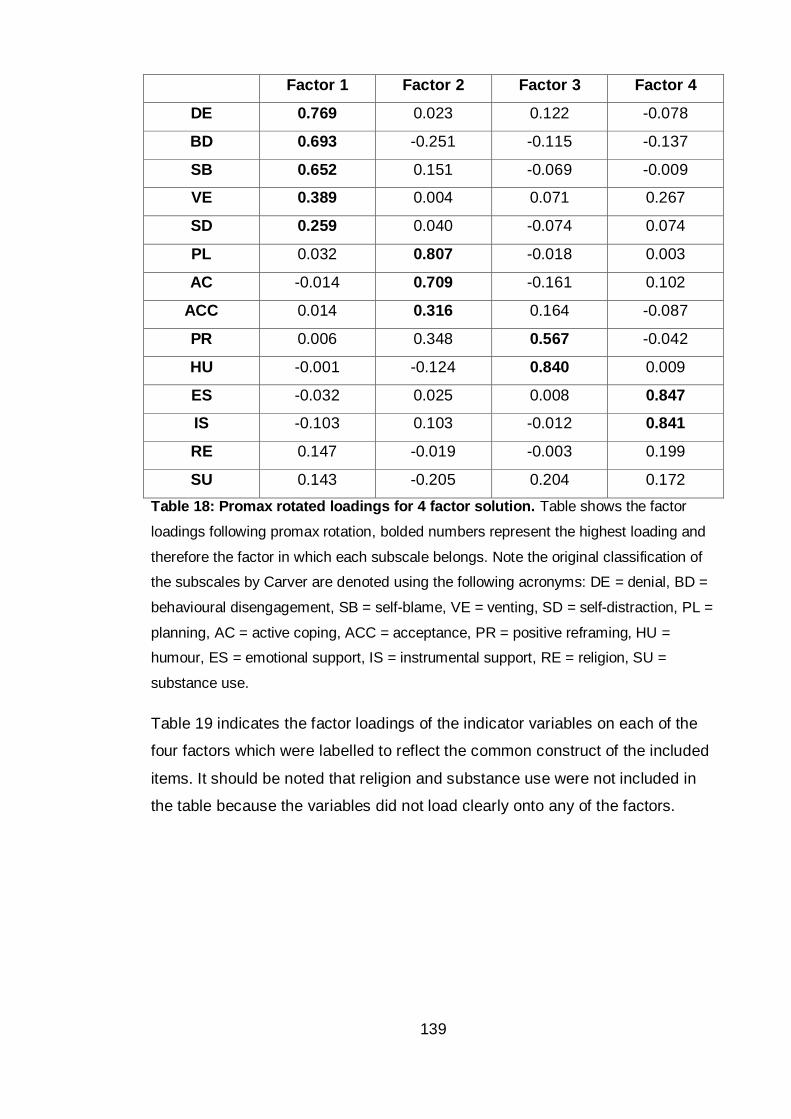
139
Factor 1 Factor 2 Factor 3 Factor 4
DE 0.769 0.023 0.122 -0.078
BD 0.693 -0.251 -0.115 -0.137
SB 0.652 0.151 -0.069 -0.009
VE 0.389 0.004 0.071 0.267
SD 0.259 0.040 -0.074 0.074
PL 0.032 0.807 -0.018 0.003
AC -0.014 0.709 -0.161 0.102
ACC 0.014 0.316 0.164 -0.087
PR 0.006 0.348 0.567 -0.042
HU -0.001 -0.124 0.840 0.009
ES -0.032 0.025 0.008 0.847
IS -0.103 0.103 -0.012 0.841
RE 0.147 -0.019 -0.003 0.199
SU 0.143 -0.205 0.204 0.172
Table 18: Promax rotated loadings for 4 factor solution. Table shows the factor
loadings following promax rotation, bolded numbers represent the highest loading and
therefore the factor in which each subscale belongs. Note the original classification of
the subscales by Carver are denoted using the following acronyms: DE = denial, BD =
behavioural disengagement, SB = self-blame, VE = venting, SD = self-distraction, PL =
planning, AC = active coping, ACC = acceptance, PR = positive reframing, HU =
humour, ES = emotional support, IS = instrumental support, RE = religion, SU =
substance use.
Table 19 indicates the factor loadings of the indicator variables on each of the
four factors which were labelled to reflect the common construct of the included
items. It should be noted that religion and substance use were not included in
the table because the variables did not load clearly onto any of the factors.
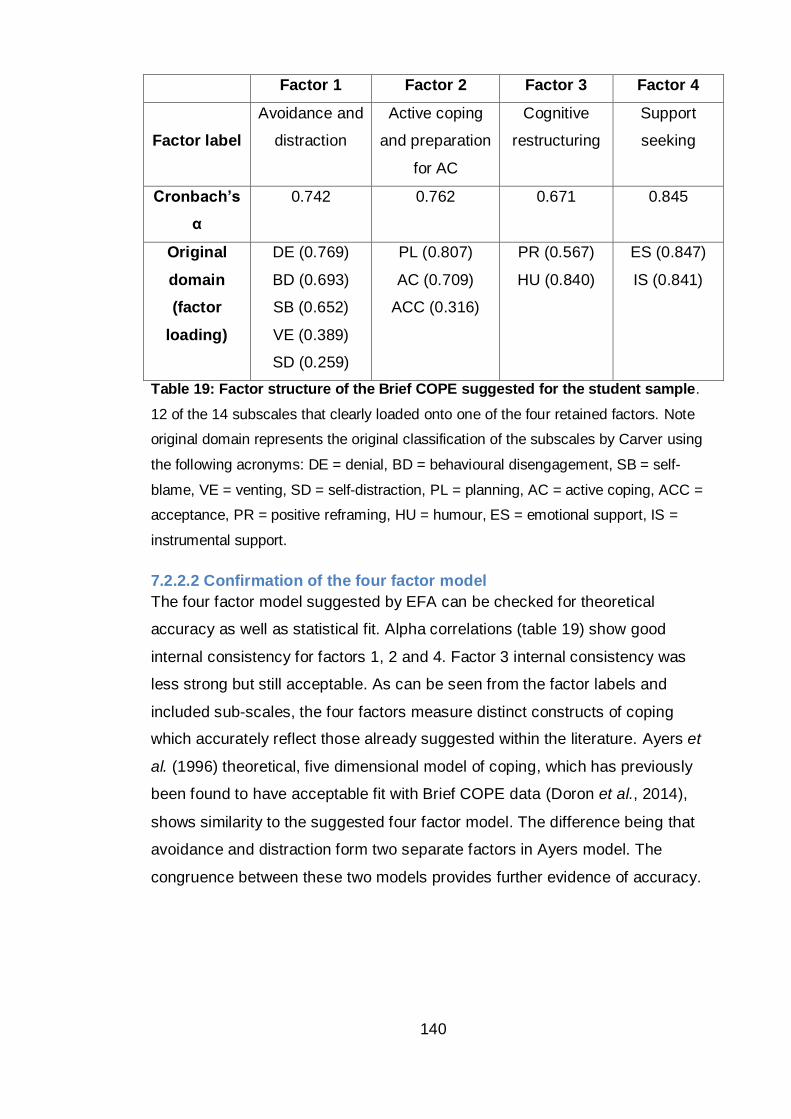
140
Factor 1 Factor 2 Factor 3 Factor 4
Factor label
Avoidance and
distraction
Active coping
and preparation
for AC
Cognitive
restructuring
Support
seeking
Cronbach’s
α
0.742 0.762 0.671 0.845
Original
domain
(factor
loading)
DE (0.769)
BD (0.693)
SB (0.652)
VE (0.389)
SD (0.259)
PL (0.807)
AC (0.709)
ACC (0.316)
PR (0.567)
HU (0.840)
ES (0.847)
IS (0.841)
Table 19: Factor structure of the Brief COPE suggested for the student sample.
12 of the 14 subscales that clearly loaded onto one of the four retained factors. Note
original domain represents the original classification of the subscales by Carver using
the following acronyms: DE = denial, BD = behavioural disengagement, SB = self-
blame, VE = venting, SD = self-distraction, PL = planning, AC = active coping, ACC =
acceptance, PR = positive reframing, HU = humour, ES = emotional support, IS =
instrumental support.
7.2.2.2 Confirmation of the four factor model
The four factor model suggested by EFA can be checked for theoretical
accuracy as well as statistical fit. Alpha correlations (table 19) show good
internal consistency for factors 1, 2 and 4. Factor 3 internal consistency was
less strong but still acceptable. As can be seen from the factor labels and
included sub-scales, the four factors measure distinct constructs of coping
which accurately reflect those already suggested within the literature. Ayers et
al. (1996) theoretical, five dimensional model of coping, which has previously
been found to have acceptable fit with Brief COPE data (Doron et al., 2014),
shows similarity to the suggested four factor model. The difference being that
avoidance and distraction form two separate factors in Ayers model. The
congruence between these two models provides further evidence of accuracy.
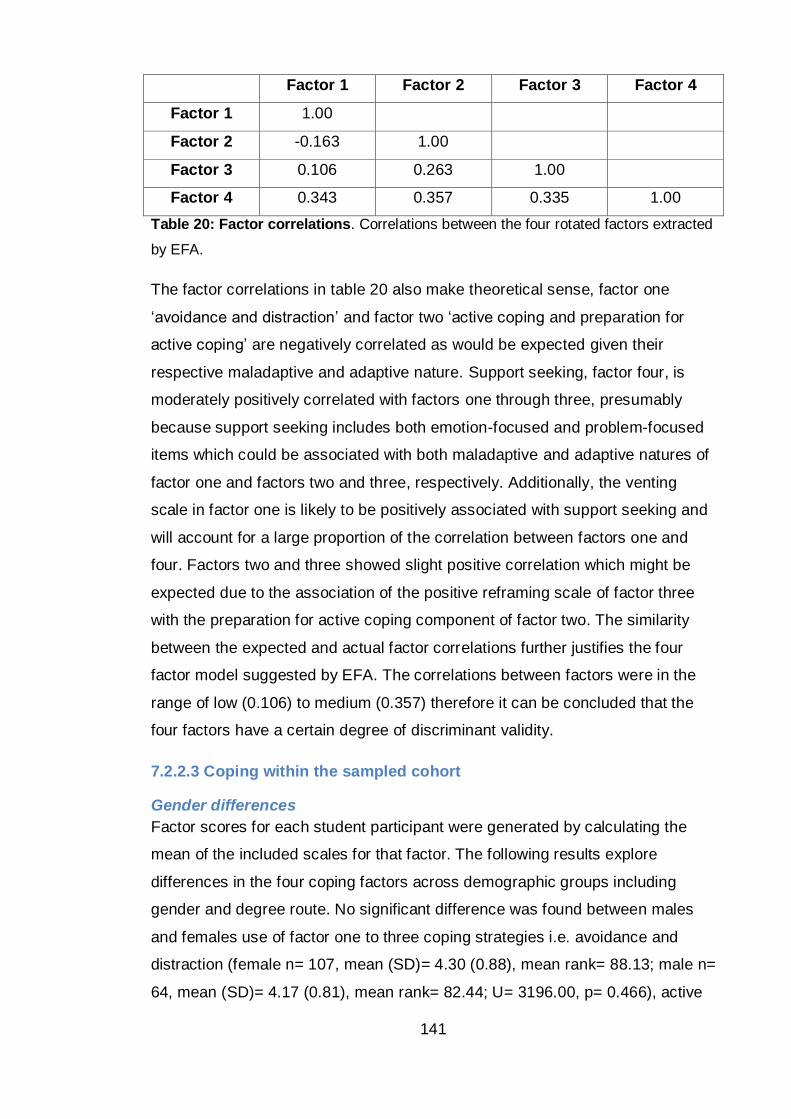
141
Factor 1 Factor 2 Factor 3 Factor 4
Factor 1 1.00
Factor 2 -0.163 1.00
Factor 3 0.106 0.263 1.00
Factor 4 0.343 0.357 0.335 1.00
Table 20: Factor correlations. Correlations between the four rotated factors extracted
by EFA.
The factor correlations in table 20 also make theoretical sense, factor one
‘avoidance and distraction’ and factor two ‘active coping and preparation for
active coping’ are negatively correlated as would be expected given their
respective maladaptive and adaptive nature. Support seeking, factor four, is
moderately positively correlated with factors one through three, presumably
because support seeking includes both emotion-focused and problem-focused
items which could be associated with both maladaptive and adaptive natures of
factor one and factors two and three, respectively. Additionally, the venting
scale in factor one is likely to be positively associated with support seeking and
will account for a large proportion of the correlation between factors one and
four. Factors two and three showed slight positive correlation which might be
expected due to the association of the positive reframing scale of factor three
with the preparation for active coping component of factor two. The similarity
between the expected and actual factor correlations further justifies the four
factor model suggested by EFA. The correlations between factors were in the
range of low (0.106) to medium (0.357) therefore it can be concluded that the
four factors have a certain degree of discriminant validity.
7.2.2.3 Coping within the sampled cohort
Gender differences
Factor scores for each student participant were generated by calculating the
mean of the included scales for that factor. The following results explore
differences in the four coping factors across demographic groups including
gender and degree route. No significant difference was found between males
and females use of factor one to three coping strategies i.e. avoidance and
distraction (female n= 107, mean (SD)= 4.30 (0.88), mean rank= 88.13; male n=
64, mean (SD)= 4.17 (0.81), mean rank= 82.44; U= 3196.00, p= 0.466), active
142
coping and preparation for active coping (female n= 107, mean (SD)= 5.70
(0.94), mean rank= 87.13; male n= 64, mean (SD)= 5.65 (1.00), mean rank
84.12; U= 3303.50, p= 0.698) and cognitive restructuring (female n= 107, mean
(SD)= 5.31 (1.44), mean rank= 84.13; male n= 64, mean (SD)= 5.45 (1.23),
mean rank 89.13; U= 3224.00, p= 0.520). A gender difference did exist in
support seeking strategies (factor four). On average females employed support
seeking strategies more often than males (female n= 107, mean (SD)= 5.31
(1.47), mean rank= 92.60; male n= 64, mean (SD)= 4.75 (1.42), mean rank
74.97; U= 2718.00, p= 0.028). This would be consistent with data in the current
literature which shows women are more likely to be involved in exchanges of
emotional support than men (women tend to befriend). In keeping with the PSS-
14 data from previous studies within this project, no difference in coping
between degree routes or year of study was observed.
Coping and withdrawal
Students who are considering dropping out of university use avoidance and
distraction coping (factor one) significantly more than those who have not
considered leaving (not considered withdrawal n= 76, mean (SD)= 4.04 (0.70),
mean rank= 42.30; considered withdrawal n= 15, mean (SD)= 4.76 (0.82),
mean rank= 64.77; Mann-Whitney U test 288.50 asymp. p= 0.002). Avoidance
and distraction strategies can be said to have a small effect on intention to
leave higher education (HE) (r= 0.1832). Those considering withdrawal also use
active coping (factor two) significantly less than those who have not considered
leaving (not considered withdrawal n= 76, mean (SD)= 5.86 (0.87), mean rank=
49.38; considered withdrawal n= 15, mean (SD)= 5.13 (1.05), mean rank=
28.87; Mann-Whitney U test 313.00 asymp. p= 0.005). Active coping and
preparation for active coping strategies can be said to have a medium effect on
intention to leave HE (r= 0.349). No difference was observed in the remaining
two factors. This can be summarised to report that students who have seriously
considered leaving use potentially maladaptive, emotion focused strategies
more often and use the adaptive, problem focused strategies less often than
those who have not considered leaving.
Coping and stress
When comparing students’ coping to self-reported stress in this study, stress
was measured using a single item stress frequency question and responses
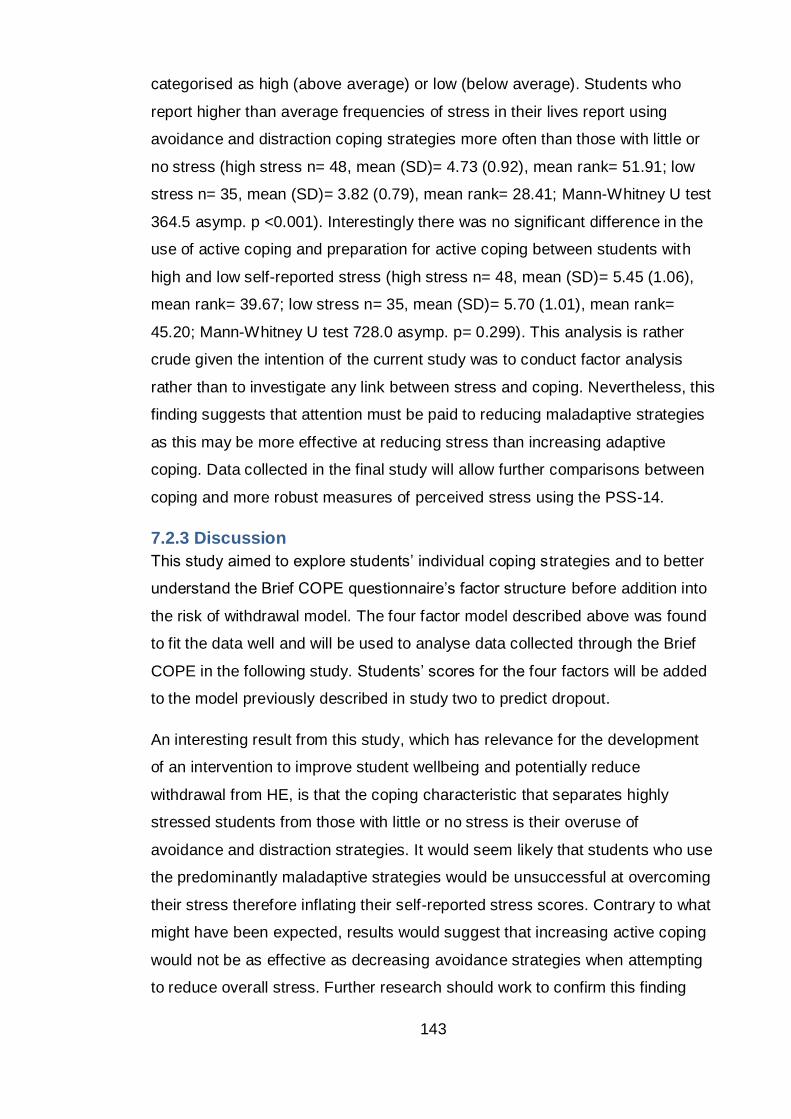
143
categorised as high (above average) or low (below average). Students who
report higher than average frequencies of stress in their lives report using
avoidance and distraction coping strategies more often than those with little or
no stress (high stress n= 48, mean (SD)= 4.73 (0.92), mean rank= 51.91; low
stress n= 35, mean (SD)= 3.82 (0.79), mean rank= 28.41; Mann-Whitney U test
364.5 asymp. p <0.001). Interestingly there was no significant difference in the
use of active coping and preparation for active coping between students with
high and low self-reported stress (high stress n= 48, mean (SD)= 5.45 (1.06),
mean rank= 39.67; low stress n= 35, mean (SD)= 5.70 (1.01), mean rank=
45.20; Mann-Whitney U test 728.0 asymp. p= 0.299). This analysis is rather
crude given the intention of the current study was to conduct factor analysis
rather than to investigate any link between stress and coping. Nevertheless, this
finding suggests that attention must be paid to reducing maladaptive strategies
as this may be more effective at reducing stress than increasing adaptive
coping. Data collected in the final study will allow further comparisons between
coping and more robust measures of perceived stress using the PSS-14.
7.2.3 Discussion
This study aimed to explore students’ individual coping strategies and to better
understand the Brief COPE questionnaire’s factor structure before addition into
the risk of withdrawal model. The four factor model described above was found
to fit the data well and will be used to analyse data collected through the Brief
COPE in the following study. Students’ scores for the four factors will be added
to the model previously described in study two to predict dropout.
An interesting result from this study, which has relevance for the development
of an intervention to improve student wellbeing and potentially reduce
withdrawal from HE, is that the coping characteristic that separates highly
stressed students from those with little or no stress is their overuse of
avoidance and distraction strategies. It would seem likely that students who use
the predominantly maladaptive strategies would be unsuccessful at overcoming
their stress therefore inflating their self-reported stress scores. Contrary to what
might have been expected, results would suggest that increasing active coping
would not be as effective as decreasing avoidance strategies when attempting
to reduce overall stress. Further research should work to confirm this finding
144
and to investigate how reducing maladaptive strategies, such as avoidance and
distraction, could be encouraged through coaching and intervention; bearing in
mind that current advice regarding improving coping often focuses on
increasing adaptive strategies including active coping.
When comparing students who reported intentions of withdrawal to those who
have not considered leaving, students report to use the potentially maladaptive
avoidance and distraction strategies more frequently and the more adaptive
strategies such as active coping and preparation for active coping less
frequently. The direction of causality cannot be clearly reported but it would be
reasonable to assume that students who favour avoidance and distraction
strategies are not coping effectively with the challenges of university life and
therefore may feel unable to continue with their studies. This shows a
progression, in the existing theory, from the findings above for stress. Where
use of avoidance and distraction predicts high stress, additional reductions in
active coping and planning for active coping can result in intentions to withdraw.
In summary, increased avoidance and distraction coping is associated with
increased self-reported stress, but it may be the combination of increased
avoidance and decreased active coping that appears to put students at a higher
risk of withdrawal.
These preliminary findings would therefore advocate that interventions
encouraging students to limit their use of avoidance and distraction coping
could result in reduced perceived stress. Interventions that aim to reduce
maladaptive while increasing adaptive active coping are suggested as the best
approach to reducing student’s withdrawal intentions. It should be noted that
reducing maladaptive behaviours will likely be harder than encouraging
students to use adaptive strategies more often and therefore methods for
intervention need to be considered further.
7.2.3.1 Limitations
Ideally confirmatory FA would have been used to compare the factor solution
suggested by the above EFA to Ayers et al. (1996) theoretical, five dimensional
model of coping which has previously been found to have acceptable fit with
Brief COPE data (Doron et al., 2014). Unfortunately this analysis could not be
145
completed due to limited availability of the Mplus software. Access to Mplus for
this project was gained through a third party and due to geographical separation
and limited budget additional sessions were not possible.
Due to time limitations it was not possible to further investigate the development
of an intervention to reduce and replace an individual’s use of maladaptive
avoidance and distraction strategies for inclusion within the larger intervention
developed as part of this project. It is suggested that this work be carried out
and reported separately at a later date.
146
Chapter summary
The four factor Brief COPE structure suggested by EFA in this study will
be applied to data collected in the final study and will be added to the
predictive model of withdrawal along with perceived stress.
The results regarding the potential benefit of reducing avoidance and
distraction strategies will require further consideration before this finding
can be applied to the intervention designed as part of this project.
However, findings from this study highlight that the current practice of
coping interventions to build an individual’s adaptive strategies may not be
sufficient and that reduction of maladaptive strategies must occur for
benefits in stress and retention to be observed.
147
Chapter Eight: Study five – design, development and evaluation of an intervention to improve student wellbeing and continuation.
Chapter overview
Results from studies one (exploration of stress and withdrawal intentions
experienced by non-health BSc students), two (use of psychometric tools
to measure students’ stress) and three (focus groups to understand
students’ use of support services) suggest students could benefit from
additional support with the early identification of stress and awareness of
the services available. Findings from study four (investigation of students’
individual coping strategies) also indicated benefits of reduced avoidance
and distraction coping. Following the transactional model of stress
(Lazarus and Folkman, 1984), an intervention to improve students’
perception of stressors, improve knowledge of coping strategies and
awareness of the support available was believed to help students modify
their primary and secondary appraisal thus manipulating both the
psychological and physiological the stress response.
Study five describes the design, development and controlled evaluation of
an evidence based, stress education intervention. The study tested the
hypothesis that exposure to the stress education intervention would
accomplish reduced self-reported and perceived stress (measured via the
Perceived Stress Scale) and increased psychological wellbeing (measured
via the General Health Questionnaire), through i) increased knowledge of
stress and a greater appreciation of stress management, ii) increased
awareness of the support available to students and iii) improved coping
behaviour (i.e. reduced use of avoidance and distraction strategies
measured via Brief COPE). Results from the pilot show that students who
volunteered to review the online intervention were satisfied with the
resource and reported to find the information interesting and helpful.
148
However, on the larger scale controlled trial, uptake of the intervention was low
and statistical analysis therefore found no significant impact on student’s
perceived stress, general health, coping, attitudes towards stress management
or withdrawal. There was some evidence that the online intervention may have
had a small effect on a student’s self-reported knowledge of the support
services overall.
149
8.1 Stress interventions
Having found a correlational relationship between stress and withdrawal, and to
address research question three (Is there a link between stress and student
withdrawal which could be exploited to improve both student wellbeing and
continuation through the use of an intervention?), study five was interested in
understanding whether retention could be improved by modifying the students’
ability to understand and cope with stress.
Many individual (as opposed to organisational) stress management
interventions (SMI) utilise the transactional model of stress and coping, as
indeed this research has, which advocates that the impact of a stressor on an
individual is moderated by that individual’s perception of the stressor and their
available and perceived resources (Lazarus & Folkman, 1984). This model and
therefore any intervention tapping aspects of the model would suggest that
stress can be modified through the manipulation of individuals’ perceptions of
stress (e.g. through cognitive restructuring), modifying their feelings and
interpretations of emotional or physical arousal and improving the individuals
coping responses and behaviours so that the stressor is diminished (Dollard
and Winefield, 1996).
Lazarus and Folkman’s (1984) model describes a transaction between the
individual where perception of stressors and coping resources are not fixed with
an individual and therefore are flexible traits which can be modified; thus
supporting an intervention to manipulate the interaction between the individual
and the environment and/or the individuals coping resources. Studies have
shown that young adults and students in HE can improve their ability to manage
stress and improve secondary outcomes (such as their physiological responses
and psychometric scores) through the use of both long and short term, face-to-
face and remotely delivered: cognitive, behavioural, mindfulness,
psychoeducational, psychosocial and psychophysiological therapeutic
interventions (Cruess et al., 2015; Davies et al., 2014; Regehr et al., 2013).
By attempting to manipulate stress in this way, the relationship identified in this
thesis between stress and withdrawal can then be tested for causality.
150
The intervention proposed in this research would fall under the category of
stress management psychoeducation which aims to develop appropriate
behaviours and ways of thinking by helping the individual to recognise the need
for change, and then helping the individual to apply better behavioural choices.
Psychoeducational interventions combine both condition-specific epidemiology
and psychophysiology with tools for identifying and managing the related
processes or outcomes. They therefore have the potential to be applied to many
physiological and psychological conditions which require some form of mind set
or behavioural change.
An underlying component of the success of psychoeducation is that it makes
use of the Health Belief Model (HBM; Rosenstock et al., 1988) which describes
that participants need to be better educated and empowered to make mind set
or behavioural changes. The HBM model contains five components that predict
an individual's openness to enact change: perceived susceptibility to the
condition; perceived severity of the impact the condition would have; perceived
benefits of participating in change; perceived barriers to change; and perceived
ability to overcome the barriers and make change. Through education of the
stress response, participants can understand their susceptibility and the
potential impact of stress (e.g. common causes of stress in the student
population, prevalence, symptoms and secondary outcomes related to stress).
Through explaining evidence based treatment within a psychoeducation
programme, participants can also better understand the benefits of change and
deduce their ability to make changes to their mind set and behaviour which will
impact their stress response. Psychoeducational SMIs could also instruct on
stress reduction techniques such as relaxation and build knowledge and use of
suitable coping strategies.
These types of intervention aim to initiate a learning process whereby reduction
of stress-related symptoms would be expected to occur over time. This is
thought to happen due to a gain in knowledge and subsequent behavioural or
mind set changes which impact on processes described within appraisal and
coping theory (Lazarus and Folkman, 1984).
Psychoeducational SMIs are aimed at reducing perceived stress, preventing
stress response activation and thus negative secondary outcomes, rather than
151
preventing stressors from occurring in the first place. Using the Lazarus and
Folkman model (1984), stress response prevention can be accomplished by
manipulating either primary appraisal (an individual’s perceptions of potential
stress caused by the current person-environment interaction) and/or secondary
appraisal (evaluation of their ability to cope). By educating and training
individuals to manipulate their cognitive processing and managing resultant
cognitive, emotional, behavioural or physiological responses, activation of the
psychophysiological response can be limited.
The aim of intervention is therefore to reduce identification of a stressor at
primary appraisal by educating that primary appraisal can be controlled and
altering the relationship between the person and the environment. This attempts
to change cognitive processing by repressing negative appraisals and unhelpful
thinking, such as worrying, which may mediate the relationship between
stressors and psychopathology (Brosschot, Gerin, & Thayer, 2006). SMIs
should also improve secondary appraisal (the participants’ perception of
resources) and coping through developing knowledge of the importance of a
flexible coping repertoire, problem and emotion focused coping and providing
direction on techniques to achieve this.
8.1.1 Effectiveness of stress management interventions
Interventions to improve health and wellbeing are widespread and have been
reported with variable success. Many studies do not provide sufficient data to
calculate effect sizes making comparison difficult, however, some meta-
analyses have provided insights into the differences between interventions
which show effect sizes to range widely.
Richardson and Rothstein (2008) calculated an average weighted effect size
(Cohen's d) of 0.526 (95% confidence interval= 0.364, 0.687) from 36 studies
conducted over 30 years on stress management in occupational settings.
Interventions included in their meta-analysis differed greatly and included face-
to-face and remote delivery of cognitive behavioural therapy, mindfulness,
relaxation and education based interventions as well as organisational level,
policy directed and multimodal studies. However, the potential for bias to be
introduced here is high in that studies with larger effect sizes may be more likely
152
to publish Cohen’s d or other statistics that could be converted into a
standardised mean effect size.
Studies carried out in health professional student populations find
psychoeducation to be effective in teaching students how to handle stress and
prevent burnout (Dziegielewski et al., 2004; Godbey & Courage, 1994; Heaman,
1995; Roembke, 1995). These studies developed educational programmes
which were delivered face-to-face and as a result participants were reported to
have acquired knowledge (Roembke, 1995) and modified behaviour at follow up
(Heaman, 1995) which provides support for the use of stress management
seminars to reduce stress and burnout. Although none of the papers discuss, in
depth, the mechanism by which the seminars brought about change to students
stress, the indication is that reduced stress and burnout occurred as a result of
increased knowledge about stress, improved identification of stress, and the
awareness of strategies for reducing stress. Dziegielewski et al. (2004 p115)
reports that students in their experimental group ‘felt more secure in regards to
identifying, monitoring, and preparing for stress.’ They believed that it was the
application of these anticipation, recognition and preparation efforts that may
act as the preventative measure for stress reduction and burnout. One limitation
with this mode of delivery is the fact that students already undertake long hours
of study and educators may also be limited in their knowledge and available
time to deliver such extracurricular content.
Within medically-ill or psychiatrically-ill populations, technology-based programs
have been found to be as effective as face-to-face therapy (Proudfoot et al.,
2003; Titov, Sachdev, and Andrews, 2010) but data relating to non-clinical
populations are lacking. Rose et al.’s (2013) paper remarks on the literature gap
and shows an interactive web-based intervention to be effective at reducing
perceived stress and increasing perceived control over stressful situations in a
stressed, but otherwise healthy, student sample. Technology based
interventions for mental health within tertiary education were compiled and
analysed by Farrer et al. (2013) which addressed anxiety symptoms and
disorders (n= 10) and depression and anxiety symptoms (k= 8). Farrer and
colleagues found average effects of d = 0.84 (range -0.07 to 2.66) and d= 0.54
(range -0.07 to 3.04) respectively for the two groups of interventions, indicating
153
promise for the use of some internet-based technology to support student
health and wellbeing.
The most referenced SMI in tertiary education is MyStudentBody-Stress; an
online, multimedia programme developed to provide stress education along with
motivational feedback about stress management (Chiauzzi et al., 2008). After
recognising the use of tailored motivational feedback to influence health
behaviours including alcoholism, drug use, diet, exercise and smoking, Chiauzzi
et al.’s study aimed to test the effect of a similar intervention on students’
perceived stress and adjustment to stressors. Participants complete a series of
online questionnaires encompassing physical stress signs, life events, daily
hassles, coping and depression measures. Feedback was provided based on
their scores for each of the five questionnaires and included suggestions such
as additional reading, stress reduction strategies, contact details of support and
interactive online tools. Participants using Chiauzzi et al.’s intervention were
found to have increased physical activity, decreased anxiety and family
problems and improvements in stress management in comparison to the
controls. These effects appeared to be short term however, and at six month
follow up student’s scores were not significantly different. Use of the
MyStudentBody-Stress intervention did not have a significant effect on PSS-10
scores however no standardised effect size can be interpreted from the
published data. The intervention for Chiauzzi et al.’s study was not an attempt
to address empirically identified issues within a specific cohort but rather to
provide more generic stress education and stress management advice. The
intervention developed for the current project therefore has significant
advantages over MyStudentBody-Stress as it aims to provide support targeted
at problem areas identified by the students themselves and reported in this
thesis. The evaluation of MyStudentBody-Stress evidenced significant student
satisfaction with the online intervention which is encouraging and will be taken
into consideration during development of the intervention in this study.
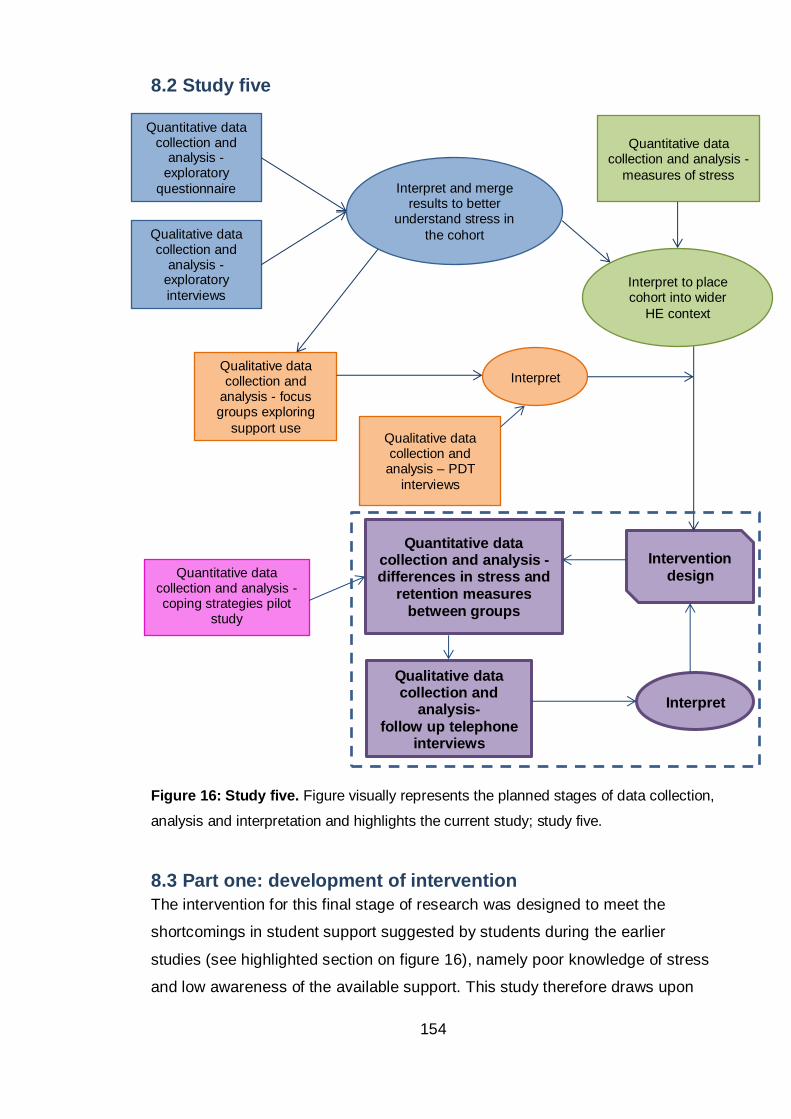
154
8.2 Study five
Figure 16: Study five. Figure visually represents the planned stages of data collection,
analysis and interpretation and highlights the current study; study five.
8.3 Part one: development of intervention
The intervention for this final stage of research was designed to meet the
shortcomings in student support suggested by students during the earlier
studies (see highlighted section on figure 16), namely poor knowledge of stress
and low awareness of the available support. This study therefore draws upon
Intervention
design
Quantitative data collection and analysis - differences in stress and
retention measures between groups
Qualitative data collection and
analysis- follow up telephone
interviews
Interpret
Quantitative data collection and analysis - coping strategies pilot
study
Qualitative data collection and
analysis – PDT
interviews
Quantitative data collection and
analysis -exploratory
questionnaire
Qualitative data collection and
analysis -exploratory
interviews
Interpret and merge results to better
understand stress in
the cohort
Qualitative data collection and
analysis - focus groups exploring
support use
Quantitative data collection and analysis -
measures of stress
Interpret to place cohort into wider
HE context
Interpret
155
the data presented throughout the thesis in conjunction with research questions
one and two: ‘what is the level of stress reported by non-health professional
BSc students at the host university and how does it compare to available
literature on students undertaking health professional BSc studies?’ and ‘how
do non-health professional BSc students utilise the university support services
and individual coping strategies to mediate stress and intentions towards
withdrawal?’.
This study also acts on the findings of study four (investigation of students’
individual coping strategies) which suggests benefits to reduced maladaptive
coping (see highlighted section on figure 16). To do this, a stress education
resource was designed and a controlled trial implemented to evaluate its ability
to affect perceived stress, student awareness and use of support and attitudes
towards stress and stress management. Data collection in this study therefore
relates to answering research question three (Is there a link between stress and
student withdrawal which could be exploited to improve both student wellbeing
and continuation through the use of an intervention?) by seeking to modify
continuation through manipulating a student’s perception of, and ability to cope
with, stress.
Looking at wellbeing in the workplace literature, interventions are described as
primary, secondary or tertiary depending on whether the aim is to reduce
stressors, improve individuals’ perception of stress and available resources or
reduce stress related conditions such as anxiety or depression, respectively
(Institute of Work, Health & Organisations, 2008). Removing all stressors from
HE would not be possible or advisable. Students need to be stretched to
improve their knowledge of the subject and to perform optimally to achieve good
degree classifications and also to prepare themselves for the world of work
where stressors such as time pressure also exist. With no academic pressure
many students would plateau. Instead students must be encouraged to use HE
as a stage for building academic and life skills which will be transferable to the
workplace such as learning to be resilient and cope under pressure. Study two
found that low perceived stress, as measured by PSS-14, was a better predictor
of continuation than high stress was of withdrawal. Therefore, it is hoped that an
intervention designed to improve students’ perceptions of their ability to cope
156
and reduce their perception of stressors may be able to exert positive influence
on continuation.
For this reason and to fill gaps in students’ understandings of the available
support and when to ask for help; the intervention described here applied the
transactional model of stress and coping, with an emphasis on secondary rather
than primary aims, through education of stress and stress management. By
improving one’s ability to cope and perceive stressors more positively, as
challenges rather than threats, a secondary intervention can also hope to have
improved tertiary outcomes such as continuation.
Steps within the common instructional systems design (ISD) model ADDIE were
followed as a guide to the resource’s development. These steps included
Assess needs, Design, Develop, Implement, and Evaluate. This basic model
can be modified and its robustness improved by building in additional
evaluations at the earlier stages. Merrill et al. (1996 p2) described instructional
systems design as the ‘development of learning experiences and environments
which promote the acquisition of specific knowledge and skills by students’. ISD
literature began to incorporate cognitive theory to improve learning experience
and student performance. Most notably are the works of Gagné (1985) who
discusses the role of learning events and how these should be reflected in the
instructional process and John Sweller and colleagues (including Clark) who
have written on the topic of cognitive load and the effect of learning material
design (Clark et al., 2006). This literature was consulted prior to commencing
the design stage of resource development to identify areas of good practice that
could be implemented in the current study.
The learning object review instrument (LORI) was designed to compare
information resources (Leacock and Nesbit, 2007). For each of the nine areas
of assessment the individual LORI items below are usually scored on a 1-5 (low
- high) Likert scale. Although this study was not comparing resources the LORI
areas of assessment were used during the design stage as a model of good
practice to produce a resource that would score well if reviewed using the LORI
in the future.
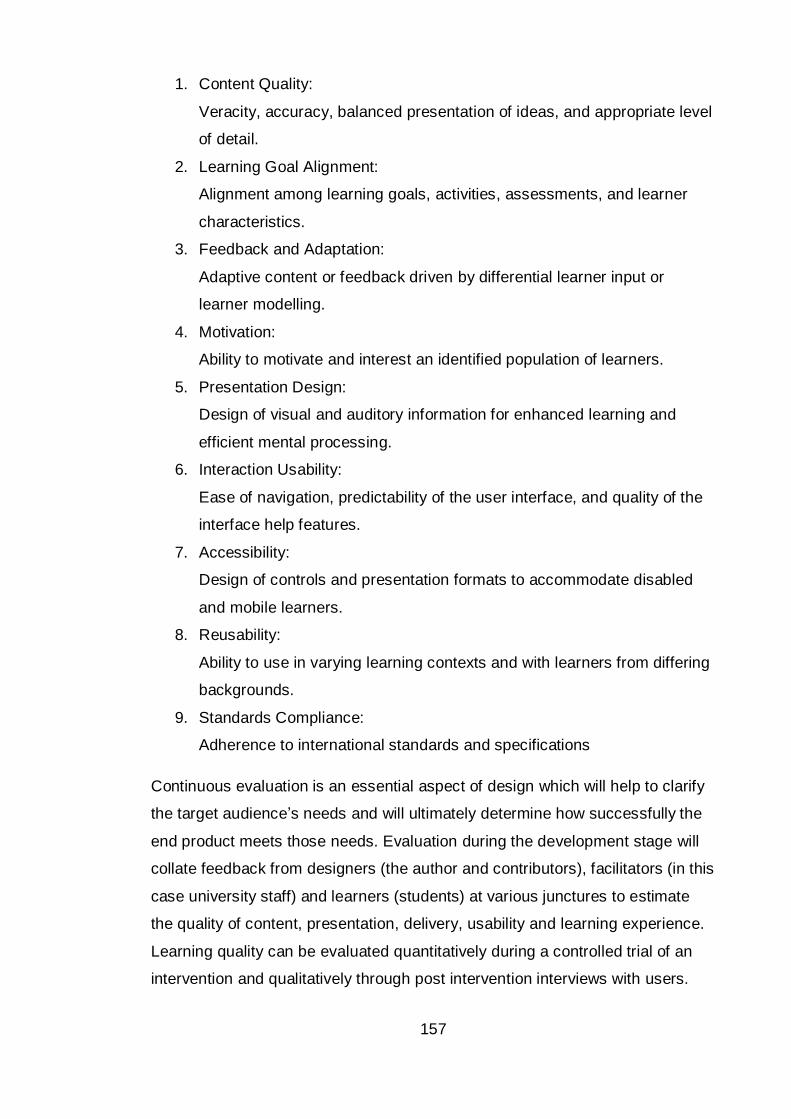
157
1. Content Quality:
Veracity, accuracy, balanced presentation of ideas, and appropriate level
of detail.
2. Learning Goal Alignment:
Alignment among learning goals, activities, assessments, and learner
characteristics.
3. Feedback and Adaptation:
Adaptive content or feedback driven by differential learner input or
learner modelling.
4. Motivation:
Ability to motivate and interest an identified population of learners.
5. Presentation Design:
Design of visual and auditory information for enhanced learning and
efficient mental processing.
6. Interaction Usability:
Ease of navigation, predictability of the user interface, and quality of the
interface help features.
7. Accessibility:
Design of controls and presentation formats to accommodate disabled
and mobile learners.
8. Reusability:
Ability to use in varying learning contexts and with learners from differing
backgrounds.
9. Standards Compliance:
Adherence to international standards and specifications
Continuous evaluation is an essential aspect of design which will help to clarify
the target audience’s needs and will ultimately determine how successfully the
end product meets those needs. Evaluation during the development stage will
collate feedback from designers (the author and contributors), facilitators (in this
case university staff) and learners (students) at various junctures to estimate
the quality of content, presentation, delivery, usability and learning experience.
Learning quality can be evaluated quantitatively during a controlled trial of an
intervention and qualitatively through post intervention interviews with users.
158
8.3.1 Methods
Design and evaluation of the educational resource was undertaken following the
ADDIE procedure as outlined below.
8.3.1.1 Assess needs
a. Identification of the areas where additional training or education should be
targeted.
These areas were identified earlier in the thesis as; poor knowledge of stress
and when to seek support; low awareness of the support available; stigma
surrounding admitting to stress and seeking support; and detrimental effect of
maladaptive coping.
b. Identification of delivery methods.
The methods available include: paper based hand-outs or an online resource
which could be either standalone or integrated within the university’s current
virtual learning environment (VLE). Resources could be generated within the
current VLE or could be separate and accessed via an external website. A third
option would be to deliver the information orally in a workshop style format.
c. Evaluation of delivery methods, assessing cost and time restraints, available
resources, maximising audience and complementing current support.
With a paper based method only students on campus who receive the hand-out
can be reached with the same being true for face to face delivery, only students
who attend the workshop will be reached. There is therefore potential for an
online resource to reach more students through link sharing, ‘stumbling’ and
web searches. Literature from Wantland et al. (2004) would suggest that the
use of an online intervention is more effective at increasing health behaviour
knowledge compared to use of non-web-based interventions. However,
anecdotally it has been noticed that students’ use of supplementary online
teaching resources is low and that information delivered directly to students,
orally or on paper, is therefore more likely to be absorbed by the majority. Paper
versions are more expensive to generate, less environmentally friendly, more
time consuming to disseminate and mistakes and updates are more costly to
revise. Another problem with a paper based resource is the size limitation, to be
an effective hand-out, information must be concise and a maximum of one page
159
in length. There is no such limit to an online resource where additional
information can be placed on links and accessed by the reader if they wish to
see more detail on the topic. It is also possible with an online resource to make
use of multimedia to appeal to variable learning styles. Although a workshop
could cover topics in depth and in an interactive way, it has been observed
within our faculty that extra-circular workshops and seminars have been poorly
attended in the past. Therefore this method could not justify the time and
financial cost associated with the design of a workshop, training of facilitators to
ensure quality and continuity, room rental, advertising and delivery of multiple
workshops to suit student groups across the faculty.
In conclusion, an online resource appears to have considerable advantages in
terms of the content that can be included and the degree of customisation the
user can have over their learning experience (Chiauzzi et al., 2008). For
example, audio visual clips can be included for auditory learners and additional
links can allow students to choose the depth to which they learn. The potential
to include adaptive content and feedback is also available through an online
delivery method. However one drawback could be that uptake of an online
resource may be lower than information given directly to students. This has
been observed elsewhere in the faculty and it can be surmised to be due to the
overwhelming volume of online learning objects that students are already
exposed to through their academic studies. On balance and taking into
consideration the significant satisfaction with and acceptance of Chiauzzi’s
MyStudentBody-Stress, it was decided that a comprehensive online resource
would be designed and piloted to test student receptiveness. If uptake of the
online resource appears acceptable testing will move forward to a controlled
trail. A brief version of the online information will be developed into a paper
based hand-out which will act as a control intervention during the final
evaluation stage. This control intervention is important for two reasons, firstly
because most studies show any intervention to be better than no intervention
leading to false positive effects being reported for an intervention which has no
control. Secondly, comparing the success of the online and paper based
resources will allow differential uptake of the two delivery methods to be
explored.
160
8.3.1.2 Design
a) Following the decision to produce an online resource, variations on the
format and assistive tools were explored.
The choices available for assistive tools were shortlisted on the criteria of ease
of use and therefore included tools which the researcher had used in the past or
that have extensive online support or beginners’ courses. The shortlisted
programs included WordPress which would facilitate the development of a
website or blog, the URL of which could be provided to students in email or on
the VLE. Learning object tools exist which enable a standalone resource to be
built and then if necessary allow integration within a VLE. The Learning Object
Creator (LOC) produced by the Centre for Languages, Linguistics and Area
Studies at the University of Southampton is supported by a beginner’s guide
course. Access to the course ‘developing learning objects in LOC’ was available
through Edinburgh Napier University (ENU) free of charge. Through the LOC a
resource can be developed that can be accessed externally via a unique URL
or imported into the VLE and accessed via Moodle. A resource could also be
developed within the university’s current VLE, Moodle.
A test with WordPress showed that despite the online support available,
customising a web-site would be more time consuming than initially anticipated.
After investigation there did not appear to be sufficient support available online
or in-house, to assist with the development of such a resource within Moodle.
Given the training available on LOC and the choice to have material sit within
Moodle it was decided that the online resource would be designed for and
developed using LOCs browser based editor.
b) Generation of content to address areas identified above.
Evidence suggests that additional learning and support could be beneficial in
the areas of recognising stress and when to seek support, increasing students’
knowledge of the support available, reducing stigma associated with stress and
accessing help and reducing the use of maladaptive strategies. The following
bite-sized learning elements were decided upon which would cumulatively
address these areas i) what is stress?, ii) causes of stress and monitoring
stress, iii) coping with stress and iv) available support. The four separate
161
sections can then be used in isolation, reducing the amount of information
presented to the student at one time and allowing students to go directly to
particular topics.
The concept of each of the four learning elements is explained in more detail
below. Additional features within each element were also researched in line with
learning object literature and the ideas of variable learning styles, instruction
associated with learning events and cognitive load.
i) What is stress?
This section introduces what stress is and will help students to understand more
about the process and how stress can be beneficial if kept within an individual’s
limits. Images used here help depict the process and the classic ‘stress curve’
visually shows the effect of increasing stress on an individual. The information
allows students to become more aware of symptoms that could be the result of
stress therefore assisting in early detection and subsequently early intervention.
Importantly this section addresses stigma by showing how stress is something
that affects us all, that it is not a sign of weakness to ask for support and that
asking for help early can help reduce the risk of problems escalating and
affecting performance at university. A video available from the NHS, which will
likely be viewed as a reputable source, summarises the background information
on the topic and provides an alternative for more visual-audial learners.
ii) Causes of stress and monitoring stress
This section covers common causes of stress and demonstrates ways of
monitoring your stress. A link to an online version of the Perceived Stress Scale
(Wellmind Media Ltd., 2014) allows students to keep track of their stress levels
and receive pre-generated feedback based on their score. The information in
this learning element demonstrates how keeping track of stress is important,
showing that when stress is prolonged it becomes the ‘normal’ state and it is
then difficult for individuals to gauge exactly how much stress they are under or
how much better they could feel with just a few changes. This section leads
onto section three which informs students about what changes they can make
to their attitudes and coping strategies in order to reduce stress.
162
The section concludes with an interactive method of monitoring heart rate,
which can be used as an indicator of stress, using a free web application. The
application’s accuracy was tested prior to recommendation and was found to be
accurate when used as instructed in daylight. The section also describes how
the app can be used as a biofeedback method of stress management via deep
breathing to bring about heart rate reduction. Breathing and other related
techniques (e.g. progressive muscle relaxation) requires the participant to give
attention to their breathing or muscle activity and to identify even small
changes. The rationale being that relaxation, breathing and muscle tension are
linked through autonomic activity and consequently impact on stress levels.
Biofeedback can be used to achieve relaxation and this is based on the
principle that people learn best when in receipt of feedback on their
performance. In this instance the participant will receive biofeedback through
the online application about their physiological function i.e. their breathing. The
idea is that, using the biofeedback, over time the individual will learn to use the
breathing technique to control their autonomic activity without the need for the
app (Murphy, 1996). Van der Klink et al. (2001) found small but positive effects
of physical and psychological relaxation techniques on psychologic responses
and resources, physiology and anxiety symptoms.
iii) Coping with stress
This section discusses positive and negative ways of coping, why positive ways
are more advantageous and helps students to decide if they use adaptive or
maladaptive strategies via a quick, tick box test. The information also outlines
the effect of a positive outlook on the physiological and psychological stress
response. This sub-section includes a TedTalk video which discusses relevant
scientific research studies in an accessible format (McGonigal, 2013). The
addition of this media again helps bring a robust, reputable and credible
impression to the intervention. It is hoped that these traits will increase uptake
and use within the BSc student cohort. Including a video also helps to reach
those with audio-visual learning styles.
Due to the necessity to pilot and evaluate during term time when students are
available on campus this section was underdeveloped with regards to
information on reducing maladaptive strategies such as avoidance and
163
distraction; which was shown in study four (investigation of students’ individual
coping strategies using the Brief COPE) to be an indicator of perceived stress
and intention to withdraw. Further research is still required to advance this
section of the intervention and ways of encouraging students to reduce their use
of maladaptive strategies need to be tested in themselves before inclusion
within the larger intervention.
iv) Available support
Section four introduces students to the help and support offered by ENU. The
information explains how accessing support early can help students take better
control of their studies and life while at university which will in turn build
resilience and help them to manage their own stress in the future. Students
reported during earlier data collection that they were not familiar with the
student support staff and that this was a barrier to accessing support. To
address this, support staff were filmed describing their role within the
university’s Student and Academic Services (SAS) department. The video clips
had two functions, firstly to introduce students to the support staff and secondly
to provide examples of the support each staff member offers thus helping
students in their decision of which service to access. Videos were kept brief,
around one minute in length, but additional information was available through
links to the SAS webpages. For accessibility, the videos were subtitled in a
minimisable box below and contact details for each staff member were
displayed throughout the video.
Draft plans were written for each of the four sections using the LOC planner
(see appendix four).
c) Evaluation of content (by author and supervisory team)
The draft plan was initially reviewed by the research team and amendments to
the content made as deemed appropriate. Ethical approval was obtained from
the relevant Faculty committee to pilot the online resource and, if successful, to
run a controlled trial with the online intervention and a control intervention.
164
8.3.1.3 Development
a) Online development
Content was entered into the LOC tool following the plans generated above.
b) Evaluation by developer
Ease of use, appearance, navigation, compatibility of the assistive tools with
content and ability to integrate with Moodle were assessed by the developer.
The functionality of the various videos and links were tested in the LOC tool and
again after the tool was integrated within Moodle. The resource navigated well
and changes to the appearance were made to improve the visual continuity
between LOC and Moodle.
c) Evaluation of media by the support staff who contributed videos for the
resource
SAS staff were asked to review their video contribution and the accompanying
text for accuracy and any revisions were made as necessary. Once satisfied
that the media were error free and truly represented their particular service, staff
provided written permission for their video to be used within the intervention.
d) Evaluation by student users
Students were invited to review the completed sections of the online resource
(sections 1-3) and their feedback on the appearance, content and usability was
collected. Students were also questioned on how long they felt they would
spend on the resource and whether they would recommend the resource to
their peers. From this we were able to gauge the satisfaction and potential
uptake of the resource. Eleven third year biology students (36% males, 64%
females) volunteered to review the intervention and their feedback is
summarised in table 21. Females have been more willing than males to
participate throughout the project and the gender split of this sample was again
slightly more biased towards female participants (in comparison to university
reported figures for Life Science which are approx. 48% males to 52% females).
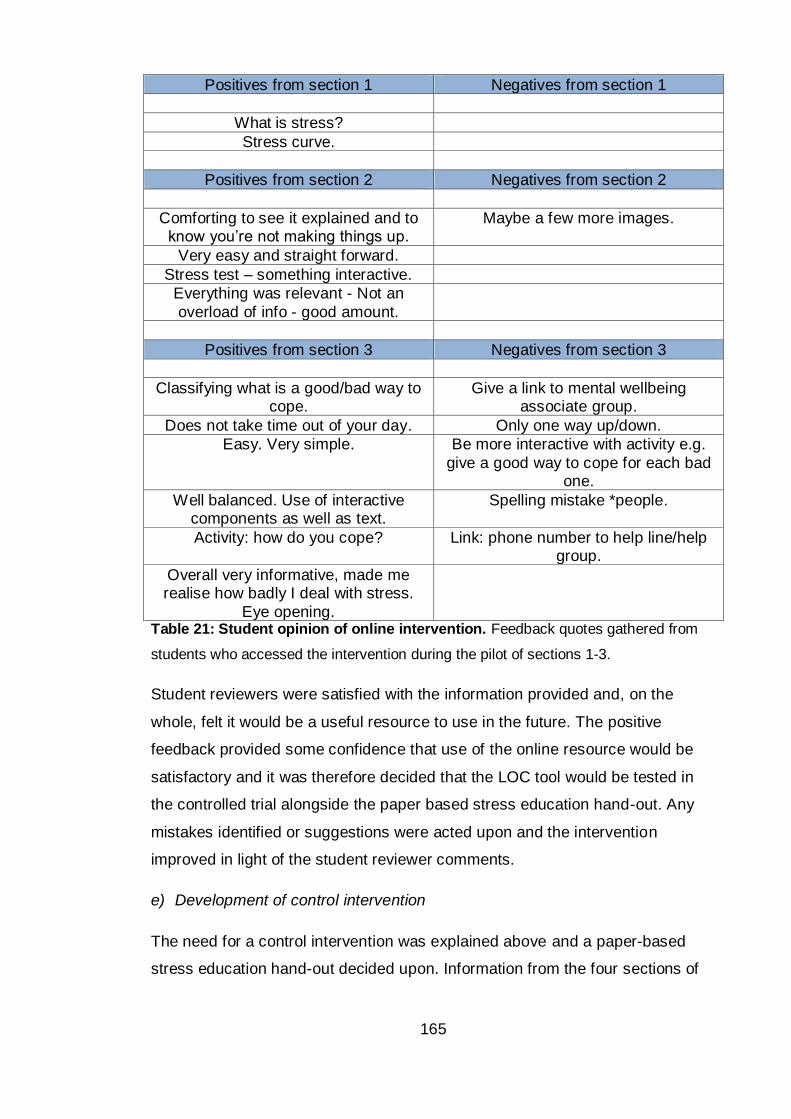
165
Positives from section 1 Negatives from section 1
What is stress?
Stress curve.
Positives from section 2 Negatives from section 2
Comforting to see it explained and to know you’re not making things up.
Maybe a few more images.
Very easy and straight forward.
Stress test – something interactive.
Everything was relevant - Not an
overload of info - good amount.
Positives from section 3 Negatives from section 3
Classifying what is a good/bad way to cope.
Give a link to mental wellbeing associate group.
Does not take time out of your day. Only one way up/down.
Easy. Very simple. Be more interactive with activity e.g.
give a good way to cope for each bad one.
Well balanced. Use of interactive components as well as text.
Spelling mistake *people.
Activity: how do you cope? Link: phone number to help line/help group.
Overall very informative, made me realise how badly I deal with stress.
Eye opening.
Table 21: Student opinion of online intervention. Feedback quotes gathered from
students who accessed the intervention during the pilot of sections 1-3.
Student reviewers were satisfied with the information provided and, on the
whole, felt it would be a useful resource to use in the future. The positive
feedback provided some confidence that use of the online resource would be
satisfactory and it was therefore decided that the LOC tool would be tested in
the controlled trial alongside the paper based stress education hand-out. Any
mistakes identified or suggestions were acted upon and the intervention
improved in light of the student reviewer comments.
e) Development of control intervention
The need for a control intervention was explained above and a paper-based
stress education hand-out decided upon. Information from the four sections of
166
the online resource were condensed into one side of A4 to form a paper based
hand-out (appendix five).
8.3.1.4 Implementation
a) Upload to Moodle (VLE)
The online intervention was uploaded to the Moodle training server and an
introductory video added to the home page that introduced students to the
resource and explained the need for and the importance of stress education.
Students were also introduced to the intervention as part of the recruitment for
the controlled trial evaluation described below.
8.3.1.5 Evaluation
a) Controlled trial
A controlled trial (CT) was designed to test the effectiveness of the stress
education intervention at increasing students’ knowledge of stress and coping,
awareness of available support and reducing perceived stress.
b) Feedback on the intervention post control trial
On the pre-intervention questionnaire students were asked to give their
permission for a follow-up telephone interview and to provide a number which
they agreed to be contacted on. Students in the intervention groups were
contacted following the end of the exam period to better understand the use and
effectiveness of the interventions. During telephone interviews students were
asked to comment on why they had or had not used the intervention available to
them.
The two evaluation stages are described in more detail along with their
respective results in parts two and three of study five, below.
8.4 Part two: controlled trial
The main interest of this study is the effect of an intervention on student stress,
mental health and coping as measured by PSS-14, GHQ-12 and Brief COPE.
The CT consisted of a pre and post intervention questionnaire which measured
perceived stress (PSS-14), knowledge of support, general health (GHQ-12),
use of coping strategies (Brief COPE), intention to continue with HE and
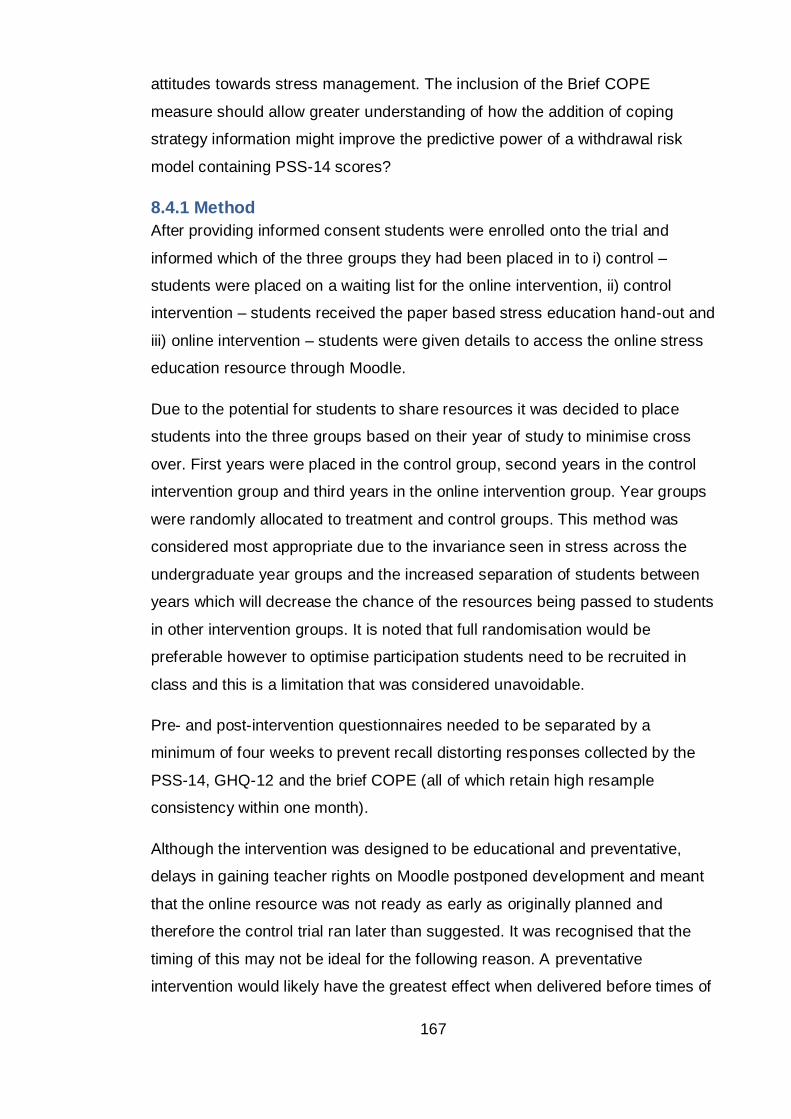
167
attitudes towards stress management. The inclusion of the Brief COPE
measure should allow greater understanding of how the addition of coping
strategy information might improve the predictive power of a withdrawal risk
model containing PSS-14 scores?
8.4.1 Method
After providing informed consent students were enrolled onto the trial and
informed which of the three groups they had been placed in to i) control –
students were placed on a waiting list for the online intervention, ii) control
intervention – students received the paper based stress education hand-out and
iii) online intervention – students were given details to access the online stress
education resource through Moodle.
Due to the potential for students to share resources it was decided to place
students into the three groups based on their year of study to minimise cross
over. First years were placed in the control group, second years in the control
intervention group and third years in the online intervention group. Year groups
were randomly allocated to treatment and control groups. This method was
considered most appropriate due to the invariance seen in stress across the
undergraduate year groups and the increased separation of students between
years which will decrease the chance of the resources being passed to students
in other intervention groups. It is noted that full randomisation would be
preferable however to optimise participation students need to be recruited in
class and this is a limitation that was considered unavoidable.
Pre- and post-intervention questionnaires needed to be separated by a
minimum of four weeks to prevent recall distorting responses collected by the
PSS-14, GHQ-12 and the brief COPE (all of which retain high resample
consistency within one month).
Although the intervention was designed to be educational and preventative,
delays in gaining teacher rights on Moodle postponed development and meant
that the online resource was not ready as early as originally planned and
therefore the control trial ran later than suggested. It was recognised that the
timing of this may not be ideal for the following reason. A preventative
intervention would likely have the greatest effect when delivered before times of
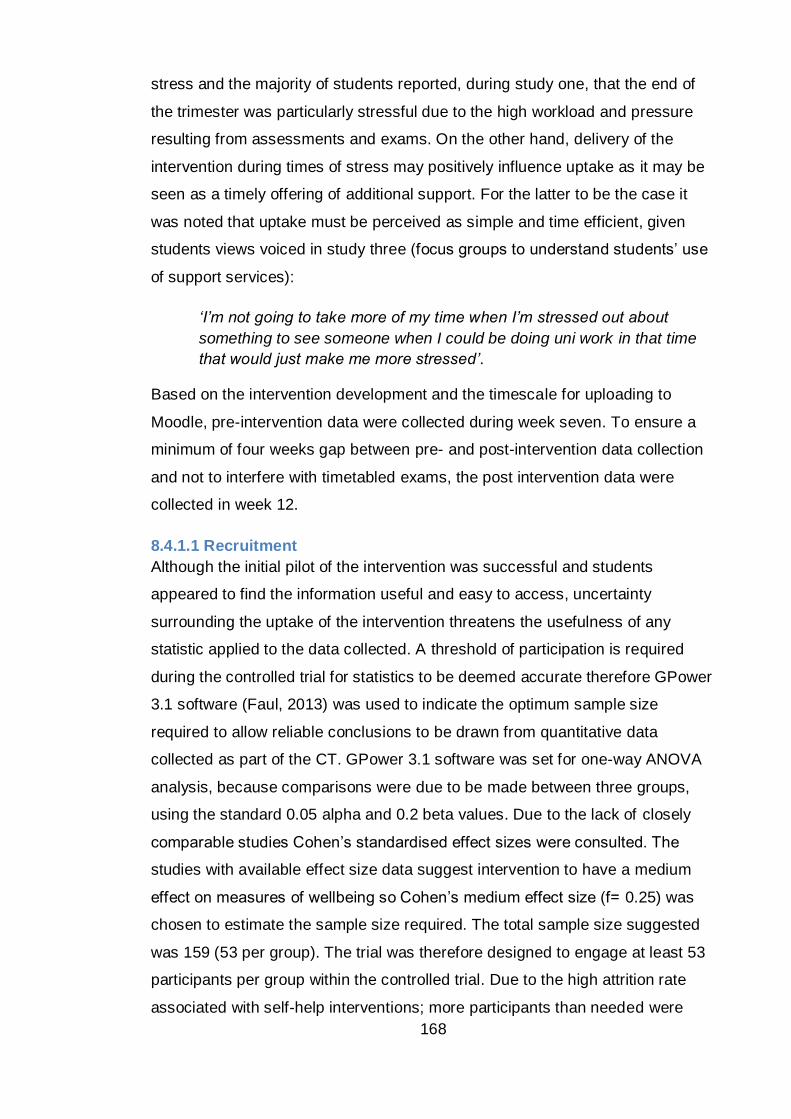
168
stress and the majority of students reported, during study one, that the end of
the trimester was particularly stressful due to the high workload and pressure
resulting from assessments and exams. On the other hand, delivery of the
intervention during times of stress may positively influence uptake as it may be
seen as a timely offering of additional support. For the latter to be the case it
was noted that uptake must be perceived as simple and time efficient, given
students views voiced in study three (focus groups to understand students’ use
of support services):
‘I’m not going to take more of my time when I’m stressed out about
something to see someone when I could be doing uni work in that time
that would just make me more stressed’.
Based on the intervention development and the timescale for uploading to
Moodle, pre-intervention data were collected during week seven. To ensure a
minimum of four weeks gap between pre- and post-intervention data collection
and not to interfere with timetabled exams, the post intervention data were
collected in week 12.
8.4.1.1 Recruitment
Although the initial pilot of the intervention was successful and students
appeared to find the information useful and easy to access, uncertainty
surrounding the uptake of the intervention threatens the usefulness of any
statistic applied to the data collected. A threshold of participation is required
during the controlled trial for statistics to be deemed accurate therefore GPower
3.1 software (Faul, 2013) was used to indicate the optimum sample size
required to allow reliable conclusions to be drawn from quantitative data
collected as part of the CT. GPower 3.1 software was set for one-way ANOVA
analysis, because comparisons were due to be made between three groups,
using the standard 0.05 alpha and 0.2 beta values. Due to the lack of closely
comparable studies Cohen’s standardised effect sizes were consulted. The
studies with available effect size data suggest intervention to have a medium
effect on measures of wellbeing so Cohen’s medium effect size (f= 0.25) was
chosen to estimate the sample size required. The total sample size suggested
was 159 (53 per group). The trial was therefore designed to engage at least 53
participants per group within the controlled trial. Due to the high attrition rate
associated with self-help interventions; more participants than needed were
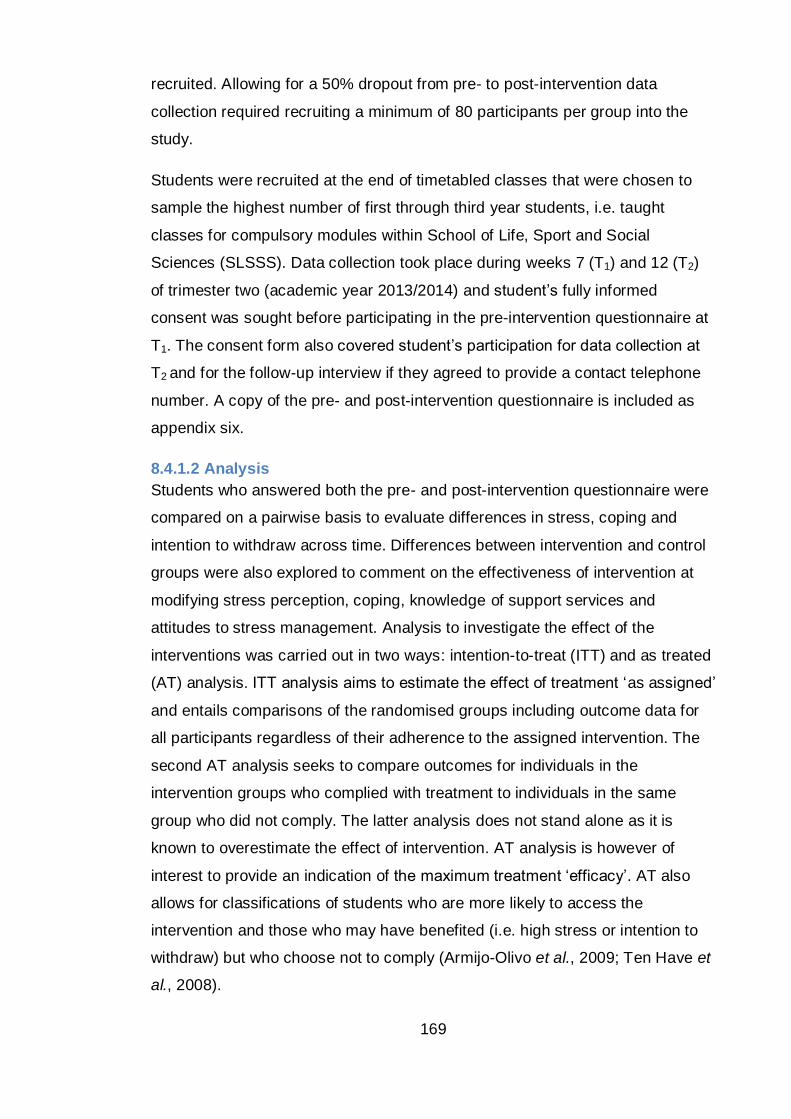
169
recruited. Allowing for a 50% dropout from pre- to post-intervention data
collection required recruiting a minimum of 80 participants per group into the
study.
Students were recruited at the end of timetabled classes that were chosen to
sample the highest number of first through third year students, i.e. taught
classes for compulsory modules within School of Life, Sport and Social
Sciences (SLSSS). Data collection took place during weeks 7 (T1) and 12 (T2)
of trimester two (academic year 2013/2014) and student’s fully informed
consent was sought before participating in the pre-intervention questionnaire at
T1. The consent form also covered student’s participation for data collection at
T2 and for the follow-up interview if they agreed to provide a contact telephone
number. A copy of the pre- and post-intervention questionnaire is included as
appendix six.
8.4.1.2 Analysis
Students who answered both the pre- and post-intervention questionnaire were
compared on a pairwise basis to evaluate differences in stress, coping and
intention to withdraw across time. Differences between intervention and control
groups were also explored to comment on the effectiveness of intervention at
modifying stress perception, coping, knowledge of support services and
attitudes to stress management. Analysis to investigate the effect of the
interventions was carried out in two ways: intention-to-treat (ITT) and as treated
(AT) analysis. ITT analysis aims to estimate the effect of treatment ‘as assigned’
and entails comparisons of the randomised groups including outcome data for
all participants regardless of their adherence to the assigned intervention. The
second AT analysis seeks to compare outcomes for individuals in the
intervention groups who complied with treatment to individuals in the same
group who did not comply. The latter analysis does not stand alone as it is
known to overestimate the effect of intervention. AT analysis is however of
interest to provide an indication of the maximum treatment ‘efficacy’. AT also
allows for classifications of students who are more likely to access the
intervention and those who may have benefited (i.e. high stress or intention to
withdraw) but who choose not to comply (Armijo-Olivo et al., 2009; Ten Have et
al., 2008).
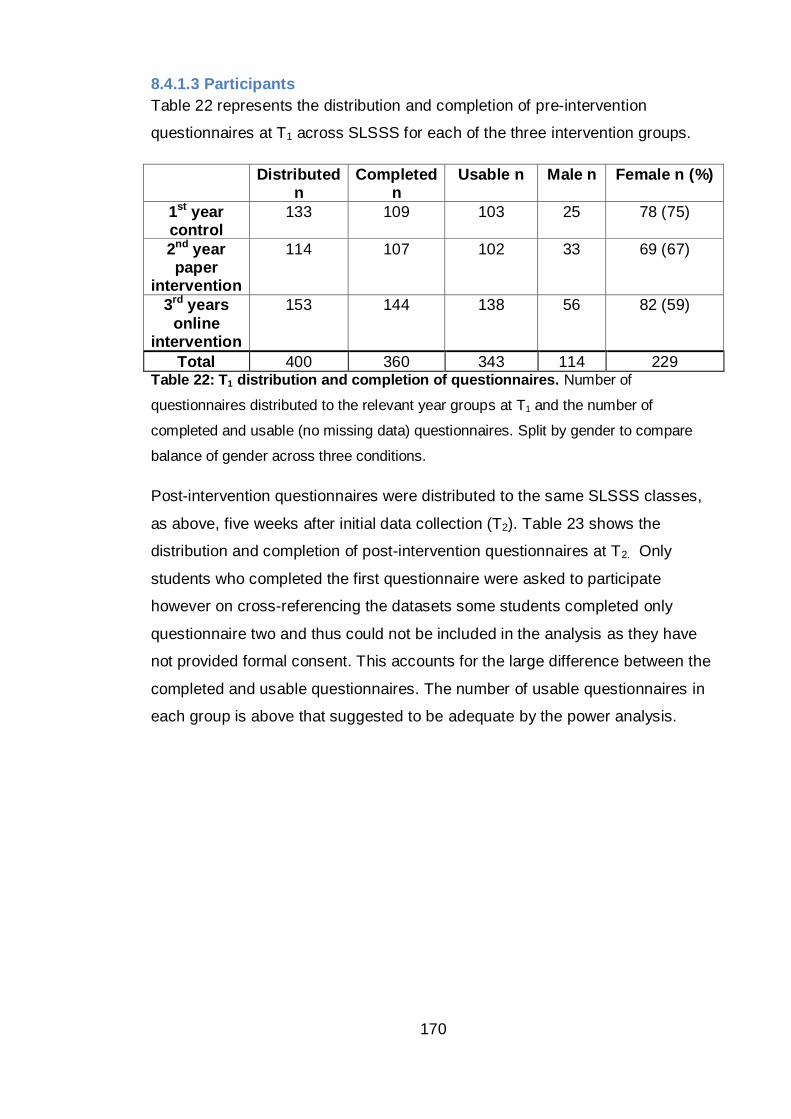
170
8.4.1.3 Participants
Table 22 represents the distribution and completion of pre-intervention
questionnaires at T1 across SLSSS for each of the three intervention groups.
Distributed n
Completed n
Usable n Male n Female n (%)
1st year control
133 109 103 25 78 (75)
2nd year paper
intervention
114 107 102 33 69 (67)
3rd years
online intervention
153 144 138 56 82 (59)
Total 400 360 343 114 229 Table 22: T1 distribution and completion of questionnaires. Number of
questionnaires distributed to the relevant year groups at T1 and the number of
completed and usable (no missing data) questionnaires. Split by gender to compare
balance of gender across three conditions.
Post-intervention questionnaires were distributed to the same SLSSS classes,
as above, five weeks after initial data collection (T2). Table 23 shows the
distribution and completion of post-intervention questionnaires at T2. Only
students who completed the first questionnaire were asked to participate
however on cross-referencing the datasets some students completed only
questionnaire two and thus could not be included in the analysis as they have
not provided formal consent. This accounts for the large difference between the
completed and usable questionnaires. The number of usable questionnaires in
each group is above that suggested to be adequate by the power analysis.
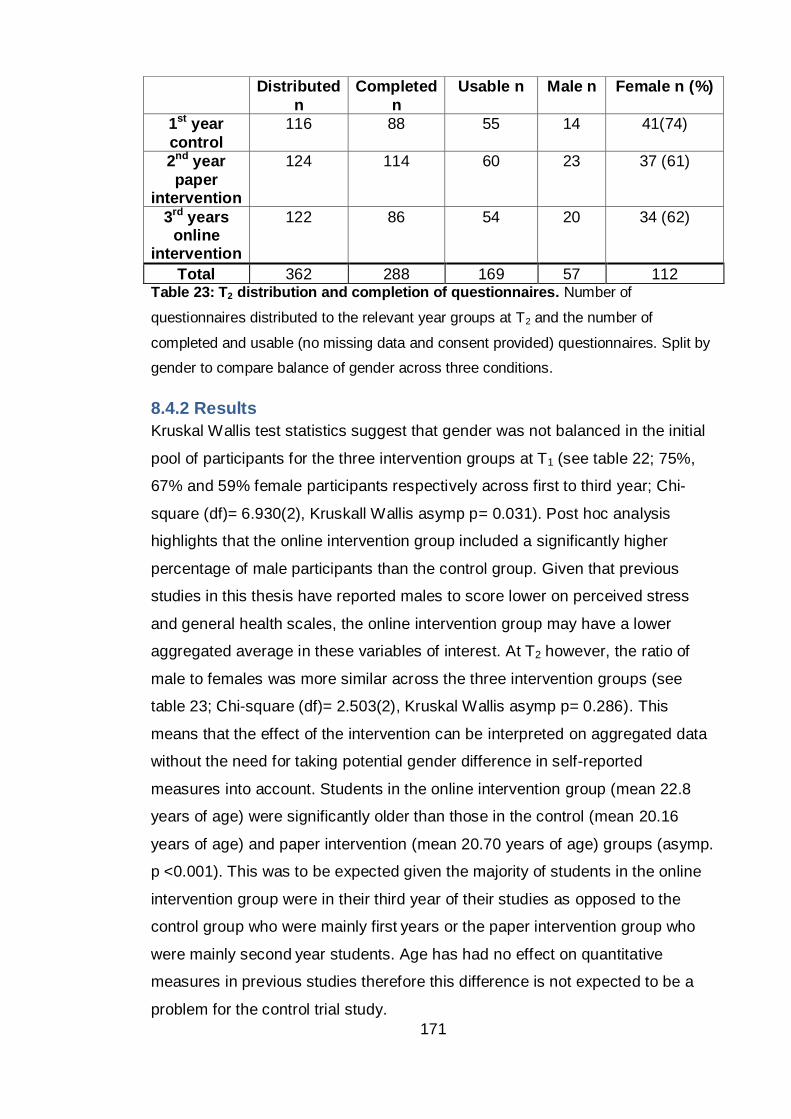
171
Table 23: T2 distribution and completion of questionnaires. Number of
questionnaires distributed to the relevant year groups at T2 and the number of
completed and usable (no missing data and consent provided) questionnaires. Split by
gender to compare balance of gender across three conditions.
8.4.2 Results
Kruskal Wallis test statistics suggest that gender was not balanced in the initial
pool of participants for the three intervention groups at T1 (see table 22; 75%,
67% and 59% female participants respectively across first to third year; Chi-
square (df)= 6.930(2), Kruskall Wallis asymp p= 0.031). Post hoc analysis
highlights that the online intervention group included a significantly higher
percentage of male participants than the control group. Given that previous
studies in this thesis have reported males to score lower on perceived stress
and general health scales, the online intervention group may have a lower
aggregated average in these variables of interest. At T2 however, the ratio of
male to females was more similar across the three intervention groups (see
table 23; Chi-square (df)= 2.503(2), Kruskal Wallis asymp p= 0.286). This
means that the effect of the intervention can be interpreted on aggregated data
without the need for taking potential gender difference in self-reported
measures into account. Students in the online intervention group (mean 22.8
years of age) were significantly older than those in the control (mean 20.16
years of age) and paper intervention (mean 20.70 years of age) groups (asymp.
p <0.001). This was to be expected given the majority of students in the online
intervention group were in their third year of their studies as opposed to the
control group who were mainly first years or the paper intervention group who
were mainly second year students. Age has had no effect on quantitative
measures in previous studies therefore this difference is not expected to be a
problem for the control trial study.
Distributed
n
Completed
n
Usable n Male n Female n (%)
1st year
control
116 88 55 14 41(74)
2nd year
paper intervention
124 114 60 23 37 (61)
3rd years online
intervention
122 86 54
20 34 (62)
Total 362 288 169 57 112
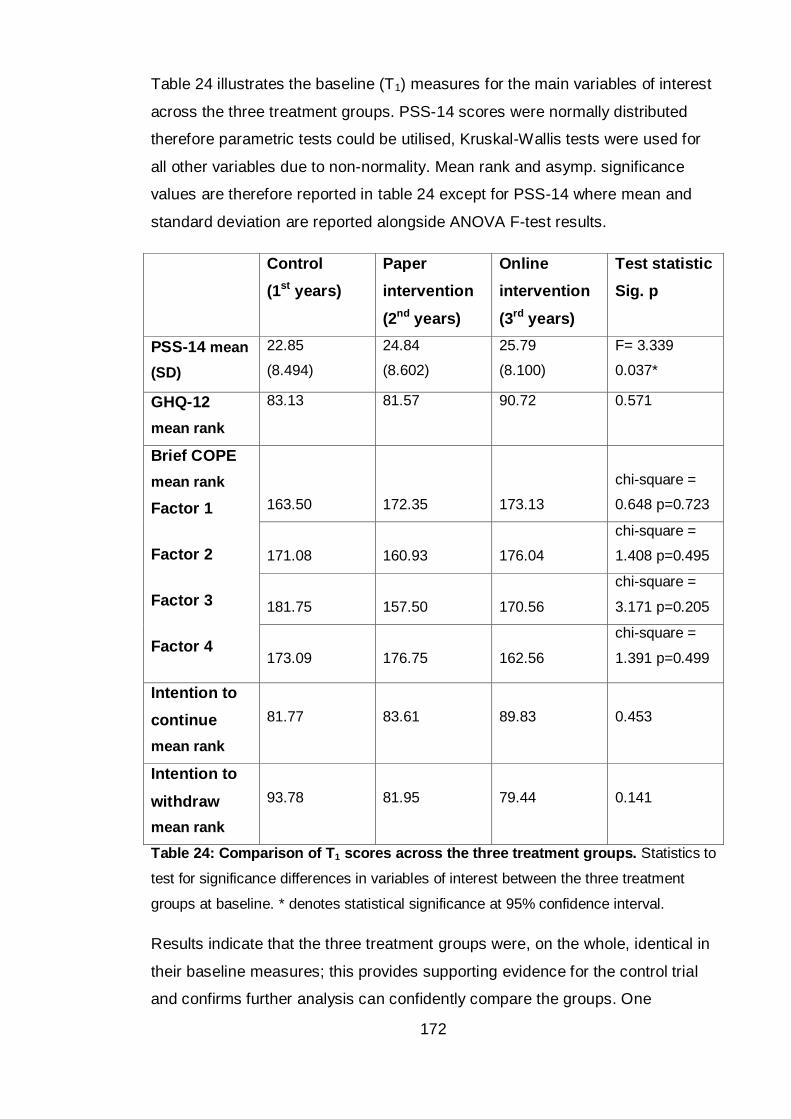
172
Table 24 illustrates the baseline (T1) measures for the main variables of interest
across the three treatment groups. PSS-14 scores were normally distributed
therefore parametric tests could be utilised, Kruskal-Wallis tests were used for
all other variables due to non-normality. Mean rank and asymp. significance
values are therefore reported in table 24 except for PSS-14 where mean and
standard deviation are reported alongside ANOVA F-test results.
Control
(1st years)
Paper
intervention
(2nd years)
Online
intervention
(3rd years)
Test statistic
Sig. p
PSS-14 mean
(SD)
22.85
(8.494)
24.84
(8.602)
25.79
(8.100)
F= 3.339
0.037*
GHQ-12
mean rank
83.13 81.57 90.72 0.571
Brief COPE
mean rank
Factor 1
Factor 2
Factor 3
Factor 4
163.50
172.35
173.13
chi-square =
0.648 p=0.723
171.08
160.93
176.04
chi-square =
1.408 p=0.495
181.75
157.50
170.56
chi-square =
3.171 p=0.205
173.09
176.75
162.56
chi-square =
1.391 p=0.499
Intention to
continue
mean rank
81.77
83.61
89.83
0.453
Intention to
withdraw
mean rank
93.78
81.95
79.44
0.141
Table 24: Comparison of T1 scores across the three treatment groups. Statistics to
test for significance differences in variables of interest between the three treatment
groups at baseline. * denotes statistical significance at 95% confidence interval.
Results indicate that the three treatment groups were, on the whole, identical in
their baseline measures; this provides supporting evidence for the control trial
and confirms further analysis can confidently compare the groups. One
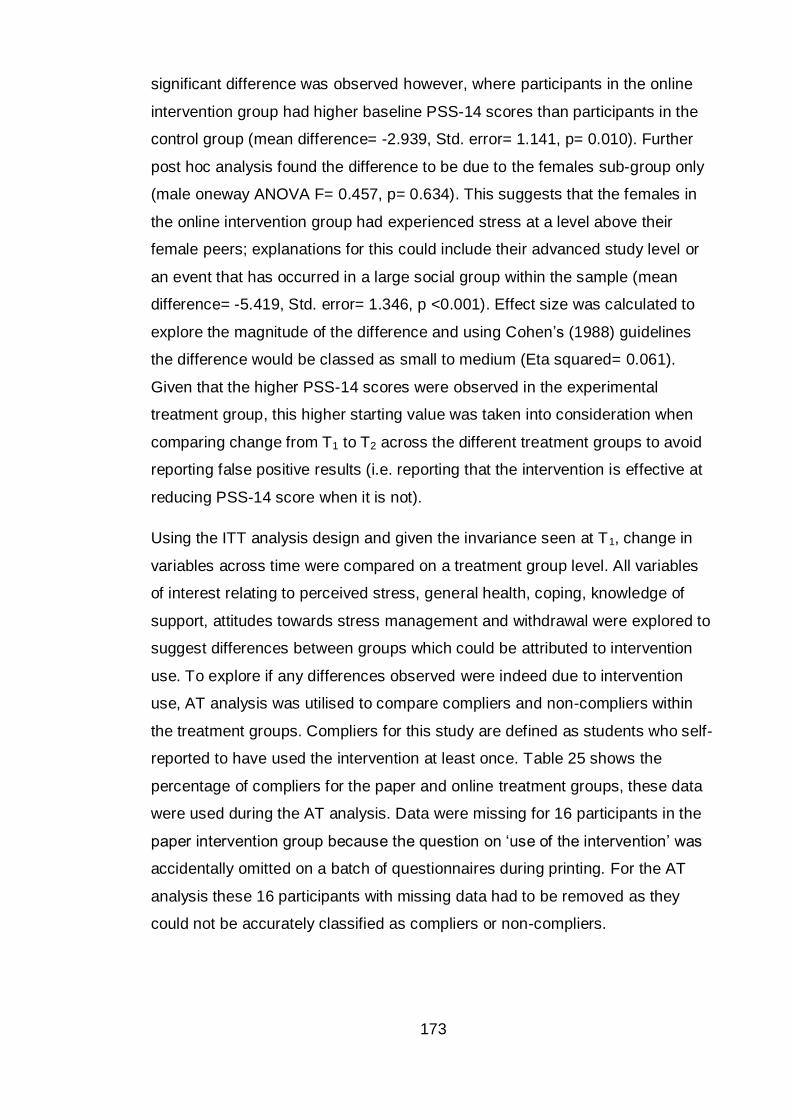
173
significant difference was observed however, where participants in the online
intervention group had higher baseline PSS-14 scores than participants in the
control group (mean difference= -2.939, Std. error= 1.141, p= 0.010). Further
post hoc analysis found the difference to be due to the females sub-group only
(male oneway ANOVA F= 0.457, p= 0.634). This suggests that the females in
the online intervention group had experienced stress at a level above their
female peers; explanations for this could include their advanced study level or
an event that has occurred in a large social group within the sample (mean
difference= -5.419, Std. error= 1.346, p <0.001). Effect size was calculated to
explore the magnitude of the difference and using Cohen’s (1988) guidelines
the difference would be classed as small to medium (Eta squared= 0.061).
Given that the higher PSS-14 scores were observed in the experimental
treatment group, this higher starting value was taken into consideration when
comparing change from T1 to T2 across the different treatment groups to avoid
reporting false positive results (i.e. reporting that the intervention is effective at
reducing PSS-14 score when it is not).
Using the ITT analysis design and given the invariance seen at T1, change in
variables across time were compared on a treatment group level. All variables
of interest relating to perceived stress, general health, coping, knowledge of
support, attitudes towards stress management and withdrawal were explored to
suggest differences between groups which could be attributed to intervention
use. To explore if any differences observed were indeed due to intervention
use, AT analysis was utilised to compare compliers and non-compliers within
the treatment groups. Compliers for this study are defined as students who self-
reported to have used the intervention at least once. Table 25 shows the
percentage of compliers for the paper and online treatment groups, these data
were used during the AT analysis. Data were missing for 16 participants in the
paper intervention group because the question on ‘use of the intervention’ was
accidentally omitted on a batch of questionnaires during printing. For the AT
analysis these 16 participants with missing data had to be removed as they
could not be accurately classified as compliers or non-compliers.
174
N Compliers (%) N Non- Compliers (%) N Data missing (%)
Paper 10 (16.65) 34 (56.65) 16 (26.7)
Online 12 (22.2) 42 (77.8) 0 Table 25: Frequency of compilers in the two treatment groups. Results indicate a
similarly small uptake for both the online and paper interventions.
As can be seen from table 25, 12 participants sampled at T2 reported to have
used the online intervention; however, 22 students are known to have enrolled
on the online course according to the VLE user descriptives. It was not possible
to see if these students were participants of the online intervention group, but
who were not sampled at T2, or if they were participants from the control groups
within the trial or students outwith the trial. The actual uptake of the online
intervention was therefore higher than the self-reported figures suggest,
however, a percentage of compliance cannot be reported because an accurate
starting population is not known.
The study did anticipate relatively low compliance for the intervention’s debut,
given low uptake of non-compulsory health interventions and educational
material by students. Uptake was to be explored further during telephone
interviews with students. Using the data collected by the VLE, it is not possible
for conclusions to be drawn regarding the original group allocation of the 22
individuals who enrolled on the online course. Some indication as to whether
these individuals were part of the trial and/or in the online intervention group
may be revealed during telephone interviews.
For the ITT analysis, change from T1 to T2 was calculated simply by subtracting
students T1 from T2 responses and the difference between treatment groups
subsequently explored. PSS-14 scores remained normally distributed at T2
therefore parametric tests could be utilised, Kruskal-Wallis tests were used for
all other variables due to non-normality, Mann-Whitney U tests were used post
hoc. Mean rank and asymp. significance values are therefore reported in table
26 except for PSS-14 where ANOVA F-test results are reported along with the
LSD post hoc analysis.
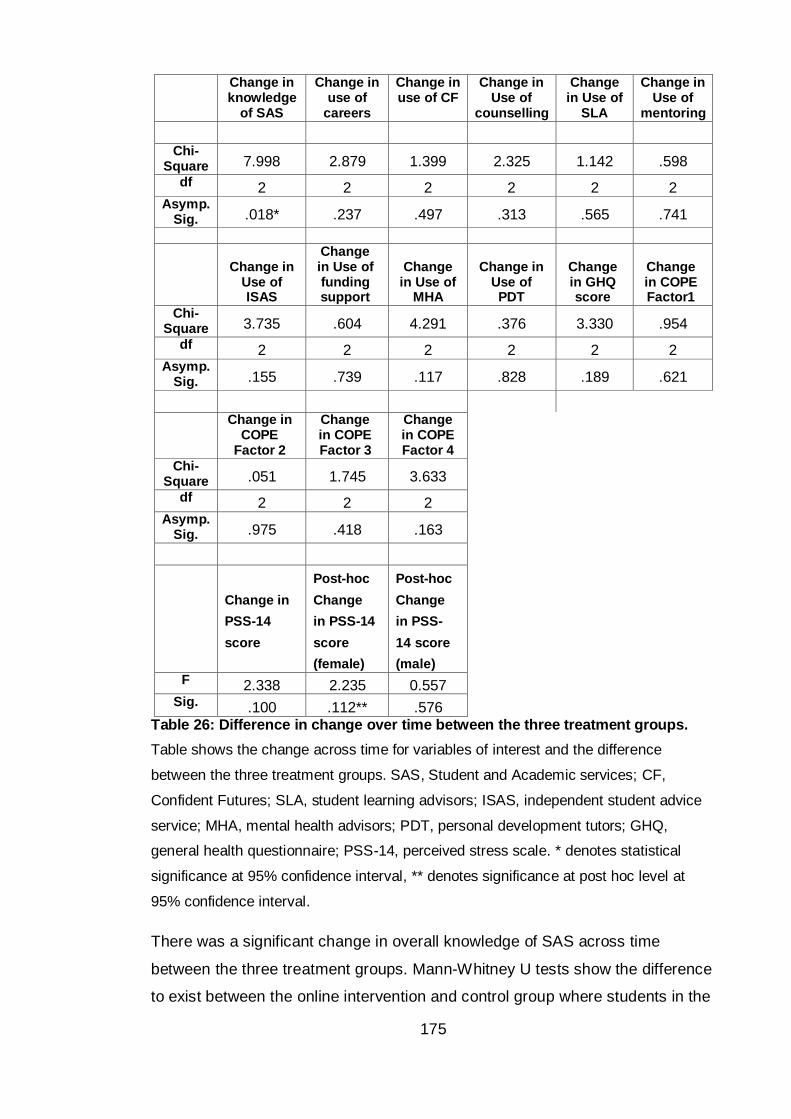
175
Change in knowledge
of SAS
Change in use of
careers
Change in use of CF
Change in Use of
counselling
Change in Use of
SLA
Change in Use of
mentoring
Chi-
Square 7.998 2.879 1.399 2.325 1.142 .598
df 2 2 2 2 2 2 Asymp.
Sig. .018* .237 .497 .313 .565 .741
Change in
Use of ISAS
Change in Use of funding support
Change
in Use of MHA
Change in
Use of PDT
Change in GHQ score
Change in COPE Factor1
Chi-Square 3.735 .604 4.291 .376 3.330 .954
df 2 2 2 2 2 2 Asymp.
Sig. .155 .739 .117 .828 .189 .621
Change in COPE
Factor 2
Change in COPE Factor 3
Change in COPE Factor 4
Chi-Square .051 1.745 3.633
df 2 2 2 Asymp.
Sig. .975 .418 .163
Change in
PSS-14
score
Post-hoc
Change
in PSS-14
score
(female)
Post-hoc
Change
in PSS-
14 score
(male)
F 2.338 2.235 0.557 Sig. .100 .112** .576
Table 26: Difference in change over time between the three treatment groups.
Table shows the change across time for variables of interest and the difference
between the three treatment groups. SAS, Student and Academic services; CF,
Confident Futures; SLA, student learning advisors; ISAS, independent student advice
service; MHA, mental health advisors; PDT, personal development tutors; GHQ,
general health questionnaire; PSS-14, perceived stress scale. * denotes statistical
significance at 95% confidence interval, ** denotes significance at post hoc level at
95% confidence interval.
There was a significant change in overall knowledge of SAS across time
between the three treatment groups. Mann-Whitney U tests show the difference
to exist between the online intervention and control group where students in the
176
online group have significantly larger increases in self-reported knowledge of
SAS from T1 to T2 in comparison to the change seen in the control group.
Students in the control group had an average increase of 0.218 points in
knowledge, in comparison to an increase of 0.741 points in the online
intervention group (control vs online p= 0.006; control vs paper p= 0.095, paper
vs online p= 0.191). The effect of being in the online intervention group on
knowledge of SAS could be described as small r= 0.265 using Cohen’s (1988)
conventions. However, the difference is unlikely due to intervention use as a
comparison between compliers and non-compliers accepted the null hypothesis
with a smaller effect (U= 208.00, p= 0.336, r= 0.131).
Due to literature which reports women and men to perceive stress and respond
to stress differently (see 2.2.1) changes in perceived stress within the three
intervention groups was explored on gender disaggregated data. This was to
understand if the response to intervention may also be gendered; some clinical
studies have suggested that gender should be considered when designing SMIs
(Xu et al., 2015). Disaggregation and post hoc tests reveal a statistically
significant difference in change in PSS-14 scores between female in the online
intervention and control group (mean difference= 2.294, std error= 1.13, p=
0.044). This difference shows female students in the online group had
significantly larger reductions in PSS-14 score from T1 to T2 in comparison to
the change seen in the control group. Females in the control group had an
average reduction of 1.00 in PSS-14 score (1.4 in the paper intervention group),
in comparison to a reduction of 3.29 in the online intervention group (control vs
paper mean difference= 0.486, p= 0.660; paper vs online mean difference=
1.808, p= 0.120). A comparison between compliers and non-compliers found
the null hypothesis to be accepted at the 0.05 alpha level (t= 1.991, p= 0.055,
d= 0.720). Although p did not reach significance, the effect size is approaching
large, using Cohen’s (1988) conventions, which suggests that use of the online
intervention had a medium to large effect on female’s PSS-14 score. Results of
this nature suggest that the study is under-powered which might have been
expected given the low intervention participation rate.
A key factor to be taken into consideration is the fact that females in the online
intervention group were found to have inflated PSS-14 scores at T1. When PSS-
177
14 scores at T2 are considered, there was no significant difference between the
three groups (F= 0.894, df= 2, p= 0.412). This suggests that the drop in PSS-14
scores from T1 to T2 have only returned scores in the online intervention group
to the overall cohort average, rather than reducing PSS-14 scores below those
of the control. Further data collection would be required to confirm if the
reduction in PSS-14 score seen for females in the online intervention group was
indeed significant and whether it was due to being placed in the intervention
group or related to use of the intervention.
AT analysis was also used to explore any participant characteristics at T1 which
were related to compliance and might indicate which students are seeking
additional support. Only one characteristic was found to be significant in
predicting use of the online intervention. Students who believed that ‘stress
control is something which can be learned’ were significantly more likely to
report using the intervention (Mann-Whitney U test= 159.000, Z= -2.111, p=
0.035). This effect can be described as ‘medium’ (r= 0.377) by Cohen’s
conventions. No significant predictors of paper intervention use were found.
8.5 Part three: feedback on intervention
Following the completion of the control trial (week 12) and after the students
had completed their end of year exams (week 15) participants were contacted
for their feedback on the interventions.
8.5.1 Method
A sample of the students who had provided their permission to be contacted
were called using the number provided and the following script read. The
questions included in the script were there as a guide and additional probing
questions were asked were appropriate to gain further information regarding the
use of the interventions.
“Hello, I’m calling from Edinburgh Napier University; we’re doing telephone
surveys of students who took part in a research study about stress before the
exams. Do you have time to talk now; it shouldn’t take longer than 10 minutes?
(If yes)
178
Before the Easter holidays you completed a questionnaire as part of a research
study into student stress and agreed to be contacted on this number for a quick
telephone interview about your use of the online/paper stress education
resource. Are you still willing to take part in the data collection?
(If yes)
Thank you, I’d like to remind you that the conversation we have will be recorded
anonymously, transcribed removing any identifiable information and the original
recording deleted. All information provided is confidential and will not be
divulged to anyone without your prior consent. All questions are optional and
should you feel unable to answer any question please say and I will move on to
the next question. If you feel uncomfortable in any way or would like to stop
please let me know and we will finish the interview.
1) Did you use the online/paper intervention?
2) What prompted you to look at the information?
3) What was your opinion of the resource?
4) Do you think you benefited from the intervention?
Thank you for taking the time to talk to me today. Do you have any questions
about your participation or the study?”
8.5.1.1 Participants
In total, 22 students reported to have used either the paper or online
intervention. Ten of those agreed, at T1, to be contacted for a telephone
interview. Four were second year students (paper) and six were in third year
(online). Within the paper intervention group two students were Life Science
females, one was a Sports Science female and one was a Social Science
female. Within the online intervention group one was a Life Science female,
three were Social Science females, one was a Social Science male and one a
Sports Science male.
Students were called a maximum of three times.
First attempt: Thursday 15th May 2014 10am – two students answered and
agreed to take part (tel. interviews one and two), messages were left on seven
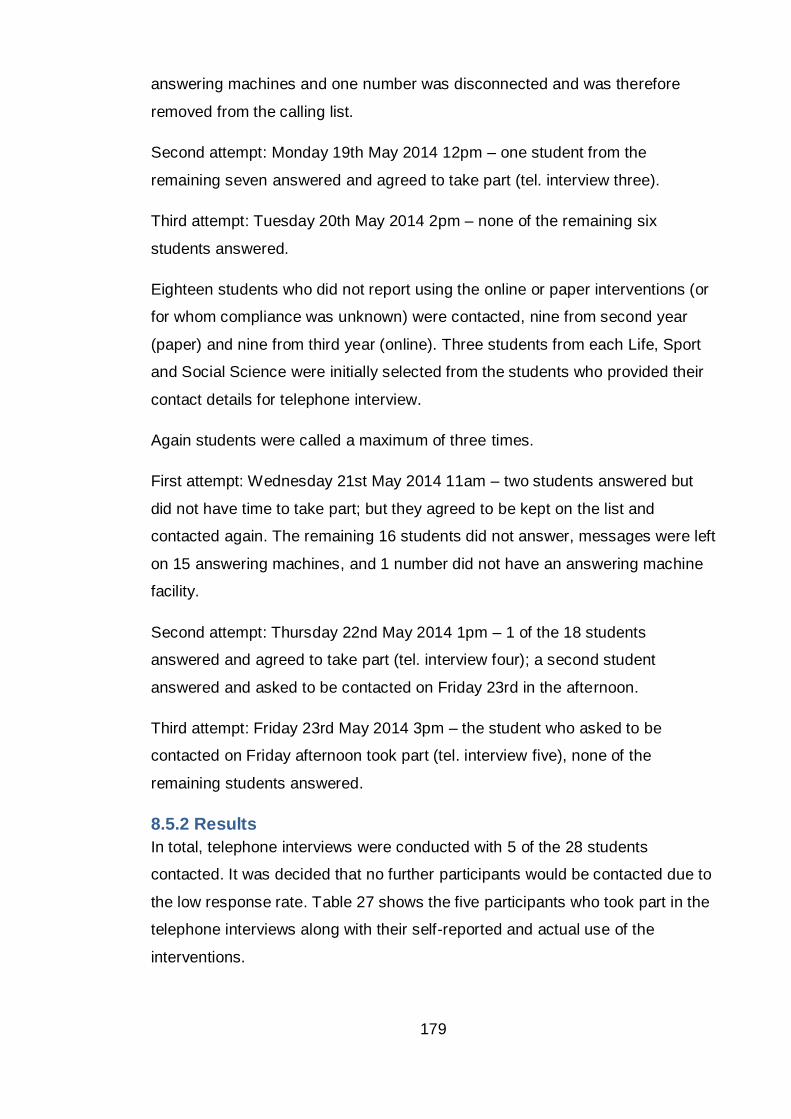
179
answering machines and one number was disconnected and was therefore
removed from the calling list.
Second attempt: Monday 19th May 2014 12pm – one student from the
remaining seven answered and agreed to take part (tel. interview three).
Third attempt: Tuesday 20th May 2014 2pm – none of the remaining six
students answered.
Eighteen students who did not report using the online or paper interventions (or
for whom compliance was unknown) were contacted, nine from second year
(paper) and nine from third year (online). Three students from each Life, Sport
and Social Science were initially selected from the students who provided their
contact details for telephone interview.
Again students were called a maximum of three times.
First attempt: Wednesday 21st May 2014 11am – two students answered but
did not have time to take part; but they agreed to be kept on the list and
contacted again. The remaining 16 students did not answer, messages were left
on 15 answering machines, and 1 number did not have an answering machine
facility.
Second attempt: Thursday 22nd May 2014 1pm – 1 of the 18 students
answered and agreed to take part (tel. interview four); a second student
answered and asked to be contacted on Friday 23rd in the afternoon.
Third attempt: Friday 23rd May 2014 3pm – the student who asked to be
contacted on Friday afternoon took part (tel. interview five), none of the
remaining students answered.
8.5.2 Results
In total, telephone interviews were conducted with 5 of the 28 students
contacted. It was decided that no further participants would be contacted due to
the low response rate. Table 27 shows the five participants who took part in the
telephone interviews along with their self-reported and actual use of the
interventions.
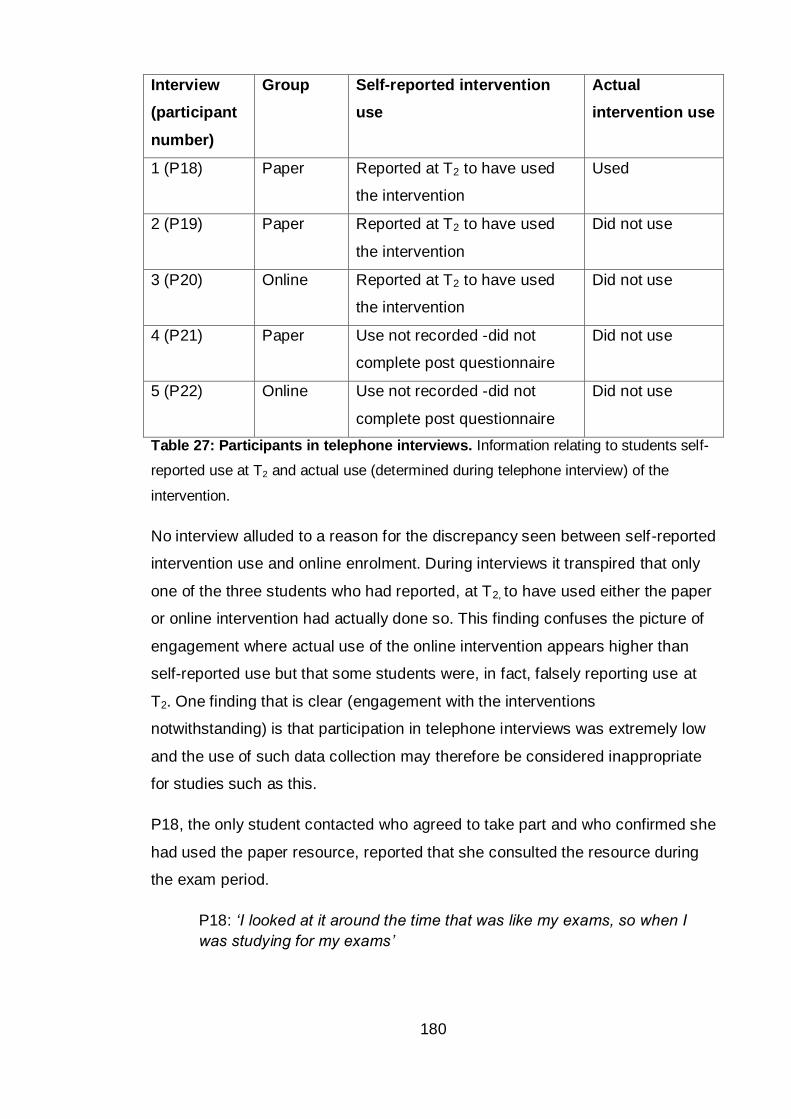
180
Interview
(participant
number)
Group Self-reported intervention
use
Actual
intervention use
1 (P18) Paper Reported at T2 to have used
the intervention
Used
2 (P19) Paper Reported at T2 to have used
the intervention
Did not use
3 (P20) Online Reported at T2 to have used
the intervention
Did not use
4 (P21) Paper Use not recorded -did not
complete post questionnaire
Did not use
5 (P22) Online Use not recorded -did not
complete post questionnaire
Did not use
Table 27: Participants in telephone interviews. Information relating to students self-
reported use at T2 and actual use (determined during telephone interview) of the
intervention.
No interview alluded to a reason for the discrepancy seen between self-reported
intervention use and online enrolment. During interviews it transpired that only
one of the three students who had reported, at T2, to have used either the paper
or online intervention had actually done so. This finding confuses the picture of
engagement where actual use of the online intervention appears higher than
self-reported use but that some students were, in fact, falsely reporting use at
T2. One finding that is clear (engagement with the interventions
notwithstanding) is that participation in telephone interviews was extremely low
and the use of such data collection may therefore be considered inappropriate
for studies such as this.
P18, the only student contacted who agreed to take part and who confirmed she
had used the paper resource, reported that she consulted the resource during
the exam period.
P18: ‘I looked at it around the time that was like my exams, so when I
was studying for my exams’
181
When asked to confirm if she had accessed the resource due to exam stress
only, P18 replied:
‘Ah, yeah it was that but a bit of curiosity as well, and yeah I think I did
feel a bit stressed, I must have felt stressed anyway’ ‘…it’s just exams
you know, there’s a lot to learn and there’s a lot riding on doing well.’
The participant commented that she believed the information to be of benefit
and implied that knowledge was gained in respect to coping
P18: ‘Yeah it was quite helpful it pretty much said things that I … kinda
knew but then it said like how to cope which is like take your mind off it,
exercise a little bit, do something completely different’ ‘yeah actually [it
was beneficial], well my exams went well.’
Three of the remaining four interviewed students (P19-21; who hadn’t used the
interventions) gave the same reason for non-compliance; they didn’t feel their
stress was at a level that necessitated seeking help or additional information.
The final participant (P22) reported that non-compliance was due to lack of
spare time and a belief that using the intervention would not have been the best
use of their time.
P19: ‘I just umm, I just didn’t bother reading it, I don’t know I kinda
manage my own stress quite well I think, it probably just got put to the
bottom of my bag if I’m honest.’ ‘I don’t think [stress] is a huge problem
for me, it was a little bit this year – I’ve not really had it before – but I
stressed out a little bit at exams this year, so umm I think it might be next
year but it wasn’t really a problem until now.’ ‘I didn’t think it was that
severe really, it felt sort of natural. I live with a few people that do the
same thing so we sort of dealt with it together.’
P20: ‘I didn’t really need it to be honest, I kinda feel like I can cope with
my own stress pretty much, I haven’t used any services so generally I
kinda feel like, well I do you know cope with stress so I’ve never really
looked for external help to be honest.’
P21: ‘I had a look at it in class but I didn’t really read it, I don’t think I
really need to read stuff about stress really’ ‘…the university can help
people with stress but I just didn’t need it then. Cause it wasn’t really a
stressful time.’ ‘…for me I didn’t feel it that bad, it’s just like get on with it
and it’s over soon’ ‘… it wasn’t that bad for me so I probably wouldn’t
have asked for any help but I think it’s better for some people to have
more help at the end of the trimester cause they get really worried about
exams’
182
P22: ‘I think I did go on it, because I couldn’t remember what it was
about, but then I didn’t actually read the information as I didn’t really have
a lot of time to spare.’ ‘…I think, or I got the impression, it was a lot to
learn and although I think it’s a good idea I don’t really have time to learn
another subject.’
P19 goes on to reaffirm data collected in previous studies regarding the lack of
support awareness.
P19: ‘Well there are services and things aren’t there? So I’d probably
look into that if I felt I needed to, I don’t think I could comment because I
don’t know what they already provide’
In addition to believing that their stress did not require intervention, P19 offers
an additional explanation for a lack of intervention use namely a strong social
support network.
P19: ‘I live with a few people that do the same thing so we sort of dealt
with it together.’
P20 reports to have good knowledge of the support offered by the university,
which may be another reason for P20’s non-compliance with the intervention if
they believe they have nothing more to learn. P20 also confirms data collected
in previous studies regarding poor advertising of support services.
P20: ‘I think, well I’m aware of most of the services and I think if the
counselling service was made more.’ ‘I think other people aren’t aware of
how easy they are to access, I think if they were advertised a bit more
maybe, I don’t really see anything advertised that much. I can’t even
think of a time I’ve seen it advertised but I must have heard it somewhere
but it’s not that well put out there I feel. I think if those things were
advertised better it would be a huge improvement.’
P21 comments on how others are highly stressed during the exam period but
explains that they personally feel confident in their ability to cope, further
evidencing why P21 may have been a non-complier with the intervention.
P21: ‘…some of [student peers] spend so much time revising that they
are not learning anything anymore cause it’s just too much you know. It’s
like you need to take a break and then you can think about things more
than if you go over and over the same book or your notes or something.
And I guess I sometimes do it too, but I don’t find it hard to remember to
keep calm and do my best.’
183
It appears that many students perceived the interventions as a support tool to
be used only when under high levels of stress rather than a tool to develop skills
that can be learned and generalised; this is in contrast to how the intervention
was intended as an educational and preventative resource. This suggests that
the manner in which the resource was described and advertised could be
modified as could the timing of the delivery of the resource to ensure that
students understood that the information was designed to build their
background knowledge of stress and how to cope so that they could implement
appropriate coping in the event of stress later on.
P22s’ responses do suggest that they at least understood the preventative
nature of the intervention however simultaneously report that although
important, stress management would not have been the best use of their time at
that point in the trimester. P22 goes on to suggest support could be targeted to
new students and provide them with a timetable of classes on stress control
scheduled across their first academic year.
P22: ‘It would be better to tell new students at the start before they start
that they will probably experience stress but that throughout the year we
will run courses… and then run courses to help us with different stressful
parts like exams and finding work.’
Overall, feedback on the intervention gained from telephone interviews was
limited due to the small uptake of both the intervention and participation in the
interviews. One key finding that has resonated throughout the study is that
despite high levels of self-reported stress, perceived stress and general ill-
health students are still reluctant to access support of any kind.
8.6 Part four: improving the model for predicting withdrawal
Following results from study two (use of psychometric tools to measure
students stress and withdrawal intention) where PSS-14 scores predicted
intention to withdraw; it was hypothesised that by adding coping strategy
information to the model, actual withdrawal could be more accurately predicted.
Improving the model for predicting actual withdrawal could provide a means of
targeting support to students who are at a higher risk of dropout and could
184
suggest areas where evidence based support could be developed to influence
retention.
A follow up of study five participants, five months later in September 2014
(week two of trimester one, academic year 2014/2015), provided actual
withdrawal data for the 169 students who participated in the post-intervention
data collection in April 2014. Students were recorded as still enrolled or
withdrawn and it was the intention to run binary logistic regression to assess the
robustness of PSS-14 and Brief COPE scores to predict withdrawal from
university and to calculate the improvement if any off the PSS-14 only model.
However, at the follow-up none of the 169 students had been recorded as
withdrawn. Given the percentage of students at the last follow-up who withdrew
and the known attrition rates for the Faculty it is suggested that the 0% dropout
found may be inaccurate. This could be due to the timing of the follow up
occurring at the start of the trimester when records may not be up-to-date. To
ensure accurate analysis a second follow-up should be scheduled to occur later
in the trimester and the logistic regression run if possible. A one year time lapse
yielded helpful information for study two’s follow up, therefore the same time
period should be allowed to pass before follow up of study five participants.
An alternative explanation for the 100% retention rate could be that in our
efforts to advertise and trial the intervention we raised awareness of the
university’s concern over student withdrawal. It is possible that this alone could
have impacted on student’s decisions to continue with their studies through the
knowledge that the institution is concerned with their academic progression and
welfare. It is not possible however, with the data currently available, to make
conclusive claims regarding the reason for the 100% continuation suggested by
student records at the beginning of the term.
8.7 Discussion
During the pilot with the online intervention students were satisfied with the
resource and reported to find the information interesting and helpful. These
students were self-selecting and therefore were likely to be compliers to any
intervention. Nevertheless the student opinions provided support for the use of
online interventions in a sub-set of the cohort. On the larger scale controlled trial
185
use of either the paper or the online intervention was not found to significantly
impact on students’ perceived stress, general health, coping, attitudes towards
stress management or withdrawal. There was some evidence that the online
intervention may have had a small effect on students ’ self-reported knowledge
of support offered by the university, although no significant change was
observed in the use or awareness of the individual support services. Results
suggest that the study was underpowered and therefore the lack of observed
intervention effect could be due to the low compliance seen with both the online
and paper resource. The observed compliance rate of 10-12% would ideally
have required a much larger starting sample for results to be considered robust
and generalisable. Due to the small uptake of the intervention in this study it is
not possible to make judgements on the existing theory (Lazarus and Folkman,
1984) or comparisons to previous studies (Heaman, 1995; Roembke, 1995)
which have found psychoeducation for stress management to be successful at
manipulating individuals perceptions of stressors (mind set change) and
application of coping strategies (behavioural change).
Student views on why compliance was low would suggest that they did not feel
the need to access the support of an intervention. This has been a theme
throughout the project where students do not believe that they are experiencing
stress at levels that necessitate seeking support. The students’ perception that
they do not need to access online support or to change their coping behaviour
could be due to little or no stress, however, given the high PSS-14 and GHQ-12
scores and qualitative descriptions of stress throughout this project, it is
suggested that themes identified in earlier studies may be impacting on this
result. Specifically, a lack of knowledge and self-awareness regarding
identifying stress and when to seek help, also, the perceived stigma reported
around support seeking could cause students to report lower levels of required
support than necessary. The Health Belief Model (HBM) of Rosenstock et al.
(1988) has identified that individuals must perceive their susceptibility of
suffering from a condition to be high, for the individual to feel capable of change
and to perceive few tangible or psychological barriers to change before a
modification to behaviour occurs. Applying the student voice to this theoretical
model, it could be surmised that students are struggling to relate to the potential
severity of the problem, the benefits and ease of intervention or are perceiving
186
barriers; concepts of the HBM which would ultimately impact on intervention
use.
The fact that COPE factor scores were unaffected by the intervention could also
be due to the support and advice on coping provided as part of the tested
intervention. Study four found the reduction of avoidance and distraction to be
linked with lower stress and withdrawal but these data could not have been
incorporated into the intervention without conducting further research into how
to reduce a negative behaviour as opposed to increasing positive behaviour. If
more time could be invested, an intervention directed at the reduction of these
maladaptive coping strategies may have been more effective than the
information provided which was more generic and focused on moving towards
choosing adaptive strategies. Although this approach may work to reduce
maladaptive strategies more research is required to understand the best
method of reducing maladaptive coping behaviour in HE students.
Before another intervention is explored, further research would have to clarify
the reasons for the low uptake of the current intervention and should perhaps
consider alternative methods of delivering the preventative stress education
messages. This information could be gathered through focus groups with both
compliers and non-compliers of the current intervention trial. It is suggested that
this information was not gathered during telephone interviews due to the timing
of interviews being in the summer trimester when many students disengage
with the university to focus on employment, family and other non-academic
pursuits. Focus groups were found in the past to produce abundantly rich data
and it is suggested that this method of data collection may have been more
appropriate for the intervention feedback if the students had still been in
session. It is also suggested that any future interventions with an aim to
increase knowledge of stress as a preventative measure should be directed to
students at the beginning of their student journey with top-up information
provided at key points within the trimesters such as assessment weeks and
exam periods where students report high stress. Marketing should also focus on
the life skills and long-term benefits that being aware of stress and wellbeing
can have.
187
Although uptake of the online intervention was low, and telephone interview
data indicate that actual use may have been lower than the students self-
reported, there was an indication that those with the belief that stress control
can be learned were more likely to engage with the resource. This would
support the perceived benefits concept in the existing HBM, where a person will
take a health-related action only if that individual feels that the negative health
condition can be avoided by following the recommendation (Rosenstock et al.,
1988). By providing students with the empirical evidence which exists to explain
the potential positive effect of stress management, students may increase their
belief that they can learn to control stress more effectively and may therefore
more readily engage with interventions similar to the one tested here. When
advertising the intervention in this project emphasis was placed on the evidence
driven design, however it is possible that confidence in this would take time to
embed.
Finally, further data collection must occur to confirm the enrolment status of
students from the intervention trial. Knowing accurately those students who
have withdrawn will allow for the hypothesised model of dropout to be tested. If,
as the current data suggests, students in the control trial had 100% retention
from academic year 2013/2014 to 2014/2015 further investigation would be
needed to suggest if this is due to i) a faculty wide reduction in withdrawal, ii)
biased sampling of students who are less likely to withdraw and/or iii) a change
in students intentions and behaviours surrounding withdrawal due to this
research or any other campaign.
8.7.1 Limitations
Limitations of study five (design, development and evaluation of an intervention
to improve student stress management and continuation) have been recognised
throughout this chapter; however these have become negligible given the low
uptake of the intervention. Limitations previously identified included the fact that
groups were not fully randomised, meaning that comparisons between the
intervention and control groups may be confounded by group demographics.
This would only have required reflection if firm conclusions regarding the
intervention’s effectiveness had been suggested by statistics. A second
limitation identified was the underdevelopment of the coping section of the
188
intervention. Again due to the limited uptake, even if this section had been
completed statistical analysis would have remained underpowered to draw solid
conclusions as to the impact on coping behaviours used by students.
The final limitation identified was the timing of the intervention, it was suggested
that because the trial ran later than might have been ideal for a preventative
intervention, that uptake would be low. Although only a small number of
students were sampled at telephone interview it appeared that the timing had
little effect on uptake, only one student said that they were too busy to access
the intervention. Rather, students reported that their stress was not yet high
enough to prompt use of a stress intervention. If students did not believe their
stress to be high enough at the end of the trimester – where stress has been
reported to be highest (study one: exploring stress and withdrawal intentions
experienced by non-health BSc students) – then it is suggested that students
will never perceive their own stress levels to be a prompt to accessing such an
intervention. This conclusion advocates that future marketing must focus on the
benefit of the skills that would be gained through use of the intervention thus
removing the stereotype that information on health should be accessed only
when crisis is reached.
189
Chapter summary
Theoretically and in previous studies, psychoeducation for stress
management would suggest a benefit not only to student wellbeing but also
retention; however the evaluation in this study was underpowered due to
limited data available for those who did access the online intervention. If data
had been available for all participants who enrolled (n=22), it is possible that
more robust conclusions could have been drawn as to the effect of online
stress education on perceived stress and withdrawal. There was an
indication that intervention use may improve awareness of SAS. Use of the
online intervention for females may also predict a drop in PSS-14 scores
however, because PSS-14 scores were inflated in the online intervention
group at baseline it is unwise with such small numbers of compliers to draw
any solid conclusions.
Before further evaluations of this intervention occur, more research is needed
to understand the reasons why students, on the whole, did not voluntarily
engage with the resource. Research focusing on the reasons for compliance,
rather than non-compliance, may provide more fruitful recommendations for
improving uptake. Based on the data collected so far it appears that students
will be unlikely to perceive their own stress levels as a driver for intervention
uptake and therefore marketing of stress education should highlight the long
term psychological and physiological benefits of stress management.
The finding from study four regarding the increased benefit of reduced
avoidance and distraction coping requires additional research to identify
ways in which students can be encouraged to reduce their maladaptive
coping behaviour. This must then be trialled alone as an intervention to
assess the effect on coping and the secondary effect on stress and
withdrawal. If successful, such an intervention could subsequently be
packaged within the larger online intervention tested here in study five.
To test the predictive model of dropout suggested earlier (PSS-14 + Brief
COPE factors) confirmation of student enrolment status is required. The
100% retention of all 169 students involved in study five’s post-intervention
data collection is inconsistent with faculty figures and previous data collected
within this project.
190
Therefore an additional follow up of students should be scheduled for later in
the trimester. This is on the basis that the 0% withdrawal may be due to a
delay in entry of this information into the student’s online records database.
191
Chapter Nine: Plenary discussion
9.1 Main findings
This research set out to investigate the relationship between two areas of
growing concern within Higher Education Institutions (HEIs); student stress and
retention. During which, the following questions were addressed over five
interconnecting studies where findings from previous studies informed the
direction of future data collection.
1) What is the level of stress reported by non-health professional BSc
students at the host university and how does it compare to available
literature on students undertaking health professional BSc studies?
2) How do non-health professional BSc students utilise the university
support services and individual coping strategies to mediate stress and
intentions towards withdrawal?
3) Is there a link between stress and student withdrawal which could be
exploited to improve both student wellbeing and continuation through the
use of an intervention?
Findings pertaining to each of the three research questions are discussed
below.
9.1.1 Levels of stress reported by non-health BSc students
Relating to research question one; results from study one (exploration of stress
and withdrawal intentions experiences by non-health BSc students) and study
two (use of psychometric tools to measure students’ stress) show students to
be reporting high levels of stress in comparison to the general public and levels
consistent with other student groups including those studying health
professional BSc courses (see section 5.4). Approximately one third of females
and one quarter of males sampled in this research reported to suffer from stress
frequently or all the time. The undergraduate students sampled in this project
would appear to be experiencing high stress regardless of degree programme
or year of study. Perceived stress was reported, in study two of this thesis, at
levels consistent with other UK and US studies implementing the PSS-14 within
non-healthcare student cohorts (Gallagher et al., 2014). Although reliant on
192
relatively old data, Rose et al. (2013) characterised stressed individuals as
those with a PSS score of half a standard deviation above the community mean
provided by Cohen & Williamson (1988). In Rose’s study that equated to
approximately 50% of students in their study screened as ‘stressed’. If taking
this interpretation, stressed individuals would therefore be those with PSS-14
scores of 23.37 equating to 41% of all students sampled in study two of this
thesis. It must be noted, however, that this cut-off is theoretical, Rose described
it for the shortened PSS-10 version and it is based on historic normative data
from America and not the UK or Scotland where the current cohort originate.
The rule that stressed individuals can be characterised by ‘scores which are half
a standard deviation above the community mean provided by Cohen &
Williamson’ could be more appropriate for Rose’s Los Angeles based
population than for the sample examined in this thesis. It would therefore be
unwise to conclude from the figures above that Rose’s University of California
students are more stressed than those at Edinburgh Napier University. This
method of characterisation of stressed individuals could be useful however if
more normative data from the UK was available to allow for an accurate
comparison.
Potential levels of psychological morbidity, suggested by GHQ-12 scores, show
students to be suffering to a greater extent than the general population. Using
cut-offs from Scotland’s 2003 Health Report (Bromley et al., 2005) female
students in this study could be 3.5 times more likely to be positively diagnosed
with psychological ill-health than the general Scottish population. Using the
same thresholds, male students sampled in this research could be 1.8 times
more likely to receive a positive diagnosis than the general public. The findings
are consistent with Carney et al. (2005) who report Scottish students to rate
themselves lower in terms of physical and mental health compared to general
population age and sex matched normative values. This suggests that students
have been experiencing poorer general health than the general population for a
considerable length of time and that it is therefore a longstanding issue which is
yet to be addressed.
As was highlighted in qualitative data collected during study one (exploration of
stress and withdrawal intentions experienced by non-health BSc students) and
193
three (focus groups to understand students’ use of support services); stigma
existed around admitting stress and seeking support for stress, this may mean
that the figures reported in this thesis are conservative estimates of distress and
ill-health in the student population. However, the extent to which this may be
true can only be hypothesised. High PSS-14 and GHQ-12 scores have been
associated with physiological and psychological symptoms (see sections 5.2.1.1
and 5.2.1.3; Andreou et al., 2011, and Pan and Goldberg, 1990). The negative
impact of this high stress and poor wellbeing on a student’s ability to perform
academically and socially could lead to an intention to withdraw, and
subsequently attrition, as suggested theoretically and by findings throughout
this thesis. The stability of the reports of high perceived stress and poor general
health across studies within the thesis and in the wider literature suggests that
findings from this research may also have generalisability outside the host
university. Similarly the reverse is true and interventions developed for other
student groups may be transferable to this cohort.
9.1.2 Link between stress and withdrawal
Relating to research question three; the thesis found measures of perceived
stress to be positively correlated with withdrawal intention. Subsequently,
intention to withdraw was found to be the best predictor of attrition within one
year (53% accurate). Study two (use of psychometric tools to measure students’
stress) found females with high PSS-14 scores were 13.45 times more likely to
consider withdrawal and 3.6 times more likely to actually withdraw. Males with
higher than average PSS-14 scores were 7.5 times more likely to consider
withdrawal and 2.4 times more likely to actually withdraw. Results suggest that
measures of perceived stress, such as the PSS-14, could therefore be used as
a tool to identify ‘at risk’ students and allow a means of administering additional
targeted support in an attempt to improve wellbeing and prevent withdrawal.
Methods for the implementation of this are discussed in recommendations for
future work below (see 9.3.2).
At a one year follow up, intention to withdraw was found to be a stronger single
predictor of actual withdrawal than was perceived stress. This finding confirms
Bean’s (1980) model that intention to leave is the single strongest predictor of
actual withdrawal. Results from this thesis suggest that there is a mediator
194
variable between perceived stress, intention to withdraw and actual withdrawal
which determines if the intention to withdrawal develops into a behaviour. It was
suggested that ability to cope effectively with the perceived stress is what
determines if a student only considered withdrawal or whether they actually
withdrew, see 9.1.5.
A single causal direction to the relationship between stress and attrition could
not be identified in this correlational study; however qualitative data from study
two suggests a link between stress and withdrawal to be through poor academic
performance. The students interviewed had not yet left the university but many
reported that stress stemming from academic and personal sources had an
impact on concentration and revision and noted that: if their performance in
exams and assessments had been any worse, they might well have left. This
finding is echoed in a report generated by Anglia Ruskin University (McCary et
al., 2011) where they found 35% of students who considered voluntary
withdrawal did so prior to assessment, or following an objective or perceived
failure. Data from this research would therefore suggest that the link between
stress and student attrition is indirect and the two are likely sequential
epiphenomena of poor coping; an inability to prevent hassles and life events
from negatively impacting academic performance.
This finding substantiates those already in the literature which show that
academic performance can in some cases better predict persistence in colleges
and universities than academic ability (DeBerard et al., 2004; Porchea et al.,
2010; Robbins et al., 2004). Also, findings from Adelman (1999; 2006) found
that students who have taken more academically challenging classes at pre-
tertiary level are more likely to succeed at tertiary level. This could be because
performance involves not only academic ability but also learned psychosocial
factors such as the ability to cope under pressure. A student may therefore
enter HE with a strong academic background, thus be academically able and
prepared, but be unable to transfer that knowledge to university study due to an
inability to cope with a change in academic learning or teaching style or other
aspects of HE. As a result they may be more likely to consider withdrawal.
Results from this thesis (students’ perceived poor academic performance to be
a result of the negative secondary outcomes of the stress response) therefore
195
also reinforce the intermediate outcomes portion of Bean’s Student Attrition
Model. This part of Bean’s model suggests better coping predicts reduced
stress response and increased academic integration and performance, which in
turn results in persistence intention and behaviour.
As would be expected, given the literature already available, combinations of
‘hassles’ appeared to culminate in higher stress than if discrete problems were
faced. As such, allowing problems to mount may put students at greater risk of
withdrawal through the increased stress experienced. This project highlights the
importance of encouraging students to seek support early for smaller issues to
prevent the knock-on effect one problem might have on other aspects of the
individual’s life and progression within HE. Data from study three (focus groups
to explore students’ use of support) show that the relationship between stress,
poor academic performance and subsequent withdrawal is allowed to exist due
to a lack of support seeking, barriers to which are discussed in section 9.1.3.
It must be noted that because the students sampled in this study were still
enrolled within the university there may be additional correlational relationships
between stress and withdrawal that have not be identified. The current project
likely sampled less vulnerable students because participants were attending
lectures and volunteered their time for research. As a result, findings therefore
reflect students who may be considered lower risk than students who have
disengaged with their studies. Sampling students who have already disengaged
from the university may highlight further relationships between the variables of
interest that were not uncovered with the current cohort.
Given the relationship between the two variables of interest (stress and
withdrawal) and addressing research question three; study five of the thesis
described the design, development and evaluation of an evidence based
intervention to modify withdrawal through improving students’ ability to
understand, recognise and cope with stress.
Self-selecting students who gave feedback during the pilot of the online
intervention (which was designed to improve student’s knowledge of stress,
coping and available support) were very positive and satisfied with the
information. Providing self-help in the form of an online toolkit was not however
196
enough to entice the majority of students to engage with building stress
resilience. According to the Health Belief Model, participants will only comply
with an intervention if they personally believe themselves to be currently at risk
and believe the resource offered will provide help relevant and accessible to
them (Rosenstock et al., 1988). Although every effort was made to explain that
stress is a prevalent problem in the student population and that the intervention
delivered was evidence based, uptake of the online intervention was very low.
Data were therefore not available to allow for conclusive results regarding the
ability of this online intervention to affect perceived stress, coping, wellbeing or
retention. In support of Rosenstock et al.’s model regarding uptake, students in
this project who believed that ‘stress control is something which can be learned’
were significantly more likely to report using the intervention. This finding
demonstrates the importance of preparing participants’ mind-sets before an
intervention is introduced. Non-compliance and dropout from technology-based
treatment in clinical populations is also reported to be high (Eysenbach, 2005).
Most online and computer based interventions which have been developed to
improve resilience and reduce stress symptomology have been done so for
clinical samples. Within these medically-ill or psychiatrically-ill populations,
technology-based programs have been found to be as effective as face-to-face
therapy (Proudfoot et al., 2003; Titov, Sachdev, and Andrews, 2010) but data
relating to non-clinical populations are lacking. Rose et al.’s (2013) paper
remarks on the literature gap and shows an interactive web-based intervention
to be effective at reducing perceived stress and increasing perceived control
over stressful situations in a stressed, but otherwise healthy, student sample.
Rose and colleagues found the interactive intervention to be more effective than
a passive delivery of stress education and stress management advice. That
being said the latter also produced the desired effect in some measures but to a
lesser extent. In comparison to the two interventions tested by Rose et al. the
intervention described within this thesis falls between the two in terms of its
interactivity. The intervention developed for this research was based on the
gaps in students’ knowledge identified throughout the thesis, this is in
comparison to the off the shelf product tested by Rose et al. The authors also
reported good compliance during their trial however participants were financially
rewarded for their participation, therefore true compliance may differ greatly. On
197
reviewing the available literature it is suggested that online and computer-based
interventions, such as the one developed for this thesis, are a viable
mechanism to reduce student stress and may therefore have positive effect on
retention of students within HE. However, the problem which requires more
attention is how to improve student engagement with these web-based
programmes when incentive is not present.
Further evaluation is required to answer the question ‘can students’ perception
of stress and coping be modified through intervention to reduce the stress
response (and resulting secondary outcomes) and therefore improve retention
in HE?’ It is also suggested that given the similarity in findings across student
groups within this project and between this and other literature that, following
further refinement of the delivery, the intervention developed here may also be
of value to other UK HEIs. Further developments of the intervention based on
results from the thesis are discussed in section 9.3.3.
9.1.3 Utilisation of support services
Addressing research question two and expanding upon the results already
mentioned above, which suggest a lack of support seeking could be fuelling the
pathway between stress and withdrawal via poor academic performance.
Quantitative data from study one (exploration of stress and withdrawal
intentions experienced by non-health BSc students) and qualitative data from
study three (focus groups to explore use of support) provided significant insights
into support service use. Results revealed that students have poor awareness
and understanding of the different support available and rely mainly on faculty
academics with an advisor role. The project also found a lack of knowledge
surrounding when, as well as where, to seek support for stress and an
unwillingness to seek help due to barriers such as stigma. This may be limiting
the ability of the University support services to provide help and improve student
coping which we believe will reduce stress and unnecessary attrition.
Stigma surrounding seeking help for stress was apparent throughout student
conversations during data collection. Negative connotations attached to support
services, in particular counselling, appeared to generate internal and external
stigma through a lack of knowledge regarding who the services are aimed at
and what support they offer; presumably resulting in self-presentational
198
concerns. These findings suggest that the various anti-stigma campaigns
endorsed by the university, such as the ‘See Me’ pledge, which aims to reduce
the stigma around many aspects of mental health and wellbeing, including
seeking support, may be insufficient. It is also possible that students
experiencing stress would not perceive this as mental ill-health and therefore
many current campaigns could be ineffective at increasing a student’s
confidence to admit needing support to manage stress. HEIs should consider
increasing the reach of their wellbeing campaigns to include stress, its
normalisation and the benefits of seeking support early. It is also worth
commenting that in the competitive culture of academia, encouraging
individuals to push their limits to reach maximal potential can result in burn-out if
the individual is not self-aware and knowledgeable in personal resilience. HEIs
must be careful not to reward students for behaviour which is beneficial to the
university but detrimental to individuals’ health.
Student support has shown to play a crucial role in mediating student stress and
preventing unnecessary attrition for some students; however the barriers
identified within this project need to be addressed to maximise their effect. A
need for students to be more self-aware is also evident and students must be
better at evaluating their own levels of stress to inform when they need to seek
support. The latter calls for student support to engage with preventative
services such as building the students’ own skills, through greater
psychoeducational provision, as well as providing reactive academic and
pastoral support.
Tinto’s (1993) model of student departure suggests that a student with a strong
commitment to the goal of completing their degree will actively engage with
faculty and peers and will thus seek assistance when confronted by goal
obstacles. Academic goal commitment was not measured within this thesis so it
is not possible to confirm if the low support seeking seen within the current
research was a result of low goal commitment across the sampled cohort.
Results from this thesis did however suggest that students are slow to
recognise when challenges are becoming unmanageable (thus have poor
awareness of when to ask for support) and that students are reluctant to seek
support from the specialist services. It is possible therefore that even those with
199
strong goal commitment could be at risk of withdrawal through not knowing
when or where to seek support. Future research could explore this to confirm if
poor knowledge of support and reluctance to seek support overrides goal
commitment to lead to stress and withdrawal intention. Or alternatively, is goal
commitment the main facilitator of support seeking and therefore it might be that
the poor support use and subsequent stress seen in this thesis could be due to
low levels of goal or institution commitment.
When investigating the over-reliance on Personal Development Tutors (PDTs),
it appears that these staff members do not feel as supported by the university
as they should and staff felt they were not in receipt of appropriate training to
carry out the role. This again substantiates the need for students to be made
aware of the full range of services available to them and to remove barriers
which may prevent the more appropriate services being accessed. Results from
this project highlight a need for additional support and training for staff who are
carrying out the additional role of PDT and for ‘good’ PDTs to be recognised
and rewarded for their direct and indirect contributions to student wellbeing and
retention. It has been suggested that the over-reliance on academic staff may
be a phenomenon specific to the culture of the host university, however, Anglia
Ruskin, for example, also report significantly more students (60% in comparison
26.2% for non-academic Student Advisers) naming a Personal Tutor as their
preferred source of support (McCary et al., 2011). It is suggested therefore, that
the training offered to academic staff carrying out a pastoral support role should
be reviewed regularly at least within post-1992 institutions, if not all HEIs.
9.1.4 Variation in perceived stress due to gender, age and degree
The undergraduate students sampled in this project would appear to be
experiencing high stress regardless of degree programme or year of study.
Although there was no difference in the direction of correlations between
perceived stress and withdrawal when data were disaggregated by gender,
there were differences in the strength of the correlations. In keeping with
previous literature (see section 4.3 paragraph 2), females were found to report
significantly higher frequencies of stress, increased perceived stress and mental
ill-health and more life events than males. Average PSS-14 scores for women
were significantly higher than that for men, which support the prevailing
200
consensus that ‘women, as a group, report higher levels of stress, depression,
anxiety, and related constructs’ (Gitchel, Roessler and Turner, 2011 p24). The
wider implication of these results for future stress research is that when
comparing perceived stress across time or between groups, gender needs to be
taken into consideration but that age within a range of approximately 8 years
(17-25 years) is unlikely to impact on perception of stress within similar student
populations. That is to say, if research is comparing stress reported by two
groups and group A has significantly more females than group B, group A will
appear more stressed if measurers of perceived stress, general health or life
events are used. The reason for differences in reports between the genders is
still unclear and this thesis has not addressed whether the observed differences
were the result of actual gender differences in stress perception or differences
in a secondary factor. Investigation into response pattern differences between
the groups may shed light on the root cause. It could be that response patterns
between groups differ because of some secondary characteristic such as
openness to report or self-awareness, if this is the case then the validity of the
PSS measure is threatened. It is suggested that this is taken into consideration
by individuals using the PSS-14 with student cohorts in the future.
9.1.5 Effect of adding coping data to the predictive model of
withdrawal
Following study two (use of psychometric tools to measure students’ stress)
which found perceived stress to better predict intention to withdraw than actual
withdrawal; a hypothesis was generated that coping strategy information along
with PSS-14 score would be more accurate, than PSS-14 alone, at identifying
the students who will, if no intervention occurs, withdraw from university. Further
data collection is required to test this hypothesis; however, a suitable period of
time must lapse before doing so. A time period of one year between initial data
collection and follow up was successful for study two and it is therefore
suggested that this amount of time is left before collecting data regarding actual
withdrawal for the students who participated in the intervention evaluation study
described in study five of this thesis. Building on the limitation of study two
(psychometric questionnaires), where only a proportion of students were
followed up, all participants from study five should have their current enrolment
status recorded.
201
Having actual withdrawal data for this cohort may allow for further comment on
any improvement adding coping strategy measures has had on the ability of the
suggested model to predict students who will leave. Gathering follow up data to
test the suggested model will also test a proportion of Bean’s Student Attrition
Model. In Bean’s model, coping is a predictor of intention to withdraw however
this thesis is suggesting that a students’ ability to cope could also be a mediator
between intention to leave and actual withdrawal. Once the model suggested
here is tested a comparison between it and Bean’s model should be
undertaken.
The benefit of the suggested model, over others already available, would be
that perceived stress and coping data as predictor variables are in themselves
useful in determining support for students. This is in contrast to traditional
theoretical models of withdrawal which rely on factors such as student
background characteristics e.g. socio-economic status, previous academic
experience and psychosocial factors e.g. commitment to goals which the
university has little or no influence over. Ethically, variables such as
demographics cannot be used to select against students who will require more
support to complete their degree and, unlike coping, the university has no ability
to exercise change at an organisation or individual level to modify these
variables after enrolment. Another advantage of the suggested model is that
variables of stress and coping are relatively well understood and easy to
measure. This is not the case for some variables in other retention models such
as institution fit in Tinto’s Student Integration Model where no explicit methods
of measuring the concept is given; therefore it is left to the researcher to tap the
intended concepts.
During investigation of students’ coping strategies in study four (investigation of
students individual coping strategies using Brief COPE), evidence was found
which suggests those who use avoidance and distraction (which would be
considered maladaptive coping strategies) less are more likely to report lower
stress than those who use adaptive active coping strategies more. This
significant finding from the thesis may have important implications for
researchers, as well as clinicians and therapists, designing and implementing
individual level interventions to modify stress. The finding is new to the HE
202
literature and is important because currently many interventions, which aim to
influence coping behaviour, focus on increasing an individual’s understanding,
and use, of adaptive strategies. The results from this project suggest that
interventions should instead be encouraging individuals to minimise their use of
avoidance and distraction strategies. The finding requires further clarification
and this is suggested below as a valuable area of further research which may
improve the effectiveness of interventions offered as part of personal resilience
training which many organisations are now investing in.
9.2 Impact of the thesis
9.2.1 Impact on author’s current practice
Building on the research included within this thesis, the author is continuing to
evaluate the effect of stress education and coping strategy support, embedded
at key progression points, on student resilience, wellbeing and retention.
Stress resilience has also been developed into a Continued Professional
Development course for NHS staff that have already graduated and therefore
are unlikely to have received this training as part of tertiary education. A pilot
evaluation is currently underway.
The role of Secondary Educators and University Outreach in laying the
foundations of stress resilience is being brought to light within wider HE debates
on transition. The author is investigating the development of an online a taught
blended toolkit to prepare students holistically for HE and therefore plans to
build on the intervention developed as part of this thesis.
9.2.2 Impact within host university
An outcome of this project, the online intervention, is still active within
Edinburgh Napier’s VLE. Students who were provided access as part of the trial
still remain enrolled and those outside the trial have been sent a link to provide
access to the information held within the tool. Since the end of the trial one
additional student has enrolled.
Results from this research were presented at a faculty-level steering group
concerned with reforming the PDT system. The group brought about changes to
allow students to remain with one advisor throughout all four years of their
203
study. It is thought that this will benefit the students by allowing staff to build a
stronger relationship and a better picture of how the student is coping through
key transition stages. Having only one advisor should mean that changes in the
student’s behaviour or thinking, over time, is noticed earlier. Having one advisor
should allow for consistency in the advice given to the student and ensure,
where students are sign posted to other services, that a follow-up is carried out
confirming if additional support was gained. It is not yet known if the findings
from this study regarding PDT training have resulted in changes to the support
offered to academic staff. A recommendation from this project is that
universities should review the training offered to academic staff that are
expected to undertake a pastoral support role. Staff should be made aware of
the issues faced by students and the potential levels of student distress they
may encounter as a PDT so that staff can prepare themselves appropriately.
PDTs should be knowledgeable about the support offered by their university in
order to appropriately sign-post students and universities should also provide
support networks for the staff themselves. The intervention developed as part of
this thesis is also accessible by staff and can be used to increase their own
knowledge of the support available to students.
Although it was not evaluated as part of the project, feedback suggests the
online intervention has been helpful for academic staff to understand more
about the support services offered centrally and to quickly provide the contact
details for the services, information which is difficult to identify within the large
university intranet.
The research project was recognised across the university and involved many
academic and support staff. A recommendation would therefore be to assess if
staff, as a result of findings disseminated from this thesis, have changed
practice to include elements of stress education within their teaching or
supplementary to the curriculum.
9.2.3 Potential impact on other Higher Education Institutions
Findings from this research have been accepted for publication within a
respected journal and have been acknowledged as original contributions to UK
pedagogical literature. The Journal of Further and Higher Education have
published data relating to the level of student stress reported in this thesis, the
204
association between perceived stress and intention to withdraw and the barriers
identified to seeking support (see page xvi). Dissemination of these results will
highlight to an academic audience, who are in the position to instigate change
from within their institution, the importance of building stress resilience, reducing
barriers to seeking support and building a supportive culture which removes the
stigma attached to reporting stress. The benefit of this being that students may
be more inclined to engage with stress management and successfully reduce
distress. In turn, results from this study would indicate that reduced perceived
stress will lead to a reduction in withdrawal intention and promote continuation.
In addition, students’ employability will develop as employers are increasingly
more aware of the skill of resilience and self-awareness, in the context of stress,
and the impact it can have on workforce productivity.
Dissemination of findings from this project which highlight the link between
stress and student retention has generated much debate at conferences and
networking events, primarily concerning a university’s ability to build stress
resilience. This research has provided evidence to show that low perceived
stress can predict continuation and suggests institutions must investigate
methods of building resilience and reducing perceived stress, within their
cohorts, which will likely need to be incorporated into the curriculum.
9.2.4 Impact on the wider higher education debate
The findings from the current project show a need for students to become more
self-aware to facilitate early detection of ill-health which would aid in the
success of any stress reduction activity. In the wider context, this project adds
evidence to support the argument for HEIs to invest in their student’s wellbeing,
as well as their academic needs, in order to ensure retention and successful
progression. There is also an operational level benefit, as cohorts become
larger and face-to-face time with faculty staff is being replaced by online
delivery, it is increasingly important for students to become more self-sufficient.
The online educational based solution suggested here is only one method of
encouraging self-awareness and stress resilience. It is recommended that
different options of building students’ resilience are explored by HEIs to suit
their cohort and course delivery. In addition, results presented here show that
HEIs could be doing more to address the stigma attached to admitting to be
205
suffering from stress and seeking support. Educational establishments must not
condone a culture of working to breaking point; that is not to say that we want to
shelter our students, on the contrary we must push them to fulfil their maximal
potential but in such a way where optimal function is maintained and burn-out is
avoided at all costs. This message is also transferable outside education
settings and is true for all organisations.
This project has also shown that it is possible to predict, with some accuracy,
students who are more likely to withdraw, through monitoring of perceived
stress. It appears that methods of identifying ‘at risk’ students are not being
utilised throughout the student journey to provide targeted support and it is
recommended that further debate around a university’s ability to do so should
be encouraged.
This research demonstrates the pivotal role of academic staff in mediating
student stress and retention while at the same time highlighting that staff may
be underprepared for the role. Other institutions may benefit from this being
brought to light and it is hoped that staff will, as a result, receive more training
and support to undertake the additional responsibility, given the wider benefit to
the university.
9.2.4.1 Impact of this research on existing theory
Results from this thesis (that poor academic performance can be the result of
negative secondary outcomes of the stress response) reinforce the intermediate
outcomes portion of Bean’s Student Attrition Model. This part of Bean’s model
suggests better coping predicts a reduced stress response and increased
academic integration and performance.
Results from this thesis also substantiate the latter stages of Bean’s theoretical
model, suggesting that although low perceived stress is a strong predictor of
intention to persist, intention is the strongest predictor of persistence behaviour.
The inverse was also found to be true in this thesis; intention to withdraw was a
stronger predictor of actual withdrawal than perceived stress was, but it did not
account for all of the variance.
In Bean’s existing model, coping is considered only as a predictor of the stress
response which results in withdrawal intention however this thesis suggests that
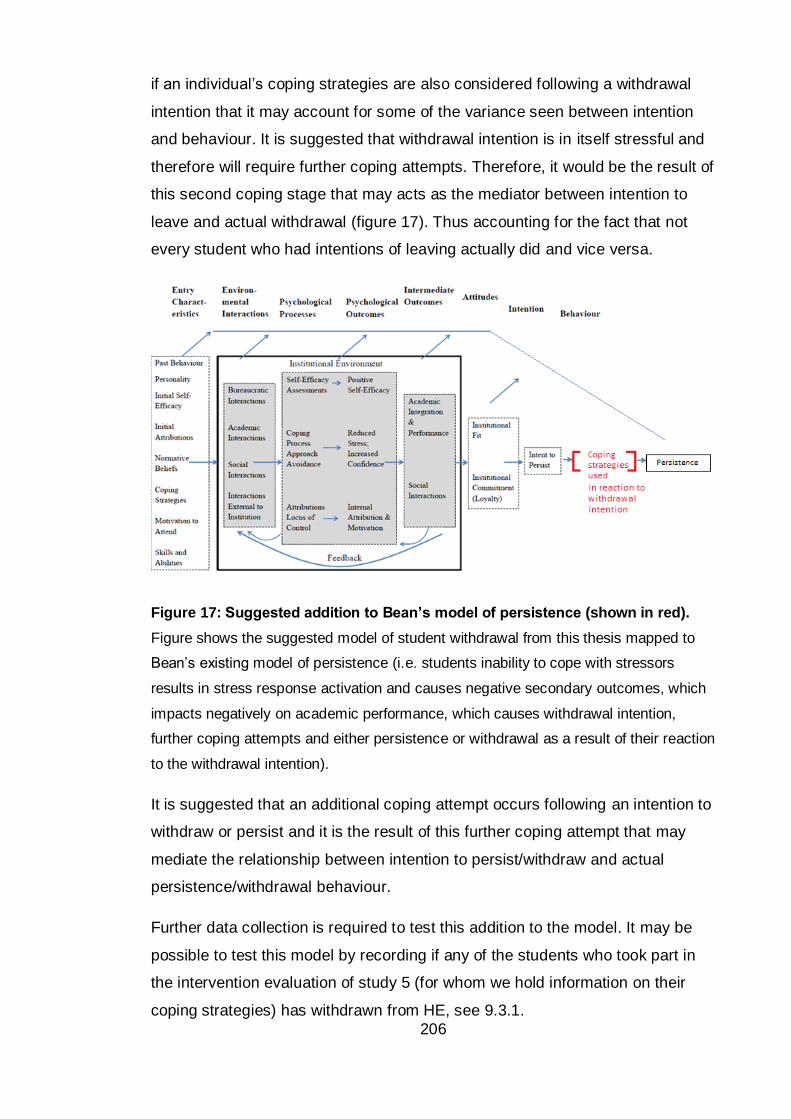
206
if an individual’s coping strategies are also considered following a withdrawal
intention that it may account for some of the variance seen between intention
and behaviour. It is suggested that withdrawal intention is in itself stressful and
therefore will require further coping attempts. Therefore, it would be the result of
this second coping stage that may acts as the mediator between intention to
leave and actual withdrawal (figure 17). Thus accounting for the fact that not
every student who had intentions of leaving actually did and vice versa.
Figure 17: Suggested addition to Bean’s model of persistence (shown in red).
Figure shows the suggested model of student withdrawal from this thesis mapped to
Bean’s existing model of persistence (i.e. students inability to cope with stressors
results in stress response activation and causes negative secondary outcomes, which
impacts negatively on academic performance, which causes withdrawal intention,
further coping attempts and either persistence or withdrawal as a result of their reaction
to the withdrawal intention).
It is suggested that an additional coping attempt occurs following an intention to
withdraw or persist and it is the result of this further coping attempt that may
mediate the relationship between intention to persist/withdraw and actual
persistence/withdrawal behaviour.
Further data collection is required to test this addition to the model. It may be
possible to test this model by recording if any of the students who took part in
the intervention evaluation of study 5 (for whom we hold information on their
coping strategies) has withdrawn from HE, see 9.3.1.
207
9.3 Recommendations for future work
The results from the current study have generated avenues for future research
which are discussed below.
9.3.1 Refining the model to predict withdrawal from stress and coping
As discussed above, further data collection could confirm if adding coping
strategy data to PSS-14 scores will improve the predictive power of the model
suggested in this thesis. This will also allow for testing of a proportion of Bean’s
model of student attrition, see 9.1.5 and 9.2.4.1.
9.3.2 Developing a screening tool based on perceived stress
The thesis findings suggest that the PSS-14 could be used as a tool to identify
at risk students and allow a means of administering additional targeted support
in an attempt to improve wellbeing and prevent withdrawal. Further research
could refine the screening tool, distilling key questions from the PSS-14 and,
depending on the results of research discussed above (see 9.3.1), perhaps add
additional measures of coping. Following this it is recommended that
operational plans are developed to integrate monitoring of student stress within
existing student support strategic plans. Given the potential additional workload
of screening for at risk students and the limited free time of staff, it is suggested
that a screening tool could be administered online. Students’ tests could then be
scored electronically and compared to their cohort average and their previous
scores (if available). Results could be emailed to students along with helpful
advice and details of available support service appointments if results show the
individual is reporting increased perceived stress and poor coping capacity.
An additional method for utilisation of a screening tool would be to copy the
results to the student’s PDT, which could help staff to manage their student
allocation. Students, whose scores are inflated in comparison to their cohort or
previous individual scores, could be flagged and advisors given the opportunity
to schedule meetings with students early before problems escalate. The latter
may help to manage the problems brought to academics and therefore reduce
the occurrence of advisors having to deal with particularly distressed students
who have waited until problems are significant before seeking support. A
problem with the introduction of another ‘flag’ for students who are potentially at
risk of withdrawal is the additional academic time which may be required to
follow up students for advisory meeting. It is suggested that stress education is
208
used in combination with monitoring to maximise the students own skills and the
impact of support.
This research also highlights the usefulness of the PSS-14 as a means of
evaluating the effectiveness of interventions designed to improve student
wellbeing and retention. Given the correlations reported in this project,
educational researchers and HEIs can also make inferences regarding
psychological wellbeing and a student’s likelihood of withdraw from their PSS-
14 scores.
9.3.3 Improving coping interventions
Research should attempt to further investigate the findings from this project
regarding the effect of student coping strategies on stress and withdrawal.
Results from study four (investigation of students’ individual coping strategies
using Brief COPE) suggest that reducing maladaptive strategies may have a
greater effect on stress reduction than increasing adaptive strategies. Due to
the time constraints for the project as a whole, this area remained
underdeveloped within the intervention trial. Research should confirm this
finding and attempt to develop interventions which are focused on reduction of
maladaptive strategies. The difficulty foreseen here is that encouraging an
individual to reduce a type of behaviour will be harder to facilitate and evaluate
than encouraging an increase in a particular behaviour.
9.3.4 Stress and coping in widening participation
A limitation of this research, highlighted in previous discussions, was the
characterisation of students who could be deemed as widening participation.
This study used a crude estimation of non-traditional students and found no
difference in perceived stress or intention to withdraw between traditional and
non-traditional groups. Studies investigating stress within HEIs in the future
should make use of the Polar3 data available from the Higher Education
Funding Council (HEFC); particularly in England where widening participation
agendas are high profile given HEFC’s stipulation that relatively large
percentages of additional fees must be committed to outreach and open access
activities. By collecting participant’s home postcodes, students can be assigned
a Polar quintile which describes historical young person participation in HE for
that geographical area. There are concerns with the accuracy of this method
209
given the potential for a student to come from a geographically low participation
area but with a strong family history of HE. Used in combination, however,
family history, past experience (High school, 6th form, college, employed or
unemployed), in-care status, pupil premium and Polar3 data may allow a better
understanding of any need differences between traditional and non-traditional
student groups.
9.3.5 Information provided at key transitions within the student journey
Another area of potentially fruitful research could build on the findings from
study one (exploration of stress and withdrawal intentions experienced by non-
health BSc students), where two distinct student profiles were identified
regarding stress at the start of the trimester. It appeared that students were
either experiencing high or no stress at the start of the trimester and that
student’s expectations and understanding of the year to come played a part in
mediating the stress experienced. HEIs therefore have a responsibility to
provide accurate and timely information to allay student fears and to allow
students to prepare themselves for the transition, which is hypothesised to
support reduced stress and increased retention. Research could explore the
information required by some students to facilitate successful integration and
methods of delivering this information at appropriate times. In relation to this, a
study is known to exist at the University of East Anglia which is investigating
student confidence, performance and retention. Initial data seems to suggest a
proportion of students within the larger cohort who have an inflated sense of
academic ability and thus report confidence in their ability to carry out tasks but
who subsequently fail and take this very badly. Potential links between this and
the current study might exist where students who are reporting little stress at the
beginning of the trimester may not necessarily be better prepared but may
instead be unaware of the potential stress that lies ahead. Although low
perceived stress would be indicative of better health, if, like in the East Anglia
study, students then find themselves to be struggling it could come as a shock
and the student may find it harder to cope. This could be worse than a slow
steady increase in stress across the trimester to which the student may be able
to build reliance given the right tools.
210
9.3.6 Different approaches
On reflection, a longitudinal study following a smaller number of students from
pre-entry through to graduation may have provided beneficial data that has not
been collected through the random sampling of students at various points
across the student life cycle in this project. A study of this nature may then be in
a better position to hold exit interviews with students who do leave, as they
would have built a relationship with the participants beforehand. This would
build on a limitation of the current project which was unable to collect data from
students after they withdrew.
211
9.4 Conclusion
The thesis has shown that students at the host university are experiencing
stress at levels consistent with other HE students and have wellbeing which is
lower than that of the general public. The studies detailed here have highlighted
the potential for measures of stress to indicate students who may be more likely
to withdraw from their studies and who therefore may require more support. The
results confirmed the importance of student wellbeing in the successful
completion of a degree, and demonstrated the potential for psychoeducational
resources to be used to improve student resilience and impact positively on
retention. Further research may be able to refine methods of monitoring
wellbeing to identify students at risk of withdrawal and delivering the benefits of
stress education to a larger audience. An avenue of research that has emerged,
and one which might impact greatly on future methods of improving coping, is
the finding that reduced maladaptive coping may be more strongly correlated to
low perceived stress than increased adaptive strategies. Further work in this
area may provide a new framework for interventions which aim to reduce stress,
and related secondary variables, through improved coping. The project has
provided data on the stress experienced by undergraduate science students, a
cohort for whom very little data exists within the literature. Data presented within
this thesis also represents a sample of students who were attending classes
and who were willing to volunteer their time for research. The results therefore
highlight the stress and attrition experienced by a cohort who could be thought
of as engaged and who may have previously been considered low risk. Overall,
the findings presented in this thesis support evidence, from studies originating
in other cohorts, that stress is a growing concern. Results highlight the
challenge faced by HEIs to support their students’ personal and professional
development needs, not least because of students’ unwillingness to seek
support. The thesis provides a platform for further work to be undertaken to
refine methods of improving student resilience to maintain high levels of
retention which benefit both the HEI and the individual.
212
References
Abouserie, R. (1994). Sources and levels of stress in relation to locus of control and self esteem in university students. Educational Psychology, 14(3),
323. Adelman, C. (1999). Answers in the toolbox: Academic intensity, attendance
patterns, and bachelor’s degree attainment (Document No. PLLI 1999-
8021). Washington, DC: U.S. Department of Education. Adelman, C. (2006). The toolbox revisited: Paths to degree completion from
high school through college. Washington, DC: U.S. Department of
Education. Adlaf, E.M., Gliksman, L., Demers, A. and Newton-Taylor, B. (2001). The
prevalence of elevated psychological distress among Canadian
undergraduates: findings from the 1998 Canadian Campus Survey. Journal of American College Health, 50, 67-72.
Agolla, J. E. and Ongori, H. (2009). An assessment of academic stress among
undergraduate students: The case of University of Botswana. Educational Research and Review, 4(2), 63-70.
Aimhigher Research and Consultancy Network (2013). Literature review of
research into widening participation to higher education: Report to HEFCE and OFFA. Available: http://www.hefce.ac.uk/pubs/rereports/Year/2013/wplitreview/Title,92181,
en.html Aitken, N. D. (1982). College student performance, satisfaction and retention:
Specification and estimation of a structural model. The Journal of Higher
Education, 53(1), 32-50.
Almeida, D.M. and Kessler, R.C. (1998). Everyday stressors and gender differences in daily distress. Journal of Personality and Social
Psychology, 75(3), 670.
Alty, A. and Rodham, K. (1998). The ouch! factor: Problems in conducting sensitive research. Qualitative Health Research, 8, 275-282.
Andreou, E., Alexopoulos, E. C., Lionis, C., Varvogli, L., Gnardellis, C.,
Chrousos, G. P., and Darviri, C. (2011). Perceived stress scale: reliability and validity study in Greece. International Journal of Environmental Research and Public Health, 8(8), 3287-3298
Armijo-Olivo, S., Warren, S. and Magee, D. (2009). Intention to treat analysis, compliance, drop-outs and how to deal with missing data in clinical research: a review. Physical Therapy Reviews, 14, 36-49.
Arnold, M.B. (1960). Emotion and personality. New York: Columbia University
Press. Augustine, L.F., Vazir, S., Rao, S.F., Rao, M.V.V., Laxmaiah, A. and Nair, K.M.
(2011). Perceived stress, life events and coping among higher secondary students of Hyderabad, India: A pilot study. The Indian Journal of Medical Research, 134(1), 61.
Ayers, T. S., Sandier, I. N., West, S. G. and Roosa, M. W. (1996). A dispositional and situational assessment of children's coping: testing alternative models of coping. Journal of Personality, 64, 923-958.
Banks, M.H., Clegg, C.W., Jackson, P.R., Kemp, N.J., Stafford, E.M. and Wall, T.D. (1980). The use of the General Health Questionnaire as an indicator of mental health in occupational studies. Journal of Occupational
Psychology, 53, 187-194.
213
Barlow, D. H. (2001). Anxiety and its disorders: The nature and treatment of
anxiety and Panic (2nd ed.). New York: Guilford.
Bean, J. and Eaton, S. B. (2001). The psychology underlying successful retention practices. Journal of College Student Retention, 3(1), 73-89.
Bean, J. P. (1980). Dropouts and turnover: The synthesis and test of a causal model of student attrition. Research in Higher Education, 12, 155–187.
Bean, J. P. (1985). Interaction effects based on class level in an explanatory model of college student dropout syndrome. American Educational Research Journal, 22(1), 35-64.
Bean, J. (2005). Chapter 8: Nine themes of college student retention. In: A. Seidman (Ed.), College student retention: Formula for student success:
Greenwood Publishing Group. Bebbington, P. E. (1996). The origins of sex differences in depressive disorder:
Bridging the gap. International Review of Psychiatry, 8, 295–332.
Becker, S., MacQueen, G. and Wojtowicz, J.M. (2009). Computational modeling and empirical studies of hippocampal neurogenesis-dependent memory: Effects of interference, stress and depression. Brain Research, 1299, 45-
54. Benzies, A., Westwood, J. . (2008). Review of Evaluation of School Support
Strategies 2006-07. Retrieved 04/11, 2011, from
www2.napier.ac.uk/ed/staffconference/june2008/.../benzies01.ppt Bernstein, I.H. and Teng. G. (1989). Factoring items and factoring scales are
different: Spurious evidence for multidimensionality due to item categorization. Psychological Bulletin, 105, 467–477.
Bilang‐Bleuel, A., Ulbricht, S., Chandramohan, Y., De Carli, S., Droste, S.K. and
Reul, J.M.H.M. (2005). Psychological stress increases histone H3 phosphorylation in adult dentate gyrus granule neurons: involvement in a glucocorticoid receptor‐dependent behavioural response. European Journal of Neuroscience, 22(7), 1691-1700.
Birks, Y., McKendree, J. and Watt, I. (2009). Emotional intelligence and perceived stress in healthcare students: a multi-institutional, multi-professional survey. BMC Medical Education, 9, 61.
Black, P. H., and Garbutt, L.D. (2002). Stress, inflammation and cardiovascular disease. Journal of Psychosomatic Research, 52, 1-23.
Bradley, L.A., Richter, J.E., Pulliam, T.J., Haile, J., Scarinci, I., Schan, C.,
Dalton, C. and Salley, A. (1993). The relationship between stress and symptoms of gastroesophageal reflux: the influence of psychological factors. The American Journal of Gastroenterology, 88(1), 11.
Braun, V. and Clarke, V. (2006). Using thematic analysis in psychology. Qualitative Research in Psychology, 3, 77-101.
Braxton, J.M. and Lee, S.D. (2005). Chapter 5: Toward reliable knowledge about college student departure. In: A. Seidman (Ed.), College student retention: Formula for student success: Greenwood Publishing Group.
Brazenor, G. and Masterton, J. (1980). Achievement levels and mental health in medical students: a Monash University Study. Medical Education, 14(5),
350-355. Breckenridge, J., Jones, D., Elliott, I. and Nicol, M. (2012). Choosing a
methodological path: Reflections on the constructivist turn. Grounded Theory Review, 11, 64-71.
214
Bromley, C., Sproston, K. and Shelton, N. (2005). The Scottish health survey
2003 (Vol. 2). Available: http://www.gov.scot/Publications/2005/12/02160336/03417
Brosschota, J. F., Gerinb,W., Thayerc, J.F. (2006) The perseverative cognition
hypothesis: A review of worry, prolonged stress-related physiological activation, and health. Journal of Psychosomatic Research, 60(2), 113–
124.
Bryant, A. (2009). Grounded Theory and Pragmatism: The Curious Case of Anselm Strauss. Forum: Qualitative Social Research, 10(3).
Buchanan, T.W. and Tranel, D. (2008). Stress and emotional memory retrieval: effects of sex and cortisol response. Neurobiology of Learning and Memory, 89(2), 134-141.
Burns, V. E., Drayson, M., Ring, C. and Carroll, D. (2002). Perceived stress and
psychological well-being are associated with antibody status after meningitis C conjugate vaccination. Psychosomatic Medicine, 64(6), 963-
970.
Cabrera, A.F., Nora, A. and Castaneda, M.B. (1993). College persistence: Structural equations modeling test of an integrated model of student retention. Journal of Higher Education, 64(2), 123-139.
Campbell, E.J.M. and Howell, J.B.L. (1963). The sensation of breathlessness. British Medical Bulletin, 19(1), 36-40.
Cannon, W. B. (1932). The wisdom of the body. New York: W W Norton and
Co. Carney, C., McNeish, S. and McColl, J. (2005). The impact of part time
employment on students' health and academic performance: a Scottish perspective. Journal of Further and Higher Education, 29, 307-319.
Carver, C.S. (1997). You want to measure coping but your protocol'too long: Consider the brief cope. International journal of behavioral medicine, 4,
92-100. Carver, C.S., Scheier, M. F. and Weintraub, J.K. (1989). Assessing coping
strategies: a theoretically based approach. Journal of Personality and
Social Psychology, 56, 267.
Chandramohan, Y., Droste, S.K. and Reul, J.M.H.M. (2007). Novelty stress
induces phospho‐acetylation of histone H3 in rat dentate gyrus granule
neurons through coincident signalling via the N‐methyl‐d‐aspartate
receptor and the glucocorticoid receptor: relevance for c‐fos induction. Journal of Neurochemistry, 101(3), 815-828.
Charmaz, K. (1995). Grounded theory. In: Smith, J., et al. (eds.), Rethinking methods in psychology, pp. 27-65. London: Sage.
Charmaz, K. (2000). Grounded theory: Objectivist and constructivist methods. In: Denzin, N. and Lincoln, Y.S. (eds.), Handbook of qualitative research, 2nd ed., pp. 509-536. Thousand Oaks, CA: Sage.
Charmaz, K. (2003). Grounded theory: Obejectivist and constructivist methods. In N.K.Denzin and Y. S. Lincoln (Eds.), Strategies of qualitative inquiry,
2nd ed., pp. 249-291. London: Sage Publications Limited.
Charmaz, K. (2006). Constructing grounded theory: A practical guide through qualitative analysis. London: Sage Publications Limited.
Chemers, M. M., Hu, L.-T., and Garcia, B. F. (2001). Academic self-efficacy and first-year college student performance and adjustment. Journal of Educational Psychology 93(1): 55–64.
215
Chiauzzi, E., Brevard, J., Thurn, C., Decembrele, S. and Lord, S. (2008).
MyStudentBody–Stress: An online stress management intervention for college students. Journal of Health Communication, 13, 555-572.
Cho, S.J., Li, F. and Bandalos, D. (2009). Accuracy of the parallel analysis procedure with polychoric correlations. Educational and Psychological Measurement, 69, 748-759.
Clark, R. C., Nguyen, F., Sweller, J. and Baddeley, M. (2006). Efficiency in
learning: Evidence‐based guidelines to manage cognitive load. Performance Improvement, 45, 46-47.
Clements, K. and Turpin, G. (1996). The life events scale for students: validation for use with British samples. Personality and Individual Differences, 20, 747-751.
Clements, K. and Turpin, G. (2000). Life event exposure, physiological reactivity, and psychological strain. Journal of Behavioral Medicine,
23(1), 73-94. Cobb, J. M. and Steptoe, A. (1996). Psychosocial stress and susceptibility to
upper respiratory tract illness in an adult population sample. Psychosomatic Medicine, 58(5), 404-412.
Cohen, J. (1988). Statistical power analysis for the behavioral sciences, 2nd ed.
New Jersey: Lawrence Erlbaum Associates, Inc. Cohen, S., Doyle, W.J. and Skoner, D.P. (1999). Psychological stress, cytokine
production, and severity of upper respiratory illness. Psychosomatic
Medicine, 61(2), 175-180.
Cohen, S., Kamarck, T. and Mermelstein, R. (1983). A global measure of perceived stress. Journal of Health and Social Behavior, 24, 386-396.
Cohen, S., Tyrrell, D.A. and Smith, A.P. (1993). Negative life events, perceived stress, negative affect, and susceptibility to the common cold. Journal of personality and social psychology, 64(1), 131.
Collins, S.M. and Vallance, B.G. (1999). Stress, inflamation and the irritable bowel syndrome. Canadian Journal of Gastroenterology, 13, 47A-49A.
Costello, A. B. and Osborne, J. W. (2005). Best practices in exploratory factor analysis: four recommendations for getting the most from your analysis. Practical Assessment Research and Evaluation 10(7).
Craske, M. G. (2003). Origins of phobias and anxiety disorders: Why women more than men?. Elsevier: Oxford.
Credé, M. and Niehorster, S. (2012). Adjustment to College as Measured by the Student Adaptation to College Questionnaire: A Quantitative Review of its Structure and Relationships with Correlates and Consequences. Educational Psychology Review, 24(1), 133-165.
Creswell, J.W. and Clark, V.L.P. (2007). Designing and conducting mixed methods research. Sage Publishing.
Creswell, J.. and Clark, V.L.P. (2011). Designing and Conducting Mixed Methods Research, 2nd ed. SAGE Publications.
Creswell, J.W. and Miller, D.L. 2000. Determining Validity in Qualitative Inquiry. Theory into Practice, 39(3): 124-130.
Cruess, D. G., Finitsis, D. J., Smith, A. L., Goshe, B. M., Burnham, K., Burbridge, C., & O’Leary, K. (2015). Brief Stress Management Reduces
Acute Distress and Buffers Physiological Response to a Social Stress Test. International Journal of Stress Management, 22(3), 270-286.
216
Curry, L.A., Krumholz, H.M., O’Cathain, A., Clark, V.L.P., Cherlin, E. and
Bradley, E.H. (2013). Mixed methods in biomedical and health services research. Circulation: Cardiovascular Quality and Outcomes, 6, 119-123.
Davies EB, Morriss R, Glazebrook C. (2014). Computer-Delivered and Web-
Based Interventions to Improve Depression, Anxiety, and Psychological Well-Being of University Students: A Systematic Review and Meta-Analysis. Journal of Medeical Internet Research, 16(5).
Davis, M.C., Matthews, K.A. and Twamley, E.W. (1999). Is life more difficult on Mars or Venus? A meta-analytic review of sex differences in major and minor life events. Annals of Behavioral Medicine, 21(1), 83-97.
DeBerard, M. S., Spielmans, G. I., & Julka, D. L. (2004). Predictors of academic achievement and retention among college freshman: A longitudinal study. College Student Journal, 38, 66–80.
De Kloet, E. R. (2003). Hormones, brain and stress. Endocrine Regulation, 3,
51-68. Devonport, T.J. and Lane, A.M. (2006). Relationships between self-efficacy,
coping and student retention. Social Behavior and Personality: An International Journal, 34, 127-138.
Dickson-Swift, V., James, E.L., Kippen, S. and Liamputtong, P. (2006). Blurring boundaries in qualitative health research on sensitive topics. Qualitative Health Research, 16, 853-871.
Diener, E., Emmons, R.A., Larsen, R. J. and Griffin, S. (1985). The satisfaction with life scale. Journal of Personality Assessment, 49(1), 71-75.
Dollard, M. F., and Winefield, A. H. (1996). Managing occupational stress: A national and international perspective. International Journal of Stress
Management, 3(2), 69-83.
Doron, J., Trouillet, R., Gana, K., Boiché, J., Neveu, D. and Ninot, G. (2014). Examination of the hierarchical structure of the Brief COPE in a French sample: empirical and theoretical convergences. Journal of Personality Assessment, 96, 567-575.
Dunn, L. (1991). Research alert! Qualitative research may be hazardous to your health!, Vol. 1, Qualitative Health Research, pp: 388-392. Sage
Publications. Dziegielewski, S.F., Turnage, B., and Roest-Marti, S. (2004) Addressing Stress
with Social Work Students: A Controlled Evaluation, Journal of Social Work Education, 40(1), 105-119
Ebrecht, M., Hextall, J., Kirtley, L.G., Taylor, A., Dyson, M. and Weinman, J.
(2004). Perceived stress and cortisol levels predict speed of wound healing in healthy male adults. Psychoneuroendocrinology, 29(6), 798-
809.
Eisenberg, D., Downs, M.F., Golberstein, E. and Zivin, K. (2009). Stigma and help seeking for mental health among college students. Medical Care Research and Review, 66, 522-541.
Eysenbach, G. (2005). The law of attrition. Journal of medical Internet research, 7(1).
Farrer, L., Gulliver, A., Chan, J.K., Batterham, P. J., Reynolds, J., Calear, A.,
Tait, R., Bennett, K. and Griffiths, K.M. (2013). Technology-based interventions for mental health in tertiary students: systematic review. Journal of Medical Internet Research, 15(5).
Faul, F. (2013). GPower 3.1, Available online:
http://gpower.software.informer.com/3.1/.
217
Feldt, R. C. (2008). Development of a brief measure of college stress: the college student stress scale. Psychological Reports, 102(3), 855-860.
Fisher, S. (1994). Stress in academic life: The mental assembly line: Open
University Press.
Flora, D. B. and Curran, P. J. (2004). An empirical evaluation of alternative methods of estimation for confirmatory factor analysis with ordinal data. Psychological Methods, 9, 466.
Folkman, S. and Lazarus, R.S. (1980). An analysis of coping in a middle-aged community sample. Journal of Health and Social Behavior, 219-239.
Folkman, S. and Lazarus, R. S. (1988). Manual for the ways of coping
questionnaire. Consulting Psychologists Press.
Folkman, S. and Moskowitz, J.T. (2000). Positive affect and the other side of coping. American Psychologist, 55, 647.
Folkman, S. (1997). Positive psychological states and coping with severe stress. Social Science and Medicine, 45, 1207-1221.
Folkman, S., Lazarus, R.S., Dunkel-Schetter, C., DeLongis, A. and Gruen, R.J.
(1986). Dynamics of a stressful encounter: cognitive appraisal, coping, and encounter outcomes. Journal of Personality and Social Psychology,
50(5), 992.
Fragala, M.S., Kraemer, W.J., Denegar, C.R., Maresh, C.M., Mastro, A.M. and Volek, J.S. (2011). Neuroendocrine-Immune Interactions and Responses to Exercise. Sports Medicine, 41(8), 621-639.
Fredrickson, B. L. and Joiner, T. (2002). Positive emotions trigger upward spirals toward emotional well-being. Psychological Science, 13, 172-175.
Gaab, J., Rohleder, N., Nater, U. M., and Ehlert, U. (2005). Psychological
determinants of the cortisol stress response: The role of anticipatory cognitive appraisal. Psychoneuroendocrinology, 30, 599-610.
Gadermann, A.M., Guhn, M. and Zumbo, B.D. (2012). Estimating ordinal
reliability for Likert-type and ordinal item response data: A conceptual, empirical, and practical guide. Practical Assessment, Research and Evaluation, 17, 1-13.
Gadzella, B. M. (1991). Student-Life Stress Inventory, Annual Meeting of the Texas Psychological Association San Antonio.
Gagné, R. M. (1985). The conditions of learning and theory of instruction. Holt,
Rinehart and Winston New York. Gale, J. (1992). When research interviews are more therapeutic than therapy
interviews. The Qualitative Report, 1, 31-38.
Gallagher, C. T., Mehta, A. N., Selvan, R., Mirza, I. B., Radia, P., Bharadia, N. S. and Hitch, G. (2014). Perceived stress levels among undergraduate pharmacy students in the UK. Currents in Pharmacy Teaching and
Learning, 6, 437-441.
Gevirtz, R. N. and Schwartz, M.S (2003). The respiratory system in applied psychophysiology. In: M. S. Schwartz (Ed.), Biofeedback: A practitioner's
guide: The Guilford Press.
Gilbert, K. (2001). Chapter 8: Collateral damage? Indirect exposure of staff members to the emotions of qualitative research. In: K.R. Gilbert (Ed.) The Emotional Nature of Qualitative Research, pp. 147-161. CRC Press.
Gill, J.S. (2002). Reported levels of alcohol consumption and binge drinking within the UK undergraduate student population over the last 25 years. Alcohol and Alcoholism, 37(2), 109-120.
218
Gillespie, N. A., Walsh, M., Winefield, A. H., Dua, J. and Stough, C. (2001).
Occupational stress in universities: staff perceptions of the causes, consequences and moderators of stress. Work and Stress, 15(1), 53-72.
Gitchel, WD., Roessler, RT. and Turner RC. (2011). Gender effect according to
item directionality on the perceived stress scale for adults with multiple sclerosis. Rehabilitation Counseling Bulletin 55(1), 20-28.
Glaser, B.G. and Strauss, A.L. (1965). Discovery of substantive theory: A basic strategy underlying qualitative research. American Behavioral Scientist 8,
5-12. Glaser, B.G. and Strauss, A.L. (1967). The discovery of grounded theory:
Strategies for ualitative research. New Jersey: AldineTransactions.
Glaser, B.G., Strauss, A.L. and Strutzel, E. (1968). The discovery of grounded theory; strategies for qualitative research. Nursing Research 17, 364.
Glaser, R. and Kiecolt-Glaser, J.K. (2005). Stress-induced immune dysfunction: implications for health. Nature Reviews Immunology, 5(3), 243-251.
Godbey, K. L., and Courage, M. M. (1994).Stress management program: Intervention in nursing student performance anxiety. Archives of Psychiatric Nursing, 8,190-199.
Goldberg, D. and Williams, P. (1988). User’s guide to the General Health
Questionnaire. London: GL Assessment Limited.
Goldberg, D.P., Gater, R., Sartorius, N., Ustun, T.B., Piccinelli, M., Gureje, O. and Rutter, C. (1997). The validity of two versions of the GHQ in the WHO study of mental illness in general health care. Psychological Medicine, 27(1), 191-197.
Grant, A. (2011). The growth and development of mental health provision in UK
higher education institutions. Universities UK/Guild HE working group for the promotion of mental wellbeing in higher education. in press.
Griep, E.N., Boersma, J.W., Lentjes, E.G., Prins, A.P., Van der Korst, J.K. and
De Kloet, E.R. (1998). Function of the hypothalamic-pituitary-adrenal axis in patients with fibromyalgia and low back pain. The Journal of Rheumatology, 25(7), 1374.
Health and Safety Executive. (2011). Stress and psychological disorders.
Retrieved 30/4, 2012, from http://www.hse.gov.uk/statistics/causdis/stress/stress.pdf
Heaman, D. (1995).The QUieting Response (QR): A modality for reduction of psychophysiologic stress in nursing students. Journal of Nursing Education, 34(1), 5-10.
Hedlund, M. A., & Chambless, D. L. (1990). Sex differences and menstrual cycle effects in aversive conditioning: A comparison of premenstrual and intermenstrual women with men. Journal of Anxiety Disorders, 4, 221–
231. Herbert, J., Goodyer, I., Grossman, A., Hastings, M., De Kloet, E., Lightman, S.,
Lupien, S., Roozendaal, B. and Seckl, J. (2006). Do corticosteroids damage the brain? Journal of Neuroendocrinology, 18(6), 393-411.
Herriot Watt University. (2007). Policy on Student Attendance Produced by Compulsory Withdrawals Working Group. Retrieved 20/10, 2011, from
www.hw.ac.uk/registry/resources/studentattendancepolicy.pdf Hewitt, P.L., Flett, G.L. and Mosher, S.W. (1992). The Perceived Stress Scale:
Factor structure and relation to depression symptoms in a psychiatric sample. Journal of Psychopathology and Behavioral Assessment, 14,
247-257.
219
Higher Education Academy. (2014). Retention and success, 2014, from
https://www.heacademy.ac.uk/workstreams-research/themes/retention-and-success
Higher Education Statistics Agency (2011/2012). Non-continuation rates: T3a,
https://www.hesa.ac.uk/pis/noncon. Higley, J.D. and Bennett, A.J. (1999). Central nervous system serotonin and
personality as variables contributing to excessive alcohol consumption in non-human primates. Alcohol and Alcoholism, 34(3), 402-418.
Holmes, T.H. and Rahe, R.H. (1967). The social readjustment rating scale Journal of Psychosomatic Research, 11, 213-218.
Hoshmand, L.T. (2003). Can lessons of history and logical analysis ensure progress in psychological science? Theory and Psychology 13, 39-44.
Hu, L.t. and Bentler, P.M. (1999). Cutoff criteria for fit indexes in covariance
structure analysis: Conventional criteria versus new alternatives. Structural Equation Modeling: A Multidisciplinary Journal, 6, 1-55.
Huang, F., Zhang, M., Chen, Y. J., Li, Q. and Wu, A. Z. (2011). Psychological
stress induces temporary masticatory muscle mechanical sensitivity in rats. Journal of Biomedicine and Biotechnology.
doi:10.1155/2011/720603 Ice, G.H. and James, G.D. (2007). Measuring stress in humans: A practical
guide for the field: Cambridge University Press. Insel, P.M. and Roth, W.T. (1985). Core concepts in health, 4th ed. California:
Mayfield. Institute of Work, Health & Organisations, 2008. Best Practice in Work-related
Stress Management Interventions: PRIMA-EF. I-WHO Publications,
Nottingham. ISBN 978-88-6230-041-4 Available from http://www.who.int/occupational_health/publications/09_Stress%20Interventions.pdf
Johnson, R.B. and Onwuegbuzie, A.J. (2004). Mixed methods research: A research paradigm whose time has come. Educational Researcher, 33,
14-26.
Katkin, E. S., & Hoffman, L. S. (1976). Sex differences and self-report of fear: A psychophysiological assessment. Journal of Abnormal Psychology, 85,
607–610.
Kelly, W.F., Checkley, S.A., Bender, D.A. and Mashiter, K. (1983). Cushing's syndrome and depression--a prospective study of 26 patients. The British Journal of Psychiatry, 142(1), 16.
Kelly, M. M., Forsyth, J. P., and Karekla, M. (2006). Sex differences in response to a panicogenic biological challenge procedure: An experimental evaluation of panic vulnerability in a non-clinical sample. Behaviour
Research and Therapy, 44, 1421–1430.
Kelly, M.M., Tyrka, A.R., Anderson, G.M., Price, L.H. and Carpenter, L.L. (2008) Sex differences in emotional and physiological responses to the Trier Social Stress Test. Journal of Behavior Therapy and Experimental Psychiatry 39: 87–98
Kessler, R. C. and McLeod, J. D. (1984). Sex differences in vulnerability to undesirable life events. American Sociological Review, 49(5), 620-631.
Kessler, R. C., McLeod, J. D. and Wethington, E. (1985). The costs of caring: A perspective on the relationship between sex and psychological distress. Social support: Theory, Research, and Applications, 491-506.
220
Kiecolt-Glaser, J. K., McGuire, L., Robles, T. F. and Glaser, R. (2002).
Psychoneuroimmunology: psychological influences on immune function and health. Journal of Consulting and Clinical Psychology, 70(3), 537.
Kirschbaum, C., Kudielka, B. M., Gaab, J., Schommer, N., & Hellhammer, D. H.
(1999). Impact of gender, menstrual cycle phase, and oral contraceptives on the activity of the hypothalamus–pituitary–adrenal axis. Psychosomatic Medicine, 61, 154–162
Kirschbaum, C., Wu¨st, S., & Hellhammer, D. (1992). Consistent sex differences in cortisol responses to psychological stress. Psychosomatic Medicine,
54, 648–657
Kivimäki, M., LeinoArjas, P., Luukkonen, R., Riihimäki, H., Vahtera, J. and Kirjonen, J. (2002). Work stress and risk of cardiovascular mortality: prospective cohort study of industrial employees. British Medical Journal,
325, 857. Klonoff, E. A., Landrine, H. and Campbell, R. (2000). Sexist discrimination may
account for well-known gender differences in psychiatric symptoms. Psychology of Women Quarterly, 24(1), 93-99.
Koss, M.P., Koss, P.G. and Woodruff, W.J. (1991). Deleterious effects of criminal victimization on women's health and medical utilization. Archives
of Internal Medicine, 151(2), 342.
Krägeloh, C.U. (2011). A systematic review of studies using the Brief COPE: Religious coping in factor analyses. Religions, 2, 216-246.
Kudielka, B.M and Kirschbaum, C. (2005). Sex differences in HPA axis responses to stress: a review. Biological Psychology, 69, 113-132.
Landrine, H., Klonoff, E. A., Gibbs, J., Manning, V. and Lund, M. (1995). Physical and psychiatric correlates of gender discrimination. Psychology of Women Quarterly, 19(4), 473-492.
Lavoie, J.A.A. and Douglas, K.S. (2012). The Perceived Stress Scale:
Evaluating Configural, Metric and Scalar Invariance across Mental Health Status and Gender. Journal of Psychopathology and Behavioral Assessment, 1-10.
Lazarus, R.S. and Folkman, S. (1984). Stress, appraisal, and coping: Springer
Publishing Company. Lazarus, R.S. and Launier, R. (1978). Stress-related transactions between
person and environment. In: L. A. Pervin et al. (eds). Perspectives in interactional psychology (pp. 287-327). Ney York: Springer.
Lazarus, R.S. (1966). Psychological stress and the coping process. New York:
McGraw-Hill. Lazarus, R.S., Deese, J. and Osler, S.F. (1952). The effects of psychological
stress upon performance. Psychological bulletin, 49(4), 293.
Leacock, T.L. and Nesbit, J.C. (2007). A Framework for Evaluating the Quality of Multimedia Learning Resources. Educational Technology and Society,
10, 44-59. LeCompte, M.D. and Schensul, J.J. (1999). Analyzing and interpreting
ethnographic data. Calinfornia: Altamira Press.
Lee, R.M. and Renzetti, C.M. (1993). The problems of researching sensitive topics. American Behavioral Scientist, 33(5), 510-28.
Lee, R.M. (1993). Doing research on sensitive topics. Sage Publications.
Leproult, R., Copinschi, G., Buxton, O. and Van Cauter, E. (1997). Sleep loss results in an elevation of cortisol levels the next evening. Sleep: Journal of Sleep Research and Sleep Medicine. 20(10), 865-70
221
Levi, L. (1998). Preface: stress in organizations - theoretical and empirical approaches. In: C. L. Cooper (Ed.), Theories of organizational stress.
Oxford: Oxford University Press. Linden, W. (1984). Development and initial validation of a life event scale for
students. Canadian Journal of Counselling and Psychotherapy, 18.
Liu, L.Y., Coe, C.L., Swenson, C.A., Kelly, E.A., Kita, H. and Busse, W.W. (2002). School examinations enhance airway inflamation to antigen challenge. American Journal of Respiratory and Critical Care Medicine,
165(8), 1062-1067. Lucki, I. (1998). The spectrum of behaviors influenced by serotonin. Biological
psychiatry. 44(3), 151-162.
Mack, N., Woodsong, C., MacQueen, K. M., Guest, G. and Namey, E. (2005). Qualitative research methods: a data collectors field guide. North
Carolina: Family Health International. Mason, J.W. (1968). A review of psychoendocrine research on the sympathetic-
adrenal medullary system. Psychosomatic Medicine, 30(5), 631–653.
Marras, W. S., Davis, K. G., Heaney, C. A., Maronitis, A. B. and Allread, W. G. (2000). The influence of psychosocial stress, gender, and personality on mechanical loading of the lumbar spine. Spine, 25(23), 3045.
Martin, R. A., Kazarian, S. S. and Breiter, H. J. (1995). Perceived stress, life events, dysfunctional attitudes, and depression in adolescent psychiatric inpatients. Journal of Psychopathology and Behavioral Assessment, 17,
81-95. Matthews, K.A., Katholi, C.R., McCreath, H., Whooley, M.A., Williams, D.R.
Zhu, S. and Markovitz, J.H. (2004). Vasular Medicine, 110, 74-78.
Matud, M. P. (2004). Gender differences in stress and coping styles. Personality and Individual Differences, 37(7), 1401-1415.
McCary, J., Pankhurst, S., Valentine, H. and Berry, A. (2011). A comparative
evaluation of the roles of student adviser and personal tutor in relation to undergraduate student retention. Final report. Anglia Ruskin University. Available: https://www.heacademy.ac.uk/resources/detail/what-works-
student-retention/Anglia_Ruskin_What_Works_Final_Report McDonough, P. and Walters, V. (2001). Gender and health: reassessing
patterns and explanations. Social science and medicine, 52(4), 547-559.
McEwen, B. S. (1998). Seminars in Medicine of the Beth Israel Deaconess Medical Center: Protective and damaging effects of stress mediators. The New England journal of medicine, 338, 171-179
McGonigal, K. (2013). How to make stress your friend [Online]. TedTalk.
Available: http://www.ted.com/talks/kelly_mcgonigal_how_to_make_stress_your_fri
end?language=en. Merrill, M. D., Drake, L., Lacy, M. J., Pratt, J. and Group, I. R. (1996).
Reclaiming instructional design. Educational Technology, 36, 5-7.
Miles, J. and Shelvin, M. (2001). Applying regression and correlation. London:
Sage Publication. Miller, S. M. and Kirsch, N. (1987). Sex differences in cognitive coping with
stress. In: R. C. Barnett, L. Biener and G. K. Baruch (eds.), Gender and stress. 278-307. New York: Free Press.
Miyazaki, Y., Bodenhorn, N., Zalaquett, C. and Ng, K.-M. (2008). Factorial
Structure of Brief COPE for International Students Attending US Colleges. College Student Journal, 42, 795-806.
222
Muthén, L. K. and Muthén, B. O. (2010). Mplus User’s Guide: Sixth Edition, Los
Angeles, California: Muthén and Muthén. National Audit Office (2015) Staying the course: the retention of students in
higher education. Available: https://www.nao.org.uk/report/staying-the-
course-the-retention-of-students-in-higher-education/ National Health Service. (2010). Symptoms of stress. Retrieved 19/10, 2011,
from http://www.nhs.uk/Conditions/Stress/Pages/Symptoms.aspx National Statistics. (2011). Higher Education Students and Qualifiers at Scottish
Institutions 2009-2010. Retrieved 07/05, 2012, from
http://www.scotland.gov.uk/Publications/2011/03/25132517/0 National Union of Students (Scotland). (2010). Silently Stressed: A Survey into
Student Mental Wellbeing, Available:
http://www.nus.org.uk/Documents/NUS%20Scotland/Silently%20Stresse
d%20THINK%20POS%20REPORT%20Final.pdf. National Union of Students (Scotland). (2011). Breaking the silence: the follow
up report to silently stressed, Available:
http://www.nus.org.uk/Documents/NUS%20Scotland/Breaking%20The%20Silence.pdf.
Nolen-Hoeksema, S., Larson, J., & Grayson, C. (1999). Explaining the gender difference in depressive symptoms. Journal of Personality and Social Psychology, 77, 1061–1072
Onwuegbuzie, A. J. and Teddlie, C. (2003). A framework for analyzing data in mixed methods research. In: Tashakkori, A. and Teddlie, C. (Eds.) Handbook of mixed methods in social and behavioral research. SAGE
Publications.
Onwuegbuzie, Jiao and Collins (2007). Mixed methods research: a new direction for the study of stress and coping. In: Gates, G.S. (Ed.) Emerging thought and research on student, teacher, and administrator
stress and coping. IAP.
Paizanis, E., Hamon, M. and Lanfumey, L. (2007). Hippocampal neurogenesis, depressive disorders, and antidepressant therapy. Neural Plasticity, 7
37-54. Palestini, R. H. (2002). Educational administration: Leading with mind and
heart: R and L Education.
Pan, P. C., and Goldberg, D. P. (1990). A comparison of the validity of GHQ-12 and CHQ-12 in Chinese primary care patients in Manchester. Psychological Medicine, 20(4), 931-940.
Park, C. L. and Folkman, S. (1997). Meaning in the context of stress and coping. Review of General Psychology, 1, 115.
Park, C. L., Armeli, S. and Tennen, H. (2004). Appraisal-coping goodness of fit: A daily internet study. Personality and Social Psychology Bulletin, 30,
558-569. Parker, J. D. and Endler, N. S. (1992). Coping with coping assessment: A
critical review. European Journal of Personality, 6, 321-344. Parrott, W. G. (2001). Emotions in social psychology: essential readings.
Psychology Press. Paykel, E. S. (2001). Stress and affective disorders in humans. Seminars in
Clinical Neuropsychiatry, (6)1, 4-11.
Peacock, E. J. and Wong, P. T. (1990). The stress appraisal measure (SAM): A multidimensional approach to cognitive appraisal. Stress Medicine, 6,
227-236.
223
Perrez, M. and Reicherts, M. (1992). Stress, coping and health: A situation-
behavior approach theory, methods, applications. Seattle, Toronto:
Hogrefe and Huber Publishers. Pitts, M. J. (2009). Identity and role of expectations, stress, and talk in short-
term student Sojourner Adjustment: An application of the integrity theory of communication and cross cultural adaptation. International Journal of Intercultural Relations. 33, 450-462.
Porchea, S., Allen, J., Robbins, S. B., & Phelps, R. (2010). Predictors of long-term enrollment and degree outcomes for community college students: Integrating academic, psychosocial, socio-demographic, and situational
factors. Journal of Higher Education, 81, 750–778. Pritchard, M. E. and Wilson, G. S. (2003). Using emotional and social factors to
predict student success. Journal of College Student Development, 44,
18-28. Pritchard, M. E., Wilson, G. S. and Yamnitz, B. (2007). What predicts
adjustment among college students? A longitudinal panel study. Journal
of American College Health, 56, 15-22.
Proudfoot, J., Goldberg, D., Mann, A., Everitt, B., Marks, I., and Gray, J. A. (2003). Computerized, interactive, multimedia cognitive-behavioural program for anxiety and depression in general practice. Psychological medicine, 33(2), 217-227.
Ptacek, J. T., Smith, R. E. and Zanas, J. (1992). Gender, appraisal, and coping: A longitudinal analysis. Journal of Personality, 60(4), 747-770.
Putwain, D. (2007). Researching academic stress and anxiety in students: some methodological considerations. British Educational Research
Journal, 33, 207-219.
Radek, K. A. (2010). Antimicrobial anxiety: the impact of stress on antimicrobial immunity. Journal of Leukocyte Biology, 88(2), 263.
Rager, K. B. (2005). Self-care and the qualitative researcher: When collecting data can break your heart. Educational Researcher, 34, 23-27.
Regehr, C., Glancy, D. and Pitts, A. (2013). Interventions to reduce stress in university students: A review and meta-analysis. Journal of Affective Disorders, 148, 1-11.
Reiche, E. M. V., Nunes, S. O. V. and Morimoto, H. K. (2004). Stress, depression, the immune system, and cancer. The Lancet Oncology,
5(10), 617-625. Reise, S. P., Waller, N.G. and Comrey, A.L. (2000). Factor analysis and scale
revision. Psychological Assessment, 12, 287.
Reul, J. M. H. M. and Chandramohan, Y. (2007). Epigenetic mechanisms in stress-related memory formation. Psychoneuroendocrinology, 32, 21-25.
Richardson, K.M. and Rothstein, H.R. (2008). Effects of occupational stress management intervention programs: a meta-analysis. Journal of Occupational Health Psychology, 13, 69.
Robbins, S. B., Lauver, K., Le, H., Davis, D., Langley, R., & Carlstrom, A. (2004). Do psychosocial and study skill factors predict college outcomes? A meta-analysis. Psychological Bulletin, 130, 261–288.
Roberts, R., Golding, J., Towell, T. and Weinreb, I. (1999). The effects of economic circumstances on British students' mental and physical health. Journal of American College Health, 48(3), 103-109.
224
Roberts, R., Zelenyanski, C., Stanley, N. and Manthorpe, J. (2002). Degrees of
debt, Students’ mental health needs: Problems and responses, pp. 107-120. London: Jessica Kingsley Publishers.
Robotham, D. and Julian, C. (2006). Stress and the higher education student: a critical review of the literature. Journal of Further and Higher Education,
30(02), 107-117. Robotham, D. (2008). Stress among higher education students: Towards a
research agenda. Higher Education, 56, 735-746.
Roembke, J. E., Jr. (1995). Prevention of burnout among graduate students and new professionals in mental health (Doctoral dissertation, Biola University, 1995). Dissertation Abstracts International, 56(6-A), 2177.
Roozendaal, B. (2000). Glucocorticoids and the regulation of memory consolidation. Psychoneuroendocrinology, 25(3), 213-238.
Roozendaal, B., Hernandez, A., Cabrera, S.M., Hagewoud, R., Malvaez, M., Stefanko, D.P., Haettig, J. and Wood, M.A. (2010). Membrane-associated glucocorticoid activity is necessary for modulation of long-term memory via chromatin modification. Journal of Neuroscience, 30,
5037-5046. Rose, R. D., Buckey, J. C., Zbozinek, T. D., Motivala, S. J., Glenn, D. E.,
Cartreine, J. A., et al. (2013). A randomized controlled trial of a self-guided, multimedia, stress management and resilience training program. Behaviour Research and Therapy, 51, 106-112.
Rosenstock, I. M., Strecher, V. J. and Becker, M. H. (1988). Social learning theory and the Health Belief Model. Health Education and Behavior,
15(2), 175-183.
Ross, S.E., Niebling, B.C. and Heckert, T.M. (1999). Sources of stress among college students. College Student Journal, 33, 312-317.
Royal College of Psychiatrists. (2011). Mental health of students in higher
education (No. CR166). Available:
http://www.rcpsych.ac.uk/files/pdfversion/cr166.pdf Rubin, R.R. and Peyrot, M. (2001). Psychological issues and treatments for
people with diabetes. Journal of Clinical Psychology, 57(4), 457-478.
Rudolph, K. D. (2002). Gender differences in emotional responses to interpersonal stress during adolescence. Journal of Adolescent Health,
30, 3–13 Sale, J.E., Lohfeld, L.H. and Brazil, K. (2002). Revisiting the quantitative-
qualitative debate: Implications for mixed-methods research. Quality and
Quantity, 36(1), 43-53.
Sandler, M.E. (2000). Career decision-making self-efficacy, perceived stress, and an integrated model of student persistence: A structural model of finances, attitudes, behavior, and career development. Research in Higher Education, 41(5), 537-580.
Schlosser, N.W., O.T. and Wingenfeld, K. (2011). Cognitive correlates of hypothalamic-pituitary-adrenal axis in major depression. Expert Review of Endocrinology and Metabolism, 6, 109-118.
Schneider, M. and Yin, L. (2011). The High Cost of Low Graduation Rates: How Much Does Dropping Out of College Really Cost? American Institutes for Research. Available:
http://www.air.org/sites/default/files/downloads/report/AIR_High_Cost_of
_Low_Graduation_Aug2011_0.pdf
225
Selye, H. (1936). A syndrome produced by diverse nocuous agents. Nature,
138, 32. Selye, H. (1956). The stress of life. New York: McGraw-Hill. Selye, H. (1987). Stress without distress. In: Levi, L. (ed.), Society, stress and
disease, vol 5: Old age. New York: Oxford University Press.
Sgoifo, A., Braglia, F., Costoli, T., Musso, E., Meerlo, P., Ceresini, G., et al. (2003). Cardiac autonomic reactivity and salivary cortisol in men and
women exposed to social stressors: Relationship with individual ethological profile. Neuroscience and Biobehavioral Reviews, 27, 179–
188
Sheline, Y.I., Sanghavi, M., Mintun, M.A. and Gado, M.H. (1999). Depression duration but not age predicts hippocampal volume loss in medically healthy women with recurrent major depression. The Journal of
neuroscience, 19(12), 5034.
Skinner, E. A., Edge, K., Altman, J. and Sherwood, H. (2003). Searching for the structure of coping: a review and critique of category systems for classifying ways of coping. PsychologicalBbulletin, 129, 216.
Skrondal, A. and Rabe-Hesketh, S. (2004). Generalized latent variable modeling: Multilevel, longitudinal, and structural equation models. CRC
Press. Smeets, T., Otgaar, H., Candel, I. and Wolf, O. T. (2008). True or false?
Memory is differentially affected by stress-induced cortisol elevations and
sympathetic activity at consolidation and retrieval. Psychoneuroendocrinology, 33(10), 1378-1386.
Spek, V., Cuijpers, P., Nyklícek, I., Riper, H., Keyzer, J. and Pop, V. (2007).
Internet-based cognitive behaviour therapy for symptoms of depression and anxiety: a meta-analysis. Psychological Medicine, 37, 319-328.
Spielberger, C.D., Gorsuch, R.L., Lushene, R.E. and Vagg, P.R. (1983). Manual
for the State-Trait Anxiety Inventory. California: Consulting Psychologists
Press. Sreeramareddy, C.T., Shankar, P.R., Binu, V., Mukhopadhyay, C., Ray, B. and
Menezes, R. G. (2007). Psychological morbidity, sources of stress and coping strategies among undergraduate medical students of Nepal. BMC medical education, 7, 26.
Stallman, H. M. (2010). Psychological distress in university students: A comparison with general population data. Australian Psychologist 45,
249-257.
Starkman, M.N., Giordani, B., Berent, S., Schork, M. A. and Schteingart, D. E. (2001). Elevated cortisol levels in Cushing’s disease are associated with cognitive decrements. Psychosomatic Medicine, 63(6), 985.
Stewart-Brown, S., Evans, J., Patterson, J., Petersen, S., Doll, H., Balding, J. and Regis, D. (2000). The Health of Students in Institutes of Higher Education: An Important and Neglected Public Health Problem. Journal
of Public Health, 22, 492.
Stoney, C. M., Davis, M. C., & Matthews, K. A. (1987). Sex differences in physiological responses to stress and in coronary heart disease: A causal link? Psychophysiology, 24, 127–131.
Strauss, A. andand Corbin, J. M. (1990). Basics of qualitative research: Grounded theory procedures and techniques. Sage Publications, Inc.
Szulecka, T.K., Springett, N.R. and De Pauw, KW. (1987). General health, psychiatric vulnerability and withdrawal from university in first-year
226
undergraduates. British Journal of Guidance and Counselling, 15(1), 82-
91. Tabachnick, B.G. and Fidell, L.S. (2007). Using multivariate statistics, 5th ed.
New York: Allyn and Bacon. Tashakkori, A. and Teddlie, C. (2003). Handbook of Mixed Methods in Social
and Behavioral Research. SAGE Publications.
Ten Have, T.R., Normand, S.L.T., Marcus, S.M., Brown, C.H., Lavori, P. and
Duan, N. (2008). Intent-to-treat vs. non-intent-to-treat analyses under treatment non-adherence in mental health randomized trials. Psychiatric Annals, 38, 772.
Theoharides, T.C. and Cochrane, D.E. (2004). Critical role of mast cells in inflammatory diseases and the effect of acute stress. Journal of Neuroimmunology, 146(1), 1-12.
Thornton, P.I. (1992). The relation of coping, appraisal, and burnout in mental health workers. The Journal of psychology, 126(3), 261-271.
Tinto, V. (1975). Dropout from higher education: A theoretical synthesis of recent research. Review of Educational Research, 45(1), 89-125.
Tinto, V. (1987). Leaving college: Rethinking the causes and cures of student attrition. Chicago: University of Chicago Press.
Tinto, V. (2006). Research and practice of student retention: what next? Journal of College Student Retention: Research, Theory and Practice, 8(1), 1-19.
Titov, N., Andrews, G., and Sachdev, P. (2010). Computer-delivered cognitive behavioural therapy: effective and getting ready for dissemination. F1000 medicine reports, 2, 49.
Towbes, L.C. and Cohen, L.H. (1996). Chronic stress in the lives of college
students: Scale development and prospective prediction of distress. Journal of Youth and Adolescence, 25(2), 199-217.
Turner, R.J., Wheaton, B. and Lloyd, D. A. (1995). The epidemiology of social stress. American Sociological Review, 104-125.
UNITE. (2002). Student Living Report. Retrieved 20/02, 2011, from
http://www.unite-
group.co.uk/Attachments/000171/The%20Student%20Living%20Report%202002.pdf
University of Bolton. (2009). Student Attendance Policy. Retrieved 20/10, 2011,
from http://www.bolton.ac.uk/Students/PoliciesProceduresRegulations/AllStudents/Documents/StudentAttendancePolicy.pdf
Viswanathan, K. and Dhabhar, F. S. (2005). Stress-induced enhancement of leukocyte trafficking into sites of surgery or immune activation. Proceedings of the National Academy of Sciences of the United States of
America, 102(16), 5808.
Vitaliano, P. P., Russo, J., Carr, J. E., Maiuro, R. D. and Becker, J. (1985). The ways of coping checklist: Revision and psychometric properties. Multivariate Behavioral Research, 20, 3-26.
Vythilingam, M., Heim, C., Newport, J., Miller, A. H., Anderson, E., Bronen, R., Brummer, M., Staib, L., Vermetten, E. and Charney, D. S. (2002).
Childhood trauma associated with smaller hippocampal volume in women with major depression. American Journal of Psychiatry, 159(12),
2072.
Wantland D.J., Portillo C.J., Holzemer W.L., Slaughter R., McGhee E.M. (2004) The effectiveness of Web-based vs. non-Web-based interventions: a
227
meta-analysis of behavioral change outcomes. Journal of Medical
Internet Research 6(4), e40.
Warttig, S. L., Forshaw, M. J., South, J. and White, A. K. (2013). New, normative, English-sample data for the Short Form Perceived Stress Scale (PSS-4). Journal of Health Psychology, 18, 1617-1628.
Webb, E., Ashton, C. H., Kelly, P. and Kamali, F. (1996). Alcohol and drug use in UK university students. The Lancet, 348(9032), 922-925.
Weinstein, L. A. (2009). College student stress and satisfaction with life. College Student Journal, 43(4), 1161-1162.
Wellmind Media Ltd. (2014). Test your stress [Online]. Available:
http://www.bemindfulonline.com/test-your-stress/. Whyte, C. B. (1977). High-risk college freshmen and locus of control. The
Humanist Educator, 16(1), 2-5.
Wilcox, P., Winn, S. and Fyvie-Gauld, M. (2005). ‘It was nothing to do with the
university, it was just the people’: the role of social support in the first‐year experience of higher education. Studies in Higher Education, 30(6),
707-722. Williams, B., Brown, T. and Onsman, A. (2012). Exploratory factor analysis: A
five-step guide for novices. Australasian Journal of Paramedicine, 8, 1.
Wintre, M.G. and Bowers, C.D. (2007). Predictors of persistence to graduation: Extending a model and data on the transition to university model. Canadian Journal of Behavioural Science/Revue canadienne des
sciences du comportement, 39(3), 220.
Xu, X., Bao, H., Strait, K., Spertus, J.A., Lichtman, J.H., D'Onofrio, G., Spatz, E., Bucholz, E.M., Geda, M., Lorenze, N.P. and Bueno, H., (2015) Sex
differences in perceived stress and early recovery in young and middle-aged patients with acute myocardial infarction. Circulation, doi:
10.1161/CIRCULATIONAHA.114.012826 Yanagiura, T. (2012). Attrition Cost Model Instruction Manual. Delta Cost
Project at American Institutes for Research.
Yorke, M. and Thomas, L. (2003). Improving the retention of students from lower socio-economic groups. Journal of Higher Education Policy and
Management, 25(1), 63-74. Yorke, M. & Longden, B., (2004) Retention and Student Success in Higher
Education, Maidenhead, UK, Society for Research into Higher Education
and Open University Press. Young, E. and Korszun, A. (1999). Women, stress, and depression: Sex
differences in hypothalamic-pituitary- adrenal axis regulation. In: E. Leibenluft (Ed.), Gender differences in mood and anxiety disorders: from bench to bedside (Vol. 18). Washington, DC: Amer Psychiatric Pub Inc.
Zajacova, A., Lynch, S.M. and Espenshade, T.J. (2005). Self-efficacy, stress, and academic success in college. Research in higher education, 46(6),
677-706. Zautra, A.J., Sheets, V.L. and Sandler, I.N. (1996). An examination of the
construct validity of coping dispositions for a sample of recently divorced mothers. Psychological Assessment, 8, 256.
Zhou, Y., Jindal‐Snape, D., Topping, K. and Todman, J. (2008). Theoretical
models of culture shock and adaptation in international students in higher education. Studies in Higher Education, 33(1), 63-75.
228
Zumbo, B.D., Gadermann, A.M. and Zeisser, C. (2007). Ordinal versions of coefficients Alpha and Theta for Likert rating scales. Journal of Modern Applied Statistical Methods, 6, 21-29.
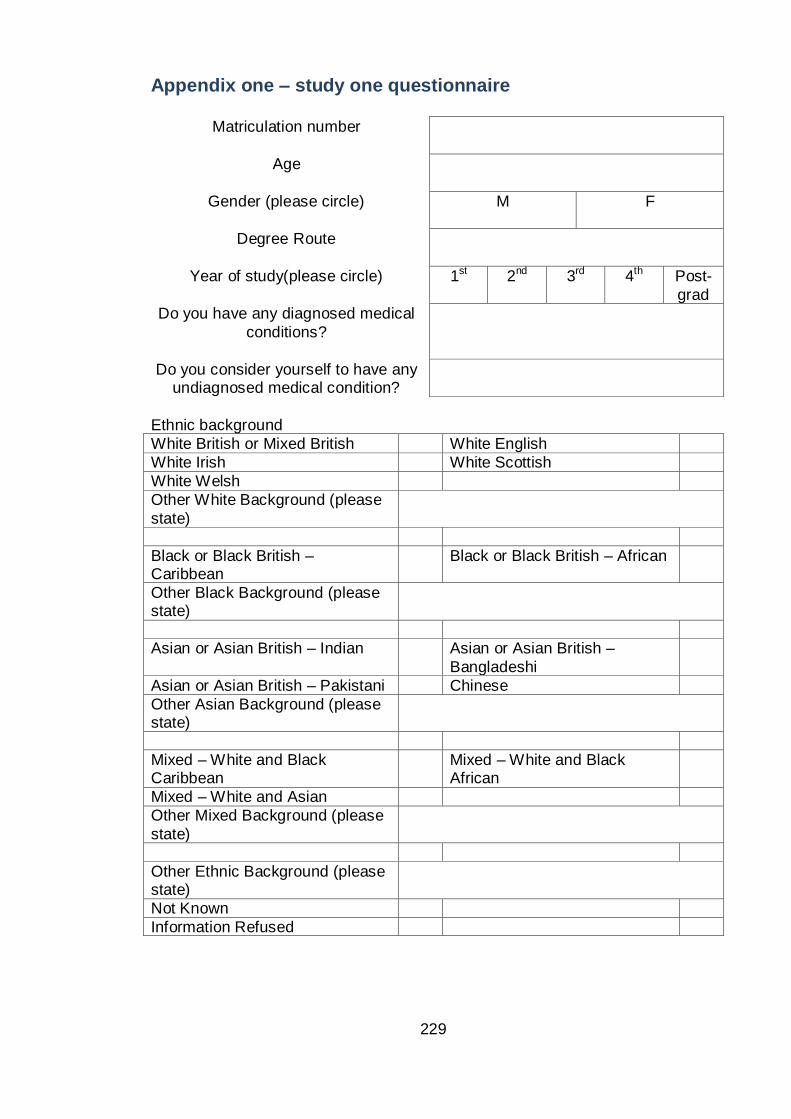
229
Appendix one – study one questionnaire
Ethnic background
White British or Mixed British White English
White Irish White Scottish
White Welsh
Other White Background (please
state)
Black or Black British – Caribbean
Black or Black British – African
Other Black Background (please state)
Asian or Asian British – Indian Asian or Asian British –
Bangladeshi
Asian or Asian British – Pakistani Chinese
Other Asian Background (please state)
Mixed – White and Black Caribbean
Mixed – White and Black African
Mixed – White and Asian
Other Mixed Background (please
state)
Other Ethnic Background (please state)
Not Known
Information Refused
Matriculation number
Age
Gender (please circle)
M F
Degree Route
Year of study(please circle)
1st 2nd 3rd 4th Post-
grad
Do you have any diagnosed medical
conditions?
Do you consider yourself to have any undiagnosed medical condition?
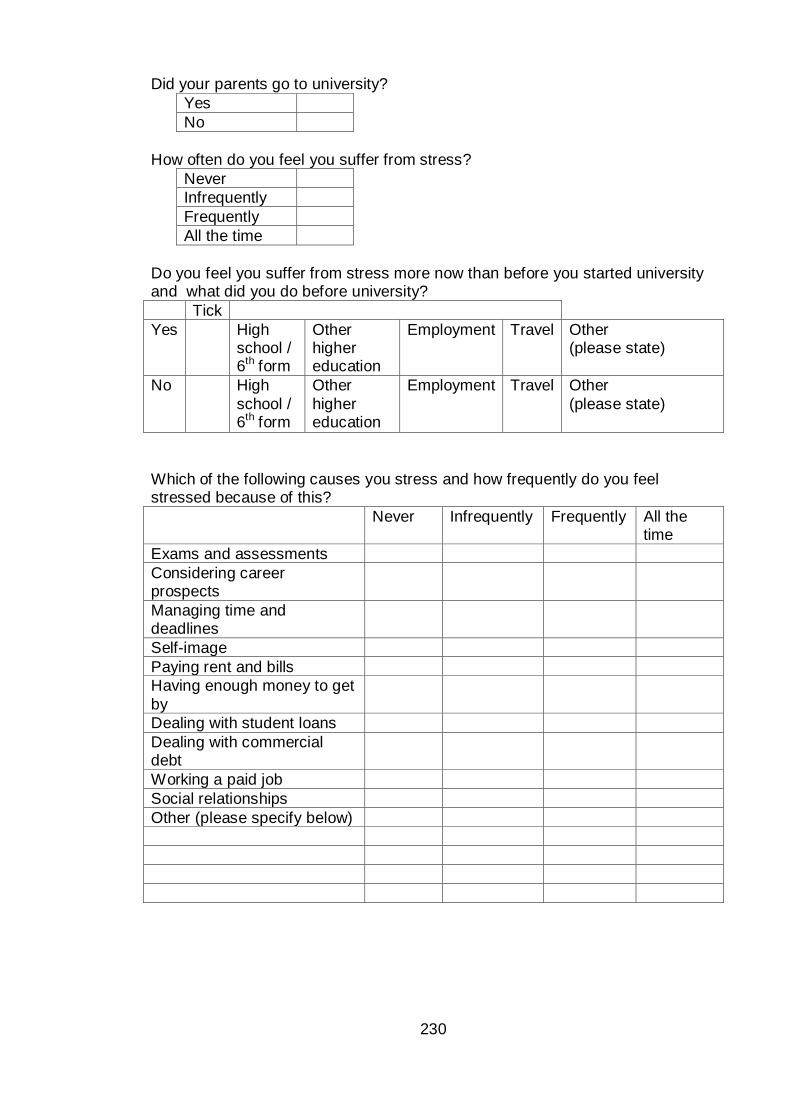
230
Did your parents go to university?
Yes
No
How often do you feel you suffer from stress?
Never
Infrequently
Frequently
All the time
Do you feel you suffer from stress more now than before you started university and what did you do before university?
Tick
Yes High school / 6th form
Other higher education
Employment Travel Other (please state)
No High
school / 6th form
Other
higher education
Employment Travel Other
(please state)
Which of the following causes you stress and how frequently do you feel stressed because of this?
Never Infrequently Frequently All the time
Exams and assessments
Considering career prospects
Managing time and deadlines
Self-image
Paying rent and bills
Having enough money to get
by
Dealing with student loans
Dealing with commercial debt
Working a paid job
Social relationships
Other (please specify below)
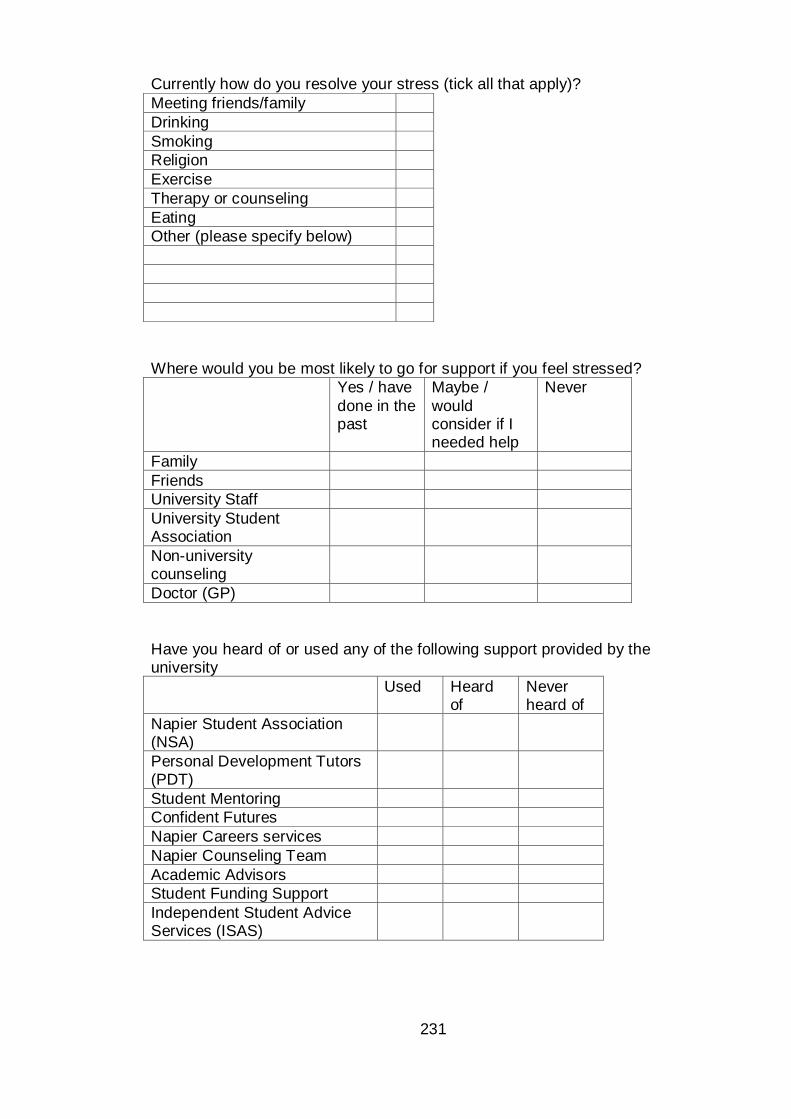
231
Currently how do you resolve your stress (tick all that apply)?
Meeting friends/family
Drinking
Smoking
Religion
Exercise
Therapy or counseling
Eating
Other (please specify below)
Where would you be most likely to go for support if you feel stressed?
Yes / have
done in the past
Maybe /
would consider if I needed help
Never
Family
Friends
University Staff
University Student Association
Non-university counseling
Doctor (GP)
Have you heard of or used any of the following support provided by the university
Used Heard of
Never heard of
Napier Student Association (NSA)
Personal Development Tutors (PDT)
Student Mentoring
Confident Futures
Napier Careers services
Napier Counseling Team
Academic Advisors
Student Funding Support
Independent Student Advice Services (ISAS)
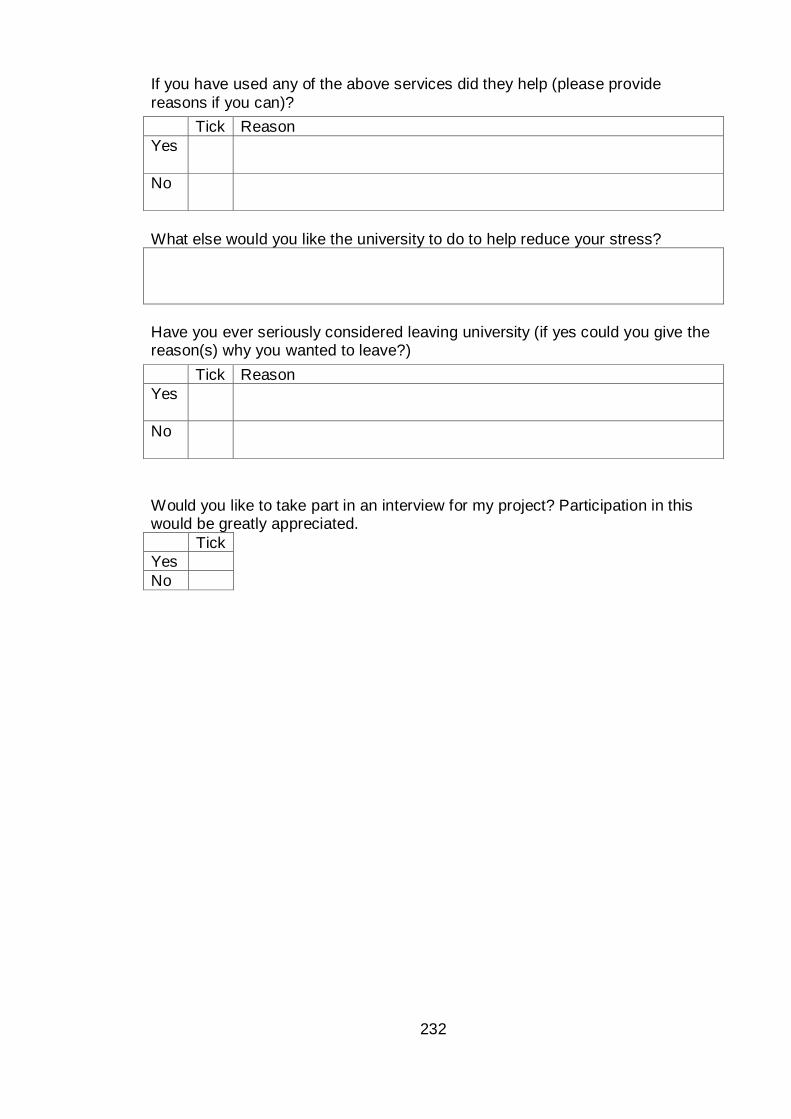
232
If you have used any of the above services did they help (please provide
reasons if you can)?
What else would you like the university to do to help reduce your stress?
Have you ever seriously considered leaving university (if yes could you give the reason(s) why you wanted to leave?)
Would you like to take part in an interview for my project? Participation in this would be greatly appreciated.
Tick
Yes
No
Tick Reason
Yes
No
Tick Reason
Yes
No
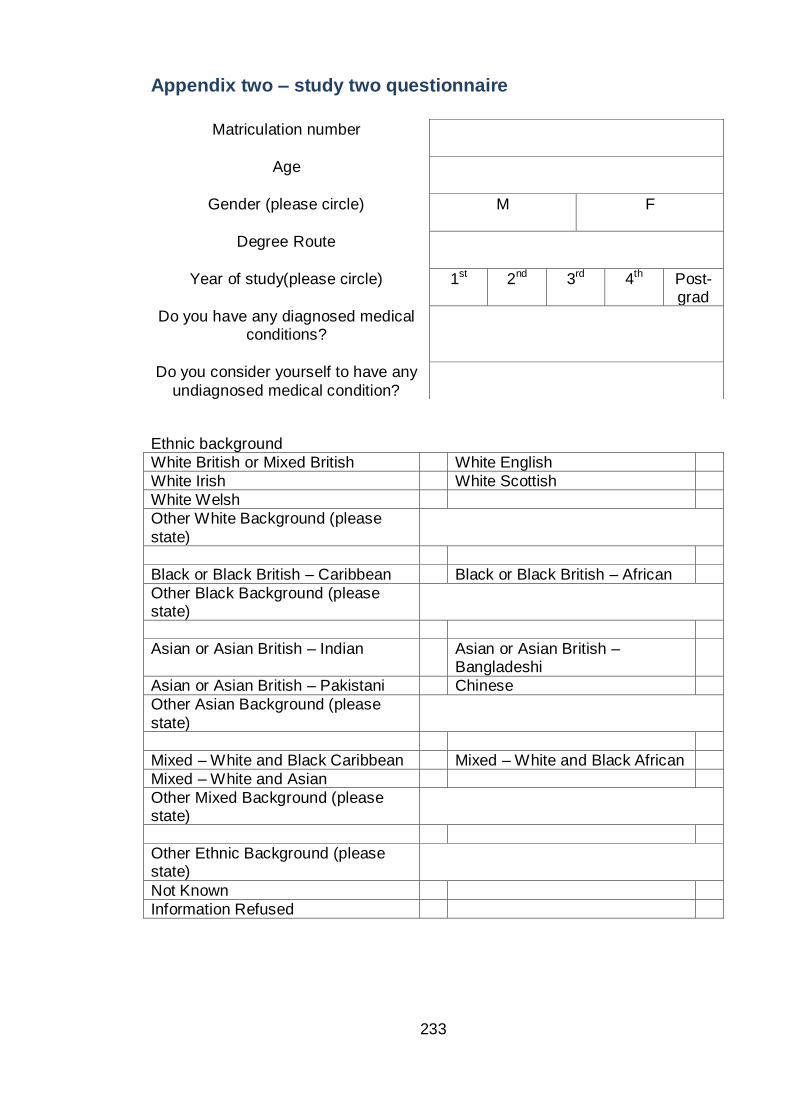
233
Appendix two – study two questionnaire
Ethnic background
White British or Mixed British White English
White Irish White Scottish
White Welsh
Other White Background (please
state)
Black or Black British – Caribbean Black or Black British – African
Other Black Background (please state)
Asian or Asian British – Indian Asian or Asian British – Bangladeshi
Asian or Asian British – Pakistani Chinese
Other Asian Background (please
state)
Mixed – White and Black Caribbean Mixed – White and Black African
Mixed – White and Asian
Other Mixed Background (please state)
Other Ethnic Background (please state)
Not Known
Information Refused
Matriculation number
Age
Gender (please circle)
M F
Degree Route
Year of study(please circle)
1st 2nd 3rd 4th Post-grad
Do you have any diagnosed medical conditions?
Do you consider yourself to have any
undiagnosed medical condition?
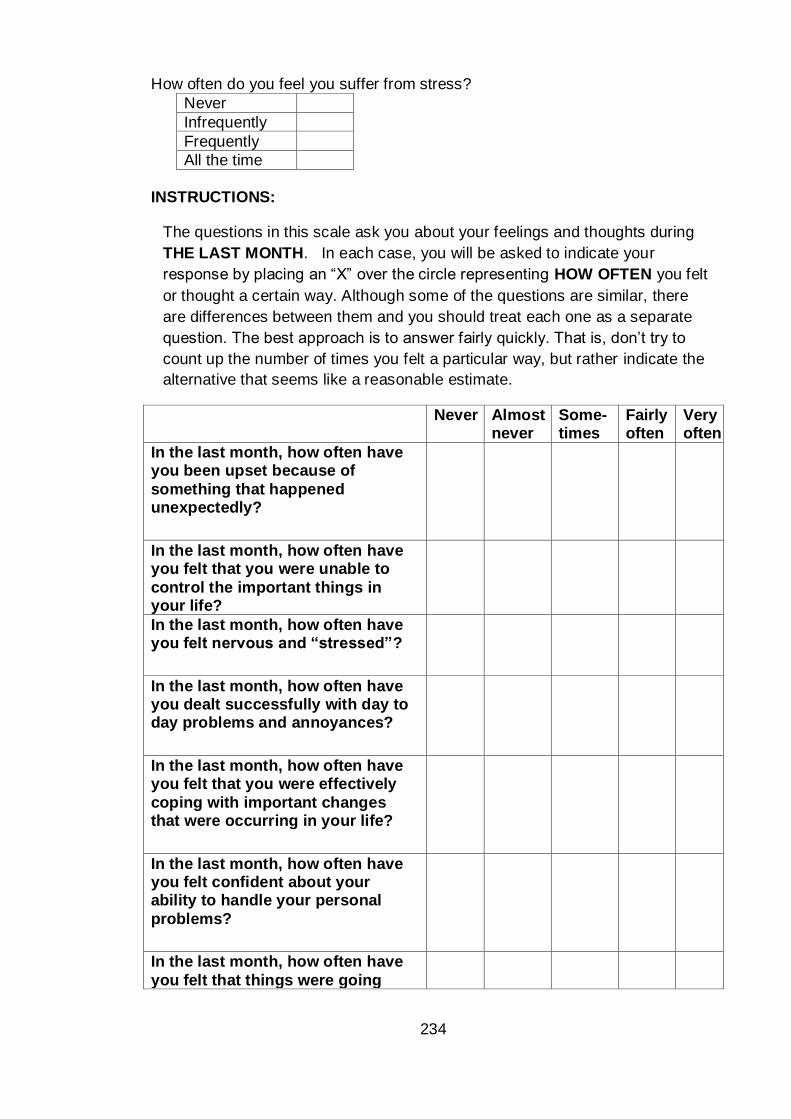
234
How often do you feel you suffer from stress?
Never
Infrequently
Frequently
All the time
INSTRUCTIONS:
The questions in this scale ask you about your feelings and thoughts during
THE LAST MONTH. In each case, you will be asked to indicate your
response by placing an “X” over the circle representing HOW OFTEN you felt
or thought a certain way. Although some of the questions are similar, there
are differences between them and you should treat each one as a separate
question. The best approach is to answer fairly quickly. That is, don’t try to
count up the number of times you felt a particular way, but rather indicate the
alternative that seems like a reasonable estimate.
Never Almost never
Some- times
Fairly often
Very often
In the last month, how often have you been upset because of
something that happened unexpectedly?
In the last month, how often have you felt that you were unable to
control the important things in your life?
In the last month, how often have you felt nervous and “stressed”?
In the last month, how often have you dealt successfully with day to day problems and annoyances?
In the last month, how often have you felt that you were effectively
coping with important changes that were occurring in your life?
In the last month, how often have you felt confident about your ability to handle your personal
problems?
In the last month, how often have
you felt that things were going
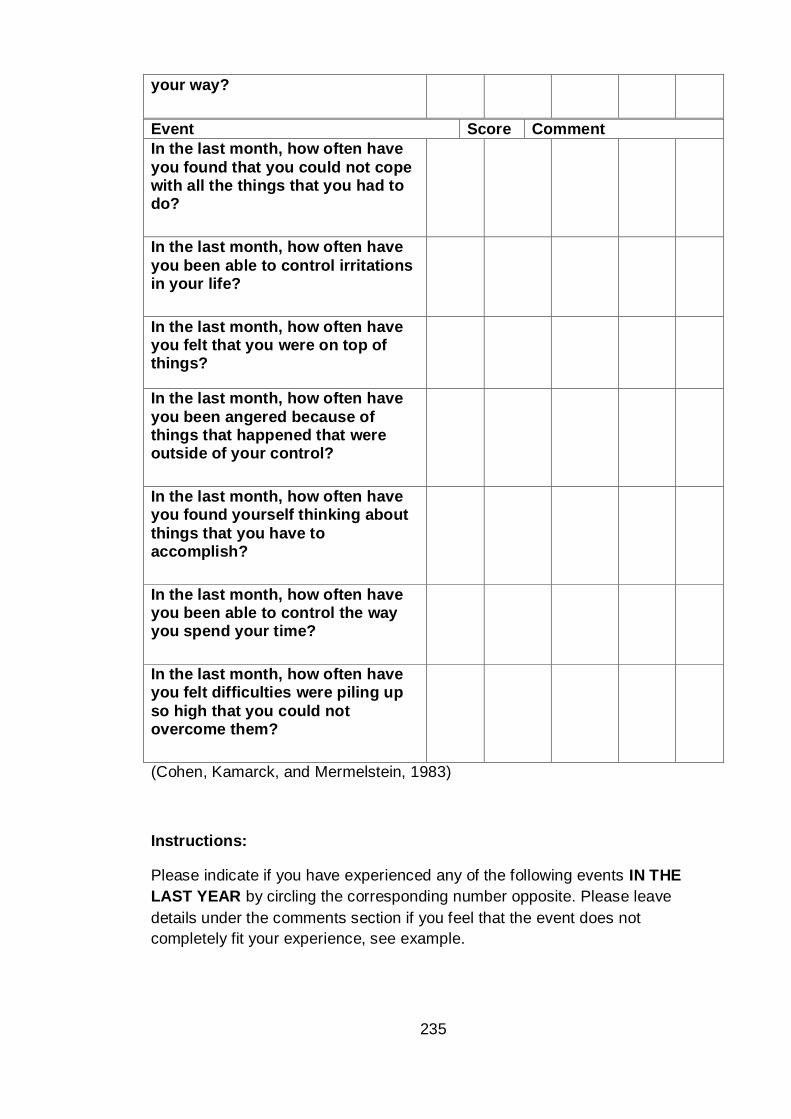
235
your way?
In the last month, how often have
you found that you could not cope with all the things that you had to do?
In the last month, how often have
you been able to control irritations in your life?
In the last month, how often have you felt that you were on top of things?
In the last month, how often have
you been angered because of things that happened that were outside of your control?
In the last month, how often have you found yourself thinking about
things that you have to accomplish?
In the last month, how often have you been able to control the way you spend your time?
In the last month, how often have you felt difficulties were piling up
so high that you could not overcome them?
(Cohen, Kamarck, and Mermelstein, 1983)
Instructions:
Please indicate if you have experienced any of the following events IN THE
LAST YEAR by circling the corresponding number opposite. Please leave
details under the comments section if you feel that the event does not
completely fit your experience, see example.
Event Score Comment
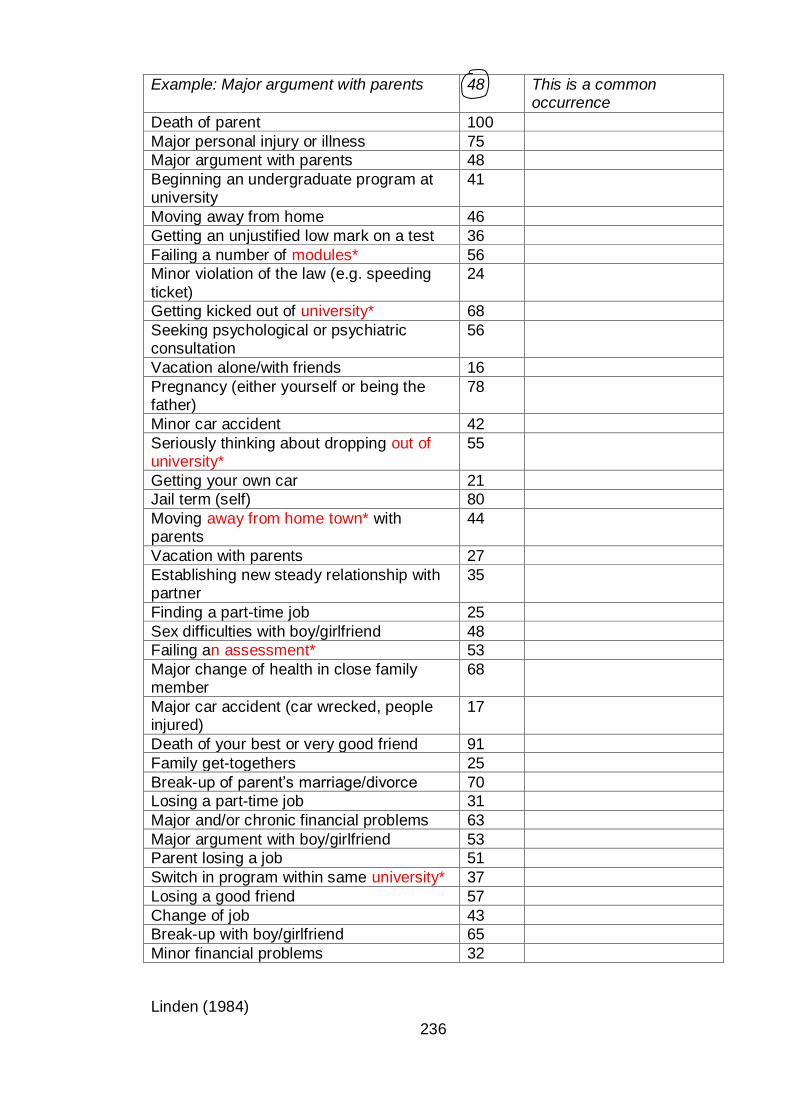
236
Linden (1984)
Example: Major argument with parents 48 This is a common occurrence
Death of parent 100
Major personal injury or illness 75
Major argument with parents 48
Beginning an undergraduate program at university
41
Moving away from home 46
Getting an unjustified low mark on a test 36
Failing a number of modules* 56
Minor violation of the law (e.g. speeding
ticket)
24
Getting kicked out of university* 68
Seeking psychological or psychiatric consultation
56
Vacation alone/with friends 16
Pregnancy (either yourself or being the father)
78
Minor car accident 42
Seriously thinking about dropping out of university*
55
Getting your own car 21
Jail term (self) 80
Moving away from home town* with parents
44
Vacation with parents 27
Establishing new steady relationship with partner
35
Finding a part-time job 25
Sex difficulties with boy/girlfriend 48
Failing an assessment* 53
Major change of health in close family member
68
Major car accident (car wrecked, people injured)
17
Death of your best or very good friend 91
Family get-togethers 25
Break-up of parent’s marriage/divorce 70
Losing a part-time job 31
Major and/or chronic financial problems 63
Major argument with boy/girlfriend 53
Parent losing a job 51
Switch in program within same university* 37
Losing a good friend 57
Change of job 43
Break-up with boy/girlfriend 65
Minor financial problems 32
237
*modifications (marked in red) to the Americanised LESS to make the questions
more appropriate to our student cohort. College changed to university, course
changed to module, out of town changed to away from home town. A comment
box has also been added to increase the stringency of any data collected.
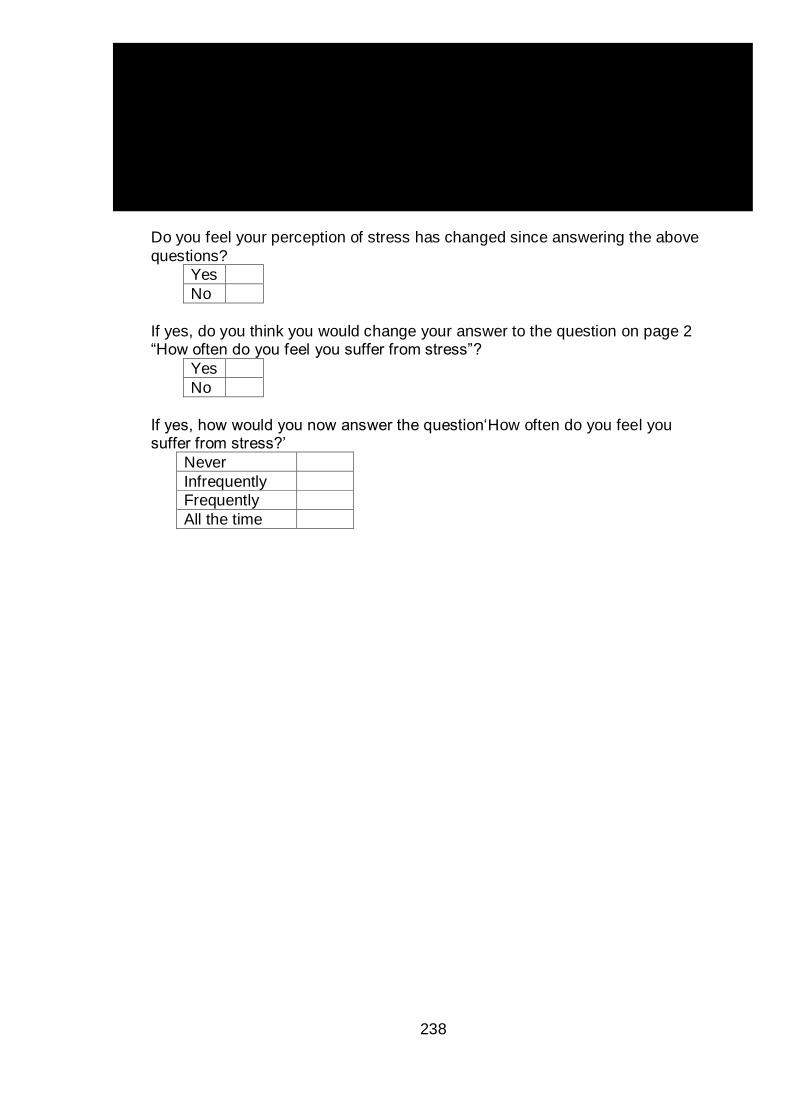
238
Do you feel your perception of stress has changed since answering the above
questions?
Yes
No
If yes, do you think you would change your answer to the question on page 2 “How often do you feel you suffer from stress”?
Yes
No
If yes, how would you now answer the question‘How often do you feel you suffer from stress?’
Never
Infrequently
Frequently
All the time
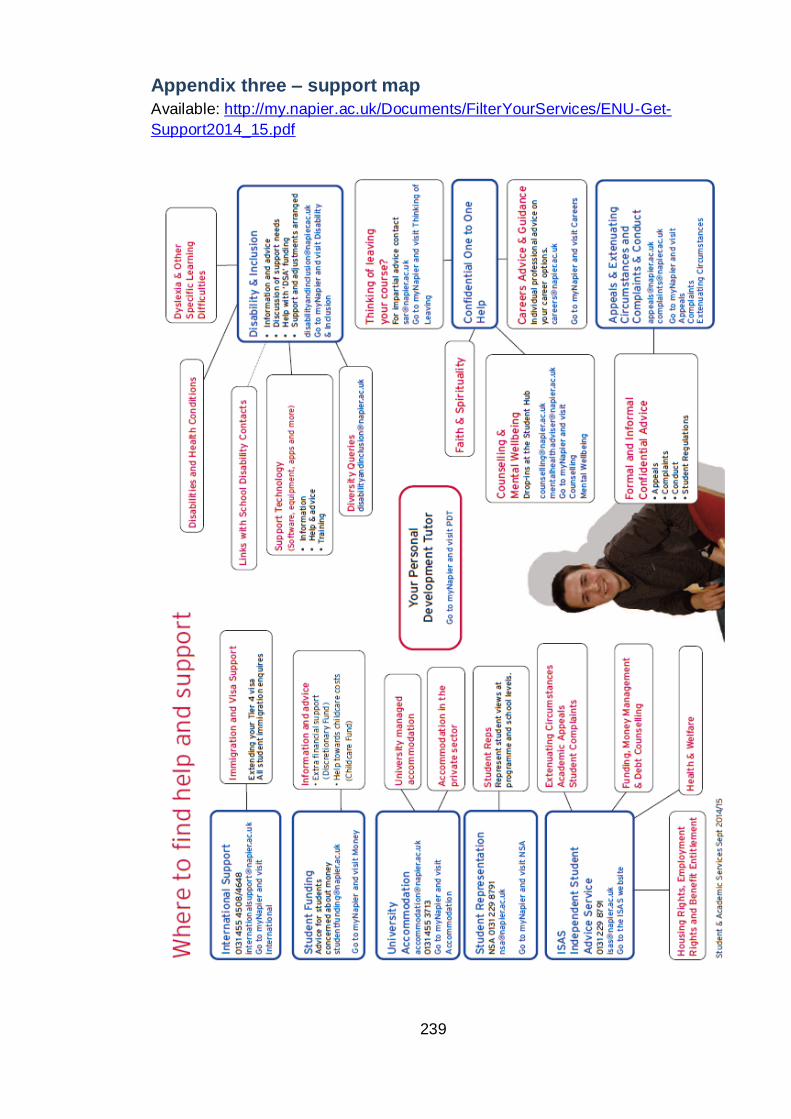
239
Appendix three – support map
Available: http://my.napier.ac.uk/Documents/FilterYourServices/ENU-Get-
Support2014_15.pdf
240
Appendix four – LOC planner
Stress Education Module
Introduction
This tool has been designed specifically for Edinburgh Napier University following research
carried out in the FHLSS that suggests students and staff could benefit from additional
information on stress and how to cope.
The findings from our project and from an National Union of Students study point towards
stigma surrounding stress preventing people from discussing their stress or seeking help when
they need to. It is thought that the stigma had arisen because of a poor understanding of what
stress really is, when to ask for help and what help is available.
The university understands that studying is a stressful time and that too much stress could prevent you
from reaching your academic potential or might hinder your enjoyment of university life. We therefore have
been given the opportunity to develop an online tool to help address stress across the university and
prevent it from escalating and becoming a barrier to success.
This tool is an attempt to reduce the stigma by:
1. helping to increase knowledge and awareness of stress across the university
2. encouraging ‘good’ coping strategies
3. informing about the support available to students
Objectives
By the end of this section you will have a better understanding of:
what stress is
what causes stress
the stress process
What is stress?
Stress is the body's natural response to challenging situations and is the result of over-loading
yourself emotionally, mentally or physically.
In small doses stress is advantageous and pushes you to work to the best of your ability. It can
do this by providing an energy boost to help you complete a task and it can encourage you to
raise your standards to improve your output.
However prolonged stress or extremely high stress can lead to symptoms that can affect your
mental and physical health.
This stress curve highlights how some stress can be helpful as long as it is managed within
optimal limits.
Section one- Introduction to stress
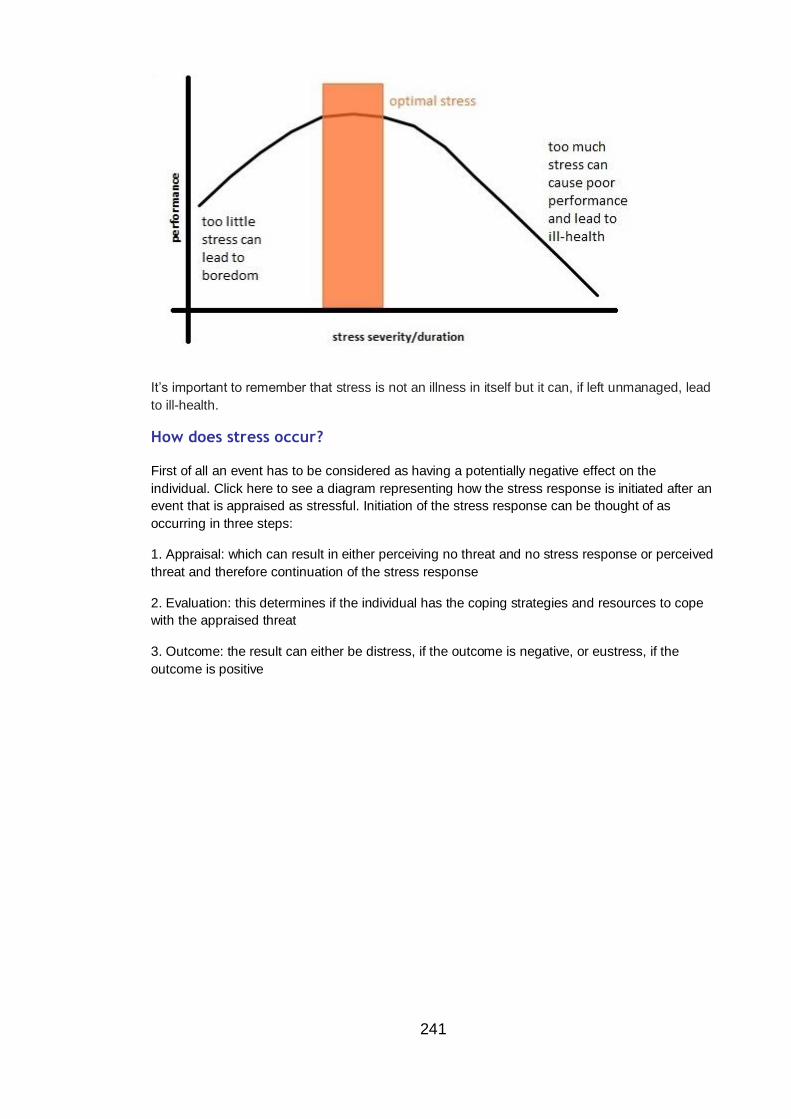
241
It’s important to remember that stress is not an illness in itself but it can, if left unmanaged, lead
to ill-health.
How does stress occur?
First of all an event has to be considered as having a potentially negative effect on the
individual. Click here to see a diagram representing how the stress response is initiated after an
event that is appraised as stressful. Initiation of the stress response can be thought of as
occurring in three steps:
1. Appraisal: which can result in either perceiving no threat and no stress response or perceived
threat and therefore continuation of the stress response
2. Evaluation: this determines if the individual has the coping strategies and resources to cope
with the appraised threat
3. Outcome: the result can either be distress, if the outcome is negative, or eustress, if the
outcome is positive
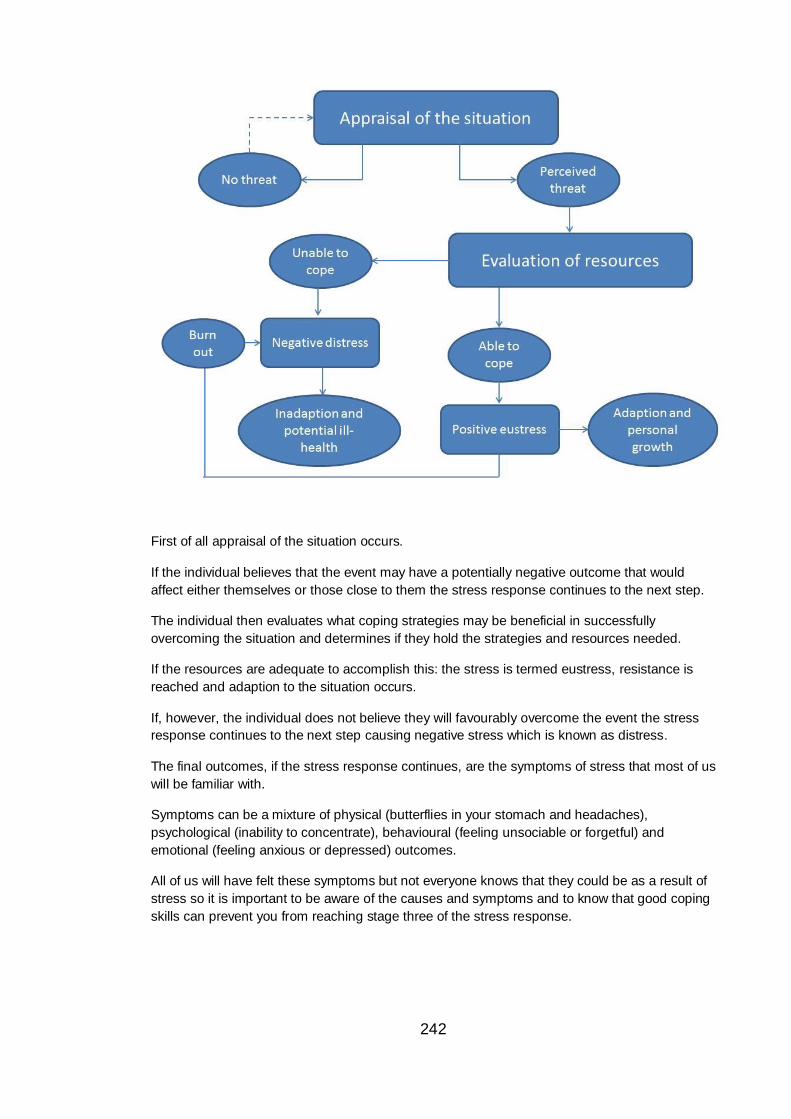
242
First of all appraisal of the situation occurs.
If the individual believes that the event may have a potentially negative outcome that would
affect either themselves or those close to them the stress response continues to the next step.
The individual then evaluates what coping strategies may be beneficial in successfully
overcoming the situation and determines if they hold the strategies and resources needed.
If the resources are adequate to accomplish this: the stress is termed eustress, resistance is
reached and adaption to the situation occurs.
If, however, the individual does not believe they will favourably overcome the event the stress
response continues to the next step causing negative stress which is known as distress.
The final outcomes, if the stress response continues, are the symptoms of stress that most of us
will be familiar with.
Symptoms can be a mixture of physical (butterflies in your stomach and headaches),
psychological (inability to concentrate), behavioural (feeling unsociable or forgetful) and
emotional (feeling anxious or depressed) outcomes.
All of us will have felt these symptoms but not everyone knows that they could be as a result of
stress so it is important to be aware of the causes and symptoms and to know that good coping
skills can prevent you from reaching stage three of the stress response.
243
It is possible that at first you may feel you have adequate coping strategies and resources to
deal with the stressful situation however over time your resources could deplete, known as
burning out, and lead to distress and the associated negative physical and mental state.
Activity 1: True or false
Instruction
Decide whether you think the statements about stress in the list below are true (by selecting
the tick symbol) or false, (by selecting the cross symbol). Then read the feedback to see if
you’re right.
Interactive task 1 – Statement 1
You do your best work while you are under stress
Write you answer options here (if required)
False.
It is stimulation and engagement with the task (i.e. setting achievable goals or tackling new
projects) that actually motivates us, not stress. Stress is simply the swirl of negative
emotions on top of stimulation and engagement.
"If you're successful and stressed out, you're succeeding in spite of your stress, not
because of it," Andrew Bernstein, author of "The Myth of Stress".
Interactive task 1 – Statement 2
Stress is unavoidable
Write you answer options here (if required)
244
False.
Feeling stressed isn't inevitable. Although we don't have the power to prevent all stressful
situations from occurring, we can control our reactions to them. Improving the way you
cope with stress can prevent exacerbation of the original problem and reduce the intensity
and duration of stress symptoms. Active coping where you deal with a manageable
problem is more likely to benefit your wellbeing than avoiding the problem altogether.
Interactive task 1 – Statement 3
Stress is the same for everyone
Write you answer options here (if required)
False.
Stress is the result of your appraisal of the situation and your ability to cope with that
situation. An event that you might think of as potentially negative and therefore potentially
stressful your friend might think of as a positive experience. Similarly the coping strategy
that you might choose to overcome a situation may be different to that of your friend.
Stress is therefore a very individual process and this should be remembered if you are
helping a friend who is stressed.
Interactive task 1 – Statement 4
Admitting to stress shows weakness
Write you answer options here (if required)
False.
Due to the myths that surround stress many people do not want to admit to feeling
stressed. However stress is a normal part of everyday life and can be managed so that its
245
effects do not interrupt your day to day routine.
For more information of the common misconceptions surrounding stress visit
http://psychcentral.com/lib/2007/six-myths-about-stress/
Summary
Many people hesitate to admit to stress however everyone will have suffered due to symptoms
of the stress response at one time or another. Controlling the way in which we react to
potentially stressful events can allow us to continue with our lives uninterrupted by the
symptoms that go hand in hand with stress.
Introduction
The findings from our project show that students are experiencing many different events which
could potentially cause stress. These events can be relatively small (e.g. late for a lecture
because of traffic) or can be larger life events (such as changing course). Stress can stem from
problems that are academic or personal in nature i.e. originate from either university or outside
university. Stress from situations inside university can then influence your personal life and vice
versa. Monitoring your stress will help you to understand where the stress originated from,
which is important to be able to tackle it successfully.
Objectives:
By the end of this section you will have a better understanding of:
the common causes of stress
how to monitor stress
Causes of stress
As explained in section one, stress is caused by appraising the situation as a potential threat. The threat could be to your reputation or social status, your financial stability or job security, your ego or beliefs or the situation may be negatively affecting someone you care about. Stress can therefore be caused by many different situations and because we all appraise situations differently what is stressful for one person may not be stressful for another. University is inevitably a stressful time and different aspects of university life will affect each student differently.
Section two- causes of stress
246
Our results show common causes of stress to include:
exams and assessments managing time and deadlines considering career prospects having enough money to get by Other causes could include:
moving away from home, taking on new responsibilities and changing routines leaving friends and family and building new social networks looking for part-time work balancing study, family, work/volunteering and time for yourself increasing difficulty of study material expectations and pressures of doing well from yourself or others
Activity
1:
Monitoring your stress
Stress is sometimes difficult to recognise and it can be hard to keep track of how you’re feeling. If you are under stress for a long period of time the symptoms of stress can start to feel normal and you may no longer realise that life can be less stressful.
For this reason it's a good idea to keep track of your stress levels and then you can identify when they increase and you can address the problem early on.
The test below can help you monitor your stress. By answering the 10 quick questions and remembering your score, you can take the test again in a few weeks and see if your stress has changed.
The highest score is 40 and the lowest score is 0. Higher scores mean you are feeling more stress and lower scores mean you are feeling less stress.
Instruction
Click on the link below to check your stress levels:
(link to online PSS)
At the end of the test there is a video that talks about Mindfulness. Mindfulness is a relaxation therapy that
can help with stress reduction. If you think this type of stress reduction is for you, there are free
Mindfulness taster sessions run periodically across Edinburgh which you can find out about online.
Another way to keep track of your stress is to keep a diary where you can record your overall
mood for the day and then think about the main events of the day along with how stressed
they made you feel. There's lots of information online about keeping a diary like this... have a
247
look at Mindtools Stress Diary for more information.
Other ways to monitor stress
Your heart rate is linked to stress through the Autonomic Nervous System (ANS). Stress causes
the release of hormones (epinephrine and norepinephrine) which trigger the sympathetic branch
of the ANS and results in increased heart rate and blood pressure.
If you have a smart phone you can monitor your heart rate by downloading the free ‘my heart
rate’ apple app or 'what's my heart rate' android app by ViTrox Technologies . It records your
heart and breathing rate using the camera on your device and gives you a heart rate reading in
beats per minute.
Using this app can help you practice breathing techniques for stress reduction. You can watch
how your heart rate responds to different breathing rhythms and learn how to control your heart
rate and ultimately your stress through breathing.
During periods of stress remember to breathe in and out slowly and in a regular rhythm
You can also do this without the technology by paying attention to your breathing and how you
feel. Try breathing deeply in through the nose and out through the mouth in a slow regular
rhythm and see if you feel calmer and more relaxed.
This is a great technique and you can do it anywhere. Being aware of your heart rate is the
corner stone to many relaxation stress reduction techniques.
Introduction
Learning to cope with stress is a life skill that can be taken forward, after university, to the work
place. Strategies that you perfect while studying at university can be applied to the situations
you will encounter once employed.
For example a lot of stress can be caused by getting a low mark on an assessment you worked
Section three- coping with stress
248
hard on. Learning to deal with this situation using healthy strategies such as ‘looking on the
bright-side’ (this is all part of the learning curve, mistakes at the beginning are expected) and
‘planning’ to address the mistake in future assessments (look at the feedback given and use the
comments to improve future work) should reduce the chances of encountering the same
disappointing mark on other assessments.
This situation is fully transferable to the work place as often work will be returned for corrections.
If you have learned to take on board comments with a positive frame of mind you will be more
productive and less distressed by the situation at work.
Objectives
By the end of this section you will have a better understanding of:
• why coping is important
• what ways are best to cope with stress
Section four will look at what support is available to assist students suffering from stress
Why is coping important?
How you cope with stress defines how the stress response continues.
If you use strategies that tackle the problem directly and reduce the stressful situation you stop
the stress response continuing and are much more likely to see long term reductions in stress
related symptoms.
However if you use strategies that only make you feel better in the short term you are unlikely to
improve the situation causing stress and in some cases you might worsen the problem by
ignoring it.
Ways of coping
There are two main groups to classify the way we cope
1. Adaptive strategies- refers to methods that are sustainable, lead to symptom reduction and improve the overall situation
2. Maladaptive strategies – refers to methods which will likely lead to burnout. Although maladaptive strategies may initially appear to reduce the symptoms, in the long term they will not improve the situation and may in some cases worsen the original problem
Adaptive coping strategies include:
Looking at the situation in a more positive light
Learning from the experience
Seeking advice from others who are/have been in the same situation
249
Concentrating efforts on doing something to improve the situation
Plan a course of action to change the situation and follow through
Maladaptive coping strategies include:
Avoiding the problem and pretending it’s not happening
Giving up – not attempting to find a solution
Venting negative emotions in ways that may physically or emotionally hurt yourself or others
Using drugs or alcohol to help you forget or avoid the problem
People will use a mixture of coping strategies and will use different coping strategies depending on the nature of the problem. Having a mix that favours adaptive strategies is better for your long term mental and physical health.
Do you have control over the situation?
If you have control over parts of a stressful situation - taking action to change that situation for the better is the most effective way to reduce your stress.
Some situations however, you will have very little control over. For example you cannot control the way others behave so in these instances you must try and control only what you can i.e. how you react to others behaviour.
Remember: attempting to change situations that are out-with your control can be stressful in itself. So it is important to concentrate efforts and set goals that you can achieve.
Activity
1:
How do you cope?
Instruction
Read through the list of adaptive and maladaptive coping strategies and tick off the ones you use during times of stress.
It is sometimes easier to do this by thinking about a specific current or recent stressful experience and answering according to how you coped.
Interactive task 1 – Statement 1
Adaptive strategies:
250
Cleared your head before tackling the problem - listened to music, watched a movie, read a magazine or practiced breathing exercises or meditation
Thought about what was causing you stress and made a plan to overcome the problem
Exercised or went outdoors (this is not only good for your physical health but also helps breakdown the negative stress hormones)
Entered a positive frame of mind to help see the potential good in the situation
Tidied your flat and workspace (this helps you to be more organised and productive)
Took part in activities that bring you closer to people - played a team sport, joined a society or went to church
Discussed the situation with your family or close friends and took advice on how to correct the problem
How many positive strategies do you use?
Now compare it to the number of negative strategies you use...
Interactive task 1 – Statement 2
Maladaptive strategies:
Went out drinking to forget about the problem
Blamed others for the negative things in your life
Let out your stress in anger - yelled at friends or family, kicked or threw something
Changed your eating/drinking habits e.g. drank more coffee or ate more chocolate
Avoided others and isolated yourself for long periods
Changed your sleeping pattern - stayed up late worrying then felt tired all day
Constantly worried and obsessed about what 'might' happen
How does the number of negative strategies compare to the number of positive ones?
You want to be using more positive than negative strategies in order to adaptively
overcome stress and avoid burnout.
The lists of coping strategies are not exhaustive, these are just some examples. You may
have other way that you cope with stress and as long as you feel that your overall stress is
reduced in the long term then you are doing the right things.
251
Think differently about stress
One of the adaptive coping strategies mentioned above was 'enter a positive frame of mind'.
Thinking positively about stress - believing that stress and overcoming stress makes you more resilient has been shown to be physically and mentally beneficial.
Watch this TedTalk video to see how the way you think about stress can alter how much stress you feel and the effect it has on your wellbeing.
(insert video)
Key points
By now, if you have read sections 1-3, you should have a better understanding of what stress is, how stress evolves and how you can use positive coping strategies and stress monitoring to keep your stress under control and within your optimal limits.
Section 4 will introduce services run by the university that you can access to build your resilience to stress and increase your ability to cope.
There may be times that you feel your stress has become too much to handle alone. Section 4 also covers the university support services trained to help in these situations to get you back on track.
Introduction
If you feel that stress is getting on top of you, you may want to think about accessing some help
to get things back under control.
There are many different teams within the university, all trained to help with different aspects of
university life that may be causing you difficulty or stress.
It is important that, as students, you are well prepared and supported to overcome the
challenges of university and that you feel comfortable accessing the support available. With that
in mind, we teamed up with the Student and Academic Services (SAS) department and
developed this page to introduce you to some of the staff that are here to help.
Objectives
This is the final section of the student stress online education tool.
This section will:
Provide information on the services available to help keep stress under control
Introduce some of the team members that are here to help
Section four- Support Available
252
When to ask for help
Section 1 shows how stress can become debilitating if it is not managed within optimal limits.
If you are no longer able to study effectively or you are not enjoying university because of the stress of studying, working or fitting in - it might be a good idea to speak to one of the Student and Academic Services (SAS) teams.
Not sure who to ask
Below is a list of the different SAS teams that are here at the university to help you through any problem that may be affecting your university work. Each team is trained to help with different aspects of university life. Have a look to see which team could help you.
Appointments with each of the SAS teams can be made using the contact details below (all details are also on the student portal) and some services have drop-in sessions that do not require an appointment.
Most SAS teams work out of the Student Hub in Merchiston but if you can’t make it to drop-in sessions at the Merchiston campus email the relevant team and they will organise to meet you at the most convenient campus.
Working from home? Don’t want to speak to someone in person?
Student Hub Online Helpdesk can also provide information on most topics without leaving your computer. Use the online helpdesk to search frequently asked questions - someone may have already answered your question.
If you can't find the answer you're looking for or want more information then contact the SAS team through the helpdesk's enquiry form and the appropriate member of staff will reply as soon as possible.
Activity
1:
Student and Academic Services
Within SAS (Student and Academic Services) there are various teams to support your academic and personal achievement while at Edinburgh Napier University.
SAS can be split into two main areas:
1. Academic support
The Centre for Learning and Study Support (CLaSS) refers to the services that are run to support academic skills. Within CLaSS there are a number of Student Learning Advisers working to support student learning while at university.
2. Personal support
253
SAS can help support personal development and wellbeing through a number of services including Counselling, Mental Health Advisers, Student Funding and Student Learning Advisers specialising in Course Changes and Retention.
But there are also areas of the SAS department that support both your personal and professional development such as Confident Futures and Careers.
There are other services within the university, which sit outwith the SAS bracket, who can also help you to control aspects of your life that are causing stress. These include ISAS (Independent Student Advice Service), [EN]gage Fitness and your PDT(Personal Development Tutor).
Instruction
Want to know more?
You can find out more about the support available for academic and personal development
in the information below and in the Student and Academic Services tab along the top of the
Student Portal home page.
service 1
Student Learning Advisers hold Academic Skills workshops and cover a variety of topics
such as critical thinking, using sources correctly, essay and report structure and managing
dissertations. The workshops are free to attend and open to all students. Getting to grip with
the basics will help make assignments easier, giving you more time to concentrate on the
content therefore helping you to improve your marks and reducing your overall stress.
To book onto an Academic Skills workshop : Go to ''All courses'' in Moodle, select ''Student
and Academic Services'' and then “Open workshop and event programme”. From here you
can sign up to any workshop run by Academic Skills, Careers and Confident Futures.
Student Learning Advisers can also meet with you on a one-to-one basis to offer advice to
help you improve your academic skills - and your grades! Similar to the academic skills
workshops they can help if you are having problems with topics such as referencing,
academic writing, managing dissertations or exam preparation.
Short online Academic Skills courses are also available on Moodle. These quick and
informative courses give you the opportunity to work through activities, in your own time, that
can improve your understanding of the key academic skills required at university. The online
academic skills courses can be found on Moodle: Click on "All courses" then "Student and
Academic Services" and choose "Academic skills Moodle".
Insert video
Mel Kinchant introduces you to her role as a Student Learning Adviser and how to
arrange a meeting with one of the team to improve your academic skills.
254
(Audio will be transcribed and types below video for visual learners, or for use without
headphones)
Service 2
Confident Futures workshops are designed to help students to develop a wide range of
relevant skills, attributes and attitudes that will enhance their chances of being successful
while at University and in life beyond.
The programme is unique within Higher Education and can help students to feel better
prepared for situations within university and also after graduation. A number of the
workshops directly address areas that may be stressful such as dealing with change, time
management, interacting with others, conflict management and taking on challenges.
Insert video
Mo Andrew is one of the Personal and Professional Development Facilitators within
Confident Futures. In this video she describes the range of workshops run by her team
and how to sign up to the classes.
(Audio will be transcribed and types below video for visual learners, or for use without
headphones)
Service 3
The Careers team provide information, advice and guidance to help students and graduates
achieve their career goals.
During this project students have told us that they worry over future employment and that
the uncertainty of getting a job causes stress. The careers team can help you identify career
options, understand the labour market, assess your skills, find opportunities to develop new
skills and experience and prepare for employment. Careers offer advice on a one-to-one
basis and in workshop format and can help to improve your CV and arrange mock
interviews.
Careers also work with the Employer Relations Team to provide opportunities for students
and graduates to liaise with relevant employers and industry professionals.
Insert video
Lyn Kennedy (Careers Adviser based in FHLSS) discusses the services available and
how to access them.
255
(Audio will be transcribed and types below video for visual learners, or for use without
headphones)
Service 4
The Counsellors are part of Student Counselling and Wellbeing and are based in the
Student Hub at Merchiston. They are there to talk to, if something in your personal life is
affecting your confidence or ability to do your work at University or if you feel distressed
and are in need of some support. The Counselling team can help even if you feel that the
issue is relatively small, it is better to seek support early when concerns are easier to
manage.
If you would like to discuss your concerns with a Counsellor please come alone to one of
the term-time, drop-in appointments at the Student Hub at Merchiston (details of the drop-
in times are available on the Student Portal under the Student and Academic Services
tab). Or register your interest via email, on [email protected], if you can’t attend a
drop-in session.
Once a counselling team member has ensured that they are the best service for you, you
will be given further appointments with one of the Counsellors. The Student Hub is open
Monday to Friday 9am - 5pm, and you can book appointments to see one of the team
during these times.
Insert video
In this video Andrew Watson from Counselling describes when their team can be of
service, how the service works and how to access their confidential support.
Service 5
The Mental Health Advisers are also part of Student Counselling and Wellbeing and are
based in the Student Hub at Merchiston. They are there to talk to if you have concerns
about your wellbeing or feel that a mental health difficulty may be causing you problems at
University.
Appointments with a Mental Health Adviser are confidential and can be made via email to
[email protected]. The Student Hub is open Monday to Friday 9am -
5pm, and you can book appointments to see one of the team during these times.
Insert video
256
Leah MacGilp (Mental Health Adviser) discusses her role and how you can contact the
advisers for confidential support.
Service 6
Feeling like you are stuck on the wrong course or doing the wrong thing for your future
can be extremely stressful. Many students change course or leave University part way
through their studies and this is likely to be a big decision for you.
To help you make the decision that is best for you and your goals, speak to one of the
Student and Academic Support staff. They can help by providing options and advice and
can help tailor a solution that suits you and your circumstances. Contact George on
[email protected] if you want to discuss leaving university.
Insert video
George Wilson is a Student Learning Adviser specialising in retention. He works mainly
with students who are considering changing course or leaving university and here George
explains how he can help.
Service 7
Money worries can cause a considerable amount of stress and a lack of money can make
you feel isolated and unable to relax or take time off.
The Student Funding team is available throughout the year to discuss any money
difficulties you may have. They provide advice and guidance on your options and identify
sources of help which could be available to you. The student funding service is available
to home students and priority is given to those who have exhausted other forms of
support such as student loans and overdrafts.
You can find out more on the Student Portal by accessing the Student and Academic
Services tab at the top and clicking on 'Money'.
Insert video
Margaret Dalgleish from the Student Funding team has made this video to demonstrate in
what circumstances Student Funding can be of help and how to arrange a meeting with
one of their team members.
257
Service 8
Entering a degree from college, or equivalent, sometimes means that you would gain
direct entry into 2nd, 3rd or 4th year. This can be stressful as you may not feel you are as
academically or socially integrated as those who have been studying at ENU from the
start of 1st year. The articulation support service run by SAS can help students entering
directly into 2nd year or above to ensure you feel confident studying at ENU.
If you are a direct entrant student you will likely have attended an articulation workshop
when you joined but one-to-one support can be provided by the Articulation Support
Advisers.
Insert video
Tom Campbell discusses his role as an Articulation Support Adviser and explains how to
access articulation support.
Service 9
The Student Mentoring Programme is for new students who are unfamiliar with the
University and who would like the chance to meet informally with a trained, successful
student. Students who participate on this programme say that it really helps them adjust to
studying at University.
Insert video
Caroline Moffat (the head of student mentoring) has asked one of her student mentors to
tell you about the mentoring program and how to get paired up with a mentor or how to
become a mentor yourself.
Service 10
As well as providing support for those who are considering leaving University, George
Wilson also provides specialist support to those who have come to University from an in
care background. He can meet with you one to one and discuss confidentially, any
concerns or needs you might have.
Insert video
George introduces his role in supporting student care leavers and explains that there are
specific support services which you can access on top of the other services mentioned
here.
258
Service 11
ISAS is the Independent Student Advice Service and operates at each of the main
campuses. They offer free independent and confidential advice on a range of issues that
may be causing you stress including: Money Advice and Debt Management, Academic
Appeals, Tenancy Issues, Employment Rights, Tax and Benefits, Course Problems and
Regulations, Disciplinary Hearings, Immigration and Visas, Complaints Negotiation,
Health Issues, Sexuality and Safe Sex.
The personal information you provide to ISAS advisers will remain confidential within the
unit and will not be shared with anyone outside the unit unless they have your consent to
do so. When you see an adviser and take advice or representation from them, you can be
confident that nobody outside the ISAS team will have access to your private information.
Insert video
In this video Maxine Wood from ISAS introduces what support her team offers and how
you can arrange a confidential meeting.
Service 12
Being active is an important part of stress reduction. Physical activity increases your
endorphins, putting you in a better mood and helping combat anxiety and depressive
symptoms. Exercise can also help to improve your sleep which can often be disrupted by
stress.
[EN]GAGE caters for all levels of fitness and their facilities are there for everyone to enjoy.
Whether you're having a game of football, a lunchtime badminton session or meeting new
friends in one of the popular classes, fitness is always fresh, different and fun at [EN]GAGE.
Insert video
Diana Wright (Wellbeing coordinator) talks about how exercise can be used to combat
stress and introduces how [EN]GAGE can help you get active or use meditation
exercises such as yoga to control stress.
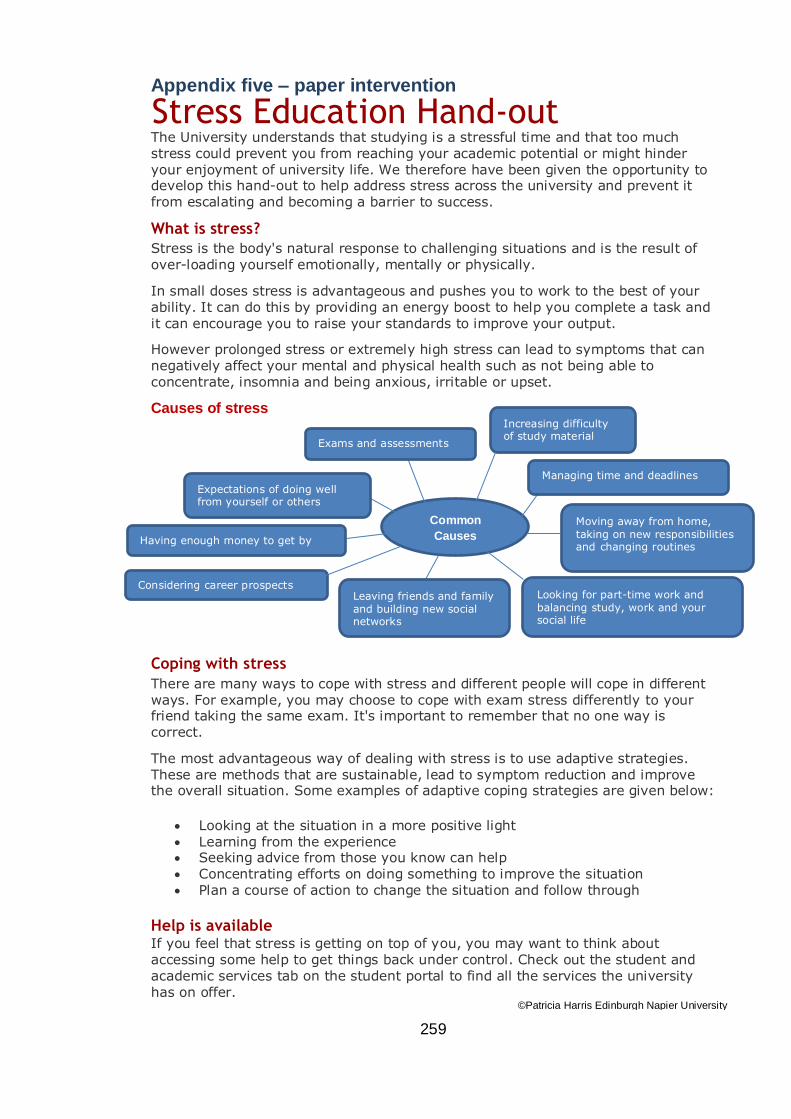
259
Stress Education Hand-out Appendix five – paper intervention
The University understands that studying is a stressful time and that too much stress could prevent you from reaching your academic potential or might hinder your enjoyment of university life. We therefore have been given the opportunity to develop this hand-out to help address stress across the university and prevent it from escalating and becoming a barrier to success.
What is stress?
Stress is the body's natural response to challenging situations and is the result of
over-loading yourself emotionally, mentally or physically.
In small doses stress is advantageous and pushes you to work to the best of your ability. It can do this by providing an energy boost to help you complete a task and it can encourage you to raise your standards to improve your output.
However prolonged stress or extremely high stress can lead to symptoms that can negatively affect your mental and physical health such as not being able to concentrate, insomnia and being anxious, irritable or upset.
Causes of stress
Coping with stress
There are many ways to cope with stress and different people will cope in different
ways. For example, you may choose to cope with exam stress differently to your friend taking the same exam. It's important to remember that no one way is correct.
The most advantageous way of dealing with stress is to use adaptive strategies.
These are methods that are sustainable, lead to symptom reduction and improve the overall situation. Some examples of adaptive coping strategies are given below:
Looking at the situation in a more positive light
Learning from the experience Seeking advice from those you know can help Concentrating efforts on doing something to improve the situation Plan a course of action to change the situation and follow through
Help is available If you feel that stress is getting on top of you, you may want to think about accessing some help to get things back under control. Check out the student and academic services tab on the student portal to find all the services the university
has on offer.
Common
Causes
Managing time and deadlines
Moving away from home,
taking on new responsibilities and changing routines
Looking for part-time work and
balancing study, work and your social life
Exams and assessments
Considering career prospects Leaving friends and family
and building new social networks
Having enough money to get by
Increasing difficulty of study material
Expectations of doing well from yourself or others
©Patricia Harris Edinburgh Napier University
2014
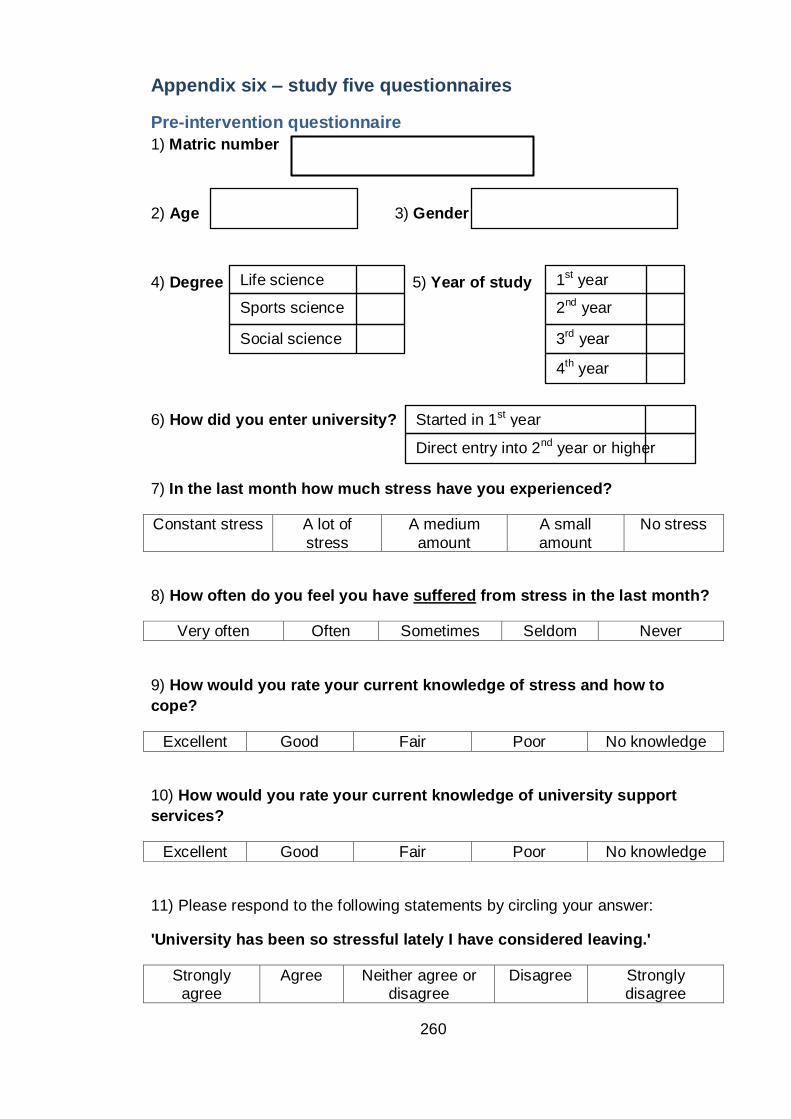
260
Appendix six – study five questionnaires
Pre-intervention questionnaire
1) Matric number
2) Age 3) Gender
4) Degree 5) Year of study
6) How did you enter university?
7) In the last month how much stress have you experienced?
Constant stress A lot of
stress
A medium
amount
A small
amount
No stress
8) How often do you feel you have suffered from stress in the last month?
Very often Often Sometimes Seldom Never
9) How would you rate your current knowledge of stress and how to
cope?
Excellent Good Fair Poor No knowledge
10) How would you rate your current knowledge of university support
services?
Excellent Good Fair Poor No knowledge
11) Please respond to the following statements by circling your answer:
'University has been so stressful lately I have considered leaving.'
Strongly agree
Agree Neither agree or disagree
Disagree Strongly disagree
Life science
Sports science
Social science
1st year
2nd year
3rd year
4th year
Started in 1st year
Direct entry into 2nd year or higher
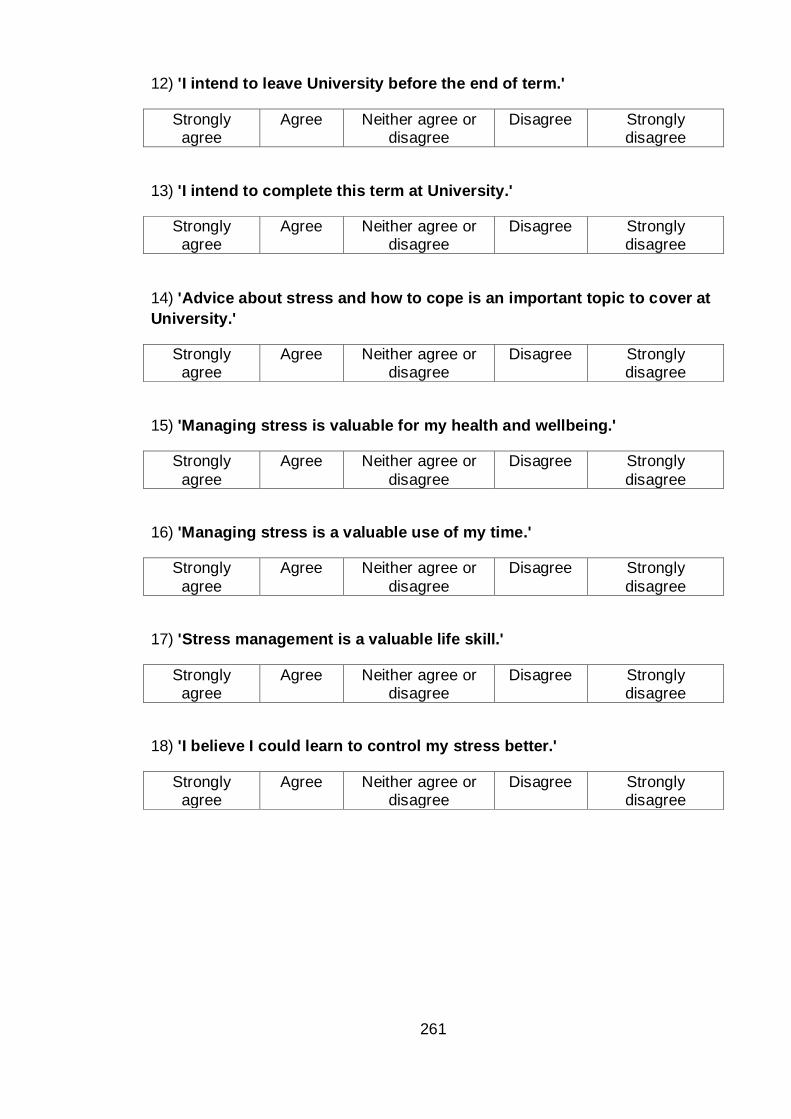
261
12) 'I intend to leave University before the end of term.'
Strongly agree
Agree Neither agree or disagree
Disagree Strongly disagree
13) 'I intend to complete this term at University.'
Strongly agree
Agree Neither agree or disagree
Disagree Strongly disagree
14) 'Advice about stress and how to cope is an important topic to cover at
University.'
Strongly agree
Agree Neither agree or disagree
Disagree Strongly disagree
15) 'Managing stress is valuable for my health and wellbeing.'
Strongly
agree
Agree Neither agree or
disagree
Disagree Strongly
disagree
16) 'Managing stress is a valuable use of my time.'
Strongly
agree
Agree Neither agree or
disagree
Disagree Strongly
disagree
17) 'Stress management is a valuable life skill.'
Strongly agree
Agree Neither agree or disagree
Disagree Strongly disagree
18) 'I believe I could learn to control my stress better.'
Strongly agree
Agree Neither agree or disagree
Disagree Strongly disagree
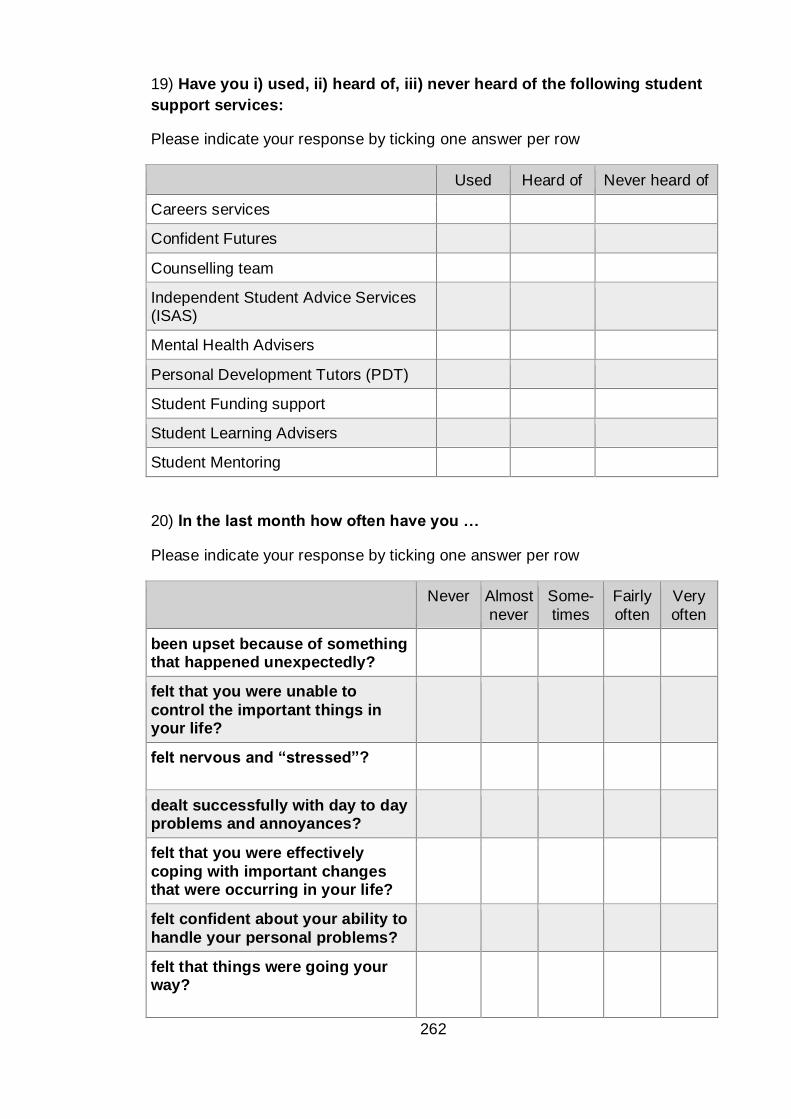
262
19) Have you i) used, ii) heard of, iii) never heard of the following student
support services:
Please indicate your response by ticking one answer per row
Used Heard of Never heard of
Careers services
Confident Futures
Counselling team
Independent Student Advice Services (ISAS)
Mental Health Advisers
Personal Development Tutors (PDT)
Student Funding support
Student Learning Advisers
Student Mentoring
20) In the last month how often have you …
Please indicate your response by ticking one answer per row
Never Almost
never
Some-
times
Fairly
often
Very
often
been upset because of something that happened unexpectedly?
felt that you were unable to
control the important things in your life?
felt nervous and “stressed”?
dealt successfully with day to day problems and annoyances?
felt that you were effectively
coping with important changes that were occurring in your life?
felt confident about your ability to
handle your personal problems?
felt that things were going your way?
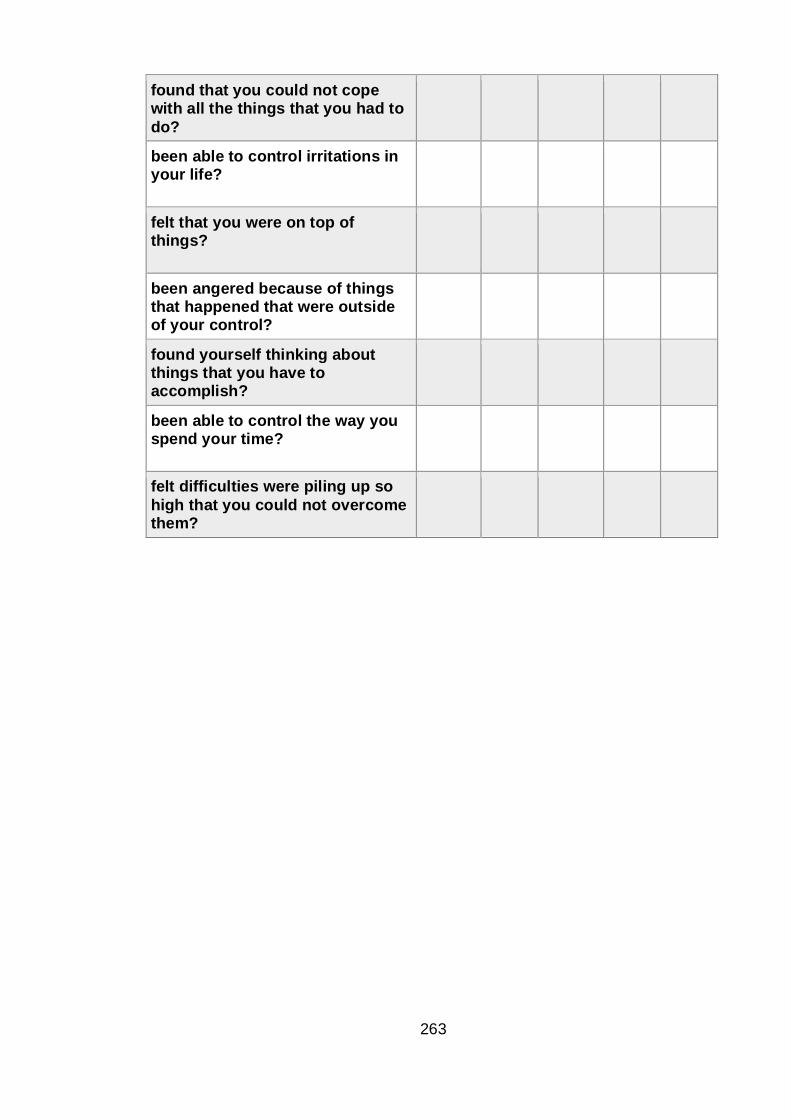
263
found that you could not cope with all the things that you had to
do?
been able to control irritations in your life?
felt that you were on top of things?
been angered because of things that happened that were outside of your control?
found yourself thinking about things that you have to accomplish?
been able to control the way you spend your time?
felt difficulties were piling up so
high that you could not overcome them?
264
21) How have you been feeling, in the last month? Please answer by underlining/circling the answer which you think most closely applies to you. Remember that we want to know about present and very recent feelings, not those you had in the past.
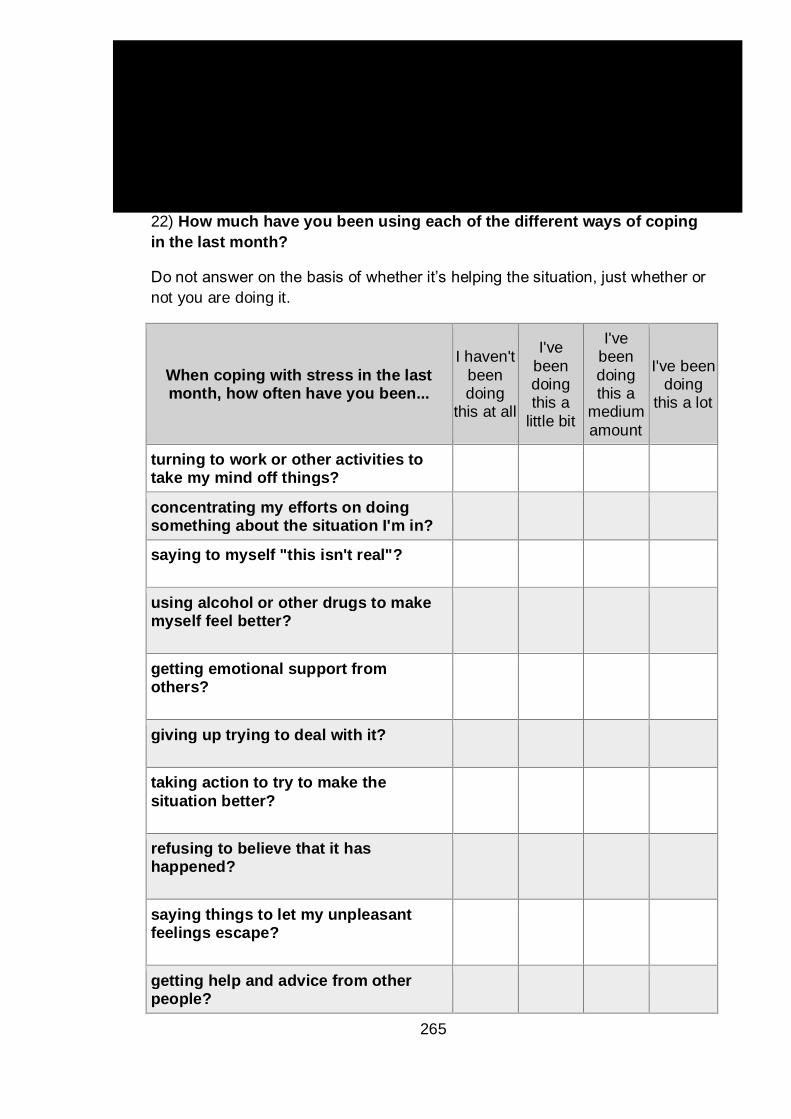
265
22) How much have you been using each of the different ways of coping
in the last month?
Do not answer on the basis of whether it’s helping the situation, just whether or
not you are doing it.
When coping with stress in the last month, how often have you been...
I haven't
been doing
this at all
I've
been doing this a
little bit
I've been
doing this a
medium
amount
I've been doing
this a lot
turning to work or other activities to take my mind off things?
concentrating my efforts on doing something about the situation I'm in?
saying to myself "this isn't real"?
using alcohol or other drugs to make myself feel better?
getting emotional support from others?
giving up trying to deal with it?
taking action to try to make the
situation better?
refusing to believe that it has happened?
saying things to let my unpleasant feelings escape?
getting help and advice from other people?
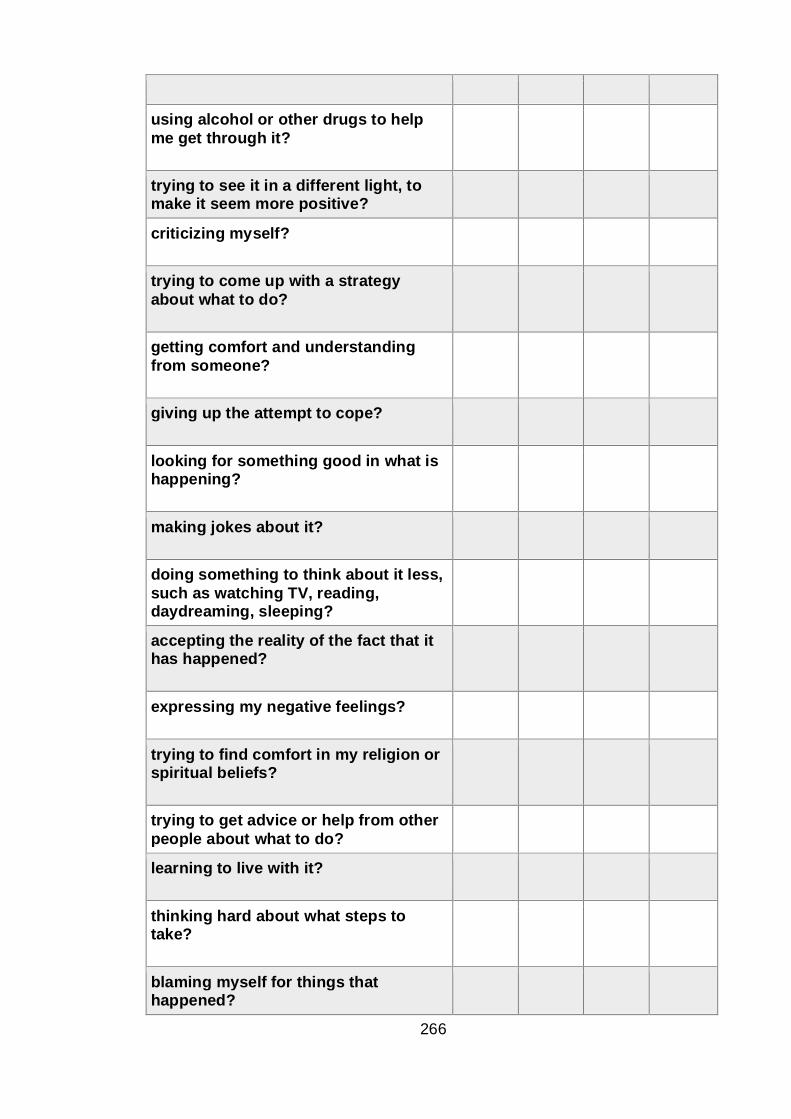
266
using alcohol or other drugs to help
me get through it?
trying to see it in a different light, to make it seem more positive?
criticizing myself?
trying to come up with a strategy
about what to do?
getting comfort and understanding
from someone?
giving up the attempt to cope?
looking for something good in what is happening?
making jokes about it?
doing something to think about it less,
such as watching TV, reading, daydreaming, sleeping?
accepting the reality of the fact that it has happened?
expressing my negative feelings?
trying to find comfort in my religion or spiritual beliefs?
trying to get advice or help from other
people about what to do?
learning to live with it?
thinking hard about what steps to take?
blaming myself for things that happened?
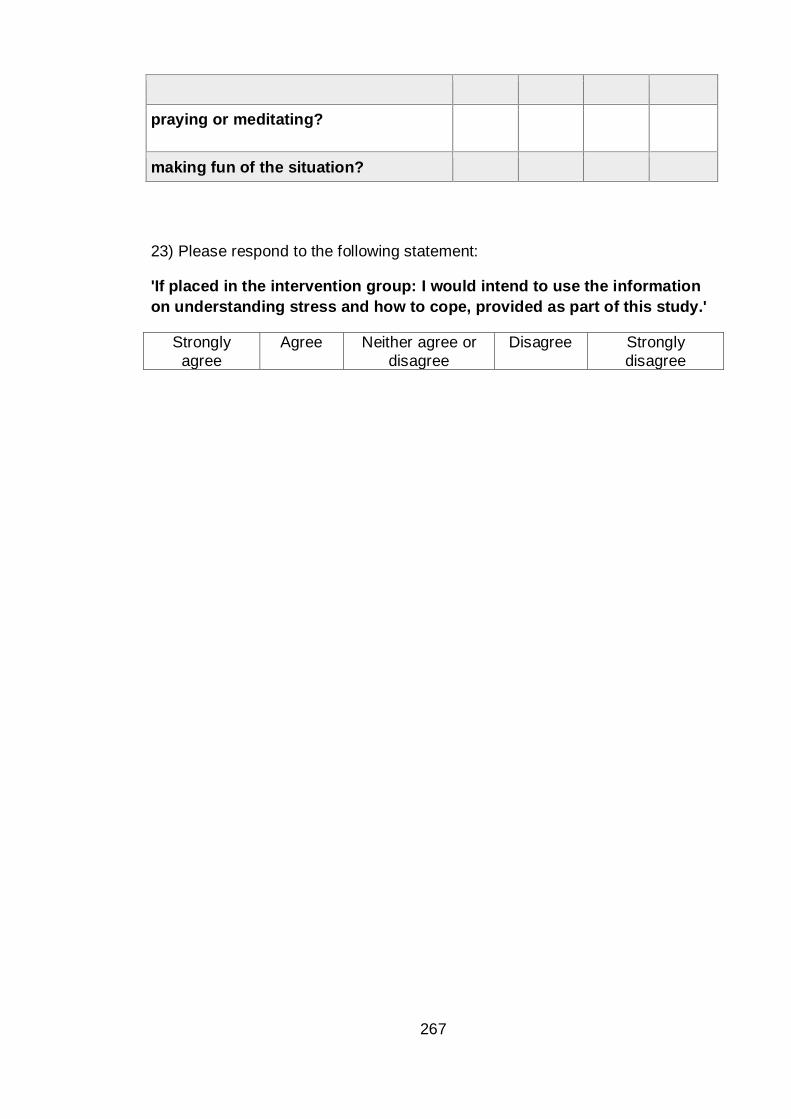
267
praying or meditating?
making fun of the situation?
23) Please respond to the following statement:
'If placed in the intervention group: I would intend to use the information
on understanding stress and how to cope, provided as part of this study.'
Strongly
agree
Agree Neither agree or
disagree
Disagree Strongly
disagree
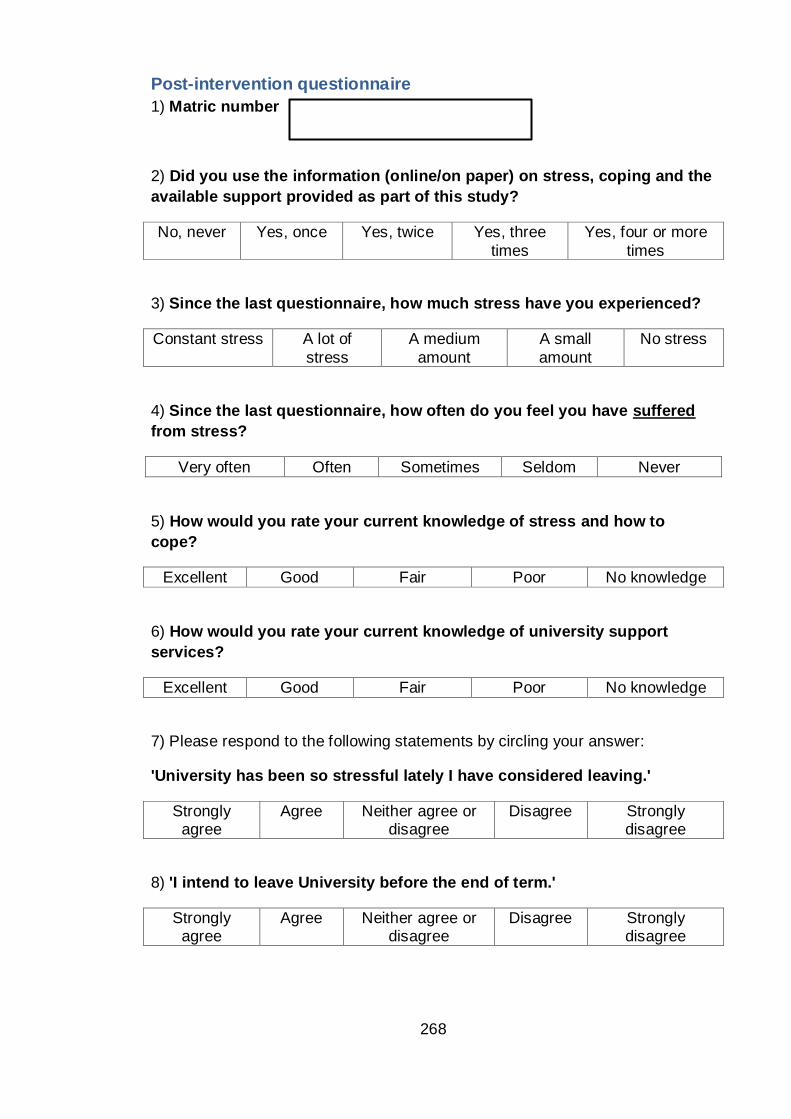
268
Post-intervention questionnaire
1) Matric number
2) Did you use the information (online/on paper) on stress, coping and the
available support provided as part of this study?
No, never Yes, once Yes, twice Yes, three
times
Yes, four or more
times
3) Since the last questionnaire, how much stress have you experienced?
Constant stress A lot of
stress
A medium
amount
A small
amount
No stress
4) Since the last questionnaire, how often do you feel you have suffered
from stress?
Very often Often Sometimes Seldom Never
5) How would you rate your current knowledge of stress and how to
cope?
Excellent Good Fair Poor No knowledge
6) How would you rate your current knowledge of university support
services?
Excellent Good Fair Poor No knowledge
7) Please respond to the following statements by circling your answer:
'University has been so stressful lately I have considered leaving.'
Strongly agree
Agree Neither agree or disagree
Disagree Strongly disagree
8) 'I intend to leave University before the end of term.'
Strongly agree
Agree Neither agree or disagree
Disagree Strongly disagree
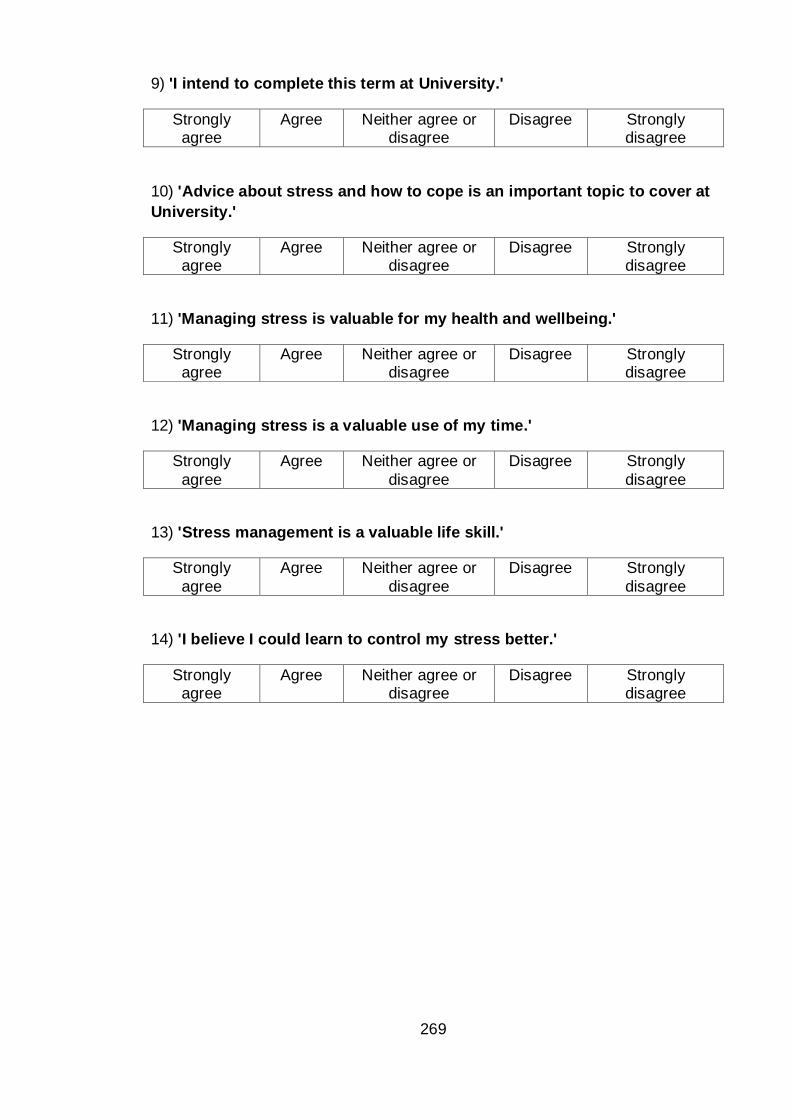
269
9) 'I intend to complete this term at University.'
Strongly agree
Agree Neither agree or disagree
Disagree Strongly disagree
10) 'Advice about stress and how to cope is an important topic to cover at
University.'
Strongly agree
Agree Neither agree or disagree
Disagree Strongly disagree
11) 'Managing stress is valuable for my health and wellbeing.'
Strongly agree
Agree Neither agree or disagree
Disagree Strongly disagree
12) 'Managing stress is a valuable use of my time.'
Strongly
agree
Agree Neither agree or
disagree
Disagree Strongly
disagree
13) 'Stress management is a valuable life skill.'
Strongly
agree
Agree Neither agree or
disagree
Disagree Strongly
disagree
14) 'I believe I could learn to control my stress better.'
Strongly agree
Agree Neither agree or disagree
Disagree Strongly disagree
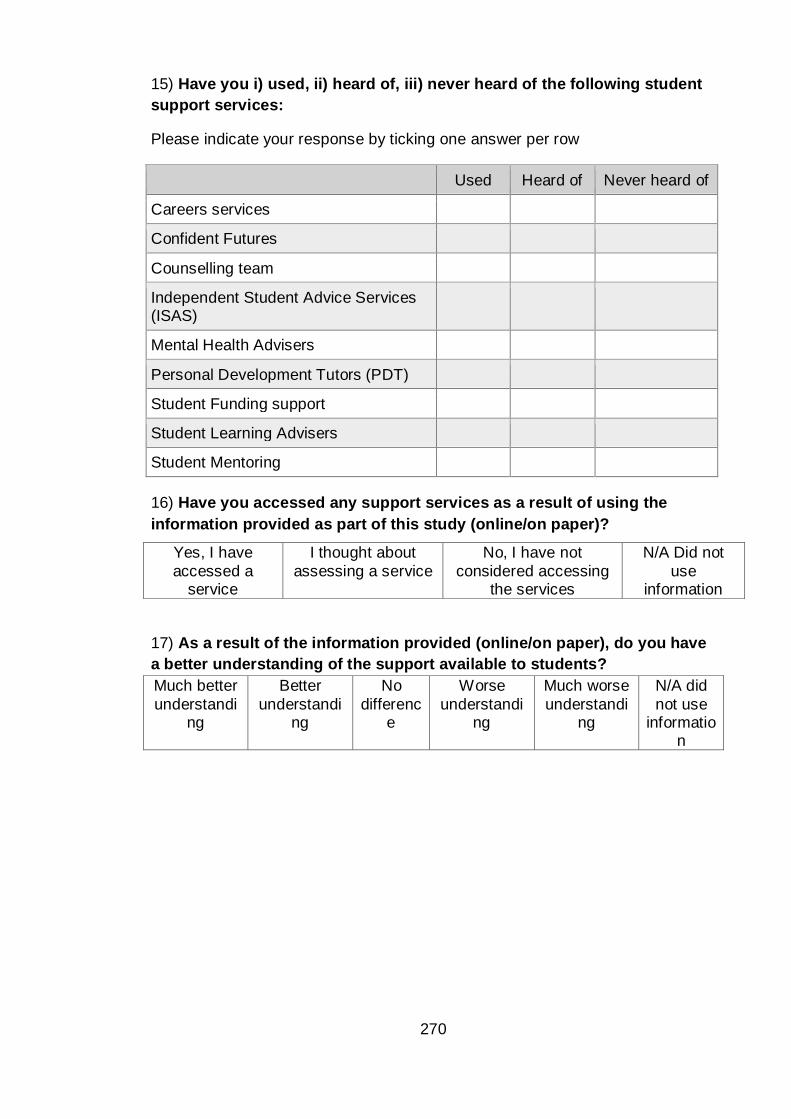
270
15) Have you i) used, ii) heard of, iii) never heard of the following student
support services:
Please indicate your response by ticking one answer per row
Used Heard of Never heard of
Careers services
Confident Futures
Counselling team
Independent Student Advice Services (ISAS)
Mental Health Advisers
Personal Development Tutors (PDT)
Student Funding support
Student Learning Advisers
Student Mentoring
16) Have you accessed any support services as a result of using the
information provided as part of this study (online/on paper)?
17) As a result of the information provided (online/on paper), do you have
a better understanding of the support available to students?
Much better
understanding
Better
understanding
No
difference
Worse
understanding
Much worse
understanding
N/A did
not use informatio
n
Yes, I have
accessed a service
I thought about
assessing a service
No, I have not
considered accessing the services
N/A Did not
use information
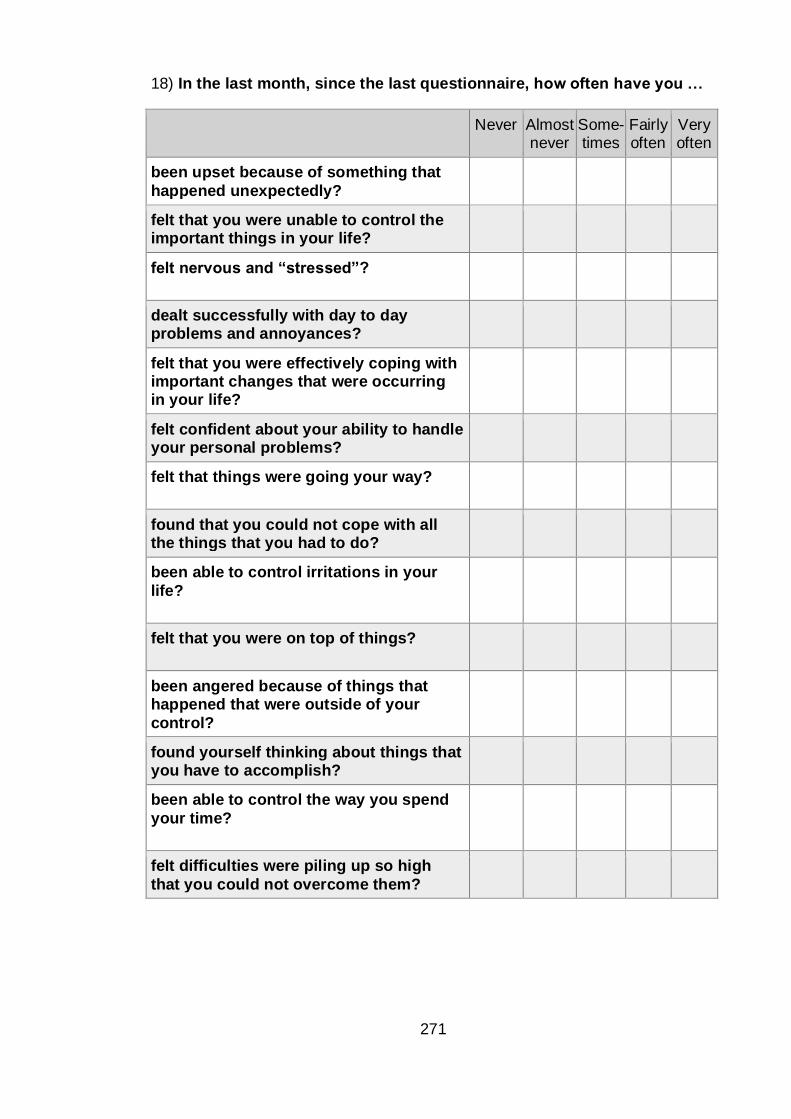
271
18) In the last month, since the last questionnaire, how often have you …
Never Almost
never Some-times
Fairly often
Very often
been upset because of something that
happened unexpectedly?
felt that you were unable to control the important things in your life?
felt nervous and “stressed”?
dealt successfully with day to day problems and annoyances?
felt that you were effectively coping with important changes that were occurring in your life?
felt confident about your ability to handle your personal problems?
felt that things were going your way?
found that you could not cope with all the things that you had to do?
been able to control irritations in your
life?
felt that you were on top of things?
been angered because of things that happened that were outside of your
control?
found yourself thinking about things that you have to accomplish?
been able to control the way you spend
your time?
felt difficulties were piling up so high
that you could not overcome them?
272
19) Have you modified how you cope with stress as a result of using the
information provided (online/on paper)?
Very much
Much Some A little Not at all
N/A did not use information
20) How have you been feeling, since the last questionnaire?
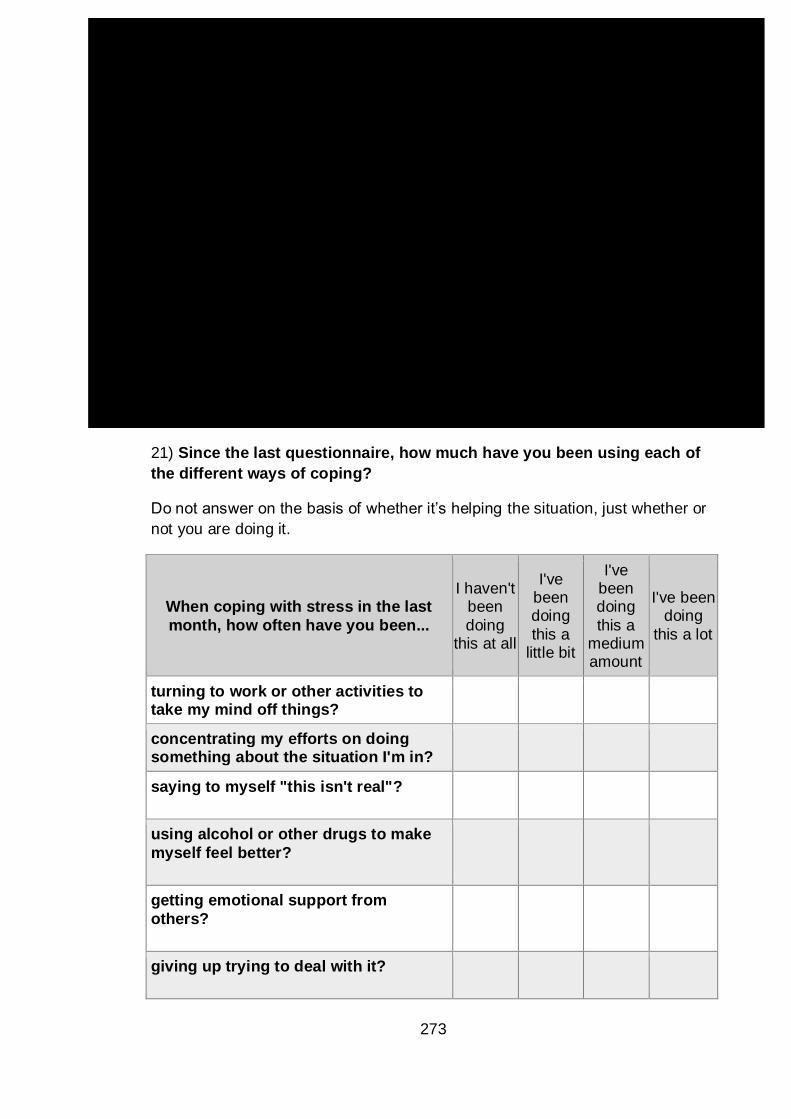
273
21) Since the last questionnaire, how much have you been using each of
the different ways of coping?
Do not answer on the basis of whether it’s helping the situation, just whether or
not you are doing it.
When coping with stress in the last
month, how often have you been...
I haven't been
doing this at all
I've been doing
this a little bit
I've been doing
this a medium amount
I've been doing
this a lot
turning to work or other activities to take my mind off things?
concentrating my efforts on doing something about the situation I'm in?
saying to myself "this isn't real"?
using alcohol or other drugs to make
myself feel better?
getting emotional support from
others?
giving up trying to deal with it?
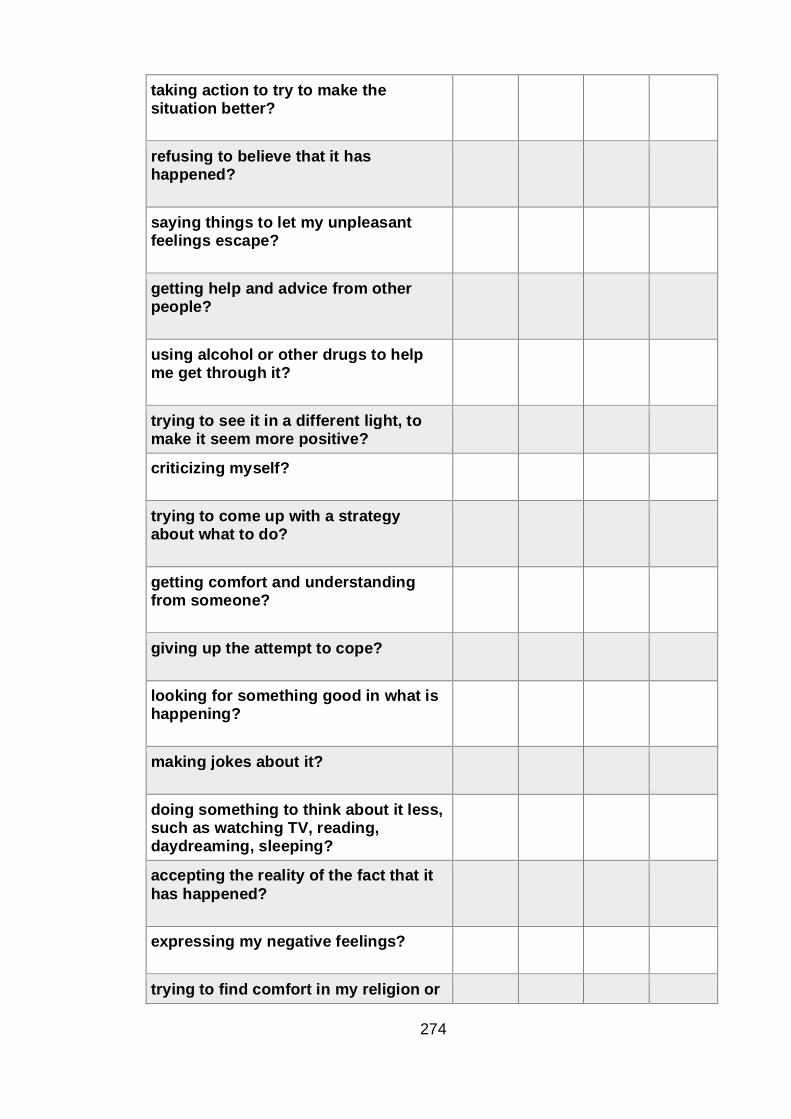
274
taking action to try to make the situation better?
refusing to believe that it has happened?
saying things to let my unpleasant feelings escape?
getting help and advice from other people?
using alcohol or other drugs to help me get through it?
trying to see it in a different light, to make it seem more positive?
criticizing myself?
trying to come up with a strategy about what to do?
getting comfort and understanding from someone?
giving up the attempt to cope?
looking for something good in what is happening?
making jokes about it?
doing something to think about it less, such as watching TV, reading, daydreaming, sleeping?
accepting the reality of the fact that it
has happened?
expressing my negative feelings?
trying to find comfort in my religion or
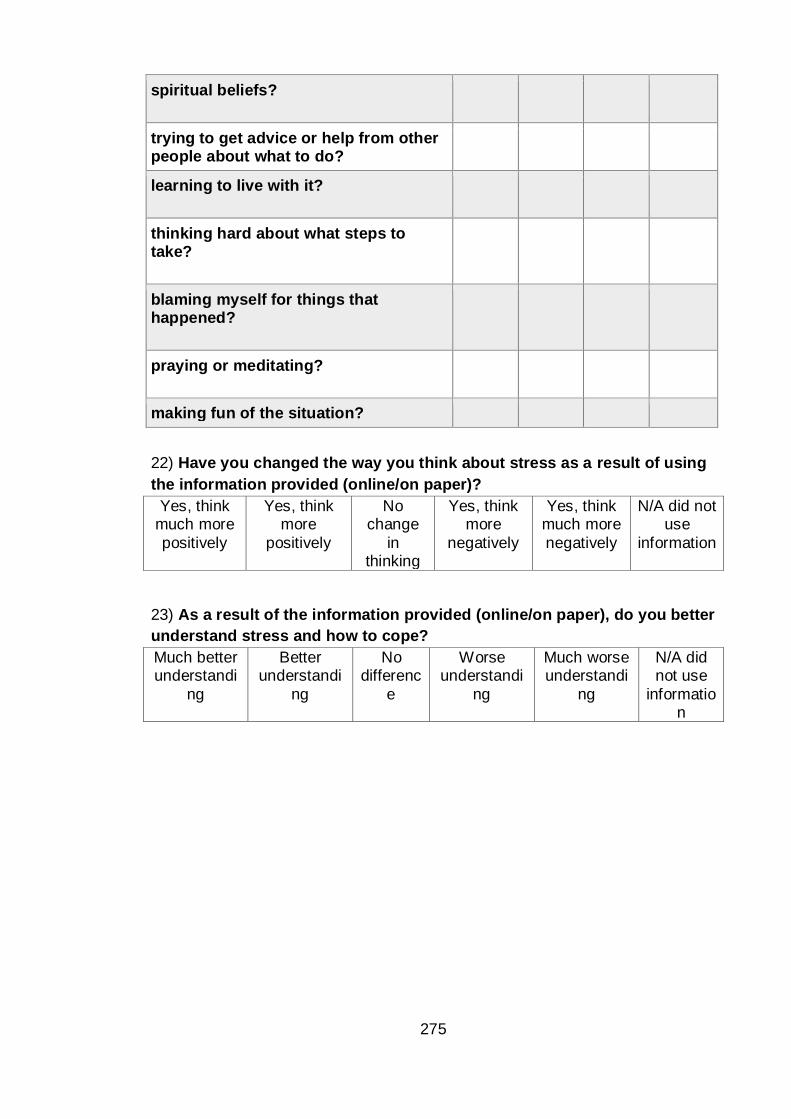
275
spiritual beliefs?
trying to get advice or help from other people about what to do?
learning to live with it?
thinking hard about what steps to take?
blaming myself for things that happened?
praying or meditating?
making fun of the situation?
22) Have you changed the way you think about stress as a result of using
the information provided (online/on paper)?
Yes, think much more
positively
Yes, think more
positively
No change
in thinking
Yes, think more
negatively
Yes, think much more
negatively
N/A did not use
information
23) As a result of the information provided (online/on paper), do you better
understand stress and how to cope?
Much better understandi
ng
Better understandi
ng
No differenc
e
Worse understandi
ng
Much worse understandi
ng
N/A did not use
information