
The Relationship between Service Quality and Customer Loyalty in the Kenyan Mobile Telecommunication...
12
European Journal of Business and Management www.iiste.org ISSN 2222-1905 (Paper) ISSN 2222-2839 (Online) Vol.5, No.23, 2013 26 The Relationship between Service Quality and Customer Loyalty in the Kenyan Mobile Telecommunication Service Industry Paul Mensah Agyei* 1 , James M. Kilika 2 , PhD 1. Centre for Continuing Education, University of Cape Coast, Cape Coast, Ghana 2. Department of Business Administration, School of Business, Kenyatta University, Nairobi, Kenya *Email of coressponding author : [email protected] Abstract Customer loyalty has been presented as an indicator of successful quality management practices in both the manufacturing and the service sectors. Due to the rapid growth of the services sector in most economies, there is need to understand how this concept is associated with business practices for supporting quality in the services sector. The study examined the relationship between service quality and customer loyalty in the Kenyan Mobile Telecommunication Service Sector. The SERVQUAL model was adopted in the study. Kenyatta University students drawn from five of its campuses were selected for the population of the study. Pearson product-moment correlation coefficient and regression analyses were the parametric statistical tools used to test the association and effect in the study. A significant relationship was found between service quality and customer loyalty r(313) = 0.47, p<0.05. The SERVQUAL model explained a significant proportion of variance in customer loyalty scores with R 2 = 0.306, F(4, 308) = 33.93, p < 0.05. The dimensions in the model predicted different values on customer loyalty: Reliability b = 0.19, t(313) = 2.89, p<0.05, Assurance b = 0.25 t(313) = 3.50, p < 0.05, Empathy b = 0.35 t(313) = 4.90, p<0.05 and Reliability b = 0.37, t(313) = 0.54, p>0.05. In sum, service quality has a positive relationship with customer loyalty. These findings hold implications for industry operators on key areas to pay attention to in order to support the quality of services offered so as to guarantee sustained customer loyalty. Keywords: Service quality, Customer satisfaction, SERVQUAL model, Kenyatta University, Customer loyalty. 1. Introduction Customer loyalty is an aspect of consumer behaviour. Organizations are focusing on this area due to the growing concerns for building long-term relationships with customers. Customer loyalty has been identified in the marketing literature to be a competitive, growth and survival tool for many companies, especially in the highly globalized, industrialized and competitive markets. According to Oliver (1999) customer loyalty is said to be a deeply held commitment to rebuy or repurchase a preferred product/service consistently in the future, thereby causing repetitive, same-brand or same brand-set purchasing, despite situational influences and marketing efforts having the potential to cause switching behaviour. Generally, it is agreed upon that growth and survival of companies depend on how loyal their customers are in almost all industries (Boohene & Agyepong, 2011). Service industries are particularly much more affected due to the unique nature of their intangible products. Service marketing is different from goods marketing, and is usually more complex to manage. In service industries, the distinctive features of services (intangibility, inseparability, perishability and heterogeneity) require an understanding of and satisfaction of customer needs and expectations, creating, communicating and delivering customer value, and keeping promises (Aksoy, Atilgan & Akinci, 2003). Within the services sector, Service quality has been identified as an important topical issue accounting for effective service management as well as that of customer service loyalty. Both are regarded as strategic tools with potential to enhance competitiveness within the service organizations (Kotler and Armstrong, 2010). Competition in the mobile phone service sector has been intense all over the globe of which Kenya is no exception. Every firm in the sector has not relented in its effort in making its products and services known to the general public all with the aim of capturing market share. Even though several studies have been conducted on customer loyalty around the world, in the service industries however, little has been done (Wernerfelt, 1991; Kuusik, 2009; Nukpezah and Nyumuyo, 2009). It is interesting to note that in the Kenyan mobile telephone service sector, no empirical study has been conducted to show the relationship between service quality and customer loyalty. In order to close this research gap in the literature, this study sought to identify and empirically
Transcript of The Relationship between Service Quality and Customer Loyalty in the Kenyan Mobile Telecommunication...

European Journal of Business and Management www.iiste.org ISSN 2222-1905 (Paper) ISSN 2222-2839 (Online) Vol.5, No.23, 2013
26
The Relationship between Service Quality and Customer Loyalty
in the Kenyan Mobile Telecommunication Service Industry
Paul Mensah Agyei*1, James M. Kilika2, PhD
1. Centre for Continuing Education, University of Cape Coast, Cape Coast, Ghana 2. Department of Business Administration, School of Business, Kenyatta University, Nairobi, Kenya
*Email of coressponding author : [email protected]
Abstract
Customer loyalty has been presented as an indicator of successful quality management practices in both the manufacturing and the service sectors. Due to the rapid growth of the services sector in most economies, there is need to understand how this concept is associated with business practices for supporting quality in the services sector. The study examined the relationship between service quality and customer loyalty in the Kenyan Mobile Telecommunication Service Sector. The SERVQUAL model was adopted in the study. Kenyatta University students drawn from five of its campuses were selected for the population of the study. Pearson product-moment correlation coefficient and regression analyses were the parametric statistical tools used to test the association and effect in the study. A significant relationship was found between service quality and customer loyalty r(313) = 0.47, p<0.05. The SERVQUAL model explained a significant proportion of variance in customer loyalty scores with R2 = 0.306, F(4, 308) = 33.93, p < 0.05. The dimensions in the model predicted different values on customer loyalty: Reliability b = 0.19, t(313) = 2.89, p<0.05, Assurance b = 0.25 t(313) = 3.50, p < 0.05, Empathy b = 0.35 t(313) = 4.90, p<0.05 and Reliability b = 0.37, t(313) = 0.54, p>0.05. In sum, service quality has a positive relationship with customer loyalty. These findings hold implications for industry operators on key areas to pay attention to in order to support the quality of services offered so as to guarantee sustained customer loyalty.
Keywords: Service quality, Customer satisfaction, SERVQUAL model, Kenyatta University, Customer loyalty.
1. Introduction
Customer loyalty is an aspect of consumer behaviour. Organizations are focusing on this area due to the growing concerns for building long-term relationships with customers. Customer loyalty has been identified in the marketing literature to be a competitive, growth and survival tool for many companies, especially in the highly globalized, industrialized and competitive markets. According to Oliver (1999) customer loyalty is said to be a deeply held commitment to rebuy or repurchase a preferred product/service consistently in the future, thereby causing repetitive, same-brand or same brand-set purchasing, despite situational influences and marketing efforts having the potential to cause switching behaviour. Generally, it is agreed upon that growth and survival of companies depend on how loyal their customers are in almost all industries (Boohene & Agyepong, 2011). Service industries are particularly much more affected due to the unique nature of their intangible products. Service marketing is different from goods marketing, and is usually more complex to manage. In service industries, the distinctive features of services (intangibility, inseparability, perishability and heterogeneity) require an understanding of and satisfaction of customer needs and expectations, creating, communicating and delivering customer value, and keeping promises (Aksoy, Atilgan & Akinci, 2003). Within the services sector, Service quality has been identified as an important topical issue accounting for effective service management as well as that of customer service loyalty. Both are regarded as strategic tools with potential to enhance competitiveness within the service organizations (Kotler and Armstrong, 2010).
Competition in the mobile phone service sector has been intense all over the globe of which Kenya is no exception. Every firm in the sector has not relented in its effort in making its products and services known to the general public all with the aim of capturing market share. Even though several studies have been conducted on customer loyalty around the world, in the service industries however, little has been done (Wernerfelt, 1991; Kuusik, 2009; Nukpezah and Nyumuyo, 2009). It is interesting to note that in the Kenyan mobile telephone service sector, no empirical study has been conducted to show the relationship between service quality and customer loyalty. In order to close this research gap in the literature, this study sought to identify and empirically
European Journal of Business and Management www.iiste.org ISSN 2222-1905 (Paper) ISSN 2222-2839 (Online) Vol.5, No.23, 2013
27
analyze the factors that influence customer loyalty in the Kenyan mobile phone service sector and establish their relationship with service quality. The general objective of the research was to identify the relationship between service quality and customer loyalty in the Kenyan mobile phone service sector. Specifically, the research sought to determine: the relationship between reliability of service quality and customer loyalty; the relationship between responsiveness of service quality and customer loyalty; the relationship between empathy of service quality and customer loyalty; the relationship between assurance of service quality and customer loyalty in mobile telecommunication service industry in Kenya.
2. Theoretical Review and conceptualization 2.1 The Concept of Customer Loyalty
Loyalty is an old-fashioned word that has traditionally been used to describe fidelity and enthusiastic devotion to a country, a cause, or an individual. More recently, it has been used in a business context to describe a customer’s willingness to continue patronizing a firm over the long term, preferably on an exclusive basis or recommending the firm’s products to friends and associates. Customer loyalty extends beyond behaviour and includes preference liking and future intentions (Loverlock and Wirtz, 2007).
Customer service loyalty conceptualisation has received tremendous attention in the literature over the past two decades because according to Nukpezah and Nyumuyo (2009), practitioners have observed its intricate relationship with a firm’s profitability. Thus customer loyalty is now accepted as indispensable in strategic decision making because it costs more to attract new customers than to retain old ones.
According to Kuusik (2007), it is important to segment customers based on their loyalty. Theories of behavioral loyalty were dominating until 1970 considering loyalty as the function of the share of total purchases, function of buying frequency or buying pattern, or function of buying probability. These approaches looked at brand loyalty in terms of outcomes (repeat purchase behavior) rather than reasons, until Day (1994) introduced the two-dimensional concept of brand loyalty, which stated that loyalty should be evaluated with both behavioral and attitudinal criteria. Contemporary researches consider and accent the psychological (mostly attitudinal and emotional) factor of loyalty (Jacoby et al. 1973; Oliver 1999; Reichheld 2003 cited in Kuusik, 2007). The relationship is so important for the customer that he or she makes maximum efforts to maintain it. Highly bonded customers will buy repeatedly from a provider to which they are bonded, recommends that provider to others, and strongly defend their choices to others by the belief based on the insistence that they have chosen the “best” product or service from that provider.
2.2 Service Quality
Service quality is an important topical issue in service management (Kotler and Armstrong, 2010). As a result, researchers are making efforts to assess what amounts to service quality and its relationship with customer satisfaction vis-a-vis customer loyalty. Boahene and Agyapong (2011), in analysing the antecedents of customer loyalty in Ghana, concluded, that telecommunication management needs to emphasise quality. They emphasised, that because service firms do not provide tangible products, their service is usually assessed through measures of the service provider’s relationship with customers. Service quality was found in the study to correlate positively and significantly with customer loyalty. Similarly, Krishman et al. (1999) in studying customer satisfaction found that satisfaction with product offerings is a primary driver of overall customer satisfaction. The findings further observed that the quality of customer service with respect to financial statements and services provided through different channels of delivery, are also important in determining overall satisfaction. A study by Nukpezah and Nyumuyo (2001) on customer loyalty in the Ghana banking industry found among other factors that service quality (especially empathy and reliability) and bank image and reputation are important instigators of customer satisfaction and loyalty.
2.3 Theoretical Models of Customer Loyalty
A number of theoretical models have been postulated in marketing to offer an explanation on the process leading to customer satisfaction and subsequently customer loyalty. Most of these however draw from the area of

European Journal of Business and Management www.iiste.org ISSN 2222-1905 (Paper) ISSN 2222-2839 (Online) Vol.5, No.23, 2013
28
marketing of services and are considered suitable for informing research in customer service loyalty studies. The most prominent of these models is the Gap (SERVQUAL) model. This model is represented in figure 1.
Insert figure 1
The premises of this model have guided much of the empirical work in relevant areas of marketing. However, in view of the evaluated state of the art in the relevant theory on customer loyalty, it is observable that a number of areas call for further explanation. For example, the model has been developed and in most cases experimented in western economies with distinct macro-economic conditions likely to produce different consumer behavioral patterns from those prevailing in most developing country market conditions (Kuusik, 2007; Consuegra, 2007). Secondly, the model alongside others adopted in marketing generalizes across industries and brands leaving a relatively wide room for possible dilemmas for practicing marketers in diverse macroeconomic settings (Wernerfelt, 1991; Islam, 2010). To add value to the existing body of knowledge in theory and research, we propose a simple model for testing within the Kenyan context the relationship between dimensions of service quality and customer loyalty. Figure 2 presents this conceptual model. The model proposes a linear relationship between the dimensions of Service Quality and Customer Loyalty. Insert figure 2 The study put forward four hypotheses for testing as shown in the conceptual model. Based on the study’s objectives, literature reviewed and the subsequent conceptual framework, the study hypothesized that:
H1: There is no statistical significant relationship between reliability of service quality and customer loyalty in mobile telecommunication service industry in Kenya.
H2: There is no statistical significant relationship between responsiveness of service quality and customer loyalty in mobile telecommunication service industry in Kenya.
H3: There is no statistical significant relationship between empathy of service quality and customer loyalty in mobile telecommunication service industry in Kenya.
H4:There is no statistical significant relationship between assurance of service quality and customer loyalty in mobile telecommunication service industry in Kenya.
3. Methodology of Research
Under the methodology section of the paper, we review the procedures followed to obtain and analyze field data to test the stated hypotheses in the study. The section discusses the design, the population, sampling, data analysis and presentation. We first provide an overview of the industry from which the concepts being tested are offered, the telecommunication industry in Kenya.
3.1 The Telecommunication Industry in Kenya
The telecommunication industry in Kenya has a history that goes back to the days of colonialism by Britain. According to Tyler et al. (1994), Kenya's earliest telecommunications connections to the outside world were the submarine cables linking Zanzibar, Mombasa, and Dar es Salaam laid by the Eastern & South African Telegraph Company in 1888. Internally, the construction of a telegraph network began with a 200-mile coastal line linking the port city of Mombasa with Lamu. In 1908, the public telephone network began service in Nairobi, the capital and in Mombasa. For a long time the industry operated as a monopoly dominated by public sector firms that enjoyed protected markets. However, due to liberalization, the sector has opened up to competition with more firms coming in to take advantage of the government’s divestiture away from business.
Currently, there are four operators in the mobile telecommunication service sector in Kenya that include Orange Kenya, operators of orange network; Essar Telcom, operators of YU network; Bharti Airtel, operators of Airtel network; and Safaricom Ltd, operators of safaricom network. Table 1 gives a summary of mobile subscription per operator. The performance of the industry by each firm is summarized in table 1 below.
Insert Table 1
This sector has been rated as the fastest growing sector keeping appropriate pace with global advancements, especially the mobile telecom market. This development has become a catalyst for the growth of the nation’s

European Journal of Business and Management www.iiste.org ISSN 2222-1905 (Paper) ISSN 2222-2839 (Online) Vol.5, No.23, 2013
29
commercial and industrial sectors. This telecommunication sector contributed much to the nation’s economic growth and development, which is consistent with the National Vision 2030. For instance, the nation accrued, according to CCK (2011), Kshs 48 billion at the end of June 2011 as the total amount of deposits made through mobile money transfer. Mobile phone becoming the main gateway for communication, money transfer, information and commerce in Kenya. The growth rate in the use of telecommunication facilities has increased dramatically, especially in the rank of increasing number of telephone subscribers (CCK Report, 2010). According to the Communications Commission of Kenya (CCK) 4th Quarter Sector Statistical Report, Kenya had 25.27 million subscribers as at June 30, 2011, representing 64% of the total population. However, it seems little empirical study have been conducted in the sector to ascertain how the growth can be sustained through loyalty (CCK, 2011).
3.2 Research Design
This study adopted the descriptive survey method. The descriptive survey design was selected because it is suitable according to Mugenda and Mugenda (2003) for gathering of data and describes the characteristics of the population. It is also concerned with relationships and practices that exist, beliefs and processes that are ongoing, effects that are being felt, or trends that are developing, hence suitable for this study. The objective in a descriptive study is to learn who, what, when, where and how of a phenomenon (Mugenda and Mugenda, 2003).
3.3 Population
The population of the study comprised of all members of the Kenyatta university student community. The Kenyatta University community is spread across Main Campus, Parklands, City and other satellite campuses in Nyeri, Kitui, Ruiru, Mombasa, Nakuru and Kericho. The study focused on members of this community within the main campus and five other satellite campuses. Kenyatta University was selected because its eight campuses are situated in key cities spread over Kenya. Respondents’ views were considered to serve as a fair representation of Kenyans, hence making it possible to generalize the findings of the study. The approximated total population size of 41070 formed the total number of students under study.
3.4 Sampling This study adopted the multi-stage stratified sampling technique. The researchers followed the following procedures. First, a design of sample frame was made. This is where the entire population was divided in to two or more relevant and significant strata based on one or a number of attributes. The strata were the various campuses of Kenyatta University. The Second stage involved proportionately sampling the population. The researchers used the formula below adopted from Kothari (2004) to determine the sample size. Nc = Z2 p . q . N d2 (N-1) + Z2 . p . q Where: Nc is the strater sample size Z is the confidence level (95%); that is, Z = 1.96
p is the proportion of the of the strata population for entire population (0.3) q (1-P) is the proportion to total population of other clusters (0.7) d is the desired precision (0.05 level) N is the total number of population in the target population.
Based on the above and subsequent calculations, a sample size of 320 students was arrived at. The sample size was spread among the campuses, as shown in Table 2. In the final stage, the researchers selected respondents randomly who were distributed to and selected from the various strata as shown in table 2. Insert Table 2
3.5 Instrument and Procedures
A self-administered structured questionnaire was used to collect data with respect to the objectives and variables of the study from a total sample size of 320 from the researcher’s sample flame. A 5-point likert scale was used to obtain primary data on the five variables of the study. The contents of the instrument were subjected to validity tests prior to commencing field work. Validity refers to the accuracy and meaningfulness of inferences,
European Journal of Business and Management www.iiste.org ISSN 2222-1905 (Paper) ISSN 2222-2839 (Online) Vol.5, No.23, 2013
30
which are based on the research results. This study conformed to the two types of validity; construct validity, and criterion-related validity. Construct validity is a measure of the degree to which data obtained from an instrument meaningfully and accurately reflects or represents a theoretical concept (Mugenda and Mugenda, 2003). This was ensured by reviewing extant literature to understand the relevant concepts and by constructing the measurement based on previous studies. In addition, this study investigated empirically, hypothesised relationships among variables (constructs) some of which have been statistically validated. The researcher through theoretical and empirical review of existing literatures ensured construct (content) validity by identifying all necessary variables necessary to validate the content of the study. Again, the researchers consulted professionals in the field of marketing in general and service marketing in particular. Criterion-related validity on the order hand involved the use of a measure in assessing subjects’ behaviour in specific situations was ensured through concurrent and predictive means (Mugenda and Mugenda, 2003). Predictive which is the degree to which obtained data predict future behaviour of a subject, were demonstrated by the results of the hypothesis testing. Reliability of the instrument was determined through computation of the Cronbach’s Alpha score on each variable. The results are presented in in Table 3. Insert Table 3 From Table 3 the aggregate Cronbach’s alpha value is 0.744 indicating a relatively strong reliability score for the instrument used for this study (Mugenda and Mugenda, 2003).
4. Results of Research
4.1 Respondents’ Characteristics
A total of three hundred and thirteen (313) responses out of the three hundred and twenty (320) were obtained (representing 97.8% response rate) which according to Kothari (2004) is large enough to undertake analysis such a study in the nature of a survey. The respondents and their constituent strata they were drawn from are shown in table 4. Insert Table 4
4.3 Test of Hypotheses
The study used the Pearson product-moment correlation coefficient and regression analysis to test and analyze the various hypotheses of the study. The Results of the correlation analysis are presented in table 5. Insert Table 5
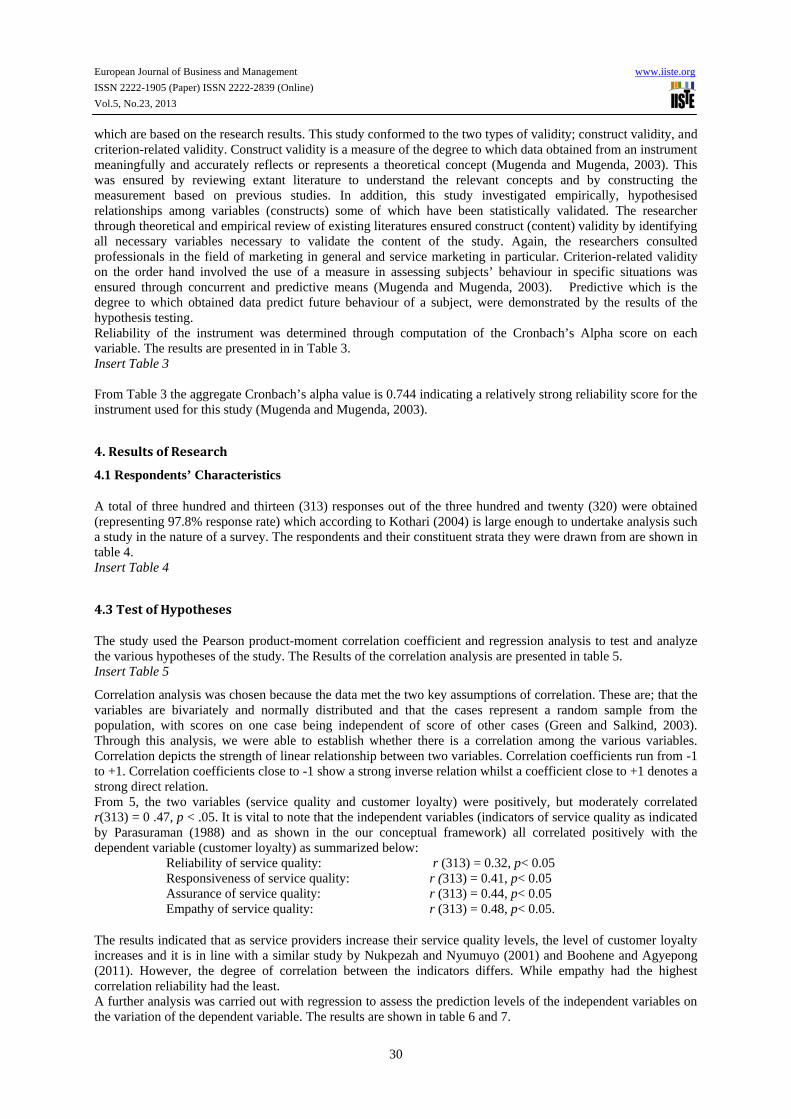
Correlation analysis was chosen because the data met the two key assumptions of correlation. These are; that the variables are bivariately and normally distributed and that the cases represent a random sample from the population, with scores on one case being independent of score of other cases (Green and Salkind, 2003). Through this analysis, we were able to establish whether there is a correlation among the various variables. Correlation depicts the strength of linear relationship between two variables. Correlation coefficients run from -1 to +1. Correlation coefficients close to -1 show a strong inverse relation whilst a coefficient close to +1 denotes a strong direct relation. From 5, the two variables (service quality and customer loyalty) were positively, but moderately correlated r(313) = 0 .47, p < .05. It is vital to note that the independent variables (indicators of service quality as indicated by Parasuraman (1988) and as shown in the our conceptual framework) all correlated positively with the dependent variable (customer loyalty) as summarized below:
Reliability of service quality: r (313) = 0.32, p< 0.05 Responsiveness of service quality: r (313) = 0.41, p< 0.05 Assurance of service quality: r (313) = 0.44, p< 0.05 Empathy of service quality: r (313) = 0.48, p< 0.05.
The results indicated that as service providers increase their service quality levels, the level of customer loyalty increases and it is in line with a similar study by Nukpezah and Nyumuyo (2001) and Boohene and Agyepong (2011). However, the degree of correlation between the indicators differs. While empathy had the highest correlation reliability had the least. A further analysis was carried out with regression to assess the prediction levels of the independent variables on the variation of the dependent variable. The results are shown in table 6 and 7.
European Journal of Business and Management www.iiste.org ISSN 2222-1905 (Paper) ISSN 2222-2839 (Online) Vol.5, No.23, 2013
31
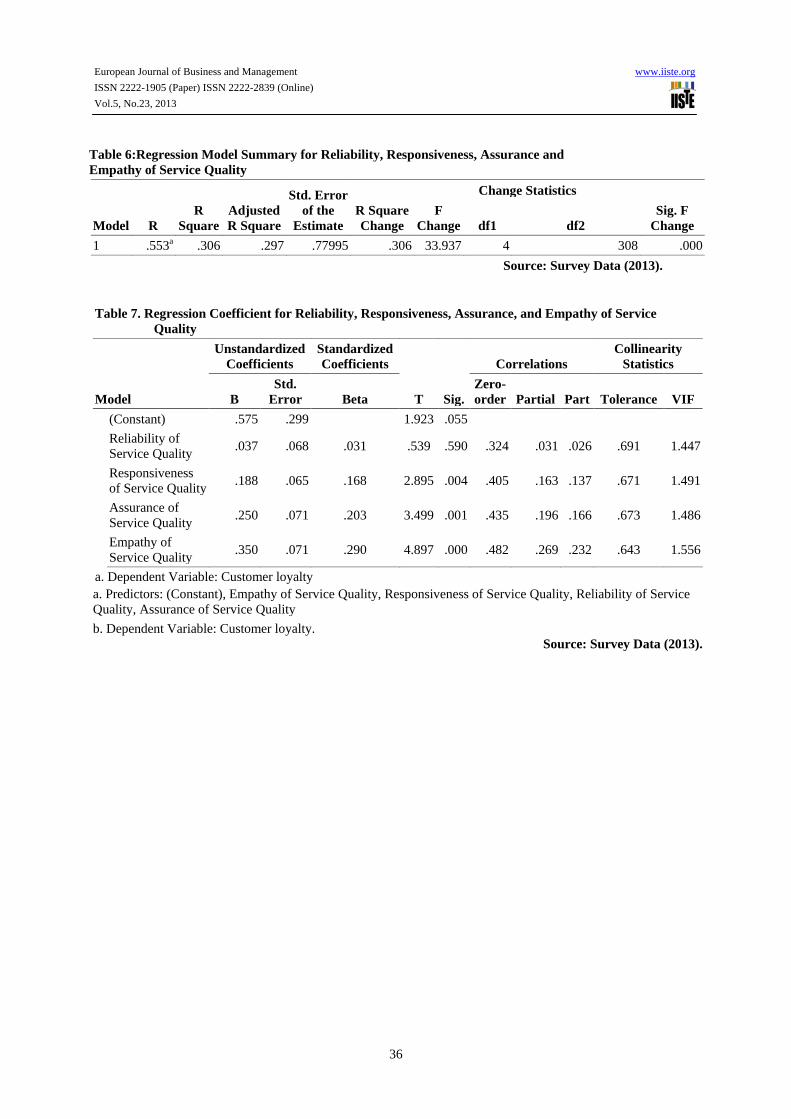
Insert Table 6 and Table 7
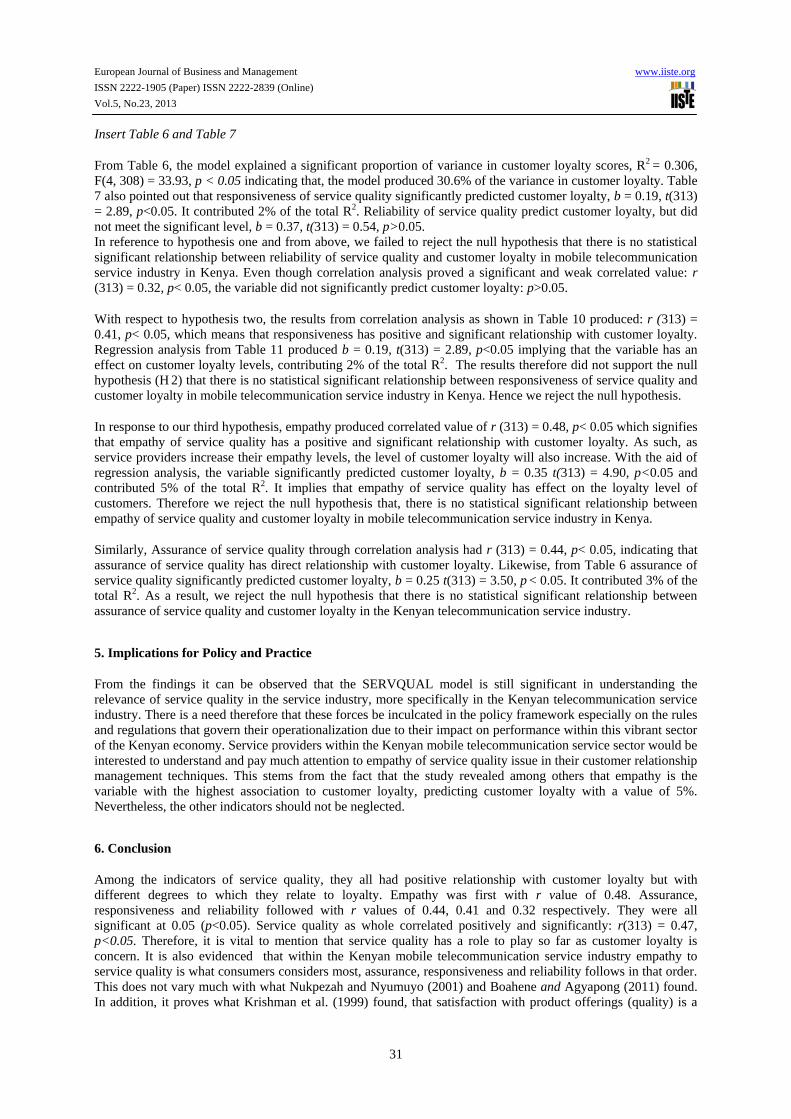
From Table 6, the model explained a significant proportion of variance in customer loyalty scores, R2 = 0.306, F(4, 308) = 33.93, p < 0.05 indicating that, the model produced 30.6% of the variance in customer loyalty. Table 7 also pointed out that responsiveness of service quality significantly predicted customer loyalty, b = 0.19, t(313) = 2.89, p<0.05. It contributed 2% of the total R2. Reliability of service quality predict customer loyalty, but did not meet the significant level, b = 0.37, t(313) = 0.54, p>0.05. In reference to hypothesis one and from above, we failed to reject the null hypothesis that there is no statistical significant relationship between reliability of service quality and customer loyalty in mobile telecommunication service industry in Kenya. Even though correlation analysis proved a significant and weak correlated value: r (313) = 0.32, p< 0.05, the variable did not significantly predict customer loyalty: p>0.05.
With respect to hypothesis two, the results from correlation analysis as shown in Table 10 produced: r (313) = 0.41, p< 0.05, which means that responsiveness has positive and significant relationship with customer loyalty. Regression analysis from Table 11 produced b = 0.19, t(313) = 2.89, p<0.05 implying that the variable has an effect on customer loyalty levels, contributing 2% of the total R2. The results therefore did not support the null hypothesis (H 2) that there is no statistical significant relationship between responsiveness of service quality and customer loyalty in mobile telecommunication service industry in Kenya. Hence we reject the null hypothesis.
In response to our third hypothesis, empathy produced correlated value of r (313) = 0.48, p< 0.05 which signifies that empathy of service quality has a positive and significant relationship with customer loyalty. As such, as service providers increase their empathy levels, the level of customer loyalty will also increase. With the aid of regression analysis, the variable significantly predicted customer loyalty, b = 0.35 t(313) = 4.90, p<0.05 and contributed 5% of the total R2. It implies that empathy of service quality has effect on the loyalty level of customers. Therefore we reject the null hypothesis that, there is no statistical significant relationship between empathy of service quality and customer loyalty in mobile telecommunication service industry in Kenya.
Similarly, Assurance of service quality through correlation analysis had r (313) = 0.44, p< 0.05, indicating that assurance of service quality has direct relationship with customer loyalty. Likewise, from Table 6 assurance of service quality significantly predicted customer loyalty, b = 0.25 t(313) = 3.50, p < 0.05. It contributed 3% of the total R2. As a result, we reject the null hypothesis that there is no statistical significant relationship between assurance of service quality and customer loyalty in the Kenyan telecommunication service industry.
5. Implications for Policy and Practice
From the findings it can be observed that the SERVQUAL model is still significant in understanding the relevance of service quality in the service industry, more specifically in the Kenyan telecommunication service industry. There is a need therefore that these forces be inculcated in the policy framework especially on the rules and regulations that govern their operationalization due to their impact on performance within this vibrant sector of the Kenyan economy. Service providers within the Kenyan mobile telecommunication service sector would be interested to understand and pay much attention to empathy of service quality issue in their customer relationship management techniques. This stems from the fact that the study revealed among others that empathy is the variable with the highest association to customer loyalty, predicting customer loyalty with a value of 5%. Nevertheless, the other indicators should not be neglected.
6. Conclusion
Among the indicators of service quality, they all had positive relationship with customer loyalty but with different degrees to which they relate to loyalty. Empathy was first with r value of 0.48. Assurance, responsiveness and reliability followed with r values of 0.44, 0.41 and 0.32 respectively. They were all significant at 0.05 (p<0.05). Service quality as whole correlated positively and significantly: r(313) = 0.47, p<0.05. Therefore, it is vital to mention that service quality has a role to play so far as customer loyalty is concern. It is also evidenced that within the Kenyan mobile telecommunication service industry empathy to service quality is what consumers considers most, assurance, responsiveness and reliability follows in that order. This does not vary much with what Nukpezah and Nyumuyo (2001) and Boahene and Agyapong (2011) found. In addition, it proves what Krishman et al. (1999) found, that satisfaction with product offerings (quality) is a
European Journal of Business and Management www.iiste.org ISSN 2222-1905 (Paper) ISSN 2222-2839 (Online) Vol.5, No.23, 2013
32
primary driver of overall customer satisfaction. In sum, service quality has a positive relationship with customer loyalty.
7. Limitations and Recommendation for Further Research
In spite of the findings of this study that supported the all the hypotheses, we cite a number of limitations that lead us to recommending the need for future research. First, the survey was conducted only in Kenyatta University community comprising of six of its campuses, therefore based on the selected sample size and the regional distribution of the population concerned, the questions will be whether the findings can be generalized. Such generalization requires further in depth studies with larger samples. In a strict sense, the results pertain only to the respondents and generalizations to a wider population or industry should be done with caution. The sample size was not large enough but was adequate for the type of analysis undertaken. Second, this study was restricted to the telecommunication service industry, nonetheless the service industry entail a lot more than this. It will be interesting to analyze how the proposed relationships may differ when compared with other service sectors or tangible products. Further researches may be done in other industries apart from the communication sector. Third, only four out of the five variables in the SERVQUAL model were studied. Tangibility as the fifth dimension of service quality was left out. Further studies might include the tangibility aspect of the SERVQUAL model.
References
Aksoy, S., Atilgan, E. and Akinci, S. (2003). Airline services marketing by domestic and foreign firms: differences from the customers’ viewpoint, Journal of Air Transport Management, Vol. 9, pp. 343-51.
Boahene, R. and Agyapong, G. K. Q., (2011). Analysis of the Antecedents of Customer Loyalty of Telecommunication Industry in Ghana: The Case of Vodafone (Ghana), International Business Research Vol. 4, No. 1. Available at www.ccsenet.org/ibr
Communication Commission of Kenya (CCK) (2010). Quarterly Sector Statistics Report 2010. Available at www.cck.go.ke/.../Sector_Statistics_Report_Q2_2009-2010.pdf
Communication Commission of Kenya (CCK) (2011). Fourth Quarter Report (http://www.cck.go.ke/news/2011/mobile_subscribers.html).
Consuegra, D., Molina, A. and Esteban, À. (2007). An Integrated Model of Price, Satisfaction and Loyalty: an Empirical Analysis in Service Sector. Journal of Product and Brand management, Vol.16 No.7, pp. 459-468.
Day, G.S. (1994). The capabilities of market-driven organizations, Journal of Marketing, Vol. 58, pp. 37-52.
Green, S and Salkiand (2003). Using SPSS for Windows and Macintosh: Analysis and understanding data. 3rd ed. NJ: Prentice Hall. Islam, M. S. (2010). The analysis of Customer Loyalty in Bangladeshi mobile phone industry. World Journal of Management Vol. 2 No. 2 pp 130 - 145
Iverson, G.R and Gergen, M (1997). Statistics, the Conceptual Approach, New York: Springer
Kothari, C. R. (2004). Research Methodology: Methods and Techniques, (2nd ed.) New Age International Publishers: New Delhi. Kotler, P. and Armstrong, K. (2010). Principles of Marketing, (Global edition) Pearson Prentice Hall: New Jersey.
Krishman, M. S., Ramaswamy, V., Meyer, M. C. and Damien, P. (1999). Customer satisfaction for financial services: The role of product, services and Information Technology. Available at http://www.jstor.org/stable/2634832
Kuusik, A (2007). Affecting customer loyalty: do different factors have various influences in different loyalty levels?
Loverlock, C. and Writz, J. (2007). Services Marketing: People, Technology, Strategy, (6th ed.) Pearson Prentice Hall: USA.

European Journal of Business and Management www.iiste.org ISSN 2222-1905 (Paper) ISSN 2222-2839 (Online) Vol.5, No.23, 2013
33
Mugenda, O. M. and Mugenda, A. G. (2003). Research Methods: Quantitative and Qualitative Approaches, Acts Press: Nairobi.
Nukpezah, D. and Nyumuyo, C. (2009), What Drives Customer Loyalty and Profitability? Analysis of Perspectives from Retail Customers in Ghana's Banking Industry”.
Oliver, R.L. (1999). Whence consumer loyalty? Journal of Marketing, Vol. 63, special issue, pp. 33-44.
Parasuraman, A., Zeithaml, V. A., and Berry, L. L. (1988). SERVQUAL: A multiple item scale for measuring consumer perceptions of service quality, Journal of Retailing, 64, 12–40.
Tyler, M., Hughes, J., and Renfrew, H (1994). Telecommunications in Kenya: Facing the Challenges of an open Economy. Available at http://www.vii.org/papers/tyler.htm
Wernerfelt, B. (1991). BRAND Loyalty and Market Equilibrium, Marketing Science, Vol. 10, No. 3 (Summer, 1991), Pp. 229-245. Available at http://www.jstor.org/stable/183943?origin=JSTOR-pdf
FIGURES AND TABLES Figure 1: The ServQual Model Figure 2: Conceptual Model on the Relationship between the Dimensions of Service Quality and Customer Loyalty

European Journal of Business and Management www.iiste.org ISSN 2222-1905 (Paper) ISSN 2222-2839 (Online) Vol.5, No.23, 2013
34
Table 1: Mobile Subscriptions per Operator Source: CCK (2012)
Table 2: Population and Sample Size STRATA POPULATION SIZE SAMPLE SIZE KU Main campus 37000 220 KU City campus 2000 20 KU Parklands campus 900 20 KU Nakuru campus 200 20 KU Nyeri campus 170 20 KU Mombasa campus 800 20 TOTAL 41070 320
Source: Researchers, 2013 Table 3: Reliability Statistics Variable Variable type Cronbach’s Alpha
Value Number of
questionnaire items
Reliability of service quality Independent variable .617 4 Responsiveness of service quality
Independent variable .596 8
Assurance of service quality Independent variable .691 4 Empathy of service quality Independent variable .824 8 Customer Loyalty Dependent variable .839 6 Aggregate score All variables .744 6
Source: Survey Data, 2013
Name of operator
June-11 Mar-11 Dec-10 Sep-10 Net additions over Mar-11 (3mths)
Net additions over Dec-10 (6mths)
Net additions over Sep-10 (9mths)
Annual net additions (12mths)
Safar- icom
17,353,186 17,205,123 17,451,325 16,714,548 148,063 -98,139 638,638 1,112,617
Airtel 3,614,619 3,817,589 3,792,404 2,977,696 -202,970 -177,785 636,923 1,780,276 Essar Telecom
1,582,947 1,584,501 1,591,700 1,465,832 -1,5540 -8,753 117,115 90,849
Telkom Orange
2,729,016 2,613,489 2,133,462 875,592 115,527 595,554 1,853,424 2,176,722
Total 25,279,768 25,220,702 24,968,891 22,033,668 59,066 310,877 3,246,100 5,160,464

European Journal of Business and Management www.iiste.org ISSN 2222-1905 (Paper) ISSN 2222-2839 (Online) Vol.5, No.23, 2013
35
Table 4: Profile of Respondents Item
Categories
Percent
Cumulative percent
Gender
Male
52
52
Female 48 100.0 Age
16-20
3.83
3.83
21-25 74.12 77.95 26-30 11.18 89.13 31-35 6.07 95.2 36-40 3.19 98.39 Over 41 1.60 100
Campus of study Main 68.05 68.05
City 6.39 74.44 Parklands 6.39 80.83 Mombasa 6.39 87.22 Nakuru 6.39 93.61 Nyeri 6.39 100
Preferred network Safaricom 65.49 65.49 Airtel 21.08 86.57 Orange 1.59 88.16 Yu 11.82 100
Source: Survey Data (2013). Table 5: Correlation between Dependent and Independent Variables 1 2 3 4 5 6
1. Reliability of Service Quality 1 2. Assurance of Service Quality .405** 1 3. Responsiveness of Service
Quality .466** .449** 1
4. Empathy of Service Quality .457** .500** .456** 1 5. Customer loyalty .324** .435** .405** .482** .473** 1
**. Correlation is significant at the 0.05 level (2-tailed). N=31 Source: Survey Data (2013).
European Journal of Business and Management www.iiste.org ISSN 2222-1905 (Paper) ISSN 2222-2839 (Online) Vol.5, No.23, 2013
36
Table 6:Regression Model Summary for Reliability, Responsiveness, Assurance and Empathy of Service Quality
Model R R
Square Adjusted R Square
Std. Error of the
Estimate
Change Statistics R Square Change
F Change df1 df2
Sig. F Change
1 .553a .306 .297 .77995 .306 33.937 4 308 .000 Source: Survey Data (2013).
Table 7. Regression Coefficient for Reliability, Responsiveness, Assurance, and Empathy of Service
Quality
Model
Unstandardized Coefficients
Standardized Coefficients
T Sig.
Correlations Collinearity
Statistics
B Std.
Error Beta Zero-order Partial Part Tolerance VIF
(Constant) .575 .299 1.923 .055 Reliability of Service Quality .037 .068 .031 .539 .590 .324 .031 .026 .691 1.447
Responsiveness of Service Quality .188 .065 .168 2.895 .004 .405 .163 .137 .671 1.491
Assurance of Service Quality .250 .071 .203 3.499 .001 .435 .196 .166 .673 1.486
Empathy of Service Quality .350 .071 .290 4.897 .000 .482 .269 .232 .643 1.556
a. Dependent Variable: Customer loyalty a. Predictors: (Constant), Empathy of Service Quality, Responsiveness of Service Quality, Reliability of Service Quality, Assurance of Service Quality b. Dependent Variable: Customer loyalty.
Source: Survey Data (2013).
This academic article was published by The International Institute for Science,
Technology and Education (IISTE). The IISTE is a pioneer in the Open Access
Publishing service based in the U.S. and Europe. The aim of the institute is
Accelerating Global Knowledge Sharing.
More information about the publisher can be found in the IISTE’s homepage:
http://www.iiste.org
CALL FOR JOURNAL PAPERS
The IISTE is currently hosting more than 30 peer-reviewed academic journals and
collaborating with academic institutions around the world. There’s no deadline for
submission. Prospective authors of IISTE journals can find the submission
instruction on the following page: http://www.iiste.org/journals/ The IISTE
editorial team promises to the review and publish all the qualified submissions in a
fast manner. All the journals articles are available online to the readers all over the
world without financial, legal, or technical barriers other than those inseparable from
gaining access to the internet itself. Printed version of the journals is also available
upon request of readers and authors.
MORE RESOURCES
Book publication information: http://www.iiste.org/book/
Recent conferences: http://www.iiste.org/conference/
IISTE Knowledge Sharing Partners
EBSCO, Index Copernicus, Ulrich's Periodicals Directory, JournalTOCS, PKP Open
Archives Harvester, Bielefeld Academic Search Engine, Elektronische
Zeitschriftenbibliothek EZB, Open J-Gate, OCLC WorldCat, Universe Digtial
Library , NewJour, Google Scholar