The radio properties of the OH megamaser galaxy IRAS ...
13
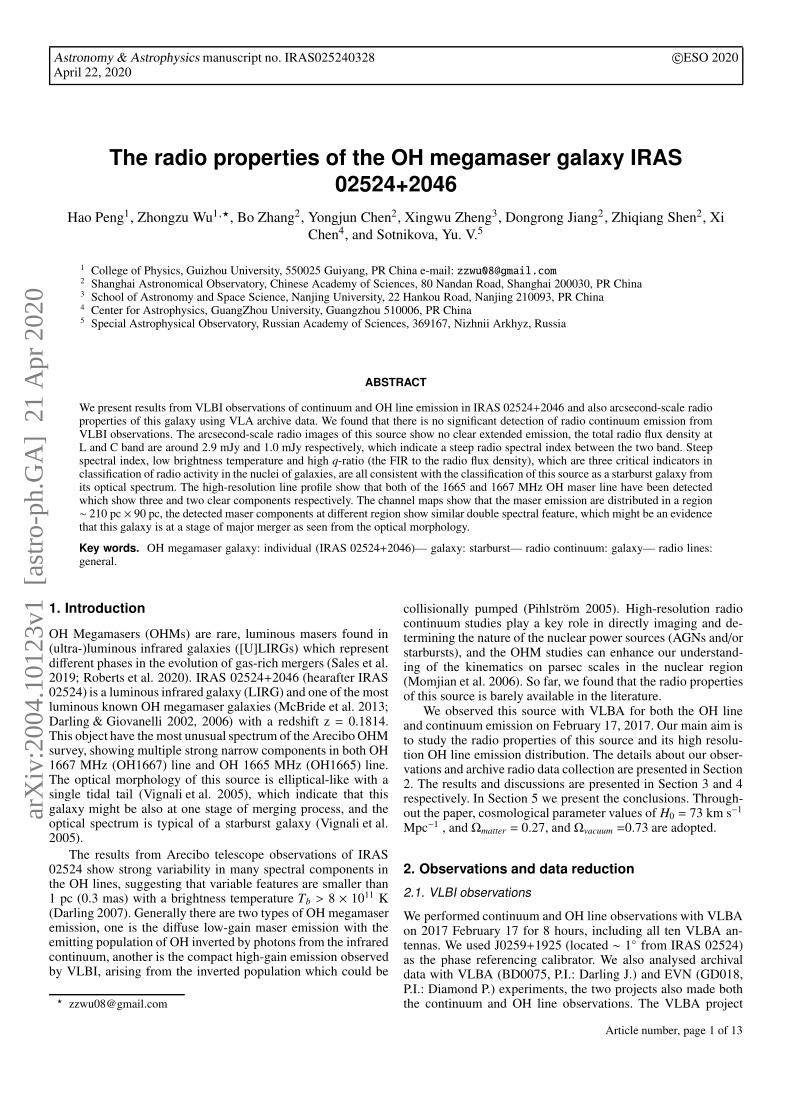
arXiv:2004.10123v1 [astro-ph.GA] 21 Apr 2020 Astronomy & Astrophysics manuscript no. IRAS025240328 c ESO 2020 April 22, 2020 The radio properties of the OH megamaser galaxy IRAS 02524+2046 Hao Peng 1 , Zhongzu Wu 1, ⋆ , Bo Zhang 2 , Yongjun Chen 2 , Xingwu Zheng 3 , Dongrong Jiang 2 , Zhiqiang Shen 2 , Xi Chen 4 , and Sotnikova, Yu. V. 5 1 College of Physics, Guizhou University, 550025 Guiyang, PR China e-mail: [email protected] 2 Shanghai Astronomical Observatory, Chinese Academy of Sciences, 80 Nandan Road, Shanghai 200030, PR China 3 School of Astronomy and Space Science, Nanjing University, 22 Hankou Road, Nanjing 210093, PR China 4 Center for Astrophysics, GuangZhou University, Guangzhou 510006, PR China 5 Special Astrophysical Observatory, Russian Academy of Sciences, 369167, Nizhnii Arkhyz, Russia ABSTRACT We present results from VLBI observations of continuum and OH line emission in IRAS 02524+2046 and also arcsecond-scale radio properties of this galaxy using VLA archive data. We found that there is no significant detection of radio continuum emission from VLBI observations. The arcsecond-scale radio images of this source show no clear extended emission, the total radio flux density at L and C band are around 2.9 mJy and 1.0 mJy respectively, which indicate a steep radio spectral index between the two band. Steep spectral index, low brightness temperature and high q-ratio (the FIR to the radio flux density), which are three critical indicators in classification of radio activity in the nuclei of galaxies, are all consistent with the classification of this source as a starburst galaxy from its optical spectrum. The high-resolution line profile show that both of the 1665 and 1667 MHz OH maser line have been detected which show three and two clear components respectively. The channel maps show that the maser emission are distributed in a region ∼ 210 pc × 90 pc, the detected maser components at different region show similar double spectral feature, which might be an evidence that this galaxy is at a stage of major merger as seen from the optical morphology. Key words. OH megamaser galaxy: individual (IRAS 02524+2046)— galaxy: starburst— radio continuum: galaxy— radio lines: general. 1. Introduction OH Megamasers (OHMs) are rare, luminous masers found in (ultra-)luminous infrared galaxies ([U]LIRGs) which represent different phases in the evolution of gas-rich mergers (Sales et al. 2019; Roberts et al. 2020). IRAS 02524+2046 (hearafter IRAS 02524) is a luminous infrared galaxy (LIRG) and one of the most luminous known OH megamaser galaxies (McBride et al. 2013; Darling & Giovanelli 2002, 2006) with a redshift z = 0.1814. This object have the most unusual spectrum of the Arecibo OHM survey, showing multiple strong narrow components in both OH 1667 MHz (OH1667) line and OH 1665 MHz (OH1665) line. The optical morphology of this source is elliptical-like with a single tidal tail (Vignali et al. 2005), which indicate that this galaxy might be also at one stage of merging process, and the optical spectrum is typical of a starburst galaxy (Vignali et al. 2005). The results from Arecibo telescope observations of IRAS 02524 show strong variability in many spectral components in the OH lines, suggesting that variable features are smaller than 1 pc (0.3 mas) with a brightness temperature T b > 8 × 10 11 K (Darling 2007). Generally there are two types of OH megamaser emission, one is the diffuse low-gain maser emission with the emitting population of OH inverted by photons from the infrared continuum, another is the compact high-gain emission observed by VLBI, arising from the inverted population which could be ⋆ [email protected] collisionally pumped (Pihlström 2005). High-resolution radio continuum studies play a key role in directly imaging and de- termining the nature of the nuclear power sources (AGNs and/or starbursts), and the OHM studies can enhance our understand- ing of the kinematics on parsec scales in the nuclear region (Momjian et al. 2006). So far, we found that the radio properties of this source is barely available in the literature. We observed this source with VLBA for both the OH line and continuum emission on February 17, 2017. Our main aim is to study the radio properties of this source and its high resolu- tion OH line emission distribution. The details about our obser- vations and archive radio data collection are presented in Section 2. The results and discussions are presented in Section 3 and 4 respectively. In Section 5 we present the conclusions. Through- out the paper, cosmological parameter values of H 0 = 73 km s −1 Mpc −1 , and Ω matter = 0.27, and Ω vacuum =0.73 are adopted. 2. Observations and data reduction 2.1. VLBI observations We performed continuum and OH line observations with VLBA on 2017 February 17 for 8 hours, including all ten VLBA an- tennas. We used J0259+1925 (located ∼ 1 ◦ from IRAS 02524) as the phase referencing calibrator. We also analysed archival data with VLBA (BD0075, P.I.: Darling J.) and EVN (GD018, P.I.: Diamond P.) experiments, the two projects also made both the continuum and OH line observations. The VLBA project Article number, page 1 of 13
-
Upload
khangminh22 -
Category
Documents
-
view
3 -
download
0
Transcript of The radio properties of the OH megamaser galaxy IRAS ...
arX
iv:2
004.
1012
3v1
[as
tro-
ph.G
A]
21
Apr
202
0Astronomy & Astrophysics manuscript no. IRAS025240328 c©ESO 2020April 22, 2020
The radio properties of the OH megamaser galaxy IRAS
02524+2046
Hao Peng1, Zhongzu Wu1,⋆, Bo Zhang2, Yongjun Chen2, Xingwu Zheng3, Dongrong Jiang2, Zhiqiang Shen2, XiChen4, and Sotnikova, Yu. V.5
1 College of Physics, Guizhou University, 550025 Guiyang, PR China e-mail: [email protected] Shanghai Astronomical Observatory, Chinese Academy of Sciences, 80 Nandan Road, Shanghai 200030, PR China3 School of Astronomy and Space Science, Nanjing University, 22 Hankou Road, Nanjing 210093, PR China4 Center for Astrophysics, GuangZhou University, Guangzhou 510006, PR China5 Special Astrophysical Observatory, Russian Academy of Sciences, 369167, Nizhnii Arkhyz, Russia
ABSTRACT
We present results from VLBI observations of continuum and OH line emission in IRAS 02524+2046 and also arcsecond-scale radioproperties of this galaxy using VLA archive data. We found that there is no significant detection of radio continuum emission fromVLBI observations. The arcsecond-scale radio images of this source show no clear extended emission, the total radio flux density atL and C band are around 2.9 mJy and 1.0 mJy respectively, which indicate a steep radio spectral index between the two band. Steepspectral index, low brightness temperature and high q-ratio (the FIR to the radio flux density), which are three critical indicators inclassification of radio activity in the nuclei of galaxies, are all consistent with the classification of this source as a starburst galaxy fromits optical spectrum. The high-resolution line profile show that both of the 1665 and 1667 MHz OH maser line have been detectedwhich show three and two clear components respectively. The channel maps show that the maser emission are distributed in a region∼ 210 pc × 90 pc, the detected maser components at different region show similar double spectral feature, which might be an evidencethat this galaxy is at a stage of major merger as seen from the optical morphology.
Key words. OH megamaser galaxy: individual (IRAS 02524+2046)— galaxy: starburst— radio continuum: galaxy— radio lines:general.
1. Introduction
OH Megamasers (OHMs) are rare, luminous masers found in(ultra-)luminous infrared galaxies ([U]LIRGs) which representdifferent phases in the evolution of gas-rich mergers (Sales et al.2019; Roberts et al. 2020). IRAS 02524+2046 (hearafter IRAS02524) is a luminous infrared galaxy (LIRG) and one of the mostluminous known OH megamaser galaxies (McBride et al. 2013;Darling & Giovanelli 2002, 2006) with a redshift z = 0.1814.This object have the most unusual spectrum of the Arecibo OHMsurvey, showing multiple strong narrow components in both OH1667 MHz (OH1667) line and OH 1665 MHz (OH1665) line.The optical morphology of this source is elliptical-like with asingle tidal tail (Vignali et al. 2005), which indicate that thisgalaxy might be also at one stage of merging process, and theoptical spectrum is typical of a starburst galaxy (Vignali et al.2005).
The results from Arecibo telescope observations of IRAS02524 show strong variability in many spectral components inthe OH lines, suggesting that variable features are smaller than1 pc (0.3 mas) with a brightness temperature Tb > 8 × 10¹¹ K(Darling 2007). Generally there are two types of OH megamaseremission, one is the diffuse low-gain maser emission with theemitting population of OH inverted by photons from the infraredcontinuum, another is the compact high-gain emission observedby VLBI, arising from the inverted population which could be
collisionally pumped (Pihlström 2005). High-resolution radiocontinuum studies play a key role in directly imaging and de-termining the nature of the nuclear power sources (AGNs and/orstarbursts), and the OHM studies can enhance our understand-ing of the kinematics on parsec scales in the nuclear region(Momjian et al. 2006). So far, we found that the radio propertiesof this source is barely available in the literature.
We observed this source with VLBA for both the OH lineand continuum emission on February 17, 2017. Our main aim isto study the radio properties of this source and its high resolu-tion OH line emission distribution. The details about our obser-vations and archive radio data collection are presented in Section2. The results and discussions are presented in Section 3 and 4respectively. In Section 5 we present the conclusions. Through-out the paper, cosmological parameter values of H0 = 73 km s−1
Mpc−1 , and Ωmatter = 0.27, and Ωvacuum =0.73 are adopted.
2. Observations and data reduction
2.1. VLBI observations
We performed continuum and OH line observations with VLBAon 2017 February 17 for 8 hours, including all ten VLBA an-tennas. We used J0259+1925 (located ∼ 1 from IRAS 02524)as the phase referencing calibrator. We also analysed archivaldata with VLBA (BD0075, P.I.: Darling J.) and EVN (GD018,P.I.: Diamond P.) experiments, the two projects also made boththe continuum and OH line observations. The VLBA project
Article number, page 1 of 13

A&A proofs: manuscript no. IRAS025240328
BD0075 was performed on 2001 October 14, the observationspanned 12 hours with 8 hours integration time on IRAS 02524,including all ten VLBA antennas. The EVN project GD018was performed on 2005 March 4, including 11 antennas, Jo-drell Bank(JB), Westerbork(WB), Effelsberg(EF), Onsala(ON),Medicina (MC), Noto(NT), Torun(TR), Urumqi(UR), VLA(Y),Green Bank(GB) and Arecibo(AR). The basic information aboutthe three VLBI observations are listed in Table. 1.
2.2. VLA archival data
In order to study the radio properties of this source, we alsoused the VLA archive data. There are four VLA Observationsavailable for IRAS02524 and the list of VLA observations issummerised in Table. 2. The project name ’NVSS’ in this tablestands for NRAO VLA Sky Survey1.
2.3. Data reduction
The VLBA, EVN and VLA data in this paper are all calibratedusing the NRAO Astronomical Image Processing System (AIPS)package. The initial calibration of VLBA and EVN data followsa online Tutorial2, the main procedures include ionospheric cor-rection, amplitude calibration, editing, instrumental phase cor-rections, antenna-based fringe-fitting of the phase calibrator andthen apply the solutions to the target source, for the velocities ofthe OH lines we have also corrected the effects of the Earth’s ro-tation and its motion within the Solar System. The calibration ofVLA data follows standard procedures in AIPS. We have flaggedthe channels that may contain OH emission lines for makingthe images of the continuum emission. After the calibration inAIPS, we imported the calibrated data into the DIFMAP pack-age (Shepherd et al. 1995) to obtain the continuum and OH lineimages. Because the weakness of continuum and line emissiongives rise to a low signal- to-noise ratio (S/N), no self-calibrationwas performed.
3. Results
3.1. Radio continuum emission in IRAS 02524
We have reduced our VLBA project and other two VLBI obser-vations listed in Table. 1, no significant continuum emission wasdetected at a 3 σ level. In order to study the continuum emis-sion, we have only included the OH emission line-free channels,the sensitivities of the three observations for continuum emissionrange from around 10 µJy/beam to 50 µJy/beam.
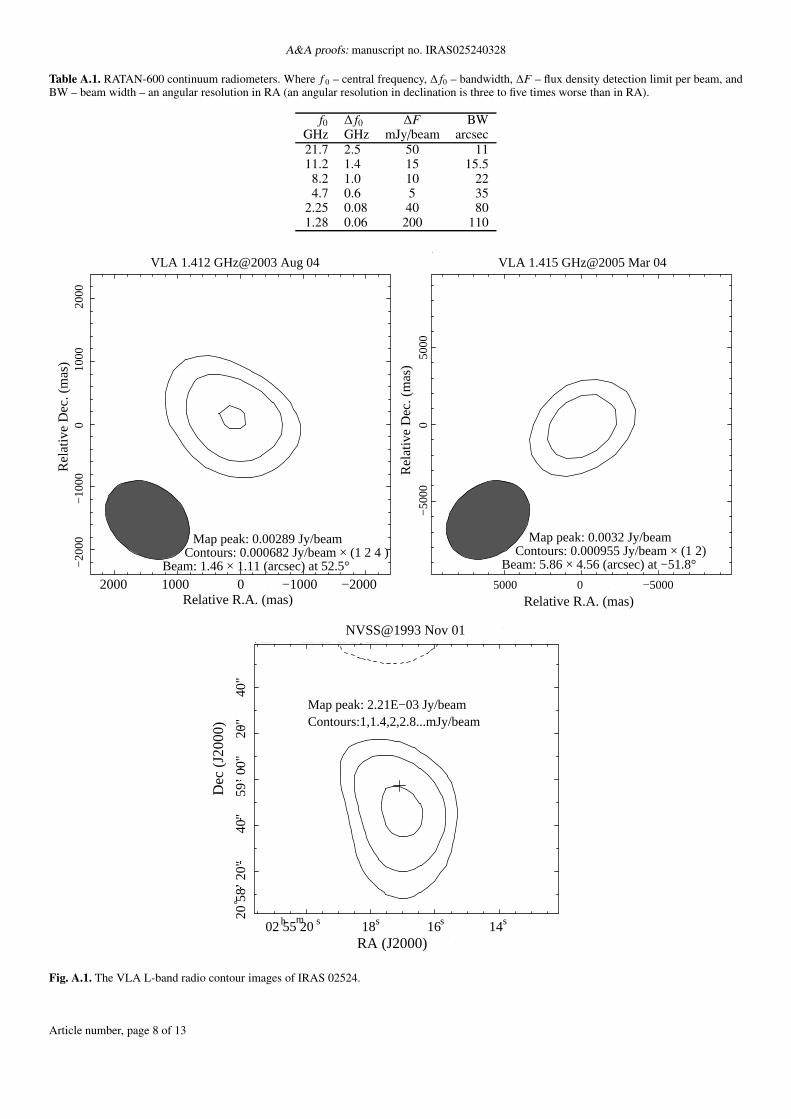
The VLA observations of this source are listed in Table. 2,there are three epoch observations at L band and one epoch at Cband. The image from VLA-A array at C band overlaid on theSDSS R- band grey image of this source is presented in Fig. 1which shows that the radio continuum emission has similar emit-ting regions as in optical, other images are presented in Fig. A.1,these images all show no significant extend structure. The peakand Integrated flux density are present in Table. 2, the L bandflux density of this source is around 2.9 mJy, and C band around1.1 mJy. The spectral indexes αtotal and αpeak derived by usingthe total flux and peak flux, are around -0.8 and -1.2 respectively.
We have also observed this source with RATAN-600 radiotelescope on Dec. 2019, our preliminary results show that theradio flux was not detected at all observed frequencies. The most
1 https://www.cv.nrao.edu/nvss/2 http://www.aoc.nrao.edu/ amiodusz/sumschool14/vlbaspectut.shtml
17.6 17.3 2:55:17.0 16.7
04.0
02.0
20:59:00.0
58.0
56.0
54.0
58:52.0
Right ascension
Dec
linat
ion
RA (J2000)
Dec
(J2
000)
Fig. 1. The VLA C-band radio contour image overlaid on SDSS R-band grey image of IRAS 02524. The pixel scale of SDSS image is0.396”/pixel, the center of this map is : RA: 02 55 17.104, Dec: +2058 57.210. The image parameters of the radio continuum image is asfollows: peak 0.000579 Jy/beam, beam width: 468 × 433 (mas) at 2.27
and the contours is 0.000135 Jy/beam × (1 2 4).
0
5
10
15 EVN
16671665
54,000 54,100 54,200 54,300 54,400
0
20
40
60
80 Arecibo
Heliocentric Velocity (km s−1)
Flu
x D
ensi
ty (
mJy
)
16671665
Fig. 2. The vector averaged cross-power OH maser spectra of IRAS02524. The upper panel is the high angular resolution VLBI spectrainspected from EVN project GD018; The bottom panel is the spectrafrom McBride & Heiles (2013), which is derived from single-dish ob-servations by Arecibo telescope.
sensitive RATAN radiometer is at 4.7 GHz, we estimated the fluxdensity upper limit at this frequency is equal to 1 mJy, which isconsistent with our VLA C-band result in Table. 2. The RATAN-600 observations are present in more detail in Section A.1.
3.2. High angular resolution OH line emission
Our VLBA project (BC229B) show no clear spectrum from thecalibrated visibility data, then we investigated the velocity pro-file of the spectrum from the calibrated EVN project GD018,which are present in Fig. 2. We can see that both of the OH mainlines(1667 MHz line and 1665 MHz line) are detected. The pro-files are consistent with the single dish line profiles observed by
Article number, page 2 of 13
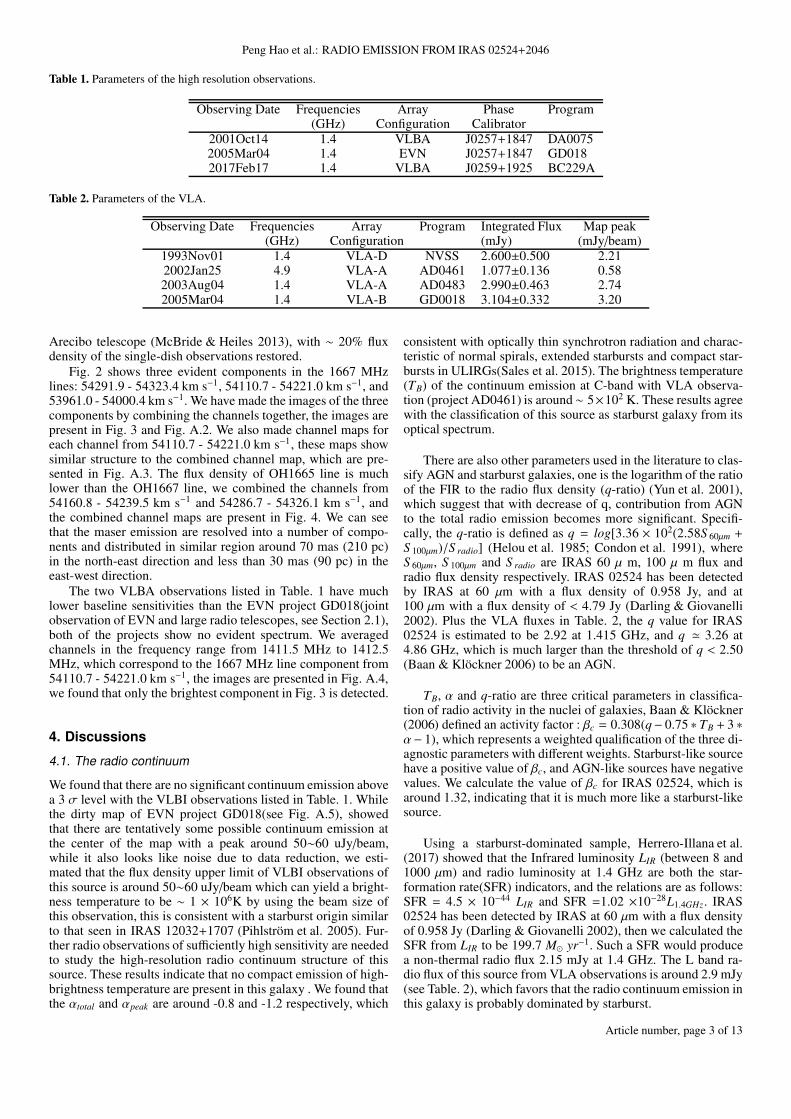
Peng Hao et al.: RADIO EMISSION FROM IRAS 02524+2046
Table 1. Parameters of the high resolution observations.
Observing Date Frequencies Array Phase Program(GHz) Configuration Calibrator
2001Oct14 1.4 VLBA J0257+1847 DA00752005Mar04 1.4 EVN J0257+1847 GD0182017Feb17 1.4 VLBA J0259+1925 BC229A
Table 2. Parameters of the VLA.
Observing Date Frequencies Array Program Integrated Flux Map peak(GHz) Configuration (mJy) (mJy/beam)
1993Nov01 1.4 VLA-D NVSS 2.600±0.500 2.212002Jan25 4.9 VLA-A AD0461 1.077±0.136 0.582003Aug04 1.4 VLA-A AD0483 2.990±0.463 2.742005Mar04 1.4 VLA-B GD0018 3.104±0.332 3.20
Arecibo telescope (McBride & Heiles 2013), with ∼ 20% fluxdensity of the single-dish observations restored.
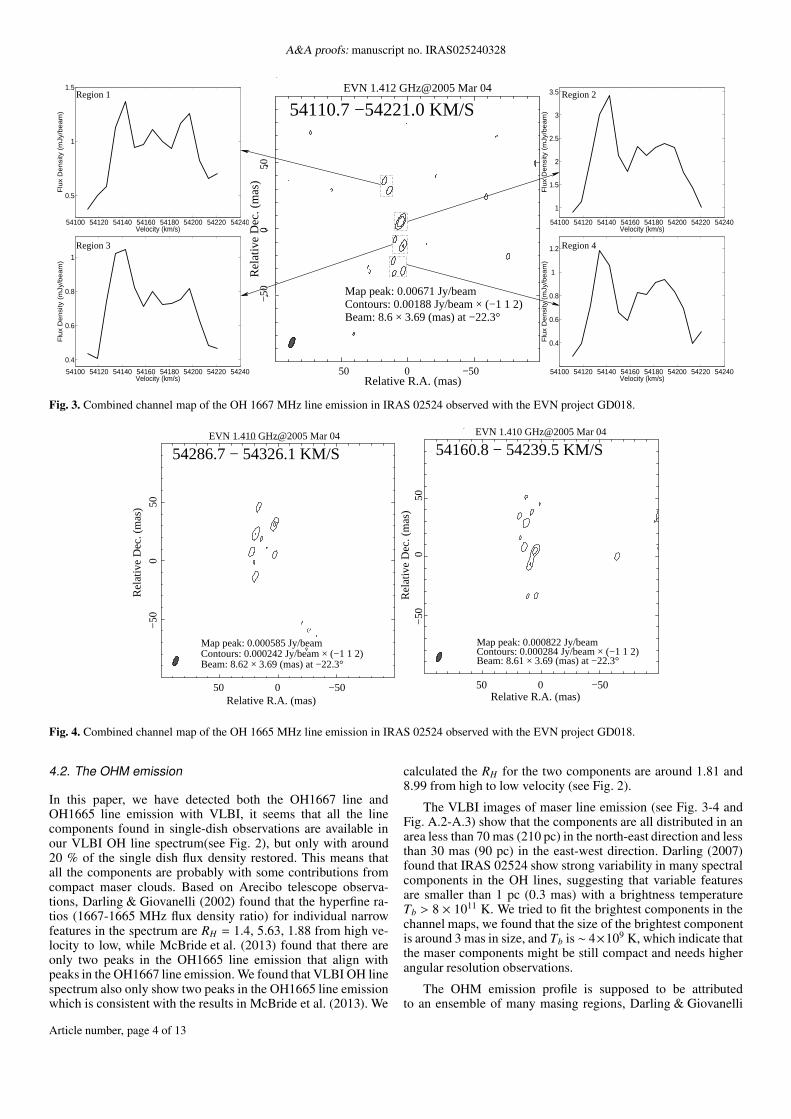
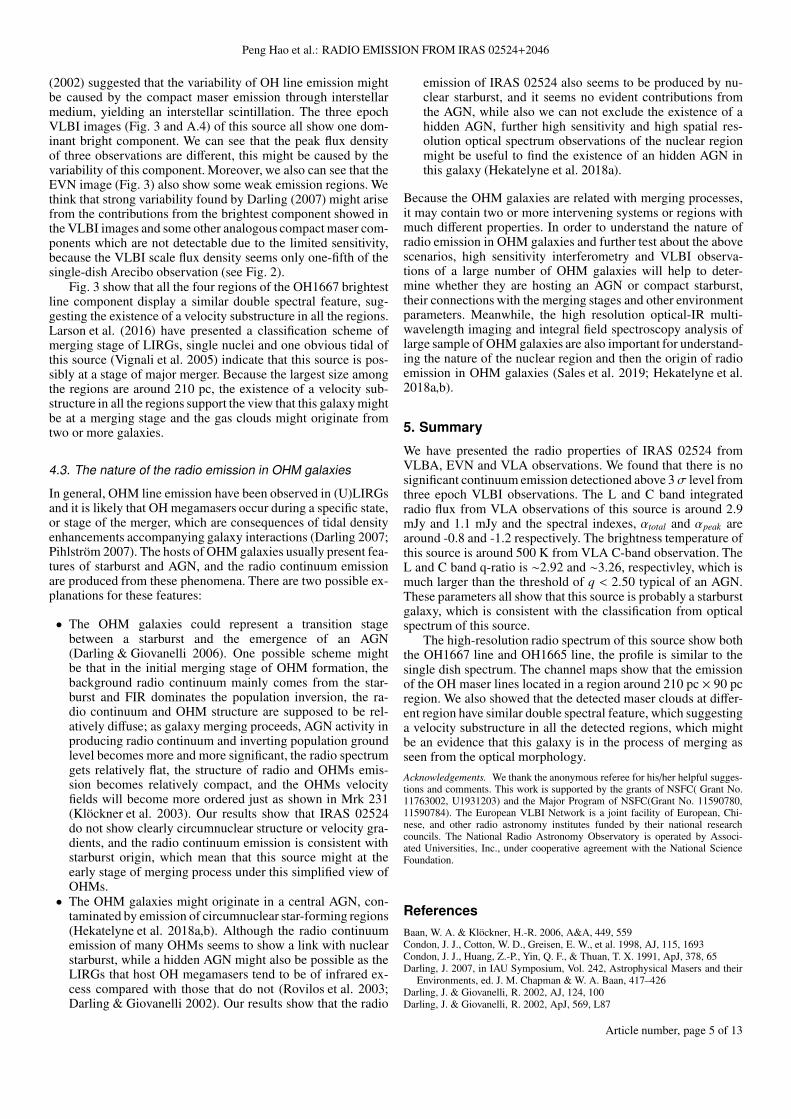
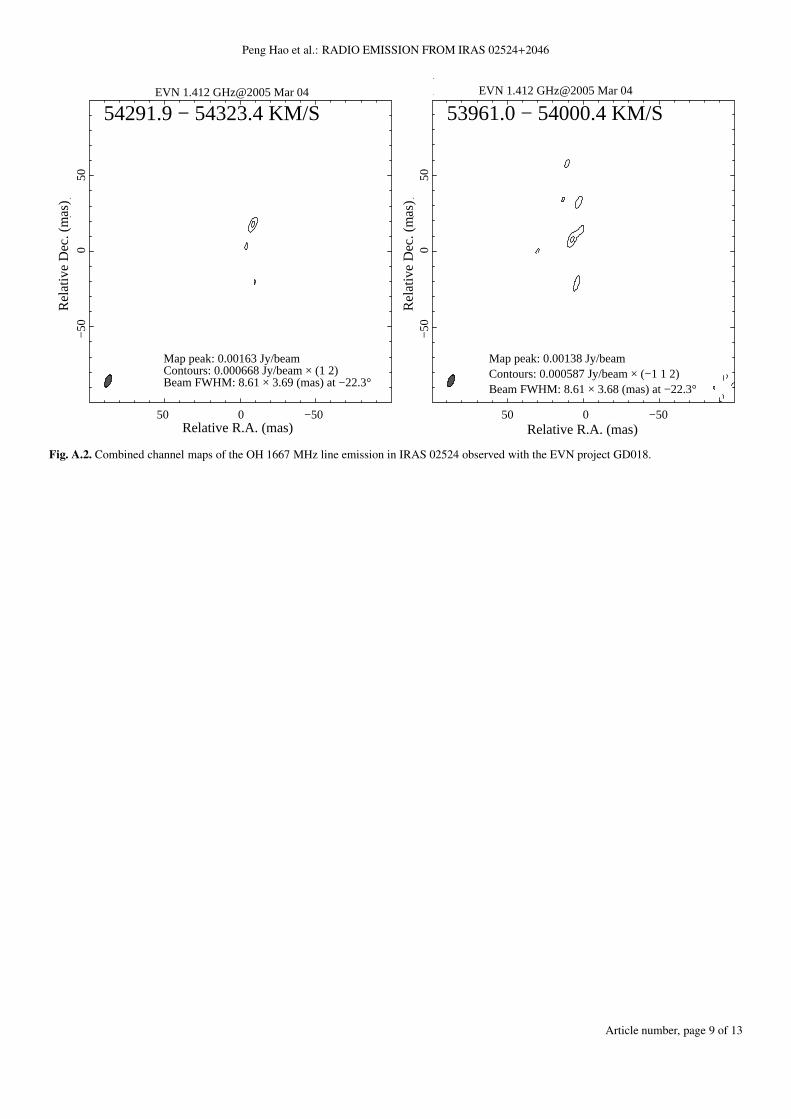
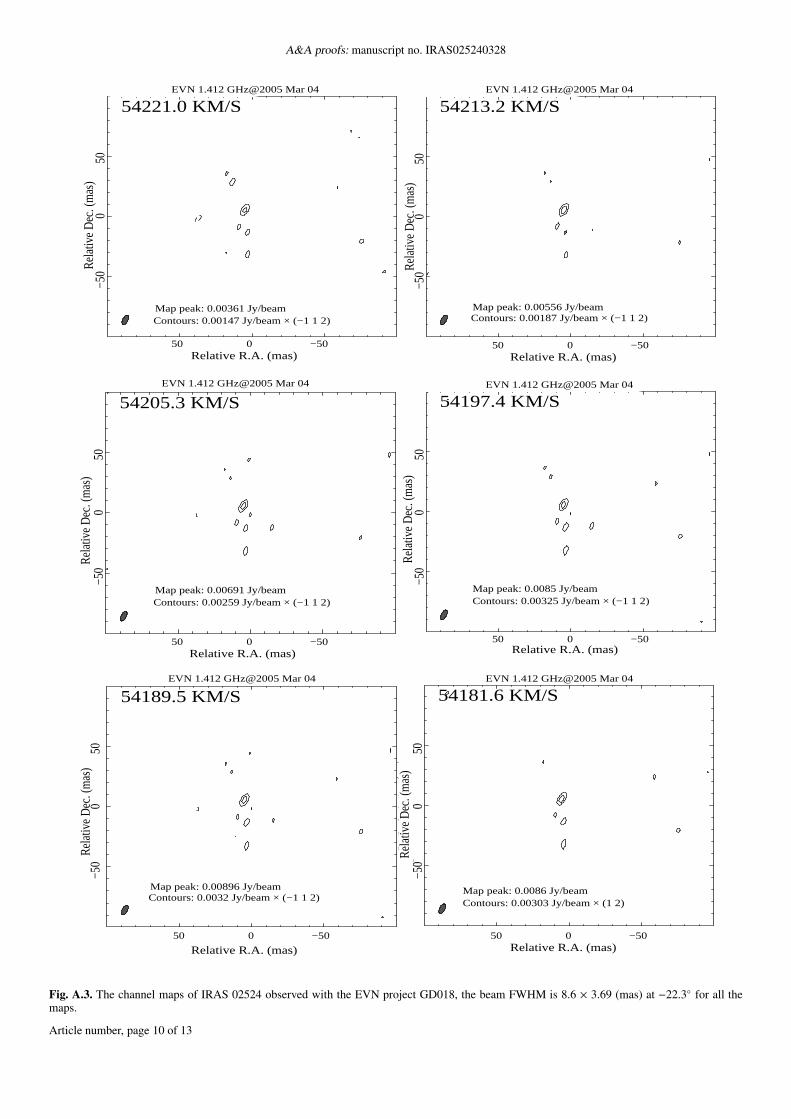
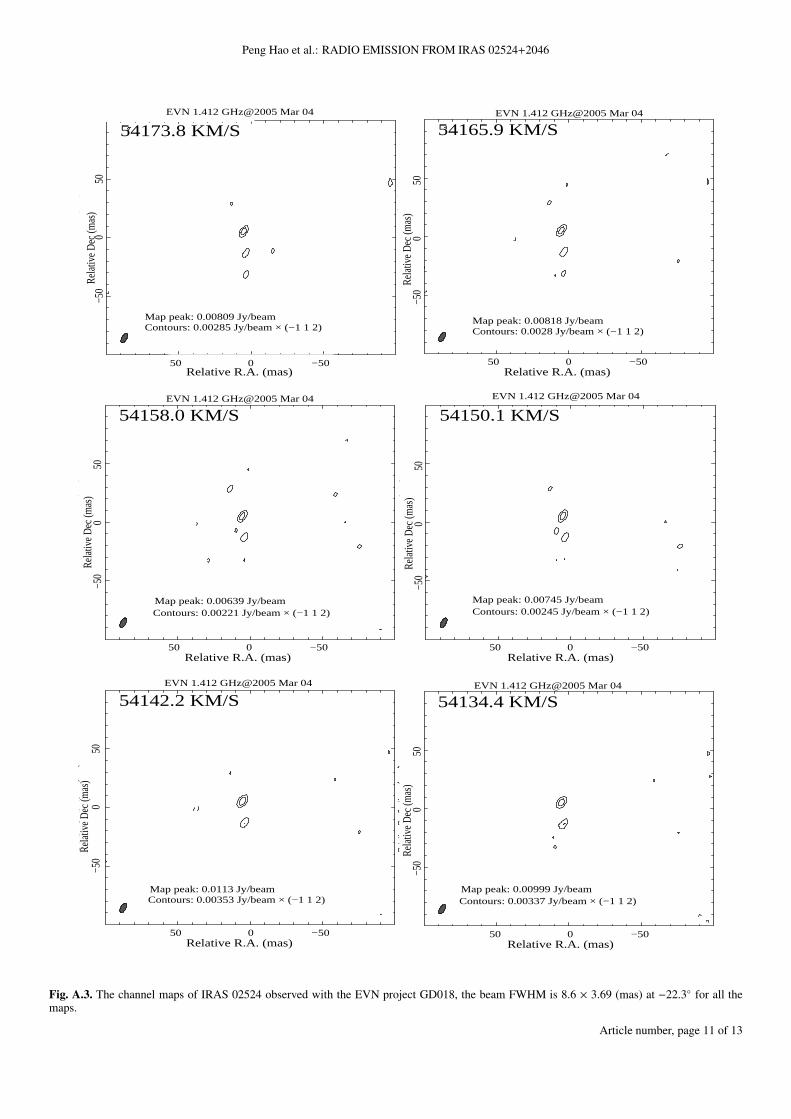
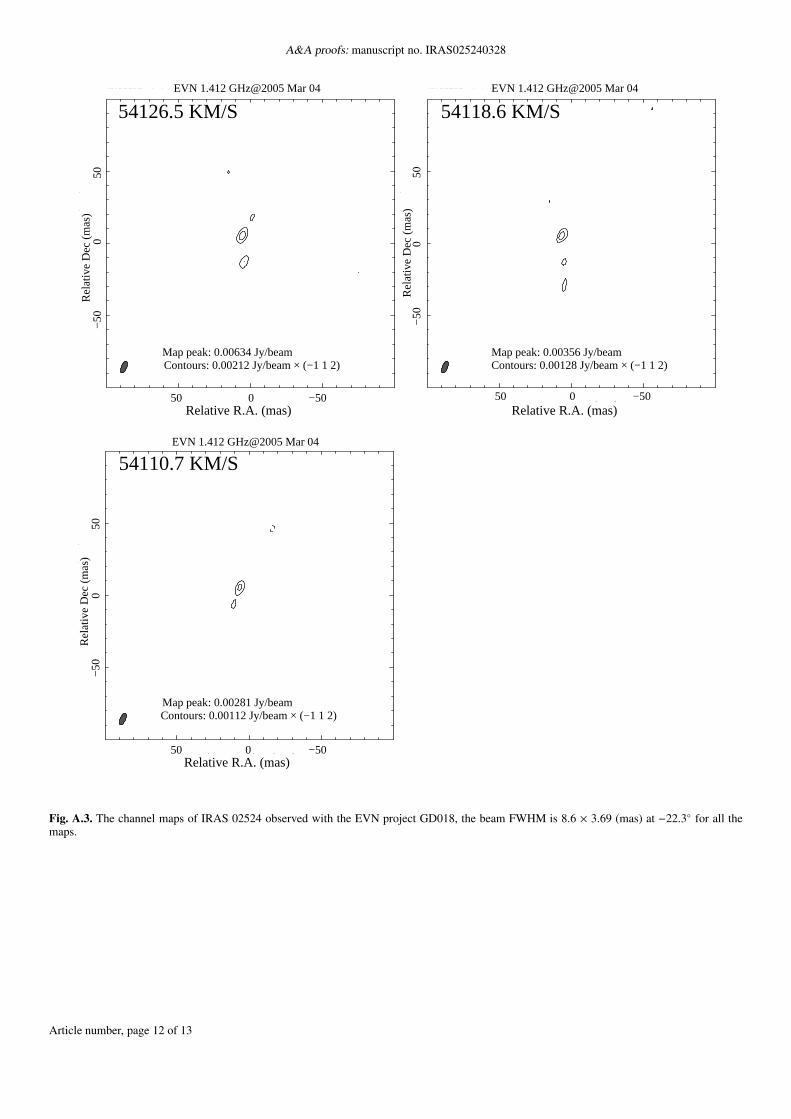
Fig. 2 shows three evident components in the 1667 MHzlines: 54291.9 - 54323.4 km s−1, 54110.7 - 54221.0 km s−1, and53961.0 - 54000.4 km s−1. We have made the images of the threecomponents by combining the channels together, the images arepresent in Fig. 3 and Fig. A.2. We also made channel maps foreach channel from 54110.7 - 54221.0 km s−1, these maps showsimilar structure to the combined channel map, which are pre-sented in Fig. A.3. The flux density of OH1665 line is muchlower than the OH1667 line, we combined the channels from54160.8 - 54239.5 km s−1 and 54286.7 - 54326.1 km s−1, andthe combined channel maps are present in Fig. 4. We can seethat the maser emission are resolved into a number of compo-nents and distributed in similar region around 70 mas (210 pc)in the north-east direction and less than 30 mas (90 pc) in theeast-west direction.
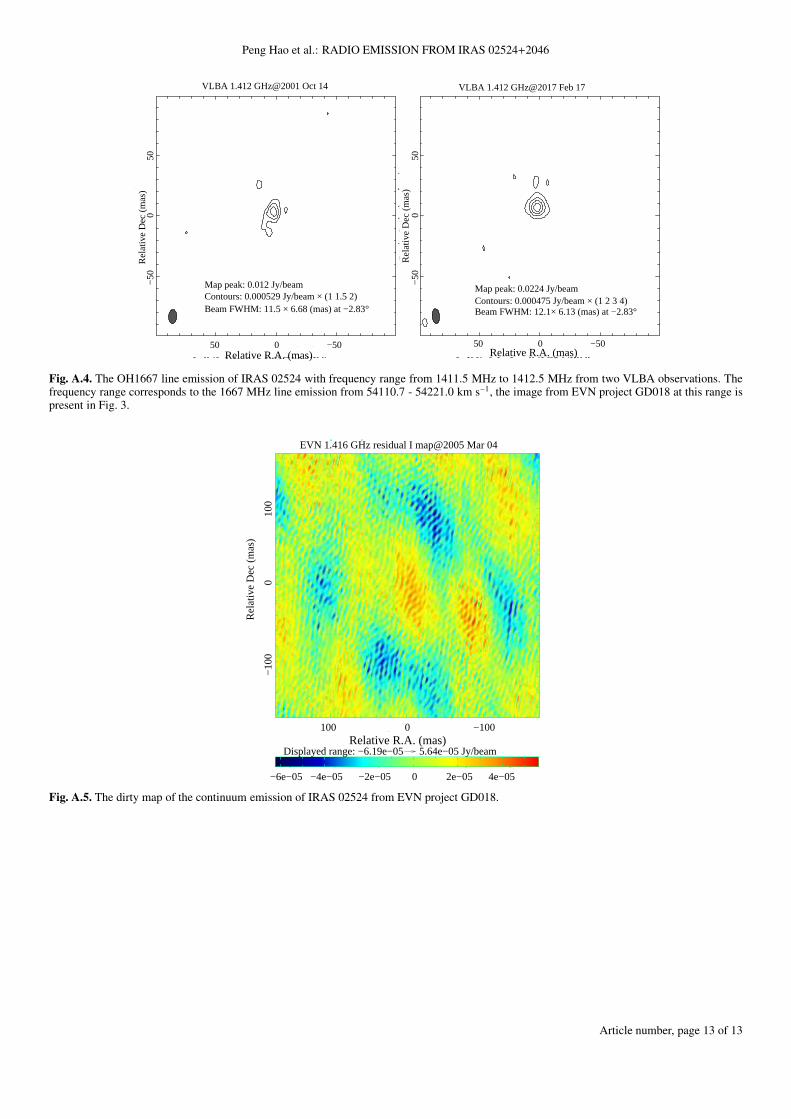
The two VLBA observations listed in Table. 1 have muchlower baseline sensitivities than the EVN project GD018(jointobservation of EVN and large radio telescopes, see Section 2.1),both of the projects show no evident spectrum. We averagedchannels in the frequency range from 1411.5 MHz to 1412.5MHz, which correspond to the 1667 MHz line component from54110.7 - 54221.0 km s−1, the images are presented in Fig. A.4,we found that only the brightest component in Fig. 3 is detected.
4. Discussions
4.1. The radio continuum
We found that there are no significant continuum emission abovea 3 σ level with the VLBI observations listed in Table. 1. Whilethe dirty map of EVN project GD018(see Fig. A.5), showedthat there are tentatively some possible continuum emission atthe center of the map with a peak around 50∼60 uJy/beam,while it also looks like noise due to data reduction, we esti-mated that the flux density upper limit of VLBI observations ofthis source is around 50∼60 uJy/beam which can yield a bright-ness temperature to be ∼ 1 × 10⁶K by using the beam size ofthis observation, this is consistent with a starburst origin similarto that seen in IRAS 12032+1707 (Pihlström et al. 2005). Fur-ther radio observations of sufficiently high sensitivity are neededto study the high-resolution radio continuum structure of thissource. These results indicate that no compact emission of high-brightness temperature are present in this galaxy . We found thatthe αtotal and αpeak are around -0.8 and -1.2 respectively, which
consistent with optically thin synchrotron radiation and charac-teristic of normal spirals, extended starbursts and compact star-bursts in ULIRGs(Sales et al. 2015). The brightness temperature(TB) of the continuum emission at C-band with VLA observa-tion (project AD0461) is around∼ 5×10² K. These results agreewith the classification of this source as starburst galaxy from itsoptical spectrum.
There are also other parameters used in the literature to clas-sify AGN and starburst galaxies, one is the logarithm of the ratioof the FIR to the radio flux density (q-ratio) (Yun et al. 2001),which suggest that with decrease of q, contribution from AGNto the total radio emission becomes more significant. Specifi-cally, the q-ratio is defined as q = log[3.36 × 10²(2.58S 60µm +
S 100µm)/S radio] (Helou et al. 1985; Condon et al. 1991), whereS 60µm, S 100µm and S radio are IRAS 60 µ m, 100 µ m flux andradio flux density respectively. IRAS 02524 has been detectedby IRAS at 60 µm with a flux density of 0.958 Jy, and at100 µm with a flux density of < 4.79 Jy (Darling & Giovanelli2002). Plus the VLA fluxes in Table. 2, the q value for IRAS02524 is estimated to be 2.92 at 1.415 GHz, and q ≃ 3.26 at4.86 GHz, which is much larger than the threshold of q < 2.50(Baan & Klöckner 2006) to be an AGN.
TB, α and q-ratio are three critical parameters in classifica-tion of radio activity in the nuclei of galaxies, Baan & Klöckner(2006) defined an activity factor : βc = 0.308(q− 0.75 ∗ TB + 3 ∗α− 1), which represents a weighted qualification of the three di-agnostic parameters with different weights. Starburst-like sourcehave a positive value of βc, and AGN-like sources have negativevalues. We calculate the value of βc for IRAS 02524, which isaround 1.32, indicating that it is much more like a starburst-likesource.
Using a starburst-dominated sample, Herrero-Illana et al.(2017) showed that the Infrared luminosity LIR (between 8 and1000 µm) and radio luminosity at 1.4 GHz are both the star-formation rate(SFR) indicators, and the relations are as follows:SFR = 4.5 × 10−44 LIR and SFR =1.02 ×10⁻²⁸L1.4GHz. IRAS02524 has been detected by IRAS at 60 µm with a flux densityof 0.958 Jy (Darling & Giovanelli 2002), then we calculated theSFR from LIR to be 199.7 M⊙ yr−1. Such a SFR would producea non-thermal radio flux 2.15 mJy at 1.4 GHz. The L band ra-dio flux of this source from VLA observations is around 2.9 mJy(see Table. 2), which favors that the radio continuum emission inthis galaxy is probably dominated by starburst.
Article number, page 3 of 13
A&A proofs: manuscript no. IRAS025240328
54100 54120 54140 54160 54180 54200 54220 54240
0.5
1
1.5
Velocity (km/s)
Flu
x D
en
sity
(m
Jy/b
ea
m)
54100 54120 54140 54160 54180 54200 54220 54240
0.4
0.6
0.8
1
Velocity (km/s)
Flu
x D
en
sity
(m
Jy/b
ea
m)
54100 54120 54140 54160 54180 54200 54220 54240
1
1.5
2
2.5
3
3.5
Velocity (km/s)
Flu
x D
en
sity
(m
Jy/b
ea
m)
54100 54120 54140 54160 54180 54200 54220 54240
0.4
0.6
0.8
1
1.2
Velocity (km/s)
Flu
x D
en
sity
(m
Jy/b
ea
m)
Region 3
Region 2Region 1
Region 4
54110.7 −54221.0 KM/SEVN 1.412 GHz@2005 Mar 04
Map peak: 0.00671 Jy/beamContours: 0.00188 Jy/beam × (−1 1 2)Beam: 8.6 × 3.69 (mas) at −22.3°
−50
0
50
Rel
ativ
e D
ec. (
mas
)
50 0 −50 Relative R.A. (mas)
Fig. 3. Combined channel map of the OH 1667 MHz line emission in IRAS 02524 observed with the EVN project GD018.
54160.8 − 54239.5 KM/SEVN 1.410 GHz@2005 Mar 04
Map peak: 0.000822 Jy/beamContours: 0.000284 Jy/beam × (−1 1 2)Beam: 8.61 × 3.69 (mas) at −22.3°
54286.7 − 54326.1 KM/SEVN 1.410 GHz@2005 Mar 04
Beam: 8.62 × 3.69 (mas) at −22.3°Contours: 0.000242 Jy/beam × (−1 1 2)Map peak: 0.000585 Jy/beam
50 0 −50 50 0 −50
Rel
ativ
e D
ec. (
mas
)
Rel
ativ
e D
ec. (
mas
)
−
50
0
50
Relative R.A. (mas) Relative R.A. (mas)
−
50
0
50
Fig. 4. Combined channel map of the OH 1665 MHz line emission in IRAS 02524 observed with the EVN project GD018.
4.2. The OHM emission
In this paper, we have detected both the OH1667 line andOH1665 line emission with VLBI, it seems that all the linecomponents found in single-dish observations are available inour VLBI OH line spectrum(see Fig. 2), but only with around20 % of the single dish flux density restored. This means thatall the components are probably with some contributions fromcompact maser clouds. Based on Arecibo telescope observa-tions, Darling & Giovanelli (2002) found that the hyperfine ra-tios (1667-1665 MHz flux density ratio) for individual narrowfeatures in the spectrum are RH = 1.4, 5.63, 1.88 from high ve-locity to low, while McBride et al. (2013) found that there areonly two peaks in the OH1665 line emission that align withpeaks in the OH1667 line emission. We found that VLBI OH linespectrum also only show two peaks in the OH1665 line emissionwhich is consistent with the results in McBride et al. (2013). We
calculated the RH for the two components are around 1.81 and8.99 from high to low velocity (see Fig. 2).
The VLBI images of maser line emission (see Fig. 3-4 andFig. A.2-A.3) show that the components are all distributed in anarea less than 70 mas (210 pc) in the north-east direction and lessthan 30 mas (90 pc) in the east-west direction. Darling (2007)found that IRAS 02524 show strong variability in many spectralcomponents in the OH lines, suggesting that variable featuresare smaller than 1 pc (0.3 mas) with a brightness temperatureTb > 8 × 10¹¹ K. We tried to fit the brightest components in thechannel maps, we found that the size of the brightest componentis around 3 mas in size, and Tb is ∼ 4×10⁹ K, which indicate thatthe maser components might be still compact and needs higherangular resolution observations.
The OHM emission profile is supposed to be attributedto an ensemble of many masing regions, Darling & Giovanelli
Article number, page 4 of 13
Peng Hao et al.: RADIO EMISSION FROM IRAS 02524+2046
(2002) suggested that the variability of OH line emission mightbe caused by the compact maser emission through interstellarmedium, yielding an interstellar scintillation. The three epochVLBI images (Fig. 3 and A.4) of this source all show one dom-inant bright component. We can see that the peak flux densityof three observations are different, this might be caused by thevariability of this component. Moreover, we also can see that theEVN image (Fig. 3) also show some weak emission regions. Wethink that strong variability found by Darling (2007) might arisefrom the contributions from the brightest component showed inthe VLBI images and some other analogous compact maser com-ponents which are not detectable due to the limited sensitivity,because the VLBI scale flux density seems only one-fifth of thesingle-dish Arecibo observation (see Fig. 2).
Fig. 3 show that all the four regions of the OH1667 brightestline component display a similar double spectral feature, sug-gesting the existence of a velocity substructure in all the regions.Larson et al. (2016) have presented a classification scheme ofmerging stage of LIRGs, single nuclei and one obvious tidal ofthis source (Vignali et al. 2005) indicate that this source is pos-sibly at a stage of major merger. Because the largest size amongthe regions are around 210 pc, the existence of a velocity sub-structure in all the regions support the view that this galaxy mightbe at a merging stage and the gas clouds might originate fromtwo or more galaxies.
4.3. The nature of the radio emission in OHM galaxies
In general, OHM line emission have been observed in (U)LIRGsand it is likely that OH megamasers occur during a specific state,or stage of the merger, which are consequences of tidal densityenhancements accompanying galaxy interactions (Darling 2007;Pihlström 2007). The hosts of OHM galaxies usually present fea-tures of starburst and AGN, and the radio continuum emissionare produced from these phenomena. There are two possible ex-planations for these features:
• The OHM galaxies could represent a transition stagebetween a starburst and the emergence of an AGN(Darling & Giovanelli 2006). One possible scheme mightbe that in the initial merging stage of OHM formation, thebackground radio continuum mainly comes from the star-burst and FIR dominates the population inversion, the ra-dio continuum and OHM structure are supposed to be rel-atively diffuse; as galaxy merging proceeds, AGN activity inproducing radio continuum and inverting population groundlevel becomes more and more significant, the radio spectrumgets relatively flat, the structure of radio and OHMs emis-sion becomes relatively compact, and the OHMs velocityfields will become more ordered just as shown in Mrk 231(Klöckner et al. 2003). Our results show that IRAS 02524do not show clearly circumnuclear structure or velocity gra-dients, and the radio continuum emission is consistent withstarburst origin, which mean that this source might at theearly stage of merging process under this simplified view ofOHMs.• The OHM galaxies might originate in a central AGN, con-
taminated by emission of circumnuclear star-forming regions(Hekatelyne et al. 2018a,b). Although the radio continuumemission of many OHMs seems to show a link with nuclearstarburst, while a hidden AGN might also be possible as theLIRGs that host OH megamasers tend to be of infrared ex-cess compared with those that do not (Rovilos et al. 2003;Darling & Giovanelli 2002). Our results show that the radio
emission of IRAS 02524 also seems to be produced by nu-clear starburst, and it seems no evident contributions fromthe AGN, while also we can not exclude the existence of ahidden AGN, further high sensitivity and high spatial res-olution optical spectrum observations of the nuclear regionmight be useful to find the existence of an hidden AGN inthis galaxy (Hekatelyne et al. 2018a).
Because the OHM galaxies are related with merging processes,it may contain two or more intervening systems or regions withmuch different properties. In order to understand the nature ofradio emission in OHM galaxies and further test about the abovescenarios, high sensitivity interferometry and VLBI observa-tions of a large number of OHM galaxies will help to deter-mine whether they are hosting an AGN or compact starburst,their connections with the merging stages and other environmentparameters. Meanwhile, the high resolution optical-IR multi-wavelength imaging and integral field spectroscopy analysis oflarge sample of OHM galaxies are also important for understand-ing the nature of the nuclear region and then the origin of radioemission in OHM galaxies (Sales et al. 2019; Hekatelyne et al.2018a,b).
5. Summary
We have presented the radio properties of IRAS 02524 fromVLBA, EVN and VLA observations. We found that there is nosignificant continuum emission detectioned above 3σ level fromthree epoch VLBI observations. The L and C band integratedradio flux from VLA observations of this source is around 2.9mJy and 1.1 mJy and the spectral indexes, αtotal and αpeak arearound -0.8 and -1.2 respectively. The brightness temperature ofthis source is around 500 K from VLA C-band observation. TheL and C band q-ratio is ∼2.92 and ∼3.26, respectivley, which ismuch larger than the threshold of q < 2.50 typical of an AGN.These parameters all show that this source is probably a starburstgalaxy, which is consistent with the classification from opticalspectrum of this source.
The high-resolution radio spectrum of this source show boththe OH1667 line and OH1665 line, the profile is similar to thesingle dish spectrum. The channel maps show that the emissionof the OH maser lines located in a region around 210 pc × 90 pcregion. We also showed that the detected maser clouds at differ-ent region have similar double spectral feature, which suggestinga velocity substructure in all the detected regions, which mightbe an evidence that this galaxy is in the process of merging asseen from the optical morphology.
Acknowledgements. We thank the anonymous referee for his/her helpful sugges-tions and comments. This work is supported by the grants of NSFC( Grant No.11763002, U1931203) and the Major Program of NSFC(Grant No. 11590780,11590784). The European VLBI Network is a joint facility of European, Chi-nese, and other radio astronomy institutes funded by their national researchcouncils. The National Radio Astronomy Observatory is operated by Associ-ated Universities, Inc., under cooperative agreement with the National ScienceFoundation.
References
Baan, W. A. & Klöckner, H.-R. 2006, A&A, 449, 559Condon, J. J., Cotton, W. D., Greisen, E. W., et al. 1998, AJ, 115, 1693Condon, J. J., Huang, Z.-P., Yin, Q. F., & Thuan, T. X. 1991, ApJ, 378, 65Darling, J. 2007, in IAU Symposium, Vol. 242, Astrophysical Masers and their
Environments, ed. J. M. Chapman & W. A. Baan, 417–426Darling, J. & Giovanelli, R. 2002, AJ, 124, 100Darling, J. & Giovanelli, R. 2002, ApJ, 569, L87
Article number, page 5 of 13
A&A proofs: manuscript no. IRAS025240328
Darling, J. & Giovanelli, R. 2002, ApJ, 572, 810Darling, J. & Giovanelli, R. 2006, AJ, 132, 2596Hekatelyne, C., Riffel, R. A., Sales, D., et al. 2018a, MNRAS, 474, 5319Hekatelyne, C., Riffel, R. A., Sales, D., et al. 2018b, MNRAS, 479, 3966Helou, G., Soifer, B. T., & Rowan-Robinson, M. 1985, ApJ, 298, L7Herrero-Illana, R., Pérez-Torres, M. Á., Rand riamanakoto, Z., et al. 2017, MN-
RAS, 471, 1634Klöckner, H. R., Baan, W. A., & Garrett, M. A. 2003, Nature, 421, 821Larson, K. L., Sanders, D. B., Barnes, J. E., et al. 2016, ApJ, 825, 128McBride, J. & Heiles, C. 2013, ApJ, 763, 8McBride, J., Heiles, C., & Elitzur, M. 2013, ApJ, 774, 35Mingaliev, M., Sotnikova, Y., Mufakharov, T., et al. 2017, Astronomische
Nachrichten, 338, 700Momjian, E., Romney, J. D., Carilli, C. L., & Troland, T. H. 2006, ApJ, 653,
1172Pihlström, Y. M. 2005, Astronomical Society of the Pacific Conference Series,
Vol. 340, OH Megamaser Galaxies at High Angular Resolution, ed. J. Rom-ney & M. Reid, 224
Pihlström, Y. M. 2007, Proceedings of the International Astronomical Union, 3,446
Pihlström, Y. M., Baan, W. A., Darling, J., & Klöckner, H.-R. 2005, ApJ, 618,705
Roberts, H., Darling, J., Baker, A., & Kannappan, S. 2020, in American Astro-nomical Society Meeting Abstracts, Vol. 52, American Astronomical SocietyMeeting Abstracts, 207.30
Rovilos, E., Diamond, P. J., Lonsdale, C. J., Lonsdale, C. J., & Smith, H. E. 2003,MNRAS, 342, 373
Sales, D. A., Robinson, A., Axon, D. J., et al. 2015, ApJ, 799, 25Sales, D. A., Robinson, A., Riffel, R. A., et al. 2019, MNRAS, 486, 3350Shepherd, M. C., Pearson, T. J., & Taylor, G. B. 1995, in BAAS, Vol. 27, Bulletin
of the American Astronomical Society, ed. B. J. Butler & D. O. Muhleman,903
Udovitskiy, R. Y., Sotnikova, Y. V., Mingaliev, M. G., et al. 2016, AstrophysicalBulletin, 71, 496
Vignali, C., Brandt, W. N., Comastri, A., & Darling, J. 2005, MNRAS, 364, 99Yun, M. S., Reddy, N. A., & Condon, J. J. 2001, ApJ, 554, 803
Article number, page 6 of 13
Peng Hao et al.: RADIO EMISSION FROM IRAS 02524+2046
Appendix A: Online materials
Appendix A.1: RATAN observations
RATAN observations were carried out in December 2019 in thetransit mode. Details of observations and data analysis can befound in Udovitskiy et al. (2016); Mingaliev et al. (2017). Themeasurements were made at six frequencies simultaneously:1.28, 2.25, 4.7, 8.2, 11.2 and 21.7 GHz. Parameters of the con-tinuum radiometers are given in the Table. A.1. The detectionlimit for RATAN single sector is approximately 5 mJy/beam un-der good conditions at 4.7 GHz and at an average antenna eleva-tion. At other frequencies this value depends on the atmosphericextinction and the effective area on the certain antenna elevation.
The number of IRAS 02524+2046 observations was 14 inDecember 2019 and the radio flux was not detected at the mostsensitive RATAN radiometer at 4.7 GHz. The flux density upperlimit at this frequency is equal to 0.001 Jy. Due to a strong RadioFrequency Interference (RFI) the bandwidths at 1.28 and 2.25GHz are quite narrow (80 and 60 MHz, respectively) and thefluxes density at these frequencies have not detected also. Onlyone measurement in the radio continuum is currently knownfor IRAS 02524+2046 at 1.4 GHz and it is equal to 2.6 mJy(Condon et al. 1998). Probably it is possible to get the radio sig-nal at 4.7 GHz with the RATAN using more long-term accumu-lation.
Article number, page 7 of 13
A&A proofs: manuscript no. IRAS025240328
Table A.1. RATAN-600 continuum radiometers. Where f 0 – central frequency, ∆ f0 – bandwidth, ∆F – flux density detection limit per beam, andBW – beam width – an angular resolution in RA (an angular resolution in declination is three to five times worse than in RA).
f0 ∆ f0 ∆F BWGHz GHz mJy/beam arcsec21.7 2.5 50 1111.2 1.4 15 15.5
8.2 1.0 10 224.7 0.6 5 35
2.25 0.08 40 801.28 0.06 200 110
VLA 1.412 GHz@2003 Aug 04
Beam: 1.46 × 1.11 (arcsec) at 52.5°Contours: 0.000682 Jy/beam × (1 2 4 )
Map peak: 0.00289 Jy/beam
VLA 1.415 GHz@2005 Mar 04
Beam: 5.86 × 4.56 (arcsec) at −51.8°Contours: 0.000955 Jy/beam × (1 2)
Map peak: 0.0032 Jy/beam
02 55 20 18 16 14h m s s s s
40"
°20
58’
20"
40"
5
9’ 0
0"
20"
Map peak: 2.21E−03 Jy/beamContours:1,1.4,2,2.8...mJy/beam
RA (J2000)
Dec
(J2
000)
NVSS@1993 Nov 01
−20
00
−10
00
0
100
0
20
00
−50
00
0
50
00
2000 1000 0 −1000 −2000 5000 0 −5000
Relative R.A. (mas)Relative R.A. (mas)
Rel
ativ
e D
ec. (
mas
)
Rel
ativ
e D
ec. (
mas
)
Fig. A.1. The VLA L-band radio contour images of IRAS 02524.
Article number, page 8 of 13
Peng Hao et al.: RADIO EMISSION FROM IRAS 02524+2046
54291.9 − 54323.4 KM/S
Beam FWHM: 8.61 × 3.69 (mas) at −22.3°Contours: 0.000668 Jy/beam × (1 2)Map peak: 0.00163 Jy/beam
EVN 1.412 GHz@2005 Mar 04
53961.0 − 54000.4 KM/S
Map peak: 0.00138 Jy/beamContours: 0.000587 Jy/beam × (−1 1 2)Beam FWHM: 8.61 × 3.68 (mas) at −22.3°
EVN 1.412 GHz@2005 Mar 04−
50
0
50
−50
0
5
050 0 −50 50 0 −50
Rel
ativ
e D
ec. (
mas
)
Rel
ativ
e D
ec. (
mas
)
Relative R.A. (mas) Relative R.A. (mas)
Fig. A.2. Combined channel maps of the OH 1667 MHz line emission in IRAS 02524 observed with the EVN project GD018.
Article number, page 9 of 13
A&A proofs: manuscript no. IRAS025240328
54213.2 KM/S54221.0 KM/S
54205.3 KM/S 54197.4 KM/S
54189.5 KM/S 54181.6 KM/S
EVN 1.412 GHz@2005 Mar 04 EVN 1.412 GHz@2005 Mar 04
EVN 1.412 GHz@2005 Mar 04 EVN 1.412 GHz@2005 Mar 04
EVN 1.412 GHz@2005 Mar 04 EVN 1.412 GHz@2005 Mar 04
Contours: 0.00187 Jy/beam × (−1 1 2)Map peak: 0.00556 Jy/beam
Contours: 0.00147 Jy/beam × (−1 1 2)Map peak: 0.00361 Jy/beam
Map peak: 0.00691 Jy/beamContours: 0.00259 Jy/beam × (−1 1 2) Contours: 0.00325 Jy/beam × (−1 1 2)
Map peak: 0.0085 Jy/beam
Contours: 0.0032 Jy/beam × (−1 1 2)Map peak: 0.00896 Jy/beam Map peak: 0.0086 Jy/beam
Contours: 0.00303 Jy/beam × (1 2)
−50
0
50
−50
0
50
−50
0
50
−50
0
50
−50
0
50
−50
0
50
Rel
ativ
e D
ec. (
mas
)
Rel
ativ
e D
ec. (
mas
)
Rel
ativ
e D
ec. (
mas
)
Rel
ativ
e D
ec. (
mas
)
Rel
ativ
e D
ec. (
mas
)
Rel
ativ
e D
ec. (
mas
)
50 0 −50 50 0 −50
50 0 −50 50 0 −50
50 0 −50 50 0 −50
Relative R.A. (mas) Relative R.A. (mas)
Relative R.A. (mas) Relative R.A. (mas)
Relative R.A. (mas)Relative R.A. (mas)
Fig. A.3. The channel maps of IRAS 02524 observed with the EVN project GD018, the beam FWHM is 8.6 × 3.69 (mas) at −22.3 for all themaps.
Article number, page 10 of 13
Peng Hao et al.: RADIO EMISSION FROM IRAS 02524+2046
54173.8 KM/S
54158.0 KM/S
54142.2 KM/S
54150.1 KM/S
54134.4 KM/S
54165.9 KM/S
Map peak: 0.00639 Jy/beamContours: 0.00221 Jy/beam × (−1 1 2)
Map peak: 0.00745 Jy/beamContours: 0.00245 Jy/beam × (−1 1 2)
Map peak: 0.0113 Jy/beamContours: 0.00353 Jy/beam × (−1 1 2)
Contours: 0.00285 Jy/beam × (−1 1 2)Map peak: 0.00809 Jy/beam Map peak: 0.00818 Jy/beam
Contours: 0.0028 Jy/beam × (−1 1 2)
Map peak: 0.00999 Jy/beamContours: 0.00337 Jy/beam × (−1 1 2)
EVN 1.412 GHz@2005 Mar 04 EVN 1.412 GHz@2005 Mar 04
EVN 1.412 GHz@2005 Mar 04 EVN 1.412 GHz@2005 Mar 04
EVN 1.412 GHz@2005 Mar 04 EVN 1.412 GHz@2005 Mar 04
−50
0
50
−50
0
50
−50
0
50
−50
0
50
−50
0
50
−50
0
50
Rel
ativ
e D
ec (m
as)
Rel
ativ
e D
ec (m
as)
Rel
ativ
e D
ec (m
as)
Rel
ativ
e D
ec (m
as)
Rel
ativ
e D
ec (m
as)
Rel
ativ
e D
ec (m
as)
50 0 −50
50 0 −50
50 0 −50
50 0 −50
50 0 −50
50 0 −50
Relative R.A. (mas) Relative R.A. (mas)
Relative R.A. (mas)Relative R.A. (mas)
Relative R.A. (mas) Relative R.A. (mas)
Fig. A.3. The channel maps of IRAS 02524 observed with the EVN project GD018, the beam FWHM is 8.6 × 3.69 (mas) at −22.3 for all themaps.
Article number, page 11 of 13
A&A proofs: manuscript no. IRAS025240328
54118.6 KM/S
54110.7 KM/S
54126.5 KM/SEVN 1.412 GHz@2005 Mar 04 EVN 1.412 GHz@2005 Mar 04
EVN 1.412 GHz@2005 Mar 04
Map peak: 0.00634 Jy/beamContours: 0.00212 Jy/beam × (−1 1 2)
Map peak: 0.00356 Jy/beamContours: 0.00128 Jy/beam × (−1 1 2)
Map peak: 0.00281 Jy/beamContours: 0.00112 Jy/beam × (−1 1 2)
−50
0
50
Rel
ativ
e D
ec (
mas
)
50 0 −50 Relative R.A. (mas)
−50
0
50
Rel
ativ
e D
ec (
mas
)
−50
0
50
Rel
ativ
e D
ec (
mas
)
50 0 −50 Relative R.A. (mas)
50 0 −50 Relative R.A. (mas)
Fig. A.3. The channel maps of IRAS 02524 observed with the EVN project GD018, the beam FWHM is 8.6 × 3.69 (mas) at −22.3 for all themaps.
Article number, page 12 of 13
Peng Hao et al.: RADIO EMISSION FROM IRAS 02524+2046
VLBA 1.412 GHz@2001 Oct 14 VLBA 1.412 GHz@2017 Feb 17
Map peak: 0.012 Jy/beamContours: 0.000529 Jy/beam × (1 1.5 2)Beam FWHM: 11.5 × 6.68 (mas) at −2.83°
Map peak: 0.0224 Jy/beamContours: 0.000475 Jy/beam × (1 2 3 4)Beam FWHM: 12.1× 6.13 (mas) at −2.83°
50 0 −50 Relative R.A. (mas)
50 0 −50 Relative R.A. (mas)
−50
0
5
0R
elat
ive
Dec
(m
as)
−50
0
5
0R
elat
ive
Dec
(m
as)
Fig. A.4. The OH1667 line emission of IRAS 02524 with frequency range from 1411.5 MHz to 1412.5 MHz from two VLBA observations. Thefrequency range corresponds to the 1667 MHz line emission from 54110.7 - 54221.0 km s−1, the image from EVN project GD018 at this range ispresent in Fig. 3.
−6e−05 −4e−05 −2e−05 0 2e−05 4e−05
100 0 −100Relative R.A. (mas)
Displayed range: −6.19e−05 5.64e−05 Jy/beam
Rel
ativ
e D
ec (
mas
)
−10
0
0
100
EVN 1.416 GHz residual I map@2005 Mar 04
Fig. A.5. The dirty map of the continuum emission of IRAS 02524 from EVN project GD018.
Article number, page 13 of 13