The quasi-static growth of bubbles
9
J. Fluid Mech. (2014), vol. 741, R1, doi:10.1017/jfm.2013.667 The quasi-static growth of CO 2 bubbles Oscar R. Enríquez 1, †, Chao Sun 1 , Detlef Lohse 1 , Andrea Prosperetti 2 and Devaraj van der Meer 1 1 Physics of Fluids Group, Faculty of Science and Technology, University of Twente, PO Box 217, 7500 AE Enschede, The Netherlands 2 Department of Mechanical Engineering, Johns Hopkins University, 3400 N. Charles Street, Baltimore, MD 21218, USA (Received 7 October 2013; revised 1 December 2013; accepted 12 December 2013) We study experimentally the growth of an isolated gas bubble in a slightly supersaturated water–CO 2 solution at 6 atm pressure. In contrast to what was found in previous experiments at higher supersaturation, the time evolution of the bubble radius differs noticeably from existing theoretical solutions. We trace the differences back to several combined effects of the concentration boundary layer around the bubble, which we disentangle in this work. In the early phase, the interaction with the surface on which the bubble grows slows down the process. In contrast, in the final phase, before bubble detachment, the growth rate is enhanced by the onset of density-driven convection. We also show that the bubble growth is affected by prior growth and detachment events, though they are up to 15 min apart. Key words: bubble dynamics, buoyancy-driven instability, convection 1. Introduction The diffusion-driven growth of bubbles in supersaturated liquids is a common occurrence in nature and technology. From carbonated drinks (Bisperink & Prins 1994; Barker, Jefferson & Judd 2002; Liger-Belair 2005; Sahu, Hazama & Ishihara 2006; Lee, McKechnie & Devereux 2011) to magmatic melts (Sparks 1978) or oil reservoirs (Pooladi-Darvish & Firoozabadi 1999), molten polymers and metals (Amon & Denson 1984), or even the blood of whales or scuba-divers (Crum & Mao 1996; Chappell & Payne 2006), the appearance of gas bubbles might be anything from beneficial to completely detrimental. They may be responsible for a pleasant flavour enhancement but can also lead to volcanic eruptions or cause decompression sickness or even death. †Email address for correspondence: [email protected] c Cambridge University Press 2014 741 R1-1
Transcript of The quasi-static growth of bubbles

J. Fluid Mech. (2014), vol. 741, R1, doi:10.1017/jfm.2013.667
The quasi-static growth of CO2 bubbles
Oscar R. Enríquez1,†, Chao Sun1, Detlef Lohse1, Andrea Prosperetti2
and Devaraj van der Meer1
1Physics of Fluids Group, Faculty of Science and Technology, University of Twente, PO Box 217,7500 AE Enschede, The Netherlands2Department of Mechanical Engineering, Johns Hopkins University, 3400 N. Charles Street,Baltimore, MD 21218, USA
(Received 7 October 2013; revised 1 December 2013; accepted 12 December 2013)
We study experimentally the growth of an isolated gas bubble in a slightlysupersaturated water–CO2 solution at 6 atm pressure. In contrast to what was foundin previous experiments at higher supersaturation, the time evolution of the bubbleradius differs noticeably from existing theoretical solutions. We trace the differencesback to several combined effects of the concentration boundary layer around thebubble, which we disentangle in this work. In the early phase, the interaction withthe surface on which the bubble grows slows down the process. In contrast, in thefinal phase, before bubble detachment, the growth rate is enhanced by the onset ofdensity-driven convection. We also show that the bubble growth is affected by priorgrowth and detachment events, though they are up to 15 min apart.
Key words: bubble dynamics, buoyancy-driven instability, convection
1. Introduction
The diffusion-driven growth of bubbles in supersaturated liquids is a commonoccurrence in nature and technology. From carbonated drinks (Bisperink & Prins 1994;Barker, Jefferson & Judd 2002; Liger-Belair 2005; Sahu, Hazama & Ishihara 2006;Lee, McKechnie & Devereux 2011) to magmatic melts (Sparks 1978) or oil reservoirs(Pooladi-Darvish & Firoozabadi 1999), molten polymers and metals (Amon & Denson1984), or even the blood of whales or scuba-divers (Crum & Mao 1996; Chappell &Payne 2006), the appearance of gas bubbles might be anything from beneficial tocompletely detrimental. They may be responsible for a pleasant flavour enhancementbut can also lead to volcanic eruptions or cause decompression sickness or even death.
†Email address for correspondence: [email protected]
c© Cambridge University Press 2014
741 R1-1

O. Enríquez, C. Sun, D. Lohse, A. Prosperetti and D. van der Meer
High pressure
Pressure regulator 1
Pressure regulator 2
Camera
Light
Silicon chip with nucleation sites
Saturated liquid
reservoirBubble
Valve
Valve
FIGURE 1. Sketch of the experimental system. A saturated aqueous solution of CO2 isprepared in the reservoir tank and part of it transferred to a smaller observation tank. Herethe mix is supersaturated by means of a small, isothermal pressure drop. In order to avoidresidual currents in the observation tank, the liquid is allowed to rest for thirty minutesafter filling before the pressure is dropped. Temperature is kept stable by circulatingwater from a refrigerated cooler through a hose wrapped around the tank (see Enríquezet al. 2013). A bubble grows from a hydrophobic micro-pit etched on a silicon wafer.The process is imaged through a window in the tank using a long-distance microscopeobjective with diffuse back light through a window in the opposite side.
Theories, both including (Scriven 1959) and neglecting (Epstein & Plesset 1950)the advective transport induced by the radially expanding bubble interface, predictthat the radius R grows proportionally to
√t (with a larger prefactor in the former
case). Experimental studies using moderately supersaturated water–CO2 solutions(corresponding to that in a carbonated beverage or beer) have confirmed such timedependence (Bisperink & Prins 1994; Jones, Evans & Galvin 1999; Barker et al.2002).
We perform an experimental study of the controlled growth of a single CO2 bubbleat high pressure (∼6 atm) in a hitherto unexplored low-supersaturation regime, whichis an order of magnitude smaller than that of a typical carbonated beverage. In contrastto other works in the moderately supersaturated regime, we find that the concentrationboundary layer around the bubble and the substrate on which the latter grows have animportant influence on the growth rate.
2. Experimental procedure and results
In the experiment, the desired supersaturation level is induced by a small, isothermalpressure drop in a water–CO2 solution equilibrated at pressure P0 and temperature T0.A suitable and controlled nucleation site is provided by a hydrophobic micro-cavityof radius Rp = 10 µm and depth 30 µm, etched in the centre of a small rectangularsilicon chip (8 mm× 6 mm). A bubble grows from the pit until buoyancy overcomesthe surface tension (estimated as 61 mN m−1 in our conditions) that attaches itto the pit, forcing it to detach (Lubetkin & Akhtar 1996). After this, anotherbubble grows from the same site in a process that can go on for hours. We takeimages with a digital camera and a long-distance microscope objective at rates of
741 R1-2

The quasi-static growth of CO2 bubbles
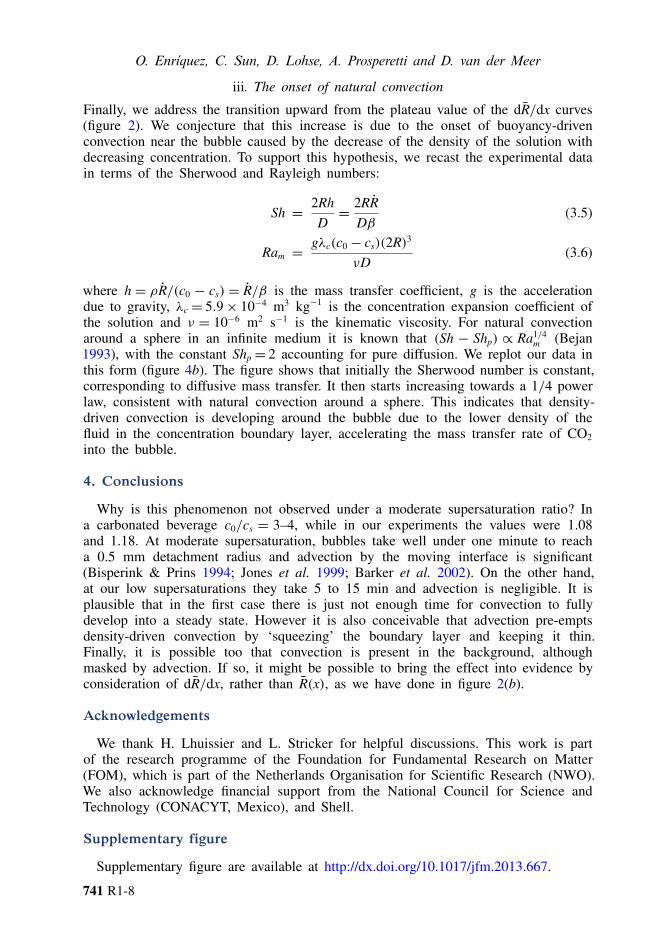
50
40
30
20
10
1.5
1.0
0.5
0
0
0.1
10 20 30 40 50 60
10 20 30 40 50 60
300 600 900
(a)
(b)
0
0.2
t (s)
FIGURE 2. Radius (a) and its derivative with respect to√
t (b) in dimensionless form.Symbols represent experimental data. Filled red ones correspond to the first bubble toemerge from the nucleation site and open blue ones to the second. Circles correspondto cs = 9.10 kg m−3 and squares to cs = 10.01 kg m−3. In (a) the lines representthe full analytical solution of (3.1) for each case. The inset shows the same data andtheoretical curves in dimensional form. In (b) the theoretical curves for both experimentalconditions collapse onto the solid line when they are divided by the asymptotic value S.The local maximum observed for the red circles corresponds to a slight initial overshootand oscillation of the pressure controller, and therefore is not present in the secondbubble. The depressurization is complete and stable at a dimensionless time around 11.For the smaller pressure drop, corresponding to the squares, the overshoot is minimal.The experimental data for this figure are provided as supplementary material available athttp//:dx.doi.org/10.1017/jfm.2013.667.
0.5–1 Hz. The smallest bubbles resolvable with our optical resolution (∼2 µm pixel−1)had a radius of about 10 µm. Figure 1 shows a sketch of the experiment and adetailed description of it can be found in Enríquez et al. (2013).
741 R1-3

O. Enríquez, C. Sun, D. Lohse, A. Prosperetti and D. van der Meer
Figure 2 shows the results of two different experiments in which the pressure wasreduced from the initial value P0 = 0.65 MPa (T0 = 21.6 ◦C) by 0.05 and 0.1 MPa.Under these conditions it took the bubbles around 5 and 15 min, respectively,to detach. Their final radius, Rdet ≈ 477 µm, agrees with the expectation for aquasi-statically grown bubble (Oguz & Prosperetti 1993).
The long detachment times and slow growth rates observed suggest that advectioncaused by the moving bubble interface is negligible. However, upon comparingexperimental results with the corresponding theory, significant discrepancies areevident.
(i) The radius is always smaller than the theoretical prediction and is not proportionalto√
t (figure 2a).(ii) The derivative dR/dx, with x∝√t, does not converge to a constant value. Instead,
the experimental curves only reach a plateau at a level 20–40% lower than thetheory and they take a longer time to do so (figure 2b). Furthermore, the growthrate of the second bubble in each case (open symbols) differs from that ofthe first one (filled symbols). In figure 2(b) it becomes clear that differencesare limited to the early growth stages and the two curves for each experimenteventually converge.
(iii) Around x∼ 20 there is a point where dR/dx starts increasing until eventually itsurpasses the maximum predicted by the standard theory summarized below.
In the remainder of this article we disentangle the causes of these differences, whichare: (i) the presence of the silicon chip, (ii) a region depleted of CO2 left behind bythe previously detached bubble, and (iii) natural convection triggered by the densitydifference between liquid in the concentration boundary layer and outside. This lastphenomenon stands in contrast to previous experimental studies in which its effectswere not detected and therefore explicitly discounted by the authors (Bisperink &Prins 1994; Jones et al. 1999).
3. Analysis
3.1. Idealized problem
Before getting further in the discussion, let us briefly recall the idealized problem of abubble growing in an unbounded, supersaturated gas–liquid solution as formulated byEpstein & Plesset (1950). The equilibrium concentration of gas is given by c0= kHP0
(Henry’s law), where kH , Henry’s coefficient, is a decreasing function of temperaturespecific for a given gas–liquid pair. Decreasing the pressure to Ps (at the sametemperature T0) leads to an out-of-equilibrium, supersaturated state. A bubble withan initial radius R0 is placed in such a supersaturated liquid at t = 0. Initially, theconcentration is c0 everywhere, and far from the bubble it is assumed it will remainso. Neglecting the Laplace pressure, the gas concentration at the bubble boundary isconstant and given by cs = kHPs. For the conditions discussed in this paper, it canbe shown that the influence of surface tension is limited to the very first instantsof growth, so that it can be neglected throughout. The bubble remains immobilewith its centre at the origin of a spherical coordinate system. One can then solvethe spherically symmetric diffusion equation to evaluate the time evolution of theconcentration gradient at the bubble surface (r= R). Equating the gas flow caused by
741 R1-4

The quasi-static growth of CO2 bubbles
this gradient to the time derivative of the bubble mass gives an expression for thequasi-static radial growth rate:
dRdt=Dβ
(1R+ 1√
πDt
), (3.1)
where β = (c0 − cs)/ρ, D = 1.97 m2 s−1 is the diffusivity of CO2 in water andρ ≈ 10 kg m−3 is the density of the gaseous phase at Ps. Equation (3.1) canbe conveniently expressed in terms of the dimensionless variables R = R/Rp and
x =√(2Dβ/R2
p)t, where Rp is the radius of the nucleation site. In the originalformulation R0 was used as a length scale; but as this quantity is not defined in thepresent experiment, we use Rp. Although the full analytical solution to the equationcan be obtained (Epstein & Plesset 1950), the asymptotic solution:
R≈ [γ + (1+ γ 2)1/2]x≡ Sx (3.2)
valid when R� 1 and x� 1, is a very good approximation. The constant γ is definedas γ =√β/2π. The solid line in figure 2(b) shows dR/dx for the complete solution,normalized by its asymptotic value, S, given by the terms inside the brackets in (3.2).We can see here how quickly the full solution to (3.1) converges to this long-termsolution (horizontal dashed line in figure 2b).
Note that the initial time t= 0 of the Epstein–Plesset theory is slightly shifted withrespect to the one used in plotting our figures due to the different initial conditions.We could define a virtual initial time by fitting a square-root behaviour to the firstfew data points, but we do not pursue this possibility as its influence is very smallin comparison with the major differences between theory and experiments that areapparent in figure 2.
As the bubble grows, the boundary layer, across which there is a concentrationgradient from cs to c0, also grows. Its thickness δ (from the bubble surface) growsproportionally to
√Dt and soon becomes of the order of, or larger than, the bubble
itself (Epstein & Plesset 1950). The assumptions made for the theory imply that δ= 0at t= 0.
We are now in a position to address the issues (i) to (iii) mentioned above.
i. The role of the silicon chipA clear difference between theory and experiments is that in the latter bubbles growon a substrate instead of in an unbounded medium. This reduces the area availablefor mass transfer through two effects. First, the bubble is no longer a full sphere,but rather a spherical cap pinned to the perimeter of the nucleation site (Bisperink& Prins 1994; Jones et al. 1999; Barker et al. 2002). An area equal to the openingof the pit will always be excluded. While such exclusion might be significant for asmall bubble, by the time R equals 5, it represents only one hundredth of the bubblesurface area (see figure 3a). Hence, this effect can be considered minimal over thecourse of the entire bubble lifetime, and clearly it cannot account for the 20–40%reduction observed in the plateau value of dR/dx (figure 2b).
The second effect is that the substrate acts like a barrier which hinders masstransfer into the bubble. This can be qualitatively estimated by removing the massdiffusing across the dashed portion of the bubble surface shown in figure 3(b), wherethe larger sphere denotes the edge of the boundary layer of thickness δ =√πDt. A
741 R1-5

O. Enríquez, C. Sun, D. Lohse, A. Prosperetti and D. van der Meer
Boundary layer
Bubble
R
Silicon chip
cs
c0
(a)
(b)
FIGURE 3. (a) Images of a growing bubble at t≈ 1, 152 and 295 s with R= 20, 307 and474 µm. In the first snapshot, the mirror image of the bubble on the silicon surface isclearly seen below the real bubble. In the other two frames only a small fraction of thereflection is visible. Before dropping the pressure and after each bubble detaches the gaspocket is completely inside the pit and therefore not visible at all. (b) Sketch to illustratethe interaction of the concentration boundary layer with the silicon substrate. The excludedbubble area (dashed line) is estimated using the cone formed by the centre of the bubbleand the intersection of the boundary layer (shown by the bigger sphere) with the siliconchip.
simple geometrical calculation shows that the remaining ‘effective’ area of the bubbleis given by
Aeff = 4πR2
(1− 1
2
√πDt
R+√πDt
)≡ 4πR2fA. (3.3)
If we repeat the process to derive (3.1) using the diffusion over an area Aeff insteadof over the full bubble surface area, we recover that same equation multiplied by fA,the factor inside the parentheses in (3.3). An asymptotic solution can be readily foundfor the equation, namely
R≈[γ +
(12+ γ 2
)1/2]
x≡ S∗x, (3.4)
where the new term inside the parentheses, S∗, is smaller than S for the unboundedcase. In spite of the crude approximations that go into deriving (3.4), the numericalsolution to the area-corrected equation (solid and dashed black curves in figure 4a)show markedly better agreement with experiments in the range x= 0–20.
It is worth noting that another difference with respect to the idealized problemis that by remaining in contact with the silicon chip, the bubble is effectivelymoving upwards. However it does so at a very small speed, equal to the radialexpansion of the bubble (R). In our experiments, the Péclet number (Pe = 2RR/D)during the diffusive growth regime (plateau in the curves in figure 2b) has valuesof approximately 0.1 and 0.3, respectively, ruling out the possibility that the bubbletranslation has a significant effect.741 R1-6

The quasi-static growth of CO2 bubbles
2.0
1.5
1.0
0.5
0
0 10 20 30
10
20
30
10 20 30 40 50 600
0.1
0.2
0.3
0.4
0.5
0.6
0.7
1.5 2.0 2.5 3.0 3.5x
(a () b)
0.40.1
FIGURE 4. (a) Experimental dR/dx rescaled with S∗. Again, circles correspond to cs =9.10 kg m−3 and squares to cs= 10.01 kg m−3, whereas filled symbols correspond to thefirst and open ones to the second bubble growing in each experimental condition. Linesshow corrections for effective diffusion area (solid black curve), and pre-existing boundarylayers for the first bubble (red dashed curve) and the second bubble in both experimentalconditions (blue, cs = 9.9 kg m−3, and green, cs = 9.1 kg m−3 curves). The inset showsthe measured time evolution of R for the second bubble of both experimental conditionstogether with its corresponding corrected curve. (b) Sherwood number (equation (3.5)) asa function of the mass transfer Rayleigh number. The lines have a slope of 1/4, whichindicates that density-driven convection develops around the bubble.
ii. CO2 depletionUpon detaching, the first bubble leaves behind a region depleted of CO2, slowingdown the growth of the second bubble. This is shown as a delay in reachingthe plateau value in the dR/dx curve (figure 2b). Although this phenomenon wasconsidered by Jones et al. (1999) and related to the time it takes the followingbubble to nucleate, alterations in the growth rate after nucleation were not reported.We introduce the effect of an initially depleted zone into the theoretical modelby modifying the initial condition of uniform concentration everywhere to a lineargradient in the radial direction from cs at r = R to c0 at r = L > R and uniformconcentration farther away. The resulting equation for dR/dt is then solved numericallywith L as a fitting parameter which is adjusted to match the experimental curves. Wefound that L≈ 350 and 890 µm (figure 4a) match the observed slowing down of therespective second bubble growth for the two experimental conditions. Subsequentbubbles, until around the tenth, grow with only minor differences with respect tothe second one, which suggests that conditions in the system quickly settle to anapproximately steady state. After the tenth bubble (1–3 h into the experiment), theplateau value of the derivative starts to decrease, indicating that the progressiveloss of CO2 in the bulk of the liquid starts to have a noticeable effect on thesystem.
As shown in figure 4(a), fitting of the first bubble growth rate also requires anon-zero value of L, namely L≈ 250 µm. A likely explanation is related to the factthat the pressure drop from P0 to Ps takes place over 30 s. It is conceivable that duringthis time a concentration gradient of thickness ∼√D× 30 s ' 243 µm will developabove the pit and hence modify the ‘effective’ initial conditions for the growingbubble.
741 R1-7
O. Enríquez, C. Sun, D. Lohse, A. Prosperetti and D. van der Meer
iii. The onset of natural convection
Finally, we address the transition upward from the plateau value of the dR/dx curves(figure 2). We conjecture that this increase is due to the onset of buoyancy-drivenconvection near the bubble caused by the decrease of the density of the solution withdecreasing concentration. To support this hypothesis, we recast the experimental datain terms of the Sherwood and Rayleigh numbers:
Sh = 2RhD= 2RR
Dβ(3.5)
Ram = gλc(c0 − cs)(2R)3
νD(3.6)
where h = ρR/(c0 − cs) = R/β is the mass transfer coefficient, g is the accelerationdue to gravity, λc = 5.9× 10⁻⁴ m3 kg−1 is the concentration expansion coefficient ofthe solution and ν = 10−6 m2 s−1 is the kinematic viscosity. For natural convectionaround a sphere in an infinite medium it is known that (Sh − Shp) ∝ Ra1/4
m (Bejan1993), with the constant Shp = 2 accounting for pure diffusion. We replot our data inthis form (figure 4b). The figure shows that initially the Sherwood number is constant,corresponding to diffusive mass transfer. It then starts increasing towards a 1/4 powerlaw, consistent with natural convection around a sphere. This indicates that density-driven convection is developing around the bubble due to the lower density of thefluid in the concentration boundary layer, accelerating the mass transfer rate of CO2into the bubble.
4. Conclusions
Why is this phenomenon not observed under a moderate supersaturation ratio? Ina carbonated beverage c0/cs = 3–4, while in our experiments the values were 1.08and 1.18. At moderate supersaturation, bubbles take well under one minute to reacha 0.5 mm detachment radius and advection by the moving interface is significant(Bisperink & Prins 1994; Jones et al. 1999; Barker et al. 2002). On the other hand,at our low supersaturations they take 5 to 15 min and advection is negligible. It isplausible that in the first case there is just not enough time for convection to fullydevelop into a steady state. However it is also conceivable that advection pre-emptsdensity-driven convection by ‘squeezing’ the boundary layer and keeping it thin.Finally, it is possible too that convection is present in the background, althoughmasked by advection. If so, it might be possible to bring the effect into evidence byconsideration of dR/dx, rather than R(x), as we have done in figure 2(b).
Acknowledgements
We thank H. Lhuissier and L. Stricker for helpful discussions. This work is partof the research programme of the Foundation for Fundamental Research on Matter(FOM), which is part of the Netherlands Organisation for Scientific Research (NWO).We also acknowledge financial support from the National Council for Science andTechnology (CONACYT, Mexico), and Shell.
Supplementary figure
Supplementary figure are available at http://dx.doi.org/10.1017/jfm.2013.667.
741 R1-8

The quasi-static growth of CO2 bubbles
References
AMON, M. & DENSON, C. D. 1984 A study of the dynamics of foam growth: analysis of thegrowth of closely spaced spherical bubbles. Polym. Engng Sci. 24 (13), 1026–1034.
BARKER, G. S., JEFFERSON, B. & JUDD, S. J. 2002 The control of bubble size in carbonatedbeverages. Chem. Engng Sci. 57 (4), 565–573.
BEJAN, A. 1993 Heat Transfer. John Wiley and Sons.BISPERINK, C. G. J. & PRINS, A. 1994 Bubble growth in carbonated liquids. Colloids Surf. A 85,
237–253.CHAPPELL, M. A. & PAYNE, S. J. 2006 A physiological model of the release of gas bubbles from
crevices under decompression. Respir. Physiol. Neurobiol. 153 (2), 166–180.CRUM, L. A. & MAO, Y. 1996 Acoustically enhanced bubble growth at low frequencies and its
implications for human diver and marine mammal safety. J. Acoust. Soc. Am. 99 (5), 2898–2907.
ENRÍQUEZ, O. R., HUMMELINK, C., BRUGGERT, G.-W., LOHSE, D., PROSPERETTI, A., VAN DER
MEER, D. & SUN, C. 2013 Growing bubbles in a slightly supersaturated solution. Rev. Sci.Instrum 84, 065111.
EPSTEIN, P. S. & PLESSET, M. S. 1950 On the stability of gas bubbles in liquid–gas solutions.J. Chem. Phys. 18, 1505.
JONES, S. F., EVANS, G. M. & GALVIN, K. P. 1999 Bubble nucleation from gas cavities – a review.Adv. Colloid Interface Sci. 80 (1), 27–50.
LEE, W. T., MCKECHNIE, J. S. & DEVEREUX, M. G. 2011 Bubble nucleation in stout beers. Phys.Rev. E 83, 051609.
LIGER-BELAIR, G. 2005 The physics and chemistry behind the bubbling properties of champagneand sparkling wines: a state-of-the-art review. J. Agric. Food Chem. 53 (8), 2788–2802.
LUBETKIN, S. D. & AKHTAR, M. 1996 The variation of surface tension and contact angle underapplied pressure of dissolved gases, and the effects of these changes on the rate of bubblenucleation. J. Colloid Interface Sci. 180, 43–60.
OGUZ, H. N. & PROSPERETTI, A. 1993 Dynamics of bubble growth and detachment from a needle.J. Fluid Mech. 257, 111–145.
POOLADI-DARVISH, M. & FIROOZABADI, A. 1999 Solution-gas drive in heavy oil reservoirs.J. Can. Petrol. Technol. 38 (4), 54–61.
SAHU, K. K., HAZAMA, Y. & ISHIHARA, K. N. 2006 Gushing in canned beer: The effect ofultrasonic vibration. J. Colloid Interface Sci. 302 (1), 356–362.
SCRIVEN, L. E. 1959 On the dynamics of phase growth. Chem. Engng Sci. 10 (1), 1–13.SPARKS, R. S. J. 1978 The dynamics of bubble formation and growth in magmas: A review and
analysis. J. Volcanol. Geotherm. Res. 3 (1–2), 1–37.
741 R1-9