The Potential for Re-Invasion by Mammalian Pests at Maungatautari Ecological Island
129
http://waikato.researchgateway.ac.nz/ Research Commons at the University of Waikato Copyright Statement: The digital copy of this thesis is protected by the Copyright Act 1994 (New Zealand). The thesis may be consulted by you, provided you comply with the provisions of the Act and the following conditions of use: Any use you make of these documents or images must be for research or private study purposes only, and you may not make them available to any other person. Authors control the copyright of their thesis. You will recognise the author’s right to be identified as the author of the thesis, and due acknowledgement will be made to the author where appropriate. You will obtain the author’s permission before publishing any material from the thesis.
-
Upload
independent -
Category
Documents
-
view
3 -
download
0
Transcript of The Potential for Re-Invasion by Mammalian Pests at Maungatautari Ecological Island

http://waikato.researchgateway.ac.nz/
Research Commons at the University of Waikato Copyright Statement:
The digital copy of this thesis is protected by the Copyright Act 1994 (New Zealand).
The thesis may be consulted by you, provided you comply with the provisions of the Act
and the following conditions of use:
Any use you make of these documents or images must be for research or private
study purposes only, and you may not make them available to any other person.
Authors control the copyright of their thesis. You will recognise the author’s right to
be identified as the author of the thesis, and due acknowledgement will be made to
the author where appropriate.
You will obtain the author’s permission before publishing any material from the thesis.

The Potential for Re-Invasion by
Mammalian Pests at Maungatautari
Ecological Island
A thesis
submitted in partial fulfilment
of the requirements for the Degree
of
Master of Science in Biological Sciences
at
The University of Waikato
by
Trevor Allan Connolly
2008
ii
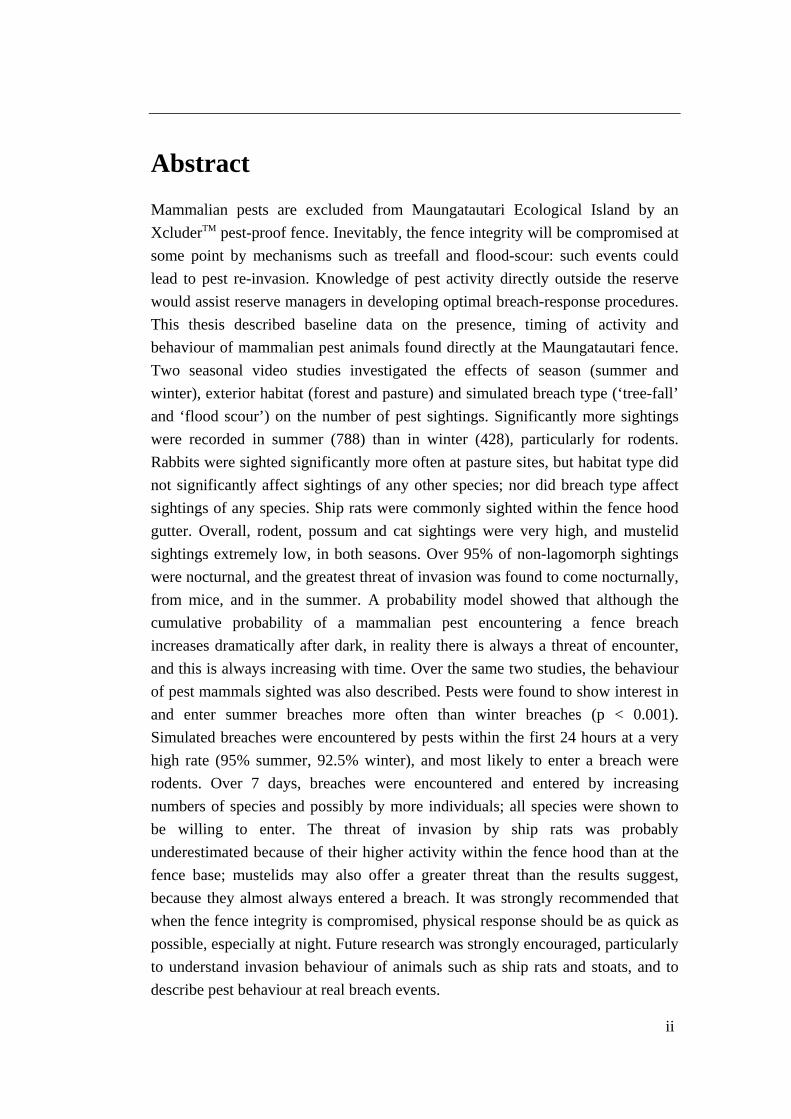
Abstract Mammalian pests are excluded from Maungatautari Ecological Island by an XcluderTM pest-proof fence. Inevitably, the fence integrity will be compromised at some point by mechanisms such as treefall and flood-scour: such events could lead to pest re-invasion. Knowledge of pest activity directly outside the reserve would assist reserve managers in developing optimal breach-response procedures. This thesis described baseline data on the presence, timing of activity and behaviour of mammalian pest animals found directly at the Maungatautari fence. Two seasonal video studies investigated the effects of season (summer and winter), exterior habitat (forest and pasture) and simulated breach type (‘tree-fall’ and ‘flood scour’) on the number of pest sightings. Significantly more sightings were recorded in summer (788) than in winter (428), particularly for rodents. Rabbits were sighted significantly more often at pasture sites, but habitat type did not significantly affect sightings of any other species; nor did breach type affect sightings of any species. Ship rats were commonly sighted within the fence hood gutter. Overall, rodent, possum and cat sightings were very high, and mustelid sightings extremely low, in both seasons. Over 95% of non-lagomorph sightings were nocturnal, and the greatest threat of invasion was found to come nocturnally, from mice, and in the summer. A probability model showed that although the cumulative probability of a mammalian pest encountering a fence breach increases dramatically after dark, in reality there is always a threat of encounter, and this is always increasing with time. Over the same two studies, the behaviour of pest mammals sighted was also described. Pests were found to show interest in and enter summer breaches more often than winter breaches (p < 0.001). Simulated breaches were encountered by pests within the first 24 hours at a very high rate (95% summer, 92.5% winter), and most likely to enter a breach were rodents. Over 7 days, breaches were encountered and entered by increasing numbers of species and possibly by more individuals; all species were shown to be willing to enter. The threat of invasion by ship rats was probably underestimated because of their higher activity within the fence hood than at the fence base; mustelids may also offer a greater threat than the results suggest, because they almost always entered a breach. It was strongly recommended that when the fence integrity is compromised, physical response should be as quick as possible, especially at night. Future research was strongly encouraged, particularly to understand invasion behaviour of animals such as ship rats and stoats, and to describe pest behaviour at real breach events.

iii
Acknowledgements
I would firstly like to thank my supervisors, Dr. Carolyn King & Dr. Tim Day, for their tireless enthusiasm, help, advice and support. Your confidence was a source of constant encouragement. Thanks also to Tim for help with installing the cages. The photographs in Figures 6, 7 and 8 of Chapter 2 are used with the kind permission of Dr. Carolyn King. Thank you to the Maungatautari Ecological Island Trust for supporting the study, particularly to Pim de Monchy and Tony Rolley for all of their help and advice. Thanks also to Selwyn and Marilyn Mackinder for the midnight rescue. A big thank you to XcluderTM Pest Proof Fence Company, for very generously providing endless cage materials; also for the loan of a quad bike and many 12V batteries for an extended period, without which the winter study would not have taken place. I am grateful also to the Department of Biological Sciences at the University of Waikato, for agreeing to the purchase of the DVRs. Again, this allowed the winter study to take place. Also thanks to Ray Littler for statistical advice and assistance. The University of Waikato Animal Ethics Committee approved all experiments presented. I am indebted to AmBreed NZ Ltd for their funding assistance, which contributed greatly to the study. To my colleagues in and around the herbarium – your inept but earnest far-left-wing views on how life should be were a constant source of amusement, amazement and despair. To Melissa and Sarah, my two beautiful daughters, you are a continued inspiration. Finally, to my wife Christine goes my biggest thank you. For doing everything possible to allow me to focus on my studies; for putting up with five years of poverty, late nights and weekends; for raising two beautiful girls; your constant support is priceless.

iv
Table of Contents ABSTRACT .................................................................................................................................... II ACKNOWLEDGEMENTS ......................................................................................................... III TABLE OF CONTENTS ............................................................................................................. IV LIST OF FIGURES .................................................................................................................... VII LIST OF TABLES ....................................................................................................................... IX
CHAPTER 1. LITERATURE REVIEW ...................................................................................... 1 GENERAL INTRODUCTION .................................................................................................... 1
Introduced Mammals as Pests ................................................................................................. 1 Eradication on New Zealand’s Offshore Islands ..................................................................... 2 DOC ‘Mainland Islands’ ......................................................................................................... 3
PEST EXCLUSION FENCES ...................................................................................................... 4 Background .............................................................................................................................. 4 Electric Fences ........................................................................................................................ 5 Physical Barrier Fences .......................................................................................................... 6 Karori Wildlife Sanctuary ........................................................................................................ 7
XCLUDERTM PEST PROOF FENCE COMPANY ..................................................................... 9 Background .............................................................................................................................. 9 Fence Designs.......................................................................................................................... 9 Interaction and Behaviour of Pest Mammals ........................................................................ 11 Breaches and Monitoring ...................................................................................................... 12
MAUNGATAUTARI ECOLOGICAL ISLAND ....................................................................... 13 Background ............................................................................................................................ 13 Pest Species Present at Maungatautari ................................................................................. 13 Fence Monitoring, Breaches and Responses ......................................................................... 14
MAMMALIAN PEST BEHAVIOUR IN RELATION TO FENCED RESERVES ................... 16 Linear Habitat Features ........................................................................................................ 16 Activity Periods ...................................................................................................................... 17 Previous Studies at NZ Pest-Proof Fences ............................................................................ 17 Importance of Increasing Knowledge of Pest Activity and Behaviour .................................. 18
AIMS AND STRUCTURE ........................................................................................................ 19 REFERENCES ........................................................................................................................... 21
CHAPTER 2. ACTIVITY OF MAMMALIAN PESTS OUTSIDE A PEST-PROOF FENCE AT MAUNGATAUTARI ECOLOGICAL ISLAND ................................................................. 29
ABSTRACT ............................................................................................................................... 29 INTRODUCTION ...................................................................................................................... 30 METHODS ................................................................................................................................. 33
Study Site ............................................................................................................................... 33 Fence Breaches ...................................................................................................................... 34 Recording Equipment ............................................................................................................ 38 Filming Schedule: Summer .................................................................................................... 40 Filming Schedule: Winter ...................................................................................................... 41 Filming Schedule: Inside the Fence Hood ............................................................................. 42 Data Analysis ......................................................................................................................... 42 Probability of Pest Encounter ............................................................................................... 43
RESULTS ................................................................................................................................... 44
v
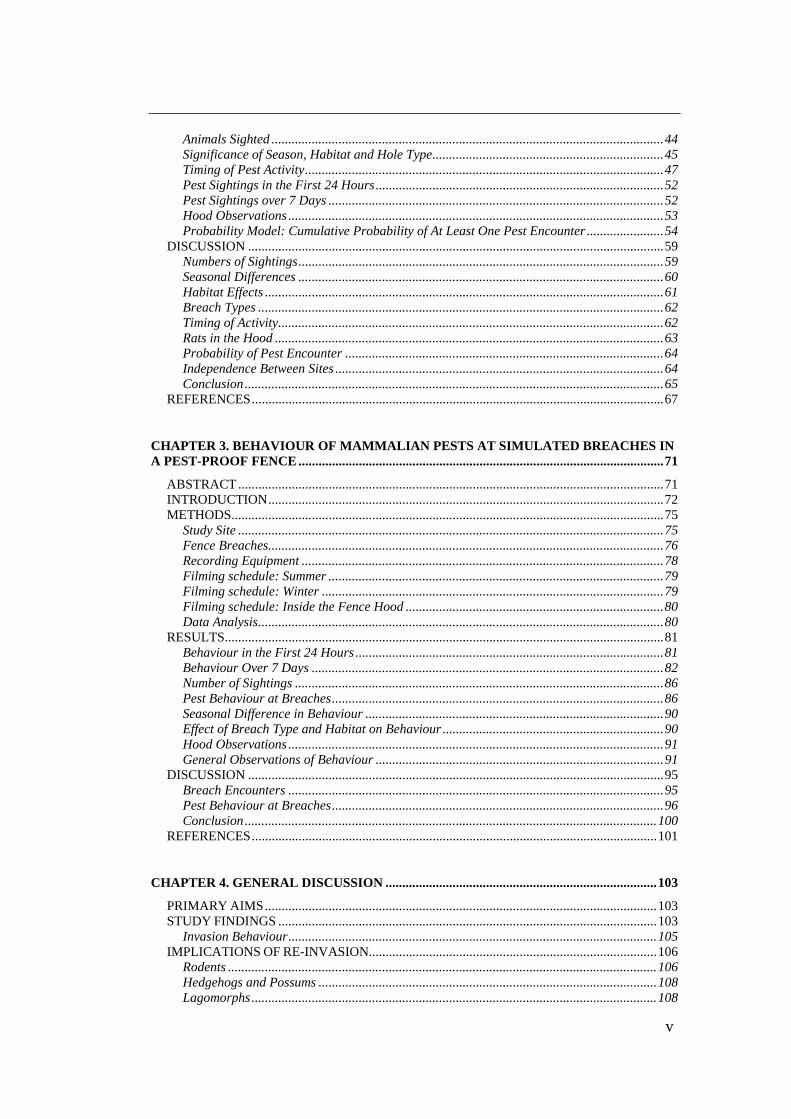
Animals Sighted ..................................................................................................................... 44 Significance of Season, Habitat and Hole Type ..................................................................... 45 Timing of Pest Activity ........................................................................................................... 47 Pest Sightings in the First 24 Hours ...................................................................................... 52 Pest Sightings over 7 Days .................................................................................................... 52 Hood Observations ................................................................................................................ 53 Probability Model: Cumulative Probability of At Least One Pest Encounter ....................... 54
DISCUSSION ............................................................................................................................ 59 Numbers of Sightings ............................................................................................................. 59 Seasonal Differences ............................................................................................................. 60 Habitat Effects ....................................................................................................................... 61 Breach Types ......................................................................................................................... 62 Timing of Activity ................................................................................................................... 62 Rats in the Hood .................................................................................................................... 63 Probability of Pest Encounter ............................................................................................... 64 Independence Between Sites .................................................................................................. 64 Conclusion ............................................................................................................................. 65
REFERENCES ........................................................................................................................... 67
CHAPTER 3. BEHAVIOUR OF MAMMALIAN PESTS AT SIMULATED BREACHES IN A PEST-PROOF FENCE ............................................................................................................. 71
ABSTRACT ............................................................................................................................... 71 INTRODUCTION ...................................................................................................................... 72 METHODS ................................................................................................................................. 75
Study Site ............................................................................................................................... 75 Fence Breaches ...................................................................................................................... 76 Recording Equipment ............................................................................................................ 78 Filming schedule: Summer .................................................................................................... 79 Filming schedule: Winter ...................................................................................................... 79 Filming schedule: Inside the Fence Hood ............................................................................. 80 Data Analysis ......................................................................................................................... 80
RESULTS ................................................................................................................................... 81 Behaviour in the First 24 Hours ............................................................................................ 81 Behaviour Over 7 Days ......................................................................................................... 82 Number of Sightings .............................................................................................................. 86 Pest Behaviour at Breaches ................................................................................................... 86 Seasonal Difference in Behaviour ......................................................................................... 90 Effect of Breach Type and Habitat on Behaviour .................................................................. 90 Hood Observations ................................................................................................................ 91 General Observations of Behaviour ...................................................................................... 91
DISCUSSION ............................................................................................................................ 95 Breach Encounters ................................................................................................................ 95 Pest Behaviour at Breaches ................................................................................................... 96 Conclusion ........................................................................................................................... 100
REFERENCES ......................................................................................................................... 101
CHAPTER 4. GENERAL DISCUSSION ................................................................................. 103 PRIMARY AIMS ..................................................................................................................... 103 STUDY FINDINGS ................................................................................................................. 103
Invasion Behaviour .............................................................................................................. 105 IMPLICATIONS OF RE-INVASION...................................................................................... 106
Rodents ................................................................................................................................ 106 Hedgehogs and Possums ..................................................................................................... 108 Lagomorphs ......................................................................................................................... 108

vi
Predators ............................................................................................................................. 109 RECOMMENDATIONS ......................................................................................................... 111
Breach Response .................................................................................................................. 111 Future Research .................................................................................................................. 113
SUMMARY ............................................................................................................................. 114 REFERENCES ......................................................................................................................... 116

vii
List of Figures CHAPTER 1.
Figure 1. Design of the pest-proof fence at Karori Wildlife Sanctuary (Reproduced from the
Karori Wildlife Sanctuary Management Plan (1997), with permission from K. Drayton,
Karori Wildlife Sanctuary Trust. The ‘outside’ face of the fence is to the right. ..................... 8 Figure 2. Fence designs built and tested in efficacy trials, by Xcluder Pest Proof Fencing Co.
(adapted from Day and MacGibbon, 2007). .......................................................................... 10
CHAPTER 2.
Figure 1. Location of Maungatuatari Ecological Island (indicated by the arrow). ......................... 33 Figure 2. Location of Maungatautari Ecological Island, in relation to Arapuni and Lake Karapiro.
The section of fenceline used in the study is highlighted black. ............................................ 34 Figure 3. Sites of the 20 simulated breaches. ................................................................................. 35 Figure 4. Schematic diagram of the XcluderTM ‘Kiwi’ fence design, as erected at Maungatautari.
The rolled colorsteel® hood is at top (adapted from Day & MacGibbon, 2007). ................. 36 Figure 5. A cage as installed at the fence. The temporary mesh cover has been removed and the
simulated ‘flood-scour’ breach is open. ................................................................................. 37 Figure 6. A ‘tree-fall’ hole, with cover removed. This breach type was open for 24 hours at a time.
............................................................................................................................................... 38 Figure 7. A video camera, infra-red light and video recorder (in black case), set up opposite a
simulated breach. ................................................................................................................... 40 Figure 8. An illustration of camera position in relation to a simulated breach, summer study. ..... 41 Figure 9. Mean sightings per 100 hole-nights, per species, by season (± SEM). ........................... 47 Figure 10. Mean (+ SEM) number of sightings per hour of the day, per species, by season.
Summer times are corrected for New Zealand Summer Time. .............................................. 49 Figure 10 (Cont.). Mean (+ SEM) number of sightings per hour of the day, per species, by season.
Summer times are corrected for New Zealand Summer Time. .............................................. 50 Figure 11. Time of sightings for all species in summer (above, corrected for NZ Summer Time)
and winter (below). Upper line, civil twilight end; lower line, civil twilight start. ................ 51 Figure 12. Mean (± SEM) cumulative number of sightings at ‘flood-scour’ breaches, over a 7 day
period. .................................................................................................................................... 52

viii
Figure 13. Mean number of ship rat fence-hood sightings per 100HN (+ SEM) according to time
of day. Times are corrected for New Zealand Summer Time. ............................................... 53 Figure 15. A selection of still images taken from the summer and winter video footage. Top row,
cat and two kittens (2 images); 2nd row, ferret (L) and stoat (R); 3rd row, possum and ship rat;
bottom row, rabbit (L) and hare (R). ..................................................................................... 57 Figure 15 (cont.). Further still images. Top left, mouse (circled); top right, hedgehog; bottom left,
two ship rats inside the fence hood, looking at the ground; bottom right, ship rat inside the
hood, in a hurry. ..................................................................................................................... 58
CHAPTER 3.
Figure 1. Location of Maungatuatari Ecological Island (indicated by the arrow). ......................... 75 Figure 2. Sites of the 20 simulated breaches. ................................................................................. 76 Figure 3. A cage as installed at the fence. The temporary mesh cover has been removed and the
simulated ‘flood-scour’ breach is open. ................................................................................. 77 Figure 4. Schematic diagram of the XcluderTM ‘Kiwi’ fence design, as erected at Maungatautari.
The rolled Colorsteel® hood is at top (adapted from Day & MacGibbon, 2007). ................. 78 Figure 5. Percentage of breaches at which pests had been sighted, had shown interest or had
entered, over 7 days in Summer (a) and in Winter (b). .......................................................... 84 Figure 6. Mean (± SEM) cumulative number of times pests had been sighted at, had showed
interest in or had entered 7-day breaches in Summer (a), and in Winter (b). ........................ 85 Figure 7. Percentage of total summer sightings that resulted in each of the three behaviours, per
species. ................................................................................................................................... 88 Figure 8. Percentage of total winter sightings that resulted in each of the three behaviours, per
species. ................................................................................................................................... 89 Figure 9. A selection of still images taken from video. Top row: mouse (L, circled), ship rat (R).
2nd row: possum scent-marking the cage (L), before entering (R). 3rd row: mouse (circled)
inside cage, with cat closely observing (L), cat then catches the mouse inside cage (R).
bottom row: a handsome stoat investigates the cage interior (L), then prepares to climb the
mesh (R). ............................................................................................................................... 93 Figure 9 (cont.). More still images. Top row, ferret (L); hedgehog (R). 2nd row, rabbit (L),
replaced within a few seconds by a hare (R). 3rd row, moth (L, circled) inside the fence hood
gutter, discovered by a ship rat (R). Bottom row, the ship rat catches the moth (L) and eats it
(R). ......................................................................................................................................... 94

ix
List of Tables
CHAPTER 2.
Table 1. Total number of sightings per season, and significance values. ....................................... 46 Table 2. Total number of sightings at holes opposite each habitat type, and significance values. . 46
Table 3. Total number of sightings at each breach type, and significance Values. ........................ 46
CHAPTER 3.
Table 1. Summary of mammalian pest behaviour in relation to simulated breaches, in the Summer.
............................................................................................................................................... 88 Table 2. Summary of mammalian pest behaviour in relation to simulated breaches, in the Winter.
............................................................................................................................................... 89 Table 3. Percentage of total sightings each species comprised, compared with percentage of
breach entries each species comprised, for both seasons. ...................................................... 90
Chapter 1: Literature Review
1
CHAPTER 1
Literature Review
GENERAL INTRODUCTION
Introduced Mammals as Pests
In the 700-750 years since the first exotic mammals arrived in New Zealand with
the colonising Polynesians (Hogg et al. 2003), up to 54 mammal species have
progressively been introduced. Of these, 31 species have established wild or feral
populations. At least 25 of these introductions are presently managed as pests in
New Zealand (King 2005; Parkes & Murphy 2003). Some species, such as stoats
(Mustela erminea) seriously threaten indigenous species (e.g. kiwi, Apteryx spp.)
Other species that threaten conservation values may also be agricultural pests, as
vectors of disease such as bovine tuberculosis (Tb) (e.g. brushtail possums
(Trichosurus vulpecula), ferrets (Mustela furo), and red deer (Cervus elaphus
scoticus)) or by damaging farmland directly (e.g. European rabbits (Oryctolagus
cuniculus cuniculus)) (King, 2005).
The two strategic options to manage pest mammals are 1) sustained
control, and 2) one-off control (e.g. eradication) (Parkes & Murphy 2003). The
complete eradication of pest mammals over any substantial area of the New
Zealand mainland has previously been thought impossible. Control techniques
used in the past rarely detected every individual in a population, and this,
combined with re-colonisation from neighbouring uncontrolled areas, has made
eradication untenable.
Hence, the strategy most commonly used to manage mainland pest mammal
populations is sustained control. This requires regular control operations, to be
sustained in perpetuity, that aim to stop further damage by the target pest or pests
(Parkes & Murphy 2003). In order to achieve maximum benefit, aspects such as
Chapter 1: Literature Review
2
frequency, intensity and spatial pattern of control must be optimised, and the most
efficient, effective and environmentally safe methods must be used (Parkes &
Murphy 2003). However, under this strategy, there will always be survivors, and
eventually other individuals will disperse into a treated area. To avert further pest
impacts (including extinctions), the Department of Conservation (DoC) has
translocated vulnerable endemic species such as kakapo (Strigops habroptilus) to
predator-free offshore islands (Powlesland et al. 1995; Saunders & Norton 2001).
Complete eradication of a pest species should be attempted only where the
protection of a resource requires it, or where it is cheaper to eradicate than to
undertake long-term sustained control (Parkes & Murphy 2003; Parkes 1990). In
order for eradication to be successful, three strategic conditions must be met
(Parkes 1990):
1. All individuals must be put at risk;
2. Re-colonisation must not be possible; and
3. Pests must be killed faster than they can replace their losses.
A fourth ‘desirable’ condition is that survivors must be detectable at low densities.
Offshore islands offer an opportunity for eradication because the
surrounding sea prevents re-colonisation. Over the past 30 years, techniques that
achieve the remaining two strategic conditions have been developed, largely
through research on offshore islands.
Eradication on New Zealand’s Offshore Islands
Attempts to eradicate pest mammals from New Zealand’s offshore islands prior to
the 1970s mostly targeted large mammals, e.g. feral goats (Capra hircus) on
Kapiti Island (Parkes 1990). More recent successful eradications include feral cats
(Felis catus) from Little Barrier Island in 1980 (Veitch 2001), and possums from
Kapiti Island in 1986 (Brown & Sherley 2002; Cowan 1992). However, rodent
eradication had only rarely been attempted before the 1970s, and never on islands
larger than 1 hectare (1ha) (Moors 1985; Veitch & Bell 1990). The prevailing
view of the time was that the possibility of “complete extermination on islands is
Chapter 1: Literature Review
3
remote, or at least a very, very difficult thing indeed” (Dingwall et al. 1978,
p.273).
Rat eradication techniques were greatly improved by the arrival in the
1980s of second-generation anticoagulant poisons such as brodifacoum (Thomas
& Taylor 2002). The new toxins and techniques allowed progressively larger
islands to be cleared of rodents such as Norway rats (Rattus norvegicus) and/or
Pacific rats (Rattus exulans), including Hawea (9ha) and Breaksea (170ha) Islands,
Codfish (1396ha) and Kapiti (1965ha) Islands, and ultimately the largest offshore
island to be cleared of rats thus far, sub-Antarctic Campbell Island (11,300ha), in
2001 (Empson & Miskelly 1999; McClelland 2002; Parkes & Murphy 2003;
Taylor & Thomas 1989; Taylor & Thomas 1993; Thomas & Taylor 2002; Towns
& Broome 2003). A DoC ‘Island Eradication Advisory Group’ now focuses on
eradication research, skills development, review and audit (Cromarty et al. 2002).
DOC ‘Mainland Islands’
The management techniques and experiences gained on offshore islands,
complemented by a significant experimental multi-pest management programme
at Mapara (Innes et al. 1999), have led to the establishment of six DoC ‘Mainland
Island’ projects on the North and South Islands of New Zealand. Of these, three
are ‘habitat islands’, (essentially, forest remnants surrounded by farmland:
Trounson Kauri Park, Paengaroa Reserve, and Boundary Stream Reserve). The
remaining three sites are ‘habitat complexes’ (core management areas inside a
greater complex of similar habitats: Northern Te Urewera National Park, Rotoiti
Nature Recovery Project and Hurunui River). The intention of the Mainland
Island programme was to use some of the new multi-pest management practices to
intensively manage the selected areas, with a focus on entire ecosystem
restoration (Parkes & Murphy 2003; Saunders 2000; Saunders & Norton 2001).
Management of Mainland Islands clearly differs from that of offshore
islands in that pest control must be ongoing, because there is no barrier preventing
re-colonisation. With the strategic condition of eradication being compromised,
complete pest eradication is impossible. Thus, pest control objectives at Mainland
Chapter 1: Literature Review
4
Islands are generally to reduce pest population densities to, and maintain them at,
levels low enough to allow ecological recovery (Saunders 2000).
PEST EXCLUSION FENCES
Background
Fences offer the potential to achieve permanent exclusion of pest mammals from
areas of high conservation value, providing the fence design takes into account the
physical abilities and behaviour of those animals it means to exclude (Clapperton
& Day 2001). Exclusion fencing may be a cost-effective form of pest control for
areas that are large relative to perimeter length. Additional benefits may include
greater conservation outcomes than would be gained by a sustained control
strategy (Clapperton & Day 2001).
Internationally, fences have been used for many years to restrict the
movements of animals (McKillop & Silby 1988), with mixed results. Until the
1990s, little research had been done on fence design, except for rabbit exclusion
fences in the United Kingdom (McKillop et al. 1998; McKillop & Silby 1988;
McKillop & Wilson 1987; McKillop & Wilson 1999). Despite a long history of
exclusion fencing in Australia targeting species such as rabbits, dingoes (Canis
lupus dingo), foxes and cats, few designs have been scientifically tested, and
guidelines to provide advice to conservation managers are scarce (Long & Robley
2004). Exclusion fences in New Zealand, prior to the 1990s, had also rarely been
tested. Many fences were designed to exclude a small selection of pest species,
rather than all species present (Aviss & Roberts 1994). Others have failed because
of design faults, poor construction, or insufficient maintenance (Day &
MacGibbon 2002; Day & MacGibbon 2007; Sanders et al. 2007).
With some overlap, most fence designs tested and constructed around the
world fall into one of two categories: electric fences, and physical barrier fences.
Chapter 1: Literature Review
5
Electric Fences
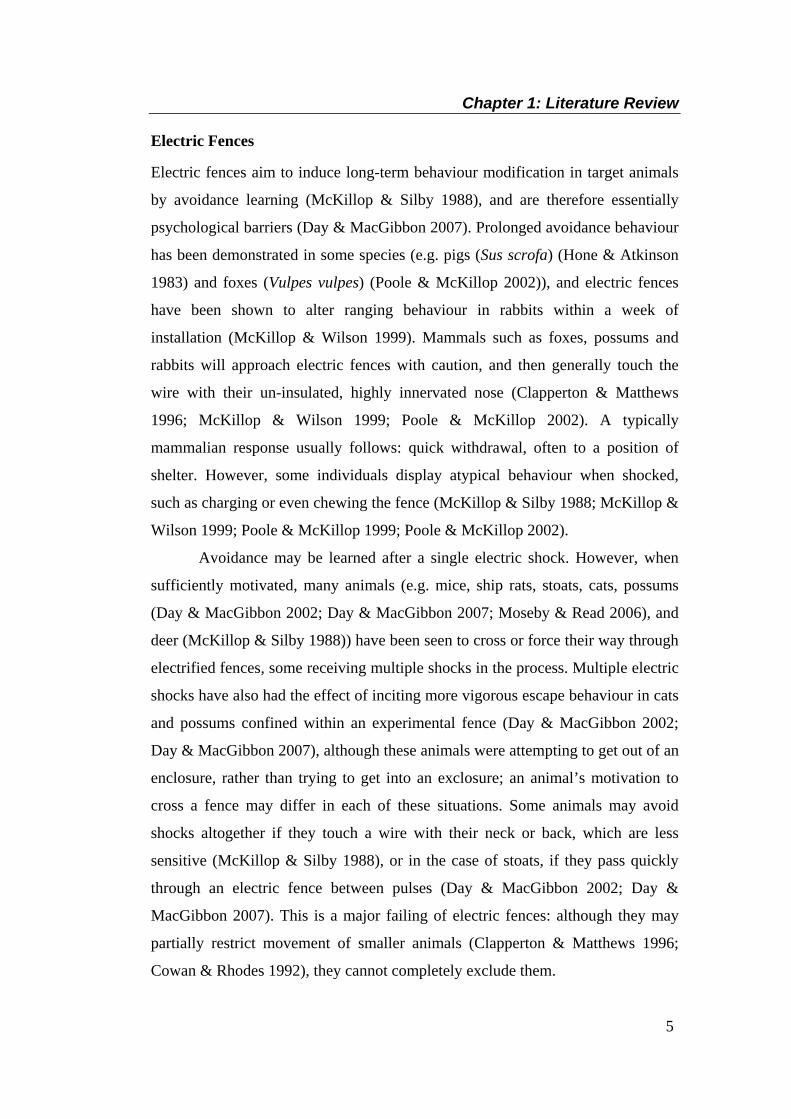
Electric fences aim to induce long-term behaviour modification in target animals
by avoidance learning (McKillop & Silby 1988), and are therefore essentially
psychological barriers (Day & MacGibbon 2007). Prolonged avoidance behaviour
has been demonstrated in some species (e.g. pigs (Sus scrofa) (Hone & Atkinson
1983) and foxes (Vulpes vulpes) (Poole & McKillop 2002)), and electric fences
have been shown to alter ranging behaviour in rabbits within a week of
installation (McKillop & Wilson 1999). Mammals such as foxes, possums and
rabbits will approach electric fences with caution, and then generally touch the
wire with their un-insulated, highly innervated nose (Clapperton & Matthews
1996; McKillop & Wilson 1999; Poole & McKillop 2002). A typically
mammalian response usually follows: quick withdrawal, often to a position of
shelter. However, some individuals display atypical behaviour when shocked,
such as charging or even chewing the fence (McKillop & Silby 1988; McKillop &
Wilson 1999; Poole & McKillop 1999; Poole & McKillop 2002).
Avoidance may be learned after a single electric shock. However, when
sufficiently motivated, many animals (e.g. mice, ship rats, stoats, cats, possums
(Day & MacGibbon 2002; Day & MacGibbon 2007; Moseby & Read 2006), and
deer (McKillop & Silby 1988)) have been seen to cross or force their way through
electrified fences, some receiving multiple shocks in the process. Multiple electric
shocks have also had the effect of inciting more vigorous escape behaviour in cats
and possums confined within an experimental fence (Day & MacGibbon 2002;
Day & MacGibbon 2007), although these animals were attempting to get out of an
enclosure, rather than trying to get into an exclosure; an animal’s motivation to
cross a fence may differ in each of these situations. Some animals may avoid
shocks altogether if they touch a wire with their neck or back, which are less
sensitive (McKillop & Silby 1988), or in the case of stoats, if they pass quickly
through an electric fence between pulses (Day & MacGibbon 2002; Day &
MacGibbon 2007). This is a major failing of electric fences: although they may
partially restrict movement of smaller animals (Clapperton & Matthews 1996;
Cowan & Rhodes 1992), they cannot completely exclude them.

Chapter 1: Literature Review
6
Other problems include difficulties in construction. To avoid ‘earthing’
through immersion in sea water, an anti-fox fence erected across a small spit on
the Sands of Forvie Nature Reserve in Aberdeenshire, Scotland, was extended
only to high-tide mark at both ends. After initially visiting the fence in the central
portion, foxes quickly learned the ends were open at low tide, and regularly
entered the protected area (Forster 1975; Patterson 1977). A short-lived electric
fence on Arapawa Island, in the Marlborough Sounds, was constantly shorted out
by falling vegetation, allowing pigs and goats to walk through at will (Aviss &
Roberts 1994). Similarly, possums, even after having learned avoidance behaviour,
are capable of quickly detecting when the power supply has been cut, and passing
through then (Clapperton & Matthews 1996; Cowan & Rhodes 1992). This has
led to the failure of several electrified fences in New Zealand (e.g. the North Cape
possum fence (Day & Flight 2002)).
For these reasons, the use of electric wires without an effective physical
barrier is not recommended (Day & MacGibbon 2002; Day & MacGibbon 2007;
Long & Robley 2004; Moseby & Read 2006). Over the last decade, research has
been conducted in New Zealand with a focus on the design of physical barrier
fences, capable of permanently excluding multiple pest species.
Physical Barrier Fences
In contrast to electric fences, physical barrier fences aim to exceed both the
physical abilities and behavioural characteristics of targeted pest mammals, and
are far more likely to achieve permanent pest exclusion (Day & MacGibbon 2007).
Almost all barrier fences have targeted exclusion of either a single pest species
(e.g. dingoes, pigs, goats, rabbits, or hedgehogs (Erinaceus europaeus
occidentalis) (Aviss & Roberts 1994; Jackson 2001; McKillop & Wilson 1987;
McKnight 1969)) or only a proportion of those present (e.g. feral foxes and cats
(Moseby & Read 2006; Robley et al. 2007)), with varying degrees of success. A
barrier fence designed to exclude multiple pest species must successfully combat
many abilities and behaviours, including attempts to climb over, jump over, push
through, chew through, and dig under fences (Day & MacGibbon 2002; Day &
Chapter 1: Literature Review
7
MacGibbon 2007; Long & Robley 2004; Moseby & Read 2006; Robley et al.
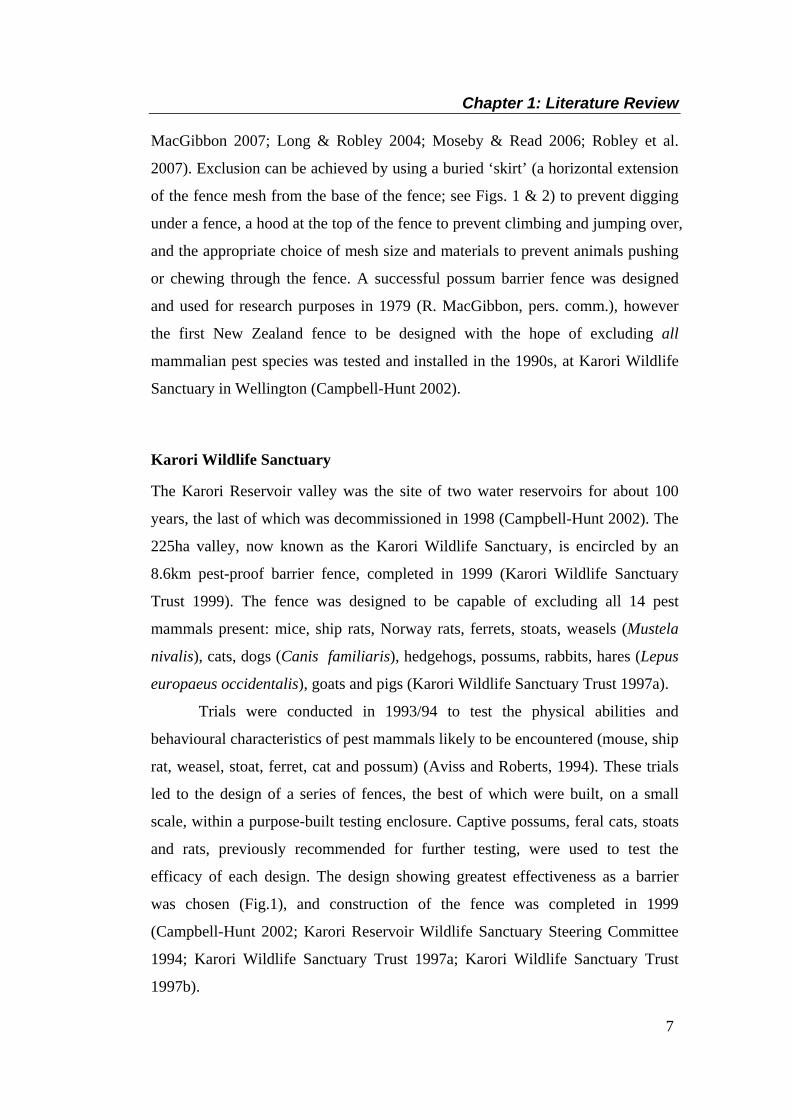
2007). Exclusion can be achieved by using a buried ‘skirt’ (a horizontal extension
of the fence mesh from the base of the fence; see Figs. 1 & 2) to prevent digging
under a fence, a hood at the top of the fence to prevent climbing and jumping over,
and the appropriate choice of mesh size and materials to prevent animals pushing
or chewing through the fence. A successful possum barrier fence was designed
and used for research purposes in 1979 (R. MacGibbon, pers. comm.), however
the first New Zealand fence to be designed with the hope of excluding all
mammalian pest species was tested and installed in the 1990s, at Karori Wildlife
Sanctuary in Wellington (Campbell-Hunt 2002).
Karori Wildlife Sanctuary
The Karori Reservoir valley was the site of two water reservoirs for about 100
years, the last of which was decommissioned in 1998 (Campbell-Hunt 2002). The
225ha valley, now known as the Karori Wildlife Sanctuary, is encircled by an
8.6km pest-proof barrier fence, completed in 1999 (Karori Wildlife Sanctuary
Trust 1999). The fence was designed to be capable of excluding all 14 pest
mammals present: mice, ship rats, Norway rats, ferrets, stoats, weasels (Mustela
nivalis), cats, dogs (Canis familiaris), hedgehogs, possums, rabbits, hares (Lepus
europaeus occidentalis), goats and pigs (Karori Wildlife Sanctuary Trust 1997a).
Trials were conducted in 1993/94 to test the physical abilities and
behavioural characteristics of pest mammals likely to be encountered (mouse, ship
rat, weasel, stoat, ferret, cat and possum) (Aviss and Roberts, 1994). These trials
led to the design of a series of fences, the best of which were built, on a small
scale, within a purpose-built testing enclosure. Captive possums, feral cats, stoats
and rats, previously recommended for further testing, were used to test the
efficacy of each design. The design showing greatest effectiveness as a barrier
was chosen (Fig.1), and construction of the fence was completed in 1999
(Campbell-Hunt 2002; Karori Reservoir Wildlife Sanctuary Steering Committee
1994; Karori Wildlife Sanctuary Trust 1997a; Karori Wildlife Sanctuary Trust
1997b).

Chapter 1: Literature Review
8
Minimum depth 100 mm
Ground skirt 0.4 metres wide
Minimum height 2.2 m
Maximum height 3.0 metres in special sites
Posts: Light Pole 140 mm small end, full round, H4 ground treated, 3.3 m long
Zincalume / Galvanised Iron "Hood" 0.95mm thick rolled to 250 mm
open diameter.
Woven wire mesh6 mm x 50 mm
longslot
Using 2.5 mm diameter high
tensile galvanised wire
Patent Pending Figure 1. Design of the pest-proof fence at Karori Wildlife Sanctuary (Reproduced from the Karori Wildlife Sanctuary Management Plan (1997), with permission from K. Drayton, Karori Wildlife Sanctuary Trust). The ‘outside’ face of the fence is to the right.
An eradication campaign inside the finished fence, which began with possums in
July 1999, expanded to target all pest mammals, and was declared successful in
January 2000.
Within weeks, mice were thought to have re-invaded (Empson 2000;
Karori Wildlife Sanctuary Trust 2000), although recent analysis of eradication
attempts behind fences since 1999 suggests that at least one year with no evidence
of mice is required to be confident that eradication has been successful (Speedy et
al. 2007). The incursion was eventually attributed to flaws in the fence. Gaps were
found between the ‘top hat’ and the wire mesh, which were large enough to allow
a mouse to squeeze through. Although these were repaired, mice were able to re-
invade through the wire mesh, as the 6mm gaps were not consistent in size
(Karori Wildlife Sanctuary Trust 2001). Mice are yet to be re-eradicated from the
reserve (Empson 2000). A single weasel was also detected in 2004, soon after a
tree-fall crushed a section of the fence. The weasel was soon trapped and
Chapter 1: Literature Review
9
destroyed (Empson 2000). A further incursion by a weasel was detected in
February 2008; this individual was also trapped and destroyed within a few days
(McDonald, 2008).
The pest-proof fence at Karori Wildlife Sanctuary, though the first of its
kind to be constructed in New Zealand, is not the only fence with the aim of
excluding all mammalian pests present. In the mid-1990s, an independent fencing
company was established in the Waikato: XcluderTM Pest Proof Fence Company
Limited.
XCLUDERTM PEST PROOF FENCE COMPANY
Background
The XcluderTM Pest Proof Fence Company Limited was formed after the
successful design, testing and construction of a prototype pest-proof fence,
surrounding a privately-owned 16 ha valley (part of a property known as
‘Warrenheip’, owned by David and Juliette Wallace) at Karapiro, New Zealand.
Design and testing began in 1996, with the aim of constructing a fence capable of
excluding the entire suite of pest mammals present, including mice (Day &
MacGibbon 2007). An experimental facility was constructed that allowed the
testing of fence designs against mice, ship rats, Norway rats, ferrets, stoats,
hedgehogs, rabbits, possums and cats (Day & MacGibbon 2002; Day &
MacGibbon 2007).
Fence Designs
The first fence component to be tested was wire mesh. Minimum wire mesh size
to be used on a fence is determined by the smallest targeted pest, and a captive
population of wild-caught mice was used to evaluate mesh of different sizes. It
was found that the smallest hole through which a juvenile mouse could pass was
7.1mm x 40mm, so a mesh size of 6mm x 25mm was chosen to provide a safety
margin (Day & MacGibbon 2007). The mesh used in the fence efficacy trials was

Chapter 1: Literature Review
10
marine grade (“316”) welded stainless steel mesh, and this is now standard for
many XcluderTM fences (Day & MacGibbon 2007).
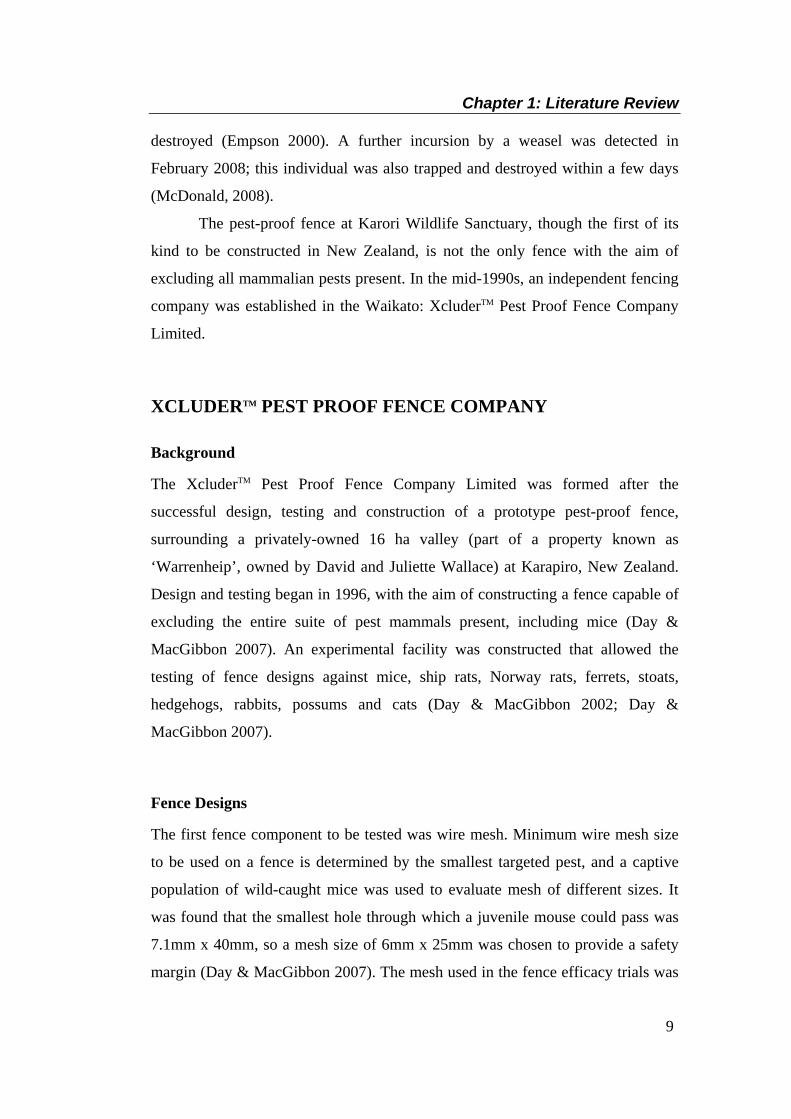
Three main fence designs were tested for efficacy (Fig. 2). All
incorporated a buried mesh ‘skirt’ to defeat digging animals. The first was an
electric fence similar in design to that described by Clapperton and Matthews
(1996), with minor modifications added during experiments (Day & MacGibbon
2002; Day & MacGibbon 2007). Long outriggers, one at 600mm height and one
at the top of the fence, supported 5 wires (3 electric, 2 earth), with an output of 58
pulses per minute at 8500 volts (Day & MacGibbon 2002; Day & MacGibbon
2007).
The second design, now known as the XcluderTM “Tui” fence, was also a
wooden post and wire mesh fence. The design also incorporated flexible plastic
netting, which extended at an angle above the fence, supported by fibreglass rods.
The third design was the XcluderTM “Kiwi” fence, which is now the mainstay of
Xcluder’sTM fence designs. This design includes a folded and rolled Colorsteel®
hood attached to the top (Day & MacGibbon 2002; Day & MacGibbon 2007).
Enclosures were built with the fence design facing inward, and animals were
placed inside in a series of trials to see whether they could escape.
Figure 2. Fence designs built and tested in efficacy trials, by Xcluder Pest Proof Fencing Co. (adapted from Day and MacGibbon, 2007).
Chapter 1: Literature Review
11
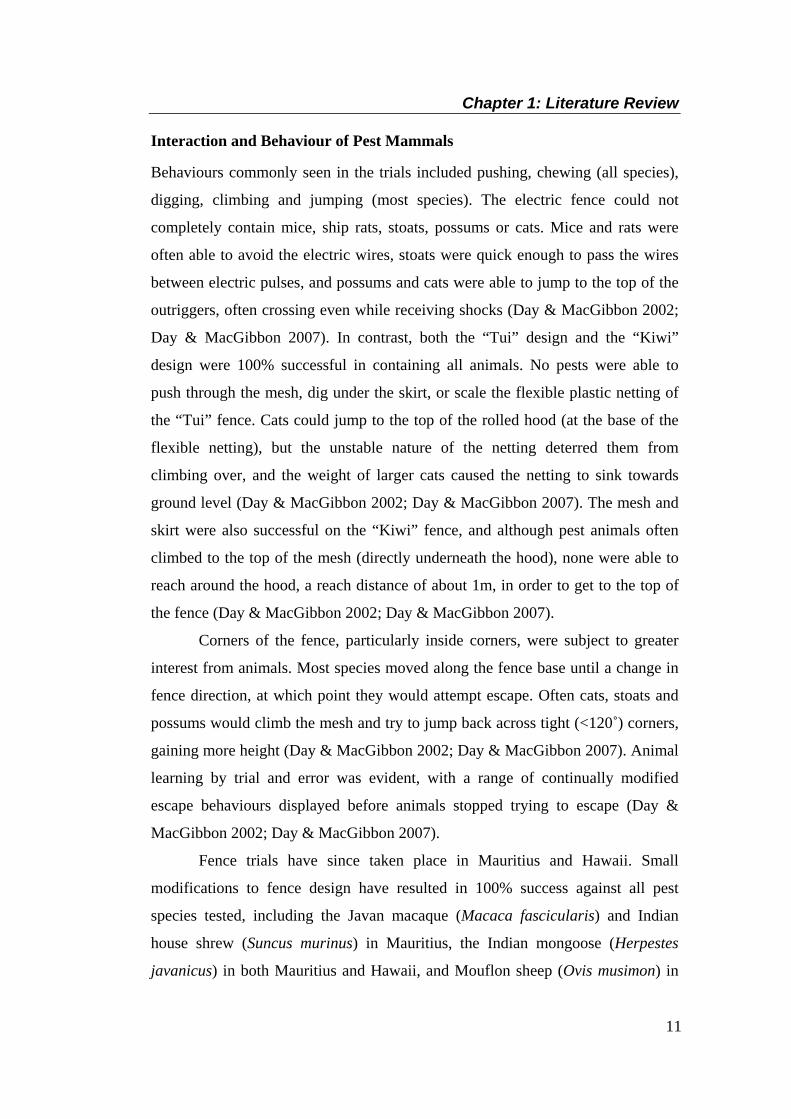
Interaction and Behaviour of Pest Mammals
Behaviours commonly seen in the trials included pushing, chewing (all species),
digging, climbing and jumping (most species). The electric fence could not
completely contain mice, ship rats, stoats, possums or cats. Mice and rats were
often able to avoid the electric wires, stoats were quick enough to pass the wires
between electric pulses, and possums and cats were able to jump to the top of the
outriggers, often crossing even while receiving shocks (Day & MacGibbon 2002;
Day & MacGibbon 2007). In contrast, both the “Tui” design and the “Kiwi”
design were 100% successful in containing all animals. No pests were able to
push through the mesh, dig under the skirt, or scale the flexible plastic netting of
the “Tui” fence. Cats could jump to the top of the rolled hood (at the base of the
flexible netting), but the unstable nature of the netting deterred them from
climbing over, and the weight of larger cats caused the netting to sink towards
ground level (Day & MacGibbon 2002; Day & MacGibbon 2007). The mesh and
skirt were also successful on the “Kiwi” fence, and although pest animals often
climbed to the top of the mesh (directly underneath the hood), none were able to
reach around the hood, a reach distance of about 1m, in order to get to the top of
the fence (Day & MacGibbon 2002; Day & MacGibbon 2007).
Corners of the fence, particularly inside corners, were subject to greater
interest from animals. Most species moved along the fence base until a change in
fence direction, at which point they would attempt escape. Often cats, stoats and
possums would climb the mesh and try to jump back across tight (<120˚) corners,
gaining more height (Day & MacGibbon 2002; Day & MacGibbon 2007). Animal
learning by trial and error was evident, with a range of continually modified
escape behaviours displayed before animals stopped trying to escape (Day &
MacGibbon 2002; Day & MacGibbon 2007).
Fence trials have since taken place in Mauritius and Hawaii. Small
modifications to fence design have resulted in 100% success against all pest
species tested, including the Javan macaque (Macaca fascicularis) and Indian
house shrew (Suncus murinus) in Mauritius, the Indian mongoose (Herpestes
javanicus) in both Mauritius and Hawaii, and Mouflon sheep (Ovis musimon) in
Chapter 1: Literature Review
12
Hawaii (Burgett et al. 2007; Day & MacGibbon 2002; Day & MacGibbon 2007).
These experiments have confirmed that it is possible to completely exclude
multiple pest species with barrier fences, as long as fence integrity is not
compromised. In the eight years since the first XcluderTM fence was erected, no
pest animal has ever been known to cross an intact fence (Day & MacGibbon
2007).
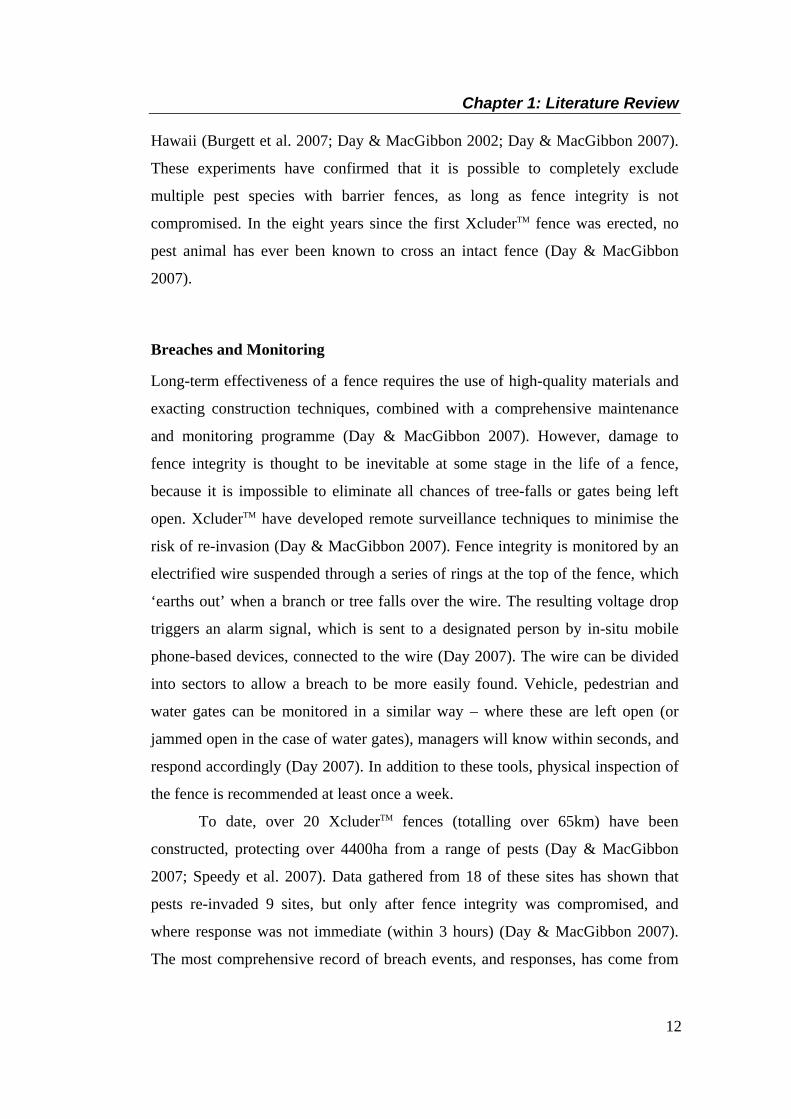
Breaches and Monitoring
Long-term effectiveness of a fence requires the use of high-quality materials and
exacting construction techniques, combined with a comprehensive maintenance
and monitoring programme (Day & MacGibbon 2007). However, damage to
fence integrity is thought to be inevitable at some stage in the life of a fence,
because it is impossible to eliminate all chances of tree-falls or gates being left
open. XcluderTM have developed remote surveillance techniques to minimise the
risk of re-invasion (Day & MacGibbon 2007). Fence integrity is monitored by an
electrified wire suspended through a series of rings at the top of the fence, which
‘earths out’ when a branch or tree falls over the wire. The resulting voltage drop
triggers an alarm signal, which is sent to a designated person by in-situ mobile
phone-based devices, connected to the wire (Day 2007). The wire can be divided
into sectors to allow a breach to be more easily found. Vehicle, pedestrian and
water gates can be monitored in a similar way – where these are left open (or
jammed open in the case of water gates), managers will know within seconds, and
respond accordingly (Day 2007). In addition to these tools, physical inspection of
the fence is recommended at least once a week.
To date, over 20 XcluderTM fences (totalling over 65km) have been
constructed, protecting over 4400ha from a range of pests (Day & MacGibbon
2007; Speedy et al. 2007). Data gathered from 18 of these sites has shown that
pests re-invaded 9 sites, but only after fence integrity was compromised, and
where response was not immediate (within 3 hours) (Day & MacGibbon 2007).
The most comprehensive record of breach events, and responses, has come from

Chapter 1: Literature Review
13
the site with the longest fenceline and the largest area: Maungatautari Ecological
Island, in the Waikato.
MAUNGATAUTARI ECOLOGICAL ISLAND
Background
Mt Maungatautari, an eroded andesitic volcanic cone, lies in the central Waikato,
in the North Island of New Zealand (Clarkson 2002; Speedy et al. 2007). The
mountain supports a dense mixed podocarp-broadleaf forest, covering
approximately 3400ha, and is completely surrounded by farmland (MacGibbon
2001). The majority of the original native fauna present on the mountain is now
absent, and the remaining flora has been intensely browsed for many years
(McQueen 2004). The Maungatautari Ecological Island Trust (MEIT) was formed
in the late 1990s, with the primary goal being to “restore the diversity, vitality and
resilience of the ecosystems of Maungatautari, as close as possible to the original
condition, to re-create self-sustaining communities of indigenous plants and
animals” (McQueen 2004). The restoration project is entirely community-driven,
and was initiated by Trust Chairman David Wallace, following on from the
successful ‘Warrenheip’ experience (T. Day, P. de Monchy pers. comm.).
Pest Species Present at Maungatautari
A vital pre-requisite to achieving the primary goal of the MEIT is the permanent
removal of all mammalian pests. Until the start of restoration, Maungatautari was
home to mammalian pest species commonly seen elsewhere, including fallow
deer (Dama dama), red deer, feral pigs, feral goats, feral cats, possums, feral
ferrets, stoats, weasels, ship rats, mice, rabbits, hares and hedgehogs (McQueen
2004). The MEIT undertook to permanently exclude mammalian pests by
encircling the entire mountain with an XcluderTM ‘Kiwi’ fence, and then
eradicating all 15 pest species within.
Two smaller enclosures were first constructed, as pilots for the main
mountain area. The fences surrounding the 35ha northern enclosure (a 2.8km
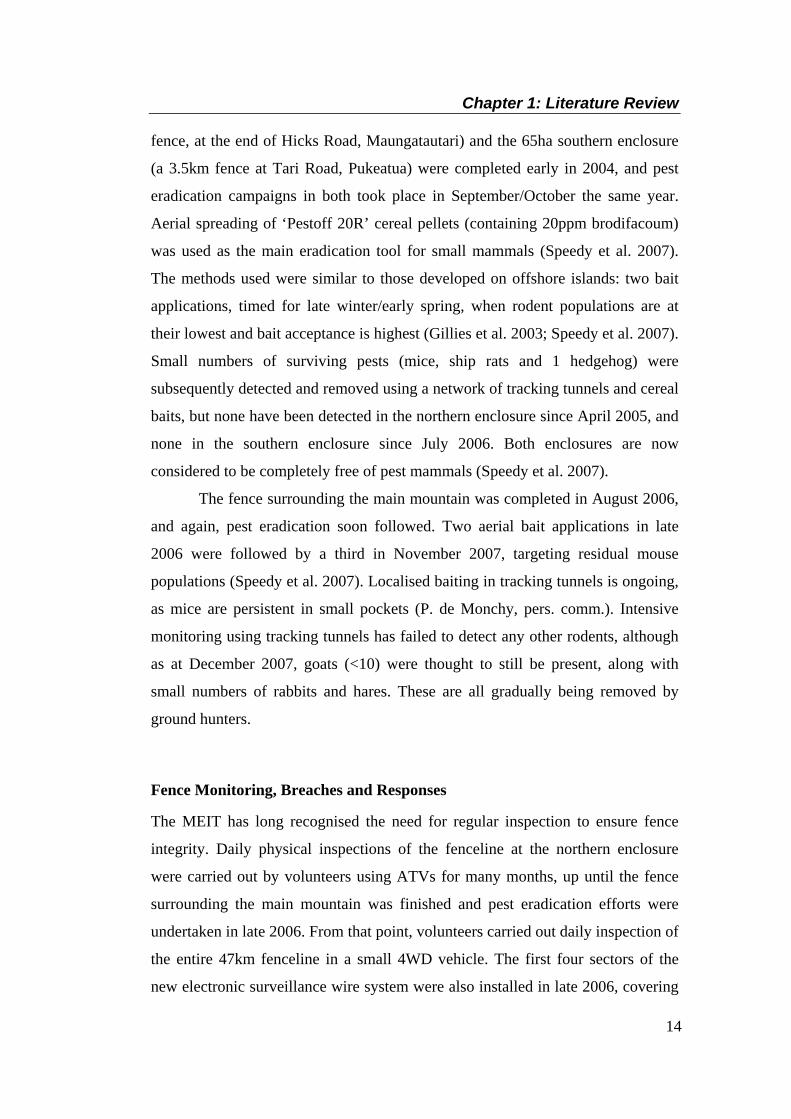
Chapter 1: Literature Review
14
fence, at the end of Hicks Road, Maungatautari) and the 65ha southern enclosure
(a 3.5km fence at Tari Road, Pukeatua) were completed early in 2004, and pest
eradication campaigns in both took place in September/October the same year.
Aerial spreading of ‘Pestoff 20R’ cereal pellets (containing 20ppm brodifacoum)
was used as the main eradication tool for small mammals (Speedy et al. 2007).
The methods used were similar to those developed on offshore islands: two bait
applications, timed for late winter/early spring, when rodent populations are at
their lowest and bait acceptance is highest (Gillies et al. 2003; Speedy et al. 2007).
Small numbers of surviving pests (mice, ship rats and 1 hedgehog) were
subsequently detected and removed using a network of tracking tunnels and cereal
baits, but none have been detected in the northern enclosure since April 2005, and
none in the southern enclosure since July 2006. Both enclosures are now
considered to be completely free of pest mammals (Speedy et al. 2007).
The fence surrounding the main mountain was completed in August 2006,
and again, pest eradication soon followed. Two aerial bait applications in late
2006 were followed by a third in November 2007, targeting residual mouse
populations (Speedy et al. 2007). Localised baiting in tracking tunnels is ongoing,
as mice are persistent in small pockets (P. de Monchy, pers. comm.). Intensive
monitoring using tracking tunnels has failed to detect any other rodents, although
as at December 2007, goats (<10) were thought to still be present, along with
small numbers of rabbits and hares. These are all gradually being removed by
ground hunters.
Fence Monitoring, Breaches and Responses
The MEIT has long recognised the need for regular inspection to ensure fence
integrity. Daily physical inspections of the fenceline at the northern enclosure
were carried out by volunteers using ATVs for many months, up until the fence
surrounding the main mountain was finished and pest eradication efforts were
undertaken in late 2006. From that point, volunteers carried out daily inspection of
the entire 47km fenceline in a small 4WD vehicle. The first four sectors of the
new electronic surveillance wire system were also installed in late 2006, covering

Chapter 1: Literature Review
15
the eastern side of the mountain, and by May 2007 this system was completed
around the whole fenceline. By this time track conditions prevented even 4WD
vehicles from circumnavigating the reserve, and with the new surveillance system
complete, daily inspections were discontinued. At present, the remote surveillance
system (comprised of the surveillance wire and vehicle, pedestrian and water gate
alarms) is supplemented by physical inspection by staff twice per week in the
winter, and once per week in the summer. Recently this has been augmented by
volunteers who have each ‘claimed’ one fence sector, which they carefully inspect
by walking, once per month. 17 out of 20 fence sectors are inspected in this way
and it is anticipated that all 20 will be ‘claimed’ in time (P. de Monchy pers.
comm.).
Currently, the Trust aims to get to the physical location of any breach
within 90 minutes. Response to a breach begins with notification from the remote
surveillance system (or a telephone call from a landowner) being received by a
manager, by cellular telephone. The manager will then contact the appropriate
person to inspect the breach, usually a Trust employee. Often, the problem turns
out to be no more serious than a tree-fern frond leaning on the inside of the alarm
wire after a period of high winds, which is easily removed. If extensive repairs are
necessary (e.g. after a large tree-fall) the employee will call for assistance and
return with appropriate equipment. If the breach occurs during daylight hours,
XcluderTM Pest Proof Fence Company can dispatch a repair crew within minutes
to effect repairs. However, should a breach occur late at night, it may be necessary
to erect a temporary fence until the morning. This consists of a length of
vertically-mounted plastic netting that is erected across the breach (once any
obstructions are cleared), and is attached to the intact fence ends. It is hoped that
filling the gap created by a treefall will prevent animals exploiting a hole before
more permanent repairs are completed the following day (T. Day, P. de Monchy
pers. comm.). This system has so far worked very well, and no invasion has been
detected provided the team responded within 3 hours.
In the 16 months to date of writing since completion of the main fence,
there have been at least 12 significant breach events (Day & MacGibbon 2007, P.
de Monchy pers. comm.). Of these, only three are known to have resulted in re-

Chapter 1: Literature Review
16
invasion by pest mammals, all by rodents and only where response time was
greater than 3 hours (Speedy et al, 2007). At all sites, once the fence damage was
repaired, a concentrated grid of tracking tunnels (including ink-cards and cereal-
based brodifacoum pellets) was installed around the inside of the breach area to
detect and destroy any potential invaders. Tunnels were checked regularly and in
all cases, tracking ceased after a short period of time, indicating that eradication of
the invader(s) had been successful (Speedy et al, 2007; P. de Monchy pers.
comm.).
MAMMALIAN PEST BEHAVIOUR IN RELATION TO
FENCED RESERVES
Linear Habitat Features
The effects of linear obstacles, particularly roads, on the ecology of nearby
animals have been extensively studied (Spellerberg 1998). Roads have been found
to inhibit movements of some forest mammals, regardless of traffic flow or road
surface type (Burnett 1992; Oxley et al. 1974). However, road-edge habitat may
also attract some animals. Mouse density in Pureora forest (North Island, New
Zealand) was found to be greater at the road edge than the forest interior (King et
al. 1996), and other rodent species (including ship rats) have also been found to
occupy road edges in greater density than in the surrounding habitat (Adams &
Geis 1983; Delgado et al. 2001; Garland & Bradley 1984; Meunier et al. 1999).
Cane toads (Bufo marinus) and microtine rodents have used roads and grassy
road-edges respectively as routes for dispersal into areas where they were
previously unknown (Getz et al. 1978; Seabrook & Dettmann 1996). Both
domestic and feral cats are known to spend a high proportion of time along linear
habitat features such as roads, waterways and field edges (Fitzgerald & Karl 1986;
Warner 1985), as are other predators such as ferrets, stoats (Alterio et al. 1998;
Dilks et al. 1996; Murphy & Dowding 1994; Ragg & Clapperton 2004; Ragg &
Moller 2000) and weasels (King et al. 1996a; King et al. 1996b).
Chapter 1: Literature Review
17
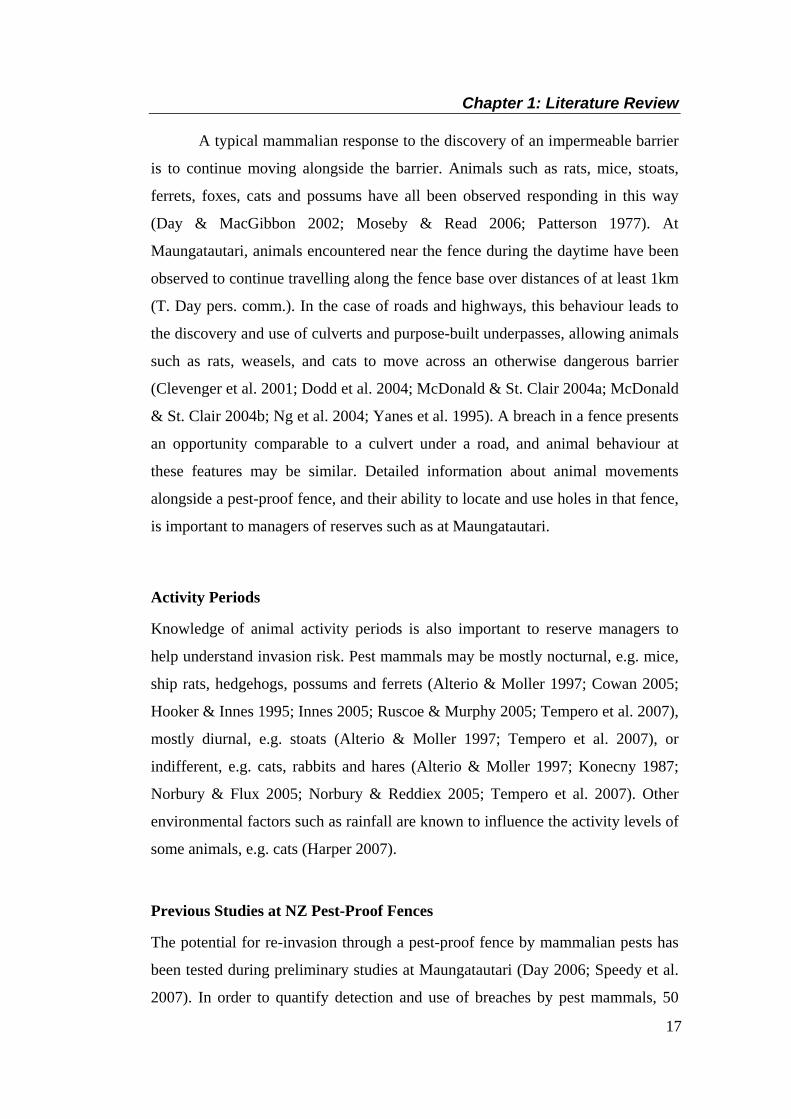
A typical mammalian response to the discovery of an impermeable barrier
is to continue moving alongside the barrier. Animals such as rats, mice, stoats,
ferrets, foxes, cats and possums have all been observed responding in this way
(Day & MacGibbon 2002; Moseby & Read 2006; Patterson 1977). At
Maungatautari, animals encountered near the fence during the daytime have been
observed to continue travelling along the fence base over distances of at least 1km
(T. Day pers. comm.). In the case of roads and highways, this behaviour leads to
the discovery and use of culverts and purpose-built underpasses, allowing animals
such as rats, weasels, and cats to move across an otherwise dangerous barrier
(Clevenger et al. 2001; Dodd et al. 2004; McDonald & St. Clair 2004a; McDonald
& St. Clair 2004b; Ng et al. 2004; Yanes et al. 1995). A breach in a fence presents
an opportunity comparable to a culvert under a road, and animal behaviour at
these features may be similar. Detailed information about animal movements
alongside a pest-proof fence, and their ability to locate and use holes in that fence,
is important to managers of reserves such as at Maungatautari.
Activity Periods
Knowledge of animal activity periods is also important to reserve managers to
help understand invasion risk. Pest mammals may be mostly nocturnal, e.g. mice,
ship rats, hedgehogs, possums and ferrets (Alterio & Moller 1997; Cowan 2005;
Hooker & Innes 1995; Innes 2005; Ruscoe & Murphy 2005; Tempero et al. 2007),
mostly diurnal, e.g. stoats (Alterio & Moller 1997; Tempero et al. 2007), or
indifferent, e.g. cats, rabbits and hares (Alterio & Moller 1997; Konecny 1987;
Norbury & Flux 2005; Norbury & Reddiex 2005; Tempero et al. 2007). Other
environmental factors such as rainfall are known to influence the activity levels of
some animals, e.g. cats (Harper 2007).
Previous Studies at NZ Pest-Proof Fences
The potential for re-invasion through a pest-proof fence by mammalian pests has
been tested during preliminary studies at Maungatautari (Day 2006; Speedy et al.
2007). In order to quantify detection and use of breaches by pest mammals, 50

Chapter 1: Literature Review
18
experimental breaches (holes and ramps) were created along a 10km section of the
fence. Ink tracking-cards were placed at each breach, and remained over a period
of four weeks. Within the first 24 hours, 8% of breaches had been used, and after
three days, this had risen to 22%. A total of 71% of breaches were used by the end
of the four week period. Mice and rats used the mesh holes, and possums, cats and
rats used the ramps. Mustelids were observed and trapped along the fenceline
during the experiment, but none were detected at the simulated breaches (Day
2006; Speedy et al. 2007).
A related experiment investigated the behaviour of an invading ship rat in
a simulated invasion event at a fenced reserve. Six individual male rats were
sequentially live-trapped alongside the pest-proof fence, fitted with radio-collars,
and then released at point of capture into the southern exclosure at Maungatautari.
Only one rat was present at any time within the exclosure. Two of the six died
after eating brodifacoum bait laid for mice, one after 31 days inside the exclosure.
The remaining four climbed out of the exclosure within 7 days of release. The rats
travelled up to 1km from the point of release, but usually stayed within 100m of
their release point for the first three days. This suggests that a quick breach
response and intensive targeting of rodents close to the point of entry is desirable
(Speedy et al. 2007). The experiment was intended to be the first of a series that
will further investigate the behaviour of invading ship rats, with other possible
scenarios including female invaders, multiple invaders and alternative species (J.
Innes pers. comm.).
Importance of Increasing Knowledge of Pest Activity and Behaviour
The MEIT currently attempts to physically respond to a breach within 90 minutes
of the breach happening. However, there may be times when this is not possible,
e.g. where weather and track conditions make a night response dangerous.
Knowledge of pest activity and behaviour at the fence may allow fence managers
to answer the question “Can we reliably find and fix a potential breach before a
pest finds and uses it?” Understanding which mammalian pest species are most
likely to locate and enter a breach, and how quickly they may do so, will assist in

Chapter 1: Literature Review
19
the development of optimal breach response procedures, and minimise invasion
risk. For the purposes of this thesis, the term “risk” refers to the potential for a
pest mammal to encounter and exploit a fence breach. In order to quantify the
risks posed by potential invaders, it is necessary to gather data through research.
AIMS AND STRUCTURE
The purpose of this thesis is to provide baseline data for future studies by
assessing the potential for reinvasion by pest mammals through the pest-proof
fence at Maungatautari Ecological Island. My main aims were to:
1. Describe baseline data on activity levels and behaviour of mammalian
pests directly adjacent to the pest-proof fence;
2. Test for the effects of exterior habitat type, breach type and season on
mammalian pest activity levels directly at the fence;
3. Determine how quickly pest mammals may locate a fence breach, and how
likely they are to exploit it; and
4. Develop a predictive model that may be used to help assess the risk of re-
invasion if response to a fence breach is delayed.
The thesis is structured as follows: Chapter 1 reviews and describes literature on the progress made in recent
decades in methods of eradicating mammalian pests from New Zealand’s offshore
islands, the limited application of these methods on the mainland, and the design
and testing of fences (both electric and physical barrier fences) as tools to exclude
mammals from mainland sites. Relevant background information is provided for
Maungatautari Ecological Island, and XcluderTM Pest Proof Fencing Ltd.
Chapter 2 describes data gathered at Maungatautari with respect to pest
mammal presence, number of sightings for each species, and the effects of 3
Chapter 1: Literature Review
20
factors (season, habitat type and breach type) on numbers of sightings. Timing of
pest sightings is also described, as are sightings of mammals within the fence
hood. A descriptive probability model is presented that calculates the cumulative
probability of at least 1 pest mammal encountering a simulated breach within 24
hours.
Chapter 3 examines the behaviour of mammalian pests that were sighted
during the study described in Chapter 2. Particular attention is paid to pest
behaviour in relation to the simulated breaches: whether they appear to show
interest in and/or enter the breach, or show no interest at all. The rate at which
simulated breaches are encountered by at least one pest mammal (and whether
interest is shown) is described, and general observations are made on the
behavioural traits each species commonly exhibited.
Chapter 4, the final chapter, discusses the conclusions on the number and
timing of pest sightings, probability of encounter and behaviour of mammalian
pests at simulated breaches. The significance of these results and the implications
for management of the reserve are discussed, and recommendations are made for
response to fence breaches, and directions of future research.
Chapters 2 and 3 in this thesis have been written as stand-alone
manuscripts, each including an abstract, full introduction, methods, results,
discussion and references relevant to that chapter. While this means that some
content (particularly introductory and methodology material) is repeated in each
of those chapters, it will significantly aid the future publication of this research in
peer-reviewed journals.
Chapter 1: Literature Review
21
REFERENCES
Adams LW, Geis AD 1983. Effects of roads on small mammals. Journal of
Applied Ecology 20: 403-415.
Alterio N, Moller H 1997. Daily activity of stoats (Mustela erminea), feral ferrets (Mustela furo) and feral house cats (Felis catus) in coastal grassland, Otago Peninsula, New Zealand. New Zealand Journal of Ecology 21(1): 89-95.
Alterio N, Moller H, Ratz H 1998. Movements and habitat use of feral house cats Felis catus, stoats Mustela erminea and ferrets Mustela furo, in grassland surrounding Yellow-eyed penguin Megadyptes antipodes breeding areas in spring. Biological Conservation 83(2): 187-194.
Aviss M, Roberts A 1994. Pest Fences: Notes and Comments. Threatened Species Occassional Publication No. 5. Wellington, Department of Conservation.
Brown KP, Sherley GH 2002. The eradication of possums from Kapiti Island, New Zealand. In: Veitch CR, Clout MN eds. Turning the Tide: The Eradication of Invasive Species. IUCN SSC Invasive Species Specialist Group. IUCN, Gland, Switzerland and Cambridge, UK. Pp. 46-52.
Burgett J, Day TD, Day KE, Pitt W, Sugihara R 2007. From Mice to Mouflon: Development and Test of a Complete Mammalian Pest Barrier for Hawai'i. Proceedings of the 15th Annual Hawaii Conservation Conference - Conservation Strategies: Matching Science and Management, Honolulu.
Burnett SE 1992. Effects of a Rainforest Road on Movements of Small Mammals: Mechanisms and Implications. Wildlife Research 19: 95-104.
Campbell-Hunt D 2002. Developing a Sanctuary - The Karori Experience. Wellington, Victoria Link Ltd.
Clapperton BK, Day TD 2001. Cost-effectiveness of exclusion fencing for stoat and other pest control compared with conventional control. DoC Science Internal Series. Wellington, Department of Conservation.
Clapperton BK, Matthews LR 1996. Trials of electric fencing for restricting the movements of common brushtail possums, Trichosurus vulpecula. Wildlife Reasearch 23: 571-579.
Clarkson BD 2002. Upland forests and special open habitats. In: Clarkson B, Merrett M, Downs T eds. Botany of the Waikato. Hamilton, Waikato Botanical Society Inc. Pp. 82-91.

Chapter 1: Literature Review
22
Clevenger AP, Chruszcz B, Gunson K 2001. Drainage culverts as habitat linkages and factors affecting passage by mammals. Journal of Applied Ecology 38: 1340-1349.
Cowan PE 1992. The eradication of introduced Australian brushtail possums, Trichosurus vulpecula, from Kapiti Island, a New Zealand nature reserve. Biological Conservation 61: 217-226.
Cowan PE 2005. Brushtail possum. In: King CM ed. The Handbook of New Zealand Mammals. Melbourne, Oxford University Press. Pp. 56-80.
Cowan PE, Rhodes DS 1992. Restricting the Movements of Brushtail Possums (Trichosurus vulpecula) on Farmland with Electric Fencing. Wildlife Research 19: 47-58.
Cromarty PL, Broome KG, Cox A, Empson RA, Hutchinson WM, McFadden I 2002. Eradication planning for invasive alien animal species on islands - the approach developed by the New Zealand Department of Conservation. In: Veitch CR, Clout MN eds. Turning the Tide: The Eradication of Invasive Species. IUCN SSC Invasive Species Specialist Group. IUCN, Gland, Switzerland and Cambridge, UK. Pp. 85-91.
Day TD 2006. Understanding and mitigating reinvasion risk at fenced sanctuaries. Proceedings of the Sanctuaries of New Zealand 2006 Annual Workshop, Kawhia.
Day TD 2007. Remote Surveillance - 24hr live monitoring. Xclude it! (3). Cambridge, XcluderTM Pest Proof Fencing Company.
Day TD, Flight KE 2002. Evaluation of the efficacy of the North Cape fence as a possum barrier. XcluderTM Pest Proof Fencing Company contract report to the Department of Conservation.
Day TD, MacGibbon RJ 2002. Escape behaviour and physical abilities of vertebrate pests towards electrified and non-electrified fences. XcluderTM Pest Proof Fencing Company unpublished internal report.
Day TD, MacGibbon RJ 2007. Multiple-species exclusion fencing and technology for mainland sites. Proceedings of the Managing Vertebrate Invasive Species International Symposium, Colorado.
Delgado JD, Arévalo JR, Fernández-Palacios J 2001. Road and topography effects on invasion: edge effects in rat foraging patterns in two oceanic island forests (Tenerife, Canary Islands). Ecography 24: 539-546.
Dilks PJ, O'Donnell CFJ, Elliott GP, Phillipson SM 1996. The effect of bait type, tunnel design, and trap position on stoat control operations for conservation management. New Zealand Journal of Zoology 23: 295-306.

Chapter 1: Literature Review
23
Dingwall PR, Atkinson IAE, Hay C eds. 1978. Proceedings of the Ecology and Control of Rodents in New Zealand Nature Reserves Symposium. Wellington, DSIR Information Series No. 4.
Dodd CK, Barichivich WJ, Smith LL 2004. Effectiveness of a barrier wall and culverts in reducing wildlife mortality on a heavily traveled highway in Florida. Biological Conservation 118: 619-631.
Empson RA 2000. Eradication of pests from Karori Wildlife Sanctuary: a brief summary. Proceedings of the Mainland Island Hui, St. Arnaud.
Empson RA, Miskelly CM 1999. The risks, costs and benefits of using brodifacoum to eradicate rats from Kapiti Island, New Zealand. New Zealand Journal of Ecology 23(2): 241-254.
Fitzgerald BM, Karl BJ 1986. Home range of feral house cats (Felis catus L.) in forest of the Orongorongo Valley, Wellington, New Zealand. New Zealand Journal of Ecology 9: 71-81.
Forster JA 1975. Electric fencing to protect sandwich terns against foxes. Biological Conservation 7: 85.
Garland T, Bradley WG 1984. Effects of a Highway on Mojave Desert Rodent Populations. The American Midland Naturalist 111(1): 47-56.
Getz LL, Cole FR, Gates DL 1978. Interstate roadsides as dispersal routes for Microtus pennsylvanicus. Journal of Mammalogy 59(1): 208-213.
Gillies C, Campbell J, Marsh N, Gembitsky M 2003. Seasonal differences in bait acceptance by forest dwelling rats following simulated aerial 1080 possum control operations in New Zealand: interim results. In: Singleton GR, Hinds LA, Krebs CJ, Spratt DM eds. Rats, mice and people: rodent biology and management. Canberra, Australian Centre for International Agricultural Research. Pp. 343-345.
Harper GA 2007. Habitat selection of feral cats (Felis catus) on a temperate, forested island. Austral Ecology 32: 305-314.
Hogg AG, Higham TFG, Lowe DJ, Palmer PJR, Newnham RM 2003. A wiggle-match date for Polynesian settlement of New Zealand. Antiquity 77: 116-125.
Hone J, Atkinson B 1983. Evaluation of Fencing to Control Feral Pig Movement. Australian Wildlife Research 10: 499-505.
Hooker S, Innes J 1995. Ranging behaviour of forest-dwelling ship rats, Rattus rattus, and effects of poisoning with brodifacoum. New Zealand Journal of Zoology 22: 291-304.

Chapter 1: Literature Review
24
Innes J 2005. Ship Rat. In: King CM ed. The Handbook of New Zealand Mammals. Melbourne, Oxford University Press. Pp. 187-203.
Innes J, Hay R, Flux M, Bradfield P, Speed H, Jansen P 1999. Successful recovery of North Island kokako Callaeas cinerea wilsoni populations, by adaptive management. Biological Conservation 87: 201-214.
Jackson DB 2001. Experimental removal of introduced hedgehogs improves wader nest success in the Western Isles, Scotland. Journal of Applied Ecology 38: 802-812.
Karori Reservoir Wildlife Sanctuary Steering Committee 1994. Feasability Report on the Native Wildlife Sanctuary Proposal for Karori Reservoir. Wellington: Karori Reservoir Wildlife Sanctuary Steering Committee.
Karori Wildlife Sanctuary Trust 1997a. Karori Wildlife Sanctuary Annual Report. Wellington, Karori Wildlife Sanctuary Trust.
Karori Wildlife Sanctuary Trust 1997b. Karori Wildlife Sanctuary Management Plan. Wellington: Karori Wildlife Sanctuary Trust.
Karori Wildlife Sanctuary Trust 1999. Karori Wildlife Sanctuary Annual Report. Wellington, Karori Wildlife Sanctuary Trust.
Karori Wildlife Sanctuary Trust 2000. Karori Wildlife Sanctuary Annual Report. Wellington, Karori Wildlife Sanctuary Trust.
Karori Wildlife Sanctuary Trust 2001. Karori Wildlife Sanctuary Annual Report. Wellington, Karori Wildlife Sanctuary Trust.
King CM ed. 2005. The Handbook of New Zealand Mammals. 2nd ed. Melbourne, Oxford University Press.
King CM, Flux M, Innes JG, Fitzgerald BM 1996a. Population biology of small mammals in Pureora Forest Park: 1. Carnivores (Mustela erminea, M. furo, M. nivalis, and Felis catus). New Zealand Journal of Ecology 20(2): 241-251.
King CM, Innes JG, Flux M, Kimberley MO, Leathwick JR, Williams DS 1996b. Distribution and abundance of small mammals in relation to habitat in Pureora Forest Park. New Zealand Journal of Ecology 20(2): 215-240.
King CM, Innes JG, Kimberley MO 1996. Population biology of small mammals in Pureora Forest Park: 2. The feral house mouse (Mus musculus). New Zealand Journal of Ecology 20(2): 253-269.
Konecny MJ 1987. Home range and activity patterns of feral house cats in the Galapagos Islands. Oikos 50: 17-23.

Chapter 1: Literature Review
25
Long K, Robley A. 2004. Cost Effective Feral Animal Exclusion Fencing for Areas of High Conservation Value in Australia. Melbourne, Natural Heritage Trust.
MacGibbon RJ 2001. Maungatautari Ecological Restoration Project Plan. Taupo, Natural Logic Ltd.
McClelland PJ 2002. Eradication of Pacific rats (Rattus exulans) from Whenua Hou Nature Reserve (Codfish Island), Putauhini and Rarotoka Islands, New Zealand. In: Veitch CR, clout MN eds. Turning the Tide: The Eradication of Invasive Species. IUCN SSC Invasive Species Specialist Group. IUCN, Gland, Switzerland and Cambridge, UK. Pp. 173-181.
McDonald G 2008. Sanctuary captures a gatecrasher. In: The Dominion Post, 23 February 2008. Wellington. P.3.
McDonald WR, St. Clair CC 2004a. The effects of artificial and natural barriers on the movement of small mammals in Banff National Park, Canada. Oikos 105: 397-407.
McDonald WR, St. Clair CC 2004b. Elements that promote highway crossing structure use by small mammals in Banff National Park. Journal of Applied Ecology 41: 82-93.
McKillop IG, Butt P, Lill J, Pepper HW, Wilson CJ 1998. Long-term cost effectiveness of fences to manage European wild rabbits. Crop Protection 17(5): 393-400.
McKillop IG, Silby RM 1988. Animal behaviour at electric fences and the implications for management. Mammal Review 18: 91-103.
McKillop IG, Wilson CJ 1987. Effectiveness of fences to exclude European rabbits from crops. Wildlife Society Bulletin 15(3): 394-401.
McKillop IG, Wilson CJ 1999. The behaviour of free-living European wild rabbits at electric fences. Crop Protection 18: 193-197.
McKnight TL 1969. Barrier fencing for vermin control in Australia. Geographical Review 59(3): 330-347.
McQueen J ed. 2004. An Ecological Restoration Plan for Maungatautari. Cambridge, Maungatautari Ecological Island Trust.
Meunier FD, Corbin J, Verheyden C, Jouventin P 1999. Effects of landscape type and extensive management on use of motorway roadsides by small mammals. Canadian Journal of Zoology 77: 108-117.
Chapter 1: Literature Review
26
Moors PJ 1985. Norway rats (Rattus norvegicus) on the Noises and Motukawao Islands, Hauraki Gulf, New Zealand. New Zealand Journal of Ecology 8: 37-54.
Moseby KE, Read JL 2006. The efficacy of feral cat, fox and rabbit exclusion fence designs for threatened species protection. Biological Conservation 127: 429-437.
Murphy EC, Dowding JE 1994. Range and diet of stoats (Mustela erminea) in a New Zealand beech forest. New Zealand Journal of Ecology 18(1): 11-18.
Ng SJ, Dole JW, Sauvajot RM, Riley SPD, Valone TJ 2004. Use of highway undercrossings by wildlife in Southern California. Biological Conservation 115: 499-507.
Norbury GL, Flux JEC 2005. Brown hare. In: King CM ed. The Handbook of New Zealand Mammals. Melbourne, Oxford University Press. Pp. 151-158.
Norbury GL, Reddiex B 2005. European rabbit. In: King CM ed. The Handbook of New Zealand Mammals. Melbourne, Oxford University Press. Pp. 131-150.
Oxley DJ, Fenton MB, Carmody GR 1974. The effects of roads on populations of small mammals. The Journal of Applied Ecology 11(1): 51-59.
Parkes J, Murphy EC 2003. Management of introduced mammals in New Zealand. New Zealand Journal of Zoology 30: 335-359.
Parkes JP 1990. Eradication of feral goats on islands and habitat islands. Journal of the Royal Society of New Zealand 20(3): 297-304.
Patterson IJ 1977. The control of fox movement by electric fencing. Biological Conservation 11: 267-278.
Poole DW, McKillop IG 1999. Comparison of the effectiveness of two types of electric fences to exclude badgers. Crop Protection 18: 61-66.
Poole DW, McKillop IG 2002. Effectiveness of two types of electric fence for excluding the Red Fox (Vulpes vulpes). Mammal Review 32(1): 51-57.
Powlesland RG, Roberts A, Lloyd BD, Merton DV 1995. Number, fate, and distribution of kakapo (Strigops habroptilus) found on Stewart Island, New Zealand, 1979-92. New Zealand Journal of Zoology 22: 239-248.
Ragg JR, Clapperton BK 2004. Ferret Control Manual. Wellington, Animal Health Board.

Chapter 1: Literature Review
27
Ragg JR, Moller H 2000. Microhabitat selection by feral ferrets (Mustela furo) in a pastoral habitat, East Otago, New Zealand. New Zealand Journal of Ecology 24(1): 39-46.
Robley A, Purdey D, Johnston M, Lindeman M, Busana F, Long K 2007. Experimental trials to determine effective fence designs for feral Cat and Fox exclusion. Ecological Management and Restoration 8(3): 193-198.
Ruscoe WA, Murphy EC 2005. House mouse. In: King CM ed. The Handbook of New Zealand Mammals. Melbourne, Oxford University Press. Pp. 204-221.
Sanders M, Brown KP, Keedwell RJ 2007. Testing the effects of a predator-exclusion fence on predator abundance and wetland bird breeding success at Ruataniwha wetlands, Twizel. Christchurch, Department of Conservation.
Saunders A 2000. A review of Department of Conservation mainland restoration projects and recommendations for further action. Wellington, Department of Conservation.
Saunders A, Norton DA 2001. Ecological restoration at Mainland Islands in New Zealand. Biological Conservation 99: 109-119.
Seabrook WA, Dettmann EB 1996. Roads as activity corridors for cane toads in Australia. Journal of Wildlife Management 60(2): 363-368.
Speedy C, Day TD, Innes J 2007. Pest eradication technology - the critical partner to pest exclusion technology: The Maungatautari experience. Proceedings of the Managing Vertebrate Invasive Species International Symposium, Colorado.
Spellerberg IF 1998. Ecological effects of roads and traffic: a literature review. Global Ecology and Biogeography Letters 7: 317-333.
Taylor RH, Thomas BW 1989. Eradication of Norway rats (Rattus norvegicus) from Hawea Island, Fiordland, using brodifacoum. New Zealand Journal of Ecology 12: 23-32.
Taylor RH, Thomas BW 1993. Rats eradicated from rugged Breaksea Island (170Ha), Fiordland, New Zealand. Biological Conservation 65: 191-198.
Tempero GW, McDonald RM, King CM 2007. Distribution and activity of small mammals on pastoral farmland and forest in New Zealand. Wildlife Biology in Practice 3(2): 43-51.
Chapter 1: Literature Review
28
Thomas BW, Taylor RH 2002. A history of ground-based rodent eradication techniques developed in New Zealand, 1959-1993. In: Veitch CR, Clout MN eds. Turning the tide: the eradication of invasive species. IUCN SSC Invasive Species Specialist Group. Gland, Switzerland and Cambridge, UK, IUCN. Pp. 301-310.
Towns DR, Broome KG 2003. From small Maria to massive Campbell: forty years of rat eradications from New Zealand islands. New Zealand Journal of Zoology 30: 377-398.
Veitch CR 2001. The eradication of feral cats (Felis catus) from Little Barrier Island, New Zealand. New Zealand Journal of Zoology 28: 1-12.
Veitch CR, Bell BD 1990. Eradication of introduced animals from the islands of New Zealand. In: Towns DR, Daugherty CH, Atkinson IAE eds. Ecological restoration of New Zealand islands. Wellington, Department of Conservation.
Warner RE 1985. Demography and movements of free-ranging domestic cats in rural Illinois. Journal of Wildlife Management 49(2): 340-346.
Yanes M, Velasco JM, Suarez F 1995. Permeability of roads and railways to vertebrates: the importance of culverts. Biological Conservation 71: 217-222.
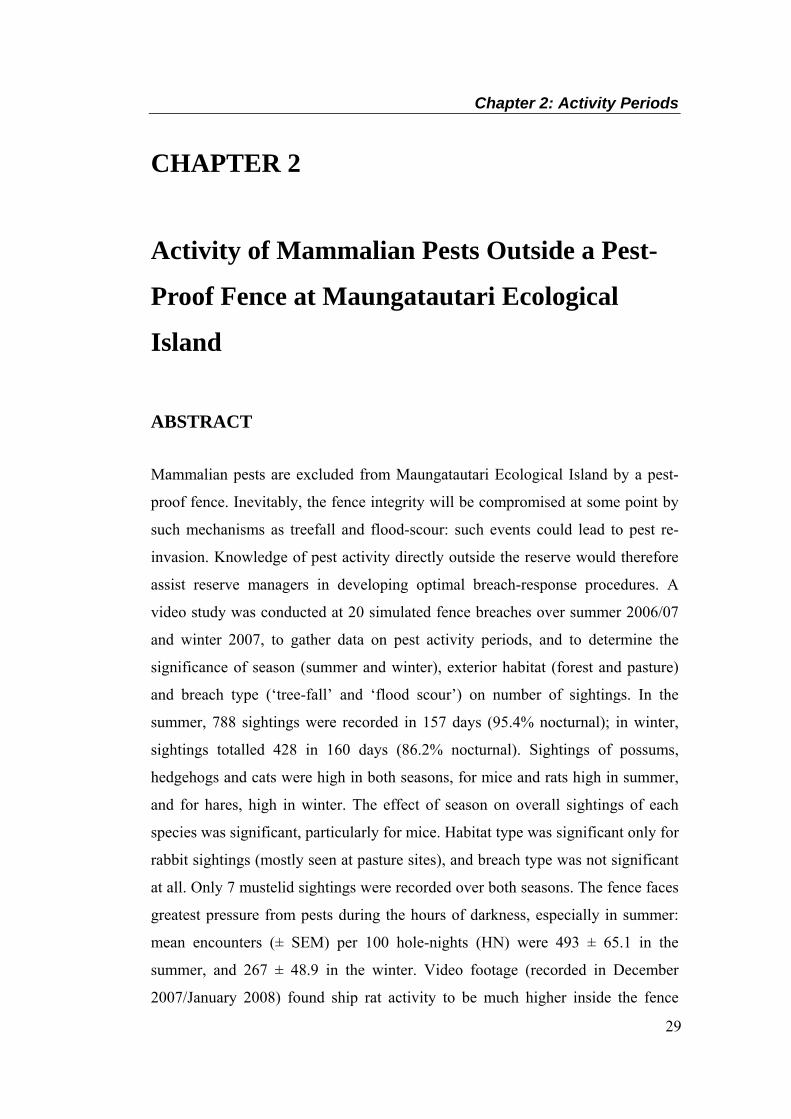
Chapter 2: Activity Periods
29
CHAPTER 2
Activity of Mammalian Pests Outside a Pest-
Proof Fence at Maungatautari Ecological
Island
ABSTRACT
Mammalian pests are excluded from Maungatautari Ecological Island by a pest-
proof fence. Inevitably, the fence integrity will be compromised at some point by
such mechanisms as treefall and flood-scour: such events could lead to pest re-
invasion. Knowledge of pest activity directly outside the reserve would therefore
assist reserve managers in developing optimal breach-response procedures. A
video study was conducted at 20 simulated fence breaches over summer 2006/07
and winter 2007, to gather data on pest activity periods, and to determine the
significance of season (summer and winter), exterior habitat (forest and pasture)
and breach type (‘tree-fall’ and ‘flood scour’) on number of sightings. In the
summer, 788 sightings were recorded in 157 days (95.4% nocturnal); in winter,
sightings totalled 428 in 160 days (86.2% nocturnal). Sightings of possums,
hedgehogs and cats were high in both seasons, for mice and rats high in summer,
and for hares, high in winter. The effect of season on overall sightings of each
species was significant, particularly for mice. Habitat type was significant only for
rabbit sightings (mostly seen at pasture sites), and breach type was not significant
at all. Only 7 mustelid sightings were recorded over both seasons. The fence faces
greatest pressure from pests during the hours of darkness, especially in summer:
mean encounters (± SEM) per 100 hole-nights (HN) were 493 ± 65.1 in the
summer, and 267 ± 48.9 in the winter. Video footage (recorded in December
2007/January 2008) found ship rat activity to be much higher inside the fence
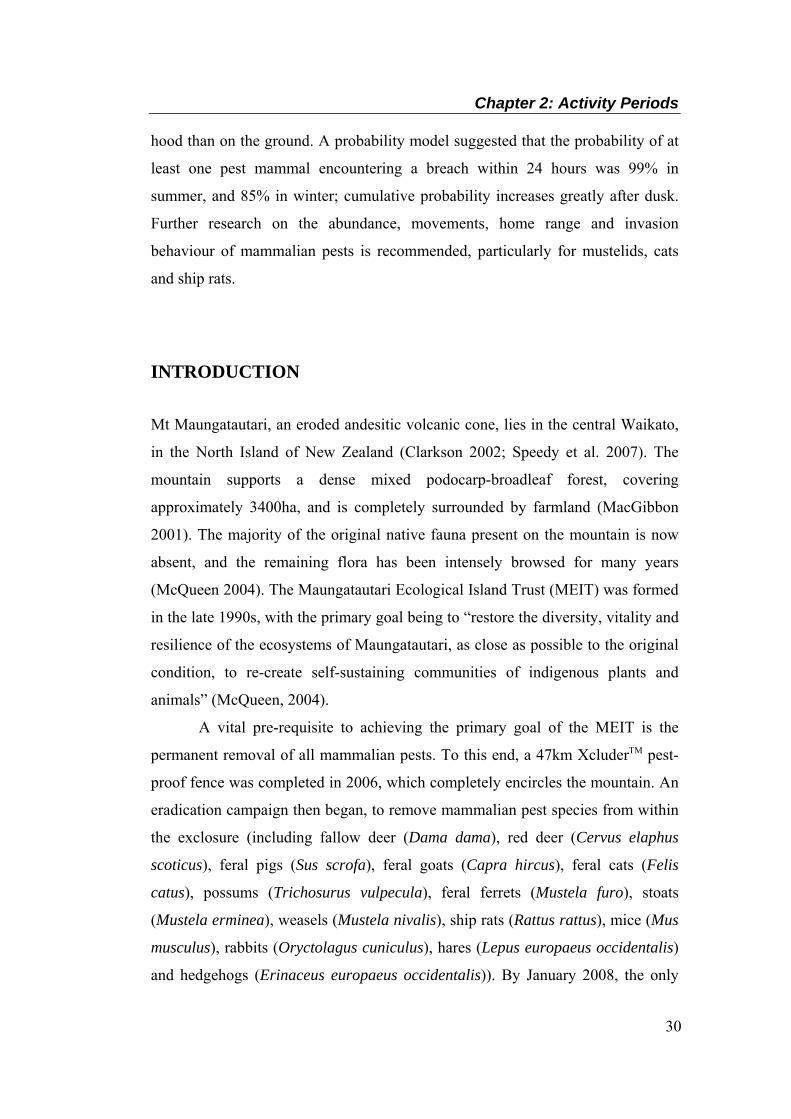
Chapter 2: Activity Periods
30
hood than on the ground. A probability model suggested that the probability of at
least one pest mammal encountering a breach within 24 hours was 99% in
summer, and 85% in winter; cumulative probability increases greatly after dusk.
Further research on the abundance, movements, home range and invasion
behaviour of mammalian pests is recommended, particularly for mustelids, cats
and ship rats.
INTRODUCTION
Mt Maungatautari, an eroded andesitic volcanic cone, lies in the central Waikato,
in the North Island of New Zealand (Clarkson 2002; Speedy et al. 2007). The
mountain supports a dense mixed podocarp-broadleaf forest, covering
approximately 3400ha, and is completely surrounded by farmland (MacGibbon
2001). The majority of the original native fauna present on the mountain is now
absent, and the remaining flora has been intensely browsed for many years
(McQueen 2004). The Maungatautari Ecological Island Trust (MEIT) was formed
in the late 1990s, with the primary goal being to “restore the diversity, vitality and
resilience of the ecosystems of Maungatautari, as close as possible to the original
condition, to re-create self-sustaining communities of indigenous plants and
animals” (McQueen, 2004).
A vital pre-requisite to achieving the primary goal of the MEIT is the
permanent removal of all mammalian pests. To this end, a 47km XcluderTM pest-
proof fence was completed in 2006, which completely encircles the mountain. An
eradication campaign then began, to remove mammalian pest species from within
the exclosure (including fallow deer (Dama dama), red deer (Cervus elaphus
scoticus), feral pigs (Sus scrofa), feral goats (Capra hircus), feral cats (Felis
catus), possums (Trichosurus vulpecula), feral ferrets (Mustela furo), stoats
(Mustela erminea), weasels (Mustela nivalis), ship rats (Rattus rattus), mice (Mus
musculus), rabbits (Oryctolagus cuniculus), hares (Lepus europaeus occidentalis)
and hedgehogs (Erinaceus europaeus occidentalis)). By January 2008, the only
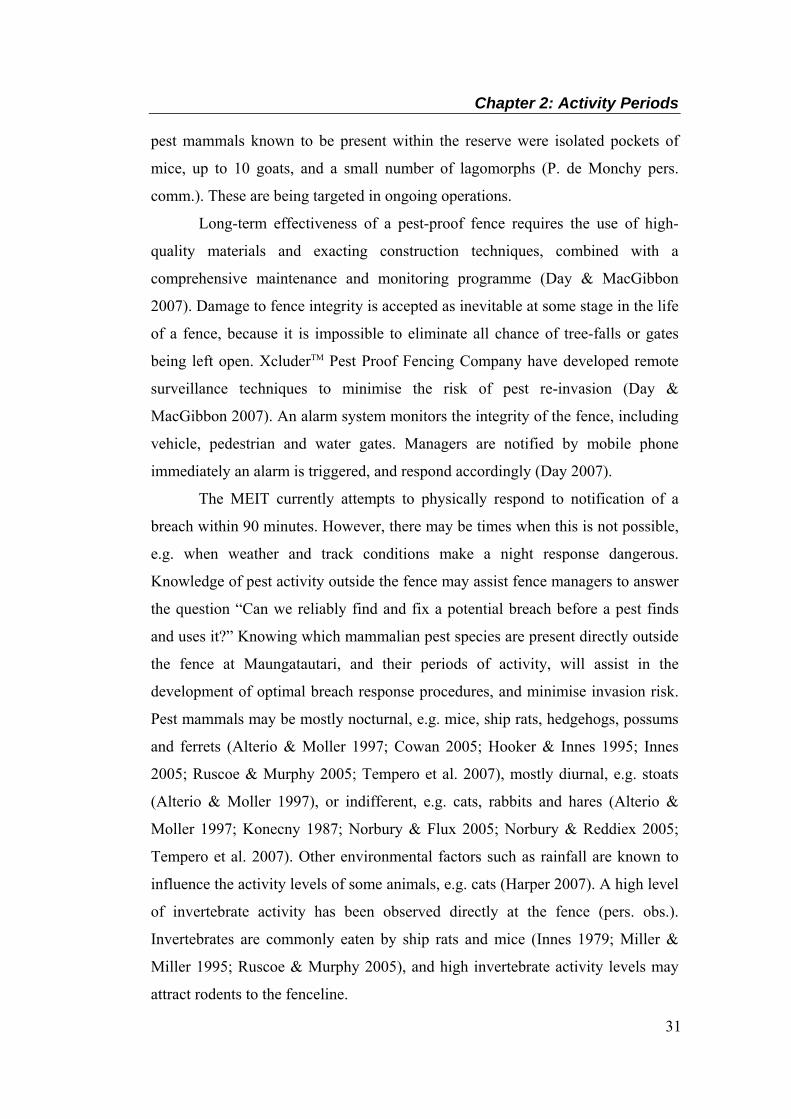
Chapter 2: Activity Periods
31
pest mammals known to be present within the reserve were isolated pockets of
mice, up to 10 goats, and a small number of lagomorphs (P. de Monchy pers.
comm.). These are being targeted in ongoing operations.
Long-term effectiveness of a pest-proof fence requires the use of high-
quality materials and exacting construction techniques, combined with a
comprehensive maintenance and monitoring programme (Day & MacGibbon
2007). Damage to fence integrity is accepted as inevitable at some stage in the life
of a fence, because it is impossible to eliminate all chance of tree-falls or gates
being left open. XcluderTM Pest Proof Fencing Company have developed remote
surveillance techniques to minimise the risk of pest re-invasion (Day &
MacGibbon 2007). An alarm system monitors the integrity of the fence, including
vehicle, pedestrian and water gates. Managers are notified by mobile phone
immediately an alarm is triggered, and respond accordingly (Day 2007).
The MEIT currently attempts to physically respond to notification of a
breach within 90 minutes. However, there may be times when this is not possible,
e.g. when weather and track conditions make a night response dangerous.
Knowledge of pest activity outside the fence may assist fence managers to answer
the question “Can we reliably find and fix a potential breach before a pest finds
and uses it?” Knowing which mammalian pest species are present directly outside
the fence at Maungatautari, and their periods of activity, will assist in the
development of optimal breach response procedures, and minimise invasion risk.
Pest mammals may be mostly nocturnal, e.g. mice, ship rats, hedgehogs, possums
and ferrets (Alterio & Moller 1997; Cowan 2005; Hooker & Innes 1995; Innes
2005; Ruscoe & Murphy 2005; Tempero et al. 2007), mostly diurnal, e.g. stoats
(Alterio & Moller 1997), or indifferent, e.g. cats, rabbits and hares (Alterio &
Moller 1997; Konecny 1987; Norbury & Flux 2005; Norbury & Reddiex 2005;
Tempero et al. 2007). Other environmental factors such as rainfall are known to
influence the activity levels of some animals, e.g. cats (Harper 2007). A high level
of invertebrate activity has been observed directly at the fence (pers. obs.).
Invertebrates are commonly eaten by ship rats and mice (Innes 1979; Miller &
Miller 1995; Ruscoe & Murphy 2005), and high invertebrate activity levels may
attract rodents to the fenceline.
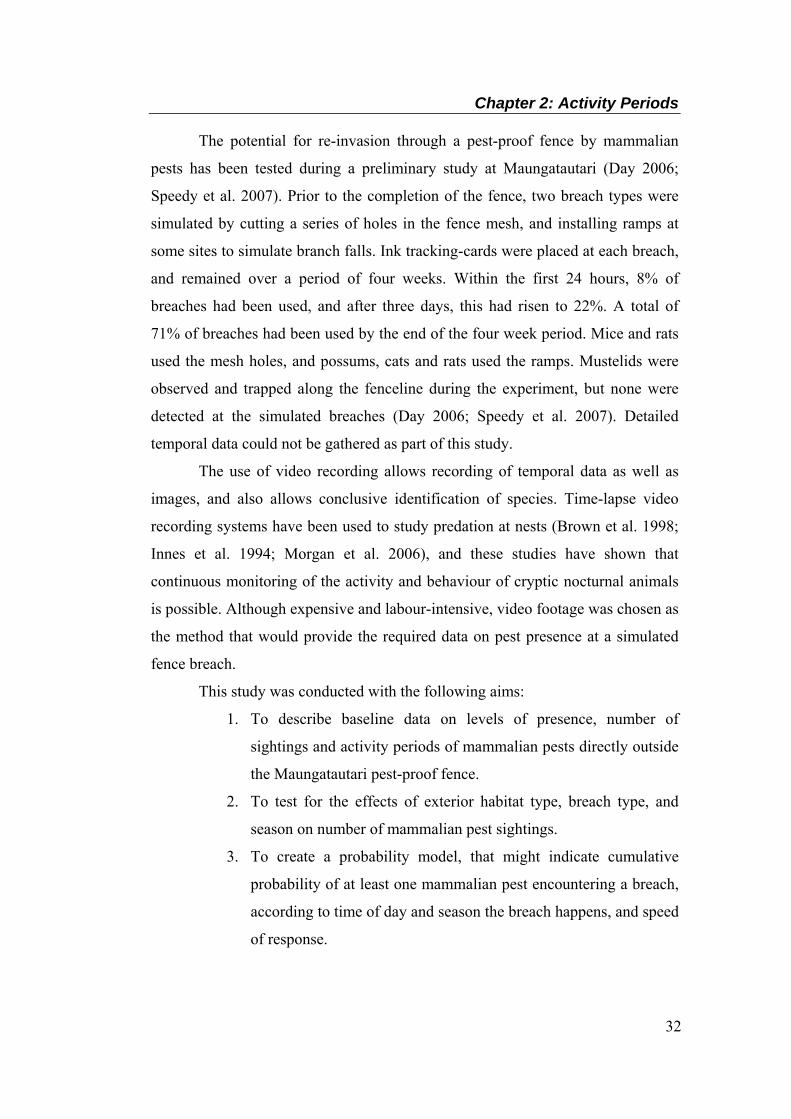
Chapter 2: Activity Periods
32
The potential for re-invasion through a pest-proof fence by mammalian
pests has been tested during a preliminary study at Maungatautari (Day 2006;
Speedy et al. 2007). Prior to the completion of the fence, two breach types were
simulated by cutting a series of holes in the fence mesh, and installing ramps at
some sites to simulate branch falls. Ink tracking-cards were placed at each breach,
and remained over a period of four weeks. Within the first 24 hours, 8% of
breaches had been used, and after three days, this had risen to 22%. A total of
71% of breaches had been used by the end of the four week period. Mice and rats
used the mesh holes, and possums, cats and rats used the ramps. Mustelids were
observed and trapped along the fenceline during the experiment, but none were
detected at the simulated breaches (Day 2006; Speedy et al. 2007). Detailed
temporal data could not be gathered as part of this study.
The use of video recording allows recording of temporal data as well as
images, and also allows conclusive identification of species. Time-lapse video
recording systems have been used to study predation at nests (Brown et al. 1998;
Innes et al. 1994; Morgan et al. 2006), and these studies have shown that
continuous monitoring of the activity and behaviour of cryptic nocturnal animals
is possible. Although expensive and labour-intensive, video footage was chosen as
the method that would provide the required data on pest presence at a simulated
fence breach.
This study was conducted with the following aims:
1. To describe baseline data on levels of presence, number of
sightings and activity periods of mammalian pests directly outside
the Maungatautari pest-proof fence.
2. To test for the effects of exterior habitat type, breach type, and
season on number of mammalian pest sightings.
3. To create a probability model, that might indicate cumulative
probability of at least one mammalian pest encountering a breach,
according to time of day and season the breach happens, and speed
of response.
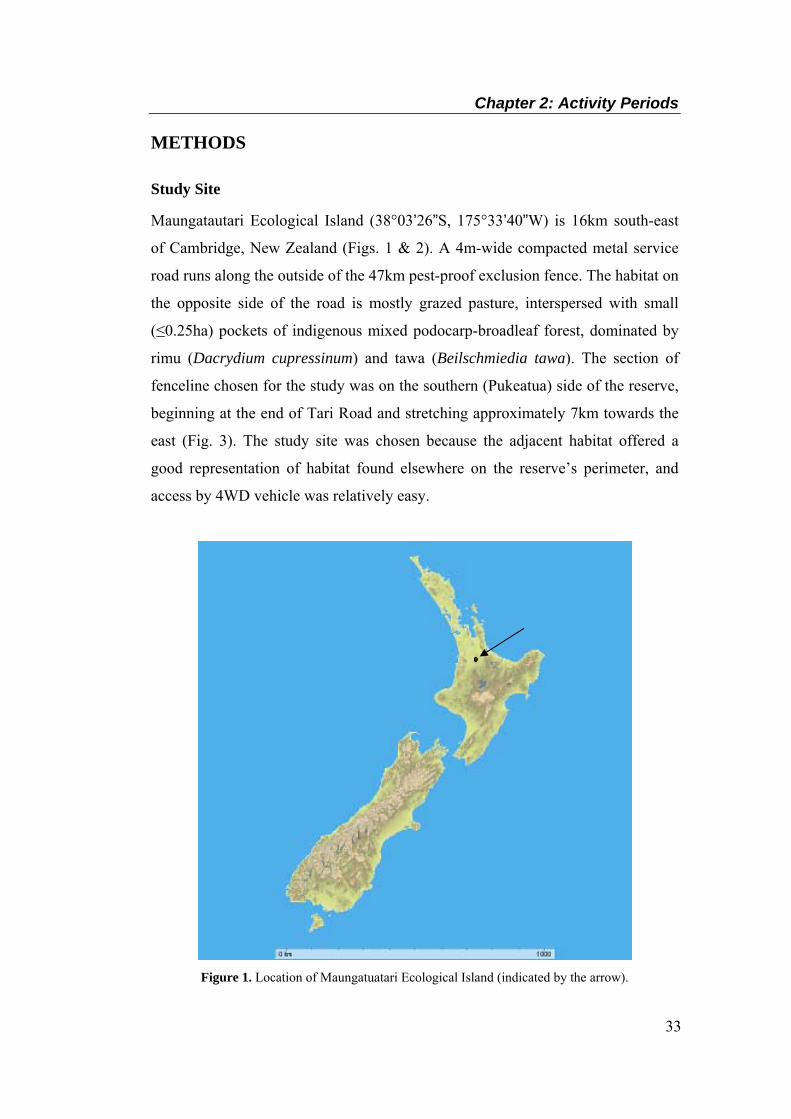
Chapter 2: Activity Periods
33
METHODS
Study Site
Maungatautari Ecological Island (38°03’26”S, 175°33’40”W) is 16km south-east
of Cambridge, New Zealand (Figs. 1 & 2). A 4m-wide compacted metal service
road runs along the outside of the 47km pest-proof exclusion fence. The habitat on
the opposite side of the road is mostly grazed pasture, interspersed with small
(≤0.25ha) pockets of indigenous mixed podocarp-broadleaf forest, dominated by
rimu (Dacrydium cupressinum) and tawa (Beilschmiedia tawa). The section of
fenceline chosen for the study was on the southern (Pukeatua) side of the reserve,
beginning at the end of Tari Road and stretching approximately 7km towards the
east (Fig. 3). The study site was chosen because the adjacent habitat offered a
good representation of habitat found elsewhere on the reserve’s perimeter, and
access by 4WD vehicle was relatively easy.
Figure 1. Location of Maungatuatari Ecological Island (indicated by the arrow).
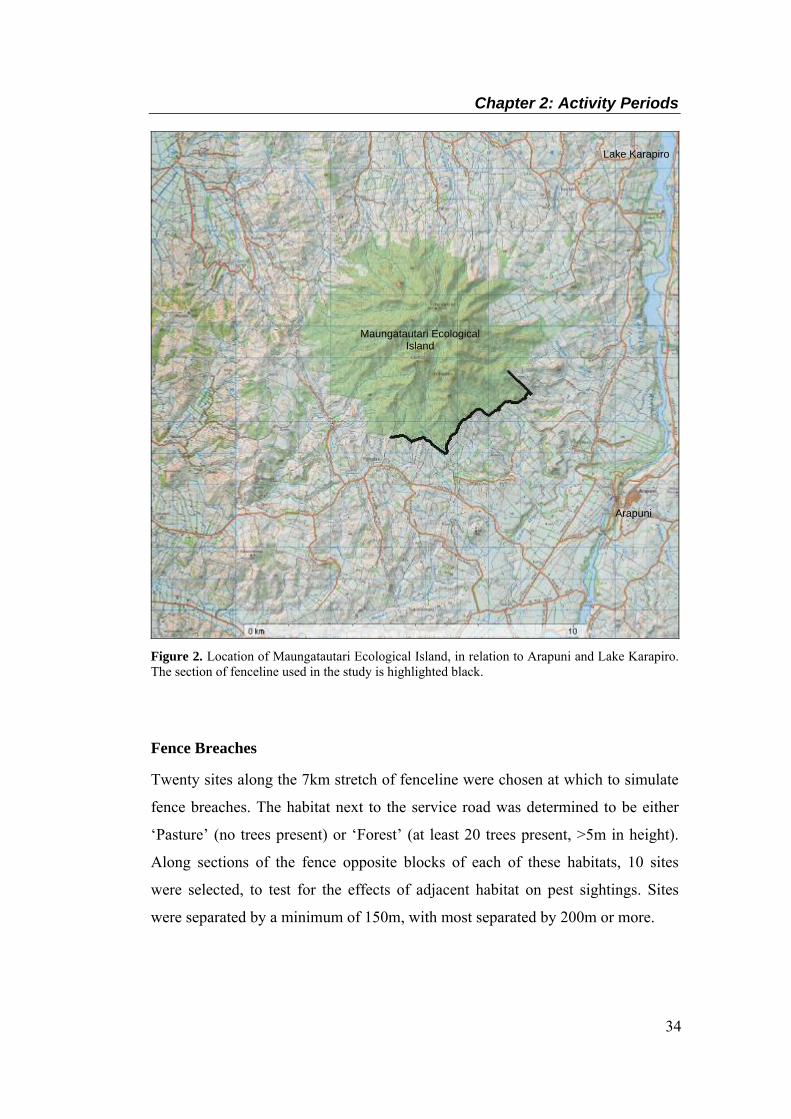
Chapter 2: Activity Periods
34
Figure 2. Location of Maungatautari Ecological Island, in relation to Arapuni and Lake Karapiro. The section of fenceline used in the study is highlighted black.
Fence Breaches
Twenty sites along the 7km stretch of fenceline were chosen at which to simulate
fence breaches. The habitat next to the service road was determined to be either
‘Pasture’ (no trees present) or ‘Forest’ (at least 20 trees present, >5m in height).
Along sections of the fence opposite blocks of each of these habitats, 10 sites
were selected, to test for the effects of adjacent habitat on pest sightings. Sites
were separated by a minimum of 150m, with most separated by 200m or more.
Maungatautari Ecological Island
Lake Karapiro
Arapuni
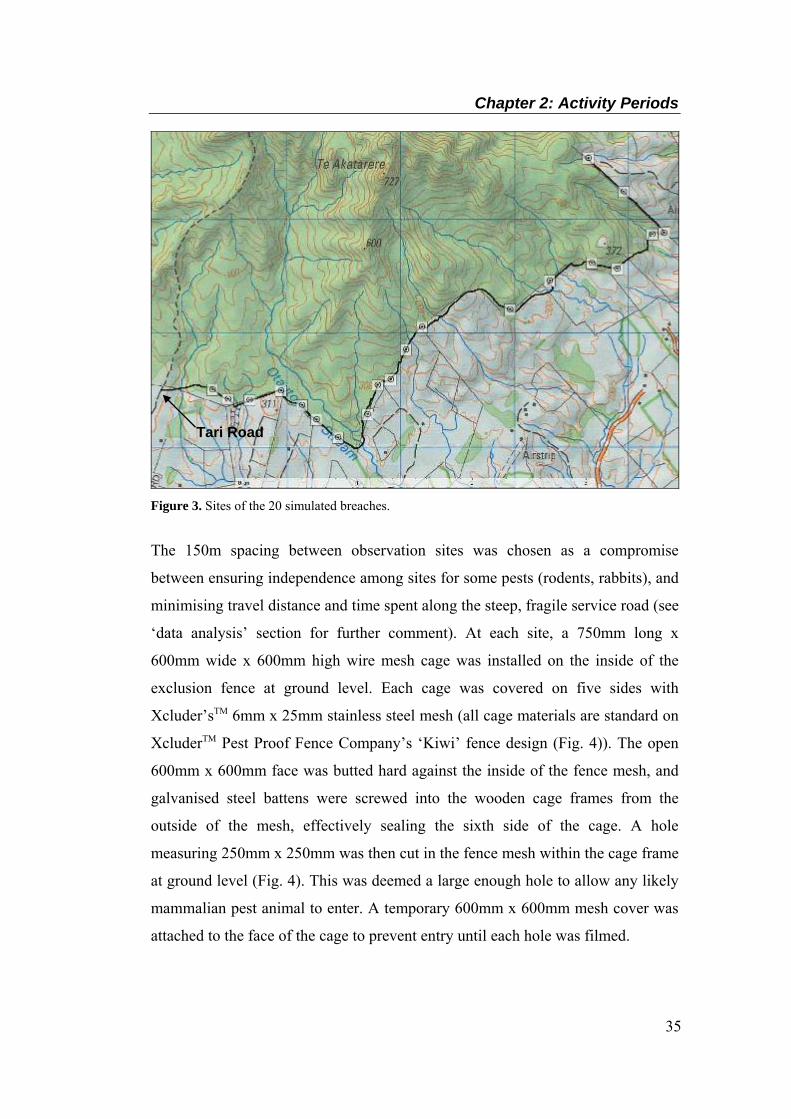
Chapter 2: Activity Periods
35
Figure 3. Sites of the 20 simulated breaches.
The 150m spacing between observation sites was chosen as a compromise
between ensuring independence among sites for some pests (rodents, rabbits), and
minimising travel distance and time spent along the steep, fragile service road (see
‘data analysis’ section for further comment). At each site, a 750mm long x
600mm wide x 600mm high wire mesh cage was installed on the inside of the
exclusion fence at ground level. Each cage was covered on five sides with
Xcluder’sTM 6mm x 25mm stainless steel mesh (all cage materials are standard on
XcluderTM Pest Proof Fence Company’s ‘Kiwi’ fence design (Fig. 4)). The open
600mm x 600mm face was butted hard against the inside of the fence mesh, and
galvanised steel battens were screwed into the wooden cage frames from the
outside of the mesh, effectively sealing the sixth side of the cage. A hole
measuring 250mm x 250mm was then cut in the fence mesh within the cage frame
at ground level (Fig. 4). This was deemed a large enough hole to allow any likely
mammalian pest animal to enter. A temporary 600mm x 600mm mesh cover was
attached to the face of the cage to prevent entry until each hole was filmed.
Tari Road

Chapter 2: Activity Periods
36
Figure 4. Schematic diagram of the XcluderTM ‘Kiwi’ fence design, as erected at Maungatautari. The rolled Colorsteel® hood is at top (adapted from Day & MacGibbon, 2007). The cages in effect formed a ballooning of the fence, and while animals could
exploit the hole, they were unable to go any further than the cage allowed, and
fence integrity was maintained. During each trial, two breach types were
simulated. The ‘flood-scour’ type was intended to simulate a breach that would
not trigger the monitored alarm, and which might remain undiscovered for up to a
week (Fig. 5), so was installed for a 7-day period. On day 1, the temporary mesh
face was removed and the ground surface at the hole disturbed. The hole was
filmed 24 hours a day for 7 days, to gather data on mammalian pest species
present, number of sightings, and time periods most active. On day 7 the hole was
re-sealed.
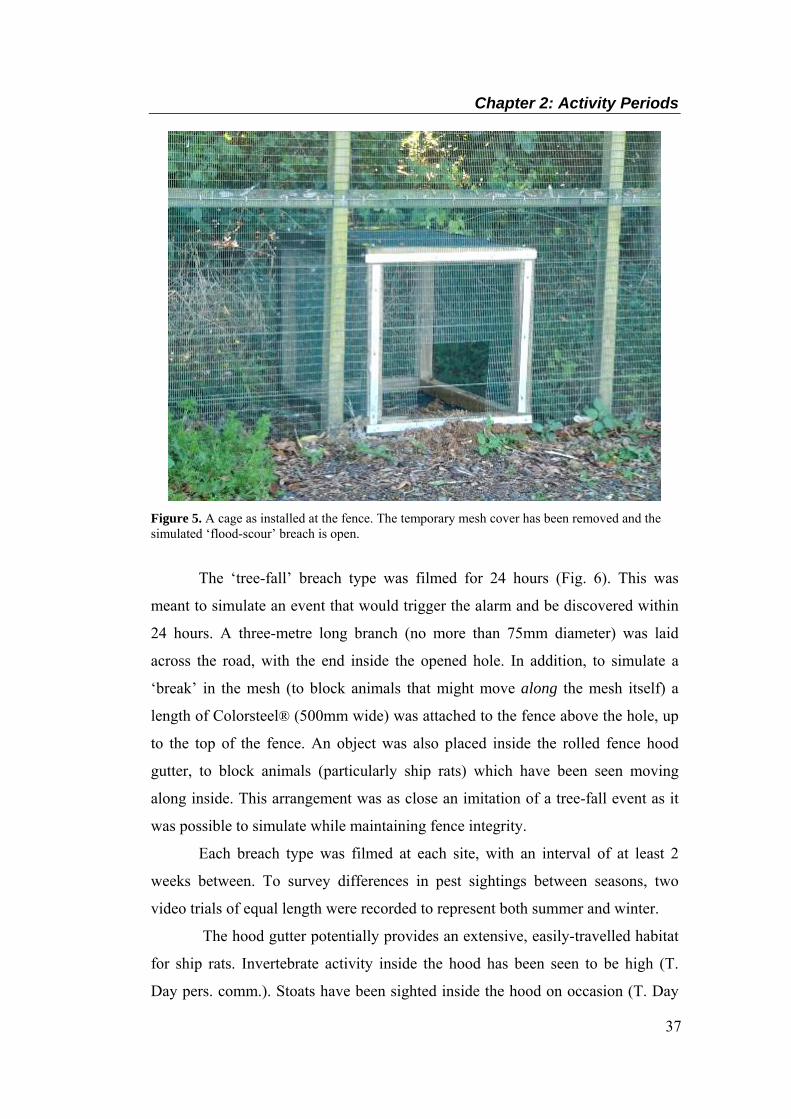
Chapter 2: Activity Periods
37
Figure 5. A cage as installed at the fence. The temporary mesh cover has been removed and the simulated ‘flood-scour’ breach is open.
The ‘tree-fall’ breach type was filmed for 24 hours (Fig. 6). This was
meant to simulate an event that would trigger the alarm and be discovered within
24 hours. A three-metre long branch (no more than 75mm diameter) was laid
across the road, with the end inside the opened hole. In addition, to simulate a
‘break’ in the mesh (to block animals that might move along the mesh itself) a
length of Colorsteel® (500mm wide) was attached to the fence above the hole, up
to the top of the fence. An object was also placed inside the rolled fence hood
gutter, to block animals (particularly ship rats) which have been seen moving
along inside. This arrangement was as close an imitation of a tree-fall event as it
was possible to simulate while maintaining fence integrity.
Each breach type was filmed at each site, with an interval of at least 2
weeks between. To survey differences in pest sightings between seasons, two
video trials of equal length were recorded to represent both summer and winter.
The hood gutter potentially provides an extensive, easily-travelled habitat
for ship rats. Invertebrate activity inside the hood has been seen to be high (T.
Day pers. comm.). Stoats have been sighted inside the hood on occasion (T. Day
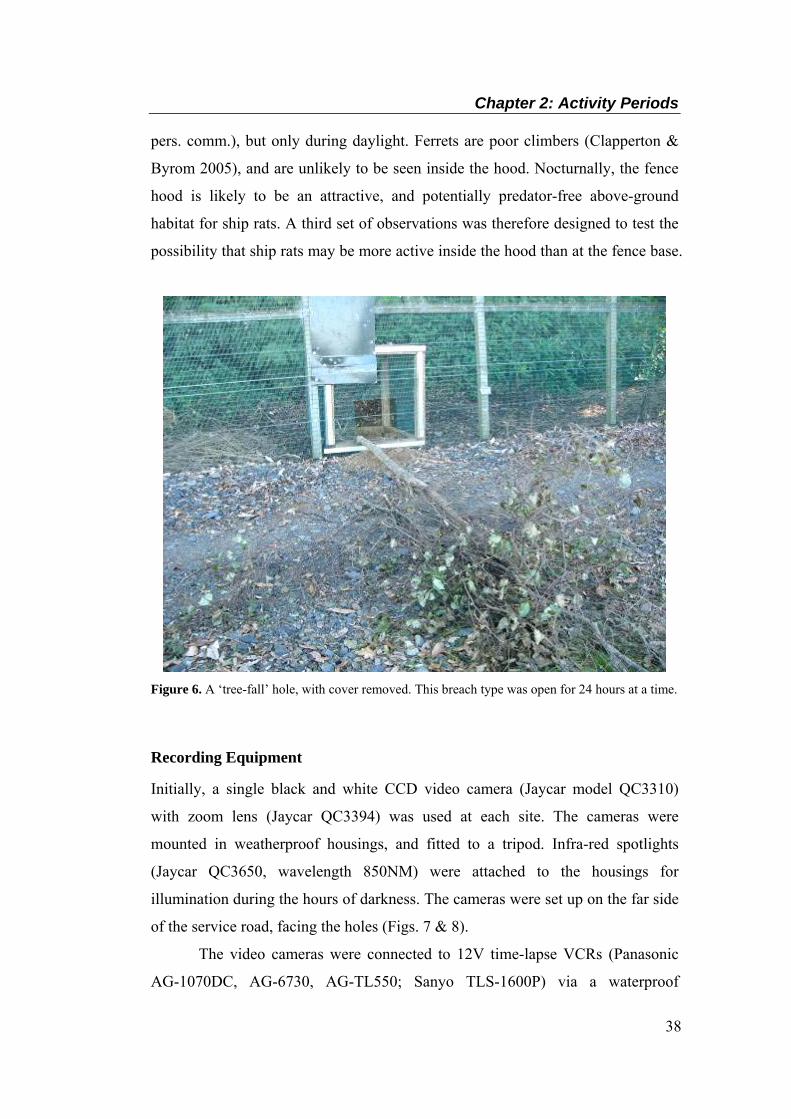
Chapter 2: Activity Periods
38
pers. comm.), but only during daylight. Ferrets are poor climbers (Clapperton &
Byrom 2005), and are unlikely to be seen inside the hood. Nocturnally, the fence
hood is likely to be an attractive, and potentially predator-free above-ground
habitat for ship rats. A third set of observations was therefore designed to test the
possibility that ship rats may be more active inside the hood than at the fence base.
Figure 6. A ‘tree-fall’ hole, with cover removed. This breach type was open for 24 hours at a time.
Recording Equipment
Initially, a single black and white CCD video camera (Jaycar model QC3310)
with zoom lens (Jaycar QC3394) was used at each site. The cameras were
mounted in weatherproof housings, and fitted to a tripod. Infra-red spotlights
(Jaycar QC3650, wavelength 850NM) were attached to the housings for
illumination during the hours of darkness. The cameras were set up on the far side
of the service road, facing the holes (Figs. 7 & 8).
The video cameras were connected to 12V time-lapse VCRs (Panasonic
AG-1070DC, AG-6730, AG-TL550; Sanyo TLS-1600P) via a waterproof

Chapter 2: Activity Periods
39
‘pelican’ case. The VCRs were set to record in 24hr time-lapse mode, recording
approximately 3 frames per second, sufficient to capture clear images of animals
as small as mice moving across the field of view. All equipment was powered by
12V 40Ah sealed lead acid batteries which, along with the video tapes, required
daily changes. The summer filming required 31 visits over 31 consecutive days.
Winter filming required changes due to site access issues during inclement
weather. Over the course of the summer study, it became obvious that after even
brief rain, the service road was impassable at some points. Daily battery and video
tape changes often required access through neighbouring farms, and constant
4WD vehicle traffic damaged the service road at some sites. Winter rainfall is
relatively high on the mountain (T. Day pers. comm.), and this meant that daily
4WD vehicle access was not going to be possible for the winter study. Even an
all-terrain vehicle (ATV), if used daily, would still cause too much track damage.
It was decided that if a winter study were to take place, it could be done only by
using video equipment that didn’t require daily visits.
Therefore, for the winter study I used six Archos 504 personal media
players (high storage capacity digital video recorders (DVRs) with low power
consumption) in place of the VCRs. These devices (the size of a pocket calculator)
have an internal 160GB hard-drive, and record video at 25 frames per second. If
set at medium video resolution (similar in quality to the VCR recording used in
summer), more than 8 days of continuous video footage can be recorded and
stored. Power consumption (~35mA) is minimal compared to a 12V VCR
(~800mA). I built weatherproof pelican cases to the same specifications as those
used for the VCRs, and used one 12V 65Ah battery connected in parallel to four
12V 12Ah batteries to power each system. Testing confirmed that this setup
would be sufficient to power a DVR, video camera and infra-red spotlight for
more than a week.
During the fence hood observations, two camera units were set up at each
site. The first used the same cameras as before, arranged in the same way as
previously, on the opposite side of the road, facing the fence breach. The second
camera was a weatherproof, miniature video camera with in-built infra-red LEDs
(Jaycar AVC307R). This was fitted to the underside of the Colorsteel® fence
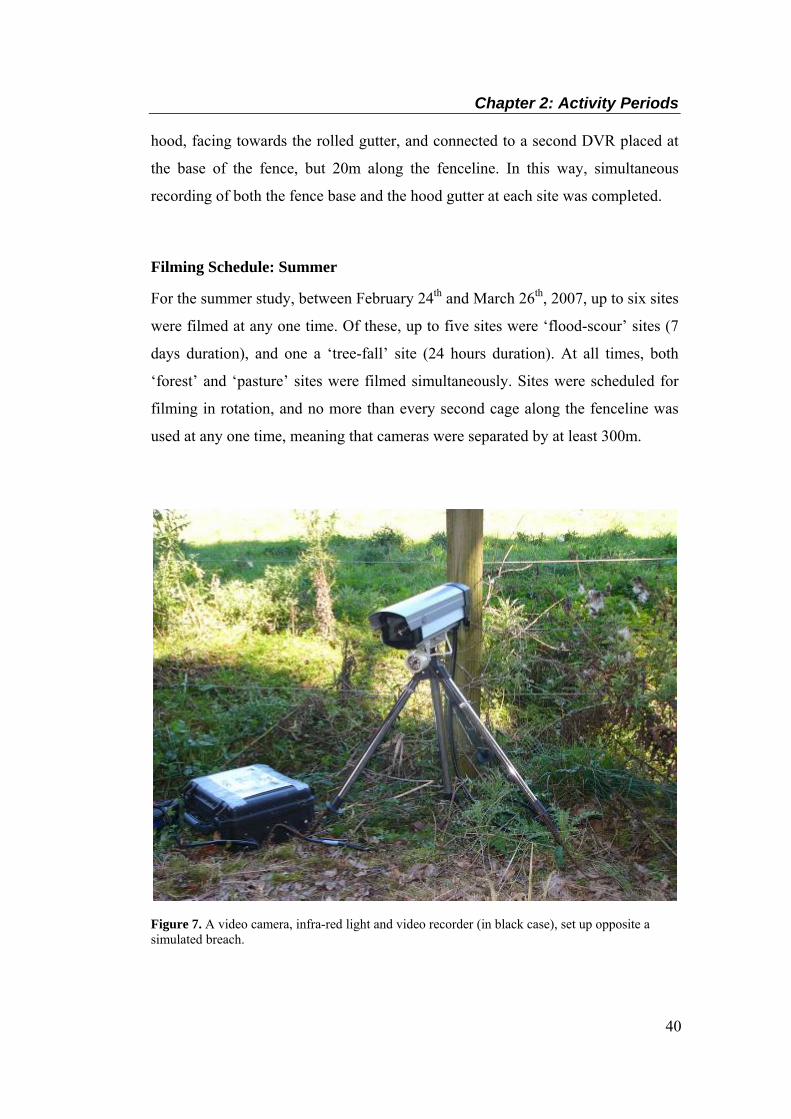
Chapter 2: Activity Periods
40
hood, facing towards the rolled gutter, and connected to a second DVR placed at
the base of the fence, but 20m along the fenceline. In this way, simultaneous
recording of both the fence base and the hood gutter at each site was completed.
Filming Schedule: Summer
For the summer study, between February 24th and March 26th, 2007, up to six sites
were filmed at any one time. Of these, up to five sites were ‘flood-scour’ sites (7
days duration), and one a ‘tree-fall’ site (24 hours duration). At all times, both
‘forest’ and ‘pasture’ sites were filmed simultaneously. Sites were scheduled for
filming in rotation, and no more than every second cage along the fenceline was
used at any one time, meaning that cameras were separated by at least 300m.
Figure 7. A video camera, infra-red light and video recorder (in black case), set up opposite a simulated breach.

Chapter 2: Activity Periods
41
Figure 8. An illustration of camera position in relation to a simulated breach, summer study.
Filming Schedule: Winter
Winter filming was completed between between August 3rd and September 21st,
2007. It was no longer possible to carry out daily visits over a long period; this
practical consideration dictated the nature and frequency of recording during the
winter study. All the ‘tree-fall’ holes in a block were filmed together at the start of
the winter session, by allocating five cameras to them over four nights, to
complete the 20 breach simulations. Then, filming of the ‘flood-scour’ holes
started. Camera and DVR units were shifted around the hole sites as for the
summer study, and again, both ‘forest’ and ‘pasture’ sites were filmed
simultaneously at all times. After filming of the first block of ‘flood-scour’ holes
was completed, only one to two visits per week were required over the winter
study, which reduced track damage considerably.
Chapter 2: Activity Periods
42
Filming Schedule: Inside the Fence Hood
The third block of filming, with cameras focussed inside the fence hood gutter,
was achieved with DVRs between December 2007 and January 2008. It was
hypothesised, based on anecdotal evidence, that ship rats may be more active
inside the hood than at the fence base. The aim was to make initial observations of
ship rats inside the hood, and compare the results with ship rat sightings recorded
simultaneously at the same sites but along the fence base. Four breach sites were
filmed for a week each, two at a time.
Data Analysis
The video recordings were watched and each sighting of a mammalian pest was
recorded by species, along with time of encounter. The intention was to analyse
and describe the overall number of sightings for each pest species at each site, and
no attempt was made to identify or count the number of individual animals
recorded (except for ship rats in the hood study). A generalised linear mixed
model (GLMM) was used to test for significance of season, habitat type and
breach type on number of sightings per hole/night. GLMM was used rather than
ANOVA because of the non-normality of the count data. This analysis was
completed assuming Poisson distribution, with a blocking structure that
recognised ‘season’, ‘habitat’ and ‘breach type’ as random factors. The 150 m
minimum distance between sites (and 300m between any two sites filmed
simultaneously) was considered enough to allow independence to be assumed for
mice, ship rats and rabbits, as home range lengths for these species have been
found to be smaller than this distance (Fitzgerald et al. 1981; Gibb et al. 1978;
Hooker & Innes 1995). For all other species, the assumption of independence
between sites may have been violated; GLMM analyses were still completed for
these data, however results should be treated with caution. Non-independence in
the data could have had the effect of overestimating the number of degrees of
freedom in the analyses for those species, which may mean a result is viewed as
being significant, when in fact it is not.
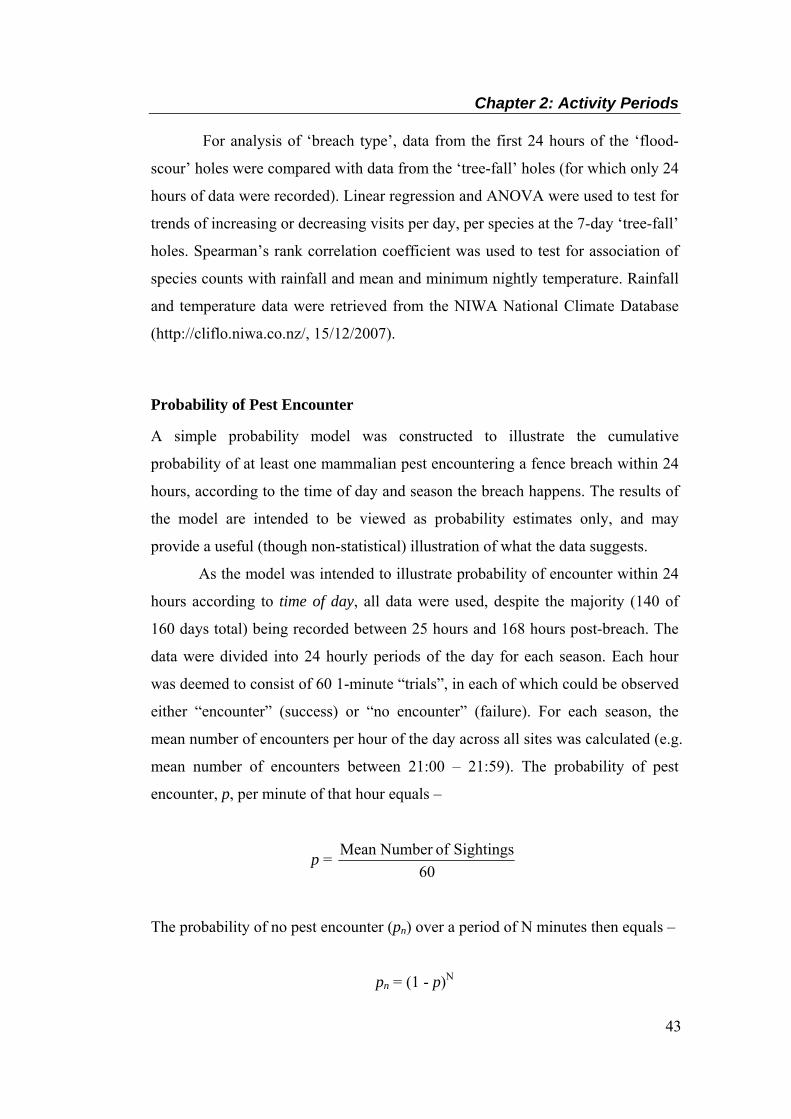
Chapter 2: Activity Periods
43
For analysis of ‘breach type’, data from the first 24 hours of the ‘flood-
scour’ holes were compared with data from the ‘tree-fall’ holes (for which only 24
hours of data were recorded). Linear regression and ANOVA were used to test for
trends of increasing or decreasing visits per day, per species at the 7-day ‘tree-fall’
holes. Spearman’s rank correlation coefficient was used to test for association of
species counts with rainfall and mean and minimum nightly temperature. Rainfall
and temperature data were retrieved from the NIWA National Climate Database
(http://cliflo.niwa.co.nz/, 15/12/2007).
Probability of Pest Encounter
A simple probability model was constructed to illustrate the cumulative
probability of at least one mammalian pest encountering a fence breach within 24
hours, according to the time of day and season the breach happens. The results of
the model are intended to be viewed as probability estimates only, and may
provide a useful (though non-statistical) illustration of what the data suggests.
As the model was intended to illustrate probability of encounter within 24
hours according to time of day, all data were used, despite the majority (140 of
160 days total) being recorded between 25 hours and 168 hours post-breach. The
data were divided into 24 hourly periods of the day for each season. Each hour
was deemed to consist of 60 1-minute “trials”, in each of which could be observed
either “encounter” (success) or “no encounter” (failure). For each season, the
mean number of encounters per hour of the day across all sites was calculated (e.g.
mean number of encounters between 21:00 – 21:59). The probability of pest
encounter, p, per minute of that hour equals –
p = 60
Sightings ofNumber Mean
The probability of no pest encounter (pn) over a period of N minutes then equals –
pn = (1 - p)N

Chapter 2: Activity Periods
44
Therefore, probability of pest encounter (pe) for a period of N minutes equals –
pe = 1 – (1 – p)N
These formula were used to calculate the probability of pest encounter for each
hour of the day, in each season. For example, if the mean number of summer pest
encounters between 21:00 – 21:59 (across 157 days) was found to be 0.637, then p
= 60637.0 = 0.0106; pn over one hour = (1 – 0.0106)60 = 0.5271; and pe over one
hour = 1 – (1 – 0.0106)60 = 0.4729. Therefore on average, if a breach happens at
21:00 in the summer, the probability of at least one pest encountering that breach
between 21:00 – 21:59 is 0.4729, or 47.29%.
The cumulative probability of pest encounter for the following 24 hour
period was then calculated by multiplying this initial probability with the 23
subsequent probability figures (e.g. for a breach occurring at 21:00, pe within hour
1 = 0.4729; pe within 2 hours = 0.4729 x pe2; pe within 3 hours = 0.4729 x pe2 x
pe3; etc). This series of calculations was completed 24 times, each starting in a
different hour, so that the cumulative probability of pest encounter was calculated
over the first 24 hours post-breach, according to time of day the breach happens.
The results were graphed to display cumulative probability curves.
RESULTS
Animals Sighted
In the summer study, a total of 788 sightings was captured on video over 157
hole-nights (HN) (three nights of footage were lost through battery failure).
Animals most often encountered in the summer study were possums (212
sightings averaging 134 ± 13.2 per 100HN) and mice (201 sightings averaging
128 ± 14.0 per 100HN) (Table 1, Fig. 9). Ship rats were sighted 99 times (51 ±
10.3 per 100HN). Cats, in contrast, were encountered 116 times (73 ± 7.5 per
100HN). Pelage markings distinguished some cats as individuals, including at

Chapter 2: Activity Periods
45
least 7 different cats sighted in each season. Mustelids were very rarely sighted,
only 6 encounters in total. Mean sightings per 100 hole-nights totalled 493 ± 65.1
across all species. A selection of still images taken from video can be seen in
Figure 15.
Altogether, 428 animal encounters were recorded over 160HN over the
winter study (Table 1). In contrast to the summer, mice were sighted only 30
times (19 ± 5.4 per 100HN), while hares (89 sightings, 55 ± 8.3 per 100HN),
possums (86 sightings, 54 ± 7.4 per 100HN) and cats (80 sightings, 50 ± 8.0 per
100HN) were most often seen. Mustelids were again rare, with only a single stoat
sighting, and no ferrets.
Significance of Season, Habitat and Hole Type
Significantly higher overall numbers of pest sightings were recorded in summer
than in winter (p < 0.001*, Table 1). Summer sightings were significantly higher
for mice (p < 0.001), ship rats (p = 0.004), cats (p = 0.05*), rabbits (p < 0.001) and
possums (p = 0.006*), whereas the greater number of hare sightings in winter was
only marginally insignificant (p = 0.06*). No seasonal difference was found for
any other species.
The effects of habitat were not significant for the overall distribution of
pest sightings (p = 0.95*), but significantly more rabbit sightings were recorded at
pasture sites than forest sites (p < 0.001). Habitat did not significantly affect
sightings of any other species.
Similarly, hole type did not have a significant effect on overall sightings (p
= 0.87*), nor did it affect sightings of any individual species – although the higher
number of rat sightings at ‘tree-fall’ holes was only marginally insignificant (p =
0.06).
* Result should be viewed with caution due to possible lack of independence between sites.
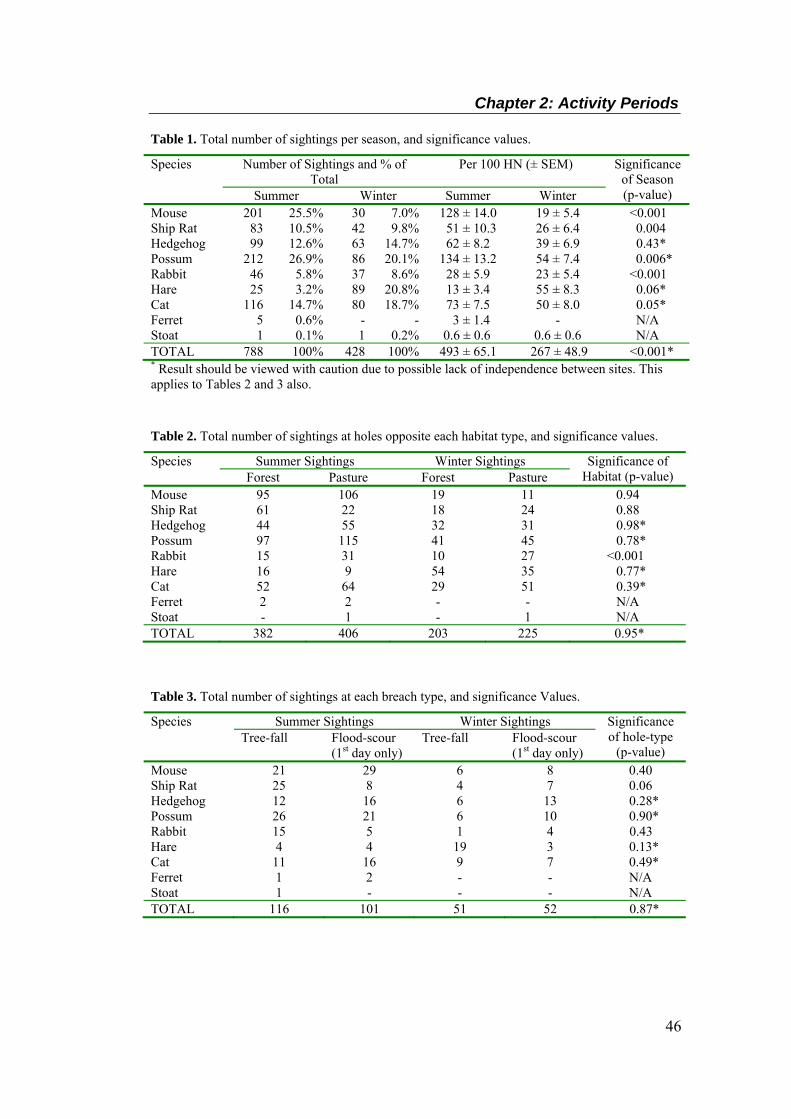
Chapter 2: Activity Periods
46
Table 1. Total number of sightings per season, and significance values.
Species Number of Sightings and % of Total
Per 100 HN (± SEM) Significance of Season (p-value) Summer Winter Summer Winter
Mouse 201 25.5% 30 7.0% 128 ± 14.0 19 ± 5.4 <0.001 Ship Rat 83 10.5% 42 9.8% 51 ± 10.3 26 ± 6.4 0.004 Hedgehog 99 12.6% 63 14.7% 62 ± 8.2 39 ± 6.9 0.43* Possum 212 26.9% 86 20.1% 134 ± 13.2 54 ± 7.4 0.006* Rabbit 46 5.8% 37 8.6% 28 ± 5.9 23 ± 5.4 <0.001 Hare 25 3.2% 89 20.8% 13 ± 3.4 55 ± 8.3 0.06* Cat 116 14.7% 80 18.7% 73 ± 7.5 50 ± 8.0 0.05* Ferret 5 0.6% - - 3 ± 1.4 - N/A Stoat 1 0.1% 1 0.2% 0.6 ± 0.6 0.6 ± 0.6 N/A TOTAL 788 100% 428 100% 493 ± 65.1 267 ± 48.9 <0.001* * Result should be viewed with caution due to possible lack of independence between sites. This applies to Tables 2 and 3 also. Table 2. Total number of sightings at holes opposite each habitat type, and significance values.
Species Summer Sightings Winter Sightings Significance of Habitat (p-value) Forest Pasture Forest Pasture
Mouse 95 106 19 11 0.94 Ship Rat 61 22 18 24 0.88 Hedgehog 44 55 32 31 0.98* Possum 97 115 41 45 0.78* Rabbit 15 31 10 27 <0.001 Hare 16 9 54 35 0.77* Cat 52 64 29 51 0.39* Ferret 2 2 - - N/A Stoat - 1 - 1 N/A TOTAL 382 406 203 225 0.95*
Table 3. Total number of sightings at each breach type, and significance Values.
Species Summer Sightings Winter Sightings Significance of hole-type
(p-value) Tree-fall Flood-scour
(1st day only) Tree-fall Flood-scour
(1st day only) Mouse 21 29 6 8 0.40 Ship Rat 25 8 4 7 0.06 Hedgehog 12 16 6 13 0.28* Possum 26 21 6 10 0.90* Rabbit 15 5 1 4 0.43 Hare 4 4 19 3 0.13* Cat 11 16 9 7 0.49* Ferret 1 2 - - N/A Stoat 1 - - - N/A TOTAL 116 101 51 52 0.87*

Chapter 2: Activity Periods
47
0
20
40
60
80
100
120
140
160
Mice Ship rats Hedgehogs Possums Rabbits Hares Cats Ferrets Stoats
Species
Mea
n S
ight
ings
per
100
HN
Summer
Winter
Figure 9. Mean sightings per 100 hole-nights, per species, by season (± SEM).
Timing of Pest Activity
Pest mammal sightings, when arranged according to hour of the day, appear to
follow distinctive patterns in timing (although this has not been statistically
tested). A total of 95.4% of overall sightings were nocturnal† in the summer,
compared with 86.2% in the winter. Sightings of mice, ship rats, possums and
hedgehogs‡ were 100% nocturnal, regardless of season (Figs. 10 and 11), and cat
sightings were 92.2% nocturnal in the summer, and 93.8% nocturnal in the winter.
If lagomorphs are discounted (as these species are possibly of least concern to
reserve managers), summer sightings were 98.6% nocturnal, and winter sightings
98.0% nocturnal. Sightings over summer in particular began, for many species,
almost immediately after end of civil twilight (Fig. 11).
A number of trends were observed in the distribution of pest activity over
24-hour periods. Mouse sightings in the summer peaked between 8-11 pm, and
† For the purposes of this thesis, the term ‘nocturnal’ refers to the period between civil twilight end in the evening, and civil twilight start the following morning. Civil twilight is defined to be the time period when the sun’s centre is no more than 6 degrees below the horizon before sunrise, or after sunset (King, 2005, p.473). ‡ One exception – a single hedgehog was seen between 9-10am, in the winter. This individual was in very poor condition and appeared to be unwell, which may have prompted atypical behaviour (Jones & Sanders, 2005).
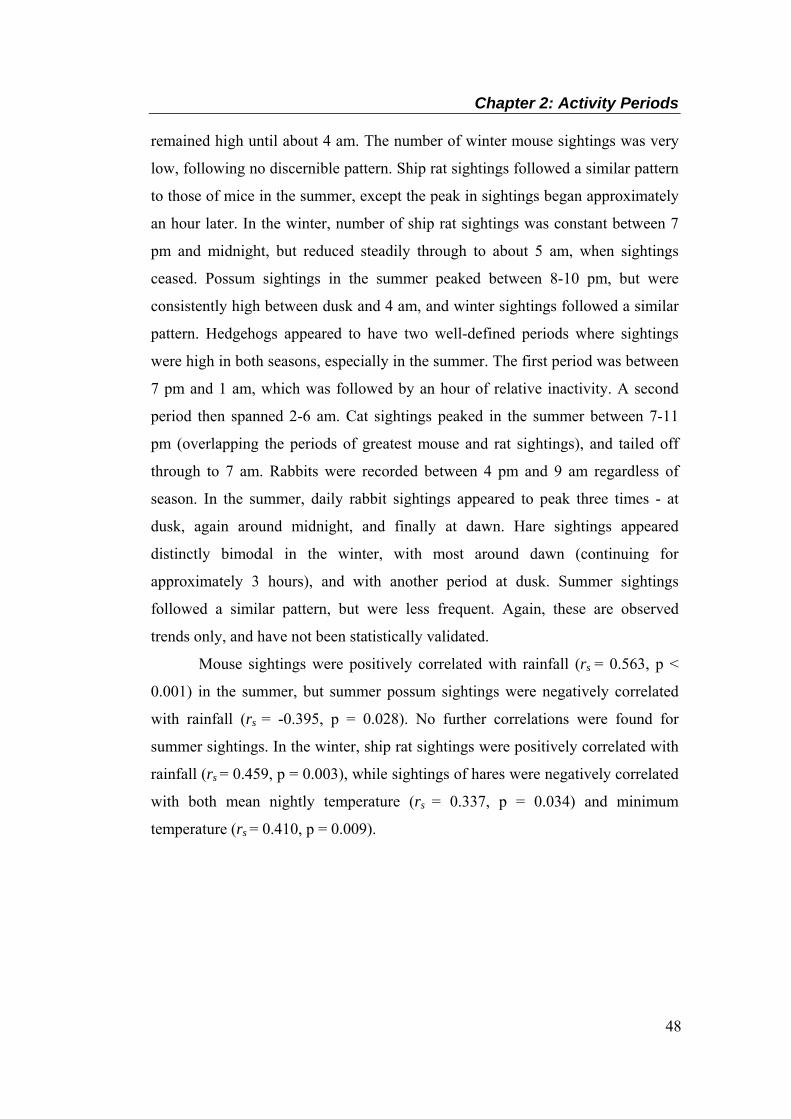
Chapter 2: Activity Periods
48
remained high until about 4 am. The number of winter mouse sightings was very
low, following no discernible pattern. Ship rat sightings followed a similar pattern
to those of mice in the summer, except the peak in sightings began approximately
an hour later. In the winter, number of ship rat sightings was constant between 7
pm and midnight, but reduced steadily through to about 5 am, when sightings
ceased. Possum sightings in the summer peaked between 8-10 pm, but were
consistently high between dusk and 4 am, and winter sightings followed a similar
pattern. Hedgehogs appeared to have two well-defined periods where sightings
were high in both seasons, especially in the summer. The first period was between
7 pm and 1 am, which was followed by an hour of relative inactivity. A second
period then spanned 2-6 am. Cat sightings peaked in the summer between 7-11
pm (overlapping the periods of greatest mouse and rat sightings), and tailed off
through to 7 am. Rabbits were recorded between 4 pm and 9 am regardless of
season. In the summer, daily rabbit sightings appeared to peak three times - at
dusk, again around midnight, and finally at dawn. Hare sightings appeared
distinctly bimodal in the winter, with most around dawn (continuing for
approximately 3 hours), and with another period at dusk. Summer sightings
followed a similar pattern, but were less frequent. Again, these are observed
trends only, and have not been statistically validated.
Mouse sightings were positively correlated with rainfall (rs = 0.563, p <
0.001) in the summer, but summer possum sightings were negatively correlated
with rainfall (rs = -0.395, p = 0.028). No further correlations were found for
summer sightings. In the winter, ship rat sightings were positively correlated with
rainfall (rs = 0.459, p = 0.003), while sightings of hares were negatively correlated
with both mean nightly temperature (rs = 0.337, p = 0.034) and minimum
temperature (rs = 0.410, p = 0.009).
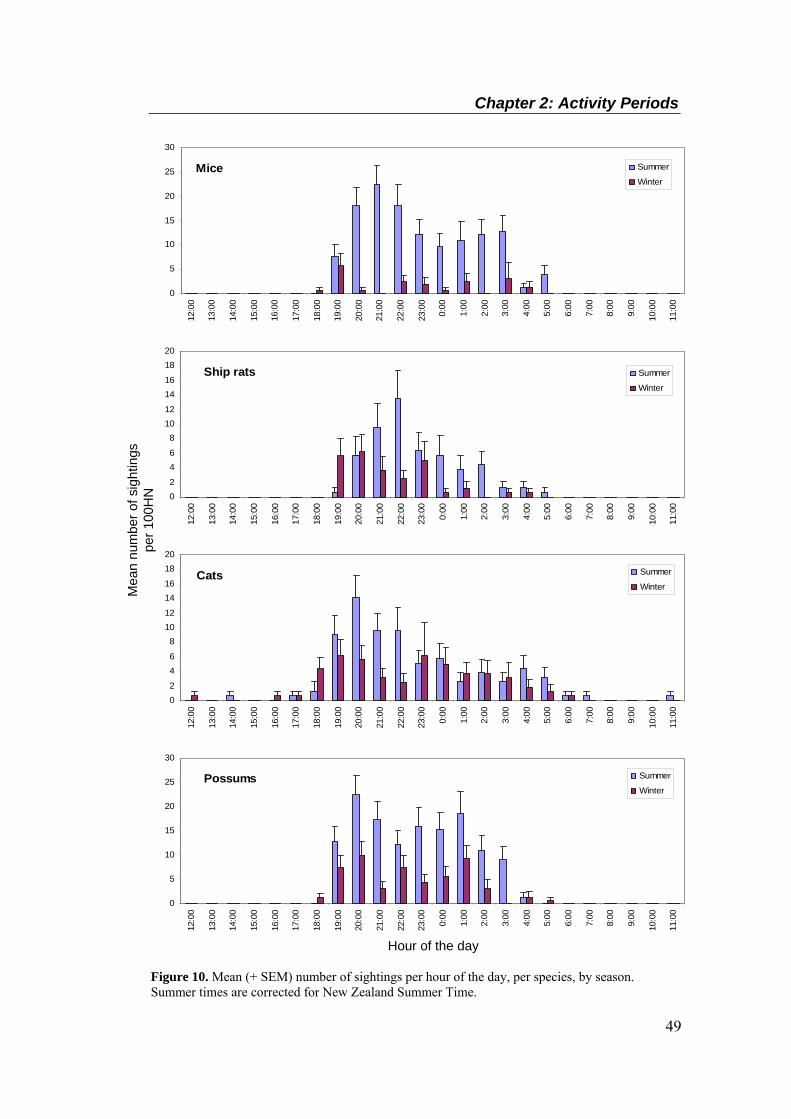
Chapter 2: Activity Periods
49
Mice
0
5
10
15
20
25
30
12:0
0
13:0
0
14:0
0
15:0
0
16:0
0
17:0
0
18:0
0
19:0
0
20:0
0
21:0
0
22:0
0
23:0
0
0:00
1:00
2:00
3:00
4:00
5:00
6:00
7:00
8:00
9:00
10:0
0
11:0
0
Summer
Winter
Ship rats
02
46
81012
1416
1820
12:0
0
13:0
0
14:0
0
15:0
0
16:0
0
17:0
0
18:0
0
19:0
0
20:0
0
21:0
0
22:0
0
23:0
0
0:00
1:00
2:00
3:00
4:00
5:00
6:00
7:00
8:00
9:00
10:0
0
11:0
0
Summer
Winter
Cats
02
46
81012
1416
1820
12:0
0
13:0
0
14:0
0
15:0
0
16:0
0
17:0
0
18:0
0
19:0
0
20:0
0
21:0
0
22:0
0
23:0
0
0:00
1:00
2:00
3:00
4:00
5:00
6:00
7:00
8:00
9:00
10:0
0
11:0
0
Summer
Winter
Possums
0
5
10
15
20
25
30
12:0
0
13:0
0
14:0
0
15:0
0
16:0
0
17:0
0
18:0
0
19:0
0
20:0
0
21:0
0
22:0
0
23:0
0
0:00
1:00
2:00
3:00
4:00
5:00
6:00
7:00
8:00
9:00
10:0
0
11:0
0
Summer
Winter
Figure 10. Mean (+ SEM) number of sightings per hour of the day, per species, by season. Summer times are corrected for New Zealand Summer Time.
Mea
n nu
mbe
r of s
ight
ings
pe
r 100
HN
Hour of the day
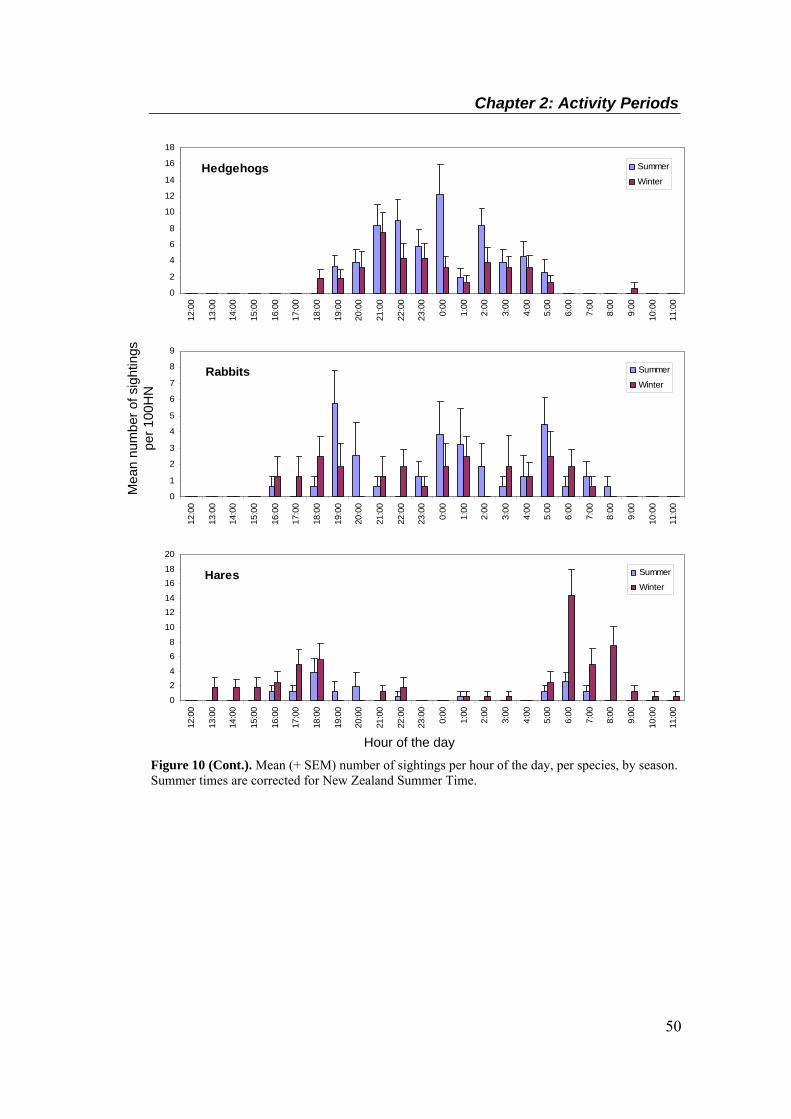
Chapter 2: Activity Periods
50
Hedgehogs
0
2
4
6
8
10
12
14
16
18
12:0
0
13:0
0
14:0
0
15:0
0
16:0
0
17:0
0
18:0
0
19:0
0
20:0
0
21:0
0
22:0
0
23:0
0
0:00
1:00
2:00
3:00
4:00
5:00
6:00
7:00
8:00
9:00
10:0
0
11:0
0
Summer
Winter
Rabbits
0
1
2
3
4
5
6
7
8
9
12:0
0
13:0
0
14:0
0
15:0
0
16:0
0
17:0
0
18:0
0
19:0
0
20:0
0
21:0
0
22:0
0
23:0
0
0:00
1:00
2:00
3:00
4:00
5:00
6:00
7:00
8:00
9:00
10:0
0
11:0
0
Summer
Winter
Hares
0
24
68
10
1214
1618
20
12:0
0
13:0
0
14:0
0
15:0
0
16:0
0
17:0
0
18:0
0
19:0
0
20:0
0
21:0
0
22:0
0
23:0
0
0:00
1:00
2:00
3:00
4:00
5:00
6:00
7:00
8:00
9:00
10:0
0
11:0
0
Summer
Winter
Figure 10 (Cont.). Mean (+ SEM) number of sightings per hour of the day, per species, by season. Summer times are corrected for New Zealand Summer Time.
Mea
n nu
mbe
r of s
ight
ings
pe
r 100
HN
Hour of the day
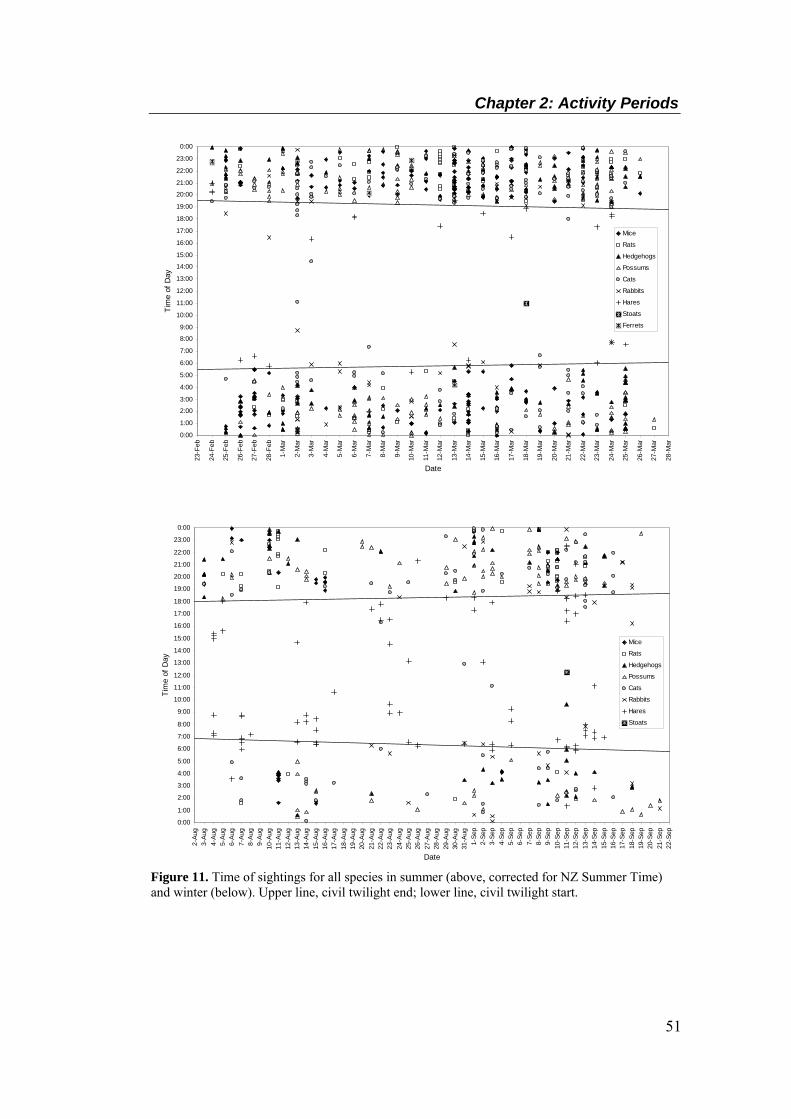
Chapter 2: Activity Periods
51
0:00
1:00
2:00
3:00
4:00
5:00
6:00
7:00
8:00
9:00
10:00
11:00
12:00
13:00
14:00
15:00
16:00
17:00
18:00
19:00
20:00
21:00
22:00
23:00
0:00
23-F
eb
24-F
eb
25-F
eb
26-F
eb
27-F
eb
28-F
eb
1-M
ar
2-M
ar
3-M
ar
4-M
ar
5-M
ar
6-M
ar
7-M
ar
8-M
ar
9-M
ar
10-M
ar
11-M
ar
12-M
ar
13-M
ar
14-M
ar
15-M
ar
16-M
ar
17-M
ar
18-M
ar
19-M
ar
20-M
ar
21-M
ar
22-M
ar
23-M
ar
24-M
ar
25-M
ar
26-M
ar
27-M
ar
28-M
ar
Date
Tim
e of
Day
Mice
Rats
Hedgehogs
Possums
Cats
Rabbits
Hares
Stoats
Ferrets
0:00
1:00
2:00
3:00
4:00
5:00
6:00
7:00
8:00
9:00
10:00
11:00
12:00
13:00
14:00
15:00
16:00
17:00
18:00
19:00
20:00
21:00
22:00
23:00
0:00
2-Au
g3-
Aug
4-Au
g5-
Aug
6-Au
g7-
Aug
8-Au
g9-
Aug
10-A
ug11
-Aug
12-A
ug13
-Aug
14-A
ug15
-Aug
16-A
ug17
-Aug
18-A
ug19
-Aug
20-A
ug21
-Aug
22-A
ug23
-Aug
24-A
ug25
-Aug
26-A
ug27
-Aug
28-A
ug29
-Aug
30-A
ug31
-Aug
1-Se
p2-
Sep
3-Se
p4-
Sep
5-Se
p6-
Sep
7-Se
p8-
Sep
9-Se
p10
-Sep
11-S
ep12
-Sep
13-S
ep14
-Sep
15-S
ep16
-Sep
17-S
ep18
-Sep
19-S
ep20
-Sep
21-S
ep22
-Sep
Date
Tim
e of
Day
Mice
Rats
Hedgehogs
Possums
Cats
Rabbits
Hares
Stoats
Figure 11. Time of sightings for all species in summer (above, corrected for NZ Summer Time) and winter (below). Upper line, civil twilight end; lower line, civil twilight start.
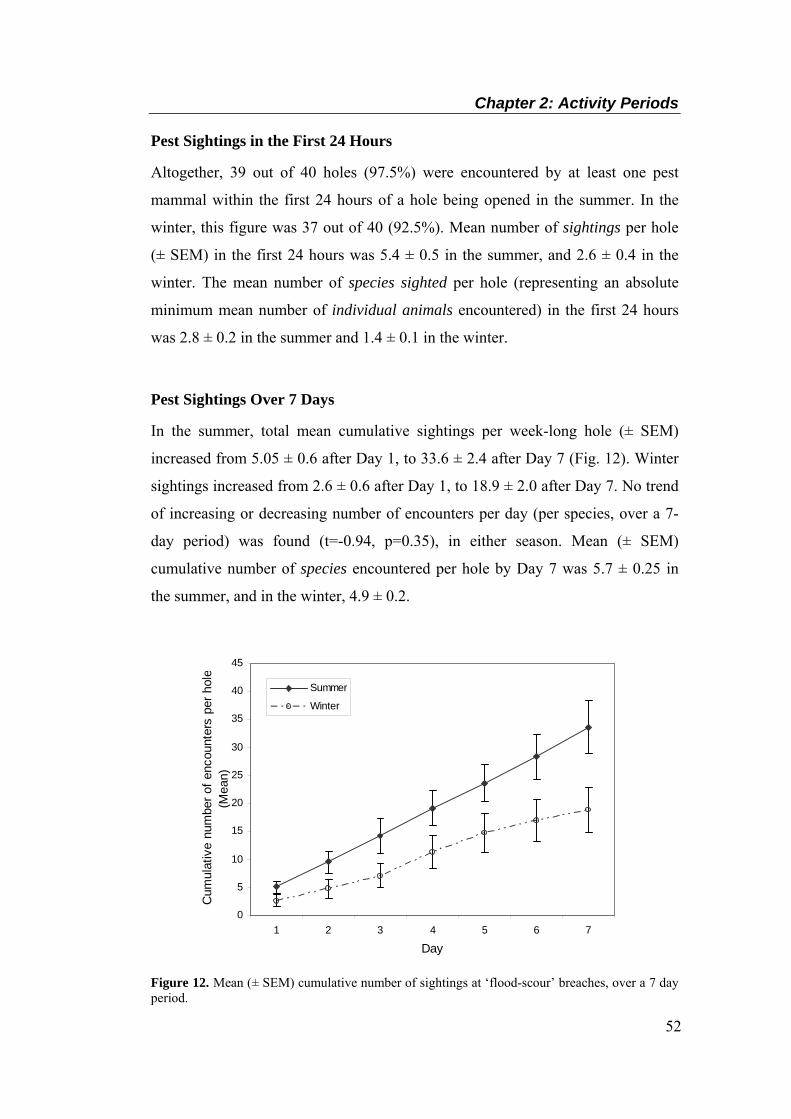
Chapter 2: Activity Periods
52
Pest Sightings in the First 24 Hours
Altogether, 39 out of 40 holes (97.5%) were encountered by at least one pest
mammal within the first 24 hours of a hole being opened in the summer. In the
winter, this figure was 37 out of 40 (92.5%). Mean number of sightings per hole
(± SEM) in the first 24 hours was 5.4 ± 0.5 in the summer, and 2.6 ± 0.4 in the
winter. The mean number of species sighted per hole (representing an absolute
minimum mean number of individual animals encountered) in the first 24 hours
was 2.8 ± 0.2 in the summer and 1.4 ± 0.1 in the winter.
Pest Sightings Over 7 Days
In the summer, total mean cumulative sightings per week-long hole (± SEM)
increased from 5.05 ± 0.6 after Day 1, to 33.6 ± 2.4 after Day 7 (Fig. 12). Winter
sightings increased from 2.6 ± 0.6 after Day 1, to 18.9 ± 2.0 after Day 7. No trend
of increasing or decreasing number of encounters per day (per species, over a 7-
day period) was found (t=-0.94, p=0.35), in either season. Mean (± SEM)
cumulative number of species encountered per hole by Day 7 was 5.7 ± 0.25 in
the summer, and in the winter, 4.9 ± 0.2.
0
5
10
15
20
25
30
35
40
45
1 2 3 4 5 6 7
Day
Cum
ulat
ive
num
ber o
f enc
ount
ers
per h
ole
(Mea
n)
Summer
Winter
Figure 12. Mean (± SEM) cumulative number of sightings at ‘flood-scour’ breaches, over a 7 day period.

Chapter 2: Activity Periods
53
Hood Observations
Because recording of an entire week failed at one of the four sites, video from
only three sites could be watched and summarised. One single night of recording
(the 7th night) at one of the three remaining sites was also lost. This reduced the
total number of nights observed from 28 down to 20 nights. Altogether, 187 ship
rat sightings were recorded inside the hood over the 20 nights of observation.
Over the same period and at the same sites, only 4 ship rat sightings were
recorded at the fence base. A mean (± SEM) of 9.35 ± 1.5 ship rat sightings per
HN were recorded within the hood. The highest number of sightings on a single
hole-night was 23, and at least one rat sighting was recorded on all 20 nights. No
other mammalian species were recorded using the fence hood, although
invertebrate activity was very high. Again, still images taken from video can be
seen in Figure 15.
Timing of ship rat sightings followed that found in the main summer study
(Fig. 13). Sightings peaked between 8pm and midnight, but remained constant
until about 5am.
0
50
100
150
200
250
300
12:0
0
13:0
0
14:0
0
15:0
0
16:0
0
17:0
0
18:0
0
19:0
0
20:0
0
21:0
0
22:0
0
23:0
0
0:00
1:00
2:00
3:00
4:00
5:00
6:00
7:00
8:00
9:00
10:0
0
11:0
0
Hour of the day
Mea
n nu
mbe
r of s
ight
ings
per
100H
N
Figure 13. Mean number of ship rat fence-hood sightings per 100HN (+ SEM) according to time of day. Times are corrected for New Zealand Summer Time.
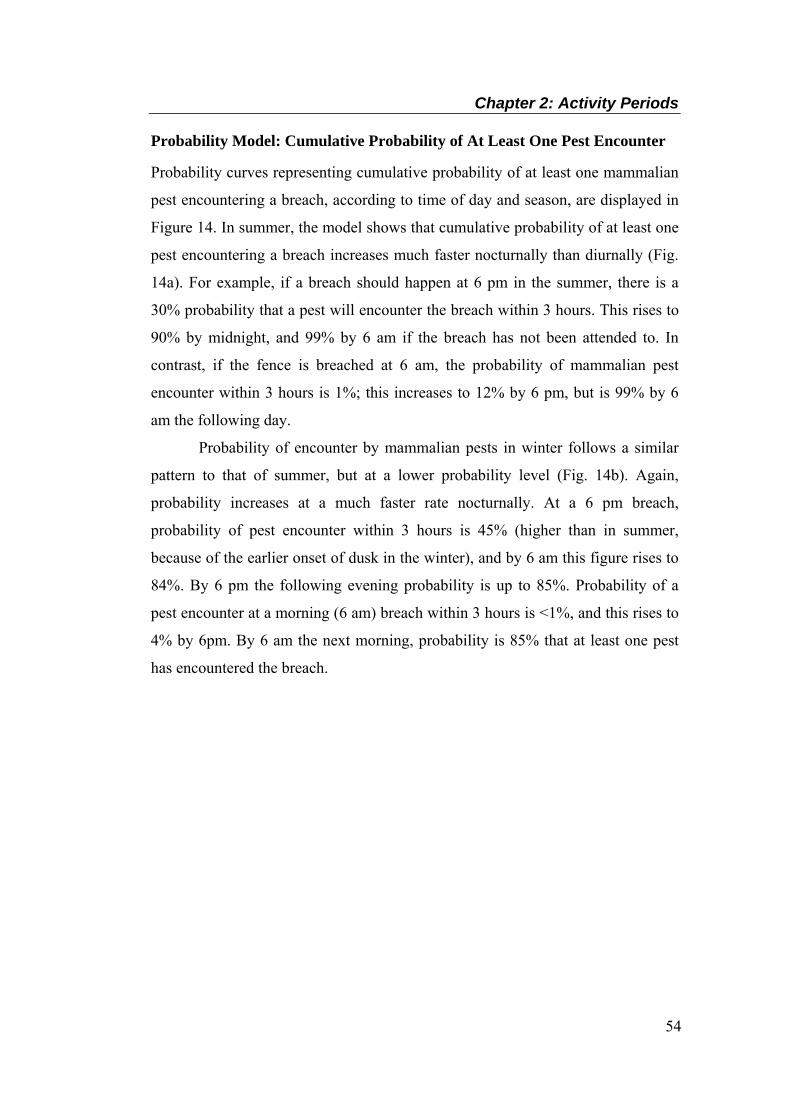
Chapter 2: Activity Periods
54
Probability Model: Cumulative Probability of At Least One Pest Encounter
Probability curves representing cumulative probability of at least one mammalian
pest encountering a breach, according to time of day and season, are displayed in
Figure 14. In summer, the model shows that cumulative probability of at least one
pest encountering a breach increases much faster nocturnally than diurnally (Fig.
14a). For example, if a breach should happen at 6 pm in the summer, there is a
30% probability that a pest will encounter the breach within 3 hours. This rises to
90% by midnight, and 99% by 6 am if the breach has not been attended to. In
contrast, if the fence is breached at 6 am, the probability of mammalian pest
encounter within 3 hours is 1%; this increases to 12% by 6 pm, but is 99% by 6
am the following day.
Probability of encounter by mammalian pests in winter follows a similar
pattern to that of summer, but at a lower probability level (Fig. 14b). Again,
probability increases at a much faster rate nocturnally. At a 6 pm breach,
probability of pest encounter within 3 hours is 45% (higher than in summer,
because of the earlier onset of dusk in the winter), and by 6 am this figure rises to
84%. By 6 pm the following evening probability is up to 85%. Probability of a
pest encounter at a morning (6 am) breach within 3 hours is <1%, and this rises to
4% by 6pm. By 6 am the next morning, probability is 85% that at least one pest
has encountered the breach.
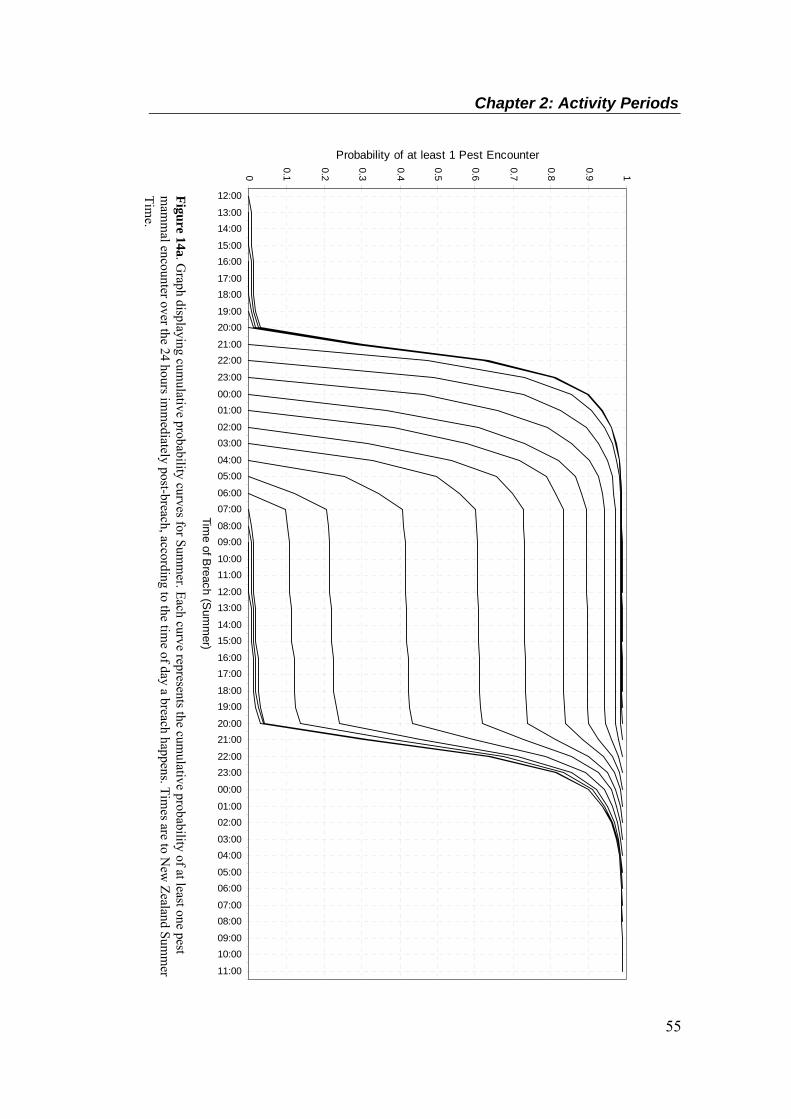
Chapter 2: Activity Periods
55
0
0.1
0.2
0.3
0.4
0.5
0.6
0.7
0.8
0.9 1
12:00
13:0014:00
15:0016:00
17:0018:00
19:0020:00
21:0022:00
23:00
00:0001:00
02:0003:00
04:0005:00
06:0007:00
08:0009:00
10:0011:00
12:0013:00
14:0015:00
16:0017:00
18:0019:00
20:0021:00
22:0023:00
00:00
01:0002:00
03:0004:00
05:0006:00
07:0008:00
09:0010:00
11:00
Time of B
reach (Sum
mer)
Probability of at least 1 Pest Encounter
Figure 14a. Graph displaying cum
ulative probability curves for Summ
er. Each curve represents the cumulative probability of at least one pest
mam
mal encounter over the 24 hours im
mediately post-breach, according to the tim
e of day a breach happens. Times are to N
ew Zealand Sum
mer
Time.
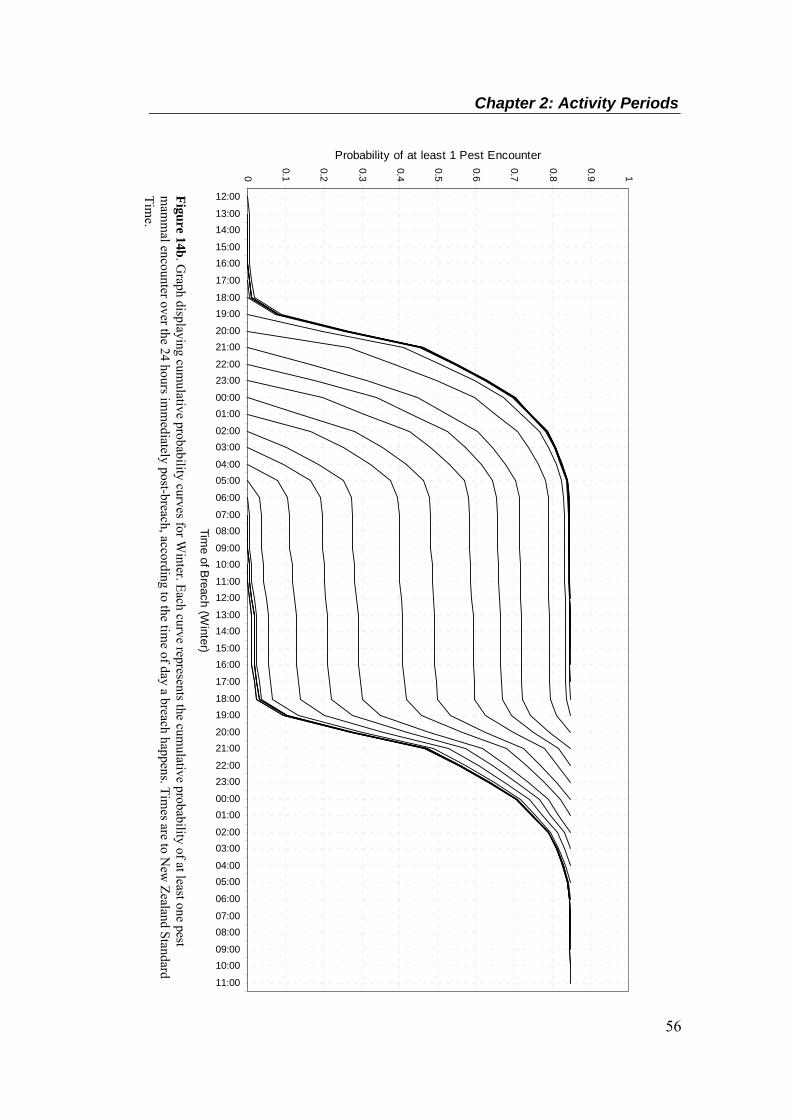
Chapter 2: Activity Periods
56
0
0.1
0.2
0.3
0.4
0.5
0.6
0.7
0.8
0.9 1
12:00
13:0014:00
15:0016:00
17:00
18:0019:00
20:0021:00
22:0023:00
00:0001:00
02:0003:00
04:0005:00
06:00
07:0008:00
09:0010:00
11:0012:00
13:0014:00
15:0016:00
17:00
18:0019:00
20:0021:00
22:0023:00
00:0001:00
02:0003:00
04:0005:00
06:00
07:0008:00
09:0010:00
11:00
Time of B
reach (Winter)
Probability of at least 1 Pest Encounter
Figure 14b. Graph displaying cum
ulative probability curves for Winter. Each curve represents the cum
ulative probability of at least one pest m
amm
al encounter over the 24 hours imm
ediately post-breach, according to the time of day a breach happens. Tim
es are to New
Zealand Standard Tim
e.
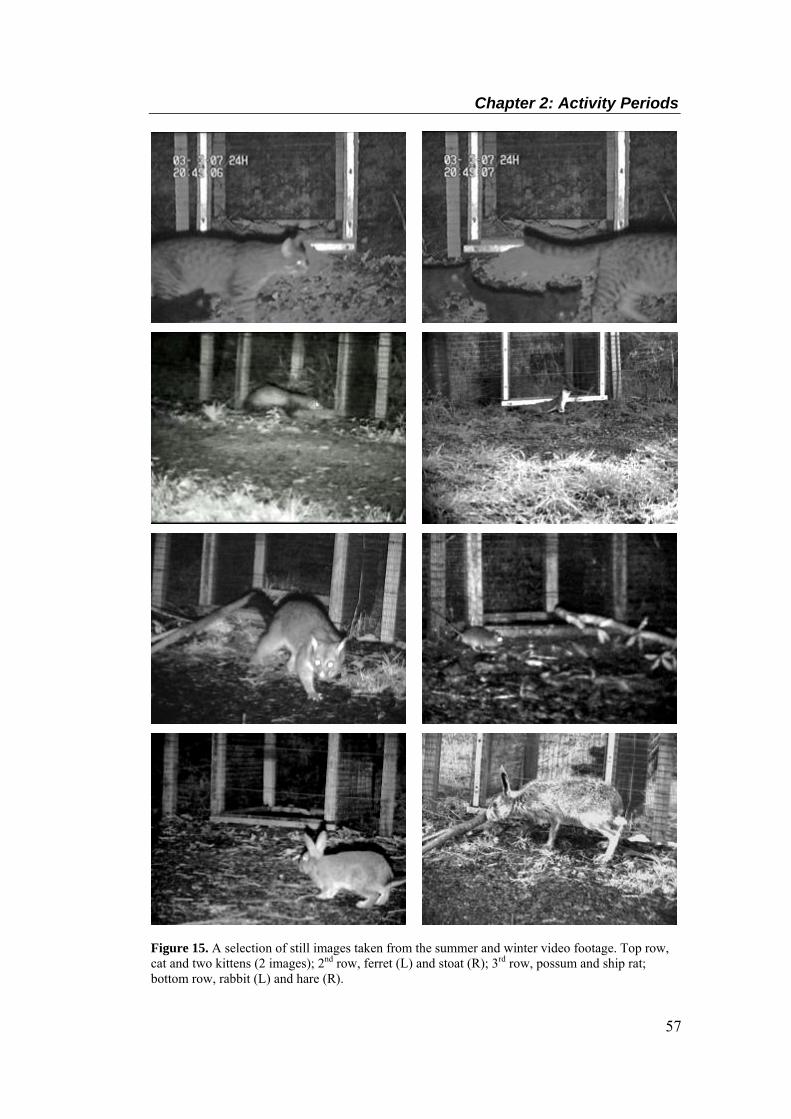
Chapter 2: Activity Periods
57
Figure 15. A selection of still images taken from the summer and winter video footage. Top row, cat and two kittens (2 images); 2nd row, ferret (L) and stoat (R); 3rd row, possum and ship rat; bottom row, rabbit (L) and hare (R).
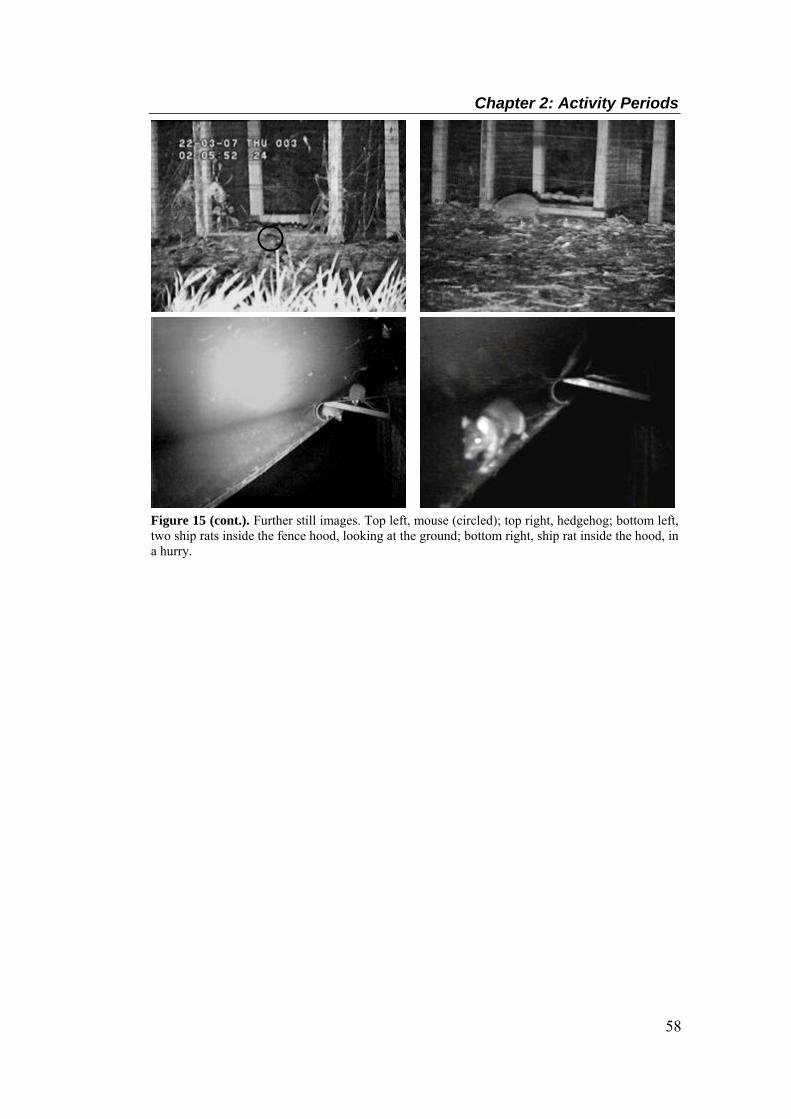
Chapter 2: Activity Periods
58
Figure 15 (cont.). Further still images. Top left, mouse (circled); top right, hedgehog; bottom left, two ship rats inside the fence hood, looking at the ground; bottom right, ship rat inside the hood, in a hurry.
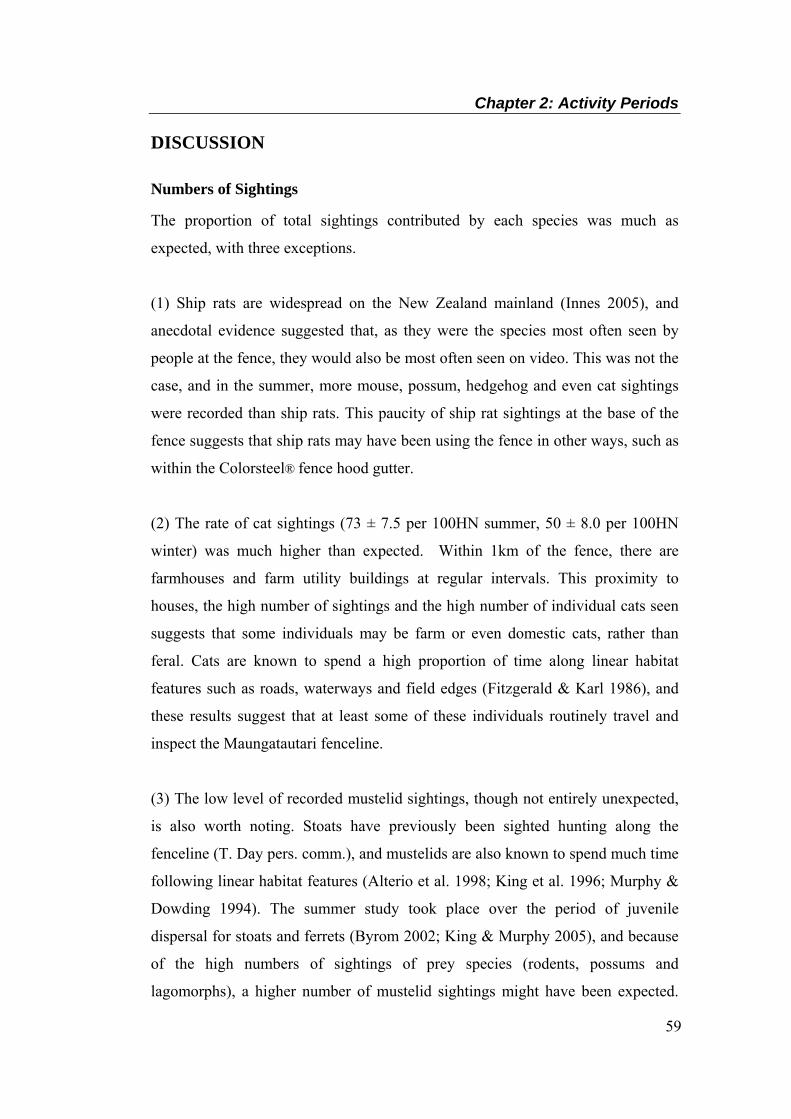
Chapter 2: Activity Periods
59
DISCUSSION
Numbers of Sightings
The proportion of total sightings contributed by each species was much as
expected, with three exceptions.
(1) Ship rats are widespread on the New Zealand mainland (Innes 2005), and
anecdotal evidence suggested that, as they were the species most often seen by
people at the fence, they would also be most often seen on video. This was not the
case, and in the summer, more mouse, possum, hedgehog and even cat sightings
were recorded than ship rats. This paucity of ship rat sightings at the base of the
fence suggests that ship rats may have been using the fence in other ways, such as
within the Colorsteel® fence hood gutter.
(2) The rate of cat sightings (73 ± 7.5 per 100HN summer, 50 ± 8.0 per 100HN
winter) was much higher than expected. Within 1km of the fence, there are
farmhouses and farm utility buildings at regular intervals. This proximity to
houses, the high number of sightings and the high number of individual cats seen
suggests that some individuals may be farm or even domestic cats, rather than
feral. Cats are known to spend a high proportion of time along linear habitat
features such as roads, waterways and field edges (Fitzgerald & Karl 1986), and
these results suggest that at least some of these individuals routinely travel and
inspect the Maungatautari fenceline.
(3) The low level of recorded mustelid sightings, though not entirely unexpected,
is also worth noting. Stoats have previously been sighted hunting along the
fenceline (T. Day pers. comm.), and mustelids are also known to spend much time
following linear habitat features (Alterio et al. 1998; King et al. 1996; Murphy &
Dowding 1994). The summer study took place over the period of juvenile
dispersal for stoats and ferrets (Byrom 2002; King & Murphy 2005), and because
of the high numbers of sightings of prey species (rodents, possums and
lagomorphs), a higher number of mustelid sightings might have been expected.

Chapter 2: Activity Periods
60
One possible explanation for the lack of sightings may be that as the base of the
fence offers no cover, mustelids mostly move along the far side of the road, in or
nearby vegetation. If they did, they would avoid detection by the video cameras.
They may not move parallel to the fenceline at all, but simply visit the fence
intermittently. Mustelids may also have been deterred by human scent, or the
presence of the camera equipment. For example, the mainly nocturnal ferrets
might have been deterred by the infra-red lighting used. Newbold (2007) found
evidence that some ferrets were capable of seeing infra-red light at a wavelength
of 870NM, on the supposedly invisible side of the 850NM wavelength for lighting
used in this study. Further study is recommended to investigate in more detail the
interaction of mustelids with the fence at Maungatautari, particularly movements
and proportion of time spent at or near the fence.
Seasonal Differences
Although this study did not include any direct measure of pest abundance,
individual activity levels or density, changes in number of sightings between
seasons for most species followed similar patterns to previous abundance studies,
as follows.
1. Rodent sightings in general (and mice in particular) significantly declined
from summer to winter. Both mouse and ship rat populations are known to
follow this general pattern in environments that are not dominated by
mast-seeding events (Badan 1979; Daniel 1978; Harper 2002; Innes et al.
2001; Murphy 1989), although annual density fluctuations may be higher
than seasonal (Daniel, 1978; Innes et al, 2001).
2. The higher number of summer possum sightings, though possibly not
statistically significant (see Methods) also concurs with previous findings
on density, as possum abundance is generally highest in late summer, and
lowest in spring (Brockie et al. 1981).
3. Hedgehog sightings did not significantly drop in the winter. The severity
of the winter influences the proportion of a hedgehog population that will
take the risk of entering hibernation (Jones & Sanders 2005), so the
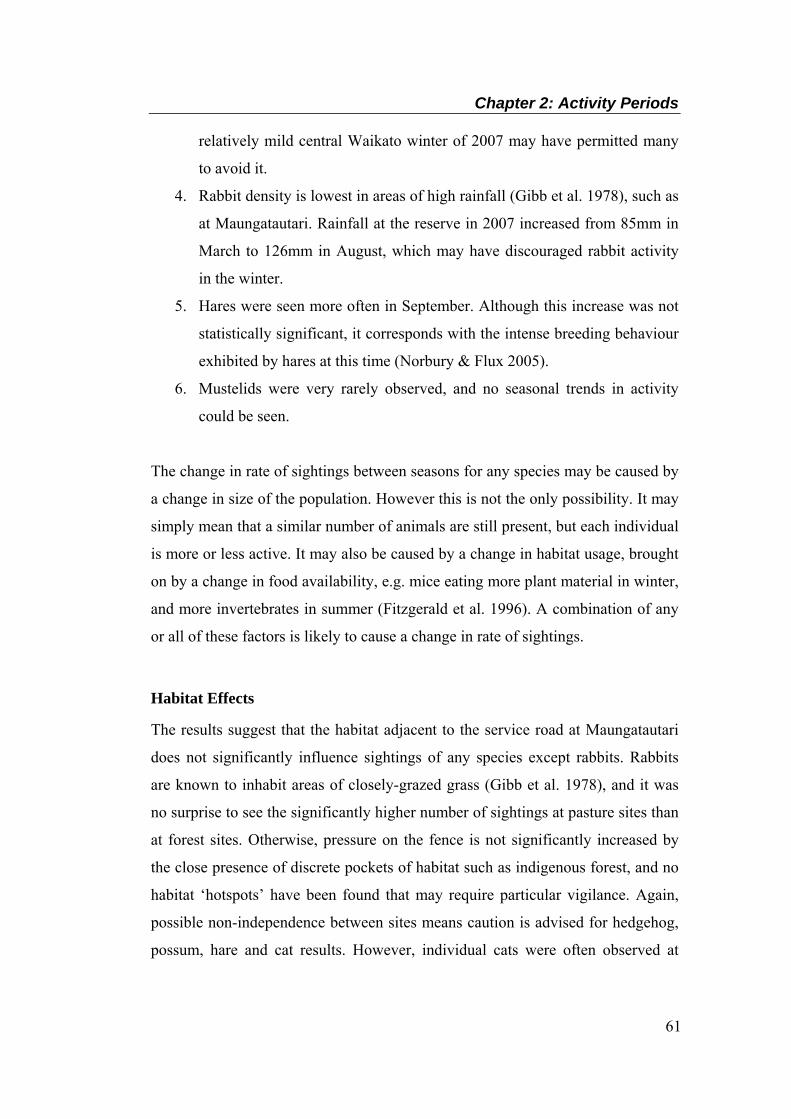
Chapter 2: Activity Periods
61
relatively mild central Waikato winter of 2007 may have permitted many
to avoid it.
4. Rabbit density is lowest in areas of high rainfall (Gibb et al. 1978), such as
at Maungatautari. Rainfall at the reserve in 2007 increased from 85mm in
March to 126mm in August, which may have discouraged rabbit activity
in the winter.
5. Hares were seen more often in September. Although this increase was not
statistically significant, it corresponds with the intense breeding behaviour
exhibited by hares at this time (Norbury & Flux 2005).
6. Mustelids were very rarely observed, and no seasonal trends in activity
could be seen.
The change in rate of sightings between seasons for any species may be caused by
a change in size of the population. However this is not the only possibility. It may
simply mean that a similar number of animals are still present, but each individual
is more or less active. It may also be caused by a change in habitat usage, brought
on by a change in food availability, e.g. mice eating more plant material in winter,
and more invertebrates in summer (Fitzgerald et al. 1996). A combination of any
or all of these factors is likely to cause a change in rate of sightings.
Habitat Effects
The results suggest that the habitat adjacent to the service road at Maungatautari
does not significantly influence sightings of any species except rabbits. Rabbits
are known to inhabit areas of closely-grazed grass (Gibb et al. 1978), and it was
no surprise to see the significantly higher number of sightings at pasture sites than
at forest sites. Otherwise, pressure on the fence is not significantly increased by
the close presence of discrete pockets of habitat such as indigenous forest, and no
habitat ‘hotspots’ have been found that may require particular vigilance. Again,
possible non-independence between sites means caution is advised for hedgehog,
possum, hare and cat results. However, individual cats were often observed at

Chapter 2: Activity Periods
62
more than one site in a single night, and appear to patrol the service road
regardless of habitat directly alongside.
The lack of habitat effect is not altogether surprising. The study did not
investigate habitat use by mammals in the vicinity of the fenceline, nor were
movements of individuals recorded (with the partial exception of some cats).
However it seems likely that while some species may den in certain habitats (e.g.
ship rats and possums in forest fragments), once on the service road (or on the
fence itself) they range widely. The service road offers a surface that is free of
obstacles, is easily travelled and is relatively dry in inclement weather; prey
(invertebrates, rodents, lagomorphs) is also present at the fence or on the road for
many species. Because the habitat opposite the fenceline is mosaic in nature, it is
unlikely to greatly affect the probability of a pest encounter; if it were more
uniform (e.g. 10 km of unbroken forest followed by 10 km of unbroken pasture),
there might well be an effect.
Breach Types
No species was sighted more often at either breach type, and a fence breach seems
as likely to be encountered by a pest mammal whether a branch has fallen across
the road or not. Ship rats were sighted more often at ‘tree-fall’ breaches in the
summer, and although this was not statistically significant, it suggests that more
research may be required to investigate the detailed effects of fallen branches and
large tree-falls. The physical nature of the breaches used in-situ in this study was
always going to be limited by the need to maintain fence integrity at the research
site. A purpose-built exclosure would be required for more rigorous testing of
breach types (e.g. large tree-falls) that completely destroy sections of fence.
Timing of Activity
Night-time (between civil twilight end and civil twilight start) pest sightings were
far more frequent, which was not unexpected. Mice are known to be mostly
nocturnal, except where numbers are high and food is limited (Rowe 1981). Ship
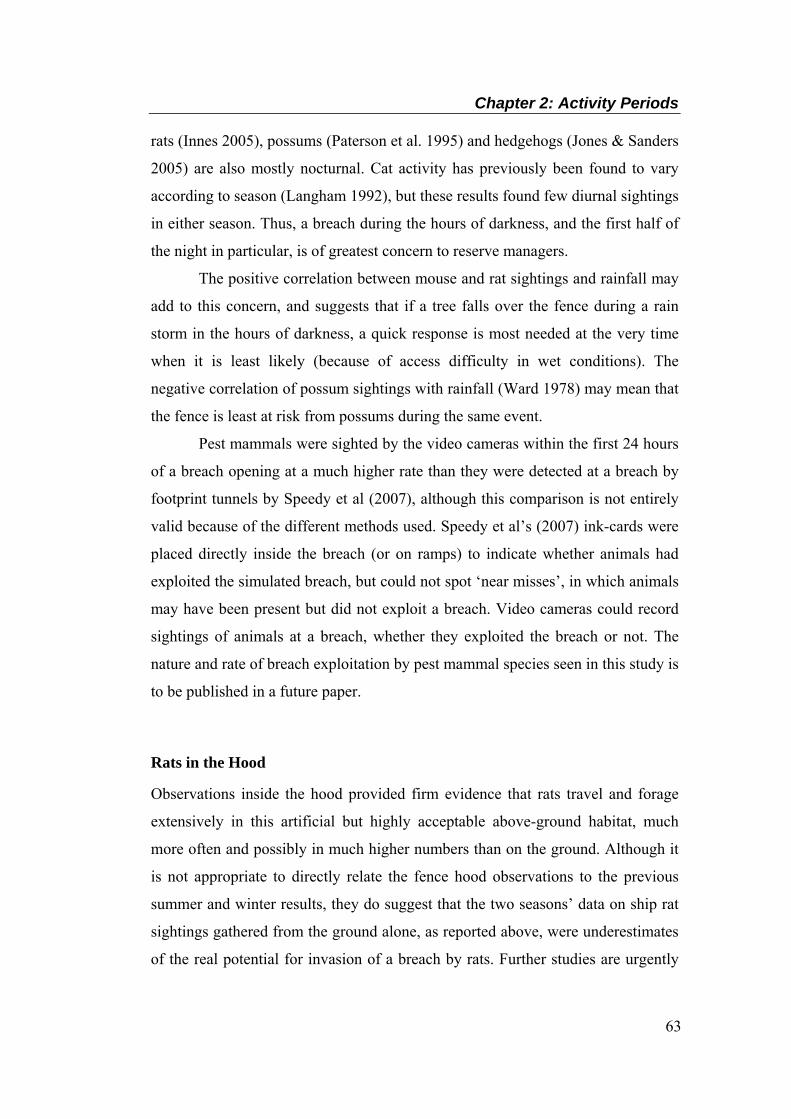
Chapter 2: Activity Periods
63
rats (Innes 2005), possums (Paterson et al. 1995) and hedgehogs (Jones & Sanders
2005) are also mostly nocturnal. Cat activity has previously been found to vary
according to season (Langham 1992), but these results found few diurnal sightings
in either season. Thus, a breach during the hours of darkness, and the first half of
the night in particular, is of greatest concern to reserve managers.
The positive correlation between mouse and rat sightings and rainfall may
add to this concern, and suggests that if a tree falls over the fence during a rain
storm in the hours of darkness, a quick response is most needed at the very time
when it is least likely (because of access difficulty in wet conditions). The
negative correlation of possum sightings with rainfall (Ward 1978) may mean that
the fence is least at risk from possums during the same event.
Pest mammals were sighted by the video cameras within the first 24 hours
of a breach opening at a much higher rate than they were detected at a breach by
footprint tunnels by Speedy et al (2007), although this comparison is not entirely
valid because of the different methods used. Speedy et al’s (2007) ink-cards were
placed directly inside the breach (or on ramps) to indicate whether animals had
exploited the simulated breach, but could not spot ‘near misses’, in which animals
may have been present but did not exploit a breach. Video cameras could record
sightings of animals at a breach, whether they exploited the breach or not. The
nature and rate of breach exploitation by pest mammal species seen in this study is
to be published in a future paper.
Rats in the Hood
Observations inside the hood provided firm evidence that rats travel and forage
extensively in this artificial but highly acceptable above-ground habitat, much
more often and possibly in much higher numbers than on the ground. Although it
is not appropriate to directly relate the fence hood observations to the previous
summer and winter results, they do suggest that the two seasons’ data on ship rat
sightings gathered from the ground alone, as reported above, were underestimates
of the real potential for invasion of a breach by rats. Further studies are urgently
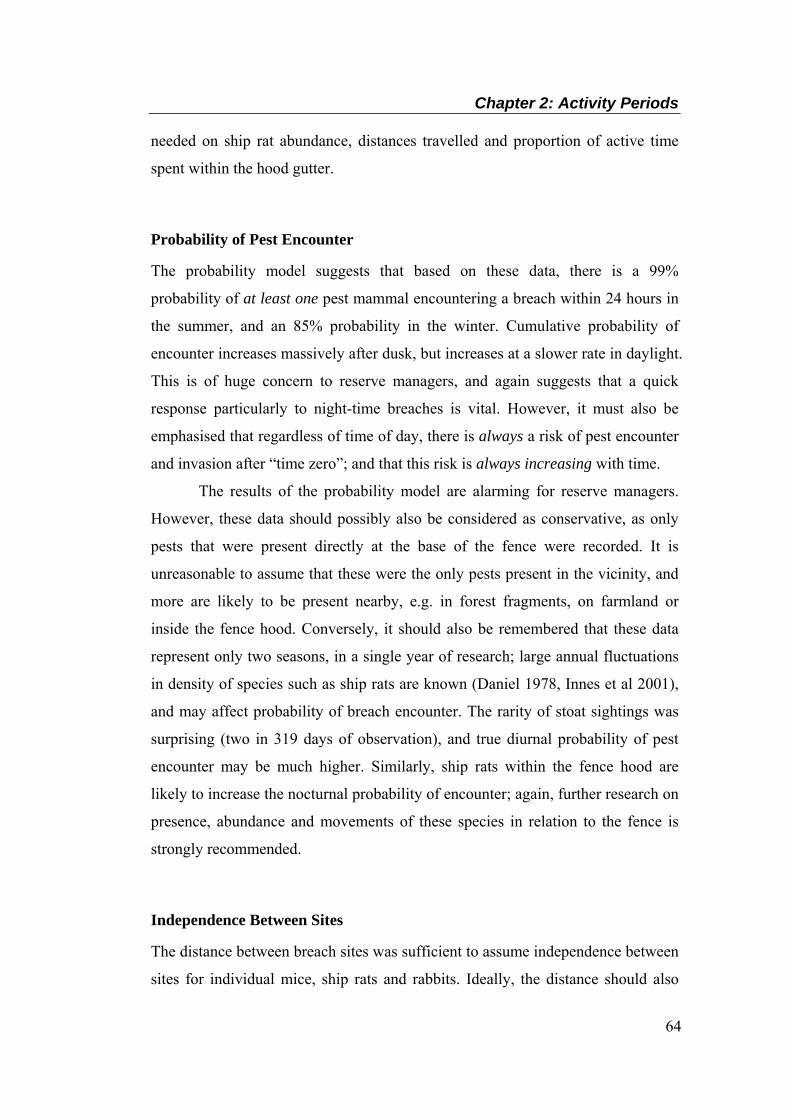
Chapter 2: Activity Periods
64
needed on ship rat abundance, distances travelled and proportion of active time
spent within the hood gutter.
Probability of Pest Encounter
The probability model suggests that based on these data, there is a 99%
probability of at least one pest mammal encountering a breach within 24 hours in
the summer, and an 85% probability in the winter. Cumulative probability of
encounter increases massively after dusk, but increases at a slower rate in daylight.
This is of huge concern to reserve managers, and again suggests that a quick
response particularly to night-time breaches is vital. However, it must also be
emphasised that regardless of time of day, there is always a risk of pest encounter
and invasion after “time zero”; and that this risk is always increasing with time.
The results of the probability model are alarming for reserve managers.
However, these data should possibly also be considered as conservative, as only
pests that were present directly at the base of the fence were recorded. It is
unreasonable to assume that these were the only pests present in the vicinity, and
more are likely to be present nearby, e.g. in forest fragments, on farmland or
inside the fence hood. Conversely, it should also be remembered that these data
represent only two seasons, in a single year of research; large annual fluctuations
in density of species such as ship rats are known (Daniel 1978, Innes et al 2001),
and may affect probability of breach encounter. The rarity of stoat sightings was
surprising (two in 319 days of observation), and true diurnal probability of pest
encounter may be much higher. Similarly, ship rats within the fence hood are
likely to increase the nocturnal probability of encounter; again, further research on
presence, abundance and movements of these species in relation to the fence is
strongly recommended.
Independence Between Sites
The distance between breach sites was sufficient to assume independence between
sites for individual mice, ship rats and rabbits. Ideally, the distance should also

Chapter 2: Activity Periods
65
have allowed this assumption to hold for all other pest species, to enable more
robust statistical analysis (except for mustelids, due to small sample size). Over
the summer study, VCRs were used for recording, and required daily battery and
video tape changes. Up to six sites had to be visited every day for 31 days.
Visiting all sites over 7 km of steep, winding terrain in a 4WD vehicle (in low
gear ratio) took most of the day, and increasing distances would have made daily
servicing impractical. The decision on distances between sites was made as a
compromise between statistical robustness (for species other than rodents and
rabbits) and practicability. While the p-values reported for comparisons in this
research should be interpreted carefully for some species, the trends described
from the data remain clear.
If DVRs had been available in the summer, distances could have been
much greater, as only weekly visits would be required. A 1 km gap between sites
may then have been possible, and sites could have been split between the northern
and southern sides of the mountain. This 1 km distance would then have allowed
the assumption of independence to hold for hedgehogs (Jones and Sanders 2005),
and possibly also for possums, stoats, ferrets and cats, although these species are
all known to range over large distances (Green 1984, Gillies & Fitzgerald 2005,
King & Murphy 2005, Clapperton & Byrom 2005). However, the DVRs became
available only after the summer study, and it was necessary to use the same sites
in the winter as used in the summer, to allow a seasonal comparison.
Conclusion
This chapter has documented the temporal and seasonal pattern of sightings for
mammalian pests recorded at a 7 km representative sample of the Maungatautari
fenceline. The fence faces greatest pressure from pest mammals during the hours
of darkness, in both summer and winter. Number of sightings for mice, ship rats,
possums, rabbits and cats are significantly higher in summer than in winter.
These data cannot tell whether there were higher numbers of individuals or the
same number of more active individuals, but as indices of abundance of unmarked
populations they generally follow those seen elsewhere. Overall number of
Chapter 2: Activity Periods
66
sightings was generally not affected by adjacent habitat type, or type of breach.
The high levels of nocturnal pest sightings (particularly cats) directly at the base
of the fence is of concern, and should be taken into account when considering the
most appropriate response to a fence breach. Ship rat activity inside the fence
hood is extremely high and likely to present the single most severe threat of
invasion, especially during a rain storm at night. The true probability of a pest
encountering a breach may be higher than the probability model suggests, and
further study into the abundance, movements, home range and invasion behaviour
of pest mammals at Maungatautari Ecological Island is strongly recommended.
Chapter 2: Activity Periods
67
REFERENCES Alterio N, Moller H 1997. Daily activity of stoats (Mustela erminea), feral ferrets
(Mustela furo) and feral house cats (Felis catus) in coastal grassland, Otago Peninsula, New Zealand. New Zealand Journal of Ecology 21(1): 89-95.
Alterio N, Moller H, Ratz H 1998. Movements and habitat use of feral house cats Felis catus, stoats Mustela erminea and ferrets Mustela furo, in grassland surrounding Yellow-eyed penguin Megadyptes antipodes breeding areas in spring. Biological Conservation 83(2): 187-194.
Badan D 1979. The ecology of mice (Mus musculus) in two forests near Auckland. Unpublished thesis, University of Auckland, Auckland.
Brockie RE, Bell BD, White AJ 1981. Age structure and mortality of possum Trichosurus vulpecula populations from New Zealand. Proceedings of the 1st Symposium on Marsupials in New Zealand, Wellington. Wellington, Victoria University.
Brown KP, Moller H, Innes J, Jansen P 1998. Identifying predators at nests of small birds in a New Zealand forest. Ibis 140: 274-279.
Byrom AE 2002. Dispersal and survival of juvenile feral ferrets Mustela furo in New Zealand. Journal of Applied Ecology 39: 67-78.
Clapperton BK, Byrom AE 2005. Feral ferret. In: King CM ed. The Handbook of New Zealand Mammals. Melbourne, Oxford University Press. Pp. 294-307.
Clarkson BD 2002. Upland forests and special open habitats. In: Clarkson B, Merrett M, Downs T eds. Botany of the Waikato. Hamilton, Waikato Botanical Society Inc. Pp. 82-91.
Cowan PE 2005. Brushtail possum. In: King CM ed. The Handbook of New Zealand Mammals. Melbourne, Oxford University Press. Pp. 56-80.
Daniel MJ 1978. Population ecology of ship and Norway rats in New Zealand. In: Dingwall PR, Atkinson IAE, Hay C eds. The Ecology and Control of Rodents in New Zealand Nature Reserves. Wellington, NZ Department of Lands and Survey.
Day TD 2006. Understanding and mitigating reinvasion risk at fenced sanctuaries. Proceedings of the Sanctuaries of New Zealand 2006 Annual Workshop, Kawhia.
Day TD 2007. Remote Surveillance - 24hr live monitoring. Xclude it! (3). Cambridge, XcluderTM Pest Proof Fencing Company.
Chapter 2: Activity Periods
68
Day TD, MacGibbon RJ 2007. Multiple-species exclusion fencing and technology for mainland sites. Proceedings of the Managing Vertebrate Invasive Species International Symposium, Colorado.
Fitzgerald BM, Daniel MJ, Fitzgerald AE, Karl BJ, Meads MJ, Notman PR 1996. Factors affecting numbers of house mice (Mus musculus) in hard beech (Nothofagus truncata) forest. Journal of the Royal Society of New Zealand 26: 237-249.
Fitzgerald BM, Karl BJ 1986. Home range of feral house cats (Felis catus L.) in forest of the Orongorongo Valley, Wellington, New Zealand. New Zealand Journal of Ecology 9: 71-81.
Gibb JA, Ward CP, Ward GD 1978. Natural control of a population of rabbits, Oryctolagus cuniculus (L.), for ten years in the Kourarau enclosure. DSIR Bulletin 223: 1-89.
Gillies C, Fitzgerald BM. 2005. Feral cat. In: King CM ed. The Handbook of New Zealand Mammals. Melbourne, Oxford University Press. Pp. 308-326.
Green WQ. 1984. A review of ecological studies relevant to management of the common brushtail possum. In: Smith A, Hume I eds. Possums and Gliders. Sydney, Surrey Beatty. Pp. 483-499.
Harper GA 2002. Habitat selection by feral cats (Felis catus) and three rat species (Rattus spp.) on Stewart Island (Rakiura) and their impacts on native birds. Unpublished PhD thesis. Dunedin, University of Otago.
Harper GA 2007. Habitat selection of feral cats (Felis catus) on a temperate, forested island. Austral Ecology 32: 305-314.
Hooker S, Innes J 1995. Ranging behaviour of forest-dwelling ship rats, Rattus rattus, and effects of poisoning with brodifacoum. New Zealand Journal of Zoology 22: 291-304.
Innes J 1979. Diet and reproduction of ship rats in the Northern Tararuas. New Zealand Journal of Ecology 2: 82-84.
Innes J 2005. Ship Rat. In: King CM ed. The Handbook of New Zealand Mammals. Melbourne, Oxford University Press. Pp. 187-203.
Innes J, Crook B, Jansen P 1994. A time-lapse video camera system for detecting predators at nests of forest birds: a trial with North Island kokako. Proceedings of the Resource Technology 1994 Conference, University of Melbourne.
Innes J, King CM, Flux JEC, Kimberley MO 2001. Population biology of the ship rat and Norway rat in Pureora Forest Park, 1983-87. New Zealand Journal of Zoology 28: 57-78.
Chapter 2: Activity Periods
69
Jones C, Sanders MD 2005. European Hedgehog. In: King CM ed. The Handbook of New Zealand Mammals. Melbourne, Oxford University Press. Pp. 81-94.
King CM ed. 2005. The Handbook of New Zealand Mammals. 2nd ed. Melbourne, Oxford University Press.
King CM, Flux M, Innes JG, Fitzgerald BM 1996. Population biology of small mammals in Pureora Forest Park: 1. Carnivores (Mustela erminea, M. furo, M. nivalis, and Felis catus). New Zealand Journal of Ecology 20(2): 241-251.
King CM, Murphy EC 2005. Stoat. In: King CM ed. The Handbook of New Zealand Mammals. Melbourne, Oxford University Press. Pp. 261-287.
Konecny MJ 1987. Home range and activity patterns of feral house cats in the Galapagos Islands. Oikos 50: 17-23.
Langham NPE 1992. Feral cats (Felis catus L.) on New Zealand farmland. II. Seasonal activity. Wildlife Research 19: 707-720.
MacGibbon RJ 2001. Maungatautari Ecological Restoration Project Plan. Taupo, Natural Logic Ltd.
McQueen J ed. 2004. An Ecological Restoration Plan for Maungatautari. Cambridge, Maungatautari Ecological Island Trust.
Miller CK, Miller TK 1995. Population dynamics and diet of rodents on Rangitoto Island, New Zealand, including the effect of a 1080 poison operation. New Zealand Journal of Ecology 19(1): 19-27.
Morgan D, Waas JR, Innes J 2006. The relative importance of Australian magpies (Gymnorhina tibicen) as nest predators of rural birds in New Zealand. New Zealand Journal of Zoology 33: 17-29.
Murphy EC 1989. The demography of an island and mainland population of house mice in the Marlborough Sounds, New Zealand. Unpublished PhD thesis. Wellington, Victoria University.
Murphy EC, Dowding JE 1994. Range and diet of stoats (Mustela erminea) in a New Zealand beech forest. New Zealand Journal of Ecology 18(1): 11-18.
Newbold HG 2007. Infra-red vision in ferrets (Mustela furo). Unpublished MSc thesis. Hamilton, University of Waikato.
Norbury GL, Flux JEC 2005. Brown hare. In: King CM ed. The Handbook of New Zealand Mammals. Melbourne, Oxford University Press. Pp. 151-158.
Chapter 2: Activity Periods
70
Norbury GL, Reddiex B 2005. European rabbit. In: King CM ed. The Handbook of New Zealand Mammals. Melbourne, Oxford University Press. Pp. 131-150.
Paterson BM, Morris RS, Weston J, Cowan PE 1995. Foraging and denning patterns of brushtail possums, and their possible relationship to contact with cattle and the transmission of bovine tuberculosis. New Zealand Veterinary Journal 43: 281-288.
Rowe FP 1981. Wild house mouse biology and control. Symposia of the Zoological Society of London 47: 575-589.
Ruscoe WA, Murphy EC 2005. House mouse. In: King CM ed. The Handbook of New Zealand Mammals. Melbourne, Oxford University Press. Pp. 204-221.
Speedy C, Day TD, Innes J 2007. Pest eradication technology - the critical partner to pest exclusion technology: The Maungatautari experience. Proceedings of the Managing Vertebrate Invasive Species International Symposium, Colorado.
Tempero GW, McDonald RM, King CM 2007. Distribution and activity of small mammals on pastoral farmland and forest in New Zealand. Wildlife Biology in Practice 3(2): 43-51.
Ward GD 1978. Habitat use and home range of radio-tagged opossums Trichosurus vulpecula (Kerr) in New Zealand lowland forest. In: Montgomery GG ed. The ecology of arboreal folivores. Washington, D.C., Smithsonian Institution Press. Pp. 267-287.
Chapter 3: Pest Behaviour at Fence Breaches
71
CHAPTER 3
Behaviour of Mammalian Pests at Simulated
Breaches in a Pest-Proof Fence
ABSTRACT
Mammalian pests are excluded from Maungatautari Ecological Island by an
XcluderTM pest-proof fence that excludes every individual unless the fence
integrity is compromised. Inevitably, the fence will be breached on occasion by
mechanisms such as treefall and flood-scour. Knowledge of pest behaviour in
relation to fence breach events would assist reserve managers in developing
optimal breach-response procedures. A video study was conducted at 20
simulated fence breaches over summer 2006/07, winter 2007 and summer
2007/08 to gather data on rates of mammalian pest interest and entry into fence
breaches, and to test whether the risk of invasion varies significantly with season
(summer and winter), exterior habitat (forest and pasture) and breach type (‘tree-
fall’ and ‘flood scour’). The number of breaches encountered by pests within 24
hours was high in both seasons (95% summer, 92.5% winter), but pests showed
interest in, and subsequently entered, more summer breaches than winter breaches
(p < 0.001). Similarly, high rates of encounter were found at 7-day breaches, with
100% of breaches encountered by pests within the week in both seasons.
Increasing numbers of encounters, and of species, were recorded at each breach
over a 7-day period. Mice, when sighted, were more likely to show interest in
and/or enter breaches than any other species. The behaviour of ship rats, the
species next most likely to enter breaches at ground level, was probably
underestimated because many rats moved along the fence inside the hood,
invisible to the ground-level cameras. Possums, cats and hedgehogs showed less
Chapter 3: Pest Behaviour at Fence Breaches
72
interest than rodents. Cats showed a willingness to follow prey into breaches, and
possums often scent-marked holes before moving on or entering. Although
seasonal differences in interest were found for rodents, hedgehogs and rabbits,
none was found for cats or possums. Ship rats (p = 0.014) and hares (p < 0.001)
showed significantly more interest in ‘tree-fall’ holes than in ‘flood-scour’ holes,
but habitat type did not affect rates of interest or entry for any species.
INTRODUCTION
Mt Maungatautari, an eroded andesitic volcanic cone, lies in the central Waikato,
in the North Island of New Zealand (Clarkson 2002; Speedy et al. 2007). The
mountain supports a dense mixed podocarp-broadleaf forest, covering
approximately 3400ha, and is completely surrounded by farmland (MacGibbon
2001). The majority of the original native fauna present on the mountain is now
absent, and the remaining flora has been intensely browsed for many years
(McQueen 2004). The Maungatautari Ecological Island Trust (MEIT) was formed
in the late 1990s. Their primary aim is to “restore the diversity, vitality and
resilience of the ecosystems of Maungatautari, as close as possible to the original
condition, to re-create self-sustaining communities of indigenous plants and
animals” (McQueen 2004).
A vital pre-requisite to achieving the primary goal of the MEIT is the
permanent removal of all mammalian pests. To this end, a 47km XcluderTM pest-
proof fence was completed in 2006, which completely encircles the 3363 ha of
forest clothing the mountain top, at an average of 475 m elevation below the
summit (252 m asl). This fence design has been proven experimentally and in-situ
to exclude 100% of the pest mammals that encounter it, unless the integrity of the
fence is compromised (Day & MacGibbon, 2007). An eradication campaign then
began, to remove mammalian pest species within the exclosure (including fallow
deer (Dama dama), red deer (Cervus elaphus scoticus), feral pigs (Sus scrofa),
feral goats (Capra hircus), feral cats (Felis catus), possums (Trichosurus
vulpecula), feral ferrets (Mustela furo), stoats (Mustela erminea), weasels

Chapter 3: Pest Behaviour at Fence Breaches
73
(Mustela nivalis), ship rats (Rattus rattus), mice (Mus musculus), rabbits
(Oryctolagus cuniculus), hares (Lepus europaeus occidentalis) and hedgehogs
(Erinaceus europaeus occidentalis)). By January 2008, the only pest mammals
known to have survived within the reserve were isolated pockets of mice, up to 10
goats, and small numbers of lagomorphs (P. de Monchy pers. comm.). The mice
are not thought to be invaders, as most are many hundreds of metres from the
nearest boundary point. All are being targeted in ongoing operations.
Damage to fence integrity is thought to be inevitable at some stage in the
life of a fence, because it is impossible to eliminate all chances of tree-falls or
gates being left open. XcluderTM Pest Proof Fencing Company have developed
remote surveillance techniques to minimise the risk of pest re-invasion (Day &
MacGibbon 2007). An alarm system monitors the integrity of the fence, including
vehicle, pedestrian and water gates. Managers are notified by mobile phone
immediately an alarm is triggered, and respond accordingly (Day 2007).
The MEIT currently attempts to physically respond to a breach within 90
minutes of notification of a breach. However, there may be times when this is not
possible, e.g. where weather and track conditions make a night response
dangerous. More than 95% of pest activity at Maungatautari is known to take
place nocturnally (see Chapter 2). Knowledge of the behaviour of pests that
encounter a breach (in particular, whether pests seem interested in the breach, and
whether they will exploit it) will assist in the development of optimal breach
response procedures, and minimise invasion risk.
The potential for re-invasion through a pest-proof fence by mammalian
pests was tested during a preliminary study at Maungatautari (Day 2006; Speedy
et al. 2007). Prior to the completion of the fence, breaches were simulated by
cutting a series of holes in the fence mesh at some sites, and installing ramps at
some of these to simulate branch falls. Ink tracking-cards were placed at each
breach, and remained over a period of four weeks. No measurement was made of
pest movement or investigation outside breaches, so only breach use events were
recorded. Within the first 24 hours, 8% of breaches had been used, and after three
days, this figure had risen to 22%. A total of 71% of breaches had been used by
the end of the four week period. Mice and rats used the mesh holes, and possums,
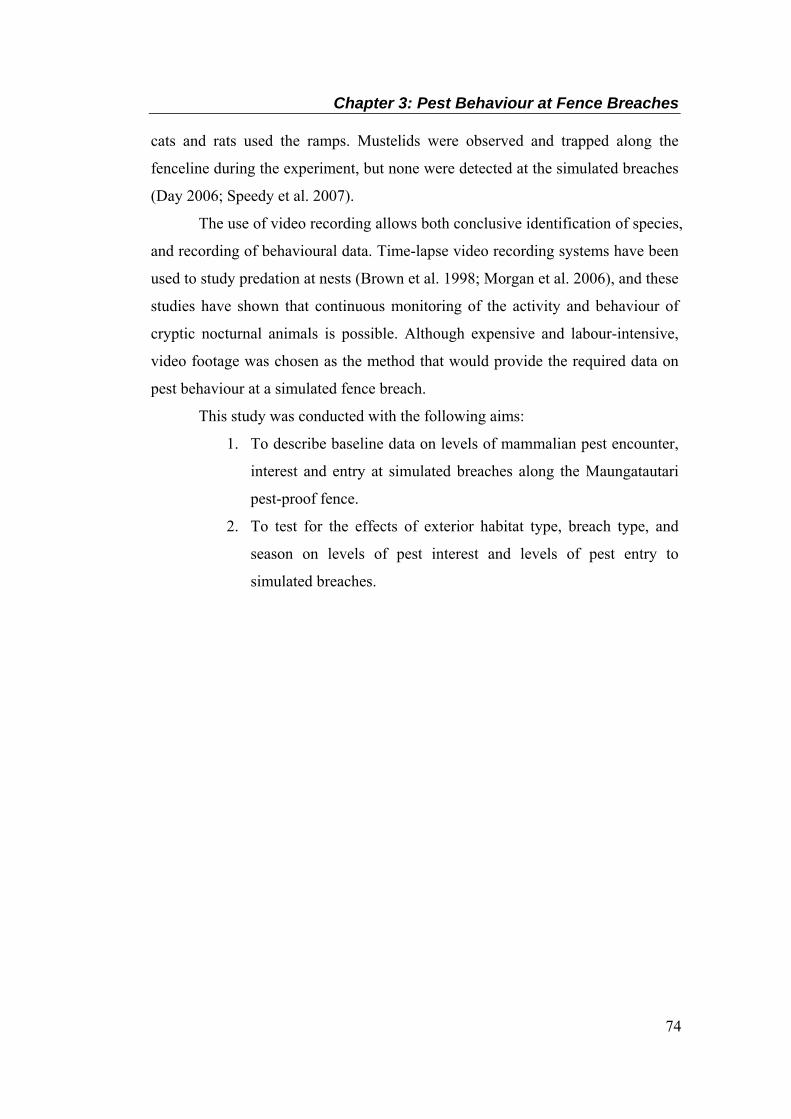
Chapter 3: Pest Behaviour at Fence Breaches
74
cats and rats used the ramps. Mustelids were observed and trapped along the
fenceline during the experiment, but none were detected at the simulated breaches
(Day 2006; Speedy et al. 2007).
The use of video recording allows both conclusive identification of species,
and recording of behavioural data. Time-lapse video recording systems have been
used to study predation at nests (Brown et al. 1998; Morgan et al. 2006), and these
studies have shown that continuous monitoring of the activity and behaviour of
cryptic nocturnal animals is possible. Although expensive and labour-intensive,
video footage was chosen as the method that would provide the required data on
pest behaviour at a simulated fence breach.
This study was conducted with the following aims:
1. To describe baseline data on levels of mammalian pest encounter,
interest and entry at simulated breaches along the Maungatautari
pest-proof fence.
2. To test for the effects of exterior habitat type, breach type, and
season on levels of pest interest and levels of pest entry to
simulated breaches.
Chapter 3: Pest Behaviour at Fence Breaches
75
METHODS
Study Site
Maungatautari Ecological Island (38°03’26”S, 175°33’40”W) is 16km south-east
of Cambridge, New Zealand (Fig. 1). A 4m-wide compacted metal service road
runs along the outside of the 47km exclusion fence. The habitat on the opposite
side of the road is mostly grazed pasture, interspersed with small (≤0.25ha)
pockets of indigenous mixed podocarp-broadleaf forest, dominated by rimu
(Dacrydium cupressinum) and tawa (Beilschmiedia tawa). The section of
fenceline chosen for the study was on the southern (Pukeatua) side of the reserve,
beginning at the end of Tari Road and stretching approximately 7km towards the
east (Fig. 2). The study site was chosen because the adjacent habitat offered a
good representation of habitat found elsewhere on the reserve’s perimeter, and
access by 4WD vehicle was relatively easy.
Figure 1. Location of Maungatuatari Ecological Island (indicated by the arrow).
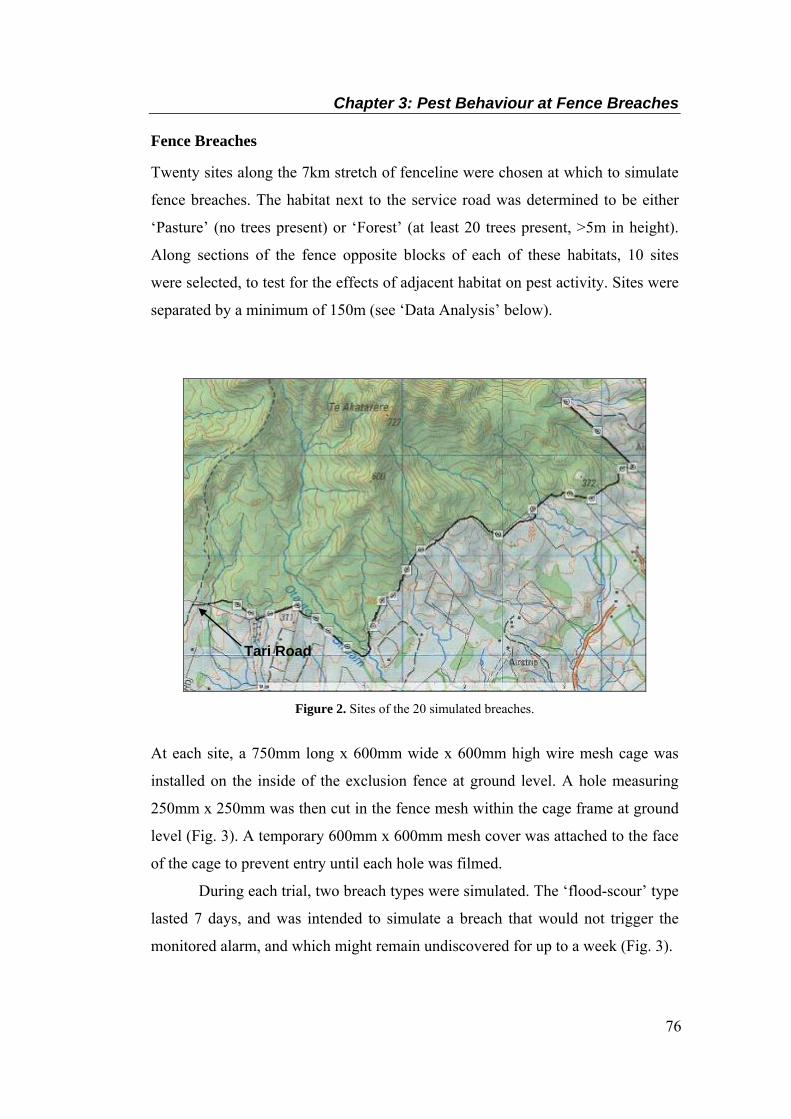
Chapter 3: Pest Behaviour at Fence Breaches
76
Fence Breaches
Twenty sites along the 7km stretch of fenceline were chosen at which to simulate
fence breaches. The habitat next to the service road was determined to be either
‘Pasture’ (no trees present) or ‘Forest’ (at least 20 trees present, >5m in height).
Along sections of the fence opposite blocks of each of these habitats, 10 sites
were selected, to test for the effects of adjacent habitat on pest activity. Sites were
separated by a minimum of 150m (see ‘Data Analysis’ below).
Figure 2. Sites of the 20 simulated breaches.
At each site, a 750mm long x 600mm wide x 600mm high wire mesh cage was
installed on the inside of the exclusion fence at ground level. A hole measuring
250mm x 250mm was then cut in the fence mesh within the cage frame at ground
level (Fig. 3). A temporary 600mm x 600mm mesh cover was attached to the face
of the cage to prevent entry until each hole was filmed.
During each trial, two breach types were simulated. The ‘flood-scour’ type
lasted 7 days, and was intended to simulate a breach that would not trigger the
monitored alarm, and which might remain undiscovered for up to a week (Fig. 3).
Tari Road
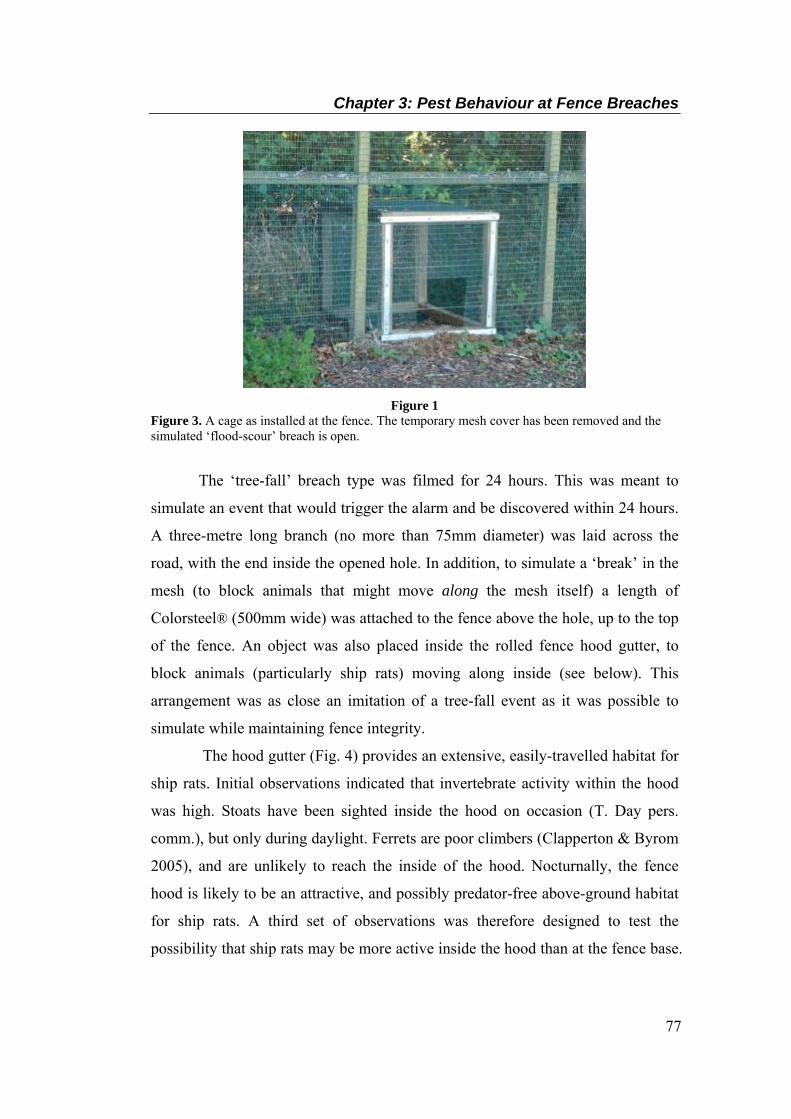
Chapter 3: Pest Behaviour at Fence Breaches
77
Figure 1
Figure 3. A cage as installed at the fence. The temporary mesh cover has been removed and the simulated ‘flood-scour’ breach is open.
The ‘tree-fall’ breach type was filmed for 24 hours. This was meant to
simulate an event that would trigger the alarm and be discovered within 24 hours.
A three-metre long branch (no more than 75mm diameter) was laid across the
road, with the end inside the opened hole. In addition, to simulate a ‘break’ in the
mesh (to block animals that might move along the mesh itself) a length of
Colorsteel® (500mm wide) was attached to the fence above the hole, up to the top
of the fence. An object was also placed inside the rolled fence hood gutter, to
block animals (particularly ship rats) moving along inside (see below). This
arrangement was as close an imitation of a tree-fall event as it was possible to
simulate while maintaining fence integrity.
The hood gutter (Fig. 4) provides an extensive, easily-travelled habitat for
ship rats. Initial observations indicated that invertebrate activity within the hood
was high. Stoats have been sighted inside the hood on occasion (T. Day pers.
comm.), but only during daylight. Ferrets are poor climbers (Clapperton & Byrom
2005), and are unlikely to reach the inside of the hood. Nocturnally, the fence
hood is likely to be an attractive, and possibly predator-free above-ground habitat
for ship rats. A third set of observations was therefore designed to test the
possibility that ship rats may be more active inside the hood than at the fence base.
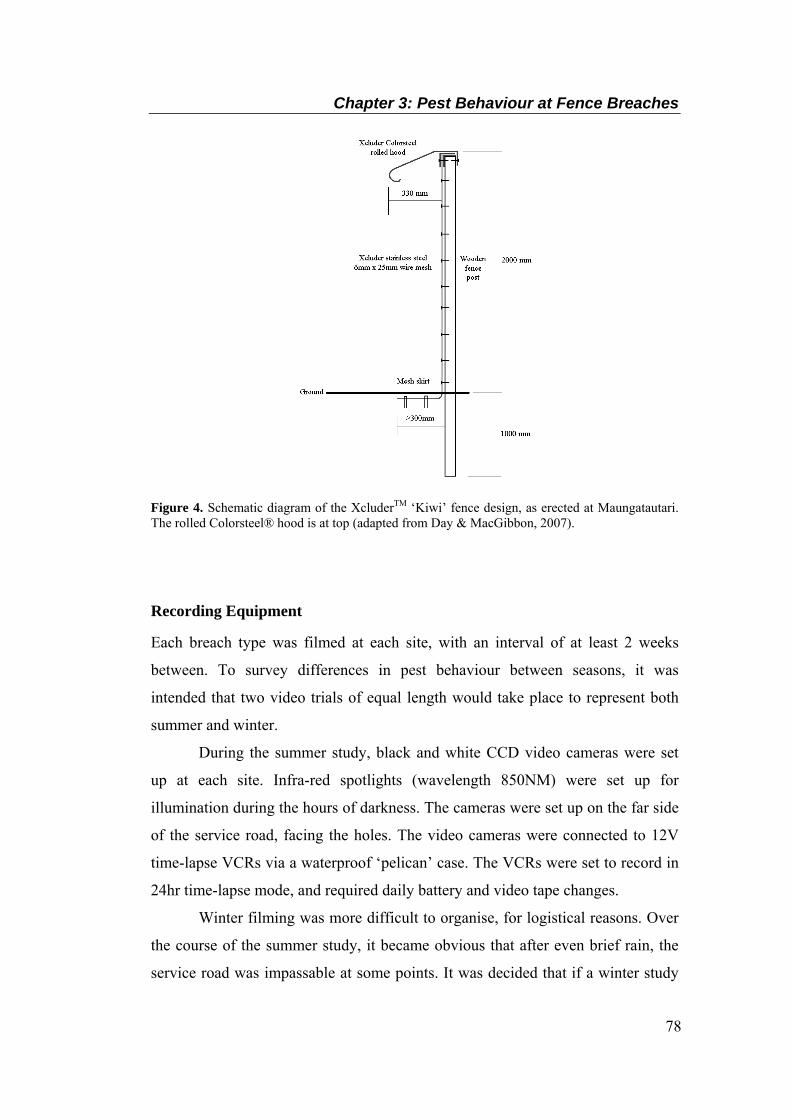
Chapter 3: Pest Behaviour at Fence Breaches
78
Figure 4. Schematic diagram of the XcluderTM ‘Kiwi’ fence design, as erected at Maungatautari. The rolled Colorsteel® hood is at top (adapted from Day & MacGibbon, 2007).
Recording Equipment
Each breach type was filmed at each site, with an interval of at least 2 weeks
between. To survey differences in pest behaviour between seasons, it was
intended that two video trials of equal length would take place to represent both
summer and winter.
During the summer study, black and white CCD video cameras were set
up at each site. Infra-red spotlights (wavelength 850NM) were set up for
illumination during the hours of darkness. The cameras were set up on the far side
of the service road, facing the holes. The video cameras were connected to 12V
time-lapse VCRs via a waterproof ‘pelican’ case. The VCRs were set to record in
24hr time-lapse mode, and required daily battery and video tape changes.
Winter filming was more difficult to organise, for logistical reasons. Over
the course of the summer study, it became obvious that after even brief rain, the
service road was impassable at some points. It was decided that if a winter study

Chapter 3: Pest Behaviour at Fence Breaches
79
were to take place, it could be done only by using six Archos 504 personal media
players (high storage capacity digital video recorders (DVR) with low power
consumption) in place of the VCRs. Testing confirmed that these devices were
capable of recording and storing more than a week of video at 25 frames per
second.
During the fence hood observations, two camera units were set up at each
site. The first used the same cameras as before, arranged in the same way as
previously, on the opposite side of the road, facing the fence breach. The second
camera was a weatherproof miniature video camera with in-built infra-red LEDs,
fitted to the underside of the Colorsteel® fence hood, facing towards the rolled
gutter and connected to a second DVR placed at the base of the fence 20m along
the fenceline. In this way, simultaneous recording of both the fence base and the
hood gutter at each site was completed.
Filming Schedule: Summer
For the summer study, between February 24th and March 26th, 2007, up to six sites
were filmed at any one time. Of these, up to five sites were ‘flood-scour’ sites (7
days duration), and one a ‘tree-fall’ site (24 hours duration). At all times, both
‘forest’ and ‘pasture’ sites were filmed simultaneously. Sites were scheduled for
filming in rotation, and no more than every second cage along the fenceline was
used at any one time, meaning that cameras were separated by at least 300m (see
‘Data Analysis’ below). Cameras were set up to record a total of 160 days of
footage.
Filming Schedule: Winter
Winter filming was completed between between August 3rd and September 21st,
2007. Because it was no longer possible to carry out daily visits over a long period,
the order in which each breach type was filmed had to be changed. All the ‘tree-
fall’ holes in a block were filmed together at the start of the winter session, by
allocating five cameras to them over four nights, to complete the 20 breach
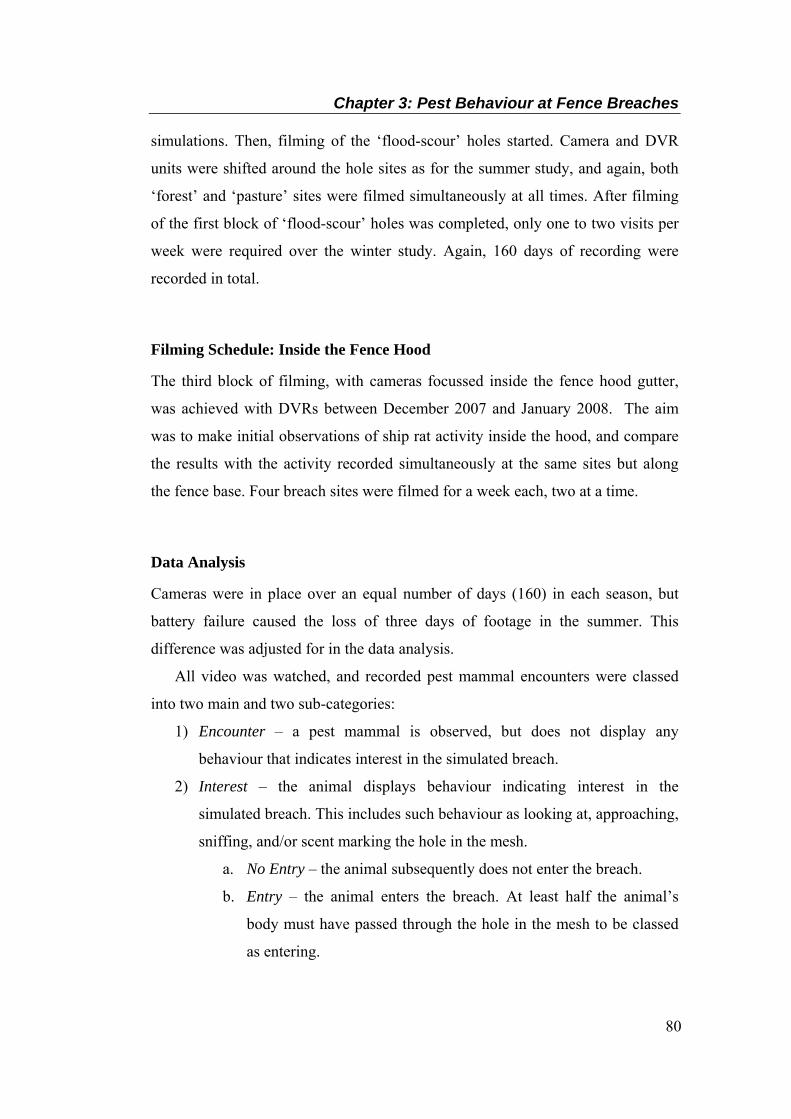
Chapter 3: Pest Behaviour at Fence Breaches
80
simulations. Then, filming of the ‘flood-scour’ holes started. Camera and DVR
units were shifted around the hole sites as for the summer study, and again, both
‘forest’ and ‘pasture’ sites were filmed simultaneously at all times. After filming
of the first block of ‘flood-scour’ holes was completed, only one to two visits per
week were required over the winter study. Again, 160 days of recording were
recorded in total.
Filming Schedule: Inside the Fence Hood
The third block of filming, with cameras focussed inside the fence hood gutter,
was achieved with DVRs between December 2007 and January 2008. The aim
was to make initial observations of ship rat activity inside the hood, and compare
the results with the activity recorded simultaneously at the same sites but along
the fence base. Four breach sites were filmed for a week each, two at a time.
Data Analysis
Cameras were in place over an equal number of days (160) in each season, but
battery failure caused the loss of three days of footage in the summer. This
difference was adjusted for in the data analysis.
All video was watched, and recorded pest mammal encounters were classed
into two main and two sub-categories:
1) Encounter – a pest mammal is observed, but does not display any
behaviour that indicates interest in the simulated breach.
2) Interest – the animal displays behaviour indicating interest in the
simulated breach. This includes such behaviour as looking at, approaching,
sniffing, and/or scent marking the hole in the mesh.
a. No Entry – the animal subsequently does not enter the breach.
b. Entry – the animal enters the breach. At least half the animal’s
body must have passed through the hole in the mesh to be classed
as entering.
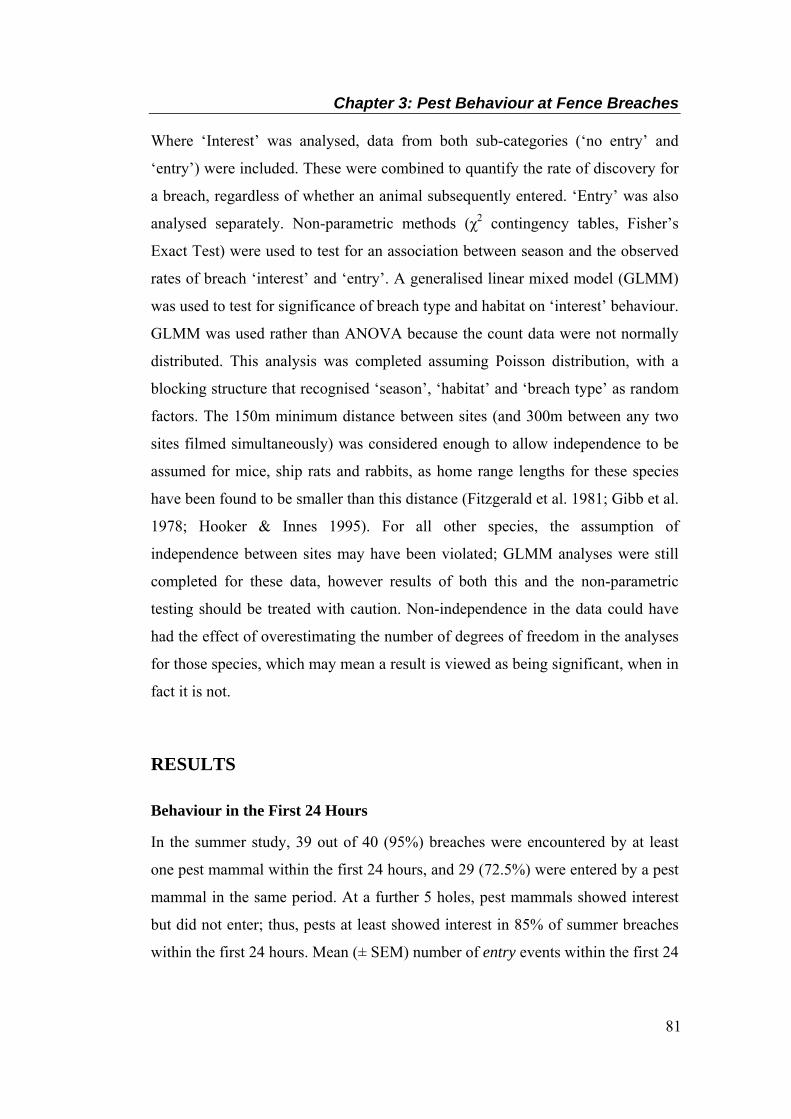
Chapter 3: Pest Behaviour at Fence Breaches
81
Where ‘Interest’ was analysed, data from both sub-categories (‘no entry’ and
‘entry’) were included. These were combined to quantify the rate of discovery for
a breach, regardless of whether an animal subsequently entered. ‘Entry’ was also
analysed separately. Non-parametric methods (χ2 contingency tables, Fisher’s
Exact Test) were used to test for an association between season and the observed
rates of breach ‘interest’ and ‘entry’. A generalised linear mixed model (GLMM)
was used to test for significance of breach type and habitat on ‘interest’ behaviour.
GLMM was used rather than ANOVA because the count data were not normally
distributed. This analysis was completed assuming Poisson distribution, with a
blocking structure that recognised ‘season’, ‘habitat’ and ‘breach type’ as random
factors. The 150m minimum distance between sites (and 300m between any two
sites filmed simultaneously) was considered enough to allow independence to be
assumed for mice, ship rats and rabbits, as home range lengths for these species
have been found to be smaller than this distance (Fitzgerald et al. 1981; Gibb et al.
1978; Hooker & Innes 1995). For all other species, the assumption of
independence between sites may have been violated; GLMM analyses were still
completed for these data, however results of both this and the non-parametric
testing should be treated with caution. Non-independence in the data could have
had the effect of overestimating the number of degrees of freedom in the analyses
for those species, which may mean a result is viewed as being significant, when in
fact it is not.
RESULTS
Behaviour in the First 24 Hours
In the summer study, 39 out of 40 (95%) breaches were encountered by at least
one pest mammal within the first 24 hours, and 29 (72.5%) were entered by a pest
mammal in the same period. At a further 5 holes, pest mammals showed interest
but did not enter; thus, pests at least showed interest in 85% of summer breaches
within the first 24 hours. Mean (± SEM) number of entry events within the first 24
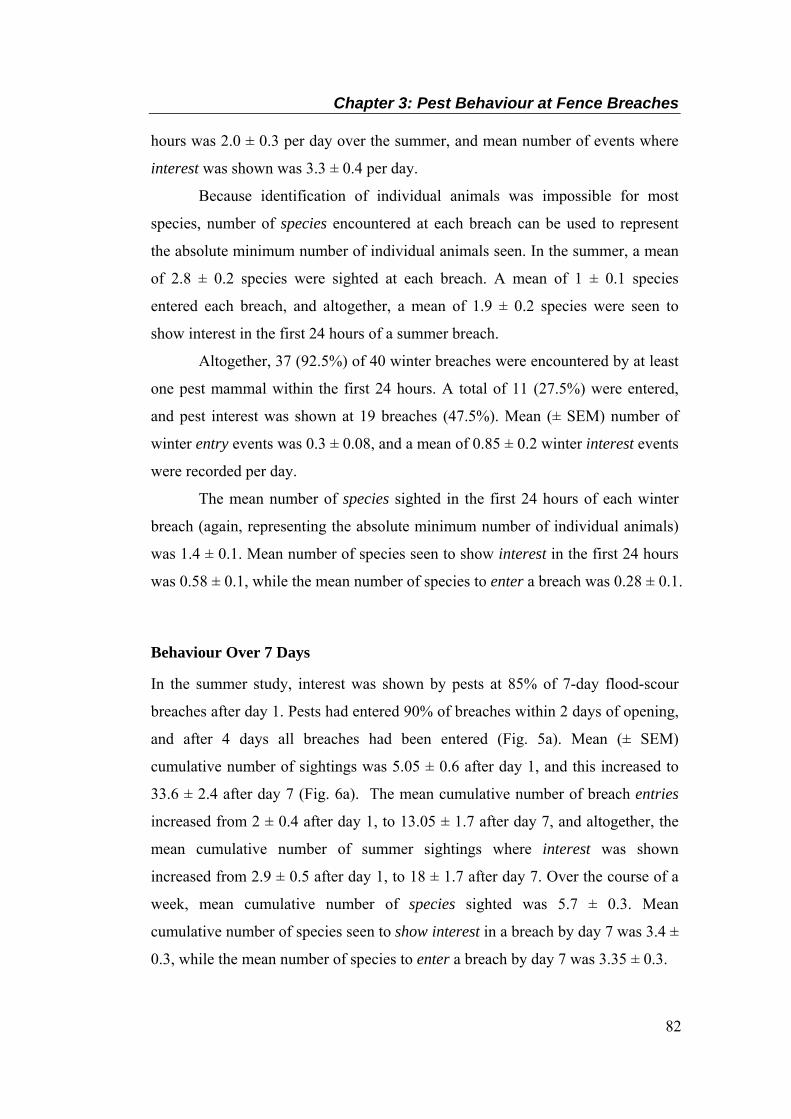
Chapter 3: Pest Behaviour at Fence Breaches
82
hours was 2.0 ± 0.3 per day over the summer, and mean number of events where
interest was shown was 3.3 ± 0.4 per day.
Because identification of individual animals was impossible for most
species, number of species encountered at each breach can be used to represent
the absolute minimum number of individual animals seen. In the summer, a mean
of 2.8 ± 0.2 species were sighted at each breach. A mean of 1 ± 0.1 species
entered each breach, and altogether, a mean of 1.9 ± 0.2 species were seen to
show interest in the first 24 hours of a summer breach.
Altogether, 37 (92.5%) of 40 winter breaches were encountered by at least
one pest mammal within the first 24 hours. A total of 11 (27.5%) were entered,
and pest interest was shown at 19 breaches (47.5%). Mean (± SEM) number of
winter entry events was 0.3 ± 0.08, and a mean of 0.85 ± 0.2 winter interest events
were recorded per day.
The mean number of species sighted in the first 24 hours of each winter
breach (again, representing the absolute minimum number of individual animals)
was 1.4 ± 0.1. Mean number of species seen to show interest in the first 24 hours
was 0.58 ± 0.1, while the mean number of species to enter a breach was 0.28 ± 0.1.
Behaviour Over 7 Days
In the summer study, interest was shown by pests at 85% of 7-day flood-scour
breaches after day 1. Pests had entered 90% of breaches within 2 days of opening,
and after 4 days all breaches had been entered (Fig. 5a). Mean (± SEM)
cumulative number of sightings was 5.05 ± 0.6 after day 1, and this increased to
33.6 ± 2.4 after day 7 (Fig. 6a). The mean cumulative number of breach entries
increased from 2 ± 0.4 after day 1, to 13.05 ± 1.7 after day 7, and altogether, the
mean cumulative number of summer sightings where interest was shown
increased from 2.9 ± 0.5 after day 1, to 18 ± 1.7 after day 7. Over the course of a
week, mean cumulative number of species sighted was 5.7 ± 0.3. Mean
cumulative number of species seen to show interest in a breach by day 7 was 3.4 ±
0.3, while the mean number of species to enter a breach by day 7 was 3.35 ± 0.3.

Chapter 3: Pest Behaviour at Fence Breaches
83
At winter breaches, pest mammals were sighted at 90% of breaches in the
first 24 hours (Fig. 5b). Pests had shown interest in 80% of winter breaches after 4
days, and had entered 60% of breaches after 5 days. Mean (± SEM) cumulative
number of sightings per breach was 2.6 ± 0.6 after day 1, and 18.9 ± 2 after day 7
(Fig. 6b). Pests had shown interest in breaches a mean of 0.55 ± 0.2 times after
the first day, and this figure increased to 4.1 ± 0.7 after 7 days. Pests had entered
breaches a mean of 0.15 ± 0.1 times per breach after day 1, which increased to 2 ±
0.5 times after the 7th day. After 7 days, mean cumulative number of species
sighted at winter ‘tree-fall’ breaches was 4.9 ± 0.2. Mean cumulative number of
species to have shown interest after a week was 2.2 ± 0.3, while the mean
cumulative number of species to enter after 7 days was 1.32 ± 0.3.
Chapter 3: Pest Behaviour at Fence Breaches
84
(a) Summer
0%
10%
20%
30%
40%
50%
60%
70%
80%
90%
100%
0 1 2 3 4 5 6 7
Day From Breach Opening
Perc
enta
ge o
f Bre
ache
s
Pest Encounters
Pest Interest
Pest Entry only
(b) Winter
0%
10%
20%
30%
40%
50%
60%
70%
80%
90%
100%
0 1 2 3 4 5 6 7
Day From Breach Opening
Perc
enta
ge o
f Bre
ache
s
Pest Encounters
Pest Interest
Pest Entry only
Figure 5. Percentage of breaches at which pests had been sighted, had shown interest or had entered, over 7 days in Summer (a) and in Winter (b).

Chapter 3: Pest Behaviour at Fence Breaches
85
(a) Summer
0
5
10
15
20
25
30
35
40
1 2 3 4 5 6 7
Day
Mea
n cu
mul
ativ
e nu
mbe
r of e
vent
s pe
r bre
ach
Pest Encounters
Pest Interest
Pest Entry only
(b) Winter
0
5
10
15
20
25
30
35
40
1 2 3 4 5 6 7Day
Mea
n cu
mul
ativ
e nu
mbe
r of e
vent
s pe
r bre
ach
Pest Encounters
Pest Interest
Pest Entry only
Figure 6. Mean (± SEM) cumulative number of times pests had been sighted at, had showed interest in or had entered 7-day breaches in Summer (a), and in Winter (b).
Chapter 3: Pest Behaviour at Fence Breaches
86
Number of Sightings
A total of 788 individual pest mammal sightings were recorded over the summer
study, and of these, 38% resulted in entry to a simulated breach (Table 1). Pests
were deemed to show interest in but not enter a breach in a further 17% of
sightings, and thus in 55% of sightings, a mammalian pest showed interest in a
breach. In the remaining 45% of sightings, pests were deemed to be showing no
interest at all.
The total number of sightings recorded in winter was 428 (Table 2), and
breaches were entered on only 49 occasions (11%). Pests showed interest in, but
did not enter a breach in another 56 sightings, and altogether, breach interest was
shown in 25% of winter sightings.
Pest Behaviour at Breaches
Mice entered summer breaches more often than any other species (174 times, 87%
of mouse sightings, Fig. 7). Altogether, mice showed breach interest in 89% of
encounters. Mice were significantly more likely to enter a breach when sighted
than ship rats (χ2 = 12.6, p < 0.001), the species next most commonly seen to enter.
Ship rats entered summer breaches 62 times (75% of ship rat sightings), and
showed interest in breaches in a total of 82% of sightings (but see below for
observations recorded inside the fence hood). Although collectively rodent
sightings comprised only 36% of total pest sightings (n = 788), 78% of all
summer breach entries (n = 302) were by rodents (Table 3).
Possums entered summer breaches on only 22 occasions (10% of possum
sightings). However, possums showed interest in, but did not enter breaches on a
further 65 occasions (31% of possum sightings), and showed breach interest in
41% of sightings in total. Similarly, hedgehogs entered breaches 19 times (19%)
and showed interest in breaches but did not enter another 21 times (21%), totalling
40 occasions of interest (40%).
Cats entered breaches rarely (5 occasions, 4% of sightings), but appeared
interested without entering on a further 26 occasions (22%), for a total of 27% of
Chapter 3: Pest Behaviour at Fence Breaches
87
sightings. In both summer and in winter, at least 7 individual cats were recorded,
and some of these were sighted at multiple sites in a single night. Most were
regularly seen along stretches of fenceline up to approximately 2 km in length.
Mustelids were rarely seen, but in all sightings at least showed interest in a
breach, and actually entered during 5 of 6 summer sightings.
Only 37% of winter mouse sightings resulted in breach entry, and 43% of
ship rats (Fig. 8). Overall, rodents were still responsible for 59% of all breach
entries, despite comprising only 17% of total winter sightings.
Possum sightings resulted in winter breach entry on 8% of occasions.
However, possums showed interest in 37% of sightings altogether. Winter cat
sightings resulted in breach entry in 6% of sightings, and altogether cats showed
breach interest in 14% of sightings. Only 1 mustelid was sighted in the winter (a
stoat), which entered a breach.
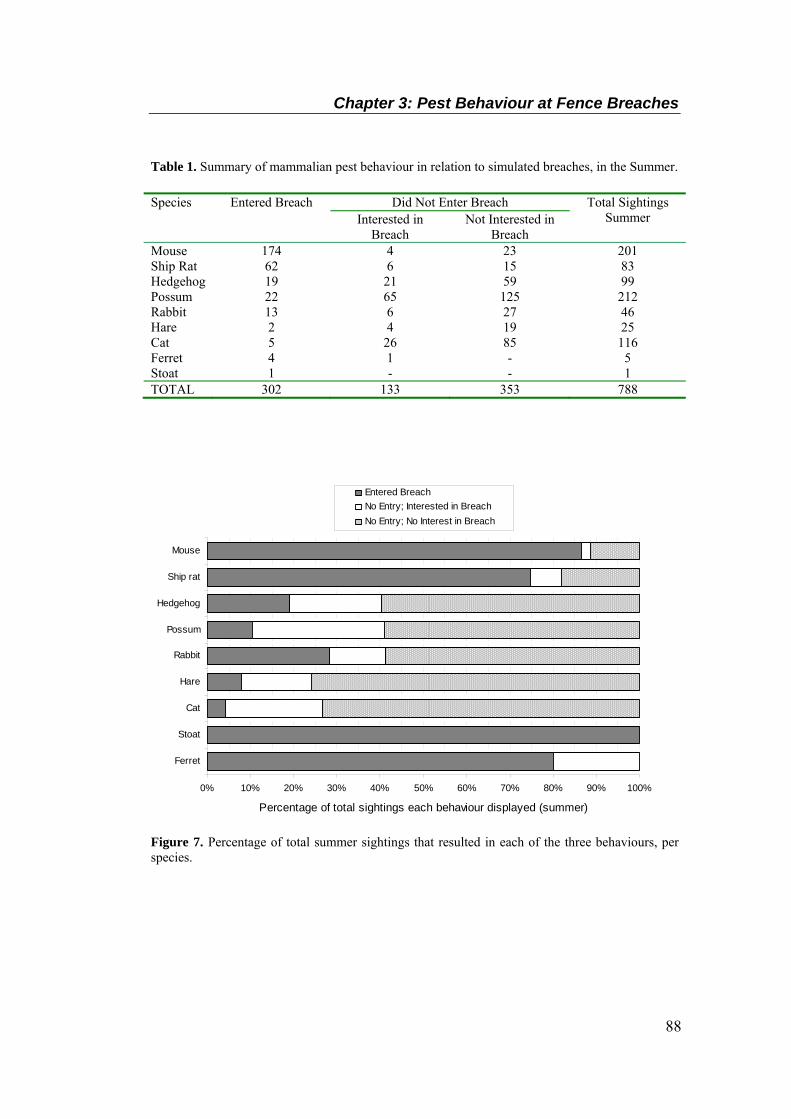
Chapter 3: Pest Behaviour at Fence Breaches
88
Table 1. Summary of mammalian pest behaviour in relation to simulated breaches, in the Summer. Species Entered Breach Did Not Enter Breach Total Sightings
Summer Interested in Breach
Not Interested in Breach
Mouse 174 4 23 201 Ship Rat 62 6 15 83 Hedgehog 19 21 59 99 Possum 22 65 125 212 Rabbit 13 6 27 46 Hare 2 4 19 25 Cat 5 26 85 116 Ferret 4 1 - 5 Stoat 1 - - 1 TOTAL 302 133 353 788
0% 10% 20% 30% 40% 50% 60% 70% 80% 90% 100%
Ferret
Stoat
Cat
Hare
Rabbit
Possum
Hedgehog
Ship rat
Mouse
Percentage of total sightings each behaviour displayed (summer)
Entered BreachNo Entry; Interested in BreachNo Entry; No Interest in Breach
Figure 7. Percentage of total summer sightings that resulted in each of the three behaviours, per species.
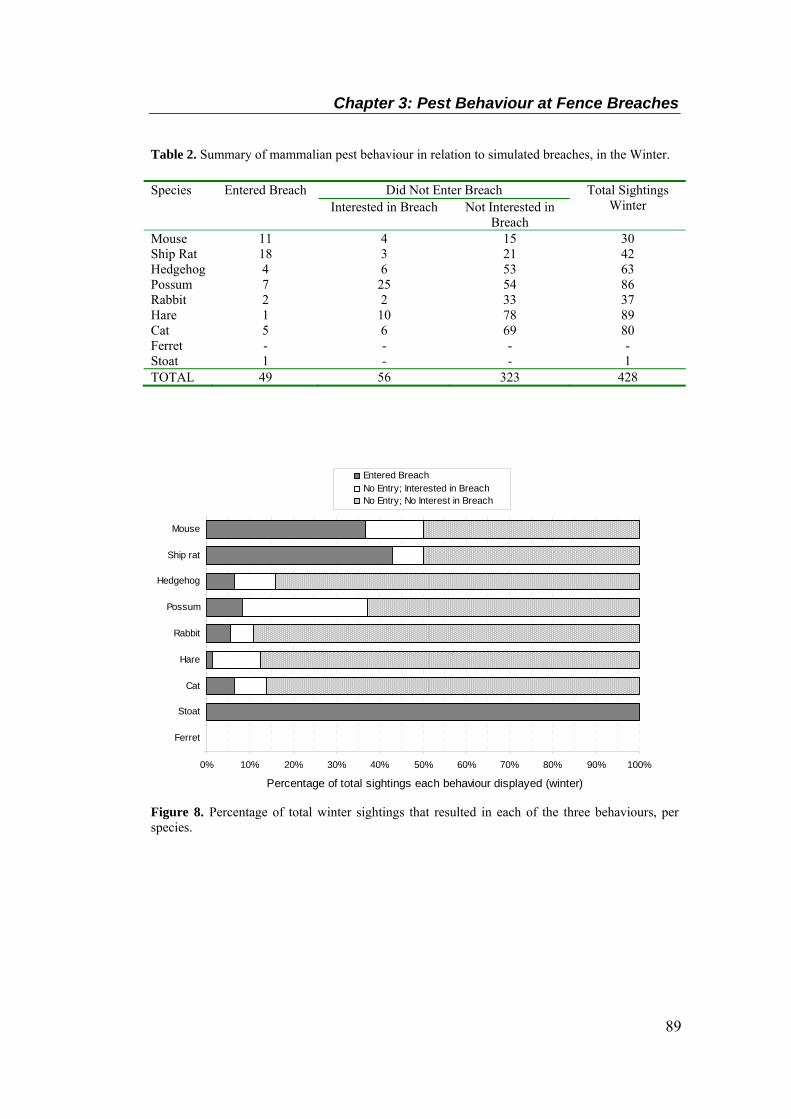
Chapter 3: Pest Behaviour at Fence Breaches
89
Table 2. Summary of mammalian pest behaviour in relation to simulated breaches, in the Winter. Species Entered Breach Did Not Enter Breach Total Sightings
Winter Interested in Breach Not Interested in Breach
Mouse 11 4 15 30 Ship Rat 18 3 21 42 Hedgehog 4 6 53 63 Possum 7 25 54 86 Rabbit 2 2 33 37 Hare 1 10 78 89 Cat 5 6 69 80 Ferret - - - - Stoat 1 - - 1 TOTAL 49 56 323 428
0% 10% 20% 30% 40% 50% 60% 70% 80% 90% 100%
Ferret
Stoat
Cat
Hare
Rabbit
Possum
Hedgehog
Ship rat
Mouse
Percentage of total sightings each behaviour displayed (winter)
Entered BreachNo Entry; Interested in BreachNo Entry; No Interest in Breach
Figure 8. Percentage of total winter sightings that resulted in each of the three behaviours, per species.
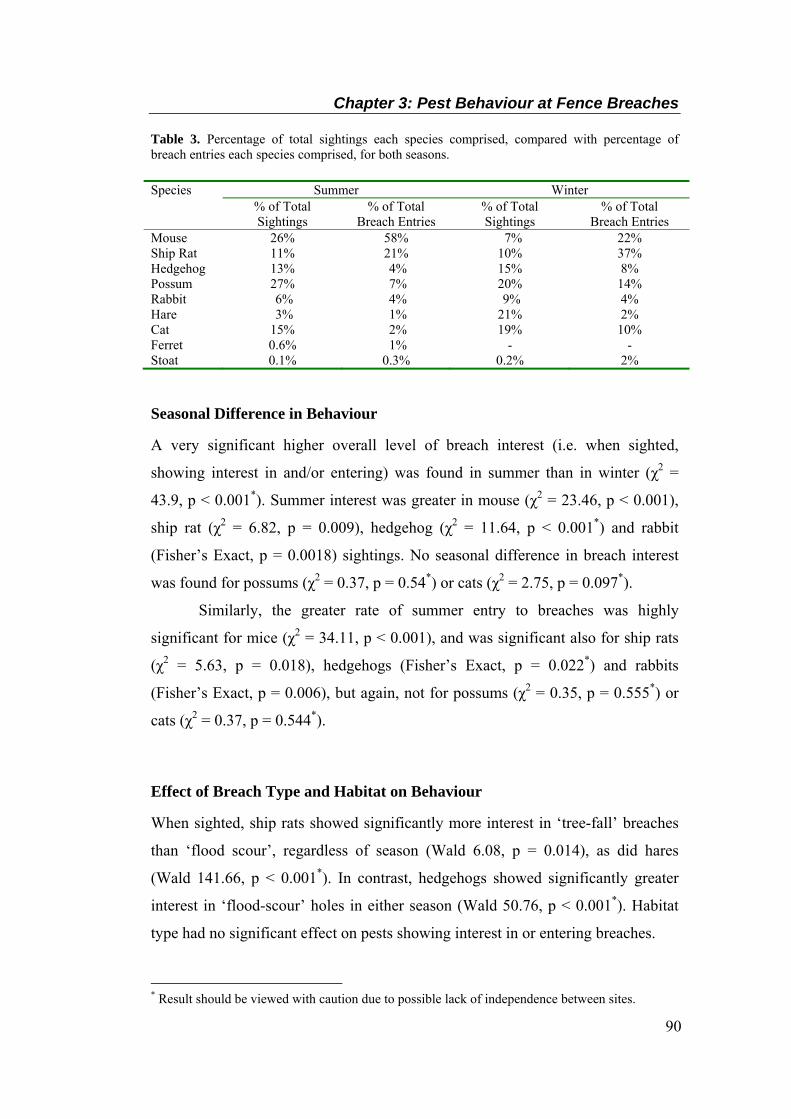
Chapter 3: Pest Behaviour at Fence Breaches
90
Table 3. Percentage of total sightings each species comprised, compared with percentage of breach entries each species comprised, for both seasons. Species Summer Winter
% of Total Sightings
% of Total Breach Entries
% of Total Sightings
% of Total Breach Entries
Mouse 26% 58% 7% 22% Ship Rat 11% 21% 10% 37% Hedgehog 13% 4% 15% 8% Possum 27% 7% 20% 14% Rabbit 6% 4% 9% 4% Hare 3% 1% 21% 2% Cat 15% 2% 19% 10% Ferret 0.6% 1% - - Stoat 0.1% 0.3% 0.2% 2%
Seasonal Difference in Behaviour
A very significant higher overall level of breach interest (i.e. when sighted,
showing interest in and/or entering) was found in summer than in winter (χ2 =
43.9, p < 0.001*). Summer interest was greater in mouse (χ2 = 23.46, p < 0.001),
ship rat (χ2 = 6.82, p = 0.009), hedgehog (χ2 = 11.64, p < 0.001*) and rabbit
(Fisher’s Exact, p = 0.0018) sightings. No seasonal difference in breach interest
was found for possums (χ2 = 0.37, p = 0.54*) or cats (χ2 = 2.75, p = 0.097*).
Similarly, the greater rate of summer entry to breaches was highly
significant for mice (χ2 = 34.11, p < 0.001), and was significant also for ship rats
(χ2 = 5.63, p = 0.018), hedgehogs (Fisher’s Exact, p = 0.022*) and rabbits
(Fisher’s Exact, p = 0.006), but again, not for possums (χ2 = 0.35, p = 0.555*) or
cats (χ2 = 0.37, p = 0.544*).
Effect of Breach Type and Habitat on Behaviour
When sighted, ship rats showed significantly more interest in ‘tree-fall’ breaches
than ‘flood scour’, regardless of season (Wald 6.08, p = 0.014), as did hares
(Wald 141.66, p < 0.001*). In contrast, hedgehogs showed significantly greater
interest in ‘flood-scour’ holes in either season (Wald 50.76, p < 0.001*). Habitat
type had no significant effect on pests showing interest in or entering breaches.
* Result should be viewed with caution due to possible lack of independence between sites.
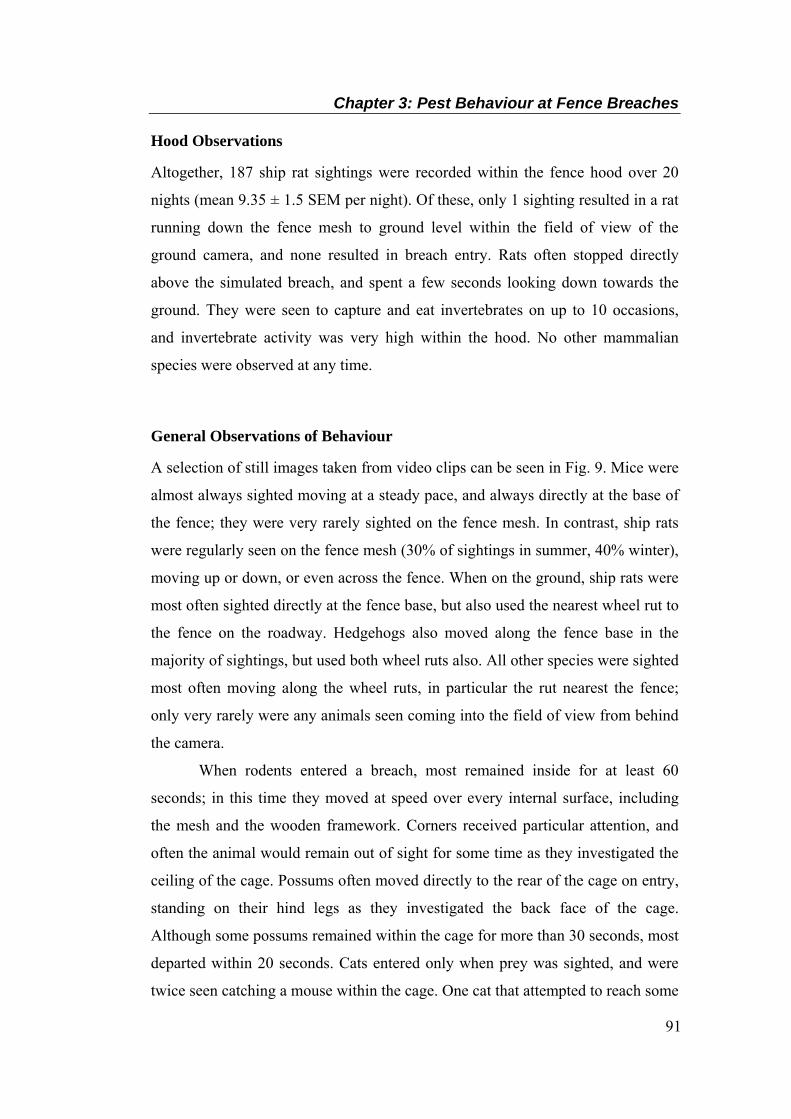
Chapter 3: Pest Behaviour at Fence Breaches
91
Hood Observations
Altogether, 187 ship rat sightings were recorded within the fence hood over 20
nights (mean 9.35 ± 1.5 SEM per night). Of these, only 1 sighting resulted in a rat
running down the fence mesh to ground level within the field of view of the
ground camera, and none resulted in breach entry. Rats often stopped directly
above the simulated breach, and spent a few seconds looking down towards the
ground. They were seen to capture and eat invertebrates on up to 10 occasions,
and invertebrate activity was very high within the hood. No other mammalian
species were observed at any time.
General Observations of Behaviour
A selection of still images taken from video clips can be seen in Fig. 9. Mice were
almost always sighted moving at a steady pace, and always directly at the base of
the fence; they were very rarely sighted on the fence mesh. In contrast, ship rats
were regularly seen on the fence mesh (30% of sightings in summer, 40% winter),
moving up or down, or even across the fence. When on the ground, ship rats were
most often sighted directly at the fence base, but also used the nearest wheel rut to
the fence on the roadway. Hedgehogs also moved along the fence base in the
majority of sightings, but used both wheel ruts also. All other species were sighted
most often moving along the wheel ruts, in particular the rut nearest the fence;
only very rarely were any animals seen coming into the field of view from behind
the camera.
When rodents entered a breach, most remained inside for at least 60
seconds; in this time they moved at speed over every internal surface, including
the mesh and the wooden framework. Corners received particular attention, and
often the animal would remain out of sight for some time as they investigated the
ceiling of the cage. Possums often moved directly to the rear of the cage on entry,
standing on their hind legs as they investigated the back face of the cage.
Although some possums remained within the cage for more than 30 seconds, most
departed within 20 seconds. Cats entered only when prey was sighted, and were
twice seen catching a mouse within the cage. One cat that attempted to reach some
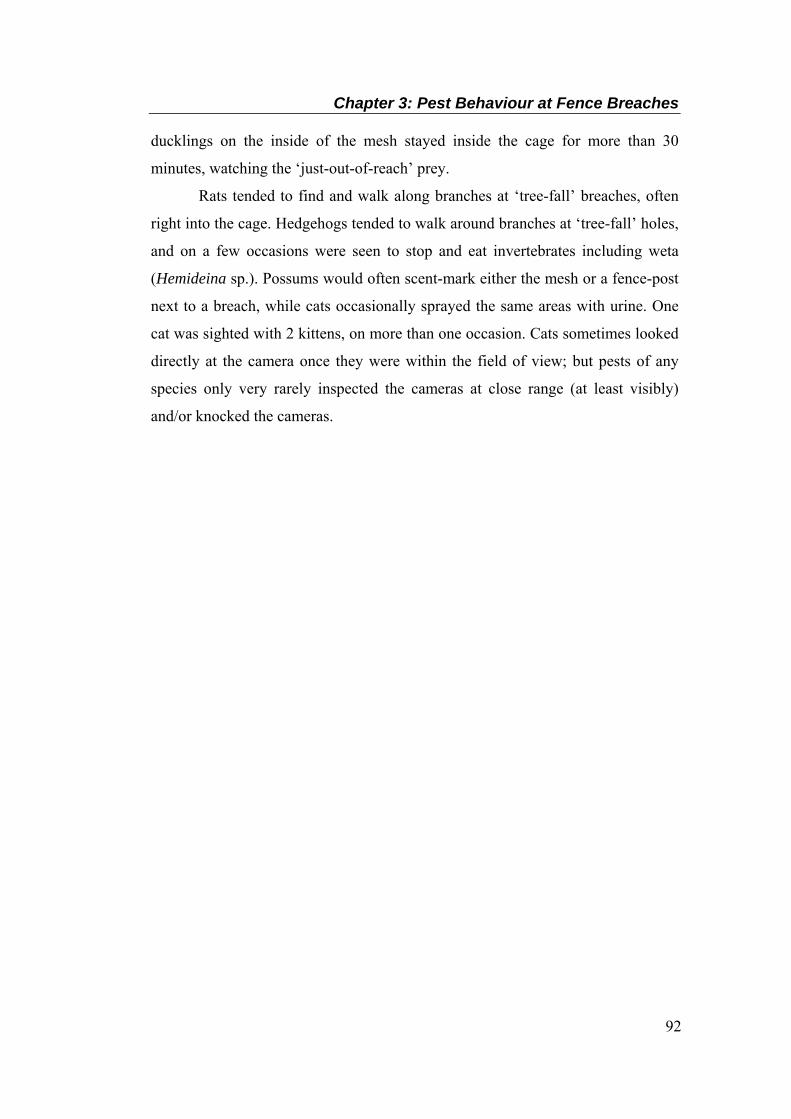
Chapter 3: Pest Behaviour at Fence Breaches
92
ducklings on the inside of the mesh stayed inside the cage for more than 30
minutes, watching the ‘just-out-of-reach’ prey.
Rats tended to find and walk along branches at ‘tree-fall’ breaches, often
right into the cage. Hedgehogs tended to walk around branches at ‘tree-fall’ holes,
and on a few occasions were seen to stop and eat invertebrates including weta
(Hemideina sp.). Possums would often scent-mark either the mesh or a fence-post
next to a breach, while cats occasionally sprayed the same areas with urine. One
cat was sighted with 2 kittens, on more than one occasion. Cats sometimes looked
directly at the camera once they were within the field of view; but pests of any
species only very rarely inspected the cameras at close range (at least visibly)
and/or knocked the cameras.
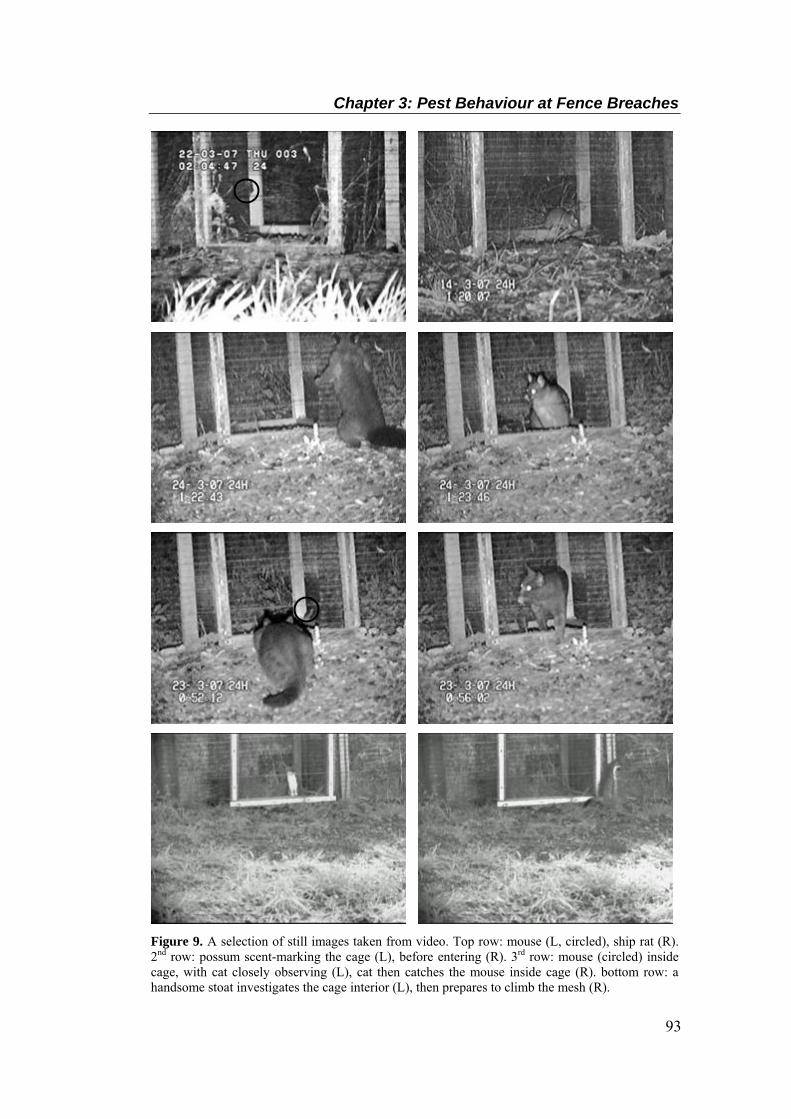
Chapter 3: Pest Behaviour at Fence Breaches
93
Figure 9. A selection of still images taken from video. Top row: mouse (L, circled), ship rat (R). 2nd row: possum scent-marking the cage (L), before entering (R). 3rd row: mouse (circled) inside cage, with cat closely observing (L), cat then catches the mouse inside cage (R). bottom row: a handsome stoat investigates the cage interior (L), then prepares to climb the mesh (R).
Chapter 3: Pest Behaviour at Fence Breaches
94
Figure 9 (cont.). More still images. Top row, ferret (L); hedgehog (R). 2nd row, rabbit (L), replaced within a few seconds by a hare (R). 3rd row, moth (L, circled) inside the fence hood gutter, discovered by a ship rat (R). Bottom row, the ship rat catches the moth (L) and eats it (R).
Chapter 3: Pest Behaviour at Fence Breaches
95
DISCUSSION
Breach Encounters
These results strongly emphasise the need for quick response to a breach in the
fence, regardless of season.
Altogether, 95% of summer breaches were encountered by a pest mammal
within 24 hours, and pests showed interest in 85% of breaches in the same period.
Over 95% of Maungatautari pest mammal activity (excluding lagomorphs) takes
place during the hours of darkness (see Chapter 2), and these results indicate that
exploitation of summer breaches by multiple individuals of multiple pest species
is highly likely on the first night even though summer nights were short (~10
hours) when filming was done. Not unexpectedly, summer breaches are likely to
be encountered and exploited by increasing numbers of species (and possibly
increasing numbers of individuals) over the course of a week.
The high rate of pest encounters with winter breaches (92.5%) suggests
that a winter breach is almost as likely to be encountered within 24 hours as a
summer breach. Fewer individuals of fewer species may do so, and of those,
fewer are likely to exploit the breach, even though they have more time (~13
hours in August). Rates of encounter and exploitation are still high however, and
exploitation on the first night is still very likely. Again, over the course of a week,
increasing numbers of species and individuals are likely to encounter and possibly
exploit a breach.
The physical nature of the simulated breaches is likely to have influenced
the entry behaviour of larger species such as cats and possums in particular. If
individuals of these species were able to perceive the experimental breach as
being ‘no-exit’, they may have been more reluctant to enter the cages. In contrast,
mustelids showed no reluctance to enter, even if they perceived the cages as being
fully enclosed. As they have evolved to hunt in confined spaces such as rabbit and
rat burrows it is possible these species may be more likely to enter a confined
space than cats or possums.
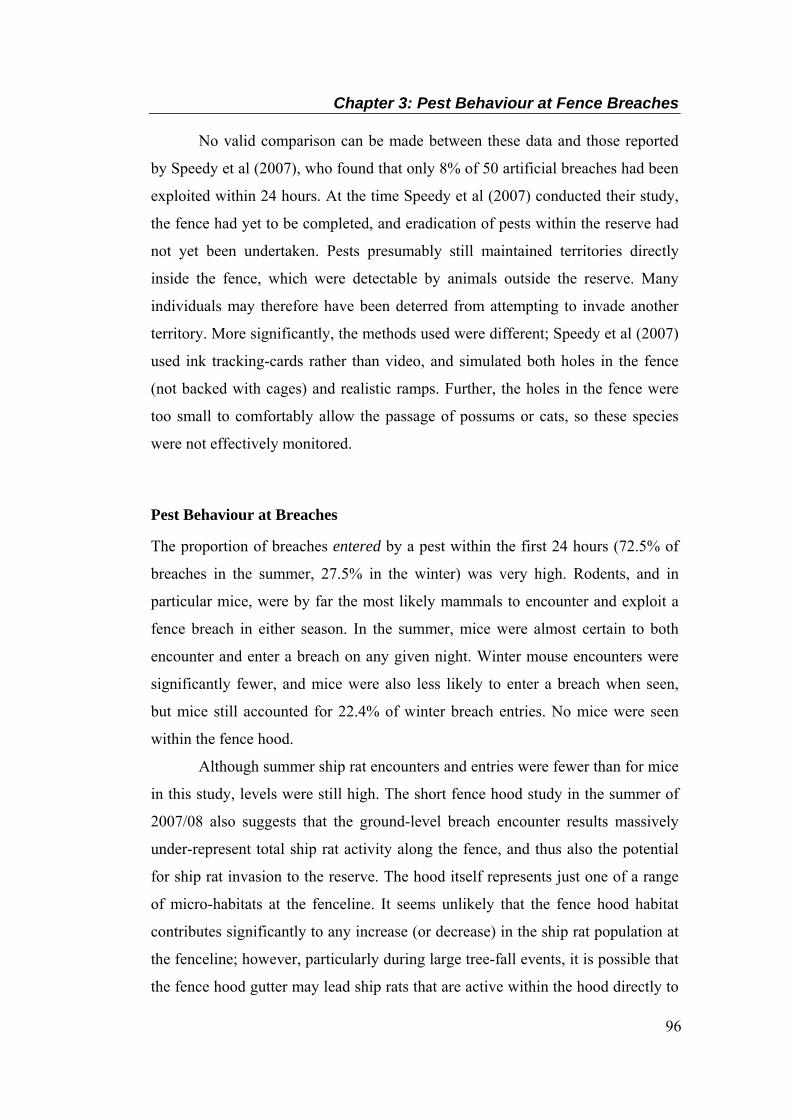
Chapter 3: Pest Behaviour at Fence Breaches
96
No valid comparison can be made between these data and those reported
by Speedy et al (2007), who found that only 8% of 50 artificial breaches had been
exploited within 24 hours. At the time Speedy et al (2007) conducted their study,
the fence had yet to be completed, and eradication of pests within the reserve had
not yet been undertaken. Pests presumably still maintained territories directly
inside the fence, which were detectable by animals outside the reserve. Many
individuals may therefore have been deterred from attempting to invade another
territory. More significantly, the methods used were different; Speedy et al (2007)
used ink tracking-cards rather than video, and simulated both holes in the fence
(not backed with cages) and realistic ramps. Further, the holes in the fence were
too small to comfortably allow the passage of possums or cats, so these species
were not effectively monitored.
Pest Behaviour at Breaches
The proportion of breaches entered by a pest within the first 24 hours (72.5% of
breaches in the summer, 27.5% in the winter) was very high. Rodents, and in
particular mice, were by far the most likely mammals to encounter and exploit a
fence breach in either season. In the summer, mice were almost certain to both
encounter and enter a breach on any given night. Winter mouse encounters were
significantly fewer, and mice were also less likely to enter a breach when seen,
but mice still accounted for 22.4% of winter breach entries. No mice were seen
within the fence hood.
Although summer ship rat encounters and entries were fewer than for mice
in this study, levels were still high. The short fence hood study in the summer of
2007/08 also suggests that the ground-level breach encounter results massively
under-represent total ship rat activity along the fence, and thus also the potential
for ship rat invasion to the reserve. The hood itself represents just one of a range
of micro-habitats at the fenceline. It seems unlikely that the fence hood habitat
contributes significantly to any increase (or decrease) in the ship rat population at
the fenceline; however, particularly during large tree-fall events, it is possible that
the fence hood gutter may lead ship rats that are active within the hood directly to
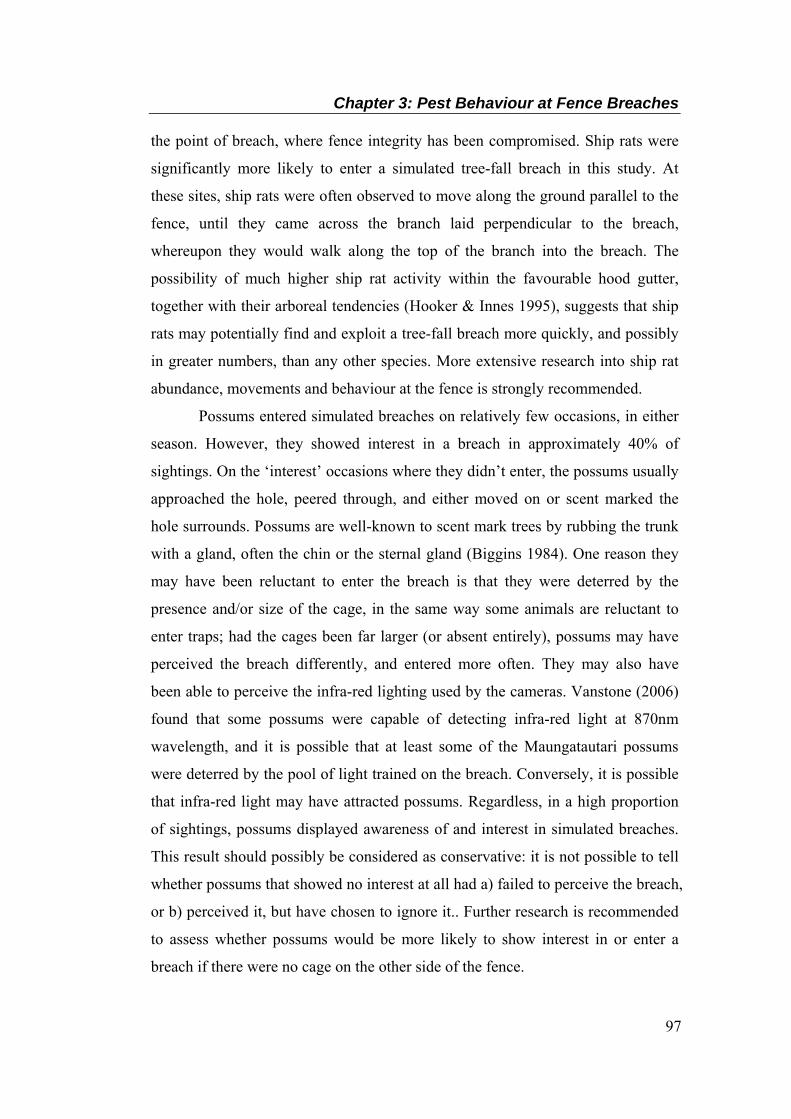
Chapter 3: Pest Behaviour at Fence Breaches
97
the point of breach, where fence integrity has been compromised. Ship rats were
significantly more likely to enter a simulated tree-fall breach in this study. At
these sites, ship rats were often observed to move along the ground parallel to the
fence, until they came across the branch laid perpendicular to the breach,
whereupon they would walk along the top of the branch into the breach. The
possibility of much higher ship rat activity within the favourable hood gutter,
together with their arboreal tendencies (Hooker & Innes 1995), suggests that ship
rats may potentially find and exploit a tree-fall breach more quickly, and possibly
in greater numbers, than any other species. More extensive research into ship rat
abundance, movements and behaviour at the fence is strongly recommended.
Possums entered simulated breaches on relatively few occasions, in either
season. However, they showed interest in a breach in approximately 40% of
sightings. On the ‘interest’ occasions where they didn’t enter, the possums usually
approached the hole, peered through, and either moved on or scent marked the
hole surrounds. Possums are well-known to scent mark trees by rubbing the trunk
with a gland, often the chin or the sternal gland (Biggins 1984). One reason they
may have been reluctant to enter the breach is that they were deterred by the
presence and/or size of the cage, in the same way some animals are reluctant to
enter traps; had the cages been far larger (or absent entirely), possums may have
perceived the breach differently, and entered more often. They may also have
been able to perceive the infra-red lighting used by the cameras. Vanstone (2006)
found that some possums were capable of detecting infra-red light at 870nm
wavelength, and it is possible that at least some of the Maungatautari possums
were deterred by the pool of light trained on the breach. Conversely, it is possible
that infra-red light may have attracted possums. Regardless, in a high proportion
of sightings, possums displayed awareness of and interest in simulated breaches.
This result should possibly be considered as conservative: it is not possible to tell
whether possums that showed no interest at all had a) failed to perceive the breach,
or b) perceived it, but have chosen to ignore it.. Further research is recommended
to assess whether possums would be more likely to show interest in or enter a
breach if there were no cage on the other side of the fence.

Chapter 3: Pest Behaviour at Fence Breaches
98
Similarly, cats rarely entered simulated breaches, but often showed interest.
Overall, cats behaved in a similar way to possums towards a breach, in that where
interest was shown (but no entry), cats would approach the breach, sniff the
surrounds, and occasionally urinate on the cage entry. On two occasions cats
approached a breach, stopped directly in front of it and then lay down for more
than 15 minutes, seeming to show no interest in the breach. Cats entered breaches
only where a) they detected prey within the cage itself (e.g. mice, on 2 occasions)
or b) they detected prey (ducklings) on the other side of the fence, next to a
simulated breach. Ducklings (both paradise ducks, Tadorna variegata and
mallards, Anas platyrhynchos), and young pheasants (Phasianus colchicus) were
commonly seen on the inside of the fence, often separated from their parents by
the fence itself. One cat was seen to attempt to catch an adult duck on the outside,
and when unsuccessful, tried to dig under the fence to catch the duckings; after
this, the cat entered the cage and remained within for more than 30 minutes, intent
on the ducklings that were only a few centimetres away. A different cat on the
outside of the fence was also seen chasing a duckling along the inside of the mesh.
Again, for those cats that showed no interest, it is impossible to know
whether they a) failed to perceive the breach, or b) perceived it, but chose to
ignore it, or were actually deterred by it. It seems likely that cats were able to
perceive the cages as being fully enclosed beyond the hole in the mesh, and were
reluctant to enter because of this (except where prey was inside). Cats were also
observed to turn their heads as they walked past, and look directly at the camera
and infra-red lighting unit. It is likely that they could perceive the dull-red glow of
the infra-red diodes (visible to humans also). It may also be possible that they can
perceive infra-red light around 870NM wavelength, as can some possums
(Vanstone 2006) and some ferrets (Newbold 2007), but this is unknown.
Regardless, an alarming number of overall cat sightings and individual cats were
recorded in this study, along with a moderate level of interest in breaches. Video
footage has shown their willingness to enter simulated breaches where prey is
sighted on the inside of the breach, and multiple individuals have been seen
‘patrolling’ laterally along the fenceline itself. This wide-ranging hunting
behaviour directly at the fenceline is highly likely to lead to coincidental
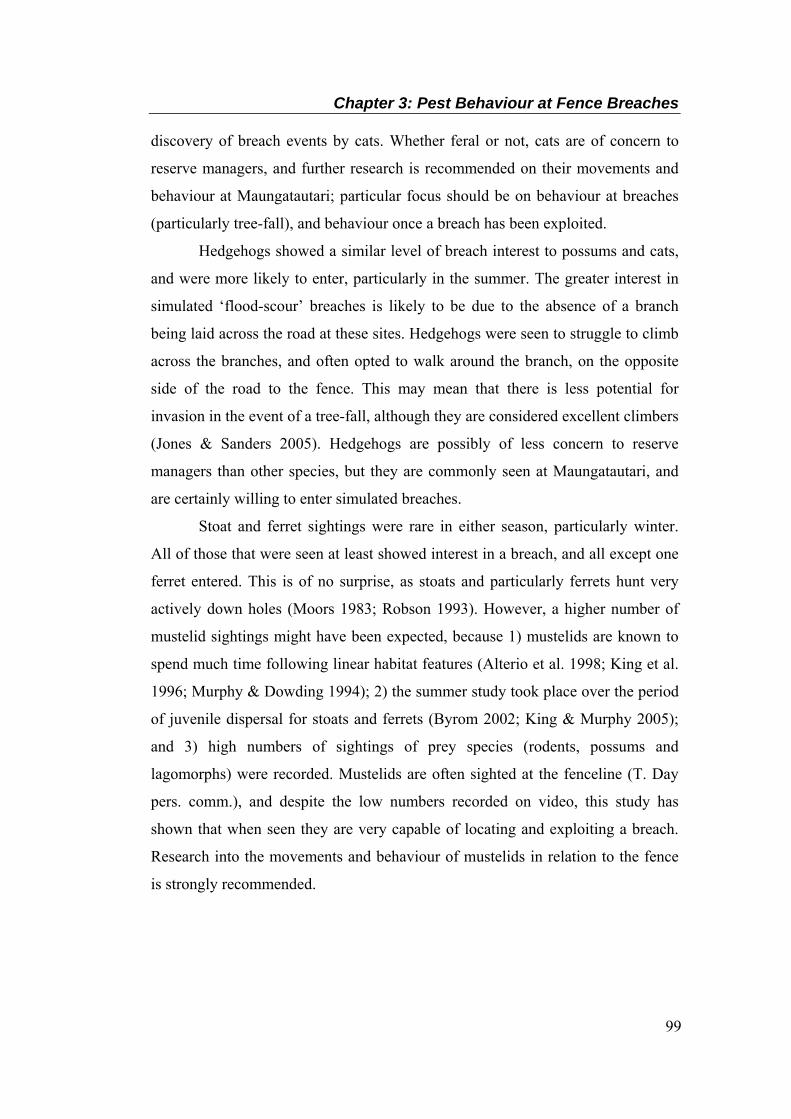
Chapter 3: Pest Behaviour at Fence Breaches
99
discovery of breach events by cats. Whether feral or not, cats are of concern to
reserve managers, and further research is recommended on their movements and
behaviour at Maungatautari; particular focus should be on behaviour at breaches
(particularly tree-fall), and behaviour once a breach has been exploited.
Hedgehogs showed a similar level of breach interest to possums and cats,
and were more likely to enter, particularly in the summer. The greater interest in
simulated ‘flood-scour’ breaches is likely to be due to the absence of a branch
being laid across the road at these sites. Hedgehogs were seen to struggle to climb
across the branches, and often opted to walk around the branch, on the opposite
side of the road to the fence. This may mean that there is less potential for
invasion in the event of a tree-fall, although they are considered excellent climbers
(Jones & Sanders 2005). Hedgehogs are possibly of less concern to reserve
managers than other species, but they are commonly seen at Maungatautari, and
are certainly willing to enter simulated breaches.
Stoat and ferret sightings were rare in either season, particularly winter.
All of those that were seen at least showed interest in a breach, and all except one
ferret entered. This is of no surprise, as stoats and particularly ferrets hunt very
actively down holes (Moors 1983; Robson 1993). However, a higher number of
mustelid sightings might have been expected, because 1) mustelids are known to
spend much time following linear habitat features (Alterio et al. 1998; King et al.
1996; Murphy & Dowding 1994); 2) the summer study took place over the period
of juvenile dispersal for stoats and ferrets (Byrom 2002; King & Murphy 2005);
and 3) high numbers of sightings of prey species (rodents, possums and
lagomorphs) were recorded. Mustelids are often sighted at the fenceline (T. Day
pers. comm.), and despite the low numbers recorded on video, this study has
shown that when seen they are very capable of locating and exploiting a breach.
Research into the movements and behaviour of mustelids in relation to the fence
is strongly recommended.
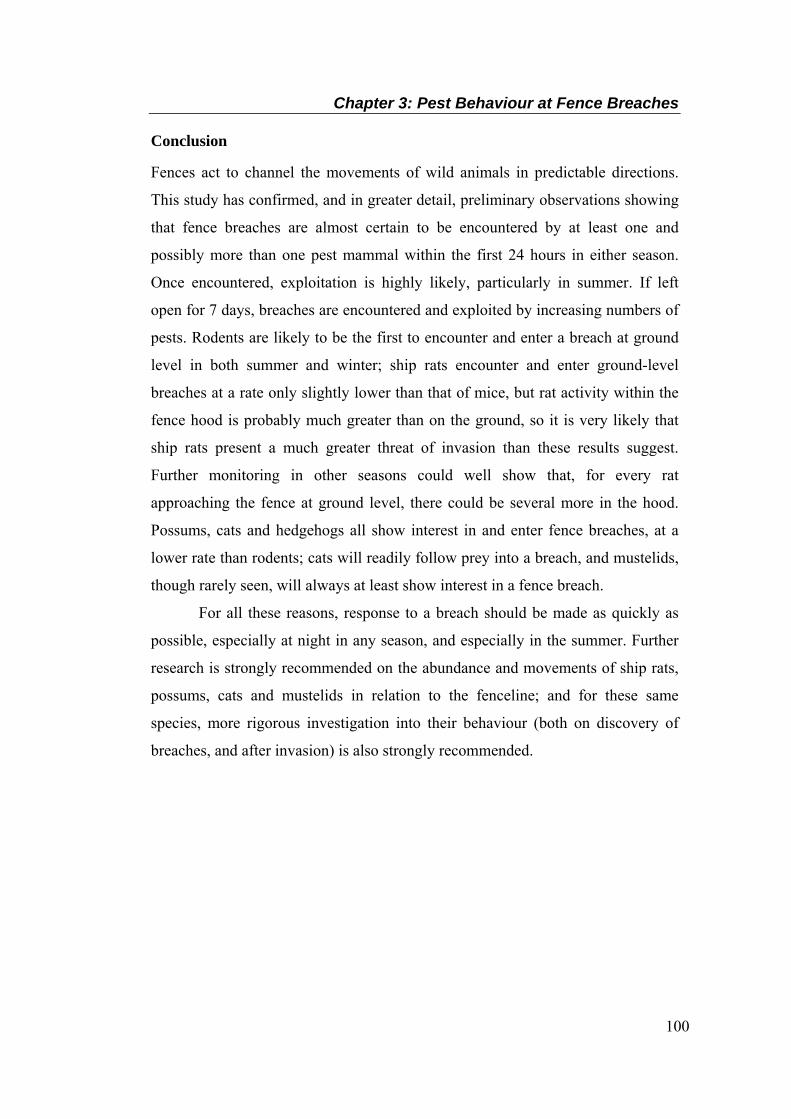
Chapter 3: Pest Behaviour at Fence Breaches
100
Conclusion
Fences act to channel the movements of wild animals in predictable directions.
This study has confirmed, and in greater detail, preliminary observations showing
that fence breaches are almost certain to be encountered by at least one and
possibly more than one pest mammal within the first 24 hours in either season.
Once encountered, exploitation is highly likely, particularly in summer. If left
open for 7 days, breaches are encountered and exploited by increasing numbers of
pests. Rodents are likely to be the first to encounter and enter a breach at ground
level in both summer and winter; ship rats encounter and enter ground-level
breaches at a rate only slightly lower than that of mice, but rat activity within the
fence hood is probably much greater than on the ground, so it is very likely that
ship rats present a much greater threat of invasion than these results suggest.
Further monitoring in other seasons could well show that, for every rat
approaching the fence at ground level, there could be several more in the hood.
Possums, cats and hedgehogs all show interest in and enter fence breaches, at a
lower rate than rodents; cats will readily follow prey into a breach, and mustelids,
though rarely seen, will always at least show interest in a fence breach.
For all these reasons, response to a breach should be made as quickly as
possible, especially at night in any season, and especially in the summer. Further
research is strongly recommended on the abundance and movements of ship rats,
possums, cats and mustelids in relation to the fenceline; and for these same
species, more rigorous investigation into their behaviour (both on discovery of
breaches, and after invasion) is also strongly recommended.
Chapter 3: Pest Behaviour at Fence Breaches
101
REFERENCES
Alterio N, Moller H, Ratz H 1998. Movements and habitat use of feral house cats
Felis catus, stoats Mustela erminea and ferrets Mustela furo, in grassland surrounding Yellow-eyed penguin Megadyptes antipodes breeding areas in spring. Biological Conservation 83(2): 187-194.
Biggins JG 1984. Communication in possums: a review. In: Smith A, Hume I eds. Possums and gliders. Sydney, Surrey Beatty. Pp. 35-57.
Brown KP, Moller H, Innes J, Jansen P 1998. Identifying predators at nests of small birds in a New Zealand forest. Ibis 140: 274-279.
Byrom AE 2002. Dispersal and survival of juvenile feral ferrets Mustela furo in New Zealand. Journal of Applied Ecology 39: 67-78.
Clapperton BK, Byrom AE 2005. Feral ferret. In: King CM ed. The Handbook of New Zealand Mammals. Melbourne, Oxford University Press. Pp. 294-307.
Clarkson BD 2002. Upland forests and special open habitats. In: Clarkson B, Merrett M, Downs T eds. Botany of the Waikato. Hamilton, Waikato Botanical Society Inc. Pp. 82-91.
Day TD 2006. Understanding and mitigating reinvasion risk at fenced sanctuaries. Proceedings of the Sanctuaries of New Zealand 2006 Annual Workshop, Kawhia.
Day TD 2007. Remote Surveillance - 24hr live monitoring. Xclude it! (3). Cambridge, XcluderTM Pest Proof Fencing Company.
Day TD, MacGibbon RJ 2007. Multiple-species exclusion fencing and technology for mainland sites. Proceedings of the Managing Vertebrate Invasive Species International Symposium, Colorado.
Fitzgerald BM, Karl BJ, Moller H 1981. Spatial organization and ecology of a sparse population of house mice (Mus musculus) in a New Zealand forest. Journal of Animal Ecology 50: 489-518.
Gibb JA, Ward CP, Ward GD 1978. Natural control of a population of rabbits, Oryctolagus cuniculus (L.), for ten years in the Kourarau enclosure. DSIR Bulletin 223: 1-89.
Hooker S, Innes J 1995. Ranging behaviour of forest-dwelling ship rats, Rattus rattus, and effects of poisoning with brodifacoum. New Zealand Journal of Zoology 22: 291-304.
Chapter 3: Pest Behaviour at Fence Breaches
102
Jones C, Sanders MD 2005. European Hedgehog. In: King CM ed. The Handbook of New Zealand Mammals. Melbourne, Oxford University Press. Pp. 81-94.
King CM, Flux M, Innes JG, Fitzgerald BM 1996. Population biology of small mammals in Pureora Forest Park: 1. Carnivores (Mustela erminea, M. furo, M. nivalis, and Felis catus). New Zealand Journal of Ecology 20(2): 241-251.
King CM, Murphy EC 2005. Stoat. In: King CM ed. The Handbook of New Zealand Mammals. Melbourne, Oxford University Press. Pp. 261-287.
McQueen J ed. 2004. An Ecological Restoration Plan for Maungatautari. Cambridge, Maungatautari Ecological Island Trust
MacGibbon RJ 2001. Maungatautari Ecological Restoration Project Plan. Taupo, Natural Logic Ltd.
Moors PJ 1983. Predation by mustelids and rodents on the eggs and chicks of native and introduced birds in Kowhai Bush, New Zealand. Ibis 125: 137-154.
Morgan D, Waas JR, Innes J 2006. The relative importance of Australian magpies (Gymnorhina tibicen) as nest predators of rural birds in New Zealand. New Zealand Journal of Zoology 33: 17-29.
Murphy EC, Dowding JE 1994. Range and diet of stoats (Mustela erminea) in a New Zealand beech forest. New Zealand Journal of Ecology 18(1): 11-18.
Newbold HG 2007. Infra-red vision in ferrets (Mustela furo). Unpublished MSc thesis. Hamilton, University of Waikato.
Robson DL 1993. Natural mortality of juvenile rabbits (Oryctolagus cuniculus) in North Canterbury, New Zealand. Wildlife Research 20: 815-831.
Speedy C, Day TD, Innes J 2007. Pest eradication technology - the critical partner to pest exclusion technology: The Maungatautari experience. Proceedings of the Managing Vertebrate Invasive Species International Symposium, Colorado.
Vanstone A 2006. Infra-red vision in possums (Trichosurus vulpecula). Unpublished MSc thesis. Hamilton, University of Waikato.
Chapter 4: General Discussion
103
CHAPTER 4
General Discussion
PRIMARY AIMS The purpose of this thesis was to provide baseline data for future studies and to
assess the potential for reinvasion by pest mammals through the pest-proof fence
at the Maungatautari Ecological Island. Two seasonal studies were undertaken in
order to: (1) describe baseline data on the periods of pest activity and behaviour of
mammalian pests directly adjacent to the pest-proof fence; (2) test for the effects
of exterior habitat type, breach type and season on mammalian pest sightings
directly at the fence; (3) determine how quickly pest mammals may locate a fence
breach, and how likely they are to exploit it; and (4) develop a predictive model
that may be used to help assess the probability of a pest encountering a breach if
response to a fence breach is delayed.
STUDY FINDINGS This study confirms and emphasises the constant threat that the pest-proof fence
faces from mammalian pests. Pests are very common directly outside the fence,
and within 24 hours there is a very high likelihood that a fence breach will be
located and exploited, possibly by multiple pest mammals. Not unexpectedly, the
greatest threat of re-invasion comes a) nocturnally, b) from rodents, and c) in the
summer; however, these results also confirm that there is constant risk from
multiple pest species, regardless of time of day or season.
The results complement and expand on the findings of Speedy et al.
(2007), who found that mice, rats, hedgehogs and rabbits made use of holes at the
base of the fence, while mice, rats, possums and cats made use of artificial ramps.
Chapter 4: General Discussion
104
Although no ramps were used in this study, these and other species were
consistently present at the fence base, and their willingness to exploit fence holes
(particularly for mice and rats) was confirmed. This study has provided significant
new detail about the timing of pest sightings at the fence, and how quickly these
animals might locate and exploit a breach.
This study may have underestimated the actual likelihood of pest
encounter and breach exploitation due to methodological limitations. The video
cameras could not record the presence of any animals out of view (e.g. behind the
cameras), and it is highly probable that many more pest animals are active very
near to the fence roadway than the cameras recorded. Ship rat activity within the
fence hood was not filmed simultaneously with the fence base in the two seasonal
studies, and overall activity is likely to have been much higher than fence base
observations suggested. Also, mustelids were rarely sighted on video, but are
commonly sighted in the vicinity of the fence; it is likely that mustelids were
present at the time of the study, but perhaps did not routinely move along the base
of the fence. When sighted they always located holes, and showed little hesitation
in entering. The actual threat of breach encounter and exploitation by mustelids is
therefore potentially higher than that found in this study, both nocturnally (by
ferrets) and diurnally (by stoats and weasels).
Cat activity was very high along the fence, and this is also of concern.
Individual cats regularly moved and on occasions were observed hunting along
the fenceline. Cats often showed interest in a breach, especially if given a chance
to follow prey through a hole in the mesh. It is possible that some of the cats seen
were domestic or farm cats, but this is unknown; either can be just as damaging to
wildlife. Regardless, it is highly likely that a fence breach will be encountered by
a cat within 24 hours, particularly between dusk and dawn. Whether it will enter
may depend on the physical nature of the breach itself; however this study
confirms that they are willing and able to do so at ground level.
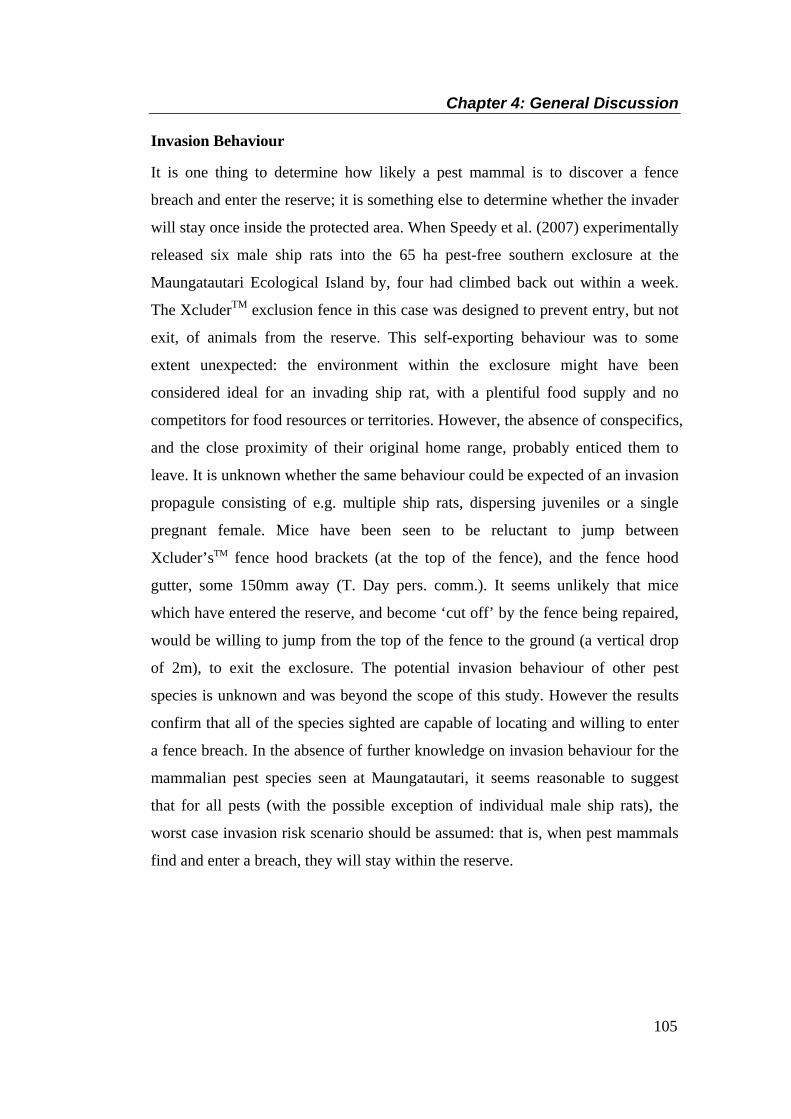
Chapter 4: General Discussion
105
Invasion Behaviour
It is one thing to determine how likely a pest mammal is to discover a fence
breach and enter the reserve; it is something else to determine whether the invader
will stay once inside the protected area. When Speedy et al. (2007) experimentally
released six male ship rats into the 65 ha pest-free southern exclosure at the
Maungatautari Ecological Island by, four had climbed back out within a week.
The XcluderTM exclusion fence in this case was designed to prevent entry, but not
exit, of animals from the reserve. This self-exporting behaviour was to some
extent unexpected: the environment within the exclosure might have been
considered ideal for an invading ship rat, with a plentiful food supply and no
competitors for food resources or territories. However, the absence of conspecifics,
and the close proximity of their original home range, probably enticed them to
leave. It is unknown whether the same behaviour could be expected of an invasion
propagule consisting of e.g. multiple ship rats, dispersing juveniles or a single
pregnant female. Mice have been seen to be reluctant to jump between
Xcluder’sTM fence hood brackets (at the top of the fence), and the fence hood
gutter, some 150mm away (T. Day pers. comm.). It seems unlikely that mice
which have entered the reserve, and become ‘cut off’ by the fence being repaired,
would be willing to jump from the top of the fence to the ground (a vertical drop
of 2m), to exit the exclosure. The potential invasion behaviour of other pest
species is unknown and was beyond the scope of this study. However the results
confirm that all of the species sighted are capable of locating and willing to enter
a fence breach. In the absence of further knowledge on invasion behaviour for the
mammalian pest species seen at Maungatautari, it seems reasonable to suggest
that for all pests (with the possible exception of individual male ship rats), the
worst case invasion risk scenario should be assumed: that is, when pest mammals
find and enter a breach, they will stay within the reserve.

Chapter 4: General Discussion
106
IMPLICATIONS OF RE-INVASION
Rodents
Mice were the species most likely to enter a breach when seen in the summer, and
though seen less in the winter, were still very likely to enter. The mouse diet is
highly flexible, and includes small invertebrates (particularly Lepidopteran larvae
and adult Coleopterans) and plant material (mostly seeds, including rimu
(Dacrydium cupressinum)) (Beveridge 1964; Ruscoe & Murphy 2005). A single
pregnant female mouse is capable of re-colonising the reserve. The direct effects
of an individual mouse or a small number of mice may not in themselves be cause
for great concern in a protected reserve; the greatest threat posed by mice (and
also rats) lies in their ability to rapidly increase in population size. Non-
commensal mice do not normally breed in winter, except in mast-seeding years in
beech forests (Ruscoe et al. 2003). In the presence of a potentially vast food
supply and no predators, winter breeding may be possible at Maungatautari and
could result in a significant mouse population increase. If uncontrolled, this may
in turn affect the composition of plant communities within the reserve, by
preferential seed predation (e.g. of rimu seed), and/or the composition of the
invertebrate community, where large litter-dwelling species are particularly
vulnerable (Ruscoe & Murphy 2005). It is unknown what the true population
potential for mice is at Maungatautari in the absence of any other mammaliam
species, but mice are known to reach plague proportions rapidly when
environmental conditions allow it (Boonstra & Redhead 1994; Choquenot &
Ruscoe 2000). In a plague situation, ecological damage could happen on a
massive scale at Maungatautari. Ultimately, a large population of mice could also
potentially sustain any invading predators, such as stoats (King 2002) and cats
(Fitzgerald & Karl 1979).
Ship rats are likely to offer a similar or even greater threat of invasion than
mice, because of their high activity within the fence hood. It is possible that a
breach may be entered by a single rat only; however, as with mice, a single
pregnant female is sufficient to re-colonise the reserve. It is possible that multiple
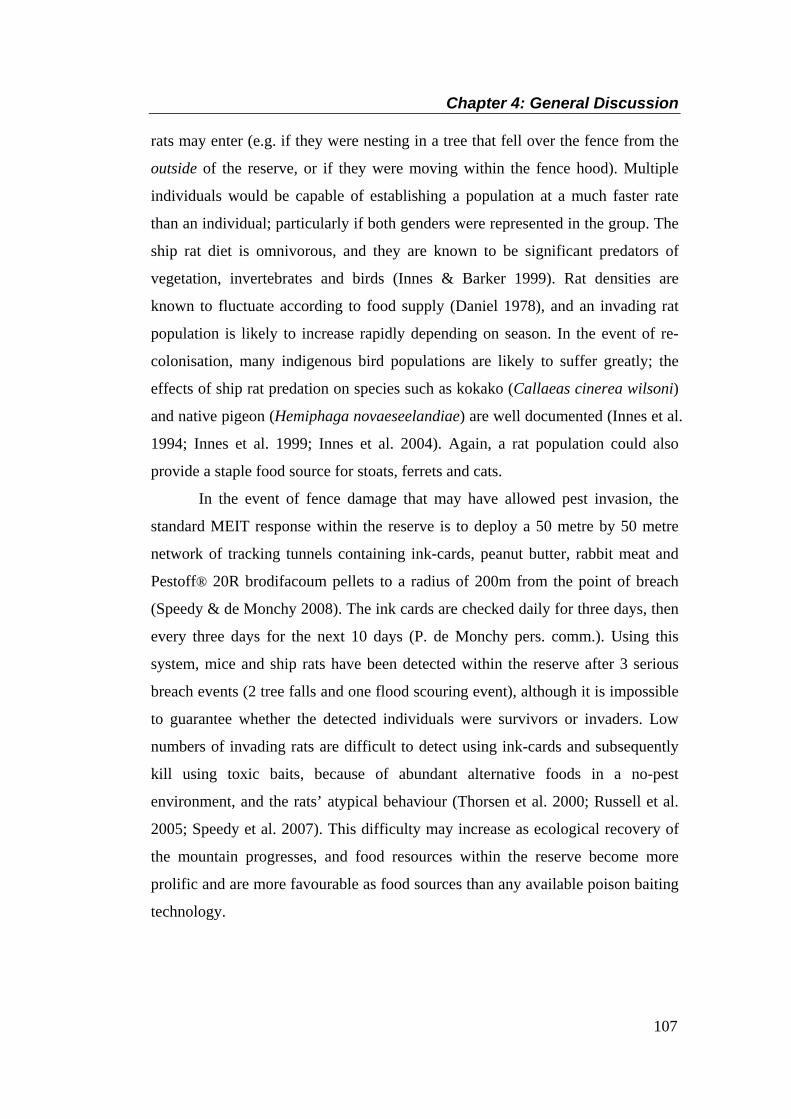
Chapter 4: General Discussion
107
rats may enter (e.g. if they were nesting in a tree that fell over the fence from the
outside of the reserve, or if they were moving within the fence hood). Multiple
individuals would be capable of establishing a population at a much faster rate
than an individual; particularly if both genders were represented in the group. The
ship rat diet is omnivorous, and they are known to be significant predators of
vegetation, invertebrates and birds (Innes & Barker 1999). Rat densities are
known to fluctuate according to food supply (Daniel 1978), and an invading rat
population is likely to increase rapidly depending on season. In the event of re-
colonisation, many indigenous bird populations are likely to suffer greatly; the
effects of ship rat predation on species such as kokako (Callaeas cinerea wilsoni)
and native pigeon (Hemiphaga novaeseelandiae) are well documented (Innes et al.
1994; Innes et al. 1999; Innes et al. 2004). Again, a rat population could also
provide a staple food source for stoats, ferrets and cats.
In the event of fence damage that may have allowed pest invasion, the
standard MEIT response within the reserve is to deploy a 50 metre by 50 metre
network of tracking tunnels containing ink-cards, peanut butter, rabbit meat and
Pestoff® 20R brodifacoum pellets to a radius of 200m from the point of breach
(Speedy & de Monchy 2008). The ink cards are checked daily for three days, then
every three days for the next 10 days (P. de Monchy pers. comm.). Using this
system, mice and ship rats have been detected within the reserve after 3 serious
breach events (2 tree falls and one flood scouring event), although it is impossible
to guarantee whether the detected individuals were survivors or invaders. Low
numbers of invading rats are difficult to detect using ink-cards and subsequently
kill using toxic baits, because of abundant alternative foods in a no-pest
environment, and the rats’ atypical behaviour (Thorsen et al. 2000; Russell et al.
2005; Speedy et al. 2007). This difficulty may increase as ecological recovery of
the mountain progresses, and food resources within the reserve become more
prolific and are more favourable as food sources than any available poison baiting
technology.

Chapter 4: General Discussion
108
Hedgehogs and Possums
The effects of invading hedgehogs and possums are also undesirable.
Insectivorous hedgehogs consume mostly invertebrates, but also lizards, frogs and
the eggs of ground-nesting birds (Jones & Sanders 2005). Hedgehog populations
do not increase as rapidly as those of rodents, although once again, conditions
inside the reserve are likely to be optimal for hedgehog reproduction, depending
on the time of year. Similarly, possums are known to prey on bird eggs and chicks
(Brown et al. 1993; Brown et al. 1998), compete for food resources with species
such as kokako (Leathwick et al. 1983), and significantly affect vegetation
through browsing (Cunningham 1979). When colonising new areas, possum
populations tend to increase slowly but steadily, reach a peak, and then rapidly
decline to stable levels (Pekelharing & Reynolds 1983). However, because of
their slow rate of population increase (by comparison to rodents), possum
incursion probably poses a less urgent threat to the reserve.
In the event of a breach, both hedgehogs and possums may be attracted to
the peanut butter attractant deployed inside the standard tracking tunnels. Possums
are probably more difficult to detect as their size usually excludes them from the
tunnels, and again, both species are likely to become more difficult to detect as
ecological recovery progresses, and food supplies increase. Possums are capable
of climbing to the top of the fence and exiting exclosures and have been observed
to do so at Maungatautari (T. Day unpubl. data); whether invading possums would
emulate Speedy et al’s (2007) ship rats in doing this routinely is unknown. As
hedgehogs cannot readily climb to the top of fences (T. Day unpubl. data), they
are unlikely to exit once fence integrity has been restored.
Lagomorphs
Lagomorphs are less likely to cause serious ecological problems if they re-invade.
Both rabbits and hares occupy open country; rabbits in particular prefer grazed
grassland, and densities are low in wet areas (Gibb et al. 1978; Norbury & Flux
2005; Norbury & Reddiex 2005). Rabbits feed largely on grasses, as do hares,
which may also eat shrubs and tussocks in the winter (Norbury & Flux 2005;
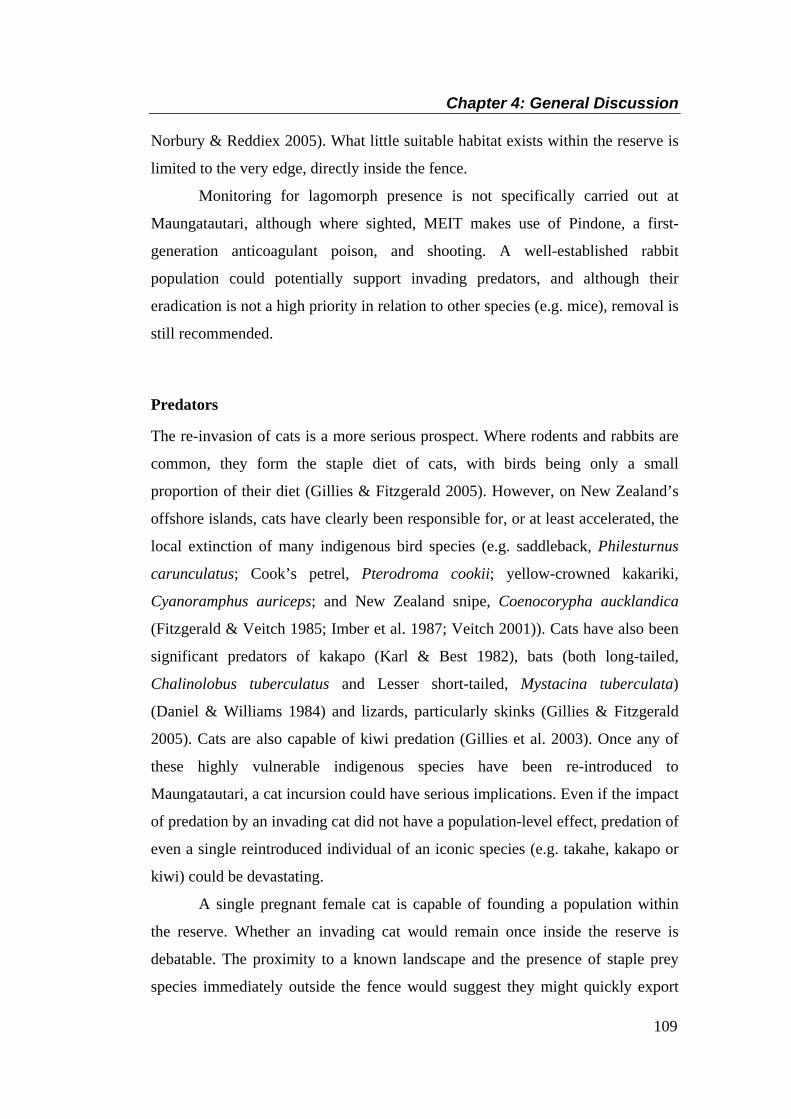
Chapter 4: General Discussion
109
Norbury & Reddiex 2005). What little suitable habitat exists within the reserve is
limited to the very edge, directly inside the fence.
Monitoring for lagomorph presence is not specifically carried out at
Maungatautari, although where sighted, MEIT makes use of Pindone, a first-
generation anticoagulant poison, and shooting. A well-established rabbit
population could potentially support invading predators, and although their
eradication is not a high priority in relation to other species (e.g. mice), removal is
still recommended.
Predators
The re-invasion of cats is a more serious prospect. Where rodents and rabbits are
common, they form the staple diet of cats, with birds being only a small
proportion of their diet (Gillies & Fitzgerald 2005). However, on New Zealand’s
offshore islands, cats have clearly been responsible for, or at least accelerated, the
local extinction of many indigenous bird species (e.g. saddleback, Philesturnus
carunculatus; Cook’s petrel, Pterodroma cookii; yellow-crowned kakariki,
Cyanoramphus auriceps; and New Zealand snipe, Coenocorypha aucklandica
(Fitzgerald & Veitch 1985; Imber et al. 1987; Veitch 2001)). Cats have also been
significant predators of kakapo (Karl & Best 1982), bats (both long-tailed,
Chalinolobus tuberculatus and Lesser short-tailed, Mystacina tuberculata)
(Daniel & Williams 1984) and lizards, particularly skinks (Gillies & Fitzgerald
2005). Cats are also capable of kiwi predation (Gillies et al. 2003). Once any of
these highly vulnerable indigenous species have been re-introduced to
Maungatautari, a cat incursion could have serious implications. Even if the impact
of predation by an invading cat did not have a population-level effect, predation of
even a single reintroduced individual of an iconic species (e.g. takahe, kakapo or
kiwi) could be devastating.
A single pregnant female cat is capable of founding a population within
the reserve. Whether an invading cat would remain once inside the reserve is
debatable. The proximity to a known landscape and the presence of staple prey
species immediately outside the fence would suggest they might quickly export
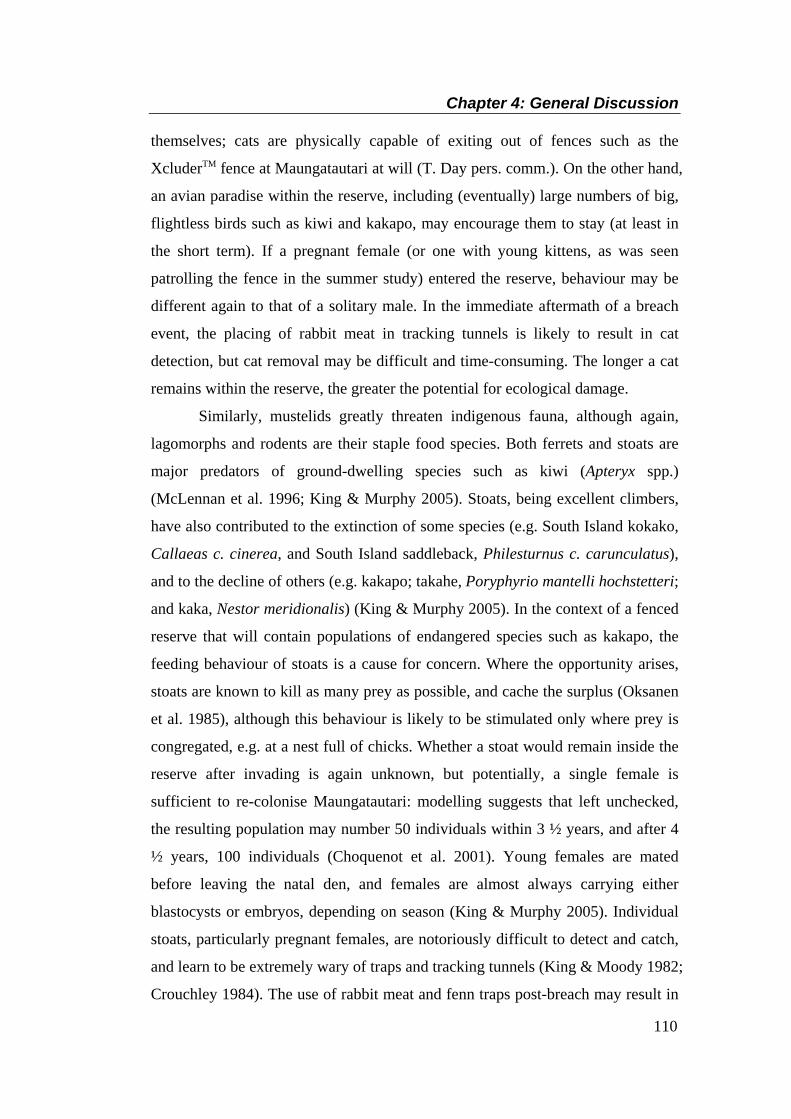
Chapter 4: General Discussion
110
themselves; cats are physically capable of exiting out of fences such as the
XcluderTM fence at Maungatautari at will (T. Day pers. comm.). On the other hand,
an avian paradise within the reserve, including (eventually) large numbers of big,
flightless birds such as kiwi and kakapo, may encourage them to stay (at least in
the short term). If a pregnant female (or one with young kittens, as was seen
patrolling the fence in the summer study) entered the reserve, behaviour may be
different again to that of a solitary male. In the immediate aftermath of a breach
event, the placing of rabbit meat in tracking tunnels is likely to result in cat
detection, but cat removal may be difficult and time-consuming. The longer a cat
remains within the reserve, the greater the potential for ecological damage.
Similarly, mustelids greatly threaten indigenous fauna, although again,
lagomorphs and rodents are their staple food species. Both ferrets and stoats are
major predators of ground-dwelling species such as kiwi (Apteryx spp.)
(McLennan et al. 1996; King & Murphy 2005). Stoats, being excellent climbers,
have also contributed to the extinction of some species (e.g. South Island kokako,
Callaeas c. cinerea, and South Island saddleback, Philesturnus c. carunculatus),
and to the decline of others (e.g. kakapo; takahe, Poryphyrio mantelli hochstetteri;
and kaka, Nestor meridionalis) (King & Murphy 2005). In the context of a fenced
reserve that will contain populations of endangered species such as kakapo, the
feeding behaviour of stoats is a cause for concern. Where the opportunity arises,
stoats are known to kill as many prey as possible, and cache the surplus (Oksanen
et al. 1985), although this behaviour is likely to be stimulated only where prey is
congregated, e.g. at a nest full of chicks. Whether a stoat would remain inside the
reserve after invading is again unknown, but potentially, a single female is
sufficient to re-colonise Maungatautari: modelling suggests that left unchecked,
the resulting population may number 50 individuals within 3 ½ years, and after 4
½ years, 100 individuals (Choquenot et al. 2001). Young females are mated
before leaving the natal den, and females are almost always carrying either
blastocysts or embryos, depending on season (King & Murphy 2005). Individual
stoats, particularly pregnant females, are notoriously difficult to detect and catch,
and learn to be extremely wary of traps and tracking tunnels (King & Moody 1982;
Crouchley 1984). The use of rabbit meat and fenn traps post-breach may result in
Chapter 4: General Discussion
111
detection and destruction of an invading stoat; but if an invader is not immediately
detected, the ecological results could be catastrophic, and removal of the stoat
may be extremely difficult. Although mustelids are far less abundant than other
species at the fenceline, they have the potential to cause major ecological damage
within the reserve in a short space of time, and must be prevented from entering if
at all possible.
RECOMMENDATIONS
Breach Response
This study has confirmed that a) pest mammals are very common directly outside
the fence; b) multiple pest mammals are almost certain to encounter a fence
breach within 24 hours; c) when pests encounter a breach, they are very likely to
show interest and enter; d) the greatest threats of re-invasion come nocturnally,
from rodents, and in the summer; and e) after a breach happens, there is always a
risk of pest exploitation, and that risk is always increasing with every minute that
response is delayed.
Despite the apparent risks, the practical experiences of the MEIT show
that pest invasion can be managed effectively when rapid response is employed,
following standard operating procedures suggested in the MEIT Breach Response
Plan (Speedy & de Monchy 2008). At least 12 significant risk events (1 x vehicle
gate open, 1 x water gate jammed open, 10 x tree falls) were recorded over the
initial three year period from establishment of the 47km of XcluderTM fence. (T.
Day unpublished data, P. de Monchy pers. comm.). These risk events resulted in
three recorded invasions: two events each resulting in a rat detection; one event
resulting in a mouse detection. The detected invaders were removed in all three
cases (as evidenced by animal capture and subsequent cessation of animal
tracking). On all three occasions where invasion resulted, there was a significant
time delay (between 6 and 24 hours) between the fence compromise and staff
being able to repair the breach. In contrast, rapid response to the other nine
breaches resulted in no detected animal invasions (Day & MacGibbon 2007). This
Chapter 4: General Discussion
112
knowledge has resulted in the MEIT currently attempting to physically respond to
any alarm notifications of breaches within 90 minutes (P. de Monchy pers. comm.)
The establishment of a pest control ‘buffer zone’ around the fenceline has
been suggested to reduce pest numbers in the vicinity of the fence, and thus
reduce the risk of pests encountering a fence breach. The costs involved in setting
up and maintaining such a regime would be high. Many hours of labour would be
needed to carry out the programme, and MEIT presence on adjoining landowners’
properties would significantly increase (Speedy 2008). The effectiveness of such a
programme in terms of reducing the risk of breach discovery by pests is debatable;
indeed, the programme may even have the effect of increasing the risk, through
the inevitable influx of naïve migrating mammals into the buffer zone, constantly
testing the fence as a barrier to movement. A buffer zone cannot guarantee the
removal of every pest, and therefore cannot remove the risk, the need for
immediate breach response, and the need for effective monitoring following a
breach (Speedy 2008). In addition, a buffer programme that relies on the
continued use of toxins and traps (tools that would normally be used to manage a
pest invasion inside the fence) may significantly reduce the efficacy of those tools
due to animal habituation, behaviour or physiological resistance or learned
avoidance (Speedy 2008; T. Day pers. comm.).
For these reasons, it is vital that the Trust:
1) continues to use a remote monitoring system that can alert project
managers to real-time compromises in fence integrity;
2) continues to physically inspect the integrity of the fence on an ongoing
basis to ensure breaches that cannot be detected remotely are found in as
shorter timeframe as possible;
3) continues to physically respond to notifications of fence breach as quickly
as possible, especially during the hours of darkness;
4) continues to repair fence integrity breaches as soon as practically possible
and (because invasion risk is NEVER zero) always implements an invader
detection and control regime after a fence breach;
5) acknowledges that a significant delay in response is almost certain to
result in multiple pest mammals re-entering the reserve.
Chapter 4: General Discussion
113
Future Research
There is room for a great deal of research on mammalian pests in relation to their
behaviour around the pest-proof fence at Maungatautari. I concur with the
recommendations of Speedy (2008), and strongly urge that research be continued
into the following questions, in order of priority:
1. How do mammals behave once they have re-invaded the reserve?
Particular focus should be on the invasion behaviour of ship rats and
mustelids (especially stoats); these pose the most significant threats to the
reserve. The current study has further confirmed that pest mammals (of
many species) will at some point enter the reserve, and knowledge of
resulting behaviour is vital. The ‘invader’ study described by Speedy et al.
(2007) should be expanded to all pest species, and many scenarios could
be investigated, e.g. multiple individuals, one gender only, both genders,
dispersing juveniles, pregnant females etc. Difficulties may arise in
ensuring the integrity of the reserve, but the knowledge gained would be
immensely valuable for managers, and could allow more efficient and
accurate breach response procedures to be developed.
2. What is the behaviour of pest mammals at ‘real’ fence breaches? Do they
enter, or does (e.g.) a large fallen tree deter them? In this study, it is likely
that the presence of a cage deterred (or attracted) individuals of some
species, e.g. possums and cats; however they commonly showed interest.
The behaviour of all species should be investigated at breaches such as
large tree-falls, which are physically quite different from those simulated
in this study. This question is more difficult and more expensive to answer,
and a purpose-built exclosure might be required. Difficulties include the
need to duplicate a real event: a captive animal’s motivation to escape an
enclosure would probably be quite different to that of a non-captive animal
that merely had an option to enter an exclosure.

Chapter 4: General Discussion
114
Less vital research could be carried out to answer the following questions:
3. How far do ship rats range within the fence hood, and will this behaviour
channel them directly to a fence breach?
4. How do pest mammals use the fenceline? In particular, do individual cats
and mustelids ‘patrol’ the roadway, or are visits intermittent? Is there
significantly more mustelid activity directly beyond the road edge?
5. Are cats at the fenceline feral, or domestic? Many farmhouses lie within 1
km of the fence. This may have implications if the MEIT were to
implement a ‘buffer’ pest control zone around the fenceline.
SUMMARY
The vision of the Maungatautari Ecological Island Trust is “To remove forever,
introduced pests and predators from Maungatautari, and restore to the forest a
healthy diversity of indigenous plants and animals not seen in our lifetime”
(McQueen 2004). The Trust’s vision depends entirely on maintaining the integrity
of the Maungatautari pest-proof fence. This study has confirmed that mammalian
pests are consistently present directly outside the Maungatautari pest-proof fence.
Fence breaches are highly likely to be encountered by pests within 24 hours, and
when encountered, are highly likely to be exploited. Rodents are most likely to
enter a fence breach in either summer or winter, but all other species (hedgehogs,
possums, rabbits, hares, cats, ferrets and stoats) have been seen to show interest or
enter simulated breaches also. While an immediate response appears to be
effective for minimising pest invasion risk in practice, a delayed breach response
is very likely to result in increasing numbers of pests encountering and entering
the breach.
I recommend that the Maungatautari Ecological Island Trust continue to
respond to a fence breach as quickly as possible. I strongly suggest that further
Chapter 4: General Discussion
115
research should be undertaken on the behaviour of individual pest mammal
invaders (particularly ship rats and mustelids) within the reserve, and of all
species at actual breach events, particularly at tree-falls. This information is vital
to the continuing improvement of breach response procedures, and to the long-
term viability of Maungatautari Ecological Island.
Chapter 4: General Discussion
116
REFERENCES
Beveridge AE 1964. Dispersal and destruction of seed in central North Island
podocarp forests. Proceedings of the New Zealand Ecological Society 11: 48-55.
Boonstra R, Redhead T 1994. Population Dynamics of an Outbreak Population of House Mice (Mus domesticus) in the Irrigated Rice-Growing Area of Australia. Wildlife Research 21: 583-598.
Brown KP, Innes J, Shorten R 1993. Evidence that possums prey on and scavenge birds' eggs, birds and mammals. Notornis 40(3): 169-177.
Brown KP, Moller H, Innes J, Jansen P 1998. Identifying predators at nests of small birds in a New Zealand forest. Ibis 140: 274-279.
Choquenot D, Ruscoe WA 2000. Mouse population eruptions in New Zealand forests: the role of population density and seedfall. Journal of Animal Ecology 68: 1058-1070.
Choquenot D, Ruscoe WA, Murphy E 2001. Colonisation of new areas by stoats: time to establishment and requirements for detection. New Zealand Journal of Ecology 25(1): 83-88.
Crouchley D 1984. Stoat control on Maud Island 1982 - 1993. New Zealand Journal of Zoology 2: 39-45.
Cunningham A 1979. A century of change in the forests of the Ruahine Range, North Island, New Zealand. New Zealand Journal of Ecology 2: 11-21.
Daniel MJ 1978. Population ecology of ship and Norway rats in New Zealand. In: Dingwall PR, Atkinson IAE, Hay C ed. The Ecology and Control of Rodents in New Zealand Nature Reserves. Wellington, NZ Department of Lands and Survey.
Daniel MJ, Williams GR 1984. A survey of the distribution, seasonal activity and roost sites of New Zealand bats. New Zealand Journal of Ecology 7: 9-25.
Day TD, MacGibbon RJ 2007. Multiple-species exclusion fencing and technology for mainland sites. Proceedings of the Managing Vertebrate Invasive Species International Symposium, Colorado.
Fitzgerald BM, Karl BJ 1979. Foods of feral house cats (Felis catus L.) in forest of the Orongorongo Valley, Wellington. New Zealand Journal of Zoology 6: 107-126.

Chapter 4: General Discussion
117
Fitzgerald BM, Veitch CR 1985. The cats of Herekopare Island, New Zealand: their history, ecology and effects on birdlife. New Zealand Journal of Zoology 12: 319-330.
Gibb JA, Ward CP, Ward GD 1978. Natural control of a population of rabbits, Oryctolagus cuniculus (L.), for ten years in the Kourarau enclosure. DSIR Bulletin 223: 1-89.
Gillies C, Fitzgerald BM 2005. Feral Cat. In: King CM ed. The Handbook of New Zealand Mammals. Melbourne, Oxford University Press. Pp. 308-326.
Gillies CA, Leach MR, Coad NB, Theobald SW, Campbell J, Herbert T, Graham PJ, Pierce RJ 2003. Six years of intensive pest mammal control at Trounson Kauri Park, a Department of Conservation "mainland island", June 1996-July 2002. New Zealand Journal of Zoology 30: 399-420.
Imber MJ, West JA, Cooper WJ 1987. Cook's petrel (Pterodroma cookii): historic distribution, breeding biology and effects of predators. Notornis 50: 221-230.
Innes J, Barker G 1999. Ecological consequences of toxin use for mammalian pest control in New Zealand - an overview. New Zealand Journal of Ecology 23(2): 111-127.
Innes J, Crook B, Jansen P 1994. A time-lapse video camera system for detecting predators at nests of forest birds: a trial with North Island kokako. Proceedings of the Resource Technology 1994 Conference, University of Melbourne.
Innes J, Nugent G, Prime K, Spurr EB 2004. Responses of kukupa (Hemiphaga novaeseelandiae) and other birds to mammal pest control at Motatau, Northland. New Zealand Journal of Ecology 28(1): 73-81.
Innes J, Hay R, Flux M, Bradfield P, Speed H, Jansen P 1999. Successful recovery of North Island kokako Callaeas cinerea wilsoni populations, by adaptive management. Biological Conservation 87: 201-214.
Jones C, Sanders MD 2005. European Hedgehog. In: King CM ed. The Handbook of New Zealand Mammals. Melbourne, Oxford University Press. Pp. 81-94.
Karl BJ, Best HA 1982. Feral cats on Stewart Island; their foods, and their effects on kakapo. New Zealand Journal of Zoology 9: 287-294.
King CM 2002. Cohort variation in the life-history parameters of stoats Mustela erminea in relation to fluctuating food resources: a challenge to boreal ecologists. Acta Theriologica 47(3): 225-244.
Chapter 4: General Discussion
118
King CM, Moody JE 1982. The biology of the stoat (Mustela erminea) in the national parks of New Zealand. New Zealand Journal of Zoology 9: 49-144.
King CM, Murphy EC 2005. Stoat. In: King CM ed. The Handbook of New Zealand Mammals. Melbourne, Oxford University Press. Pp. 261-287.
Leathwick JR, Hay JR, Fitzgerald AE 1983. The influence of browsing by introduced mammals on the decline of the North Island kokako New Zealand Journal of Ecology 6: 55-70.
McLennan JA, Potter MA, Robertson HA, Wake GC, Colbourne R, Dew L, Joyce L, McCann AJ, Miles AJ, Miller PJ and others 1996. Role of predation in the decline of kiwi, Apteryx spp., in New Zealand. New Zealand Journal of Ecology 20: 27-35.
McQueen J ed. 2004. An Ecological Restoration Plan for Maungatautari. Cambridge, Maungatautari Ecological Island Trust.
Norbury GL, Flux JEC 2005. Brown hare. In: King CM ed. The Handbook of New Zealand Mammals. Melbourne, Oxford University Press. Pp. 151-158.
Norbury GL, Reddiex B 2005. European rabbit. In: King CM ed. The Handbook of New Zealand Mammals. Melbourne, Oxford University Press. Pp. 131-150.
Oksanen T, Oksanen L, Fretwell SD 1985. Surplus killing in the hunting strategy of small predators. The American Naturalist 126: 328-346.
Pekelharing CJ, Reynolds RN 1983. Distribution and abundance of browsing mammals in Westland National Park in 1978, and some observations on their impact on the vegetation. New Zealand Journal of Forestry Science 13: 247-265.
Ruscoe WA, Murphy EC 2005. House mouse. In: King CM ed. The Handbook of New Zealand Mammals. Melbourne, Oxford University Press. Pp. 204-221.
Ruscoe WA, Choquenot D, Heyward RP, Yockney I, Young N, Drew K 2003. Seed production, predators and house mouse population eruptions in New Zealand beech forests. In: Singleton GR, Hinds LA, Krebs CJ, Spratt DM ed. Rats, Mice and People: Rodent Biology and Management. Canberra, ACIAR. Pp. 334-337.
Russell JC, Towns DR, Anderson SH, Clout MN 2005. Intercepting the first rat ashore. Nature 437: 1107.
Chapter 4: General Discussion
119
Speedy C 2008. Buffer pest control around the outside perimeter of the Maungatautari Reserve. Cambridge, Maungatautari Ecological Island Trust.
Speedy C, de Monchy P 2008. Managing Animal Pest Invasion into the Maungatautari Ecological Island Enclosures. Cambridge, Maungatautari Ecological Island Trust.
Speedy C, Day TD, Innes J 2007. Pest eradication technology - the critical partner to pest exclusion technology: The Maungatautari experience. Proceedings of the Managing Vertebrate Invasive Species International Symposium, Colorado.
Thorsen M, Shorten R, Lucking R, Lucking V 2000. Norway rats (Rattus norvegicus) on Frégate Island, Seychelles: the invasion; subsequent eradication attempts and implications for the island's fauna. Biological Conservation 96: 133-138.
Veitch CR 2001. The eradication of feral cats (Felis catus) from Little Barrier Island, New Zealand. New Zealand Journal of Zoology 28: 1-12.